The Development of Non-Cognitive Skills in Adolescence
20
Universität Zürich IBW – Institut für Betriebswirtschaftslehre Working Paper No. 138 The Development of Non-Cognitive Skills in Adolescence Peter Hoeschler, Simone Balestra and Uschi Backes-Gellner
Transcript of The Development of Non-Cognitive Skills in Adolescence
UniversitätZürichIBW–InstitutfürBetriebswirtschaftslehre
Working Paper No. 138 The Development of Non-Cognitive Skills in Adolescence
Peter Hoeschler, Simone Balestra and Uschi Backes-Gellner
October 2017
Die Discussion Papers dienen einer möglichst schnellen Verbreitung von neueren Forschungsarbeiten des Leading Houses und seiner Konferenzen und Workshops. Die Beiträge liegen in alleiniger Verantwortung der
Autoren und stellen nicht notwendigerweise die Meinung des Leading House dar.
Disussion Papers are intended to make results of the Leading House research or its conferences and workshops promptly available to other economists in order to encourage discussion and suggestions for revisions. The
authors are solely responsible for the contents which do not necessarily represent the opinion of the Leading House.
The Swiss Leading House on Economics of Education, Firm Behavior and Training Policies is a Research Program of the Swiss State Secretariat for Education, Research, and Innovation (SERI).
www.economics-of-education.ch
Working Paper No. 138 The Development of Non-Cognitive Skills in Adolescence
Peter Hoeschler, Simone Balestra and Uschi Backes-Gellner
Published as: "The Development of Non-Cognitive Skills in Adolescence." Economics Letters, 163 (2018): 40–45. By Peter Hoeschler, Simone Balestra and Uschi Backes-Gellner. DOI: https://doi.org/10.1016/j.econlet.2017.11.012
The Development of Non-Cognitive Skills in Adolescence
⇤
Peter Hoeschler†, Simone Balestra‡, and Uschi Backes-Gellner§
October 30, 2017
Abstract
We use a unique longitudinal data set to study the development of non-cognitive skills in ado-lescence. We measure—for the first time—the development over six years of the recently introducednon-cognitive skill “Grit.” We also measure the traditional Big Five personality traits. For Grit,we find significant within-person mean-level increases of about .5 standard deviation units for oursample of adolescent students. These increases are comparable with increases in the Big Five, whereconscientiousness, agreeableness, and emotional stability also increase with similar magnitude. Weshow that these changes are heterogeneous and robust to reasonable measurement error.
Keywords: non-cognitive skills, Grit, Big Five personality traits, vocational education and training.
JEL Classification: I21, I26, J24.
⇤ We would like to thank Eric Bettinger, Thomas Dohmen, Edward Lazear, Ofer Malamud, Simon Janssen, Carmit Segal,seminar participants at the University of Zurich, participants of the Meeting of the Economics of Education Association,and of the Fall Research Conference of the Association for Public Policy Analysis and Management for helpful comments.This study is partly funded by the Swiss Federal O�ce for Professional Education and Technology through its LeadingHouse on the Economics of Education, Firm Behavior and Training Policies. Peter Hoeschler benefited from a grantprovided by the Swiss National Science Foundation for a research stay at the University of Chicago Harris School of PublicPolicy (project P1ZHP1-161627), and is grateful to his colleagues at Harris for their great inspiration and support.
† Corresponding author: University of Zurich, Switzerland. Telephone: +4144 634 42 74; e-mail: [email protected]. Address: Plattenstrasse 14, CH-8032 Zurich, Switzerland.
‡ University of St. Gallen, Switzerland. Telephone: +4171 224 23 18; e-mail: [email protected]. Address:Rosenbergstrasse 51, CH-9000 St. Gallen, Switzerland.
§ University of Zurich, Switzerland. Telephone: +4144 634 42 81; e-mail: [email protected]. Address:Plattenstrasse 14, CH-8032 Zurich, Switzerland.
1 Introduction
Economists recognize the importance of non-cognitive skills for individuals’ economic behavior and their
labor market outcomes (Heckman, Stixrud, & Urzua, 2006), a recognition that has led researchers to
investigate the formation and stability of non-cognitive skills. While most of the literature suggests
that non-cognitive skills are stable during adulthood (Cobb-Clark & Schurer, 2012), there is hardly any
evidence on the formation and malleability of these skills during adolescence. This lack of research is
surprising, because many personality traits appear responsive to policy interventions and educational
investments (Almlund, Duckworth, Heckman, & Kautz, 2011). However, measurement issues and the
lack of high-quality data have prevented researchers from providing definitive answers. Our paper
intends to fill this research gap.
We use unique panel data that measures adolescents’ non-cognitive skills with well-established
multiple-question inventories to study the formation and malleability of non-cognitive skills. We fo-
cus on two types of non-cognitive skills: Grit (i.e., the perseverance and passion for long-term goals)
and the Big Five personality traits (i.e., conscientiousness, extraversion, agreeableness, openness, and
emotional stability). While studying the Big Five has a long tradition in economics and psychology,
research on Grit started only in 2007 with the establishment of a reliable scale (Duckworth, Peterson,
Matthews, & Kelly, 2007). Grit has attracted researchers’ interest, because studies have shown it to be
highly predictive of labor market success as well as of other life outcomes (Eskreis-Winkler, Shulman,
Beal, & Duckworth, 2014). As early as 2009 we have started a longitudinal data set that allows us to
study the development of Grit among adolescents over a six-year period. In our analysis, we focus on
the development of Grit and compare it to the development of the Big Five.
The present study contributes to the literature by answering the following three questions: (1)
Do Grit and the Big Five change during adolescence? (2) Are changes in these non-cognitive skills
heterogeneous across individuals? (3) How much of the change is reliable under reasonable assumptions
on measurement error?
2 Research Design
To study the development of non-cognitive skills during adolescence, we use a unique panel data set,
which provides us with repeated measures of Grit and the Big Five.1 We derive the measures of non-
cognitive skills from standard multiple-question inventories. For Grit, we use the 8-item Grit scale, a
highly e�cient full-sentence questionnaire developed in Duckworth and Quinn (2009).2 To the best of
our knowledge, ours is the first data set that provides repeated Grit measures over a period spanning
1For a detailed description of the data see Oswald and Backes-Gellner (2014), who use early waves of the data to investigatethe education production of grades.
2Grit, however, while characterizing the passion for long-term goals, is not merely a measure of time preferences: thecorrelation between the Grit measure and experimentally elicited time preferences in our data is only .1.
1
several years, and, therefore, is the first that allows to study the development of Grit over such a long
time span and for adolescents.
For the Big Five, we use the established 3-items-per-trait scale, based on the original Big Five
Inventory (BFI) scale and further developed in Gerlitz and Schupp (2005). To assess the Big Five,
the BFI scale uses short-sentence questions, which John, Naumann, and Soto (2008) argue are less
ambiguous and provide more consistent answers than the frequently used sets of adjectives (e.g., in
Cobb-Clark & Schurer, 2012, and, Elkins, Kassenboehmer, & Schurer, 2016).
We use a sample of adolescents because psychologists, who have intensively studied the development
of personality over the life span (Costa & McCrae, 1994; Roberts, Walton, & Viechtbauer, 2015), suggest
that adolescence is a critical phase in that development. During adolescence, individuals are usually
enrolled in educational programs. Therefore, when studying the development of non-cognitive skills
during adolescence, we have to take education into account.
A natural place to start studying the development of non-cognitive skills is vocational education
and training (VET). VET has at least three characteristics that may foster the e↵ective development of
non-cognitive skills in adolescence: it is well-structured, provides close mentoring, and has labor-market
proximity (Heckman & Mosso, 2014; Kautz, Heckman, Diris, ter Weel, & Borghans, 2014). Moreover,
VET is the main path of education in many parts of western Europe and is becoming increasingly
important in the UK and the U.S. We use a sample of adolescents who were enrolled in a VET program
in Switzerland, a country where 70 percent of every cohort choose VET (Ho↵man & Schwartz, 2015).
The program, which starts around age 16, lasts three to four years and combines one to two days per
week of classroom learning in a vocational school with workplace-based training in a host company
(Wolter & Ryan, 2011).
We collected baseline measures at age 15-16 and final outcomes at age 21-22. The initial sample in
2009 consisted of 265 individuals, of which 255 provided measures of non-cognitive skills. In the final
wave, six years later, 159 individuals responded to our survey e↵orts (via e-mails, letters, phone calls,
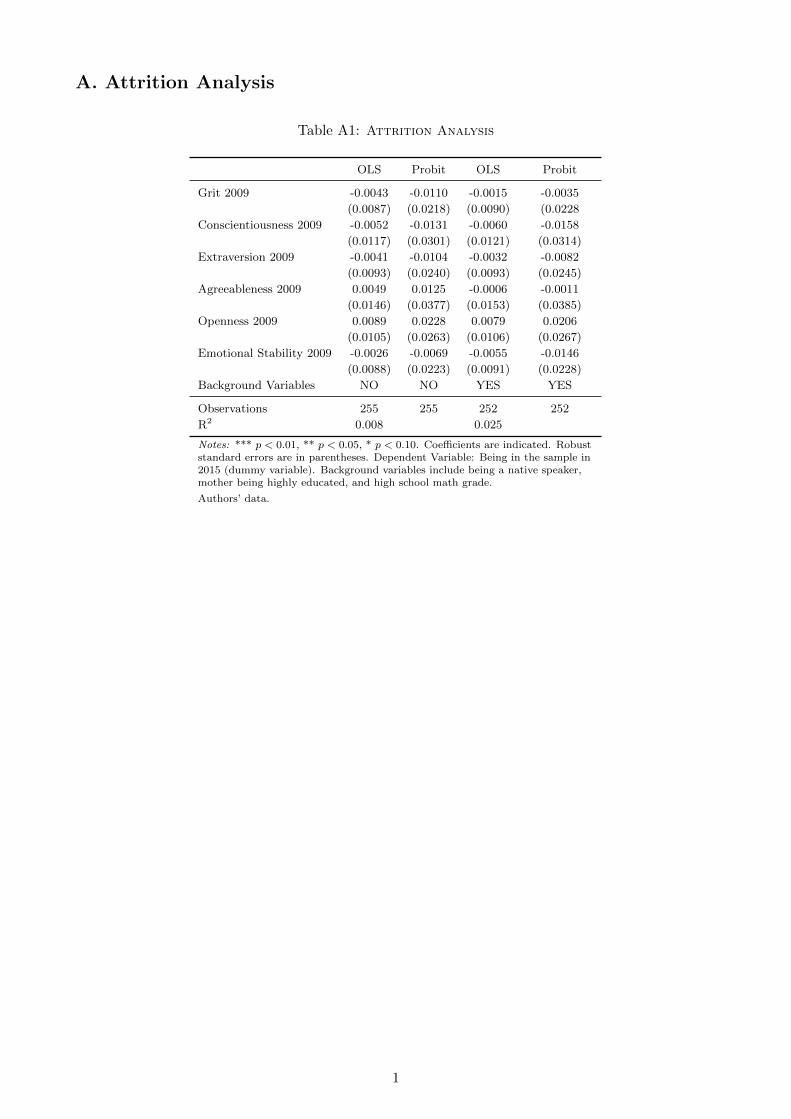
and social media) and 153 individuals provided measures of non-cognitive skills. The overall attrition is
40 percent and is unrelated to baseline non-cognitive skills and various background variables (see table
A1 in the online appendix). Given that we focus on changes over time, we base all our analyses on the
subsample of individuals with valid measures of non-cognitive skills at both points in time.
3 Results
3.1 Average Within-Person Changes
To examine our group of individuals over time, we start by investigating average within-person changes.
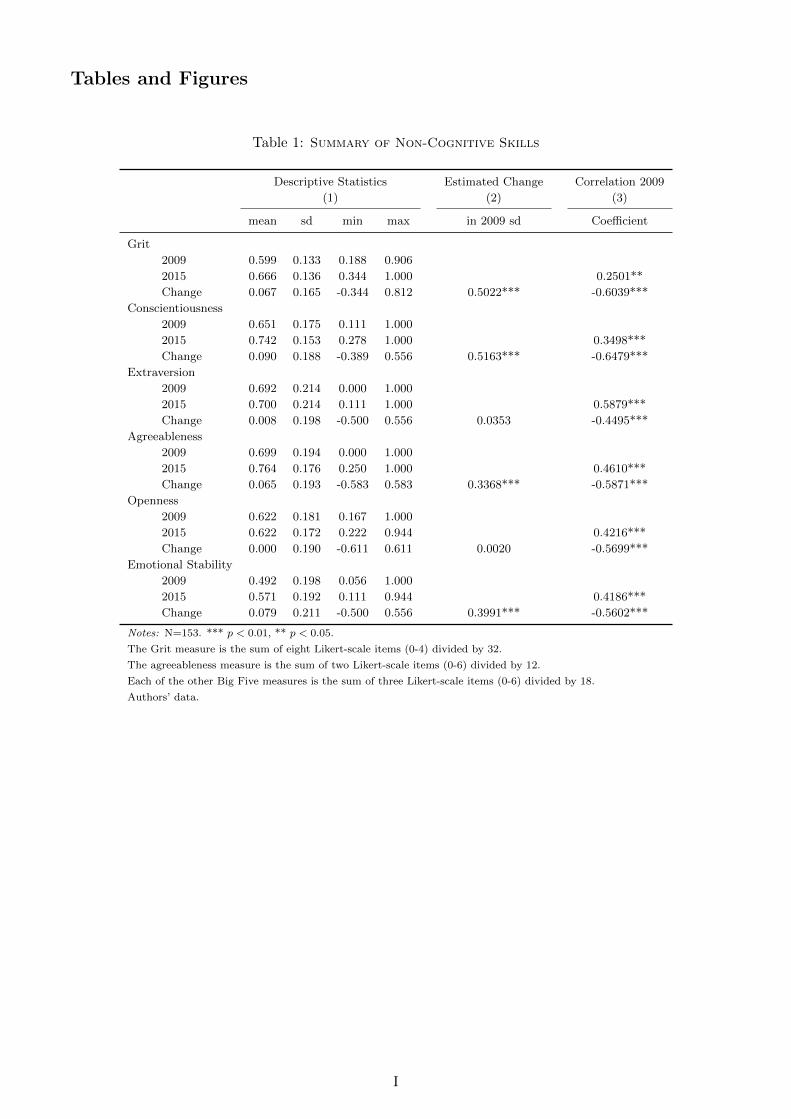
Table 1, column 1 provides means and standard deviations for the baseline score, the final score, and the
within-person change over time. We estimate a significant average increase for Grit of about .5 standard
2
deviation units of the baseline score (table 1, column 2). For the Big Five, we estimate similar significant
increases for conscientiousness and—to a lesser extent—for agreeableness and emotional stability.
[ Table 1 here ]
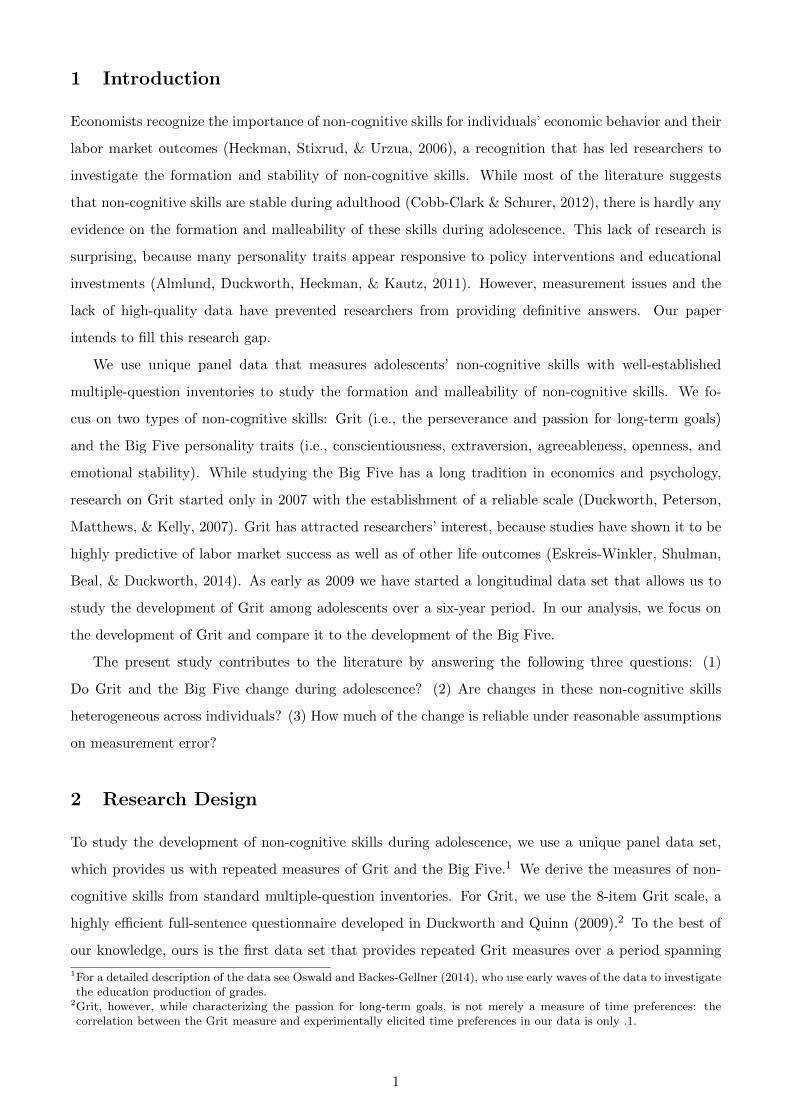
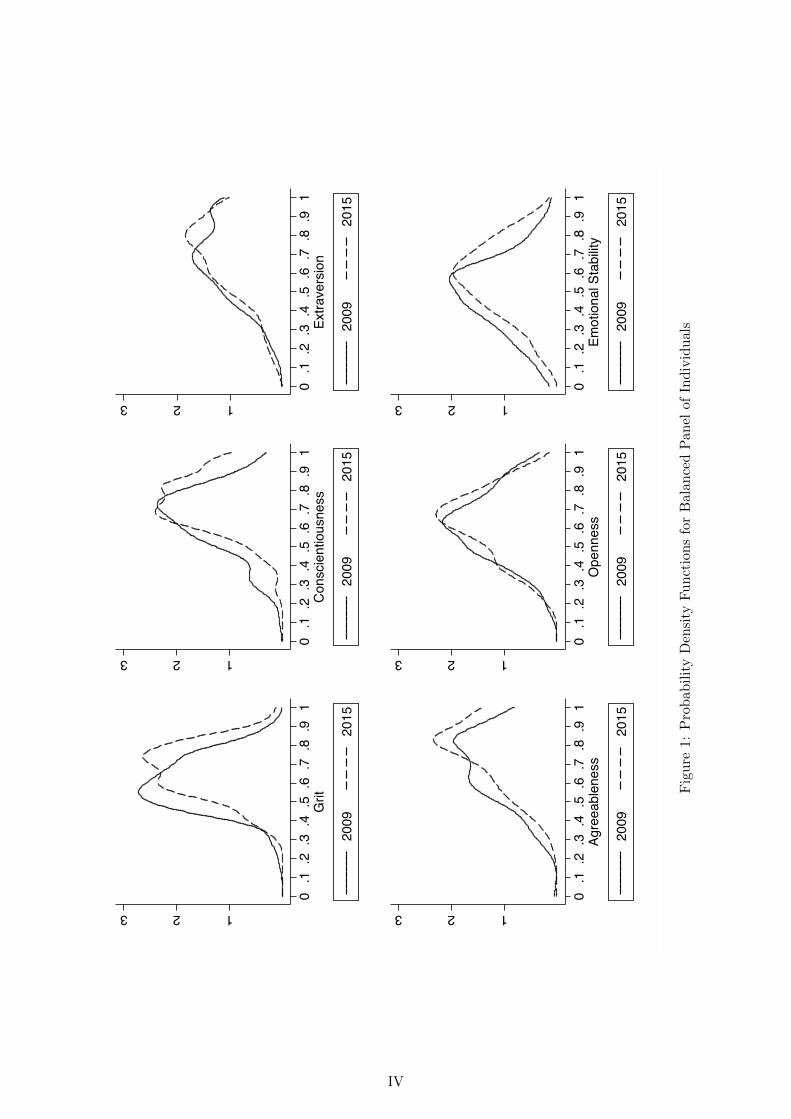
Moving towards a distributional analysis, Figure 1 depicts the probability density functions at the
two points in time (2009 and 2015). For Grit, Figure 1 shows that the mean-level increase is the result
of a parallel shift of the distribution to the right. These developments could be the result from either of
two mechanisms: first, a homogeneous increase (i.e., each individual develops in the same positive way)
or, second, heterogeneous changes over time (i.e., individuals experience both positive and negative
changes, with the positive outweighing the negative on average). For the Big Five, we observe similar
developments for conscientiousness, agreeableness, and emotional stability.
[ Figure 1 here ]
By investigating the first potential mechanism, we find that the mean-level changes are not the
same for all individuals. Although the mean-level change in Grit is sizable, the two scores over time
appear only loosely correlated at .3 (table 1, column 3).3 For the three Big Five traits with significant
mean-level changes, we find very similar results (table 1, column 3). Moreover, while openness shows
no mean-level change, it appears to be unstable at the individual level (table 1, column 3). In sum,
Grit and some of the Big Five, primarily conscientiousness and—to a lesser extent—agreeableness and
emotional stability are unstable during adolescence, with significant average within-person increases.
This changes cannot be explained entirely by the correlation between the measures over time, leaving us
with the second explanation: individuals experience heterogeneous changes over time. We investigate
this hypothesis in the next section.
3.2 Heterogeneous Within-Person Changes
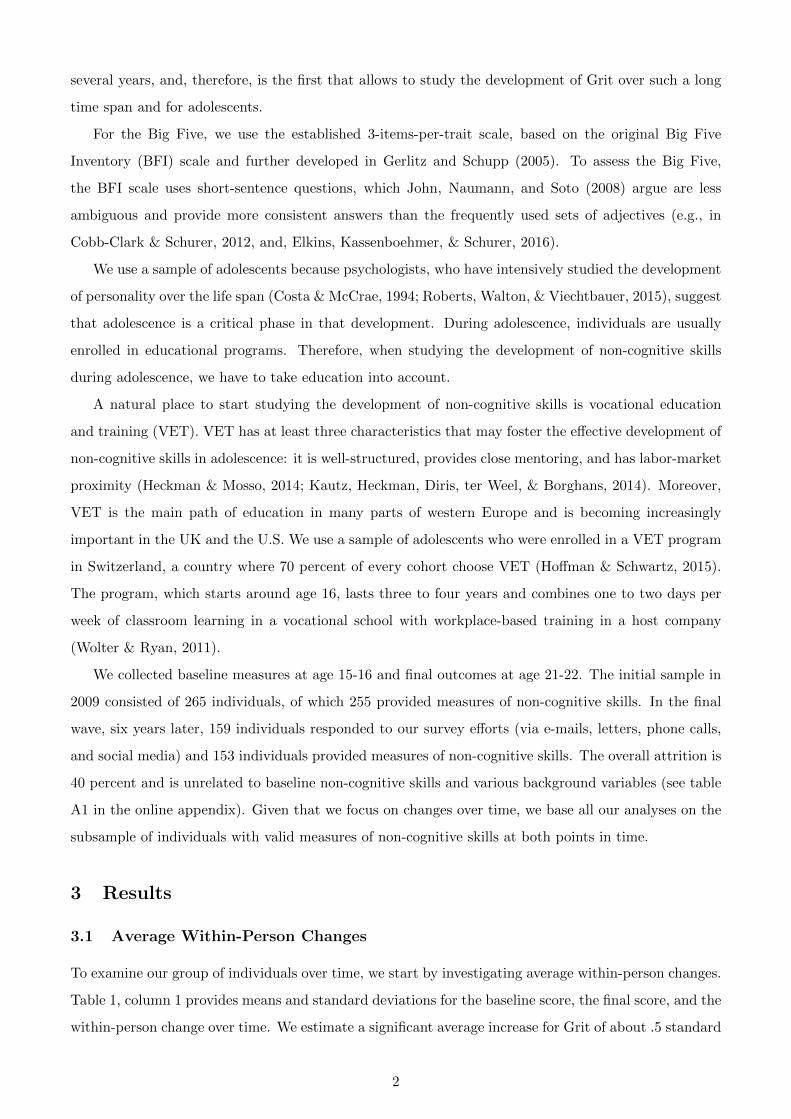
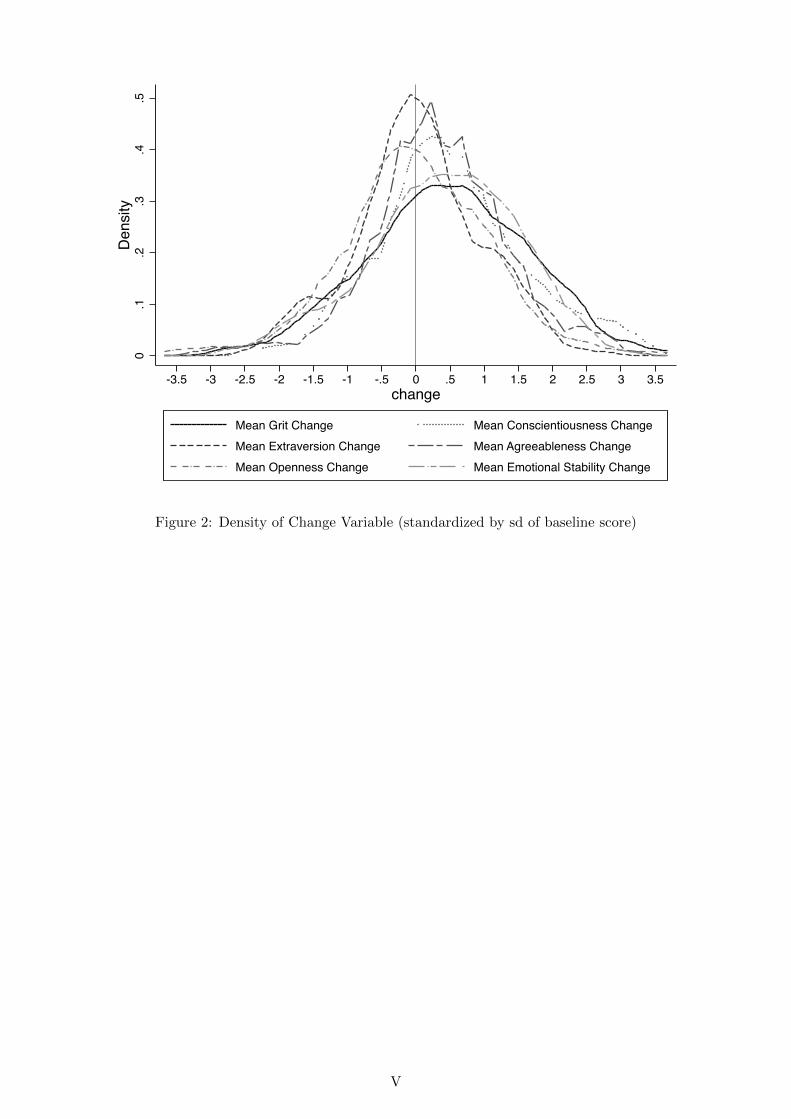
To investigate the heterogeneity in within-person changes, we depict the density functions of the within-
person changes over time in Figure 2. For Grit, we clearly find that the development is heterogeneous
during adolescence. Although the density mass of the changes is positive, some individuals show negative
growth in Grit. While this general pattern also holds for the Big Five, the distribution of Grit change
shows fatter tails. Grit thus appears to develop even more heterogeneously than the Big Five.
[ Figure 2 here ]
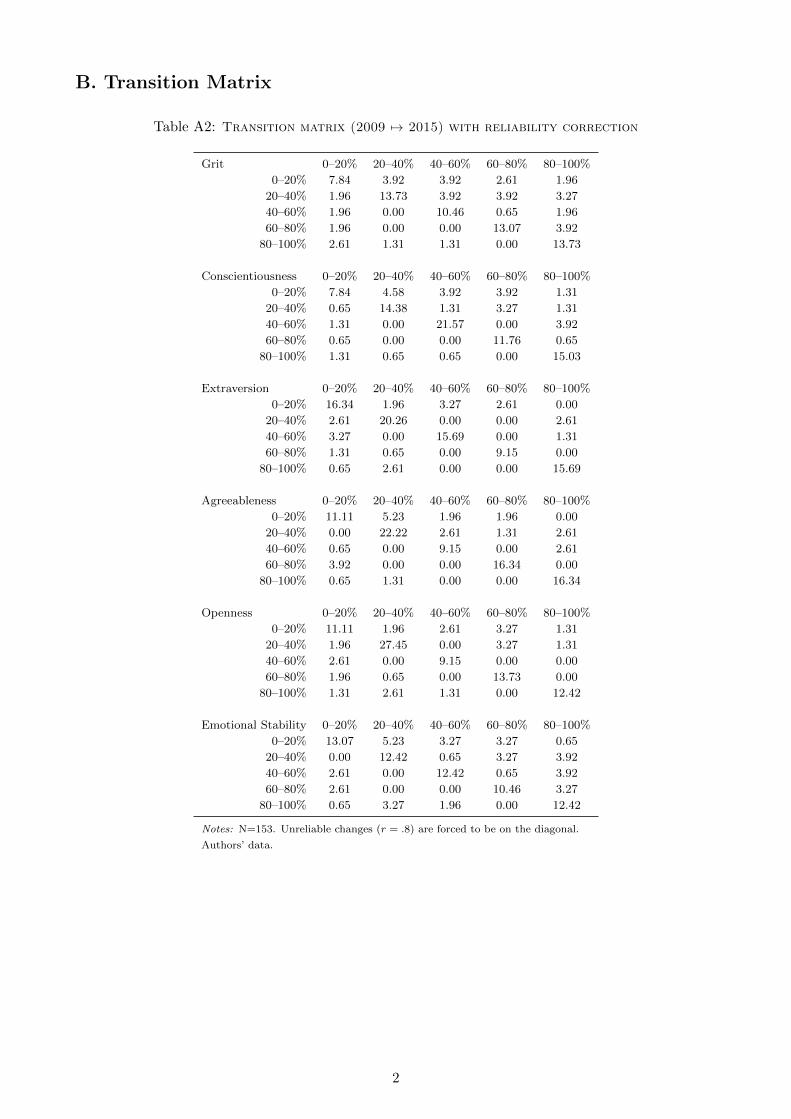
Another way to investigate the heterogeneity in changes is by using a transition matrix. Table 2
presents the transition matrix between 2009 and 2015 for the ranges of percentiles 0-20%, 20-40%, 40-
60%, 60-80%, and 80-100%. For Grit, this matrix shows that a substantial share of individuals changes
3Rank correlations over time are close in magnitude to the correlation coe�cients in Table 1, column 3.
3
the position in the distribution. About 73 percent of the individuals are o↵ the diagonal, i.e., they are
in di↵erent quintiles of the distribution at the two points in time. Moreover, we observe that almost
all cells are filled, suggesting that individuals move quite heterogeneously. For the Big Five, we find
similar results.
[ Table 2 here ]
The heterogeneous development of non-cognitive skills could be partly—or, in the worst case,
entirely—explained by measurement error. Given our sample size, this is a potential threat and the
next section tests the robustness of out results with respect to measurement error.
3.3 Measurement Error and Reliability of Changes
A major issue when investigating changes in skills over time is measurement error. One might think that
the early score is correct, the real score is stable, and all change over time is just measurement error. Even
more detrimental, both scores might be measured with error. Because measurement error is a serious
problem particularly in small samples, we need to know if our results are purely driven by noise and how
much of the change is actually reliable. To deal with measurement error issues, we use a “reliable change
index,” which accounts for reasonable levels of measurement error, to investigate average changes, and,
further add noise to Figure 2 (previously discussed) to investigate the heterogeneous changes.
To understand how much of the observed change is reliable, we borrow from the clinical literature and
estimate reliable change indexes. Jacobson and Truax (1991) define a reliable change index (RC), which
corrects any observed change for a reliability coe�cient (r).4 If the scale produces only measurement
error, r will be equal to 0 and no reliable changes would exist. On the contrary, when the scale entails
no measurement error at all, r will be equal to 1 and all changes would be reliable. We follow the
approach by Jacobson and Truax (1991) and rely on typical reliability coe�cients which range around
.8 (John et al., 2008).
We find that for Grit 30-40 percent of the individuals change in a reliable way, either positively
or negatively. Even in our most conservative specification (r = .7), at least 23 percent of the sample
actually experience a reliable increase (table 3). We also find substantial shares of individuals with
reliable increases for conscientiousness, agreeableness, and emotional stability (table 3).
[ Table 3 here ]
The intuition behind the RC index is that small changes in non-cognitive skills are likely measure-
ment error and thus are unreliable. However, assuming that all small changes are unreliable and setting
them to zero would have no strong e↵ect on the heterogeneity of changes. We can instead obtain a
4RC = x2�x1p2(s1
p
1�r)2, with s1 being the standard deviation of the baseline score. We test RC = 0 with a t-test.
4
graphical representation of the impact of measurement error on the full distribution of changes by sim-
ulating counterfactual distributions of changes under di↵erent levels of error in the data. To do so, we
duplicate our initial data set 1,000 times and, in each duplication, we randomly draw the individuals
whose change is unreliable.5 After repeating this replication exercise for di↵erent levels of error, we plot
the new distributions of changes.
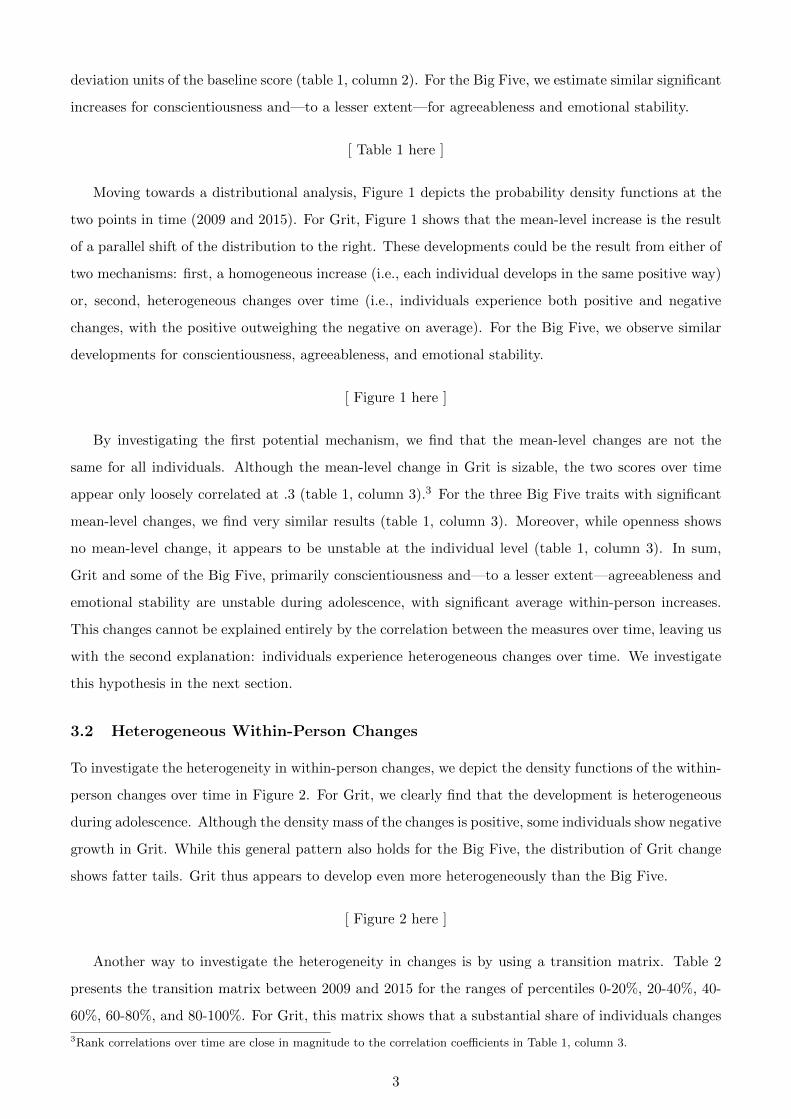
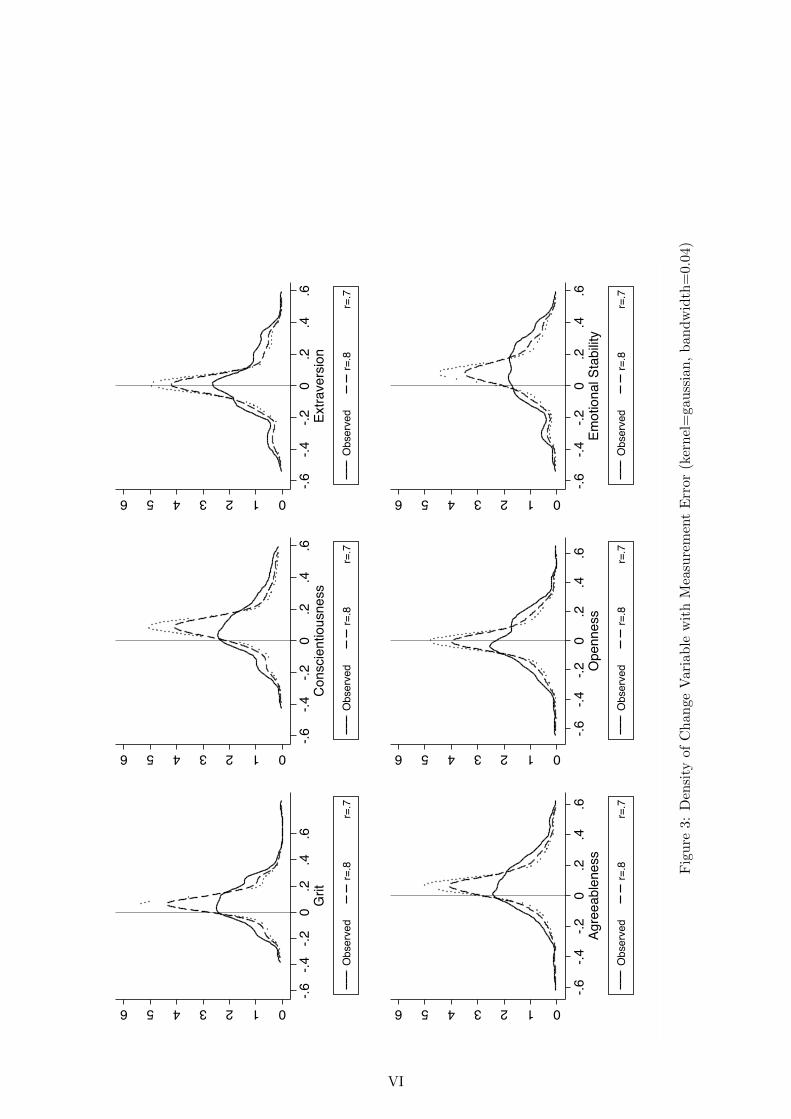
Figure 3 is a graphical representation of how the distribution of change in Grit varies with di↵erent
levels of error in the data. The figure shows the changes in counterfactual measures, compared to the
observed change. Figure 3 suggests that increasing measurement error reduces the heterogeneity in
changes but this heterogeneity does not completely disappear. Again, we find similar results for the
development of conscientiousness, agreeableness, and emotional stability.6
[ Figure 3 here ]
Overall, we conclude that measurement error only partially explains the heterogeneous development
of Grit and the Big Five components conscientiousness, agreeableness, and emotional stability. These
findings suggest that Grit and three of the Big Five change during adolescence and that the change—
although positive on average—appears to be heterogeneous across individuals.7
4 Conclusion
Given the labor market relevance of non-cognitive skills, economists need to understand whether these
skills change over time and, if so, how they are malleable. Our results show that a particular set of
non-cognitive skills increases on-average during adolescence: Grit and three of the Big Five personality
traits (conscientiousness, agreeableness, and emotional stability) substantially improve between the ages
of 15 and 22. However, these changes are heterogeneous, which is surprising given our homogeneous
sample. Moreover, these changes are robust to reasonable assumptions about measurement error.
In contrast to other studies, we find substantial changes in non-cognitive skills over time. Elkins
et al. (2016) only investigate individuals enrolled in general education and conclude that personality
(measured roughly by sets of adjectives) is rather stable for adolescents while in school. For a similar
age group, we investigate students enrolled in vocational education and training to investigate whether
work-based learning may have di↵erent e↵ects. Thus, our results suggest that work-based learning
5In practice, we implement the following two-step procedure. First, for a given proportion of the sample (i.e., 1 � r2) wesubstitute the observed values (initial and final value) with random draws from a uniform distribution between zero andone. Second, we bootstrap our initial data set 1,000 times and, in each replication, randomly select the individuals whoreceive measurement error. As for the RC analysis, we set r = .7 and .8. Since we are interested in investigating theheterogeneity, we perform this analysis in a mean-preserving manner.
6We can also apply the RC correction to the transition matrix discussed previously. Intuitively, all small—and thuspotentially unreliable—changes should lie on the diagonal of the transition matrix. The results, presented in Table A2 inthe online appendix, show that the RC shifts mass from cells that are close to the diagonal to cells that are actually onthe diagonal. Again, however, the correction does not eliminate entirely the heterogeneity in changes.
7We also investigate the correlations between individuals’ observable characteristics and the development of non-cognitiveskills without finding any systematic relationships (see table A3 in the online appendix).
5
with its more varied types of learning experiences, including its hands-on learning in a real business
environment with coworkers and customer interactions, plays an important role in the formation of
non-cognitive skills.
Our results give first insights into the development of Grit during adolescence but also leave some
questions unanswered. For example, due to our small sample size and limited variation in the training
set-up, we are so far not able to explain the heterogeneity in changes by observable characteristics. In
this regard, it would also be beneficial to investigate how di↵erent aspects of the learning environment in
di↵erent types of education systematically a↵ect the development of non-cognitive skills. Future research
should address these questions by using large-scale longitudinal data sets. Given the importance of Grit
and given that we show that it changes over time, including high-quality Grit questionnaires in large
longitudinal data sets such as the National Longitudinal Survey of Youth (NLSY), the Household,
Income and Labor Dynamics in Australia (HILDA), or the German Socio-Economic Panel (SOEP)
would be particularly useful.
6
References
Almlund, M., Duckworth, A. L., Heckman, J. J., & Kautz, T. (2011). Personality Psychology andEconomics. In E. A. Hanushek, S. J. Machin, & L. Woessmann (Eds.), Handbook of the economicsof education (pp. 1–181). Amsterdam: Elsevier.
Cobb-Clark, D. A., & Schurer, S. (2012). The Stability of Big-Five Personality Traits. EconomicsLetters, 115 (1), 11–15.
Costa, P. T., & McCrae, R. R. (1994). Stability and Change in Personality from Adolesence throughAdulthood. In C. F. Halverson, G. A. Kohnstamm, & R. Martin (Eds.), The developing strucutreof temperament and personaility from infancy to adulthood (pp. 139–150). Hillsdale, NJ: LawrenceErlbaum Associates.
Duckworth, A. L., Peterson, C., Matthews, M. D., & Kelly, D. R. (2007). Grit: Perseverance andPassion for Long-Term Goals. Journal of Personality and Social Psychology , 92 (6), 1087–1101.
Duckworth, A. L., & Quinn, P. D. (2009, March). Development and Validation of the Short Grit Scale(Grit-S). Journal of Personality Assessment , 91 (2), 166–174.
Elkins, R., Kassenboehmer, S. C., & Schurer, S. (2016). The Malleability of Personality Traits inAdolesence. Life Course Center Working Paper Series, 2016-20 .
Eskreis-Winkler, L., Shulman, E. P., Beal, S. A., & Duckworth, A. L. (2014). The Grit E↵ect: PredictingRetention in the Military, the Workplace, School and Marriage. Front. Psychol., 5 , 1–12.
Gerlitz, J.-Y., & Schupp, J. (2005). Zur Erhebung der Big-Five-Basierten Personlichkeitsmerkmale imSOEP. DIW Research Notes,.
Heckman, J. J., & Mosso, S. (2014). The Economics of Human Development and Social Mobility.Annu. Rev. Econ., 6 (1), 689–733.
Heckman, J. J., Stixrud, J., & Urzua, S. (2006). The E↵ects of Cognitive and Noncognitive Abilitieson Labor Market Outcomes and Social Behavior. Journal of Labor Economics, 24 (3), 411–482.
Ho↵man, N., & Schwartz, R. (2015). Gold Standard: The Swiss Vocational Education and TrainingSystem. Washington, DC: National Center on Education and the Economy.
Jacobson, N. S., & Truax, P. (1991). Clinical significance: A statistical Approach to Defining MeaningfulChange in Psychotherapy Research. Journal of Consulting and Clinical Psychology , 59 (1), 12–19.
John, O. P., Naumann, L. P., & Soto, C. J. (2008). Paradigm Shift to the Integrative Big FiveTrait Taxonomy: History, Measurement, and Conceptual Issues. In O. P. John, R. W. Robins,& L. A. Pervin (Eds.), Handbook of Personality: Theory and Research (pp. 114–158). GuilfordPress New York, NY.
Kautz, T., Heckman, J., Diris, R., ter Weel, B., & Borghans, L. (2014). Fostering and Measuring Skills:Improving Cognitive and Non-Cognitive Skills to Promote Lifetime Success. NBER WorkingPaper Series, 20749 .
Oswald, Y., & Backes-Gellner, U. (2014). Learning for a Bonus: How Financial Incentives Interact withPreferences. Journal of Public Economics, 118 , 52–61.
Roberts, B. W., Walton, K. E., & Viechtbauer, W. (2015). Patterns of Mean-Level Change in PersonalityTraits Across the Life Course: A Meta-Analysis of Longitudinal Studies. Psychological Bulletin,132 (1), 1–25.
Wolter, S. C., & Ryan, P. (2011). Apprenticeship. In E. A. Hanushek, S. Machin, & L. Woessmann(Eds.), Handbook of the economics of education (pp. 521–576). Amsterdam: Elsevier.
7
Tables and Figures
Table 1: Summary of Non-Cognitive Skills
Descriptive Statistics Estimated Change Correlation 2009
(1) (2) (3)
mean sd min max in 2009 sd Coe�cient
Grit
2009 0.599 0.133 0.188 0.906
2015 0.666 0.136 0.344 1.000 0.2501**
Change 0.067 0.165 -0.344 0.812 0.5022*** -0.6039***
Conscientiousness
2009 0.651 0.175 0.111 1.000
2015 0.742 0.153 0.278 1.000 0.3498***
Change 0.090 0.188 -0.389 0.556 0.5163*** -0.6479***
Extraversion
2009 0.692 0.214 0.000 1.000
2015 0.700 0.214 0.111 1.000 0.5879***
Change 0.008 0.198 -0.500 0.556 0.0353 -0.4495***
Agreeableness
2009 0.699 0.194 0.000 1.000
2015 0.764 0.176 0.250 1.000 0.4610***
Change 0.065 0.193 -0.583 0.583 0.3368*** -0.5871***
Openness
2009 0.622 0.181 0.167 1.000
2015 0.622 0.172 0.222 0.944 0.4216***
Change 0.000 0.190 -0.611 0.611 0.0020 -0.5699***
Emotional Stability
2009 0.492 0.198 0.056 1.000
2015 0.571 0.192 0.111 0.944 0.4186***
Change 0.079 0.211 -0.500 0.556 0.3991*** -0.5602***
Notes: N=153. *** p < 0.01, ** p < 0.05.
The Grit measure is the sum of eight Likert-scale items (0-4) divided by 32.
The agreeableness measure is the sum of two Likert-scale items (0-6) divided by 12.
Each of the other Big Five measures is the sum of three Likert-scale items (0-6) divided by 18.
Authors’ data.
I
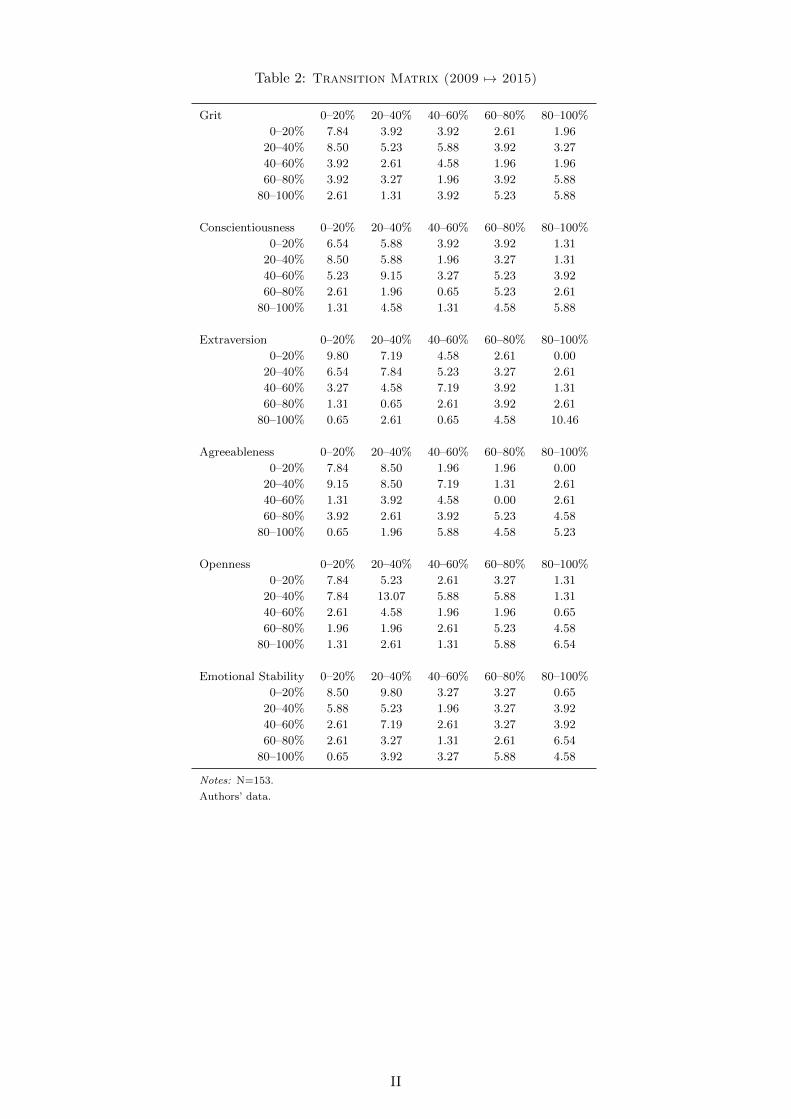
Table 2: Transition Matrix (2009 7! 2015)
Grit 0–20% 20–40% 40–60% 60–80% 80–100%
0–20% 7.84 3.92 3.92 2.61 1.96
20–40% 8.50 5.23 5.88 3.92 3.27
40–60% 3.92 2.61 4.58 1.96 1.96
60–80% 3.92 3.27 1.96 3.92 5.88
80–100% 2.61 1.31 3.92 5.23 5.88
Conscientiousness 0–20% 20–40% 40–60% 60–80% 80–100%
0–20% 6.54 5.88 3.92 3.92 1.31
20–40% 8.50 5.88 1.96 3.27 1.31
40–60% 5.23 9.15 3.27 5.23 3.92
60–80% 2.61 1.96 0.65 5.23 2.61
80–100% 1.31 4.58 1.31 4.58 5.88
Extraversion 0–20% 20–40% 40–60% 60–80% 80–100%
0–20% 9.80 7.19 4.58 2.61 0.00
20–40% 6.54 7.84 5.23 3.27 2.61
40–60% 3.27 4.58 7.19 3.92 1.31
60–80% 1.31 0.65 2.61 3.92 2.61
80–100% 0.65 2.61 0.65 4.58 10.46
Agreeableness 0–20% 20–40% 40–60% 60–80% 80–100%
0–20% 7.84 8.50 1.96 1.96 0.00
20–40% 9.15 8.50 7.19 1.31 2.61
40–60% 1.31 3.92 4.58 0.00 2.61
60–80% 3.92 2.61 3.92 5.23 4.58
80–100% 0.65 1.96 5.88 4.58 5.23
Openness 0–20% 20–40% 40–60% 60–80% 80–100%
0–20% 7.84 5.23 2.61 3.27 1.31
20–40% 7.84 13.07 5.88 5.88 1.31
40–60% 2.61 4.58 1.96 1.96 0.65
60–80% 1.96 1.96 2.61 5.23 4.58
80–100% 1.31 2.61 1.31 5.88 6.54
Emotional Stability 0–20% 20–40% 40–60% 60–80% 80–100%
0–20% 8.50 9.80 3.27 3.27 0.65
20–40% 5.88 5.23 1.96 3.27 3.92
40–60% 2.61 7.19 2.61 3.27 3.92
60–80% 2.61 3.27 1.31 2.61 6.54
80–100% 0.65 3.92 3.27 5.88 4.58
Notes: N=153.
Authors’ data.
II
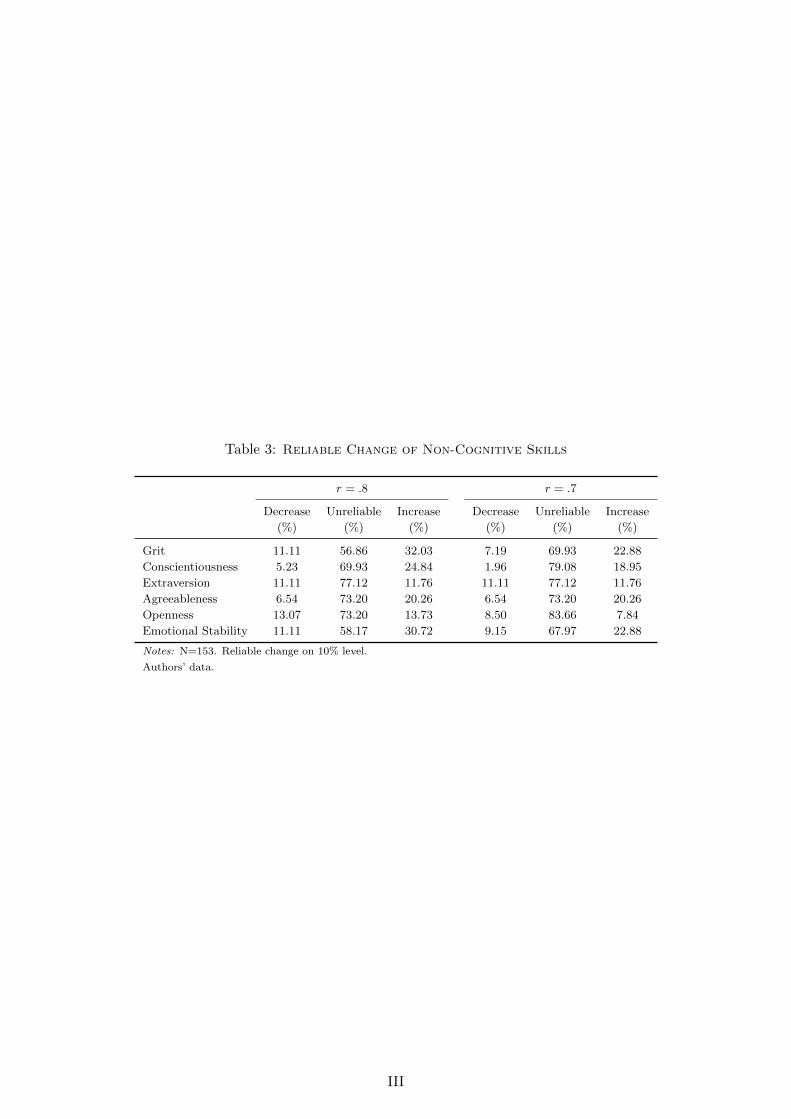
Table 3: Reliable Change of Non-Cognitive Skills
r = .8 r = .7
Decrease Unreliable Increase Decrease Unreliable Increase
(%) (%) (%) (%) (%) (%)
Grit 11.11 56.86 32.03 7.19 69.93 22.88
Conscientiousness 5.23 69.93 24.84 1.96 79.08 18.95
Extraversion 11.11 77.12 11.76 11.11 77.12 11.76
Agreeableness 6.54 73.20 20.26 6.54 73.20 20.26
Openness 13.07 73.20 13.73 8.50 83.66 7.84
Emotional Stability 11.11 58.17 30.72 9.15 67.97 22.88
Notes: N=153. Reliable change on 10% level.
Authors’ data.
III
123
0.1
.2.3
.4.5
.6.7
.8.9
1G
rit
2009
2015
123
0.1
.2.3
.4.5
.6.7
.8.9
1Co
nscie
ntio
usne
ss
2009
2015
123
0.1
.2.3
.4.5
.6.7
.8.9
1Ex
trave
rsio
n
2009
2015
123
0.1
.2.3
.4.5
.6.7
.8.9
1Ag
reea
blen
ess
2009
2015
123
0.1
.2.3
.4.5
.6.7
.8.9
1O
penn
ess
2009
2015
123
0.1
.2.3
.4.5
.6.7
.8.9
1Em
otio
nal S
tabi
lity
2009
2015
Figure
1:Probab
ilityDen
sity
FunctionsforBalan
cedPan
elof
Individuals
IV
0.1
.2.3
.4.5
Dens
ity
-3.5 -3 -2.5 -2 -1.5 -1 -.5 0 .5 1 1.5 2 2.5 3 3.5change
Mean Grit Change Mean Conscientiousness ChangeMean Extraversion Change Mean Agreeableness ChangeMean Openness Change Mean Emotional Stability Change
Figure 2: Density of Change Variable (standardized by sd of baseline score)
V
0123456
-.6-.4
-.20
.2.4
.6G
rit
Obs
erve
dr=
.8r=
.70123456
-.6-.4
-.20
.2.4
.6Co
nscie
ntio
usne
ss
Obs
erve
dr=
.8r=
.7
0123456
-.6-.4
-.20
.2.4
.6Ex
trave
rsio
n
Obs
erve
dr=
.8r=
.7
0123456
-.6-.4
-.20
.2.4
.6Ag
reea
blen
ess
Obs
erve
dr=
.8r=
.7
0123456
-.6-.4
-.20
.2.4
.6O
penn
ess
Obs
erve
dr=
.8r=
.70123456
-.6-.4
-.20
.2.4
.6Em
otio
nal S
tabi
lity
Obs
erve
dr=
.8r=
.7
Figure
3:Den
sity
ofChan
geVariable
withMeasurementError
(kernel=ga
ussian,ban
dwidth=0.04
)
VI
Online Appendix to “Development of Non-Cognitive Skills in
Adolescence”
Peter Hoeschler⇤, Simone Balestra†, and Uschi Backes-Gellner‡
October 30, 2017
⇤ University of Zurich, Switzerland. E-mail: [email protected].† University of St.Gallen, Switzerland. E-mail: [email protected].‡ University of Zurich, Switzerland. E-mail: [email protected].
A. Attrition Analysis
Table A1: Attrition Analysis
OLS Probit OLS Probit
Grit 2009 -0.0043 -0.0110 -0.0015 -0.0035
(0.0087) (0.0218) (0.0090) (0.0228
Conscientiousness 2009 -0.0052 -0.0131 -0.0060 -0.0158
(0.0117) (0.0301) (0.0121) (0.0314)
Extraversion 2009 -0.0041 -0.0104 -0.0032 -0.0082
(0.0093) (0.0240) (0.0093) (0.0245)
Agreeableness 2009 0.0049 0.0125 -0.0006 -0.0011
(0.0146) (0.0377) (0.0153) (0.0385)
Openness 2009 0.0089 0.0228 0.0079 0.0206
(0.0105) (0.0263) (0.0106) (0.0267)
Emotional Stability 2009 -0.0026 -0.0069 -0.0055 -0.0146
(0.0088) (0.0223) (0.0091) (0.0228)
Background Variables NO NO YES YES
Observations 255 255 252 252
R2 0.008 0.025
Notes: *** p < 0.01, ** p < 0.05, * p < 0.10. Coe�cients are indicated. Robuststandard errors are in parentheses. Dependent Variable: Being in the sample in2015 (dummy variable). Background variables include being a native speaker,mother being highly educated, and high school math grade.
Authors’ data.
1
B. Transition Matrix
Table A2: Transition matrix (2009 7! 2015) with reliability correction
Grit 0–20% 20–40% 40–60% 60–80% 80–100%
0–20% 7.84 3.92 3.92 2.61 1.96
20–40% 1.96 13.73 3.92 3.92 3.27
40–60% 1.96 0.00 10.46 0.65 1.96
60–80% 1.96 0.00 0.00 13.07 3.92
80–100% 2.61 1.31 1.31 0.00 13.73
Conscientiousness 0–20% 20–40% 40–60% 60–80% 80–100%
0–20% 7.84 4.58 3.92 3.92 1.31
20–40% 0.65 14.38 1.31 3.27 1.31
40–60% 1.31 0.00 21.57 0.00 3.92
60–80% 0.65 0.00 0.00 11.76 0.65
80–100% 1.31 0.65 0.65 0.00 15.03
Extraversion 0–20% 20–40% 40–60% 60–80% 80–100%
0–20% 16.34 1.96 3.27 2.61 0.00
20–40% 2.61 20.26 0.00 0.00 2.61
40–60% 3.27 0.00 15.69 0.00 1.31
60–80% 1.31 0.65 0.00 9.15 0.00
80–100% 0.65 2.61 0.00 0.00 15.69
Agreeableness 0–20% 20–40% 40–60% 60–80% 80–100%
0–20% 11.11 5.23 1.96 1.96 0.00
20–40% 0.00 22.22 2.61 1.31 2.61
40–60% 0.65 0.00 9.15 0.00 2.61
60–80% 3.92 0.00 0.00 16.34 0.00
80–100% 0.65 1.31 0.00 0.00 16.34
Openness 0–20% 20–40% 40–60% 60–80% 80–100%
0–20% 11.11 1.96 2.61 3.27 1.31
20–40% 1.96 27.45 0.00 3.27 1.31
40–60% 2.61 0.00 9.15 0.00 0.00
60–80% 1.96 0.65 0.00 13.73 0.00
80–100% 1.31 2.61 1.31 0.00 12.42
Emotional Stability 0–20% 20–40% 40–60% 60–80% 80–100%
0–20% 13.07 5.23 3.27 3.27 0.65
20–40% 0.00 12.42 0.65 3.27 3.92
40–60% 2.61 0.00 12.42 0.65 3.92
60–80% 2.61 0.00 0.00 10.46 3.27
80–100% 0.65 3.27 1.96 0.00 12.42
Notes: N=153. Unreliable changes (r = .8) are forced to be on the diagonal.
Authors’ data.
2
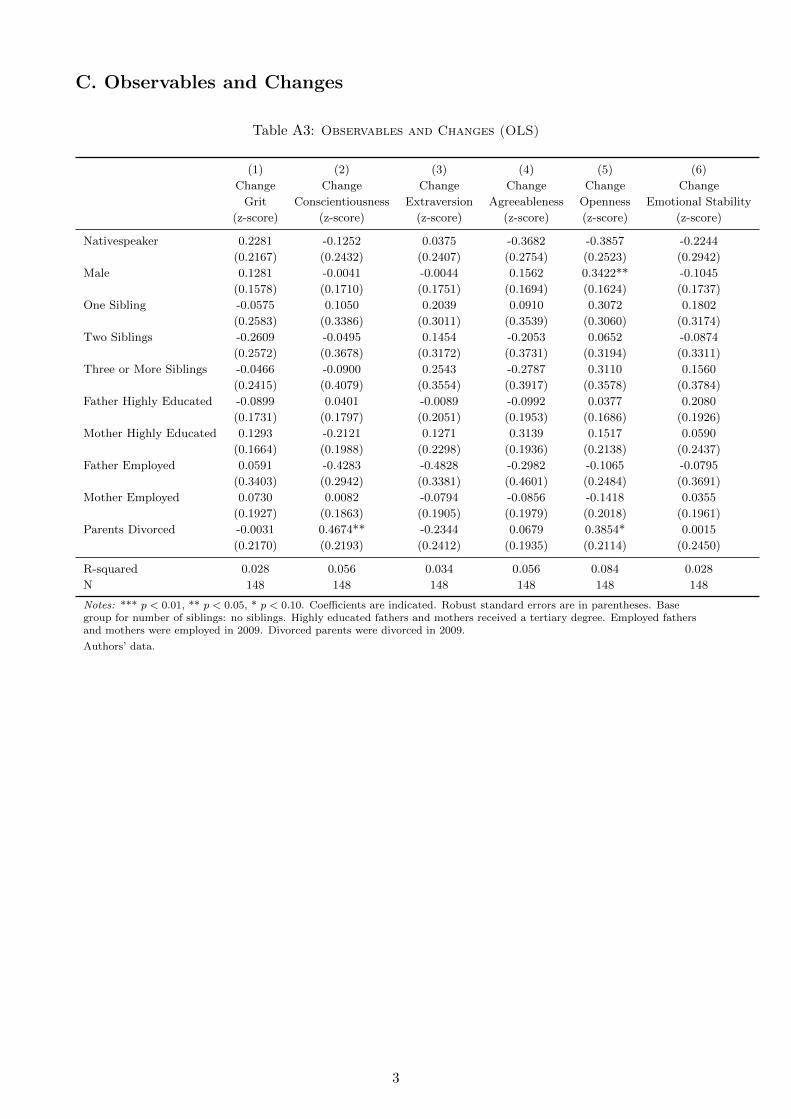
C. Observables and Changes
Table A3: Observables and Changes (OLS)
(1) (2) (3) (4) (5) (6)
Change Change Change Change Change Change
Grit Conscientiousness Extraversion Agreeableness Openness Emotional Stability
(z-score) (z-score) (z-score) (z-score) (z-score) (z-score)
Nativespeaker 0.2281 -0.1252 0.0375 -0.3682 -0.3857 -0.2244
(0.2167) (0.2432) (0.2407) (0.2754) (0.2523) (0.2942)
Male 0.1281 -0.0041 -0.0044 0.1562 0.3422** -0.1045
(0.1578) (0.1710) (0.1751) (0.1694) (0.1624) (0.1737)
One Sibling -0.0575 0.1050 0.2039 0.0910 0.3072 0.1802
(0.2583) (0.3386) (0.3011) (0.3539) (0.3060) (0.3174)
Two Siblings -0.2609 -0.0495 0.1454 -0.2053 0.0652 -0.0874
(0.2572) (0.3678) (0.3172) (0.3731) (0.3194) (0.3311)
Three or More Siblings -0.0466 -0.0900 0.2543 -0.2787 0.3110 0.1560
(0.2415) (0.4079) (0.3554) (0.3917) (0.3578) (0.3784)
Father Highly Educated -0.0899 0.0401 -0.0089 -0.0992 0.0377 0.2080
(0.1731) (0.1797) (0.2051) (0.1953) (0.1686) (0.1926)
Mother Highly Educated 0.1293 -0.2121 0.1271 0.3139 0.1517 0.0590
(0.1664) (0.1988) (0.2298) (0.1936) (0.2138) (0.2437)
Father Employed 0.0591 -0.4283 -0.4828 -0.2982 -0.1065 -0.0795
(0.3403) (0.2942) (0.3381) (0.4601) (0.2484) (0.3691)
Mother Employed 0.0730 0.0082 -0.0794 -0.0856 -0.1418 0.0355
(0.1927) (0.1863) (0.1905) (0.1979) (0.2018) (0.1961)
Parents Divorced -0.0031 0.4674** -0.2344 0.0679 0.3854* 0.0015
(0.2170) (0.2193) (0.2412) (0.1935) (0.2114) (0.2450)
R-squared 0.028 0.056 0.034 0.056 0.084 0.028
N 148 148 148 148 148 148
Notes: *** p < 0.01, ** p < 0.05, * p < 0.10. Coe�cients are indicated. Robust standard errors are in parentheses. Basegroup for number of siblings: no siblings. Highly educated fathers and mothers received a tertiary degree. Employed fathersand mothers were employed in 2009. Divorced parents were divorced in 2009.
Authors’ data.
3