The Political Economy of Xenophobia and Distribution: The ...
27
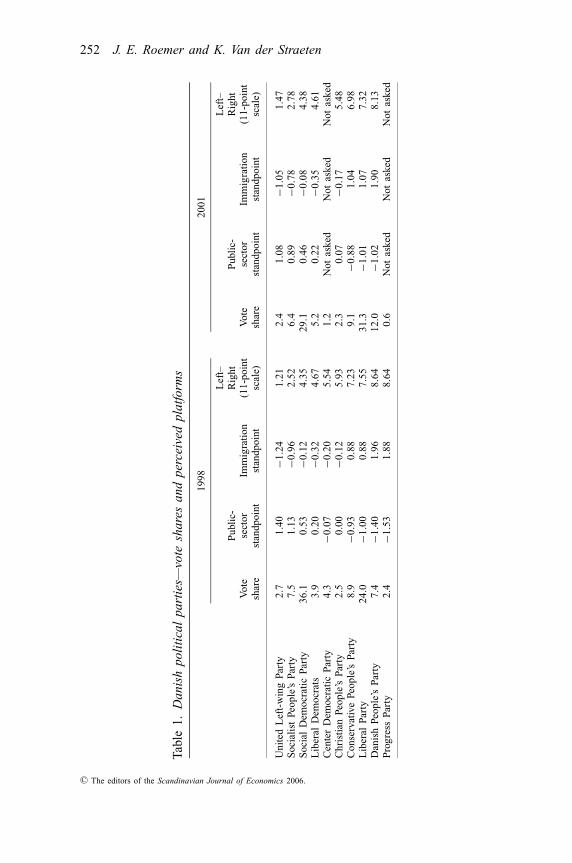
Scand. J. of Economics 108(2), 251–277, 2006 DOI: 10.1111/j.1467-9442.2006.00450.x The Political Economy of Xenophobia and Distribution: The Case of Denmark ∗ John E. Roemer Yale University, New Haven, CT 06520-8301, USA [email protected] Karine Van der Straeten ´ Ecole Polytechnique, F-75005 Paris, France [email protected] Abstract For the first time in some years, a conservative government came to power in Denmark in 2001, due primarily to the citizenry’s disaffection with social-democratic policies on immi- gration. We represent political competition in Denmark as taking place over two issues—the size of the public sector and immigration—and model political equilibrium using the party unanimity Nash equilibrium (PUNE) concept, which generates equilibria on multi- dimensional policy spaces where parties form endogenously. By fitting the model to Danish data, we argue that citizen xenophobia may be expected to decrease the size of the Danish public sector by an amount between 12% and 36% of one standard deviation of the probability distribution of citizens’ ideal points of the size of the public sector. Keywords: Political equilibrium; PUNE; xenophobia; distribution JEL classification: D3; D7 I. Politics and Anti-immigrant Sentiment in Denmark With the 2001 election, the Social Democratic Party (SDP), primary archi- tects of the Danish welfare state, lost its 80-year status as the largest party. The Liberal Party won a larger vote share (see Table 1), and formed a coalition government with the Conservatives. For a parliamentary majority, this coalition has, in the intervening period, relied upon the support of the right-wing populist, anti-immigrant Danish People’s Party. Many observers believe that the fall of the social-democratic government in Denmark is due to its failure to respond adequately to the anti-immigrant ∗ We are grateful to the Russell Sage Foundation for having financed this project. We thank Woojin Lee for his advice on econometric issues. We are also grateful to the Danish Statistical Archive for providing us with the Danish election studies. The project originated while Van der Straeten was visiting Yale University; financial support for her stay from the Department of Economics and the Cowles Foundation is gratefully acknowledged. C The editors of the Scandinavian Journal of Economics 2006. Published by Blackwell Publishing, 9600 Garsington Road, Oxford, OX4 2DQ, UK and 350 Main Street, Malden, MA 02148, USA.
Transcript of The Political Economy of Xenophobia and Distribution: The ...

Scand. J. of Economics 108(2), 251–277, 2006DOI: 10.1111/j.1467-9442.2006.00450.x
The Political Economy of Xenophobiaand Distribution: The Case of Denmark∗
John E. RoemerYale University, New Haven, CT 06520-8301, [email protected]
Karine Van der StraetenEcole Polytechnique, F-75005 Paris, [email protected]
Abstract
For the first time in some years, a conservative government came to power in Denmark in2001, due primarily to the citizenry’s disaffection with social-democratic policies on immi-gration. We represent political competition in Denmark as taking place over two issues—thesize of the public sector and immigration—and model political equilibrium using the partyunanimity Nash equilibrium (PUNE) concept, which generates equilibria on multi-dimensional policy spaces where parties form endogenously. By fitting the model to Danishdata, we argue that citizen xenophobia may be expected to decrease the size of the Danishpublic sector by an amount between 12% and 36% of one standard deviation of the probabilitydistribution of citizens’ ideal points of the size of the public sector.
Keywords: Political equilibrium; PUNE; xenophobia; distribution
JEL classification: D3; D7
I. Politics and Anti-immigrant Sentiment in Denmark
With the 2001 election, the Social Democratic Party (SDP), primary archi-tects of the Danish welfare state, lost its 80-year status as the largest party.The Liberal Party won a larger vote share (see Table 1), and formed acoalition government with the Conservatives. For a parliamentary majority,this coalition has, in the intervening period, relied upon the support of theright-wing populist, anti-immigrant Danish People’s Party.
Many observers believe that the fall of the social-democratic governmentin Denmark is due to its failure to respond adequately to the anti-immigrant
∗ We are grateful to the Russell Sage Foundation for having financed this project. We thankWoojin Lee for his advice on econometric issues. We are also grateful to the Danish StatisticalArchive for providing us with the Danish election studies. The project originated while Vander Straeten was visiting Yale University; financial support for her stay from the Departmentof Economics and the Cowles Foundation is gratefully acknowledged.
C© The editors of the Scandinavian Journal of Economics 2006. Published by Blackwell Publishing, 9600 Garsington Road,Oxford, OX4 2DQ, UK and 350 Main Street, Malden, MA 02148, USA.
252 J. E. Roemer and K. Van der Straeten
Tab
le1
.D
anis
hpo
liti
cal
part
ies—
vote
shar
esan
dpe
rcei
ved
plat
form
s
19
98
20
01
Lef
t–L
eft–
Pu
blic
-R
igh
tP
ubl
ic-
Rig
ht
Vo
tese
cto
rIm
mig
rati
on
(11
-po
int
Vo
tese
cto
rIm
mig
rati
on
(11
-po
int
shar
est
and
po
int
stan
dp
oin
tsc
ale)
shar
est
and
po
int
stan
dp
oin
tsc
ale)
Un
ited
Lef
t-w
ing
Par
ty2.7
1.4
0−1
.24
1.2
12.4
1.0
8−1
.05
1.4
7S
oci
alis
tP
eop
le’s
Par
ty7.5
1.1
3−0
.96
2.5
26.4
0.8
9−0
.78
2.7
8S
oci
alD
emo
crat
icP
arty
36.1
0.5
3−0
.12
4.3
52
9.1
0.4
6−0
.08
4.3
8L
iber
alD
emo
crat
s3.9
0.2
0−0
.32
4.6
75.2
0.2
2−0
.35
4.6
1C
ente
rD
emo
crat
icP
arty
4.3
−0.0
7−0
.20
5.5
41.2
No
tas
ked
No
tas
ked
No
tas
ked
Ch
rist
ian
Peo
ple
’sP
arty
2. 5
0.0
0−0
.12
5.9
32.3
0.0
7−0
.17
5.4
8C
on
serv
ativ
eP
eop
le’s
Par
ty8.9
−0.9
30.8
87.2
39.1
−0.8
81.0
46.9
8L
iber
alP
arty
24.0
−1.0
00.8
87.5
53
1.3
−1.0
11.0
77.3
2D
anis
hP
eop
le’s
Par
ty7.4
−1.4
01.9
68.6
41
2.0
−1.0
21.9
08.1
3P
rog
ress
Par
ty2.4
−1.5
31.8
88.6
40.6
No
tas
ked
No
tas
ked
No
tas
ked
C© The editors of the Scandinavian Journal of Economics 2006.

The political economy of xenophobia and distribution 253
sentiment among the native citizenry. Although immigrants and theirdescendants account for only about 7% of the population, their presencehas provoked a remarkable reaction among natives. Upon gaining power,the Liberal–Conservative coalition passed a law, in May 2002, restrictingthe rights of immigrants in a number of ways: (1) refugee status will hence-forth be granted only under stricter conditions (not to include those flee-ing from war or famine); (2) permanent-resident permits will be grantedafter seven years of residence, instead of three; (3) residents are no longerpermitted to bring in a foreign spouse under the age of 24; (4) spouseswill not be allowed to join their partners in Denmark unless the couplehave a sufficiently large income; (5) applicants for Danish nationality mustdemonstrate linguistic ability of a 14-year-old native; and (6) reunificationwith parents over 60 years of age is abolished.
For the purposes of this article, we will often describe anti-immigrantfeeling as xenophobia. Ours is not a sociological or psychological inves-tigation; we observe the distribution of xenophobic views based on votersurvey data, and do not inquire into their causes or possible justifications.
Our concern in this article is with the effect that increasing Danish xeno-phobic sentiment among voters will have on the size of the welfare state,as the latter is determined through political competition. We will arguethat the size of the welfare state and the government’s position on immi-gration are the two most important issues in contemporary Danish politics.Political parties—of which there are 10 in Denmark—put forward positionson both these issues, and voters choose among the parties based on theirpreferences on the two issues. We will model the political game amongthese parties, and then ask: “How would the equilibrium values of the par-ties’ positions on the size of the public-sector change, were voters lessxenophobic?”1
It is conceptually useful to distinguish between two ways in which anti-immigrant voter sentiment can alter the equilibrium party platforms on theissue of public-sector size. First, there is a direct effect which we call theanti-solidarity effect (ASE): to the extent that voters dislike immigrants,and believe that immigrants exploit the welfare state, they may desire todecrease the generosity of state benefits. It is often said that the generouswelfare states of the Nordic countries are the historical consequence ofpopulation homogeneity, engendering solidarity among citizens. The anti-solidarity effect is the other side of this coin. A similar argument is putforward by Alesina et al. (2001) to explain large differences in welfare pro-grams between the US and Europe: in the US, racism and prejudice against
1 This should be related to the emerging literature linking distribution to racial or immigrationissues; see also, for example, Alesina, Glaeser and Sacerdote (2001), Austen-Smith andWallerstein (2003), Luttmer (2001) and Ortega (2004, 2005).
C© The editors of the Scandinavian Journal of Economics 2006.

254 J. E. Roemer and K. Van der Straeten
the black minority may reduce the demand for redistribution expressed bywhite citizens.
The second effect is indirect. Suppose that a voter is very xenophobic,although quite moderate on the issue of public-sector size: she may votefor a xenophobic party if the immigration issue is sufficiently importantfor her, even if that party is more right-wing on the size of the publicsector than she is. If there are many voters of this kind, then parties thatwant large cuts in the size of the public sector may gain larger supportthan they would, were immigration not a political issue. We call this thepolicy-bundle effect (PBE). It is a political portfolio effect, a consequenceof the bundling of issues.
In our analysis, we decompose the total effect of xenophobia on equilib-rium values of party policy on public-sector size into these two effects.
Our data consist of micro-data from the Danish Election Survey, Year1998 (2,001 respondents, 327 variables) and Year 2001 (2,026 respondents,316 variables).2 Table 1 presents the average perception among voters ofthe parties’ positions on the economic issue (size of the public sector) andthe immigration issue (see the exact definition in Section IV below). Partiesare ranked on a Left–Right scale, as perceived by the voters.3 Note thaton both issues, the ranking of parties is very similar to their ranking onthe Left–Right scale. In particular, the two most anti-immigrant parties, theDanish People’s Party and the Progress Party, are also the most conservativeon the economic issue.
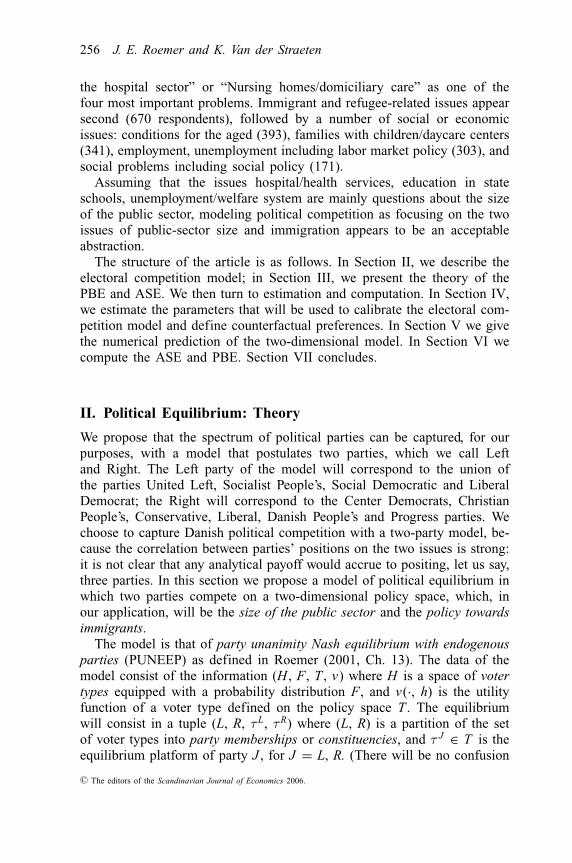
Throughout this article, we model the electoral competition as takingplace on two issues: the size of the public sector and the immigration policy.In order to motivate this assumption, we want to assess the main politicalissues in Denmark, using a question about the problems that respondentsperceive as being the most important in Denmark. Table 2 reports, fora selection of issues, the number of individuals (in 1998, out of a totalof 2,001 respondents) who listed the issue in question as among the fourmost important problems facing the country. Problems are ranked accordingto the number of respondents who reported this specific problem as thesingle most important in the country (down to a total of 14 respondents).Clearly, the health issue is the single most important problem: over 900respondents, almost one-half of the sample, name either “Health sector and
2 Our sources are the “Danish Election Survey 1998” and the “Danish Election Survey 2001”.The results and interpretation in the current article are the sole responsibility of the authors.3 This scale derives from the answers to the following questions: “In politics one often talksabout left and right. Where would you place yourself on this scale? Where would you placethe various parties on this scale?” (Show a card with 11 possible values, from 0 indicatingleft to 10 indicating right.) For each party we compute the average answer.
C© The editors of the Scandinavian Journal of Economics 2006.

The political economy of xenophobia and distribution 255
Tab
le2
.T
hem
ost
impo
rtan
tpr
oble
ms
inD
enm
ark:
1998
elec
tion
surv
ey
No
.1
No
.2
No
.3
No
.4
To
tal
Imm
igra
tion
of
refu
gee
san
dim
mig
rants
incl
udin
gth
efi
ght
agai
nst
raci
sm305
195
123
47
670
Hea
lth
sect
or
and
the
ho
spit
alse
cto
r3
05
25
61
07
38
70
6E
nvir
on
men
t/en
vir
on
men
tal
issu
es1
68
10
28
02
73
77
Co
nd
itio
ns
for
the
aged
15
31
61
60
19
39
3E
mp
loy
men
t,u
nem
plo
ym
ent
incl
ud
ing
lab
or
mar
ket
po
licy
14
78
64
52
53
03
Th
eec
on
om
y1
30
50
26
10
21
6Fam
ilie
sw
ith
chil
dre
n/d
ayca
rece
nte
rs1
19
14
46
21
63
41
So
cial
pro
blem
sin
clu
din
gso
cial
po
licy
80
58
25
81
71
EU
-rel
ated
to,
ing
ener
al,
gen
eral
han
dli
ng
of
the
Am
ster
dam
Tre
aty
78
52
31
14
17
5N
urs
ing
ho
mes
/do
mic
ilia
ryca
re5
98
84
87
20
2B
alan
ceo
fp
aym
ents
/fo
reig
nd
ebt
34
24
11
67
5V
iole
nce
,cr
ime,
law
and
ord
er/j
ust
ice
po
licy
30
52
45
23
15
0T
axre
form
/tax
bu
rden
,in
clu
din
gd
eter
iora
tio
no
fp
riva
tep
ensi
on
s2
12
01
64
61
Un
clea
ran
swer
:ev
ery
thin
g2
03
00
23
Sta
tesc
ho
ols
/sch
oo
lsp
oli
cy1
94
23
61
11
08
Dis
trib
uti
on
of
pu
blic
exp
end
itu
re1
91
31
01
43
Th
ep
oll
uti
on
pro
blem
16
84
43
2E
du
cati
on
/ed
uca
tio
nst
and
ard
s1
43
52
71
79
3S
oci
alb
enef
its
incl
ud
ing
mat
ern
ity
and
oth
ersu
chle
ave
14
95
02
8W
elfa
rest
ate
wit
ho
ut
furt
her
det
ails
14
52
02
1D
on
ot
kn
ow2
81
00
29
Do
no
tan
swer
19
36
21
,05
31
,64
5
Not
e:T
her
ear
e2,0
01
resp
onden
tsin
the
sam
ple
.Q
uest
ion:
We
hav
e,as
you
know
,ju
sthad
par
liam
enta
ryel
ecti
ons,
and
ther
efore
Iw
ould
like
toas
kyo
uw
hat
pro
blem
syo
uth
ink
are
the
most
import
ant
ones
that
poli
tici
ans
should
be
doin
gso
met
hin
gab
out
today
?(M
ost
import
ant
pro
blem
no.
1,
no.
2,
no.
3,
no.
4.)
C© The editors of the Scandinavian Journal of Economics 2006.
256 J. E. Roemer and K. Van der Straeten
the hospital sector” or “Nursing homes/domiciliary care” as one of thefour most important problems. Immigrant and refugee-related issues appearsecond (670 respondents), followed by a number of social or economicissues: conditions for the aged (393), families with children/daycare centers(341), employment, unemployment including labor market policy (303), andsocial problems including social policy (171).
Assuming that the issues hospital/health services, education in stateschools, unemployment/welfare system are mainly questions about the sizeof the public sector, modeling political competition as focusing on the twoissues of public-sector size and immigration appears to be an acceptableabstraction.
The structure of the article is as follows. In Section II, we describe theelectoral competition model; in Section III, we present the theory of thePBE and ASE. We then turn to estimation and computation. In Section IV,we estimate the parameters that will be used to calibrate the electoral com-petition model and define counterfactual preferences. In Section V we givethe numerical prediction of the two-dimensional model. In Section VI wecompute the ASE and PBE. Section VII concludes.
II. Political Equilibrium: Theory
We propose that the spectrum of political parties can be captured, for ourpurposes, with a model that postulates two parties, which we call Leftand Right. The Left party of the model will correspond to the union ofthe parties United Left, Socialist People’s, Social Democratic and LiberalDemocrat; the Right will correspond to the Center Democrats, ChristianPeople’s, Conservative, Liberal, Danish People’s and Progress parties. Wechoose to capture Danish political competition with a two-party model, be-cause the correlation between parties’ positions on the two issues is strong:it is not clear that any analytical payoff would accrue to positing, let us say,three parties. In this section we propose a model of political equilibrium inwhich two parties compete on a two-dimensional policy space, which, inour application, will be the size of the public sector and the policy towardsimmigrants.
The model is that of party unanimity Nash equilibrium with endogenousparties (PUNEEP) as defined in Roemer (2001, Ch. 13). The data of themodel consist of the information (H , F, T , v) where H is a space of votertypes equipped with a probability distribution F, and v(·, h) is the utilityfunction of a voter type defined on the policy space T . The equilibriumwill consist in a tuple (L, R, τL, τR) where (L, R) is a partition of the setof voter types into party memberships or constituencies, and τ J ∈ T is theequilibrium platform of party J , for J = L, R. (There will be no confusion
C© The editors of the Scandinavian Journal of Economics 2006.

The political economy of xenophobia and distribution 257
if we refer to a party and its constituency by the same variable: e.g. R forRight.)
For our application, a voter’s type will be an ordered pair (π , ρ) whereπ is the voter’s ideal public-sector size (which we sometimes call, for short,her “tax rate”) and ρ is her position on the immigration issue. The policyspace T is a set of ordered pairs (t, r), which we may take to be the realplane, where t is a party’s policy on the size of the public sector and r isits policy on immigration. The utility function of the polity is a functionv : T × H → R given by:
v(t, r ;π, ρ) = −(t − π )2 − γ (r − ρ)2. (1)
We refer to γ as the relative salience of the immigration issue, and assumeit is the same for all voters.
We briefly review the concept of party unanimity Nash equilibrium(PUNE). A party possesses entrepreneurs or organizers, and members orconstituents. The members of a party are citizens who, in equilibrium, preferthat party’s policy to the policy of the other party. The entrepreneurs areprofessional politicians who make policy in the party. Think of them as avery small group of individuals, who are not identified with citizens charac-terized by a type. (Their type is irrelevant.) We will assume that the organ-izers of the Left and Right parties are each divided into two factions—anOpportunist faction and a Militant faction. The Opportunist faction wishes,in the party competition game, to propose a policy that will maximize theparty’s vote share, or probability of winning. The Militant faction wishesto propose a policy that will maximize the average welfare of the party’sconstituency. The idea that parties consist of bargaining factions capturesthe view that parties have conflicting goals: to represent constituencies, andto win office, or, more generally, to maximize vote share. Mathematically,the virtue of the factional model of parties is that it engenders the existenceof political equilibria when policy spaces are multi-dimensional. Unlike themodel of Downs, in our model, parties will generically propose distinctpolicies in equilibrium. The idea of PUNE is that parties compete againsteach other strategically, as in Nash equilibrium, and factions bargain witheach other, inside parties. At an equilibrium, each party’s platform is a bestresponse to the other parties’ platforms in the sense that it is a bargainingsolution between the party’s factions, given the platform proposed by theother party.
Suppose the members of a party consist of all citizens whose types liein the set J ⊂ H . We define the average welfare function for this party asa function mapping from T to the real numbers defined by:
V J (τ ) =∫
h∈Jv(τ ; h) d F(h). (2)
C© The editors of the Scandinavian Journal of Economics 2006.
258 J. E. Roemer and K. Van der Straeten
That is, V J (τ ) is just (a constant times) the average utility of the coalitionJ at the policy τ . For (2) to make sense, we must assume that the utilityfunctions v are unit-comparable.
Suppose the two parties propose policies τL and τR. Define:
�(τ L , τ R) = {h | v(τ L , h) > v(τ R, h)}.We define ϕ(τL, τR) as the fraction of the polity who prefer the policyτL to the policy τR. In our model, if the policies are distinct, then theset of voters indifferent between two policies will always have F-measurezero. Then the share of the polity who (should) vote for the L policy is:ϕ(τ L , τ R) = F(�(tL, tR)).
Definition. A party unanimity Nash equilibrium (PUNE) for the model (H ,F, T , v) is:
(a) a partition of the set of types H = L ∪ R, possibly ignoring a set ofmeasure zero;
(b) a pair of policies (τL, τR), such that:
(C1a) given τL there is no policy τ ∈ T , s.t. V R(τ ) ≥ V R(τ R) andϕ(τ L , τ ) ≤ ϕ(τ L , τ R) with at least one of these inequalitiesstrict;
(C1b) given τR there is no policy τ ∈ T , s.t. V L(τ ) ≥ V L(τ L ) and ϕ(τ ,τ R) ≥ ϕ(τ L , τ R) with at least one of these inequalities strict;
(C2) for J = L, R, every member of coalition J prefers policy τ J tothe other policy, i.e., h ∈ J ⇒ v(τ J , h) > v(τ J ′
, h) for J ′ �= J .
Condition (C1a) states that, when facing the policy τL, there is no feasiblepolicy that would increase both the average welfare of party R’s constituentsand the vote fraction of party R. Thus, we may view policy τR as being abargaining solution between party R’s two factions when facing the oppo-sition’s policy, as the Militants’ desire to maximize the average welfare ofconstituents, and the Opportunists desire to maximize vote share. All weemploy here is the assumption that a bargain must be Pareto-efficient forthe two players in the bargaining game. Condition (C1b) similarly statesthat policy τL is a bargaining solution for party L’s factions when facingthe policy τR. Condition (C2) states that the endogenous party member-ships are stable: each party member prefers her party’s policy to the otherparties’ policies.
There are two “free” parameters in this equilibrium concept: one mightthink that the relative strength of the Militants with respect to the Oppor-tunists in a party is an important variable, in determining where on themini-Pareto frontier of the factions the bargaining solution lies. There is
C© The editors of the Scandinavian Journal of Economics 2006.

The political economy of xenophobia and distribution 259
one such parameter for each party L and R. Thus, we can expect that, ifthere is an equilibrium, there will be a two-parameter manifold of equilibria,where the elements in this manifold are associated with different pairs ofrelative bargaining strengths of the pairs of factions in L and R. This indeedturns out to be the case, as we will see below.
With differentiability, we can characterize a PUNE as the solution of asystem of simultaneous equations. Denote by ∇Jϕ(τL, τR) the gradient ofthe function ϕ with respect to the policy τ J . Denote by ∇V J the gradientof V J . Then, we can write the necessary conditions for a PUNE where τL
and τR are interior points in T as:
(1a) there is a non-negative number x such that −∇Lϕ(τ L , τ R) = x∇V L (τ L )
(3a)
(1b) there is a non-negative number y such that ∇Rϕ(τ L , τ R) = y∇V R(τ R).
(3b)
Our next task is to explicitly express V L, V R and ϕ, which requires usto formulate precisely the party constituencies. We compute that
�(τ a, τ b) ={ {(π, ρ) | ρ < ψ (τ a, τ b,π ) if ra < rb
{(π, ρ) | ρ > ψ (τ a, τ b,π ) if ra > rb,(4)
where
ψ (τ a, τ b,π ) = tb2 − ta2 + 2π (ta − tb) + γ(rb2 − ra2)
2(rb − ra). (5)
We will specify the value of the policy r so that larger r means morexenophobic (anti-immigrant). Thus, at equilibrium, we will expect thatrL < rR. For an equilibrium with this characteristic, it follows from (4) thatthe constituency L will be precisely L = {(π , ρ) ∈ H | ρ < ψ (τ L , τ R , π )},for these are the types who will prefer policy τL to policy τR. R, of course,comprises the remaining. Assuming the support of the distribution F is thereal plane, we can therefore write:
ϕ(τ ) =∫ ∞
−∞
∫ ψ (τ,π )
−∞d F(π, ρ), (6)
where the inside integral is over ρ and the outside integral is over π and
C© The editors of the Scandinavian Journal of Economics 2006.

260 J. E. Roemer and K. Van der Straeten
where τ ≡ (τ L , τ R). Similarly,
V L (τ L ) =∫ ∞
−∞
∫ ψ (τ L ,τ R ,π )
−∞v(τ L ;π, ρ) d F(π, ρ)
V R(τ R) =∫ ∞
−∞
∫ ∞
ψ (τ L ,τ R ,π )
v(τ R;π, ρ) d F(π, ρ).
(7)
Now we substitute expressions (6) and (7) into the first-orderconditions (3), and we have fully modeled PUNE—that is, condition (C2)of the definition of PUNE holds by construction.
The first-order conditions now comprise four equations in six un-knowns—the four policy unknowns of the Left and Right parties, and thetwo Lagrangian multipliers x and y. If there is a solution, there will (gener-ically) be, therefore, a two-parameter family of solutions. As we describedabove, the points in this family or manifold can be viewed as correspondingto equilibria associated with different relative bargaining strengths of thepairs of factions in the parties L and R. We remark that, at any PUNE, wecan compute the associated relative bargaining powers of the Opportunistsand Militants in each party. (We model the bargaining game within theparties as a Nash-bargaining game with threat points. The details of thegame and the computation of bargaining powers are presented in Roemer,2001, Ch. 8.)
III. The Policy Bundle and Anti-solidarity Effects: Theory
Our strategy to compute the two effects of voter xenophobia on the size ofthe public sector will be to estimate the above PUNE model, and then torun two counterfactual experiments, which we now describe. Our concernis with the effect of xenophobia on the size of public sector (tax policy).
We first summarize the value of the “tax policy” t that parties propose inequilibrium in the two-dimensional PUNE model described above, by oneaverage expected policy, that we will define later, which we will denotetexp.
In the first counterfactual experiment, we assume that immigrationpolicy (r) is not an issue in the election. Parties compete, that is, over thesingle issue of public-sector size, t. We still use the PUNE model, whichis now one-dimensional. Voters, however, continue to possess exactly thedistribution of preferences on public-sector size as described by the marginaldistribution of F on its first component. Since those preferences are influ-enced by their views on immigration, it continues to be the case, in thiscounterfactual contest, that voters’ views on immigration will indirectlyaffect the political equilibrium, via their effect on preferences over sizeof the public sector. We summarize the tax-policy equilibria of the set of
C© The editors of the Scandinavian Journal of Economics 2006.

The political economy of xenophobia and distribution 261
PUNEs for this counterfactual election by one policy, texpI . The difference
texpI − texp is a measure of the policy-bundle effect.4
Next, we estimate (in a manner to be described below in Section IV) adistribution of racism-free demands for the public sector That is, we es-timate what the distribution of preferences over public-sector size wouldbe, were all voters non-xenophobic, or not anti-immigrant. Call this distri-bution G. We next run a second unidimensional election, on public-sectorsize, where we assume that the distribution of voter preferences on the taxissue is given by G. The results of this election will be sterilized of boththe policy-bundle and the anti-solidarity effects. If we summarize the policyof the PUNEs here calculated by texp
II then we say that the total effect ofxenophobia is texp
II − texp, and the anti-solidarity effect is texpII − texp
I .
IV. Estimation of Model Parameters
Distribution of Voter Traits
We now discuss our use of the Danish voter surveys to calibrate the dis-tribution of voter preferences on the size of the public sector and immi-gration policy. We select questions that enable us to calibrate both voters’preferences and their views about where the parties stand on the issues inquestion. We use the two following questions.
(i) The economic issueQuestion: Among other things, the parties disagree about how big thepublic sector should be. Some parties say we should cut down on publicrevenue and expenditure, others say we should expect increasing expen-diture and revenue in the future. Here is a scale from 1 to 5, where 1means the revenue and expenditure should be cut substantially, 2 meansthat they should be cut a little, 3 means that the public revenue andexpenditure are appropriate as they are now, 4 means that they shouldincrease a little and 5 means that they should increase a lot. Where
4 Note that the size of the policy-bundle effect depends on the model and the equilibriumconcept we use to describe parties’ behavior in an election. Consider, for example, someprobabilistic models of political equilibrium with multi-dimensional policy spaces—e.g. themodels of Coughlin (1992) and Lindbeck and Weibull (1987)—which predict that partiespropose the same policy in equilibrium. In the simplest version of the probabilistic setting,both parties simply maximize the average welfare of the voters. In that case, it is straight-forward to check that there is no policy-bundle effect. Indeed, with our specification of theutility function (1), both parties propose the average voters’ ideal position on each issuein the two-dimensional model; thus proposals on the economic issue are the same, whetherparties compete on this single dimension or on a larger number of issues, even if voters’bliss points on the various issues are correlated.
C© The editors of the Scandinavian Journal of Economics 2006.
262 J. E. Roemer and K. Van der Straeten
Size of the public sector
05
10152025303540
Cut
dee
ply
Cut
a little
About
righ
t
Incr
ease
a little
Incr
ease
a lo
t
Do
not k
now
1998
2001
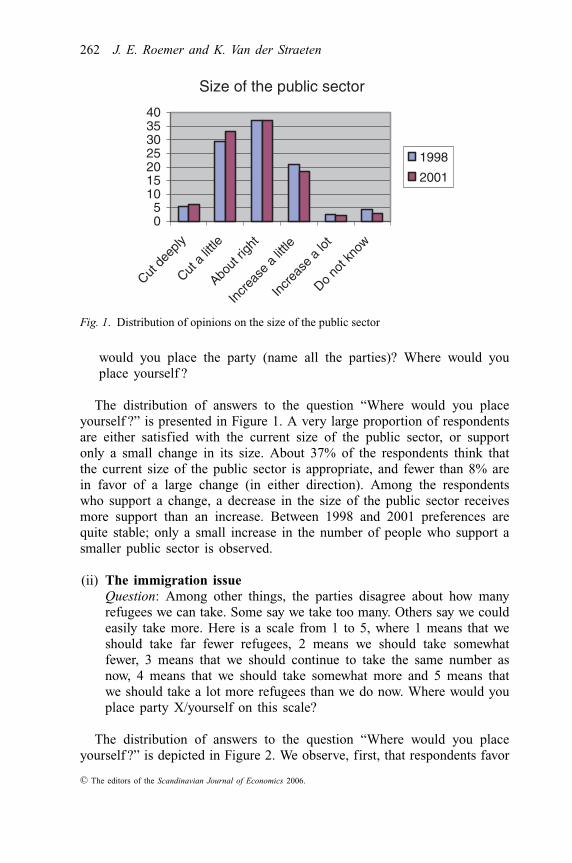
Fig. 1. Distribution of opinions on the size of the public sector
would you place the party (name all the parties)? Where would youplace yourself ?
The distribution of answers to the question “Where would you placeyourself ?” is presented in Figure 1. A very large proportion of respondentsare either satisfied with the current size of the public sector, or supportonly a small change in its size. About 37% of the respondents think thatthe current size of the public sector is appropriate, and fewer than 8% arein favor of a large change (in either direction). Among the respondentswho support a change, a decrease in the size of the public sector receivesmore support than an increase. Between 1998 and 2001 preferences arequite stable; only a small increase in the number of people who support asmaller public sector is observed.
(ii) The immigration issueQuestion: Among other things, the parties disagree about how manyrefugees we can take. Some say we take too many. Others say we couldeasily take more. Here is a scale from 1 to 5, where 1 means that weshould take far fewer refugees, 2 means we should take somewhatfewer, 3 means that we should continue to take the same number asnow, 4 means that we should take somewhat more and 5 means thatwe should take a lot more refugees than we do now. Where would youplace party X/yourself on this scale?
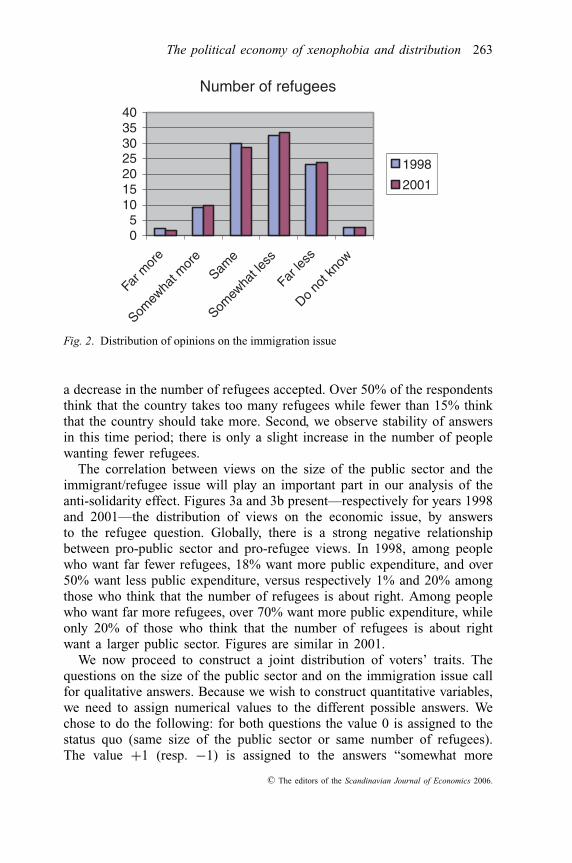
The distribution of answers to the question “Where would you placeyourself ?” is depicted in Figure 2. We observe, first, that respondents favor
C© The editors of the Scandinavian Journal of Economics 2006.
The political economy of xenophobia and distribution 263
Number of refugees
05
10152025303540
Far m
ore
Somew
hat m
ore
Same
Somew
hat les
s
Far le
ss
Do
not k
now
1998
2001
Fig. 2. Distribution of opinions on the immigration issue
a decrease in the number of refugees accepted. Over 50% of the respondentsthink that the country takes too many refugees while fewer than 15% thinkthat the country should take more. Second, we observe stability of answersin this time period; there is only a slight increase in the number of peoplewanting fewer refugees.
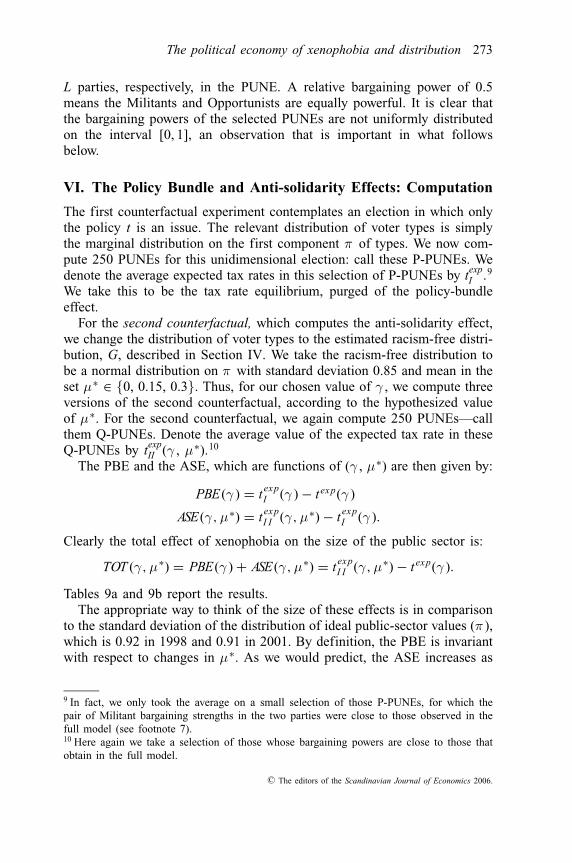
The correlation between views on the size of the public sector and theimmigrant/refugee issue will play an important part in our analysis of theanti-solidarity effect. Figures 3a and 3b present—respectively for years 1998and 2001—the distribution of views on the economic issue, by answersto the refugee question. Globally, there is a strong negative relationshipbetween pro-public sector and pro-refugee views. In 1998, among peoplewho want far fewer refugees, 18% want more public expenditure, and over50% want less public expenditure, versus respectively 1% and 20% amongthose who think that the number of refugees is about right. Among peoplewho want far more refugees, over 70% want more public expenditure, whileonly 20% of those who think that the number of refugees is about rightwant a larger public sector. Figures are similar in 2001.
We now proceed to construct a joint distribution of voters’ traits. Thequestions on the size of the public sector and on the immigration issue callfor qualitative answers. Because we wish to construct quantitative variables,we need to assign numerical values to the different possible answers. Wechose to do the following: for both questions the value 0 is assigned to thestatus quo (same size of the public sector or same number of refugees).The value +1 (resp. −1) is assigned to the answers “somewhat more
C© The editors of the Scandinavian Journal of Economics 2006.

264 J. E. Roemer and K. Van der Straeten
Year 1998
0
20
40
60
80
100
Pe
rce
nt
Mu
ch
mo
re
Sa
me
nu
mb
er
Fa
r
few
er
Increase publicsector a lot
Increase publicsector a little
Public sectorabout right
Cut public sectora little
Cut public sectora lot
Fig. 3a. The distribution of economic views by xenophobic type, year 1998
Year 2001
0
20
40
60
80
100
Perc
ent
Much
more
Sam
e
num
ber
Far
few
er
Increase publicsector a lot
Increase publicsector a little
Public sectorabout right
Cut public sectora little
Cut public sectora lot
Fig. 3b. The distribution of economic views by xenophobic type, year 2001
public sector” and “somewhat fewer refugees” (resp. to the answers “some-what smaller public sector” and “somewhat more refugees”); the value +2(resp. −2) is assigned to the answers “much larger public sector” and “farfewer refugees” (resp. to the answers “much smaller public sector” and“many more refugees”). The quantitative variables thus defined are labeledπ for the economic issue and ρ for the immigration issue. Some descriptivestatistics for these two variables are provided in Table 3.
As noted, individuals are, on average, favorable to a small decrease inthe size of the public sector and to a large decrease in the number of
C© The editors of the Scandinavian Journal of Economics 2006.

The political economy of xenophobia and distribution 265
Table 3. Some descriptive statistics on the pro-public sector and the anti-immigrants variables
1998 2001
Variable Mean Std. dev. Obs. Mean Std. dev. Obs.
π −0.15 0.92 1,914 −0.24 0.91 1,967ρ 0.67 1.02 1,948 0.70 1.01 1,972Correlation −0.33 1,886 −0.34 1,933
refugees. The correlation coefficient between the two variables is −0.33in 1998, and −0.34 in 2001. We approximate the joint distribution by abivariate normal density with mean and standard deviation of the marginaldistributions given in Table 3 and correlation coefficient equal −0.33 in1998 and −0.34 in 2001.5
Parties’ Vote Shares and Platforms
Vote shares obtained by the various parties, in the 1998 and 2001 elections,as well as the parties’ proposals on the issues we are concerned about,were presented in Table 1. As explained in Section II, we model Danishpolitics in terms of broader coalitions of parties: Left and Right. Wecompute the broader parties’ vote shares by summing the vote shares of theparties forming the coalition. These are reported in Table 4. We also com-pute coalitions’ positions, defined as the average of the parties’ positionson the various issues, weighted by their vote share within the coalition.Note that, as far as the immigration issue is concerned, the Right party iscloser to the voters’ average point of view than the Left. As to the size ofthe public sector, the average point of view of voters is equidistant from theLeft and Right positions. If we compare the voters’ perceived positions ofthe parties across time, we see that the Left coalition is viewed as almoststable, with only a very small anti-public sector, anti-immigrants shift overthe three-year period, whereas the Right party is viewed as having mademore spectacular changes, becoming much more anti-immigrant on theperiod.
Another useful indicator of the division of the electorate on these twoissues is the average ideal tax policy (and the average ideal immigrationpolicy) of respondents who declared voting for a party in the Left coalition,
5 Some discussion on the interpretation of these variables and on the choice of coding isprovided in the working-paper version of this article; see Roemer and Van der Straeten(2004).
C© The editors of the Scandinavian Journal of Economics 2006.

266 J. E. Roemer and K. Van der Straeten
Table 4. Coalitions’ vote shares and political platforms
1998 2001
Public sector Immigration Vote share Public sector Immigration Vote share
Left 0.67 −0.37 50.3 0.53 −0.28 43.1Right −0.94 0.94 49.7 −0.95a 1.18a 56.9Voters −0.15 0.67 −0.24 0.70
a In the 2001 survey there is no question about the perceived position of the Center Democratic Party and ofthe Progress Party (see Table 1). Since these parties receive only a small share of the votes, we simply ignorethem when computing the average observed policies of the Right coalition.
Table 5. Average ideal tax policy and average ideal immigration policy ofrespondents who declared voting for a party in the Left coalition/for a partyin the Right coalition
1998 2001
Average ideal policy for Public sector Immigration Public sector Immigration
Voters who vote for L 0.28 0.29 0.21 0.23Voters who vote for R −0.54 0.97 −0.59 1.02All voters −0.15 0.67 −0.24 0.70
and those of respondents who declared voting for a party in the Rightcoalition. Results are reported in Table 5.
Estimation of Counterfactual Preferences
To compute the anti-solidarity effect, as we have described above, we needto construct counterfactual “racism-free” demands for the public sector,that is, voter preferences on the size of the public sector that would beobserved were hostility towards immigrants and refugees not to reduce thefeeling of solidarity. There is no unique way to do this; our results willdepend on exactly how we interpret the significant correlation betweenopinions on the size of the public sector and the immigration issue. Wecannot expect, given the available data, to provide definitive evidence thatxenophobia indeed causes a decrease in the support for the public sector,or to give a definitive answer as to the exact size of this effect. Our goalis less ambitious: it is to provide some weak evidence that this correlationremains even when we control for demographic factors, and to provide arange of values for the effect. In the working-paper version of this article,we discuss several methods to explore this relationship. Here, we chooseto report only on the use of regression analysis to explore the empirical
C© The editors of the Scandinavian Journal of Economics 2006.

The political economy of xenophobia and distribution 267
relationship between the size of the public sector and views on immigration.We estimate the following model:
πi = −δρi + X ′iβ + εi ,
where Xi is a set of individual characteristics, including social and demo-graphic variables, as well as responses to questions about how the respon-dents feel on a number of justice issues, or about the behavior of peopleliving on welfare. The disturbance term εi represents the unobserved charac-teristics of individual i; it is a zero mean disturbance with standard normaldistribution. We estimate the model with OLS. Results are presented inTable 6. (The definition of the added independent variables is provided inthe Appendix.)
The anti-immigration variable is highly significant and attracts theexpected negative sign. Unsurprisingly, people who think that the unem-ployed are lazy, that too many people take advantage of the system, orwho think that a higher level of justice is not desirable, tend to favor lowertax rates. The young, female respondents tend to support a larger publicsector.6
The figures in Table 6 suggest that an increase of 1 point (on the (−2, 2)scale) in the level of xenophobia reduces the ProPublicSector by δ = 0.18in 1998 and by δ = 0.23 in 2001. We use this estimator to construct whatwe will define as racism-free demands for the public sector. We proceedas follows. First, we select a critical level of AntiImmigration ρref that wetake to be the non-xenophobic threshold. Then, we define all individualswith ρ ≤ ρ ref to be free of racism, and take their observed preferences forthe public sector to be their racism-free economic preferences; whereas, forall individuals with ρ > ρ ref , we assume that there is some racism at play,and define their racism-free economic preferences to be those they wouldhave if ρ = ρ ref . More specifically, consider an individual with observedtraits (π , ρ). We define her racism-free demand for public sector to be πif ρ ≤ ρ ref , and to be π + δ(ρ − ρ ref ) if ρ ≥ ρ ref . We will consider threedifferent values for ρ ref : ρ ref = −2 (option 1), ρ ref = −1 (option 2), ρref =0 (option 3). Table 7 presents the mean and standard deviation of the
6 Note that there is no canonical way to decide upon the exact list of the variables that shouldbe included on the RHS of the regression in Table 3. For example, if we regress π on ρ alonewith 1998 data, the coefficient on ρ is −0.30 (column 2). Now consider adding the variableTakeAdvantage to this regression, which measures whether the respondent thinks that toomany people take advantage of the public system (see the Appendix for the exact definition).The correlation between AntiImmigration and TakeAdvantage is very large: 0.40. If we addthe variable TakeAdvantage to the regression, the coefficient on AntiImmigration drops to−0.17 (see column 3). Whether we should add this variable to the RHS of the regressiondepends on how we interpret the correlation between AntiImmigration and TakeAdvantage.We chose here to add all possible variables to the RHS of the regression.
C© The editors of the Scandinavian Journal of Economics 2006.

268 J. E. Roemer and K. Van der Straeten
Tab
le6
.D
epen
dent
vari
able
:P
roP
ubli
cSec
tor
(est
imat
ion
wit
hO
LS)
19
98
20
01
An
ti-i
mm
igra
nts
−0.2
95
∗∗∗
−0.1
73
∗∗∗
−0.3
08
∗∗∗
−0.2
26
∗∗∗
(0.0
20
)(0
.02
3)
(0.0
19
)(0
.02
3)
Co
nst
ant
0.0
43
∗0.1
05
−0.0
28
0.0
51
(0.0
24
)(0
.20
3)
(0.0
23
)(0
.19
1)
Un
emp
loye
dla
zy−0
.10
3∗∗
∗−0
.04
4∗∗
∗(0
.01
8)
(0.0
17
)T
ake
adva
nta
ge
−0.1
04
∗∗∗
−0.1
25
∗∗∗
(0.0
20
)(0
.01
8)
Sam
eec
on
om
icco
nd
itio
ns
for
all
0.0
88
∗∗∗
0.1
04
∗∗∗
(0.0
16
)(0
.01
5)
Ho
use
ho
ldin
com
e−0
.01
7∗∗
∗−0
.02
1∗∗
∗(0
.00
6)
(0.0
06
)F
emal
e0.3
13
∗∗∗
0.2
03
∗∗∗
(0.0
43
)(0
.04
1)
Ag
e0.0
14
∗0.0
13
∗(0
.00
8)
(0.0
07
)A
ge
squ
ared
−0.0
00
2∗∗
−0.0
00
2∗∗
(8.1
0−
5)
(7.1
0−
5)
Cit
y−0
.01
80.0
15
(0.0
15
)(0
.01
5)
Ed
uca
tio
n−0
.03
6−0
.06
1∗∗
∗(0
.02
5)
(0.0
23
)
No
.o
fo
bse
rvat
ion
s1
,88
61
,48
31
,93
31
,64
5R
-sq
uar
ed0.1
06
60.2
41
10.1
16
60.2
15
6
Not
es:
∗∗∗
Sig
nif
ican
tat
the
1%
level
;∗∗
atth
e5%
level
;∗
atth
e10%
level
.S
tandar
der
rors
are
inpar
enth
eses
ben
eath
the
valu
eof
the
coef
fici
ents
.
C© The editors of the Scandinavian Journal of Economics 2006.

The political economy of xenophobia and distribution 269
Table 7. Mean and standard deviation of the racism-free economic preferencesand of the observed preferences
1998 2001
Mean Std. dev. Mean Std. dev.
Racism-free, option 1 0.33 0.87 0.37 0.86Racism-free, option 2 0.15 0.87 0.15 0.86Racism-free, option 3 −0.01 0.88 −0.05 0.87Observed preferences −0.15 0.91 −0.24 0.91
racism-free economic preferences for the three options, and the two yearsunder study. The last line also presents the figures for observed preferences.
Note that the obtained values are almost identical in 1998 and 2001. In2001, there is a slight decrease in the observed demand for public sectorcompared to 1998, but an increase in the coefficient δ balances this effect,so that racism-free demands are practically the same. We conclude that areasonable set of racism-free distributions of public-sector preferences forboth years are normal distributions with mean = 0, mean = 0.15, mean =0.3, and standard deviation 0.85.
V. Political Equilibrium: Observation and Prediction
We describe the computation of equilibrium PUNEs. We perform thesecomputations for various values of γ ; our choice of the ones to report herewill be motivated below. For each value of γ , we computed many (ap-proximately 100) PUNEs. (Recall that there is a two-manifold of PUNEs.)We then selected those for which the Left vote share is within 5% of theobserved vote share for Left in that election. Recall that to compute aPUNE, we solve four simultaneous equations in six unknowns, such thattwo of the unknowns, the Lagrangian multipliers, are non-negative.
In Figure 4a we graph the selected PUNEs for 1998 for the value ofsalience γ = 0.5. The space of the figure is (t, r). The three large dotsin the figure are, reading from left to right, the average policy position(i.e., ideal point) of those who, in the voter survey, identified themselveswith one of the Right parties, the average ideal point of all respondents,and the average ideal point of those identified with Left parties. The nextpair of smaller dots are the average values of the PUNEs;7 the pair ofsmallest points are the average ideal points of the Militants in the PUNEs
7 That is, the average value of the share-weighted average of the parties’ policies, overselected PUNEs. A sophisticated form of averaging was used. We computed kernel densitiesof the bargaining powers in the PUNEs, and then weighted each PUNE with its predicted“frequency”, so computed. This procedure reflects our view that the “missing data” in theanalysis are the bargaining powers of the factions.
C© The editors of the Scandinavian Journal of Economics 2006.

270 J. E. Roemer and K. Van der Straeten
Fig. 4a. PUNEs, 1998, γ = 0.5Legend: Abscissa is t, ordinate is r. The three largest black dots are the average ideal pointof all voters (middle), of Right voters (upper left), and of Left voters (lower right). Thetwo black dots of next lower size are the average PUNE policies of R and L. The pair ofblack dots of next lower size are the average policy views of the Militants in R and L atthe PUNEs. The cluster of light gray small dots (upper left) are PUNE policies of Left; thecluster of deeper gray small dots (lower right) are PUNE policies of Right.
calculated. (Of course, it is to be expected that the average PUNE values aremore moderate than the average values of the Militants in the two parties.)The very small dots are the PUNE policies of the two parties. Note thatthe Right party average PUNE is quite close to the average policy ideal ofvoters who identify with Right. In contrast, the Left party average PUNE isconsiderably more extreme than the average policy value of Left voters—itis more left on the size of the public sector, and less xenophobic than areLeft voters.
We can now describe why we choose to report the results for γ = 0.5:note that the three large dots, which report observed values, are collinearwith the PUNE values. This characterizes the value γ = 0.5. For larger andsmaller values of γ , that collinearity fails to hold. In this sense, the valueγ = 0.5 gives the best fit of the model to the data.8
8 In the working-paper version of this article, we describe how we also directly estimated γfrom the Danish electoral survey, using for each respondent her opinions of the immigrationissue, on the economic issue, and her reported vote in the election. It is worth noting thatthe best-fitting value of γ (0.5 in 1998 and 0.6 in 2001) lies in the interval, for each year,that was estimated from the survey data.
C© The editors of the Scandinavian Journal of Economics 2006.

The political economy of xenophobia and distribution 271
Fig. 4b. PUNEs, 2001, γ = 0.6. See legend for Figure 4a.
If the model were perfect, then we would expect that the average idealpoint of the Militants in Left and Right would coincide with the averageobserved policy preferences of voters who identify with Left and Right.We do not achieve this coincidence of model and data: the Militants inthe model’s equilibria are considerably more extreme than the citizens whoactually identify with the parties, in Figure 4a. The PUNE analysis predictsthat the Left and Right parties are more extreme than are the voters whoidentify with them.
In Figure 4b we graph the PUNEs for 2001: this time, the choice ofγ to achieve the desired collinearity of observation with data is 0.6. Notethat the average Right policy in PUNEs is very close to the average policyview of voters in 2001: this means that Opportunists in Right were relativelymuch more powerful (with respect to Right Militants) in 2001 than in 1998.Left, on the other hand, has not compromised as much as Right. In bothelections, it appears, then, that the Left party is considerably more radicalon both issues than its observed constituency.
Indeed, the contrast between the Right policies in PUNEs in 1998 and2001 leads us to conjecture that the major explanation for the growth inRight’s vote share between 1998 and 2001 was not the change in thedistribution of voter preferences, but rather a strengthening of theOpportunist faction in Right over this period, where a comparable strength-ening did not occur for Left’s Opportunists.
C© The editors of the Scandinavian Journal of Economics 2006.

272 J. E. Roemer and K. Van der Straeten
Table 8a. PUNEs, 1998, with Left vote share at least 40%
γ BPR BPL tL tR rL rR L vote share
0.5 0.628697 0.829203 0.576437 −0.549139 0.154231 0.953317 0.4257250.5 0.698542 0.92285 0.622139 −0.589915 0.121768 0.982299 0.4246220.5 0.79183 0.933811 0.58198 −0.683665 0.150244 1.04895 0.4548310.5 0.762134 0.876167 0.544513 −0.677612 0.176775 1.04472 0.4619610.5 0.5057 0.703209 0.532761 −0.448701 0.185197 0.882103 0.4130390.5 0.733015 0.925206 0.604972 −0.626399 0.133949 1.00827 0.4366850.5 0.798179 0.974892 0.614719 −0.67374 0.127003 1.0419 0.445170.5 0.745414 0.969462 0.637299 −0.622016 0.111006 1.00509 0.4284230.5 0.63046 0.849025 0.594551 −0.542426 0.141326 0.948653 0.420169
Table 8b. PUNEs, 2001, Left vote share within 5% of observed share
γ BPR BPL tL tR rL rR L vote share
0.6 0.707899 0.824854 0.402725 −0.709326 0.161638 1.09316 0.4585370.6 0.10902 0.172715 0.137341 −0.132147 0.383917 0.609667 0.3853870.6 0.603916 0.742785 0.383003 −0.630981 0.178149 1.02753 0.4445950.6 0.527798 0.835404 0.525453 −0.493153 0.058798 0.912085 0.3791780.6 0.548844 0.724427 0.400995 −0.571501 0.163077 0.977703 0.4262810.6 0.389954 0.437284 0.171502 −0.526511 0.355341 0.940018 0.4700880.6 0.608437 0.745537 0.382953 −0.635012 0.178186 1.03092 0.4455650.6 0.0616152 0.101041 0.0992047 −0.0610826 0.415864 0.550136 0.3778480.6 0.709374 0.789291 0.367985 −0.72704 0.190741 1.10799 0.4710530.6 0.803782 0.988439 0.496988 −0.739256 0.0826683 1.11823 0.4432420.6 0.62673 0.866212 0.487299 −0.602427 0.0907843 1.00361 0.4132840.6 0.0983831 0.157582 0.131187 −0.115182 0.389072 0.595455 0.3829060.6 0.0889009 0.138909 0.105288 −0.115836 0.410767 0.596003 0.3890060.6 0.453796 0.540747 0.26021 −0.547335 0.280998 0.957474 0.4538980.6 0.275986 0.453519 0.339955 −0.284499 0.214176 0.737297 0.3738970.6 0.279262 0.405217 0.257957 −0.336495 0.282893 0.780844 0.4047470.6 0.661735 0.798265 0.403085 −0.671376 0.161323 1.06137 0.4494190.6 0.107554 0.172471 0.142826 −0.125007 0.379322 0.603686 0.3824910.6 0.424257 0.492003 0.219858 −0.537488 0.3148 0.949223 0.4611640.6 0.553328 0.748387 0.422536 −0.565467 0.145033 0.972649 0.419798
It must be emphasized that our utility function has only one degree offreedom, γ ; had we a more complex utility function, we would be able tocalibrate the model to better fit the data. In particular, it might be desirableto characterize each voter with her own value of salience. That, however,would require a three-dimensional-type space, leading to considerablycomplex numerical computation of the equilibria. It is also far from clearthat the survey observations on individual voters’ saliences are reliable.
Finally, Tables 8a and 8b present the numerical values of the PUNEswe have graphed in Figures 4a and 4b. The columns labeled “BPR” and“BPL” report the relative bargaining power of the Militants in the R and
C© The editors of the Scandinavian Journal of Economics 2006.
The political economy of xenophobia and distribution 273
L parties, respectively, in the PUNE. A relative bargaining power of 0.5means the Militants and Opportunists are equally powerful. It is clear thatthe bargaining powers of the selected PUNEs are not uniformly distributedon the interval [0, 1], an observation that is important in what followsbelow.
VI. The Policy Bundle and Anti-solidarity Effects: Computation
The first counterfactual experiment contemplates an election in which onlythe policy t is an issue. The relevant distribution of voter types is simplythe marginal distribution on the first component π of types. We now com-pute 250 PUNEs for this unidimensional election: call these P-PUNEs. Wedenote the average expected tax rates in this selection of P-PUNEs by texp
I .9
We take this to be the tax rate equilibrium, purged of the policy-bundleeffect.
For the second counterfactual, which computes the anti-solidarity effect,we change the distribution of voter types to the estimated racism-free distri-bution, G, described in Section IV. We take the racism-free distribution tobe a normal distribution on π with standard deviation 0.85 and mean in theset μ∗ ∈ {0, 0.15, 0.3}. Thus, for our chosen value of γ , we compute threeversions of the second counterfactual, according to the hypothesized valueof μ∗. For the second counterfactual, we again compute 250 PUNEs—callthem Q-PUNEs. Denote the average value of the expected tax rate in theseQ-PUNEs by texp
II (γ , μ∗).10
The PBE and the ASE, which are functions of (γ , μ∗) are then given by:
PBE(γ ) = t expI (γ ) − t exp(γ )
ASE(γ,μ∗) = t expI I (γ,μ∗) − t exp
I (γ ).
Clearly the total effect of xenophobia on the size of the public sector is:
TOT (γ,μ∗) = PBE(γ ) + ASE(γ,μ∗) = t expI I (γ,μ∗) − t exp(γ ).
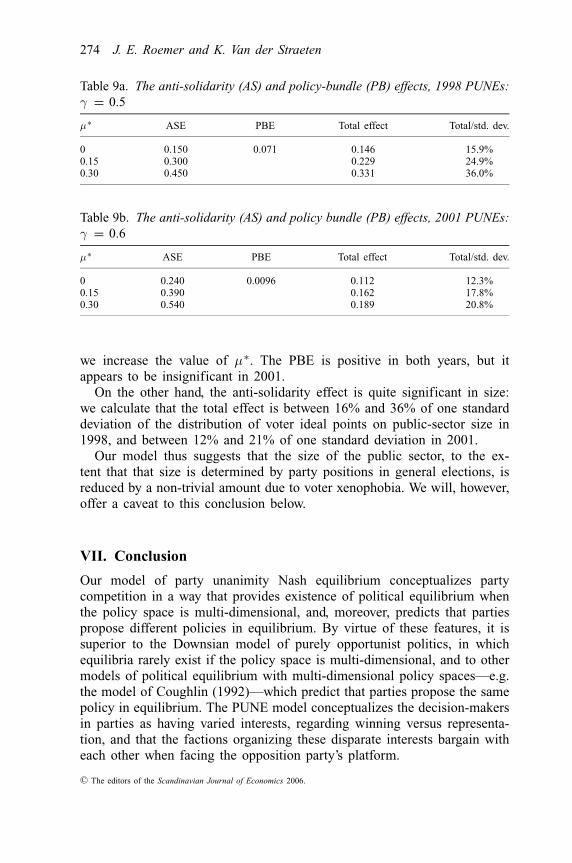
Tables 9a and 9b report the results.The appropriate way to think of the size of these effects is in comparison
to the standard deviation of the distribution of ideal public-sector values (π ),which is 0.92 in 1998 and 0.91 in 2001. By definition, the PBE is invariantwith respect to changes in μ∗. As we would predict, the ASE increases as
9 In fact, we only took the average on a small selection of those P-PUNEs, for which thepair of Militant bargaining strengths in the two parties were close to those observed in thefull model (see footnote 7).10 Here again we take a selection of those whose bargaining powers are close to those thatobtain in the full model.
C© The editors of the Scandinavian Journal of Economics 2006.
274 J. E. Roemer and K. Van der Straeten
Table 9a. The anti-solidarity (AS) and policy-bundle (PB) effects, 1998 PUNEs:γ = 0.5
μ∗ ASE PBE Total effect Total/std. dev.
0 0.150 0.071 0.146 15.9%0.15 0.300 0.229 24.9%0.30 0.450 0.331 36.0%
Table 9b. The anti-solidarity (AS) and policy bundle (PB) effects, 2001 PUNEs:γ = 0.6
μ∗ ASE PBE Total effect Total/std. dev.
0 0.240 0.0096 0.112 12.3%0.15 0.390 0.162 17.8%0.30 0.540 0.189 20.8%
we increase the value of μ∗. The PBE is positive in both years, but itappears to be insignificant in 2001.
On the other hand, the anti-solidarity effect is quite significant in size:we calculate that the total effect is between 16% and 36% of one standarddeviation of the distribution of voter ideal points on public-sector size in1998, and between 12% and 21% of one standard deviation in 2001.
Our model thus suggests that the size of the public sector, to the ex-tent that that size is determined by party positions in general elections, isreduced by a non-trivial amount due to voter xenophobia. We will, however,offer a caveat to this conclusion below.
VII. Conclusion
Our model of party unanimity Nash equilibrium conceptualizes partycompetition in a way that provides existence of political equilibrium whenthe policy space is multi-dimensional, and, moreover, predicts that partiespropose different policies in equilibrium. By virtue of these features, it issuperior to the Downsian model of purely opportunist politics, in whichequilibria rarely exist if the policy space is multi-dimensional, and to othermodels of political equilibrium with multi-dimensional policy spaces—e.g.the model of Coughlin (1992)—which predict that parties propose the samepolicy in equilibrium. The PUNE model conceptualizes the decision-makersin parties as having varied interests, regarding winning versus representa-tion, and that the factions organizing these disparate interests bargain witheach other when facing the opposition party’s platform.
C© The editors of the Scandinavian Journal of Economics 2006.

The political economy of xenophobia and distribution 275
Like all equilibrium models, ours is best viewed as one that describesa political system in which preferences of voters are stable. In periodswhen voter preferences are in flux, we cannot expect the PUNE modelto give perfect predictions. With stable constituencies, party entrepreneurswill come to know their constituencies’ interests well, and we can expectthat those entrepreneurs who wish to represent constituents will do so withmore precision than when voter preferences are unstable and constituenciesare shifting. The mechanism by which this occurs may well be that thoseMilitants who rise within the party structure are ones who best representthe constituents’ interests. Once ensconced, however, a particular Militantwill have a career within the party that may last for years or decades. Thus,in periods of voter-preference flux, the established Militants in a party maycease to represent its evolving constituency.
Our policy space is only two-dimensional. In reality, the policy spacehas many more dimensions. In particular, it is possible, in fact, to differen-tiate public-sector policy towards immigrants from policy towards natives:for example, immigrants may receive less favorable treatment with regardto transfer payments than natives, as is currently the case in Denmark.To represent this possibility in our model would require a third policydimension. With such a third dimension, both the anti-solidarity effect andthe policy bundle effect should decrease, because presumably parties couldthen propose to retain high public-sector benefits for natives, while reduc-ing them for immigrants. We cannot, therefore, predict that the total sizeof the welfare state will radically fall in Denmark.11
Indeed, this point illustrates the necessity for political economists tomodel political competition as occurring over multi-dimensional policyspaces. Our work begins this task, although, as we have just noted, it stillfalls short of what is ultimately desirable. The binding constraints, at thispoint, are two: first, the availability of reliable data on voter preferences overmulti-dimensional policy spaces, and second, the difficulty of computingequilibria (PUNEs) in real time, when the dimension of the type spaceand/or policy space is larger than two.
With respect to substantive conclusions, we will not review the estimatesof Section VI. We do, however, repeat in conclusion our conjecture fromthe examination of PUNEs in 1998 and 2001: that the increased vote shareof Right may be due not to the change in the distribution of voter types,but rather to increasing opportunism in Right parties.
11 We contrast this with the United States, where voter racism is directed primarily towardsAfrican-Americans, who, as citizens, cannot be legally discriminated against, as can aliens.Thus, we would expect the size of the welfare state to be more affected by voter racismin the US than by voter xenophobia in Denmark. See Lee and Roemer (2006) for furtheranalysis.
C© The editors of the Scandinavian Journal of Economics 2006.
276 J. E. Roemer and K. Van der Straeten
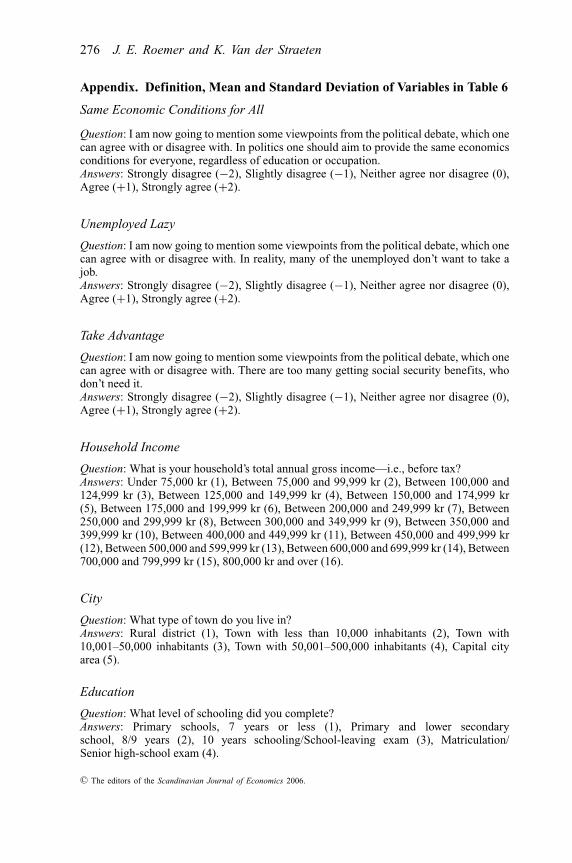
Appendix. Definition, Mean and Standard Deviation of Variables in Table 6
Same Economic Conditions for All
Question: I am now going to mention some viewpoints from the political debate, which onecan agree with or disagree with. In politics one should aim to provide the same economicsconditions for everyone, regardless of education or occupation.Answers: Strongly disagree (−2), Slightly disagree (−1), Neither agree nor disagree (0),Agree (+1), Strongly agree (+2).
Unemployed Lazy
Question: I am now going to mention some viewpoints from the political debate, which onecan agree with or disagree with. In reality, many of the unemployed don’t want to take ajob.Answers: Strongly disagree (−2), Slightly disagree (−1), Neither agree nor disagree (0),Agree (+1), Strongly agree (+2).
Take Advantage
Question: I am now going to mention some viewpoints from the political debate, which onecan agree with or disagree with. There are too many getting social security benefits, whodon’t need it.Answers: Strongly disagree (−2), Slightly disagree (−1), Neither agree nor disagree (0),Agree (+1), Strongly agree (+2).
Household Income
Question: What is your household’s total annual gross income—i.e., before tax?Answers: Under 75,000 kr (1), Between 75,000 and 99,999 kr (2), Between 100,000 and124,999 kr (3), Between 125,000 and 149,999 kr (4), Between 150,000 and 174,999 kr(5), Between 175,000 and 199,999 kr (6), Between 200,000 and 249,999 kr (7), Between250,000 and 299,999 kr (8), Between 300,000 and 349,999 kr (9), Between 350,000 and399,999 kr (10), Between 400,000 and 449,999 kr (11), Between 450,000 and 499,999 kr(12), Between 500,000 and 599,999 kr (13), Between 600,000 and 699,999 kr (14), Between700,000 and 799,999 kr (15), 800,000 kr and over (16).
City
Question: What type of town do you live in?Answers: Rural district (1), Town with less than 10,000 inhabitants (2), Town with10,001–50,000 inhabitants (3), Town with 50,001–500,000 inhabitants (4), Capital cityarea (5).
Education
Question: What level of schooling did you complete?Answers: Primary schools, 7 years or less (1), Primary and lower secondaryschool, 8/9 years (2), 10 years schooling/School-leaving exam (3), Matriculation/Senior high-school exam (4).
C© The editors of the Scandinavian Journal of Economics 2006.
The political economy of xenophobia and distribution 277
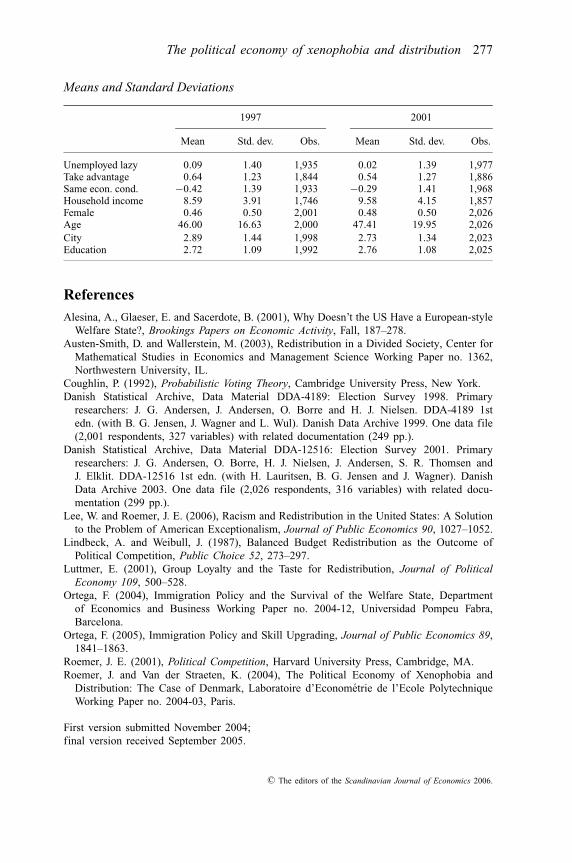
Means and Standard Deviations
1997 2001
Mean Std. dev. Obs. Mean Std. dev. Obs.
Unemployed lazy 0.09 1.40 1,935 0.02 1.39 1,977Take advantage 0.64 1.23 1,844 0.54 1.27 1,886Same econ. cond. −0.42 1.39 1,933 −0.29 1.41 1,968Household income 8.59 3.91 1,746 9.58 4.15 1,857Female 0.46 0.50 2,001 0.48 0.50 2,026Age 46.00 16.63 2,000 47.41 19.95 2,026
City 2.89 1.44 1,998 2.73 1.34 2,023Education 2.72 1.09 1,992 2.76 1.08 2,025
ReferencesAlesina, A., Glaeser, E. and Sacerdote, B. (2001), Why Doesn’t the US Have a European-style
Welfare State?, Brookings Papers on Economic Activity, Fall, 187–278.Austen-Smith, D. and Wallerstein, M. (2003), Redistribution in a Divided Society, Center for
Mathematical Studies in Economics and Management Science Working Paper no. 1362,Northwestern University, IL.
Coughlin, P. (1992), Probabilistic Voting Theory, Cambridge University Press, New York.Danish Statistical Archive, Data Material DDA-4189: Election Survey 1998. Primary
researchers: J. G. Andersen, J. Andersen, O. Borre and H. J. Nielsen. DDA-4189 1stedn. (with B. G. Jensen, J. Wagner and L. Wul). Danish Data Archive 1999. One data file(2,001 respondents, 327 variables) with related documentation (249 pp.).
Danish Statistical Archive, Data Material DDA-12516: Election Survey 2001. Primaryresearchers: J. G. Andersen, O. Borre, H. J. Nielsen, J. Andersen, S. R. Thomsen andJ. Elklit. DDA-12516 1st edn. (with H. Lauritsen, B. G. Jensen and J. Wagner). DanishData Archive 2003. One data file (2,026 respondents, 316 variables) with related docu-mentation (299 pp.).
Lee, W. and Roemer, J. E. (2006), Racism and Redistribution in the United States: A Solutionto the Problem of American Exceptionalism, Journal of Public Economics 90, 1027–1052.
Lindbeck, A. and Weibull, J. (1987), Balanced Budget Redistribution as the Outcome ofPolitical Competition, Public Choice 52, 273–297.
Luttmer, E. (2001), Group Loyalty and the Taste for Redistribution, Journal of PoliticalEconomy 109, 500–528.
Ortega, F. (2004), Immigration Policy and the Survival of the Welfare State, Departmentof Economics and Business Working Paper no. 2004-12, Universidad Pompeu Fabra,Barcelona.
Ortega, F. (2005), Immigration Policy and Skill Upgrading, Journal of Public Economics 89,1841–1863.
Roemer, J. E. (2001), Political Competition, Harvard University Press, Cambridge, MA.Roemer, J. and Van der Straeten, K. (2004), The Political Economy of Xenophobia and
Distribution: The Case of Denmark, Laboratoire d’Econometrie de l’Ecole PolytechniqueWorking Paper no. 2004-03, Paris.
First version submitted November 2004;final version received September 2005.
C© The editors of the Scandinavian Journal of Economics 2006.