Thioredoxin-1 improves the immuno-metabolic …...2019/04/10 · ability and capacity of Trx-Tg T...
42
1 Thioredoxin-1 improves the immuno-metabolic phenotype of anti-tumor T cells Paramita Chakraborty 1# , Shilpak Chatterjee 1# , Pravin Kesarwani 1# , Krishnamurthy Thyagarajan, Supinya Iamsawat 2 , Annika Dalheim 3 , Hung Nguyen 2 , Shanmugam P. Selvam 4 , Patrick Nasarre 1 , Gina Scurti 3 , Gary Hardiman 5 , Nilanjana Maulik 6 , Lauren Ball 7 , Vamsi Gangaraju 4 , Mark P. Rubinstein 1 , Nancy Klauber-DeMore 1 , Elizabeth G. Hill 8 , Besim Ogretmen 4 , Xue-Zhong Yu 2 , Michael I. Nishimura 3 , Shikhar Mehrotra* Departments of 1 Surgery, 2 Microbiology & Immunology, 4 Biochemistry & Molecular Biology, 5 Nephrology, 7 Pharmaceutical and Biomedical Sciences, 8 Public Health, Hollings Cancer Center, Medical University of South Carolina, Charleston, 29425; 3 Department of Surgery, Loyola University, Maywood, IL 60153; and 6 Department of Surgery, University of Connecticut Health Center, 263 Farmington Avenue, Farmington, CT 06030. # Shared first author Running title: Anti-oxidant capacity regulates T cell phenotype Keywords: T-cell, melanoma, cell metabolism, antioxidant, immunotherapy, cancer, adoptive cell transfer (ACT), thioredoxin, redox protein, cell surface thiol Financial Support: The work was supported in part by funds from Department of Surgery, and NIH grants R01CA138930, R21CA137725, and P01CA154778. Support from Hollings Cancer Center Shared Resources (partly supported by P30 CA138313), SCTR Grant UL1TR001450, and SC COBRE in Oxidants, Redox Balance and Stress Signaling (5P20GM103542) at MUSC is also acknowledged. Conflicts of Interest: The authors declare no potential conflicts of interest. *Corresponding Author: Shikhar Mehrotra, Ph.D. Department of Surgery Hollings Cancer Center (HO 512H), Medical University of South Carolina 86 Jonathan Lucas Street, Charleston, SC 29425, USA Phone: 843-792-9195; FAX: 843-792-2556; E-mail: [email protected] http://www.jbc.org/cgi/doi/10.1074/jbc.RA118.006753 The latest version is at JBC Papers in Press. Published on April 10, 2019 as Manuscript RA118.006753 by guest on April 20, 2020 http://www.jbc.org/ Downloaded from
Transcript of Thioredoxin-1 improves the immuno-metabolic …...2019/04/10 · ability and capacity of Trx-Tg T...
1
Thioredoxin-1 improves the immuno-metabolic phenotype of anti-tumor T cells
Paramita Chakraborty1#, Shilpak Chatterjee1#, Pravin Kesarwani1#, Krishnamurthy Thyagarajan,
Supinya Iamsawat2, Annika Dalheim3, Hung Nguyen2, Shanmugam P. Selvam4, Patrick
Nasarre1, Gina Scurti3, Gary Hardiman5, Nilanjana Maulik6, Lauren Ball7, Vamsi Gangaraju4,
Mark P. Rubinstein1, Nancy Klauber-DeMore1, Elizabeth G. Hill8, Besim Ogretmen4, Xue-Zhong
Yu2, Michael I. Nishimura3, Shikhar Mehrotra*
Departments of 1Surgery, 2Microbiology & Immunology, 4Biochemistry & Molecular Biology,
5Nephrology, 7Pharmaceutical and Biomedical Sciences, 8Public Health, Hollings Cancer
Center, Medical University of South Carolina, Charleston, 29425; 3Department of Surgery,
Loyola University, Maywood, IL 60153; and 6Department of Surgery, University of Connecticut
Health Center, 263 Farmington Avenue, Farmington, CT 06030.
#Shared first author
Running title: Anti-oxidant capacity regulates T cell phenotype
Keywords: T-cell, melanoma, cell metabolism, antioxidant, immunotherapy, cancer, adoptive cell transfer (ACT), thioredoxin, redox protein, cell surface thiol
Financial Support: The work was supported in part by funds from Department of Surgery, and
NIH grants R01CA138930, R21CA137725, and P01CA154778. Support from Hollings Cancer
Center Shared Resources (partly supported by P30 CA138313), SCTR Grant UL1TR001450,
and SC COBRE in Oxidants, Redox Balance and Stress Signaling (5P20GM103542) at MUSC
is also acknowledged.
Conflicts of Interest: The authors declare no potential conflicts of interest.
*Corresponding Author:
Shikhar Mehrotra, Ph.D. Department of Surgery Hollings Cancer Center (HO 512H), Medical University of South Carolina 86 Jonathan Lucas Street, Charleston, SC 29425, USA Phone: 843-792-9195; FAX: 843-792-2556; E-mail: [email protected]
http://www.jbc.org/cgi/doi/10.1074/jbc.RA118.006753The latest version is at JBC Papers in Press. Published on April 10, 2019 as Manuscript RA118.006753
by guest on April 20, 2020
http://ww
w.jbc.org/
Dow
nloaded from

ABSTRACT
Adoptive transfer of tumor epitope reactive
T cells has emerged as a promising strategy
to control tumor growth. However,
chronically stimulated T cells expanded for
adoptive cell transfer (ACT) are susceptible
to cells death in an oxidative tumor
microenvironment. Since oxidation of cell
surface thiols (c-SH) also alters protein
functionality, we hypothesized that
increasing the levels of thioredoxin (Trx), an
anti-oxidant molecule facilitating reduction
of proteins through cysteine thiol-disulfide
exchange, in T cells will promote their
sustained anti-tumor function. Using pre-
melanosome protein (Pmel)-Trx1 transgenic
mouse-derived splenic T cells, flow
cytometry, and gene expression analysis,
here we observed that higher Trx
expression inversely correlated with ROS,
and susceptibility to TCR restimulation or
oxidation mediated cell death. These Trx1
overexpressing T cells exhibited a cluster of
differentiation 62Lhi (CD62Lhi) central
memory-like (Tcm) phenotype with reduced
glucose uptake (2-NBDGlo) and decreased
effector function (IFNγlo). Further, culturing
tumor reactive T cells in the presence of
recombinant Trx increased the dependence
of T cells on mitochondrial metabolism and
improved tumor control. We conclude that
strategies for increasing the anti-oxidant
capacity of anti-tumor T cells modulate their
immune-metabolic phenotype leading to
improved immunotherapeutic control of
established tumors.
INTRODUCTION
Adoptive T cell therapy (ACT) is a promising
approach for treating patients with
advanced malignancies (1). However,
quantitative or qualitative decrease of
transferred anti-tumor T cells in tumor
bearing host results in tumor recurrence,
leaving a substantial room for improvement.
Successful approaches to program T cells
towards a central memory (Tcm) or stem
cell memory (Tscm) phenotype or by
blocking the mTOR, the Akt, or the
glycolytic pathways has led to increased
persistence and exhibit better tumor control
(2). Therefore, understanding mechanisms
by guest on April 20, 2020
http://ww
w.jbc.org/
Dow
nloaded from
3
that are central to Tcm or Tscm phenotype
has potential to improve the effectiveness of
ACT.
It has been widely recognized that
Reduction-Oxidation (redox) responses
occurring at the intra- and extra-cellular
levels are important in regulating several
biological processes (3). Recent studies
have also shown importance of redox-
mediated regulation of immune response
(4,5). We have previously observed that
reactive oxygen species (ROS) contribute to
T cell re-stimulation induced cell death (6),
and T cells with higher cell surface thiol (c-
SH) expression exhibit improved
immunotherapeutic control of established
melanomas (5). Therefore, we hypothesized
that c-SHhi is a biomarker for T cells with
increased persistence and mechanisms that
results in c-SHhi phenotype would lead to
improved anti-tumor activity in vitro and in
vivo. Since thioredoxin enzyme system
(thioredoxin (Trx), thioredoxin reductase,
NADPH) has the capacity to reduce
oxidized thiols and contribute to cellular
redox balance (7), we determined in Trx-1
over expression alters T cell phenotype and
function. We show in here that T cells
overexpressing thiol regulating molecule
thioredoxin (Trx) are not only c-SHhi, but
also provide unique immune-metabolic
phenotype akin to the memory T cells. This
leads to improved persistence of anti-tumor
T cells in an oxidative tumor
microenvironment. We believe that this
strategy to generate robust “anti-tumor T
cells” by targeting redox status of a T cells
will be of high translational significance in
ACT.
RESULTS
Trx transgenic T cells exhibit increased
thiols, reduced susceptibility to tumor
microenvironment (TME) mediated
oxidative stress, and Tcm/Tscm
phenotype. Trx is a class of 12 kDa
ubiquitous redox proteins found primarily in
the cytosol . Trx possess a catalytically
active di-thiol function in a Cys-Gly-Pro-Cys
motif and are present in all organisms.
Biomolecules with redox-active sulfhydryl (-
SH) functions are necessary for the
by guest on April 20, 2020
http://ww
w.jbc.org/
Dow
nloaded from
4
maintenance of mildly reductive cellular
environments to counteract oxidative stress,
and for the execution of redox reactions for
metabolism and detoxification (10). We
recently bred melanoma epitope gp100
reactive TCR bearing transgenic mouse
Pmel with Thioredoxin1 (Trx1)-transgenic
mouse, in which human Trx1 is systemically
over expressed under control of the β-actin
promoter (11), to obtain Pmel-Trx mouse.
Fig. S1A shows successful generation of
the Pmel-Trx mice. The gel picture shows
the characterization of the Pmel-Trx mice.
While Pmel mice showed gp100 TCRα (600
bp) and TCRβ (500 bp) in lane 1, Trx
expression was undetectable in lane 2.
Similarly, the Trx-Tg mouse does not show
any Pmel TCRαβ expression (lane 3), but is
positive for Trx (lane 4). Further, the Pmel-
Trx mouse shows expression of Pmel
TCRαβ (lane 5), and Trx (lane 6). A
comparison of thymus showed a reduction
in the CD8 single positive (SP), increase in
CD4+ SP and CD4+CD8+ double positive
cells (Fig. S1B). A FACS based comparison
also showed increased Trx expression in
class I epitope gp100 reactive Pmel-Trx
CD8+ T cells, than that observed in Pmel
CD8+ T cells (Fig. 1A). The high expression
of Trx also correlated with increased
expression of cell surface thiols (c-SH) in
splenic Pmel-Trx T cells as compared to T
cells from Pmel mice (Fig. 1B). The c-SH
staining was done using the alexa-fluor
labeled maleimide dye (Invitrogen), as
previously reported (5). The increased anti-
oxidant thiol levels also inversely correlated
to the ROS levels in the activated T cells as
measured by DCFDA (Fig. 1C), and less
cell death mediated by oxidant injury using
H2O2 (Fig. 1D), or activation induced cell
death induced by TCR restimulation (Fig.
1E). Importantly, the levels of receptor-
interacting protein kinase (RIPK)-1 and
RIPK-3, which are known to regulate
oxidative stress and AICD leading to
necroptosis (12) were also reduced in
activated T cells overexpressing Trx (Fig.
1F, and Fig. S1C).
In order to confirm the functional
advantage of Trx overexpression on T cells,
activated congenic Pmel or Pmel-Trx Tg T
by guest on April 20, 2020
http://ww
w.jbc.org/
Dow
nloaded from
5
cells were transferred i.p. into the C57BL/6
mice with EL4 ascites. The analysis of
Vβ13+ T cells retrieved after 24 hr. from
ascites showed reduced 8-hydroxy guanine
[8-OHdG], and reduced nitrotyrosine
(marker for ROS/RNS stress) (13) in Pmel-
Trx, as compared to Pmel cells alone (Fig.
1G). This established that increased Trx
levels indeed protect the T cells in oxidative
tumor microenvironment.
Since a recent study has shown that
T stem cell-like memory (Tscm) cells may
reside within the Tcm group (14), we
evaluated if Trx overexpressing T cells from
Pmel-Trx mouse have increased Tscm
phenotype, which could be responsible for
better tumor control. We found that Tscm
fraction, which can be tracked by gating on
CD8+CD62LhiCD44loSca-1hiCD122hi (15),
was indeed greater in Pmel-Trx T cells (Fig.
2A). The increased ‘stemness’ in Pmel-Trx
T cells also correlated with significantly high
expression of stem cell genes as Lef1,
Oct4, β-catenin, and Bcl6 (Fig. 2B). Thus,
our data confirms that Trx indeed increases
“stemness” phenotype in Trx
overexpressing T cells.
In order to determine the trafficking
ability and capacity of Trx-Tg T cells to
establish memory in vivo, we activated both
Pmel and Pmel-Trx mouse derived splenic
T cells with melanoma epitope gp100 for
three days and transferred them i.v. into
Rag1-/- mice. After 25 days of initial transfer
of T cell, the recipient mice were sub-
cutaneously injected with murine melanoma
B16-F10 cells. Then transgenic T cells were
tracked after 5 days of tumor injection in
different lymphoid and non-lymphoid
organs. We observed that Pmel-Trx T cells
exhibited higher recall response to tumor
challenge as compared to Pmel control
T cells, which was evident by its significantly
increased expansion in each organ (Fig.
2C). Additionally, the Pmel-Trx T cells
tracked from the spleen of recipient mice
also showed enhanced cytokine secretion
upon restimulation, as compared to the
Pmel T cells (Fig. 2D). This indicates that
Trx overexpression renders T cells with a
functional memory phenotype.
by guest on April 20, 2020
http://ww
w.jbc.org/
Dow
nloaded from
6
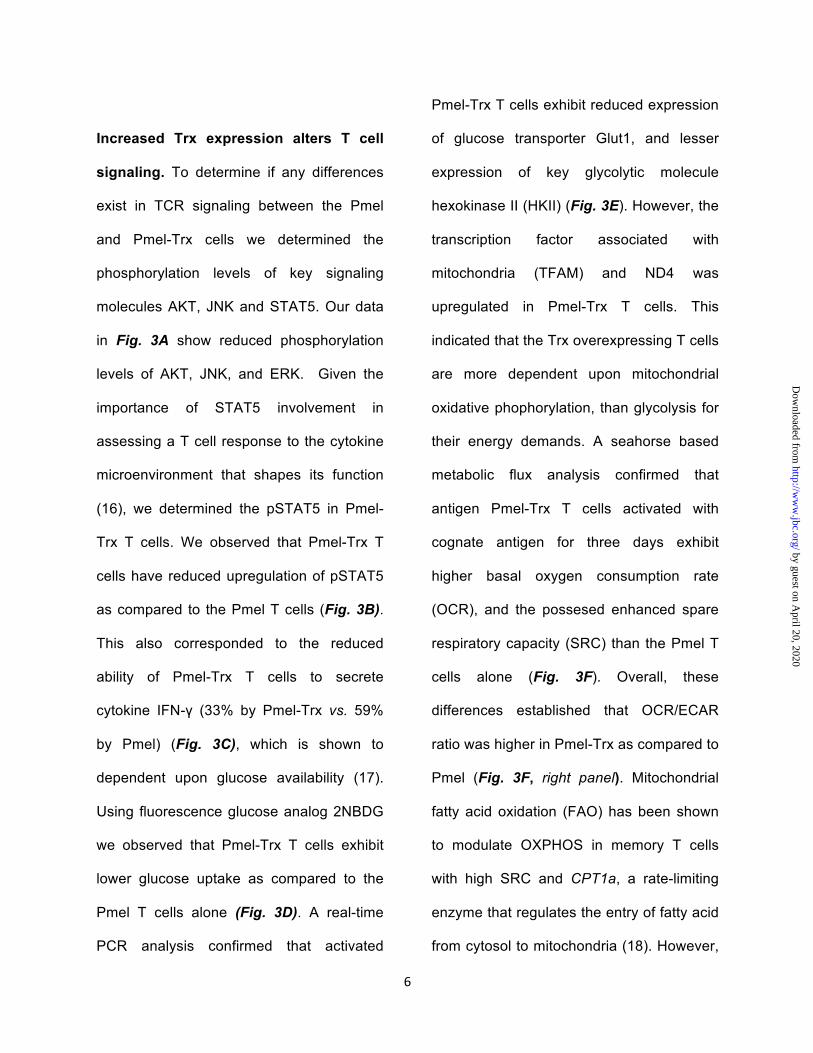
Increased Trx expression alters T cell
signaling. To determine if any differences
exist in TCR signaling between the Pmel
and Pmel-Trx cells we determined the
phosphorylation levels of key signaling
molecules AKT, JNK and STAT5. Our data
in Fig. 3A show reduced phosphorylation
levels of AKT, JNK, and ERK. Given the
importance of STAT5 involvement in
assessing a T cell response to the cytokine
microenvironment that shapes its function
(16), we determined the pSTAT5 in Pmel-
Trx T cells. We observed that Pmel-Trx T
cells have reduced upregulation of pSTAT5
as compared to the Pmel T cells (Fig. 3B).
This also corresponded to the reduced
ability of Pmel-Trx T cells to secrete
cytokine IFN-γ (33% by Pmel-Trx vs. 59%
by Pmel) (Fig. 3C), which is shown to
dependent upon glucose availability (17).
Using fluorescence glucose analog 2NBDG
we observed that Pmel-Trx T cells exhibit
lower glucose uptake as compared to the
Pmel T cells alone (Fig. 3D). A real-time
PCR analysis confirmed that activated
Pmel-Trx T cells exhibit reduced expression
of glucose transporter Glut1, and lesser
expression of key glycolytic molecule
hexokinase II (HKII) (Fig. 3E). However, the
transcription factor associated with
mitochondria (TFAM) and ND4 was
upregulated in Pmel-Trx T cells. This
indicated that the Trx overexpressing T cells
are more dependent upon mitochondrial
oxidative phophorylation, than glycolysis for
their energy demands. A seahorse based
metabolic flux analysis confirmed that
antigen Pmel-Trx T cells activated with
cognate antigen for three days exhibit
higher basal oxygen consumption rate
(OCR), and the possesed enhanced spare
respiratory capacity (SRC) than the Pmel T
cells alone (Fig. 3F). Overall, these
differences established that OCR/ECAR
ratio was higher in Pmel-Trx as compared to
Pmel (Fig. 3F, right panel). Mitochondrial
fatty acid oxidation (FAO) has been shown
to modulate OXPHOS in memory T cells
with high SRC and CPT1a, a rate-limiting
enzyme that regulates the entry of fatty acid
from cytosol to mitochondria (18). However,
by guest on April 20, 2020
http://ww
w.jbc.org/
Dow
nloaded from
7
we observed that inhibition of CPT1a using
etomoxir did not deplete OCR and SRC in
Trx-Tg T cells. Thus, it is possible that other
pathway, as glutaminolysis, is involved in
shaping phenotype of Trx-Tg T cells.
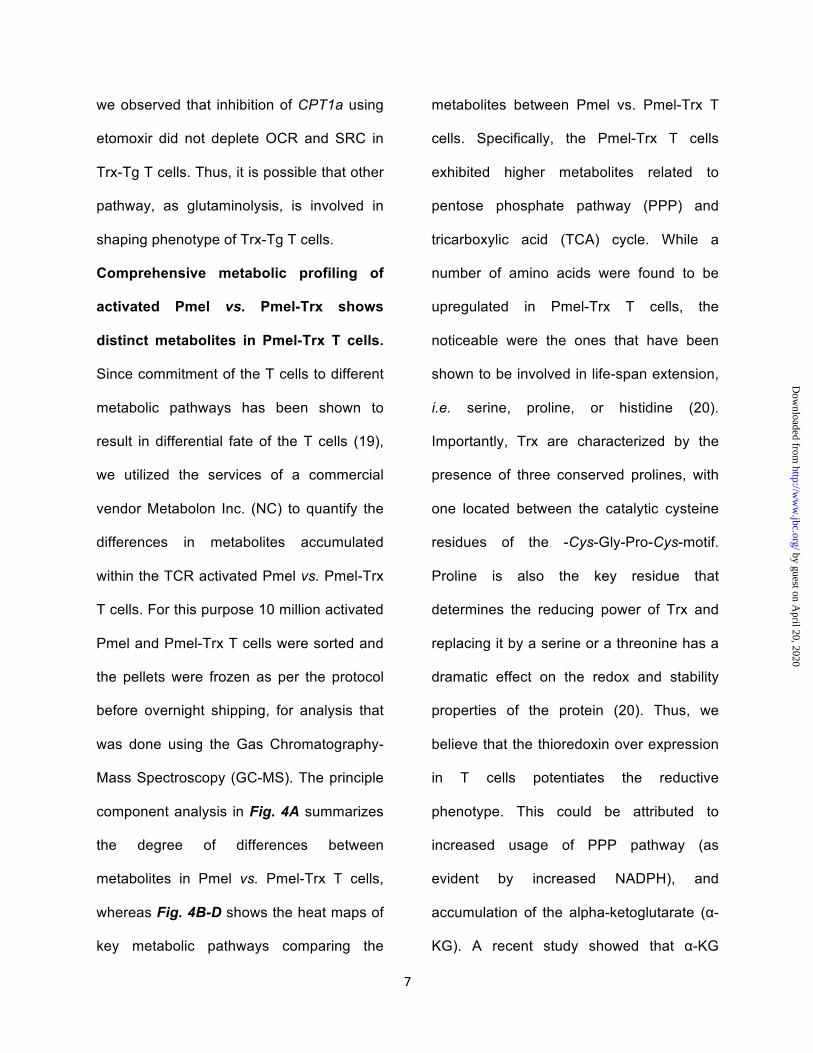
Comprehensive metabolic profiling of
activated Pmel vs. Pmel-Trx shows
distinct metabolites in Pmel-Trx T cells.
Since commitment of the T cells to different
metabolic pathways has been shown to
result in differential fate of the T cells (19),
we utilized the services of a commercial
vendor Metabolon Inc. (NC) to quantify the
differences in metabolites accumulated
within the TCR activated Pmel vs. Pmel-Trx
T cells. For this purpose 10 million activated
Pmel and Pmel-Trx T cells were sorted and
the pellets were frozen as per the protocol
before overnight shipping, for analysis that
was done using the Gas Chromatography-
Mass Spectroscopy (GC-MS). The principle
component analysis in Fig. 4A summarizes
the degree of differences between
metabolites in Pmel vs. Pmel-Trx T cells,
whereas Fig. 4B-D shows the heat maps of
key metabolic pathways comparing the
metabolites between Pmel vs. Pmel-Trx T
cells. Specifically, the Pmel-Trx T cells
exhibited higher metabolites related to
pentose phosphate pathway (PPP) and
tricarboxylic acid (TCA) cycle. While a
number of amino acids were found to be
upregulated in Pmel-Trx T cells, the
noticeable were the ones that have been
shown to be involved in life-span extension,
i.e. serine, proline, or histidine (20).
Importantly, Trx are characterized by the
presence of three conserved prolines, with
one located between the catalytic cysteine
residues of the -Cys-Gly-Pro-Cys-motif.
Proline is also the key residue that
determines the reducing power of Trx and
replacing it by a serine or a threonine has a
dramatic effect on the redox and stability
properties of the protein (20). Thus, we
believe that the thioredoxin over expression
in T cells potentiates the reductive
phenotype. This could be attributed to
increased usage of PPP pathway (as
evident by increased NADPH), and
accumulation of the alpha-ketoglutarate (α-
KG). A recent study showed that α-KG
by guest on April 20, 2020
http://ww
w.jbc.org/
Dow
nloaded from
8
blocks ATP synthase and lowers ATP levels
in the cells with longer lifespan, and aids in
stem cell differentiation (21).
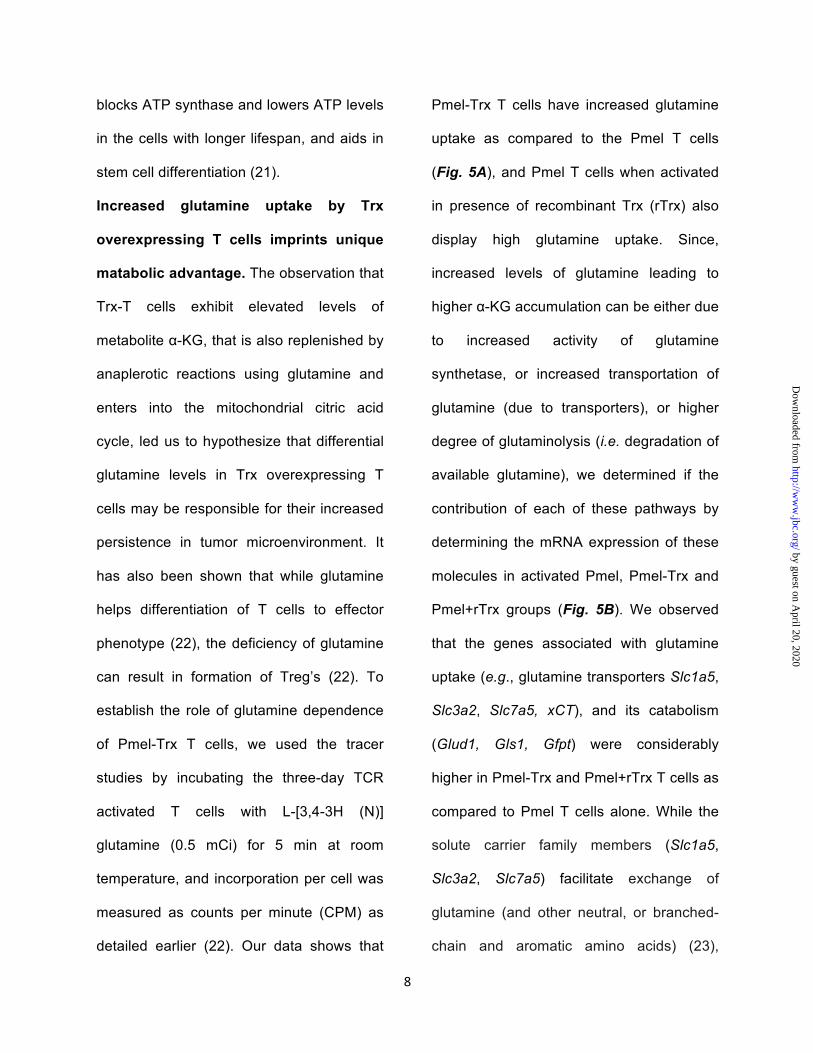
Increased glutamine uptake by Trx
overexpressing T cells imprints unique
matabolic advantage. The observation that
Trx-T cells exhibit elevated levels of
metabolite α-KG, that is also replenished by
anaplerotic reactions using glutamine and
enters into the mitochondrial citric acid
cycle, led us to hypothesize that differential
glutamine levels in Trx overexpressing T
cells may be responsible for their increased
persistence in tumor microenvironment. It
has also been shown that while glutamine
helps differentiation of T cells to effector
phenotype (22), the deficiency of glutamine
can result in formation of Treg’s (22). To
establish the role of glutamine dependence
of Pmel-Trx T cells, we used the tracer
studies by incubating the three-day TCR
activated T cells with L-[3,4-3H (N)]
glutamine (0.5 mCi) for 5 min at room
temperature, and incorporation per cell was
measured as counts per minute (CPM) as
detailed earlier (22). Our data shows that
Pmel-Trx T cells have increased glutamine
uptake as compared to the Pmel T cells
(Fig. 5A), and Pmel T cells when activated
in presence of recombinant Trx (rTrx) also
display high glutamine uptake. Since,
increased levels of glutamine leading to
higher α-KG accumulation can be either due
to increased activity of glutamine
synthetase, or increased transportation of
glutamine (due to transporters), or higher
degree of glutaminolysis (i.e. degradation of
available glutamine), we determined if the
contribution of each of these pathways by
determining the mRNA expression of these
molecules in activated Pmel, Pmel-Trx and
Pmel+rTrx groups (Fig. 5B). We observed
that the genes associated with glutamine
uptake (e.g., glutamine transporters Slc1a5,
Slc3a2, Slc7a5, xCT), and its catabolism
(Glud1, Gls1, Gfpt) were considerably
higher in Pmel-Trx and Pmel+rTrx T cells as
compared to Pmel T cells alone. While the
solute carrier family members (Slc1a5,
Slc3a2, Slc7a5) facilitate exchange of
glutamine (and other neutral, or branched-
chain and aromatic amino acids) (23),
by guest on April 20, 2020
http://ww
w.jbc.org/
Dow
nloaded from
9
Glud1 (glutamate dehydrogenase), is a
mitochondrial matrix enzyme that catalyzes
the oxidative deamination of glutamate to
alpha-ketoglutarate and ammonia (24).
Glud1 plays a key role in glutamine
anaplerosis by producing alpha-
ketoglutarate, an important intermediate in
the tricarboxylic acid cycle. Similarly, Gls1
(glutaminase I) is an aminohydrolase
enzyme that generates gluatamate from
glutamine. Further, flow-cytometry analysis
confirmed the increased expression of xCT
(SLC7A11), the antiporter that plays an
antioxidant role by exporting glutamate for
cysteine (Fig. 5C). However, we observed
the lower level of free enzyme in glutamine
pathway (Fig. 5C), which indicates active
utilization of glutamine and elevated
glutaminolysis in Trx-T cells. The enhanced
expression of glutaminolysis enzymes in
Pmel-Trx T cells was supported by the
increased accumulation of the key
metabolites glutamine, gluatamate, and α-
KG (Fig. 5D).
Further, to determine if glutamine
catabolized α-KG (which supports energy
production through TCA cycle anaplerosis)
is responsible for memory phenotype
exhibited by Pmel-Trx T cells, we used cell
permeable octyl-α-KG (Cayman, stock #
CAS 876150) in cell culture. Our data
shows that Pmel T cells activated and
expanded for 72 hr. with octyl-α-KG results
in an increased fraction of cells co-
expressing CD44loCD62L+, (7.43% in
untreated vs. 23.9 % in treated in lower right
quadrant), indicating an increase in Pmel
cells with a Tscm phenotype (Fig. 5E), and
exhibit decreased glucose uptake (≈80%
lower mean intensity of the fluorescence
glucose uptake) (Fig. 5F). It has also been
shown that many chromatin modifying
enzymes including Jumonji C domain-
containing histone demethylases and Tet
DNA demethylases are sensitive to α-KG
levels (25). To further address the role of
Trx in mediating epigenetic modification we
used a qPCR array analysis for epigenetic
modifiers (cat # PAMM-085A, Qiagen). Our
data in Fig. 5G shows that the expression of
Hdac11 was lower, whereas enzymes
involved in modifying methylation (as
by guest on April 20, 2020
http://ww
w.jbc.org/
Dow
nloaded from
10
PRMT1), and chromatin structure (as Setd
family) were increased in in Trx-Tg T cells.
Next, a comprehensive RNA analysis
revealed that Trx transgenic T cells
differentially expressed 1689 genes. Table
1 and Fig. S2 shows the iPathway guide
analysis (Advaita Bioinformatics) for key
biological pathway and genes that were
significantly different in Trx overexpressing
T cells. This data indicates that Trx
overexpression renders unique metabolic
phenotype to T cells, which in turn could
also modify epigenetic pathway molecules
and boost its anti-tumor potential.
Pmel-Trx T cells secrete Trx upon
antigen stimulation, and recombinant Trx
reprograms Pmel T cells ex vivo: To get
an insight into the mechanism that may be
responsible for the phenotypic differences
observed between the antigen activated
gp100 epitope reactive Pmel and Pmel-Trx
T cells, we determined if Pmel-Trx secreted
Trx upon antigen restimulation that in-turn
affected the functional outcome. We
observed that as compared to Pmel T cells,
Pmel-Trx T cells upon overnight activation
with cognate antigen do secrete significantly
high amount (≥1000 pg/ml) of Trx in the
culture supernatant (Fig. 6A). In order to
determine how secreted Trx would have
modulated the Pmel T cells, we used
recombinant Trx during antigen induced in
vitro Pmel activation and compared the
phenotype with untreated Pmel and Pmel-
Trx T cells. We observed that T cells loose
Trx with every cell division (Fig. 6B), as has
been linked with cellular aging (26), and
incorporating rTrx during T cell activation is
non-toxic as it does not hamper the cell
division (Fig. 6C), but leads to increased
expression of Trx and iGSH (Fig. 6D, 6E). It
has also been shown recently that Trx1-
mediated reduction of Cys130 and Cys174
is essential for AMPK function, and
decreased Trx levels could lead to oxidation
of Cys130 and Cys174 by inducing
aggregation that prevents its activation and
phosphorylation by AMPK kinases (27).
Given the role of AMPK in T cell memory,
and in regulating T cell metabolic adaptation
for effector responses in vivo (28), we next
by guest on April 20, 2020
http://ww
w.jbc.org/
Dow
nloaded from
11
compared AMPK levels between different T
cells. Our data in shows that Pmel-Trx and
rTrx treated Pmel T cells exhibit increased
pAMPK compared to activated Pmel T cells
(Fig. 6F), and supports that maintaining
high Trx levels on T cells is essential for
“metabolic fitness” of T cells. Since,
crosstalk between AMPK and mTOR is
known to regulate energy balance (29), we
next determined if rTrx would modulate
phosphorylation of S6, a downstream
molecule in mTOR pathway. We observed
that Trx concentration present during the
activation of T cells inversely correlated to
pS6 levels, as its expression decreased with
increasing concentration of rTrx (Fig. 6G).
The ability of rTRx to downregulate pS6 is
intriguing, since another anti-oxidant
intracellular glutathione has been shown to
increase mTOR activity recently (30). We
also observed that while Trx and L-NAC
treatment reduced pS6, GSH increased pS6
(Fig. S3A), along with a concomitant
increase in Trx (Fig. S3B). Importantly,
qPCR analysis for ‘stemness’ genes
showed up-regulation of the Lef1 and Tcf7
genes in Pmel T cells that were activated in
presence of recombinant Trx (Fig. 6H).
While it has been reported that regulatory T
cells exhibit higher Trx levels (31), when
using rTrx in an iTreg generation protocol,
we did not observe any increase in the
quantity or suppressive quality of the iTreg’s
generated (Fig. S3C). Additionally,
compared to cognate antigen activated
Pmel T cells (light blue overlay), Pmel T
cells cultured with recombinant Trx for three
days (orange overlay) exhibit reduced cell
death as measured by Annexin V levels
(Fig. 6I), and glucose uptake (similar to
Pmel-Trx T cells in dark blue overlay) (Fig.
6J) upon TCR re-stimulation with cognate
antigen (hgp100). Thus, this data indicates
that restoring high Trx levels on immediate
effector T cells could be important to render
the memory phenotype with unique
differentiation program (as high AMPK, low
glucose uptake) (28).
Further, we determined if the
strategy to activate and expand in presence
of rTrx ex vivo would render tumor epitope
reactive T cells with robust anti-tumor
by guest on April 20, 2020
http://ww
w.jbc.org/
Dow
nloaded from

12
property. Our data shows that gp100
reactive effector T cells generated in
presence of rTrx do survive longer in vivo
after adoptive transfer in a C57BL/6 host
bearing subcutaneous B16-F10 murine
melanoma and lead to much improved
tumor control (Fig. 6K). Further, a tracking
experiment done to compare any
quantitative and qualitative differences
between the adoptively transferred Pmel
and Pmel+rTrx treated T cells showed that
higher number of gp100 TCR Vβ13+ T cells
were obtained from the tumors, draining
lymph nodes, spleen and blood of the mice
were ACT was performed with Pmel+rTrx T
cells (Fig. 6L). Importantly, the increased
numbers of Vβ13+ T cells tracked in
Pmel+rTrx group also showed higher ability
to secrete effector cytokine IFNγ upon
restimulation (Fig. 6M, Fig. S3D), and
express enhanced levels of granzyme B
(Fig. 6N, Fig. S3E). The frequency of Treg’s
from these sites was also not found to be
any different between the two groups (Fig.
S3F). This data shows that rTrx cultured T
cells could keep their functional phenotype
in vivo, and similar strategies could be
employed in clinical scenario where TCR
transduced T cells or chimeric antigen
receptor (CAR) transduced patient T cells
could be reprogrammed to improve their
anti-tumor function.
Human T cells engineered to express Trx
exhibit enhanced anti-oxidant levels and
central memory phenotype. T cells from
human patients are being used for adoptive
immunotherapy approaches after
engineering them with tumor reactive T cell
receptors (TCR) or chimeric antigen
receptors (CARs). In order to determine if
our strategy to increase anti-oxidant
property of T cells will render human T cells
with altered phenotype (as observed in
mouse studies) we generated a human
melanoma epitope tyrosinase reactive
TIL1383I retroviral construct with human Trx
inserted to it. For this purpose we
synthesized the gene construct (at
Genscript) with a Trx gene flanked by
Bsp119i restriction sites and then cloned it
into the original Samen/1383I-34t vector.
The clones were screened for correct
by guest on April 20, 2020
http://ww
w.jbc.org/
Dow
nloaded from

13
orientation (Fig. S4A). The retroviral
supernatant was used to transduce the
activated human T cells with either TIL1383I
TCR or TIL1383I-TCR+Trx. Fig. S4B shows
that retroviral construct with Trx could be
used to generate tyrosinase epitope
reactive T cells with transduction efficiency
of 40% or more. Fig. S4C shows that
majority of the expanded cells exhibited
CD62L+CD44+CD45RA+ Tscm phenotype
(14,32). Importantly, engineering Trx on
human T cells also resulted in reducing the
glycolytic commitment as observed by lower
glucose uptake in 2NBDG assay (Fig. S4D).
Further, upon overnight TCR re-stimulation
with cognate antigen the TIL1383I-Trx
transduced T cells showed less cell death
as indicated by higher mitochondrial
membrane potential (Fig. S4E), and
reduced NO accumulation (Fig. S4F). A
qPCR based analysis also showed that
TIL1383I-Trx transduced T cells express
significantly higher level of ‘stemness’
genes as compared to the TIL1383I TCR
transduced T cells (Fig. S4G, p<0.005).
This data establishes that the antitumor
effector T cells can be programmed ex vivo
for increasing anti-oxidant phenotype that
could translate to better tumor control in
vivo.
DISCUSSION
It has long been known that
lymphocytes require a reducing milieu for
optimal activation/proliferation (33). It has
been shown that T lymphocytes are
defective in cystine uptake and require
exogenous thiols for activation and function
(33). As the functional group of the amino
acid cysteine, the thiol (-SH) group plays a
very important role in biology (34). Recently,
oxidative cysteine modifications have
emerged as a central mechanism for
dynamic post-translational regulation of
almost all major protein classes, and
correlate with many disease states (35).
Certain proteins in which the redox state of
cysteine residues are modified (termed
‘redox sensors’), seem to be involved in the
initial and direct regulation of signaling
molecules in response to ROS. Such ‘redox
sensors’ commonly possess highly
conserved free cysteine (Cys) residues of
by guest on April 20, 2020
http://ww
w.jbc.org/
Dow
nloaded from

14
which the -SH functional groups are the
most important direct cellular targets or
‘sensors’ of ROS (36). A number of ‘redox
sensors’ have been identified that
participate in many important biological
functions, some of which are crucial
molecules modulating stem cell self-renewal
and differentiation, including HIF-1α, FoxOs,
APE1/Ref-1, Nrf2, AMPK, p38 and p53 (37).
In addition, glutamate (Glu) and anti-Trx-
inactivating antibodies inhibit antigen-
dependent T lymphocyte proliferation (33).
In T lymphocytes, intracellular GSH is
critical for the proliferative response to
mitogens or antigens (38). However,
lymphocytes lack an efficient system of
Cys2 import, whereas they easily take up
free thiols (39). Therefore, to sustain
lymphocyte activation and proliferation,
exogenous thiols must somehow be
generated in the microenvironment of an
immune response. Extracellular thioredoxin
(Trx) has been proposed to exert a
synergistic activity on the mitogen- or
cytokine-induced proliferation of
lymphocytes (40). The importance of
thioredoxin reductase in the last step of
nucleotide biosynthesis has also
beendescribed recently, where it donates
reducing equivalents to ribonucleotide
reductase to overcome DNA damage
response (41). We show here that
increasing the Trx in tumor
microenvironment by using Trx over-
expressing T cells that secrete Trx or by
using rTrx during ex vivo programming
maintains the reducing environment and
leads to long-term T cell anti-tumor function
in vivo.
Our data indicates the functional
differences between the CD8+ T cells
obtained from the Pmel and Pmel-Trx mice,
likely due to the protein thiol alterations that
remain unknown at this time. Oxidation of
thiol (-SH) groups is a post-translational
modification that regulates numerous
processes, including differentiation, cellular
proliferation and apoptosis (35). We
hypothesize that “number of free reduced
vs. oxidized thiols present on signaling
molecules could lead to differences in their
functionality, and thus dictate the effector T
by guest on April 20, 2020
http://ww
w.jbc.org/
Dow
nloaded from

15
cells vs. memory T cell phenotype”. Our
data shows that the difference observed
between the Pmel and Pmel-Trx T cells is
exclusively due to Trx, since addition of rTrx
also leads to similar phenotype as observed
when using T cells over expressing Trx. We
observed the reduction in mTOR when T
cells where incubated with L-NAC, and
rTRx, there was an increase in pS6 in
presence of GSH. While the role of GSH in
upregulating mTOR has been shown
recently (30), it is likely that increased c-SH
due to rTRx and L-NAC resulted in lower
pS6 levels that we reported earlier (5). An
earlier study done using T cells from
systemic lupus erythematosus patients also
showed that T-cell dysfunction in patients
was controlled by orally administering L-
NAC that resulted in inhibition of mTOR
(42). Given the role of oxidative stress
signaling and use of mTOR inhibitor
rapamycin and other anti-oxidant to promote
anti-aging (43), one would expect that Trx
treatment should reduce mTOR activation,
as observed by us. The growing evidence
that Trx and GSH target different cysteines
in the proteome could also support the
existence of non-redundant functions
observed by us (44).
The commitment to different
metabolic pathways could lead to
differences in level of intrinsic metabolites in
a cell, which could be important in
regulating various signaling pathways (45).
Our preliminary data quantifying the
metabolite levels between TCR activated
Pmel vs. Pmel-Trx T cells show distinct
profile in thioredoxin over expressing T
cells. The activated Pmel-Trx cells exhibit
increased level of pentose phosphate
pathway (PPP) metabolites that contribute
to nucleotide precursors and helps
regenerate the reducing agent NADPH,
which can contribute to ROS scavenging. In
addition, the tricarboxylic acid cycle (TCA,
also known as Krebs’s cycle) metabolite
alpha-ketoglutarate (α-KG) was also found
to be significantly elevated in the Pmel-Trx
cells. The role of α-KG, also produced by
deamination of glutamate, in the
detoxification of ROS has only recently
begun to be appreciated (46). This keto-acid
by guest on April 20, 2020
http://ww
w.jbc.org/
Dow
nloaded from
16
neutralizes ROS in an NADPH-independent
manner with the concomitant formation of
the succinate and CO2. In addition, α-KG
has also been shown to extend the lifespan
of adult C. elegans (21). This study showed
that α-KG inhibits ATP synthase leading to
reduced ATP content, decreased oxygen
consumption, and is dependent on the
target of rapamycin (TOR) downstream.
Further, the role of metabolite α-KG has
also been shown in maintaining the
pluripotency of the embryonic stem cells
(25). It has been shown that many
chromatin modifying enzymes including
Jumonji C domain-containing histone
demethylases and Tet DNA demethylases
are sensitive to α-KG levels (25). This
study also showed that embryonic stem
cells cultured in glutamine-free media had
high ratio of tri- to mono-methylation on
H3K9, H3K27, H3K36 and H4K20 and the
addition of α-KG reversed these changes
(25). Thus, high levels of the small
metabolite α-KG in cells promote naive
pluripotency by suppressing the
accumulation of repressive histone
modifications and DNA methylation.
Further, Trx overexpressing T cells
also showed differences epigenetic
modifiers as compared to normal T cells.
The reduced expression of HDAC11 was
observed in Trx-T cells, which has been
recently shown enhance the T cell effector
function and enhanced alloreactivity in a
murine model (47). We also observed
increased expression of Protein arginine N-
methyltransferase (PRMT1), which is the
main enzyme that mediates
monomethylation and asymmetric
dimethylation of histone H4 'Arg-4'
(H4R3me1 and H4R3me2a, respectively), a
specific tag for epigenetic transcriptional
activation. Importantly, it has been shown to
methylate Foxo1 and retain it in the nucleus
leading to increased transcriptional activity
(48). Similarly, we also observed an in
increase in expression of the SET domain-
containing proteins that play a vital role in
regulating gene expression during
development through modifications in
chromatin structure (49). We observed that
by guest on April 20, 2020
http://ww
w.jbc.org/
Dow
nloaded from
17
histone methyltransferase SETD1B, which
specifically methylates 'Lys-4' of histone H3,
was elevated in the Trx-Tg T cells. Similarly,
Setd5 expression was also increased in Trx-
T cells. Setd5-deficient embryonic stem
cells have impaired cellular proliferation,
increased apoptosis, and defective cell
cycle progression (50). Additionally, Setd7,
histone methyltransferase that specifically
monomethylates 'Lys-4' of histone H3, was
increased in Trx-T cells. This has also been
shown to have methyltransferase activity
toward non-histone proteins such as
p53/TP53 and TAF10 (51). Thus, it is likely
that Trx mediated differences in metabolic
pathways that lead to difference in
accumulation of metabolites (such as α-KG)
may have led to epigenetic reprogramming
of T cells resulting in sustained tumor
control and memory generation.
The increased glutamine uptake due
to enhanced expression of anti-porter xCT
in Pmel-Trx T cells or in presence of rTrx
could be an important feature that renders
potent anti-tumor control, a mechanism that
has been shown to promote tumor growth
where ambient glutamine indirectly supports
environmental cystine acquisition via the
xCT antiporter (52). The observation that
Trx overexpressing T cells exhibit increased
glutamine uptake also implies that this
amino acid may have contributed towards
the programming of Pmel-Trx effectors for
enhanced anti-tumor phenotype. It has also
been shown that while glutamine helps
differentiation of T cells to effector
phenotype (22), and the deficiency of
glutamine can result in formation of Treg’s
(22). Importantly, higher glutamine levels in
Pmel-Trx T cells would have led to down-
regulation of CD95 and CD95L expression,
and up-regulation of memory marker
CD45RO and Bcl-2 expression as has been
shown earlier (53). Thus, the results
presented here in support the role of Trx in
regulating redox status of adoptively
transferred T cells, and that Trx mediated
“anti-oxidant help” in vivo may be important
in generating long-lived anti-tumor memory
T cells in the oxidative tumor
microenvironment. We believe that the
strategy to generate anti-tumor memory T
by guest on April 20, 2020
http://ww
w.jbc.org/
Dow
nloaded from
18
cells using Trx will have great translational
significance in the field of cancer
immunotherapy.
MATERIALS AND METHODS
Mice
C57BL/6, B6-Thy1.1 (B6.PL-Thy1a/CyJ) and
Pmel mice were obtained from Jackson
Laboratory (Bar Harbor, ME). Animals were
maintained in pathogen-free facilities and
experimental procedures were approved by
Institutional Animal Care and Use
Committees of Medical University of South
Carolina, Charleston.
Reagents and cell lines
Penicillin, streptomycin, glucose-free RPMI-
1640, and Iscove's Modified Dulbecco's
Medium (IMDM) were purchased from Life
Technologies, Grand Island, NY. FBS was
procured from Atlanta Biologicals, Atlanta.
hgp10025-33 peptide (KVPRNQDW) peptide
was purchased from GenScript
(Piscataway, NJ). Recombinant IL2 (rIL2)
was procured from NCI, Biological
Resources Branch. Fluorochrome
conjugated anti-mouse CD8 (53-6.7), CD71
(RI7217), CD25 (PC61), CD69 (H1.2F3),
CD44 (IM7), CD62L (MEL-14), Sca1 (D7),
and anti-human CD8 (SK1), CD44 (IM7),
CD62L (DREG-56), CD28 (CD28.2) were
purchased from Biolegend, San Diego, CA.
Anti-mouse Vβ13 (MR12-3) was procured
from BD Biosciences, San Jose, CA. Anti-
human Vβ12 was from Thermo Scientific
(Rockford, IL). Anti-mouse pS6 conjugated
with Alexa647, pAkt (S473) conjugated with
PE and pFoxo1 (S256) were purchased
from Cell Signaling Technology, Danvers,
MA. Anti-mouse CD3 (145-2C11), and
CD28 (37.51) were purchased from
BioXcell, West Lebanon, NH. B16-F10
melanoma (Cat # CRL-6475) was obtained
from ATCC, Manassas, VA. PBMCs from
healthy donors were obtained from a
commercial vendor, Research Blood
Components, LLC, after institutional
approval by the Human Investigation
Review Board.
Cell Culture. Splenocytes from Pmel or
Pmel-Trx mice were activated with using
by guest on April 20, 2020
http://ww
w.jbc.org/
Dow
nloaded from
19
hgp10025-33 peptide (KVPRNQDW, 1µg/ml)
for three days. rIL2 (100U/ml) was added
during T cell activation. In some cases Pmel
splenic T cells were activated with cognate
antigen in presence of rTrx. Complete
IMDM media supplemented with 10% FCS,
4 mM L-glutamine, 100 U/ml penicillin, 100
µg/ml streptomycin, 5 µM beta-
mercaptoethanol was used for T cell culture.
Where indicated purified CD4+ T cells were
differentiated to induced regulatory T cells
using the standard protocol as published
recently (8).
Adoptive T cell protocol. Mouse
melanoma tumor (B16-F10) was maintained
in vitro in complete IMDM. On day 9th
following B16-F10 cell inoculation, the
C57BL/6 recipient mice were injected
intraperitoneally (i.p.) with
cyclophosphamide (CTX) at 4 mg/mice.
After 24 h of CTX injection, tumor-bearing
C57BL/6 were either kept untreated or
adoptively transferred with three–day-
activated pMel cells (1 × 10⁶/mouse).
Recipient mice were given IL2 (50,000
U/mouse; i.p) for 3 consecutive days after
ACT.
Flow cytometry. Detailed protocol for
staining of cell surface molecules and
intracellular proteins has been described
earlier (8). Samples were acquired on
LSRFortessa and analysed with FlowJo
software (Tree Star, OR).
Real-time quantitative-PCR array. Total
RNA was isolated from pellets of the
indicated T cell subsets (2 x 10⁶ cells) using
Trizol reagent (Life Technologies, Grand
Island, NY). cDNA was generated from 1 µg
total RNA using iScript cDNA Synthesis Kit
(BioRad, Hercules, CA). SYBR Green
incorporation quantitative real-time PCR
was performed using a SYBR Green mix
(Biorad, Hercules, CA) in the CFX96
Detection System (BioRad, Hercules, CA).
All array data has been deposited in the EBI
ArrayExpress Database accession number
E-MTAB-7571.
Activation-induced T cell death. Three-
day-activated T cells from either Pmel or
by guest on April 20, 2020
http://ww
w.jbc.org/
Dow
nloaded from
20
Pmel-Trx mice were either left untreated or
re-stimulated overnight with cognate antigen
gp100. Apoptosis was measured by
Annexin V (BD Biosciences, San Jose, CA)
vs. 7AAD staining according to the
manufacturer’s protocol, followed by flow
cytometry. Data were analysed with FlowJo
software (Tree Star, OR).
Glucose uptake, oxygen consumption
and glycolytic flux. Glucose uptake by
activated T cells were determined by
incubating cells with 100 µM 2NBDG
(Cayman Chemical, Ann Arbor, MI) for 30
minutes before measuring fluorescence by
flow cytometry. Extracellular acidification
rate (ECAR) was evaluated as described
earlier (8).
Statistical analysis. All data reported are
the arithmetic mean from three independent
experiments performed in triplicate ±
standard deviation (SD) unless stated
otherwise. The unpaired Student's t-test
was used to evaluate the significance of
differences observed between groups,
accepting p < 0.05 as a threshold of
significance. Data analyses were performed
using the Prism software (GraphPad, San
Diego, CA). Analysis of tumor size (mm2)
was performed using R statistical software
version 3.2.3 and SAS version 9.4. Tumor
size at each time point was measured
relative to tumor size at the day of T cell
transfer (day 9) to adjust for differences
between animals at baseline. We
transformed resulting fold-change (FC)
values using a log base 2 transformation to
achieve approximate normality. Using
maximum likelihood, we fit linear mixed
effects regression models of log2 FC as a
function of experimental group, time (as a
continuous variable), group-by-time
interaction and mouse-specific random
effects to account for the correlation among
measures obtained from the same animal
over time. We evaluated the functional form
of time in each model, and considered non-
linear transformations as appropriate based
on fractional polynomials (9). Group
comparisons were performed using model-
based linear contrasts, and were restricted
by guest on April 20, 2020
http://ww
w.jbc.org/
Dow
nloaded from

21
to time points at which data were available
from at least two animals per group.
ACKNOWLEDGEMENT
Conception and design: PC, SC, PK, SM.
Development of methodology: SC, PK, PC,
KT, SI, AD, HN, SPS, PN, GS, MIN, SM.
Acquisition of data (provided animals,
acquired and managed patients, provided
facilities, etc.): NM, LB, MPR, ND, XZY.
Analysis and interpretation of data (e.g.,
statistical analysis, biostatistics,
computational analysis): SC, PK, PC, GH,
VG, EGH, SM. Writing, review, and/or
revision of the manuscript: SC, PK, PC, BO,
XZY, MIN, SM. Administrative, technical, or
material support (i.e., reporting or
organizing data, constructing databases):
SC, PK, PC, GH, EGH, VG, SM. Study
supervision: SM.
REFERENCES
1. Rosenberg, S. A., and Restifo, N. P.
(2015) Adoptive cell transfer as
personalized immunotherapy for
human cancer. Science 348, 62-68
2. Kishton, R. J., Sukumar, M., and
Restifo, N. P. (2017) Metabolic
Regulation of T Cell Longevity and
Function in Tumor Immunotherapy.
Cell Metab 26, 94-109
3. Schieber, M., and Chandel, N. S.
(2014) ROS function in redox
signaling and oxidative stress. Curr
Biol 24, R453-462
4. Mehrotra, S., Mougiakakos, D.,
Johansson, C. C., Voelkel-Johnson,
C., and Kiessling, R. (2009)
Oxidative stress and lymphocyte
persistence: implications in
immunotherapy. Advances in cancer
research 102, 197-227
5. Kesarwani, P., Al-Khami, A. A.,
Scurti, G., Thyagarajan, K., Kaur, N.,
Husain, S., Fang, Q., Naga, O. S.,
Simms, P., Beeson, G., Voelkel-
Johnson, C., Garrett-Mayer, E.,
Beeson, C. C., Nishimura, M. I., and
Mehrotra, S. (2014) Promoting thiol
expression increases the durability
of antitumor T-cell functions. Cancer
research 74, 6036-6047
by guest on April 20, 2020
http://ww
w.jbc.org/
Dow
nloaded from
22
6. Norell, H., Martins da Palma, T.,
Lesher, A., Kaur, N., Mehrotra, M.,
Naga, O. S., Spivey, N., Olafimihan,
S., Chakraborty, N. G., Voelkel-
Johnson, C., Nishimura, M. I.,
Mukherji, B., and Mehrotra, S.
(2009) Inhibition of superoxide
generation upon T-cell receptor
engagement rescues Mart-1(27-35)-
reactive T cells from activation-
induced cell death. Cancer research
69, 6282-6289
7. Berndt, C., Lillig, C. H., and
Holmgren, A. (2007) Thiol-based
mechanisms of the thioredoxin and
glutaredoxin systems: implications
for diseases in the cardiovascular
system. Am J Physiol Heart Circ
Physiol 292, H1227-1236
8. Chatterjee, S., Daenthanasanmak,
A., Chakraborty, P., Wyatt, M. W.,
Dhar, P., Selvam, S. P., Fu, J.,
Zhang, J., Nguyen, H., Kang, I.,
Toth, K., Al-Homrani, M., Husain, M.,
Beeson, G., Ball, L., Helke, K.,
Husain, S., Garrett-Mayer, E.,
Hardiman, G., Mehrotra, M.,
Nishimura, M. I., Beeson, C. C.,
Bupp, M. G., Wu, J., Ogretmen, B.,
Paulos, C. M., Rathmell, J., Yu, X.
Z., and Mehrotra, S. (2018) CD38-
NAD(+)Axis Regulates
Immunotherapeutic Anti-Tumor T
Cell Response. Cell Metab 27, 85-
100 e108
9. Royston, P., and Sauerbrei, W.
(2004) A new measure of prognostic
separation in survival data. Stat Med
23, 723-748
10. Mailloux, R. J., Jin, X., and Willmore,
W. G. (2014) Redox regulation of
mitochondrial function with emphasis
on cysteine oxidation reactions.
Redox biology 2, 123-139
11. Adluri, R. S., Thirunavukkarasu, M.,
Zhan, L., Akita, Y., Samuel, S. M.,
Otani, H., Ho, Y. S., Maulik, G., and
Maulik, N. (2011) Thioredoxin 1
enhances neovascularization and
reduces ventricular remodeling
during chronic myocardial infarction:
a study using thioredoxin 1
by guest on April 20, 2020
http://ww
w.jbc.org/
Dow
nloaded from
23
transgenic mice. Journal of
molecular and cellular cardiology 50,
239-247
12. Kesarwani, P., Chakraborty, P.,
Gudi, R., Chatterjee, S., Scurti, G.,
Toth, K., Simms, P., Husain, M.,
Armeson, K., Husain, S., Garrett-
Mayer, E., Vasu, C., Nishimura, M.
I., and Mehrotra, S. (2016) Blocking
TCR restimulation induced
necroptosis in adoptively transferred
T cells improves tumor control.
Oncotarget 7, 69371-69383
13. Darwish, R. S., Amiridze, N., and
Aarabi, B. (2007) Nitrotyrosine as an
oxidative stress marker: evidence for
involvement in neurologic outcome
in human traumatic brain injury. The
Journal of trauma 63, 439-442
14. Graef, P., Buchholz, V. R.,
Stemberger, C., Flossdorf, M.,
Henkel, L., Schiemann, M., Drexler,
I., Hofer, T., Riddell, S. R., and
Busch, D. H. (2014) Serial transfer
of single-cell-derived
immunocompetence reveals
stemness of CD8(+) central memory
T cells. Immunity 41, 116-126
15. Gattinoni, L., Zhong, X. S., Palmer,
D. C., Ji, Y., Hinrichs, C. S., Yu, Z.,
Wrzesinski, C., Boni, A., Cassard,
L., Garvin, L. M., Paulos, C. M.,
Muranski, P., and Restifo, N. P.
(2009) Wnt signaling arrests effector
T cell differentiation and generates
CD8+ memory stem cells. Nature
medicine 15, 808-813
16. Tripathi, P., Kurtulus, S.,
Wojciechowski, S., Sholl, A., Hoebe,
K., Morris, S. C., Finkelman, F. D.,
Grimes, H. L., and Hildeman, D. A.
(2010) STAT5 is critical to maintain
effector CD8+ T cell responses. J
Immunol 185, 2116-2124
17. Cham, C. M., and Gajewski, T. F.
(2005) Glucose availability regulates
IFN-gamma production and p70S6
kinase activation in CD8+ effector T
cells. J Immunol 174, 4670-4677
18. van der Windt, G. J., Everts, B.,
Chang, C. H., Curtis, J. D., Freitas,
T. C., Amiel, E., Pearce, E. J., and
by guest on April 20, 2020
http://ww
w.jbc.org/
Dow
nloaded from
24
Pearce, E. L. (2012) Mitochondrial
respiratory capacity is a critical
regulator of CD8+ T cell memory
development. Immunity 36, 68-78
19. Sukumar, M., Liu, J., Ji, Y.,
Subramanian, M., Crompton, J. G.,
Yu, Z., Roychoudhuri, R., Palmer, D.
C., Muranski, P., Karoly, E. D.,
Mohney, R. P., Klebanoff, C. A., Lal,
A., Finkel, T., Restifo, N. P., and
Gattinoni, L. (2013) Inhibiting
glycolytic metabolism enhances
CD8+ T cell memory and antitumor
function. The Journal of clinical
investigation 123, 4479-4488
20. Edwards, C., Canfield, J., Copes, N.,
Brito, A., Rehan, M., Lipps, D.,
Brunquell, J., Westerheide, S. D.,
and Bradshaw, P. C. (2015)
Mechanisms of amino acid-mediated
lifespan extension in Caenorhabditis
elegans. BMC genetics 16, 8
21. Chin, R. M., Fu, X., Pai, M. Y.,
Vergnes, L., Hwang, H., Deng, G.,
Diep, S., Lomenick, B., Meli, V. S.,
Monsalve, G. C., Hu, E., Whelan, S.
A., Wang, J. X., Jung, G., Solis, G.
M., Fazlollahi, F., Kaweeteerawat,
C., Quach, A., Nili, M., Krall, A. S.,
Godwin, H. A., Chang, H. R., Faull,
K. F., Guo, F., Jiang, M., Trauger, S.
A., Saghatelian, A., Braas, D.,
Christofk, H. R., Clarke, C. F.,
Teitell, M. A., Petrascheck, M.,
Reue, K., Jung, M. E., Frand, A. R.,
and Huang, J. (2014) The metabolite
alpha-ketoglutarate extends lifespan
by inhibiting ATP synthase and
TOR. Nature 510, 397-401
22. Klysz, D., Tai, X., Robert, P. A.,
Craveiro, M., Cretenet, G.,
Oburoglu, L., Mongellaz, C., Floess,
S., Fritz, V., Matias, M. I., Yong, C.,
Surh, N., Marie, J. C., Huehn, J.,
Zimmermann, V., Kinet, S.,
Dardalhon, V., and Taylor, N. (2015)
Glutamine-dependent alpha-
ketoglutarate production regulates
the balance between T helper 1 cell
and regulatory T cell generation.
Science signaling 8, ra97
by guest on April 20, 2020
http://ww
w.jbc.org/
Dow
nloaded from
25
23. Cha, Y. J., Kim, E. S., and Koo, J. S.
(2018) Amino Acid Transporters and
Glutamine Metabolism in Breast
Cancer. Int J Mol Sci 19
24. Spanaki, C., and Plaitakis, A. (2012)
The role of glutamate
dehydrogenase in mammalian
ammonia metabolism. Neurotox Res
21, 117-127
25. Carey, B. W., Finley, L. W., Cross, J.
R., Allis, C. D., and Thompson, C. B.
(2015) Intracellular alpha-
ketoglutarate maintains the
pluripotency of embryonic stem
cells. Nature 518, 413-416
26. Yoshida, T., Oka, S., Masutani, H.,
Nakamura, H., and Yodoi, J. (2003)
The role of thioredoxin in the aging
process: involvement of oxidative
stress. Antioxidants & redox
signaling 5, 563-570
27. Shao, D., Oka, S., Liu, T., Zhai, P.,
Ago, T., Sciarretta, S., Li, H., and
Sadoshima, J. (2014) A redox-
dependent mechanism for regulation
of AMPK activation by Thioredoxin1
during energy starvation. Cell Metab
19, 232-245
28. Blagih, J., Coulombe, F., Vincent, E.
E., Dupuy, F., Galicia-Vazquez, G.,
Yurchenko, E., Raissi, T. C., van der
Windt, G. J., Viollet, B., Pearce, E.
L., Pelletier, J., Piccirillo, C. A.,
Krawczyk, C. M., Divangahi, M., and
Jones, R. G. (2015) The energy
sensor AMPK regulates T cell
metabolic adaptation and effector
responses in vivo. Immunity 42, 41-
54
29. Xu, J., Ji, J., and Yan, X. H. (2012)
Cross-talk between AMPK and
mTOR in regulating energy balance.
Crit Rev Food Sci Nutr 52, 373-381
30. Mak, T. W., Grusdat, M., Duncan, G.
S., Dostert, C., Nonnenmacher, Y.,
Cox, M., Binsfeld, C., Hao, Z.,
Brustle, A., Itsumi, M., Jager, C.,
Chen, Y., Pinkenburg, O., Camara,
B., Ollert, M., Bindslev-Jensen, C.,
Vasiliou, V., Gorrini, C., Lang, P. A.,
Lohoff, M., Harris, I. S., Hiller, K.,
and Brenner, D. (2017) Glutathione
by guest on April 20, 2020
http://ww
w.jbc.org/
Dow
nloaded from
26
Primes T Cell Metabolism for
Inflammation. Immunity 46, 1089-
1090
31. Mougiakakos, D., Johansson, C. C.,
Jitschin, R., Bottcher, M., and
Kiessling, R. (2011) Increased
thioredoxin-1 production in human
naturally occurring regulatory T cells
confers enhanced tolerance to
oxidative stress. Blood 117, 857-861
32. Gattinoni, L., Lugli, E., Ji, Y., Pos, Z.,
Paulos, C. M., Quigley, M. F.,
Almeida, J. R., Gostick, E., Yu, Z.,
Carpenito, C., Wang, E., Douek, D.
C., Price, D. A., June, C. H.,
Marincola, F. M., Roederer, M., and
Restifo, N. P. (2011) A human
memory T cell subset with stem cell-
like properties. Nature medicine 17,
1290-1297
33. Angelini, G., Gardella, S., Ardy, M.,
Ciriolo, M. R., Filomeni, G., Di
Trapani, G., Clarke, F., Sitia, R., and
Rubartelli, A. (2002) Antigen-
presenting dendritic cells provide the
reducing extracellular
microenvironment required for T
lymphocyte activation. Proc Natl
Acad Sci U S A 99, 1491-1496
34. Haugaard, N. (2000) Reflections on
the role of the thiol group in biology.
Annals of the New York Academy of
Sciences 899, 148-158
35. Leonard, S. E., and Carroll, K. S.
(2011) Chemical 'omics' approaches
for understanding protein cysteine
oxidation in biology. Current opinion
in chemical biology 15, 88-102
36. Janssen-Heininger, Y. M.,
Mossman, B. T., Heintz, N. H.,
Forman, H. J., Kalyanaraman, B.,
Finkel, T., Stamler, J. S., Rhee, S.
G., and van der Vliet, A. (2008)
Redox-based regulation of signal
transduction: principles, pitfalls, and
promises. Free radical biology &
medicine 45, 1-17
37. Wang, K., Zhang, T., Dong, Q., Nice,
E. C., Huang, C., and Wei, Y. (2013)
Redox homeostasis: the linchpin in
stem cell self-renewal and
by guest on April 20, 2020
http://ww
w.jbc.org/
Dow
nloaded from
27
differentiation. Cell death & disease
4, e537
38. Smyth, M. J. (1991) Glutathione
modulates activation-dependent
proliferation of human peripheral
blood lymphocyte populations
without regulating their activated
function. J Immunol 146, 1921-1927
39. Ishii, T., Sugita, Y., and Bannai, S.
(1987) Regulation of glutathione
levels in mouse spleen lymphocytes
by transport of cysteine. J Cell
Physiol 133, 330-336
40. Wakasugi, N., Tagaya, Y.,
Wakasugi, H., Mitsui, A., Maeda, M.,
Yodoi, J., and Tursz, T. (1990) Adult
T-cell leukemia-derived
factor/thioredoxin, produced by both
human T-lymphotropic virus type I-
and Epstein-Barr virus-transformed
lymphocytes, acts as an autocrine
growth factor and synergizes with
interleukin 1 and interleukin 2. Proc
Natl Acad Sci U S A 87, 8282-8286
41. Muri, J., Heer, S., Matsushita, M.,
Pohlmeier, L., Tortola, L., Fuhrer, T.,
Conrad, M., Zamboni, N., Kisielow,
J., and Kopf, M. (2018) The
thioredoxin-1 system is essential for
fueling DNA synthesis during T-cell
metabolic reprogramming and
proliferation. Nat Commun 9, 1851
42. Lai, Z. W., Hanczko, R., Bonilla, E.,
Caza, T. N., Clair, B., Bartos, A.,
Miklossy, G., Jimah, J., Doherty, E.,
Tily, H., Francis, L., Garcia, R.,
Dawood, M., Yu, J., Ramos, I.,
Coman, I., Faraone, S. V., Phillips,
P. E., and Perl, A. (2012) N-
acetylcysteine reduces disease
activity by blocking mammalian
target of rapamycin in T cells from
systemic lupus erythematosus
patients: a randomized, double-
blind, placebo-controlled trial.
Arthritis Rheum 64, 2937-2946
43. Blagosklonny, M. V. (2008) Aging:
ROS or TOR. Cell Cycle 7, 3344-
3354
44. Go, Y. M., Roede, J. R., Walker, D.
I., Duong, D. M., Seyfried, N. T., Orr,
M., Liang, Y., Pennell, K. D., and
by guest on April 20, 2020
http://ww
w.jbc.org/
Dow
nloaded from

28
Jones, D. P. (2013) Selective
targeting of the cysteine proteome
by thioredoxin and glutathione redox
systems. Mol Cell Proteomics 12,
3285-3296
45. Metallo, C. M., and Vander Heiden,
M. G. (2010) Metabolism strikes
back: metabolic flux regulates cell
signaling. Genes & development 24,
2717-2722
46. Lemire, J., Milandu, Y., Auger, C.,
Bignucolo, A., Appanna, V. P., and
Appanna, V. D. (2010) Histidine is a
source of the antioxidant, alpha-
ketoglutarate, in Pseudomonas
fluorescens challenged by oxidative
stress. FEMS microbiology letters
309, 170-177
47. Woods, D. M., Woan, K. V., Cheng,
F., Sodre, A. L., Wang, D., Wu, Y.,
Wang, Z., Chen, J., Powers, J.,
Pinilla-Ibarz, J., Yu, Y., Zhang, Y.,
Wu, X., Zheng, X., Weber, J.,
Hancock, W. W., Seto, E., Villagra,
A., Yu, X. Z., and Sotomayor, E. M.
(2017) T cells lacking HDAC11 have
increased effector functions and
mediate enhanced alloreactivity in a
murine model. Blood 130, 146-155
48. Yamagata, K., Daitoku, H.,
Takahashi, Y., Namiki, K., Hisatake,
K., Kako, K., Mukai, H., Kasuya, Y.,
and Fukamizu, A. (2008) Arginine
methylation of FOXO transcription
factors inhibits their phosphorylation
by Akt. Mol Cell 32, 221-231
49. Dillon, S. C., Zhang, X., Trievel, R.
C., and Cheng, X. (2005) The SET-
domain protein superfamily: protein
lysine methyltransferases. Genome
Biol 6, 227
50. Osipovich, A. B., Gangula, R.,
Vianna, P. G., and Magnuson, M. A.
(2016) Setd5 is essential for
mammalian development and the
co-transcriptional regulation of
histone acetylation. Development
143, 4595-4607
51. Huang, J., Perez-Burgos, L., Placek,
B. J., Sengupta, R., Richter, M.,
Dorsey, J. A., Kubicek, S., Opravil,
S., Jenuwein, T., and Berger, S. L.
by guest on April 20, 2020
http://ww
w.jbc.org/
Dow
nloaded from
29
(2006) Repression of p53 activity by
Smyd2-mediated methylation.
Nature 444, 629-632
52. Timmerman, L. A., Holton, T.,
Yuneva, M., Louie, R. J., Padro, M.,
Daemen, A., Hu, M., Chan, D. A.,
Ethier, S. P., van 't Veer, L. J.,
Polyak, K., McCormick, F., and
Gray, J. W. (2013) Glutamine
sensitivity analysis identifies the xCT
antiporter as a common triple-
negative breast tumor therapeutic
target. Cancer Cell 24, 450-465
53. Chang, W. K., Yang, K. D., Chuang,
H., Jan, J. T., and Shaio, M. F.
(2002) Glutamine protects activated
human T cells from apoptosis by up-
regulating glutathione and Bcl-2
levels. Clinical immunology 104,
151-160
by guest on April 20, 2020
http://ww
w.jbc.org/
Dow
nloaded from
30
FIGURE LEGENDS
Figure 1: Trx overexpressing transgenic
T cells exhibit higher anti-oxidant
capacity and reduced susceptibility to
oxidative stress. Splenic T cells from Pmel
and Pmel-Trx T cells were activated with
gp100 pepide antigen for three days in
presence of IL2 (50 IU/ml) before using to
determine: A) Trx expression staining on
the Pmel and Pmel-Trx T cells. B)
Expression of cell surface thiols (c-SH)
using alexa-fluor labeled malemide dye. C)
Intracellular reactive oxygen species
accumulation (H2O2) by DCFDA. D) Annexin
V levels after overnight culture in presence
of 50 µM of exogenous H2O2. E) Annexin V
levels 4 hr after restimulation with cognate
antigen. F). Cell in E were stained
intracellularly using flurochrome conjuagetd
anti-RIPK3 antibody. G) Three day activated
Pmel and Pmel-Trx splenocytes were
transferred i.p. to the EL4 ascitis
established for 14 days in C57BL/6 mice.
The T cells were retrieved after 24 hrs. and
oxidative stress markers 8-OHdG (left
panel) and nitrotyrosine (right panel) were
determined in Vβ13 gated CD8+ T cells.
Mean fluorescence intensity (MFI) from 2
independent experiments is represented as
bar diagram. The bar diagram adjacent to
each panel represents the cumulative data
of mean fluorescence intensity (MFI) from 3-
5 independent experiments *p value < 0.05,
**p value <0.01.
Figure 2: Trx overexpressing T cells
exhibit enhanced Tscm phenotype and
recall response. A) Three day antigen
activated gp100 TCR specific splenic T cells
from Pmel and Pmel-Trx mouse were gated
on CD44loCD62L+ and evaluated for CD122
and Sca1 expression. B) RNA prepared
from activated Pmel and Pmel-Trx T cells
was used to determine expression of stem
cell related genes. N=3. C) Three day
activated Pmel and Pmel-Trx transgenic T
cells (1×10⁶ cells/mouse) were adoptively
transferred into Rag1-/- mice. After 25 days
of T cell transferred mice were sub-
cutaneously injected with B16-F10 solid
tumors (0.25 × 10⁶ cells/mouse). Upper
panel shows representative flow cytometric
by guest on April 20, 2020
http://ww
w.jbc.org/
Dow
nloaded from
31
analysis done to determine the percentage
of TCR transgenic T cells retrieved from
spleen, lymph nodes, blood, lung, liver after
5 days of tumor injection. Lower panel is the
cumulative data from different mice. D)
Splenocytes from (C) were stimulated
overnight with hgp100 antigen before being
analyzed for intracellular signature of IFNγ.
N=3. *p<0.05, **p<0.005, ***p<0.0005.
Figure 3: Cell signaling and function of
Pmel-Trx T cells. Pmel and Pmel-Trx
derived splenic T cells were activated for
three days with cognate antigen and used
for determining: A) Phosphorylation levels of
key signaling molecules by intracellular
staining with phospho-Abs (from BD) as per
the manufacturers protocol. B). Cells were
left in IL2 (50 IU) for 15 minutes and 60
minutes before staining with fluorochrome
conjugated antibody for phopho-STAT5. C)
Intracellular IFNγ staining after reactivation
with cognate antigen overnight. Adjacent
bar diagram represents the cumulative data
for the percentage of Vβ13+CD8+ cells
producing IFNγ from 3 independent
experiments. D) Glucose uptake (using
2NBDG) after antigen restimulation for 4
hrs. Adjacent bar diagram represents the
cumulative data of MFI from 3 independent
experiments. E) qPCR analysis of various
genes in three day activated Pmel and
Pmel-Trx cells. Data are representative of 3
independent experiments. F) Oxygen
consumption rate (OCR) was measured
using Seahorse flux analyzer in presence or
absence of etomoxir (200 µM) followed by
the addition of indicated mitochondrial
inhibitors in 3 day activated WT or Trx over
expressing T cells in the left panel. Graphs
in the right panel represents Maximum OCR
(maximum rate measured after FCCP
injection), spare respiratory capacity (SRC,
maximum respiration-basal respiration) and
OCR/ECAR ratio. Results are
representative of 3 independent
experiments with similar observation.
*p<0.05, **p< 0.01 and ***p<0.005.
Figure 4: Metabolic profiling of Pmel-Trx
T cells. Pmel and Pmel-Trx T cells were
activated with the cognate antigen for three
by guest on April 20, 2020
http://ww
w.jbc.org/
Dow
nloaded from
32
days and used for quantifying intracellular
metabolites using mass spectrometry. A)
The Principal Component Analysis (PCA)
shows distribution of the metabolites. B-D)
Relative amount of metabolites evaluated
between the triplicate Pmel and Pmel-Trx T
cells are segregated into different metabolic
pathways and shown in heat maps.
Figure 5: Increased glutamine
dependence of Trx overexpressing T
cells. Pmel and Pmel-Trx T cells activated
using cognate peptide antigen for three
days were used to: A) determine uptake of
radiolabeled glutamine that was measured
in count per minute (CPM) and presented
as mean of 4 replicate samples from 3
repeat experiments; B) obtain RNA and
determine the expression of various
glutaminolysis associated genes using
qPCR. The data presented is from 3
experiments. C) Cell surface expression of
amino acid transporter xCT and
glutaminolytic enzymes (upper panel). Bar
diagrams (lower panel) represent the
cumulative data of MFI from 3 independent
experiments. *p<0.05, **p< 0.01. D)
Activated Pmel and Pmel-Trx cells were
used to measure intracellular metabolites
using mass spectrometry. E) Splenic T cells
from C57BL/6 mouse were activated with
anti-CD3/28 (each 2µg/ml) either in
absence or presence of α-KG for three
days, after which: Tscm phenotype was
evaluated using CD62L and CD44 cell
surface expression. F) The cells in E) were
also used for determining glucose uptake
using 2NBDG. Representative data from
one of three experiments with similar results
is presented. G) RNA was used to
determine the expression of genes involved
in chromatin modification Enz using mouse
epigenetic chromatin modification enzymes
PCR array (Qiagen).
Figure 6: Exogenous Trx renders
increased anti-oxidant capacity, altered
signaling and improved anti-tumor
property to T cells. A) Three day activated
gp100 epitope reactive splenic T cells from
Pmel and Pmel-Trx mouse were re-
stimulated overnight with cognate antigen,
by guest on April 20, 2020
http://ww
w.jbc.org/
Dow
nloaded from
33
and supernatant was evaluated for secreted
Trx by ELISA as per protocol. N=3
**p<0.005. B) Pmel T cells were labeled
with CFSE and stimulated with cognate
antigen gp100 for three days. The
expression of Trx was then determined
using flurochrome conjugated antibody by
gating on the cells in different phase of
division. C) CFSE labeled Pmel T cells were
stimulated with cognate antigen in absence
or presence of rTRx at various doses. D)
Pmel T cells activated with cognate antigen
in presence of rTrx (5 µg/ml) were used at
day 3 to determine the expression of Trx.
Cells in D were also used for determining:
E) iGSH, and F) pAMPK. G) Pmel T cells
stimulated with cognate antigen in absence
or presence of rTRx at various doses were
used to determine pS6 levels using
flurochrome conjugated antibody. H) Three
day activated Pmel and Pmel-Trx T cells
were used to prepare RNA for determining
stemness genes using qPCR. I) Three day
TCR activated T cells were used for
determining Annexin V upregulation after 4
hr of TCR restimulation with cognate
antigen hgp100 or non-cognate ova peptide.
J) Cell in I were used for glucose uptake
using 2NBDG. Numerical values in each
plot represent mean fluorescence intensity.
*p <0.05, **p<0.01. K) Melanoma epitope
gp100 reactive T cells obtained from Pmel
TCR transgenic mouse were activated with
cognate antigen either in presence or
absence of rTrx for three days before being
adoptively transferred to the
immunocompetent C57BL/6 recipient mice
with ten day subcutaneously established
murine melanoma B16-F10. Tumor
measurements from two different
experiments where Pmel and Pmel+rTrx
were transferred to a minimum of nine
recipient mice were compiled for this
presentation. *** p value < 0.01 obtained at
last time point of the tumor measurement
before the experiment was terminated. L)
C57BL/6 mice (n=3 mice/group) were
inoculated (s.c) with 0.25×10⁶ B16-F10
melanoma cells for 14 days, after which
mice were adoptively transferred with 1×10⁶
three day gp100 activated Pmel T cells,
Pmel cells treated with rTrx (10 µg/ml).
by guest on April 20, 2020
http://ww
w.jbc.org/
Dow
nloaded from
34
After 12 days of T cells transfer,
lymphocytes were retrieved from the
excised tumor and the indicated lymphoid
organs. Upper panel shows FACS plot for
TCR transgenic T cell determined by
staining for Vβ13 expression. Lower panel
shows cumulative data. Retrieved
lymphocytes were stimulated overnight with
αCD3 (2 µg/ml) and αCD28 antibody (5
µg/ml) before staining with flurochrome-
conjugated antibodies to determine: M)
intracellular IFNγ level, and N) Granzyme B
(GzmB) level. N=3. *p<0.05, **p<0.005.
by guest on April 20, 2020
http://ww
w.jbc.org/
Dow
nloaded from
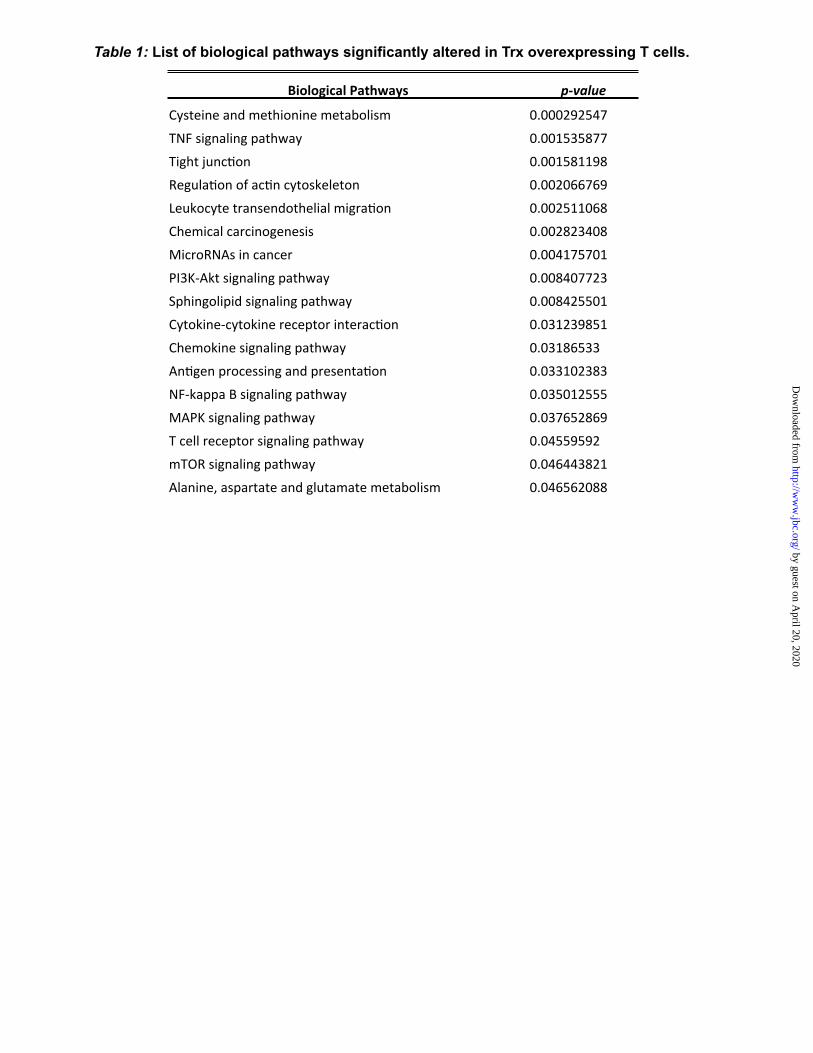
Table 1: List of biological pathways significantly altered in Trx overexpressing T cells. Biological Pathways p-‐value
Cysteine and methionine metabolism 0.000292547
TNF signaling pathway 0.001535877
Tight juncCon 0.001581198
RegulaCon of acCn cytoskeleton 0.002066769
Leukocyte transendothelial migraCon 0.002511068
Chemical carcinogenesis 0.002823408
MicroRNAs in cancer 0.004175701
PI3K-‐Akt signaling pathway 0.008407723
Sphingolipid signaling pathway 0.008425501
Cytokine-‐cytokine receptor interacCon 0.031239851
Chemokine signaling pathway 0.03186533
AnCgen processing and presentaCon 0.033102383
NF-‐kappa B signaling pathway 0.035012555
MAPK signaling pathway 0.037652869
T cell receptor signaling pathway 0.04559592
mTOR signaling pathway 0.046443821
Alanine, aspartate and glutamate metabolism 0.046562088
by guest on April 20, 2020
http://ww
w.jbc.org/
Dow
nloaded from
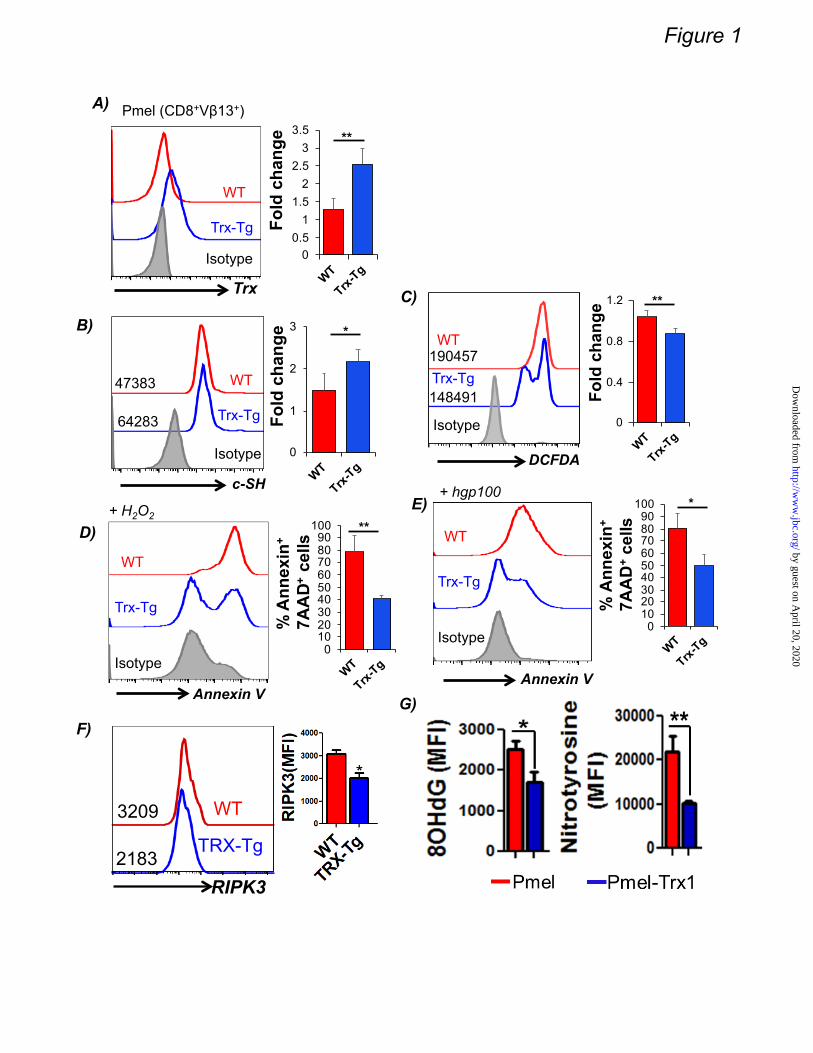
B)
G)
Annexin V
+ H2O2
c-SH
47383
64283
WT
Trx-Tg
0
1
2
3
WTTrx-
Tg
*
Fold
cha
nge
0102030405060708090100
WT
Trx-Tg
**
% A
nnex
in+
7AA
D+ce
lls
A)
Trx
Pmel (CD8+Vβ13+)
WT
Trx-Tg
00.51
1.52
2.53
3.5
WTTrx-
TgFo
ld c
hang
e **
Isotype
Isotype
WT
Trx-Tg
Isotype
DCFDA
190457
148491
**
0
0.4
0.8
1.2
WTTrx-
Tg
Fold
cha
nge **
WT
Trx-Tg
Isotype
C)
D)
2183
3209
RIPK3
TRX-Tg
WT
F)
+ hgp100
0102030405060708090100
WT
Trx-Tg
*
% A
nnex
in+
7AA
D+
cells
Annexin V
WT
Trx-Tg
Isotype
E)
Figure 1 by guest on A
pril 20, 2020http://w
ww
.jbc.org/D
ownloaded from
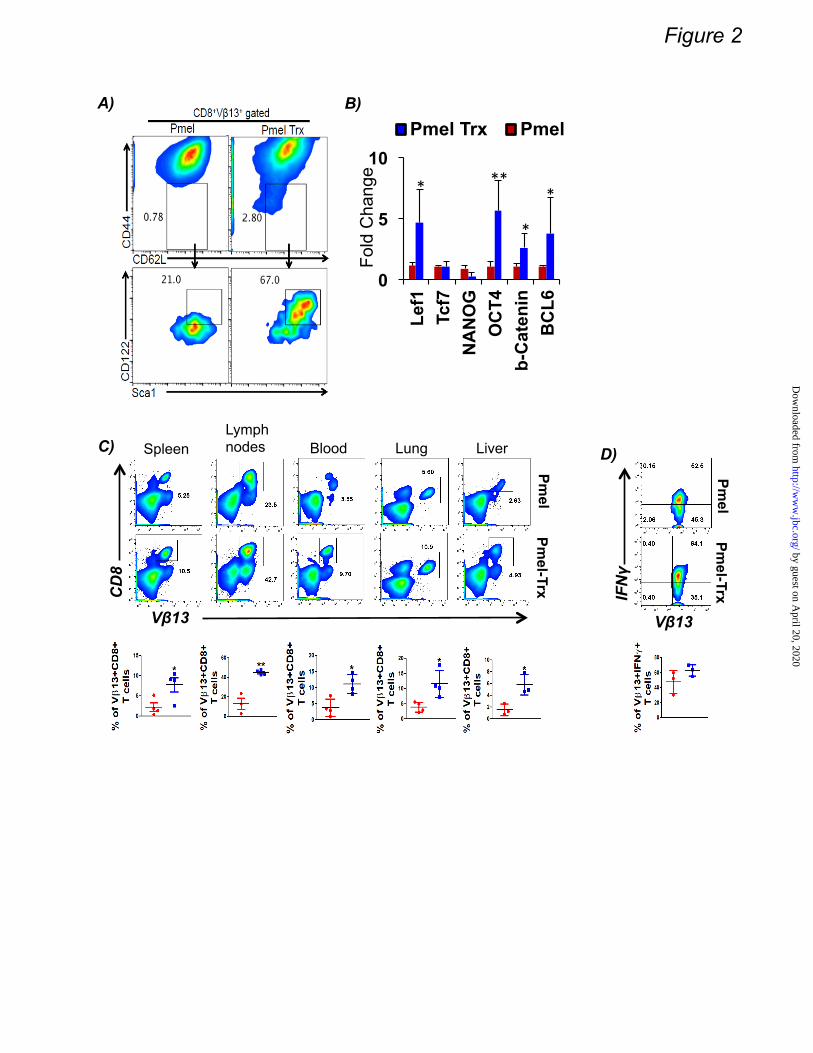
A)
Vβ13
CD
8
Pmel-Trx
Pmel
Spleen Lymph nodes Blood Lung Liver
Vβ13 IF
Nγ
Pmel-Trx
Pmel
D) C)
B)
Figure 2
Pmel Trx Pmel
Fold
Cha
nge *
**
**
*
*
0
5
10
Lef1
Tc
f7
NA
NO
G
OC
T4
b-C
aten
in
BC
L6
*"
*"**"*"
by guest on April 20, 2020
http://ww
w.jbc.org/
Dow
nloaded from
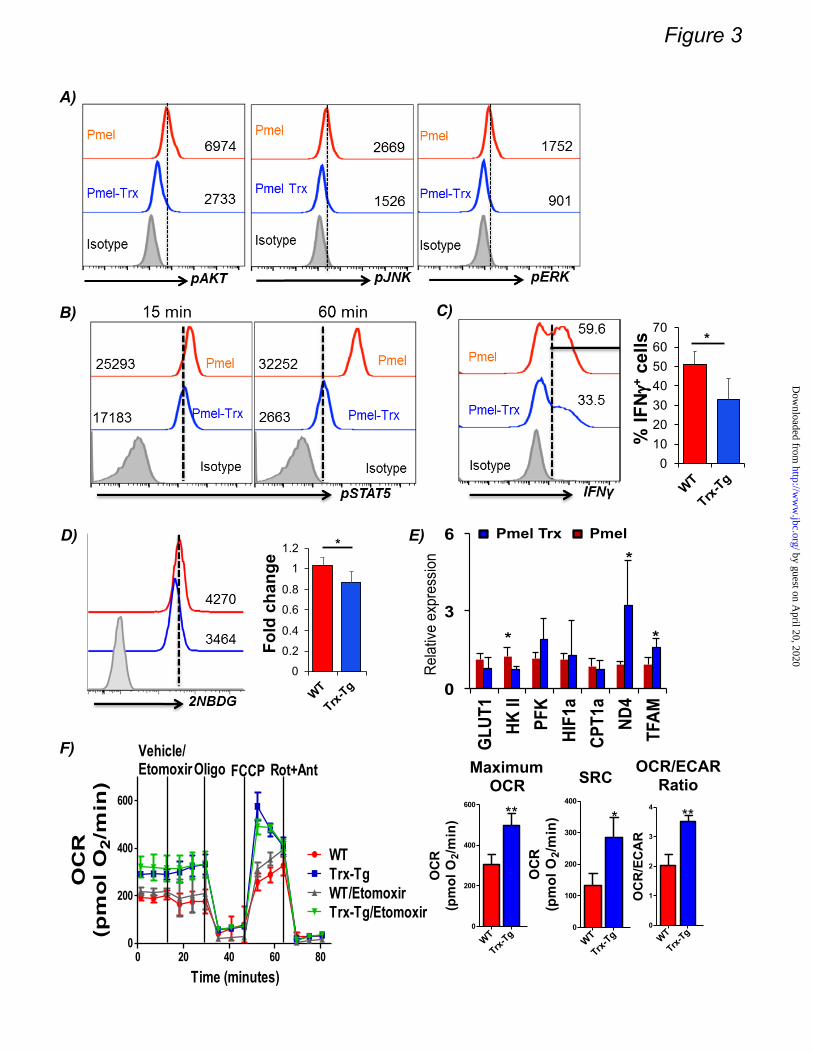
A)
B) C)
E)
F)
D)
0
0.2
0.4
0.6
0.8
1
1.2
WTTrx-
Tg
Fold
cha
nge
*
010203040506070
WTTrx-
Tg
% IF
Ng+
cells *
Figure 3
0 20 40 60 800
200
400
600
WTTrx-TgWT/EtomoxirTrx-Tg/Etomoxir
Oligo FCCP Rot+AntVehicle/Etomoxir
Time (minutes)
OC
R(p
mo
l O
2/m
in)
Maximum OCR SRC
OCR/ECAR Ratio
WT
Trx-Tg
0
200
400
600**
OC
R(p
mol
O2/
min
)
WT
Trx-Tg
0
100
200
300
400
*
OC
R(p
mol
O2/
min
)
WT
Trx-Tg
0
1
2
3
4**
OCR/ECAR
Pmel Trx Pmel
0
3
6
GLU
T1
HK II
PF
K HI
F1a
CPT1
a ND
4 TF
AM
*
*
*
Rel
ativ
e ex
pres
sion
by guest on April 20, 2020
http://ww
w.jbc.org/
Dow
nloaded from
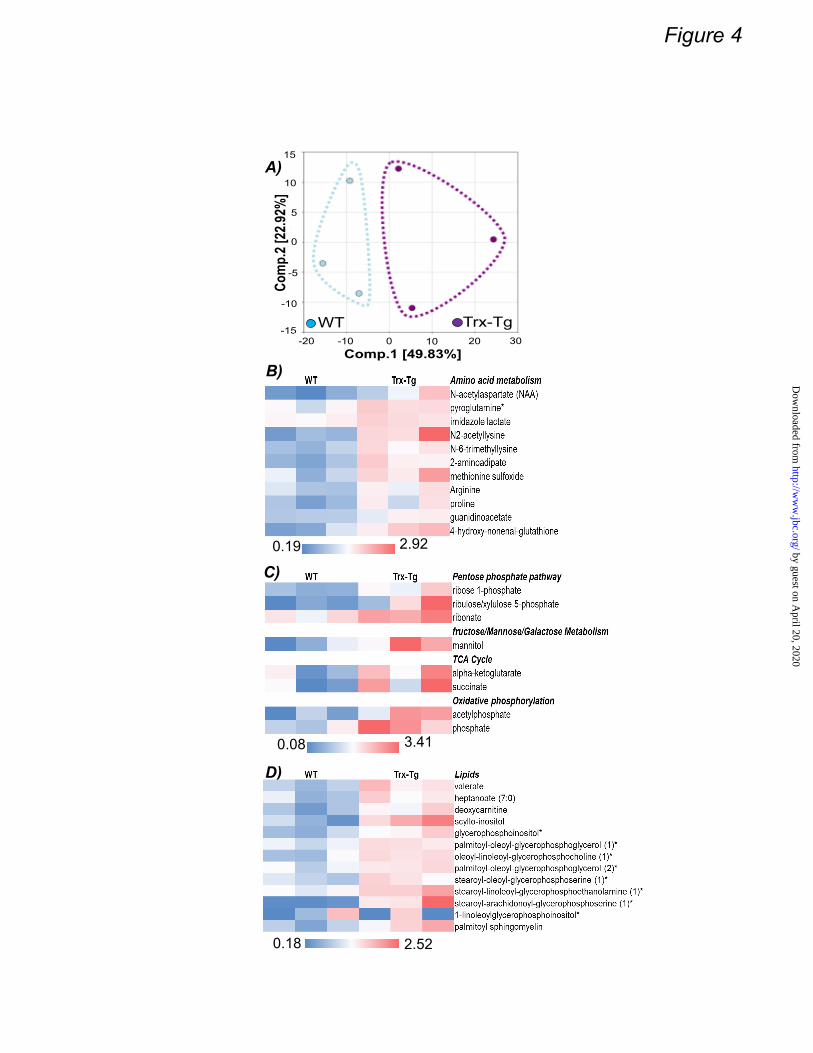
Figure 4
0.19 2.92
0.08 3.41
B)
C)
D)
WT Trx-Tg -15
-10
0
5
15
Com
p.2
[22.
92%
]
10
-5
-20 20 30 Comp.1 [49.83%]
10 0 -10
A)
0.18 2.52
by guest on April 20, 2020
http://ww
w.jbc.org/
Dow
nloaded from
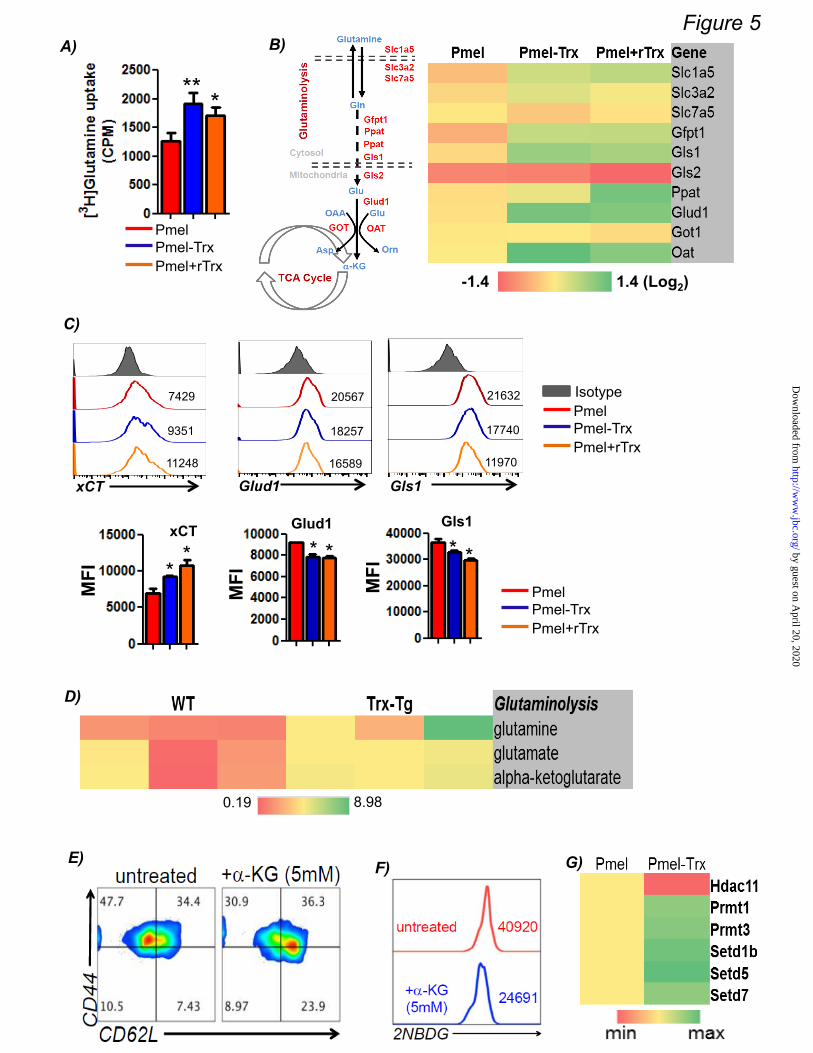
Figure 5
** *
-1.4 1.4 (Log2)
7429
9351
11248
xCT
20567
18257
16589
Glud1
21632
17740
11970
Gls1
Isotype Pmel Pmel-Trx Pmel+rTrx
MFI
xCT
* *
MFI
* * Glud1
MFI
* *
Gls1
Pmel Pmel-Trx Pmel+rTrx
A) B)
C)
D)
E)
0.19 8.98
F) G)
Pmel Pmel-Trx Pmel+rTrx
by guest on April 20, 2020
http://ww
w.jbc.org/
Dow
nloaded from
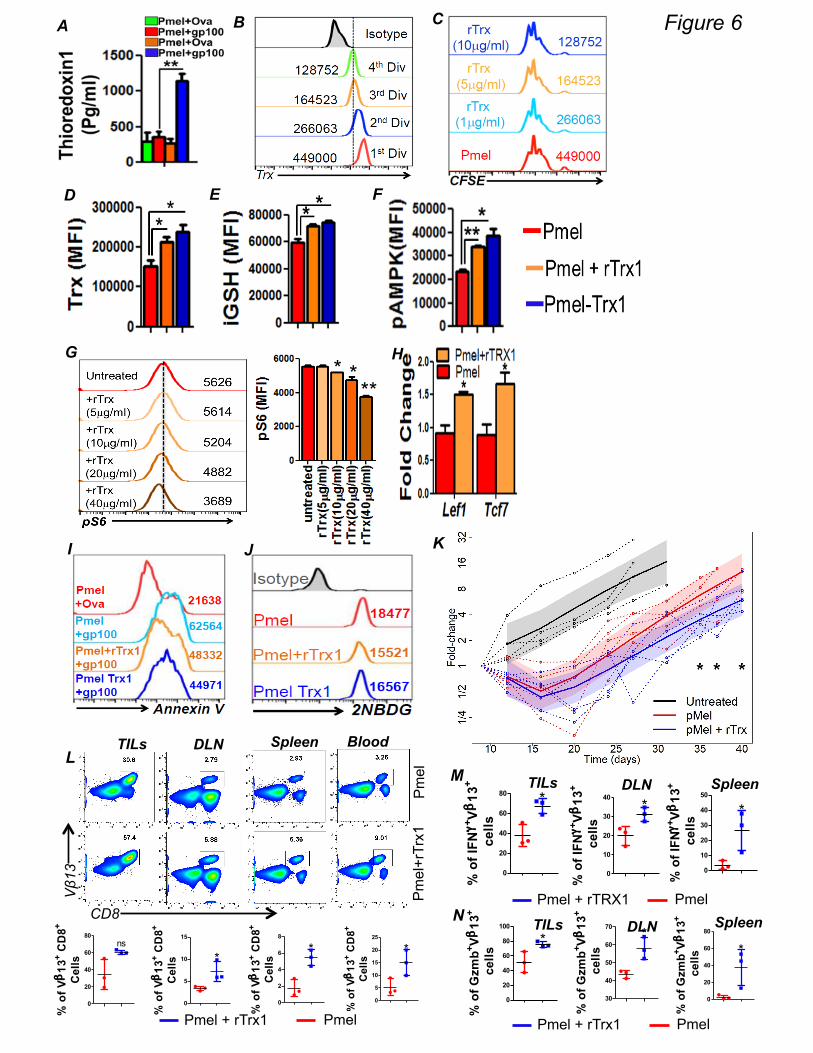
A
E
B
I
F
C
D
J
* * **
Figure 6
G
K
H
wt
wt+rtrx
0
2
4
6
8
*
% o
f Vβ
13+ C
D8+
Cel
ls
wt
wt+rtrx
0
5
10
15
*
% o
f Vβ
13+ C
D8+
Cel
ls
0
20
40
60
80ns
% o
f Vβ
13+ C
D8+
Cel
ls
pMel
pMel+rT
RX
0
10
20
30
40*
% o
f IFN
γ+Vβ
13+
cel
ls
pMel
pMel+rT
RX
0
20
40
60
80 *
% o
f IFN
γ+Vβ
13+
cel
ls
WTrT
RX
0
10
20
30
40
50
*
% o
f IFN
γ+Vβ
13+
cel
ls
pMel
pMel+rT
RX
0
20
40
60
80
100
*
% o
f Gzm
b+ Vβ13
+
cel
ls
WTrT
RX
30
40
50
60
70 *
% o
f Gzm
b+ Vβ13
+
cel
ls
0
20
40
60
80
*
% o
f Gzm
b+ Vβ13
+
cel
ls
CD8
Vβ1
3
TILs DLN Spleen Blood
Pm
el
Pm
el+r
Trx1
J
wt
wt+rtrx
0
5
10
15
20
25
*
% o
f Vβ
13+ C
D8+
Cel
ls
Pmel + rTRX1 Pmel
Pmel + rTrx1 Pmel Pmel + rTrx1 Pmel
TILs DLN Spleen
TILs DLN Spleen
L M
N

Xue-Zhong Yu, Michael I. Nishimura and Shikhar MehrotraMark P. Rubinstein, Nancy Klauber-DeMore, Elizabeth G. Hill, Besim Ogretmen,
Nasarre, Gina Scurti, Gary Hardiman, Nilanjana Maulik, Lauren E Ball, Vamsi Gangaraju,Supinya Iamsawat, Annika Dalheim, Hung Nguyen, Shanmugam P. Selvam, Patrick
Paramita Chakraborty, Shilpak Chatterjee, Pravin Kesarwani, Krishnamurthy Thyagarajan,Thioredoxin-1 improves the immuno-metabolic phenotype of anti-tumor T cells
published online April 10, 2019J. Biol. Chem.
10.1074/jbc.RA118.006753Access the most updated version of this article at doi:
Alerts:
When a correction for this article is posted•
When this article is cited•
to choose from all of JBC's e-mail alertsClick here
by guest on April 20, 2020
http://ww
w.jbc.org/
Dow
nloaded from