This paper adopts an instrumental variable approach to ... · PDF filethat predicts rice yield...
25
econstor www.econstor.eu Der Open-Access-Publikationsserver der ZBW – Leibniz-Informationszentrum Wirtschaft The Open Access Publication Server of the ZBW – Leibniz Information Centre for Economics Standard-Nutzungsbedingungen: Die Dokumente auf EconStor dürfen zu eigenen wissenschaftlichen Zwecken und zum Privatgebrauch gespeichert und kopiert werden. Sie dürfen die Dokumente nicht für öffentliche oder kommerzielle Zwecke vervielfältigen, öffentlich ausstellen, öffentlich zugänglich machen, vertreiben oder anderweitig nutzen. Sofern die Verfasser die Dokumente unter Open-Content-Lizenzen (insbesondere CC-Lizenzen) zur Verfügung gestellt haben sollten, gelten abweichend von diesen Nutzungsbedingungen die in der dort genannten Lizenz gewährten Nutzungsrechte. Terms of use: Documents in EconStor may be saved and copied for your personal and scholarly purposes. You are not to copy documents for public or commercial purposes, to exhibit the documents publicly, to make them publicly available on the internet, or to distribute or otherwise use the documents in public. If the documents have been made available under an Open Content Licence (especially Creative Commons Licences), you may exercise further usage rights as specified in the indicated licence. zbw Leibniz-Informationszentrum Wirtschaft Leibniz Information Centre for Economics Caruso, Raul; Petrarca, Ilaria; Ricciuti, Roberto Working Paper Climate Change, Rice Crops and Violence. Evidence from Indonesia CESifo Working Paper, No. 4665 Provided in Cooperation with: Ifo Institute – Leibniz Institute for Economic Research at the University of Munich Suggested Citation: Caruso, Raul; Petrarca, Ilaria; Ricciuti, Roberto (2014) : Climate Change, Rice Crops and Violence. Evidence from Indonesia, CESifo Working Paper, No. 4665 This Version is available at: http://hdl.handle.net/10419/93401
Transcript of This paper adopts an instrumental variable approach to ... · PDF filethat predicts rice yield...
econstor www.econstor.eu
Der Open-Access-Publikationsserver der ZBW – Leibniz-Informationszentrum WirtschaftThe Open Access Publication Server of the ZBW – Leibniz Information Centre for Economics
Standard-Nutzungsbedingungen:
Die Dokumente auf EconStor dürfen zu eigenen wissenschaftlichenZwecken und zum Privatgebrauch gespeichert und kopiert werden.
Sie dürfen die Dokumente nicht für öffentliche oder kommerzielleZwecke vervielfältigen, öffentlich ausstellen, öffentlich zugänglichmachen, vertreiben oder anderweitig nutzen.
Sofern die Verfasser die Dokumente unter Open-Content-Lizenzen(insbesondere CC-Lizenzen) zur Verfügung gestellt haben sollten,gelten abweichend von diesen Nutzungsbedingungen die in der dortgenannten Lizenz gewährten Nutzungsrechte.
Terms of use:
Documents in EconStor may be saved and copied for yourpersonal and scholarly purposes.
You are not to copy documents for public or commercialpurposes, to exhibit the documents publicly, to make thempublicly available on the internet, or to distribute or otherwiseuse the documents in public.
If the documents have been made available under an OpenContent Licence (especially Creative Commons Licences), youmay exercise further usage rights as specified in the indicatedlicence.
zbw Leibniz-Informationszentrum WirtschaftLeibniz Information Centre for Economics
Caruso, Raul; Petrarca, Ilaria; Ricciuti, Roberto
Working Paper
Climate Change, Rice Crops and Violence. Evidencefrom Indonesia
CESifo Working Paper, No. 4665
Provided in Cooperation with:Ifo Institute – Leibniz Institute for Economic Research at the University ofMunich
Suggested Citation: Caruso, Raul; Petrarca, Ilaria; Ricciuti, Roberto (2014) : Climate Change,Rice Crops and Violence. Evidence from Indonesia, CESifo Working Paper, No. 4665
This Version is available at:http://hdl.handle.net/10419/93401
Climate Change, Rice Crops and Violence. Evidence from Indonesia
Raul Caruso Ilaria Petrarca
Roberto Ricciuti
CESIFO WORKING PAPER NO. 4665 CATEGORY 10: ENERGY AND CLIMATE ECONOMICS
FEBRUARY 2014
An electronic version of the paper may be downloaded • from the SSRN website: www.SSRN.com • from the RePEc website: www.RePEc.org
• from the CESifo website: Twww.CESifo-group.org/wp T
CESifo Working Paper No. 4665
Climate Change, Rice Crops and Violence. Evidence from Indonesia
Abstract This paper adopts an instrumental variable approach to uncover the impact of variations in minimum temperature on emergence and severity of actual violence through the effect on food availability, captured by rice crops per capita. The link between increase in minimum temperature and rice crops is suggested by natural science literature. We use Indonesia as a case study over the period 1990-2003. Results show that an increase of the minimum temperature during the core month of the ‘wet planting season’, i.e. December, determines an increase in violence fuelled by the reduction in future rice production per capita.
JEL-Code: D740, Q540, O130.
Keywords: Indonesia, climate change, minimum temperature, rainfall, food availability, paddy rice, rice crops, routine violence.
Raul Caruso* Center for Applied Economics (CSEA)
Via Necchi 5 Italy – 20123 Milan
Ilaria Petrarca University of Verona
Verona / Italy [email protected]
Roberto Ricciuti University of Verona
Verona / Italy [email protected]
*corresponding author November 19, 2013 Earlier drafts of this paper have been presented at: the 13th Jan Tinbergen European Peace Science Conference, June 24-26 2013, Milan, the Post-doctoral seminars at the University of Verona, the II Workshop on the Political Economy of Conflict organized by EPS-Italy and CSEA at the Catholic University of the Sacred Heart in Milan, and the University of Manchester. We warmly thank the participants who commented on this work. In particular, we also thank Syed Mansoob Murshed for providing us with data on poverty in Indonesia. Roberto Ricciuti thanks Nuffield College for hospitality under the Jemolo Fellowship. We also acknowledge financial support from the University of Verona.
2
1. Introduction
The impact of climate change on emergence and recrudescence of violent conflicts
has become one of the more lively debates in the latest years. However, despite the
substantial number of studies, results are puzzled, contradictory and somehow
inconclusive (see Buhaug et al., and 2013Hsiang et al., 2013). In brief, on the basis
of the existing studies, scholars are not able to espouse a general interpretation of
the climate change/violence nexus.1
Several aspects contribute to the inconclusiveness of the literature. First, as
pointed out by Theisen et al. (2013), the causal mechanism behind the climate
change/violence relationship may vary across societies, regions and territories. In
the eyes of economists, climate change results into exogenous shocks that
significantly affect agricultural production so shaping the set of economic
opportunities, and thereby the incentives and opportunity cost of individuals.
Needless to say, characteristics of agricultural sectors differ significantly among
countries, regions and territories so shaping any potential relationship between
agricultural shocks induced by climate change and actual conflict.
Secondly, measures of climate change differ and therefore results of empirical
studies can lead to different interpretations. Among social scientists, climate
change has been frequently approximated in the literature on conflict by means of
variations in rainfall and mean temperature. In particular, since Miguel et al.
(2004), rainfall has been the core variable of interest to explain the relationship
between conflict and climatic variations. The explanation grounds on the idea that
substantial negative variations of rainfall induce drought so raising the risk of
conflict. Ciccone (2011) challenges the previous results so stating that rainfall is
unrelated to conflict.2 Burke at al. (2009) had shifted the focus on the temperature
so predicting that warming can be considered a strong predictor of civil war in
Africa, but Buhaug (2010) showed that the results are not robust if using
alternative specification. Briefly stated, alternative measures and specifications of
the climatic variables contribute to make the results puzzled and inconclusive. This
1 The literature on the nexus between climate change and violence increased dramatically in the
latest years. See among others Gleditsch (2012), Hendrix and Salehyan (2012), Fjelde and Uexkull
(2012), Koubi et al. (2012), Slettebak (2012), Scheffran et al. (2012), Raleigh et al. (2008), Raleigh and
Urdal, (2013). 2 See also Miguel and Satyanath (2011) that replies to criticism proposed by Ciccone (2011).
3
poses well-grounded doubts on the universal application of a predictable causal
from path climate change to violence.
Moreover, actual violence takes several shapes and it can be either influenced
or inflamed differently by climatic variables. Actors of civil wars can be expected to
react differently from individuals involved in unorganized rioting, routine violence
and other types of spontaneous societal unrest. Eventually, the role played by other
societal factors as the level of development or the institutional architecture can be
expected to be substantial. Consequently, it must not be surprising that studies
focusing on large panels of countries present inconclusive and puzzled results. In
particular, as noted by Bernauer et al. (2012), drawing general proposition from
large-N studies is not appropriate because most of them are not robust to
alternative specifications.
In the light of the previous points, we have chosen to bound our study to a
single country with a dominant crop and a substantial history of violence. Then, we
focus on Indonesia for the period 1990-2003. The choice is well-grounded: the
country is a case study that does fit particularly well into such approach.
First, Indonesia has a well-studied history of violence. In particular,
Tadjoeddin and Murshed (2007) explain the emergence of routine violence by
pointing out the economic factors associated with everyday violence in Java. The
escalation of violence, in particular, has been accompanied by the three transitions
at the end of the 1990s (Tadjoeddin, 2002): (i) political (from autocracy to
democracy), (ii) economic (from crony capitalism to ruled-based market system) and
(iii) social (centralized-decentralized). The overall severity of conflict peaked after
the fall of Suharto's regime in 1998 and decreased after 2001. Reduction of violence
can be explained in the light of: (1) fiscal decentralization. (Murshed and
Tadjoeddin, 2008); repression against terrorism in the aftermath of Bali bombing
in 2002; the end of the long lasting separatist war in Aceh. However, despite the
decreasing pattern of conflict severity, the number of violent incidents has risen
after 2002 (World Bank Conflict and Development Program, 2010).
The second facet taken into account is that the Indonesian economy is heavily
dependent on rice crops. According to the figures drawn from FAO dataset,3 rice is
the main crop in terms of both quantity and value as well as the top commodity
3 See http://faostat.fao.org/CountryProfiles/Country_Profile/Direct.aspx?lang=en&area=101
4
available for internal consumption. In this respect, it is necessary to note that in
spite of being a top rice-producer in the world, Indonesia has historically been a net
importer of rice (McCulloch, 2008).4 Food availability heavily depends on rice crops,
and more than one fifth of the population is involved in agricultural production.
Then, it is not surprising that climate change has been already studied with regard
to agricultural production and food availability (see among others Naylor et al.
2001; Naylor et al. 2007; Keil et al., 2008; Skoufias et al., 2012).
Then, we investigate the impact of climate change on violence by exploring
the causal mechanism of agricultural production. In particular, we analyze the
impact of climate change on rice crops and eventually on emergence of violence. We
test this hypothesis by exploiting a newly assembled provincial dataset that
matches the data provided by the United Nations Support Facility for Indonesian
Recovery5 (hereafter UNSFIR) with climatic data and a set of socio-economic
controls over the period 1990-2003.
The main novelty we claim for this work is that drawing insights from the
natural science literature, we use variations in minimum temperature rather than
average temperature. Such choice drives significant results, therefore
strengthening the idea that climate change inflames violence.
In sum, the results show, consistently with our hypothesis, that an increase
of the minimum temperature during the core month of the ‘wet planting season’,
i.e., December, determines an increase in violence fuelled by the reduction in future
rice production. Therefore, we find support for the hypothesis that minimum
temperature negatively affects rice availability (per capita), which in turn inflames
violence. This evidence is robust to alternative specifications of the dependent
variable, as well as the inclusion of a number of controls. In particular, we study
two measures of violence, namely the emergence of violence proxied by number of
monthly events, and the severity of violence proxied by means of the number of
monthly victims (sum of injured and killed people). Unfortunately, this work has
limitations due to the number of observations available and the lack of data.
However, we consider the results robust enough to provide new evidence on the
relationship between climate variables and variables in Indonesia and to warrant
4 Indonesia is considered the third top producer in the world. In 2011 the quantity of rice production
was 65,741 thousands of tons but the quantity exported was 0.8 thousand of tons. 5 For a description of the dataset see Varshney et al. (2004).
5
further explorations for different countries and crop/temperature bundles. Another
result we claim for this work is methodological. We believe that the robust evidence
descends from taking into account the agricultural specificities of paddy rice.
Stated broadly, our work cautiously suggests that some inconclusive results in
literature on the climate change/violence nexus could suffer from not considering
heterogeneity and specific characteristics of different crops.
The rest of the paper develops as follows. Section 2 illustrates from the
perspective of the natural science the relationship between minimum temperature
and violence. Section 4 provides an overview on the dataset and the empirical
strategy, whose results are eventually presented in Section 5. Some robustness
checks are presented in section 6 and finally, Section 7 concludes.
2. Rice and minimum temperature
In what follows, we report the results expounded in the natural science literature
on the impact of minimum temperature on cereal production. Since minimum
temperature is reached during the night, by smoothing the variations across the
24-hour temperature range, scholars might have failed to consider the actual
transmission channels to conflict. The evidence is substantial in this respect. Dore
(1959) suggested length of day and night and related change in temperature have
an impact on rice flowering. We focus on evidence proposed about the impact of
minimum temperature on rice crops. Sinha et al. (1991) estimate that in India and
China the rice yield is severely dependent on total radiation and minimum
temperature from flowering to ripening. In Indonesia, higher air temperatures
increase the respiration rate of rice plants, reduce net photosynthesis, and
eventually reduce plant yield. Amien et al. (1996), based on a forecasting model
that predicts rice yield given climate change in Java, suggested that the observed
slight increase in minimum temperature will significantly decreases the yield.
Wheeler et al. (2000) emphasize the impact of minimum temperature
variations during the rice cropping seasons. They acknowledge that ''research into
the effect of high night temperature is not been understood well and should be
prioritized with much higher mean night temperatures’ predicted'' (page 75).
Higher minimum temperatures increase the maintenance respiration requirement
of the crops and shorten the time to maturity, thus reducing net growth and
productivity. Peng et al. (2004) find that also increased night-time temperatures
6
associated with global warming cause rice yields to fall in Indonesia. Although this
result holds for other south-eastern countries (e.g. Welch et al., 2010 provide
estimates for the Philippines), Peng et al., (2004) have been criticized in those
studies that focus on China (Huang et al., 2013; Deng et al., 2010; Zhang et al.,
2010; You et al., 2009), where an increase in temperatures, especially minimum
temperatures (Tao et al., 2008), increases rice yields. This apparent contradiction
depends on the fact that climate warming may rise yield in cooler climates and
lower them in warmer climate (Grant et al., 2011). The aggregate world effect in
the period 1961-2002, as estimated by Lobell and Field (2007), is in fact negative
but close to zero, given the different impact across countries. In a subsequent work,
extending the dataset until 2008, Lobell et al. (2011) confirm that global warming
reduces rice and soybeans production in Indonesia.6
Lal (2011) confirms the presence of such a biological mechanism in South
Asia; there is also a direct evidence that rainfall and temperatures affect rice yields
in Indonesia. Yet, rainfall is the most common variable exploited in empirical
studies. Evidence of a negative correlation between sea surface temperature
anomaly (SSTA) and rainfall has been provided by Naylor et al. (2007) in a study of
Java and Bali, Deng et al. (2010) in China and Roberts et al., (2008) in the
Philippines. Naylor et al. (2001) quantify the connections between El Niño-
Southern Oscillation (ENSO) indices, rainfall, and rice production for Java –
Indonesia’s main rice-growing region. They find that El Niño causes drought, due
to the deep atmospheric convection associated with the Indonesian low shifts
eastward, and threatens rice production.
In sum, natural sciences clearly indicate to look at the minimum temperature, that
is the air warmth reached during the night, as a crucial variable of rice crops.
3. Sources, data and variables
We use the UNSFIR dataset on social violence events, covering 14 provinces for the
years 1990-2003.7 It provides detailed information about the date of any event,
namely among others: the exact location, the degree of severity (number of killed
6 A similar apparent ambiguity is found in the study of wheat production: despite the negative
correlation between global warming and yield in the world dataset (Lobell and Field, 2007; Lobell et
al., 2011; Semenov, 2009), Nicholls (1997) reports that in Australia the increase in minimum
temperatures reduces the likelihood of frosts, therefore increasing wheat yield. 7 Data downloaded from www.conflictanddevelopment.org.
and injured individuals), the involvement o
of the event (arrested individuals, burned houses, shops and public buildings), and
the source of the data. The data are drawn from 19 newspapers at the provincial
level. The UNSFIR dataset records incidents of collect
communal, separatist, state
on a specific type of violence, i.e. 'group violence'. In particular, the dataset includes
3608 events of social violence.
level so obtaining 12x14=168 observations per province.
two alternative dependent variables, in order to consider both the emergence and
the severity of violence, namely:
(2) the number of monthly victims (defined as the sum of injured and killed people),
labeled severity. If we look at the territorial patterns of violence, all the provinces
show decreasing levels of violence in the last years of the data
Jawa (Jawa Timur) and Riau.
severity. The figure shows that
distributed across time, peaking in the years around the transition and
decreasing (more sharply in the case of severity)
data at the monthly level so obtaining 12x14=168 observations per province.
Figure
Note: own calculations from UNSFIR dataset. Left scale:
7
and injured individuals), the involvement of the army, the material consequences
of the event (arrested individuals, burned houses, shops and public buildings), and
the source of the data. The data are drawn from 19 newspapers at the provincial
level. The UNSFIR dataset records incidents of collective violence and listed
communal, separatist, state-community and industrial relations violence. It focuses
on a specific type of violence, i.e. 'group violence'. In particular, the dataset includes
3608 events of social violence. We have aggregated the violence data at the
level so obtaining 12x14=168 observations per province. We draw from this dataset
two alternative dependent variables, in order to consider both the emergence and
the severity of violence, namely: (1) the count of monthly events, labeled
(2) the number of monthly victims (defined as the sum of injured and killed people),
If we look at the territorial patterns of violence, all the provinces
show decreasing levels of violence in the last years of the dataset, except for East
) and Riau. Figure 1 reports the number of incidents and their
The figure shows that both share a similar pattern, and are
distributed across time, peaking in the years around the transition and
creasing (more sharply in the case of severity). We have aggregated the violence
data at the monthly level so obtaining 12x14=168 observations per province.
Figure 1. Yearly frequency of violence
Note: own calculations from UNSFIR dataset. Left scale: incidents; right scale: severity
f the army, the material consequences
of the event (arrested individuals, burned houses, shops and public buildings), and
the source of the data. The data are drawn from 19 newspapers at the provincial
ive violence and listed
community and industrial relations violence. It focuses
on a specific type of violence, i.e. 'group violence'. In particular, the dataset includes
olence data at the yearly
e draw from this dataset
two alternative dependent variables, in order to consider both the emergence and
labeled incidents;
(2) the number of monthly victims (defined as the sum of injured and killed people),
If we look at the territorial patterns of violence, all the provinces
set, except for East
number of incidents and their
both share a similar pattern, and are unevenly
distributed across time, peaking in the years around the transition and then
We have aggregated the violence
data at the monthly level so obtaining 12x14=168 observations per province.
incidents; right scale: severity
8
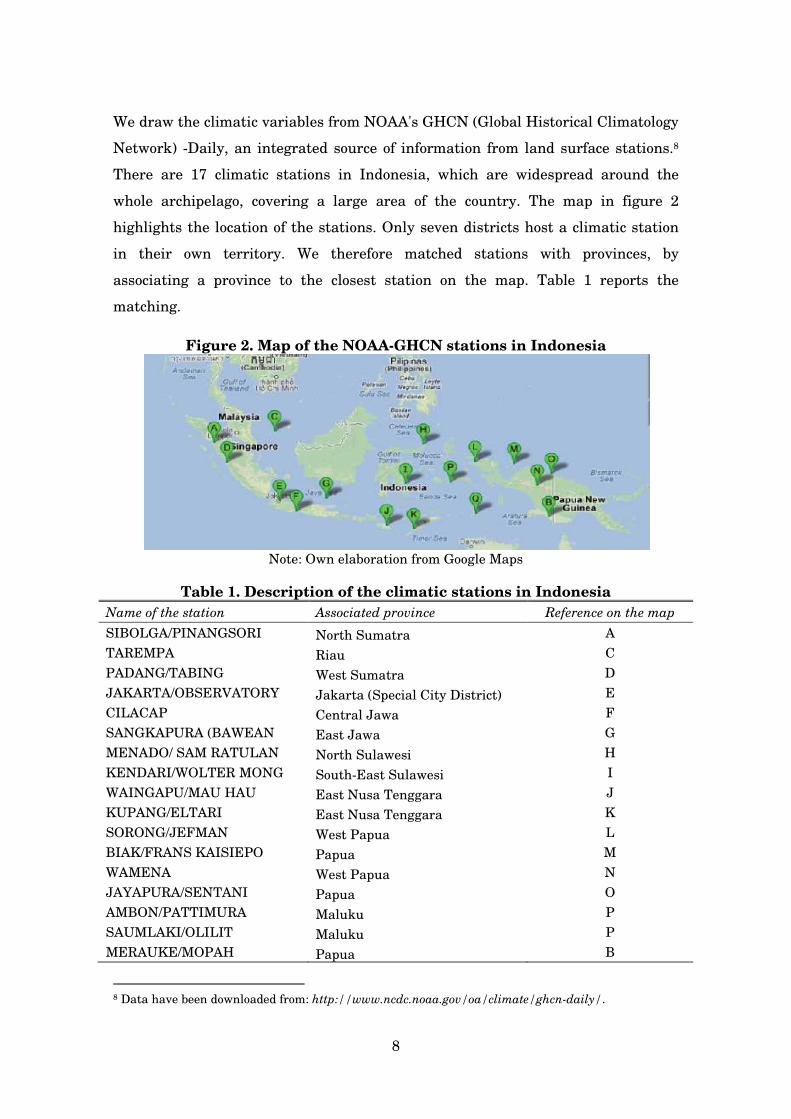
We draw the climatic variables from NOAA's GHCN (Global Historical Climatology
Network) -Daily, an integrated source of information from land surface stations.8
There are 17 climatic stations in Indonesia, which are widespread around the
whole archipelago, covering a large area of the country. The map in figure 2
highlights the location of the stations. Only seven districts host a climatic station
in their own territory. We therefore matched stations with provinces, by
associating a province to the closest station on the map. Table 1 reports the
matching.
Figure 2. Map of the NOAA-GHCN stations in Indonesia
Note: Own elaboration from Google Maps
Table 1. Description of the climatic stations in Indonesia
Name of the station Associated province Reference on the map
SIBOLGA/PINANGSORI North Sumatra A
TAREMPA Riau C
PADANG/TABING West Sumatra D
JAKARTA/OBSERVATORY Jakarta (Special City District) E
CILACAP Central Jawa F
SANGKAPURA (BAWEAN East Jawa G
MENADO/ SAM RATULAN North Sulawesi H
KENDARI/WOLTER MONG South-East Sulawesi I
WAINGAPU/MAU HAU East Nusa Tenggara J
KUPANG/ELTARI East Nusa Tenggara K
SORONG/JEFMAN West Papua L
BIAK/FRANS KAISIEPO Papua M
WAMENA West Papua N
JAYAPURA/SENTANI Papua O
AMBON/PATTIMURA Maluku P
SAUMLAKI/OLILIT Maluku P
MERAUKE/MOPAH Papua B
8 Data have been downloaded from: http://www.ncdc.noaa.gov/oa/climate/ghcn-daily/.
9
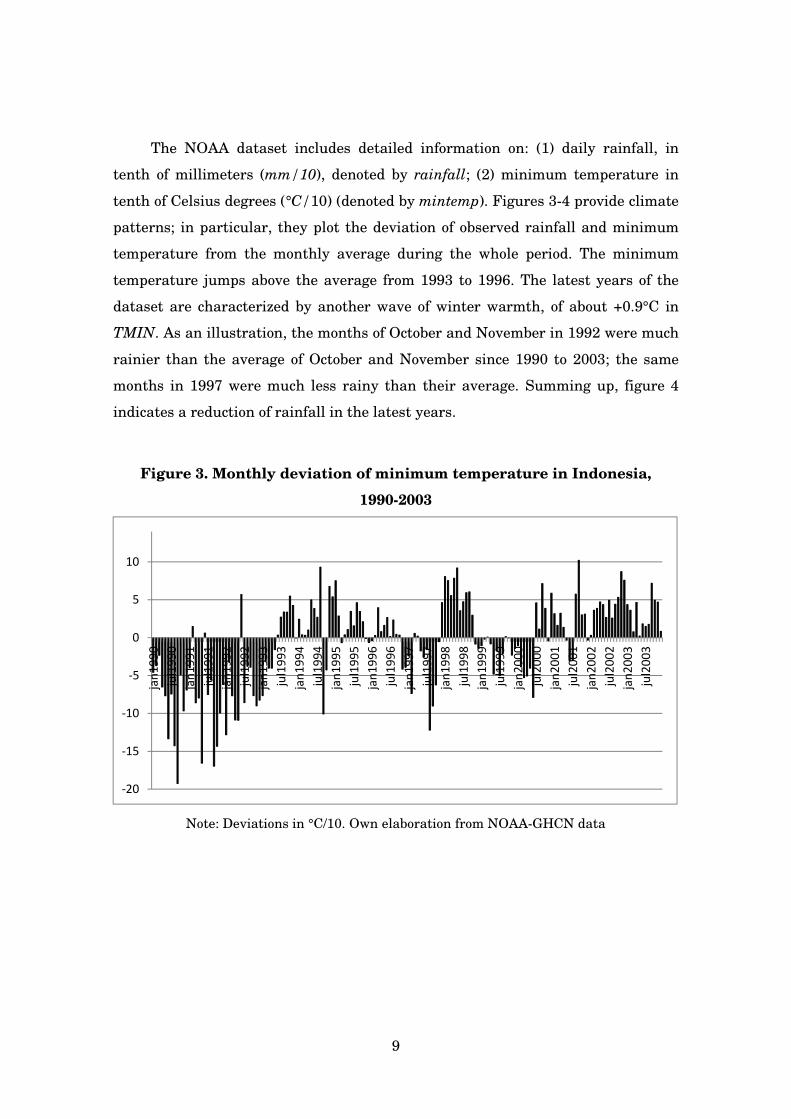
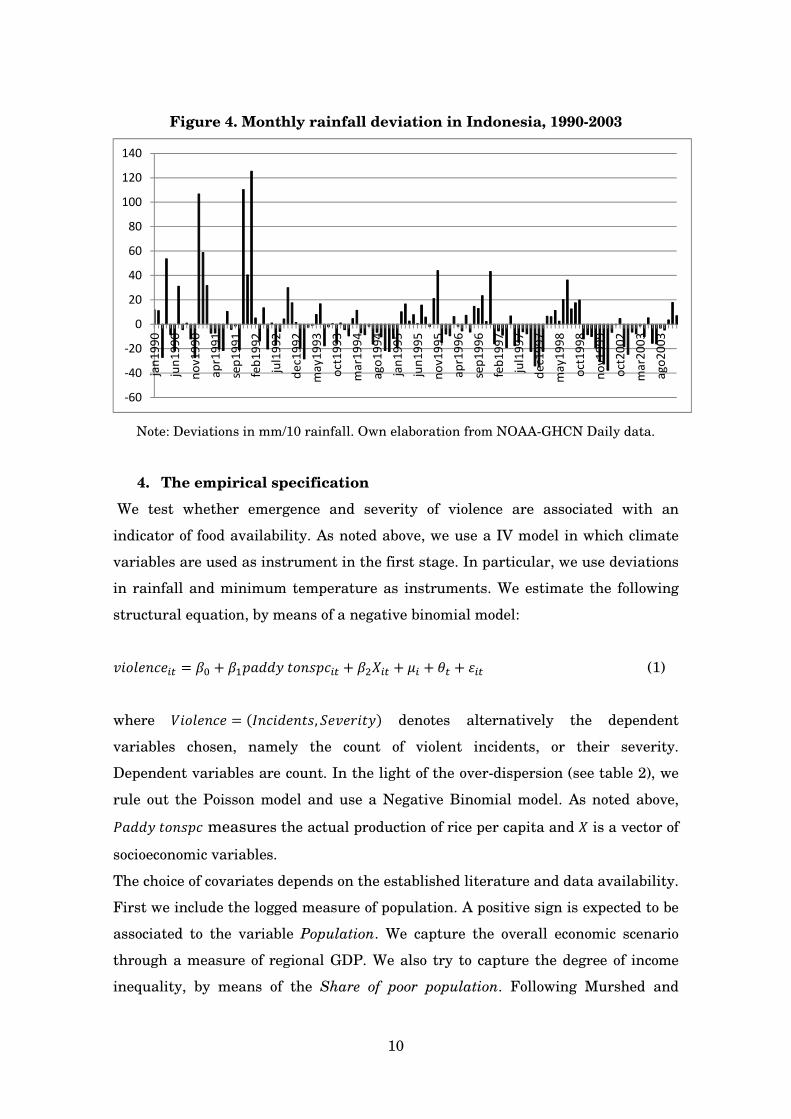
The NOAA dataset includes detailed information on: (1) daily rainfall, in
tenth of millimeters (mm/10), denoted by rainfall; (2) minimum temperature in
tenth of Celsius degrees (°C/10) (denoted by mintemp). Figures 3-4 provide climate
patterns; in particular, they plot the deviation of observed rainfall and minimum
temperature from the monthly average during the whole period. The minimum
temperature jumps above the average from 1993 to 1996. The latest years of the
dataset are characterized by another wave of winter warmth, of about +0.9°C in
TMIN. As an illustration, the months of October and November in 1992 were much
rainier than the average of October and November since 1990 to 2003; the same
months in 1997 were much less rainy than their average. Summing up, figure 4
indicates a reduction of rainfall in the latest years.
Figure 3. Monthly deviation of minimum temperature in Indonesia,
1990-2003
Note: Deviations in °C/10. Own elaboration from NOAA-GHCN data
-20
-15
-10
-5
0
5
10
jan
19
90
jul1
99
0
jan
19
91
jul1
99
1
jan
19
92
jul1
99
2
jan
19
93
jul1
99
3
jan
19
94
jul1
99
4
jan
19
95
jul1
99
5
jan
19
96
jul1
99
6
jan
19
97
jul1
99
7
jan
19
98
jul1
99
8
jan
19
99
jul1
99
9
jan
20
00
jul2
00
0
jan
20
01
jul2
00
1
jan
20
02
jul2
00
2
jan
20
03
jul2
00
3
10
Figure 4. Monthly rainfall deviation in Indonesia, 1990-2003
Note: Deviations in mm/10 rainfall. Own elaboration from NOAA-GHCN Daily data.
4. The empirical specification
We test whether emergence and severity of violence are associated with an
indicator of food availability. As noted above, we use a IV model in which climate
variables are used as instrument in the first stage. In particular, we use deviations
in rainfall and minimum temperature as instruments. We estimate the following
structural equation, by means of a negative binomial model:
��������� = �� + �������������� + ���� + �� + � + �� (1)
where �������� = ����������, ���� ���! denotes alternatively the dependent
variables chosen, namely the count of violent incidents, or their severity.
Dependent variables are count. In the light of the over-dispersion (see table 2), we
rule out the Poisson model and use a Negative Binomial model. As noted above,
"���������� measures the actual production of rice per capita and � is a vector of
socioeconomic variables.
The choice of covariates depends on the established literature and data availability.
First we include the logged measure of population. A positive sign is expected to be
associated to the variable Population. We capture the overall economic scenario
through a measure of regional GDP. We also try to capture the degree of income
inequality, by means of the Share of poor population. Following Murshed and
-60
-40
-20
0
20
40
60
80
100
120
140ja
n1
99
0
jun
19
90
no
v1
99
0
ap
r19
91
sep
19
91
feb
19
92
jul1
99
2
de
c19
92
ma
y1
99
3
oct
19
93
ma
r19
94
ag
o1
99
4
jan
19
95
jun
19
95
no
v1
99
5
ap
r19
96
sep
19
96
feb
19
97
jul1
99
7
de
c19
97
ma
y1
99
8
oct
19
98
no
v1
99
9
oct
20
02
ma
r20
03
ag
o2
00
3
11
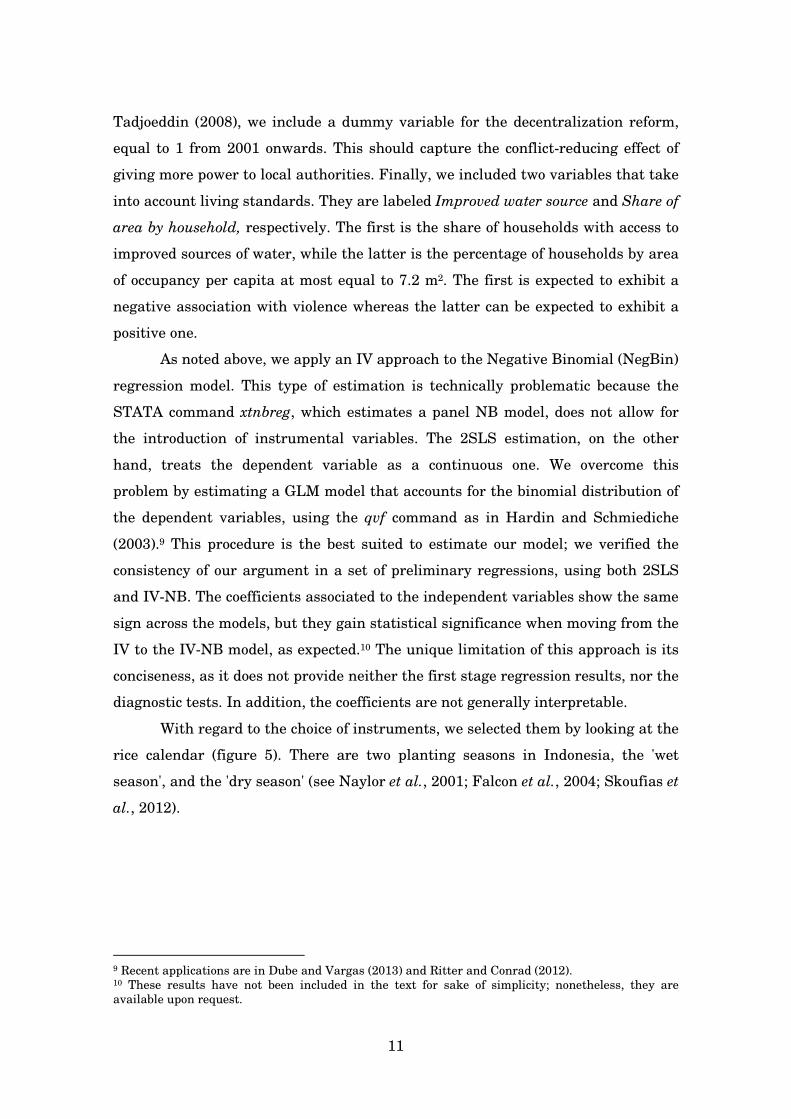
Tadjoeddin (2008), we include a dummy variable for the decentralization reform,
equal to 1 from 2001 onwards. This should capture the conflict-reducing effect of
giving more power to local authorities. Finally, we included two variables that take
into account living standards. They are labeled Improved water source and Share of
area by household, respectively. The first is the share of households with access to
improved sources of water, while the latter is the percentage of households by area
of occupancy per capita at most equal to 7.2 m2. The first is expected to exhibit a
negative association with violence whereas the latter can be expected to exhibit a
positive one.
As noted above, we apply an IV approach to the Negative Binomial (NegBin)
regression model. This type of estimation is technically problematic because the
STATA command xtnbreg, which estimates a panel NB model, does not allow for
the introduction of instrumental variables. The 2SLS estimation, on the other
hand, treats the dependent variable as a continuous one. We overcome this
problem by estimating a GLM model that accounts for the binomial distribution of
the dependent variables, using the qvf command as in Hardin and Schmiediche
(2003).9 This procedure is the best suited to estimate our model; we verified the
consistency of our argument in a set of preliminary regressions, using both 2SLS
and IV-NB. The coefficients associated to the independent variables show the same
sign across the models, but they gain statistical significance when moving from the
IV to the IV-NB model, as expected.10 The unique limitation of this approach is its
conciseness, as it does not provide neither the first stage regression results, nor the
diagnostic tests. In addition, the coefficients are not generally interpretable.
With regard to the choice of instruments, we selected them by looking at the
rice calendar (figure 5). There are two planting seasons in Indonesia, the 'wet
season', and the 'dry season' (see Naylor et al., 2001; Falcon et al., 2004; Skoufias et
al., 2012).
9 Recent applications are in Dube and Vargas (2013) and Ritter and Conrad (2012). 10 These results have not been included in the text for sake of simplicity; nonetheless, they are
available upon request.
12
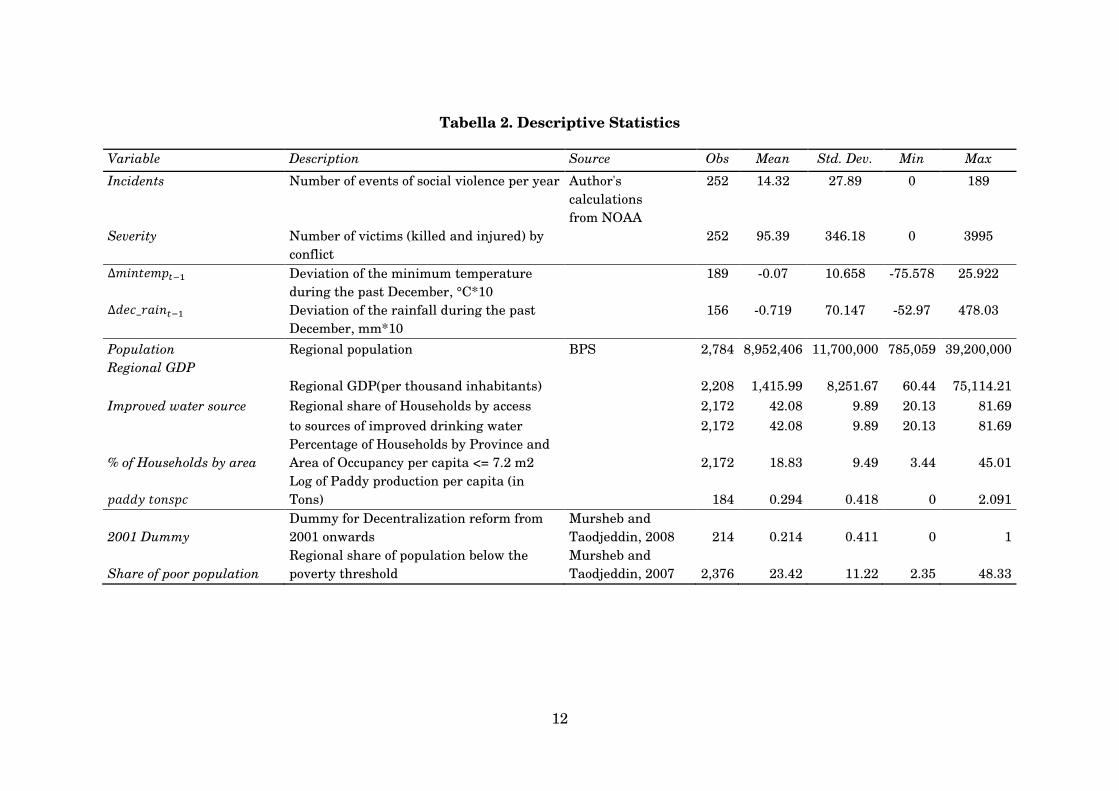
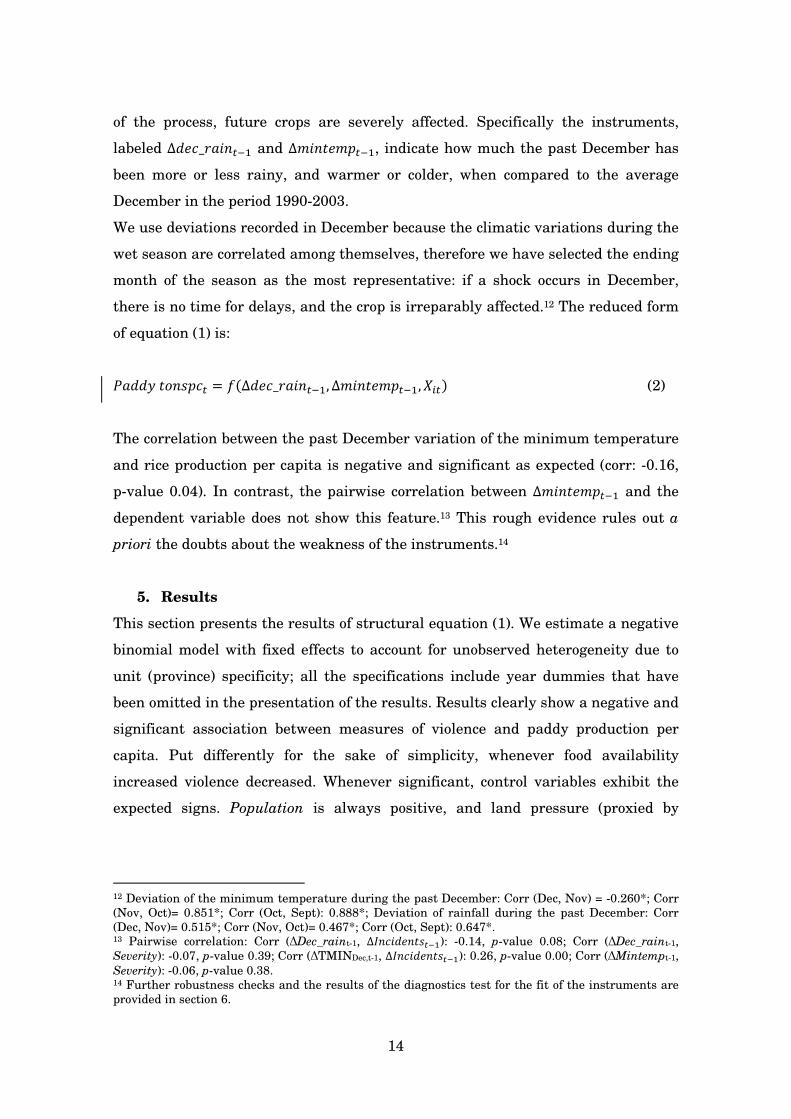
Tabella 2. Descriptive Statistics
Variable Description Source Obs Mean Std. Dev. Min Max
Incidents Number of events of social violence per year Author's
calculations
from NOAA
252 14.32 27.89 0 189
Severity Number of victims (killed and injured) by
conflict
252 95.39 346.18 0 3995
∆$����$�%� Deviation of the minimum temperature
during the past December, °C*10
189 -0.07 10.658 -75.578 25.922
∆���_ ���%� Deviation of the rainfall during the past
December, mm*10
156 -0.719 70.147 -52.97 478.03
Population Regional population BPS 2,784 8,952,406 11,700,000 785,059 39,200,000
Regional GDP
Regional GDP(per thousand inhabitants) 2,208 1,415.99 8,251.67 60.44 75,114.21
Improved water source Regional share of Households by access 2,172 42.08 9.89 20.13 81.69
to sources of improved drinking water 2,172 42.08 9.89 20.13 81.69
% of Households by area
Percentage of Households by Province and
Area of Occupancy per capita <= 7.2 m2 2,172 18.83 9.49 3.44 45.01
�����������
Log of Paddy production per capita (in
Tons) 184 0.294 0.418 0 2.091
2001 Dummy
Dummy for Decentralization reform from
2001 onwards
Mursheb and
Taodjeddin, 2008 214 0.214 0.411 0 1
Share of poor population
Regional share of population below the
poverty threshold
Mursheb and
Taodjeddin, 2007 2,376 23.42 11.22 2.35 48.33
13
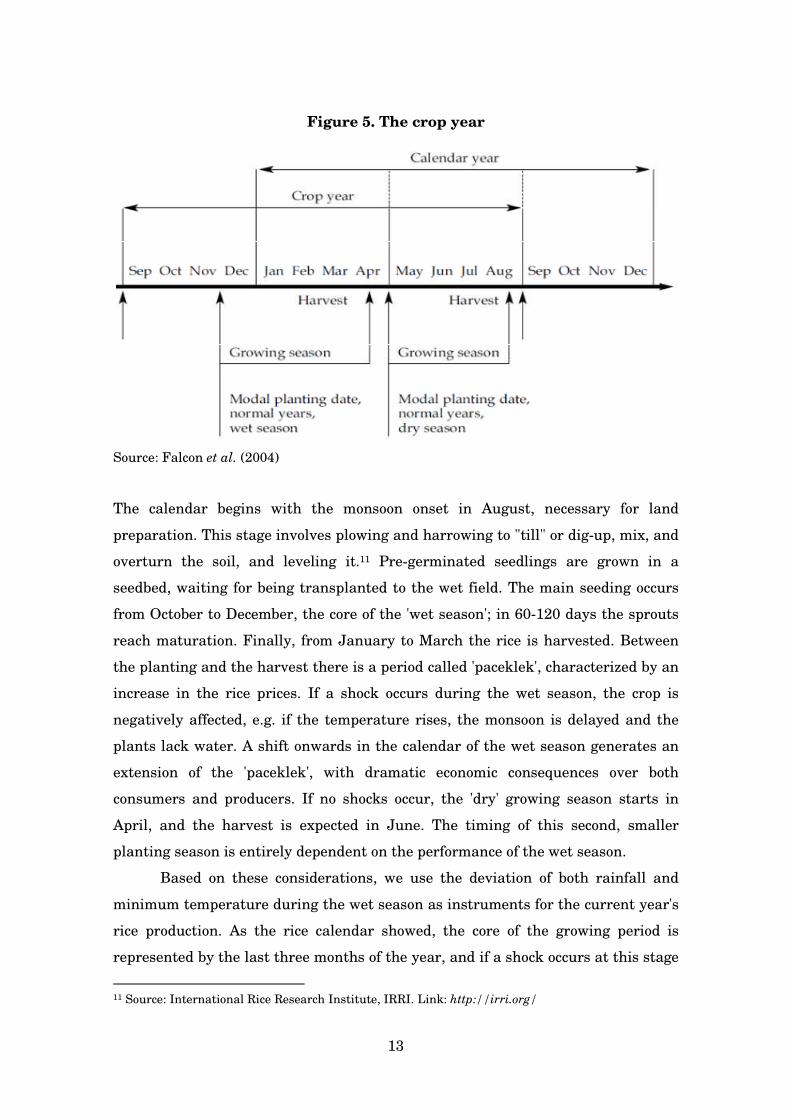
Figure 5. The crop year
Source: Falcon et al. (2004)
The calendar begins with the monsoon onset in August, necessary for land
preparation. This stage involves plowing and harrowing to "till" or dig-up, mix, and
overturn the soil, and leveling it.11 Pre-germinated seedlings are grown in a
seedbed, waiting for being transplanted to the wet field. The main seeding occurs
from October to December, the core of the 'wet season'; in 60-120 days the sprouts
reach maturation. Finally, from January to March the rice is harvested. Between
the planting and the harvest there is a period called 'paceklek', characterized by an
increase in the rice prices. If a shock occurs during the wet season, the crop is
negatively affected, e.g. if the temperature rises, the monsoon is delayed and the
plants lack water. A shift onwards in the calendar of the wet season generates an
extension of the 'paceklek', with dramatic economic consequences over both
consumers and producers. If no shocks occur, the 'dry' growing season starts in
April, and the harvest is expected in June. The timing of this second, smaller
planting season is entirely dependent on the performance of the wet season.
Based on these considerations, we use the deviation of both rainfall and
minimum temperature during the wet season as instruments for the current year's
rice production. As the rice calendar showed, the core of the growing period is
represented by the last three months of the year, and if a shock occurs at this stage
11 Source: International Rice Research Institute, IRRI. Link: http://irri.org/
14
of the process, future crops are severely affected. Specifically the instruments,
labeled ∆���_ ���%� and ∆$����$�%�, indicate how much the past December has
been more or less rainy, and warmer or colder, when compared to the average
December in the period 1990-2003.
We use deviations recorded in December because the climatic variations during the
wet season are correlated among themselves, therefore we have selected the ending
month of the season as the most representative: if a shock occurs in December,
there is no time for delays, and the crop is irreparably affected.12 The reduced form
of equation (1) is:
"���������� = '�∆���_ ���%�, ∆$����$�%�, ��! (2)
The correlation between the past December variation of the minimum temperature
and rice production per capita is negative and significant as expected (corr: -0.16,
p-value 0.04). In contrast, the pairwise correlation between ∆$����$�%� and the
dependent variable does not show this feature.13 This rough evidence rules out a
priori the doubts about the weakness of the instruments.14
5. Results
This section presents the results of structural equation (1). We estimate a negative
binomial model with fixed effects to account for unobserved heterogeneity due to
unit (province) specificity; all the specifications include year dummies that have
been omitted in the presentation of the results. Results clearly show a negative and
significant association between measures of violence and paddy production per
capita. Put differently for the sake of simplicity, whenever food availability
increased violence decreased. Whenever significant, control variables exhibit the
expected signs. Population is always positive, and land pressure (proxied by
12 Deviation of the minimum temperature during the past December: Corr (Dec, Nov) = -0.260*; Corr
(Nov, Oct)= 0.851*; Corr (Oct, Sept): 0.888*; Deviation of rainfall during the past December: Corr
(Dec, Nov)= 0.515*; Corr (Nov, Oct)= 0.467*; Corr (Oct, Sept): 0.647*. 13 Pairwise correlation: Corr (∆Dec_raint-1, ∆���������%�): -0.14, p-value 0.08; Corr (∆Dec_raint-1,
Severity): -0.07, p-value 0.39; Corr (∆TMINDec,t-1, ∆���������%�): 0.26, p-value 0.00; Corr (∆Mintempt-1,
Severity): -0.06, p-value 0.38. 14 Further robustness checks and the results of the diagnostics test for the fit of the instruments are
provided in section 6.
15
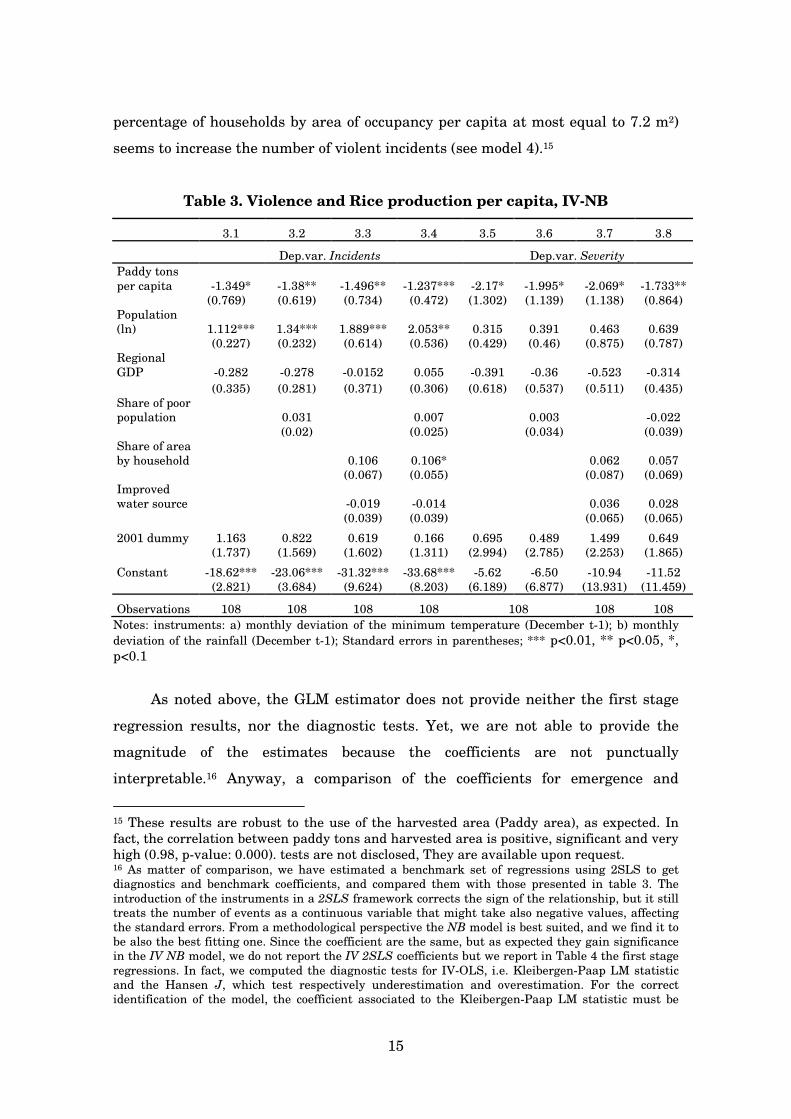
percentage of households by area of occupancy per capita at most equal to 7.2 m2)
seems to increase the number of violent incidents (see model 4).15
Table 3. Violence and Rice production per capita, IV-NB
3.1 3.2 3.3 3.4 3.5 3.6 3.7 3.8
Dep.var. Incidents Dep.var. Severity
Paddy tons
per capita -1.349* -1.38** -1.496** -1.237*** -2.17* -1.995* -2.069* -1.733**
(0.769) (0.619) (0.734) (0.472) (1.302) (1.139) (1.138) (0.864)
Population
(ln) 1.112*** 1.34*** 1.889*** 2.053** 0.315 0.391 0.463 0.639
(0.227) (0.232) (0.614) (0.536) (0.429) (0.46) (0.875) (0.787)
Regional
GDP -0.282 -0.278 -0.0152 0.055 -0.391 -0.36 -0.523 -0.314
(0.335) (0.281) (0.371) (0.306) (0.618) (0.537) (0.511) (0.435)
Share of poor
population 0.031 0.007 0.003 -0.022
(0.02) (0.025) (0.034) (0.039)
Share of area
by household 0.106 0.106* 0.062 0.057
(0.067) (0.055) (0.087) (0.069)
Improved
water source -0.019 -0.014 0.036 0.028
(0.039) (0.039) (0.065) (0.065)
2001 dummy 1.163 0.822 0.619 0.166 0.695 0.489 1.499 0.649
(1.737) (1.569) (1.602) (1.311) (2.994) (2.785) (2.253) (1.865)
Constant -18.62*** -23.06*** -31.32*** -33.68*** -5.62 -6.50 -10.94 -11.52
(2.821) (3.684) (9.624) (8.203) (6.189) (6.877) (13.931) (11.459)
Observations 108 108 108 108 108 108 108
Notes: instruments: a) monthly deviation of the minimum temperature (December t-1); b) monthly
deviation of the rainfall (December t-1); Standard errors in parentheses; *** p<0.01, ** p<0.05, *,
p<0.1
As noted above, the GLM estimator does not provide neither the first stage
regression results, nor the diagnostic tests. Yet, we are not able to provide the
magnitude of the estimates because the coefficients are not punctually
interpretable.16 Anyway, a comparison of the coefficients for emergence and
15 These results are robust to the use of the harvested area (Paddy area), as expected. In
fact, the correlation between paddy tons and harvested area is positive, significant and very
high (0.98, p-value: 0.000). tests are not disclosed, They are available upon request. 16 As matter of comparison, we have estimated a benchmark set of regressions using 2SLS to get
diagnostics and benchmark coefficients, and compared them with those presented in table 3. The
introduction of the instruments in a 2SLS framework corrects the sign of the relationship, but it still
treats the number of events as a continuous variable that might take also negative values, affecting
the standard errors. From a methodological perspective the NB model is best suited, and we find it to
be also the best fitting one. Since the coefficient are the same, but as expected they gain significance
in the IV NB model, we do not report the IV 2SLS coefficients but we report in Table 4 the first stage
regressions. In fact, we computed the diagnostic tests for IV-OLS, i.e. Kleibergen-Paap LM statistic
and the Hansen J, which test respectively underestimation and overestimation. For the correct
identification of the model, the coefficient associated to the Kleibergen-Paap LM statistic must be
16
severity of violence suggests that superior food availability explains more
effectively a decrease in severity of violence. Stated differently, the current number
of monthly victims (defined as the sum of injured and killed people) decreases with
respect to the value of the paddy production per capita. This sheds light on the
causal mechanism between climate variables and violence in Indonesia. If
minimum temperature in the previous December increases, paddy rice per capita
decreases. This implies lower food availability so inflaming violence.
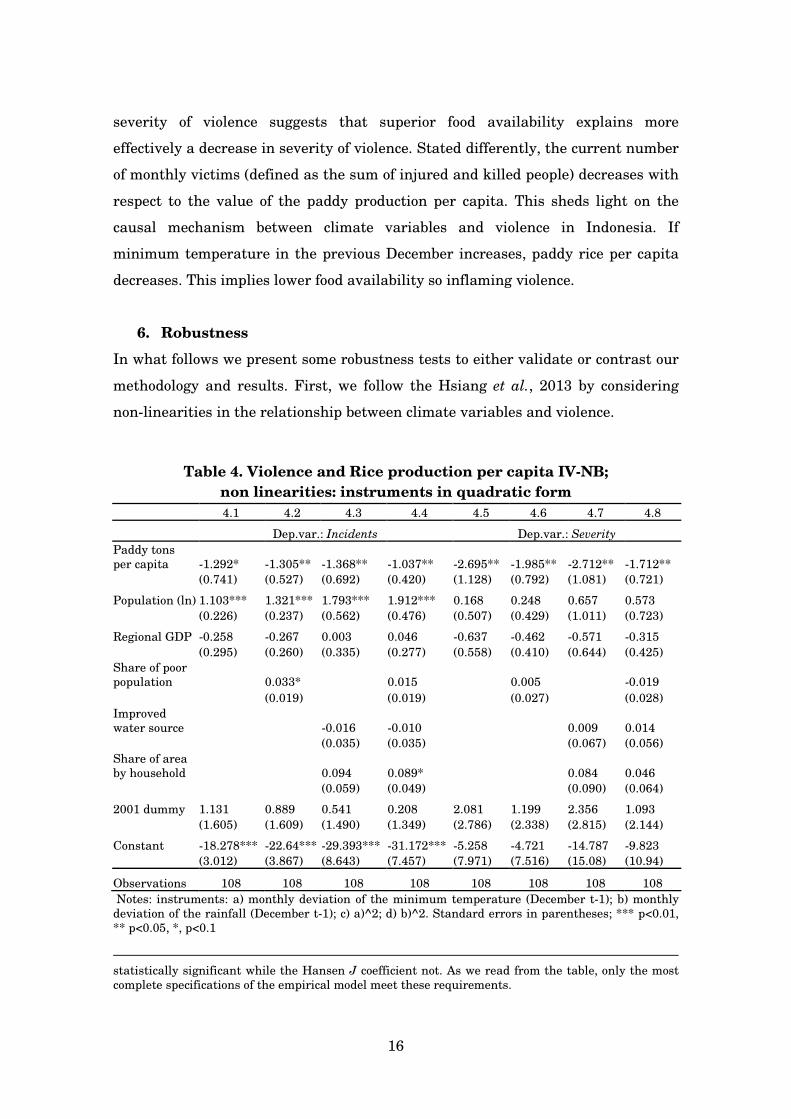
6. Robustness
In what follows we present some robustness tests to either validate or contrast our
methodology and results. First, we follow the Hsiang et al., 2013 by considering
non-linearities in the relationship between climate variables and violence.
Table 4. Violence and Rice production per capita IV-NB;
non linearities: instruments in quadratic form
4.1 4.2 4.3 4.4 4.5 4.6 4.7 4.8
Dep.var.: Incidents Dep.var.: Severity
Paddy tons
per capita -1.292* -1.305** -1.368** -1.037** -2.695** -1.985** -2.712** -1.712**
(0.741) (0.527) (0.692) (0.420) (1.128) (0.792) (1.081) (0.721)
Population (ln) 1.103*** 1.321*** 1.793*** 1.912*** 0.168 0.248 0.657 0.573
(0.226) (0.237) (0.562) (0.476) (0.507) (0.429) (1.011) (0.723)
Regional GDP -0.258 -0.267 0.003 0.046 -0.637 -0.462 -0.571 -0.315
(0.295) (0.260) (0.335) (0.277) (0.558) (0.410) (0.644) (0.425)
Share of poor
population 0.033* 0.015 0.005 -0.019
(0.019) (0.019) (0.027) (0.028)
Improved
water source -0.016 -0.010 0.009 0.014
(0.035) (0.035) (0.067) (0.056)
Share of area
by household 0.094 0.089* 0.084 0.046
(0.059) (0.049) (0.090) (0.064)
2001 dummy 1.131 0.889 0.541 0.208 2.081 1.199 2.356 1.093
(1.605) (1.609) (1.490) (1.349) (2.786) (2.338) (2.815) (2.144)
Constant -18.278*** -22.64*** -29.393*** -31.172*** -5.258 -4.721 -14.787 -9.823
(3.012) (3.867) (8.643) (7.457) (7.971) (7.516) (15.08) (10.94)
Observations 108 108 108 108 108 108 108 108
Notes: instruments: a) monthly deviation of the minimum temperature (December t-1); b) monthly
deviation of the rainfall (December t-1); c) a)^2; d) b)^2. Standard errors in parentheses; *** p<0.01,
** p<0.05, *, p<0.1
statistically significant while the Hansen J coefficient not. As we read from the table, only the most
complete specifications of the empirical model meet these requirements.
17
We re-estimated equation (1) by including also the climatic variables in
quadratic form within the instrument set. Results of the baseline estimation are
confirmed. In addition, coefficients seem to gain significance. In particular, as
noted in table 3, among dependent variables severity of violence appears to be more
sensitive to non-linearities.
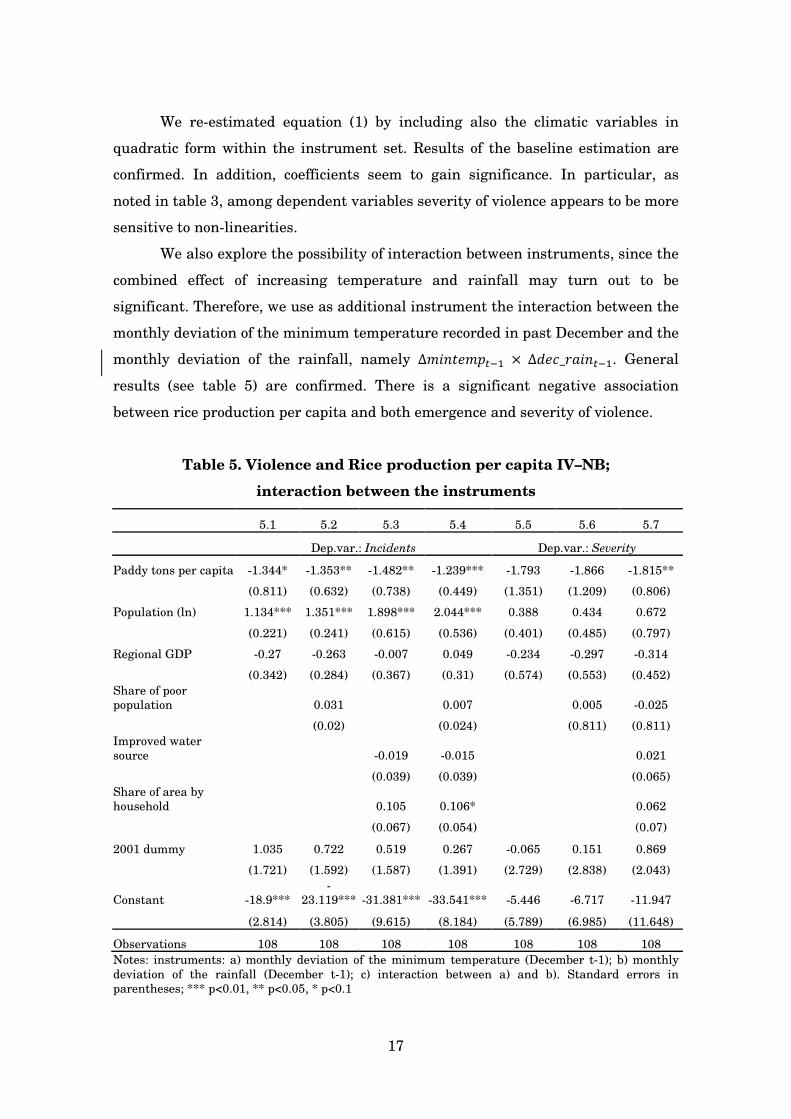
We also explore the possibility of interaction between instruments, since the
combined effect of increasing temperature and rainfall may turn out to be
significant. Therefore, we use as additional instrument the interaction between the
monthly deviation of the minimum temperature recorded in past December and the
monthly deviation of the rainfall, namely ∆$����$�%� ×∆���_ ���%�. General
results (see table 5) are confirmed. There is a significant negative association
between rice production per capita and both emergence and severity of violence.
Table 5. Violence and Rice production per capita IV–NB;
interaction between the instruments
5.1 5.2 5.3 5.4 5.5 5.6 5.7
Dep.var.: Incidents Dep.var.: Severity
Paddy tons per capita -1.344* -1.353** -1.482** -1.239*** -1.793 -1.866 -1.815**
(0.811) (0.632) (0.738) (0.449) (1.351) (1.209) (0.806)
Population (ln) 1.134*** 1.351*** 1.898*** 2.044*** 0.388 0.434 0.672
(0.221) (0.241) (0.615) (0.536) (0.401) (0.485) (0.797)
Regional GDP -0.27 -0.263 -0.007 0.049 -0.234 -0.297 -0.314
(0.342) (0.284) (0.367) (0.31) (0.574) (0.553) (0.452)
Share of poor
population 0.031 0.007 0.005 -0.025
(0.02) (0.024) (0.811) (0.811)
Improved water
source -0.019 -0.015 0.021
(0.039) (0.039) (0.065)
Share of area by
household 0.105 0.106* 0.062
(0.067) (0.054) (0.07)
2001 dummy 1.035 0.722 0.519 0.267 -0.065 0.151 0.869
(1.721) (1.592) (1.587) (1.391) (2.729) (2.838) (2.043)
Constant -18.9***
-
23.119*** -31.381*** -33.541*** -5.446 -6.717 -11.947
(2.814) (3.805) (9.615) (8.184) (5.789) (6.985) (11.648)
Observations 108 108 108 108 108 108 108
Notes: instruments: a) monthly deviation of the minimum temperature (December t-1); b) monthly
deviation of the rainfall (December t-1); c) interaction between a) and b). Standard errors in
parentheses; *** p<0.01, ** p<0.05, * p<0.1

18
Models (1-4) employing the emergence of violence as dependent variable do
perform better than models (5-8) in which the dependent variable is the severity of
violence. Interestingly, in model 4 the share of poor population turns to be
significantly and positively associated to the emergence of violence.
7. Concluding remarks
This paper contributes to the growing literature on the nexus between climate
variables and violence by focusing on Indonesia for the period 1990-2003. We
explored how variations in minimum temperature - as suggested by natural science
literature – affects rice crops. Paddy rice is the main crop of Indonesia and
therefore its scarcity can be blamed for fuelling violence. We adopted an IV
approach to uncover the impact of variations in minimum temperature on
emergence of actual violence through the effect on food availability, captured by
rice crops per capita. Results show that an increase of the minimum temperature
during the core month of the ‘wet planting season’, (i.e. past December), determines
an increase in violence fuelled by the reduction in future rice production per capita.
Put differently, there is a significant negative association between food availability
and violence. Results are robust to some robustness checks.
Needless to say, the works also suffers from some limitations and caveats.
First, the number of observations and the lack of data. Matching the UNSFIR data
with NOAA climatic data provides a small number of observations (slightly larger
than one hundred). Moreover, the choice of covariates also suffers from lack of data
at province level. The main result we would claim for this work is methodological.
Under the assumption that climate change affects emergence of violence through
the agricultural production, we have chosen to focus on specific characteristics of a
dominant crop in a specific country, namely paddy rice in Indonesia. From natural
science literature we have drawn that crucial to rice growing is the minimum
temperature in a limited period of time (wet planting season, December). We
modelled our estimation framework upon such evidence. We believe that the robust
evidence descends from such punctuality in taking into account the agricultural
specificities of paddy rice. Stated broadly, our work cautiously suggests that some
inconclusive results in literature on the climate change/violence nexus could suffer
from not considering specificities of different crops. Further research seems
necessary to overcome these weaknesses and to provide a more effective picture.
19
References
Amien, I., Rejekiningrum, P., Pramudia, A., and Susanti, E. (1996). Effects of
interannual climate variability and climate change on rice yield in Java,
Indonesia. Water, Air, and Soil Pollution, 92(1-2), 29-39.
Auffhammer, M., S.M. Hsiang, W. Schlenker, A.H. Sobel (2013). Using Weather
Data and Climate Model Output in Economic Analyses of Climate
Change. Review of Environmental Economics and Policy, 7(2), 1-18.
Bernauer T., Bohemelt T., Koubi V. (2012), Environmental changes and violent
conflict, Enviromental Research Letters, vol. 7
Bordey, F. H., Launio, C. C., Quilang, E. J. P., Tolentino, C. M. A., & Ogena, N. B.
(2013). Linking climate change, rice yield, and migration: the Philippine
experience. WorldFish (ICLARM) - Economy and Environment Program for
Southeast Asia (EEPSEA), Philippines.
Buhaug, H. (2010). Climate not to blame for African civil wars. Proceedings of the
National Academy of Sciences, 107(38), 16477-16482.
Buhaug, H., Gleditsch, N. P., and Theisen, O. M. (2013). Is climate change a driver
of armed conflict? Climatic Change, 1-13.
Burke, M. B., Miguel, E., Satyanath, S., Dykema, J. A., and Lobell, D. B. (2009).
Warming increases the risk of civil war in Africa. Proceedings of the National
Academy of Sciences, 106(49), 20670-20674.
Ciccone A., (2011), Economic Shocks and Civil Conflict: A Comment, American
Economic Journal: Applied Economics, vol.3, n.1, pp. 215-227
Deng, X., Huang J., Qiao F., Naylor R.L., Falcon W.P., Burke M., Rozelle S.,
Battisti D. (2010). Impacts of El Nino-Southern Oscillation events on China’s
rice production, Journal of Geographical Science, 20(1): 3-16.
Dore, J. (1959). Response of Rice to Small Differences in Length of Day, Nature
183, 413-414.
Dube O., Vargas J., (2013), Commodity Price Shocks and Civil Conflict: Evidence
from Colombia, The Review of Economic Studies, vol. 80, n.4, pp.1384-1421.
Falcon, W. P., Naylor, R. L., Smith, W. L., Burke, M. B., & McCullough, E. B.
(2004). Using climate models to improve Indonesian food security. Bulletin of
Indonesian Economic Studies, 40(3), 355-377.
20
Fjelde, H., and von Uexkull, N. (2012). Climate triggers: Rainfall anomalies,
vulnerability and communal conflict in sub-Saharan Africa. Political
Geography.
Gleditsch, N. P. (2012). Whither the weather? Climate change and conflict. Journal
of Peace Research, 49(1), 3-9.
Grant, R. F., Kimball, B. A., Conley, M. M., White, J. W.,Wall, G. W., Ottman, M. J.
(2011). Controlled Warming Effects on Wheat Growth and Yield: Field
Measurements and Modeling, Agronomy Journal 103: 1742–1754.
Hardin J.W., Schmiediche H., (2003), Instrumental variables, bootstrapping and
generalized linear models, The Stata Journal, vol. 3, n.4, pp. 351-360.
Hendrix C.S., and Salehyan I. (2012). Climate change, rainfall, and social conflict
in Africa, Journal of Peace Research 49: 35.
Hsiang, S.M., Burke, M., & Miguel, E., (2013). Quantifying the influence of climate
on human conflict. Science 341, 1235367.
Huang M., Zhang W., Jiang L., Zou Y. (2013). Impact of temperature changes on
early-rice productivity in a subtropical environment of China, Field Crops
Research, No. 146:10–15.
Keil, A., Zeller, M., Wida, A., Sanim, B., & Birner, R. (2008). What determines
farmers’ resilience towards ENSO-related drought? An empirical assessment
in Central Sulawesi, Indonesia. Climatic Change, 86(3-4), 291-307.
Koubi, V., Spilker, G., Böhmelt, T., & Bernauer, T. (2013). Do natural resources
matter for interstate and intrastate armed conflict? Journal of Peace
Research, August, 1-17.
Lal, M. (2011). Implications of climate change in sustained agricultural
productivity in South Asia. Regional Environmental Change, 11(1), 79-94.
Lobell, D. B., & Field, C. B. (2007). Global scale climate–crop yield relationships
and the impacts of recent warming. Environmental Research Letters, 2(1),
014002.
Lobell, D. B., Schlenker, W., and Costa-Roberts, J. (2011). Climate trends and
global crop production since 1980. Science, 333(6042), 616-620.
McCulloch, N. (2008). Rice prices and poverty in Indonesia. Bulletin of Indonesian
Economic Studies, 44(1), 45-64.
21
Miguel, E., Satyanath, S., & Sergenti, E. (2004). Economic shocks and civil conflict:
An instrumental variables approach. Journal of political Economy, 112(4),
725-753.
Miguel E., Satyanath S., (2011), Re-examining Economic Shocks and Civil Conflict,
American Economic Journal: Applied Economics, 3, 228-232.
Murshed M., Tadjoeddin M.Z. (2007), Socio-Economic Determinants of Everyday
Violence in Indonesia: An Empirical Investigation of Javanese Districts, 1994
--2003'', Journal of Peace Research 44: 689.
Murshed, M. and Tadjoeddin., Z. (2008), Is Fiscal Decentralization Conflict
Abating? Routine Violence and District Level Government in Java, Indonesia,
MICROCON Research Working Paper No. 7, Brighton: MICROCON.
Naylor, R. L., Battisti, D. S., Vimont, D. J., Falcon, W. P., and Burke, M. B. (2007).
Assessing risks of climate variability and climate change for Indonesian rice
agriculture. Proceedings of the National Academy of Sciences, 104(19), 7752-
7757.
Naylor, R. L., Falcon W. P., Rochberg D. and Wada N. (2001). Using El
Nino/Southern Oscillation climate data to predict rice production in
Indonesia, Climatic Change 50: 255–265.
Nicholls, N. (1997). Increased Australian wheat yield due to recent climate trends.
Nature, 38 7(6632), 484-485.
Peng, S., Huang, J., Sheehy, J. E., Laza, R. C., Visperas, R. M., Zhong, X., Centeno
G.S., Khush G.S. and Cassman, K. G. (2004). Rice yields decline with higher
night temperature from global warming. Proceedings of the National
Academy of Sciences of the United States of America, 101(27), 9971-9975.
Raleigh C.; L. Jordan; and I. Salehyan. (2008). Assessing the impact of climate
change on migration and conflict. The Social Development Department. The
World Bank Group, Washington, DC.
Raleigh, C., & Urdal, H. (2013). Climate change demography environmental
degradation and armed conflict. Environmental Change and Security
Program Report, 13, 27-33.
Ritter, E., & Conrad, C. (2012). Let the Rain Settle It: Estimating the Effect of
Dissent on Repression. In APSA 2012 Annual Meeting Paper.
22
Roberts, M.G., Dawe D., Falcon W.P. and Naylor R.L. (2008). El Nino–Southern
Oscillation Impacts on Rice Production in Luzon, the Philippines, Journal of
Applied Meteorology and Climatology, 48:1718-1724.
Scheffran, J., Brzoska, M., Kominek, J., Link, P., & Schilling, J. (2012). Climate
change and violent conflict. Science(Washington), 336(6083), 869-871.
Semenov, M. A. (2009). Impacts of climate change on wheat in England and Wales.
Journal of the Royal Society Interface, 6(33), 343-350.
Sinha, S. K., and Swaminathan, M. S. (1991). Deforestation, climate change and
sustainable nutrition security: A case study of India. Climatic Change, 19(1-
2), 201-209.
Skoufias, E., Katayama, R. S., & Essama-Nssah, B. (2012). Too little too late:
welfare impacts of rainfall shocks in rural Indonesia. Bulletin of Indonesian
Economic Studies, 48(3), 351-368.
Slettebak, R. T. (2012). Don’t blame the weather! Climate-related natural disasters
and civil conflict. Journal of Peace Research, 49(1), 163-176.
Tadjoeddin, M.Z. (2002). Anatomy of social violence in the context of transition: the
case of Indonesia, 1990-2001, Politics Administration and Change, 38:1-35.
Tadjoeddin, M.Z., Murshed S.M., (2007), Socio-Economic Determinants of Everyday
Violence in Indonesia: An Empirical Investigation of Javanese Districts,
1994—2003, Journal of Peace Research, vol.44, no. 6, pp.689-709.
Tao F., Yokozawa M., Liu J., and Zhang Z. (2008). Climate-crop yield relationships
at provincial scales in China and the impacts of recent climate trends,
Climate Research, 38(1), pp-83-94.
Tol, R. S., & Wagner, S. (2010). Climate change and violent conflict in Europe over
the last millennium. Climatic Change, 99(1-2), 65-79.
Varshney, A., Panggabean, R. and Tadjoeddin, M.Z. (2004). Patterns of Collective
Violence in Indonesia (1990-2003), UNSFIR Working Paper 04/03.
Welch, J. R., Vincent, J. R., Auffhammer, M., Moya, P. F., Dobermann, A., and
Dawe, D. (2010). Rice yields in tropical/subtropical Asia exhibit large but
opposing sensitivities to minimum and maximum temperatures. Proceedings
of the National Academy of Sciences, 107(33), 14562-14567.
Wheeler T.R., Craufurd P.Q., Ellis R.H., Porter J.R., and Prasad P.V.V. (2000).
Temperature variability and the yield of annual crops. Agric Ecosyst Environ
82(1-3):159–167.
23
World Bank Conflict and Development Program (2010). New patterns of violence in
Indonesia: preliminary evidence from six 'high-conflict' provinces,
http://reliefweb.int/report/indonesia/new-patterns-violence-indonesia-
preliminary-evidence-six-high-conflict-provinces.
You, L., Rosegrant, M. W., Wood, S., and Sun, D. (2009). Impact of growing season
temperature on wheat productivity in China. Agricultural and Forest
Meteorology, 149(6), 1009-1014.
Zhang, T., Zhu, J., and Wassmann, R. (2010). Responses of rice yields to recent
climate change in China: an empirical assessment based on long-term
observations at different spatial scales (1981–2005). Agricultural and Forest
Meteorology, 150(7), 1128-1137.