This paper argues that high political competition does … · ... they will substitute salienttaxes...
44
econstor www.econstor.eu Der Open-Access-Publikationsserver der ZBW – Leibniz-Informationszentrum Wirtschaft The Open Access Publication Server of the ZBW – Leibniz Information Centre for Economics Standard-Nutzungsbedingungen: Die Dokumente auf EconStor dürfen zu eigenen wissenschaftlichen Zwecken und zum Privatgebrauch gespeichert und kopiert werden. Sie dürfen die Dokumente nicht für öffentliche oder kommerzielle Zwecke vervielfältigen, öffentlich ausstellen, öffentlich zugänglich machen, vertreiben oder anderweitig nutzen. Sofern die Verfasser die Dokumente unter Open-Content-Lizenzen (insbesondere CC-Lizenzen) zur Verfügung gestellt haben sollten, gelten abweichend von diesen Nutzungsbedingungen die in der dort genannten Lizenz gewährten Nutzungsrechte. Terms of use: Documents in EconStor may be saved and copied for your personal and scholarly purposes. You are not to copy documents for public or commercial purposes, to exhibit the documents publicly, to make them publicly available on the internet, or to distribute or otherwise use the documents in public. If the documents have been made available under an Open Content Licence (especially Creative Commons Licences), you may exercise further usage rights as specified in the indicated licence. zbw Leibniz-Informationszentrum Wirtschaft Leibniz Information Centre for Economics Bracco, Emanuele; Porcelli, Francesco; Redoano, Michela Working Paper Political Competition, Tax Salience and Accountability: Theory and Some Evidence from Italy CESifo Working Paper: Public Finance, No. 4167 Provided in Cooperation with: Ifo Institute – Leibniz Institute for Economic Research at the University of Munich Suggested Citation: Bracco, Emanuele; Porcelli, Francesco; Redoano, Michela (2013) : Political Competition, Tax Salience and Accountability: Theory and Some Evidence from Italy, CESifo Working Paper: Public Finance, No. 4167 This Version is available at: http://hdl.handle.net/10419/71164
Transcript of This paper argues that high political competition does … · ... they will substitute salienttaxes...

econstor www.econstor.eu
Der Open-Access-Publikationsserver der ZBW – Leibniz-Informationszentrum WirtschaftThe Open Access Publication Server of the ZBW – Leibniz Information Centre for Economics
Standard-Nutzungsbedingungen:
Die Dokumente auf EconStor dürfen zu eigenen wissenschaftlichenZwecken und zum Privatgebrauch gespeichert und kopiert werden.
Sie dürfen die Dokumente nicht für öffentliche oder kommerzielleZwecke vervielfältigen, öffentlich ausstellen, öffentlich zugänglichmachen, vertreiben oder anderweitig nutzen.
Sofern die Verfasser die Dokumente unter Open-Content-Lizenzen(insbesondere CC-Lizenzen) zur Verfügung gestellt haben sollten,gelten abweichend von diesen Nutzungsbedingungen die in der dortgenannten Lizenz gewährten Nutzungsrechte.
Terms of use:
Documents in EconStor may be saved and copied for yourpersonal and scholarly purposes.
You are not to copy documents for public or commercialpurposes, to exhibit the documents publicly, to make thempublicly available on the internet, or to distribute or otherwiseuse the documents in public.
If the documents have been made available under an OpenContent Licence (especially Creative Commons Licences), youmay exercise further usage rights as specified in the indicatedlicence.
zbw Leibniz-Informationszentrum WirtschaftLeibniz Information Centre for Economics
Bracco, Emanuele; Porcelli, Francesco; Redoano, Michela
Working Paper
Political Competition, Tax Salience andAccountability: Theory and Some Evidence from Italy
CESifo Working Paper: Public Finance, No. 4167
Provided in Cooperation with:Ifo Institute – Leibniz Institute for Economic Research at the University ofMunich
Suggested Citation: Bracco, Emanuele; Porcelli, Francesco; Redoano, Michela (2013) : PoliticalCompetition, Tax Salience and Accountability: Theory and Some Evidence from Italy, CESifoWorking Paper: Public Finance, No. 4167
This Version is available at:http://hdl.handle.net/10419/71164

Political Competition, Tax Salience and Accountability: Theory and Some Evidence
from Italy
Emanuele Bracco Francesco Porcelli Michela Redoano
CESIFO WORKING PAPER NO. 4167 CATEGORY 1: PUBLIC FINANCE
MARCH 2013
An electronic version of the paper may be downloaded • from the SSRN website: www.SSRN.com • from the RePEc website: www.RePEc.org
• from the CESifo website: Twww.CESifo-group.org/wp T

CESifo Working Paper No. 4167
Political Competition, Tax Salience and Accountability: Theory and Some Evidence
from Italy
Abstract This paper argues that high political competition does not necessarily induce policy makers to perform better as previous research has shown. We develop a political economy model and we show that when political competition is tight, and elected politicians can rely on more tax instruments, they will substitute salient taxes with less salient ones, which are not necessarily preferable. These predictions are largely confirmed using a dataset on Italian municipal elections and taxes.
JEL-Code: H110, H200, H770, H870, D700, N120.
Keywords: political competition, government, accountability, tax salience.
Emanuele Bracco Department of Economics University of Lancaster /
Management School UK – Lancaster, LA1 4YW
United Kingdom [email protected]
Francesco Porcelli Department of Economics
University of Warwick UK – Coventry, CV4 7AL
United Kingdom [email protected]
Michela Redoano
Department of Economics University of Warwick
UK – Coventry, CV4 7AL United Kingdom
This version: February 2013 We would like to thank seminar participants at Warwick and Lancaster University, PEUK and SIEP 2012 Conferences and CES-IfoWorkshop on Political Economy (Dresden). Financial support from CAGE (Warwick) is gratefully acknowledged.

1. Introduction
One of the main arguments used in favour of delegating expenditures and taxation to
elected subnational governments is that elections are a powerful instrument to favour
citizens participation to local decisions and promote political accountability, works in this
area include Besley and Smart (2007), Faguet (2004), Hindriks and Lockwood (2009).
Moreover, this positive e¤ect of elections is thought to be stronger where opposing
parties face high competition to gain political consensus. There is a growing literature
both in economics and political sciences recognizing that political competition improves
governments’ e¢ciency and economic outcomes. See for example the studies by Stigler
(1972), and Wittman (1989, 1995) on the e¤ect of political competition on governments’
e¢ciency, the recent contribution by Besley, Persson and Sturm (2010) on political com-
petition and economic growth, and the papers by Galasso and Nannicini (2009), Gagliar-
ducci, Nannicini, and Naticchioni, (2008) and Merlo et al., (2008) on political competition
and candidate performances. The common denominator to all these studies is that when
parties (or candidates) face a strong political competition, voters are more able to hold
them accountable. This, in turn, reduces rent diversion and induces parties (and candi-
dates) to exert more e¤ort.
In this paper we suggest a possible alternative story: stronger political competition
does not necessarily make politicians more accountable to voters, but instead may induce
an opposite behaviour. We focus on a particular aspect which is common to most countries
and, we believe, plays an important role in shaping local public …nance: the fact that
governments usually rely on more than on type of tax to …nance their public expenditures,
and they have some discretionally on how to use them. It is a well-known and established
fact that some taxes are more salient than others. For example Chetty, Looney, and Kroft
(2009) show how voters are likely to underestimate their aggregate tax burdens from tax
instruments (like sale taxes or indirect taxes in general) that are paid in small amounts
over time, compared to tax instruments (like the property taxes, or income taxes) for
which taxpayers make lump-sum payments of their aggregate tax liabilities on an annual
basis.
Our conjecture is that when electoral competition is high, incumbent policy makers—
exploiting the fact that voters are not fully informed on the costs of public goods provision—
satisfy jurisdictions’ budget requirements by means of substituting the more salient taxes
with the less salient ones, with detrimental e¤ects on the transparency and accountability
of …scal policy. When, instead, electoral competition is low, since the incumbent does not
2

face a real threat to loose elections, she can decide the mix of taxes, irrespective of their
degree of salience.
To address this issue we develop a simple political economy model based on Dixit
and Londregan (1998) and Arulampalam et al. (2008) which veri…es and re…nes these
intuitions. The focus is on how the degree of political competition a¤ects politicians’
choice between the available …scal instruments. We model the behaviour of an incumbent
local policy maker (mayor) who is responsible for providing a local public good, and
has power to decide over its funding. Two di¤erent policy instruments are available: a
property tax , which is paid by everyone and has high degree of salience, and a composite
fee, , which is paid only by a fraction of voters for the provision of a service, and has lower
salience. When elections take place, voters base their voting decisions both on economic
grounds—i.e. looking retrospectively at the level of public good provision and taxation—
and on ideology. Moreover, voters hold the mayor fully accountable for property tax but
they are not perfectly able to hold her into account when they consider the other source
of …scal revenue, .
While it is well established that in Italy and elsewhere property taxes are the most
salient local taxes—see for example Cabral and Hoxby (2010)—and they are often object
of heated political debate and campaigning, other smaller taxes and fees are much less
visible to voters because they are collected several times during the …scal year, generally
their amount is relatively small and also it is not easy for voters to understand how
much leverage and freedom a mayor has in setting these fees. For example, McCa¤ery
and Baron (2006) use laboratory simulations of tax setting to show that test subjects
are willing to tolerate higher overall tax levels when the tax is imposed through many
smaller taxes, rather than through a single large tax, because of inability of correctly
remember the overall tax burden1. Along these lines Chetty, Looney, and Kroft (2009)
use variation across US states and over time and analyse the behavioural response of
alcohol consumption to variation in excise (included in price) and sales taxes (added to
price) and …nd that consumers respond more to the more salient (excise) and less to
less salient (sales) taxes. Finkelstein (2009) shows that the introduction of electronic toll
collections (ETC) on U.S. roads, tunnels, and bridges has two e¤ects: (i) it makes citizens
less likely to know amount of toll they pay and (ii) it is associated with an increase in
tolls; i.e. ETC increases the equilibrium toll rate by decreasing its salience.
1McCa¤ery and Baron dubbed this phenomenon the “disaggregation bias”; subjects appeared unable
to hold together in their minds the cumulative e¤ects of several small taxes.
3

Our model predicts that—in order to fund public good provision—parties rely rela-
tively more on the less-salient tax when electoral competition is high, reducing the trans-
parency of their …scal choices, and—with that—the e¤ectiveness of elections in e¢ciently
selecting voters’ preferred candidate.
When voters react more strongly to changes in their tax burden (i.e. when electoral
competition is more relevant) mayors have stronger incentives to hide their true …scal
burden from voters, in order to be re-elected; in the opposite case—when voters do not
react much to changes in public good provision or tax burden—, mayors are not subject
to such electoral pressure and are free to choose the tax mix to …nance the public good
minding less at its electoral e¤ect.
We then bring this prediction to the data, building a large dataset on Italian local
elections and taxes for the period 1999-2008. Italian municipalities derive their main
source of tax revenue from a property tax, denoted ICI. This tax, which accounts for about
33% of municipalities’ own …scal revenue, is characterised by a high degree of transparency:
citizens-property owners have to pay it every year directly to the municipality where
the estate is located (in one or two installments). Other salient sources of revenues
in Italian municipalities are related to waste disposal (TARSU) and to the taxation of
personal income,2 which account respectively for 16% and 13% of municipalities’ own
…scal revenues.
Additional revenue can be raised by Italian municipalities, more silently, through
means of much smaller fees, for example on the issue of parking permits and certi…cates,
or related to the occupation of public spaces and the use of public billboards etc., which
account for around 38% of municipalities’ …scal revenues. The main problem with these
small fees is that they are collected several times during the …nancial years, and they are
often linked to the provision of a speci…c service. For these reasons, it is very di¢cult
for voters—…rstly—to have a clear picture of their overall amount, and—secondly—to
impute them to the political choices of the mayors, rather than to the necessity (e.g) of
covering the costs for providing these services. Generally speaking, most of these fees are
calculated in a way that is unrelated to the true costs of providing particular services,
and often serve as an additional source of revenues to …nance the general spending needs
of the local government.
From the municipality point of view, as fees are often paid to access to some service,
2Municipalities can apply a surtax on the personal income tax rates, i.e. they can increase the tax
rate up 0.8%. This faculty is exercised by the vast majority of mayors.
4

their revenues are more likely to be elastic with respect to the fee itself. The property
tax instead3 is calculated applying a simple tax rate to the land-registry value of the
property. In short, taxes are more transparent, and their revenues are inelastic with
respect the tax rate. One may also argue that the property tax is simpler and cheaper in
terms of administrative burden for the municipality itself. It is well known in the current
policy debate that there are too many small taxes and fees in the Italian local tax system,
which create ine¢ciencies.4 It was already recognised by Buchanan (1967)5 that …scal
illusion (or low salience) is the product of complex tax systems where multiple smaller tax
instruments (as opposed to only a single comprehensive tax instrument) are employed.
The results of the empirical analysis broadly con…rm the predictions of the theory. In
particular we …nd that when the distance between the elected mayor and her opponent
shrinks by 1%, the per capita tax revenue from ICI —the main local tax in Italy—drops by
0.80 Euros but, at the same time, revenue raised from fees for general and other services,
in per-capita terms, increases respectively by 0.64 and 0.28 Euros. Consistently with our
hypothesis, we …nd that electoral cycles play an important role in shaping tax/fees setting
decisions and, in particular, that substitution between fees and taxes occurs mainly in
the years close to elections, when politicians need more to do so for being re-elected, i.e.
when political competition is high and elections are close. Moreover, we employ Regres-
sion Discontinuity Design to show that mayors supported by the two main Italian political
coalitions, namely centre-left and centre-right, exhibit a similar response to di¤erent de-
grees of political competition, reinforcing the hypothesis that tax setting behaviour is not
related to parties’ preferences or parties targeting special interest groups.
This is not the …rst attempt in the literature to analyse the e¤ect of government
…nancing on political accountability. However, as far as we know, this is the …rst attempt
to relate this to the degree of political competition. The related literature is as follows.
Milesi-Ferretti (2003) studies the e¤ect of …scal rules on economics outcomes, Alt and
3About 80% of Italians own the house they live in, and ICI property tax on the main dwelling (as
opposed to businesses, farmland, holiday or rented properties) is the main component of property tax
revenues, other than being the one on which electoral campaigns usually concentrate on.4There is an outgoing proposal to reform Italian local tax system and replace the current taxes and
fees with a single Service Tax, but despite the fact that the issue has been debated for years and its
introduction has been agreed in principle by the Italian parliament its implementation has not occurred
yet.5“... to the extent that the total tax load on an individual can be fragmented so that he confronts numer-
ous small levies rather than a few signi…cant ones, illusionary e¤ects may be created.”James Buchanan,
Public Finance in Democratic Process: Fiscal Institutions and Individual Choice 135 (1967)
5

Dreyer Lassen (2003) look at government’s choice between taxes or debt, Coate and Morris
(1995) investigates the hidden …nancing of interest groups, Bordignon and Minelli, (2001)
consider the trade o¤ between accountability and e¢ciency. Among all contributions the
paper more closely related to ours is Bordignon and Piazza (2010) which uses a dataset
on municipalities in the Piedmont Region in Italy to investigate the e¤ect on probability
of mayor’s re-elections after a tax reform introduced the possibility for majors to partially
substitute a more accountable source of tax revenue (the local property tax) with a less
transparent one (the local income tax). Using arguments similar to ours, their analysis
suggests that the availability of these two tax instruments gives incompetent mayors a
cheap way to hide themselves, allowing them to be more easily re-elected.
The paper is organised as follows. The next section introduces the economic environ-
ment and the model. Section 3 provides some background information on Italian local
electoral and tax systems as well as data description. Our empirical strategy and main
results are in section 4 and robustness checks are in section 5. Conclusions and discussions
are in the last section of the paper.
2. The Theoretical Framework
We develop a simple model of political competition based on Dixit and Londregan (1998),
Arulampalam et al. (2008), which focuses on the incentive that political parties face to
replace salient taxes with less salient ones when electoral competition is high.
2.1. The Economic Environment
A local incumbent mayor is responsible of providing a local public good, and has power
to decide over its funding. The public good has a price , normalised to 1 for simplicity
and without loss of generality. Voters receive utility from consuming the public good, but
are not aware of its price. Two di¤erent policy instruments are available to the mayor: a
property tax , which is paid by everyone and has high degree of salience, and a fee ,
which is paid only by a fraction of voters, and has lower salience. This fee can be thought
as aggregating in a simpli…ed way all the other non-tax sources of revenues available to
municipalities, such as planning permission fees, parking tickets, burial fees, fees for the
use of public billboards or public spaces, the price of issuing vital record certi…cates.
Unlike taxes, these fees are strictly speaking not compulsory, in the sense that they are
paid to have access to services which citizens may decide to purchase or not, and unlike
6

prices of private goods, the amount is generally not linked with the cost of providing these
goods or services, on which the municipality usually exerts full monopoly power.
As this large array of revenues hardly ever comes up in the public debate, it is often
di¢cult for voters to understand how much leverage and freedom a mayor has in setting
these fees, and how much are instead set by, for example, national laws. For example,
the cost of issuing an ID card or the cost of a parking ticket is the same all over Italy,
while planning permission, burial fees, and advertising prices are more freely set by each
municipality.
This has two main implications, which will be re‡ected in our modelling choice: …rstly,
the revenues coming from these fees, unlike property tax revenues, are a¤ected by the fee
itself; in other words, one cannot decide not to pay property tax,6 but one may decide
not to put an advertising poster, or postpone building an extension to one’s property if
the relevant fee is too expensive. Secondly, voters are not perfectly able to hold mayors
into account when they consider these particular sources of revenues, while the property
tax is often object of heated political debate and campaigning. As the great majority of
Italian households owns the house they live in, it seems reasonable to assume that voters
fully discount the e¤ect of this tax on them when voting for a given mayor. This implies,
in more general terms, that fees are less salient than taxes.
There is a continuum of voters of mass 1. Voters are homogeneous with respect to their
preferences over the public policy, but di¤er in their ideology embodied by two existing
parties, one supporting the incumbent mayor and the other against her. Ideologies are dis-
tributed according to a uniform distribution de…ned over the interval » [¡12+12].
Voters in the negative part of the ideology spectrum prefer the party of the incumbent
mayor over that of the challenger, and this preference is stronger the more distant is the
voter’s ideology from the origin 0. Following a long tradition (Dixit and Londregan (1998),
Arulampalam et al. (2008)), we interpret the exogenous parameter as the sensitivity of
the locality’s voting behaviour to changes in policy. In other words, a municipality with
a higher level of is considered electorally more competitive.
Citizens vote retrospectively conditioning their choice on the ideology of the candi-
dates and on the public policies implemented by the local governments. By public policy
we mean the positive e¤ect of public good provision, which is funded through taxes and
6One may, of course, sell its property, but the buyer would still have to pay the tax. Moreover, in
the Italian case, the tax base is the land-registry value, so that tax revenues are una¤ected by housing
market ‡uctuations.
7

fees. Every voter pays the property tax , while only a fraction 1 pays the fee .7
More speci…cally, as the municipality partially sells these fee-based services in a monop-
olistic regime, we assume that the number of people purchasing the fee-based services
is negatively related with the fee itself, and with disposable income in particular. More
precisely:
Assumption 1.
0
2
· 0 (1 + ) 0 0
These assumptions imply that both raising taxes and fees has a negative e¤ect on the
number of people “choosing” to pay the fee, and this e¤ect is stronger the higher the fee.
Moreover, it implies that increasing taxes has always a positive e¤ect on total revenues,
irrespective of the negative e¤ect it may have on the number of fee payers.
Voters who pay the fee attribute only a fraction 1 to the mayor’s will, for the
reasons spelled out in the previous paragraph.8
Voters’ utility is negatively a¤ected by local taxes and fees (adjusted for their salience),
as they reduce private consumption, and positively a¤ected by the consumption of a local
public good = + . Finally, we assume that voters can perfectly observe the amount
of provided but are not aware of the price of the public good .
More precisely, a voter’s is going to vote for the incumbent if:
()¡ ¡ ¡ ¸ 0 (2.1)
()¡ ¡ ¡ ¸ 0 (2.2)
according to whether he or she has to pay a fee (2.1) or not (2.2), and where is a strictly
concave and monotonically increasing function in .
Following Arulampalam et al. (2008) and Solé-Ollé and Sorribas-Navarro (2009), we
assume that mayors care simultaneously about the votes accruing to the parties they
belong to, and about the public good produced. This implies that incumbent mayors
share with voters the preference for public good, but are also o¢ce-motivated.
The utility of the incumbent mayor can be written as:
7We assume as well that paying the fees and ideology are uncorrelated.8One could also include in this parameter the fact that fee-payers are more likely to be non-residents.
8

= () + (2.3)
where is a strictly increasing and concave function, and is the share of votes accruing
to the incumbent mayor, and is strictly concave.
2.2. Theoretical Results
Let’s …rst of all calculate what is the expected amount of votes the incumbent mayor,
given the uncertainty on the realisation of the opinion shock and the amount of fees being
paid/collected.
Lemma 1. The share of votes the incumbent mayor expects to receive, given the tax
and fee level he or she sets, is:
=1
2+
with =1
2[(+ )¡ ¡ ]
As we can see, raising taxes or fees has an ambiguous e¤ect, as it simultaneously
raises public good provision and decreases disposable income. Secondly, increasing fees
(as opposed to taxes) has the advantage of impacting less on voters’ perception of their
disposable income, and the disadvantage of negatively a¤ecting the demand for fee-based
services.
We can then derive the incumbent mayor’s …rst-order conditions given his or her utility
(2.3)—where subscripts indicate partial derivatives:
: (1 + ) [
0() + (0()¡ ] + ( ¡ 1) = 0 (2.4)
: (+ ) [
0() + (0()¡ ] = 0 : (2.5)
Focusing on interior solutions, we can derive the following testable prediction:
Proposition 1. Mayors of jurisdictions with stronger electoral competition set lower
taxes and higher fees.
Proof in Appendix.
As we chose to keep the model as general as possible, we are not able to say what
would be the e¤ect of electoral competition on overall spending , as it is instead highly
dependent on the functional forms for parties’ and voters’ utilities.
9

3. Background Information and Data
In this section we present some relevant background information on the Italian local
electoral system and public …nance. In particular we describe the main characteristics of
the electoral system and the basic structure of local taxation.
3.1. Italian Institutional Framework
There are more than 8,000 municipalities (comuni) in Italy, 90% of which with a popula-
tion below 15,000. Comuni are ruled by a local government (giunta), headed by an elected
mayor (sindaco), who stays in power for …ve years9 and is subject to a two-term limit.
Mayors are in charge of appointing the other members of the giunta, whose competencies
are primarily in the areas of land management and environment (water, sewage, public
hygiene), local transport, local police, culture and recreation, education (nursery schools,
training programmes). They also have some discretionary powers on how to raise …scal
revenue to …nance local public expenditures, more on this in the next section.
In 1992, a major electoral reform took place in Italy; the main objective of the reform
was to increase political accountability at local level by introducing the direct election
of mayors under plurality rule. The reform established a single round election for small
municipalities (i.e. below 15,000 inhabitants), and a runo¤ system for large municipalities
(i.e. above the 15,000-inhabitant threshold). In particular, in small municipalities, each
party (or coalition of parties) presents a list of candidates for the council and supports one
mayoral candidate, voters then express one vote jointly for the mayor and the associated
council list. The mayoral candidate who gets the majority of votes is elected and the
associated city-council list is awarded 2/3 of all seats. In large municipalities, instead,
parties (or coalitions of parties) present lists of candidates for the council and support one
mayoral candidate. At the …rst round, voters express two votes, one for the mayor and
one for the council. A mayoral candidate is elected only if he or she obtains more than
50% of votes. If no mayoral candidate obtains an absolute majority of votes, in two weeks
time, the two top candidates run again in a second round, and the candidate who get the
most votes is elected mayor. As in the single-round plurality system, the city-council lists
associated with the winning candidate are awarded an absolute majority of seats in the
council.10
9Note that mayors elected before 2000 were subject to a 4-year term instead.10In the vast majority of cases the lists supporting the winning mayor are awarded 60% of the city-
council seats. This rule has two (rare) exceptions: …rstly, if the coalition of lists supporting the winning
10

The two-tier system of election according to the size of the population have generated
also di¤erent political incentives: in smaller municipalities, the incentives is for parties to
join together in a single list that supports a single mayoral candidate, while in larger mu-
nicipalities, the incentive is for parties to form explicit coalitions behind a single mayoral
candidate, and at the same time to each maintain its separate (albeit coalised) list for the
city council. This has also implied that in smaller municipalities the occurrence of ad-hoc
voters’ associations (lista civica) supporting a mayor is much more frequent than in larger
municipalities, where instead one usually …nds the national parties running under their
names. This of course does not imply that party politics is less lively in municipalities
just below the 15,000-inhabitant threshold. It does nevertheless make it very di¢cult to
code correctly a mayor as left- or right-wing, as the name of the list under which was
elected is more likely to disguise his or her partisan belonging. Therefore we construct
our sample considering only municipalities above the 15,000-inhabitant threshold.
Generally speaking, in our sample period the political system was dominated by two
large electoral cartels that alternated in governments in every tier. At the national level,
a right-wing coalition chaired by Silvio Berlusconi and his party Forza Italia ruled Italy
from 2001 to 2006. The left-wing coalition, going from Communist parties to left-wing
Christian Democrats, ruled from 1996 to 2001, and then again from 2006 until 2008.
The same coalitions generally run for local elections as such, supporting joint mayoral
candidates, such that the local and the national political debate appeared quite coherent
with each other. From o¢cial data on mayors published by the Interior Ministry we are
able to see each mayor’s political allegiance (i.e. under which party-label he or she ran
for elections); considering municipalities above the 15,000-inhabitant threshold a full list
of parties coded by political coalitions in provided in Table A1 in the Appendix where it
is possible to check that we have not been able to assign to the centre-left or centre-right
majority only a very small number of municipalities that we coded as "independents".
3.2. Local government …nancing
Municipalities’ revenues come from two main sources: transfers from upper levels of gov-
ernment (mainly central and regional governments) and own revenues (from own taxes
mayor gets less than 40% of votes and the mayor is elected at the …rst round; secondly, if instead a
second round occurs, and the lists supporting the losing mayoral candidate obtained more than 50% of
votes in the …rst round. In these two circumstances, city council seats are distributed according to a pure
proportional-representation rule. These occurrences are practically extremely rare.
11

and fees). 11
There are two types of own revenue recorded in Italian municipalities’ Final Budget
Accounts: (i) revenue from taxes and (ii) revenue from fees. The main and, often subtle,
formal di¤erence between them is that while both are a charge paid to the government
by individuals or by a business, a tax is levied as a part of the common burden while a
fee is speci…cally applied for the use of a service and unlike taxes, it should be directly
linked to the cost of providing the service.
The main source of tax revenue for Italian municipalities is a property tax, called ICI,
introduced in 1992 and applied to real estate. This tax, which accounts for about 33% of
municipalities’ own revenue, is characterised by a high degree of transparency: property
owners have to pay it every year directly to the municipality where the estate is located
(in one or two installments). The tax base is represented by the cadastral income and
mayors are free to set the tax rate within a given boundary (0.4 and 0.7% of cadastral
income) and also have the power to lower the tax burden of resident-home-owners by
imposing a discounted tax rate for residents. Another important source of tax revenue in
Italian municipalities come from the waste disposal tax (TARSU), which is, similarly to
ICI, calculated on land registry values, and for which municipalities enjoy total freedom in
tax rate setting. Finally other minor sources of tax revenues are the taxation of personal
income, through the national income-tax surcharge and electricity surcharge.
Additional own revenues can be raised by Italian municipalities, through means of a
number of much smaller fees: (i) on the issue of parking permits and certi…cates, (ii) re-
lated to the occupation of public spaces and areas, (iii) on the use of public billboards etc.,
which account for around 38% of municipalities’ own revenue. The common denominators
of these fees is that they are comparatively small, they are generally paid several times
during the year and, as mentioned earlier, they are linked to the provision of a service by
the local authority.12 For all these reasons, it is very di¢cult for voters to have a clear
picture of their overall amount. As fees are paid in exchange of a speci…c service, it may
be more di¢cult for voters to impute them to the political choices of the mayors, rather
11The use of debt instrument is strongly restricted by the so-called "Internal Stability and Growth
Pact", through which the central government limits the possibility of local authorities to incur in debts,
in order to comply with the EU constraints on de…cit and debt moreover the Art.119 of the Italian
Constitution states that local governments can use debt …nancing only to cover capital expenditures.
Therefore, as our analysis is focused on current expenditures, we abstract from considering the debt as
an active source of …nancing.12In the Appendix (Table A2) a full list of fees is provided.
12

than to the necessity (e.g) of covering the costs for providing these services. Generally
speaking, most of these fees are indeed calculated in a way that is unrelated to the true
costs of providing particular services, and often serve as an additional source of revenues
to …nance the general spending needs of the local government.
The subdivision of municipal taxes and fees according to their level of salience is
provided in more details in the next section.
3.3. Data Description and Variables’ De…nition
Our dataset includes municipal …nancial data, census data, and ballot data of the munic-
ipal elections from 1999 to 2008. The large number of municipalities implies that every
year local elections can be observed. We have restricted our analysis to large municipal-
ities, i.e. with a population over 15,000 residents, for the reasons spelled in the previous
section and that can be summarised as follows: …rstly, smaller polities are subject to dif-
ferent coalition-formation dynamics; secondly, very small municipalities are dominated by
voters’ association which can not be considered neither related to the centre-left nor to the
centre-right coalition. The exclusion of small municipalities, outliers and municipalities
with missing values from our dataset leaves us with a sample of over 500 local councils.
Our theoretical model predicts that there is a relationship between local governments’
preferred mix of tax instruments and the extent of electoral competition; i.e. as munici-
palities become electorally more competitive, mayors want to reduce the electoral impact
of their …scal choice, so they shift tax revenue collection more towards the less salient
instruments, compared to the case where they can runs safely for re-election.
We begin with describing our main variables of interest (the dependent variables of
the empirical model), which are measures of salient and non-salient …scal instruments.
In our theoretical model a property tax, , is the salient …scal instrument while fees,
denoted , are the non-salient one. In the empirical part of the paper we use, with some
modi…cations, municipalities’ …nal budget accounts classi…cation revenues from local taxes
to proxy for the salient instrument and revenues from local fees, for the non-salient one.
In particular salient source of revenues ( in our theoretical model) include: the
property tax, taxes related to waste disposal management, the municipal income tax and
the electricity surcharge. The local property tax (ICI) is undoubtedly the main and most
salient tax for Italian municipalities. As a main measure we compute the per capita
value calculated as the property tax revenue divided by the resident population (ICI per
capita), we also include values of the "reduced" tax rate, applied only to residents, and
13
the standard tax rate, applied to everybody else. Second, we calculate per capita values
of the waste disposal tax (TARSU). Like ICI, TARSU is paid once a year directly to the
council but it is (politically) much less important and the tax revenue that is able to
raise is much lower. Third, we aggregate the per capita tax burden coming from other
local smaller taxes, which includes mainly the Income Tax Surcharge and the electricity
surcharge. Clearly, this latter group of taxes is either much less visible to voters or less
directly imputable to mayors compared to the property tax and the waste disposal tax,
for more on this see Bordignon and Piazza (2010).
Instead, non-salient sources of revenue ( in our theoretical model) are grouped in
two categories: (i) Fees for General Services, which includes the long list of small fees
reported in the Final Budget Accounts under the voice revenues from local fees (burial
fees, …nes, etc.), (ii) Fees for other services which includes municipal advertising taxes,
fees for the occupation of public spaces and areas and fees related to the issue of vital
record certi…cates.
In order to make them comparable across municipalities we compute the per-capita
values of all monetary variables and we also de‡ate them using the consumption price
index with base 2010 provided by the Italian Institute of Statistics (ISTAT).
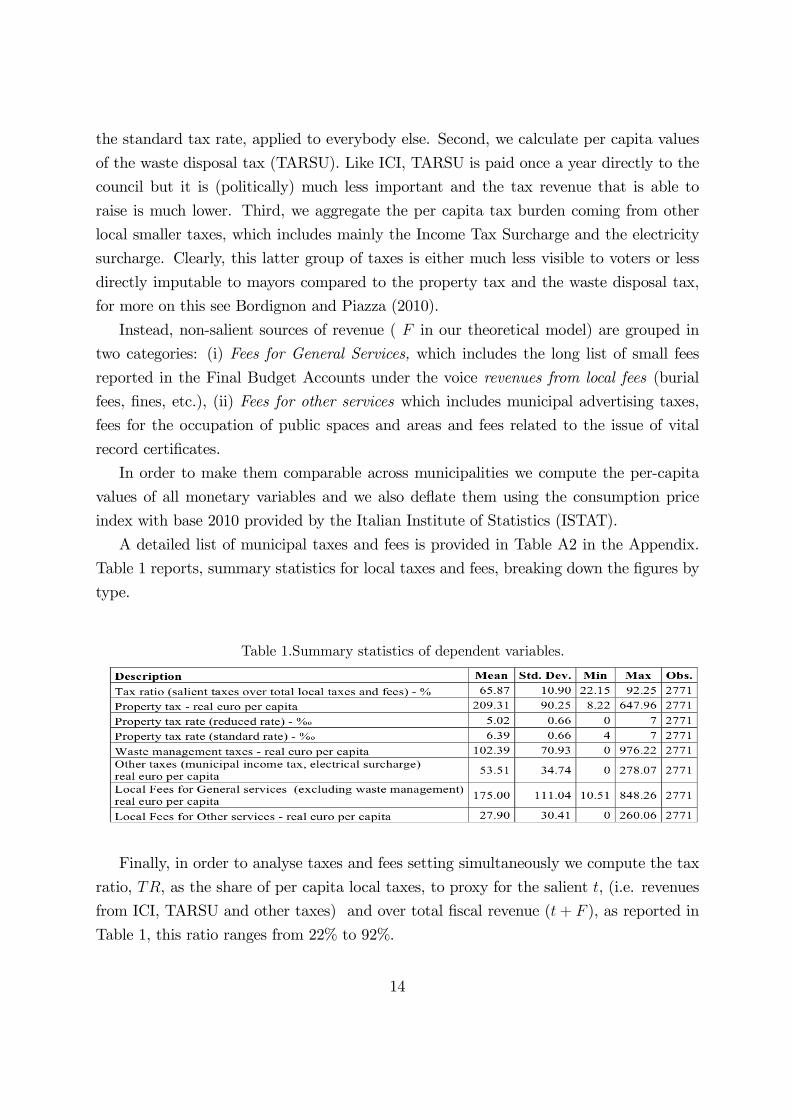
A detailed list of municipal taxes and fees is provided in Table A2 in the Appendix.
Table 1 reports, summary statistics for local taxes and fees, breaking down the …gures by
type.
Table 1.Summary statistics of dependent variables.
Finally, in order to analyse taxes and fees setting simultaneously we compute the tax
ratio, , as the share of per capita local taxes, to proxy for the salient , (i.e. revenues
from ICI, TARSU and other taxes) and over total …scal revenue (+ ), as reported in
Table 1, this ratio ranges from 22% to 92%.
14

Table 2. Summary statistics of political variables
Next, our key explanatory variable is a measure of political competition, , to
proxy for ª in each municipality over time. An obvious measure for ex ante political
contestabilty is the lagged margin of victory in mayoral election results ( ) calculated
as the di¤erence between the votes obtained by the winning mayor and the votes obtained
by the runner-up.13 Values of close to zero refer to mayors, who won with a very
small margin, and so electoral competition is assumed to be high; high values correspond
to municipalities and periods with less political competition, since the mayor won the
electoral race with a large margin. Moreover, as a robustness check, we compute an
alternative measure of political contestability: we construct the margin of victory using
municipality-speci…c vote share of centre-right and centre-left coalitions in the previous
regional councils elections disaggregated at the municipal level. Regional councils are
elected contextually to regional governors, however voters can vote split their vote, i.e.
they cast two separate votes: one for the presidential candidate, and one for the party
lists running for the regional council.14 It is reasonable to assume that citizens tend to
cast their vote more ideologically for the election of the councils and to put more weight,
13If the mayor is elected in the …rst round (because he or she got 50%+1 votes), the …rst-round results
are used, if a second round is held, then second-round results are used instead.14The president is elected through a …rst-past-the-post system. The winning president is also automat-
ically awarded 20% of the council through a so-called regional list. The remaining 80% of the council is
elected through proportional representation, in large districts corresponding to the provinces (the inter-
mediate tier of local government, between the municipalities and the region). Each province-level party
list is clearly and explicitly linked with presidential candidate. This system, similarly to the mayoral
one, allows the president to have a stable and consonant working majority in the council. Split vote is
allowed, that is, one can vote for, say, a party-list A and simultaneously for a presidential candidate Z,
irrespective of the fact that the district list A is linked with another presidential candidate, and that
presidential candidate Z is linked with di¤erent party lists.
15

instead, on candidates’ personal charisma when they decide on the governors. So, the
former should constitute a good representation of ex ante distribution of ideologies across
municipalities. Finally, for the ease of exposition we de…ne = ¡ as our measure
of political competition.
Moreover in order to control if our results are e¤ectively driven by political com-
petition rather than by other municipalities’ political attributes, we employ additional
political controls. First, to take into account mayor’s political preferences, we construct
an indicator variable, local government coalition dummy, taking the value of one if the
mayor is supported by a left-wing coalition and zero otherwise. Second, to control for the
e¤ect of central government’ policy preferences on local tax setting, we include a central
government coalition dummy taking the value of one if the central government is run by
a left wing coalition and zero otherwise. In order to test for a possible alignment e¤ect
on tax policies (occurring when the mayor and the prime minister share the same polit-
ical coalition), we construct an alignment dummy, taking the value of one if the mayor
is aligned and zero otherwise. We also address the issue that tax setting may exhibit a
cyclical behaviour by including an electoral cycle control, which measures the number of
years from last elections (i.e. the variable takes value of zero the year of the election,
one the following year and so on, the maximum value being four and corresponding to
the year before new elections). Finally, since a mayor who cannot re-run for elections
(because of the two terms limit) may face di¤erent incentives compared to a mayor who
can run again, we include an incumbent dummy, which is equal to one if the mayor is at
her second mandate and zero otherwise. Detailed summary statistics for these variables
are presented in Table 2.
16

Table 3. Summary statistics of other controls.
Other control variables we employ in the regressions are the following:
1. Socio-demographic and geographical variables: resident population, proportion of
population less than 14 and over 65 years old, proportion of residents with an
university degree and illiterate, altimetric zone, rural degree. These variables are
collected from the Statistical Atlas of Municipalities, yearly issued by the Italian
National Statistical Institute (ISTAT).
2. Economic variables: total income from real estate, total income di¤erent from real
estate, percentage of resident taxpayers, proportion of unemployed, of self employed,
and of residents working for the service sector. The sources for these variables are
ISTAT, and the Ministry of Finance.
3. Public Finance variables: municipalities total public expenditures, total grants from
the central government and government de…cit. All these variable are lagged of one
year in the empirical model. The sources for these variables are the Ministries of
Finance and of Internal A¤airs.
We observe a lot of variation in the data, starting from the size of the municipali-
ties, demographic characteristics, economic pro…le, to political and public …nance data.
Descriptive statistics for these variables are reported in Table 3.
17

4. Empirical Strategy and Results
We test our the theoretical predictions in two ways. We …rst look at the link between
and and the degree of political competition by estimating the tax ratio equation, ;
we then look at convergence of fees and taxes setting in close races.
4.1. Tax Ratio Equation
The driving mechanism illustrated by Proposition 1 is that political competition changes
policy makers’ incentives on how to raise tax revenue. In particular, our theoretical model
suggests that when electoral competition is strong, mayors raise a higher proportion of
tax revenue by increasing mean of the less salient instruments and reduce the use of the
salient ones compared to the case when electoral competition is low. To examine this link
empirically we estimate regressions of the form:
= + + + (4.1)
where represents the proportion of the salient instrument () as a share of overall …scal
revenues (+ ) in municipality at time , is our measure of political competition,
and are municipality and year e¤ects, and is an i.i.d. error term. We estimate
the panel data model reported in equation (4.1) using the Feasible-GLS estimator and
Mundlak (1978) approach. 15 Finally, we also report robust standard errors adjusted for
clustering at the municipal level.
The baseline results are presented in Tables 4 and 5. In Table 4 our measure of political
competition is constructed on the lagged in mayoral elections while in Table 5 we
use the lagged values of calculated on regional elections. Starting from Table 4: the
…rst column contains estimates of the basic speci…cation in (4.1). We …nd that there is a
strong positive link between the extent of political competition and tax policy decisions.
For example, in this speci…cation, without other controls, one percentage point increase
in incumbent’s political competition is associated with a decrease in the tax ratio of 0.15
percentage points.
15This approach consists of including among the regressors municipal means of each time-variant vari-
able. In this way it is possible to include among the regressors also variables that measure time invariant
characteristics of each local government, such as the rural degree and the altimetric zone obtaining, at
the same time, estimates equivalent to those one would have had using as estimator With-in-the-Group
or Least Squares Dummy Variables.
18
The remaining columns of Table 4 present the results when additional controls are
added to the baseline speci…cation in (4.1). In particular, in column two, we include
our political variables: the incumbent, the alignment dummy, the local and the central
government coalition dummies as well as the electoral cycle (in linear form and squared).
In column three, these political dummies are interacted with our political competition
measure, , and, in the last column, the model is augmented with the full set of controls
described in the previous section. Apart from the electoral cycle dummies and the central
government coalition dummy the other additional political controls are not signi…cant.
There are some interesting results that need to be emphasized. First, that there is
no evidence that mayors supported by left-wing coalitions behave di¤erently from mayors
supported by right-wing one, when they make decisions on the source of …scal revenues.
Second, that electoral cycles play, instead, an important role in shaping taxes and fees
setting decisions, with all the related coe¢cients being highly signi…cant. The interpre-
tation of this result is that the substitution between fees and taxes occurs mainly in the
years close to elections and reaches its minimum around the middle of the …ve year period.
Third, that the fact the mayor cannot re-run in the following term because of term limit
(i.e. incumbent equal to one) makes her less likely to rely heavily on fees rather than
taxes when electoral competition is high. Moreover, our results are not sensitive to the
inclusion of additional controls as shown in the last column of Table 4.
19

Table 4. Tax ratio equation (MVcalculated on mayoral elections)
In order to check wether or not our results are sensitive to the way ex ante political
contestability is measured, we re-run the same regressions as the ones displayed in Table
4, but using our second measure of political competition, based on the regional elections’
margin of victory.
20

Table 5. Tax ratio equation (MVcalculated on elections of Regional Councils)
The coe¢cients for these estimates are displayed in Table 5. The main feature is that
there is not substantial di¤erence in the estimated coe¢cients in the two tables, both in
term sign, signi…cance and magnitude.
In synthesis, the emerging picture con…rms our hypothesis that mayors who are in
more competitive municipalities, in the period of elections, substitute the more visible
and politically “costly” source of revenues (taxes) with the less salient fees.
4.2. Convergence of taxes and fees choices in close races.
In the previous section we have shown that mayors are more likely to set higher fees
and lower taxes in contestable elections, as predicted by Proposition 1 in our theoretical
21

model. In this section we address whether this behaviour is common to both centre-left
and centre-right mayors.
Our empirical strategy is to exploit the fact that mayors’ victory changes discontin-
uously at 50% of mayoral candidates’ vote share. This allows us to identify a possible
coalition e¤ect in taxes and fees setting behaviour by implementing a regression dis-
continuity design (RDD) on the margin of victory of one coalition over the other, by
comparing municipalities where centre-left (right) mayors have barely won the elections
against a centre-right (left) opponent. In other words, the focus is on left and right can-
didates’ races decided by a narrow margin. Lee (2001, 2008) shows that this approach
represents quasi-random variation in candidate winner , because—as long as there are
some unpredictability in voting behavior—when the race is very tight, the winner is likely
to be determined by pure chance.
More formally, we compute the margin of victory for the centre-right mayor ()
in each municipality: positive (negative) values indicate that a centre-right, , (left)
candidate has won the electoral race. Note that the probability of having a centre-right
wing mayor has a sharp discontinuity equal to 1 at the threshold = 0. So RDD
estimates the e¤ect of the mayor’s party-coalition on taxes and fees setting. Note that, also
in this speci…cation the margin of victory is lagged, because municipal elections usually
take place in April-May of year , while …scal variables of year depend on decisions
taken in December of year ¡ 1.
There are various ways in which RDD can be implemented. In what follows we present
two di¤erent approaches. First, following Pettersson-Lidbom (2008), we use all sample
available and we regress our dependent variable on a pth-order polynomial in the control
function, in addition to the binary treatment indicator. As we are interested in the e¤ect
of political coalitions on taxes and fees setting, our dependent variable is , previously
de…ned. The model we estimate takes the following form:
= 0 + ()+ 0 + + + (4.2)
where is our centre-right coalition dummy that takes value of one if the mayor ruling
municipality is supported by a centre-right coalition, this is our treatment variable. The
coalition e¤ect is estimated controlling for the margin of victory under di¤erent hypothesis
on its functional form ()16 as well as the interaction of all of these terms with .
16Our control function is: () = 01 + 022 + + 0
+ 1 +
22 + +
22
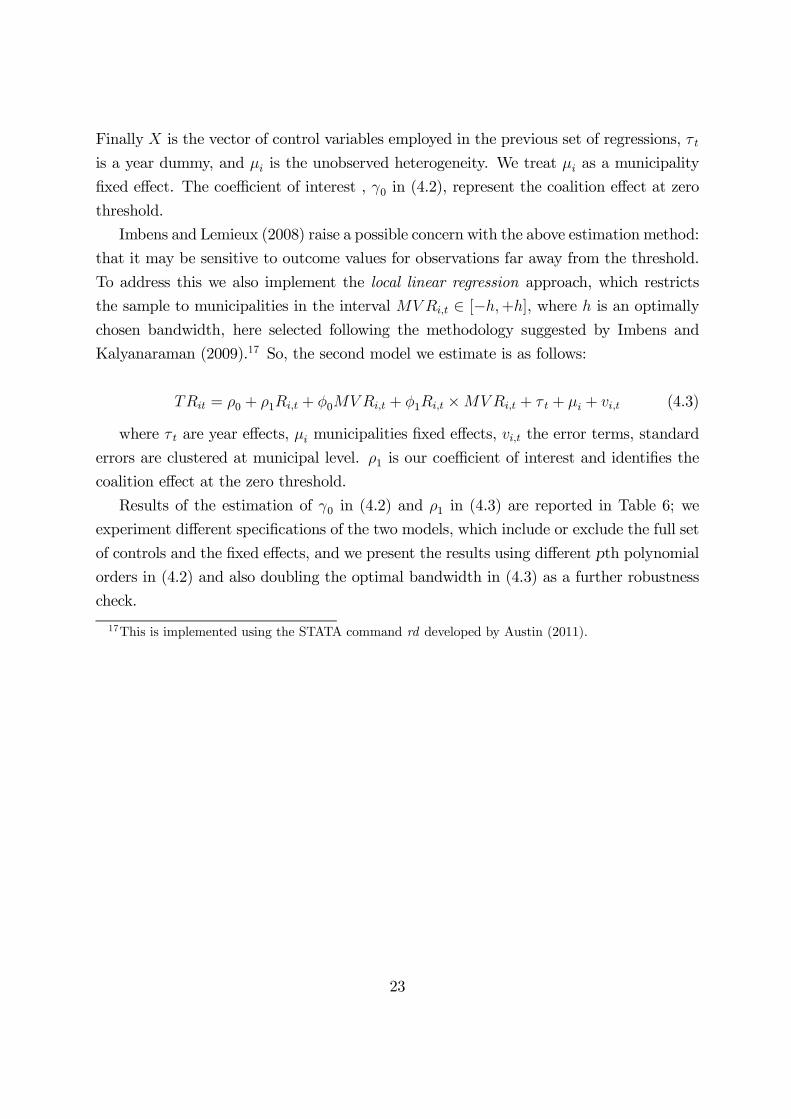
Finally is the vector of control variables employed in the previous set of regressions,
is a year dummy, and is the unobserved heterogeneity. We treat as a municipality
…xed e¤ect. The coe¢cient of interest , 0 in (4.2), represent the coalition e¤ect at zero
threshold.
Imbens and Lemieux (2008) raise a possible concern with the above estimation method:
that it may be sensitive to outcome values for observations far away from the threshold.
To address this we also implement the local linear regression approach, which restricts
the sample to municipalities in the interval 2 [¡+], where is an optimally
chosen bandwidth, here selected following the methodology suggested by Imbens and
Kalyanaraman (2009).17 So, the second model we estimate is as follows:
= 0 + 1 + 0 + 1 £ + + + (4.3)
where are year e¤ects, municipalities …xed e¤ects, the error terms, standard
errors are clustered at municipal level. 1 is our coe¢cient of interest and identi…es the
coalition e¤ect at the zero threshold.
Results of the estimation of 0 in (4.2) and 1 in (4.3) are reported in Table 6; we
experiment di¤erent speci…cations of the two models, which include or exclude the full set
of controls and the …xed e¤ects, and we present the results using di¤erent pth polynomial
orders in (4.2) and also doubling the optimal bandwidth in (4.3) as a further robustness
check.
17This is implemented using the STATA command rd developed by Austin (2011).
23

Table 6. RDD results on coalition e¤ect on tax ratio.
The table shows quite clearly that there is not a clear di¤erent behaviour in the tax
ratio setting by left and right wing mayors estimated around the zero threshold. Both
models presents similar results.
We also report graphical analysis for the two models above. Figure 1 displays graphical
representation of (4.2), by reporting running-mean smoothing (separately on either side
of the threshold) for the percentage of votes won by the incumbent mayor in the latest
election (on the horizontal axis) and the tax ratio (on the vertical axis). The visual analysis
of the data and the cross-validation procedure (proposed by Lee, Lemieux (2010)) always
suggests using a bandwidth of 0.02 or more, therefore, in order to make the graphical
representation more e¤ective, 50 bins are reported in all …gures. From the inspection of
the graph there is no clear evidence of a discontinuity at the cuto¤ point for .
24

Figure 1. Tax Ratio, bandwidth 0.02.
Figure 2 shows graphical analysis for (4.3), implemented using the optimal bandwidth
selected following Imbens and Kalyanaraman (2009). Again there is no clear evidence of
a signi…cant discontinuity in around the threshold.
Figure 2. Tax Ratio, local linear regression optimal bandwidth (h=5.5).
One important validity test for regression discontinuity estimates is to check whether
the density of the running variable is continuous at the threshold. The underlying as-
sumption that generates the local random assignment result is that each individual has
25

imprecise control over the assignment variable. An intuitive test of this assumption is
whether the aggregate distribution of the assignment variable is discontinuous, since a
mixture of individual-level continuous densities is itself a continuous density. Using Mc-
Crary (2008) procedure, Figure A1 in the Appendix shows a graph of the raw densities
computed over bins with a bandwidth of 0.01 (100 bins in the graph), along with a smooth
2nd-order polynomial model. The graphs show no evidence of discontinuity at the cuto¤
con…rmed also by a formal RD regression using the up to the 4th-order polynomial in the
control function.
Another important test for the validity of the RD design is to examine whether the
covariates do not exhibit any discontinuity in relation to the margin of victory. As sug-
gested by Lee and Lemieux (2010) we test the null of discontinuities in all covariates
simultaneously estimating a Seemingly Unrelated Regression (SUR) where each equation
represents a di¤erent baseline covariate, and then performing chi-square test for the dis-
continuity gaps in all equations being zero. As reported in Table A3 in the Appendix we
cannot reject, whit high level of signi…cance, the null hypothesis of zero discontinuity in
all covariates in relation to almost all polynomial orders of the margin of victory.
5. Robustness
We conduct two di¤erent robustness checks: …rst we look at di¤erent measures of taxes and
fees setting separately; second we investigate further our main salient tax, the property
tax, by substituting the per capita values with its actual rates, which allows us to separate
the analysis between ICI at reduced rate- paid by residents only-, and at standard rate
-paid by everybody else.
5.1. Taxes and Fees Setting.
In the previous section we have established that taxes will be relatively low (high) com-
pared to fees when electoral competition is high (low); in this section we aim to look at
taxes and fees setting behavior in term of their absolute value rather than the ratio be-
tween them. Proposition 1 clearly predict that as electoral contestability increases taxes
should decrease and fees rise. The model we now estimate is:
= + + + + ; = (5.1)
where is in turn equal to taxes, and fees, , is the matrix of controls
26

employed in the previous sets of regressions, and are …xed e¤ects and time dummies
and the error. is our measure of political contestability18, so the coe¢cient of
interest is The expected sign forb is therefore negative for the salient taxes (in particular
the property tax, and also the waste disposal tax, but possibly less signi…cant for the latter
group) and positive for the non-salient fees.
Table 7. Sources of revenue regressions, MV municipal elections
The results are displayed in Table 7: the …rst three columns report the estimated
coe¢cients when our dependent variable is a measure of our salient instruments (property
18In this section we present results when political competition is peroxide by lagged MV in municipal
elections, results for MV calculated on regional elections are in Table A4 in the Appendix.
27

tax, waste disposal tax, and other taxes, respectively), and the last two columns present
the results for the non salient instruments (fees for local services and other fees). From
the inspection of the table, the results appear clearly consistent with this view: if political
competition increases of one percentage point, on one hand, the revenues from property
taxes, waste disposal and other taxes decreases respectively of 0.80, 0.49 and 0.24 Euros
per capita, however the latter two are not signi…cantly di¤erent from zero. On the other
hand, revenues from fees increases of about the same amount (0.64 Euros per capita for
fees for local services and 0.27 Euros per capita for other fees).
5.2. Alternative measures for property tax: residents vs non residents
In this section we focus on the main and most salient local tax, the property tax, and
we check whether or not our results are robust to the use of an alternative measure: the
actual tax rates rather that the per capita burden. This also allows us to separate the
analysis between ICI standard and reduced rates. As previously mentioned, there are
two main rates for ICI, the …rst one is the so called "reduced" one, paid by resident
home-owners and the second one is the "standard" one, applied largely to non residents
(and therefore non-voters). So if our hypothesis is correct we should expect that, as
electoral uncertainty increases, policy makers- if motivated by electoral purposes-, will
mainly reduce the rate whose the majority of voters care about, rather than that the one
that mainly non-residents non-voters are subject to.
28

Table 8. Property Tax (ICI) rates, reduced rates.
Table 9. Property Tax (ICI) rates, standard .
29

Tables 8 and 9 report regression results for (5.1) when our dependent variable, is in
turn the standard and the reduced property tax rate. Political competition is calculated
on the lagged MV of municipal elections as well as regional elections. The inspection of the
tables reveals that political competition only a¤ects the reduced tax rate, a 1% increase
in the level of political competition has a negative impact on reduced tax rates of about
0.8% points and it appears highly sensitive to the position in the electoral cycle. There
is no e¤ect of political competition instead on the standard tax rate, which is consistent
with our hypothesis.
Moreover it is also important to note that the impact exerted by the degree of political
competition on the reduced tax rate is strongly a¤ected by the political cycle, because the
coe¢cients’ points estimates related to the interaction between political competition and
the electoral cycle are very signi…cant. Figure 3 below shows how the impact of political
competition on the reduced tax rate is changing with the electoral cycle, reaching is
maximum of -0.01 (per percentage point of political competition) in the year before the
election, and becoming much weaker in the middle of the electoral mandate.
Figure 3. Electoral cycle (ICI reduced tax rates)
5.3. Do voters really do not understand?
An obvious question that still remains unanswered is why incumbent policy makers are
able to carry on with substituting taxes with fees for electoral purposes only. Our results
30

are consistent with the fact that since fees are less salient than taxes, for the reasons
spelled in the previous sections of the paper, voters are not able to fully understand
the responsibility and the amount of their …scal burden. But how is it possible that
at least challenger politicians are not able to understand that and turn this in their
favour by informing voters? We believe this actually is not the case, possibly because
the bureaucratic machine is very complicated and policy maker themselves do not fully
understand how it works until they are in power. The understanding of the full mechanism
goes beyond the scope of this paper. Moreover we do not model challenger’s behaviour
in our theory, but nevertheless, in this section we want to provide and informal test
by checking whether or not voters will punish incumbents who have manipulated the
taxes and fees for electoral purposes. In other words we are estimating the probability of
incumbent re-elections as a function of sources of tax revenue.
Our empirical strategy, in this case, is to estimate the following probit model consid-
ering only the subsample of the electoral years.19
= + 0X + ; (5.2)
In equation (5.2) = 1 if the incumbent party is re-elected at the head of the council
and zero otherwise, will correspond in turn to the tax ratio and the other measures
of local taxes and fees. Then, X is a vector of control variables which includes also:
population brackets dummies, regional dummies, and the whole set of control variables
reported in Table 3. Finally, is an i.i.d. error term. In order to avoid problems of
collinearity we estimate a regression model for each measure of local taxes and fees and
for the tax ratio separately.
Table 10 reports the point estimates for the coe¢cient in terms of marginal e¤ect. It
is possible to note that only when is equal to the property tax we obtain a statistically
signi…cant result, i.e. increasing ICI by 1 euro per-capita reduces the probability of re-
election by 0.1%. Instead, for all the other measures of local taxes and fees and, in
particular, for the tax ratio we do not have any empirical evidence of their impact on the
probability of re-election.
19Since we consider only the election years we loose the panel structure of the data, because only for
very few municipalities is possible to have data for two consecutive elections.
31

Table 10. Impact of …scal variables on re-election probability (marginal e¤ects)
This results support the idea that voters react only on changes in the most salient
source of local revenues, the property tax. Instead, it seems that they do not take into
account the tax ratio or other sources of revenues. Therefore, to the question "Do voters
really do not understand?" the empirical evidence seems to suggest a positive answer.
6. Conclusions
This paper has explored the link between electoral competition and tax setting behaviour.
Our theoretical model predicts that mayors who face stronger electoral competition behave
di¤erently than mayors in electorally safer municipalities. In particular, we analysed the
trade-o¤ between a more salient tax, paid by each citizen, with a less salient source of
revenues (fee), which corresponds to the sale of services monopolistically supplied by the
municipality. Our model’s prediction is that in more competitive jurisdictions mayors are
less likely to use a larger proportion of salient sources of revenues, as the e¤ect of “hiding”
from the voters some revenues is electorally more convenient. On the other hand, mayors
who face a less …erce electoral competition do not need to hide their sources of revenues
from voters, and therefore can rely more on the safer and more salient taxes, as opposed
to fees.
These …ndings are con…rmed by our empirical analysis, which focuses on the choice of
…nancing by Italian mayor in the period 1999-2008. Mayors have a choice between more
salient property and waste collection taxes, and less salient fees for other services (parking
permits, vital records certi…cates, planning permission, advertising billboards). The data
con…rm that mayors who won with a narrower margin of victory, i.e. who face a tighter
electoral competition, are more likely to increase the proportion of revenue coming from
32

fees, as opposed to taxes, and vice versa. Moreover we …nd that this behaviour is common
to both left and right Italian party coalitions.
33

References
[1] Alt J.E., Lassen D.D., (2003), "Fiscal Transparency and Fiscal Policy Outcomes in
OECD Countries", EPRU Working Paper Series, Economic Policy Research Unit
(EPRU), University of Copenhagen.
[2] Arulampalam, W., S. Dasgupta, A. Dhillon, and B. Dutta, (2008) "Electoral Goals
and Center-State Transfers: A Theoretical Model and Empirical Evidence from In-
dia," Journal of Development Economics, 88, 103-119.
[3] Austin Nichols (2011). rd 2.0: Revised Stata module for regression discontinuity
estimation.
[4] Besley T., Smart, M., (2007), "Fiscal restraints and voter welfare," Journal of Public
Economics, 91(3-4), pp 755-773.
[5] Besley T., T. Persson, D. Sturm, (2010) "Political Competition and Economic Per-
formance: Evidence from the United States", Review of Economic Studies, 77(3),
1329-1352.
[6] Besley T., 2007, "Principled Agents?. The Political Economy of Good Government",
Oxford University Press.
[7] Bordignon M., S. Piazza, (2010) "Who do you Blame in Local Finance? An Analysis
of Municipal Financing in Italy," CESifo Working Paper Series, 3100.
[8] Bordignon, M., E. Minelli, (2001) "Rules transparency and political accountability,"
Journal of Public Economics, vol. 80(1), pages 73-98.
[9] Buchanan, J. (1967), Public Finance in Democratic Process; Fiscal Institutions and
the Individual
[10] Choice. Chapel Hill, University of North Carolina Press.
[11] Cabral M., C. Hoxby, (2010) The Hated Property Tax: Salience, Tax Rates, and Tax
Revolts, mimeo.
[12] Case, A., (2001), "Election goals and income redistribution: Recent evidence from
Albania," European Economic Review, 45 (3), 405-423.
34

[13] Coate S., Morris S. (1995), "On the form of transfers to special interests" Journal of
Political Economy, Vol. 103, pp. 1210-1235.
[14] Chetty, R., A. Looney, K. Kroft (2009) "Salience and Taxation: Theory and Evi-
dence," American Economic Review, 1145-1177..
[15] Cox, G. W., M. D. McCubbins, (1986), "Electoral Politics as a Redistributive Game",
The Journal of Politics, 48 (2), 370-389.
[16] Dixit, A., J. Londregan, (1998), "Fiscal federalism and redistributive politics", Jour-
nal of Public Economics, 68 (2), 153-180.
[17] Faguet, J.P. (2004), Does decentralization Increase Government Responsiveness to
Local Needs? Evidence from Bolivia, Journal of Public Economics, 88, 667-893.
[18] Finkelstein, A, (2009), "EZ-Tax: Tax Salience and Tax Rates," Quarterly Journal of
Economics, vol. 124, no.3, pp. 969-1010.
[19] Gagliarducci, S., Nannicini, T., Naticchioni, P., (2008), “Outside Income and Moral
Hazard: The Elusive Quest for Good Politicians”. IZA Discussion Paper 3295.
[20] Galasso, V., Nannicini, T., (2009), “Competing on Good Politicians”. CEPR Discus-
sion Paper 7363.
[21] Hindriks, J., Lockwood, B., (2009), "Decentralization and electoral accountability:
Incentives, separation and voter welfare," European Journal of Political Economy,
25(3), pp. 385-397.
[22] Imbens, G. W. and Lemieux, T., (2008), "Regression discontinuity designs", Journal
of Econometrics, 142, 615-635.
[23] Imbens, G. W. and Kalyanaraman, K., (2009), "Optimal Bandwidth Choice for the
Regression Discontinuity Estimator," NBER WP 14726.
[24] Lee, D. S., (2001), "The Electoral advantage to incumbency and voters’ valuation
of politicians’ experience: A regression discontinuity analysis of elections to the U.S.
House", NBER WP 8441.
[25] Lee, D. S., (2008), "Randomized experiments from non-random selection in U.S.
House elections", Journal of Econometrics, 142 (2), 675-697.
35

[26] Lee, D. S., T. Lemieux, (2010), "Regression Discontinuity design in Economics",
Journal of Economic Literature, XLVIII, 281-355.
[27] McCa¤ery E., J. Baron, (2006) Thinking About Tax, 12, Psychology, Public Policy,
and Law, 106 .
[28] Mc Crary J. (2008) "Manipulation of the Running Variable in the Regression Dis-
continuity Design: A Density Test", Journal of Econometrics, Volume 142 , Issue
2.
[29] Merlo, A., Galasso, V., Landi, M., Mattozzi, A., 2008. “The Labour Market of Italian
Politicians”, Fondazione Rodolfo DeBenedetti, mimeo.
[30] Milesi-Ferretti G.M., (2003) "Good,Bad or Ugly? On The e¤ects of Fiscal Rules
with Creative Accounting" Journal of Public Economics, Volume: 88, Issue: 1-2, pp.
377-394.
[31] Mundlak Yair, (1978) "On the Pooling of Time-Series and Cross-Section Data",
Econometrica, 46:68- 86.
[32] Pettersson-Lidbom, P., (2008), "Do parties matter for economic outcomes? A regres-
sion discontinuity approach", Journal of the European Economic Association, 6(5),
1037-1056.
[33] Persson and Tabellini (1998) Political Economics, The MIT Press.
[34] Rogo¤ K., Sibert A. 1988, "Elections and Macroeconomic Policy Cycles", Review of
Economic Studies, LV, pp. 1-16.
[35] Solé-Ollé, A., P. Sorribas-Navarro, (2008), "The e¤ects of partisan alignment on
the allocation of intergovernmental transfers. Di¤erences in-Di¤erences estimates for
Spain," Journal of Public Economics, 92, 2302-19.
[36] Stigler, G., (1972) Stigler, “Economic Competition and Political Competition”, Pub-
lic Choice, 13(1), 91-106.
[37] Wittman, D., (1989), “Why Democracies Produce E¢cient Results”, Journal of Po-
litical Economy, 97(6), pp. 1395-1424.
36

[38] Wittman, D., (1995), The Myth of Democratic Failure: Why Political Institutions
are E¢cient, Chicago, IL: University of Chicago Press.
[39] "Gli Immobili in Italia 2011", published by Agenzia del Territorio.
37

Appendix
Table A1. Party coalitions, large municipalities only, between 1998 and 2009
Centre-Left No. Centre-Right No. Independents No.
CEN-SIN(LS.CIVICHE) 2565 CEN-DES(LS.CIVICHE) 1,252 LISTA CIVICA 251
CEN-SIN 325 FORZA ITALIA 237 IND 56
DEMOCRATICI SINISTRA 230 CEN-DES 201 SVP 18
PDS 192 LEGA NORD 174 UV 7
SINISTRA 135 CENTRO 117 PATTO SEGNI 6
L’ULIVO 82 ALLEANZA NAZIONALE 84 SI 4
P.POPOLARE ITALIANO 39 POLO PER LE LIBERTA’ 30 MOV. PER L’AUTONOMIA 3
PPI (POP) 27 CCD 26 LA RETE-MOV.DEM. 3
LA MARGHERITA 15 CASA DELLE LIBERTA’ 17 LEGA D’AZIONE MERID. 1
RIF.COM. 15 CDU 14 LISTA LOCALE 1
DL.LA MARGHERITA 14 LEGA LOMB-LEGA NORD 10 PRI 1
PROGRESSISTI (1994) 7 L.VEN-L.NORD 9
CEN-SIN(CONTR.UFF.) 6 LG.NORD-LG.VENETA 9
POPOLARI 6 UDC 8
IND.SIN. 5 CCD-CDU 7
PER VERONA 5 DESTRA 7
PROGRESSISTI SALERNO 5 FI-CCD 5
SDI-ALTRI 5 FI-CCD-AN 5
FED.DEI VERDI 4 POLO BUON GOVERNO 5
ALL. DI PROGRESSO 3 CDL 3
I DEMOCRATICI 3 LG.VENETA REPUBBLICA 3
UNITI NELL’ULIVO 3 U.D.EUR 2
U.D.EUR 2 FI-CCD-CDU 1
SDI 2 FORZA IT.-POLO POP. 1
U.D.EUR POPOLARI 2
LA MARG. 1
PATTO DEMOCRATICI 1
POPOLARI-CIVICA 1
VERDI 1
38
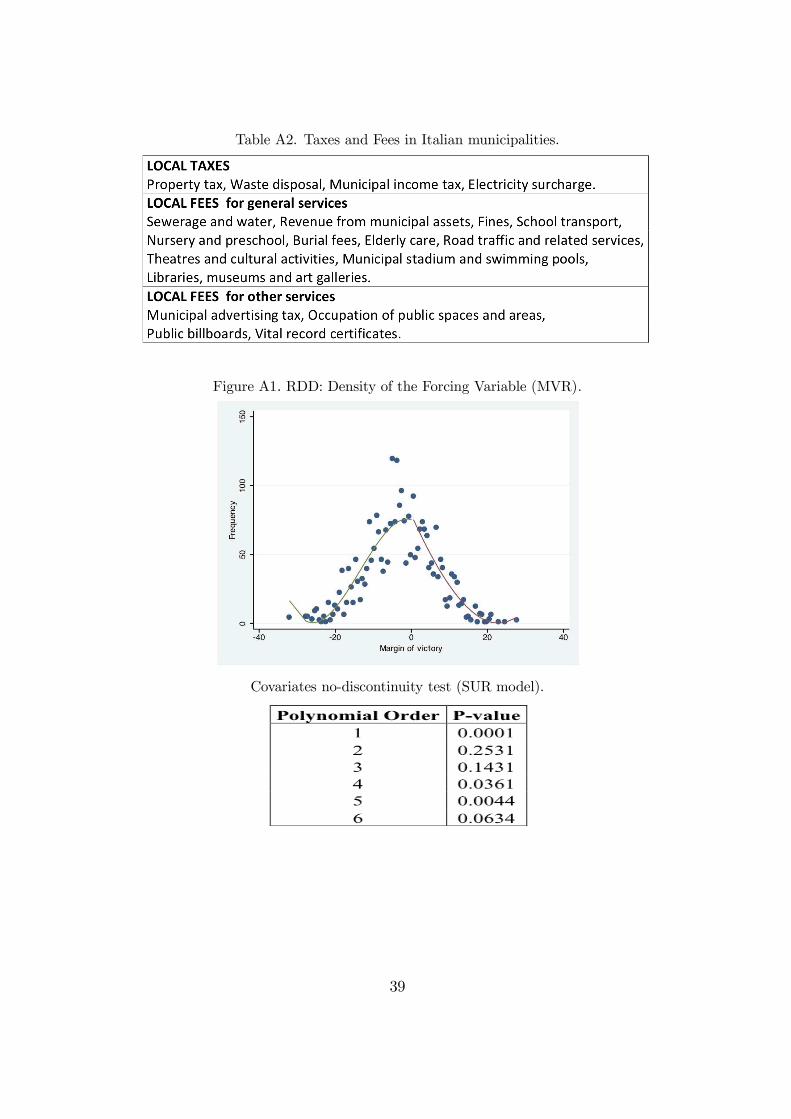
Table A2. Taxes and Fees in Italian municipalities.
Figure A1. RDD: Density of the Forcing Variable (MVR)
Covariates no-discontinuity test (SUR model).
39

Table A4. Sources of revenue regressions, MV regional elections
40

Proof of Lemma 1
Both for the share of voters who pay the fee, and for the complementary share
(1¡ ), there exist a voter who is indi¤erent between the incumbent and the challenger.
These voters have ideology:
= ()¡
= ()¡ ¡
The cumulative distribution function of voters is = 12+ , where X is the position of
the indi¤erent voter. As ideology and fee-paying are uncorrelated, the vote share of the
incumbent mayor is:
=
·1
2+
¸
+ (1¡ )
·1
2+
¸
which can be re-written as:
=1
2+ [()¡ ¡ ]
Proof of Proposition 1
Let us see …rst under what circumstances the …rst-order conditions as in (2.4)-(2.5:) are
satis…ed. Given that all functions are continuous, and strictly concave, existence of the
equilibrium is not an issue. In equilibrium it must be that (+ ) = 0. If it were not
so, for the …rst-order conditions to be satis…ed, from (2.5) it would have to be true that:
[0() + (0()¡ ] = 0
which implies, substituting in (2.4), that : ( ¡ 1) 6= 0 , which means that the …rst
order condition (2.4) is not satis…ed.
Let us now focus on the comparative statics with respect to on the equilibrium, i.e.:
d¤
d 0
d ¤
d
In order to …nd the values of these two expression, we need to solve the following
matrix-form simultaneous equations, i.e. we need to apply the Implicit Function theorem
41

in order to check how the equilibrium changes with the competitiveness of the political
arena. 2
64
3
75
2
64
d¤
d
d¤
d
3
75 = ¡
2
64
3
75 (.1)
By de…nition, as is assumed to be concave:
() =
¯¯¯¯¯¯¯
¯¯¯¯¯¯¯ 0 (.2)
By concavity we also know that 0 and 0. We can calculate the other
second-order di¤erentials:
: ( + ) [0() + (0()¡ )] + (1 + )[
00() + (00()]
which is negative as long as 0. From the …rst-order conditions, we can also say:
: (1 + )(0()¡ ) + ( ¡ 1) 0 (.3)
: (+ )(0 ¡ ) = 0 (.4)
This implies that
d¤
d=
¯¯¯¯¯¯¯
¡
0
¯¯¯¯¯¯¯
¯¯¯¯¯¯¯
¯¯¯¯¯¯¯
=¡
jj 0 (.5)
d ¤
d=
¯¯¯¯¯¯¯
¡
0
¯¯¯¯¯¯¯
¯¯¯¯¯¯¯
¯¯¯¯¯¯¯
=
jj 0 (.6)
Simply applying the chain rule, we can also state that () 0. ¥
42