UBS (D) Euroinvest Immobilien Annual Report UBS (D) Euroinvest Immobilien Annual Report ... For...
39
ab UBS (D) Euroinvest Immobilien Annual Report Custodian bank: CACEIS Bank Deutschland GmbH UBS Real Estate Kapitalanlagegesellschaft mbH ab Real estate investment funds Reporting date: August 31, 2011 UBS Real Estate Kapitalanlagegesellschaft mbH Theatinerstrasse 16, D-80333 Munich www.ubs.com Contact: Phone: +49-89-20 60 95 0 Fax: +49-89-20 60 95 200 © UBS 2011. The key symbol and UBS are registered trademarks of UBS. All rights reserved.
Transcript of UBS (D) Euroinvest Immobilien Annual Report UBS (D) Euroinvest Immobilien Annual Report ... For...
2
ab
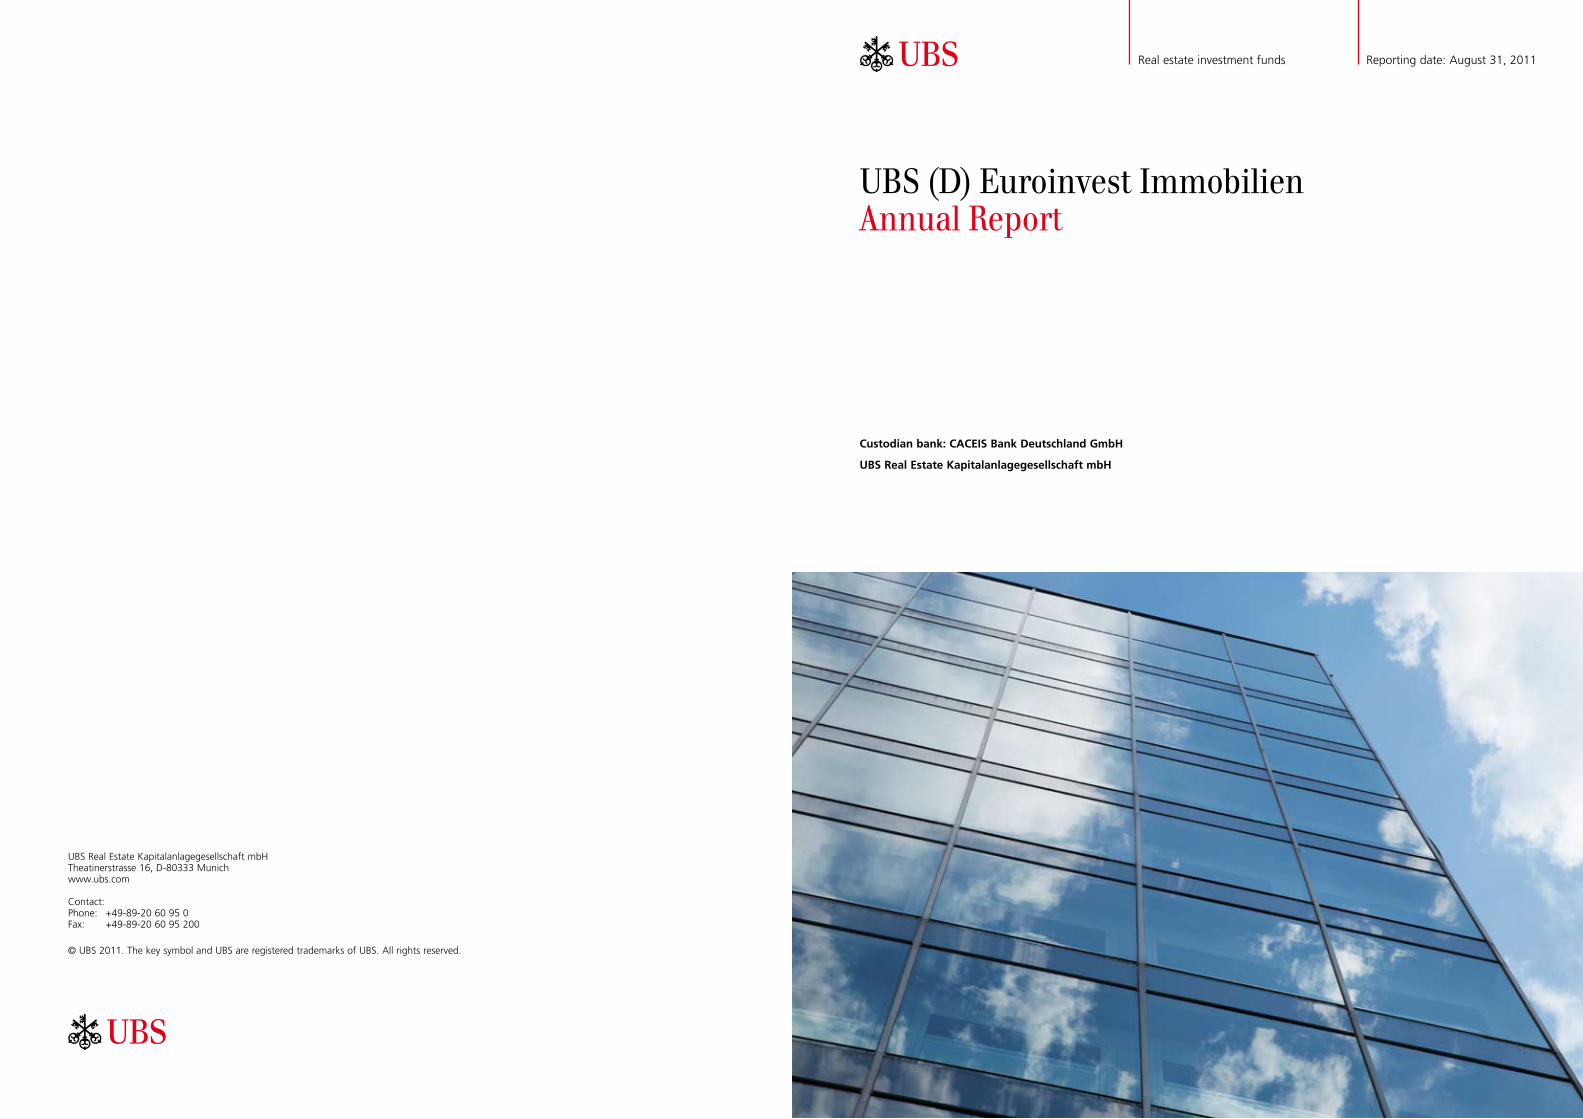
UBS (D) Euroinvest ImmobilienAnnual Report
Custodian bank: CACEIS Bank Deutschland GmbH
UBS Real Estate Kapitalanlagegesellschaft mbH
ab
Real estate investment funds Reporting date: August 31, 2011
UBS Real Estate Kapitalanlagegesellschaft mbHTheatinerstrasse 16, D-80333 Munichwww.ubs.com
Contact:Phone: +49-89-20 60 95 0Fax: +49-89-20 60 95 200
© UBS 2011. The key symbol and UBS are registered trademarks of UBS. All rights reserved.
2 3
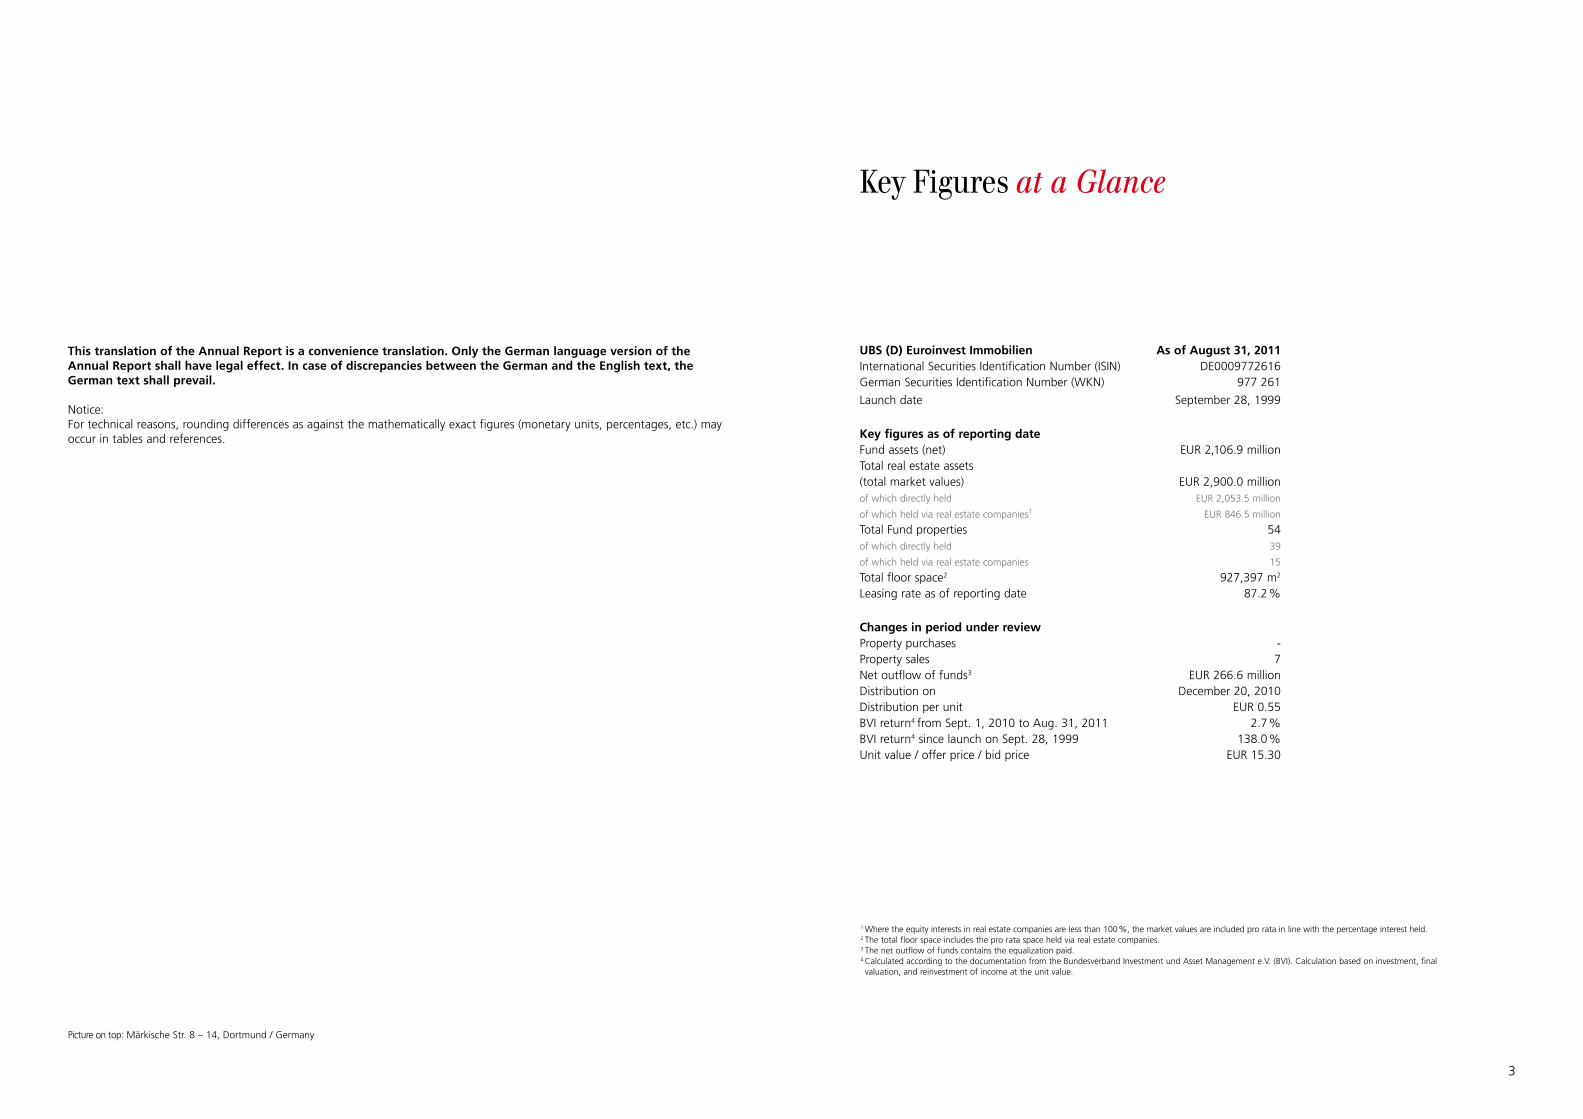
UBS (D) Euroinvest ImmobilienInternational Securities Identification Number (ISIN)German Securities Identification Number (WKN)
Launch date
Key figures as of reporting dateFund assets (net)Total real estate assets (total market values)of which directly held
of which held via real estate companies1
Total Fund propertiesof which directly held
of which held via real estate companies
Total floor space2
Leasing rate as of reporting date
Changes in period under reviewProperty purchasesProperty salesNet outflow of funds3
Distribution onDistribution per unitBVI return4 from Sept. 1, 2010 to Aug. 31, 2011BVI return4 since launch on Sept. 28, 1999Unit value / offer price / bid price
As of August 31, 2011DE0009772616
977 261
September 28, 1999
EUR 2,106.9 million
EUR 2,900.0 millionEUR 2,053.5 million
EUR 846.5 million
5439
15
927,397 m2
87.2 %
-7
EUR 266.6 millionDecember 20, 2010
EUR 0.552.7 %
138.0 %EUR 15.30
1 Where the equity interests in real estate companies are less than 100 %, the market values are included pro rata in line with the percentage interest held.2 The total floor space includes the pro rata space held via real estate companies.3 The net outflow of funds contains the equalization paid.4 Calculated according to the documentation from the Bundesverband Investment und Asset Management e.V. (BVI). Calculation based on investment, final valuation, and reinvestment of income at the unit value.
Key Figures at a Glance
Picture on top: Märkische Str. 8 – 14, Dortmund / Germany
This translation of the Annual Report is a convenience translation. Only the German language version of the Annual Report shall have legal effect. In case of discrepancies between the German and the English text, the German text shall prevail.
Notice: For technical reasons, rounding differences as against the mathematically exact figures (monetary units, percentages, etc.) may occur in tables and references.
4 5
Table of Contents
Key Figures at a Glance
Fund Management Report
Overview: Returns, Valuation, and Leasing
Condensed Statement of Assets and Liabilities
Statement of Assets and Liabilities Part I:Schedule of Properties and Leasing Information
Statement of Assets and Liabilities Part II:Liquid Assets
Statement of Assets and Liabilities Part III:Other Assets, Liabilities and Provisions, Additional Disclosures
Schedule of Property Purchases and Sales
Notes to the Statement of Assets and Liabilities
Statement of Income and Expenditure
Notes to the Statement of Income and Expenditure
Application of Fund Income Including Notes
Statement of Changes in Fund Assets
Notes to the Statement of Changes in Fund Assets
Development of the Fund (Multi-year Review)
Development of Returns (Multi-year Review)
Tax Information
Committees
3
6
16
21
22
45
46
48
49
52
53
56
57
58
59
59
61
77
Page
6 7
limited availability of debt finance, is likely to prevent initial yields from falling further. This leads us to believe that current yields and potential rent increases will take on more and more significance. This being the case, we are maintaining our core segment strategy. Asset management will continue to play an important role, especially outside inner-city locations.
During the last 18 months, the UK office market has experienced an investor-driven upturn that entails risks given the ongoing fragile economic environment and that has so far only been based to a limited extent on positive economic fundamentals. A very selective approach is therefore advisable here. The windows of opportunity in the Central European markets of Prague and Warsaw seem to be closing again already. Due to the small size of these markets, even minor changes in capital flows can bring about substantial price changes. The focus of investors on the export-oriented Nordic economies had led to sharp price rises, which have already factored in the rental growth expected in the future. We will employ an extremely discriminating selection process in the Nordic office markets. We continue to see opportunities in France and Germany, markets with a very large absolute size and a traditional focus on longer-term rental income, which is conducive to stable portfolio performance.
Office real estate markets in Europe1
For many European office letting markets, 2011 began on a rather restrained note, with the situation improving slightly in the second quarter. Office real estate markets in London, Frankfurt and most northern real estate markets were stable. By contrast, performance was relatively weak in the first half of 2011, particularly in the southern European office real estate markets. Many companies continue to operate in a fragile economic environment. In addition, discussions about the state of public finances in a number of eurozone economies have done little to boost companies’ confidence. As before, companies’ rental activities are focusing on increasing the efficiency of their space requirements. There also continues to be a marked risk aversion among both tenants and real estate investors. As has been the case since the financial crisis broke in 2007, investors are focusing on properties that offer a stable long-term cash flow. During the first half of 2011, investments in European commercial properties totaled in the region of EUR 53.4 billion, an increase of around 22 % compared with the corresponding prior-year period. A particularly pronounced rise in investor interest was seen in Germany (28.3 %), France (20.3 %), and the Nordic countries (16.0 %) in the first six months of the year. These economies emerged from the global economic crisis in relatively robust shape and are seen by investors as “safe havens”. The UK market continues to be an attractive option for many investors, although investment was primarily concentrated on core properties in central London. Investor focus on core and first-class properties has meant that prime yields remained under pressure in almost all European office real estate markets in 2011. However, owing to rising finance costs and uncertainty on the government bond markets, a lower resistance line is emerging for prime office yields in many markets. Because of this, prime yields in the key European office property investment markets – London’s West End (4 %) and Paris (4.5 %) – remained stable in the first half of 2011. In Germany, too, prime yields have remained stable in 2011, ranging between 4.8 % in Munich and 5.3 % in Cologne.
The fact that yields in most European office real estate markets are declining or remaining stable at low levels has more to do with the relative attractiveness of real estate as an investment class than with the economic fundamentals of the office real estate markets. Although most European economies have come out of recession and are demonstrating marked growth, it should not be forgotten that many will
not reach pre-crisis levels until the end of this year. Following economic growth of around 1.8 % in the eurozone in 2010, the figure is expected to remain stable in 2011 (i. e., also 1.8 %). However, economic growth is expected to vary greatly across the individual European countries. Export-oriented economies such as Germany, the Netherlands, and Sweden are benefiting from the global economic upturn, which is mainly being driven by the Asian and South American economies. Southern European states such as Greece, Portugal, and Spain still have to adapt their economic structures, a process that is not likely to be completed in the short term. Because of this, we expect growth in the Southern European economies to remain below the European average in 2011 and 2012 as well. There are also further risks relating in particular to the credit markets and public sector financing.
Since in 2010 many companies implemented rental decisions that had been postponed from 2009, we only expect the market to recover to a limited extent in 2011. Owing to the low level of completions expected, we believe that vacancy rates have peaked. However, there is still no indication that office vacancies will decline dramatically. In mid-2011, the highest vacancy rates in Europe were in Dublin (24.1 %) and Budapest (21.0 %). The lowest levels of vacancies in the middle of the year were registered in Geneva (2.4 %) and Marseille (3.0 %). Although vacancy rates remain high in the market as a whole, prime rents are currently rising. This is due above all to the already very limited availability of prime properties in central locations. However, the rental growth rate eased year-on-year in the first six months of the year. Prime rents in the City of London and Paris remained stable in the first half of the year, having increased by 28 % and 7 % respectively in 2010. The highest rent increases in the first half of 2011 were recorded in Oslo (9.4 %) and in London’s West End (7.3 %). In contrast, prime rents in Spain’s key office locations of Barcelona and Madrid fell by a further 2 % each during the same period. We also see rental growth trends outside the prime segment, although this is limited to inner-city areas. On the other hand, pressure on rents continued in non-integrated locations.
We expect that overall performance in most European office real estate markets in the coming years will be determined by current yields. In the prime segment, we believe that there is very little remaining potential for value appreciation owing to the declining initial yields. An expected increase in interest rates at the end of the year, combined with the ongoing
Fund Management Report
1 Sources: UBS Global Asset Management, European Real Estate Outlook, Q2 2010, Initial Yields and Market Assessments UBS Investment Bank: Forecast Database, July 25, 2011 DTZ PMI Europe Export Q2 2011 or vacancy rates CBRE: Market View European Investment Quarterly Q2 2011 for the investment volume
8 9
Liquidity
There was still some discussion about the liquidity position of open-ended real estate funds in the course of fiscal year 2010/2011, but this declined noticeably by the middle of 2011. This was largely due to the Gesetz zur Stärkung des Anlegerschutzes und Verbesserung der Funktionsfähigkeit des Kapitalmarktes (AnsFuG – Act to Increase Investor Protection and Improve the Functioning of the Capital Market) passed by the Bundestag (the Lower House of the German Parliament) in its session on February 11, 2011.
The Act was announced in the Bundesgesetzblatt (Federal Law Gazette) on April 7, 2011, and entered into force on April 8, 2011.
The scheduled deadline for investment companies to amend the fund rules for existing open-ended mutual real estate funds in line with the new legislation is December 31, 2012. The most important changes are summarized as follows:
- Introduction of holding periods: A minimum holding period of 24 months will apply for all newly issued shares (once the fund rules have been amended by the investment company). Exception: All investors will be entitled at any time to redeem units worth up to EUR 30,000.00 per calendar six months. For investors who acquired their units before the fund rules were amended, the abovementioned holding period will be deemed to have already been complied with, which means that it no longer needs to be taken into consideration for redemptions.
- Notice periods: Unit redemptions in excess of EUR 30,000 per calendar six months can only be made following a twelve-month notice period. This notice period can already start to run during the 24-month minimum holding period.
- Valuation of properties and real estate companies:
The valuation cycle depends on the frequency with which units are redeemed/issued. Valuations must be performed most frequently in the case of redemptions that can be made each exchange trading day, week, month, or quarter. In these cases, properties must be valued on a quarterly basis.
- Debt finance: As of January 1, 2015, the maximum leverage ratio will be limited to 30 % of the value of all fund properties rather than 50 %, as was previously the case.
- Holding and notice periods for mixed investment funds: The abovementioned 24-month holding period and 12-month notice period also apply to investors in mixed funds (e. g., funds of funds) whose fund rules permit over 50 % of fund assets to be invested in open-ended real estate fund units.
UBS Real Estate Kapitalanlagesesellschaft mbH (UBS Real Estate KAG mbH) implemented the Fund Rules for the UBS (D) Euroinvest Immobilien Investment Fund incorporating the new regulations in accordance with AnsFuG effective July 1, 2011.
We explicitly welcome the amendment to the law and are delighted that the Act’s entry into force and rapid implementation will create a more secure and reliable basis for our customers that is in keeping with the long-term character of investments in open-ended real estate funds.
Above all, the introduction of the new redemption arrangements, which we had already partially introduced in a similar form at an earlier stage under the law valid at the time, permits much more effective Fund management.
We have already recorded increased interest in the Investment Fund among both new and existing investors in connection with the introduction of holding and notice periods. In the coming fiscal year, we aim to focus once again on growing the Investment Fund, taking into account the investment strategy agreed with our customers.
Gross liquidity amounted to EUR 410.6 million as of August 31, 2011, corresponding to 19.5 % of the Fund’s assets.
Performance
The Fund closed fiscal year 2010/2011 with a performance of 2.7 % according to the BVI method, down on the previous year (3.0 %). This was mainly attributable to the negative valuation result, which in turn is primarily due to declining market rents in a number of countries.
Leasing performance
The current uncertainty about economic and monetary stability in Europe is still leading to extreme hesitancy among many companies. As a result, many property-related decisions are being put off at present, even if these could potentially have the effect of optimizing office rental space and reducing rental and ancillary costs. Because of this, lasting improvements on the European rental markets can only really be expected when confidence has been restored.
Most rental markets are still experiencing a supply overhang - which in some cases is considerable – and strong competitive pressure. This being the case, it is more important than ever for the Fund to adopt special strategies to differentiate its properties from the strong competition. For instance, in the case of large office properties outside inner-city areas, it is becoming increasingly important to provide a special range of services. Even in difficult market situations, it is possible to achieve comparatively large leasing successes by offering additional benefits for office tenants, such as canteens / restaurants, concierge services, day care facilities, conference centers, etc. Such services are also suitable for boosting loyalty among existing property tenants. These and similar active asset management strategies are more essential than ever before for safeguarding and further increasing property returns.
At the end of the period under review, the occupancy rate was 87.2 %. Including all leases already signed but not yet in force, the occupancy rate is 88.0 %. This represents a decline during fiscal year 2010/2011. The main reason for this is newly completed construction projects, which could not be leased during the scheduled period owing to the difficult market situation prevailing in 2009 and 2010. We registered a marked increase in rental requests in the course of the fiscal year, due not least to our expanded tenant services and other strategic measures. These include a renewed upturn in the number of potential tenants looking for large rental spaces. Many letting negotiations yielded positive results, which makes us optimistic that we will succeed in cutting vacancies in the new fiscal year and further reduce the proportion of leases due to expire in 2011 and 2012.
The vast majority of the new and follow-on leases signed were for properties in France, Belgium, Spain, Italy, and Germany.
In early 2011, we succeeded in signing the first lease for one of our properties in Toulouse. A company from the services sector leased around 6,000 m² in the “Cap Constellation” building as of July 2011. This means that, measured in terms of space, the occupancy rate for this property is just under 50 % as of the reporting date.
We also secured new leases for around 2,000 m² in St. Denis, Paris. Around 500 m² is attributable to a new lease in the “Pleyad 3” property and some 1,500 m² to additional space leased by two existing tenants in the “Pleyad 1,2,5” property.
In March 2011, we succeeded in seamlessly renewing the lease for around 23,000 m² in our “Le Madone” building in Paris for over ten years. The previous lease with a tenant from the financial services sector would have expired in September 2011. The property was leased to a French family-run conglomerate almost without a break.
We also chalked up a second major leasing success with another Paris property, “ex-libris” (around 41,000 m²), for which the anchor tenant’s lease would have expired in 2012 and 2013. By approaching the tenant early on, we were able to extend the entire lease well before it was due to expire.
New leases were also signed for the former Atlantis construction project involving the Belgian real estate companies, amounting to around 2,100 m² of space in all. Of this, around 1,300 m² is attributable to two new tenants in the “Atlantis-CORNER” property and around 800 m² to the “Atlantis-BRIDGE” property.
We also secured additional new leases for the “VallSolana Business Park”, VINSON Building property in San Cugat, Barcelona. A new tenant from the consumer electronics sector has leased around 1,000 m² of space since March 15, 2011. In mid-2011, we successfully completed negotiations with one of the existing tenants of the “VallSolana Business Park”, VINSON Building, an international sporting goods manufacturer, for around 1,400 m² of additional space.
We redesigned the grounds of the “WTC Almeda Park” in Barcelona, building a pavilion with a restaurant and bar area among other things. Located in the middle of the Business Park, this new “plaza” is already serving customers and has been very well received so far. Around 1,000 m² of new rental space was created, which was leased in full to a restaurant operator beforehand. We also signed a major
Fund Management Report
10 11
lease for around 3,300 m² with an existing tenant in the “WTC Almeda Park, Building 7” property.
Similarly, new leases for a total of approximately 3,000 m² of space were secured for the indirectly held “Innovazione 3” and “Centro Leoni” properties in Milan. Approximately 1,600 m² of rental space in the “Innovazione 3” property was leased by a company from the financial services sector. In the “Centro Leoni” property, a tenant from the consumer electronics sector leased approximately 1,400 m² of space.
We succeeded in extending the anchor tenant leases in our two indirectly held properties at Frankfurt Airport – “FAC 1” and “FAC 2” – by around 12,000 m² in total. In addition, some 3,000 m² of space was leased as a result of new and follow-on rentals and by existing tenants expanding their space requirements. Part of this space is being used for a new café/bistro/lounge in “FAC 1”.
We succeeded in extending the lease for the single-tenant property in Werner-von-Siemens-Strasse, Erlangen, for ten more years with the existing tenant, a leading international technology group. This meant that it was possible to prolong the previous lease for around 17,500 m², which would have expired in September 2011, without any vacancy period.
Other new leases or extensions were signed for our properties in Nuremberg (approx. 3,800 m²), for “Chmielna 134” in Warsaw (approx. 1,600 m²), Taufkirchen (approx. 1,500 m²), and for “Quinta da Fonte” in Lisbon (approx. 1,100 m²).
Around 5.4 % of leases are still due to expire in 2011, although this figure also regularly includes the earliest possible break options.
This means we were able to reduce the figure at the beginning of the year, when the proportion of expiring leases was as high as 20.5 %, substantially without a noticeable increase in the vacancy rate. These encouraging results to date bear testimony to the effectiveness of our active asset management measures, such as approaching existing tenants in good time and implementing strategic leasing activities.
We are already holding negotiations with the largest tenants with a view to extending leases that are due to expire in 2012 and 2013 (overall, these two years account for 18.6 % and 16.8 % of expiring leases respectively). Furthermore, we
expect to see a gradual improvement in demand for office rental space in 2011/2012.
Sales
The sale of the “Le Malesherbes” property in Paris was completed in September 2010 and the risks and rewards of ownership transferred. At the time of purchase, the property was fully let, and the selling price was around 30 % higher than the purchase price and around 5 % up on the most recent market value determined by the Expert Committee.
In addition, we sold the “Leopoldstrasse” property in Munich in November 2010 for around 19 % more than the original purchase price and some 15 % above the most recent market value determined by the Expert Committee.
We also sold the “Les Portes d’Arcueil” office building – consisting of parts A and C – in Arcueil, Paris at the end of 2010. The property was acquired in 2004 as a development project and was completed in 2006. The main factor contributing to the sale of the buildings was the high demand for core properties in the Paris market at the time. With regard to the property itself, the remaining term (four years) of the single-tenant lease with France Telecom was another selling point. The selling price was EUR 162.8 million, which was roughly 3 % up on the most recent market value determined by the Expert Committee. “Les Portes d’Arcueil” was bought by Gecina S.A., one of the leading real estate companies in France.
A further transaction was finalized at the beginning of 2011 with the sale of the two office buildings in The Hague, “Beatrixpark”, Phase I and II. The “Beatrixpark” office complex, which consists of three sections (Phase I, Phase II, and Phase III) and is well situated on Wilhelmina van Pruisenweg in The Hague, was acquired in 1999 for EUR 97.7 million. Phase III is leased to a Dutch governmental authority and remains part of the UBS (D) Euroinvest Immobilien portfolio.
In July 2011, we also sold our stake in the two Norwegian real estate companies. The two companies owned the “Grev Wedel Plass” property under a heritable lease. The selling price for the property was around 14 % higher than the purchase price and around 8 % up on the most recent market value determined by the Expert Committee.
Sustainability strategy
In 2010/2011, our main focus was on collecting and evaluating the key consumption and emission data for the Fund buildings. A system of key performance indicators (KPIs) has been developed covering energy, heat, and water consumption, CO² emissions, and the amount of waste produced by the buildings. At the same time, we also analyzed and evaluated qualitative building attributes that influence tenant comfort, resource consumption, and other factors.
The evaluation data was used to define specific improvement measures for the whole portfolio.
In April 2011, we received a certificate: an LEED (Leadership in Energy and Environmental Design) silver certificate in the New Construction and Major Renovations category for the “Centro Leoni” office property in Milan. This certificate is the first of its kind ever to be awarded to an office building in Italy. LEED certificates acknowledge in particular high energy efficiency, use of a high proportion of green electricity, low water consumption, and the use of local and low-emission materials. Consequently, the building offers users low running costs and a high level of comfort.
Our “Atlantis-ACCESS” and “Atlantis-BRIDGE” development projects in Brussels are the first properties in Europe to receive a rating of “very good” according to the “BREEAM Europe Offices 2008” standard. BREEAM (BRE Environmental Assessment Method) is the oldest certification system for sustainable construction. The two buildings belonging to the “Atlantis” office complex make impressively effective use of space and energy in addition to offering state-of-the-art building technology.
In France, the “Cap Constellation” office building in the northwest of Toulouse was certified in accordance with French standard HQE (Haute Qualité Environnementale). The building received the highest ranking for its superior energy performance, making it the first building in the Midi-Pyrénées region of southwest France to receive this award.
However, our objective is not only to attain certification, but also to further increase the sustainability of the Fund’s portfolio through our active property management. Every measure undertaken is examined to determine its impact on
sustainability performance. In particular, ongoing and cost-conscious leveraging of the portfolio properties’ energy-saving potential plays a major role.
A prime example of this is the project for the “Malakoff Park” building in Mainz, completed in 2011, in which the building’s lighting and energy consumption concept was optimized as part of extensive renovations. The substantial savings in electricity means that this investment will pay for itself within a short period of time.
Completed in 2008, the “WTC Almeda Park” office complex not only boasts a high level of climatic and visual comfort; the grounds completed in the past year also contribute to the high user comfort. The center of this office park is an extensive, well-kept area. The newly built pavilion and patio feature a café that is also open to the public.
Otherwise, our main focus is on actively promoting long-term partnerships with our tenants. Tenants’ expectations as regards sustainability are documented as part of our regular tenant dialog. As the lessor, we see it as our duty to provide tenants with support and advice. Our aim is to make them aware of the potential that exists in this area and to approach them proactively with possible ways of ensuring sustainable business management.
Strategy
Effective July 1, 2011, we modified the Fund rules to comply with the requirements set out in the Gesetz zur Stärkung des Anlegerschutzes und Verbesserung der Funktionsfähigkeit des Kapitalmarktes. We expect to see improvements in two areas. Firstly, we anticipate an increase in the reliability of liquidity planning and, in turn, a permanent improvement is protection against outflows of funds that cannot be quantified in advance. Secondly, we expect the market for open-ended real estate funds to calm down following the introduction of a clear regulatory framework that does justice to the irreconcilable discrepancy between short-term liquidity needs and long-term real estate investments. Thanks to this last move, we have already registered a renewed slight inflow of funds and expect to see growth in the forthcoming fiscal year, although this will certainly be moderate to begin with.
In the area of asset management, we stepped up the measures in our leasing campaign and our “Key Agent”
Fund Management Report
12 13
and “Tenant Retention” strategies, and increased human resources in this area.
Our active approach to portfolio management enabled us to identify a number of potential sales in the past fiscal year as part of our regular hold/sell analyses. Since the beginning of September 2010, this has enabled us to dispose very successfully of properties in Paris, Munich, The Hague, and Oslo with a total value of around EUR 429.5 million.
The aggregate selling prices were around EUR 76.5 million (approx. 21.7 %) above the original purchase price and around EUR 18.5 million (approx. 4.5 %) up on the most recent market value determined by the Expert Committee.
Risk management
As an international company that is part of a larger group, UBS Real Estate KAG mbH is exposed to various risks as part of its worldwide operations. Since business activities inevitably entail taking reasonable risks, risk management and control focuses on a responsible approach to handling risk. The goals, principles, and strategies of the existing end-to-end system for identifying and monitoring various types of risk are documented in manuals and working instructions.
Taking a holistic approach to risk management is natural for us. This covers risks from the Investment Fund and the Company (primary risk), from operating activities (operating risk), and from strategic issues. Product and Company risks are examined together.
The Company’s risk management system is a combination of risk management at the level of the specialist departments, risk control, and risk management, and provides a number of different risk early warning and management systems. The general rule is that all employees of UBS Real Estate KAG mbH are risk managers and are responsible for managing the risks in their areas. In addition, the Company has dedicated specialist departments that are responsible for risk control and compliance. These are independent units that report directly to the Group or to local senior management. The departments prepare total risk allocations and perform risk-bearing capacity analyses. Specific risk areas have also been defined that require special, systematic monitoring of inherent risks. The close links between the specialist departments ensure that the risks identified in the operating
area are taken into account when setting strategic goals, and that medium- and long-term strategic goals are incorporated into operational planning. This means that potential risks are taken into account in the long term. The specialist departments responsible for risk control and compliance analyze and assess risk elements in the various areas and coordinate the measures taken to ensure compliance with regulatory and strategic requirements.
The Internal Audit department monitors the functioning and appropriateness of the risk management and risk control system. All departments at UBS Real Estate KAG mbH are included in appropriate, customized control procedures. Risk inventories are performed and updated on a quarterly basis for all departments from Business Development & Client Services, Portfolio Management, Asset Management, Transaction Management, and Fund Control down to Fund Accounting & Reporting, and measures are taken to mitigate the risks.
The following risks to the Investment Fund, among others, are monitored: currency risk, interest rate risk, counterparty credit risk, and property market risk. Reputational risk, operational and strategic risk at UBS Real Estate KAG mbH are also managed: This includes the preparation of risk inventories, risk monitoring and reporting, the preparation and maintenance of manuals, policies, and processes for risk minimization, as well as outsourcing control, business continuity management, and SOX certification. Risk identification and assessment is performed on an ongoing basis for all risk groups, and risks are subject to permanent monitoring.
Risk-related results and the results of the scenario analyses focusing on risk-bearing capacity are sent regularly to the senior management and the Supervisory Board, which are therefore kept up to date on the risk situation at all times. Clearly defined reporting and escalation procedures are in place. There are clear guidelines in the event of unforeseeable events to ensure swift reporting. The Investment Company’s Supervisory Board receives a risk report every quarter that contains an assessment of the overall risk situation.
Changes in real estate values and interest rate trends and their effect on rental income performance, as well as other market-specific and legal factors influence UBS (D) Euroinvest Immobilien’s unit value. Investing in this Fund is only suitable for investors with a medium- to long-term investment horizon
who are willing and able to assume a commensurate level of risk. All investments are subject to market fluctuations. The Investment Fund has specific risks that may increase significantly under unusual market conditions.
Outlook
In the area of asset management, we have had very good results with the abovementioned additional services for tenants in particular. We intend to expand these further in the coming months with a view to creating optimum conditions for increasing occupancy rates. This means that the main focus of activities for the forthcoming fiscal year will be on this approach and on further asset management measures. We assume that our activities in this area will lead to greater demand for office space. We also expect transaction volumes on the European investment markets to continue increasing and intend to seize this opportunity to place further potential sales. Given the improved liquidity conditions and the expected additional inflow of funds, we are planning acquisitions with a view to further diversifying and expanding the portfolio. As far as new acquisitions are concerned, the main focus in the first stage will be on Germany and the Nordic countries in particular.
UBS Real Estate Kapitalanlagegesellschaft mbH
Christian PaulPortfolio Manager
Dr. Christine Bernhofer Dr. Tilman HicklManaging Director Managing Director
Munich, October 2011
Fund Management Report
14 15
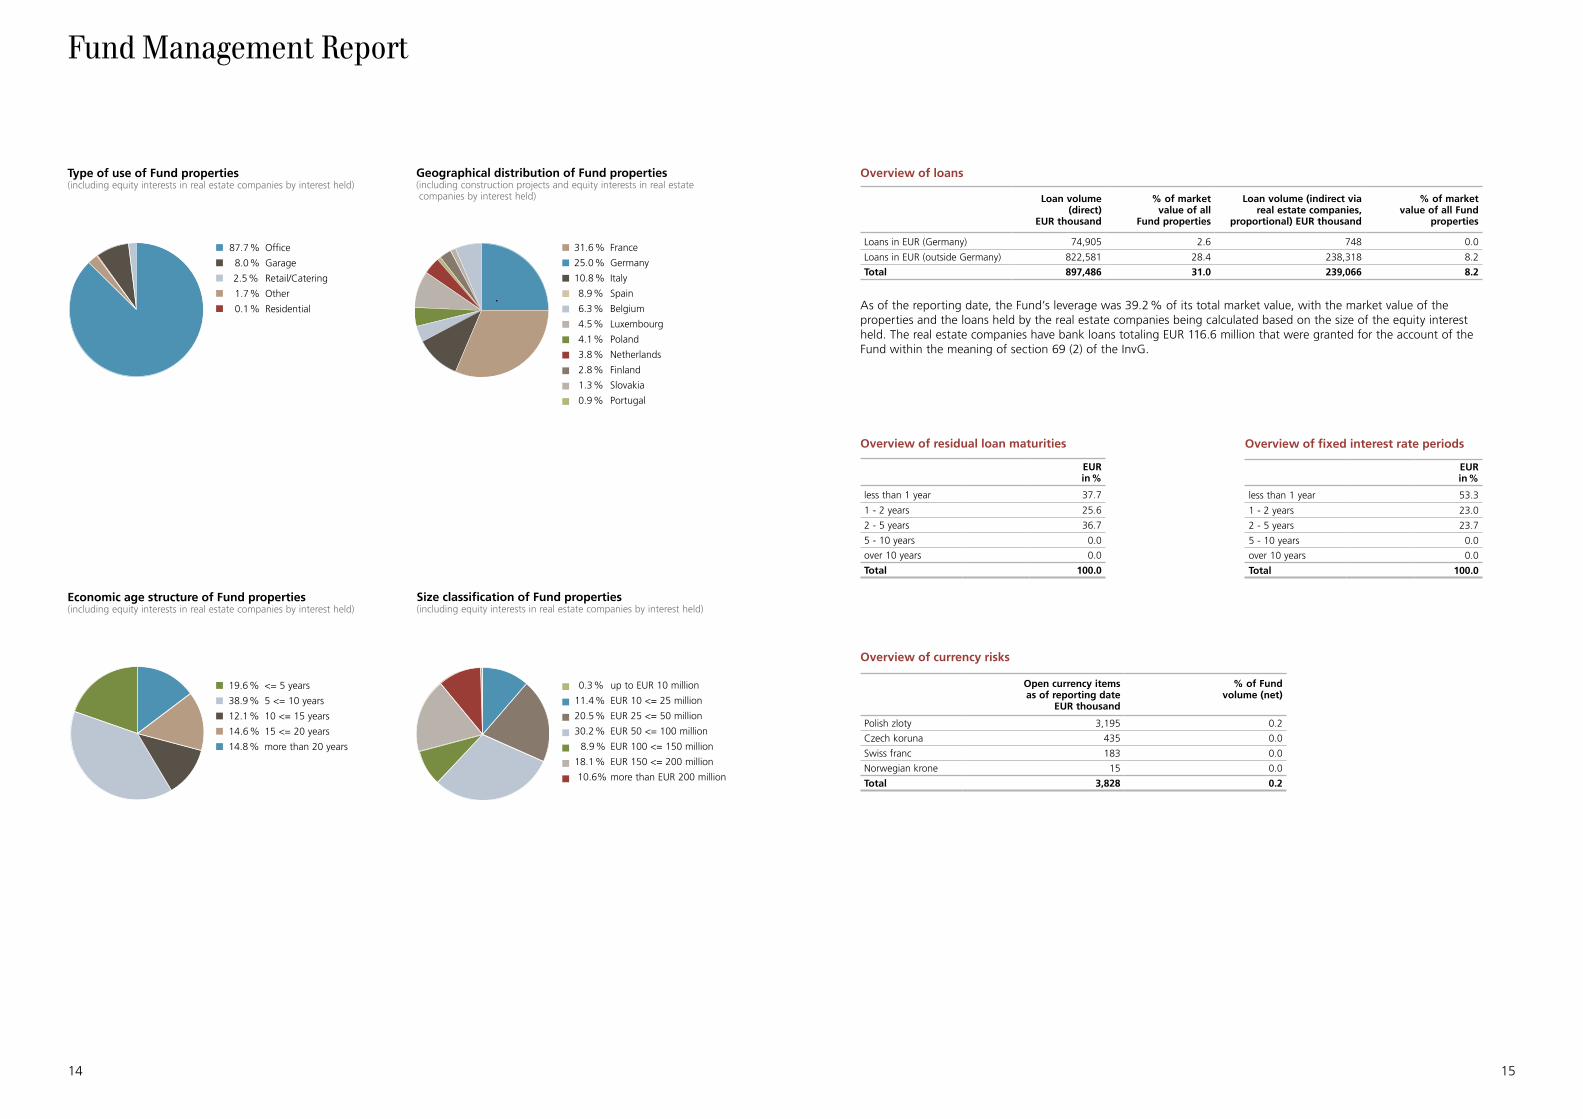
Overview of loans
Loan volume(direct)
EUR thousand
% of marketvalue of all
Fund properties
Loan volume (indirect via real estate companies,
proportional) EUR thousand
% of marketvalue of all Fund
properties
Loans in EUR (Germany) 74,905 2.6 748 0.0
Loans in EUR (outside Germany) 822,581 28.4 238,318 8.2
Total 897,486 31.0 239,066 8.2
As of the reporting date, the Fund’s leverage was 39.2 % of its total market value, with the market value of the properties and the loans held by the real estate companies being calculated based on the size of the equity interest held. The real estate companies have bank loans totaling EUR 116.6 million that were granted for the account of the Fund within the meaning of section 69 (2) of the InvG.
Overview of residual loan maturities
EURin %
less than 1 year 37.7
1 - 2 years 25.6
2 - 5 years 36.7
5 - 10 years 0.0
over 10 years 0.0
Total 100.0
Overview of currency risks
Open currency items as of reporting date
EUR thousand
% of Fundvolume (net)
Polish zloty 3,195 0.2
Czech koruna 435 0.0
Swiss franc 183 0.0
Norwegian krone 15 0.0
Total 3,828 0.2
Overview of fixed interest rate periods
EURin %
less than 1 year 53.3
1 - 2 years 23.0
2 - 5 years 23.7
5 - 10 years 0.0
over 10 years 0.0
Total 100.0
Fund Management Report
87.7 % Office
8.0 % Garage
2.5 % Retail/Catering
1.7 % Other
0.1 % Residential
31.6 % France
25.0 % Germany
10.8 % Italy
8.9 % Spain
6.3 % Belgium
4.5 % Luxembourg
4.1 % Poland
3.8 % Netherlands
2.8 % Finland
1.3 % Slovakia
0.9 % Portugal
Type of use of Fund properties( including equity interests in real estate companies by interest held)
Geographical distribution of Fund properties( including construction projects and equity interests in real estate companies by interest held)
Economic age structure of Fund properties (including equity interests in real estate companies by interest held)
Size classification of Fund properties( including equity interests in real estate companies by interest held)
19.6 % <= 5 years
38.9 % 5 <= 10 years
12.1 % 10 <= 15 years
14.6 % 15 <= 20 years
14.8 % more than 20 years
0.3 % up to EUR 10 million
11.4 % EUR 10 <= 25 million
20.5 % EUR 25 <= 50 million
30.2 % EUR 50 <= 100 million
8.9 % EUR 100 <= 150 million
18.1 % EUR 150 <= 200 million
10.6% more than EUR 200 million
16 17
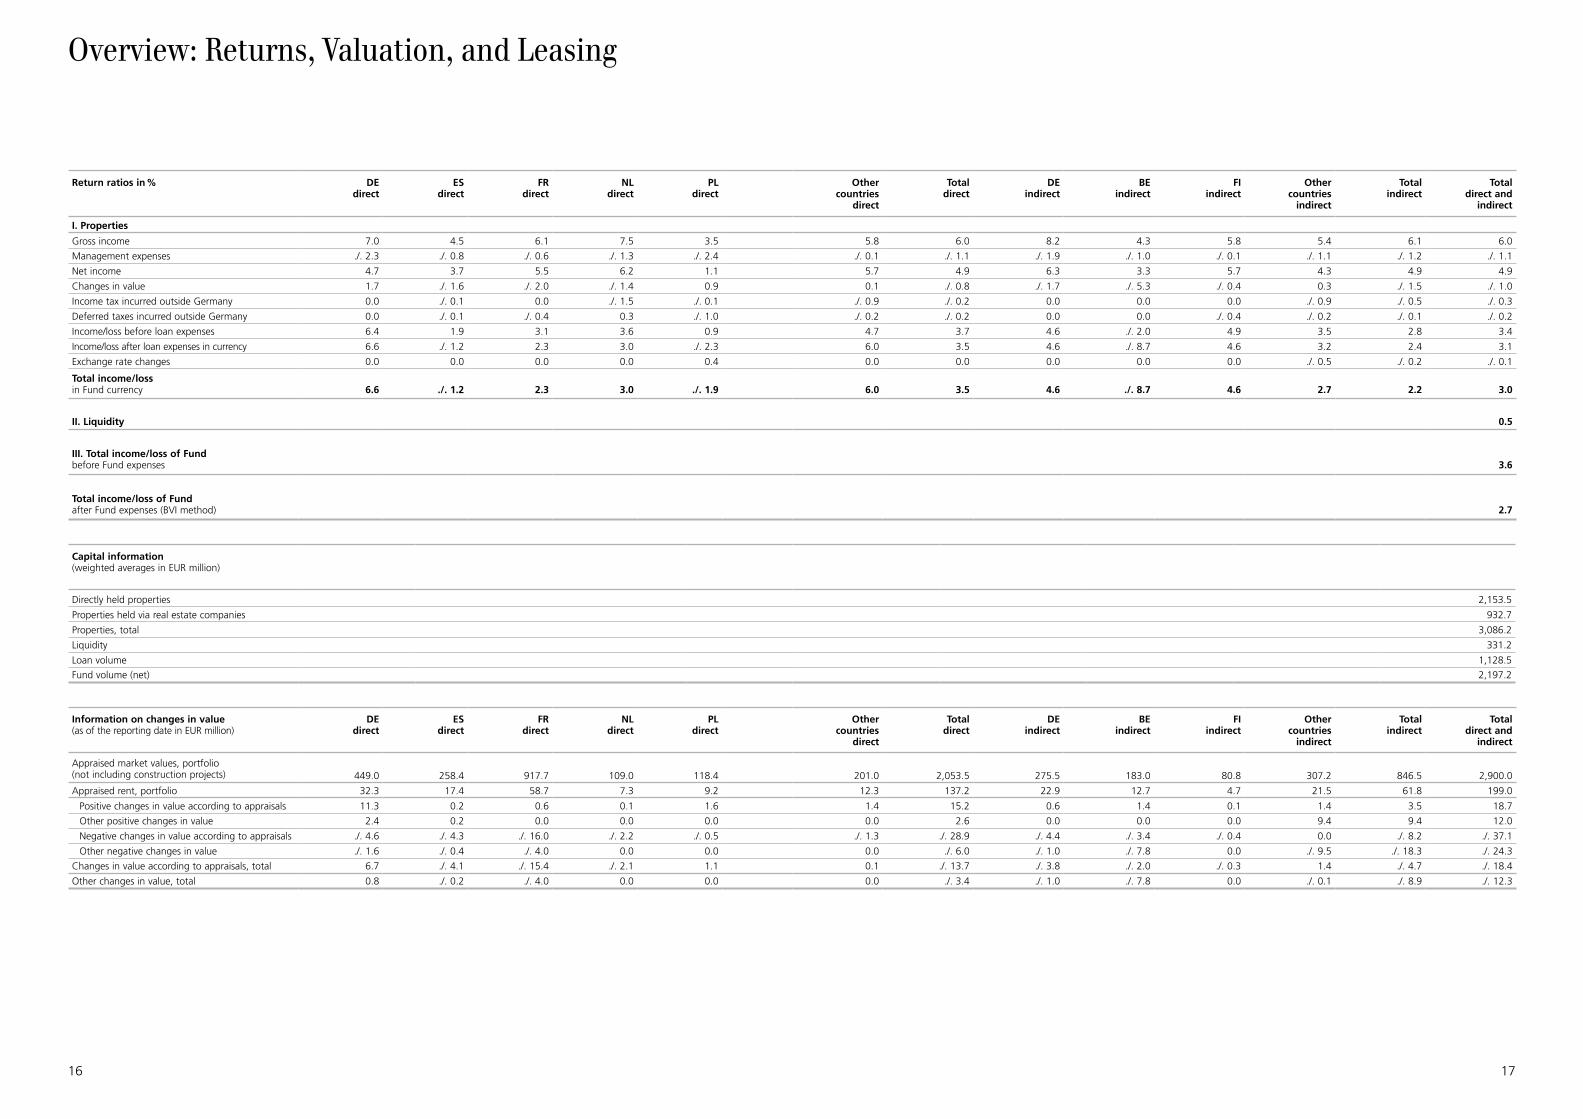
Return ratios in % DEdirect
ESdirect
FRdirect
NLdirect
PLdirect
I. Properties
Gross income 7.0 4.5 6.1 7.5 3.5
Management expenses ./. 2.3 ./. 0.8 ./. 0.6 ./. 1.3 ./. 2.4
Net income 4.7 3.7 5.5 6.2 1.1
Changes in value 1.7 ./. 1.6 ./. 2.0 ./. 1.4 0.9
Income tax incurred outside Germany 0.0 ./. 0.1 0.0 ./. 1.5 ./. 0.1
Deferred taxes incurred outside Germany 0.0 ./. 0.1 ./. 0.4 0.3 ./. 1.0
Income/loss before loan expenses 6.4 1.9 3.1 3.6 0.9
Income/loss after loan expenses in currency 6.6 ./. 1.2 2.3 3.0 ./. 2.3
Exchange rate changes 0.0 0.0 0.0 0.0 0.4
Total income/loss in Fund currency 6.6 ./. 1.2 2.3 3.0 ./. 1.9
II. Liquidity
III. Total income/loss of Fundbefore Fund expenses
Total income/loss of Fundafter Fund expenses (BVI method)
Capital information(weighted averages in EUR million)
Directly held properties
Properties held via real estate companies
Properties, total
Liquidity
Loan volume
Fund volume (net)
Information on changes in value (as of the reporting date in EUR million)
DEdirect
ESdirect
FRdirect
NLdirect
PLdirect
Appraised market values, portfolio (not including construction projects) 449.0 258.4 917.7 109.0 118.4
Appraised rent, portfolio 32.3 17.4 58.7 7.3 9.2
Positive changes in value according to appraisals 11.3 0.2 0.6 0.1 1.6
Other positive changes in value 2.4 0.2 0.0 0.0 0.0
Negative changes in value according to appraisals ./. 4.6 ./. 4.3 ./. 16.0 ./. 2.2 ./. 0.5
Other negative changes in value ./. 1.6 ./. 0.4 ./. 4.0 0.0 0.0
Changes in value according to appraisals, total 6.7 ./. 4.1 ./. 15.4 ./. 2.1 1.1
Other changes in value, total 0.8 ./. 0.2 ./. 4.0 0.0 0.0
Other countries
direct
Totaldirect
DEindirect
BEindirect
FIindirect
Other countries
indirect
Totalindirect
Totaldirect and
indirect
5.8 6.0 8.2 4.3 5.8 5.4 6.1 6.0
./. 0.1 ./. 1.1 ./. 1.9 ./. 1.0 ./. 0.1 ./. 1.1 ./. 1.2 ./. 1.1
5.7 4.9 6.3 3.3 5.7 4.3 4.9 4.9
0.1 ./. 0.8 ./. 1.7 ./. 5.3 ./. 0.4 0.3 ./. 1.5 ./. 1.0
./. 0.9 ./. 0.2 0.0 0.0 0.0 ./. 0.9 ./. 0.5 ./. 0.3
./. 0.2 ./. 0.2 0.0 0.0 ./. 0.4 ./. 0.2 ./. 0.1 ./. 0.2
4.7 3.7 4.6 ./. 2.0 4.9 3.5 2.8 3.4
6.0 3.5 4.6 ./. 8.7 4.6 3.2 2.4 3.1
0.0 0.0 0.0 0.0 0.0 ./. 0.5 ./. 0.2 ./. 0.1
6.0 3.5 4.6 ./. 8.7 4.6 2.7 2.2 3.0
0.5
3.6
2.7
2,153.5
932.7
3,086.2
331.2
1,128.5
2,197.2
Other countries
direct
Totaldirect
DEindirect
BEindirect
FIindirect
Other countries
indirect
Totalindirect
Total direct and
indirect
201.0 2,053.5 275.5 183.0 80.8 307.2 846.5 2,900.0
12.3 137.2 22.9 12.7 4.7 21.5 61.8 199.0
1.4 15.2 0.6 1.4 0.1 1.4 3.5 18.7
0.0 2.6 0.0 0.0 0.0 9.4 9.4 12.0
./. 1.3 ./. 28.9 ./. 4.4 ./. 3.4 ./. 0.4 0.0 ./. 8.2 ./. 37.1
0.0 ./. 6.0 ./. 1.0 ./. 7.8 0.0 ./. 9.5 ./. 18.3 ./. 24.3
0.1 ./. 13.7 ./. 3.8 ./. 2.0 ./. 0.3 1.4 ./. 4.7 ./. 18.4
0.0 ./. 3.4 ./. 1.0 ./. 7.8 0.0 ./. 0.1 ./. 8.9 ./. 12.3
Overview: Returns, Valuation, and Leasing
18 19
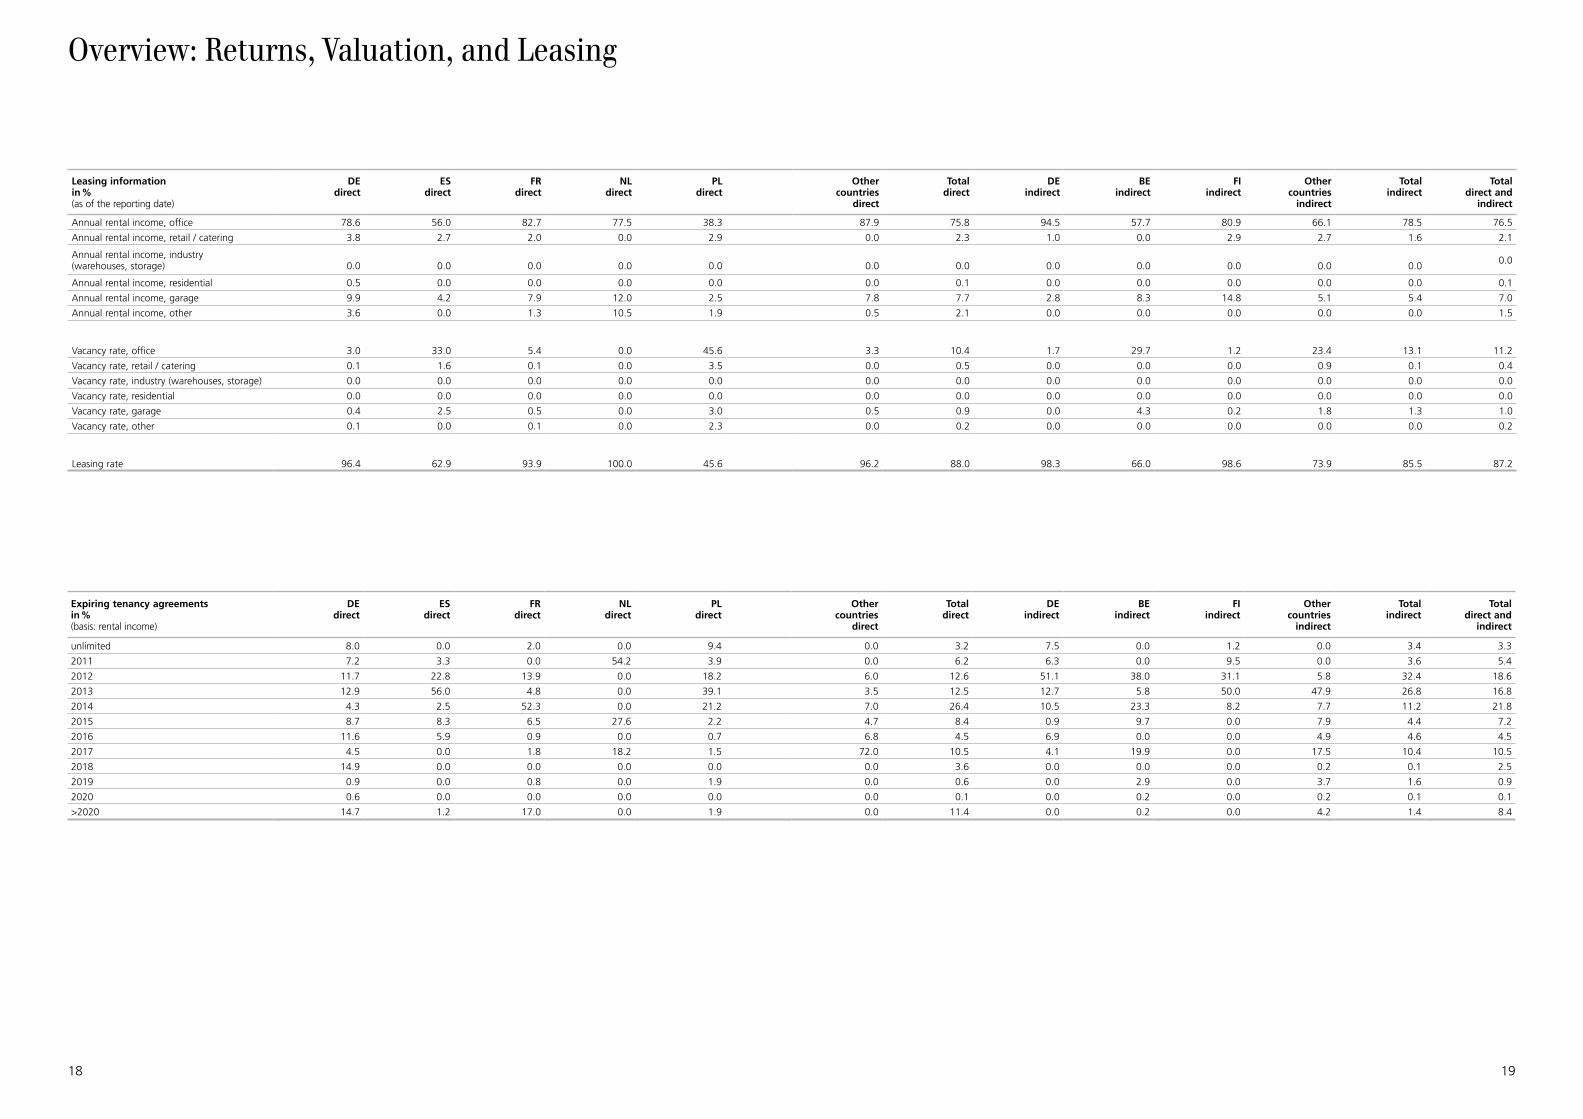
Leasing informationin %(as of the reporting date)
DEdirect
ESdirect
FRdirect
NLdirect
PLdirect
Other countries
direct
Totaldirect
DEindirect
BEindirect
FIindirect
Other countries
indirect
Totalindirect
Total direct and
indirect
Annual rental income, office 78.6 56.0 82.7 77.5 38.3 87.9 75.8 94.5 57.7 80.9 66.1 78.5 76.5
Annual rental income, retail / catering 3.8 2.7 2.0 0.0 2.9 0.0 2.3 1.0 0.0 2.9 2.7 1.6 2.1
Annual rental income, industry (warehouses, storage) 0.0 0.0 0.0 0.0 0.0 0.0 0.0 0.0 0.0 0.0 0.0 0.0 0.0
Annual rental income, residential 0.5 0.0 0.0 0.0 0.0 0.0 0.1 0.0 0.0 0.0 0.0 0.0 0.1
Annual rental income, garage 9.9 4.2 7.9 12.0 2.5 7.8 7.7 2.8 8.3 14.8 5.1 5.4 7.0
Annual rental income, other 3.6 0.0 1.3 10.5 1.9 0.5 2.1 0.0 0.0 0.0 0.0 0.0 1.5
Vacancy rate, office 3.0 33.0 5.4 0.0 45.6 3.3 10.4 1.7 29.7 1.2 23.4 13.1 11.2
Vacancy rate, retail / catering 0.1 1.6 0.1 0.0 3.5 0.0 0.5 0.0 0.0 0.0 0.9 0.1 0.4
Vacancy rate, industry (warehouses, storage) 0.0 0.0 0.0 0.0 0.0 0.0 0.0 0.0 0.0 0.0 0.0 0.0 0.0
Vacancy rate, residential 0.0 0.0 0.0 0.0 0.0 0.0 0.0 0.0 0.0 0.0 0.0 0.0 0.0
Vacancy rate, garage 0.4 2.5 0.5 0.0 3.0 0.5 0.9 0.0 4.3 0.2 1.8 1.3 1.0
Vacancy rate, other 0.1 0.0 0.1 0.0 2.3 0.0 0.2 0.0 0.0 0.0 0.0 0.0 0.2
Leasing rate 96.4 62.9 93.9 100.0 45.6 96.2 88.0 98.3 66.0 98.6 73.9 85.5 87.2
Expiring tenancy agreementsin % (basis: rental income)
DEdirect
ESdirect
FRdirect
NLdirect
PLdirect
Other countries
direct
Totaldirect
DEindirect
BEindirect
FIindirect
Other countries
indirect
Totalindirect
Total direct and
indirect
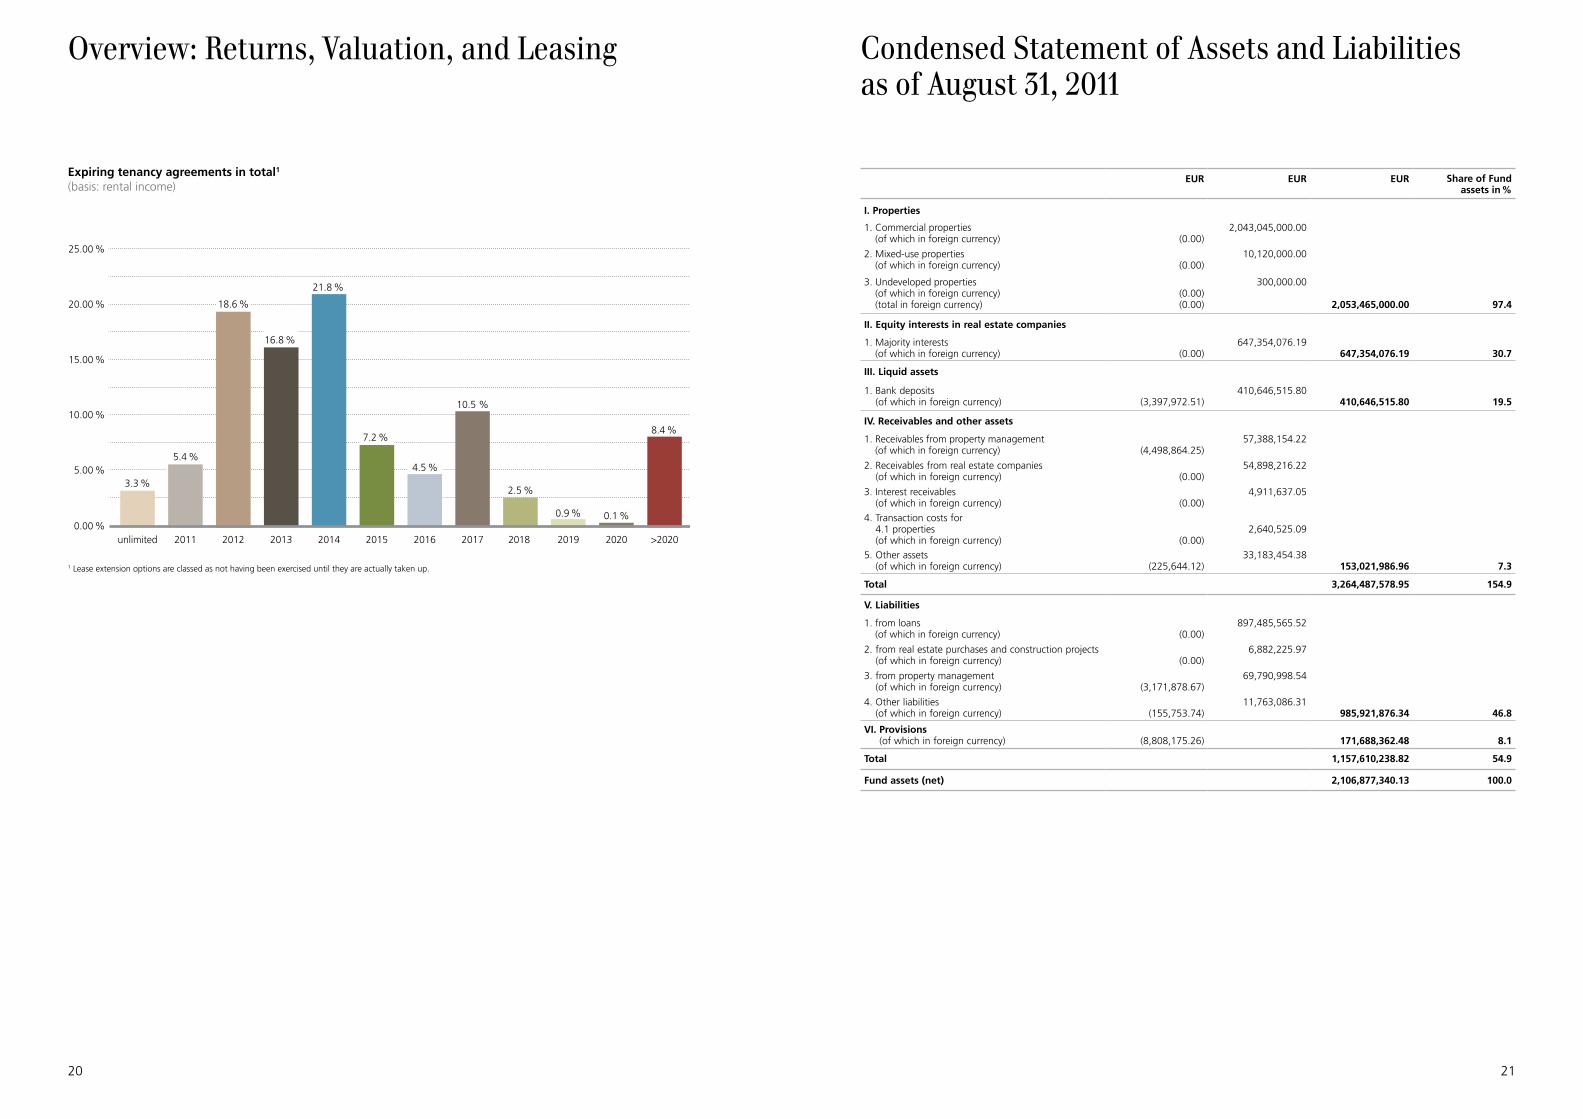
unlimited 8.0 0.0 2.0 0.0 9.4 0.0 3.2 7.5 0.0 1.2 0.0 3.4 3.3
2011 7.2 3.3 0.0 54.2 3.9 0.0 6.2 6.3 0.0 9.5 0.0 3.6 5.4
2012 11.7 22.8 13.9 0.0 18.2 6.0 12.6 51.1 38.0 31.1 5.8 32.4 18.6
2013 12.9 56.0 4.8 0.0 39.1 3.5 12.5 12.7 5.8 50.0 47.9 26.8 16.8
2014 4.3 2.5 52.3 0.0 21.2 7.0 26.4 10.5 23.3 8.2 7.7 11.2 21.8
2015 8.7 8.3 6.5 27.6 2.2 4.7 8.4 0.9 9.7 0.0 7.9 4.4 7.2
2016 11.6 5.9 0.9 0.0 0.7 6.8 4.5 6.9 0.0 0.0 4.9 4.6 4.5
2017 4.5 0.0 1.8 18.2 1.5 72.0 10.5 4.1 19.9 0.0 17.5 10.4 10.5
2018 14.9 0.0 0.0 0.0 0.0 0.0 3.6 0.0 0.0 0.0 0.2 0.1 2.5
2019 0.9 0.0 0.8 0.0 1.9 0.0 0.6 0.0 2.9 0.0 3.7 1.6 0.9
2020 0.6 0.0 0.0 0.0 0.0 0.0 0.1 0.0 0.2 0.0 0.2 0.1 0.1
>2020 14.7 1.2 17.0 0.0 1.9 0.0 11.4 0.0 0.2 0.0 4.2 1.4 8.4
Overview: Returns, Valuation, and Leasing
20 21
25.00 %
20.00 %
15.00 %
10.00 %
5.00 %
>20202019
2.5 %
2018
10.5 %
0.9 %
2017
4.5 %
20162015
16.8 %
20132012
5.4 %
unlimited0.00 %
2011 2014
21.8 %
7.2 %
2020
0.1 %
8.4 %
3.3 %
18.6 %
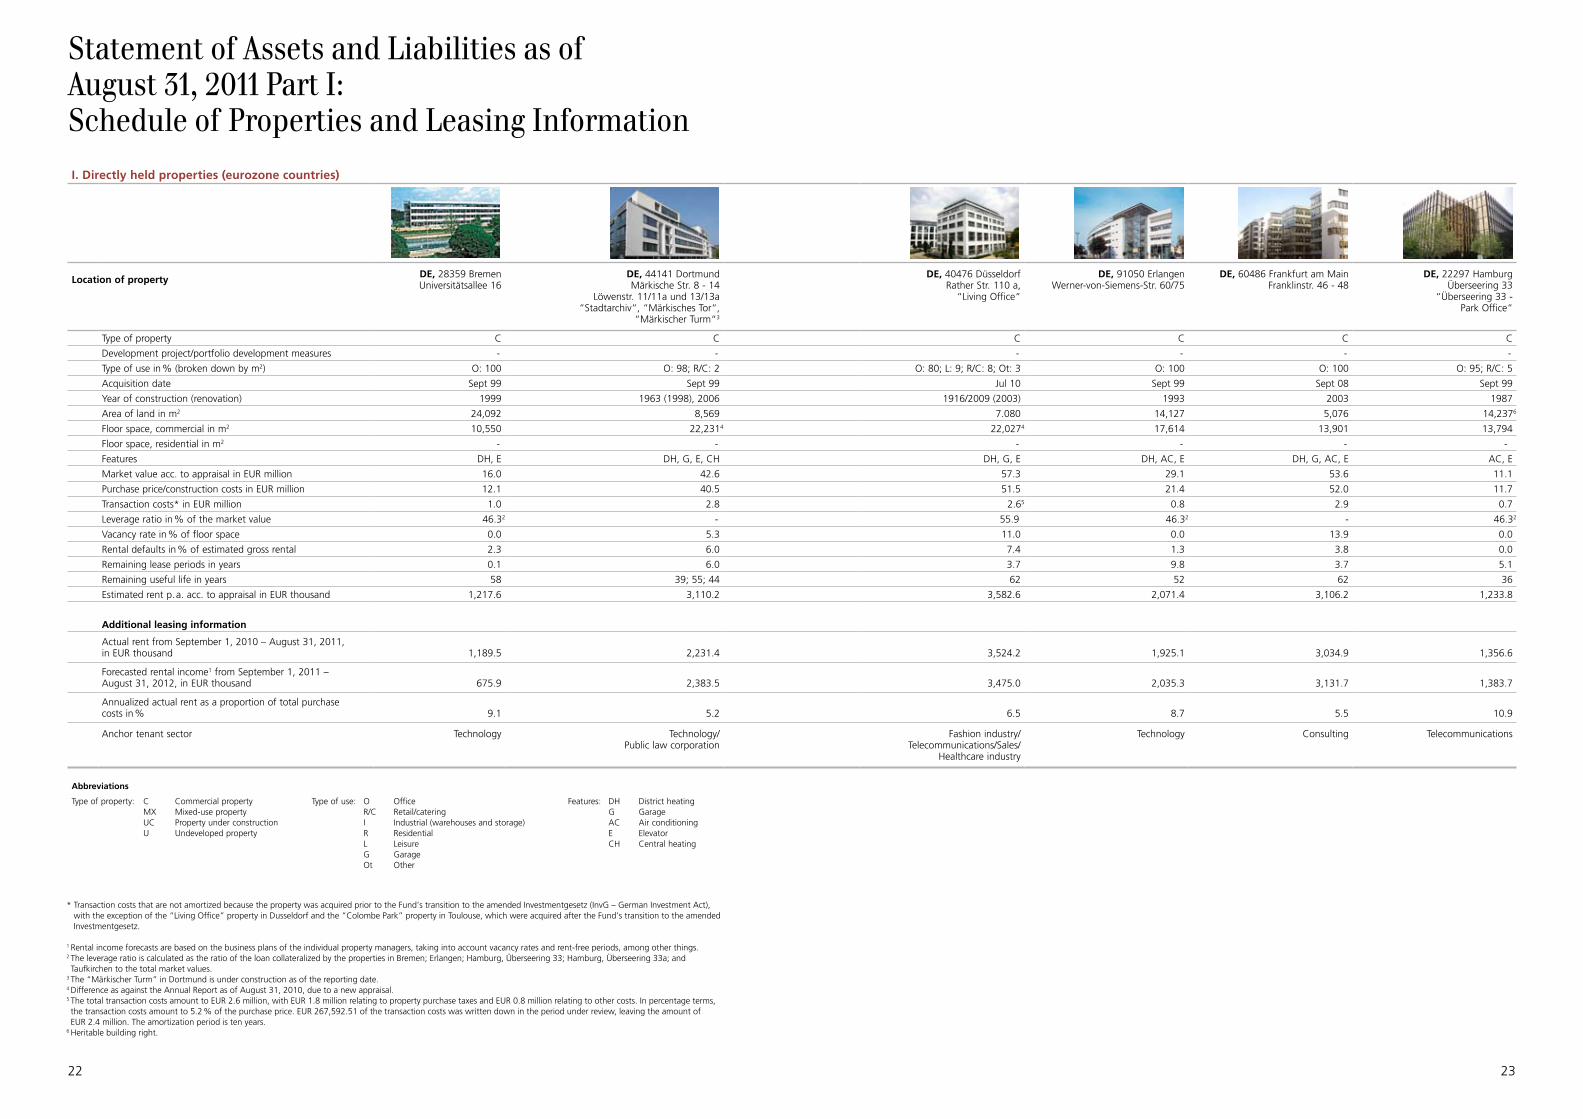
EUR EUR EUR Share of Fundassets in %
I. Properties
1. Commercial properties (of which in foreign currency) (0.00)
2,043,045,000.00
2. Mixed-use properties (of which in foreign currency) (0.00)
10,120,000.00
3. Undeveloped properties (of which in foreign currency) (total in foreign currency)
(0.00)(0.00)
300,000.00
2,053,465,000.00 97.4
II. Equity interests in real estate companies
1. Majority interests (of which in foreign currency) (0.00)
647,354,076.19647,354,076.19 30.7
III. Liquid assets
1. Bank deposits (of which in foreign currency) (3,397,972.51)
410,646,515.80410,646,515.80 19.5
IV. Receivables and other assets
1. Receivables from property management (of which in foreign currency) (4,498,864.25)
57,388,154.22
2. Receivables from real estate companies (of which in foreign currency) (0.00)
54,898,216.22
3. Interest receivables (of which in foreign currency) (0.00)
4,911,637.05
4. Transaction costs for 4.1 properties (of which in foreign currency) (0.00)
2,640,525.09
5. Other assets (of which in foreign currency) (225,644.12)
33,183,454.38153,021,986.96 7.3
Total 3,264,487,578.95 154.9
V. Liabilities
1. from loans (of which in foreign currency) (0.00)
897,485,565.52
2. from real estate purchases and construction projects (of which in foreign currency) (0.00)
6,882,225.97
3. from property management (of which in foreign currency) (3,171,878.67)
69,790,998.54
4. Other liabilities (of which in foreign currency) (155,753.74)
11,763,086.31985,921,876.34 46.8
VI. Provisions (of which in foreign currency) (8,808,175.26) 171,688,362.48 8.1
Total 1,157,610,238.82 54.9
Fund assets (net) 2,106,877,340.13 100.0
Expiring tenancy agreements in total1
(basis: rental income)
Overview: Returns, Valuation, and Leasing
1 Lease extension options are classed as not having been exercised until they are actually taken up.
Condensed Statement of Assets and Liabilitiesas of August 31, 2011
22 23
* Transaction costs that are not amortized because the property was acquired prior to the Fund’s transition to the amended Investmentgesetz (InvG – German Investment Act), with the exception of the “Living Office” property in Dusseldorf and the “Colombe Park” property in Toulouse, which were acquired after the Fund’s transition to the amended Investmentgesetz.
1 Rental income forecasts are based on the business plans of the individual property managers, taking into account vacancy rates and rent-free periods, among other things.2 The leverage ratio is calculated as the ratio of the loan collateralized by the properties in Bremen; Erlangen; Hamburg, Überseering 33; Hamburg, Überseering 33a; and Taufkirchen to the total market values.
3 The “Märkischer Turm” in Dortmund is under construction as of the reporting date.4 Difference as against the Annual Report as of August 31, 2010, due to a new appraisal.5 The total transaction costs amount to EUR 2.6 million, with EUR 1.8 million relating to property purchase taxes and EUR 0.8 million relating to other costs. In percentage terms, the transaction costs amount to 5.2 % of the purchase price. EUR 267,592.51 of the transaction costs was written down in the period under review, leaving the amount of EUR 2.4 million. The amortization period is ten years.
6 Heritable building right.
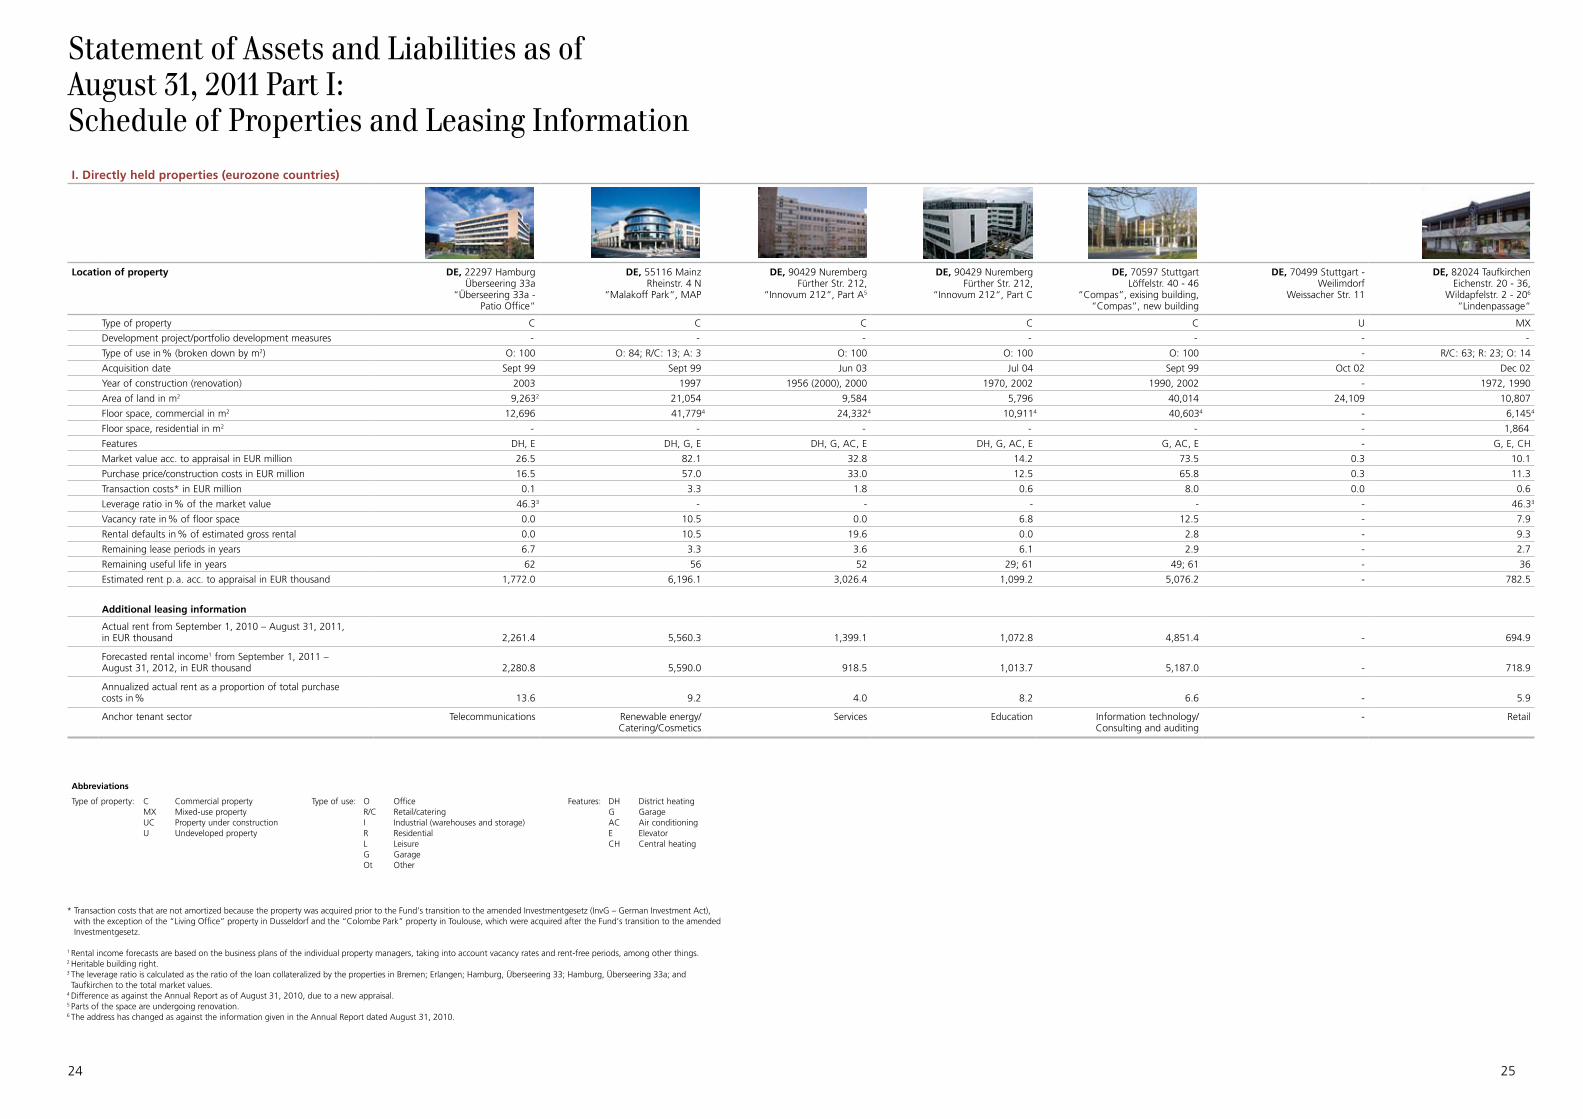
I. Directly held properties (eurozone countries)
Location of property DE, 28359 Bremen Universitätsallee 16
DE, 44141 Dortmund Märkische Str. 8 - 14
Löwenstr. 11/11a und 13/13a“Stadtarchiv“, “Märkisches Tor“,
“Märkischer Turm“3
DE, 40476 DüsseldorfRather Str. 110 a,
“Living Office“
DE, 91050 ErlangenWerner-von-Siemens-Str. 60/75
DE, 60486 Frankfurt am MainFranklinstr. 46 - 48
DE, 22297 HamburgÜberseering 33
“Überseering 33 - Park Office“
Type of property C C C C C C
Development project/portfolio development measures - - - - - -
Type of use in % (broken down by m2) O: 100 O: 98; R/C: 2 O: 80; L: 9; R/C: 8; Ot: 3 O: 100 O: 100 O: 95; R/C: 5
Acquisition date Sept 99 Sept 99 Jul 10 Sept 99 Sept 08 Sept 99
Year of construction (renovation) 1999 1963 (1998), 2006 1916/2009 (2003) 1993 2003 1987
Area of land in m2 24,092 8,569 7.080 14,127 5,076 14,2376
Floor space, commercial in m2 10,550 22,2314 22,0274 17,614 13,901 13,794
Floor space, residential in m2 - - - - - -
Features DH, E DH, G, E, CH DH, G, E DH, AC, E DH, G, AC, E AC, E
Market value acc. to appraisal in EUR million 16.0 42.6 57.3 29.1 53.6 11.1
Purchase price/construction costs in EUR million 12.1 40.5 51.5 21.4 52.0 11.7
Transaction costs* in EUR million 1.0 2.8 2.65 0.8 2.9 0.7
Leverage ratio in % of the market value 46.32 - 55.9 46.32 - 46.32
Vacancy rate in % of floor space 0.0 5.3 11.0 0.0 13.9 0.0
Rental defaults in % of estimated gross rental 2.3 6.0 7.4 1.3 3.8 0.0
Remaining lease periods in years 0.1 6.0 3.7 9.8 3.7 5.1
Remaining useful life in years 58 39; 55; 44 62 52 62 36
Estimated rent p. a. acc. to appraisal in EUR thousand 1,217.6 3,110.2 3,582.6 2,071.4 3,106.2 1,233.8
Additional leasing information
Actual rent from September 1, 2010 – August 31, 2011, in EUR thousand 1,189.5 2,231.4 3,524.2 1,925.1 3,034.9 1,356.6
Forecasted rental income1 from September 1, 2011 – August 31, 2012, in EUR thousand 675.9 2,383.5 3,475.0 2,035.3 3,131.7 1,383.7
Annualized actual rent as a proportion of total purchase costs in % 9.1 5.2 6.5 8.7 5.5 10.9
Anchor tenant sector Technology Technology/ Public law corporation
Fashion industry/Telecommunications/Sales/
Healthcare industry
Technology Consulting Telecommunications
Abbreviations
Type of property: CMXUCU
Commercial propertyMixed-use propertyProperty under constructionUndeveloped property
Type of use: OR/CIRLGOt
OfficeRetail/cateringIndustrial (warehouses and storage)ResidentialLeisureGarageOther
Features: DHGACECH
District heatingGarageAir conditioningElevatorCentral heating
Statement of Assets and Liabilities as ofAugust 31, 2011 Part I:Schedule of Properties and Leasing Information
24 25
* Transaction costs that are not amortized because the property was acquired prior to the Fund’s transition to the amended Investmentgesetz (InvG – German Investment Act), with the exception of the “Living Office” property in Dusseldorf and the “Colombe Park” property in Toulouse, which were acquired after the Fund’s transition to the amended Investmentgesetz.
1 Rental income forecasts are based on the business plans of the individual property managers, taking into account vacancy rates and rent-free periods, among other things.2 Heritable building right.3 The leverage ratio is calculated as the ratio of the loan collateralized by the properties in Bremen; Erlangen; Hamburg, Überseering 33; Hamburg, Überseering 33a; and Taufkirchen to the total market values.
4 Difference as against the Annual Report as of August 31, 2010, due to a new appraisal.5 Parts of the space are undergoing renovation.6 The address has changed as against the information given in the Annual Report dated August 31, 2010.
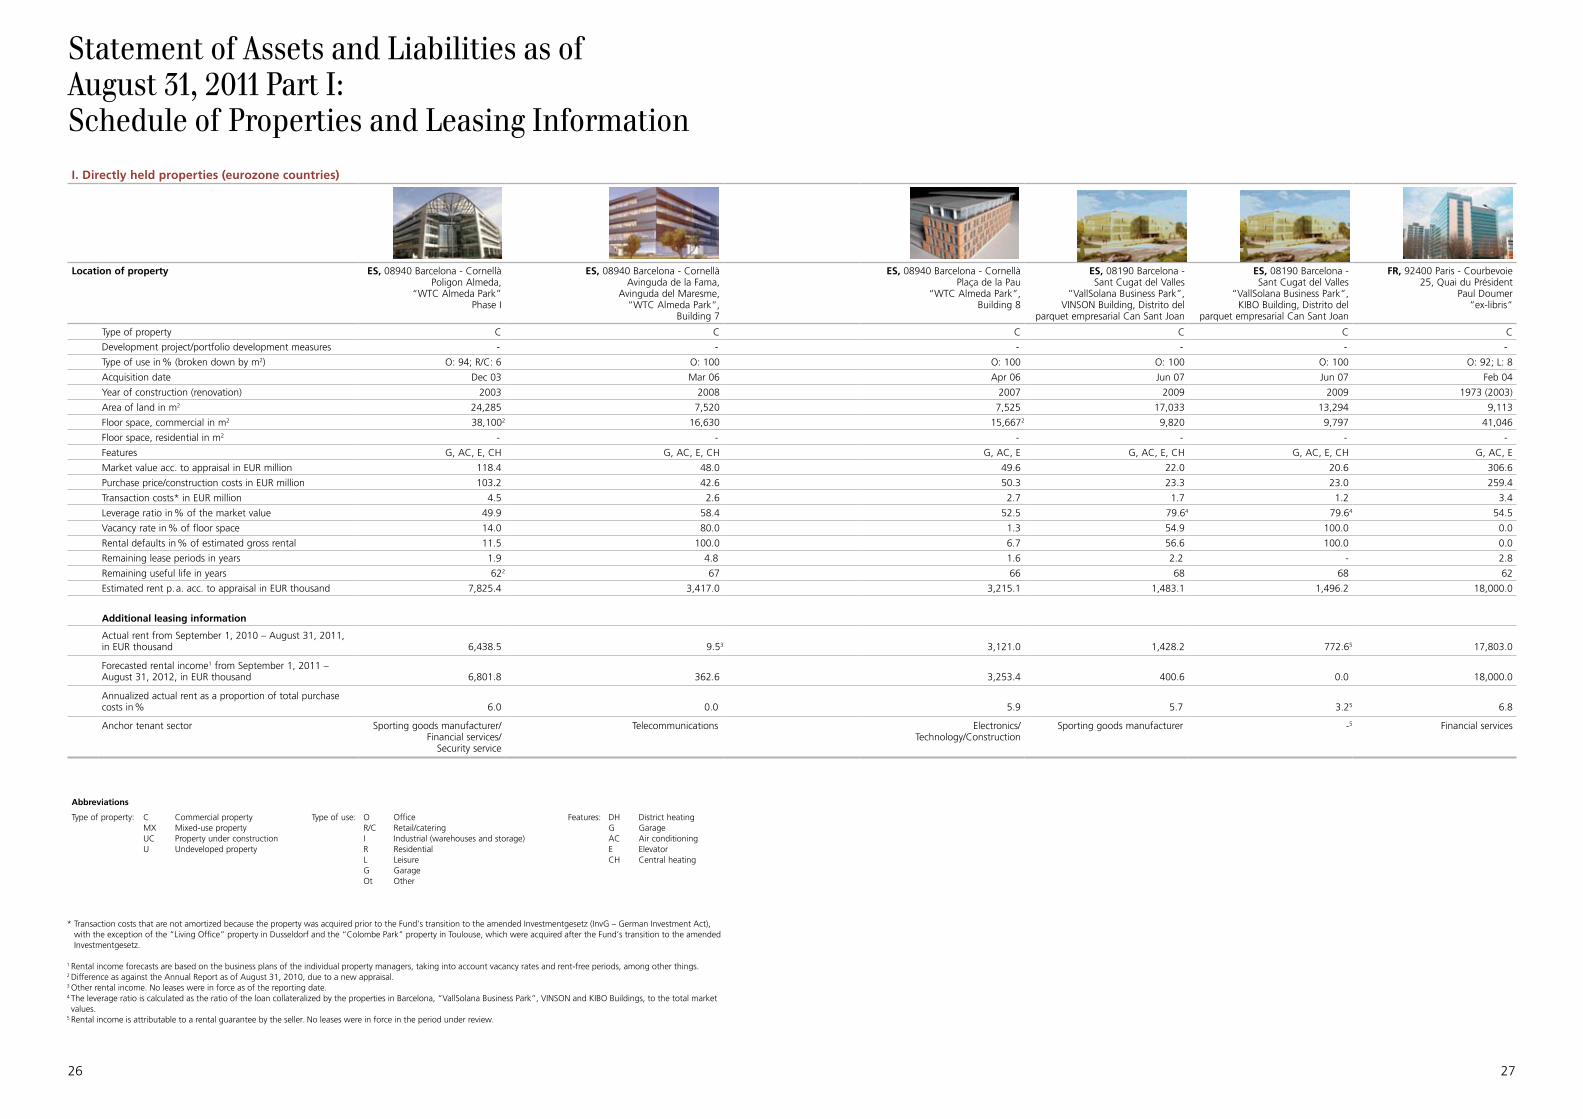
I. Directly held properties (eurozone countries)
Location of property DE, 22297 HamburgÜberseering 33a
“Überseering 33a - Patio Office“
DE, 55116 MainzRheinstr. 4 N
“Malakoff Park“, MAP
DE, 90429 NurembergFürther Str. 212,
“Innovum 212“, Part A5
DE, 90429 NurembergFürther Str. 212,
“Innovum 212“, Part C
DE, 70597 StuttgartLöffelstr. 40 - 46
“Compas”, exising building,“Compas”, new building
DE, 70499 Stuttgart -Weilimdorf
Weissacher Str. 11
DE, 82024 TaufkirchenEichenstr. 20 - 36,
Wildapfelstr. 2 - 206
“Lindenpassage“
Type of property C C C C C U MX
Development project/portfolio development measures - - - - - - -
Type of use in % (broken down by m2) O: 100 O: 84; R/C: 13; A: 3 O: 100 O: 100 O: 100 - R/C: 63; R: 23; O: 14
Acquisition date Sept 99 Sept 99 Jun 03 Jul 04 Sept 99 Oct 02 Dec 02
Year of construction (renovation) 2003 1997 1956 (2000), 2000 1970, 2002 1990, 2002 - 1972, 1990
Area of land in m2 9,2632 21,054 9,584 5,796 40,014 24,109 10,807
Floor space, commercial in m2 12,696 41,7794 24,3324 10,9114 40,6034 - 6,1454
Floor space, residential in m2 - - - - - - 1,864
Features DH, E DH, G, E DH, G, AC, E DH, G, AC, E G, AC, E - G, E, CH
Market value acc. to appraisal in EUR million 26.5 82.1 32.8 14.2 73.5 0.3 10.1
Purchase price/construction costs in EUR million 16.5 57.0 33.0 12.5 65.8 0.3 11.3
Transaction costs* in EUR million 0.1 3.3 1.8 0.6 8.0 0.0 0.6
Leverage ratio in % of the market value 46.33 - - - - - 46.33
Vacancy rate in % of floor space 0.0 10.5 0.0 6.8 12.5 - 7.9
Rental defaults in % of estimated gross rental 0.0 10.5 19.6 0.0 2.8 - 9.3
Remaining lease periods in years 6.7 3.3 3.6 6.1 2.9 - 2.7
Remaining useful life in years 62 56 52 29; 61 49; 61 - 36
Estimated rent p. a. acc. to appraisal in EUR thousand 1,772.0 6,196.1 3,026.4 1,099.2 5,076.2 - 782.5
Additional leasing information
Actual rent from September 1, 2010 – August 31, 2011, in EUR thousand 2,261.4 5,560.3 1,399.1 1,072.8 4,851.4 - 694.9
Forecasted rental income1 from September 1, 2011 – August 31, 2012, in EUR thousand 2,280.8 5,590.0 918.5 1,013.7 5,187.0 - 718.9
Annualized actual rent as a proportion of total purchase costs in % 13.6 9.2 4.0 8.2 6.6 - 5.9
Anchor tenant sector Telecommunications Renewable energy/Catering/Cosmetics
Services Education Information technology/Consulting and auditing
- Retail
Abbreviations
Type of property: CMXUCU
Commercial propertyMixed-use propertyProperty under constructionUndeveloped property
Type of use: OR/CIRLGOt
OfficeRetail/cateringIndustrial (warehouses and storage)ResidentialLeisureGarageOther
Features: DHGACECH
District heatingGarageAir conditioningElevatorCentral heating
Statement of Assets and Liabilities as ofAugust 31, 2011 Part I:Schedule of Properties and Leasing Information
26 27
* Transaction costs that are not amortized because the property was acquired prior to the Fund’s transition to the amended Investmentgesetz (InvG – German Investment Act), with the exception of the “Living Office” property in Dusseldorf and the “Colombe Park” property in Toulouse, which were acquired after the Fund’s transition to the amended Investmentgesetz.
1 Rental income forecasts are based on the business plans of the individual property managers, taking into account vacancy rates and rent-free periods, among other things.2 Difference as against the Annual Report as of August 31, 2010, due to a new appraisal.3 Other rental income. No leases were in force as of the reporting date.4 The leverage ratio is calculated as the ratio of the loan collateralized by the properties in Barcelona, “VallSolana Business Park”, VINSON and KIBO Buildings, to the total market values.
5 Rental income is attributable to a rental guarantee by the seller. No leases were in force in the period under review.
I. Directly held properties (eurozone countries)
Location of property ES, 08940 Barcelona - CornellàPoligon Almeda,
“WTC Almeda Park”Phase I
ES, 08940 Barcelona - CornellàAvinguda de la Fama,
Avinguda del Maresme,“WTC Almeda Park“,
Building 7
ES, 08940 Barcelona - CornellàPlaça de la Pau
“WTC Almeda Park”, Building 8
ES, 08190 Barcelona - Sant Cugat del Valles
“VallSolana Business Park”,VINSON Building, Distrito del
parquet empresarial Can Sant Joan
ES, 08190 Barcelona - Sant Cugat del Valles
“VallSolana Business Park”,KIBO Building, Distrito del
parquet empresarial Can Sant Joan
FR, 92400 Paris - Courbevoie25, Quai du Président
Paul Doumer“ex-libris“
Type of property C C C C C C
Development project/portfolio development measures - - - - - -
Type of use in % (broken down by m2) O: 94; R/C: 6 O: 100 O: 100 O: 100 O: 100 O: 92; L: 8
Acquisition date Dec 03 Mar 06 Apr 06 Jun 07 Jun 07 Feb 04
Year of construction (renovation) 2003 2008 2007 2009 2009 1973 (2003)
Area of land in m2 24,285 7,520 7,525 17,033 13,294 9,113
Floor space, commercial in m2 38,1002 16,630 15,6672 9,820 9,797 41,046
Floor space, residential in m2 - - - - - -
Features G, AC, E, CH G, AC, E, CH G, AC, E G, AC, E, CH G, AC, E, CH G, AC, E
Market value acc. to appraisal in EUR million 118.4 48.0 49.6 22.0 20.6 306.6
Purchase price/construction costs in EUR million 103.2 42.6 50.3 23.3 23.0 259.4
Transaction costs* in EUR million 4.5 2.6 2.7 1.7 1.2 3.4
Leverage ratio in % of the market value 49.9 58.4 52.5 79.64 79.64 54.5
Vacancy rate in % of floor space 14.0 80.0 1.3 54.9 100.0 0.0
Rental defaults in % of estimated gross rental 11.5 100.0 6.7 56.6 100.0 0.0
Remaining lease periods in years 1.9 4.8 1.6 2.2 - 2.8
Remaining useful life in years 622 67 66 68 68 62
Estimated rent p. a. acc. to appraisal in EUR thousand 7,825.4 3,417.0 3,215.1 1,483.1 1,496.2 18,000.0
Additional leasing information
Actual rent from September 1, 2010 – August 31, 2011, in EUR thousand 6,438.5 9.53 3,121.0 1,428.2 772.65 17,803.0
Forecasted rental income1 from September 1, 2011 – August 31, 2012, in EUR thousand 6,801.8 362.6 3,253.4 400.6 0.0 18,000.0
Annualized actual rent as a proportion of total purchase costs in % 6.0 0.0 5.9 5.7 3.25 6.8
Anchor tenant sector Sporting goods manufacturer/Financial services/
Security service
Telecommunications Electronics/Technology/Construction
Sporting goods manufacturer -5 Financial services
Abbreviations
Type of property: CMXUCU
Commercial propertyMixed-use propertyProperty under constructionUndeveloped property
Type of use: OR/CIRLGOt
OfficeRetail/cateringIndustrial (warehouses and storage)ResidentialLeisureGarageOther
Features: DHGACECH
District heatingGarageAir conditioningElevatorCentral heating
Statement of Assets and Liabilities as ofAugust 31, 2011 Part I:Schedule of Properties and Leasing Information
28 29
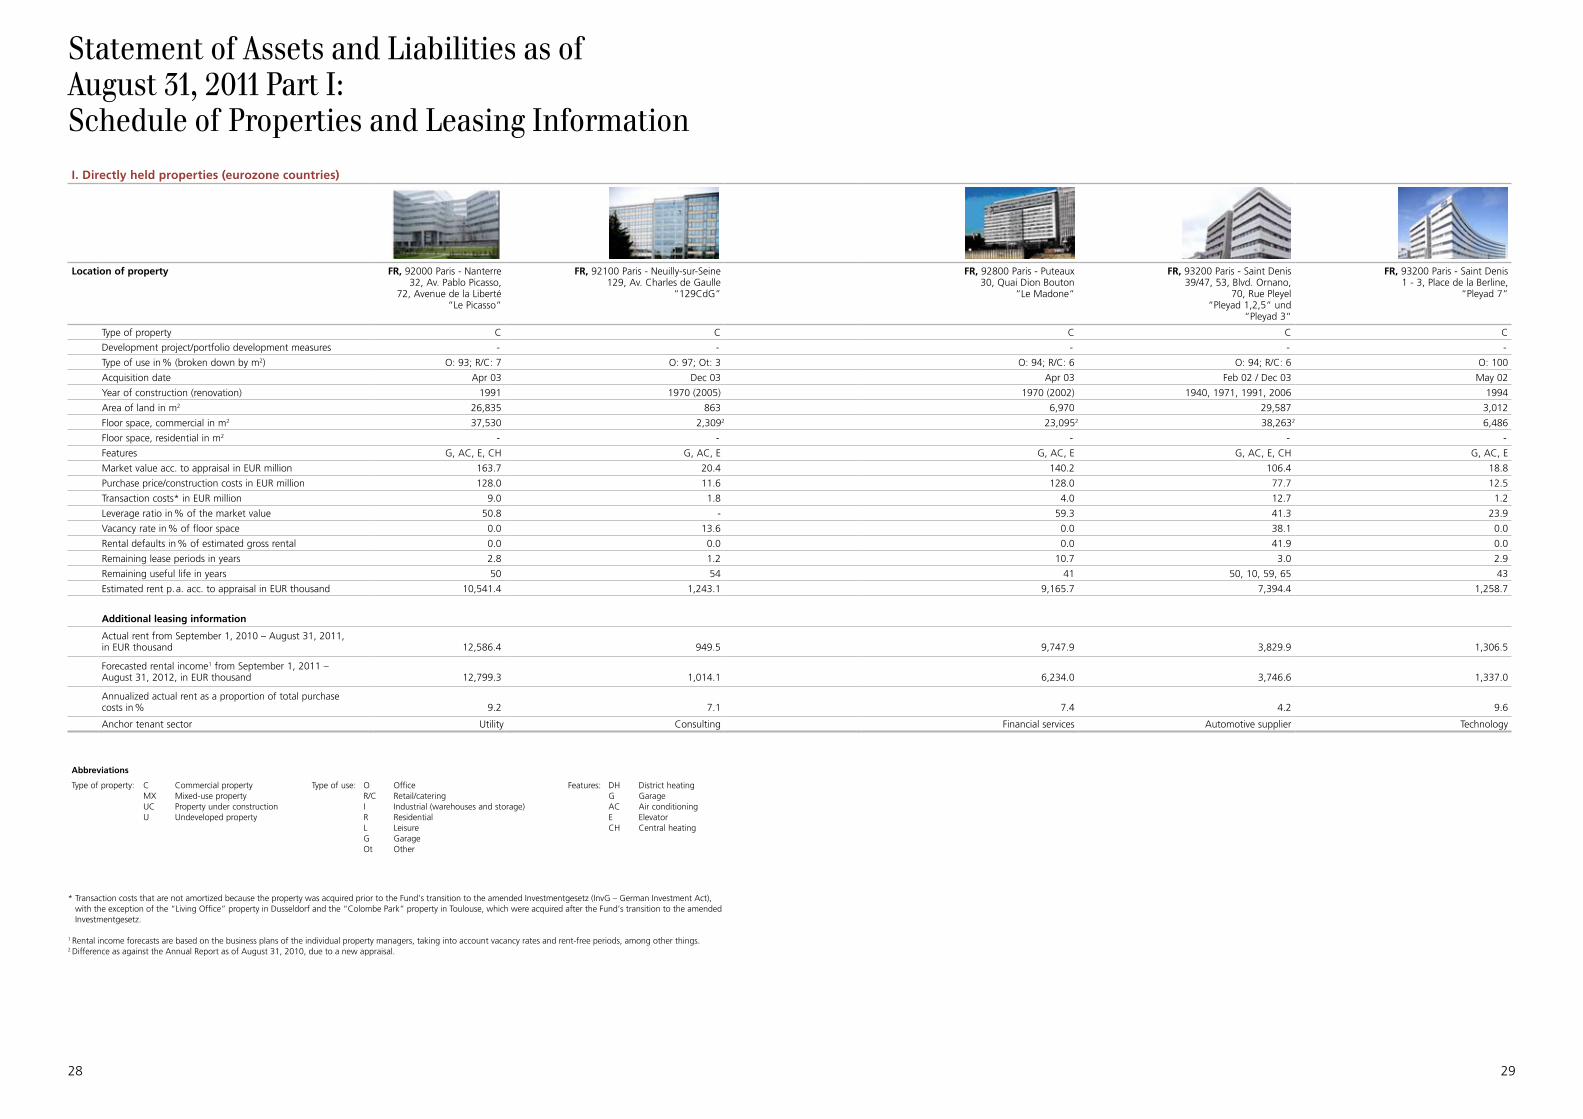
* Transaction costs that are not amortized because the property was acquired prior to the Fund’s transition to the amended Investmentgesetz (InvG – German Investment Act), with the exception of the “Living Office” property in Dusseldorf and the “Colombe Park” property in Toulouse, which were acquired after the Fund’s transition to the amended Investmentgesetz.
1 Rental income forecasts are based on the business plans of the individual property managers, taking into account vacancy rates and rent-free periods, among other things.2 Difference as against the Annual Report as of August 31, 2010, due to a new appraisal.
I. Directly held properties (eurozone countries)
Location of property FR, 92000 Paris - Nanterre32, Av. Pablo Picasso,
72, Avenue de la Liberté“Le Picasso“
FR, 92100 Paris - Neuilly-sur-Seine129, Av. Charles de Gaulle
“129CdG”
FR, 92800 Paris - Puteaux30, Quai Dion Bouton
“Le Madone“
FR, 93200 Paris - Saint Denis39/47, 53, Blvd. Ornano,
70, Rue Pleyel “Pleyad 1,2,5“ und
“Pleyad 3“
FR, 93200 Paris - Saint Denis1 - 3, Place de la Berline,
“Pleyad 7”
Type of property C C C C C
Development project/portfolio development measures - - - - -
Type of use in % (broken down by m2) O: 93; R/C: 7 O: 97; Ot: 3 O: 94; R/C: 6 O: 94; R/C: 6 O: 100
Acquisition date Apr 03 Dec 03 Apr 03 Feb 02 / Dec 03 May 02
Year of construction (renovation) 1991 1970 (2005) 1970 (2002) 1940, 1971, 1991, 2006 1994
Area of land in m2 26,835 863 6,970 29,587 3,012
Floor space, commercial in m2 37,530 2,3092 23,0952 38,2632 6,486
Floor space, residential in m2 - - - - -
Features G, AC, E, CH G, AC, E G, AC, E G, AC, E, CH G, AC, E
Market value acc. to appraisal in EUR million 163.7 20.4 140.2 106.4 18.8
Purchase price/construction costs in EUR million 128.0 11.6 128.0 77.7 12.5
Transaction costs* in EUR million 9.0 1.8 4.0 12.7 1.2
Leverage ratio in % of the market value 50.8 - 59.3 41.3 23.9
Vacancy rate in % of floor space 0.0 13.6 0.0 38.1 0.0
Rental defaults in % of estimated gross rental 0.0 0.0 0.0 41.9 0.0
Remaining lease periods in years 2.8 1.2 10.7 3.0 2.9
Remaining useful life in years 50 54 41 50, 10, 59, 65 43
Estimated rent p. a. acc. to appraisal in EUR thousand 10,541.4 1,243.1 9,165.7 7,394.4 1,258.7
Additional leasing information
Actual rent from September 1, 2010 – August 31, 2011, in EUR thousand 12,586.4 949.5 9,747.9 3,829.9 1,306.5
Forecasted rental income1 from September 1, 2011 – August 31, 2012, in EUR thousand 12,799.3 1,014.1 6,234.0 3,746.6 1,337.0
Annualized actual rent as a proportion of total purchase costs in % 9.2 7.1 7.4 4.2 9.6
Anchor tenant sector Utility Consulting Financial services Automotive supplier Technology
Abbreviations
Type of property: CMXUCU
Commercial propertyMixed-use propertyProperty under constructionUndeveloped property
Type of use: OR/CIRLGOt
OfficeRetail/cateringIndustrial (warehouses and storage)ResidentialLeisureGarageOther
Features: DHGACECH
District heatingGarageAir conditioningElevatorCentral heating
Statement of Assets and Liabilities as ofAugust 31, 2011 Part I:Schedule of Properties and Leasing Information
30 31
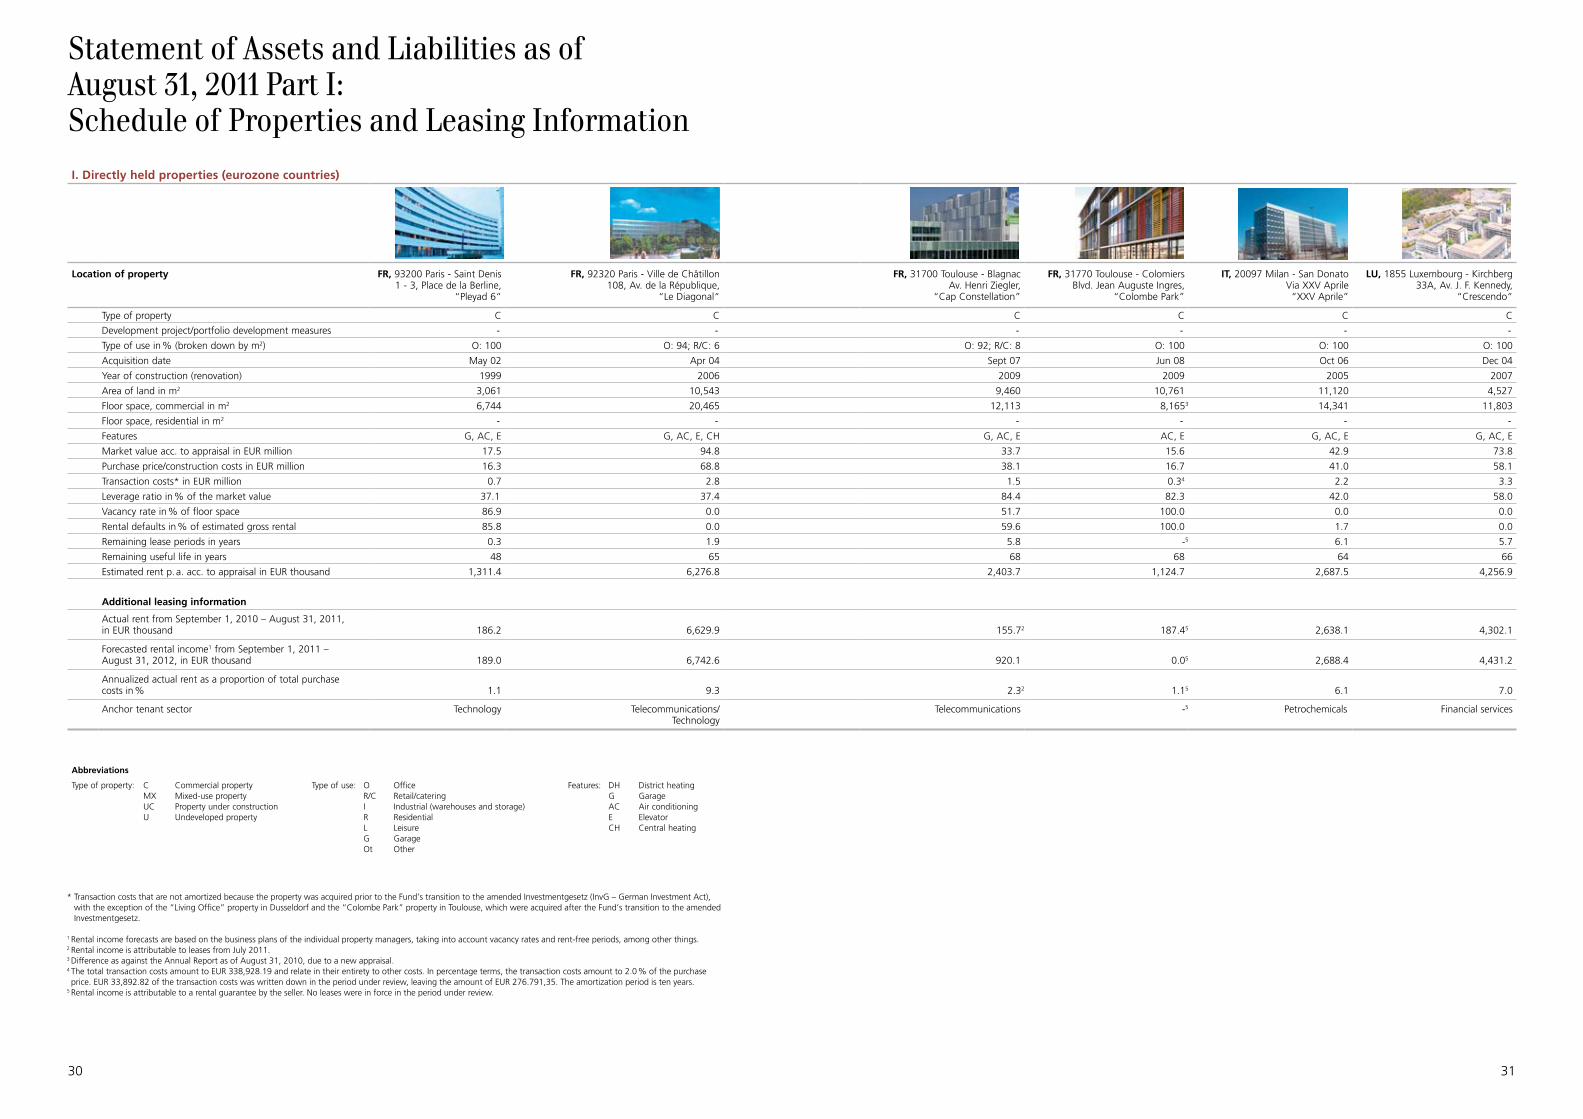
* Transaction costs that are not amortized because the property was acquired prior to the Fund’s transition to the amended Investmentgesetz (InvG – German Investment Act), with the exception of the “Living Office” property in Dusseldorf and the “Colombe Park” property in Toulouse, which were acquired after the Fund’s transition to the amended Investmentgesetz.
1 Rental income forecasts are based on the business plans of the individual property managers, taking into account vacancy rates and rent-free periods, among other things.2 Rental income is attributable to leases from July 2011.3 Difference as against the Annual Report as of August 31, 2010, due to a new appraisal.4 The total transaction costs amount to EUR 338,928.19 and relate in their entirety to other costs. In percentage terms, the transaction costs amount to 2.0 % of the purchase price. EUR 33,892.82 of the transaction costs was written down in the period under review, leaving the amount of EUR 276.791,35. The amortization period is ten years.
5 Rental income is attributable to a rental guarantee by the seller. No leases were in force in the period under review.
I. Directly held properties (eurozone countries)
Location of property FR, 93200 Paris - Saint Denis1 - 3, Place de la Berline,
“Pleyad 6“
FR, 92320 Paris - Ville de Châtillon108, Av. de la République,
“Le Diagonal“
FR, 31700 Toulouse - BlagnacAv. Henri Ziegler,
“Cap Constellation”
FR, 31770 Toulouse - ColomiersBlvd. Jean Auguste Ingres,
“Colombe Park”
IT, 20097 Milan - San DonatoVia XXV Aprile“XXV Aprile”
LU, 1855 Luxembourg - Kirchberg33A, Av. J. F. Kennedy,
“Crescendo“
Type of property C C C C C C
Development project/portfolio development measures - - - - - -
Type of use in % (broken down by m2) O: 100 O: 94; R/C: 6 O: 92; R/C: 8 O: 100 O: 100 O: 100
Acquisition date May 02 Apr 04 Sept 07 Jun 08 Oct 06 Dec 04
Year of construction (renovation) 1999 2006 2009 2009 2005 2007
Area of land in m2 3,061 10,543 9,460 10,761 11,120 4,527
Floor space, commercial in m2 6,744 20,465 12,113 8,1653 14,341 11,803
Floor space, residential in m2 - - - - - -
Features G, AC, E G, AC, E, CH G, AC, E AC, E G, AC, E G, AC, E
Market value acc. to appraisal in EUR million 17.5 94.8 33.7 15.6 42.9 73.8
Purchase price/construction costs in EUR million 16.3 68.8 38.1 16.7 41.0 58.1
Transaction costs* in EUR million 0.7 2.8 1.5 0.34 2.2 3.3
Leverage ratio in % of the market value 37.1 37.4 84.4 82.3 42.0 58.0
Vacancy rate in % of floor space 86.9 0.0 51.7 100.0 0.0 0.0
Rental defaults in % of estimated gross rental 85.8 0.0 59.6 100.0 1.7 0.0
Remaining lease periods in years 0.3 1.9 5.8 -5 6.1 5.7
Remaining useful life in years 48 65 68 68 64 66
Estimated rent p. a. acc. to appraisal in EUR thousand 1,311.4 6,276.8 2,403.7 1,124.7 2,687.5 4,256.9
Additional leasing information
Actual rent from September 1, 2010 – August 31, 2011, in EUR thousand 186.2 6,629.9 155.72 187.45 2,638.1 4,302.1
Forecasted rental income1 from September 1, 2011 – August 31, 2012, in EUR thousand 189.0 6,742.6 920.1 0.05 2,688.4 4,431.2
Annualized actual rent as a proportion of total purchase costs in % 1.1 9.3 2.32 1.15 6.1 7.0
Anchor tenant sector Technology Telecommunications/Technology
Telecommunications -5 Petrochemicals Financial services
Abbreviations
Type of property: CMXUCU
Commercial propertyMixed-use propertyProperty under constructionUndeveloped property
Type of use: OR/CIRLGOt
OfficeRetail/cateringIndustrial (warehouses and storage)ResidentialLeisureGarageOther
Features: DHGACECH
District heatingGarageAir conditioningElevatorCentral heating
Statement of Assets and Liabilities as ofAugust 31, 2011 Part I:Schedule of Properties and Leasing Information
32 33
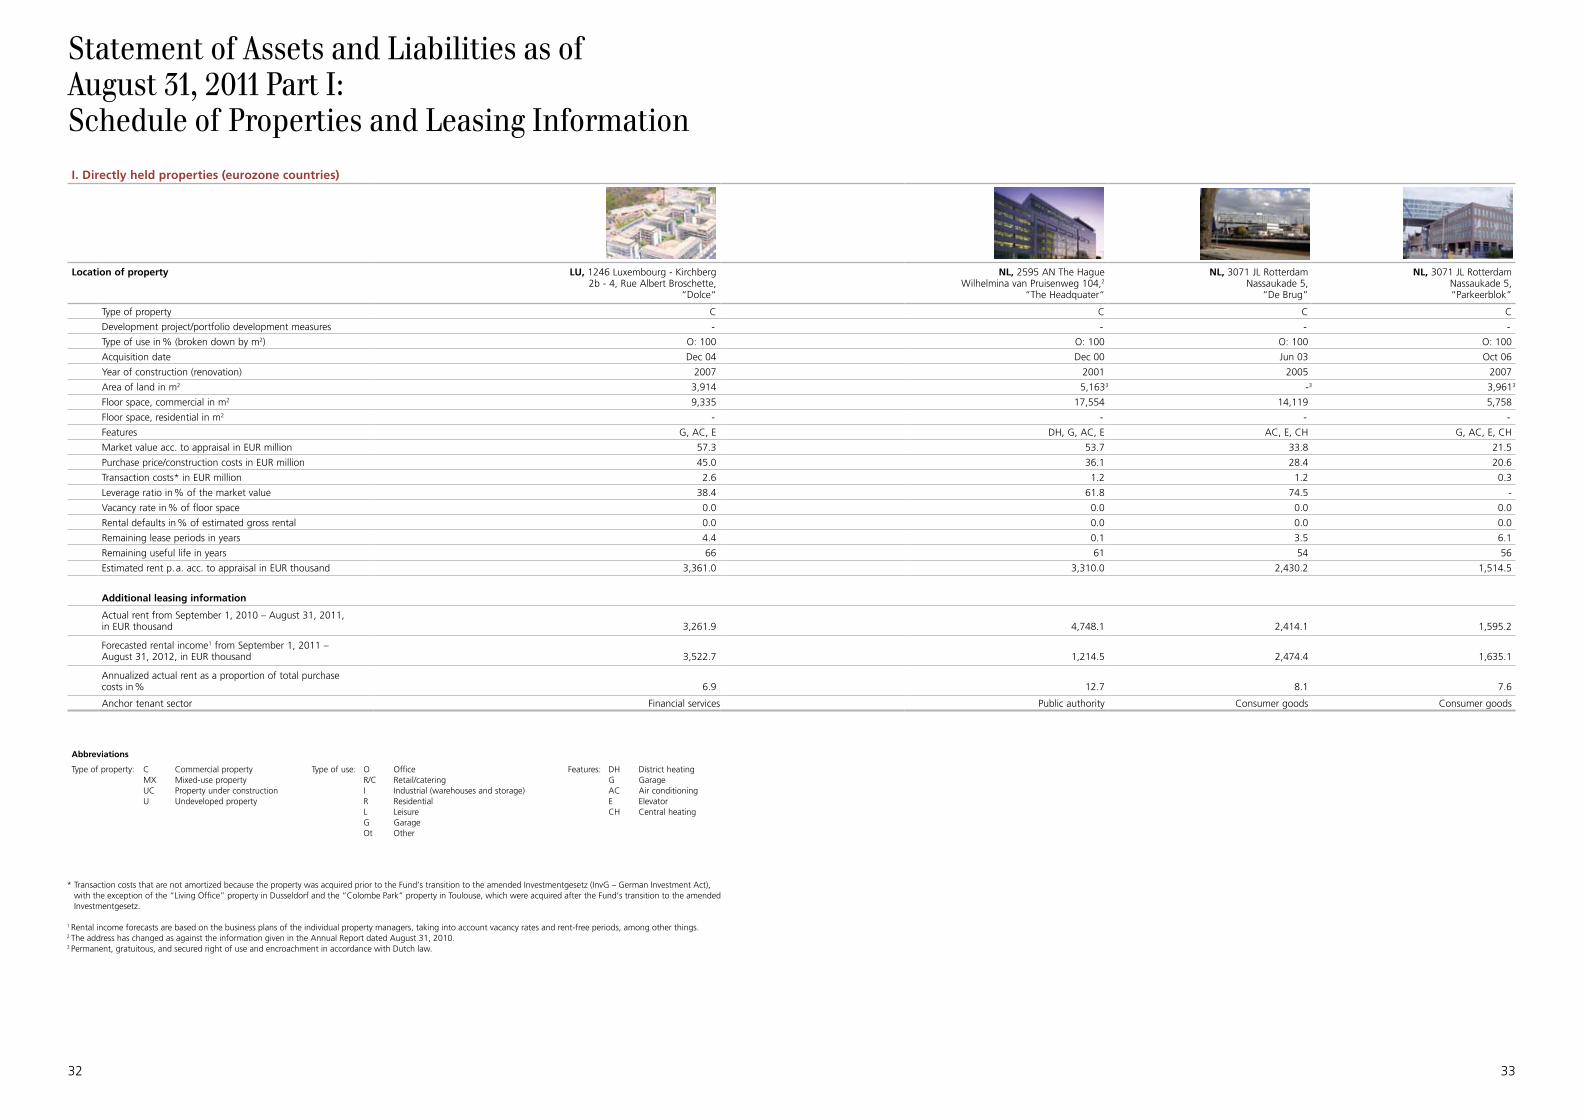
* Transaction costs that are not amortized because the property was acquired prior to the Fund’s transition to the amended Investmentgesetz (InvG – German Investment Act), with the exception of the “Living Office” property in Dusseldorf and the “Colombe Park” property in Toulouse, which were acquired after the Fund’s transition to the amended Investmentgesetz.
1 Rental income forecasts are based on the business plans of the individual property managers, taking into account vacancy rates and rent-free periods, among other things.2 The address has changed as against the information given in the Annual Report dated August 31, 2010.3 Permanent, gratuitous, and secured right of use and encroachment in accordance with Dutch law.
I. Directly held properties (eurozone countries)
Location of property LU, 1246 Luxembourg - Kirchberg2b - 4, Rue Albert Broschette,
“Dolce“
NL, 2595 AN The HagueWilhelmina van Pruisenweg 104,2
“The Headquater“
NL, 3071 JL RotterdamNassaukade 5,
“De Brug”
NL, 3071 JL RotterdamNassaukade 5,“Parkeerblok”
Type of property C C C C
Development project/portfolio development measures - - - -
Type of use in % (broken down by m2) O: 100 O: 100 O: 100 O: 100
Acquisition date Dec 04 Dec 00 Jun 03 Oct 06
Year of construction (renovation) 2007 2001 2005 2007
Area of land in m2 3,914 5,1633 -3 3,9613
Floor space, commercial in m2 9,335 17,554 14,119 5,758
Floor space, residential in m2 - - - -
Features G, AC, E DH, G, AC, E AC, E, CH G, AC, E, CH
Market value acc. to appraisal in EUR million 57.3 53.7 33.8 21.5
Purchase price/construction costs in EUR million 45.0 36.1 28.4 20.6
Transaction costs* in EUR million 2.6 1.2 1.2 0.3
Leverage ratio in % of the market value 38.4 61.8 74.5 -
Vacancy rate in % of floor space 0.0 0.0 0.0 0.0
Rental defaults in % of estimated gross rental 0.0 0.0 0.0 0.0
Remaining lease periods in years 4.4 0.1 3.5 6.1
Remaining useful life in years 66 61 54 56
Estimated rent p. a. acc. to appraisal in EUR thousand 3,361.0 3,310.0 2,430.2 1,514.5
Additional leasing information
Actual rent from September 1, 2010 – August 31, 2011, in EUR thousand 3,261.9 4,748.1 2,414.1 1,595.2
Forecasted rental income1 from September 1, 2011 – August 31, 2012, in EUR thousand 3,522.7 1,214.5 2,474.4 1,635.1
Annualized actual rent as a proportion of total purchase costs in % 6.9 12.7 8.1 7.6
Anchor tenant sector Financial services Public authority Consumer goods Consumer goods
Abbreviations
Type of property: CMXUCU
Commercial propertyMixed-use propertyProperty under constructionUndeveloped property
Type of use: OR/CIRLGOt
OfficeRetail/cateringIndustrial (warehouses and storage)ResidentialLeisureGarageOther
Features: DHGACECH
District heatingGarageAir conditioningElevatorCentral heating
Statement of Assets and Liabilities as ofAugust 31, 2011 Part I:Schedule of Properties and Leasing Information
34 35
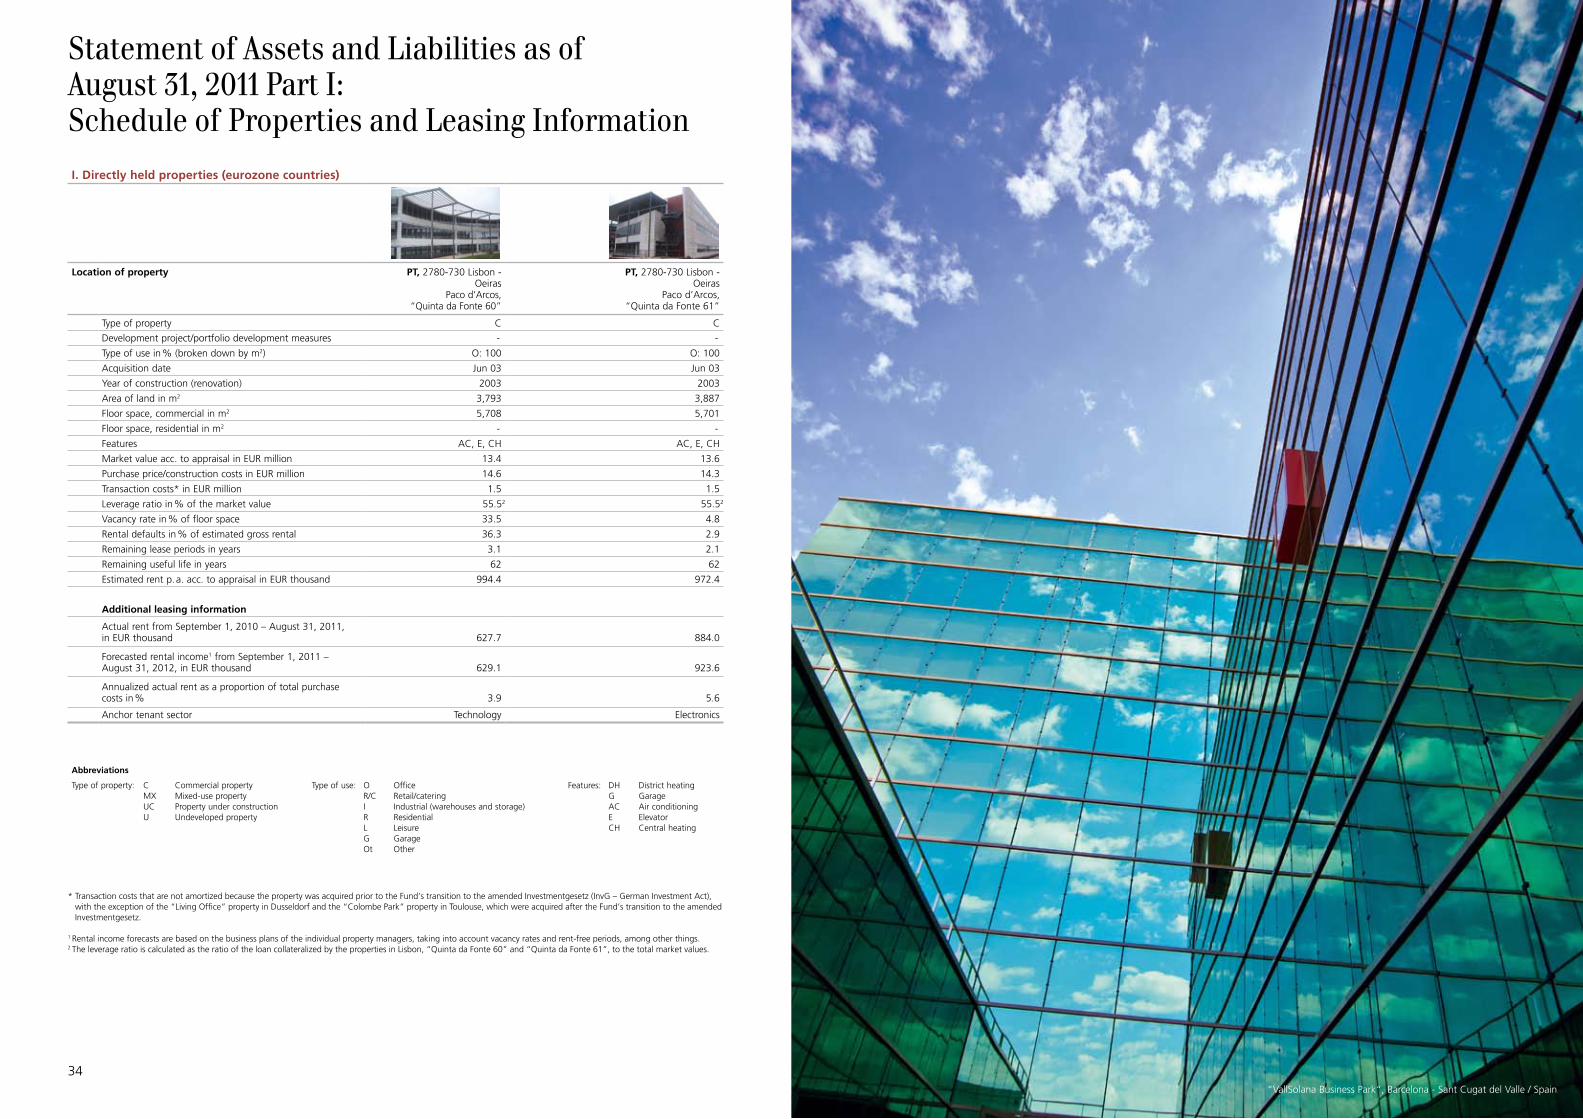
* Transaction costs that are not amortized because the property was acquired prior to the Fund’s transition to the amended Investmentgesetz (InvG – German Investment Act), with the exception of the “Living Office” property in Dusseldorf and the “Colombe Park” property in Toulouse, which were acquired after the Fund’s transition to the amended Investmentgesetz.
1 Rental income forecasts are based on the business plans of the individual property managers, taking into account vacancy rates and rent-free periods, among other things.2 The leverage ratio is calculated as the ratio of the loan collateralized by the properties in Lisbon, “Quinta da Fonte 60” and “Quinta da Fonte 61”, to the total market values.
I. Directly held properties (eurozone countries)
Location of property PT, 2780-730 Lisbon - Oeiras
Paco d’Arcos,“Quinta da Fonte 60”
PT, 2780-730 Lisbon - Oeiras
Paco d’Arcos,“Quinta da Fonte 61”
Type of property C C
Development project/portfolio development measures - -
Type of use in % (broken down by m2) O: 100 O: 100
Acquisition date Jun 03 Jun 03
Year of construction (renovation) 2003 2003
Area of land in m2 3,793 3,887
Floor space, commercial in m2 5,708 5,701
Floor space, residential in m2 - -
Features AC, E, CH AC, E, CH
Market value acc. to appraisal in EUR million 13.4 13.6
Purchase price/construction costs in EUR million 14.6 14.3
Transaction costs* in EUR million 1.5 1.5
Leverage ratio in % of the market value 55.52 55.52
Vacancy rate in % of floor space 33.5 4.8
Rental defaults in % of estimated gross rental 36.3 2.9
Remaining lease periods in years 3.1 2.1
Remaining useful life in years 62 62
Estimated rent p. a. acc. to appraisal in EUR thousand 994.4 972.4
Additional leasing information
Actual rent from September 1, 2010 – August 31, 2011, in EUR thousand 627.7 884.0
Forecasted rental income1 from September 1, 2011 – August 31, 2012, in EUR thousand 629.1 923.6
Annualized actual rent as a proportion of total purchase costs in % 3.9 5.6
Anchor tenant sector Technology Electronics
Abbreviations
Type of property: CMXUCU
Commercial propertyMixed-use propertyProperty under constructionUndeveloped property
Type of use: OR/CIRLGOt
OfficeRetail/cateringIndustrial (warehouses and storage)ResidentialLeisureGarageOther
Features: DHGACECH
District heatingGarageAir conditioningElevatorCentral heating
“VallSolana Business Park“, Barcelona - Sant Cugat del Valle / Spain
Statement of Assets and Liabilities as ofAugust 31, 2011 Part I:Schedule of Properties and Leasing Information
36 37
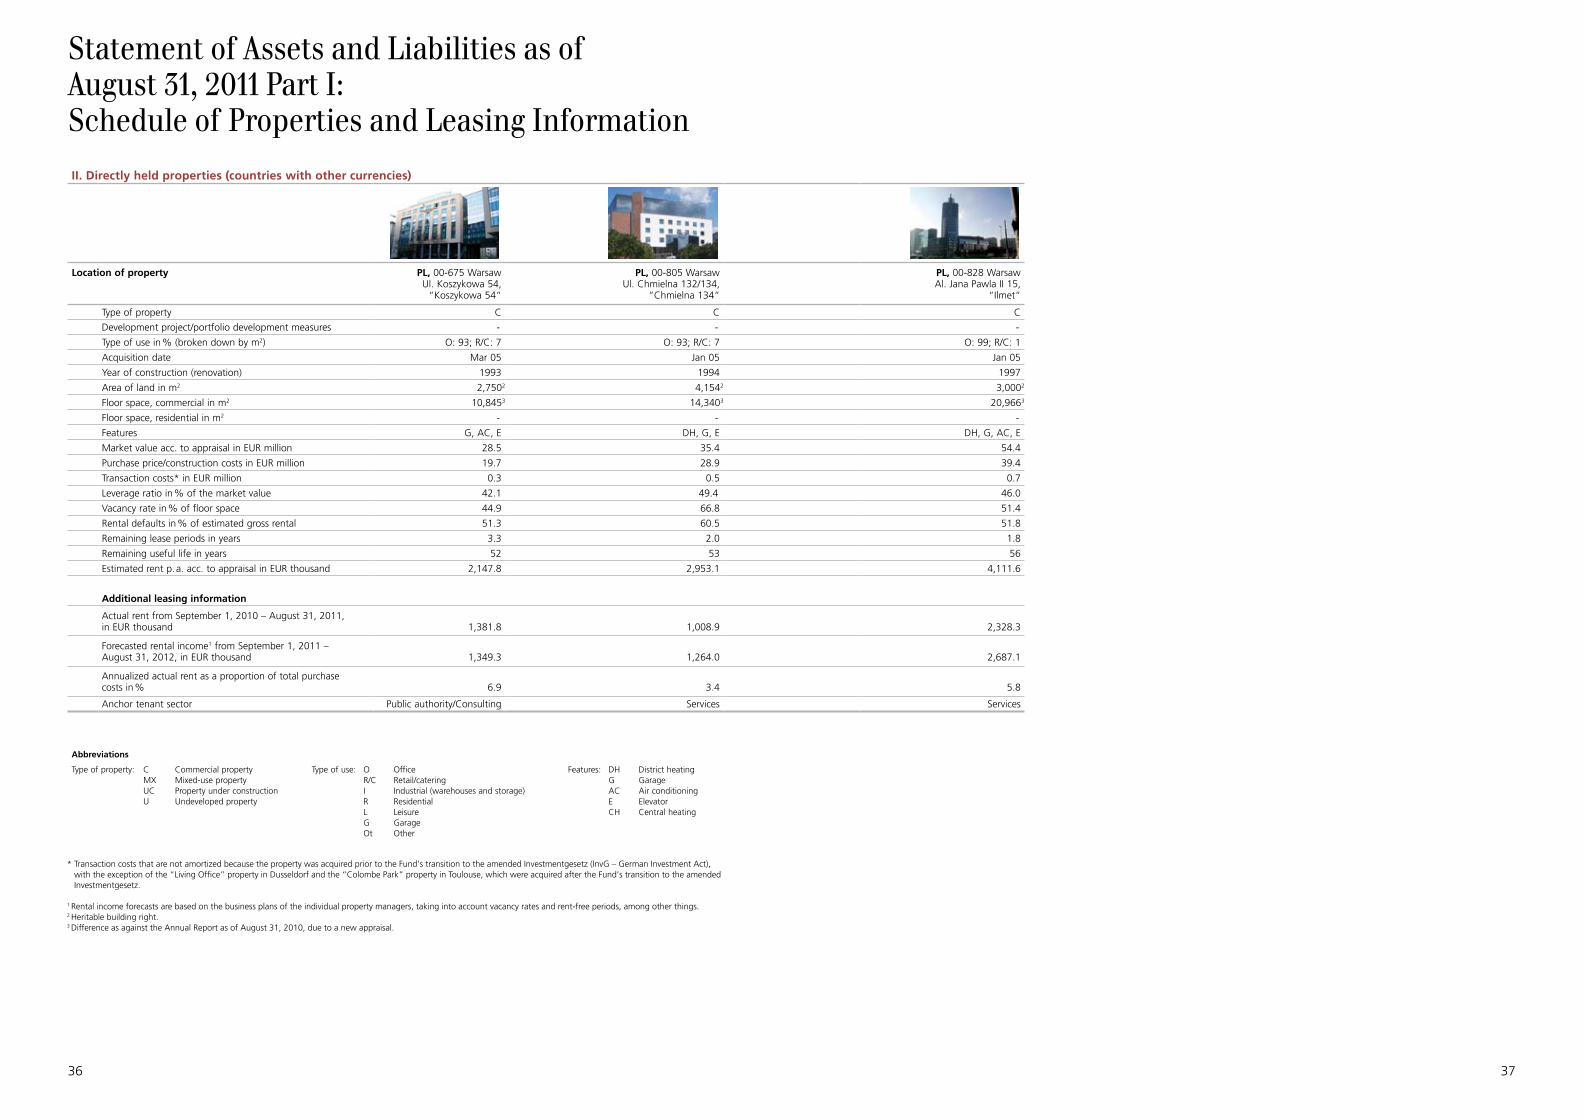
II. Directly held properties (countries with other currencies)
Location of property PL, 00-675 WarsawUl. Koszykowa 54,
“Koszykowa 54“
PL, 00-805 WarsawUl. Chmielna 132/134,
“Chmielna 134“
PL, 00-828 WarsawAl. Jana Pawla II 15,
“Ilmet“
Type of property C C C
Development project/portfolio development measures - - -
Type of use in % (broken down by m2) O: 93; R/C: 7 O: 93; R/C: 7 O: 99; R/C: 1
Acquisition date Mar 05 Jan 05 Jan 05
Year of construction (renovation) 1993 1994 1997
Area of land in m2 2,7502 4,1542 3,0002
Floor space, commercial in m2 10,8453 14,3403 20,9663
Floor space, residential in m2 - - -
Features G, AC, E DH, G, E DH, G, AC, E
Market value acc. to appraisal in EUR million 28.5 35.4 54.4
Purchase price/construction costs in EUR million 19.7 28.9 39.4
Transaction costs* in EUR million 0.3 0.5 0.7
Leverage ratio in % of the market value 42.1 49.4 46.0
Vacancy rate in % of floor space 44.9 66.8 51.4
Rental defaults in % of estimated gross rental 51.3 60.5 51.8
Remaining lease periods in years 3.3 2.0 1.8
Remaining useful life in years 52 53 56
Estimated rent p. a. acc. to appraisal in EUR thousand 2,147.8 2,953.1 4,111.6
Additional leasing information
Actual rent from September 1, 2010 – August 31, 2011, in EUR thousand 1,381.8 1,008.9 2,328.3
Forecasted rental income1 from September 1, 2011 – August 31, 2012, in EUR thousand 1,349.3 1,264.0 2,687.1
Annualized actual rent as a proportion of total purchase costs in % 6.9 3.4 5.8
Anchor tenant sector Public authority/Consulting Services Services
Abbreviations
Type of property: CMXUCU
Commercial propertyMixed-use propertyProperty under constructionUndeveloped property
Type of use: OR/CIRLGOt
OfficeRetail/cateringIndustrial (warehouses and storage)ResidentialLeisureGarageOther
Features: DHGACECH
District heatingGarageAir conditioningElevatorCentral heating
* Transaction costs that are not amortized because the property was acquired prior to the Fund’s transition to the amended Investmentgesetz (InvG – German Investment Act), with the exception of the “Living Office” property in Dusseldorf and the “Colombe Park” property in Toulouse, which were acquired after the Fund’s transition to the amended Investmentgesetz.
1 Rental income forecasts are based on the business plans of the individual property managers, taking into account vacancy rates and rent-free periods, among other things.2 Heritable building right.3 Difference as against the Annual Report as of August 31, 2010, due to a new appraisal.
Statement of Assets and Liabilities as ofAugust 31, 2011 Part I:Schedule of Properties and Leasing Information
38 39
* Transaction costs that are not amortized because the property was acquired prior to the Fund’s transition to the amended Investmentgesetz (InvG – German Investment Act), with the exception of the “Living Office” property in Dusseldorf and the “Colombe Park” property in Toulouse, which were acquired after the Fund’s transition to the amended Investmentgesetz.
1 Rental income forecasts are based on the business plans of the individual property managers, taking into account vacancy rates and rent-free periods, among other things.
2 The company owns the “FAC 1” and “FAC 2” properties. 3 Partial heritable building right for 8,559 m². 4 Difference as against the Annual Report as of August 31, 2010, due to a new appraisal. 5 The figures given are for 100 %. 6 Proportional figure based on size of equity interest. 7 Partial heritable building right for 3,951 m². 8 0.01 % of the equity is held in a trust; as a result, 100.0 % is allocated constructively to the Fund. 9 Construction projects completed during the fiscal year are only included in the vacancy rate after a 12-month waiting period.10 No leases were in force as of the reporting date.
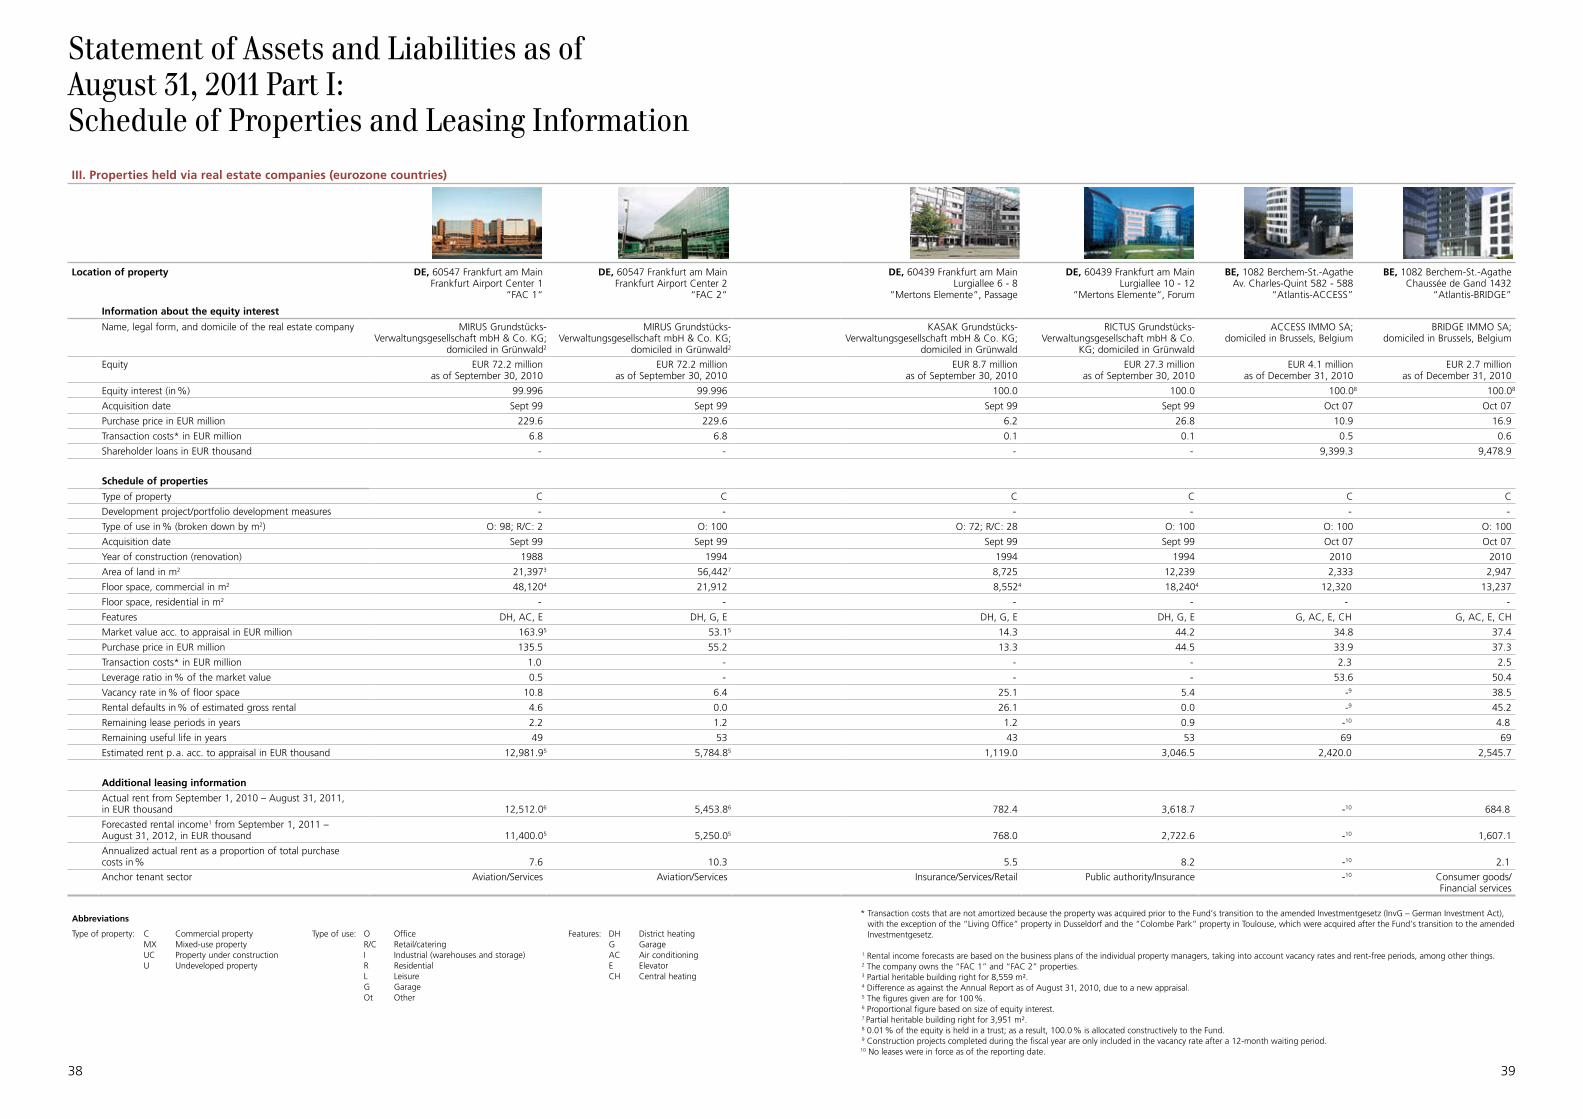
III. Properties held via real estate companies (eurozone countries)
Location of property DE, 60547 Frankfurt am MainFrankfurt Airport Center 1
“FAC 1“
DE, 60547 Frankfurt am MainFrankfurt Airport Center 2
“FAC 2“
DE, 60439 Frankfurt am MainLurgiallee 6 - 8
“Mertons Elemente“, Passage
DE, 60439 Frankfurt am MainLurgiallee 10 - 12
“Mertons Elemente“, Forum
BE, 1082 Berchem-St.-AgatheAv. Charles-Quint 582 - 588
“Atlantis-ACCESS”
BE, 1082 Berchem-St.-AgatheChaussée de Gand 1432
“Atlantis-BRIDGE”
Information about the equity interest
Name, legal form, and domicile of the real estate company MIRUS Grundstücks-Verwaltungsgesellschaft mbH & Co. KG;
domiciled in Grünwald2
MIRUS Grundstücks-Verwaltungsgesellschaft mbH & Co. KG;
domiciled in Grünwald2
KASAK Grundstücks-Verwaltungsgesellschaft mbH & Co. KG;
domiciled in Grünwald
RICTUS Grundstücks-Verwaltungsgesellschaft mbH & Co.
KG; domiciled in Grünwald
ACCESS IMMO SA;domiciled in Brussels, Belgium
BRIDGE IMMO SA;domiciled in Brussels, Belgium
Equity EUR 72.2 millionas of September 30, 2010
EUR 72.2 millionas of September 30, 2010
EUR 8.7 millionas of September 30, 2010
EUR 27.3 millionas of September 30, 2010
EUR 4.1 millionas of December 31, 2010
EUR 2.7 millionas of December 31, 2010
Equity interest (in %) 99.996 99.996 100.0 100.0 100.08 100.08
Acquisition date Sept 99 Sept 99 Sept 99 Sept 99 Oct 07 Oct 07
Purchase price in EUR million 229.6 229.6 6.2 26.8 10.9 16.9
Transaction costs* in EUR million 6.8 6.8 0.1 0.1 0.5 0.6
Shareholder loans in EUR thousand - - - - 9,399.3 9,478.9
Schedule of properties
Type of property C C C C C C
Development project/portfolio development measures - - - - - -
Type of use in % (broken down by m2) O: 98; R/C: 2 O: 100 O: 72; R/C: 28 O: 100 O: 100 O: 100
Acquisition date Sept 99 Sept 99 Sept 99 Sept 99 Oct 07 Oct 07
Year of construction (renovation) 1988 1994 1994 1994 2010 2010
Area of land in m2 21,3973 56,4427 8,725 12,239 2,333 2,947
Floor space, commercial in m2 48,1204 21,912 8,5524 18,2404 12,320 13,237
Floor space, residential in m2 - - - - - -
Features DH, AC, E DH, G, E DH, G, E DH, G, E G, AC, E, CH G, AC, E, CH
Market value acc. to appraisal in EUR million 163.95 53.15 14.3 44.2 34.8 37.4
Purchase price in EUR million 135.5 55.2 13.3 44.5 33.9 37.3
Transaction costs* in EUR million 1.0 - - - 2.3 2.5
Leverage ratio in % of the market value 0.5 - - - 53.6 50.4
Vacancy rate in % of floor space 10.8 6.4 25.1 5.4 -9 38.5
Rental defaults in % of estimated gross rental 4.6 0.0 26.1 0.0 -9 45.2
Remaining lease periods in years 2.2 1.2 1.2 0.9 -10 4.8
Remaining useful life in years 49 53 43 53 69 69
Estimated rent p. a. acc. to appraisal in EUR thousand 12,981.95 5,784.85 1,119.0 3,046.5 2,420.0 2,545.7
Additional leasing information
Actual rent from September 1, 2010 – August 31, 2011, in EUR thousand 12,512.06 5,453.86 782.4 3,618.7 -10 684.8
Forecasted rental income1 from September 1, 2011 – August 31, 2012, in EUR thousand 11,400.05 5,250.05 768.0 2,722.6 -10 1,607.1
Annualized actual rent as a proportion of total purchase costs in % 7.6 10.3 5.5 8.2 -10 2.1
Anchor tenant sector Aviation/Services Aviation/Services Insurance/Services/Retail Public authority/Insurance -10 Consumer goods/Financial services
Abbreviations
Type of property: CMXUCU
Commercial propertyMixed-use propertyProperty under constructionUndeveloped property
Type of use: OR/CIRLGOt
OfficeRetail/cateringIndustrial (warehouses and storage)ResidentialLeisureGarageOther
Features: DHGACECH
District heatingGarageAir conditioningElevatorCentral heating
Statement of Assets and Liabilities as ofAugust 31, 2011 Part I:Schedule of Properties and Leasing Information
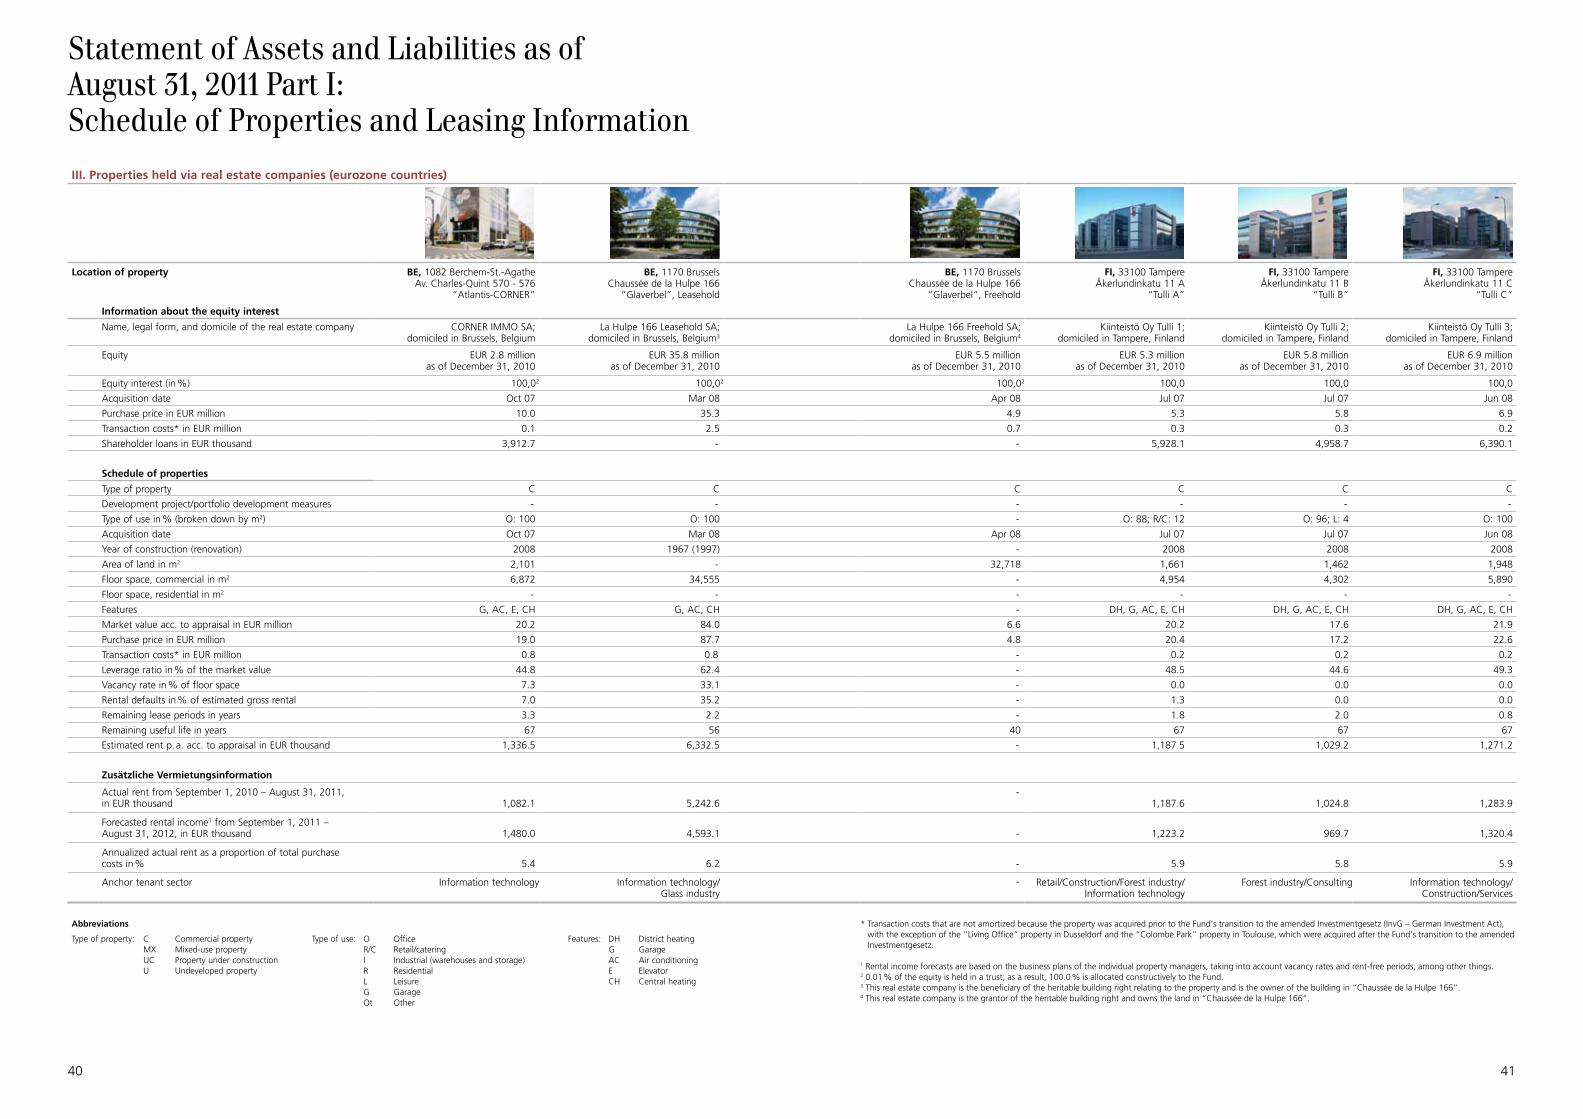
40 41
* Transaction costs that are not amortized because the property was acquired prior to the Fund’s transition to the amended Investmentgesetz (InvG – German Investment Act), with the exception of the “Living Office” property in Dusseldorf and the “Colombe Park” property in Toulouse, which were acquired after the Fund’s transition to the amended Investmentgesetz.
1 Rental income forecasts are based on the business plans of the individual property managers, taking into account vacancy rates and rent-free periods, among other things.
2 0.01 % of the equity is held in a trust; as a result, 100.0 % is allocated constructively to the Fund.3 This real estate company is the beneficiary of the heritable building right relating to the property and is the owner of the building in “Chaussée de la Hulpe 166”.4 This real estate company is the grantor of the heritable building right and owns the land in “Chaussée de la Hulpe 166”.
III. Properties held via real estate companies (eurozone countries)
Location of property BE, 1082 Berchem-St.-AgatheAv. Charles-Quint 570 - 576
“Atlantis-CORNER”
BE, 1170 BrusselsChaussée de la Hulpe 166
“Glaverbel”, Leasehold
BE, 1170 BrusselsChaussée de la Hulpe 166
“Glaverbel“, Freehold
FI, 33100 TampereÅkerlundinkatu 11 A
“Tulli A”
FI, 33100 TampereÅkerlundinkatu 11 B
“Tulli B”
FI, 33100 TampereÅkerlundinkatu 11 C
“Tulli C“
Information about the equity interest
Name, legal form, and domicile of the real estate company CORNER IMMO SA;domiciled in Brussels, Belgium
La Hulpe 166 Leasehold SA;domiciled in Brussels, Belgium3
La Hulpe 166 Freehold SA;domiciled in Brussels, Belgium4
Kiinteistö Oy Tulli 1; domiciled in Tampere, Finland
Kiinteistö Oy Tulli 2; domiciled in Tampere, Finland
Kiinteistö Oy Tulli 3; domiciled in Tampere, Finland
Equity EUR 2.8 millionas of December 31, 2010
EUR 35.8 millionas of December 31, 2010
EUR 5.5 millionas of December 31, 2010
EUR 5.3 millionas of December 31, 2010
EUR 5.8 millionas of December 31, 2010
EUR 6.9 millionas of December 31, 2010
Equity interest (in %) 100,02 100,02 100,02 100,0 100,0 100,0
Acquisition date Oct 07 Mar 08 Apr 08 Jul 07 Jul 07 Jun 08
Purchase price in EUR million 10.0 35.3 4.9 5.3 5.8 6.9
Transaction costs* in EUR million 0.1 2.5 0.7 0.3 0.3 0.2
Shareholder loans in EUR thousand 3,912.7 - - 5,928.1 4,958.7 6,390.1
Schedule of properties
Type of property C C C C C C
Development project/portfolio development measures - - - - - -
Type of use in % (broken down by m2) O: 100 O: 100 - O: 88; R/C: 12 O: 96; L: 4 O: 100
Acquisition date Oct 07 Mar 08 Apr 08 Jul 07 Jul 07 Jun 08
Year of construction (renovation) 2008 1967 (1997) - 2008 2008 2008
Area of land in m2 2,101 - 32,718 1,661 1,462 1,948
Floor space, commercial in m2 6,872 34,555 - 4,954 4,302 5,890
Floor space, residential in m2 - - - - - -
Features G, AC, E, CH G, AC, CH - DH, G, AC, E, CH DH, G, AC, E, CH DH, G, AC, E, CH
Market value acc. to appraisal in EUR million 20.2 84.0 6.6 20.2 17.6 21.9
Purchase price in EUR million 19.0 87.7 4.8 20.4 17.2 22.6
Transaction costs* in EUR million 0.8 0.8 - 0.2 0.2 0.2
Leverage ratio in % of the market value 44.8 62.4 - 48.5 44.6 49.3
Vacancy rate in % of floor space 7.3 33.1 - 0.0 0.0 0.0
Rental defaults in % of estimated gross rental 7.0 35.2 - 1.3 0.0 0.0
Remaining lease periods in years 3.3 2.2 - 1.8 2.0 0.8
Remaining useful life in years 67 56 40 67 67 67
Estimated rent p. a. acc. to appraisal in EUR thousand 1,336.5 6,332.5 - 1,187.5 1,029.2 1,271.2
Zusätzliche Vermietungsinformation
Actual rent from September 1, 2010 – August 31, 2011, in EUR thousand 1,082.1 5,242.6
-1,187.6 1,024.8 1,283.9
Forecasted rental income1 from September 1, 2011 – August 31, 2012, in EUR thousand 1,480.0 4,593.1 - 1,223.2 969.7 1,320.4
Annualized actual rent as a proportion of total purchase costs in % 5.4 6.2 - 5.9 5.8 5.9
Anchor tenant sector Information technology Information technology/Glass industry
- Retail/Construction/Forest industry/Information technology
Forest industry/Consulting Information technology/Construction/Services
Abbreviations
Type of property: CMXUCU
Commercial propertyMixed-use propertyProperty under constructionUndeveloped property
Type of use: OR/CIRLGOt
OfficeRetail/cateringIndustrial (warehouses and storage)ResidentialLeisureGarageOther
Features: DHGACECH
District heatingGarageAir conditioningElevatorCentral heating
Statement of Assets and Liabilities as ofAugust 31, 2011 Part I:Schedule of Properties and Leasing Information
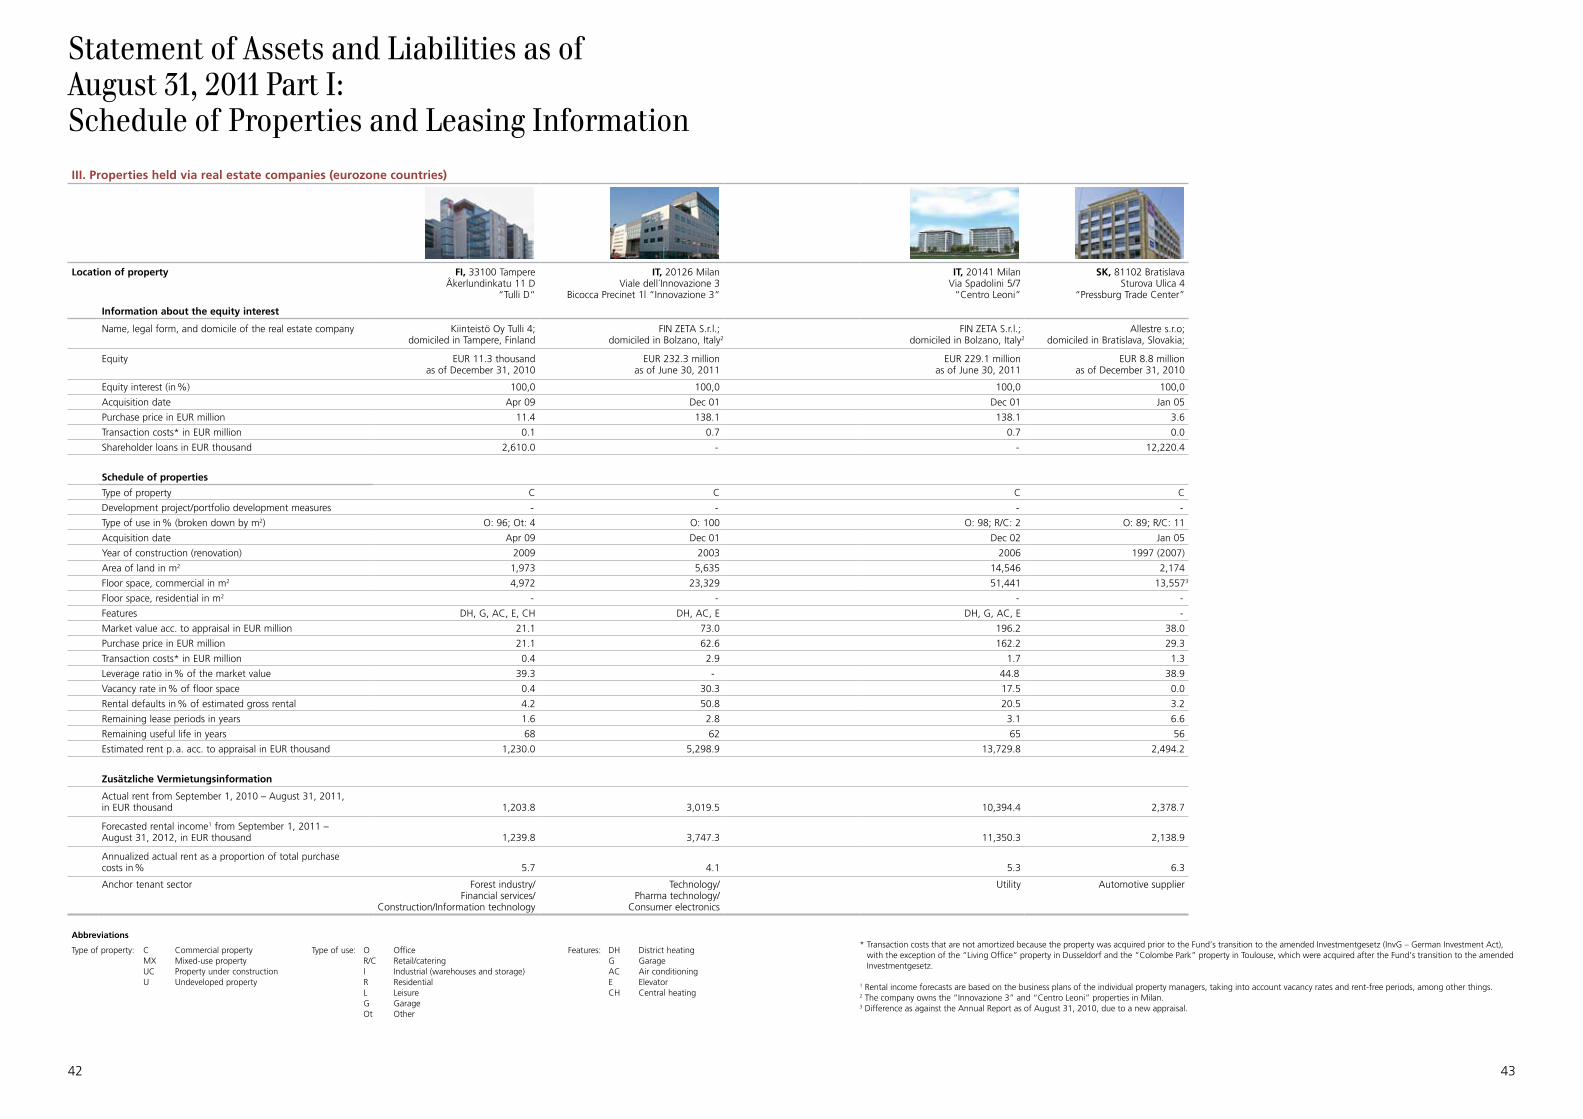
42 43
* Transaction costs that are not amortized because the property was acquired prior to the Fund’s transition to the amended Investmentgesetz (InvG – German Investment Act), with the exception of the “Living Office” property in Dusseldorf and the “Colombe Park” property in Toulouse, which were acquired after the Fund’s transition to the amended Investmentgesetz.
1 Rental income forecasts are based on the business plans of the individual property managers, taking into account vacancy rates and rent-free periods, among other things.
2 The company owns the “Innovazione 3” and “Centro Leoni” properties in Milan.3 Difference as against the Annual Report as of August 31, 2010, due to a new appraisal.
III. Properties held via real estate companies (eurozone countries)
Location of property FI, 33100 TampereÅkerlundinkatu 11 D
“Tulli D“
IT, 20126 MilanViale dell´Innovazione 3
Bicocca Precinet 1l “Innovazione 3“
IT, 20141 MilanVia Spadolini 5/7
“Centro Leoni”
SK, 81102 BratislavaSturova Ulica 4
“Pressburg Trade Center”
Information about the equity interest
Name, legal form, and domicile of the real estate company Kiinteistö Oy Tulli 4; domiciled in Tampere, Finland
FIN ZETA S.r.l.; domiciled in Bolzano, Italy2
FIN ZETA S.r.l.; domiciled in Bolzano, Italy2
Allestre s.r.o;domiciled in Bratislava, Slovakia;
Equity EUR 11.3 thousandas of December 31, 2010
EUR 232.3 millionas of June 30, 2011
EUR 229.1 millionas of June 30, 2011
EUR 8.8 millionas of December 31, 2010
Equity interest (in %) 100,0 100,0 100,0 100,0
Acquisition date Apr 09 Dec 01 Dec 01 Jan 05
Purchase price in EUR million 11.4 138.1 138.1 3.6
Transaction costs* in EUR million 0.1 0.7 0.7 0.0
Shareholder loans in EUR thousand 2,610.0 - - 12,220.4
Schedule of properties
Type of property C C C C
Development project/portfolio development measures - - - -
Type of use in % (broken down by m2) O: 96; Ot: 4 O: 100 O: 98; R/C: 2 O: 89; R/C: 11
Acquisition date Apr 09 Dec 01 Dec 02 Jan 05
Year of construction (renovation) 2009 2003 2006 1997 (2007)
Area of land in m2 1,973 5,635 14,546 2,174
Floor space, commercial in m2 4,972 23,329 51,441 13,5573
Floor space, residential in m2 - - - -
Features DH, G, AC, E, CH DH, AC, E DH, G, AC, E -
Market value acc. to appraisal in EUR million 21.1 73.0 196.2 38.0
Purchase price in EUR million 21.1 62.6 162.2 29.3
Transaction costs* in EUR million 0.4 2.9 1.7 1.3
Leverage ratio in % of the market value 39.3 - 44.8 38.9
Vacancy rate in % of floor space 0.4 30.3 17.5 0.0
Rental defaults in % of estimated gross rental 4.2 50.8 20.5 3.2
Remaining lease periods in years 1.6 2.8 3.1 6.6
Remaining useful life in years 68 62 65 56
Estimated rent p. a. acc. to appraisal in EUR thousand 1,230.0 5,298.9 13,729.8 2,494.2
Zusätzliche Vermietungsinformation
Actual rent from September 1, 2010 – August 31, 2011, in EUR thousand 1,203.8 3,019.5 10,394.4 2,378.7
Forecasted rental income1 from September 1, 2011 – August 31, 2012, in EUR thousand 1,239.8 3,747.3 11,350.3 2,138.9
Annualized actual rent as a proportion of total purchase costs in % 5.7 4.1 5.3 6.3
Anchor tenant sector Forest industry/Financial services/
Construction/Information technology
Technology/Pharma technology/
Consumer electronics
Utility Automotive supplier
Abbreviations
Type of property: CMXUCU
Commercial propertyMixed-use propertyProperty under constructionUndeveloped property
Type of use: OR/CIRLGOt
OfficeRetail/cateringIndustrial (warehouses and storage)ResidentialLeisureGarageOther
Features: DHGACECH
District heatingGarageAir conditioningElevatorCentral heating
Statement of Assets and Liabilities as ofAugust 31, 2011 Part I:Schedule of Properties and Leasing Information
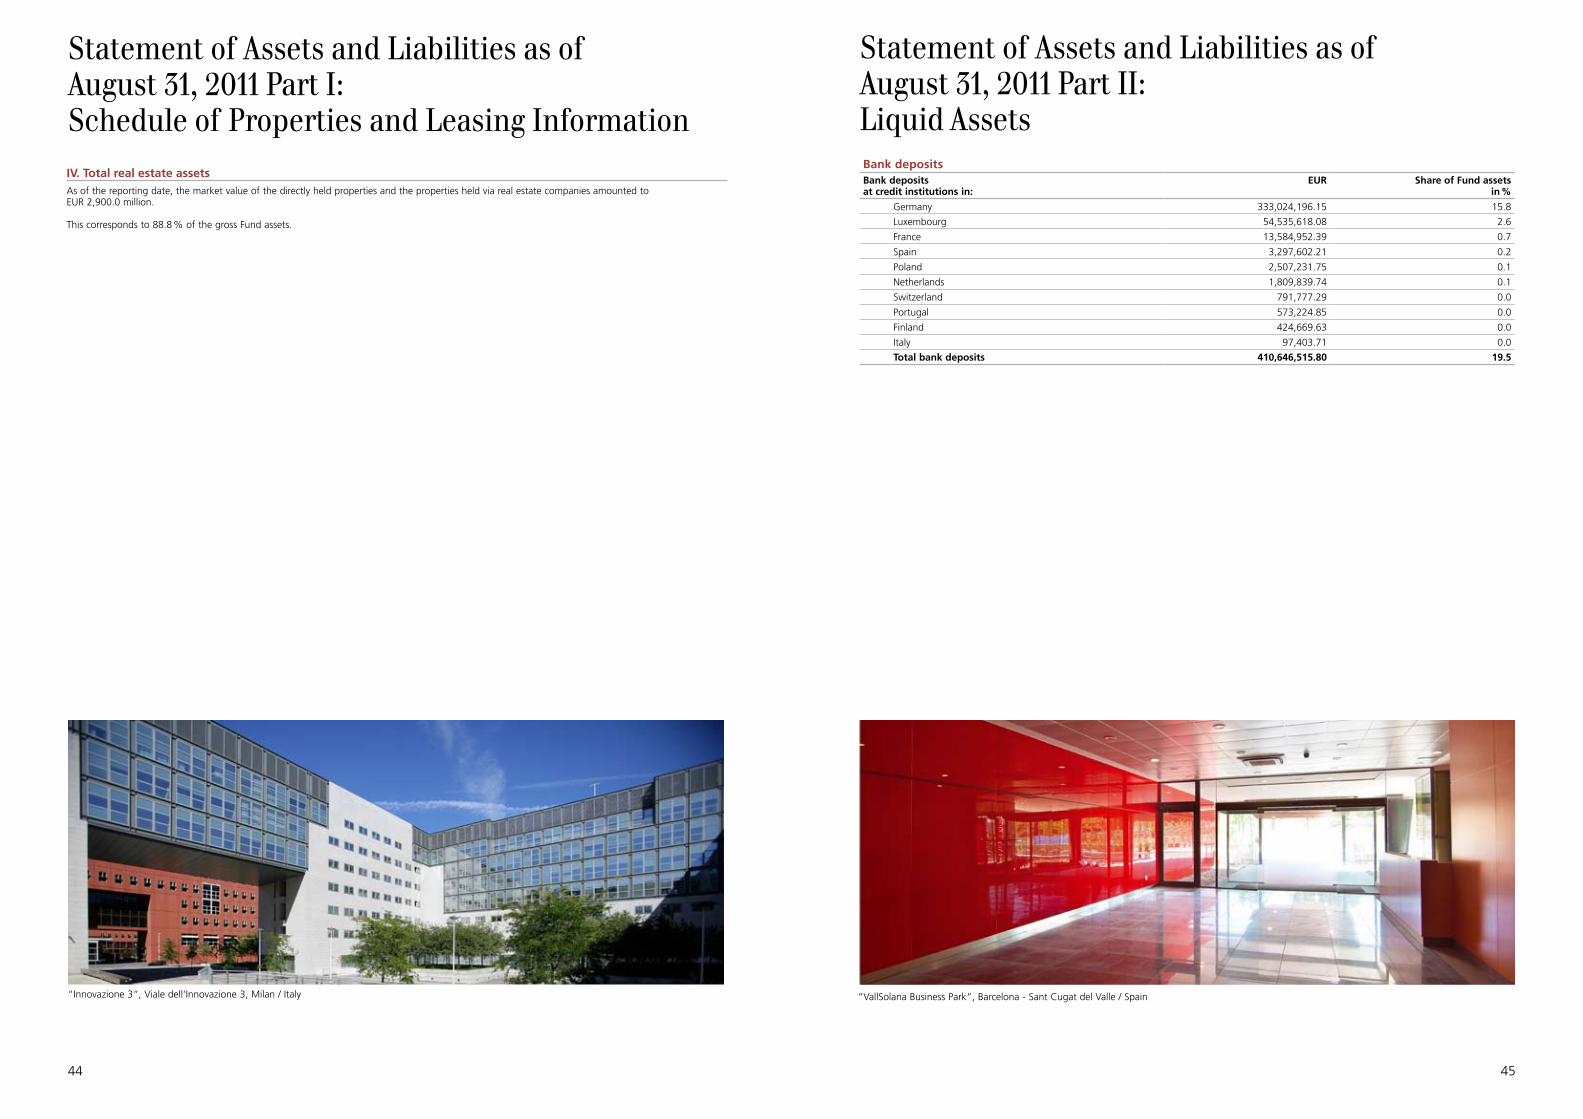
44 45
IV. Total real estate assets As of the reporting date, the market value of the directly held properties and the properties held via real estate companies amounted to EUR 2,900.0 million.
This corresponds to 88.8 % of the gross Fund assets.
“Innovazione 3“, Viale dell‘Innovazione 3, Milan / Italy
Statement of Assets and Liabilities as of August 31, 2011 Part II: Liquid AssetsBank depositsBank depositsat credit institutions in:
EUR Share of Fund assets in %
Germany 333,024,196.15 15.8
Luxembourg 54,535,618.08 2.6
France 13,584,952.39 0.7
Spain 3,297,602.21 0.2
Poland 2,507,231.75 0.1
Netherlands 1,809,839.74 0.1
Switzerland 791,777.29 0.0
Portugal 573,224.85 0.0
Finland 424,669.63 0.0
Italy 97,403.71 0.0
Total bank deposits 410,646,515.80 19.5
“VallSolana Business Park“, Barcelona - Sant Cugat del Valle / Spain
Statement of Assets and Liabilities as ofAugust 31, 2011 Part I:Schedule of Properties and Leasing Information
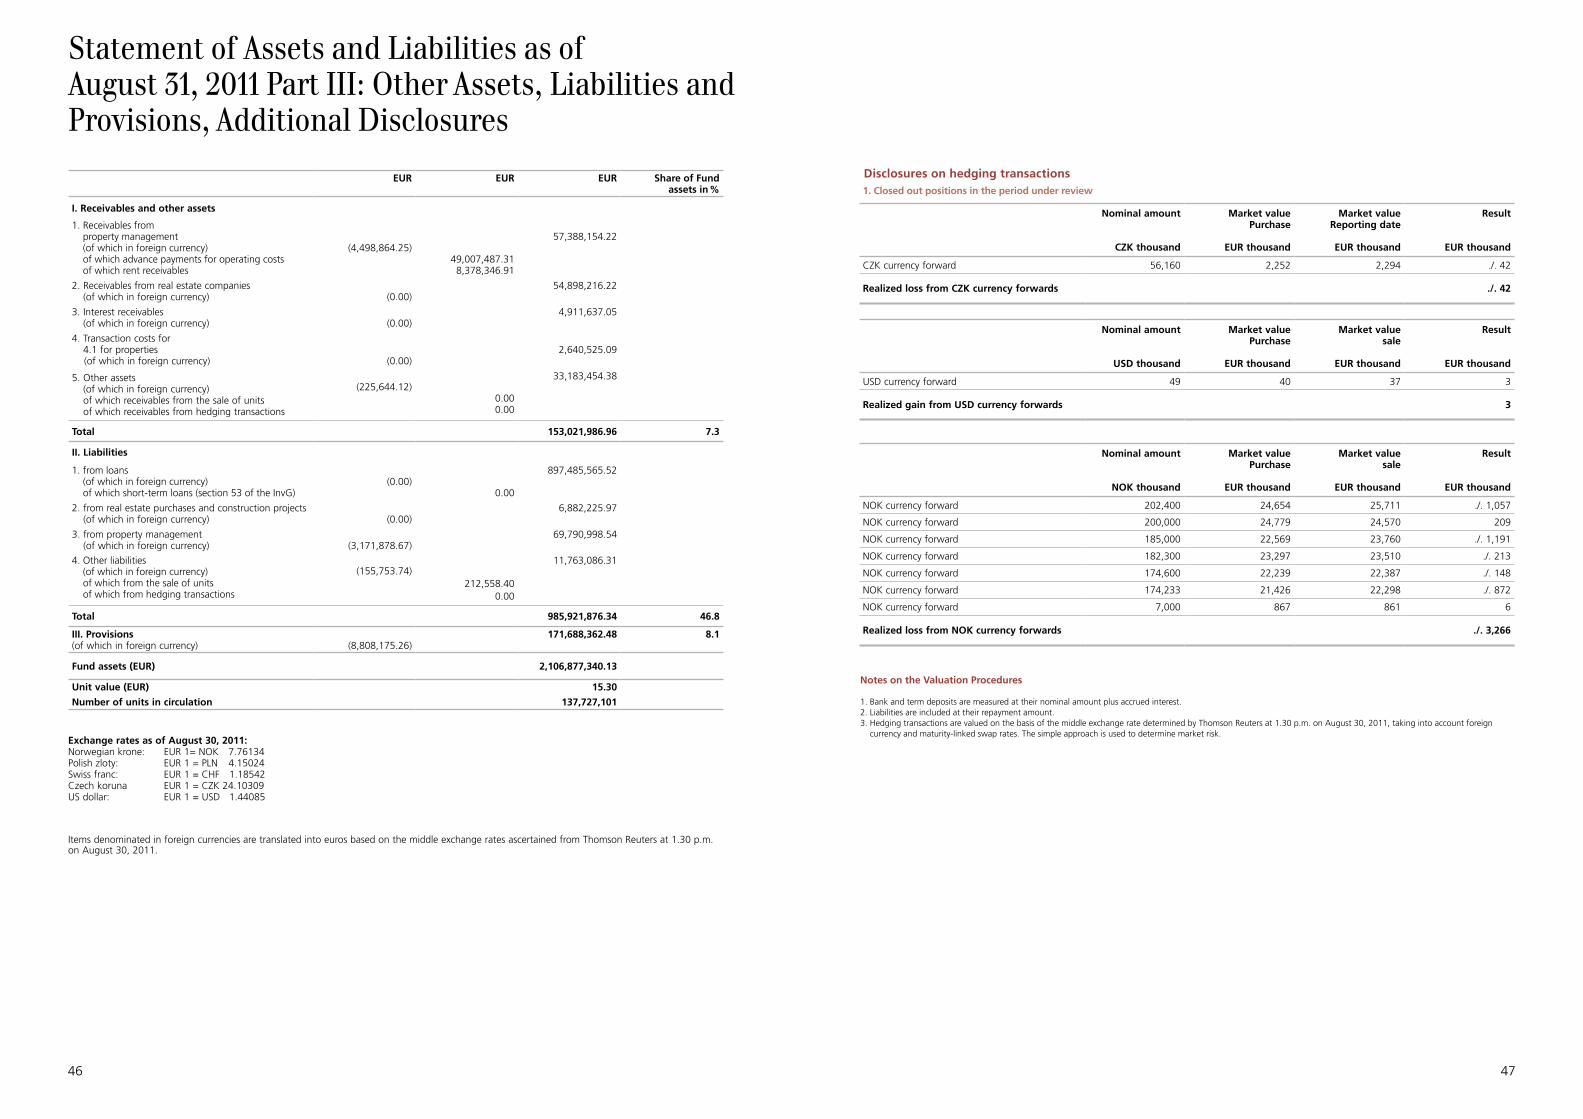
46 47
Statement of Assets and Liabilities as of August 31, 2011 Part III: Other Assets, Liabilities and Provisions, Additional Disclosures
EUR EUR EUR Share of Fundassets in %
I. Receivables and other assets
1. Receivables from property management (of which in foreign currency) of which advance payments for operating costs of which rent receivables
(4,498,864.25)49,007,487.31
8,378,346.91
57,388,154.22
2. Receivables from real estate companies (of which in foreign currency) (0.00)
54,898,216.22
3. Interest receivables (of which in foreign currency) (0.00)
4,911,637.05
4. Transaction costs for 4.1 for properties
(of which in foreign currency) (0.00)2,640,525.09
5. Other assets (of which in foreign currency) of which receivables from the sale of units of which receivables from hedging transactions
(225,644.12)0.000.00
33,183,454.38
Total 153,021,986.96 7.3
II. Liabilities
1. from loans (of which in foreign currency) of which short-term loans (section 53 of the InvG)
(0.00)0.00
897,485,565.52
2. from real estate purchases and construction projects (of which in foreign currency) (0.00)
6,882,225.97
3. from property management (of which in foreign currency) (3,171,878.67)
69,790,998.54
4. Other liabilities (of which in foreign currency) of which from the sale of units of which from hedging transactions
(155,753.74)212,558.40
0.00
11,763,086.31
Total 985,921,876.34 46.8
III. Provisions (of which in foreign currency) (8,808,175.26)
171,688,362.48 8.1
Fund assets (EUR) 2,106,877,340.13
Unit value (EUR)
Number of units in circulation
15.30
137,727,101
Exchange rates as of August 30, 2011:Norwegian krone: EUR 1= NOK 7.76134Polish zloty: EUR 1 = PLN 4.15024Swiss franc: EUR 1 = CHF 1.18542Czech koruna EUR 1 = CZK 24.10309US dollar: EUR 1 = USD 1.44085
Items denominated in foreign currencies are translated into euros based on the middle exchange rates ascertained from Thomson Reuters at 1.30 p.m. on August 30, 2011.
Disclosures on hedging transactions1. Closed out positions in the period under review
Nominal amount
CZK thousand
Market valuePurchase
EUR thousand
Market valueReporting date
EUR thousand
Result
EUR thousand
CZK currency forward 56,160 2,252 2,294 ./. 42
Realized loss from CZK currency forwards ./. 42
Nominal amount
USD thousand
Market valuePurchase
EUR thousand
Market valuesale
EUR thousand
Result
EUR thousand
USD currency forward 49 40 37 3
Realized gain from USD currency forwards 3
Nominal amount
NOK thousand
Market valuePurchase
EUR thousand
Market valuesale
EUR thousand
Result
EUR thousand
NOK currency forward 202,400 24,654 25,711 ./. 1,057
NOK currency forward 200,000 24,779 24,570 209
NOK currency forward 185,000 22,569 23,760 ./. 1,191
NOK currency forward 182,300 23,297 23,510 ./. 213
NOK currency forward 174,600 22,239 22,387 ./. 148
NOK currency forward 174,233 21,426 22,298 ./. 872
NOK currency forward 7,000 867 861 6
Realized loss from NOK currency forwards ./. 3,266
Notes on the Valuation Procedures
1. Bank and term deposits are measured at their nominal amount plus accrued interest. 2. Liabilities are included at their repayment amount.3. Hedging transactions are valued on the basis of the middle exchange rate determined by Thomson Reuters at 1.30 p.m. on August 30, 2011, taking into account foreign
currency and maturity-linked swap rates. The simple approach is used to determine market risk.
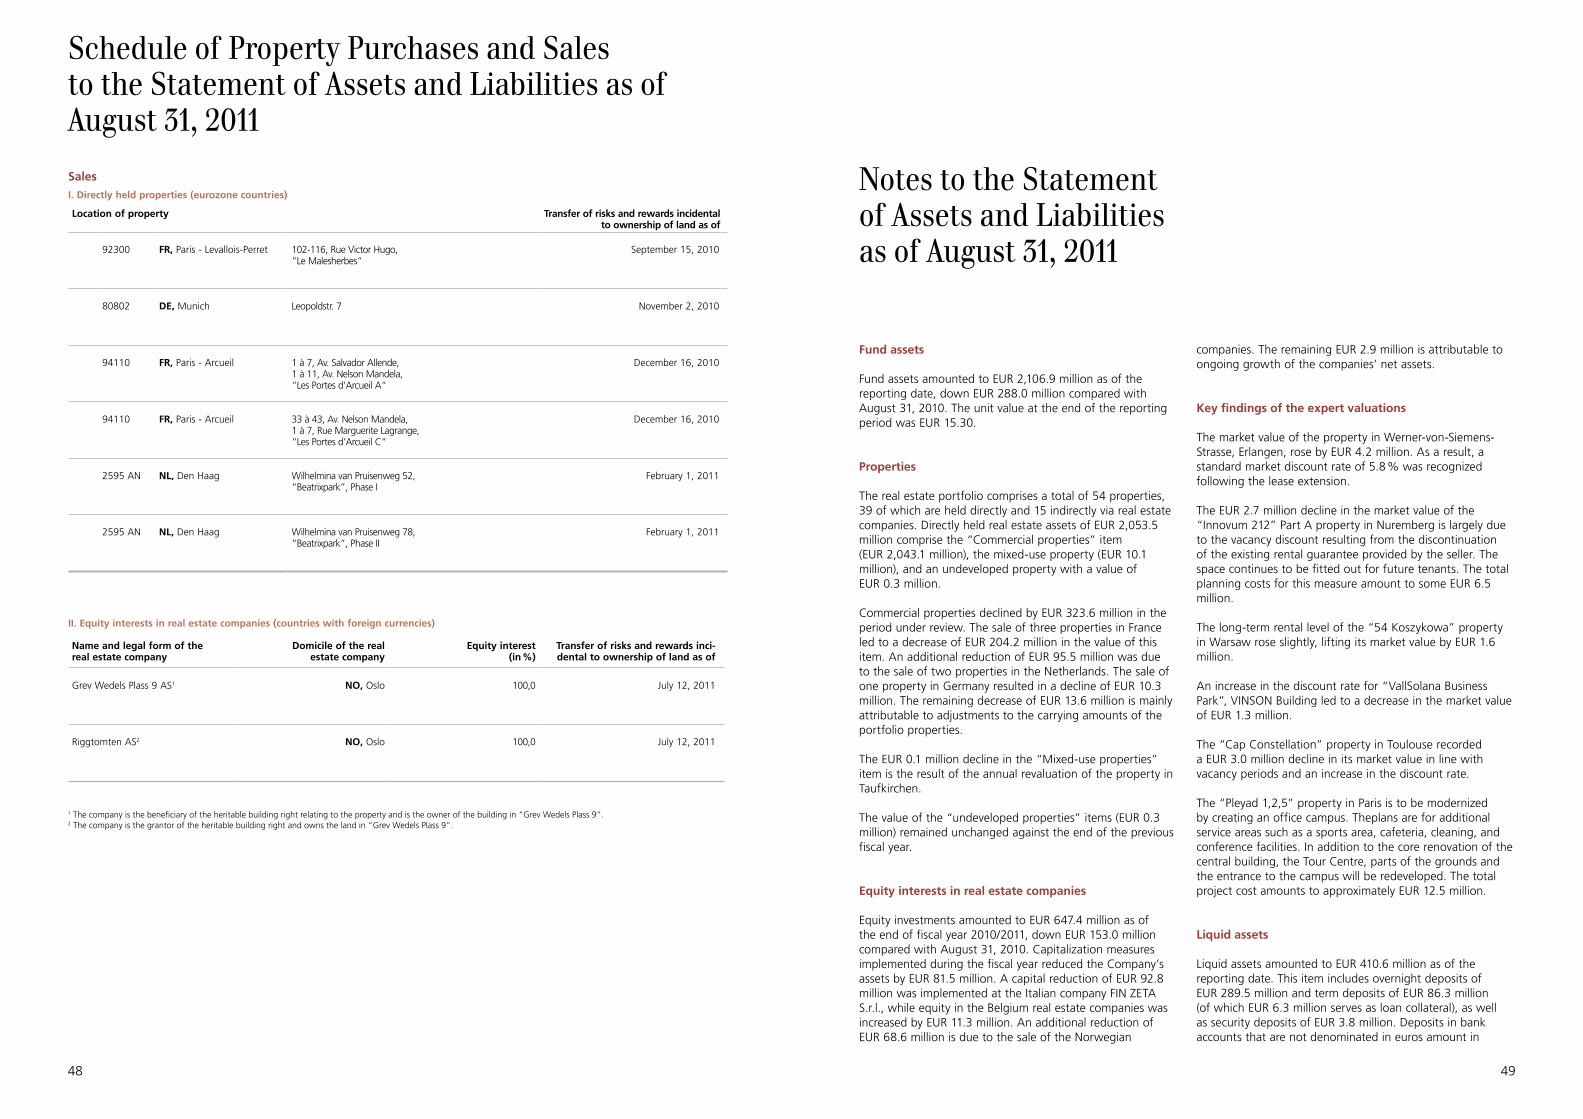
48 49
Schedule of Property Purchases and Sales to the Statement of Assets and Liabilities as of August 31, 2011
1 The company is the beneficiary of the heritable building right relating to the property and is the owner of the building in “Grev Wedels Plass 9”. 2 The company is the grantor of the heritable building right and owns the land in “Grev Wedels Plass 9”.
Sales
I. Directly held properties (eurozone countries)
Location of property Transfer of risks and rewards incidentalto ownership of land as of
92300 FR, Paris - Levallois-Perret 102-116, Rue Victor Hugo, “Le Malesherbes“
September 15, 2010
80802 DE, Munich Leopoldstr. 7 November 2, 2010
94110 FR, Paris - Arcueil 1 à 7, Av. Salvador Allende, 1 à 11, Av. Nelson Mandela, “Les Portes d’Arcueil A“
December 16, 2010
94110 FR, Paris - Arcueil 33 à 43, Av. Nelson Mandela, 1 à 7, Rue Marguerite Lagrange, “Les Portes d’Arcueil C“
December 16, 2010
2595 AN NL, Den Haag Wilhelmina van Pruisenweg 52, “Beatrixpark”, Phase I
February 1, 2011
2595 AN NL, Den Haag Wilhelmina van Pruisenweg 78, “Beatrixpark”, Phase II
February 1, 2011
II. Equity interests in real estate companies (countries with foreign currencies)
Name and legal form of the real estate company
Domicile of the real estate company
Equity interest(in %)
Transfer of risks and rewards inci-dental to ownership of land as of
Grev Wedels Plass 9 AS1 NO, Oslo 100,0 July 12, 2011
Riggtomten AS2 NO, Oslo 100,0 July 12, 2011
Fund assets
Fund assets amounted to EUR 2,106.9 million as of the reporting date, down EUR 288.0 million compared with August 31, 2010. The unit value at the end of the reporting period was EUR 15.30.
Properties
The real estate portfolio comprises a total of 54 properties, 39 of which are held directly and 15 indirectly via real estate companies. Directly held real estate assets of EUR 2,053.5 million comprise the “Commercial properties” item (EUR 2,043.1 million), the mixed-use property (EUR 10.1 million), and an undeveloped property with a value of EUR 0.3 million.
Commercial properties declined by EUR 323.6 million in the period under review. The sale of three properties in France led to a decrease of EUR 204.2 million in the value of this item. An additional reduction of EUR 95.5 million was due to the sale of two properties in the Netherlands. The sale of one property in Germany resulted in a decline of EUR 10.3 million. The remaining decrease of EUR 13.6 million is mainly attributable to adjustments to the carrying amounts of the portfolio properties.
The EUR 0.1 million decline in the “Mixed-use properties” item is the result of the annual revaluation of the property in Taufkirchen.
The value of the “undeveloped properties” items (EUR 0.3 million) remained unchanged against the end of the previous fiscal year.
Equity interests in real estate companies
Equity investments amounted to EUR 647.4 million as of the end of fiscal year 2010/2011, down EUR 153.0 million compared with August 31, 2010. Capitalization measures implemented during the fiscal year reduced the Company’s assets by EUR 81.5 million. A capital reduction of EUR 92.8 million was implemented at the Italian company FIN ZETA S.r.l., while equity in the Belgium real estate companies was increased by EUR 11.3 million. An additional reduction of EUR 68.6 million is due to the sale of the Norwegian
companies. The remaining EUR 2.9 million is attributable to ongoing growth of the companies’ net assets.
Key findings of the expert valuations
The market value of the property in Werner-von-Siemens-Strasse, Erlangen, rose by EUR 4.2 million. As a result, a standard market discount rate of 5.8 % was recognized following the lease extension.
The EUR 2.7 million decline in the market value of the “Innovum 212” Part A property in Nuremberg is largely due to the vacancy discount resulting from the discontinuation of the existing rental guarantee provided by the seller. The space continues to be fitted out for future tenants. The total planning costs for this measure amount to some EUR 6.5 million.
The long-term rental level of the “54 Koszykowa” property in Warsaw rose slightly, lifting its market value by EUR 1.6 million.
An increase in the discount rate for “VallSolana Business Park”, VINSON Building led to a decrease in the market value of EUR 1.3 million.
The “Cap Constellation” property in Toulouse recorded a EUR 3.0 million decline in its market value in line with vacancy periods and an increase in the discount rate.
The “Pleyad 1,2,5” property in Paris is to be modernized by creating an office campus. Theplans are for additional service areas such as a sports area, cafeteria, cleaning, and conference facilities. In addition to the core renovation of the central building, the Tour Centre, parts of the grounds and the entrance to the campus will be redeveloped. The total project cost amounts to approximately EUR 12.5 million. Liquid assets
Liquid assets amounted to EUR 410.6 million as of the reporting date. This item includes overnight deposits of EUR 289.5 million and term deposits of EUR 86.3 million (of which EUR 6.3 million serves as loan collateral), as well as security deposits of EUR 3.8 million. Deposits in bank accounts that are not denominated in euros amount in
Notes to the Statement of Assets and Liabilities as of August 31, 2011
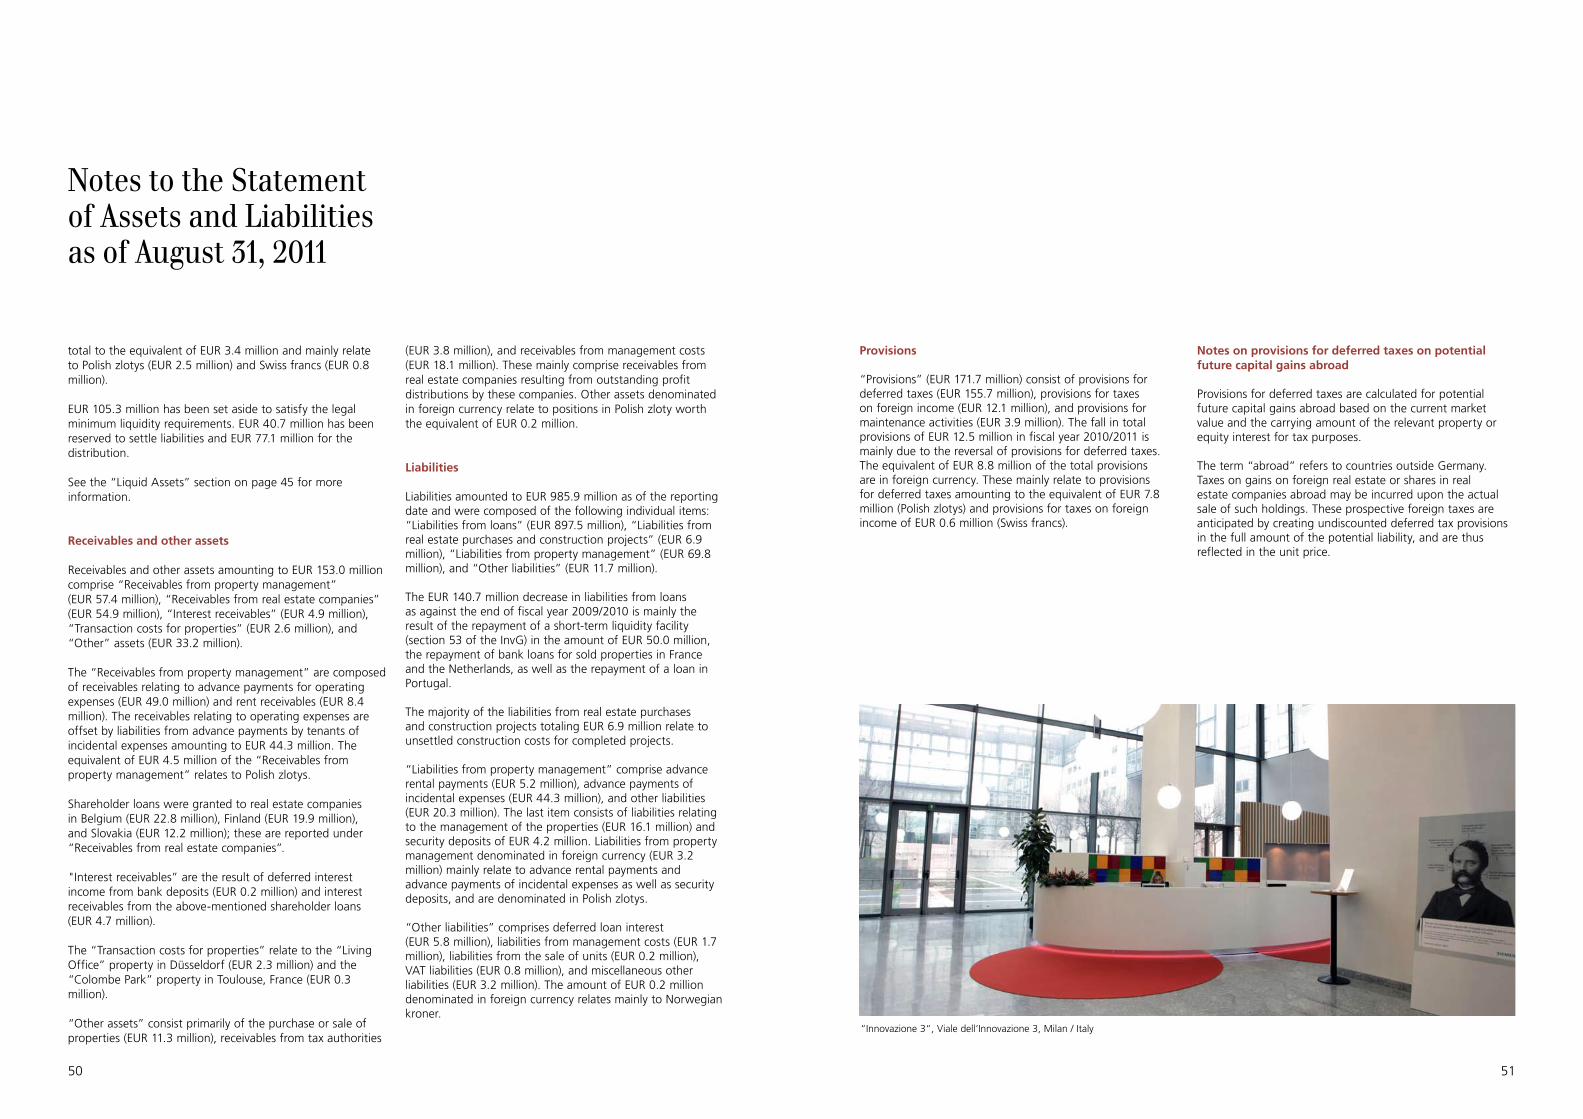
50 51
total to the equivalent of EUR 3.4 million and mainly relate to Polish zlotys (EUR 2.5 million) and Swiss francs (EUR 0.8 million).
EUR 105.3 million has been set aside to satisfy the legal minimum liquidity requirements. EUR 40.7 million has been reserved to settle liabilities and EUR 77.1 million for the distribution.
See the “Liquid Assets” section on page 45 for more information.
Receivables and other assets
Receivables and other assets amounting to EUR 153.0 million comprise “Receivables from property management” (EUR 57.4 million), “Receivables from real estate companies” (EUR 54.9 million), “Interest receivables” (EUR 4.9 million), “Transaction costs for properties” (EUR 2.6 million), and “Other” assets (EUR 33.2 million).
The “Receivables from property management” are composed of receivables relating to advance payments for operating expenses (EUR 49.0 million) and rent receivables (EUR 8.4 million). The receivables relating to operating expenses are offset by liabilities from advance payments by tenants of incidental expenses amounting to EUR 44.3 million. The equivalent of EUR 4.5 million of the “Receivables from property management” relates to Polish zlotys.
Shareholder loans were granted to real estate companies in Belgium (EUR 22.8 million), Finland (EUR 19.9 million), and Slovakia (EUR 12.2 million); these are reported under “Receivables from real estate companies”.
"Interest receivables” are the result of deferred interest income from bank deposits (EUR 0.2 million) and interest receivables from the above-mentioned shareholder loans (EUR 4.7 million).
The “Transaction costs for properties” relate to the “Living Office” property in Düsseldorf (EUR 2.3 million) and the “Colombe Park” property in Toulouse, France (EUR 0.3 million).
“Other assets” consist primarily of the purchase or sale of properties (EUR 11.3 million), receivables from tax authorities
(EUR 3.8 million), and receivables from management costs (EUR 18.1 million). These mainly comprise receivables from real estate companies resulting from outstanding profit distributions by these companies. Other assets denominated in foreign currency relate to positions in Polish zloty worth the equivalent of EUR 0.2 million.
Liabilities
Liabilities amounted to EUR 985.9 million as of the reporting date and were composed of the following individual items: “Liabilities from loans” (EUR 897.5 million), “Liabilities from real estate purchases and construction projects” (EUR 6.9 million), “Liabilities from property management” (EUR 69.8 million), and “Other liabilities” (EUR 11.7 million).
The EUR 140.7 million decrease in liabilities from loans as against the end of fiscal year 2009/2010 is mainly the result of the repayment of a short-term liquidity facility (section 53 of the InvG) in the amount of EUR 50.0 million, the repayment of bank loans for sold properties in France and the Netherlands, as well as the repayment of a loan in Portugal.
The majority of the liabilities from real estate purchases and construction projects totaling EUR 6.9 million relate to unsettled construction costs for completed projects.
“Liabilities from property management” comprise advance rental payments (EUR 5.2 million), advance payments of incidental expenses (EUR 44.3 million), and other liabilities (EUR 20.3 million). The last item consists of liabilities relating to the management of the properties (EUR 16.1 million) and security deposits of EUR 4.2 million. Liabilities from property management denominated in foreign currency (EUR 3.2 million) mainly relate to advance rental payments and advance payments of incidental expenses as well as security deposits, and are denominated in Polish zlotys.
“Other liabilities” comprises deferred loan interest (EUR 5.8 million), liabilities from management costs (EUR 1.7 million), liabilities from the sale of units (EUR 0.2 million), VAT liabilities (EUR 0.8 million), and miscellaneous other liabilities (EUR 3.2 million). The amount of EUR 0.2 million denominated in foreign currency relates mainly to Norwegian kroner.
“Innovazione 3“, Viale dell‘Innovazione 3, Milan / Italy
Notes to the Statement of Assets and Liabilities as of August 31, 2011
Provisions
“Provisions” (EUR 171.7 million) consist of provisions for deferred taxes (EUR 155.7 million), provisions for taxes on foreign income (EUR 12.1 million), and provisions for maintenance activities (EUR 3.9 million). The fall in total provisions of EUR 12.5 million in fiscal year 2010/2011 is mainly due to the reversal of provisions for deferred taxes. The equivalent of EUR 8.8 million of the total provisions are in foreign currency. These mainly relate to provisions for deferred taxes amounting to the equivalent of EUR 7.8 million (Polish zlotys) and provisions for taxes on foreign income of EUR 0.6 million (Swiss francs).
Notes on provisions for deferred taxes on potential future capital gains abroad
Provisions for deferred taxes are calculated for potential future capital gains abroad based on the current market value and the carrying amount of the relevant property or equity interest for tax purposes.
The term “abroad” refers to countries outside Germany. Taxes on gains on foreign real estate or shares in real estate companies abroad may be incurred upon the actual sale of such holdings. These prospective foreign taxes are anticipated by creating undiscounted deferred tax provisions in the full amount of the potential liability, and are thus reflected in the unit price.
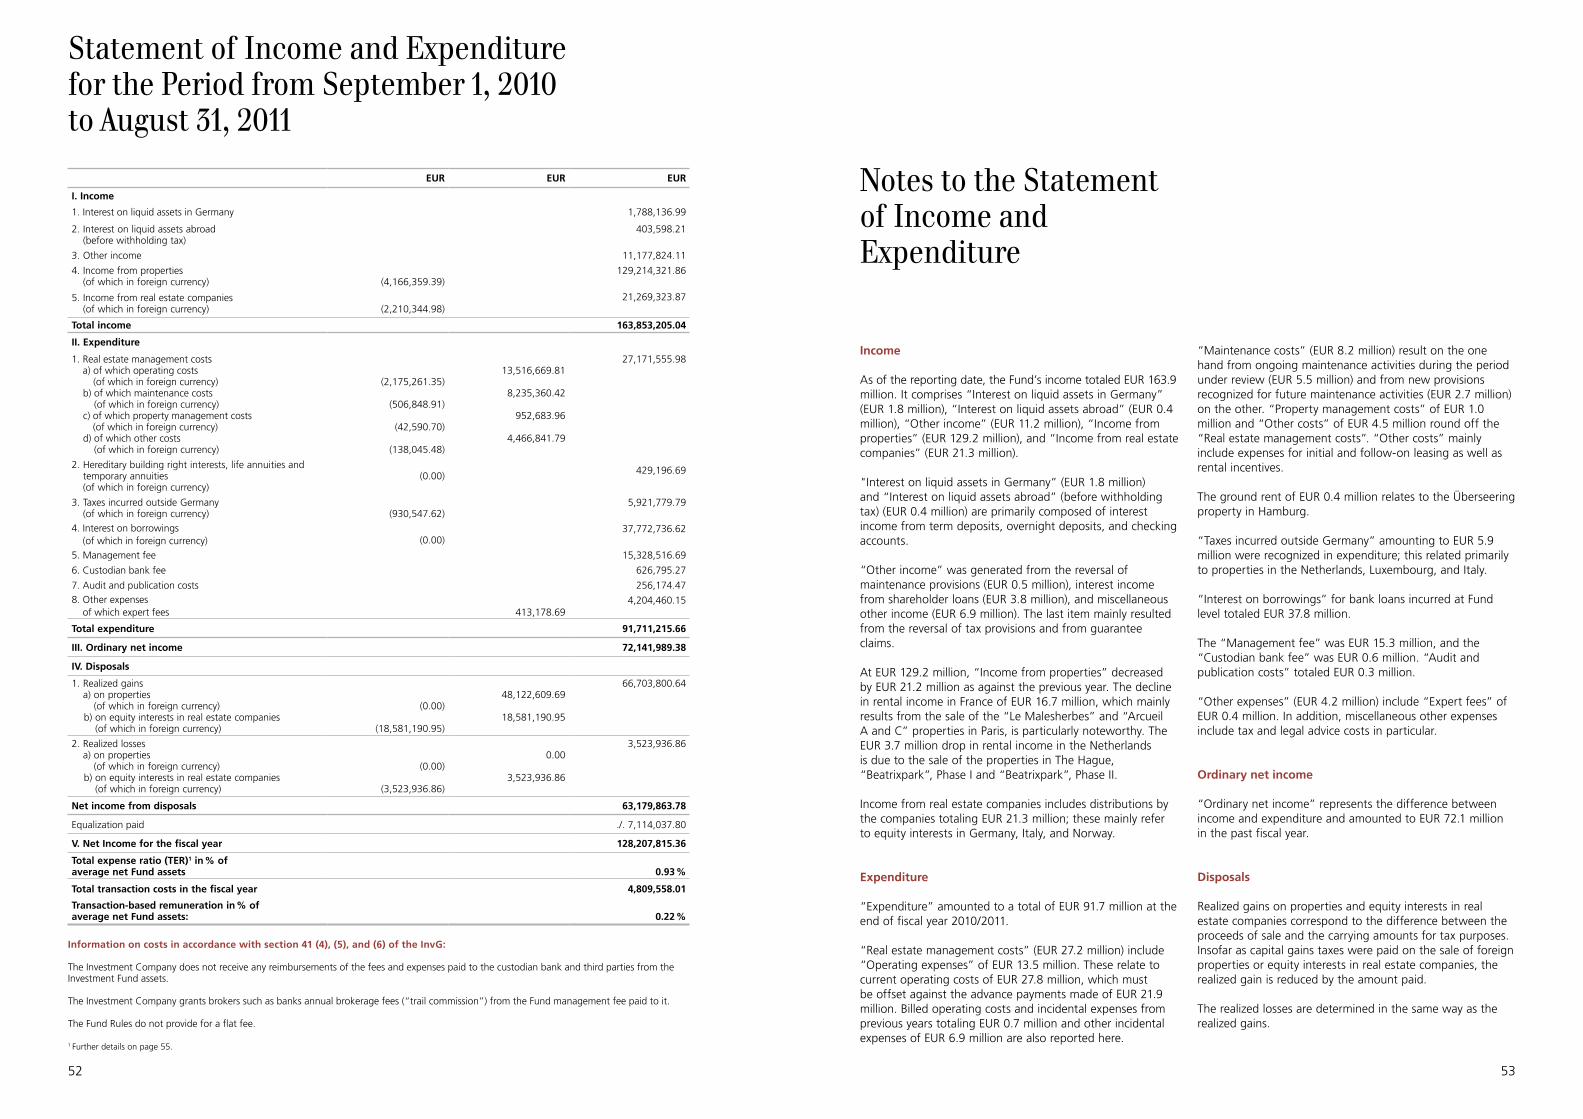
52 53
Statement of Income and Expenditure for the Period from September 1, 2010 to August 31, 2011
EUR EUR EUR
I. Income
1. Interest on liquid assets in Germany 1,788,136.99
2. Interest on liquid assets abroad (before withholding tax)
403,598.21
3. Other income 11,177,824.11
4. Income from properties (of which in foreign currency) (4,166,359.39)
129,214,321.86
5. Income from real estate companies (of which in foreign currency) (2,210,344.98)
21,269,323.87
Total income 163,853,205.04
II. Expenditure
1. Real estate management costs a) of which operating costs
(of which in foreign currency)b) of which maintenance costs
(of which in foreign currency)c) of which property management costs
(of which in foreign currency)d) of which other costs
(of which in foreign currency)
(2,175,261.35)
(506,848.91)
(42,590.70)
(138,045.48)
13,516,669.81
8,235,360.42
952,683.96
4,466,841.79
27,171,555.98
2. Hereditary building right interests, life annuities and temporary annuities (of which in foreign currency)
(0.00) 429,196.69
3. Taxes incurred outside Germany (of which in foreign currency) (930,547.62)
5,921,779.79
4. Interest on borrowings (of which in foreign currency) (0.00)
37,772,736.62
5. Management fee 15,328,516.69
6. Custodian bank fee 626,795.27
7. Audit and publication costs 256,174.47
8. Other expenses of which expert fees 413,178.69
4,204,460.15
Total expenditure 91,711,215.66
III. Ordinary net income 72,141,989.38
IV. Disposals
1. Realized gains a) on properties
(of which in foreign currency) b) on equity interests in real estate companies
(of which in foreign currency)
(0.00)
(18,581,190.95)
48,122,609.69
18,581,190.95
66,703,800.64
2. Realized losses a) on properties
(of which in foreign currency) b) on equity interests in real estate companies
(of which in foreign currency)
(0.00)
(3,523,936.86)
0.00
3,523,936.86
3,523,936.86
Net income from disposals 63,179,863.78
Equalization paid ./. 7,114,037.80
V. Net Income for the fiscal year 128,207,815.36
Total expense ratio (TER)1 in % ofaverage net Fund assets 0.93 %
Total transaction costs in the fiscal year 4,809,558.01
Transaction-based remuneration in % ofaverage net Fund assets: 0.22 %
Information on costs in accordance with section 41 (4), (5), and (6) of the InvG:
The Investment Company does not receive any reimbursements of the fees and expenses paid to the custodian bank and third parties from the Investment Fund assets.
The Investment Company grants brokers such as banks annual brokerage fees (“trail commission”) from the Fund management fee paid to it.
The Fund Rules do not provide for a flat fee.
1 Further details on page 55.
Income
As of the reporting date, the Fund’s income totaled EUR 163.9 million. It comprises “Interest on liquid assets in Germany” (EUR 1.8 million), “Interest on liquid assets abroad” (EUR 0.4 million), “Other income” (EUR 11.2 million), “Income from properties” (EUR 129.2 million), and “Income from real estate companies” (EUR 21.3 million).
"Interest on liquid assets in Germany” (EUR 1.8 million) and “Interest on liquid assets abroad” (before withholding tax) (EUR 0.4 million) are primarily composed of interest income from term deposits, overnight deposits, and checking accounts.
“Other income” was generated from the reversal of maintenance provisions (EUR 0.5 million), interest income from shareholder loans (EUR 3.8 million), and miscellaneous other income (EUR 6.9 million). The last item mainly resulted from the reversal of tax provisions and from guarantee claims.
At EUR 129.2 million, “Income from properties” decreased by EUR 21.2 million as against the previous year. The decline in rental income in France of EUR 16.7 million, which mainly results from the sale of the “Le Malesherbes” and “Arcueil A and C” properties in Paris, is particularly noteworthy. The EUR 3.7 million drop in rental income in the Netherlands is due to the sale of the properties in The Hague, “Beatrixpark”, Phase I and “Beatrixpark”, Phase II.
Income from real estate companies includes distributions by the companies totaling EUR 21.3 million; these mainly refer to equity interests in Germany, Italy, and Norway.
Expenditure
“Expenditure” amounted to a total of EUR 91.7 million at the end of fiscal year 2010/2011.
“Real estate management costs” (EUR 27.2 million) include “Operating expenses” of EUR 13.5 million. These relate to current operating costs of EUR 27.8 million, which must be offset against the advance payments made of EUR 21.9 million. Billed operating costs and incidental expenses from previous years totaling EUR 0.7 million and other incidental expenses of EUR 6.9 million are also reported here.
“Maintenance costs” (EUR 8.2 million) result on the one hand from ongoing maintenance activities during the period under review (EUR 5.5 million) and from new provisions recognized for future maintenance activities (EUR 2.7 million) on the other. “Property management costs” of EUR 1.0 million and “Other costs” of EUR 4.5 million round off the “Real estate management costs”. “Other costs” mainly include expenses for initial and follow-on leasing as well as rental incentives.
The ground rent of EUR 0.4 million relates to the Überseering property in Hamburg.
“Taxes incurred outside Germany” amounting to EUR 5.9 million were recognized in expenditure; this related primarily to properties in the Netherlands, Luxembourg, and Italy.
“Interest on borrowings” for bank loans incurred at Fund level totaled EUR 37.8 million.
The “Management fee” was EUR 15.3 million, and the “Custodian bank fee” was EUR 0.6 million. “Audit and publication costs” totaled EUR 0.3 million.
“Other expenses” (EUR 4.2 million) include “Expert fees” of EUR 0.4 million. In addition, miscellaneous other expenses include tax and legal advice costs in particular.
Ordinary net income
“Ordinary net income” represents the difference between income and expenditure and amounted to EUR 72.1 million in the past fiscal year.
Disposals
Realized gains on properties and equity interests in real estate companies correspond to the difference between the proceeds of sale and the carrying amounts for tax purposes. Insofar as capital gains taxes were paid on the sale of foreign properties or equity interests in real estate companies, the realized gain is reduced by the amount paid.
The realized losses are determined in the same way as the realized gains.
Notes to the Statement of Income and Expenditure

54 55
EUR 66.7 million of the “Disposals” relates to “Realized gains”. EUR 48.1 million is accounted for by properties. EUR 35.2 million relates to the sale of the three properties in Paris, EUR 10.6 million to the sale of the two properties in The Hague, and EUR 2.3 million to the realized gains on properties from the sale of a property in Munich. The realized gains on the equity interests in real estate companies (EUR 18.6 million) are mainly due to the sale of the Norwegian equity interests.
In addition, EUR 3.5 million of the “Disposals” relate to “Realized losses” on equity interests in real estate companies. These are mainly due to the currency forwards in Norwegian kroner that were closed out during the period under review.
Equalization paid
The equalization paid (EUR 7.1 million) prevents the distributable amount per unit (EUR 0.56) (see Application of Fund Income) being affected by changes in the number of units issued (issues / redemptions). All ordinary and extraordinary income and expenditure recorded in the fiscal year up to the sale of the units as well as the amount carried forward from previous year are taken into account in equalization accounting and are reported in this item.
Net income for the fiscal year
Net income for the fiscal year of EUR 128.2 million corresponds to the aggregate of ordinary net income (EUR 72.1 million) and net income from disposals (EUR 63.2 million), as well as the negative equalization paid (EUR 7.1 million).
Total expense ratio (TER)
The total expense ratio of 0.93 % is calculated as the ratio of the Investment Fund administration costs to the average Fund assets during the fiscal year. The total expenses include the following items: “Management fee”, “Custodian bank fee”, “Audit and publication costs”, “Expert fees”, and tax and legal advisory costs.
Transaction-based fees
Additionally, in accordance with section 13 (2) of the BVB, the Investment Fund was charged transaction-based fees amounting to EUR 4.8 million that are not included in the “Management fee”. This corresponds to 0.22 % of the average net fund assets. This value naturally fluctuates substantially over the lifetime of the Fund and therefore does not allow any conclusions to be drawn regarding performance.
“Innovazione 3“, Viale dell‘Innovazione 3, Milan / Italy
Notes to the Statement of Income and Expenditure
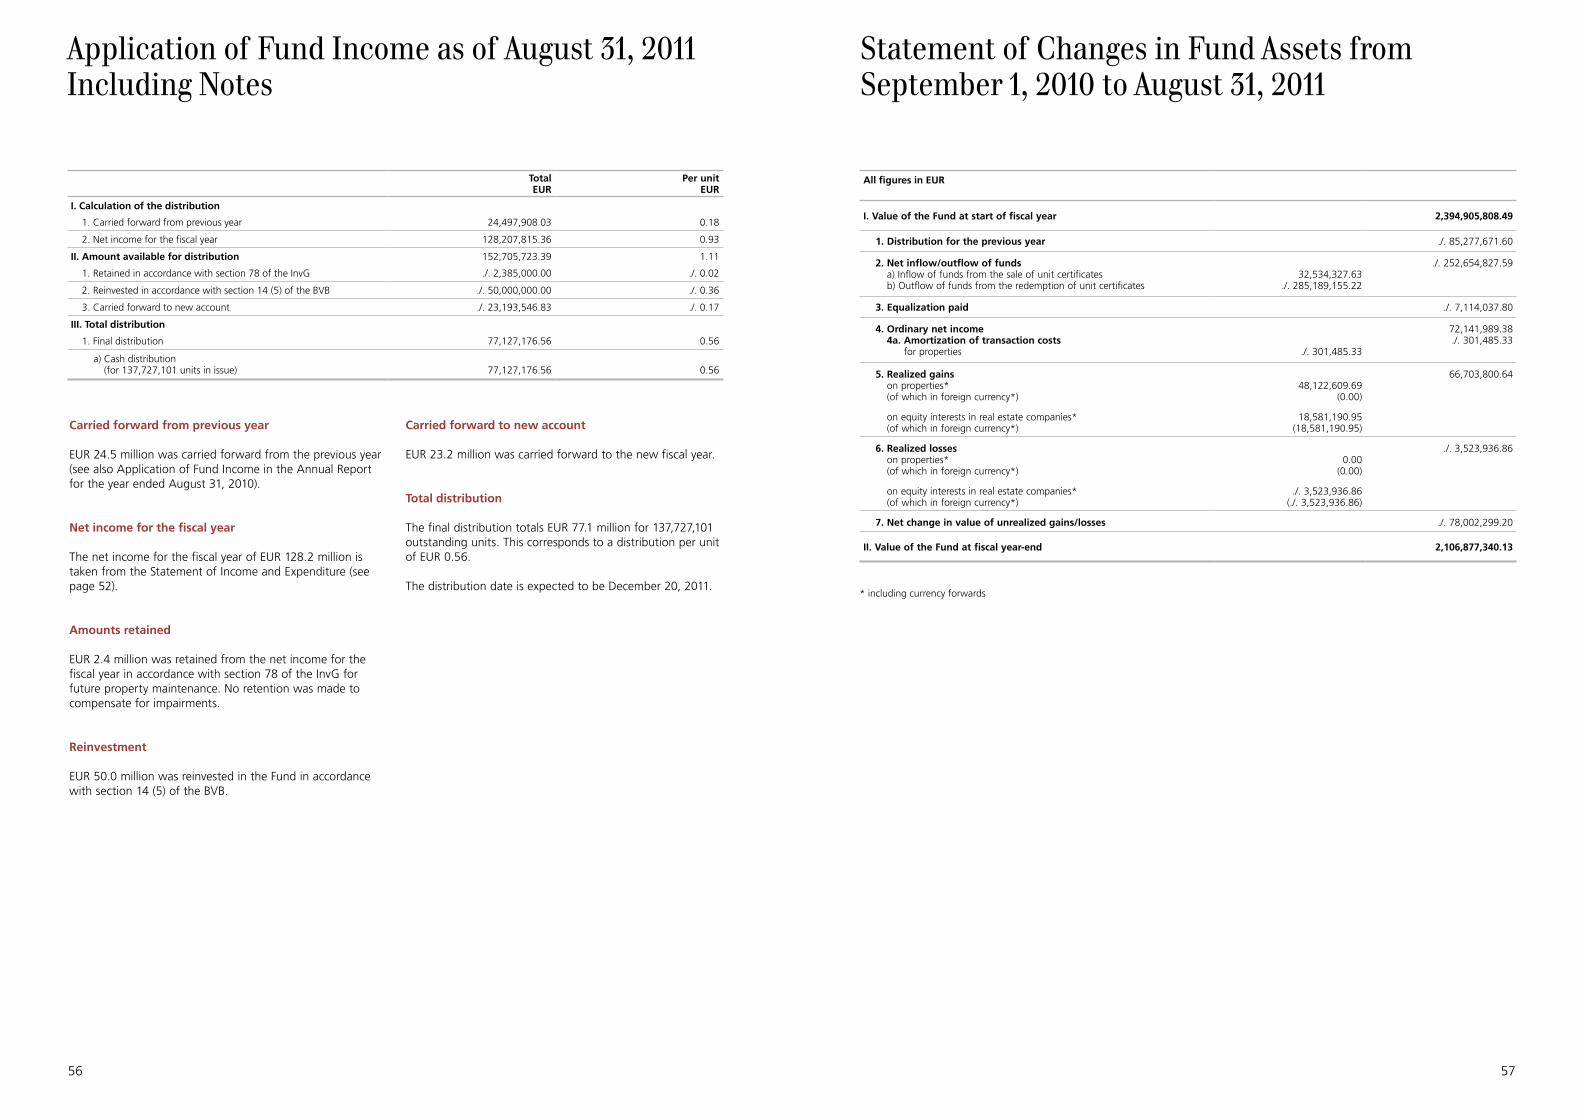
56 57
Carried forward from previous year
EUR 24.5 million was carried forward from the previous year (see also Application of Fund Income in the Annual Report for the year ended August 31, 2010).
Net income for the fiscal year
The net income for the fiscal year of EUR 128.2 million is taken from the Statement of Income and Expenditure (see page 52).
Amounts retained
EUR 2.4 million was retained from the net income for the fiscal year in accordance with section 78 of the InvG for future property maintenance. No retention was made to compensate for impairments.
Reinvestment
EUR 50.0 million was reinvested in the Fund in accordance with section 14 (5) of the BVB.
Carried forward to new account
EUR 23.2 million was carried forward to the new fiscal year.
Total distribution
The final distribution totals EUR 77.1 million for 137,727,101 outstanding units. This corresponds to a distribution per unit of EUR 0.56.
The distribution date is expected to be December 20, 2011.
TotalEUR
Per unitEUR
I. Calculation of the distribution
1. Carried forward from previous year 24,497,908.03 0.18
2. Net income for the fiscal year 128,207,815.36 0.93
II. Amount available for distribution 152,705,723.39 1.11
1. Retained in accordance with section 78 of the InvG ./. 2,385,000.00 ./. 0.02
2. Reinvested in accordance with section 14 (5) of the BVB ./. 50,000,000.00 ./. 0.36
3. Carried forward to new account ./. 23,193,546.83 ./. 0.17
III. Total distribution
1. Final distribution 77,127,176.56 0.56
a) Cash distribution (for 137,727,101 units in issue) 77,127,176.56 0.56
All figures in EUR
I. Value of the Fund at start of fiscal year 2,394,905,808.49
1. Distribution for the previous year ./. 85,277,671.60
2. Net inflow/outflow of funds a) Inflow of funds from the sale of unit certificates b) Outflow of funds from the redemption of unit certificates
32,534,327.63./. 285,189,155.22
./. 252,654,827.59
3. Equalization paid ./. 7,114,037.80
4. Ordinary net income 4a. Amortization of transaction costs
for properties ./. 301,485.33
72,141,989.38./. 301,485.33
5. Realized gains on properties* (of which in foreign currency*)
48,122,609.69(0.00)
66,703,800.64
on equity interests in real estate companies* (of which in foreign currency*)
18,581,190.95(18,581,190.95)
6. Realized losses on properties* (of which in foreign currency*)
0.00(0.00)
./. 3,523,936.86
on equity interests in real estate companies* (of which in foreign currency*)
./. 3,523,936.86(./. 3,523,936.86)
7. Net change in value of unrealized gains/losses ./. 78,002,299.20
II. Value of the Fund at fiscal year-end 2,106,877,340.13
* including currency forwards
Statement of Changes in Fund Assets from September 1, 2010 to August 31, 2011
Application of Fund Income as of August 31, 2011 Including Notes
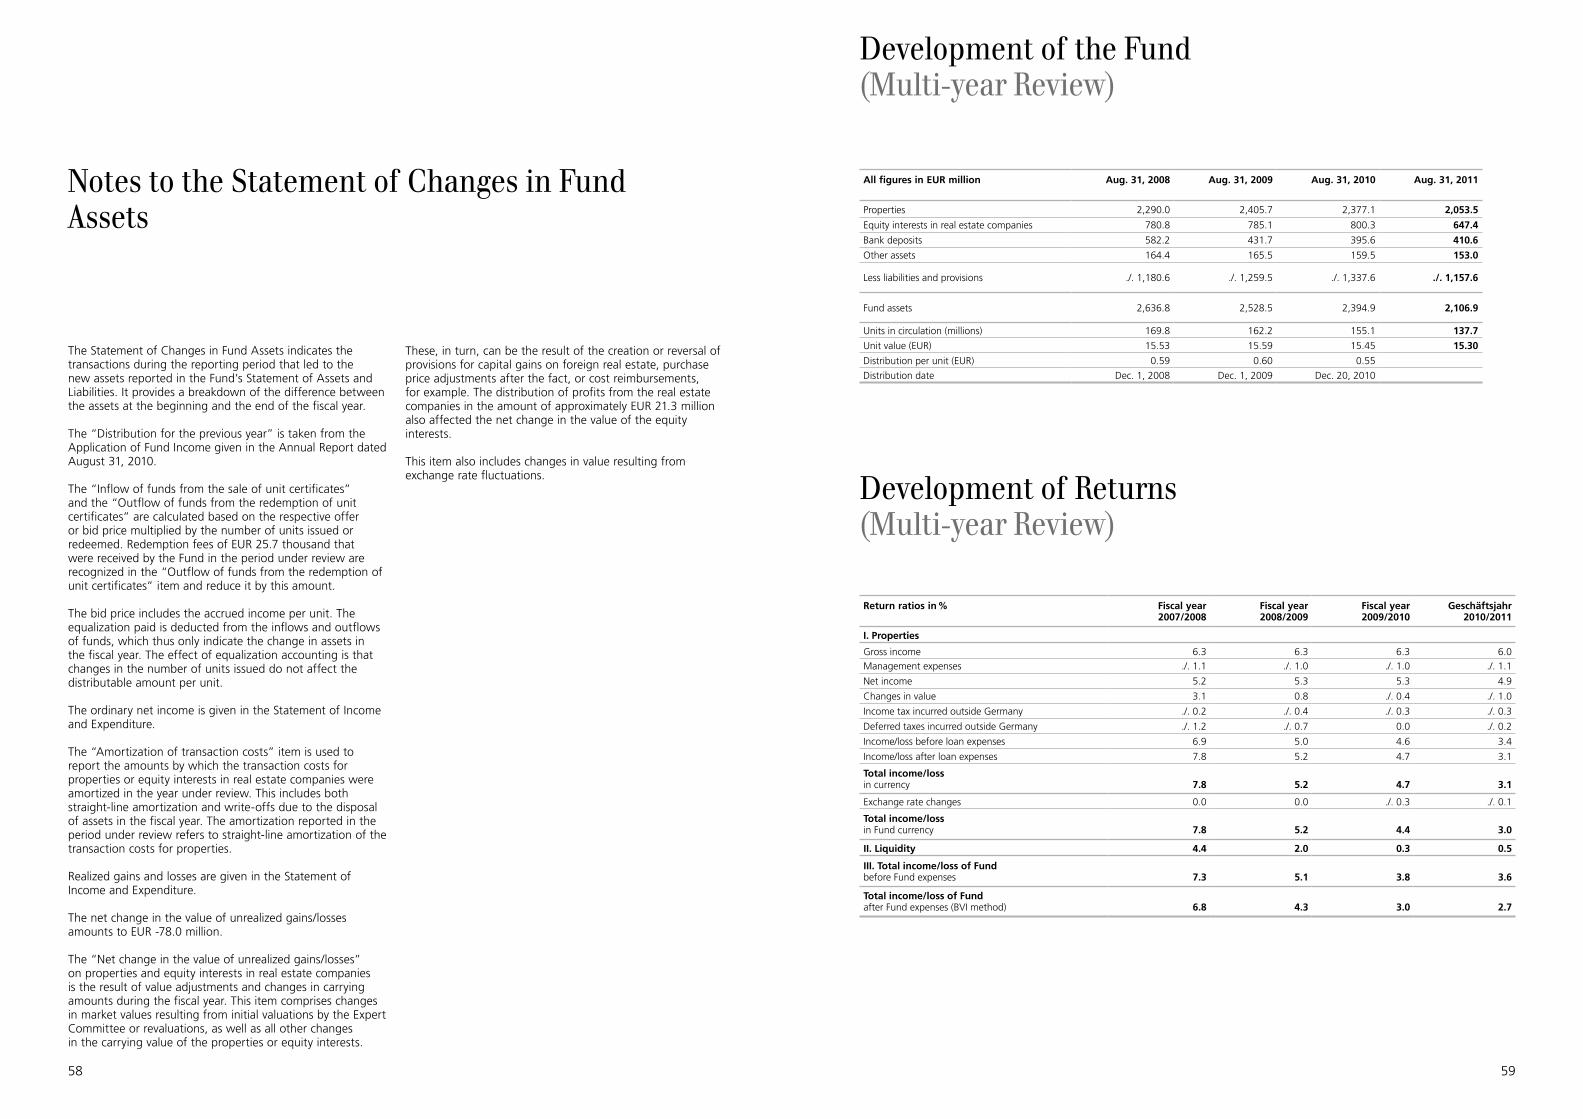
58 59
Notes to the Statement of Changes in Fund Assets
The Statement of Changes in Fund Assets indicates the transactions during the reporting period that led to the new assets reported in the Fund’s Statement of Assets and Liabilities. It provides a breakdown of the difference between the assets at the beginning and the end of the fiscal year.
The “Distribution for the previous year” is taken from the Application of Fund Income given in the Annual Report dated August 31, 2010.
The “Inflow of funds from the sale of unit certificates” and the “Outflow of funds from the redemption of unit certificates” are calculated based on the respective offer or bid price multiplied by the number of units issued or redeemed. Redemption fees of EUR 25.7 thousand that were received by the Fund in the period under review are recognized in the “Outflow of funds from the redemption of unit certificates” item and reduce it by this amount.
The bid price includes the accrued income per unit. The equalization paid is deducted from the inflows and outflows of funds, which thus only indicate the change in assets in the fiscal year. The effect of equalization accounting is that changes in the number of units issued do not affect the distributable amount per unit.
The ordinary net income is given in the Statement of Income and Expenditure.
The “Amortization of transaction costs” item is used to report the amounts by which the transaction costs for properties or equity interests in real estate companies were amortized in the year under review. This includes both straight-line amortization and write-offs due to the disposal of assets in the fiscal year. The amortization reported in the period under review refers to straight-line amortization of the transaction costs for properties.
Realized gains and losses are given in the Statement of Income and Expenditure.
The net change in the value of unrealized gains/losses amounts to EUR -78.0 million.
The “Net change in the value of unrealized gains/losses” on properties and equity interests in real estate companies is the result of value adjustments and changes in carrying amounts during the fiscal year. This item comprises changes in market values resulting from initial valuations by the Expert Committee or revaluations, as well as all other changes in the carrying value of the properties or equity interests.
These, in turn, can be the result of the creation or reversal of provisions for capital gains on foreign real estate, purchase price adjustments after the fact, or cost reimbursements, for example. The distribution of profits from the real estate companies in the amount of approximately EUR 21.3 million also affected the net change in the value of the equity interests.
This item also includes changes in value resulting from exchange rate fluctuations.
Development of the Fund (Multi-year Review)
All figures in EUR million Aug. 31, 2008 Aug. 31, 2009 Aug. 31, 2010 Aug. 31, 2011
Properties 2,290.0 2,405.7 2,377.1 2,053.5
Equity interests in real estate companies 780.8 785.1 800.3 647.4
Bank deposits 582.2 431.7 395.6 410.6
Other assets 164.4 165.5 159.5 153.0
Less liabilities and provisions ./. 1,180.6 ./. 1,259.5 ./. 1,337.6 ./. 1,157.6
Fund assets 2,636.8 2,528.5 2,394.9 2,106.9
Units in circulation (millions) 169.8 162.2 155.1 137.7
Unit value (EUR) 15.53 15.59 15.45 15.30
Distribution per unit (EUR) 0.59 0.60 0.55
Distribution date Dec. 1, 2008 Dec. 1, 2009 Dec. 20, 2010
Development of Returns (Multi-year Review)
Return ratios in % Fiscal year2007/2008
Fiscal year2008/2009
Fiscal year2009/2010
Geschäftsjahr2010/2011
I. Properties
Gross income 6.3 6.3 6.3 6.0
Management expenses ./. 1.1 ./. 1.0 ./. 1.0 ./. 1.1
Net income 5.2 5.3 5.3 4.9
Changes in value 3.1 0.8 ./. 0.4 ./. 1.0
Income tax incurred outside Germany ./. 0.2 ./. 0.4 ./. 0.3 ./. 0.3
Deferred taxes incurred outside Germany ./. 1.2 ./. 0.7 0.0 ./. 0.2
Income/loss before loan expenses 6.9 5.0 4.6 3.4
Income/loss after loan expenses 7.8 5.2 4.7 3.1
Total income/lossin currency 7.8 5.2 4.7 3.1
Exchange rate changes 0.0 0.0 ./. 0.3 ./. 0.1
Total income/lossin Fund currency 7.8 5.2 4.4 3.0
II. Liquidity 4.4 2.0 0.3 0.5
III. Total income/loss of Fundbefore Fund expenses 7.3 5.1 3.8 3.6
Total income/loss of Fundafter Fund expenses (BVI method) 6.8 4.3 3.0 2.7
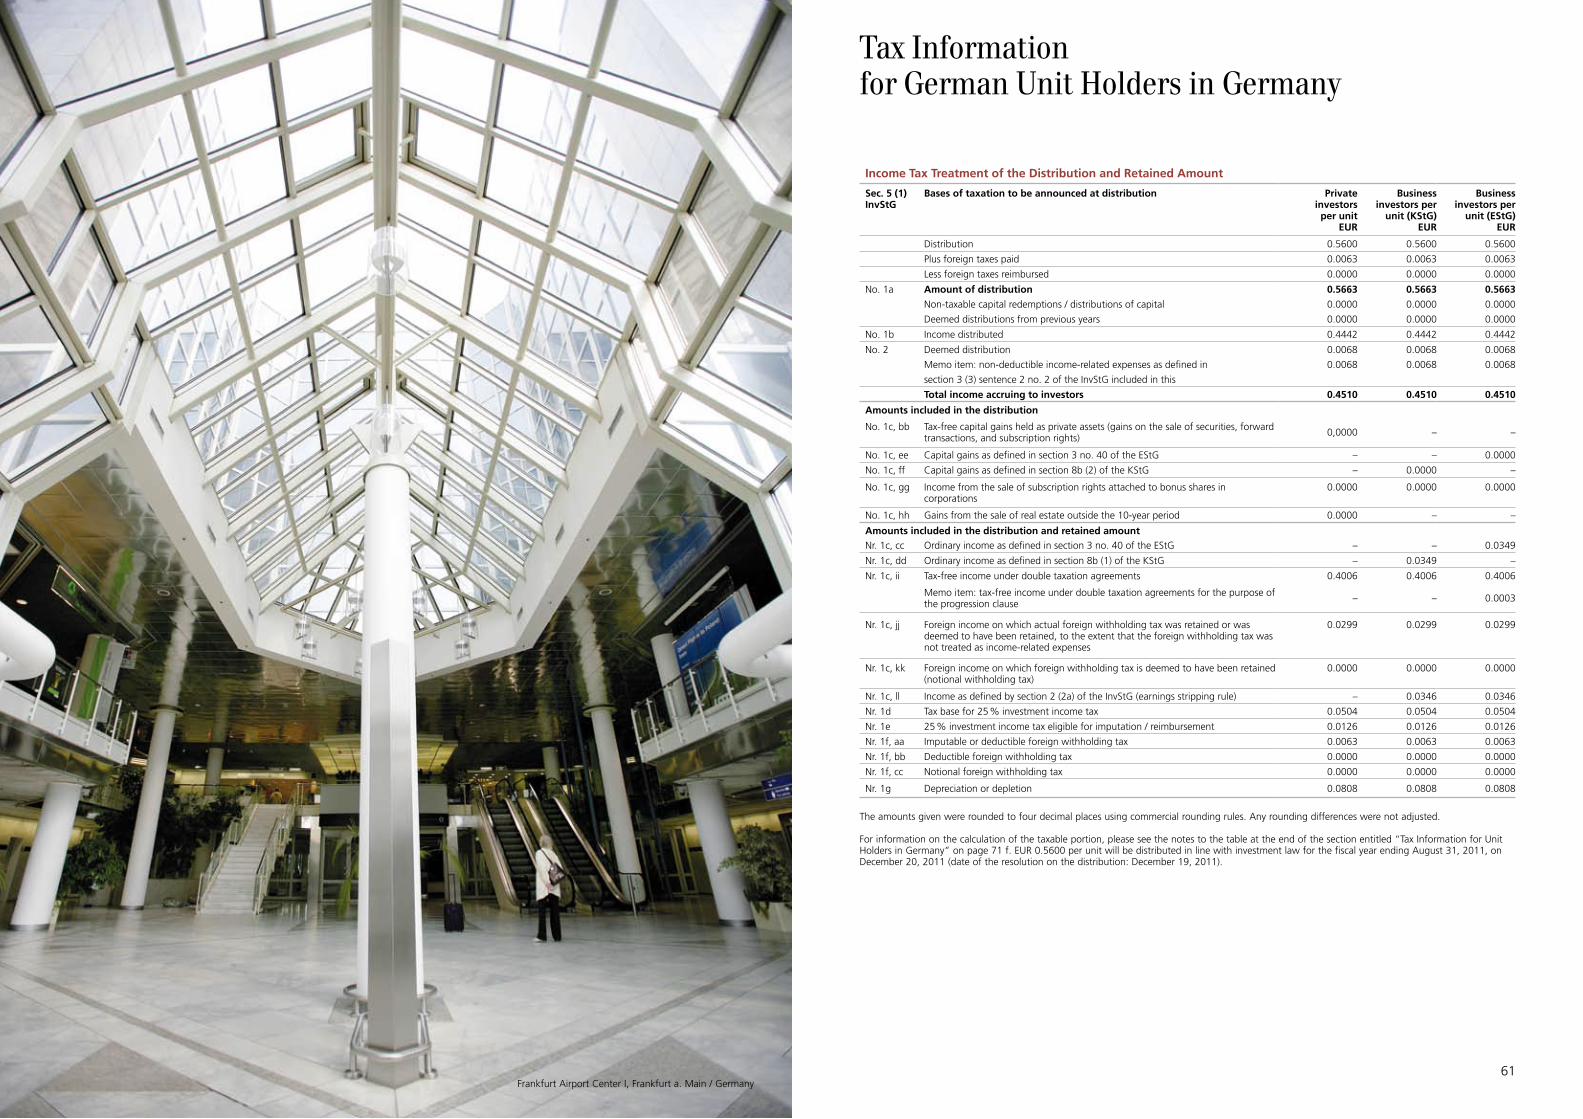
60 61
Besonderer Vermerk des Abschlussprüfers
An die UBS Real Estate Kapitalanlagegesellschaft mbH, München
Die UBS Real Estate Kapitalanlagegesellschaft mbH, München, hat uns beauftragt, gemäß § 44 Abs. 5 des Investmentgeset-zes (InvG) den Jahresbericht des Sondervermögens UBS (D) Euroinvest Immobilien für das Geschäftsjahr vom 1. September 2010 bis 31. August 2011 zu prüfen.
Verantwortung der gesetzlichen Vertreter
Die Aufstellung des Jahresberichts nach den Vorschriften des InvG liegt in der Verantwortung der gesetzlichen Vertreter der Kapitalanlagegesellschaft.
Verantwortung des Abschlussprüfers
Unsere Aufgabe ist es, auf der Grundlage der von uns durch-geführten Prüfung eine Beurteilung über den Jahresbericht abzugeben.
Wir haben unsere Prüfung nach § 44 Abs. 5 InvG unter Beachtung der vom Institut der Wirtschaftsprüfer (IDW) fest-gestellten deutschen Grundsätze ordnungsmäßiger Abschluss-prüfung vorgenommen. Danach ist die Prüfung so zu planen und durchzuführen, dass Unrichtigkeiten und Verstöße, die sich auf den Jahresbericht wesentlich auswirken, mit hinrei-chender Sicherheit erkannt werden. Bei der Festlegung der Prüfungshandlungen werden die Kenntnisse über die Ver-waltung des Sondervermögens sowie die Erwartungen über mögliche Fehler berücksichtigt. Im Rahmen der Prüfung wer-den die Wirksamkeit des rechnungslegungsbezogenen inter-nen Kontrollsystems und die Nachweise für die Angaben im Jahresbericht überwiegend auf der Basis von Stichproben beurteilt.
Die Prüfung umfasst die Beurteilung der angewandten Rech-nungslegungsgrundsätze für den Jahresbericht und der wesentlichen Einschätzungen der gesetzlichen Vertreter der Kapitalanlagegesellschaft. Wir sind der Auffassung, dass unsere Prüfung eine hinreichend sichere Grundlage für unse-re Beurteilung bildet.
Prüfungsurteil
Unsere Prüfung hat zu keinen Einwendungen geführt.
Nach unserer Beurteilung aufgrund der bei der Prüfung gewonnenen Erkenntnisse entspricht der Jahresbericht den gesetzlichen Vorschriften.
Eschborn/Frankfurt am Main
21. November 2011
Eisenhuth BraunWirtschaftsprüfer Wirtschaftsprüferin
Ernst & Young GmbHWirtschaftsprüfungsgesellschaft
Income Tax Treatment of the Distribution and Retained Amount
Sec. 5 (1)InvStG
Bases of taxation to be announced at distribution Privateinvestorsper unit
EUR
Businessinvestors per
unit (KStG)EUR
Businessinvestors per
unit (EStG)EUR
Distribution 0.5600 0.5600 0.5600
Plus foreign taxes paid 0.0063 0.0063 0.0063
Less foreign taxes reimbursed 0.0000 0.0000 0.0000
No. 1a Amount of distribution 0.5663 0.5663 0.5663
Non-taxable capital redemptions / distributions of capital 0.0000 0.0000 0.0000
Deemed distributions from previous years 0.0000 0.0000 0.0000
No. 1b Income distributed 0.4442 0.4442 0.4442
No. 2 Deemed distribution 0.0068 0.0068 0.0068
Memo item: non-deductible income-related expenses as defined in 0.0068 0.0068 0.0068
section 3 (3) sentence 2 no. 2 of the InvStG included in this
Total income accruing to investors 0.4510 0.4510 0.4510
Amounts included in the distribution
No. 1c, bb Tax-free capital gains held as private assets (gains on the sale of securities, forward transactions, and subscription rights) 0,0000 – –
No. 1c, ee Capital gains as defined in section 3 no. 40 of the EStG – – 0.0000
No. 1c, ff Capital gains as defined in section 8b (2) of the KStG – 0.0000 –
No. 1c, gg Income from the sale of subscription rights attached to bonus shares incorporations
0.0000 0.0000 0.0000
No. 1c, hh Gains from the sale of real estate outside the 10-year period 0.0000 – –
Amounts included in the distribution and retained amountNr. 1c, cc Ordinary income as defined in section 3 no. 40 of the EStG – – 0.0349
Nr. 1c, dd Ordinary income as defined in section 8b (1) of the KStG – 0.0349 –
Nr. 1c, ii Tax-free income under double taxation agreements 0.4006 0.4006 0.4006
Memo item: tax-free income under double taxation agreements for the purpose of the progression clause – – 0.0003
Nr. 1c, jj Foreign income on which actual foreign withholding tax was retained or was deemed to have been retained, to the extent that the foreign withholding tax was not treated as income-related expenses
0.0299 0.0299 0.0299
Nr. 1c, kk Foreign income on which foreign withholding tax is deemed to have been retained (notional withholding tax)
0.0000 0.0000 0.0000
Nr. 1c, ll Income as defined by section 2 (2a) of the InvStG (earnings stripping rule) – 0.0346 0.0346
Nr. 1d Tax base for 25 % investment income tax 0.0504 0.0504 0.0504
Nr. 1e 25 % investment income tax eligible for imputation / reimbursement 0.0126 0.0126 0.0126
Nr. 1f, aa Imputable or deductible foreign withholding tax 0.0063 0.0063 0.0063
Nr. 1f, bb Deductible foreign withholding tax 0.0000 0.0000 0.0000
Nr. 1f, cc Notional foreign withholding tax 0.0000 0.0000 0.0000
Nr. 1g Depreciation or depletion 0.0808 0.0808 0.0808
Tax Informationfor German Unit Holders in Germany
The amounts given were rounded to four decimal places using commercial rounding rules. Any rounding differences were not adjusted.
For information on the calculation of the taxable portion, please see the notes to the table at the end of the section entitled “Tax Information for Unit Holders in Germany” on page 71 f. EUR 0.5600 per unit will be distributed in line with investment law for the fiscal year ending August 31, 2011, on December 20, 2011 (date of the resolution on the distribution: December 19, 2011).
Frankfurt Airport Center I, Frankfurt a. Main / Germany
62 63
General tax system
German legislation exempts real estate investment funds from all income taxes. Income is taxed at the level of the investors.
For units held as private assets, however, the taxable income from the Investment Fund is treated as a matter of principle as income from capital investments and is subject to income tax if this income, together with the investor’s other investment income, exceeds the annual lump-sum savings allowance of EUR 801.00 (for single persons or married couples assessed separately) or EUR 1,602.00 (for married couples assessed jointly).
Income from capital investments is subject to 25 % withholding tax (plus the solidarity surcharge and, if applicable, church tax). Income from capital investments includes income distributed by the Investment Fund, deemed distributed income, interim profits, and gains from the purchase and sale of Fund units if these were or are purchased after December 31, 2008.1) Income-related expenses in connection with income from capital investments in excess of the lump-sum allowance may no longer be claimed.
In the case of private investors, the tax withheld generally has definitive effect (“flat tax”), meaning that income from capital investments generally does not have to be disclosed in the investor’s income tax return. However, tax return disclosures may still be necessary for church tax purposes, for example. When withholding the tax, the custodian, as a matter of principle, already offsets any losses and credits any foreign withholding taxes.
The tax withheld may not have definitive effect in some circumstances, e. g., if the investor’s personal tax rate is lower than the flat tax rate of 25 % or if the lump-sum savings allowance has not been exhausted. In this case, income from capital investments can be disclosed in the investor’s income tax return. The tax office then applies the lower personal tax rate and counts the tax withheld against the investor’s personal tax liability (Günstigerprüfung – most favorable tax treatment).
If no tax has been withheld on income from capital investments (e. g., because a gain was generated from the sale of fund units in a foreign custody account), this must be disclosed in the tax return. This income from capital investments is then also subject to the flat tax rate of 25 % or the lower personal tax rate in the course of the assessment.
Even if the tax is withheld and the investor has a higher personal tax rate, information regarding income from capital investments may be required if extraordinary expenses or special personal deductions (e. g., donations) are claimed in the investor’s income tax return.
Units held as business assets are treated as operating income for tax purposes. German tax legislation requires a differentiated approach in order to calculate the amount of taxable income or income subject to investment income tax.
Units held as private assets (German tax residents)
Interest and similar income and foreign dividends (particularly from real estate corporations)
25 % tax (plus the solidarity surcharge and church tax, if applicable) is withheld on interest and similar income and foreign dividends that are distributed or retained in the case of domestic custody.
No tax needs to be withheld if the investor is a German tax resident and submits an exemption instruction, provided that the taxable income components do not exceed EUR 801.00 for single persons or EUR 1,602.00 for married couples assessed jointly. The same also applies if a non-assessment certificate is submitted or if foreign investors furnish proof of their non-resident status for tax purposes.
If the domestic investor holds the units of an investment fund that distributes all or part of its income for tax purposes in a German custody account at the investment company or a credit institution (custody), the respective custodian, as the paying agent, will not withhold any tax provided that, prior to the specified distribution date, it receives either an official exemption instruction for a sufficient amount or a non-assessment certificate issued by the tax office for a maximum
period of three years. In this case, the entire distribution is credited to the investor without deduction.
If units are held in an investment fund classed as an accumulating fund for tax law purposes, the investment company itself remits the 25 % tax (plus the solidarity surcharge) withheld on Investment Fund income retained before January 1, 2012, that is subject to tax. Thus, the offer and bid prices for the Fund units are reduced by the tax withheld at the end of the fiscal year. As investors are generally unknown to the investment company, church tax cannot be retained in this case; as a result, investors who are subject to church tax must disclose the corresponding information in their income tax returns.
In respect of income retained after December 31, 2011, the Investment Fund will make the investment income tax plus the maximum surtaxes incurred (solidarity surcharge and church tax) available to the custodians. As in the case of distributed income, the custodians will then withhold the tax while taking investors’ personal circumstances into account, allowing any church tax in particular to be remitted. Any amounts that the Investment Fund has made available to the custodians and that do not have to be remitted are refunded to investors.
If investors hold their units in a custody account at a German credit institution or a German investment company and submit an exemption instruction for a sufficient amount or a non-assessment certificate to their custodian prior to the end of the Investment Fund’s fiscal year, the remitted tax withheld (or, from 2012 onwards, the amount made available to the custodians) is credited to their account.
If investors fail to submit an exemption instruction or non-assessment certificate, or fail to submit it in good time, they will receive a tax certificate on request from their custodian showing the tax withheld and remitted and the solidarity surcharge . Investors can then credit the tax withheld against their personal tax liability in the course of their income tax assessment.
If units in distributing investment funds are not held in a custody account and the investor presents coupons to a German credit institution (self-custody), 25 % tax is withheld (plus the solidarity surcharge). Investors are issued with a tax certificate on request so that the withheld tax and the
solidarity surcharge can be offset if appropriate in the course of their income tax assessment.
In the view of the tax authorities, dividends paid by foreign real estate corporations may not be tax-free in all cases since they may qualify as intercompany dividends (“Schachteldividenden”).
Gains from the sale of domestic and foreign real estate not falling within the ten-year holding period
Gains from the sale of domestic and foreign real estate not falling within the ten-year holding period that are generated at the Investment Fund level are always tax-free at the investor level.
Foreign rental income and gains from the sale of foreign real estate within the ten-year holding period
Foreign rental income and gains from the sale of foreign real estate within the ten-year holding period in respect of which Germany has waived taxation under a double taxation agreement (exemption method) are also tax-free (general rule). Equally, the tax-free income does not influence the applicable tax rate (the progression clause does not apply).
The Fund’s rental income from real estate in Spain is subject to the tax credit method, i.e., the Spanish income is taxable in Germany but income taxes paid in Spain can be credited / deducted.
If, exceptionally, the tax credit method has been adopted under the relevant double taxation agreement (such as is the case with Spain) or no double taxation agreement has been concluded, the statements made regarding the treatment of gains from the sale of domestic real estate within the ten-year holding period shall apply analogously. Taxes paid in the relevant countries of origin may be set off against German income tax where appropriate, insofar as the taxes paid have not been claimed as income-related expenses at the level of the Investment Fund.
1 Gains on the sale of fund units held by private investors that were acquired prior to January 1, 2009, are tax-free.
Tax Informationfor German Unit Holders
64 65
Gains from the sale of securities, gains from forward transactions, and income from option premiums
Gains from the sale of shares, equity-equivalent profit participation rights and investment units, gains from forward transactions, and income from option premiums generated at the Investment Fund level are not recognized at the level of the investor unless they are distributed. Moreover, gains from the sale of the capital claims listed in section 1 (3) sentence 3 no. 1 letters a) to f) of the Investmentsteuergesetz (InvStG – German Investment Tax Act) are not recognized at the level of the investor if they are not distributed.
These include the following capital claims:
a) capital claims that have an issue yield,
b) “normal” bonds and unsecuritized receivables with a fixed coupon as well as down-rating bonds, floaters, and reverse floaters,
c) risk certificates that track a share price or a published index for a large number of shares 1:1,
d) equity-linked bonds, exchangeable bonds, and convertible bonds,
e) flat income bonds and profit participation rights classified as debt instruments, and
f) bonds cum warrants.
If gains from the sale of the abovementioned securities / capital claims, gains from forward transactions, and income from option premiums are distributed, they are taxable in principle; 25 % tax is withheld if the units are held in a domestic custody account (plus the solidarity surcharge and if applicable, church tax). However, distributed gains from the sale of securities and gains from forward transactions are tax-free if the securities at the Investment Fund level were acquired before January 1, 2009, or the forward transactions were entered into before January 1, 2009.
Gains from the sale of capital claims that are not included in the abovementioned list must be treated in the same way as interest for tax purposes (see above).
Domestic rents and dividends (particularly from real estate corporations) and gains from the sale of domestic real estate within ten years of acquisition
Domestic rents, dividends (especially from real estate corporations) and gains from the sale of domestic real estate within ten years of acquisition that are distributed or retained by the Investment Fund are taxable in principle at the investor level.
25 % tax (plus the solidarity surcharge) is withheld by the custodian or the investment company in the case of income that is distributed or retained before January 1, 2012. Moreover, the custodian takes any applications for church tax to be withheld that have been received into account when making distributions. Investors are immediately reimbursed the 25 % tax withheld (plus the solidarity surcharge) in full if the units are held in custody by the investment company or a German credit institution and an exemption instruction for a sufficient amount or a non-assessment certificate has been received there. Otherwise, investors can offset the 25 % tax withheld (plus the solidarity surcharge) against their personal income tax liability by supplying a tax certificate from their custodian.
In respect of income distributed and retained after December 31, 2011, the Investment Fund will make the investment income tax plus the maximum surtaxes incurred (solidarity surcharge and church tax) available to the custodians. The custodians will withhold the tax while taking investors’ personal circumstances into account, allowing any church tax in particular to be remitted. Any amounts that the Investment Fund has made available to the custodians and that do not have to be remitted are refunded to investors.
Income from equity interests in domestic and foreign real estate partnerships
Income from equity interests in domestic and foreign real estate partnerships must be reported for tax purposes at Investment Fund level at the end of the fiscal year of the partnership concerned. It must be measured in accordance with general tax principles.
Negative taxable income
Should negative income remain after being offset against similar positive income at Investment Fund level, this is carried forward at Investment Fund level for tax purposes. It can be offset against similar future positive taxable income at Investment Fund level in subsequent periods. Negative taxable income may not be directly allocated to investors. This means that such negative amounts will only be reflected in investors’ income tax assessments in the assessment period (tax year) in which the Investment Fund’s fiscal year ends, or in which the distribution for the Investment Fund’s fiscal year for which the negative taxable income is offset at Investment Fund level takes place. Claims by investors for the negative income to be taken into account in earlier income tax assessments are not possible.
Repayments of capital
Repayments of capital (e. g., in the form of construction project interest) are not taxable.
However, repayments of capital that investors receive during their period of ownership must be added to the taxable net income from the sale of the fund units, i.e., they increase the taxable profit.
Capital gains at investor level
If units in an investment fund that were acquired after December 31, 2008, are sold by a private investor, the capital gains are subject to the 25 % flat tax. If the units are held in a domestic custody account, the custodian withholds the tax. The 25 % flat tax (plus the solidarity surcharge and if applicable, church tax) need not be withheld if a sufficient exemption instruction or a non-assessment certificate is submitted.
If units acquired before January 1, 2009, are sold, any gains are tax-free for private investors.
In calculating the capital gains, the interim profit at the time of acquisition must be deducted from the acquisition
costs, and the interim profit at the time of disposal must be deducted from the sale price, so that interim profits are not taxed twice (see below). In addition, the retained income on which the investor has already been taxed must be deducted from the disposal price, along with the taxes attributable to this income that have already been paid by the investment company and that have been reduced by any rebate claim that has arisen in accordance with section 4 (2) and section 7 (3) and (4) of the InvStG.
Gains from the sale of fund units acquired after December 31, 2008, are tax-free insofar as they relate to income that is tax-free under double taxation agreements, that accrued to the fund during the holding period, and that has not yet been recognized at investor level (gain from real estate for the proportionate period of ownership). Where units are held in custody in a domestic custody account, the tax exemption on these gains will be taken into account directly by the custodian.
The investment company publishes the gains from real estate on each valuation date as a percentage of the value of the investment unit.
Units held as business assets (German tax residents)
Domestic rental income and interest and similar income
Domestic rental income and interest and similar income from units held as assets are taxable by the investor.1 This applies regardless of whether this income is retained or distributed.
Tax need only not be withheld, or withheld tax can only be refunded, upon presentation of a corresponding non-assessment certificate. Otherwise, the investor receives a tax certificate documenting the tax withheld.
Foreign rental income
Germany generally exempts rental income from foreign real estate from taxation (exemption due to a double taxation agreement). However, investors that are not incorporated entities are subject in part to the progression clause.
Tax Informationfor German Unit Holders
1 Pursuant to section 2 (2a) of the InvStG, the taxable interest must be taken into account in relation to the earnings stripping rule in accordance with section 4h of the EStG.
66 67
If, exceptionally, the tax credit method has been adopted under the relevant double taxation agreement (such as is the case in Spain) or no double taxation agreement has been concluded, income tax paid in the relevant countries of origin may be offset against German income tax or corporation tax where appropriate, insofar as the taxes paid have not been claimed as income-related expenses at the level of the Investment Fund.
Gains from the sale of domestic and foreign real estate
Retained gains from the sale of domestic and foreign real estate are of no significance for tax purposes at the investor level if they were generated outside the ten-year period at Fund level. Gains only become taxable upon distribution, whereby Germany generally does not tax foreign gains (exemption due to a double taxation agreement; if applicable, the progression clause must be taken into account).
Gains from the sale of domestic and foreign real estate within the ten-year period, whether retained or distributed, are taxable at the investor level. Gains from the sale of domestic real estate are fully taxable.
Germany generally exempts gains from the sale of foreign real estate from taxation (exemption due to a double taxation agreement). However, investors that are not incorporated entities are subject to the progression clause.
If, exceptionally, the tax credit method has been adopted under the relevant double taxation agreement (such is the case in Spain) or no double taxation agreement has been concluded, income tax paid in the relevant countries of origin may be offset against German income tax or corporation tax where appropriate, insofar as the taxes paid have not been claimed as income-related expenses at the level of the Investment Fund.
Tax need only not be withheld, or withheld tax can only be refunded, upon presentation of a corresponding non-assessment certificate. Otherwise, the investor receives a tax certificate documenting the tax withheld.
Gains from the sale of securities, gains from forward transactions, and income from option premiums
Gains from the sale of securities, equity-equivalent profit participation rights, and investment units, gains from forward transactions, and income from option premiums are of no significance for tax purposes at the investor level if they are retained. Moreover, gains from the sale of the capital claims listed below are not recognized at the level of the investor if they are not distributed:
a) capital claims that have an issue yield,
b) “normal” bonds and unsecuritized receivables with a fixed coupon as well as down-rating bonds, floaters, and reverse floaters,
c) risk certificates that track a share price or a published
index for a large number of shares 1:1,
d) equity-linked bonds, exchangeable bonds, and convertible bonds,
e) flat income bonds and profit participation rights classified as debt instruments, and
f) bonds cum warrants.
If these gains are distributed, they are taxable by the investor. Gains from the sale of shares are fully tax-free1 for investors that are corporations, or 40 % tax-free for other business investors such as sole proprietorships (partial income method). However, capital gains from bonds / capital claims, gains from forward transactions, and income from option premiums are fully taxable.
Income from the sale of capital claims that are not included in the abovementioned list must be treated in the same way as interest for tax purposes (see above).
Distributed capital gains on securities, distributed gains on forward transactions, and distributed income from option premiums are subject in principle to withholding tax (25 % investment income tax plus the solidarity surcharge). This does not apply to gains from the sale of securities purchased
before January 1, 2009, and to gains from forward transactions entered into before January 1, 2009. However, the paying agent does not withhold any tax in particular if the investor is a corporation with unlimited tax liability or if the investment income represents operating income of a domestic business and this is declared to the paying agent by the creditor of the investment income in an official form.
Domestic and foreign dividends (particularly from real estate corporations)
Dividends paid by domestic and foreign real estate corporations that are distributed or retained on shares held as business assets are tax-free1 in principle for corporations with the exception of dividends in accordance with the REIT-Gesetz (German REIT Act). Sole proprietorships are required to tax 60 % of these amounts (partial income method).
Domestic dividends are subject to withholding tax (25 % investment income tax plus the solidarity surcharge).
Foreign dividends are generally subject to withholding tax (25 % investment income tax plus the solidarity surcharge). However, the paying agent does not withhold any tax in particular if the investor is a corporation with unlimited tax liability (whereby corporations as defined by section 1 (1) nos. 4 and 5 of the Körperschaftsteuergesetz (KStG – German Corporation Tax Act) must submit a certificate from their tax office to the paying agent) or the foreign dividends represent operating income of a domestic business and this is declared to the paying agent by the creditor of the investment income in an official form.
The partially income tax- and corporation tax-free dividend income of investors subject to trade tax must be added back, rather than deducted, when calculating their trade income.In the view of the tax authorities, dividends paid by foreign real estate corporations can, as qualifying intercompany dividends, only be fully tax-free if the investor is a company (corporation) as defined in the corresponding double taxation agreement and a sufficiently high overall (intercompany) interest is attributable to it.
Income from equity interests in domestic and foreign real estate partnerships
Income from equity interests in domestic and foreign real estate partnerships must be reported for tax purposes at Investment Fund level at the end of the fiscal year of the partnership concerned. It must be measured in accordance with general tax principles.
Negative taxable income
Should negative income remain after being offset against similar positive income at Investment Fund level, this is carried forward at Investment Fund level for tax purposes. It can be offset at Investment Fund level against similar future positive taxable income in subsequent periods. Negative taxable income may not be directly allocated to investors. This means that such negative amounts will only be reflected in investors’ income or corporation tax assessments in the assessment period (tax year) in which the Investment Fund’s fiscal year ends, or in which the distribution for the Investment Fund’s fiscal year for which the negative taxable income is offset at Investment Fund level takes place. Claims by investors for the negative income to be taken into account in earlier income or corporation tax assessments are not possible.
Repayments of capital
SRepayments of capital (e. g., in the form of construction project interest) are not taxable.
For investors required to prepare accounts, this means that the repayments of capital must be recognized in income in the financial accounts and an offsetting liability must be expensed in the tax accounts, thus technically reducing the historical acquisition cost without affecting tax. Alternatively, the amortized cost may be reduced by the proportionate amount of the repayment of capital.
1 In the case of corporations, 5 % of dividends are considered as non-deducti-ble business expenses and are therefore taxable.
1 In the case of corporations, 5 % of capital gains from shares are considered as non-deductible business expenses and are therefore taxable..
Tax Informationfor German Unit Holders
68 69
Capital gains at investor level
Gains from the sale of units held as business assets are tax-free for business investors, provided that these consist of foreign rental income that has not yet been received or that is considered to have not yet been received and realized or unrealized Investment Fund gains from foreign real estate, insofar as Germany has waived taxation (gain from real estate).
The investment company publishes the gain from real estate on each valuation date as a percentage of the value of the investment unit.
Furthermore, gains from the sale of units held as business assets are tax-free1 for corporations if they consist of dividends that have not yet been received or that are considered to have not yet been received and realized or unrealized Investment Fund gains from domestic and foreign real estate corporations (gain from shares). Sole proprietorships are required to tax 60 % of these capital gains. The investment company publishes the gain from shares on each valuation date as a percentage of the value of the investment unit.
Non-residents for tax purposes
If a non-resident for tax purposes holds units in a distributing investment fund in a custody account at a German custodian (custody), no tax is withheld on interest and similar income, capital gains on securities, gains on forward transactions, and foreign dividends if the investor furnishes proof of his or her non-resident status for tax purposes. If the custodian concerned is unaware of the investor’s non-resident status or if proof of this status is not furnished in good time, the foreign investor is required to apply for reimbursement of the tax withheld in accordance with section 37 (2) of the Abgabenordnung (AO – German Tax Code) to the tax office at the place of business of the custodian.
If a foreign investor holds units of accumulating investment funds in a custody account at a German custodian, the investor is reimbursed the 25 % tax withheld plus the solidarity surcharge (unless this applies to domestic dividends) in the case of income retained before January 1, 2012, on furnishing proof of his or her non-resident status for tax purposes. If the application for reimbursement is made too
late, the investor may apply for reimbursement in accordance with section 37 (2) of the AO even after the income is retained, as in the case where proof of non-resident status is furnished too late by investors holding units of distributing funds. If, in this case, income is retained after December 31, 2011, no tax is withheld where such income does not relate to domestic dividends, domestic rental income, or gains from the disposal of domestic real estate within the ten-year holding period.
By contrast, tax is withheld where the income relates to domestic dividends, domestic rental income, or gains from the disposal of domestic real estate within the ten-year holding period. The extent to which the tax withheld may be offset or refunded for foreign investors depends on the double taxation agreement between the investor’s country of residence and the Federal Republic of Germany. The Bundeszentralamt für Steuern (BZSt – Federal Central Office of Taxation) in Bonn reimburses investment income tax on domestic dividends and domestic rental income in accordance with double taxation agreements.
Solidarity surcharge
A 5.5 % solidarity surcharge is levied on the tax withheld to be remitted when the Investment Fund distributes or retains income. The solidarity surcharge may in some cases be deducted in the investor’s income or corporation tax assessment.
If no tax is withheld or if tax withheld is reimbursed where income is retained before January 1, 2012 – for example, because a sufficient exemption instruction, or a non-assessment certificate has been presented, or proof of non-resident status for tax purposes has been submitted – there is no requirement to remit the solidarity surcharge or, in the case of retained income, the solidarity surcharge is reimbursed.
Church tax
If income tax has already been levied via the tax withheld by a German custodian (withholding agent), the church tax payable on it is levied as a surcharge to the tax withheld in
accordance with the church tax rate applied by the religious community to which the investor belongs.
For this purpose, persons subject to church tax must provide the withholding agent with a written application stating the religion to which they belong. In this application, married couples must also declare which portion of the couple’s overall investment income is attributable to each partner, so that the church tax can be allocated, retained, and remitted in this ratio. If no allocation ratio is indicated, the allocation is made on a per capita basis.
The deductibility of church tax as a special personal deduction is already recognized as reducing the tax burden when the tax is withheld.
Foreign withholding tax
Withholding tax is sometimes retained on the Investment Fund’s foreign income in the country of origin.
The investment company may deduct the eligible withholding tax in the same way as an income-related expense at the level of the Investment Fund. In this case, the foreign withholding tax cannot be offset or deducted at investor level.
If the investment company does not exercise its option to deduct the foreign withholding tax at Investment Fund level, the eligible withholding tax will be recognized as reducing the tax to be withheld.
Equalization paid
Those portions of the offer price attributable to income for units that are eligible for inclusion in the distribution (equalization accounting) are to be treated in the same way for tax purposes as the income to which these portions of the offer price are attributable.
Taxation of interim profits
Interim profits consist of income included in the sale or bid price for interest received or accrued as well as gains from the sale of capital claims not listed in section 1 (3) sentence
3 no. 1 letters a) to f) of the InvStG that have not yet been distributed or retained by the Fund and that are therefore not yet taxable for the investor (comparable to accrued interest on fixed-income securities). Interim profits generated by the Investment Fund are subject to income tax when investors redeem or sell their units. 25 % tax is withheld on interim profits (plus solidarity surcharge and, if applicable, church tax).
Private investors can deduct interim profits paid on the purchase of units as negative income for income tax purposes in the year of payment if an equalization paid item has been recognized and if reference is made to this in both the publication of interim profits and the tax data to be attested by the professional services providers. Interim profits are already recognized as reducing the tax burden when the tax is withheld. In addition, no tax is withheld in the case of an exemption instruction or submission of a non-assessment certificate.
If the interim profits are not published, 6 % of the payment made in connection with the redemption or sale of the investment unit must be recognized per annum as interim profits. In the case of business investors, the interim profits paid are a dependent component of the cost of acquisition, which may not be adjusted. If investment units are redeemed or sold, the interim profits received represent a dependent component of the sale proceeds. No adjustment may be made.
Interim profits are computed every time the unit value is determined and are published on each valuation date. Interim profits may also be ascertained regularly from the account and income statements issued by the banks.
EU Savings Tax Directive/German Interest Information Regulation
The Zinsinformationsverordnung (ZIV – German Interest Information Regulation), implementing Council Directive 2003/48/EC of June 3, 2003 (OJ EU No. L 157 p. 38) is designed to ensure the effective cross-border taxation of natural persons’ interest income throughout the EU area. The EU has signed agreements with a number of third countries (notably Switzerland, Liechtenstein, the Channel Islands, Monaco, and Andorra) which correspond to a considerable extent to the EU Savings Tax Directive.1 In the case of corporations, 5 % of tax-free capital gains are considered as
non-deductible business expenses and are therefore taxable.
Tax Informationfor German Unit Holders
70 71
To this end, interest income credited by a German credit institution (acting to this extent as paying agent) to a natural person resident in a European country other than Germany or in certain third countries is reported by the German credit institution to the Bundeszentralamt für Steuern (Federal Central Office of Taxation) and, ultimately, to the tax office in the natural person’s country of residence.
Correspondingly, interest income credited to a natural person resident in Germany by a credit institution in another European country or in certain third countries is ultimately reported by the overseas credit institution to the tax office in the person’s place of residence in Germany. Alternatively, some overseas states retain withholding tax that is eligible for offsetting in Germany.
This affects private investors resident in the European Union or in one of the third countries that have acceded to the Directive who maintain their account or custody account in another EU country and generate interest income there.
Luxembourg and Switzerland, among other countries, have agreed to impose a withholding tax of 20 % on this interest income (as of July 1, 2011: 35 %). The tax documentation received by investors includes a certificate with which they can offset the withholding tax deducted in the course of their income tax assessment.
Alternatively, private investors may obtain exemption from tax being withheld abroad by authorizing their foreign credit institution to voluntarily disclose their interest income; this permits the institution to dispense with withholding the tax and, instead, to report the income to the tax authorities specified by law.
Under the ZIV, the investment company must disclose for each German and foreign fund whether it is in scope or out of scope, i.e., whether it is subject to the ZIV or not.
In this regard, the ZIV contains two main investment limits.
If a fund’s assets consist of no more than 15 % receivables as defined by the ZIV, the paying agents which ultimately access the data reported by the investment company do not have to send reports to the Bundeszentralamt für Steuern. However, once the 15 % limit is exceeded, the paying agents are obliged to report the interest portion of the distribution to the Bundeszentralamt für Steuern.
If the 40 % limit is exceeded (a 25 % threshold applies to financial years ending after December 31, 2010), the interest portion of the redemption or sale of the fund units must be reported. In the case of a distributing fund, the interest portion of any distribution must also be reported to the Bundeszentralamt für Steuern. In the case of an accumulating fund, reports are, logically enough, only made when fund units are redeemed or sold.
Property purchase tax
The sale of units in the Investment Fund does not give rise to any property purchase tax.
French 3 % tax
Since January 1, 2008, real estate investment funds have, in principle, fallen with the scope of a special French tax (known as the “French 3 % tax”) that is levied annually on the market value of properties located in France. The French law provides for the exemption from the 3 % tax of French real estate funds and comparable foreign funds. In the opinion of the French tax authorities, German real estate funds are not comparable in principle with French real estate funds, meaning that they are not exempt in principle from the 3 % tax.
In order to be exempt from this tax, the French tax authorities are of the opinion that the UBS (D) Euroinvest Immobilien Investment Fund must issue an annual return specifying its French properties as of January 1 of each year and disclosing the names of those unit holders who held 1 % or more of the Investment Fund as of January 1 of each year. This means that the names of investors who held at least 1,427,527 units in the UBS (D) Euroinvest Immobilien Investment Fund as of January 1, 2011, must be disclosed.
So that the Investment Fund can comply with its obligation to submit a return and thus avoid the French 3 % tax being levied, we ask that you send us a written declaration consenting to the disclosure of your name, address, and the size of your investment to the French tax authorities if you held 1,427,527 or more units in the UBS (D) Euroinvest Immobilien Investment Fund on January 1, 2011.
This disclosure has no financial repercussions, nor does it require you to file a return with or inform the French tax authorities yourself, if you held less than 5 % of the Investment Fund on January 1, 2011, and this is the only investment you have in French property.
If, on January 1, 2011, your equity interest amounted to or exceeded 5 %, or if you held additional properties in France either indirectly or directly, you may be liable for tax in your own right on account of your investment in French real estate and you must ensure that you are exempted from taxation by providing the French tax authorities with your own return.
However, various groups of investors may be covered by general exemptions; for example, natural persons and listed companies are exempted from the 3% tax. In these cases, no separate return need be submitted.
For more information on the potential obligation to submit a return, we recommend that you contact a French tax advisor.
Notice
The tax information is designed to provide an overview of the tax consequences of an investment. It cannot cover all tax aspects that could result from investors’ individual situations. Interested investors are advised to consult a tax adviser on the tax consequences of investing in the Fund.
The tax information is based on the legal position as currently known. It applies to investors with unlimited income tax or corporation tax liability in Germany. However, no assurance can be given that the tax treatment will not change as a result of legislation, court rulings, or decrees issued by the tax authorities.
A paragraph on the legal and tax risks is included in the Sales Prospectus (see the section entitled “Separate Determination of Profits, External Audit” in the Summary of Important Tax Regulations for Investors), with the aim of informing investors of the possible consequences of changes in the bases for tax assessment pursuant to section 13 (4) of the InvStG.
Further information regarding the tax treatment of Fund income can be found in the Summary of Important Tax Regulations for Unit Holders in the Sales Prospectus.
Notes to the table on page 61
The structure of the table complies with the disclosure requirements under the InvStG. All figures listed in the columns Private investors, Business investors (KStG), and Business investors (EStG) are given in euros per unit. The distribution amount per unit is EUR 0.5663 and can be found in row no. 1a of Table 1.
An example using a private investor explains how the taxable portion is calculated:
The distribution amount of EUR 0.5663 differs from the total amount of distributed income and the deemed distributed income for tax purposes of EUR 0.4510 (no. 1b and no. 2). This difference is due in particular to tax depreciation on real estate and the restrictions on the deductibility of certain expenses. These items are not taken into account in calculating income under investment law, but reduce or increase the amount of distributed and deemed distributed income for tax purposes. An additional difference arises since certain income (e.g., rental income, interest) is deemed to have been distributed to investors even if it is not used in the distribution (this is known as “deemed distributed income”).The different tax treatment of equity interests in domestic partnerships, as well as differences in the determination of gains from the sale of real estate in countries for which an exemption under a double taxation agreement applies, lead to further significant differences.
The distributed income and deemed distributed income also includes income of EUR 0.4006 (no. 1c, ii) that is tax-exempt in Germany under treaties aimed at avoiding double taxation. For the private investor, the total taxable portion is therefore:
The amount subject to withholding tax is EUR 0.0504 (no. 1d). The row containing imputable / reimbursable investment income tax (no. 1e) shows the amount of tax (EUR 0.0126) that may possibly need to be withheld by the custodian bank (not including the solidarity surcharge and church tax).
Tax Informationfor German Unit Holders
EUR 0,4510 EUR./. EUR 0,4006 EUR EUR 0,0504 EUR
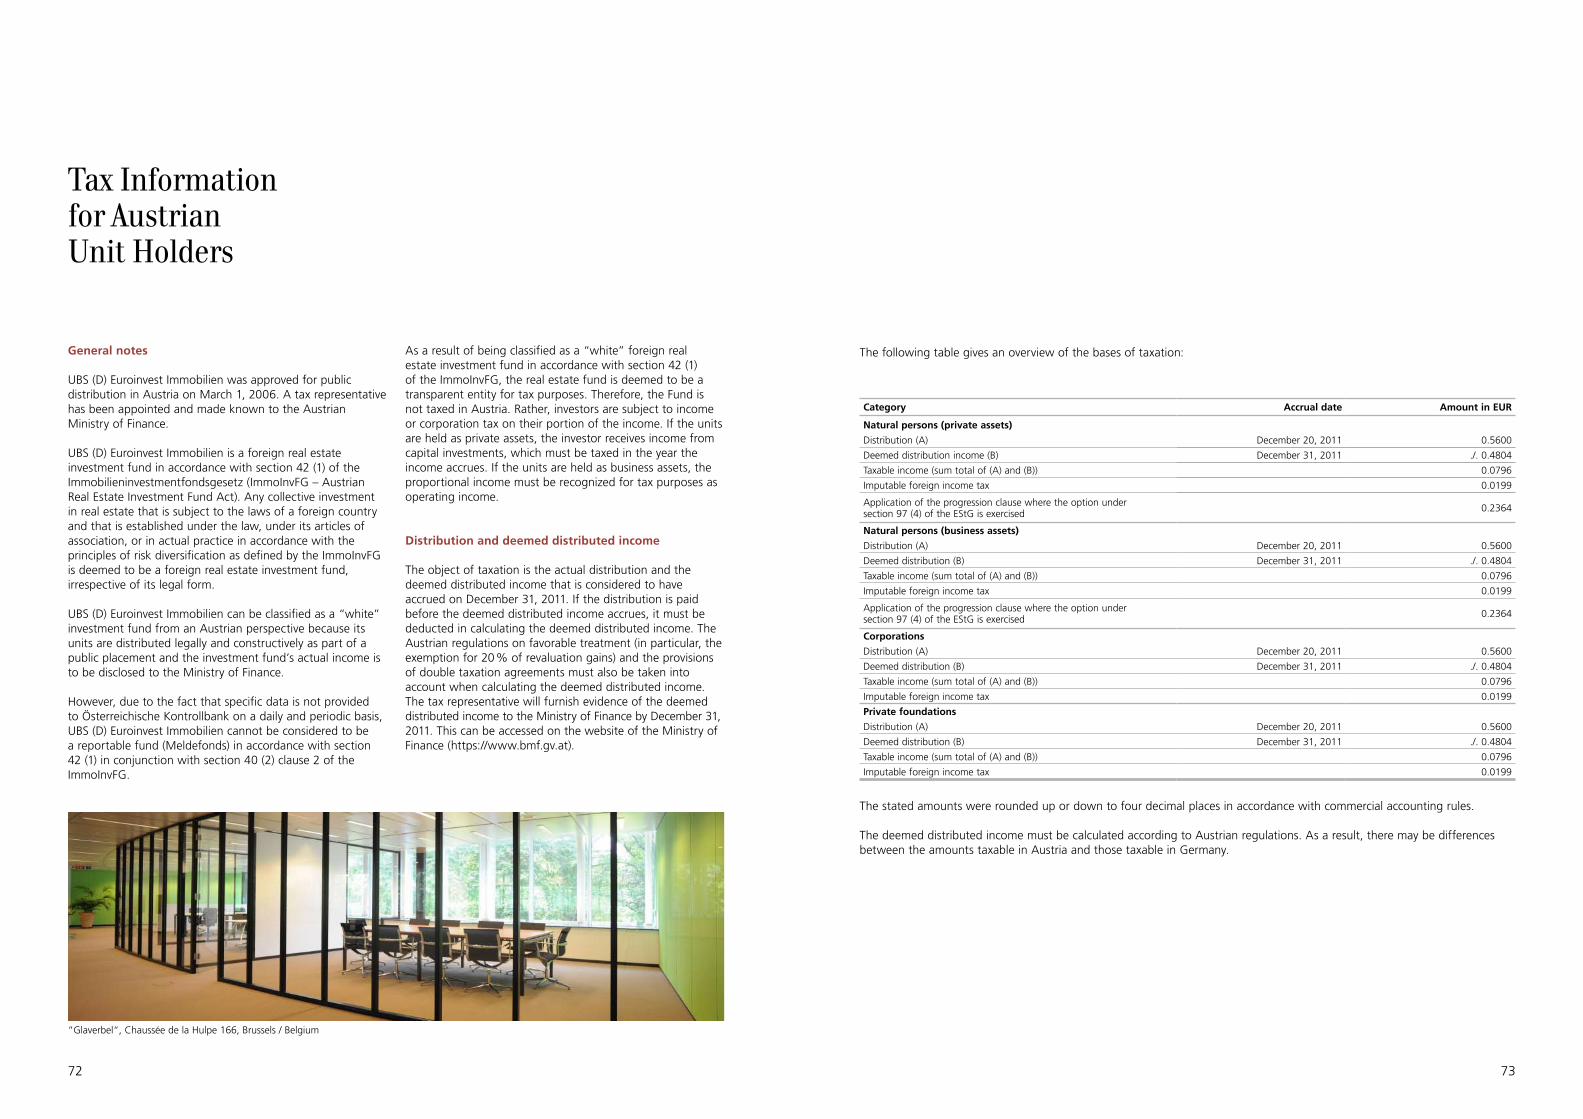
72 73
The following table gives an overview of the bases of taxation:
The stated amounts were rounded up or down to four decimal places in accordance with commercial accounting rules.
The deemed distributed income must be calculated according to Austrian regulations. As a result, there may be differences between the amounts taxable in Austria and those taxable in Germany.
General notes
UBS (D) Euroinvest Immobilien was approved for public distribution in Austria on March 1, 2006. A tax representative has been appointed and made known to the Austrian Ministry of Finance.
UBS (D) Euroinvest Immobilien is a foreign real estate investment fund in accordance with section 42 (1) of the Immobilieninvestmentfondsgesetz (ImmoInvFG – Austrian Real Estate Investment Fund Act). Any collective investment in real estate that is subject to the laws of a foreign country and that is established under the law, under its articles of association, or in actual practice in accordance with the principles of risk diversification as defined by the ImmoInvFG is deemed to be a foreign real estate investment fund, irrespective of its legal form.
UBS (D) Euroinvest Immobilien can be classified as a “white” investment fund from an Austrian perspective because its units are distributed legally and constructively as part of a public placement and the investment fund’s actual income is to be disclosed to the Ministry of Finance.
However, due to the fact that specific data is not provided to Österreichische Kontrollbank on a daily and periodic basis, UBS (D) Euroinvest Immobilien cannot be considered to be a reportable fund (Meldefonds) in accordance with section 42 (1) in conjunction with section 40 (2) clause 2 of the ImmoInvFG.
As a result of being classified as a “white” foreign real estate investment fund in accordance with section 42 (1) of the ImmoInvFG, the real estate fund is deemed to be a transparent entity for tax purposes. Therefore, the Fund is not taxed in Austria. Rather, investors are subject to income or corporation tax on their portion of the income. If the units are held as private assets, the investor receives income from capital investments, which must be taxed in the year the income accrues. If the units are held as business assets, the proportional income must be recognized for tax purposes as operating income.
Distribution and deemed distributed income
The object of taxation is the actual distribution and the deemed distributed income that is considered to have accrued on December 31, 2011. If the distribution is paid before the deemed distributed income accrues, it must be deducted in calculating the deemed distributed income. The Austrian regulations on favorable treatment (in particular, the exemption for 20 % of revaluation gains) and the provisions of double taxation agreements must also be taken into account when calculating the deemed distributed income. The tax representative will furnish evidence of the deemed distributed income to the Ministry of Finance by December 31, 2011. This can be accessed on the website of the Ministry of Finance (https://www.bmf.gv.at).
Tax Information for Austrian Unit Holders
Category Accrual date Amount in EUR
Natural persons (private assets)
Distribution (A) December 20, 2011 0.5600
Deemed distribution income (B) December 31, 2011 ./. 0.4804
Taxable income (sum total of (A) and (B)) 0.0796
Imputable foreign income tax 0.0199
Application of the progression clause where the option undersection 97 (4) of the EStG is exercised 0.2364
Natural persons (business assets)
Distribution (A) December 20, 2011 0.5600
Deemed distribution (B) December 31, 2011 ./. 0.4804
Taxable income (sum total of (A) and (B)) 0.0796
Imputable foreign income tax 0.0199
Application of the progression clause where the option undersection 97 (4) of the EStG is exercised 0.2364
Corporations
Distribution (A) December 20, 2011 0.5600
Deemed distribution (B) December 31, 2011 ./. 0.4804
Taxable income (sum total of (A) and (B)) 0.0796
Imputable foreign income tax 0.0199
Private foundations
Distribution (A) December 20, 2011 0.5600
Deemed distribution (B) December 31, 2011 ./. 0.4804
Taxable income (sum total of (A) and (B)) 0.0796
Imputable foreign income tax 0.0199
“Glaverbel“, Chaussée de la Hulpe 166, Brussels / Belgium
74 75
Taxation
Where units are held in custody in an Austrian custody account (domestic custody), Austrian investment income tax of 25 % is withheld on the distribution (A). Levying this tax is treated as definitive taxation in the case of a natural person (private assets, business assets). Investors therefore do not have to include the distribution in their annual tax returns unless they exercise the option to be taxed at the standard rate in accordance with section 97 (4) of the Einkommensteuergesetz (EStG – Income Tax Act). However, it should be noted that Austrian regulations on exemptions and provisions of double taxation agreements cannot be taken into account at the distribution date, as a result of which the entire distribution is subject to investment income tax and therefore too much investment income tax will be withheld. To enable the application of national regulations and double taxation agreements, deemed distributed income and foreign income taxes must be declared in the investor’s annual tax return. If a tax return is not submitted, an application can be made in accordance with section 240 (3) of the Bundesabgabenordnung (BAO – Austrian Federal Fiscal Code) (reimbursement of wrongly withheld investment income tax). The excess investment income tax withheld as a result of the agreement provisions not being taken into account at the distribution date (more specifically, the exemption applicable to income from real estate in, for example, Germany, Belgium, and Spain, as well as the offsetting of Italian and Finnish income tax) is reimbursed to investors in the course of their tax assessments or following an application in accordance with section 240 (3) of the BAO.
Where units are held in custody in a foreign custody account (foreign custody), the sum total of the distribution and the deemed distributed income accruing to a natural person (private assets, business assets) is subject to the special tax rate of 25 % (definitive taxation on assessment), unless the investor exercises the option to be taxed at the standard rate in accordance with section 97 (4) of the EStG. The sum total of the distribution and the deemed distributed income must be declared in the investor’s annual tax return (assessment).
The sum total of the distribution and the deemed distributed income accruing to institutional investors (corporations, private foundations) is subject to taxation as part of the annual assessment. Corporation tax is levied at 25 % (corporations and private foundations). Any investment income tax charged is treated as a prepayment of corporation tax.
Security tax
Where units are held in custody in an Austrian custody account, a security tax of 25 % is withheld at the end of the calendar year or, in the case of their previous sale or withdrawal, at the time of such sale or withdrawal. The basis of calculation is 6 % (per year) or 0.5 % (per month) of the redemption value of the unit certificates. The amount of security tax is therefore 1.5 % (per year) or 0.125 % (per month) of the redemption value of the unit certificates. Security tax is offset against investors’ tax liability as part of their annual assessment, or reimbursed to investors following an application according to section 240 (3) of the BAO.
No security tax is withheld if investors have fulfilled their disclosure obligation or if an exemption from investment income tax is applicable (declaration of exemption in accordance with section 94 (5) of the EStG for corporations, exemption for private foundations in accordance with section 94 (11) of the EStG).
Foreign taxes
In principle, foreign income tax (including deferred taxes on revaluation gains) can be offset against investors’ income or corporation tax liability as part of their annual assessment or following an application in accordance with section 240 (3) of the BAO, provided that all prerequisites specified in the double taxation agreements are satisfied. The amounts creditable were calculated in line with the maximum percentage that may be offset as well as on the basis of the per-country limitation.
Sale of units
Where units are sold or redeemed during the year, investors receive deemed distributed income that must be taxed in general in accordance with the principles outlined above – qualification of income, tax rate, and security tax. In derogation of the above, however, the deemed distributed income must be determined as a lump-sum amount. In accordance with section 42 (1) of the ImmoInvFG in conjunction with section 42 (2) of the Investmentfondsgesetz (InvFG – Austrian Investment Fund Act), the difference between the redemption price at the time of the disposal (redemption) and the last redemption price (determined
Tax Information for Austrian Unit Holders
in the previous calendar year), but at least 0.8 % of the redemption price at the time of the disposal (redemption), is taxable for each month or part-month for which the units were held. However, in accordance with tax authority practice, deemed distributed income disclosed in relation to a later point (such as the end of the Fund’s fiscal year in which the sale occurred) may be recognized without being calculated on a monthly basis.
In the case of units held as private assets, any increase in value above and beyond the deemed distributed income is deemed to be a taxable capital gain if the units are sold or redeemed within one year of purchase. In the case of units held as business assets, the increase in value is taxable irrespective of the holding period. The normal tax rate must be applied in both cases.
Limited tax liability
In the absence of any Austrian real estate, investors subject to limited tax liability are not subject to Austrian income tax. However, units acquired as domestic business assets (Austrian production facilities) may be subject to Austrian income tax.
Gratuitous transfer of units
No inheritance or gift tax is levied. However, the regulations regarding the reporting of gifts in accordance with section 121a of the BAO and the taxation of foundation receipts in the event of the gratuitous transfer of units to a private foundation or a comparable legal entity must be observed.
Savings Directive
Since the entry into force of Directive 2003/48/EC on July 1, 2005, Austrian investors have been subject to its provisions. As a result, information may be exchanged, or EU withholding tax deducted, insofar as the units are held in a foreign securities account. Further information is provided in the section on the Zinsinformationsverordnung in the chapter entitled Tax Information for German Unit Holders.
Due to the home country rule, an option exercised in Germany in accordance with section 4 (3) of Directive
2003/48/EC is binding on Austrian paying agents. However, the EU withholding tax is not reported to the Österreichische Kontrollbank.
Changes resulting from the BBG 2011, the AbgÄG 2011, and the InvFG 2011
The Budgetbegleitgesetz 2011 (BBG 2011 – Budget Trailer Act 2011) was published in the Bundesgesetzblatt (Federal Gazette) on December 30, 2010 (BGBl I 111/2010) and entered into force on January 1, 2011. The BBG 2011 introduced a far-reaching reform of the tax treatment of investment income, including for investment funds and real estate funds. The Abgabenänderungsgesetz 2011 (AbgÄG 2011 – Tax Amendment Act 2011, BGBl I 76/2011) and the Investmentfondsgesetz 2011 (InvFG – Investment Fund Act 2011, BGBl I 77/2011) (both published in the Federal Gazette on August 1, 2011) led to a further change in the provisions governing the taxation of real estate fund units. Although the amendments to the law do not affect the calculation of the taxable net income as of August 31, 2011, they will have a significant impact on the Fund’s fiscal year ending August 31, 2012.
Under the BBG 2011, the tax base for real estate investment funds continues to comprise income from real estate management, revaluation gains, gains from securities, and liquidity gains; together, these represent the real estate fund’s annual profit. The taxable annual profit is taken to have been accrued four months after the end of the fund’s fiscal year and is taxable (deemed distributed income). The distribution is tax-neutral regardless of when it takes place. Effective April 1, 2012, the distinction made between “white” investment funds and reportable funds will be abolished. In future, the real estate fund’s tax representative will only have to report the deemed distributed income to the central registration office (Österreichische Kontrollbank).
The deemed distributed income is still subject to 25 % investment income tax where the units are held in an Austrian custody account. Where the units are held in custody abroad, the deemed distributed income must be taken into account during investors’ tax assessments.
However, in the case of units purchased after December 31, 2010, the statutory amendments introduced by the BBG 2011, AbgÄG 2011, and InvFG 2011 are already relevant. In
76 77
Tax Information for Austrian Unit Holders
the case of such units (new holdings), realized gains in value are taxable regardless of the period for which they have been held (i.e., they are also taxable outside the one-year taxable period). The normal tax rate is to be used until March 31, 2012, and the special tax rate of 25 % from April 1, 2012, onwards.
In the case of units held in custody in Austria, the custodian must retain the investment income tax, whereas investors who hold the units in custody accounts abroad are required to submit a tax return. There is no longer any need to calculate the deemed distributed income accruing on the sale of units separately; this is taxable as part of the gain in the value of the units in the real estate fund. The annual deemed distributed income increases the acquisition costs for the fund units, whereas the actual tax-free distributions reduce the acquisition costs. In contrast, the current tax system must still be applied in the case of units that were purchased before January 1, 2011 (legacy holdings).
In the case of legacy holdings, losses on sale can only be offset where they are realized within the one-year taxable period (specula-tive losses), and then only against other speculative gains; they cannot be carried forward. As from April 1, 2012, losses on sale relating to new holdings can be offset against other investment income – after adjustment for any restrictions – but cannot be carried forward. Any tax losses can only be offset as part of the tax assessment procedure.
Effective April 1, 2012, the requirement to levy the security tax will be abolished.
In principle, the same provisions apply in the case of units in real estate funds held by natural persons as business assets as to fund units held as private assets. However, there are greater opportunities for offsetting tax losses and – within certain limits – for partial writedowns and loss carryforwards.
In the case of corporations holding units in real estate funds, there is basically no change relating to the transfer of units in comparison to the legal situation applicable to acquisitions of units in the period up to December 31, 2010.
Additional information
The information given above provides a condensed summary of the tax consequences for Austrian investors. The information is based on the legal position as of August 31, 2011. It is also necessary to point out that there are as yet no rulings by supreme courts and no generally accepted tax authority practice in respect of the way units in foreign real estate funds are viewed for tax purposes. The Investmentfondsrichtlinien 2008 (Austrian Fund Guidelines 2008) still leave many questions unanswered regarding the taxation of real estate funds, including the calculation of the deemed distributed income. No assurance can therefore be given that the method by which taxable income from an interest in a foreign real estate fund is calculated will not change as a result of changes in the legislation, court rulings, or administrative practice. The consequences of any such divergent opinion on the part of the fiscal authorities shall be borne solely by the investor.
Committees
Investment company:UBS Real Estate Kapitalanlagegesellschaft mbH
Legal form:GmbH (Gesellschaft mit beschränkter Haftung – private limited liability company)
Registered office::Theatinerstrasse 1680333 Munich, GermanyPhone: +49(0)89-20 60 95 0Fax: +49(0)89-20 60 95 200
Local court/registration court:Munich HR B 10 10 08
Formation:October 22, 1992
Fiscal year: January 1 - December 31
Subscribed and paid-in capital as of December 31, 2010: EUR 7.5 million
Liable capital as of December 31, 2010: EUR 7.5 million
Shareholders:since October 1, 2010:UBS Beteiligungs-GmbH & Co. KG, Frankfurt (94.9 %)Siemens AG, Berlin and Munich (5.1 %)until September 30, 2010:UBS Beteiligungs-GmbH & Co. KG, Frankfurt (51 %)Siemens AG, Berlin and Munich (49 %)
Management:Dr. Christine Bernhofer Dr. Tilman HicklJörg Sihler (as of October 15, 2011)
Supervisory Board:Reto KettererUBS AG – Global Asset ManagementGlobal Real Estate – Chief Operating Officer- Chairman -
Hans-Peter RupprechtSiemens Financial Services GmbHHead of Treasury and Investment Management- Deputy Chairman -
Dr. Riccardo BoscardinUBS AG – Global Asset ManagementHead Global Real Estate – Switzerland
Axel Hörger (since October 2010)UBS Deutschland AG – Wealth ManagementChairman of the Executive Board – CEO Wealth Management
Prof. Dr. Thomas KinatederDean of Studies, Real Estate IndustryHFWU Hochschule für Wirtschaft und Umwelt, Nürtingen-Geislingen- Independent member in accordance with section 6 (2a) of the InvG -
Brigitta Kocherhans (until September 30, 2010)Siemens Financial Services GmbHHead of Corporate Pensions
Andreas VarnavidesUBS Deutschland AG – Global Asset ManagementMember of the Executive Board – CEO Germany and Austria
Independent auditor:Ernst & Young GmbHWirtschaftsprüfungsgesellschaftEschborn / Frankfurt am Main
Custodian bank:CACEIS Bank Deutschland GmbHRegistered office: MunichSubscribed capital as of December 31, 2010: EUR 5,113 thousandLiable capital as of December 31, 2010: EUR 161,226 thousand
Expert Committee for the UBS (D) Euroinvest Immobilien real estate investment fundUwe DittBetriebswirt BdH,publicly certified, sworn expert,Mainz- Chairman -
Florian LehnDipl.-Ing. (FH), architect,Publicly certified, sworn expert,Munich- Deputy Chairman -
Dirk EßelmannDipl.-Ing.,Publicly certified, sworn expert,Münster
Substitute member:Prof. Dr. Gerrit LeopoldsbergerFRICS MAI,Frankfurt am Main
Information correct as of August 31, 2011, unless stated otherwise