Umweltdaten der deutschen Zementindustrie … · Vorwort/Foreword 3 Liebe Leserinnen und Leser, die...
40
Umweltdaten der deutschen Zementindustrie Environmental Data of the German Cement Industry 2012
Transcript of Umweltdaten der deutschen Zementindustrie … · Vorwort/Foreword 3 Liebe Leserinnen und Leser, die...
Vorwort/Foreword
1
Umweltdaten der deutschen ZementindustrieEnvironmental Data of the German Cement Industry
2012
VDZ Umweltdaten 2012/ VDZ Environmental Data 2012
Inhalt / Contents
Vorwort / Foreword 3
1 Zementherstellung / Cement manufacture 5
2 Produktions- und Strukturdaten / Production and structural data 6
3 Einsatzstoffe / Input materials 8
3.1 Rohstoffe / Raw materials 8
3.2 Brennstoffe / Fuels 9
4 Energie / Energy 10
5 Emissionen / Emissions 12
5.1 Treibhausgase / Kohlenstoffdioxid / greenhouse gases / carbon dioxide 14
5.2 Staub / Dust 15
5.3 Stickstoffoxide / Nitrogen oxides 16
5.4 Schwefeldioxid / Sulphur dioxide 17
5.5 Kohlenstoffmonoxid und organischer Gesamtkohlenstoff / Carbon monoxide and total organic carbon 18
5.6 Dioxine und Furane / Dioxins und Furans 20
5.7 Polychlorierte Biphenyle / Polychlorinated biphenyls 21
5.8 Polycyclische aromatische Kohlenwasserstoffe / Polycyclic aromatic hydrocarbons 22
5.9 Benzol, Toluol, Ethylbenzol, Xylol / Benzene, toluene, ethylbenzene, xylene 23
5.10 Benzol / Benzene 24
5.11 Gasförmige anorganische Chlorverbindungen / Gaseous inorganic chlorine compounds 25
5.12 Gasförmige anorganische Fluorverbindungen / Gaseous inorganic fluorine compounds 26
5.13 Spurenelemente / Trace elements 27
5.13.1 Cadmium / Cadmium (Cd) 28
5.13.2 Thallium / Thallium (TI) 29
5.13.3 Quecksilber / Mercury (Hg) 30
5.13.4 Antimon / Antimony (Sb) 31
5.13.5 Arsen / Arsenic (As) 32
5.13.6 Blei / Lead (Pb) 33
5.13.7 Chrom / Chromium (Cr) 34
5.13.8 Cobalt / Cobalt (Co) 35
5.13.9 Kupfer / Copper (Cu) 36
5.13.10 Mangan / Manganese (Mn) 37
5.13.11 Nickel / Nickel (Ni) 38
5.13.12 Vanadium / Vanadium (V) 39
5.13.13 Zinn / Tin (Sn) 40
5.13.14 Beryllium / Beryllium (Be) 41
5.13.15 Selen / Selenium (Se) 42 5.13.16 Tellur / Tellurium (Te) 43
5.13.17 Zink / Zinc (Zn) 44
Literatur / Ergänzende Literatur / Literature / Additional literature 45
Impressum / Imprint 47
Anmerkung: Zahlendarstellung in Tabellen und Grafiken entsprechend deutscher Regeln.Note: Numerical expressions in tables and diagrams are shown using standard German punctuation.
Vorwort/Foreword
3
Liebe Leserinnen und Leser,
die vorliegende 14. Ausgabe der „Umweltdaten der deutschen Zementindustrie“ gibt in bewährter Form einen umfangreichen Überblick über die umweltrelevanten Emissionen sämtlicher Klin-ker produzierenden Werke in Deutschland. Seit September 2000 dokumentiert der VDZ damit die Ergebnisse sowohl kontinuier-licher Emissionsüberwachungen als auch von Einzelmessungen von Spurenelementen und organischen Abgasbestandteilen in den deutschen Zementwerken.
Mit durchschnittlich rund 178 Kilogramm Kohlendioxid sank der spezifische energiebedingte CO2-Ausstoß pro hergestell-ter Tonne Zement von 1990 bis 2012 um 49 Prozent. Neben verfahrenstechnischen Innovationen und der Reduzierung des Klinkeranteils am Zement durch andere Hauptbestand-teile verhalf vor allem der vermehrte Einsatz alternativer Brennstoffe zur Minderung der CO2-Emissionen. Altreifen, Altöl und Altholz sowie Fraktionen aus Industrie- und Ge-werbeabfällen sorgten 2012 in den Drehöfen der deutschen Zementwerke für rund 61 Prozent der benötigten thermischen Energie. Ihre CO2-Emissionen werden in der Gesamtrechnung nicht berücksichtigt, da sie fossile Brennstoffe ersetzen und somit zu einer CO2-Minderung an anderer Stelle beitragen.
Als Verwerter dieser Abfälle unterliegen die deutschen Zement-werke strengen Auflagen wie dem Bundes-Immissionsschutzge-setz. Aber auch verfahrensbedingte Immissionen von Staub oder Stickstoffoxiden unterliegen Regelungen zur Reinhaltung der Luft. Die Zementhersteller in Deutschland bekannten sich bereits vor Jahrzehnten zu ihrer Verantwortung und setzen weltweit führende Standards, wie beispielweise bei der Minderung von NOx- oder SO2-Emissionen. Auf den folgenden Seiten dokumentiert der VDZ Art und Umfang dieser und weiterer umweltrelevanter Emissionen für das Jahr 2012.
Düsseldorf, im Dezember 2013
Dr. Martin SchneiderHauptgeschäftsführerVDZ
Dear readers,
The present 14th edition of the “Environmental Data of the German Cement Industry” provides a comprehensive overview of all clinker producing works in Germany in proven form. Since September 2000, VDZ has documented the results of continuous emission monitoring as well as individual measurements of trace elements and organic gas components in German cement works.
With an average of around 178 kilograms of carbon dioxide, the specific energy-related CO2 emission per ton of produced cement fell between 1990 and 2012 by 49 per cent. Apart from technologi-cal and process innovations and the reduction of the clinker/cement factor due to the use of other main constituents, the increased use of alternative fuels primarily helped to reduce CO2 emissions. In 2012 waste tyres, waste oil and waste wood as well as fractions of industrial and commercial waste provided about 61 per cent of the required thermal energy in the rotary kilns of the German cement works. The CO2 emissions from alternative fuels are not included in the total accounts, as they replace fossil fuels and therefore contribute to a CO2 reduction elsewhere.
As co-incinerators of these wastes, German cement works are subject to strict restrictions, such as the Federal Pollution Control Act. Process-related emissions of dust or nitrogen oxides also are subject to regulations for clean air. Cement manufacturers in Germany committed themselves decades ago to upholding their responsibility and set world-leading standards in the reduction of NOx and SO2 emissions. On the following pages, the VDZ has documented the nature and extent of these and other environmental emissions during 2012.
Duesseldorf, December 2013
Dr. Martin SchneiderChief ExecutiveVDZ

5
1 Zementherstellung / Cement manufacture
1 Zementherstellung
Zement ist ein Baustoff, der infolge chemischer Reaktionen mit Wasser selbstständig erhärtet und danach sowohl an der Luft als auch unter Wasser fest und raumbeständig bleibt.
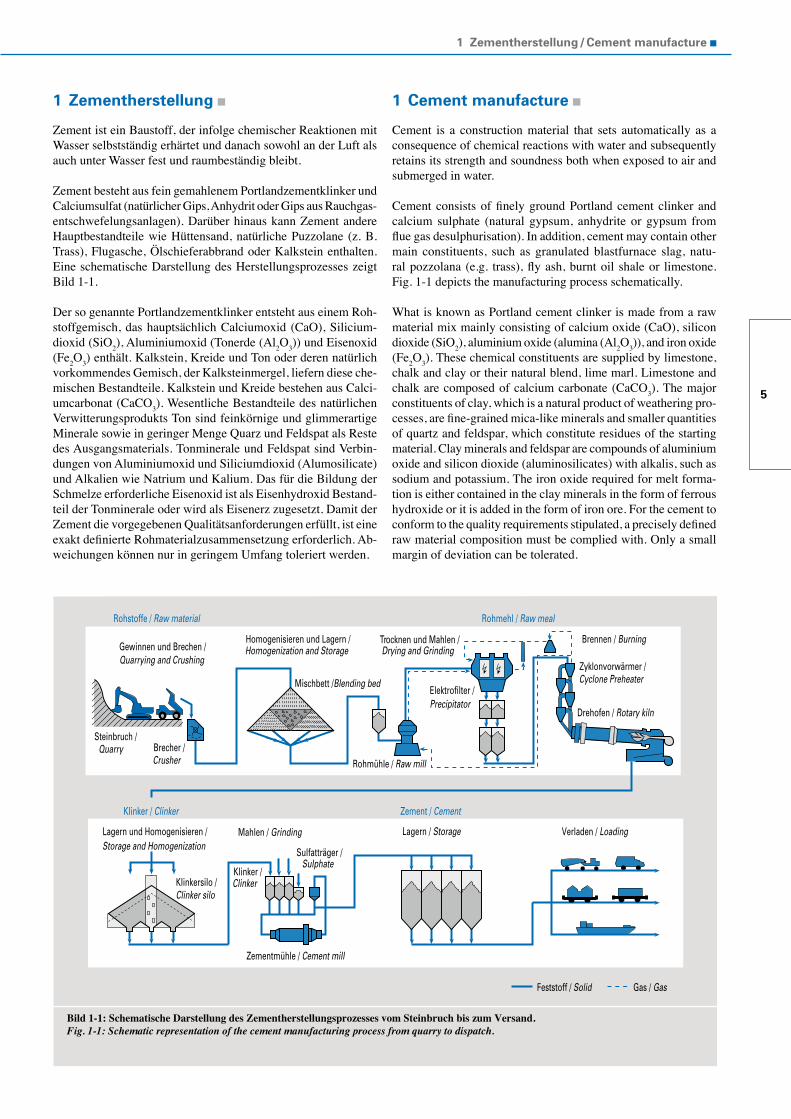
Zement besteht aus fein gemahlenem Portlandzementklinker und Calciumsulfat (natürlicher Gips, Anhydrit oder Gips aus Rauchgas- entschwefelungsanlagen). Darüber hinaus kann Zement andere Hauptbestandteile wie Hüttensand, natürliche Puzzolane (z. B. Trass), Flugasche, Ölschieferabbrand oder Kalkstein enthalten. Eine schematische Darstellung des Herstellungsprozesses zeigt Bild 1-1.
Der so genannte Portlandzementklinker entsteht aus einem Roh-stoffgemisch, das hauptsächlich Calciumoxid (CaO), Silicium-dioxid (SiO2), Aluminiumoxid (Tonerde (Al2O3)) und Eisenoxid (Fe2O3) enthält. Kalkstein, Kreide und Ton oder deren natürlich vorkommendes Gemisch, der Kalksteinmergel, liefern diese che-mischen Bestandteile. Kalkstein und Kreide bestehen aus Calci-umcarbonat (CaCO3). Wesentliche Bestandteile des natürlichen Verwitterungsprodukts Ton sind feinkörnige und glimmerartige Minerale sowie in geringer Menge Quarz und Feldspat als Reste des Ausgangsmaterials. Tonminerale und Feldspat sind Verbin-dungen von Aluminiumoxid und Siliciumdioxid (Alumosilicate) und Alkalien wie Natrium und Kalium. Das für die Bildung der Schmelze erforderliche Eisenoxid ist als Eisenhydroxid Bestand-teil der Tonminerale oder wird als Eisenerz zugesetzt. Damit der Zement die vorgegebenen Qualitätsanforderungen erfüllt, ist eine exakt definierte Rohmaterialzusammensetzung erforderlich. Ab-weichungen können nur in geringem Umfang toleriert werden.
Bild 1-1: Schematische Darstellung des Zementherstellungsprozesses vom Steinbruch bis zum Versand.Fig. 1-1: Schematic representation of the cement manufacturing process from quarry to dispatch.
Klinker / Clinker Zement / Cement
Rohmehl / Raw meal
Gewinnen und Brechen / Quarrying and Crushing
CrusherQuarry
Homogenisieren und Lagern / Homogenization and Storage Drying and Grinding
Cyclone Preheater
Trocknen und Mahlen / Brennen / Burning
Lagern und Homogenisieren / Storage and Homogenization
Mahlen / Grinding Verladen / Loading
Rohstoffe / Raw material
Drehofen / Rotary kiln
Rohmühle / Raw mill
Steinbruch /Brecher /
Mischbett /Blending bed Elektrofilter / Precipitator
Zyklonvorwärmer /
Klinkersilo /Clinker silo
Zementmühle / Cement mill
Lagern / Storage
Feststoff / Solid Gas / Gas
Klinker /
Sulfatträger /
Clinker
Sulphate
1 Cement manufacture
Cement is a construction material that sets automatically as a consequence of chemical reactions with water and subsequently retains its strength and soundness both when exposed to air and submerged in water.
Cement consists of finely ground Portland cement clinker and calcium sulphate (natural gypsum, anhydrite or gypsum from flue gas desulphurisation). In addition, cement may contain other main constituents, such as granulated blastfurnace slag, natu-ral pozzolana (e.g. trass), fly ash, burnt oil shale or limestone. Fig. 1-1 depicts the manufacturing process schematically.
What is known as Portland cement clinker is made from a raw material mix mainly consisting of calcium oxide (CaO), silicon dioxide (SiO2), aluminium oxide (alumina (Al2O3)), and iron oxide (Fe2O3). These chemical constituents are supplied by limestone, chalk and clay or their natural blend, lime marl. Limestone and chalk are composed of calcium carbonate (CaCO3). The major constituents of clay, which is a natural product of weathering pro-cesses, are fine-grained mica-like minerals and smaller quantities of quartz and feldspar, which constitute residues of the starting material. Clay minerals and feldspar are compounds of aluminium oxide and silicon dioxide (aluminosilicates) with alkalis, such as sodium and potassium. The iron oxide required for melt forma- tion is either contained in the clay minerals in the form of ferrous hydroxide or it is added in the form of iron ore. For the cement to conform to the quality requirements stipulated, a precisely defined raw material composition must be complied with. Only a small margin of deviation can be tolerated.
VDZ Umweltdaten 2012/ VDZ Environmental Data 2012
6
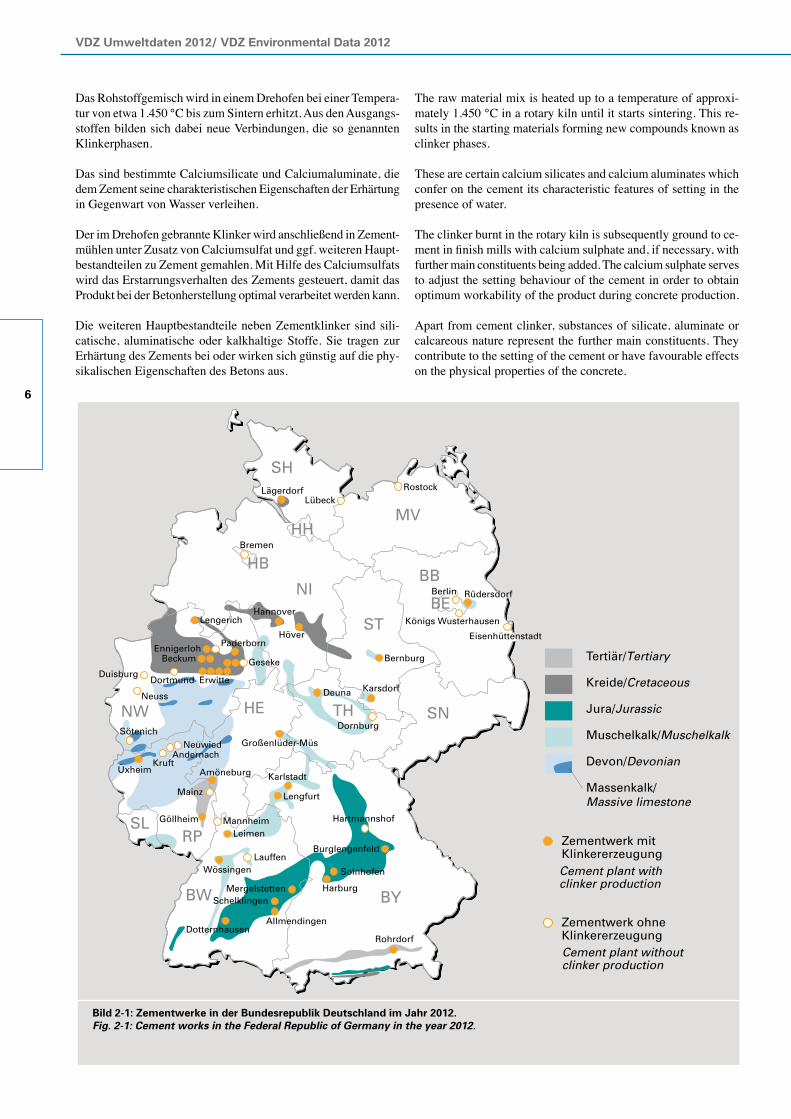
Bild 2-1: Zementwerke in der Bundesrepublik Deutschland im Jahr 2012.Fig. 2-1: Cement works in the Federal Republic of Germany in the year 2012.
Großenlüder-Müs
Rohrdorf
Mergelstetten Harburg
Solnhofen
Schelklingen
AllmendingenDotternhausen
Burglengenfeld
Hartmannshof
LauffenWössingen
LeimenMannheimGöllheim
Amöneburg
Mainz
Karlstadt
Lengfurt
Dornburg
Karsdorf
Bernburg
Deuna
Eisenhüttenstadt
Königs Wusterhausen
Berlin
Höver
Hannover
Bremen
Ennigerloh
Lengerich
LübeckLägerdorf Rostock
Paderborn
GesekeBeckum
ErwitteDortmundDuisburg
Neuss
Sötenich
SH
MV
NI
ST
BB
SNHENW
SLRP
BW BY
TH
HH
BE
HB
Rüdersdorf
Üxheim
AndernachNeuwied
Kruft
Tertiär/Tertiary
Kreide/Cretaceous
Jura/Jurassic
Muschelkalk/Muschelkalk
Devon/Devonian
Massenkalk/Massive limestone
Zementwerk mitKlinkererzeugung
Zementwerk ohneKlinkererzeugung
Cement plant withclinker production
Cement plant withoutclinker production
Das Rohstoffgemisch wird in einem Drehofen bei einer Tempera-tur von etwa 1.450 °C bis zum Sintern erhitzt. Aus den Ausgangs-stoffen bilden sich dabei neue Verbindungen, die so genannten Klinkerphasen.
Das sind bestimmte Calciumsilicate und Calciumaluminate, die dem Zement seine charakteristischen Eigenschaften der Erhärtung in Gegenwart von Wasser verleihen.
Der im Drehofen gebrannte Klinker wird anschließend in Zement-mühlen unter Zusatz von Calciumsulfat und ggf. weiteren Haupt-bestandteilen zu Zement gemahlen. Mit Hilfe des Calciumsulfats wird das Erstarrungsverhalten des Zements gesteuert, damit das Produkt bei der Betonherstellung optimal verarbeitet werden kann.
Die weiteren Hauptbestandteile neben Zementklinker sind sili-catische, aluminatische oder kalkhaltige Stoffe. Sie tragen zur Erhärtung des Zements bei oder wirken sich günstig auf die phy-sikalischen Eigenschaften des Betons aus.
The raw material mix is heated up to a temperature of approxi- mately 1.450 °C in a rotary kiln until it starts sintering. This re-sults in the starting materials forming new compounds known as clinker phases.
These are certain calcium silicates and calcium aluminates which confer on the cement its characteristic features of setting in the presence of water.
The clinker burnt in the rotary kiln is subsequently ground to ce-ment in finish mills with calcium sulphate and, if necessary, with further main constituents being added. The calcium sulphate serves to adjust the setting behaviour of the cement in order to obtain optimum workability of the product during concrete production.
Apart from cement clinker, substances of silicate, aluminate or calcareous nature represent the further main constituents. They contribute to the setting of the cement or have favourable effects on the physical properties of the concrete.
7
2 Produktions- und Strukturdaten / Production and structural data
2 Produktions- und Strukturdaten
Zement ist ein homogenes Massengut, das zu Lande per Lkw transportiert wird und deshalb hier transportkostenintensiv ist. Zement wird überwiegend zu lokalen Absatzmärkten geliefert. Die Produktionsstandorte der deutschen Zementindustrie sind gleichmäßig über das Bundesgebiet verteilt und befinden sich in unmittelbarer Nähe zu den jeweiligen Kalksteinvorkommen. Im Jahr 2012 produzierten 22 Unternehmen in 54 Werken etwa 32,4 Mio. t Zement [1] (Bild 2-1).
Die Tafeln 2-1 und 2-3 geben einen Überblick über die Klinker-produktion in Deutschland sowie den daraus hergestellten Zement. Zu den Hauptabnehmern gehören die Transportbetonindustrie mit ca. 56 % sowie die Hersteller von Betonbauteilen mit ca. 23 % des inländischen Zementversandes. Etwa 7 % des Zements wird als Sackzement versandt.
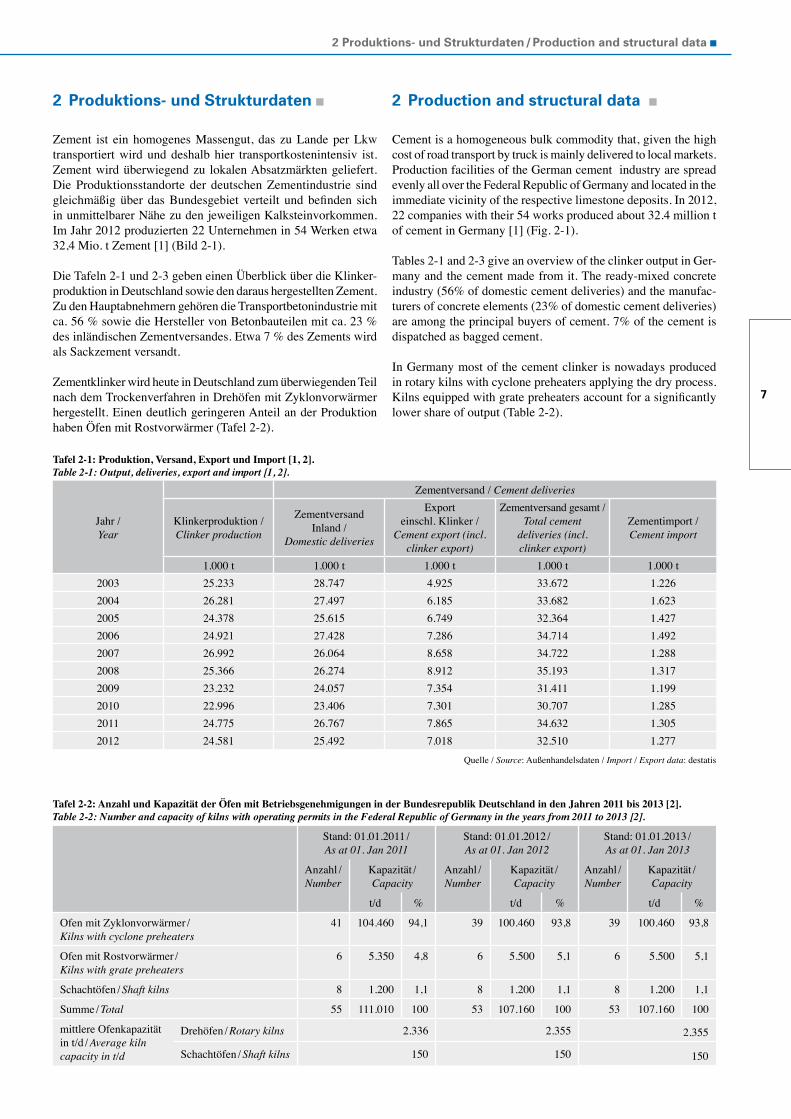
Zementklinker wird heute in Deutschland zum überwiegenden Teil nach dem Trockenverfahren in Drehöfen mit Zyklonvorwärmer hergestellt. Einen deutlich geringeren Anteil an der Produktion haben Öfen mit Rostvorwärmer (Tafel 2-2).
2 Production and structural data
Cement is a homogeneous bulk commodity that, given the high cost of road transport by truck is mainly delivered to local markets. Production facilities of the German cement industry are spread evenly all over the Federal Republic of Germany and located in the immediate vicinity of the respective limestone deposits. In 2012, 22 companies with their 54 works produced about 32.4 million t of cement in Germany [1] (Fig. 2-1).
Tables 2-1 and 2-3 give an overview of the clinker output in Ger-many and the cement made from it. The ready-mixed concrete industry (56% of domestic cement deliveries) and the manufac-turers of concrete elements (23% of domestic cement deliveries) are among the principal buyers of cement. 7% of the cement is dispatched as bagged cement.
In Germany most of the cement clinker is nowadays produced in rotary kilns with cyclone preheaters applying the dry process. Kilns equipped with grate preheaters account for a significantly lower share of output (Table 2-2).
Tafel 2-1: Produktion, Versand, Export und Import [1, 2]. Table 2-1: Output, deliveries, export and import [1, 2].
Jahr /Year
Zementversand / Cement deliveries
Klinkerproduktion /Clinker production
Zementversand Inland /
Domestic deliveries
Export einschl. Klinker /
Cement export (incl. clinker export)
Zementversand gesamt / Total cement
deliveries (incl. clinker export)
Zementimport /Cement import
1.000 t 1.000 t 1.000 t 1.000 t 1.000 t2003 25.233 28.747 4.925 33.672 1.2262004 26.281 27.497 6.185 33.682 1.6232005 24.378 25.615 6.749 32.364 1.4272006 24.921 27.428 7.286 34.714 1.4922007 26.992 26.064 8.658 34.722 1.2882008 25.366 26.274 8.912 35.193 1.3172009 23.232 24.057 7.354 31.411 1.1992010 22.996 23.406 7.301 30.707 1.2852011 24.775 26.767 7.865 34.632 1.3052012 24.581 25.492 7.018 32.510 1.277
Quelle / Source: Außenhandelsdaten / Import / Export data: destatis
Tafel 2-2: Anzahl und Kapazität der Öfen mit Betriebsgenehmigungen in der Bundesrepublik Deutschland in den Jahren 2011 bis 2013 [2].Table 2-2: Number and capacity of kilns with operating permits in the Federal Republic of Germany in the years from 2011 to 2013 [2].
Stand: 01.01.2011 / As at 01. Jan 2011
Stand: 01.01.2012 / As at 01. Jan 2012
Stand: 01.01.2013 / As at 01. Jan 2013
Anzahl / Number
Kapazität / Capacity
Anzahl / Number
Kapazität / Capacity
Anzahl / Number
Kapazität / Capacity
t/d % t/d % t/d %
Ofen mit Zyklonvorwärmer / Kilns with cyclone preheaters
41 104.460 94,1 39 100.460 93,8 39 100.460 93,8
Ofen mit Rostvorwärmer / Kilns with grate preheaters
6 5.350 4,8 6 5.500 5,1 6 5.500 5,1
Schachtöfen / Shaft kilns 8 1.200 1,1 8 1.200 1,1 8 1.200 1,1
Summe / Total 55 111.010 100 53 107.160 100 53 107.160 100
mittlere Ofenkapazität in t/d / Average kilncapacity in t/d
Drehöfen / Rotary kilns 2.336 2.355 2.355
Schachtöfen / Shaft kilns 150 150 150
VDZ Umweltdaten 2012/ VDZ Environmental Data 2012
8
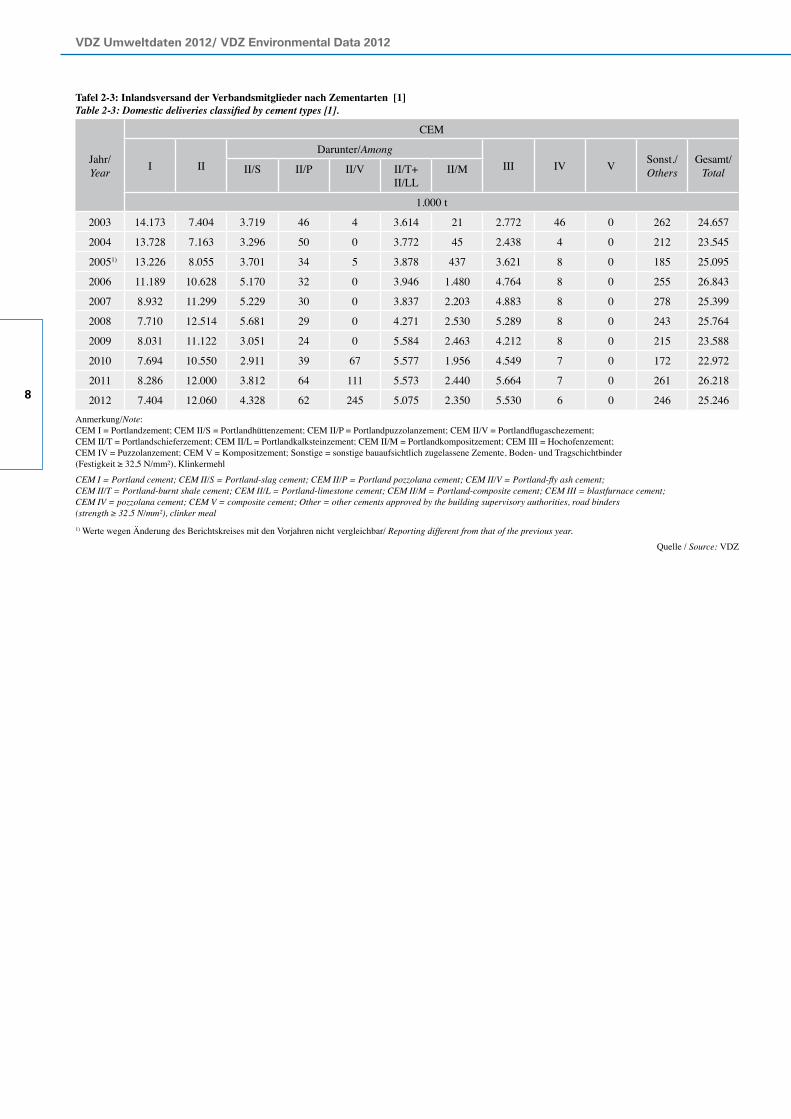
Tafel 2-3: Inlandsversand der Verbandsmitglieder nach Zementarten [1]Table 2-3: Domestic deliveries classified by cement types [1].
Jahr/Year
CEM
I IIDarunter/Among
III IV V Sonst./Others
Gesamt/TotalII/S II/P II/V II/T+
II/LLII/M
1.000 t
2003 14.173 7.404 3.719 46 4 3.614 21 2.772 46 0 262 24.657
2004 13.728 7.163 3.296 50 0 3.772 45 2.438 4 0 212 23.545
20051) 13.226 8.055 3.701 34 5 3.878 437 3.621 8 0 185 25.095
2006 11.189 10.628 5.170 32 0 3.946 1.480 4.764 8 0 255 26.843
2007 8.932 11.299 5.229 30 0 3.837 2.203 4.883 8 0 278 25.399
2008 7.710 12.514 5.681 29 0 4.271 2.530 5.289 8 0 243 25.764
2009 8.031 11.122 3.051 24 0 5.584 2.463 4.212 8 0 215 23.588
2010 7.694 10.550 2.911 39 67 5.577 1.956 4.549 7 0 172 22.972
2011 8.286 12.000 3.812 64 111 5.573 2.440 5.664 7 0 261 26.218
2012 7.404 12.060 4.328 62 245 5.075 2.350 5.530 6 0 246 25.246Anmerkung/Note:CEM I = Portlandzement; CEM II/S = Portlandhüttenzement; CEM II/P = Portlandpuzzolanzement; CEM II/V = Portlandflugaschezement;CEM II/T = Portlandschieferzement; CEM II/L = Portlandkalksteinzement; CEM II/M = Portlandkompositzement; CEM III = Hochofenzement;CEM IV = Puzzolanzement; CEM V = Kompositzement; Sonstige = sonstige bauaufsichtlich zugelassene Zemente, Boden- und Tragschichtbinder(Festigkeit ≥ 32,5 N/mm²), Klinkermehl
CEM I = Portland cement; CEM II/S = Portland-slag cement; CEM II/P = Portland pozzolana cement; CEM II/V = Portland-fly ash cement; CEM II/T = Portland-burnt shale cement; CEM II/L = Portland-limestone cement; CEM II/M = Portland-composite cement; CEM III = blastfurnace cement; CEM IV = pozzolana cement; CEM V = composite cement; Other = other cements approved by the building supervisory authorities, road binders (strength ≥ 32.5 N/mm²), clinker meal1) Werte wegen Änderung des Berichtskreises mit den Vorjahren nicht vergleichbar/ Reporting different from that of the previous year.
Quelle / Source: VDZ
9
3 Einsatzstoffe / Input materials
3 Einsatzstoffe
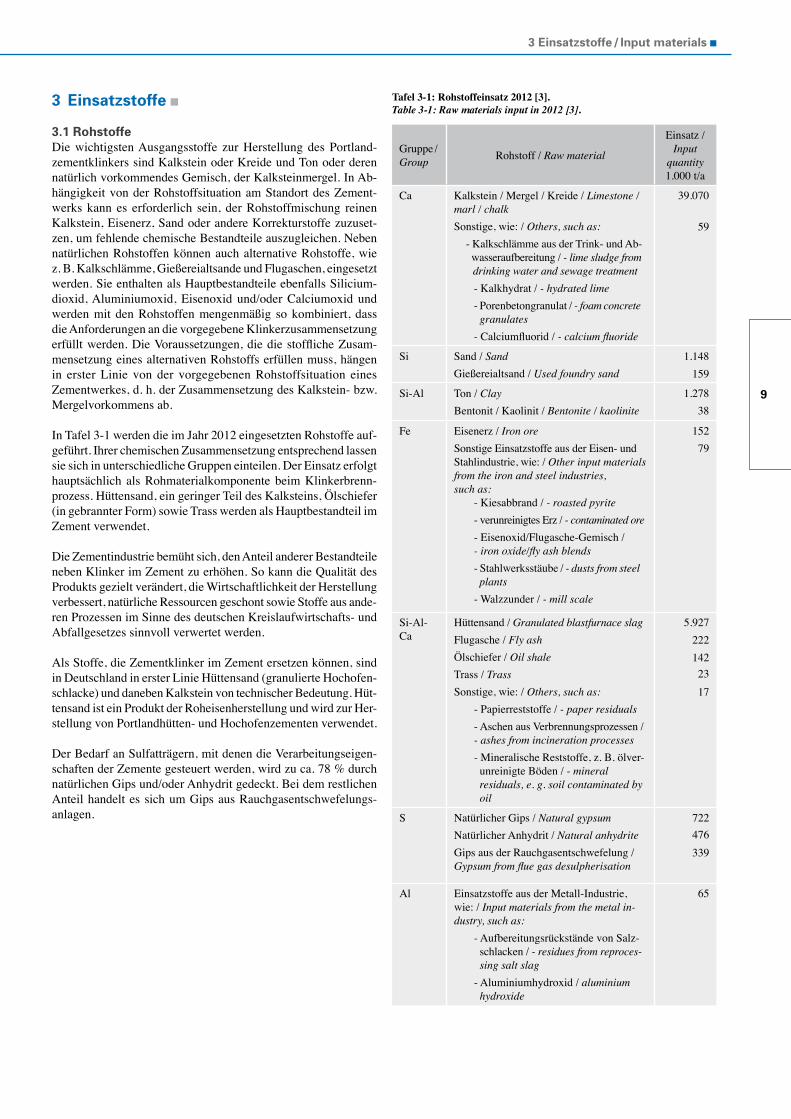
3.1 RohstoffeDie wichtigsten Ausgangsstoffe zur Herstellung des Portland- zementklinkers sind Kalkstein oder Kreide und Ton oder deren natürlich vorkommendes Gemisch, der Kalksteinmergel. In Ab-hängigkeit von der Rohstoffsituation am Standort des Zement-werks kann es erforderlich sein, der Roh stoffmischung reinen Kalkstein, Eisenerz, Sand oder andere Korrekturstoffe zuzuset-zen, um fehlende chemische Bestandteile auszugleichen. Neben natürlichen Rohstoffen können auch alternative Rohstoffe, wie z. B. Kalkschlämme, Gießereialtsande und Flugaschen, eingesetzt werden. Sie enthalten als Hauptbestandteile ebenfalls Silicium-dioxid, Aluminiumoxid, Eisenoxid und/oder Calciumoxid und werden mit den Rohstoffen mengenmäßig so kombiniert, dass die Anforderungen an die vorgegebene Klinkerzusammensetzung erfüllt werden. Die Voraussetzungen, die die stoffliche Zusam-mensetzung eines alternativen Rohstoffs erfüllen muss, hängen in erster Linie von der vorgegebenen Rohstoffsituation eines Zementwerkes, d. h. der Zusammensetzung des Kalkstein- bzw. Mergelvorkommens ab.
In Tafel 3-1 werden die im Jahr 2012 eingesetzten Rohstoffe auf-geführt. Ihrer chemischen Zusammensetzung entsprechend lassen sie sich in unterschiedliche Gruppen einteilen. Der Einsatz erfolgt hauptsächlich als Rohmaterialkomponente beim Klinkerbrenn-prozess. Hüttensand, ein geringer Teil des Kalksteins, Ölschiefer (in gebrannter Form) sowie Trass werden als Haupt bestandteil im Zement verwendet.
Die Zementindustrie bemüht sich, den Anteil anderer Bestandteile neben Klinker im Zement zu erhöhen. So kann die Qualität des Produkts gezielt verändert, die Wirtschaftlichkeit der Herstellung verbessert, natürliche Ressourcen geschont sowie Stoffe aus ande-ren Prozessen im Sinne des deutschen Kreislaufwirtschafts- und Abfallgesetzes sinnvoll verwertet werden.
Als Stoffe, die Zementklinker im Zement ersetzen können, sind in Deutschland in erster Linie Hüttensand (granulierte Hochofen-schlacke) und daneben Kalkstein von technischer Bedeutung. Hüt-tensand ist ein Produkt der Roheisenherstellung und wird zur Her-stellung von Portlandhütten- und Hochofenzementen verwendet.
Der Bedarf an Sulfatträgern, mit denen die Verarbeitungseigen-schaften der Zemente gesteuert werden, wird zu ca. 78 % durch natürlichen Gips und/oder Anhydrit gedeckt. Bei dem restlichen Anteil handelt es sich um Gips aus Rauchgasentschwefelungs-anlagen.
Tafel 3-1: Rohstoffeinsatz 2012 [3]. Table 3-1: Raw materials input in 2012 [3].
Gruppe / Group Rohstoff / Raw material
Einsatz / Input
quantity 1.000 t/a
Ca Kalkstein / Mergel / Kreide / Limestone / marl / chalkSonstige, wie: / Others, such as: - Kalkschlämme aus der Trink- und Ab- wasseraufbereitung / - lime sludge from drinking water and sewage treatment - Kalkhydrat / - hydrated lime - Porenbetongranulat / - foam concrete granulates - Calciumfluorid / - calcium fluoride
39.070
59
Si Sand / SandGießereialtsand / Used foundry sand
1.148 159
Si-Al Ton / ClayBentonit / Kaolinit / Bentonite / kaolinite
1.27838
Fe Eisenerz / Iron ore Sonstige Einsatzstoffe aus der Eisen- und Stahlindustrie, wie: / Other input materials from the iron and steel industries, such as: - Kiesabbrand / - roasted pyrite - verunreinigtes Erz / - contaminated ore - Eisenoxid/Flugasche-Gemisch / - iron oxide/fly ash blends - Stahlwerksstäube / - dusts from steel plants - Walzzunder / - mill scale
15279
Si-Al-Ca
Hüttensand / Granulated blastfurnace slagFlugasche / Fly ash Ölschiefer / Oil shale Trass / Trass Sonstige, wie: / Others, such as: - Papierreststoffe / - paper residuals - Aschen aus Verbrennungsprozessen / - ashes from incineration processes - Mineralische Reststoffe, z. B. ölver- unreinigte Böden / - mineral residuals, e. g. soil contaminated by oil
5.927 222
142 23 17
S Natürlicher Gips / Natural gypsumNatürlicher Anhydrit / Natural anhydriteGips aus der Rauchgasentschwefelung / Gypsum from flue gas desulpherisation
722 476339
Al Einsatzstoffe aus der Metall-Industrie, wie: / Input materials from the metal in-dustry, such as: - Aufbereitungsrückstände von Salz- schlacken / - residues from reproces- sing salt slag - Aluminiumhydroxid / aluminium hydroxide
65
VDZ Umweltdaten 2012/ VDZ Environmental Data 2012
10
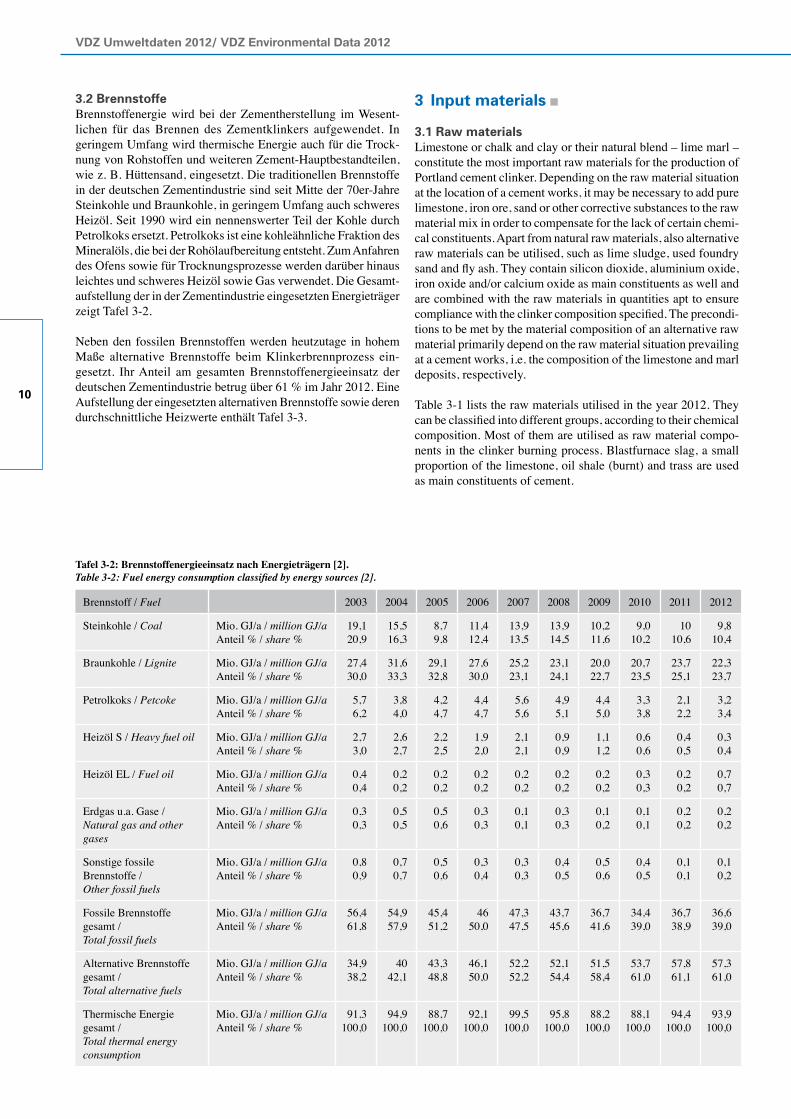
3.2 BrennstoffeBrennstoffenergie wird bei der Zementherstellung im Wesent-lichen für das Brennen des Zementklinkers aufgewendet. In geringem Umfang wird thermische Energie auch für die Trock-nung von Rohstoffen und weiteren Zement-Hauptbestandteilen, wie z. B. Hüttensand, eingesetzt. Die traditionellen Brennstoffe in der deutschen Zementindustrie sind seit Mitte der 70er-Jahre Steinkohle und Braunkohle, in geringem Umfang auch schweres Heizöl. Seit 1990 wird ein nennenswerter Teil der Kohle durch Petrolkoks ersetzt. Petrolkoks ist eine kohleähnliche Fraktion des Mineralöls, die bei der Rohölaufbereitung entsteht. Zum Anfahren des Ofens sowie für Trocknungsprozesse werden darüber hinaus leichtes und schweres Heizöl sowie Gas verwendet. Die Gesamt-aufstellung der in der Zementindustrie eingesetzten Energieträger zeigt Tafel 3-2.
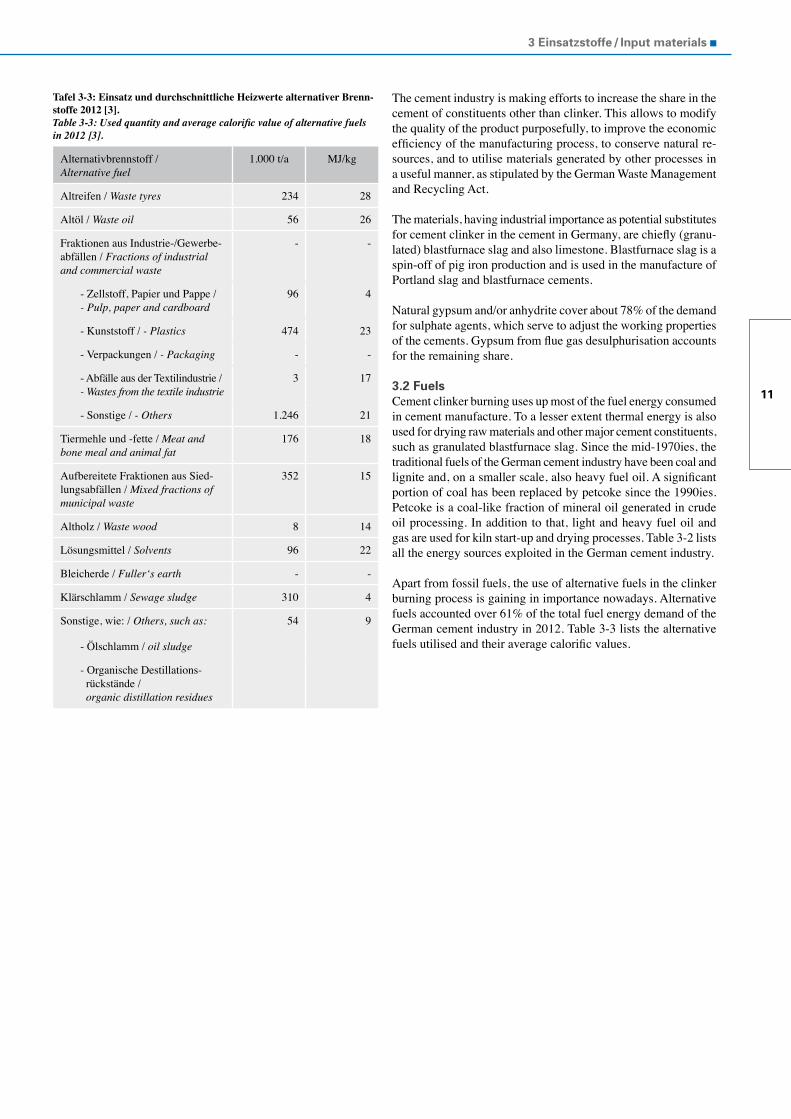
Neben den fossilen Brennstoffen werden heutzutage in hohem Maße alternative Brennstoffe beim Klinkerbrennprozess ein-gesetzt. Ihr Anteil am gesamten Brennstoffenergieeinsatz der deutschen Zementindustrie betrug über 61 % im Jahr 2012. Eine Aufstellung der eingesetzten alternativen Brennstoffe sowie deren durchschnittliche Heizwerte enthält Tafel 3-3.
Tafel 3-2: Brennstoffenergieeinsatz nach Energieträgern [2].Table 3-2: Fuel energy consumption classified by energy sources [2].
Brennstoff / Fuel 2003 2004 2005 2006 2007 2008 2009 2010 2011 2012
Steinkohle / Coal Mio. GJ/a / million GJ/aAnteil % / share %
19,120,9
15,516,3
8,79,8
11,412,4
13,913,5
13,914,5
10,211,6
9,010,2
1010,6
9,810,4
Braunkohle / Lignite Mio. GJ/a / million GJ/aAnteil % / share %
27,430,0
31,633,3
29,132,8
27,630,0
25,223,1
23,124,1
20,022,7
20,723,5
23,725,1
22,323,7
Petrolkoks / Petcoke Mio. GJ/a / million GJ/aAnteil % / share %
5,76,2
3,84,0
4,24,7
4,44,7
5,65,6
4,95,1
4,45,0
3,33,8
2,12,2
3,23,4
Heizöl S / Heavy fuel oil Mio. GJ/a / million GJ/aAnteil % / share %
2,73,0
2,62,7
2,22,5
1,92,0
2,12,1
0,90,9
1,11,2
0,60,6
0,40,5
0,30,4
Heizöl EL / Fuel oil Mio. GJ/a / million GJ/aAnteil % / share %
0,40,4
0,20,2
0,20,2
0,20,2
0,20,2
0,20,2
0,20,2
0,30,3
0,20,2
0,70,7
Erdgas u.a. Gase / Natural gas and other gases
Mio. GJ/a / million GJ/aAnteil % / share %
0,30,3
0,50,5
0,50,6
0,30,3
0,10,1
0,30,3
0,10,2
0,10,1
0,20,2
0,20,2
Sonstige fossile Brennstoffe / Other fossil fuels
Mio. GJ/a / million GJ/aAnteil % / share %
0,80,9
0,70,7
0,50,6
0,30,4
0,30,3
0,40,5
0,50,6
0,40,5
0,10,1
0,10,2
Fossile Brennstoffe gesamt / Total fossil fuels
Mio. GJ/a / million GJ/aAnteil % / share %
56,461,8
54,957,9
45,451,2
4650,0
47,347,5
43,745,6
36,741,6
34,439,0
36,738,9
36,639,0
Alternative Brennstoffe gesamt / Total alternative fuels
Mio. GJ/a / million GJ/aAnteil % / share %
34,938,2
4042,1
43,348,8
46,150,0
52,252,2
52,154,4
51,558,4
53,761,0
57,861,1
57,361,0
Thermische Energie gesamt / Total thermal energy consumption
Mio. GJ/a / million GJ/aAnteil % / share %
91,3100,0
94,9100,0
88,7100,0
92,1100,0
99,5100,0
95,8100,0
88,2100,0
88,1100,0
94,4100,0
93,9100,0
3 Input materials
3.1 Raw materialsLimestone or chalk and clay or their natural blend – lime marl – constitute the most important raw materials for the production of Portland cement clinker. Depending on the raw material situation at the location of a cement works, it may be necessary to add pure limestone, iron ore, sand or other corrective substances to the raw material mix in order to compensate for the lack of certain chemi-cal constituents. Apart from natural raw materials, also alternative raw materials can be utilised, such as lime sludge, used foundry sand and fly ash. They contain silicon dioxide, aluminium oxide, iron oxide and/or calcium oxide as main constituents as well and are combined with the raw materials in quantities apt to ensure compliance with the clinker composition specified. The precondi-tions to be met by the material composition of an alternative raw material primarily depend on the raw material situation prevailing at a cement works, i.e. the composition of the limestone and marl deposits, respectively.
Table 3-1 lists the raw materials utilised in the year 2012. They can be classified into different groups, according to their chemical composition. Most of them are utilised as raw material compo-nents in the clinker burning process. Blastfurnace slag, a small proportion of the limestone, oil shale (burnt) and trass are used as main constituents of cement.
11
3 Einsatzstoffe / Input materials
The cement industry is making efforts to increase the share in the cement of constituents other than clinker. This allows to modify the quality of the product purposefully, to improve the economic efficiency of the manufacturing process, to conserve natural re-sources, and to utilise materials generated by other processes in a useful manner, as stipulated by the German Waste Management and Recycling Act.
The materials, having industrial importance as potential substitutes for cement clinker in the cement in Germany, are chiefly (granu-lated) blastfurnace slag and also limestone. Blastfurnace slag is a spin-off of pig iron production and is used in the manufacture of Portland slag and blastfurnace cements.
Natural gypsum and/or anhydrite cover about 78% of the demand for sulphate agents, which serve to adjust the working properties of the cements. Gypsum from flue gas desulphurisation accounts for the remaining share.
3.2 FuelsCement clinker burning uses up most of the fuel energy consumed in cement manufacture. To a lesser extent thermal energy is also used for drying raw materials and other major cement constituents, such as granulated blastfurnace slag. Since the mid-1970ies, the traditional fuels of the German cement industry have been coal and lignite and, on a smaller scale, also heavy fuel oil. A significant portion of coal has been replaced by petcoke since the 1990ies. Petcoke is a coal-like fraction of mineral oil generated in crude oil processing. In addition to that, light and heavy fuel oil and gas are used for kiln start-up and drying processes. Table 3-2 lists all the energy sources exploited in the German cement industry.
Apart from fossil fuels, the use of alternative fuels in the clinker burning process is gaining in importance nowadays. Alternative fuels accounted over 61% of the total fuel energy demand of the German cement industry in 2012. Table 3-3 lists the alternative fuels utilised and their average calorific values.
Tafel 3-3: Einsatz und durchschnittliche Heizwerte alternativer Brenn-stoffe 2012 [3]. Table 3-3: Used quantity and average calorific value of alternative fuels in 2012 [3].
Alternativbrennstoff / Alternative fuel
1.000 t/a MJ/kg
Altreifen / Waste tyres 234 28
Altöl / Waste oil 56 26
Fraktionen aus Industrie-/Gewerbe- abfällen / Fractions of industrial and commercial waste
- -
- Zellstoff, Papier und Pappe / - Pulp, paper and cardboard
96 4
- Kunststoff / - Plastics 474 23
- Verpackungen / - Packaging - -
- Abfälle aus der Textilindustrie / - Wastes from the textile industrie
3 17
- Sonstige / - Others 1.246 21
Tiermehle und -fette / Meat and bone meal and animal fat
176 18
Aufbereitete Fraktionen aus Sied-lungsabfällen / Mixed fractions of municipal waste
352 15
Altholz / Waste wood 8 14
Lösungsmittel / Solvents 96 22
Bleicherde / Fuller‘s earth - -
Klärschlamm / Sewage sludge 310 4
Sonstige, wie: / Others, such as: 54 9
- Ölschlamm / oil sludge
- Organische Destillations- rückstände / organic distillation residues
VDZ Umweltdaten 2012/ VDZ Environmental Data 2012
12
4 Energie
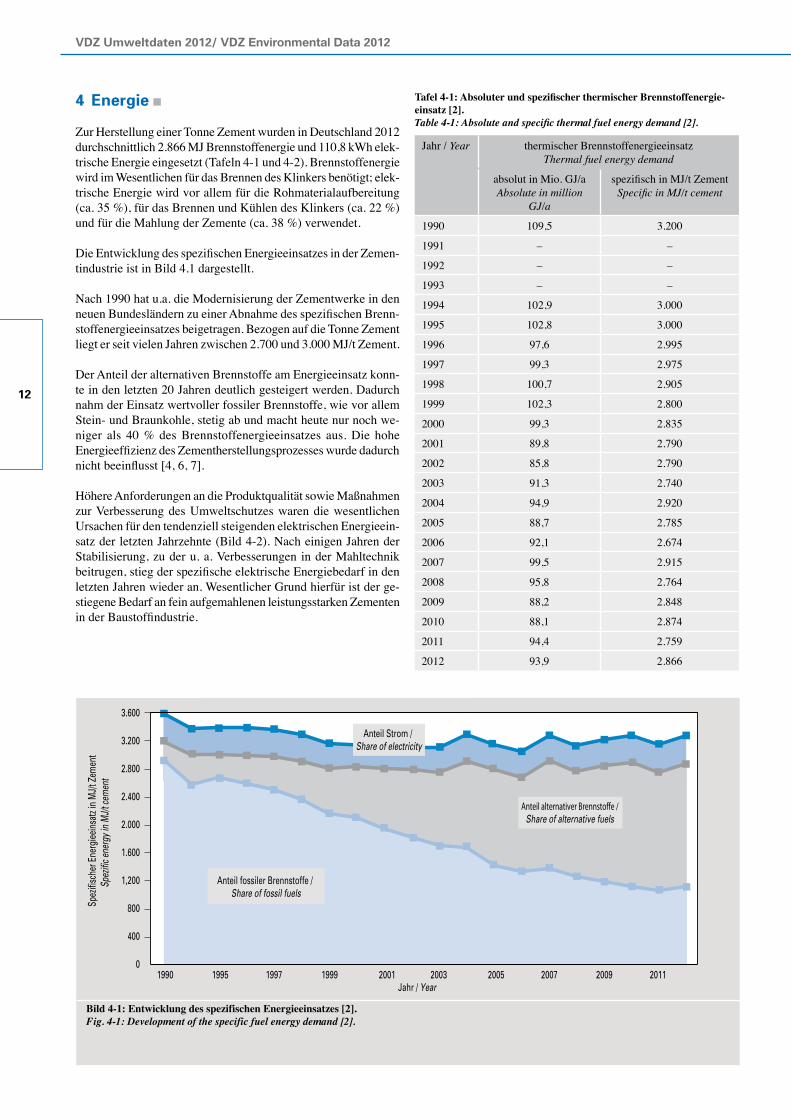
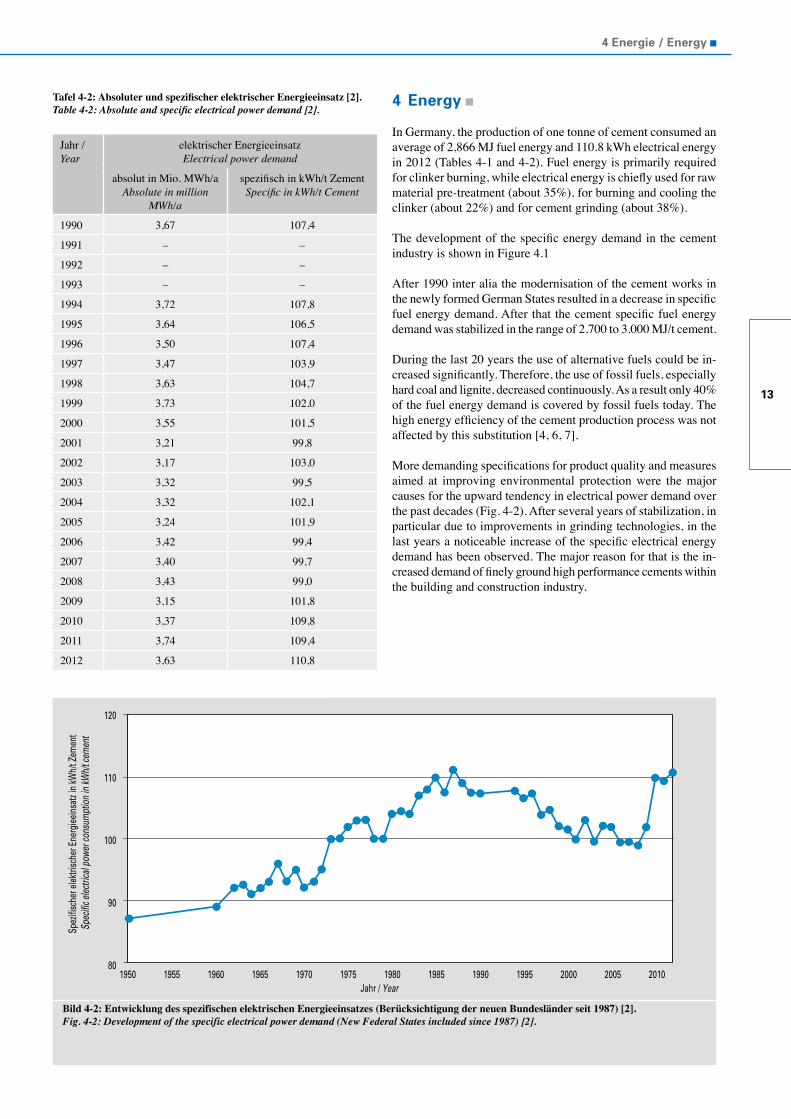
Zur Herstellung einer Tonne Zement wurden in Deutschland 2012 durchschnittlich 2.866 MJ Brennstoffenergie und 110,8 kWh elek-trische Energie eingesetzt (Tafeln 4-1 und 4-2). Brennstoffenergie wird im Wesentlichen für das Brennen des Klinkers benötigt; elek-trische Energie wird vor allem für die Rohmaterialaufbereitung (ca. 35 %), für das Brennen und Kühlen des Klinkers (ca. 22 %) und für die Mahlung der Zemente (ca. 38 %) verwendet.
Die Entwicklung des spezifischen Energieeinsatzes in der Zemen-tindustrie ist in Bild 4.1 dargestellt.
Nach 1990 hat u.a. die Modernisierung der Zementwerke in den neuen Bundesländern zu einer Abnahme des spezifischen Brenn-stoffenergieeinsatzes beigetragen. Bezogen auf die Tonne Zement liegt er seit vielen Jahren zwischen 2.700 und 3.000 MJ/t Zement.
Der Anteil der alternativen Brennstoffe am Energieeinsatz konn-te in den letzten 20 Jahren deutlich gesteigert werden. Dadurch nahm der Einsatz wertvoller fossiler Brennstoffe, wie vor allem Stein- und Braunkohle, stetig ab und macht heute nur noch we-niger als 40 % des Brennstoffenergieeinsatzes aus. Die hohe Energieeffizienz des Zementherstellungsprozesses wurde dadurch nicht beeinflusst [4, 6, 7].
Höhere Anforderungen an die Produktqualität sowie Maßnahmen zur Verbesserung des Umweltschutzes waren die wesentlichen Ursachen für den tendenziell steigenden elektrischen Energieein-satz der letzten Jahrzehnte (Bild 4-2). Nach einigen Jahren der Stabilisierung, zu der u. a. Verbesserungen in der Mahltechnik beitrugen, stieg der spezifische elektrische Energiebedarf in den letzten Jahren wieder an. Wesentlicher Grund hierfür ist der ge-stiegene Bedarf an fein aufgemahlenen leistungsstarken Zementen in der Baustoffindustrie.
Jahr / Year thermischer Brennstoffenergieeinsatz Thermal fuel energy demand
absolut in Mio. GJ/aAbsolute in million
GJ/a
spezifisch in MJ/t ZementSpecific in MJ/t cement
1990 109,5 3.200
1991 – –
1992 – –
1993 – –
1994 102,9 3.000
1995 102,8 3.000
1996 97,6 2.995
1997 99,3 2.975
1998 100,7 2.905
1999 102,3 2.800
2000 99,3 2.835
2001 89,8 2.790
2002 85,8 2.790
2003 91,3 2.740
2004 94,9 2.920
2005 88,7 2.785
2006 92,1 2.674
2007 99,5 2.915
2008 95,8 2.764
2009 88,2 2.848
2010 88,1 2.874
2011 94,4 2.759
2012 93,9 2.866
Tafel 4-1: Absoluter und spezifischer thermischer Brennstoffenergie-einsatz [2].Table 4-1: Absolute and specific thermal fuel energy demand [2].
Bild 4-1: Entwicklung des spezifischen Energieeinsatzes [2].Fig. 4-1: Development of the specific fuel energy demand [2].
3.600
3.200
2.800
2.400
2.000
1.600
1,200
800
400
0
Spez
ifisc
her E
nerg
ieein
satz
in M
J/t Z
emen
tSp
ezifi
c ene
rgy i
n M
J/t ce
men
t
1990Jahr / Year
1995 1997 1999 2001 2003 2005 2007 2009 2011
Anteil Strom / Share of electricity
Anteil alternativer Brennstoffe /Share of alternative fuels
Anteil fossiler Brennstoffe / Share of fossil fuels
13
4 Energie / Energy
Jahr / Year
elektrischer EnergieeinsatzElectrical power demand
absolut in Mio. MWh/aAbsolute in million
MWh/a
spezifisch in kWh/t ZementSpecific in kWh/t Cement
1990 3,67 107,4
1991 – –
1992 – –
1993 – –
1994 3,72 107,8
1995 3,64 106,5
1996 3,50 107,4
1997 3,47 103,9
1998 3,63 104,7
1999 3,73 102,0
2000 3,55 101,5
2001 3,21 99,8
2002 3,17 103,0
2003 3,32 99,5
2004 3,32 102,1
2005 3,24 101,9
2006 3,42 99,4
2007 3,40 99,7
2008 3,43 99,0
2009 3,15 101,8
2010 3,37 109,8
2011 3,74 109,4
2012 3,63 110,8
Tafel 4-2: Absoluter und spezifischer elektrischer Energieeinsatz [2].Table 4-2: Absolute and specific electrical power demand [2].
4 Energy In Germany, the production of one tonne of cement consumed an average of 2,866 MJ fuel energy and 110.8 kWh electrical energy in 2012 (Tables 4-1 and 4-2). Fuel energy is primarily required for clinker burning, while electrical energy is chiefly used for raw material pre-treatment (about 35%), for burning and cooling the clinker (about 22%) and for cement grinding (about 38%).
The development of the specific energy demand in the cement industry is shown in Figure 4.1
After 1990 inter alia the modernisation of the cement works in the newly formed German States resulted in a decrease in specific fuel energy demand. After that the cement specific fuel energy demand was stabilized in the range of 2.700 to 3.000 MJ/t cement.
During the last 20 years the use of alternative fuels could be in-creased significantly. Therefore, the use of fossil fuels, especially hard coal and lignite, decreased continuously. As a result only 40% of the fuel energy demand is covered by fossil fuels today. The high energy efficiency of the cement production process was not affected by this substitution [4, 6, 7].
More demanding specifications for product quality and measures aimed at improving environmental protection were the major causes for the upward tendency in electrical power demand over the past decades (Fig. 4-2). After several years of stabilization, in particular due to improvements in grinding technologies, in the last years a noticeable increase of the specific electrical energy demand has been observed. The major reason for that is the in-creased demand of finely ground high performance cements within the building and construction industry.
Bild 4-2: Entwicklung des spezifischen elektrischen Energieeinsatzes (Berücksichtigung der neuen Bundesländer seit 1987) [2].Fig. 4-2: Development of the specific electrical power demand (New Federal States included since 1987) [2].
Spez
ifisc
her e
lektri
sche
r Ene
rgiee
insa
tz in
kWh/
t Zem
ent
Spec
ific e
lectri
cal p
ower
cons
umpt
ion
in kW
h/t c
emen
t
120
110
100
90
801950
Jahr / Year1955 1960 1965 1970 1975 19851980 1990 1995 2000 20102005
VDZ Umweltdaten 2012/ VDZ Environmental Data 2012
14
5 Emissionen
In Deutschland unterliegen die Errichtung und der Betrieb von Zementwerken den Bestimmungen des Bundes-Immissions-schutzgesetzes. Je nach Brennstoffeinsatz werden unterschiedliche Anforderungen an die einzuhaltenden Emissionskonzentrationen gestellt. Falls ausschließlich Regelbrennstoffe eingesetzt werden, sind die Regelungen der Technischen Anleitung zur Reinhaltung der Luft (TA) maßgeblich. Wird ein Teil der Regelbrennstoffe durch Abfälle als alternative Brennstoffe ersetzt, so gelten zusätz-lich die Bestimmungen der 17. Verordnung zum Bundes-Immis-sionsschutzgesetz (17. BImSchV). Auf dieser gesetzlichen Basis kann die zuständige Behörde sowohl Messungen aus besonde-rem Anlass als auch erstmalige und wiederkehrende Messungen anordnen, die nur von zugelassenen Messstellen durchgeführt werden dürfen.
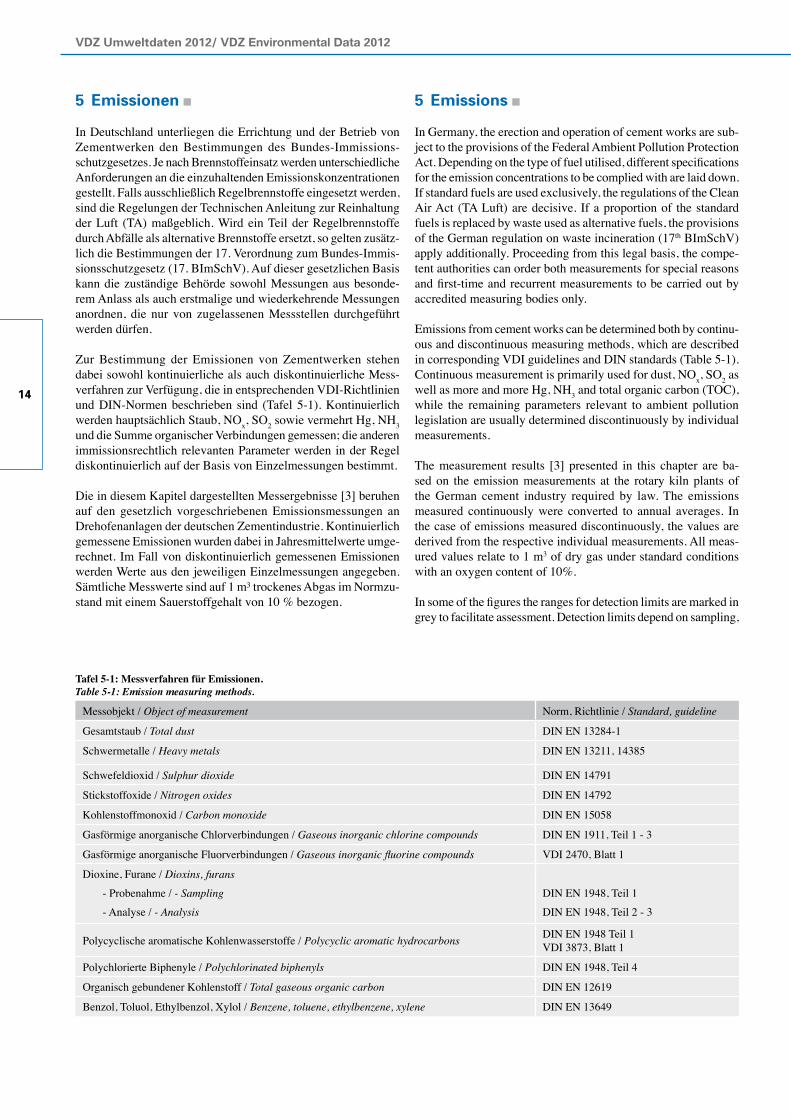
Zur Bestimmung der Emissionen von Zementwerken stehen dabei sowohl kontinuierliche als auch diskontinuierliche Mess-verfahren zur Verfügung, die in entsprechenden VDI-Richtlinien und DIN-Normen beschrieben sind (Tafel 5-1). Kontinuierlich werden hauptsächlich Staub, NOx, SO2 sowie vermehrt Hg, NH3 und die Summe organischer Verbindungen gemessen; die anderen immissionsrechtlich relevanten Parameter werden in der Regel diskontinuierlich auf der Basis von Einzelmessungen bestimmt.
Die in diesem Kapitel dargestellten Messergebnisse [3] beruhen auf den gesetzlich vorgeschriebenen Emissionsmessungen an Drehofenanlagen der deutschen Zementindustrie. Kontinuierlich gemessene Emissionen wurden dabei in Jahresmittelwerte umge-rechnet. Im Fall von diskontinuierlich gemessenen Emissionen werden Werte aus den jeweiligen Einzelmessungen angegeben. Sämtliche Messwerte sind auf 1 m³ trockenes Abgas im Normzu-stand mit einem Sauerstoffgehalt von 10 % bezogen.
Messobjekt / Object of measurement Norm, Richtlinie / Standard, guideline
Gesamtstaub / Total dust DIN EN 13284-1
Schwermetalle / Heavy metals DIN EN 13211, 14385
Schwefeldioxid / Sulphur dioxide DIN EN 14791
Stickstoffoxide / Nitrogen oxides DIN EN 14792
Kohlenstoffmonoxid / Carbon monoxide DIN EN 15058
Gasförmige anorganische Chlorverbindungen / Gaseous inorganic chlorine compounds DIN EN 1911, Teil 1 - 3
Gasförmige anorganische Fluorverbindungen / Gaseous inorganic fluorine compounds VDI 2470, Blatt 1
Dioxine, Furane / Dioxins, furans - Probenahme / - Sampling - Analyse / - Analysis
DIN EN 1948, Teil 1 DIN EN 1948, Teil 2 - 3
Polycyclische aromatische Kohlenwasserstoffe / Polycyclic aromatic hydrocarbons DIN EN 1948 Teil 1 VDI 3873, Blatt 1
Polychlorierte Biphenyle / Polychlorinated biphenyls DIN EN 1948, Teil 4
Organisch gebundener Kohlenstoff / Total gaseous organic carbon DIN EN 12619
Benzol, Toluol, Ethylbenzol, Xylol / Benzene, toluene, ethylbenzene, xylene DIN EN 13649
Tafel 5-1: Messverfahren für Emissionen.Table 5-1: Emission measuring methods.
5 Emissions
In Germany, the erection and operation of cement works are sub-ject to the provisions of the Federal Ambient Pollution Protection Act. Depending on the type of fuel utilised, different specifications for the emission concentrations to be complied with are laid down. If standard fuels are used exclusively, the regulations of the Clean Air Act (TA Luft) are decisive. If a proportion of the standard fuels is replaced by waste used as alternative fuels, the provisions of the German regulation on waste incineration (17th BImSchV) apply additionally. Proceeding from this legal basis, the compe-tent authorities can order both measurements for special reasons and first-time and recurrent measurements to be carried out by accredited measuring bodies only.
Emissions from cement works can be determined both by continu- ous and discontinuous measuring methods, which are described in corresponding VDI guidelines and DIN standards (Table 5-1). Continuous measurement is primarily used for dust, NOx, SO2 as well as more and more Hg, NH3 and total organic carbon (TOC), while the remaining parameters relevant to ambient pollution legislation are usually determined discontinuously by individual measurements.
The measurement results [3] presented in this chapter are ba-sed on the emission measurements at the rotary kiln plants of the German cement industry required by law. The emissions measured continuously were converted to annual averages. In the case of emissions measured discontinuously, the values are derived from the respective individual measurements. All meas- ured values relate to 1 m3 of dry gas under standard conditions with an oxygen content of 10%.
In some of the figures the ranges for detection limits are marked in grey to facilitate assessment. Detection limits depend on sampling,
15
5 Emissionen / Emissions
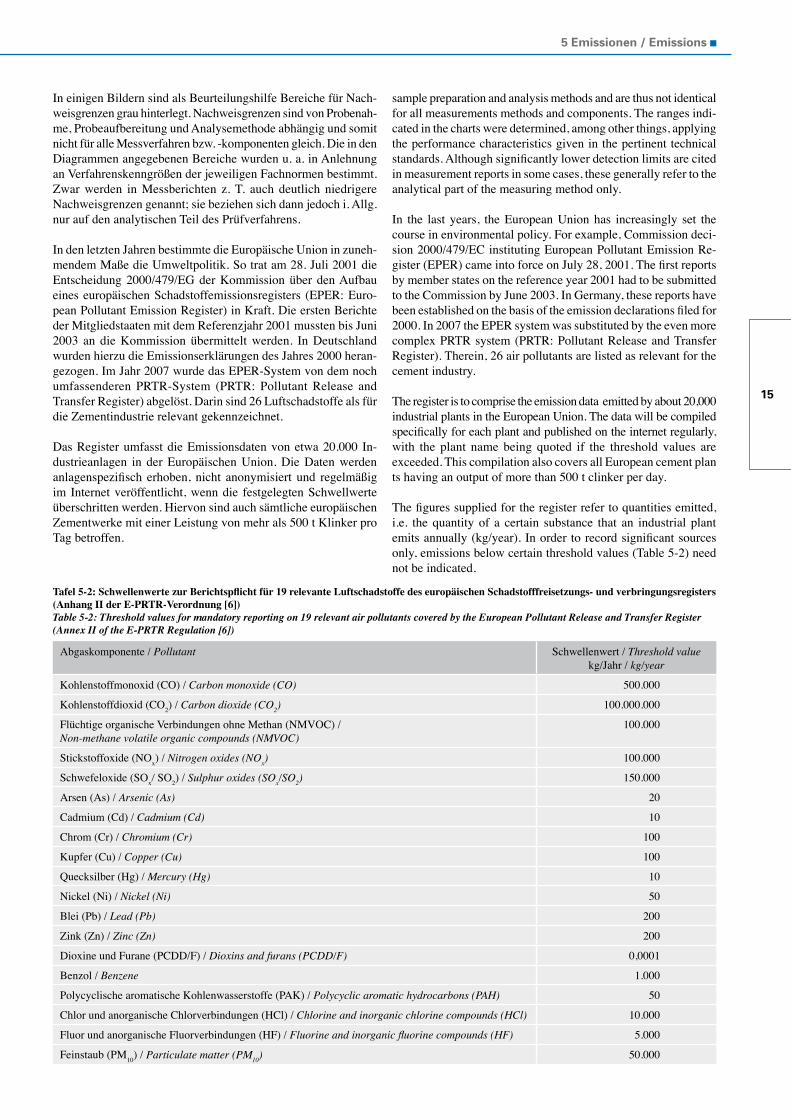
Tafel 5-2: Schwellenwerte zur Berichtspflicht für 19 relevante Luftschadstoffe des europäischen Schadstofffreisetzungs- und verbringungsregisters (Anhang II der E-PRTR-Verordnung [6])Table 5-2: Threshold values for mandatory reporting on 19 relevant air pollutants covered by the European Pollutant Release and Transfer Register (Annex II of the E-PRTR Regulation [6])
Abgaskomponente / Pollutant Schwellenwert / Threshold value kg/Jahr / kg/year
Kohlenstoffmonoxid (CO) / Carbon monoxide (CO) 500.000
Kohlenstoffdioxid (CO2) / Carbon dioxide (CO2) 100.000.000
Flüchtige organische Verbindungen ohne Methan (NMVOC) / Non-methane volatile organic compounds (NMVOC)
100.000
Stickstoffoxide (NOx) / Nitrogen oxides (NOx) 100.000
Schwefeloxide (SOx/ SO2) / Sulphur oxides (SOx/SO2) 150.000
Arsen (As) / Arsenic (As) 20
Cadmium (Cd) / Cadmium (Cd) 10
Chrom (Cr) / Chromium (Cr) 100
Kupfer (Cu) / Copper (Cu) 100
Quecksilber (Hg) / Mercury (Hg) 10
Nickel (Ni) / Nickel (Ni) 50
Blei (Pb) / Lead (Pb) 200
Zink (Zn) / Zinc (Zn) 200
Dioxine und Furane (PCDD/F) / Dioxins and furans (PCDD/F) 0,0001
Benzol / Benzene 1.000
Polycyclische aromatische Kohlenwasserstoffe (PAK) / Polycyclic aromatic hydrocarbons (PAH) 50
Chlor und anorganische Chlorverbindungen (HCl) / Chlorine and inorganic chlorine compounds (HCl) 10.000
Fluor und anorganische Fluorverbindungen (HF) / Fluorine and inorganic fluorine compounds (HF) 5.000
Feinstaub (PM10) / Particulate matter (PM10) 50.000
In einigen Bildern sind als Beurteilungshilfe Bereiche für Nach-weisgrenzen grau hinterlegt. Nachweisgrenzen sind von Probenah-me, Probeaufbereitung und Analysemethode abhängig und somit nicht für alle Messverfahren bzw. -komponenten gleich. Die in den Diagrammen angegebenen Bereiche wurden u. a. in Anlehnung an Verfahrenskenngrößen der jeweiligen Fachnormen bestimmt. Zwar werden in Messberichten z. T. auch deutlich niedrigere Nachweisgrenzen genannt; sie beziehen sich dann jedoch i. Allg. nur auf den analytischen Teil des Prüfverfahrens.
In den letzten Jahren bestimmte die Europäische Union in zuneh-mendem Maße die Umweltpolitik. So trat am 28. Juli 2001 die Entscheidung 2000/479/EG der Kommission über den Aufbau eines europäischen Schadstoffemissionsregisters (EPER: Euro-pean Pollutant Emission Register) in Kraft. Die ersten Berichte der Mitgliedstaaten mit dem Referenzjahr 2001 mussten bis Juni 2003 an die Kommission übermittelt werden. In Deutschland wurden hierzu die Emissionserklärungen des Jahres 2000 heran-gezogen. Im Jahr 2007 wurde das EPER-System von dem noch umfassenderen PRTR-System (PRTR: Pollutant Release and Transfer Register) abgelöst. Darin sind 26 Luftschadstoffe als für die Zementindustrie relevant gekennzeichnet.
Das Register umfasst die Emissionsdaten von etwa 20.000 In-dustrieanlagen in der Europäischen Union. Die Daten werden anlagenspezifisch erhoben, nicht anonymisiert und regelmäßig im Internet veröffentlicht, wenn die festgelegten Schwellwerte überschritten werden. Hiervon sind auch sämtliche europäischen Zementwerke mit einer Leistung von mehr als 500 t Klinker pro Tag betroffen.
sample preparation and analysis methods and are thus not identical for all measurements methods and components. The ranges indi-cated in the charts were determined, among other things, applying the performance characteristics given in the pertinent technical standards. Although significantly lower detection limits are cited in measurement reports in some cases, these generally refer to the analytical part of the measuring method only.
In the last years, the European Union has increasingly set the course in environmental policy. For example, Commission deci-sion 2000/479/EC instituting European Pollutant Emission Re-gister (EPER) came into force on July 28, 2001. The first reports by member states on the reference year 2001 had to be submitted to the Commission by June 2003. In Germany, these reports have been established on the basis of the emission declarations filed for 2000. In 2007 the EPER system was substituted by the even more complex PRTR system (PRTR: Pollutant Release and Transfer Register). Therein, 26 air pollutants are listed as relevant for the cement industry.
The register is to comprise the emission data emitted by about 20,000 industrial plants in the European Union. The data will be compiled specifically for each plant and published on the internet regularly, with the plant name being quoted if the threshold values are exceeded. This compilation also covers all European cement plan ts having an output of more than 500 t clinker per day.
The figures supplied for the register refer to quantities emitted, i.e. the quantity of a certain substance that an industrial plant emits annually (kg/year). In order to record significant sources only, emissions below certain threshold values (Table 5-2) need not be indicated.
VDZ Umweltdaten 2012/ VDZ Environmental Data 2012
16
Die Angaben für das Register beziehen sich auf Frachten, d. h. auf die von einer Betriebstätte in einem Jahr emittierte Menge eines Stoffs (kg/Jahr). Um ausschließlich signifikante Quellen zu erfassen, sind Emissionen unterhalb bestimmter Schwellenwerte (Tafel 5-2) nicht anzugeben.
Im Folgenden wird zusätzlich zur mittleren Konzentration eines Schadstoffs im Reingas der Drehofenanlagen in einem weiteren Bild auch die hiermit verbundene Emissionsfracht aufgeführt. Sie errechnet sich aus dem in einem Jahr emittierten Reingasvolumen-strom (m³/Jahr) und der Konzentration des darin enthaltenen Stoffs (g/m³). Wenn der Stoff im Reingas bestimmbar war, sind eindeu-tige Angaben möglich, deren Genauigkeit z. B. durch die Mess- unsicherheit beschrieben werden kann. Ist dies jedoch nicht der Fall (z. B. nicht abgesicherte Werte oder Messungen unterhalb der Nachweisgrenze), kann lediglich eine theoretische Obergrenze für die emittierte Fracht angegeben werden. Sie errechnet sich unter der Annahme, dass die Konzentration des Stoffs im Reingas die Nachweisgrenze erreicht. Die tatsächlich emittierte Fracht ist je-doch niedriger und der Bereich der möglichen Werte wird in den Bildern mit Hilfe einer Linie dargestellt.
Die Auswertung der Messergebnisse zeigt, dass die Emissionen von Drehofenanlagen der Zementindustrie die Schwellenwerte für eine Berichtspflicht gemäß PRTR z. T. deutlich unterschreiten.
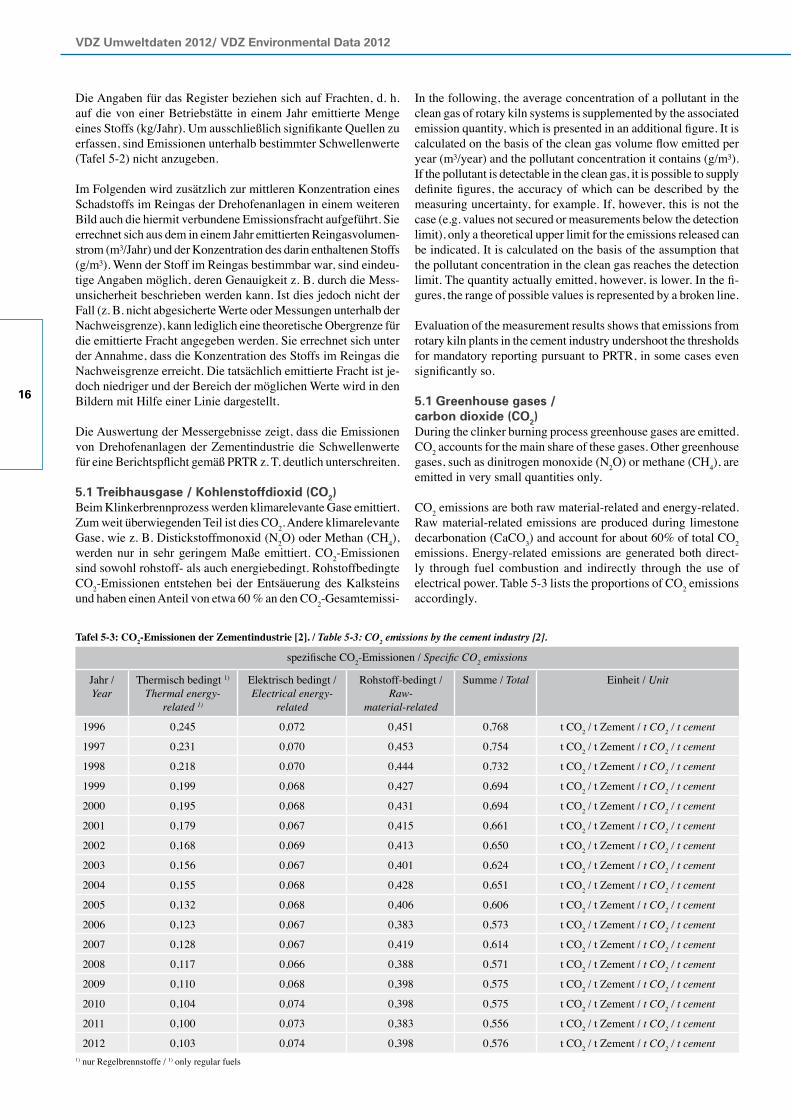
5.1 Treibhausgase / Kohlenstoffdioxid (CO2)Beim Klinkerbrennprozess werden klimarelevante Gase emittiert. Zum weit überwiegenden Teil ist dies CO2. Andere klimarelevante Gase, wie z. B. Distickstoffmonoxid (N2O) oder Methan (CH4), werden nur in sehr geringem Maße emittiert. CO2-Emissionen sind sowohl rohstoff- als auch energiebedingt. Rohstoffbedingte CO2-Emissionen entstehen bei der Entsäuerung des Kalksteins und haben einen Anteil von etwa 60 % an den CO2-Gesamtemissi-
Tafel 5-3: CO2-Emissionen der Zementindustrie [2]. / Table 5-3: CO2 emissions by the cement industry [2].
1) nur Regelbrennstoffe / 1) only regular fuels
spezifische CO2-Emissionen / Specific CO2 emissions
Jahr / Year
Thermisch bedingt 1)
Thermal energy-related 1)
Elektrisch bedingt / Electrical energy-
related
Rohstoff-bedingt / Raw-
material-related
Summe / Total Einheit / Unit
1996 0,245 0,072 0,451 0,768 t CO2 / t Zement / t CO2 / t cement
1997 0,231 0,070 0,453 0,754 t CO2 / t Zement / t CO2 / t cement
1998 0,218 0,070 0,444 0,732 t CO2 / t Zement / t CO2 / t cement
1999 0,199 0,068 0,427 0,694 t CO2 / t Zement / t CO2 / t cement
2000 0,195 0,068 0,431 0,694 t CO2 / t Zement / t CO2 / t cement
2001 0,179 0,067 0,415 0,661 t CO2 / t Zement / t CO2 / t cement
2002 0,168 0,069 0,413 0,650 t CO2 / t Zement / t CO2 / t cement
2003 0,156 0,067 0,401 0,624 t CO2 / t Zement / t CO2 / t cement
2004 0,155 0,068 0,428 0,651 t CO2 / t Zement / t CO2 / t cement
2005 0,132 0,068 0,406 0,606 t CO2 / t Zement / t CO2 / t cement
2006 0,123 0,067 0,383 0,573 t CO2 / t Zement / t CO2 / t cement
2007 0,128 0,067 0,419 0,614 t CO2 / t Zement / t CO2 / t cement
2008 0,117 0,066 0,388 0,571 t CO2 / t Zement / t CO2 / t cement
2009 0,110 0,068 0,398 0,575 t CO2 / t Zement / t CO2 / t cement
2010 0,104 0,074 0,398 0,575 t CO2 / t Zement / t CO2 / t cement
2011 0,100 0,073 0,383 0,556 t CO2 / t Zement / t CO2 / t cement
2012 0,103 0,074 0,398 0,576 t CO2 / t Zement / t CO2 / t cement
In the following, the average concentration of a pollutant in the clean gas of rotary kiln systems is supplemented by the associated emission quantity, which is presented in an additional figure. It is calculated on the basis of the clean gas volume flow emitted per year (m³/year) and the pollutant concentration it contains (g/m³). If the pollutant is detectable in the clean gas, it is possible to supply definite figures, the accuracy of which can be described by the measuring uncertainty, for example. If, however, this is not the case (e.g. values not secured or measurements below the detection limit), only a theoretical upper limit for the emissions released can be indicated. It is calculated on the basis of the assumption that the pollutant concentration in the clean gas reaches the detection limit. The quantity actually emitted, however, is lower. In the fi-gures, the range of possible values is represented by a broken line.
Evaluation of the measurement results shows that emissions from rotary kiln plants in the cement industry undershoot the thresholds for mandatory reporting pursuant to PRTR, in some cases even significantly so.
5.1 Greenhouse gases / carbon dioxide (CO2)During the clinker burning process greenhouse gases are emitted. CO2 accounts for the main share of these gases. Other greenhouse gases, such as dinitrogen monoxide (N2O) or methane (CH4), are emitted in very small quantities only.
CO2 emissions are both raw material-related and energy-related. Raw material-related emissions are produced during limestone decarbonation (CaCO3) and account for about 60% of total CO2 emissions. Energy-related emissions are generated both direct-ly through fuel combustion and indirectly through the use of electrical power. Table 5-3 lists the proportions of CO2 emissions accordingly.
17
5 Emissionen / Emissions
onen. Energiebedingte Emissionen entstehen sowohl direkt bei der Verbrennung der Brennstoffe als auch indirekt durch den Einsatz von elektrischer Energie. In Tafel 5-3 werden die CO2-Emissionen diesen Anteilen entsprechend aufgeführt.
Im Jahr 1995 hat sich die deutsche Zementindustrie verpflichtet, ihren Beitrag zum Klimaschutz zu leisten und den spezifischen Brennstoffenergiebedarf von 1987 bis 2005 um 20 % zu sen-ken. Diese Verpflichtung wurde weiterentwickelt und sieht seit dem 9. November 2000 eine 28 %ige Minderung der energie-bedingten spezifischen CO2-Emissionen im Zeitraum von 1990 bis 2008/2012 vor. Die deutsche Zementindustrie hat ihr Ziel im Jahr 2012 erfüllt.
Am 01.01.2005 wurde in der EU ein Handelssystem für CO2-Emis-sionen eingeführt. Der Emissionshandel erstreckt sich auf die direkten CO2-Emissionen aus der Verbrennung aller Brennstoffe (ohne biogene Anteile) und der Entsäuerung des Kalksteins. Die Selbstverpflichtung der Zementindustrie umfasste dagegen auch indirekte Emissionen aus dem elektrischen Energieverbrauch. Die CO2-Emissionen aus alternativen Brennstoffen wurden hier-bei nicht berücksichtigt, da sie fossile Brennstoffe ersetzen und somit zu einer CO2-Minderung an anderer Stelle führen. Da sich der Emissionshandel weiterhin nur auf den Klinkerbrennprozess bezieht, die Selbstverpflichtung aber auf die gesamte Zementher-stellung, ergeben sich unterschiedliche Emissionsmengen in den entsprechenden Berichtssystemen.
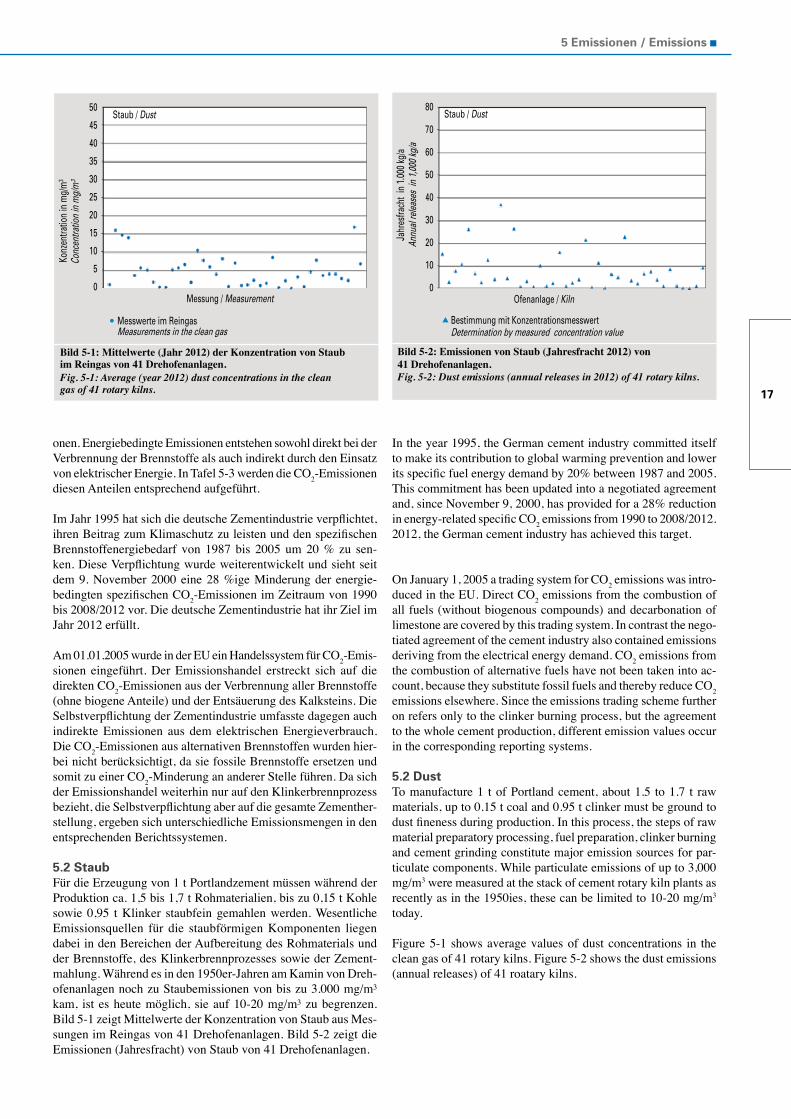
5.2 StaubFür die Erzeugung von 1 t Portlandzement müssen während der Produktion ca. 1,5 bis 1,7 t Rohmaterialien, bis zu 0,15 t Kohle sowie 0,95 t Klinker staubfein gemahlen werden. Wesentliche Emissionsquellen für die staubförmigen Komponenten liegen dabei in den Bereichen der Aufbereitung des Rohmaterials und der Brennstoffe, des Klinkerbrennprozesses sowie der Zement-mahlung. Während es in den 1950er-Jahren am Kamin von Dreh- ofenanlagen noch zu Staubemissionen von bis zu 3.000 mg/m³ kam, ist es heute möglich, sie auf 10-20 mg/m³ zu begrenzen. Bild 5-1 zeigt Mittelwerte der Konzentration von Staub aus Mes-sungen im Reingas von 41 Drehofenanlagen. Bild 5-2 zeigt die Emissionen (Jahresfracht) von Staub von 41 Drehofenanlagen.
In the year 1995, the German cement industry committed itself to make its contribution to global warming prevention and lower its specific fuel energy demand by 20% between 1987 and 2005. This commitment has been updated into a negotiated agreement and, since November 9, 2000, has provided for a 28% reduction in energy-related specific CO2 emissions from 1990 to 2008/2012. 2012, the German cement industry has achieved this target.
On January 1, 2005 a trading system for CO2 emissions was intro- duced in the EU. Direct CO2 emissions from the combustion of all fuels (without biogenous compounds) and decarbonation of limestone are covered by this trading system. In contrast the nego-tiated agreement of the cement industry also contained emissions deriving from the electrical energy demand. CO2 emissions from the combustion of alternative fuels have not been taken into ac-count, because they substitute fossil fuels and thereby reduce CO2 emissions elsewhere. Since the emissions trading scheme further on refers only to the clinker burning process, but the agreement to the whole cement production, different emission values occur in the corresponding reporting systems.
5.2 DustTo manufacture 1 t of Portland cement, about 1.5 to 1.7 t raw materials, up to 0.15 t coal and 0.95 t clinker must be ground to dust fineness during production. In this process, the steps of raw material preparatory processing, fuel preparation, clinker burning and cement grinding constitute major emission sources for par-ticulate components. While particulate emissions of up to 3,000 mg/m3 were measured at the stack of cement rotary kiln plants as recently as in the 1950ies, these can be limited to 10-20 mg/m3 today.
Figure 5-1 shows average values of dust concentrations in the clean gas of 41 rotary kilns. Figure 5-2 shows the dust emissions (annual releases) of 41 roatary kilns.
Messwerte im Reingas Measurements in the clean gas
Bild 5-1: Mittelwerte (Jahr 2012) der Konzentration von Staub im Reingas von 41 Drehofenanlagen.Fig. 5-1: Average (year 2012) dust concentrations in the clean gas of 41 rotary kilns.
Messung / Measurement
Konz
entra
tion
in m
g/m
3
Con
cent
ratio
n in
mg/
m3
Staub / Dust 50
45
40
35
30
25
20
15
10
5
0
Ofenanlage / Kiln
Jahr
esfra
cht
in 1.
000 k
g/a
Annu
al re
lease
s in
1,00
0 kg/
a
Bild 5-2: Emissionen von Staub (Jahresfracht 2012) von 41 Drehofenanlagen. Fig. 5-2: Dust emissions (annual releases in 2012) of 41 rotary kilns.
Bestimmung mit Konzentrationsmesswert Determination by measured concentration value
Staub / Dust 80
70
60
50
40
30
20
10
0
VDZ Umweltdaten 2012/ VDZ Environmental Data 2012
18
5.3 Stickstoffoxide (NOx)Der Klinkerbrennprozess ist ein Hochtemperaturprozess, bei dem Stickstoffoxide (NOx) entstehen. Im Abgas von Drehofenanlagen liegen sie zu einem Anteil von etwa 95 % in Form von Stick-stoffmonoxid (NO) und zu etwa 5 % als Stickstoffdioxid (NO2) vor. Da NO in der Atmosphäre weitgehend zu NO2 umgewandelt wird, werden die Emissionen als NO2 pro m³ Abgas angegeben.
Die prozessbedingten NOX-Gehalte im Abgas von Drehofenanla-gen würden ohne Minderungsmaßnahmen in den meisten Fällen die heute gültige Vorgabe der europäischen Industrieemissi-ons-Richtlinie von 0,50 g/m³ deutlich übersteigen.
Primäre Minderungsmaßnahmen betreffen eine Vergleichmäßi-gung und Optimierung des Anlagenbetriebs. Darüber hinaus wur-den erhebliche Anstrengungen unternommen, um auf verschiedene Weise die anspruchsvollen NOx-Grenzwerte einhalten zu können. In 2012 wurden zehn Anlagen mit gestufter Verbrennung und 38 Anlagen mit SNCR-Verfahren betrieben. Weiterhin sind zwei Anlagen zur Demonstration der SCR-Technologie in Betrieb.
Um das Rohstoffgemisch in Portlandzementklinker umzuwandeln, sind hohe Prozesstemperaturen erforderlich. In der Sinterzone des Drehofens betragen die Brennguttemperaturen etwa 1.450 °C. Um sie zu erreichen, sind Flammentemperaturen von ca. 2.000 °C erforderlich.
Aus Gründen der Klinkerqualität findet der Brennvorgang unter oxidierenden Bedingungen statt. Unter diesen Voraussetzungen überwiegt die partielle Oxidation des molekularen Stickstoffs der Verbrennungsluft zu Stickstoffmonoxid, die auch als thermische NO-Bildung bezeichnet wird.
Die thermische NO-Bildung ist bei den niedrigeren Temperaturen in einer Ofeneinlauf- oder Calcinatorfeuerung hingegen kaum von Bedeutung: hier kann der im Brennstoff gebundene Stickstoff zum so genannten brennstoffbedingten NO führen.
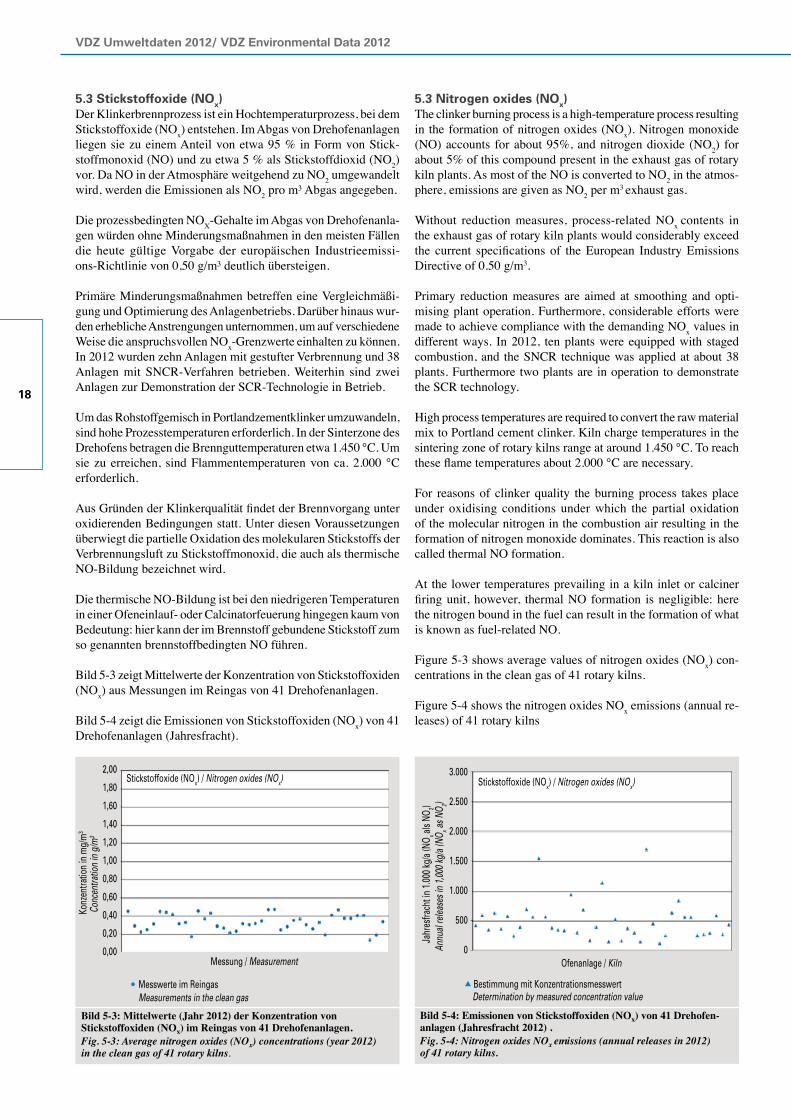
Bild 5-3 zeigt Mittelwerte der Konzentration von Stickstoffoxiden (NOx) aus Messungen im Reingas von 41 Drehofenanlagen.
Bild 5-4 zeigt die Emissionen von Stickstoffoxiden (NOx) von 41 Drehofenanlagen (Jahresfracht).
5.3 Nitrogen oxides (NOx)The clinker burning process is a high-temperature process resulting in the formation of nitrogen oxides (NOx). Nitrogen monoxide (NO) accounts for about 95%, and nitrogen dioxide (NO2) for about 5% of this compound present in the exhaust gas of rotary kiln plants. As most of the NO is converted to NO2 in the atmos- phere, emissions are given as NO2 per m3 exhaust gas.
Without reduction measures, process-related NOx contents in the exhaust gas of rotary kiln plants would considerably exceed the current specifications of the European Industry Emissions Directive of 0.50 g/m3.
Primary reduction measures are aimed at smoothing and opti-mising plant operation. Furthermore, considerable efforts were made to achieve compliance with the demanding NOx values in different ways. In 2012, ten plants were equipped with staged combustion, and the SNCR technique was applied at about 38 plants. Furthermore two plants are in operation to demonstrate the SCR technology.
High process temperatures are required to convert the raw material mix to Portland cement clinker. Kiln charge temperatures in the sintering zone of rotary kilns range at around 1.450 °C. To reach these flame temperatures about 2.000 °C are necessary.
For reasons of clinker quality the burning process takes place under oxidising conditions under which the partial oxidation of the molecular nitrogen in the combustion air resulting in the formation of nitrogen monoxide dominates. This reaction is also called thermal NO formation.
At the lower temperatures prevailing in a kiln inlet or calciner firing unit, however, thermal NO formation is negligible: here the nitrogen bound in the fuel can result in the formation of what is known as fuel-related NO.
Figure 5-3 shows average values of nitrogen oxides (NOx) con-centrations in the clean gas of 41 rotary kilns.
Figure 5-4 shows the nitrogen oxides NOx emissions (annual re-leases) of 41 rotary kilns
Bild 5-3: Mittelwerte (Jahr 2012) der Konzentration von Stickstoffoxiden (NOx) im Reingas von 41 Drehofenanlagen.Fig. 5-3: Average nitrogen oxides (NOx) concentrations (year 2012) in the clean gas of 41 rotary kilns.
Messung / Measurement
Konz
entra
tion
in m
g/m
3
Conc
entra
tion
in g
/m3
Stickstoffoxide (NOx) / Nitrogen oxides (NOx)
Messwerte im Reingas Measurements in the clean gas
2,00
1,80
1,60
1,40
1,20
1,00
0,80
0,60
0,40
0,20
0,00
Bild 5-4: Emissionen von Stickstoffoxiden (NOx) von 41 Drehofen-anlagen (Jahresfracht 2012) .Fig. 5-4: Nitrogen oxides NOx emissions (annual releases in 2012) of 41 rotary kilns.
Annu
al re
lease
s in
1,000
kg/a
(NO x as
NO 2)
Jahr
esfra
cht i
n 1.0
00 kg
/a (N
O x als N
O 2)
Bestimmung mit Konzentrationsmesswert
Ofenanlage / Kiln
Determination by measured concentration value
Stickstoffoxide (NOx) / Nitrogen oxides (NOx)3.000
2.500
2.000
1.500
1.000
500
0
19
5 Emissionen / Emissions
5.4 Schwefeldioxid (SO2)Schwefel wird dem Klinkerprozess über die Roh- und Brennstoffe zugeführt. In den Rohstoffen kann der Schwefel lagerstättenbe-dingt als Sulfid und als Sulfat gebunden vorliegen. Ursache für höhere SO2-Emissionen von den Drehofenanlagen der Zement- industrie können die im Rohmaterial enthaltenen Sulfide sein, die bei der Vorwärmung des Brennguts bei Temperaturen zwi-schen 370 °C und ca. 420 °C zu SO2 oxidiert werden. Die Sulfide kommen überwiegend in Form von Pyrit oder Markasit in den Rohstoffen vor. Aufgrund der in den deutschen Rohstoffvor-kommen auftretenden Sulfidgehalte können die SO2-Emissions-konzentrationen standortabhängig bis zu 1,2 g/m³ betragen. Die Zementindustrie hat erhebliche Anstrengungen zur Reduzierung der SO2-Emissionen unternommen. So wird beispielsweise an 11 Ofenanlagen Kalkhydrat zur Minderung der SO2-Emissionen eingesetzt.
Der mit den Brennstoffen eingetragene Schwefel wird bei der Ver-brennung im Drehofen vollständig zu SO2 umgewandelt. Dieses SO2 reagiert im Vorwärmer- und Ofenbereich zu Alkalisulfaten, die überwiegend im Klinker gebunden werden.
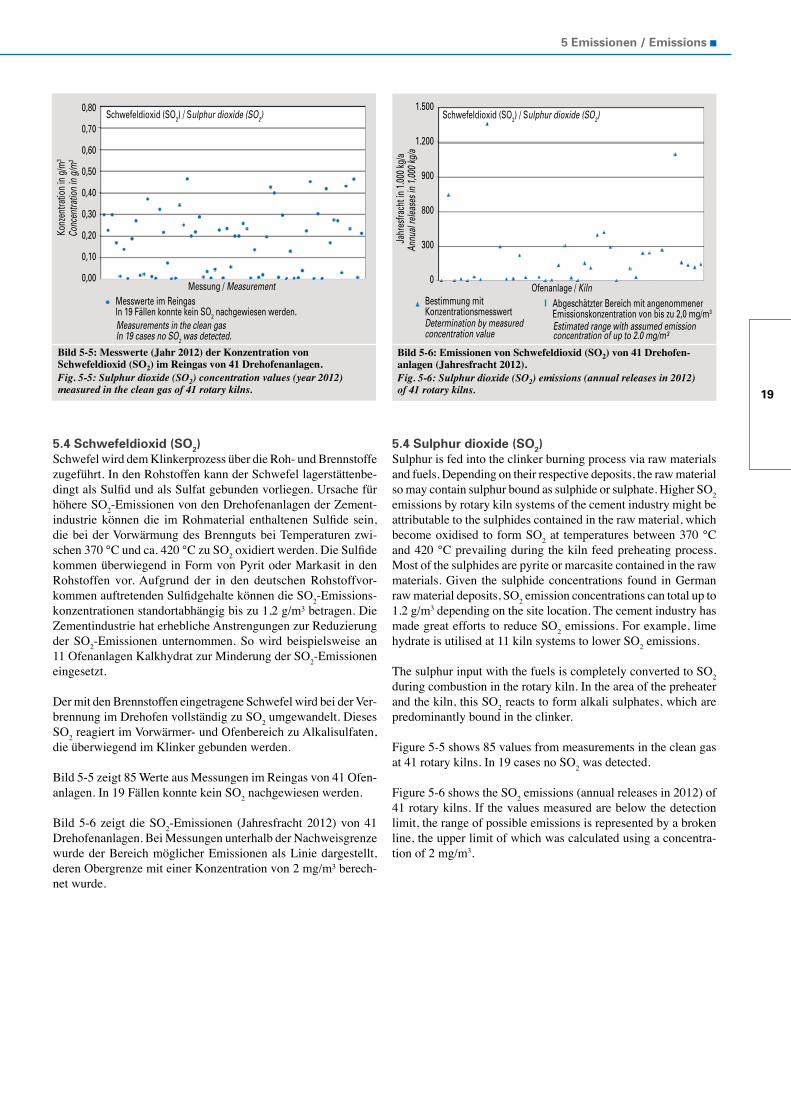
Bild 5-5 zeigt 85 Werte aus Messungen im Reingas von 41 Ofen-anlagen. In 19 Fällen konnte kein SO2 nachgewiesen werden.
Bild 5-6 zeigt die SO2-Emissionen (Jahresfracht 2012) von 41 Drehofenanlagen. Bei Messungen unterhalb der Nachweisgrenze wurde der Bereich möglicher Emissionen als Linie dargestellt, deren Obergrenze mit einer Konzentration von 2 mg/m³ berech-net wurde.
5.4 Sulphur dioxide (SO2)Sulphur is fed into the clinker burning process via raw materials and fuels. Depending on their respective deposits, the raw material so may contain sulphur bound as sulphide or sulphate. Higher SO2 emissions by rotary kiln systems of the cement industry might be attributable to the sulphides contained in the raw material, which become oxidised to form SO2 at temperatures between 370 °C and 420 °C prevailing during the kiln feed preheating process. Most of the sulphides are pyrite or marcasite contained in the raw materials. Given the sulphide concentrations found in German raw material deposits, SO2 emission concentrations can total up to 1.2 g/m3 depending on the site location. The cement industry has made great efforts to reduce SO2 emissions. For example, lime hydrate is utilised at 11 kiln systems to lower SO2 emissions.
The sulphur input with the fuels is completely converted to SO2 during combustion in the rotary kiln. In the area of the preheater and the kiln, this SO2 reacts to form alkali sulphates, which are predominantly bound in the clinker.
Figure 5-5 shows 85 values from measurements in the clean gas at 41 rotary kilns. In 19 cases no SO2 was detected.
Figure 5-6 shows the SO2 emissions (annual releases in 2012) of 41 rotary kilns. If the values measured are below the detection limit, the range of possible emissions is represented by a broken line, the upper limit of which was calculated using a concentra-tion of 2 mg/m3.
Bild 5-5: Messwerte (Jahr 2012) der Konzentration von Schwefeldioxid (SO2) im Reingas von 41 Drehofenanlagen. Fig. 5-5: Sulphur dioxide (SO2) concentration values (year 2012) measured in the clean gas of 41 rotary kilns.
Messung / Measurement
Schwefeldioxid (SO2) / Sulphur dioxide (SO2)
Measurements in the clean gas In 19 cases no SO2 was detected.
Messwerte im ReingasIn 19 Fällen konnte kein SO2 nachgewiesen werden.
Conc
entra
tion
in g
/m3
0,80
0,70
0,60
0,50
0,40
0,30
0,20
0,10
0,00
Konz
entra
tion
in g
/m3
Bild 5-6: Emissionen von Schwefeldioxid (SO2) von 41 Drehofen-anlagen (Jahresfracht 2012).Fig. 5-6: Sulphur dioxide (SO2) emissions (annual releases in 2012) of 41 rotary kilns.
Determination by measured concentration value
Estimated range with assumed emission concentration of up to 2.0 mg/m³
Abgeschätzter Bereich mit angenommener Emissionskonzentration von bis zu 2,0 mg/m3
Ofenanlage / KilnBestimmung mit Konzentrationsmesswert
Schwefeldioxid (SO2) / Sulphur dioxide (SO2)
Annu
al re
lease
s in
1,000
kg/a
Jahr
esfra
cht i
n 1.0
00 kg
/a
1.500
1.200
900
800
300
0
VDZ Umweltdaten 2012/ VDZ Environmental Data 2012
20
5.5 Kohlenstoffmonoxid (CO) und organischer Gesamtkohlenstoff (S C)Die Abgaskonzentrationen von CO und organisch gebun-denem Kohlenstoff sind bei Energieumwandlungsanlagen, wie z. B. Kraftwerken, ein Maß für den Ausbrand der ein-gesetzten Brennstoffe. Der Klinkerbrennprozess ist dage-gen ein Stoffumwandlungsprozess, der aus Gründen der Klinkerqualität stets mit Luftüberschuss betrieben werden muss. In Verbindung mit langen Verweilzeiten im Hoch- temperaturbereich führt dies zu einem vollständigen Brenn-stoffausbrand. Die auftretenden Emissionen von Kohlenstoffmo-noxid und organischem Gesamtkohlenstoff stammen daher nicht aus der Verbrennung, sondern aus der thermischen Zersetzung organischer Bestandteile des Rohmaterials im Vorwärmer.
Ursache der Emissionen von CO und organisch gebundenem Koh-lenstoff beim Klinkerbrennprozess sind v.a. die mit den natürlichen Rohstoffen in geringen Mengen zugeführten organischen Bestand-teile (Überreste von Organismen und Pflanzen, die im Laufe der Erdgeschichte im Gestein eingebaut wurden). Sie werden beim Vorwärmen des Brennguts umgesetzt und weitgehend zu CO und CO2 oxidiert. Ein sehr geringer verbleibender Anteil organischer Spurengase (organischer Gesamtkohlenstoff) wird emittiert. Der im Reingas vorliegende Gehalt an CO und organischen Spuren-gasen lässt beim Klinkerbrennprozess somit keinen Rückschluss auf die Verbrennungsbedingungen zu.
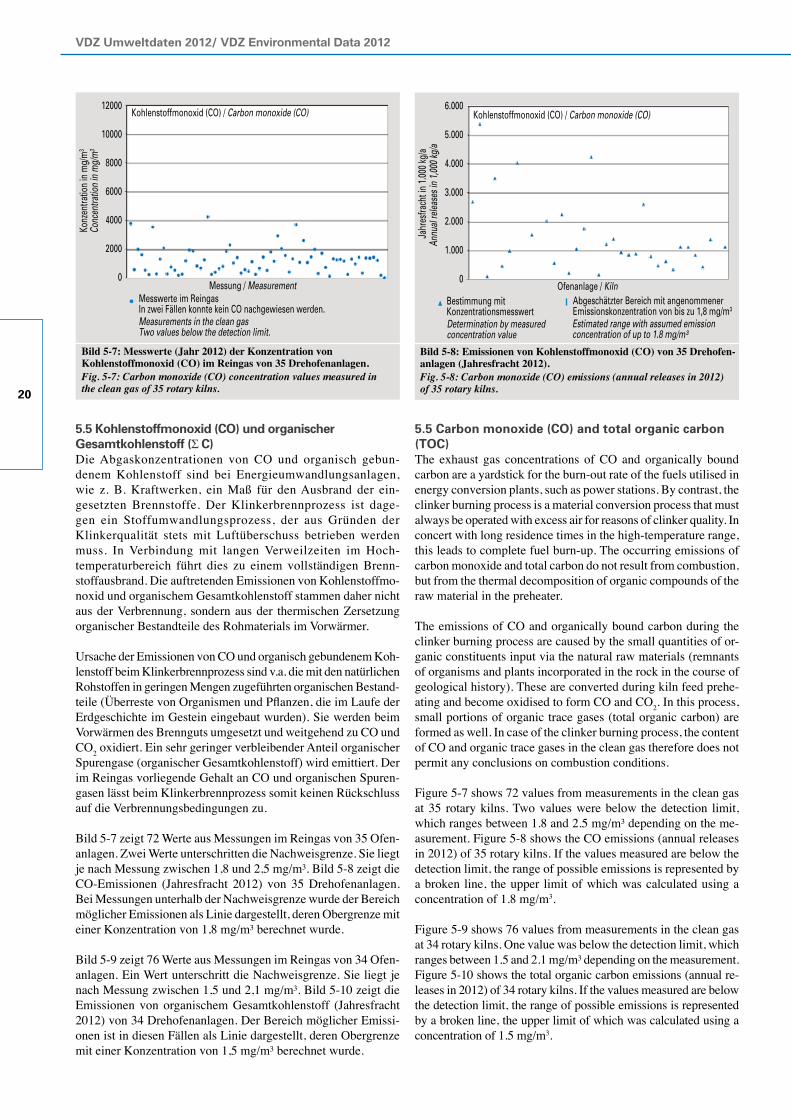
Bild 5-7 zeigt 72 Werte aus Messungen im Reingas von 35 Ofen-anlagen. Zwei Werte unterschritten die Nachweisgrenze. Sie liegt je nach Messung zwischen 1,8 und 2,5 mg/m³. Bild 5-8 zeigt die CO-Emissionen (Jahresfracht 2012) von 35 Drehofenanlagen. Bei Messungen unterhalb der Nachweisgrenze wurde der Bereich möglicher Emissionen als Linie dargestellt, deren Obergrenze mit einer Konzentration von 1,8 mg/m³ berechnet wurde.
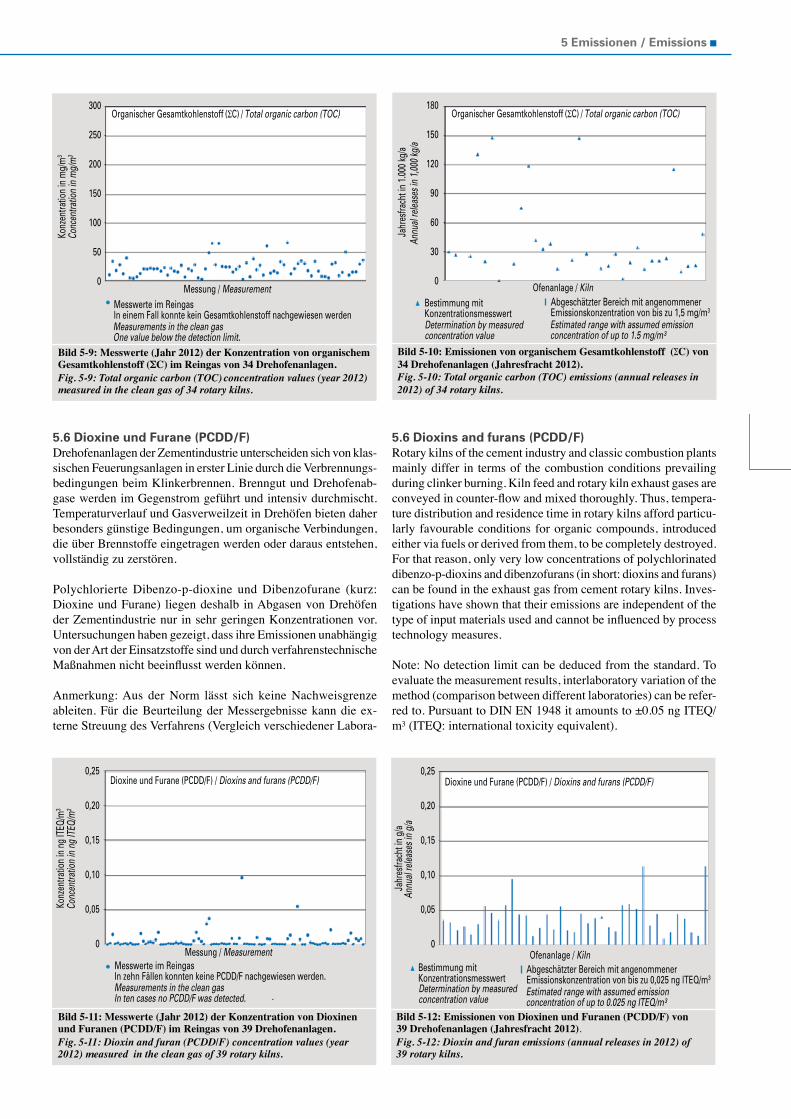
Bild 5-9 zeigt 76 Werte aus Messungen im Reingas von 34 Ofen-anlagen. Ein Wert unterschritt die Nachweisgrenze. Sie liegt je nach Messung zwischen 1,5 und 2,1 mg/m³. Bild 5-10 zeigt die Emissionen von organischem Gesamtkohlenstoff (Jahresfracht 2012) von 34 Drehofenanlagen. Der Bereich möglicher Emissi-onen ist in diesen Fällen als Linie dargestellt, deren Obergrenze mit einer Konzentration von 1,5 mg/m³ berechnet wurde.
5.5 Carbon monoxide (CO) and total organic carbon (TOC)The exhaust gas concentrations of CO and organically bound carbon are a yardstick for the burn-out rate of the fuels utilised in energy conversion plants, such as power stations. By contrast, the clinker burning process is a material conversion process that must always be operated with excess air for reasons of clinker quality. In concert with long residence times in the high-temperature range, this leads to complete fuel burn-up. The occurring emissions of carbon monoxide and total carbon do not result from combustion, but from the thermal decomposition of organic compounds of the raw material in the preheater.
The emissions of CO and organically bound carbon during the clinker burning process are caused by the small quantities of or-ganic constituents input via the natural raw materials (remnants of organisms and plants incorporated in the rock in the course of geological history). These are converted during kiln feed prehe-ating and become oxidised to form CO and CO2. In this process, small portions of organic trace gases (total organic carbon) are formed as well. In case of the clinker burning process, the content of CO and organic trace gases in the clean gas therefore does not permit any conclusions on combustion conditions.
Figure 5-7 shows 72 values from measurements in the clean gas at 35 rotary kilns. Two values were below the detection limit, which ranges between 1.8 and 2.5 mg/m³ depending on the me-asurement. Figure 5-8 shows the CO emissions (annual releases in 2012) of 35 rotary kilns. If the values measured are below the detection limit, the range of possible emissions is represented by a broken line, the upper limit of which was calculated using a concentration of 1.8 mg/m3.
Figure 5-9 shows 76 values from measurements in the clean gas at 34 rotary kilns. One value was below the detection limit, which ranges between 1.5 and 2.1 mg/m³ depending on the measurement.Figure 5-10 shows the total organic carbon emissions (annual re-leases in 2012) of 34 rotary kilns. If the values measured are below the detection limit, the range of possible emissions is represented by a broken line, the upper limit of which was calculated using a concentration of 1.5 mg/m3.
Bild 5-7: Messwerte (Jahr 2012) der Konzentration von Kohlenstoffmonoxid (CO) im Reingas von 35 Drehofenanlagen. Fig. 5-7: Carbon monoxide (CO) concentration values measured in the clean gas of 35 rotary kilns.
Messwerte im ReingasIn zwei Fällen konnte kein CO nachgewiesen werden.
Messung / Measurement
Konz
entra
tion
in m
g/m
3
Kohlenstoffmonoxid (CO) / Carbon monoxide (CO)
Measurements in the clean gasTwo values below the detection limit.
Conc
entra
tion
in m
g/m
3
12000
10000
8000
6000
4000
2000
0
Bild 5-8: Emissionen von Kohlenstoffmonoxid (CO) von 35 Drehofen-anlagen (Jahresfracht 2012).Fig. 5-8: Carbon monoxide (CO) emissions (annual releases in 2012) of 35 rotary kilns.
Ofenanlage / KilnBestimmung mit Konzentrationsmesswert
Abgeschätzter Bereich mit angenommener Emissionskonzentration von bis zu 1,8 mg/m3
Jahr
esfra
cht i
n 1.0
00 kg
/a
Determination by measured concentration value
Estimated range with assumed emission concentration of up to 1.8 mg/m³
Annu
al re
lease
s in
1,000
kg/a
Kohlenstoffmonoxid (CO) / Carbon monoxide (CO)6.000
5.000
4.000
3.000
2.000
1.000
0
21
5 Emissionen / Emissions
5.6 Dioxine und Furane (PCDD/F)Drehofenanlagen der Zementindustrie unterscheiden sich von klas-sischen Feuerungsanlagen in erster Linie durch die Verbrennungs-bedingungen beim Klinkerbrennen. Brenngut und Drehofenab-gase werden im Gegenstrom geführt und intensiv durchmischt. Temperaturverlauf und Gasverweilzeit in Drehöfen bieten daher besonders günstige Bedingungen, um organische Verbindungen, die über Brennstoffe eingetragen werden oder daraus entstehen, vollständig zu zerstören.
Polychlorierte Dibenzo-p-dioxine und Dibenzofurane (kurz: Dioxine und Furane) liegen deshalb in Abgasen von Drehöfen der Zementindustrie nur in sehr geringen Konzentrationen vor. Untersuchungen haben gezeigt, dass ihre Emissionen unabhängig von der Art der Einsatzstoffe sind und durch verfahrenstechnische Maßnahmen nicht beeinflusst werden können.
Anmerkung: Aus der Norm lässt sich keine Nachweisgrenze ableiten. Für die Beurteilung der Messergebnisse kann die ex-terne Streuung des Verfahrens (Vergleich verschiedener Labora-
5.6 Dioxins and furans (PCDD/F)Rotary kilns of the cement industry and classic combustion plants mainly differ in terms of the combustion conditions prevailing during clinker burning. Kiln feed and rotary kiln exhaust gases are conveyed in counter-flow and mixed thoroughly. Thus, tempera- ture distribution and residence time in rotary kilns afford particu- larly favourable conditions for organic compounds, introduced either via fuels or derived from them, to be completely destroyed. For that reason, only very low concentrations of polychlorinated dibenzo-p-dioxins and dibenzofurans (in short: dioxins and furans) can be found in the exhaust gas from cement rotary kilns. Inves- tigations have shown that their emissions are independent of the type of input materials used and cannot be influenced by process technology measures.
Note: No detection limit can be deduced from the standard. To evaluate the measurement results, interlaboratory variation of the method (comparison between different laboratories) can be refer-red to. Pursuant to DIN EN 1948 it amounts to ±0.05 ng ITEQ/m³ (ITEQ: international toxicity equivalent).
Bild 5-9: Messwerte (Jahr 2012) der Konzentration von organischem Gesamtkohlenstoff ( C) im Reingas von 34 Drehofenanlagen. Fig. 5-9: Total organic carbon (TOC) concentration values (year 2012) measured in the clean gas of 34 rotary kilns.
Messwerte im ReingasIn einem Fall konnte kein Gesamtkohlenstoff nachgewiesen werden
Messung / Measurement
Konz
entra
tion
in m
g/m
3
Organischer Gesamtkohlenstoff (ΣC) / Total organic carbon (TOC)
Measurements in the clean gasOne value below the detection limit.
Conc
entra
tion
in m
g/m
3
300
250
200
150
100
50
0
Bild 5-10: Emissionen von organischem Gesamtkohlenstoff (ΣC) von 34 Drehofenanlagen (Jahresfracht 2012). Fig. 5-10: Total organic carbon (TOC) emissions (annual releases in 2012) of 34 rotary kilns.
Annu
al re
lease
s in
1,000
kg/a
Determination by measured concentration value
Estimated range with assumed emission concentration of up to 1.5 mg/m³
Ofenanlage / Kiln
Jahr
esfra
cht i
n 1.0
00 kg
/a
Bestimmung mit Konzentrationsmesswert
Abgeschätzter Bereich mit angenommener Emissionskonzentration von bis zu 1,5 mg/m3
Organischer Gesamtkohlenstoff (ΣC) / Total organic carbon (TOC) 180
150
120
90
60
30
0
Bild 5-11: Messwerte (Jahr 2012) der Konzentration von Dioxinen und Furanen (PCDD/F) im Reingas von 39 Drehofenanlagen. Fig. 5-11: Dioxin and furan (PCDD/F) concentration values (year 2012) measured in the clean gas of 39 rotary kilns.
.
Measurements in the clean gasIn ten cases no PCDD/F was detected.
Conc
entra
tion
in n
g IT
EQ/m
3
Messwerte im ReingasIn zehn Fällen konnten keine PCDD/F nachgewiesen werden.
Messung / Measurement
Konz
entra
tion
in n
g IT
EQ/m
3
Dioxine und Furane (PCDD/F) / Dioxins and furans (PCDD/F)0,25
0,20
0,15
0,10
0,05
0
Bild 5-12: Emissionen von Dioxinen und Furanen (PCDD/F) von 39 Drehofenanlagen (Jahresfracht 2012).Fig. 5-12: Dioxin and furan emissions (annual releases in 2012) of 39 rotary kilns.
Ofenanlage / Kiln
Jahr
esfra
cht i
n g/
a
Bestimmung mit Konzentrationsmesswert
Abgeschätzter Bereich mit angenommener Emissionskonzentration von bis zu 0,025 ng lTEQ/m3
Determination by measured concentration value
Estimated range with assumed emission concentration of up to 0.025 ng ITEQ/m³
Annu
al re
lease
s in
g/a
Dioxine und Furane (PCDD/F) / Dioxins and furans (PCDD/F)0,25
0,20
0,15
0,10
0,05
0
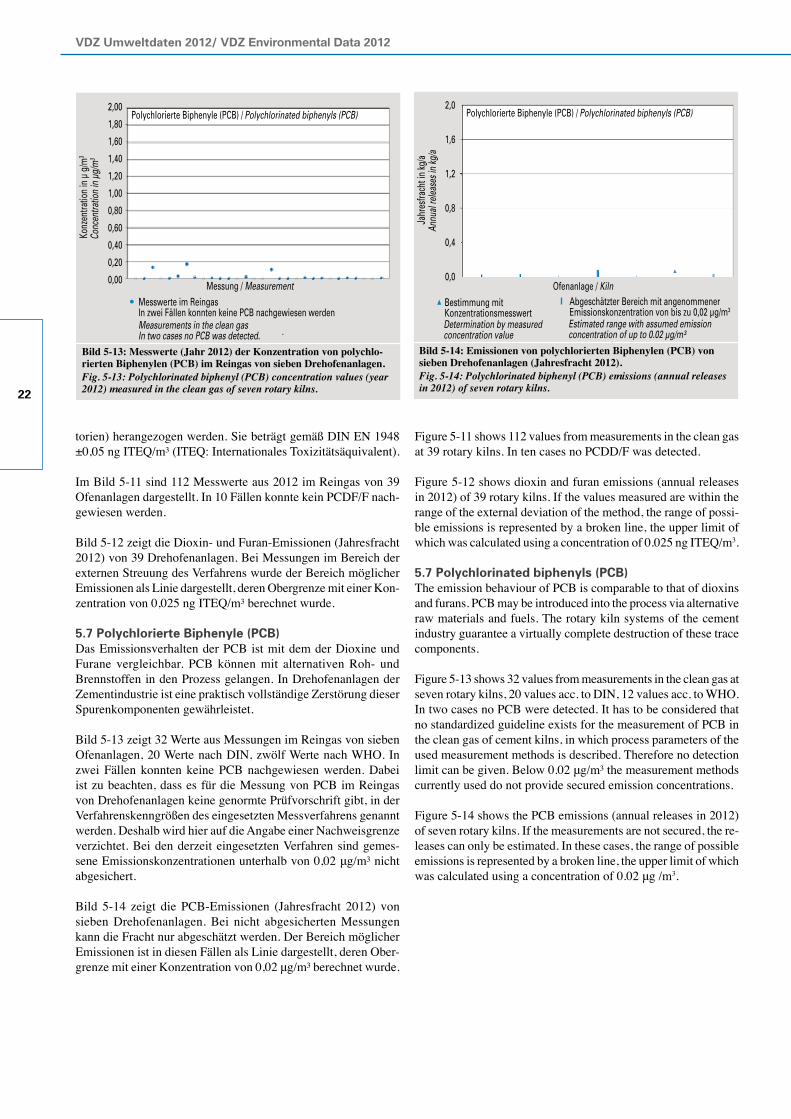
VDZ Umweltdaten 2012/ VDZ Environmental Data 2012
22
torien) herangezogen werden. Sie beträgt gemäß DIN EN 1948 ±0,05 ng ITEQ/m³ (ITEQ: Internationales Toxizitätsäquivalent).
Im Bild 5-11 sind 112 Messwerte aus 2012 im Reingas von 39 Ofenanlagen dargestellt. In 10 Fällen konnte kein PCDF/F nach-gewiesen werden.
Bild 5-12 zeigt die Dioxin- und Furan-Emissionen (Jahresfracht 2012) von 39 Drehofenanlagen. Bei Messungen im Bereich der externen Streuung des Verfahrens wurde der Bereich möglicher Emissionen als Linie dargestellt, deren Obergrenze mit einer Kon-zentration von 0,025 ng ITEQ/m³ berechnet wurde.
5.7 Polychlorierte Biphenyle (PCB)Das Emissionsverhalten der PCB ist mit dem der Dioxine und Furane vergleichbar. PCB können mit alternativen Roh- und Brennstoffen in den Prozess gelangen. In Drehofenanlagen der Zementindustrie ist eine praktisch vollständige Zerstörung dieser Spurenkomponenten gewährleistet.
Bild 5-13 zeigt 32 Werte aus Messungen im Reingas von sieben Ofenanlagen, 20 Werte nach DIN, zwölf Werte nach WHO. In zwei Fällen konnten keine PCB nachgewiesen werden. Dabei ist zu beachten, dass es für die Messung von PCB im Reingas von Drehofenanlagen keine genormte Prüfvorschrift gibt, in der Verfahrenskenngrößen des eingesetzten Messverfahrens genannt werden. Deshalb wird hier auf die Angabe einer Nachweisgrenze verzichtet. Bei den derzeit eingesetzten Verfahren sind gemes-sene Emissionskonzentrationen unterhalb von 0,02 μg/m³ nicht abgesichert.
Bild 5-14 zeigt die PCB-Emissionen (Jahresfracht 2012) von sieben Drehofenanlagen. Bei nicht abgesicherten Messungen kann die Fracht nur abgeschätzt werden. Der Bereich möglicher Emissionen ist in diesen Fällen als Linie dargestellt, deren Ober-grenze mit einer Konzentration von 0,02 μg/m³ berechnet wurde.
Figure 5-11 shows 112 values from measurements in the clean gas at 39 rotary kilns. In ten cases no PCDD/F was detected.
Figure 5-12 shows dioxin and furan emissions (annual releases in 2012) of 39 rotary kilns. If the values measured are within the range of the external deviation of the method, the range of possi-ble emissions is represented by a broken line, the upper limit of which was calculated using a concentration of 0.025 ng ITEQ/m3.
5.7 Polychlorinated biphenyls (PCB)The emission behaviour of PCB is comparable to that of dioxins and furans. PCB may be introduced into the process via alternative raw materials and fuels. The rotary kiln systems of the cement industry guarantee a virtually complete destruction of these trace components.
Figure 5-13 shows 32 values from measurements in the clean gas at seven rotary kilns, 20 values acc. to DIN, 12 values acc. to WHO. In two cases no PCB were detected. It has to be considered that no standardized guideline exists for the measurement of PCB in the clean gas of cement kilns, in which process parameters of the used measurement methods is described. Therefore no detection limit can be given. Below 0.02 μg/m³ the measurement methods currently used do not provide secured emission concentrations.
Figure 5-14 shows the PCB emissions (annual releases in 2012) of seven rotary kilns. If the measurements are not secured, the re-leases can only be estimated. In these cases, the range of possible emissions is represented by a broken line, the upper limit of which was calculated using a concentration of 0.02 μg /m3.
Bild 5-13: Messwerte (Jahr 2012) der Konzentration von polychlo-rierten Biphenylen (PCB) im Reingas von sieben Drehofenanlagen. Fig. 5-13: Polychlorinated biphenyl (PCB) concentration values (year 2012) measured in the clean gas of seven rotary kilns.
.
Messwerte im ReingasIn zwei Fällen konnten keine PCB nachgewiesen werden
Messung / Measurement
Polychlorierte Biphenyle (PCB) / Polychlorinated biphenyls (PCB)
Measurements in the clean gasIn two cases no PCB was detected.
Conc
entra
tion
in µ
g/m
3Ko
nzen
tratio
n in
µ g
/m3
2,00
1,80
1,60
1,40
1,20
1,00
0,80
0,60
0,40
0,20
0,00
Bild 5-14: Emissionen von polychlorierten Biphenylen (PCB) von sieben Drehofenanlagen (Jahresfracht 2012).Fig. 5-14: Polychlorinated biphenyl (PCB) emissions (annual releases in 2012) of seven rotary kilns.
Ofenanlage / Kiln
Jahr
esfra
cht i
n kg
/a
Bestimmung mit Konzentrationsmesswert
Abgeschätzter Bereich mit angenommener Emissionskonzentration von bis zu 0,02 µg/m3
Annu
al re
lease
s in
kg/a
Determination by measuredconcentration value
Estimated range with assumed emission concentration of up to 0.02 µg/m³
2,0
1,6
1,2
0,8
0,4
0,0
Polychlorierte Biphenyle (PCB) / Polychlorinated biphenyls (PCB)
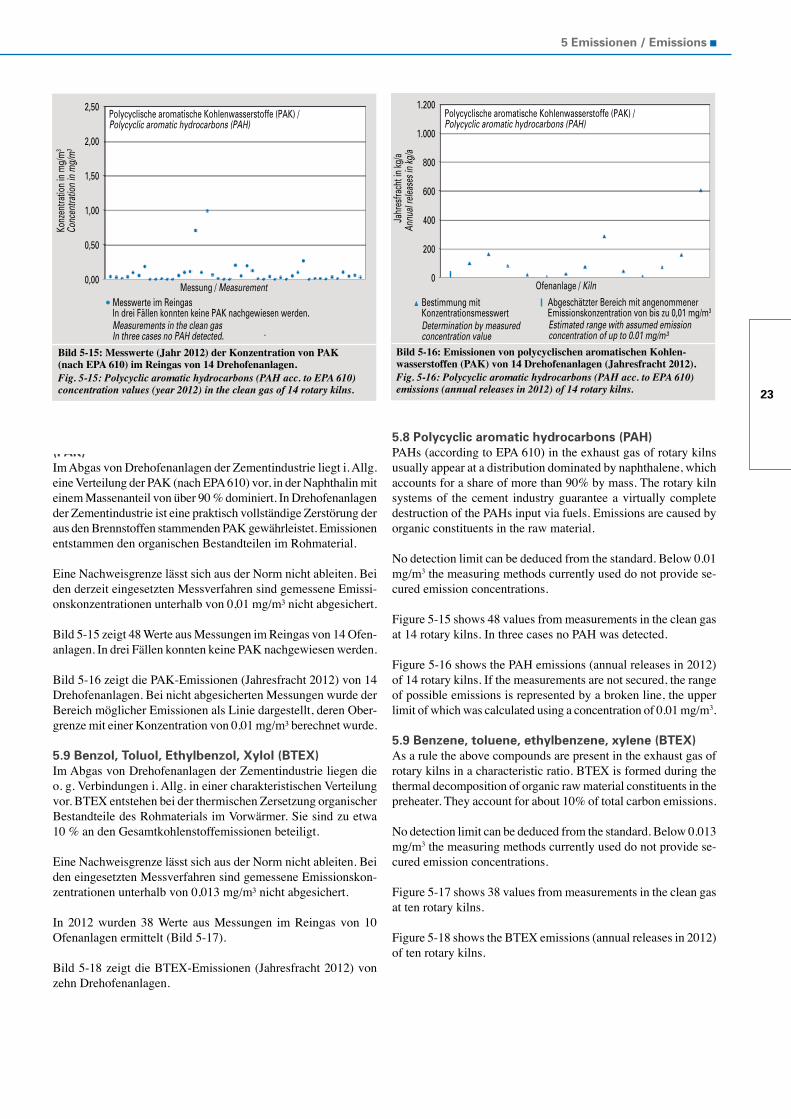
23
5 Emissionen / Emissions
5.8 Polycyclische aromatische Kohlenwasserstoffe (PAK)Im Abgas von Drehofenanlagen der Zementindustrie liegt i. Allg. eine Verteilung der PAK (nach EPA 610) vor, in der Naphthalin mit einem Massenanteil von über 90 % dominiert. In Drehofenanlagen der Zementindustrie ist eine praktisch vollständige Zerstörung der aus den Brennstoffen stammenden PAK gewährleistet. Emissionen entstammen den organischen Bestandteilen im Rohmaterial.
Eine Nachweisgrenze lässt sich aus der Norm nicht ableiten. Bei den derzeit eingesetzten Messverfahren sind gemessene Emissi-onskonzentrationen unterhalb von 0,01 mg/m³ nicht abgesichert.
Bild 5-15 zeigt 48 Werte aus Messungen im Reingas von 14 Ofen-anlagen. In drei Fällen konnten keine PAK nachgewiesen werden.
Bild 5-16 zeigt die PAK-Emissionen (Jahresfracht 2012) von 14 Drehofenanlagen. Bei nicht abgesicherten Messungen wurde der Bereich möglicher Emissionen als Linie dargestellt, deren Ober-grenze mit einer Konzentration von 0,01 mg/m³ berechnet wurde.
5.9 Benzol, Toluol, Ethylbenzol, Xylol (BTEX)Im Abgas von Drehofenanlagen der Zementindustrie liegen die o. g. Verbindungen i. Allg. in einer charakteristischen Verteilung vor. BTEX entstehen bei der thermischen Zersetzung organischer Bestandteile des Rohmaterials im Vorwärmer. Sie sind zu etwa 10 % an den Gesamtkohlenstoffemissionen beteiligt.
Eine Nachweisgrenze lässt sich aus der Norm nicht ableiten. Bei den eingesetzten Messverfahren sind gemessene Emissionskon-zentrationen unterhalb von 0,013 mg/m³ nicht abgesichert.
In 2012 wurden 38 Werte aus Messungen im Reingas von 10 Ofenanlagen ermittelt (Bild 5-17).
Bild 5-18 zeigt die BTEX-Emissionen (Jahresfracht 2012) von zehn Drehofenanlagen.
5.8 Polycyclic aromatic hydrocarbons (PAH)PAHs (according to EPA 610) in the exhaust gas of rotary kilns usually appear at a distribution dominated by naphthalene, which accounts for a share of more than 90% by mass. The rotary kiln systems of the cement industry guarantee a virtually complete destruction of the PAHs input via fuels. Emissions are caused by organic constituents in the raw material.
No detection limit can be deduced from the standard. Below 0.01 mg/m3 the measuring methods currently used do not provide se-cured emission concentrations.
Figure 5-15 shows 48 values from measurements in the clean gas at 14 rotary kilns. In three cases no PAH was detected.
Figure 5-16 shows the PAH emissions (annual releases in 2012) of 14 rotary kilns. If the measurements are not secured, the range of possible emissions is represented by a broken line, the upper limit of which was calculated using a concentration of 0.01 mg/m3.
5.9 Benzene, toluene, ethylbenzene, xylene (BTEX)As a rule the above compounds are present in the exhaust gas of rotary kilns in a characteristic ratio. BTEX is formed during the thermal decomposition of organic raw material constituents in the preheater. They account for about 10% of total carbon emissions.
No detection limit can be deduced from the standard. Below 0.013 mg/m3 the measuring methods currently used do not provide se-cured emission concentrations.
Figure 5-17 shows 38 values from measurements in the clean gas at ten rotary kilns.
Figure 5-18 shows the BTEX emissions (annual releases in 2012) of ten rotary kilns.
Bild 5-15: Messwerte (Jahr 2012) der Konzentration von PAK (nach EPA 610) im Reingas von 14 Drehofenanlagen.Fig. 5-15: Polycyclic aromatic hydrocarbons (PAH acc. to EPA 610) concentration values (year 2012) in the clean gas of 14 rotary kilns.
.
Messwerte im ReingasIn drei Fällen konnten keine PAK nachgewiesen werden.
Messung / Measurement
Konz
entra
tion
in m
g/m
3
Polycyclische aromatische Kohlenwasserstoffe (PAK) / Polycyclic aromatic hydrocarbons (PAH)
Measurements in the clean gasIn three cases no PAH detected.
Conc
entra
tion
in m
g/m
3
2,50
2,00
1,50
1,00
0,50
0,00
Bild 5-16: Emissionen von polycyclischen aromatischen Kohlen-wasserstoffen (PAK) von 14 Drehofenanlagen (Jahresfracht 2012).Fig. 5-16: Polycyclic aromatic hydrocarbons (PAH acc. to EPA 610) emissions (annual releases in 2012) of 14 rotary kilns.
Annu
al re
lease
s in
kg/a
Determination by measured concentration value
Estimated range with assumed emission concentration of up to 0.01 mg/m³
Ofenanlage / Kiln
Jahr
esfra
cht i
n kg
/a
Bestimmung mit Konzentrationsmesswert
Abgeschätzter Bereich mit angenommener Emissionskonzentration von bis zu 0,01 mg/m3
Polycyclische aromatische Kohlenwasserstoffe (PAK) / Polycyclic aromatic hydrocarbons (PAH)
1.200
1.000
800
600
400
200
0
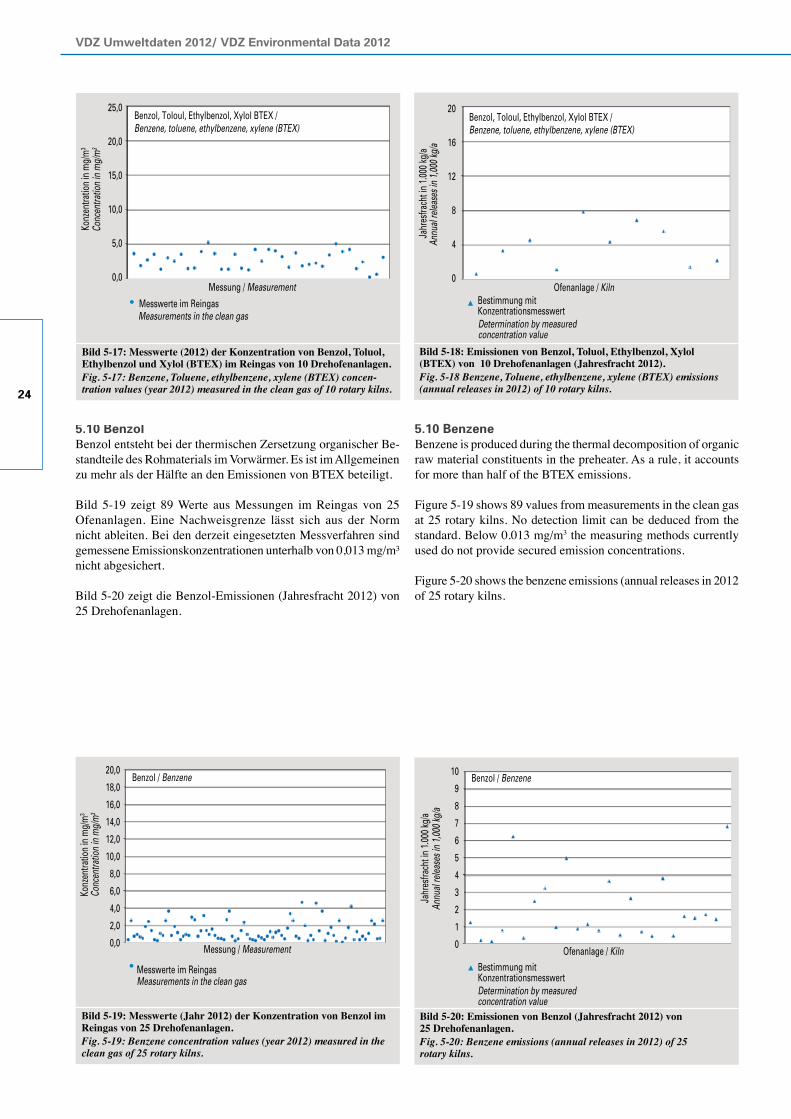
VDZ Umweltdaten 2012/ VDZ Environmental Data 2012
24
5.10 BenzolBenzol entsteht bei der thermischen Zersetzung organischer Be-standteile des Rohmaterials im Vorwärmer. Es ist im Allgemeinen zu mehr als der Hälfte an den Emissionen von BTEX beteiligt.
Bild 5-19 zeigt 89 Werte aus Messungen im Reingas von 25 Ofenanlagen. Eine Nachweisgrenze lässt sich aus der Norm nicht ableiten. Bei den derzeit eingesetzten Messverfahren sind gemessene Emissionskonzentrationen unterhalb von 0,013 mg/m³ nicht abgesichert.
Bild 5-20 zeigt die Benzol-Emissionen (Jahresfracht 2012) von 25 Drehofenanlagen.
5.10 BenzeneBenzene is produced during the thermal decomposition of organic raw material constituents in the preheater. As a rule, it accounts for more than half of the BTEX emissions.
Figure 5-19 shows 89 values from measurements in the clean gas at 25 rotary kilns. No detection limit can be deduced from the standard. Below 0.013 mg/m3 the measuring methods currently used do not provide secured emission concentrations.
Figure 5-20 shows the benzene emissions (annual releases in 2012 of 25 rotary kilns.
Bild 5-17: Messwerte (2012) der Konzentration von Benzol, Toluol, Ethylbenzol und Xylol (BTEX) im Reingas von 10 Drehofenanlagen. Fig. 5-17: Benzene, Toluene, ethylbenzene, xylene (BTEX) concen-tration values (year 2012) measured in the clean gas of 10 rotary kilns.
Messwerte im Reingas
Messung / Measurement
Konz
entra
tion
in m
g/m
3
Benzol, Toloul, Ethylbenzol, Xylol BTEX / Benzene, toluene, ethylbenzene, xylene (BTEX)
Measurements in the clean gas
Conc
entra
tion
in m
g/m
3
25,0
20,0
15,0
10,0
5,0
0,0
Bild 5-18: Emissionen von Benzol, Toluol, Ethylbenzol, Xylol (BTEX) von 10 Drehofenanlagen (Jahresfracht 2012). Fig. 5-18 Benzene, Toluene, ethylbenzene, xylene (BTEX) emissions (annual releases in 2012) of 10 rotary kilns.
Annu
al re
lease
s in
1,000
kg/a
Determination by measured concentration value
Ofenanlage / Kiln
Jahr
esfra
cht i
n 1.0
00 kg
/a
Bestimmung mit Konzentrationsmesswert
Benzol, Toloul, Ethylbenzol, Xylol BTEX / Benzene, toluene, ethylbenzene, xylene (BTEX)
20
16
12
8
4
0
Bild 5-19: Messwerte (Jahr 2012) der Konzentration von Benzol im Reingas von 25 Drehofenanlagen. Fig. 5-19: Benzene concentration values (year 2012) measured in the clean gas of 25 rotary kilns.
Messwerte im Reingas
Messung / Measurement
Konz
entra
tion
in m
g/m
3
Benzol / Benzene
Measurements in the clean gas
Conc
entra
tion
in m
g/m
3
20,0
18,0
16,0
14,0
12,0
10,0
8,0
6,0
4,0
2,0
0,0
Bild 5-20: Emissionen von Benzol (Jahresfracht 2012) von 25 Drehofenanlagen.Fig. 5-20: Benzene emissions (annual releases in 2012) of 25 rotary kilns.
Annu
al re
lease
s in
1,000
kg/a
Determination by measured concentration value
Ofenanlage / Kiln
Jahr
esfra
cht i
n 1.0
00 kg
/a
Bestimmung mit Konzentrationsmesswert
10
9
8
7
6
5
4
3
2
1
0
Benzol / Benzene
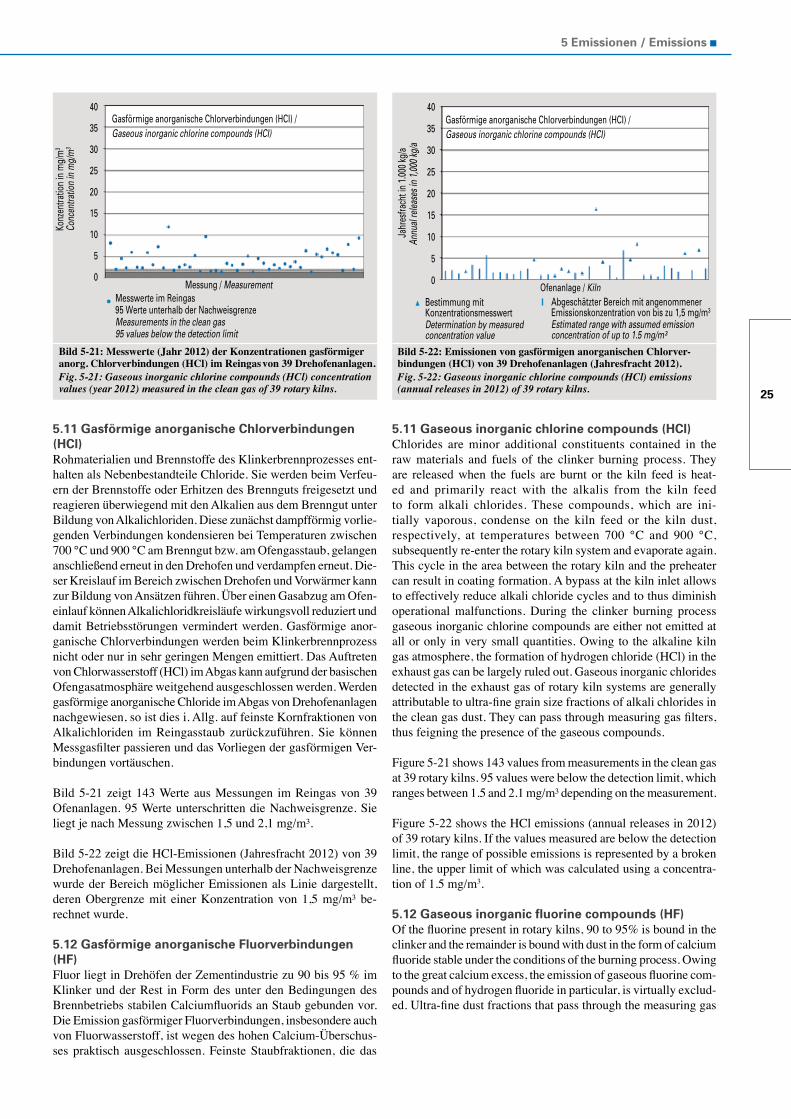
25
5 Emissionen / Emissions
5.11 Gasförmige anorganische Chlorverbindungen (HCl)Rohmaterialien und Brennstoffe des Klinkerbrennprozesses ent-halten als Nebenbestandteile Chloride. Sie werden beim Verfeu-ern der Brennstoffe oder Erhitzen des Brennguts freigesetzt und reagieren überwiegend mit den Alkalien aus dem Brenngut unter Bildung von Alkalichloriden. Diese zunächst dampfförmig vorlie-genden Verbindungen kondensieren bei Temperaturen zwischen 700 °C und 900 °C am Brenngut bzw. am Ofengasstaub, gelangen anschließend erneut in den Drehofen und verdampfen erneut. Die-ser Kreislauf im Bereich zwischen Drehofen und Vorwärmer kann zur Bildung von Ansätzen führen. Über einen Gasabzug am Ofen-einlauf können Alkalichloridkreisläufe wirkungsvoll reduziert und damit Betriebsstörungen vermindert werden. Gasförmige anor-ganische Chlorverbindungen werden beim Klinkerbrennprozess nicht oder nur in sehr geringen Mengen emittiert. Das Auftreten von Chlorwasserstoff (HCl) im Abgas kann aufgrund der basischen Ofengasatmosphäre weitgehend ausgeschlossen werden. Werden gasförmige anorganische Chloride im Abgas von Drehofenanlagen nachgewiesen, so ist dies i. Allg. auf feinste Kornfraktionen von Alkalichloriden im Reingasstaub zurückzuführen. Sie können Messgasfilter passieren und das Vorliegen der gasförmigen Ver-bindungen vortäuschen.
Bild 5-21 zeigt 143 Werte aus Messungen im Reingas von 39 Ofenanlagen. 95 Werte unterschritten die Nachweisgrenze. Sie liegt je nach Messung zwischen 1,5 und 2,1 mg/m³.
Bild 5-22 zeigt die HCl-Emissionen (Jahresfracht 2012) von 39 Drehofenanlagen. Bei Messungen unterhalb der Nachweisgrenze wurde der Bereich möglicher Emissionen als Linie dargestellt, deren Obergrenze mit einer Konzentration von 1,5 mg/m³ be-rechnet wurde.
5.12 Gasförmige anorganische Fluorverbindungen (HF)Fluor liegt in Drehöfen der Zementindustrie zu 90 bis 95 % im Klinker und der Rest in Form des unter den Bedingungen des Brennbetriebs stabilen Calciumfluorids an Staub gebunden vor. Die Emission gasförmiger Fluorverbindungen, insbesondere auch von Fluorwasserstoff, ist wegen des hohen Calcium-Überschus-ses praktisch ausgeschlossen. Feinste Staubfraktionen, die das
5.11 Gaseous inorganic chlorine compounds (HCl)Chlorides are minor additional constituents contained in the raw materials and fuels of the clinker burning process. They are released when the fuels are burnt or the kiln feed is heat- ed and primarily react with the alkalis from the kiln feed to form alkali chlorides. These compounds, which are ini-tially vaporous, condense on the kiln feed or the kiln dust, respectively, at temperatures between 700 °C and 900 °C, subsequently re-enter the rotary kiln system and evaporate again. This cycle in the area between the rotary kiln and the preheater can result in coating formation. A bypass at the kiln inlet allows to effectively reduce alkali chloride cycles and to thus diminish operational malfunctions. During the clinker burning process gaseous inorganic chlorine compounds are either not emitted at all or only in very small quantities. Owing to the alkaline kiln gas atmosphere, the formation of hydrogen chloride (HCl) in the exhaust gas can be largely ruled out. Gaseous inorganic chlorides detected in the exhaust gas of rotary kiln systems are generally attributable to ultra-fine grain size fractions of alkali chlorides in the clean gas dust. They can pass through measuring gas filters, thus feigning the presence of the gaseous compounds.
Figure 5-21 shows 143 values from measurements in the clean gas at 39 rotary kilns. 95 values were below the detection limit, which ranges between 1.5 and 2.1 mg/m³ depending on the measurement.
Figure 5-22 shows the HCl emissions (annual releases in 2012) of 39 rotary kilns. If the values measured are below the detection limit, the range of possible emissions is represented by a broken line, the upper limit of which was calculated using a concentra-tion of 1.5 mg/m3.
5.12 Gaseous inorganic fluorine compounds (HF)Of the fluorine present in rotary kilns, 90 to 95% is bound in the clinker and the remainder is bound with dust in the form of calcium fluoride stable under the conditions of the burning process. Owing to the great calcium excess, the emission of gaseous fluorine com-pounds and of hydrogen fluoride in particular, is virtually exclud- ed. Ultra-fine dust fractions that pass through the measuring gas
Bild 5-21: Messwerte (Jahr 2012) der Konzentrationen gasförmiger anorg. Chlorverbindungen (HCl) im Reingas von 39 Drehofenanlagen.Fig. 5-21: Gaseous inorganic chlorine compounds (HCl) concentration values (year 2012) measured in the clean gas of 39 rotary kilns.
Messwerte im Reingas
Konz
entra
tion
in m
g/m
3
95 Werte unterhalb der Nachweisgrenze
Messung / Measurement
Gasförmige anorganische Chlorverbindungen (HCI) / Gaseous inorganic chlorine compounds (HCI)
Measurements in the clean gas
Conc
entra
tion
in m
g/m
3
95 values below the detection limit
40
35
30
25
20
15
10
5
0
Bild 5-22: Emissionen von gasförmigen anorganischen Chlorver-bindungen (HCl) von 39 Drehofenanlagen (Jahresfracht 2012).Fig. 5-22: Gaseous inorganic chlorine compounds (HCl) emissions (annual releases in 2012) of 39 rotary kilns.
Determination by measured concentration value
Estimated range with assumed emission concentration of up to 1.5 mg/m³
Ofenanlage / KilnBestimmung mit Konzentrationsmesswert
Abgeschätzter Bereich mit angenommener Emissionskonzentration von bis zu 1,5 mg/m3
Gasförmige anorganische Chlorverbindungen (HCI) / Gaseous inorganic chlorine compounds (HCI)
Annu
al re
lease
s in
1,000
kg/a
Jahr
esfra
cht i
n 1.0
00 kg
/a
40
35
30
25
20
15
10
5
0
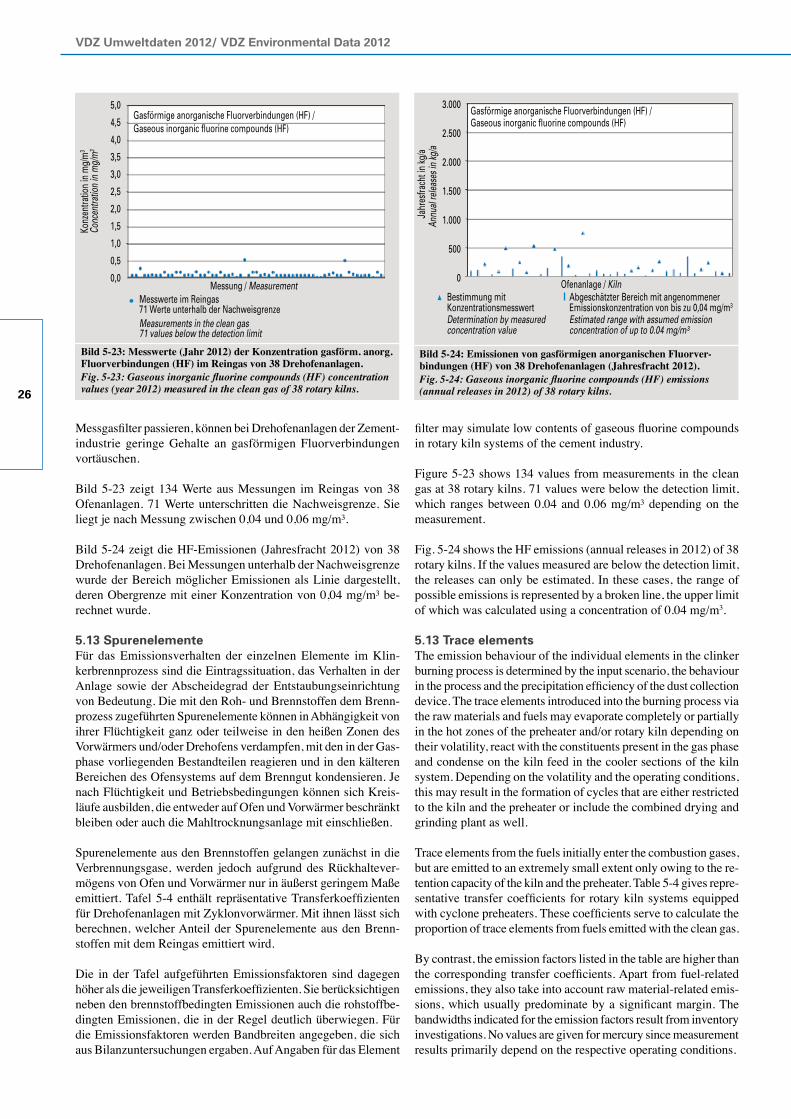
VDZ Umweltdaten 2012/ VDZ Environmental Data 2012
26
Messgasfilter passieren, können bei Drehofenanlagen der Zement- industrie geringe Gehalte an gasförmigen Fluorverbindungen vortäuschen.
Bild 5-23 zeigt 134 Werte aus Messungen im Reingas von 38 Ofenanlagen. 71 Werte unterschritten die Nachweisgrenze. Sie liegt je nach Messung zwischen 0,04 und 0,06 mg/m³.
Bild 5-24 zeigt die HF-Emissionen (Jahresfracht 2012) von 38 Drehofenanlagen. Bei Messungen unterhalb der Nachweisgrenze wurde der Bereich möglicher Emissionen als Linie dargestellt, deren Obergrenze mit einer Konzentration von 0,04 mg/m³ be-rechnet wurde.
5.13 SpurenelementeFür das Emissionsverhalten der einzelnen Elemente im Klin-kerbrennprozess sind die Eintragssituation, das Verhalten in der Anlage sowie der Abscheidegrad der Entstaubungseinrichtung von Bedeutung. Die mit den Roh- und Brennstoffen dem Brenn-prozess zugeführten Spurenelemente können in Abhängigkeit von ihrer Flüchtigkeit ganz oder teilweise in den heißen Zonen des Vorwärmers und/oder Drehofens verdampfen, mit den in der Gas-phase vorliegenden Bestandteilen reagieren und in den kälteren Bereichen des Ofensystems auf dem Brenngut kondensieren. Je nach Flüchtigkeit und Betriebsbedingungen können sich Kreis-läufe ausbilden, die entweder auf Ofen und Vorwärmer beschränkt bleiben oder auch die Mahltrocknungsanlage mit einschließen.
Spurenelemente aus den Brennstoffen gelangen zunächst in die Verbrennungsgase, werden jedoch aufgrund des Rückhaltever-mögens von Ofen und Vorwärmer nur in äußerst geringem Maße emittiert. Tafel 5-4 enthält repräsentative Transferkoeffizienten für Drehofenanlagen mit Zyklonvorwärmer. Mit ihnen lässt sich berechnen, welcher Anteil der Spurenelemente aus den Brenn-stoffen mit dem Reingas emittiert wird.
Die in der Tafel aufgeführten Emissionsfaktoren sind dagegen höher als die jeweiligen Transferkoeffizienten. Sie berücksichtigen neben den brennstoffbedingten Emissionen auch die rohstoffbe-dingten Emissionen, die in der Regel deutlich überwiegen. Für die Emissionsfaktoren werden Bandbreiten angegeben, die sich aus Bilanzuntersuchungen ergaben. Auf Angaben für das Element
filter may simulate low contents of gaseous fluorine compounds in rotary kiln systems of the cement industry.
Figure 5-23 shows 134 values from measurements in the clean gas at 38 rotary kilns. 71 values were below the detection limit, which ranges between 0.04 and 0.06 mg/m³ depending on the measurement.
Fig. 5-24 shows the HF emissions (annual releases in 2012) of 38 rotary kilns. If the values measured are below the detection limit, the releases can only be estimated. In these cases, the range of possible emissions is represented by a broken line, the upper limit of which was calculated using a concentration of 0.04 mg/m3.
5.13 Trace elementsThe emission behaviour of the individual elements in the clinker burning process is determined by the input scenario, the behaviour in the process and the precipitation efficiency of the dust collection device. The trace elements introduced into the burning process via the raw materials and fuels may evaporate completely or partially in the hot zones of the preheater and/or rotary kiln depending on their volatility, react with the constituents present in the gas phase and condense on the kiln feed in the cooler sections of the kiln system. Depending on the volatility and the operating conditions, this may result in the formation of cycles that are either restricted to the kiln and the preheater or include the combined drying and grinding plant as well.
Trace elements from the fuels initially enter the combustion gases, but are emitted to an extremely small extent only owing to the re-tention capacity of the kiln and the preheater. Table 5-4 gives repre- sentative transfer coefficients for rotary kiln systems equipped with cyclone preheaters. These coefficients serve to calculate the proportion of trace elements from fuels emitted with the clean gas.
By contrast, the emission factors listed in the table are higher than the corresponding transfer coefficients. Apart from fuel-related emissions, they also take into account raw material-related emis-sions, which usually predominate by a significant margin. The bandwidths indicated for the emission factors result from inventory investigations. No values are given for mercury since measurement results primarily depend on the respective operating conditions.
Bild 5-23: Messwerte (Jahr 2012) der Konzentration gasförm. anorg. Fluorverbindungen (HF) im Reingas von 38 Drehofenanlagen. Fig. 5-23: Gaseous inorganic fluorine compounds (HF) concentration values (year 2012) measured in the clean gas of 38 rotary kilns.
Messwerte im Reingas
Konz
entra
tion
in m
g/m
3
71 Werte unterhalb der Nachweisgrenze
Gasförmige anorganische Fluorverbindungen (HF) / Gaseous inorganic fluorine compounds (HF)
Measurements in the clean gas
Conc
entra
tion
in m
g/m
3
71 values below the detection limit
Messung / Measurement
5,0
4,5
4,0
3,5
3,0
2,5
2,0
1,5
1,0
0,5
0,0
Bild 5-24: Emissionen von gasförmigen anorganischen Fluorver-bindungen (HF) von 38 Drehofenanlagen (Jahresfracht 2012).Fig. 5-24: Gaseous inorganic fluorine compounds (HF) emissions (annual releases in 2012) of 38 rotary kilns.
Annu
al re
lease
s in
kg/a
Determination by measured concentration value
Estimated range with assumed emission concentration of up to 0.04 mg/m³
Ofenanlage / Kiln
Jahr
esfra
cht i
n kg
/a
Bestimmung mit Konzentrationsmesswert
Abgeschätzter Bereich mit angenommener Emissionskonzentration von bis zu 0,04 mg/m3
Gasförmige anorganische Fluorverbindungen (HF) / Gaseous inorganic fluorine compounds (HF)
3.000
2.500
2.000
1.500
1.000
500
0
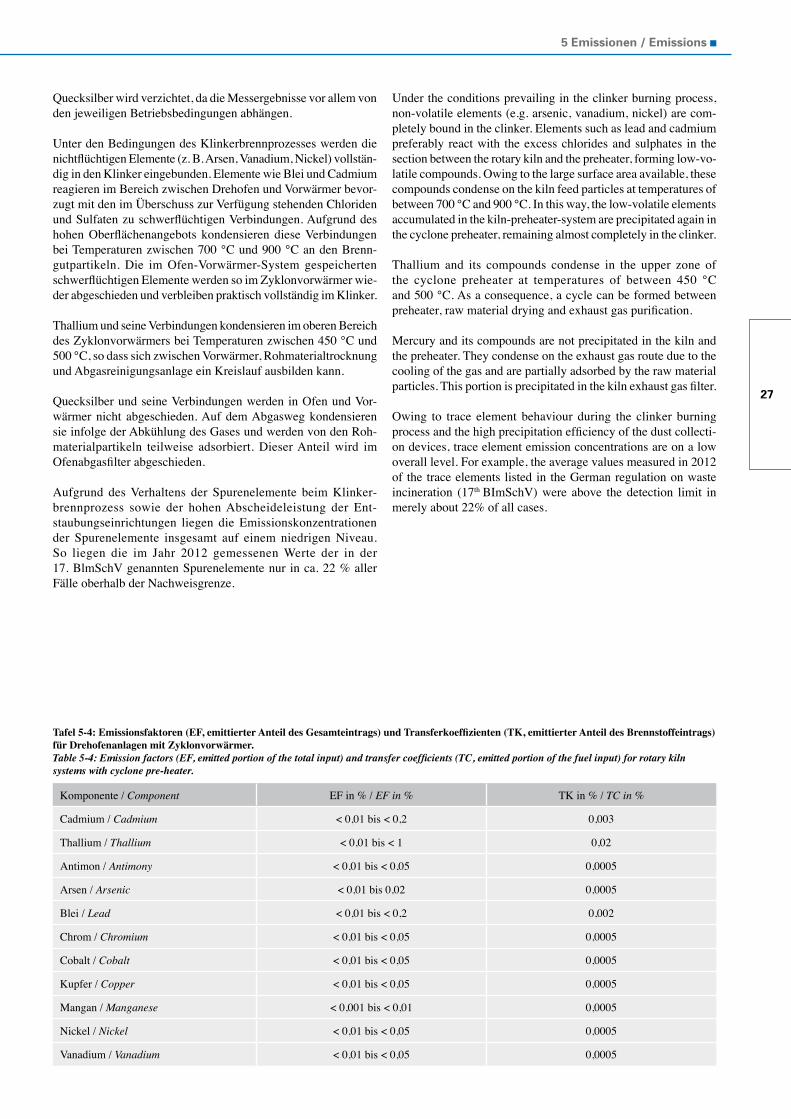
27
5 Emissionen / Emissions
Quecksilber wird verzichtet, da die Messergebnisse vor allem von den jeweiligen Betriebsbedingungen abhängen.
Unter den Bedingungen des Klinkerbrennprozesses werden die nichtflüchtigen Elemente (z. B. Arsen, Vanadium, Nickel) vollstän-dig in den Klinker eingebunden. Elemente wie Blei und Cadmium reagieren im Bereich zwischen Drehofen und Vorwärmer bevor-zugt mit den im Überschuss zur Verfügung stehenden Chloriden und Sulfaten zu schwerflüchtigen Verbindungen. Aufgrund des hohen Oberflächenangebots kondensieren diese Verbindungen bei Temperaturen zwischen 700 °C und 900 °C an den Brenn-gutpartikeln. Die im Ofen-Vorwärmer-System gespeicherten schwerflüchtigen Elemente werden so im Zyklonvorwärmer wie-der abgeschieden und verbleiben praktisch vollständig im Klinker.
Thallium und seine Verbindungen kondensieren im oberen Bereich des Zyklonvorwärmers bei Temperaturen zwischen 450 °C und 500 °C, so dass sich zwischen Vorwärmer, Rohmaterialtrocknung und Abgasreinigungsanlage ein Kreislauf ausbilden kann.
Quecksilber und seine Verbindungen werden in Ofen und Vor-wärmer nicht abgeschieden. Auf dem Abgasweg kondensieren sie infolge der Abkühlung des Gases und werden von den Roh-materialpartikeln teilweise adsorbiert. Dieser Anteil wird im Ofenabgasfilter abgeschieden.
Aufgrund des Verhaltens der Spurenelemente beim Klinker-brennprozess sowie der hohen Abscheideleistung der Ent-staubungseinrichtungen liegen die Emissionskonzentrationen der Spurenelemente insgesamt auf einem niedrigen Niveau. So liegen die im Jahr 2012 gemessenen Werte der in der 17. BlmSchV genannten Spurenelemente nur in ca. 22 % aller Fälle oberhalb der Nachweisgrenze.
Under the conditions prevailing in the clinker burning process, non-volatile elements (e.g. arsenic, vanadium, nickel) are com-pletely bound in the clinker. Elements such as lead and cadmium preferably react with the excess chlorides and sulphates in the section between the rotary kiln and the preheater, forming low-vo-latile compounds. Owing to the large surface area available, these compounds condense on the kiln feed particles at temperatures of between 700 °C and 900 °C. In this way, the low-volatile elements accumulated in the kiln-preheater-system are precipitated again in the cyclone preheater, remaining almost completely in the clinker.
Thallium and its compounds condense in the upper zone of the cyclone preheater at temperatures of between 450 °C and 500 °C. As a consequence, a cycle can be formed between preheater, raw material drying and exhaust gas purification.
Mercury and its compounds are not precipitated in the kiln and the preheater. They condense on the exhaust gas route due to the cooling of the gas and are partially adsorbed by the raw material particles. This portion is precipitated in the kiln exhaust gas filter.
Owing to trace element behaviour during the clinker burning process and the high precipitation efficiency of the dust collecti-on devices, trace element emission concentrations are on a low overall level. For example, the average values measured in 2012 of the trace elements listed in the German regulation on waste incineration (17th BImSchV) were above the detection limit in merely about 22% of all cases.
Tafel 5-4: Emissionsfaktoren (EF, emittierter Anteil des Gesamteintrags) und Transferkoeffizienten (TK, emittierter Anteil des Brennstoffeintrags) für Drehofenanlagen mit Zyklonvorwärmer.Table 5-4: Emission factors (EF, emitted portion of the total input) and transfer coefficients (TC, emitted portion of the fuel input) for rotary kiln systems with cyclone pre-heater.
Komponente / Component EF in % / EF in % TK in % / TC in %
Cadmium / Cadmium < 0,01 bis < 0,2 0,003
Thallium / Thallium < 0,01 bis < 1 0,02
Antimon / Antimony < 0,01 bis < 0,05 0,0005
Arsen / Arsenic < 0,01 bis 0,02 0,0005
Blei / Lead < 0,01 bis < 0,2 0,002
Chrom / Chromium < 0,01 bis < 0,05 0,0005
Cobalt / Cobalt < 0,01 bis < 0,05 0,0005
Kupfer / Copper < 0,01 bis < 0,05 0,0005
Mangan / Manganese < 0,001 bis < 0,01 0,0005
Nickel / Nickel < 0,01 bis < 0,05 0,0005
Vanadium / Vanadium < 0,01 bis < 0,05 0,0005
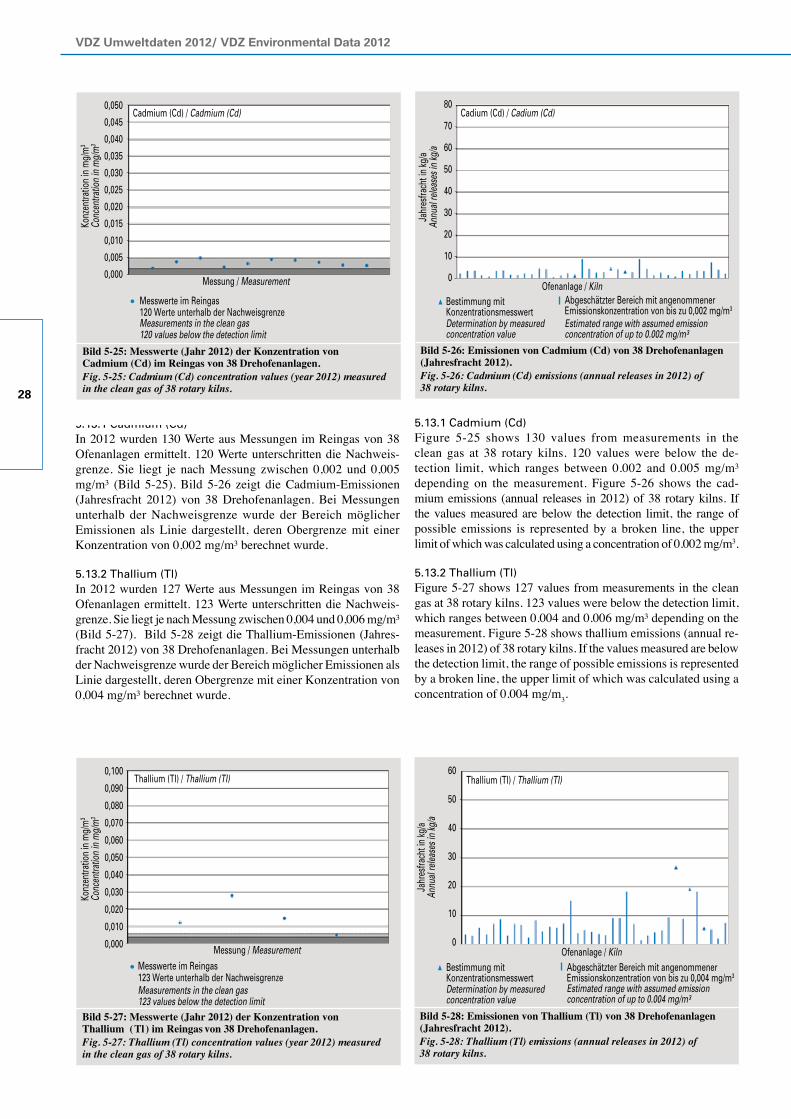
VDZ Umweltdaten 2012/ VDZ Environmental Data 2012
28
5.13.1 Cadmium (Cd)In 2012 wurden 130 Werte aus Messungen im Reingas von 38 Ofenanlagen ermittelt. 120 Werte unterschritten die Nachweis-grenze. Sie liegt je nach Messung zwischen 0,002 und 0,005 mg/m³ (Bild 5-25). Bild 5-26 zeigt die Cadmium-Emissionen (Jahresfracht 2012) von 38 Drehofenanlagen. Bei Messungen unterhalb der Nachweisgrenze wurde der Bereich möglicher Emissionen als Linie dargestellt, deren Obergrenze mit einer Konzentration von 0,002 mg/m³ berechnet wurde.
5.13.2 Thallium (Tl)In 2012 wurden 127 Werte aus Messungen im Reingas von 38 Ofenanlagen ermittelt. 123 Werte unterschritten die Nachweis-grenze. Sie liegt je nach Messung zwischen 0,004 und 0,006 mg/m³ (Bild 5-27). Bild 5-28 zeigt die Thallium-Emissionen (Jahres-fracht 2012) von 38 Drehofenanlagen. Bei Messungen unterhalb der Nachweisgrenze wurde der Bereich möglicher Emissionen als Linie dargestellt, deren Obergrenze mit einer Konzentration von 0,004 mg/m³ berechnet wurde.
5.13.1 Cadmium (Cd)Figure 5-25 shows 130 values from measurements in the clean gas at 38 rotary kilns. 120 values were below the de-tection limit, which ranges between 0.002 and 0.005 mg/m³ depending on the measurement. Figure 5-26 shows the cad-mium emissions (annual releases in 2012) of 38 rotary kilns. If the values measured are below the detection limit, the range of possible emissions is represented by a broken line, the upper limit of which was calculated using a concentration of 0.002 mg/m3.
5.13.2 Thallium (Tl)Figure 5-27 shows 127 values from measurements in the clean gas at 38 rotary kilns. 123 values were below the detection limit, which ranges between 0.004 and 0.006 mg/m³ depending on the measurement. Figure 5-28 shows thallium emissions (annual re-leases in 2012) of 38 rotary kilns. If the values measured are below the detection limit, the range of possible emissions is represented by a broken line, the upper limit of which was calculated using a concentration of 0.004 mg/m3.
Bild 5-25: Messwerte (Jahr 2012) der Konzentration von Cadmium (Cd) im Reingas von 38 Drehofenanlagen. Fig. 5-25: Cadmium (Cd) concentration values (year 2012) measured in the clean gas of 38 rotary kilns.
Messwerte im Reingas120 Werte unterhalb der Nachweisgrenze
Cadmium (Cd) / Cadmium (Cd)
Konz
entra
tion
in m
g/m
3
Measurements in the clean gas120 values below the detection limit
Conc
entra
tion
in m
g/m
3
Messung / Measurement
0,050
0,045
0,040
0,035
0,030
0,025
0,020
0,015
0,010
0,005
0,000
Bild 5-26: Emissionen von Cadmium (Cd) von 38 Drehofenanlagen(Jahresfracht 2012).Fig. 5-26: Cadmium (Cd) emissions (annual releases in 2012) of 38 rotary kilns.
Annu
al re
lease
s in
kg/a
Determination by measured concentration value
Estimated range with assumed emission concentration of up to 0.002 mg/m³
Jahr
esfra
cht i
n kg
/a
Bestimmung mit Konzentrationsmesswert
Abgeschätzter Bereich mit angenommener Emissionskonzentration von bis zu 0,002 mg/m3
Cadium (Cd) / Cadium (Cd)
Ofenanlage / Kiln
80
70
60
50
40
30
20
10
0
Bild 5-27: Messwerte (Jahr 2012) der Konzentration von Thallium (Tl ) im Reingas von 38 Drehofenanlagen. Fig. 5-27: Thallium (Tl) concentration values (year 2012) measured in the clean gas of 38 rotary kilns.
Messwerte im Reingas
Konz
entra
tion
in m
g/m
3
123 Werte unterhalb der Nachweisgrenze
Messung / Measurement
Measurements in the clean gas
Conc
entra
tion
in m
g/m
3
123 values below the detection limit
Thallium (TI) / Thallium (TI)0,100
0,090
0,080
0,070
0,060
0,050
0,040
0,030
0,020
0,010
0,000
Bild 5-28: Emissionen von Thallium (Tl) von 38 Drehofenanlagen (Jahresfracht 2012). Fig. 5-28: Thallium (Tl) emissions (annual releases in 2012) of 38 rotary kilns.
Annu
al re
lease
s in
kg/a
Determination by measured concentration value
Estimated range with assumed emission concentration of up to 0.004 mg/m³
Jahr
esfra
cht i
n kg
/a
Bestimmung mit Konzentrationsmesswert
Abgeschätzter Bereich mit angenommener Emissionskonzentration von bis zu 0,004 mg/m3
Ofenanlage / Kiln
Thallium (TI) / Thallium (TI)60
50
40
30
20
10
0
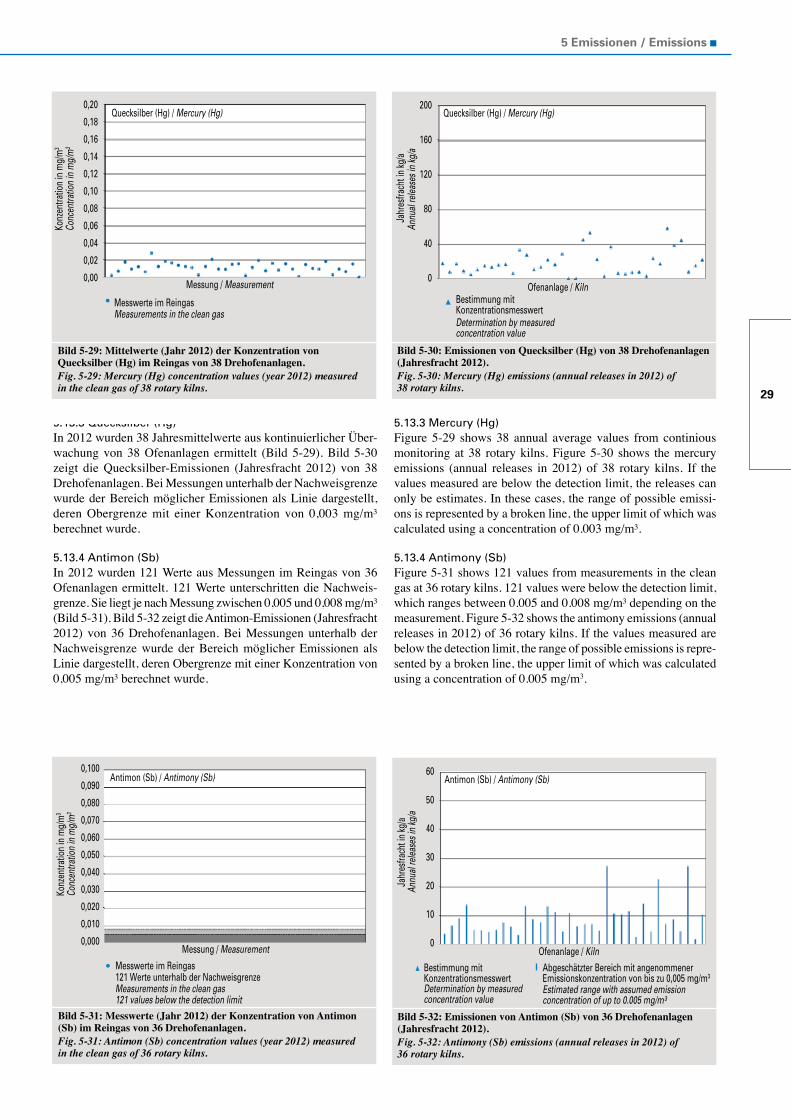
29
5 Emissionen / Emissions
5.13.3 Quecksilber (Hg)In 2012 wurden 38 Jahresmittelwerte aus kontinuierlicher Über-wachung von 38 Ofenanlagen ermittelt (Bild 5-29). Bild 5-30 zeigt die Quecksilber-Emissionen (Jahresfracht 2012) von 38 Drehofenanlagen. Bei Messungen unterhalb der Nachweisgrenze wurde der Bereich möglicher Emissionen als Linie dargestellt, deren Obergrenze mit einer Konzentration von 0,003 mg/m³ berechnet wurde.
5.13.4 Antimon (Sb)In 2012 wurden 121 Werte aus Messungen im Reingas von 36 Ofenanlagen ermittelt. 121 Werte unterschritten die Nachweis-grenze. Sie liegt je nach Messung zwischen 0,005 und 0,008 mg/m³ (Bild 5-31). Bild 5-32 zeigt die Antimon-Emissionen (Jahresfracht 2012) von 36 Drehofenanlagen. Bei Messungen unterhalb der Nachweisgrenze wurde der Bereich möglicher Emissionen als Linie dargestellt, deren Obergrenze mit einer Konzentration von 0,005 mg/m³ berechnet wurde.
5.13.3 Mercury (Hg)Figure 5-29 shows 38 annual average values from continious monitoring at 38 rotary kilns. Figure 5-30 shows the mercury emissions (annual releases in 2012) of 38 rotary kilns. If the values measured are below the detection limit, the releases can only be estimates. In these cases, the range of possible emissi-ons is represented by a broken line, the upper limit of which was calculated using a concentration of 0.003 mg/m³.
5.13.4 Antimony (Sb)Figure 5-31 shows 121 values from measurements in the clean gas at 36 rotary kilns. 121 values were below the detection limit, which ranges between 0.005 and 0.008 mg/m³ depending on the measurement. Figure 5-32 shows the antimony emissions (annual releases in 2012) of 36 rotary kilns. If the values measured are below the detection limit, the range of possible emissions is repre-sented by a broken line, the upper limit of which was calculated using a concentration of 0.005 mg/m3.
Bild 5-29: Mittelwerte (Jahr 2012) der Konzentration von Quecksilber (Hg) im Reingas von 38 Drehofenanlagen. Fig. 5-29: Mercury (Hg) concentration values (year 2012) measured in the clean gas of 38 rotary kilns.
Messwerte im Reingas
Konz
entra
tion
in m
g/m
3
Quecksilber (Hg) / Mercury (Hg)
Messung / Measurement
Measurements in the clean gas
Conc
entra
tion
in m
g/m
3
0,20
0,18
0,16
0,14
0,12
0,10
0,08
0,06
0,04
0,02
0,00
Bild 5-30: Emissionen von Quecksilber (Hg) von 38 Drehofenanlagen (Jahresfracht 2012). Fig. 5-30: Mercury (Hg) emissions (annual releases in 2012) of 38 rotary kilns.
Annu
al re
lease
s in
kg/a
Determination by measured concentration value
Ofenanlage / Kiln
Jahr
esfra
cht i
n kg
/a
Bestimmung mit Konzentrationsmesswert
200
160
120
80
40
0
Quecksilber (Hg) / Mercury (Hg)
Bild 5-31: Messwerte (Jahr 2012) der Konzentration von Antimon (Sb) im Reingas von 36 Drehofenanlagen. Fig. 5-31: Antimon (Sb) concentration values (year 2012) measured in the clean gas of 36 rotary kilns.
Messwerte im Reingas
Konz
entra
tion
in m
g/m
3
121 Werte unterhalb der Nachweisgrenze
Antimon (Sb) / Antimony (Sb)
Messung / Measurement
Measurements in the clean gas
Conc
entra
tion
in m
g/m
3
121 values below the detection limit
0,100
0,090
0,080
0,070
0,060
0,050
0,040
0,030
0,020
0,010
0,000
Bild 5-32: Emissionen von Antimon (Sb) von 36 Drehofenanlagen (Jahresfracht 2012). Fig. 5-32: Antimony (Sb) emissions (annual releases in 2012) of 36 rotary kilns.
Annu
al re
lease
s in
kg/a
Determination by measured concentration value
Estimated range with assumed emission concentration of up to 0.005 mg/m³
Ofenanlage / Kiln
Jahr
esfra
cht i
n kg
/a
Bestimmung mit Konzentrationsmesswert
Abgeschätzter Bereich mit angenommener Emissionskonzentration von bis zu 0,005 mg/m3
60
50
40
30
20
10
0
Antimon (Sb) / Antimony (Sb)
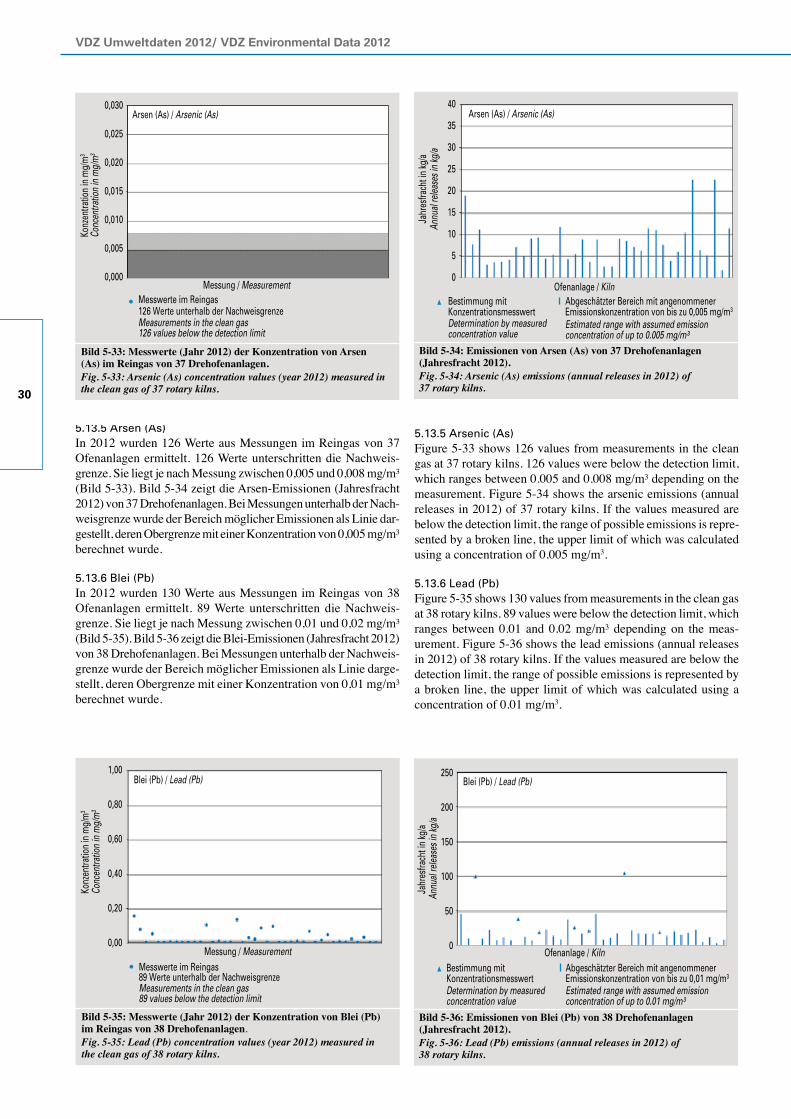
VDZ Umweltdaten 2012/ VDZ Environmental Data 2012
30
5.13.5 Arsen (As)In 2012 wurden 126 Werte aus Messungen im Reingas von 37 Ofenanlagen ermittelt. 126 Werte unterschritten die Nachweis-grenze. Sie liegt je nach Messung zwischen 0,005 und 0,008 mg/m³ (Bild 5-33). Bild 5-34 zeigt die Arsen-Emissionen (Jahresfracht 2012) von 37 Drehofenanlagen. Bei Messungen unterhalb der Nach-weisgrenze wurde der Bereich möglicher Emissionen als Linie dar-gestellt, deren Obergrenze mit einer Konzentration von 0,005 mg/m³ berechnet wurde.
5.13.6 Blei (Pb)In 2012 wurden 130 Werte aus Messungen im Reingas von 38 Ofenanlagen ermittelt. 89 Werte unterschritten die Nachweis-grenze. Sie liegt je nach Messung zwischen 0,01 und 0,02 mg/m³ (Bild 5-35). Bild 5-36 zeigt die Blei-Emissionen (Jahresfracht 2012) von 38 Drehofenanlagen. Bei Messungen unterhalb der Nachweis-grenze wurde der Bereich möglicher Emissionen als Linie darge-stellt, deren Obergrenze mit einer Konzentration von 0,01 mg/m³ berechnet wurde.
5.13.5 Arsenic (As)Figure 5-33 shows 126 values from measurements in the clean gas at 37 rotary kilns. 126 values were below the detection limit, which ranges between 0.005 and 0.008 mg/m³ depending on the measurement. Figure 5-34 shows the arsenic emissions (annual releases in 2012) of 37 rotary kilns. If the values measured are below the detection limit, the range of possible emissions is repre-sented by a broken line, the upper limit of which was calculated using a concentration of 0.005 mg/m3.
5.13.6 Lead (Pb)Figure 5-35 shows 130 values from measurements in the clean gas at 38 rotary kilns. 89 values were below the detection limit, which ranges between 0.01 and 0.02 mg/m³ depending on the meas- urement. Figure 5-36 shows the lead emissions (annual releases in 2012) of 38 rotary kilns. If the values measured are below the detection limit, the range of possible emissions is represented by a broken line, the upper limit of which was calculated using a concentration of 0.01 mg/m3.
Bild 5-33: Messwerte (Jahr 2012) der Konzentration von Arsen (As) im Reingas von 37 Drehofenanlagen. Fig. 5-33: Arsenic (As) concentration values (year 2012) measured in the clean gas of 37 rotary kilns.
Messung / MeasurementMesswerte im Reingas
Konz
entra
tion
in m
g/m
3
126 Werte unterhalb der Nachweisgrenze
Arsen (As) / Arsenic (As)
Measurements in the clean gas
Conc
entra
tion
in m
g/m
3
126 values below the detection limit
0,030
0,025
0,020
0,015
0,010
0,005
0,000
Bild 5-34: Emissionen von Arsen (As) von 37 Drehofenanlagen (Jahresfracht 2012).Fig. 5-34: Arsenic (As) emissions (annual releases in 2012) of 37 rotary kilns.
Annu
al re
lease
s in
kg/a
Determination by measured concentration value
Estimated range with assumed emission concentration of up to 0.005 mg/m³
Ofenanlage / Kiln
Jahr
esfra
cht i
n kg
/a
Bestimmung mit Konzentrationsmesswert
Abgeschätzter Bereich mit angenommener Emissionskonzentration von bis zu 0,005 mg/m3
Arsen (As) / Arsenic (As)40
35
30
25
20
15
10
5
0
Bild 5-35: Messwerte (Jahr 2012) der Konzentration von Blei (Pb) im Reingas von 38 Drehofenanlagen. Fig. 5-35: Lead (Pb) concentration values (year 2012) measured in the clean gas of 38 rotary kilns.
Messwerte im Reingas
Konz
entra
tion
in m
g/m
3
89 Werte unterhalb der Nachweisgrenze
Blei (Pb) / Lead (Pb)
Messung / Measurement
Measurements in the clean gas
Conc
entra
tion
in m
g/m
3
89 values below the detection limit
1,00
0,80
0,60
0,40
0,20
0,00
Bild 5-36: Emissionen von Blei (Pb) von 38 Drehofenanlagen (Jahresfracht 2012). Fig. 5-36: Lead (Pb) emissions (annual releases in 2012) of 38 rotary kilns.
Annu
al re
lease
s in
kg/a
Determination by measured concentration value
Estimated range with assumed emission concentration of up to 0.01 mg/m³
Ofenanlage / Kiln
Jahr
esfra
cht i
n kg
/a
Bestimmung mit Konzentrationsmesswert
Abgeschätzter Bereich mit angenommener Emissionskonzentration von bis zu 0,01 mg/m3
250
200
150
100
50
0
Blei (Pb) / Lead (Pb)
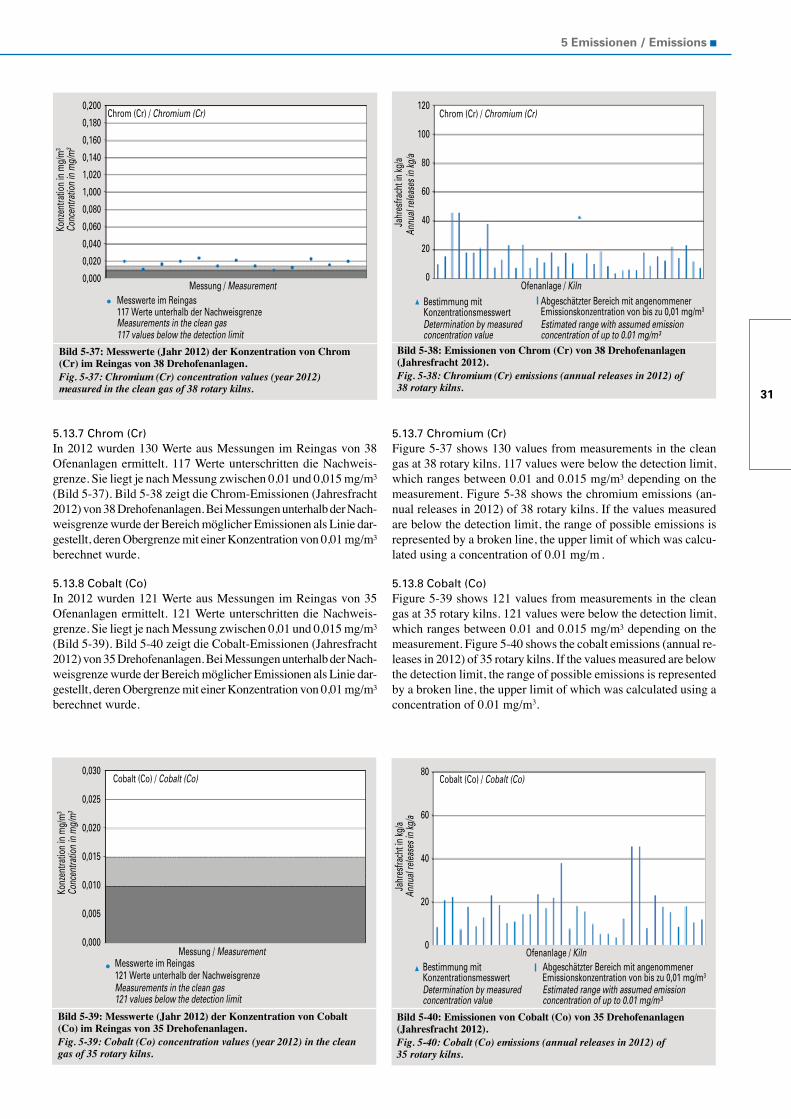
31
5 Emissionen / Emissions
5.13.7 Chromium (Cr)Figure 5-37 shows 130 values from measurements in the clean gas at 38 rotary kilns. 117 values were below the detection limit, which ranges between 0.01 and 0.015 mg/m³ depending on the measurement. Figure 5-38 shows the chromium emissions (an-nual releases in 2012) of 38 rotary kilns. If the values measured are below the detection limit, the range of possible emissions is represented by a broken line, the upper limit of which was calcu-lated using a concentration of 0.01 mg/m .
5.13.8 Cobalt (Co)Figure 5-39 shows 121 values from measurements in the clean gas at 35 rotary kilns. 121 values were below the detection limit, which ranges between 0.01 and 0.015 mg/m³ depending on the measurement. Figure 5-40 shows the cobalt emissions (annual re-leases in 2012) of 35 rotary kilns. If the values measured are below the detection limit, the range of possible emissions is represented by a broken line, the upper limit of which was calculated using a concentration of 0.01 mg/m3.
5.13.7 Chrom (Cr)In 2012 wurden 130 Werte aus Messungen im Reingas von 38 Ofenanlagen ermittelt. 117 Werte unterschritten die Nachweis-grenze. Sie liegt je nach Messung zwischen 0,01 und 0,015 mg/m³ (Bild 5-37). Bild 5-38 zeigt die Chrom-Emissionen (Jahresfracht 2012) von 38 Drehofenanlagen. Bei Messungen unterhalb der Nach-weisgrenze wurde der Bereich möglicher Emissionen als Linie dar-gestellt, deren Obergrenze mit einer Konzentration von 0,01 mg/m³ berechnet wurde.
5.13.8 Cobalt (Co)In 2012 wurden 121 Werte aus Messungen im Reingas von 35 Ofenanlagen ermittelt. 121 Werte unterschritten die Nachweis-grenze. Sie liegt je nach Messung zwischen 0,01 und 0,015 mg/m³ (Bild 5-39). Bild 5-40 zeigt die Cobalt-Emissionen (Jahresfracht 2012) von 35 Drehofenanlagen. Bei Messungen unterhalb der Nach-weisgrenze wurde der Bereich möglicher Emissionen als Linie dar-gestellt, deren Obergrenze mit einer Konzentration von 0,01 mg/m³ berechnet wurde.
Bild 5-37: Messwerte (Jahr 2012) der Konzentration von Chrom (Cr) im Reingas von 38 Drehofenanlagen.Fig. 5-37: Chromium (Cr) concentration values (year 2012) measured in the clean gas of 38 rotary kilns.
Messwerte im Reingas
Konz
entra
tion
in m
g/m
3
117 Werte unterhalb der Nachweisgrenze
Chrom (Cr) / Chromium (Cr)
Messung / Measurement
Measurements in the clean gas
Conc
entra
tion
in m
g/m
3
117 values below the detection limit
0,200
0,180
0,160
0,140
1,020
1,000
0,080
0,060
0,040
0,020
0,000
Bild 5-38: Emissionen von Chrom (Cr) von 38 Drehofenanlagen(Jahresfracht 2012). Fig. 5-38: Chromium (Cr) emissions (annual releases in 2012) of 38 rotary kilns.
Annu
al re
lease
s in
kg/a
Determination by measured concentration value
Estimated range with assumed emission concentration of up to 0.01 mg/m³
Ofenanlage / Kiln
Jahr
esfra
cht i
n kg
/a
Bestimmung mit Konzentrationsmesswert
Abgeschätzter Bereich mit angenommener Emissionskonzentration von bis zu 0,01 mg/m3
Chrom (Cr) / Chromium (Cr)120
100
80
60
40
20
0
Bild 5-39: Messwerte (Jahr 2012) der Konzentration von Cobalt (Co) im Reingas von 35 Drehofenanlagen. Fig. 5-39: Cobalt (Co) concentration values (year 2012) in the clean gas of 35 rotary kilns.
Messung / MeasurementMesswerte im Reingas
Konz
entra
tion
in m
g/m
3
121 Werte unterhalb der Nachweisgrenze
Cobalt (Co) / Cobalt (Co)
Measurements in the clean gas
Conc
entra
tion
in m
g/m
3
121 values below the detection limit
0,030
0,025
0,020
0,015
0,010
0,005
0,000
Bild 5-40: Emissionen von Cobalt (Co) von 35 Drehofenanlagen (Jahresfracht 2012). Fig. 5-40: Cobalt (Co) emissions (annual releases in 2012) of 35 rotary kilns.
Annu
al re
lease
s in
kg/a
Determination by measured concentration value
Estimated range with assumed emission concentration of up to 0.01 mg/m³
Jahr
esfra
cht i
n kg
/a
Bestimmung mit Konzentrationsmesswert
Abgeschätzter Bereich mit angenommener Emissionskonzentration von bis zu 0,01 mg/m3
Ofenanlage / Kiln
80
60
40
20
0
Cobalt (Co) / Cobalt (Co)
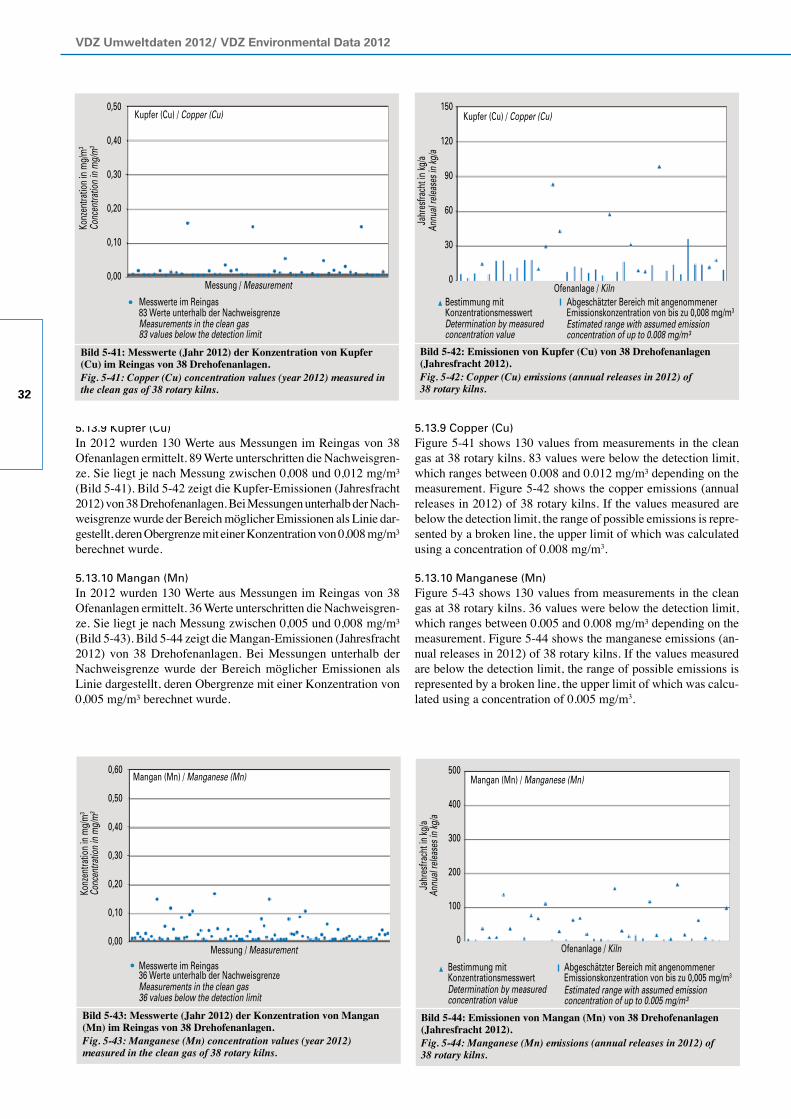
VDZ Umweltdaten 2012/ VDZ Environmental Data 2012
32
5.13.9 Kupfer (Cu)In 2012 wurden 130 Werte aus Messungen im Reingas von 38 Ofenanlagen ermittelt. 89 Werte unterschritten die Nachweisgren-ze. Sie liegt je nach Messung zwischen 0,008 und 0,012 mg/m³ (Bild 5-41). Bild 5-42 zeigt die Kupfer-Emissionen (Jahresfracht 2012) von 38 Drehofenanlagen. Bei Messungen unterhalb der Nach-weisgrenze wurde der Bereich möglicher Emissionen als Linie dar-gestellt, deren Obergrenze mit einer Konzentration von 0,008 mg/m³ berechnet wurde.
5.13.10 Mangan (Mn)In 2012 wurden 130 Werte aus Messungen im Reingas von 38 Ofenanlagen ermittelt. 36 Werte unterschritten die Nachweisgren-ze. Sie liegt je nach Messung zwischen 0,005 und 0,008 mg/m³ (Bild 5-43). Bild 5-44 zeigt die Mangan-Emissionen (Jahresfracht 2012) von 38 Drehofenanlagen. Bei Messungen unterhalb der Nachweisgrenze wurde der Bereich möglicher Emissionen als Linie dargestellt, deren Obergrenze mit einer Konzentration von 0,005 mg/m³ berechnet wurde.
5.13.9 Copper (Cu)Figure 5-41 shows 130 values from measurements in the clean gas at 38 rotary kilns. 83 values were below the detection limit, which ranges between 0.008 and 0.012 mg/m³ depending on the measurement. Figure 5-42 shows the copper emissions (annual releases in 2012) of 38 rotary kilns. If the values measured are below the detection limit, the range of possible emissions is repre-sented by a broken line, the upper limit of which was calculated using a concentration of 0.008 mg/m3.
5.13.10 Manganese (Mn)Figure 5-43 shows 130 values from measurements in the clean gas at 38 rotary kilns. 36 values were below the detection limit, which ranges between 0.005 and 0.008 mg/m³ depending on the measurement. Figure 5-44 shows the manganese emissions (an-nual releases in 2012) of 38 rotary kilns. If the values measured are below the detection limit, the range of possible emissions is represented by a broken line, the upper limit of which was calcu-lated using a concentration of 0.005 mg/m3.
Bild 5-41: Messwerte (Jahr 2012) der Konzentration von Kupfer (Cu) im Reingas von 38 Drehofenanlagen. Fig. 5-41: Copper (Cu) concentration values (year 2012) measured in the clean gas of 38 rotary kilns.
Messwerte im Reingas
Konz
entra
tion
in m
g/m
3
83 Werte unterhalb der Nachweisgrenze
Kupfer (Cu) / Copper (Cu)
Messung / Measurement
Measurements in the clean gas
Conc
entra
tion
in m
g/m
3
83 values below the detection limit
0,50
0,40
0,30
0,20
0,10
0,00
Bild 5-42: Emissionen von Kupfer (Cu) von 38 Drehofenanlagen (Jahresfracht 2012). Fig. 5-42: Copper (Cu) emissions (annual releases in 2012) of 38 rotary kilns.
Annu
al re
lease
s in
kg/a
Determination by measured concentration value
Estimated range with assumed emission concentration of up to 0.008 mg/m³
Ofenanlage / Kiln
Jahr
esfra
cht i
n kg
/a
Bestimmung mit Konzentrationsmesswert
Abgeschätzter Bereich mit angenommener Emissionskonzentration von bis zu 0,008 mg/m3
150
120
90
60
30
0
Kupfer (Cu) / Copper (Cu)
Bild 5-43: Messwerte (Jahr 2012) der Konzentration von Mangan (Mn) im Reingas von 38 Drehofenanlagen. Fig. 5-43: Manganese (Mn) concentration values (year 2012) measured in the clean gas of 38 rotary kilns.
Messwerte im Reingas
Konz
entra
tion
in m
g/m
3
36 Werte unterhalb der Nachweisgrenze
Mangan (Mn) / Manganese (Mn)
Messung / Measurement
Measurements in the clean gas
Conc
entra
tion
in m
g/m
3
36 values below the detection limit
0,60
0,50
0,40
0,30
0,20
0,10
0,00
Bild 5-44: Emissionen von Mangan (Mn) von 38 Drehofenanlagen (Jahresfracht 2012). Fig. 5-44: Manganese (Mn) emissions (annual releases in 2012) of 38 rotary kilns.
Ofenanlage / Kiln
Annu
al re
lease
s in
kg/a
Determination by measured concentration value
Estimated range with assumed emission concentration of up to 0.005 mg/m³
Jahr
esfra
cht i
n kg
/a
Bestimmung mit Konzentrationsmesswert
Abgeschätzter Bereich mit angenommener Emissionskonzentration von bis zu 0,005 mg/m3
500
400
300
200
100
0
Mangan (Mn) / Manganese (Mn)
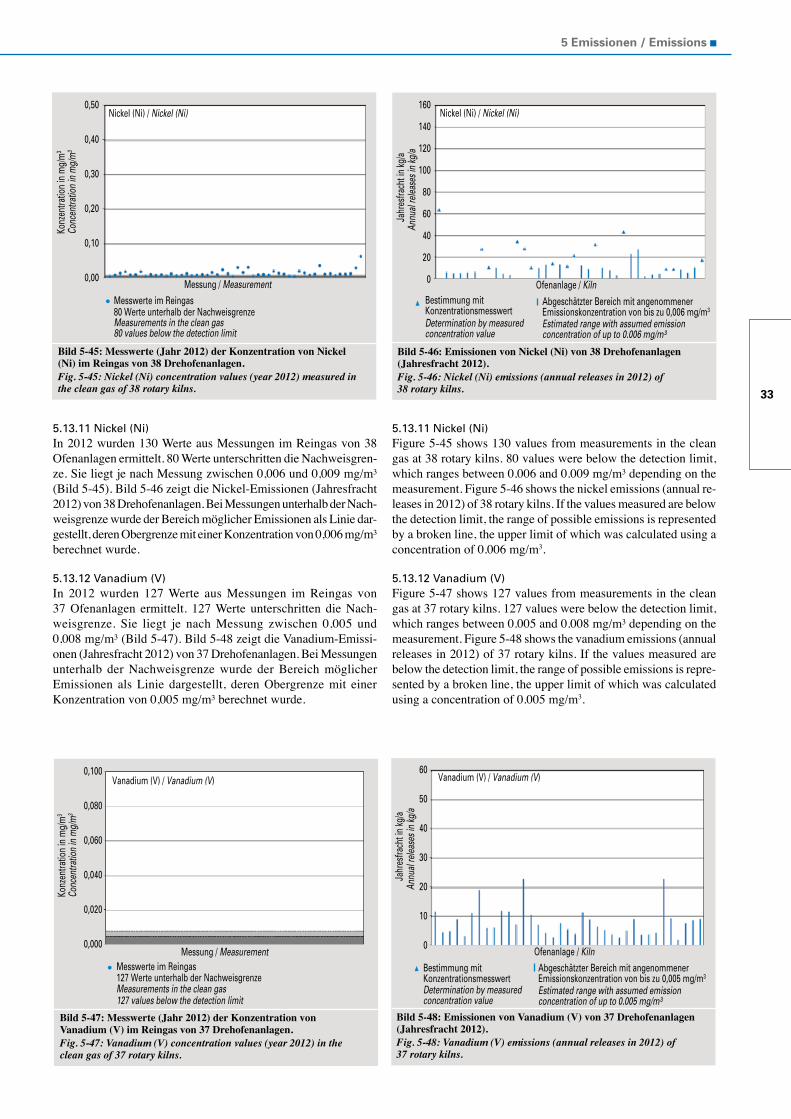
33
5 Emissionen / Emissions
5.13.11 Nickel (Ni)In 2012 wurden 130 Werte aus Messungen im Reingas von 38 Ofenanlagen ermittelt. 80 Werte unterschritten die Nachweisgren-ze. Sie liegt je nach Messung zwischen 0,006 und 0,009 mg/m³ (Bild 5-45). Bild 5-46 zeigt die Nickel-Emissionen (Jahresfracht 2012) von 38 Drehofenanlagen. Bei Messungen unterhalb der Nach-weisgrenze wurde der Bereich möglicher Emissionen als Linie dar-gestellt, deren Obergrenze mit einer Konzentration von 0,006 mg/m³ berechnet wurde.
5.13.12 Vanadium (V)In 2012 wurden 127 Werte aus Messungen im Reingas von 37 Ofenanlagen ermittelt. 127 Werte unterschritten die Nach-weisgrenze. Sie liegt je nach Messung zwischen 0,005 und 0,008 mg/m³ (Bild 5-47). Bild 5-48 zeigt die Vanadium-Emissi-onen (Jahresfracht 2012) von 37 Drehofenanlagen. Bei Messungen unterhalb der Nachweisgrenze wurde der Bereich möglicher Emissionen als Linie dargestellt, deren Obergrenze mit einer Konzentration von 0,005 mg/m³ berechnet wurde.
5.13.11 Nickel (Ni)Figure 5-45 shows 130 values from measurements in the clean gas at 38 rotary kilns. 80 values were below the detection limit, which ranges between 0.006 and 0.009 mg/m³ depending on the measurement. Figure 5-46 shows the nickel emissions (annual re-leases in 2012) of 38 rotary kilns. If the values measured are below the detection limit, the range of possible emissions is represented by a broken line, the upper limit of which was calculated using a concentration of 0.006 mg/m3.
5.13.12 Vanadium (V)Figure 5-47 shows 127 values from measurements in the clean gas at 37 rotary kilns. 127 values were below the detection limit, which ranges between 0.005 and 0.008 mg/m³ depending on the measurement. Figure 5-48 shows the vanadium emissions (annual releases in 2012) of 37 rotary kilns. If the values measured are below the detection limit, the range of possible emissions is repre-sented by a broken line, the upper limit of which was calculated using a concentration of 0.005 mg/m3.
Bild 5-45: Messwerte (Jahr 2012) der Konzentration von Nickel (Ni) im Reingas von 38 Drehofenanlagen. Fig. 5-45: Nickel (Ni) concentration values (year 2012) measured in the clean gas of 38 rotary kilns.
Messung / MeasurementMesswerte im Reingas
Konz
entra
tion
in m
g/m
3
80 Werte unterhalb der Nachweisgrenze
Nickel (Ni) / Nickel (Ni)
Measurements in the clean gas
Conc
entra
tion
in m
g/m
3
80 values below the detection limit
0,50
0,40
0,30
0,20
0,10
0,00
Bild 5-46: Emissionen von Nickel (Ni) von 38 Drehofenanlagen (Jahresfracht 2012). Fig. 5-46: Nickel (Ni) emissions (annual releases in 2012) of 38 rotary kilns.
Annu
al re
lease
s in
kg/a
Determination by measured concentration value
Estimated range with assumed emission concentration of up to 0.006 mg/m³
Jahr
esfra
cht i
n kg
/a
Bestimmung mit Konzentrationsmesswert
Abgeschätzter Bereich mit angenommener Emissionskonzentration von bis zu 0,006 mg/m3
Ofenanlage / Kiln
Nickel (Ni) / Nickel (Ni)160
140
120
100
80
60
40
20
0
Bild 5-47: Messwerte (Jahr 2012) der Konzentration von Vanadium (V) im Reingas von 37 Drehofenanlagen. Fig. 5-47: Vanadium (V) concentration values (year 2012) in the clean gas of 37 rotary kilns.
Messwerte im Reingas
Konz
entra
tion
in m
g/m
3
127 Werte unterhalb der Nachweisgrenze
Vanadium (V) / Vanadium (V)
Measurements in the clean gas
Conc
entra
tion
in m
g/m
3
127 values below the detection limit
Messung / Measurement
0,100
0,080
0,060
0,040
0,020
0,000
Bild 5-48: Emissionen von Vanadium (V) von 37 Drehofenanlagen (Jahresfracht 2012). Fig. 5-48: Vanadium (V) emissions (annual releases in 2012) of 37 rotary kilns.
Annu
al re
lease
s in
kg/a
Determination by measured concentration value
Estimated range with assumed emission concentration of up to 0.005 mg/m³
Jahr
esfra
cht i
n kg
/a
Bestimmung mit Konzentrationsmesswert
Abgeschätzter Bereich mit angenommener Emissionskonzentration von bis zu 0,005 mg/m3
Ofenanlage / Kiln
60
50
40
30
20
10
0
Vanadium (V) / Vanadium (V)
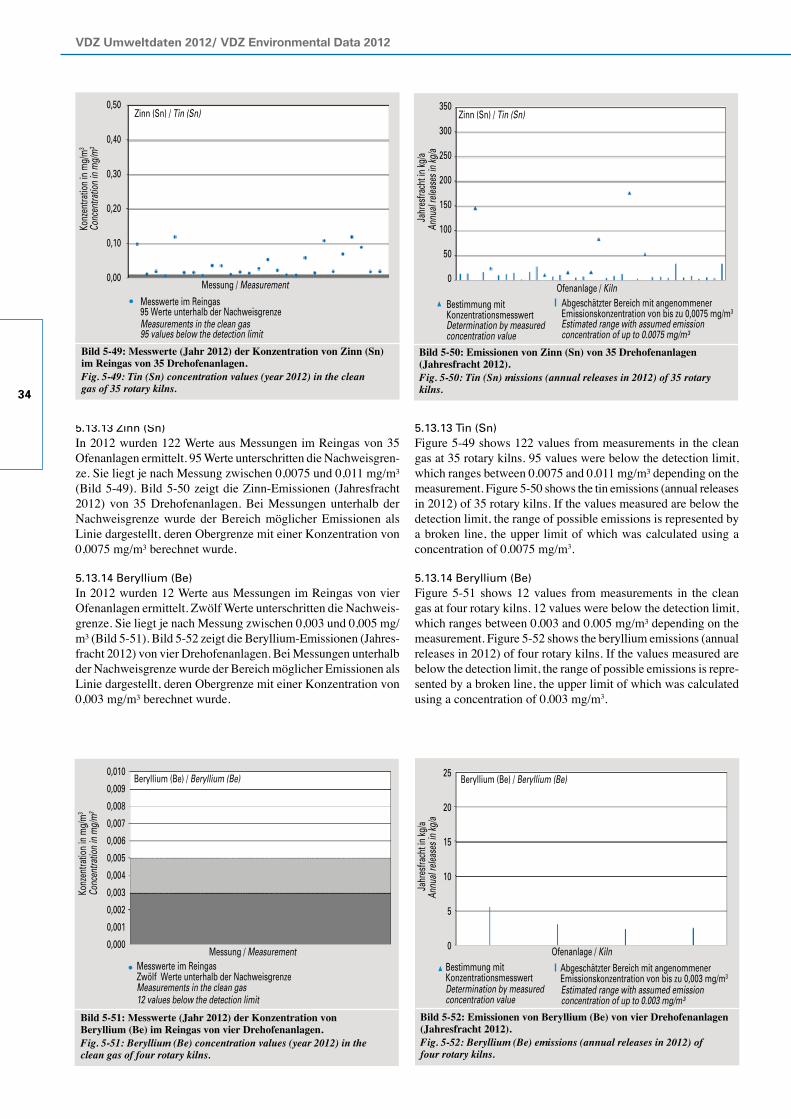
VDZ Umweltdaten 2012/ VDZ Environmental Data 2012
34
5.13.13 Zinn (Sn)In 2012 wurden 122 Werte aus Messungen im Reingas von 35 Ofenanlagen ermittelt. 95 Werte unterschritten die Nachweisgren-ze. Sie liegt je nach Messung zwischen 0,0075 und 0,011 mg/m³ (Bild 5-49). Bild 5-50 zeigt die Zinn-Emissionen (Jahresfracht 2012) von 35 Drehofenanlagen. Bei Messungen unterhalb der Nachweisgrenze wurde der Bereich möglicher Emissionen als Linie dargestellt, deren Obergrenze mit einer Konzentration von 0,0075 mg/m³ berechnet wurde.
5.13.14 Beryllium (Be)In 2012 wurden 12 Werte aus Messungen im Reingas von vier Ofenanlagen ermittelt. Zwölf Werte unterschritten die Nachweis-grenze. Sie liegt je nach Messung zwischen 0,003 und 0,005 mg/m³ (Bild 5-51). Bild 5-52 zeigt die Beryllium-Emissionen (Jahres-fracht 2012) von vier Drehofenanlagen. Bei Messungen unterhalb der Nachweisgrenze wurde der Bereich möglicher Emissionen als Linie dargestellt, deren Obergrenze mit einer Konzentration von 0,003 mg/m³ berechnet wurde.
5.13.13 Tin (Sn)Figure 5-49 shows 122 values from measurements in the clean gas at 35 rotary kilns. 95 values were below the detection limit, which ranges between 0.0075 and 0.011 mg/m³ depending on the measurement. Figure 5-50 shows the tin emissions (annual releases in 2012) of 35 rotary kilns. If the values measured are below the detection limit, the range of possible emissions is represented by a broken line, the upper limit of which was calculated using a concentration of 0.0075 mg/m3.
5.13.14 Beryllium (Be)Figure 5-51 shows 12 values from measurements in the clean gas at four rotary kilns. 12 values were below the detection limit, which ranges between 0.003 and 0.005 mg/m³ depending on the measurement. Figure 5-52 shows the beryllium emissions (annual releases in 2012) of four rotary kilns. If the values measured are below the detection limit, the range of possible emissions is repre-sented by a broken line, the upper limit of which was calculated using a concentration of 0.003 mg/m3.
Bild 5-49: Messwerte (Jahr 2012) der Konzentration von Zinn (Sn) im Reingas von 35 Drehofenanlagen. Fig. 5-49: Tin (Sn) concentration values (year 2012) in the clean gas of 35 rotary kilns.
Messwerte im Reingas
Konz
entra
tion
in m
g/m
3
95 Werte unterhalb der Nachweisgrenze
Zinn (Sn) / Tin (Sn)
Measurements in the clean gas
Conc
entra
tion
in m
g/m
3
95 values below the detection limit
0,50
0,40
0,30
0,20
0,10
0,00Messung / Measurement
Bild 5-50: Emissionen von Zinn (Sn) von 35 Drehofenanlagen (Jahresfracht 2012). Fig. 5-50: Tin (Sn) missions (annual releases in 2012) of 35 rotary kilns.
Annu
al re
lease
s in
kg/a
Determination by measured concentration value
Estimated range with assumed emission concentration of up to 0.0075 mg/m³
Jahr
esfra
cht i
n kg
/a
Bestimmung mit Konzentrationsmesswert
Abgeschätzter Bereich mit angenommener Emissionskonzentration von bis zu 0,0075 mg/m3
Ofenanlage / Kiln
Zinn (Sn) / Tin (Sn)350
300
250
200
150
100
50
0
Bild 5-51: Messwerte (Jahr 2012) der Konzentration von Beryllium (Be) im Reingas von vier Drehofenanlagen. Fig. 5-51: Beryllium (Be) concentration values (year 2012) in the clean gas of four rotary kilns.
Messwerte im Reingas
Konz
entra
tion
in m
g/m
3
Zwölf Werte unterhalb der Nachweisgrenze
Beryllium (Be) / Beryllium (Be)
Measurements in the clean gas
Conc
entra
tion
in m
g/m
3
12 values below the detection limit
Messung / Measurement
0,010
0,009
0,008
0,007
0,006
0,005
0,004
0,003
0,002
0,001
0,000Ofenanlage / Kiln
Bild 5-52: Emissionen von Beryllium (Be) von vier Drehofenanlagen (Jahresfracht 2012). Fig. 5-52: Beryllium (Be) emissions (annual releases in 2012) of four rotary kilns.
Annu
al re
lease
s in
kg/a
Determination by measured concentration value
Estimated range with assumed emission concentration of up to 0.003 mg/m³
Jahr
esfra
cht i
n kg
/a
Bestimmung mit Konzentrationsmesswert
Abgeschätzter Bereich mit angenommener Emissionskonzentration von bis zu 0,003 mg/m3
Ofenanlage / Kiln
25
20
15
10
5
0
Beryllium (Be) / Beryllium (Be)
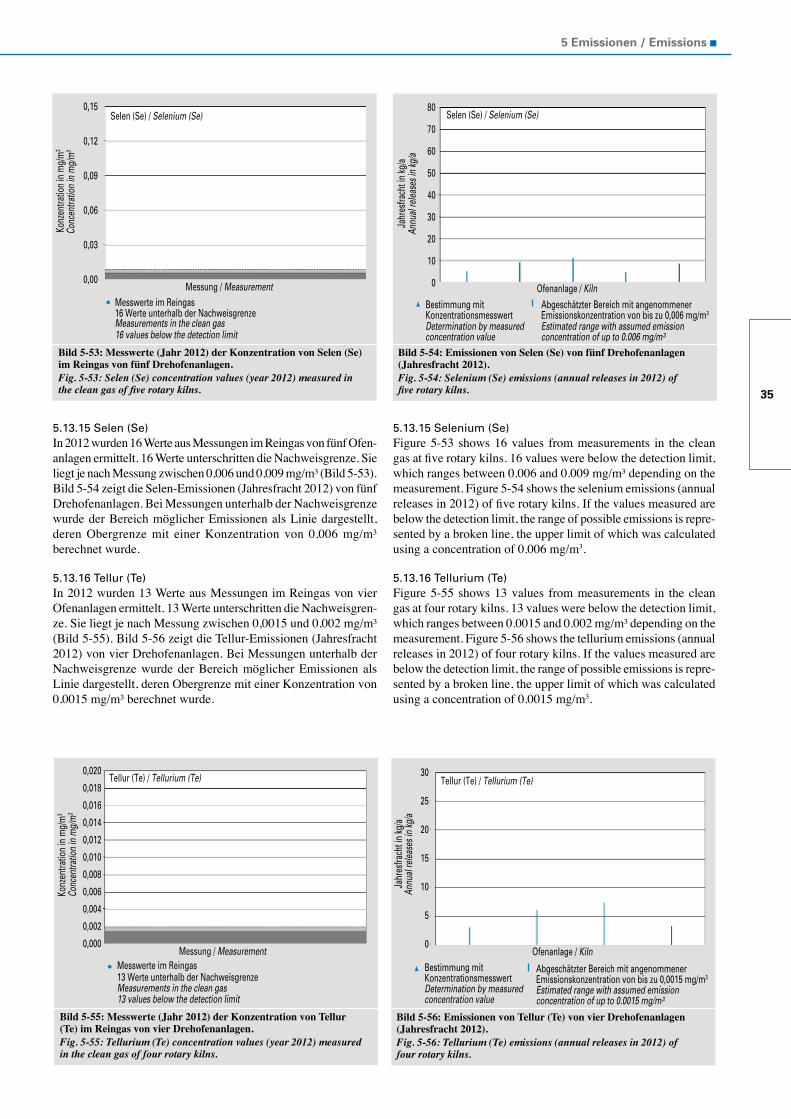
35
5 Emissionen / Emissions
5.13.15 Selen (Se)In 2012 wurden 16 Werte aus Messungen im Reingas von fünf Ofen-anlagen ermittelt. 16 Werte unterschritten die Nachweisgrenze. Sie liegt je nach Messung zwischen 0,006 und 0,009 mg/m³ (Bild 5-53). Bild 5-54 zeigt die Selen-Emissionen (Jahresfracht 2012) von fünf Drehofenanlagen. Bei Messungen unterhalb der Nachweisgrenze wurde der Bereich möglicher Emissionen als Linie dargestellt, deren Obergrenze mit einer Konzentration von 0,006 mg/m³ berechnet wurde.
5.13.16 Tellur (Te)In 2012 wurden 13 Werte aus Messungen im Reingas von vier Ofenanlagen ermittelt. 13 Werte unterschritten die Nachweisgren-ze. Sie liegt je nach Messung zwischen 0,0015 und 0,002 mg/m³ (Bild 5-55). Bild 5-56 zeigt die Tellur-Emissionen (Jahresfracht 2012) von vier Drehofenanlagen. Bei Messungen unterhalb der Nachweisgrenze wurde der Bereich möglicher Emissionen als Linie dargestellt, deren Obergrenze mit einer Konzentration von 0,0015 mg/m³ berechnet wurde.
5.13.15 Selenium (Se)Figure 5-53 shows 16 values from measurements in the clean gas at five rotary kilns. 16 values were below the detection limit, which ranges between 0.006 and 0.009 mg/m³ depending on the measurement. Figure 5-54 shows the selenium emissions (annual releases in 2012) of five rotary kilns. If the values measured are below the detection limit, the range of possible emissions is repre-sented by a broken line, the upper limit of which was calculated using a concentration of 0.006 mg/m3.
5.13.16 Tellurium (Te)Figure 5-55 shows 13 values from measurements in the clean gas at four rotary kilns. 13 values were below the detection limit, which ranges between 0.0015 and 0.002 mg/m³ depending on the measurement. Figure 5-56 shows the tellurium emissions (annual releases in 2012) of four rotary kilns. If the values measured are below the detection limit, the range of possible emissions is repre-sented by a broken line, the upper limit of which was calculated using a concentration of 0.0015 mg/m3.
Bild 5-53: Messwerte (Jahr 2012) der Konzentration von Selen (Se) im Reingas von fünf Drehofenanlagen. Fig. 5-53: Selen (Se) concentration values (year 2012) measured in the clean gas of five rotary kilns.
Messwerte im Reingas
Konz
entra
tion
in m
g/m
3
16 Werte unterhalb der Nachweisgrenze
Selen (Se) / Selenium (Se)
Measurements in the clean gas
Conc
entra
tion
in m
g/m
3
16 values below the detection limit
Messung / Measurement
0,15
0,12
0,09
0,06
0,03
0,00
Bild 5-54: Emissionen von Selen (Se) von fünf Drehofenanlagen (Jahresfracht 2012). Fig. 5-54: Selenium (Se) emissions (annual releases in 2012) of five rotary kilns.
Annu
al re
lease
s in
kg/a
Determination by measured concentration value
Estimated range with assumed emission concentration of up to 0.006 mg/m³
Jahr
esfra
cht i
n kg
/a
Bestimmung mit Konzentrationsmesswert
Abgeschätzter Bereich mit angenommener Emissionskonzentration von bis zu 0,006 mg/m3
Ofenanlage / Kiln
80
70
60
50
40
30
20
10
0
Selen (Se) / Selenium (Se)
Bild 5-55: Messwerte (Jahr 2012) der Konzentration von Tellur (Te) im Reingas von vier Drehofenanlagen.Fig. 5-55: Tellurium (Te) concentration values (year 2012) measured in the clean gas of four rotary kilns.
Messwerte im Reingas
Konz
entra
tion
in m
g/m
3
13 Werte unterhalb der Nachweisgrenze
Tellur (Te) / Tellurium (Te)
Measurements in the clean gas
Conc
entra
tion
in m
g/m
3
13 values below the detection limit
Messung / Measurement
0,020
0,018
0,016
0,014
0,012
0,010
0,008
0,006
0,004
0,002
0,000
Bild 5-56: Emissionen von Tellur (Te) von vier Drehofenanlagen (Jahresfracht 2012). Fig. 5-56: Tellurium (Te) emissions (annual releases in 2012) of four rotary kilns.
Annu
al re
lease
s in
kg/a
Determination by measured concentration value
Estimated range with assumed emission concentration of up to 0.0015 mg/m³
Jahr
esfra
cht i
n kg
/a
Bestimmung mit Konzentrationsmesswert
Abgeschätzter Bereich mit angenommener Emissionskonzentration von bis zu 0,0015 mg/m3
Ofenanlage / Kiln
Tellur (Te) / Tellurium (Te)30
25
20
15
10
5
0
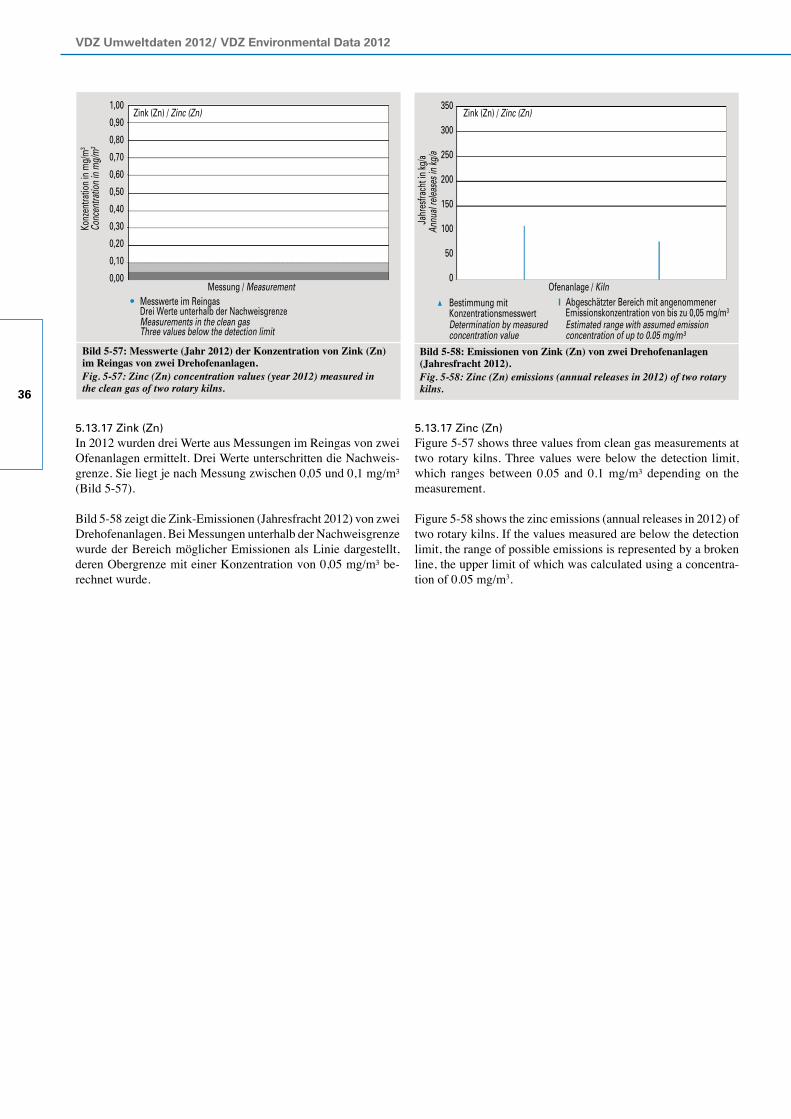
VDZ Umweltdaten 2012/ VDZ Environmental Data 2012
36
5.13.17 Zink (Zn)In 2012 wurden drei Werte aus Messungen im Reingas von zwei Ofenanlagen ermittelt. Drei Werte unterschritten die Nachweis-grenze. Sie liegt je nach Messung zwischen 0,05 und 0,1 mg/m³ (Bild 5-57).
Bild 5-58 zeigt die Zink-Emissionen (Jahresfracht 2012) von zwei Drehofenanlagen. Bei Messungen unterhalb der Nachweisgrenze wurde der Bereich möglicher Emissionen als Linie dargestellt, deren Obergrenze mit einer Konzentration von 0,05 mg/m³ be-rechnet wurde.
5.13.17 Zinc (Zn)Figure 5-57 shows three values from clean gas measurements at two rotary kilns. Three values were below the detection limit, which ranges between 0.05 and 0.1 mg/m³ depending on the measurement.
Figure 5-58 shows the zinc emissions (annual releases in 2012) of two rotary kilns. If the values measured are below the detection limit, the range of possible emissions is represented by a broken line, the upper limit of which was calculated using a concentra-tion of 0.05 mg/m3.
Bild 5-57: Messwerte (Jahr 2012) der Konzentration von Zink (Zn) im Reingas von zwei Drehofenanlagen.Fig. 5-57: Zinc (Zn) concentration values (year 2012) measured in the clean gas of two rotary kilns.
Messwerte im Reingas
Konz
entra
tion
in m
g/m
3
Drei Werte unterhalb der Nachweisgrenze
Zink (Zn) / Zinc (Zn)
Measurements in the clean gas
Conc
entra
tion
in m
g/m
3
Three values below the detection limit
Messung / Measurement
1,00
0,90
0,80
0,70
0,60
0,50
0,40
0,30
0,20
0,10
0,00
Bild 5-58: Emissionen von Zink (Zn) von zwei Drehofenanlagen (Jahresfracht 2012). Fig. 5-58: Zinc (Zn) emissions (annual releases in 2012) of two rotary kilns.
Annu
al re
lease
s in
kg/a
Determination by measured concentration value
Estimated range with assumed emission concentration of up to 0.05 mg/m³
Jahr
esfra
cht i
n kg
/a
Bestimmung mit Konzentrationsmesswert
Abgeschätzter Bereich mit angenommener Emissionskonzentration von bis zu 0,05 mg/m3
Ofenanlage / Kiln
350
300
250
200
150
100
50
0
Zink (Zn) / Zinc (Zn)
37
Literatur / Literature
Literatur
[1] Zahlen und Daten 2013, Verein Deutscher Zementwerke e. V., Düsseldorf
[2] Verminderung der CO2-Emission Umfrage zum Monito-ring-Bericht 2012, Verein Deutscher Zementwerke e. V., Düsseldorf
[3] Umfrage des Forschungsinstituts der Zementindustrie 2011/2012, Verein Deutscher Zementwerke e. V., Düsseldorf
[4] Klein, H.; Hoenig, V.: Modellrechnungen zum Brennstoffener-giebedarf des Klinkerbrennprozesses, Cement International 3/2006 Vol. 4
[5] Verordnung (EG) 166/2006 des Europäischen Parlaments und des Rates vom 18. Januar 2006 über die Schaffung eines Eu-ropäischen Schadstofffreisetzungs- und -verbringungsregisters und zur Änderung der Richtlinien 91/689/EWG und 96/61/EG
[6] Hoenig, V. et al.: Energieeffizienz bei der Zementherstellung, Teil 1; Cement International 3/2013
[7] Hoenig, V. et al.: Energieeffizienz bei der Zementherstellung, Teil 2, Cement International 4/2013
Ergänzende Literatur
Umweltdaten der deutschen Zementindustrie (1998 - 2011), Verein Deutscher Zementwerke e. V., Düsseldorf
Zement-Taschenbuch 2009, Verein Deutscher Zementwerke e. V., Düsseldorf
Ökologische Positionierung von Zement und Beton. IZB, Köln; BDZ, Berlin; VDZ, Düsseldorf, 3. Auflage, 2001
Naturschutz und Zementindustrie (Projektteil 1), Bundesverband der Deutschen Zementindustrie e. V., Köln; Verein Deutscher Zementwerke e. V., Düsseldorf
Beton – Hart im Nehmen, Stark in der Leistung, Fair zur Umwelt, Verein Deutscher Zementwerke e.V., Düsseldorf
Altöl – Wo Abfall Wunder wirkt, Verein Deutscher Zementwerke e. V., Düsseldorf
Alte Steinbrüche – Neues Leben, Verein Deutscher Zementwerke e. V., Düsseldorf
Richtlinie VDI 2094:2003-03. Zementwerke: Emissionsminde-rung
Norm DIN 1164-10:2013-03. Zement mit besonderen Eigen-schaften
Norm DIN EN 197-1:2011-11. Zement: Teil 1: Zusammensetzung, Anforderungen und Konformitätskriterien von Normalzement
Literature
[1] Zahlen und Daten 2013, Verein Deutscher Zementwerke e. V., Duesseldorf
[2] Verminderung der CO2-Emission, Umfrage zum Monito-ring-Bericht 2012,Verein Deutscher Zementwerke e. V., Duesseldorf
[3] Umfrage des Forschungsinstituts der Zementindustrie 2011/2012, Verein Deutscher Zementwerke e. V., Duesseldorf
[4] Klein, H.; Hoenig, V.: Model calculations of the fuel energy requirement for the clinker burning process, Cement Inter- national 3/2006 Vol. 4
[5] Regulation (EC) No 166/2006 of the European Parliament and the Council of 18 January 2006 concerning the establishment of a European Pollutant Release and Transfer Register and amending Council Directives 91/689/EEC and 96/61/EC
[6] Hoenig, V. et al.: Energy efficiency in cement production, part 1; Cement International 3/2013
[7] Hoenig, V. et al.: Energy efficiency in cement production, part 2; Cement International 4/2013
Additional literature
Environmental Data of the German Cement Industry (1998 - 2011), Verein Deutscher Zementwerke e. V., Duesseldorf
Zement-Taschenbuch 2009, Verein Deutscher Zementwerke e. V., Duesseldorf
Ökologische Positionierung von Zement und Beton. IZB, Cologne; BDZ, Berlin; VDZ, Duesseldorf, 3. Auflage, 2001
Naturschutz und Zementindustrie (Projektteil 1). Bundesverband der Deutschen Zementindustrie e. V., Cologne; Verein Deutscher Zementwerke e. V., Duesseldorf
Beton – Hart im Nehmen, Stark in der Leistung, Fair zur Umwelt, Verein Deutscher Zementwerke e. V., Duesseldorf
Altöl – Wo Abfall Wunder wirkt, Verein Deutscher Zementwerke e. V., Duesseldorf
Alte Steinbrüche – Neues Leben, Verein Deutscher Zementwerke e. V., Duesseldorf
VDI-Guideline 2094:2003-03. Cement plants: Emission control
Standard DIN 1164-10: 2013-03. Special cement - Part 10
Standard DIN EN 197-1:2011-11. Cement - Part 1: Composition, specifications and conformity criteria for common cements

Copyright/Herausgeber:
Verein Deutscher Zementwerke e.V. Postfach 30 10 63, D-40410 DüsseldorfTannenstraße 2, D-40476 DüsseldorfTelefon: (02 11) 45 78 - 1Telefax: (02 11) 45 78 - 296E-Mail: [email protected]: http://www.vdz-online.de
Alle Rechte vorbehalten
Veröffentlichung und Gesamtproduktion:Verein Deutscher Zementwerke e. V.
Redaktionsschluss: Dezember 2013
Copyright/Publisher:
Verein Deutscher Zementwerke e.V. P.O. Box 30 10 63, D-40410 DuesseldorfTannenstrasse 2, D-40476 DuesseldorfPhone: +49 (0) 211 45 78 - 1Fax: +49 (0) 211 45 78 - 296E-Mail: [email protected]: http://www.vdz-online.de
All rights reserved
Overall production:Verein Deutscher Zementwerke e. V.
Press deadline: December 2013
VDZ Umweltdaten 2012/ VDZ Environmental Data 2012
40
VDZ Postfach 30 10 63 D-40410 Düsseldorf Tannenstraße 2 D-40476 Düsseldorf