UNIVERSITÄT HOHENHEIM Sichere und schonende … · akzept unsteril p. = p C V p V C B ......
27
UNIVERSITÄT HOHENHEIM Institut für Lebensmittelwissenschaft und Biotechnologie Fg. Lebensmittel tierischer Herkunft mit Forschungs- und Lehrmolkerei Sichere und schonende thermische Behandlung von Lebensmitteln: Daten zur Sporeninaktivierung und deren Analyse beim Design von Prozessen J. Hinrichs Bacillus licheniformis Sporen
Transcript of UNIVERSITÄT HOHENHEIM Sichere und schonende … · akzept unsteril p. = p C V p V C B ......
UNIVERSITÄT HOHENHEIMInstitut für Lebensmittelwissenschaft und BiotechnologieFg. Lebensmittel tierischer Herkunft mit Forschungs- und Lehrmolkerei
Sichere und schonende thermische Behandlungvon Lebensmitteln:
Daten zur Sporeninaktivierung und deren Analyse bei m Designvon Prozessen
J. Hinrichs
Bacillus licheniformis Sporen
2
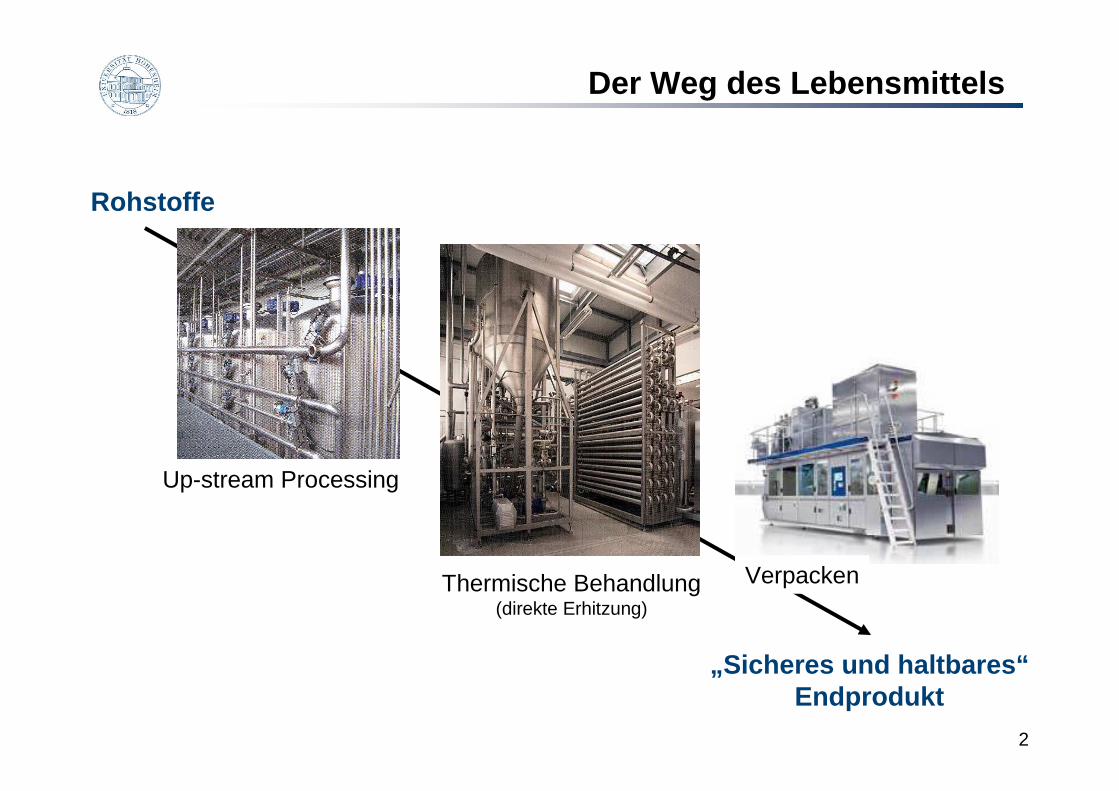
Der Weg des Lebensmittels
Thermische Behandlung(direkte Erhitzung)
Up-stream Processing
Rohstoffe
Verpacken
„Sicheres und haltbares“Endprodukt
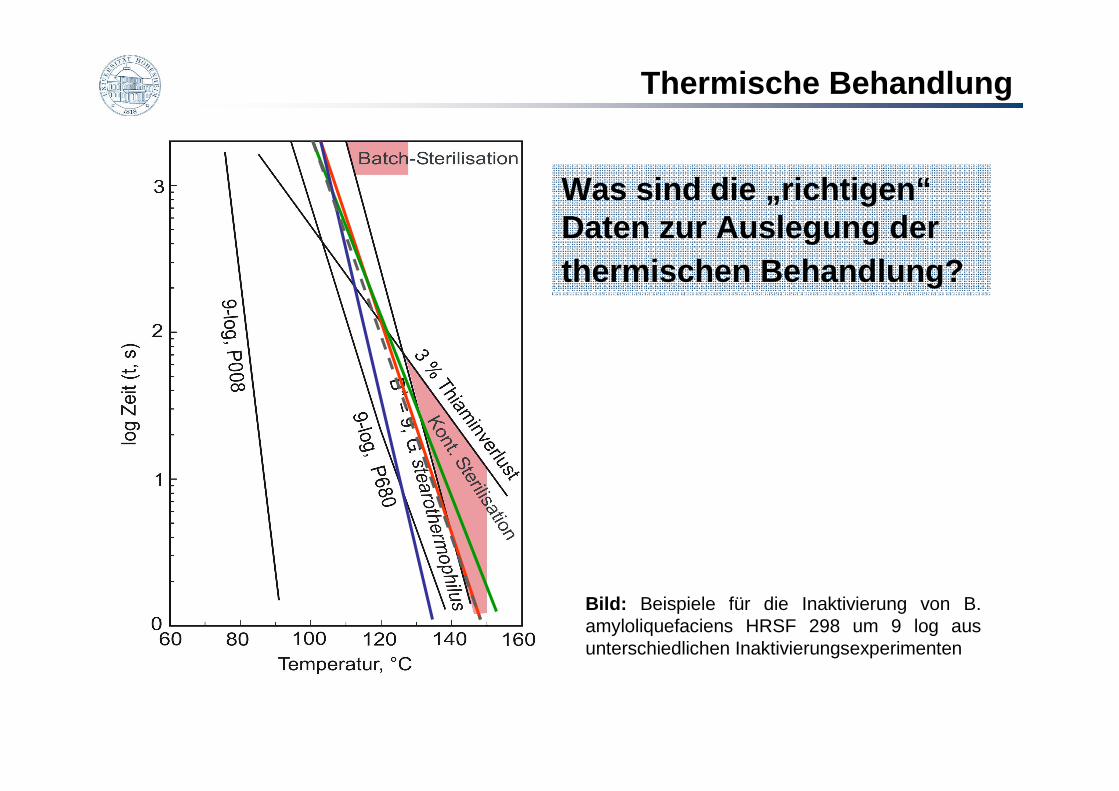
Thermische Behandlung
Bild: Beispiele für die Inaktivierung von B. amyloliquefaciens HRSF 298 um 9 log aus unterschiedlichen Inaktivierungsexperimenten
Was sind die „richtigen“Daten zur Auslegung der thermischen Behandlung?
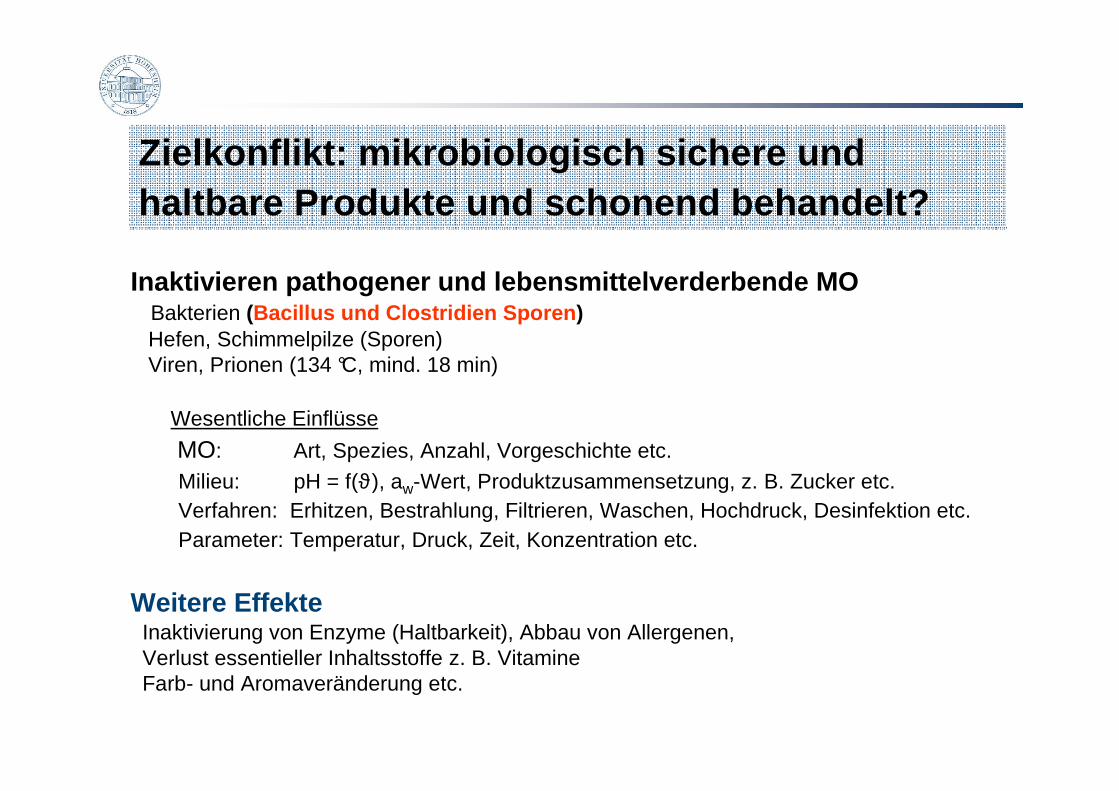
Inaktivieren pathogener und lebensmittelverderbende MOBakterien (Bacillus und Clostridien Sporen )Hefen, Schimmelpilze (Sporen)Viren, Prionen (134 °C, mind. 18 min)
Wesentliche Einflüsse
MO: Art, Spezies, Anzahl, Vorgeschichte etc.
Milieu: pH = f(ϑ), aw-Wert, Produktzusammensetzung, z. B. Zucker etc. Verfahren: Erhitzen, Bestrahlung, Filtrieren, Waschen, Hochdruck, Desinfektion etc.Parameter: Temperatur, Druck, Zeit, Konzentration etc.
Weitere EffekteInaktivierung von Enzyme (Haltbarkeit), Abbau von Allergenen, Verlust essentieller Inhaltsstoffe z. B. Vitamine Farb- und Aromaveränderung etc.
Zielkonflikt: mikrobiologisch sichere und haltbare Produkte und schonend behandelt?
steril
unsterilakzeptp
.=
p
VC
pV
CB
⋅=⋅
= 00 log1
log*
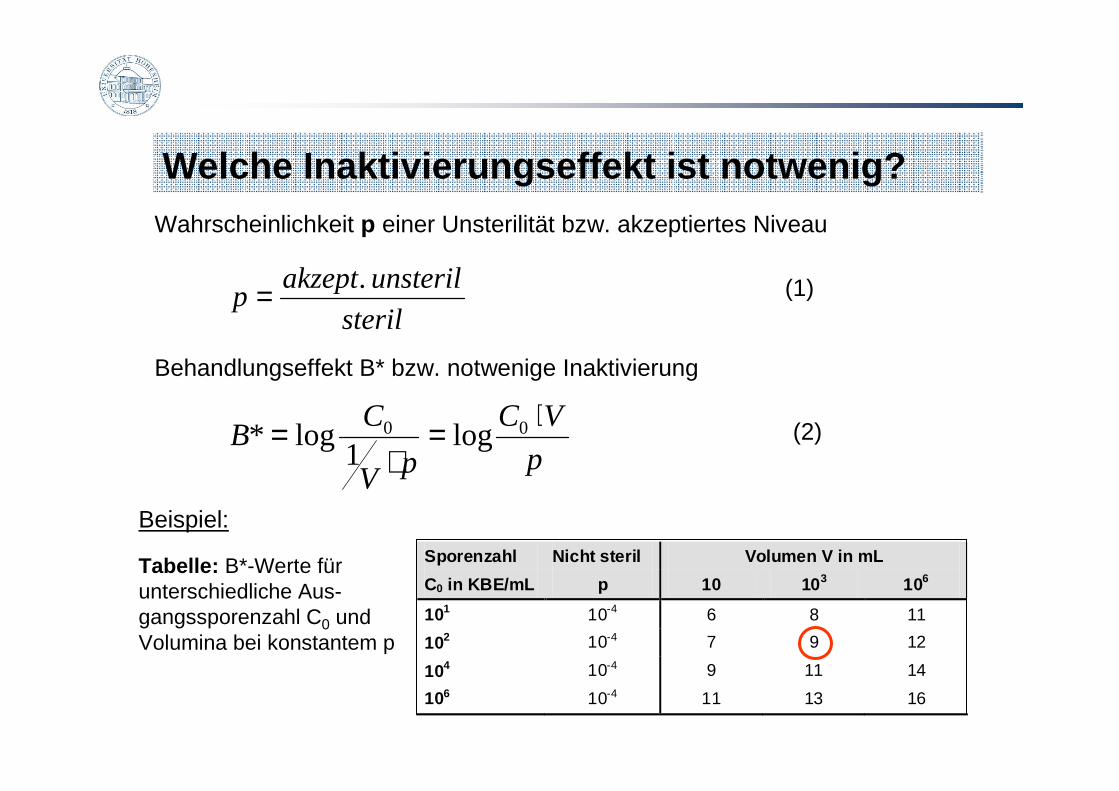
Behandlungseffekt B* bzw. notwenige Inaktivierung
Wahrscheinlichkeit p einer Unsterilität bzw. akzeptiertes Niveau
(1)
(2)
Welche Inaktivierungseffekt ist notwenig?
Beispiel:
Tabelle: B*-Werte für unterschiedliche Aus-gangssporenzahl C0 und Volumina bei konstantem p
Sporenzahl Nicht steril Volumen V in mL
C0 in KBE/mL p 10 103 106
101 10-4 6 8 11
102 10-4 7 9 12
104 10-4 9 11 14
106 10-4 11 13 16
Welche Inaktivierungseffekt ist notwenig?
Man benötigt also Inaktivierungseffekte für Sporen
von B*= 9 bis 12
oder sogar mehr, wobei dennoch ein Ausfallrisiko bleibt.
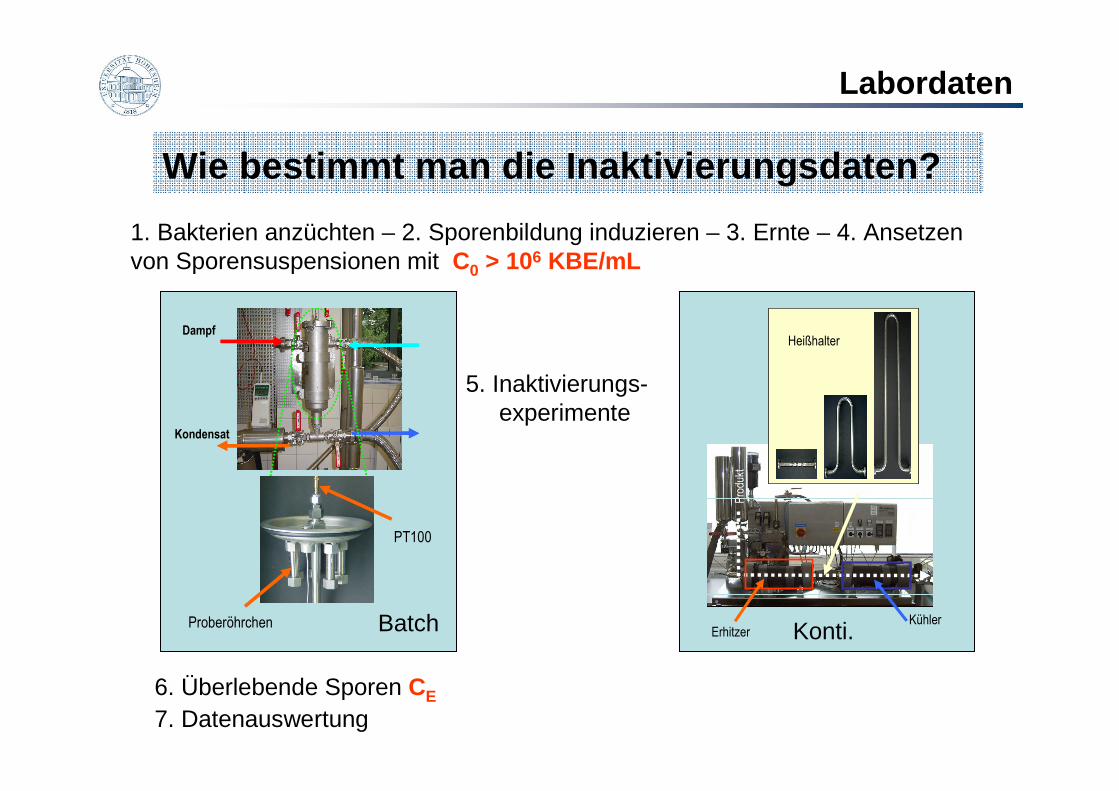
Wie bestimmt man die Inaktivierungsdaten?
Dampf
Kondensat
PT100
Proberöhrchen
1. Bakterien anzüchten – 2. Sporenbildung induzieren – 3. Ernte – 4. Ansetzen von Sporensuspensionen mit C0 > 106 KBE/mL
5. Inaktivierungs-experimente
6. Überlebende Sporen CE
7. Datenauswertung
Batch ErhitzerKühler
HeißhalterHeißhalter
Produkt
Konti.
Labordaten
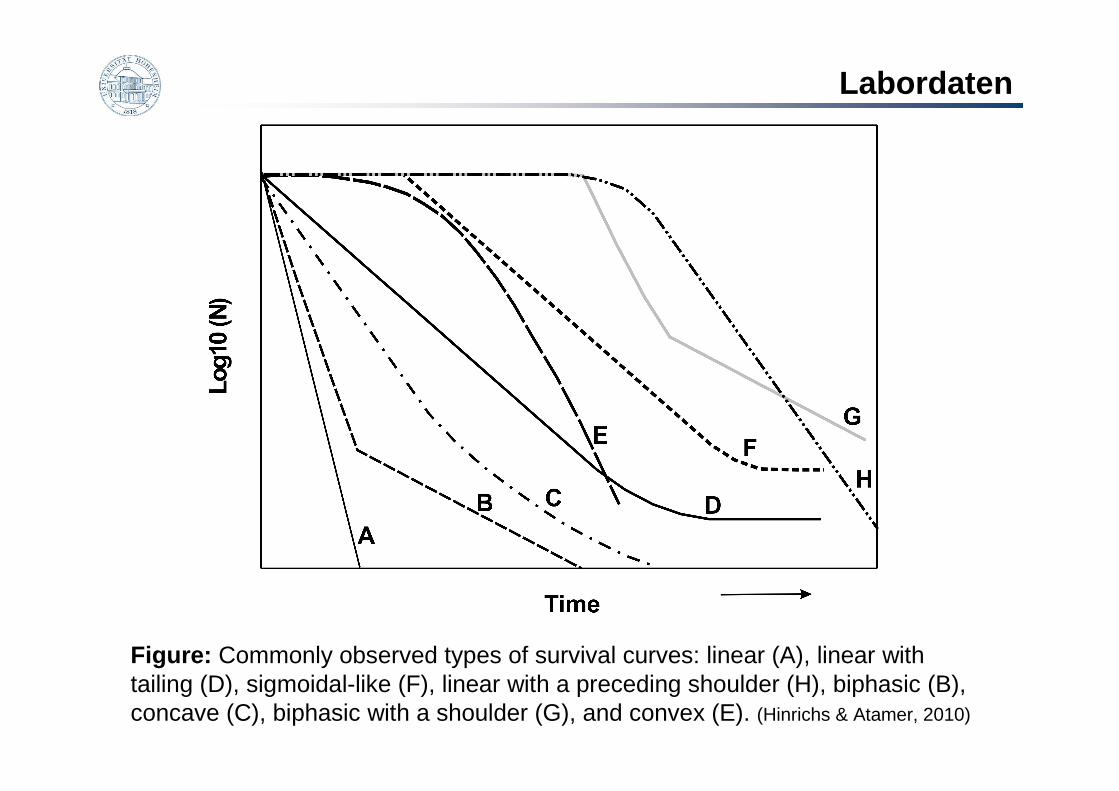
Figure: Commonly observed types of survival curves: linear (A), linear with tailing (D), sigmoidal-like (F), linear with a preceding shoulder (H), biphasic (B), concave (C), biphasic with a shoulder (G), and convex (E). (Hinrichs & Atamer, 2010)
Labordaten
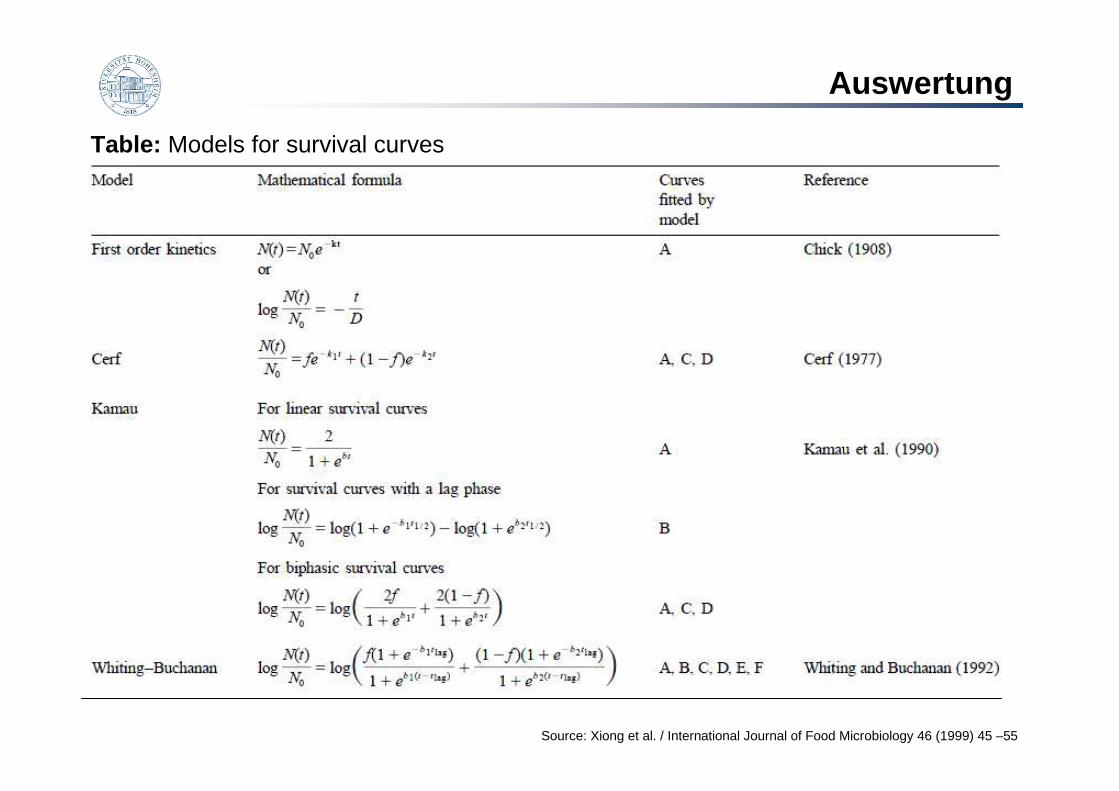
Table: Models for survival curves
Source: Xiong et al. / International Journal of Food Microbiology 46 (1999) 45 –55
Auswertung
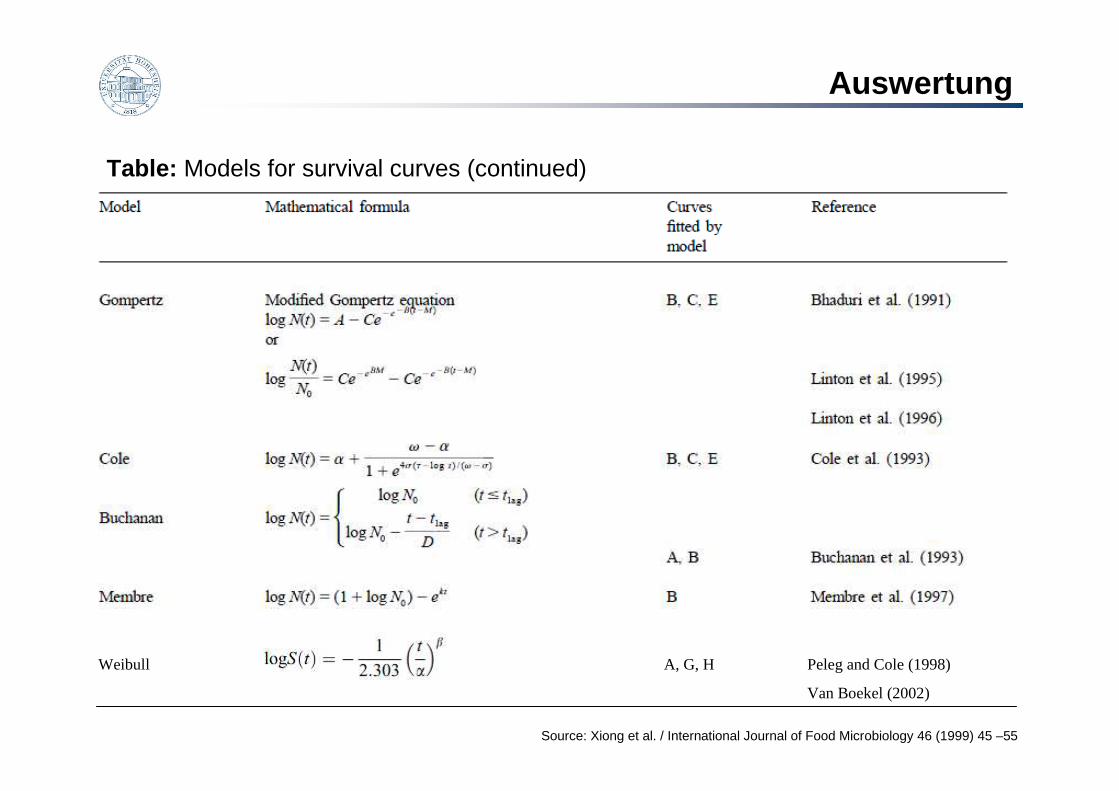
Table: Models for survival curves (continued)
Source: Xiong et al. / International Journal of Food Microbiology 46 (1999) 45 –55
Weibull Peleg and Cole (1998)
Van Boekel (2002)
A, G, H
Auswertung
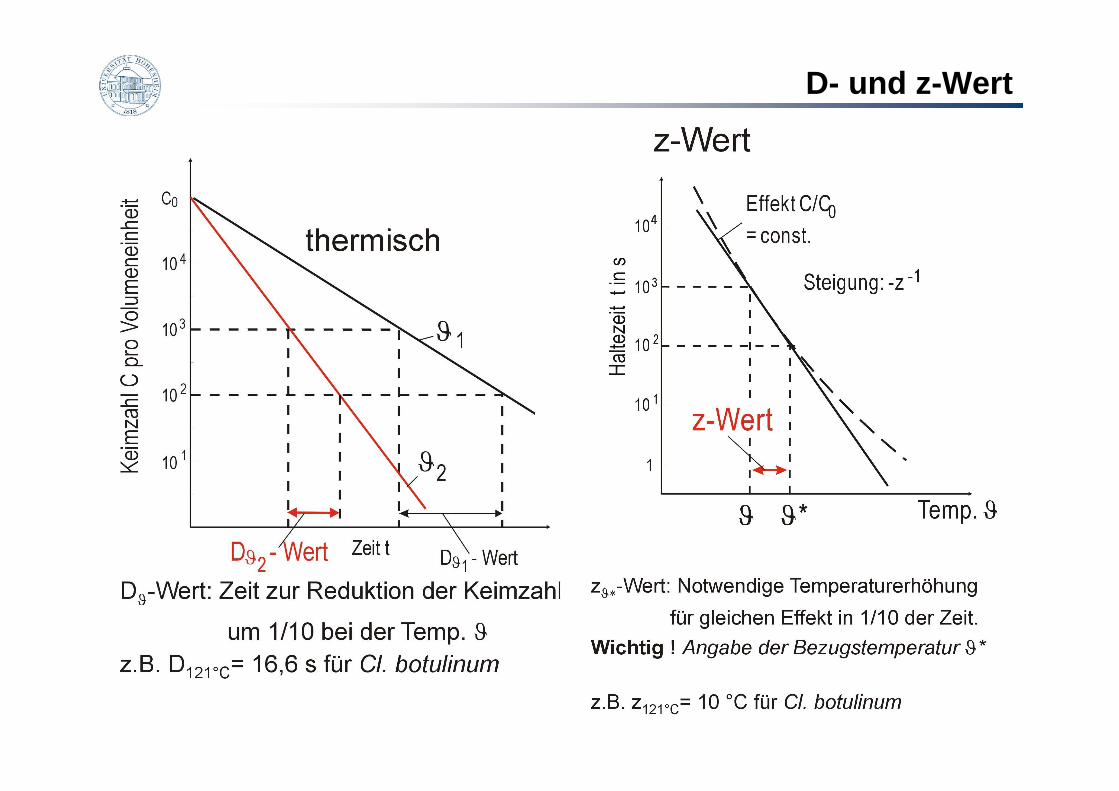
D- und z-Wert
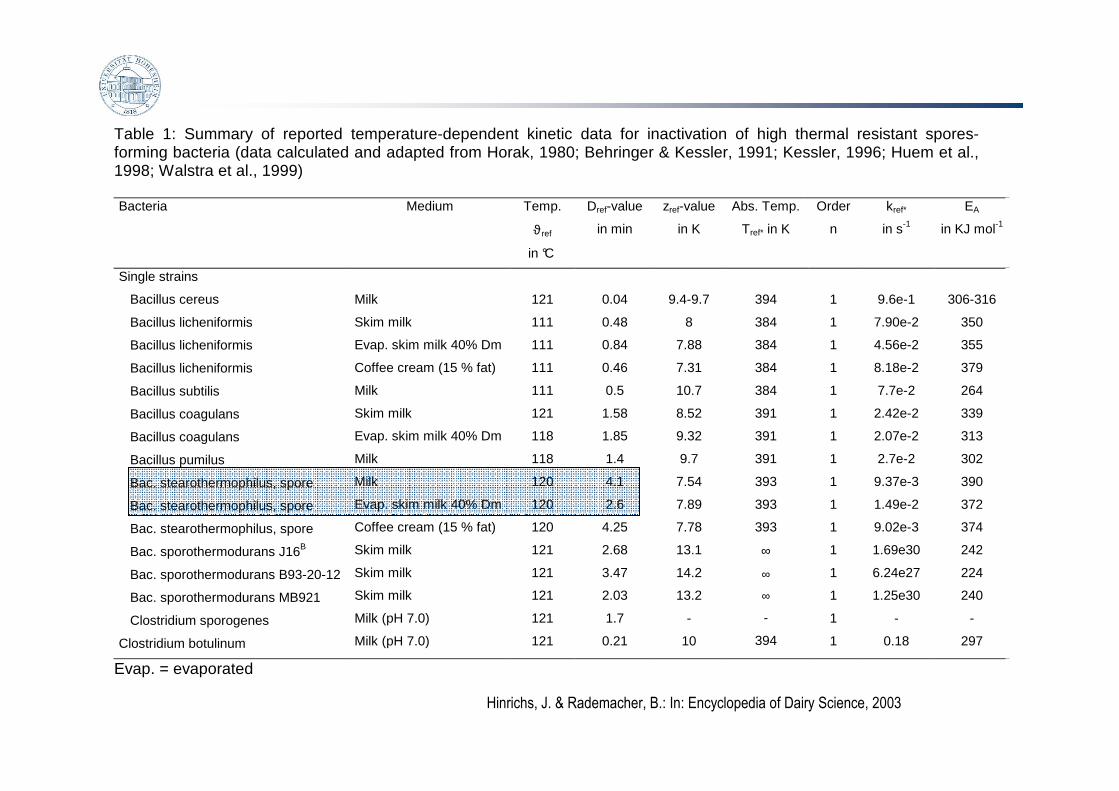
Table 1: Summary of reported temperature-dependent kinetic data for inactivation of high thermal resistant spores-forming bacteria (data calculated and adapted from Horak, 1980; Behringer & Kessler, 1991; Kessler, 1996; Huem et al., 1998; Walstra et al., 1999) Bacteria Medium Temp.
ϑref
in °C
Dref-value
in min
zref-value
in K
Abs. Temp.
Tref* in K
Order
n
kref*
in s-1
EA
in KJ mol-1
Single strains
Bacillus cereus
Bacillus licheniformis
Bacillus licheniformis
Bacillus licheniformis
Bacillus subtilis
Bacillus coagulans
Bacillus coagulans
Bacillus pumilus
Bac. stearothermophilus, spore
Bac. stearothermophilus, spore
Bac. stearothermophilus, spore
Bac. sporothermodurans J16B
Bac. sporothermodurans B93-20-12
Bac. sporothermodurans MB921
Clostridium sporogenes
Clostridium botulinum
Milk
Skim milk
Evap. skim milk 40% Dm
Coffee cream (15 % fat)
Milk
Skim milk
Evap. skim milk 40% Dm
Milk
Milk
Evap. skim milk 40% Dm
Coffee cream (15 % fat)
Skim milk
Skim milk
Skim milk
Milk (pH 7.0)
Milk (pH 7.0)
121
111
111
111
111
121
118
118
120
120
120
121
121
121
121
121
0.04
0.48
0.84
0.46
0.5
1.58
1.85
1.4
4.1
2.6
4.25
2.68
3.47
2.03
1.7
0.21
9.4-9.7
8
7.88
7.31
10.7
8.52
9.32
9.7
7.54
7.89
7.78
13.1
14.2
13.2
-
10
394
384
384
384
384
391
391
391
393
393
393
∞
∞
∞
-
394
1
1
1
1
1
1
1
1
1
1
1
1
1
1
1
1
9.6e-1
7.90e-2
4.56e-2
8.18e-2
7.7e-2
2.42e-2
2.07e-2
2.7e-2
9.37e-3
1.49e-2
9.02e-3
1.69e30
6.24e27
1.25e30
-
0.18
306-316
350
355
379
264
339
313
302
390
372
374
242
224
240
-
297
Evap. = evaporated
Hinrichs, J. & Rademacher, B.: In: Encyclopedia of Dairy Science, 2003
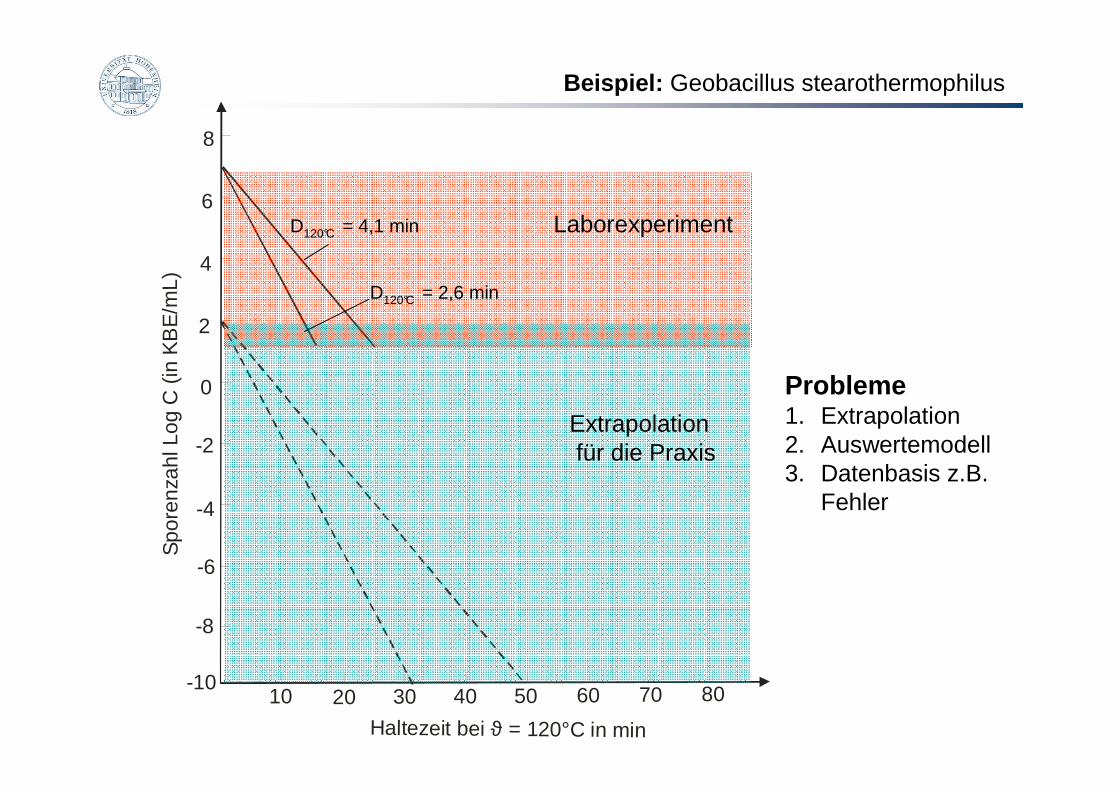
Beispiel: Geobacillus stearothermophilus
-8
-1010 20 30 40 50 60 70 80
-6
-4
-2
0
2
4
6
8
Spo
renz
ahl L
og C
(in
KB
E/m
L)
Haltezeit bei = 120°C in minϑ
Probleme1. Extrapolation2. Auswertemodell3. Datenbasis z.B.
Fehler
D120°C = 4,1 min Laborexperiment
Extrapolationfür die Praxis
D120°C = 2,6 min
7≠ 1117 - 125B. sporothermodurans IC4
6100.39105≠ 12740.098100 - 109B. coagulans CCT 2467
37.83.5810013410.01198 - 115B. cereus 9818
50.151.9
104≠ 10.2590.020
96 - 104 B. pumilus
121
120
108
Tref(°C)
16
7.4
9.0
z (K)
180
400
309
EA (kJ/mol)
1
1
1
n (-)
24.20.55100 - 125B. flexus
42.360.016115 - 130Geobacillus stearothermophilus 12980
10.520.074102 - 111Bacillus subtilis 4524
SourceDref(min)
kref(1/s)
Temperaturerange (°C)
Species
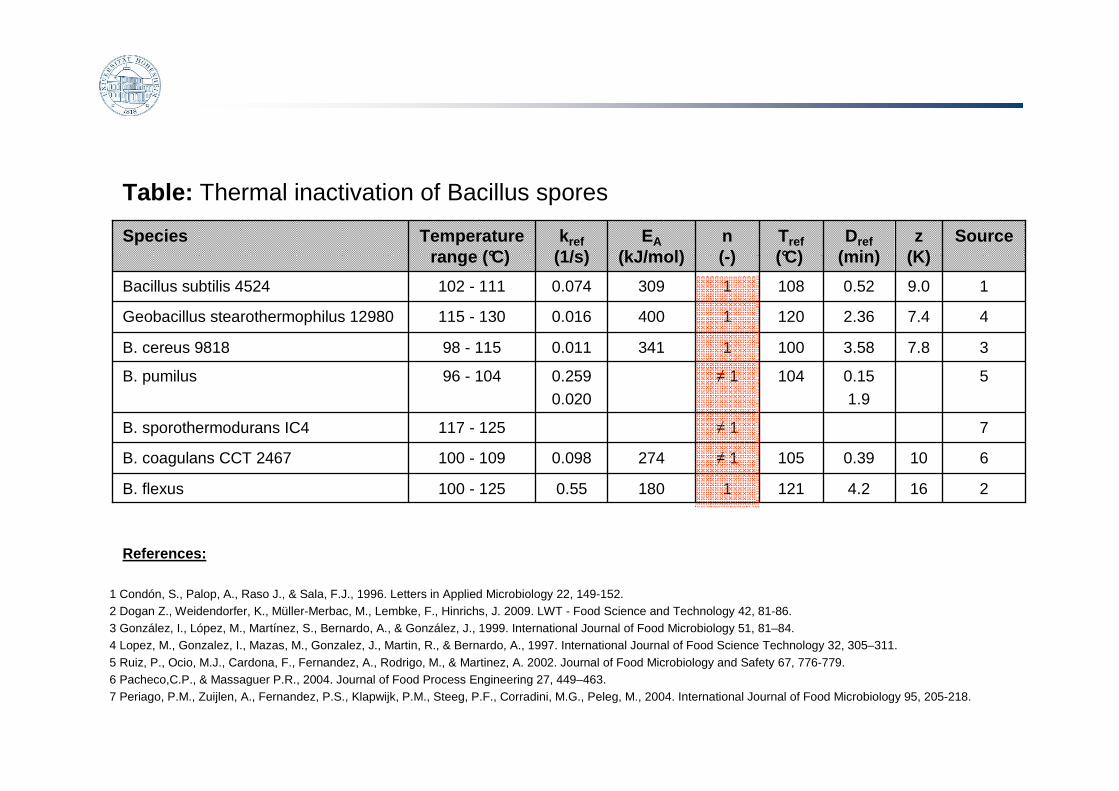
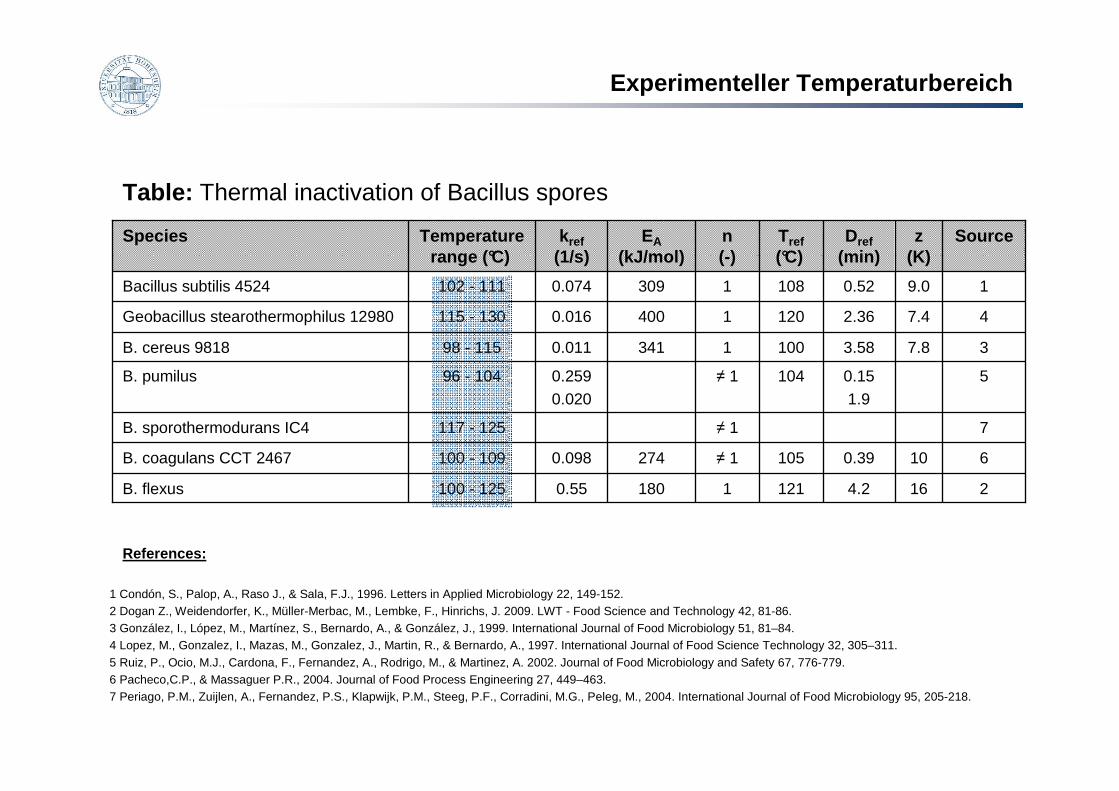
Table: Thermal inactivation of Bacillus spores
1 Condón, S., Palop, A., Raso J., & Sala, F.J., 1996. Letters in Applied Microbiology 22, 149-152.2 Dogan Z., Weidendorfer, K., Müller-Merbac, M., Lembke, F., Hinrichs, J. 2009. LWT - Food Science and Technology 42, 81-86.3 González, I., López, M., Martínez, S., Bernardo, A., & González, J., 1999. International Journal of Food Microbiology 51, 81–84.4 Lopez, M., Gonzalez, I., Mazas, M., Gonzalez, J., Martin, R., & Bernardo, A., 1997. International Journal of Food Science Technology 32, 305–311.5 Ruiz, P., Ocio, M.J., Cardona, F., Fernandez, A., Rodrigo, M., & Martinez, A. 2002. Journal of Food Microbiology and Safety 67, 776-779.6 Pacheco,C.P., & Massaguer P.R., 2004. Journal of Food Process Engineering 27, 449–463.7 Periago, P.M., Zuijlen, A., Fernandez, P.S., Klapwijk, P.M., Steeg, P.F., Corradini, M.G., Peleg, M., 2004. International Journal of Food Microbiology 95, 205-218.
References:
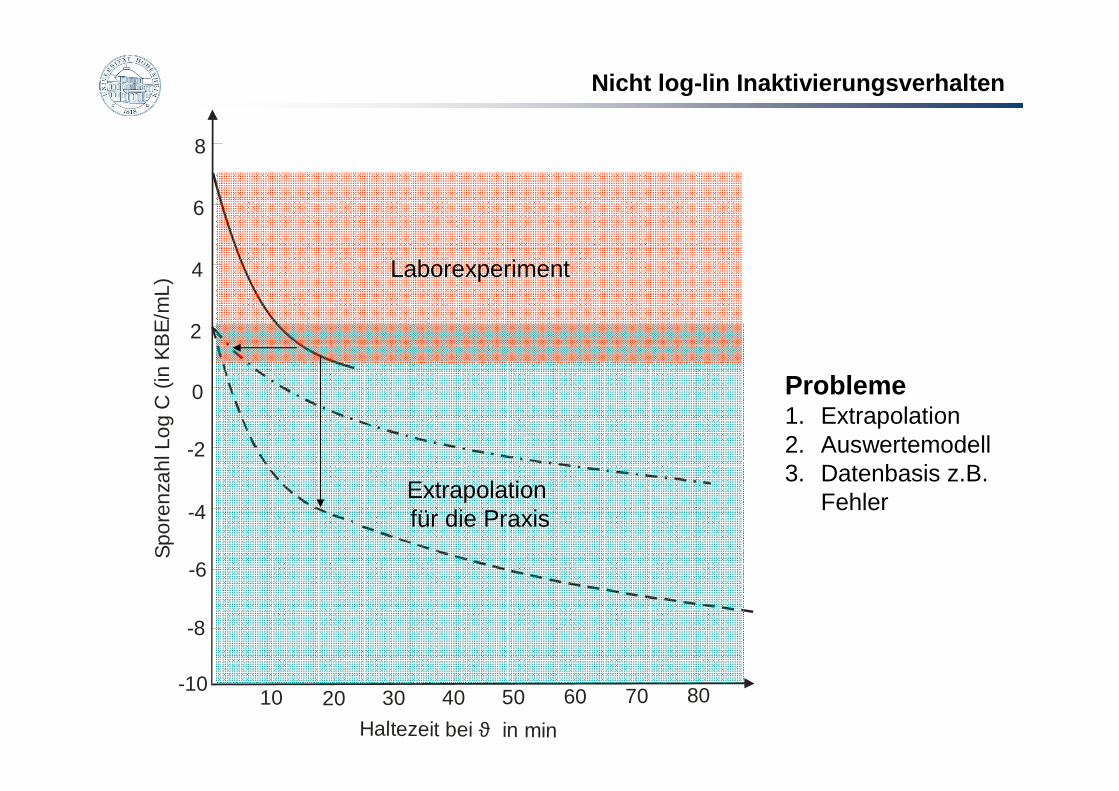
Nicht log-lin Inaktivierungsverhalten
-8
-1010 20 30 40 50 60 70 80
-6
-4
-2
0
2
4
6
8S
pore
nzah
l Log
C (
in K
BE
/mL)
Haltezeit bei in minϑ
Extrapolation für die Praxis
Laborexperiment
Probleme1. Extrapolation2. Auswertemodell3. Datenbasis z.B.
Fehler
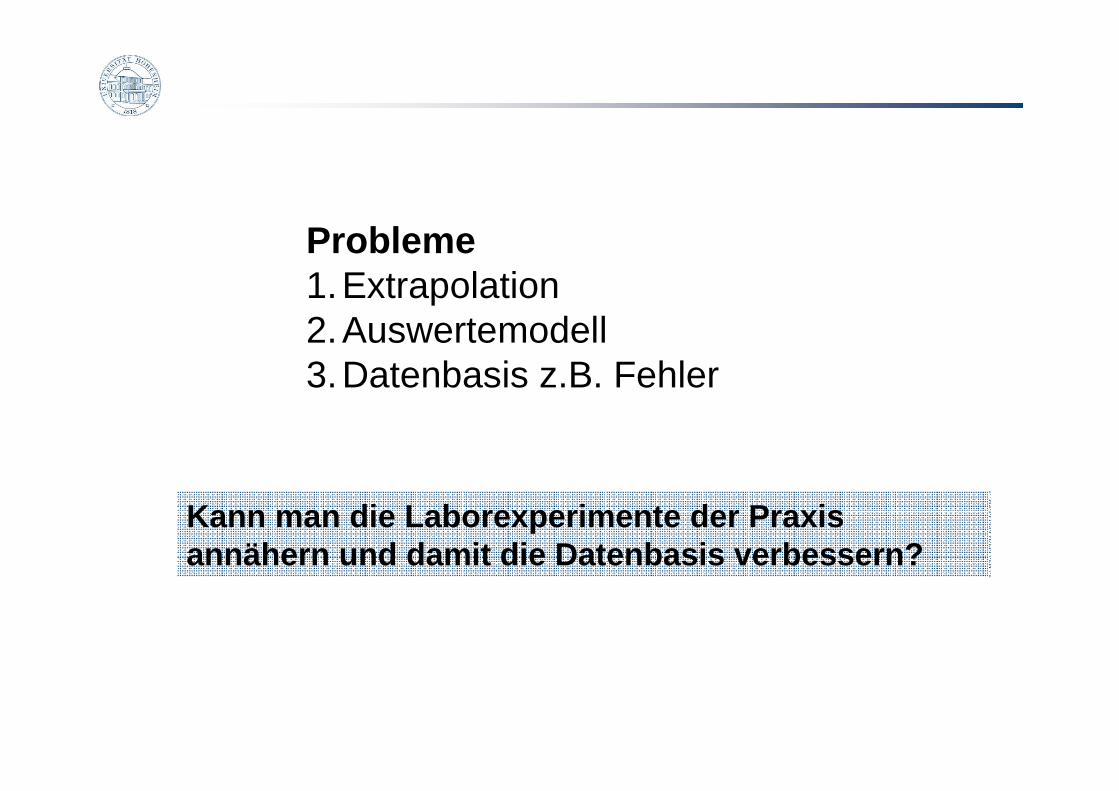
Probleme1.Extrapolation2.Auswertemodell3.Datenbasis z.B. Fehler
Kann man die Laborexperimente der Praxis annähern und damit die Datenbasis verbessern?
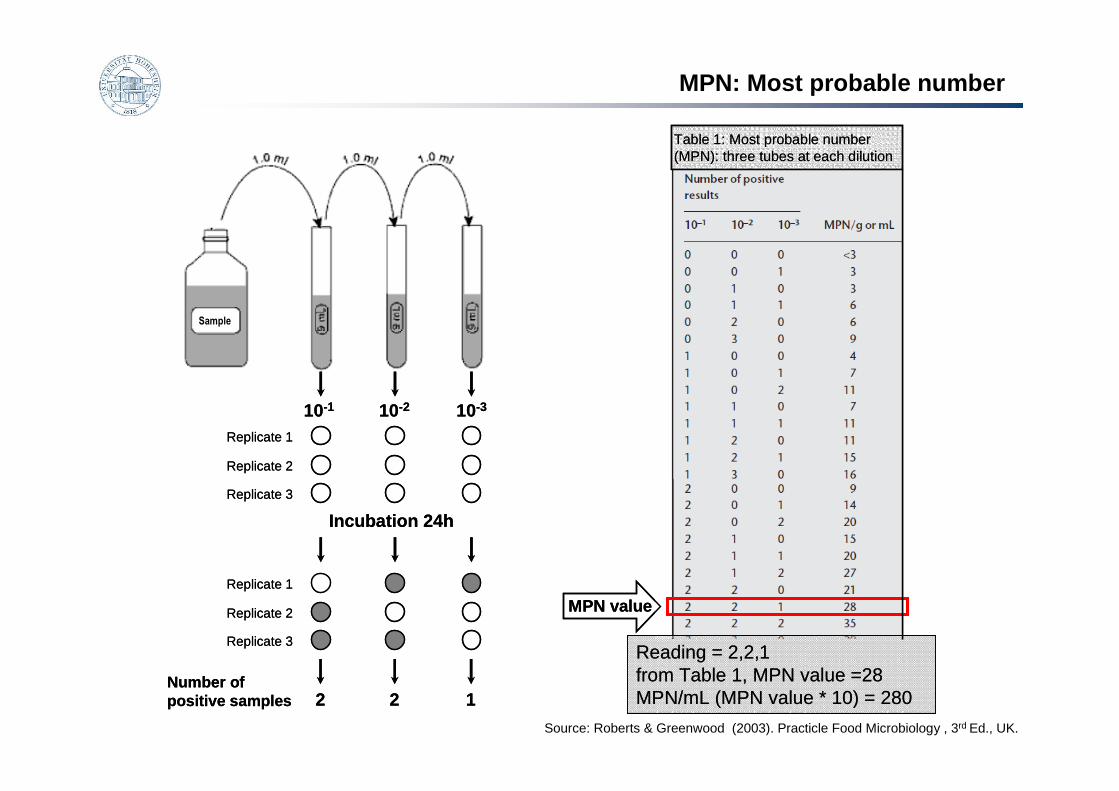
Source: Roberts & Greenwood (2003). Practicle Food Microbiology , 3rd Ed., UK.
Replicate 1
Replicate 2
Replicate 3
Sample
Replicate 1
Replicate 2
Replicate 3
Incubation 24h
Number of positive samples 2 2 1
10-1 10-2 10-3
Replicate 1
Replicate 2
Replicate 3
Sample
Replicate 1
Replicate 2
Replicate 3
Incubation 24h
Number of positive samples 2 2 1
10-1 10-2 10-3
Reading = 2,2,1from Table 1, MPN value =28MPN/mL (MPN value * 10) = 280
MPN value
Table 1: Most probable number(MPN): three tubes at each dilution
Reading = 2,2,1from Table 1, MPN value =28MPN/mL (MPN value * 10) = 280
MPN value
Table 1: Most probable number(MPN): three tubes at each dilution
MPN: Most probable number
7≠ 1117 - 125B. sporothermodurans IC4
6100.39105≠ 12740.098100 - 109B. coagulans CCT 2467
37.83.5810013410.01198 - 115B. cereus 9818
50.151.9
104≠ 10.2590.020
96 - 104 B. pumilus
121
120
108
Tref(°C)
16
7.4
9.0
z (K)
180
400
309
EA (kJ/mol)
1
1
1
n (-)
24.20.55100 - 125B. flexus
42.360.016115 - 130Geobacillus stearothermophilus 12980
10.520.074102 - 111Bacillus subtilis 4524
SourceDref(min)
kref(1/s)
Temperaturerange (°C)
Species
Table: Thermal inactivation of Bacillus spores
1 Condón, S., Palop, A., Raso J., & Sala, F.J., 1996. Letters in Applied Microbiology 22, 149-152.2 Dogan Z., Weidendorfer, K., Müller-Merbac, M., Lembke, F., Hinrichs, J. 2009. LWT - Food Science and Technology 42, 81-86.3 González, I., López, M., Martínez, S., Bernardo, A., & González, J., 1999. International Journal of Food Microbiology 51, 81–84.4 Lopez, M., Gonzalez, I., Mazas, M., Gonzalez, J., Martin, R., & Bernardo, A., 1997. International Journal of Food Science Technology 32, 305–311.5 Ruiz, P., Ocio, M.J., Cardona, F., Fernandez, A., Rodrigo, M., & Martinez, A. 2002. Journal of Food Microbiology and Safety 67, 776-779.6 Pacheco,C.P., & Massaguer P.R., 2004. Journal of Food Process Engineering 27, 449–463.7 Periago, P.M., Zuijlen, A., Fernandez, P.S., Klapwijk, P.M., Steeg, P.F., Corradini, M.G., Peleg, M., 2004. International Journal of Food Microbiology 95, 205-218.
References:
Experimenteller Temperaturbereich
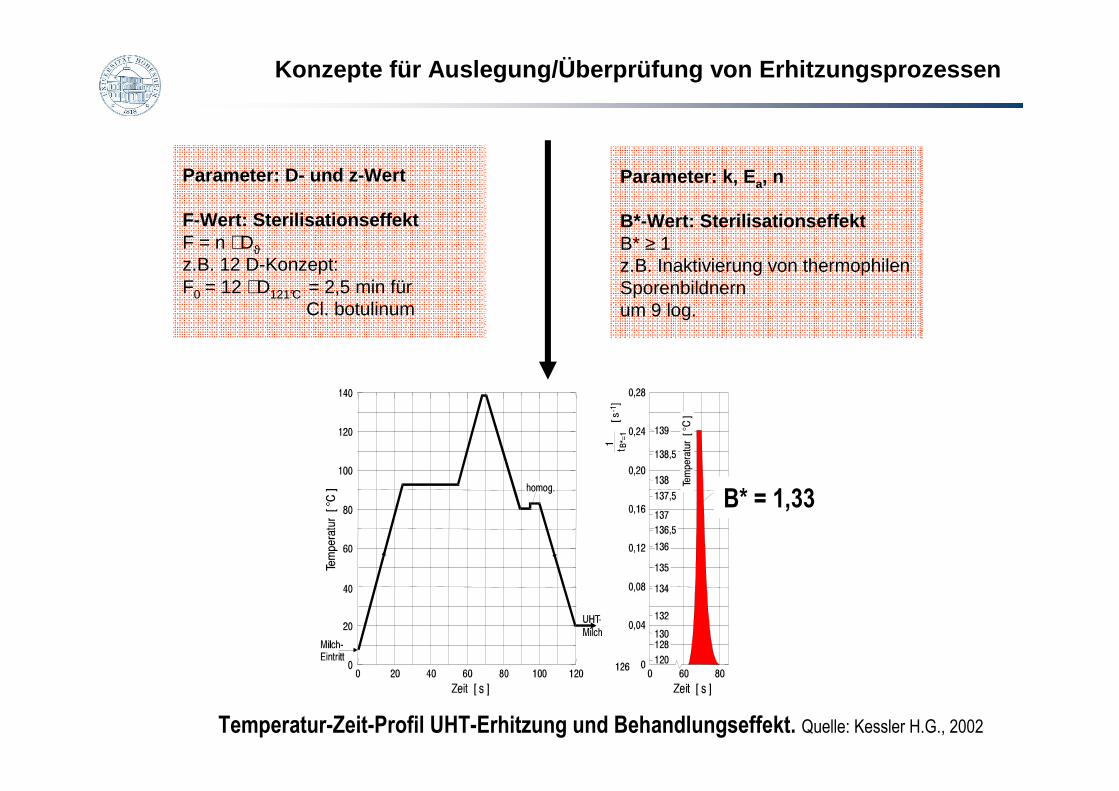
Parameter: D- und z-Wert
F-Wert: SterilisationseffektF = n ⋅ Dϑz.B. 12 D-Konzept: F0 = 12 ⋅ D121°C = 2,5 min für
Cl. botulinum
Parameter: k, E a, n
B*-Wert: SterilisationseffektB* ≥ 1z.B. Inaktivierung von thermophilen Sporenbildnernum 9 log.
Temperatur-Zeit-Profil UHT-Erhitzung und Behandlungseffekt. Quelle: Kessler H.G., 2002
B* = 1,33
Konzepte für Auslegung/Überprüfung von Erhitzungspr ozessen
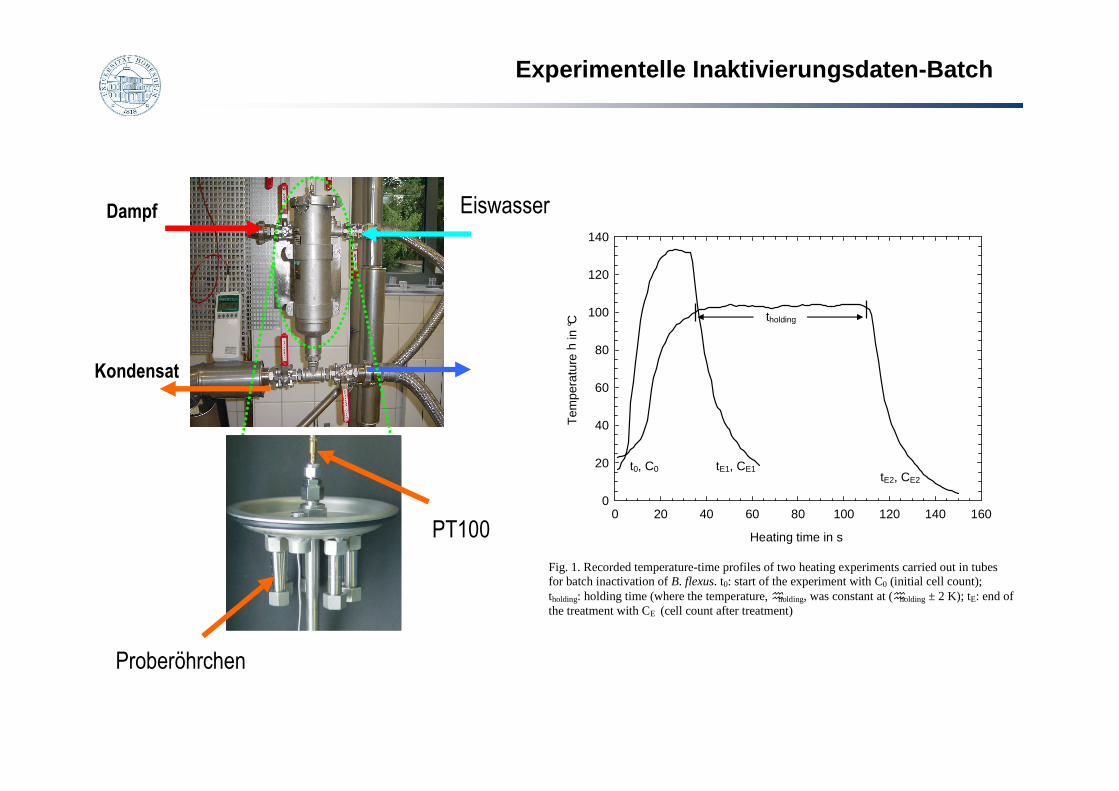
Dampf
Kondensat
Eiswasser
PT100
Produkt
Heating time in s
0 20 40 60 80 100 120 140 160
Tem
pera
ture
h in
°C
0
20
40
60
80
100
120
140
Fig. 1. Recorded temperature-time profiles of two heating experiments carried out in tubes for batch inactivation of B. flexus. t0: start of the experiment with C0 (initial cell count); tholding: holding time (where the temperature, �holding, was constant at (�holding ± 2 K); tE: end of the treatment with CE (cell count after treatment)
t0, C0 tE1, CE1 tE2, CE2
tholding
Proberöhrchen
Experimentelle Inaktivierungsdaten-Batch
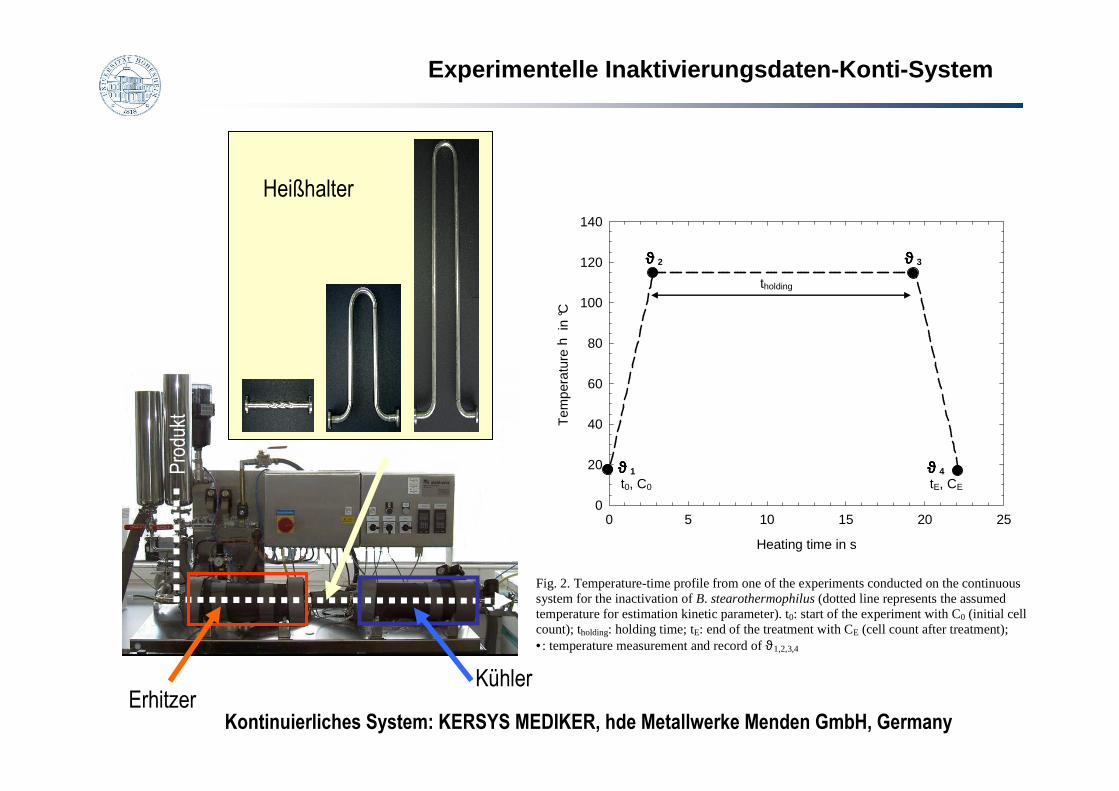
ErhitzerKühler
HeißhalterProdukt
Heating time in s
0 5 10 15 20 25
Tem
pera
ture
h i
n °C
0
20
40
60
80
100
120
140
Fig. 2. Temperature-time profile from one of the experiments conducted on the continuous system for the inactivation of B. stearothermophilus (dotted line represents the assumed temperature for estimation kinetic parameter). t0: start of the experiment with C0 (initial cell count); tholding: holding time; tE: end of the treatment with CE (cell count after treatment); •: temperature measurement and record of ϑ1,2,3,4
t0, C0 ϑϑϑϑ 1
tE, CE ϑϑϑϑ 4
ϑϑϑϑ 2 ϑϑϑϑ 3
tholding
Kontinuierliches System: KERSYS MEDIKER, hde Metallwerke Menden GmbH, Germany
Experimentelle Inaktivierungsdaten-Konti-System
Heating time in s
0 20 40 60 80 100 120 140 160
Tem
pera
ture
h in
°C
0
20
40
60
80
100
120
140
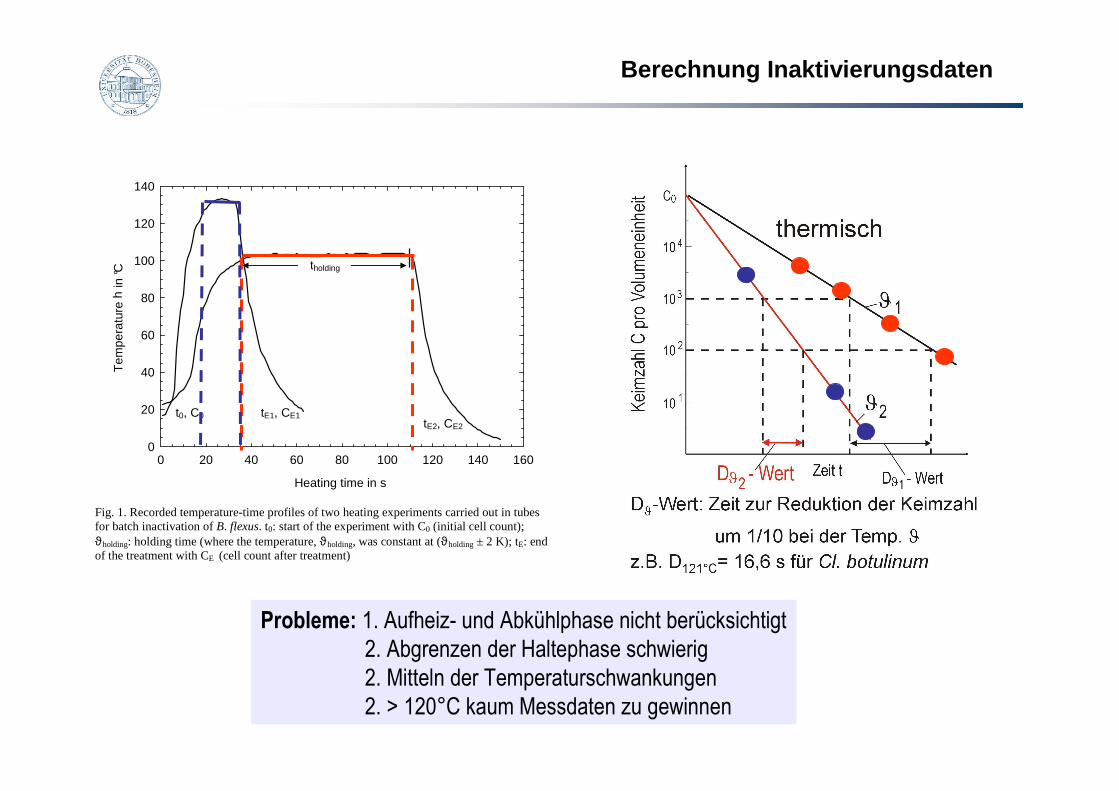
Fig. 1. Recorded temperature-time profiles of two heating experiments carried out in tubes for batch inactivation of B. flexus. t0: start of the experiment with C0 (initial cell count); ϑholding: holding time (where the temperature, ϑholding, was constant at (ϑholding ± 2 K); tE: end of the treatment with CE (cell count after treatment)
t0, C0 tE1, CE1 tE2, CE2
tholding
Probleme: 1. Aufheiz- und Abkühlphase nicht berücksichtigt
2. Abgrenzen der Haltephase schwierig
2. Mitteln der Temperaturschwankungen
2. > 120°C kaum Messdaten zu gewinnen
Berechnung Inaktivierungsdaten
Ea in kJmol-10 200 400 600 800 1000
log
k ref
(k
ref i
n s-1
)
-2
-1
0
1
2
3
4
5
6
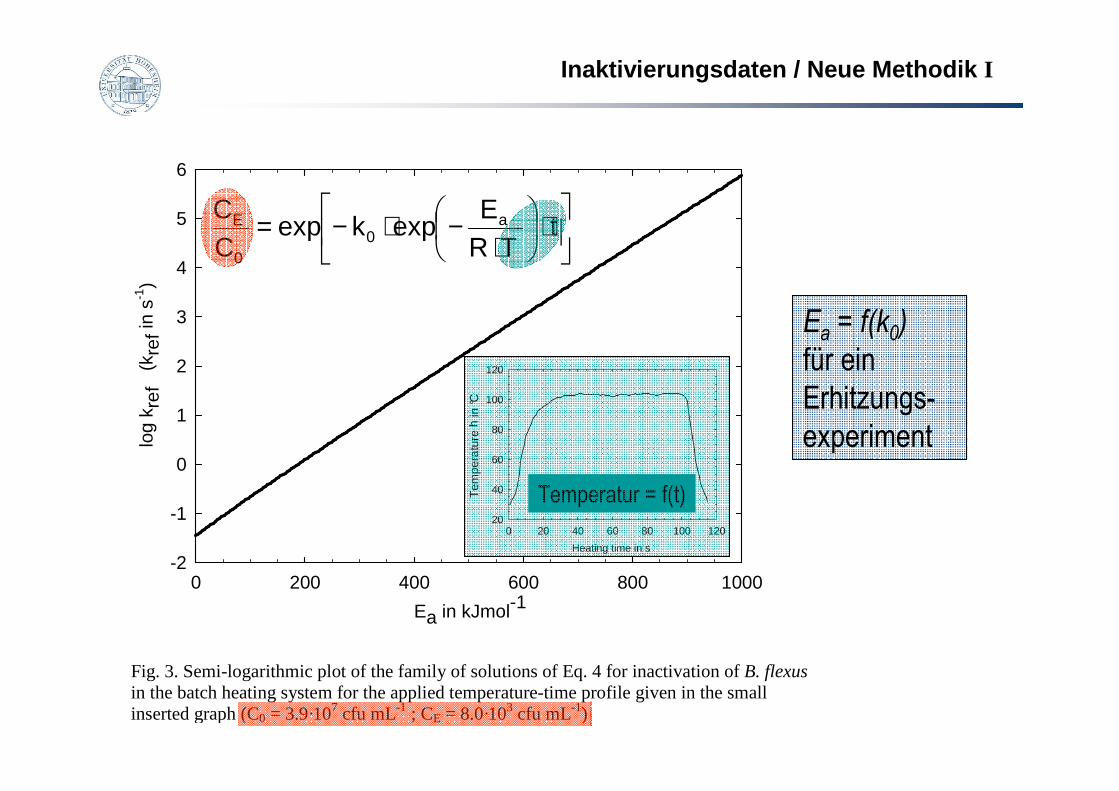
Fig. 3. Semi-logarithmic plot of the family of solutions of Eq. 4 for inactivation of B. flexus in the batch heating system for the applied temperature-time profile given in the small inserted graph (C0 = 3.9·107 cfu mL-1 ; CE = 8.0·103 cfu mL-1)
Heating time in s
0 20 40 60 80 100 120
Tem
pera
ture
h in
°C
20
40
60
80
100
120
Temperatur = f(t)
⋅
⋅−⋅−= t
TE
kCC aE
Rexpexp 0
0
Ea = f(k0)
für ein
Erhitzungs-
experiment
Inaktivierungsdaten / Neue Methodik I
Ea in kJmol-10 200 400 600 800 1000
log
k ref
(k
ref i
n s-1
)
-2
-1
0
1
2
3
4
5
6
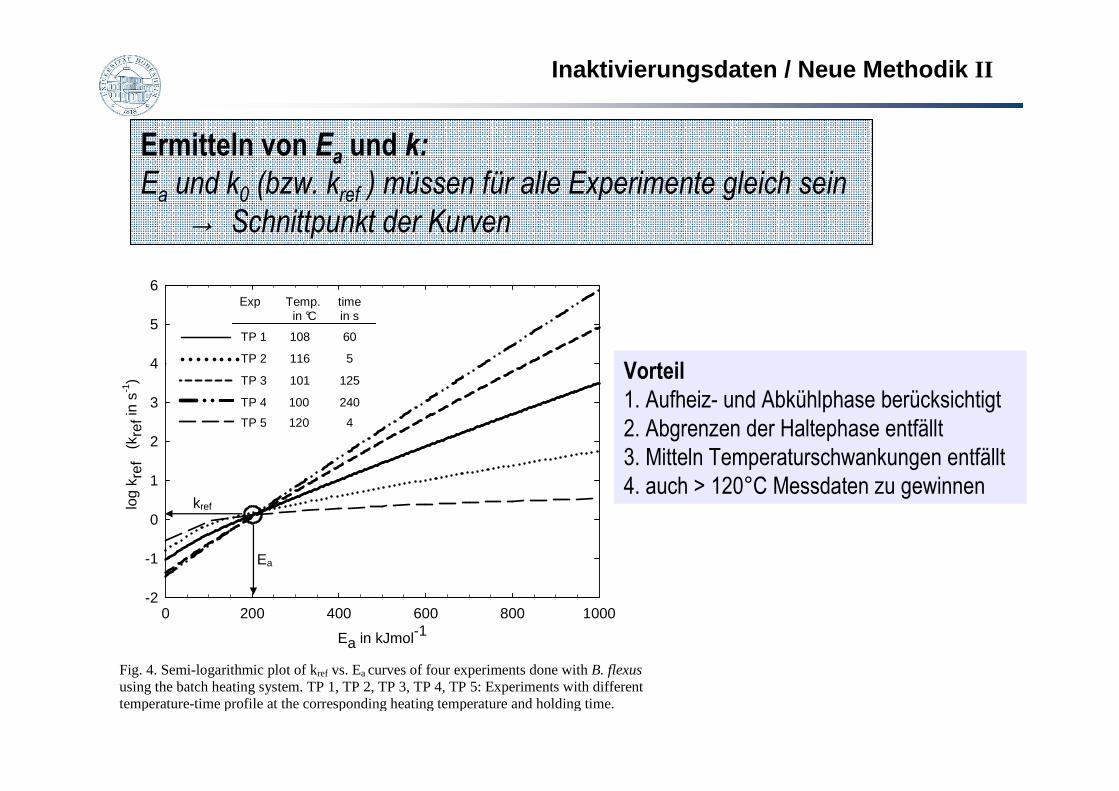
Fig. 4. Semi-logarithmic plot of kref vs. Ea curves of four experiments done with B. flexus using the batch heating system. TP 1, TP 2, TP 3, TP 4, TP 5: Experiments with different temperature-time profile at the corresponding heating temperature and holding time.
Ea
kref
240 100 TP 4
125 101 TP 3
5 116 TP 2
60 108 TP 1
time in s
Temp. in °C
Exp
4 120 TP 5
Ermitteln von Eaund k:
Ea und k0 (bzw. kref ) müssen für alle Experimente gleich sein
→ Schnittpunkt der Kurven
Vorteil
1. Aufheiz- und Abkühlphase berücksichtigt
2. Abgrenzen der Haltephase entfällt
3. Mitteln Temperaturschwankungen entfällt
4. auch > 120°C Messdaten zu gewinnen
Inaktivierungsdaten / Neue Methodik II
-1.6
-1.2
-0.8
-0.4
0
0.4
0.8
1.2
0 100 200 300 400
-1.8
-1.6
-1.4
-1.2
-1
-0.8
-0.6
-0.4
-0.2
0 100 200
99%
99%
99%
99%
95%
95%
95%
95%
90%
90%
90%
90%
300 400 500
E in kJ/mol a
E in kJ/mol a
G. stearothermophilus
B. flexus
Batch system
Batch system
Conti. system
Conti. system
log
k(k
in s
)
ref
ref
-1lo
g k
(kin
s)
re
f re
f -1
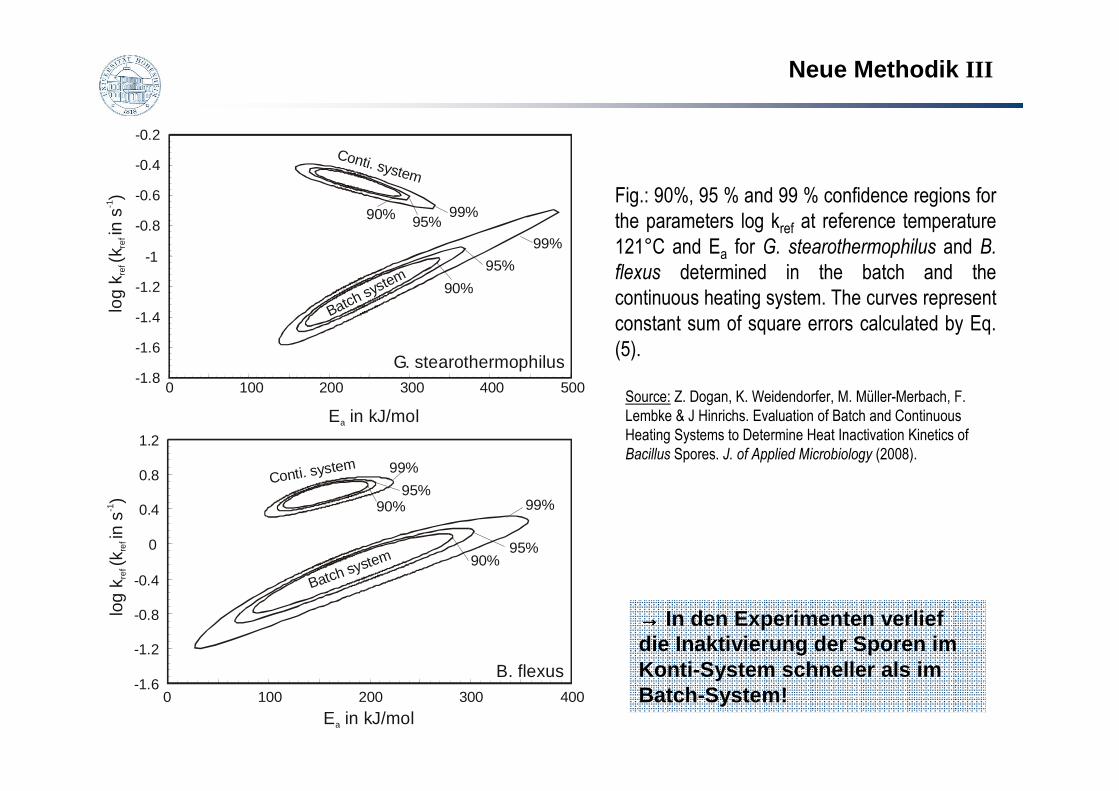
Fig.: 90%, 95 % and 99 % confidence regions for
the parameters log kref at reference temperature
121°C and Ea for G. stearothermophilus and B.
flexus determined in the batch and the
continuous heating system. The curves represent
constant sum of square errors calculated by Eq.
(5).
Neue Methodik III
Source: Z. Dogan, K. Weidendorfer, M. Müller-Merbach, F.
Lembke & J Hinrichs. Evaluation of Batch and Continuous
Heating Systems to Determine Heat Inactivation Kinetics of
Bacillus Spores. J. of Applied Microbiology (2008).
→→→→ In den Experimenten verlief die Inaktivierung der Sporen im Konti-System schneller als im Batch-System!
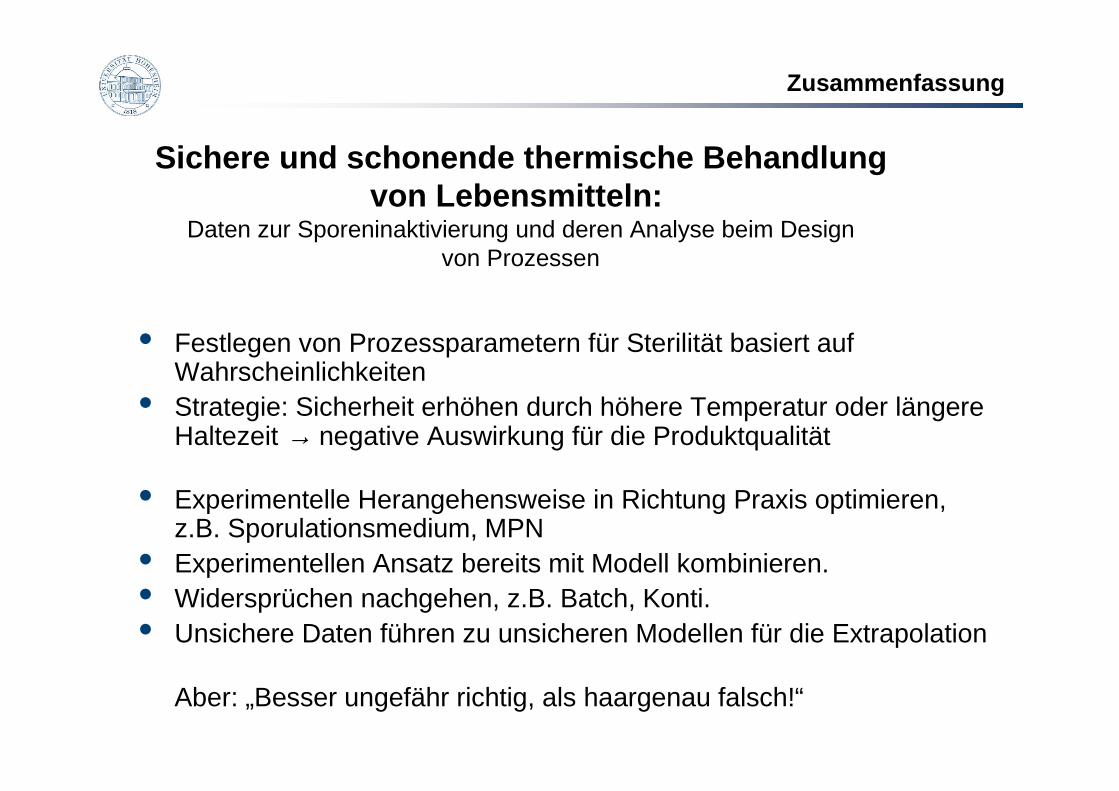
Zusammenfassung
• Festlegen von Prozessparametern für Sterilität basiert auf Wahrscheinlichkeiten
• Strategie: Sicherheit erhöhen durch höhere Temperatur oder längere Haltezeit → negative Auswirkung für die Produktqualität
• Experimentelle Herangehensweise in Richtung Praxis optimieren, z.B. Sporulationsmedium, MPN
• Experimentellen Ansatz bereits mit Modell kombinieren.• Widersprüchen nachgehen, z.B. Batch, Konti. • Unsichere Daten führen zu unsicheren Modellen für die Extrapolation
Aber: „Besser ungefähr richtig, als haargenau falsch!“
Sichere und schonende thermische Behandlungvon Lebensmitteln:
Daten zur Sporeninaktivierung und deren Analyse beim Designvon Prozessen
UNIVERSITÄT HOHENHEIMInstitut für Lebensmittelwissenschaft und BiotechnologieFg. Lebensmittel tierischer Herkunft mit Forschungs- und Lehrmolkerei
Hinrichs │ [email protected] │April 2010
Sept. 2009
DankPräsentierte Ergebnisse wurden im Rahmen verschiedener AiF-Forschungsvorhaben gewonnen (AiF-
FV 14339 N, 15886N, 16012 N). Die Arbeiten wurden und werden im „Programm zur Förderung der Industriellen Gemeinschaftsforschung (IGF)“ vom Bundesministerium für Wirtschaft und Technologie (via AiF) über den Forschungskreis der Ernährungsindustrie e.V. (FEI) gefördert.
Dank
Prof. S. Scherer, Dr. G. Lücking, Prof. M. Ehling-Schulz, Prof. K. Heller, Dr. Neve, Prof. A. Kuhn
Z. Atamer, Frau J. Hauger
Studenten: S. Bachmann, M. Witthuhn
und den vielen Firmen.