Update on PSE in Poultry Meat
46
Update on PSE in Poultry Meat Christine Z. Alvarado, Ph.D. Department of Animal and Food Sciences Texas Tech University
Transcript of Update on PSE in Poultry Meat

Update on PSE in Poultry Meat
Christine Z. Alvarado, Ph.D.
Department of Animal and Food SciencesTexas Tech University

Meat Quality
Attributes influenced by postmortem muscle metabolism:
Color
Water Holding Capacity
Texture
Ferket and Foegeding, 1994; Pearson, 1994

Pale, Soft, Exudative
accelerated postmortem glycolysis
protein denaturation
Hedrick et al., 1989; Lawrie, 1998
Meat Quality

Combination of events:
Rapid postmortem decline in muscle pH
High carcass temperatures (early postmortem)
Bendall and Wismer-Pederson, 1962; Penny, 1969
Meat Quality
Pale, Soft, Exudative Meat
Pale colorSoft textureLow water holding capacity
= reduced yields and poor quality
Meat Quality
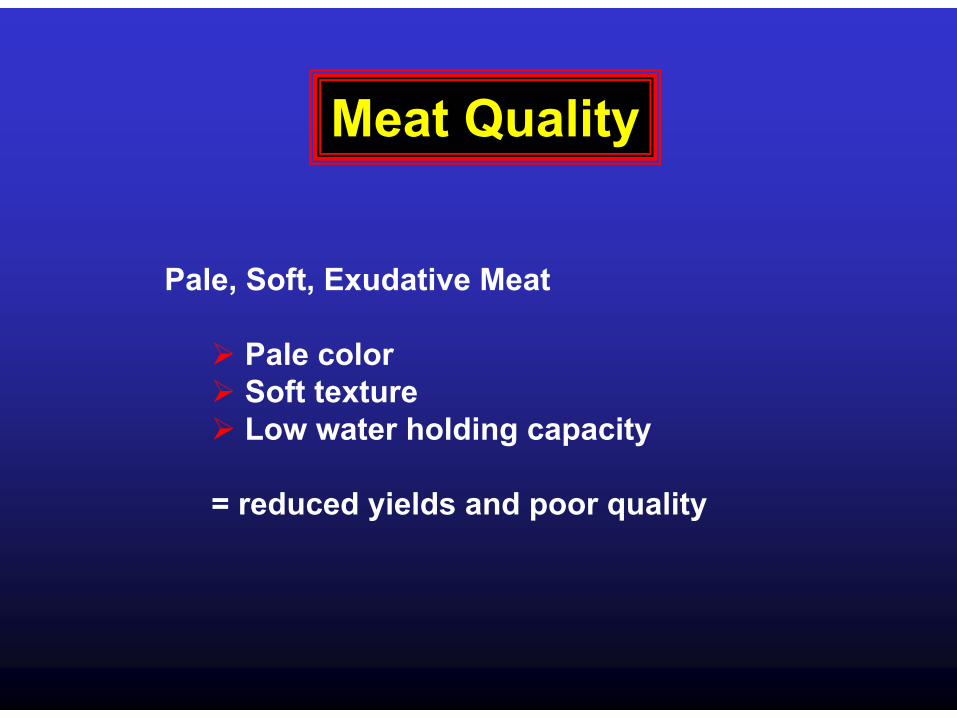
Protein Denaturation
Myofibrillar proteins
Sarcomplasmic proteins
Bendall and Wismer-Pederson, 1962; Penny, 1969
Water holding capacity / gel strength
Color

Protein denaturation can cause low strength (poor) gels to form resulting in softer (mushy) texture.
Protein Denaturation
Example: Pale, SOFT, Exudative meat

Protein Denaturation
Poor slice ability
PSE meat

Deli Loaves and RollsMade with PSE Turkey Meat
Excessive Purge

Pale color
Low WHC

Problems with PSE Broiler Meat
Lost yield (sometimes hidden)
Problems in further processing equipment (e.g. automatic breast deboner)
Variation in color

Economic Implications
4The use of PSE meat in cooked products can cost a processing plant $2-4 million/year in lost meat yield alone.
4Estimate does not factor in:
hpackaging costshrework laborhmultiplier effect

PSE Incidence in Poultry
Ranges from 5-40%
20-25% is “background” (genetic?)
Remainder varies with day, week, or season (environment?)
Genetic and environmental factors not distinctly separated

Genetic EnvironmentalPSEAntemortemPostmortem
RyanodineReceptor (RyR)
Factors Influencing PSE Meat

Porcine Stress Syndrome
Hall et al., 1966; Harrison et al., 1968; Webb and Jordan, 1978; Fujii et al., 1991
genetic disorder (autosomal recessive)
linked to the ryanodine receptor gene
single point mutation
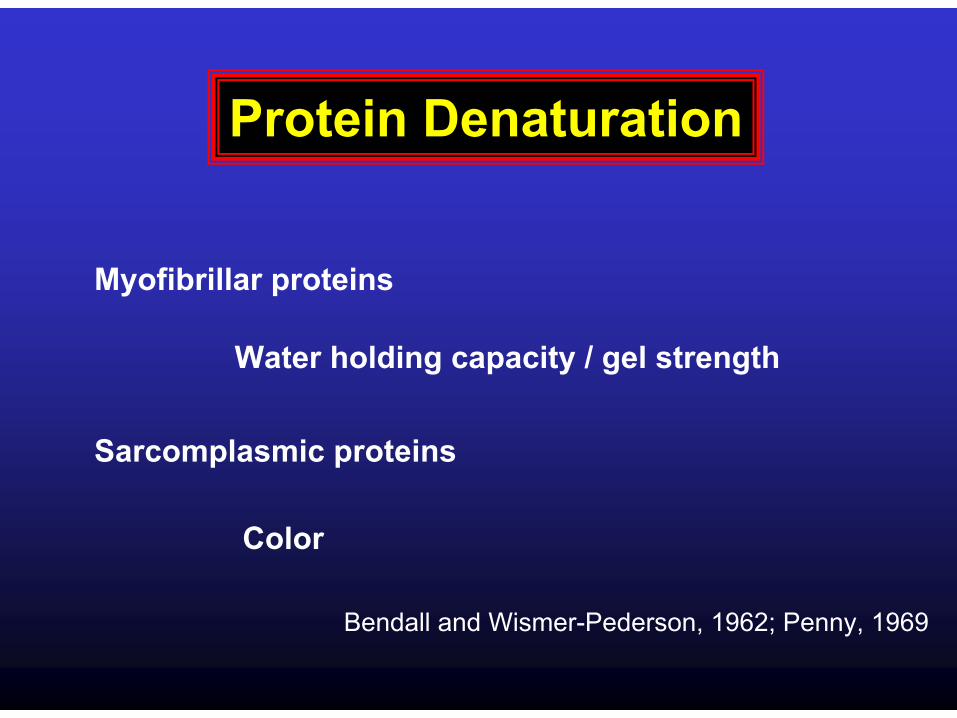
induced by halothane and succinylcholine
induced by stress
Malignant Hyperthermia in other species

The Ryanodine Receptor
Single Point Mutation
Fujii et al., 1991
Cytosine (C) to thymine (T) at nucleotide 1843
Substitution of cysteine for arginine in position 615
Abnormal calcium release
Observed in swine and humans – PSS/MH
No evidence to support or refute mutation in avian species
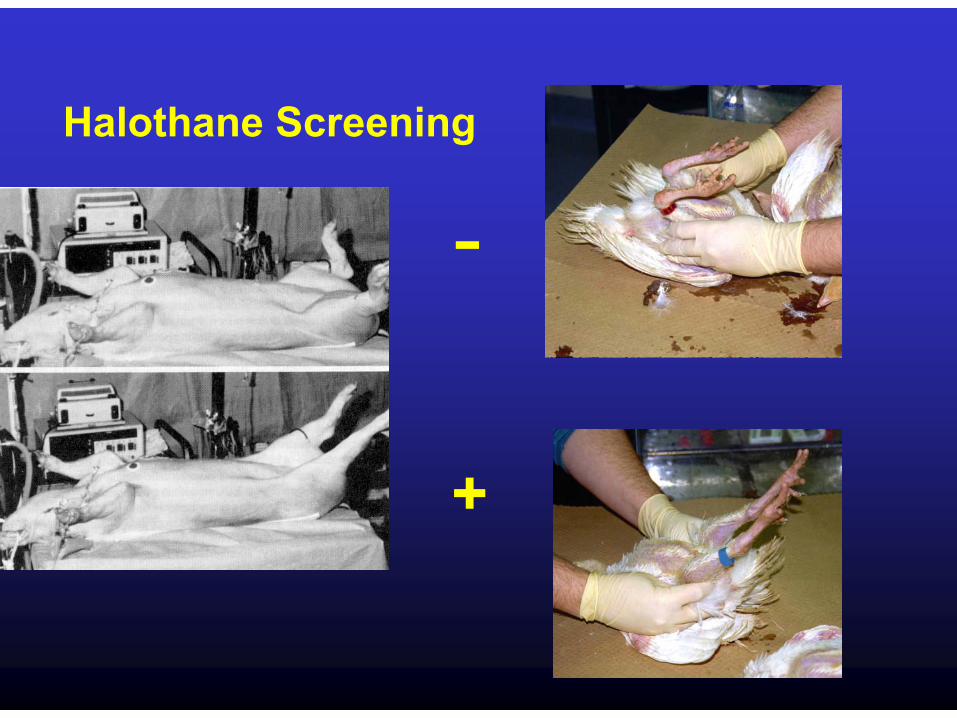
Halothane Screening
-
+
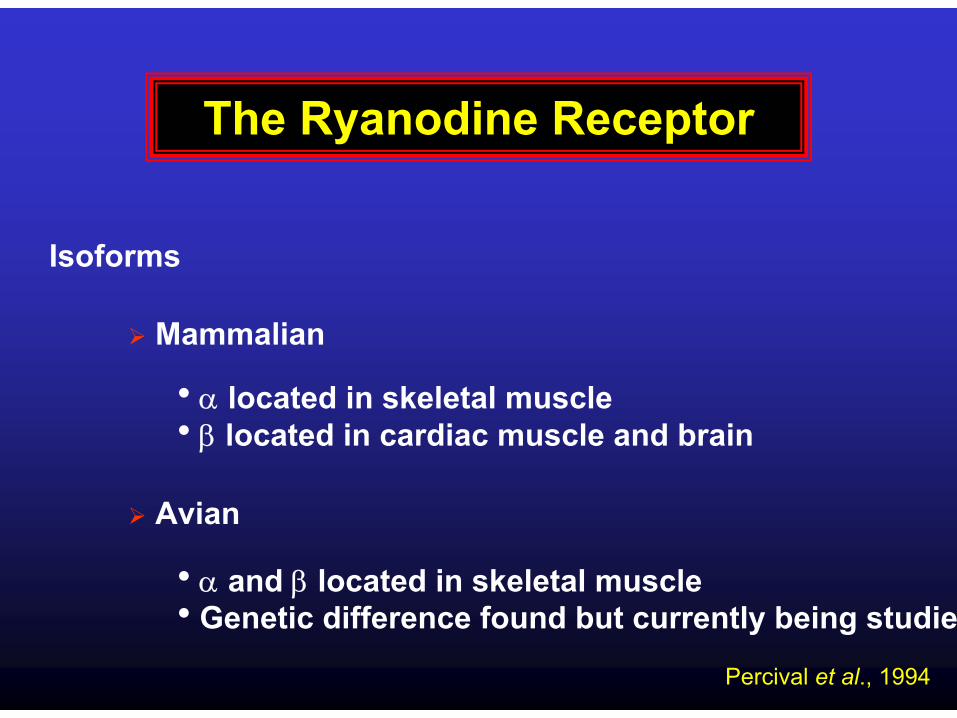
The Ryanodine Receptor
Isoforms
Mammalian
hα located in skeletal musclehβ located in cardiac muscle and brain
hα and β located in skeletal musclehGenetic difference found but currently being studied
Avian
Percival et al., 1994

Cassens et al., 1975; Backstrom and Kaufmann, 1995; D’Souza et al., 1998; Maribo et al., 1998
hRapid Growth hPreslaughter handling practiceshTransportationhEnvironmental temperatures
Stresses associated with PSE meat in swine
Poultry are subjected to similar conditions
Antemortem Stress Factors

Rapid Growth
Fast growing/heavier birds
Bohren et al., 1982; Sosnicki and Wilson, 1991;Hunt et al., 1999; Mahon, 1999; Mills et al., 1999
hhigher body temperaturehgreater metabolic heat productionhhigher mortality
More susceptible to heat stress
Greater incidence of muscle abnormalities
Muscles may outgrow life support system

Antemortem Stress Factors
Transportation
Physiologically stresses poultry
No increase in PSE incidence associated with 3 h of transportation prior to slaughter
May be dependent on duration and other conditions
Kannan et al., 1997; Freeman et al., 1984; Kannan et al., 1998Gregory, 1994; Cashman et al., 1989; Owens and Sams, 1999
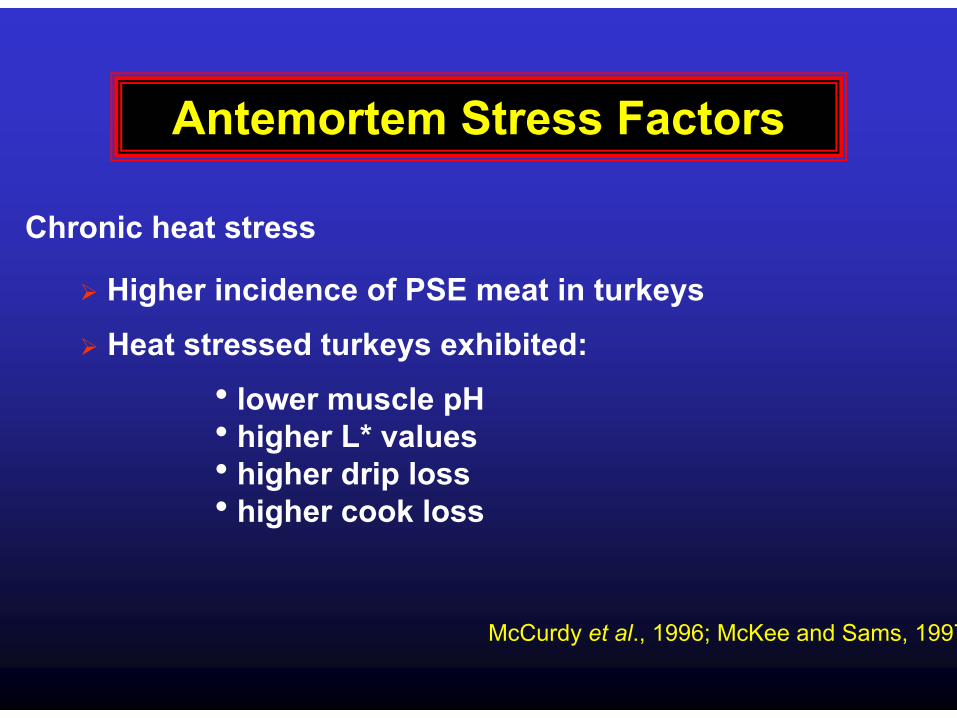
Antemortem Stress Factors
McCurdy et al., 1996; McKee and Sams, 1997
Chronic heat stress
Higher incidence of PSE meat in turkeys
hlower muscle pHhhigher L* valueshhigher drip losshhigher cook loss
Heat stressed turkeys exhibited:

Postmortem Factors
Chilling Rates
Slow or inadequate chilling increases PSE
Problem in turkeys due to size
McKee and Sams, 1998; Alvarado and Sams, 2002; Alvarado and Sams, 2003
Postmortem temperature is the most important factor influencing overall meat quality

Objectives
To evaluate the relationships between muscle chilling rates, pH decline, color, water holding capacity, and texture, in turkey carcasses
To develop a time and temperature range for chilling turkey carcasses to decrease meat quality problems associated with PSE meat.

Materials and Methods
48 Male Nicholas Turkeys processed in 2 trials
Bled, scalded, picked, eviscerated
Chilled at 0, 10, 20, 30 C
Deboned
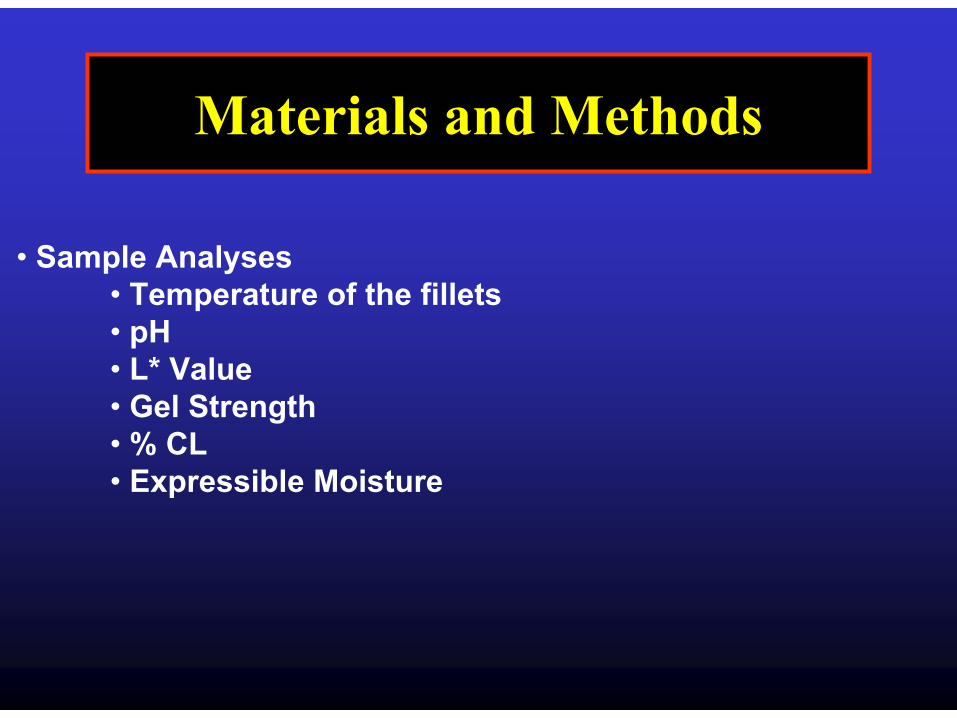
• Sample Analyses• Temperature of the fillets • pH • L* Value • Gel Strength • % CL • Expressible Moisture
Materials and Methods

Time Postmortem (min)0 20 40 60 80 100
Car
cass
Tem
pera
ture
(C)
26
28
30
32
34
36
38
40
420 C10 C20 C30 C
Temperatures of Turkey Pectoralis from Various Chilling Times and Temperatures
aa
b
b a
c
dPooled SEM = 0.43
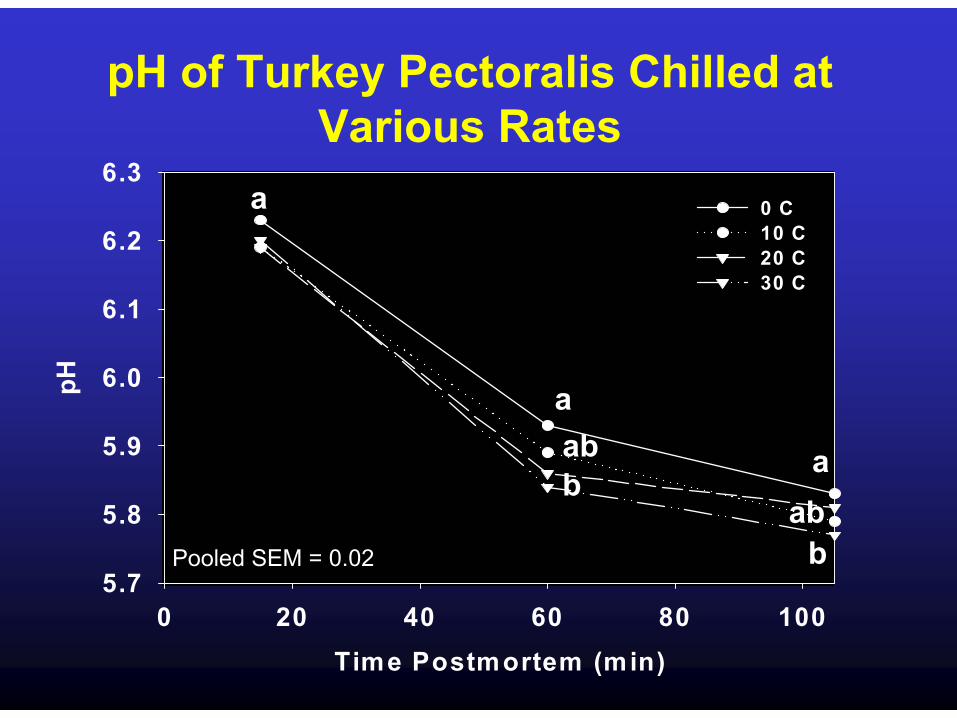
pH of Turkey Pectoralis Chilled at Various Rates
Time Postmortem (min)0 20 40 60 80 100
pH
5.7
5.8
5.9
6.0
6.1
6.2
6.30 C10 C20 C30 C
a
bab
bab a
a
Pooled SEM = 0.02

5.72
5.76
5.8
5.84
5.88
5.92
5.96
24 26 28 30 32
Carcass Temperature (C)
pHMuscle Temperature and pH Decline from
Turkey Lobes
a a
b
b
Pooled SEM = 0.02
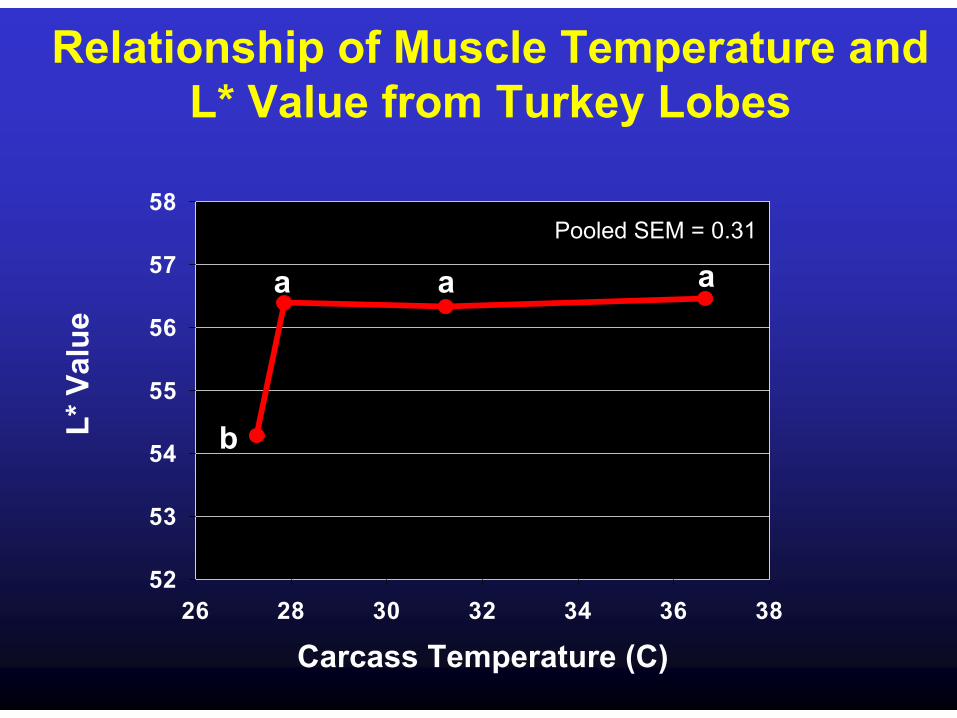
26 28 30 32 34 36 3852
53
54
55
56
57
58
Carcass Temperature (C)
L* V
alue
Relationship of Muscle Temperature and L* Value from Turkey Lobes
b
a a aPooled SEM = 0.31
Temperature ( C )
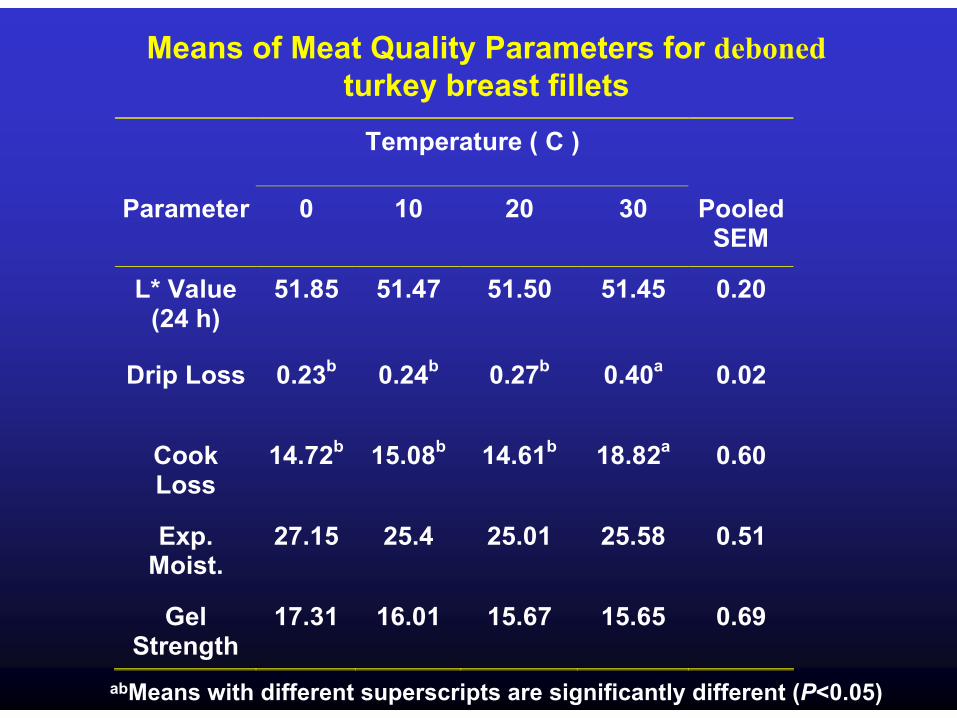
Parameter 0 10 20 30 Pooled SEM
L* Value (24 h)
51.85 51.47 51.50 51.45 0.20
Drip Loss 0.23b 0.24b 0.27b 0.40a 0.02
Cook Loss
14.72b 15.08b 14.61b 18.82a 0.60
Exp. Moist.
27.15 25.4 25.01 25.58 0.51
Gel Strength
17.31 16.01 15.67 15.65 0.69
abMeans with different superscripts are significantly different (P<0.05)
Means of Meat Quality Parameters for debonedturkey breast fillets

Conclusion
There is a chilling time and temperature relationship which can be a factor in the development of PSE meat.
Therefore, processors should implement a proper chilling regime in order to maintain acceptable meat quality.
Carcass Temperature recommendations
< 35 - 36 C at 0.75 h PM
< 28 - 30 C at 1.5 h PMAlvarado and Sams, 2003,2003

Strategies to Improve PSE Meat
Adjustment of pH or ionic strength
• use ingredients to restore protein function
• High pH phosphates (Pre-rigor and PM)• Increased pH• Decreased Cook loss• Improved color by 24 h PM3

Objectives
To determine the effects of pre-rigor marination with sodium phosphates on pH, color, and WHC in both normal and pale broiler breast fillets

Poultry Research Center (3h PM):• Injected (15% solution, 25 PSI)
pH 9 (0.9% NaCl, 0.45% PO4)pH 11 (0.9% NaCl, 0.45% PO4)
• Vacuum tumbled (25 mm Hg, 30 min, 14 RPM)• pH• Lab* value • Marinade pick-up/ retention • Cook Loss • Expressible moisture• Sensory• TBARS
Materials and Methods

pH(2h)
pH(24h)
L*(2h)
L*(24h)
EM(%)
CL(%)
Normal 6.30a,x 6.12a,y 49.57b,x 49.19b,x 18.58b 22.38a
Pale 6.09b,x 6.00b,x 53.79a,x 51.38a,y 22.65a 24.09a
PooledSEM
0.03 0.02 0.40 0.27 1.34 0.60
Measurements from Normal and Pale Fillets Marinated with a pH 9 Solution
a, bMeans in a column differ ( P < 0.05)x, yMeans in a row and within the same parameter differ (P < 0.05)
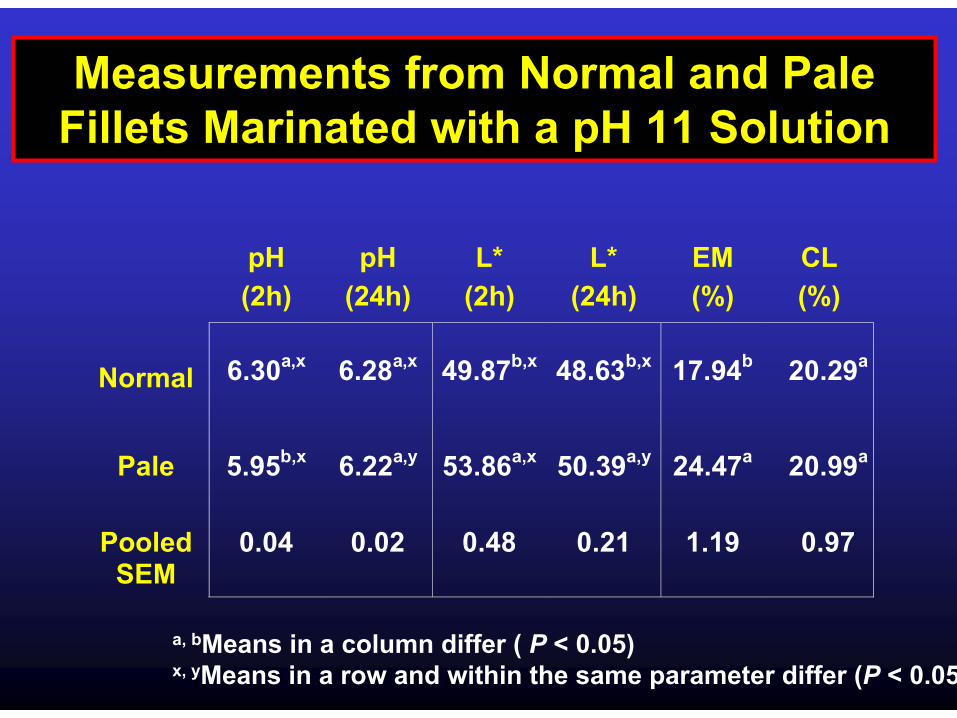
pH (2h)
pH (24h)
L* (2h)
L* (24h)
EM (%)
CL (%)
Normal
6.30a,x
6.28a,x
49.87b,x
48.63b,x
17.94b
20.29a
Pale
5.95b,x
6.22a,y
53.86a,x
50.39a,y
24.47a
20.99a
Pooled
SEM
0.04
0.02
0.48
0.21
1.19
0.97
Measurements from Normal and Pale Fillets Marinated with a pH 11 Solution
a, bMeans in a column differ ( P < 0.05)x, yMeans in a row and within the same parameter differ (P < 0.05)

Sensory Measurements from Marinated Fillets
Hedonic Scale ValueTreatment
3.42pH 11
3.44pH 9

TBARS Measurements from Marinated Fillets
4.464.171.99pH 11
3.73.921.76pH 9
TBARS (Day 4)
TBARS (Day 2)
TBARS (Day 0)
Normal
3.934.062.07pH 11
4.783.222.17pH 9
TBARS (Day 4)
TBARS (Day 2)
TBARS (Day 0)
Pale
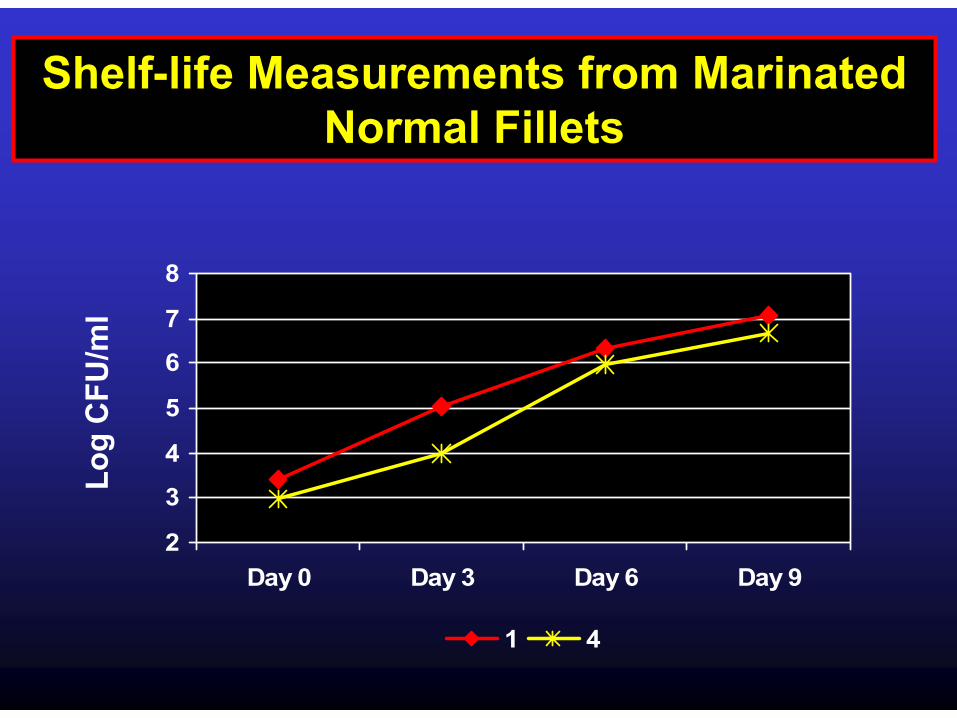
Shelf-life Measurements from Marinated Normal Fillets
Log
CFU
/ml
2
3
4
5
6
7
8
Day 0 Day 3 Day 6 Day 9
1 4
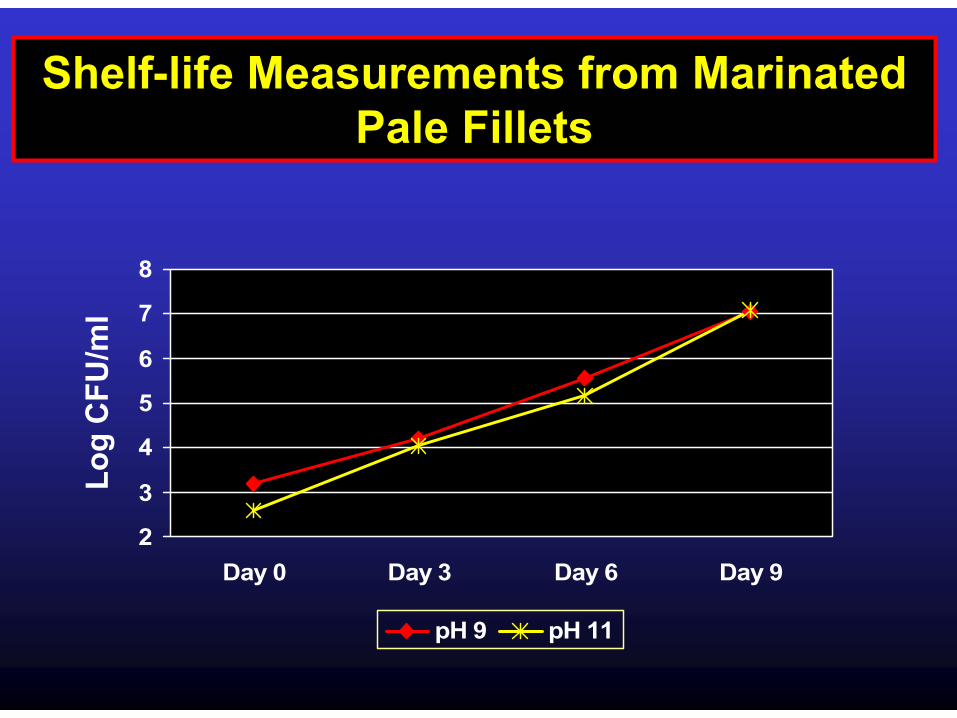
Shelf-life Measurements from Marinated Pale Fillets
2
3
4
5
6
7
8
Day 0 Day 3 Day 6 Day 9
pH 9 pH 11
Log
CFU
/ml
Conclusion
High pH phosphatesIncreased pHDecreased Cook lossImproved color by 24 h PM
Impacts to industry: higher yield, increased consumer acceptability

Strategies to Improve PSE Meat
Sort meat based on color or meat pH
• direct PSE meat to “non-problem” products
• away from products with no or low amounts of salts and phosphates

Sorting Breast Fillets
Based on Color
• easy and rapid• human eye• optical scanning equipment
Based on Meat pH
• more complicated• currently used in pork and beef industry

Conclusions
Long-term strategies
• genetic typing• screening tests• selective breeding
Short-term strategies
• reduce environmental stress• sort meat• control flow/distribution of PSE meat

Questions?
Christine Alvarado, Ph.D.International Center for Food Industry Excellence
Animal and Food SciencesTexas Tech University