Urban green spaces enhance carbon sequestration and ...
158
Zentrum für Entwicklungsforschung Urban green spaces enhance carbon sequestration and conserve biodiversity in cities of the Global South case of Kumasi, Ghana Inaugural – Dissertation Zur Erlangung des Grades Doktor der Agrarwissenschaften (Dr. agr.) der Landwirtschaftlichen Fakultät der Rheinischen Friedrich-Wilhelms-Universität Bonn von Bertrand Festus Nero aus Nandom, Ghana Bonn 2017
Transcript of Urban green spaces enhance carbon sequestration and ...
Zentrum für Entwicklungsforschung
Urban green spaces enhance carbon sequestration and
conserve biodiversity in cities of the Global South
case of Kumasi, Ghana
Inaugural – Dissertation
Zur
Erlangung des Grades Doktor der Agrarwissenschaften
(Dr. agr.)
der Landwirtschaftlichen Fakultät
der Rheinischen Friedrich-Wilhelms-Universität Bonn
von
Bertrand Festus Nero
aus Nandom, Ghana
Bonn 2017

Referent: Prof. Dr. Christian Borgemeister
Korreferent: PD Dr. Christine B. Schmitt
Tag der mündlichen Prüfung: 21.12.2016
Angefertigt mit Genehmigung der Landwirtschaftlichen Fakultät der
Rheinischen Friedrich-Wilhelms-Universität Bonn
i
ABSTRACT
Urbanization has the propensity to alter ecosystems, enervate ecosystem function and possibly jeopardise human wellbeing. While adequate integration of nature into the city landscape can pragmatically ameliorate urban environmental challenges, particularly those related to climate change and ecosystem degradation, in the developing regions, especially in Africa, urban green spaces (UGS) are hardly planned for and their ecosystem services unquantified and hence misappropriated. This study analyses 1) the spatio-temporal dynamics and distributional equity, 2) carbon sequestration potential, and 3) biodiversity patterns of UGS in Kumasi metropolis, Ghana. Direct ecosystem assessment (inventory and survey) and remote sensing techniques were adopted in this study. The vegetation cover of Kumasi is about 33 % and is declining fourfold faster in recent years (2009 – 2014) than previously (986 – 2001). Per capita UGS area for 2009 and 2014 are significantly correlated with the socio-economic conditions of submetropolis. The green area stores about 3758.1 Gg C: equivalent to 270±22 t C/ha per UGS cover or 125.7 ± 8 t C/ha for the entire study area in both soil and vegetation. Exactly 176 tree species in 46 families of both native and exotic origins occur in the city. Carbon stocks and species richness differ significantly across UGS types. Natural forest, public parks, cemeteries and institutional compounds stored more carbon in vegetation whereas soil organic carbon storage was highest in the home gardens, farmlands, plantations, and grasslands. The outer fringes of the city support more species and carbon stocks than the core urban area. Species and trait diversity are important drivers of urban ecosystem productivity (carbon storage). UGS species richness correlated strongly with vegetation carbon storage in the city. UGS are carbon sinks and biodiversity reservoirs which can be relevant to climate change mitigation and adaptation as well as the overall wellbeing of urbanites. However, UGS cover is currently plummeting and is threatened by further urbanization processes including rise in population. Maintenance, expansion, and uniform distribution of green spaces in cities should be a priority for planners, national and local governments as well as traditional leaders. It is recommended that urban biodiversity and carbon stocks be integrated into national and regional biodiversity and carbon stock assessments in Africa.
ii
URBAN GREEN SPACES ENHANCE CARBON SEQUESTRATION AND CONSERVE BIODIVERSITY IN THE GLOBAL SOUTH – CASE OF KUMASI, GHANA
KURZFASSUNG
Durch Verstädterung besteht die Tendenz, dass Ökosysteme verändert werden, die Funktion von Ökosystemen geschwächt wird und möglicherweise das menschliche Wohlergehen gefährdet wird. Während eine angemessene Integration von Grünflächen in die Stadtlandschaft bei der Bewältigung der städtischen ökologischen Herausforderungen, besonders in Bezug auf Klimawandel und die Beeinträchtigung des Ökosystems, pragmatisch helfen kann, werden in Entwicklungsgebieten, vor allem in Afrika, kaum städtische Grünflächen (urban green spaces - UGS) geplant. Des Weiteren werden die von UGS geleisteten Ökosystemdienstleistungen zumeist nicht beziffert und demnach in globalen Analysen nicht erfasst. Diese Studie analysiert 1) die räumlich-zeitliche Dynamik und das Verteilungsmuster, 2) das Potential von Kohlenstoffbindung und 3) die biologische Vielfalt und Funktion von UGS im städtischen Großraum von Kumasi, Ghana. In dieser Studie wurden Methoden zur direkten Bewertung des Ökosystems und Fernerkundungstechniken verwandt.
UGS in Kumasi umfassen z.Z. etwa 33 % des städtischen Großraum von Kumasi und diese Fläche schrumpfte in den letzten Jahren (2009 – 2014) viermal schneller als zuvor (1986 – 2001). Die pro Kopf Verteilung von UGS in Kumasi korreliert signifikant mit den dortigen sozioökonomischen Bedingungen. Die Grünflächen speichern etwa 3758,1 Gg Kohlenstoff; im Durchschnitt entspricht dies 270 ± 22 t Kohlenstoff / ha UGS oder 125,7 t Kohlenstoff / ha im gesamten Untersuchungsgebiet, sowohl in Form von Böden als auch Vegetation. Im Großraum Kumasi kommen 176 verschiedene Baumarten aus 46 heimischen und nicht-heimischen Familien vor. Kohlenstoffbestände und Artenvielfalt unterscheiden sich strak in Abhängigkeit des Typus von UGS. Reste natürlichen Waldbestandes, öffentliche Parks, Friedhöfe und Bäume auf dem Gelände von öffentlichen Institutionen speicherten mehr Kohlenstoff in der Vegetation, wobei der organische Kohlenstoffspeicher in privaten Gärten, auf Feldern, Plantagen und Grasflächen am höchsten war. Stadtrandgebiete haben eine höhere Biodiversität und speichern mehr Biomasse als der innenstädtische Bereich. Arten- und phenotypische Vielfalt haben einen grossen Einfluß auf die Funktion städtischer Ökosysteme. Das Ausmaß der Artenvielfalt in städtischen Grünflächen steht im engen Zusammenhang mit dem Kohlenstoffbestand in der städtischen Vegetation.
Städtische Grünflächen sind wichtige Kohlenstoffspeicher und Quellen der biologischen Vielfalt, die für die Vermeidung von und Anpassung an Klimawandelfolgen und das allgemeine Wohlergehen von Städten sehr relevant sind. Allerdings gefährdet das rapide Bevölkerungswachstum und die zunehmende Urbaniserung die existierenden städtischem Grünflächen in Afrika. Instandhaltung, Erweiterung und auch eine verbesserte und gerechtere Verteilung von städtischen Grünflächen sollten für Städteplaner, Landesregierungen, Lokalverwaltungen und traditionelle Führer eine Priorität darstellen.
iii
LIST OF ACRONYMS AND ABBREVIATIONS AGB Aboveground biomass AGC Aboveground carbon BA Basal area BGB Belowground biomass BGC Belowground carbon BS Broken-stick model C Carbon CA Correspondence analysis CBD Convention on Biological Diversity CI Confidence Interval DBH Diameter at breast height (1.3 m above ground) EF Ecological footprint ESS Ecosystem services FAO Food and Agriculture Organization of the United Nations GHG Greenhouse gas GI Gini index GS Geometric series model HDUZ High density urban zone HH House hold HQI Housing Quality Index ICT Institutional Compound trees KMA Kumasi metropolitan assembly KNUST Kwame Nkrumah University of Science and technology LDUZ Low density urban zone LN LogNormal NDVI Normalized difference vegetation index NIR Near infra-red PCA Principal Component Analysis R Red RMSE Root mean square error SDG Sustainable development goals SOC Soil organic carbon SOM Soil organic matter UGS Urban green spaces UN United Nations WRB World resource base
iv
TABLE OF CONTENTS
ABSTRACT ............................................................................................................i
KURZFASSUNG …............................................................................................... ii
LIST OF ACRONYMS AND ABBREVIATIONS …………………………………………………… iii
1 GENERAL INTRODUCTION ................................................................................. 1
1.1 Background and problem statement ................................................................ 1
1.2 Objectives .......................................................................................................... 3
1.3 Hypothesis ......................................................................................................... 4
1.4 Scope of the study ............................................................................................. 5
1.5 The organization of the study ........................................................................... 5
2 GROWING URBANITIES, CLIMATE CHANGE RESILIENCE AND URBAN GREEN SPACE MANAGEMENT IN AFRICA ...................................................................... 7
2.1 Introduction ....................................................................................................... 7
2.2 Methodology and approach .............................................................................. 8
2.3 Urban population growth in Africa.................................................................... 8
2.3.1 Historical background ........................................................................................ 9
2.3.2 Current urbanization trends in Africa ................................................................ 9
2.3.3 Causes of urban population growth ................................................................ 11
2.3.4 Side effects of urbanization: poverty and cultural erosion ............................. 11
2.3.5 Urbanization impacts on quality of life and health ......................................... 13
2.4 Environmental impacts of urbanization .......................................................... 14
2.4.1 Urban land expansion and land-use change ................................................... 14
2.4.2 Resource consumption and greenhouse gas (GHG) emissions ....................... 17
2.4.3 Addressing climate change: Mitigation and adaptation opportunities .......... 18
2.5 Green space management and adaptation to climate change in Kumasi ...... 19
2.5.1 Background ...................................................................................................... 19
2.5.2 Climate change and adaptation ...................................................................... 20
2.5.3 Green space management issues and urban resilience .................................. 22
2.6 Conclusion ....................................................................................................... 27
3 URBAN GREEN SPACE DYNAMICS AND SOCIO-ENVIRONMENTAL (IN-) JUSTICE IN KUMASI, GHANA ......................................................................................... 28
3.1 Introduction ..................................................................................................... 28
3.2 Methodology ................................................................................................... 30
3.2.1 Study area ........................................................................................................ 30
v
3.2.2 Land cover change detection procedures ....................................................... 31
3.2.3 Socio-economics and vegetation distribution in Kumasi ................................ 35
3.2.4 Inequality in vegetation distribution ............................................................... 36
3.2.5 Statistical analysis ............................................................................................ 37
3.3 Results ............................................................................................................. 37
3.4 Discussion ........................................................................................................ 51
3.4.1 Green space decline and urban sprawl ........................................................... 51
3.4.2 Green space composition and distribution ..................................................... 53
3.4.3 Green space distribution and equity ............................................................... 55
3.5 Conclusion ....................................................................................................... 59
4 BELOW AND ABOVEGROUND CARBON STORAGE IN KUMASI, GHANA: DOES GREEN SPACE TYPE MATTER? ......................................................................... 61
4.1 Introduction ..................................................................................................... 61
4.2 Materials and methods ................................................................................... 63
4.2.1 Study area ........................................................................................................ 63
4.2.2 Vegetation sampling and aboveground carbon estimation ............................ 64
4.2.3 Soil sampling and carbon measurements ....................................................... 69
4.2.4 Statistical analysis ............................................................................................ 70
4.3 Results ............................................................................................................. 70
4.3.1 Vegetation carbon ........................................................................................... 70
4.3.2 Soil carbon ....................................................................................................... 74
4.3.3 Total ecosystem carbon................................................................................... 77
4.4 Discussion ........................................................................................................ 78
4.5 Conclusion ....................................................................................................... 83
5 TREE AND TRAIT DIVERSITY, COEXISTENCE AND DIVERSITY-FUNCTIONAL RELATIONS OF GREEN SPACES IN KUMASI ...................................................... 85
5.1 Introduction ..................................................................................................... 85
5.2 Methodology ................................................................................................... 87
5.2.1 Study area ........................................................................................................ 87
5.2.2 Sampling procedure ........................................................................................ 87
5.2.3 Species richness and diversity estimation ....................................................... 87
5.2.4 Correspondence analysis ................................................................................. 89
5.2.5 Model fitting .................................................................................................... 90
5.2.6 Life history traits .............................................................................................. 92
5.3 Results ............................................................................................................. 92
5.3.1 Species richness ............................................................................................... 92
5.3.2 Comparison of UGS species composition (Beta diversity) .............................. 96
5.3.3 Species abundance distribution model for species co-existence ................. 100
vi
5.3.4 UGS tree diversity and function .................................................................... 104
5.3.5 Plant traits and biomass accretion ................................................................ 105
5.4 Discussion ...................................................................................................... 106
5.4.1 Species diversity in green spaces and different urban zones ....................... 106
5.4.2 Comparison with regional species richness and diversity ............................. 109
5.4.3 Species abundance distribution and species coexistence............................. 110
5.4.4 Urban green space diversity and function .................................................... 111
5.4.5 Ecological importance of urban tree diversity .............................................. 113
5.5 Conclusion ..................................................................................................... 113
6 GENERAL CONCLUSIONS, RECOMMENDATIONS AND FUTURE RESEARCH .. 116
7 REFERENCES ................................................................................................... 120
8 APPENDICES ................................................................................................... 133
ACKNOWLEDGEMENT .................................................................................................. 149
1
1 GENERAL INTRODUCTION
1.1 Background and problem statement
Urbanization is a major driver of global change: driving land use change, habitat
loss, biodiversity decline, climate change, and pollution both within and outside the city
(Grimm et al. 2008; Mcdonald et al. 2008; Pickett et al. 2008; Seto et al. 2012). Through
their savaging resource consumption, waste generation and enormous greenhouse gas
(GHG) emission, cities strongly influence ecological processes and biogeochemical cycles
as well as alter regional and global climate and biodiversity. Cities and climate change
feedback on each other in complex ways and together exert synergistic debilitating
effects on ecosystems and biodiversity. However, cities can be instrumental in reducing
climate change impacts and biodiversity loss, both locally and regionally. It is the target
of the sustainable development goal (SDG) for cities (No. 11, make cities and human
settlements inclusive, safe , resilient and sustainable) to reduce environmental impact
of cities, provide universal access to green and public spaces for all, and preserve
nature/environment networks in cities and their environs.
Among the many alternatives to conserve biodiversity, mitigate climate change
and adapt to its impacts as well as address the multi-faceted challenges of cities are
nature-based solutions (NbS): actions inspired by, supported by or copied from nature
(European Commission 2015). Nature based solutions aim at enhancing sustainable
urbanization, restoring degraded ecosystems, supporting climate change mitigation and
adaptation, and improving risk management and resilience. They are energy and
resource efficient, resilient to change, but must be adaptable to local conditions to be
successful. They also offer multiple co-benefits for health, the economy, society and the
environment (European Commission 2015). Green infrastructure/spaces, a classic form
of NbS, have quite a long history in urban planning and in resolving urban environmental
challenges (Benedict and McMahon 2002; Firehock 2010) although evidence of the
effectiveness and implementation of NbS is still scanty.
2
A burgeoning wealth of literature exist on the functions and to some extent
the processes underpinning the existence of urban nature but mainly from cities in the
global north. In particular, the role of urban green spaces (UGS, or vegetation) in
adapting to and partially mitigating climate change and its impacts (Jo and McPherson
2001; Jo 2002; Nowak and Crane 2002; Pouyat et al. 2006; Davies et al. 2011; Strohbach
and Haase 2012; Edmondson et al. 2012; Edmondson et al. 2014) and averting
biodiversity loss (Alvey 2006; Pickett et al. 2008) have been thoroughly examined.
Biodiversity and nature conservation in cities can contribute to protecting the climate
by avoiding emissions and capturing carbon in plants and soil and support adaptation to
climate change (Natural Capital Germany-TEEB DE 2015). In recent years, emphasis on
urban biodiversity studies have shifted from merely understanding the spatio-temporal
dynamics and drivers of species richness/diversity patterns (Balmford et al. 2001; Araújo
2003; Hope et al. 2003; Kinzig et al. 2005; Faeth et al. 2011; Elmqvist et al. 2013) to
establishing how modifications in species and trait states of urban species (Knapp et al.
2008a; Knapp et al. 2008b) affect ecosystem function. Meanwhile ecosystem services
from UGS have been well elaborated (Bolunds and Hunhammer 1999; Tzoulas et al.
2007; Coutts and Hahn 2015).
Nevertheless, the global skewness and paucity of knowledge about NbS to
urban environmental problems in the global south are well acknowledged (Aronson et
al. 2014; Fischer et al. 2016). Since developing countries are still in the process of rapid
urbanization, there are rife opportunities to construct cities with sufficient green cover,
to protect sensitive ecological zones, and avoid or minimize environmental challenges
confronting already established cities.
Africa, which is billed to become considerably more urbanized in the near
future, is characterized by severe poverty (slums) (Chen and Ravallion 2007; Baker
2008), high vulnerability to climate change related hazards (heat waves, desertification,
floods, droughts, diseases i.e. malaria), compounded by uncontrolled population growth
and unplanned urban land expansion (Giugni et al. 2015). Consequently, dependence on
3
urban nature for sustenance is high (Cilliers et al. 2013; Zérah and Landy 2013) and
overexploitation of resources in the hinterlands is accelerating degradation and
desertification. Some evidence that UGS (urban nature) can aid coping with and partially
attenuate climate change impacts (Lindley et al. 2015) and biodiversity loss/modification
(van Rensburg et al. 2009; Seto et al. 2012; Aronson et al. 2014) already exist. However,
considering the wide socioeconomic, geopolitical, and ecogeographic disparities in
African cities, more evidence is needed to set the context appropriately. The amount of
ecosystem services and disservices from UGS can be linked to the biological diversity,
extent (cover), composition and distribution of UGS, which in most African cities are
fraught with uncertainties. These uncertainties impede adequate planning and
management of UGS and undermines comprehension of biodiversity patterns and
functional capacity of urban ecosystems in developing countries. The present study
attempts to portray the relevance of incorporating nature/green spaces into cities in the
global south in the light of biodiversity conservation and climate change mitigation and
adaptation using remote sensing and ecosystem inventory techniques in Kumasi, Ghana.
Green spaces are not just recreational spaces or aesthetic artefacts, but also important
embodiments of biological diversity and several ecosystem services (ESS) such as carbon
sinks.
1.2 Objectives
The goal of this study is to assess the extent, composition, distribution and
function of green spaces in Kumasi, Ghana. The specific objectives included; to
1. map and examine the spatio-temporal dynamics of UGS at a citywide scale.
2. map the distribution and analyze the carbon storage potential of UGS at a
citywide scale
3. analyze the impacts of urbanization on the diversity, co-existence and diversity-
productivity relations of tree species in the UGS of Kumasi, Ghana.
4
1.3 Hypothesis
Cities support a wealth of plant diversity in UGS which can be sufficient to
partially sequester some of the GHGs they emit and enhance environmental
sustainability.
Premises
- The theoretical background of the study denotes that sufficiently providing for UGS
in cities is an optimal and efficient means to sustainably supply ecosystem services
to meet the wellbeing of urban inhabitants.
- It is assumed that urban areas support a variety of UGS types which in turn contain
a wealth of plant diversity unique to the city in terms of species, trait, adaptability
and function and which together diversify the ESS they deliver.
- Regions yet to undergo considerable urbanization, present the greatest
opportunities to ensure nature is adequately integrated into the urban fabric, both
morphologically and physiologically.
- Several scientific studies underscore the capability of cities to combat local climate
change crisis, attenuate global biodiversity loss, and boost urban sustainability but
the evidence is insufficient and regionally skewed.
The sub-hypothesis include:
1. The luxury effect hypothesis (Hope et al. 2003) – the distribution of vegetation or
green cover within the city depends on the socioeconomic status of the suburbs
(submetropolis).
2. Urban tree species/trait diversity and carbon sequestration depend on the UGS
type and urban zone in the city.
5
1.4 Scope of the study
The urban landscape is a complex socio-ecological system in which the ecological
subsystem is subdued by the social subsystem (processes and influence) in its
morphological expression locally. In other words, urban landscapes are the most human
dominated ecosystems on earth and occur at one extreme end of a continuum of
ecosystems (prestine to urban): so arranged to depict the increasing degree of human
influence (Collins et al. 2000; Grimm et al. 2000). Consequently, most solutions to urban
environmental challenges are technically engineered and socially oriented. This study
digresses from this worldview to embrace nature into the fabric of the city as a solution
to urban environmental challenges. It is common knowledge that green spaces are
synonymous to public parks, exploited for their recreational, health and scenic benefits.
Here, the horizon is stretched to encompass private lots and cultural sites. The study
assumes that UGS vary in extent, composition, distribution, and perform several
functions. It further assumes that the species and trait diversities of the urban landscape
are regionally unique and inherent in its socio-ecological origins. It is acknowledged that
carbon storage in vegetation and soils in cities is 1) only a petite part of the measures of
carbon mitigation in cities and 2) does not complete the carbon budget of the city.
1.5 The organization of the study
The organization of the thesis is as follows. The trends and consequences of
urbanization in Africa with a special section on UGS management challenges and
adaptation to climate change issues in Kumasi, Ghana are discussed in chapter 2.
Chapter 3 addresses the dynamics of UGS in the study area: highlighting the spatial and
temporal fates, possible distributional injustices and the composition of UGS in Kumasi.
This is followed by a comprehensive analysis of vegetation and soil carbon stocks and
carbon mapping in Kumasi, Ghana in chapter 4. Chapter 5 discusses tree diversity
patterns among UGS types and urban zones in Kumasi: seeking to unearth the principles
underlying species coexistence and ecosystem productivity at varying scales. Chapter 6

6
concludes and summarizes the findings of the study with special dedication to the
outlook on future research. Reference section and the appendices are the final add-ons
to the thesis.
7
2 GROWING URBANITIES, URBAN CLIMATE RESILIENCE AND URBAN GREEN SPACE MANAGEMENT IN AFRICA
2.1 Introduction
Besides rapid urbanization processes, cities in Africa are characterized by high
informality and poverty, high vulnerability to climate related disasters, relatively high
GHG emission rates, and low infrastructure, hence rife opportunities exist for African
cities to develop effective adaptive measures to cope with climate change (Taylor and
Peter 2014).
Mitigating and adapting to climate change entails reducing GHG emission rates.
Three principles to aid the creation of a carbon-neutral future which can be adapted to
cities include: 1) planning (at city and national level) for a low-carbon future, 2)
developing policies that trigger changes in investment patterns, technology, and
environmental behavior of urbanites, and 3) protecting the interest of the heavily
affected urban poor (Fay et al. 2015).
An important action to mediate a carbon-neutral future and engender climate
resilience in urban areas is improving carbon sinks (e.g. vegetation and soils; IPCC 2013).
In cities in Africa, protecting, conserving, and managing green spaces within the city
matrix and along sensitive ecological zones offer numerous ecosystem services including
reduced flash floods and heatwave impacts, improved air quality, carbon sequestration,
food security.
However, whether urbanization in Africa is an opportunity for or catastrophic to
Africa’s urban climate resilience remains nebulous. Thus, this chapter discusses 1) urban
population and land expansion patterns in Africa in the light of climate change and 2)
climate change adaptation, resilience, and green space management constraints in
Kumasi, Ghana.
8
2.2 Methodology and approach
These objectives were pursued by, first, compiling and analyzing national
urban population data for the entire Africa to put Africa’s current urban population
growth in context. Second, studies with a focus on urban land expansion using remote
sensing were reviewed to provide insights on urban land dynamics on the continent.
Cities were grouped into three based on their population size: mega (≥ 10 million),
medium (1 - < 10 million) and small (<1 million) inhabitants. Total area of the city, change
in built-up area, change in green space area, and duration of the study (or period during
which change occurred) were extracted from these studies. Rates of growth in urban
land area and per capita green space area for each city considered were calculated. The
criteria for the selection of a city was based on the availability of published land
cover/land use and population growth data. The UGS dynamics data were evaluated and
complemented with literature reviews on urbanization impacts on climate change and
the well-being of urbanites. Third, a resilience matrix was applied at an elicitation
workshop involving academics from Ghana based at Center for Development Research
(ZEF), University of Bonn, during which responses to how different UGS management
may contribute to urban climate resilience in Kumasi, Ghana were obtained. Current
adaptation strategies to climate change in Kumasi were also reviewed.
2.3 Urban population growth in Africa
About 54 % of the world’s population now lives in urban areas, and all projections
signal a world that will get more urban. Africa, which was without Western-styled cities
at the onset of the 20th century, currently accounts for 12 % of the world’s urban
population. From 10 % in the 1950s, Africa’s urban population amplified steadily to 40
% (439 million) today and is projected to reach 56 % (1.1 billion) by 2050. The numbers
of megacities and medium-sized cities are expected to, respectively, double and
quadruple by 2030 (United Nations 2014). Hosting 25 % of the world’s fastest growing
cities, behind only Asia with 50 %, Africa will become the fastest urbanizing continent
9
between 2020 and 2050 (Satterthwaite 2007; United Nations 2014). Hence, Africa’s
urban population will constitute 21 % of the world’s urban population by 2050.
2.3.1 Historical background
As early as 3200 B.C., large settlements already existed in Africa, initially confined
to North Africa and later spreading to sub-Saharan Africa (SSA) (Özden and Enwere
2012). Ancient urban centers and peri-urban areas were characterized by their ability to
produce agricultural surplus, specialized craftsmen, and monumental architecture
(Coquery-Vidrovitch 2005). However, compared to contemporary urban centers, cities
in ancient Africa were rare, low in population, small in size, and indigenous in character
but nonetheless vibrant politically, economically, and socially.
Contact with Arab and later European merchants and missionaries fostered the
rapid spread and development of cities (Kitto 2012). Colonization, economic expansion
and international politics changed the face of African cities, introducing new
technologies, and creating economic opportunities that stimulated the attractiveness of
these cities. Indeed, the history, shape and character of most African cities today can be
traced to colonial city plans, designs, function, and policies (Watson and Agbola 2013).
For instance, urban plans for Lusaka, Zambia and Kumasi, Ghana were based on
Howard’s “Garden City” concept – the archetypical car-oriented elitist European city
(Quagraine 2011; Watson and Agbola 2013). However, such colonial master plans did
not anticipate the sprawl that has redefined the shape and configuration of modern
African cities.
2.3.2 Current urbanization trends in Africa
Cairo, Egypt; Lagos, Nigeria; and Kinshasa, DR Congo are the only megacities (≥
ten million inhabitants) on the continent and contribute 15 % of the urban population.
About 66 % of Africa’s urban population lives in cities with 1–5 million people (UN-
Habitat 2014). Of these, 16 cities are in West Africa (e.g. Kano, Dakar, Accra, Abidjan),
10
nine in southern Africa (e.g. Johannesburg, Maputo, Harare and Lusaka), seven in each
of North (e.g. Fes, Tripoli, Algiers, Rabat), East (e.g. Dar es Salaam, Nairobi, Addis Ababa,
Antananarivo) and four in Central Africa (e.g. Doula, Yaoundé, Brazzaville, Mbuji). Small
cities (< one million inhabitants) are generally regarded as the fastest growing cities in
the world (2.4–6 % per annum) (United Nations 2014).
Although Africa remains the least urbanized continent, sub-regional variations
are wide. Excluding Mozambique, Zambia and Zimbabwe, southern Africa is the most
urbanized subregion with 61 % of the population living in urban areas, followed by North
Africa with 51 %. In Central and West Africa the share is about 44 %, higher than in East
Africa where it is 25 % (United Nations 2014).
Most of the urban population is concentrated in coastal areas (e.g. Gulf of
Guinea), alluvial plains (e.g. Nile River) or lacustrine plains (e.g. Lake Victoria).
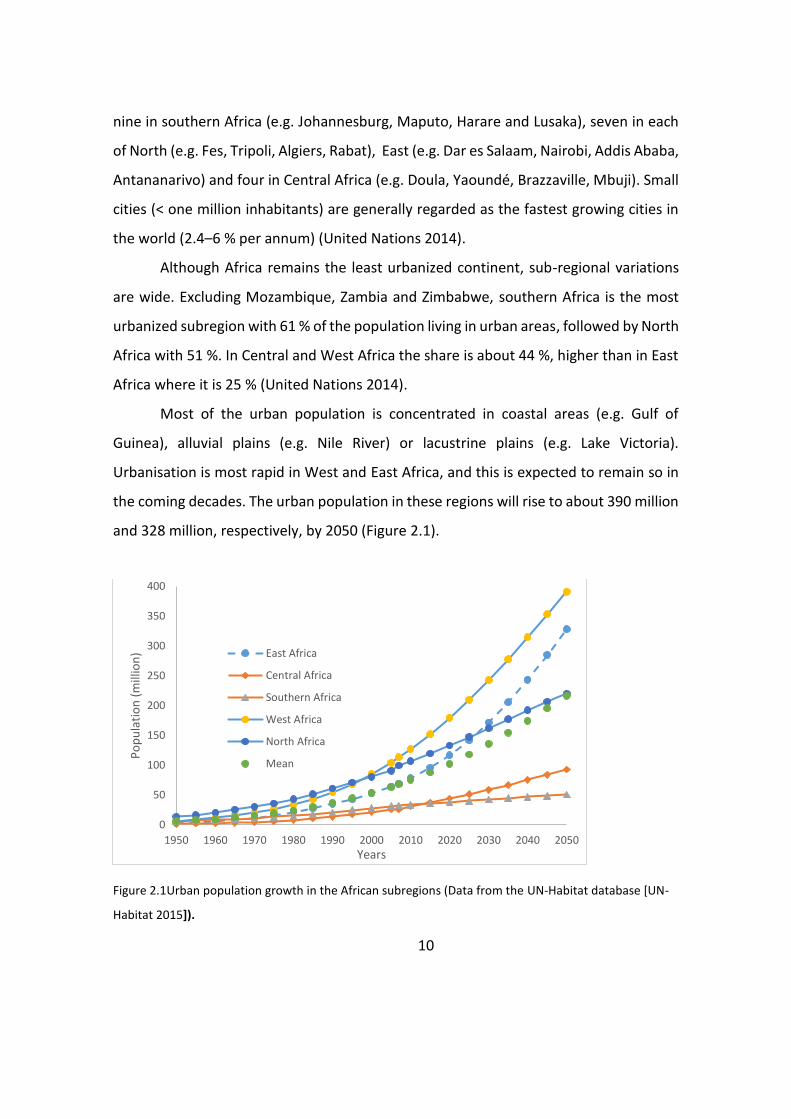
Urbanisation is most rapid in West and East Africa, and this is expected to remain so in
the coming decades. The urban population in these regions will rise to about 390 million
and 328 million, respectively, by 2050 (Figure 2.1).
Figure 2.1Urban population growth in the African subregions (Data from the UN-Habitat database [UN-
Habitat 2015]).
0
50
100
150
200
250
300
350
400
1950 1960 1970 1980 1990 2000 2010 2020 2030 2040 2050
Po
pu
lati
on
(m
illio
n)
Years
East Africa
Central Africa
Southern Africa
West Africa
North Africa
Mean
11
2.3.3 Causes of urban population growth
Urbanization in Africa has been attributed to rural-urban migration. Demand for
labor during the primordial industrialization era propelled the exodus of the rural
inhabitants into towns and cities (Caldwell 1969). Additionally, civil unrest and violence
due to political instability, natural disasters provoked by climatic events (e.g. drought
and flood-driven famine), excommunication of individuals from tribal life, and desire to
taste urban life triggered rural-urban migration (Caldwell 1969; Satterthwaite 2007;
Henderson 2014).
Natural increases through high birthrates and reclassification of rural areas as
urban areas now provide the most noteworthy explanations of the current urbanization
patterns in Africa (Kessides and Street 2006; Potts 2012). The availability of better health
care systems in the cities has increased natality while reducing mortality rates. In
resource-endowed countries like Ghana, Ivory Coast or Nigeria, proceeds from the
export of natural resources are disproportionately invested in developing urban goods
and services, which further spurs urbanization (Jedwab 2012).
However, due to lack of opportunities in the cities, high living costs and cultural
discomfort of migrants, rural-urban migration is plummeting (Beauchemin 2011; Potts
2012). In Burkina Faso and Ivory Coast, for instance, counter-urbanization processes
have been detected (Beauchemin 2011). Nevertheless, inter and intra city mobility
among urbanites remains widespread (Simone 2011). The question is how will
urbanization in Africa influence urban life economically, socially, culturally, and
environmentally?
2.3.4 Side effects of urbanization: poverty and cultural erosion
The number of urban poor (income below USD 2.15 per day) is rising even faster
than the global urban population (Chen and Ravallion 2007). About 72 % of Africa’s
urban population lives in slums and represents the most prevalent and fastest growing
12
group of poor people in the world. About 40 % of Africa’s urban population currently
live below the poverty line (<USD 1.08 per day) and will likely remain so by 2050 (Chen
and Ravallion 2007; Baker 2008). As a consequence, Africa’s urbanization is
characterized by inadequate asset base (e.g. infrastructure), unavailability and uneven
access to services, amenities, education and human capital development, and worsening
environmental conditions (Satterthwaite 2001; Kessides and Street 2006; Baker 2008).
Thus, African cities are not the engines of economic growth, characteristic of cities on
other continents, but instead are a cause and a major symptom of economic crises
(World Bank 2000). This situation arises out of scarcity in development opportunities
and high proportion of unskilled labor. Interestingly, most cities are primarily centers of
administrative and political power, and require skilled manpower.
Although not thoroughly researched, the majority of Africa’s urban poor
seemingly live in East, Central, and West Africa (Mabogunje 2005). Country-level studies
indicate that 25 % of the households and 30 % of the population in Mombasa, Kenya live
below the absolute poverty line of <USD 2.15 per day (Rakodi et al. 2000); 50 % of the
population of Maputo, Mozambique is poor, with 30 % characterized as destitute
(Jenkins 2000); 95 % in Kinshasa, DR Congo have low incomes, and 90 % are jobless (Mia
et al. 2014).
The westernization of African cities exerts strong impacts on cultural values. For
instance, the large extended family system and communal life are giving way to a nuclear
family system, individualism, and an unhealthy scramble for survival as inter-tribal wars
increase in poor urban neighborhoods. An example is Mombasa, Kenya, where frequent
clashes occur between coastal residents and up-country immigrants due to economic
inequality fueled by a political system that is tribally inclined (Rakodi et al. 2000).
Technology and mechanization have replaced the manual and animal traction culture
typical of the region. Organic waste, formerly an important asset as fertilizer, has
become adulterated with non-biodegradable material and a health menace in the cities.

13
These factors notwithstanding, the traditional music and dance culture as well as other
pleasant aspects of the African heritage continue to thrive in cities.
2.3.5 Urbanization impacts on quality of life and health
The high resource consumption in urban areas coupled with the transformation
of nature has triggered the emergence of Urban Heat Island (UHI) effects common in
industrialized cities. This effect refers to the surface temperature differences between
urban and suburban (or rural) areas (Peng et al. 2012), and is attributable to numerous
factors. These include urban land-use and cover patterns, population size, increase in
impervious area (low albedo, high heat capacity), decrease in area covered by
vegetation and water evaporation (decline in evaporative cooling), increased surface
area for absorption of solar radiation due to multi-story buildings, canyon-like heat
trapping structure of high-rise buildings (Grimm et al. 2008), and the broadening long-
wave radiation trap of CO2 in the atmosphere. A recent evaluation of UHI effects in cities
worldwide, including 47 in Africa, revealed differences in day and night temperatures
between urban and suburban areas of 1.5°C and 1.1°C, respectively (Peng et al. 2012).
In Sekondi-Takoradi, Ghana, urban development resulted in 4.3°C in temperature within
17 years (Kumi-Boateng et al. 2015).
Furthermore, sudden heat waves claim numerous lives every year in many cities
in Europe and North America (Gabriel and Endlicher 2011; Walters and Lane 2014).
Rising air pollutant concentrations in cities interact with climate change and UHI leading
to health burdens on cities (Harlan and Ruddell 2011). Outdoor air pollution in African
cities accounts for 49,000 premature deaths annually (UN-Habitat 2008). In Durban,
South Africa, an inventory of GHGs emitted from the transport sector revealed high
concentrations of particulate matter (PM10), NOx, CO and SO2 (Thambiran and Diab
2010). In China, reducing pollution in Beijing during the 2010 Olympics led to a 23-g
weight gain in newborn babies compared to their counterparts born during similar time
periods in previous years (Rich et al. 2015). Indoor air pollution causes between 2.7 and
14
2.8 million premature deaths globally, and is the leading cause of respiratory ailments
among women and children in African slums (UN-Habitat 2008). A clear policy goal in
Africa’s urbanization is required to design and construct decarbonized cities with
improved indoor and outdoor air quality.
Other climate change-related vulnerabilities include the prevalence of
waterborne diseases such as cholera, malaria, dengue and yellow fever (Unger and Riley
2007; WHO 2009), and exacerbated droughts and floods (IPCC 2007). Over 90 % of the
victims of these precipitation-related disasters are the poor living in informal
settlements and slums (ActionAid 2006; Amoako and Boamah 2014).
2.4 Environmental impacts of urbanization
2.4.1 Urban land expansion and land-use change
Globally, urban areas occupy about 3-4 % of the earth surface and are growing
at a rate twice that of the global population (Angel 2011; Seto et al. 2011). With 256
cities and a population of 132 million, urban areas in SSA occupy an area of
approximately 13,000 km2 while those in North Africa with 115 cities and a population
of 53 million occupy an area of 5,342 km2 (Angel 2011). These areas combined are
predicted to increase by 590 % by 2030 (Seto et al. 2011).
Urban expansion occurs unevenly, mostly concentrated along the Guinea coast
of West Africa, the Nile River in Egypt, the northern shore of Lake Victoria in Kenya and
Uganda stretching into Burundi and Rwanda, the Kano region in northern Nigeria, and
greater Addis Ababa in Ethiopia (Seto et. al. 2012). Losses in natural land cover to
urbanization are greatest in East, North, and West Africa and slowest in southern and
Central Africa (Nguh 2013; Sebego and Gwebu 2013; Otunga et al. 2014).
Generally, the mega and medium-sized cities are undergoing the most rapid land
expansion with significantly higher expansion rates of 743 and 620 ha/year, respectively
(Table 2.1). However, small cities with < 1 million inhabitants are numerous and,
therefore, growing fast in terms of their share of the total population (United Nations
15
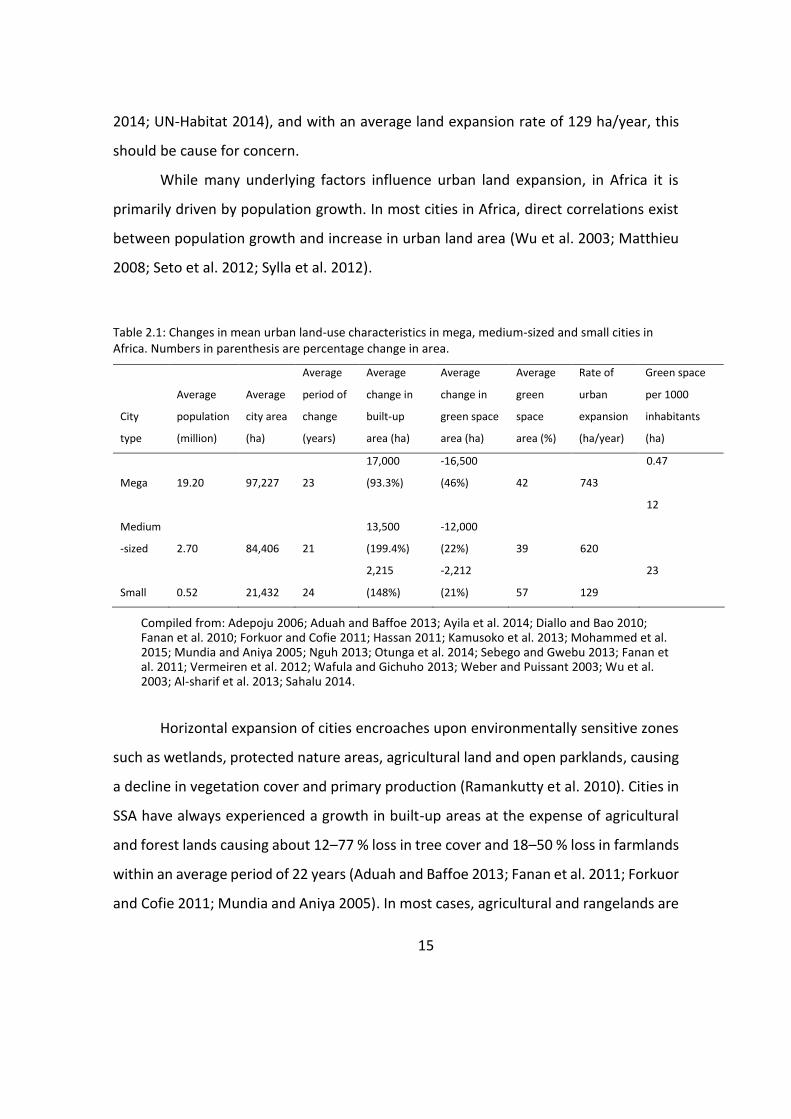
2014; UN-Habitat 2014), and with an average land expansion rate of 129 ha/year, this
should be cause for concern.
While many underlying factors influence urban land expansion, in Africa it is
primarily driven by population growth. In most cities in Africa, direct correlations exist
between population growth and increase in urban land area (Wu et al. 2003; Matthieu
2008; Seto et al. 2012; Sylla et al. 2012).
Table 2.1: Changes in mean urban land-use characteristics in mega, medium-sized and small cities in Africa. Numbers in parenthesis are percentage change in area.
City
type
Average
population
(million)
Average
city area
(ha)
Average
period of
change
(years)
Average
change in
built-up
area (ha)
Average
change in
green space
area (ha)
Average
green
space
area (%)
Rate of
urban
expansion
(ha/year)
Green space
per 1000
inhabitants
(ha)
Mega 19.20 97,227 23
17,000
(93.3%)
-16,500
(46%) 42 743
0.47
Medium
-sized 2.70 84,406 21
13,500
(199.4%)
-12,000
(22%) 39 620
12
Small 0.52 21,432 24
2,215
(148%)
-2,212
(21%) 57 129
23
Compiled from: Adepoju 2006; Aduah and Baffoe 2013; Ayila et al. 2014; Diallo and Bao 2010; Fanan et al. 2010; Forkuor and Cofie 2011; Hassan 2011; Kamusoko et al. 2013; Mohammed et al. 2015; Mundia and Aniya 2005; Nguh 2013; Otunga et al. 2014; Sebego and Gwebu 2013; Fanan et al. 2011; Vermeiren et al. 2012; Wafula and Gichuho 2013; Weber and Puissant 2003; Wu et al. 2003; Al-sharif et al. 2013; Sahalu 2014.
Horizontal expansion of cities encroaches upon environmentally sensitive zones
such as wetlands, protected nature areas, agricultural land and open parklands, causing
a decline in vegetation cover and primary production (Ramankutty et al. 2010). Cities in
SSA have always experienced a growth in built-up areas at the expense of agricultural
and forest lands causing about 12–77 % loss in tree cover and 18–50 % loss in farmlands
within an average period of 22 years (Aduah and Baffoe 2013; Fanan et al. 2011; Forkuor
and Cofie 2011; Mundia and Aniya 2005). In most cases, agricultural and rangelands are
16
the most severely converted, although non-forest areas in Bamako, Mali increased
within a 20-year period due to interland use conversions (Diallo and Bao 2010).
Vegetation loss due to urban land expansion augments and exacerbates climate
change and its impacts. By replacing trees with grey infrastructure, the carbon (C) stocks
in the vegetation and soils are released to the atmosphere via several processes. At an
annual built-up area expansion rate of 340 ha, SSA cities could be emitting about 68,000
t C per year due to urbanization-driven forest loss. It is estimated that urban expansion-
related deforestation in Africa will emit about 490 million t C by 2030 (Seto et al. 2012).
Land-use conversion and their ancillary effects of accumulated CO2 concentrations in
the atmosphere tinker with climate variables, altering precipitation and temperature
patterns at local and regional scales. However, urbanization-driven vegetation loss and
its effects on GHG emissions and climate change require further investigation given the
wide ecological and socioeconomic disparities among African cities.
A slightly divergent view posits that land-use change rather than climate change
may have more acute deleterious thermal effects on urban living. A temperature
simulation study in Addis Ababa, Ethiopia and Dar es Salaam, Tanzania reveals
converting vegetation to a built-up or bare area may lead to small-scale instant 25°C
rises in temperature compared to climate change-related larger-scale temperature
increases of 1 – 2 °C which require several decades to occur (Lindley et al. 2015). Also,
the hard, compacted surfaces characteristic of cities redefine water flow paths within
the landscape, impeding infiltration and facilitating overland flow, which together with
elevated water tables cause frequent flash floods and major flood events (Stephan
Pauleit and Duhme 2000) .
However, urbanisation does not necessarily always exacerbate loss of vegetation
(Pouyat et al. 2006). In arid areas, the environmental conditions of cities resulting from
elevated CO2 emissions, soil nutrient improvements from wastewater irrigation and
organic waste disposal, and higher temperatures can provide better conditions for plant
growth and hence induce city greening.
17
2.4.2 Resource consumption and greenhouse gas (GHG) emissions
A standardized measure of human resource consumption is the Ecological
Footprint (EF). This is a measure of how much biologically productive land actually
sustains a given population of people indefinitely regardless of its location (Rees and
Wackernagel 1996). The EF of cities varies depending on the level of industrial activity.
In Africa, EF and related bio-capacities (an estimate of a system’s biological productive
and waste absorption capacities) of cities are 1.1 global hectares (gha) and 1.4 gha,
respectively, which is well below the global average EF of 2.7 gha and biocapacity of 1.8
gha (GFN, 2010). The lower EF compared to biocapacity values mean that African cities
are consuming within the ecosystem productive capacity and can naturally regenerate.
In other words urban resource demand is sparingly below supply (Wackernagel et al.
2006; Rees and Wackernagel 1996).
By being the predominant source of energy for the African urban population,
particularly the poor, fuelwood and charcoal constitute a major part of the EF of cities
(Razack et al. 2013). About 60 % of African urban households depend on fuelwood for
cooking (AREAP 2011). The fuelwood is obtained from forests in peri-urban and
neighboring hinterlands. In Dar es Salaam, Tanzania, the radius of exploitation areas in
the surrounding forests for timber and charcoal expands at a rate of 9 km/year and 2
km/year, respectively, and causes a reduction in C storage and species richness up to a
radius of 220 km from the city center (Ahrends et al. 2010). Urbanization in Africa is
therefore expected to further exacerbate deforestation in the hinterlands, and weaken
the potential for terrestrial C sequestration and consequently negatively affect the
temperature, relative humidity and precipitation patterns. As urban population and
demand for resources sour in Africa, city EF may soon overshoot bio-capacity,
consequently resulting in unheralded environmental challenges including exacerbated
GHG emissions.
18
2.4.3 Addressing climate change: Mitigation and adaptation opportunities
If managed properly, cities may be both a vice and virtue from a climate change
perspective. By taking advantage of the huge human capital concentrations, cities can
innovatively contribute to mitigating emissions, and provide measures of adaptation
and resilience to climate change (Fong et al. 2014; N. B. Grimm et al. 2008).
In climate change parlance, adaptation refers to proactive adjustments in natural
or human systems in response to actual or expected climatic stimuli, their effects or
impacts, whereas mitigation comprises reactive anthropogenic interventions to reduce
the sources or enhance the sinks of GHGs (IPCC 2001). Ultimately, both aim at
minimizing the undesireable effects of climate change, and therefore an effective
response should explore the two simultaneously (Parker-Flynn 2014).
Adaptation strategies are best linked to life style and policy choices. In the
context of climate change in African cities these include: avoiding human habitations in
flood-prone areas (includes relocation etc.), building high walls around houses,
constructing drains and channels to redirect flood water, maintaining adequate tree
cover for shade, cooling, filtering air pollutants and enhancing subsurface runoff, and
constructing well-ventilated housing to improve the indoor microclimate and minimize
waterborne diseases and indoor pollution.
Mitigative strategies include reducing travel distances within cities, promoting
public transport systems (i.e. fewer cars on the roads), and improving fuel-use efficiency
of vehicles (Stockholm Environment Institute 2013). Fitting vehicles with air pollution
filters, increasing the number of diesel-powered vehicles and decreasing that of petrol-
powered vehicles, and the use of diesel particulate filters are among other alternative
measures that could reduce emission and pollution levels in African cities (Kennedy et
al. 2010). Maintaining dense and compact cities (Kennedy et al. 2010; Makido et al.
2012), and the culture of hiking and cycling in cities (Thambiran and Diab 2010) could
minimize transport emissions. Using alternative sources of energy and implementing
improved waste management approaches are also options to reduce emissions and
19
subsequently impacts on climate change and the wellbeing of urbanites. Sequestration
of carbon in urban trees, soil (Nowak and Crane 2002; Pouyat et al. 2006; Davies et al.
2011; Strohbach and Haase 2012), landfills, buildings/furniture and in people (Churkina
et al. 2010). However, the majority of these adaptation and mitigation measures, while
promising, lack empirical backing, and should be the bases for future research.
2.5 Green space management and adaptation to climate change in Kumasi
2.5.1 Background
Kumasi metropolis is the second largest and fastest growing city in Ghana with a
land area of 254 km2 inhabited by approximately 2.5 million people. The population
density is about 8,000 persons per km2 with an annual growth rate of 4.8 % (Ghana
Statistical Service 2012; KMA 2013). Not only is Kumasi a central point for transiting
travelers from within and beyond the borders of the country, the largest open market
in West Africa is also located here, thus making the city an economic hub (Adarkwa
2011).
Urban Kumasi in the early 19th century had a population of about 1,500
concentrated on a land area of about 2 km2 (Amoako and Korboe 2011). Its growth and
development took place after the Asante Kingdom was defeated by the Britains in the
late 19th century who subsequently developed a Western infrastructure in the town.
The establishment of a railway system opened Kumasi to merchants from the coastal
belt while brisk trade, cocoa boom, and establishment of offices fostered new and
refined infrastructural development beyond the town’s boundary. By 1950, Kumasi's
land area had expanded to 25 km2, and has since swelled to its present size and
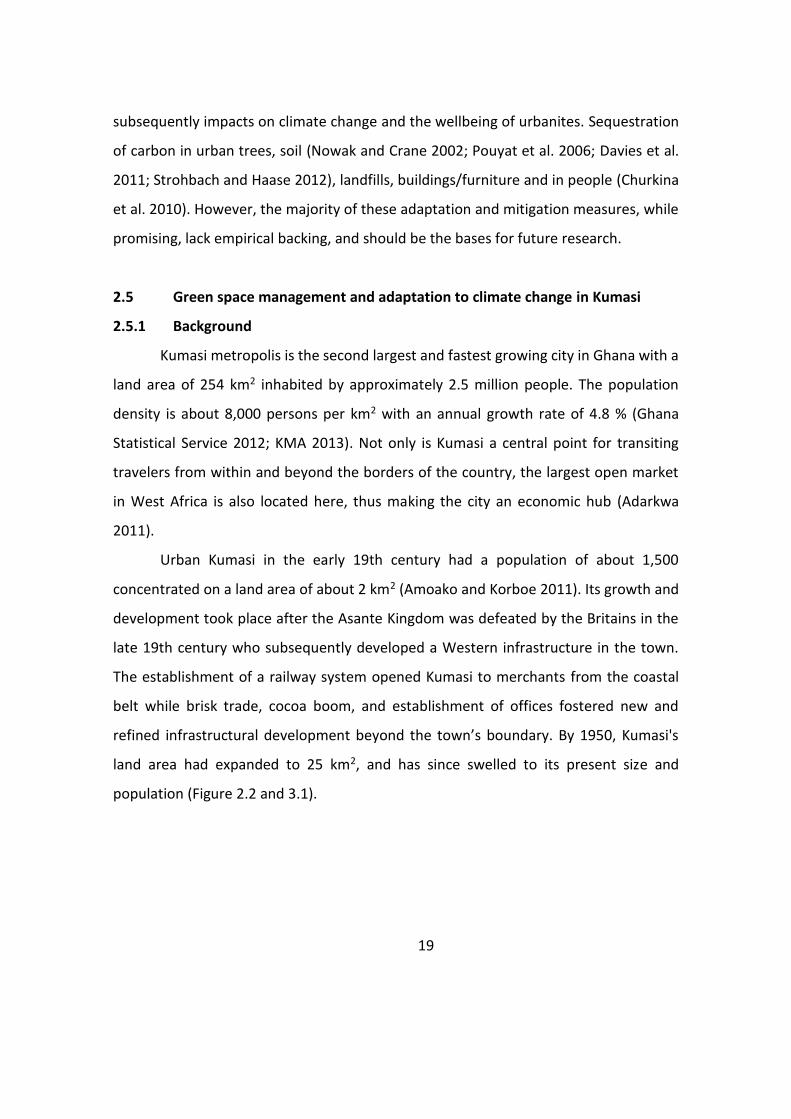
population (Figure 2.2 and 3.1).
20
Figure 2.2 Population and cumulative number of registered cars in Kumasi metropolis, Ghana, since 1995 Data source:(DVLA 2014).
2.5.2 Climate change and adaptation
The explosion in population led to major land use transformations.
Consequently, Kumasi, once dubbed “Garden City” of West Africa because of its lush
vegetation cover (90 % in the 1970s and earlier), has witnessed its green cover decline
over the years to about 50 % (Quagraine 2011; Campion 2012) mainly due to conversions
to build-up and other grey infrastructure. It is worthy to note that biomass energy
supplies 64 % of the total energy consumed in Ghana (FAO 2009) and the continues
massive dependence on fuelwood for cooking in Ghanaian cities (Ghana Statistical
Service 2012), will further exacerbate deforestation in the hinterlands and CO2
emissions. Already, due to progressive hikes in vehicular usage (Figure 2.2), Kumasi’s
transport sector GHG emissions (97.6% of which is CO2) increased from 665,000 to
860,000 t at a rate of 39, 000 t/year between 2000 and 2005 (Agyemang-Bonsu et al.
2010). Combinded with the large piles of waste generated, demonstrates Kumasi’s high
potential as a source of GHGs relative to other cities in this region.
0
50000
100000
150000
200000
250000
0.00
0.50
1.00
1.50
2.00
2.50
19
95
19
96
19
97
19
98
19
99
20
00
20
01
20
02
20
03
20
04
20
05
20
06
20
07
20
08
20
09
20
10
20
11
20
12
20
13
Cu
mu
lati
ve n
um
ber
of
regi
ster
ed v
ehic
les
Po
pu
lati
on
(m
illio
n)
Year
Population
Vehicles
21
Apparently the urbanization processes have resulted in climatic changes in
Kumasi. An increase of at least 1°C in daily minimum and maximum temperatures
between 1970 and 2000 (Manu et al. 2006), and a 20 % decline in precipitation over the
past 40 - 50 years (Owusu 2009) have been reported. In the last 10–15 years flood
frequency and intensity in the city ascended, imputed mainly to poor urban planning
and ineffective protection efforts for wetlands and riparian ecosystems (Campion and
Venzke 2011; Campion 2012), but cannot be entirely disentangled from climate change.
In coping with these floods and other hazards, residents in low lands and flood prone
areas of Kumasi resort to constructing embankments around houses, raised walkways
in house compounds, stilt foundations for houses, relocate till water subsides or
permanently away from the community, keeping belongings in higher grounds (e.g. roof
tops, tables, etc), dredging and channel construction, and having strong faith in the
divinity (Campion 2012).
Judicious integration of green spaces into the landscapes of cities can be
instrumental in adapting to and coping with climate change. Evidence of availability of
green spaces in Kumasi (see Chapter 3) suggests that the residents enjoy the evaporative
cooling, shade and air cleansing benefits from these spaces. By setting aside, flood-
prone areas and lowlands as UGS maintained and managed purposely for recreation and
biodiversity conservation, floods can be avoided and the cost of flood damage and
water-related diseases minimized. Overall, adaptation interventions should encompass
three key aspects: infrastructure, community-based, and institutional adaptations
(Lwasa 2010). Adequately and evenly integrating UGS into the city matrix is crucial in
effectively harnessing their complete positive impacts. The use of green spaces offers
an added advantage of climate change mitigation (see chapter 4). Management issues
related to enhancing climate change resilience through green spaces are discussed next.
22
2.5.3 Green space management issues and urban resilience
For implementing greening actions, community participation is fundamental,
and a general consensus is crucial for operationalization. In developed countries, top-
down mechanisms where governments and local authorities plan, decide and invest in
promoting urban greening seem to be hegemonic, while in developing countries the
situation appears to be determined by bottom-up processes. Hence, policy instruments
that affect the social and environmental performance are key.
In this context, the resilience premise was applied to identify factors that favour
or negatively influence the existence and maintenance of UGS (Carpenter et al. 2001).
This implies that increasing the city’s resilience to climate change requires increasing the
populations’ adaptation and mitigation capabilities as described above. Resilience is the
ability of a system to absorb and reorganize itself to overcome shocks and changes in its
surroundings (Walker et al. 2003). Resilience may include societal and ecological
subsystems in mutual interaction (Gallopin 2006), and it is circumstance- and time-
dependent relying on constant adjustments in the system to fit with the external
changes, thus leading to adaptive processes (Smit and Wandel 2006).
The performance and potential of each UGS to contribute to the city’s resilience
to climate change were assessed against the following contrasting criteria: 1) the
encouraging decisions and actions that promote UGS, and 2) the pervasive decisions and
actions that deplete UGS. In both cases, three components were taken into account: 1)
the managerial actions (what?), 2) the actors or persons responsible (who?), and 3) the
underlying reasons (why?). Responses and their tabulation were carried out in an
elicitation workshop involving Ghanaian academics based at ZEF and the author, and
complemented by first-hand information gathered from stakeholders in the field and
secondary data from literature (Table 2.2).
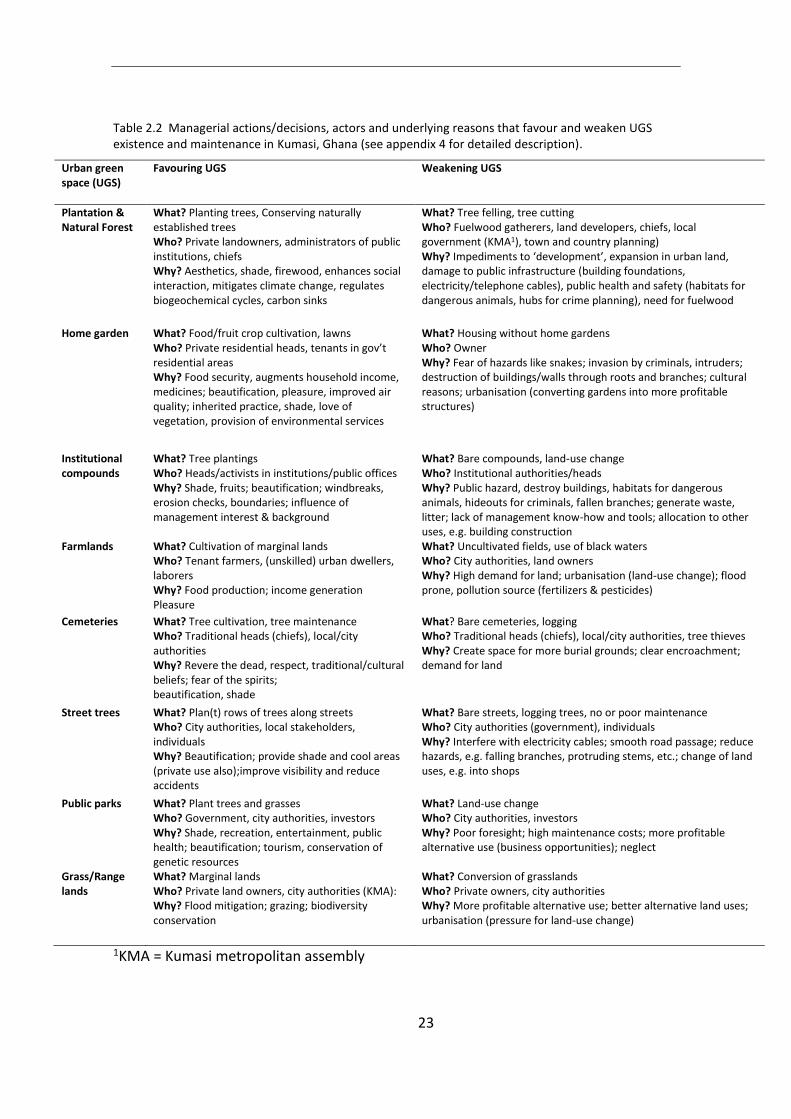
23
Table 2.2 Managerial actions/decisions, actors and underlying reasons that favour and weaken UGS existence and maintenance in Kumasi, Ghana (see appendix 4 for detailed description).
Urban green space (UGS)
Favouring UGS Weakening UGS
Plantation & Natural Forest
What? Planting trees, Conserving naturally established trees Who? Private landowners, administrators of public institutions, chiefs Why? Aesthetics, shade, firewood, enhances social interaction, mitigates climate change, regulates biogeochemical cycles, carbon sinks
What? Tree felling, tree cutting Who? Fuelwood gatherers, land developers, chiefs, local government (KMA1), town and country planning) Why? Impediments to ‘development’, expansion in urban land, damage to public infrastructure (building foundations, electricity/telephone cables), public health and safety (habitats for dangerous animals, hubs for crime planning), need for fuelwood
Home garden What? Food/fruit crop cultivation, lawns Who? Private residential heads, tenants in gov’t residential areas Why? Food security, augments household income, medicines; beautification, pleasure, improved air quality; inherited practice, shade, love of vegetation, provision of environmental services
What? Housing without home gardens Who? Owner Why? Fear of hazards like snakes; invasion by criminals, intruders; destruction of buildings/walls through roots and branches; cultural reasons; urbanisation (converting gardens into more profitable structures)
Institutional compounds
What? Tree plantings Who? Heads/activists in institutions/public offices Why? Shade, fruits; beautification; windbreaks, erosion checks, boundaries; influence of management interest & background
What? Bare compounds, land-use change Who? Institutional authorities/heads Why? Public hazard, destroy buildings, habitats for dangerous animals, hideouts for criminals, fallen branches; generate waste, litter; lack of management know-how and tools; allocation to other uses, e.g. building construction
Farmlands What? Cultivation of marginal lands Who? Tenant farmers, (unskilled) urban dwellers, laborers Why? Food production; income generation Pleasure
What? Uncultivated fields, use of black waters Who? City authorities, land owners Why? High demand for land; urbanisation (land-use change); flood prone, pollution source (fertilizers & pesticides)
Cemeteries What? Tree cultivation, tree maintenance Who? Traditional heads (chiefs), local/city authorities Why? Revere the dead, respect, traditional/cultural beliefs; fear of the spirits; beautification, shade
What? Bare cemeteries, logging Who? Traditional heads (chiefs), local/city authorities, tree thieves Why? Create space for more burial grounds; clear encroachment; demand for land
Street trees What? Plan(t) rows of trees along streets Who? City authorities, local stakeholders, individuals Why? Beautification; provide shade and cool areas (private use also);improve visibility and reduce accidents
What? Bare streets, logging trees, no or poor maintenance Who? City authorities (government), individuals Why? Interfere with electricity cables; smooth road passage; reduce hazards, e.g. falling branches, protruding stems, etc.; change of land uses, e.g. into shops
Public parks What? Plant trees and grasses Who? Government, city authorities, investors Why? Shade, recreation, entertainment, public health; beautification; tourism, conservation of genetic resources
What? Land-use change Who? City authorities, investors Why? Poor foresight; high maintenance costs; more profitable alternative use (business opportunities); neglect
Grass/Range lands
What? Marginal lands Who? Private land owners, city authorities (KMA): Why? Flood mitigation; grazing; biodiversity conservation
What? Conversion of grasslands Who? Private owners, city authorities Why? More profitable alternative use; better alternative land uses; urbanisation (pressure for land-use change)
1KMA = Kumasi metropolitan assembly
24
In Kumasi, the measures that favour or disfavour UGS existence are a blend of
top-down and bottom-up mechanisms. Several UGS are maintained by various interest
groups for varied purposes. At the same time, these interest groups may convert the
UGS to other preferred uses driven by socio-economic, cultural and political influences.
The relevant actors in UGS management are city authorities, private owners,
‘chiefs’ and to a limited extent non-governmental and community-based organizations
(NGOs and CBOs). In the case of the city authorities, their competences and roles are
regulated by local and national legislation and conventional property rights. These
regulations, defined in the state-of-the-art of policy documents, although
comprehensively and theoretically well framed, are mostly not applied.
The authority of the local and central governments over land is limited and lacks
enforcing capabilities. Hence, the scope of influence in defining and administering UGS
is frequently restricted to jurisdiction regarding, for example, public parks (i.e. botanic
gardens, zoos, protected areas), and vegetation on institutional compounds.
Moreover, it is quite frequently observed that a site originally designated as UGS
is in practice utilized differently or at best converted into grey infrastructure, not only
by individuals with an interest in its benefits but also by public authorities who spot
potential selfish benefits. This is not new. Kumasi has experienced several city plans
since its foundation. The 1945 plan, conceived as a quintessential ‘Garden City’ plan
according to Howard’s concept, advocated for the creation of a 300 m green belt along
stream channels and the establishment of urban parks within Kumasi but not on its
periphery. Most of the designated green belt zone is currently occupied by grey/brown
infrastructure, i.e. buildings, roads, and other land uses detrimental to UGS (Schmidt
2005). Adjustments as a result of population growth by re-designating land uses, mostly
unplanned sprawl, has rendered these early plans immaterial. Kumasi’s UGS may have
declined drastically but its tag as a “Garden City” is still widely eulogized by its
inhabitants.
Singular is the role of ‘chiefs’, a specific case in the region. With the exception of
small areas of state land, all land in the Asante region is held in trust for the Asante
people by their king, the Asantehene. He allocates land through a network of local chiefs
25
and in conjunction with the office of the administrator of stool lands (land held in
allodial, (i.e. land ownership that is outright and absolute) title by a traditional head on
behalf of a community or group of people) (Devas and Korboe 2000). These rights are
acknowledged by society and recognized by local and central governments.
However, some chiefs and their people regard UGS as wasteland, hence their
protection can be contentious. Even recognized public parks and gardens and also
sensitive wetlands that require mandatory protection may be annihilated if land values
appreciate and the demand is high. The policy of non-interference in the chieftaincy
issues by the government weakens its ability to promote and enhance development of
UGS. On the other hand, the power of traditional authorities could be harnessed for the
purpose of UGS conservation, environmental protection, and climate change
mitigation/adaptation. Citizens swear allegiance to their chiefs, thus urban
environmental policies instituted and administered through the chiefs can promote a
green, climate change-resilient city. The involvement of chiefs in environmental
management in the country is only now gaining momentum in cities and in the country.
Although potentially regulated by national and mainly local institutions, the
management of UGS tends de facto to be the responsibility of private land users. Hence,
individual behavior still appears to be the major determinant of both favorable and
unfavorable decisions to green the city (Table 2.2). Individual behavior is at least
unpredictable, but a pattern can be observed where decisions of land users are practical
and obey only short-term interests. For instance, a good number of tree owning
residents in Kumasi acknowledged the direct benefits, e.g. shading, air purification,
food, etc., derived from UGS, but stated categorically that they would transform these
spaces and erect more profitable structures such as buildings and shops once the need
arose. Several household heads resent trees and green spaces in their compounds for
the potential hazards they might pose. Among other disincentives, trees and green
spaces regularly interfere with the roofs and foundations of buildings, litter and soil the
compounds, increase fuel loadings and thus the risk of fires, provide habitats to
dangerous animals such as snakes, scorpions, etc., increase the risk of damage due to
falling branches, and may serve as hideouts for criminals. Yet there were others who for
26
lack of space merely wished they had green spaces in their compounds. In general, the
reasons favouring the establishment and maintenance of UGS include: 1) beautification,
independent of socioeconomic status, property stand of the UGS, and authority
position, 2) provision of goods, such as food, fodder, fuelwood, etc. (tangible benefits),
and 3) provision of services, e.g. air quality improvement, shade, windbreaks, erosion
checks, flood mitigation, etc. (intangible benefits) (Table 2.2). On the other hand, UGS
existence is threatened by: 1) land-use conversion towards a more profitable use, e.g.
houses, public buildings, roads, channels, etc., and 2) neglect of landscape plans, and
ad-hoc legislation, and 3) urbanites’ lack of awareness of the value of existing UGS.
As frequently observed in the Global South, the management of UGS lacks
appropriate legislation, planning and/or enforcing capabilities. Consequently, their
importance may be downplayed in favor of more profitable short-term interests and
activities. Although this situation is often justified by the lack of financial means, it seems
related to systemic malfunctions, such as inadequate governance expressed in the
defiance of laws and in corruption.
At the individual level, decisions concerning management and promotion of UGS
can generate a considerable impact in either a positive or negative way. Decisions
appear influenced by a person’s background (connection with nature, countryside
provenance) and education, i.e. degree of information on the importance and roles of
UGS, and finally by short-term interests. Although not thoroughly examined, it appears
that people who live near the outskirts of the city are more likely to have vegetation in
their compounds than those who live in the center of the city. People living on the
outskirts, belong to the relatively wealthy class, most of whom are well educated and
appreciate and conserve nature. Often though, the permanence of such UGS, mainly
home gardens, cannot be guaranteed as they are mostly only temporary, awaiting
conversion into some more rewarding permanent infrastructures when the economy
becomes favorable.
27
2.6 Conclusion
Considering the growing awareness of urbanisation and the relevance of urban
resilience to climate change impacts, understanding that urban resilience is
multidimensional and accomplished via various means is crucial. Attaining climate
resilience in cities is not a homogenous process and the significance of green spaces as
part of resilience in cities must not be peripheral.
This chapter discussed the growing urban population in Africa in the light of
climate change and the role of green spaces, and presents Kumasi as a case study to
illustrate the potential of African cities to be climate resilient. Unequivocally,
urbanization drives the depletion of natural land cover, exacerbates anthropogenic
environmental change, and threatens human wellbeing on the African continent.
However, through improved management of the urban space and
environmentally friendlier life style choices, it is possible to cope with climate change
and engender climate-resilient urbanization on the continent. Adequate management
of green spaces in African cities could minimize air pollution and lessen climate-related
hazards such as heat waves, floods, droughts, and thus increase their resilience to
climate change (Lindley et al. 2015).
The inadequate implementation of existing legislation and lack of ad-hoc policies
leaves the green space management initiative to customary and private interests.
Therefore, de facto bottom-up processes determine the existence and management of
UGS. Here, the roles of chieftancy (traditional leadership) and individual landowners are
particularly relevant.
Involvement of the government, traditional leaders and civil society in defining
priorities, streamlining actions and enforcing them are essential requisites to sustain and
enhance green cover in African cities. Empirical research to identify and operationalize
measurements to confront climate change as revealed in this chapter are key, but
without the appropriate governance maybe in vain.
28
3 URBAN GREEN SPACE DYNAMICS AND SOCIO-ENVIRONMENTAL (IN-) JUSTICE IN
KUMASI, GHANA
3.1 Introduction
About 54 % of the world’s population now lives in cities and is expected to rise to 66 %
by 2050 (United Nations 2014), underlining the importance of cities on earth. Africa, presently
predominantly rural but among the fastest urbanizing regions in the world, could have 56 % of its
population in cities by 2050 (United Nations 2014). Besides causing severe losses in natural
ecosystems (Seto, Güneralp, and Hutyra 2012), about 90 % of Africa’s cities are prone to at least
one environmental hazard (Di Ruocco, Gasparini, and Weets 2015), and two out of every five
urbanites live in penury (Chen and Ravallion 2007; Baker 2008). UGS provide a variety of
ecosystem services (ESS) and have the potential to enhance sustainability and resilience to
environmental disasters as well as minimize poverty (Andersson 2006; Sandström 2009; Haq
2011; Benedict and McMahon 2002). Urban green spaces are diverse in character, composition
and function and are often defined to include parks, street trees, urban farmlands, residential
lawns and any open undeveloped/non-bare land within and immediately around cities (Benedict
and McMahon 2002; Breuste et al. 2013).
The ESS provided by UGS are essential to maintaining ecological sanctity of cities, urban
health and food security needs of the urban populace. For instance, home gardens and farmlands
are essential sources of food, income and employment to the informal sector (Aworinde et al.
2013; Galhena, Freed, and Maredia 2013; Cilliers et al. 2013; Zérah and Landy 2013). UGS are also
essential for improving air quality (David J. Nowak, Crane, and Stevens 2006; Jim and Chen 2008),
shade provisioning (Bowler et al. 2010; Norton et al. 2015), noise reduction, water infiltration and
purification (Stephan Pauleit and Duhme 2000; Bolund and Hunhammer 1999), for recreation
and human health, particularly stress reduction and physical exercises (Thompson 2002; Tzoulas
et al. 2007; Coutts and Hahn 2015), energy conservation, and a host of other ecological, social,
cultural and psychological benefits. To emphasize their relevance, the SDGs advocate for the
provision and universal access to urban green spaces by all urbanites by 2030 (United Nations
2015).
29
However, UGS extent and distribution vary among and within cities. On average percent
verdant cover in medium (1 - 10 million inhabitants) and small (<1 million inhabitants) cities in
Africa is 39 and 57, respectively (Chapter 2). The inter-city non-built-up cover ranges from 3.3 %
in Omdurman, Sudan (Mohammed et al. 2015) to about 90 % in Nairobi, Kenya (Mundia and Aniya
2005). The extent and persistence of UGS depends on the city size and form, socio-political
factors, population growth, economics, and biophysical factors (Fuller and Gaston 2009).
Furthermore, in Africa UGS extent within cities are ill-defined and hardly planned for, and where
they are planned for, the focus is solely on public parks and gardens (Mensah 2014a; Mensah
2014c; Quagraine 2011) leading to discordant characterization of the extent and composition of
green cover among spatial scientists and urban planners. Coupled with institutional failures and
path dependency, poor attitude towards public property, neglect and misconceptions about
urban nature, conventional UGS cover often drastically decline in extent and condition (Mensah
2014b; Mensah 2014c). Within many African cities, UGS extent is inversely related to population
increase (Tontoh 2011; Wu, Courel, and Rhun 2003; Kayembe wa Kayembe, Matthieu, and Wolff
2012; Sylla et al. 2012; Sebego and Gwebu 2013), hence future urban population growth would
further deplete UGS cover in African cities, if UGS are not innovatively planned for and regularly
monitored.
In addition, UGS within cities are not justly distributed. Availability and access are
stratified based on socio-economic conditions of urbanites, race, and other socio-political and
geographic factors (McConnachie and Shackleton 2010; Heynen, Perkins, and Roy 2006; Kabisch
and Haase 2014; Stow et al. 2012). Uneven access to UGS is regarded an environmental injustice
(Jennings, Gaither, and Gragg 2012; Wolch, Byrne, and Newell 2014). Most analyses focus on
access to public spaces. As the urban poor in the developing world rely heavily on natural
resources (Vollmer and Grêt-Regamey 2013; Cilliers et al. 2013; Zérah and Landy 2013) inequity
in UGS availability and access has potential livelihood setbacks.
It has been suggested that discussions on urban nature inequity should encompass UGS
other than public parks (Jennings, Gaither, and Gragg 2012) whereas incomplete understanding
of what constitutes UGS can stifle its management and inclusion in planning programs (Matthews,

30
Lo, and Byrne 2015). Moreover, to successfully plan for nature in cities, it is important to know
the extent, composition, distribution and its functional characteristics (Niemelä 1999).
Medium resolution satellite images provide accurate and reliable means to map, analyze
spatial patterns and temporal changes in land use/cover in urban landscapes (Herold et al. 2003;
Van de Voorde et al. 2010). Prior studies have analyzed and mapped urban growth and processes
in major African cities using high and medium resolution satellite imagery in the context of land
use change and urban planning/expansion (Mundia and Aniya 2005; Mohammed et al. 2015),
urban vegetation distribution in relation to wealth (Stow et al. 2012) and a host of others. By
combining spatial and equity measurement techniques, it is possible to analyze drivers and
distributional inequities associated with urban vegetation cover.
The goal of this chapter is to provide insights/updates on the spatio-temporal dynamics of
vegetation cover in Kumasi. More specifically, the study analyzes the vegetation change over time
and space using multi-resolution images, explores the current composition of UGS types, and
examines possible drivers and injustices associated with UGS distribution in Kumasi, Ghana.
3.2 Methodology
3.2.1 Study area
Kumasi metropolis is located in south central Ghana (6° 41”N, 1° 37”W, Figure 3.1). The
climate is tropical, characterized by a bi-modal rainfall system. Mean annual rainfall and
temperature are respectively, 1,250 mm (Owusu 2009) and 26.4°C (Manu, Twumasi, and Coleman
2006).
Kumasi is inhabited by > 2 million people with a population density of 8,000 persons per
km2 and an annual growth rate of 4.8 % (Ghana Statistical Service 2012; KMA 2013). It is a central
transiting point for travelers from within and beyond Ghana and hosts the largest open market in
West Africa (Adarkwa 2011). Due to map generation short-comings, the area considered in this
study (178.3 km2) is less than the 254 km2 often quoted for Kumasi by the Kumasi Metropolitan
Assembly (KMA). A political map of Kumasi displaying the 10 submetropolises is given in Figure
3.1.
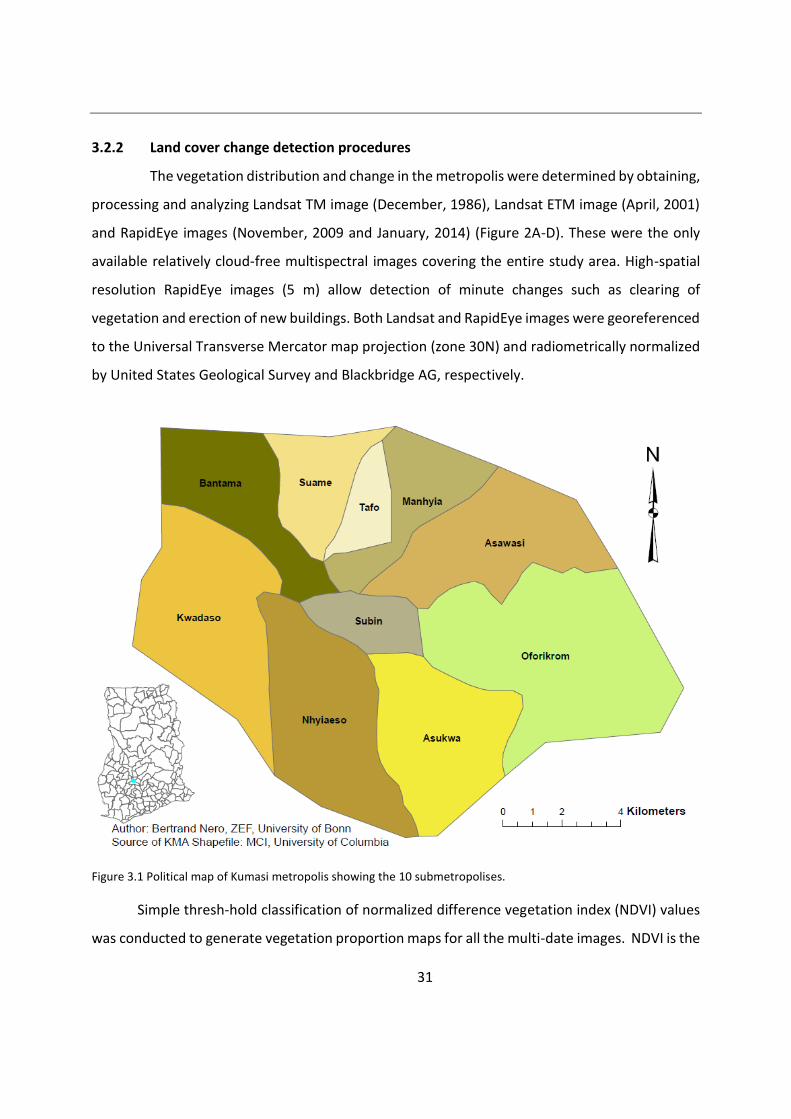
31
3.2.2 Land cover change detection procedures
The vegetation distribution and change in the metropolis were determined by obtaining,
processing and analyzing Landsat TM image (December, 1986), Landsat ETM image (April, 2001)
and RapidEye images (November, 2009 and January, 2014) (Figure 2A-D). These were the only
available relatively cloud-free multispectral images covering the entire study area. High-spatial
resolution RapidEye images (5 m) allow detection of minute changes such as clearing of
vegetation and erection of new buildings. Both Landsat and RapidEye images were georeferenced
to the Universal Transverse Mercator map projection (zone 30N) and radiometrically normalized
by United States Geological Survey and Blackbridge AG, respectively.
Figure 3.1 Political map of Kumasi metropolis showing the 10 submetropolises.
Simple thresh-hold classification of normalized difference vegetation index (NDVI) values
was conducted to generate vegetation proportion maps for all the multi-date images. NDVI is the
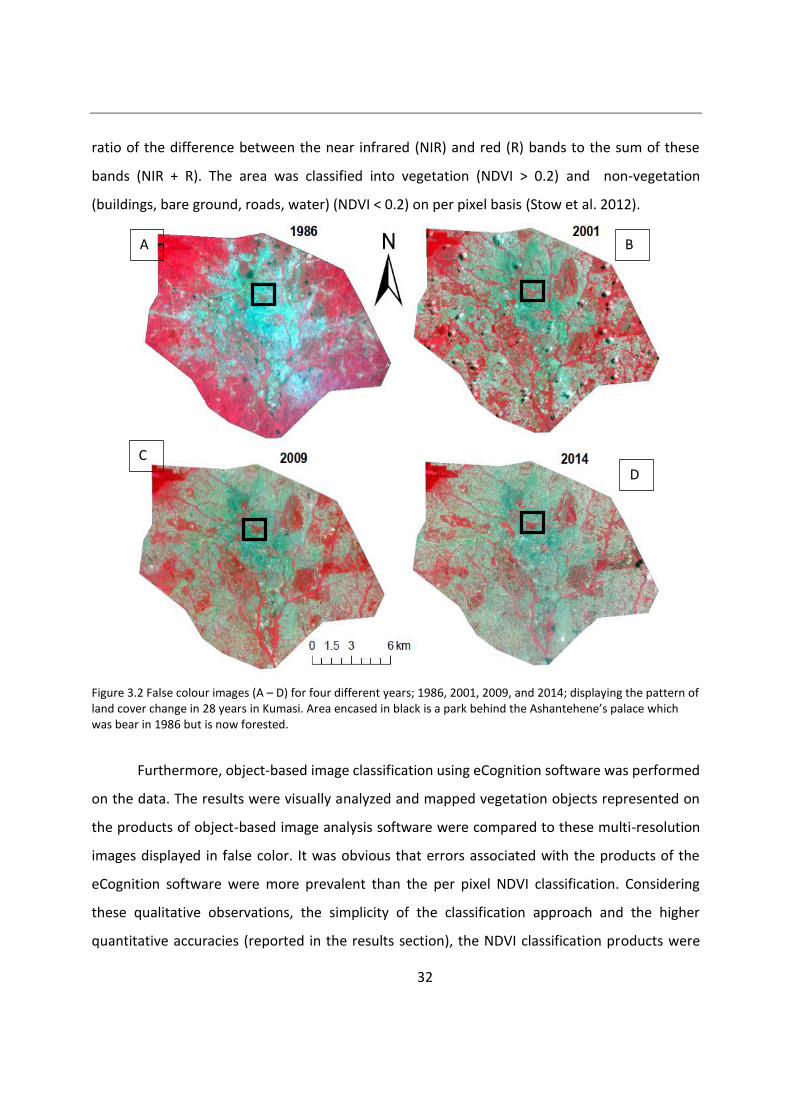
32
ratio of the difference between the near infrared (NIR) and red (R) bands to the sum of these
bands (NIR + R). The area was classified into vegetation (NDVI > 0.2) and non-vegetation
(buildings, bare ground, roads, water) (NDVI < 0.2) on per pixel basis (Stow et al. 2012).
Figure 3.2 False colour images (A – D) for four different years; 1986, 2001, 2009, and 2014; displaying the pattern of land cover change in 28 years in Kumasi. Area encased in black is a park behind the Ashantehene’s palace which was bear in 1986 but is now forested.
Furthermore, object-based image classification using eCognition software was performed
on the data. The results were visually analyzed and mapped vegetation objects represented on
the products of object-based image analysis software were compared to these multi-resolution
images displayed in false color. It was obvious that errors associated with the products of the
eCognition software were more prevalent than the per pixel NDVI classification. Considering
these qualitative observations, the simplicity of the classification approach and the higher
quantitative accuracies (reported in the results section), the NDVI classification products were
A B
C
D
33
used for further analysis. Supervised (maximum-likelihood) classification was performed on all
four NDVI classified products. Up to 150 training data points were collected using stratified
random sampling techniques during a field visit to Kumasi for land cover analysis. Equal samples
were collected for each land cover class. For images predating 2014, training data were obtained
from old land cover and urban plan maps in consultation with local residents. Two interviewers
who agreed on the land cover classes based on the historical map objects went out and conducted
independent interviews among local residents (over 50 years old) who had lived in the
neighborhoods within the last 30 years to ascertain the precision of the training samples. The
training data was separated into 100 samples for classification and 50 for validation for each
image using split layer tool in ArcGIS. The sample size for validation data was determined based
on an overall accuracy target of 90 %, a confidence interval of 95 % and a desired half-width of 8
%.
To provide the current UGS composition and distribution map of Kumasi, a detailed
supervised (maximum-likelihood) classification of the 2014 RapidEye image was performed. Up
to 12 land uses (including UGS types) were identified and mapped; urban built-up, peri-urban
built-up, bare ground, home gardens, institutional compounds, farmlands, grasslands,
plantations, natural forest, wetlands (areas that experience inundation at least 14 consecutive
days within the year), and water(Appendix 3). A total of 850 ground-truth data points were also
collected during a field visit to Kumasi in 2014 for detailed mapping of UGS distribution in the city.
Of this total, 365 data points were used for supervised classification and 485 data points for
validation and accuracy assessment. A stratified sampling design with land use (UGS) as a stratum
was adopted to increase the precision of sample estimates (Levy and Lemeshow 2008). Overall,
User’s, producer’s accuracies, and kappa coefficient were computed from the resulting confusion
matrices. All maps satisfied the minimum accuracy standards stipulated in the Anderson
classification scheme (Anderson et al. 1976), except the detailed land use/UGS map of the 2014
image. Because detailed classification of images predating 2014 consistently turned out classified
images with low overall accuracies < 45 % (high errors of commission and omission), no further
analysis were performed using these detailed UGS maps. The large errors (uncertainties) in the
classified images predating 2014 stemmed from collocation issues between field observations
34
and pixels, lack of detailed historical land use maps, uncertainties among respondents about the
exact historical land uses and the low spatial resolution of Landsat.
Post-classification change detection approach was used for land cover change analysis
between 1986 and 2014. The classified land cover maps for the respective years were directly
compared. This approach provides descriptive information on the nature of the land use classes
and change that occurred. One demerit of this approach is that, the accuracy of the change map
depends on the accuracy of the classifications of the individual maps being compared. The
proportion of each land cover was estimated by extracting the pixels in each land cover class
based on GIS algorithms. Furthermore, the land cover change map was subjected to accuracy
assessment, quantification of area and uncertainty using stratified estimation procedures
outlined in Olofsson et al. (2013; 2014). Four strata including: stable vegetation cover, stable non-
vegetation cover, vegetation loss, and vegetation gain by 2014 were identified on the 1986-2014
change map. A sample size of about 440 was determined based on a targeted standard error of
the overall accuracy of 2.5 % and speculated user’s accuracies of 0.75, 0.9, 0.95, and 0.95,
respectively, for the vegetation gain, vegetation loss, stable non-vegetation, and stable
vegetation classes. Speculated user’s accuracies were derived from previous urban land cover
studies in cities in Ghana. Since vegetation gain was the rarest class, a sample size of 80 was
allocated to it following procedures outlined in Olofsson et al. (2014). Equal sample size allocation
was applied to the remaining classes since land areas of these classes were almost equal. Data
collected during a field visit in 2014 were complemented with sample data extracted from Google
EarthTM in conjunction with old land use/cover maps and local knowledge of Kumasi (gathered as
described previously) to constitute the reference data for the accuracy assessment of the change
map. Following accuracy assessment of the change map, uncertainty of the accuracy and the area
estimates were estimated in accord with the good practice guidelines by Olofsson et al. (2014).
Accuracy assessment of the 2009-2014 change map was performed with a sample size of 352
following these guidelines above.
Absolute percentage change in land cover between 1986 and 2014 were determined at
the citywide scale. Additionally, the proportion of vegetation cover was estimated for each
political submetropolitan unit of Kumasi in 2009 and 2014 by summing the area classified as
35
vegetation for each submetropolis and dividing by the total area of each submetropolis. Absolute
percentage change in vegetation cover, expressed as the difference in percentage vegetation
cover between two time periods, was also computed for each submetropolis for the period of
2009 and 2014. Relative percentage change in vegetation, expressed as the absolute percentage
vegetation change between 2009 and 2014 divided by the percent vegetation cover in 2009 for
each submetropolis was also computed for each submetropolis. Area coverage for green and tree
cover classes (2009 and 2014) were extracted at the submetropolitan level using a political
submetropolitan map of the city and the data used for further analysis.
In addition, urban sprawl in 1986 and 2014 were estimated using Shannon entropy (En).
Shannon entropy can be used to indicate the degree of spatial concentration and dispersion
exhibited by geographic variables (Yeh and Li 2001). It is estimated by defining zones along major
roads or by defining buffers from the city center and calculating the built-up area in each zone.
The Shannon entropy is calculated as (eq. 3.1):
En = ∑ 𝑝𝑖𝑙𝑜𝑔(1
𝑝𝑖)/log(𝑛)𝑛
𝑖 (3.1)
Where En = Shannon entropy, pi = Xi/∑ 𝑋𝑖𝑛𝑖 and Xi is the density of land development = area of
built-up divided by total land area in the ith of n total zones, and n is the number of zones from
the city center. The value of the entropy ranges from 0 – 1. An index of 0 implies the urban spread
is compact whereas an index of 1 implies the urbanization is scattered. To analyse sprawl in
Kumasi, the area was divided into six concentric zones. Zones were separated by 2 km radius
except for the sixth zone which had a 1 km radius because it was beyond the boundary of the
study area.
3.2.3 Socio-economic and vegetation distribution in Kumasi
Principal component analysis (PCA) was employed in creating housing quality index
(HQI) for sub-metropolitan areas of Kumasi. Dummy variables were created for all housing and
infrastructure characteristics available in the 2010 census at the housing unit and sub-
metropolitan levels. Household constituted the unit of analysis for the PCA. The variables
considered were: number of separate/self-contained houses, number of compound houses,
number of improvised houses, house hold (HH) size, mean number of people sharing a room,
36
number of HH with access to three sleeping rooms, number of HH with access to at least four
sleeping rooms, percentage of HH not sharing at least a sleeping room, number of houses with
wooden walls and number with concrete cement walls. Other variables include percentage of HH
living in rooms with cement floors, earth mud floors, shared bathroom facility, use veranda as
cooking space, dispose liquid waste in gutter/drain and percent that depend on public toilets.
Over all, there were 25 variables entered into the PCA, from which four components
with an eigenvalue > 1 were extracted, explaining 91 % of the variance in the set of variables. The
first and second components had eigenvalues of 11.88 and 7.68 and were significantly larger than
the eigenvalues of the other components. The first component alone accounted for 46.2 % of the
variance and consisted of nine variables, each of which loaded with coefficients above 0.70. These
variables were whether a submetropolis had greater percentage of HH with access to: 1) private
water closet toilet facilities at home, 2) used gas for cooking, 3) had a separate space for cooking
(lesser usage of veranda as cooking space), 4) disposed their solid waste through collection by an
organization, 5) put their liquid waste in sewers, 6) disposed their solid waste through public
dumpsites, 7) live in houses with zinc roofing sheets, 8) used charcoal for cooking, and 9) live in
houses with asbestos roofing materials. Because factor scores are centered around a mean of
zero, with a minimum in this case of -1.91, a constant was added to each score such that the range
was from zero (0) for submetropolises with lowest quality of housing to 5 for the highest quality
housing. Since there are currently no spatial data at the neighborhood level in Kumasi, the
housing and household data were obtained at the submetropolis level. Hence, the factor scores
produced here represent the HQI for each submetropolis and used as surrogates for socio-
economic standards for each submetropolis.
3.2.4 Inequality in vegetation distribution
Dissimilarity analysis was applied to determine whether UGS are equally distributed
among inhabitants in the ten submetropolises in Kumasi. Among the numerous indices often
adopted for characterizing inequality in UGS distribution among urban inhabitants, the Gini
coefficient was selected for this study. The Gini coefficient is a value between 0 and 1; where 0
represents perfect equality of potential access to green spaces (or the share of UGS are evenly
37
distributed within the city scape) and 1 represents perfect inequality (or the share of UGS is
extremely high in fewer submetropolises). Applying the Gini coefficient therefore is a simple way
to obtain an overview of the distribution and the relation between green spaces and population.
One major caveat of this coefficient is that it is sensitive to changes around the median of the
distribution but is silent on the spatial distribution of possible dissimilarities. It was however,
successfully applied in evaluating inequality in green space distribution among certain population
groups in Berlin (Kabisch and Haase 2014) and in analysis of land use structure in China (Zheng et
al. 2013).
The Gini coefficient for the green cover was computed for the entire city using submetropolis level population data. The Gini coefficient is presented as (eq. 3.2):
GC = [∑𝑘𝑖=1 (Ui-1 + Ui)p] - 1 (3.2)
Where GC = Gini coefficient for green space distribution, p is the relative share of
population in the submetropolis, and U is the cumulative share of UGS in the submetropolis.
In addition, a Lorenz curve was constructed using the cumulative proportion of
population in the submetropolis (Ghana Statistical Service 2012) and cumulative proportion of
UGS and tree cover in each submetropolis obtained from analyses of 2009 and 2014 RapidEye
images.
3.2.5 Statistical analysis
Ordinary least square regression was used to analyze the strength of the relationship
between HQI from the 2010 census and vegetation cover in 2009 and 2014. Since the data
appeared to be normally distributed parametric regression statistics were applied. Diagnostics
were performed on the standardized residuals to check for the presence of spatial autocorrelation
(based on Moran’s I) and heteroscedasticity (based on Breusch-Pagan test).
3.3 Results
Overall accuracy >89 % and a Kappa coefficient >0.8 were obtained for all the land cover
classifications in all four years (images) (Table 3.1). User’s accuracy (accounting for errors of
commission) for non-vegetation (bare and built areas) was 84 % in 1986, 87 % in 2014 and 100 %
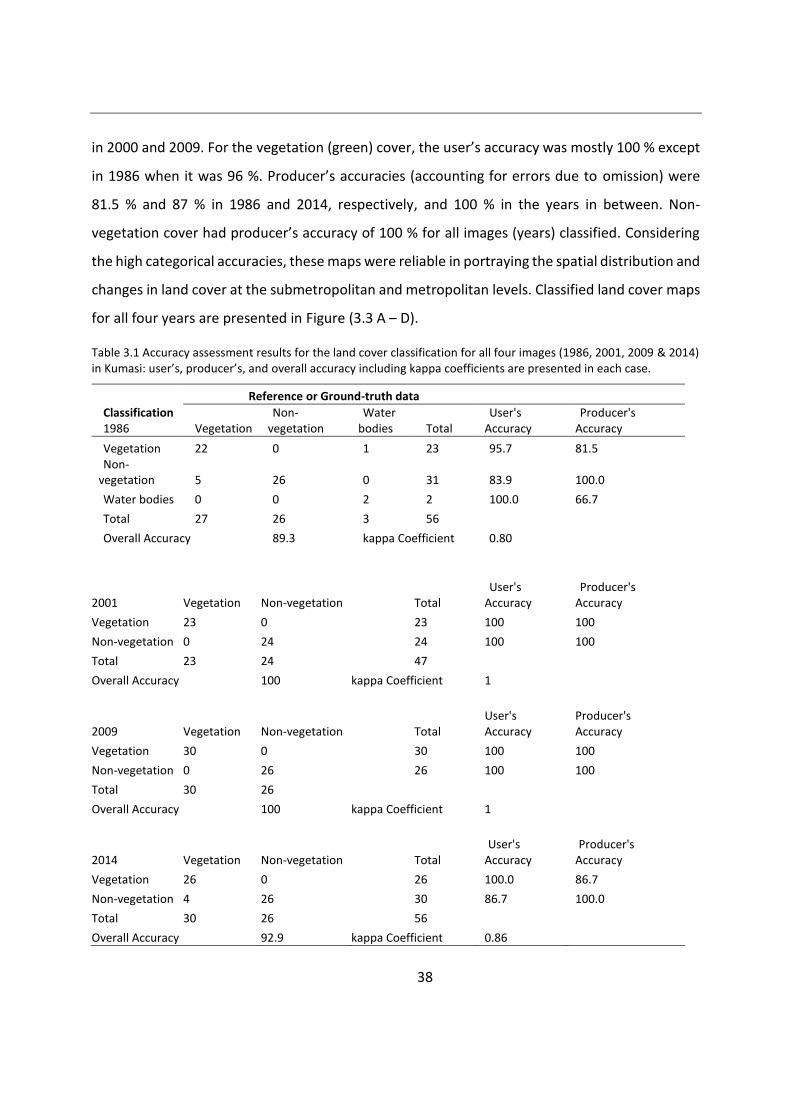
38
in 2000 and 2009. For the vegetation (green) cover, the user’s accuracy was mostly 100 % except
in 1986 when it was 96 %. Producer’s accuracies (accounting for errors due to omission) were
81.5 % and 87 % in 1986 and 2014, respectively, and 100 % in the years in between. Non-
vegetation cover had producer’s accuracy of 100 % for all images (years) classified. Considering
the high categorical accuracies, these maps were reliable in portraying the spatial distribution and
changes in land cover at the submetropolitan and metropolitan levels. Classified land cover maps
for all four years are presented in Figure (3.3 A – D).
Table 3.1 Accuracy assessment results for the land cover classification for all four images (1986, 2001, 2009 & 2014) in Kumasi: user’s, producer’s, and overall accuracy including kappa coefficients are presented in each case.
Reference or Ground-truth data
Classification 1986 Vegetation
Non-vegetation
Water bodies Total
User's Accuracy
Producer's Accuracy
Vegetation 22 0 1 23 95.7 81.5 Non-
vegetation 5 26 0 31 83.9 100.0
Water bodies 0 0 2 2 100.0 66.7
Total 27 26 3 56
Overall Accuracy 89.3 kappa Coefficient 0.80
2001 Vegetation Non-vegetation Total User's
Accuracy Producer's
Accuracy
Vegetation 23 0 23 100 100
Non-vegetation 0 24 24 100 100
Total 23 24 47
Overall Accuracy 100 kappa Coefficient 1
2009 Vegetation Non-vegetation Total User's Accuracy
Producer's Accuracy
Vegetation 30 0 30 100 100
Non-vegetation 0 26 26 100 100
Total 30 26
Overall Accuracy 100 kappa Coefficient 1
2014 Vegetation Non-vegetation Total User's
Accuracy Producer's
Accuracy
Vegetation 26 0 26 100.0 86.7
Non-vegetation 4 26 30 86.7 100.0
Total 30 26 56
Overall Accuracy 92.9 kappa Coefficient 0.86
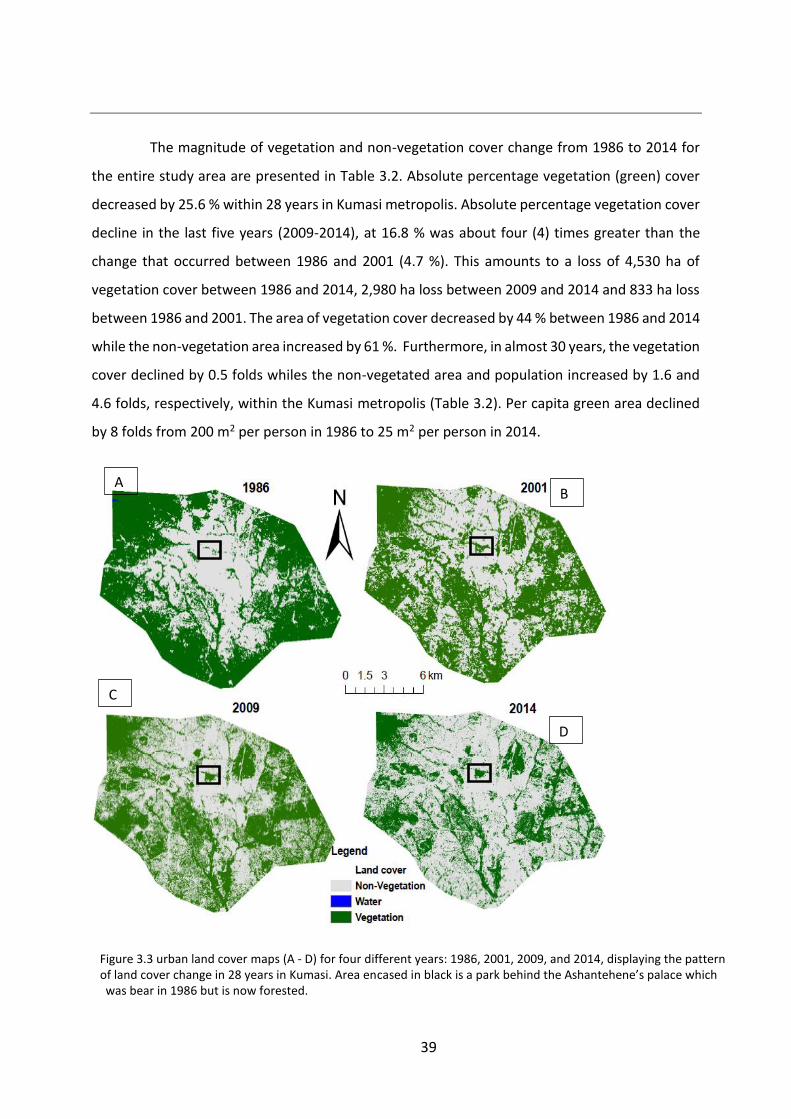
The magnitude of vegetation and non-vegetation cover change from 1986 to 2014 for
the entire study area are presented in Table 3.2. Absolute percentage vegetation (green) cover
decreased by 25.6 % within 28 years in Kumasi metropolis. Absolute percentage vegetation cover
decline in the last five years (2009-2014), at 16.8 % was about four (4) times greater than the
change that occurred between 1986 and 2001 (4.7 %). This amounts to a loss of 4,530 ha of
vegetation cover between 1986 and 2014, 2,980 ha loss between 2009 and 2014 and 833 ha loss
between 1986 and 2001. The area of vegetation cover decreased by 44 % between 1986 and 2014
while the non-vegetation area increased by 61 %. Furthermore, in almost 30 years, the vegetation
cover declined by 0.5 folds whiles the non-vegetated area and population increased by 1.6 and
4.6 folds, respectively, within the Kumasi metropolis (Table 3.2). Per capita green area declined
by 8 folds from 200 m2 per person in 1986 to 25 m2 per person in 2014.
A B
D
C
Figure 3.3 urban land cover maps (A - D) for four different years: 1986, 2001, 2009, and 2014, displaying the pattern of land cover change in 28 years in Kumasi. Area encased in black is a park behind the Ashantehene’s palace which was bear in 1986 but is now forested.
39
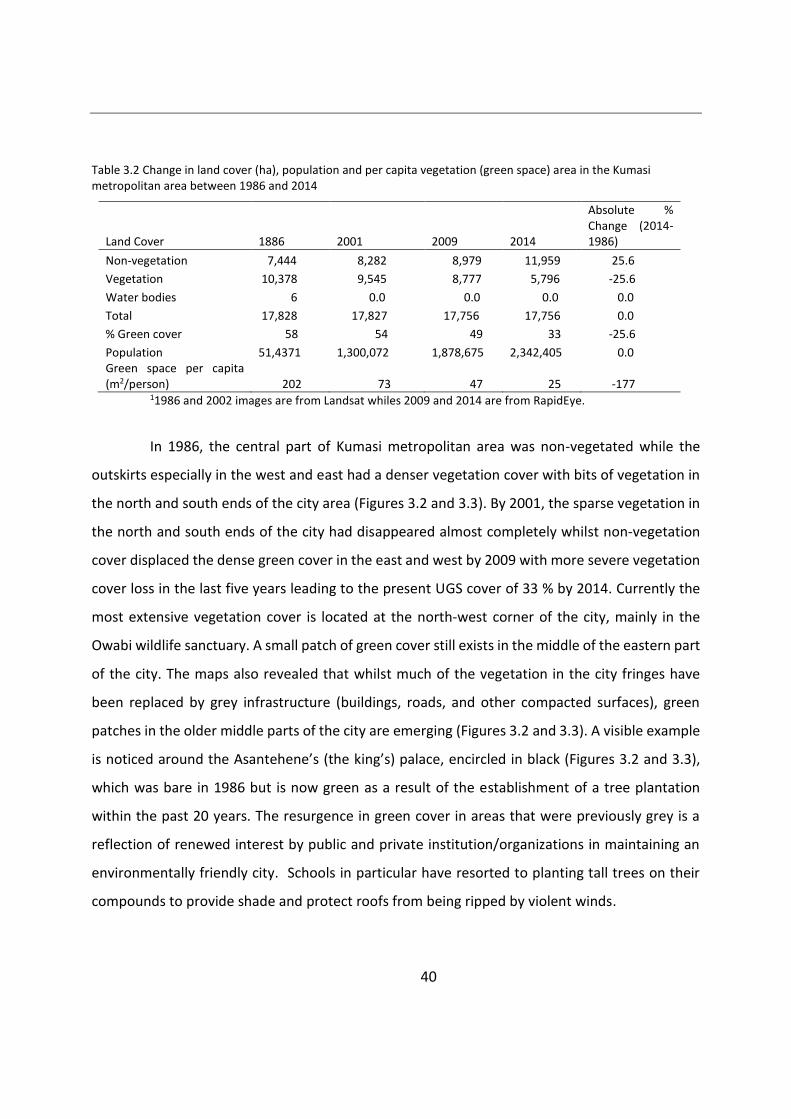
Table 3.2 Change in land cover (ha), population and per capita vegetation (green space) area in the Kumasi metropolitan area between 1986 and 2014
Land Cover 1886 2001 2009 2014
Absolute % Change (2014-1986)
Non-vegetation 7,444 8,282 8,979 11,959 25.6
Vegetation 10,378 9,545 8,777 5,796 -25.6
Water bodies 6 0.0 0.0 0.0 0.0
Total 17,828 17,827 17,756 17,756 0.0
% Green cover 58 54 49 33 -25.6
Population 51,4371 1,300,072 1,878,675 2,342,405 0.0 Green space per capita (m2/person) 202 73 47 25 -177
11986 and 2002 images are from Landsat whiles 2009 and 2014 are from RapidEye.
In 1986, the central part of Kumasi metropolitan area was non-vegetated while the
outskirts especially in the west and east had a denser vegetation cover with bits of vegetation in
the north and south ends of the city area (Figures 3.2 and 3.3). By 2001, the sparse vegetation in
the north and south ends of the city had disappeared almost completely whilst non-vegetation
cover displaced the dense green cover in the east and west by 2009 with more severe vegetation
cover loss in the last five years leading to the present UGS cover of 33 % by 2014. Currently the
most extensive vegetation cover is located at the north-west corner of the city, mainly in the
Owabi wildlife sanctuary. A small patch of green cover still exists in the middle of the eastern part
of the city. The maps also revealed that whilst much of the vegetation in the city fringes have
been replaced by grey infrastructure (buildings, roads, and other compacted surfaces), green
patches in the older middle parts of the city are emerging (Figures 3.2 and 3.3). A visible example
is noticed around the Asantehene’s (the king’s) palace, encircled in black (Figures 3.2 and 3.3),
which was bare in 1986 but is now green as a result of the establishment of a tree plantation
within the past 20 years. The resurgence in green cover in areas that were previously grey is a
reflection of renewed interest by public and private institution/organizations in maintaining an
environmentally friendly city. Schools in particular have resorted to planting tall trees on their
compounds to provide shade and protect roofs from being ripped by violent winds.
40
41
Accuracy assessment of the land change map is presented in table 3.3. The overall
accuracy is 96±2 % while the producer’s and user’s accuracies range between 75±9 % and 99±2
%. These reflect the precision and reliability of the change map. Overall, 1,448 ha were converted
from non-vegetated area to vegetation cover while 5,967 ha were converted from vegetation
cover to non-vegetation cover between 1986 and 2014 (Table 3.4). Substantial amounts of the
vegetation and non-vegetation land cover classes remained unconverted within the 28 year
period.
Table 3.3 Error matrix of the area proportions of 1986-2014 change map with sample counts shown in parenthesis. Map categories are rows and reference categories are the columns. Accuracy measures are presented with 95% confidence interval and the overall accuracy was 0.96±0.02.
Vegetation gain
Vegetation loss
Stable non-vegetation
Stable vegetation
Total User’s accuracy Producer’s accuracy
Vegetation gain Vegetation loss Stable non-vegetation Stable vegetation
0.061 (60) 0.000 0.000 0.006 (3)
0.003 (3) 0.328 (117) 0.331 0.000
0.017 (17) 0.000 0.332 (118) 0.000
0.000 0.008 (3) 0.006 (2) 0.239 (117)
0.082 (80) 0.336 (120) 0.337 (120) 0.337 (120)
0.75±0.09 0.97±0.03 0.98±0.02 0.97±0.03
0.91±0.07 0.99±0.02 0.95±0.04 0.94±0.04
Total 0.067 (63) 0.331(120) 0.349(135) 0.253 (122) 1.000 (440)
Table 3.4 Land cover mapped area, adjusted area, proportion of mapped area of land cover i (Wi), and margin of error of the 1986-2014 change map.
Mapped Adjusted Margin of error Wi Land cover area (ha) area (ha) 95% CI
Vegetation gain 1,448 1,195 ±265.5 0.082 Vegetation loss 5,967 5,872 ±232.7 0.336 Stable non-vegetation 5,992 6,200 ±273.9 0.337 Stable vegetation 4,348 4,488 ±435.9 0.245
Wi = mapped area of land cover i / total area of map
The absolute and relative percentage vegetation change for the ten submetropolises are
presented in Figure 3.4. Absolute percentage vegetation change was < 10 % in Menhyia, Suame
and Tafo and > 20 % in Asukwa, Oforikrom, and Nhyieaso between 2009 and 2014. Relative
percentage vegetation change was in the range of 19 – 45 % with Menhyia undergoing the least
relative change in vegetation (<20 %) whiles that of Suame, Asukwa, and Nhyieaso was > 40 %.
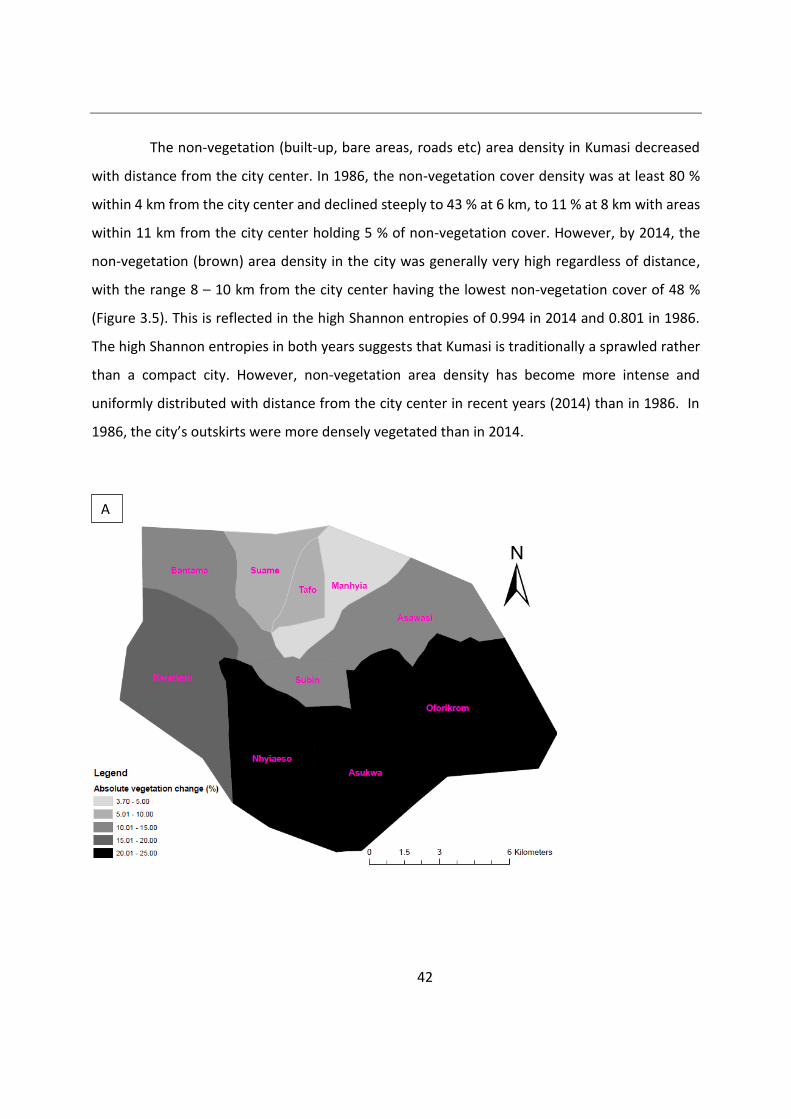
42
The non-vegetation (built-up, bare areas, roads etc) area density in Kumasi decreased
with distance from the city center. In 1986, the non-vegetation cover density was at least 80 %
within 4 km from the city center and declined steeply to 43 % at 6 km, to 11 % at 8 km with areas
within 11 km from the city center holding 5 % of non-vegetation cover. However, by 2014, the
non-vegetation (brown) area density in the city was generally very high regardless of distance,
with the range 8 – 10 km from the city center having the lowest non-vegetation cover of 48 %
(Figure 3.5). This is reflected in the high Shannon entropies of 0.994 in 2014 and 0.801 in 1986.
The high Shannon entropies in both years suggests that Kumasi is traditionally a sprawled rather
than a compact city. However, non-vegetation area density has become more intense and
uniformly distributed with distance from the city center in recent years (2014) than in 1986. In
1986, the city’s outskirts were more densely vegetated than in 2014.
A
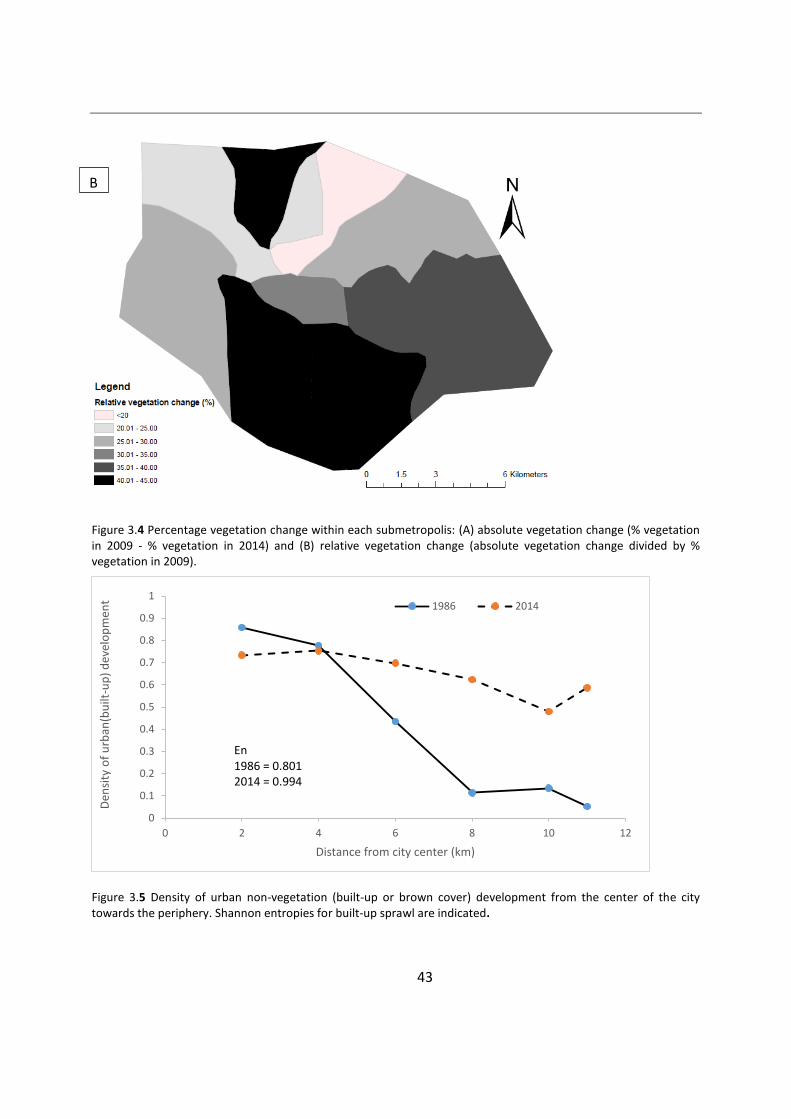
43
Figure 3.4 Percentage vegetation change within each submetropolis: (A) absolute vegetation change (% vegetation in 2009 - % vegetation in 2014) and (B) relative vegetation change (absolute vegetation change divided by % vegetation in 2009).
Figure 3.5 Density of urban non-vegetation (built-up or brown cover) development from the center of the city towards the periphery. Shannon entropies for built-up sprawl are indicated.
0
0.1
0.2
0.3
0.4
0.5
0.6
0.7
0.8
0.9
1
0 2 4 6 8 10 12
Den
sity
of
urb
an(b
uilt
-up
) d
evel
op
men
t
Distance from city center (km)
1986 2014
B
En
1986 = 0.801
2014 = 0.994

44
Table 3.5 Error matrix for land use /green space classification of 2014 image of Kumasi metropolis. The 95% confidence intervals of the user’s and producer’s accuracies are indicated. Kappa = 0.56, Overall Accuracy = 62.3±5.5%.
Reference or Ground-truth data
Classification Plantation Natural Forest
Home garden Farmland
Urban built-up
Peri_urban built-up
Grass_ upland
Grass_ wetland
Grass_ lawn/lowland
Bare ground Water
Institutional compound Total User's Accuracy
Plantation 53 2 3 5 0 0 0 0 0 0 0 1 64 82.8±9.3
Natural forest 2 6 0 2 0 0 0 0 0 0 0 1 11 54.5±29.5
Home garden 4 0 44 5 0 1 3 1 2 0 0 18 78 56.4±11.0
Farmland 11 0 5 31 0 0 0 1 0 0 0 4 52 59.6±13.4
Urban built-up 3 0 10 0 27 3 0 0 0 2 0 5 50 54.0±13.8
Peri-urban built-up 0 0 0 0 0 11 0 0 0 1 0 0 12 91.7±15.7
Grass_upland 3 1 5 2 0 0 23 0 0 0 0 0 34 67.6±15.7
Grass_wetland 2 0 0 1 0 0 14 0 0 0 0 17 82.4±18.2
Grass_lawn/lowland 1 0 3 4 0 0 0 1 17 1 0 0 27 63.0±18.2
Bare ground 0 0 3 1 3 0 0 0 0 9 0 1 17 52.9±23.8
Water 0 0 0 0 0 0 0 0 0 0 6 0 6 100.0±0.1 Institutional compound 20 0 24 10 0 0 0 1 0 1 0 61 117 52.1±9.1
Total 99 9 97 61 30 15 26 18 19 14 6 91 485
Producer’s Accuracy 53.5±9.8 66.7±30.9 45.4±9.9 50.8±12.6 90.0±10.8 73.3±22.4 88.5±12.3 77.8±19.2 89.5±13.8 64.3±25.1 100.0±0.1 67.0±9.7
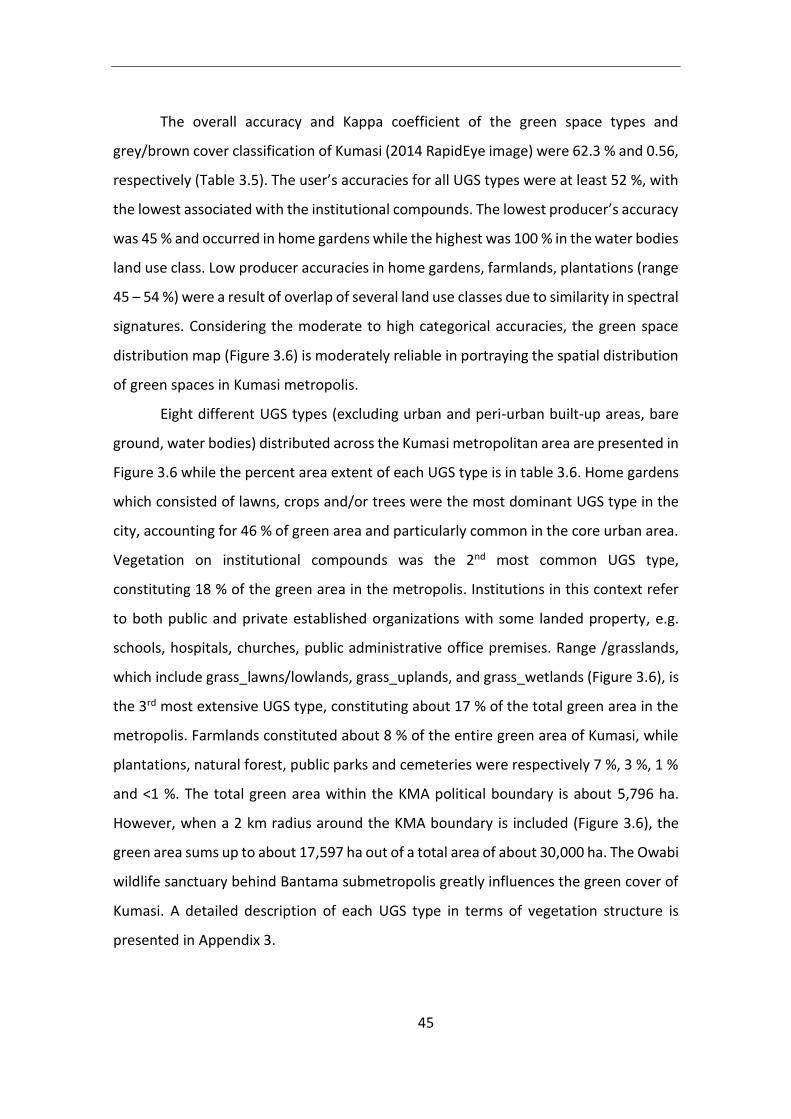
45
The overall accuracy and Kappa coefficient of the green space types and
grey/brown cover classification of Kumasi (2014 RapidEye image) were 62.3 % and 0.56,
respectively (Table 3.5). The user’s accuracies for all UGS types were at least 52 %, with
the lowest associated with the institutional compounds. The lowest producer’s accuracy
was 45 % and occurred in home gardens while the highest was 100 % in the water bodies
land use class. Low producer accuracies in home gardens, farmlands, plantations (range
45 – 54 %) were a result of overlap of several land use classes due to similarity in spectral
signatures. Considering the moderate to high categorical accuracies, the green space
distribution map (Figure 3.6) is moderately reliable in portraying the spatial distribution
of green spaces in Kumasi metropolis.
Eight different UGS types (excluding urban and peri-urban built-up areas, bare
ground, water bodies) distributed across the Kumasi metropolitan area are presented in
Figure 3.6 while the percent area extent of each UGS type is in table 3.6. Home gardens
which consisted of lawns, crops and/or trees were the most dominant UGS type in the
city, accounting for 46 % of green area and particularly common in the core urban area.
Vegetation on institutional compounds was the 2nd most common UGS type,
constituting 18 % of the green area in the metropolis. Institutions in this context refer
to both public and private established organizations with some landed property, e.g.
schools, hospitals, churches, public administrative office premises. Range /grasslands,
which include grass_lawns/lowlands, grass_uplands, and grass_wetlands (Figure 3.6), is
the 3rd most extensive UGS type, constituting about 17 % of the total green area in the
metropolis. Farmlands constituted about 8 % of the entire green area of Kumasi, while
plantations, natural forest, public parks and cemeteries were respectively 7 %, 3 %, 1 %
and <1 %. The total green area within the KMA political boundary is about 5,796 ha.
However, when a 2 km radius around the KMA boundary is included (Figure 3.6), the
green area sums up to about 17,597 ha out of a total area of about 30,000 ha. The Owabi
wildlife sanctuary behind Bantama submetropolis greatly influences the green cover of
Kumasi. A detailed description of each UGS type in terms of vegetation structure is
presented in Appendix 3.
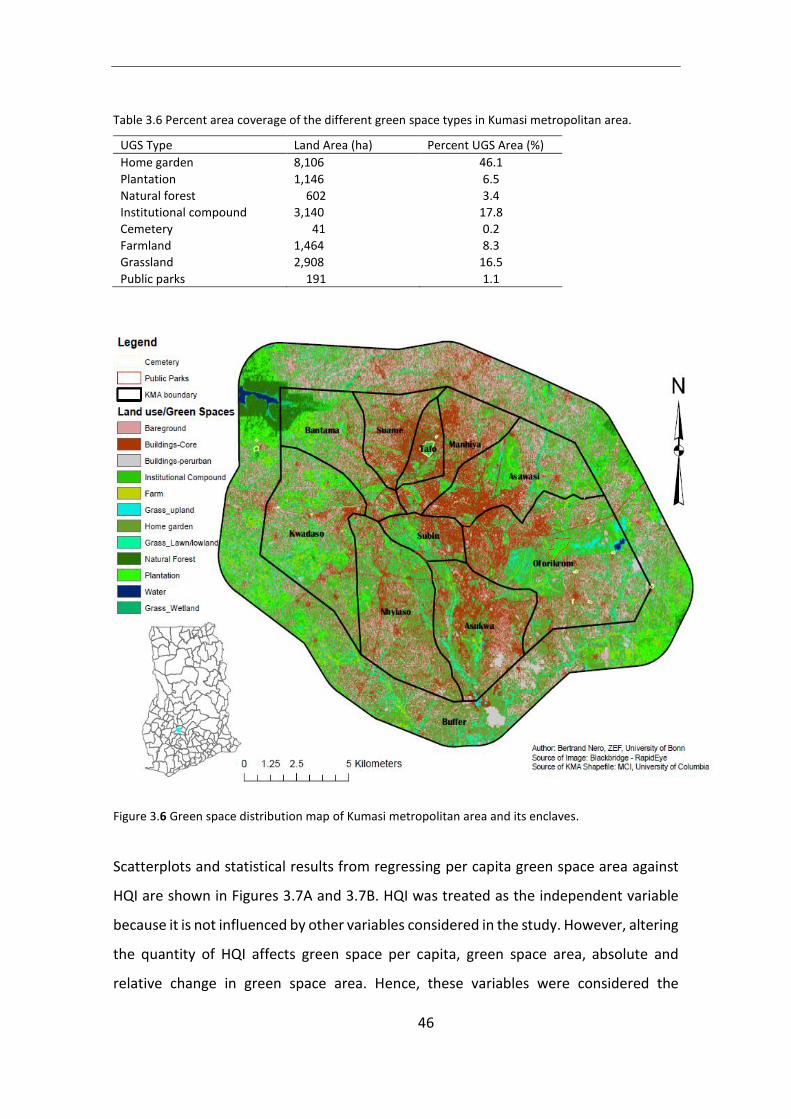
46
Table 3.6 Percent area coverage of the different green space types in Kumasi metropolitan area.
UGS Type Land Area (ha) Percent UGS Area (%)
Home garden 8,106 46.1
Plantation 1,146 6.5
Natural forest 602 3.4
Institutional compound 3,140 17.8
Cemetery 41 0.2
Farmland 1,464 8.3
Grassland 2,908 16.5
Public parks 191 1.1
Figure 3.6 Green space distribution map of Kumasi metropolitan area and its enclaves.
Scatterplots and statistical results from regressing per capita green space area against
HQI are shown in Figures 3.7A and 3.7B. HQI was treated as the independent variable
because it is not influenced by other variables considered in the study. However, altering
the quantity of HQI affects green space per capita, green space area, absolute and
relative change in green space area. Hence, these variables were considered the
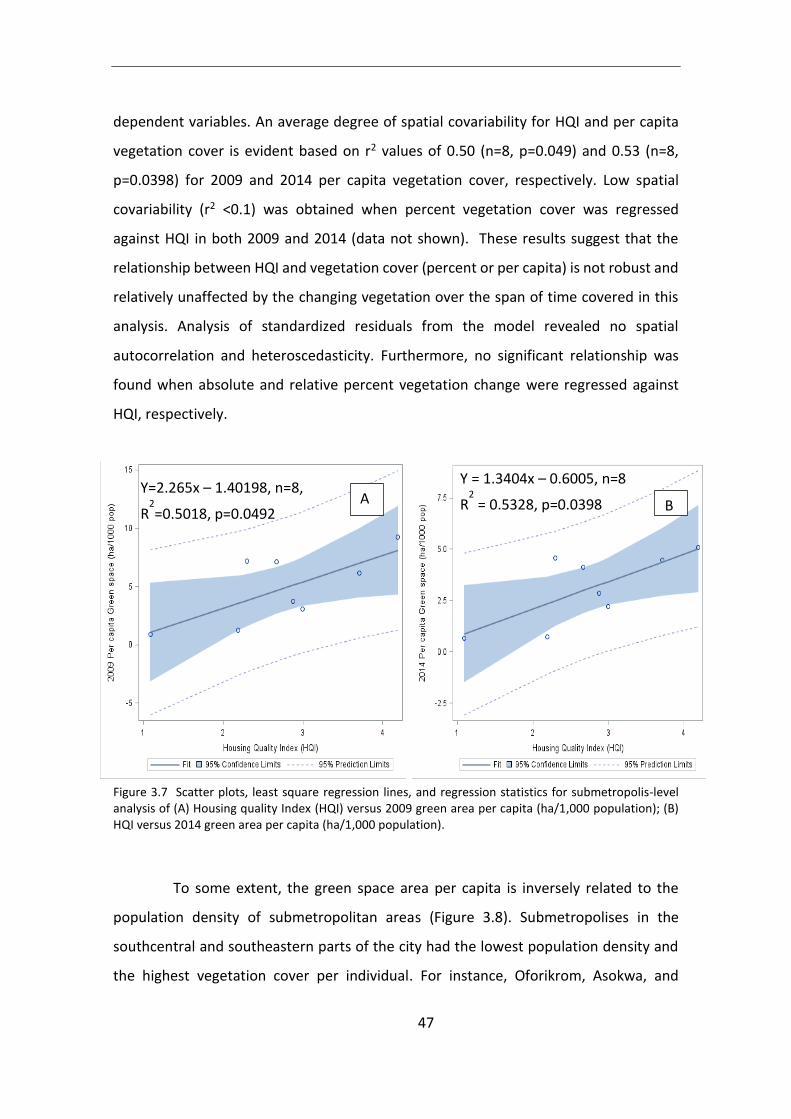
47
dependent variables. An average degree of spatial covariability for HQI and per capita
vegetation cover is evident based on r2 values of 0.50 (n=8, p=0.049) and 0.53 (n=8,
p=0.0398) for 2009 and 2014 per capita vegetation cover, respectively. Low spatial
covariability (r2 <0.1) was obtained when percent vegetation cover was regressed
against HQI in both 2009 and 2014 (data not shown). These results suggest that the
relationship between HQI and vegetation cover (percent or per capita) is not robust and
relatively unaffected by the changing vegetation over the span of time covered in this
analysis. Analysis of standardized residuals from the model revealed no spatial
autocorrelation and heteroscedasticity. Furthermore, no significant relationship was
found when absolute and relative percent vegetation change were regressed against
HQI, respectively.
Figure 3.7 Scatter plots, least square regression lines, and regression statistics for submetropolis-level analysis of (A) Housing quality Index (HQI) versus 2009 green area per capita (ha/1,000 population); (B) HQI versus 2014 green area per capita (ha/1,000 population).
To some extent, the green space area per capita is inversely related to the
population density of submetropolitan areas (Figure 3.8). Submetropolises in the
southcentral and southeastern parts of the city had the lowest population density and
the highest vegetation cover per individual. For instance, Oforikrom, Asokwa, and
Y=2.265x – 1.40198, n=8,
R2=0.5018, p=0.0492
Y = 1.3404x – 0.6005, n=8
R2 = 0.5328, p=0.0398 A B
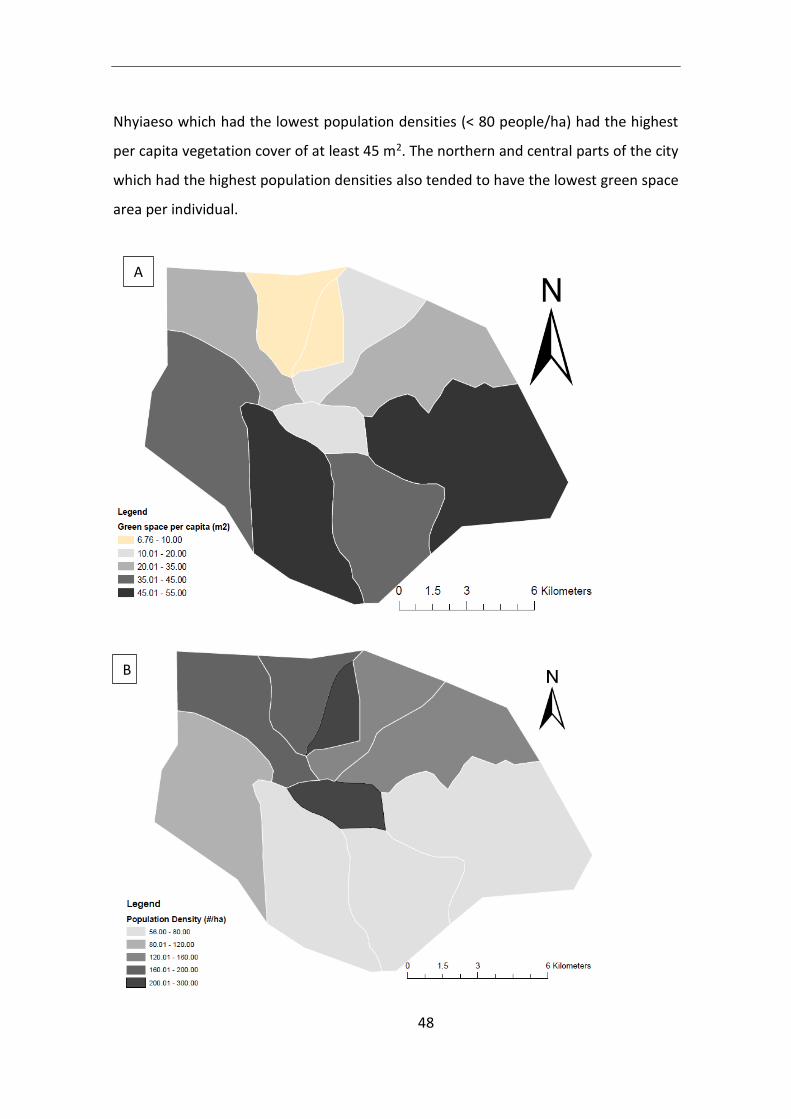
48
Nhyiaeso which had the lowest population densities (< 80 people/ha) had the highest
per capita vegetation cover of at least 45 m2. The northern and central parts of the city
which had the highest population densities also tended to have the lowest green space
area per individual.
A
B
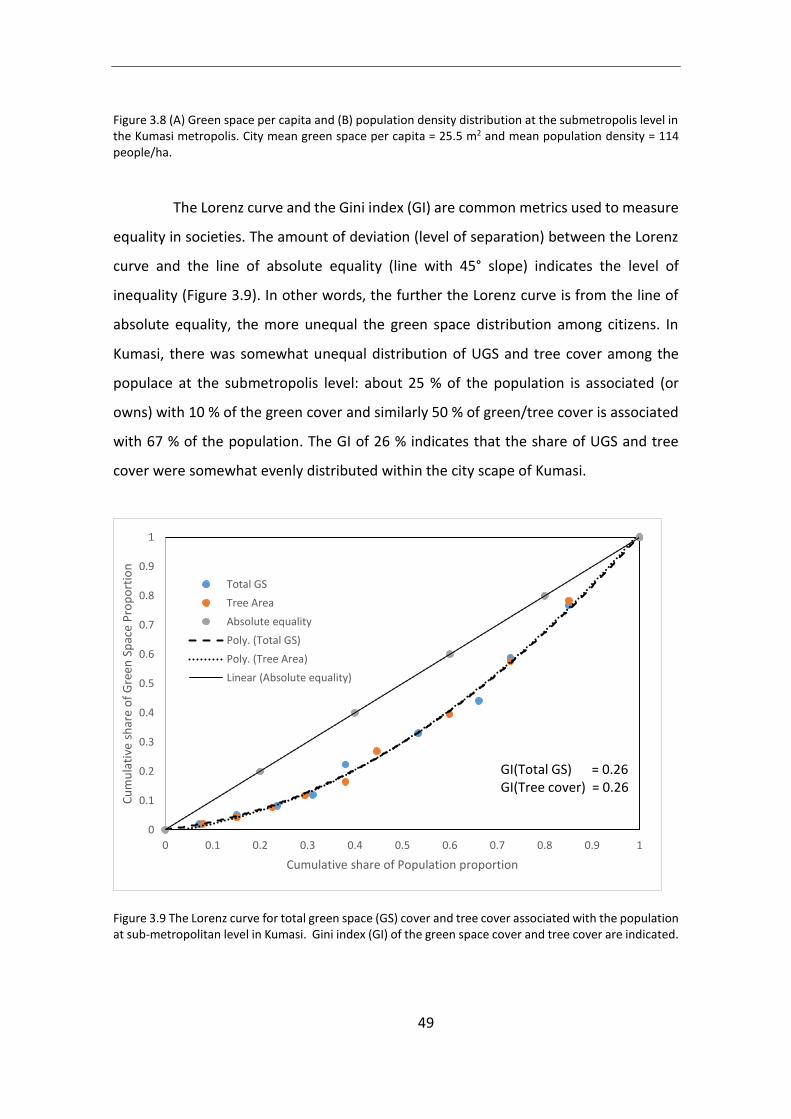
49
Figure 3.8 (A) Green space per capita and (B) population density distribution at the submetropolis level in the Kumasi metropolis. City mean green space per capita = 25.5 m2 and mean population density = 114 people/ha.
The Lorenz curve and the Gini index (GI) are common metrics used to measure
equality in societies. The amount of deviation (level of separation) between the Lorenz
curve and the line of absolute equality (line with 45° slope) indicates the level of
inequality (Figure 3.9). In other words, the further the Lorenz curve is from the line of
absolute equality, the more unequal the green space distribution among citizens. In
Kumasi, there was somewhat unequal distribution of UGS and tree cover among the
populace at the submetropolis level: about 25 % of the population is associated (or
owns) with 10 % of the green cover and similarly 50 % of green/tree cover is associated
with 67 % of the population. The GI of 26 % indicates that the share of UGS and tree
cover were somewhat evenly distributed within the city scape of Kumasi.
Figure 3.9 The Lorenz curve for total green space (GS) cover and tree cover associated with the population at sub-metropolitan level in Kumasi. Gini index (GI) of the green space cover and tree cover are indicated.
0
0.1
0.2
0.3
0.4
0.5
0.6
0.7
0.8
0.9
1
0 0.1 0.2 0.3 0.4 0.5 0.6 0.7 0.8 0.9 1
Cu
mu
lati
ve s
har
e o
f G
reen
Sp
ace
Pro
po
rtio
n
Cumulative share of Population proportion
Total GS
Tree Area
Absolute equality
Poly. (Total GS)
Poly. (Tree Area)
Linear (Absolute equality)
GI(Total GS) = 0.26GI(Tree cover) = 0.26
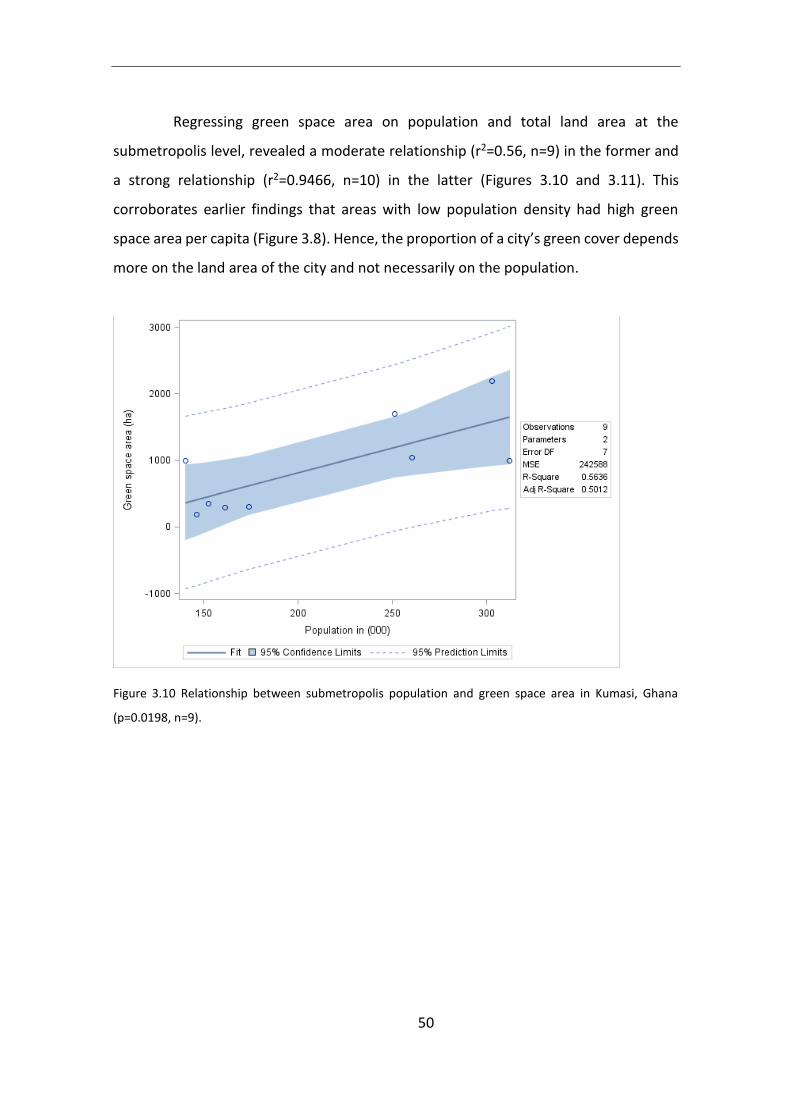
50
Regressing green space area on population and total land area at the
submetropolis level, revealed a moderate relationship (r2=0.56, n=9) in the former and
a strong relationship (r2=0.9466, n=10) in the latter (Figures 3.10 and 3.11). This
corroborates earlier findings that areas with low population density had high green
space area per capita (Figure 3.8). Hence, the proportion of a city’s green cover depends
more on the land area of the city and not necessarily on the population.
Figure 3.10 Relationship between submetropolis population and green space area in Kumasi, Ghana
(p=0.0198, n=9).
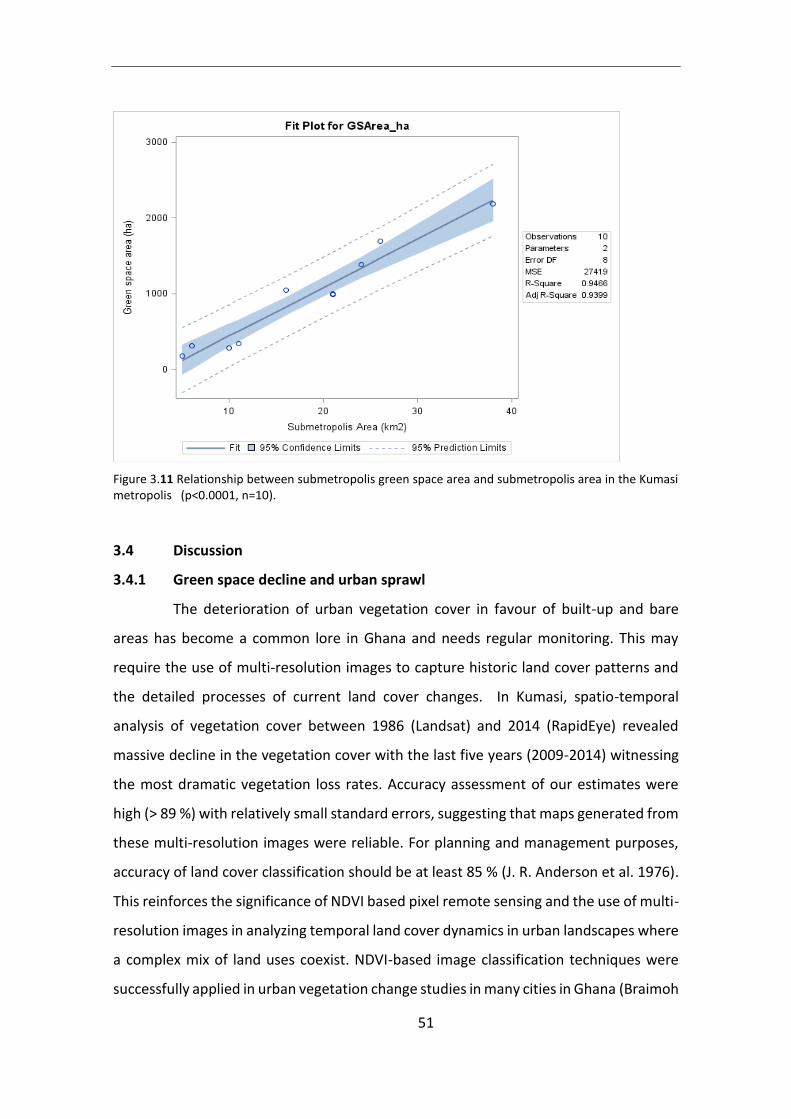
51
Figure 3.11 Relationship between submetropolis green space area and submetropolis area in the Kumasi metropolis (p<0.0001, n=10).
3.4 Discussion
3.4.1 Green space decline and urban sprawl
The deterioration of urban vegetation cover in favour of built-up and bare
areas has become a common lore in Ghana and needs regular monitoring. This may
require the use of multi-resolution images to capture historic land cover patterns and
the detailed processes of current land cover changes. In Kumasi, spatio-temporal
analysis of vegetation cover between 1986 (Landsat) and 2014 (RapidEye) revealed
massive decline in the vegetation cover with the last five years (2009-2014) witnessing
the most dramatic vegetation loss rates. Accuracy assessment of our estimates were
high (> 89 %) with relatively small standard errors, suggesting that maps generated from
these multi-resolution images were reliable. For planning and management purposes,
accuracy of land cover classification should be at least 85 % (J. R. Anderson et al. 1976).
This reinforces the significance of NDVI based pixel remote sensing and the use of multi-
resolution images in analyzing temporal land cover dynamics in urban landscapes where
a complex mix of land uses coexist. NDVI-based image classification techniques were
successfully applied in urban vegetation change studies in many cities in Ghana (Braimoh

52
and Vlek 2004; Stow et al. 2012; Aduah and Baffoe 2013) although none used mixed
resolution imagery nor did any measure uncertainty of the changes detected. Due to the
differences in resolution, higher resolution images tend to capture more precise details
of land cover and area than the medium-resolution images and hence provide better
estimates of change. Furthermore, the change map of Kumasi in this study elicited high
accuracy estimates, low standard errors, and mapped area estimates were within the
95 % confidence interval of the reference or adjusted area estimates. These presuppose
that the measurement bias associated with the mapped area estimated using pixel
counting and the uncertainty due to sampling variability were minimal and that mapped
outcomes were consistent. Detecting significantly large changes in vegetation gain and
loss especially within a span of 5 years (2009-2014) can be attributed to relatively large
accuracies in mapping and adequate accuracy assessment sample sizes (McRoberts and
Walters 2012). Amidst budget and time limitations, city environments are readily
traversable, making it possible to sample as thoroughly as desired. The high accuracies
of these change maps and low biases of area estimates suggest that NDVI-based pixel
techniques are comparable to map products of sophisticated techniques such as object-
based image analysis and spectral mixtures.
Increased population, high inequality, and disregard for the city plan account
for the loss in vegetation cover in Kumasi (Tontoh 2011). As the most vibrant commercial
city in Ghana coupled with its strategic central location, Kumasi is the destination of
people of all walks of life. Consequently, its population quadrupled between 1986 and
2014 due mainly to natural increase resulting from high fertility and better health care
within cities and rural-urban migration. This triggered the large expansion in built-up
area, culminating in the massive loss in vegetation cover between 1986 and 2014 and
especially so in recent years. The boom in the housing industry in recent years owed
much to the high demand for residential and student hostel facilities provoked an
inexpedient conversion of natural land to buildings by private individuals and estate
developers. This peculiar situation may have accounted for the high absolute
percentage vegetation cover loss in submetropolises such as Oforikrom, Asukwa and
Kwadaso which host major tertiary institutions in the city and had prior to 2000 been
53
densely vegetated. However, it must be noted that the existence of bare ground which
is a major component of the non-vegetated land cover may be a legacy of the culture of
neglect and lack of interest in green spaces.
Sprawl analysis indicated high entropy values of 0.80 and 0.99 for 1986 and
2014, respectively, suggesting that Kumasi has for long been a sprawled metropolis.
Sprawl is attributed to the housing culture and the pattern of development adopted in
this city. Historically, the middle class and the wealthy had a disdain for vegetation in
the city because vegetation served as habitat for dangerous wild animals e.g. snakes,
scorpions etc and as hideouts for criminals. As a result, old towns such as Tafo, Suame,
Manhyia etc were (are still) devoid of vegetation. However, high congestion,
depreciating environmental conditions in these old core urban zones, improving
economic conditions and the quest for privacy have led to many elites in Kumasi
relocating to the peri-urban areas. This practice explains the scattered and nucleated
development congregated in the outskirts of the city, characterized by self-contained
gated houses with large compounds maintained as green spaces (Cobbinah and Amoako
2014). Although infill densification is still high, there are conscious efforts to convert
bare and vacant areas in the core (old towns) urban zones to vegetation cover. This
clarifies the difference in built-up density within 4 to 6 km from the city center and the
gain in vegetation cover of about 1,448 ha between 1986 and 2014. However, the
current population and housing growth rates of 5.7 and 2.4 percent per annum,
respectively (Afrane and Asamoah 2011), highlight a housing deficit. Meeting this deficit
could further compromise green cover within Kumasi and its enclaves. Adequate urban
plans and housing schemes must be invoked by government, administrators and private
developers to satisfy the service needs of the city without compromising the boundaries
and vegetation relics in the city.
3.4.2 Green space composition and distribution
The overall accuracy and some of the producer’s and user’s accuracies of the
green space/land use map of Kumasi in 2014 (Figure 3.6) were lower than the
recommended 0.85 (Anderson et al. 1976). Several reasons may account for this: 1)
54
confusion between green space classes since these were not intrinsically discrete, 2)
inherent characteristics of GPS receivers may have resulted in sample points being
associated with incorrect pixels, and 3) similarity or indistinguishability in the spectral
signatures of green spaces/land uses classes. Other reasons for low map accuracies are
discussed in McRoberts (2011). A thorough examination of the reference data in the
current study indicated that home garden sample classes were erroneously classified as
institutional compounds, urban built-up or peri-urban built-up on the map due to
similarity in spectral signatures and other reasons cited above. These were not surprising
because a small house garden may be captured as built-up area by the sensor whiles the
vegetation within institutional compound and the home gardens are only semantically
different but practically the same. Considering these accuracy estimates, the green
space map is moderately precise. Hence, map products should be used with caution.
UGS are a reminder of our innate intimate rapport with nature. The variety of
UGS types therefore reflects the complex diversity of interest groups co-habiting in
urban landscapes. Home gardens for instance are maintained for different reasons: to
the wealthy for mere aesthetics and other environmental reasons and to the middle
class and the less privileged for alimentary, shade, protection, boundary demarcations,
and other cultural services. The culture of maintaining small – large back or front yard
gardens near both private and public residential houses explain the extensive cover of
home gardens in this city. Due to historical, high congestion and high demand for land,
UGS in the core urban area are characteristically smaller in sizes compared to those of
the peri-urban area. The existence of home gardens and institutional compound
vegetation are however without policy and legal backing and hence are at risk of being
converted to grey infrastructure.
Public parks which constitute about 1 % of the green cover of Kumasi and street
trees remain the only green spaces directly under government jurisdiction and
“managed” by the local government. Except for five functionally upright public spaces
(i.e. the Otumfuo park, Kwame Nkrumah University of Science and Technology (KNUST)
botanical gardens, the Kumasi zoo, the Royal Golf Course, and the Rattray park) all the
other colonially designated public parks have either disappeared or been abandoned
55
(Mensah 2014a). It is essential to increase the awareness on the value of UGS and
strengthen stakeholder participation and institutional capacities engaged in UGS
management. UGS discourse especially in this part of the world should encompass non-
public green spaces. This will be essential in the strife to satisfy tenet 7 of the sustainable
development goal 11 on green space availability and accessibility by all in cities. The
skewed location of public spaces and variations in home garden sizes and distribution
could incite environmental conflicts as we awaken to the realization of our stakes in
their values.
3.4.3 Green space distribution and equity
Green spaces are essential for the wellbeing of urban communities
ecologically, socially and economically. However, in many developing countries, their
distribution ( or access), maintenance, and value are often downplayed mainly due to
negligence and overreliance on the hinterlands, culminating in the disappearance,
deterioration, and misuse of once glamorous and elaborate public green spaces in
“Garden Cities” such as Kumasi (Mensah 2014a). Uneven distribution can create
restrictions in access to green spaces or their services and hence compromise the
achievement of the SDG target 11.7 and potentially degenerate into environmental
injustice.
Mean green space per capita in Kumasi is about 25 m2 per individual and varies
among submetropolises. In contrast to the traditional worldview that urban green
spaces are synonymous to public parks and gardens, the green spaces in this study are
contextualized to include both public and private green spaces. This contextualization
stems from the fact that: 1) public spaces which once were the premise for Kumasi’s
status as a “Garden City”, currently consist of only five functional parks and constitute
about 1 % of vegetation cover in the city; and 2) much of the remnant green cover of
Kumasi is private green space. Therefore, per capita green space comparisons between
cities should be done with enormous caution, since in addition to the above
consideration, city form and population have a dovetail influence on this metric. The
findings of this study closely corroborate mean green space per capita of 36.5 m2 in ten
56
South African towns (McConnachie and Shackleton 2008), far below the mean of 122 m2
green space per inhabitant observed in medium-sized (> 1 million inhabitants) cities in
Africa (Chapter 2), well above the WHO recommended 9 m2 green space per individual
and is within the range of United Nations recommended 30 m2 green space per capita
(Laghai and Bahmanpour 2012; Khalil 2014). It is also within the range of per capita
green space (6 – 422 m2 per individual) for European cities for green spaces (+ forest)
(Table 3.5, Kabisch et al. 2015) and between 1.9 - 52 m2 per person for South American
cities (SustainableCitiesNetwork, 2011). In the UK, it is recommended that households
live within 300 m from the nearest public park with cities like Sheffield hosting 64 % of
households who contravene this rule (Barbosa et al. 2007). It must be noted that
availability of green spaces is a function of city area. Hence compact cities will tend to
have low per capita green space area (Fuller and Gaston 2009), further confirming the
strong relationship between submetropolitan area and green space area in Kumasi
metropolis. The differences in per capita green spaces among submetropolises in
Kumasi is a subtle indication of distributive injustice.
Table 3.2 Per capita green spaces of cities across Europe. Numbers in parentheses are per capita green spaces when forest area is excluded.
City Country Per capita green space (m2/person) Source
Amsterdam Netherlands 14 Beatley 2000 Malmo Sweden 99 (89) Kabisch et al. 2015 Berlin Germany 60 (16.3) Kabisch et al. 2015 Ljubljana Slovenia 422 (9) Kabisch et al. 2015 Bari Italy 6 (5.8) Kabisch et al. 2015 Edinburgh United Kingd. 60 (31) Kabisch et al. 2015 Lodz Poland 60 (12.5) Kabisch et al. 2015
The amount of green space per individual and the proportion of public parks
and open spaces (the commons) elicit the city’s sustainability status (Chiesura 2004) and
can constitute environmental injustice (Kabisch and Haase 2014). In many cities in
Europe and North America, luxuriant green space extent is often associated with the
wealthy class because of their ability to meet expensive cost of maintenance (Kabisch
and Haase 2014; Heynen et al. 2006; Wen et al. 2013). However, conflicting results about
the luxury-nature hypothesis do exist (Jennings et al. 2012; Wolch et al. 2014). In Boston
57
and several other US cities, environmental injustice among wealthy neighborhoods are
quite common (Pickett et al. 2008). Also, in South African towns and cities, negative
correlations between income levels, quality and area of green spaces are ostensible
(McConnachie and Shackleton 2008).
The results of this study depict moderate relationships between per capita
green space and socioeconomic variables and no relationships between green space
area (relative or absolute) and SE condition of the submetropolis. Lack of strong
correlation between UGS and SE in Kumasi contradicts findings in neighborhoods in
Accra where UGS cover positively correlated with socio-economic conditions (Stow et
al. 2012). Each submetropolis consists of several neighborhoods of varying socio-
economic conditions. This obscured possible glaring correlations between HQI and
vegetation cover. Furthermore, the traditional land tenure system administered in
Kumasi which allows both wealthy and poor native Asantes to acquire land at fairly low
“drink money” values under the auspices of the Asantehene (the king of the Asante
kingdom) and his sub-chiefs (Devas and Korboe 2000) and to live together in the same
neighborhood and submetropolis prevents the creation of distinct constellations of
under privileged submetropolises in the city. Nevertheless the wide variation in per
capita UGS among submetropolises is tantamount to environmental injustice. As
explained previously, this pattern of UGS distribution could be an artefact of the history
of urbanization in the city: hitherto the traditional old towns (submetropolises) such as
Tafo, Suame, Menhyia, Subin and Bantama have the lowest per capita UGS area. Due to
the influence of past imperialism, better environmental education and awareness,
government residential and rapidly developing peri-urban areas have assumed a
greener outlook. A thorough investigation of UGS distribution at the neighborhood level
in Kumasi may reveal more compelling evidence of distributive injustices and is strongly
recommended.
Conveyed in the UGS and tree cover Gini coefficient of 0.26 is the implication
that vegetation is somewhat evenly distributed among the inhabitants of Kumasi.
However, closely matching vegetation to inhabitants does not necessarily mean access
or utilization of these green spaces. Indeed, only a few privileged households/individuals
58
or interest groups or parties actually own, access, and exploit the green spaces of
Kumasi. There are many others who see green but hardly benefit directly from it besides
the inherent intrinsic and public goods and services these green spaces provide.
The results further reveal that fewer public green spaces than originally
intended currently exist in Kumasi, fomenting doubts as to whether Kumasi is still the
“Garden city” of West Africa. With several home gardens, vegetation on institutional
compounds, and a network of grasslands and farmlands along water flow paths, the
jurisdictional area of KMA is 33 % green albeit at risk of being completely greyed out due
to pressure from built-up expansion. Strict adherence to urban plans, policies (e.g.
Water Resources Commission advocated 100 m no development zone around
waterbodies policy) and actions restraining neglect, destruction and unguided
conversion of green spaces are required to revert the status quo. The current green
cover can persist and even expand if 1) bare areas in the city are converted into some
green cover: lawns or plantations; 2) trees are planted along all major and minor roads
in the city; 3) best management practices geared at greening and protecting wetlands
and other sensitive landscapes in the city are instituted; 4) UGS are given a facelift and
turned into attractive spaces for tourism, recreation etc. and 5) halt all form of non-
green activities in such buffers including waste disposal, mechanical/fitting shops,
buildings, etc., and prohibition of open defecation. Green spaces could be artistically
planted with adequate trees and beautiful lawns and maintained for recreational
purposes which could lead to the creation of a useful blue-green corridor connecting
nature in the city to the rural areas.
It is important to reiterate that green cover is an indicator of the city’s
resilience to climate change (Lindley et al. 2015). Green spaces minimize surface runoff
and floods by providing conduits for accelerated runoff water from the paved surfaces
in the city. Through evaporative cooling and shading urban vegetation directly regulate
temperatures, hence mitigate heat island effects and reduce cost of cooling homes.
Carbon storage benefits to partially compensate for the vast amount of CO2 released
into the atmosphere via urban energy consumption are discussed in the next chapter
whilst biodiversity, the basis for all ecosystem services supplied by green spaces is
59
discussed in chapter 5. Food, fiber, fuelwood, air purification, supply of supporting and
cultural services for the wellbeing of urbanites are at the domain of UGS.
3.5 Conclusion
Availability and equitable distribution of vegetation in cities is essential to
advancing the course of sustainable development. However, the extent, composition
and basis of distribution of green spaces in cities in developing countries is fraught with
uncertainties. This chapter discussed the temporal and spatial changes in green cover,
major green space types, and the possible distributive injustices pertaining to green
spaces in Kumasi. Multi-resolution image analysis provides a worthwhile means to
monitor land cover dynamics in cities: about 44 % loss in green cover in Kumasi since
1986, with the rate of loss in the most recent five years (2009-2014) being far greater
than any period before. Severe vegetation losses due built-up expansion are to some
extent partially compensated for by some vegetation recovery in the core urban area
attributable to greater awareness and concern for environmental issues in the city.
Sprawl accentuates natural resource consumption and feedbacks positively on climate
and urban life.
At the current pace of vegetation loss, there is high likelihood of further
compromising Kumasi’s current 33 % green cover. Home gardens and vegetation on
institutional compounds being the dominant green space types sustaining the bulk of
this green cover, underlines the importance of private individuals and traditional leaders
in spearheading the greening of the city. The caveat however is that home gardens and
land under the jurisdiction of traditional leaders are driven by economic motives and at
severe risk of being converted to build up areas as and when land values rise. The local
government, KMA, however, needs to be proactive to revamp greening of the city for
the common good of the inhabitants and in accord with the targets of SDG 11. In this
regard, reclaiming and rejuvenating bare, deplorable, encroached, and usurped public
parks should be a major priority.
While no explicit socioeconomic evidence accounts for distribution of green
spaces in the city at the submetropolis level, there is nuance evidence of distributive
60
injustices in terms of uneven amounts of per capita UGS among submetropolises, subtle
inequalities in UGS distribution among populace and limited availability of public spaces
for common access of all inhabitants. Further investigations of this subject at the finer
scale of neighborhood may provide more explicit answers and is suggested. Given the
pace of urbanization and changes in life styles of urbanites, the need for public spaces
for the aged and particularly for children and the youth cannot be overemphasized.
Establishing public green spaces as well as greening streets and bare areas in parts of
the city where per capita green space is low is extremely necessary. These findings are
essential for local government and urban planners to better manage the land and plan
for green infrastructure networks in the city. For the sustainability of Kumasi, green
space conservation and management plans are required. It is also imperative to
innovatively reconstruct the urban planning institutions to integrate multiple disciplines
such as ecology and aspects of the social and physical environment into its folds. Failure
to heed this latter suggestion could lead to path dependency (Matthews, Lo, and Byrne
2015). Furthermore, research on monitoring urban land use change and addressing
environmental injustices, institutional motivators of urban greening and intrinsic and
extrinsic values of green spaces at the neighborhood level are encouraged. Institutional,
social, and economic evaluation of the human actions and green space availability and
relevance are long overdue. Future research should also focus on use of higher
resolution satellite images in mapping and monitoring green cover changes, urban
vulnerability to disasters and health implications of green spaces especially in relation
to short-lived climate pollutants (SLCPs) in African cities.
61
4 BELOW AND ABOVEGROUND CARBON STORAGE IN KUMASI, GHANA: DOES
GREEN SPACE TYPE MATTER?
4.1 Introduction
Urbanization and climate change are coupled contemporary global processes that
interact on the earth surface with feedback effects on each other and are predicted to escalate
with time (UN-Habitat 2011). Africa, the most vulnerable and fastest urbanizing continent in
the world with urban population growth rate of 1.1 % per annum, is expected to further
urbanize by 16 percentage points by 2050 (United Nations 2014). Nearly 90 % of African cities
are exposed to and affected by at least one form of natural disaster, i.e. desertification,
cyclones, extreme heat, floods, volcanic eruptions, drought, air pollution, etc. (Di Ruocco et
al. 2015). Climate change is projected to aggravate these disasters and further endanger the
lives of urbanites. Moreover, cities globally, account for 70 – 80 % of CO2 emissions into the
atmosphere including other greenhouse gases (GHG) (OECD 2014; UN-Habitat 2011). Carbon
dioxide, in conjunction with bare surfaces resulting from urbanization create ‘heat islands’ and
severe air pollution (Lindén 2011; Hardy and Nel 2015; Bowler et al. 2010; Peng et al. 2012),
causing discomfort to the living and sometimes fatalities. Although additional conurbation
expansion in the developing world, further convolutes these climate-related challenges, it
presents opportunities to innovatively create livable, carbon neutral, and environmentally
benign cities.
Multiple alternatives exists that can address climate change and its effects in cities.
The choice of a solution, depends on the political, social, economic conditions and resources
available to design and implement an intervention. UGS constitute a low-cost local strategy
that can easily be adopted and practiced in most human settlements at a limited scale and
with limited institutional support. Although often obliterated by human demographic growth
as a consequence of poor planning, it is clear from the literature that UGS of various forms
remain a major part of the urban landscape of many cities in developing countries (Lindley et
al. 2015). Urban green spaces, in addition to their numerous co-benefits, collapse slowly, are
more resource-efficient and more resilient to stress induced by both urbanization and climate
change processes compared to engineering solutions (European Commission 2015).
62
In cities in the Global North, UGS have been documented as important carbon
sinks(Nowak 1993; Jo and McPherson 2001; Nowak and Crane 2002; Hutyra et al. 2011; Davies
et al. 2011; Strohbach and Haase 2012; Nowak et al. 2013; Russo et al. 2014; Schreyer et al.
2014; Dorendorf et al. 2015). Defined as the relics of vegetation (i.e. parks, tree lots,
cemeteries, home gardens, lawns, grass and farmlands, wetlands, and bare ground),
sandwiched by grey infrastructure (buildings, roads and paved surfaces) in cities (Benedict and
McMahon 2002; Breuste et al. 2013), UGS can sequester carbon in trees, other vegetation
and soil. Carbon stocks and fluxes have been estimated from allometric equations, remote
sensing, eddy covariance techniques, GHG inventory using emission factors and activity data
and models (e.g. i-Tree) (Nowak and Crane 2002; Velasco et al. 2016; Zhang et al. 2012).
Through photosynthesis, plants absorb CO2 from the atmosphere, transmit it to the soil in the
form of living (roots) and dead organic matter (humus) and release it back to the atmosphere
during respiration. Human management of UGS can alter these source/sink processes with
the climate and hence the ecosystem services they provide (Davies et al. 2011; Francis 2013).
Because urbanization patterns differ markedly at the global and regional scales governed by
varying political, social and economic drivers, it will be a misestimate to extrapolate carbon
stocks measurements in cities in other regions to cities in Africa.
Besides influencing the local and regional climates, carbon cycle, and energy budgets
(Lal 2012), UGS are preserves of several ecosystem services. These include direct mitigation
of urban heat island effect by cooling through evapotranspiration and shading, improving air
quality (regulating particulate matter, NOx, SO2, CO and O3) (Brack 2002; Nowak et al. 2006;
Chaparro 2009; Jim and Chen 2009), mitigating floods and runoff (Van Leeuwen and Koomen
2012), recreation and cultural services supply, erosion control (Heinze 2011; Bolund and
Hunhammer 1999), solid waste and sewage disposal, fuel and food provisioning, ground water
supply (Vollmer and Grêt-Regamey 2013), acting as windbreaks, psychological and other
health benefits (Tzoulas et al. 2007). The capacity of UGS to provide ecosystem services is
reinforced by their area extent in the city, composition and biodiversity, and efficiency in their
management.
Despite their worth, UGS remain marginalized in many national and regional carbon
budgets. In Ghana and indeed throughout Africa, carbon stocks of cities are assumed to be
zero (Henry et al. 2011). Where cities have been studied, carbon stocks estimates are based

63
on low resolution satellite images (Asare 2009), which tend to severely underestimate carbon
stocks (Raciti et al. 2012; Davies et al. 2013). Furthermore, the variation of carbon stocks
among different green space types within the city matrix remains largely nebulous
(Edmondson et al. 2014). Besides, carbon storage in both soils and vegetation differ strongly
among cities (Pouyat et al. 2006; Nowak et al. 2013) because of varying socioeconomic,
geographical, and biophysical peculiarities.
The goal of this chapter was to quantify and map the distribution of vegetation, soil
and ecosystem carbon storage in Kumasi, Ghana. More specifically, the variability in carbon
storage among UGS types and along urban zones was estimated. It was hypothesized that
vegetation carbon densities and stocks in Kumasi are sensitive to green space type and urban
zone.
4.2 Materials and methods
4.2.1 Study area
Kumasi metropolis is located in south central Ghana (6° 41”N, 1° 37”W, Figure 3.1).
The climate is tropical, characterized by a bi-modal rainfall system: the major raining season
being April to June and the minor season September and October. Mean annual rainfall and
temperature are respectively, 1250 mm (Owusu 2009) and 26.4°C (Manu et al. 2006). Kumasi
is sited in the moist semi-deciduous South-East Ecological Zone of Ghana with Ceiba,
Triplochiton, Celtis and some exotic species being among the most common tree genera (KMA
2013). Soils are mainly forest ochrosols comprising of four main associations: Bekwai-
Nzima/Oda compound association, Kumasi-Asuansi/Nta-Ofin association, Akomadan-Bekwai
Association, and Bomso-Nta-Ofin Compound association (largest in area extent) developed
over Cape Coast granites and lower Birrimian phyillites (Adu, 1988). The FAO World Reference
Base (WRB) classifies the soil in Kumasi into two types: Haphic Alisols and Lithic Leptosols in
the northern and southern halves of the city, respectively (European Commission 2013).
Kumasi has a land area of 254 km2 inhabited by about 2.5 million people at a
population density of 8,000 persons per km2 and a growth rate of 4.8 % (Ghana Statistical
Service 2012; KMA 2013). It hosts the largest open market in West Africa and is a central
transiting point for travelers from within and beyond Ghana (Adarkwa 2011).
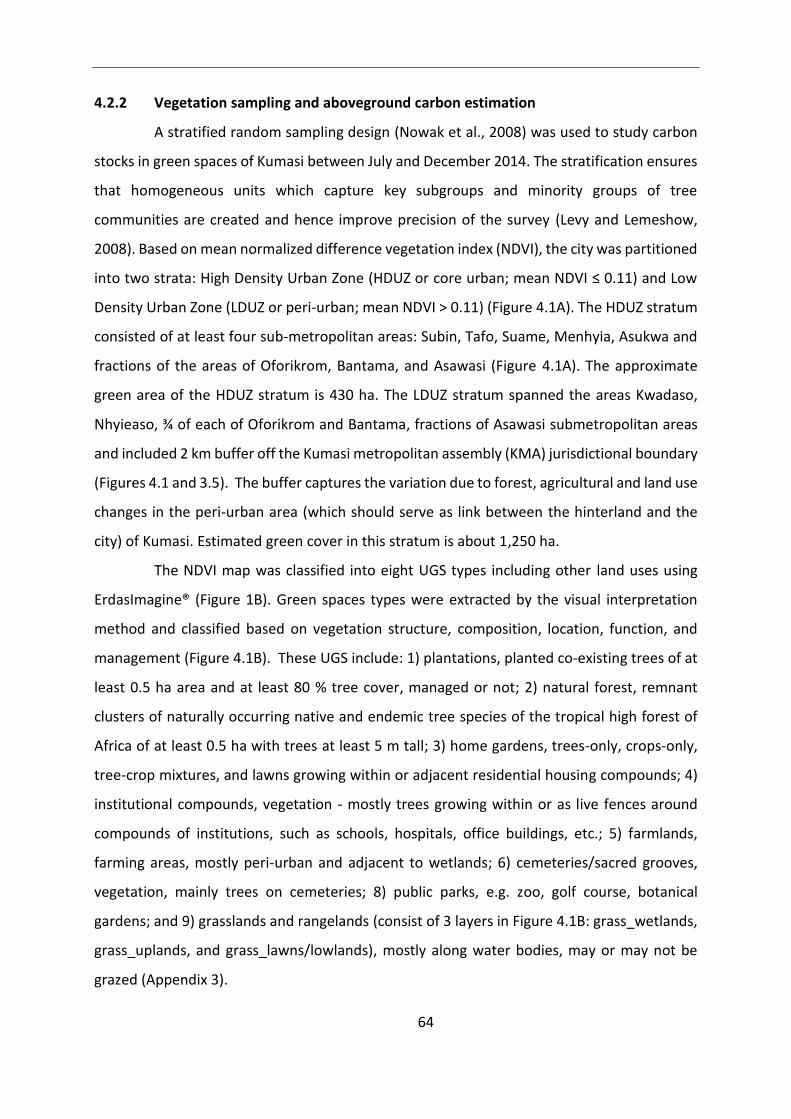
64
4.2.2 Vegetation sampling and aboveground carbon estimation
A stratified random sampling design (Nowak et al., 2008) was used to study carbon
stocks in green spaces of Kumasi between July and December 2014. The stratification ensures
that homogeneous units which capture key subgroups and minority groups of tree
communities are created and hence improve precision of the survey (Levy and Lemeshow,
2008). Based on mean normalized difference vegetation index (NDVI), the city was partitioned
into two strata: High Density Urban Zone (HDUZ or core urban; mean NDVI ≤ 0.11) and Low
Density Urban Zone (LDUZ or peri-urban; mean NDVI > 0.11) (Figure 4.1A). The HDUZ stratum
consisted of at least four sub-metropolitan areas: Subin, Tafo, Suame, Menhyia, Asukwa and
fractions of the areas of Oforikrom, Bantama, and Asawasi (Figure 4.1A). The approximate
green area of the HDUZ stratum is 430 ha. The LDUZ stratum spanned the areas Kwadaso,
Nhyieaso, ¾ of each of Oforikrom and Bantama, fractions of Asawasi submetropolitan areas
and included 2 km buffer off the Kumasi metropolitan assembly (KMA) jurisdictional boundary
(Figures 4.1 and 3.5). The buffer captures the variation due to forest, agricultural and land use
changes in the peri-urban area (which should serve as link between the hinterland and the
city) of Kumasi. Estimated green cover in this stratum is about 1,250 ha.
The NDVI map was classified into eight UGS types including other land uses using
ErdasImagine® (Figure 1B). Green spaces types were extracted by the visual interpretation
method and classified based on vegetation structure, composition, location, function, and
management (Figure 4.1B). These UGS include: 1) plantations, planted co-existing trees of at
least 0.5 ha area and at least 80 % tree cover, managed or not; 2) natural forest, remnant
clusters of naturally occurring native and endemic tree species of the tropical high forest of
Africa of at least 0.5 ha with trees at least 5 m tall; 3) home gardens, trees-only, crops-only,
tree-crop mixtures, and lawns growing within or adjacent residential housing compounds; 4)
institutional compounds, vegetation - mostly trees growing within or as live fences around
compounds of institutions, such as schools, hospitals, office buildings, etc.; 5) farmlands,
farming areas, mostly peri-urban and adjacent to wetlands; 6) cemeteries/sacred grooves,
vegetation, mainly trees on cemeteries; 8) public parks, e.g. zoo, golf course, botanical
gardens; and 9) grasslands and rangelands (consist of 3 layers in Figure 4.1B: grass_wetlands,
grass_uplands, and grass_lawns/lowlands), mostly along water bodies, may or may not be
grazed (Appendix 3).
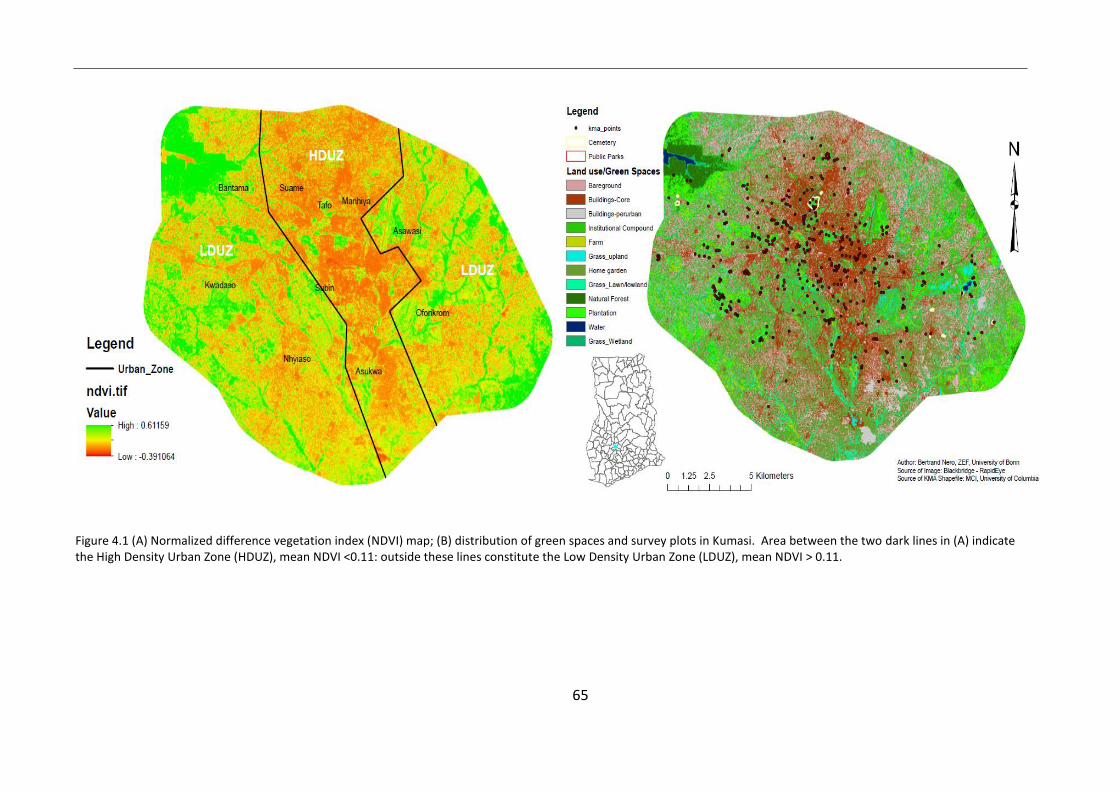
65
Figure 4.1 (A) Normalized difference vegetation index (NDVI) map; (B) distribution of green spaces and survey plots in Kumasi. Area between the two dark lines in (A) indicate the High Density Urban Zone (HDUZ), mean NDVI <0.11: outside these lines constitute the Low Density Urban Zone (LDUZ), mean NDVI > 0.11.
A B
66
Producer’s and user’s accuracies for the different green spaces as well as non-green
spaces (Figure 4.1B) were calculated. The producer’s accuracy is the probability that a particular
land cover on the ground was correctly classified as such (omission error). The user’s accuracy is
the probability that a classified object on the map was really the same object in the real world
(commission error). Nevertheless, errors due to rapid changes in landscape may amount to
misclassification and should not be discounted. The overall accuracy of the classification was 62.3
% with a Kappa coefficient of 0.56. A detailed description of accuracy assessment of the green
space map is presented in chapter 3.
Sampling points were randomly generated on the green space map of Kumasi (Figure
4.1B). Except for home gardens, 10 m x 10 m quadrats were centered on each sampling point on
the ground with the help of a compass, a distance tape measure, and ranging poles. All trees with
diameter at breast height (DBH =1.3 m from ground) greater than 5 cm within the plot were
counted by species and subsequently heights and DBH of each tree measured with a clinometer
and diameter tape, respectively. In addition, the canopy cover and proportion of the plot covered
by grass, crops, bare ground (or hard surface), small trees and shrubs (DBH = 1 – 5 cm), and
buildings were determined. In plots containing herbaceous vegetation, cereals, and vegetables as
well as on open grasslands 1 m x 1m quadrats were randomly established, the vegetation within
was clipped to ground level and conveyed to the laboratory for oven drying.
In each stratum (zone), sampling intensity depended on the type of UGS, the extent of
vegetation cover, size of trees, composition and diversity of species (Table 4.1). For instance, in
the HDUZ stratum, home gardens and trees on institutional compounds, which constituted more
than half the green space cover, were the most sampled (196 plots). However, home gardens can
be as varied as a single tree in a house yard to as large and complex as an acre (436 m2) of several
large and small tree species mixed with perennial and annual crops. Overall, 273 and 181 sample
plots were surveyed in the HDUZ and LDUZ, respectively.
On large farmlands containing staple food crops such as Musa spp., Manihot spp., and
Colocasia spp., 25 x 25 m plots were established on sample points and the number of individuals
per species counted. Fifteen individual plantain crops of varying sizes were destructively sampled
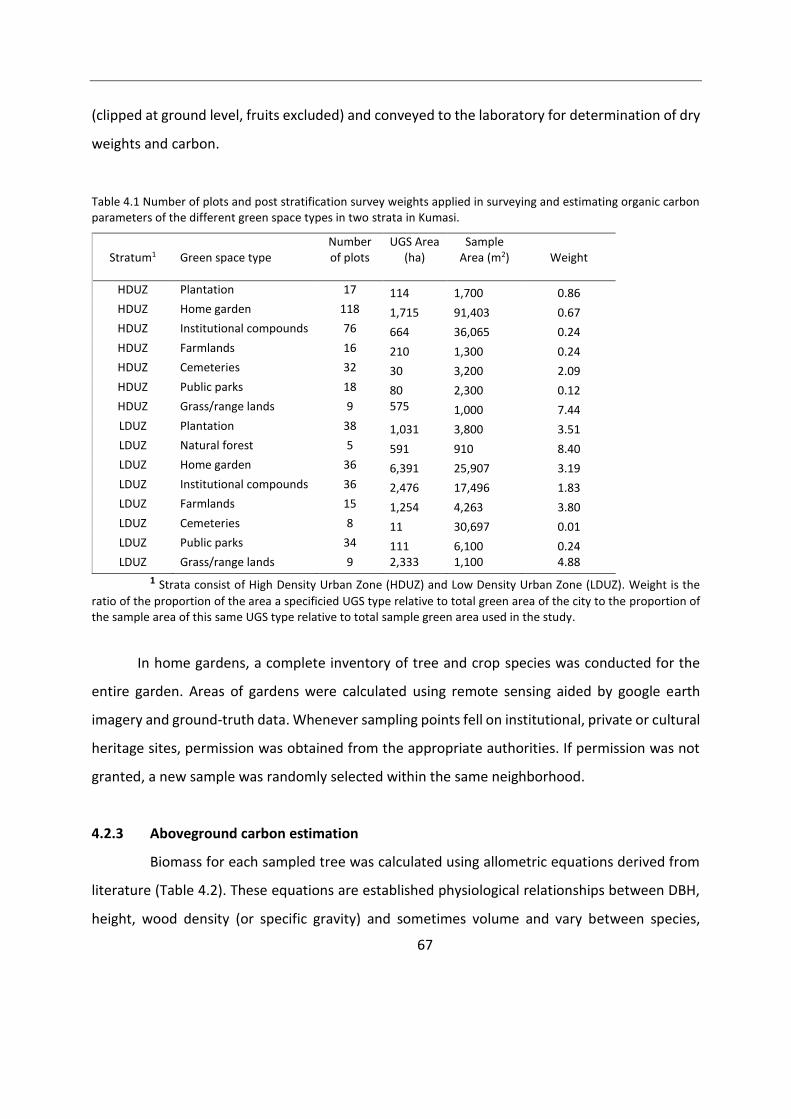
67
(clipped at ground level, fruits excluded) and conveyed to the laboratory for determination of dry
weights and carbon.
Table 4.1 Number of plots and post stratification survey weights applied in surveying and estimating organic carbon parameters of the different green space types in two strata in Kumasi.
Stratum1 Green space type Number of plots
UGS Area (ha)
Sample Area (m2) Weight
HDUZ Plantation 17 114 1,700 0.86 HDUZ Home garden 118 1,715 91,403 0.67 HDUZ Institutional compounds 76 664 36,065 0.24 HDUZ Farmlands 16 210 1,300 0.24 HDUZ Cemeteries 32 30 3,200 2.09 HDUZ Public parks 18 80 2,300 0.12 HDUZ Grass/range lands 9 575 1,000 7.44 LDUZ Plantation 38 1,031 3,800 3.51 LDUZ Natural forest 5 591 910 8.40 LDUZ Home garden 36 6,391 25,907 3.19 LDUZ Institutional compounds 36 2,476 17,496 1.83 LDUZ Farmlands 15 1,254 4,263 3.80 LDUZ Cemeteries 8 11 30,697 0.01 LDUZ Public parks 34 111 6,100 0.24 LDUZ Grass/range lands 9 2,333 1,100 4.88
1 Strata consist of High Density Urban Zone (HDUZ) and Low Density Urban Zone (LDUZ). Weight is the
ratio of the proportion of the area a specificied UGS type relative to total green area of the city to the proportion of the sample area of this same UGS type relative to total sample green area used in the study.
In home gardens, a complete inventory of tree and crop species was conducted for the
entire garden. Areas of gardens were calculated using remote sensing aided by google earth
imagery and ground-truth data. Whenever sampling points fell on institutional, private or cultural
heritage sites, permission was obtained from the appropriate authorities. If permission was not
granted, a new sample was randomly selected within the same neighborhood.
4.2.3 Aboveground carbon estimation
Biomass for each sampled tree was calculated using allometric equations derived from
literature (Table 4.2). These equations are established physiological relationships between DBH,
height, wood density (or specific gravity) and sometimes volume and vary between species,
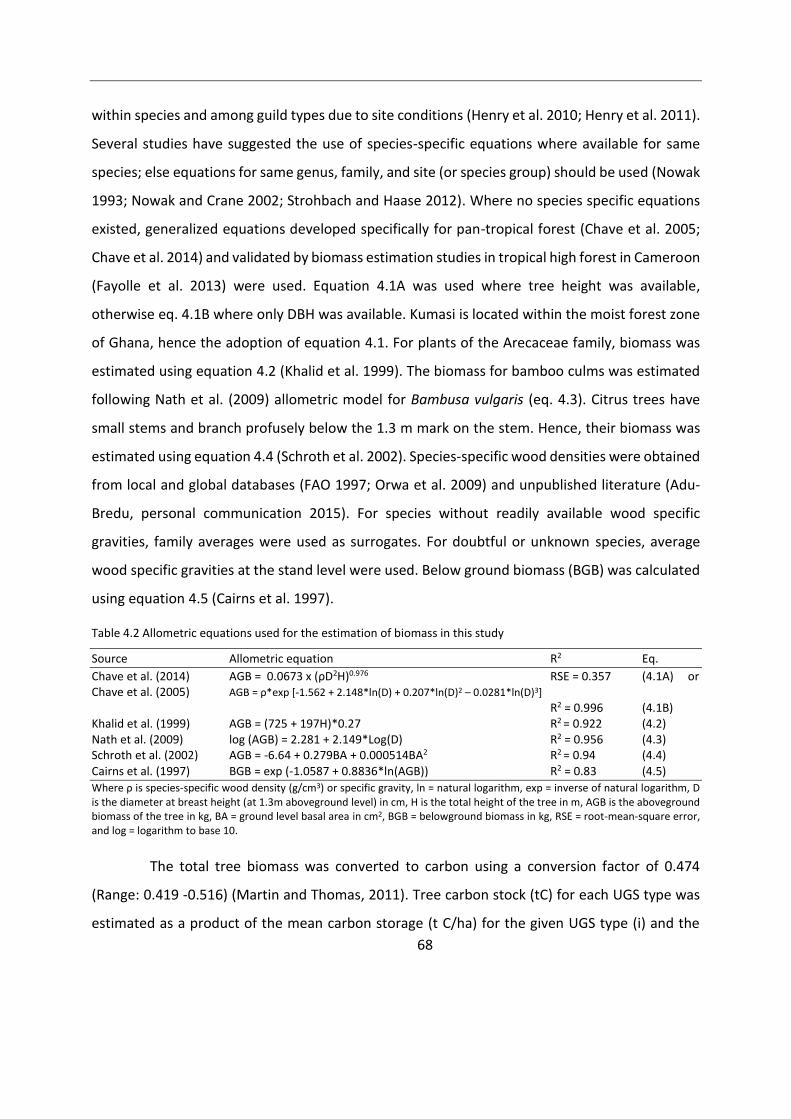
68
within species and among guild types due to site conditions (Henry et al. 2010; Henry et al. 2011).
Several studies have suggested the use of species-specific equations where available for same
species; else equations for same genus, family, and site (or species group) should be used (Nowak
1993; Nowak and Crane 2002; Strohbach and Haase 2012). Where no species specific equations
existed, generalized equations developed specifically for pan-tropical forest (Chave et al. 2005;
Chave et al. 2014) and validated by biomass estimation studies in tropical high forest in Cameroon
(Fayolle et al. 2013) were used. Equation 4.1A was used where tree height was available,
otherwise eq. 4.1B where only DBH was available. Kumasi is located within the moist forest zone
of Ghana, hence the adoption of equation 4.1. For plants of the Arecaceae family, biomass was
estimated using equation 4.2 (Khalid et al. 1999). The biomass for bamboo culms was estimated
following Nath et al. (2009) allometric model for Bambusa vulgaris (eq. 4.3). Citrus trees have
small stems and branch profusely below the 1.3 m mark on the stem. Hence, their biomass was
estimated using equation 4.4 (Schroth et al. 2002). Species-specific wood densities were obtained
from local and global databases (FAO 1997; Orwa et al. 2009) and unpublished literature (Adu-
Bredu, personal communication 2015). For species without readily available wood specific
gravities, family averages were used as surrogates. For doubtful or unknown species, average
wood specific gravities at the stand level were used. Below ground biomass (BGB) was calculated
using equation 4.5 (Cairns et al. 1997).
Table 4.2 Allometric equations used for the estimation of biomass in this study
Source Allometric equation R2 Eq.
Chave et al. (2014) AGB = 0.0673 x (ρD2H)0.976 RSE = 0.357 (4.1A) or Chave et al. (2005) AGB = ρ*exp [-1.562 + 2.148*ln(D) + 0.207*ln(D)2 – 0.0281*ln(D)3]
R2 = 0.996 (4.1B) Khalid et al. (1999) AGB = (725 + 197H)*0.27 R2 = 0.922 (4.2) Nath et al. (2009) log (AGB) = 2.281 + 2.149*Log(D) R2 = 0.956 (4.3) Schroth et al. (2002) AGB = -6.64 + 0.279BA + 0.000514BA2 R2 = 0.94 (4.4) Cairns et al. (1997) BGB = exp (-1.0587 + 0.8836*ln(AGB)) R2 = 0.83 (4.5)
Where ρ is species-specific wood density (g/cm3) or specific gravity, ln = natural logarithm, exp = inverse of natural logarithm, D is the diameter at breast height (at 1.3m aboveground level) in cm, H is the total height of the tree in m, AGB is the aboveground biomass of the tree in kg, BA = ground level basal area in cm2, BGB = belowground biomass in kg, RSE = root-mean-square error, and log = logarithm to base 10.
The total tree biomass was converted to carbon using a conversion factor of 0.474
(Range: 0.419 -0.516) (Martin and Thomas, 2011). Tree carbon stock (tC) for each UGS type was
estimated as a product of the mean carbon storage (t C/ha) for the given UGS type (i) and the
69
area coverage of the same UGS type (i), adjusting for tree cover. The total number of trees for
each UGS type was estimated using a similar approach as above. Carbon storage, basal area (BA),
and tree population density were estimated as the plot total (carbon, number of trees, BA)
divided by the area of the plot.
Dry weights of crops, herbs and grasses were determined after oven drying at 68°C for
72 hours. However, dry weights of some food crops e.g. Manihot spp., Colocasia spp., Dioscorea
spp., were obtained from the literature. Herbaceous biomass was converted to carbon stocks
using a conversion factor of 0.45 (Piao et al., 2007). Because crops and herbaceous plants grow
under trees, their area coverage exceeds the area coverage derived from aerial images. Hence,
area cover for herbs and crops was adjusted to account for plants growing under trees. The total
carbon stock for the crops and herbaceous plants was determined as a product of the mean UGS
vegetation carbon density and the respective UGS area.
4.2.4 Soil sampling and carbon measurements
About 480 soil samples from 161 profiles were collected within August – December
2014. Samples were randomly drawn from all eight UGS types in each stratum as described
previously. Each profile was cored to a depth of 60 cm (0-15 cm, 15-30 cm, 30-60 cm) using a
regular soil auger and a bulk density soil sampling ring, each with 53 mm diameter (Eijkelkamp
Agrisearch Equipment, Netherlands). The undisturbed soil collected in cylinders down each
profile (partitioned into the three layers or depth segments) was conveyed to the laboratory for
bulk density determination.
Bulk density samples were dried at 105°C, weighed and the density determined as the
dry weight per unit volume of cylinder. Samples for chemical analysis were dried at 68°C, grinded
and sieved through a 2 mm mesh to remove large pebbles and stones. Coarse roots were removed
by hand. The particles > 2 mm weighed less than 5 % of the total weight of each soil sample. The
sieved sample was analyzed for C and pH. The Walkley-Black technique was used for carbon
analysis. Soil organic carbon (SOC) content was calculated without a recovery factor. Since soil
organic matter (SOM) contains 58 % organic carbon, % SOM is estimated by multiplying % SOC
concentration by a factor of 1.724.
70
4.2.5 Statistical analysis
Statistical analyses were conducted using SAS (version 9.3, SAS Institute Inc 2013).
Differences in carbon densities, BA, and number of trees in the different UGS types and urban
zones were assessed using SURVEYREG procedure in SAS. SUVEYREG takes into account
stratification and complex design information together with the auxiliary information about
independent variables and improves the precision of the estimates compared to other
procedures such as GLM, ANOVA, and mixed models (SAS Institute Inc., 2008). It fits linear models
for survey data and computes regression co-efficients and their variance-covariance matrices as
well as provides test of significance for model effects and for specified estimable linear functions
of the model parameters (SAS Institute Inc. 2008). Post stratification survey weights were applied
to reduce biases in the estimators and variances arising from several sources (Table 4.1). Weights
were computed as ratios of the proportion of the area of a specified green space type at a citywide
scale to the proportion of the sample area of this same green space type relative to the total area
of green spaces sampled in the study. Weightings were necessary to minimize the effects of errors
due to noncoverage and erroneous inclusions (Levy and Lemeshow 2008). Statistically significant
differences were tested at alpha =0.05. Erdas Imagine®2015 and ArcGIS ArcGIS (version 10.1,
ESRI) were combined to generate the green space (Figure 4.1) and carbon stock maps.
4.3 Results
4.3.1 Vegetation carbon
A total of 3,527 stems belonging to 2,755 trees were recorded in Kumasi. At least 162
species belonging to 42 families were correctly identified. Sixteen species could not be identified
to the species nor genus level because they were either dead or in a form without conspicuous
phenological features. Thirty plots had no trees. The largest tree was a Kapok tree (Ceiba
pentandra (L.) Gaertn) with a diameter of 272 cm, located in a plantation. Among UGS types,
mean DBH was significantly different (p<0.0001). With 61.8 cm, trees on institutional compounds
had the highest mean DBH while plantation, home garden, farmlands, and grasslands were not
significantly different among them with mean DBH of 32±4.2 cm, 33.6±2.1 cm, 44.3±8.3 cm and
71
39.9±8.8 cm, respectively. The overall site mean trees density was 377 trees/ha (95 % CI = 335 –
419) with pocket plantations having the highest mean tree density of 800 trees/ha (95 % CI = 619
– 981) (Table 4.3). Dead trees, deadwood, and trees with DBH < 5 cm and forest undergrowth
trees, common only in the few secondary natural forest in this city, were excluded in the survey.
About 55 % of the study area (KMA area+2km buffer) is covered by UGS (Table 4.3;
Figure 4.1). Home gardens and institutional compound constitute 46 % and 18 % of the UGS cover
of Kumasi, respectively (Table 3.4). Plantations, natural forest, public parks, grasslands and
farmlands account for 7, 3, 1, 17, and 8 % of green area, respectively. The green cover is 40 % in
the HDUZ area and 60 % in the LDUZ area. Tree cover constitutes 61 % of the entire green area of
Kumasi.
A total of 2,180,845 ± 26,617 t C is stored within vegetation across Kumasi metropolis
(Table 4.3; Figure 4.2), equivalent to 211.28 ± 18 t C/ha for UGS within the study area (and 111 ±
7.0 t C/ha for the entire metropolitan area covered in this study. More than 99 % (2,175,759 ±
26,614 t C) of this total carbon is stored in trees, out of which 12 % is stored in the roots. Green
spaces that stored the most vegetation carbon included plantations (15 %), natural forest (19 %),
home gardens (23 %), and institutional compounds (35 %). Green spaces with the least carbon
stocks were public parks, farmlands, grasslands, and cemeteries, which respectively stored 3.4,
3.5, 0.8 and 0.4 % of the total vegetation carbon. Crops and herbaceous vegetation combined
stored about 5,086 ± 2.5 t C citywide (Table 4.3). The HDUZ area stored about 11 % of the total
carbon estimated in the city (Table 4.3; Figure 4.2).
Carbon stored in trees is significantly different (p = 0.0088) for aboveground carbon
(AGC) and for belowground carbon (BGC) (p = 0.0097) among the UGS types in the two urban
zones. Except for farmlands where tree carbon storage in the HDUZ is almost twice that of the
LDUZ area, carbon storage in all other UGS types in LDUZ exceed that of the HDUZ. Comparison
of means of the different green spaces are shown in Table 4.3. Natural forest had the highest AGC
storage of 618 t C/ha (95 % CI = -163 – 1399) while that of public parks, cemeteries, trees on
institutional compounds, and plantations are not significantly different (Table 4.3) and are
respectively: 420 (95 % CI = 275 – 564), 291 (95 % CI = 165 – 417), 228 (95 % CI = 179 – 277) and
256 t C/ha (95 % CI = 132 – 378).
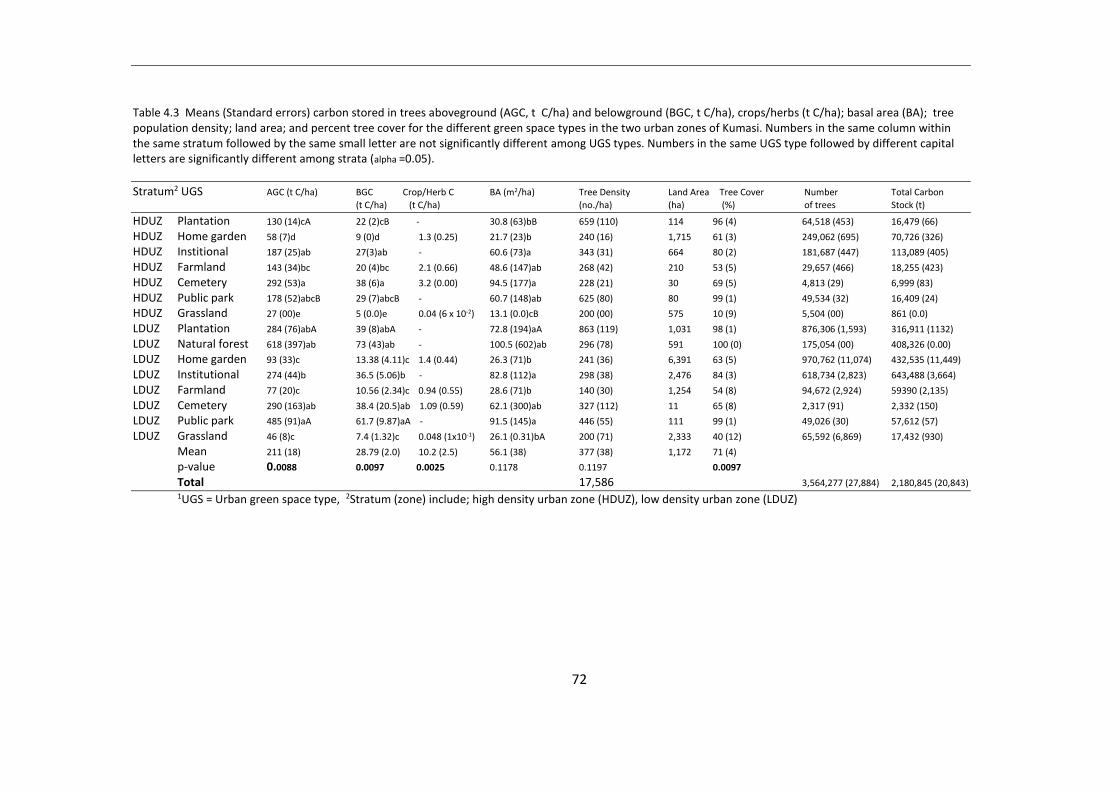
72
Table 4.3 Means (Standard errors) carbon stored in trees aboveground (AGC, t C/ha) and belowground (BGC, t C/ha), crops/herbs (t C/ha); basal area (BA); tree population density; land area; and percent tree cover for the different green space types in the two urban zones of Kumasi. Numbers in the same column within the same stratum followed by the same small letter are not significantly different among UGS types. Numbers in the same UGS type followed by different capital letters are significantly different among strata (alpha =0.05).
Stratum2 UGS AGC (t C/ha) BGC Crop/Herb C BA (m2/ha) Tree Density Land Area Tree Cover Number Total Carbon (t C/ha) (t C/ha) (no./ha) (ha) (%) of trees Stock (t)
HDUZ Plantation 130 (14)cA 22 (2)cB - 30.8 (63)bB 659 (110) 114 96 (4) 64,518 (453) 16,479 (66) HDUZ Home garden 58 (7)d 9 (0)d 1.3 (0.25) 21.7 (23)b 240 (16) 1,715 61 (3) 249,062 (695) 70,726 (326) HDUZ Institional 187 (25)ab 27(3)ab - 60.6 (73)a 343 (31) 664 80 (2) 181,687 (447) 113,089 (405) HDUZ Farmland 143 (34)bc 20 (4)bc 2.1 (0.66) 48.6 (147)ab 268 (42) 210 53 (5) 29,657 (466) 18,255 (423) HDUZ Cemetery 292 (53)a 38 (6)a 3.2 (0.00) 94.5 (177)a 228 (21) 30 69 (5) 4,813 (29) 6,999 (83) HDUZ Public park 178 (52)abcB 29 (7)abcB - 60.7 (148)ab 625 (80) 80 99 (1) 49,534 (32) 16,409 (24) HDUZ Grassland 27 (00)e 5 (0.0)e 0.04 (6 x 10⁻²) 13.1 (0.0)cB 200 (00) 575 10 (9) 5,504 (00) 861 (0.0) LDUZ Plantation 284 (76)abA 39 (8)abA - 72.8 (194)aA 863 (119) 1,031 98 (1) 876,306 (1,593) 316,911 (1132) LDUZ Natural forest 618 (397)ab 73 (43)ab - 100.5 (602)ab 296 (78) 591 100 (0) 175,054 (00) 408,326 (0.00) LDUZ Home garden 93 (33)c 13.38 (4.11)c 1.4 (0.44) 26.3 (71)b 241 (36) 6,391 63 (5) 970,762 (11,074) 432,535 (11,449) LDUZ Institutional 274 (44)b 36.5 (5.06)b - 82.8 (112)a 298 (38) 2,476 84 (3) 618,734 (2,823) 643,488 (3,664) LDUZ Farmland 77 (20)c 10.56 (2.34)c 0.94 (0.55) 28.6 (71)b 140 (30) 1,254 54 (8) 94,672 (2,924) 59390 (2,135) LDUZ Cemetery 290 (163)ab 38.4 (20.5)ab 1.09 (0.59) 62.1 (300)ab 327 (112) 11 65 (8) 2,317 (91) 2,332 (150) LDUZ Public park 485 (91)aA 61.7 (9.87)aA - 91.5 (145)a 446 (55) 111 99 (1) 49,026 (30) 57,612 (57) LDUZ Grassland 46 (8)c 7.4 (1.32)c 0.048 (1x10⁻¹) 26.1 (0.31)bA 200 (71) 2,333 40 (12) 65,592 (6,869) 17,432 (930)
Mean 211 (18) 28.79 (2.0) 10.2 (2.5) 56.1 (38) 377 (38) 1,172 71 (4) p-value 0.0088 0.0097 0.0025 0.1178 0.1197 0.0097
Total 17,586 3,564,277 (27,884) 2,180,845 (20,843) 1UGS = Urban green space type, 2Stratum (zone) include; high density urban zone (HDUZ), low density urban zone (LDUZ)
73
Figure 4.2 Aboveground tree carbon storage (A) and submetropolis-level aboveground tree carbon storage (B) distribution map of Kumasi metropolitan area.
A B

74
Although significantly lower than the aforementioned green spaces, AGC storage in
farmlands and home gardens are not significantly different, respectively storing 94 (95 % CI = 60
– 129) and 71 t C/ha (95 % CI = 45 – 97). AGC storage in grasslands was significantly lower than all
other UGS types in the metropolis with a mean of 41.9 t C/ha (95 % CI = 27 – 57). Differences in
mean BGC carbon densities are similar to the patterns observed in AGC (Figure 4.2A, Table 4.3).
Carbon storage for crops on farmlands and home gardens are significantly greater than
C stored in grasslands (Table 4.3; p<0.0001) though C storage in crops and grasslands were just
incommensurable to C storage in tree dominated green spaces. Mean crop carbon storage are
1.4 t C/ha (95 % CI = 0.9 – 1.9) and 1.5 t C/ha (95 % CI = 0.5 – 2.2) for home gardens and farmlands,
respectively. Grassland has a carbon storage of 0.00045 t C/ha (Table 4.3).
Carbon storage in live vegetation increased from the middle of the city to the periurban
fringes (Figure 4.2A). Vegetation carbon storage range from 0 t C/ha in built-up areas, bare
ground and roads to 690 t C/ha in the relics of natural forests found in the periurban fringes in
riparian areas e.g. the Owabi Wildlife sanctuary behind Bantama (Figure 4.2). Submetropolitan
UGS carbon storage also vary widely across the city (Figure 4.2B). Oforikrom stores the highest
carbon (~380 t C/ha) and Menhyia has the least (<100 t C/ha). The 2 km buffer around the political
boundary of Kumasi metropolis stored slightly more carbon (400 t C/ha) than any submetropolis
in the city. Carbon accumulated mostly in the west and east parts of the city, the area designated
as LDUZ. The HDUZ holds little carbon due to high build-up density. Mean above ground and
belowground tree carbon storage in the LDUZ are statistically greater (p= 0.0121 and p=0.0115,
respectively) than in the HDUZ. Tree size (basal area) per stand explained 83 % of the variation in
stand biomass.
4.3.2 Soil carbon
Urban green space type and soil depth interaction effect significantly affect SOC storage
(p<0.0001), reflecting a general decline in soil carbon storage with depth (0-15 cm = 29.4 ± 2.5 t
C/ha; 15-30 cm = 23.4 ± 1.2 t C/ha; 30-60 cm = 34 ± 2.65 t C/ha, n = 161). In the A (0-15 cm) soil
depth, cemeteries and plantations hold the highest SOC. Except for natural forests which hold the
least SOC in all depths, the other UGS types do not differ significantly in the top layer. Similar
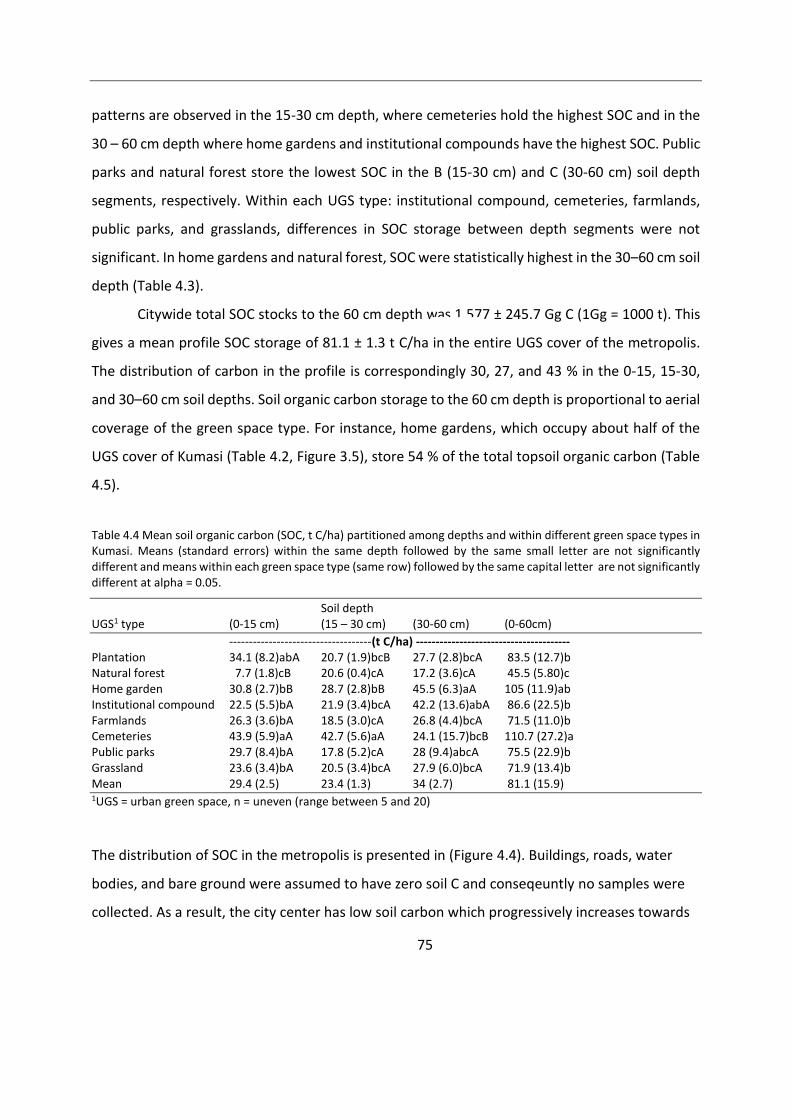
75
patterns are observed in the 15-30 cm depth, where cemeteries hold the highest SOC and in the
30 – 60 cm depth where home gardens and institutional compounds have the highest SOC. Public
parks and natural forest store the lowest SOC in the B (15-30 cm) and C (30-60 cm) soil depth
segments, respectively. Within each UGS type: institutional compound, cemeteries, farmlands,
public parks, and grasslands, differences in SOC storage between depth segments were not
significant. In home gardens and natural forest, SOC were statistically highest in the 30–60 cm soil
depth (Table 4.3).
Citywide total SOC stocks to the 60 cm depth was 1,577 ± 245.7 Gg C (1Gg = 1000 t). This
gives a mean profile SOC storage of 81.1 ± 1.3 t C/ha in the entire UGS cover of the metropolis.
The distribution of carbon in the profile is correspondingly 30, 27, and 43 % in the 0-15, 15-30,
and 30–60 cm soil depths. Soil organic carbon storage to the 60 cm depth is proportional to aerial
coverage of the green space type. For instance, home gardens, which occupy about half of the
UGS cover of Kumasi (Table 4.2, Figure 3.5), store 54 % of the total topsoil organic carbon (Table
4.5).
Table 4.4 Mean soil organic carbon (SOC, t C/ha) partitioned among depths and within different green space types in Kumasi. Means (standard errors) within the same depth followed by the same small letter are not significantly different and means within each green space type (same row) followed by the same capital letter are not significantly different at alpha = 0.05.
Soil depth UGS1 type (0-15 cm) (15 – 30 cm) (30-60 cm) (0-60cm)
------------------------------------(t C/ha) --------------------------------------- Plantation 34.1 (8.2)abA 20.7 (1.9)bcB 27.7 (2.8)bcA 83.5 (12.7)b Natural forest 7.7 (1.8)cB 20.6 (0.4)cA 17.2 (3.6)cA 45.5 (5.80)c Home garden 30.8 (2.7)bB 28.7 (2.8)bB 45.5 (6.3)aA 105 (11.9)ab Institutional compound 22.5 (5.5)bA 21.9 (3.4)bcA 42.2 (13.6)abA 86.6 (22.5)b Farmlands 26.3 (3.6)bA 18.5 (3.0)cA 26.8 (4.4)bcA 71.5 (11.0)b Cemeteries 43.9 (5.9)aA 42.7 (5.6)aA 24.1 (15.7)bcB 110.7 (27.2)a Public parks 29.7 (8.4)bA 17.8 (5.2)cA 28 (9.4)abcA 75.5 (22.9)b Grassland 23.6 (3.4)bA 20.5 (3.4)bcA 27.9 (6.0)bcA 71.9 (13.4)b Mean 29.4 (2.5) 23.4 (1.3) 34 (2.7) 81.1 (15.9) 1UGS = urban green space, n = uneven (range between 5 and 20)
The distribution of SOC in the metropolis is presented in (Figure 4.4). Buildings, roads, water
bodies, and bare ground were assumed to have zero soil C and conseqeuntly no samples were
collected. As a result, the city center has low soil carbon which progressively increases towards
C
D
A
B
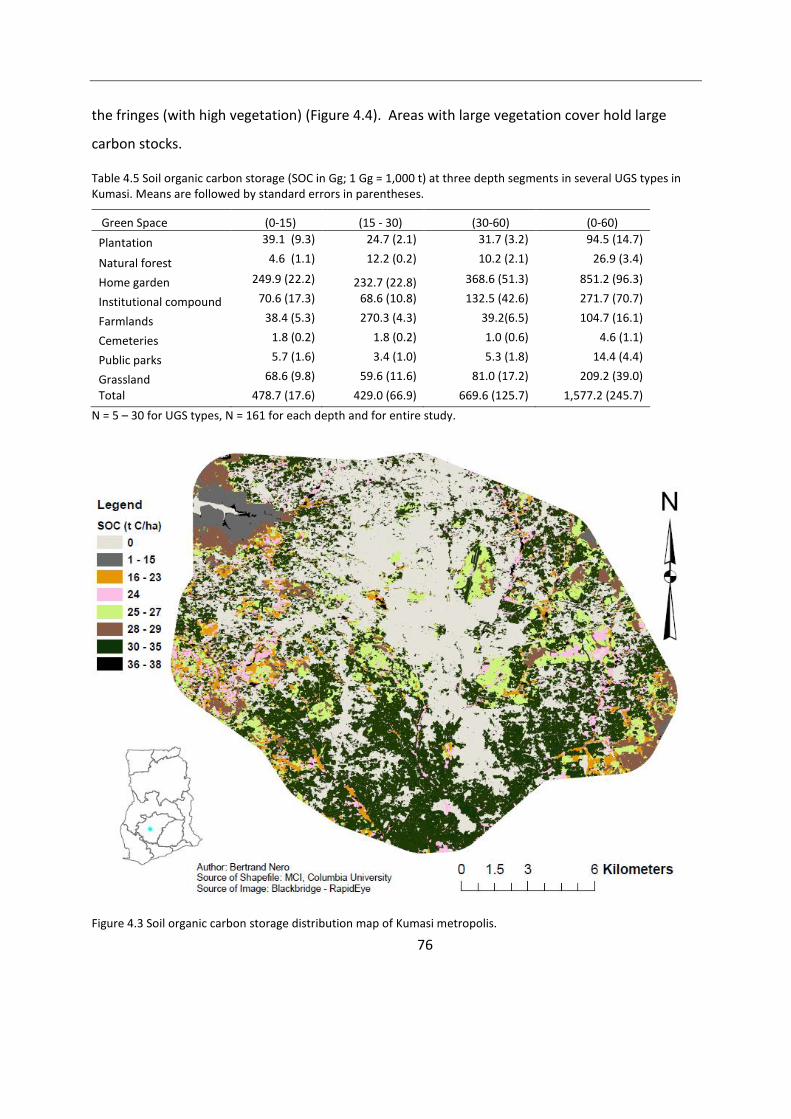
76
the fringes (with high vegetation) (Figure 4.4). Areas with large vegetation cover hold large
carbon stocks.
Table 4.5 Soil organic carbon storage (SOC in Gg; 1 Gg = 1,000 t) at three depth segments in several UGS types in Kumasi. Means are followed by standard errors in parentheses.
Green Space (0-15) (15 - 30) (30-60) (0-60)
Plantation 39.1 (9.3) 24.7 (2.1) 31.7 (3.2) 94.5 (14.7)
Natural forest 4.6 (1.1) 12.2 (0.2) 10.2 (2.1) 26.9 (3.4)
Home garden 249.9 (22.2) 232.7 (22.8) 368.6 (51.3) 851.2 (96.3)
Institutional compound 70.6 (17.3) 68.6 (10.8) 132.5 (42.6) 271.7 (70.7)
Farmlands 38.4 (5.3) 270.3 (4.3) 39.2(6.5) 104.7 (16.1)
Cemeteries 1.8 (0.2) 1.8 (0.2) 1.0 (0.6) 4.6 (1.1)
Public parks 5.7 (1.6) 3.4 (1.0) 5.3 (1.8) 14.4 (4.4)
Grassland 68.6 (9.8) 59.6 (11.6) 81.0 (17.2) 209.2 (39.0)
Total 478.7 (17.6) 429.0 (66.9) 669.6 (125.7) 1,577.2 (245.7)
N = 5 – 30 for UGS types, N = 161 for each depth and for entire study.
Figure 4.3 Soil organic carbon storage distribution map of Kumasi metropolis.
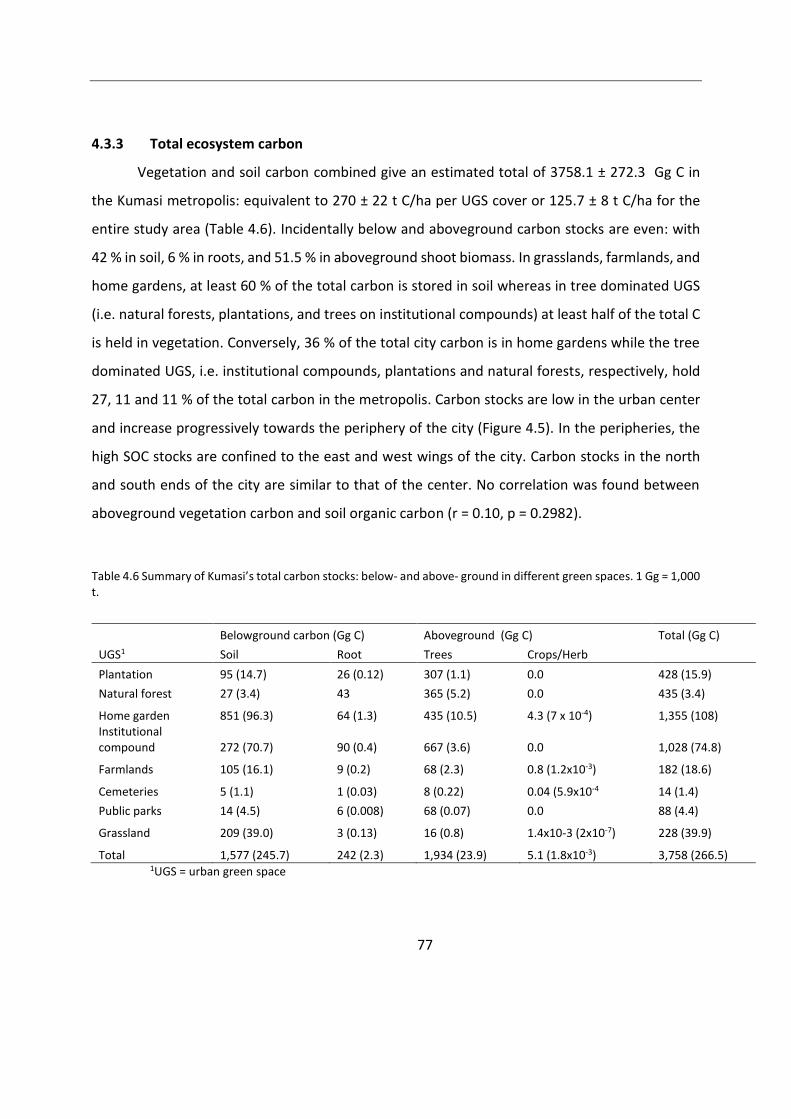
77
4.3.3 Total ecosystem carbon
Vegetation and soil carbon combined give an estimated total of 3758.1 ± 272.3 Gg C in
the Kumasi metropolis: equivalent to 270 ± 22 t C/ha per UGS cover or 125.7 ± 8 t C/ha for the
entire study area (Table 4.6). Incidentally below and aboveground carbon stocks are even: with
42 % in soil, 6 % in roots, and 51.5 % in aboveground shoot biomass. In grasslands, farmlands, and
home gardens, at least 60 % of the total carbon is stored in soil whereas in tree dominated UGS
(i.e. natural forests, plantations, and trees on institutional compounds) at least half of the total C
is held in vegetation. Conversely, 36 % of the total city carbon is in home gardens while the tree
dominated UGS, i.e. institutional compounds, plantations and natural forests, respectively, hold
27, 11 and 11 % of the total carbon in the metropolis. Carbon stocks are low in the urban center
and increase progressively towards the periphery of the city (Figure 4.5). In the peripheries, the
high SOC stocks are confined to the east and west wings of the city. Carbon stocks in the north
and south ends of the city are similar to that of the center. No correlation was found between
aboveground vegetation carbon and soil organic carbon (r = 0.10, p = 0.2982).
Table 4.6 Summary of Kumasi’s total carbon stocks: below- and above- ground in different green spaces. 1 Gg = 1,000 t.
Belowground carbon (Gg C) Aboveground (Gg C) Total (Gg C)
UGS1 Soil Root Trees Crops/Herb
Plantation 95 (14.7) 26 (0.12) 307 (1.1) 0.0 428 (15.9)
Natural forest 27 (3.4) 43 365 (5.2) 0.0 435 (3.4)
Home garden 851 (96.3) 64 (1.3) 435 (10.5) 4.3 (7 x 10⁻⁴) 1,355 (108) Institutional compound 272 (70.7) 90 (0.4) 667 (3.6) 0.0 1,028 (74.8)
Farmlands 105 (16.1) 9 (0.2) 68 (2.3) 0.8 (1.2x10⁻³) 182 (18.6)
Cemeteries 5 (1.1) 1 (0.03) 8 (0.22) 0.04 (5.9x10⁻⁴ 14 (1.4)
Public parks 14 (4.5) 6 (0.008) 68 (0.07) 0.0 88 (4.4)
Grassland 209 (39.0) 3 (0.13) 16 (0.8) 1.4x10⁻³ (2x10⁻⁷) 228 (39.9)
Total 1,577 (245.7) 242 (2.3) 1,934 (23.9) 5.1 (1.8x10⁻³) 3,758 (266.5) 1UGS = urban green space
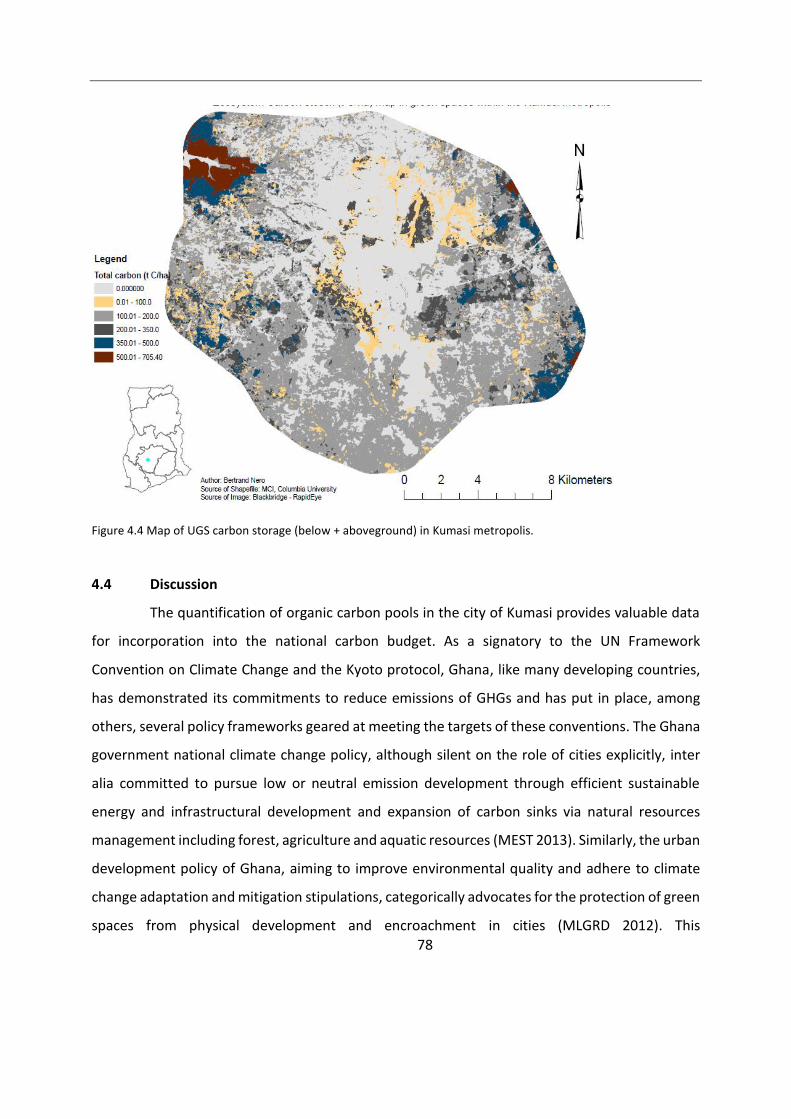
78
Figure 4.4 Map of UGS carbon storage (below + aboveground) in Kumasi metropolis.
4.4 Discussion
The quantification of organic carbon pools in the city of Kumasi provides valuable data
for incorporation into the national carbon budget. As a signatory to the UN Framework
Convention on Climate Change and the Kyoto protocol, Ghana, like many developing countries,
has demonstrated its commitments to reduce emissions of GHGs and has put in place, among
others, several policy frameworks geared at meeting the targets of these conventions. The Ghana
government national climate change policy, although silent on the role of cities explicitly, inter
alia committed to pursue low or neutral emission development through efficient sustainable
energy and infrastructural development and expansion of carbon sinks via natural resources
management including forest, agriculture and aquatic resources (MEST 2013). Similarly, the urban
development policy of Ghana, aiming to improve environmental quality and adhere to climate
change adaptation and mitigation stipulations, categorically advocates for the protection of green
spaces from physical development and encroachment in cities (MLGRD 2012). This
79
notwithstanding, the contributions of UGS to climate mitigation in Ghana have hardly been
assessed, despite burgeoning global efforts to admit urban forest carbon credits to national and
regional carbon markets (Poudyal et al., 2011).
The findings of this study suggest that the current national estimates of vegetation
carbon do not adequately account for this ecosystem service within SSA cities (Henry et al., 2011).
Kumasi’s overall carbon pool is estimated at 3,758.1 Gg C which is roughly evenly partitioned in
below- and aboveground components. Soils to 60 cm depth stored 42 % of the total ecosystem C
pool (excluding buildings and furniture, landfill sites, people, etc) with roots and aboveground
vegetation, respectively, holding 6 % and 52 %. Carbon storage is greater in the LDUZ (periurban)
compared to HDUZ (core urban). Similar discrepancies have been shown in the UK and Germany
where national carbon estimates undervalued carbon stocks of cities (Davies et al. 2011;
Dorendorf et al. 2015). Comparison of Kumasi’s carbon stocks to cities in the global north is
necessitated by the paucity of similar data in tropical cities.
The total aboveground vegetation carbon in Ghana is estimated to be 1,158 Tg C (1Tg =
106 t, Henry et al. 2011), meaning Kumasi’s vegetation C accounts for 0.2 % of Ghana’s total
aboveground C store, but represents only 0.1 % of its land area (Ghana’s land area = 239,460
km2). When soil C pool is included the proportion might be considerably higher.
The organic carbon storage in the city is unevenly distributed especially when built-up
infrastructure are assumed to have no organic carbon. Urban green spaces such as public parks,
institutional compounds and cemeteries have high carbon storage values in the core (HDUZ)
areas. The outer fringes are, however, most relevant for carbon storage, mainly due to large forest
patches or tree congregations and wetlands (Figures 4.2, 4.4, and 4.5). The importance of sparsely
built-up areas in carbon storage is illustrated by comparing “core-urban” or HDUZ to “peri-urban”
or LDUZ in the city. Assuming no carbon storage in buildings and compacted bare surfaces, the
significant difference in carbon stocks between the two zones suggest that a definition of “urban”
following political boundaries and not based on vegetation density could easily have resulted in
misestimate of the total carbon storage of Kumasi.
The lopsided partitioning of organic C in favor of trees in Kumasi contradicts what is
commonly observed in cities in the global north (Churkina et al. 2010; Edmondson et al. 2012;

80
Dorendorf et al. 2015) where about two-thirds of the urban ecosystem carbon pool is stored in
the soil. Generally, trees in Kumasi were relatively larger (in both girth and height) than the
average urban tree in these northern cities. However, larger differences in SOC can be attributed
to the relatively higher temperature and moisture regimes in Kumasi which tend to accelerate
decomposition, a characteristic of tropical environments. It is noteworthy that citywide
vegetation and soil carbon in Kumasi are consistent with vegetation and soil carbon storage of
204 and 327 t C/ha, respectively, in the neighboring moist-deciduous forest (Adu-Bredu et al.
2011). In tropical forests of Africa, soils contribute about 40 % of ecosystem carbon storage (Henry
et al. 2009; Henry et al. 2011), consistent with the findings of this study in Kumasi.
A hypothesis of this study asserted that carbon storage was similar regardless of UGS
type for both vegetation and SOC. In contrast, carbon storage in UGS differed significantly.
Natural forest had the highest vegetation carbon. However, the high standard errors in this green
space type (Table 4.3) lead to uncertainties in carbon estimates, hence comparisons with other
UGS types and neighboring land uses in the hinterlands may not be warranted. Nevertheless, it
creates room for further investigations, as the small sample size and plot area for such large forest
trees could have accounted for the incongruent error.
Public parks, cemeteries, institutional compounds in both the core (HDUZ) and peri-
urban (LDUZ) areas store more carbon compared to the other UGS except in the natural forests.
These high C storing green spaces were stocked with some of the largest and predominantly
native tropical tree species in this region. The proportion of large trees and tree densities (Nowak
1993; Liu and Li 2012) and the species composition, diversity and land use (Jo 2002; Timilsina et
al. 2014) are major drivers of carbon storage in plant ecosystems. Many native slow growing tree
species tend to have high wood densities (specific gravity), a major parameter in C stock
estimation apart from size. Though plantations have numerous trees per stand, the carbon they
store is generally lower than that of the natural forest because of the small sizes of trees (except
for the largest Kapok tree in this study found on a plantation which skewed the result) and
because of simpler species composition (mostly pure stands of Tectona grandis, Gmelina arborea
and Senna siamea). Farmlands, home gardens, and grasslands store the lowest carbon because
of smaller sizes of trees in home gardens and fewer trees per area in farmlands and grasslands. A
81
multiple of factors therefore account for the vegetation carbon storage differences among green
spaces in the city. This is especially relevant for urban authorities when designing a city to meet
ecological, economic and political interests.
Unlike tree carbon, soil organic carbon stocks closely corroborate the area coverage of
the UGS type with home gardens, institutional compounds and grasslands in decreasing order
having the highest soil carbon stocks to 60 cm depth (Table 4.5). Urban green space SOC stocks
in decreasing order were farmlands, plantations, natural forest and public parks. These patterns
are a reflection of differences in area coverage of each green space type and the SOC stored as
UGS with largest area coverage (Table 4.3; Figure 3.6) tended to store the highest SOC (Table 4.4).
Home gardens and institutional compounds are artifacts of human management and hence the
findings here are consistent with the 65 % urban SOC stocks under residential green spaces in six
cities in the United States of America strengthened primarily by area extent and high SOC storage
(Pouyat et al. 2006). Although cemeteries contain relatively higher SOC, the total SOC stock was
low because of the small area extent of this green space. Since cemeteries could not be
completely mapped because of lack of resources to traverse all communities within the city to
track locations of cemeteries, the precise quantification of their total carbon stocks was obscured.
The relatively higher SOC in home gardens, plantations and institutional compound over
soils of other UGS types were not particularly surprising. Indeed, home gardens in Kumasi benefit
from waste water irrigation and organic waste including animal dung amendments whiles trees
on institutional compounds if on lawns occasionally receive extra water amendments. Plantations
are particularly heavily littered with human excreta and/or household waste which are a major
source of nutrients (carbon and nitrogen). This perhaps explains the significantly higher SOC in
the top 0 -15 cm for plantations compared to other UGS types (Table 3). In spite of geographic,
climatic and soil differences, the SOC storage (46 – 111 t C/ha) to 60 cm depth of green spaces in
Kumasi were comparable to SOC in green spaces in cities in Europe (Dorendorf et al., 2015;
Edmondson et al., 2014, 2012) and in North America (Pouyat et al. 2006; Yesilonis and Pouyat
2012; Campbell et al. 2014). In general, higher organic carbon in soils under residential vegetation
in these cities in the Global North are a reflection of intensive management and inputs in home
82
lawns and domestic gardens (Pouyat et al. 2006; Edmondson et al. 2012; Edmondson et al. 2014)
and to some extent climatic differences.
Low pH owed to less human disturbance and limited inputs from external sources (Bationo
et al. 2006) and addition of organic acids, including increased uptake of base cations by trees
(Berthrong et al. 2009), may have caused the significantly low SOC concentrations of the
preserved natural forest (Owabi catchment) and the KNUST botanic garden in Kumasi. The high
productivity of the natural forests reflect high nutrient uptake rates, consequently freeing cation
exchange sites for attachment of H+ ions. Whereas the link between low pH and SOC depletion is
still nebulous, acidification of soils modifies organic matter quality (Kanianska et al. 2014).
Excluding wet forest SOC in Kumasi metropolis, wetlands hold 114 t C/ha in soils to 60
cm depth being only marginally greater than SOC in cemeteries and home gardens. Periodic or
permanent inundation, which is a characteristic of wetlands, alters pH and suppresses oxidation
and aerobic microbial activity resulting in accumulation of carbon (Schoenholtz 1994; Londo
2000). From organic matter concentrations determined for wetlands in Kumasi (Campion and
Owusu-Boateng 2013), the mean SOC was estimated to be about 176 t C/ha to 23 cm depth which
is similar to the estimates in this study. Higher wetland SOC may also be attributed to human
activities (i.e. waste disposal, mechanical shops, wood works, etc) on the immediate banks of
these wetlands (Campion and Odametey 2012). Furthermore, a citywide study of soil carbon in
Hamburg, Germany, revealed wetlands, including wet forest soils, hold the highest SOC of 144 t
C/ha among other land uses (Dorendorf et al. 2015), further underlining the importance of
conserving urban wetlands in cities.
By virtue of the high concentrations in the upper most soil depth, this layer is very
important to climate change mitigation not only because it is the recipient of most organic debris
but also because it is most vulnerable to disturbances and is the main source and shield against
upward losses of carbon and other GHGs from the subsoil. In the soils in Kumasi, 30 % of the SOC
to 60 cm depth was held in the top 15 cm depth, 27 % in 15–30 cm layer and 43 % in the 30 – 60
cm layer (Table 4.5). This is comparable to the 42 % C in the top 20 cm of Leicester city soils
measured to 1m depth (Edmondson et al. 2012) and more so to the 52 % SOC in the top 30 cm
layer of soils in Africa (Henry et al. 2009) . Disturbances, conversion to grey (built-up areas) spaces,
83
and poor management of these soils can cause massive losses of carbon and other GHGs
especially from the A-horizon (surface soil layers).
Aside the unusually high vegetation and low soil C stocks in remnant natural forest in
the city, C stocks for the other UGS types were fairly comparable to C stocks in land uses in the
neighboring hinterlands. Vegetation carbon storage in plantations in this study were similar to
carbon stocks in regular tree and fruit tree plantations within the forest belt of Ghana (Adu-Bredu
et al., 2008; Kongsager et al., 2013). Aboveground C stocks of public parks, institutional
compounds and cemeteries were within the range often reported for forest tree carbon stocks in
the region (Adu-Bredu et al., 2011; Lewis et al., 2009). Soil organic carbon under plantations were
similar to those of plantations in rural dry forest but less than SOC under plantations in the moist
forest zone with 48.8 and 38.3 t C/ha C in 0-20 and 20-40 cm depths, respectively (Adu-Bredu et
al. 2011). Similarly, SOC in urban farmlands were less than those of cultivated fields in the moist
forest region but greater than SOC in cultivated fields in the dry forest region of Ghana (Adu-
Bredu et al. 2011) and in cocoa farmlands (Asase et al. 2011). Nutrient enrichments from organic
waste and human excreta plus other urban environmental inducements (N deposition, CO2
enrichment, light, high temperatures), can provoke higher urban vegetation productivity than
natural forests in the hinterlands (Gregg et al. 2003; Hutyra et al. 2011; Searle et al. 2012; Davis
et al. 2015). Thus, the findings here partially corroborate previous findings that SOC in soils under
urban crops and trees were higher than neighboring rural farm and forest lands (Pouyat et al.
2006; Yesilonis and Pouyat 2012; Raciti et al. 2012; Edmondson et al. 2012; Edmondson et al.
2014). Estimation of national carbon stocks ought to consider incorporating urban carbon stocks
into the national and regional carbon budget.
4.5 Conclusion
This chapter examined the potential of cities in developing countries to partially mitigate
some of the GHGs they emit into the atmosphere using in-city ecological networks. It is evident
that cities in Africa have significant carbon stocks in their green spaces, similar to or even more
than cities in the developed north. The large carbon stocks in Kumasi clearly makes a case for the
inclusion of cities in the national and regional carbon assessments in Africa. Below- and
84
aboveground carbon storage combined account for 45 % of citywide annual emissions in Kumasi.
Hence, integrating ample quantities of vegetation into cities in Africa will be essential in boosting
urban sustainability and mitigating local GHG emissions and climate change.
Green space type has a strong influence on the allocation of carbon to the topsoil and
ecosystem carbon. Tree dominated green spaces (public parks and natural forests with limited
inputs and human interference) sequester more carbon in aboveground vegetation while green
spaces closely associated with built-up areas and rampant human activity (home gardens,
plantations and institutional compounds) store more carbon in soils. Soil C is the most relevant C
pool in grass and farmlands. Therefore, to enhance carbon sequestration and other climate
change benefits of ecological systems in cities, conservation and management of tree dominated
green spaces are key. In addition, greening bare areas with grass and trees and planting streets
with trees on the side could greatly boost the carbon stocks of the city. Since the outer regions
(LDUZ) have more carbon than the core (HDUZ) of the city, greening the HDUZ without
compromising the stocks in outer edges should be a priority of the city authorities.
This is one of few if any studies to discuss carbon storage at a citywide scale in sub-
Saharan Africa and the findings could be an important addition to the already expanding global
database on urban carbon storage and contribute positively to policy discourse on urbanization
and global climate change. They are particularly timely and relevant to both national and local
governments, as many African nations garner efforts to realign national and urban climate change
policies geared at minimizing emissions and creating a conducive carbon neutral society. The
findings are by no means exhaustive and both within and inter-city investigations will be essential
to strengthen the interlinkages between urban green spaces, carbon sequestration and other
ecosystems services derived from cities.
The current study quantified and mapped carbon stocks in green spaces of Kumasi but
not the carbon stocks for the anthropogenic pool (i.e. SOC under impervious surfaces, C stocks in
buildings and people, and C stocks in landfill sites). Estimating carbon storage and emissions from
the urban anthropogenic pool will advance our understanding of the contribution of cities in the
Global South to the global carbon budget and climate change mitigation.
85
5 TREE AND TRAIT DIVERSITY, COEXISTENCE AND DIVERSITY-FUNCTIONAL
RELATIONS OF GREEN SPACES IN KUMASI, GHANA
5.1 Introduction
Change in biodiversity is a global change with important and sometimes
irreversible ecological and social impacts (Chapin et al. 2000). Furthermore, a challenge
confronting contemporary ecology is the paucity of knowledge about biological diversity
on earth (including cities) (Mora et al. 2011). This is even murkier in cities in developing
countries in that urban biodiversity concerns are not merely subsidiary to more pressing
issues such as unemployment, poverty alleviation (Anderson et al. 2013), national
biodiversity strategies and most assessments neglect urban biodiversity outright (MES
2002; Hackman 2014). Consequently, empirical and conceptual understanding of the
biological diversity and the fundamental principles behind plant community assembly
and function in cities remain elusive.
Historically, ecological studies in cities treated urban areas as single habitats
(Burton et al. 2005; Pauchard et al. 2006; McKinney 2008) or were conducted at broad
spatial scales that blurred the distinctions in microhabitat effects in cities (Ellis and
Ramankutty 2008). However, urban landscapes consists of severely fragmented and
heterogeneous habitats (green spaces) which may prescribe varied savage
consequences on patterns of species diversity, abundance and distribution (Savard et al.
2000; Pauleit et al. 2005; Angold et al. 2006; Savage et al. 2015). Such fine-scale
heterogeneity in habitats are important forces structuring animal species assemblages
within cities (Savage et al. 2015). For plants, which are sessile and restricted in
distribution by ecological and social filters, analysis of the array of heterogeneous fine-
scale green space (microhabitat) types in cities may reveal new patterns underpinning
urban communities and important for global biodiversity conservation.
Urbanization also causes shifts in plant species traits with many urban plant
species being wind-pollinated, scleromophic or animal dispersed (zoochory) (Knapp et
al. 2008) and mostly pioneers (Glaeser 2006; Huang et al. 2013). Such changes in urban
species and trait compositions can have important consequences on ecosystem
productivity and hence the amount and variety of ecosystem services they deliver. In
86
natural habitats, high productivity or ecosystem function is associated with high species
diversity or richness (Naeem et al. 1994; Reich et al. 2001; Bezemer and Van Der Putten
2007) or to trait and functional group diversity and richness (Hooper and Vitousek 1997;
Hector 1999; Roscher et al. 2012). Although most urban areas are uniquely
heterogeneous in terms of green spaces (patches) and species, plant species traits or
functional groups can be uniquely similar (McKinney 2006; Knapp et al. 2008a) due to
environmental selection pressure favoring only closely related species (Williams et al.
2008). Such species and/or trait plasticity in cities results in plants with high affinity for
nutrient-rich warm habitats, high irradiance, and recurrent disturbance (Burton et al.
2005; Knapp et al. 2008b; Lososova et al. 2008; Albrecht and Haider 2013). Hence,
maintaining a variety of green spaces in urban landscapes are encouraged to enhance
species and functional group diversities which intend accelerate ecosystem function and
diversify the range of ecosystem services they provide.
While, urban floral diversity is critical to providing ecosystem services and
improving human wellbeing, preserving local diversity, averting environmental change,
promoting environmental education, and providing contact with nature (Dearborn and
Kark 2010), it remains threatened by both anthropogenic and environmental
consequences due to the process of urbanization (Seto et al. 2012; Mcdonald et al. 2013)
and research linking floral species and functional groups (functional types or life history
traits) to ecosystem processes/functions such as carbon sequestration and storage in
tropical cities is lacking (Wright et al. 2006). Furthermore, a unifying theory to explain
species distribution and coexistence (Griffin and Silliman 2012) is an unknown subject in
urban plant diversity studies. Aronson et al. (2014) underscored the dearth of urban
biodiversity data from tropical cities and the immediate need for research in the current
frontiers of urban ecology. Hence, this chapter seeks to fill these knowledge voids using
a case study in Kumasi, Ghana. Knowledge of species co-existence in any ecosystem is
relevant to the restoration, conservation, and management of such ecosystems as well
as enhancement of their functions.
The goal of this chapter is to examine tree diversity patterns of UGS and the
linkages between ecosystem diversity and function. It is hypothesized that the niche

87
space limits tree species abundance distribution in cities and that green spaces which
are more species rich are more productive. It is also hypothesized that species life
history traits are essential determinants of species productivity at the tree level. These
objectives were pursued using inventory and survey techniques and were combined
with species abundance modeling.
5.2 Methodology
5.2.1 Study area
Refer to chapters 3 and 4.
5.2.2 Sampling procedure
Refer to chapter 4 - Trees in each sample plot were identified to the species level
and number of each species present counted and recorded. Understory vegetation
rarely exist in these green spaces, and hence were not sampled. Tree identification was
carried out with the aid of tree experts and published tree identification guides such as
those by Hawthorne and Gyakari (2006) and Oteng-Amoako (2002).
5.2.3 Species richness and diversity estimation
Species richness for each green space type, urban zone and for the entire city
were calculated. In addition, expected species richness for UGS type and urban zone
was computed using Chao1. Chao1, the simplest nonparametric estimator estimates
total number of species (Sest) by adding a term that depends only on the observed
number of singletons (a, species each represented by a single individual) and doubletons
(b, species each represented by exactly two individuals) to the number of species
observed (Sobs) (equation 5.1, Chao et al. 2006);
𝑆𝑒𝑠𝑡 = 𝑆𝑜𝑏𝑠 +𝑎2
2𝑏 (5.1)
Shannon (H) and Simpson (D) indices which combine richness and evenness
parameters and Pielou (J), a measure of evenness, were also estimated. Both Shannon
and Simpson diversities increase as richness increases for a given pattern of evenness
and the vice versa. Differences in species richness among UGS were established using
Chi-square test.
88
To determine species similarities/dissimilarities among UGS types and urban
zones, beta diversity between UGS and among urban zones were estimated. Beta
diversity is the difference in alpha diversity (habitat species richness) between two
areas/sites or spatial variation in species composition (Wilson and Shmida 1984). Beta
diversity was estimated with the reformulated Sørenson and Jaccard indices proposed
by Chao et al. (2005) instead of the binary techniques previously employed. Binary
techniques often fail to account for missing or unidentified species and assume both
rare and common species have equal weighting (Krebs 2014). To circumvent this short-
coming, a probabilistic approach which combines the incidence-based indices with
relative abundance data to compute these adjusted indices was used, thus minimizing
bias and placing unequal weightings on rare and common species (Chao et al. 2005).
The adjusted Sørenson’s and Jaccard’s indices are given in equations 5.2 and 5.3
respectively.
Sørenson’s Adjusted Index = 2𝑈𝑉
𝑈+𝑉 (5.2)
Jaccard’s Adjusted Index = 𝑈𝑉
𝑈+𝑉−𝑈𝑉 (5.3)
Where
U = ∑𝑋𝑖
𝑛
𝐷12𝑖=1 +
(𝑚−1)
𝑚(𝑓+1
2𝑓+2)∑
𝑋𝑖
𝑛/(𝑌𝑖 = 1)𝐷12
𝑖=1 (5.4)
V = ∑𝑌𝑖
𝑚+
(𝑛−1)
𝑛(𝑓1+
2𝑓2+)∑
𝑌𝑖
𝑚/(𝑋𝑖 = 1)𝐷12
𝑖=1𝐷12𝑖=1 (5.5)
Where
/(expression) = indicator function (/=1 if expression is true, /=0 if false)
Xi = number of individuals of species i in sample 1
D12 = number of shared species between samples 1 and 2.
n = total number of individuals in sample 1
m = total number of individuals in sample 2
f+1 = observed number of singletons (species with exactly 1 individual) in
sample 1
f+2 = observed number of doubletons (species with exactly 2 individuals) in
sample 1
Yi = number of individuals of species i in sample 2
89
f1+ = observed number of singletons in sample 2
f2+ = observed number of doubletons in sample 2.
When f+2 = 0 or f2+ = 0, replace that particular denominator by +1. If the value
of U or V is greater than 1, then it is replaced with the value of 1.
The assumption of unity where observed doubletons is equal to zero is one of
the caveats of this approach. Another caveat is that it does not address incidences where
no similar singletons exist in a pair of samples. The values of both adjusted Jaccard’s
and Sørenson’s coefficients range between 0 and 1: with a value of 0 implying absolute
dissimilarity and a value of 1 implying absolute similarity (Koleff et al. 2003; Chao et al.
2006). Thus, high values reflect low Beta diversity (high similarity) and low values reflect
high beta diversity (high dissimilarity). Undesirable biases may result from inequality in
sampling efforts or variation in spatial scale of sample habitats (Koleff et al. 2003).
5.2.4 Correspondence analysis
Correspondence analysis (CA) was performed to show the association between
tree species, UGS type and urban zone or stratum (HDUZ, LDUZ). Correspondence
analysis locates species simply by the average position of the samples in which they
occur and locates samples by the mean position of the species included. Species
abundance data were used to generate axis scores. Detailed application of CA in tropical
tree diversity studies are reported by Anglaaere et al. (2011) and Fayolle et al. (2014).
Correspondence analysis accommodates all types of categorical variables
whether binary, nominal, or ordinal and does not require the underlying fulfillment of
any distributional assumptions (Sourial et al. 2010). It graphically displays the
relationship between variables which otherwise would not be detected using pairwise
test of associations. The graphs represent relative frequencies based on the distance
between row (green space or urban zone or stratum) and column (species) profiles and
the distances to the average row and column profiles in a low dimensional space. The
distance is measured as a chi-square metric. A map of the first and second dimensions
of the CA was generated.
90
5.2.5 Model fitting
To find a theoretical explanation to the basis of tree species co-existence in
urban areas, the species abundance distributions (SAD) obtained from this study were
fitted to three community ecological models: geometric series (GS) and Broken-Stick
(BS) models with the primary focus on niche apportionment (Tokeshi 1990) and the
lognormal (LN) model, which reflects unperturbed communities under the influence of
multiple environmental factors.
The niche apportionment models are most applicable in cases where a few
factors (e.g. light) dominate the ecology of the assemblage. Both GS and BS models
assume that the fraction of niche space occupied by each species is proportional to its
relative abundance and that the relative proportions of the species are in equilibrium.
However, the models differ in how the niche space is sub-partitioned, resulting in
differences in evenness.
The BS model depicts a simultaneous random division of a resource space into
species’ niches (i.e. species share a specific resource or factor evenly) (Wilson et al.
1996). This results in a curve with few abundant species, several species with
intermediate abundance and a tail with rare species.
Similarly, the GS model, often referred to as the niche pre-emption model,
assumes that the abundance of a species is directly proportional to the amount of
resources it utilizes such that the most abundant species consumes k amount of
resources (Magurran 2004; Fattorini 2005). The next most abundant species consumes
k amount of resources from the left over and the trend continues until the entire space
is occupied (resources are exhausted). This results in a geometrically decreasing
sequence of species abundance. Communities in early stages of succession as well as
disturbed communities usually fit the geometric model (Magurran 2004; Caruso and
Migliorini 2006).
The lognormal distribution assumes that there are few species with high and
low species abundances and several species with intermediate abundances. It is
modeled based on Sugihara (1980) model in which a given resources space is
91
sequentially divided into niches, thus, resulting in a curve slightly similar to that of the
Broken-stick model but is more highly parameterized and more flexible in shape.
Both GS and BS models were fitted using regression techniques involving
species abundance and the rank in abundance of the species (Fattorini 2005). In the GS
model, species abundance is log transformed (eq. 5.6) whereas in the BS model, the rank
in abundance is log transformed (eq. 5.7). Hence, the following models were depicted:
log A = b0+b1R (5.6)
logR = b0 +b1A (5.7)
Where A = abundance of species, b0 and b1 represent regression coefficients
and R = rank in abundance.
The regression approach is more robust in selecting the best fit model from
among competing models, precludes the need to adhere to the assumptions of chi-
square test and estimates expected frequencies (Fattorini 2005).
The lognormal distribution is a plot of the number of species as the ordinate
and the logarithm of the abundance as the abscissa. A bell-shaped curve reveals a
normal distribution in the data. This approach was cross-checked by plotting cumulative
species richness on the probit scale against logarithm of species abundance. A diagonal
straight line of the plot indicates that the data is normally distributed.
However, several caveats underlie the use of biological or statistical models as
basis to provide explanations to community assemblages: 1) a natural community
conforming to a specific SAD model does not in itself justify the assumptions of the
model, hence inferences about the community should be made with caution, and 2) an
assemblage may assume the assumptions of more than one of these models (Magurran
2004).
Using life history traits of the plant species as proxies for the environmental
factors regulating the urban tree assemblage, the possible environmental filters
underpinning species coexistence (fitted model) are discussed. The environmental filter
(abiotic) such as light using guild type as surrogate and biotic filters, using dispersal
mechanism as proxy were examined.
92
5.2.6 Life history traits
From literature, plant species were classified into several guild types or life
history traits. The main dispersal mechanisms of trees were zoochory (animal),
anemochory (wind), anthropochory (humans), hydrochory (water),
barochory/autochory (gravity/natural fall). Species were also classified into guild types:
pioneers (heavy light demanders which grow in gaps), non-pioneer light demanders
(intermediate light demanders of which seedlings occur in shade and the adults in full
light), and shade-tolerant species (both young and adults tend to be abundant in the
forest understory). Species were further grouped according to leaf longevity (deciduous
and evergreen), main reproductive mechanism (seed, vegetative or both), and origin
(native or exotic). Functional traits (i.e. leaf area) and common uses of each species
found in the literature were extracted. Plant traits were obtained from the Agroforestry
database 4.0 (Orwa et al. 2009) and the TRY global database of plant traits (Kattge et al.
2011). Life history traits among plants in the HDUZ (core urban), LDUZ (peri-urban) and
natural forest (Owabi sanctuary) were analyzed using chi-square test and principal
component analysis (PCA). Twelve life history traits of tree species in conjunction with
species abundance data were analyzed with PCA, using ones as prior communality
estimates. Components were extracted using the principal axis technique followed by a
varimax (orthogonal) rotation. Factor scores generated from the PCA were used in a
multiple regression against mean tree species carbon storage, and species abundance
in the area. Mean carbon densities for each green space type were correlated with UGS
total species richness. Life history traits of the plant species were used as proxies for the
environmental factors as well as social and biotic factors regulating the urban tree
assemblage to analyze and extract possible factors shaping the plant community. All
statistical analyses were performed using SAS and Stata.
5.3 Results
5.3.1 Species richness
Overall 3,757 individual trees and shrubs made of 176 species and 42 families
were sampled across the different UGS types in Kumasi, excluding the neighboring
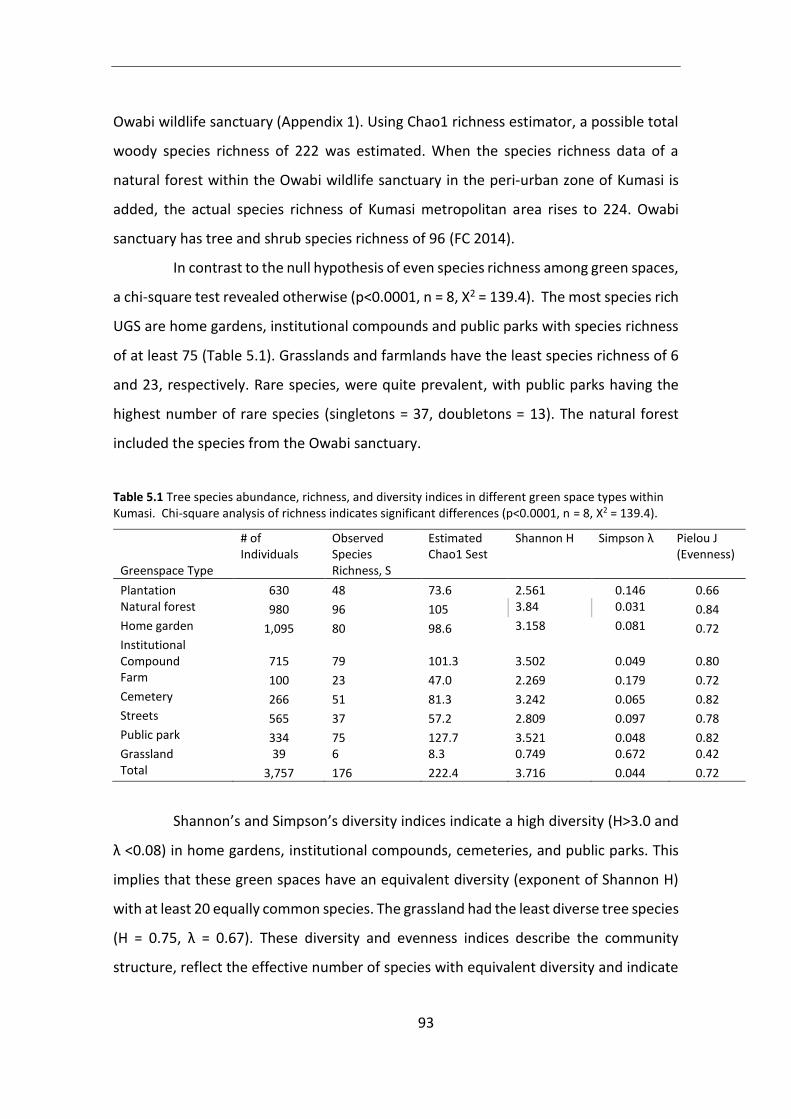
93
Owabi wildlife sanctuary (Appendix 1). Using Chao1 richness estimator, a possible total
woody species richness of 222 was estimated. When the species richness data of a
natural forest within the Owabi wildlife sanctuary in the peri-urban zone of Kumasi is
added, the actual species richness of Kumasi metropolitan area rises to 224. Owabi
sanctuary has tree and shrub species richness of 96 (FC 2014).
In contrast to the null hypothesis of even species richness among green spaces,
a chi-square test revealed otherwise (p<0.0001, n = 8, X2 = 139.4). The most species rich
UGS are home gardens, institutional compounds and public parks with species richness
of at least 75 (Table 5.1). Grasslands and farmlands have the least species richness of 6
and 23, respectively. Rare species, were quite prevalent, with public parks having the
highest number of rare species (singletons = 37, doubletons = 13). The natural forest
included the species from the Owabi sanctuary.
Table 5.1 Tree species abundance, richness, and diversity indices in different green space types within Kumasi. Chi-square analysis of richness indicates significant differences (p<0.0001, n = 8, X2 = 139.4).
Greenspace Type
# of Individuals
Observed Species Richness, S
Estimated Chao1 Sest
Shannon H Simpson λ Pielou J (Evenness)
Plantation 630 48 73.6 2.561 0.146 0.66 Natural forest 980 96 105 3.84 0.031 0.84 Home garden 1,095 80 98.6 3.158 0.081 0.72 Institutional Compound 715 79 101.3
3.502
0.049 0.80
Farm 100 23 47.0 2.269 0.179 0.72 Cemetery 266 51 81.3 3.242 0.065 0.82 Streets 565 37 57.2 2.809 0.097 0.78 Public park 334 75 127.7 3.521 0.048 0.82 Grassland 39 6 8.3 0.749 0.672 0.42 Total 3,757 176 222.4 3.716 0.044 0.72
Shannon’s and Simpson’s diversity indices indicate a high diversity (H>3.0 and
λ <0.08) in home gardens, institutional compounds, cemeteries, and public parks. This
implies that these green spaces have an equivalent diversity (exponent of Shannon H)
with at least 20 equally common species. The grassland had the least diverse tree species
(H = 0.75, λ = 0.67). These diversity and evenness indices describe the community
structure, reflect the effective number of species with equivalent diversity and indicate
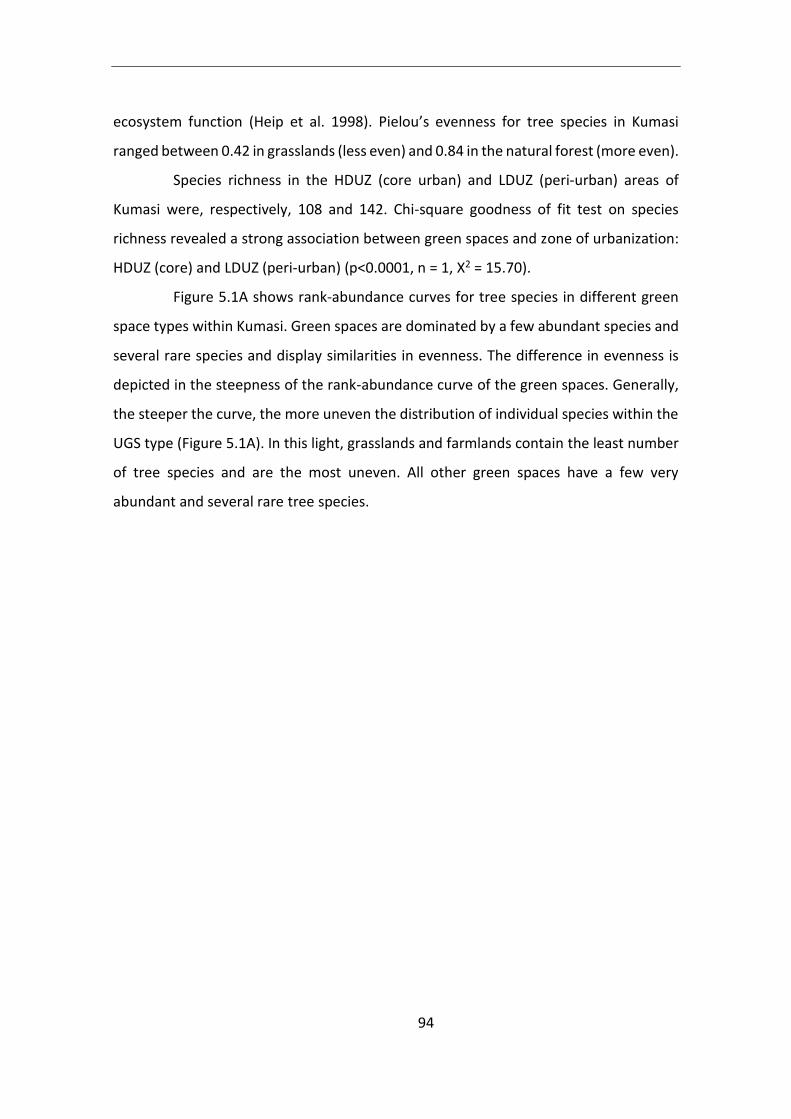
94
ecosystem function (Heip et al. 1998). Pielou’s evenness for tree species in Kumasi
ranged between 0.42 in grasslands (less even) and 0.84 in the natural forest (more even).
Species richness in the HDUZ (core urban) and LDUZ (peri-urban) areas of
Kumasi were, respectively, 108 and 142. Chi-square goodness of fit test on species
richness revealed a strong association between green spaces and zone of urbanization:
HDUZ (core) and LDUZ (peri-urban) (p<0.0001, n = 1, X2 = 15.70).
Figure 5.1A shows rank-abundance curves for tree species in different green
space types within Kumasi. Green spaces are dominated by a few abundant species and
several rare species and display similarities in evenness. The difference in evenness is
depicted in the steepness of the rank-abundance curve of the green spaces. Generally,
the steeper the curve, the more uneven the distribution of individual species within the
UGS type (Figure 5.1A). In this light, grasslands and farmlands contain the least number
of tree species and are the most uneven. All other green spaces have a few very
abundant and several rare tree species.
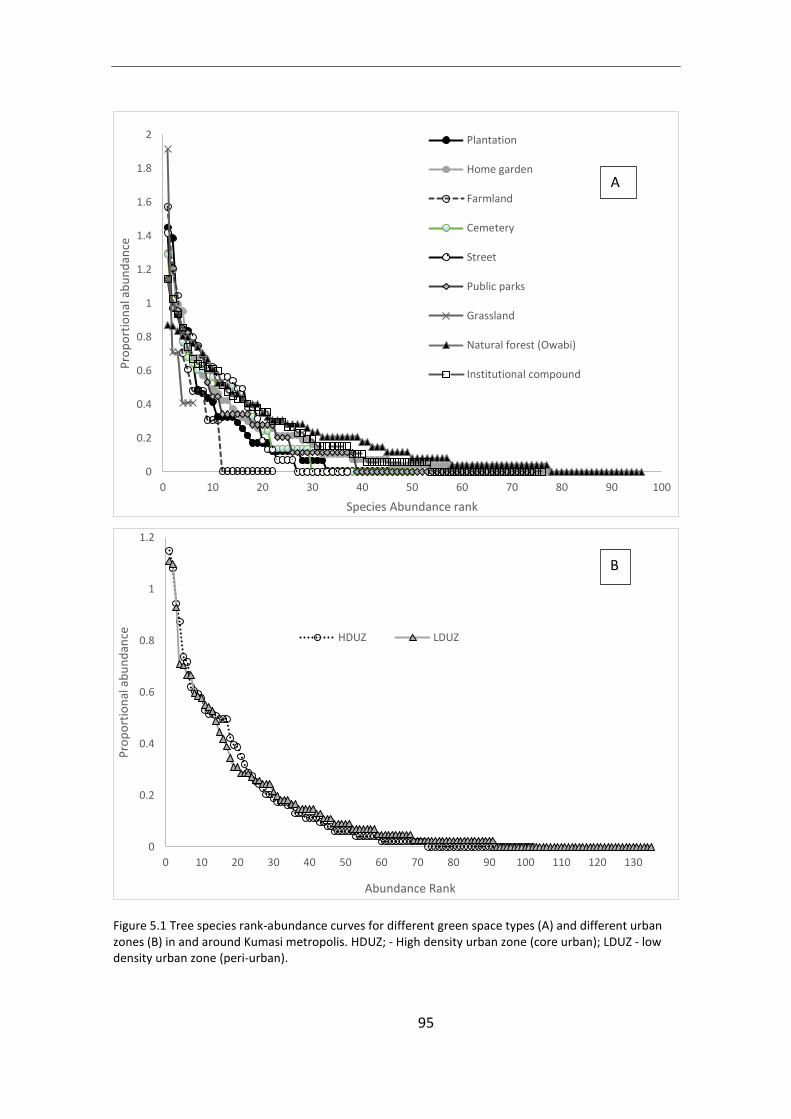
95
Figure 5.1 Tree species rank-abundance curves for different green space types (A) and different urban zones (B) in and around Kumasi metropolis. HDUZ; - High density urban zone (core urban); LDUZ - low density urban zone (peri-urban).
0
0.2
0.4
0.6
0.8
1
1.2
1.4
1.6
1.8
2
0 10 20 30 40 50 60 70 80 90 100
Pro
po
rtio
nal
ab
un
dan
ce
Species Abundance rank
Plantation
Home garden
Farmland
Cemetery
Street
Public parks
Grassland
Natural forest (Owabi)
Institutional compound
0
0.2
0.4
0.6
0.8
1
1.2
0 10 20 30 40 50 60 70 80 90 100 110 120 130
Pro
po
rtio
nal
ab
un
dan
ce
Abundance Rank
HDUZ LDUZ
A
B
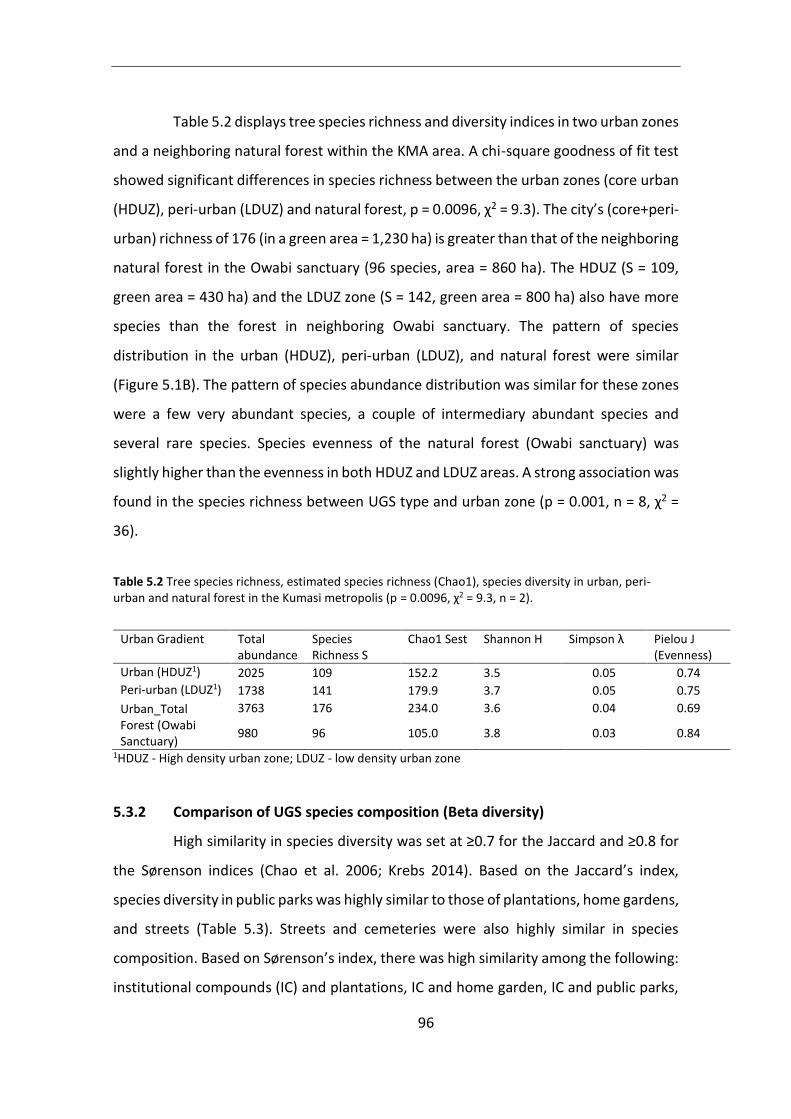
96
Table 5.2 displays tree species richness and diversity indices in two urban zones
and a neighboring natural forest within the KMA area. A chi-square goodness of fit test
showed significant differences in species richness between the urban zones (core urban
(HDUZ), peri-urban (LDUZ) and natural forest, p = 0.0096, χ2 = 9.3). The city’s (core+peri-
urban) richness of 176 (in a green area = 1,230 ha) is greater than that of the neighboring
natural forest in the Owabi sanctuary (96 species, area = 860 ha). The HDUZ (S = 109,
green area = 430 ha) and the LDUZ zone (S = 142, green area = 800 ha) also have more
species than the forest in neighboring Owabi sanctuary. The pattern of species
distribution in the urban (HDUZ), peri-urban (LDUZ), and natural forest were similar
(Figure 5.1B). The pattern of species abundance distribution was similar for these zones
were a few very abundant species, a couple of intermediary abundant species and
several rare species. Species evenness of the natural forest (Owabi sanctuary) was
slightly higher than the evenness in both HDUZ and LDUZ areas. A strong association was
found in the species richness between UGS type and urban zone (p = 0.001, n = 8, χ2 =
36).
Table 5.2 Tree species richness, estimated species richness (Chao1), species diversity in urban, peri-urban and natural forest in the Kumasi metropolis (p = 0.0096, χ2 = 9.3, n = 2).
Urban Gradient Total abundance
Species Richness S
Chao1 Sest Shannon H Simpson λ Pielou J (Evenness)
Urban (HDUZ1) 2025 109 152.2 3.5 0.05 0.74
Peri-urban (LDUZ1) 1738 141 179.9 3.7 0.05 0.75
Urban_Total 3763 176 234.0 3.6 0.04 0.69
Forest (Owabi Sanctuary)
980 96 105.0 3.8 0.03 0.84
1HDUZ - High density urban zone; LDUZ - low density urban zone
5.3.2 Comparison of UGS species composition (Beta diversity)
High similarity in species diversity was set at ≥0.7 for the Jaccard and ≥0.8 for
the Sørenson indices (Chao et al. 2006; Krebs 2014). Based on the Jaccard’s index,
species diversity in public parks was highly similar to those of plantations, home gardens,
and streets (Table 5.3). Streets and cemeteries were also highly similar in species
composition. Based on Sørenson’s index, there was high similarity among the following:
institutional compounds (IC) and plantations, IC and home garden, IC and public parks,
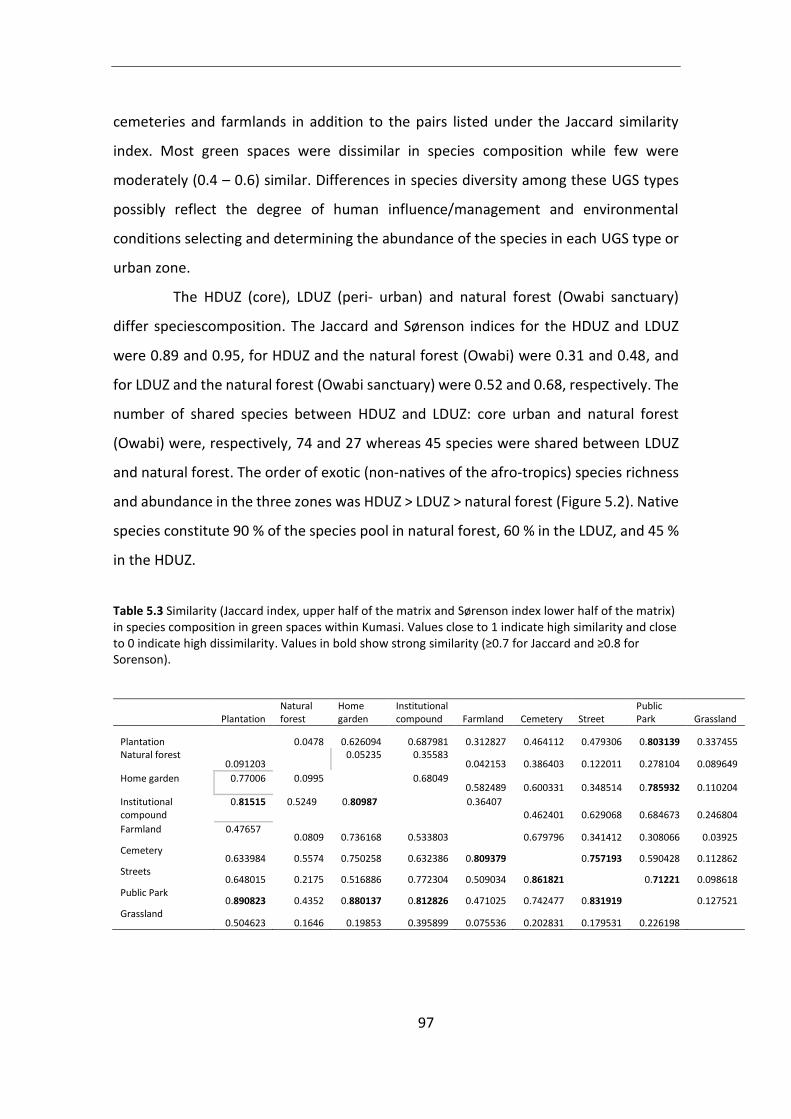
97
cemeteries and farmlands in addition to the pairs listed under the Jaccard similarity
index. Most green spaces were dissimilar in species composition while few were
moderately (0.4 – 0.6) similar. Differences in species diversity among these UGS types
possibly reflect the degree of human influence/management and environmental
conditions selecting and determining the abundance of the species in each UGS type or
urban zone.
The HDUZ (core), LDUZ (peri- urban) and natural forest (Owabi sanctuary)
differ speciescomposition. The Jaccard and Sørenson indices for the HDUZ and LDUZ
were 0.89 and 0.95, for HDUZ and the natural forest (Owabi) were 0.31 and 0.48, and
for LDUZ and the natural forest (Owabi sanctuary) were 0.52 and 0.68, respectively. The
number of shared species between HDUZ and LDUZ: core urban and natural forest
(Owabi) were, respectively, 74 and 27 whereas 45 species were shared between LDUZ
and natural forest. The order of exotic (non-natives of the afro-tropics) species richness
and abundance in the three zones was HDUZ > LDUZ > natural forest (Figure 5.2). Native
species constitute 90 % of the species pool in natural forest, 60 % in the LDUZ, and 45 %
in the HDUZ.
Table 5.3 Similarity (Jaccard index, upper half of the matrix and Sørenson index lower half of the matrix) in species composition in green spaces within Kumasi. Values close to 1 indicate high similarity and close to 0 indicate high dissimilarity. Values in bold show strong similarity (≥0.7 for Jaccard and ≥0.8 for Sorenson).
Plantation Natural forest
Home garden
Institutional compound Farmland Cemetery Street
Public Park Grassland
Plantation 0.0478 0.626094 0.687981 0.312827 0.464112 0.479306 0.803139 0.337455 Natural forest
0.091203 0.05235 0.35583
0.042153 0.386403 0.122011 0.278104 0.089649
Home garden 0.77006 0.0995
0.68049 0.582489 0.600331 0.348514 0.785932 0.110204
Institutional compound
0.81515 0.5249 0.80987
0.36407 0.462401 0.629068 0.684673 0.246804
Farmland 0.47657 0.0809 0.736168 0.533803 0.679796 0.341412 0.308066 0.03925
Cemetery 0.633984 0.5574 0.750258 0.632386 0.809379 0.757193 0.590428 0.112862
Streets 0.648015 0.2175 0.516886 0.772304 0.509034 0.861821 0.71221 0.098618
Public Park 0.890823 0.4352 0.880137 0.812826 0.471025 0.742477 0.831919 0.127521
Grassland 0.504623 0.1646 0.19853 0.395899 0.075536 0.202831 0.179531 0.226198

98
Figure 5.2 The proportion of native species in the tree species composition of the rural-urban zones in Kumasi metropolis: Core (HDUZ), peri-urban (LDUZ) and natural forest (Owabi sanctuary). 1HDUZ - High density urban zone; LDUZ - low density urban zone
Correspondence analysis further reinforced similarity (proximity implies
similarity) in species among green space types and urban zones. About 51 % of the
association was represented well in two dimensions. Dimension 1 (x-axis) representing
green space types, explained 28.5 % of the total variation. Striking similarities are found
among plantations and grasslands; public parks, streets, and institutional compounds
(IC); home gardens (HG) and farmlands; cemeteries and natural forest. Dimension 2 (y-
axis), representing species, accounted for 22.1 % of the total variation. The most
important deviation is the cluster around HG (negative dim2, negative dim1) and
comprises mostly edible trees such as Moringa oleifera, Psidium guajava, Citrus sinensis,
Persea americana, Annona squamosa, Mangifera indica etc. The 2nd most important
deviation consists of species associated with the plantation-grassland cluster (positive
dim2, negative dim1) and comprises: Tectona grandis, Bambusa vulgaris, Hevea
brasiliensis, Entadrophragma utile, Eucalyptus spp., and a host of others (Figure 5.3). A
3rd prominent deviation is the cluster containing species in the natural forest (Owabi
sanctuary) and cemeteries. It consists of native species such as Antiaris toxicaria,
Triplochiton scleroxylem, Piptadeniastrum africanum, Cola gigantea, Terminalia
superba, Sterculia spp., Amphimas pterocarpoides, Cedrela odorata, Morus mesozygia.
Rule of thumb for the interpretation of the biplot: species near each other are most
0
10
20
30
40
50
60
70
80
90
100
Core Urban Peri Urban Owabi sanctuary
Per
cen
t
Urban-Rural zones
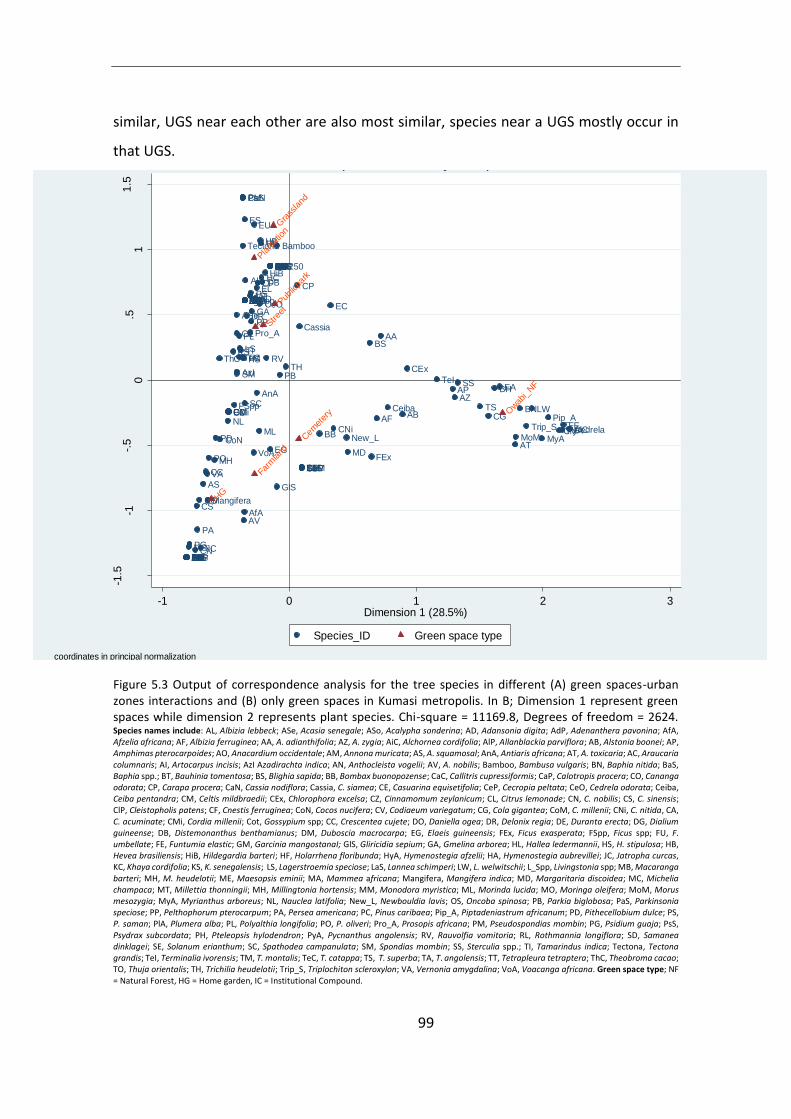
99
similar, UGS near each other are also most similar, species near a UGS mostly occur in
that UGS.
Figure 5.3 Output of correspondence analysis for the tree species in different (A) green spaces-urban zones interactions and (B) only green spaces in Kumasi metropolis. In B; Dimension 1 represent green spaces while dimension 2 represents plant species. Chi-square = 11169.8, Degrees of freedom = 2624. Species names include: AL, Albizia lebbeck; ASe, Acasia senegale; ASo, Acalypha sonderina; AD, Adansonia digita; AdP, Adenanthera pavonina; AfA, Afzelia africana; AF, Albizia ferruginea; AA, A. adianthifolia; AZ, A. zygia; AiC, Alchornea cordifolia; AlP, Allanblackia parviflora; AB, Alstonia boonei; AP, Amphimas pterocarpoides; AO, Anacardium occidentale; AM, Annona muricata; AS, A. squamosal; AnA, Antiaris africana; AT, A. toxicaria; AC, Araucaria columnaris; AI, Artocarpus incisis; AzI Azadirachta indica; AN, Anthocleista vogelii; AV, A. nobilis; Bamboo, Bambusa vulgaris; BN, Baphia nitida; BaS, Baphia spp.; BT, Bauhinia tomentosa; BS, Blighia sapida; BB, Bombax buonopozense; CaC, Callitris cupressiformis; CaP, Calotropis procera; CO, Cananga odorata; CP, Carapa procera; CaN, Cassia nodiflora; Cassia, C. siamea; CE, Casuarina equisetifolia; CeP, Cecropia peltata; CeO, Cedrela odorata; Ceiba, Ceiba pentandra; CM, Celtis mildbraedii; CEx, Chlorophora excelsa; CZ, Cinnamomum zeylanicum; CL, Citrus lemonade; CN, C. nobilis; CS, C. sinensis; ClP, Cleistopholis patens; CF, Cnestis ferruginea; CoN, Cocos nucifera; CV, Codiaeum variegatum; CG, Cola gigantea; CoM, C. millenii; CNi, C. nitida, CA, C. acuminate; CMi, Cordia millenii; Cot, Gossypium spp; CC, Crescentea cujete; DO, Daniella ogea; DR, Delonix regia; DE, Duranta erecta; DG, Dialium guineense; DB, Distemonanthus benthamianus; DM, Duboscia macrocarpa; EG, Elaeis guineensis; FEx, Ficus exasperata; FSpp, Ficus spp; FU, F. umbellate; FE, Funtumia elastic; GM, Garcinia mangostanaI; GlS, Gliricidia sepium; GA, Gmelina arborea; HL, Hallea ledermannii, HS, H. stipulosa; HB, Hevea brasiliensis; HiB, Hildegardia barteri; HF, Holarrhena floribunda; HyA, Hymenostegia afzelii; HA, Hymenostegia aubrevillei; JC, Jatropha curcas, KC, Khaya cordifolia; KS, K. senegalensis; LS, Lagerstroemia speciose; LaS, Lannea schimperi; LW, L. welwitschii; L_Spp, Livingstonia spp; MB, Macaranga barteri; MH, M. heudelotii; ME, Maesopsis eminii; MA, Mammea africana; Mangifera, Mangifera indica; MD, Margaritaria discoidea; MC, Michelia champaca; MT, Millettia thonningii; MH, Millingtonia hortensis; MM, Monodora myristica; ML, Morinda lucida; MO, Moringa oleifera; MoM, Morus mesozygia; MyA, Myrianthus arboreus; NL, Nauclea latifolia; New_L, Newbouldia lavis; OS, Oncoba spinosa; PB, Parkia biglobosa; PaS, Parkinsonia speciose; PP, Pelthophorum pterocarpum; PA, Persea americana; PC, Pinus caribaea; Pip_A, Piptadeniastrum africanum; PD, Pithecellobium dulce; PS, P. saman; PlA, Plumera alba; PL, Polyalthia longifolia; PO, P. oliveri; Pro_A, Prosopis africana; PM, Pseudospondias mombin; PG, Psidium guaja; PsS, Psydrax subcordata; PH, Pteleopsis hylodendron; PyA, Pycnanthus angolensis; RV, Rauvolfia vomitoria; RL, Rothmannia longiflora; SD, Samanea dinklagei; SE, Solanum erianthum; SC, Spathodea campanulata; SM, Spondias mombin; SS, Sterculia spp.; TI, Tamarindus indica; Tectona, Tectona grandis; TeI, Terminalia ivorensis; TM, T. montalis; TeC, T. catappa; TS, T. superba; TA, T. angolensis; TT, Tetrapleura tetraptera; ThC, Theobroma cacao; TO, Thuja orientalis; TH, Trichilia heudelotii; Trip_S, Triplochiton scleroxylon; VA, Vernonia amygdalina; VoA, Voacanga africana. Green space type; NF = Natural Forest, HG = Home garden, IC = Institutional Compound.
AfA
ASe
Bamboo
AL
AF
AD
AZ
AoC
AB
AP
AzI
BS
BB
Cassia
CeP
CeO
Ceiba
CM
CEx
CN
CoN
CG
CoM
DR
DM
EGFEx
FSpp
GlS
GA
LaS
Mangifera
MD
MLMoMNew_L
PB
PP
PA
Pro_A
PyA
SE
SS
Tectona
TM
TS
TeC
TT
TH
Trip_S
VA
VoA
AV
AnA
CS
HS
JC
NL
SC
PD
AOAMBTCaP
CO
CP
CE
CZ
CL
CNi
CMi
Cot
CC
ErSEJ
GM
JE
KSLS
MH
ME
MT
MO
MyA
PaS
PC
PlA
PO
PL
PG
RV
SM
TI
TeI
ThC
TO
ASoAdP
AS
ACAI
CF
CVDE
ES
EL
FU
HiBHC
HyAL_SppMBMAMCOSPS
PH
AA
AlC
AT
BH
BN
Cedrela
EA
EC
FE
LWPip_A
CaN
EU
HLHB
PMPsS
AlPunk250ANBaSCaCChPClPDODG
DB
HFHAKCMMRLSD
Cem
eter
y
Farm
land
Gra
ssla
nd
HG
IC
Owab
i_NF
Plant
atio
n
Public
park
Street
-1.5
-1-.
50
.51
1.5
Dim
en
sio
n 2
(2
2.1
%)
-1 0 1 2 3Dimension 1 (28.5%)
Species_ID Green space type
coordinates in principal normalization
Correspondence analysis biplot
100
In appendix A2.1, a gradient can be noticed from core urban (mostly negative
dim2 and around the centroid) through peri – urban (around centroid and first part of
positive Dim2) to the natural forest (sitting further up the positive Dim2 axis) hence
depicting high similarity between core urban (HDUZ) and peri-urban (LDUZ) species
composition and moderate similarity between peri-urban and the natural forest. High
dissimilarity between the core urban and the natural forest is also obvious (Appendix
A2.1). Dimension 2 which represents plant species accounted for 14.3 % of the total
variation. The most important deviations along this axis were similar to the species-
green space associations alreay described above. Dimension 1 which comprised the
green space and urban zone explained 17.6 % of the total variation.
5.3.3 Species abundance distribution model for species co-existence
Analysis using species cumulative plots and Kolmogorov-Smirnov test for
normality (natural forest at Owabi: D = 0.158, p=0.010; Core urban (HDUZ): D=0.146,
p=0.10; and peri-urban (LDUZ): D=0.167, p=0.010) showed that the tree species
abundance distribution in all three zones (core, peri-urban and natural forest) were not
normally distributed (Figure 5.4 A &B). For a lognormally distributed data, a plot of
cumulative number of species on a probit scale against logarithm of species abundance
should yield a straight line. This was not the case for all three sites where a sigmoid curve
was always produced.
The data were then fitted to two traditional niche models: the Broken-Stick
(BS) and Geometric series (GS) models. The GS model always proofed to be a superior
model over the null BS model, displaying lower R2, coefficients of variation (CV) and
smaller root mean squares errors (RMSE) (Table 5.4). Hence, the geometric series model
best explains the distribution of the species abundances within and immediately around
Kumasi. The niche preemption model is a deterministic model which assumes that the
resource space (niche) occupied by each species is directly related to the species relative
abundance in the assemblage. In other words, the tree diversity of Kumasi is constrained
by resource availability and dominated by few (most common) species, which exploit
these limited resources at the expense of other species in the community in a declining
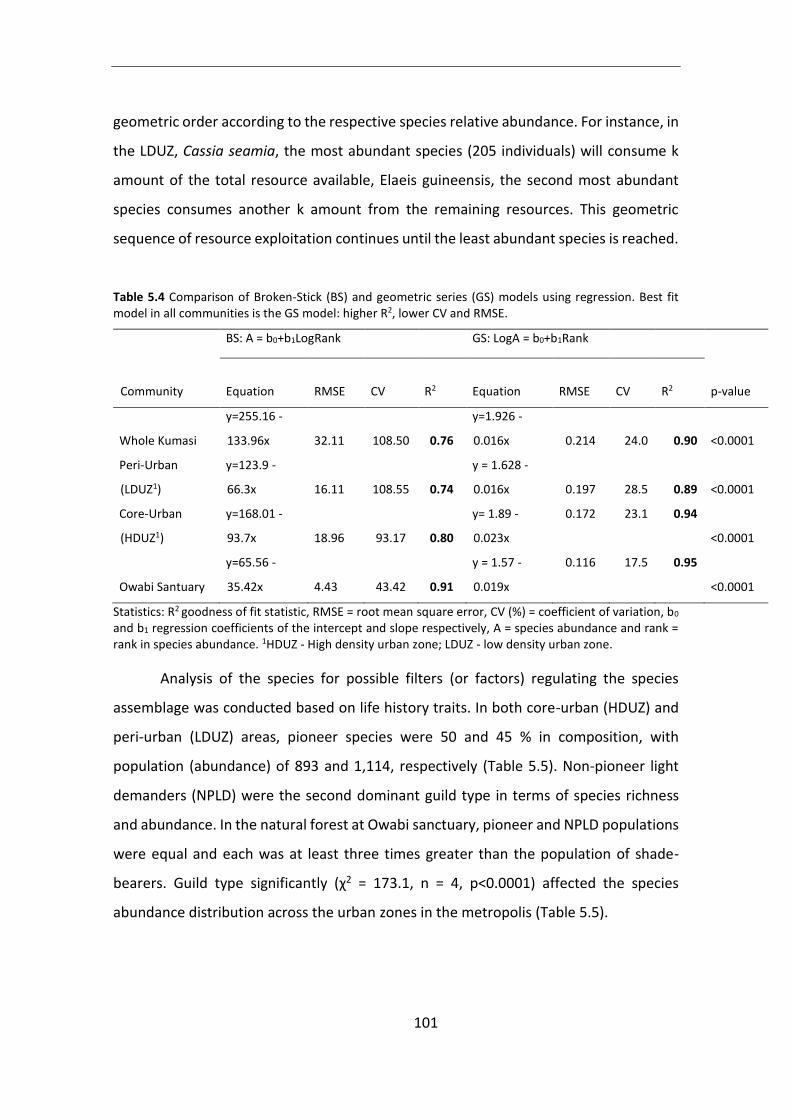
101
geometric order according to the respective species relative abundance. For instance, in
the LDUZ, Cassia seamia, the most abundant species (205 individuals) will consume k
amount of the total resource available, Elaeis guineensis, the second most abundant
species consumes another k amount from the remaining resources. This geometric
sequence of resource exploitation continues until the least abundant species is reached.
Table 5.4 Comparison of Broken-Stick (BS) and geometric series (GS) models using regression. Best fit model in all communities is the GS model: higher R2, lower CV and RMSE.
BS: A = b0+b1LogRank GS: LogA = b0+b1Rank
Community Equation RMSE CV
R2 Equation RMSE CV
R2 p-value
Whole Kumasi
y=255.16 -
133.96x 32.11 108.50 0.76
y=1.926 -
0.016x 0.214 24.0 0.90 <0.0001
Peri-Urban
(LDUZ1)
y=123.9 -
66.3x 16.11 108.55 0.74
y = 1.628 -
0.016x 0.197 28.5 0.89 <0.0001
Core-Urban
(HDUZ1)
y=168.01 -
93.7x 18.96 93.17 0.80
y= 1.89 -
0.023x
0.172 23.1 0.94
<0.0001
Owabi Santuary
y=65.56 -
35.42x 4.43 43.42 0.91
y = 1.57 -
0.019x
0.116 17.5 0.95
<0.0001
Statistics: R2 goodness of fit statistic, RMSE = root mean square error, CV (%) = coefficient of variation, b0 and b1 regression coefficients of the intercept and slope respectively, A = species abundance and rank = rank in species abundance. 1HDUZ - High density urban zone; LDUZ - low density urban zone.
Analysis of the species for possible filters (or factors) regulating the species
assemblage was conducted based on life history traits. In both core-urban (HDUZ) and
peri-urban (LDUZ) areas, pioneer species were 50 and 45 % in composition, with
population (abundance) of 893 and 1,114, respectively (Table 5.5). Non-pioneer light
demanders (NPLD) were the second dominant guild type in terms of species richness
and abundance. In the natural forest at Owabi sanctuary, pioneer and NPLD populations
were equal and each was at least three times greater than the population of shade-
bearers. Guild type significantly (χ2 = 173.1, n = 4, p<0.0001) affected the species
abundance distribution across the urban zones in the metropolis (Table 5.5).
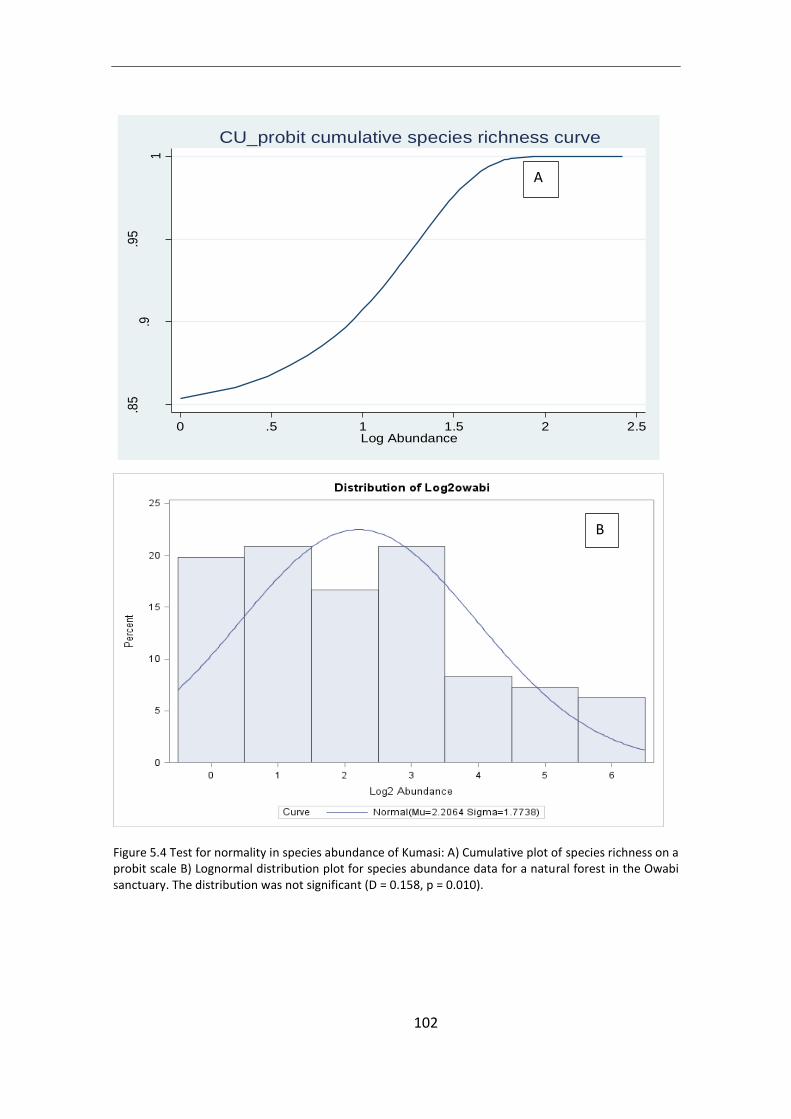
102
Figure 5.4 Test for normality in species abundance of Kumasi: A) Cumulative plot of species richness on a probit scale B) Lognormal distribution plot for species abundance data for a natural forest in the Owabi sanctuary. The distribution was not significant (D = 0.158, p = 0.010).
.85
.9.9
5
1
Pr(
Cu
mula
tive
ric
hn
ess
)
0 .5 1 1.5 2 2.5Log Abundance
CU_probit cumulative species richness curve
A
B
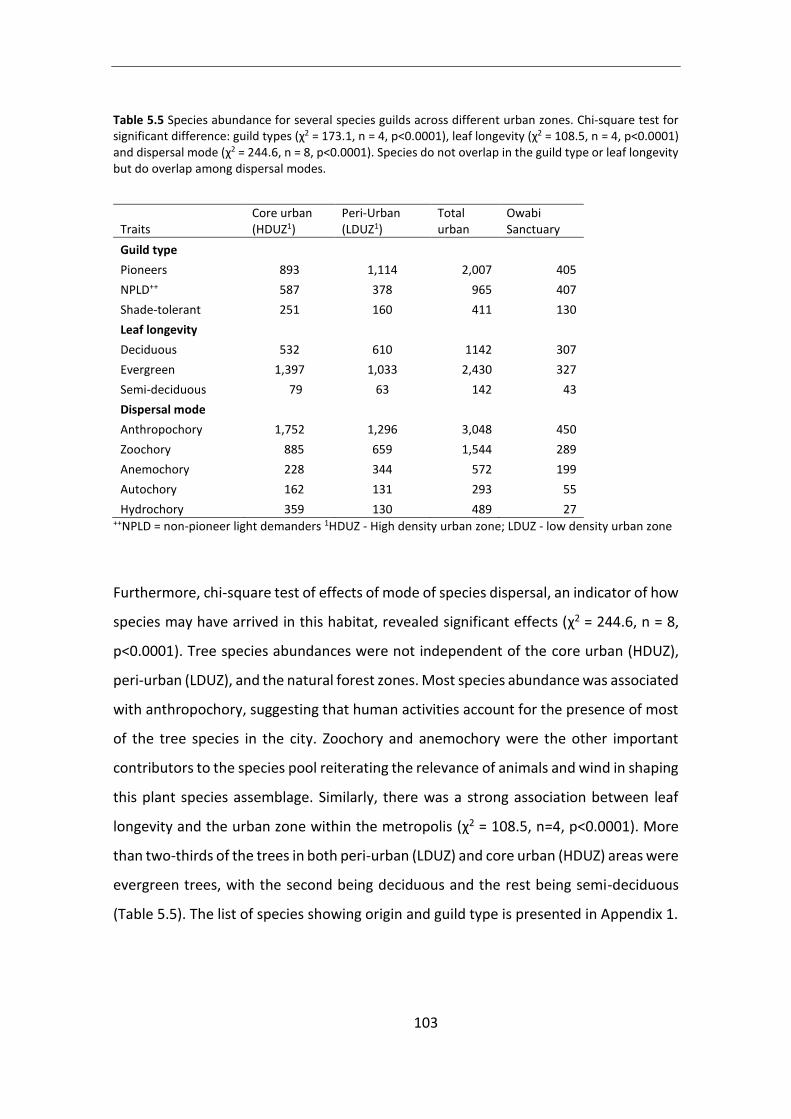
103
Table 5.5 Species abundance for several species guilds across different urban zones. Chi-square test for significant difference: guild types (χ2 = 173.1, n = 4, p<0.0001), leaf longevity (χ2 = 108.5, n = 4, p<0.0001) and dispersal mode (χ2 = 244.6, n = 8, p<0.0001). Species do not overlap in the guild type or leaf longevity but do overlap among dispersal modes.
Traits Core urban (HDUZ1)
Peri-Urban (LDUZ1)
Total urban
Owabi Sanctuary
Guild type
Pioneers 893 1,114 2,007 405
NPLD++ 587 378 965 407
Shade-tolerant 251 160 411 130
Leaf longevity Deciduous 532 610 1142 307
Evergreen 1,397 1,033 2,430 327
Semi-deciduous 79 63 142 43
Dispersal mode Anthropochory 1,752 1,296 3,048 450
Zoochory 885 659 1,544 289
Anemochory 228 344 572 199
Autochory 162 131 293 55
Hydrochory 359 130 489 27 ++NPLD = non-pioneer light demanders 1HDUZ - High density urban zone; LDUZ - low density urban zone
Furthermore, chi-square test of effects of mode of species dispersal, an indicator of how
species may have arrived in this habitat, revealed significant effects (χ2 = 244.6, n = 8,
p<0.0001). Tree species abundances were not independent of the core urban (HDUZ),
peri-urban (LDUZ), and the natural forest zones. Most species abundance was associated
with anthropochory, suggesting that human activities account for the presence of most
of the tree species in the city. Zoochory and anemochory were the other important
contributors to the species pool reiterating the relevance of animals and wind in shaping
this plant species assemblage. Similarly, there was a strong association between leaf
longevity and the urban zone within the metropolis (χ2 = 108.5, n=4, p<0.0001). More
than two-thirds of the trees in both peri-urban (LDUZ) and core urban (HDUZ) areas were
evergreen trees, with the second being deciduous and the rest being semi-deciduous
(Table 5.5). The list of species showing origin and guild type is presented in Appendix 1.
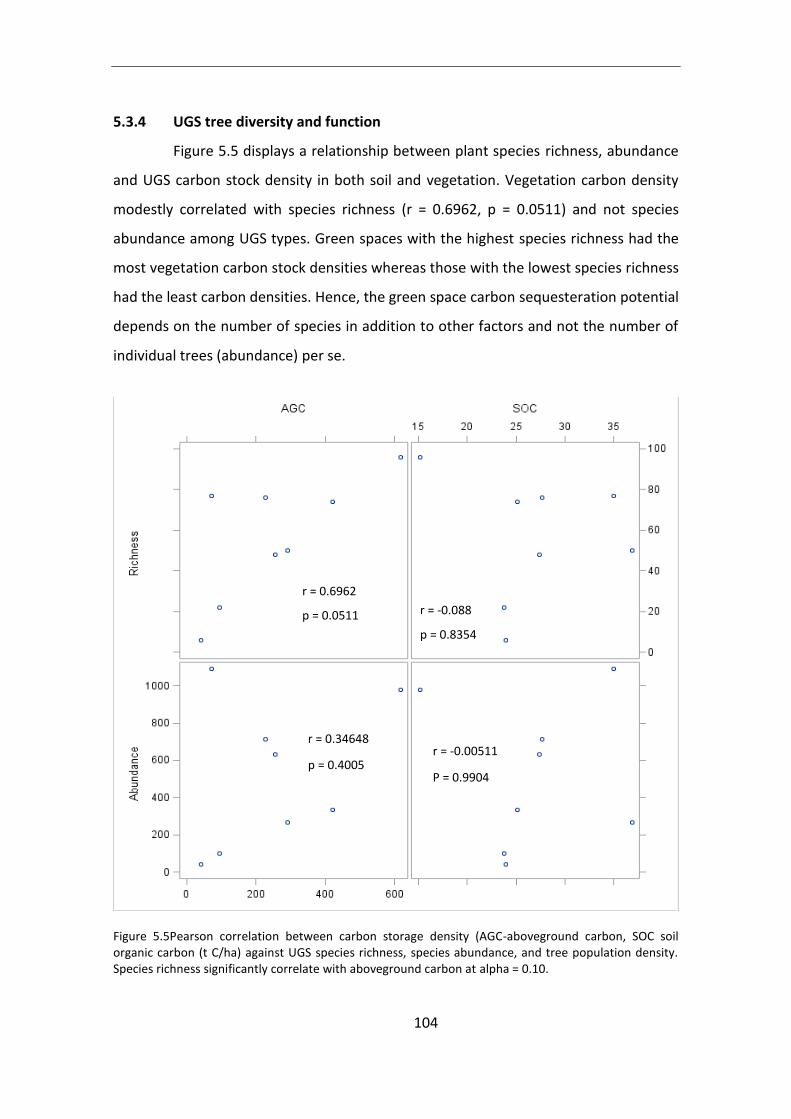
104
5.3.4 UGS tree diversity and function
Figure 5.5 displays a relationship between plant species richness, abundance
and UGS carbon stock density in both soil and vegetation. Vegetation carbon density
modestly correlated with species richness (r = 0.6962, p = 0.0511) and not species
abundance among UGS types. Green spaces with the highest species richness had the
most vegetation carbon stock densities whereas those with the lowest species richness
had the least carbon densities. Hence, the green space carbon sequesteration potential
depends on the number of species in addition to other factors and not the number of
individual trees (abundance) per se.
Figure 5.5Pearson correlation between carbon storage density (AGC-aboveground carbon, SOC soil organic carbon (t C/ha) against UGS species richness, species abundance, and tree population density. Species richness significantly correlate with aboveground carbon at alpha = 0.10.
r = 0.6962
p = 0.0511 r = -0.088
p = 0.8354
r = 0.34648
p = 0.4005
r = -0.00511
P = 0.9904
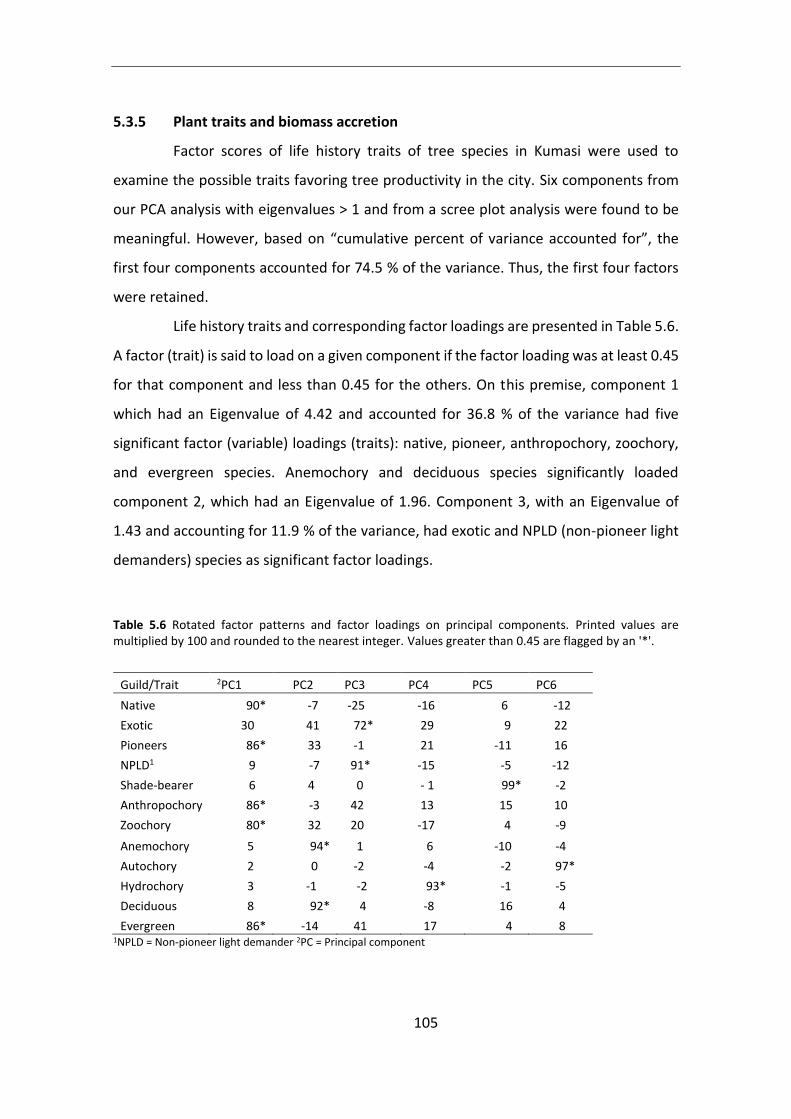
105
5.3.5 Plant traits and biomass accretion
Factor scores of life history traits of tree species in Kumasi were used to
examine the possible traits favoring tree productivity in the city. Six components from
our PCA analysis with eigenvalues > 1 and from a scree plot analysis were found to be
meaningful. However, based on “cumulative percent of variance accounted for”, the
first four components accounted for 74.5 % of the variance. Thus, the first four factors
were retained.
Life history traits and corresponding factor loadings are presented in Table 5.6.
A factor (trait) is said to load on a given component if the factor loading was at least 0.45
for that component and less than 0.45 for the others. On this premise, component 1
which had an Eigenvalue of 4.42 and accounted for 36.8 % of the variance had five
significant factor (variable) loadings (traits): native, pioneer, anthropochory, zoochory,
and evergreen species. Anemochory and deciduous species significantly loaded
component 2, which had an Eigenvalue of 1.96. Component 3, with an Eigenvalue of
1.43 and accounting for 11.9 % of the variance, had exotic and NPLD (non-pioneer light
demanders) species as significant factor loadings.
Table 5.6 Rotated factor patterns and factor loadings on principal components. Printed values are multiplied by 100 and rounded to the nearest integer. Values greater than 0.45 are flagged by an '*'.
Guild/Trait 2PC1 PC2 PC3 PC4 PC5 PC6
Native 90* -7 -25 -16 6 -12
Exotic 30 41 72* 29 9 22
Pioneers 86* 33 -1 21 -11 16
NPLD1 9 -7 91* -15 -5 -12
Shade-bearer 6 4 0 - 1 99* -2
Anthropochory 86* -3 42 13 15 10
Zoochory 80* 32 20 -17 4 -9
Anemochory 5 94* 1 6 -10 -4
Autochory 2 0 -2 -4 -2 97*
Hydrochory 3 -1 -2 93* -1 -5
Deciduous 8 92* 4 -8 16 4
Evergreen 86* -14 41 17 4 8 1NPLD = Non-pioneer light demander 2PC = Principal component
106
Factor scores generated from PCA analysis of multiple traits discussed apriori
were considered as independent variables, while mean tree species carbon and total
species abundance were used as dependent variables in multiple regression analysis.
The regression of standardized mean tree carbon on component 1 (p=0.02) and
component 2 (p=0.025) were statistically significant. Regression of total abundance on
component 1 (0.024) was also statistically significant. With respect to mean tree carbon,
30 % of the variation was explained by components 1 and 2 whereas 20 % of the
variation in total species abundance was explained by component 1 (Table 5.7). The
effect of components 1 and 2 on the former were negative whereas the effect of
component 1 on the latter was positive. Therefore, mean tree carbon decreased when
species abundance of the following traits: native, pioneer, anthropochory, zoochory,
evergreen, anemochory and deciduousness increased. In contrast species abundance
increased when native, pioneer, anthropochory, zoochory, and evergreen species
populations increased.
Table 5.7 Coefficients of multiple regression of factor scores against mean tree species and total abundance in Kumasi metropolis. p-values in bold are significantly different at alpha (α) = 0.05.
Component Tree carbon p-value R2 Species abundance p-value R2
Intercept 965.3 9.32E-06 0.30 25.404 2.55E-06 0.20 Component 1 -497.5 0.0209 11.801 0.0241 Component 2 -475.4 0.0250 5.374 0.3032 Component 3 294.47 0.1719 -4.06 0.4361 Component 4 279.59 0.1693 -1.08 0.8350
Component 1 consists of the following species traits; native, pioneer, anthropochory, zoochory, and evergreen, Component 2; anemochory and deciduousness, Component 3; exotic and NPLD, and Component 4; hydrochory.
5.4 Discussion
5.4.1 Species diversity in green spaces and different urban zones
The tree diversity of Kumasi consists of several tree species of native and exotic
origins and of various life history traits. Species richness, diversity, and evenness differ
widely among UGS types and urban zones. Several UGS are fairly similar in species
composition. The most species rich and abundant green spaces being: natural forest,
home gardens, institutional compounds, and public parks.
The presence of natural forest, the high proportion (>50%) of native species in
the city’s species pool, and the low prospects of artificially regenerating many native
107
species, are subtle indications that Kumasi was inherently high in tree diversity prior to
being severely urbanized and that the current species assemblage is partly shaped by its
geodiversity. Urban biodiversity is often attributed to the inherent and preferential
location of cities in biodiversity hotspots (Kühn et al. 2004), socio-ecological factors
(Muller et al. 2013; Hope et al. 2003; Kinzig et al. 2005; Cilliers et al. 2013), the varied
niches and as safeguard against inadvertent pests and disease outbreaks (Santamour
1990), and human actions through species introduction and landscape heterogeneity
(Niemelä 1999; Araújo 2003). Indeed, strong correlations between dense human
settlemnets and biodiversity have led to conclusions that conditions attracting humans
to cities also attract biodiversity (Balmford et al. 2001; Araújo 2003).
Cemeteries and natural forest share many species (mostly natives) in common
but the former are less species rich due to selective preservation of native species e.g.
Morinda lucida, Ceiba pentandra, Bombax buonopozense, Margariteria discoidea etc.,
planting of preferred exotic species Cassia siamea, Gliricidia sepium, Mangifera indica
and the need for space for burial. Examination of size and location (urban zones) effects
on plant diversity of cemeteries could provide better insights on their overall
contribution to the species pool of Kumasi.
Home gardens and institutional compounds in cities signify the proximity and
dependence of humans on nature. Their species richness and diversity in Kumasi are
similar to the home garden tree species richness, diversity and evenness reported in Rio
Claro, Brazil (Eichemberg et al. 2009). High species diversity in home gardens are
manifestations of their multifunctional and structural complexities (Agbogidi and Adolor
2013), underpinned by various socio-ecological constraints (Eichemberg et al. 2009:
Cilliar et al. 2013). Whereas poorer urbanites maintain small home gardens for
provisioning of basic services such as alimentary, medicinal, income, livelihood services
which reflect their (urbanites) rural origins and cultural heritage, the relatively wealthier
class invest in large home gardens for their aesthetic and recreational functions
(Eichemberg et al. 2009; Cilliers et al. 2013). Most species on home gardens and
institutional compounds are selectively cultivated or conserved natural regenerations.
However, unlike home gardens, species on institutional compounds are primarily
108
maintained by government administrative jurisdictions for their shade and ornamental
attributes, boundary demarcations, wind breaks, etc. Species such as Elaeis guineensis,
Mangifera indica, Persea americana, Citrus species, and Cocos nucifera are common
home garden trees whilst Cassia siamea, Millettia thornningii, Polyalthia species,
Mangifera indica, Citrus spp., are common on institutional compounds. Home garden
ownership and management in developing countries is an attribute of women
(Aworinde et al. 2013) but no explicit evidence linking home garden diversity and
richness to social class and gender exists at the moment.
Streets and parks contain modest amount of tree diversity in Kumasi and
reflect a profound human influence on species richness and diversity, since they are
mostly planted. Species richness may be dominated by native species since the best
locally adapted species are planted (Richards 1993). In Kumasi trees on streets and parks
include both retained natural regenerations of natives and planted exotics. For instance,
the KNUST botanical garden consists of cultivated and natural forest zones and harbors
about 115 tree species (Anning et al. 2008). Common street and public park tree species
include: Cassia siamea, Cedrela odorata, Terminalia catappa, and Peltophorum
pterocarpum planted mostly because they are fast growers, adapt easily to the urban
environment and provide a unique aesthetic value to the cityscape. Exotic tree species
commonly found in parks include: Thuja occidentalis, Callistris cupressiformis, Pinus
spp., imported from the temperate regions for experimental purposes but also perhaps
as a legacy of colonialism and present day global migration. Because of limited human
use and interference, parks furthest from the city center tend to have higher species
richness (Kendal et al. 2012). Although this hypothesis was not explicitly tested in this
study, it is possible that the level of control and use, as well as the distance from the city
center, in conjunction with other variables might explain inter park disparities in species
richness in Kumasi.
Plantations contain modest species richness and diversity because several
monocultures of different well adapted species have been cultivated for both individual
and group goals. Farms and grasslands have the lowest species richness and diversities
because only few economic species are often retained on the farms for their direct or
109
indirect benefits to landowners. Besides, trees are often felled to create space for the
agricultural and grazing activities, hence the low tree densities in these green spaces.
Species richness and diversity are significantly higher in the peri-urban (LDUZ)
compared to the core urban (HDUZ) area. Proportion of native species increased
progressively from the core urban area to the peri-urban and to the neighboring natural
forest. These results are congruent with findings by Burton et al. (2005) who noticed a
decreasing trend in exotic species composistion, richness and diversity with distance
from the urban center due to varying intensity of disturbance. The modified
environments in cities and human preference for certain species give non-native species
competitive advantage (Knapp and Kühn 2012). In Kumasi, the pattern of exotic/native
species distribution in the core, periurban and natural forest may be due to differences
in environmental quality (light, heat and pollution), the level of heterogeneity in green
cover, and human preferences. In most cities globally, core areas are characterized by
low species richness and high number of synanthropes (global homogenizers) whereas
the peri-urban habitats are more species rich and dominated by native species
(McKinney 2006; McKinney 2008). It is unclear whether Kumasi’s non-native tree species
can adequately be classified as synanthropes due to the paucity of urban biodiversity
data from cities in developing countries in the tropical regions.
5.4.2 Comparison with regional species richness and diversity
The species richness, diversity and guild composition of woody plants in
Kumasi are numerically comparable to tree species diversity and composition in other
traditional land uses within the country. The tree species richness (176) of Kumasi is
greater than the species richness of 66 in a cocoa farm (Anglaaere et al. 2011), 73 in
Kakum National Park (Pappoe et al. 2010), 88 in transitional forest located in the Brong-
Ahafo region, 70 in the Boabeng Fiama Monkey sanctuary (Kankam et al. 2013) and fairly
similar to the 126 and 133 species found in natural forest and fallow lands respectively
within the high forest zone of Ghana (Anglaaere et al. 2011) and the 171 species in the
Tano Ofin globally significant biodiversity area (GBSA) (Enninful 2013). Urbanization
alters both the abiotic environment (e.g. light regime, nutrient supply, moisture levels)
110
and biotic environment (human interferences and changes in predator populations),
often creating ambiance and multiple environmental subsets conducive for generalists,
synanthropes, and urbanophilic species of both native and exotic origins as well as
favoring the best adapted species of different guild compositions (McKinney 2006;
McKinney 2008; The Convention on Biological Diversity (CBD) 2012) and consequently
promote high beta diversity (Niemelä 1999). Overall, the tree species richness of Kumasi
alone accounts for 8 % of the total plant species in the high forest zone (2,100 species)
of Ghana. This is far less than what is observed in Concepcion, Chile (Pauchard et al.
2006) which contain at least 50 % of the plant species richness of the country, but
significant for conservation considerations.
The proportional composition of the guild types of species in Kumasi portrays
the landscape as a degraded habitat. The guild composition of pioneers and non-pioneer
light demanders (NPLD) are respectively, 42 and 34 % at Boabeng Fiama sanctuary
(Kankam et al. 2013) and 29 and 40 % at the Kakum National Park (Pappoe et al. 2010).
The Tano Ofin GBSA, located in a forest reserve within the tropical high forest zone of
Ghana, has 46 % of shade bearers (Enninful 2013). Light, a common feature of urban
habitats, has been shown to correlate positively with pioneer and stress-tolerant species
in cities in China (Zhan et al. 2013; Huang et al. 2013). Hence, the guild composition of
Kumasi suggests light was an important filter determining species composition and
diversity in the city.
5.4.3 Species abundance distribution and species coexistence
Level of urbanization altered the community assemblage of tree species in
Kumasi. In all three urban zones (urban, peri-urban zones, and the natural forest at
Owabi sanctuary), the geometric series (GS) model was the best fit to the species
abundance distribution. The GS model has been shown to describe many faunal and
plant assemblages (Fattorini 2005; Caruso and Migliorini 2006; Do et al. 2014), often
depicting early stages of succession or a species-poor environment (Whittaker 1965) or
disturbed environments (Caruso and Migliorini 2006). This indicates that a few or a
single species exploit a greater proportion of the ecosystems resources relative to their
111
respective relative abundances, leading to resource exhaustion. Considering that light
is an important abiotic resource and is readily available in urban areas, it is appropriate
that majority of the tree species in Kumasi metropolis are light demanders: either
pioneers or non-pioneer light demanders. While the high light levels may have selected
for shade-intolerant species, ease of propagation and dispersal ability could have
contributed significantly too. Most tree species in Kumasi are dispersed by
anthropochory followed by zoochory. Presence of tall buildings and dense compact
surfaces in cities, limits the possibility of anemochory (buildings act as barriers) and
hydrochory. These results are quite consistent with findings suggesting that urban areas
tend to have higher proportion of animal dispersed rather than wind dispersed plants
(Knapp et al. 2008a). Urbanization favors plants with high dispersal capacities (Kuhner
and Kleyer 2009; Moffatt et al. 2004). By implication, these embody plants with the most
viable dispersal agents and which are tolerant to a wide range of environmental
conditions. Hence, both biophysical and social factors determine species coexistence in
urban landscapes (Pickett et al. 2008). The influence of dispersal limitations and
environmental filtering in the tree assemblage of Kumasi is premonition that tree
species distribution of Kumasi may be founded on both niche-based and neutral-based
theories (López-Martínez et al. 2013). It would be interesting to pry into the applicability
of this latter theory in urban landscapes.
5.4.4 Urban green space diversity and function
Tree species richness of green spacea is correlated with mean green space
aboveground carbon density but unrelated to the mean soil C densities of UGS within
Kumasi metropolis. Since Darwin’s diversity-productivity postulates, several
investigations have upheld the consensus that increasing ecosystem diversity
corresponds with increased ecosystem functioning or processes (Naeem et al. 1994;
Hector 1999; Chapin et al. 2000b; Reich et al. 2001; Cardinale et al. 2011). Higher primary
productivity (carbon storage/sequestration) in mixed species communities compared to
monocultures have been reported in several experimental and observational studies
(Tilman 2001; Cardinale et al. 2007; Nero 2009; Reich et al. 2001; Bezemer and Van Der
112
Putten 2007). Such diversity related increases in primary productivity is attributed to
species selection effects, species complementarity, facilitation, and niche differentiation
(Hillerislambers et al. 2012; Hector 1999; Tilman 2001; Cardinale et al. 2007). Tree
species richness and productivity relations in the green spaces in Kumasi can possibly be
attributed tp a combination of species selection and niche differentiation effects as well
as other confounding factors. Species in the natural forest and public parks are of several
different guild types suggesting that these species are exploiting different parts of the
resource space in order to coexist. Yet in several other green spaces, species are selectd
preferentially for specific desired services they confer on society. Evidence of selection
effect is apparent when the mean biomass of the most productive species exceeds the
mean biomass of the entire community or green space (Cardinale et al. 2007). This
however, was not categorically tested in the current study. The positive richness-
productivity relationship among tree species of green spaces in Kumasi reiterates the
importance of adopting mixed species afforestation programs for the purposes of
enhacing urban sustainability. The findings provide partial evidence supporting the
richness-productivity research gap highlighted in Cardinale et al. (2011).
The results further reveal the importance of life history traits of tree species
on biomass accretion and species abundance in the metropolis. Decrease in carbon
storage per tree in each principal components imply plant traits loading each principal
component are interacting antagonistically. Due to ease of dispersal (anthropochoric
and zoochoric dispersal habits), native pioneer species are more abundant in the city.
However, their relatively fast growing habit coupled with their relatively shorter
lifespans have profound influence on tree size and wood density and hence compromise
biomass accretion. Evergreen species have trade-off of investing more energy and
resources in defense rather than on growth (photosynthesis) (Santiago and Wright
2007) which further compromises aboveground carbon storage. Similarly,
deciduousness which is often associated with high photosynthetic assimilation rates
(Santiago and Wright 2007) may have been negatively affected by wind dispersal, an
attribute heavily impeded in cities because of the buildings and pavements. Species
origin and guild types (light requirements, dispersal mechanisms, and leaf life span)
113
contributed enormously to carbon storage in trees in the metropolis. The findings here
do not quite agree with conclusive assertions that high functional groups/trait diversity
in a community, which is often linked to species richness, contributes more to ecosystem
functioning/processes (Tilman 2001; Hector 1999; Roscher et al. 2012). Plant trait
variations in cities and their surrounding neighborhoods are quite thoroughly studied
(Albrecht and Haider 2013) but little is known about how urban plant traits influence
productivity (ecosystem service provisioning) let alone life history trait effects on carbon
storage (ecosystem services delivery in general). It is also worth noting that many studies
linking plant traits to ecosystem productivity were experiments conducted on
grasslands. It is therefore appealing to conduct experimental studies on urban plant
(tree) species/trait effects on ecosystem services delivery in cities in developing
countries, where most urbanization is currently taking place.
5.4.5 Ecological importance of urban tree diversity
Aside from harboring a chunk of native tree species, the flora of Kumasi
metropolis includes some 14 tree species listed as vulnerable or near threatened in the
IUCN database. From literature survey, many tree species of the metropolis were
multipurpose in attributes, at least in their native ranges. Nearly all tree species are a
source of food, shade, fuel and medicine. Many other species are known for the
provision of timber, ornamental services, tannins, essential oils, handicrafts, gum,
fodder, soil amendments, and habitats for fauna. These together highlight the
conservation significance of the urban ecosystem. Hence, governments and private
enterprises in developing countries ought to intensify conservation interest in urban
ecosystems and biodiversity. In Ghana, like many other African countries, a clear policy
guideline for biodiversity conservation in cities is necessary to foster better conservation
efforts in the country.
5.5 Conclusion
This study explores tree species diversity of a developing country city, uncovers
a fundamental theory behind its tree species assemblage, and wades into the urban
114
biodiversity-ecosystem productivity discourse. Relatively high species richness fortified
by both native and alien species of nearly equal proportions occur in Kumasi metropolis.
Globalization, profound human activity, and the unique ambience of the metropolis
collectively foster higher non-native species in the core urban area compared to the
peri-urban and surrounding urban fringes. Further urbanization processes in the city
could increase the amount and proportion of non-native species especially in the peri-
urban zone. The parity of species richness between this metropolis and some national
parks, biosphere and forest reserves of global significance in the country, reiterates the
need to wholistically prioritize and conserve urban ecosystems. In particular,
conservation efforts should target the natural forest, home gardens, institutional
compounds, and public parks, which are high in species richness and contain some
important but vulnerable native species.
The geometric series model best fitted the tree species assembly data in both
the core urban (HDUZ) and peri-urban (LDUZ) zones, depicting an environmentally
impoverished community. It is inferred that species abundance and distribution is
limited by the niche space/resource availability. In other words, anthropogenic
disturbances in the environmental regime (i.e. high light) and in the dispersal and
propagation of species (anthropochoric dispersal) whether deliberate or accidental, may
have contributed to shape the species assemblage and pool of this metropolis. It is
concluded that Kumasi’s tree diversity and species community assemblage is a result of
its geodiversity, disparate socio-economic interests, and the prevalence of few or limited
environmental or abiotic conditions.
Tree species richness of UGS positively correlated with mean carbon stock
density for each green space type whereas clusters of life history traits negatively
correlated with mean carbon per tree species. These findings are in partial agreement
with species diversity-productivity (function/process) and functional group-productivity
theses. It is concluded that species richness and species life history traits determine
ecosystem productivity at the stand and tree level, respectively. To harness greater
benefits from urban ecosystems, mixed species afforestation is recommended in urban
areas across developing countries. Experimental manipulations of tree species richness
115
and functional groups/traits effects on ecosystem processes/function in the urban
settings are crucial in solidifying the aforementioned arguments. The impacts of exotic
species on overall ecosystem processes and service delivery require further
investigation. Response of urban plant species/traits to the dynamics of urban
environmental conditions (i.e. temperature and moisture regimes) remain interesting
research gaps in developing country cities and so is testing the validity of more models
fitting urban tree species assemblages.
116
6 GENERAL CONCLUSIONS, RECOMMENDATIONS AND FUTURE RESEARCH
Urban green spaces (UGS) are an emerging force in redressing contemporary
local environmental change concerns. They are not only the immediate contact with
nature for the greater majority of the world’s population, they are also a priceless source
of a wide range of ecosystem services and are essential to reducing the ecological
footprint of cities (Gómez-Baggethun and Barton 2013; Bolund and Hunhammer 1999;
Tzoulas et al. 2007; Cilliers et al. 2013; Coutts and Hahn 2015). In particular, UGS can
directly minimize urban climate change related hazards such as urban heat island
effects, flash floods, and air pollution through evaporative cooling, shading from trees,
directly removing CO2 from the atmosphere, and filtering air pollutants. They are also a
rich preserve of biological diversity upon which all ESS emanate. While well integrated
into urban landscape planning in developed countries, in cities in developing countries
UGS are hardly planned for and are outcompeted by housing and other grey
infrastructure projects. Beside the uncertainties in the magnitude of green cover in
cities, inequities in their distribution is rapidly metamorphosing into issues of
environmental injustices. Furthermore, the contributions of UGS to biodiversity
conservation and climate change mitigation and adaptation are not thoroughly
investigated, despite their high potential. Hence, this study was initiated to partially
address these voids using Kumasi, Ghana as a case study.
The general objective was to assess the extent of green cover in an African city
and its biodiversity and climate change mitigation values/potential.
This study broadly concludes that cities in developing countries can contain a
substantial amount of green space cover with high biological diversity values and
provide key ecosystem functions/services, particularly mitigating and adapting to
climate change. The area of Kumasi considered in this study is about 45-50 % green: 2/3
of which is covered with trees. The green cover contains 176 tree species and stores up
to 3,758 Gg C. Hence, maintaining adequate green space cover in cities in developing
countries can contribute appreciably to mitigate climate change effects and biodiversity
loss as well as provide essential ecosystem services such as food and health gains.
117
However, the uneven distribution of green cover in Kumasi could precipitate into
environmental/distributional injustice.
One specific objective of this study was to examine spatio-temporal dynamics
of green spaces in relation to socio-economic wellbeing of urbanites in Kumasi. Green
space distribution in the city is not only uneven and slightly unrelated to the socio-
economic patterns of submetropolis; UGS are in a state of tremendous decline with time
and population increase. At the current rate of decline, Kumasi could loose almost all
the green cover to buildings and other grey infrastructure within the next ten years. This
would compromise the achievement of SDG 11.7 and the attainment of the
recommended WHO and UN per capita green space area requirements in the
metropolis. So far, the coarse scale of submetropolis obscures any glaring correlations
between the socio-economic variables of inhabitants and green space cover of the city.
Perhaps, a detailed study at the fine scale of neighborhood should reinforce the
confidence in this hypothesis. UGS distribution in Kumasi is, however, uneven among
submetropolises and could precipitate into environmental injustices. This is
compounded by the fact that the character (extent, species composition and type) of
green spaces varies widely in the city. Considering the multifaceted environmental
problems of cities, it is important urban policy recognizes and integrates private green
spaces into urban planning process. Efforts at ensuring uniformity in green space
distribution and in protecting sensitive ecological risk averse areas within the city should
encompass both public and private green spaces. This entails, substituting unpaved and
paved bare surfaces in the city with living green surfaces.
Another objective of this study was to examine carbon sequestration patterns
of green spaces in the metropolis. It is concluded that the carbon storage in the city
depends on the type of green space. Tree dominated green spaces (parks and natural
forest with limited human interference) sequestered more carbon in aboveground
vegetation whereas green spaces closely associated with built-up areas (home gardens,
plantations and trees on institutional compounds) stored more carbon belowground.
The core urban area also tended to store less carbon compared to the periurban fringes.
Soil C was the most relevant C pool in grass and farmlands. Greening bare areas with
118
grass and trees and planting trees and lawns along streets could greatly enhance the
carbon stocks of the metropolis. The outer regions (LDUZ) had more carbon than the
core (HDUZ) of the metropolis. Hence, greening the HDUZ area without compromising
the stocks in outer edges should be a major priority of the city authorities. Readjusting
existing municipal housing and land acquisition policies in Ghana and in Africa to by
default include trees in house compounds and around houses can foster greener cities
and enhance carbon sequestration. Deliberately maintaining a swath of vegetation
around the peri-urban fringes to serve as an ecotone between rural and urban
ecosystems can massively boost the urban biodiversity and ecosystem functions.
The final specific objective of this study was to analyze the diversity,
composition, coexistence, and diversity-productivity relations of tree species and life
history traits of green spaces in Kumasi. Here, the study concludes that tree species
diversity and distribution depend on the type of green space and portrays a perturbed
landscape in early seres of succession with the overall ecosystem productivity sustained
by both species and life history trait diversities. In other words, the tree diversity of
cities can be very high: higher than some natural forest and agricultural landscapes in
this region. Natural forest, home gardens, institutional compounds, public parks, have
the highest species richness and diversity indices. Streets, cemeteries, and plantations
had moderate species richness while farmlands and rangelands within the city had the
lowest richness values. The core (HDUZ) urban area was less species rich compared to
the outer peri-urban zone (LDUZ). However, the reverse was true when exotic species
richness was considered. Furthermore, the geometric series model best fitted the tree
species assembly data in both these zones and in the neighboring natural forest,
depicting an environmentally and species impoverished community. It is inferred that
species abundance and distribution is limited by the niche space/resource availability.
In congruence with the niche partitioning hypothesis, majority of the species were
pioneers and non-pioneer light demanders, indicating that light (abiotic factors)
regulates the species assemblage of Kumasi. Similarly, most species although exhibit
other modes of dispersal have the tendency to dispersed by humans (anthropochory),
thus, reavowing the importance of society in shaping the species assemblages of cities.
119
The unique diversity of Kumasi, agrees with previous studies asserting that urbanization
tends to select for species with traits adaptable to unique environmental conditions.
Furthermore, it reiterates the significance of high species and trait diversity in boosting
ecosystem productivity, since UGS species richness correlated strongly with UGS carbon
storage and life history traits of species with tree biomass carbon. By maintaining high
tree diversity, there is high certainty of increasing tree productivity and diversifying the
kinds and amount of ecosystem services that green spaces can offer. A burgeoning
question is how do we increase plant/tree diversity in cities?
Urban ecological studies, especially in relation to UGS tree species and trait
diversity to the ecosystem services they provide, are scanty and not well grounded.
Therefore, it is important to conduct similar studies in other cities in Africa and in other
developing countries in order to capture climatic and socioeconomic differences and
impacts on green space cover and the ecosystem services they provide. Besides, climate
change and pollution mitigation, green spaces offer many other services for human
wellbeing. An interesting and long over looked research gap is linking green space and
plant diversity to the specific services they provide. How biodiversity and ecosystem
services generated within the city mitigate regional and global biodiversity loss and
augments ecosystem service supply from landscapes in the surrounding hinterlands are
exciting fields that remain understudied. It is equally important to find creative ways to
improve urban biodiversity and boost ecosystem service supply. Pollution impacts on
urban ecosystem health within developing countries could be an equally exciting field
of study. Finally, it is anticipated that as we transition to a more urban society, green
spaces will be become more central to sustainable urbanism, triggering a variety of
research interests and uniting man with nature.
References
120
7 REFERENCES
ActionAid. 2006. “Climate Change, Urban Flooding and the Rights of the Urban Poor in Africa,” no. October: 1–8. Adarkwa, Kwafo Kwasi. 2011. “The Role of Kumasi in National Development – Kumasi as a Central Place.” In Future of
the Tree: Towards Growth and Development of Kumasi, edited by Kwesi Kwafo Adarkwa, 14–34. Kumasi: KNUST University Printing Press.
Adepoju, M O. 2006. “LAND USE / LAND COVER CHANGE DETECTION IN METROPOLITAN LAGOS.” Aduah, Ms, and R Aabeyir. 2012. “Land Cover Dynamics in Wa Municipality, Upper West Region of Ghana.” Research
Journal of Environmental and Earth Sciences 4 (6): 658–64. Aduah, Ms, and Pe Baffoe. 2013. “Remote Sensing for Mapping Land-Use/Cover Changes and Urban Sprawl in
Sekondi-Takoradi, Western Region of Ghana.” The International Journal of Enginering and Science (IJES), 66–73.
Adu-Bredu, Stephen, Abekoe M.K., Tachie-Obeng E., Tschakert P. 2008. “Carbon Stocks under Four Land Use Systems in Three Varied Ecological Zones in Ghana.” ROme.
Adu-Bredu, Stephen, M.K. Abekoe, E. Tachie-Obeng, and P. Tschakert. 2011. “Carbon Stocks under Four Land Use Systems in Three Varied Ecological Zones in Ghana.” In Proceedings on the Open Science Conference on “Africa and the Carbon Cycle: The CarboAfrica Project,” edited by A. Bombelli and R. Valentini, 105–14. Accra: Food and Agriculture Organization of the United Nations,.
Afrane, Sam, and P.K.B. Asamoah. 2011. “Housing Situation in Kumasi.” In Future of the Tree: Towards Growth and Development of Kumasi, edited by Kwasi Kwafo Adarkwa, 69–91. Kumasi: KNUST University Printing Press.
Agbogidi, O.M. & Adolor, E.B. 2013. “Home Gardens in the Maintenance of Biological Diversity.” Applied Science 1 (1): 19–25.
Agyemang-Bonsu, K.W., I.K. Dontwi, D. Tutu-Benefoh, D.E. Bentil, O.G. Boateng, K. Asuobonteng, and W. Agyemang. 2010. “Traffic-Data Driven Modelling of Vehicular Emissions Using COPERT III in Ghana : A Case Study of Kumasi.” American Journal of Scientific and Industrial Research 134350: 32–40.
Albrecht, Harald, and Sylvia Haider. 2013. “Species Diversity and Life History Traits in Calcareous Grasslands Vary along an Urbanization Gradient.” Biodiversity and Conservation 22 (10): 2243–67. doi:10.1007/s10531-013-0437-0.
Al-sharif, Abubakr a a, Biswajeet Pradhan, Helmi Zulhaidi, Mohd Shafri, and Shattri Mansor. 2013. “Spatio-Temporal Analysis of Urban and Population Growths in Tripoli Using Remotely Sensed Data and GIS.” Indian Journal of Science and Technology 6 (8): 5134–42.
Alvey, Alexis a. 2006. “Promoting and Preserving Biodiversity in the Urban Forest.” Urban Forestry & Urban Greening 5 (4): 195–201. doi:10.1016/j.ufug.2006.09.003.
Amoako, Clifford, and Frempong E Boamah. 2014. “The Three-Dimensional Causes of Flooding in Accra, Ghana.” International Journal of Urban Sustainable Development 7 (1): 109–29. doi:10.1080/19463138.2014.984720.
Amoako, Clifford, and David Korboe. 2011. “Historical Development, Population Growth and Present Structure of Kumasi.” In Future of the Tree: Towards Growth and Development of Kumasi, edited by Kwafo Kwasi Adarkwa, 35–54. Kumasi: KNUST University Printing Press.
Anderson, J R, E E Hardy, J T Roach, and R Witmer E. 1976. “A Land Use and Land Cover Classification System for Use with Remote Sensor Data.” Washington D.C.
Anderson, Pippin M L, Chukwumerije Okereke, Andrew Rudd, and Susan Parnell. 2013. “Urbanization, Biodiversity and Ecosystem Services: Challenges and Opportunities.” In Urbanization, Biodiversity and Ecosystem Services: Challenges and Opportunities. A Global Assessment, edited by Thomas Elmqvist, Michail Fragkias, Julie Goodness, Burak Güneralp, Peter J. Marcotullio, Robert I. McDonald, Susan Parnell, et al., 453–59. Dordrecht: Springer Netherlands. doi:10.1007/978-94-007-7088-1.
Andersson, Erik. 2006. “Urban Landscapes and Sustainable Cities.” Ecology And Society 11 (1): 7. doi:34. Angel. 2011. “The Dimensions of Global Urban Expansion: Estimates and Projections for All Countries, 2000–2050.”
Progress in Planning, 53–107. Anglaaere, Luke C N, Joseph Cobbina, Fergus L. Sinclair, and Morag A. McDonald. 2011. “The Effect of Land Use
Systems on Tree Diversity: Farmer Preference and Species Composition of Cocoa-Based Agroecosystems in Ghana.” Agroforestry Systems 81 (3): 249–65. doi:10.1007/s10457-010-9366-z.
Angold, P. G., J. P. Sadler, M. O. Hill, A. Pullin, S. Rushton, K. Austin, E. Small, et al. 2006. “Biodiversity in Urban Habitat Patches.” Science of the Total Environment 360 (1–3): 196–204. doi:10.1016/j.scitotenv.2005.08.035.
Anning, A. K., S. Akyeampong, P. Addo-Fordjour, K. K. Anti, Alexander Kwarteng, and Y. F. Tettey. 2008. “Floristic Composition and Vegetation Structure of the KNUST Botanic Garden, Kumasi, Ghana.” Journal of Science and Technology 28 (3): 103–16.
Araújo, Miguel B. 2003. “The Coincidence of People and Biodiversity in Europe.” Global Ecology and Biogeography 12 (1): 5–12. doi:10.1046/j.1466-822X.2003.00314.x.
AREAP, Africa Renewable Energy Access Program. 2011. “Wood-Based Biomass Energy Development for Sub-Saharan Africa.”
Aronson, Myla F J, Frank a La Sorte, Charles H Nilon, Madhusudan Katti, Mark a Goddard, Christopher a Lepczyk,
References
121
Paige S Warren, et al. 2014. “A Global Analysis of the Impacts of Urbanization on Bird and Plant Diversity Reveals Key Anthropogenic Drivers A Global Analysis of the Impacts of Urbanization on Bird and Plant Diversity Reveals Key Anthropogenic Drivers.” Proceedings of the Royal Society B: Biological Sciences 281: 20133330. doi:10.1098/rspb.2013.3330.
Asare. 2009. “Biomass Map of Ghana 2008 / 2009,” 2009. Asase, A., S.A. Wade, K. Ofori-Frimpong, P. Hadley, and K. Norris. 2011. “Carbon Storage and the Health of Cocoa
Agroforestry Ecosystems in South-Eastern Ghana.” In Proceedings of the Open Science Conference on “Africa and Carbon Cycle: The CarboAfrica Project,” edited by A. Bombelli and R. Valentini, 131. Rome: Food and Agriculture Organization of the United Nations.
Aworinde, D. O., S. M. Erinoso, B. O. Ogundairo, and A. O. Olanloye. 2013. “Assessment of Plants Grown and Maintained in Home Gardens in Odeda Area Southwestern Nigeria.” Journal of Horticulture and Forestry 5 (2): 29–36. doi:10.5897/JHF2013.0294.
Ayila, Adzandeh Emmanuel, Fabiyi O Oluseyi, and Bello Yakasai Anas. 2014. “Statistical Analysis of Urban Growth in Kano Metropolis , Nigeria” 2 (1): 50–56. doi:10.11648/j.ijema.20140201.16.
Baker, Judy L. 2008. “Urban Poverty : A Global View.” The World Bank Group, v-27. doi:http://www.worldbank.org/urban/.
Balmford, Andrew, Joslin L Moore, and Thomas Brooks. 2001. “Conservation Conflicts Across Africa” 291 (March): 2616–19. doi:10.1126/science.291.5513.2616.
Barbosa, Olga, Jamie a. Tratalos, Paul R. Armsworth, Richard G. Davies, Richard a. Fuller, Pat Johnson, and Kevin J. Gaston. 2007. “Who Benefits from Access to Green Space? A Case Study from Sheffield, UK.” Landscape and Urban Planning 83 (2–3): 187–95. doi:10.1016/j.landurbplan.2007.04.004.
Bationo, Andre, Job Kihara, Bernard Vanlauwe, Boaz Waswa, and Joseph Kimetu. 2006. “Soil Organic Carbon Dynamics , Functions and Management in West African Agro-Ecosystems,” no. 308. doi:10.1016/j.agsy.2005.08.011.
Beauchemin, Cris. 2011. “Rural – Urban Migration in West Africa : And Economic Situation in Burkina Faso.” Population, Space and Place 17 (October 2009): 47–72. doi:10.1002/psp.
Benedict, Mark A., and Edward T. McMahon. 2002. Green Infrastructure: Smart Conservation for the 21st Century. Washington D.C.: sprawl Watch Clearinghouse Monograph Series.
Berthrong, Sran T., Esteban G. Jobb??gy, and Robert B. Jackson. 2009. “A Global Meta-Analysis of Soil Exchangeable Cations, pH, Carbon, and Nitrogen with Afforestation.” Ecological Applications 19 (8): 2228–41. doi:10.1890/08-1730.1.
Bezemer, T Martijn, and Wim H Van Der Putten. 2007. “Diversity and Stability in Plant Communities.” Nature 446 (7135): E6-7-8. doi:10.1038/nature05749.
Bolund, P, and S Hunhammer. 1999. “Ecosystem Services in Urban Areas.” Ecological Economics 29: 293–301. Bowler, Diana E., Lisette Buyung-Ali, Teri M. Knight, and Andrew S. Pullin. 2010. “Urban Greening to Cool Towns and
Cities: A Systematic Review of the Empirical Evidence.” Landscape and Urban Planning 97 (3). Elsevier B.V.: 147–55. doi:10.1016/j.landurbplan.2010.05.006.
Brack, C. L. 2002. “Pollution Mitigation and Carbon Sequestration by an Urban Forest.” Environmental Pollution 116 (SUPPL. 1). doi:10.1016/S0269-7491(01)00251-2.
Braimoh, a K, and P L G Vlek. 2004. “The Impact of Land-Cover Change on Soil Properties in Northern Ghana.” Land Degradation & Development 15 (1): 65–74. doi:Doi 10.1002/Ldr.590.
Breuste, Jürgen, Dagmar Haase, and Thomas Elmqvist. 2013. “Urban Landscapes and Ecosystem Services.” In Ecosystem Services in Agricultural and Urban Landscapes, edited by Steve Wratten, Harpinder Sandhu, Ross Cullen, and Robert Constanza, 83–104.
Breuste, Jürgen, Salman Qureshi, and Junxiang Li. 2013. “Applied Urban Ecology for Sustainable Urban Environment.” Urban Ecosystems 16 (4): 675–80. doi:10.1007/s11252-013-0337-9.
Burton, Michele L, Lisa J Samuelson, and Shufen Pan. 2005. “Riparian Woody Plant Diversity and Forest Structure along an Urban-Rural Gradient.” Urban Ecosystems 8 (1): 93–106. doi:10.1007/s11252-005-1421-6.
Cairns, Michael a., Sandra Brown, Eileen H. Helmer, and Greg a. Baumgardner. 1997. “Root Biomass Allocation in the World’s Upland Forests.” Oecologia 111 (1): 1–11. doi:10.1007/s004420050201.
Caldwell, Robert. 1969. African Rural-Urban Migration: The Movement to Ghana’s Towns. New York: Columbia University Press.
Campbell, Chad D., John R. Seiler, P. Eric Wiseman, Brian D. Strahm, and John F. Munsell. 2014. “Soil Carbon Dynamics in Residential Lawns Converted from Appalachian Mixed Oak Stands.” Forests 5 (3): 425–38. doi:10.3390/f5030425.
Campion, Benjamin Betey, and Godfred Owusu-boateng. 2013. “The Political Ecology of Wetlands in Kumasi , Ghana.” International Journal of Environment and Bioenergy 7 (2): 108–28.
Campion, Benjamin Betey, and Jörg Friedhelm Venzke. 2011. “Spatial Patterns and Determinants of Wetland Vegetation Distribution in the Kumasi Metropolis, Ghana.” Wetlands Ecology and Management 19 (5): 423–31. doi:10.1007/s11273-011-9226-2.
Campion, Betey Benjamin, and Simeon Nii Laryea Odametey. 2012. “Can Wetland Vegetation Be Used to Describe

References
122
Anthropogenic Effects and Pollution Patterns? The Case of Dakodwom and Kaase Wetlands in the Kumasi Metropolis, Ghana.” Journal of Environment and Ecology 3 (1): 185–202. doi:10.5296/jee.v3i1.1812.
Cardinale, Bradley J, Kristin L Matulich, David U Hooper, Jarrett E Byrnes, Emmett Duffy, Lars Gamfeldt, Patricia Balvanera, Mary I O’Connor, and Andrew Gonzalez. 2011. “The Functional Role of Producer Diversity in Ecosystems.” American Journal of Botany 98 (3): 572–92. doi:10.3732/ajb.1000364.
Cardinale, Bradley J, Justin P Wright, Marc W Cadotte, Ian T Carroll, Andy Hector, Diane S Srivastava, Michel Loreau, and Jerome J Weis. 2007. “Impacts of Plant Diversity on Biomass Production Increase through Time because of Species Complementarity.” Proceedings of the National Academy of Sciences of the United States of America 104 (46): 18123–28. doi:10.1073/pnas.0709069104.
Carpenter, Steve, Brian Walker, J. Marty Anderies, and Nick Abel. 2001. “From Metaphor to Measurement: Resilience of What to What?” Ecosystems 4 (8): 765–81. doi:10.1007/s10021-001-0045-9.
Caruso, Tancredi, and Massimo Migliorini. 2006. “A New Formulation of the Geometric Series with Applications to Oribatid (Acari, Oribatida) Species Assemblages from Human-Disturbed Mediterranean Areas.” Ecological Modelling 195 (3–4): 402–6. doi:10.1016/j.ecolmodel.2005.11.042.
Chao, Anne, Robin L. Chazdon, Robert K. Colwell, and Tsung Jen Shen. 2006. “Abundance-Based Similarity Indices and Their Estimation When There Are Unseen Species in Samples.” Biometrics 62 (2): 361–71. doi:10.1111/j.1541-0420.2005.00489.x.
Chao, Anne, Robin L. Chazdon, and Tsung J. Shen. 2005. “A New Statistical Approach for Assessing Similarity of Species Composition with Incidence and Abundance Data.” Ecology Letters 8 (2): 148–59. doi:10.1111/j.1461-0248.2004.00707.x.
Chaparro, Lydia. 2009. “Ecological Services of Urban Forest in Barcelona.” Chapin, F S, E S Zavaleta, V T Eviner, R L Naylor, P M Vitousek, H L Reynolds, D U Hooper, et al. 2000. “Consequences
of Changing Biodiversity.” Nature 405 (6783): 234–42. doi:10.1038/35012241. Chave, J., C. Andalo, S. Brown, M. a. Cairns, J. Q. Chambers, D. Eamus, H. Fölster, et al. 2005. “Tree Allometry and
Improved Estimation of Carbon Stocks and Balance in Tropical Forests.” Oecologia 145 (1): 87–99. doi:10.1007/s00442-005-0100-x.
Chave, Jérôme, Maxime Réjou-Méchain, Alberto Búrquez, Emmanuel Chidumayo, Matthew S. Colgan, Welington B C Delitti, Alvaro Duque, et al. 2014. “Improved Allometric Models to Estimate the Aboveground Biomass of Tropical Trees.” Global Change Biology, 3177–90. doi:10.1111/gcb.12629.
Chen, Shaohua, and Martin Ravallion. 2007. “Absolute Poverty Measures for the Developing World, 1981-2004.” Proceedings of the National Academy of Sciences of the United States of America 104 (43): 16757–62. doi:10.1073/pnas.0702930104.
Chiesura, Anna. 2004. “The Role of Urban Parks for the Sustainable City.” Landscape and Urban Planning 68 (1): 129–38. doi:10.1016/j.landurbplan.2003.08.003.
Churkina, Galina, Daniel G. Brown, and Gregory Keoleian. 2010. “Carbon Stored in Human Settlements: The Conterminous United States.” Global Change Biology 16 (1): 135–43. doi:10.1111/j.1365-2486.2009.02002.x.
Churkina, G, S Zaehle, J Hughes, N Viovy, Y Chen, and M Jung. 2010. “Interactions between Nitrogen Deposition , Land Cover Conversion , and Climate Change Determine the Contemporary Carbon Balance of Europe,” 2227–65.
Cilliers, Sarel, Juaneé Cilliers, Rina Lubbe, and Stefan Siebert. 2013. “Ecosystem Services of Urban Green Spaces in African Countries—perspectives and Challenges.” Urban Ecosystems 16 (4): 681–702. doi:10.1007/s11252-012-0254-3.
Cobbinah, Patrick B, and Clifford Amoako. 2014. “Urban Sprawl and the Loss of Peri-Urban Land in Kumasi, Ghana.” International Journal of Social, Business, Psychological and Human Sciences 8 (1): 328–37.
Collins, James P, Ann Kinzig, Nancy B Grimm, William F Fagan, Diane Hope, Jianguo Wu, Elizabeth T Borer, and William R Fagan. 2000. “A New Ecology; Modeling Human Communities as Integrated Parts of the Ecosystems Poses Special Problems for the Development and Testing of Ecological Theory.” American Scientist 88: 416–25.
Commission, European. 2013. Soil Atlas of Africa. Soil Atlas of Africa. doi:10.2788/52319. Coutts, Christopher, and Micah Hahn. 2015. “Green Infrastructure , Ecosystem Services , and Human Health.”
International Journal on Environmental Research and Public Health 12: 9768–98. doi:10.3390/ijerph120809768.
David Q. Rich, K. Liu, J. Zhang, S. W. Thurston, T.P. Stemvens, Z. Pan, C. Kane, B. Weinberger, P. Ohman-Strickland, T.J. Woodruff, X. Duan, V. Assibey-Mensah, and J. Zhang. 2015. “Difference in Birth Weight Associated with the 2008 Beijing Olympic Air Pollution Reduction: Results from a Natural Experiment.” Environmental Health Perspectives, no. April: 1–36. doi:10.1289/ehp.0900933.
Davies, Zoe G., Jill L. Edmondson, Andreas Heinemeyer, Jonathan R. Leake, and Kevin J. Gaston. 2011. “Mapping an Urban Ecosystem Service: Quantifying above-Ground Carbon Storage at a City-Wide Scale.” Journal of Applied Ecology 48 (5): 1125–34. doi:10.1111/j.1365-2664.2011.02021.x.
Davies, Zoe G, Martin Dallimer, Jill L Edmondson, Jonathan R Leake, and Kevin J Gaston. 2013. “Identifying Potential Sources of Variability between Vegetation Carbon Storage Estimates for Urban Areas.” Environmental Pollution (Barking, Essex : 1987) 183. Elsevier Ltd: 133–42. doi:10.1016/j.envpol.2013.06.005.
References
123
Davis, Michelle K., Elizabeth M. Cook, Scott L. Collins, and Sharon J. Hall. 2015. “Top-down vs. Bottom-up Regulation of Herbaceous Primary Production and Composition in an Arid, Urbanizing Ecosystem.” Journal of Arid Environments 116. Elsevier Ltd: 103–14. doi:10.1016/j.jaridenv.2015.01.018.
Dearborn, Donald C., and Salit Kark. 2010. “Motivaciones Para Conservar La Biodiversidad Urbana.” Conservation Biology 24 (2): 432–40. doi:10.1111/j.1523-1739.2009.01328.x.
Devas, Nick, and David Korboe. 2000. “City Governance and Poverty: The Case of Kumasi.” Environment and Urbanization 12 (1): 123–36. doi:10.1177/095624780001200109.
Diallo, Boubacar Amadou, and Zhengyu Bao. 2010. “Land Cover Change Assessment Using Remote Sensing: Case Study of Bamako, Mali.” Researcher 2 (4): 7–17.
Di Ruocco, Angela, Paolo Gasparini, and Guy Weets. 2015. “Urbanization and Climate Change in Africa: Setting the Scene.” In Urban Vulnerability and Climate Change in Africa; A Multidiscplinary Approach, edited by Stephen Pauleit, Adrien Coly, Sandra Fohlmeister, Paolo Gasparini, Gertrud Jorgensen, Sigrun Kabisch, Wilbard J. Kombe, Sarah Lindley, Ingo Simonis, and Kumelachew Yeshitela, 1–35. Heidelberg, London, New York, Dordrecht: Springer.
Do, Yuno, Maurice Lineman, and Gea Jae Joo. 2014. “Carabid Beetles in Green Infrastructures: The Importance of Management Practices for Improving the Biodiversity in a Metropolitan City.” Urban Ecosystems, 1–13. doi:10.1007/s11252-014-0348-1.
Dorendorf, Jens, Annette Eschenbach, Katharina Schmidt, and Kai Jensen. 2015. “Both Tree and Soil Carbon Need to Be Quantified for Carbon Assessments of Cities.” Urban Forestry and Urban Greening 14 (3). Elsevier GmbH.: 447–55. doi:10.1016/j.ufug.2015.04.005.
DVLA. 2014. “Drivers and Vehicular License Authority (DVLA) Vehicle Registration Database.” Kumasi: unpublished. Edmondson, Jill L., Zoe G. Davies, Sarah A. McCormack, Kevin J. Gaston, and Jonathan R. Leake. 2014. “Land-Cover
Effects on Soil Organic Carbon Stocks in a European City.” Science of the Total Environment 472. The Authors: 444–53. doi:10.1016/j.scitotenv.2013.11.025.
Edmondson, Jill L, Zoe G Davies, Nicola McHugh, Kevin J Gaston, and Jonathan R Leake. 2012. “Organic Carbon Hidden in Urban Ecosystems.” Scientific Reports 2: 963. doi:10.1038/srep00963.
Eichemberg, Mayra Teruya, Maria Christina, De Mello Amorozo, and Cunha De Moura. 2009. “Species Composition and Plant Use in Old Urban Homegardens in Rio Claro, Southeast of Brazil.” Acta Botanica Brasilica 23 (4): 1057–75. doi:10.1590/S0102-33062009000400016.
Ellis, Erle C., and Navin Ramankutty. 2008. “Putting People in the Map: Anthropogenic Biomes of the World.” Frontiers in Ecology and the Environment 6 (8): 439–47. doi:10.1890/070062.
Elmqvist, Thomas, Michail Fragkias, Julie Goodness, Burak Guneralp, Peter J. Marcotullio, Robert I Mcdonald, Susan Parnell, Maria Schewenius, Karen C. Seto, and Cathy Wilkinson. 2013. Urbanization, Biodiversity and Ecosystem Services: Challenges and Opportunities. Edited by Thomas Elmqvist, Michail Fragkias, Julie Goodness, Burak Güneralp, Peter J. Marcotullio, Robert I. McDonald, Susan Parnell, et al. Dordrecht: Springer Netherlands. doi:10.1007/978-94-007-7088-1.
Enninful, Regina. 2013. “Assessment of Floral Compostion, Structure and Natural Regeneration of the Tano Offin Globally Significant Biodiversity Area.” Kwame Nkrumah University of Science and Technology. doi:10.1017/CBO9781107415324.004.
European Commission. 2015. “Towards an EU Research and Innovation Policy Agenda for Nature-Based Solutions & Re-Naturing Cities.” Brussels. doi:10.2777/765301.
Faeth, Stanley H., Christofer Bang, and Susanna Saari. 2011. “Urban Biodiversity: Patterns and Mechanisms.” Annals of the New York Academy of Sciences 1223 (1): 69–81. doi:10.1111/j.1749-6632.2010.05925.x.
Fanan, Ujoh, Kwabe Isa Dlama, and Ifatimehin Olarewaju Oluseyi. 2011. “Urban Expansion and Vegetal Cover Loss in and around Nigeria ’ S Federal Capital City” 3 (January): 1–10.
FAO. 1997. “Estimating Biomass and Biomass Change of Tropical Forests.” Rome: Food and Agriculutre Organization of the United Nations.
Fao. 2009. State of the World’s Forests 2009. SciencesNew York. doi:10.1209/epl/i2005-10515-2. FAO. 2010. “Global Forest Resources Assessment 2010.” Vol. 1. Rome. doi:10.1017/CBO9781107415324.004. Fattorini, Simone. 2005. “A Simple Method to Fit Geometric Series and Broken Stick Models in Community Ecology
and Island Biogeography.” Acta Oecologica 28 (3): 199–205. doi:10.1016/j.actao.2005.04.003. Fay, Marianne, Stephane Hallegatte, Adrien Vogt-Schilb, Julie Rozenberg, Ulf Narloch, Tom Kerr, and Zero-carbon
Future. 2015. Decarbonizing Development : Three Steps to a Zero-Carbon Future. Washington, DC: The World Bank.
Fayolle, Adeline, Jean Louis Doucet, Jean François Gillet, Nils Bourland, and Philippe Lejeune. 2013. “Tree Allometry in Central Africa: Testing the Validity of Pantropical Multi-Species Allometric Equations for Estimating Biomass and Carbon Stocks.” Forest Ecology and Management 305. Elsevier B.V.: 29–37. doi:10.1016/j.foreco.2013.05.036.
Fayolle, Adeline, Michael D. Swaine, Jean-François Bastin, Nils Bourland, James a. Comiskey, Gilles Dauby, Jean-Louis Doucet, et al. 2014. “Patterns of Tree Species Composition across Tropical African Forests.” Journal of Biogeography 41 (October 2015): 2320–31. doi:10.1111/jbi.12382.
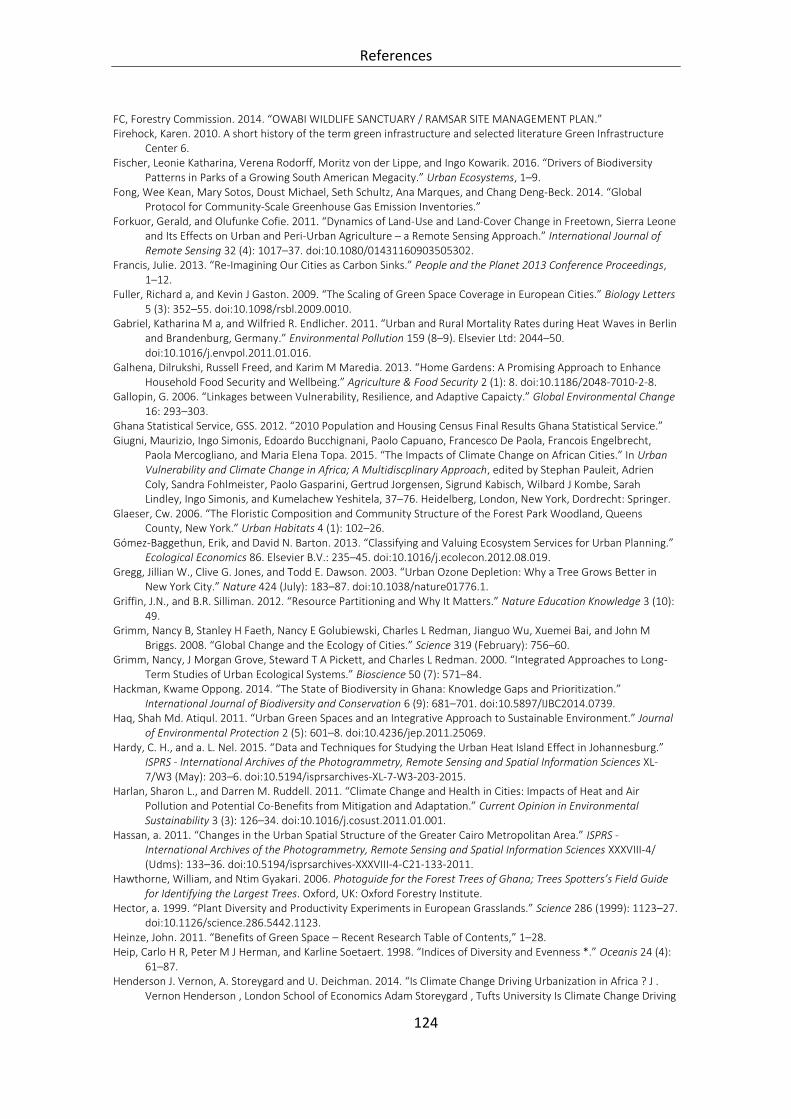
References
124
FC, Forestry Commission. 2014. “OWABI WILDLIFE SANCTUARY / RAMSAR SITE MANAGEMENT PLAN.” Firehock, Karen. 2010. A short history of the term green infrastructure and selected literature Green Infrastructure
Center 6. Fischer, Leonie Katharina, Verena Rodorff, Moritz von der Lippe, and Ingo Kowarik. 2016. “Drivers of Biodiversity
Patterns in Parks of a Growing South American Megacity.” Urban Ecosystems, 1–9. Fong, Wee Kean, Mary Sotos, Doust Michael, Seth Schultz, Ana Marques, and Chang Deng-Beck. 2014. “Global
Protocol for Community-Scale Greenhouse Gas Emission Inventories.” Forkuor, Gerald, and Olufunke Cofie. 2011. “Dynamics of Land-Use and Land-Cover Change in Freetown, Sierra Leone
and Its Effects on Urban and Peri-Urban Agriculture – a Remote Sensing Approach.” International Journal of Remote Sensing 32 (4): 1017–37. doi:10.1080/01431160903505302.
Francis, Julie. 2013. “Re-Imagining Our Cities as Carbon Sinks.” People and the Planet 2013 Conference Proceedings, 1–12.
Fuller, Richard a, and Kevin J Gaston. 2009. “The Scaling of Green Space Coverage in European Cities.” Biology Letters 5 (3): 352–55. doi:10.1098/rsbl.2009.0010.
Gabriel, Katharina M a, and Wilfried R. Endlicher. 2011. “Urban and Rural Mortality Rates during Heat Waves in Berlin and Brandenburg, Germany.” Environmental Pollution 159 (8–9). Elsevier Ltd: 2044–50. doi:10.1016/j.envpol.2011.01.016.
Galhena, Dilrukshi, Russell Freed, and Karim M Maredia. 2013. “Home Gardens: A Promising Approach to Enhance Household Food Security and Wellbeing.” Agriculture & Food Security 2 (1): 8. doi:10.1186/2048-7010-2-8.
Gallopin, G. 2006. “Linkages between Vulnerability, Resilience, and Adaptive Capaicty.” Global Environmental Change 16: 293–303.
Ghana Statistical Service, GSS. 2012. “2010 Population and Housing Census Final Results Ghana Statistical Service.” Giugni, Maurizio, Ingo Simonis, Edoardo Bucchignani, Paolo Capuano, Francesco De Paola, Francois Engelbrecht,
Paola Mercogliano, and Maria Elena Topa. 2015. “The Impacts of Climate Change on African Cities.” In Urban Vulnerability and Climate Change in Africa; A Multidiscplinary Approach, edited by Stephan Pauleit, Adrien Coly, Sandra Fohlmeister, Paolo Gasparini, Gertrud Jorgensen, Sigrund Kabisch, Wilbard J Kombe, Sarah Lindley, Ingo Simonis, and Kumelachew Yeshitela, 37–76. Heidelberg, London, New York, Dordrecht: Springer.
Glaeser, Cw. 2006. “The Floristic Composition and Community Structure of the Forest Park Woodland, Queens County, New York.” Urban Habitats 4 (1): 102–26.
Gómez-Baggethun, Erik, and David N. Barton. 2013. “Classifying and Valuing Ecosystem Services for Urban Planning.” Ecological Economics 86. Elsevier B.V.: 235–45. doi:10.1016/j.ecolecon.2012.08.019.
Gregg, Jillian W., Clive G. Jones, and Todd E. Dawson. 2003. “Urban Ozone Depletion: Why a Tree Grows Better in New York City.” Nature 424 (July): 183–87. doi:10.1038/nature01776.1.
Griffin, J.N., and B.R. Silliman. 2012. “Resource Partitioning and Why It Matters.” Nature Education Knowledge 3 (10): 49.
Grimm, Nancy B, Stanley H Faeth, Nancy E Golubiewski, Charles L Redman, Jianguo Wu, Xuemei Bai, and John M Briggs. 2008. “Global Change and the Ecology of Cities.” Science 319 (February): 756–60.
Grimm, Nancy, J Morgan Grove, Steward T A Pickett, and Charles L Redman. 2000. “Integrated Approaches to Long-Term Studies of Urban Ecological Systems.” Bioscience 50 (7): 571–84.
Hackman, Kwame Oppong. 2014. “The State of Biodiversity in Ghana: Knowledge Gaps and Prioritization.” International Journal of Biodiversity and Conservation 6 (9): 681–701. doi:10.5897/IJBC2014.0739.
Haq, Shah Md. Atiqul. 2011. “Urban Green Spaces and an Integrative Approach to Sustainable Environment.” Journal of Environmental Protection 2 (5): 601–8. doi:10.4236/jep.2011.25069.
Hardy, C. H., and a. L. Nel. 2015. “Data and Techniques for Studying the Urban Heat Island Effect in Johannesburg.” ISPRS - International Archives of the Photogrammetry, Remote Sensing and Spatial Information Sciences XL-7/W3 (May): 203–6. doi:10.5194/isprsarchives-XL-7-W3-203-2015.
Harlan, Sharon L., and Darren M. Ruddell. 2011. “Climate Change and Health in Cities: Impacts of Heat and Air Pollution and Potential Co-Benefits from Mitigation and Adaptation.” Current Opinion in Environmental Sustainability 3 (3): 126–34. doi:10.1016/j.cosust.2011.01.001.
Hassan, a. 2011. “Changes in the Urban Spatial Structure of the Greater Cairo Metropolitan Area.” ISPRS - International Archives of the Photogrammetry, Remote Sensing and Spatial Information Sciences XXXVIII-4/ (Udms): 133–36. doi:10.5194/isprsarchives-XXXVIII-4-C21-133-2011.
Hawthorne, William, and Ntim Gyakari. 2006. Photoguide for the Forest Trees of Ghana; Trees Spotters’s Field Guide for Identifying the Largest Trees. Oxford, UK: Oxford Forestry Institute.
Hector, a. 1999. “Plant Diversity and Productivity Experiments in European Grasslands.” Science 286 (1999): 1123–27. doi:10.1126/science.286.5442.1123.
Heinze, John. 2011. “Benefits of Green Space – Recent Research Table of Contents,” 1–28. Heip, Carlo H R, Peter M J Herman, and Karline Soetaert. 1998. “Indices of Diversity and Evenness *.” Oceanis 24 (4):
61–87. Henderson J. Vernon, A. Storeygard and U. Deichman. 2014. “Is Climate Change Driving Urbanization in Africa ? J .
Vernon Henderson , London School of Economics Adam Storeygard , Tufts University Is Climate Change Driving
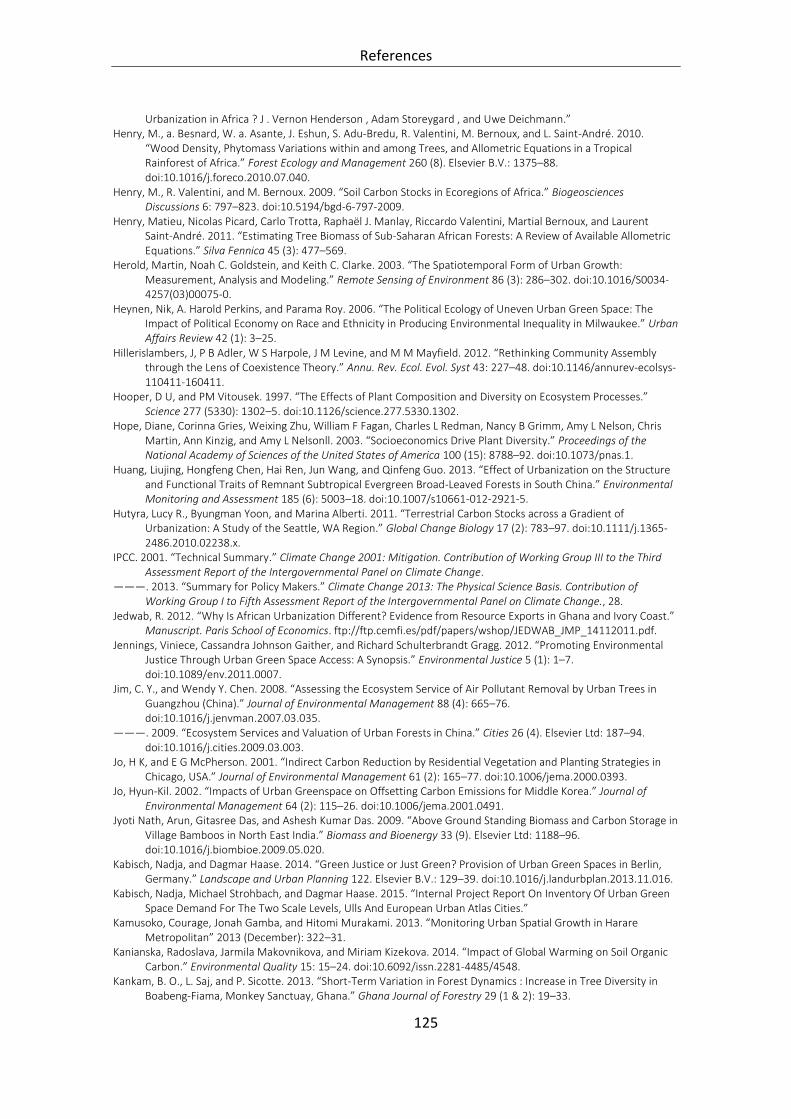
References
125
Urbanization in Africa ? J . Vernon Henderson , Adam Storeygard , and Uwe Deichmann.” Henry, M., a. Besnard, W. a. Asante, J. Eshun, S. Adu-Bredu, R. Valentini, M. Bernoux, and L. Saint-André. 2010.
“Wood Density, Phytomass Variations within and among Trees, and Allometric Equations in a Tropical Rainforest of Africa.” Forest Ecology and Management 260 (8). Elsevier B.V.: 1375–88. doi:10.1016/j.foreco.2010.07.040.
Henry, M., R. Valentini, and M. Bernoux. 2009. “Soil Carbon Stocks in Ecoregions of Africa.” Biogeosciences Discussions 6: 797–823. doi:10.5194/bgd-6-797-2009.
Henry, Matieu, Nicolas Picard, Carlo Trotta, Raphaël J. Manlay, Riccardo Valentini, Martial Bernoux, and Laurent Saint-André. 2011. “Estimating Tree Biomass of Sub-Saharan African Forests: A Review of Available Allometric Equations.” Silva Fennica 45 (3): 477–569.
Herold, Martin, Noah C. Goldstein, and Keith C. Clarke. 2003. “The Spatiotemporal Form of Urban Growth: Measurement, Analysis and Modeling.” Remote Sensing of Environment 86 (3): 286–302. doi:10.1016/S0034-4257(03)00075-0.
Heynen, Nik, A. Harold Perkins, and Parama Roy. 2006. “The Political Ecology of Uneven Urban Green Space: The Impact of Political Economy on Race and Ethnicity in Producing Environmental Inequality in Milwaukee.” Urban Affairs Review 42 (1): 3–25.
Hillerislambers, J, P B Adler, W S Harpole, J M Levine, and M M Mayfield. 2012. “Rethinking Community Assembly through the Lens of Coexistence Theory.” Annu. Rev. Ecol. Evol. Syst 43: 227–48. doi:10.1146/annurev-ecolsys-110411-160411.
Hooper, D U, and PM Vitousek. 1997. “The Effects of Plant Composition and Diversity on Ecosystem Processes.” Science 277 (5330): 1302–5. doi:10.1126/science.277.5330.1302.
Hope, Diane, Corinna Gries, Weixing Zhu, William F Fagan, Charles L Redman, Nancy B Grimm, Amy L Nelson, Chris Martin, Ann Kinzig, and Amy L Nelsonll. 2003. “Socioeconomics Drive Plant Diversity.” Proceedings of the National Academy of Sciences of the United States of America 100 (15): 8788–92. doi:10.1073/pnas.1.
Huang, Liujing, Hongfeng Chen, Hai Ren, Jun Wang, and Qinfeng Guo. 2013. “Effect of Urbanization on the Structure and Functional Traits of Remnant Subtropical Evergreen Broad-Leaved Forests in South China.” Environmental Monitoring and Assessment 185 (6): 5003–18. doi:10.1007/s10661-012-2921-5.
Hutyra, Lucy R., Byungman Yoon, and Marina Alberti. 2011. “Terrestrial Carbon Stocks across a Gradient of Urbanization: A Study of the Seattle, WA Region.” Global Change Biology 17 (2): 783–97. doi:10.1111/j.1365-2486.2010.02238.x.
IPCC. 2001. “Technical Summary.” Climate Change 2001: Mitigation. Contribution of Working Group III to the Third Assessment Report of the Intergovernmental Panel on Climate Change.
———. 2013. “Summary for Policy Makers.” Climate Change 2013: The Physical Science Basis. Contribution of Working Group I to Fifth Assessment Report of the Intergovernmental Panel on Climate Change., 28.
Jedwab, R. 2012. “Why Is African Urbanization Different? Evidence from Resource Exports in Ghana and Ivory Coast.” Manuscript. Paris School of Economics. ftp://ftp.cemfi.es/pdf/papers/wshop/JEDWAB_JMP_14112011.pdf.
Jennings, Viniece, Cassandra Johnson Gaither, and Richard Schulterbrandt Gragg. 2012. “Promoting Environmental Justice Through Urban Green Space Access: A Synopsis.” Environmental Justice 5 (1): 1–7. doi:10.1089/env.2011.0007.
Jim, C. Y., and Wendy Y. Chen. 2008. “Assessing the Ecosystem Service of Air Pollutant Removal by Urban Trees in Guangzhou (China).” Journal of Environmental Management 88 (4): 665–76. doi:10.1016/j.jenvman.2007.03.035.
———. 2009. “Ecosystem Services and Valuation of Urban Forests in China.” Cities 26 (4). Elsevier Ltd: 187–94. doi:10.1016/j.cities.2009.03.003.
Jo, H K, and E G McPherson. 2001. “Indirect Carbon Reduction by Residential Vegetation and Planting Strategies in Chicago, USA.” Journal of Environmental Management 61 (2): 165–77. doi:10.1006/jema.2000.0393.
Jo, Hyun-Kil. 2002. “Impacts of Urban Greenspace on Offsetting Carbon Emissions for Middle Korea.” Journal of Environmental Management 64 (2): 115–26. doi:10.1006/jema.2001.0491.
Jyoti Nath, Arun, Gitasree Das, and Ashesh Kumar Das. 2009. “Above Ground Standing Biomass and Carbon Storage in Village Bamboos in North East India.” Biomass and Bioenergy 33 (9). Elsevier Ltd: 1188–96. doi:10.1016/j.biombioe.2009.05.020.
Kabisch, Nadja, and Dagmar Haase. 2014. “Green Justice or Just Green? Provision of Urban Green Spaces in Berlin, Germany.” Landscape and Urban Planning 122. Elsevier B.V.: 129–39. doi:10.1016/j.landurbplan.2013.11.016.
Kabisch, Nadja, Michael Strohbach, and Dagmar Haase. 2015. “Internal Project Report On Inventory Of Urban Green Space Demand For The Two Scale Levels, Ulls And European Urban Atlas Cities.”
Kamusoko, Courage, Jonah Gamba, and Hitomi Murakami. 2013. “Monitoring Urban Spatial Growth in Harare Metropolitan” 2013 (December): 322–31.
Kanianska, Radoslava, Jarmila Makovnikova, and Miriam Kizekova. 2014. “Impact of Global Warming on Soil Organic Carbon.” Environmental Quality 15: 15–24. doi:10.6092/issn.2281-4485/4548.
Kankam, B. O., L. Saj, and P. Sicotte. 2013. “Short-Term Variation in Forest Dynamics : Increase in Tree Diversity in Boabeng-Fiama, Monkey Sanctuay, Ghana.” Ghana Journal of Forestry 29 (1 & 2): 19–33.
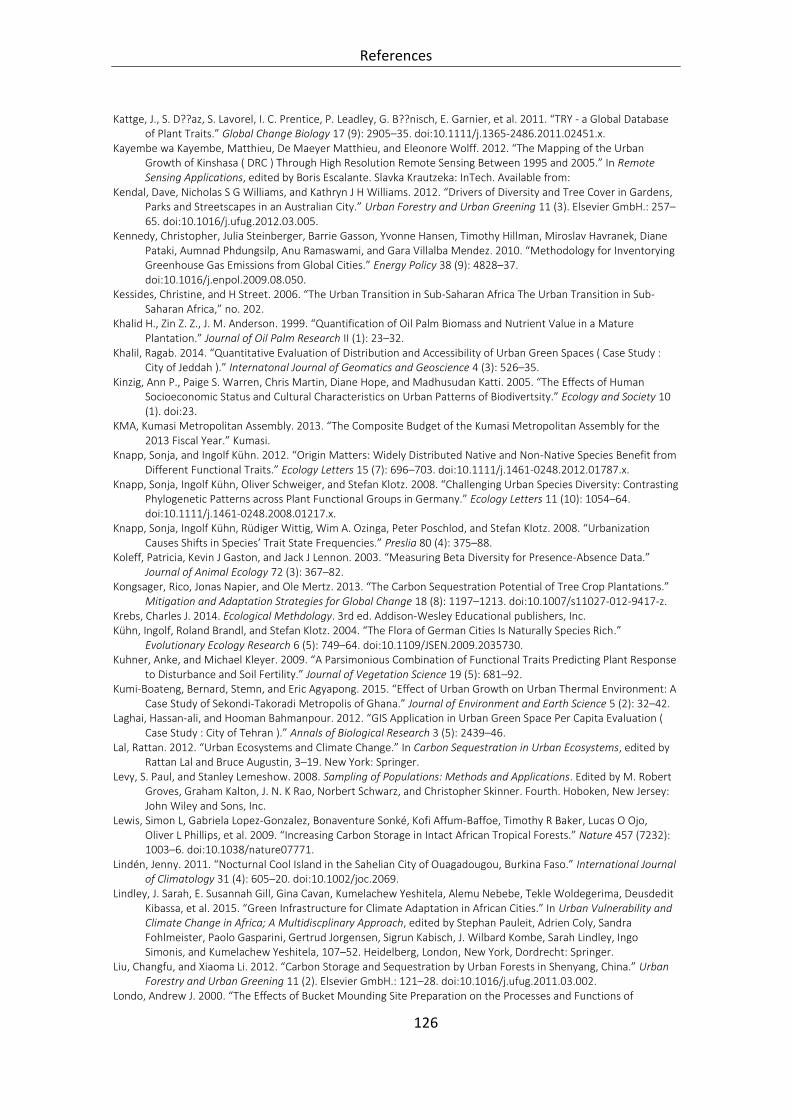
References
126
Kattge, J., S. D??az, S. Lavorel, I. C. Prentice, P. Leadley, G. B??nisch, E. Garnier, et al. 2011. “TRY - a Global Database of Plant Traits.” Global Change Biology 17 (9): 2905–35. doi:10.1111/j.1365-2486.2011.02451.x.
Kayembe wa Kayembe, Matthieu, De Maeyer Matthieu, and Eleonore Wolff. 2012. “The Mapping of the Urban Growth of Kinshasa ( DRC ) Through High Resolution Remote Sensing Between 1995 and 2005.” In Remote Sensing Applications, edited by Boris Escalante. Slavka Krautzeka: InTech. Available from:
Kendal, Dave, Nicholas S G Williams, and Kathryn J H Williams. 2012. “Drivers of Diversity and Tree Cover in Gardens, Parks and Streetscapes in an Australian City.” Urban Forestry and Urban Greening 11 (3). Elsevier GmbH.: 257–65. doi:10.1016/j.ufug.2012.03.005.
Kennedy, Christopher, Julia Steinberger, Barrie Gasson, Yvonne Hansen, Timothy Hillman, Miroslav Havranek, Diane Pataki, Aumnad Phdungsilp, Anu Ramaswami, and Gara Villalba Mendez. 2010. “Methodology for Inventorying Greenhouse Gas Emissions from Global Cities.” Energy Policy 38 (9): 4828–37. doi:10.1016/j.enpol.2009.08.050.
Kessides, Christine, and H Street. 2006. “The Urban Transition in Sub-Saharan Africa The Urban Transition in Sub-Saharan Africa,” no. 202.
Khalid H., Zin Z. Z., J. M. Anderson. 1999. “Quantification of Oil Palm Biomass and Nutrient Value in a Mature Plantation.” Journal of Oil Palm Research II (1): 23–32.
Khalil, Ragab. 2014. “Quantitative Evaluation of Distribution and Accessibility of Urban Green Spaces ( Case Study : City of Jeddah ).” Internatonal Journal of Geomatics and Geoscience 4 (3): 526–35.
Kinzig, Ann P., Paige S. Warren, Chris Martin, Diane Hope, and Madhusudan Katti. 2005. “The Effects of Human Socioeconomic Status and Cultural Characteristics on Urban Patterns of Biodivertsity.” Ecology and Society 10 (1). doi:23.
KMA, Kumasi Metropolitan Assembly. 2013. “The Composite Budget of the Kumasi Metropolitan Assembly for the 2013 Fiscal Year.” Kumasi.
Knapp, Sonja, and Ingolf Kühn. 2012. “Origin Matters: Widely Distributed Native and Non-Native Species Benefit from Different Functional Traits.” Ecology Letters 15 (7): 696–703. doi:10.1111/j.1461-0248.2012.01787.x.
Knapp, Sonja, Ingolf Kühn, Oliver Schweiger, and Stefan Klotz. 2008. “Challenging Urban Species Diversity: Contrasting Phylogenetic Patterns across Plant Functional Groups in Germany.” Ecology Letters 11 (10): 1054–64. doi:10.1111/j.1461-0248.2008.01217.x.
Knapp, Sonja, Ingolf Kühn, Rüdiger Wittig, Wim A. Ozinga, Peter Poschlod, and Stefan Klotz. 2008. “Urbanization Causes Shifts in Species’ Trait State Frequencies.” Preslia 80 (4): 375–88.
Koleff, Patricia, Kevin J Gaston, and Jack J Lennon. 2003. “Measuring Beta Diversity for Presence-Absence Data.” Journal of Animal Ecology 72 (3): 367–82.
Kongsager, Rico, Jonas Napier, and Ole Mertz. 2013. “The Carbon Sequestration Potential of Tree Crop Plantations.” Mitigation and Adaptation Strategies for Global Change 18 (8): 1197–1213. doi:10.1007/s11027-012-9417-z.
Krebs, Charles J. 2014. Ecological Methdology. 3rd ed. Addison-Wesley Educational publishers, Inc. Kühn, Ingolf, Roland Brandl, and Stefan Klotz. 2004. “The Flora of German Cities Is Naturally Species Rich.”
Evolutionary Ecology Research 6 (5): 749–64. doi:10.1109/JSEN.2009.2035730. Kuhner, Anke, and Michael Kleyer. 2009. “A Parsimonious Combination of Functional Traits Predicting Plant Response
to Disturbance and Soil Fertility.” Journal of Vegetation Science 19 (5): 681–92. Kumi-Boateng, Bernard, Stemn, and Eric Agyapong. 2015. “Effect of Urban Growth on Urban Thermal Environment: A
Case Study of Sekondi-Takoradi Metropolis of Ghana.” Journal of Environment and Earth Science 5 (2): 32–42. Laghai, Hassan-ali, and Hooman Bahmanpour. 2012. “GIS Application in Urban Green Space Per Capita Evaluation (
Case Study : City of Tehran ).” Annals of Biological Research 3 (5): 2439–46. Lal, Rattan. 2012. “Urban Ecosystems and Climate Change.” In Carbon Sequestration in Urban Ecosystems, edited by
Rattan Lal and Bruce Augustin, 3–19. New York: Springer. Levy, S. Paul, and Stanley Lemeshow. 2008. Sampling of Populations: Methods and Applications. Edited by M. Robert
Groves, Graham Kalton, J. N. K Rao, Norbert Schwarz, and Christopher Skinner. Fourth. Hoboken, New Jersey: John Wiley and Sons, Inc.
Lewis, Simon L, Gabriela Lopez-Gonzalez, Bonaventure Sonké, Kofi Affum-Baffoe, Timothy R Baker, Lucas O Ojo, Oliver L Phillips, et al. 2009. “Increasing Carbon Storage in Intact African Tropical Forests.” Nature 457 (7232): 1003–6. doi:10.1038/nature07771.
Lindén, Jenny. 2011. “Nocturnal Cool Island in the Sahelian City of Ouagadougou, Burkina Faso.” International Journal of Climatology 31 (4): 605–20. doi:10.1002/joc.2069.
Lindley, J. Sarah, E. Susannah Gill, Gina Cavan, Kumelachew Yeshitela, Alemu Nebebe, Tekle Woldegerima, Deusdedit Kibassa, et al. 2015. “Green Infrastructure for Climate Adaptation in African Cities.” In Urban Vulnerability and Climate Change in Africa; A Multidiscplinary Approach, edited by Stephan Pauleit, Adrien Coly, Sandra Fohlmeister, Paolo Gasparini, Gertrud Jorgensen, Sigrun Kabisch, J. Wilbard Kombe, Sarah Lindley, Ingo Simonis, and Kumelachew Yeshitela, 107–52. Heidelberg, London, New York, Dordrecht: Springer.
Liu, Changfu, and Xiaoma Li. 2012. “Carbon Storage and Sequestration by Urban Forests in Shenyang, China.” Urban Forestry and Urban Greening 11 (2). Elsevier GmbH.: 121–28. doi:10.1016/j.ufug.2011.03.002.
Londo, Andrew J. 2000. “The Effects of Bucket Mounding Site Preparation on the Processes and Functions of

References
127
Subboreal Mineral Wetland.” Michigan Technological University. López-Martínez, Jorge Omar, Lucía Sanaphre-Villanueva, Juan Manuel Dupuy, José Luis Hernández-Stefanoni, Jorge
Arturo Meave, and José Alberto Gallardo-Cruz. 2013. “β-Diversity of Functional Groups of Woody Plants in a Tropical Dry Forest in Yucatan.” PloS One 8 (9): e73660. doi:10.1371/journal.pone.0073660.
Lososova, Zdenka, Milan Chytry, and Ingolf Kuhn. 2008. “Plant Attributes Determining the Regional Abundance of Weeds on Central European Arable Land.” Journal of Biogeography 35 (1): 177–87. doi:10.1111/j.1365-2699.2007.01778.x.
Lwasa, Shuaib. 2010. “Adapting Urban Areas in Africa to Climate Change: The Case of Kampala.” Current Opinion in Environmental Sustainability 2 (3). Elsevier B.V.: 166–71. doi:10.1016/j.cosust.2010.06.009.
Mabogunje, Akin L. 2005. “Global Urban Poverty Reseach Agenda: The African Case.” Global Urban Poverty: Setting the Research Agenda, 28.
Magurran, Anne E. 2004. Measuring Biological Diversity. Oxford, UK: B;ackwell Publishing. Makido, Yasuyo, Shobhakar Dhakal, and Yoshiki Yamagata. 2012. “Relationship between Urban Form and CO 2
Emissions: Evidence from Fifty Japanese Cities.” Urban Climate 2. Elsevier Ltd: 55–67. doi:10.1016/j.uclim.2012.10.006.
Manu, Andrew, Yaw A Twumasi, and Tommy L Coleman. 2006. “Is It the Result of Global Warming or Urbanization ? The Rise in Air Temperature in Two Cities in Ghana Is It the Result of Global Warming or Urbanization ? The Rise in Air Temperature in Two Cities in Ghana.” In 5th FIG Regional Conference.
Martin, Adam R., and Sean C. Thomas. 2011. “A Reassessment of Carbon Content in Tropical Trees.” PLoS ONE 6 (8). doi:10.1371/journal.pone.0023533.
Matthews, Tony, Alex Y. Lo, and Jason a. Byrne. 2015. “Reconceptualizing Green Infrastructure for Climate Change Adaptation: Barriers to Adoption and Drivers for Uptake by Spatial Planners.” Landscape and Urban Planning 138. Elsevier B.V.: 155–63. doi:10.1016/j.landurbplan.2015.02.010.
McConnachie, M.M., and C.M. Shackleton. 2008. “Public Green Space Inequality in Small Towns in South Africa By M M McConnachie and C M Shackleton.”
———. 2010. “Public Green Space Inequality in Small Towns in South Africa.” Habitat International 34 (2): 244–48. Mcdonald, Robert I., Peter Kareiva, and Richard T.T. Forman. 2008. “The Implications of Current and Future
Urbanization for Global Protected Areas and Biodiversity Conservation.” Biological Conservation 141 (6): 1695–1703. doi:10.1016/j.biocon.2008.04.025.
Mcdonald, Robert I., Peter J. Marcotullio, and Burak Guneralp. 2013. “Urbanization, Biodiversity and Ecosystem Services: Challenges and Opportunities.” In Urbanization, Biodiversity and Ecosystem Services: Challenges and Opportunities. A Global Assessment, edited by Thomas Elmqvist, Michail Fragkias, Julie Goodness, Burak Güneralp, Peter J. Marcotullio, Robert I. McDonald, Susan Parnell, et al., 609–28. doi:10.1007/978-94-007-7088-1.
Mcdonald, Robert I, Peter J Marcotullio, and Burak Güneralp. 2013. “Urbanization and Global Trends in Biodiversity and Ecosystem Services.” In Urbanization, Biodiversity and Ecosystem Services: Challenges and Opportunities: A Global Assessment, edited by Thomas Elmqvist, Michail Fragkias, Julie Goodness, Burak Güneralp, Peter J. Marcotullio, Robert I. McDonald, Susan Parnell, et al., 31–52. Dordrecht: Springer Netherlands. doi:10.1007/978-94-007-7088-1.
McKinney, Michael L. 2006. “Urbanization as a Major Cause of Biotic Homogenization.” Biological Conservation 127 (3): 247–60. doi:10.1016/j.biocon.2005.09.005.
———. 2008. “Effect of Urbanization on Species Richness: A Review of Plants and Animals.” Urban Ecosystems 11: 161–76.
McRoberts, Ronald E. 2011. “Satellite Image-Based Maps: Scientific Inference or Pretty Pictures?” Remote Sensing of Environment 115 (2). Elsevier B.V.: 715–24. doi:10.1016/j.rse.2010.10.013.
McRoberts, Ronald E., and Brian F. Walters. 2012. “Statistical Inference for Remote Sensing-Based Estimates of Net Deforestation.” Remote Sensing of Environment 124. Elsevier B.V.: 394–401. doi:10.1016/j.rse.2012.05.011.
Mensah, Collins Adjei. 2014a. “Destruction of Urban Green Spaces : A Problem beyond Urbanization in Kumasi City ( Ghana ).” American Journal of Environmental Protection 3 (1): 1–9. doi:10.11648/j.ajep.20140301.11.
———. 2014b. “Destruction of Urban Green Spaces: A Problem Beyond Urbanization in Kumasi City (Ghana).” American Journal of Environmental Protection 3 (1): 1. doi:10.11648/j.ajep.20140301.11.
———. 2014c. “Urban Green Spaces in Africa : Nature and Challenges.” International Journal of Ecosystems 4 (1): 1–11. doi:10.5923/j.ije.20140401.01.
MES, Ministry of Environment and Science. 2002. “National Biodiversity Strategy for Ghana.” Mia, Misilu, Nsokimieno Eric, Earl Bailey, Mpinda Tushiminine Martin, Carleen Abraham, and Jiangfeng Li. 2014.
“Ongoing Informal Settlements in Democratic Republic of Congo : Implementing New Urban Policy for Creating Sustainable Neighborhoods” 7 (5): 254–65. doi:10.5539/jsd.v7n5p254.
Ministry of Environment Science and Technology, MEST. 2013. “Ghana National Climate Change Policy.” MLGRD, Ministry of Local Government and Rural Development. 2012. “National Urban Policy Framework,” no. May. Moffatt, S.F., S.M. McLachlan, and N.C. Kenkel. 2004. “Impacts of Land Use on Riparian Forest along an Urban-Rural
Gradient in Southern Manitoba.” Plant Ecology 174 (1): 119–35.

References
128
Mohammed, Eiman A, Hanan M Alawad, Khalid A Elsayed Zeinelabdein, and Abdelhafiz G Ali. 2015. “Urban Expansion and Population Growth in Omdurman City , Sudan Using Geospatial Technologies and Statistical Approaches.” American Journal of Earth Science 2 (1): 1–7.
Mokany, Karel, R. Johnson Raison, and Anatoly S. Prokushkin. 2006. “Critical Analysis of Root: Shoot Ratios in Terrestrial Biomes.” Global Change Biology 12 (1): 84–96. doi:10.1111/j.1365-2486.2005.001043.x.
Mora, Camilo, Derek P. Tittensor, Sina Adl, Alastair G B Simpson, and Boris Worm. 2011. “How Many Species Are There on Earth and in the Ocean?” PLoS Biology 9 (8): 1–8. doi:10.1371/journal.pbio.1001127.
Muller, Norbert, Maria Ignatieva, Charles H. Nilon, Peter Werner, and Wayne C. Zipper. 2013. “Patterns and Trends in Urban Biodviersity and Landscape Design.” In Urbanization, Biodiversity and Ecosystem Services: Challenges and Opportunities, 609–28. doi:10.1007/978-94-007-7088-1.
Mundia, C. N., and M. Aniya. 2005. “Analysis of Land Use/cover Changes and Urban Expansion of Nairobi City Using Remote Sensing and GIS.” International Journal of Remote Sensing 26 (13): 2831–49. doi:10.1080/01431160500117865.
Naeem, Shahid, Lindsey J. Thompson, Sharon P. Lawler, John H. Lawton, and Richard M. Woodfin. 1994. “Declining Biodiversity Can Alter the Performance of Ecosystems.” Nature 367: 566–68.
Natural Capital Germany-TEEB DE. 2015. Natural Capital and Climate Policy - Synergies and Conflicts. Summary for Decision Makers. Leipzig: NaturalKapital Deutschland - TEEB DE.
Nero, Bertrand Festus. 2009. “Carbon Squestration Resulting from Bottomland Hardwood Afforestation in the Lower Mississippi Alluvial Valley (LMAV).” Mississippi State University.
Nguh, Balgah Sounders. 2013. “Land Tenure and Land Use Dynamics in Limbe City , South West Region of Cameroon.” Agriculture Science Development 2 (March): 14–24.
Niemelä, Jari. 1999. “Ecology and Urban Planning.” Biodiversity and Conservation 8 (1): 119–31. doi:10.1023/A:1008817325994.
Norton, Briony a., Andrew M. Coutts, Stephen J. Livesley, Richard J. Harris, Annie M. Hunter, and Nicholas S.G. Williams. 2015. “Planning for Cooler Cities: A Framework to Prioritise Green Infrastructure to Mitigate High Temperatures in Urban Landscapes.” Landscape and Urban Planning 134. Elsevier B.V.: 127–38. doi:10.1016/j.landurbplan.2014.10.018.
Nowak, D J, D E Crane, Jack C Stevens, R E Hoehn, Jeffrey T Walton, and Jerry Bond. 2008. “A Ground-Based Method of Assessing Urban Forest Structure and Ecosystem Services.” Aboriculture & Urban Forestry 34 (6): 347–58. doi:10.1039/b712015j.
Nowak, David J. 1993. “Atmospheric Carbon Reduction by Urban Trees.” Journal of Environmental Management 37 (3): 207–17. doi:10.1006/jema.1993.1017.
Nowak, David J., Daniel E. Crane, and Jack C. Stevens. 2006. “Air Pollution Removal by Urban Trees and Shrubs in the United States.” Urban Forestry & Urban Greening 4 (3–4): 115–23. doi:10.1016/j.ufug.2006.01.007.
Nowak, David J, and Daniel E Crane. 2002. “Carbon Storage and Sequestration by Urban Trees in the USA.” Environmental Pollution 116 (3): 381–89.
Nowak, David J, Eric J Greenfield, Robert E Hoehn, and Elizabeth Lapoint. 2013. “Carbon Storage and Sequestration by Trees in Urban and Community Areas of the United States.” Environmental Pollution (Barking, Essex : 1987) 178 (July): 229–36. doi:10.1016/j.envpol.2013.03.019.
OECD. 2014. “Cities and Climate Change,” 279. doi:10.1787/9789264091375-en. Olofsson, Pontus, Giles M. Foody, Martin Herold, Stephen V. Stehman, Curtis E. Woodcock, and Michael A. Wulder.
2014. “Good Practices for Estimating Area and Assessing Accuracy of Land Change.” Remote Sensing of Environment 148. Elsevier Inc.: 42–57. doi:10.1016/j.rse.2014.02.015.
Olofsson, Pontus, Giles M. Foody, Stephen V. Stehman, and Curtis E. Woodcock. 2013. “Making Better Use of Accuracy Data in Land Change Studies: Estimating Accuracy and Area and Quantifying Uncertainty Using Stratified Estimation.” Remote Sensing of Environment 129. Elsevier Inc.: 122–31. doi:10.1016/j.rse.2012.10.031.
Orwa, C., Mutua, A., Kindt, R., Jamnadass, R. & Anthony, S. 2009. Agroforestree Database: A Tree Reference and Selection Guide. Version 4.0. Vol. 0. Nairobi, Kenya: World Agroforestry Center.
Oteng-Amoako, A.A. 2002. 100 Tropical African Timber Trees from Ghana: Tree Description and Wood Identification with Notes on Distribution, Ecology, Silviculture, Ethnobotany, and Wood Uses. Kumasi: Forest Research Institute of Ghana.
Otunga, Charles, John Odindi, and Onisimo Mutanga. 2014. “Land Use and Land Cover Change in the Fringe of eThekwini Municipality: Implications for Urban Green Spaces Using Remote Sensing.” South African Journal of Geomatics 3 (2): 145–62.
Owusu, Kwadwo. 2009. “Changing Rainfall Climatology Of West Africa: Implications For Rainfed Agriculture In Ghana And Water Sharing In The Volta Basin.” University of Florida.
Özden, Kemal, and Chigozie Enwere. 2012. “Urbanization and Its Political Challenges in Developing Countries.” Eurasian Journal of Business and Economics 5 (10): 99–120.
Pappoe, A N M, F A Armah, E C Quaye, P K Kwakye, and G N T Buxton. 2010. “Composition and Stand Structure of a Tropical Moist Semi-Deciduous Forest in Ghana.” Plant Science 1 (4): 095–106.
References
129
Parker-Flynn, James E. 2014. “The Intersection of Mitigation and Adaptation in Climate Law and Policy.” University of Carlifornia, Davis 38 (1).
Pauchard, Aníbal, Mauricio Aguayo, Eduardo Peña, and Roberto Urrutia. 2006. “Multiple Effects of Urbanization on the Biodiversity of Developing Countries: The Case of a Fast-Growing Metropolitan Area (Concepción, Chile).” Biological Conservation 127 (3): 272–81. doi:10.1016/j.biocon.2005.05.015.
Pauleit, Stephan, and Friedrich Duhme. 2000. “Assessing the Environmental Performance of Land Cover Types for Urban Planning.” Landscape and Urban Planning 52 (1): 1–20. doi:10.1016/S0169-2046(00)00109-2.
Pauleit, Stephan, Roland Ennos, and Yvonne Golding. 2005. “Modeling the Environmental Impacts of Urban Land Use and Land Cover Change—a Study in Merseyside, UK.” Landscape and Urban Planning 71 (2–4): 295–310. doi:10.1016/j.landurbplan.2004.03.009.
Peng, Shushi, Shilong Piao, Philippe Ciais, Pierre Friedlingstein, Catherine Ottle, François-Marie Bréon, Huijuan Nan, Liming Zhou, and Ranga B Myneni. 2012. “Surface Urban Heat Island across 419 Global Big Cities.” Environmental Science & Technology 46 (2): 696–703. doi:10.1021/es2030438.
Pickett, Steward T A, Mary L Cadenasso, J Morgan Grove, Peter M Groffman, Lawrence E Band, Neely L Law, Charles H Nilon, et al. 2008. “Beyond Urban Legends : An Emerging Framework of Urban Ecology , as Illustrated by the.” BioScience 58 (2): 139–50.
Potts, Deborah. 2012. Whatever Happened to Africa’s Rapid Urbanization? Edited by Edward Paice. Africa Research Institute, Counterpoints.
Pouyat, Richard V, Ian D Yesilonis, and David J Nowak. 2006. “Carbon Storage by Urban Soils in the United States.” Journal of Environmental Quality, no. ii: 1566–75. doi:10.2134/jeq2005.0215.
Quagraine, Victor Kwesi. 2011. “Urban Landscape Depletion in the Kumasi Metropolis.” In Future of the Tree: Towards Growth and Development of Kumasi, edited by Kwafo Kwasi Adarkwa, 212–33. KUMASI: KNUST University Printing Press.
Raciti, Steve M., Lucy R. Hutyra, and Adrien C. Finzi. 2012. “Depleted Soil Carbon and Nitrogen Pools beneath Impervious Surfaces.” Environmental Pollution 164. Elsevier Ltd: 248–51. doi:10.1016/j.envpol.2012.01.046.
Rakodi, Carole, Rose Gatabaki-Kamau, and Nick Devas. 2000. “Poverty and Political Conflict in Mombasa.” Environment and Urbanization 12 (1): 153.
Razack, A B D, T A Nelson, and Ahmad Nazri. 2013. “WOOD FUEL CONSUMPTION AND ECOLOGICAL FOOTPRINT OF AFRICAN CITIES” 1 (2): 1–18.
Rees, W. E., and Mathis Wackernagel. 1996. “URBAN ECOLOGICAL F O O T P R I N T S : W H Y CITIES CANNOT BE SUSTAINABLE AND WHY THEY.” Environmental Impact Assessment Review, 223–48.
Reich, P B, J Knops, D Tilman, J Craine, D Ellsworth, M Tjoelker, T Lee, et al. 2001. “Plant Diversity Enhances Ecosystem Responses to Elevated CO2 and Nitrogen Deposition.” Nature 410 (6830): 809–12. doi:10.1038/35071062.
Richards, N. A. 1993. “Reasonable Guidelines for Street Tree Diversity.” Journal of Arboriculture 19 (6): 344–50. Roscher, Christiane, Jens Schumacher, Marl??n Gubsch, Annett Lipowsky, Alexandra Weigelt, Nina Buchmann,
Bernhard Schmid, and Ernst Detlef Schulze. 2012. “Using Plant Functional Traits to Explain Diversity-Productivity Relationships.” PLoS ONE 7 (5). doi:10.1371/journal.pone.0036760.
Russo, Alessio, Francisco J. Escobedo, Nilesh Timilsina, Armin Otto Schmitt, Sebastian Varela, and Stefan Zerbe. 2014. “Assessing Urban Tree Carbon Storage and Sequestration in Bolzano, Italy.” International Journal of Biodiversity Science, Ecosystem Services & Management 10 (1). Taylor & Francis: 54–70. doi:10.1080/21513732.2013.873822.
Sahalu, Atalel Getu. 2014. “ANALYSIS OF URBAN LAND USE AND LAND COVER CHANGES : A Case Study in Bahir Dar, Ethiopia.” Universidade Nova de Lisboa, Lisbon, Portugal.
Sandström, Ulf G. 2009. “Urban Green Spaces for Human Well-Being.” In IAIA09 Conference Proceedings: Impact Assessment and Human Well-Being. 29th Annual Conference of the International Association for Impact Assessment, 46:5p. Accra.
Santamour, Frank S. 1990. “Trees for Urban Planting : Diversity, Uniformity , and Common Sense.” Proceedings of the Seventh Conference of The Metropolitan Tree Improvement Alliance 7: 57–65.
Santiago, L. S., and S. J. Wright. 2007. “Leaf Functional Traits of Tropical Forest Plants in Relation to Growth Form.” Functional Ecology 21 (1): 19–27. doi:10.1111/j.1365-2435.2006.01218.x.
Sarah Walters, Kathryn Lane, and Eryn Murphy. 2014. “Heat Related Deaths in New York City, 2013.” Epi Data Brief 27 (5): 6–8.
SAS Institute Inc. 2008. SAS/STAT 9.2 User’s Guide. Cary, NC: SAS Institute Inc. Satterthwaite, D. 2001. “Reducing Urban Poverty: Constraints on the Effectiveness of Aid Agencies and Development
Banks and Some Suggestions for Change.” Environment and Urbanization 13 (1): 137–57. doi:10.1177/095624780101300111.
Satterthwaite, David. 2007. “The Transition to a Predominantly Urban World and Its Underpinnings.” Human Settlements Discussion Paper Series: Urban Change-4, no. 2006: 99p. doi:1 84369 560 X.
Savage, Amy M., Britn?? Hackett, Benoit Gu??nard, Elsa K. Youngsteadt, and Robert R. Dunn. 2015. “Fine-Scale Heterogeneity across Manhattan’s Urban Habitat Mosaic Is Associated with Variation in Ant Composition and

References
130
Richness.” Insect Conservation and Diversity 8 (3): 216–28. doi:10.1111/icad.12098. Savard, Jean-Pierre L, Philippe Clergeau, and Gwenaelle Mennechez. 2000. “Biodiversity Concepts and Urban
Ecosystems.” Landscape and Urban Planning 48 (3–4): 131–42. doi:10.1016/S0169-2046(00)00037-2. Schmidt, S. 2005. “Cultural Influences and the Built Environment. An Examination of Kumasi, Ghana.” Journal of
Urban Design 10 (3): 353–70. Schoenholtz, Stephen H. 1994. “Hydrological Responses of Bottomland Hardwood Ecosystems to Logging.” In
Hardwood Symposium. Proceedings of the 22nd Annual Hardwood Symposium of the Hardwood Research Council: Opportunities for the Hardwood Industry to Address Environmental Challeneges, 63–68. Cashiers, NC.
Schreyer, Johannes, Jan Tigges, Tobia Lakes, and Galina Churkina. 2014. “Using Airborne LiDAR and QuickBird Data for Modelling Urban Tree Carbon Storage and Its Distribution-a Case Study of Berlin.” Remote Sensing 6 (11): 10636–55. doi:10.3390/rs61110636.
Schroth, È, Sammya Agra, D Angelo, and Wenceslau Geraldes. 2002. “Conversion of Secondary Forest into Agroforestry and Monoculture Plantations in Amazonia : Consequences for Biomass , Litter and Soil Carbon Stocks after 7 Years” 163: 131–50.
Searle, Stephanie Y., Matthew H. Turnbull, Natalie T. Boelman, William S F Schuster, Dan Yakir, and Kevin L. Griffin. 2012. “Urban Environment of New York City Promotes Growth in Northern Red Oak Seedlings.” Tree Physiology 32 (4): 389–400. doi:10.1093/treephys/tps027.
Sebego, Reuben J, and Thando D Gwebu. 2013. “Patterns, Determinants, Impacts and Policy Implications of the Spatial Expansion of an African Capital City: The Greater Gaborone Example.” International Journal of Sustainable Built Environment 2 (2). The Gulf Organisation for Research and Development: 193–208. doi:http://dx.doi.org/10.1016/j.ijsbe.2013.12.002.
Seto, Karen C, Michail Fragkias, and Burak Gu. 2011. “A Meta-Analysis of Global Urban Land Expansion.” Plos One 6 (8): 1–9. doi:10.1371/Citation.
Seto, Karen C, Burak Güneralp, and Lucy R Hutyra. 2012. “Global Forecasts of Urban Expansion to 2030 and Direct Impacts on Biodiversity and Carbon Pools.” Proceedings of the National Academy of Sciences of the United States of America 109 (40): 16083–88. doi:10.1073/pnas.1211658109.
Smit, Barry, and Johanna Wandel. 2006. “Adaptation, Adaptive Capacity and Vulnerability.” Global Environmental Change 16 (3): 282–92. doi:10.1016/j.gloenvcha.2006.03.008.
Sourial, Nadia, Christina Wolfson, Bin Zhu, Jacqueline Quail, John Fletcher, Sathya Karunananthan, Karen Bandeen-Roche, Francois Beland, and Howard Bergman. 2010. “Correspondence Analysis Is a Useful Tool to Uncover the Relationships among Categorical Variables.” Journal of Clinical Epidemiology 63 (6): 638–46. doi:10.1210/jc.2009-1990.Glucose.
Stockholm Environment Institute, SEI. 2013. “Transport and Environment in Sub-Saharan Africa.” Stow, Douglas a., John R. Weeks, Sory Toure, Lloyd L. Coulter, Christopher D. Lippitt, and Eric Ashcroft. 2012. “Urban
Vegetation Cover and Vegetation Change in Accra, Ghana: Connection to Housing Quality.” The Professional Geographer, no. July: 120718104048000. doi:10.1080/00330124.2012.697856.
Strohbach, Michael W., and Dagmar Haase. 2012. “Above-Ground Carbon Storage by Urban Trees in Leipzig, Germany: Analysis of Patterns in a European City.” Landscape and Urban Planning 104 (1). Elsevier B.V.: 95–104. doi:10.1016/j.landurbplan.2011.10.001.
Sylla, L., D. Xiong, H. Y. Zhang, and S. T. Bangoura. 2012. “A GIS Technology and Method to Assess Environmental Problems from Land Use/cover Changes: Conakry, Coyah and Dubreka Region Case Study.” Egyptian Journal of Remote Sensing and Space Science 15 (1). Elsevier B.V.: 31–38. doi:10.1016/j.ejrs.2011.12.002.
Taylor, By Anna, and Camaren Peter. 2014. “Strengthening Climate Resilience in African Cities A Framework for Working with Informality.” Cape Town.
Thambiran, Tirusha, and Roseanne D Diab. 2010. “Air Pollution and Climate Change Co-Benefit Opportunities in the Road Transportation Sector in Durban , South Africa Author for Correspondence : [email protected] CSIR Natural Resources and the Environment , PO Box 17001 , Congella 4013 , South Africa,” 1–21.
The Convention on Biological Diversity (CBD). 2012. “Cities and Biodiversity Outlook.” Executive Summary. doi:doi:10.6084/m9.figshare.99889.
The World Bank. 2000. Entering the 21st Century: World Development Report 1999/2000. Vol. 0. Thompson, Catharine Ward. 2002. “Urban Open Space in the 21st Century.” Landscape and Urban Planning 60 (2):
59–72. doi:10.1016/S0169-2046(02)00059-2. Tilman, David. 2001. “Functional Diversity.” Encyclopedia of Biodiversity 3: 109–21. Timilsina, Nilesh, Francisco J. Escobedo, Christina L. Staudhammer, and Thomas Brandeis. 2014. “Analyzing the Causal
Factors of Carbon Stores in a Subtropical Urban Forest.” Ecological Complexity 20 (July 2015): 23–32. doi:10.1016/j.ecocom.2014.07.001.
Tokeshi, Mutsunori. 1990. “Niche Apportionment or Random Assortment: Species Abundance Patterns Revisited.” Journal of Animal Ecology 59 (3): 1129–46. doi:10.2307/5036.
Tontoh, Albert Agyemang. 2011. “A Study To Ascertain the Growth Situation of the Kumasi.” Kwame Nkrumah University of Science and Technology.
Tzoulas, Konstantinos, Kalevi Korpela, Stephen Venn, Vesa Yli-Pelkonen, Aleksandra Kaźmierczak, Jari Niemela, and
References
131
Philip James. 2007. “Promoting Ecosystem and Human Health in Urban Areas Using Green Infrastructure: A Literature Review.” Landscape and Urban Planning 81 (3): 167–78. doi:10.1016/j.landurbplan.2007.02.001.
Ujoh, Fanan, Olarewaju Oluseyi Ifatimehin, and Adams Ndalai Baba. 2011. “Detecting Changes in Landuse / Cover of Umuahia , South-Eastern Nigeria Using Remote Sensing and GIS Techniques.” COnfluence Journal of Environmental Studies, no. July.
Unger, Alon, and Lee W. Riley. 2007. “Slum Health: From Understanding to Action.” PLoS Medicine 4 (10): 1561–66. doi:10.1371/journal.pmed.0040295.
UN-Habitat. 2008. State of the World Cities 2008/2009; Harmonic Cities. doi:10.1142/9789814280730. ———. 2011. Global Report on Human Settlements 2011: Cities and Climate Change. doi:10.1787/9789264091375-
en. ———. 2014. The State of African Cities 2014: Re-Imagining Sustainable Urban Transitions.
doi:10.2174/97816080506351100101. ———. 2015. “UN-Habitat Urban Data.” United Nations. 2014. World Urbanization Prospects. New York: United Nations. ———. 2015. “Transforming Our World: The 2030 Agenda for Sustainable Development.” Vol. 16301. “URBAN WETLAND ECOLOGY AND FLOODS IN KUMASI , GHANA Benjamin Betey Campion URBAN WETLAND
ECOLOGY AND FLOODS IN KUMASI , GHANA Benjamin Betey Campion.” 2012. Van de Voorde, Tim, Jonathan Cheung-wai Chan, and Frank Canters. 2010. “Mapping Update and Analysis of the
Evolution of Non- Built ( Green ) Spaces in the Brussels Capital Region Part I : Mapping of Non-Built ( Green ) Spaces Based on Recent High Resolution Remote Sensing Data Part II : Analysis of the Evolution of Non-Built,” no. December.
Van Leeuwen, Eveline, and Eric Koomen. 2012. “Adapting Urban Land Use in the Time of Climate Change; Optimistic Future Land Use Patterns to Decrease Flood Risks.” In Carbon Sequestration in Urban Ecosystems, edited by Rattan Lal and Bruce Augustin, 21–41. New York: Springer.
van Rensburg, Berndt J., Derick S. Peacock, and Mark P. Robertson. 2009. “Biotic Homogenization and Alien Bird Species along an Urban Gradient in South Africa.” Landscape and Urban Planning 92 (3–4): 233–41. doi:10.1016/j.landurbplan.2009.05.002.
Velasco, Erik, Matthias Roth, Leslie Norford, and Luisa T. Molina. 2016. “Does Urban Vegetation Enhance Carbon Sequestration?” Landscape and Urban Planning 148. Elsevier B.V.: 99–107. doi:10.1016/j.landurbplan.2015.12.003.
Vermeiren, Karolien, Anton Van Rompaey, Maarten Loopmans, Eria Serwajja, and Paul Mukwaya. 2012. “Urban Growth of Kampala, Uganda: Pattern Analysis and Scenario Development.” Landscape and Urban Planning 106 (2). Elsevier B.V.: 199–206. doi:10.1016/j.landurbplan.2012.03.006.
Vollmer, Derek, and Adrienne Grêt-Regamey. 2013. “Rivers as Municipal Infrastructure: Demand for Environmental Services in Informal Settlements along an Indonesian River.” Global Environmental Change 23 (6): 1542–55. doi:10.1016/j.gloenvcha.2013.10.001.
Wackernagel, M., J. Kitzes, D. Moran, S. Goldfinger, and M. Thomas. 2006. “The Ecological Footprint of Cities and Regions: Comparing Resource Availability with Resource Demand.” Environment and Urbanization 18 (1): 103–12. doi:10.1177/0956247806063978.
Wafula, Munialo Evans, and Chege Moses Gichuho. 2013. “The Pattern of Expansion of Urban Residential in Eldoret Municipality , Kenya” 2 (4): 586–89.
Walker, B., S. Carpenter, J. Anderies, N. Abel, G.S. Cumming, and M. Janssen. 2003. “Resilience Management in Social-Ecological Systems: A Working Hypothesis for a Participatory Approach.” Conservation Ecology 6: 1–14.
Watson, Vanessa, and Babatunde Agbola. 2013. “Who Will Plan Africa’s Cities?” Counterpoints. Vol. 1. London. doi:10.1017/CBO9781107415324.004.
Weber, C., and a. Puissant. 2003. “Urbanization Pressure and Modeling of Urban Growth: Example of the Tunis Metropolitan Area.” Remote Sensing of Environment 86 (3): 341–52. doi:10.1016/S0034-4257(03)00077-4.
Wen, Ming, Xingyou Zhang, Carmen D Harris, James B Holt, and Janet B Croft. 2013. “Spatial Disparities in the Distribution of Parks and Green Spaces in the USA.” Annals of Behavioral Medicine : A Publication of the Society of Behavioral Medicine 45 Suppl 1 (SUPPL.1): S18-27. doi:10.1007/s12160-012-9426-x.
Whittaker, R H. 1965. “Dominance and Diversity in Land Plant Communities.” Science 147 (3655): 250–60. doi:10.1126/science.147.3655.250.
WHO. 2009. “Slums, Climate Change and Human Health in Sub-Saharan Africa.” Bulletin of the World Health Organization 87: 886–886.
Williams, Nicholas S G, Mark W. Schwartz, Peter A. Vesk, Michael A. McCarthy, Amy K. Hahs, Steven E. Clemants, Richard T. Corlett, et al. 2008. “A Conceptual Framework for Predicting the Effects of Urban Environments on Floras.” Journal of Ecology 97 (1): 4–9. doi:10.1111/j.1365-2745.2008.01460.x.
Wilson, Bastow J., Terry C.E. Wells, Ian C. Trueman, Grant Jones, M.D. Atkinsons, Mick J. Crawley, Mike E. Dodd, and Jonathan Silvertown. 1996. “Are There Assembly Rules for Plant Species Abundance? An Investigation in Relation to Soil Resources and Succional Trends.” Journal of Ecology 84 (4): 527–38.
Wilson, M.V. MV, and a. Shmida. 1984. “Measuring Beta Diversity with Presence-Absence Data.” Journal of Ecology
References
132
72 (3): 1055–64. doi:10.2307/2259551. Wolch, Jennifer R., Jason Byrne, and Joshua P. Newell. 2014. “Urban Green Space, Public Health, and Environmental
Justice: The Challenge of Making Cities ‘Just Green Enough.’” Landscape and Urban Planning 125. Elsevier B.V.: 234–44. doi:10.1016/j.landurbplan.2014.01.017.
Wright, Joseph, D Bunker, J Dalling, S Davies, S Díaz, Betina Engelbrecht, K Harns, et al. 2006. “Towards a Functional Trait Based Research Program within the Center for Tropical Forest Science. .” Unpublished Report Synthesizing the Recommendations of a CTFS Workshop on the Priorities of a Functional Trait Research Program, 15.
Wu, Weicheng, Marie-Françoise Courel, and Jeannine Le Rhun. 2003. “Application of Remote Sensing to the Urban Expansion Analysis for Nouakchott, Mauritania.” Geocarto International 18 (1): 17–24. doi:10.1080/10106040308542259.
Yeh, Anthony Gar-on, and Xia Li. 2001. “Measurement and Monitoring of Urban Sprawl in a Rapidly Growing Region Using Entropy.” Photogrammetric Engineering & Remote Sensing 67 (1): 83–90.
Yesilonis, I.D., and R.V. Pouyat. 2012. “Carbon Stocks in Urban Forest Remnants: Atlanta and Baltimore as Case Studies.” In Carbon Sequestration in Urban Ecosystems, edited by Rattan Lal and Bruce Augustin, 103–20. Heidelberg, Lndon, New York: Springer Netherlands.
Zérah, Marie-Hélène, and Frédéric Landy. 2013. “Nature and Urban Citizenship Redefined: The Case of the National Park in Mumbai.” Geoforum 46: 25–33. doi:10.1016/j.geoforum.2012.11.027.
Zhan, Jinyan, Juan Huang, Tao Zhao, Xiaoli Geng, and Yihui Xiong. 2013. “Modeling the Impacts of Urbanization on Regional Climate Change: A Case Study in the Beijing-Tianjin-Tangshan Metropolitan Area.” Advances in Meteorology 2013: 1–8. doi:10.1155/2013/849479.
Zhang, Xin, Yong Zhao, Mark S Ashton, and Xuhui Lee. 2012. “Measuring Carbon in Forest.” In Managing Forest Carbon in a Changing Climate, edited by Mark S Ashton, Mary L Tyrrell, Deborah Spalding, and Gentry Bradford, 139–64. Springer.
Zheng, Xinqi, Tian Xia, Xin Yang, Tao Yuan, and Yecui Hu. 2013. “The Land Gini Coefficient and Its Application for Land Use Structure Analysis in China.” PLoS ONE 8 (10): e76165. doi:10.1371/journal.pone.0076165.
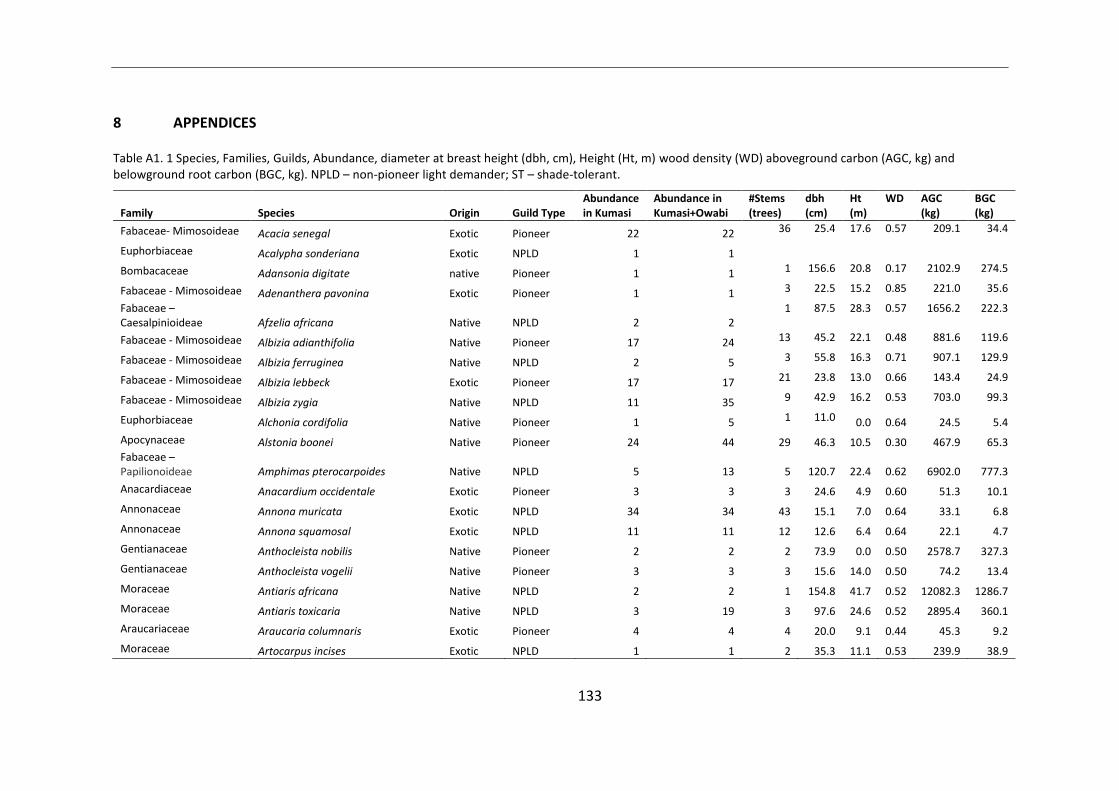
133
8 APPENDICES
Table A1. 1 Species, Families, Guilds, Abundance, diameter at breast height (dbh, cm), Height (Ht, m) wood density (WD) aboveground carbon (AGC, kg) and belowground root carbon (BGC, kg). NPLD – non-pioneer light demander; ST – shade-tolerant.
Family Species Origin Guild Type Abundance in Kumasi
Abundance in Kumasi+Owabi
#Stems (trees)
dbh (cm)
Ht (m)
WD AGC (kg)
BGC (kg)
Fabaceae- Mimosoideae Acacia senegal Exotic Pioneer 22 22 36 25.4 17.6 0.57 209.1 34.4
Euphorbiaceae Acalypha sonderiana Exotic NPLD 1 1 Bombacaceae Adansonia digitate native Pioneer 1 1 1 156.6 20.8 0.17 2102.9 274.5
Fabaceae - Mimosoideae Adenanthera pavonina Exotic Pioneer 1 1 3 22.5 15.2 0.85 221.0 35.6
Fabaceae – Caesalpinioideae Afzelia africana Native NPLD 2 2
1 87.5 28.3 0.57 1656.2 222.3
Fabaceae - Mimosoideae Albizia adianthifolia Native Pioneer 17 24 13 45.2 22.1 0.48 881.6 119.6
Fabaceae - Mimosoideae Albizia ferruginea Native NPLD 2 5 3 55.8 16.3 0.71 907.1 129.9
Fabaceae - Mimosoideae Albizia lebbeck Exotic Pioneer 17 17 21 23.8 13.0 0.66 143.4 24.9
Fabaceae - Mimosoideae Albizia zygia Native NPLD 11 35 9 42.9 16.2 0.53 703.0 99.3
Euphorbiaceae Alchonia cordifolia Native Pioneer 1 5 1 11.0 0.0 0.64 24.5 5.4
Apocynaceae Alstonia boonei Native Pioneer 24 44 29 46.3 10.5 0.30 467.9 65.3 Fabaceae – Papilionoideae Amphimas pterocarpoides Native NPLD 5 13 5 120.7 22.4 0.62 6902.0 777.3
Anacardiaceae Anacardium occidentale Exotic Pioneer 3 3 3 24.6 4.9 0.60 51.3 10.1
Annonaceae Annona muricata Exotic NPLD 34 34 43 15.1 7.0 0.64 33.1 6.8
Annonaceae Annona squamosal Exotic NPLD 11 11 12 12.6 6.4 0.64 22.1 4.7
Gentianaceae Anthocleista nobilis Native Pioneer 2 2 2 73.9 0.0 0.50 2578.7 327.3
Gentianaceae Anthocleista vogelii Native Pioneer 3 3 3 15.6 14.0 0.50 74.2 13.4
Moraceae Antiaris africana Native NPLD 2 2 1 154.8 41.7 0.52 12082.3 1286.7
Moraceae Antiaris toxicaria Native NPLD 3 19 3 97.6 24.6 0.52 2895.4 360.1
Araucariaceae Araucaria columnaris Exotic Pioneer 4 4 4 20.0 9.1 0.44 45.3 9.2
Moraceae Artocarpus incises Exotic NPLD 1 1 2 35.3 11.1 0.53 239.9 38.9
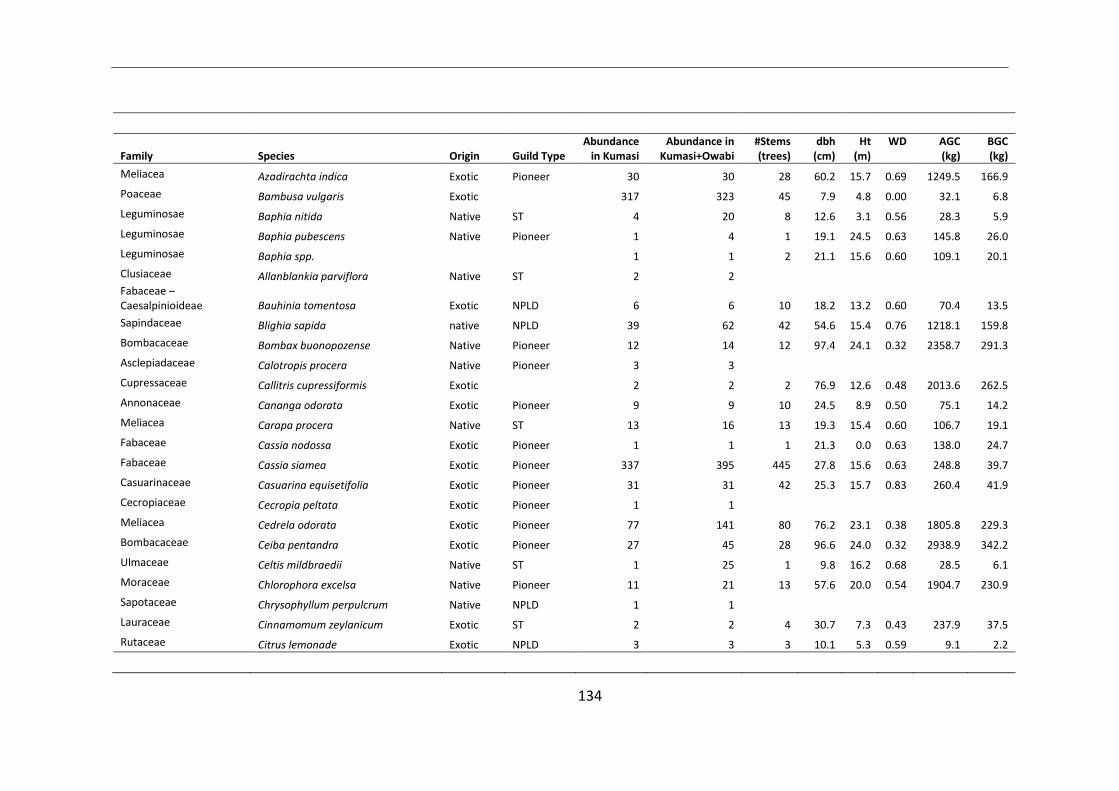
134
Family Species Origin Guild Type Abundance
in Kumasi Abundance in
Kumasi+Owabi #Stems (trees)
dbh (cm)
Ht (m)
WD AGC (kg)
BGC (kg)
Meliacea Azadirachta indica Exotic Pioneer 30 30 28 60.2 15.7 0.69 1249.5 166.9
Poaceae Bambusa vulgaris Exotic 317 323 45 7.9 4.8 0.00 32.1 6.8
Leguminosae Baphia nitida Native ST 4 20 8 12.6 3.1 0.56 28.3 5.9
Leguminosae Baphia pubescens Native Pioneer 1 4 1 19.1 24.5 0.63 145.8 26.0
Leguminosae Baphia spp. 1 1 2 21.1 15.6 0.60 109.1 20.1
Clusiaceae Allanblankia parviflora Native ST 2 2 Fabaceae – Caesalpinioideae Bauhinia tomentosa Exotic NPLD 6 6 10 18.2 13.2 0.60 70.4 13.5
Sapindaceae Blighia sapida native NPLD 39 62 42 54.6 15.4 0.76 1218.1 159.8
Bombacaceae Bombax buonopozense Native Pioneer 12 14 12 97.4 24.1 0.32 2358.7 291.3
Asclepiadaceae Calotropis procera Native Pioneer 3 3 Cupressaceae Callitris cupressiformis Exotic 2 2 2 76.9 12.6 0.48 2013.6 262.5
Annonaceae Cananga odorata Exotic Pioneer 9 9 10 24.5 8.9 0.50 75.1 14.2
Meliacea Carapa procera Native ST 13 16 13 19.3 15.4 0.60 106.7 19.1
Fabaceae Cassia nodossa Exotic Pioneer 1 1 1 21.3 0.0 0.63 138.0 24.7
Fabaceae Cassia siamea Exotic Pioneer 337 395 445 27.8 15.6 0.63 248.8 39.7
Casuarinaceae Casuarina equisetifolia Exotic Pioneer 31 31 42 25.3 15.7 0.83 260.4 41.9
Cecropiaceae Cecropia peltata Exotic Pioneer 1 1 Meliacea Cedrela odorata Exotic Pioneer 77 141 80 76.2 23.1 0.38 1805.8 229.3
Bombacaceae Ceiba pentandra Exotic Pioneer 27 45 28 96.6 24.0 0.32 2938.9 342.2
Ulmaceae Celtis mildbraedii Native ST 1 25 1 9.8 16.2 0.68 28.5 6.1
Moraceae Chlorophora excelsa Native Pioneer 11 21 13 57.6 20.0 0.54 1904.7 230.9
Sapotaceae Chrysophyllum perpulcrum Native NPLD 1 1 Lauraceae Cinnamomum zeylanicum Exotic ST 2 2 4 30.7 7.3 0.43 237.9 37.5
Rutaceae Citrus lemonade Exotic NPLD 3 3 3 10.1 5.3 0.59 9.1 2.2
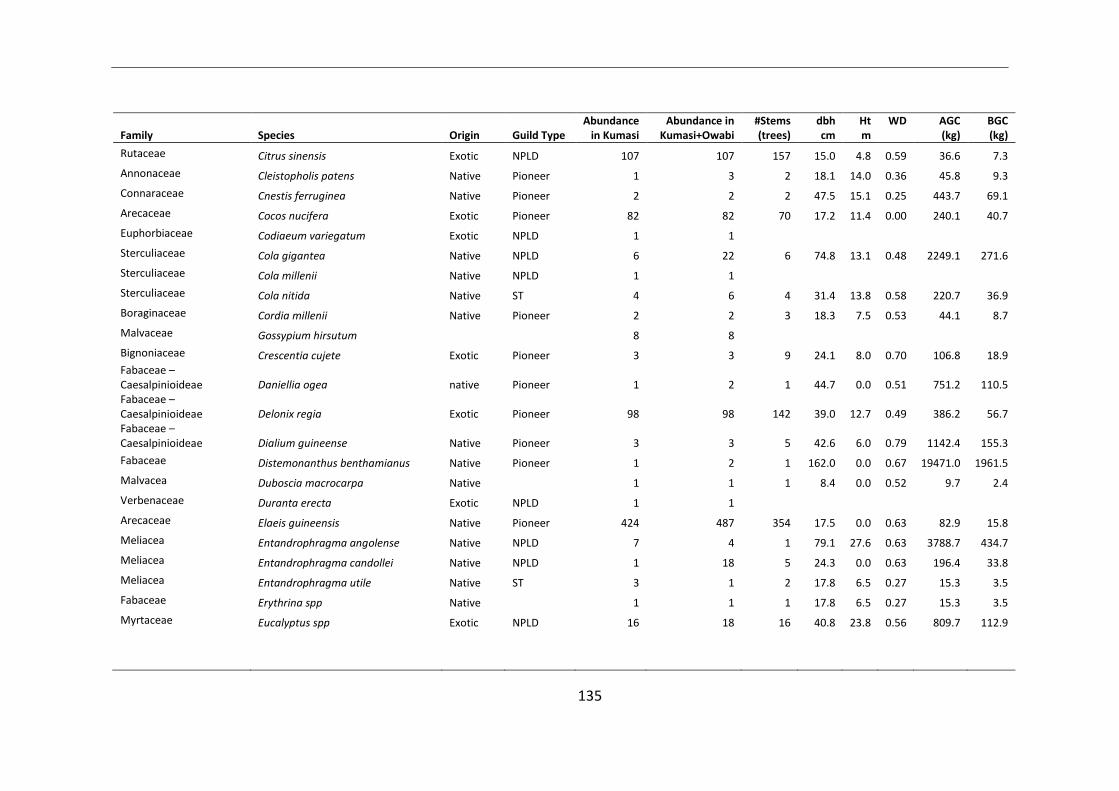
135
Family Species Origin Guild Type Abundance
in Kumasi Abundance in
Kumasi+Owabi #Stems (trees)
dbh cm
Ht m
WD AGC (kg)
BGC (kg)
Rutaceae Citrus sinensis Exotic NPLD 107 107 157 15.0 4.8 0.59 36.6 7.3
Annonaceae Cleistopholis patens Native Pioneer 1 3 2 18.1 14.0 0.36 45.8 9.3
Connaraceae Cnestis ferruginea Native Pioneer 2 2 2 47.5 15.1 0.25 443.7 69.1
Arecaceae Cocos nucifera Exotic Pioneer 82 82 70 17.2 11.4 0.00 240.1 40.7
Euphorbiaceae Codiaeum variegatum Exotic NPLD 1 1 Sterculiaceae Cola gigantea Native NPLD 6 22 6 74.8 13.1 0.48 2249.1 271.6
Sterculiaceae Cola millenii Native NPLD 1 1 Sterculiaceae Cola nitida Native ST 4 6 4 31.4 13.8 0.58 220.7 36.9
Boraginaceae Cordia millenii Native Pioneer 2 2 3 18.3 7.5 0.53 44.1 8.7
Malvaceae Gossypium hirsutum 8 8 Bignoniaceae Crescentia cujete Exotic Pioneer 3 3 9 24.1 8.0 0.70 106.8 18.9 Fabaceae – Caesalpinioideae Daniellia ogea native Pioneer 1 2 1 44.7 0.0 0.51 751.2 110.5 Fabaceae – Caesalpinioideae Delonix regia Exotic Pioneer 98 98 142 39.0 12.7 0.49 386.2 56.7 Fabaceae –Caesalpinioideae Dialium guineense Native Pioneer 3 3 5 42.6 6.0 0.79 1142.4 155.3
Fabaceae Distemonanthus benthamianus Native Pioneer 1 2 1 162.0 0.0 0.67 19471.0 1961.5
Malvacea Duboscia macrocarpa Native 1 1 1 8.4 0.0 0.52 9.7 2.4
Verbenaceae Duranta erecta Exotic NPLD 1 1 Arecaceae Elaeis guineensis Native Pioneer 424 487 354 17.5 0.0 0.63 82.9 15.8
Meliacea Entandrophragma angolense Native NPLD 7 4 1 79.1 27.6 0.63 3788.7 434.7
Meliacea Entandrophragma candollei Native NPLD 1 18 5 24.3 0.0 0.63 196.4 33.8
Meliacea Entandrophragma utile Native ST 3 1 2 17.8 6.5 0.27 15.3 3.5
Fabaceae Erythrina spp Native 1 1 1 17.8 6.5 0.27 15.3 3.5
Myrtaceae Eucalyptus spp Exotic NPLD 16 18 16 40.8 23.8 0.56 809.7 112.9
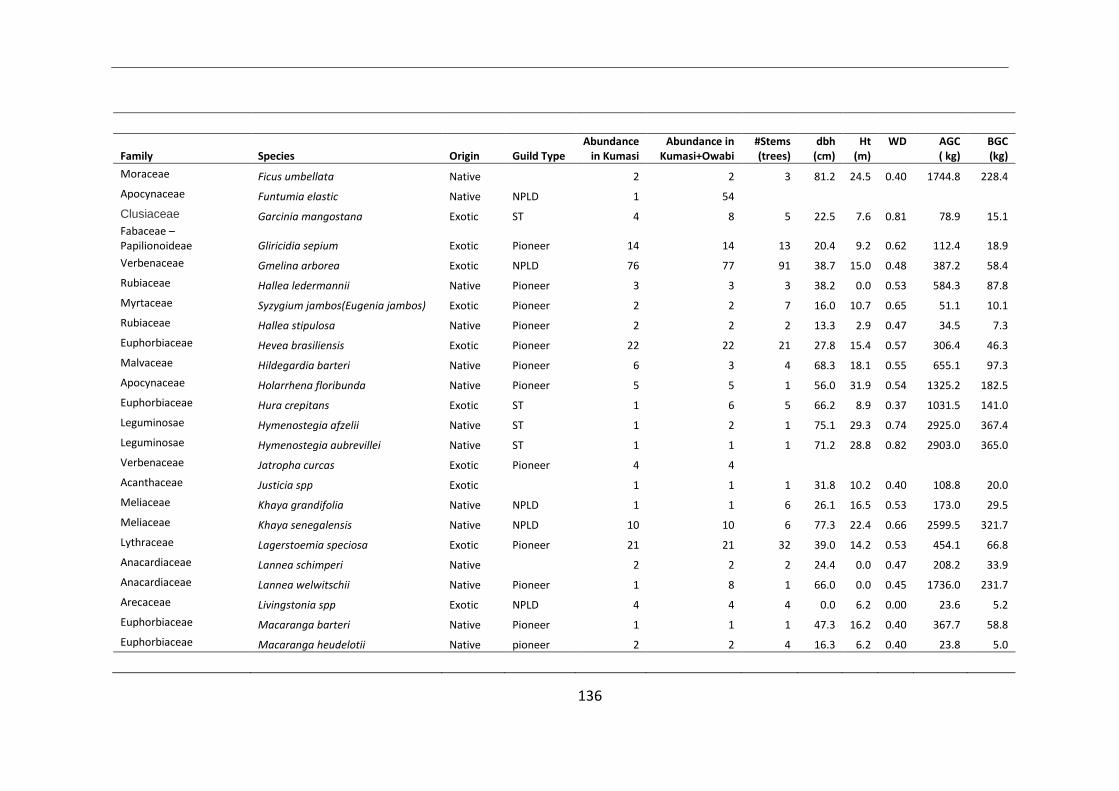
136
Family Species Origin Guild Type Abundance
in Kumasi Abundance in
Kumasi+Owabi #Stems (trees)
dbh (cm)
Ht (m)
WD AGC ( kg)
BGC (kg)
Moraceae Ficus umbellata Native 2 2 3 81.2 24.5 0.40 1744.8 228.4
Apocynaceae Funtumia elastic Native NPLD 1 54 Clusiaceae Garcinia mangostana Exotic ST 4 8 5 22.5 7.6 0.81 78.9 15.1 Fabaceae – Papilionoideae Gliricidia sepium Exotic Pioneer 14 14 13 20.4 9.2 0.62 112.4 18.9
Verbenaceae Gmelina arborea Exotic NPLD 76 77 91 38.7 15.0 0.48 387.2 58.4
Rubiaceae Hallea ledermannii Native Pioneer 3 3 3 38.2 0.0 0.53 584.3 87.8
Myrtaceae Syzygium jambos(Eugenia jambos) Exotic Pioneer 2 2 7 16.0 10.7 0.65 51.1 10.1
Rubiaceae Hallea stipulosa Native Pioneer 2 2 2 13.3 2.9 0.47 34.5 7.3
Euphorbiaceae Hevea brasiliensis Exotic Pioneer 22 22 21 27.8 15.4 0.57 306.4 46.3
Malvaceae Hildegardia barteri Native Pioneer 6 3 4 68.3 18.1 0.55 655.1 97.3
Apocynaceae Holarrhena floribunda Native Pioneer 5 5 1 56.0 31.9 0.54 1325.2 182.5
Euphorbiaceae Hura crepitans Exotic ST 1 6 5 66.2 8.9 0.37 1031.5 141.0
Leguminosae Hymenostegia afzelii Native ST 1 2 1 75.1 29.3 0.74 2925.0 367.4
Leguminosae Hymenostegia aubrevillei Native ST 1 1 1 71.2 28.8 0.82 2903.0 365.0
Verbenaceae Jatropha curcas Exotic Pioneer 4 4 Acanthaceae Justicia spp Exotic 1 1 1 31.8 10.2 0.40 108.8 20.0
Meliaceae Khaya grandifolia Native NPLD 1 1 6 26.1 16.5 0.53 173.0 29.5
Meliaceae Khaya senegalensis Native NPLD 10 10 6 77.3 22.4 0.66 2599.5 321.7
Lythraceae Lagerstoemia speciosa Exotic Pioneer 21 21 32 39.0 14.2 0.53 454.1 66.8
Anacardiaceae Lannea schimperi Native 2 2 2 24.4 0.0 0.47 208.2 33.9
Anacardiaceae Lannea welwitschii Native Pioneer 1 8 1 66.0 0.0 0.45 1736.0 231.7
Arecaceae Livingstonia spp Exotic NPLD 4 4 4 0.0 6.2 0.00 23.6 5.2
Euphorbiaceae Macaranga barteri Native Pioneer 1 1 1 47.3 16.2 0.40 367.7 58.8
Euphorbiaceae Macaranga heudelotii Native pioneer 2 2 4 16.3 6.2 0.40 23.8 5.0
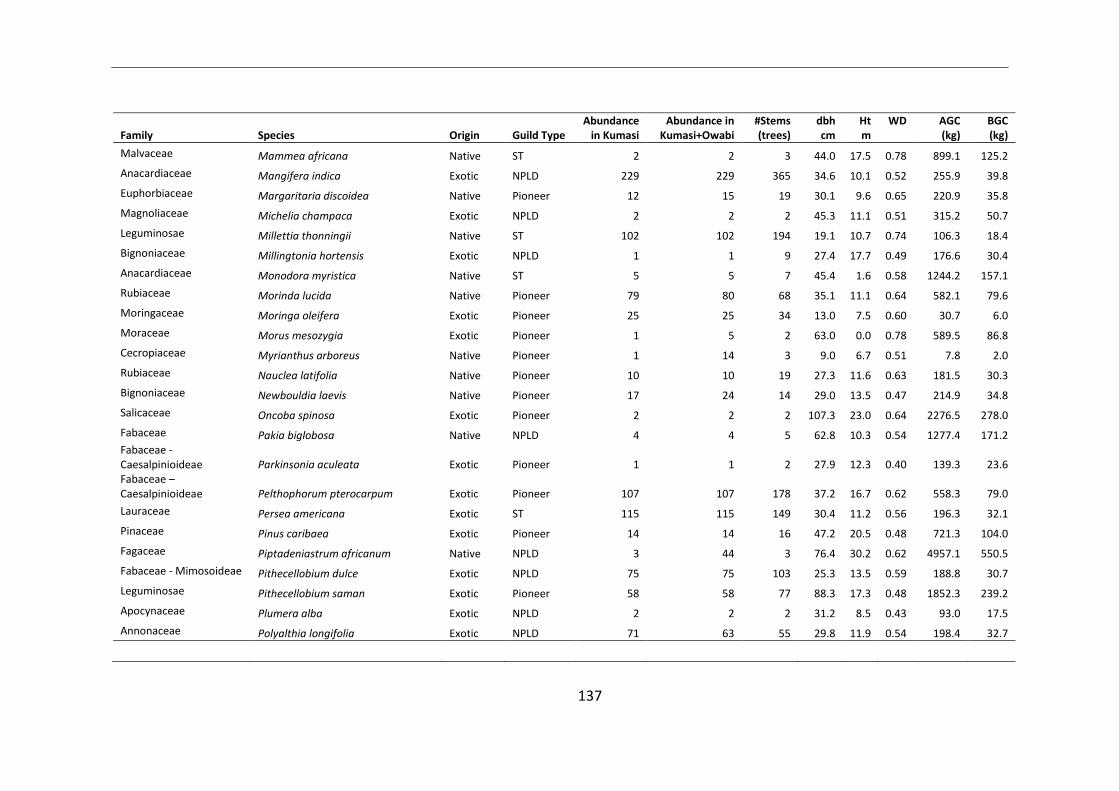
137
Family Species Origin Guild Type Abundance
in Kumasi Abundance in
Kumasi+Owabi #Stems (trees)
dbh cm
Ht m
WD AGC (kg)
BGC (kg)
Malvaceae Mammea africana Native ST 2 2 3 44.0 17.5 0.78 899.1 125.2
Anacardiaceae Mangifera indica Exotic NPLD 229 229 365 34.6 10.1 0.52 255.9 39.8
Euphorbiaceae Margaritaria discoidea Native Pioneer 12 15 19 30.1 9.6 0.65 220.9 35.8
Magnoliaceae Michelia champaca Exotic NPLD 2 2 2 45.3 11.1 0.51 315.2 50.7
Leguminosae Millettia thonningii Native ST 102 102 194 19.1 10.7 0.74 106.3 18.4
Bignoniaceae Millingtonia hortensis Exotic NPLD 1 1 9 27.4 17.7 0.49 176.6 30.4
Anacardiaceae Monodora myristica Native ST 5 5 7 45.4 1.6 0.58 1244.2 157.1
Rubiaceae Morinda lucida Native Pioneer 79 80 68 35.1 11.1 0.64 582.1 79.6
Moringaceae Moringa oleifera Exotic Pioneer 25 25 34 13.0 7.5 0.60 30.7 6.0
Moraceae Morus mesozygia Exotic Pioneer 1 5 2 63.0 0.0 0.78 589.5 86.8
Cecropiaceae Myrianthus arboreus Native Pioneer 1 14 3 9.0 6.7 0.51 7.8 2.0
Rubiaceae Nauclea latifolia Native Pioneer 10 10 19 27.3 11.6 0.63 181.5 30.3
Bignoniaceae Newbouldia laevis Native Pioneer 17 24 14 29.0 13.5 0.47 214.9 34.8
Salicaceae Oncoba spinosa Exotic Pioneer 2 2 2 107.3 23.0 0.64 2276.5 278.0
Fabaceae Pakia biglobosa Native NPLD 4 4 5 62.8 10.3 0.54 1277.4 171.2 Fabaceae - Caesalpinioideae Parkinsonia aculeata Exotic Pioneer 1 1 2 27.9 12.3 0.40 139.3 23.6 Fabaceae – Caesalpinioideae Pelthophorum pterocarpum Exotic Pioneer 107 107 178 37.2 16.7 0.62 558.3 79.0
Lauraceae Persea americana Exotic ST 115 115 149 30.4 11.2 0.56 196.3 32.1
Pinaceae Pinus caribaea Exotic Pioneer 14 14 16 47.2 20.5 0.48 721.3 104.0
Fagaceae Piptadeniastrum africanum Native NPLD 3 44 3 76.4 30.2 0.62 4957.1 550.5
Fabaceae - Mimosoideae Pithecellobium dulce Exotic NPLD 75 75 103 25.3 13.5 0.59 188.8 30.7
Leguminosae Pithecellobium saman Exotic Pioneer 58 58 77 88.3 17.3 0.48 1852.3 239.2
Apocynaceae Plumera alba Exotic NPLD 2 2 2 31.2 8.5 0.43 93.0 17.5
Annonaceae Polyalthia longifolia Exotic NPLD 71 63 55 29.8 11.9 0.54 198.4 32.7
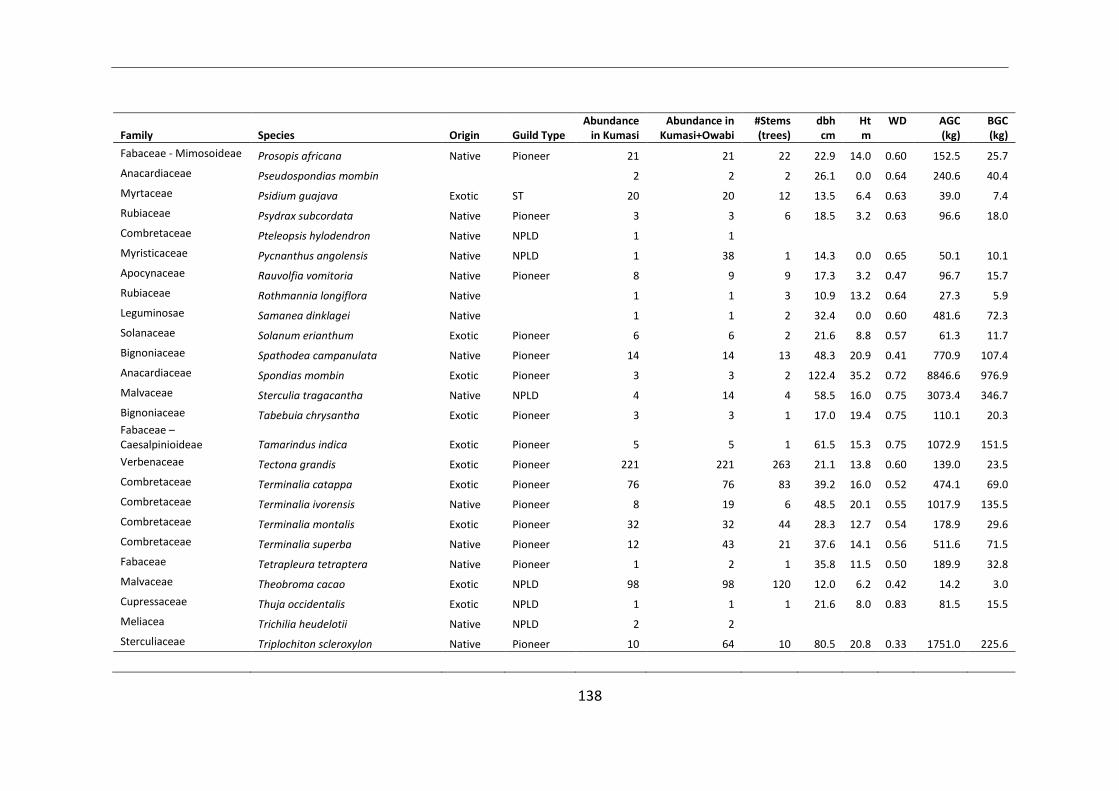
138
Family Species Origin Guild Type Abundance
in Kumasi Abundance in
Kumasi+Owabi #Stems (trees)
dbh cm
Ht m
WD AGC (kg)
BGC (kg)
Fabaceae - Mimosoideae Prosopis africana Native Pioneer 21 21 22 22.9 14.0 0.60 152.5 25.7
Anacardiaceae Pseudospondias mombin 2 2 2 26.1 0.0 0.64 240.6 40.4
Myrtaceae Psidium guajava Exotic ST 20 20 12 13.5 6.4 0.63 39.0 7.4
Rubiaceae Psydrax subcordata Native Pioneer 3 3 6 18.5 3.2 0.63 96.6 18.0
Combretaceae Pteleopsis hylodendron Native NPLD 1 1 Myristicaceae Pycnanthus angolensis Native NPLD 1 38 1 14.3 0.0 0.65 50.1 10.1
Apocynaceae Rauvolfia vomitoria Native Pioneer 8 9 9 17.3 3.2 0.47 96.7 15.7
Rubiaceae Rothmannia longiflora Native 1 1 3 10.9 13.2 0.64 27.3 5.9
Leguminosae Samanea dinklagei Native 1 1 2 32.4 0.0 0.60 481.6 72.3
Solanaceae Solanum erianthum Exotic Pioneer 6 6 2 21.6 8.8 0.57 61.3 11.7
Bignoniaceae Spathodea campanulata Native Pioneer 14 14 13 48.3 20.9 0.41 770.9 107.4
Anacardiaceae Spondias mombin Exotic Pioneer 3 3 2 122.4 35.2 0.72 8846.6 976.9
Malvaceae Sterculia tragacantha Native NPLD 4 14 4 58.5 16.0 0.75 3073.4 346.7
Bignoniaceae Tabebuia chrysantha Exotic Pioneer 3 3 1 17.0 19.4 0.75 110.1 20.3 Fabaceae – Caesalpinioideae Tamarindus indica Exotic Pioneer 5 5 1 61.5 15.3 0.75 1072.9 151.5
Verbenaceae Tectona grandis Exotic Pioneer 221 221 263 21.1 13.8 0.60 139.0 23.5
Combretaceae Terminalia catappa Exotic Pioneer 76 76 83 39.2 16.0 0.52 474.1 69.0
Combretaceae Terminalia ivorensis Native Pioneer 8 19 6 48.5 20.1 0.55 1017.9 135.5
Combretaceae Terminalia montalis Exotic Pioneer 32 32 44 28.3 12.7 0.54 178.9 29.6
Combretaceae Terminalia superba Native Pioneer 12 43 21 37.6 14.1 0.56 511.6 71.5
Fabaceae Tetrapleura tetraptera Native Pioneer 1 2 1 35.8 11.5 0.50 189.9 32.8
Malvaceae Theobroma cacao Exotic NPLD 98 98 120 12.0 6.2 0.42 14.2 3.0
Cupressaceae Thuja occidentalis Exotic NPLD 1 1 1 21.6 8.0 0.83 81.5 15.5
Meliacea Trichilia heudelotii Native NPLD 2 2 Sterculiaceae Triplochiton scleroxylon Native Pioneer 10 64 10 80.5 20.8 0.33 1751.0 225.6
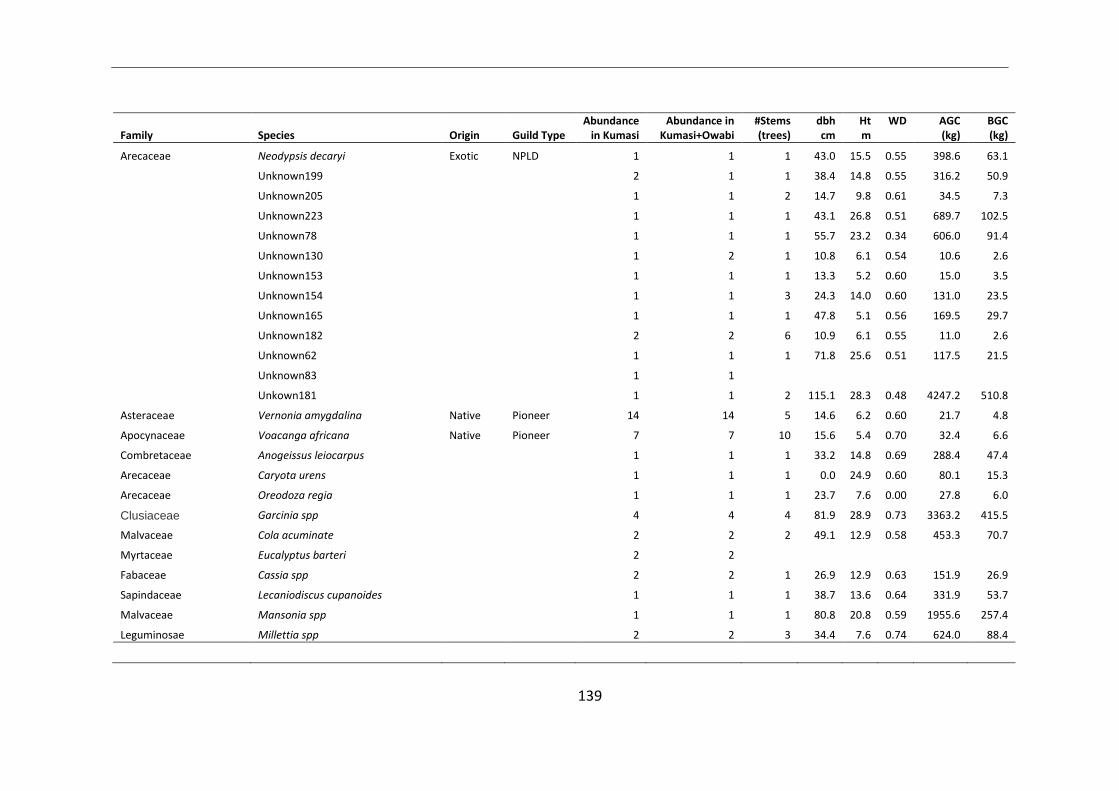
139
Family Species Origin Guild Type Abundance
in Kumasi Abundance in
Kumasi+Owabi #Stems (trees)
dbh cm
Ht m
WD AGC (kg)
BGC (kg)
Arecaceae Neodypsis decaryi Exotic NPLD 1 1 1 43.0 15.5 0.55 398.6 63.1
Unknown199 2 1 1 38.4 14.8 0.55 316.2 50.9
Unknown205 1 1 2 14.7 9.8 0.61 34.5 7.3
Unknown223 1 1 1 43.1 26.8 0.51 689.7 102.5
Unknown78 1 1 1 55.7 23.2 0.34 606.0 91.4
Unknown130 1 2 1 10.8 6.1 0.54 10.6 2.6
Unknown153 1 1 1 13.3 5.2 0.60 15.0 3.5
Unknown154 1 1 3 24.3 14.0 0.60 131.0 23.5
Unknown165 1 1 1 47.8 5.1 0.56 169.5 29.7
Unknown182 2 2 6 10.9 6.1 0.55 11.0 2.6
Unknown62 1 1 1 71.8 25.6 0.51 117.5 21.5
Unknown83 1 1
Unkown181 1 1 2 115.1 28.3 0.48 4247.2 510.8
Asteraceae Vernonia amygdalina Native Pioneer 14 14 5 14.6 6.2 0.60 21.7 4.8
Apocynaceae Voacanga africana Native Pioneer 7 7 10 15.6 5.4 0.70 32.4 6.6
Combretaceae Anogeissus leiocarpus 1 1 1 33.2 14.8 0.69 288.4 47.4
Arecaceae Caryota urens 1 1 1 0.0 24.9 0.60 80.1 15.3
Arecaceae Oreodoza regia 1 1 1 23.7 7.6 0.00 27.8 6.0
Clusiaceae Garcinia spp 4 4 4 81.9 28.9 0.73 3363.2 415.5
Malvaceae Cola acuminate 2 2 2 49.1 12.9 0.58 453.3 70.7
Myrtaceae Eucalyptus barteri 2 2
Fabaceae Cassia spp 2 2 1 26.9 12.9 0.63 151.9 26.9
Sapindaceae Lecaniodiscus cupanoides 1 1 1 38.7 13.6 0.64 331.9 53.7
Malvaceae Mansonia spp 1 1 1 80.8 20.8 0.59 1955.6 257.4
Leguminosae Millettia spp 2 2 3 34.4 7.6 0.74 624.0 88.4
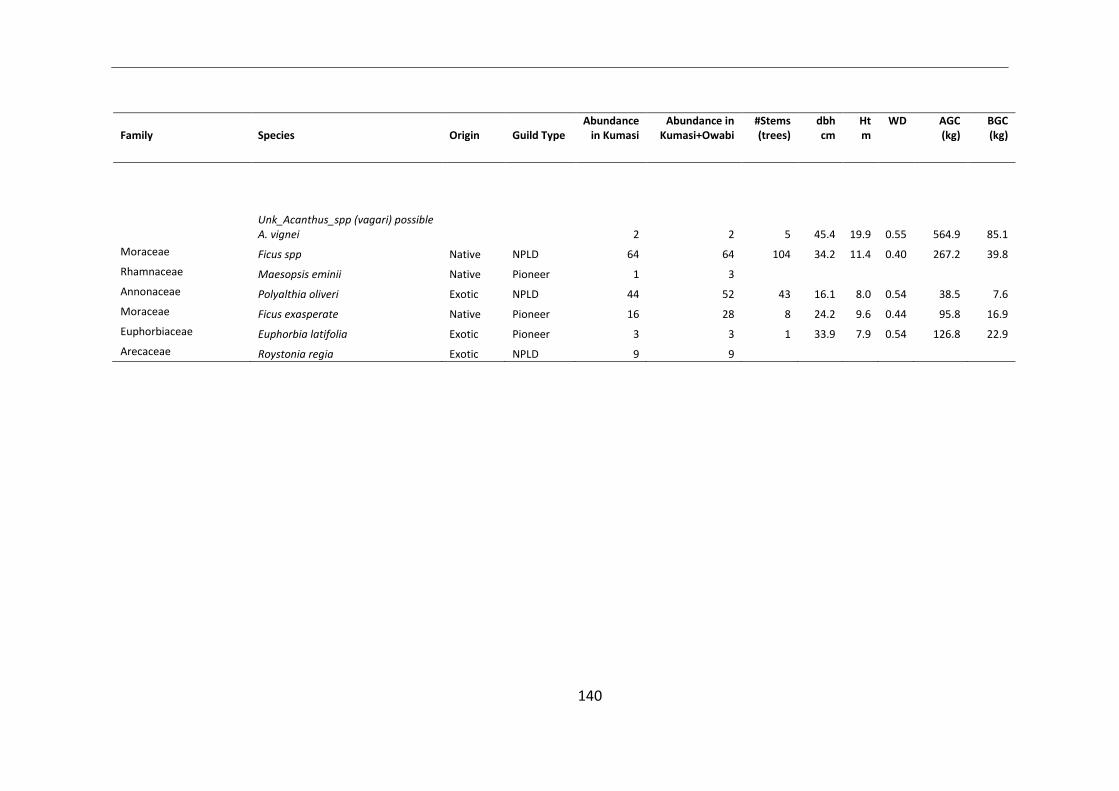
140
Family Species Origin Guild Type Abundance
in Kumasi Abundance in
Kumasi+Owabi #Stems (trees)
dbh cm
Ht m
WD AGC (kg)
BGC (kg)
Unk_Acanthus_spp (vagari) possible A. vignei 2 2 5 45.4 19.9 0.55 564.9 85.1
Moraceae Ficus spp Native NPLD 64 64 104 34.2 11.4 0.40 267.2 39.8
Rhamnaceae Maesopsis eminii Native Pioneer 1 3
Annonaceae Polyalthia oliveri Exotic NPLD 44 52 43 16.1 8.0 0.54 38.5 7.6
Moraceae Ficus exasperate Native Pioneer 16 28 8 24.2 9.6 0.44 95.8 16.9
Euphorbiaceae Euphorbia latifolia Exotic Pioneer 3 3 1 33.9 7.9 0.54 126.8 22.9
Arecaceae Roystonia regia Exotic NPLD 9 9
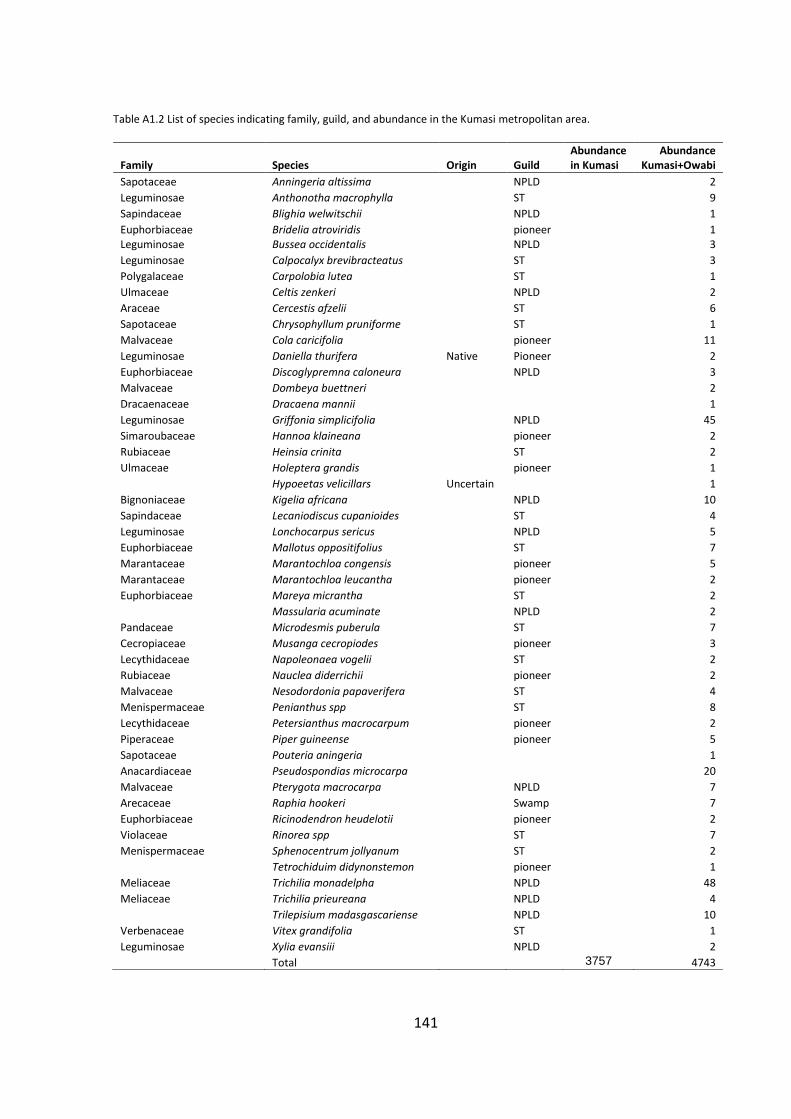
141
Table A1.2 List of species indicating family, guild, and abundance in the Kumasi metropolitan area.
Family Species Origin Guild Abundance in Kumasi
Abundance Kumasi+Owabi
Sapotaceae Anningeria altissima NPLD 2
Leguminosae Anthonotha macrophylla ST 9
Sapindaceae Blighia welwitschii NPLD 1
Euphorbiaceae Bridelia atroviridis pioneer 1 Leguminosae Bussea occidentalis NPLD 3
Leguminosae Calpocalyx brevibracteatus ST 3
Polygalaceae Carpolobia lutea ST 1
Ulmaceae Celtis zenkeri NPLD 2
Araceae Cercestis afzelii ST 6
Sapotaceae Chrysophyllum pruniforme ST 1
Malvaceae Cola caricifolia pioneer 11
Leguminosae Daniella thurifera Native Pioneer 2
Euphorbiaceae Discoglypremna caloneura NPLD 3
Malvaceae Dombeya buettneri 2
Dracaenaceae Dracaena mannii 1
Leguminosae Griffonia simplicifolia NPLD 45
Simaroubaceae Hannoa klaineana pioneer 2
Rubiaceae Heinsia crinita ST 2
Ulmaceae Holeptera grandis pioneer 1
Hypoeetas velicillars Uncertain 1
Bignoniaceae Kigelia africana NPLD 10
Sapindaceae Lecaniodiscus cupanioides ST 4
Leguminosae Lonchocarpus sericus NPLD 5
Euphorbiaceae Mallotus oppositifolius ST 7
Marantaceae Marantochloa congensis pioneer 5
Marantaceae Marantochloa leucantha pioneer 2
Euphorbiaceae Mareya micrantha ST 2
Massularia acuminate NPLD 2
Pandaceae Microdesmis puberula ST 7
Cecropiaceae Musanga cecropiodes pioneer 3
Lecythidaceae Napoleonaea vogelii ST 2
Rubiaceae Nauclea diderrichii pioneer 2
Malvaceae Nesodordonia papaverifera ST 4
Menispermaceae Penianthus spp ST 8
Lecythidaceae Petersianthus macrocarpum pioneer 2
Piperaceae Piper guineense pioneer 5
Sapotaceae Pouteria aningeria 1
Anacardiaceae Pseudospondias microcarpa 20
Malvaceae Pterygota macrocarpa NPLD 7
Arecaceae Raphia hookeri Swamp 7
Euphorbiaceae Ricinodendron heudelotii pioneer 2
Violaceae Rinorea spp ST 7
Menispermaceae Sphenocentrum jollyanum ST 2
Tetrochiduim didynonstemon pioneer 1
Meliaceae Trichilia monadelpha NPLD 48
Meliaceae Trichilia prieureana NPLD 4
Trilepisium madasgascariense NPLD 10
Verbenaceae Vitex grandifolia ST 1
Leguminosae Xylia evansiii NPLD 2
Total 3757 4743
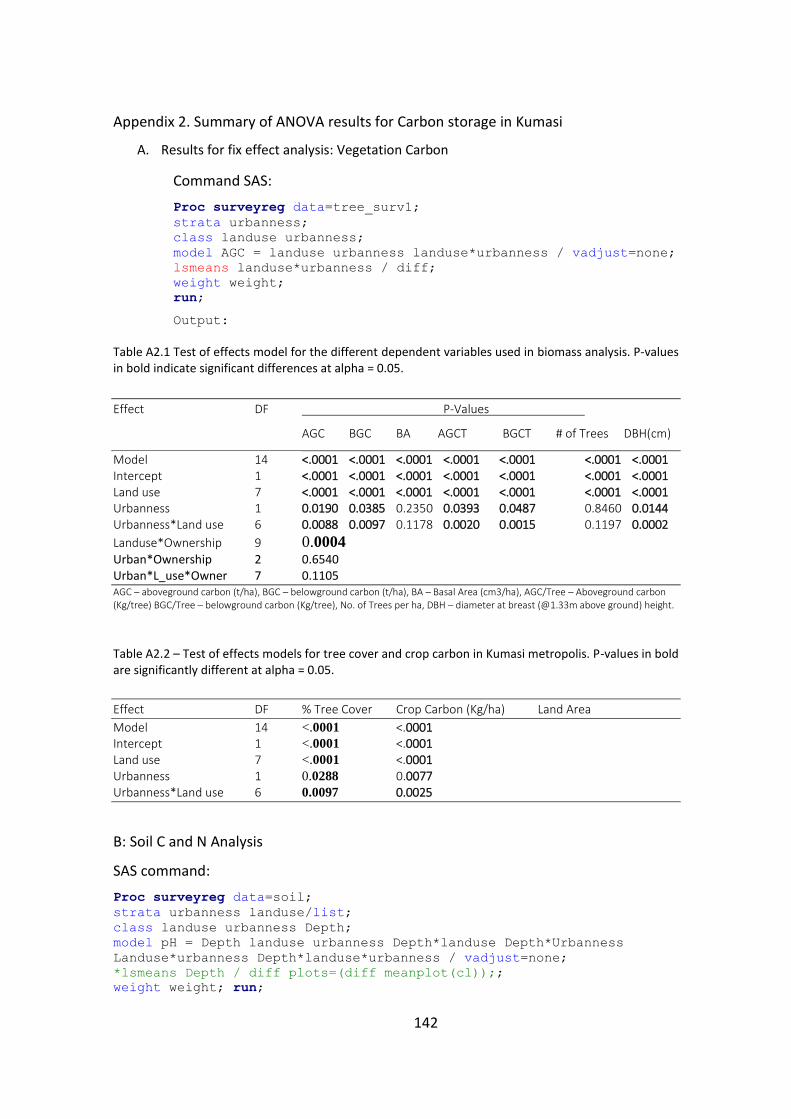
142
Appendix 2. Summary of ANOVA results for Carbon storage in Kumasi
A. Results for fix effect analysis: Vegetation Carbon
Command SAS:
Proc surveyreg data=tree_surv1;
strata urbanness;
class landuse urbanness;
model AGC = landuse urbanness landuse*urbanness / vadjust=none;
lsmeans landuse*urbanness / diff;
weight weight;
run;
Output:
Table A2.1 Test of effects model for the different dependent variables used in biomass analysis. P-values in bold indicate significant differences at alpha = 0.05.
Effect DF P-Values
AGC BGC BA AGCT BGCT # of Trees DBH(cm)
Model 14 <.0001 <.0001 <.0001 <.0001 <.0001 <.0001 <.0001 Intercept 1 <.0001 <.0001 <.0001 <.0001 <.0001 <.0001 <.0001 Land use 7 <.0001 <.0001 <.0001 <.0001 <.0001 <.0001 <.0001 Urbanness 1 0.0190 0.0385 0.2350 0.0393 0.0487 0.8460 0.0144 Urbanness*Land use 6 0.0088 0.0097 0.1178 0.0020 0.0015 0.1197 0.0002
Landuse*Ownership 9 0.0004 Urban*Ownership 2 0.6540 Urban*L_use*Owner 7 0.1105 AGC – aboveground carbon (t/ha), BGC – belowground carbon (t/ha), BA – Basal Area (cm3/ha), AGC/Tree – Aboveground carbon (Kg/tree) BGC/Tree – belowground carbon (Kg/tree), No. of Trees per ha, DBH – diameter at breast (@1.33m above ground) height.
Table A2.2 – Test of effects models for tree cover and crop carbon in Kumasi metropolis. P-values in bold are significantly different at alpha = 0.05.
Effect DF % Tree Cover Crop Carbon (Kg/ha) Land Area
Model 14 <.0001 <.0001
Intercept 1 <.0001 <.0001
Land use 7 <.0001 <.0001 Urbanness 1 0.0288 0.0077 Urbanness*Land use 6 0.0097 0.0025
B: Soil C and N Analysis
SAS command:
Proc surveyreg data=soil;
strata urbanness landuse/list;
class landuse urbanness Depth;
model pH = Depth landuse urbanness Depth*landuse Depth*Urbanness
Landuse*urbanness Depth*landuse*urbanness / vadjust=none;
*lsmeans Depth / diff plots=(diff meanplot(cl));;
weight weight; run;
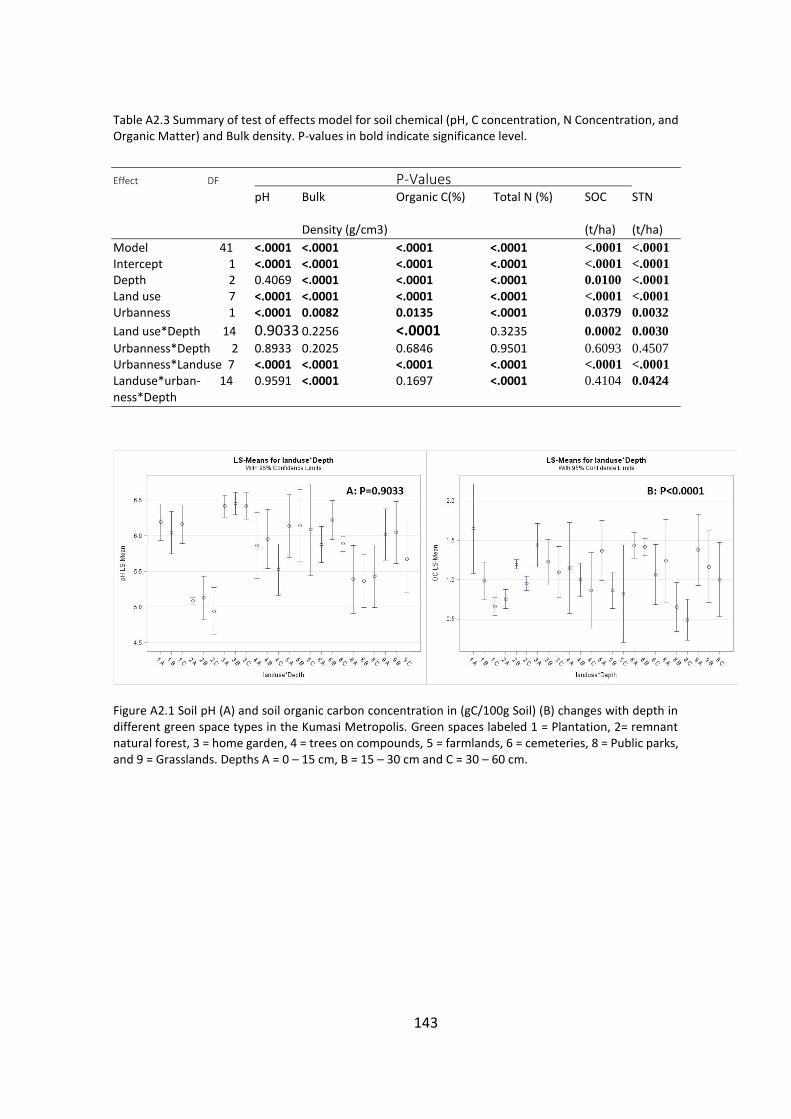
143
Table A2.3 Summary of test of effects model for soil chemical (pH, C concentration, N Concentration, and Organic Matter) and Bulk density. P-values in bold indicate significance level.
Effect DF P-Values
pH Bulk Organic C(%) Total N (%) SOC STN Density (g/cm3) (t/ha) (t/ha)
Model 41 <.0001 <.0001 <.0001 <.0001 <.0001 <.0001 Intercept 1 <.0001 <.0001 <.0001 <.0001 <.0001 <.0001 Depth 2 0.4069 <.0001 <.0001 <.0001 0.0100 <.0001 Land use 7 <.0001 <.0001 <.0001 <.0001 <.0001 <.0001 Urbanness 1 <.0001 0.0082 0.0135 <.0001 0.0379 0.0032
Land use*Depth 14 0.9033 0.2256 <.0001 0.3235 0.0002 0.0030
Urbanness*Depth 2 0.8933 0.2025 0.6846 0.9501 0.6093 0.4507 Urbanness*Landuse 7 <.0001 <.0001 <.0001 <.0001 <.0001 <.0001 Landuse*urban- 14 0.9591 <.0001 0.1697 <.0001 0.4104 0.0424 ness*Depth
Figure A2.1 Soil pH (A) and soil organic carbon concentration in (gC/100g Soil) (B) changes with depth in different green space types in the Kumasi Metropolis. Green spaces labeled 1 = Plantation, 2= remnant natural forest, 3 = home garden, 4 = trees on compounds, 5 = farmlands, 6 = cemeteries, 8 = Public parks, and 9 = Grasslands. Depths A = 0 – 15 cm, B = 15 – 30 cm and C = 30 – 60 cm.
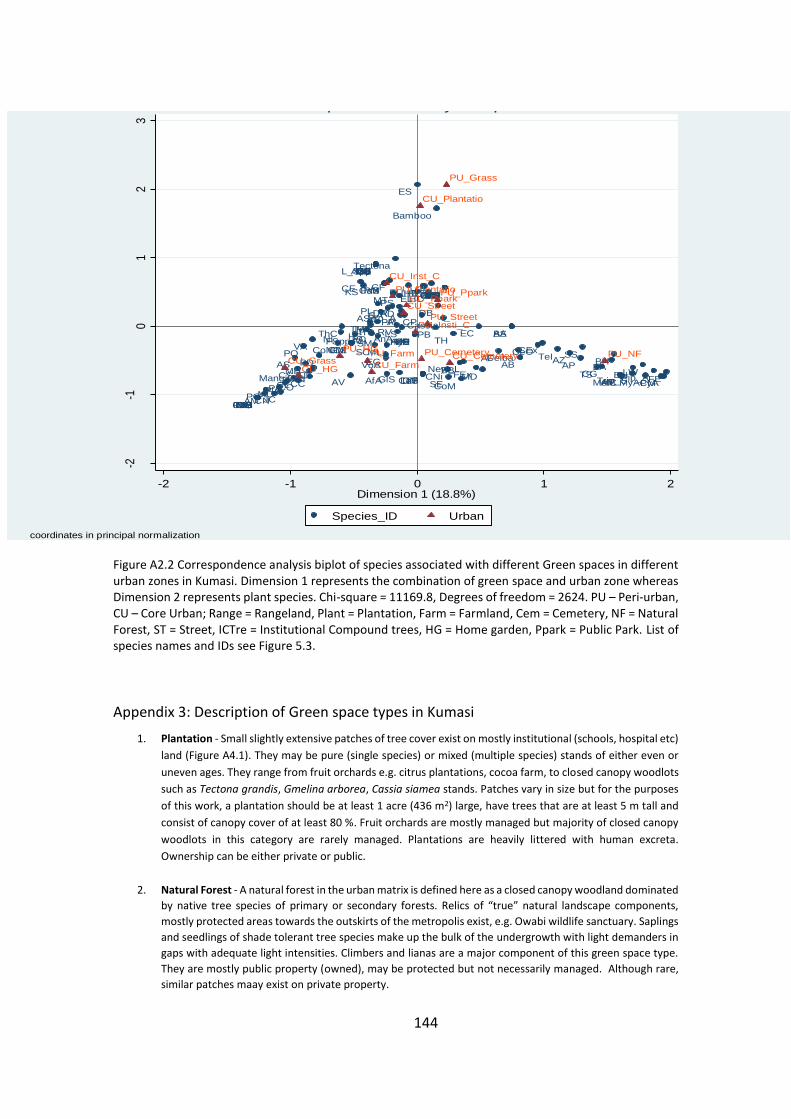
144
Figure A2.2 Correspondence analysis biplot of species associated with different Green spaces in different urban zones in Kumasi. Dimension 1 represents the combination of green space and urban zone whereas Dimension 2 represents plant species. Chi-square = 11169.8, Degrees of freedom = 2624. PU – Peri-urban, CU – Core Urban; Range = Rangeland, Plant = Plantation, Farm = Farmland, Cem = Cemetery, NF = Natural Forest, ST = Street, ICTre = Institutional Compound trees, HG = Home garden, Ppark = Public Park. List of species names and IDs see Figure 5.3.
Appendix 3: Description of Green space types in Kumasi
1. Plantation - Small slightly extensive patches of tree cover exist on mostly institutional (schools, hospital etc)
land (Figure A4.1). They may be pure (single species) or mixed (multiple species) stands of either even or
uneven ages. They range from fruit orchards e.g. citrus plantations, cocoa farm, to closed canopy woodlots
such as Tectona grandis, Gmelina arborea, Cassia siamea stands. Patches vary in size but for the purposes
of this work, a plantation should be at least 1 acre (436 m2) large, have trees that are at least 5 m tall and
consist of canopy cover of at least 80 %. Fruit orchards are mostly managed but majority of closed canopy
woodlots in this category are rarely managed. Plantations are heavily littered with human excreta.
Ownership can be either private or public.
2. Natural Forest - A natural forest in the urban matrix is defined here as a closed canopy woodland dominated
by native tree species of primary or secondary forests. Relics of “true” natural landscape components,
mostly protected areas towards the outskirts of the metropolis exist, e.g. Owabi wildlife sanctuary. Saplings
and seedlings of shade tolerant tree species make up the bulk of the undergrowth with light demanders in
gaps with adequate light intensities. Climbers and lianas are a major component of this green space type.
They are mostly public property (owned), may be protected but not necessarily managed. Although rare,
similar patches maay exist on private property.
AfA
PD
ALAD
ASe
Bamboo
AF AZAB AP
AzIBS
CeOCeiba
CEx
CoM
EG
FSpp
Mangifera
ML
New_L
PB
SS
Tectona
TM
TS
TeC
TH
Trip_S
VoA
CS
SC
AOCaP
CP
CE
CZ
CLCNi
CMi
Cot
CC
ErS
GM
JE
MH
ME
MT
PaS
PC
PlA
POSM
TI
TO
ASo
AS
AC
CF
CVDE
ES
ELHiBHC
L_SppMBMAOS
AlC
BB
Cassia
CeP CM
CN
CoN
CG
DR
DMFEx
GlS
GA
LaS MDMoM
PP
PA
Pro_A
PyASETT
VA
AV
AnAHS
JC
NL
AM
BT
CO
EJ
KS
LS
MO
MyA
PL
PG
RV
TeI
ThCAdPAIFUHyAMC
PS
PHAA
AT
BH
BNEA
EC
FELWPip_A
CaN EU HLHBPMPsSAlPANBaSCaCChPClPDODG
DB
HFHAKCMMRLSD
CU_CemeteryCU_Farm
CU_GrassCU_HG
CU_Inst_C
CU_Plantatio
CU_PparkCU_Street
PU_CemeteryPU_Farm
PU_Grass
PU_HG
PU_Insti_C
PU_NF
PU_PlantatioPU_Ppark
PU_Street
-2-1
01
23
Dim
en
sio
n 2
(1
6.6
%)
-2 -1 0 1 2Dimension 1 (18.8%)
Species_ID Urban
coordinates in principal normalization
Correspondence analysis biplot
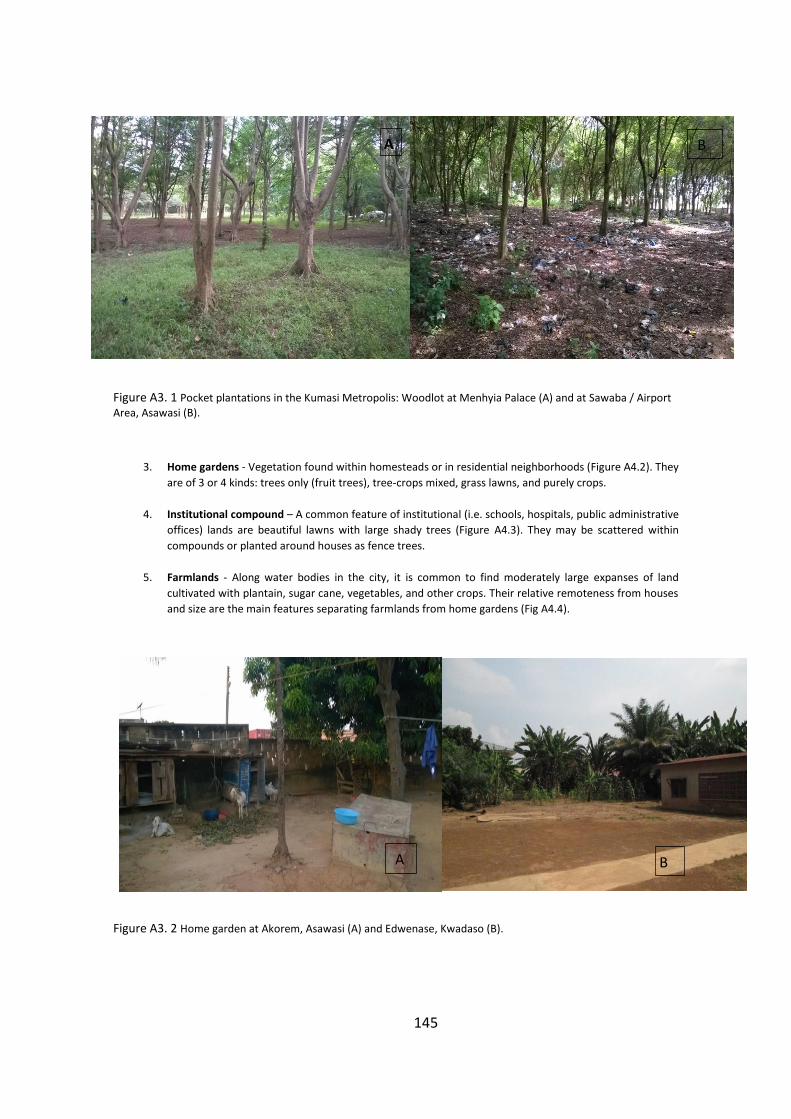
145
Figure A3. 1 Pocket plantations in the Kumasi Metropolis: Woodlot at Menhyia Palace (A) and at Sawaba / Airport
Area, Asawasi (B).
3. Home gardens - Vegetation found within homesteads or in residential neighborhoods (Figure A4.2). They
are of 3 or 4 kinds: trees only (fruit trees), tree-crops mixed, grass lawns, and purely crops.
4. Institutional compound – A common feature of institutional (i.e. schools, hospitals, public administrative
offices) lands are beautiful lawns with large shady trees (Figure A4.3). They may be scattered within
compounds or planted around houses as fence trees.
5. Farmlands - Along water bodies in the city, it is common to find moderately large expanses of land
cultivated with plantain, sugar cane, vegetables, and other crops. Their relative remoteness from houses
and size are the main features separating farmlands from home gardens (Fig A4.4).
Figure A3. 2 Home garden at Akorem, Asawasi (A) and Edwenase, Kwadaso (B).
A B
A B
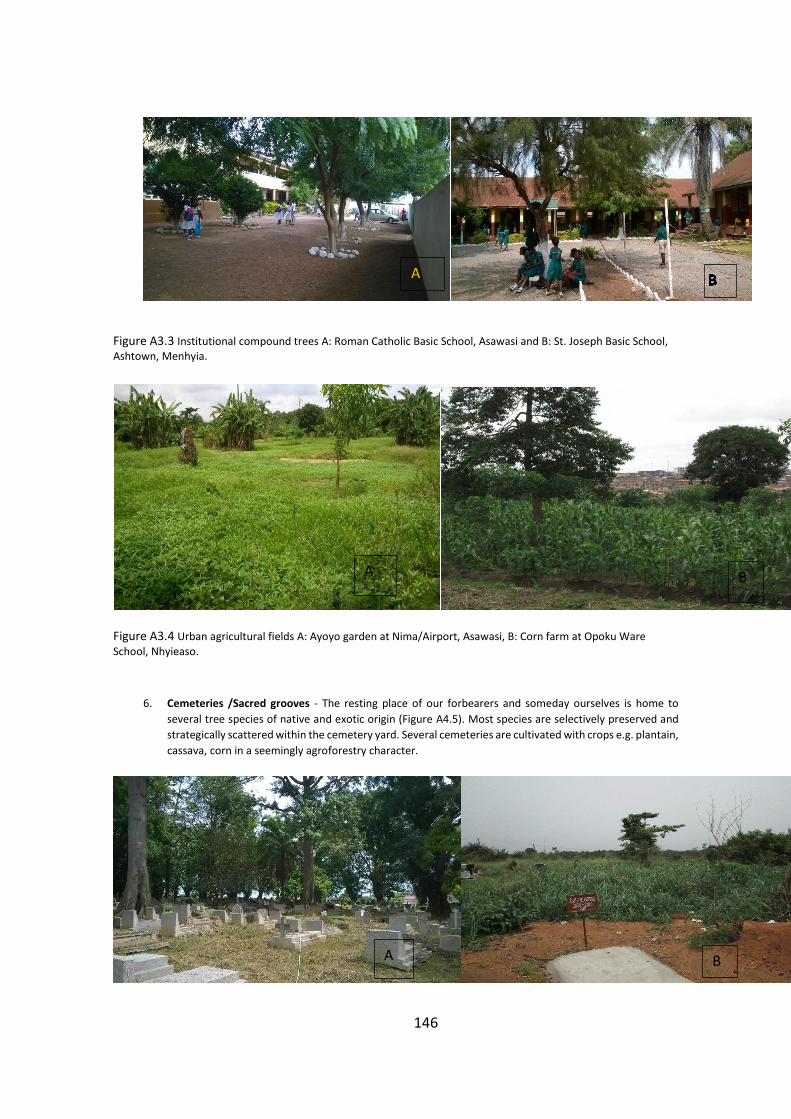
146
Figure A3.3 Institutional compound trees A: Roman Catholic Basic School, Asawasi and B: St. Joseph Basic School, Ashtown, Menhyia.
Figure A3.4 Urban agricultural fields A: Ayoyo garden at Nima/Airport, Asawasi, B: Corn farm at Opoku Ware
School, Nhyieaso.
6. Cemeteries /Sacred grooves - The resting place of our forbearers and someday ourselves is home to
several tree species of native and exotic origin (Figure A4.5). Most species are selectively preserved and
strategically scattered within the cemetery yard. Several cemeteries are cultivated with crops e.g. plantain,
cassava, corn in a seemingly agroforestry character.
A
A B
A B

147
Figure A3.5 Vegetation on cemeteries A: Tafo main and B: Boadi, Oforikrom.
7. Street trees – Trees along streets are not a familiar feature of the Kumasi Metropolis. Exceptions include, the Okodea road (KNUST) (Figure A4.6), Major Cobbina Drive, Harper Rd, Bekwai roundabout – Golden Tulip, Suame roundabout – Abrepo Junction.
Figure A3. 6 Street trees along Okodea Road at KNUST campus, Kumasi.
8. Public parks – The once renowned “Garden city” of West Africa is fortified by six public spaces, two of which are the only functional and well maintained spaces remaining: the KNUST botanical gardens and the Zoo at Bantama. The golf course is actively utilized in this category.
9. Grass/Range lands - Adjacent farmlands especially in wetland areas are stretches of uncultivated fields
frequently used for grazing when the soils are moderately wet and also during the dry season. On upland areas, land intended for future housing development may lie fallow and falls in category of grassland if the predominant plant cover is grass/herbaceous matter (Figure A4.7).
Figure A3. 7 Grasslands in the heart of the Kumasi metropolis. A) near Pelelee stream, Aboabo, Asawasi; B) along
Sesa river, Bumso, Oforikrom.
A B
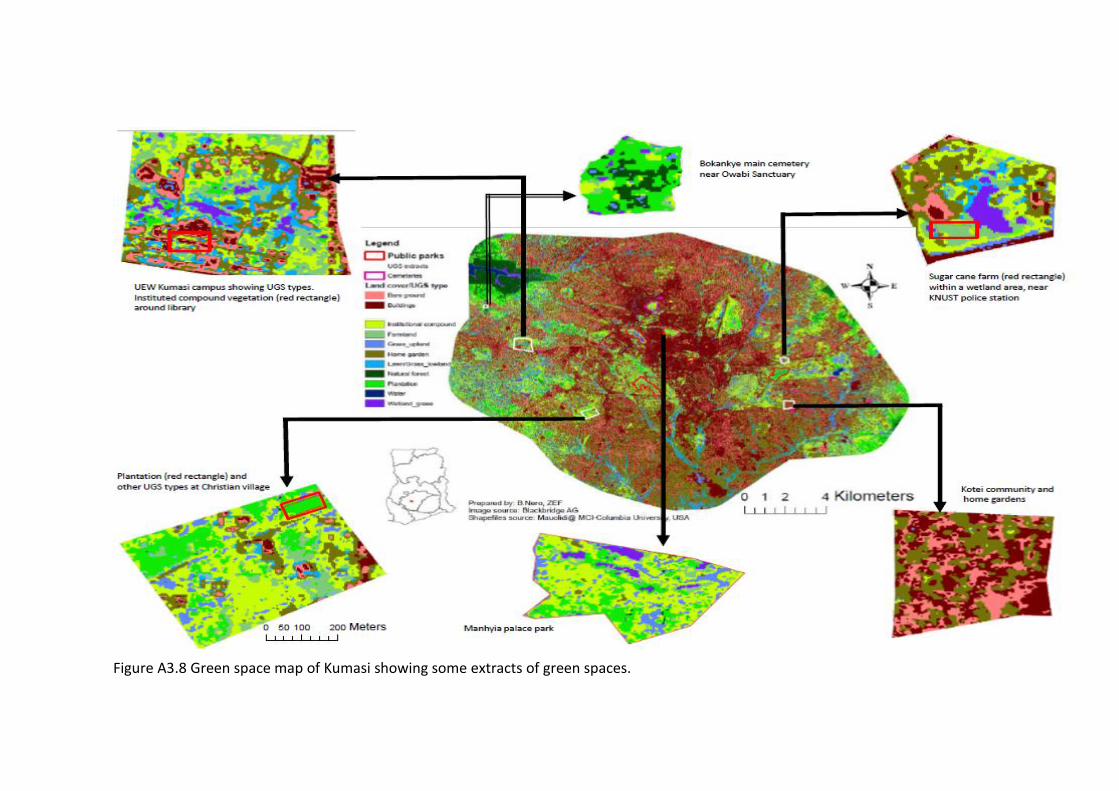
Figure A3.8 Green space map of Kumasi showing some extracts of green spaces.

149
ACKNOWLEDGEMENT
All glory due the GOD almighty who maketh all things possible!! Indeed, may
your name be praised forever!! My profound gratitude to BMZ via DAAD and Foundation
Fiat Panis for funding my time here in Bonn and the production of this piece of artistry.
It was a capricious idea to pursue ecological systems in cities for a higher
degree. My sincere indebtedness to Dr. Manfred Denich for having faith in the idea and
eruditely guiding the debate and the formulation of the arguments till the end. To Prof.
Dr. Borgemeister and PD Dr. Christine Schmitt for their supervisory and wise counsel
that hauled the work to the finish line, I am indeed very grateful. To Dr. Callo-Concha for
the engaging debates, which brought us to this point, your efforts are duly
acknowledged.
My profound gratitude to Dr. Gunther Manske and the entire ZEF doctoral
program office, for your indefatigable support for me, my colleagues and indeed all ZEF
students: often facilitating our arrival, orientation and making our stay in Bonn and
Germany a worthwhile experience.
I am frantically appreciative of Drs. Alex Anning, Nelson Agbo, George Obeng
and Benjamin Campion of the Kwame Nkrumah University of Science and Technology
(KNUST) for their overwhelming support during my return to Kumasi for field data
collection. I am equally indebted to Mr. Bertrand Yosangfo, Mr. Callistus Nero, and Mr.
Isaac Duah-Boateng for without your support I would not have been able to gather the
data so quickly. The support of the FRNR students who assisted with data collection is
also duly acknowledged. Mr. Degan Amissah (Rtd Botanist) and Mr. Asare of Faculty of
Pharmacy, KNUST were indispensable assets in the identification of plants. Mr. Wiredu,
Mrs. Gloria Owusu, and Ms Selina, kudos for the taking care of the laboratory analysis
of both soils and vegetation. To all institutional and household heads in Kumasi who
gave us the privilege to conduct surveys in their premises, a big thank you for your
unflinching support and cooperation.
To my parents and my siblings for always believing in me in thick or thin, we
have another reason to make merry. My gratitude to Dr. Fulgence Sanber-Dery (of
blessed memory), Mr. Peter Sangber-Dery and Rev. Bro. Gracious Sangber-Dery for

150
mentoring me and all my Sangber-yir peers. To all extended family members, I am
indeed grateful for your prayers and moral support.
To all my colleagues, senior researchers at ZEF, and the Ghanaian students in
Bonn, I honestly appreciate all your support. Whether it was a high on the street/hallway
or a beer moment together, it all contributed to making my stay in Bonn memorable.