
Using the framework provided by the asymmetric · PDF file · 2016-06-162,3+*4 ......
48
econstor www.econstor.eu Der Open-Access-Publikationsserver der ZBW – Leibniz-Informationszentrum Wirtschaft The Open Access Publication Server of the ZBW – Leibniz Information Centre for Economics Standard-Nutzungsbedingungen: Die Dokumente auf EconStor dürfen zu eigenen wissenschaftlichen Zwecken und zum Privatgebrauch gespeichert und kopiert werden. Sie dürfen die Dokumente nicht für öffentliche oder kommerzielle Zwecke vervielfältigen, öffentlich ausstellen, öffentlich zugänglich machen, vertreiben oder anderweitig nutzen. Sofern die Verfasser die Dokumente unter Open-Content-Lizenzen (insbesondere CC-Lizenzen) zur Verfügung gestellt haben sollten, gelten abweichend von diesen Nutzungsbedingungen die in der dort genannten Lizenz gewährten Nutzungsrechte. Terms of use: Documents in EconStor may be saved and copied for your personal and scholarly purposes. You are not to copy documents for public or commercial purposes, to exhibit the documents publicly, to make them publicly available on the internet, or to distribute or otherwise use the documents in public. If the documents have been made available under an Open Content Licence (especially Creative Commons Licences), you may exercise further usage rights as specified in the indicated licence. zbw Leibniz-Informationszentrum Wirtschaft Leibniz Information Centre for Economics Ghosal, Vivek; Ye, Yang Working Paper Business Decision-Making under Uncertainty: Evidence from Employment and Number of Businesses CESifo Working Paper, No. 4312 Provided in Cooperation with: Ifo Institute – Leibniz Institute for Economic Research at the University of Munich Suggested Citation: Ghosal, Vivek; Ye, Yang (2013) : Business Decision-Making under Uncertainty: Evidence from Employment and Number of Businesses, CESifo Working Paper, No. 4312 This Version is available at: http://hdl.handle.net/10419/77662
Transcript of Using the framework provided by the asymmetric · PDF file · 2016-06-162,3+*4 ......

econstor www.econstor.eu
Der Open-Access-Publikationsserver der ZBW – Leibniz-Informationszentrum WirtschaftThe Open Access Publication Server of the ZBW – Leibniz Information Centre for Economics
Standard-Nutzungsbedingungen:
Die Dokumente auf EconStor dürfen zu eigenen wissenschaftlichenZwecken und zum Privatgebrauch gespeichert und kopiert werden.
Sie dürfen die Dokumente nicht für öffentliche oder kommerzielleZwecke vervielfältigen, öffentlich ausstellen, öffentlich zugänglichmachen, vertreiben oder anderweitig nutzen.
Sofern die Verfasser die Dokumente unter Open-Content-Lizenzen(insbesondere CC-Lizenzen) zur Verfügung gestellt haben sollten,gelten abweichend von diesen Nutzungsbedingungen die in der dortgenannten Lizenz gewährten Nutzungsrechte.
Terms of use:
Documents in EconStor may be saved and copied for yourpersonal and scholarly purposes.
You are not to copy documents for public or commercialpurposes, to exhibit the documents publicly, to make thempublicly available on the internet, or to distribute or otherwiseuse the documents in public.
If the documents have been made available under an OpenContent Licence (especially Creative Commons Licences), youmay exercise further usage rights as specified in the indicatedlicence.
zbw Leibniz-Informationszentrum WirtschaftLeibniz Information Centre for Economics
Ghosal, Vivek; Ye, Yang
Working Paper
Business Decision-Making under Uncertainty:Evidence from Employment and Number ofBusinesses
CESifo Working Paper, No. 4312
Provided in Cooperation with:Ifo Institute – Leibniz Institute for Economic Research at the University ofMunich
Suggested Citation: Ghosal, Vivek; Ye, Yang (2013) : Business Decision-Making underUncertainty: Evidence from Employment and Number of Businesses, CESifo Working Paper,No. 4312
This Version is available at:http://hdl.handle.net/10419/77662
Business Decision-Making under Uncertainty: Evidence from Employment and Number of Businesses
Vivek Ghosal Yang Ye
CESIFO WORKING PAPER NO. 4312 CATEGORY 11: INDUSTRIAL ORGANISATION
JUNE 2013
Presented at CESifo Area Conference on Applied Microeconomics, March 2013
An electronic version of the paper may be downloaded • from the SSRN website: www.SSRN.com • from the RePEc website: www.RePEc.org
• from the CESifo website: Twww.CESifo-group.org/wp T

CESifo Working Paper No. 4312
Business Decision-Making under Uncertainty: Evidence from Employment and Number of Businesses
Abstract Using the framework provided by the asymmetric-information and real-options theories, we examine the impact of uncertainty on firms’ decisions and market outcomes. We construct alternative measures of uncertainty based on survey of professional forecasters and our estimation of regression-based forecasting models for GDP growth, inflation, S&P500 stock price index, and fuel prices. Our results indicate that greater uncertainty has a negative impact on growth of employment and the number of businesses, and the effects are primarily felt by relatively smaller businesses. The impact on large businesses are generally non-existent or weaker. Our results suggest that to truly understand the effects of uncertainty on firms’ decisions, we need to focus on the relatively smaller and entrepreneurial businesses. We discuss some implications for framing of policy.
JEL-Code: L110, D800, O300, G100, L400.
Keywords: uncertainty, small businesses, entrepreneurship, employment, number of businesses, financing-constraints, real-options.
Vivek Ghosal School of Economics
Georgia Institute of Technology Atlanta / Georgia / USA
Yang Ye Whitman School of Management
Syracuse University Syracuse / New York / USA
June 7, 2013 Part of this work was conducted when I was a Visiting Scholar at the Research Department of the International Monetary Fund (Washington, D.C.). I benefited from valuable discussions with Prakash Loungani. I am indebted to Christian Gollier and Pierre-André Chiappori for insightful comments on an earlier version of this paper, and to the seminar participants at Mizuho Research Institute (Tokyo), the Development Bank of Japan (Tokyo) and the Center for Economic Studies (Munich) for feedback.
2 Ghosal and Ye. Impact of Uncertainty on Employment and Number of Businesses.
1. Introduction
Theory identifies alternative channels via which uncertainty may affect firms’ strategic
decisions related to capital outlays, entry, exit, employment, production and choice of
technology. The broad classes of theories include: (1) information-asymmetries between
borrowers and lenders which, under greater uncertainty, may affect the flow of credit to specific
categories of businesses (e.g., Greenwald and Stiglitz, 1990); (2) real-options and the
irreversibility of capital expenditures which posit a delaying strategy by businesses when
confronted with greater uncertainty (e.g., Dixit and Pindyck, 1994); (3) businesses’ attitudes
towards risk, with greater risk-aversion dampening a range of strategic decisions (e.g.,
Appelbaum and Katz, 1986; Hartman, 1976); and (4) the convexity of the marginal-product of
capital function (e.g., Abel, 1983). The first three channels tend to predict a negative effect of
uncertainty on firms’ key decision variables. The fourth channel predicts a positive effect. While
a large number of papers have presented the core theory models and their refinements, in this
paper we focus on the information-asymmetries and real-options channels as these appear
important to gaining insights into firms’ strategic and intertemporal decision-making under
uncertainty.
There is a considerable empirical literature that has examined how uncertainty affects
firms’ strategic decisions and market outcomes. The literature highlights the different types of
businesses that appear to be affected, and offers some insights into the possible reasons for the
differential effects. The broader empirical literature reveals that the estimated effects of
uncertainty and qualitative inferences vary considerably across the studies and the particular
decision variable under consideration (investment, entry, production, among others). In section 3
we discuss the empirical literature in a bit more detail.
In this paper we use data on U.S. businesses to examine the effects of uncertainty on
growth of employment and number of businesses. While there is a significant literature in
strategic management, entrepreneurship and economics that has examined the impact of
uncertainty on various aspects of firms’ strategic decision-making and key choice variables, we
are not aware of any systematic study which has examined the uncertainty-employment link, and
focused on small businesses in particular. As we note below, given the importance of the small
and entrepreneurial businesses in the economy, examining the effects of uncertainty on their
employment and number of businesses may be important to understanding the true effects of

3 Ghosal and Ye. Impact of Uncertainty on Employment and Number of Businesses.
uncertainty on firms’ strategic decisions and market outcomes, as well as implications for the
study of business cycles and framing of policy. In the ongoing financial crisis, the inability of
the small businesses and entrepreneurial sector to start growing rapidly was been noted as a
distinctive concern for business and economic growth in coming years.
Our focus on small businesses is motivated by several key factors. First, small businesses
play an important role in the economy in several dimensions. The U.S. Small Business
Administration (henceforth, SBA) defines a small business as an independent business having
fewer than 500 employees. According to the SBA, small businesses represent about 99 percent of
all employer firms, and employ about one-half of all private sector employees. Small businesses
pay about 43 percent of total U.S. private payroll and have generated 65 percent of net new jobs
over the past 18 years. Small businesses create more than half of the non-farm private GDP,
made up 97 percent of all identified exporters and produced 31 percent of export value in 2008.
Small businesses are also important to U.S. technology improvement. According to the SBA,
small businesses hire over 40 percent of high tech workers (scientists, engineers, computer
programmers, and others). Finally, small businesses generate patents more efficiently than large
firms: they produce 16 times more patents per employee than large patenting firms. Irrespective
of the specific dimension under consideration, small businesses play a vital role in the economy.
The importance of small businesses is a global phenomenon. As noted in ACCA (2010)
and di Giovanni et al. (2010), the vast majority of businesses globally are very small. They note
that small businesses are special because they have several important characteristics: they
contribute disproportionately to local economic growth by improving innovation ability; increase
job opportunities; and contribute significant tax revenues. Given these attributes, it has become
commonplace in the aftermath of the current global economic crisis to refer to SMEs as the
backbone of the global economy.
Second, there is a significant literature on entrepreneurship which notes the similarities
and differences between small business and entrepreneurship in dimensions related to growth
and innovation. Some scholars have characterized a small business as a firm that is not dominant
in its field, and engages in relatively less innovative practices. In contrast, an entrepreneurial
venture is viewed to be a business whose primary goals are growth and profitability, and
characterized by strategic and innovative practices. Carland et al. (1984) and Katz and Green
(2010), for example, present a discussion of these issues. In terms of innovation, this literature

4 Ghosal and Ye. Impact of Uncertainty on Employment and Number of Businesses.
notes that small businesses may sell goods and services which other firms also provide, whereas
entrepreneurial businesses are characterized by novelty, in their products, services, or business
models. In terms of growth, an entrepreneurial firm may begin at any size level, but key on
growth over time, while many small businesses tend to remain small for long periods. Although
there are differences in how scholars in Management and Economics view small businesses
versus entrepreneurial ventures, in reality there is common ground in many areas and it is
relatively difficult to clearly distinguish between them. The literature, therefore, often uses a
broad definition of a Small Entrepreneurial Business - anyone who owns a business is an
entrepreneur, which suggests anyone who is a small business owner is an entrepreneur. Our
examination of the effects of uncertainty on small businesses, therefore, also sheds light on the
effects on entrepreneurial ventures.
Third, while the empirical literature on uncertainty is quite extensive, there have been
relatively few studies that have distinctly emphasized the effects of uncertainty on the economic
activity of small businesses. Examining this link is important, given the structural significance of
small business in the economy, and during economic expansions and contractions. Those papers
that have focused on the uncertainty-small business effects, have tended to be related to
investment (e.g., Ghosal and Loungani, 2000). Our primary focus is on the uncertainty-
employment link, along with the impact on the number of businesses, and the potential
distinction between the effects on small versus large businesses. Examining the effects of
uncertainty on employment and creation and survival of businesses is important as it has taken
on a larger than life significance following the 2007 onwards economic crisis, as well as past
crises, where employment effects have taken center stage in policy debates on how to improve
economic conditions.
Against this backdrop, we examine the effects of uncertainty, focusing on potential
differences between small versus large businesses. Our data on small businesses obtained from
the SBA are U.S.-wide, including all small, medium and large businesses in the U.S. Since the
data are designed to portray a broader economy-wide picture, our uncertainty measures are
constructed using economy-wide variables related to GDP, industrial production, inflation, stock
prices, and fuel prices.
In section 2 we note the central results from theory, and present the key hypotheses.
Section 3 presents a brief overview of the empirical literature. Data sources and variables are

5 Ghosal and Ye. Impact of Uncertainty on Employment and Number of Businesses.
discussed in section 4, and in section 5 we outline construction of our measures of uncertainty.
Sections 6 and 7 describe the empirical specification we estimate, and present the results. Our
findings are that uncertainty negatively affects the growth of employment and the number of
businesses, and this impact appears to be concentrated primarily in the relatively smaller
business category. The impact on large businesses is either non-existent or quantitatively smaller.
Section 8 concludes with a discussion of our findings and some policy issues.
2. Theoretical literature on the effects of uncertainty
We focus on two channels when examining the effects of uncertainty. First relates to
asymmetric-information and agency problems in borrower-lender relationships. Examining the
implications of this channel is particularly important due to our focus on smaller businesses.
Second relates to real-options, which has become the mainstay of much of the contemporary
literature on examining the effects of uncertainty.
A significant portion of this literature has posed the problem as one of firms’ investment
decisions under uncertainty. But the broader literature has also examined the complementary
issues related to production, technology choices, among other variables. In our discussion below
we first detail the entry and investment problems, and then note the implications for employment
and number of businesses. Below we review the key results in the theoretical literature, and spell
out the hypotheses for our empirical analysis.3
2.1 Uncertainty and information asymmetries
Information asymmetry between borrowers and lenders may constrain the flow of credit.
In an influential paper, Greenwald and Stiglitz (1990) model firms as maximizing expected
equity minus expected cost of bankruptcy and examine scenarios where firms may be equity or
borrowing constrained. A key result is that greater uncertainty exacerbates information
asymmetries, tightens financing constraints and lowers capital outlays. Since uncertainty
increases the risk of bankruptcy, firms cannot issue equity to absorb the risk. Those relying
primarily on credit and operating outside of equity markets, find the flow of credit rationed. Delli
3 As noted in the introduction, the broader literature on uncertainty is rather extensive, covering issues related to
risk-aversion (Appelbaum and Katz, 1986; Hartman, 1976), convexity of the marginal-profit function of capital
(Abel, 1983), consumption-based capital asset pricing model (Lucas, 1976), among others. Due to the current
emphasis of the literature on the two channels we consider below, and to keep the issues focused, we do not provide
elaborate details of all the different theoretical models that have been written in the literature.

6 Ghosal and Ye. Impact of Uncertainty on Employment and Number of Businesses.
Gatti et al. (2003) extend the Greenwald and Stiglitz framework and develop a model in which
the financial conditions of businesses affect capital accumulation and entry and exit which affect
the distribution of firms differentiated by the equity ratio. In their model flow of exiting firms is
endogenously determined through bankruptcy while the flow of entering firms is affected by
stochastic factors. Lensink, Bo and Sterken (2001) provide a lucid discussion of credit market
conditions in the general context of investment behavior, including the roles played by
uncertainty and sunk costs.
This literature shows that periods of greater uncertainty widens the information
asymmetry, increases the likelihood of bankruptcy and exacerbates financing constraints.
Incumbent businesses who are more dependent on borrowing and adversely affected by tighter
credit will have greater likelihood of exit. Similarly, entry is likely to be impeded for potential
entrants who are more adversely affected by tighter credit conditions. Thus, periods of greater
uncertainty are expected to accelerate exits and retard entry leading to negative net entry – that
is, a decline in the number of firms in an industry.
Similar results hold if we examine physical capital investment or employment.
Considering employment, periods of greater uncertainty, by constraining credit flows, limit the
ability of existing firms to hire and grow. Since new entry is dampened, this negatively affects
employment. As the likelihood of exit by businesses is greater, this also negatively affects
employment. Periods of greater uncertainty, therefore, are likely to lead to lower employment.
The literature points to not all businesses being equally affected by credit market
conditions. In different strands of this literature, the papers by Evans and Jovanovic (1989) and
Fazzari, Hubbard and Petersen (1988), for example, offer insights on small versus larger firm
effects. Gertler and Gilchrist (1994) strongly emphasize the negative impact of information
asymmetric and credit constraints on smaller firms. Li (2008) shows the differential effects of
market uncertainty and competition, project-specific uncertainty on venture capital investment.
Tying the two literatures on uncertainty and the effects of financing constraints on small
businesses, the prediction that emerges from is that periods of greater uncertainty, via the credit
market channel discussed above, is likely to have a dampening effect on employment and the
number of businesses. Given that the effects of financing constraints are more likely to be borne
by the smaller businesses, the prediction is that the negative effect of uncertainty will primarily
manifest itself in data on small businesses.
7 Ghosal and Ye. Impact of Uncertainty on Employment and Number of Businesses.
Finally, in contrast to the agency-based models noted above, Campbell and Cochrane
(1999) demonstrate countercyclical variation of volatility and risk-premia, with more
macroeconomic uncertainty after a crash. This yields a negative correlation between uncertainty
and firms’ key decision variables such as investment. Credit rationing that results from this effect
can be alleviated by the existence of collateral assets. In general, and as noted by Gertler and
Gilchrist (1994) and Fazzari et al. (1988), smaller business are far less likely to be in a position
to offer meaningful collateral. On average, larger businesses which also tend to be older and
more established, are in a position to offer significant collateral. This implies that the effect
identified by Cochrane and Campbell will, on average, manifest itself more for smaller
businesses.
From the asymmetric-information driven financing-constraints channel, we have the
following hypotheses:
Hypothesis 1: Greater uncertainty is expected to negatively affect employment and
number of businesses, and this effect is likely to be more pronounced for smaller
businesses.
2.2 Uncertainty and real-options
A second channel that affects firms’ decisions under uncertainty is real-options. Dixit
(1989) shows that uncertainty and sunk costs imply an option-value of waiting and this raises the
entry trigger price and lowers the exit trigger price.4 For prices below the entry trigger, the
potential entrant holds on to its option to enter, and an incumbent firm does not exit at prices
above the exit trigger. The intuition is that to enter during periods of greater uncertainty, firms
require a premium over the conventional Marshallian entry price. And incumbent firms would
wait longer to exit (i.e., let prices fall below average variable cost before they exit) as they know
that to re-enter the market they would have to re-incur various transactions and sunk entry costs.
The key results related to entry and exit can be summarized as follows: (1) numerical
results in Dixit (p.632-33) show that even small amounts of uncertainty are sufficient to generate
significant changes in entry and exit patterns; and (2) the numerical simulations in Dixit (1989,
4 Dixit and Pindyck (1994) outline the theoretical framework for studying firms’ decision-making regarding entry
and exit under uncertainty and sunk entry costs. Hopenhayn (1992) and Pakes and Ericsson (1998), for example,
study firm dynamics with firm-specific uncertainty. These models, however, are best subjected to empirical tests
using very micro-datasets as in Pakes and Ericsson, and is beyond the scope of our paper.
8 Ghosal and Ye. Impact of Uncertainty on Employment and Number of Businesses.
p.632-33) and Dixit and Pindyck (Ch. 7, p.224-228; and Ch. 8.) show that an increase in
uncertainty results in the entry trigger price increasing by more than the decrease in the exit
trigger. These results reveal that entry is affected more than exit leading to negative net entry. In
other words, periods of greater uncertainty lead to a decrease in entry but exits, while lower,
continue at a closer to normal pace resulting in the industry experiencing a decrease in the
number of firms.
The results are similar if we examine physical capital investment or employment. Dixit
and Pindyck (1994) present an extensive analysis of the detrimental effects of uncertainty on
investment. The effects on employment are qualitatively similar. If greater uncertainty retards
entry and investment, it will also be expected to have a negative effect on employment.
From the real-options channel, we have the following hypotheses:
Hypotheses 2: Greater uncertainty is expected to negatively affect employment and
number of businesses.
Unlike the financing-constraints channel which a priori is dominantly expected to affect smaller
firms, the real-options theory does not allow a clear distinction of potential divergence in effects
between smaller and larger firms. The inherent tendency to delay investments, employment,
entry, among other strategic decisions, apply to firms of all classes.
3. Empirical findings on the impact of uncertainty
The empirical literature examining the effects of uncertainty is quite extensive and it is
difficult to review the full spectrum of this literature. To offer a perspective in a convenient
format, we present a table in Appendix A which summarizes selected papers. These are not
meant to be comprehensive, but display the range of variables used to measure uncertainty
(GDP, inflation, prices, energy prices, stock prices, among others), the specific statistical
constructs to capture uncertainty (unconditional variance, conditional variance derived from
regression estimates, survey measures), the level of aggregation of the studies (firm or industry
level, and economy-wide), and the estimated quantitative and qualitative effects.
Regarding differences in the effects of uncertainty on small and large business, we briefly
note some of the findings in the empirical literature useful for our analysis. Using industry-level
data, Ghosal and Loungani (2000) find that the investment-uncertainty relationship is negative,
and this negative impact is greater in industries dominated by small firms. Ghosal (1991) finds

9 Ghosal and Ye. Impact of Uncertainty on Employment and Number of Businesses.
that uncertainty affects firms’ choices of the capital-labor ratio, and that larger firms’ input
choices appear less affected by uncertainty. Results in Koetse and Vlist (2006) reveal that there
are differential effects of uncertainty on input and output variables. Bianco, Bontempi, Golinelli
and Parigi (2012) find small family firms’ investments are significantly more sensitive to
uncertainty than non-family firms. Findings in Ghosal and Loungani (1996) reveal that the
effects of uncertainty on investment depends on whether the industry is relatively
atomistic/competitive in structure. Lensink et al. (2005) find that uncertainty adversely affects
firms’ capital investment decisions, and discuss results related to firm size.
Regarding small entrepreneurial businesses, Li (2008) finds that market uncertainty
encourages venture capital firms to delay investing, whereas competition and agency concerns
prompt venture capital firms to invest sooner. Using data on venture capital investments in the
U.S., Li and Mahoney (2011) find that venture capitalists tend to defer new investment projects
in target industries with substantial market volatility. The negative impact is dampened if the
target industry has high sales growth or if competition among venture capitalists is intense in the
target industry. Their examination of the effects of uncertainty on venture capital funding is
particularly important as smaller entrepreneurial businesses are often highly credit constrained
from traditional sources, and have to rely on own cash-flows or venture funding (Baldwin,
Gellatly and Gaudreault, 2002).
4. Data description
For our empirical analysis, we use data from multiple sources. Below we provide details
of the datasets we use.
First, is the U.S. Small Business Administration (SBA) database. This database contains
information on various economic and business variables by ‘size of businesses’ generally over
the period 1988 to 2011. Data by business size classification were not available prior to 1988.
From the SBA database we use annual data on employment by the size of business. The SBA
database also provides information on the number of firms according to the size of firms. It is
important to note that the SBA data are ‘aggregated’ in the sense that they provide data on, say,
the total number of small businesses in the entire U.S. economy. In other words, the data are not
firm-or-industry specific. As an illustration, if there are a total of 100 businesses in the U.S. in a
given year, the SBA database tells us how many of these were large, medium of small, by

10 Ghosal and Ye. Impact of Uncertainty on Employment and Number of Businesses.
specific firm-size classes. While the SBA data are not helpful in examining firm-or-industry-
specific issues, they are very useful in gauging an economy-wide picture. In our context, the
SBA data allow us to examine how uncertainty may affect employment and the total number of
businesses by different firm-size classes.
Second, are some U.S. macroeconomic data we use in our analysis. Data on real GDP
and GDP implicit price deflator are from the Federal Reserve Economic Data. The data on S&P
500 stock price index are from Yahoo Finance. And data on fuel price index are from the U.S.
Bureau of Labor Statistics (BLS); the fuel price index contains information on a broad range of
the most commonly used fuels by producers, such as gasoline, electricity, natural gas, heating
oil, among others.
Next we create firm size classes to examine the potential smaller versus larger business
effects. We use the following size classifications:
1. ‘All’ businesses;
2. ‘Large’ businesses – these are businesses with ≥500 employees;
3. ‘Small’ businesses – these are businesses with <500 employees; and
4. ‘Smaller’ businesses – these are businesses with <20 employees.
The 500 employee cutoff is the one used by the U.S. SBA, and we use this as the baseline. We
consider an additional cutoff of <20 employees for the following reasons: (a) a 500 employee
firm is relatively large, so we wanted to consider an alternate cutoff for defining small; (b) data
with the <20 employee cutoff was available consistently for both our variables (employment and
number of businesses); and (c) a large percentage of the truly small business fall in this category.
In our estimation of growth employment and number of businesses specifications, we
will present estimates for each of the four groupings (1-4) noted above. In Figures 1 and 2 we
display the time paths for the growth of employment and number of businesses by size class.
Table 1 presents the summary statistics for the growth of employment and number of businesses
by size class.
5. Measures of uncertainty
As noted in section 3, Appendix A summarizes selected papers and displays the range of
variables used to measure uncertainty (GDP, inflation, prices, energy prices, stock prices, survey
opinions, among others), and the specific statistical constructs to capture uncertainty

11 Ghosal and Ye. Impact of Uncertainty on Employment and Number of Businesses.
(unconditional variance, conditional variance derived from regression estimates, survey forecast
variance). The broader literature reveals a wide range of variables and methods to capture
uncertainty. In the spirit of this literature, we construct six measures to examine the impact of
uncertainty.
As noted in section 4, our data are U.S.-wide and include all relatively smaller and larger
businesses in the U.S. Since the data are designed to portray a broader economy-wide picture,
our uncertainty measures are created using economy-wide indicators.
First, we use the forecasts from the Survey of Professional Forecasters (henceforth, SPF)
provided by the Federal Reserve Bank of Philadelphia. The SPF asks professional forecasters to
give their forecast for 32 key macroeconomic variables, including GDP, industrial production,
inflation, and unemployment, among other variables. The forecasters provide quarterly and
annual forecasts for the current year and the following year. The respondents are asked to attach
a probability to each of a number of pre-assigned intervals over which their forecast may fall.
The Philadelphia Fed then takes the mean probabilities over the individual respondents and
reports them in the SPF release in the form of a histogram. From the survey we use forecasts for
growth of GDP and industrial production to construct two measures of uncertainty. We use GDP
growth as it is the broadest measure of economic activity. We use growth of industrial
production as the other measure as it is the most cyclical component of the economy, and is used
by many forecasters as a leading indicator. Our measures of uncertainty are constructed as the
within-year variance of survey forecasts for growth of GDP and industrial production. These two
measures of uncertainty are labeled and
, with spf denoting ‘survey of
professional forecasters’.5
Second, we use forecasting specifications to construct four additional measures related to
uncertainty about:
1. real GDP growth. This indicates the overall state of the economy capturing demand and
supply effects;6
5 In a complementary literature, some differentiate between uncertainty versus disagreement. Compare two contexts:
experts agree that there is a lot of uncertainty on the future growth rate; experts are confident about their estimation
of future growth, but these estimations are very heterogeneous. Gollier and Zeckhauser (2005) demonstrate the
effect of disagreement on the aggregate risk premium. While distinguishing between the effects of uncertainty v.
disagreement on firms’ decision variables is a useful exercise, we do not explore the implications of this in the
current paper. 6 GDP uncertainty measures, in different forms, have been used by, for example, Driver et al. (2005), Asteriou et al.
(2005) and Bloom (2009).

12 Ghosal and Ye. Impact of Uncertainty on Employment and Number of Businesses.
2. inflation rate. We measure inflation as the annual percentage growth of the GDP deflator.
Inflation uncertainty captures effects related to input and product prices, as well as
affecting firms’ real borrowing rates;7
3. stock prices. We use the S&P500 stock price index. As with real GDP, this is an indicator
of the overall state of the economy, and forward looking indicator of investor and
business confidence;8 and
4. real fuel price growth. Here we use the Bureau of Labor Statistics price index of a range
of commonly used fuels by businesses. The nominal fuel price index is converted to real
values after deflating by the implicit GDP deflator. This variable serves to proxy a critical
input – fuels and energy – price for businesses.9
To create our measures of uncertainty, we use the following procedure. We assume that
firms use a forecasting equation to predict future values of the relevant variable, an economy-
wide indicator in our case. As noted earlier, since our data on businesses are U.S.-wide, our
uncertainty measures are also created using economy-wide variables related to GDP, inflation,
stock prices, and fuel prices.
As our baseline, we use a second-order autoregressive, AR(2), specification as the
forecasting model. AR(n) models are based on Box and Jenkins (1970) formulation for
forecasting economic variables, and historically they have performed well in forecasting
exercises (e.g., Meese and Geweke, 1984; Marcellino, Stock and Watson, 2003). Given this
literature, and our annual time-series data for the smaller and larger business variables, we use
this methodology to forecast the relevant state variables.
The forecasting specification is:
7 Inflation has been used to construct uncertainty measures by, for example, Huizinga (1993), Fountas et al. (2006)
and Elder (2004). 8 Stock prices have been used to measure uncertainty by, for example, Bloom (2009), Chen et al. (2011), Bloom et
al. (2007), Greasley et al. (2006), and Stein et al. (2010). 9 Fuel and energy prices have been used to construct uncertainty measures by, for example, Koetse et al. (2006),
Kilian (2008) and Guo et al. (2005).

13 Ghosal and Ye. Impact of Uncertainty on Employment and Number of Businesses.
where Z is either: (i) real GDP growth; or (ii) inflation rate; or (iii) S&P500 growth; or (iv) real
fuel price growth. From specification (1), the predicted values represent the forecastable
component. The residuals:
represent the unsystematic, or unforecastable, component. Since can take positive or negative
values, we use the squared value of , interpreted as the conditional-variance, as our measure
of uncertainty about the relevant variable. Using the residuals from forecasting equations and
conditional-variance to construct uncertainty measures is common: see, for example, the
insightful review in Lensink, Bo and Sterken (2001), and the references cited in the preceding
footnotes. If the forecasting specification is for GDP (i.e., Z is real GDP growth), then we denote
the uncertainty measure as:
Using this procedure for our four economy-wide variables (Z), we obtain four measures of
uncertainty denoted by: (i) ; (ii)
; (iii) ; and (iv)
. While we report our
baseline results using an AR(2) specification for (1), as we note in section 7, our results are
robust to including longer lag lengths and alternative specifications.
To estimate the forecasting specification (1), we use available data on Z from 1960 to
2011. The rationale is as follows. The objective is obtain a good forecasting specification, which
is better done with a longer time-series ensuring that the parameters of the equation are estimated
precisely. While data on GDP, inflation and S&P 500 are available for earlier periods, the BLS
fuel price indices are available starting 1960. So we use 1960 as the starting year for which all of
our variables (that we consider for Z) are available. The terminal period, 2011, is the same as the
last period for which the small business data are available. This implies that the generated time-
series in our four uncertainty measures ,
, and
are over 1962-2011
(two initial observations are lost due to use of lagged values in specification 1).
While our AR(.) forecasting equation is fairly standard, the length and frequency (annual
from 1988-2011) of the available SBA business variables restricts us from considering alternate

14 Ghosal and Ye. Impact of Uncertainty on Employment and Number of Businesses.
procedures, such as using ARCH or GARCH models, to construct measures of uncertainty.
While this may be viewed as a limitation, the SBA data on employment and number of
businesses are simply not available at a higher frequency. Since we need to harmonize the
estimation periods and frequency, we are restricted to using annual data to forecast our
specification (1).
A final comment is that we are using two broad sets of uncertainty measures: from survey
of professional forecasters, and using regression-based forecasting specifications. While the
regression-based measure admittedly has various econometric issues we need to grapple with,
the survey of professional forecasters measure is not being generated by a regression-based
procedure. In this sense, it acts a very important check of robustness to our estimates and
inferences.
6. Empirical Specification
There is a substantial literature on estimation of dynamic specifications related to firms’
decision variables, such as new investments in physical capital, employment, capital investments
for entry into markets, among others. Holt et al. (1960), Kennan (1979), Hendry et al. (1983) and
Jorgenson (1986) present detailed expositions of the underlying theory behind the econometric
models. Following this literature, we use a partial-adjustment framework to structure our
empirical specification. The partial-adjustment model is based on a quadratic cost-minimizing
framework where firms, when making their optimal adjustment decisions (e.g., related to
investment or employment), aim to minimize disequilibrium and adjustment costs.
The disequilibrium costs arise due to lost revenue (and profits) from having the decision
variables at sub-optimal levels. For example, delayed entry investment, delayed employment
adjustments, delayed expansion of existing facilities, among others, can lead to lost revenues and
profits. The adjustment costs are incurred when the firm attempts to align the actual values of the
decision variables to their optimal levels. A firm’s attempt to rapidly align the decision variable
to its optimal level – incur capital investments to enter a market or expand employment too

15 Ghosal and Ye. Impact of Uncertainty on Employment and Number of Businesses.
rapidly – will result in higher adjustment costs. Disequilibrium costs motivate firms to adjust the
decision variable faster, whereas adjustment costs induces the firm to align it to optimal levels in
a smoother, slower, adjustment process. The actual adjustment speed of the decision variable will
be a weighted-average of these two opposing effects.
Let X be a decision variable for the firm (e.g., capital investment to enter a market,
employment, expand existing facilities). The partial adjustment model is given by:10
where i and t denote firm and time, X* the optimal value of X, and λ the speed-of-response
parameter. In (4), actual adjustment ) is a fraction λ of the ‘desired’ intertemporal
adjustment . High (low) values of λ imply high (low) speed-of-response. Since X
*
is private information for the firm and not observed directly by the external researcher, it is
modeled as a function of relevant driving variables.
In our case, X can be, for example, employment. We model employment as a function of
its own intertemporal dynamics (captured by lagged values), expectations of macroeconomic
conditions (expected GDP growth), and uncertainty. The optimal choice of X* is therefore a
function of future expectations of GDP growth, ; the intuition being that if expected
economic conditions are improving, firms will plan to adjust their decision variable, X, upwards.
If GDP follows an autoregressive process of order n, AR(n), then can be replaced by its
forecasting equation consisting of lagged values of GDP: , where
k=0,1,2,...,n.
10
As the theoretical solution for these models are well established (e.g., Holt et al. 1960; Kennan, 1979), we do not
repeat the entire model structure here.

16 Ghosal and Ye. Impact of Uncertainty on Employment and Number of Businesses.
As discussed earlier, we use uncertainty as the other variable affecting firms’ decisions to
adjust X. With these considerations, we model
where
is a measure of
uncertainty (section 5). Using the expression for from above, we get:
,
where k and m are the appropriate lag lengths.
With the above structure, the partial-adjustment model for estimation is given by (6):
where (replacing X) is a measure of business activity (in our case, growth of employment or
growth of number of businesses), L represents the lagged operator, is real GDP growth,
is the measure of uncertainty measured in natural logarithms,
11 and is the error term. As
described earlier, the six alternative measures of uncertainty we use are ,
,
,
, and
.
Since we are interested in the short-term effects of uncertainty on business activity, and
that the underlying data on employment and the number of businesses contain trends, we
measure in logarithmic first-differences; that is, rate of growth (annual percentage change)
and denoted by .
Our experiments with lag lengths indicated: (1) for the majority of specifications only
one autoregressive lag of M was significant, but in a few specifications two lags were significant;
11
We enter the uncertainty measure in natural logarithms as the mean values of the uncertainty variables vary
enormously in size across the different measures (see table 1). Using the actual values of the uncertainty variables in
the estimated regressions resulted in large numerical differences in the estimates due to pure scaling effects.
Entering the uncertainty variables in natural logarithms resulted in no differences in inferences (related to the small
versus large business differences) compared to entering them in levels. Estimates with the uncertainty variables
entered in levels (not logarithms) are available on request.

17 Ghosal and Ye. Impact of Uncertainty on Employment and Number of Businesses.
(2) GDP effects were captured by current and one lag; (3) at most one lag of the uncertainty
variable was significant.
As noted in section 4, the available data on Small Businesses are annual and cover the
period 1988-2011. We, therefore, estimate specification (6) over 1988-2011.12
Estimating (6)
informs us about the impact of uncertainty on growth of employment or growth of number of
businesses, after controlling for overall economic activity (GDP growth) and the dynamic
intertemporal lagged structure for the included variables.13
In our examination of the effects of uncertainty on growth of employment and number of
businesses, we present estimates for four groups noted in the data section 4: (1) All businesses;
(2) Large businesses (≥500 employees); (3) Small businesses (businesses with <500 employees);
and (4) Smaller businesses (<20 employees).
7. Estimation results
Our results are presented as follows. First, in tables 2-3, we present the estimates from
specification (6), and highlight key observations. These tables inform us of the statistical
significance of the effects and the qualitative inferences. Second, due to considerable differences
in the mean values of variables in the estimated regressions, is difficult to assess the quantitative
magnitudes of the effects of uncertainty. To do this, in tables 4-5 we present the quantitative
effects; these are calculated as the effect of a one-standard-deviation increase in uncertainty on
growth of employment or growth of the number of businesses. Third, to present the quantitative
effects calculations in a more compact form, in tables 6-7 we present the total quantitative
effects. These numbers are systematized and aggregated from those in tables 4-5, and present a
clear picture of the quantitative effects of uncertainty, and the relative effects of uncertainty
versus GDP growth.
7.1 Estimates
Uncertainty and growth of employment
12
As noted earlier, our six uncertainty measures are constructed over a longer time period, we use their values over
1988-2011 in estimating specification (6). 13
As we note in section 7.3, our experiments using longer lag lengths did not provide additional insights into the
effects of uncertainty.

18 Ghosal and Ye. Impact of Uncertainty on Employment and Number of Businesses.
The results for the growth of employment specifications are presented in tables 2.1 and
2.2. Table 2.1 presents estimates for All and Large businesses, and table 2.2 presents estimates
for the Small and Smaller size classes.
In table 2.1, the
are in the 75% to 87% range indicating good fit of the specification.
The estimates of the first-order autocorrelation coefficient, ρ, are relatively low on average. The
estimates show that uncertainty related to GDP, Inflation, S&P500 and Fuel prices have a
negative effect on the growth of employment for All businesses, but the timing
(contemporaneous versus lagged) and size of the estimated coefficients vary. Turning to the
Large businesses, only Inflation and Fuel price uncertainty dampen growth of employment, and
the estimated coefficients are a bit smaller for the Large business group.
For the small business groups in table 2.2, the
are in the 62% to 78% range. The
estimates of the first-order autocorrelation coefficient, ρ, are generally quite low. The estimates
show that aside from the mixed inferences from the Inflation and S&P500 based measures,
uncertainty related to the two survey-based measures, and GDP, Inflation and Fuel prices have a
negative effect on growth of employment for the Small and Smaller businesses.
The broad inferences from the estimates in tables 2.1 and 2.2 are as follows. Most of the
uncertainty coefficients for Large businesses are not significant, which imply that employment
growth in Large businesses are not sensitive to uncertainty. The results show only GDP
uncertainty and stock price uncertainty have negative and significant effects on large firms. In
contrast, almost all the uncertainty coefficients are significant for the Small and Smaller business
groups. The results show that small businesses’ employment decisions are more likely to be
adversely affected by uncertainty than those of large businesses.
Uncertainty and growth of number of businesses
The results for the growth of the number of businesses specifications are presented in
tables 3.1 and 3.2. Table 3.1 presents estimates for All and Large businesses, and table 3.2
presents estimates for the Small and Smaller size classes.
In table 3.1, the
for All businesses specifications are in the 70% to 75% range, while
they are only in the 40% to 55% range for the Large businesses, indicating lower explanatory
power for the latter group. Aside from a couple of specifications, the estimates of the first-order

19 Ghosal and Ye. Impact of Uncertainty on Employment and Number of Businesses.
autocorrelation coefficient, ρ, are relatively low. The estimates show that uncertainty related to
the survey-based measures, and GDP and S&P500 have a negative effect on the number of All
business, but the quantitative effects vary. Fuel price or inflation uncertainty does not appear to
affect the growth of the number of All businesses. Turning to Large businesses, we see that four
of the uncertainty measures appears to decrease the growth of the number of these businesses.
For the small businesses specifications in table 3.2, the
are in the 50% to 60% range
for the Smaller group, and in the 70% range for the Small group. The estimates of the first-order
autocorrelation coefficient, ρ, are uniformly low. The estimates show that uncertainty related to
both the survey-based measures, and GDP growth and Inflation have a negative effect on the
number of Smaller business, but fuel price and S&P500 uncertainty does not appear to affect this
group. Turning to the Small group, the two survey-based measures, and GDP and Inflation
uncertainty have a negative effect on the growth of the number of businesses.
Based on the estimates in tables 3.1 and 3.2, uncertainty has a negative impact on the
growth of the number of businesses, and, as compared to the growth of employment
specifications, this effect appears to be more mixed across the size classes. Although for Large
businesses group, GDP uncertainty, stock price uncertainty and fuel price uncertainty have
significant negative effect on number of businesses, other uncertainty measures do not yield
statistically significant results. On the other hand, almost all uncertainty measures show
significant negative effect on the number of businesses for Small and Smaller businesses. Thus,
entry and exit decisions of smaller businesses are more sensitive to uncertainty.
Broad inferences from estimates
The overall inferences we draw from the estimates presented in tables 2 and 3 are that
uncertainty dampens growth of employment, and the effects appear to be concentrated in the
Smaller (<20 employees) and Small (<500 employees) groups. At broad brush, our findings
appear supportive of the results from the theoretical models we discussed in section 2. The
effects on the number of businesses appears to be more mixed and need further investigation.
The fact that we find the effects related to uncertainty even after controlling for GDP growth and
the lagged dynamics, makes our finding even more noteworthy.
Effects of GDP growth

20 Ghosal and Ye. Impact of Uncertainty on Employment and Number of Businesses.
The estimated specifications include real GDP growth, and model the dynamics of the
included variables via lagged effects. Real GDP growth is a key control variable in either growth
of employment or growth of number of businesses specifications. With increasing GDP growth,
business opportunities are expected to expand allowing for growth of jobs as well as new
businesses. As expected, the regression estimates in tables 2-3 indicate that GDP growth, as
contemporaneous and/or lagged effect, is important in all specifications.
Table 2 shows that GDP growth has a significant and positive effect on the growth of
employment regardless of the firms’ size. When we compare the effect on large and small
businesses, we see that GDP has a larger positive effect on large firms in a 51% to 74% range.
For the smaller firms group (<20 employment), the effect range varies from 6% to 47%. Table 3
shows that the GDP growth has a complex effect on number of businesses. In all groups, we see
some positive, negative and not significant coefficients. Also, the magnitudes of the effects are
mixed. GDP growth appears to affect the large businesses the most. For the Small (<500
employment) and Small (< 20 employment), we see that the first lag of GDP growth affects the
growth number of businesses positively while the second lag affects it negatively.
7.2. Assessing quantitative effects
Since the means and standard deviations of the dependent and explanatory variables vary
widely (table 1), the coefficient estimates in tables 2 and 3 do not convey a clear sense of the
‘quantitative’ importance of the effects related to uncertainty and GDP growth. Tables 4.1 and
4.2 present the quantitative effects for growth of employment, and tables 5.1 and 5.2 for growth
of number of businesses. In tables 4.1 and 4.2 we do not report the regression statistics and
details about lagged coefficients and focus only on uncertainty and GDP growth effects.
The numbers in tables 4 and 5 show the effect of a one-standard-deviation (henceforth,
one-s.d.) increase in the relevant independent variable. That is, if a particular uncertainty
measure increased by one-s.d., the reported numbers show the estimated increase in growth of
employment or growth of number of businesses. We do not report the standard errors in tables 4-
5 as they are the same as in tables 2 and 3. We keep the asterisk * notation to denote that the
particular quantitative effects are statistically significant at least at the 10% level. Finally, in the
headers for tables 4-5, we note the mean values of growth of employment and growth of number
of businesses for the relevant samples.

21 Ghosal and Ye. Impact of Uncertainty on Employment and Number of Businesses.
As an illustration to interpret the numbers, consider table 4.2 and the reported numbers
for the Smaller (<20) group. The reported numbers for (column S1) are -0.0039 and -
0.0044. Since both are statistically significant, the total effect is the sum of the two: -0.0083.
This implies that a one-s.d. increase in results in the growth of employment decreasing by
0.0083. This decline is to be compared to the mean growth of employment of 0.0053 for the
Smaller (<20) size group. The uncertainty-generated decline, therefore, represents a relatively
large quantitative effect for this group and specific measure of uncertainty.
To facilitate easy interpretation of the numbers, we summarize all of the effects in table
4-5 in tables 6-7. In our above illustration, the total effect was -0.0083. This number appears in
table 6, column 1 and row 4; that is, for uncertainty measure and size group Smaller (<20).
The numbers in tables 6-7 and therefore interpreted as the total quantitative effects. In
displaying the numbers in tables 6-7, we only report those effects that are statistically significant.
Since we are considering significance at least at the 10% level, this is a fairly safe-harbor
threshold. If an estimate was not significant at least at the 10% level, for our illustrative purposes
we assign a value of 0.0.
In viewing the numbers in tables 6-7, the final detail is that the column labeled which
represents the mean value of all the numbers in that particular row. This is then interpreted as the
‘average estimated quantitative effect’ of uncertainty (across the various measures) on growth of
employment or growth of the number of businesses for that particular sample (by size class). The
column labeled is interpreted similarly; the average estimated quantitative effect of GDP
growth on growth of employment or growth of the number of businesses for that particular
sample (by size class).
With these details, we are now in a position to comment on the total estimated
quantitative effects for uncertainty and GDP growth.
From table 6, we see that the difference in effects between the Large and Small size
groups is dramatic, with the Small group effect being about 4.5 times larger. While there are
some variations across the specific measures of uncertainty, the effects of uncertainty on growth
of employment, for all practical purposes, are felt largely by the relatively smaller businesses.
The total quantitative effect for the Smaller (<20) group is somewhat smaller than the Small
(<500) size group. This implies that the effects of uncertainty on some of the intermediate size

22 Ghosal and Ye. Impact of Uncertainty on Employment and Number of Businesses.
classes is likely to be large. In table 6, comparing the uncertainty effects to the GDP growth
effects, we find that the quantitative effects of GDP growth are consistently larger.
Turning to the growth of number of businesses in table 7, the quantitative effects on the
Large businesses are mixed (as was noted in table 3.1); the average effect as noted in column
is positive. Aside from some variation across the uncertainty measures, the impact on growth of
the number of small businesses is negative. The quantitative effects, therefore, show that smaller
businesses are adversely impacted. As was the case with the growth of employment effects in
table 6, the effect of GDP growth on the number of businesses is consistently larger than those
for uncertainty.
7.3 Comments on robustness
Our analysis builds in several checks of robustness. First, the uncertainty measures are
constructed using two broad approaches: survey of professional forecasters based; and
forecasting regression generated. Further, we consider uncertainty about several alternative
variables: GDP, industrial production, S&P500, inflation and fuel prices. In combination, these
offer a measure of reassurance that our results are not being driven by a single measure,
procedure or variable.
In addition to the above, we conducted the following checks of robustness. First, we
estimated our forecasting specification (1) using longer autoregressive lag lengths, and
generating the uncertainty measures. Second, we used augmented forecasting specifications
where apart from using autoregressive lags of Z – as in specification (1) – we also included the
growth of oil prices and a monetary policy variable, the Federal Funds Rate. The impact of oil
prices and monetary policy actions on economic variables such as GDP growth, inflation, among
others have been extensively examined, and are standard in the macroeconomic literature. These
controls are important because if agents and firms are using these driving variables to forecast
movements in key economy-wide variables, ignoring them would produce potentially biased
estimates of our uncertainty measures.
Across these range of experiments, our broader set of results and inferences related to the
impact of uncertainty on growth of employment and growth of the number of businesses remain
intact. Due to the rather space-consuming nature of the tables (as is evident from the set of tables
2 and 3), we do not report these in the paper.

23 Ghosal and Ye. Impact of Uncertainty on Employment and Number of Businesses.
8. Discussion of results and implications
Our paper provides the first set of evidence on the differential effects of uncertainty, by
firm size, on employment growth, with complementary results related to the growth of the
number of businesses. Our findings on the differential effects of uncertainty on the relatively
smaller versus larger businesses is quite robust across alternative procedures to construct the
measures of uncertainty (information from the survey of professional forecasters versus
forecasting regression based methods), and alternative variables to measure uncertainty about
(GDP, industrial production, inflation, S&P500 and fuel prices). These results appear even after
controlling for GDP growth, and controls for lagged dynamics of the included variables.
As we noted in the introduction, the literature notes a rough equivalence between small
businesses and entrepreneurship. Given the significance of entrepreneurship in generating new
businesses, technologies and employment, our results on the effects of uncertainty on small
businesses, therefore, also sheds light on the potentially adverse effects on entrepreneurial
ventures.
The spirit of our results are not in isolation as earlier studies on uncertainty, related to
investment spending and using very different datasets and estimation procedures, have found
similar results related to firm size: for example, Bianco, Bontempi, Golinelli and Parigi (2012),
Ghosal and Loungani (1996 and 2000), Ghosal (1991), Koetse and Vlist (2006) and Lensink et
al. (2005). This is reassuring as it points to our results not being an artifact of our specific
dataset, methods of estimation, and construction of uncertainty variables.
We used the insights from the theories related to information-asymmetry generated
financing-constraints, and real-options, to obtain predictions on the impact of uncertainty on
employment and number of businesses. As we noted in section 2, the real-options theory does
not offer direct predictions related to why small and large firms may differ in their responses to
uncertainty.14
The asymmetric-information related financing-constraints theory on the other hand
14
Studies on industry dynamics and firm-churning data show that most business churning occurs at the smaller firm
end: for example, Audretsch (1995), Sutton (1997) and Caves (1998). To this extent, purely as an accounting matter,
one can argue that if we observe effects, it will more likely be in the smaller business category. But this is not a
direct theoretical prediction.

24 Ghosal and Ye. Impact of Uncertainty on Employment and Number of Businesses.
offers clear predictions, with smaller firms being the ones most likely to be adversely affected by
uncertainty due to their greater likelihood of being credit constrained.15
Given that the data we use from the U.S. Small Business Administration are relatively
aggregated, it is difficult to clearly disentangle which of these two theories may be playing the
more dominant role. It is fair to assume that both channels are important in determining the
outcomes, with somewhat greater support for the financing-constraints channel due to the more
direct predictions.
To the question as to why governments might pay special attention to small businesses,
there are several responses. First, we noted earlier in the paper that a large fraction of
employment and businesses fall into the smaller categories. Second, a number of emerging
structural factors – such as those related to globalization and banking sector consolidation – are
likely to favor large businesses relative to the smaller ones. These considerations alone provide
important economic policy justification.
If it is true that our results on the effects of uncertainty in important part are being driven
by the financing-constraints channel, then potential policy implications emerge, primarily in the
form of initiatives and instruments designed to partly ease the financing-constraints faced by
smaller businesses. As with many governments worldwide, the U.S. recently implemented
policies and programs to help small businesses bridge the capital and market gap and encouraged
public-private partnerships to support small business and entrepreneurship by, for example: (a)
supporting more than $53 billion in SBA loan guarantees to more than 113,000 small businesses;
(b) awarding more than $221 billion in Federal contracts to small businesses (FY 2009 through
April 30, 2011); and (c) awarding more than $4.5 billion in research funding through the Small
Business Innovation and Research Program during FY 2009 and FY 2010.16
Such initiatives, along with appropriate lending policies, can help ease some of the
financing-constraints faced by smaller businesses in times of economic and financial distress.17
15
The literature has noted important differences between smaller and larger businesses, and point to smaller firms
being relatively credit-constrained. E.g., Audretsch and Elston (1997), Fazzari, Hubbard and Petersen (1988),
Gertler and Gilchrist (1994), Evans and Jovanovic (1989), Lensink, Bo and Sterken (2001), Ghosal and Loungani
(2000), Himmelberg and Petersen (1994) and Winker (1999). 16
The National Economic Council (2011) and Sheets and Sockin (2012) provide extensive discussion on the
importance of small businesses and policy. 17
The papers by Audretsch and Elston (1997, 2002), for example, provide important insights in this dimension from
German policy initiatives.

25 Ghosal and Ye. Impact of Uncertainty on Employment and Number of Businesses.
By doing so, and in the context of this paper, such policies may also help alleviate some of the
negative impact of uncertainty on smaller businesses.
In ongoing research we are pursuing more detailed analysis using firm and industry level
data to more precisely disentangle the likely effects of the information-asymmetry versus real-
options theories. This may also help us with better insights related to the economies exiting from
the ongoing financial and economic crisis.

26 Ghosal and Ye. Impact of Uncertainty on Employment and Number of Businesses.
Appendix A: Selected empirical findings on the impact of uncertainty The papers included below are not meant to be a comprehensive review of the studies in this area, but to display the
range of variables used to measure uncertainty (GDP, inflation, prices, energy prices, stock prices, among others),
the specific statistical constructs to capture uncertainty (unconditional variance, conditional variance derived from
regression estimates, survey measures), the level of aggregation of the studies (firm-level, industry level, economy-
wide), and the estimated quantitative and qualitative effects.
Table A.1. Selected papers examining the effects of uncertainty
Paper Data
Estimation method
State variables
Uncertainty measure
Estimation results
Lensink, Robert, Paul van Steen and Elmer Sterken. “Uncertainty and
Growth of the Firm,” Small Business
Economics, 2005, 381-391.
Survey of 1,097 Dutch firms in 1999.
Logit model.
Sales. Return on Investment.
Conditional variance/mean.
Uncertainty has a negative impact on the size of investment, no matter what
the type of investment is used. Smaller
firms have a lower probability to invest if uncertainty increases.
Koetse, Mark J., Arno J. van der Vlist
and Henri L.F. de Groot. “The Impact
of Perceived Expectations and Uncertainty on Firm Investment,”
Small Business Economics, 2006,
365-376.
Survey of 135 plant locations in
Netherlands in 1998.
Tobit model.
Wages. Energy prices.
Output prices.
Survey based.
Uncertainty has a larger influence on
decision making in small firms than in
large firms specifically for investment in energy-saving technologies.
Bo, Hong, and Elmer Sterken.
“Volatility of the interest rate, debt
and firm investment: Dutch evidence,” Journal of Corporate
Finance, 2002, 179–193.
Data for 41 Dutch listed firms
from 1984 to 1995.
Panel Data, , Fixed effect
estimation.
Interest rate.
Conditional variance. ARCH model.
Cross-effect of the interest rate
volatility and debt on investment is
positive. This effect is more important for highly indebted firms than for less-
indebted firms.
Driver, Ciaran, and Brendan Whelan. “The Effect of Business Risk on
Manufacturing Investment,” Journal
of Economic Behavior and Organization, 2001, 403-412.
Disaggregated survey data of Ireland in 1995.
Comparing the percentage of different respondents in the
survey questions.
Future demand and future price
Future unit input cost
Capacity Delay risk
Subjective descriptions
No strong effect of risk due to convexities. Risk did affect the timing
of investment for between a quarter and
a third of the sample. The greatest caution in respect of timing was in the
Hi-tech sector which was also the sector
with the greatest damage from delay.
Oriani, Raffaele, and Maurizio Sobrero. “Uncertainty and the Market
Valuation of R&D within a Real
Options Logic,” Strategic Management Journal, 2008, 343-361.
Data for 290 manufacturing firms in UK from 1989 to 1998.
Panel Data, Hedonic model
Industry output. Patents.
Absolute percentage
difference. Inverse of the median age.
They find a U-shaped relationship between market uncertainty and value
of investment. Also, they find an
inverted U-shaped relationship between technological uncertainty and the value
of R&D capital.
Bianco, Magda, Maria Elena Bontempi, Roberto Golinelli and
Giuseppe Parigi. “Family Firms’
Investments, Uncertainty and Opacity,” Small Business Economics,
2012, 1-24.
Data for 2,959 Italian private companies from 1996 to 2007.
Panel data, GMM
Sales.
Coefficient of variation.
Family firms’ investments are significantly more sensitive to
uncertainty than nonfamily firms and
that is due to the greater opacity of family firms and higher risk aversion,
rather than to the degree of sunk fixed
capital.
Bloom, Nick, Stephen Bond and John Van Reenen. “Uncertainty and
Investment Dynamics,” Review of Economic Studies, 2007, 391-415.
Data for 672 UK manufacturing firms from 1972 to 1991.
Panel data, GMM
Stock returns.
Std. deviation of daily stock returns.
Effects of uncertainty are large. Uncertainty distribution halves the first
year investment response to demand shocks.
Ghosal, Vivek, and Prakash
Loungani. “Product Market
Competition and the Impact of Price
Uncertainty on Investment: Some
Evidence From US Manufacturing
Industries,” Journal of Industrial Economics, 1996, 217-228.
Data for 254 US 4-digit SIC
manufacturing industries from
1958 to 1989.
Panel data, fixed effect – IVE.
Product price.
Rolling regression
based conditional std.
deviation.
A negative relationship between
investment and price uncertainty only
exists in competitive industries. One
percentage increases in price
uncertainty is estimated to cause the
ratio of gross industry investment (I/K) decrease by 0.358 for most competitive
industries.
Fuss, Catherine, and Philip Vermeulen. “Firms' Investment
Decisions in Response to Demand
and Price Uncertainty,” Applied Economics, 2008, 2337-2351.
Survey of 279 firms from 1987-2000, and another survey of 319
firms from 1987-1999.
Panel data, GMM.
Expectations of future demand and prices.
Theil index.
Demand uncertainty at the time of planning depresses planned and realized
investment. One standard deviation
increases in demand uncertainty is estimated to reduce 6% of the average
investment ratio.
Ghosal, Vivek, and Prakash Data for 330 US SIC 4-digit Profits. Investment-uncertainty relationship is

27 Ghosal and Ye. Impact of Uncertainty on Employment and Number of Businesses.
Loungani. “The Differential Impact of
Uncertainty on Investment in Small and Large Businesses,” Review of
Economics and Statistics, 2000, 338-
343.
manufacturing industries from
1958 to 1991.
Panel data, IVE.
Rolling regression based conditional std.
deviation.
negative and this negative impact is
greater in industries dominated by small firms.
Huizinga, John. “Inflation Uncertainty, Relative Price
Uncertainty, and Investment in U.S.
Manufacturing,” Journal of Money, Credit and Banking, 1993, 521-549.
Data for 450 U.S. SIC 4-digit manufacturing industries from
1954 to 1989.
Cross-sectional data.
Real wage. Output price. Real materials
price.
Conditional std.
deviation.
Bivariate ARCH model.
Increased uncertainty about real wages portends an immediate and large drop in
capital expenditures, while increased
uncertainty about real output price does not.
Stein, Luke C.D., and Elizabeth C.
Stone. “The Effect of Uncertainty on
Investment: Evidence from Options,” Stanford University Working Paper,
2010.
Data for 2,230 US
manufacturing firms from 1996
to 2009.
Panel data, 2SLS.
Stock price.
Expected volatility.
They find a negative and statistically
significant relationship between
uncertainty and investment. The coefficients are larger after addressing
the endogeneity of the uncertainty
measure.
Folta, Timothy, and Jonathan P. O’Brien. “Entry in the Presence of
Dueling Options,” Strategic
Management Journal, 2004, 121-138.
Data for 2,230 US manufacturing firms from 1996
to 2009 and 17,897 firms from
1980 to 1999.
Multivariate binomial logit model
Industry’s contribution to GDP.
Square root of conditional variance.
GARCH model.
They find the effect of uncertainty on entry is non-monotonic and U-shaped.
And the turning points are influenced
by factors which should influence options to grow and defer. Uncertainty
has a potent effect on entry even after
controlling for firm resource profiles, including the relatedness to the target
industry.
Baker, Scott, Nick Bloom and Steven J. Davis. “Has Economic Policy
Uncertainty Hampered the
Recovery?” Chicago Booth Paper, No. 12-06, 2012.
Index of economic policy uncertainty, news-based proxy,
government purchases data,
disagreement about future indexes from 1985 to 2011. And
tax code expiration data is from
1991 to 2011.
VAR model
Merge economic policy uncertainty, news-based
proxy, government
purchases data and disagreement about
future indexes into a
new proxy.
Aggregating the above
Components to Obtain an Index of Economic
Policy Uncertainty
High levels of policy uncertainty in 2010 and 2011 mainly reflect concerns
about tax and monetary policy. Policy-
related concerns account for a large share of overall economic uncertainty. A
rise in policy uncertainty is associated
with substantially lower levels of output and employment compared with that of
actual changes since 2006.
Driver, Ciaran, Paul Temple and Giovanni Urga. “Profitability,
capacity, and uncertainty: a model of
UK manufacturing investment,” Oxford Economic Papers, 2005, 120–
141.
Aggregate data of UK manufacturing on two capital
assets (machinery and building)
from 1972 to 1999.
Linear-quadratic model
Output growth.
Time-series conditional
volatility. GARCH model
The GARCH model shows uncertainty variable for the full sample are
estimated to be negatively significant at
the 5% level for machinery, and negative but not significant for building.
Greasley, David, and Jakob B.
Madsen. “Investment and Uncertainty: Precipitating the Great
Depression in the United States,”
Economica, 2006, 393–412.
Data of investment information
in US from 1920 to 1938.
Tobin’s q
Real stock prices.
Squared monthly
proportional change.
Effects of uncertainty of the expected
marginal profitability of capital can explain around 80% of the actual fall in
the business fixed investment ratio in
1930. Thus, the investment slump largely led the declines in income.
Kilian, Lutz. “Exogenous Oil Supply
Shocks: How Big Are They and How Much Do They Matter for the U.S.
Economy?” Review of Economics
and Statistics. 2008, 216-240.
Monthly production data for all
OPEC countries and for aggregate non-OPEC oil
production since 1973.
OLS
Oil production.
Exogenous variation.
Using new exogenous oil supply shock
measure, it finds statistically significant evidence of a sharp drop in real GDP
growth and of a spike in CPI inflation
after an exogenous oil supply shock.
Guo, Hui, and Kevin L. Kliesen. “Oil
Price Volatility and U.S. Macroeconomic Activity,” Federal
Reserve Bank of St. Louis Review,
2005, 669-83.
Data of daily price of U.S. 1-
month futures and 12- month futures contracts from 1983 to
2004.
Forecasting regression
Oil prices.
Realized variance
series.
Oil price volatility has a negative and
significant effect on future GDP growth over the period 1984-2004. Moreover,
the effect becomes more significant
after oil price changes are also included in the regression to control for the
symmetric effect.
Elder, John. “Another Perspective on
the Effects of Inflation Uncertainty,” Journal of Money, Credit & Banking,
2004, 911-928.
Data of U.S. output growth rate,
inflation, CPI, commodity price from 1966 to 2000.
Cross-section data,
Inflation
Conditional variance. MGARCH-M VAR
model
Uncertainty about inflation has
significantly reduced real economic activity over the post-1982 period. One
standard deviation increase in inflation
uncertainty tends to reduce real

28 Ghosal and Ye. Impact of Uncertainty on Employment and Number of Businesses.
VAR model
economic activity by about 22 basis
points in the post-1982 period.
Stilianos Fountas, Menelaos Karanasos and Jinki Kim. “Inflation
Uncertainty, Output Growth
Uncertainty and Macroeconomic Performance,” Oxford Bulletin of
Economics and Statistics. 2006, 319-
343.
Monthly data for the G7 on PI and the IPI.
VAR model. Granger-causality
tests
Inflation Output growth
Bivariate GARCH
model. Conditional variance
First, inflation causes negative welfare effect. Second, in some countries
(Canada and the UK) more inflation
uncertainty provokes Central Banks to surprise the public by raising inflation
unexpectedly. Thirdly, More business
cycle variability increases output growth.
Ghosal, Vivek. “Demand Uncertainty
and Capital-Labor Ration: Evidence from U.S. manufacturing Sector,” The
Review of Economics and Statistics,
1991, 157-161.
Date for 125 U.S.
manufacturing industries from 1968 to 1977.
OLS
Fluctuations of
shipments
Standard deviation
There is a significant negative
relationship between demand uncertainty and the capital-labor ratio,
and that an increase in firm size
counteracts this negative influence.
Ghosal, Vivek. “Does uncertainty influence the number of firms in an
industry?” Economics Letters, 1996,
229-236.
Date for 196 U.S. industries from 1973-1986.
IV Estimation
Industry-specific price
Standard deviation of
residuals
Price uncertainty has a statistically significant and quantitatively large
negative impact on the number of firms
in an industry.
Li, Yong. “Duration analysis of
venture capital staging: A real options
perspective,” Journal of Business Venturing, 2008, 497–512.
46,976 portfolio company-round
pairs in U.S. for 1975–2005,
involving 3737 venture capital firms and 15,786 portfolio
companies.
Weibull regression model
Market price volatility;
The stage of
development.
Conditional variance for
market uncertainty GARCH model
Market uncertainty encourages venture
capital firms to delay investing at each
round of financing, whereas competition, project-specific
uncertainty and agency concerns
prompt venture capital firms to invest sooner.
Podoynitsyna, Ksenia, Michael Song,
Hans van der Bij and Mathieu Weggeman. “Improving new
technology venture performance
under direct and indirect network externality conditions,” Journal of
Business Venturing, 2013 195–210.
A sample of 385 NTVs drawn
from the VentureOne 2001 database and the 1995–2000
Inc. 500 list.
OLS multiple regression
Five main uncertainty
management strategies
Use scales to measure
each of the five strategies.
They show that real option reasoning
does not always perform better under conditions of higher uncertainty, such as
uncertainty due to direct network
externalities.
Li, Yong, Joseph T. Mahoney “When
are venture capital projects initiated?” Journal of Business Venturing, 2011,
239–254.
Date of venture capital
investment of 22,164 ventures made between 1980 and 2007 in
the U.S.
Accelerated-failure-time models
Volatility of market
returns.
The standard error of
the regression.
Venture capitalists tend to defer new
investment projects in target industries with substantial market volatility. This
delay effect is reduced if the target
industry experiences high sales growth or if competition is intense.
Li, Dan. “Multilateral R&D alliances
by new ventures,” Journal of Business Venturing, 2013, 241–260.
346 new ventures in high-
technology industries from 1990 to 2005.
Heckman two-stage regressions.
Mean monthly stock
price volatility.
Standard deviation.
An inverted U-shaped relationship
between market uncertainty and a new venture's likelihood of forming
multilateral R&D alliances.
Freel, Mark S.. “Perceived Environmental Uncertainty and
Innovation in Small Firms,” Small
Business Economics, 2005, 49–64.
Firm-level survey data of UK SMEs in 1996, 1998, 2000.
Discriminant functions
Supply, finance, competitors, trade
Asking the firms to report their feeling of
uncertainty on a five-
point scale.
Higher levels of innovation in manufacturing firms are associated with
higher perceptions of supplier
uncertainty, whilst, higher levels of innovation in service firms are
associated with higher perceptions of
human resource uncertainty.
Drakos, Konstantinos and Panagiotis
T. Konstantinou. “Investment
Decisions in Manufacturing: Assessing the Effects of Real Oil
Prices and their Uncertainty,” Journal
of Applied Econometrics. 2013, 151-
165.
Data of 51881 plant-year
observations for Greece for the
period 1994 to 2005.
Unbalanced panel data.
Dynamic discrete choice
models.
Real oil price.
Profits.
Daily stock returns from the Industrials
Price Index.
GARCH model.
Using he CRE estimators of
Wooldridge, they find that that an
increase in measure of real oil price uncertainty by 0.01 reduces the
probability of investment action by 0.46
percent.
Smaller plants are influenced more by
rising real oil-price uncertainty.
29 Ghosal and Ye. Impact of Uncertainty on Employment and Number of Businesses.
References
Abel, Andrew. “Optimal Investment under Uncertainty,” American Economic Review, 1983,
228–233.
Appelbaum, Elie, and Eliakim Katz. “Measures of Risk Aversion and Comparative Statics of
Industry Equilibrium,” American Economic Review, 1986, 524–529.
Association of Chartered Certified Accountants (ACCA). “Small Business: A Global Agenda,”
ACCA Accountants for Business Report, 2010.
Audretsch, David. Innovation and Industry Evolution. Cambridge: MIT Press, 1995.
Audretsch, David, and Julie Elston. “Does Firm Size Matter? Evidence on the Impact of
Liquidity Constraints on Firm Investment Behavior in Germany,” International Journal of
Industrial Organization, 2002, 1–17.
Audretsch, David, and Julie Elston. “Financing the German Mittelstand,” Small Business
Economics, 1997, 97-110.
Baker, Scott, Nicholas Bloom and Steven Davis. “Has Economic Policy Uncertainty Hampered
the Recovery?” Chicago Booth Paper, No. 12-06, 2012.
Baldwin, John, Guy Gellatly and Valérie Gaudreault. “Financing Innovation in New Small
Firms: New Evidence From Canada,” Statistics Canada Analytical Studies Series, 2002.
Bianco, Magda, Maria Elena Bontempi, Roberto Golinelli and Giuseppe Parigi. “Family Firms’
Investments, Uncertainty and Opacity,” Small Business Economics, 2012, 1-24.
Bloom, Nick, Stephen Bond and John van Reenen. “Uncertainty and Investment Dynamics,”
Review of Economic Studies, 2007, 391-415.
Bo, Hong, and Elmer Sterken. “Volatility of the Interest Rate, Debt and Firm Investment: Dutch
Evidence,” Journal of Corporate Finance, 2002, 179–193.
Box, G.E.P., and , G.M. Jenkins. Time Series Analysis, Forecasting and Control. San
Francisco: Holden Day, 1970.
Carland, J.W., F. Hoy, W. R. Boulton, and J.A.C. Carland, “Differentiating Entrepreneurs from
Small Business Owners: A Conceptualization,” Academy of Management Review, 1984, 358.
Caves, Richard. “Industrial Organization and New Findings on the Turnover and Mobility of
Firms,” Journal of Economic Literature, 1998, 1947-1982.

30 Ghosal and Ye. Impact of Uncertainty on Employment and Number of Businesses.
Campbell, John, and John Cochrane. “By Force of Habit: A Consumption-Based Explanation of
Aggregate Stock Market Behavior,” Journal of Political Economy 107, 1999, 205-251.
Delli Gatti, Domenico, Mauro Gallegati, Gianfranco Giulioni and Antonio Palestrini. “Financial
Fragility, Patterns of Firms’ Entry and Exit and Aggregate Dynamics,” Journal of Economic
Behavior and Organization 51, 2003, 79-97.
Driver, Ciaran, Paul Temple and Giovanni Urga. “Profitability, Capacity, and Uncertainty: A
Model of UK Manufacturing Investment,” Oxford Economic Papers, 2005, 120–141.
Driver, Ciaran, and Brendan Whelan. “The Effect of Business Risk on Manufacturing
Investment,” Journal of Economic Behavior and Organization 44, 2001, 403-412.
Evans, David and Boyan Jovanovic. “An Estimated Model of Entrepreneurial Choice under
Liquidity Constraints,” Journal of Political Economy, 1989, 808-827.
Fazzari, Steven, Glenn Hubbard and Bruce Petersen, “Financing Constraints and Corporate
Investment.” Brookings Papers on Economic Activity, 1988, 141-195.
Federal Reserve Bank of Philadelphia. “Survey of Professional Forecasters.”
Folta, Timothy, and Jonathan O’Brien. “Entry in the Presence of Dueling Options,” Strategic
Management Journal, 2004, 121-138.
Freel, Mark S. “Perceived Environmental Uncertainty and Innovation in Small Firms,” Small
Business Economics, 2005, 49–64.
Fuss, Catherine, and Philip Vermeulen. “Firms’ Investment Decisions in Response to Demand
and Price Uncertainty,” Applied Economics, 2008, 2337-2351.
Gertler, Mark, and Simon Gilchrist. “Monetary Policy, Business Cycles, and the Behavior of
Small Manufacturing Firms,” Quarterly Journal of Economics, 1994, 309-340.
Ghosal, Vivek, and Prakash Loungani. “The Differential Impact of Uncertainty on Investment in
Small and Large Businesses,” Review of Economics and Statistics, 2000, 338-343.
Ghosal, Vivek, and Prakash Loungani. “Product Market Competition and the Impact of Price
Uncertainty on Investment: Some Evidence From US Manufacturing Industries,” Journal of
Industrial Economics, 1996, 217-228.
Ghosal, Vivek. “Does Uncertainty Influence the Number of Firms in an Industry?” Economics
Letters 50, 1996, 229 – 237.
Ghosal, Vivek. “Demand Uncertainty and the Capital-Labor Ratio: Evidence from the U.S.
Manufacturing Sector,” Review of Economics and Statistics 73, 1991, 157 – 162.

31 Ghosal and Ye. Impact of Uncertainty on Employment and Number of Businesses.
Gollier, Christian, and Richard Zeckhauser. “Aggregation of Heterogeneous Time Preferences,”
Journal of Political Economy 113, 2005, 878-896.
Greasley, David, and Jakob Madsen. “Investment and Uncertainty: Precipitating the Great
Depression in the United States,” Economica, 2006, 393–412.
Greenwald, Bruce, and Joseph Stiglitz. “Macroeconomic Models with Equity and Credit
Rationing,” in Hubbard, R. Glenn. ed., Asymmetric Information, Corporate Finance, and
Investment. Chicago: University of Chicago Press, 1990, 15-42.
Guo, Hui, and Kevin Kliesen. “Oil Price Volatility and U.S. Macroeconomic Activity,” Federal
Reserve Bank of St. Louis Review, 2005, 669-83.
Hartman, Richard. “Factor Demand with Output Price Uncertainty,” American Economic
Review, 1976, 675–681.
Hendry, David, Adrian Pagan and Denis Sargan. “Dynamic Specification,” in Zvi Griliches and
Michael Intriligator (Eds.), Handbook of Econometrics, Amsterdam: North-Holland, 1983.
Himmelberg, Charles, and Bruce Petersen. “R & D and Internal Finance: A Panel Study of Small
Firms in High-Tech Industries,” Review of Economics and Statistics, 1994, 38-51.
Holt Charles, Franco Modigliani, John Muth and Herbert Simon. Planning Production,
Inventories and Work Force, Englewood Cliffs: Prentice Hall, 1960.
Hopenhayn, Hugo. “Entry, Exit and Firm Dynamics in Long Run Equilibrium,” Econometrica,
1992, 1127-1150.
Huizinga, John. “Inflation Uncertainty, Relative Price Uncertainty, and Investment in U.S.
Manufacturing,” Journal of Money, Credit and Banking, 1993, 521-549.
Jorgenson, Dale. “Econometric Methods for Modeling Producer Behavior,” in Zvi Griliches and
Michael Intriligator (Eds.), Handbook of Econometrics, Amsterdam: North Holland, 1986.
Kilian, Lutz. “Exogenous Oil Supply Shocks: How Big Are They and How Much Do They
Matter for the U.S. Economy?” Review of Economics and Statistics. 2008, 216-240.
Katz, Jerome, and Richard Green. Entrepreneurial Small Business, McGraw-Hill, 2010.
Koetse, Mark J., Arno J. van der Vlist and Henri L. F. de Groot, “The Impact of Perceived
Expectations and Uncertainty on Firm Investment,” Small Business Economics, 2006, 365-376.
Kennan, John. “The Estimation of Partial Adjustment Models with Rational Expectations,”
Econometrica, 1979. 1441–1455.

32 Ghosal and Ye. Impact of Uncertainty on Employment and Number of Businesses.
Lensink, Robert, Hong Bo and Elmer Sterken Investment. Capital Market Imperfections, and
Uncertainty: Theory and Empirical Results. Edgar Elgar, 2001.
Lensink, Robert, Paul van Steen and Elmer Sterken. “Uncertainty and Growth of the Firm,”
Small Business Economics, 2005, 381-391.
Li, Dan. “Multilateral R&D Alliances by New Ventures,” Journal of Business Venturing, 2013,
241–260.
Li, Yong. “Duration Analysis of Venture Capital Staging: A Real Options Perspective,” Journal
of Business Venturing, 2008, 497–512.
Li, Yong, Joseph T. Mahoney “When are venture capital projects initiated?” Journal of Business
Venturing, 2011, 239–254.
Lucas, Robert E. “Asset Prices in an Exchange Economy,” Econometrica 46, 1976, 1429–1445.
Marcellino, Massimiliano, James Stock and Mark Watson. “Macroeconomic Forecasting in
the Euro Area: Country Specific versus Euro Wide Information,” European Economic
Review, 2003, 1-18.
Meese, Richard, and John Geweke. “A Comparison of Autoregressive Univariate Forecasting
Procedures for Macroeconomic Time Series,” Journal of Business and Economic
Statistics, 1984, 191-200.
National Economic Council. “The Small Business Agenda: Growing America’s Small
Businesses to Win the Future,” 2011.
Oriani, Raffaele, and Maurizio Sobrero. “Uncertainty and the Market Valuation of R&D within a
Real Options Logic,” Strategic Management Journal, 2008, 343-361.
Pakes, Ariel, and Richard Ericson. “Empirical Implications of Alternate Models of Firm
Dynamics,” Journal of Economic Theory, 1998, 1-45.
Podoynitsyna, Ksenia, Michael Song, Hans van der Bij and Mathieu Weggeman. “Improving
New Technology Venture Performance under Direct and Indirect Network Externality
Conditions,” Journal of Business Venturing, 2013 195–210.
Saemundsson, Rognvaldur, and Asa Lindholm Dahlstrand. “How Business Opportunities
Constrain Young Technology-Based Firms from Growing into Medium-Sized Firms,” Small
Business Economics, 2005, 113-129.
Schmitt, John, and Nathan Lane “An International Comparison of Small Business Employment,”
Center for Economic and Policy Research (CEPR) Reports and Issue Briefs, 2009.

33 Ghosal and Ye. Impact of Uncertainty on Employment and Number of Businesses.
Sheets, Nathan, and Robert Sockin. “Does Size Really Matter?: The Evolving Role of Small
Firms in the U.S. Economy,” Empirical & Thematic Perspectives, Citi Research, 2012.
Stein, Luke, and Elizabeth Stone. “The Effect of Uncertainty on Investment: Evidence from
Options,” Stanford University Working Paper, 2010.
Sutton, John. “Gibrat’s Legacy,” Journal of Economic Literature, 1997(a), 40-59.
U.S. Small Business Administration. Advocacy: the voice of small business in government.
“Frequently Asked Questions about Small Business Finance,”
Winker, Peter. “Causes and Effects of Financing Constraints at the Firm Level,” Small Business
Economics, 1999, 169-181.

34 Ghosal and Ye. Impact of Uncertainty on Employment and Number of Businesses.
Figures 1.1-1.4: Growth of employment by size class
Figure 1.1. Growth of total employment
Figure 1.2. Growth of employment in large (≥500 employees) businesses
Figure 1.3. Growth of employment in small (<500 employees) businesses
Figure 1.4. Growth of employment in small (<20 employees) businesses
-0.06
-0.04
-0.02
-1E-16
0.02
0.04
0.06
1988 1990 1992 1994 1996 1998 2000 2002 2004 2006 2008 2010
-0.06
-0.04
-0.02
0
0.02
0.04
0.06
1988 1990 1992 1994 1996 1998 2000 2002 2004 2006 2008 2010
-0.06
-0.04
-0.02
0
0.02
0.04
1988 1990 1992 1994 1996 1998 2000 2002 2004 2006 2008 2010
-0.04
-0.02
0
0.02
0.04
1988 1990 1992 1994 1996 1998 2000 2002 2004 2006 2008 2010

35 Ghosal and Ye. Impact of Uncertainty on Employment and Number of Businesses.
Figures 2.1-2.4: Growth of number of businesses by size class
Figure 2.1. Growth of total number of businesses
Figure 2.2. Growth of number of large (≥500 employees) businesses
Figure 2.3. Growth of number of small (<500 employees) businesses
Figure 2.4. Growth of number of small (<20 employees) businesses
-0.04
-0.02
0
0.02
0.04
1988 1990 1992 1994 1996 1998 2000 2002 2004 2006 2008 2010
-0.06
-0.04
-0.02
0
0.02
0.04
0.06
0.08
1988 1990 1992 1994 1996 1998 2000 2002 2004 2006 2008 2010
-0.04
-0.02
0
0.02
0.04
1988 1990 1992 1994 1996 1998 2000 2002 2004 2006 2008 2010
-0.03
-0.02
-0.01
0
0.01
0.02
0.03
1988 1990 1992 1994 1996 1998 2000 2002 2004 2006 2008 2010

36 Ghosal and Ye. Impact of Uncertainty on Employment and Number of Businesses.
Table 1. Summary statistics
Variable Mean Std. Dev. C.V.
1. Growth of Employment
EMP Size: All
0.01103 0.02258 204.7
EMP
Size: Large w ≥500 employees
0.01615 0.02537 157.1
EMP Size: Small w <500 employees
0.00626 0.02158 344.7
EMP
Size: Small w <20 employees
0.00527 0.01281 243.1
2. Growth of Number of Businesses
FIRMS
Size: All
0.00664 0.01226 184.6
FIRMS
Size: Large w ≥500 employees
0.01219 0.03188 261.5
FIRMS
Size: Small w <500 employees
0.00662 0.01224 338.3
FIRMS
Size: Small w <20 employees
0.00679 0.01168 172.0
3. Growth of Real GDP 0.02550 0.01814 71.1
4. Uncertainty Measures
0.17861 0.25266 141.4
0.51206 0.73873 144.2
0.00027 0.00052 192.6
0.00003 0.00005 166.7
0.01836 0.01920 104.6
0.00842 0.01281 152.1
Notes: C.V. denotes coefficient of variation (percent).
Table 2. Pearson correlation coefficients
Uncertainty measures
1.0000
0.6543
(0.001)
0.7510
(0.001)
0.4144
(0.044)
0.4083
(0.048)
0.4381
(0.032)
0.6543
(0.001) 1.0000 0.7772
(0.001) 0.6002 (0.002)
0.4559 (0.025)
0.6358 (0.001)
0.7510
(0.001)
0.7772
(0.001)
1.0000 0.6941
(0.001)
0.5501
(0.005)
0.6934
(0.001)
0.4144
(0.044) 0.6002 (0.002)
0.6941 (0.001)
1.00000
0.4047 (0.050)
0.6288 (0.001)
0.4083
(0.048)
0.4559
(0.025)
0.5501
(0.005)
0.4047
(0.050)
1.0000 0.3688
(0.076)
0.4381
(0.032) 0.6358 (0.001)
0.6934 (0.0002)
0.6288 (0.001)
0.3688 (0.076)
1.0000
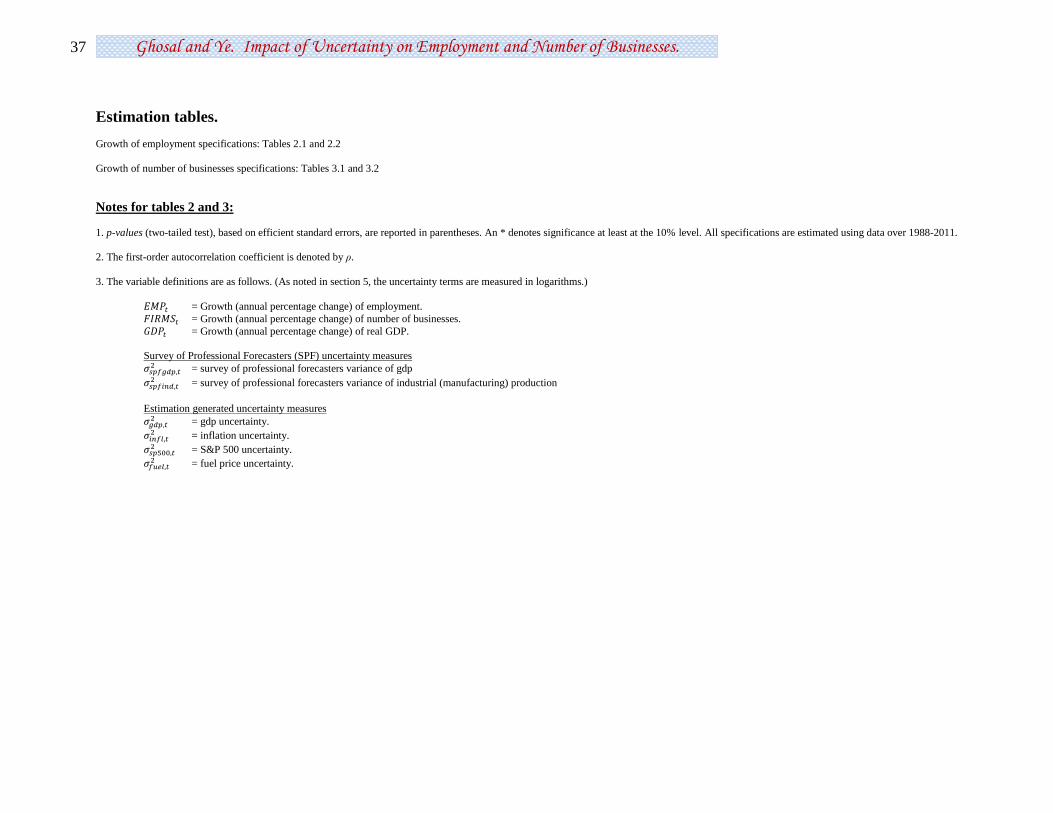
37 Ghosal and Ye. Impact of Uncertainty on Employment and Number of Businesses.
Estimation tables. Growth of employment specifications: Tables 2.1 and 2.2
Growth of number of businesses specifications: Tables 3.1 and 3.2
Notes for tables 2 and 3:
1. p-values (two-tailed test), based on efficient standard errors, are reported in parentheses. An * denotes significance at least at the 10% level. All specifications are estimated using data over 1988-2011.
2. The first-order autocorrelation coefficient is denoted by ρ.
3. The variable definitions are as follows. (As noted in section 5, the uncertainty terms are measured in logarithms.)
= Growth (annual percentage change) of employment.
= Growth (annual percentage change) of number of businesses.
= Growth (annual percentage change) of real GDP.
Survey of Professional Forecasters (SPF) uncertainty measures
= survey of professional forecasters variance of gdp
= survey of professional forecasters variance of industrial (manufacturing) production
Estimation generated uncertainty measures
= gdp uncertainty.
= inflation uncertainty.
= S&P 500 uncertainty.
= fuel price uncertainty.
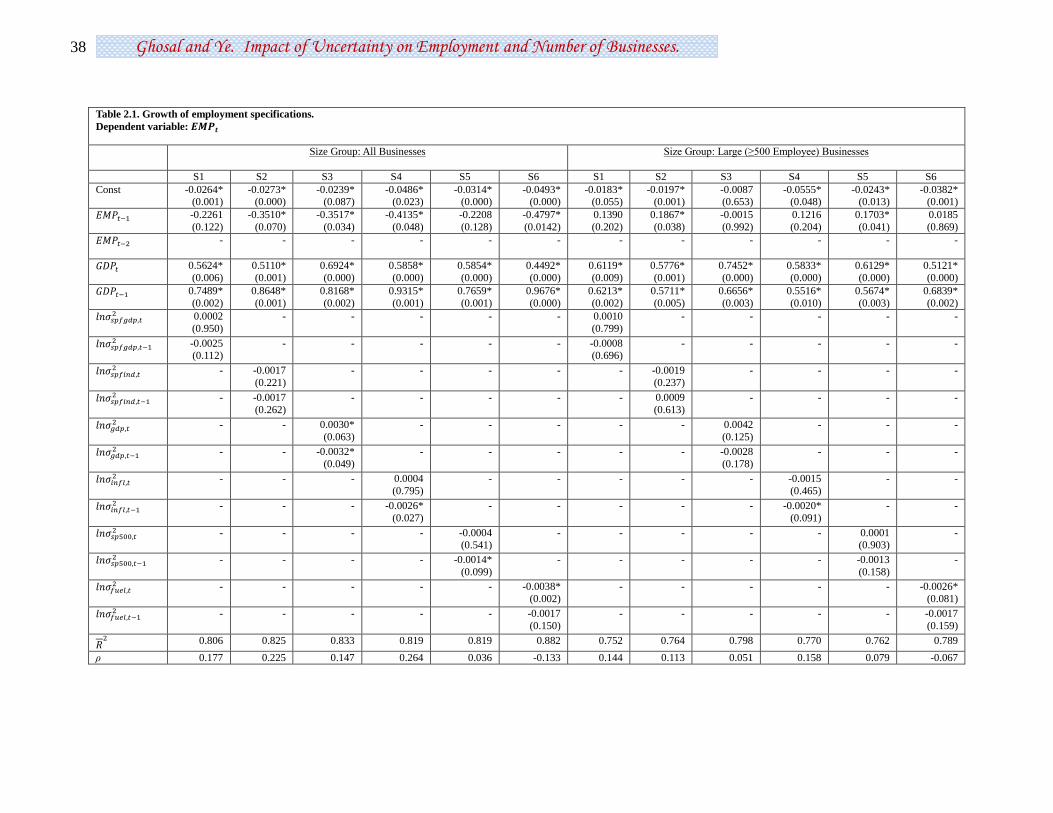
38 Ghosal and Ye. Impact of Uncertainty on Employment and Number of Businesses.
Table 2.1. Growth of employment specifications.
Dependent variable:
Size Group: All Businesses
Size Group: Large (≥500 Employee) Businesses
S1 S2 S3 S4 S5 S6 S1 S2 S3 S4 S5 S6
Const
-0.0264* (0.001)
-0.0273* (0.000)
-0.0239* (0.087)
-0.0486* (0.023)
-0.0314* (0.000)
-0.0493* (0.000)
-0.0183* (0.055)
-0.0197* (0.001)
-0.0087 (0.653)
-0.0555* (0.048)
-0.0243* (0.013)
-0.0382* (0.001)
-0.2261
(0.122)
-0.3510*
(0.070)
-0.3517*
(0.034)
-0.4135*
(0.048)
-0.2208
(0.128)
-0.4797*
(0.0142)
0.1390
(0.202)
0.1867*
(0.038)
-0.0015
(0.992)
0.1216
(0.204)
0.1703*
(0.041)
0.0185
(0.869)
- - - - - - - - - - - -
0.5624*
(0.006)
0.5110*
(0.001)
0.6924*
(0.000)
0.5858*
(0.000)
0.5854*
(0.000)
0.4492*
(0.000)
0.6119*
(0.009)
0.5776*
(0.001)
0.7452*
(0.000)
0.5833*
(0.000)
0.6129*
(0.000)
0.5121*
(0.000)
0.7489*
(0.002)
0.8648*
(0.001)
0.8168*
(0.002)
0.9315*
(0.001)
0.7659*
(0.001)
0.9676*
(0.000)
0.6213*
(0.002)
0.5711*
(0.005)
0.6656*
(0.003)
0.5516*
(0.010)
0.5674*
(0.003)
0.6839*
(0.002)
0.0002
(0.950)
- - - - - 0.0010
(0.799)
- - - - -
-0.0025 (0.112)
- - - - - -0.0008 (0.696)
- - - - -
- -0.0017
(0.221)
- - - - - -0.0019
(0.237)
- - - -
- -0.0017
(0.262)
- - - - - 0.0009
(0.613)
- - - -
- - 0.0030*
(0.063)
- - - - - 0.0042
(0.125)
- - -
- - -0.0032*
(0.049)
- - - - - -0.0028
(0.178)
- - -
- - - 0.0004
(0.795)
- - - - - -0.0015
(0.465)
- -
- - - -0.0026*
(0.027)
- - - - - -0.0020*
(0.091)
- -
- - - - -0.0004 (0.541)
- - - - - 0.0001 (0.903)
-
- - - - -0.0014*
(0.099)
- - - - - -0.0013
(0.158)
-
- - - - - -0.0038*
(0.002)
- - - - - -0.0026*
(0.081)
- - - - - -0.0017
(0.150)
- - - - - -0.0017
(0.159)
0.806 0.825 0.833 0.819 0.819 0.882 0.752 0.764 0.798 0.770 0.762 0.789
ρ 0.177 0.225 0.147 0.264 0.036 -0.133 0.144 0.113 0.051 0.158 0.079 -0.067
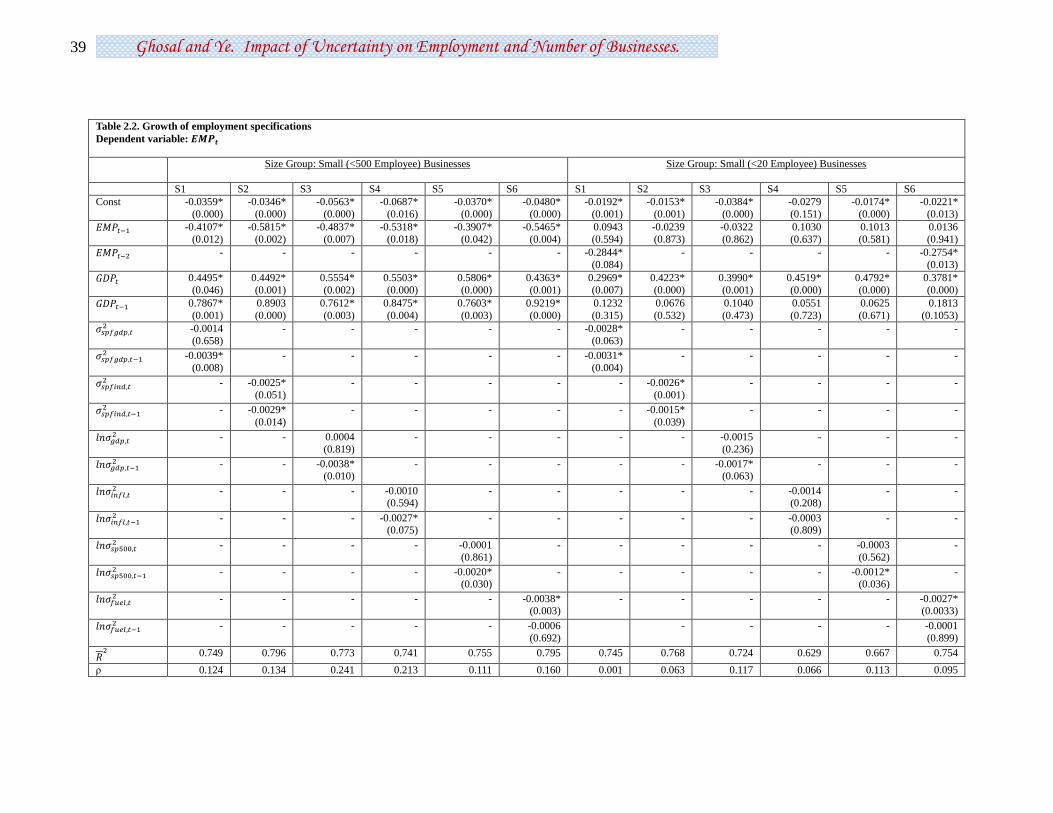
39 Ghosal and Ye. Impact of Uncertainty on Employment and Number of Businesses.
Table 2.2. Growth of employment specifications
Dependent variable:
Size Group: Small (<500 Employee) Businesses
Size Group: Small (<20 Employee) Businesses
S1 S2 S3 S4 S5 S6 S1 S2 S3 S4 S5 S6
Const
-0.0359*
(0.000)
-0.0346*
(0.000)
-0.0563*
(0.000)
-0.0687*
(0.016)
-0.0370*
(0.000)
-0.0480*
(0.000)
-0.0192*
(0.001)
-0.0153*
(0.001)
-0.0384*
(0.000)
-0.0279
(0.151)
-0.0174*
(0.000)
-0.0221*
(0.013)
-0.4107*
(0.012)
-0.5815*
(0.002)
-0.4837*
(0.007)
-0.5318*
(0.018)
-0.3907*
(0.042)
-0.5465*
(0.004)
0.0943
(0.594)
-0.0239
(0.873)
-0.0322
(0.862)
0.1030
(0.637)
0.1013
(0.581)
0.0136
(0.941)
- - - - - - -0.2844*
(0.084)
- - - - -0.2754*
(0.013)
0.4495*
(0.046)
0.4492*
(0.001)
0.5554*
(0.002)
0.5503*
(0.000)
0.5806*
(0.000)
0.4363*
(0.001)
0.2969*
(0.007)
0.4223*
(0.000)
0.3990*
(0.001)
0.4519*
(0.000)
0.4792*
(0.000)
0.3781*
(0.000)
0.7867*
(0.001)
0.8903
(0.000)
0.7612*
(0.003)
0.8475*
(0.004)
0.7603*
(0.003)
0.9219*
(0.000)
0.1232
(0.315)
0.0676
(0.532)
0.1040
(0.473)
0.0551
(0.723)
0.0625
(0.671)
0.1813
(0.1053)
-0.0014
(0.658)
- - - - - -0.0028*
(0.063)
- - - - -
-0.0039*
(0.008)
- - - - - -0.0031*
(0.004)
- - - - -
- -0.0025*
(0.051)
- - - - - -0.0026*
(0.001)
- - - -
- -0.0029*
(0.014)
- - - - - -0.0015*
(0.039)
- - - -
- - 0.0004
(0.819)
- - - - - -0.0015
(0.236)
- - -
- - -0.0038* (0.010)
- - - - - -0.0017* (0.063)
- - -
- - - -0.0010 (0.594)
- - - - - -0.0014 (0.208)
- -
- - - -0.0027* (0.075)
- - - - - -0.0003 (0.809)
- -
- - - - -0.0001
(0.861)
- - - - - -0.0003
(0.562)
-
- - - - -0.0020* (0.030)
- - - - - -0.0012* (0.036)
-
- - - - - -0.0038* (0.003)
- - - - - -0.0027* (0.0033)
- - - - - -0.0006
(0.692)
- - - - -0.0001
(0.899)
0.749 0.796 0.773 0.741 0.755 0.795 0.745 0.768 0.724 0.629 0.667 0.754
ρ 0.124 0.134 0.241 0.213 0.111 0.160 0.001 0.063 0.117 0.066 0.113 0.095
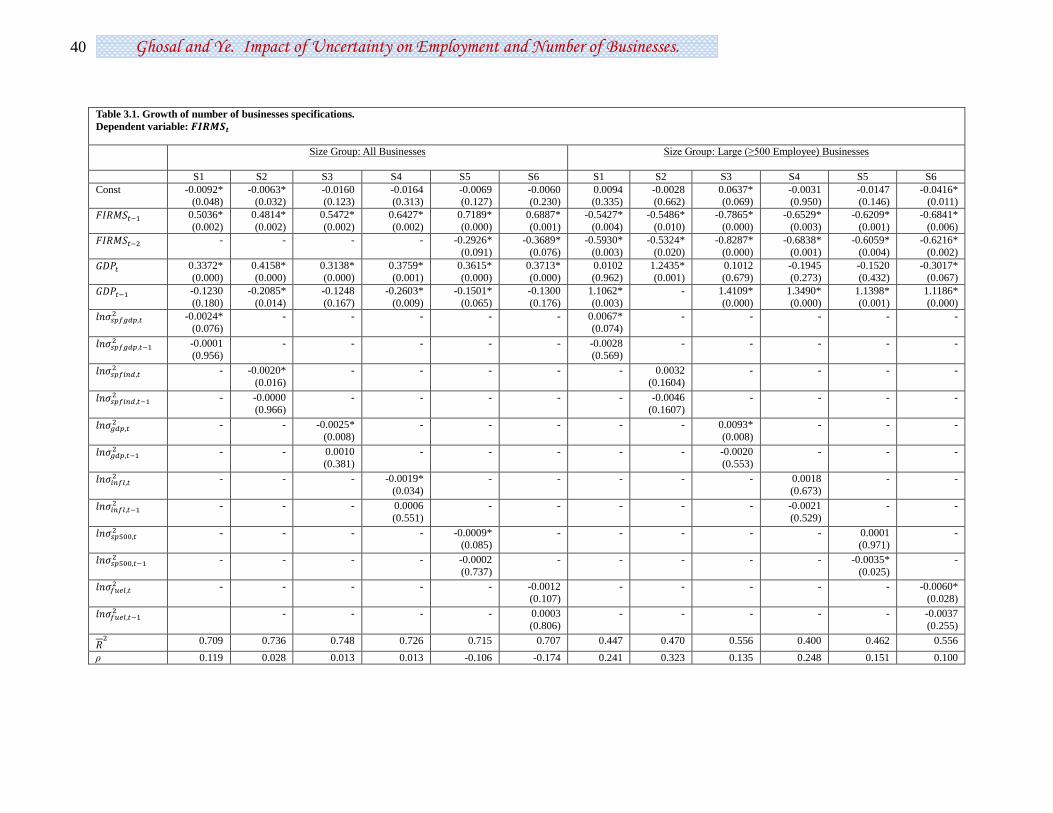
40 Ghosal and Ye. Impact of Uncertainty on Employment and Number of Businesses.
Table 3.1. Growth of number of businesses specifications.
Dependent variable:
Size Group: All Businesses
Size Group: Large (≥500 Employee) Businesses
S1 S2 S3 S4 S5 S6 S1 S2 S3 S4 S5 S6
Const
-0.0092* (0.048)
-0.0063* (0.032)
-0.0160 (0.123)
-0.0164 (0.313)
-0.0069 (0.127)
-0.0060 (0.230)
0.0094 (0.335)
-0.0028 (0.662)
0.0637* (0.069)
-0.0031 (0.950)
-0.0147 (0.146)
-0.0416* (0.011)
0.5036*
(0.002)
0.4814*
(0.002)
0.5472*
(0.002)
0.6427*
(0.002)
0.7189*
(0.000)
0.6887*
(0.001)
-0.5427*
(0.004)
-0.5486*
(0.010)
-0.7865*
(0.000)
-0.6529*
(0.003)
-0.6209*
(0.001)
-0.6841*
(0.006)
- - - - -0.2926*
(0.091)
-0.3689*
(0.076)
-0.5930*
(0.003)
-0.5324*
(0.020)
-0.8287*
(0.000)
-0.6838*
(0.001)
-0.6059*
(0.004)
-0.6216*
(0.002)
0.3372*
(0.000)
0.4158*
(0.000)
0.3138*
(0.000)
0.3759*
(0.001)
0.3615*
(0.000)
0.3713*
(0.000)
0.0102
(0.962)
1.2435*
(0.001)
0.1012
(0.679)
-0.1945
(0.273)
-0.1520
(0.432)
-0.3017*
(0.067)
-0.1230
(0.180)
-0.2085*
(0.014)
-0.1248
(0.167)
-0.2603*
(0.009)
-0.1501*
(0.065)
-0.1300
(0.176)
1.1062*
(0.003)
- 1.4109*
(0.000)
1.3490*
(0.000)
1.1398*
(0.001)
1.1186*
(0.000)
-0.0024*
(0.076)
- - - - - 0.0067*
(0.074)
- - - - -
-0.0001 (0.956)
- - - - - -0.0028 (0.569)
- - - - -
- -0.0020*
(0.016)
- - - - - 0.0032
(0.1604)
- - - -
- -0.0000
(0.966)
- - - - - -0.0046
(0.1607)
- - - -
- - -0.0025*
(0.008)
- - - - - 0.0093*
(0.008)
- - -
- - 0.0010
(0.381)
- - - - - -0.0020
(0.553)
- - -
- - - -0.0019*
(0.034)
- - - - - 0.0018
(0.673)
- -
- - - 0.0006
(0.551)
- - - - - -0.0021
(0.529)
- -
- - - - -0.0009* (0.085)
- - - - - 0.0001 (0.971)
-
- - - - -0.0002
(0.737)
- - - - - -0.0035*
(0.025)
-
- - - - - -0.0012
(0.107)
- - - - - -0.0060*
(0.028)
- - - - 0.0003
(0.806)
- - - - - -0.0037
(0.255)
0.709 0.736 0.748 0.726 0.715 0.707 0.447 0.470 0.556 0.400 0.462 0.556
ρ 0.119 0.028 0.013 0.013 -0.106 -0.174 0.241 0.323 0.135 0.248 0.151 0.100

41 Ghosal and Ye. Impact of Uncertainty on Employment and Number of Businesses.
Table 3.2. Growth of number of businesses specifications.
Dependent variable:
Size Group: Small (<500 Employee) Businesses
Size Group: Small (<20 Employee) Businesses
S1 S2 S3 S4 S5 S6 S1 S2 S3 S4 S5 S6
Const
-0.0091* (0.049)
-0.0062* (0.033)
-0.0157 (0.129)
-0.0159 (0.318)
-0.0067 (0.128)
-0.0057 (0.245)
-0.0077 (0.137)
-0.0048 (0.185)
-0.0153 (0.259)
-0.0201 (0.3203)
-0.0079 (0.152)
-0.0044 (0.371)
0.515*
(0.001)
0.4919*
(0.002)
0.5591*
(0.002)
0.6506*
(0.002)
0.7356*
(0.000)
0.7052*
(0.000)
0.4558*
(0.011)
0.4012*
(0.032)
0.4619*
(0.032)
0.5159*
(0.027)
0.4710*
(0.013)
0.4802*
(0.021)
- - - - -0.3007*
(0.074)
-0.3720*
(0.070)
- - - - - -
0.3340*
(0.000)
0.4126*
(0.000)
0.3103*
(0.000)
0.3740*
(0.001)
0.3576*
(0.000)
0.3686
(0.158)
0.2765*
(0.001)
0.3774*
(0.001)
0.2638*
(0.004)
0.3454*
(0.007)
0.3806*
(0.0008)
0.3760*
(0.001)
-0.1266
(0.162)
-0.2116*
(0.013)
-0.1274
(0.154)
-0.2609*
(0.008)
-0.1529*
(0.056)
-0.1345
(0.158)
-0.1061
(0.288)
-0.2085*
(0.011)
-0.1073
(0.274)
-0.2434*
(0.014)
-0.1897*
(0.023)
-0.1755*
(0.053)
-0.0024*
(0.075)
- - - - - -0.0030*
(0.057)
- - - - -
-0.0001
(0.961)
- - - - - 0.0005
(0.691)
- - - - -
- -0.0020*
(0.017)
- - - - - -0.0020*
(0.0513)
- - - -
- -0.0000
(0.966)
- - - - - -0.0002
(0.801)
- - - -
- - -0.0025*
(0.008)
- - - - - -0.0027*
(0.008)
- - -
- - 0.0011
(0.366)
- - - - - 0.0012
(0.382)
- - -
- - - -0.0019*
(0.039)
- - - - - -0.0020*
(0.062)
- -
- - - 0.0006
(0.555)
- - - - - 0.0002
(0.863)
- -
- - - - -0.0009* (0.081)
- - - - - -0.0005 (0.438)
-
- - - - -0.0002
(0.763)
- - - - - -0.0007
(0.260)
-
- - - - - -0.0011
(0.105)
- - - - - -0.0006
(0.531)
- - - - 0.0003
(0.781)
- - - - - 0.0001
(0.929)
0.712 0.738 0.750 0.726 0.719 0.711 0.606 0.609 0.637 0.594 0.575 0.545
ρ 0.126 0.034 0.017 0.021 -0.107 -0.178 -0.024 -0.090 -0.110 -0.099 -0.056 -0.032

42 Ghosal and Ye. Impact of Uncertainty on Employment and Number of Businesses.
Table 4.1. Growth of employment specifications
Dependent variable:
Quantitative effect of one-s.d. increase in driving variable
Size Group: All Businesses Mean growth of employment=0.0110
Size Group: Large (≥500 Employee) Businesses Mean growth of employment=0.0161
S1 S2 S3 S4 S5 S6 S1 S2 S3 S4 S5 S6
0.0101* 0.0092* 0.0125* 0.0105* 0.0105* 0.0081* 0.0110* 0.0104* 0.0134* 0.0105* 0.0110* 0.0092*
0.0135* 0.0156* 0.0147* 0.0167* 0.0138* 0.0174* 0.0112* 0.0103* 0.0119* 0.0099* 0.0102* 0.0123*
0.0003 - - - - - 0.0014 - - - - -
-0.0036 - - - - - -0.0011 - - - - -
- -0.0024 - - - - - -0.0027 - - - -
- -0.0023 - - - - - 0.0013 - - - -
- - 0.0058* - - - - - 0.0081 - - -
- - -0.0062* - - - - - -0.0054 - - -
- - - 0.0007 - - - - - -0.0025 - -
- - - -0.0043* - - - - - -0.0033* - -
- - - - -0.0004 - - - - - 0.0001 -
- - - - -0.0015* - - - - - -0.0013 -
- - - - - -0.0058* - - - - - -0.0039*
- - - - - -0.0026 - - - - - -0.0026
Notes:
1.The reported numbers above measure the effect of a one-standard-deviation increase in the relevant independent variable on growth of employment by size category. See section 7.2 for details.
2. An asterisk denotes that the estimated effect is significant at least at the 10% level (see notes to tables 2 and 3).
3. To keep the tables more compact, the effects of lagged dependent variable are not reported. For each specification’s regression statistics ( and ρ), see tables 2 and 3.
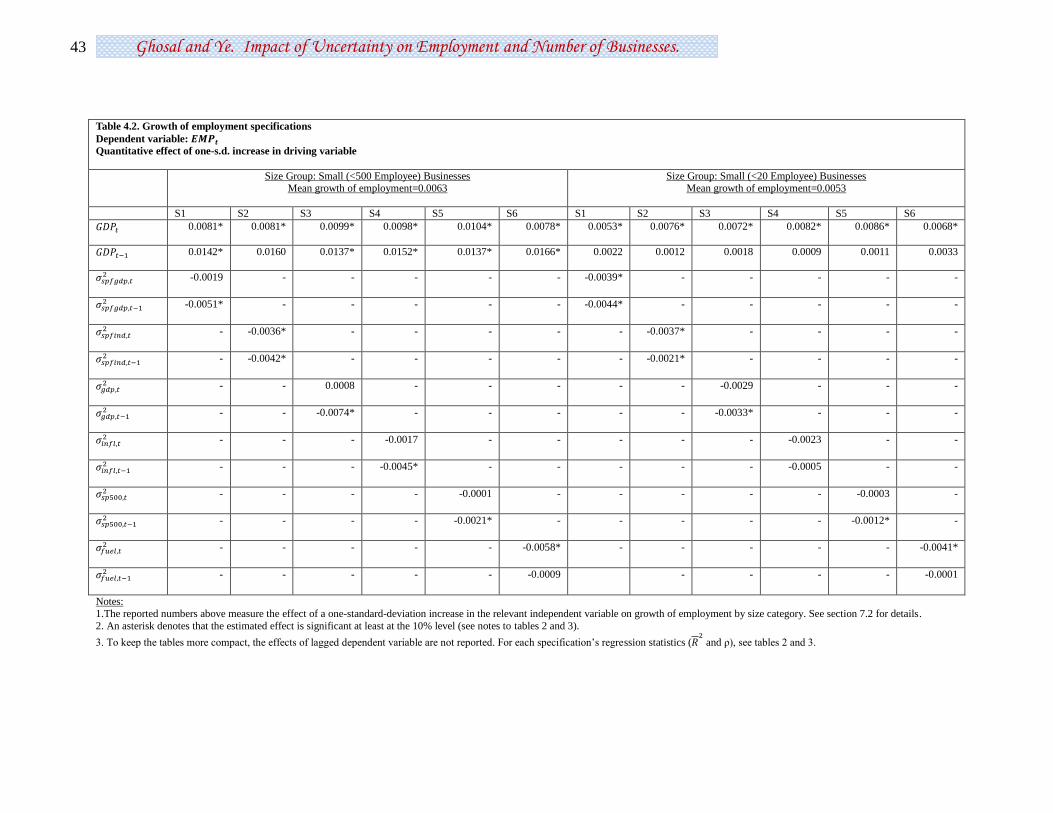
43 Ghosal and Ye. Impact of Uncertainty on Employment and Number of Businesses.
Table 4.2. Growth of employment specifications
Dependent variable:
Quantitative effect of one-s.d. increase in driving variable
Size Group: Small (<500 Employee) Businesses Mean growth of employment=0.0063
Size Group: Small (<20 Employee) Businesses Mean growth of employment=0.0053
S1 S2 S3 S4 S5 S6 S1 S2 S3 S4 S5 S6
0.0081* 0.0081* 0.0099* 0.0098* 0.0104* 0.0078* 0.0053* 0.0076* 0.0072* 0.0082* 0.0086* 0.0068*
0.0142* 0.0160 0.0137* 0.0152* 0.0137* 0.0166* 0.0022 0.0012 0.0018 0.0009 0.0011 0.0033
-0.0019 - - - - - -0.0039* - - - - -
-0.0051* - - - - - -0.0044* - - - - -
- -0.0036* - - - - - -0.0037* - - - -
- -0.0042* - - - - - -0.0021* - - - -
- - 0.0008 - - - - - -0.0029 - - -
- - -0.0074* - - - - - -0.0033* - - -
- - - -0.0017 - - - - - -0.0023 - -
- - - -0.0045* - - - - - -0.0005 - -
- - - - -0.0001 - - - - - -0.0003 -
- - - - -0.0021* - - - - - -0.0012* -
- - - - - -0.0058* - - - - - -0.0041*
- - - - - -0.0009 - - - - -0.0001
Notes:
1.The reported numbers above measure the effect of a one-standard-deviation increase in the relevant independent variable on growth of employment by size category. See section 7.2 for details.
2. An asterisk denotes that the estimated effect is significant at least at the 10% level (see notes to tables 2 and 3).
3. To keep the tables more compact, the effects of lagged dependent variable are not reported. For each specification’s regression statistics ( and ρ), see tables 2 and 3.
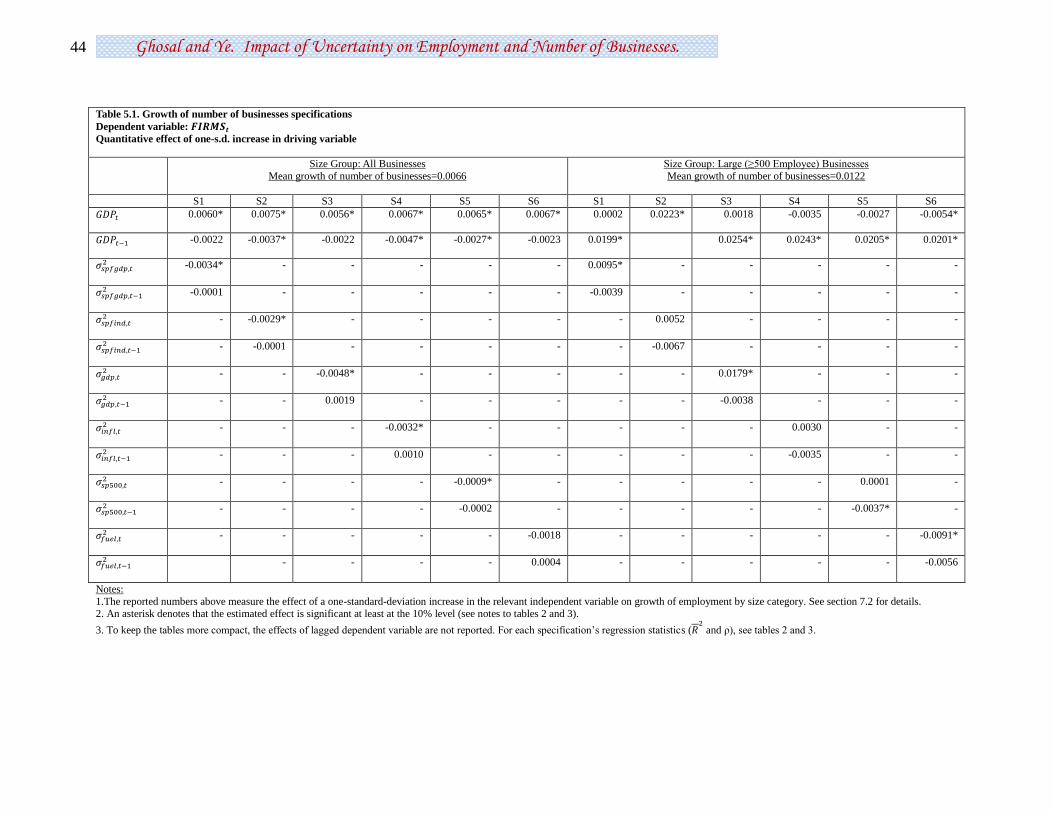
44 Ghosal and Ye. Impact of Uncertainty on Employment and Number of Businesses.
Table 5.1. Growth of number of businesses specifications
Dependent variable:
Quantitative effect of one-s.d. increase in driving variable
Size Group: All Businesses
Mean growth of number of businesses=0.0066
Size Group: Large (≥500 Employee) Businesses
Mean growth of number of businesses=0.0122
S1 S2 S3 S4 S5 S6 S1 S2 S3 S4 S5 S6
0.0060* 0.0075* 0.0056* 0.0067* 0.0065* 0.0067* 0.0002 0.0223* 0.0018 -0.0035 -0.0027 -0.0054*
-0.0022 -0.0037* -0.0022 -0.0047* -0.0027* -0.0023 0.0199* 0.0254* 0.0243* 0.0205* 0.0201*
-0.0034* - - - - - 0.0095* - - - - -
-0.0001 - - - - - -0.0039 - - - - -
- -0.0029* - - - - - 0.0052 - - - -
- -0.0001 - - - - - -0.0067 - - - -
- - -0.0048* - - - - - 0.0179* - - -
- - 0.0019 - - - - - -0.0038 - - -
- - - -0.0032* - - - - - 0.0030 - -
- - - 0.0010 - - - - - -0.0035 - -
- - - - -0.0009* - - - - - 0.0001 -
- - - - -0.0002 - - - - - -0.0037* -
- - - - - -0.0018 - - - - - -0.0091*
- - - - 0.0004 - - - - - -0.0056
Notes:
1.The reported numbers above measure the effect of a one-standard-deviation increase in the relevant independent variable on growth of employment by size category. See section 7.2 for details.
2. An asterisk denotes that the estimated effect is significant at least at the 10% level (see notes to tables 2 and 3).
3. To keep the tables more compact, the effects of lagged dependent variable are not reported. For each specification’s regression statistics ( and ρ), see tables 2 and 3.

45 Ghosal and Ye. Impact of Uncertainty on Employment and Number of Businesses.
Table 5.2. Growth of number of businesses specifications
Dependent variable:
Quantitative effect of one-s.d. increase in driving variable
Size Group: Small (<500 Employee) Businesses
Mean growth of number of businesses=0.0066
Size Group: Small (<20 Employee) Businesses
Mean growth of number of businesses=0.0068
S1 S2 S3 S4 S5 S6 S1 S2 S3 S4 S5 S6
0.0060* 0.0074* 0.0055* 0.0067* 0.0064* 0.0066 0.0049* 0.0068* 0.0047* 0.0062* 0.0068* 0.0067*
-0.0022 -0.0038* -0.0023 -0.0047* -0.0027* -0.0024 -0.0019 -0.0037* -0.0019 -0.0044* -0.0034* -0.0031*
-0.0034* - - - - - -0.0042* - - - - -
-0.0001 - - - - - 0.0007 - - - - -
- -0.0029* - - - - - -0.0029* - - - -
- -0.0001 - - - - - -0.0003 - - - -
- - -0.0048* - - - - - -0.0052* - - -
- - 0.0021 - - - - - 0.0023 - - -
- - - -0.0032* - - - - - -0.0033* - -
- - - 0.0010 - - - - - 0.0003 - -
- - - - -0.0009* - - - - - -0.0005 -
- - - - -0.0002 - - - - - -0.0007 -
- - - - - -0.0017 - - - - - -0.0009
- - - - 0.0005 - - - - - 0.0001
Notes:
1.The reported numbers above measure the effect of a one-standard-deviation increase in the relevant independent variable on growth of employment by size category. See section 7.2 for details.
2. An asterisk denotes that the estimated effect is significant at least at the 10% level (see notes to tables 2 and 3).
3. To keep the tables more compact, the effects of lagged dependent variable are not reported. For each specification’s regression statistics ( and ρ), see tables 2 and 3.
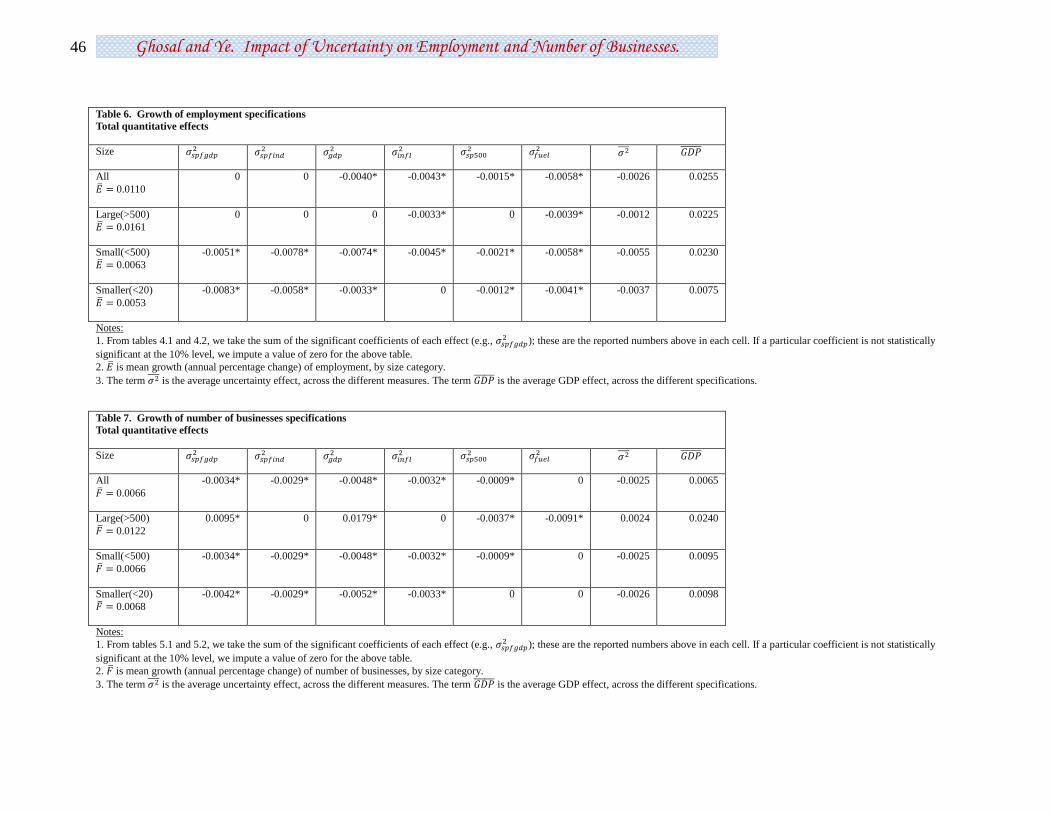
46 Ghosal and Ye. Impact of Uncertainty on Employment and Number of Businesses.
Table 6. Growth of employment specifications
Total quantitative effects
Size
All
0.0110
0
0
-0.0040*
-0.0043*
-0.0015*
-0.0058*
-0.0026 0.0255
Large(>500)
0.0161
0
0
0
-0.0033*
0
-0.0039*
-0.0012 0.0225
Small(<500)
0.0063
-0.0051*
-0.0078*
-0.0074*
-0.0045*
-0.0021*
-0.0058*
-0.0055 0.0230
Smaller(<20)
0.0053
-0.0083*
-0.0058*
-0.0033*
0
-0.0012*
-0.0041*
-0.0037 0.0075
Notes:
1. From tables 4.1 and 4.2, we take the sum of the significant coefficients of each effect (e.g., ); these are the reported numbers above in each cell. If a particular coefficient is not statistically
significant at the 10% level, we impute a value of zero for the above table.
2. is mean growth (annual percentage change) of employment, by size category.
3. The term is the average uncertainty effect, across the different measures. The term is the average GDP effect, across the different specifications.
Table 7. Growth of number of businesses specifications
Total quantitative effects
Size
All
0.0066
-0.0034*
-0.0029*
-0.0048*
-0.0032*
-0.0009*
0
-0.0025 0.0065
Large(>500)
0.0122
0.0095*
0
0.0179*
0
-0.0037*
-0.0091*
0.0024 0.0240
Small(<500)
0.0066
-0.0034*
-0.0029*
-0.0048*
-0.0032*
-0.0009*
0
-0.0025 0.0095
Smaller(<20)
0.0068
-0.0042*
-0.0029*
-0.0052*
-0.0033*
0
0
-0.0026 0.0098
Notes:
1. From tables 5.1 and 5.2, we take the sum of the significant coefficients of each effect (e.g., ); these are the reported numbers above in each cell. If a particular coefficient is not statistically
significant at the 10% level, we impute a value of zero for the above table.
2. is mean growth (annual percentage change) of number of businesses, by size category.
3. The term is the average uncertainty effect, across the different measures. The term is the average GDP effect, across the different specifications.