Wachstumsmarkt Healthcare Industrie - Gewinner und Verlierer
21
Copyright © 2016 QuintilesIMS. All rights reserved. Wachstumsmarkt Healthcare Industrie Gewinner und Verlierer Dr. Frank Wartenberg President Central Europe QuintilesIMS
-
Upload
quintilesims-germany -
Category
Healthcare
-
view
146 -
download
0
Transcript of Wachstumsmarkt Healthcare Industrie - Gewinner und Verlierer

Copyright © 2016 QuintilesIMS. All rights reserved.
Wachstumsmarkt Healthcare Industrie
Gewinner und Verlierer
Dr. Frank Wartenberg
President Central Europe
QuintilesIMS
1
Source: IMS Market Prognosis March 2016; at ex-manufacturer price levels, not including rebates and discounts. Contains
Audited + Unaudited data; Sept 2015 forecasts used for all countries outside of top 52
Der Gesundheitsmarkt wächst bis 2020 4-7% jährlich
© 2016, QuintilesIMS – Dr. Frank Wartenberg (Twitter: @FrankWartenberg)
Developed Markets
CAGR 2016-2020
US 6%-9%
Japan (-1)%-2%
Germany 3%-6%
UK* 4%-7%
Italy 2%-5%
France (-2)%-1%
Spain 2%-5%
Canada 3%-6%
Developed 4%-7%
Pharmerging Markets
CAGR 2016-20 LCUS$
China 5%-8%
Brazil 7%-10%
India 10%-13%
Russia 6%-9%
Turkey 12%-15%
Mexico 2%-5%
Pharmerging
LCUS$6%-9%
Pharmerging
US$4%-7%
Global Sales and Market Growth
At par with region CAGR
Lower than region CAGR
Higher than region CAGR
*Subject to clawback
0%
2%
4%
6%
8%
10%
12%
0
200
400
600
800
1.000
1.200
1.400
1.600
2015 2016 2017 2018 2019 2020
Gro
wth
Sa
les
(B
n L
CU
S$
)
Global sales Developed growth Pharmerging growth
2
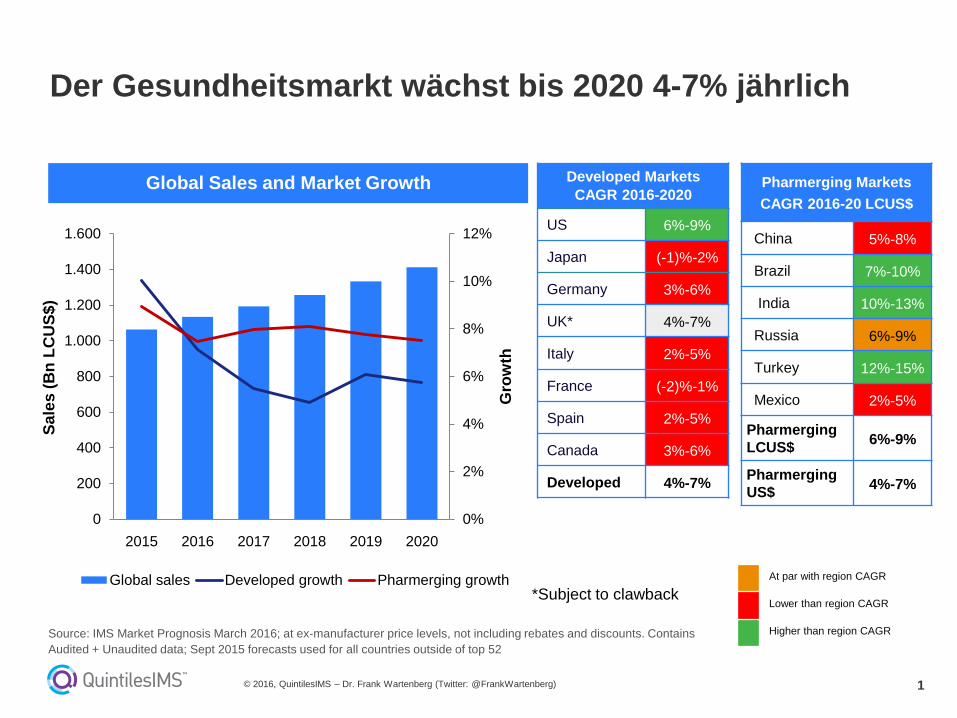
Die Top-8 tragen rund zwei Drittel zum Wachstum bei
© 2016, QuintilesIMS – Dr. Frank Wartenberg (Twitter: @FrankWartenberg)
41%
55%
8%
8%
4%
1%19%
13%
8%8%
8%
9%11%
6%
Rest of World
Pharmerging T3 & T4
BRI
China
Japan
EU5
Canada
US
44%
2%
13%
6%
11%
6%
7%
12%
Region Contribution to Global Growth 2020 Region Market Share
2011 - 2015 2016 - 2020
BRI
Pharmerging
T3 & T4
China
Japan
EU5Canada
US
RoW
Ab
solu
te g
row
th c
ontr
ibutio
n in
LC
US
$
Source: IMS Market Prognosis March 2016; at ex-manufacturer price levels, not including rebates and discounts. Contains
Audited + Unaudited data; Sept 2015 forecasts used for all countries outside of top 52

3
Deutschland wächst im Vergleich zu anderen
europäischen Ländern stark
© 2016, QuintilesIMS – Dr. Frank Wartenberg (Twitter: @FrankWartenberg)
Top 25 Europe
Growth dynamic
EU RestEU5
2011-2015 Europe
CAGR 2.8%
2016-2020
Europe CAGR 2-
5%
Source: IMS Health Market Prognosis, May 2016, at ex-manufacturer price levels, excluding rebates and discounts.
Contains Audited + Unaudited data. Bubble Size indicates 2014 US$ Sales; Europe excludes Russia
1
0
-1
3
10
6
14
5
2
3210-1 98765-2-5-6
4
4
Sweden
Netherlands
Belgium
Switzerland
Poland
Finland
Denmark
RomaniaPortugal
Greece
Historical Growth % (CAGR 2011-15)
Turkey
Spain
Italy
England
Hungary
France
Germany
Austria
Pro
gn
os
ed
Gro
wth
% (
CA
GR
20
16
-20
)
Slovenia
Croatia
Bulgaria
Slovakia
Norway
IrelandCzech Republic
4
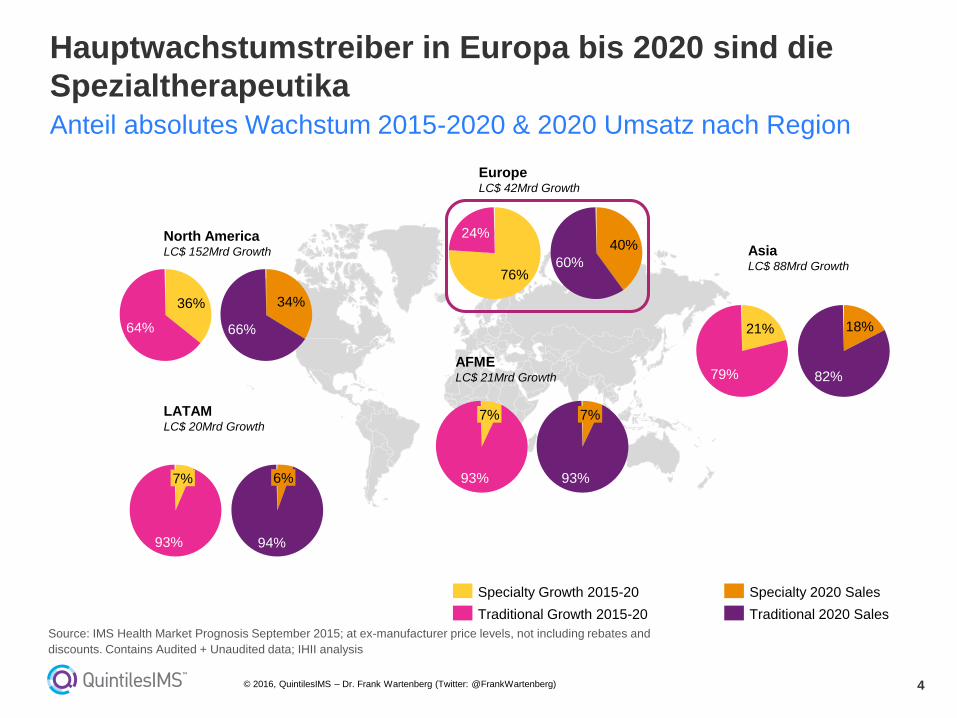
Hauptwachstumstreiber in Europa bis 2020 sind die
SpezialtherapeutikaAnteil absolutes Wachstum 2015-2020 & 2020 Umsatz nach Region
© 2016, QuintilesIMS – Dr. Frank Wartenberg (Twitter: @FrankWartenberg)
93%
7%
Traditional 2020 Sales
Specialty 2020 Sales
93%
7%
Traditional Growth 2015-20
Specialty Growth 2015-20
66%
34%
64%
36%
94%
6%
93%
7%
60%
40%24%
76%
82%
18%
79%
21%
LATAMLC$ 20Mrd Growth
North AmericaLC$ 152Mrd Growth
EuropeLC$ 42Mrd Growth
AFMELC$ 21Mrd Growth
AsiaLC$ 88Mrd Growth
Source: IMS Health Market Prognosis September 2015; at ex-manufacturer price levels, not including rebates and
discounts. Contains Audited + Unaudited data; IHII analysis

5
Onkologie und Autoimmun-Krankheiten werden die
führenden Therapiegebiete gemessen am Umsatz
© 2016, QuintilesIMS – Dr. Frank Wartenberg (Twitter: @FrankWartenberg)
Oncology
Autoimmune
Viral Hepatitis
Immunosuppressants
HIV Antivirals
Immunostimulants
Interferons
Erythropoietins
Macular Degeneration
*Sales in
2020
CAGR
2016-2020
9-12%
11-14%
7-10%
11-14%
1-4%
2-5%
1-4%
0-3%
6-9%
$100-120Bn
$55-65Bn
$45-55Bn
$20-30Bn
$20-30Bn
$15-18Bn
$7-9Bn
$7-9Bn
$6-8Bn
*Sales represented in constant US dollars.
Leading Specialty Therapy Areas
Source: IMS Health, IMS Therapy Prognosis, September 2015; IMS Institute for Healthcare Informatics, October 2015
Note: Leading traditional therapy areas shown for 8 developed countries and 6 pharmerging countries.
6
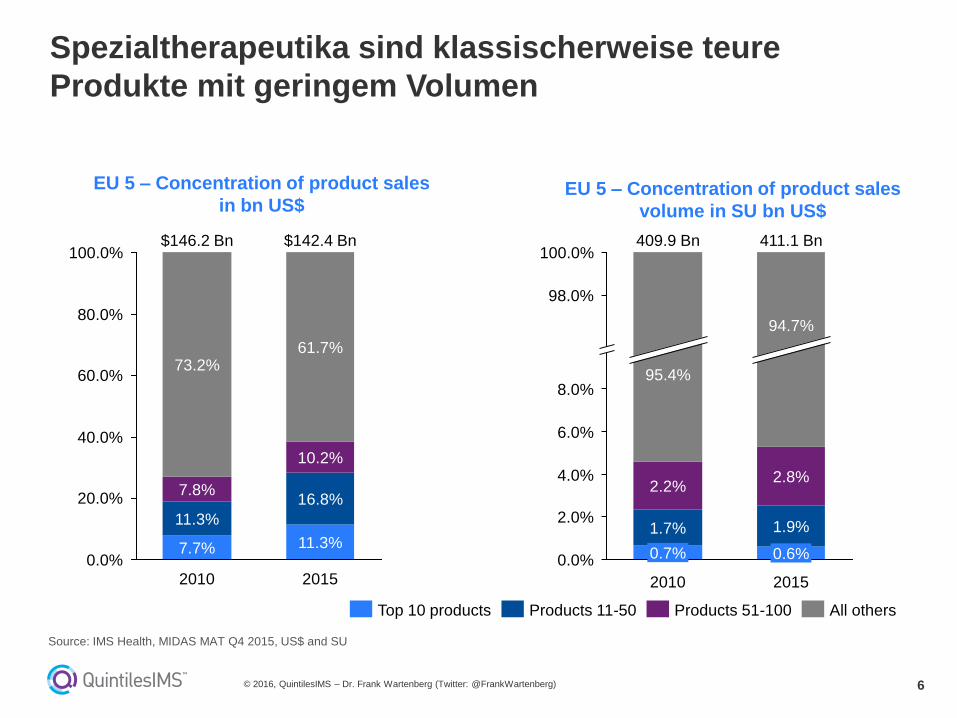
Spezialtherapeutika sind klassischerweise teure
Produkte mit geringem Volumen
© 2016, QuintilesIMS – Dr. Frank Wartenberg (Twitter: @FrankWartenberg)
100.0%
80.0%
60.0%
40.0%
20.0%
0.0%
2015
$142.4 Bn
61.7%
10.2%
16.8%
11.3%
2010
$146.2 Bn
73.2%
7.8%
11.3%
7.7%
EU 5 – Concentration of product sales
volume in SU bn US$
All othersProducts 51-100Products 11-50Top 10 products
4.0%
2.0%
0.0%
100.0%
8.0%
98.0%
6.0%
2015
411.1 Bn
94.7%
2.8%
1.9%1.7%
2.2%
95.4%
409.9 Bn
2010
0.6%0.7%
EU 5 – Concentration of product sales
in bn US$
Source: IMS Health, MIDAS MAT Q4 2015, US$ and SU
7
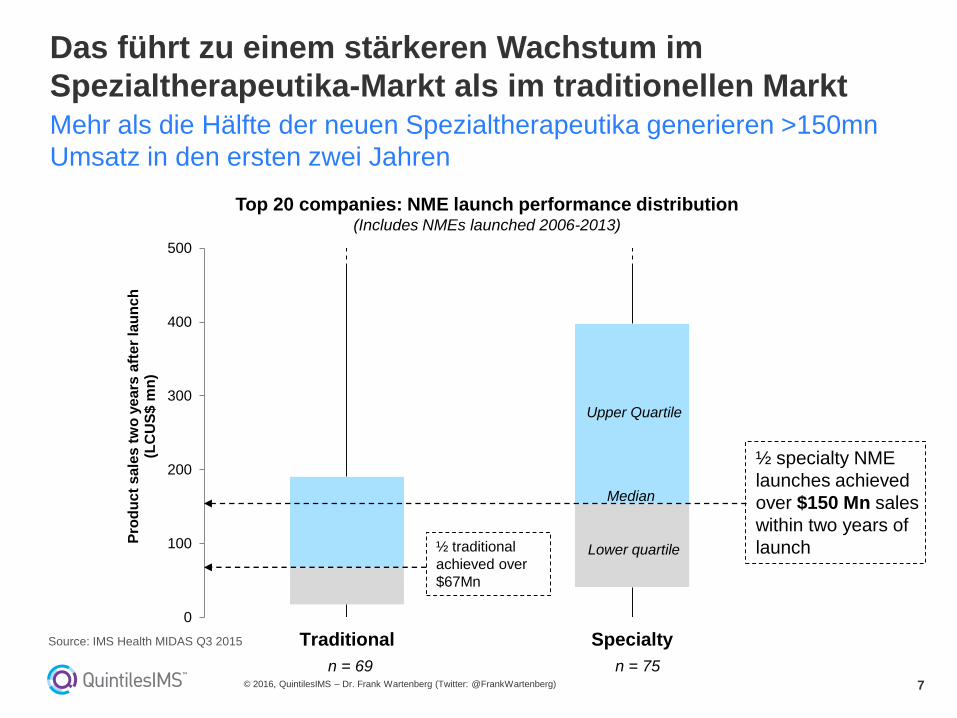
Das führt zu einem stärkeren Wachstum im
Spezialtherapeutika-Markt als im traditionellen MarktMehr als die Hälfte der neuen Spezialtherapeutika generieren >150mn
Umsatz in den ersten zwei Jahren
© 2016, QuintilesIMS – Dr. Frank Wartenberg (Twitter: @FrankWartenberg)
0
100
200
300
400
500
Traditional Specialty
Pro
du
ct
sale
s t
wo
ye
ars
aft
er
lau
nch
(LC
US
$ m
n)
Top 20 companies: NME launch performance distribution(Includes NMEs launched 2006-2013)
n = 69 n = 75
½ specialty NME
launches achieved
over $150 Mn sales
within two years of
launch½ traditional
achieved over
$67Mn
Median
Lower quartile
Upper Quartile
Source: IMS Health MIDAS Q3 2015
8
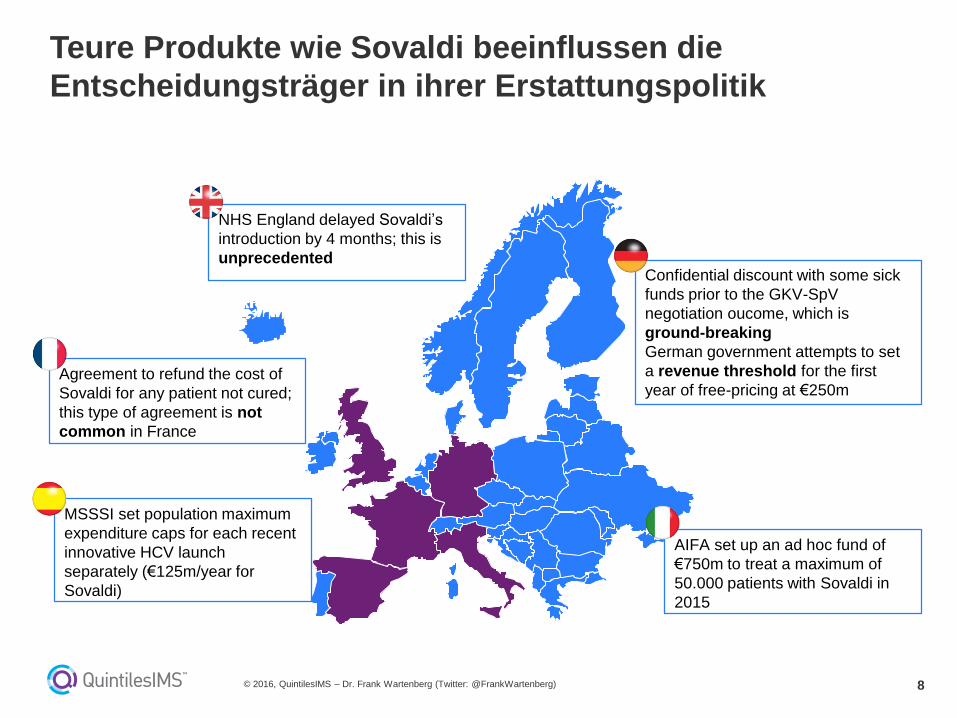
Teure Produkte wie Sovaldi beeinflussen die
Entscheidungsträger in ihrer Erstattungspolitik
© 2016, QuintilesIMS – Dr. Frank Wartenberg (Twitter: @FrankWartenberg)
Confidential discount with some sick
funds prior to the GKV-SpV
negotiation oucome, which is
ground-breaking
German government attempts to set
a revenue threshold for the first
year of free-pricing at €250m
NHS England delayed Sovaldi’s
introduction by 4 months; this is
unprecedented
Agreement to refund the cost of
Sovaldi for any patient not cured;
this type of agreement is not
common in France
MSSSI set population maximum
expenditure caps for each recent
innovative HCV launch
separately (€125m/year for
Sovaldi)
AIFA set up an ad hoc fund of
€750m to treat a maximum of
50.000 patients with Sovaldi in
2015
9
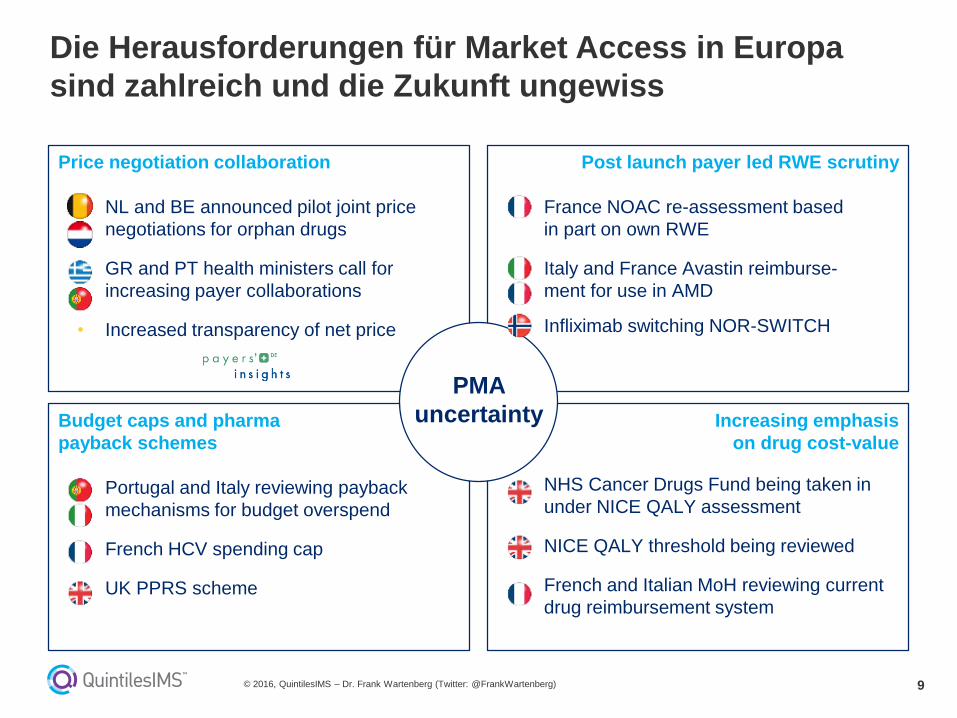
Die Herausforderungen für Market Access in Europa
sind zahlreich und die Zukunft ungewiss
© 2016, QuintilesIMS – Dr. Frank Wartenberg (Twitter: @FrankWartenberg)
Price negotiation collaboration
• NL and BE announced pilot joint price
negotiations for orphan drugs
• GR and PT health ministers call for
increasing payer collaborations
• Increased transparency of net price
Post launch payer led RWE scrutiny
• France NOAC re-assessment based
in part on own RWE
• Italy and France Avastin reimburse-
ment for use in AMD
• Infliximab switching NOR-SWITCH
Budget caps and pharma
payback schemes
• Portugal and Italy reviewing payback
mechanisms for budget overspend
• French HCV spending cap
• UK PPRS scheme
Increasing emphasis
on drug cost-value
• NHS Cancer Drugs Fund being taken in
under NICE QALY assessment
• NICE QALY threshold being reviewed
• French and Italian MoH reviewing current
drug reimbursement system
PMA
uncertainty
10
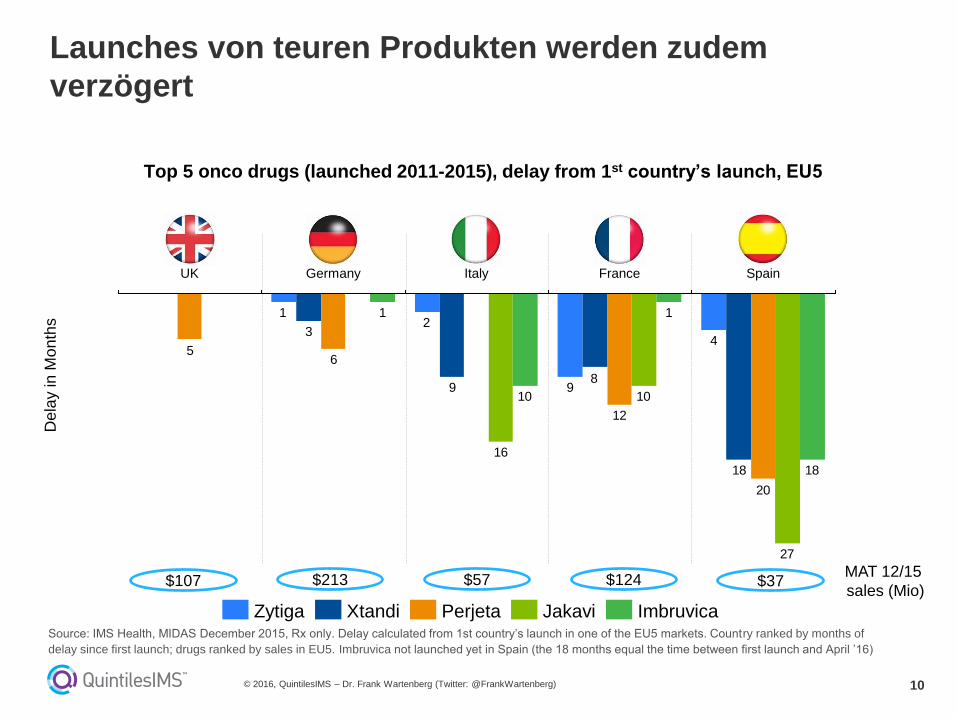
Launches von teuren Produkten werden zudem
verzögert
© 2016, QuintilesIMS – Dr. Frank Wartenberg (Twitter: @FrankWartenberg)
Dela
y in
Mo
nth
s
Top 5 onco drugs (launched 2011-2015), delay from 1st country’s launch, EU5
$107 $213 $57 $124 $37
4
9
21
18
89
3
20
12
65
27
10
16
18
1
10
1
SpainFranceItalyGermanyUK
JakaviPerjeta ImbruvicaXtandiZytiga
MAT 12/15
sales (Mio)
Source: IMS Health, MIDAS December 2015, Rx only. Delay calculated from 1st country’s launch in one of the EU5 markets. Country ranked by months of
delay since first launch; drugs ranked by sales in EU5. Imbruvica not launched yet in Spain (the 18 months equal the time between first launch and April ’16)
11
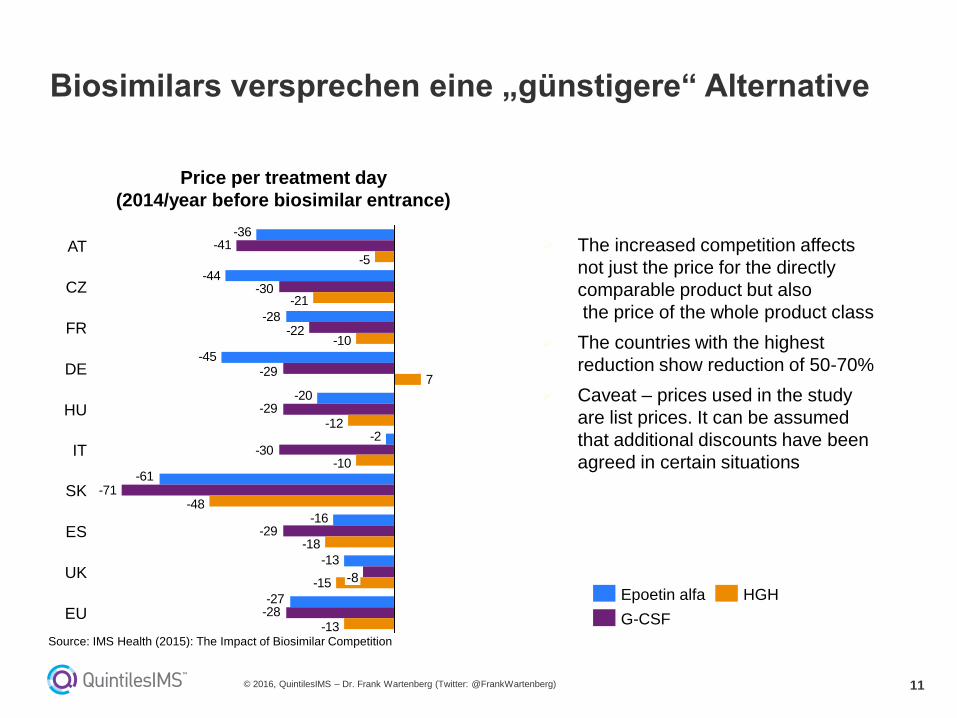
The increased competition affects
not just the price for the directly
comparable product but also
the price of the whole product class
The countries with the highest
reduction show reduction of 50-70%
Caveat – prices used in the study
are list prices. It can be assumed
that additional discounts have been
agreed in certain situations
Biosimilars versprechen eine „günstigere“ Alternative
© 2016, QuintilesIMS – Dr. Frank Wartenberg (Twitter: @FrankWartenberg)
Price per treatment day
(2014/year before biosimilar entrance)
-27
-13
-16
-61
-2
-20
-45
-28
-44
-36
-28
-29
-71
-30
-29
-29
-22
-30
-41
-13
-15
-18
-48
-10
-12
7
-10
-21
-5
UK -8
ES
SK
IT
HU
DE
EU
FR
CZ
AT
Epoetin alfa HGH
G-CSF
Source: IMS Health (2015): The Impact of Biosimilar Competition
12
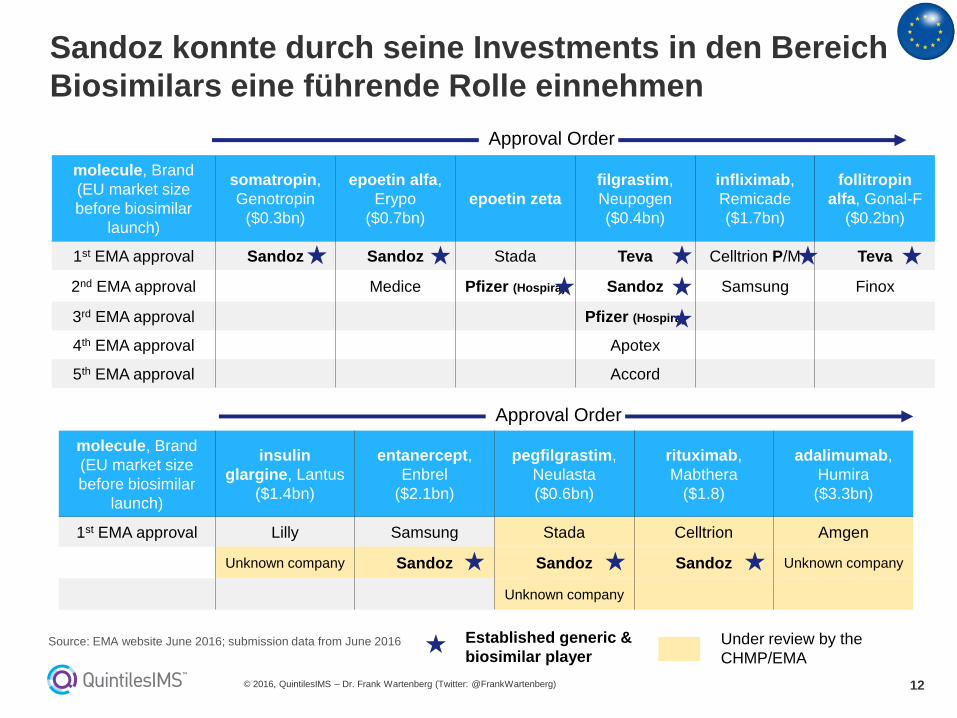
Sandoz konnte durch seine Investments in den Bereich
Biosimilars eine führende Rolle einnehmen
© 2016, QuintilesIMS – Dr. Frank Wartenberg (Twitter: @FrankWartenberg)
molecule, Brand
(EU market size
before biosimilar
launch)
somatropin,
Genotropin
($0.3bn)
epoetin alfa,
Erypo
($0.7bn)
epoetin zeta
filgrastim,
Neupogen
($0.4bn)
infliximab,
Remicade
($1.7bn)
follitropin
alfa, Gonal-F
($0.2bn)
1st EMA approval Sandoz Sandoz Stada Teva Celltrion P/M Teva
2nd EMA approval Medice Pfizer (Hospira) Sandoz Samsung Finox
3rd EMA approval Pfizer (Hospira)
4th EMA approval Apotex
5th EMA approval Accord
molecule, Brand
(EU market size
before biosimilar
launch)
insulin
glargine, Lantus
($1.4bn)
entanercept,
Enbrel
($2.1bn)
pegfilgrastim,
Neulasta
($0.6bn)
rituximab,
Mabthera
($1.8)
adalimumab,
Humira
($3.3bn)
1st EMA approval Lilly Samsung Stada Celltrion Amgen
Unknown company Sandoz Sandoz Sandoz Unknown company
Unknown company
Approval Order
Approval Order
Under review by the
CHMP/EMA
Established generic &
biosimilar playerSource: EMA website June 2016; submission data from June 2016

13
In den kommenden Jahren werden Biosimilars primär
für onkologische und autoimmun Krankheiten erwartet
© 2016, QuintilesIMS – Dr. Frank Wartenberg (Twitter: @FrankWartenberg)
12
23
1
23
32
0
5
10
15
20
25
30
35
No. o
f b
iosim
ilars
in d
eve
lop
men
t
Ph
ase
III
Pre
-Reg/R
eg
Ph
ase
II
Ph
ase
I
Pre
clin
ica
l
Biosimilar pipeline by phase 2015
Pre-clinical to registration
5
2
2
3
3
3
3
7
10
25
28
0 5 10 15 20 25 30
Erythropoietins
Antidiabetics
Sex Hormones
Dermatologics
Number of biosimilars in development *
Multiple Sclerosis
Others
Growth Hormones
Oncologics
HGFs
Immunosuppr.
Autoimmune
Biosimilar pipeline by therapy area 2015
Pre-clinical to registration
35 biosimilars in late
stage development
Source: IMS Health R&D focus Dec 2015; Not exhaustive
14
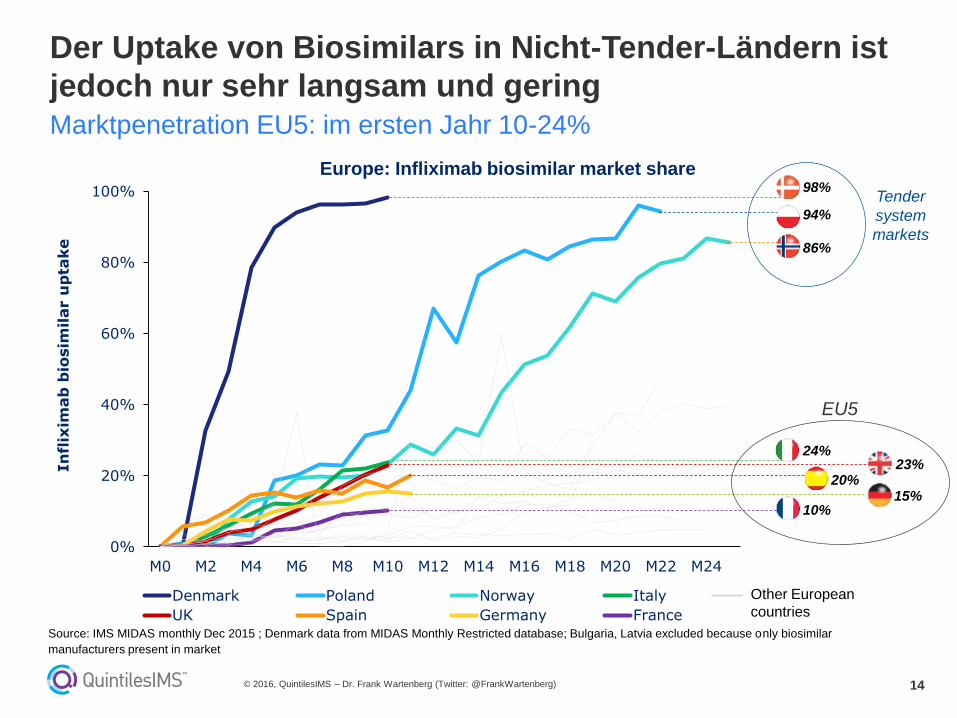
Der Uptake von Biosimilars in Nicht-Tender-Ländern ist
jedoch nur sehr langsam und geringMarktpenetration EU5: im ersten Jahr 10-24%
© 2016, QuintilesIMS – Dr. Frank Wartenberg (Twitter: @FrankWartenberg)
Europe: Infliximab biosimilar market share
0%
20%
40%
60%
80%
100%
M0 M2 M4 M6 M8 M10 M12 M14 M16 M18 M20 M22 M24
In
flix
imab
bio
sim
ilar u
pta
ke
Denmark Poland Norway Italy
UK Spain Germany France
98%
94%
86%
24%23%
20%
10%15%
EU5
Tender
system
markets
Other European
countries
Source: IMS MIDAS monthly Dec 2015 ; Denmark data from MIDAS Monthly Restricted database; Bulgaria, Latvia excluded because only biosimilar
manufacturers present in market

15
Die Regularien für den Market Access von Biosimilars
ändern sich jedoch – zu Gunsten der Biosimilars
© 2016, QuintilesIMS – Dr. Frank Wartenberg (Twitter: @FrankWartenberg)
Source: QuintilesIMS
Proposed new concrete
biosimilar approval
guidelines in 2016
Behind in terms of
regulation, particularly on
clinical requirements and
length of regulatory process
Established biosimilar
legislation and
guidance (PMDA)
Established biosimilar
legislation and guidance
aligned to EMA
framework.
Fully established framework and solid
draft guidance for biosimilar Mab.
Substitution not allowed
Guidance published.
Global reference
product accepted
Regulatory maturity framework
Fully established
framework
Lack of a clear
framework
Legal pathway
established, FDA
guidelines published.
Pathway now being
tested
Pathway under development.
Access through national and
regional tenders
Global Biosimilar Landscape
Guidance finalized in 2010. Dual
pathway with abbreviated non-
clinical and clinical data
Guidance finalized. No clear
clinical criteria for biosimilar
approval (case-by-case
approach)
• Regulatory framework of biosimilars in EMs varies and likely to evolve differently from country to
country
• Competition of biosimilars vs. NOBs in EMs to be influenced by local policies (e.g. PDPs in Brazil)
Approval of a “biosimilar product”
requires submission of an “abridged”
application to the MOH. Biosimilars have
interchangeable status

16
Auf lange Sicht werden drei Faktoren, den Uptake von
Biosimilars beeinflussen
© 2016, QuintilesIMS – Dr. Frank Wartenberg (Twitter: @FrankWartenberg)
Market
opportunity for
biosimilar
players
Huge financial incentive in pursuing
this growing market
Payer
willCost Savings (~20-30% vs. Originator)
and better patient healthcare management
Patients seeking
access
Affordable Access to breakthrough therapies
leading to better health outcomes
Source: IMS Health
17
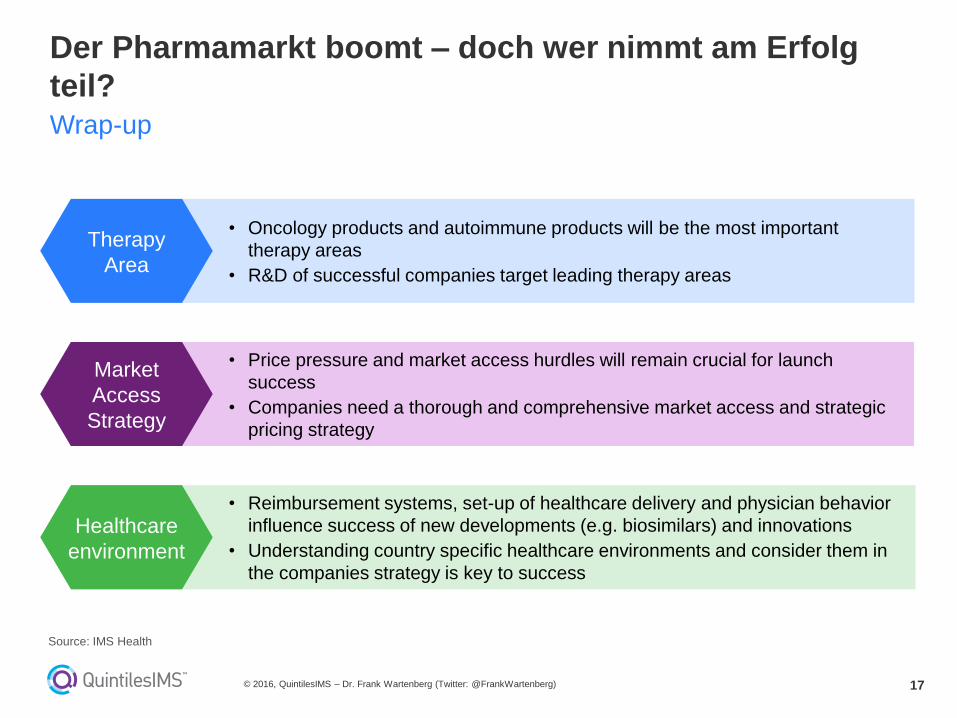
• Reimbursement systems, set-up of healthcare delivery and physician behavior
influence success of new developments (e.g. biosimilars) and innovations
• Understanding country specific healthcare environments and consider them in
the companies strategy is key to success
• Price pressure and market access hurdles will remain crucial for launch
success
• Companies need a thorough and comprehensive market access and strategic
pricing strategy
• Oncology products and autoimmune products will be the most important
therapy areas
• R&D of successful companies target leading therapy areas
Der Pharmamarkt boomt – doch wer nimmt am Erfolg
teil? Wrap-up
© 2016, QuintilesIMS – Dr. Frank Wartenberg (Twitter: @FrankWartenberg)
Therapy
Area
Market
Access
Strategy
Healthcare
environment
Source: IMS Health
18
Please contact me for further information
© 2016, QuintilesIMS – Dr. Frank Wartenberg (Twitter: @FrankWartenberg)
Dr. Frank Wartenberg
President Central Europe
+49 (0) 69 6604-4315
Follow me on Twitter: @FrankWartenberg
19© 2016, QuintilesIMS – Dr. Frank Wartenberg (Twitter: @FrankWartenberg)
© 2016, IMS HEALTH GmbH & Co. OHG
Alle Rechte vorbehalten. Die Informationen dürfen weder ganz noch teilweise ohne vorherige ausdrückliche Erlaubnis von
IMS HEALTH GmbH & Co. OHG vervielfältigt, gespeichert, weiterverarbeitet und in keiner Weise zugänglich gemacht werden.
Die gegebenenfalls im Zusammenhang mit Daten verwendeten Begriffe „Patient, Arzt, Arztpraxis, Verordner oder Apotheke“ bezeichnen keine
personenbezogenen, sondern ausschließlich (nach § 3 Abs. 6 Bundesdatenschutzgesetz) anonyme Informationen.
IMS stellt durch den Einsatz modernster Technologien und Verfahren sicher, dass seine Dienstleistungen, unabhängig davon wie die Daten
untereinander verknüpft werden, den Datenschutzbestimmungen entsprechen.
20© 2016, QuintilesIMS – Dr. Frank Wartenberg (Twitter: @FrankWartenberg)
© 2016, IMS HEALTH GmbH & Co. OHG
All rights reserved. The information may not be duplicated, stored, further processed, nor be made accessible in whole or in part to any third party
without the prior express written consent of IMS HEALTH.
In connection with data/figures used terms, such as „patient, doctor, medical practice, prescriber or pharmacy”, do not designate any personal data
but exclusively anonymous information (in accordance with § 3 Abs. 6 “Bundesdatenschutzgesetz” – German Federal Data Protection Act)
IMS employs high sophisticated technologies and methods which ensure all its Information Services to meet the applicable data-protection
requirements, regardless the way data are combined with one another.