
What Difference Does Good Monitoring & Evaluation Make to ... · It subsequently describes the M&E...
32
Policy Research Working Paper 7726 What Difference Does Good Monitoring & Evaluation Make to World Bank Project Performance? Estelle Raimondo Independent Evaluation Group June 2016 WPS7726 Public Disclosure Authorized Public Disclosure Authorized Public Disclosure Authorized Public Disclosure Authorized
Transcript of What Difference Does Good Monitoring & Evaluation Make to ... · It subsequently describes the M&E...
Policy Research Working Paper 7726
What Difference Does Good Monitoring & Evaluation Make to World Bank Project
Performance?Estelle Raimondo
Independent Evaluation GroupJune 2016
WPS7726P
ublic
Dis
clos
ure
Aut
horiz
edP
ublic
Dis
clos
ure
Aut
horiz
edP
ublic
Dis
clos
ure
Aut
horiz
edP
ublic
Dis
clos
ure
Aut
horiz
ed
Produced by the Research Support Team
Abstract
The Policy Research Working Paper Series disseminates the findings of work in progress to encourage the exchange of ideas about development issues. An objective of the series is to get the findings out quickly, even if the presentations are less than fully polished. The papers carry the names of the authors and should be cited accordingly. The findings, interpretations, and conclusions expressed in this paper are entirely those of the authors. They do not necessarily represent the views of the International Bank for Reconstruction and Development/World Bank and its affiliated organizations, or those of the Executive Directors of the World Bank or the governments they represent.
Policy Research Working Paper 7726
This paper is a product of the Independent Evaluation Group. It is part of a larger effort by the World Bank to provide open access to its research and make a contribution to development policy discussions around the world. Policy Research Working Papers are also posted on the Web at http://econ.worldbank.org. The author may be contacted at [email protected].
For more than 20 years, the development community has claimed that monitoring and evaluation helps projects achieve their objectives. This study uses data from 1,300 World Bank projects evaluated between 2008 and 2014 to investigate this suggested link between the quality of monitoring and evaluation and project performance. The propensity score matching results indicate that the quality of monitoring and evaluation is significantly and positively associated with project outcome as institutionally measured at the World Bank. This positive relationship holds when controlling for project manager identity, and is robust to
various specification choices. Through a systematic text analysis of the narrative produced by the Independent Evaluation Group to justify its monitoring and evaluation quality rating, the study shows that there are common mark-ers of good quality monitoring and evaluation, such as: clear institutional setup and division of labor around monitoring and evaluation activities; simple monitoring and evalua-tion framework that is well aligned with clients’ existing monitoring and evaluation systems; good integration with operational tasks; and a system that can generate regular and timely reporting, and that is used during and after lending.
What DifferenceDoes Good Monitoring & Evaluation Make to World Bank Project Performance?
Estelle Raimondo
(Independent Evaluation Group)
JEL classification: H43, O19, O01, O12, F61
Keywords: monitoring and evaluation, performance management, World Bank projects
Estelle Raimondo is an evaluation officer in the Independent Evaluation Group. I am particularly grateful to Rasmus Heltberg and Kenneth Chomitz (at IEG) and to Kathy Newcomer (at GWU) for their continuous support during this research and their thorough comments on earlier drafts. I also thank Alex McKenzie for his assistance in retrieving project‐level data from the IEG project evaluation database. I am thankful to Marie Gaarder and Nick York (Director at IEG) for their endorsement and to the full IEG team in charge of the Review of Self‐Evaluation System for their constant flow of ideas and feedback. The views expressed here are the author's, and do not reflect those of the World Bank, Independent Evaluation Group, Its Executive Directors, or the countries they represent.
Raimondo —M&E quality and World Bank Project Performance
2
1. Introduction
In the ambitious 2030 Agenda for Sustainable Development, the development community has
committed to a large number of sustainable development goals and targets. The resolution that seals
this renewed global partnership for development reiterates the importance of monitoring and
evaluation (M&E) by promoting reviews of progress achieved that are "rigorous and based on evidence,
informed by country‐led evaluations and data which is high‐quality, accessible, timely, reliable and
disaggregated" (UN, 2015, parag74).
Over the past 20 years, there has been a growing consensus around the importance of M&E,
among development practitioners and academics, to the point that the value‐added of M&E is rarely
questioned. The World Bank has been a pioneering agency in this regard, insofar as it has performed
systematic assessments of its projects since the mid‐1970s and has embedded monitoring, self‐
evaluation, and independent evaluation in its development practice early on in its history. By the early
2000s, most bilateral and multilateral donor agencies had followed‐suit, putting in place M&E systems
to track performance indicators from the inception to the delivery of outputs and the achievement of
outcomes.
Simply put, M&E is expected to improve project performance via two sets of mechanisms. First,
and quite prosaically, good M&E provides better evidence of whether a project has achieved its
objectives or not. Second, champions of M&E also claim that there is more to M&E quality than simply
capturing results. By helping project managers think through their goals and project design, by keeping
track of performance indicators, and by including systematic feedback loops within a project cycle, M&E
is thought to bolster the quality of project supervision and implementation, and ultimately impact. For
example, Legovini, Di Maro and Piza (2015) lay out a number of possible channels that link impact
evaluations and project performance, including better planning and evidence‐base in project design,
greater implementation capacity due to training and support by the M&E team, better data for policy
decisions and observer effects and motivation (2015, p. 4).
Measuring the association between M&E and project performance is a salient issue in the
development industry, as every year millions of aid dollars are spent on conducting M&E and building
M&E capacity. However, it is a particularly challenging question to address. While a number of recent
research streams point to the importance of proactive supervision and project management in
explaining the variation in project performance (e.g., Denizer et al., 2013; Buntaine & Parks, 2013; Geli
et al., 2014; Bulman et al., 2015), to date studies that directly investigate whether M&E quality also
makes a difference in project performance are scarce.
Raimondo —M&E quality and World Bank Project Performance
3
The direction of the relationship between M&E quality and project performance is not
straightforward to predict. On the one hand, if good M&E simply provides better evidence of whether
outcomes are achieved, then the relationship between good M&E and project performance could go
either way: good M&E would have a positive relationship with project outcomes for successful projects,
but a negative relationship for failing projects. On the other hand, if M&E also improves project design,
planning and implementation, then one anticipates that, everything else held constant, projects with
better M&E quality are more likely to achieve their intended development outcomes. Finding a
systematic positive relationship between M&E quality and project performance would give credence to
this argument and justify the added‐value of M&E processes. Moreover, one should anticipate that the
association between M&E quality and project performance is not proportional. It may indeed take a
really high M&E quality to make a significant contribution to project performance. One of the estimation
strategies used in this study seeks to capture non‐proportionality.
Measuring this association on a large number of diverse projects requires a common measure of
M&E quality and of project outcome, as well as a way to control for possible confounders. Given that a
robust counterfactual would prove difficult to put in place, this study develops an alternative correlation
approach1 that exploits data on the portfolio of 1,385 World Bank investment loan projects that were
evaluated by IEG between 2008 and 2014, and for which both a measure of M&E quality and of project
outcome were available.
Because the quality of M&E is a complicated construct and the rating by IEG is a composite
measure of several dimensions (design, implementation and use), it is important to unpack possible
mechanisms that explain why M&E quality and project outcomes are related. The study thus also
includes a systematic text analysis of the narrative produced by IEG to justify its project M&E quality
rating. From this text analysis, the paper concludes that projects with high M&E quality have the
following markers: a clear institutional setup for M&E from the very beginning of the project, a
framework that is well aligned with the client's existing M&E system, and that builds to the extent
possible on existing data sources; a process that is well integrated with operational tasks, rather than an
add‐on; a system that can generate regular and timely reporting, and that is used both while lending and
after lending.
In turn, the main quantitative estimation strategy relies on the principle of Propensity Score
Matching (PSM). Simply put, PSM consists of creating groups of comparable projects (on a range of
1 This research started in 2013 and was refined in the framework of the report on self‐evaluation systems of the World Bank Group conducted with the Independent Evaluation Group (IEG) in 2015.
Raimondo —M&E quality and World Bank Project Performance
4
dimensions that influence their potential for reaching their development outcomes) but that differ in
their quality of M&E. This approach has a number of desirable properties considering the nature of the
data.2 The main assumption underlying this estimation strategy is the following: conditional on the
propensity score, each project has the same probability of assignment to treatment. It follows that the
expected difference between the two matched groups for a particular propensity score is an unbiased
estimate of the average treatment effect on the treated (Rosenbaum and Rubin, 1983).
To control for possible confounding factors, I include a series of country‐specific and project‐
specific factors in the computation of the propensity score, with the assumption that possible
confounders are observable. Regressions and propensity score analysis indeed share the common
caveat of not being able to control for unobservable factors that would influence both project outcome
and M&E quality. The risk of omitted variable bias cannot be avoided, especially concerning the risk of
rater effects associated with this type of data. Notwithstanding this limitation, the identification strategy
is quite robust, insofar as it includes a number of factors (such as project managers fixed effects and
programmatic sector dummies) that control for a range of potential unobserved confounders (e.g., the
complexity and the nature of the interventions, leadership skills).
I find that good M&E quality is positively and significantly associated with project outcome
rating as institutionally measured within the Bank. Depending on whether the outcome is measured by
IEG or by the team in charge of operations, I find that projects with good M&E quality score between
0.13 and 0.40 points higher—on a six‐point outcome scale— than similar projects with poor M&E
quality. The magnitude of this relationship is on par with the magnitude of the relationship between
project outcome rating and the quality of supervision, which was identified in previous research as a key
correlate of project outcome (Denizer et al., 2013; Buntaine & Parks, 2013; Geli et al., 2014; Bulman et
al., 2015).
The paper is structured in six sections. First it presents an overview of the relevant literature
(section2). It subsequently describes the M&E system and process at the Bank, and summarizes the
2 Most notably, it relaxes the assumption of linearity, which is important when dealing with categorical variables. Moreover,
given the multitude of dimensions that can confound the effect of M&E quality on project outcome, including project‐level and country‐level characteristics, a propensity score approach consists in reducing the multidimensionality of the covariates to a one dimensional score, called a propensity score. Third, there is a range of modeling strategies within the large family of propensity score analyses that allow us to exploit the full graduation of the original six‐category outcome as opposed to dichotomizing the outcome into a 'successful vs. non‐successful' variable as done in previous work (e.g., Buntaine & Park, 2013; Denizer et al., 2013). Finally, propensity score analysis also focuses the attention on models for treatment assignment, instead of the more complex process of determining outcome. This is particularly compelling in this case as treatment assignment into good quality M&E is the object of institutional and managerial choices at the World Bank, while project outcome is determined by an array of factors in a more anonymous and stratified system (Angrist & Pischke, 2009, p. 84).
Raimondo —M&E quality and World Bank Project Performance
5
results of the systematic text analysis of M&E quality rating, revealing a number of mechanisms that
explain what quality M&E involves and why it is possibly linked to project outcome (section 3). Section 4
presents the data and the methodological approach of the quantitative analysis. In section 5, I sum up
the results of the analysis, and conclude in section 6.
2. Related Literature
Recently, there has been an increased focus in the development literature on better understanding the
project characteristics that explain why some projects are successful and others fail to reach their
development objectives (e.g., Denizer et al., 2013; Buntaine & Parks, 2013; Geli et al., 2014; Legovini et
al., 2015; Bulman et al., 2015). Bridging the empirical gap around the micro‐level factors that determine
development project performance is all the more necessary as the evidence points to a situation where
project outcome is more likely to be affected by differences across projects within a given country, than
differences across countries. For example, Denizer et al. (2013) found that 80% of the variation in Bank
project outcomes can be explained by within countries and across projects variations rather than by
country characteristics.
Proactive supervision of project implementation has been identified as an important correlate of
project success in a number of studies on the Bank. For instance, Denizer et al. (2013) demonstrated
that when projects are flagged early on as problem projects, and remedial actions are taken, projects
can be turned around and become successful. These findings are echoed in a paper by Buntaine & Parks
(2013) that looks specifically at World Bank environmental projects. In that study, the rating of the
quality of supervision by project managers is found to be the strongest predictor of project success.
Moreover, the very identity and the track record of project managers has been shown to play a
critical role in explaining project outcome. Denizer et al. (2013) showed that when regressing project
outcome ratings on a full set of project manager dummies and on a full set of country dummies, project
manager effects account for 32 percent of the variation in project outcomes, whereas pure country
effects account for only 19 percent of the variation (2013, p. 21). Bulman, Kolma and Kraay (2015) find
the same patterns using data on 1,342 projects of the Asian Development Bank. In turn, Geli et al. (2014)
found that the track record of the project manager is a better predictor of project outcome rating than
prediction made based on self‐assessments of project performance during implementation.
However, to my knowledge only one large‐N quantitative study has looked at the effect of
evaluation on project performance (Legovini et al., 2015). Indeed, hitherto, the literature on this topic
Raimondo —M&E quality and World Bank Project Performance
6
had been largely circumscribed to in‐depth case‐studies and small‐N survey‐based inquiries.3 Legovini et
al. (2015) specifically look at whether impact evaluations help or hamper the timely disbursement of
Bank development loans and grants. Reconstructing a database of 100 impact evaluations and 1,135
Bank projects between 2005 and 2011, the authors find that projects with an impact evaluation are less
likely to have delays in disbursements.
In this paper, I build on the existing body of evidence and attempt to investigate more directly
the connection between M&E quality and project performance (as opposed to project disbursement).
The study also looks at M&E as it is generally practiced at the Bank, as opposed to a particular subset of
evaluation, as in Legovini et al. (2015).
3. Monitoring and Evaluation at the World Bank
3.1. M&E institutional process
For the past 20 years, there have been continuous efforts at the Bank and other development agencies
to strengthen M&E. The rationale for embedding an M&E framework within each project is that it leads
to improvement in the quality of delivery and ultimately results in better outcome by generating
feedback loops at each stage of a project’s life. While M&E systems and practices have changed
incrementally since their inception under McNamara's presidency in the 1970s, the main principles have
remained generally the same (OED, 2003).4
At the inception of each project, a results‐framework is developed. This effort to rationalize
project design and to "think hard" about project logic is thought to be a decisive step towards project
success. During project preparation, Bank teams work with borrowers to set up Management and
Information Systems and gather the necessary baseline information. During implementation, Bank staffs
are in charge of conducting bi‐annual self‐evaluation of the project with an Implementation Supervision
report (ISR). In the ISR, the project manager formally takes the pulse of the project, by rating whether
the project is likely to achieve its development objective.5 This embedded monitoring and continuous
self‐evaluation process is supposed to generate feedback loops into the operation and guide course
corrections or more radical changes to the project plan (called restructuring). Upon completion, the
project manager is tasked with producing an Implementation Completion Report (ICR), which is meant
3 For a systematic review of this literature, see Johnson (2009) 4 The World Bank does not have an official monitoring and evaluation policy. The basic principles underpinning monitoring, self and independent evaluations are captured in an operational policy (OP 13.60) which lays out the general roles of responsibilities between operational team, the independent evaluation group and borrowers in the conduct of M&E activities. 5 The definition of project outcome retained in this study is consistent with the one defined by IEG as the "extent to which the
operation's major relevant objectives were achieved, or are expected to be achieved, efficiently" 5(IEG, 2014).
Raimondo —M&E quality and World Bank Project Performance
7
to offer a comprehensive ex‐post self‐evaluation of the project implementation and results. The self‐
evaluation is then validated by IEG.6
Starting in 2006, IEG has systematically rated the quality of project M&E with a dual objective:
tracking institutional progress on improving M&E (a long‐standing commitment of the Bank), and
creating an incentive for better performance "that would ultimately improve the quality of evaluations
and the operations themselves" (IEG, 2014 p. 49).
3.2. What does good M&E look like?
I start by unpacking the characteristics of good and poor M&E quality trough a systematic text analysis
of the narratives produced by IEG to justify its M&E quality rating. The narratives provide an assessment
of three aspects of M&E quality: its design, its implementation, and its use. To maximize variation, only
the narratives for which the M&E quality was rated as negligible (the lowest rating) or high (the highest
rating) were coded. All projects evaluated between January 2008 and December 2014 with an M&E
quality rating of negligible or high were extracted from the IEG project performance database. There
were 39 projects with a 'high' quality of M&E and 254 projects with a 'negligible' rating. Using the
software MaxQDA, a code system was and applied to all of the 293 text segments in the sample.7
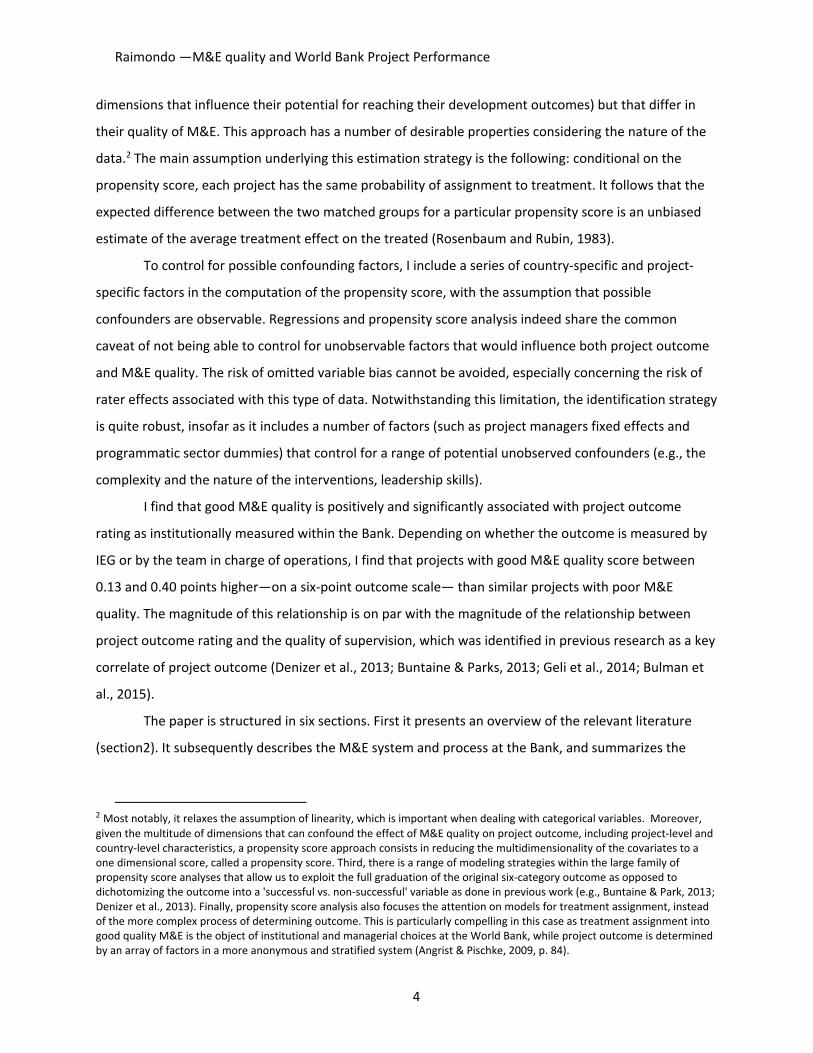
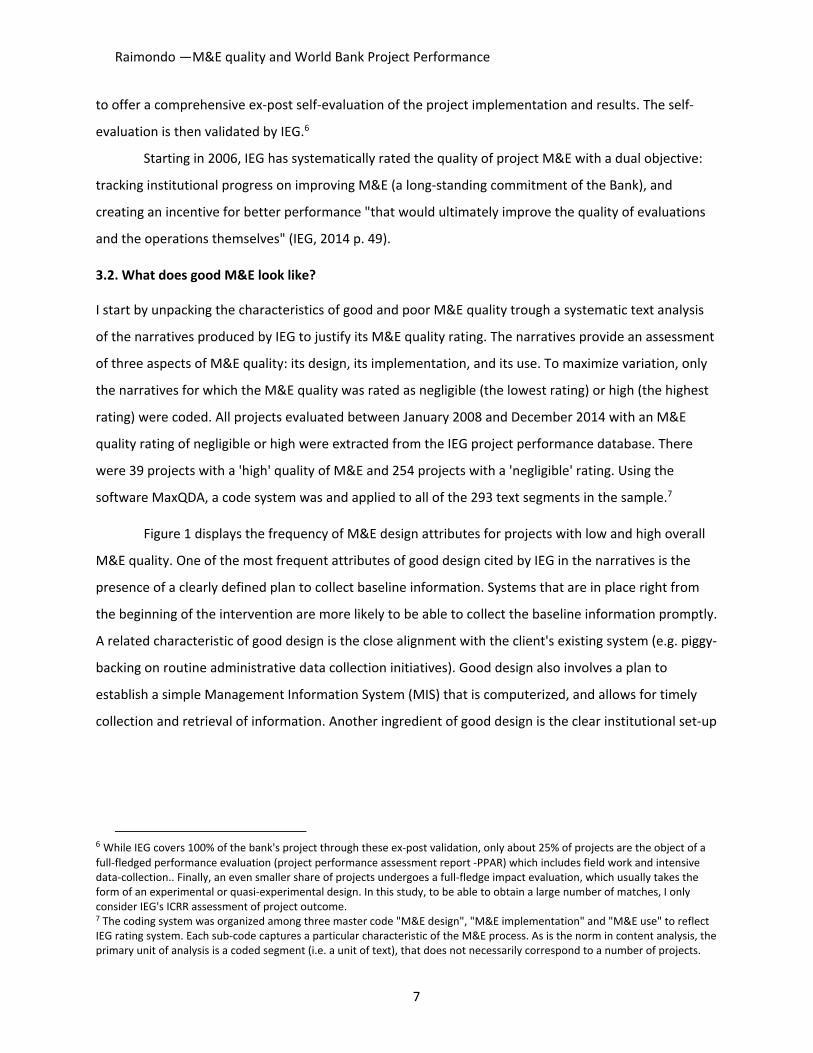
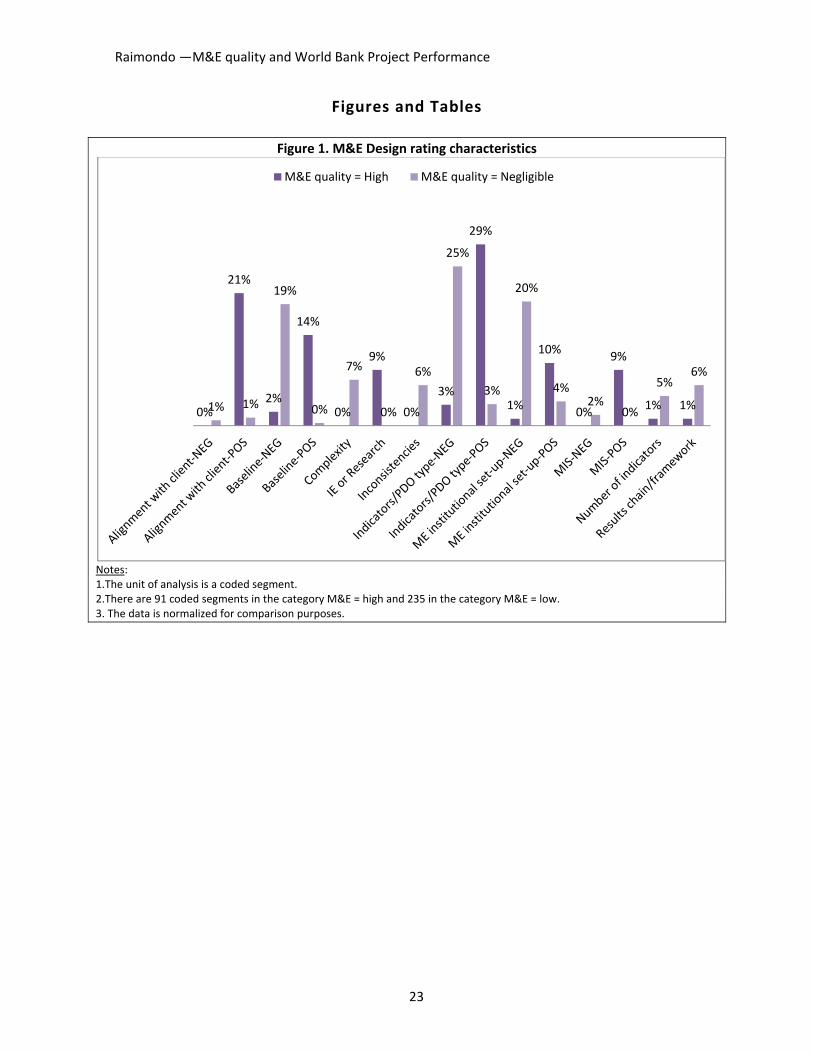
Figure 1 displays the frequency of M&E design attributes for projects with low and high overall
M&E quality. One of the most frequent attributes of good design cited by IEG in the narratives is the
presence of a clearly defined plan to collect baseline information. Systems that are in place right from
the beginning of the intervention are more likely to be able to collect the baseline information promptly.
A related characteristic of good design is the close alignment with the client's existing system (e.g. piggy‐
backing on routine administrative data collection initiatives). Good design also involves a plan to
establish a simple Management Information System (MIS) that is computerized, and allows for timely
collection and retrieval of information. Another ingredient of good design is the clear institutional set‐up
6 While IEG covers 100% of the bank's project through these ex‐post validation, only about 25% of projects are the object of a
full‐fledged performance evaluation (project performance assessment report ‐PPAR) which includes field work and intensive data‐collection.. Finally, an even smaller share of projects undergoes a full‐fledge impact evaluation, which usually takes the form of an experimental or quasi‐experimental design. In this study, to be able to obtain a large number of matches, I only consider IEG's ICRR assessment of project outcome. 7 The coding system was organized among three master code "M&E design", "M&E implementation" and "M&E use" to reflect IEG rating system. Each sub‐code captures a particular characteristic of the M&E process. As is the norm in content analysis, the primary unit of analysis is a coded segment (i.e. a unit of text), that does not necessarily correspond to a number of projects.
Raimondo —M&E quality and World Bank Project Performance
8
with regards to M&E tasks, oftentimes relying on an existing structure within the client country and an
oversight body (e.g., a steering committee) in charge of quality control.8
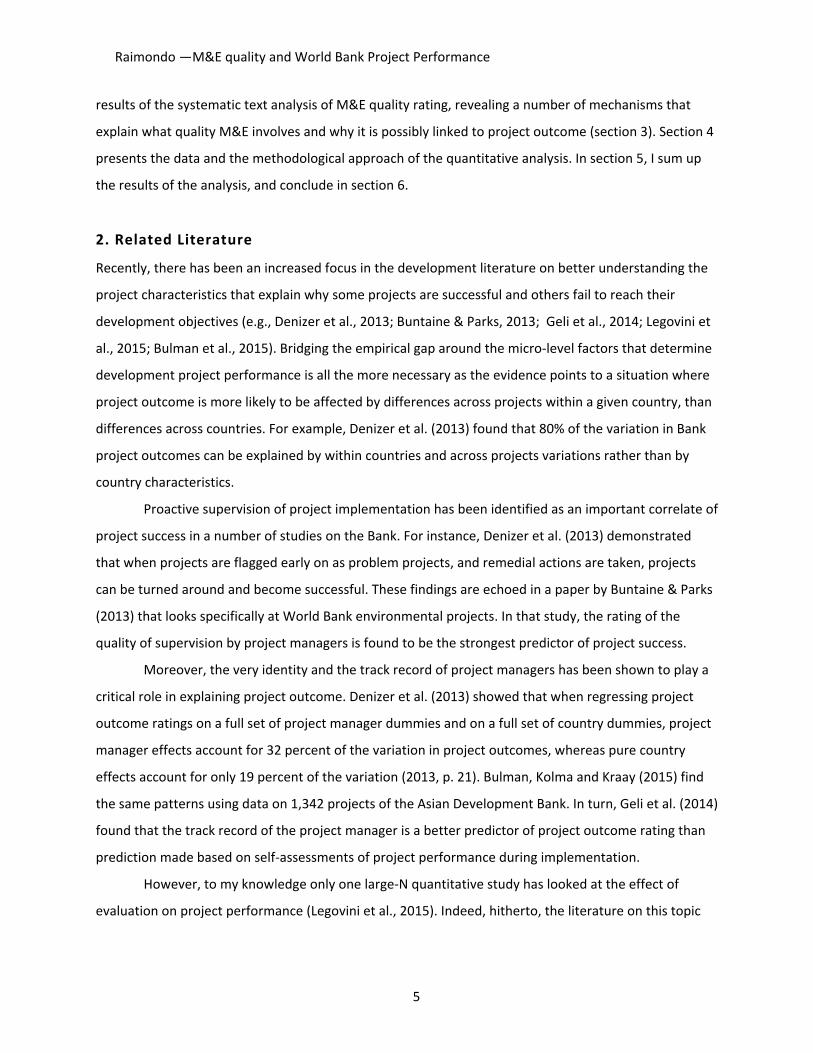
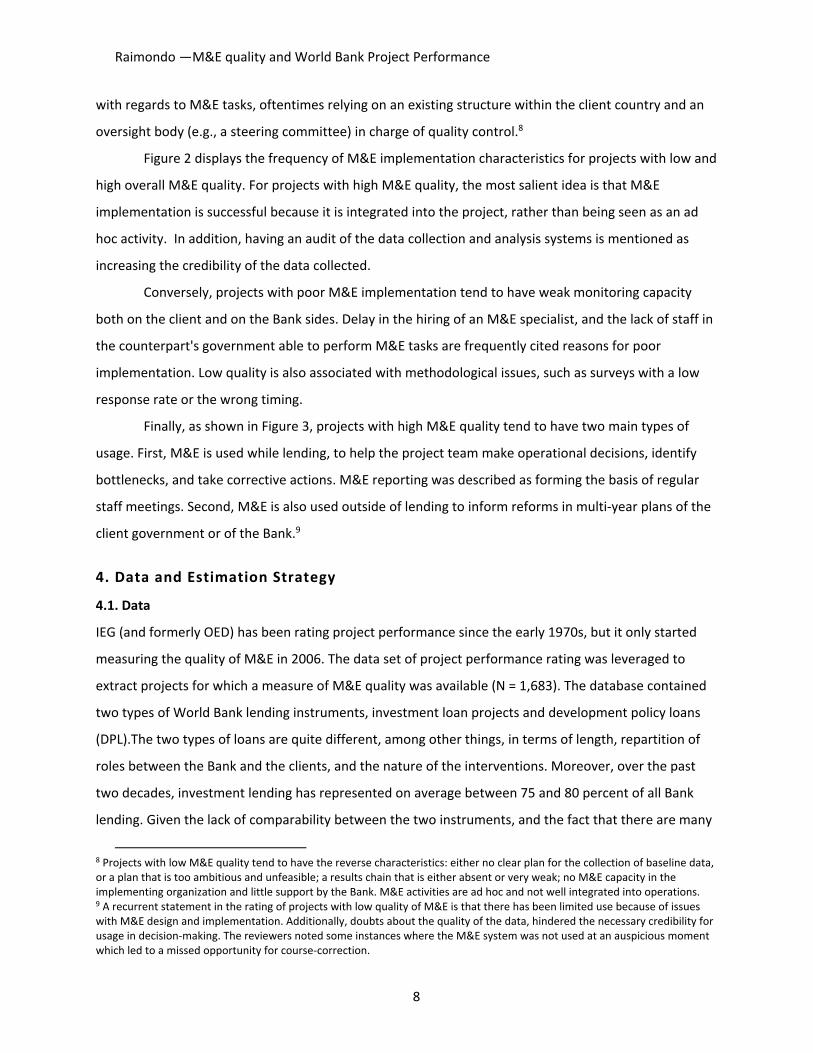
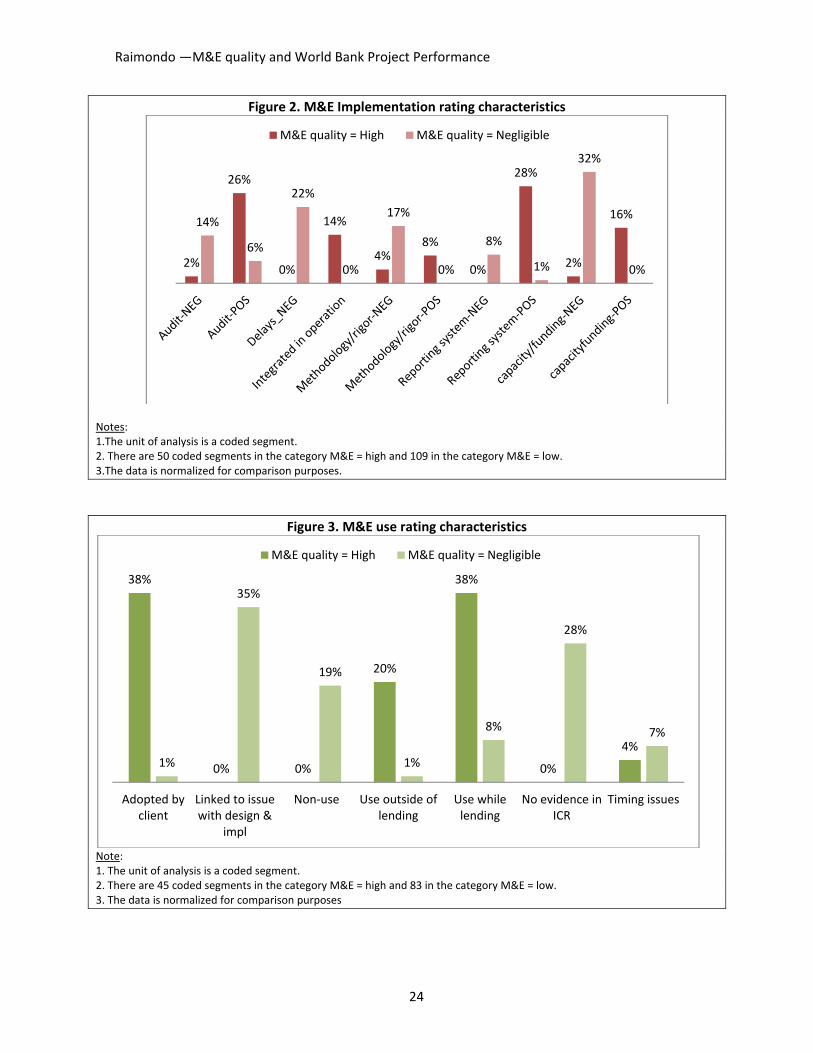
Figure 2 displays the frequency of M&E implementation characteristics for projects with low and
high overall M&E quality. For projects with high M&E quality, the most salient idea is that M&E
implementation is successful because it is integrated into the project, rather than being seen as an ad
hoc activity. In addition, having an audit of the data collection and analysis systems is mentioned as
increasing the credibility of the data collected.
Conversely, projects with poor M&E implementation tend to have weak monitoring capacity
both on the client and on the Bank sides. Delay in the hiring of an M&E specialist, and the lack of staff in
the counterpart's government able to perform M&E tasks are frequently cited reasons for poor
implementation. Low quality is also associated with methodological issues, such as surveys with a low
response rate or the wrong timing.
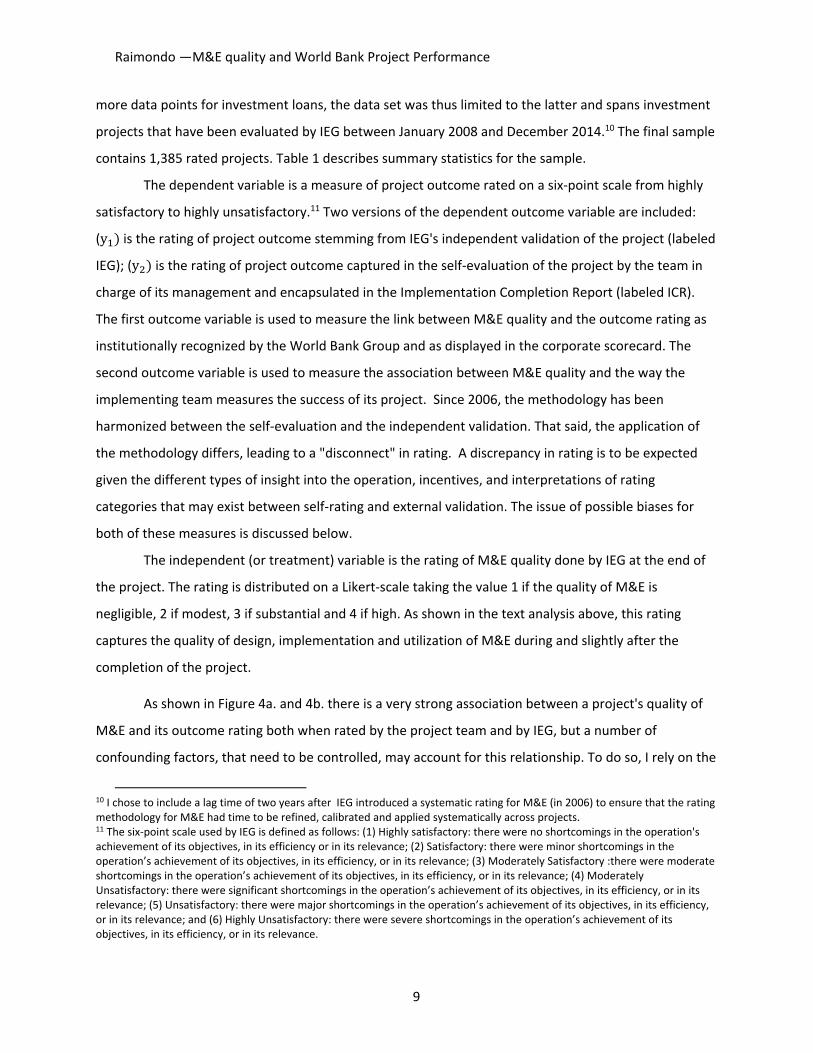
Finally, as shown in Figure 3, projects with high M&E quality tend to have two main types of
usage. First, M&E is used while lending, to help the project team make operational decisions, identify
bottlenecks, and take corrective actions. M&E reporting was described as forming the basis of regular
staff meetings. Second, M&E is also used outside of lending to inform reforms in multi‐year plans of the
client government or of the Bank.9
4. Data and Estimation Strategy
4.1. Data
IEG (and formerly OED) has been rating project performance since the early 1970s, but it only started
measuring the quality of M&E in 2006. The data set of project performance rating was leveraged to
extract projects for which a measure of M&E quality was available (N = 1,683). The database contained
two types of World Bank lending instruments, investment loan projects and development policy loans
(DPL).The two types of loans are quite different, among other things, in terms of length, repartition of
roles between the Bank and the clients, and the nature of the interventions. Moreover, over the past
two decades, investment lending has represented on average between 75 and 80 percent of all Bank
lending. Given the lack of comparability between the two instruments, and the fact that there are many
8 Projects with low M&E quality tend to have the reverse characteristics: either no clear plan for the collection of baseline data, or a plan that is too ambitious and unfeasible; a results chain that is either absent or very weak; no M&E capacity in the implementing organization and little support by the Bank. M&E activities are ad hoc and not well integrated into operations. 9 A recurrent statement in the rating of projects with low quality of M&E is that there has been limited use because of issues with M&E design and implementation. Additionally, doubts about the quality of the data, hindered the necessary credibility for usage in decision‐making. The reviewers noted some instances where the M&E system was not used at an auspicious moment which led to a missed opportunity for course‐correction.
Raimondo —M&E quality and World Bank Project Performance
9
more data points for investment loans, the data set was thus limited to the latter and spans investment
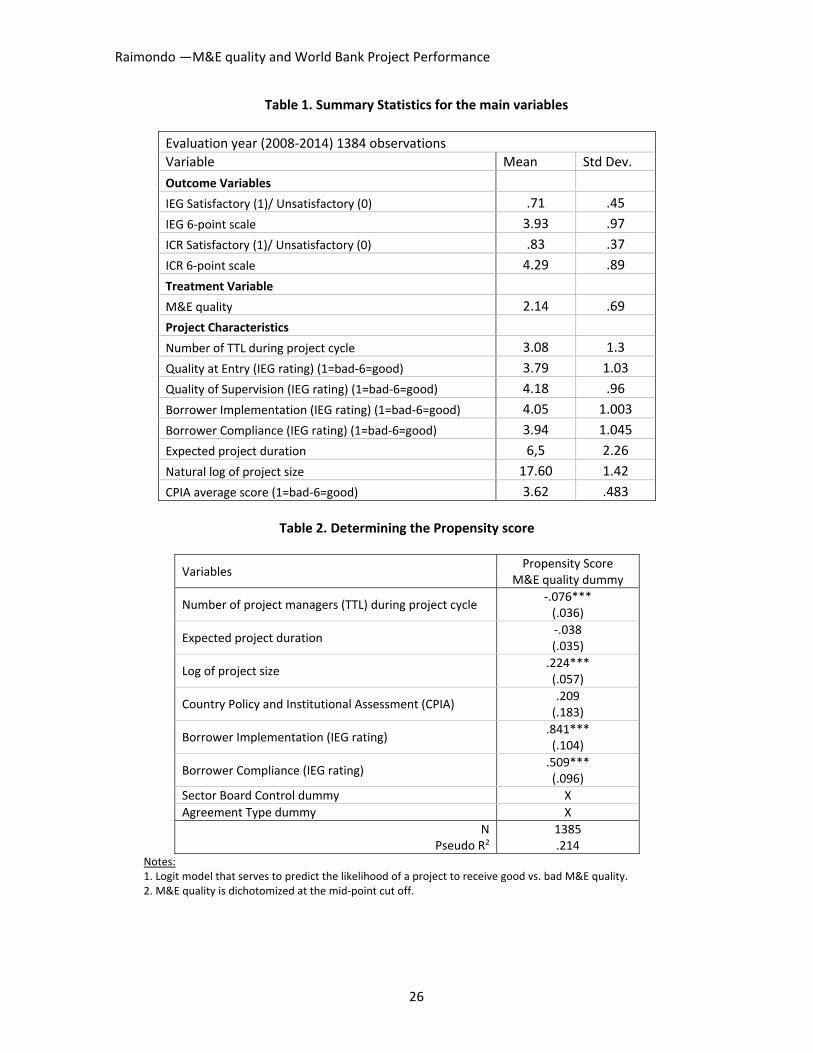
projects that have been evaluated by IEG between January 2008 and December 2014.10 The final sample
contains 1,385 rated projects. Table 1 describes summary statistics for the sample.
The dependent variable is a measure of project outcome rated on a six‐point scale from highly
satisfactory to highly unsatisfactory.11 Two versions of the dependent outcome variable are included:
(y is the rating of project outcome stemming from IEG's independent validation of the project (labeled
IEG); (y is the rating of project outcome captured in the self‐evaluation of the project by the team in
charge of its management and encapsulated in the Implementation Completion Report (labeled ICR).
The first outcome variable is used to measure the link between M&E quality and the outcome rating as
institutionally recognized by the World Bank Group and as displayed in the corporate scorecard. The
second outcome variable is used to measure the association between M&E quality and the way the
implementing team measures the success of its project. Since 2006, the methodology has been
harmonized between the self‐evaluation and the independent validation. That said, the application of
the methodology differs, leading to a "disconnect" in rating. A discrepancy in rating is to be expected
given the different types of insight into the operation, incentives, and interpretations of rating
categories that may exist between self‐rating and external validation. The issue of possible biases for
both of these measures is discussed below.
The independent (or treatment) variable is the rating of M&E quality done by IEG at the end of
the project. The rating is distributed on a Likert‐scale taking the value 1 if the quality of M&E is
negligible, 2 if modest, 3 if substantial and 4 if high. As shown in the text analysis above, this rating
captures the quality of design, implementation and utilization of M&E during and slightly after the
completion of the project.
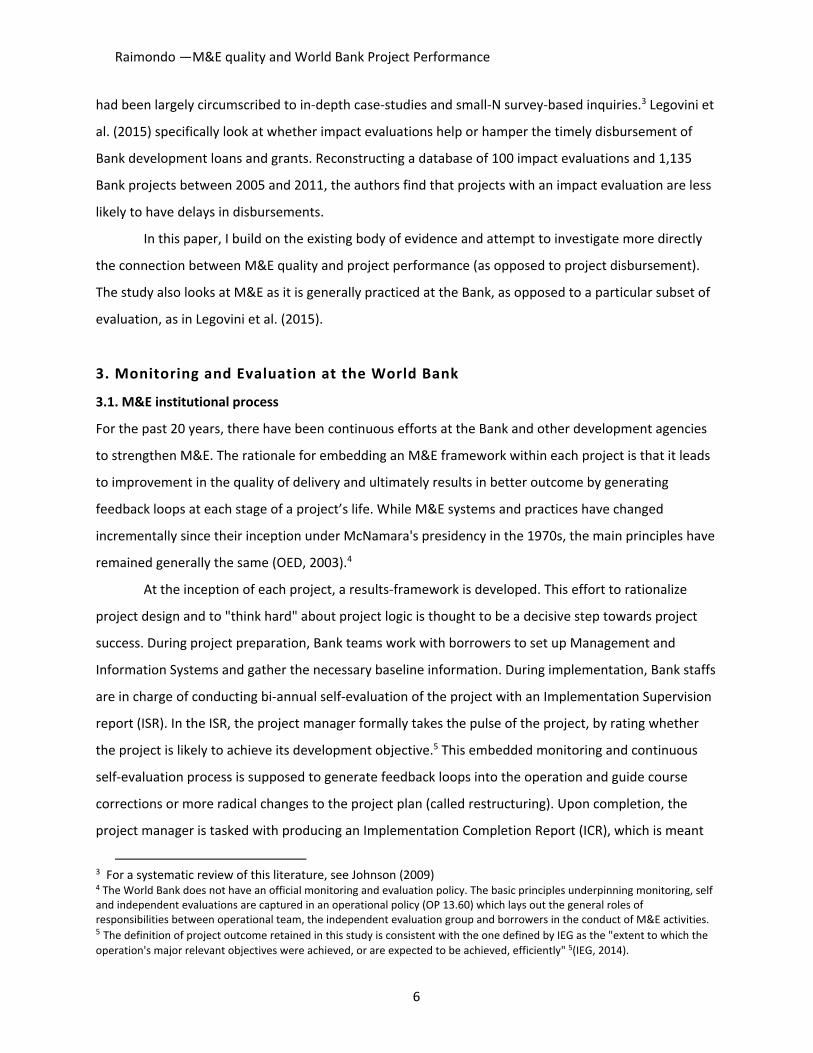
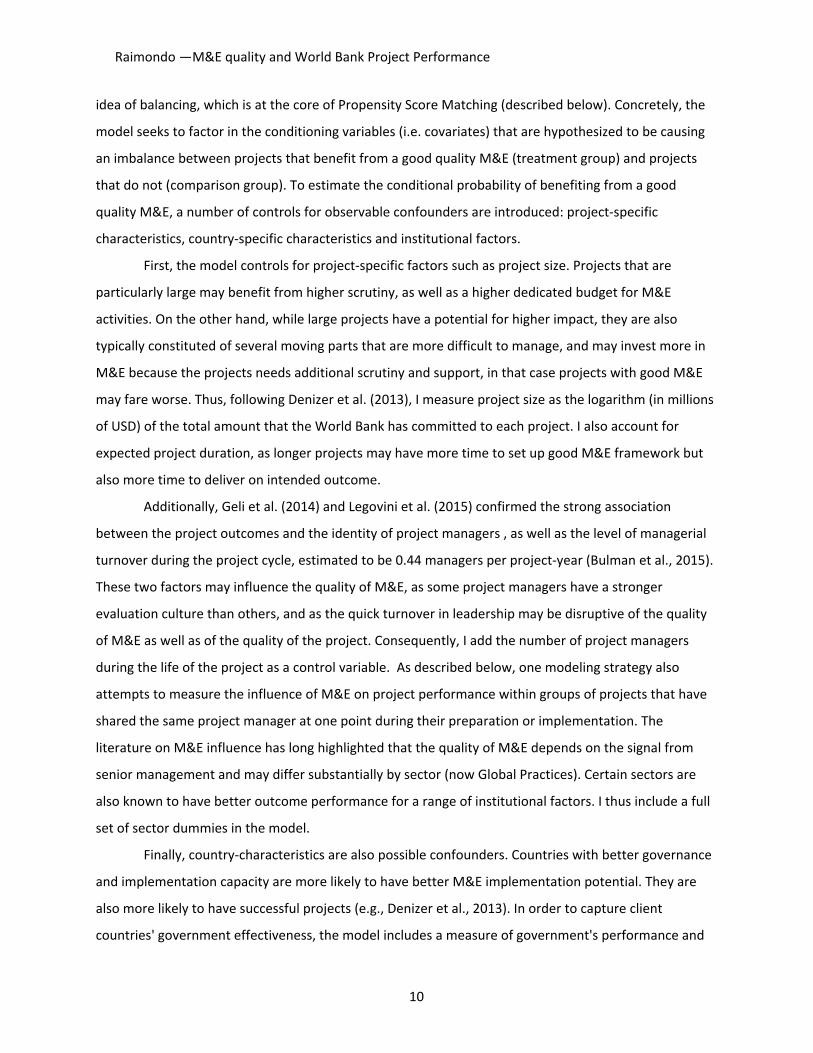
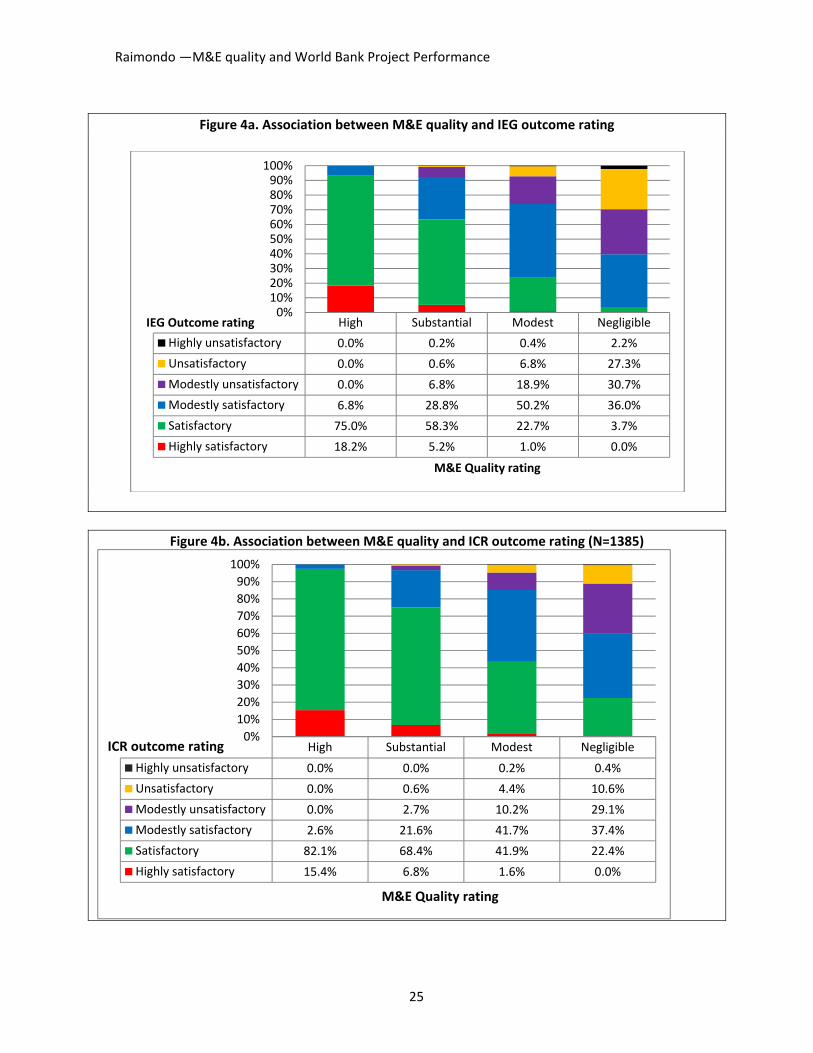
As shown in Figure 4a. and 4b. there is a very strong association between a project's quality of
M&E and its outcome rating both when rated by the project team and by IEG, but a number of
confounding factors, that need to be controlled, may account for this relationship. To do so, I rely on the
10 I chose to include a lag time of two years after IEG introduced a systematic rating for M&E (in 2006) to ensure that the rating methodology for M&E had time to be refined, calibrated and applied systematically across projects. 11 The six‐point scale used by IEG is defined as follows: (1) Highly satisfactory: there were no shortcomings in the operation's achievement of its objectives, in its efficiency or in its relevance; (2) Satisfactory: there were minor shortcomings in the operation’s achievement of its objectives, in its efficiency, or in its relevance; (3) Moderately Satisfactory :there were moderate shortcomings in the operation’s achievement of its objectives, in its efficiency, or in its relevance; (4) Moderately Unsatisfactory: there were significant shortcomings in the operation’s achievement of its objectives, in its efficiency, or in its relevance; (5) Unsatisfactory: there were major shortcomings in the operation’s achievement of its objectives, in its efficiency, or in its relevance; and (6) Highly Unsatisfactory: there were severe shortcomings in the operation’s achievement of its objectives, in its efficiency, or in its relevance.
Raimondo —M&E quality and World Bank Project Performance
10
idea of balancing, which is at the core of Propensity Score Matching (described below). Concretely, the
model seeks to factor in the conditioning variables (i.e. covariates) that are hypothesized to be causing
an imbalance between projects that benefit from a good quality M&E (treatment group) and projects
that do not (comparison group). To estimate the conditional probability of benefiting from a good
quality M&E, a number of controls for observable confounders are introduced: project‐specific
characteristics, country‐specific characteristics and institutional factors.
First, the model controls for project‐specific factors such as project size. Projects that are
particularly large may benefit from higher scrutiny, as well as a higher dedicated budget for M&E
activities. On the other hand, while large projects have a potential for higher impact, they are also
typically constituted of several moving parts that are more difficult to manage, and may invest more in
M&E because the projects needs additional scrutiny and support, in that case projects with good M&E
may fare worse. Thus, following Denizer et al. (2013), I measure project size as the logarithm (in millions
of USD) of the total amount that the World Bank has committed to each project. I also account for
expected project duration, as longer projects may have more time to set up good M&E framework but
also more time to deliver on intended outcome.
Additionally, Geli et al. (2014) and Legovini et al. (2015) confirmed the strong association
between the project outcomes and the identity of project managers , as well as the level of managerial
turnover during the project cycle, estimated to be 0.44 managers per project‐year (Bulman et al., 2015).
These two factors may influence the quality of M&E, as some project managers have a stronger
evaluation culture than others, and as the quick turnover in leadership may be disruptive of the quality
of M&E as well as of the quality of the project. Consequently, I add the number of project managers
during the life of the project as a control variable. As described below, one modeling strategy also
attempts to measure the influence of M&E on project performance within groups of projects that have
shared the same project manager at one point during their preparation or implementation. The
literature on M&E influence has long highlighted that the quality of M&E depends on the signal from
senior management and may differ substantially by sector (now Global Practices). Certain sectors are
also known to have better outcome performance for a range of institutional factors. I thus include a full
set of sector dummies in the model.
Finally, country‐characteristics are also possible confounders. Countries with better governance
and implementation capacity are more likely to have better M&E implementation potential. They are
also more likely to have successful projects (e.g., Denizer et al., 2013). In order to capture client
countries' government effectiveness, the model includes a measure of government's performance and
Raimondo —M&E quality and World Bank Project Performance
11
implementing agent performance, both stemming from the project evaluation dataset. It also includes a
measure of country‐level policy performance, the Country Policy and Institutional Assessment (CPIA)
ratings of the World Bank.12 Given that projects require several years to be fully implemented, the
indicator measures the annual average of the CPIA in the given country where the project was
implemented, over the years during which the project was underway.
4. 2. Caveats with the data
The inherent caveats with the rating system underlying these data have been addressed in details by
Denizer et al. (2013) and Bulman et al. (2015). I share the view that, while there is certainly
considerable measurement error in the outcome measures, this dataset represents a meaningful picture
of project performance from the perspectives of experienced development specialists and evaluators
over a long period of time. That being said, the cautious interpretation of the results ought to be done in
light of the following limitations.
One general concern is that IEG and the World Bank share a common, objectives‐based project
evaluation methodology that assesses achievements against each project's stated objectives (called
project development objectives or PDO). However, the outcome rating also takes into account the
relevance and efficiency of the project objectives based on the country context.13 It is thus possible that
part of the variation in project outcome ratings is due to differences in ambition or feasibility of the
stated PDO, rather than to a difference in the magnitude of the actual outcome. That being said, as
explained by Bulman et al. (2015, p. 9), this issue with constructed validity is largely unavoidable given
the wide variety of Bank projects across sectors. Ratings on objectives provide a common relative
standard that can be applied to very different projects. Finding an alternative absolute standard seems
unlikely.
Secondly, the measures of project performance captured in the data set are not the object of
outcome or impact evaluations. Rather they are the product of reasonably careful administrative
assessments by an independent evaluation unit, which helps to minimize conflict of interest and a
natural bias towards optimism inherent in self‐evaluations by project managers. The scores provided are
proxies for complicated phenomena that are difficult to observe and measure. While there are inherent
12 CPIA rates countries on 16 criteria in four different clusters: economic management, structural policies, and policies for social inclusion and equity, and public sector management. 13 The rationale for an objectives‐based evaluation model is that the Bank is ultimately accountable for delivering results based on these objectives that were the basis of an agreement between the bank and the client country.
Raimondo —M&E quality and World Bank Project Performance
12
limitations with this type of data, the rating method has been quite stable for the period under
observation and it has been the object of reviews and audits. It relies on thorough training of the raters,
and is laid out in much detail in a training manual. Moreover, when an IEG staff has completed an ICR
review, it is peer‐reviewed by another expert, and checked by an IEG coordinator or manager.
Occasionally, the review can be the object of a panel discussion. It thus represents the professional
judgment of experts on the topic. All in all, the IEG rating carries more institutional credibility due to the
organizational independence of the group expertise.
Nevertheless, a third caveat is that using the project performance rating system exposes the
research to a number of non‐negligible endogeneity issues, as well as rater effects in the process of
having a single IEG validator retrospectively rate a project on a range of dimensions. For example, since
2006 IEG guidelines apply a "no benefit of the doubt rule" to the validation of self‐evaluations. In other
words, IEG is compelled to "downgrade" the outcome rating if the evidence presented is weak.14
Consequently, IEG project outcome ratings can at time collapse two different phenomena, poor results
(i.e., severe shortcomings in the operation's achievements of its objectives) and the lack of evidence
that the results have been achieved.
The strategy to partially mitigate these risks of mechanistic relationships between M&E quality
ratings and project outcome ratings—the main source of bias that may threaten the validity of the
empirical analysis in this paper—relies on the use of a second measure of project outcome, produced by
the team in charge of the project. This modeling strategy seeks to reduce the mechanistic link between
M&E quality and outcome rating in two ways:
M&E quality ratings and ICR outcome ratings are not rated by the same raters, thereby
diminishing rater effects.
ICR outcome ratings are produced before a measure of M&E quality exists, as the latter is
produced by IEG at the time of the validation.15
Nonetheless, this strategy does not resolve an additional source of endogeneity, which stems
from the fact that due to possible raters’ effects IEG outcome ratings may not be fully statistically
14 IEG coordinators and managers ensure that the guidelines are applied consistently. For instance, if an IEG validator were to deem the quality of M&E as low, but the outcome rating as high, this would raise a 'red flag' for inconsistency by one of the subsequent reviewers. However, the opposite would not be true, there can be very good M&E quality showing important shortcomings in outcome achievements. 15 The model relies on the assumption that the ICR outcome rating is not mechanistically related to the M&E quality rating.
There is some anecdotal evidence that the ICR outcome raters may at times try to anticipate and game IEG rating. However, there is no evidence that this is done systematically, nor that this is done primarily based on an anticipated measure of M&E quality. That said, this issue definitely adds to the noise in the data.
Raimondo —M&E quality and World Bank Project Performance
13
independent of ICR outcome ratings. It is likely that IEG validators use the ICR rating as a reference
point, are generally more likely to adjust the rating by one point.
A better way to sever these mechanistic links would have been to use data from outside the
World Bank performance measurement system to assess the outcome of projects or the quality of M&E.
However, these data were not available for such a large sample of projects. While the use of a
secondary outcome measure does not fully resolve endogeneity and rater effects issues, it constitutes a
"second‐best" with the available data.
Another caveat relates to the potential for unobserved factors that influence both M&E quality
and outcomes and needs to be considered. For instance certain type of projects may be particularly
complex and thus inherently difficult to monitor and evaluate, and inherently challenging to achieve
good outcomes. The control for sectors may partly capture this inherent relationship, but not fully.
Finally, the relatively large sample size subjects the study to a risk of Type I error.
4.3. Estimation strategy
This section describes the three main modeling strategies employed in measuring the link between M&E
quality and project outcome.16
Propensity Score Matching
The main estimation strategy, Propensity Score Matching (PSM), relies on an intuitive idea: if one
compares two groups of projects that are very similar on a range of characteristics but differ in terms of
their quality of M&E, then any difference in project performance could be attributable to M&E quality.
The PSM estimator can measure the average treatment effect of M&E quality on the treated (ATT) if the
following two sets of assumptions are met. First, PSM relies on a Conditional Independence Assumption
(CIA): assignment to one condition (i.e. good M&E) or another (i.e. bad M&E) is independent of the
potential outcome if observable covariates are held constant.17 Second, it is necessary to attempt to rule
out automatic relations between the rating of M&E quality and the rating of project outcome. Given
that IEG might downgrade a project if the self‐evaluation does not present enough evidence to support
16 The data were screened in order to test whether the assumptions underlying ordered logit and propensity score analysis were met. The data were tested for multicolinearity and it was found that the tolerance statistics ranged between [0.4721; 0.96] which is within Kline's recommended range of 0.10 and above (Kline, 2011). The VIF statistics ranged between [1.08; 2.12] which is below Kline's cut‐off value of 10.0 (Kline, 2011). I conclude that standards multicolinearity is not an issue in this dataset. While univariate normality is not necessary for the models in use, it brings a more stable solution. It was tested graphically by plotting the kernel density estimate against a normal density. Homoskedasticity is not needed in the models used here. 17 The original PSM theorem of Rosenbaum and Rubin (1983), defined propensity score as the conditional probability of assignment to a particular treatment given a vector of observed covariates.
Raimondo —M&E quality and World Bank Project Performance
14
its claim of performance due to weak M&E, I use two distinct measures of project outcome, one rating
by IEG where the risk of mechanistic relationship is high and one rating by the project team where such
risk is low, but where the risk of over‐optimistic rating is high.
Based on these assumptions, matching corresponds to a covariate‐specific treatment vs. control
comparison, weighted conjunctly to obtain a single ATT (Angrist & Pischke, 2009, p. 69). This method
essentially aims to do three things: (i) to relax the stringent assumptions about the shape of the
distribution and functional forms, (ii) to balance conditions across groups so that they approximate data
generated randomly, (iii) to estimate counterfactuals representing the differential treatment effect (Guo
& Fraser, 2010, p. 37). In this case, the regressor (M&E quality) is a categorical variable, which is
transformed into a dichotomous variable. Given the score distribution of M&E quality centered on the
middle scores of "modest" vs. "substantial" the data is dichotomized at the middle cut point.18 In order
to balance the two groups, a propensity score is then estimated, which captures the likelihood that a
project will receive good M&E based on a combination of institutional, project, and country level
characteristics. Equation (1) represents this idea formally:
e x Pr Z 1|X x (1)
The propensity score for project i (i =1,....., N), is the conditional probability of being assigned to
treatment Zi =1 (high quality M&E) vs. control Zi =0 (low quality M&E) given a vector Xi of observed
covariates (project and country characteristics). It is assumed that after controlling for these
characteristics Xi and Zi are independent. I use the recommended logistic regression model to estimate
the propensity score. This first step is displayed in Table 2.
As pedagogically explained by Guo and Fraser (2010) among others, the central idea of the
method is to match each treated project x |w 1 to n non‐treated projects x |w 0 on the
vector of matching variable x presented above. It is then possible to compare the average of y of the
matched non‐treated projects. The resulting difference is an estimate of the average treatment effect
on the treated ATT. The standard estimator is presented in equation (2): ATT
E Y , W 1 E Y , W 0 (2)
The subscript 'match' defines a matched subsample. For W 1, the group includes all projects that
have good M&E quality whose matched projects are found. For W 0, the group is made up of all
projects with poor M&E quality that were matched to projects with good M&E. Different matching
18 The rating of M&E quality as negligible or modest are entered as good M&E =0 and the rating of M&E quality as substantial or high are entered as good M&E =1.
Raimondo —M&E quality and World Bank Project Performance
15
methods and specifications are used to check the robustness of the results.19 One issue that can surface
is that for some propensity scores there might not be sufficient comparable observations between the
control and treatment groups (Heckman et al., 1997). Given that the estimation of the average
treatment effect is only defined in the region of common support, it is important to check the overlap
between treatment and comparison group and ensure that any combination of characteristics observed
in the treatment group can also be found among the projects within the comparison group (Caliendo &
Koepenig, 2005). A formal balancing test for the main models is conducted; they all successfully pass the
balancing test.20
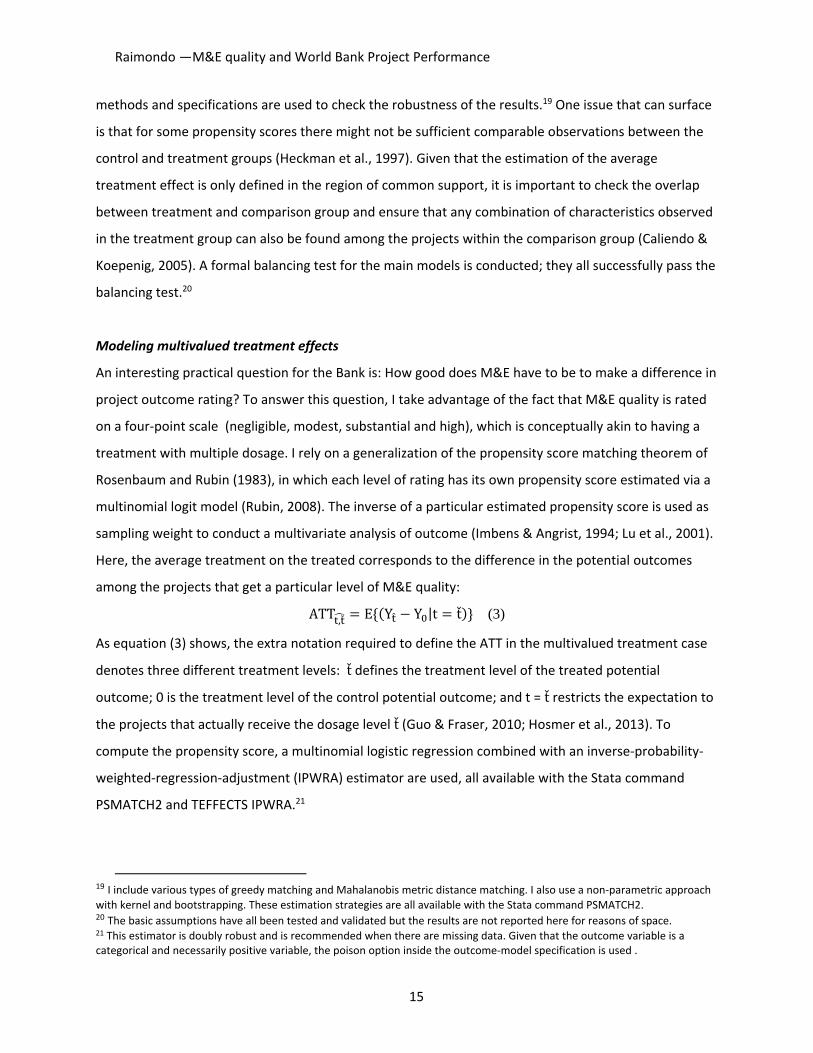
Modeling multivalued treatment effects
An interesting practical question for the Bank is: How good does M&E have to be to make a difference in
project outcome rating? To answer this question, I take advantage of the fact that M&E quality is rated
on a four‐point scale (negligible, modest, substantial and high), which is conceptually akin to having a
treatment with multiple dosage. I rely on a generalization of the propensity score matching theorem of
Rosenbaum and Rubin (1983), in which each level of rating has its own propensity score estimated via a
multinomial logit model (Rubin, 2008). The inverse of a particular estimated propensity score is used as
sampling weight to conduct a multivariate analysis of outcome (Imbens & Angrist, 1994; Lu et al., 2001).
Here, the average treatment on the treated corresponds to the difference in the potential outcomes
among the projects that get a particular level of M&E quality:
ATT , E Y Y |t t (3)
As equation (3) shows, the extra notation required to define the ATT in the multivalued treatment case
denotes three different treatment levels: t defines the treatment level of the treated potential
outcome; 0 is the treatment level of the control potential outcome; and t = t restricts the expectation to
the projects that actually receive the dosage level t(Guo & Fraser, 2010; Hosmer et al., 2013). To
compute the propensity score, a multinomial logistic regression combined with an inverse‐probability‐
weighted‐regression‐adjustment (IPWRA) estimator are used, all available with the Stata command
PSMATCH2 and TEFFECTS IPWRA.21
19 I include various types of greedy matching and Mahalanobis metric distance matching. I also use a non‐parametric approach
with kernel and bootstrapping. These estimation strategies are all available with the Stata command PSMATCH2. 20 The basic assumptions have all been tested and validated but the results are not reported here for reasons of space. 21 This estimator is doubly robust and is recommended when there are missing data. Given that the outcome variable is a categorical and necessarily positive variable, the poison option inside the outcome‐model specification is used .
Raimondo —M&E quality and World Bank Project Performance
16
Project manager fixed‐effects
Another practical question for the Bank is whether the observed association between M&E quality and
project outcome rating is a simple proxy for the intrinsic performance of its project managers. As shown
above and in past work, the quality of supervision is a strong and significant correlate of project
outcome, and one would expect that M&E is a partial determinant of quality of supervision: how well
can project managers supervise the operation if they cannot track progress achieved and challenges?
Consequently, using a fixed effect for the identity of the TTL instead of an indicator for the quality of
supervision, can help solve this correlation issue.
The third modeling strategy is thus to use a conditional (fixed effect) logistic regressions.22
Essentially, this modeling technique looks at the relationship between the “treatment” (good M&E
quality) and a dummy dependent variable (project outcome rating dichotomized as successful or not
successful) within a specific group of projects. Here projects are grouped by their project manager
identification numbers.
Throughout the paper, the unit of analysis is a project. All specifications include a number of
basic controls for the type of agreement, the type of sector and the year of the evaluation. I also include
a number of project characteristics such as number of TTLs that were assigned to the project during its
entire cycle, the expected project duration and the log of project size, as well as a measure of country
government’s capacity.
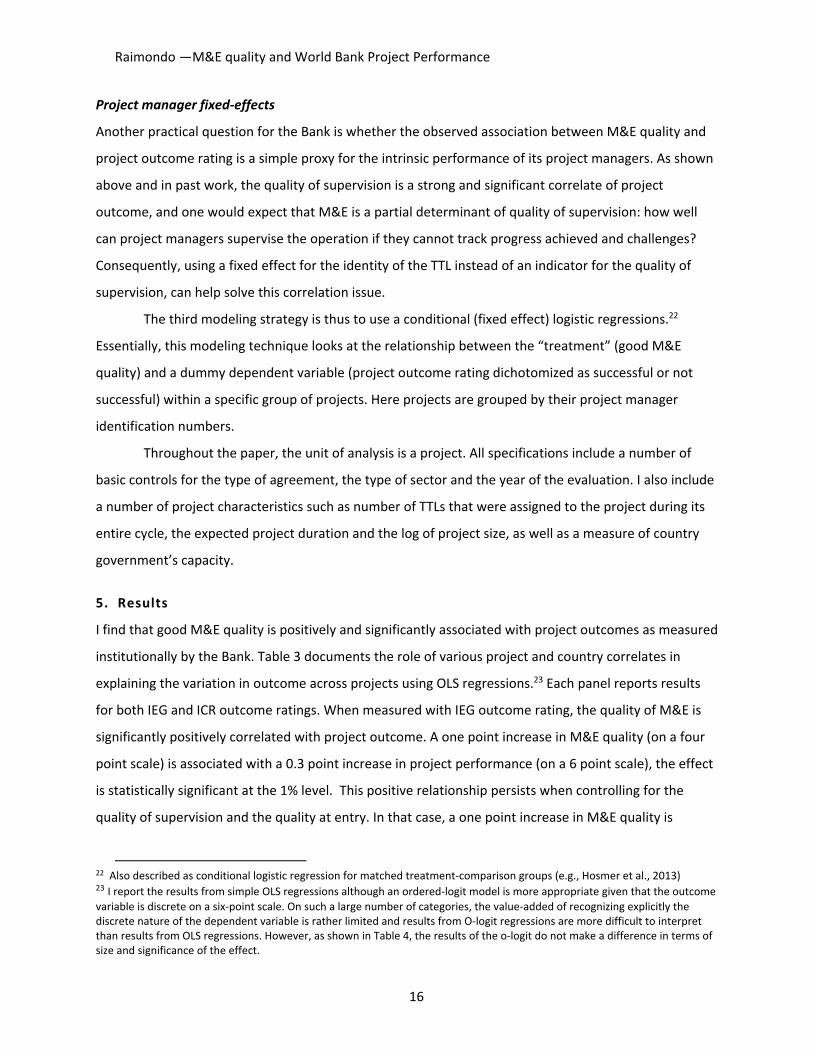
5. Results
I find that good M&E quality is positively and significantly associated with project outcomes as measured
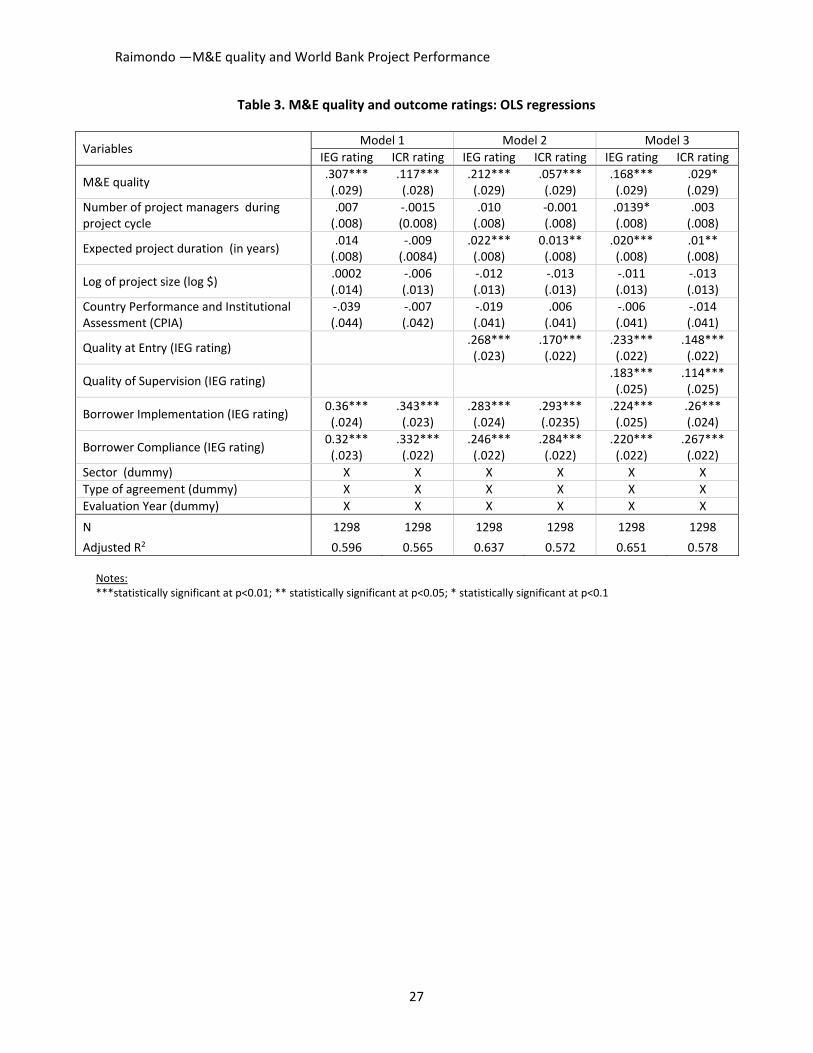
institutionally by the Bank. Table 3 documents the role of various project and country correlates in
explaining the variation in outcome across projects using OLS regressions.23 Each panel reports results
for both IEG and ICR outcome ratings. When measured with IEG outcome rating, the quality of M&E is
significantly positively correlated with project outcome. A one point increase in M&E quality (on a four
point scale) is associated with a 0.3 point increase in project performance (on a 6 point scale), the effect
is statistically significant at the 1% level. This positive relationship persists when controlling for the
quality of supervision and the quality at entry. In that case, a one point increase in M&E quality is
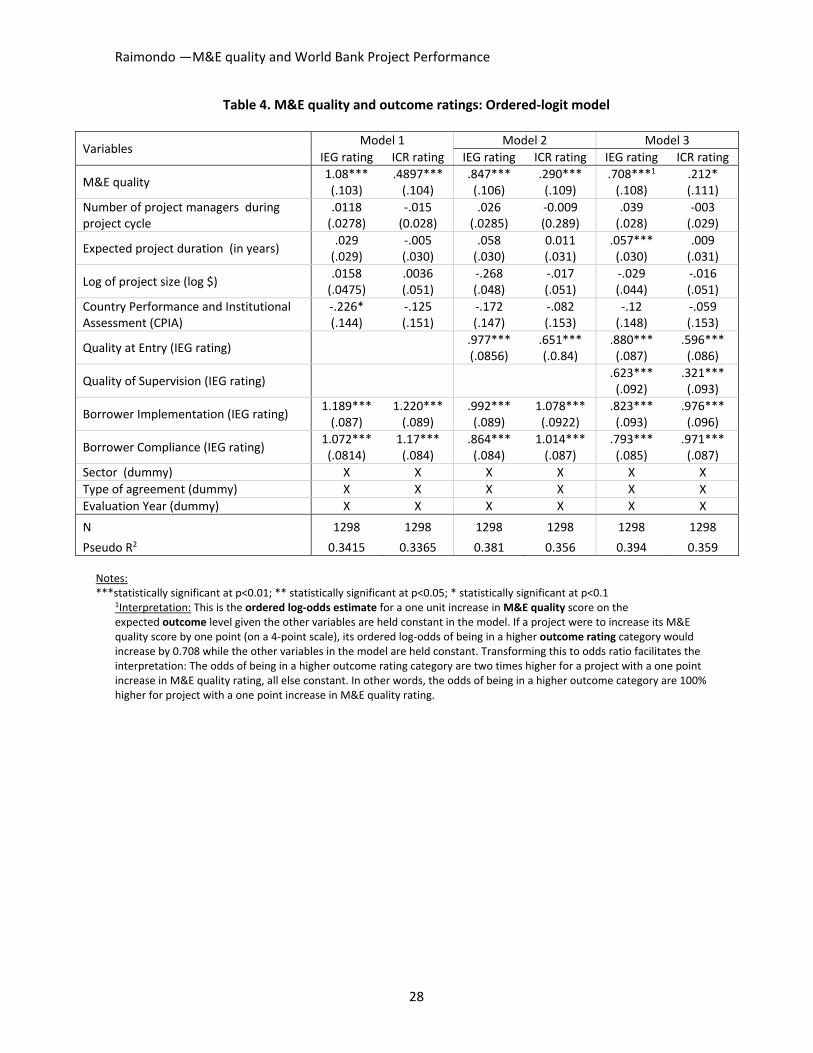
22 Also described as conditional logistic regression for matched treatment‐comparison groups (e.g., Hosmer et al., 2013) 23 I report the results from simple OLS regressions although an ordered‐logit model is more appropriate given that the outcome
variable is discrete on a six‐point scale. On such a large number of categories, the value‐added of recognizing explicitly the discrete nature of the dependent variable is rather limited and results from O‐logit regressions are more difficult to interpret than results from OLS regressions. However, as shown in Table 4, the results of the o‐logit do not make a difference in terms of size and significance of the effect.
Raimondo —M&E quality and World Bank Project Performance
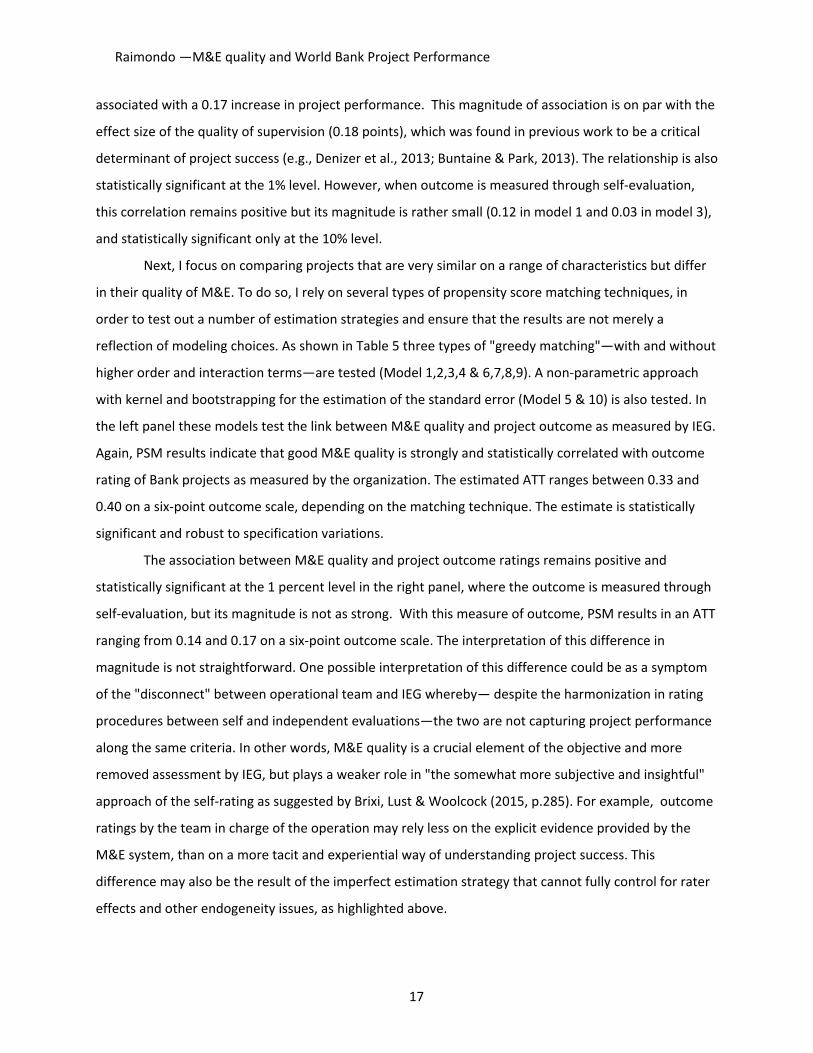
17
associated with a 0.17 increase in project performance. This magnitude of association is on par with the
effect size of the quality of supervision (0.18 points), which was found in previous work to be a critical
determinant of project success (e.g., Denizer et al., 2013; Buntaine & Park, 2013). The relationship is also
statistically significant at the 1% level. However, when outcome is measured through self‐evaluation,
this correlation remains positive but its magnitude is rather small (0.12 in model 1 and 0.03 in model 3),
and statistically significant only at the 10% level.
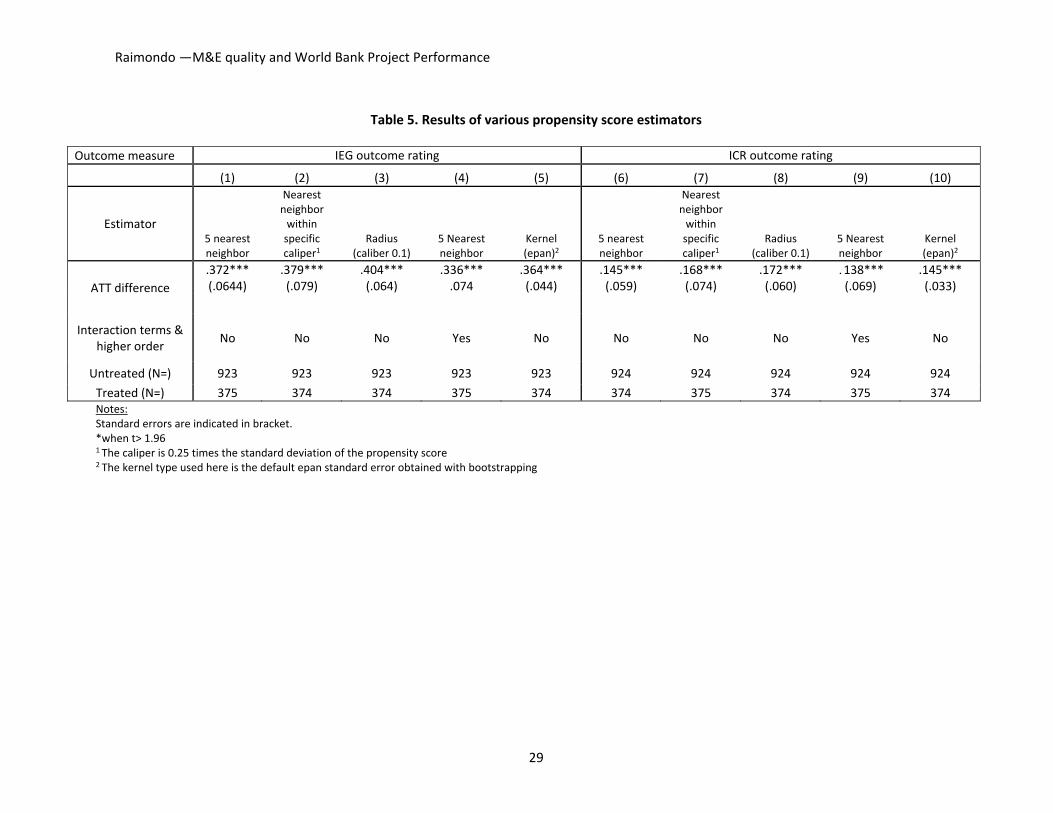
Next, I focus on comparing projects that are very similar on a range of characteristics but differ
in their quality of M&E. To do so, I rely on several types of propensity score matching techniques, in
order to test out a number of estimation strategies and ensure that the results are not merely a
reflection of modeling choices. As shown in Table 5 three types of "greedy matching"—with and without
higher order and interaction terms—are tested (Model 1,2,3,4 & 6,7,8,9). A non‐parametric approach
with kernel and bootstrapping for the estimation of the standard error (Model 5 & 10) is also tested. In
the left panel these models test the link between M&E quality and project outcome as measured by IEG.
Again, PSM results indicate that good M&E quality is strongly and statistically correlated with outcome
rating of Bank projects as measured by the organization. The estimated ATT ranges between 0.33 and
0.40 on a six‐point outcome scale, depending on the matching technique. The estimate is statistically
significant and robust to specification variations.
The association between M&E quality and project outcome ratings remains positive and
statistically significant at the 1 percent level in the right panel, where the outcome is measured through
self‐evaluation, but its magnitude is not as strong. With this measure of outcome, PSM results in an ATT
ranging from 0.14 and 0.17 on a six‐point outcome scale. The interpretation of this difference in
magnitude is not straightforward. One possible interpretation of this difference could be as a symptom
of the "disconnect" between operational team and IEG whereby— despite the harmonization in rating
procedures between self and independent evaluations—the two are not capturing project performance
along the same criteria. In other words, M&E quality is a crucial element of the objective and more
removed assessment by IEG, but plays a weaker role in "the somewhat more subjective and insightful"
approach of the self‐rating as suggested by Brixi, Lust & Woolcock (2015, p.285). For example, outcome
ratings by the team in charge of the operation may rely less on the explicit evidence provided by the
M&E system, than on a more tacit and experiential way of understanding project success. This
difference may also be the result of the imperfect estimation strategy that cannot fully control for rater
effects and other endogeneity issues, as highlighted above.
Raimondo —M&E quality and World Bank Project Performance
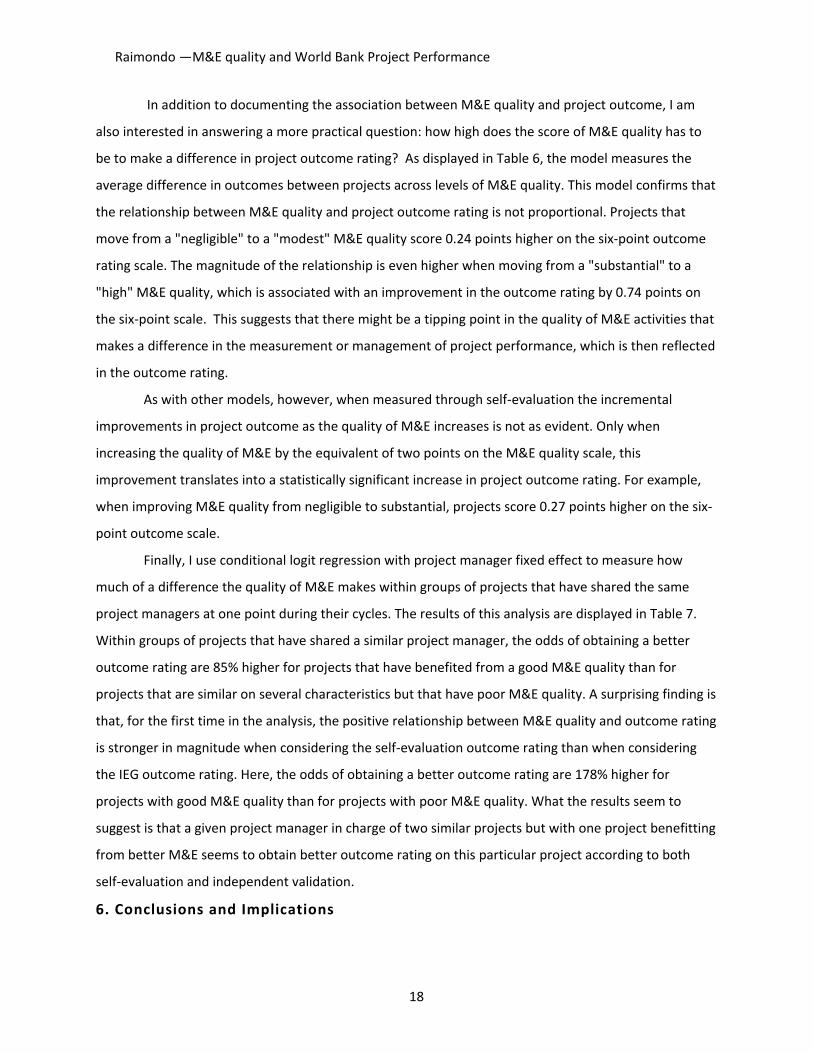
18
In addition to documenting the association between M&E quality and project outcome, I am
also interested in answering a more practical question: how high does the score of M&E quality has to
be to make a difference in project outcome rating? As displayed in Table 6, the model measures the
average difference in outcomes between projects across levels of M&E quality. This model confirms that
the relationship between M&E quality and project outcome rating is not proportional. Projects that
move from a "negligible" to a "modest" M&E quality score 0.24 points higher on the six‐point outcome
rating scale. The magnitude of the relationship is even higher when moving from a "substantial" to a
"high" M&E quality, which is associated with an improvement in the outcome rating by 0.74 points on
the six‐point scale. This suggests that there might be a tipping point in the quality of M&E activities that
makes a difference in the measurement or management of project performance, which is then reflected
in the outcome rating.
As with other models, however, when measured through self‐evaluation the incremental
improvements in project outcome as the quality of M&E increases is not as evident. Only when
increasing the quality of M&E by the equivalent of two points on the M&E quality scale, this
improvement translates into a statistically significant increase in project outcome rating. For example,
when improving M&E quality from negligible to substantial, projects score 0.27 points higher on the six‐
point outcome scale.
Finally, I use conditional logit regression with project manager fixed effect to measure how
much of a difference the quality of M&E makes within groups of projects that have shared the same
project managers at one point during their cycles. The results of this analysis are displayed in Table 7.
Within groups of projects that have shared a similar project manager, the odds of obtaining a better
outcome rating are 85% higher for projects that have benefited from a good M&E quality than for
projects that are similar on several characteristics but that have poor M&E quality. A surprising finding is
that, for the first time in the analysis, the positive relationship between M&E quality and outcome rating
is stronger in magnitude when considering the self‐evaluation outcome rating than when considering
the IEG outcome rating. Here, the odds of obtaining a better outcome rating are 178% higher for
projects with good M&E quality than for projects with poor M&E quality. What the results seem to
suggest is that a given project manager in charge of two similar projects but with one project benefitting
from better M&E seems to obtain better outcome rating on this particular project according to both
self‐evaluation and independent validation.
6. Conclusions and Implications
Raimondo —M&E quality and World Bank Project Performance
19
As shown by Denizer et al. (2013), there is a wide range of as‐yet‐unmeasured factors, at both the
country and project levels, that account for the variation in project performance. The development
community for the past 20 years has hypothesized that one of these important explaining factors is the
quality of M&E. This study is among the first to investigate quantitatively patterns of regularity in the
association between M&E quality and project performance across a large sample of development
projects. The study presents evidence that within the institutional context of the organization, M&E
quality is an important factor in explaining the variation in World Bank project outcome ratings. To
summarize, I find that the quality of M&E is systematically positively associated with project outcome
ratings as institutionally measured within the World Bank and its Independent Evaluation Group. The
PSM results show that on average, projects with high M&E quality score between 0.13 and 0.40 points
better than projects with poor M&E quality on a six‐point outcome scale, depending on whether the
outcome is measured by IEG or the team in charge of operations. This positive relationship holds when
controlling for a range of project characteristics and is robust to various modeling strategies and
specification choices. More specifically, the study shows that:
(1) When measured through OLS, and when controlling for a wide range of factors, including the
quality of supervision and the project quality at entry, the magnitude of the relationship between M&E
quality is on par with the association between quality of supervision and project outcome rating
(respectively 0.17 and 0.18 points better on a 6 point scales).
(2) When matching projects, the average treatment effect on the treated of good M&E quality
on project outcome ratings ranges from 0.33 to 0.40 points when measured by IEG, and between 0.14
and 0.17 points when measured by the self‐evaluation.
(2) Even when controlling for project manager identity (which was found in the past to be the
strongest predictor of project performance), the ATT of M&E quality remains positive and statistically
significant. The odds of scoring better on project outcome are 85% higher for projects with high M&E
quality than for otherwise similar projects that were managed by the same project manager at one point
in their project cycle but have low M&E quality.
All in all, the systematic positive association between M&E quality and outcome rating found in
this study gives credence to the notion that within the institutional performance rating system of the
World Bank and IEG, M&E quality is a potentially strong determinant of satisfactory project ratings.
However, there are important caveats to this study that have been highlighted above. Future research
can help bolster this evidence, by finding empirical strategies that would overcome these limitations, in
particular endogeneity issues and rater effects. Notwithstanding these caveats, the findings of this study
Raimondo —M&E quality and World Bank Project Performance
20
have some institutional implications for the World Bank and the larger development community. A
number of these implications are highlighted here.
First, these findings suggest that there is some institutional value in investing in M&E, given that
the overall quality of M&E remains weak at the Bank. While strengthening the evaluation culture within
the organization is a long and complex process, the systematic text analysis conducted as a preliminary
step in this paper suggests that a number of rather simple actions can lead to improving M&E quality at
the margin. For instance:
Ensuring that M&E design is not overly complex, and is aligned with the existing
management information system that the client countries already have would go a long way
in improving M&E quality.
Ensuring that the data collected are quality controlled or audited is also an important
determinant of M&E credibility and ultimately its usability for performance management.
Ensuring that M&E is not an operational afterthought but supported by a clear division of
labor between the World Bank team, clients, and implementing teams is key.
A second finding is that the relationship between M&E quality and project performance is higher
when measured by IEG, in the framework of an independent validation, than when it is measured by the
implementing team, in the framework of a self‐evaluation. Although this study cannot explain
empirically why such a gap exists, it confirms that there is a substantial 'disconnect' between how an
independent evaluation unit and operational staff measure success. It is possible that while the former
puts a lot of emphasis on formal and explicit evidence of impact, the latter relies more on tacit and
implicit evidence of success. This discrepancy is not unique to the Bank but a recurrent theme of the
results based management literature in international organizations. The Bank has actively worked
towards bridging the 'disconnect' in ratings for years, and monitors this gap closely. This study echoes
others in suggesting that working on the M&E culture would go a long way in bridging this gap.24 It is
thus critical to further investigate the institutional dynamic around project performance measurement,
and results‐based management within the World Bank, which is partly addressed in a forthcoming
evaluation of the World Bank’s self‐evaluation system.
Third this study highlights the need to better understand the underlying mechanisms through
which M&E makes a difference in project success. Recently, Legovini et al. (2015) tested and confirmed
24 The series of annual report on the Results and Performance of the World Bank Group (RAP) have consistently showed that M&E quality is weak and should be improved to help project perform better. The recent study on Learning and Results in World Bank operations also corroborated these findings: http://ieg.worldbankgroup.org/evaluations/learning‐results‐wb‐operations2
Raimondo —M&E quality and World Bank Project Performance
21
the hypothesis that certain types of evaluation, in this case impact evaluation, can help keep the
implementation process on track and facilitate disbursement of funds. Others suggest that as
development interventions become increasingly complex, adaptive management— i.e. iterative
processes of trials, errors, learning and course corrections— is necessary to ensuring project success.
M&E is thought to play a critical role in this process (e.g., Pritchett et al., 2013; Andrews, 2015). Certain
approaches to M&E may be more impactful than others in certain contexts, and this should be studied
closely.
References
Andrews, M. (2015). Doing Complex Reforms through PDIA: Judicial Sector Change in Mozambique. Public Administration and Development 35, 288‐300 Bulman, D., Kolkma, W. & Kraay, A. (2015). Good countries or Good Projects? Comparing Macro and Micro Correlates of World Bank and Asian Development Bank Project Performance. World Bank Policy Research Working Paper 7245 Buntaine, M. T. & Parks, B.D. (2013). When Do Environmentally Focused Assistance Projects Achieve their Objectives? Evidence from World Bank Post‐Project Evaluations. Global Environmental Politics, 13(2) pp. 65‐88. Brixi, H., Lust, E. & Woolcock, M. (2015). Trust, Voice, and Incentives: Learning from Local success stories in service delivery in the Middle East and North Africa. World Bank Group, 95769 Caliendo, M., & Kopeining, S. (2005) "Some Practical Guidance for the Implementation of Propensity‐score matching". Iza Discussion Paper 1588. Institute for the Study of Labor (IZA). Denizer C., Kaufmann D., and Kraay A. (2013). "Good countries or good projects? Macro and Micro correlates of World Bank Project Performance" Journal of Development Economics 105: 288‐302. Geli, P. Kraay, A. & Nobakht, H. (2014). Predicting World Bank Project Outcome Ratings. World Bank Policy Research Working Paper 7001.
Guo, S. & Fraser, M.W. (2010). Propensity Score Analysis: Statistical Methods and Applications (Advanced Quantitative Techniques in the Social Sciences). Sage: Thousand Oaks. Hosmer, D. W., Jr., S. A. Lemeshow, and R. X. Sturdivant. (2013). Applied Logistic Regression. 3rd ed. Hoboken, NJ: Wiley. Imbens, G. W., and Angrist, J. D. (1994), “Identification and Estimation of Local Average Treatment Effects,” Econometrica, 62, 467–475.
Raimondo —M&E quality and World Bank Project Performance
22
Johnson. K., Geenseid, L.O., Toal, S.A., King, J.A., Lawrenz, F., & Volkov, B. (2009). Research on Evaluation Use: A Review of the Empirical Literature from 1986 to 2005. American Journal of Evaluation 30(3): 377‐410.
Legovini A., Di Maro, V. Piza C. (2015) Impact Evaluation helps Deliver Development Projects. World Bank Policy Research Working Paper 7157. Lu, Zanutto, Hornik, Rosenbaum.(2001). Matching with doses in an observational study of a media campaign against drug abuse. Journal of the American statistical association, 96, 1245‐1253. Pritchett, L., Samji. S. & Hammer, J. (2012). It's All About MeE: Using Structured Experiential Learning ("e") to Crawl the Design Space. Center for Global Development Working Paper 406. Rosenbaum, P.R. & Rubin, D.B. (1983) "The central role of the propensity score in observational studies for causal effects. Biometrika, Vol. 70(1), pp. 41‐55 Rubin, D.B. (2008). For objective causal inference, design trumps analysis. Annals of Applied Statistics. 2: 808‐840
Raimondo —M&E quality and World Bank Project Performance
23
Figures and Tables
Figure 1. M&E Design rating characteristics
Notes: 1.The unit of analysis is a coded segment. 2.There are 91 coded segments in the category M&E = high and 235 in the category M&E = low. 3. The data is normalized for comparison purposes.
0%
21%
2%
14%
0%
9%
0%
3%
29%
1%
10%
0%
9%
1% 1%1% 1%
19%
0%
7%
0%
6%
25%
3%
20%
4%2%
0%
5%6%
M&E quality = High M&E quality = Negligible
Raimondo —M&E quality and World Bank Project Performance
24
Figure 2. M&E Implementation rating characteristics
Notes: 1.The unit of analysis is a coded segment. 2. There are 50 coded segments in the category M&E = high and 109 in the category M&E = low. 3.The data is normalized for comparison purposes.
Figure 3. M&E use rating characteristics
Note: 1. The unit of analysis is a coded segment. 2. There are 45 coded segments in the category M&E = high and 83 in the category M&E = low. 3. The data is normalized for comparison purposes
2%
26%
0%
14%
4%8%
0%
28%
2%
16%14%
6%
22%
0%
17%
0%
8%
1%
32%
0%
M&E quality = High M&E quality = Negligible
38%
0% 0%
20%
38%
0%
4%1%
35%
19%
1%
8%
28%
7%
Adopted byclient
Linked to issuewith design &
impl
Non‐use Use outside oflending
Use whilelending
No evidence inICR
Timing issues
M&E quality = High M&E quality = Negligible
Raimondo —M&E quality and World Bank Project Performance
25
Figure 4a. Association between M&E quality and IEG outcome rating
Figure 4b. Association between M&E quality and ICR outcome rating (N=1385)
High Substantial Modest Negligible
Highly unsatisfactory 0.0% 0.2% 0.4% 2.2%
Unsatisfactory 0.0% 0.6% 6.8% 27.3%
Modestly unsatisfactory 0.0% 6.8% 18.9% 30.7%
Modestly satisfactory 6.8% 28.8% 50.2% 36.0%
Satisfactory 75.0% 58.3% 22.7% 3.7%
Highly satisfactory 18.2% 5.2% 1.0% 0.0%
0%10%20%30%40%50%60%70%80%90%
100%
M&E Quality rating
IEG Outcome rating
High Substantial Modest Negligible
Highly unsatisfactory 0.0% 0.0% 0.2% 0.4%
Unsatisfactory 0.0% 0.6% 4.4% 10.6%
Modestly unsatisfactory 0.0% 2.7% 10.2% 29.1%
Modestly satisfactory 2.6% 21.6% 41.7% 37.4%
Satisfactory 82.1% 68.4% 41.9% 22.4%
Highly satisfactory 15.4% 6.8% 1.6% 0.0%
0%
10%
20%
30%
40%
50%
60%
70%
80%
90%
100%
M&E Quality rating
ICR outcome rating
Raimondo —M&E quality and World Bank Project Performance
26
Table 1. Summary Statistics for the main variables
Evaluation year (2008‐2014) 1384 observations
Variable Mean Std Dev.
Outcome Variables
IEG Satisfactory (1)/ Unsatisfactory (0) .71 .45
IEG 6‐point scale 3.93 .97
ICR Satisfactory (1)/ Unsatisfactory (0) .83 .37
ICR 6‐point scale 4.29 .89
Treatment Variable
M&E quality 2.14 .69
Project Characteristics
Number of TTL during project cycle 3.08 1.3
Quality at Entry (IEG rating) (1=bad‐6=good) 3.79 1.03
Quality of Supervision (IEG rating) (1=bad‐6=good) 4.18 .96
Borrower Implementation (IEG rating) (1=bad‐6=good) 4.05 1.003
Borrower Compliance (IEG rating) (1=bad‐6=good) 3.94 1.045
Expected project duration 6,5 2.26
Natural log of project size 17.60 1.42
CPIA average score (1=bad‐6=good) 3.62 .483
Table 2. Determining the Propensity score
Variables Propensity Score
M&E quality dummy
Number of project managers (TTL) during project cycle ‐.076*** (.036)
Expected project duration ‐.038 (.035)
Log of project size .224*** (.057)
Country Policy and Institutional Assessment (CPIA) .209 (.183)
Borrower Implementation (IEG rating) .841*** (.104)
Borrower Compliance (IEG rating) .509*** (.096)
Sector Board Control dummy X
Agreement Type dummy X
N 1385 Pseudo R2 .214
Notes: 1. Logit model that serves to predict the likelihood of a project to receive good vs. bad M&E quality. 2. M&E quality is dichotomized at the mid‐point cut off.
Raimondo —M&E quality and World Bank Project Performance
27
Table 3. M&E quality and outcome ratings: OLS regressions
Variables Model 1 Model 2 Model 3
IEG rating ICR rating IEG rating ICR rating IEG rating ICR rating
M&E quality .307*** (.029)
.117*** (.028)
.212*** (.029)
.057*** (.029)
.168*** (.029)
.029* (.029)
Number of project managers during project cycle
.007 (.008)
‐.0015 (0.008)
.010 (.008)
‐0.001 (.008)
.0139* (.008)
.003 (.008)
Expected project duration (in years) .014 (.008)
‐.009 (.0084)
.022*** (.008)
0.013** (.008)
.020*** (.008)
.01** (.008)
Log of project size (log $) .0002 (.014)
‐.006 (.013)
‐.012 (.013)
‐.013 (.013)
‐.011 (.013)
‐.013 (.013)
Country Performance and Institutional Assessment (CPIA)
‐.039 (.044)
‐.007 (.042)
‐.019 (.041)
.006 (.041)
‐.006 (.041)
‐.014 (.041)
Quality at Entry (IEG rating) .268***
(.023) .170*** (.022)
.233*** (.022)
.148*** (.022)
Quality of Supervision (IEG rating)
.183*** (.025)
.114*** (.025)
Borrower Implementation (IEG rating) 0.36*** (.024)
.343*** (.023)
.283*** (.024)
.293*** (.0235)
.224*** (.025)
.26*** (.024)
Borrower Compliance (IEG rating) 0.32*** (.023)
.332*** (.022)
.246*** (.022)
.284*** (.022)
.220*** (.022)
.267*** (.022)
Sector (dummy) X X X X X X
Type of agreement (dummy) X X X X X X
Evaluation Year (dummy) X X X X X X
N 1298 1298 1298 1298 1298 1298
Adjusted R2 0.596 0.565 0.637 0.572 0.651 0.578 Notes: ***statistically significant at p<0.01; ** statistically significant at p<0.05; * statistically significant at p<0.1
Raimondo —M&E quality and World Bank Project Performance
28
Table 4. M&E quality and outcome ratings: Ordered‐logit model
Variables Model 1 Model 2 Model 3
IEG rating ICR rating IEG rating ICR rating IEG rating ICR rating
M&E quality 1.08*** (.103)
.4897*** (.104)
.847*** (.106)
.290*** (.109)
.708***1 (.108)
.212* (.111)
Number of project managers during project cycle
.0118 (.0278)
‐.015 (0.028)
.026 (.0285)
‐0.009 (0.289)
.039 (.028)
‐003 (.029)
Expected project duration (in years) .029 (.029)
‐.005 (.030)
.058 (.030)
0.011 (.031)
.057*** (.030)
.009 (.031)
Log of project size (log $) .0158 (.0475)
.0036 (.051)
‐.268 (.048)
‐.017 (.051)
‐.029 (.044)
‐.016 (.051)
Country Performance and Institutional Assessment (CPIA)
‐.226* (.144)
‐.125 (.151)
‐.172 (.147)
‐.082 (.153)
‐.12 (.148)
‐.059 (.153)
Quality at Entry (IEG rating) .977***
(.0856) .651*** (.0.84)
.880*** (.087)
.596*** (.086)
Quality of Supervision (IEG rating)
.623*** (.092)
.321*** (.093)
Borrower Implementation (IEG rating) 1.189*** (.087)
1.220*** (.089)
.992*** (.089)
1.078*** (.0922)
.823*** (.093)
.976*** (.096)
Borrower Compliance (IEG rating) 1.072*** (.0814)
1.17*** (.084)
.864*** (.084)
1.014*** (.087)
.793*** (.085)
.971*** (.087)
Sector (dummy) X X X X X X
Type of agreement (dummy) X X X X X X
Evaluation Year (dummy) X X X X X X
N 1298 1298 1298 1298 1298 1298
Pseudo R2 0.3415 0.3365 0.381 0.356 0.394 0.359 Notes: ***statistically significant at p<0.01; ** statistically significant at p<0.05; * statistically significant at p<0.1
1Interpretation: This is the ordered log‐odds estimate for a one unit increase in M&E quality score on the expected outcome level given the other variables are held constant in the model. If a project were to increase its M&E quality score by one point (on a 4‐point scale), its ordered log‐odds of being in a higher outcome rating category would increase by 0.708 while the other variables in the model are held constant. Transforming this to odds ratio facilitates the interpretation: The odds of being in a higher outcome rating category are two times higher for a project with a one point increase in M&E quality rating, all else constant. In other words, the odds of being in a higher outcome category are 100% higher for project with a one point increase in M&E quality rating.
Raimondo —M&E quality and World Bank Project Performance
29
Table 5. Results of various propensity score estimators
Outcome measure IEG outcome rating ICR outcome rating
(1) (2) (3) (4) (5) (6) (7) (8) (9) (10)
Estimator 5 nearest neighbor
Nearest neighbor within specific caliper1
Radius (caliber 0.1)
5 Nearest neighbor
Kernel (epan)2
5 nearest neighbor
Nearest neighbor within specific caliper1
Radius (caliber 0.1)
5 Nearest neighbor
Kernel (epan)2
ATT difference
.372*** (.0644)
.379*** (.079)
.404*** (.064)
.336*** .074
.364*** (.044)
.145*** (.059)
.168*** (.074)
.172*** (.060)
.138*** (.069)
.145*** (.033)
Interaction terms & higher order
No No No Yes No No No No Yes No
Untreated (N=) 923 923 923 923 923 924 924 924 924 924
Treated (N=) 375 374 374 375 374 374 375 374 375 374 Notes: Standard errors are indicated in bracket. *when t> 1.96 1 The caliper is 0.25 times the standard deviation of the propensity score 2 The kernel type used here is the default epan standard error obtained with bootstrapping
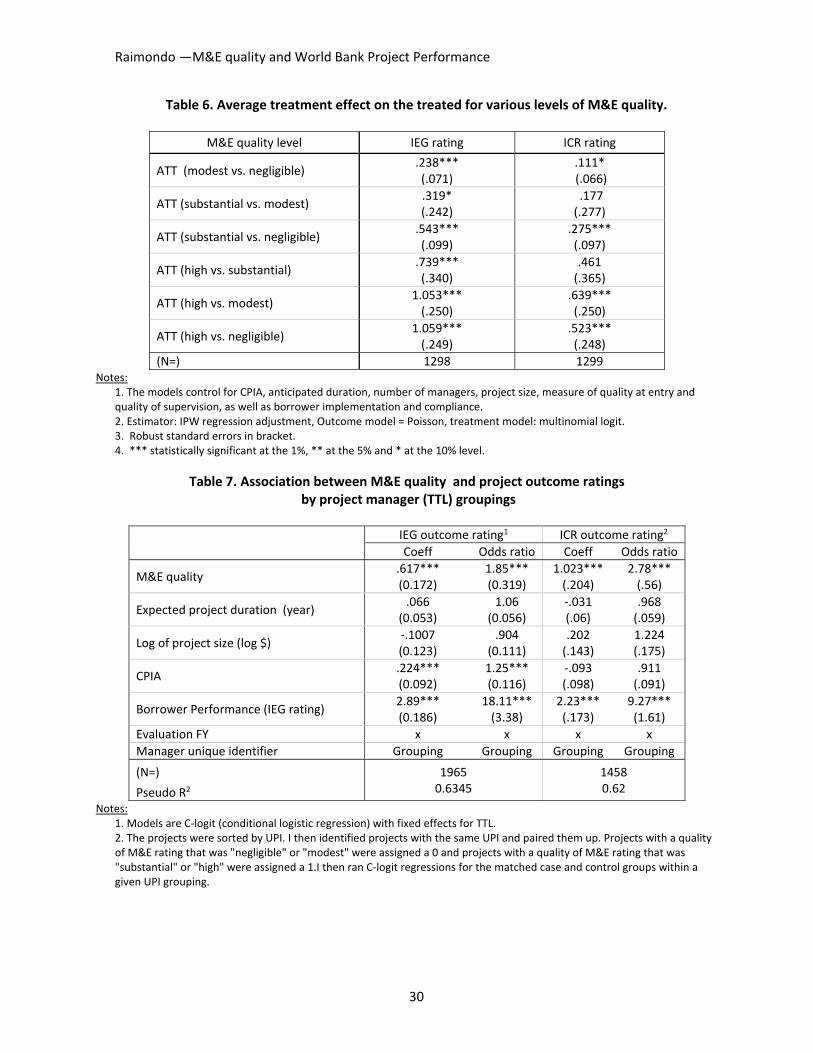
Raimondo —M&E quality and World Bank Project Performance
30
Table 6. Average treatment effect on the treated for various levels of M&E quality.
M&E quality level IEG rating ICR rating
ATT (modest vs. negligible) .238*** (.071)
.111* (.066)
ATT (substantial vs. modest) .319* (.242)
.177 (.277)
ATT (substantial vs. negligible) .543*** (.099)
.275*** (.097)
ATT (high vs. substantial) .739*** (.340)
.461 (.365)
ATT (high vs. modest) 1.053*** (.250)
.639*** (.250)
ATT (high vs. negligible) 1.059*** (.249)
.523*** (.248)
(N=) 1298 1299 Notes:
1. The models control for CPIA, anticipated duration, number of managers, project size, measure of quality at entry and quality of supervision, as well as borrower implementation and compliance. 2. Estimator: IPW regression adjustment, Outcome model = Poisson, treatment model: multinomial logit. 3. Robust standard errors in bracket. 4. *** statistically significant at the 1%, ** at the 5% and * at the 10% level.
Table 7. Association between M&E quality and project outcome ratings by project manager (TTL) groupings
IEG outcome rating1 ICR outcome rating2
Coeff Odds ratio Coeff Odds ratio
M&E quality .617*** (0.172)
1.85*** (0.319)
1.023*** (.204)
2.78*** (.56)
Expected project duration (year) .066
(0.053) 1.06
(0.056) ‐.031 (.06)
.968 (.059)
Log of project size (log $) ‐.1007 (0.123)
.904 (0.111)
.202 (.143)
1.224 (.175)
CPIA .224*** (0.092)
1.25*** (0.116)
‐.093 (.098)
.911 (.091)
Borrower Performance (IEG rating) 2.89*** (0.186)
18.11*** (3.38)
2.23*** (.173)
9.27*** (1.61)
Evaluation FY x x x x
Manager unique identifier Grouping Grouping Grouping Grouping
(N=) 1965 0.6345
1458 0.62 Pseudo R2
Notes: 1. Models are C‐logit (conditional logistic regression) with fixed effects for TTL. 2. The projects were sorted by UPI. I then identified projects with the same UPI and paired them up. Projects with a quality of M&E rating that was "negligible" or "modest" were assigned a 0 and projects with a quality of M&E rating that was "substantial" or "high" were assigned a 1.I then ran C‐logit regressions for the matched case and control groups within a given UPI grouping.