Zooplankton, phytoplankton and the microbial food web in ... · Received 21 November 2001; accepted...
14
Zooplankton, phytoplankton and the microbial food web in two turbid and two clearwater shallow lakes in Belgium Koenraad Muylaert 1, *, Steven Declerck 2 , Vanessa Geenens 1 , Jeroen Van Wichelen 1 , Hanne Degans 2 , Jochen Vandekerkhove 2 , Katleen Van der Gucht 1,4 , Nele Vloemans 1,4 , Wouter Rommens 3 , Danny Rejas 2,6 , Roberto Urrutia 1,7 , Koen Sabbe 1 , Moniek Gillis 4 , Kris Decleer 5 , Luc De Meester 2 and Wim Vyverman 1 1 Dept. Biology, University Gent, K.L. Ledeganckstraat 35, Gent, 9000, Belgium; 2 Lab. Aquatic Ecology, KULeuven, Debériotstraat 32, Leuven, 3000, Belgium; 3 Lab. Botany, KULeuven, Kasteelpark Arenberg 31, Heverlee, 3001, Belgium; 4 Dept. Microbiology, University Gent, K.L. Ledeganckstraat 35, Gent, 9000, Belgium; 5 Institute for Nature Conservation, Kliniekstraat 25, Brussel, 1070, Belgium; 6 Current address: Laboratory of Limnology, Universidad Mayor de San Simón, Cochabamba, Bolivia; 7 Centro EULA, Universidad de Concepcion, Concepcion, Chile; *Author for correspondence (e-mail: [email protected]; phone: +32 9 264 53 66; fax: +32 9 264 53 34) Received 21 November 2001; accepted in revised form 19 November 2002 Key words: Alternative stable states, Biomanipulation, Eutrophic shallow lakes, Macrophytes, Phytoplankton, Zooplankton Abstract Components of the pelagic food web in four eutrophic shallow lakes in two wetland reserves in Belgium (‘Blan- kaart’ and ‘De Maten’) were monitored during the course of 1998–1999. In each wetland reserve, a clearwater and a turbid lake were sampled. The two lakes in each wetland reserve had similar nutrient loadings and oc- curred in close proximity of each other. In accordance with the alternative stable states theory, food web struc- ture differed strongly between the clearwater and turbid lakes. Phytoplankton biomass was higher in the turbid than the clearwater lakes. Whereas chlorophytes dominated the phytoplankton in the turbid lakes, cryptophytes were the most important phytoplankton group in the clearwater lakes. The biomass of microheterotrophs (bac- teria, heterotrophic nanoflagellates and ciliates) was higher in the turbid than the clearwater lakes. Biomass and community composition of micro- and macrozooplankton was not clearly related to water clarity. The ratio of macrozooplankton to phytoplankton biomass – an indicator of zooplankton grazing pressure on phytoplankton – was higher in the clearwater when compared to the turbid lakes. The factors potentially regulating water clarity, phytoplankton, microheterotrophs and macrozooplankton are discussed. Implications for the management of these lakes are discussed. Abbreviations: CPUE – catch per unit effort, HNF – heterotrophic nanoflagellates, SPM – suspended particulate matter Introduction Because of intensive exchange of nutrients between their water columns and sediments, shallow lakes are sensitive to eutrophication (e.g., Ekholm et al. (1997)). When nutrient loading is low, shallow lakes are relatively clear with low phytoplankton biomass and dense stands of submerged macrophytes. Under the influence of eutrophication, these clearwater lakes become more turbid. Phytoplankton blooms develop and submerged macrophytes disappear due to a lack of light. Due to the loss of submerged macrophyte 137 Aquatic Ecology 37: 137–150, 2003. © 2003 Kluwer Academic Publishers. Printed in the Netherlands.
Transcript of Zooplankton, phytoplankton and the microbial food web in ... · Received 21 November 2001; accepted...
Zooplankton, phytoplankton and the microbial food web in two turbidand two clearwater shallow lakes in Belgium
Koenraad Muylaert1,*, Steven Declerck2, Vanessa Geenens1, Jeroen Van Wichelen1, HanneDegans2, Jochen Vandekerkhove2, Katleen Van der Gucht1,4, Nele Vloemans1,4, WouterRommens3, Danny Rejas2,6, Roberto Urrutia1,7, Koen Sabbe1, Moniek Gillis4, KrisDecleer5, Luc De Meester2 and Wim Vyverman1
1Dept. Biology, University Gent, K.L. Ledeganckstraat 35, Gent, 9000, Belgium; 2Lab. Aquatic Ecology,KULeuven, Debériotstraat 32, Leuven, 3000, Belgium; 3Lab. Botany, KULeuven, Kasteelpark Arenberg 31,Heverlee, 3001, Belgium; 4Dept. Microbiology, University Gent, K.L. Ledeganckstraat 35, Gent, 9000,Belgium; 5Institute for Nature Conservation, Kliniekstraat 25, Brussel, 1070, Belgium; 6Current address:Laboratory of Limnology, Universidad Mayor de San Simón, Cochabamba, Bolivia; 7Centro EULA,Universidad de Concepcion, Concepcion, Chile; *Author for correspondence (e-mail:[email protected]; phone: +32 9 264 53 66; fax: +32 9 264 53 34)
Received 21 November 2001; accepted in revised form 19 November 2002
Key words: Alternative stable states, Biomanipulation, Eutrophic shallow lakes, Macrophytes, Phytoplankton,Zooplankton
Abstract
Components of the pelagic food web in four eutrophic shallow lakes in two wetland reserves in Belgium (‘Blan-kaart’ and ‘De Maten’) were monitored during the course of 1998–1999. In each wetland reserve, a clearwaterand a turbid lake were sampled. The two lakes in each wetland reserve had similar nutrient loadings and oc-curred in close proximity of each other. In accordance with the alternative stable states theory, food web struc-ture differed strongly between the clearwater and turbid lakes. Phytoplankton biomass was higher in the turbidthan the clearwater lakes. Whereas chlorophytes dominated the phytoplankton in the turbid lakes, cryptophyteswere the most important phytoplankton group in the clearwater lakes. The biomass of microheterotrophs (bac-teria, heterotrophic nanoflagellates and ciliates) was higher in the turbid than the clearwater lakes. Biomass andcommunity composition of micro- and macrozooplankton was not clearly related to water clarity. The ratio ofmacrozooplankton to phytoplankton biomass – an indicator of zooplankton grazing pressure on phytoplankton –was higher in the clearwater when compared to the turbid lakes. The factors potentially regulating water clarity,phytoplankton, microheterotrophs and macrozooplankton are discussed. Implications for the management of theselakes are discussed.
Abbreviations: CPUE – catch per unit effort, HNF – heterotrophic nanoflagellates, SPM – suspended particulatematter
Introduction
Because of intensive exchange of nutrients betweentheir water columns and sediments, shallow lakes aresensitive to eutrophication (e.g., Ekholm et al.(1997)). When nutrient loading is low, shallow lakes
are relatively clear with low phytoplankton biomassand dense stands of submerged macrophytes. Underthe influence of eutrophication, these clearwater lakesbecome more turbid. Phytoplankton blooms developand submerged macrophytes disappear due to a lackof light. Due to the loss of submerged macrophyte
137Aquatic Ecology 37: 137–150, 2003.© 2003 Kluwer Academic Publishers. Printed in the Netherlands.

stands, this transition is usually associated with a lossof structural diversity and, as a result, a decrease inbiodiversity at the higher trophic levels takes place(e.g., Hanson and Butler (1994) and Scheffer (1998)).At the same time, the transition results in a loss ofimportant socio-economical functions like the recre-ational use of the lake for swimming or its use as asource of drinking water. While oligotrophic lakes aregenerally clear and hypertrophic lakes frequently tur-bid, shallow lakes at intermediate nutrient concentra-tions may exhibit either clearwater or turbid states(Scheffer et al. 1993). Many, predominantly biologi-cal, feedback mechanisms stabilise these alternativestates. As a consequence, during eutrophication, theclearwater state is often maintained until nutrientsreach high levels. Conversely, turbid shallow lakesoften do not respond to even major nutrient reduc-tions and remain turbid. The stability of each statedepends on the nutrient levels: at increasing nutrientlevels, there is a decrease in the stability of the clear-water state and an increase in the stability of the tur-bid state. Several studies have demonstrated that it ispossible to reconvert turbid shallow lakes to clearwa-ter lakes (e.g., Meijer et al. (1999)) when reductionsin nutrient loading are accompanied by the applica-tion of management strategies that alter the structureof the food web itself (biomanipulation, Shapiro andWright (1984)).
Like many low-lying countries in Western Europe,Belgium has numerous wetlands. Due to the adventof industrial activity as well as an intensification ofagriculture, many of these wetlands have receivedhigh nutrient inputs during the previous century andas a result many are severely eutrophied. Shallowlakes are the dominant lake type in Flanders and,where many of these lakes were of the clearwater typeand possessed rich submerged vegetations in the past,most are now eutrophic and turbid (e.g., Denys(1997)). These shallow lakes have a potentially highecological value if submerged vegetations are re-stored. This can be attained by applying appropriatemanagement strategies. However, to develop effectivemanagement strategies, a good knowledge of thefunctioning of the ecosystem is required. In contrastto many other Western European countries, relativelyfew studies have been carried out in Belgium withrespect to the functioning of shallow lakes. Toachieve a better knowledge on shallow lakes in Bel-gium and to provide a framework for developingmanagement strategies aimed at restoring the clear-water state in shallow lakes, a research study was
carried out during 1998–2000 in the framework of theFlemish Impulse Program for Nature Development(VLINA). In four lakes from two important wetlandreserves in Belgium, all components of the pelagicfood web were monitored during two years. In con-trast to many previous studies of shallow lakes, thisstudy also included microheterotrophs like bacteria,heterotrophic nanoflagellates and ciliates, importantcomponents of the microbial food web. Here wepresent an initial account and general overview of theresults and aim at evaluating the potential factors reg-ulating water clarity in these lakes. Based on theseconclusions, some recommendations for the develop-ment of management strategies aimed at restoring theclearwater state in the lakes were formulated.
Materials and methods
Study sites
Four shallow lakes from two nature reserves were se-lected for this study (Figure 1). Both reserves are im-portant wetlands in Belgium and are protected by na-tional and international agreements. Two lakes, lakeVisvijver and lake Blankaart, are situated in the‘Blankaart’ wetland reserve (Diksmuide, Province ofWest-Vlaanderen), in the South-West of Belgium,close to the coast. It is positioned close the river Ijzerand is frequently flooded by this river in winter, re-sulting in the two lakes being connected. The lakeswere created by peat digging and are on averageabout 1 m deep. Lake Blankaart is the larger of thetwo (surface area 32 ha) and receives surface waterloaded with nutrients and sediments via two rivulets.Nutrient inputs through these rivulets are very highdue to intensive agriculture and stock breeding in thecatchment. Lake Visvijver is a small lake (0.6 ha) re-ceiving no surface water inputs. Both lakes weredredged in 1995 to remove sediment and associatednutrients. Simultaneously, the fish community wasmanipulated in lake Visvijver, but not in lake Blan-kaart. These management activities resulted in thetransition to a clearwater state in lake Visvijver buthad no effect on lake Blankaart (Peeters et al. 1996).The two other lakes, lake Maten 12 and lake Maten13, are situated in the ‘De Maten’ wetland reserve inthe North-Eastern part of Belgium (Genk, Province ofLimburg). The ‘De Maten’ reserve contains a total of32 small lakes with a surface area ranging from 0.5–9ha (lake Maten 12: 3.2 ha, lake Maten 13: 3.3 ha).
138

The ‘De Maten’ lakes were created by peat diggingaround the year 1400 and have been used for fish cul-ture until 1991. All lakes in this pond system are di-rectly or indirectly connected by a system of over-flows and are fed by surface water via two mainrivulets (Cottenie et al. 2001). Between the two ‘DeMaten’ lakes studied, water flows from lake Maten 13to lake Maten 12.
Sampling and analyses
All lakes were sampled monthly during winter andbiweekly during summer from January 1998 to De-cember 1999, resulting in 34 sampling occasions ineach lake. Subsurface samples were collected duringdaytime at a fixed sampling station in each lake. Tem-perature, pH and Secchi depth were measured at thetime of sample collection. Samples for bacteria, het-erotrophic nanoflagellates (HNF), ciliates and phy-toplankton were fixed in the field using Lugol’s solu-tion, formalin and thiosulphate (Sherr et al. 1989).Macrozooplankton was sampled using a Schindler-Patalas trap. The trap was deployed at different depthsto include the entire water column. Macrozooplank-ton samples were fixed with sucrose-saturated forma-lin (Haney and Hall 1973). Rotifers were collectedquantitatively by filtering 0.5–3 l water through a 30�m pore size nylon mesh. The mesh containing therotifers was stored in 30 �m filtered lake water fixedwith 5% w/v formalin. A whole water sample wastransferred to the laboratory (cooled and darkened) tobe subsampled for dissolved nutrients and suspendedparticulate matter (SPM).
Bacteria were stained with DAPI, filtered onto 0.2�m pore size membrane filters and counted using epi-fluorescence microscopy (Porter and Feig 1980).Counts were converted to biomass assuming a cellu-lar carbon content of 2 10−11 mg C cell−1 (Lee andFuhrman 1987). HNF were also stained with DAPI,filtered onto 0.8 �m pore size membrane filters andenumerated using epifluorescence microscopy (Sherret al. 1993). Three size classes were discerned duringenumeration (< 4 �m, 4–10 �m and > 10 �m). Cili-ates were enumerated using inverted microscopy af-ter staining with Bengal rose to facilitate the distinc-tion between living organisms and detritus. Ciliateswere identified up to genus level where possible orwere assigned to a given size class (< 20 �m, 20–40�m or > 40 �m). For conversion of HNF and ciliateabundances to biomass, in each lake and for all gen-era or size classes, 25–100 individuals from differentsamples were measured. For each lake, an annual av-erage biovolume was calculated for each genus orsize class. Biovolume was converted to biomass us-ing a conversion factor of 15 10−11 mg C �m−3 forHNF (Fenchel 1982) and 22 10−11 mg C �m−3 forciliates (Putt and Stoecker 1989). Phytoplankton wasidentified up to genus level and enumerated using in-verted microscopy. For each lake, of each genus,25–50 cells from different samples were measured.For each lake, an average biovolume was calculatedfor each genus and biovolume was converted to bio-mass using the formulations given by Menden-Deuerand Lessard (2000). Macrozooplankton was enumer-ated using a dissection microscope. Cladocerans wereidentified up to species level while copepods were
Figure 1. The location of the ‘Blankaart’ (B) and ‘De Maten’ (M) wetland reserves in Belgium (left) and detailed maps at identical scales ofthe four lakes studied (right). Scale bar is 500 m.
139
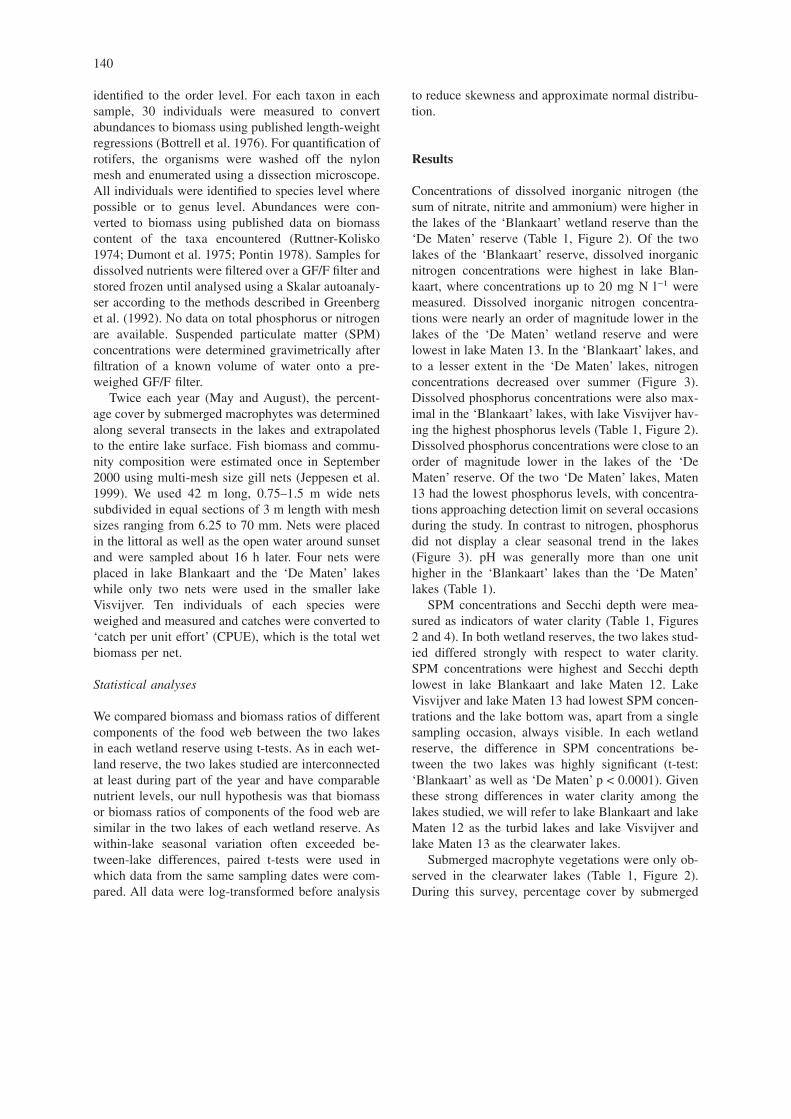
identified to the order level. For each taxon in eachsample, 30 individuals were measured to convertabundances to biomass using published length-weightregressions (Bottrell et al. 1976). For quantification ofrotifers, the organisms were washed off the nylonmesh and enumerated using a dissection microscope.All individuals were identified to species level wherepossible or to genus level. Abundances were con-verted to biomass using published data on biomasscontent of the taxa encountered (Ruttner-Kolisko1974; Dumont et al. 1975; Pontin 1978). Samples fordissolved nutrients were filtered over a GF/F filter andstored frozen until analysed using a Skalar autoanaly-ser according to the methods described in Greenberget al. (1992). No data on total phosphorus or nitrogenare available. Suspended particulate matter (SPM)concentrations were determined gravimetrically afterfiltration of a known volume of water onto a pre-weighed GF/F filter.
Twice each year (May and August), the percent-age cover by submerged macrophytes was determinedalong several transects in the lakes and extrapolatedto the entire lake surface. Fish biomass and commu-nity composition were estimated once in September2000 using multi-mesh size gill nets (Jeppesen et al.1999). We used 42 m long, 0.75–1.5 m wide netssubdivided in equal sections of 3 m length with meshsizes ranging from 6.25 to 70 mm. Nets were placedin the littoral as well as the open water around sunsetand were sampled about 16 h later. Four nets wereplaced in lake Blankaart and the ‘De Maten’ lakeswhile only two nets were used in the smaller lakeVisvijver. Ten individuals of each species wereweighed and measured and catches were converted to‘catch per unit effort’ (CPUE), which is the total wetbiomass per net.
Statistical analyses
We compared biomass and biomass ratios of differentcomponents of the food web between the two lakesin each wetland reserve using t-tests. As in each wet-land reserve, the two lakes studied are interconnectedat least during part of the year and have comparablenutrient levels, our null hypothesis was that biomassor biomass ratios of components of the food web aresimilar in the two lakes of each wetland reserve. Aswithin-lake seasonal variation often exceeded be-tween-lake differences, paired t-tests were used inwhich data from the same sampling dates were com-pared. All data were log-transformed before analysis
to reduce skewness and approximate normal distribu-tion.
Results
Concentrations of dissolved inorganic nitrogen (thesum of nitrate, nitrite and ammonium) were higher inthe lakes of the ‘Blankaart’ wetland reserve than the‘De Maten’ reserve (Table 1, Figure 2). Of the twolakes of the ‘Blankaart’ reserve, dissolved inorganicnitrogen concentrations were highest in lake Blan-kaart, where concentrations up to 20 mg N l−1 weremeasured. Dissolved inorganic nitrogen concentra-tions were nearly an order of magnitude lower in thelakes of the ‘De Maten’ wetland reserve and werelowest in lake Maten 13. In the ‘Blankaart’ lakes, andto a lesser extent in the ‘De Maten’ lakes, nitrogenconcentrations decreased over summer (Figure 3).Dissolved phosphorus concentrations were also max-imal in the ‘Blankaart’ lakes, with lake Visvijver hav-ing the highest phosphorus levels (Table 1, Figure 2).Dissolved phosphorus concentrations were close to anorder of magnitude lower in the lakes of the ‘DeMaten’ reserve. Of the two ‘De Maten’ lakes, Maten13 had the lowest phosphorus levels, with concentra-tions approaching detection limit on several occasionsduring the study. In contrast to nitrogen, phosphorusdid not display a clear seasonal trend in the lakes(Figure 3). pH was generally more than one unithigher in the ‘Blankaart’ lakes than the ‘De Maten’lakes (Table 1).
SPM concentrations and Secchi depth were mea-sured as indicators of water clarity (Table 1, Figures2 and 4). In both wetland reserves, the two lakes stud-ied differed strongly with respect to water clarity.SPM concentrations were highest and Secchi depthlowest in lake Blankaart and lake Maten 12. LakeVisvijver and lake Maten 13 had lowest SPM concen-trations and the lake bottom was, apart from a singlesampling occasion, always visible. In each wetlandreserve, the difference in SPM concentrations be-tween the two lakes was highly significant (t-test:‘Blankaart’ as well as ‘De Maten’ p < 0.0001). Giventhese strong differences in water clarity among thelakes studied, we will refer to lake Blankaart and lakeMaten 12 as the turbid lakes and lake Visvijver andlake Maten 13 as the clearwater lakes.
Submerged macrophyte vegetations were only ob-served in the clearwater lakes (Table 1, Figure 2).During this survey, percentage cover by submerged
140
macrophytes was around 50% in both clearwaterlakes. In lake Visvijver, the dominant macrophyte wasChara globularis, while floating beds of filamentousalgae covered a large part of the lake surface towardsthe end of summer. In lake Maten 13, Drepanocladusfluitans, Polygonum amphibium and Nitella trans-
lucens dominated the submerged vegetation, withUtricularia vulgaris also being commonly observed.
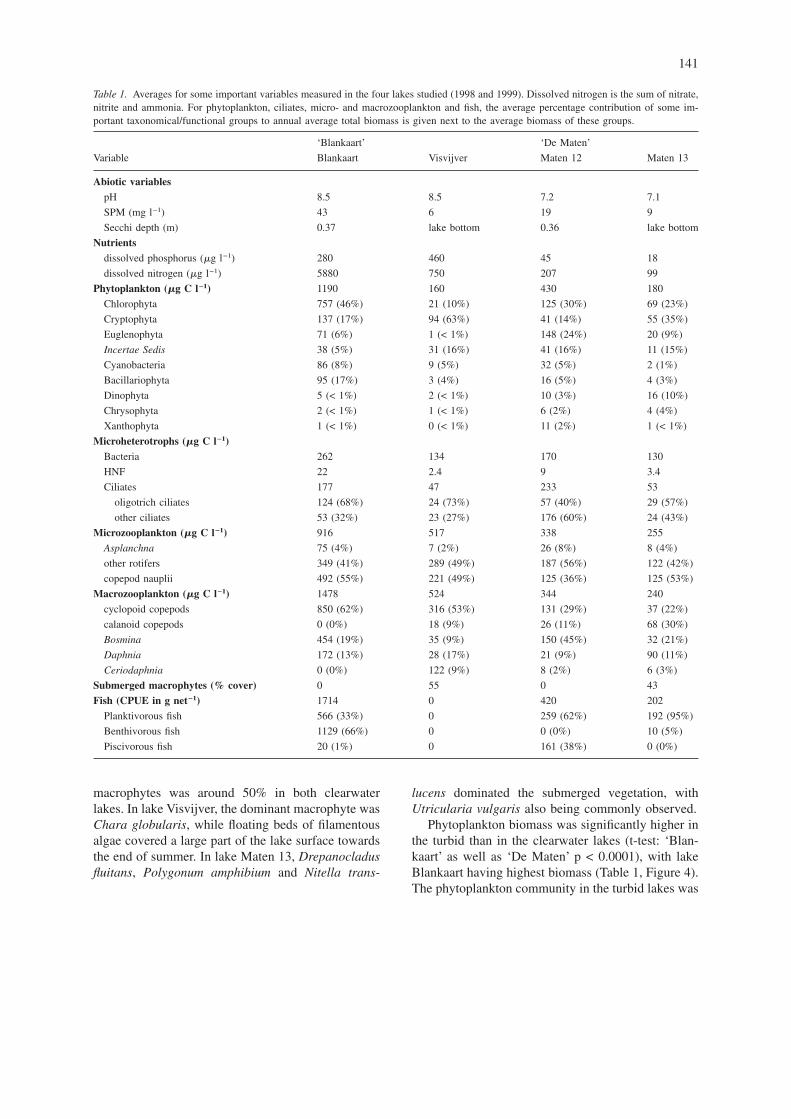
Phytoplankton biomass was significantly higher inthe turbid than in the clearwater lakes (t-test: ‘Blan-kaart’ as well as ‘De Maten’ p < 0.0001), with lakeBlankaart having highest biomass (Table 1, Figure 4).The phytoplankton community in the turbid lakes was
Table 1. Averages for some important variables measured in the four lakes studied (1998 and 1999). Dissolved nitrogen is the sum of nitrate,nitrite and ammonia. For phytoplankton, ciliates, micro- and macrozooplankton and fish, the average percentage contribution of some im-portant taxonomical/functional groups to annual average total biomass is given next to the average biomass of these groups.
‘Blankaart’ ‘De Maten’
Variable Blankaart Visvijver Maten 12 Maten 13
Abiotic variablespH 8.5 8.5 7.2 7.1
SPM (mg l−1) 43 6 19 9
Secchi depth (m) 0.37 lake bottom 0.36 lake bottom
Nutrientsdissolved phosphorus (�g l−1) 280 460 45 18
dissolved nitrogen (�g l−1) 5880 750 207 99
Phytoplankton (�g C l−1) 1190 160 430 180
Chlorophyta 757 (46%) 21 (10%) 125 (30%) 69 (23%)
Cryptophyta 137 (17%) 94 (63%) 41 (14%) 55 (35%)
Euglenophyta 71 (6%) 1 (< 1%) 148 (24%) 20 (9%)
Incertae Sedis 38 (5%) 31 (16%) 41 (16%) 11 (15%)
Cyanobacteria 86 (8%) 9 (5%) 32 (5%) 2 (1%)
Bacillariophyta 95 (17%) 3 (4%) 16 (5%) 4 (3%)
Dinophyta 5 (< 1%) 2 (< 1%) 10 (3%) 16 (10%)
Chrysophyta 2 (< 1%) 1 (< 1%) 6 (2%) 4 (4%)
Xanthophyta 1 (< 1%) 0 (< 1%) 11 (2%) 1 (< 1%)
Microheterotrophs (�g C l−1)Bacteria 262 134 170 130
HNF 22 2.4 9 3.4
Ciliates 177 47 233 53
oligotrich ciliates 124 (68%) 24 (73%) 57 (40%) 29 (57%)
other ciliates 53 (32%) 23 (27%) 176 (60%) 24 (43%)
Microzooplankton (�g C l−1) 916 517 338 255
Asplanchna 75 (4%) 7 (2%) 26 (8%) 8 (4%)
other rotifers 349 (41%) 289 (49%) 187 (56%) 122 (42%)
copepod nauplii 492 (55%) 221 (49%) 125 (36%) 125 (53%)
Macrozooplankton (�g C l−1) 1478 524 344 240
cyclopoid copepods 850 (62%) 316 (53%) 131 (29%) 37 (22%)
calanoid copepods 0 (0%) 18 (9%) 26 (11%) 68 (30%)
Bosmina 454 (19%) 35 (9%) 150 (45%) 32 (21%)
Daphnia 172 (13%) 28 (17%) 21 (9%) 90 (11%)
Ceriodaphnia 0 (0%) 122 (9%) 8 (2%) 6 (3%)
Submerged macrophytes (% cover) 0 55 0 43
Fish (CPUE in g net−1) 1714 0 420 202
Planktivorous fish 566 (33%) 0 259 (62%) 192 (95%)
Benthivorous fish 1129 (66%) 0 0 (0%) 10 (5%)
Piscivorous fish 20 (1%) 0 161 (38%) 0 (0%)
141

dominated by chlorophytes (mostly coenobial taxalike Scenedesmus) while, in the clearwater lakes,cryptophytes were the dominant group of algae. High-est biomass of cyanobacteria was observed in lakeBlankaart, where a Planktothrix bloom developed to-wards the end of the summer in 1998. In the turbidlakes, phytoplankton biomass increased graduallyover summer (Figure 3). In the clearwater lakes,blooms developed rather irregularly between springand autumn. During summer, phytoplankton biomasstended to be low in the clearwater lakes.
Bacterial biomass was, like phytoplankton bio-mass, significantly higher in the turbid than in theclearwater lakes (t-test: ‘Blankaart’ p < 0.0002 and‘De Maten’ p < 0.01), with maximal average biomassoccurring in lake Blankaart (Table 1, Figure 4, Figure
5). Differences in heterotrophic protistan biomass be-tween turbid and clearwater lakes were more pro-nounced than differences in bacterial biomass (Table1, Figure 4). Biomass of ciliates was much higherthan that of HNF in all lakes. Combined biomass ofheterotrophic protists (HNF and ciliates), as well asbiomass of HNF and ciliates separately, was on aver-age higher in the turbid than in the clearwater lakes.This difference was significant for ciliates as well asHNF (t-test: ‘Blankaart’ and ‘De Maten’ p < 0.0001,both for ciliates and HNF). Oligotrich ciliates wererelatively more important in the lakes of the ‘Blan-kaart’ reserve than in those from the ‘De Maten’ re-serve.
In contrast to phytoplankton, bacteria and het-erotrophic protists, biomass of micro- as well as mac-
Figure 2. a–d: Median values (horizontal line) and 25 (top of box) and 75 percentiles (bottom of box) for some important chemical andphysical variables. e: Fish biomass (as catch per unit effort or CPUE) and community composition as measured in September 2000. f: Theaverage (May and August in 1998 and 1999) cover by submerged macrophytes.
142

rozooplankton seemed not to be clearly related to wa-ter clarity (Table 1, Figure 4). Biomass ofmacrozooplankton was significantly higher in the tur-bid lake in the ‘Blankaart’ reserve (t-test: p < 0.01)but did not differ significantly between the two lakesfrom the ‘De Maten’ reserve (t-test: p = 0.059). Bio-
mass of microzooplankton also was significantlyhigher in the turbid lake in the ‘Blankaart’ reserve (t-test: p < 0.05) but did not differ significantly betweenthe two lakes from the ‘De Maten’ reserve (t-test: p =0.46). In the clearwater lakes, total zooplankton bio-mass was generally highest during spring. In the tur-
Figure 3. Temporal dynamics of suspended particulate matter (SPM) concentration, dissolved phosphorus concentration, dissolved inorganicnitrogen concentration (nitrate + nitrite + ammonia) and phytoplankton biomass in the lakes from the ‘Blankaart’ (left) and the ‘De Maten’(right) wetland reserves in 1998 and 1999. Note different scales for the ‘The Blankaart’ lakes and the ‘De Maten’ lakes.
143

Figure 4. a–c, e, g, i: Median values (horizontal line) and 25 (top of box) and 75 percentiles (bottom of box) for some important biologicalvariables. d, f, h, j: Percentage contribution of some important groups to total biomass of phytoplankton (d), ciliates (f), microzooplankton(h) and macrozooplankton (j).
144

bid lakes, total zooplankton biomass peaked duringsummer (Figure 5). Of all lakes, the biomass of mac-rozooplankton was on average highest in lake Blan-kaart. Biomass of microzooplankton was comparableto macrozooplankton biomass in all lakes except lakeBlankaart, where macrozooplankton biomass wasabout twice as high as microzooplankton biomass.Copepod nauplii and rotifers contributed equally tototal microzooplankton biomass in all lakes. The car-nivorous rotifer Asplanchna contributed on averageonly 2–8% of total microzooplankton biomass in thelakes studied. The percentage contribution of daph-nids (Daphnia and Ceriodaphnia) to total macrozo-oplankton biomass was slightly higher in the clearwa-ter lakes than in the turbid lakes, but this differencewas only significant in the ‘Blankaart’ reserve (t-test:‘Blankaart’ p < 0.05 and ‘De Maten’ p = 0.88).
To estimate the grazing impact of macrozooplank-ton on phytoplankton, the macrozooplankton to phy-toplankton biomass ratio was calculated as an indica-tor of macrozooplankton grazing pressure onphytoplankton (Table 2). In each wetland reserve, thebiomass ratio of total macrozooplankton (t-test:‘Blankaart’ p < 0.001 and ‘De Maten’ p < 0.005) ordaphnids (t-test: ‘Blankaart’ p < 0.0005 and ‘DeMaten’ p < 0.05) over phytoplankton was signifi-cantly higher in the turbid when compared to theclearwater lake. While the macrozooplankton to phy-toplankton ratio differed only about 5-fold betweenthe clearwater and turbid lakes, the daphnids to phy-toplankton ratio was 16 and 24 times higher in theclearwater than the turbid lake in the ‘Blankaart’ and‘De Maten’ reserve, respectively.
Fish biomass (as CPUE) tended to be higher in theturbid than the clearwater lakes, with lake Blankaarthaving highest fish biomass (Table 1, Figure 2). Nofish were caught in lake Visvijver, where a period ofanoxia preceded a massive fish kill in 1998. Plank-tivorous and benthivorous species like white bream(Blicca bjoerkna), roach (Rutilus rutilus) and bream(Abramis brama) dominated in lake Blankaart whilethe exotic and piscivorous brown bullhead (Ameiurusnebulosus) and (to a lesser extent) roach and rudd(Scardinius erythrophtalmus) were the most impor-tant species observed in lake Maten 12. In lake Maten13 rudd and tench (Tinca tinca) dominated the fishcommunity with the exotic pumpkinseed (Lepomisgibbosus) and topmouth gudgeon (Pseudorasboraparva) being common too.
Discussion
Dissolved inorganic nutrient concentrations in thelakes from the ‘Blankaart’ wetland reserve exceededthose from the lakes in the ‘De Maten’ reserve bynearly an order of magnitude. In both wetland re-serves, dissolved nutrient concentrations in the twolakes studied were comparable. This is not surprising,given the fact that the lakes in both reserves were atleast during some part of the year interconnected.Flooding of the small dike separating the clearwaterlake Visvijver from the turbid lake Blankaart occursregularly in winter, resulting in an exchange of waterbetween both lakes. Lake Maten 13 discharges intolake Maten 12 by an overflow system and both lakesare fed by the same rivulet. Despite the fact that thetwo lakes in both wetland reserves had similar nutri-ent concentrations, a clearwater and a turbid lakewere present in each wetland reserve. This observa-tion supports the alternative stable states theory(Scheffer et al. 1993) in that water clarity may differstrongly in shallow lakes having similar water chem-istry. The fact that a clear and a turbid lake occurredin both wetland reserves despite large differences innutrient concentrations between the two reserves il-lustrates that alternative stable states may occur overa wide range of nutrient loadings. In general, it is as-sumed that at total phosphorus concentrations exceed-ing 100–150 �g l−1, a stable clearwater state cannotbe achieved (Jeppesen et al. 1990; Hosper and Jagt-man 1990). Although unfortunately no data on totalphosphorus were available for this study, with an av-erage dissolved phosphorus concentration of 460�g l−1, this limit must have been exceeded in lakeVisvijver.
Water clarity in the four lakes studied was relatedto food web structure rather than nutrient concentra-tion. Biomass of phytoplankton and microheterotro-phs, the zooplankton to phytoplankton ratio, occur-rence of submerged macrophytes and the fishcommunity differed markedly between the clearwaterand turbid lakes. Phytoplankton biomass was nearlytwice as high in the turbid lakes when compared tothe clearwater lakes. Being a component of theseston, phytoplankton contributes to total SPM andmay therefore be a direct cause of high suspendedmatter concentrations in turbid lakes. When phy-toplankton biomass was converted to dry weight (as-suming a carbon to dry weight ratio of 0.5, Reynolds(1984)), however, phytoplankton accounted only foron average 5.9% (maximum 22%, in lake Blankaart)
145

or 5.1% (maximum 14%, in lake Maten 13) of totalsuspended matter in the turbid lakes. Therefore, al-though high SPM concentrations are associated withhigh phytoplankton biomass, phytoplankton cannotbe the only factor responsible for the high suspended
sediment levels in the turbid lakes. Submerged mac-rophytes covered about half the lake surface in theclearwater lakes but were absent in the turbid lakes.When forming a dense vegetation, submerged macro-phytes may reduce water column turbulence and in-
Figure 5. Temporal dynamics of bacterial biomass, biomass of heterotrophic protists (HNF + ciliates), biomass of microzooplankton (rotifers+ copepod nauplii) and macrozooplankton biomass in the lakes from the ‘Blankaart’ (left) and the ‘De Maten’ (right) wetland reserves in1998 and 1999. Note different scales for the ‘Blankaart’ lakes and the ‘De Maten’ lakes.
146

crease water clarity through a reduction of sedimentresuspension and an increase in SPM sedimentationrates (e.g., James and Barko (1990) and Jones(1990)). In turbid lakes, no submerged macrophytesare present to reduce turbulence in the water columnand, as a result, even low wind velocities may createturbulence that is strong enough to cause resuspen-sion of bottom sediments (Kristensen et al. 1992).Differences in the fish community may also explainthe difference in water clarity between the clear andturbid lakes. Benthivorous fish species attained highbiomass in the turbid lakes. Moreover, the piscivorousbrown bullhead, which attained high biomass in theturbid lake Maten 12, also has a benthic lifestyle.Through their foraging activities, fish communitiesfrom the turbid lakes may contribute substantially tosediment resuspension (cf. Meijer et al. (1990) andHavens (1991)). Next to the presence of macrophytestands, which prevent resuspension and promote sed-imentation of suspended matter, low biomass or com-plete absence of benthivorous fish may be an addi-tional cause of the low SPM concentrations in theclearwater lakes.
Total nutrient concentrations were similar in theclear and turbid lakes in both wetland reserves stud-ied, while phytoplankton biomass differed about two-fold. Therefore, some factor other than nutrients musthave been regulating phytoplankton biomass in theclearwater lakes. In shallow lakes, macrozooplanktonare generally considered to be the dominant grazerson phytoplankton. Macrozooplankton is in turnpreyed upon by planktivorous fish. Planktivorous fishinfluence macrozooplankton biomass as well as com-munity composition, as certain macrozooplanktongroups like Bosmina and copepods are able to avoidfish predation (Verity and Smetacek 1996; Slusarczyk1997) while the relatively large daphnids are highlysensitive to fish predation (e.g., Brooks and Dodson(1965) and Schriver et al. (1995)). In the four lakesstudied, however, no clear relation could be foundbetween CPUE of planktivorous fish and total mac-rozooplankton biomass or the contribution of daph-nids to macrozooplankton biomass. Neither total bio-
mass nor community composition, however, is a goodindicator of zooplankton grazing pressure on phy-toplankton. We calculated the ratio of zooplanktonbiomass over phytoplankton biomass as an indicatorof zooplankton grazing pressure on phytoplankton.This ratio was significantly higher in the clearwaterthan in the turbid lakes. Most zooplankton groups,like rotifers, copepods or Bosmina, graze selectivelyon specific phytoplankton size classes and are there-fore generally considered incapable of efficiently con-trolling phytoplankton biomass (Hansson and Car-penter 1993; Havens 1993; Cyr and Curtis 1999).Only daphnids like Daphnia and Ceriodaphnia havehigh clearance rates on a wide size-range of particlesand capable of regulating phytoplankton biomass(Hall et al. 1976). The biomass ratio of daphnids tophytoplankton was also significantly higher in theclearwater when compared to the turbid lakes. More-over, the difference between clearwater and turbidlakes with respect to this ratio was much higher fordaphnids than for total macrozooplankton. This sug-gests than grazing by daphnids may play an impor-tant role in regulating phytoplankton biomass in theclearwater lakes.
Like for phytoplankton biomass, microhet-erotrophic components of the microbial food web(bacteria, HNF and ciliates) attained significantlyhigher biomass in the turbid than in the clearwaterlakes. To a large extent, these microheterotrophs de-pend directly or indirectly on phytoplankton as a foodsource. Exudates produced by phytoplankton are animportant substrate for aquatic bacteria in shallowlakes (Kamjunke et al. 1997). HNF and ciliates feedon bacteria (e.g., Sanders et al. (1989)) and smallphytoplankton (e.g., Weisse et al. (1990)). The lowbiomass of bacteria, HNF and ciliates in the clearwa-ter lakes may therefore reflect lower food availability.Top-down regulation, however, may also explain thelower biomass of the components of the microbialfood web in the clearwater lakes. Daphnids are non-selective filter feeders whose filter apparatus is capa-ble of retaining particles down to about 1 �m in size(Brendelberger 1991). Phytoplankton, bacteria, HNF
Table 2. Average ratios of zooplankton biomass over phytoplankton biomass in the four lakes studied.
‘Blankaart’ ‘De Maten’
Ratio Blankaart Visvijver Maten 12 Maten 13
Macrozooplankton/phytoplankton 1.6 6.7 0.9 4.4
Daphnids/phytoplankton 0.15 2.4 0.09 2.1
147

and ciliates comprise potential food items for daph-nids (Jürgens 1994). Therefore, if grazing by daph-nids affects phytoplankton populations, it is alsolikely to affect bacterial, HNF and ciliate populations.
In both wetland reserves, a clearwater and a turbidlake occurred next to each other in an interconnectedsystem and with virtually identical nutrient loading.This indicates that, in both wetland reserves, restora-tion of the turbid lakes to the clearwater state shouldbe possible. The differences between the turbid andthe clearwater lakes are well in agreement with thetheory of the alternative stable states (Scheffer et al.1993) and suggest that the restoration of the clearwa-ter state in the turbid lakes can be accomplished bychanges in food web structure rather than by waterquality improvement alone (Perrow et al. 1997; Hans-son et al. 1998; Meijer et al. 1999). Such changes infood web structure can be achieved by the applica-tion of biomanipulation (Shapiro and Wright 1984;Gulati et al. 1990). In practice, this method most of-ten involves a strong reduction of the planktivorousand benthivorous fish biomass via large scale fish re-movals, often combined with stocking of piscivorousfish (e.g., pike). The removal of planktivorous fish ismeant to allow for populations of large-bodied filterfeeding Cladocera to develop and gain control overphytoplankton by grazing. The reduction of the bio-mass of benthic fish results in a decrease of sedimentresuspension and associated nutrient release from thelake sediments. A decrease in phytoplankton biomassand the amount of suspended matter results in an in-crease in water clarity, resulting in opportunities forthe establishment of macrophytes. These macrophytesare now considered to stabilize the clearwater statethrough several positive feedback mechanisms (e.g.,Hansson et al. (1998)).
The difference in water clarity between the stud-ied ponds is to a large extent due to differences infood web structure. Biomanipulation, for instance,has been successfully applied in ponds of the Blan-kaart system. Although lake Visvijver originally wasa turbid pond lacking submerged vegetation, the lakeswitched to the clearwater state after it was dredgedin 1995 and biomanipulated during three subsequentyears (Declerck et al. 2000; Declerck 2001). A simi-lar result was obtained in lake Kasteelvijver, anotherlake in the Blankaart reserve. Although a large pro-portion of superficial sediments of lake Maten 12 ismade up by peat, which is a potentially importantsource of organic matter and humic acids that can in-crease water turbidity, the difference in water clarity
between the ponds in de Maten reserve probably alsoresults from differences in water level regime. In con-trast to lake Maten 12, water levels in lake Maten 13are highly variable and often quite low. The pondwater level has repeatedly fallen dry during the lastdecades. By impacting the fish community, suchevents may have acted in a similar way as biomanip-ulation. In addition, low water levels may have stim-ulated the germination of submerged vegetations.
Both the successful biomanipulation of lakes in theBlankaart system and the impact of water levels onfood web structure in lake Maten 13 suggest that fishremoval or temporal drainage may be a very promis-ing techniques for the restoration of the clearwaterstate in the turbid lakes of the two wetland reserves.This is certainly true for lake Maten 12, as this lakeis very similar to lake Maten 13 with respect to mor-phometry, size and water quality. In Lake Blankaart,several small scale in situ enclosure experiments haveresulted in strong increases in water clarity when fishwere excluded (Declerck et al. 1997; Declerck 2001).In these experiments, a rapid growth of populationsof large cladocerans was observed, resulting in strongreductions in phytoplankton biomass due to grazing.Such results indicate that planktivorous fish suppresslarge zooplankton in lake Blankaart and that bioma-nipulation may contribute to the restoration of theBlankaart system. However, a large proportion of theincrease of water transparency may also have resultedfrom an enclosure artefact causing sedimentation ofalgae and suspended matter. Moreover, a large scalefood web manipulation experiment that was carriedout in a 1 ha part of the lake that was separated by anet and in which a 60% removal of the benthic andplanktivorous fish biomass was combined with theintroduction of pike fingerlings, did not result in anyincrease of water transparency (Declerck et al. 2001).Extrapolation of the results of the successful foodweb manipulations done in lake Visvijver shouldtherefore be made with care, as lake Blankaart differsfrom lake Visvijver in many aspects. Lake Blankaartis considerably larger than lake Visvijver and is moreexposed to wind. Wind can be a very important causeof sediment resuspension in shallow lakes (Douglasand Rippey 2000) and wind-induced waves can ham-per the development of submerged vegetation (Hos-per 1997). Furthermore, in contrast to lake Visvijver,lake Blankaart is a very open system that is connectedwith several rivulets. These rivulets allow an easyimmigration of fish. Moreover, via the rivulets, thereis a continuous inflow of water rich in nutrients, sus-
148

pended matter and pesticides. If a large scale bioma-nipulation of lake Blankaart would be undertaken,these factors would hamper the development of sub-merged vegetation and would continuously have a de-stabilising effect on the clearwater state, decreasingthe probability of a successful restoration on a longterm. We therefore advocate that large-scale food webmanipulations in Lake Blankaart should be precededby a drastic reduction in nutrient loading of the up-stream rivulets in the Blankaart catchment area. Thiscan be achieved by an alteration of the agriculturalpractice, encompassing measures to reduce erosionand a restriction of the use of fertilizers and pesti-cides. Moreover, the input of suspended matter can bereduced by the re-meandering and dredging of therivulets and the implementation of buffer strips (De-clerck et al. 2001).
Acknowledgements
The research presented in this paper was carried outin the framework of the Flemish VLINA project97/03 ‘Restoration of nature values in shallow lakes:investigating the structure and functioning of the mi-crobial loop and the trophic cascade in a series ofmodel systems’. KM and KS are postdoctoral fellowsof the Belgian Fund for Scientific Research. HD ac-knowledges a fellowship from the Flemish Institutefor the Promotion of Scientific-Technological Re-search in Industry (IWT). During data analysis andwriting, SD, KvdG, NV, WR, MG and LDM were fi-nancially supported by EU project BIOMAN (EVK2-CT-1999-00046).
References
Bottrell H.H., Duncan A., Gliwicz Z.M., Grygierek E., Herzig A.,Hillbricht-Ilkowska A. et al. 1976. A review of some problemsin zooplankton production studies; Contribution from thePlankton Ecology Group (IBP). Norw. J. Zool. 24: 419–456.
Brendelberger H. 1991. Filter mesh size of cladocerans predicts re-tention efficiency for bacteria. Limnol. Oceanogr. 36: 884–894.
Brooks D. and Dodson S.L. 1965. Predation, body size, and com-position of plankton. Science 150: 28–35.
Cottenie K., Nuytten N., Michels E. and De Meester L. 2001. Zoo-plankton community structure and environmental conditions ina set of interconnected ponds. Hydrobiologia 442: 339–350.
Cyr H. and Curtis J.M. 1999. Zooplankton community size struc-ture and taxonomic composition affects size-selective grazingin natural communities. Oecologia 118: 306–315.
Declerck S. 2001. An ecological and ecological-genetic study ofDaphnia in a shallow hypertrophic lake. PhD Dissertation, Uni-versity Gent.
Declerck S., De Meester L., De Smedt P., Rommens W., VyvermanW., Geenens V. et al. 2000. Clear water and charophytes in ahypertrophic pond. Verhandlungen Internationale Vereinigungfür Theoretische und Angewandte Limnologie 27: 541.
Declerck S., De Meester L., Geenens V., Vyverman W., RommensW. and Decleer K. 2001. Experimenteel ecologisch onderzoeknaar de herstelkansen van het aquatisch ecosysteem van deBlankaart door hydrologische isolatie en voedselwebmanipu-latie. Report IN/KD/98.002. Institute for Nature Conservation,Brussel.
Declerck S., De Meester L., Podoor N. and Conde-Porcuna J.M.1997. The relevance of size efficiency to biomanipulation the-ory: a field test under hypertrophic conditions. Hydrobiologia360: 265–275.
Denys L. 1997. Een paleolimnologische terugblik op de teloorgangvan de Blankaart te Woumen (W.-Vlaanderen, België). Di-atoMededelingen 21: 49–73.
Douglas R.W. and Rippey B. 2000. The random redistribution ofsediment by wind in a lake. Limnol. Oceanogr. 45: 686–694.
Dumont H.J., Van De Velde I. and Dumont S. 1975. The dry weightestimate of biomass in a selection of Cladocera, Copepoda andRotifera from the plankton, perifyton and benthos of continen-tal waters. Oecologia 19: 75–97.
Ekholm P., Malve O. and Kirkkala T. 1997. Internal and externalloading as regulators of nutrient concentrations in the agricul-turally loaded Lake Pyhajarvi (Southwest Finland). Hydrobio-logia 345: 3–14.
Fenchel T. 1982. Ecology of heterotrophic microflagellates.2.Bioenergetics and growth. Mar. Ecol. Progr. Ser. 8: 225–231.
Greenberg A.C., Clesceri L.S. and Eaton A.D. 1992. Standardmethods for the examination of water and waste water. Ameri-can Public Health Association, Baltimore.
Gulati R.D., Lammens E., Meijer M.L. and Vandonk E. 1990.Biomanipulation – tool for water management – preface. Hy-drobiologia 200: 9–10.
Hall D.J., Threlkeld S.T., Burns C.W. and Crowley P.H. 1976. Size-efficiency hypothesis and size structure of zooplankton commu-nities. Ann. Rev. Ecol. Syst. 7: 177–208.
Haney J.F. and Hall D.J. 1973. Sugar-coated Daphnia – preserva-tion technique for Cladocera. Limnol. Oceanogr. 18: 331–333.
Hanson M.A. and Butler M.G. 1994. Responses to food-web ma-nipulation in a shallow waterfowl lake. Hydrobiologia 280:457–466.
Hansson L.A., Annadotter H., Bergman E., Hamrin S.F., JeppesenE., Kairesalo T. et al. 1998. Biomanipulation as an applicationof food-chain theory: constraints, synthesis, and recommenda-tions for temperate lakes. Ecosystems 1: 558–574.
Hansson L.A. and Carpenter S.R. 1993. Relative importance ofnutrient availability and food-chain for size and communitycomposition in phytoplankton. Oikos 67: 257–263.
Havens K.E. 1993. An experimental-analysis of macrozooplankton,microzooplankton and phytoplankton interactions in a temper-ate eutrophic lake. Arch. f. Hydrobiol. 127: 9–20.
Havens K.E. 1991. Fish-induced sediment resuspension – effectson phytoplankton biomass and community structure in a shal-low hypereutrophic lake. J. Plankt. Res. 13: 1163–1176.
Hosper H. 1997. Clearing lakes. PhD Dissertation, UniversityWageningen.
149
Hosper S.H. and Jagtman E. 1990. Biomanipulation additional tonutrient control for restoration of shallow lakes in The Nether-lands. Hydrobiologia 200: 523–534.
James W.F. and Barko J.W. 1990. Macrophyte influences on thezonation of sediment accretion and composition in a north-temperate reservoir. Arch. f. Hydrobiol. 120: 129–142.
Jeppesen E., Jensen J.P., Kristensen P., Sondergaard M., MortensenE., Sortkjaer O. et al. 1990. Fish manipulation as a lake resto-ration tool in shallow, eutrophic, temperate lakes.2. Thresholdlevels, long-term stability and conclusions. Hydrobiologia 200:219–227.
Jeppesen E., Jensen J.P., Sondergaard M. and Lauridsen T. 1999.Trophic dynamics in turbid and clearwater lakes with specialemphasis on the role of zooplankton for water clarity. Hydro-biologia 410: 217–231.
Jones R.C. 1990. The effect of submersed aquatic vegetation onphytoplankton and water-quality in the tidal fresh-water Poto-mac River. J. Freshw. Ecol. 5: 279–288.
Jürgens K. 1994. Impact of Daphnia on planktonic microbial foodwebs: a review. Mar. Microb. Food Webs 8: 295–324.
Kamjunke N., Böing W. and Voigt H. 1997. Bacterial and primaryproduction under hypertrophic conditions. Aquat. Microb. Ecol.13: 29–35.
Kristensen P., Sondergaard M. and Jeppesen E. 1992. Resuspen-sion in a shallow eutrophic lake. Hydrobiologia 228: 101–109.
Lee S. and Fuhrman J.A. 1987. Relationships between biovolumeand biomass of naturally derived marine bacterioplankton.Appl. Envir. Microbiol. 53: 1298–1303.
Meijer M.L., De Boois I., Scheffer M., Portielje R. and Hosper H.1999. Biomanipulation in shallow lakes in The Netherlands: anevaluation of 18 case studies. Hydrobiologia 409: 13–30.
Meijer M.L., Dehaan M.W., Breukelaar A.W. and Buiteveld H.1990. Is reduction of the benthivorous fish an important causeof high transparency following biomanipulation in shallowlakes. Hydrobiologia 200: 303–315.
Menden-Deuer S. and Lessard E.J. 2000. Carbon to volume rela-tionships for dinoflagellates, diatoms, and other protist plank-ton. Limnol. Oceanogr. 45: 569–579.
Peeters B., De Meester L., Denayer B., De Smedt P., Nuydens K.and Ollevier F. 1996. Inventarisatie van het visbestand van deBlankaartvijver en omliggende waterlopen met afvissing van deKasteel- en Visvijver. Beschrijving van de visstand en voor-stellen inzake actief biologisch beheer. Report AMINAL Nat-uur., Belgium.
Perrow M.R., Meijer M.L., Dawidowicz P. and Coops H. 1997.Biomanipulation in the shallow lakes: state of the art. Hydro-biologia 342: 355–365.
Pontin M. 1978. A Key to the British Freshwater Planktonic Ro-tifera. Freshwater Biological Association, Ambleside.
Porter K.G. and Feig Y.S. 1980. The use of DAPI for identifyingand counting aquatic microflora. Limnol. Oceanogr. 25: 943–948.
Putt M. and Stoecker D.K. 1989. An experimentally determinedcarbon: volume ratio for marine “oligotrichous” ciliates fromestuarine and coastal waters. Limnol. Oceanogr. 34:1097–1103.
Reynolds C.S. 1984. The Ecology of Freshwater Phytoplankton.Cambridge University Press, Cambridge.
Ruttner-Kolisko A. 1974. Plankton rotifers – Biology and taxon-omy. Die Binnengewässer. Lubrecht & Cramer, Port Jervis,XXVI/1 suppl.
Sanders R.W., Porter K.G., Bennett S.J. and DeBiase A.E. 1989.Seasonal patterns of bacterivory by flagellates, ciliates, rotifers,and cladocerans in a fresh-water planktonic community. Lim-nol. Oceanogr. 34: 673–687.
Scheffer M. 1998. Ecology of Shallow Lakes. Chapman & Hall,London.
Scheffer M., Hosper S.H., Meijer M.L., Moss B. and Jeppesen E.1993. Alternative equilibria in shallow lakes. Trends Ecol.Evol. 8: 275–279.
Schriver P., Bøgestrand J., Jeppesen E. and Sondergaard M. 1995.Impact of submerged macrophytes on fish-zooplankton- phy-toplankton interactions – large-scale enclosure experiments ina shallow eutrophic lake. Freshw. Biol. 33: 255–270.
Shapiro J. and Wright D.I. 1984. Lake restoration by biomanipu-lation – Round Lake, Minnesota, the first 2 Years. Freshw. Biol.14: 371–383.
Sherr B.F., Sherr E.B. and Pedrós-Alió C. 1989. Simultaneous mea-surements of bacterioplankton production and protozoan her-bivory. Mar. Ecol. Progr. Ser. 54: 209–219.
Sherr E.B., Caron D.A. and Sherr B.F. 1993. Staining of het-erotrophic protists for visualisation via epifluorescence micros-copy. In: Kemp P.F., Sherr B.F., Sherr E.B. and Cole J.J. (eds),Aquatic Microbial Ecology. Lewis Publishers, Boca Raton, pp.213–228.
Slusarczyk M. 1997. Impact of fish predation on a small-bodiedcladoceran: limitation or stimulation? Hydrobiologia 342: 215–221.
Verity P.G. and Smetacek V. 1996. Organism life cycles, predation,and the structure of marine pelagic ecosystems. Mar. Ecol.Progr. Ser. 130: 277–293.
Weisse T., Müller H., Pinto-Coelho M., Schweizer A., SpringmannD. and Baldinger G. 1990. Response of the microbial loop tothe phytoplankton spring bloom in a large pre-alpine lake. Lim-nol. Oceanogr. 35: 781–794.
150