


Sprachen
Seiten
Rechtliche


0202
0200
PCBS0202
03400200
02000202
0869
(970/972) 2 2982700
(970/972) 2 2982710
0022422422
http://www.pcbs.gov.ps
0228
PCBS0202

PCBS0202
PCBS0202
0202
(PNA)
CFG 2011
SDC
CFG

PCBS0202

PCBS0202

PCBS0202
PCBS0202
07
0 001
0.002
09
0 002
0 002
4 000
3 000
1 042
0 142
0 140
4 140
3 140
1 144
57
59
5;

PCBS0202
PCBS0202
الصفحة
0<
0202
60
0<
0202
60
5<
0202
60
6<020260
7<
0202
65
8<0202 65
9<
0202
44
:<
0202
44
;<020267
02<020267
00<020268
00<020268
05<
0202
69
06<
0202
69
07<
0202
6:
08<02026:

PCBS0202

PCBS0202
0202
0200

PCBS0202
PCBS0202
01
0202
0 0
42.043.033.2
60 00202
30 401 2
43 033 2
0202
0202
44.741.3
34.2
25.0
55.358.7
65.8
75.0
0
10
20
30
40
50
60
70
80
30 1
020204.443.0
PCBS0202
06
03.1
21.702 6
0202
%24.5
21.7
%20.6
%9.9
8.3
6.1
40.2
44 203.0
04 1
0202
%
%
%
%
...0
2 0
ــة ــفة الغربيــ ــمال الضــ شــ
طــــستولمر اــ ــحالب
ت ـــمي الــرحـلبا
األردن
Med
iterr
anea
n Se
a
Dea
d Se
a
North of West Bank
Jordanــر مص
Egypt
ــة ــفة الغربيــ ــط الضــ وســMiddle of West Bank
ــة ــفة الغربيــ ــوب الضــ جنــ
South of West Bank
قطاع غــزةGaza Strip
ــدر 2011الجهــــاز المــــرآزي لإلحصــــاء الفلســــطيني، : المصـ
Source: Palestinian Central Bureau of Statistics, 2011
ــة، ــب المنطقـ ــة حسـ ــالت محليـ ــذت رحـ ــتي نفـ ــر الـ ــبة األسـ 2010نسـ
Percentage of the Households that Conducted Domestic Trips by Region, 2010
/ 0 8 16 244
Kilometers
25.0
34.2
41.3
44.7
17

PCBS0202
00
PCBS0202
0.
0601 0
64 612 3
40.62.0
3 3
0202
86.0
57.4
31.6
7.8
0
20
40
60
80
100
10.0
61.600.0
20.616.9
7.15.4
0202
20.6
16.9
7.15.4
1.1
0
5
10
15
20
25
PCBS0202
02
0.0
00.300 60202
04.6.0.2
00.2
03.600.60.2
0202
0202
24.612.7 12.6
2.0
75.487.3 87.4
98.0
0
20
40
60
80
100
120
20.4
020202 6
00.00202
62.101.0
2 34 1
00.0
ــن جنيـ
ــاس طولكــرمطوب
قلقيليــــــــــة
ســــــلفيت
نـــــابلس
رام اهللا والبـــــــــيرة
أريحــاواألغــوار
ــدس القـ
بيـــت لحـــم
الخليـــــل
طــــستولمر اــ ــحالب
ت ـــمي الــرحـلبا
األردن
Med
iterr
anea
n Se
a
Dea
d Se
a
Jenin
Jordan
Tubas
Nablus
Tulkarm
Qalqiliya
Salfit
Ramallah & Al Bireh
Jerusalem
Bethlehem
Hebron
& JerichoAl Aghwar
ــر مص
Egypt
رفــحRafah
Khan Younis
خـــــانيونس
ديــــر البلــــحDier Alballah
Gazaغزة
شمال غزة
North Gaza
ــدر 2011الجهــــاز المــــرآزي لإلحصــــاء الفلســــطيني، : المصـ
Source: Palestinian Central Bureau of Statistics, 2011
2010التوزيـــع النســـبي للـــرحالت المحليـــة حســـب وجهـــة الرحلـــة،
Percentage Distribution of Domestic Trips by Destination, 2010
/ 0 9 18 274.5
Kilometers
0.0 - 3.1
3.2 - 6.2
6.3 - 9.3
9.4 - 12.3
12.4 - 15.4
21

PCBS0202
00
PCBS0202
04
0202
%60.5
%3.5
%15.8
%7.4
%12.8
06 6
60 602 0
02 2
04 2
0200 2
269.3010.0
042.2006.2060.4
21.6
PCBS0202
03
0202
269.3252.8
161.3137.0
126.0
75.6
0
50
100
150
200
250
300
2005 34.0 27.7 34.8 18.7 24.8 46.2
6 42.7 35.5 38.1 31.4 36.2 57.6
6 8.92 8.92 6 ..9.
6 38.1 33.9 35.9 26.6 38.8 47.9
6 37.8 34.2 41.3 25.0 34.2 44.7
6 12.5 15.5 15.7 15.7 15.0 6.6
6 15.6 21.9 16.5 25.9 25.1 0.7
6 11.4 16.4 12.7 24.6 12.6 2.0
ــة ــفة الغربيــ ــمال الضــ شــ
طــــستولمر اــ ــحالب
ت ـــمي الــرحـلبا
األردن
Med
iterr
anea
n Se
a
Dea
d Se
a
North of West Bank
Jordanــر مص
Egypt
ــة ــفة الغربيــ ــط الضــ وســ
Middle of West Bank
ــة ــفة الغربيــ ــوب الضــ جنــ
South of West Bank
قطاع غــزة
Gaza Strip
ــدر 2011الجهــــاز المــــرآزي لإلحصــــاء الفلســــطيني، : المصـ
Source: Palestinian Central Bureau of Statistics, 2011
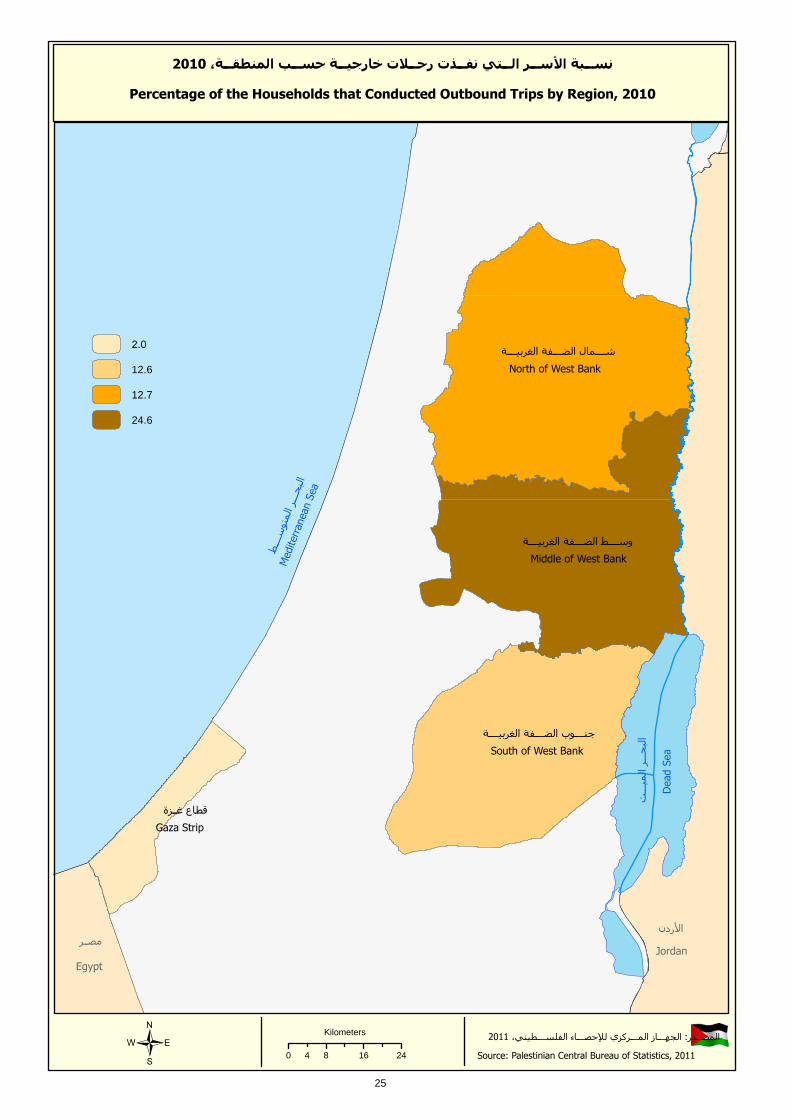
2010نســـبة األســـر الـــتي نفـــذت رحـــالت خارجيـــة حســـب المنطقـــة،
Percentage of the Households that Conducted Outbound Trips by Region, 2010
/ 0 8 16 244
Kilometers
2.0
12.6
12.7
24.6
25

PCBS0202
06
PCBS0202
02
0 0
0 0
0200
0222
003
PSUs
002,2
0..104
0200
PCBS0202
00
6
06
0 06
0
5.0
0200
6.0
Video
Conference
PCBS0202
0.
2420020001230200
03
3301
7,8207,124
6.6
0
0Access
User-Friendly
SPSS
PCBS0202
42
7.0
0.7
0202
;7
2.5 %36.0 %39.7
6
6 6 6 6
6 6 6
6 66 6 6
PCBS0202
40
3.4
2.2
0
2200222003
32240024.0
.1
.2
7,124
23
58
006
14
402
0
60
7,820
PCBS0202
40
x0223.0
x0223.4
022 95.7
rg
ng co
wi
wiwifg
.
wi i
g
fgg
ngwig
cgowi
.
rgwi
fgiw'
fgiwiiw *'
5
0222
6.7
PCBS0202
44
7

PCBS0202
43
PCBS0202
41

PCBS0202
46
PCBS0202
42
0 0..3
0 0..0
4 0...0..0
3 02210223
1 02260221
6 02220226
2 022.0220
0 0202022.

PCBS0202
40

PCBS0202
4.
Tables

04
PCBS: Domestic and Outbound Tourism Survey, 2010 PCBS2010
Palestinian TerritoryWest BankNorth of West BankMiddle of West BankSouth of West BankGaza Strip
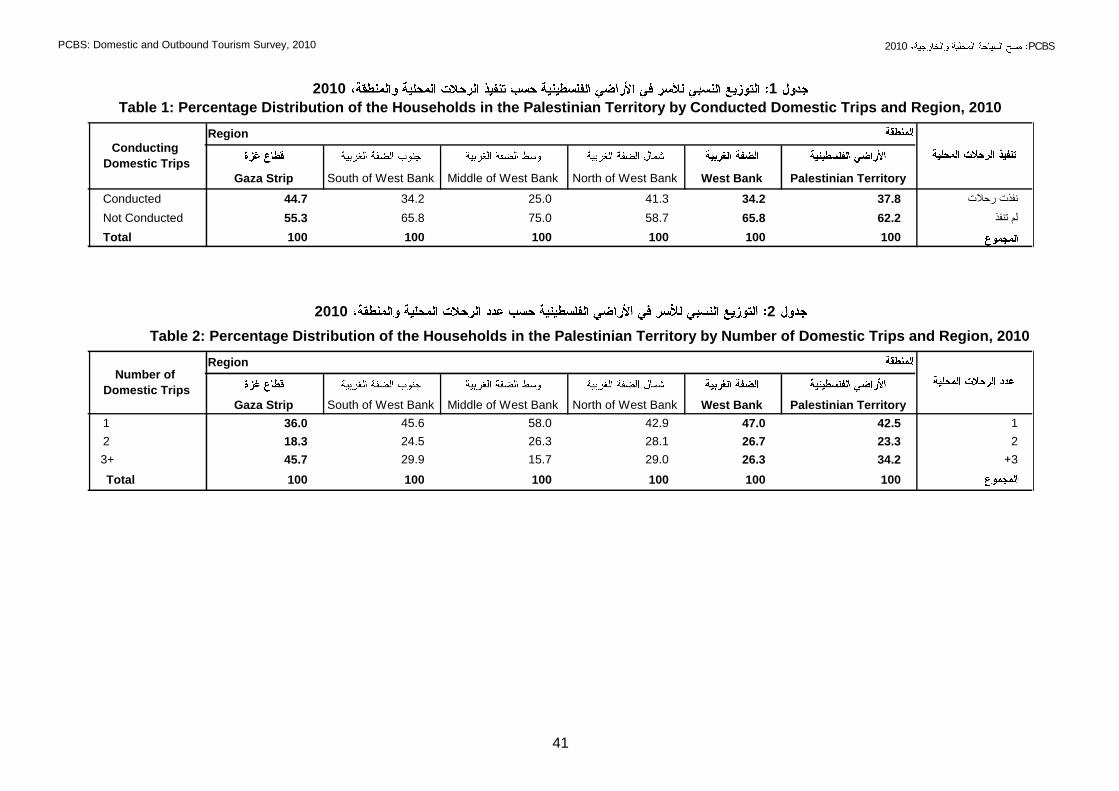
37.834.241.325.034.244.7Conductedنفذت رحالت
62.265.858.775.065.855.3Not Conductedلم تنفذ
100100100100100100Total
Palestinian TerritoryWest Bank North of West BankMiddle of West BankSouth of West BankGaza Strip
142.547.042.958.045.636.01
223.326.728.126.324.518.32
3+34.226.329.015.729.945.7 3+
100100100100100100 Total
12010Table 1: Percentage Distribution of the Households in the Palestinian Territory by Conducted Domestic Trips and Region, 2010
Region
Conducting
Domestic Trips
22010Table 2: Percentage Distribution of the Households in the Palestinian Territory by Number of Domestic Trips and Region, 2010
RegionNumber of
Domestic Trips
41
PCBS: Domestic and Outbound Tourism Survey, 2010 PCBS2010
Palestinian TerritoryWest BankNorth of West BankMiddle of West BankSouth of the West
BankGaza Strip
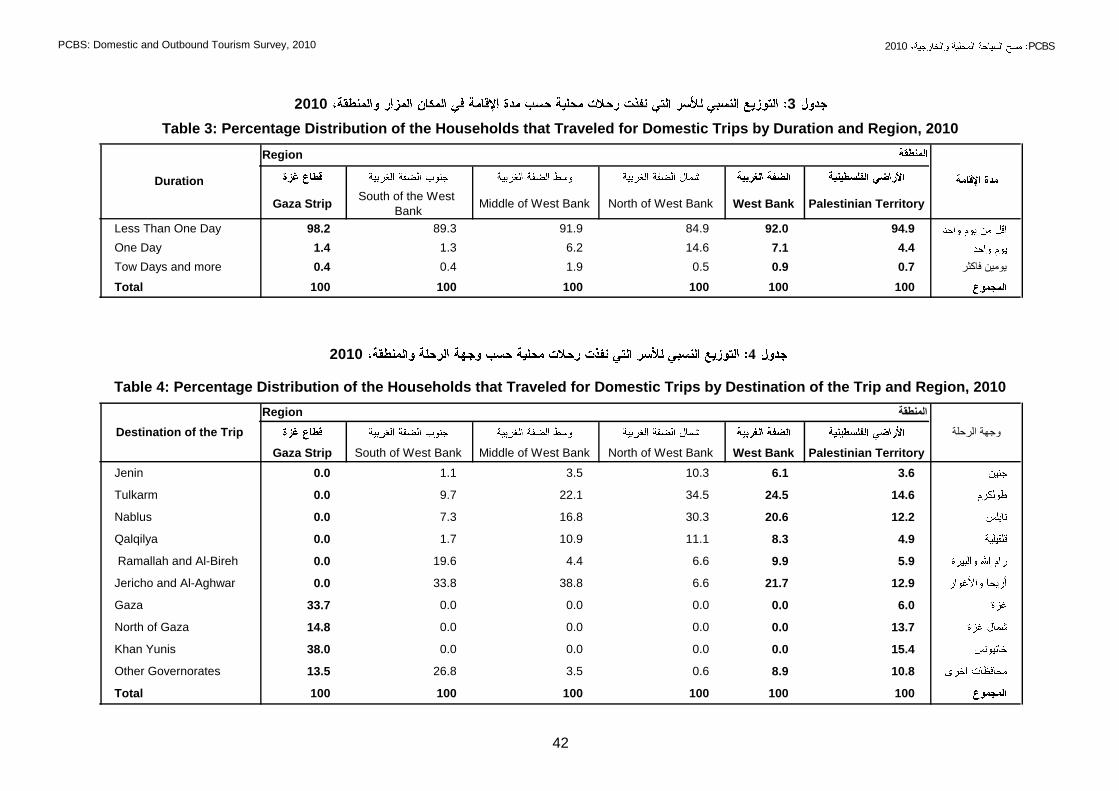
94.992.084.991.989.398.2Less Than One Day
4.47.114.66.21.31.4One Day
0.70.90.51.90.40.4Tow Days and moreيومين فاكثر
100100100100100100Total
Palestinian TerritoryWest BankNorth of West BankMiddle of West BankSouth of West BankGaza Strip
3.66.110.33.51.10.0Jenin
14.624.534.522.19.70.0Tulkarm
12.220.630.316.87.30.0Nablus
4.98.311.110.91.70.0Qalqilya
5.99.96.64.419.60.0 Ramallah and Al-Bireh
12.921.76.638.833.80.0Jericho and Al-Aghwar
6.00.00.00.00.033.7Gaza
13.70.00.00.00.014.8North of Gaza
15.40.00.00.00.038.0Khan Yunis
10.88.90.63.526.813.5Other Governorates
100100100100100100Total
32010Table 3: Percentage Distribution of the Households that Traveled for Domestic Trips by Duration and Region, 2010
Region
Duration
42010
Table 4: Percentage Distribution of the Households that Traveled for Domestic Trips by Destination of the Trip and Region, 2010
وجهة الزحلة
Region
Destination of the Trip
المنطقة
42
PCBS: Domestic and Outbound Tourism Survey, 2010 PCBS2010
Palestinian TerritoryWest BankNorth of West BankMiddle of West BankSouth of West BankGaza Strip
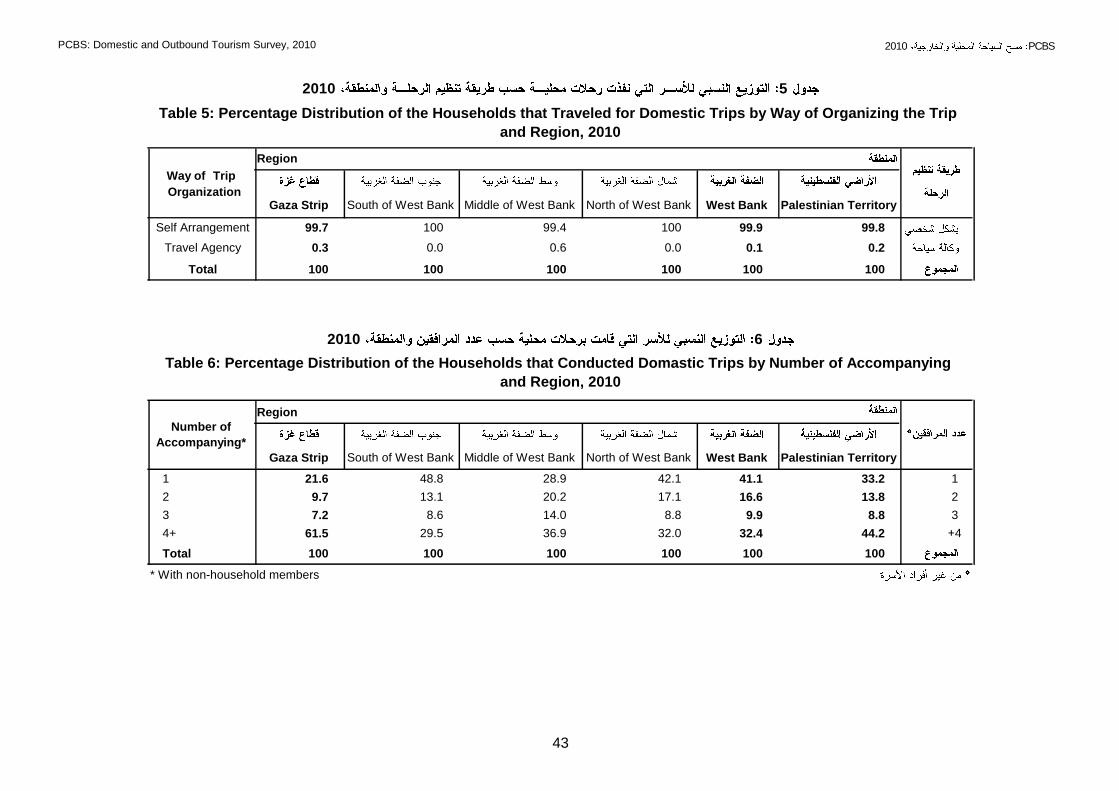
99.899.910099.410099.7 Self Arrangement
0.20.10.00.60.00.3 Travel Agency
100100100100100100 Total
Region
Palestinian TerritoryWest BankNorth of West BankMiddle of West BankSouth of West BankGaza Strip
133.241.142.128.948.821.61
213.816.617.120.213.19.72
38.89.98.814.08.67.23
4 +44.232.432.036.929.561.54+
100100100100100100Total
* With non-household members
52010Table 5: Percentage Distribution of the Households that Traveled for Domestic Trips by Way of Organizing the Trip
and Region, 2010
Region
Way of Trip
Organization
62010Table 6: Percentage Distribution of the Households that Conducted Domastic Trips by Number of Accompanying
and Region, 2010
Number of
Accompanying*
43
PCBS: Domestic and Outbound Tourism Survey, 2010 PCBS2010
Restaurants &
ParksCoffee Shops
Swimming
PoolsHotelsShops
Health
Facilities
Tourism
Guides
86.063.631.64.457.485.87.8
12.032.265.393.040.611.691.3
2.04.23.12.62.02.60.9
100100100100100100100المجموع
Restaurants &
ParksCoffee Shops
Swimming
PoolsHotelsShops
Health
Facilities
Tourism
Guides
23.315.718.26.14.36.557.0
55.754.153.315.846.026.127.3
11.411.79.25.131.228.73.3
1.71.51.30.07.721.60.0
0.30.40.80.01.47.12.9
7.616.617.273.09.410.09.5ال اعزف
100100100100100100100المجموع
7 2010
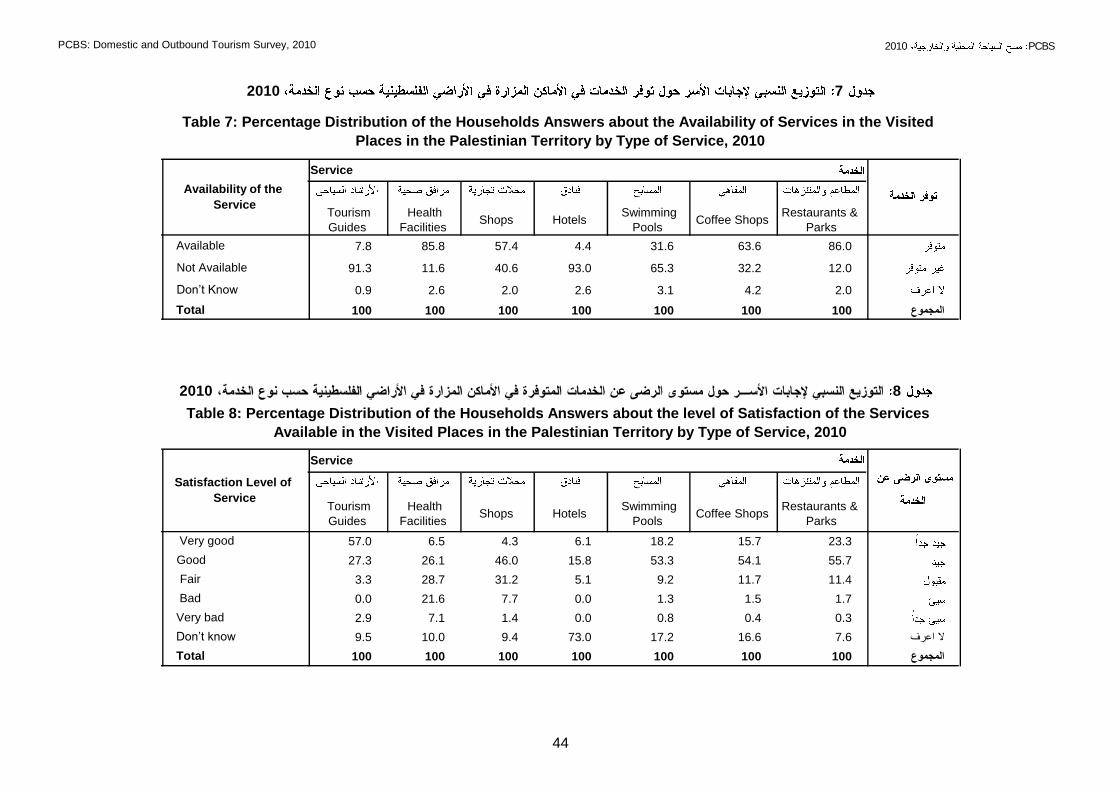
Table 7: Percentage Distribution of the Households Answers about the Availability of Services in the Visited
Places in the Palestinian Territory by Type of Service, 2010
Availability of the
Service
Service
Available
Not Available
Don’t Know
Total
82010Table 8: Percentage Distribution of the Households Answers about the level of Satisfaction of the Services
Available in the Visited Places in the Palestinian Territory by Type of Service, 2010
Satisfaction Level of
Service
Service
Total
Very good
Good
Fair
Bad
Very bad
Don’t know
44
PCBS: Domestic and Outbound Tourism Survey, 2010 PCBS2010
Palestinian TerritoryWest BankNorth of West BankMiddle of West BankSouth of West BankGaza Strip
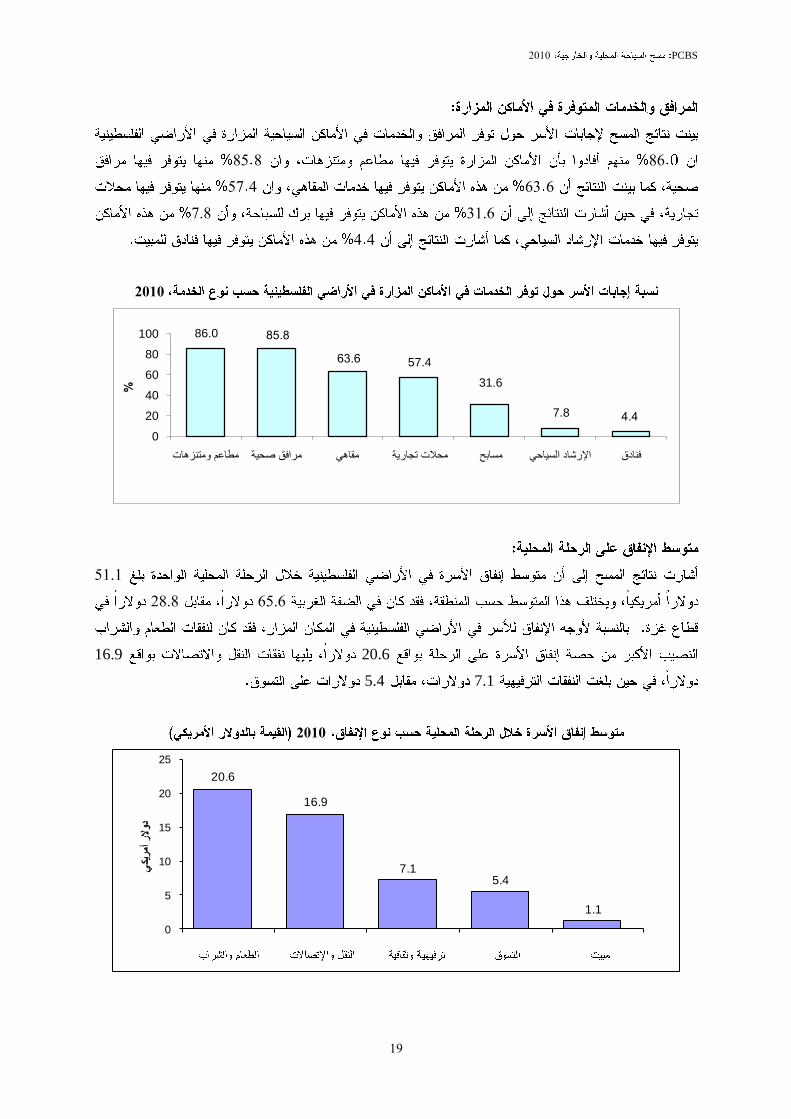
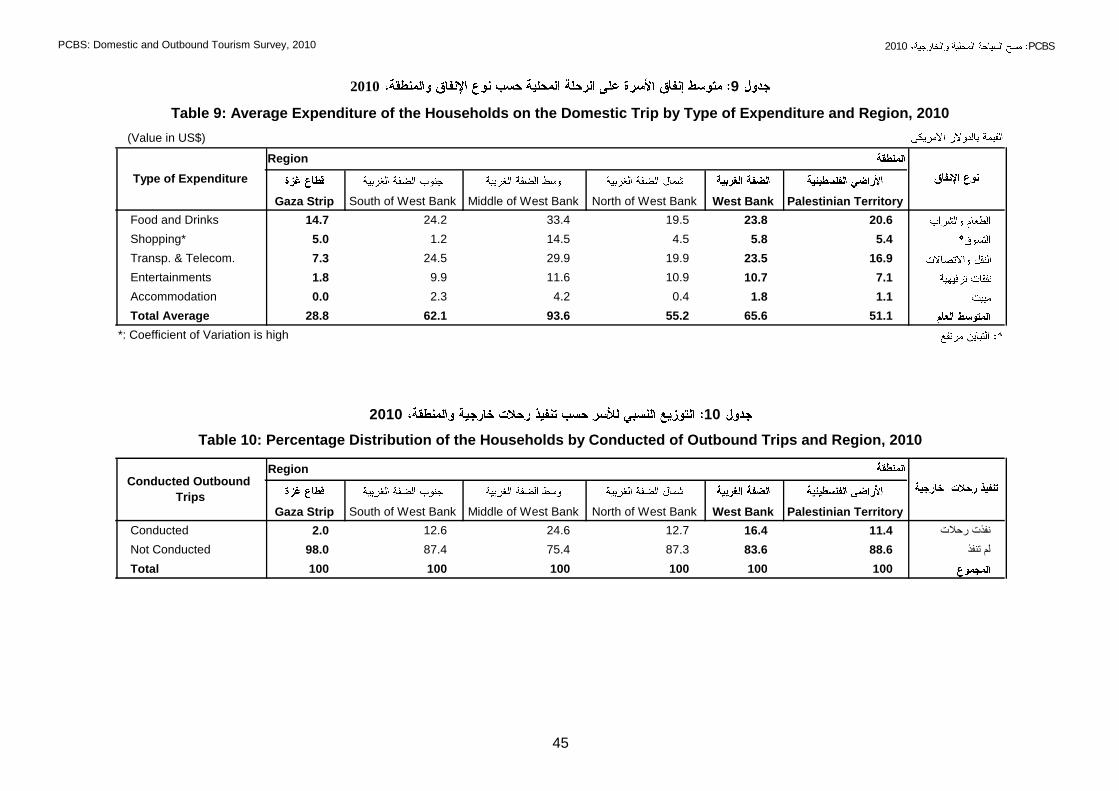
20.623.819.533.424.214.7Food and Drinks
5.45.84.514.51.25.0Shopping*
16.923.519.929.924.57.3Transp. & Telecom.
7.110.710.911.69.91.8Entertainments
1.11.80.44.22.30.0Accommodation
51.165.655.293.662.128.8Total Average
Palestinian TerritoryWest Bank North of West BankMiddle of West BankSouth of West BankGaza Strip
11.416.412.724.612.62.0Conductedنفذت رحالت
88.683.687.375.487.498.0Not Conductedلم تنفذ
100100100100100100Total
92010
*: Coefficient of Variation is high
Table 9: Average Expenditure of the Households on the Domestic Trip by Type of Expenditure and Region, 2010
(Value in US$)
Region
Type of Expenditure
102010Table 10: Percentage Distribution of the Households by Conducted of Outbound Trips and Region, 2010
RegionConducted Outbound
Trips
45
PCBS: Domestic and Outbound Tourism Survey, 2010 PCBS2010
Palestinian
TerritoryWest Bank
North of West
Bank
Middle of West
Bank
South of West
BankGaza Strip
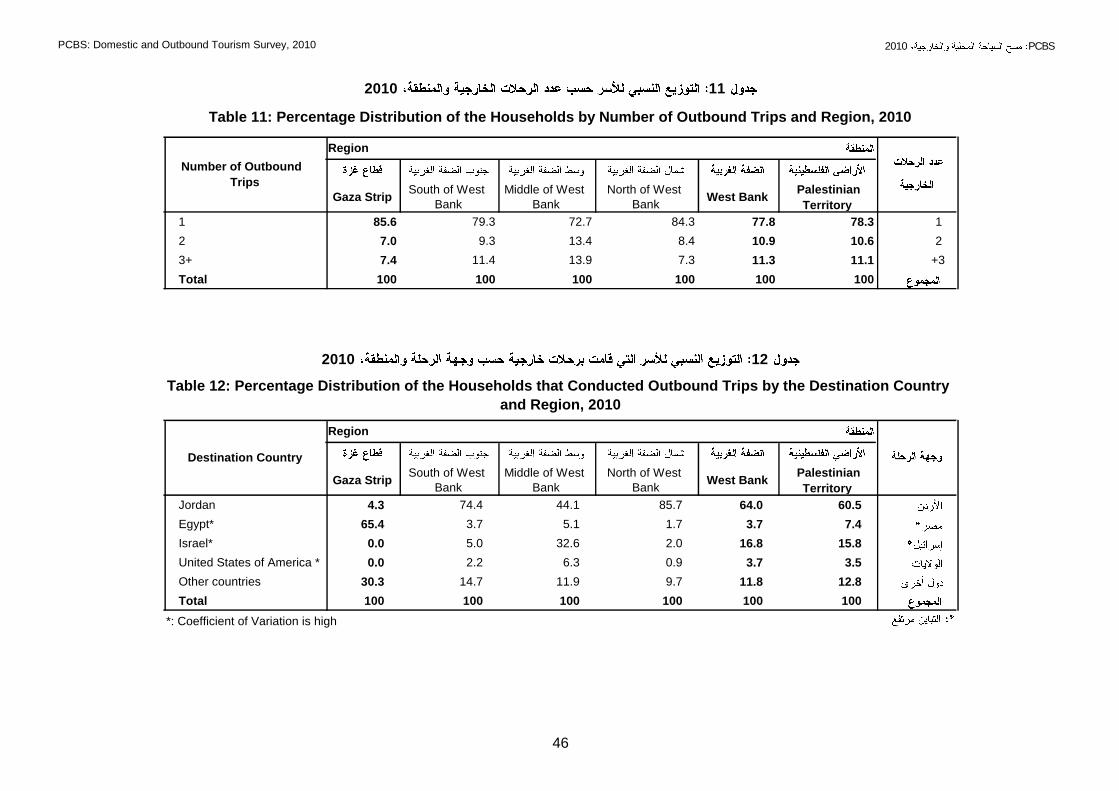
178.377.884.372.779.385.61
210.610.98.413.49.37.02
+311.111.37.313.911.47.43+
100100100100100100Total
Palestinian
TerritoryWest Bank
North of West
Bank
Middle of West
Bank
South of West
BankGaza Strip
60.564.085.744.174.44.3Jordan
7.43.71.75.13.765.4Egypt*
15.816.82.032.65.00.0Israel*
3.53.70.96.32.20.0United States of America *
12.811.89.711.914.730.3Other countries
100100100100100100Total
112010Table 11: Percentage Distribution of the Households by Number of Outbound Trips and Region, 2010
Region
Number of Outbound
Trips
*: Coefficient of Variation is high
12 2010Table 12: Percentage Distribution of the Households that Conducted Outbound Trips by the Destination Country
and Region, 2010
Region
Destination Country
46
PCBS: Domestic and Outbound Tourism Survey, 2010 PCBS2010
Region
Palestinian TerritoryWest BankNorth of West BankMiddle of West BankSouth of West BankGaza Strip
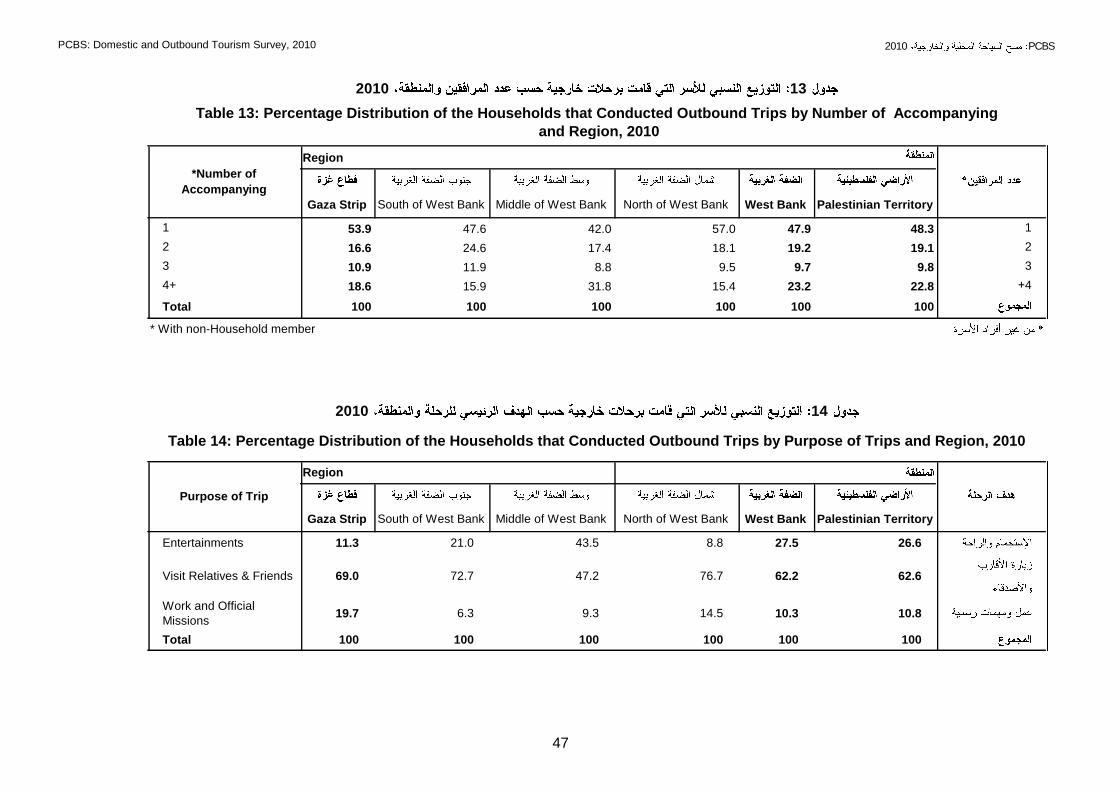
148.347.957.042.047.653.91
219.119.218.117.424.616.62
39.89.79.58.811.910.93
4+22.823.215.431.815.918.64+
100100100100100100Total
Palestinian TerritoryWest BankNorth of West BankMiddle of West BankSouth of West BankGaza Strip
26.627.58.843.521.011.3Entertainments
62.662.276.747.272.769.0Visit Relatives & Friends
10.810.314.59.36.319.7Work and Official
Missions
100100100100100100Total
* With non-Household member
13 2010
and Region, 2010
*Number of
Accompanying
Table 13: Percentage Distribution of the Households that Conducted Outbound Trips by Number of Accompanying
14 2010Table 14: Percentage Distribution of the Households that Conducted Outbound Trips by Purpose of Trips and Region, 2010
Region
Purpose of Trip
47
PCBS: Domestic and Outbound Tourism Survey, 2010 PCBS2010
Palestinian TerritoryWest BankNorth of West BankMiddle of West BankSouth of West BankGaza Strip
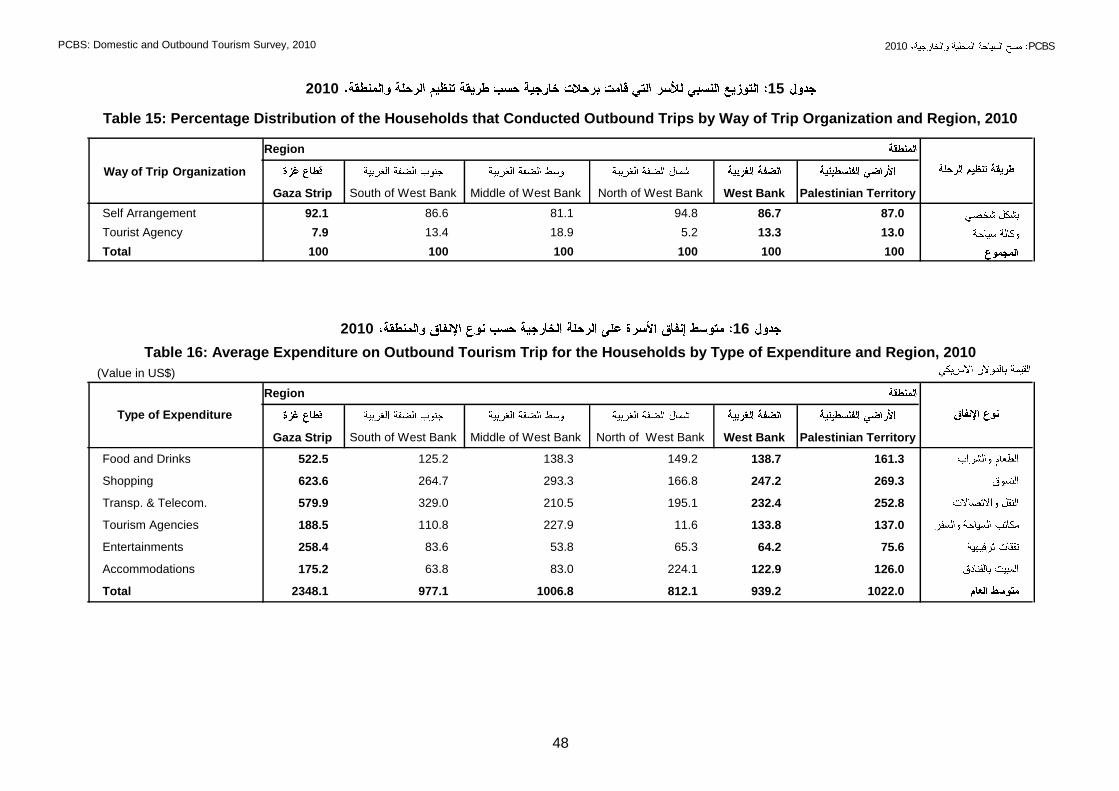
87.086.794.881.186.692.1Self Arrangement
13.013.35.218.913.47.9Tourist Agency
100100100100100100Total
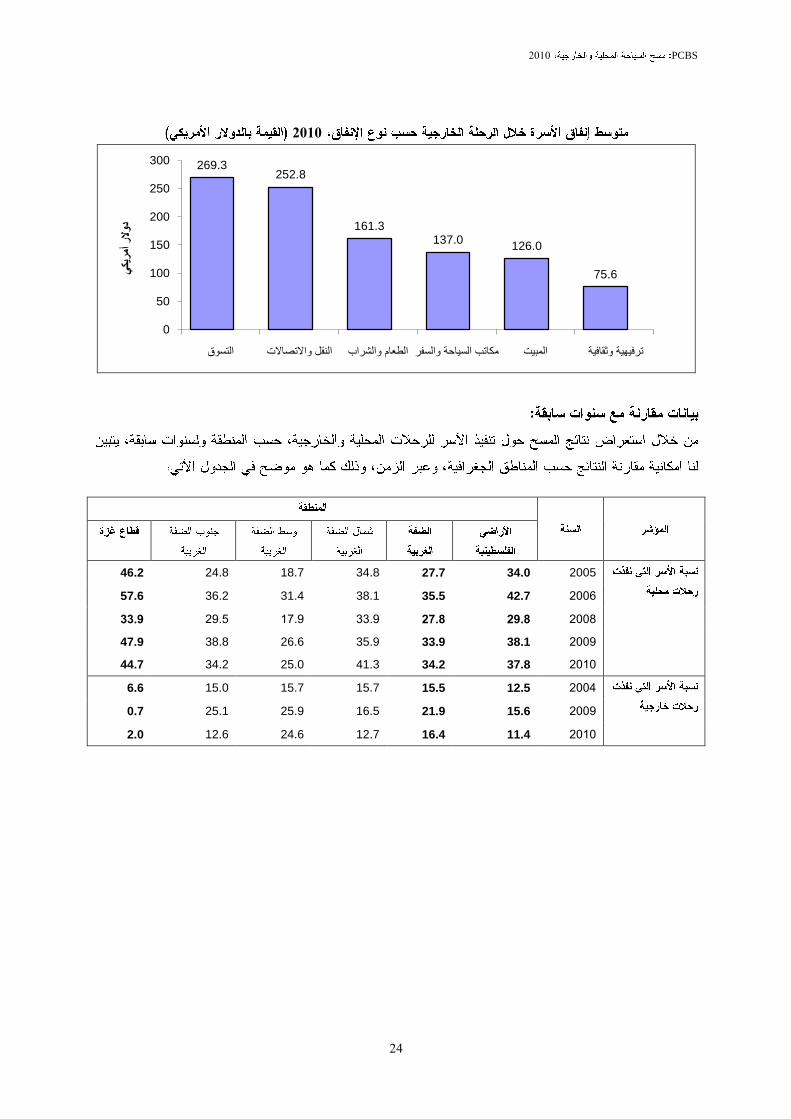
(Value in US$)
Palestinian TerritoryWest BankNorth of West BankMiddle of West BankSouth of West BankGaza Strip
161.3138.7149.2138.3125.2522.5Food and Drinks
269.3247.2166.8293.3264.7623.6Shopping
252.8232.4195.1210.5329.0579.9Transp. & Telecom.
137.0133.811.6227.9110.8188.5Tourism Agencies
75.664.265.353.883.6258.4Entertainments
126.0122.9224.183.063.8175.2Accommodations
1022.0939.2812.11006.8977.12348.1Total
152010Table 15: Percentage Distribution of the Households that Conducted Outbound Trips by Way of Trip Organization and Region, 2010
Region
Way of Trip Organization
162010Table 16: Average Expenditure on Outbound Tourism Trip for the Households by Type of Expenditure and Region, 2010
Region
Type of Expenditure
48
Palestinian National Authority
Palestinian Central Bureau of Statistics
Domestic and Outbound Tourism Survey, 2010
Main Results
August, 2011
PCBS: Domestic and Outbound Tourism Survey, 2010
PAGE NUMBERS OF ENGLISH TEXT ARE PRINTED IN SQUARE BRACKETS.
TABLES ARE PRINTED IN THE ARABIC ORDER (FROM RIGHT TO LEFT)
© August, 2011.
All rights reserved.
Suggested Citation:
Palestinian Central Bureau of Statistics, 2011. Domestic and Outbound Tourism Survey,
2010. Main Results. Ramallah - Palestine.
All correspondence should be directed to:
Palestinian Central Bureau of Statistics
P.O.Box 1647 Ramallah, Palestine.
Tel: (972/970) 4 4 98 2700
Fax: (972/970) 2 298 2710
Toll Free: 1800300300
E-Mail: [email protected]
web-site: http://www.pcbs.gov.ps
This document is prepared in accordance with the standard
procedures stated in the Code of Practice for Palestine Official
Statistics 2006
PCBS: Domestic and Outbound Tourism Survey, 2010
Acknowledgments
The Palestinian Central Bureau of Statistics (PCBS) extends its deep appreciations to all
resident families in the Palestinian Territory who contributed to the success of collecting
the survey data and to all workers in the survey for being well dedicated in performing
their duties.
The survey of Domestic and Outbound Tourism 2010 has been planed and conducted by
a technical team from PCBS and with joint funding by the Palestinian National
Authority (PNA) and the Core Funding Group (CFG) for the year 2011 represented by
the by the Representative office of Norway to PNA and the Swiss Development and
Cooperation Agency (SDC).
Moreover, PCBS very much appreciates the distinctive efforts of the Core Funding
Group (CFG) for their valuable contribution to funding the project.

PCBS: Domestic and Outbound Tourism Survey, 2010
PCBS: Domestic and Outbound Tourism Survey, 2010
Team Work
Report Preparation
Fathi Farasin
Inas Al-Rifai
Maps Design
Mosab Aboulhayja
Preliminary Review Mahmoud Abdalrahman
Mahmoud Al qayya
Final Review
Inaya Zidan
Overall Supervision
Ola Awad President of PCBS
PCBS: Domestic and Outbound Tourism Survey, 2010
Table of Contents
Subject Page
List of Tables
Introduction
Chapter One: Main Findings [13]
1.1 Conducting the Domestic Trips [13]
1.2 Conducting the Outbound Trips [14]
Chapter Two: Methodology and Data Quality [17]
2.1 Questionnaire [17]
2.2 Sample Frame [17]
2.3 Fieldwork [18]
2.4 Data Processing [18]
2.5 Data Quality [18]
2.5.1 Data Accuracy [19]
2.5.2 Response Rates [20]
2.5.3 Comparability [21]
2.5.4 Data Quality Assurance Procedures [21]
2.5.5 Technical Notes [21]
Chapter Three: Concepts and Definitions [23]
References [25]
Tables 39
PCBS: Domestic and Outbound Tourism Survey, 2010
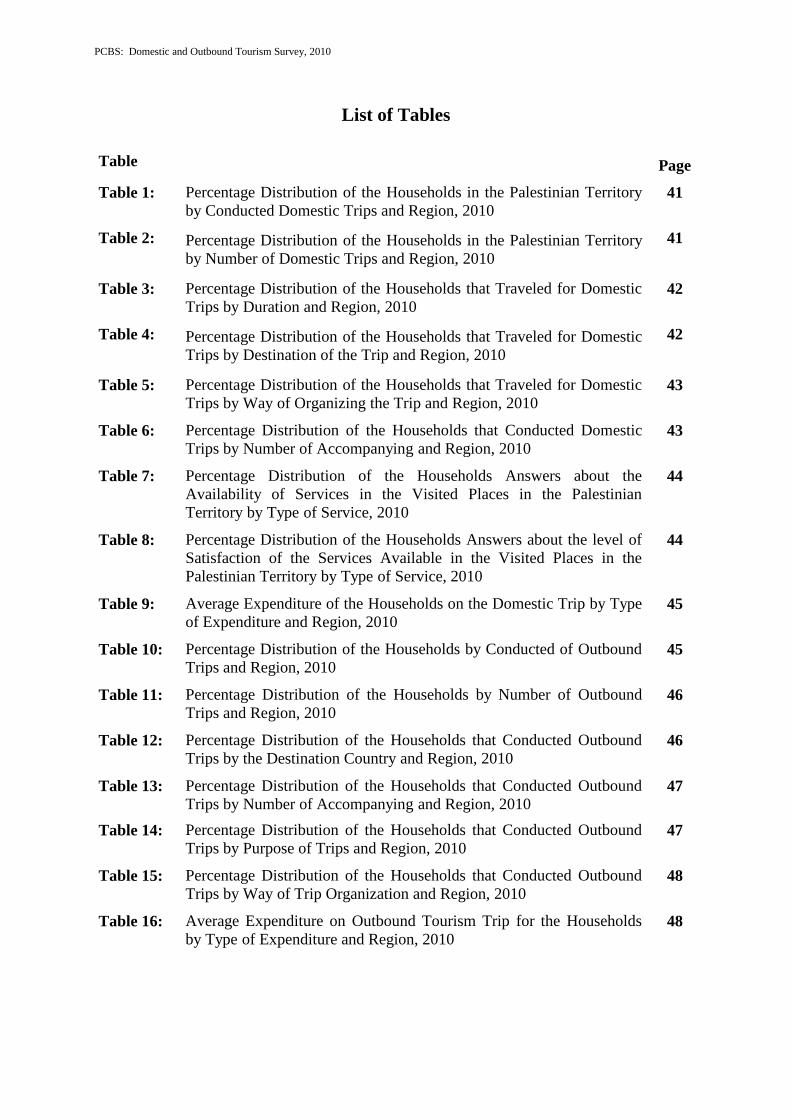
List of Tables
Table Page
Table 1: Percentage Distribution of the Households in the Palestinian Territory
by Conducted Domestic Trips and Region, 2010 41
Table 2: Percentage Distribution of the Households in the Palestinian Territory
by Number of Domestic Trips and Region, 2010
41
Table 3: Percentage Distribution of the Households that Traveled for Domestic
Trips by Duration and Region, 2010 42
Table 4: Percentage Distribution of the Households that Traveled for Domestic
Trips by Destination of the Trip and Region, 2010
42
Table 5: Percentage Distribution of the Households that Traveled for Domestic
Trips by Way of Organizing the Trip and Region, 2010 43
Table 6: Percentage Distribution of the Households that Conducted Domestic
Trips by Number of Accompanying and Region, 2010 43
Table 7: Percentage Distribution of the Households Answers about the
Availability of Services in the Visited Places in the Palestinian
Territory by Type of Service, 2010
44
Table 8: Percentage Distribution of the Households Answers about the level of
Satisfaction of the Services Available in the Visited Places in the
Palestinian Territory by Type of Service, 2010
44
Table 9: Average Expenditure of the Households on the Domestic Trip by Type
of Expenditure and Region, 2010 45
Table 10: Percentage Distribution of the Households by Conducted of Outbound
Trips and Region, 2010 45
Table 11: Percentage Distribution of the Households by Number of Outbound
Trips and Region, 2010 46
Table 12: Percentage Distribution of the Households that Conducted Outbound
Trips by the Destination Country and Region, 2010 46
Table 13: Percentage Distribution of the Households that Conducted Outbound
Trips by Number of Accompanying and Region, 2010 47
Table 14: Percentage Distribution of the Households that Conducted Outbound
Trips by Purpose of Trips and Region, 2010 47
Table 15: Percentage Distribution of the Households that Conducted Outbound
Trips by Way of Trip Organization and Region, 2010 48
Table 16: Average Expenditure on Outbound Tourism Trip for the Households
by Type of Expenditure and Region, 2010 48
PCBS: Domestic and Outbound Tourism Survey, 2010
Introduction
Tourism statistics are traditionally considered to be an important field of official statistics,
serving as a significant input in economic and market analysis of the tourism sector in
Palestine.
The Palestinian Territory is an attractive area for tourists due to the presence of many valued
religious and historical sites. The tourism sector is one of the leading sectors in the
Palestinian economy and makes a significant contribution to GDP. For this reason, PCBS
established a statistical program to supervise and implement the production of reliable and
timely statistics on the main indicators of tourism activity. This program began in 1995 with
the implementation of the hotel survey in order to provide periodic data on accommodation
statistics.
PCBS is pleased to introduce this report on the Domestic and Outbound Tourism Survey 2010
as an additional component of tourism statistics on internal tourism. The main objective of
this survey is to provide basic information about the demand aspect of tourism for use in the
Tourism Satellite Accounts system in the Palestinian Territory.
This report provides statistical data on domestic and outbound tourism, including expenditure
during trips to tourist resorts, trips conducted by households, destination countries, and the
facilities and services available in the resorts visited by resident households in the Palestinian
Territory.
PCBS hopes that this report will provide national governmental institutions, non-
governmental organizations, and research institutes in the Palestinian Territory with statistical
data needed for planning and developing the tourism sector in Palestine.
August, 2011 Ola Awad
President of PCBS

PCBS: Domestic and Outbound Tourism Survey, 2010
PCBS: Domestic and Outbound Tourism Survey, 2010
35
Chapter One
Main Findings
This section presents the main findings of the Domestic and Outbound Tourism Survey for
resident households during 2010 and illustrates the nature of trips and activities of those
households inside and outside of the Palestinian Territory.
The aim of the survey is to identify indicators related to the behavior of households in the
Palestinian Territory during the trip, such as expenditure, mode of consumption, destination,
average length of stay, activities engaged in during domestic trips, in addition to the reasons
for other households not conducting domestic trips.
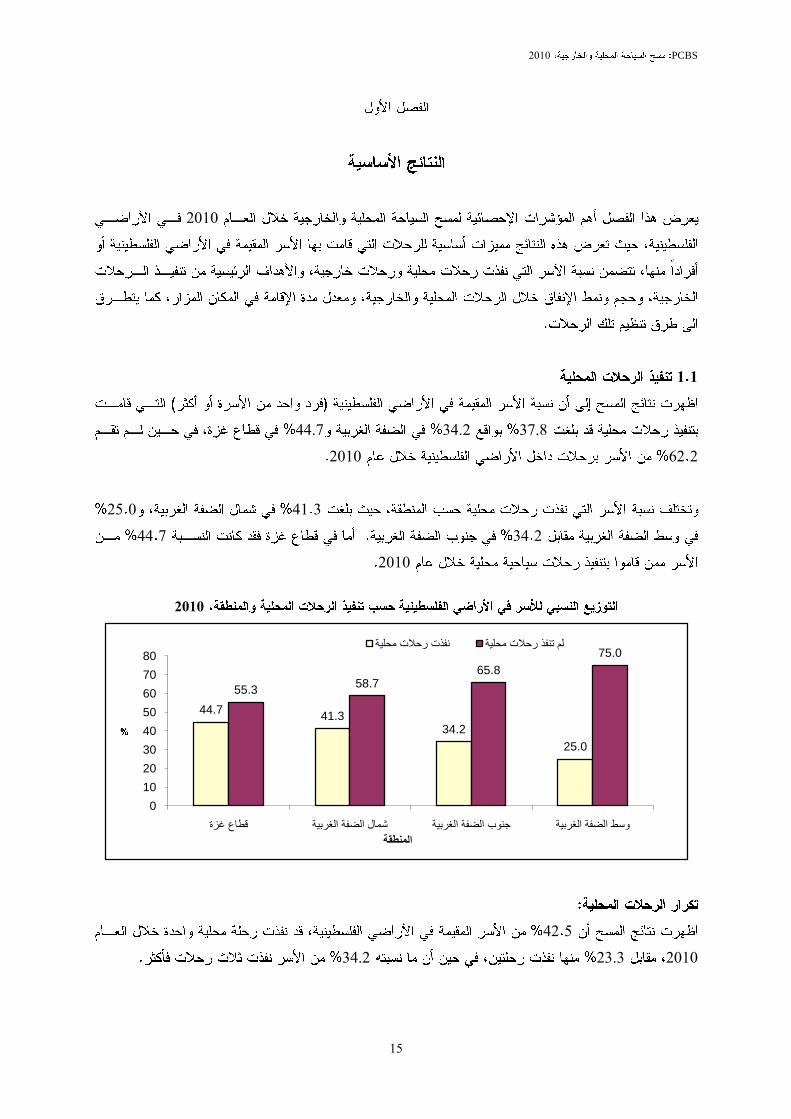
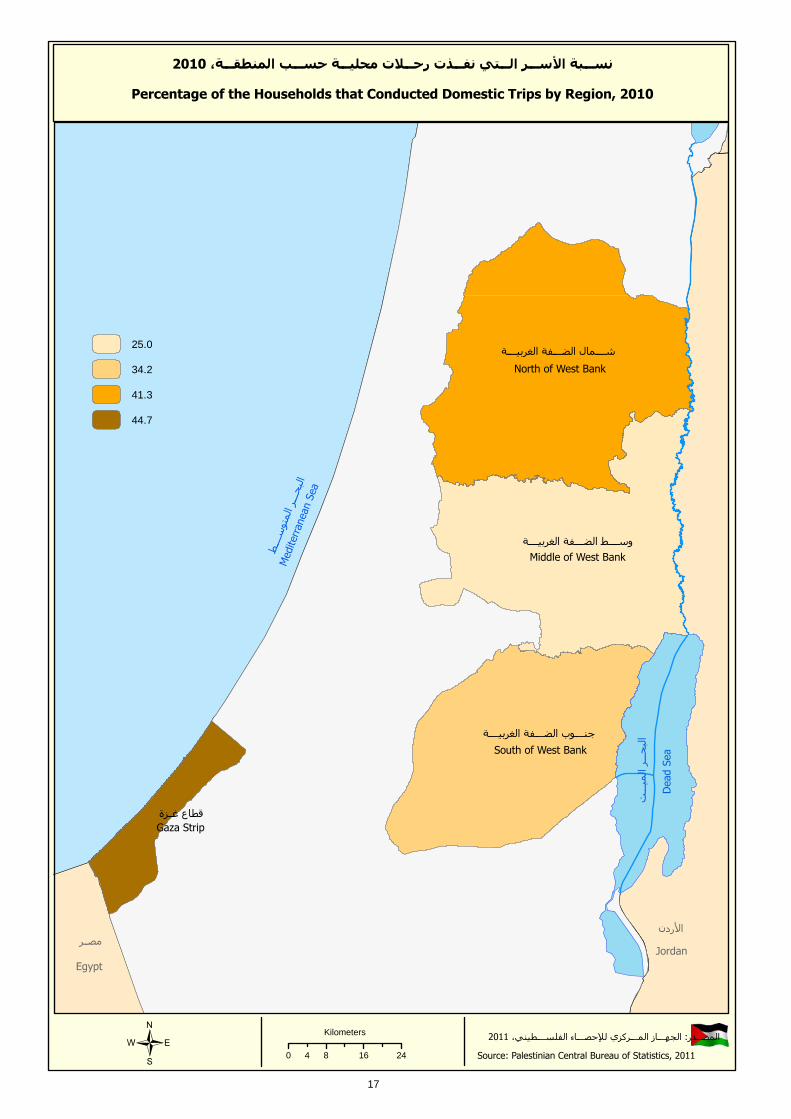
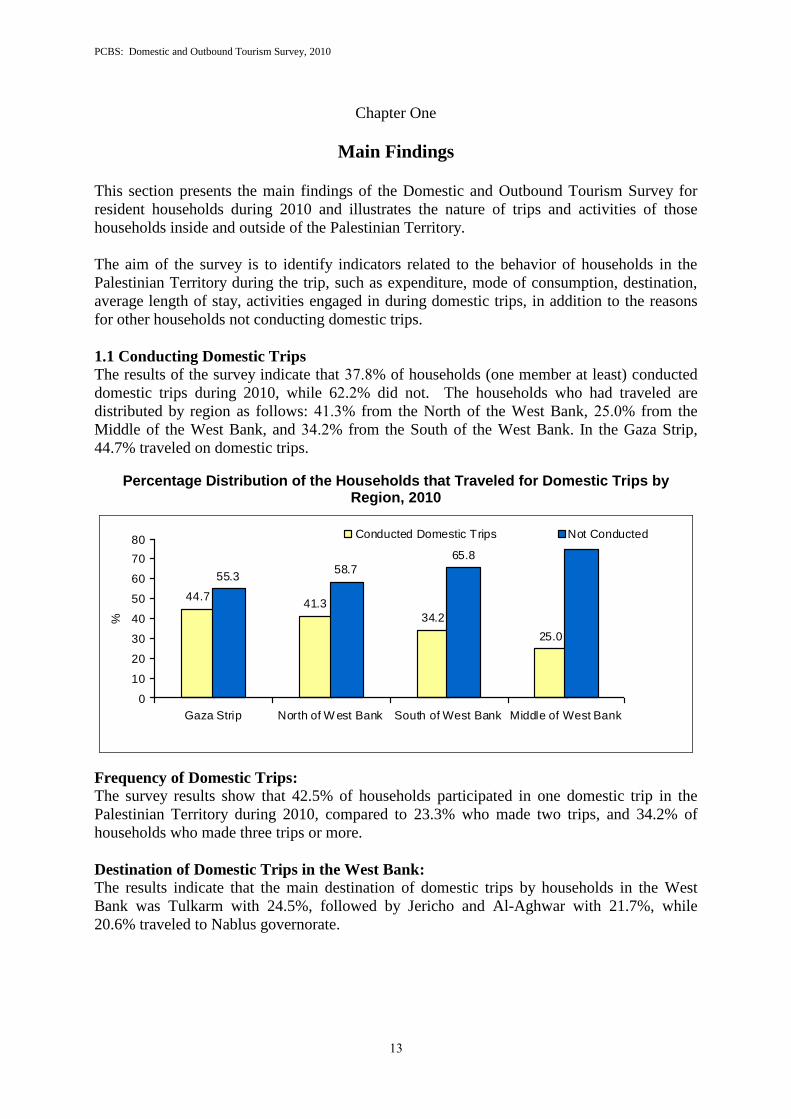
1.1 Conducting Domestic Trips
The results of the survey indicate that 597:% of households (one member at least) conducted
domestic trips during 2010, while 64.4% did not. The households who had traveled are
distributed by region as follows: 6375% from the North of the West Bank, 4772% from the
Middle of the West Bank, and 5674% from the South of the West Bank. In the Gaza Strip,
44.7% traveled on domestic trips.
Percentage Distribution of the Households that Traveled for Domestic Trips by Region, 2010
44.741.3
34.2
25.0
55.358.7
65.8
75.0
0
10
20
30
40
50
60
70
80
Gaza Strip North of W est Bank South of West Bank Middle of West Bank
%
Conducted Domestic Trips Not Conducted
Frequency of Domestic Trips:
The survey results show that 42.5% of households participated in one domestic trip in the
Palestinian Territory during 2010, compared to 23.3% who made two trips, and 34.2% of
households who made three trips or more.
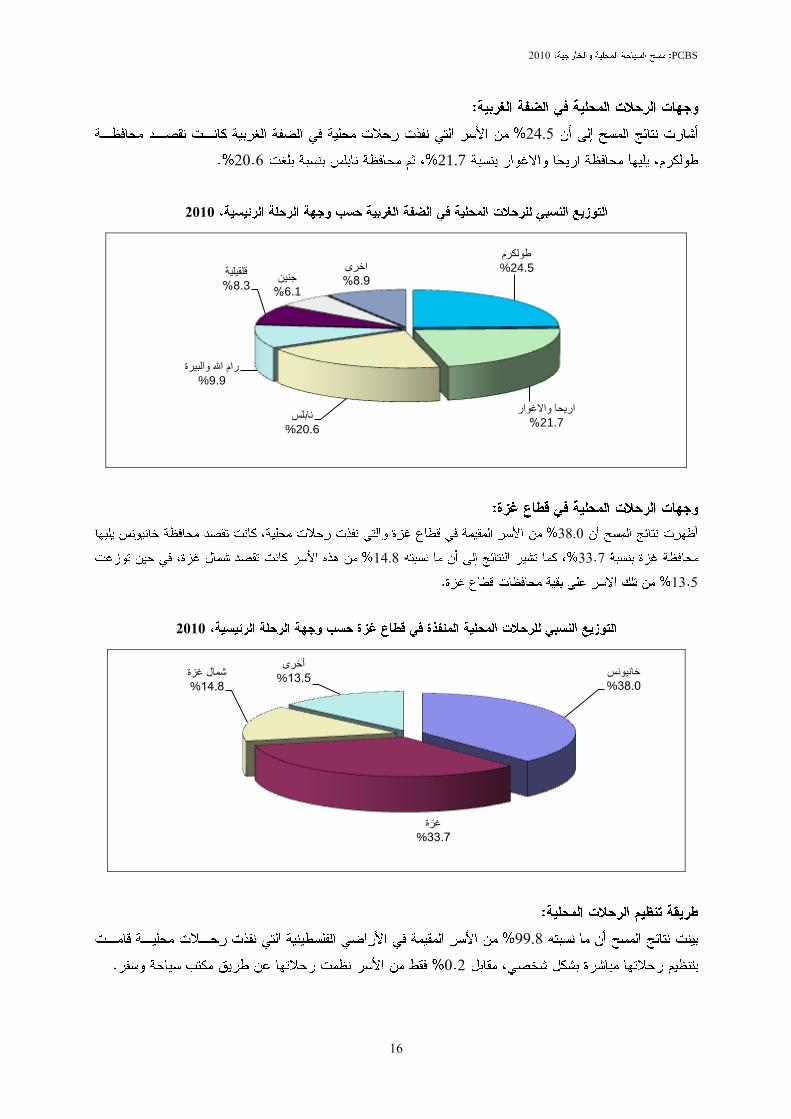
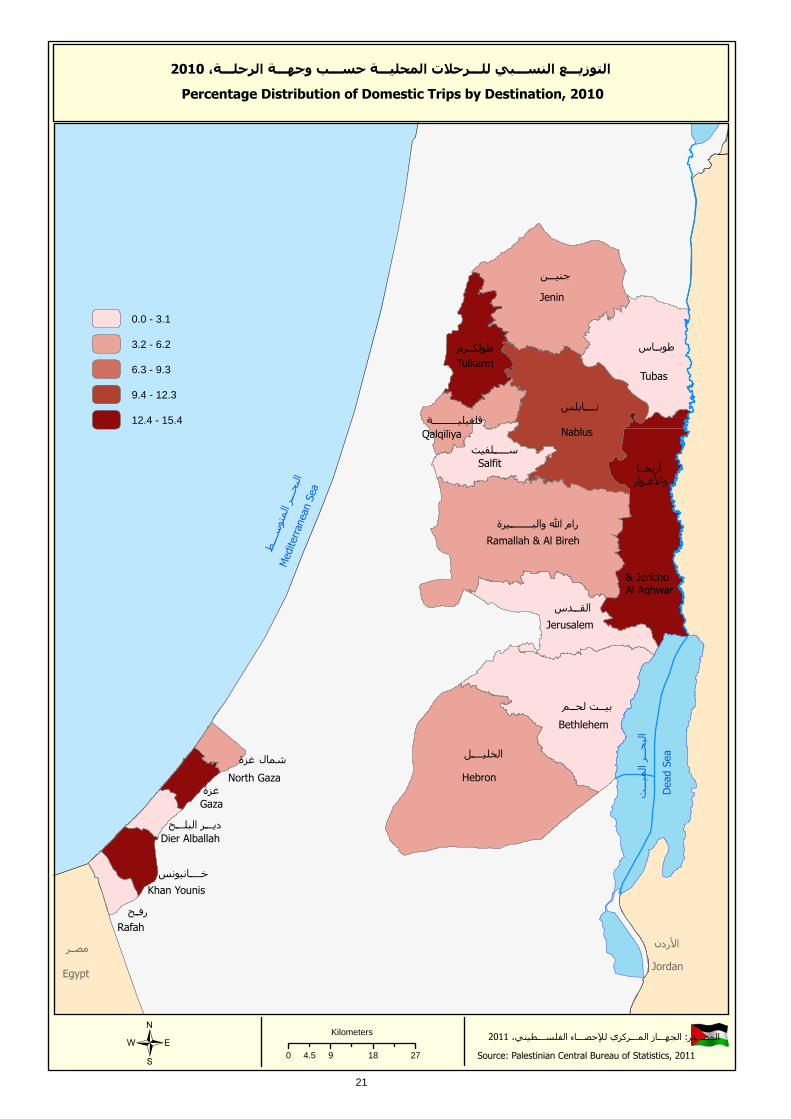
Destination of Domestic Trips in the West Bank:
The results indicate that the main destination of domestic trips by households in the West
Bank was Tulkarm with 24.5%, followed by Jericho and Al-Aghwar with 21.7%, while
20.6% traveled to Nablus governorate.
PCBS: Domestic and Outbound Tourism Survey, 2010
36
Destination of Domestic Trips in the Gaza Strip:
In the Gaza Strip, 6679% of all traveled households conducted a domestic trip in 2010 with
38.0% traveling to Khan Yunis governorate and 33.7% to Gaza governorate.
Organizing the Domestic Trip:
The results indicate that 99.8% of the domestic trips taken by households in the Palestinian
Territory were organized independently and 0.2% used travel agencies to organize their trips.
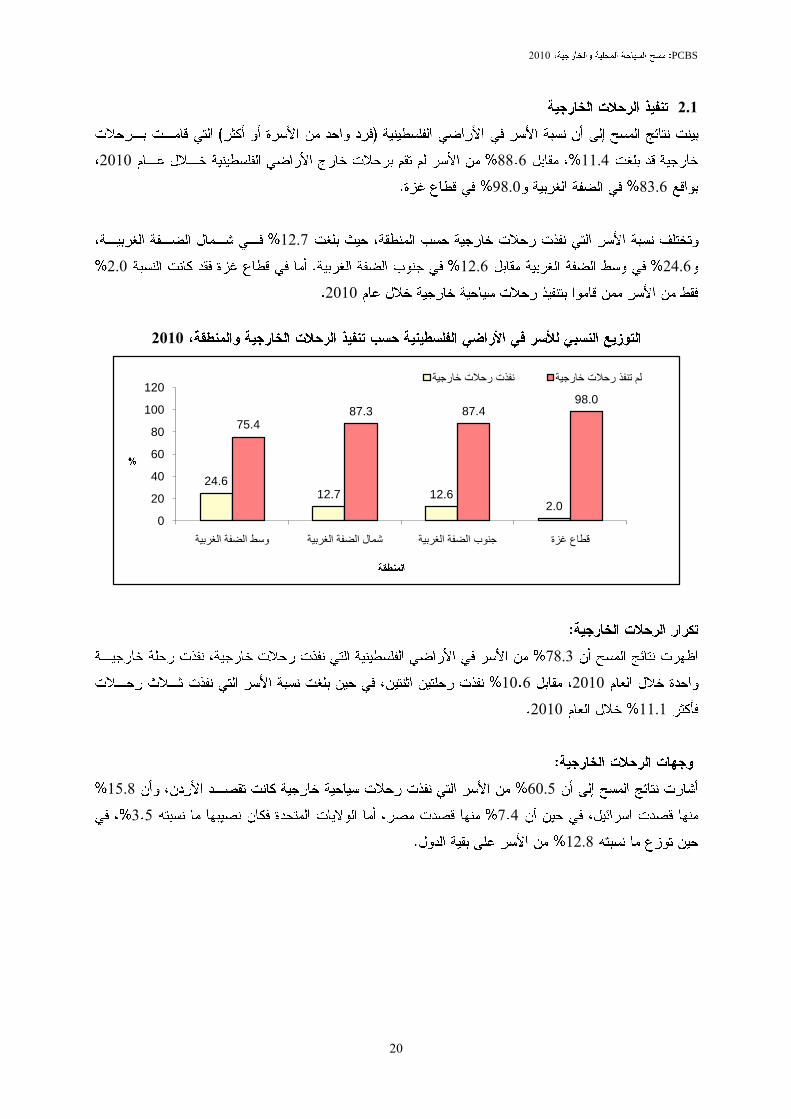
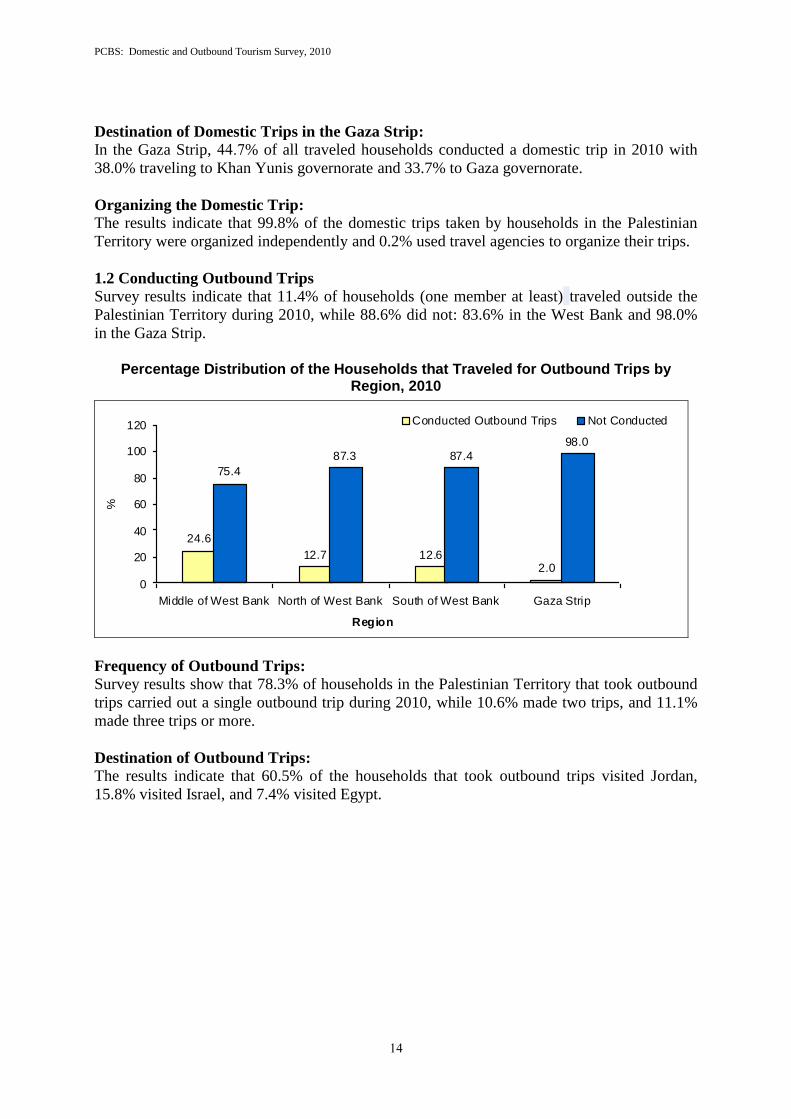
1.2 Conducting Outbound Trips
Survey results indicate that 11.4% of households (one member at least) traveled outside the
Palestinian Territory during 2010, while 88.6% did not: 83.6% in the West Bank and 98.0%
in the Gaza Strip.
Percentage Distribution of the Households that Traveled for Outbound Trips by
Region, 2010
24.6
12.7 12.62.0
75.4
87.3 87.4
98.0
0
20
40
60
80
100
120
Middle of West Bank North of West Bank South of West Bank Gaza Strip
Region
%
Conducted Outbound Trips Not Conducted
Frequency of Outbound Trips:
Survey results show that 78.3% of households in the Palestinian Territory that took outbound
trips carried out a single outbound trip during 2010, while 10.6% made two trips, and 11.1%
made three trips or more.
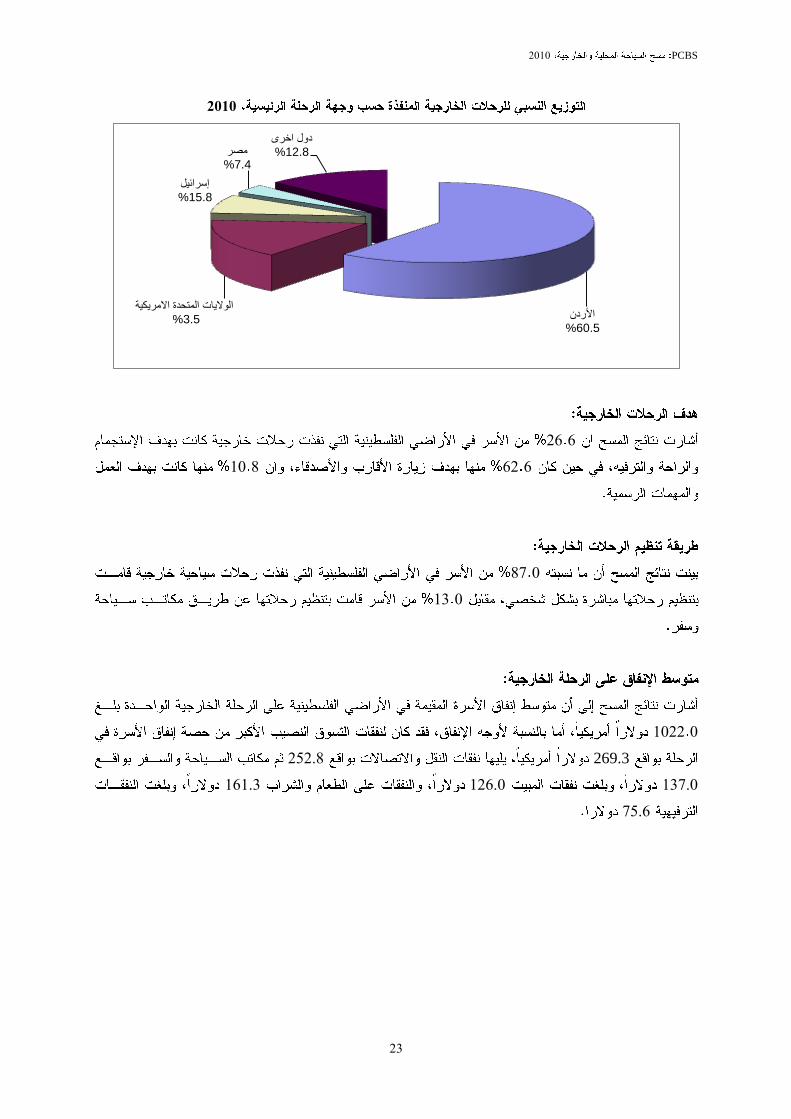
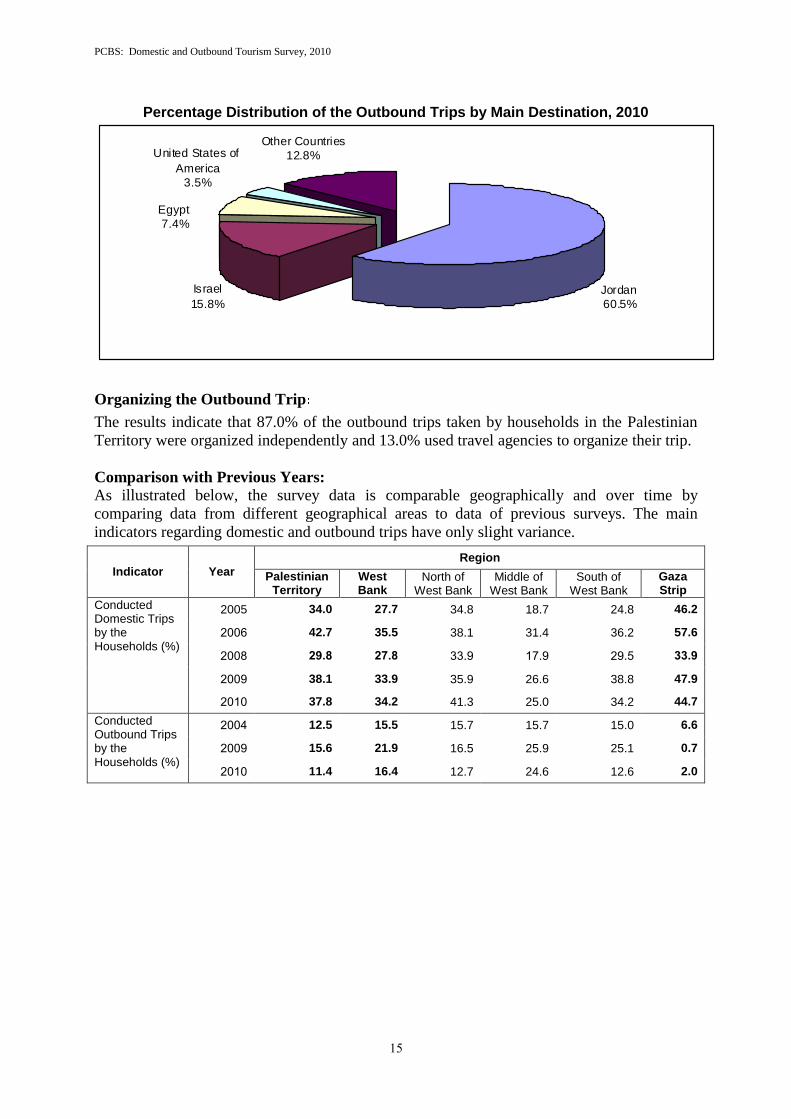
Destination of Outbound Trips:
The results indicate that 60.5% of the households that took outbound trips visited Jordan,
15.8% visited Israel, and 7.4% visited Egypt.
PCBS: Domestic and Outbound Tourism Survey, 2010
37
Percentage Distribution of the Outbound Trips by Main Destination, 2010
Jordan
60.5%
Israel
15.8%
Egypt
7.4%
United States of
America
3.5%
Other Countries
12.8%
Organizing the Outbound Trip
The results indicate that 87.0% of the outbound trips taken by households in the Palestinian
Territory were organized independently and 13.0% used travel agencies to organize their trip.
Comparison with Previous Years:
As illustrated below, the survey data is comparable geographically and over time by
comparing data from different geographical areas to data of previous surveys. The main
indicators regarding domestic and outbound trips have only slight variance.
Indicator Year
Region
Palestinian Territory
West Bank
North of West Bank
Middle of West Bank
South of West Bank
Gaza Strip
Conducted Domestic Trips by the Households (%)
2005 34.0 27.7 34.8 18.7 24.8 46.2
6002 42.7 35.5 38.1 31.4 36.2 57.6
6002 8.92 8.92 ..33 9.33 6332 ..9.
6003 38.1 33.9 35.9 26.6 38.8 47.9
6090 37.8 34.2 41.3 25.0 34.2 44.7
Conducted Outbound Trips by the Households (%)
6002 12.5 15.5 15.7 15.7 15.0 6.6
6003 15.6 21.9 16.5 25.9 25.1 0.7
6090 11.4 16.4 12.7 24.6 12.6 2.0

PCBS: Domestic and Outbound Tourism Survey, 2010
38
PCBS: Domestic and Outbound Tourism Survey, 2010
39
Chapter Two
Methodology and Data Quality
This section presents the methodology used in conducting the Domestic and Outbound
Survey, including the design of the survey's instruments, data collection, data processing, and
data tabulation. It also presents data quality control from the preparatory stage to conducting
the survey and data dissemination.
2.1 Questionnaire
The design of the questionnaire was based on the experiences of similar countries, as well as
on international standards and recommendations for the most important indicators, taking into
account the special situation of the Palestinian Territory.
2.2 Sample Frame
The sampling frame consists of all enumeration areas defined in the Population, Housing and
Establishment Census 2007. Each enumeration area consists of buildings and housing units
comprising an average of 124 households. These enumeration areas are used as primary
sampling units (PSUs) in the first stage of the sampling selection.
Sample Size:
The estimated sample size is 7,820 households in the West Bank and Gaza Strip.
Target Population:
This consists of all Palestinian households who normally reside in the Palestinian Territory
(West Bank and Gaza Strip) during 2031.
Sampling Design:
The sample for this survey is the same as that of the Labour Force Survey (LFS), which has
been conducted quarterly by PCBS since 1995. The Domestic and Outbound Tourism survey
is attached with the LFS in the first quarter of 2011.
The sample is a stratified cluster sample with two stages. In the first stage, we selected a
systematic random sample of 502 enumeration areas for the whole round. In the second stage,
we selected a random area sample of 16 households on average from each enumeration area
selected in the first stage.
Sample Strata:
The population was divided by:
1- Governorate (16 governorates)
2- Type of Locality (urban, rural, refugee camp)
Weight Calculation of Households:
The weight of statistical units (sampling unit) in the sample is defined as the mathematical
inverse of the selection probability where the sample of the survey is a two-stage stratified
cluster sample. In the first stage, we calculate the weight of enumeration areas depending on
the probability of each enumeration area (a systematic random sample). In the second stage,
we calculate the weight of households in each enumeration area: initial household weights
resulted from the product of weight of the first stage and weight of the second stage. Final
PCBS: Domestic and Outbound Tourism Survey, 2010
3:
household weights were obtained after adjustment of initial weights with the household
estimates mid-2011 on the level of design strata (governorate, locality type).
2.3 Fieldwork
1. Training Fieldworkers:
Fieldworkers were trained in basic skills prior to the start of data collection. The interviewers
were trained in the Domestic and Outbound Tourism Survey during a training course in
Ramallah for West Bank trainees and in Gaza for Gaza Strip trainees. The training provided
the interviewers with the aims and definitions of the different indicators and terminology in
the survey and gave them instructions on how to fill in the questionnaire.
2. Data Collection: Fieldwork started on 3
rd January 2011 and lasted until 15 April 2011. Fieldwork teams were
distributed to all districts according to the sample size of each governorate. The fieldwork
team consisted of 24 members, including one fieldwork coordinator, 4 supervisors, 4 editors,
and 15 interviewers.
During fieldwork, 7,820 households were visited in the Palestinian Territory. The results of
the interviews were as follows:
Complete questionnaires 7,124
Incomplete questionnaires 696
2.4 Data Processing
The data processing stage consisted of the following steps:
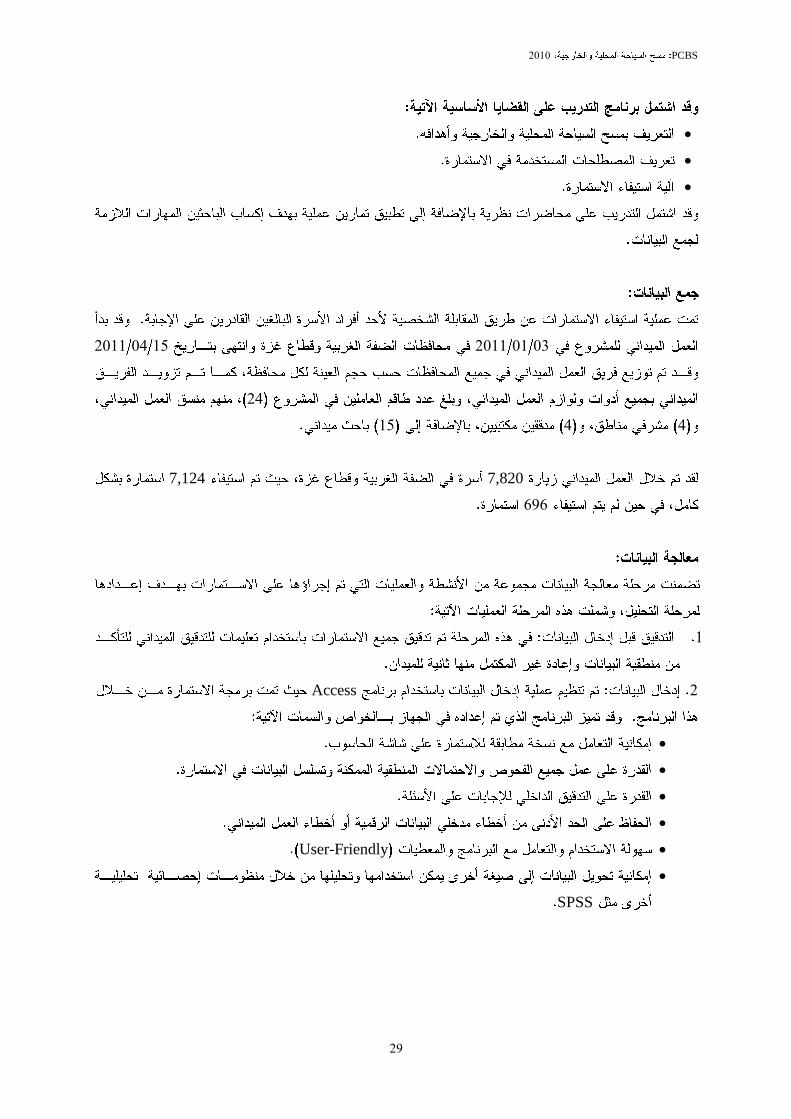
1. Editing and coding before data entry: All questionnaires were edited and coded in the
office using the same instructions adopted for editing in the field.
2. Data entry: At this stage, data was entered into the computer using a data entry template
designed in Access. The data entry program was created to satisfy a number of
requirements such as:
Duplication of the questionnaires on the computer screen.
Check on the logic and consistency of data entered.
Possibility for internal editing of replies to questions.
Maintaining a minimum of digital data entry and fieldwork errors.
User friendly handling.
Possibility of transferring data into another format to be used and analyzed using other
statistical analysis systems, such as SPSS.
2.5 Data Quality
The concept of data quality covers many aspects, starting from the initial planning of the
survey to the dissemination of the results and how well users understand and use the data.
There are seven dimensions of statistical quality: relevance, accuracy, timeliness,
accessibility, comparability, coherence, and completeness.
PCBS: Domestic and Outbound Tourism Survey, 2010
3;
2.5.1 Data Accuracy
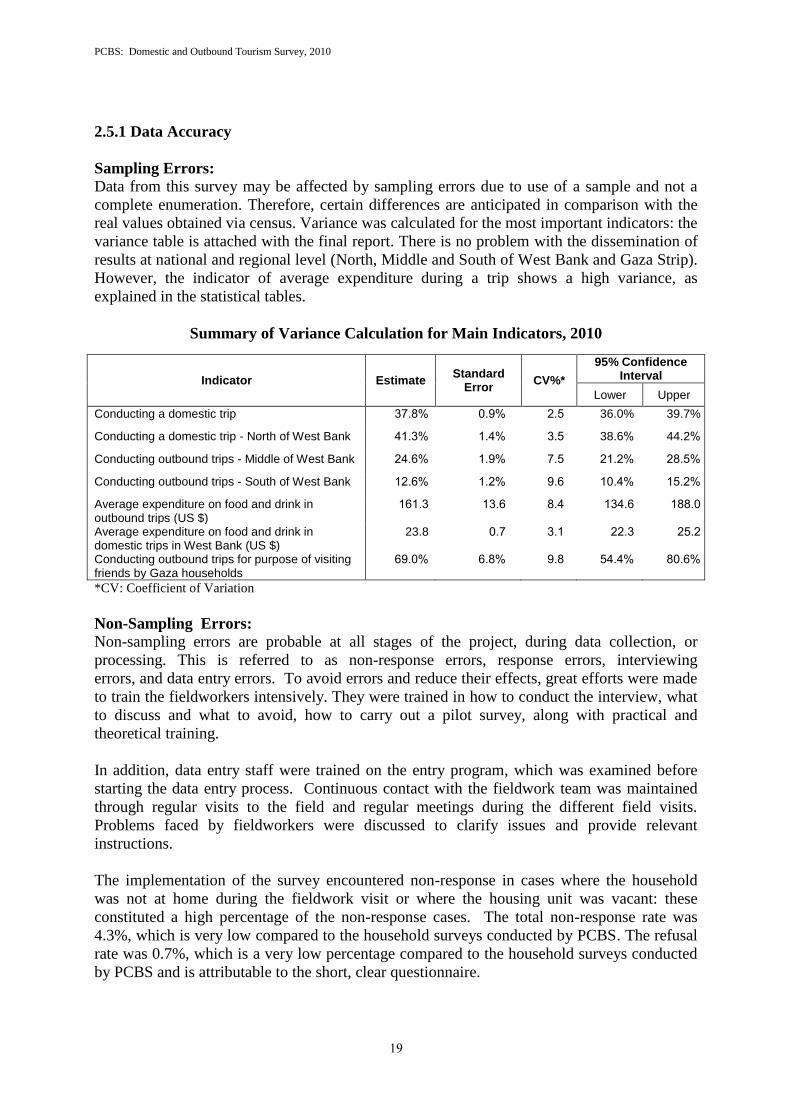
Sampling Errors:
Data from this survey may be affected by sampling errors due to use of a sample and not a
complete enumeration. Therefore, certain differences are anticipated in comparison with the
real values obtained via census. Variance was calculated for the most important indicators: the
variance table is attached with the final report. There is no problem with the dissemination of
results at national and regional level (North, Middle and South of West Bank and Gaza Strip).
However, the indicator of average expenditure during a trip shows a high variance, as
explained in the statistical tables.
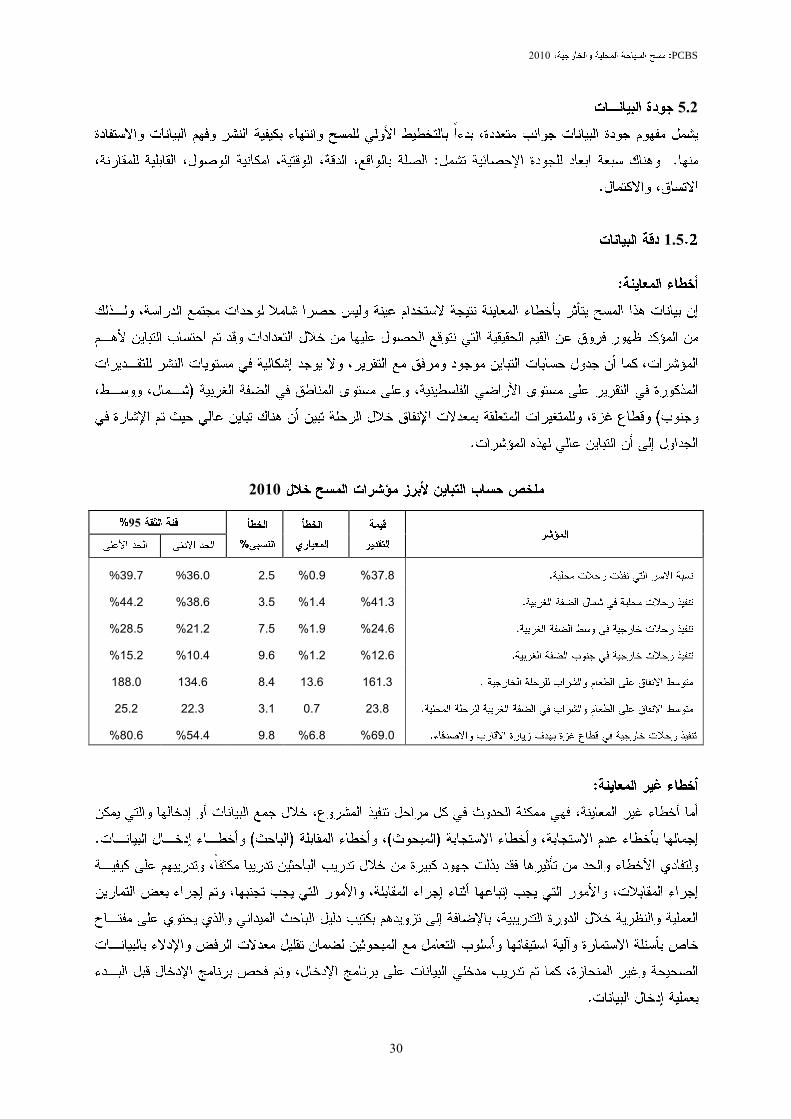
Summary of Variance Calculation for Main Indicators, 2010
Indicator Estimate Standard
Error CV%*
95% Confidence Interval
Lower Upper
Conducting a domestic trip %..32 %033 632 36.0% 39.7%
Conducting a domestic trip - North of West Bank %293. %932 .32 %38.6 %44.2
Conducting outbound trips - Middle of West Bank %6232 %933 .32 %6936 %6232
Conducting outbound trips - South of West Bank %9632 %936 332 %9032 %9236
Average expenditure on food and drink in outbound trips (US $)
9293. 9.32 232 9.232 92230
Average expenditure on food and drink in domestic trips in West Bank (US $)
23.8 03. .39 663. 6236
Conducting outbound trips for purpose of visiting friends by Gaza households
%2330 %232 332 %2232 %2032
*CV: Coefficient of Variation
Non-Sampling Errors:
Non-sampling errors are probable at all stages of the project, during data collection, or
processing. This is referred to as non-response errors, response errors, interviewing
errors, and data entry errors. To avoid errors and reduce their effects, great efforts were made
to train the fieldworkers intensively. They were trained in how to conduct the interview, what
to discuss and what to avoid, how to carry out a pilot survey, along with practical and
theoretical training.
In addition, data entry staff were trained on the entry program, which was examined before
starting the data entry process. Continuous contact with the fieldwork team was maintained
through regular visits to the field and regular meetings during the different field visits.
Problems faced by fieldworkers were discussed to clarify issues and provide relevant
instructions.
The implementation of the survey encountered non-response in cases where the household
was not at home during the fieldwork visit or where the housing unit was vacant: these
constituted a high percentage of the non-response cases. The total non-response rate was
4.3%, which is very low compared to the household surveys conducted by PCBS. The refusal
rate was 0.7%, which is a very low percentage compared to the household surveys conducted
by PCBS and is attributable to the short, clear questionnaire.
PCBS: Domestic and Outbound Tourism Survey, 2010
42
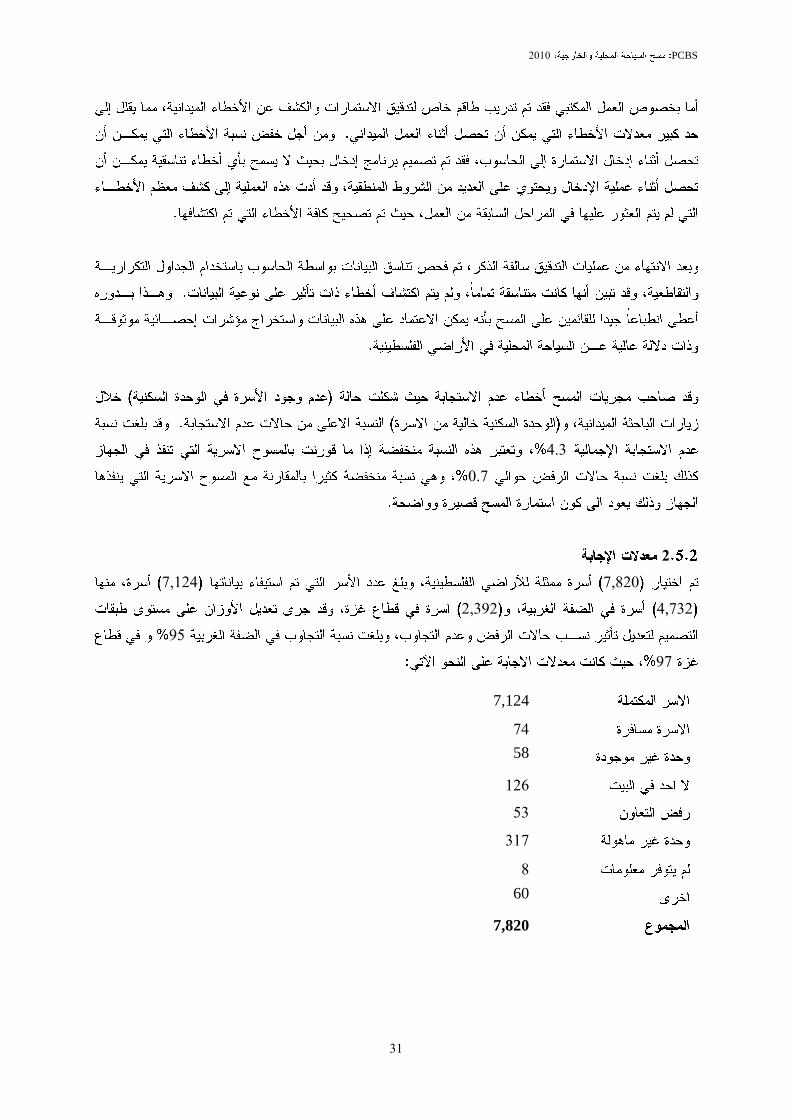
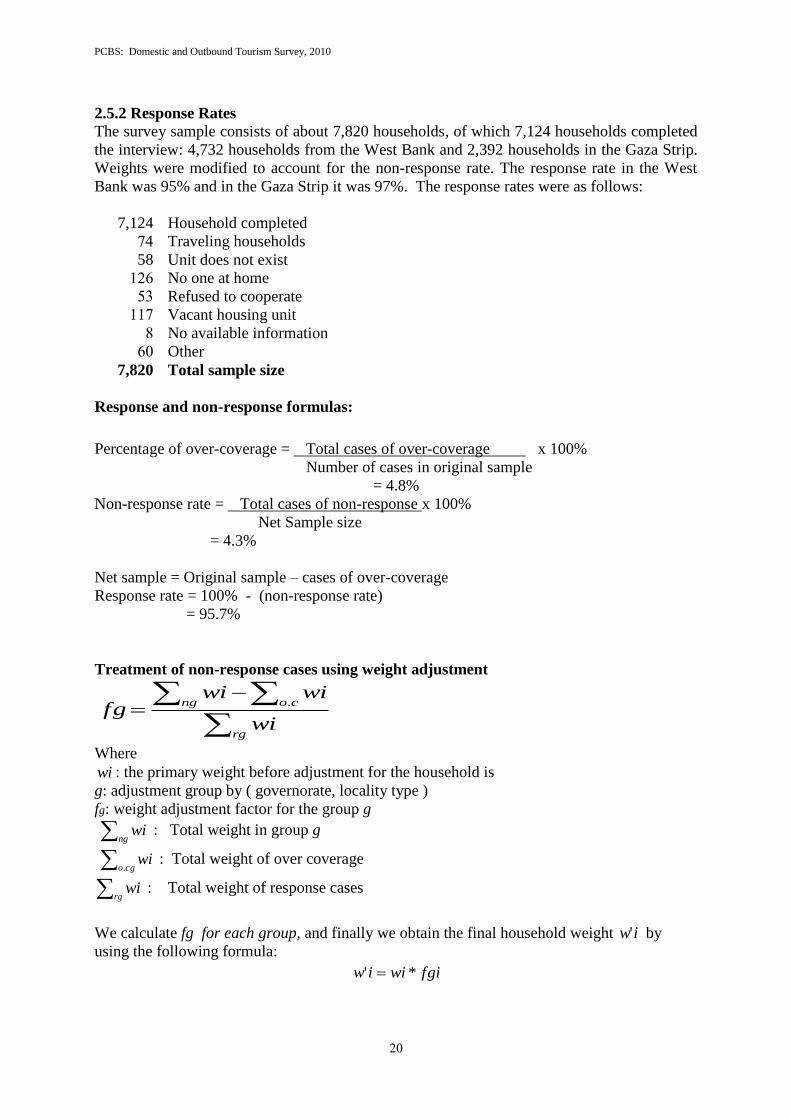
2.5.2 Response Rates
The survey sample consists of about 7,820 households, of which 7,124 households completed
the interview: 4,732 households from the West Bank and 2,392 households in the Gaza Strip.
Weights were modified to account for the non-response rate. The response rate in the West
Bank was 95% and in the Gaza Strip it was 97%. The response rates were as follows:
Household completed 7,124
Traveling households 96
Unit does not exist 58
No one at home 348
Refused to cooperate 75
Vacant housing unit 339
No available information :
Other 82
Total sample size 7,820
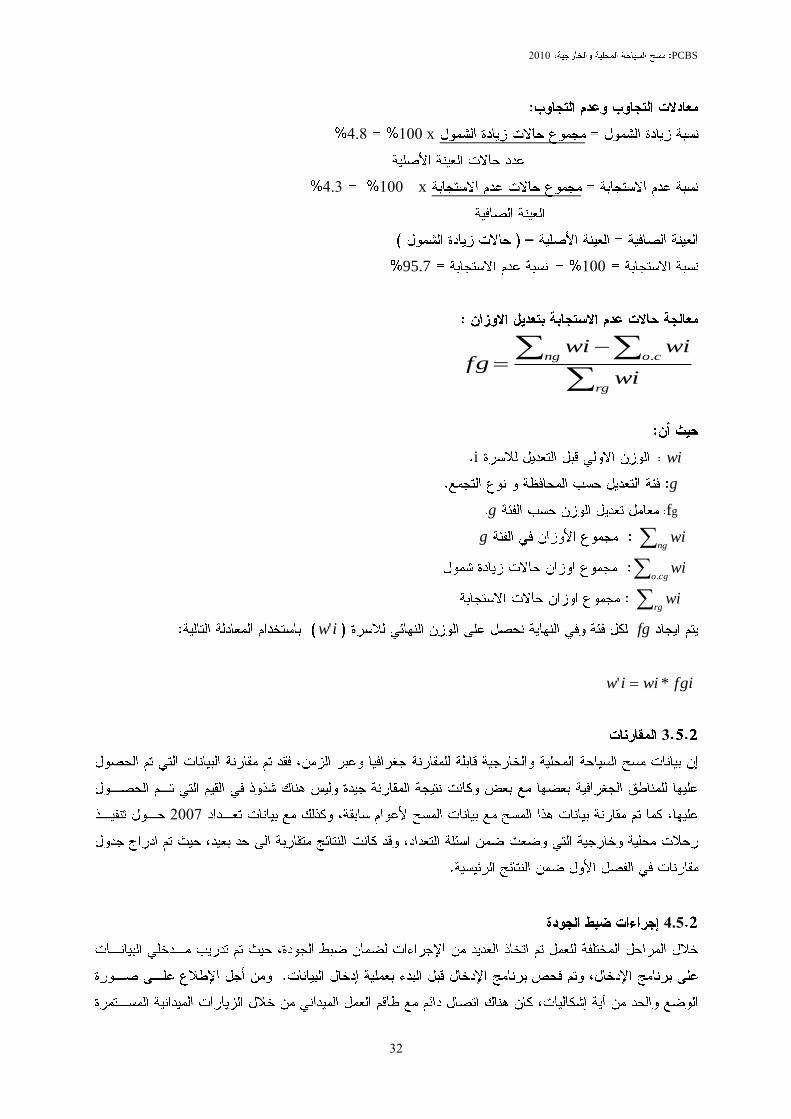
Response and non-response formulas:
x 100% coverage -Total cases of over coverage = -Percentage of over
Number of cases in original sample
= 4.8%
x 100%response -Total cases of non response rate = -Non
Net Sample size
= 4.3%
Net sample = Original sample – cases of over-coverage
Response rate = 100% - (non-response rate)
= 95.7%
Treatment of non-response cases using weight adjustment
rg
ng co
wi
wiwifg
.
Where
wi : the primary weight before adjustment for the household is
g: adjustment group by ( governorate, locality type )
fg: weight adjustment factor for the group g
ngwi : Total weight in group g
cgowi
. : Total weight of over coverage
: Total weight of response casesrgwi
We calculate fg for each group, and finally we obtain the final household weight iw' by
using the following formula:
fgiwiiw *'
PCBS: Domestic and Outbound Tourism Survey, 2010
43
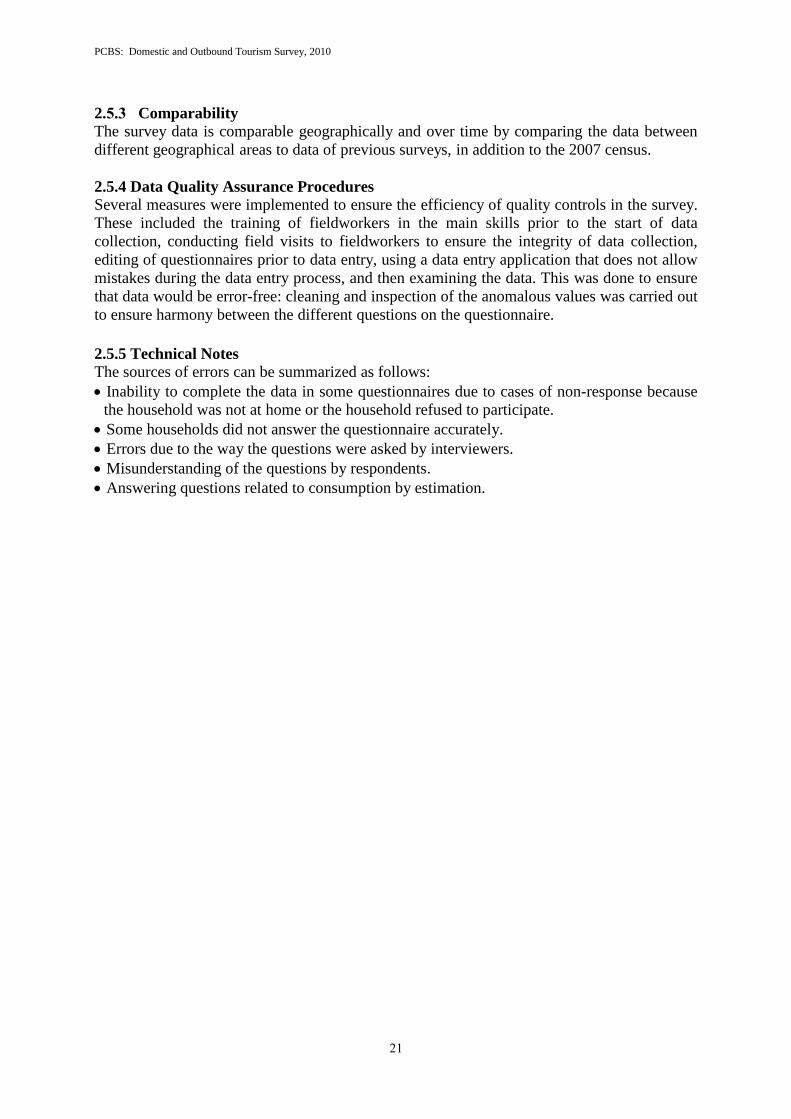
2.5.3 Comparability
The survey data is comparable geographically and over time by comparing the data between
different geographical areas to data of previous surveys, in addition to the 2007 census.
2.5.4 Data Quality Assurance Procedures
Several measures were implemented to ensure the efficiency of quality controls in the survey.
These included the training of fieldworkers in the main skills prior to the start of data
collection, conducting field visits to fieldworkers to ensure the integrity of data collection,
editing of questionnaires prior to data entry, using a data entry application that does not allow
mistakes during the data entry process, and then examining the data. This was done to ensure
that data would be error-free: cleaning and inspection of the anomalous values was carried out
to ensure harmony between the different questions on the questionnaire.
2.5.5 Technical Notes
The sources of errors can be summarized as follows:
Inability to complete the data in some questionnaires due to cases of non-response because
the household was not at home or the household refused to participate.
Some households did not answer the questionnaire accurately.
Errors due to the way the questions were asked by interviewers.
Misunderstanding of the questions by respondents.
Answering questions related to consumption by estimation.

PCBS: Domestic and Outbound Tourism Survey, 2010
44
PCBS: Domestic and Outbound Tourism Survey, 2010
45
Chapter Three
Concepts and Definitions
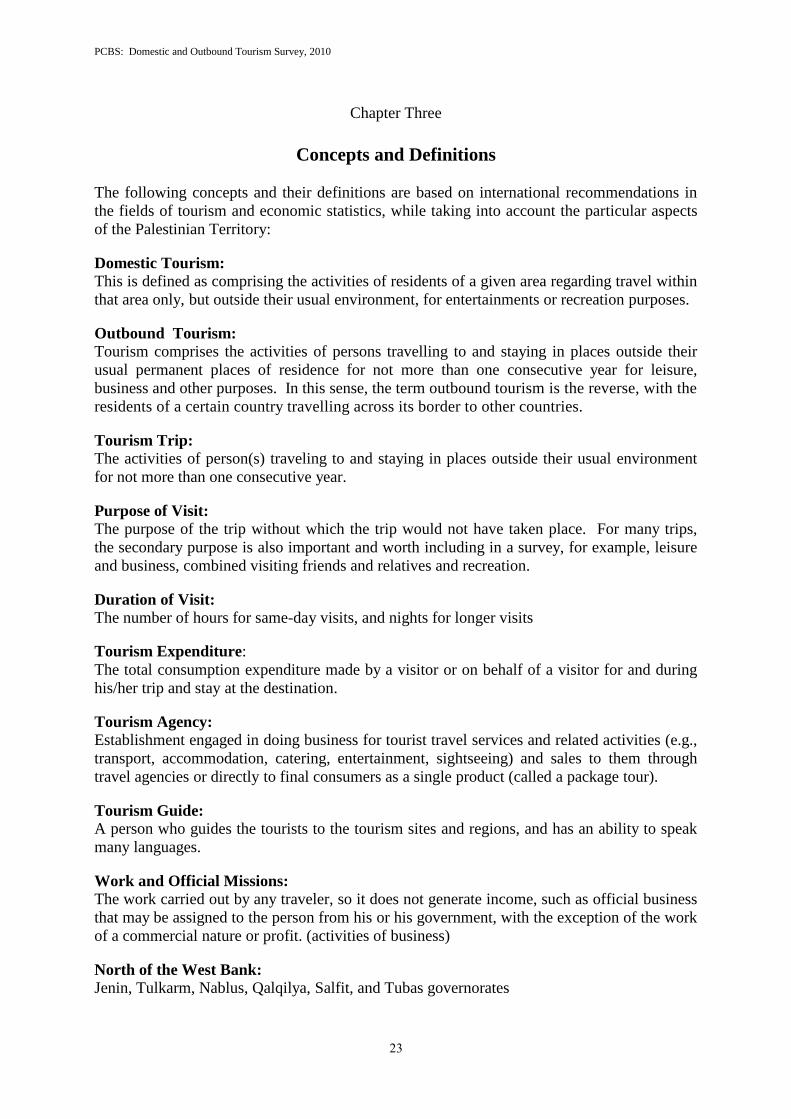
The following concepts and their definitions are based on international recommendations in
the fields of tourism and economic statistics, while taking into account the particular aspects
of the Palestinian Territory:
Domestic Tourism:
This is defined as comprising the activities of residents of a given area regarding travel within
that area only, but outside their usual environment, for entertainments or recreation purposes.
Outbound Tourism:
Tourism comprises the activities of persons travelling to and staying in places outside their
usual permanent places of residence for not more than one consecutive year for leisure,
business and other purposes. In this sense, the term outbound tourism is the reverse, with the
residents of a certain country travelling across its border to other countries.
Tourism Trip:
The activities of person(s) traveling to and staying in places outside their usual environment
for not more than one consecutive year.
Purpose of Visit:
The purpose of the trip without which the trip would not have taken place. For many trips,
the secondary purpose is also important and worth including in a survey, for example, leisure
and business, combined visiting friends and relatives and recreation.
Duration of Visit:
The number of hours for same-day visits, and nights for longer visits
Tourism Expenditure:
The total consumption expenditure made by a visitor or on behalf of a visitor for and during
his/her trip and stay at the destination.
Tourism Agency:
Establishment engaged in doing business for tourist travel services and related activities (e.g.,
transport, accommodation, catering, entertainment, sightseeing) and sales to them through
travel agencies or directly to final consumers as a single product (called a package tour).
Tourism Guide:
A person who guides the tourists to the tourism sites and regions, and has an ability to speak
many languages.
Work and Official Missions:
The work carried out by any traveler, so it does not generate income, such as official business
that may be assigned to the person from his or his government, with the exception of the work
of a commercial nature or profit. (activities of business)
North of the West Bank:
Jenin, Tulkarm, Nablus, Qalqilya, Salfit, and Tubas governorates

PCBS: Domestic and Outbound Tourism Survey, 2010
46
Middle of the West Bank:
Ramallah and Al-Bireh, Jericho and Al-Aghwar, and Jerusalem governorates
South of the West Bank:
Bethlehem and Hebron governorates
Gaza Strip:
North Gaza, Gaza, Deir El-Balah, Khan Yunis and Rafah governorates
PCBS: Domestic and Outbound Tourism Survey, 2010
47
References
1. United Nations, 1994. Recommendations on Tourism Statistics. New York.
2. World Tourism Organization 1999. Tourism Satellite Account (TSA), The Conceptual
Framework. Madrid - Spain.
3. Palestinian Central Bureau of Statistics, 1999. Domestic Tourism Survey 1998, Main
Results. Ramallah- Palestine
4. Palestinian Central Bureau of Statistics, 2005. Outbound Tourism Survey 2004, Main
Results. Ramallah- Palestine
5. Palestinian Central Bureau of Statistics, 2006. Domestic Tourism Survey 2005, Main
Results. Ramallah- Palestine
6. Palestinian Central Bureau of Statistics, 2007. Domestic Tourism Survey 2006, Main
Results. Ramallah- Palestine.
7. Palestinian Central Bureau of Statistics, 2009. Domestic Tourism Survey 2008, Main
Results. Ramallah- Palestine.
8. Palestinian Central Bureau of Statistics, 2010. Domestic Tourism Survey 2009, Main
Results. Ramallah- Palestine.
Top Related