


Sprachen
Seiten
Rechtliche

Mitochondria and Disease: Mutation and expression landscape of mitochondria-associated
genes in different disease types
Dissertation der Fakultät für Biologie der Ludwigs-Maximilians-
Universität München
zur Erlangung des Doktorgrades der
Naturwissenschaften Dr. rer. nat.
durchgeführt im
Max-Planck-Institut für Biochemie
Martinsried
vorgelegt von
Prasanna S Koti
aus Indien
München, September 2015

ii
iii
Erstgutachter: Prof. Dr. Barbara Conradt
Zweitgutachter: Prof. Dr. John Parsch
Tag der Einreichung: 24. 10. 2016 Tag der mündlichen Prüfung: 18. 10. 2016

iv
v
Curriculum vitae
Prasanna S Koti
0091 80 23636825 (Land line phone) [email protected]
COMPUTER SKILLS
Languages
· Perl, python, JavaScript, php, HTML, R, MySQL, Linux
Software
· FastQ toolkit, GATK software, Integrated genome viewer, Microsoft office suite
EXPERIENCE
April 2010 -
June 2010
Research Assistant, Max Planck Institute for Plant Breeding
Research, Germany
· Analysis of biologically significant sequence motifs in Colletotrichum higginsianumgenome
December
2009 - April
2010
Member of Blumeria genome sequencing consortium, Max Planck
Institute for Plant Breeding Research, Germany
· Computational prediction and annotation of function regions in the genome.
EDUCATION
January 2011 - Current
PhD (Computational Biology), Ludwig Maximilian University of Munich and Max Planck Institute of Biochemistry, Germany
October 2007 - March 2010
Master of Science in Life Science informatics, Bonn Aachen International center for Information technology, Bonn University, Germany
vi
PUBLICATIONS
Villaveces JM, Koti P, Habermann BH. Tools for visualization and analysis of molecularnetworks, pathways, and -omics data. Adv Appl Bioinform Chem. 2015;8:11-22
Spanu PD et al. (2010) Genome expansion and gene loss in powdery mildew fungi revealtradeoffs in extreme parasitism. Science 330: 1543 - 1546.
vii
Eidesstattliche Erklärung
Ich, Prasanna. S. Koti versichere hiermit an Eides statt, dass die vorgelegte
Dissertation von mir selbständig und ohne unerlaubte Hilfe angefertigt ist.
Erklärung
Hiermit erkläre ich, dass die Dissertation nicht ganz oder in wesentlichen
Teilen einer anderen Prüfungskommission vorgelegt worden ist und dass ich
mich anderweitig einer Doktorprüfung ohne Erfolg nicht unterzogen habe.
München, den 17. 09. 2015 ........................................................................................
(Prasanna. S. Koti)

viii
ix
ABSTRACT
Mitochondria are indispensable organelles of eukaryotic cells, takes part in the
efficient generation of energy required for the cellular activities. They also converge
to accomplish various functions such as intrinsic apoptotic pathway, fatty acid beta
oxidation, cellular balance of reactive oxygen species (ROS), iron sulphur cluster
biogenesis and so-forth which are necessary for the viability of the cell.
Ominous diseases may arise of incompetent mitochondrial function activity, for
example, cardiomyopathy, optic atrophy and diabetes mellitus. Mitochondrial
disorders may emerge as a result of mutations not only in the mitochondria DNA
(mtDNA) but also in the nuclear DNA (nDNA) encoding proteins, which forms part
of the mitochondrial proteome.
The advent of next generation sequencing (NGS) data has hugely accelerated the
generation of millions of DNA sequences and opened up avenues to study diseases
at a rapid pace. NGS enables transcriptome sequencing of both the normal and the
disease samples realised by the RNA sequencing (RNA-seq) technology. This
facilitate the measure of the gene expression in the diseases compared to their
normal samples, in addition to the capture of disease specific mutations. In this
thesis, workflows to extract mutation and expression data from the RNAseq samples
using well developed bioinformatics tools have been achieved.
Mitochondria encompassing crucial cellular functions are fulfilled by protein coding
genes encoded by both mtDNA and nDNA. In this thesis, an overall model termed as
mitochondrial model (MitoModel) is developed, which at present includes 17
mitochondria specific processes with 659 genes further grouped into functional
clusters. The MitoModel forms a network model with genes connected not only
within a single function but also across functions. It is an interactive model with an
x
option to map mutation and expression data and further the MitoModel provide
users several information including enrichment analysis of most affected
mitochondrial function and a downloadable variants file.
The usage of MitoModel has proved the efficiency of the approach to understand the
behaviour of the mitochondria from the RNA-seq data in HCT116 5/4, RPE1 5/3
12/3 and RPE1H2B 21/3 aneuploidy cell lines generated by collaborators. It also
throws light on the differences in the mitochondrial metabolism and physiology in
the extreme stress reactivity mice from the expression data. Finally, MitoModel was
successfully used to emphasize on the representative mitochondrial genes that were
consistently affected in the RNA-seq data of 16 samples of primary colorectal cancer
and corresponding liver metastases samples.
xi
CONTENTS
LIST OF TABLES…………………………………………………………………………….. xv
LIST OF FIGURES…………………………………………………………………………… xxiii
1 Introduction
1.1.1 Anatomy of mitochondria………………………………………………………………... 1
1.1.2 Mitochondrial genome…………………………………………………………………….. 2
1.1.3 Mitochondria and nuclear genome interaction…………………………………. 3
1.1.4 Homoplasmy and heteroplasmy………………………………………………………. 3
1.1.5 Mitochondria and diseases………………………………………………………………. 4
1.1.6 Mitochondria in cancer and aneuploidy…………………………………………… 5
1.1.7 Mitochondria in major depression…………………………………………………… 6
1.1.8 Goals of the thesis…………………………………………………………………………… 7
1.1.9 Outline of this thesis………………………………………………………………………… 8
1.2 Mitochondria and their functions
1.2.1 Mitochondria associated functions…………………………………………………… 11
1.2.1.1 Electron transport chain…………………………………………… 12
1.2.1.2 Glycolysis…………………………………………………………………. 12
1.2.1.3 Pyruvate transfer……………………………………………………… 13
1.2.1.4 Formation of Acetyl CoA…………………………………………… 13
1.2.1.5 Tricarboxylic acid cycle…………………………………………….. 13
1.2.1.6 Beta oxidation of fatty acids………………………………………. 14
1.2.1.7 ROS defence……………………………………………………………… 14
1.2.1.8 Apoptosis…………………………………………………………………. 15
1.2.1.9 Import and sorting……………………………………………………. 15
1.2.1.10 Mitochondrial dynamics……………………………………………. 16
1.2.1.11 Iron sulphur cluster biosynthesis………………………………. 17
1.2.1.12 Replication and transcription……………………………………. 18
xii
1.2.1.13 Translation………………………………………………………………. 18
1.2.1.14 Calcium transport………………………………………………………. 19
1.2.1.15 Heme biosynthesis……………………………………………………. 19
1.2.1.16 Cardiolipin biosynthesis……………………………………………. 20
1.2.1.17 Urea cycle………………………………………………………………… 20
2 Methods and Implementation
2.1 RNA-sequencing…………………………………………………………………………….. 23
2.2 Illumina sequencing……………………………………………………………………….. 24
2.3 Base call accuracy…………………………………………………………………………... 24
2.4 Trim Galore……………………………………………………………………………………. 25
2.5 Alignment………………………………………………………………………………………. 25
2.6 Mapping quality……………………………………………………………………………… 28
2.7 Picard tools…………………………………………………………………………………….. 28
2.8 The genome analysis toolkit…………………………………………………………….. 29
2.9 SNPiR filtration……………………………………………………………………………….. 32
2.10 Oncotator……………………………………………………………………………………….. 32
2.11 Mitowheel………………………………………………………………………………………. 32
2.12 Cufflinks package……………………………………………………………………………. 32
2.13 Variant discovery workflow…………………………………………………………….. 33
2.14 Mitochondrial model……………………………………………………………………….. 40
3 Results
3.1 Gene expression and mutation analysis using MitoModel in three different
aneuploidy cell lines
3.1.1 Task description…………………………………………………………………… 52
3.1.2 Data analysis………………………………………………………………………… 52
3.1.3 MitoModel of the HCT116 5/4 cell line ………...………………………… 52
3.1.3.1 Summary for HCT116 5/4 MitoModel…………………………. 72
3.1.4 MitoModel of the RPE1 5/3 12/3 cell line….…………………………….. 72
3.1.4.1 Summary for RPE1 5/3 12/3 MitoModel……………………… 90
xiii
3.1.5 MitoModel of the RPE1H2B 21/3 cell line ……………………………… 91
3.1.5.1 Summary for RPE1H2B 21/3 MitoModel…………………….. 100
3.1.6 Comparison between HCT116 5/4, RPE1 5/3 12/3 and
RPE1H2B 21/3 MitoModels…………………………………………………… 101
3.2 Analysis of expression difference between LR and HR stress reactivity mice:
impact of mitochondrial function
3.2.1 Data analysis………………………………………………………………………… 104
3.2.2 LR vs. HR MitoModel……………………………………………………………... 104
3.3 Representative MitoModel in 16 samples of primary colorectal cancer and
liver metastases
3.3.1 Task description……………………………………………………………………. 130
3.3.2 Data analysis…………………………………………………………………………. 130
3.3.3 Clustering analysis……………………………………………………………… … 130
3.3.4 Representative MitoModels……………………………………………………. 131
3.3.5 Characterizing representative genes………………………………………. 132
4 Discussion………………………………………………………………………………. 145
5 Conclusion and future perspectives
5.1 Conclusion…………………………………………………………………………….. 153
5.2 Future perspective………………………………………………………………… 154
Appendix A Bibliography…………………………………………………………………. 157
Appendix B Acknowledgements………………..……………………………………… 171
Appendix C Mitochondria associated genes, functions and their
references………………………............................................................ 173

xiv
xv
LIST OF TABLES
Table 1: An example of expression input file…………………......................................................... 51
Table 2: An example of mutation input file………………................................................................ 51
Table 3: An example of MitoModel variant output file…………………………………………….. 50
Table 4: Up-regulated genes in the electron transport chain of HCT116 5/4
cell line…………………………………………………………………………………………………………………. 55
Table 5: Down-regulated genes in the electron transport chain of HCT116 5/4
cell line………………………………………...……………………………………………………………………….. 56
Table 6: Mutated genes in the electron transport chain of the HCT116 5/4 cell line… 56
Table 7: Up-regulated genes in fatty acid beta-oxidation of HCT116 5/4 cell line…….. 57
Table 8: Down-regulated genes in the fatty acid beta-oxidation of HCT116 5/4 cell
line……………………………………………………………………………………………………………………….. 57
Table 9: Up-regulated genes in the apoptosis of HCT116 5/4 cell line……………………... 58
Table 10: Down-regulated genes in the apoptosis of HCT116 5/4 cell line………………. 58
Table 11: Mutated genes in the apoptosis of the HCT116 5/4 cell line…………………….. 59
Table 12: Up-regulated genes in the heme biosynthesis of HCT116 5/4 cell line……… 59
Table 13: Down-regulated genes in the heme biosynthesis of HCT116 5/4 cell line…. 60
Table 14: Up-regulated genes in the glycolysis of HCT116 5/4 cell line…………………… 60
Table 15: Down-regulated genes in the glycolysis of HCT116 5/4 cell line………………. 61
Table 16: Up-regulated genes in the TCA cycle of HCT116 5/4 cell line…………………… 61
Table 17: Up-regulated genes in the pyruvate transfer of HCT116 5/4 cell line……….. 62
Table 18: Up-regulated genes in the Fe-S cluster biosynthesis of HCT116 5/4
cell line…………………………………………………………………………………………………………………..62
Table 19: Down-regulated genes in the Fe-S cluster biosynthesis of HCT116 5/4
cell line…………………………………………………………………………………………………………………. 62
Table 20: Up-regulated genes in the mitochondrial dynamics of the HCT116 5/4 cell
line……………………………………………………………………………………………………………………….. 63
Table 21: Down-regulated genes in the mitochondrial dynamics of the HCT116 5/4
xvi
cell line…………………………………………………………………………………………………………………. 64
Table 22: Mutated genes in the mitochondrial dynamics of HCT116 5/4 cell line……. 64
Table 23: Up-regulated genes in the import and sorting of HCT116 5/4 cell line……... 64
Table 24: Down-regulated genes in the import and sorting of HCT116 5/4 cell line… 65
Table 25: Mutated genes in the import and sorting of the HCT116 5/4 cell line………. 65
Table 26: Up-regulated genes in the replication and transcription of the HCT116 5/4
cell line…………………………………………………………………………………………………………………. 66
Table 27: Down-regulated genes in the replication and transcription of the
HCT116 5/4 cell line……………………………………………………………………………………………… 67
Table 28: Mutated genes in the replication and transcription of the
HCT116 5/4 cell line……………………………………………………………………………………………… 67
Table 29: Up-regulated genes in the translation of HCT116 5/4 cell line………………….68
Table 30: Down-regulated genes in the translation of HCT116 5/4 cell line……………. 69
Table 31: Mutated genes in the translation of HCT116 5/4 cell line………………………… 69
Table 32: Up-regulated genes in the calcium transport of the HCT116 5/4 cell line… 70
Table 33: Down-regulated genes in the calcium transport of the HCT116 5/4
cell line…………………………………………………………………………………………………………………. 70
Table 34: Down-regulated genes in the cardiolipin biosynthesis of the HCT116 5/4
cell line…………………………………………………………………………………………………………………. 70
Table 35: Up-regulated genes in the ROS defence of the HCT116 5/4 cell line…………..71
Table 36: Down-regulated genes in the ROS defence of the HCT116 5/4 cell line…….. 71
Table 37: Up-regulated genes in the electron transport chain of RPE1 5/3 12/3
cell line…………………………………………………………………………………………………………………. 76
Table 38: Down-regulated genes in the electron transport chain of RPE1 5/3 12/3
cell line…………………………………………………………………………………………………………………. 76
Table 39: Up-regulated genes in the fatty acid beta oxidation of RPE1 5/3 12/3
cell line………………………………………………………………………………………………………………… 77
Table 40: Down-regulated genes in the fatty acid beta oxidation of RPE1 5/3 12/3
cell line…………………………………………………………………………………………………………………. 77
Table 41: Up-regulated genes in the apoptosis of RPE1 5/3 12/3 cell line………………. 78
Table 42: Down-regulated genes in the apoptosis of RPE1 5/3 12/3 cell line………….. 78
xvii
Table 43: Up-regulated genes in the heme biosynthesis of RPE1 5/3 12/3
cell line…………………………………………………………………………………………………………………. 79
Table 44: Down-regulated genes in the heme biosynthesis of RPE1 5/3 12/3
cell line…………………………………………………………………………………………………………………. 79
Table 45: Up-regulated genes in the glycolysis of RPE1 5/3 12/3 cell line………………. 80
Table 46: Down-regulated genes in the glycolysis of RPE1 5/3 12/3 cell line………….. 80
Table 47: Up-regulated genes in the formation of Acetyl CoA function of
RPE1 5/3 12/3 cell line…………………………………………………………………………………………. 81
Table 48: Up-regulated genes in the TCA cycle of RPE1 5/3 12/3 cell line………………..81
Table 49: Down-regulated genes in the TCA cycle of RPE1 5/3 12/3 cell line………….. 81
Table 50: Up-regulated genes in the Fe-S cluster biosynthesis of RPE1 5/3 12/3
cell line…………………………………………………………………………………………………………………. 82
Table 51: Up-regulated genes in the mitochondrial dynamics of the RPE1 5/3 12/3
cell line…………………………………………………………………………………………………………………. 83
Table 52: Down-regulated genes in the mitochondrial dynamics of the
RPE1 5/3 12/3 cell line…………………………………………………………………………………………. 83
Table 53: Up-regulated genes in the import and sorting of the RPE1 5/3 12/3
cell line…………………………………………………………………………………………………………………84
Table 54: Down-regulated genes in the import and sorting of the RPE1 5/3 12/3
cell line…………………………………………………………………………………………………………………. 84
Table 55: Mutated gene in the import and sorting of the RPE1 5/3 12/3 cell line……. 84
Table 56: Up-regulated genes in the replication and transcription of the
RPE1 5/3 12/3 cell line…………………………………………………………………………………………..85
Table 57: Down-regulated genes in the replication and transcription of the
RPE1 5/3 12/3 cell line…………………………………………………………………………………………..85
Table 58: Up-regulated genes in the translation of the RPE1 5/3 12/3 cell line……….. 87
Table 59: Down-regulated genes in the translation of the RPE1 5/3 12/3 cell line…... 87
Table 60: Up-regulated genes in the calcium transport of the RPE1 5/3 12/3
cell line…………………………………………………………………………………………………………………..87
Table 61: Down-regulated genes in the calcium transport of the RPE1 5/3 12/3
cell line…………………………………………………………………………………………………………………. 88
xviii
Table 62: Up-regulated genes in the cardiolipin biosynthesis of the RPE1 5/3 12/3
cell line…………………………………………………………………………………………………………………. 88
Table 63: Up-regulated genes in the ROS defence of the RPE1 5/3 12/3 cell line…….. 89
Table 64: Down-regulated genes in the ROS defence of the RPE1 5/3 12/3 cell line….89
Table 65: Up-regulated genes in the electron transport chain of the RPE1H2B 21/3
cell line…………………………………………………………………………………………………………………. 93
Table 66: Down-regulated genes in the fatty acid beta oxidation function of the
RPE1H2B 21/3 cell line…………………………………………………………………………………………. 94
Table 67: Up-regulated genes in the apoptosis function of the RPE1H2B 21/3
cell line…………………………………………………………………………………………………………………. 94
Table 68: Down-regulated genes in the glycolysis function of the RPE1H2B 21/3
cell line…………………………………………………………………………………………………………………..95
Table 69: Up-regulated gene in the Fe-S cluster biosynthesis function of the
RPE1H2B 21/3 cell line…………………………………………………………………………………………. 95
Table 70: Down-regulated gene in the Fe-S cluster biosynthesis function of the
RPE1H2B 21/3 cell line…………………………………………………………………………………………. 96
Table 71: Up-regulated genes in the mitochondrial dynamics of the RPE1H2B 21/3
cell line…………………………………………………………………………………………………………………. 96
Table 72: Down-regulated genes in the mitochondrial dynamics of the
RPE1H2B 21/3 cell line…………………………………………………………………………………………. 97
Table 73: Down-regulated genes in the import and sorting function of the
RPE1H2B 21/3 cell line…………………………………………………………………………………………. 97
Table 74: Up-regulated genes in the replication and transcription function of the
RPE1H2B 21/3 cell line…………………………………………………………………………………………. 98
Table 75: Down-regulated genes in the replication and transcription of the
RPE1H2B 21/3 cell line…………………………………………………………………………………………. 98
Table 76: Up-regulated genes in the translation of the RPE1H2B 21/3 cell line……….. 99
Table 77: Down-regulated genes in the translation of the RPE1H2B 21/3 cell line……99
Table 78: Up-regulated genes in the ROS defence function of the RPE1H2B 21/3
cell line…………………………………………………………………………………………………………………. 99
Table 79: Down-regulated genes in the ROS defence function of the
xix
RPE1H2B 21/3 cell line…………………………………………………………………………………………. 100
Table 80: The top 5 up-regulated genes of the TCA cycle, in the LR vs. HR
Comparison……………………………………………………………………………………………………………108
Table 81: The top 5 down-regulated genes of the TCA cycle, in the LR vs. HR
Comparison…………………………………………………………………………………………………………... 108
Table 82: The top up-regulated genes of the cardiolipin biosynthesis, in the LR vs. HR
comparison…………………………………………………………………………………………………………… 109
Table 83: The top down-regulated genes of the cardiolipin biosynthesis, in the
LR vs. HR comparison……………………………………………………………………………………………. 109
Table 84: The top 5 up-regulated genes of the ETC, in the LR vs. HR comparison…….. 110
Table 85: The top 5 down-regulated genes of the ETC, in the LR vs. HR comparison….111
Table 86: The top 5 up-regulated genes of the mitochondrial dynamics, in the
LR vs. HR comparison……………………………………………………………………………………………. 112
Table 87: The top 5 down-regulated genes of the mitochondrial dynamics, in the
LR vs. HR comparison……………………………………………………………………………………………. 112
Table 88: The top 5 up-regulated genes of the glycolysis, in the LR vs. HR
comparison………………………………………………………………………………………………………….... 113
Table 89: The top 5 down-regulated genes of the glycolysis, in the LR vs. HR
comparison…………………………………………………………………………………………………………… 113
Table 90: The top 5 up-regulated genes of the ROS defence, in the LR vs. HR
comparison…………………………………………………………………………………………………………… 115
Table 91: The top 5 down-regulated genes of the ROS defense, in the LR vs. HR
comparison…………………………………………………………………………………………………………… 115
Table 92: The top up-regulated genes of the heme biosynthesis, in the LR vs. HR
comparison…………………………………………………………………………………………………………… 116
Table 93: The top down-regulated genes of the heme biosynthesis, in the LR vs. HR
comparison…………………………………………………………………………………………………………… 116
Table 94: The Top 5 up-regulated genes of the apoptosis, in the LR vs. HR
comparison…………………………………………………………………………………………………………… 117
Table 95: The top 5 down-regulated genes of the apoptosis, in the LR vs. HR
comparison……………………………………………………………………………………………………………117
xx
Table 96: The top down-regulated gene of the pyruvate transfer, in the LR vs. HR
comparison…………………………………………………………………………………………………………… 118
Table 97: The top up-regulated genes of the import and sorting, in the LR vs. HR
comparison…………………………………………………………………………………………………………….119
Table 98: The top 5 down-regulated genes of the import and sorting, in the LR vs. HR
comparison…………………………………………………………………………………………………………… 119
Table 99: Top 5 up-regulated genes of the Fe-S cluster biosynthesis, in the LR vs. HR
comparison…………………………………………………………………………………………………………… 120
Table 100: The top 5 down-regulated genes of the Fe-S cluster biosynthesis, in the
LR vs. HR comparison……………………………………………………………………………………………. 121
Table 101: The top 5 up-regulated genes of the replication and transcription, in the
LR vs. HR comparison……………………………………………………………………………………………. 122
Table 102: The top 5 down-regulated genes of the replication and transcription,
in the LR vs. HR comparison…………………………………………………………………………………... 122
Table 103: The up-regulated gene of the ‘formation of acetyl CoA’, in the
LR vs. HR comparison……………………………………………………………………………………………. 123
Table 104: The down-regulated gene of the ‘formation of acetyl CoA’, in the
LR vs. HR comparison……………………………………………………………………………………………. 123
Table 105: The top 5 up-regulated genes of the translation, in the
LR vs. HR comparison……………………………………………………………………………………………. 124
Table 106: Top 5 down-regulated genes of the translation, in the
LR vs. HR comparison……………………………………………………………………………………………. 124
Table 107: The top 5 up-regulated genes of the beta-oxidation of fatty acids, in the
LR vs. HR comparison……………………………………………………………………………………………. 125
Table 108: The top 5 down-regulated genes of the beta-oxidation of fatty acids,
in the LR vs. HR comparison…………………………………………………………………………………... 125
Table 109: The top up-regulated genes of the Calcium transport, in the
LR vs. HR comparison……………………………………………………………………………………………. 126
Table 110: The top down-regulated gene of the Calcium transport, in the
LR vs. HR comparison……………………………………………………………………………………………. 127
Table 111: The top down-regulated gene of the Urea cycle, in the
xxi
LR vs. HR comparison……………………………………………………………………………………………. 127
Table 112: Differentially expressed, representative genes observed in both
primary CRC and liver metastases of all the clusters in the
electron transport chain function……………………………………………………………………………132
Table 113: Representative genes with mutation sites observed in both the
primary CRC and the liver metastases of all the clusters in the
electron transport chain function…………………………………………………………………………… 133
Table 114: Differentially expressed, representative genes observed in both
primary CRC and liver metastases of all the clusters in the
beta oxidation of fatty acids function………………………………………………………………………135
Table 115: Representative genes with mutation sites observed in both the
primary CRC and the liver metastases of all the clusters in the
beta oxidation of fatty acids function……………………………………………………………………… 135
Table 116: Differentially expressed, representative genes observed in both
primary CRC and liver metastases of all the clusters in the glycolytic
function………………………………………………………………………………………………………………… 137
Table 117: Representative genes with mutation sites observed in both the
primary CRC and the liver metastases of all the clusters in the
glycolysis function…………………………………………………………………………………………………. 137
Table 118: Differentially expressed, representative genes observed in both
primary CRC and liver metastases of all the clusters in the Urea cycle function………... 138
Table 119: Representative genes with mutation sites observed in both the
primary CRC and the liver metastases of all the clusters in the
Urea cycle function………………………………………………………………………………………………... 138
Table 120: Differentially expressed, representative genes observed in
both primary CRC and liver metastases of all the clusters in the
mitochondrial dynamics function…………………………………………………………………………... 139
Table 121: Representative genes with mutation sites observed in
both the primary CRC and the liver metastases of all the clusters in the
mitochondrial dynamics function…………………………………………………………………………... 140
Table 122: Differentially expressed, representative genes observed in both
xxii
primary CRC and liver metastases of all the clusters in the apoptosis function………..... 140
Table 123: Representative genes with mutation sites observed in
both the primary CRC and the liver metastases of all the clusters in the
apoptosis function………………………………………………………………………………………………….141
Table 124: Differentially expressed, representative genes observed in
both primary CRC and liver metastases of all the clusters in the
replication and transcription function……………………………………………………………………..142
Table 125: Representative genes with mutation sites observed in both the
primary CRC and the liver metastases of all the clusters in the
replication and transcription function…………………………………………………………………….142
Table 126: Differentially expressed, representative genes observed in both
primary CRC and liver metastases of all the clusters in the ROS defence function……...143
Table 127: Representative genes with mutation sites observed in both the
primary CRC and the liver metastases of all the clusters in the ROS defence
function.………………………………………………………………………………………………………………... 143
xxiii
LIST OF FIGURES
Figure 1: Structure of mitochondria.................................................................................................. .. 2
Figure 2: The human mitochondrial genome……………................................................................ 3
Figure 3: Variant discovery workflow……………………………………………………………………. 34
Figure 4: Overview of variants analysis workflow depicting the levels of data
handling (input, manipulation and output)....................................................................................... 35
Figure 5: Visual representation of MitoModel with functions as clusters
annotated with their names..................................................................................................................... 42
Figure 6: A simple depiction of the interactive ability brandished by the
MitoModel........................................................................................................................................................ 44
Figure 7: An instance of Percentage (%) affected functions observed on
the MitoModel................................................................................................................................................. 45
Figure 8: Graphical visualization of overall expression changes in MitoModel............... 46
Figure 9: A further graphical representaiton of the MitoModel’s overall
expression pattern........................................................................................................................ .............. 49
Figure 10: An overview of the interaction architecture between user and
MitoModel server............................................................................................................. ............................. 47
Figure 11: Visual display of the HCT 116 5/4 MitoModel..................................................... 53
Figure 12: Percentage (%) of affected functions observed on the
HCT116 5/4 MitoModel............................................................................................................................. 54
Figure 13: Number of affected genes observed on all the functions of
HCT116 5/4 MitoModel.................................................................................................................................. 72
Figure 14: Visual display of the RPE1 5/3 12/3 MitoModel.................................................... 73
Figure 15: Percentage (%) of affected functions observed on the RPE1 5/3 12/3
MitoModel........................................................................................................................................................ 74
Figure 16: Number of affected genes observed on all the functions of RPE1H2B 21/3
MitoModel………………………………………………………………………………………………………. 90
Figure 17: A visual representation of the RPE1H2B 21/3 MitoModel……........................ 91
xxiv
Figure 18: Percentage (%) of affected functions observed on the
RPE1H2B 21/3 MitoModel…………………………………………………………………………………….. 92
Figure 19: Number of affected genes observed on all the functions of
RPE1H2B 21/3MitoModel..……………………………………………………………………………………. 101
Figure 20: Comparison of HCT116 5/4, RPE1 5/3 12/3 and RPE1H2B 21/3
MitoModels…………………………………………………………………………………………………………… 102
Figure 21: Visual representation of LR vs. HR mouse MitoModel with functions
as clusters annotated with their names ………………………………………………………………….. 105
Figure 22: Percentage (%) of affected functions observed on the mouse MitoModel... 106
Figure 23: Graphical display of model parameters, two horizontal lines describing
log2fold change cutoff values (up: 1.50 and down -1.50) and a vertical line
describing p-value cutoff (0.05).…………………………………………………………………………….. 107
Figure 24: Dendrogram showing 4 distinct clusters derived from 16 primary
CRC samples and liver metastases samples……………………………………………........................ 131
CHAPTER 1
Introduction
Mitochondria are ubiquitous organelles present in eukaryotic cells with the major
function of energy production in the form of ATP through oxidative
phosphorylation. Acquired several billion years ago by eubacterial invasion through
symbiosis, they have immensely impacted the metabolism and homeostasis of
eukaryotes [Dyall et al., 2004].
1.1.1 ANATOMY OF MITOCHONDRIA:
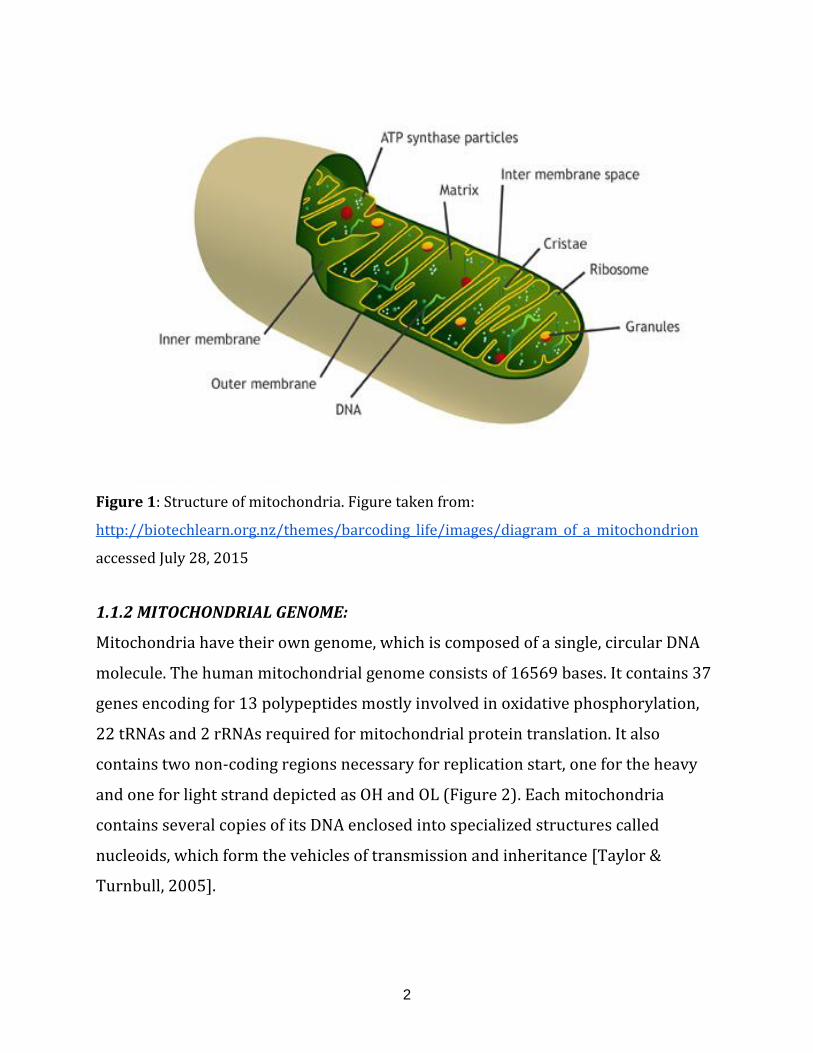
Anatomically mitochondria are enclosed by two membranes designated as outer
and inner mitochondrial membranes, which are separated by the so-called
intermembrane space (Figure 1). Both the membranes have specific functions. The
inner membrane houses the complete electron transport chain and ATP synthase
complex for the generation of energy. The outer membrane accommodates channels
and multi-protein translocase complexes which aid the import of molecules and
proteins into mitochondria, respectively. In the living cells, mitochondrial shape
varies and range from punctuate structures to tubular networks [Anesti & Scorrano,
2006].
The inner membrane forms several folds called cristae, which enclose the main
mitochondrial area, which is referred to as the mitochondrial matrix. This matrix
contains the mitochondrial DNA (mtDNA) and enzymes that take part in many
critical functions of the organelle (see for instance:
http://www.ncbi.nlm.nih.gov/books/NBK9896/ , accessed July 28, 2015).
2
Figure 1: Structure of mitochondria. Figure taken from:
http://biotechlearn.org.nz/themes/barcoding_life/images/diagram_of_a_mitochondrion
accessed July 28, 2015
1.1.2 MITOCHONDRIAL GENOME:
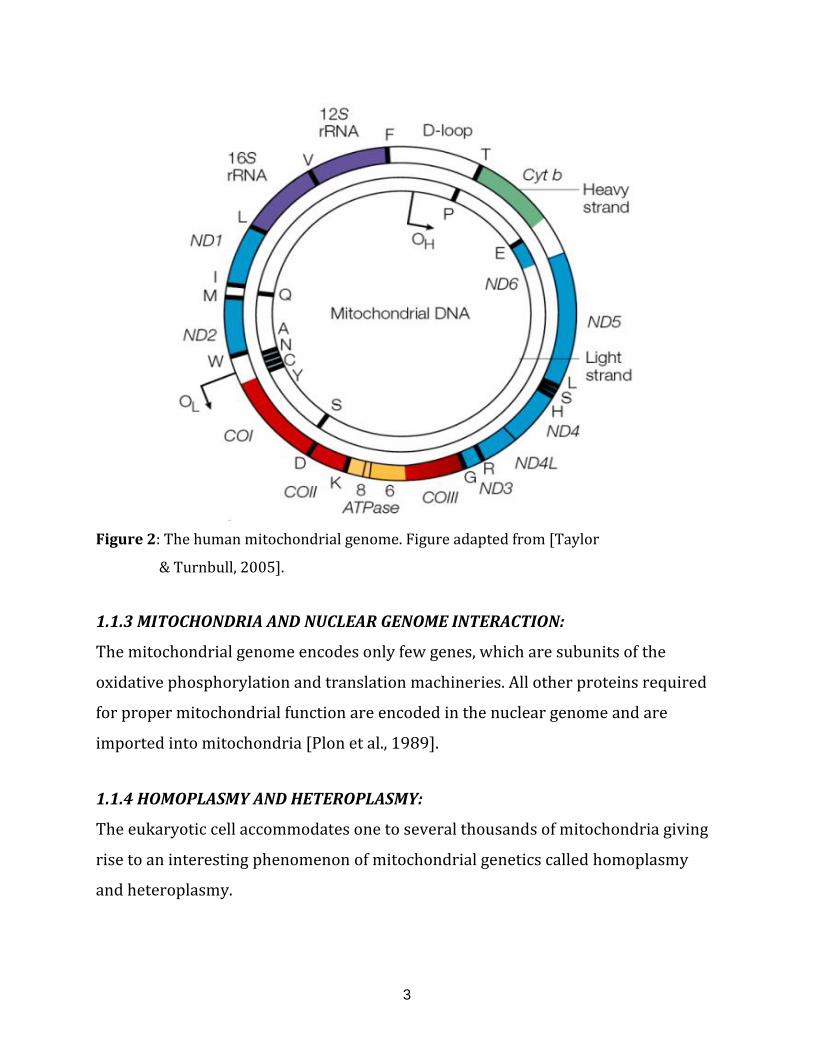
Mitochondria have their own genome, which is composed of a single, circular DNA
molecule. The human mitochondrial genome consists of 16569 bases. It contains 37
genes encoding for 13 polypeptides mostly involved in oxidative phosphorylation,
22 tRNAs and 2 rRNAs required for mitochondrial protein translation. It also
contains two non-coding regions necessary for replication start, one for the heavy
and one for light strand depicted as OH and OL (Figure 2). Each mitochondria
contains several copies of its DNA enclosed into specialized structures called
nucleoids, which form the vehicles of transmission and inheritance [Taylor &
Turnbull, 2005].
3
Figure 2: The human mitochondrial genome. Figure adapted from [Taylor
& Turnbull, 2005].
1.1.3 MITOCHONDRIA AND NUCLEAR GENOME INTERACTION:
The mitochondrial genome encodes only few genes, which are subunits of the
oxidative phosphorylation and translation machineries. All other proteins required
for proper mitochondrial function are encoded in the nuclear genome and are
imported into mitochondria [Plon et al., 1989].
1.1.4 HOMOPLASMY AND HETEROPLASMY:
The eukaryotic cell accommodates one to several thousands of mitochondria giving
rise to an interesting phenomenon of mitochondrial genetics called homoplasmy
and heteroplasmy.
4
Homoplasmy is referred to the presence of identical copies of the mitochondrial
genome in a cell, whereas heteroplasmy refers to the habitation of two or more
mitochondrial genotypes in a single eukaryotic cell.
These terms are frequently used to define the mtDNA mutations leading to diseases.
For instance, a homoplasmic mutation is present in all the copies of the genome and
heteroplasmic mutation is present in only few copies of the mitochondrial genome.
In case of heteroplasmic mutations, there is a minimum threshold level for the
disease to develop and manifest clinical symptoms [Rossignol et al., 2003].
The mtDNA is inherited maternally and transmission of mtDNA mutations also
occur maternally. Homoplasmic mtDNA mutations are transmitted to all the
offsprings, for example patients with LEBER HEREDITARY OPTIC NEUROPATHY
(LHON) have homoplasmic mtDNA mutations and all the offsprings inherit the
mutation. Even though all the offsprings inherit the mutation, only few develop the
disease [Man et al., 2003], which points out that not only mtDNA factors but also
nuclear genetic factors are important for the development of this disease.
Transmission of a heteroplasmic mutation is more complicated due to the fact that
there is a genetic bottleneck during development and the amount of mutated
mtDNA transmitted to offspring is variable [Brown et al., 2001]. Hence both, nuclear
genetic [Battersby et al., 2003] and environmental factors affect the development of
a disease caused by a heteroplasmic, mitochondrial mutation. [Taylor & Turnbull,
2005].
1.1.5 MITOCHONDRIA AND DISEASES:
Mitochondrial diseases are effectively disorders that result from the dysfunction of
the electron transport chain. Furthermore, there are other crucial functions
converging in mitochondria, such as the apoptotic pathway, fatty acid beta
5
oxidation, cellular balance of reactive oxygen species (ROS) and iron sulphur cluster
biogenesis, which could directly or indirectly affect the efficient operational activity
of mitochondria.
Mitochondrial disorders may arise from mutations not only in the mtDNA but also in
the nuclear DNA encoding mitochondrial proteins. For example, individuals with
external ophthalmoplegia display a diverse variation pattern: some patients have
large deletions in mtDNA, others have a single nucleotide variation, and still others
have heterozygous variants of nuclear encoded, mitochondrial genes[Chinnery,
2014].
Some of the most common disorders associated either with the mtDNA encoded
genes or nuclear encoded mitochondrial genes include ptosis, external
ophthalmoplegia, proximal myopathy and exercise intolerance, cardiomyopathy,
sensorineural deafness, optic atrophy, pigmentary retinopathy, and diabetes
mellitus (see: http://www.ncbi.nlm.nih.gov/books/NBK1224/, accessed on 28 July
2015).
1.1.6 MITOCHONDRIA IN CANCER AND ANEUPLOIDY:
Deriving energy by cells, from glycolysis rather than a highly efficient oxidative
phosphorylation was termed ‘Warburg effect’ [Zheng, 2012]. This effect was
formulated by the observation from Otto Warburg that the tumour cells yield more
lactate in the presence of oxygen, which he termed “aerobic glycolysis“ resulting
from impairment of the oxidative phosphorylation machinery in mitochondria.
However, several investigation found that defects of mitochondrial OXPHOS are not
common in spontaneous tumors and is intact in most cancers [Zheng, 2012].
6
mtDNA mutations have been reported in a variety of cancers, including renal
adenocarcinoma, colon cancer cells, head and neck tumours, astrocytic tumours,
thyroid tumours, breast tumours, ovarian tumours, prostate and bladder cancer,
neuroblastomas and oncocytomas [Wallace, 2012]. These mutations belong to two
classes: mutations that assist the neoplastic transformation, and those that aid the
cancer cell adaptation to the changing bioenergetic environments. Next to mutations
in the mitochondrial genome, many mutations in the nuclear encoded mitochondrial
genes have been observed in specific cancers [Wallace, 2012].
Mitochondrial ROS are not only signalling molecules, but also potent mutagens and
an increase in the ROS production along with dysfunctional apoptosis, could lead to
neoplastic transformation [Wallace, 2012].
Mitochondrial activity and misregulations has been observed in the Down’s
syndrome (DS) or trisomy 21. It is one of the most common aneuploidies resulting
in intellectual disability disorder caused by three copies of chromosome 21.
Increased oxidative stress due to decreased regulation of several mitochondrial
components have been observed in the DS [Coskun & Busciglio, 2012]. It was also
suggested that mitochondrial biogenesis was up-regulated in trisomy 21:
mitochondrial superoxide production and oxidative stress were observed to be 3
times higher in DS fibroblasts [Coskun & Busciglio, 2012].
1.1.7 MITOCHONDRIA IN MAJOR DEPRESSION:
Misregulations associated with mitochondrial functions in major depression (MD)
are differences in the translation, decreased gene expression of mtDNA encoded
genes and nuclear encoded genes, decreased complex I activity and low ATP
production rates [Gardner & Boles, 2011].
7
Patients suffering from major depression have been reported to have dysregulations
in the hypothalamus-pituitary-adrenocortical (HPA) axis and deficits in cognitive
processes caused by hippocampal and prefrontal cortex (PFC) malfunction. Three
mouse lines were selectively bred for high (HR), intermediate (IR), and low (LR)
stress reactivity, determined by the corticosterone response to a psychological
stressor, probing the behavioural and functional consequences of increased vs.
decreased HPA axis reactivity on the hippocampus and PFC. The hippocampal
proteomic analysis identified several proteins differentially expressed in HR and LR
mice, those including proteins involved in the energy metabolism pathway
[Knapman et al., 2012].
1.1.8 GOALS OF THE THESIS:
There are a large scale availability of sequence data for several diseases from
various data sources, which can be utilized to generate gene expression and
mutation data. The main aim of this study is to understand the mitochondrial
contribution in diseases. Thus the work is aimed at the development and
deployment of a mitochondrial model (MitoModel) that would operate in an
inclusive manner with both mtDNA encoded and nuclear encoded mitochondrial
genes. The mapping of the gene expression and mutation data on to the MitoModel
will be an efficient approach to disclose the metabolic and physiological variations
carried by mitochondria in a disease state.
GOAL-1: Functional classification of mitochondrial genes and brief annotation of
gene function in the respective mitochondrial function [see Chapter 1.2].
GOAL-2: Development and deployment of a user-friendly, interactive MitoModel
[see Chapter 2].
8
GOAL-3: Development of workflows to analyse RNA-sequencing data, extracting
mutational and gene expression data in different disease types.
GOAL-4: Utilising the MitoModel to understand three different disease phenotypes:
a. Gene expression and mutation analysis using the MitoModel in three different
aneuploidy cell lines: the HCT 116 cell line tetrasomic for chromosome 5
(HCT116 5/4), the RPE1 cell line trisomic for chromosome 5 and
chromosome 12 (RPE1 5/3 12/3) and finally, the RPE1H2B cell line trisomic
for chromosome 21 (RPE1H2B 21/3) [see Chapter 3.1].
b. Using the MitoModel to understand the expression difference between the HR
and LR stress reactivity mice to elucidate potential malfunctions of
mitochondria [see chapter 3.2].
c. Retrieval of representative mitochondrial genes consistently afflicted in the
MitoModel, in 16 samples of colorectal cancer and corresponding liver
metastasis [see chapter 3.3].
1.1.9 OUTLINE OF THIS THESIS:
Chapter 1.2 provides a brief introduction to the methodology followed by the
collection of mitochondria-associated genes and their functional classification.
Chapter 2 describes the methods utilized for the development of the analysis
pipeline to deduce mutation and expression data; it also gives information about the
construction and deployment of the MitoModel.
Chapter 3.1 discusses the application of expression and mutation data on the
MitoModel for the three aneuploidy cell lines to analyse a potential mitochondrial
involvement.
9
Chapter 3.2 describes the employment of MitoModel on the two extreme stress
reactivity (LR vs. HR) mice to elucidate the contrasting behaviour with respect to
mitochondrial metabolism and physiology.
Chapter 3.3 provides details on the application of MitoModel and extraction of the
most representative MitoModel genes in 16 colorectal cancer samples and its
corresponding liver metastases
Chapter 4 provides conclusions and outlook onto future perspectives of this work.

10
11
CHAPTER 1.2
Mitochondria and their functions
Mitochondria are the power houses of the cell, efficiently producing ATP for cellular
functions and activities. In addition, they are involved in diverse functions such as
beta oxidation of fatty acids, apoptosis, biosynthesis of heme, FE-S cluster
biosynthesis and calcium signalling. The human mitochondrial genome encodes
only 13 polypeptides; the remaining 99% of mitochondrial proteins are synthesized
at cytosolic ribosomes and then imported into mitochondria. Efforts to compile the
mitochondrial proteome have been done and Pagliarini et al in 2008 came up with
MitoCarta, a list of nearly 1100 genes coding for mouse mitochondrial genome
[Pagliarini et al., 2008].
A seemingly quarter proportion of the mouse mitochondrial proteome have no
known biological functions [Meisinger et al., 2008]. In this chapter, an approach is
taken to organize mitochondria associated genes, including all mtDNA- and nuclear
encoded mitochondrial genes into groups based on their function. This is
accomplished by a comprehensive literature survey, specifically pinpointing the role
of a gene in mitochondria-associated functions.
1.2.1 MITOCHONDRIA ASSOCIATED FUNCTIONS:
In this section, the approach was to bring all mitochondria associated genes
together, specifically focussing on the functions that are well defined through
decades of experimental research. These functions included until now are briefly
defined below and the genes with their roles and their references are catalogued in
the Appendix C.
12
1.2.1.1 ELECTRON TRANSPORT CHAIN:
Situated in the inner mitochondrial membrane, the electron transport chain consists
of a series of enzyme complexes reducing oxygen to water resulting in protons (H+)
being pumped across the inner mitochondrial membrane from the matrix. This gives
rise to an electrochemical proton gradient across the inner membrane which is later
utilized by the ATP synthase complex to synthesize ATP from ADP and inorganic
phosphate [Schaffer & Suleiman, 2010].
The gene information of all the complexes involved and the gene symbols were
downloaded from the Hugo gene nomenclature committee (HGNC) under the gene
group.“Mitochondrial respiratory chain complexes” (available at:
http://www.genenames.org/cgi-bin/genefamilies/set/639 , accessed August 4,
2015). Respiratory chain assembly factors were also downloaded from the HGNC
under the gene group “Mitochondrial respiratory chain complex assembly factors”
(available at: http://www.genenames.org/cgi-bin/genefamilies/set/645 , accessed
August 4, 2015). There are a total of 131 genes included in the electron transport
chain function (1 until 131 in Appendix C).
1.2.1.2 GLYCOLYSIS:
All cells crave for energy not only for their homeostasis but also for growth and
division. The major source of cellular energy is glucose, which is assimilated by its
breakdown via glycolysis to pyruvate. The pyruvate then enters mitochondria
where it is further broken down by the tricarboxylic acid cycle (TCA) and oxidative
phosphorylation to produce large amounts of ATP.
Glycolysis is capable of producing ATP but to a much lesser extent as compared to
oxidative phosphorylation in the mitochondria. Glycolytic ATP generation for a
molecule of glucose results in only 2 ATP molecules compared to 36 ATP molecules
generated by oxidative phosphorylation. Even though the energy generation
13
efficiency is low, the pace of energy production is faster [Lunt & Vander heiden,
2011].
Glycolysis in its entirety takes place in the cytoplasm of the cell. Inclusion of the
genes taking part in this process is deliberate to take into account changed
mitochondrial functions in a disease state, which depend primarily on the glycolytic
fuel. Furthermore, glycolysis is tighlty linked to the TCA cycle. There are in total 31
genes catalogued in this function (132 until 163 in Appendix C).
1.2.1.3 PYRUVATE TRANSFER:
Pyruvate is formed by the breakdown of glucose in the glycolytic pathway. It is
further taken up as a major substrate by the TCA cycle in mitochondria. The process
of transferring pyruvate is yielded by the formation of the complex between two
proteins Mpc1 and Mpc2 (BRP44 and BRP44L in humans) in the inner
mitochondrial membrane [Bricker et al., 2012]. Only two genes were catalogued for
this function (164 until 165 in Appendix C).
1.2.1.4 FORMATION OF ACETYL COA:
Irreversible conversion of pyruvate to acetyl CoA is performed before it is taken up
by the TCA cycle. At this point the carbon atoms from the glycolysis are either
transformed into energy or further stored as lipids. The oxidative decarboxylation of
pyruvate to acetyl CoA is oerformed by the pyruvate dehydrogenase complex, which
is a multi enzyme complex in the mitochondrial matrix (available at:
http://www.ncbi.nlm.nih.gov/books/NBK22347/ , accessed on August 5, 2015).
There were 5 genes catalogued in this section ( 166 until 170 in Appendix C).
1.2.1.5 TRICARBOXYLIC ACID (TCA) CYCLE:
Tricarboxylic acid (TCA) cycle also known as Krebs cycle or citric acid cycle takes
place inside mitochondria. The major function of the TCA cycle is reaping high
14
energy electrons from acetyl CoA. The cycle includes a series of oxidation reduction
reactions giving rise to two molecules of CO2 , one molecule of GTP and high energy
electrons in the form of NADH and FADH2(available at:
http://www.ncbi.nlm.nih.gov/books/NBK21163/, accessed on August 6, 2015).
There were 18 genes catalogued in this function (171 until 189 in Appendix C).
1.2.1.6 BETA OXIDATION OF FATTY ACIDS:
Fatty acid metabolism is one of the major metabolic functions that play an
important role in the energy homoeostasis of an organism. Though peroxisomes
harbors a machinery for fatty acid metabolism, it is the mitochondrial beta oxidation
of fatty acids, which is the primary pathway in the degradation of the fatty acids.
Defects in fatty acid metabolism have harmful consequences that include
hypoglycaemia, hypertrophic cardiomyopathy, myopathy and rhabdomyolysis
[Houten & Wanders, 2010]. There are 53 genes catalogued in this function (190
until 243 in Appendix C).
1.2.1.7 ROS DEFENCE:
Efficient energy manufacturing is conducted by the mitochondrial electron
transport chain. Misregulations in transport activity of electrons from one to
another complex may lead to direct interaction of the electrons with the O2, leading
to the generation of superoxide, a free radical. These reactive oxygen species (ROS)
can act under normal conditions as signalling molecules. In pathophysiological
conditions, they contribute to critical disease phenotypes including cancer.
The antioxidant defence machinery inside mitochondria as well as the cytoplasm
can target ROS molecules and limit their oxidative damage capacity. A failure in
controlling ROS by antioxidant enzymes or excessive ROS generation can
significantly damage lipids, proteins and DNA and eventually disrupting cellular
15
functions [Sabharwal & Schumacker, 2014]. There were 23 genes catalogued in this
function (244 until 267 in Appendix C).
1.2.1.8 APOPTOSIS:
Apoptosis is a well-orchestrated set of cellular processes that will lead to the death
of the cell. It is as important as cell division and development due of the fact that it
contributes to poper cellular homeostasis. In vertebrate cells, there are two
apoptotic pathways, the extrinsic and the intrinsic pathway. Both converge at the
point of activating the death caspases.
Mitochondria can activate the intrinsic pathway through the inception of
mitochondrial outer membrane permeabilization. This leads to the release of
Cytochrome C from the inter membrane space further activating caspases and in
turn apoptosis [Tait & Green, 2010]. There were 35 genes catalogued in this
function (268 until 303 in Appendix C).
1.2.1.9 IMPORT AND SORTING:
The endosymbiotic theory confers that mitochondria lost most of its genetic
material to the nuclear genome. As a result the nuclear genome encodes almost
99% of the mitochondrial proteins that were transferred from the endosymbiont
during eukaryotic evolution [Dolezal et al., 2006]. Mitochondria with its own
replication, transcription and translation machinery encodes only 1% of the
mitochondrial proteins which forms a part of the respiratory chain complexes
[Schmidt et al., 2010].
Mitochondria not only possess a central role in energy conversion, but also have
crucial roles in multiple metabolic and signalling pathways. A well-established
protein import machinery is necessary and is present in all eukaryotic cells,
including the last common ancestor to all eukaryotes [Dolezal et al., 2006].
16
Proteins entering mitochondria through the import machinery contain special
targeting signals that are recognized by mitochondrial receptors. Depending on
their signals and import route, they are are transported to different mitochondrial
sub compartments. There are several types of targeting signals. The best known
signal is the N-terminal mitochondrial targeting peptide, which is cleaved off after
mitochondrial import. This signal targets proteins to the mitochondrial matrix.
Several other internal targeting signals exist. Internal signals remain within the
mature protein [Schmidt et al., 2010, Dolezal et al., 2006]. There were 32 genes
catalogued in this function (304 until 336 in Appendix C).
1.2.1.10 MITOCHONDRIAL DYNAMICS:
In eukaryotic cells, mitochondria do not form a static organelle. They are rather
highly dynamic and constantly change via fusion with other mitochondria or fission,
dividing to equip cells with new mitochondria. Mitochondria thus form a highly
interconnected network in the cell [Palmer et al., 2011]. The viability of a cell is
highly dependent on the proper functioning of this network and the regulation of
the mitochondrial network depends on proper coordination between fusion and
fission events [Hales, 2010].
Fusion or joining of two mitochondria forms the fundamental process of the
mitochondrial dynamics [Ranieri et al., 2013]. The mechanism is essential to
maintain the organelle population in the cell homogeneously [Palmer et al., 2011].
It also provides an opportunity to exchange the mitochondrial contents between the
fused mitochondria, and aides damaged and aged mitochondria, prolonging their
survivability [Ranieri et al., 2013].
Fission or division of mitochondria in a cell is essential for many reasons: it is
necessary to maintain sufficiently high numbers of mitochondria so that a full
17
complement of mitochondria are inherited by daughter cells during cell division; it
is also required for segregating old and damaged mitochondria through mitophagy.
Finally, fission is also required for the remodelling and rearrangement of the
mitochondrial network [Palmer et al., 2011, Hales, 2010 and Ranieri et al., 2013].
Mitophagy is the autophagic clearance of the mitochondria and it is tightly linked to
both, fusion and fission events. The selection of impaired mitochondria is
established based on their membrane potential and the ones with reduced
membrane potential are selected, enclosed in autophagosomes and subsequently
broken down by lysosomes [Thomas & Gustafsson, 2013].
Mitochondrial movement plays an important role in reaching the mitochondria in
highly polarized cells such as neurons. Impaired fission and fusion dynamics have
been suggested to reduce mitochondrial motility, though the relationship is yet to be
established [Chen & Chan, 2009]. There were 40 genes catalogued in this function
(583 until 623 in Appendix C).
1.2.1.11 Iron Sulphur (FE-S) CLUSTER BIOSYNTHESIS:
Fe-S cluster proteins are important cofactors involved in crucial cellular activities
like electron transfer reactions, catalytic and regulatory processes. They serve as the
main donors of sulphur during the biosynthesis of lipoic acid and biotin. There are
several forms of Fe-S clusters, the simplest form being [2Fe-2S]; [4Fe-4S] and [3Fe-
4S] are more complex clusters with an additional heavy metal ion.
The pathway for the synthesis for Fe-S clusters initiates in the mitochondria with a
complex called the mitochondrial iron sulphur cluster (ISC) assembly machinery.
The core of this machinery is not only required for the biosynthesis of Fe-S proteins
in mitochondria but also for the maturation of the same proteins in the cytoplasm
by the cytosolic iron-sulphur protein assembly (CIA) machinery. Defects in Fe-S
18
cluster biogenesis can severely affect other cellular functions like the electron
transport chain, the TCA cycle and other cofactor biosynthesis processes including
heme biosynthesis [Rouault & Tong, 2005] & [Lill, 2009]. There were 25 genes
catalogued in this function (337 until 362 in Appendix C).
1.2.1.12 REPLICATION AND TRANSCRIPTION:
The mitochondrial genome only encodes a few polypeptides and RNA molecules
required for mitochondrial translation processes. The genome itself is a double
stranded circular molecule. Mitochondrial genes are devoid of introns. It also consist
of non-coding regions on both the heavy and light strands, which are important
blocks in the genome and contain essential elements for the transcription and
replication.
Transcription from the mitochondrial genome gives rise to polycistronic precursor
RNAs later processed to yield mRNA, rRNA and tRNA molecules. The replication
process and its regulation in mitochondria are complex and efforts are ongoing to
identify enzymatic activities during the replication process. There are also intense
debates about the models of mitochondrial replication. Currently there are two
documented models. In the strand-asymmetric model, the transcription of the light
strand promoter provides primers for the heavy strand replication and once the
leading strand replication has reached two thirds of the genome, the light strand
replication is initiated in the opposite direction resulting in new mtDNA molecules
of both strands. In the symmetric replication model, both the leading and the lagging
strand replicates symmetrically from multiple replication forks in the genome
[Falkenberg et al., 2007]. There are 73 genes catalogued in this function (363 until
435 in Appendix C).
1.2.1.13 TRANSLATION:
19
Mitochondria contain their own translation machinery. The human mitochondrial
genome itself encodes the 22 tRNAs and 2 mitochondrial rRNAs required for
translation. For an efficient translation process to take place, the mtDNA has to be
transcribed and a sizable number of nuclear encoded translational regulators must
be imported into the mitochondria.
The mitochondrial translation machinery includes the mtDNA encoded tRNAs and
rRNAs as well as nuclear encoded initiation, elongation and termination factors,
mitochondrial ribosomal proteins, aminoacyl-tRNA synthetases and methionyl-
tRNA transformylase. The translation process includes initiation, elongation and
termination followed by quality control and protein insertion into the inner
mitochondrial membrane [Smits et al., 2010]. There are 146 genes catalogued in this
function (436 until 582 in Appendix C).
1.2.1.14 CALCIUM TRANSPORT:
Calcium signalling is a process which coordinates several extracellular stimuli and
triggers several important functions within a cell. Cells respond differentially to the
increase or decrease of calcium concentration. It has been shown that the
membrane potential difference generated within the mitochondria acts as a major
driving force for calcium accumulation in mitochondria. The mitochondria are also
in close proximity of Endoplasmic reticulum (ER) and the sarcoplasmic reticulum,
which serves as the important intracellular calcium stores.
Calcium in mitochondria regulates several crucial cellular functions. Calcium inside
mitochondria regulates the ATP production by oxidative phosphorylation, cell death
pathways, intrinsic apoptosis and autophagy [Rizzuto et al., 2012]. There were 15
genes catalogued in this function (624 until 639 in Appendix C).
1.2.1.15 HEME BIOSYNTHESIS:

20
Heme is a non-protein chemical compound, which becomes part of a protein by
binding to it. For instance, it is a cofactor of crucial proteins such as haemoglobin,
myoglobin and cytochrome proteins. Heme consists of central ferrous ion with four
nitrogen atoms binding to it in porphyrin compounds, such as hemoproteins.
Hemeproteins play a central role in the many cellular activities such as electron
transport, apoptosis, detoxification, protection against oxygen radicals, nitrogen
monoxide synthesis and oxygen transport [Dailey, 1997]. There are 8 genes
catalogued in this function (640 until 648 in Appendix C).
1.2.1.16 CARDIOLIPIN BIOSYNTHESIS:
Phospholipids form the basic component of the lipid bilayer that surrounds cells as
well as organelles present inside cells. Cardiolipin is a phospholipid, which is almost
exclusively present in the mitochondrial inner membrane [Kiebish et al., 2008]. The
uniqueness of the cardiolipin is its structure, which is formed by
diphosphatidylglycerol together with four acyl chains giving it its dimeric nature.
This dimer in turn gives rise to a highly specific conical structure favouring the
hexagonal HII phase of the membrane and is implicated in the membrane fusion
[Cullis et al., 1986].
By adopting the hexagonal HII phase, cardiolipin in mitochondria can form contact
sites between the inner and outer mitochondrial membrane [Ardail et al., 1990].
There are 5 genes catalogued in this function (649 until 653 in Appendix C).
1.2.1.17 UREA CYCLE:
Ammonium ions are formed during the breakdown of amino acids and are used for
the biosynthesis of nitrogen compounds. The excess free NH4⁺ ions is however toxic
and is thus quickly converted into the more tolerable form called urea. In this form,
it can then be secreted. The synthesis of urea is conducted through the urea cycle

21
and any defects in this cycle will result in the build-up of NH4+ in the blood in
humans (available at: http://www.ncbi.nlm.nih.gov/books/NBK22450/ , accessed
on August 6, 2015). There are 6 genes catalogued in this function (654 until 659 in
Appendix C).

22
23
CHAPTER 2
Methods And Implementation
Sequencing is a technique to capture the whole array of nucleotides present in a
DNA or RNA molecule. One of the major achievement of the sequencing technology
is the human genome sequencing project, concluded in 2003 [Grada & Weinbrecht,
2013]. The human genome project was realized by the first generation sequencing
technology, dominated by Sanger sequencing [Sanger et al., 1977].
With the availability of the human genome, the demand for faster and much cheaper
alternatives lead to the development of second or next generation sequencing (NGS)
technology. The major advancements in NGS compared to its predecessor are the
higher pace and the lower cost of sequencing. There are a number of NGS platforms
which deliver low cost, high throughput data such as Illumina, Roche 454, Ion
torrent and SOLiD sequencing [Grada & Weinbrecht, 2013]. In this thesis, the
sequencing data used for the analysis was RNA-sequencing generated by the
Illumina sequencing technology.
2.1 RNA-SEQUENCING (RNA-seq):
Transcriptome analysis reveals a thorough understanding of functional elements of
the genome and is an effective approach to recognize transcriptional changes during
development and diseases. It provides an insight into the complete set of
transcripts, transcriptional structures of the genes and the changing expression
levels of the transcripts under different conditions. The NGS based approach to
determine the complete transcriptome, termed RNA-seq, has revolutionized the
manner in which transcriptomes are analysed.
24
In RNA-seq, total RNA is sheared into a collection of cDNA fragments with adapters
attached to one or both ends. These fragments are deep sequenced to obtain either
single end reads or paired end reads based on the protocol [Wang et al., 2009].
2.2 ILLUMINA SEQUENCING:
The Illumina sequencing technology provides a wide variety of applications in
genomics, transcriptomics and epigenomics. Input samples to be sequenced are
sheared into smaller sections and attached to slides using adapters. These
fragments are PCR-amplified on the slide, creating several copies of the same read.
Single strands from the read to be sequenced are retained on the slides. In the next
step, the slides are flooded with the fluorescently labelled nucleotides, DNA
polymerase and a terminator to allow only a single base addition at a time. A
fluorescent image of the slide indicating the base is recorded. In the next cycle,
terminator and the fluorescent signal are removed and the addition of the following
base and imaging process is further continued. Consequently, all signals of an
Illumina run are recored on a computer and used to construct the sequence
[available at: https://www.ebi.ac.uk/training/online/course/ebi-next-generation-
sequencing-practical-course/what-next-generation-dna-sequencing/illumina- ,
accessed August 17, 2015].
2.3 BASE CALL ACCURACY:
The base call accuracy from NGS is determined by the phred quality score, which
determines the quality of the base call during the sequencing [Ewing & Green,
1998]. A base call is assigned a quality value q which is logarithmically related to the
estimated error probability p of that base call.
q = -10 X log10(p)
25
If the quality score of a base is 30 then the error probability of that base call is
1/1000. The higher the quality value, the lower is the error probability of that base
call and vice versa.
2.4 TRIM GALORE:
Trim Galore (available at:
http://www.bioinformatics.babraham.ac.uk/projects/trim_galore/, accessed June
14, 2015) accomplishes both, the removal of the adapter sequences and subsequent
quality control of the raw RNA-seq reads in a single pass. For adapter sequence
removal the default 13 bp standard Illumina adapters ('AGATCGGAAGAGC') suitable
for both single and paired end libraries are used with the option for the provision of
other adapter sequences. Trim Galore specifically uses Cutadapt [Martin, 2011] to
remove adapter sequences from the raw sequencing reads. It removes the reads
that are too short after the trimming process. However for paired end reads, there is
an option to retain the best quality partner read, if one of the reads in the read pair
becomes too short during the trimming process. For the quality control, the phred
quality value of the base calls can be specified. The processed raw RNA-seq reads
are output in the form of FastQ files which are quality checked with FastQC
(available at: http://www.bioinformatics.bbsrc.ac.uk/projects/fastqc/, accessed
June 21, 2015).
2.5 ALIGNMENT:
Alignment is the process of arranging the sequences of DNA, RNA, or protein to
identify regions of similarity that may be a consequence of functional, structural, or
evolutionary relationships between the sequences [available at:
https://en.wikipedia.org/wiki/Sequence_alignment , accessed July 20, 2015]. With
the advent of NGS data, aligning millions of short to long reads to the reference
genome is the primary and critical task after the sequencing process. For RNA-seq
26
data, there are a number of aligners that are capable of aligning the reads with high
accuracy. A brief discussion of the aligners used in this thesis are put forth below:
2.5.1 BWA ALIGNER:
Burrows-Wheeler Alignment tool (BWA) is a fast short read aligner based on
backward search with Burrows-Wheeler Transform [Li and Durbin, 2009]. It
supports both single and paired-end reads, and is also capable of allowing
mismatches and gaps while aligning reads against a reference sequence.
Performance is reduced with long reads because BWA seeks a global alignment from
first to last base of the read and long reads may inherently contain structural
variations or there might be misassemblies in the reference genome.
2.5.2 STAR ALIGNER:
Spliced Transcripts Alignment to a Reference (STAR) is an ultrafast universal RNA-
seq reads aligner [Dobin et al., 2013]. It has the ability to map both long and short
RNA-seq reads to the reference sequences. It is provided as a C++ standalone code
capable of running parallel threads on multicore systems.
It aligns the RNA-seq reads to the genome in a twostep process:
a. Seed search
In this step, the STAR algorithm discovers for each read the longest substring
or maximum mappable prefix (MMP) that matches exactly to one or more
substrings in the genomic sequences. These MMPs serve as the foundations in
the genome, where the reads are aligned to with allowed mismatches.
27
The advantage of this step is that the algorithm recognizes splice junction
information for each read without previous information of splice junction
location.
b. Clustering, stitching and scoring:
In this step, the algorithm takes the log of all MMPs defined for the whole
genome in the first phase and builds alignments for the entire read sequence.
In case of paired end reads, seeds of the mates are clustered and stitched or
aligned concurrently.
The alignment is validated by the local alignment scoring scheme, which is
user controlled for defining the penalties for matches, mismatches, insertions,
deletions and splice junction gaps.
The ability of the STAR algorithm to identify the splice junction information for the
entire read sequences in the first pass alignment (PASS 1) provides an option to
accurately align the entire read sequence to the genome in the second pass
alignment (PASS 2). Alternatively, STAR can also be provided with possible splice
junction information from an annotation file.
2.5.3 TOPHAT2 ALIGNER:
The TopHat aligner [Trapnell et al., 2009] is one of the most popular aligners used
for the RNA-seq experiments. TopHat2 [Kim et al., 2013] is a significant extension of
TopHat with several important enhancements. It can align both single and also
paired-end reads with varying lengths. TopHat2 is also enhanced to align reads
across fusion break events occurring as a consequence of genomic translocations.
Provided with transcriptome annotation file, TopHat2 aligns the reads across the
known transcriptome with significant speed, sensitivity and accuracy. The
28
unmapped reads that remain after the mapping are realigned to identify novel exons
and novel introns based on the known junction signals (GT-AG, GC-AG, and AT-AC).
Some of the reads are remapped with Bowtie2 [Langmead et al., 2012] by splitting
them into smaller non overlapping segments (25 bp each by default).
2.6 MAPPING QUALITY
Mapping quality is the post alignment probability that a read aligned belongs to its
assigned position [Li et al., 2008]. The probability p is calculated as:
p = 10 -q/10
Where q is the mapping quality. If for instance, mapping quality value q = 20 then
p = 10-20/10
p = 10-2 = 0.01
Which means there is 0.01 percent chance that the read aligned is erroneous.
2.7 PICARD TOOLS
The Picard tools (available at: http://broadinstitute.github.io/picard/index.html,
accessed July 13, 2015) are a set of java command line tools used in the
manipulation of next generation sequencing data. The tools are implemented in the
HTSJDK (available at: http://samtools.github.io/htsjdk/ , accessed July 13, 2015)
java library and supports both SAM and BAM formats retrieved during NGS data
analysis.
2.7.1 MARK DUPLICATES
During the sequencing process DNA molecules are sequenced several times
resulting in the accumulation of duplicate reads, which would distort the calling of
putative variants during SNP analysis.
29
MarkDuplicates (available at: http://broadinstitute.github.io/picard/command-
line-overview.html#MarkDuplicates , accessed July 13, 2015) is a Picard command
line tool which inspects the alignments to locate and subsequently flag duplicate
reads, such that they will be ignored in downstream SNP calling steps.
2.8 THE GENOME ANALYSIS TOOLKIT (GATK):
GATK is a software package developed for the analysis of next generation DNA
sequencing data [Mckenna et al., 2010], emphasizing principally on variant
discovery and genotyping [Depristo et al., 2011].
The toolkit maintains a stable and most upto date version of tools called “walkers”,
that can be used individually or in combination eventuating into pipelines for the
analysis of data. It is built to be highly generic and can be used for multiple
organisms including humans.
It is proficient in handling whole genome, exome and also RNA-seq data and for each
kind of data, best practices recommendations for variant calling are provided and
updated frequently [Van der Auwera, 2013].
2.8.1 SPLIT’N’TRIM:
This step includes the removal of the sequences overhanging into intronic regions.
The process involves slicing the reads into exonic segments by hard clipping the
part mapped to the intronic region. This is achieved by GATK’s SplitNCigarReads
tool (available at:
https://www.broadinstitute.org/gatk/guide/tooldocs/org_broadinstitute_gatk_tool
s_walkers_RNA-seq_SplitNCigarReads.php, accessed July 19, 2015). It is mainly
focussed on reducing false calls generated by the reads mapping to intronic regions.
2.8.2 REASSIGN MAPPING QUALITIES:
30
STAR aligner assigns a mapping quality value of 255 for good alignments, which
technically means “UNKNOWN” and would be rejected by GATK during the variant
calling step.
This is circumvented by reassigning the mapping quality value of 255 to 60, which is
acceptable by GATK. Reassigning mapping qualities is accomplished by the tool,
ReassignOneMappingQualityFilter (available at:
https://www.broadinstitute.org/gatk/gatkdocs/org_broadinstitute_gatk_engine_filt
ers_ReassignOneMappingQualityFilter.php, accessed July 19, 2015).
2.8.3 REALIGNMENT AROUND INDELS:
Mapping artifacts around indels often are miscalled as SNPs. To avoid this, a
realignment process is done, which identifies the region for reads around indels to
eliminate these artifacts.
Realignment is achieved in two steps:
a. In the first step, genomic intervals that require realignment are identified.
This task is achieved by RealignerTargetCreator tool (available at:
https://www.broadinstitute.org/gatk/guide/tooldocs/org_broadinstitute_gat
k_tools_walkers_indels_RealignerTargetCreator.php , accessed July 20, 2015).
b. In the second step, realignment of reads is performed after identifying the
optimal consensus sequence. Local realignment of reads around indels is
performed by IndelRealigner tool (available at:
https://www.broadinstitute.org/gatk/guide/tooldocs/org_broadinstitute_gat
k_tools_walkers_indels_IndelRealigner.php, accessed July 20, 2015 ).
2.8.4 BASE RECALIBRATION:
Variant calling algorithms use base quality score as a criteria to call variants in the
genomic data. Quality scores assigned to individual bases in the sequencing read are
subjected to various sources of systematic errors. These systemic errors could lead
31
to the erroneous base calls. Base quality score recalibration adjusts the base quality
scores in the data based on a model of covariation calculated based on a list of
already known SNPs, such as dbSNP [Sherry et al., 2001]. This step is accomplished
by the tool BaseRecalibrator (available at:
https://www.broadinstitute.org/gatk/guide/tooldocs/org_broadinstitute_gatk_tool
s_walkers_bqsr_BaseRecalibrator.php, accessed July 20, 2015).
2.8.5 VARIANT CALLING AND FILTERING:
This step involves the identification of variant sites corresponding to the reference
genome and calculates the genotypes of each sample at that site. The major
challenge is to establish a balance between sensitivity (minimize false negatives:
inability of the model to predict real variants) and specificity (minimize false
positives: failure of the model to recognize false variants). This balance is achieved
by dividing this process into two steps:
a. The variant calling step: This step aims to maximize sensitivity by conducting
local de-novo assembly of reads in the active region to identify SNPs and
indels simultaneously. This is accomplished by the tool HaplotypeCaller
(available at:
https://www.broadinstitute.org/gatk/guide/tooldocs/org_broadinstitute_gat
k_tools_walkers_haplotypecaller_HaplotypeCaller.php . accessed July 20,
2015).
b. The variant filtering step: This step aims to achieve maximum specificity and
can be customizable by users based on the data. Here the output generated by
the HaplotypeCaller is subjected to hard filtering such as minimum base
quality, strand bias, clustered SNPs and many more. This step is accomplished
by the tool VariantFiltration (available at:
https://www.broadinstitute.org/gatk/guide/tooldocs/org_broadinstitute_gat
k_tools_walkers_filters_VariantFiltration.php . accessed July 20, 2015).
32
2.9 SNPiR FILTRATION:
To further process and minimize false positives from the filtered data obtained from
GATK’s VariantFiltration step, several filtering steps are defined in the study
“Reliable identification of genomic variants from RNA-seq data” [Piskol et al., 2013].
These include the removal of false calls in the repetitive regions of the genome, in
homopolymer regions, removal of variants close to splice junctions and finally
filtering known RNA editing sites.
2.10 ONCOTATOR:
Oncotator is a tool which annotates point mutations and indels integrating cancer
relevant information to the annotations [Ramos et al., 2015]. It is available as a web
server [available at: http://www.broadinstitute.org/oncotator , accessed July 21,
2015], which restricts the amount of data submission. However a standalone
version can be used in case of large amounts of data.
2.11 MITOWHEEL:
MitoWheel is a web based visual representation of the human mitochondrial
genome [Zsurka and Csordás, 2009]. It displays the revised Cambridge reference
sequence and has several components to browse upon (available at:
http://mitowheel.org/mitowheel.html . accessed July 21, 2015).
The mitochondrial genome is represented in a circular manner which can be
spinned to view specific components of the genome such as its genes. It also consists
of a search box to specifically select a region of interest. One important feature of
the tool is its ability to map mutations to understand the genes affected and the
functional consequences.
2.12 CUFFLINKS PACKAGE:
33
Cufflinks [Trapnell et al., 2012] works with TopHat alignment files of each condition
and is designed to address the issue of alternative splicing events in the genes.
Cufflinks [Trapnell et al., 2012] collects a transcriptome assembly and then reports
full length transcript fragments or transfrags, which explains all the splicing events
in the input data. Post assembly, expression abundance of each transfrag is
quantified in the data using a rigorous statistical model of RNA-seq and is reported
as Fragments Per Kilobase of transcript per Million fragments mapped (FPKM)
[Trapnell et al., 2010].
2.12.1 CUFFMERGE:
For all the samples in the experiment, Cuffmerge performs a meta assembly of the
transfrags which were put forth by the Cufflinks process. Provided a reference
genome annotation file, it integrates the reference transcripts into a merged
assembly producing a single annotation file to be used for differential analysis
[Trapnell et al., 2012].
2.12.2 CUFFDIFF:
Cuffdiff [Trapnell et al., 2012]calculates the expression difference between two or
more samples in an experiment and tests the statistical significance of the observed
change in expression between them. Multiple replicates, either biological or
technical can be provided per condition and Cuffdiff learns for each gene the
variation among the replicates to calculate the significance of expression change
[Trapnell et al., 2012].
2.13 VARIANT DISCOVERY WORKFLOW:
The discovery of the variants in the form of mutation sites and expression difference
between two samples (Normal vs. Disease) is conducted by following the workflow
depicted in the Figure 3.
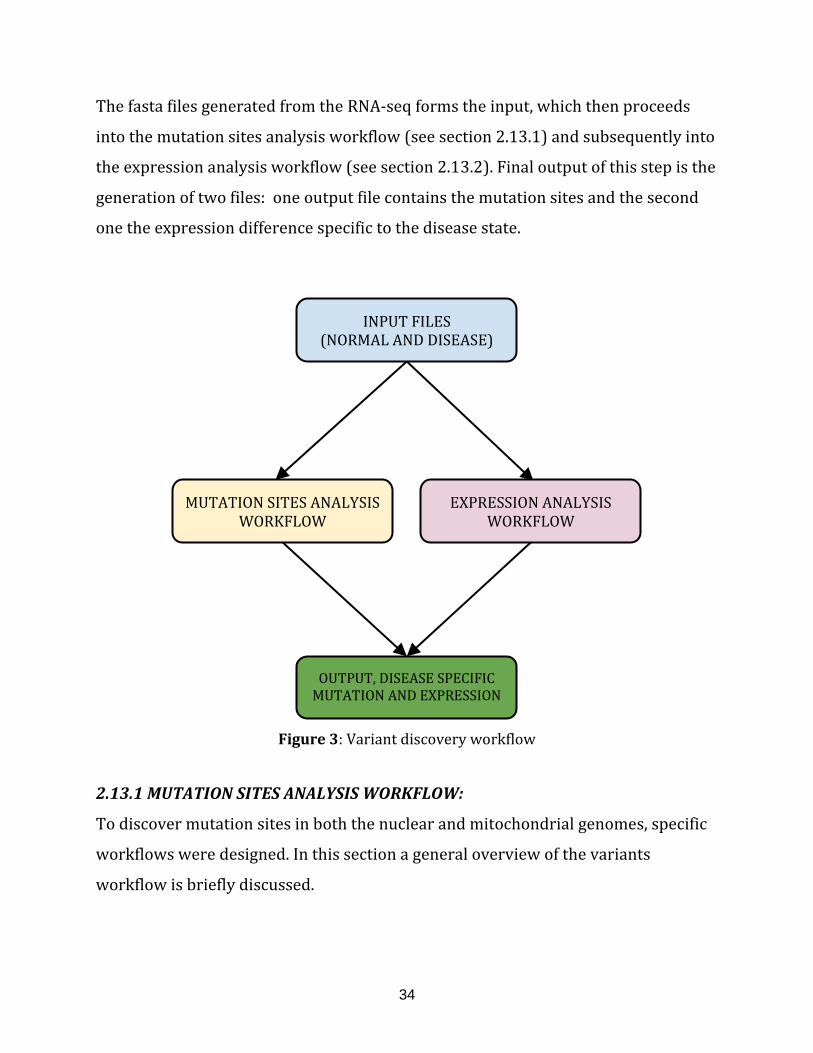
34
The fasta files generated from the RNA-seq forms the input, which then proceeds
into the mutation sites analysis workflow (see section 2.13.1) and subsequently into
the expression analysis workflow (see section 2.13.2). Final output of this step is the
generation of two files: one output file contains the mutation sites and the second
one the expression difference specific to the disease state.
Figure 3: Variant discovery workflow
2.13.1 MUTATION SITES ANALYSIS WORKFLOW:
To discover mutation sites in both the nuclear and mitochondrial genomes, specific
workflows were designed. In this section a general overview of the variants
workflow is briefly discussed.
INPUT FILES
(NORMAL AND DISEASE)
MUTATION SITES ANALYSIS WORKFLOW
EXPRESSION ANALYSIS WORKFLOW
OUTPUT, DISEASE SPECIFIC MUTATION AND EXPRESSION
EXPRESSION FILES
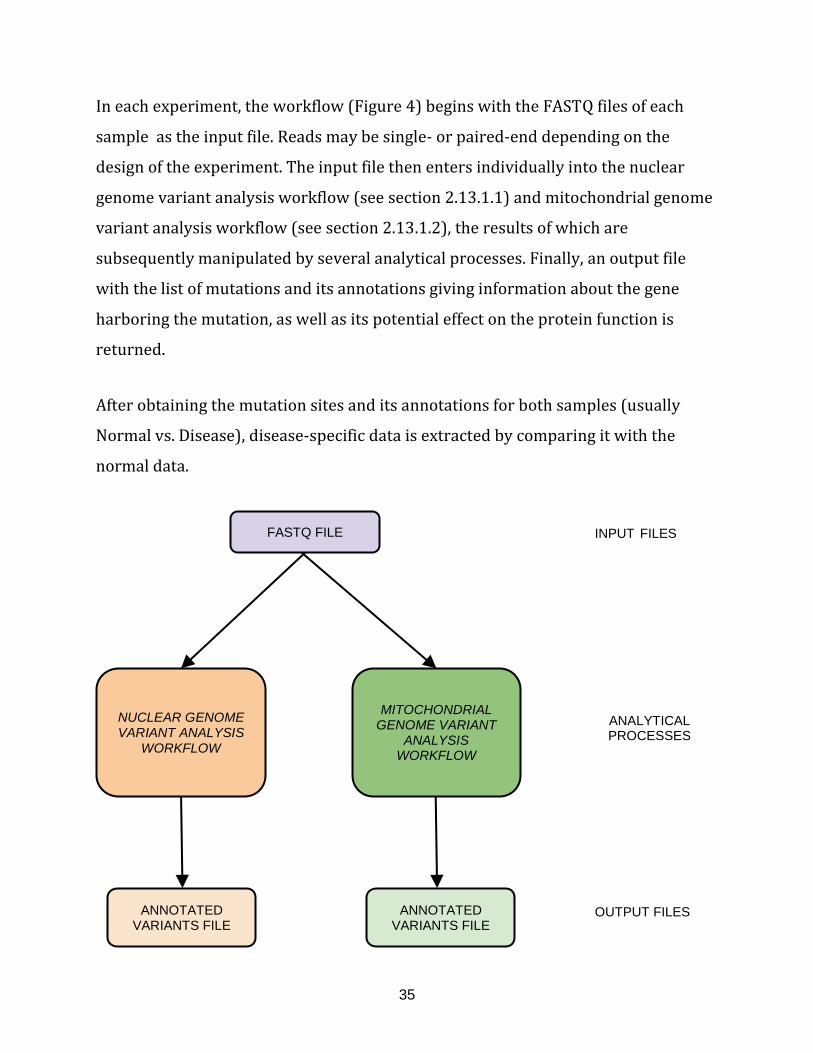
35
In each experiment, the workflow (Figure 4) begins with the FASTQ files of each
sample as the input file. Reads may be single- or paired-end depending on the
design of the experiment. The input file then enters individually into the nuclear
genome variant analysis workflow (see section 2.13.1.1) and mitochondrial genome
variant analysis workflow (see section 2.13.1.2), the results of which are
subsequently manipulated by several analytical processes. Finally, an output file
with the list of mutations and its annotations giving information about the gene
harboring the mutation, as well as its potential effect on the protein function is
returned.
After obtaining the mutation sites and its annotations for both samples (usually
Normal vs. Disease), disease-specific data is extracted by comparing it with the
normal data.
FASTQ FILE
NUCLEAR GENOME VARIANT ANALYSIS
WORKFLOW
MITOCHONDRIAL GENOME VARIANT
ANALYSIS WORKFLOW
ANNOTATED VARIANTS FILE
ANNOTATED VARIANTS FILE
INPUT FILES
ANALYTICAL PROCESSES
OUTPUT FILES

36
Figure 4: Overview of variants analysis workflow depicting the levels of data handling
(input, manipulation and output).
2.13.1.1 NUCLEAR GENOME VARIANT ANALYSIS WORKFLOW:
For each sample in the experiment, identification of variants in RNA-seq data is
achieved by following the best practice recommendations provided by GATK (
available at: https://www.broadinstitute.org/gatk/guide/best-
practices?bpm=RNAseq . accessed on July 21, 2015).
Module I. Pre-processing RNA-seq reads:
This module pre-processes raw RNA-seq reads, which includes removal of adapter
sequences and quality control. This is achieved by processing the raw RNA-seq
reads using Trim Galore (see section 2.4) with selecting default adapter sequence
for illumina reads and a quality cutoff score of 20 on phred scale.
The processed FastQ reads move over to module II, and here they are mapped to the
reference genome.
Module II. Map to the Reference genome:
This module maps pre-processed RNA-seq reads to the human genome version 19.
This is accomplished by the STAR aligner (see section 2.5.2) using the 2-PASS
approach, wherein the first pass (1-PASS) identifies the splice junctions and then
guides the second pass (2-PASS) towards the final alignment.
MarkDuplicates (see section 4.3a), a command line tool belonging to the Picard tool
(see section 4.3) is used to remove duplicate reads.
The final alignment file in BAM format further pre-processed (module III) for
subsequent variant detection using the variant calling and filtering module (module
IV).
37
Module III. Pre-processing alignment file:
Module III pre-processes the alignment file for variant calling by removing
overhanging reads in intronic regions. This is accomplished by the tool Split’N’Trim
(see section 2.8.1) available in the GATK (see section 2.8) package.
Furthermore, the mapping quality value of the alignment file is adjusted using a tool
called ReassignOneMappingQualityFilter (see section 2.8.2) offered in the GATK
package.
Finally, local realignment around indels is performed (see section 2.8.3) and base
score recalibration is done using the tool BaseRecalibrator (see section 2.8.4)
provided by GATK package.
The alignment file in BAM format is next submitted to varant calling and filtering
(module IV).
Module IV. Variant calling and filtering:
In this module the critical task of variant calling (see section 2.8.5) is performed.
Identified variants are subsequently filtered to obtain the bona fide variants present
in a sample.
Filtering of the variants is done using the SNPiR pipeline (see section 2.9). In this
step, false calls are removed in repetitive regions of the genome, homopolymer
regions, around splice junctions and known RNA editing sites. Finally, one is left
with the most likely, genomic SNPs.
Module V. Annotation of filtered variants:
38
The final annotation of identified variants is achieved by the Oncotator tool (see
section 2.10).
2.13.1.2 MITOCHONDRIAL GENOME VARIANT ANALYSIS:
In this section, the prediction of variants in the form of homoplasmic or
heteroplasmic sites in the mitochondrial genome is described. The workflow to
decode heteroplasmic sites in mitochondrial genome was adapted from the work of
[Goto et al., 2011] and was integrated in a Galaxy workflow [available at:
https://usegalaxy.org/u/aun1/p/heteroplasmy, accessed on July 21, 2015], which
is an open, web based platform to do biomedical research [Giardine et al., 2005].
The workflow is divided into several modules as detailed below.
Module I. Pre-processing RNA-seq reads:
This module pre-processes raw RNA-seq reads, which includes removal of adapter
sequences and quality control. Trim Galore (see section 2.4) was used with selecting
default adapter sequence for illumina reads and a quality cutoff score of 20 on phred
scale.
The processed FastQ reads are in the next step mapped to the reference genome
(module II).
Module II. Map to the Reference genome:
The filtered reads are mapped to the human mitochondrial revised Cambridge
reference sequence [Andrews et al., 1999]. Since the mitochondrial genome is a
circular molecule, the genome has to be extended on both ends by the length of the
input reads -1. Reads are mapped to this extended genome using the BWA aligner
(see section 2.5.1) with the default settings.
39
The alignment file in BAM format is further used for calling variant sites (module
III).
Module III. Segregating the alignment file:
In this module reads mapped to the plus strand are separated from reads mapped to
the minus strand of the genome.
Both resulting read files are investigated for variant sites with a minimum coverage
of 100 reads and the base quality value of 20. Only variant sites passing this filter
are retained for further processing.
Module IV. Applying conservative filter settings:
For mitochondrial variant calling, a conservative variant detection setting of at least
5 % coverage a and base quality value of 20 on the phred scale is applied to call the
variants. Variant calling is done for all reads in plus and minus direction separately.
Module V. Calling variant sites:
Variants present in the plus and minus strand files are merged and those sites which
are common to both the files are chosen and retained as bona fide variant sites. This
process eliminates the variants present on only strand, which are moste likely due
to technical issues during sequencing.
The variant sites are further manually analysed for their hetero- and homoplasmic
nature. Further annotation information is extracted for the variants by mapping
them on MitoWheel (see section 2.11).
2.13.2 EXPRESSION ANALYSIS WORKFLOW:
Differential gene expression analysis for two conditions (Normal and Disease) is
done in a workflow described below:
40
Module I. Pre-processing RNA-seq reads:
Pre-processing of reads is done as described in section 2.13.1.1 Module I,
Module II. Map to the Reference genome:
Pre-processed RNA-seq reads for the 2 conditions to be compared are individually
mapped to the reference genome using TopHat2 (see section 2.5.3) with default
settings. The alignment files is then submitted to transcriptome assembly and
merging (module III).
Module III. Transcriptome assembly and merging:
For both conditions, Cufflinks assembles full length transcripts for all the genes
expressed and provides an expression value in form of a metric called FPKM (see
section 2.12).
The transcriptomes of both conditions are merged by Cuffmerge (see section 2.12.1)
and further annotated using a provided annotation file.
Module IV. Differential expression of genes:
Keeping the merged transcriptomes as background gene models, Cuffdiff (see
section 2.12.2) calculates the expression difference between two conditions and
provides the statistical significance of the expression change between two samples.
2.14 MITOCHONDRIAL MODEL (MitoModel):
The MitoModel is a web-based application that was developed for analysing
mitochondrial contributions in diseases. The main aim is to map analysed
expression and/or mutation data from NGS studies onto MitoModel. By this, we can
identify the mitochondria specific metabolic and physiological changes in the
disease state compared to the normal condition.
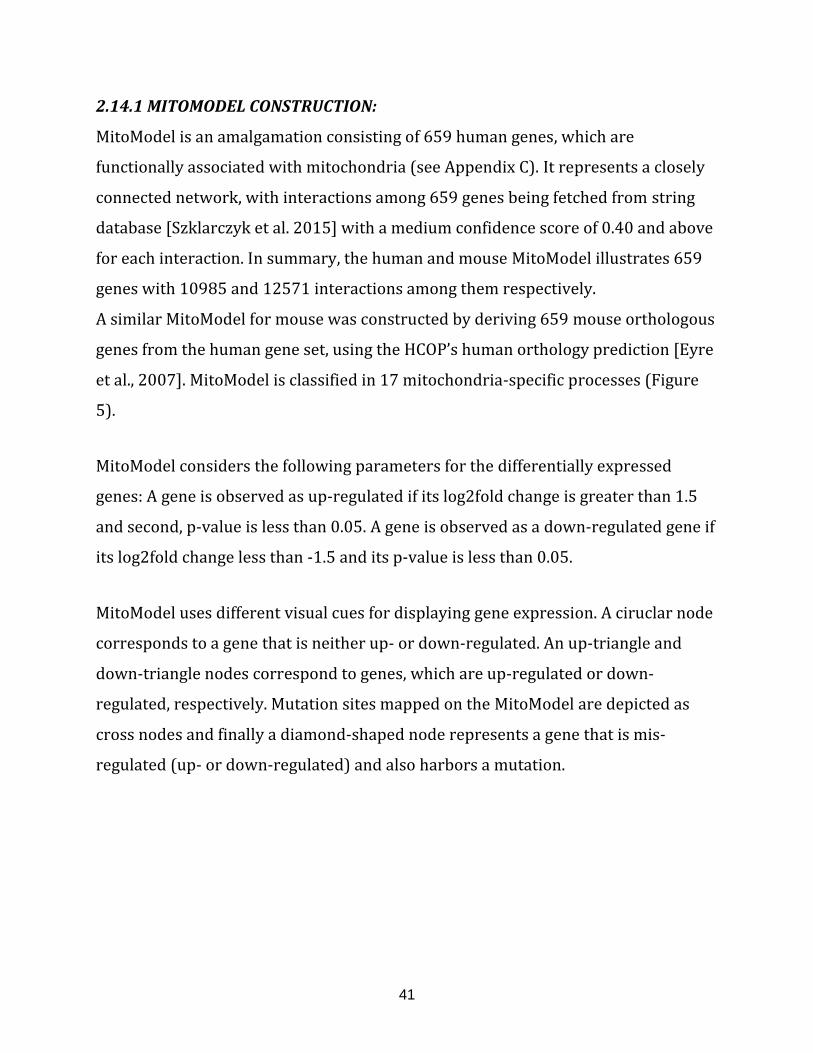
41
2.14.1 MITOMODEL CONSTRUCTION:
MitoModel is an amalgamation consisting of 659 human genes, which are
functionally associated with mitochondria (see Appendix C). It represents a closely
connected network, with interactions among 659 genes being fetched from string
database [Szklarczyk et al. 2015] with a medium confidence score of 0.40 and above
for each interaction. In summary, the human and mouse MitoModel illustrates 659
genes with 10985 and 12571 interactions among them respectively.
A similar MitoModel for mouse was constructed by deriving 659 mouse orthologous
genes from the human gene set, using the HCOP’s human orthology prediction [Eyre
et al., 2007]. MitoModel is classified in 17 mitochondria-specific processes (Figure
5).
MitoModel considers the following parameters for the differentially expressed
genes: A gene is observed as up-regulated if its log2fold change is greater than 1.5
and second, p-value is less than 0.05. A gene is observed as a down-regulated gene if
its log2fold change less than -1.5 and its p-value is less than 0.05.
MitoModel uses different visual cues for displaying gene expression. A ciruclar node
corresponds to a gene that is neither up- or down-regulated. An up-triangle and
down-triangle nodes correspond to genes, which are up-regulated or down-
regulated, respectively. Mutation sites mapped on the MitoModel are depicted as
cross nodes and finally a diamond-shaped node represents a gene that is mis-
regulated (up- or down-regulated) and also harbors a mutation.
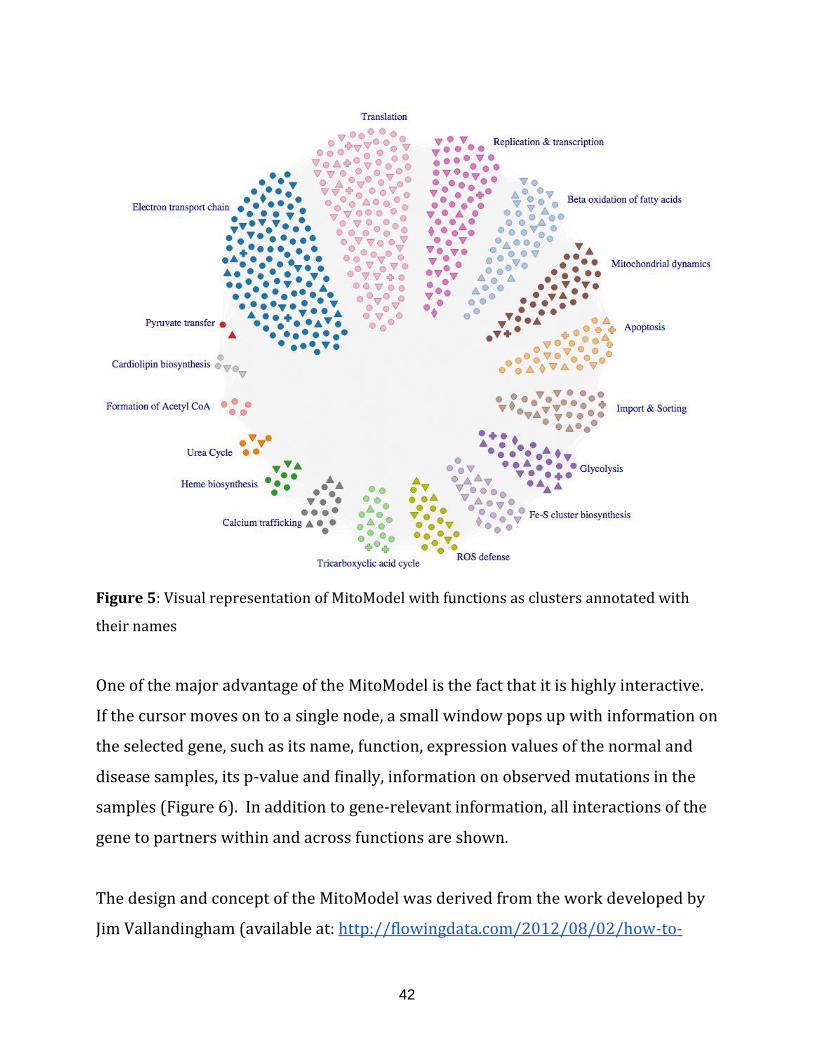
42
Figure 5: Visual representation of MitoModel with functions as clusters annotated with
their names
One of the major advantage of the MitoModel is the fact that it is highly interactive.
If the cursor moves on to a single node, a small window pops up with information on
the selected gene, such as its name, function, expression values of the normal and
disease samples, its p-value and finally, information on observed mutations in the
samples (Figure 6). In addition to gene-relevant information, all interactions of the
gene to partners within and across functions are shown.
The design and concept of the MitoModel was derived from the work developed by
Jim Vallandingham (available at: http://flowingdata.com/2012/08/02/how-to-
43
make-an-interactive-network-visualization/, accessed July 23, 2015) and
restructured by us to fulfil our specific requirements.
The MitoModel is complemented by an enrichment analysis, identifying the most
affected functions based on the percentage changed genes [Percentage = (number of
affected genes in the function / total genes in the function) X 100].
Analysed functional categories are represented as clusters, whereby each node
corresponds to a gene (Figure 7). The size of the node corresponds to the log2fold
change value, where higher log2fold change corresponds to bigger circle and vice
versa. The colour corresponds to the gene regulation, where blue corresponds to
up-regulation, green corresponds to no differential regulation and red corresponds
to down-regulation. The nodes with dark borders represents genes containing
mutations.
Differentially regulated genes in MitoModel (Figure 8) are also displayed as a graph
briefly described below: two horizontal lines describe log2fold change cutoff values
(up: 1.50 and down: -1.50) and a vertical line describes the p-value cutoff (0.05).
The overall expression pattern is printed, giving an idea about the number of up-
regulated and down-regulated genes. In Figure 9, for example, there is a higher
number of down-regulated genes compared to up-regulated genes.
The design and concept, for the display of enrichment analysis were adapted from
the work by Shan Carter (available at:
http://www.nytimes.com/interactive/2012/02/13/us/politics/2013-budget-
proposal-graphic.html , accessed July 23, 2015) and restructured (kindly provided
by José Villaveces, Computational Biology group, Max Planck Institute of
Biochemistry) to our specific needs.
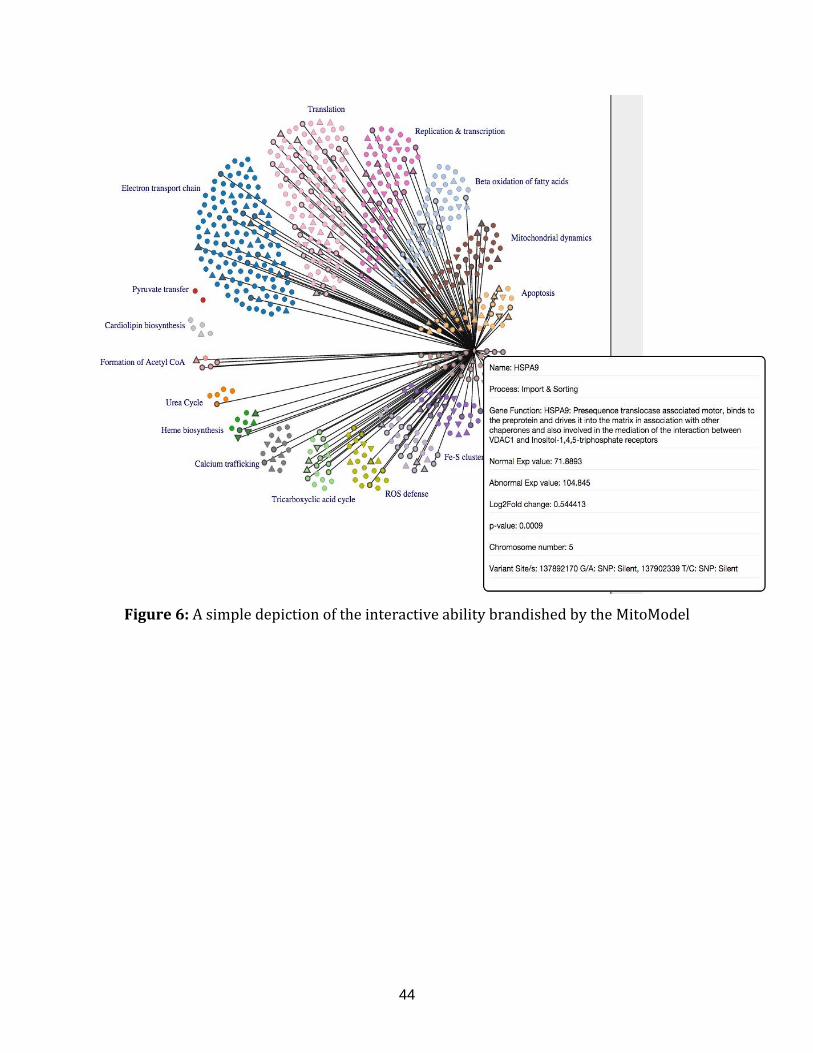
44
Figure 6: A simple depiction of the interactive ability brandished by the MitoModel
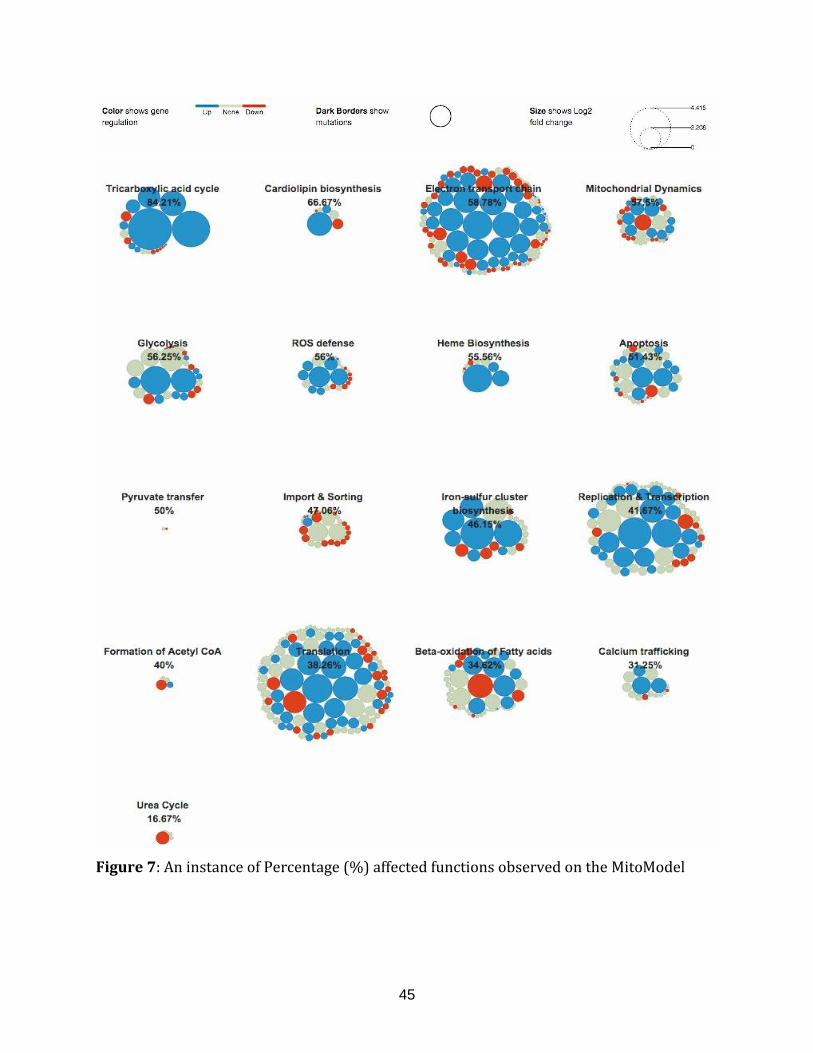
45
Figure 7: An instance of Percentage (%) affected functions observed on the MitoModel
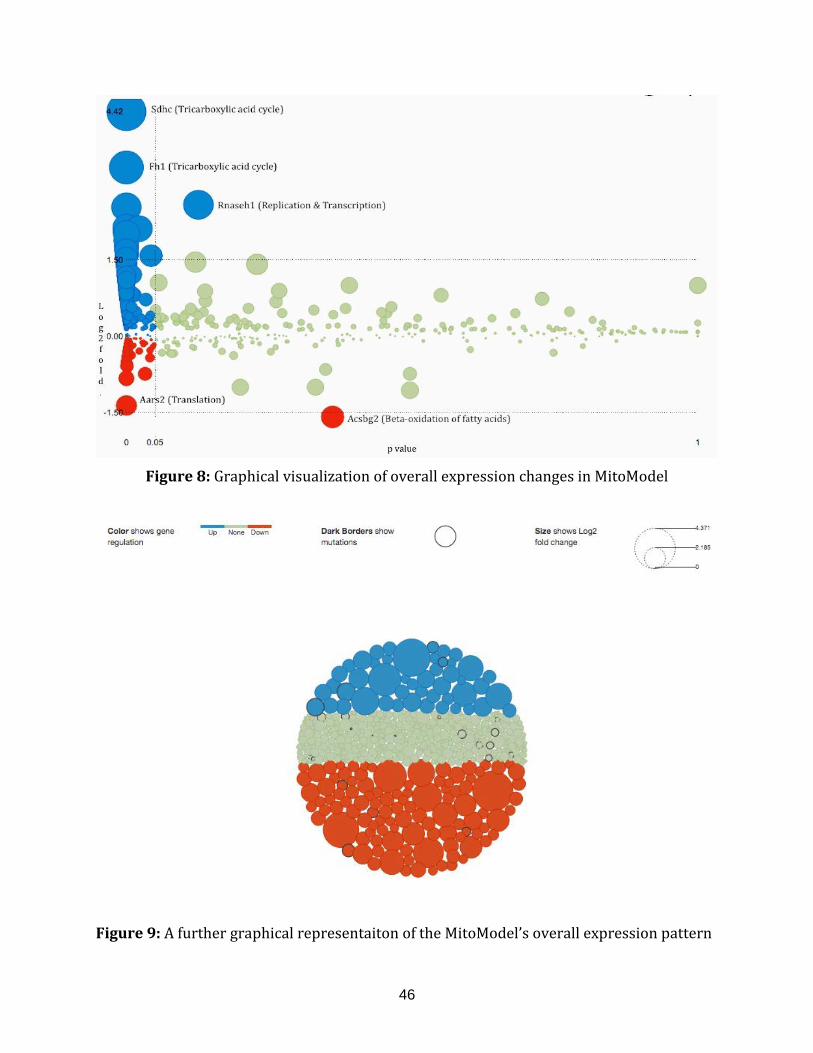
46
Figure 8: Graphical visualization of overall expression changes in MitoModel
Figure 9: A further graphical representaiton of the MitoModel’s overall expression pattern
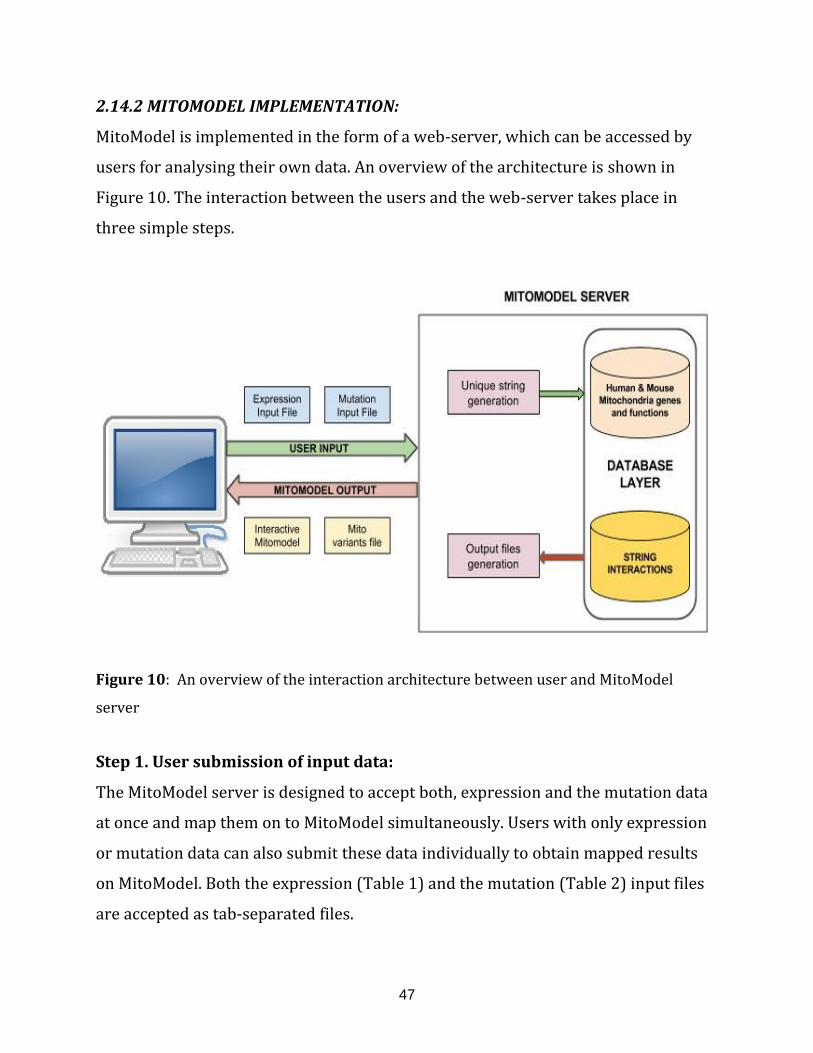
47
2.14.2 MITOMODEL IMPLEMENTATION:
MitoModel is implemented in the form of a web-server, which can be accessed by
users for analysing their own data. An overview of the architecture is shown in
Figure 10. The interaction between the users and the web-server takes place in
three simple steps.
Figure 10: An overview of the interaction architecture between user and MitoModel
server
Step 1. User submission of input data:
The MitoModel server is designed to accept both, expression and the mutation data
at once and map them on to MitoModel simultaneously. Users with only expression
or mutation data can also submit these data individually to obtain mapped results
on MitoModel. Both the expression (Table 1) and the mutation (Table 2) input files
are accepted as tab-separated files.
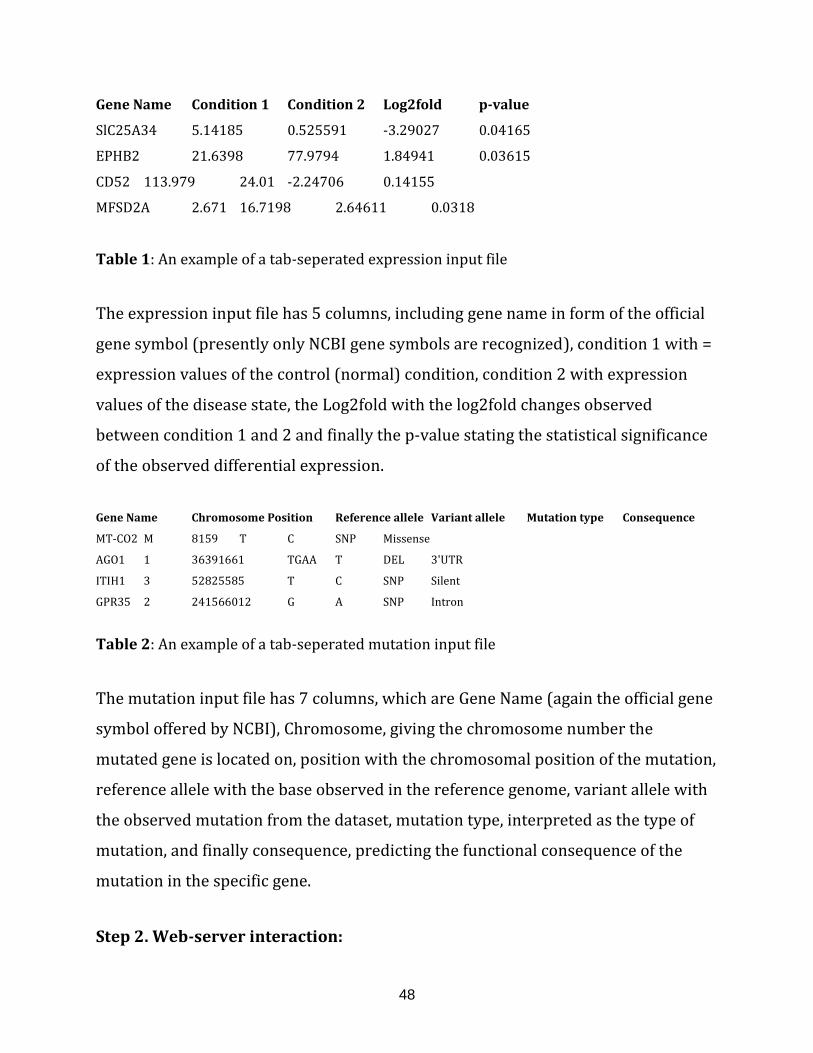
48
Gene Name Condition 1 Condition 2 Log2fold p-value
SlC25A34 5.14185 0.525591 -3.29027 0.04165
EPHB2 21.6398 77.9794 1.84941 0.03615
CD52 113.979 24.01 -2.24706 0.14155
MFSD2A 2.671 16.7198 2.64611 0.0318
Table 1: An example of a tab-seperated expression input file
The expression input file has 5 columns, including gene name in form of the official
gene symbol (presently only NCBI gene symbols are recognized), condition 1 with =
expression values of the control (normal) condition, condition 2 with expression
values of the disease state, the Log2fold with the log2fold changes observed
between condition 1 and 2 and finally the p-value stating the statistical significance
of the observed differential expression.
Gene Name Chromosome Position Reference allele Variant allele Mutation type Consequence
MT-CO2 M 8159 T C SNP Missense
AGO1 1 36391661 TGAA T DEL 3'UTR
ITIH1 3 52825585 T C SNP Silent
GPR35 2 241566012 G A SNP Intron
Table 2: An example of a tab-seperated mutation input file
The mutation input file has 7 columns, which are Gene Name (again the official gene
symbol offered by NCBI), Chromosome, giving the chromosome number the
mutated gene is located on, position with the chromosomal position of the mutation,
reference allele with the base observed in the reference genome, variant allele with
the observed mutation from the dataset, mutation type, interpreted as the type of
mutation, and finally consequence, predicting the functional consequence of the
mutation in the specific gene.
Step 2. Web-server interaction:
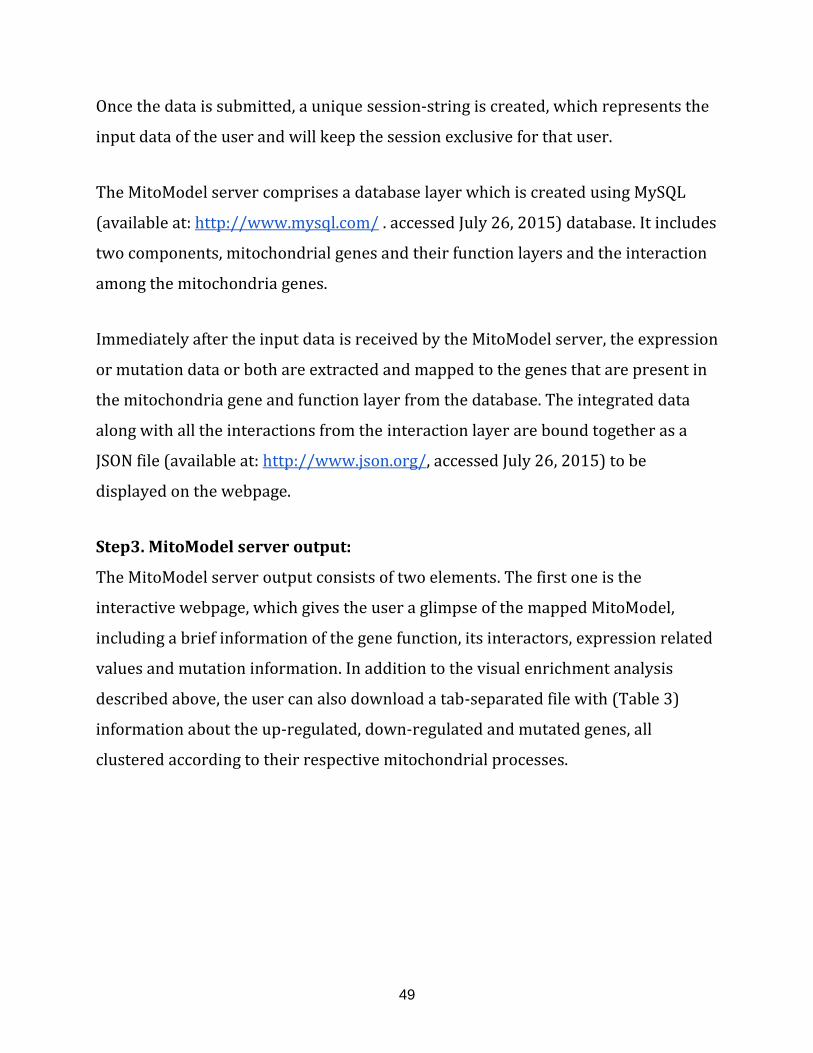
49
Once the data is submitted, a unique session-string is created, which represents the
input data of the user and will keep the session exclusive for that user.
The MitoModel server comprises a database layer which is created using MySQL
(available at: http://www.mysql.com/ . accessed July 26, 2015) database. It includes
two components, mitochondrial genes and their function layers and the interaction
among the mitochondria genes.
Immediately after the input data is received by the MitoModel server, the expression
or mutation data or both are extracted and mapped to the genes that are present in
the mitochondria gene and function layer from the database. The integrated data
along with all the interactions from the interaction layer are bound together as a
JSON file (available at: http://www.json.org/, accessed July 26, 2015) to be
displayed on the webpage.
Step3. MitoModel server output:
The MitoModel server output consists of two elements. The first one is the
interactive webpage, which gives the user a glimpse of the mapped MitoModel,
including a brief information of the gene function, its interactors, expression related
values and mutation information. In addition to the visual enrichment analysis
described above, the user can also download a tab-separated file with (Table 3)
information about the up-regulated, down-regulated and mutated genes, all
clustered according to their respective mitochondrial processes.
50
Table 3: An example of MitoModel variant output file
51
CHAPTER 3
RESULTS
3.1 Gene expression and mutation analysis using
MitoModel in three different aneuploidy cell lines
Aneuploidy refers to an abnormal chromosome count in a cell, whose chromosome
numbers are either greater or smaller than its wild type on the level of the whole
genome or part of it [Griffiths et al., 2000]. These extra copies of chromosomes are
detrimental to eukaryotic cells. In humans, chromosomal abnormalities are often
detected in cancer [Gordon et al., 2012], developmental growth, mental retardation
and multiple congenital malformations. The elementary process of how aneuploidy
is formed and what its consequences are to the cell remain illusive to date [Biancotti
& Benvenisty, 2011].
To further our knowledge on the underlying mechanisms of aneuploidy, aneuploid
cell lines were created in the lab of Zuzana Storchova. Three cell lines were created
in this project: tetrasomic derivatives of HCT116 carrying 4 additional copies of
chromosome 5 (HCT116 5/4), trisomic derivatives of RPE1 carrying 3 additional
copies of chromosome 5 and 12 (RPE1 5/3 12/3) and trisomic derivatives of RPE1
carrying 3 additional copies of chromosome 21 (RPE1H2B 21/3) [Stingele et al.,
2012]. Cell lines were further investigated by Dürrbaum et al in 2014, revealing that
complex aneuploidy exhibits the same pathway changes as simple trisomy and
tetrasomy [Dürrbaum et al., 2014].
52
3.1.1 TASK DESCRIPTION:
The data used for this task was generated at Max Planck institute of Biochemistry by
Milena Dürrbaum and Zuzana Storchová and provided for us for further analysis of
mitochondrial functions. The data included RNA-seq samples of HCT116 5/4, RPE1
5/3 12/3 and RPE1H2B 21/3 with their corresponding wild types. All sample were
provided with 3 biological replicates.
Our task was to deduce the differential expression and the mutation data specific for
each cell line and map them on to MitoModel to identify mitochondrial variations in
each cell line.
3.1.2 DATA ANALYSIS:
The mutation and expression data for each cell line and for each replicate were
generated by comparing aneuploidy cell lines with their wild type cell lines by
following the workflow defined in the section 2.13. Subsequently, only aneuploidy
specific variants were recorded and input files specifics for MitoModel were
prepared. The input files were prepared following the MitoModel format
specification described in the section 2.14.2.
The MitoModel input files for each cell line were then mapped to the MitoModel to
obtain individual MitoModels for each cell line.
3.1.3 MitoModel of the HCT116 5/4 cell line:
A simple depiction of the HCT116 5/4 MitoModel, after mapping the mutation and
expression input files, describes the nodes with mutations, as well as nodes, which
were up-regulated and down-regulated in respective functions (Figure 11).
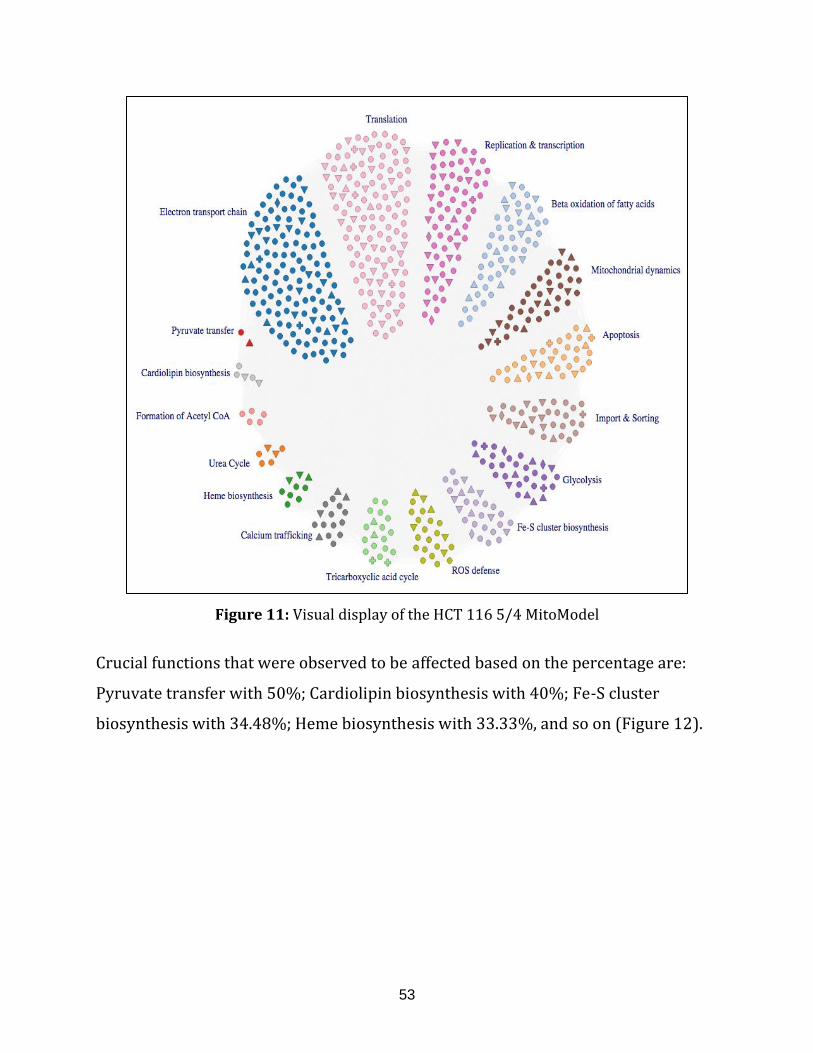
53
Figure 11: Visual display of the HCT 116 5/4 MitoModel
Crucial functions that were observed to be affected based on the percentage are:
Pyruvate transfer with 50%; Cardiolipin biosynthesis with 40%; Fe-S cluster
biosynthesis with 34.48%; Heme biosynthesis with 33.33%, and so on (Figure 12).
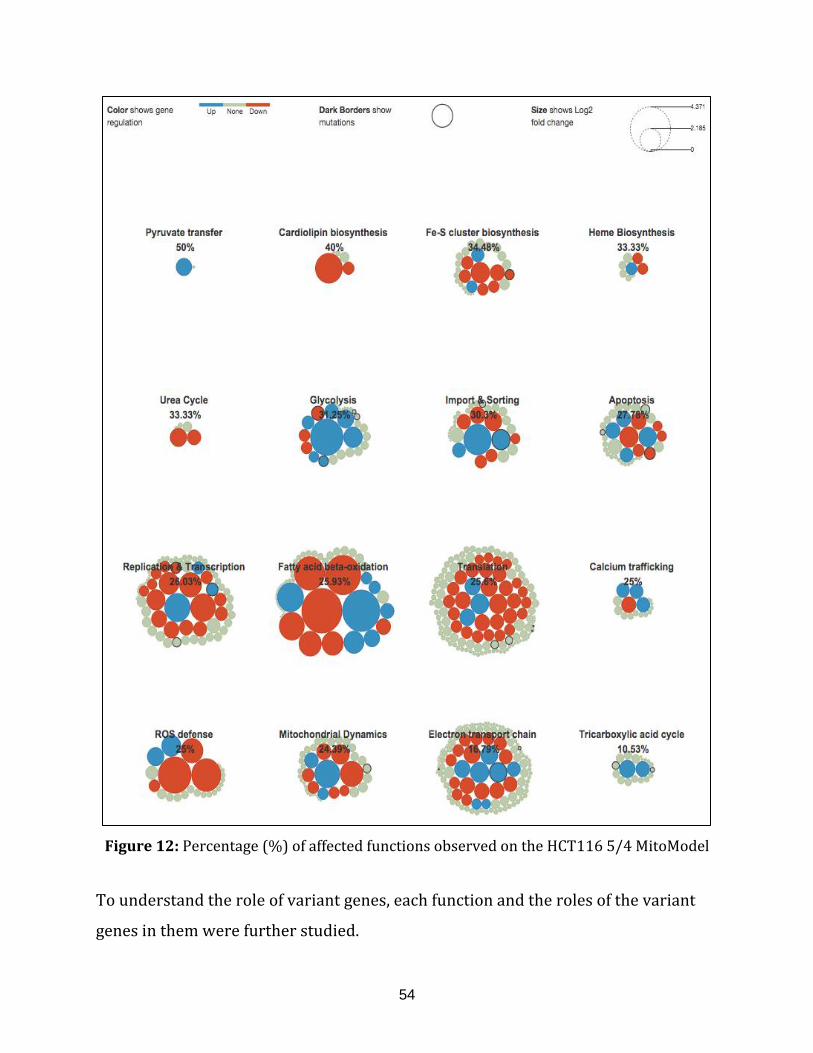
54
Figure 12: Percentage (%) of affected functions observed on the HCT116 5/4 MitoModel
To understand the role of variant genes, each function and the roles of the variant
genes in them were further studied.
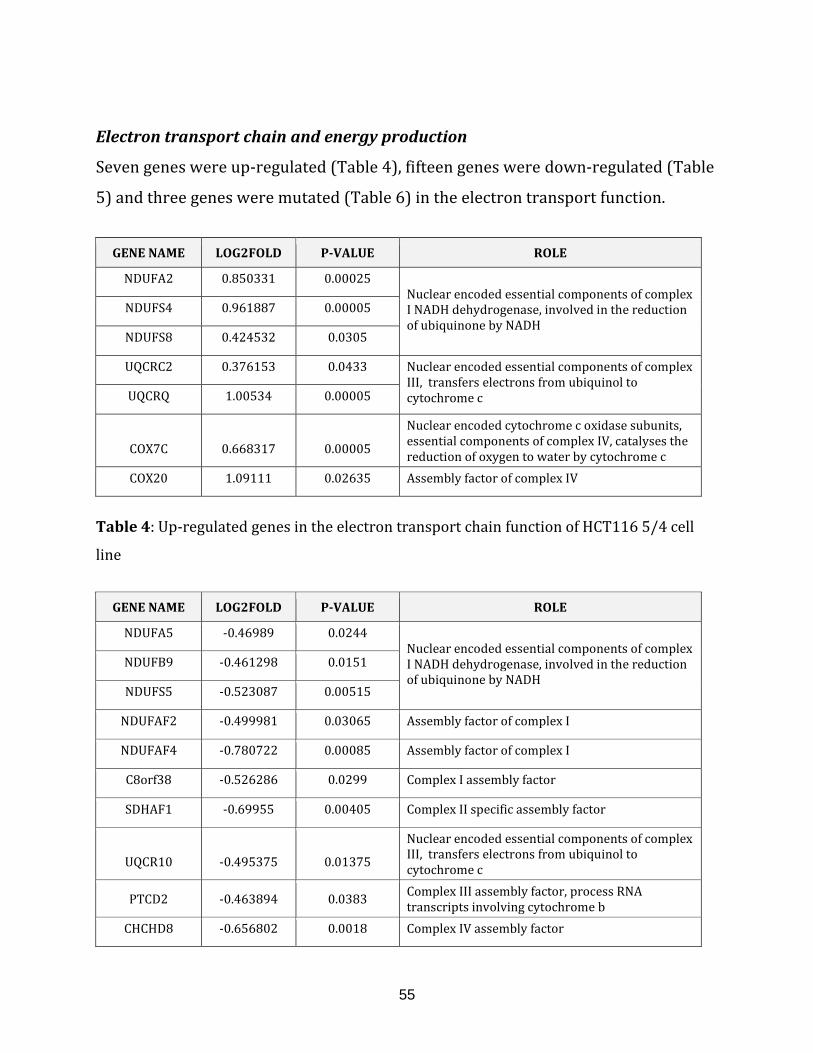
55
Electron transport chain and energy production
Seven genes were up-regulated (Table 4), fifteen genes were down-regulated (Table
5) and three genes were mutated (Table 6) in the electron transport function.
GENE NAME LOG2FOLD P-VALUE ROLE
NDUFA2 0.850331 0.00025 Nuclear encoded essential components of complex I NADH dehydrogenase, involved in the reduction of ubiquinone by NADH
NDUFS4 0.961887 0.00005
NDUFS8 0.424532 0.0305
UQCRC2 0.376153 0.0433 Nuclear encoded essential components of complex III, transfers electrons from ubiquinol to cytochrome c UQCRQ 1.00534 0.00005
COX7C 0.668317 0.00005
Nuclear encoded cytochrome c oxidase subunits, essential components of complex IV, catalyses the reduction of oxygen to water by cytochrome c
COX20 1.09111 0.02635 Assembly factor of complex IV
Table 4: Up-regulated genes in the electron transport chain function of HCT116 5/4 cell
line
GENE NAME LOG2FOLD P-VALUE ROLE
NDUFA5 -0.46989 0.0244 Nuclear encoded essential components of complex I NADH dehydrogenase, involved in the reduction of ubiquinone by NADH
NDUFB9 -0.461298 0.0151
NDUFS5 -0.523087 0.00515
NDUFAF2 -0.499981 0.03065 Assembly factor of complex I
NDUFAF4 -0.780722 0.00085 Assembly factor of complex I
C8orf38 -0.526286 0.0299 Complex I assembly factor
SDHAF1 -0.69955 0.00405 Complex II specific assembly factor
UQCR10 -0.495375 0.01375
Nuclear encoded essential components of complex III, transfers electrons from ubiquinol to cytochrome c
PTCD2 -0.463894 0.0383 Complex III assembly factor, process RNA transcripts involving cytochrome b
CHCHD8 -0.656802 0.0018 Complex IV assembly factor
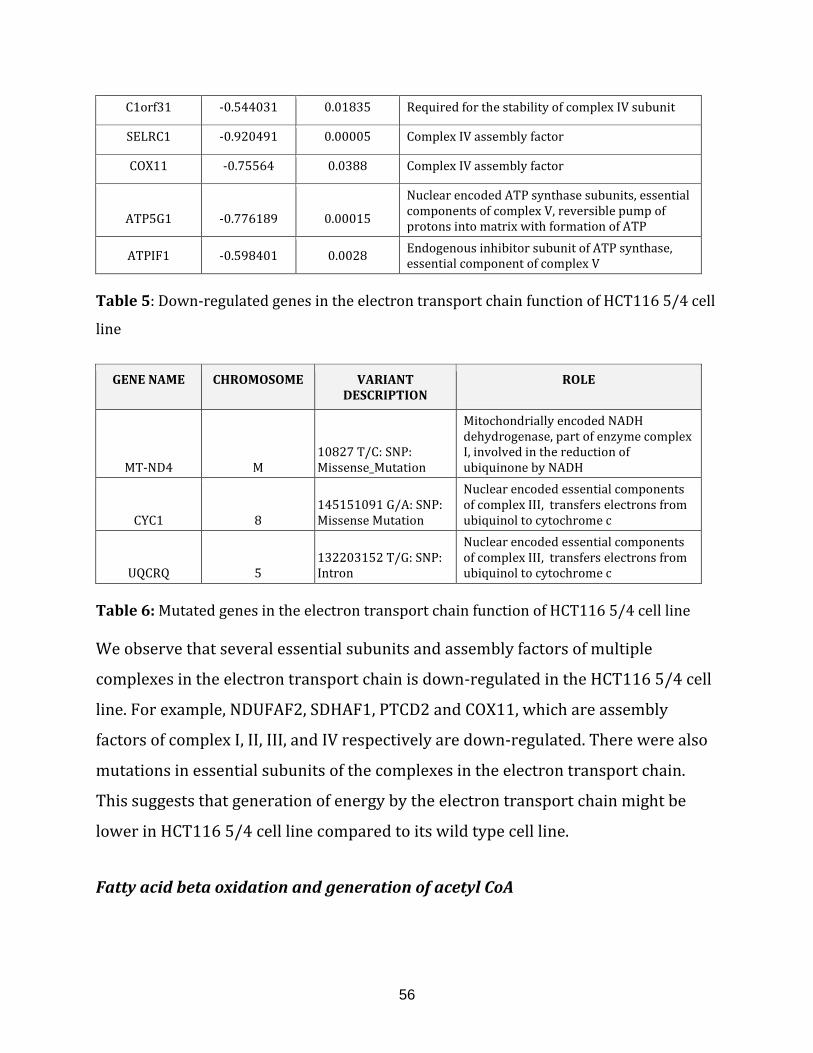
56
C1orf31 -0.544031 0.01835 Required for the stability of complex IV subunit
SELRC1 -0.920491 0.00005 Complex IV assembly factor
COX11 -0.75564 0.0388 Complex IV assembly factor
ATP5G1 -0.776189 0.00015
Nuclear encoded ATP synthase subunits, essential components of complex V, reversible pump of protons into matrix with formation of ATP
ATPIF1 -0.598401 0.0028 Endogenous inhibitor subunit of ATP synthase, essential component of complex V
Table 5: Down-regulated genes in the electron transport chain function of HCT116 5/4 cell
line
GENE NAME CHROMOSOME VARIANT DESCRIPTION
ROLE
MT-ND4 M
10827 T/C: SNP: Missense_Mutation
Mitochondrially encoded NADH dehydrogenase, part of enzyme complex I, involved in the reduction of ubiquinone by NADH
CYC1 8
145151091 G/A: SNP: Missense Mutation
Nuclear encoded essential components of complex III, transfers electrons from ubiquinol to cytochrome c
UQCRQ 5 132203152 T/G: SNP: Intron
Nuclear encoded essential components of complex III, transfers electrons from ubiquinol to cytochrome c
Table 6: Mutated genes in the electron transport chain function of HCT116 5/4 cell line We observe that several essential subunits and assembly factors of multiple
complexes in the electron transport chain is down-regulated in the HCT116 5/4 cell
line. For example, NDUFAF2, SDHAF1, PTCD2 and COX11, which are assembly
factors of complex I, II, III, and IV respectively are down-regulated. There were also
mutations in essential subunits of the complexes in the electron transport chain.
This suggests that generation of energy by the electron transport chain might be
lower in HCT116 5/4 cell line compared to its wild type cell line.
Fatty acid beta oxidation and generation of acetyl CoA
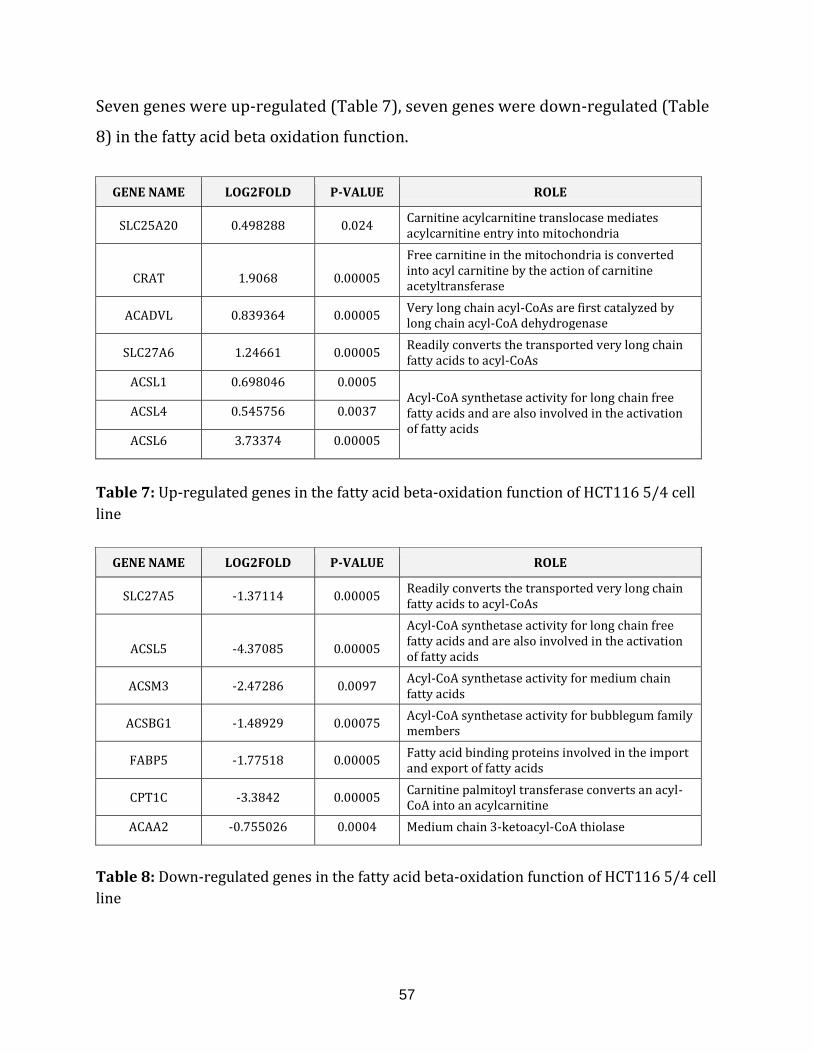
57
Seven genes were up-regulated (Table 7), seven genes were down-regulated (Table
8) in the fatty acid beta oxidation function.
GENE NAME LOG2FOLD P-VALUE ROLE
SLC25A20 0.498288 0.024 Carnitine acylcarnitine translocase mediates acylcarnitine entry into mitochondria
CRAT 1.9068 0.00005
Free carnitine in the mitochondria is converted into acyl carnitine by the action of carnitine acetyltransferase
ACADVL 0.839364 0.00005 Very long chain acyl-CoAs are first catalyzed by long chain acyl-CoA dehydrogenase
SLC27A6 1.24661 0.00005 Readily converts the transported very long chain fatty acids to acyl-CoAs
ACSL1 0.698046 0.0005 Acyl-CoA synthetase activity for long chain free fatty acids and are also involved in the activation of fatty acids
ACSL4 0.545756 0.0037
ACSL6 3.73374 0.00005
Table 7: Up-regulated genes in the fatty acid beta-oxidation function of HCT116 5/4 cell
line
GENE NAME LOG2FOLD P-VALUE ROLE
SLC27A5 -1.37114 0.00005 Readily converts the transported very long chain fatty acids to acyl-CoAs
ACSL5 -4.37085 0.00005
Acyl-CoA synthetase activity for long chain free fatty acids and are also involved in the activation of fatty acids
ACSM3 -2.47286 0.0097 Acyl-CoA synthetase activity for medium chain fatty acids
ACSBG1 -1.48929 0.00075 Acyl-CoA synthetase activity for bubblegum family members
FABP5 -1.77518 0.00005 Fatty acid binding proteins involved in the import and export of fatty acids
CPT1C -3.3842 0.00005 Carnitine palmitoyl transferase converts an acyl-CoA into an acylcarnitine
ACAA2 -0.755026 0.0004 Medium chain 3-ketoacyl-CoA thiolase
Table 8: Down-regulated genes in the fatty acid beta-oxidation function of HCT116 5/4 cell
line
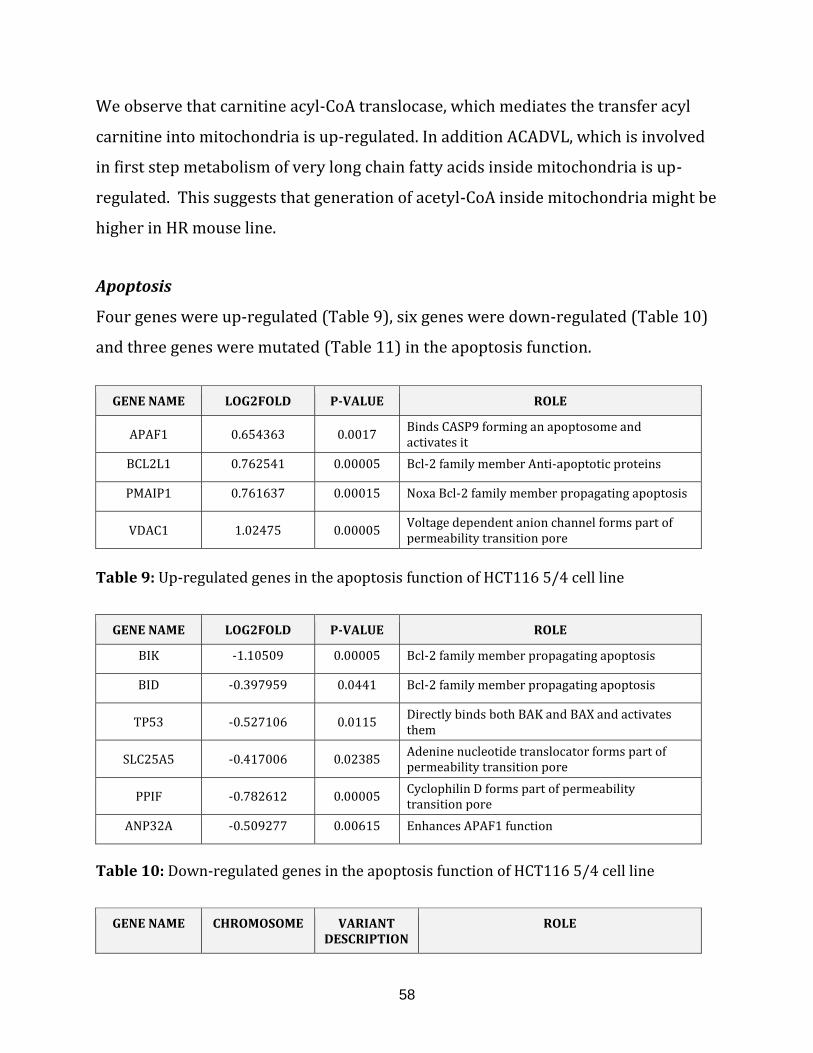
58
We observe that carnitine acyl-CoA translocase, which mediates the transfer acyl
carnitine into mitochondria is up-regulated. In addition ACADVL, which is involved
in first step metabolism of very long chain fatty acids inside mitochondria is up-
regulated. This suggests that generation of acetyl-CoA inside mitochondria might be
higher in HR mouse line.
Apoptosis
Four genes were up-regulated (Table 9), six genes were down-regulated (Table 10)
and three genes were mutated (Table 11) in the apoptosis function.
GENE NAME LOG2FOLD P-VALUE ROLE
APAF1 0.654363 0.0017 Binds CASP9 forming an apoptosome and activates it
BCL2L1 0.762541 0.00005 Bcl-2 family member Anti-apoptotic proteins
PMAIP1 0.761637 0.00015 Noxa Bcl-2 family member propagating apoptosis
VDAC1 1.02475 0.00005 Voltage dependent anion channel forms part of permeability transition pore
Table 9: Up-regulated genes in the apoptosis function of HCT116 5/4 cell line
GENE NAME LOG2FOLD P-VALUE ROLE
BIK -1.10509 0.00005 Bcl-2 family member propagating apoptosis
BID -0.397959 0.0441 Bcl-2 family member propagating apoptosis
TP53 -0.527106 0.0115 Directly binds both BAK and BAX and activates them
SLC25A5 -0.417006 0.02385 Adenine nucleotide translocator forms part of permeability transition pore
PPIF -0.782612 0.00005 Cyclophilin D forms part of permeability transition pore
ANP32A -0.509277 0.00615 Enhances APAF1 function
Table 10: Down-regulated genes in the apoptosis function of HCT116 5/4 cell line
GENE NAME CHROMOSOME VARIANT DESCRIPTION
ROLE
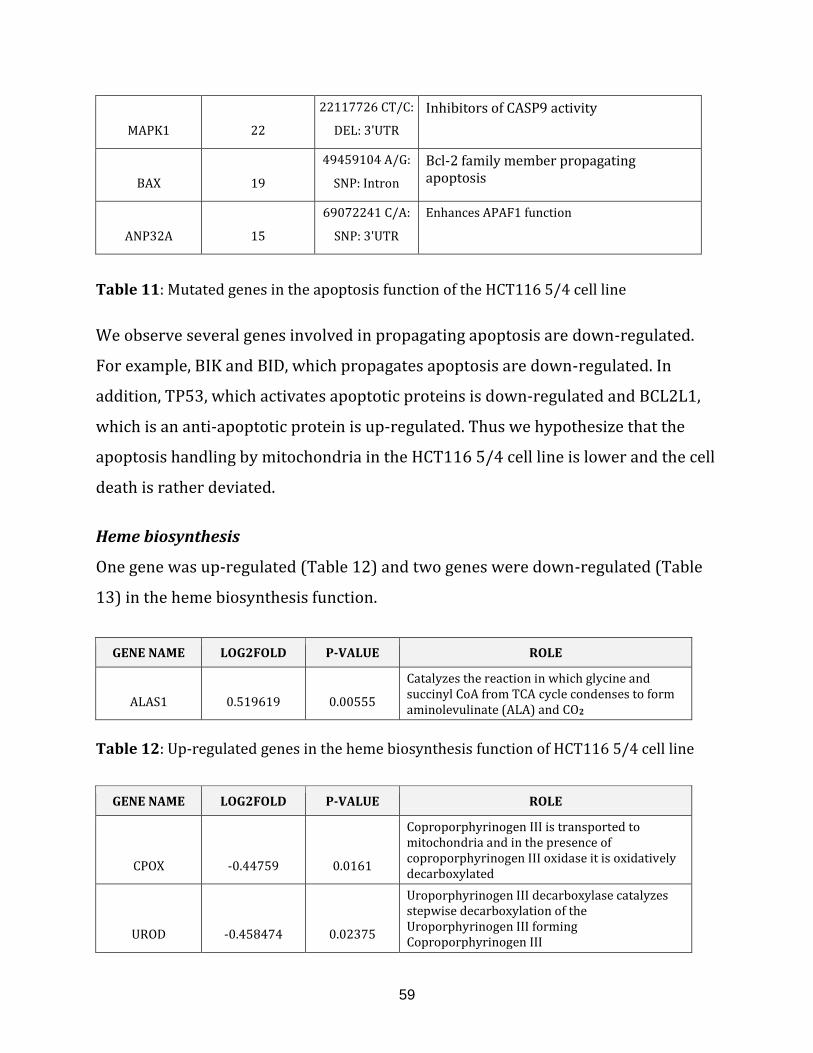
59
MAPK1 22
22117726 CT/C:
DEL: 3'UTR
Inhibitors of CASP9 activity
BAX 19
49459104 A/G:
SNP: Intron
Bcl-2 family member propagating apoptosis
ANP32A 15
69072241 C/A:
SNP: 3'UTR
Enhances APAF1 function
Table 11: Mutated genes in the apoptosis function of the HCT116 5/4 cell line
We observe several genes involved in propagating apoptosis are down-regulated.
For example, BIK and BID, which propagates apoptosis are down-regulated. In
addition, TP53, which activates apoptotic proteins is down-regulated and BCL2L1,
which is an anti-apoptotic protein is up-regulated. Thus we hypothesize that the
apoptosis handling by mitochondria in the HCT116 5/4 cell line is lower and the cell
death is rather deviated.
Heme biosynthesis
One gene was up-regulated (Table 12) and two genes were down-regulated (Table
13) in the heme biosynthesis function.
GENE NAME LOG2FOLD P-VALUE ROLE
ALAS1 0.519619 0.00555
Catalyzes the reaction in which glycine and succinyl CoA from TCA cycle condenses to form aminolevulinate (ALA) and CO2
Table 12: Up-regulated genes in the heme biosynthesis function of HCT116 5/4 cell line
GENE NAME LOG2FOLD P-VALUE ROLE
CPOX -0.44759 0.0161
Coproporphyrinogen III is transported to mitochondria and in the presence of coproporphyrinogen III oxidase it is oxidatively decarboxylated
UROD -0.458474 0.02375
Uroporphyrinogen III decarboxylase catalyzes stepwise decarboxylation of the Uroporphyrinogen III forming Coproporphyrinogen III
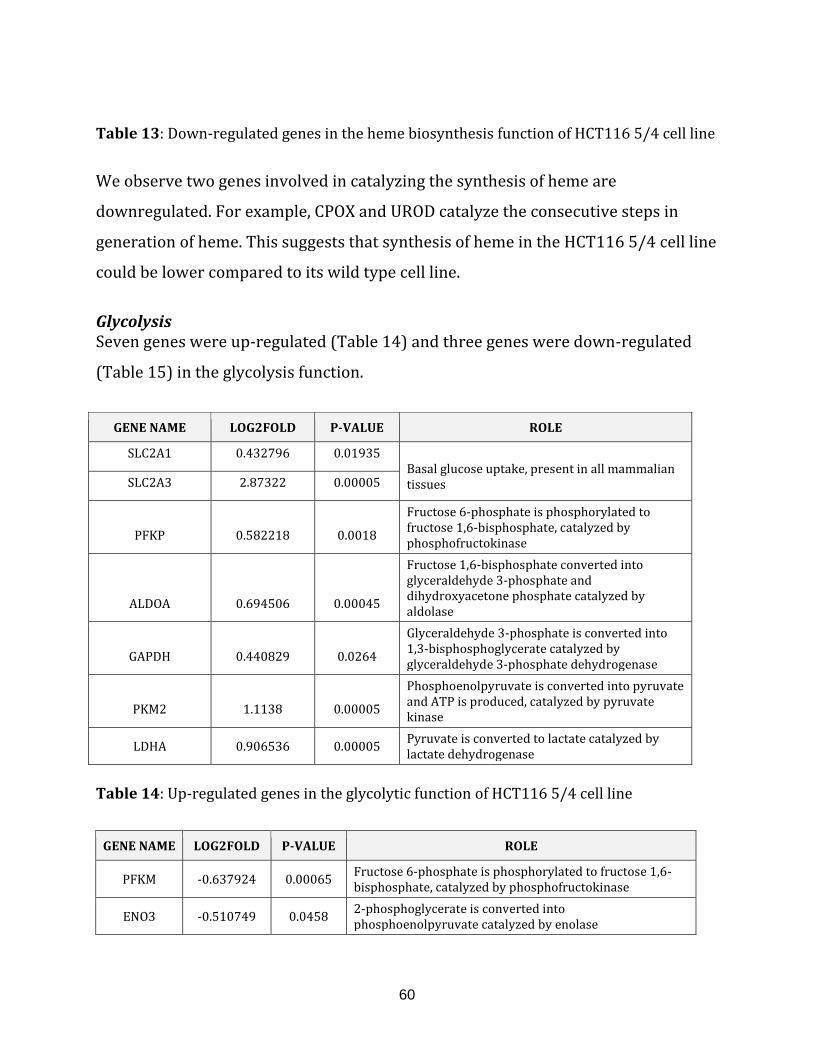
60
Table 13: Down-regulated genes in the heme biosynthesis function of HCT116 5/4 cell line
We observe two genes involved in catalyzing the synthesis of heme are
downregulated. For example, CPOX and UROD catalyze the consecutive steps in
generation of heme. This suggests that synthesis of heme in the HCT116 5/4 cell line
could be lower compared to its wild type cell line.
Glycolysis Seven genes were up-regulated (Table 14) and three genes were down-regulated
(Table 15) in the glycolysis function.
GENE NAME LOG2FOLD P-VALUE ROLE
SLC2A1 0.432796 0.01935 Basal glucose uptake, present in all mammalian tissues SLC2A3 2.87322 0.00005
PFKP 0.582218 0.0018
Fructose 6-phosphate is phosphorylated to fructose 1,6-bisphosphate, catalyzed by phosphofructokinase
ALDOA 0.694506 0.00045
Fructose 1,6-bisphosphate converted into glyceraldehyde 3-phosphate and dihydroxyacetone phosphate catalyzed by aldolase
GAPDH 0.440829 0.0264
Glyceraldehyde 3-phosphate is converted into 1,3-bisphosphoglycerate catalyzed by glyceraldehyde 3-phosphate dehydrogenase
PKM2 1.1138 0.00005
Phosphoenolpyruvate is converted into pyruvate and ATP is produced, catalyzed by pyruvate kinase
LDHA 0.906536 0.00005 Pyruvate is converted to lactate catalyzed by lactate dehydrogenase
Table 14: Up-regulated genes in the glycolytic function of HCT116 5/4 cell line
GENE NAME LOG2FOLD P-VALUE ROLE
PFKM -0.637924 0.00065 Fructose 6-phosphate is phosphorylated to fructose 1,6-bisphosphate, catalyzed by phosphofructokinase
ENO3 -0.510749 0.0458 2-phosphoglycerate is converted into phosphoenolpyruvate catalyzed by enolase
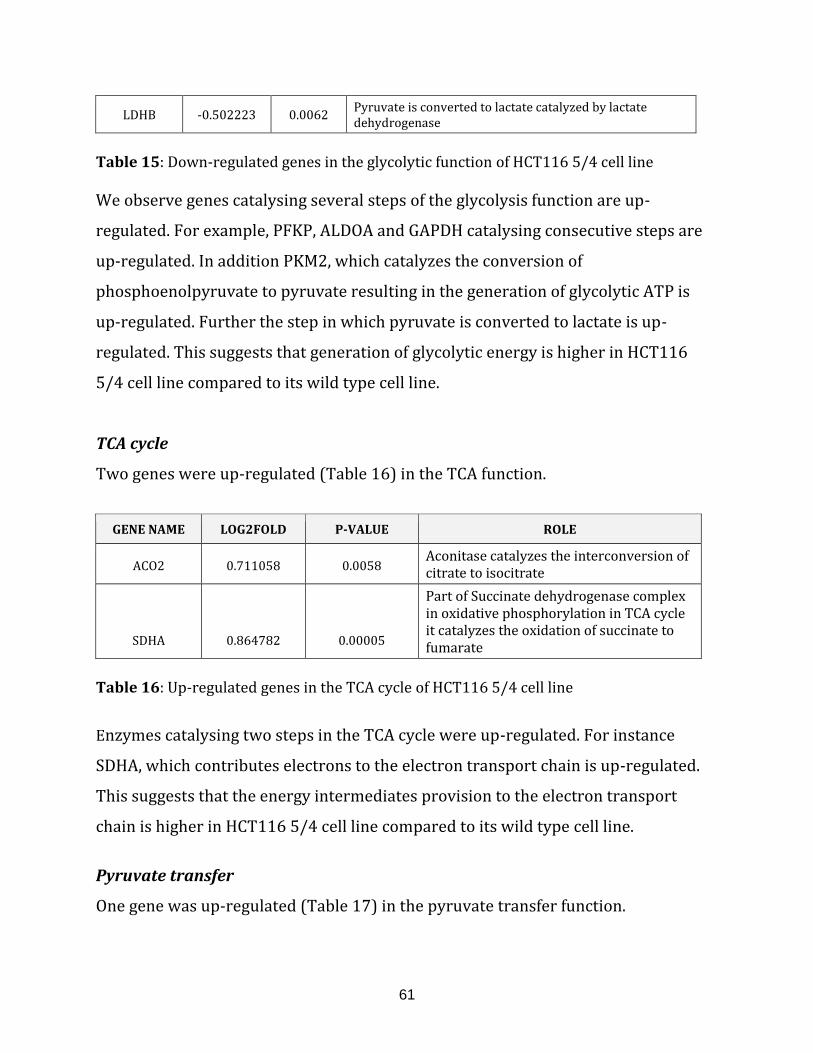
61
LDHB -0.502223 0.0062 Pyruvate is converted to lactate catalyzed by lactate dehydrogenase
Table 15: Down-regulated genes in the glycolytic function of HCT116 5/4 cell line We observe genes catalysing several steps of the glycolysis function are up-
regulated. For example, PFKP, ALDOA and GAPDH catalysing consecutive steps are
up-regulated. In addition PKM2, which catalyzes the conversion of
phosphoenolpyruvate to pyruvate resulting in the generation of glycolytic ATP is
up-regulated. Further the step in which pyruvate is converted to lactate is up-
regulated. This suggests that generation of glycolytic energy is higher in HCT116
5/4 cell line compared to its wild type cell line.
TCA cycle
Two genes were up-regulated (Table 16) in the TCA function.
GENE NAME LOG2FOLD P-VALUE ROLE
ACO2 0.711058 0.0058 Aconitase catalyzes the interconversion of citrate to isocitrate
SDHA 0.864782 0.00005
Part of Succinate dehydrogenase complex in oxidative phosphorylation in TCA cycle it catalyzes the oxidation of succinate to fumarate
Table 16: Up-regulated genes in the TCA cycle of HCT116 5/4 cell line
Enzymes catalysing two steps in the TCA cycle were up-regulated. For instance
SDHA, which contributes electrons to the electron transport chain is up-regulated.
This suggests that the energy intermediates provision to the electron transport
chain is higher in HCT116 5/4 cell line compared to its wild type cell line.
Pyruvate transfer
One gene was up-regulated (Table 17) in the pyruvate transfer function.
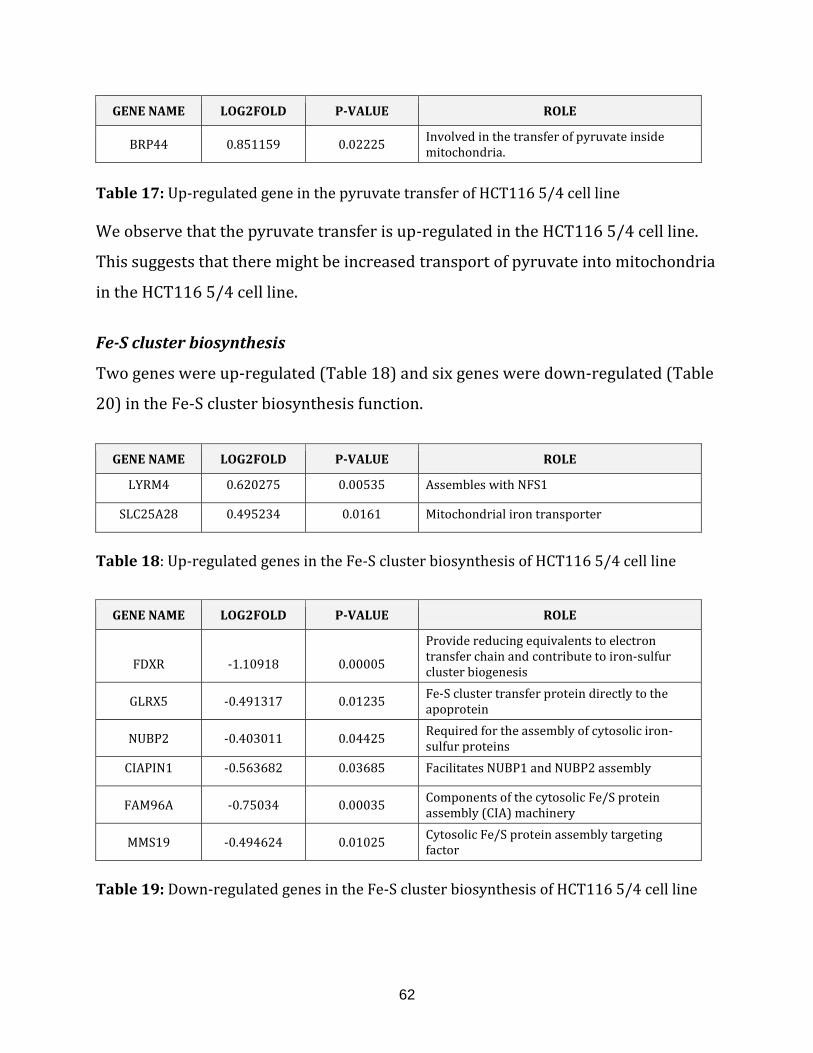
62
GENE NAME LOG2FOLD P-VALUE ROLE
BRP44 0.851159 0.02225 Involved in the transfer of pyruvate inside mitochondria.
Table 17: Up-regulated gene in the pyruvate transfer of HCT116 5/4 cell line We observe that the pyruvate transfer is up-regulated in the HCT116 5/4 cell line.
This suggests that there might be increased transport of pyruvate into mitochondria
in the HCT116 5/4 cell line.
Fe-S cluster biosynthesis
Two genes were up-regulated (Table 18) and six genes were down-regulated (Table
20) in the Fe-S cluster biosynthesis function.
GENE NAME LOG2FOLD P-VALUE ROLE
LYRM4 0.620275 0.00535 Assembles with NFS1
SLC25A28 0.495234 0.0161 Mitochondrial iron transporter
Table 18: Up-regulated genes in the Fe-S cluster biosynthesis of HCT116 5/4 cell line
GENE NAME LOG2FOLD P-VALUE ROLE
FDXR -1.10918 0.00005
Provide reducing equivalents to electron transfer chain and contribute to iron-sulfur cluster biogenesis
GLRX5 -0.491317 0.01235 Fe-S cluster transfer protein directly to the apoprotein
NUBP2 -0.403011 0.04425 Required for the assembly of cytosolic iron-sulfur proteins
CIAPIN1 -0.563682 0.03685 Facilitates NUBP1 and NUBP2 assembly
FAM96A -0.75034 0.00035 Components of the cytosolic Fe/S protein assembly (CIA) machinery
MMS19 -0.494624 0.01025 Cytosolic Fe/S protein assembly targeting factor
Table 19: Down-regulated genes in the Fe-S cluster biosynthesis of HCT116 5/4 cell line
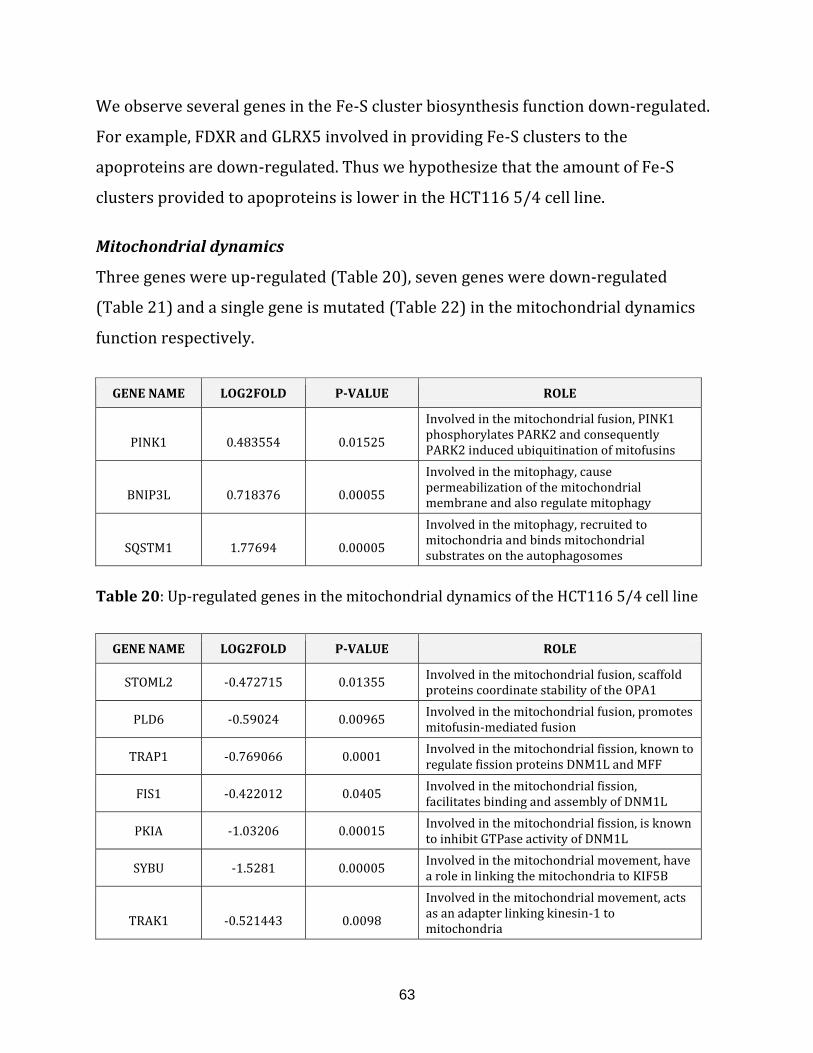
63
We observe several genes in the Fe-S cluster biosynthesis function down-regulated.
For example, FDXR and GLRX5 involved in providing Fe-S clusters to the
apoproteins are down-regulated. Thus we hypothesize that the amount of Fe-S
clusters provided to apoproteins is lower in the HCT116 5/4 cell line.
Mitochondrial dynamics
Three genes were up-regulated (Table 20), seven genes were down-regulated
(Table 21) and a single gene is mutated (Table 22) in the mitochondrial dynamics
function respectively.
GENE NAME LOG2FOLD P-VALUE ROLE
PINK1 0.483554 0.01525
Involved in the mitochondrial fusion, PINK1 phosphorylates PARK2 and consequently PARK2 induced ubiquitination of mitofusins
BNIP3L 0.718376 0.00055
Involved in the mitophagy, cause permeabilization of the mitochondrial membrane and also regulate mitophagy
SQSTM1 1.77694 0.00005
Involved in the mitophagy, recruited to mitochondria and binds mitochondrial substrates on the autophagosomes
Table 20: Up-regulated genes in the mitochondrial dynamics of the HCT116 5/4 cell line
GENE NAME LOG2FOLD P-VALUE ROLE
STOML2 -0.472715 0.01355 Involved in the mitochondrial fusion, scaffold proteins coordinate stability of the OPA1
PLD6 -0.59024 0.00965 Involved in the mitochondrial fusion, promotes mitofusin-mediated fusion
TRAP1 -0.769066 0.0001 Involved in the mitochondrial fission, known to regulate fission proteins DNM1L and MFF
FIS1 -0.422012 0.0405 Involved in the mitochondrial fission, facilitates binding and assembly of DNM1L
PKIA -1.03206 0.00015 Involved in the mitochondrial fission, is known to inhibit GTPase activity of DNM1L
SYBU -1.5281 0.00005 Involved in the mitochondrial movement, have a role in linking the mitochondria to KIF5B
TRAK1 -0.521443 0.0098
Involved in the mitochondrial movement, acts as an adapter linking kinesin-1 to mitochondria
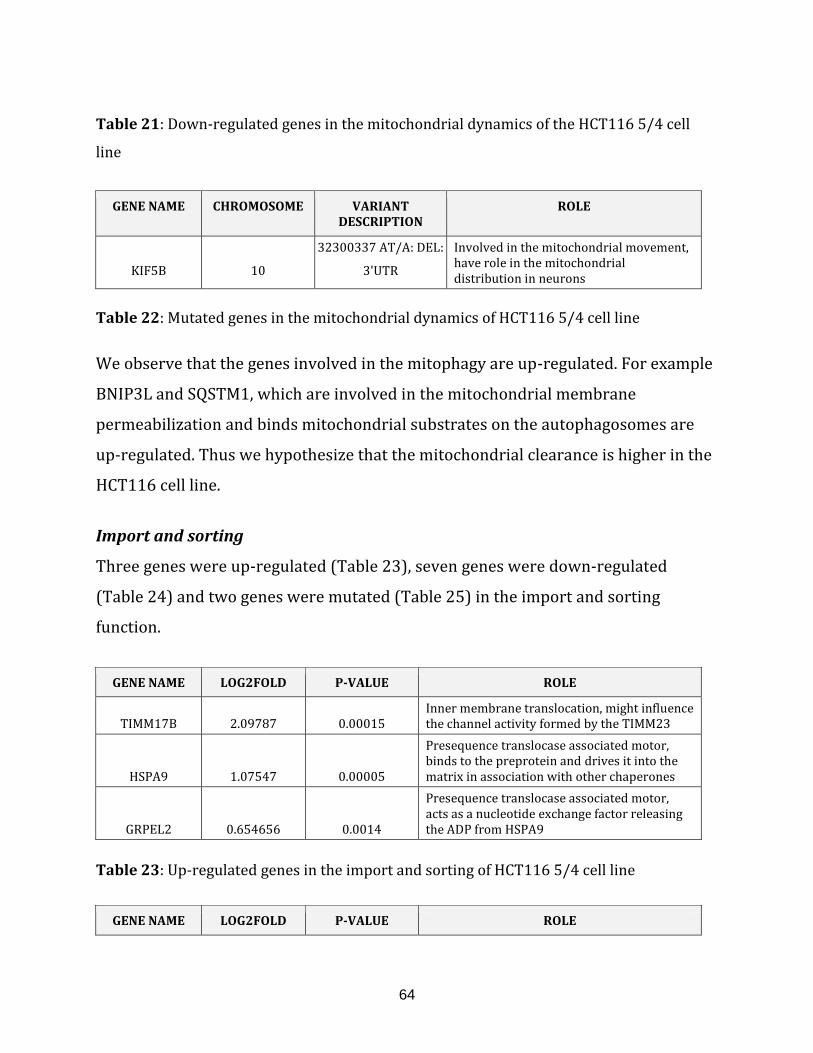
64
Table 21: Down-regulated genes in the mitochondrial dynamics of the HCT116 5/4 cell
line
GENE NAME CHROMOSOME VARIANT DESCRIPTION
ROLE
KIF5B 10
32300337 AT/A: DEL:
3'UTR
Involved in the mitochondrial movement, have role in the mitochondrial distribution in neurons
Table 22: Mutated genes in the mitochondrial dynamics of HCT116 5/4 cell line
We observe that the genes involved in the mitophagy are up-regulated. For example
BNIP3L and SQSTM1, which are involved in the mitochondrial membrane
permeabilization and binds mitochondrial substrates on the autophagosomes are
up-regulated. Thus we hypothesize that the mitochondrial clearance is higher in the
HCT116 cell line.
Import and sorting
Three genes were up-regulated (Table 23), seven genes were down-regulated
(Table 24) and two genes were mutated (Table 25) in the import and sorting
function.
GENE NAME LOG2FOLD P-VALUE ROLE
TIMM17B 2.09787 0.00015 Inner membrane translocation, might influence the channel activity formed by the TIMM23
HSPA9 1.07547 0.00005
Presequence translocase associated motor, binds to the preprotein and drives it into the matrix in association with other chaperones
GRPEL2 0.654656 0.0014
Presequence translocase associated motor, acts as a nucleotide exchange factor releasing the ADP from HSPA9
Table 23: Up-regulated genes in the import and sorting of HCT116 5/4 cell line
GENE NAME LOG2FOLD P-VALUE ROLE
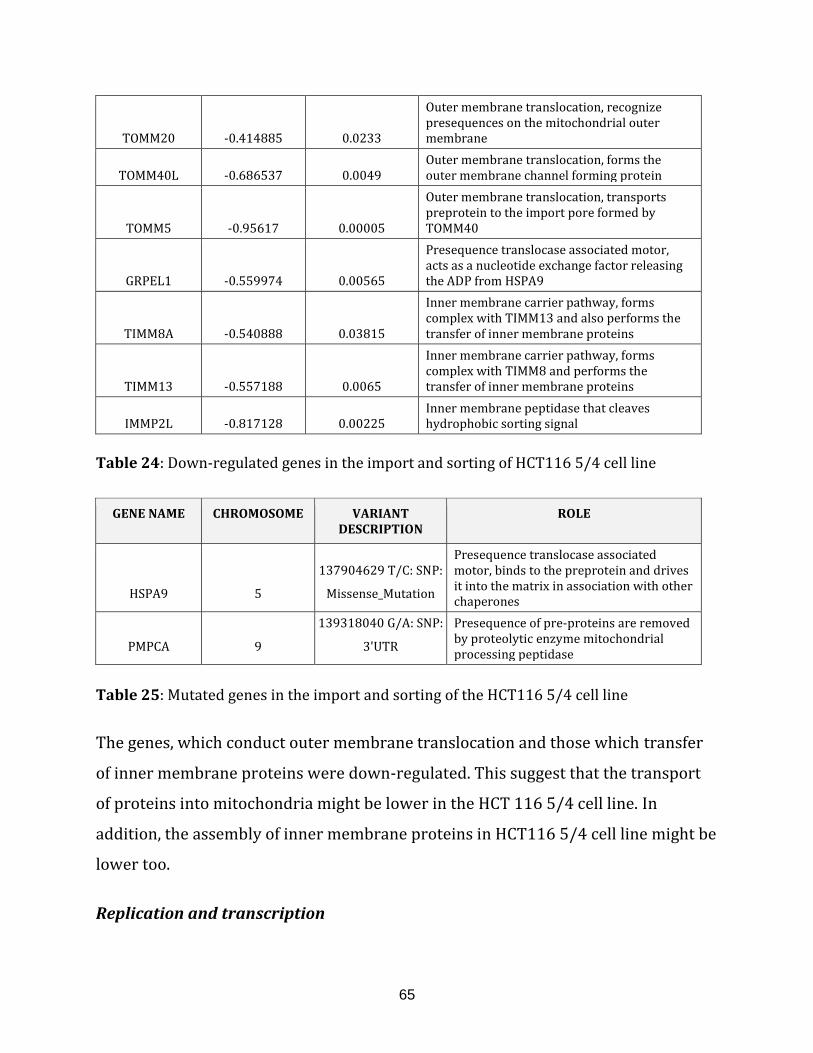
65
TOMM20 -0.414885 0.0233
Outer membrane translocation, recognize presequences on the mitochondrial outer membrane
TOMM40L -0.686537 0.0049
Outer membrane translocation, forms the outer membrane channel forming protein
TOMM5 -0.95617 0.00005
Outer membrane translocation, transports preprotein to the import pore formed by TOMM40
GRPEL1 -0.559974 0.00565
Presequence translocase associated motor, acts as a nucleotide exchange factor releasing the ADP from HSPA9
TIMM8A -0.540888 0.03815
Inner membrane carrier pathway, forms complex with TIMM13 and also performs the transfer of inner membrane proteins
TIMM13 -0.557188 0.0065
Inner membrane carrier pathway, forms complex with TIMM8 and performs the transfer of inner membrane proteins
IMMP2L -0.817128 0.00225 Inner membrane peptidase that cleaves hydrophobic sorting signal
Table 24: Down-regulated genes in the import and sorting of HCT116 5/4 cell line
GENE NAME CHROMOSOME VARIANT DESCRIPTION
ROLE
HSPA9 5
137904629 T/C: SNP:
Missense_Mutation
Presequence translocase associated motor, binds to the preprotein and drives it into the matrix in association with other chaperones
PMPCA 9
139318040 G/A: SNP:
3'UTR
Presequence of pre-proteins are removed by proteolytic enzyme mitochondrial processing peptidase
Table 25: Mutated genes in the import and sorting of the HCT116 5/4 cell line
The genes, which conduct outer membrane translocation and those which transfer
of inner membrane proteins were down-regulated. This suggest that the transport
of proteins into mitochondria might be lower in the HCT 116 5/4 cell line. In
addition, the assembly of inner membrane proteins in HCT116 5/4 cell line might be
lower too.
Replication and transcription
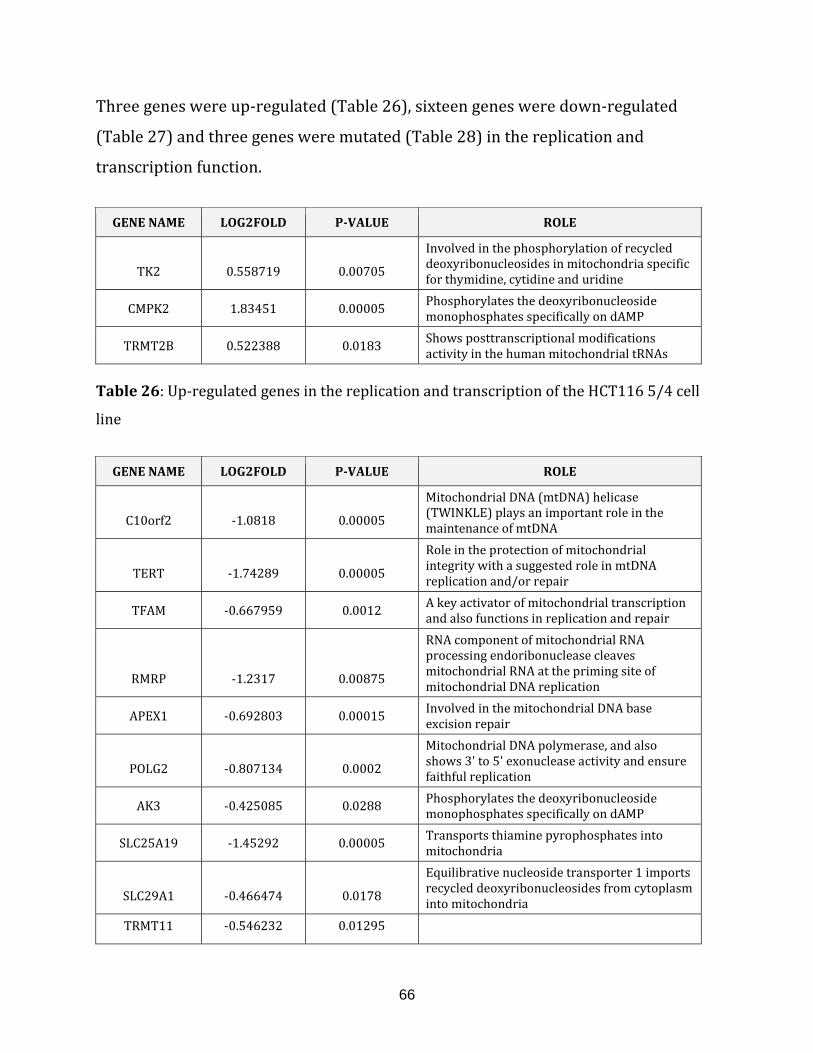
66
Three genes were up-regulated (Table 26), sixteen genes were down-regulated
(Table 27) and three genes were mutated (Table 28) in the replication and
transcription function.
GENE NAME LOG2FOLD P-VALUE ROLE
TK2 0.558719 0.00705
Involved in the phosphorylation of recycled deoxyribonucleosides in mitochondria specific for thymidine, cytidine and uridine
CMPK2 1.83451 0.00005 Phosphorylates the deoxyribonucleoside monophosphates specifically on dAMP
TRMT2B 0.522388 0.0183 Shows posttranscriptional modifications activity in the human mitochondrial tRNAs
Table 26: Up-regulated genes in the replication and transcription of the HCT116 5/4 cell
line
GENE NAME LOG2FOLD P-VALUE ROLE
C10orf2 -1.0818 0.00005
Mitochondrial DNA (mtDNA) helicase (TWINKLE) plays an important role in the maintenance of mtDNA
TERT -1.74289 0.00005
Role in the protection of mitochondrial integrity with a suggested role in mtDNA replication and/or repair
TFAM -0.667959 0.0012 A key activator of mitochondrial transcription and also functions in replication and repair
RMRP -1.2317 0.00875
RNA component of mitochondrial RNA processing endoribonuclease cleaves mitochondrial RNA at the priming site of mitochondrial DNA replication
APEX1 -0.692803 0.00015 Involved in the mitochondrial DNA base excision repair
POLG2 -0.807134 0.0002
Mitochondrial DNA polymerase, and also shows 3' to 5' exonuclease activity and ensure faithful replication
AK3 -0.425085 0.0288 Phosphorylates the deoxyribonucleoside monophosphates specifically on dAMP
SLC25A19 -1.45292 0.00005 Transports thiamine pyrophosphates into mitochondria
SLC29A1 -0.466474 0.0178
Equilibrative nucleoside transporter 1 imports recycled deoxyribonucleosides from cytoplasm into mitochondria
TRMT11 -0.546232 0.01295
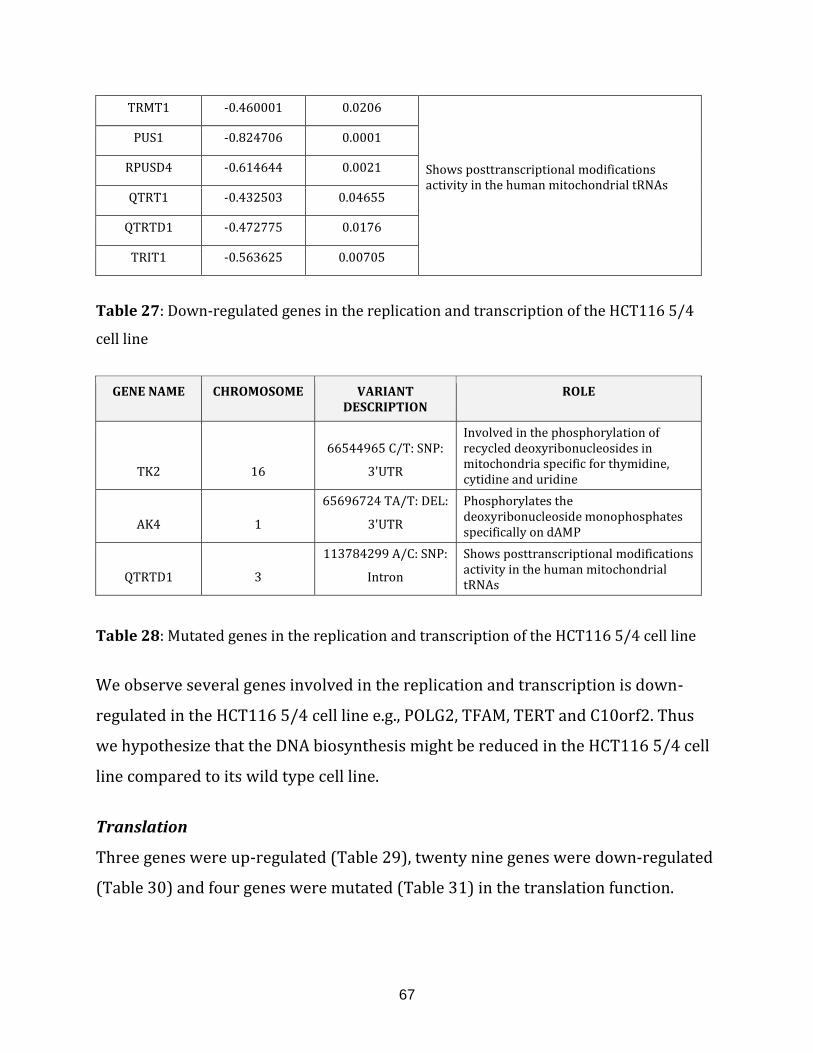
67
TRMT1 -0.460001 0.0206 Shows posttranscriptional modifications activity in the human mitochondrial tRNAs
PUS1 -0.824706 0.0001
RPUSD4 -0.614644 0.0021
QTRT1 -0.432503 0.04655
QTRTD1 -0.472775 0.0176
TRIT1 -0.563625 0.00705
Table 27: Down-regulated genes in the replication and transcription of the HCT116 5/4
cell line
GENE NAME CHROMOSOME VARIANT DESCRIPTION
ROLE
TK2 16
66544965 C/T: SNP:
3'UTR
Involved in the phosphorylation of recycled deoxyribonucleosides in mitochondria specific for thymidine, cytidine and uridine
AK4 1
65696724 TA/T: DEL:
3'UTR
Phosphorylates the deoxyribonucleoside monophosphates specifically on dAMP
QTRTD1 3
113784299 A/C: SNP:
Intron
Shows posttranscriptional modifications activity in the human mitochondrial tRNAs
Table 28: Mutated genes in the replication and transcription of the HCT116 5/4 cell line
We observe several genes involved in the replication and transcription is down-
regulated in the HCT116 5/4 cell line e.g., POLG2, TFAM, TERT and C10orf2. Thus
we hypothesize that the DNA biosynthesis might be reduced in the HCT116 5/4 cell
line compared to its wild type cell line.
Translation
Three genes were up-regulated (Table 29), twenty nine genes were down-regulated
(Table 30) and four genes were mutated (Table 31) in the translation function.
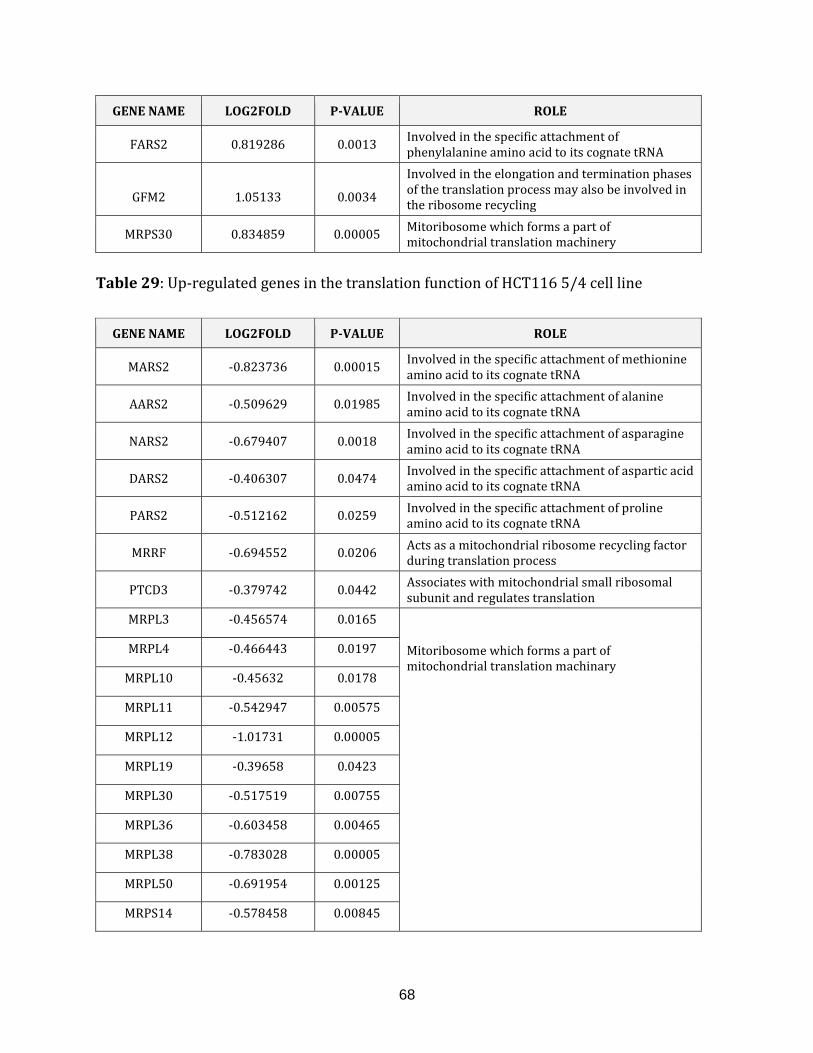
68
GENE NAME LOG2FOLD P-VALUE ROLE
FARS2 0.819286 0.0013 Involved in the specific attachment of phenylalanine amino acid to its cognate tRNA
GFM2 1.05133 0.0034
Involved in the elongation and termination phases of the translation process may also be involved in the ribosome recycling
MRPS30 0.834859 0.00005 Mitoribosome which forms a part of mitochondrial translation machinery
Table 29: Up-regulated genes in the translation function of HCT116 5/4 cell line
GENE NAME LOG2FOLD P-VALUE ROLE
MARS2 -0.823736 0.00015 Involved in the specific attachment of methionine amino acid to its cognate tRNA
AARS2 -0.509629 0.01985 Involved in the specific attachment of alanine amino acid to its cognate tRNA
NARS2 -0.679407 0.0018 Involved in the specific attachment of asparagine amino acid to its cognate tRNA
DARS2 -0.406307 0.0474 Involved in the specific attachment of aspartic acid amino acid to its cognate tRNA
PARS2 -0.512162 0.0259 Involved in the specific attachment of proline amino acid to its cognate tRNA
MRRF -0.694552 0.0206 Acts as a mitochondrial ribosome recycling factor during translation process
PTCD3 -0.379742 0.0442 Associates with mitochondrial small ribosomal subunit and regulates translation
MRPL3 -0.456574 0.0165 Mitoribosome which forms a part of mitochondrial translation machinary
MRPL4 -0.466443 0.0197
MRPL10 -0.45632 0.0178
MRPL11 -0.542947 0.00575
MRPL12 -1.01731 0.00005
MRPL19 -0.39658 0.0423
MRPL30 -0.517519 0.00755
MRPL36 -0.603458 0.00465
MRPL38 -0.783028 0.00005
MRPL50 -0.691954 0.00125
MRPS14 -0.578458 0.00845
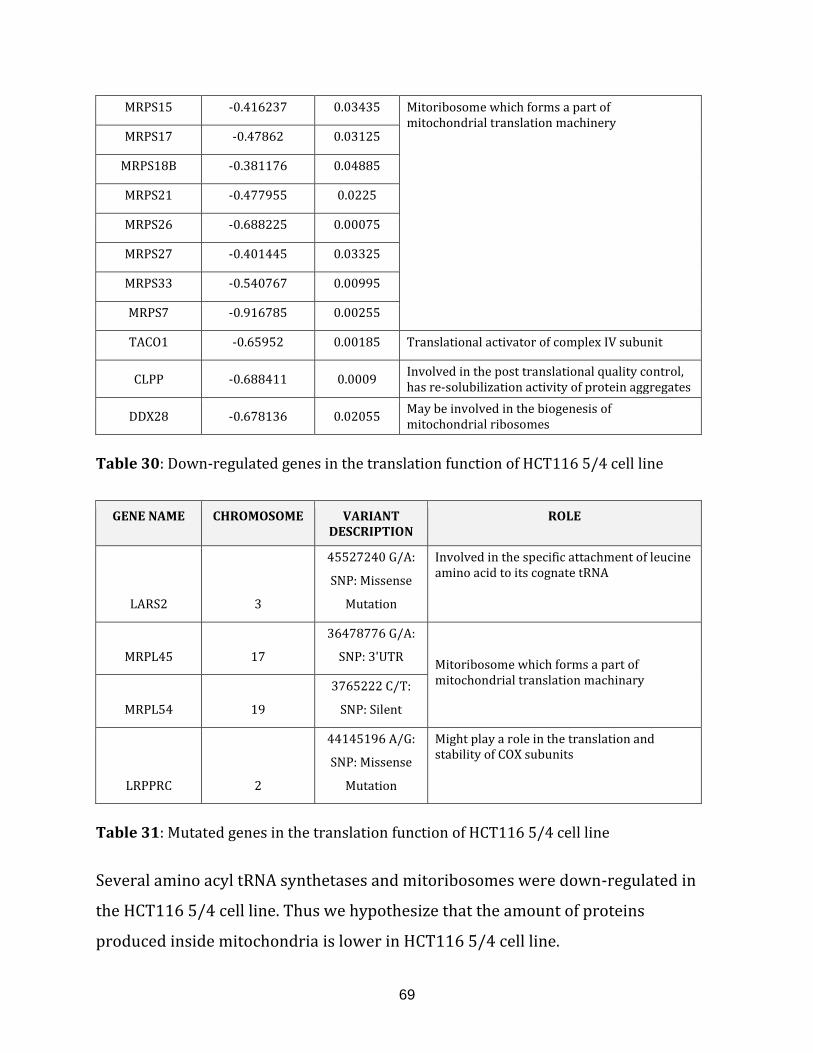
69
MRPS15 -0.416237 0.03435 Mitoribosome which forms a part of mitochondrial translation machinery
MRPS17 -0.47862 0.03125
MRPS18B -0.381176 0.04885
MRPS21 -0.477955 0.0225
MRPS26 -0.688225 0.00075
MRPS27 -0.401445 0.03325
MRPS33 -0.540767 0.00995
MRPS7 -0.916785 0.00255
TACO1 -0.65952 0.00185 Translational activator of complex IV subunit
CLPP -0.688411 0.0009 Involved in the post translational quality control, has re-solubilization activity of protein aggregates
DDX28 -0.678136 0.02055 May be involved in the biogenesis of mitochondrial ribosomes
Table 30: Down-regulated genes in the translation function of HCT116 5/4 cell line
GENE NAME CHROMOSOME VARIANT DESCRIPTION
ROLE
LARS2 3
45527240 G/A:
SNP: Missense
Mutation
Involved in the specific attachment of leucine amino acid to its cognate tRNA
MRPL45 17
36478776 G/A:
SNP: 3'UTR
Mitoribosome which forms a part of mitochondrial translation machinary
MRPL54 19
3765222 C/T:
SNP: Silent
LRPPRC 2
44145196 A/G:
SNP: Missense
Mutation
Might play a role in the translation and stability of COX subunits
Table 31: Mutated genes in the translation function of HCT116 5/4 cell line
Several amino acyl tRNA synthetases and mitoribosomes were down-regulated in
the HCT116 5/4 cell line. Thus we hypothesize that the amount of proteins
produced inside mitochondria is lower in HCT116 5/4 cell line.
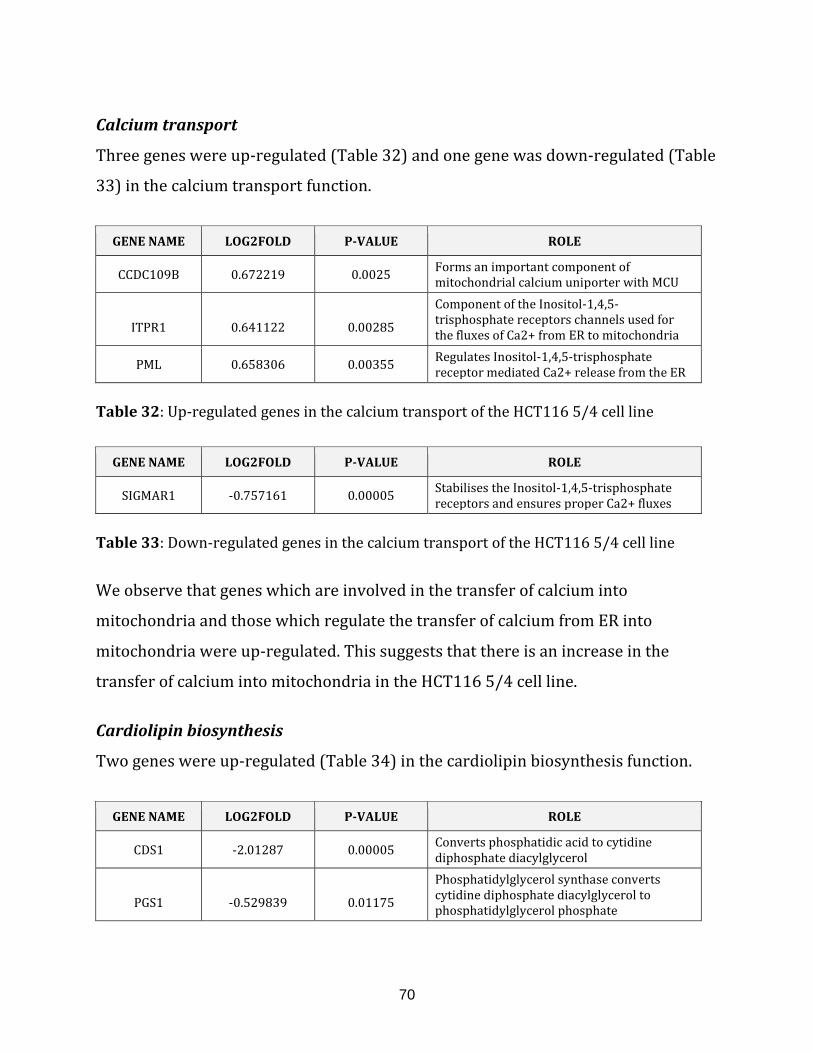
70
Calcium transport
Three genes were up-regulated (Table 32) and one gene was down-regulated (Table
33) in the calcium transport function.
GENE NAME LOG2FOLD P-VALUE ROLE
CCDC109B 0.672219 0.0025 Forms an important component of mitochondrial calcium uniporter with MCU
ITPR1 0.641122 0.00285
Component of the Inositol-1,4,5-trisphosphate receptors channels used for the fluxes of Ca2+ from ER to mitochondria
PML 0.658306 0.00355 Regulates Inositol-1,4,5-trisphosphate receptor mediated Ca2+ release from the ER
Table 32: Up-regulated genes in the calcium transport of the HCT116 5/4 cell line
GENE NAME LOG2FOLD P-VALUE ROLE
SIGMAR1 -0.757161 0.00005 Stabilises the Inositol-1,4,5-trisphosphate receptors and ensures proper Ca2+ fluxes
Table 33: Down-regulated genes in the calcium transport of the HCT116 5/4 cell line
We observe that genes which are involved in the transfer of calcium into
mitochondria and those which regulate the transfer of calcium from ER into
mitochondria were up-regulated. This suggests that there is an increase in the
transfer of calcium into mitochondria in the HCT116 5/4 cell line.
Cardiolipin biosynthesis
Two genes were up-regulated (Table 34) in the cardiolipin biosynthesis function.
GENE NAME LOG2FOLD P-VALUE ROLE
CDS1 -2.01287 0.00005 Converts phosphatidic acid to cytidine diphosphate diacylglycerol
PGS1 -0.529839 0.01175
Phosphatidylglycerol synthase converts cytidine diphosphate diacylglycerol to phosphatidylglycerol phosphate
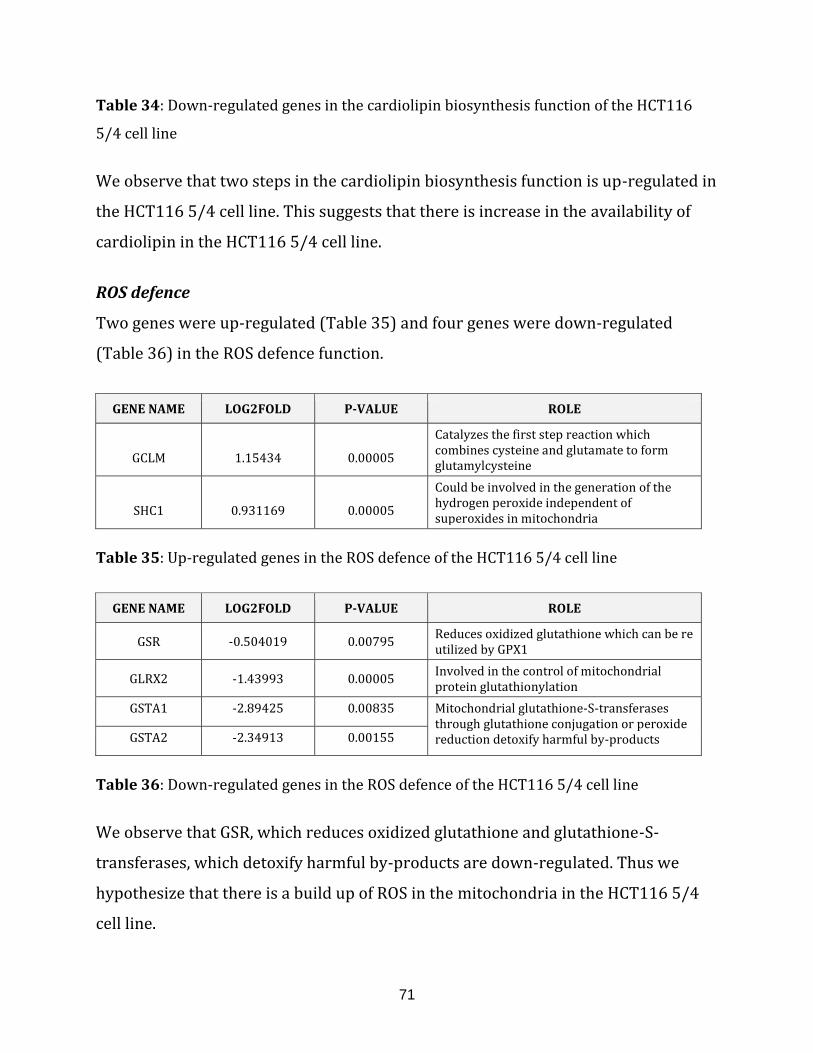
71
Table 34: Down-regulated genes in the cardiolipin biosynthesis function of the HCT116
5/4 cell line
We observe that two steps in the cardiolipin biosynthesis function is up-regulated in
the HCT116 5/4 cell line. This suggests that there is increase in the availability of
cardiolipin in the HCT116 5/4 cell line.
ROS defence
Two genes were up-regulated (Table 35) and four genes were down-regulated
(Table 36) in the ROS defence function.
GENE NAME LOG2FOLD P-VALUE ROLE
GCLM 1.15434 0.00005
Catalyzes the first step reaction which combines cysteine and glutamate to form glutamylcysteine
SHC1 0.931169 0.00005
Could be involved in the generation of the hydrogen peroxide independent of superoxides in mitochondria
Table 35: Up-regulated genes in the ROS defence of the HCT116 5/4 cell line
GENE NAME LOG2FOLD P-VALUE ROLE
GSR -0.504019 0.00795 Reduces oxidized glutathione which can be re utilized by GPX1
GLRX2 -1.43993 0.00005 Involved in the control of mitochondrial protein glutathionylation
GSTA1 -2.89425 0.00835 Mitochondrial glutathione-S-transferases through glutathione conjugation or peroxide reduction detoxify harmful by-products GSTA2 -2.34913 0.00155
Table 36: Down-regulated genes in the ROS defence of the HCT116 5/4 cell line
We observe that GSR, which reduces oxidized glutathione and glutathione-S-
transferases, which detoxify harmful by-products are down-regulated. Thus we
hypothesize that there is a build up of ROS in the mitochondria in the HCT116 5/4
cell line.
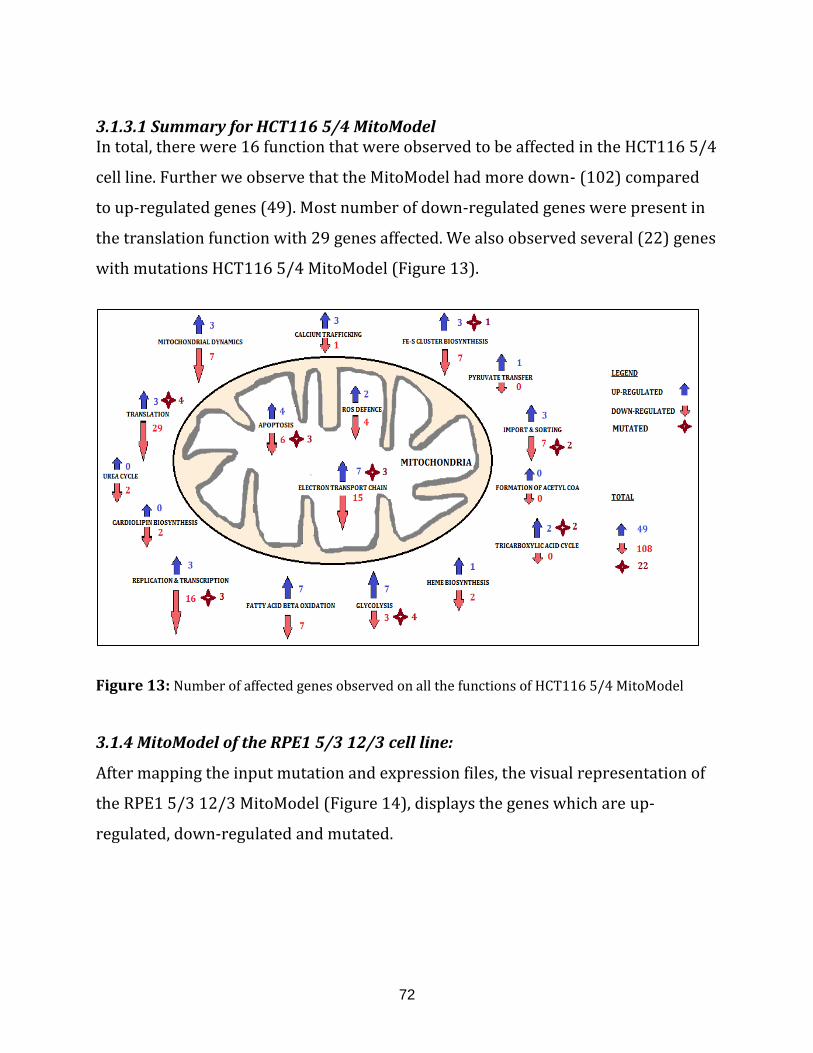
72
3.1.3.1 Summary for HCT116 5/4 MitoModel In total, there were 16 function that were observed to be affected in the HCT116 5/4
cell line. Further we observe that the MitoModel had more down- (102) compared
to up-regulated genes (49). Most number of down-regulated genes were present in
the translation function with 29 genes affected. We also observed several (22) genes
with mutations HCT116 5/4 MitoModel (Figure 13).
Figure 13: Number of affected genes observed on all the functions of HCT116 5/4 MitoModel
3.1.4 MitoModel of the RPE1 5/3 12/3 cell line:
After mapping the input mutation and expression files, the visual representation of
the RPE1 5/3 12/3 MitoModel (Figure 14), displays the genes which are up-
regulated, down-regulated and mutated.
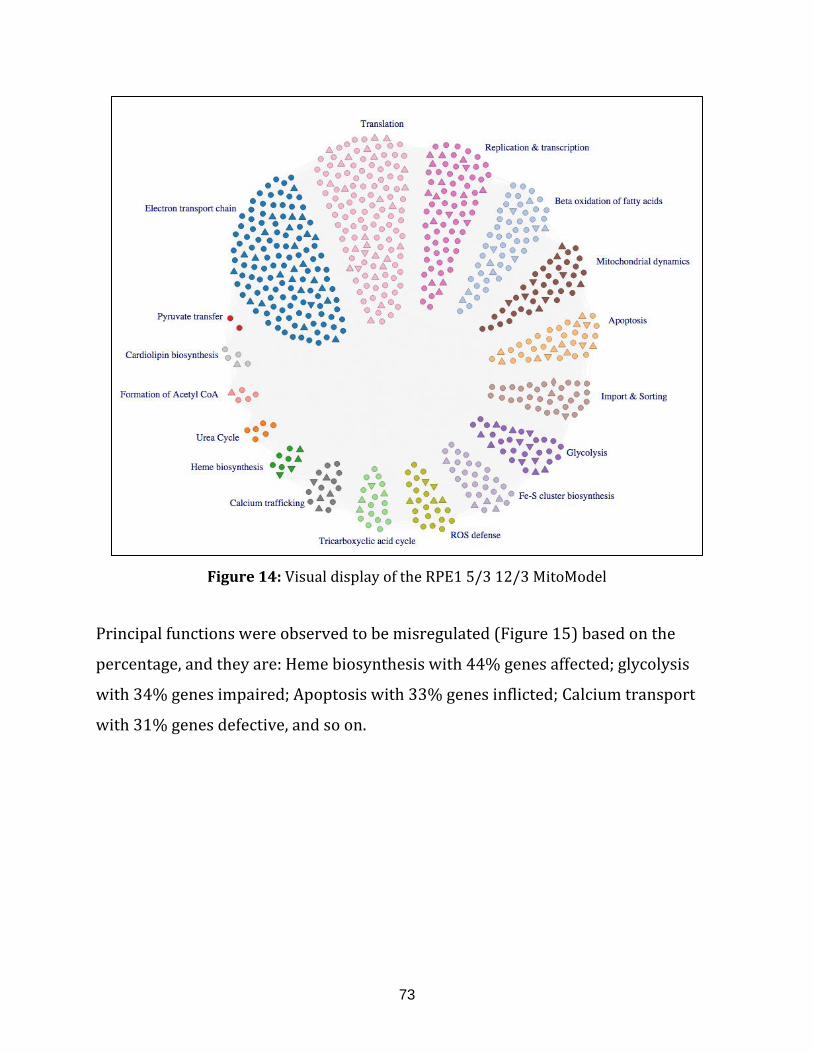
73
Figure 14: Visual display of the RPE1 5/3 12/3 MitoModel
Principal functions were observed to be misregulated (Figure 15) based on the
percentage, and they are: Heme biosynthesis with 44% genes affected; glycolysis
with 34% genes impaired; Apoptosis with 33% genes inflicted; Calcium transport
with 31% genes defective, and so on.
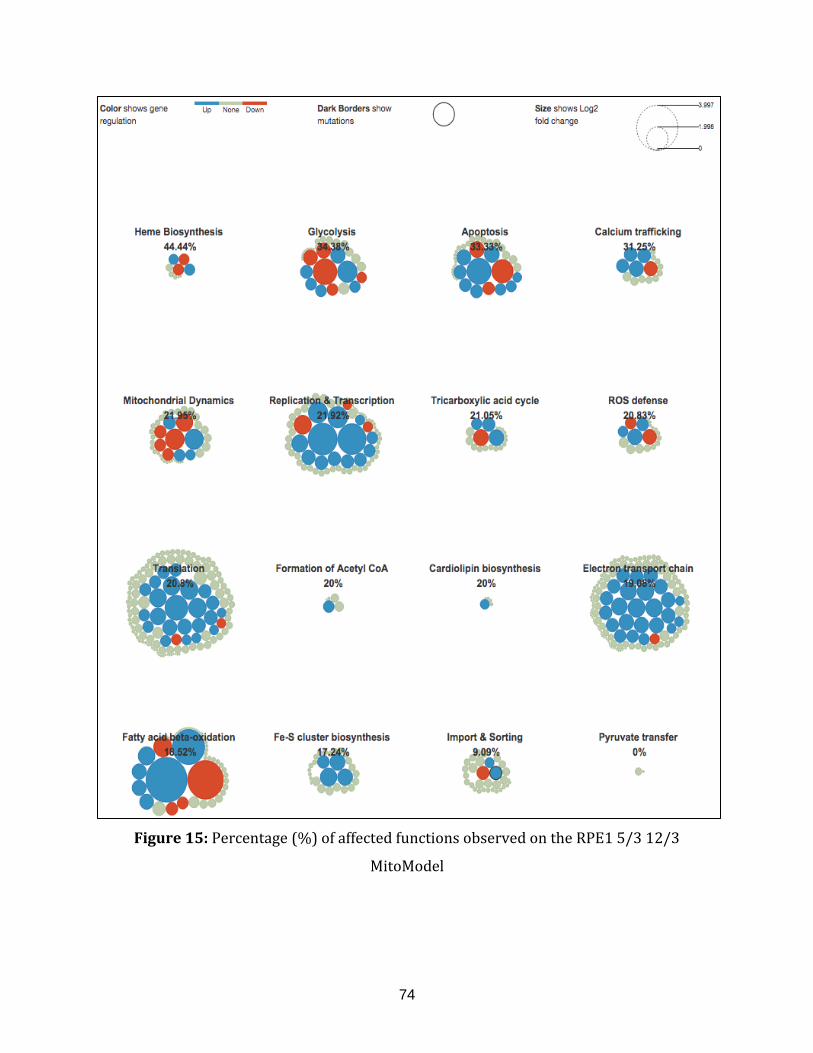
74
Figure 15: Percentage (%) of affected functions observed on the RPE1 5/3 12/3
MitoModel
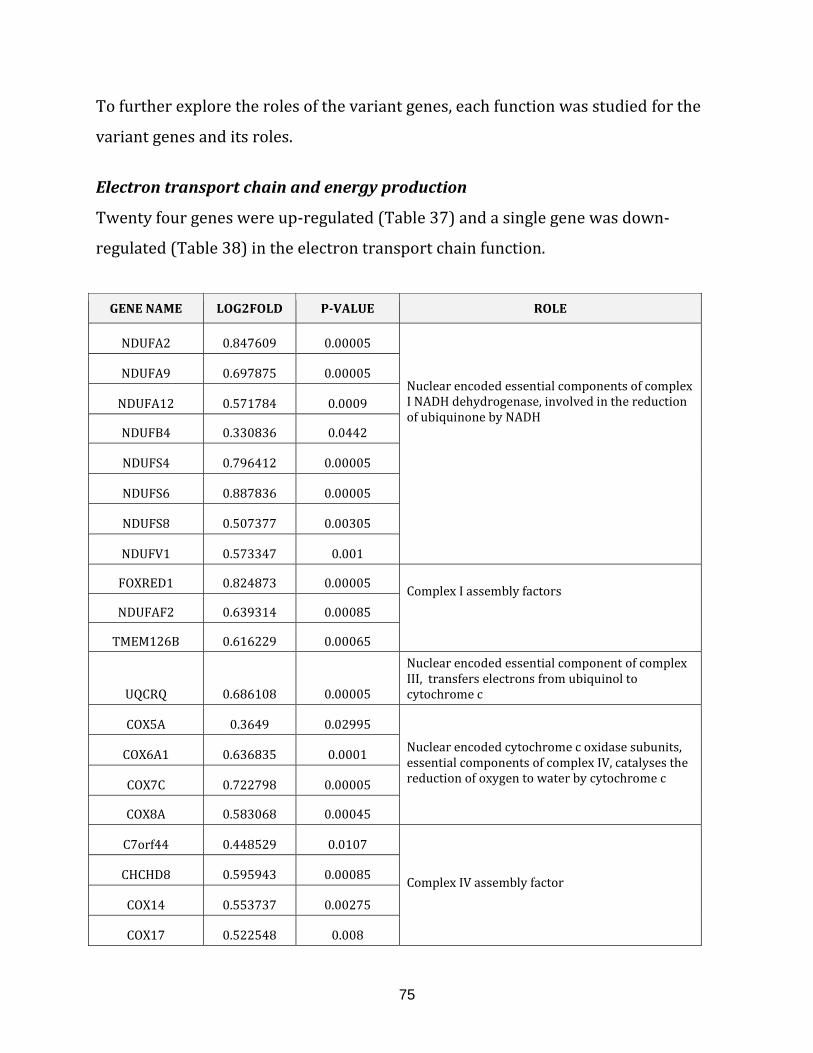
75
To further explore the roles of the variant genes, each function was studied for the
variant genes and its roles.
Electron transport chain and energy production
Twenty four genes were up-regulated (Table 37) and a single gene was down-
regulated (Table 38) in the electron transport chain function.
GENE NAME LOG2FOLD P-VALUE ROLE
NDUFA2 0.847609 0.00005 Nuclear encoded essential components of complex I NADH dehydrogenase, involved in the reduction of ubiquinone by NADH
NDUFA9 0.697875 0.00005
NDUFA12 0.571784 0.0009
NDUFB4 0.330836 0.0442
NDUFS4 0.796412 0.00005
NDUFS6 0.887836 0.00005
NDUFS8 0.507377 0.00305
NDUFV1 0.573347 0.001
FOXRED1 0.824873 0.00005 Complex I assembly factors
NDUFAF2 0.639314 0.00085
TMEM126B 0.616229 0.00065
UQCRQ 0.686108 0.00005
Nuclear encoded essential component of complex III, transfers electrons from ubiquinol to cytochrome c
COX5A 0.3649 0.02995 Nuclear encoded cytochrome c oxidase subunits, essential components of complex IV, catalyses the reduction of oxygen to water by cytochrome c
COX6A1 0.636835 0.0001
COX7C 0.722798 0.00005
COX8A 0.583068 0.00045
C7orf44 0.448529 0.0107 Complex IV assembly factor
CHCHD8 0.595943 0.00085
COX14 0.553737 0.00275
COX17 0.522548 0.008
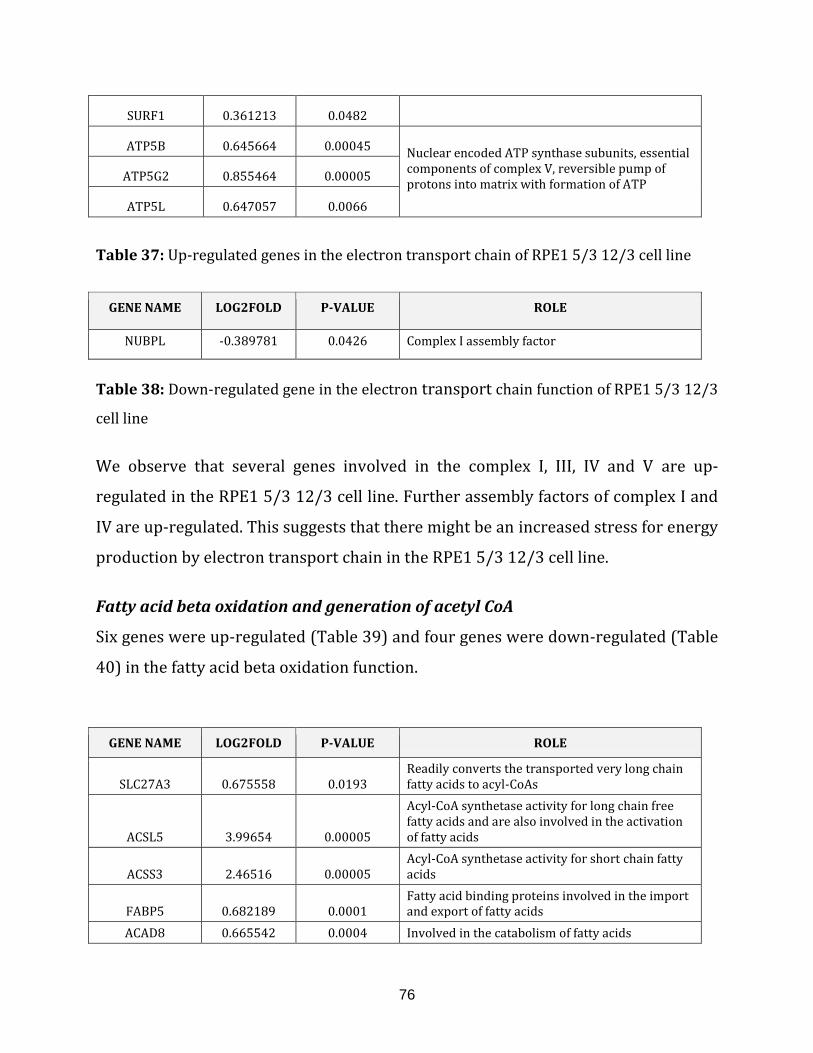
76
SURF1 0.361213 0.0482
ATP5B 0.645664 0.00045 Nuclear encoded ATP synthase subunits, essential components of complex V, reversible pump of protons into matrix with formation of ATP
ATP5G2 0.855464 0.00005
ATP5L 0.647057 0.0066
Table 37: Up-regulated genes in the electron transport chain of RPE1 5/3 12/3 cell line
GENE NAME LOG2FOLD P-VALUE ROLE
NUBPL -0.389781 0.0426 Complex I assembly factor
Table 38: Down-regulated gene in the electron transport chain function of RPE1 5/3 12/3
cell line
We observe that several genes involved in the complex I, III, IV and V are up-
regulated in the RPE1 5/3 12/3 cell line. Further assembly factors of complex I and
IV are up-regulated. This suggests that there might be an increased stress for energy
production by electron transport chain in the RPE1 5/3 12/3 cell line.
Fatty acid beta oxidation and generation of acetyl CoA
Six genes were up-regulated (Table 39) and four genes were down-regulated (Table
40) in the fatty acid beta oxidation function.
GENE NAME LOG2FOLD P-VALUE ROLE
SLC27A3 0.675558 0.0193
Readily converts the transported very long chain fatty acids to acyl-CoAs
ACSL5 3.99654 0.00005
Acyl-CoA synthetase activity for long chain free fatty acids and are also involved in the activation of fatty acids
ACSS3 2.46516 0.00005
Acyl-CoA synthetase activity for short chain fatty acids
FABP5 0.682189 0.0001 Fatty acid binding proteins involved in the import and export of fatty acids
ACAD8 0.665542 0.0004 Involved in the catabolism of fatty acids
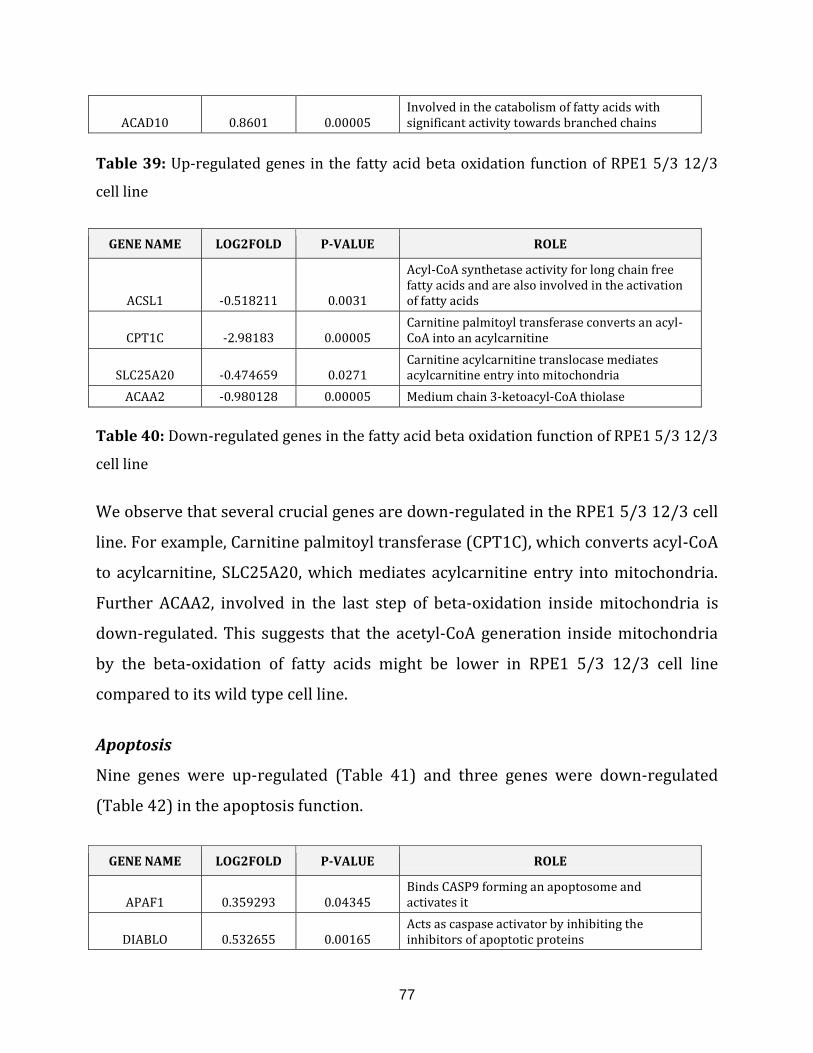
77
ACAD10 0.8601 0.00005
Involved in the catabolism of fatty acids with significant activity towards branched chains
Table 39: Up-regulated genes in the fatty acid beta oxidation function of RPE1 5/3 12/3
cell line
GENE NAME LOG2FOLD P-VALUE ROLE
ACSL1 -0.518211 0.0031
Acyl-CoA synthetase activity for long chain free fatty acids and are also involved in the activation of fatty acids
CPT1C -2.98183 0.00005 Carnitine palmitoyl transferase converts an acyl-CoA into an acylcarnitine
SLC25A20 -0.474659 0.0271 Carnitine acylcarnitine translocase mediates acylcarnitine entry into mitochondria
ACAA2 -0.980128 0.00005 Medium chain 3-ketoacyl-CoA thiolase
Table 40: Down-regulated genes in the fatty acid beta oxidation function of RPE1 5/3 12/3
cell line
We observe that several crucial genes are down-regulated in the RPE1 5/3 12/3 cell
line. For example, Carnitine palmitoyl transferase (CPT1C), which converts acyl-CoA
to acylcarnitine, SLC25A20, which mediates acylcarnitine entry into mitochondria.
Further ACAA2, involved in the last step of beta-oxidation inside mitochondria is
down-regulated. This suggests that the acetyl-CoA generation inside mitochondria
by the beta-oxidation of fatty acids might be lower in RPE1 5/3 12/3 cell line
compared to its wild type cell line.
Apoptosis
Nine genes were up-regulated (Table 41) and three genes were down-regulated
(Table 42) in the apoptosis function.
GENE NAME LOG2FOLD P-VALUE ROLE
APAF1 0.359293 0.04345
Binds CASP9 forming an apoptosome and activates it
DIABLO 0.532655 0.00165
Acts as caspase activator by inhibiting the inhibitors of apoptotic proteins
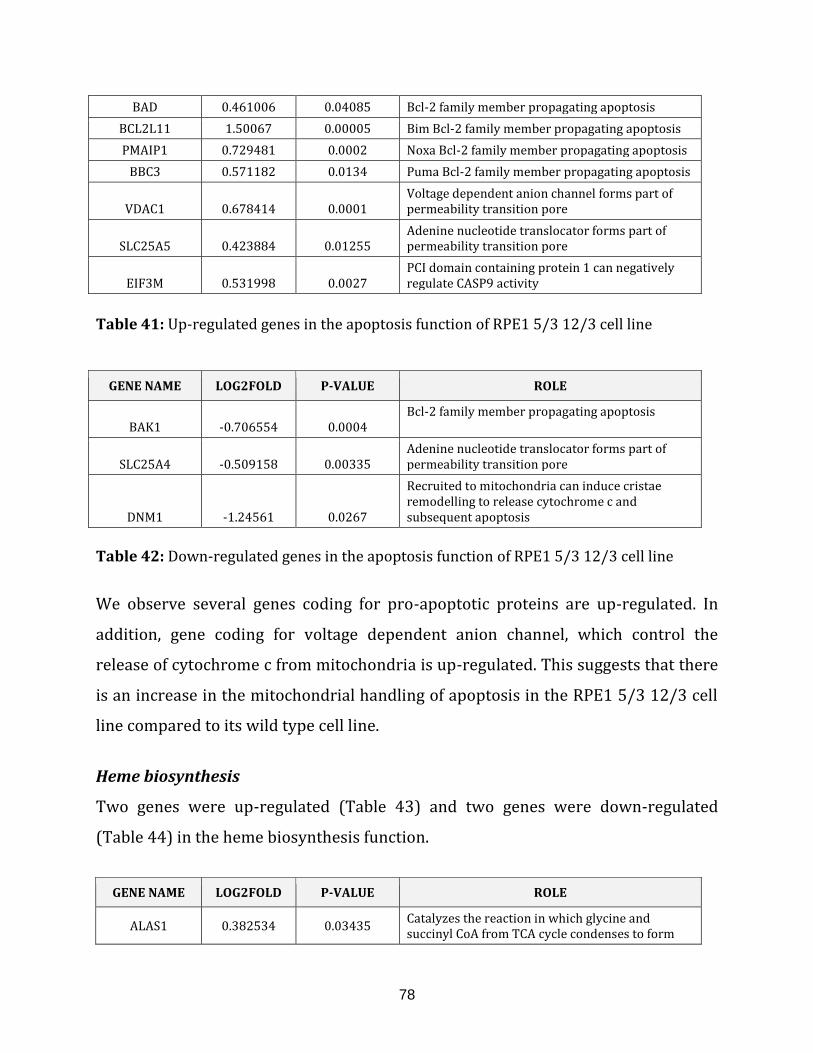
78
BAD 0.461006 0.04085 Bcl-2 family member propagating apoptosis
BCL2L11 1.50067 0.00005 Bim Bcl-2 family member propagating apoptosis
PMAIP1 0.729481 0.0002 Noxa Bcl-2 family member propagating apoptosis
BBC3 0.571182 0.0134 Puma Bcl-2 family member propagating apoptosis
VDAC1 0.678414 0.0001 Voltage dependent anion channel forms part of permeability transition pore
SLC25A5 0.423884 0.01255 Adenine nucleotide translocator forms part of permeability transition pore
EIF3M 0.531998 0.0027
PCI domain containing protein 1 can negatively regulate CASP9 activity
Table 41: Up-regulated genes in the apoptosis function of RPE1 5/3 12/3 cell line
GENE NAME LOG2FOLD P-VALUE ROLE
BAK1 -0.706554 0.0004
Bcl-2 family member propagating apoptosis
SLC25A4 -0.509158 0.00335
Adenine nucleotide translocator forms part of permeability transition pore
DNM1 -1.24561 0.0267
Recruited to mitochondria can induce cristae remodelling to release cytochrome c and subsequent apoptosis
Table 42: Down-regulated genes in the apoptosis function of RPE1 5/3 12/3 cell line
We observe several genes coding for pro-apoptotic proteins are up-regulated. In
addition, gene coding for voltage dependent anion channel, which control the
release of cytochrome c from mitochondria is up-regulated. This suggests that there
is an increase in the mitochondrial handling of apoptosis in the RPE1 5/3 12/3 cell
line compared to its wild type cell line.
Heme biosynthesis
Two genes were up-regulated (Table 43) and two genes were down-regulated
(Table 44) in the heme biosynthesis function.
GENE NAME LOG2FOLD P-VALUE ROLE
ALAS1 0.382534 0.03435 Catalyzes the reaction in which glycine and succinyl CoA from TCA cycle condenses to form
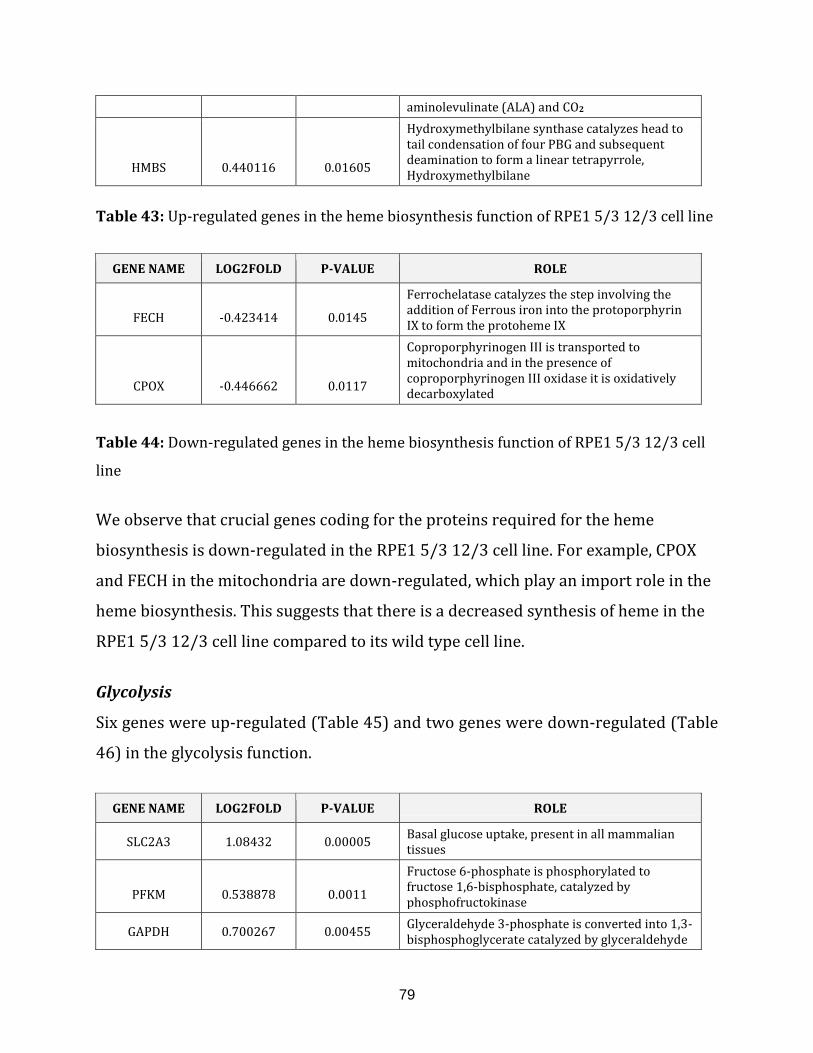
79
aminolevulinate (ALA) and CO2
HMBS 0.440116 0.01605
Hydroxymethylbilane synthase catalyzes head to tail condensation of four PBG and subsequent deamination to form a linear tetrapyrrole, Hydroxymethylbilane
Table 43: Up-regulated genes in the heme biosynthesis function of RPE1 5/3 12/3 cell line
GENE NAME LOG2FOLD P-VALUE ROLE
FECH -0.423414 0.0145
Ferrochelatase catalyzes the step involving the addition of Ferrous iron into the protoporphyrin IX to form the protoheme IX
CPOX -0.446662 0.0117
Coproporphyrinogen III is transported to mitochondria and in the presence of coproporphyrinogen III oxidase it is oxidatively decarboxylated
Table 44: Down-regulated genes in the heme biosynthesis function of RPE1 5/3 12/3 cell
line
We observe that crucial genes coding for the proteins required for the heme
biosynthesis is down-regulated in the RPE1 5/3 12/3 cell line. For example, CPOX
and FECH in the mitochondria are down-regulated, which play an import role in the
heme biosynthesis. This suggests that there is a decreased synthesis of heme in the
RPE1 5/3 12/3 cell line compared to its wild type cell line.
Glycolysis
Six genes were up-regulated (Table 45) and two genes were down-regulated (Table
46) in the glycolysis function.
GENE NAME LOG2FOLD P-VALUE ROLE
SLC2A3 1.08432 0.00005 Basal glucose uptake, present in all mammalian tissues
PFKM 0.538878 0.0011
Fructose 6-phosphate is phosphorylated to fructose 1,6-bisphosphate, catalyzed by phosphofructokinase
GAPDH 0.700267 0.00455 Glyceraldehyde 3-phosphate is converted into 1,3-bisphosphoglycerate catalyzed by glyceraldehyde
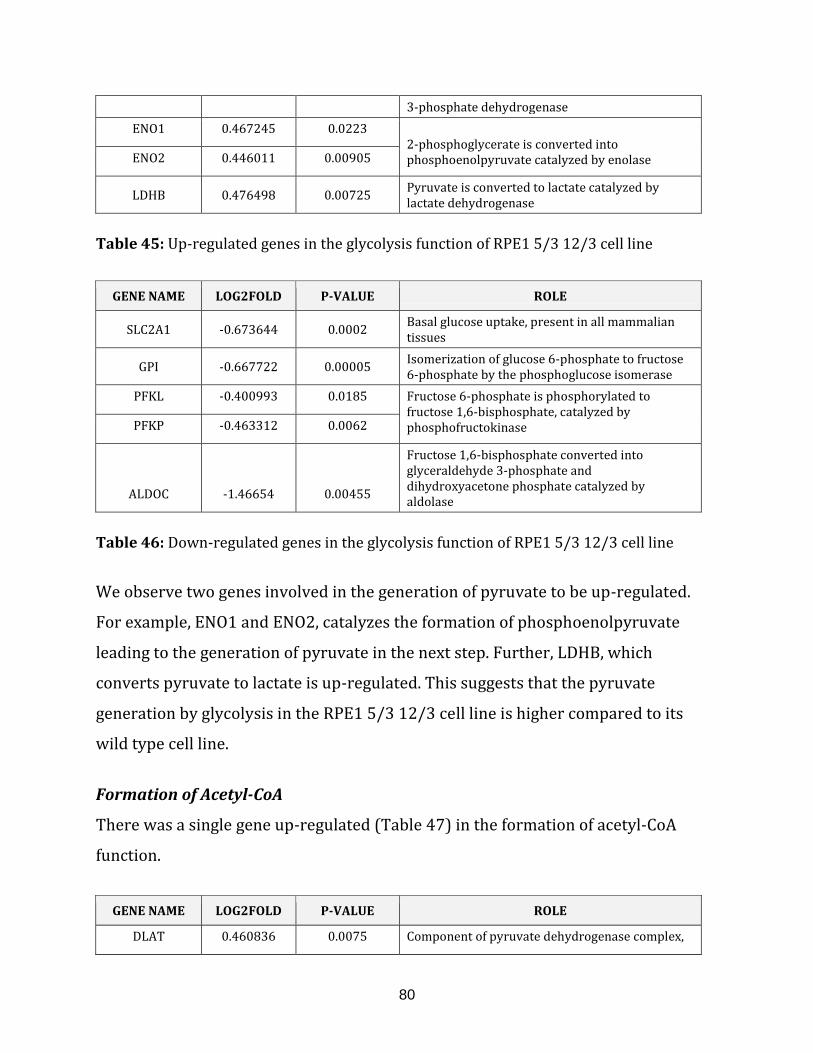
80
3-phosphate dehydrogenase
ENO1 0.467245 0.0223 2-phosphoglycerate is converted into phosphoenolpyruvate catalyzed by enolase ENO2 0.446011 0.00905
LDHB 0.476498 0.00725 Pyruvate is converted to lactate catalyzed by lactate dehydrogenase
Table 45: Up-regulated genes in the glycolysis function of RPE1 5/3 12/3 cell line
GENE NAME LOG2FOLD P-VALUE ROLE
SLC2A1 -0.673644 0.0002 Basal glucose uptake, present in all mammalian tissues
GPI -0.667722 0.00005 Isomerization of glucose 6-phosphate to fructose 6-phosphate by the phosphoglucose isomerase
PFKL -0.400993 0.0185 Fructose 6-phosphate is phosphorylated to fructose 1,6-bisphosphate, catalyzed by phosphofructokinase PFKP -0.463312 0.0062
ALDOC -1.46654 0.00455
Fructose 1,6-bisphosphate converted into glyceraldehyde 3-phosphate and dihydroxyacetone phosphate catalyzed by aldolase
Table 46: Down-regulated genes in the glycolysis function of RPE1 5/3 12/3 cell line
We observe two genes involved in the generation of pyruvate to be up-regulated.
For example, ENO1 and ENO2, catalyzes the formation of phosphoenolpyruvate
leading to the generation of pyruvate in the next step. Further, LDHB, which
converts pyruvate to lactate is up-regulated. This suggests that the pyruvate
generation by glycolysis in the RPE1 5/3 12/3 cell line is higher compared to its
wild type cell line.
Formation of Acetyl-CoA
There was a single gene up-regulated (Table 47) in the formation of acetyl-CoA
function.
GENE NAME LOG2FOLD P-VALUE ROLE
DLAT 0.460836 0.0075 Component of pyruvate dehydrogenase complex,
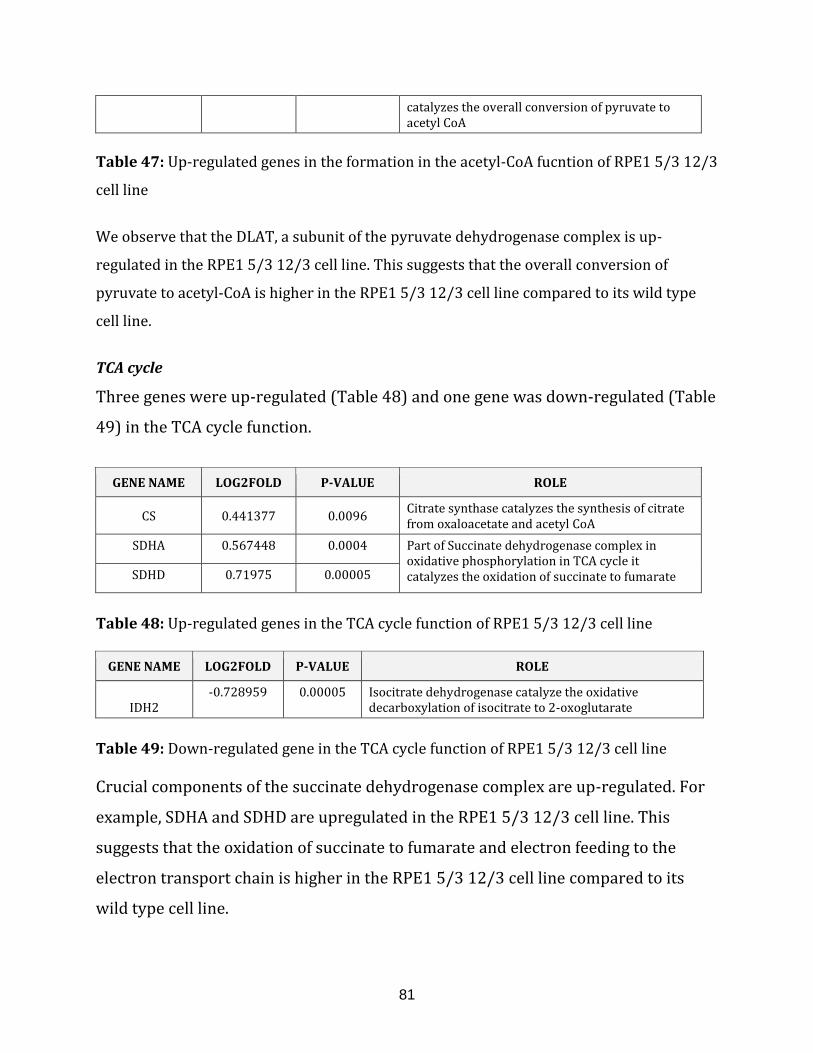
81
catalyzes the overall conversion of pyruvate to acetyl CoA
Table 47: Up-regulated genes in the formation in the acetyl-CoA fucntion of RPE1 5/3 12/3
cell line
We observe that the DLAT, a subunit of the pyruvate dehydrogenase complex is up-
regulated in the RPE1 5/3 12/3 cell line. This suggests that the overall conversion of
pyruvate to acetyl-CoA is higher in the RPE1 5/3 12/3 cell line compared to its wild type
cell line.
TCA cycle
Three genes were up-regulated (Table 48) and one gene was down-regulated (Table
49) in the TCA cycle function.
GENE NAME LOG2FOLD P-VALUE ROLE
CS 0.441377 0.0096 Citrate synthase catalyzes the synthesis of citrate from oxaloacetate and acetyl CoA
SDHA 0.567448 0.0004 Part of Succinate dehydrogenase complex in oxidative phosphorylation in TCA cycle it catalyzes the oxidation of succinate to fumarate SDHD 0.71975 0.00005
Table 48: Up-regulated genes in the TCA cycle function of RPE1 5/3 12/3 cell line
GENE NAME LOG2FOLD P-VALUE ROLE
IDH2 -0.728959 0.00005 Isocitrate dehydrogenase catalyze the oxidative
decarboxylation of isocitrate to 2-oxoglutarate
Table 49: Down-regulated gene in the TCA cycle function of RPE1 5/3 12/3 cell line Crucial components of the succinate dehydrogenase complex are up-regulated. For
example, SDHA and SDHD are upregulated in the RPE1 5/3 12/3 cell line. This
suggests that the oxidation of succinate to fumarate and electron feeding to the
electron transport chain is higher in the RPE1 5/3 12/3 cell line compared to its
wild type cell line.
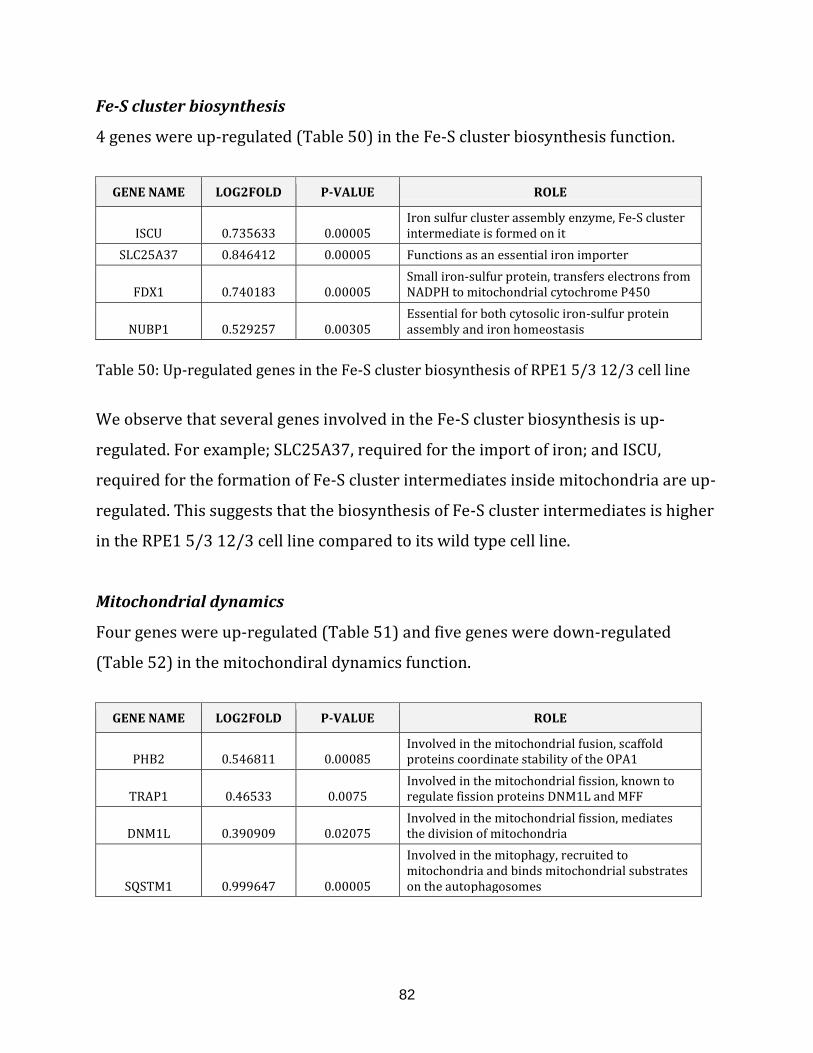
82
Fe-S cluster biosynthesis
4 genes were up-regulated (Table 50) in the Fe-S cluster biosynthesis function.
GENE NAME LOG2FOLD P-VALUE ROLE
ISCU 0.735633 0.00005
Iron sulfur cluster assembly enzyme, Fe-S cluster intermediate is formed on it
SLC25A37 0.846412 0.00005 Functions as an essential iron importer
FDX1 0.740183 0.00005
Small iron-sulfur protein, transfers electrons from NADPH to mitochondrial cytochrome P450
NUBP1 0.529257 0.00305
Essential for both cytosolic iron-sulfur protein assembly and iron homeostasis
Table 50: Up-regulated genes in the Fe-S cluster biosynthesis of RPE1 5/3 12/3 cell line
We observe that several genes involved in the Fe-S cluster biosynthesis is up-
regulated. For example; SLC25A37, required for the import of iron; and ISCU,
required for the formation of Fe-S cluster intermediates inside mitochondria are up-
regulated. This suggests that the biosynthesis of Fe-S cluster intermediates is higher
in the RPE1 5/3 12/3 cell line compared to its wild type cell line.
Mitochondrial dynamics
Four genes were up-regulated (Table 51) and five genes were down-regulated
(Table 52) in the mitochondiral dynamics function.
GENE NAME LOG2FOLD P-VALUE ROLE
PHB2 0.546811 0.00085 Involved in the mitochondrial fusion, scaffold proteins coordinate stability of the OPA1
TRAP1 0.46533 0.0075 Involved in the mitochondrial fission, known to regulate fission proteins DNM1L and MFF
DNM1L 0.390909 0.02075 Involved in the mitochondrial fission, mediates the division of mitochondria
SQSTM1 0.999647 0.00005
Involved in the mitophagy, recruited to mitochondria and binds mitochondrial substrates on the autophagosomes
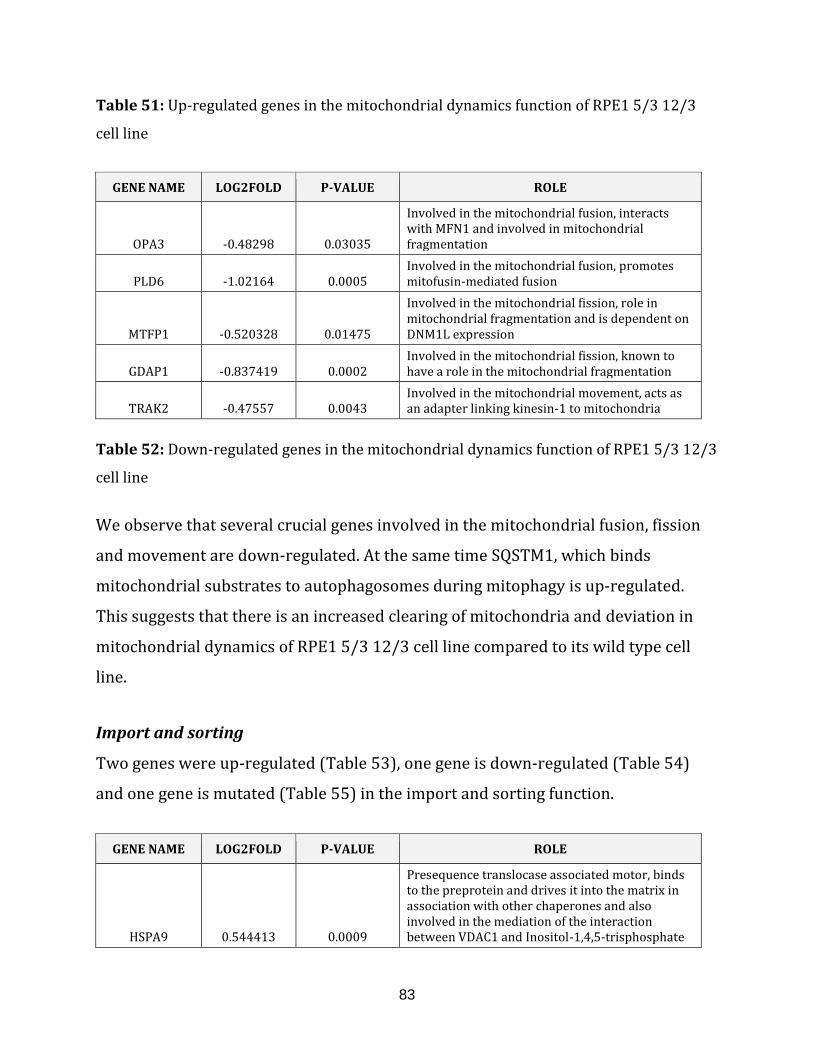
83
Table 51: Up-regulated genes in the mitochondrial dynamics function of RPE1 5/3 12/3
cell line
GENE NAME LOG2FOLD P-VALUE ROLE
OPA3 -0.48298 0.03035
Involved in the mitochondrial fusion, interacts with MFN1 and involved in mitochondrial fragmentation
PLD6 -1.02164 0.0005
Involved in the mitochondrial fusion, promotes mitofusin-mediated fusion
MTFP1 -0.520328 0.01475
Involved in the mitochondrial fission, role in mitochondrial fragmentation and is dependent on DNM1L expression
GDAP1 -0.837419 0.0002
Involved in the mitochondrial fission, known to have a role in the mitochondrial fragmentation
TRAK2 -0.47557 0.0043 Involved in the mitochondrial movement, acts as an adapter linking kinesin-1 to mitochondria
Table 52: Down-regulated genes in the mitochondrial dynamics function of RPE1 5/3 12/3
cell line
We observe that several crucial genes involved in the mitochondrial fusion, fission
and movement are down-regulated. At the same time SQSTM1, which binds
mitochondrial substrates to autophagosomes during mitophagy is up-regulated.
This suggests that there is an increased clearing of mitochondria and deviation in
mitochondrial dynamics of RPE1 5/3 12/3 cell line compared to its wild type cell
line.
Import and sorting
Two genes were up-regulated (Table 53), one gene is down-regulated (Table 54)
and one gene is mutated (Table 55) in the import and sorting function.
GENE NAME LOG2FOLD P-VALUE ROLE
HSPA9 0.544413 0.0009
Presequence translocase associated motor, binds to the preprotein and drives it into the matrix in association with other chaperones and also involved in the mediation of the interaction between VDAC1 and Inositol-1,4,5-trisphosphate
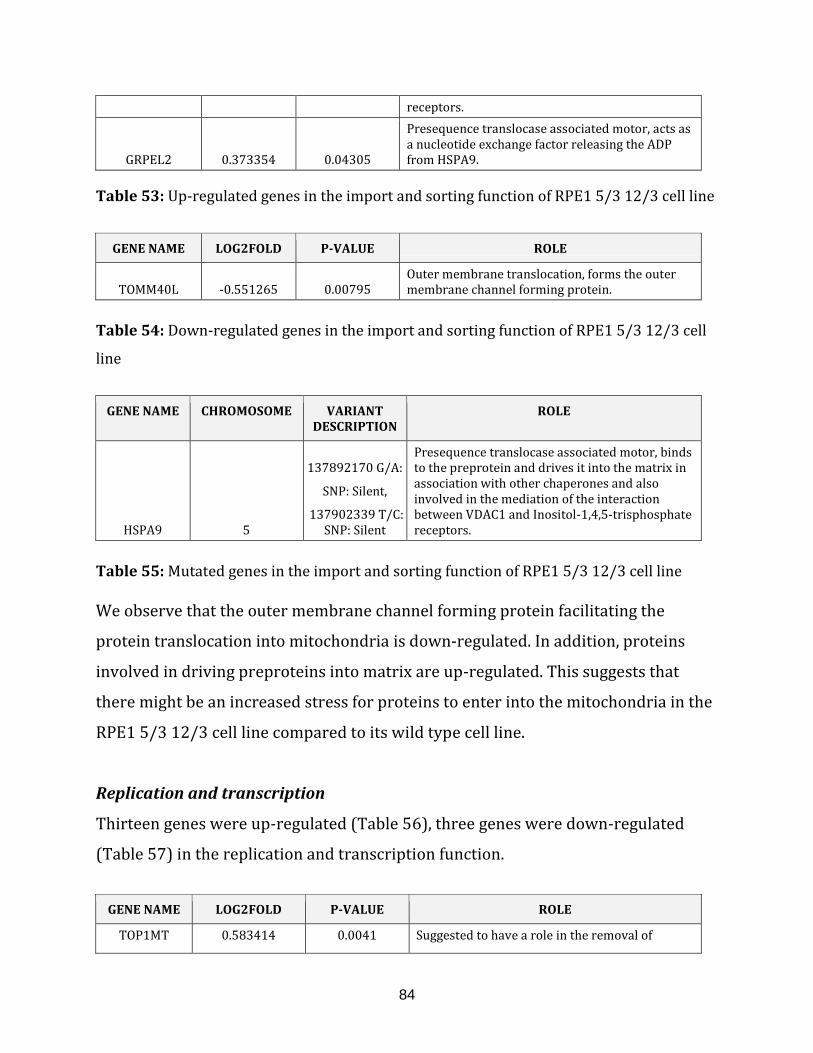
84
receptors.
GRPEL2 0.373354 0.04305
Presequence translocase associated motor, acts as a nucleotide exchange factor releasing the ADP from HSPA9.
Table 53: Up-regulated genes in the import and sorting function of RPE1 5/3 12/3 cell line
GENE NAME LOG2FOLD P-VALUE ROLE
TOMM40L -0.551265 0.00795 Outer membrane translocation, forms the outer membrane channel forming protein.
Table 54: Down-regulated genes in the import and sorting function of RPE1 5/3 12/3 cell
line
GENE NAME CHROMOSOME VARIANT DESCRIPTION
ROLE
HSPA9 5
137892170 G/A:
SNP: Silent,
137902339 T/C: SNP: Silent
Presequence translocase associated motor, binds to the preprotein and drives it into the matrix in association with other chaperones and also involved in the mediation of the interaction between VDAC1 and Inositol-1,4,5-trisphosphate receptors.
Table 55: Mutated genes in the import and sorting function of RPE1 5/3 12/3 cell line We observe that the outer membrane channel forming protein facilitating the
protein translocation into mitochondria is down-regulated. In addition, proteins
involved in driving preproteins into matrix are up-regulated. This suggests that
there might be an increased stress for proteins to enter into the mitochondria in the
RPE1 5/3 12/3 cell line compared to its wild type cell line.
Replication and transcription
Thirteen genes were up-regulated (Table 56), three genes were down-regulated
(Table 57) in the replication and transcription function.
GENE NAME LOG2FOLD P-VALUE ROLE
TOP1MT 0.583414 0.0041 Suggested to have a role in the removal of
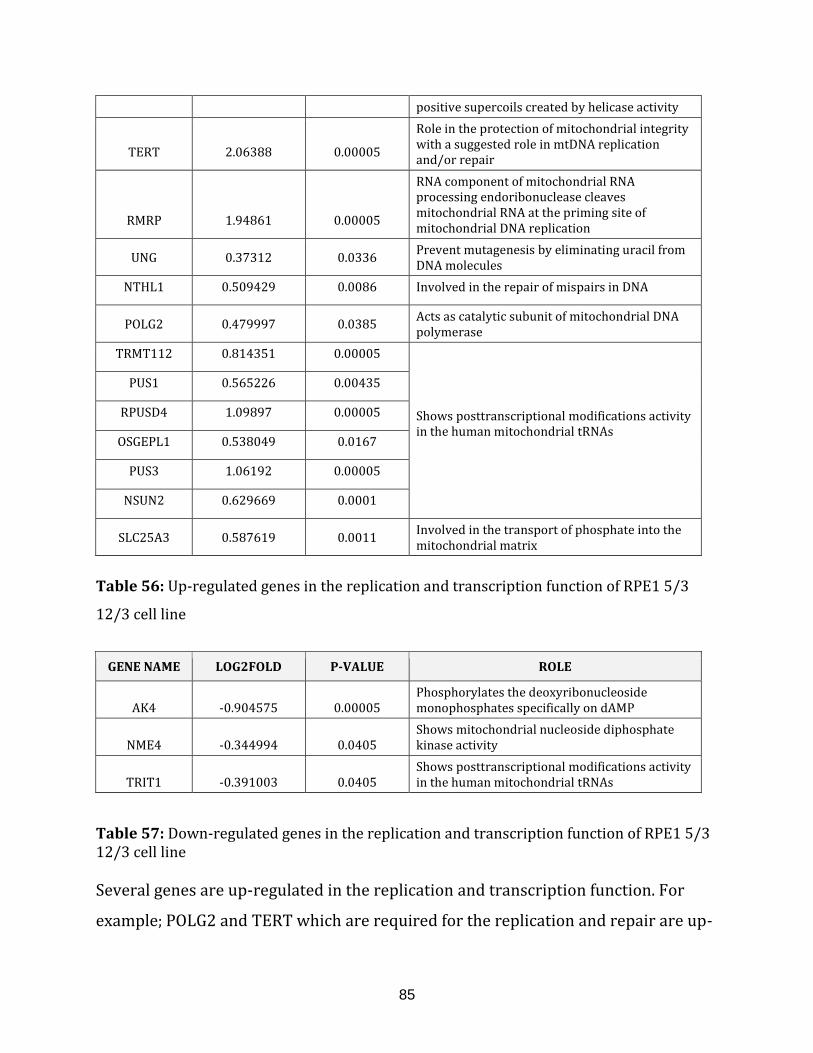
85
positive supercoils created by helicase activity
TERT 2.06388 0.00005
Role in the protection of mitochondrial integrity with a suggested role in mtDNA replication and/or repair
RMRP 1.94861 0.00005
RNA component of mitochondrial RNA processing endoribonuclease cleaves mitochondrial RNA at the priming site of mitochondrial DNA replication
UNG 0.37312 0.0336 Prevent mutagenesis by eliminating uracil from DNA molecules
NTHL1 0.509429 0.0086 Involved in the repair of mispairs in DNA
POLG2 0.479997 0.0385 Acts as catalytic subunit of mitochondrial DNA polymerase
TRMT112 0.814351 0.00005 Shows posttranscriptional modifications activity in the human mitochondrial tRNAs
PUS1 0.565226 0.00435
RPUSD4 1.09897 0.00005
OSGEPL1 0.538049 0.0167
PUS3 1.06192 0.00005
NSUN2 0.629669 0.0001
SLC25A3 0.587619 0.0011 Involved in the transport of phosphate into the mitochondrial matrix
Table 56: Up-regulated genes in the replication and transcription function of RPE1 5/3
12/3 cell line
GENE NAME LOG2FOLD P-VALUE ROLE
AK4 -0.904575 0.00005
Phosphorylates the deoxyribonucleoside monophosphates specifically on dAMP
NME4 -0.344994 0.0405
Shows mitochondrial nucleoside diphosphate kinase activity
TRIT1 -0.391003 0.0405
Shows posttranscriptional modifications activity in the human mitochondrial tRNAs
Table 57: Down-regulated genes in the replication and transcription function of RPE1 5/3 12/3 cell line Several genes are up-regulated in the replication and transcription function. For
example; POLG2 and TERT which are required for the replication and repair are up-
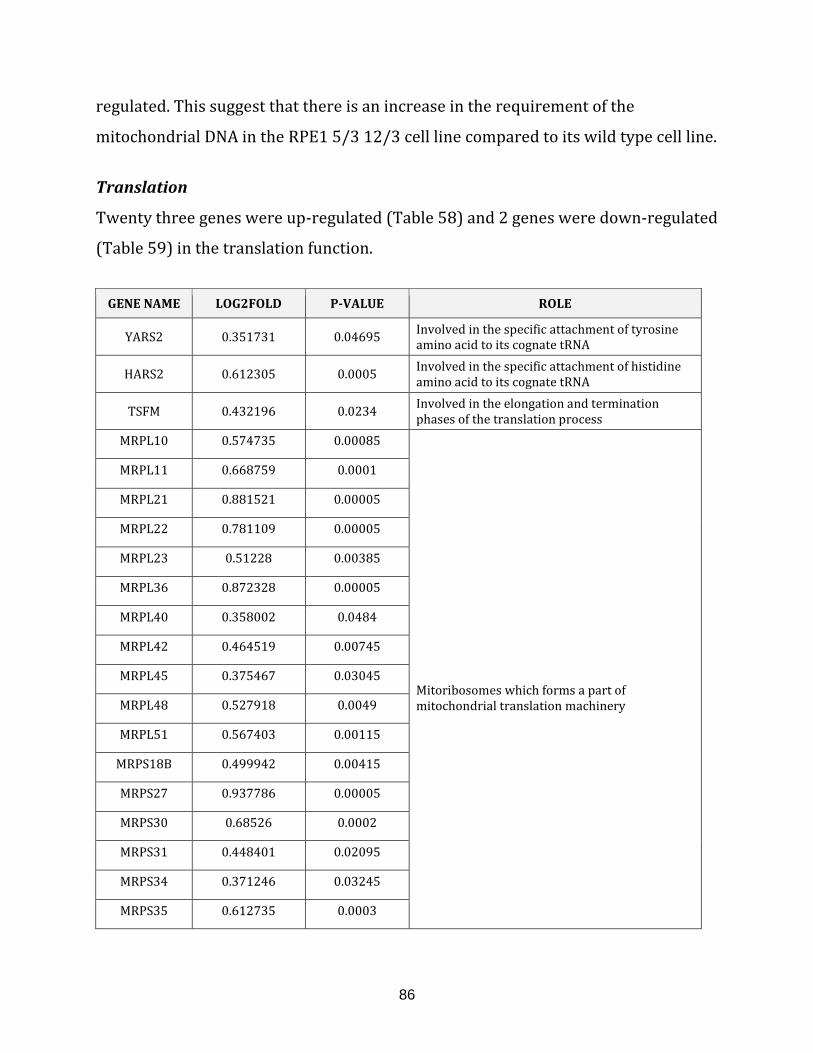
86
regulated. This suggest that there is an increase in the requirement of the
mitochondrial DNA in the RPE1 5/3 12/3 cell line compared to its wild type cell line.
Translation
Twenty three genes were up-regulated (Table 58) and 2 genes were down-regulated
(Table 59) in the translation function.
GENE NAME LOG2FOLD P-VALUE ROLE
YARS2 0.351731 0.04695 Involved in the specific attachment of tyrosine amino acid to its cognate tRNA
HARS2 0.612305 0.0005 Involved in the specific attachment of histidine amino acid to its cognate tRNA
TSFM 0.432196 0.0234 Involved in the elongation and termination phases of the translation process
MRPL10 0.574735 0.00085 Mitoribosomes which forms a part of mitochondrial translation machinery
MRPL11 0.668759 0.0001
MRPL21 0.881521 0.00005
MRPL22 0.781109 0.00005
MRPL23 0.51228 0.00385
MRPL36 0.872328 0.00005
MRPL40 0.358002 0.0484
MRPL42 0.464519 0.00745
MRPL45 0.375467 0.03045
MRPL48 0.527918 0.0049
MRPL51 0.567403 0.00115
MRPS18B 0.499942 0.00415
MRPS27 0.937786 0.00005
MRPS30 0.68526 0.0002
MRPS31 0.448401 0.02095
MRPS34 0.371246 0.03245
MRPS35 0.612735 0.0003
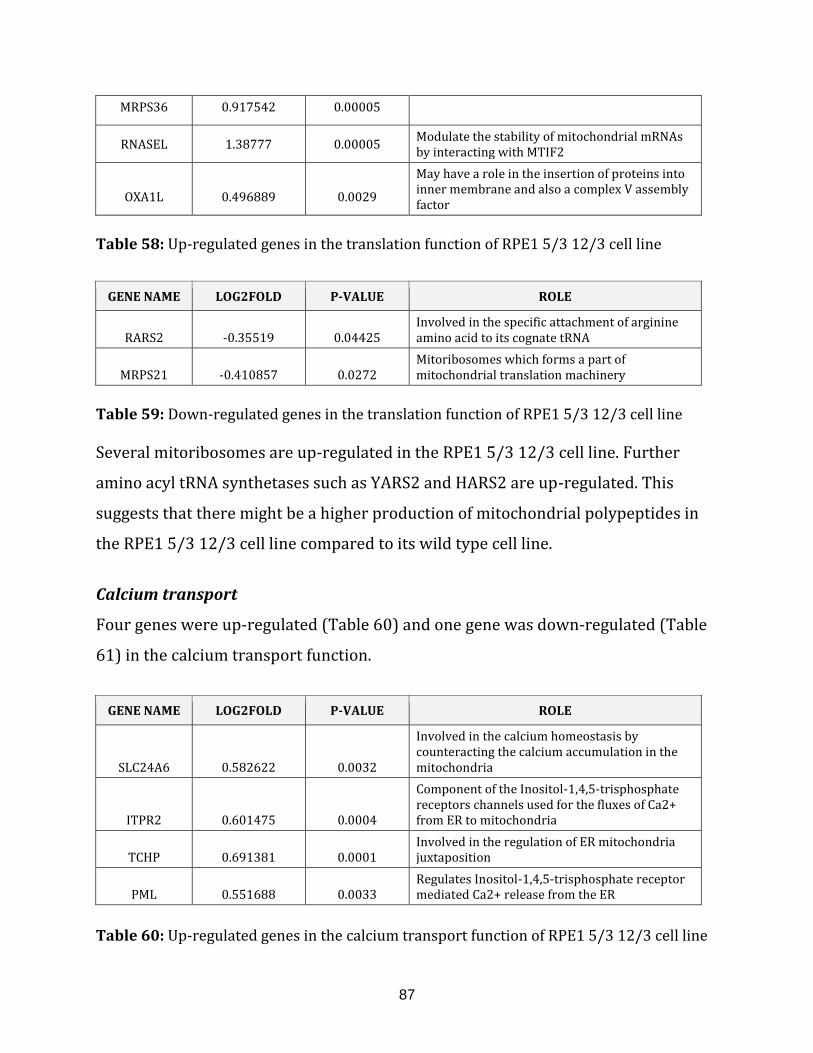
87
MRPS36 0.917542 0.00005
RNASEL 1.38777 0.00005 Modulate the stability of mitochondrial mRNAs by interacting with MTIF2
OXA1L 0.496889 0.0029
May have a role in the insertion of proteins into inner membrane and also a complex V assembly factor
Table 58: Up-regulated genes in the translation function of RPE1 5/3 12/3 cell line
GENE NAME LOG2FOLD P-VALUE ROLE
RARS2 -0.35519 0.04425
Involved in the specific attachment of arginine amino acid to its cognate tRNA
MRPS21 -0.410857 0.0272
Mitoribosomes which forms a part of mitochondrial translation machinery
Table 59: Down-regulated genes in the translation function of RPE1 5/3 12/3 cell line Several mitoribosomes are up-regulated in the RPE1 5/3 12/3 cell line. Further
amino acyl tRNA synthetases such as YARS2 and HARS2 are up-regulated. This
suggests that there might be a higher production of mitochondrial polypeptides in
the RPE1 5/3 12/3 cell line compared to its wild type cell line.
Calcium transport
Four genes were up-regulated (Table 60) and one gene was down-regulated (Table
61) in the calcium transport function.
GENE NAME LOG2FOLD P-VALUE ROLE
SLC24A6 0.582622 0.0032
Involved in the calcium homeostasis by counteracting the calcium accumulation in the mitochondria
ITPR2 0.601475 0.0004
Component of the Inositol-1,4,5-trisphosphate receptors channels used for the fluxes of Ca2+ from ER to mitochondria
TCHP 0.691381 0.0001 Involved in the regulation of ER mitochondria juxtaposition
PML 0.551688 0.0033 Regulates Inositol-1,4,5-trisphosphate receptor mediated Ca2+ release from the ER
Table 60: Up-regulated genes in the calcium transport function of RPE1 5/3 12/3 cell line
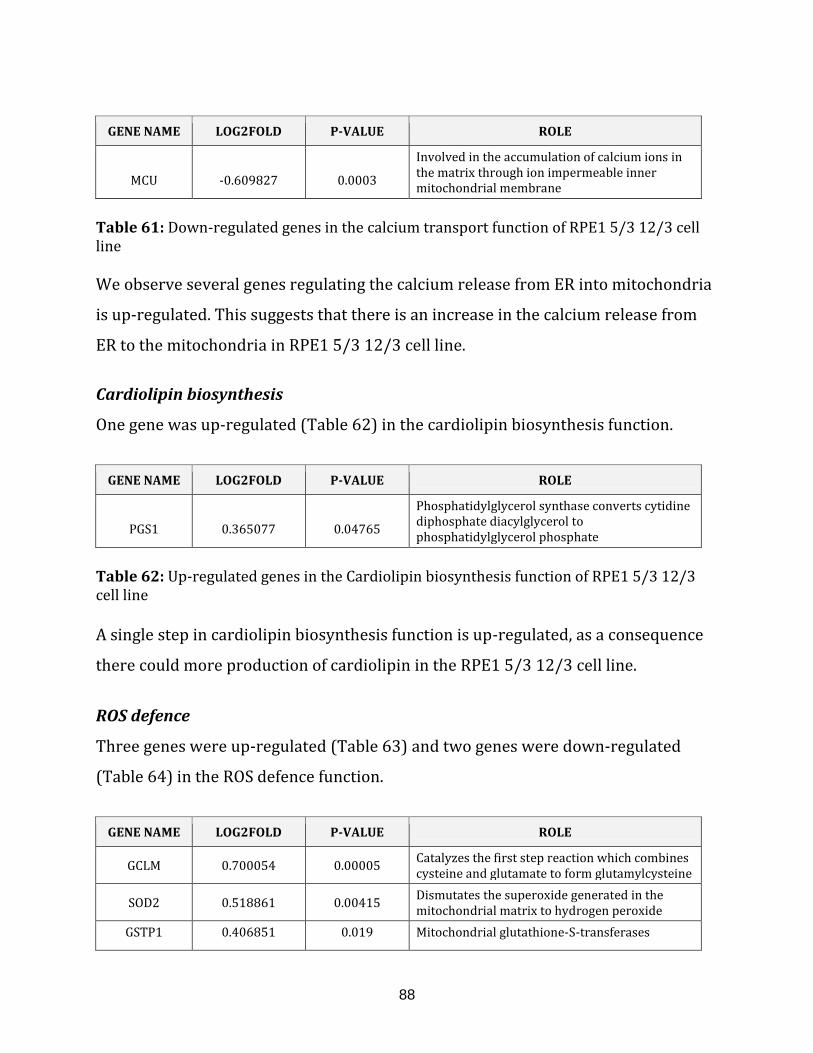
88
GENE NAME LOG2FOLD P-VALUE ROLE
MCU -0.609827 0.0003
Involved in the accumulation of calcium ions in the matrix through ion impermeable inner mitochondrial membrane
Table 61: Down-regulated genes in the calcium transport function of RPE1 5/3 12/3 cell line We observe several genes regulating the calcium release from ER into mitochondria
is up-regulated. This suggests that there is an increase in the calcium release from
ER to the mitochondria in RPE1 5/3 12/3 cell line.
Cardiolipin biosynthesis
One gene was up-regulated (Table 62) in the cardiolipin biosynthesis function.
GENE NAME LOG2FOLD P-VALUE ROLE
PGS1 0.365077 0.04765
Phosphatidylglycerol synthase converts cytidine diphosphate diacylglycerol to phosphatidylglycerol phosphate
Table 62: Up-regulated genes in the Cardiolipin biosynthesis function of RPE1 5/3 12/3 cell line A single step in cardiolipin biosynthesis function is up-regulated, as a consequence
there could more production of cardiolipin in the RPE1 5/3 12/3 cell line.
ROS defence
Three genes were up-regulated (Table 63) and two genes were down-regulated
(Table 64) in the ROS defence function.
GENE NAME LOG2FOLD P-VALUE ROLE
GCLM 0.700054 0.00005 Catalyzes the first step reaction which combines cysteine and glutamate to form glutamylcysteine
SOD2 0.518861 0.00415 Dismutates the superoxide generated in the mitochondrial matrix to hydrogen peroxide
GSTP1 0.406851 0.019 Mitochondrial glutathione-S-transferases
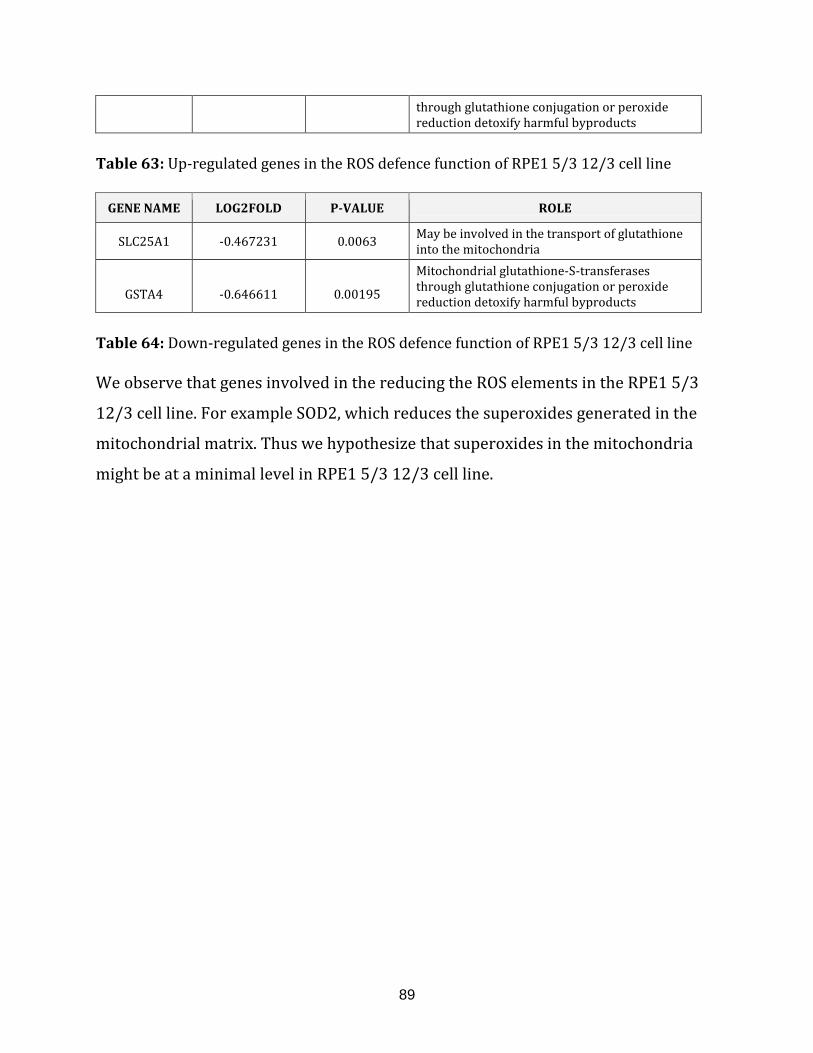
89
through glutathione conjugation or peroxide reduction detoxify harmful byproducts
Table 63: Up-regulated genes in the ROS defence function of RPE1 5/3 12/3 cell line
GENE NAME LOG2FOLD P-VALUE ROLE
SLC25A1 -0.467231 0.0063 May be involved in the transport of glutathione into the mitochondria
GSTA4 -0.646611 0.00195
Mitochondrial glutathione-S-transferases through glutathione conjugation or peroxide reduction detoxify harmful byproducts
Table 64: Down-regulated genes in the ROS defence function of RPE1 5/3 12/3 cell line We observe that genes involved in the reducing the ROS elements in the RPE1 5/3
12/3 cell line. For example SOD2, which reduces the superoxides generated in the
mitochondrial matrix. Thus we hypothesize that superoxides in the mitochondria
might be at a minimal level in RPE1 5/3 12/3 cell line.
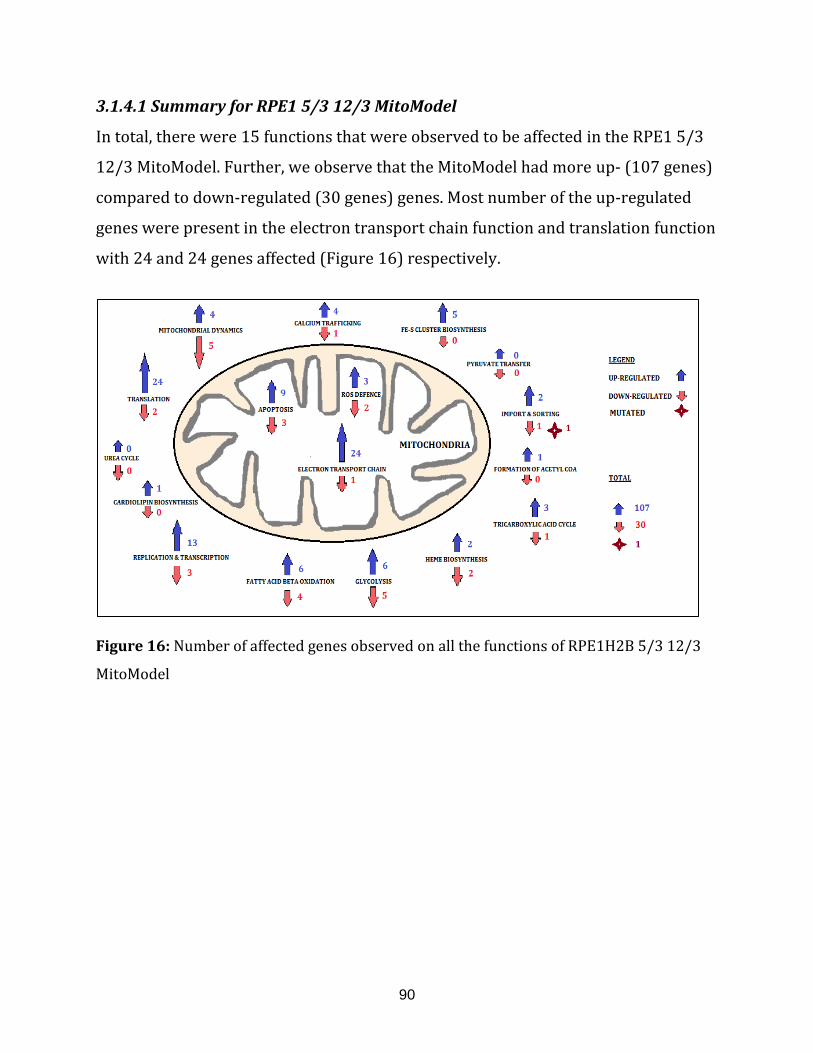
90
3.1.4.1 Summary for RPE1 5/3 12/3 MitoModel
In total, there were 15 functions that were observed to be affected in the RPE1 5/3
12/3 MitoModel. Further, we observe that the MitoModel had more up- (107 genes)
compared to down-regulated (30 genes) genes. Most number of the up-regulated
genes were present in the electron transport chain function and translation function
with 24 and 24 genes affected (Figure 16) respectively.
Figure 16: Number of affected genes observed on all the functions of RPE1H2B 5/3 12/3
MitoModel
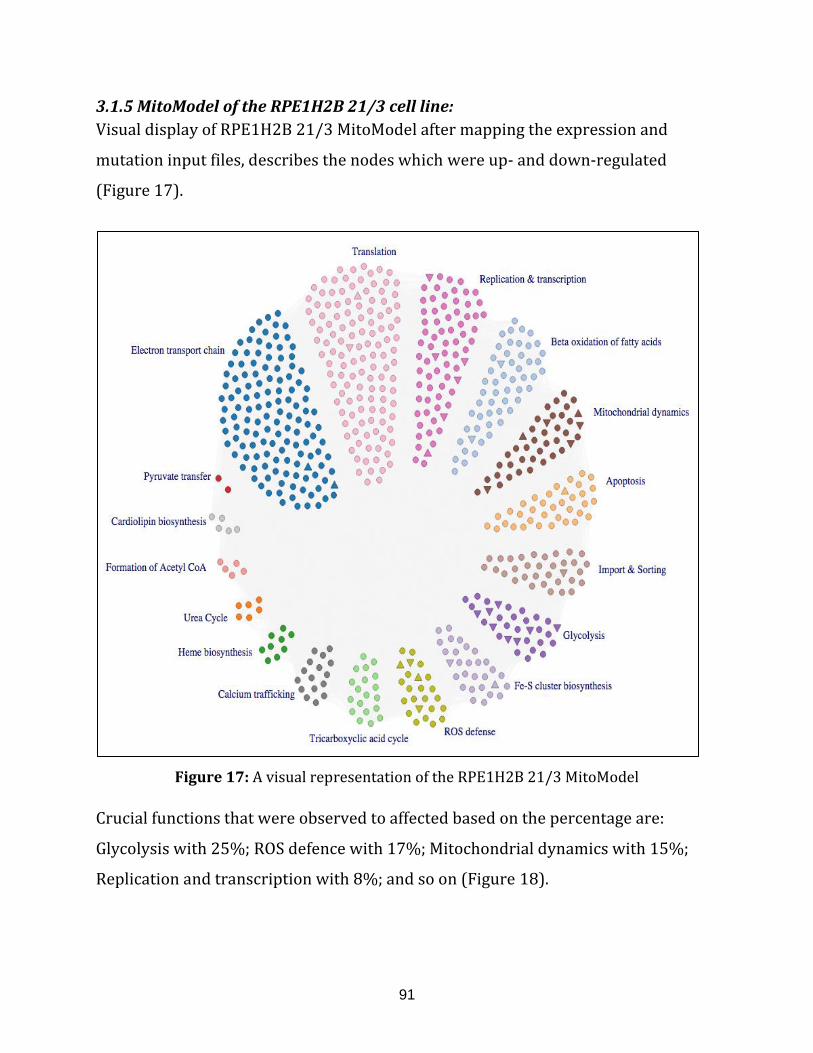
91
3.1.5 MitoModel of the RPE1H2B 21/3 cell line:
Visual display of RPE1H2B 21/3 MitoModel after mapping the expression and
mutation input files, describes the nodes which were up- and down-regulated
(Figure 17).
Figure 17: A visual representation of the RPE1H2B 21/3 MitoModel
Crucial functions that were observed to affected based on the percentage are:
Glycolysis with 25%; ROS defence with 17%; Mitochondrial dynamics with 15%;
Replication and transcription with 8%; and so on (Figure 18).
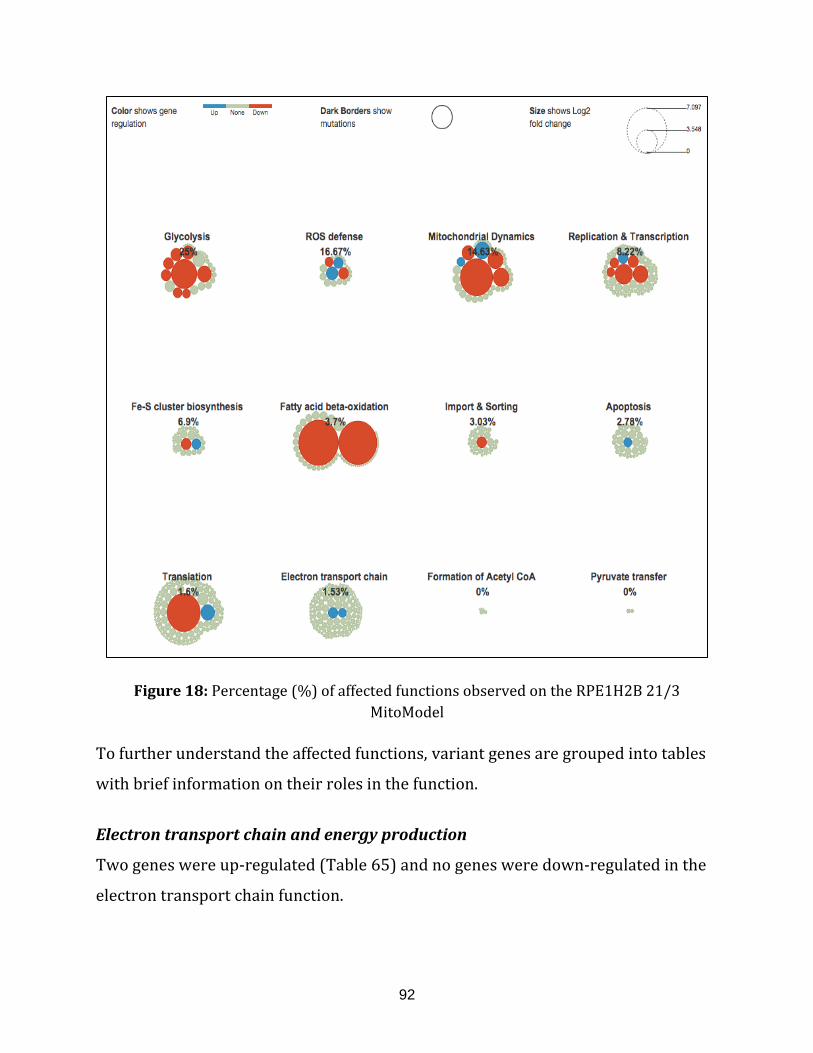
92
Figure 18: Percentage (%) of affected functions observed on the RPE1H2B 21/3
MitoModel
To further understand the affected functions, variant genes are grouped into tables
with brief information on their roles in the function.
Electron transport chain and energy production
Two genes were up-regulated (Table 65) and no genes were down-regulated in the
electron transport chain function.
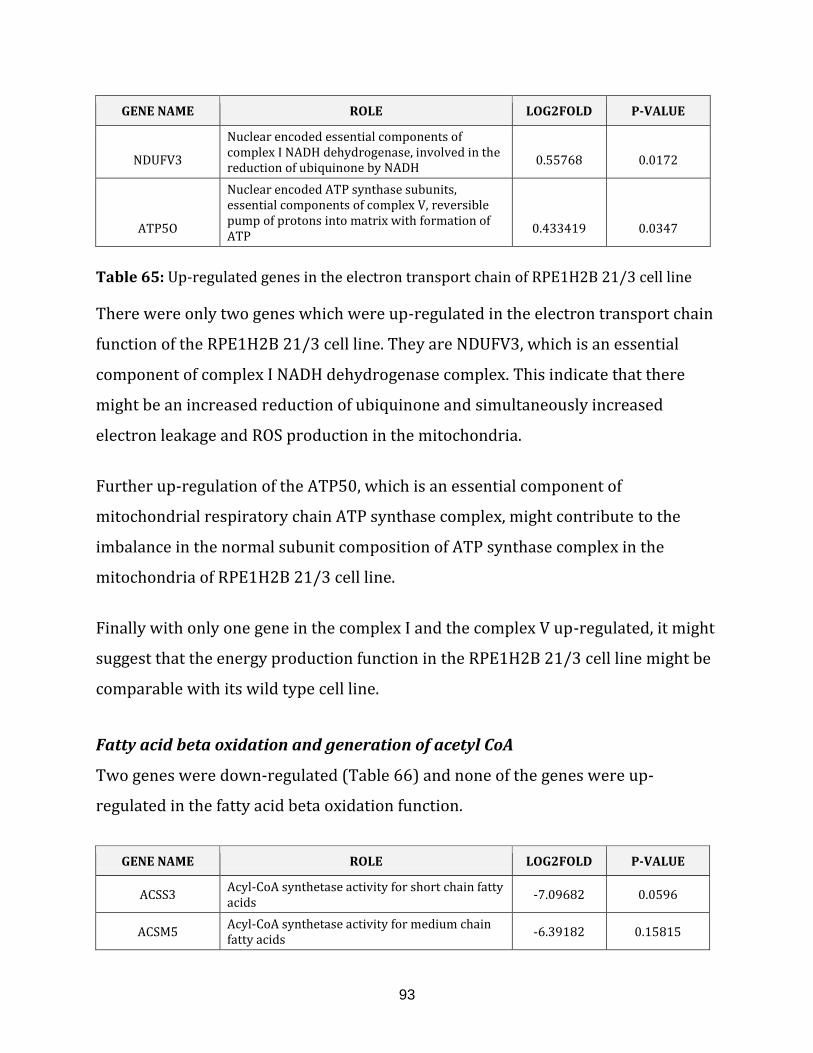
93
GENE NAME ROLE LOG2FOLD P-VALUE
NDUFV3
Nuclear encoded essential components of complex I NADH dehydrogenase, involved in the reduction of ubiquinone by NADH
0.55768 0.0172
ATP5O
Nuclear encoded ATP synthase subunits, essential components of complex V, reversible pump of protons into matrix with formation of ATP
0.433419 0.0347
Table 65: Up-regulated genes in the electron transport chain of RPE1H2B 21/3 cell line
There were only two genes which were up-regulated in the electron transport chain
function of the RPE1H2B 21/3 cell line. They are NDUFV3, which is an essential
component of complex I NADH dehydrogenase complex. This indicate that there
might be an increased reduction of ubiquinone and simultaneously increased
electron leakage and ROS production in the mitochondria.
Further up-regulation of the ATP50, which is an essential component of
mitochondrial respiratory chain ATP synthase complex, might contribute to the
imbalance in the normal subunit composition of ATP synthase complex in the
mitochondria of RPE1H2B 21/3 cell line.
Finally with only one gene in the complex I and the complex V up-regulated, it might
suggest that the energy production function in the RPE1H2B 21/3 cell line might be
comparable with its wild type cell line.
Fatty acid beta oxidation and generation of acetyl CoA
Two genes were down-regulated (Table 66) and none of the genes were up-
regulated in the fatty acid beta oxidation function.
GENE NAME ROLE LOG2FOLD P-VALUE
ACSS3 Acyl-CoA synthetase activity for short chain fatty acids
-7.09682 0.0596
ACSM5 Acyl-CoA synthetase activity for medium chain fatty acids
-6.39182 0.15815
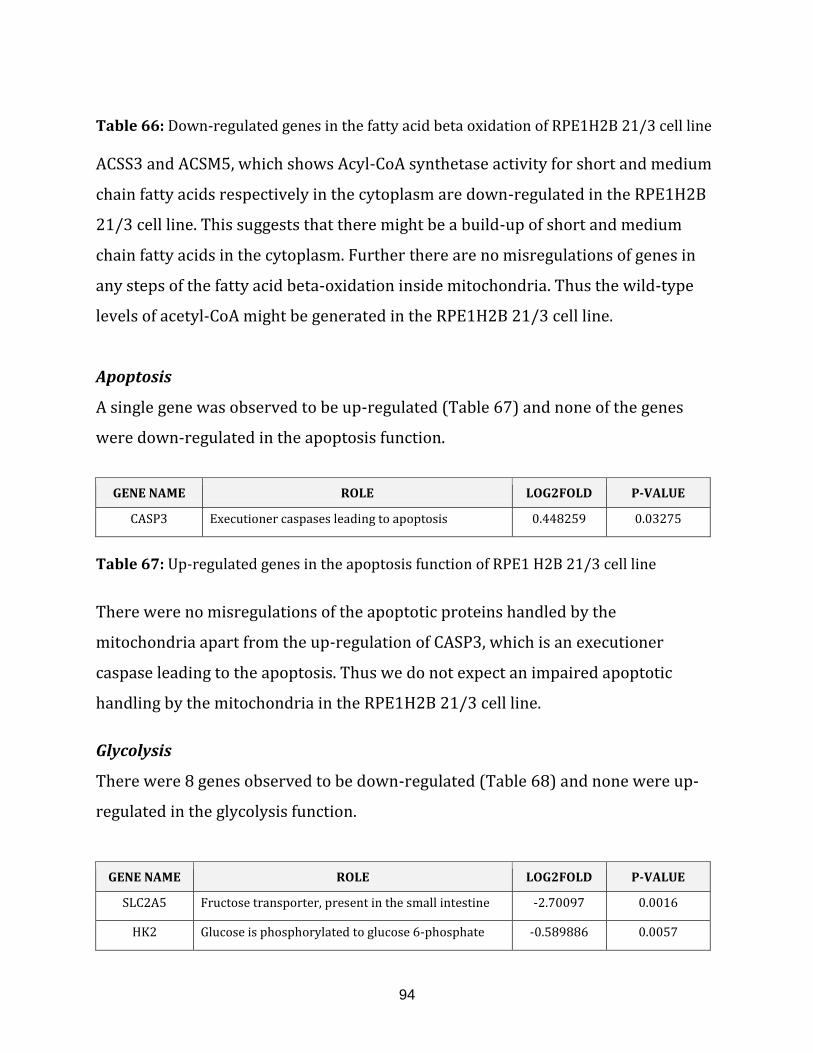
94
Table 66: Down-regulated genes in the fatty acid beta oxidation of RPE1H2B 21/3 cell line ACSS3 and ACSM5, which shows Acyl-CoA synthetase activity for short and medium
chain fatty acids respectively in the cytoplasm are down-regulated in the RPE1H2B
21/3 cell line. This suggests that there might be a build-up of short and medium
chain fatty acids in the cytoplasm. Further there are no misregulations of genes in
any steps of the fatty acid beta-oxidation inside mitochondria. Thus the wild-type
levels of acetyl-CoA might be generated in the RPE1H2B 21/3 cell line.
Apoptosis
A single gene was observed to be up-regulated (Table 67) and none of the genes
were down-regulated in the apoptosis function.
GENE NAME ROLE LOG2FOLD P-VALUE
CASP3 Executioner caspases leading to apoptosis 0.448259 0.03275
Table 67: Up-regulated genes in the apoptosis function of RPE1 H2B 21/3 cell line
There were no misregulations of the apoptotic proteins handled by the
mitochondria apart from the up-regulation of CASP3, which is an executioner
caspase leading to the apoptosis. Thus we do not expect an impaired apoptotic
handling by the mitochondria in the RPE1H2B 21/3 cell line.
Glycolysis
There were 8 genes observed to be down-regulated (Table 68) and none were up-
regulated in the glycolysis function.
GENE NAME ROLE LOG2FOLD P-VALUE
SLC2A5 Fructose transporter, present in the small intestine -2.70097 0.0016
HK2 Glucose is phosphorylated to glucose 6-phosphate -0.589886 0.0057
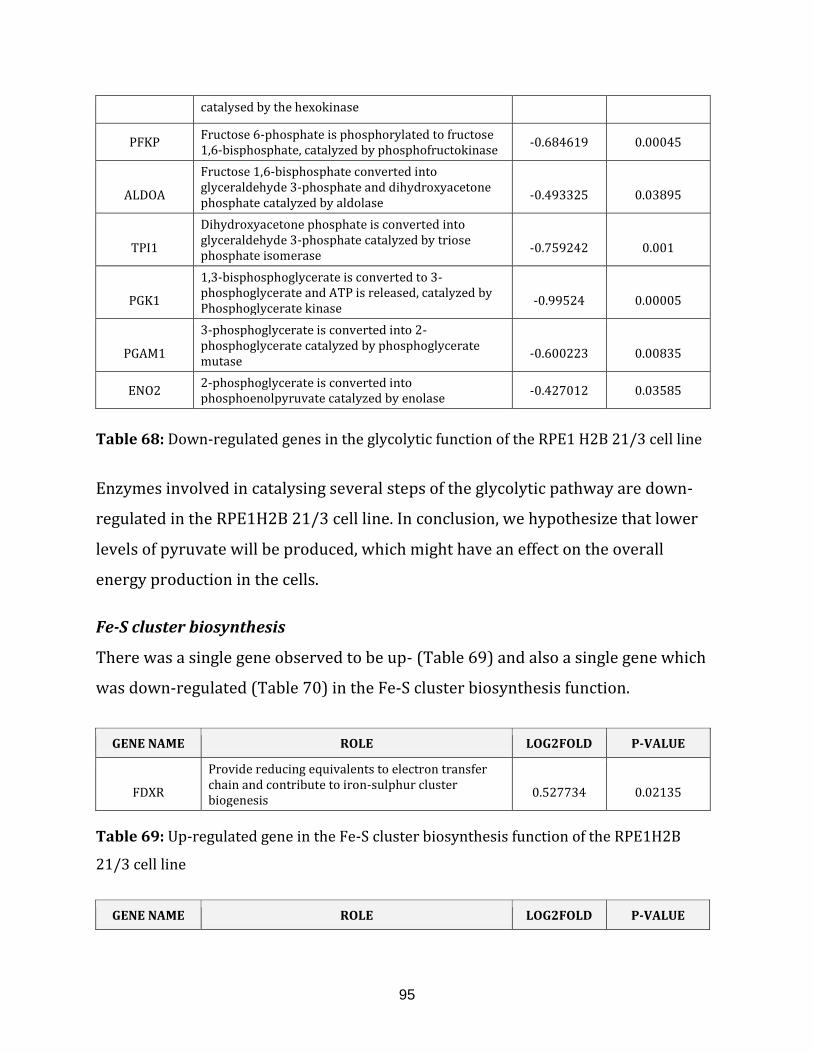
95
catalysed by the hexokinase
PFKP Fructose 6-phosphate is phosphorylated to fructose 1,6-bisphosphate, catalyzed by phosphofructokinase
-0.684619 0.00045
ALDOA
Fructose 1,6-bisphosphate converted into glyceraldehyde 3-phosphate and dihydroxyacetone phosphate catalyzed by aldolase
-0.493325 0.03895
TPI1
Dihydroxyacetone phosphate is converted into glyceraldehyde 3-phosphate catalyzed by triose phosphate isomerase
-0.759242 0.001
PGK1
1,3-bisphosphoglycerate is converted to 3-phosphoglycerate and ATP is released, catalyzed by Phosphoglycerate kinase
-0.99524 0.00005
PGAM1
3-phosphoglycerate is converted into 2-phosphoglycerate catalyzed by phosphoglycerate mutase
-0.600223 0.00835
ENO2 2-phosphoglycerate is converted into phosphoenolpyruvate catalyzed by enolase
-0.427012 0.03585
Table 68: Down-regulated genes in the glycolytic function of the RPE1 H2B 21/3 cell line
Enzymes involved in catalysing several steps of the glycolytic pathway are down-
regulated in the RPE1H2B 21/3 cell line. In conclusion, we hypothesize that lower
levels of pyruvate will be produced, which might have an effect on the overall
energy production in the cells.
Fe-S cluster biosynthesis
There was a single gene observed to be up- (Table 69) and also a single gene which
was down-regulated (Table 70) in the Fe-S cluster biosynthesis function.
GENE NAME ROLE LOG2FOLD P-VALUE
FDXR
Provide reducing equivalents to electron transfer chain and contribute to iron-sulphur cluster biogenesis
0.527734 0.02135
Table 69: Up-regulated gene in the Fe-S cluster biosynthesis function of the RPE1H2B
21/3 cell line
GENE NAME ROLE LOG2FOLD P-VALUE
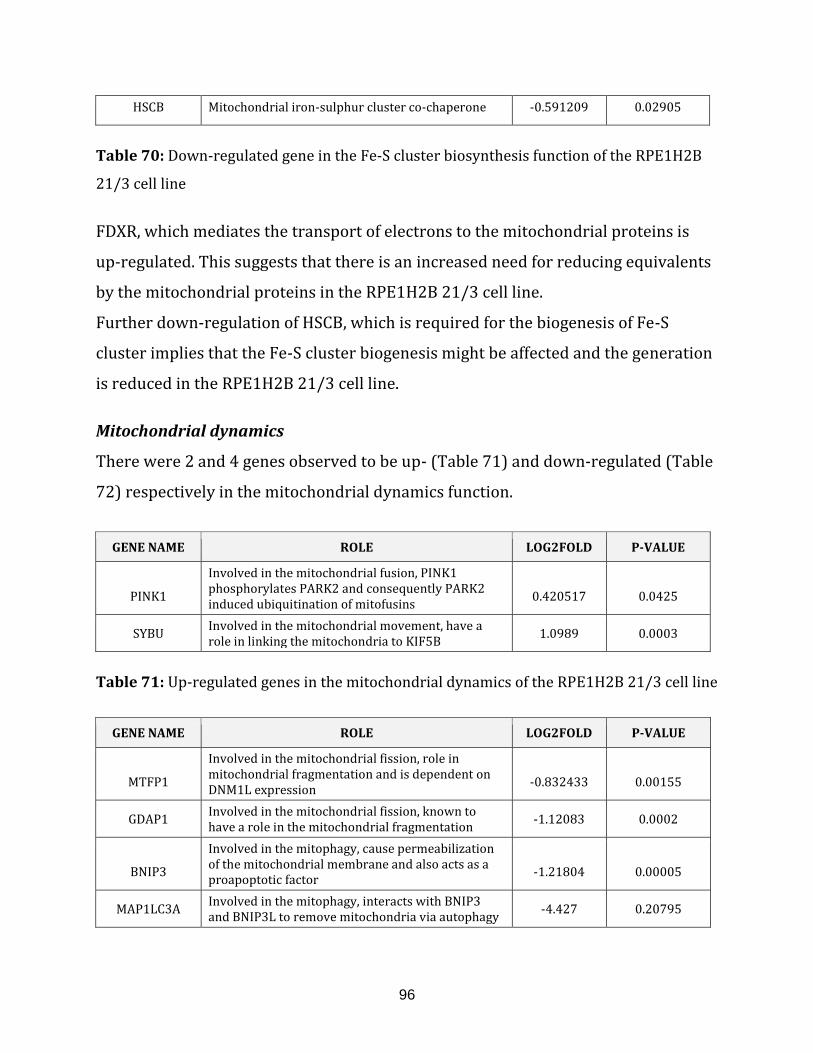
96
HSCB Mitochondrial iron-sulphur cluster co-chaperone -0.591209 0.02905
Table 70: Down-regulated gene in the Fe-S cluster biosynthesis function of the RPE1H2B
21/3 cell line
FDXR, which mediates the transport of electrons to the mitochondrial proteins is
up-regulated. This suggests that there is an increased need for reducing equivalents
by the mitochondrial proteins in the RPE1H2B 21/3 cell line.
Further down-regulation of HSCB, which is required for the biogenesis of Fe-S
cluster implies that the Fe-S cluster biogenesis might be affected and the generation
is reduced in the RPE1H2B 21/3 cell line.
Mitochondrial dynamics
There were 2 and 4 genes observed to be up- (Table 71) and down-regulated (Table
72) respectively in the mitochondrial dynamics function.
GENE NAME ROLE LOG2FOLD P-VALUE
PINK1
Involved in the mitochondrial fusion, PINK1 phosphorylates PARK2 and consequently PARK2 induced ubiquitination of mitofusins
0.420517 0.0425
SYBU Involved in the mitochondrial movement, have a role in linking the mitochondria to KIF5B
1.0989 0.0003
Table 71: Up-regulated genes in the mitochondrial dynamics of the RPE1H2B 21/3 cell line
GENE NAME ROLE LOG2FOLD P-VALUE
MTFP1
Involved in the mitochondrial fission, role in mitochondrial fragmentation and is dependent on DNM1L expression
-0.832433 0.00155
GDAP1 Involved in the mitochondrial fission, known to have a role in the mitochondrial fragmentation
-1.12083 0.0002
BNIP3
Involved in the mitophagy, cause permeabilization of the mitochondrial membrane and also acts as a proapoptotic factor
-1.21804 0.00005
MAP1LC3A Involved in the mitophagy, interacts with BNIP3 and BNIP3L to remove mitochondria via autophagy
-4.427 0.20795
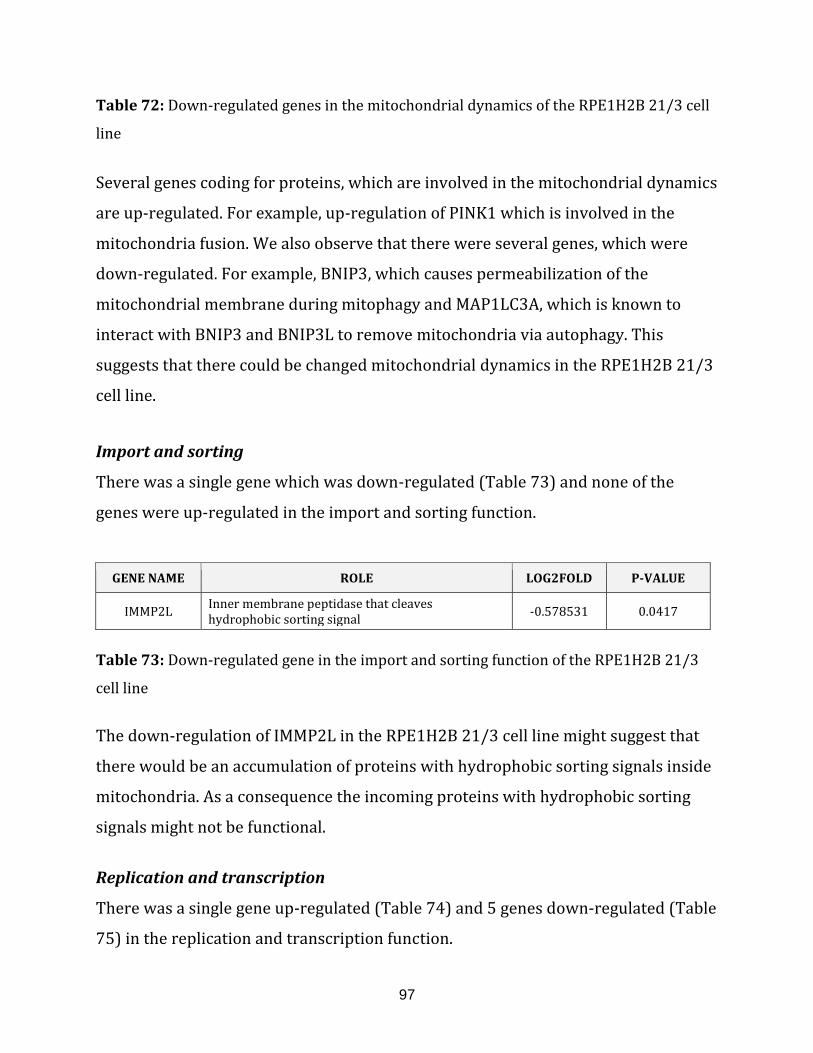
97
Table 72: Down-regulated genes in the mitochondrial dynamics of the RPE1H2B 21/3 cell
line
Several genes coding for proteins, which are involved in the mitochondrial dynamics
are up-regulated. For example, up-regulation of PINK1 which is involved in the
mitochondria fusion. We also observe that there were several genes, which were
down-regulated. For example, BNIP3, which causes permeabilization of the
mitochondrial membrane during mitophagy and MAP1LC3A, which is known to
interact with BNIP3 and BNIP3L to remove mitochondria via autophagy. This
suggests that there could be changed mitochondrial dynamics in the RPE1H2B 21/3
cell line.
Import and sorting
There was a single gene which was down-regulated (Table 73) and none of the
genes were up-regulated in the import and sorting function.
GENE NAME ROLE LOG2FOLD P-VALUE
IMMP2L Inner membrane peptidase that cleaves hydrophobic sorting signal
-0.578531 0.0417
Table 73: Down-regulated gene in the import and sorting function of the RPE1H2B 21/3
cell line
The down-regulation of IMMP2L in the RPE1H2B 21/3 cell line might suggest that
there would be an accumulation of proteins with hydrophobic sorting signals inside
mitochondria. As a consequence the incoming proteins with hydrophobic sorting
signals might not be functional.
Replication and transcription
There was a single gene up-regulated (Table 74) and 5 genes down-regulated (Table
75) in the replication and transcription function.
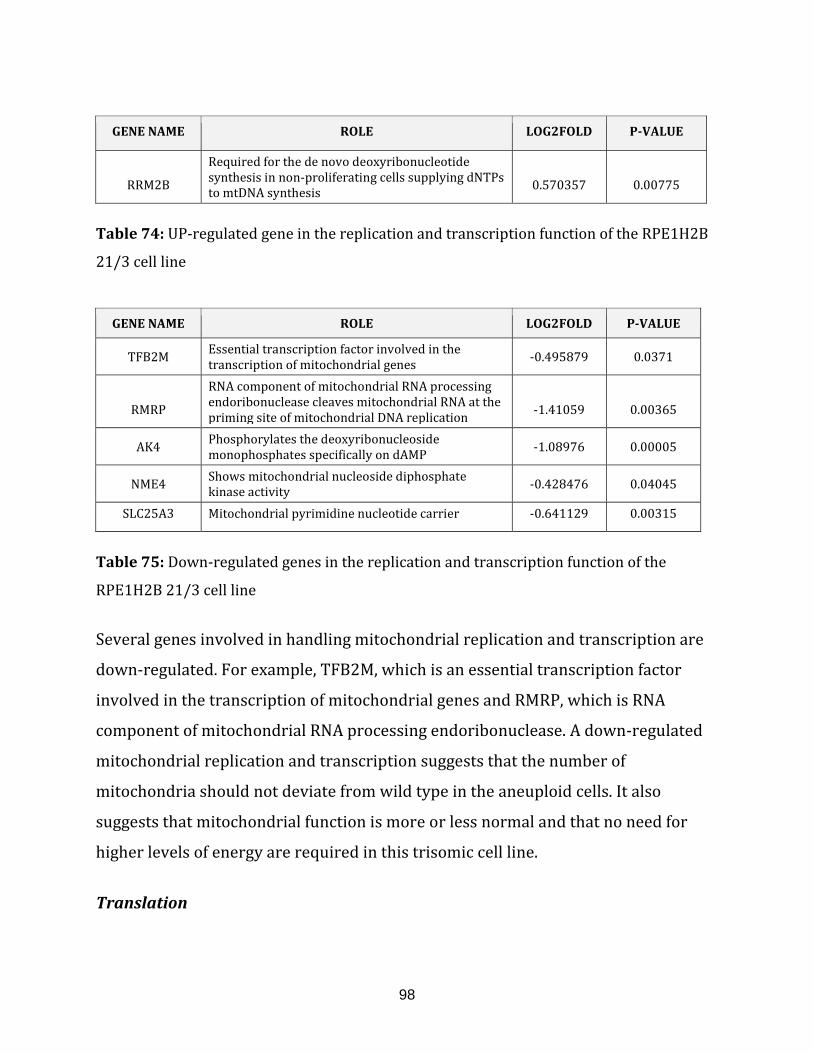
98
GENE NAME ROLE LOG2FOLD P-VALUE
RRM2B
Required for the de novo deoxyribonucleotide synthesis in non-proliferating cells supplying dNTPs to mtDNA synthesis
0.570357 0.00775
Table 74: UP-regulated gene in the replication and transcription function of the RPE1H2B
21/3 cell line
GENE NAME ROLE LOG2FOLD P-VALUE
TFB2M Essential transcription factor involved in the transcription of mitochondrial genes
-0.495879 0.0371
RMRP
RNA component of mitochondrial RNA processing endoribonuclease cleaves mitochondrial RNA at the priming site of mitochondrial DNA replication
-1.41059 0.00365
AK4 Phosphorylates the deoxyribonucleoside monophosphates specifically on dAMP
-1.08976 0.00005
NME4 Shows mitochondrial nucleoside diphosphate kinase activity
-0.428476 0.04045
SLC25A3 Mitochondrial pyrimidine nucleotide carrier -0.641129 0.00315
Table 75: Down-regulated genes in the replication and transcription function of the
RPE1H2B 21/3 cell line
Several genes involved in handling mitochondrial replication and transcription are
down-regulated. For example, TFB2M, which is an essential transcription factor
involved in the transcription of mitochondrial genes and RMRP, which is RNA
component of mitochondrial RNA processing endoribonuclease. A down-regulated
mitochondrial replication and transcription suggests that the number of
mitochondria should not deviate from wild type in the aneuploid cells. It also
suggests that mitochondrial function is more or less normal and that no need for
higher levels of energy are required in this trisomic cell line.
Translation
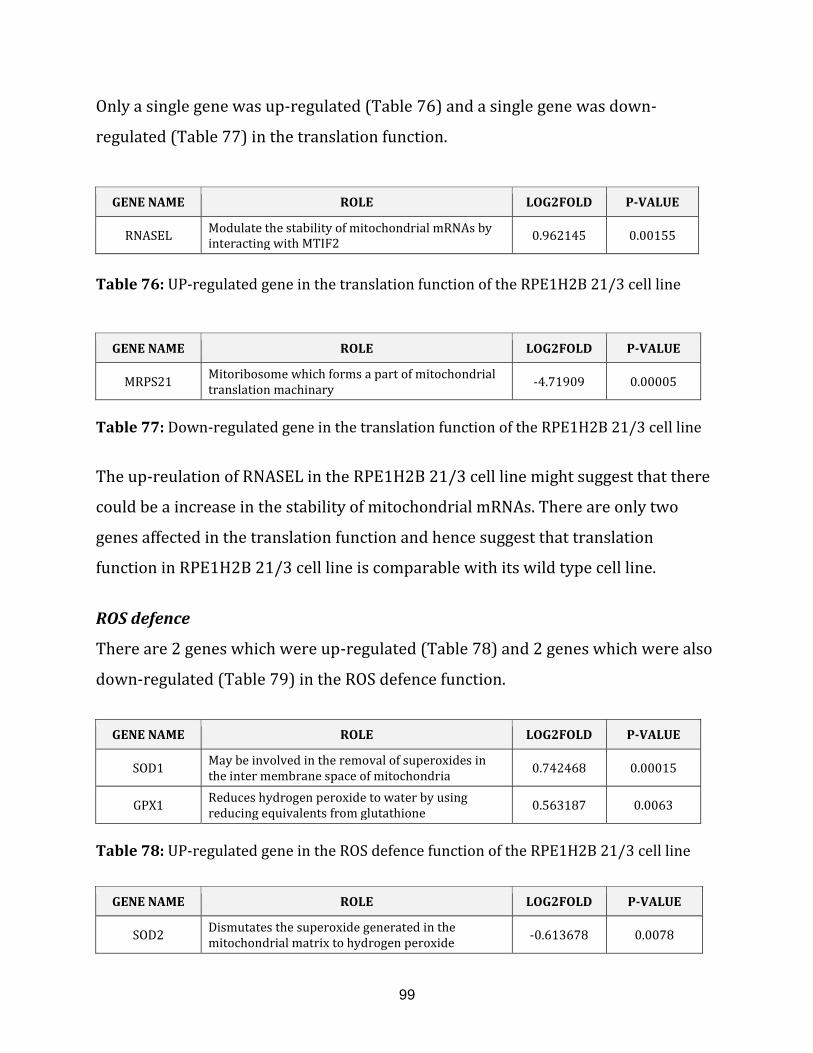
99
Only a single gene was up-regulated (Table 76) and a single gene was down-
regulated (Table 77) in the translation function.
GENE NAME ROLE LOG2FOLD P-VALUE
RNASEL Modulate the stability of mitochondrial mRNAs by interacting with MTIF2
0.962145 0.00155
Table 76: UP-regulated gene in the translation function of the RPE1H2B 21/3 cell line
GENE NAME ROLE LOG2FOLD P-VALUE
MRPS21 Mitoribosome which forms a part of mitochondrial translation machinary
-4.71909 0.00005
Table 77: Down-regulated gene in the translation function of the RPE1H2B 21/3 cell line
The up-reulation of RNASEL in the RPE1H2B 21/3 cell line might suggest that there
could be a increase in the stability of mitochondrial mRNAs. There are only two
genes affected in the translation function and hence suggest that translation
function in RPE1H2B 21/3 cell line is comparable with its wild type cell line.
ROS defence
There are 2 genes which were up-regulated (Table 78) and 2 genes which were also
down-regulated (Table 79) in the ROS defence function.
GENE NAME ROLE LOG2FOLD P-VALUE
SOD1 May be involved in the removal of superoxides in the inter membrane space of mitochondria
0.742468 0.00015
GPX1 Reduces hydrogen peroxide to water by using reducing equivalents from glutathione
0.563187 0.0063
Table 78: UP-regulated gene in the ROS defence function of the RPE1H2B 21/3 cell line
GENE NAME ROLE LOG2FOLD P-VALUE
SOD2 Dismutates the superoxide generated in the mitochondrial matrix to hydrogen peroxide
-0.613678 0.0078
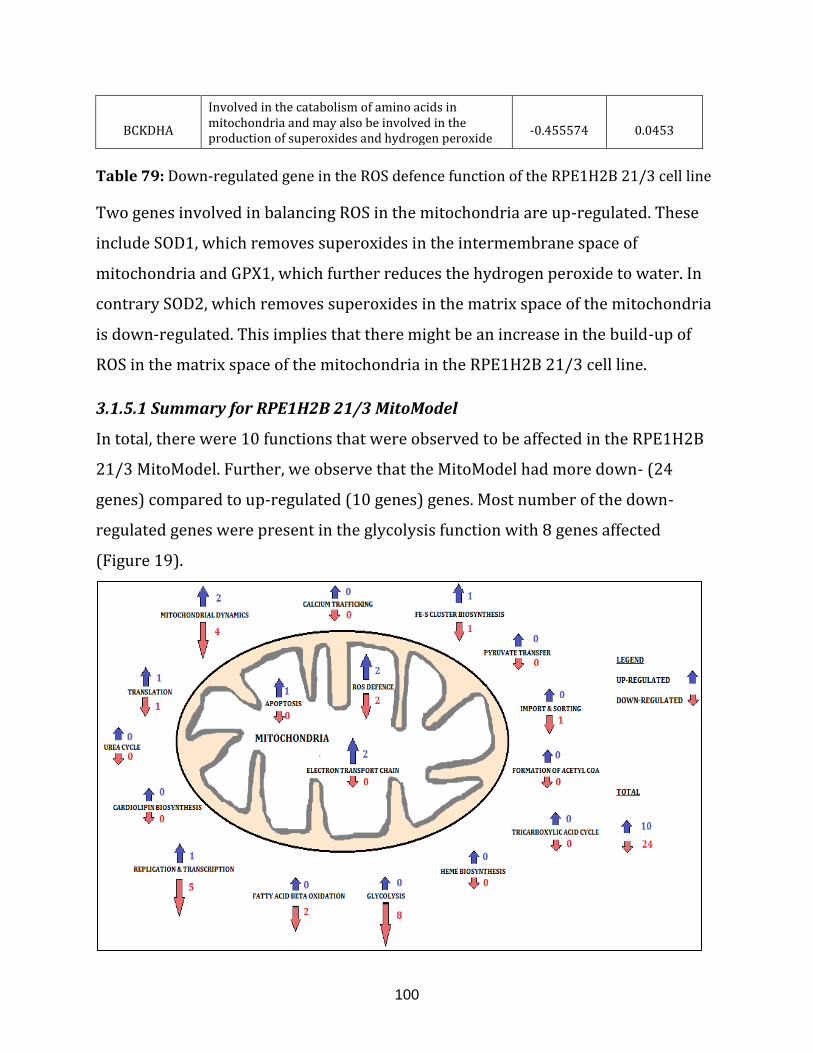
100
BCKDHA
Involved in the catabolism of amino acids in mitochondria and may also be involved in the production of superoxides and hydrogen peroxide
-0.455574 0.0453
Table 79: Down-regulated gene in the ROS defence function of the RPE1H2B 21/3 cell line
Two genes involved in balancing ROS in the mitochondria are up-regulated. These
include SOD1, which removes superoxides in the intermembrane space of
mitochondria and GPX1, which further reduces the hydrogen peroxide to water. In
contrary SOD2, which removes superoxides in the matrix space of the mitochondria
is down-regulated. This implies that there might be an increase in the build-up of
ROS in the matrix space of the mitochondria in the RPE1H2B 21/3 cell line.
3.1.5.1 Summary for RPE1H2B 21/3 MitoModel
In total, there were 10 functions that were observed to be affected in the RPE1H2B
21/3 MitoModel. Further, we observe that the MitoModel had more down- (24
genes) compared to up-regulated (10 genes) genes. Most number of the down-
regulated genes were present in the glycolysis function with 8 genes affected
(Figure 19).
101
Figure 19: Number of affected genes observed on all the functions of RPE1H2B 21/3
MitoModel
3.1.6 Comparison between HCT116 5/4, RPE1 5/3 12/3 and RPE1H2B 21/3
MitoModels:
Differentially expressed genes from five functions: Electron transport chain,
glycolysis; translation; fatty acid beta oxidation; and replication and transcription
were recorded and used to compare the MitoModels for each cell line (Figure 20).
From Figure 20 it is clear that the differentially expression of genes is more towards
up-regulation compared to down-reguation in translation electron transport chain
and replication and transcription functions of RPE1 5/3 12/3 cell line when
compared with the HCT116 5/4 cell line. Where as in RPE1H2B 21/3 cell line
glycolysis with more differentially expressed genes tend towards dwnregulation.
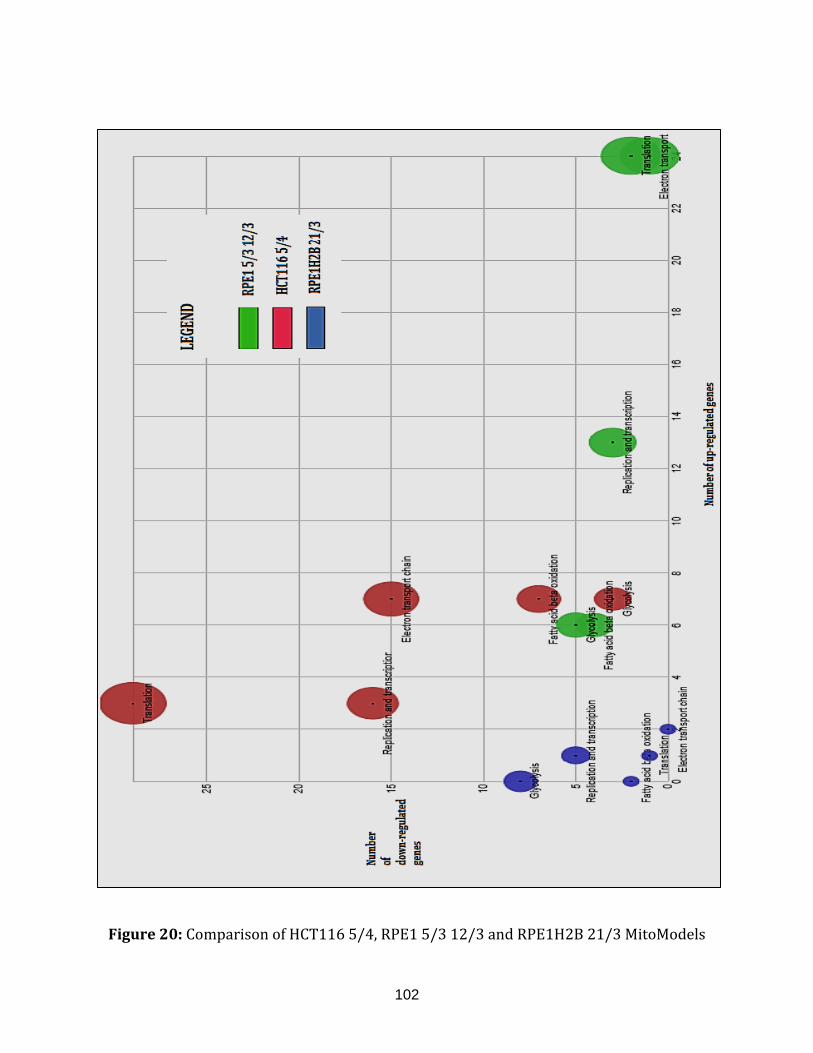
102
Figure 20: Comparison of HCT116 5/4, RPE1 5/3 12/3 and RPE1H2B 21/3 MitoModels
103
CHAPTER 3.2
Analysis of expression difference between LR and HR
stress reactivity mice: impact of mitochondrial function
Many studies suggest a relationship between hypothalamus-pituitary-
adrenocortical (HPA) axis dysregulation and major depression (MD) [Heinzmann et
al., 2014]. About 60 to 80% of depressed patients are observed to have
neuroendocrine alterations in HPA axis activity [Heinzmann et al., 2014]. Reports
also suggest the improvement of clinical symptoms with normalisation of HPA axis
function [Heinzmann et al., 2014]. Therefore dysregulated HPA axis as one of the
key endophenotype of MD and may provide an opportunity to elucidate underlying
mechanism of the disease [Heinzmann et al., 2014].
Mouse model selected for extremes in HPA axis reactivity were established by
Touma and colleagues [Touma et al., 2008] and kindly provided for us for
mitochondrial analysis. This ‘stress reactivity’ (SR) mouse model system consists of
a high (HR), intermediate (IR) and low (LR) reactivity mouse line. Distinct
differences in their corticosterone (CORT) secretion response to stressors are
observed in these mouse line [Touma et al., 2008].
To understand the different phenotypes in the three mouse lines, differential
expression data was generated by our collaborators generated using SAGE
[Velculescu et al., 1995]. RNA was derived from Hippocampus tissue from brain
from the LR and HR mice and libraries were pooled from six animals. Our aim was to
understand the mitochondrial contribution to different stress reactivity types.
104
3.2.1 DATA ANALYSIS:
The data we received consisted of the mouse gene symbols and expression values of
LR pool and HR pool with log2fold change and respective p-values.
In order to analyse mouse differential expression data, we generated a mouse
MitoModel by using the orthologs of the genes present in the human MitoModel.
3.2.2 LR VS. HR MITOMODEL:
Mouse MitoModel is an amalgamation, consisting of 659 genes which are
functionally associated with the mitochondria. The model is further classified into
17 mitochondria specific processes grouped into clusters (Figure 21).
After mapping expression data on to the mouse MitoModel, some of the crucial
functions that were observed to be impaired, based on the percentage are:
tricarboxylic acid cycle, which heavily affected with 84.21% of the genes either up-
or down-regulated (Figure 22); cardiolipin biosynthesis, with 66.67% genes
implicated; the electron transport chain, with 58.78% genes differentially regulated;
Mitochondrial dynamics, with 57.5%; Glycolysis, with 56.25% affected genes.
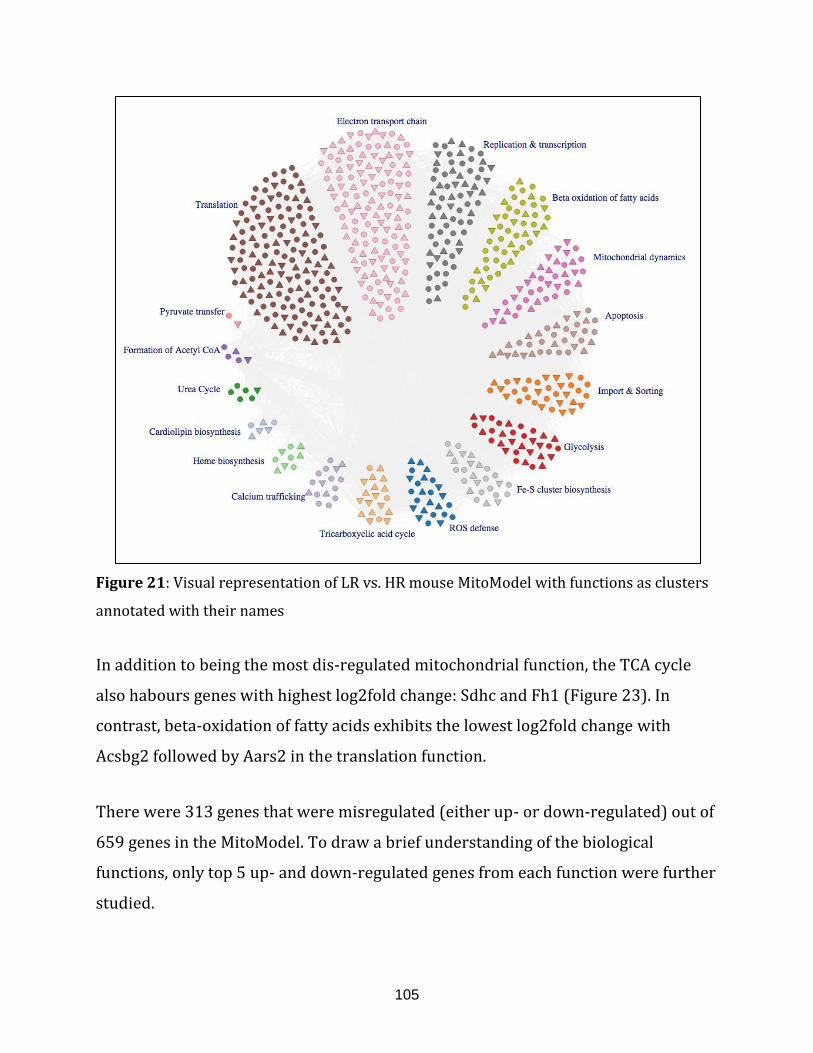
105
Figure 21: Visual representation of LR vs. HR mouse MitoModel with functions as clusters
annotated with their names
In addition to being the most dis-regulated mitochondrial function, the TCA cycle
also habours genes with highest log2fold change: Sdhc and Fh1 (Figure 23). In
contrast, beta-oxidation of fatty acids exhibits the lowest log2fold change with
Acsbg2 followed by Aars2 in the translation function.
There were 313 genes that were misregulated (either up- or down-regulated) out of
659 genes in the MitoModel. To draw a brief understanding of the biological
functions, only top 5 up- and down-regulated genes from each function were further
studied.
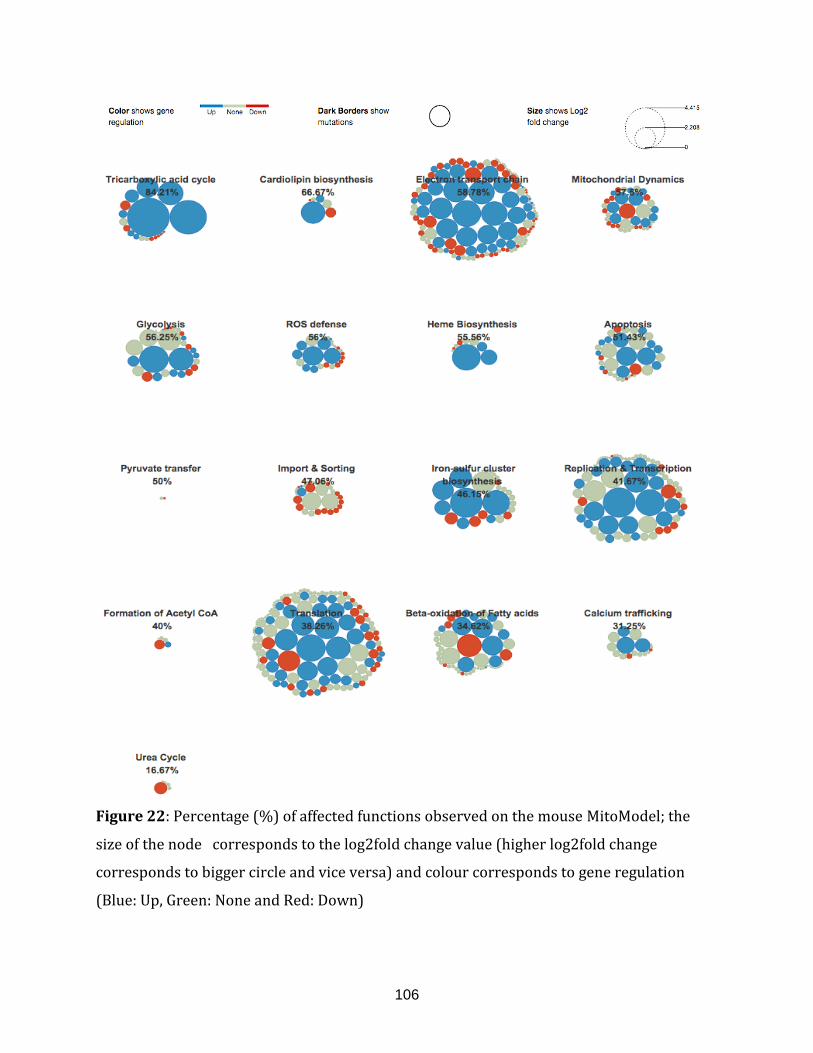
106
Figure 22: Percentage (%) of affected functions observed on the mouse MitoModel; the
size of the node corresponds to the log2fold change value (higher log2fold change
corresponds to bigger circle and vice versa) and colour corresponds to gene regulation
(Blue: Up, Green: None and Red: Down)
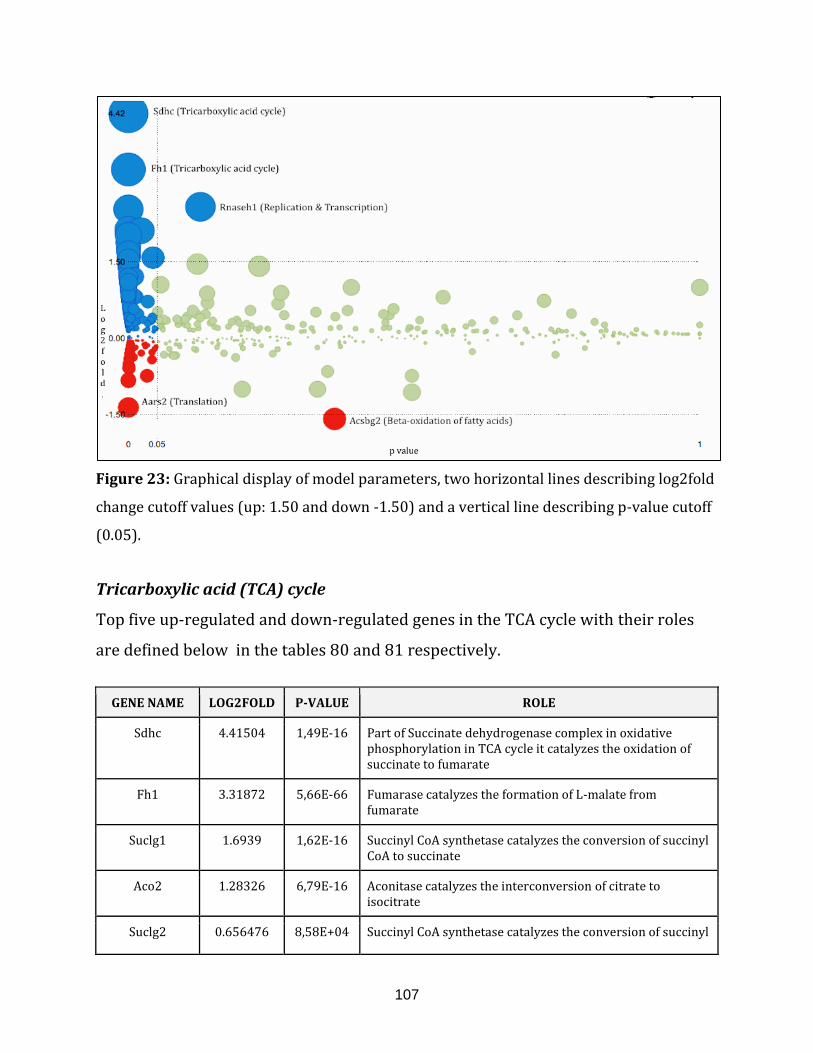
107
Figure 23: Graphical display of model parameters, two horizontal lines describing log2fold
change cutoff values (up: 1.50 and down -1.50) and a vertical line describing p-value cutoff
(0.05).
Tricarboxylic acid (TCA) cycle
Top five up-regulated and down-regulated genes in the TCA cycle with their roles
are defined below in the tables 80 and 81 respectively.
GENE NAME LOG2FOLD P-VALUE ROLE
Sdhc 4.41504 1,49E-16 Part of Succinate dehydrogenase complex in oxidative phosphorylation in TCA cycle it catalyzes the oxidation of succinate to fumarate
Fh1 3.31872 5,66E-66 Fumarase catalyzes the formation of L-malate from fumarate
Suclg1 1.6939 1,62E-16 Succinyl CoA synthetase catalyzes the conversion of succinyl CoA to succinate
Aco2 1.28326 6,79E-16 Aconitase catalyzes the interconversion of citrate to isocitrate
Suclg2 0.656476 8,58E+04 Succinyl CoA synthetase catalyzes the conversion of succinyl
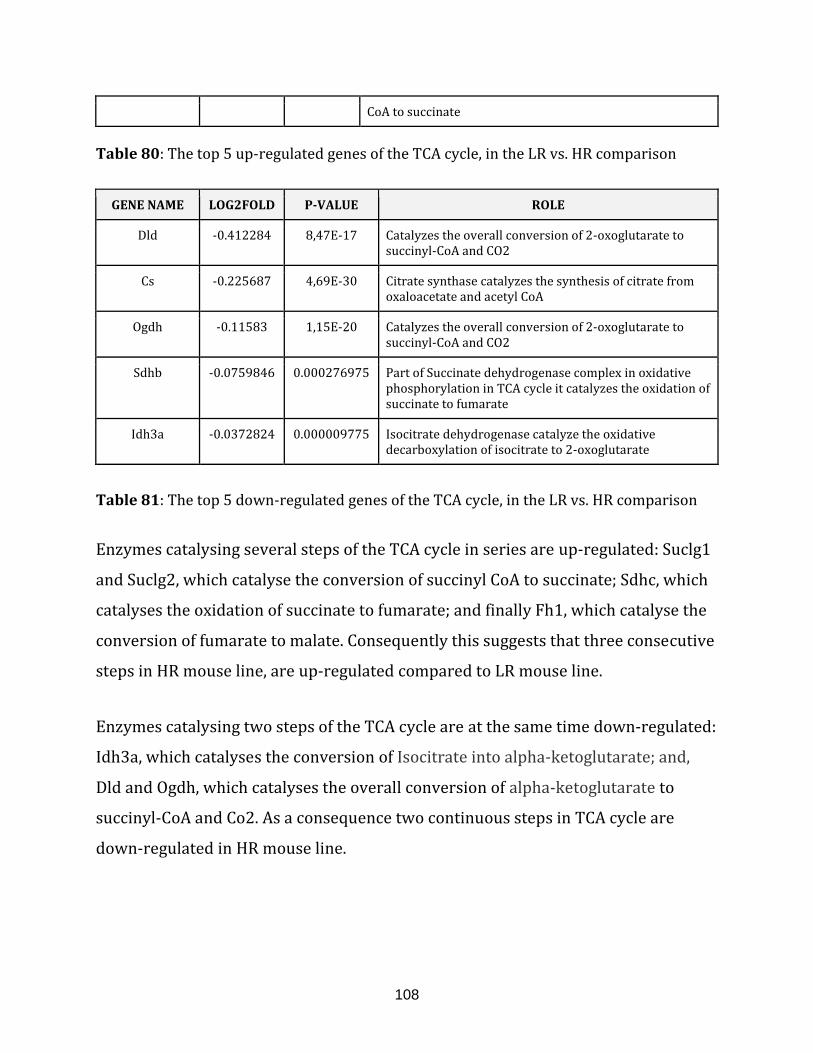
108
CoA to succinate
Table 80: The top 5 up-regulated genes of the TCA cycle, in the LR vs. HR comparison
GENE NAME LOG2FOLD P-VALUE ROLE
Dld -0.412284 8,47E-17 Catalyzes the overall conversion of 2-oxoglutarate to succinyl-CoA and CO2
Cs -0.225687 4,69E-30 Citrate synthase catalyzes the synthesis of citrate from oxaloacetate and acetyl CoA
Ogdh -0.11583 1,15E-20 Catalyzes the overall conversion of 2-oxoglutarate to succinyl-CoA and CO2
Sdhb -0.0759846 0.000276975 Part of Succinate dehydrogenase complex in oxidative phosphorylation in TCA cycle it catalyzes the oxidation of succinate to fumarate
Idh3a -0.0372824 0.000009775 Isocitrate dehydrogenase catalyze the oxidative decarboxylation of isocitrate to 2-oxoglutarate
Table 81: The top 5 down-regulated genes of the TCA cycle, in the LR vs. HR comparison
Enzymes catalysing several steps of the TCA cycle in series are up-regulated: Suclg1
and Suclg2, which catalyse the conversion of succinyl CoA to succinate; Sdhc, which
catalyses the oxidation of succinate to fumarate; and finally Fh1, which catalyse the
conversion of fumarate to malate. Consequently this suggests that three consecutive
steps in HR mouse line, are up-regulated compared to LR mouse line.
Enzymes catalysing two steps of the TCA cycle are at the same time down-regulated:
Idh3a, which catalyses the conversion of Isocitrate into alpha-ketoglutarate; and,
Dld and Ogdh, which catalyses the overall conversion of alpha-ketoglutarate to
succinyl-CoA and Co2. As a consequence two continuous steps in TCA cycle are
down-regulated in HR mouse line.
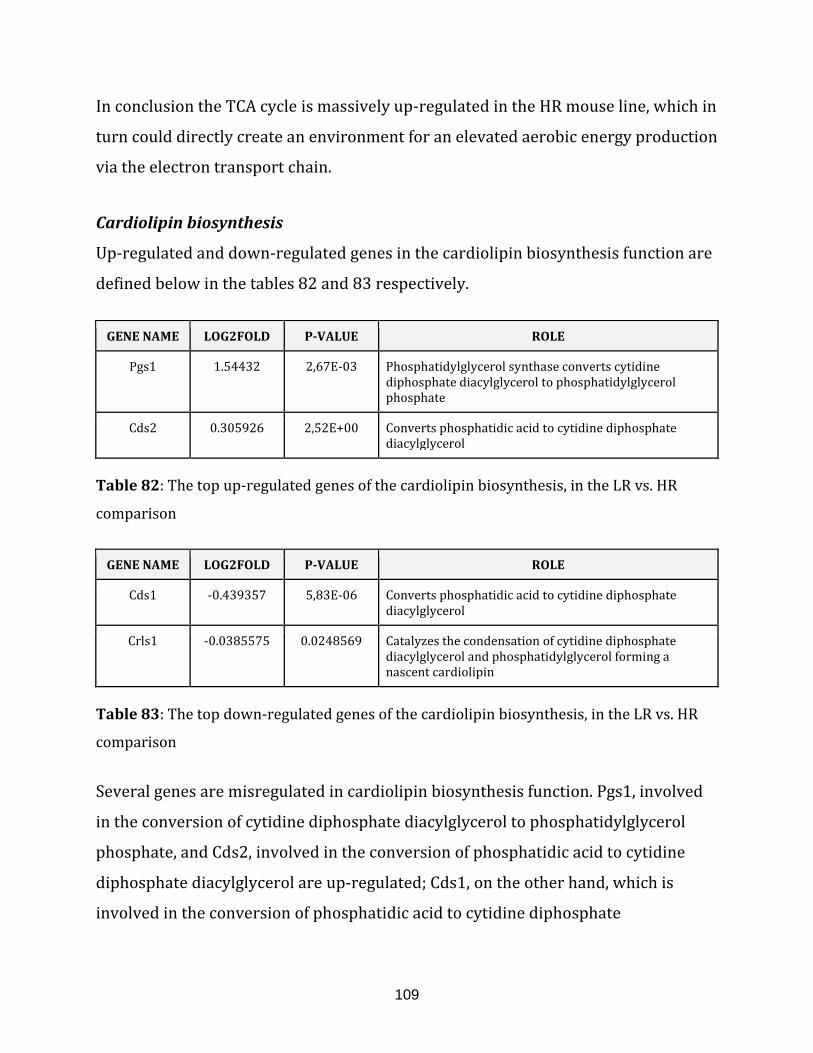
109
In conclusion the TCA cycle is massively up-regulated in the HR mouse line, which in
turn could directly create an environment for an elevated aerobic energy production
via the electron transport chain.
Cardiolipin biosynthesis
Up-regulated and down-regulated genes in the cardiolipin biosynthesis function are
defined below in the tables 82 and 83 respectively.
GENE NAME LOG2FOLD P-VALUE ROLE
Pgs1 1.54432 2,67E-03 Phosphatidylglycerol synthase converts cytidine diphosphate diacylglycerol to phosphatidylglycerol phosphate
Cds2 0.305926 2,52E+00 Converts phosphatidic acid to cytidine diphosphate diacylglycerol
Table 82: The top up-regulated genes of the cardiolipin biosynthesis, in the LR vs. HR
comparison
GENE NAME LOG2FOLD P-VALUE ROLE
Cds1 -0.439357 5,83E-06 Converts phosphatidic acid to cytidine diphosphate diacylglycerol
Crls1 -0.0385575 0.0248569 Catalyzes the condensation of cytidine diphosphate diacylglycerol and phosphatidylglycerol forming a nascent cardiolipin
Table 83: The top down-regulated genes of the cardiolipin biosynthesis, in the LR vs. HR
comparison
Several genes are misregulated in cardiolipin biosynthesis function. Pgs1, involved
in the conversion of cytidine diphosphate diacylglycerol to phosphatidylglycerol
phosphate, and Cds2, involved in the conversion of phosphatidic acid to cytidine
diphosphate diacylglycerol are up-regulated; Cds1, on the other hand, which is
involved in the conversion of phosphatidic acid to cytidine diphosphate
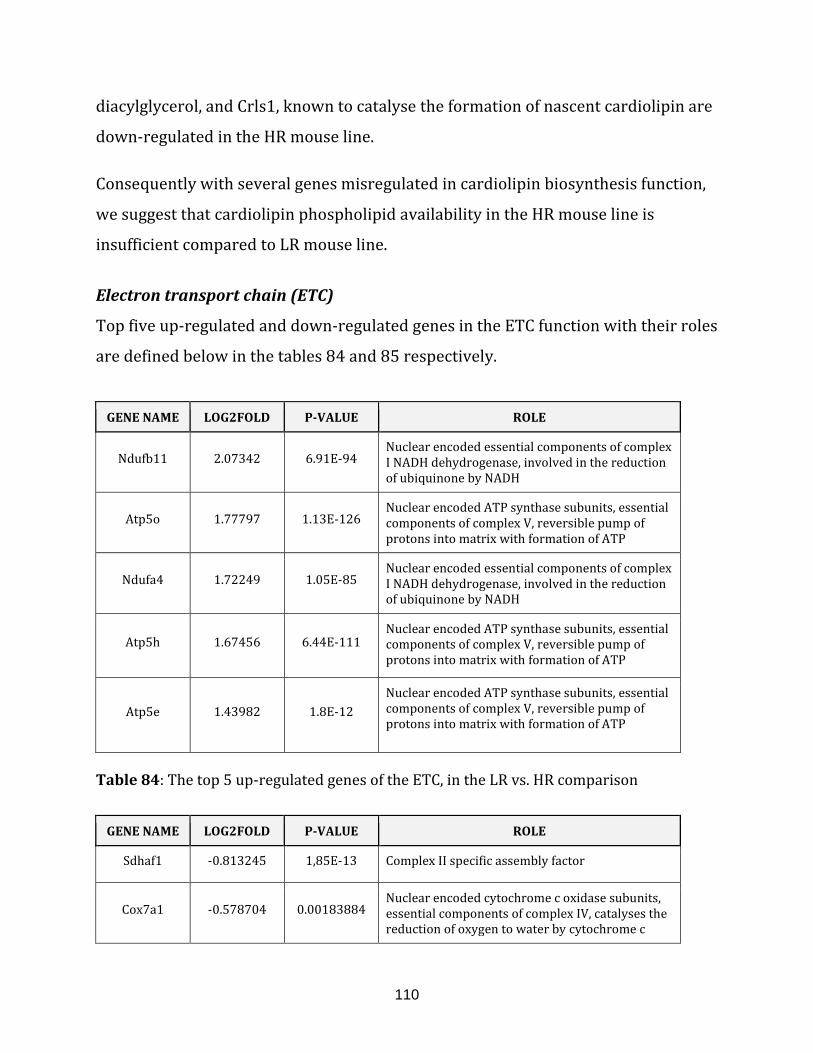
110
diacylglycerol, and Crls1, known to catalyse the formation of nascent cardiolipin are
down-regulated in the HR mouse line.
Consequently with several genes misregulated in cardiolipin biosynthesis function,
we suggest that cardiolipin phospholipid availability in the HR mouse line is
insufficient compared to LR mouse line.
Electron transport chain (ETC)
Top five up-regulated and down-regulated genes in the ETC function with their roles
are defined below in the tables 84 and 85 respectively.
GENE NAME LOG2FOLD P-VALUE ROLE
Ndufb11 2.07342 6.91E-94 Nuclear encoded essential components of complex I NADH dehydrogenase, involved in the reduction of ubiquinone by NADH
Atp5o 1.77797 1.13E-126 Nuclear encoded ATP synthase subunits, essential components of complex V, reversible pump of protons into matrix with formation of ATP
Ndufa4 1.72249 1.05E-85 Nuclear encoded essential components of complex I NADH dehydrogenase, involved in the reduction of ubiquinone by NADH
Atp5h 1.67456 6.44E-111 Nuclear encoded ATP synthase subunits, essential components of complex V, reversible pump of protons into matrix with formation of ATP
Atp5e 1.43982 1.8E-12
Nuclear encoded ATP synthase subunits, essential components of complex V, reversible pump of protons into matrix with formation of ATP
Table 84: The top 5 up-regulated genes of the ETC, in the LR vs. HR comparison
GENE NAME LOG2FOLD P-VALUE ROLE
Sdhaf1 -0.813245 1,85E-13 Complex II specific assembly factor
Cox7a1 -0.578704 0.00183884 Nuclear encoded cytochrome c oxidase subunits, essential components of complex IV, catalyses the reduction of oxygen to water by cytochrome c
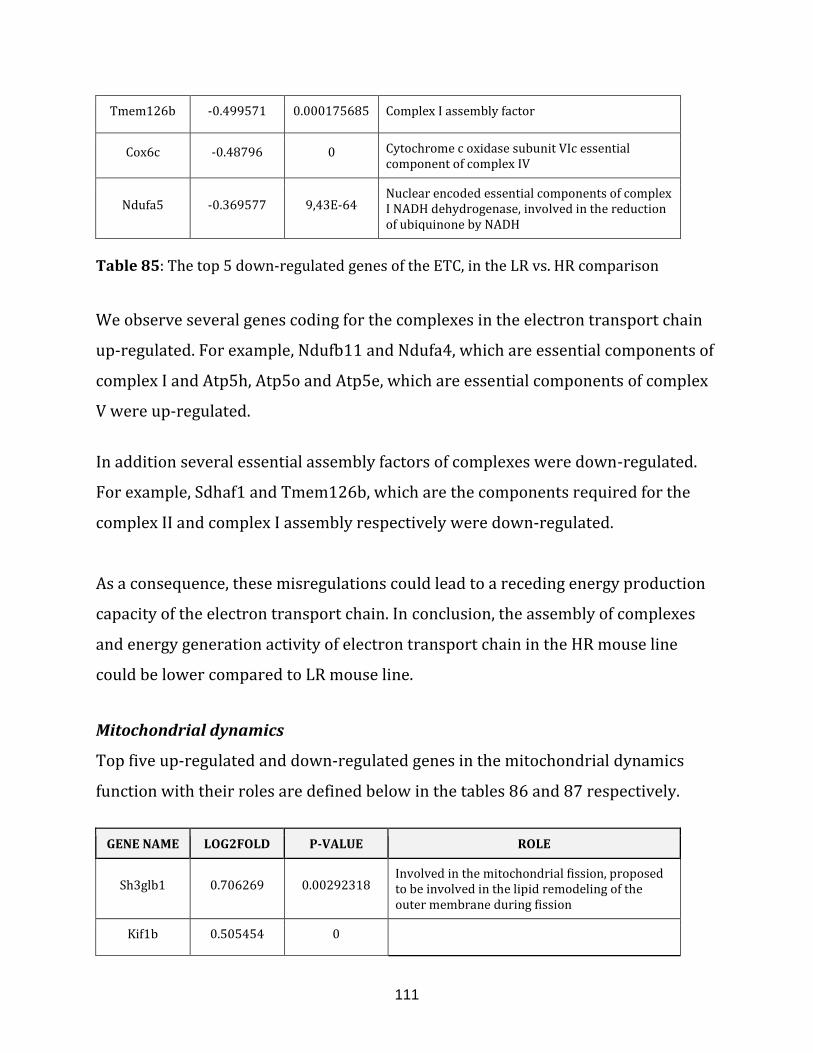
111
Tmem126b -0.499571 0.000175685 Complex I assembly factor
Cox6c -0.48796 0 Cytochrome c oxidase subunit VIc essential component of complex IV
Ndufa5 -0.369577 9,43E-64 Nuclear encoded essential components of complex I NADH dehydrogenase, involved in the reduction of ubiquinone by NADH
Table 85: The top 5 down-regulated genes of the ETC, in the LR vs. HR comparison
We observe several genes coding for the complexes in the electron transport chain
up-regulated. For example, Ndufb11 and Ndufa4, which are essential components of
complex I and Atp5h, Atp5o and Atp5e, which are essential components of complex
V were up-regulated.
In addition several essential assembly factors of complexes were down-regulated.
For example, Sdhaf1 and Tmem126b, which are the components required for the
complex II and complex I assembly respectively were down-regulated.
As a consequence, these misregulations could lead to a receding energy production
capacity of the electron transport chain. In conclusion, the assembly of complexes
and energy generation activity of electron transport chain in the HR mouse line
could be lower compared to LR mouse line.
Mitochondrial dynamics
Top five up-regulated and down-regulated genes in the mitochondrial dynamics
function with their roles are defined below in the tables 86 and 87 respectively.
GENE NAME LOG2FOLD P-VALUE ROLE
Sh3glb1 0.706269 0.00292318 Involved in the mitochondrial fission, proposed to be involved in the lipid remodeling of the outer membrane during fission
Kif1b 0.505454 0
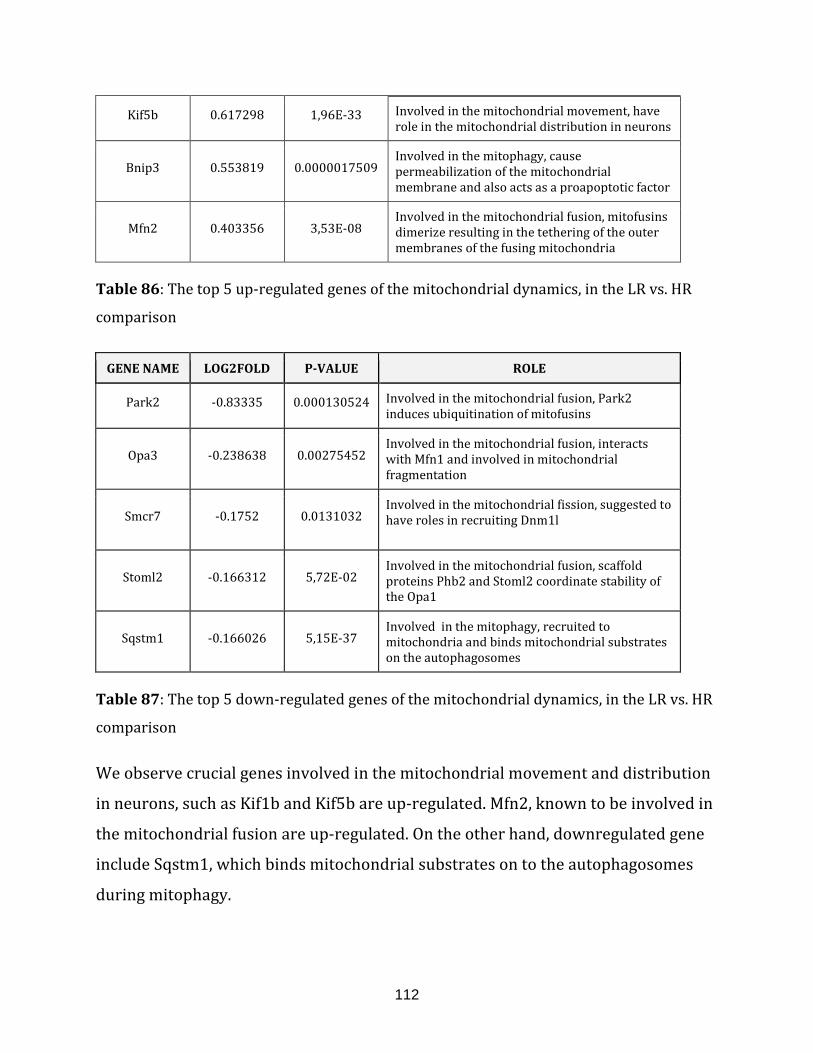
112
Kif5b 0.617298 1,96E-33 Involved in the mitochondrial movement, have role in the mitochondrial distribution in neurons
Bnip3 0.553819 0.0000017509 Involved in the mitophagy, cause permeabilization of the mitochondrial membrane and also acts as a proapoptotic factor
Mfn2 0.403356 3,53E-08 Involved in the mitochondrial fusion, mitofusins dimerize resulting in the tethering of the outer membranes of the fusing mitochondria
Table 86: The top 5 up-regulated genes of the mitochondrial dynamics, in the LR vs. HR
comparison
GENE NAME LOG2FOLD P-VALUE ROLE
Park2 -0.83335 0.000130524 Involved in the mitochondrial fusion, Park2 induces ubiquitination of mitofusins
Opa3 -0.238638 0.00275452 Involved in the mitochondrial fusion, interacts with Mfn1 and involved in mitochondrial fragmentation
Smcr7 -0.1752 0.0131032 Involved in the mitochondrial fission, suggested to have roles in recruiting Dnm1l
Stoml2 -0.166312 5,72E-02 Involved in the mitochondrial fusion, scaffold proteins Phb2 and Stoml2 coordinate stability of the Opa1
Sqstm1 -0.166026 5,15E-37 Involved in the mitophagy, recruited to mitochondria and binds mitochondrial substrates on the autophagosomes
Table 87: The top 5 down-regulated genes of the mitochondrial dynamics, in the LR vs. HR
comparison
We observe crucial genes involved in the mitochondrial movement and distribution
in neurons, such as Kif1b and Kif5b are up-regulated. Mfn2, known to be involved in
the mitochondrial fusion are up-regulated. On the other hand, downregulated gene
include Sqstm1, which binds mitochondrial substrates on to the autophagosomes
during mitophagy.
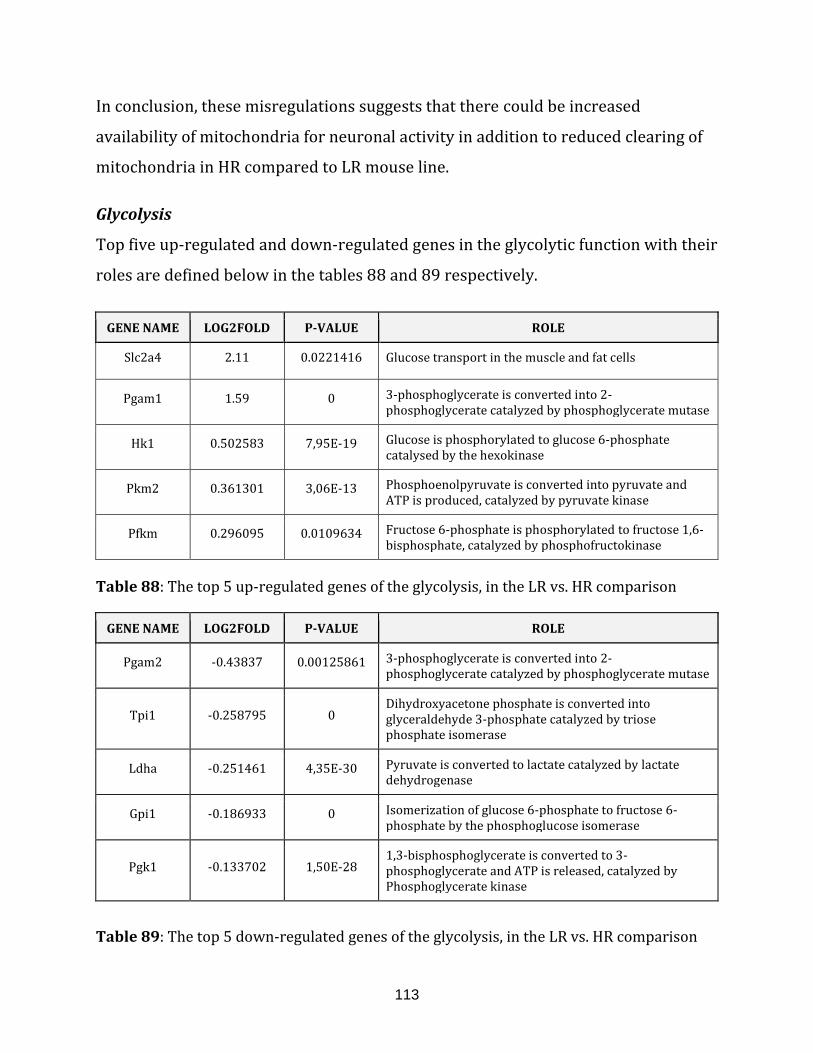
113
In conclusion, these misregulations suggests that there could be increased
availability of mitochondria for neuronal activity in addition to reduced clearing of
mitochondria in HR compared to LR mouse line.
Glycolysis
Top five up-regulated and down-regulated genes in the glycolytic function with their
roles are defined below in the tables 88 and 89 respectively.
GENE NAME LOG2FOLD P-VALUE ROLE
Slc2a4 2.11 0.0221416 Glucose transport in the muscle and fat cells
Pgam1 1.59 0 3-phosphoglycerate is converted into 2-phosphoglycerate catalyzed by phosphoglycerate mutase
Hk1 0.502583 7,95E-19 Glucose is phosphorylated to glucose 6-phosphate catalysed by the hexokinase
Pkm2 0.361301 3,06E-13 Phosphoenolpyruvate is converted into pyruvate and ATP is produced, catalyzed by pyruvate kinase
Pfkm 0.296095 0.0109634 Fructose 6-phosphate is phosphorylated to fructose 1,6-bisphosphate, catalyzed by phosphofructokinase
Table 88: The top 5 up-regulated genes of the glycolysis, in the LR vs. HR comparison
GENE NAME LOG2FOLD P-VALUE ROLE
Pgam2 -0.43837 0.00125861 3-phosphoglycerate is converted into 2-phosphoglycerate catalyzed by phosphoglycerate mutase
Tpi1 -0.258795 0 Dihydroxyacetone phosphate is converted into glyceraldehyde 3-phosphate catalyzed by triose phosphate isomerase
Ldha -0.251461 4,35E-30 Pyruvate is converted to lactate catalyzed by lactate dehydrogenase
Gpi1 -0.186933 0 Isomerization of glucose 6-phosphate to fructose 6-phosphate by the phosphoglucose isomerase
Pgk1 -0.133702 1,50E-28 1,3-bisphosphoglycerate is converted to 3-phosphoglycerate and ATP is released, catalyzed by Phosphoglycerate kinase
Table 89: The top 5 down-regulated genes of the glycolysis, in the LR vs. HR comparison
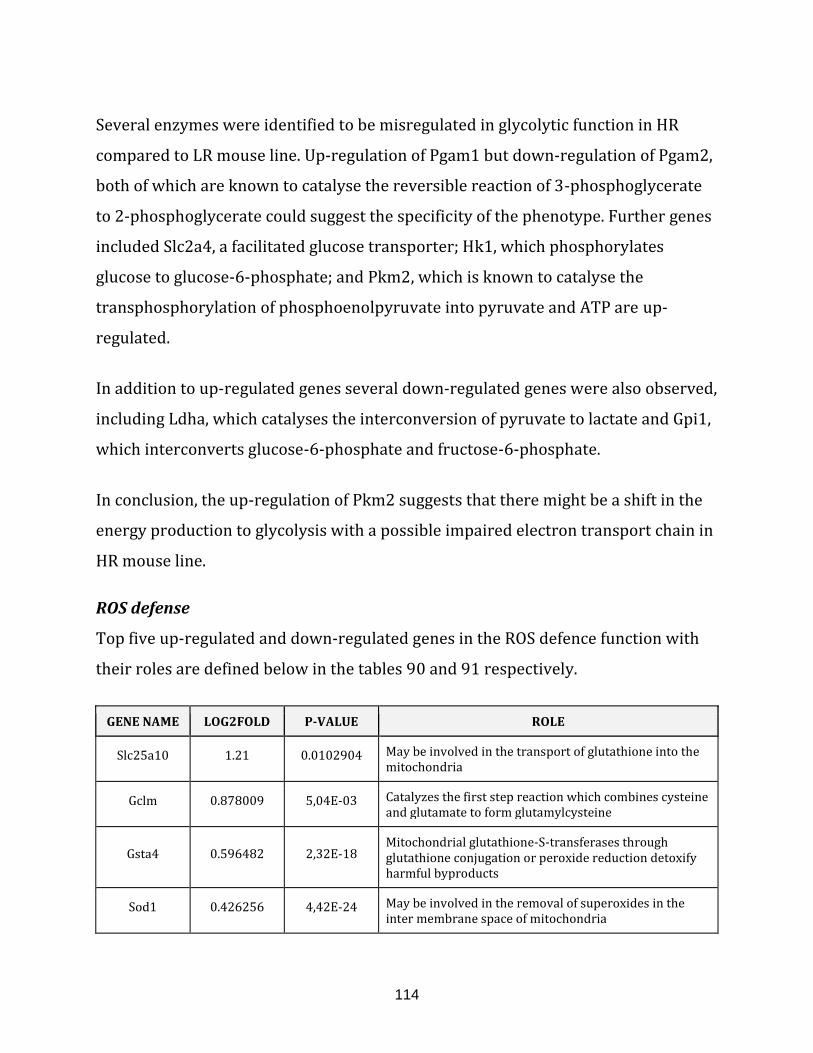
114
Several enzymes were identified to be misregulated in glycolytic function in HR
compared to LR mouse line. Up-regulation of Pgam1 but down-regulation of Pgam2,
both of which are known to catalyse the reversible reaction of 3-phosphoglycerate
to 2-phosphoglycerate could suggest the specificity of the phenotype. Further genes
included Slc2a4, a facilitated glucose transporter; Hk1, which phosphorylates
glucose to glucose-6-phosphate; and Pkm2, which is known to catalyse the
transphosphorylation of phosphoenolpyruvate into pyruvate and ATP are up-
regulated.
In addition to up-regulated genes several down-regulated genes were also observed,
including Ldha, which catalyses the interconversion of pyruvate to lactate and Gpi1,
which interconverts glucose-6-phosphate and fructose-6-phosphate.
In conclusion, the up-regulation of Pkm2 suggests that there might be a shift in the
energy production to glycolysis with a possible impaired electron transport chain in
HR mouse line.
ROS defense
Top five up-regulated and down-regulated genes in the ROS defence function with
their roles are defined below in the tables 90 and 91 respectively.
GENE NAME LOG2FOLD P-VALUE ROLE
Slc25a10 1.21 0.0102904 May be involved in the transport of glutathione into the mitochondria
Gclm 0.878009 5,04E-03 Catalyzes the first step reaction which combines cysteine and glutamate to form glutamylcysteine
Gsta4 0.596482 2,32E-18 Mitochondrial glutathione-S-transferases through glutathione conjugation or peroxide reduction detoxify harmful byproducts
Sod1 0.426256 4,42E-24 May be involved in the removal of superoxides in the inter membrane space of mitochondria
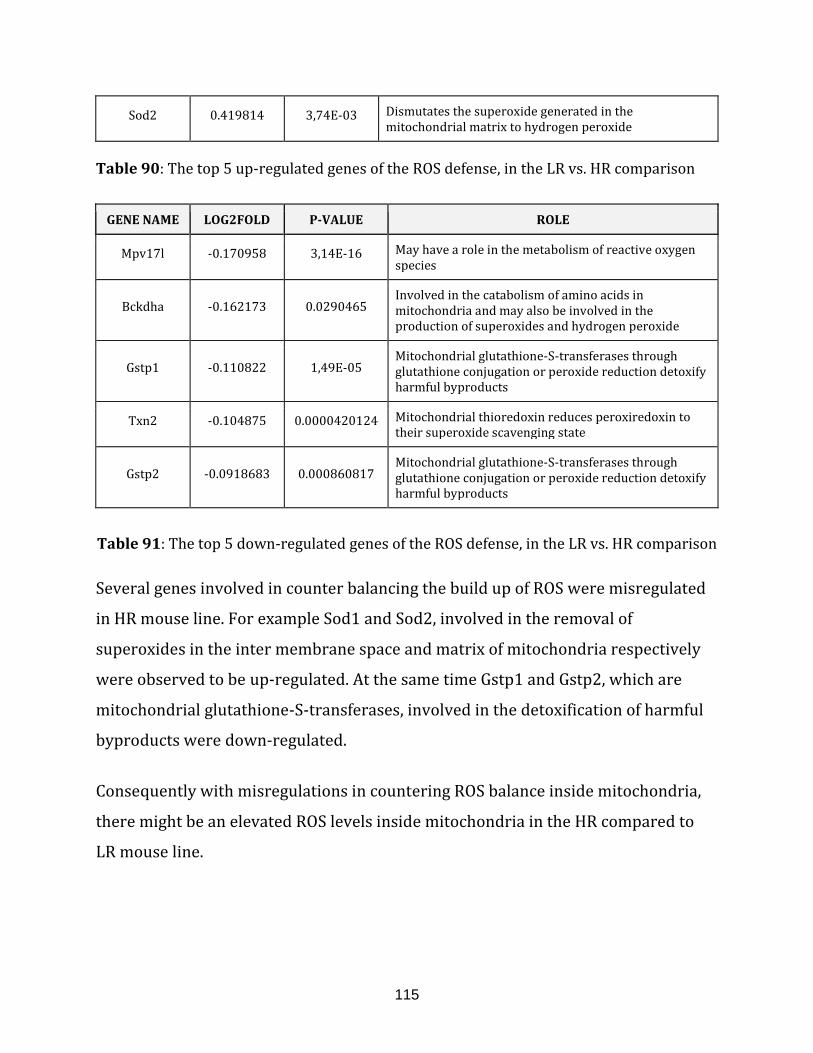
115
Sod2 0.419814 3,74E-03 Dismutates the superoxide generated in the mitochondrial matrix to hydrogen peroxide
Table 90: The top 5 up-regulated genes of the ROS defense, in the LR vs. HR comparison
GENE NAME LOG2FOLD P-VALUE ROLE
Mpv17l -0.170958 3,14E-16 May have a role in the metabolism of reactive oxygen species
Bckdha -0.162173 0.0290465 Involved in the catabolism of amino acids in mitochondria and may also be involved in the production of superoxides and hydrogen peroxide
Gstp1 -0.110822 1,49E-05 Mitochondrial glutathione-S-transferases through glutathione conjugation or peroxide reduction detoxify harmful byproducts
Txn2 -0.104875 0.0000420124 Mitochondrial thioredoxin reduces peroxiredoxin to their superoxide scavenging state
Gstp2 -0.0918683 0.000860817 Mitochondrial glutathione-S-transferases through glutathione conjugation or peroxide reduction detoxify harmful byproducts
Table 91: The top 5 down-regulated genes of the ROS defense, in the LR vs. HR comparison
Several genes involved in counter balancing the build up of ROS were misregulated
in HR mouse line. For example Sod1 and Sod2, involved in the removal of
superoxides in the inter membrane space and matrix of mitochondria respectively
were observed to be up-regulated. At the same time Gstp1 and Gstp2, which are
mitochondrial glutathione-S-transferases, involved in the detoxification of harmful
byproducts were down-regulated.
Consequently with misregulations in countering ROS balance inside mitochondria,
there might be an elevated ROS levels inside mitochondria in the HR compared to
LR mouse line.
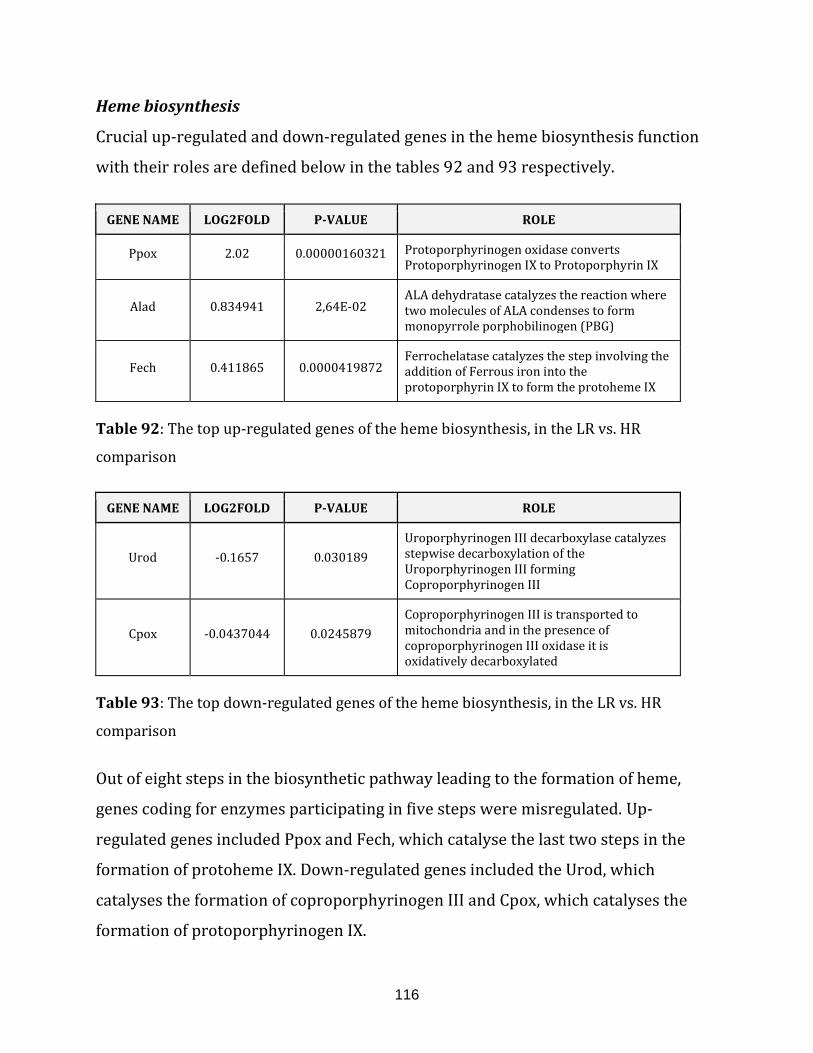
116
Heme biosynthesis
Crucial up-regulated and down-regulated genes in the heme biosynthesis function
with their roles are defined below in the tables 92 and 93 respectively.
GENE NAME LOG2FOLD P-VALUE ROLE
Ppox 2.02 0.00000160321 Protoporphyrinogen oxidase converts Protoporphyrinogen IX to Protoporphyrin IX
Alad 0.834941 2,64E-02 ALA dehydratase catalyzes the reaction where two molecules of ALA condenses to form monopyrrole porphobilinogen (PBG)
Fech 0.411865 0.0000419872 Ferrochelatase catalyzes the step involving the addition of Ferrous iron into the protoporphyrin IX to form the protoheme IX
Table 92: The top up-regulated genes of the heme biosynthesis, in the LR vs. HR
comparison
GENE NAME LOG2FOLD P-VALUE ROLE
Urod -0.1657 0.030189
Uroporphyrinogen III decarboxylase catalyzes stepwise decarboxylation of the Uroporphyrinogen III forming Coproporphyrinogen III
Cpox -0.0437044 0.0245879
Coproporphyrinogen III is transported to mitochondria and in the presence of coproporphyrinogen III oxidase it is oxidatively decarboxylated
Table 93: The top down-regulated genes of the heme biosynthesis, in the LR vs. HR
comparison
Out of eight steps in the biosynthetic pathway leading to the formation of heme,
genes coding for enzymes participating in five steps were misregulated. Up-
regulated genes included Ppox and Fech, which catalyse the last two steps in the
formation of protoheme IX. Down-regulated genes included the Urod, which
catalyses the formation of coproporphyrinogen III and Cpox, which catalyses the
formation of protoporphyrinogen IX.
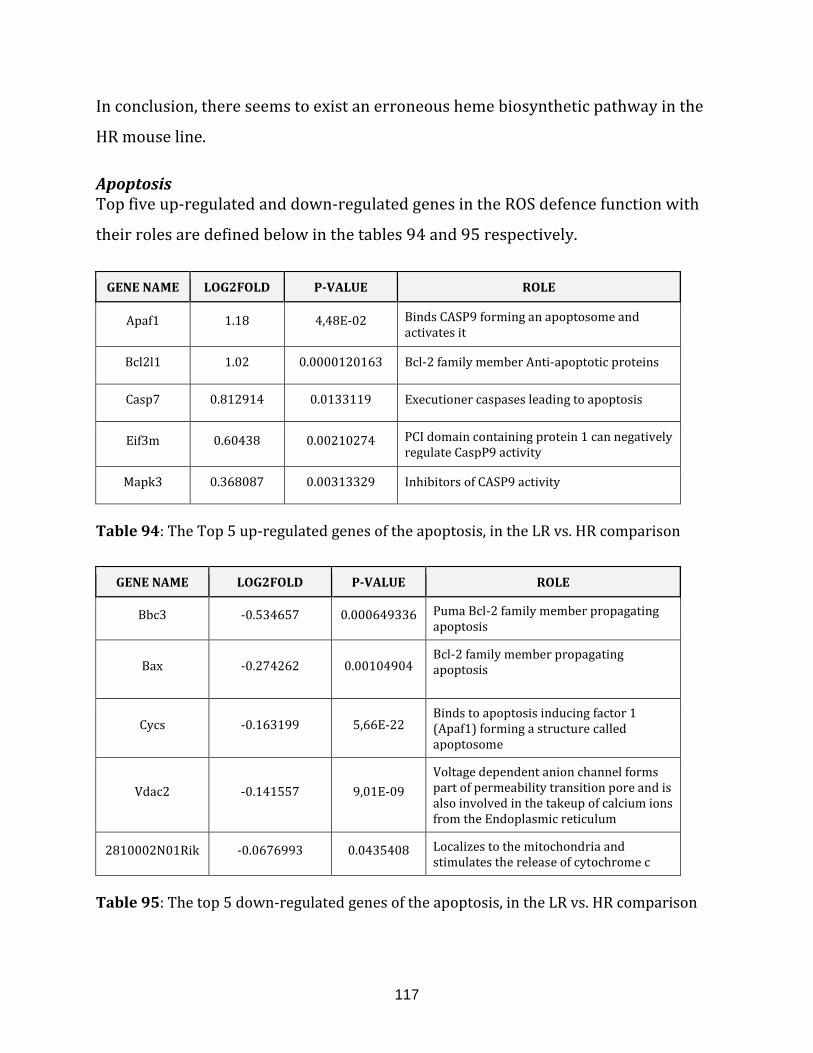
117
In conclusion, there seems to exist an erroneous heme biosynthetic pathway in the
HR mouse line.
Apoptosis Top five up-regulated and down-regulated genes in the ROS defence function with
their roles are defined below in the tables 94 and 95 respectively.
GENE NAME LOG2FOLD P-VALUE ROLE
Apaf1 1.18 4,48E-02 Binds CASP9 forming an apoptosome and activates it
Bcl2l1 1.02 0.0000120163 Bcl-2 family member Anti-apoptotic proteins
Casp7 0.812914 0.0133119 Executioner caspases leading to apoptosis
Eif3m 0.60438 0.00210274 PCI domain containing protein 1 can negatively regulate CaspP9 activity
Mapk3 0.368087 0.00313329 Inhibitors of CASP9 activity
Table 94: The Top 5 up-regulated genes of the apoptosis, in the LR vs. HR comparison
GENE NAME LOG2FOLD P-VALUE ROLE
Bbc3 -0.534657 0.000649336 Puma Bcl-2 family member propagating apoptosis
Bax -0.274262 0.00104904 Bcl-2 family member propagating apoptosis
Cycs -0.163199 5,66E-22 Binds to apoptosis inducing factor 1 (Apaf1) forming a structure called apoptosome
Vdac2 -0.141557 9,01E-09
Voltage dependent anion channel forms part of permeability transition pore and is also involved in the takeup of calcium ions from the Endoplasmic reticulum
2810002N01Rik -0.0676993 0.0435408 Localizes to the mitochondria and stimulates the release of cytochrome c
Table 95: The top 5 down-regulated genes of the apoptosis, in the LR vs. HR comparison
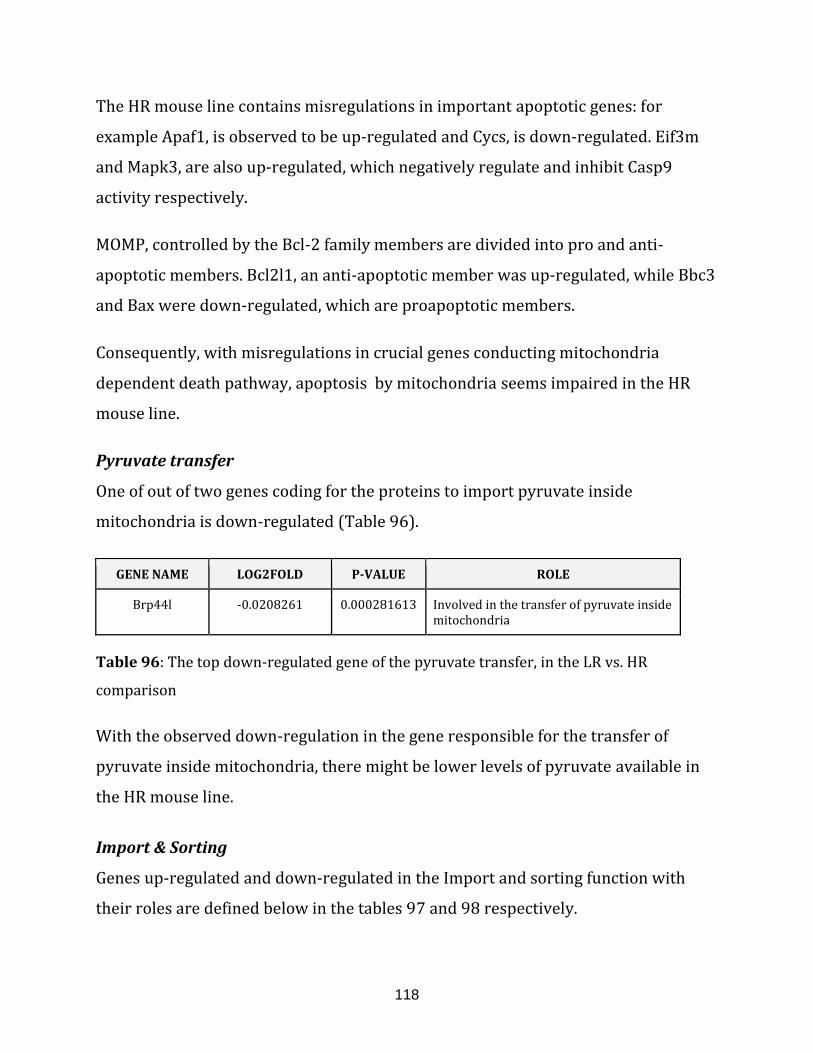
118
The HR mouse line contains misregulations in important apoptotic genes: for
example Apaf1, is observed to be up-regulated and Cycs, is down-regulated. Eif3m
and Mapk3, are also up-regulated, which negatively regulate and inhibit Casp9
activity respectively.
MOMP, controlled by the Bcl-2 family members are divided into pro and anti-
apoptotic members. Bcl2l1, an anti-apoptotic member was up-regulated, while Bbc3
and Bax were down-regulated, which are proapoptotic members.
Consequently, with misregulations in crucial genes conducting mitochondria
dependent death pathway, apoptosis by mitochondria seems impaired in the HR
mouse line.
Pyruvate transfer
One of out of two genes coding for the proteins to import pyruvate inside
mitochondria is down-regulated (Table 96).
GENE NAME LOG2FOLD P-VALUE ROLE
Brp44l -0.0208261 0.000281613 Involved in the transfer of pyruvate inside mitochondria
Table 96: The top down-regulated gene of the pyruvate transfer, in the LR vs. HR
comparison
With the observed down-regulation in the gene responsible for the transfer of
pyruvate inside mitochondria, there might be lower levels of pyruvate available in
the HR mouse line.
Import & Sorting
Genes up-regulated and down-regulated in the Import and sorting function with
their roles are defined below in the tables 97 and 98 respectively.
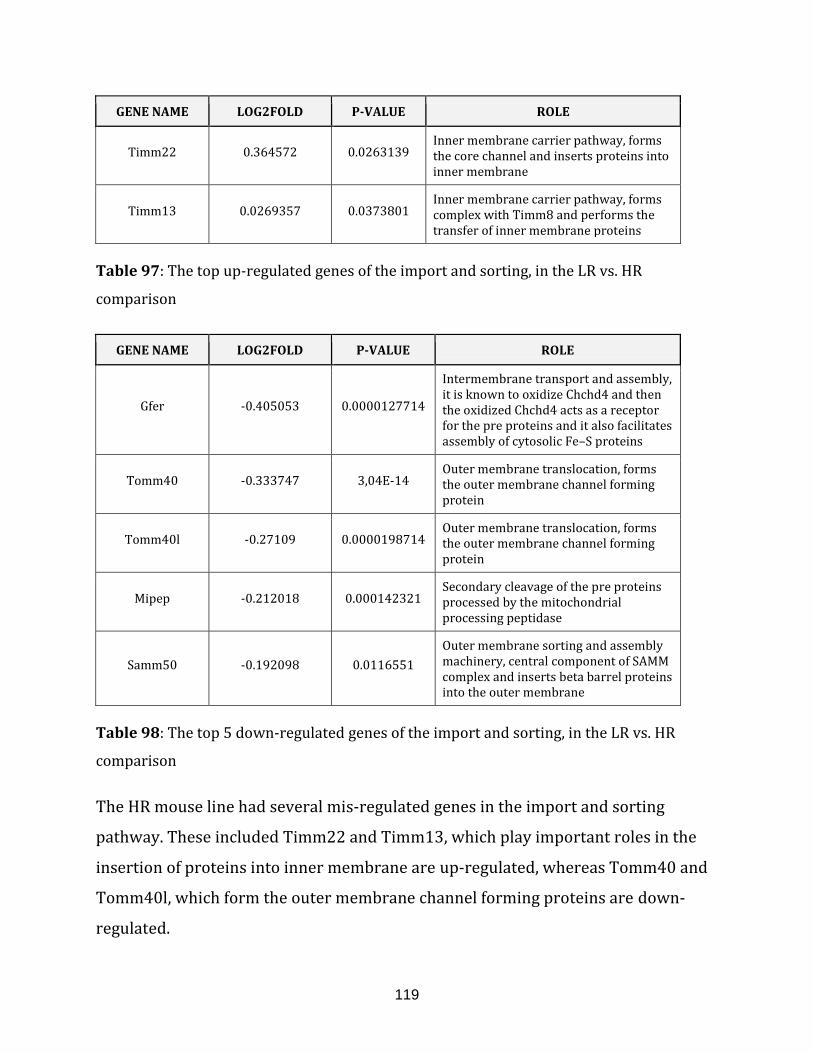
119
GENE NAME LOG2FOLD P-VALUE ROLE
Timm22 0.364572 0.0263139 Inner membrane carrier pathway, forms the core channel and inserts proteins into inner membrane
Timm13 0.0269357 0.0373801 Inner membrane carrier pathway, forms complex with Timm8 and performs the transfer of inner membrane proteins
Table 97: The top up-regulated genes of the import and sorting, in the LR vs. HR
comparison
GENE NAME LOG2FOLD P-VALUE ROLE
Gfer -0.405053 0.0000127714
Intermembrane transport and assembly, it is known to oxidize Chchd4 and then the oxidized Chchd4 acts as a receptor for the pre proteins and it also facilitates assembly of cytosolic Fe–S proteins
Tomm40 -0.333747 3,04E-14 Outer membrane translocation, forms the outer membrane channel forming protein
Tomm40l -0.27109 0.0000198714 Outer membrane translocation, forms the outer membrane channel forming protein
Mipep -0.212018 0.000142321 Secondary cleavage of the pre proteins processed by the mitochondrial processing peptidase
Samm50 -0.192098 0.0116551
Outer membrane sorting and assembly machinery, central component of SAMM complex and inserts beta barrel proteins into the outer membrane
Table 98: The top 5 down-regulated genes of the import and sorting, in the LR vs. HR
comparison
The HR mouse line had several mis-regulated genes in the import and sorting
pathway. These included Timm22 and Timm13, which play important roles in the
insertion of proteins into inner membrane are up-regulated, whereas Tomm40 and
Tomm40l, which form the outer membrane channel forming proteins are down-
regulated.
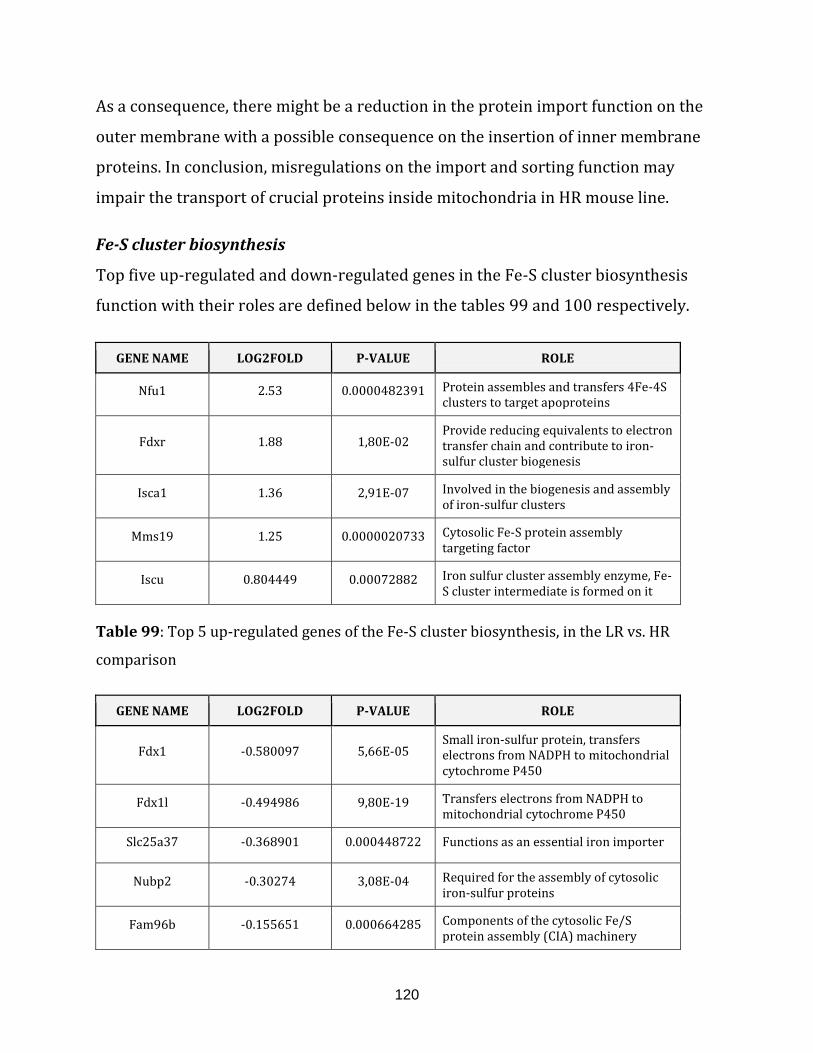
120
As a consequence, there might be a reduction in the protein import function on the
outer membrane with a possible consequence on the insertion of inner membrane
proteins. In conclusion, misregulations on the import and sorting function may
impair the transport of crucial proteins inside mitochondria in HR mouse line.
Fe-S cluster biosynthesis
Top five up-regulated and down-regulated genes in the Fe-S cluster biosynthesis
function with their roles are defined below in the tables 99 and 100 respectively.
GENE NAME LOG2FOLD P-VALUE ROLE
Nfu1 2.53 0.0000482391 Protein assembles and transfers 4Fe-4S clusters to target apoproteins
Fdxr 1.88 1,80E-02 Provide reducing equivalents to electron transfer chain and contribute to iron-sulfur cluster biogenesis
Isca1 1.36 2,91E-07 Involved in the biogenesis and assembly of iron-sulfur clusters
Mms19 1.25 0.0000020733 Cytosolic Fe-S protein assembly targeting factor
Iscu 0.804449 0.00072882 Iron sulfur cluster assembly enzyme, Fe-S cluster intermediate is formed on it
Table 99: Top 5 up-regulated genes of the Fe-S cluster biosynthesis, in the LR vs. HR
comparison
GENE NAME LOG2FOLD P-VALUE ROLE
Fdx1 -0.580097 5,66E-05 Small iron-sulfur protein, transfers electrons from NADPH to mitochondrial cytochrome P450
Fdx1l -0.494986 9,80E-19 Transfers electrons from NADPH to mitochondrial cytochrome P450
Slc25a37 -0.368901 0.000448722 Functions as an essential iron importer
Nubp2 -0.30274 3,08E-04 Required for the assembly of cytosolic iron-sulfur proteins
Fam96b -0.155651 0.000664285 Components of the cytosolic Fe/S protein assembly (CIA) machinery
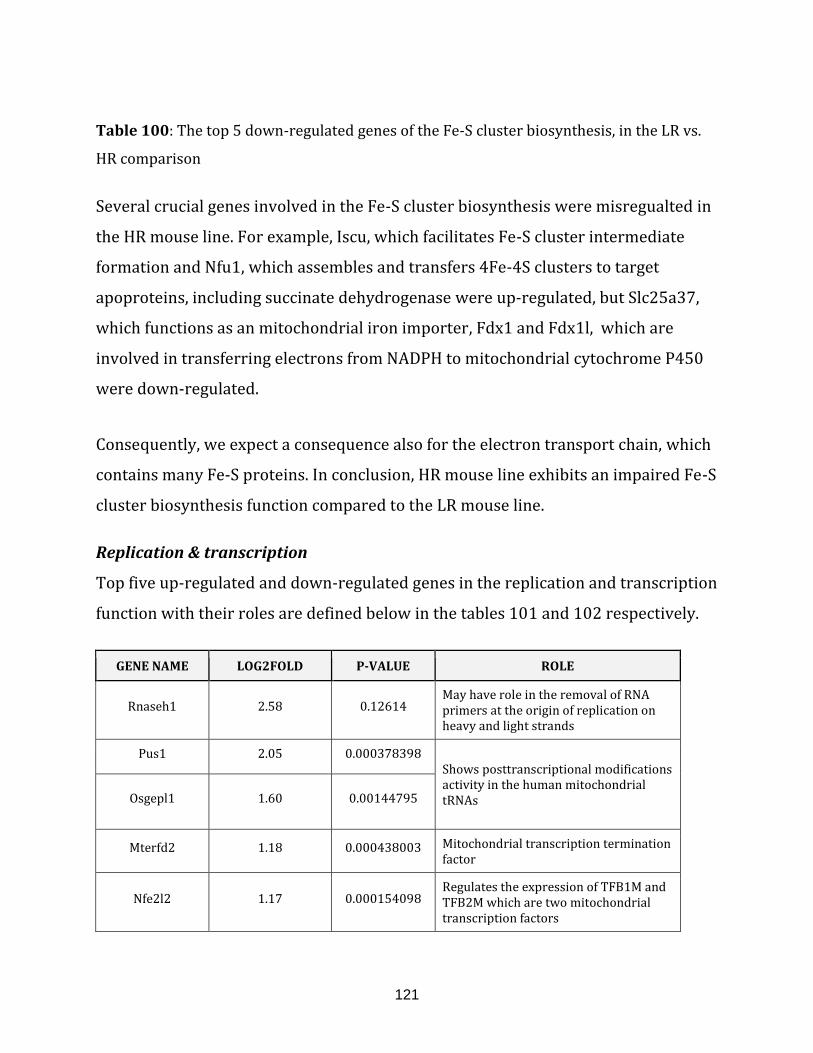
121
Table 100: The top 5 down-regulated genes of the Fe-S cluster biosynthesis, in the LR vs.
HR comparison
Several crucial genes involved in the Fe-S cluster biosynthesis were misregualted in
the HR mouse line. For example, Iscu, which facilitates Fe-S cluster intermediate
formation and Nfu1, which assembles and transfers 4Fe-4S clusters to target
apoproteins, including succinate dehydrogenase were up-regulated, but Slc25a37,
which functions as an mitochondrial iron importer, Fdx1 and Fdx1l, which are
involved in transferring electrons from NADPH to mitochondrial cytochrome P450
were down-regulated.
Consequently, we expect a consequence also for the electron transport chain, which
contains many Fe-S proteins. In conclusion, HR mouse line exhibits an impaired Fe-S
cluster biosynthesis function compared to the LR mouse line.
Replication & transcription
Top five up-regulated and down-regulated genes in the replication and transcription
function with their roles are defined below in the tables 101 and 102 respectively.
GENE NAME LOG2FOLD P-VALUE ROLE
Rnaseh1 2.58 0.12614 May have role in the removal of RNA primers at the origin of replication on heavy and light strands
Pus1 2.05 0.000378398 Shows posttranscriptional modifications activity in the human mitochondrial tRNAs
Osgepl1 1.60 0.00144795
Mterfd2 1.18 0.000438003 Mitochondrial transcription termination factor
Nfe2l2 1.17 0.000154098 Regulates the expression of TFB1M and TFB2M which are two mitochondrial transcription factors
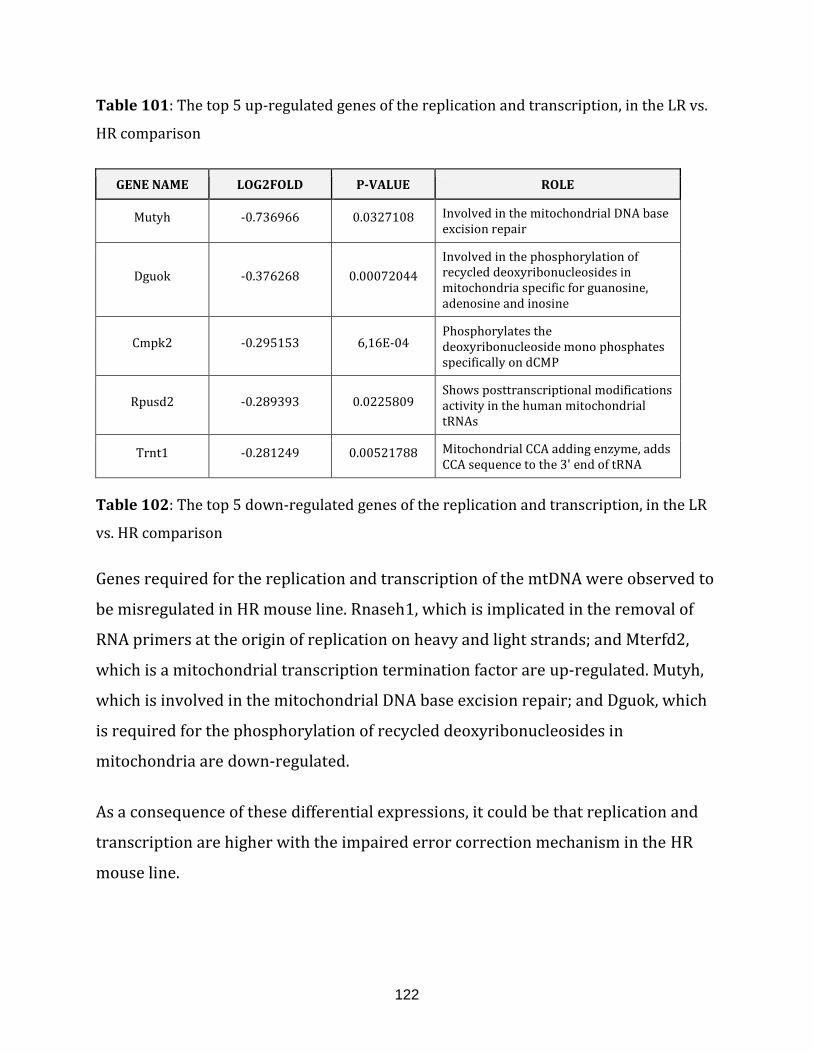
122
Table 101: The top 5 up-regulated genes of the replication and transcription, in the LR vs.
HR comparison
GENE NAME LOG2FOLD P-VALUE ROLE
Mutyh -0.736966 0.0327108 Involved in the mitochondrial DNA base excision repair
Dguok -0.376268 0.00072044
Involved in the phosphorylation of recycled deoxyribonucleosides in mitochondria specific for guanosine, adenosine and inosine
Cmpk2 -0.295153 6,16E-04 Phosphorylates the deoxyribonucleoside mono phosphates specifically on dCMP
Rpusd2 -0.289393 0.0225809 Shows posttranscriptional modifications activity in the human mitochondrial tRNAs
Trnt1 -0.281249 0.00521788 Mitochondrial CCA adding enzyme, adds CCA sequence to the 3' end of tRNA
Table 102: The top 5 down-regulated genes of the replication and transcription, in the LR
vs. HR comparison
Genes required for the replication and transcription of the mtDNA were observed to
be misregulated in HR mouse line. Rnaseh1, which is implicated in the removal of
RNA primers at the origin of replication on heavy and light strands; and Mterfd2,
which is a mitochondrial transcription termination factor are up-regulated. Mutyh,
which is involved in the mitochondrial DNA base excision repair; and Dguok, which
is required for the phosphorylation of recycled deoxyribonucleosides in
mitochondria are down-regulated.
As a consequence of these differential expressions, it could be that replication and
transcription are higher with the impaired error correction mechanism in the HR
mouse line.
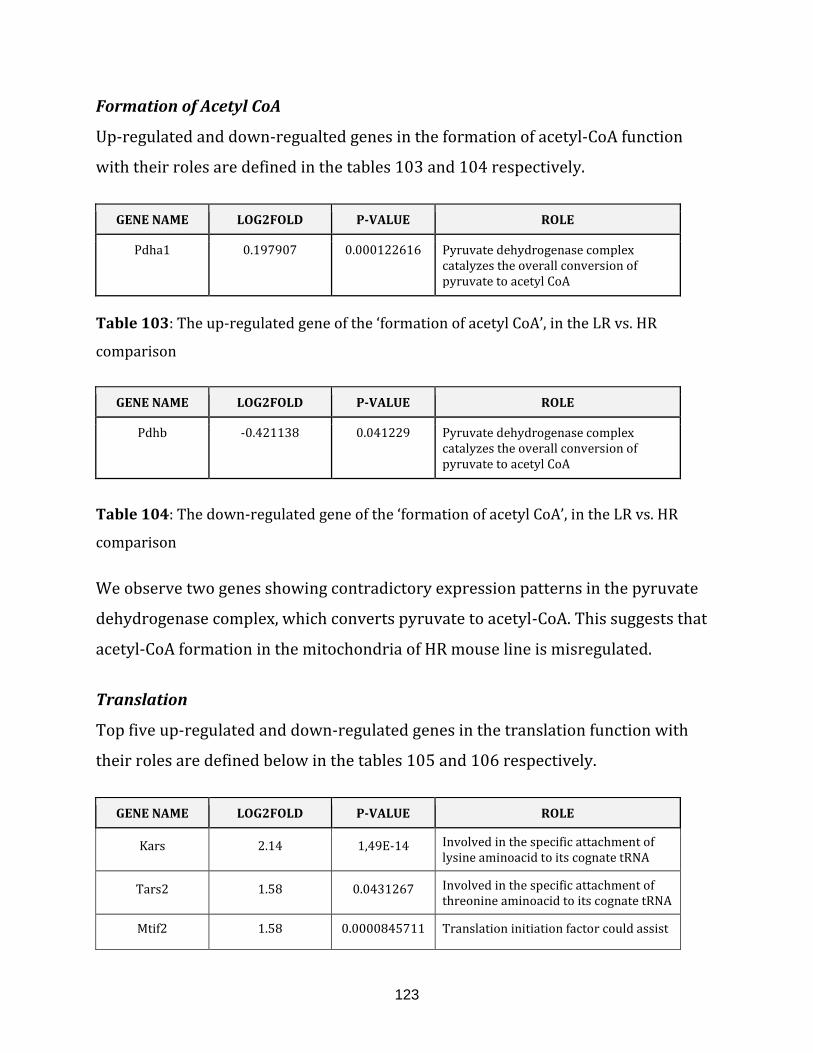
123
Formation of Acetyl CoA
Up-regulated and down-regualted genes in the formation of acetyl-CoA function
with their roles are defined in the tables 103 and 104 respectively.
GENE NAME LOG2FOLD P-VALUE ROLE
Pdha1 0.197907 0.000122616 Pyruvate dehydrogenase complex catalyzes the overall conversion of pyruvate to acetyl CoA
Table 103: The up-regulated gene of the ‘formation of acetyl CoA’, in the LR vs. HR
comparison
GENE NAME LOG2FOLD P-VALUE ROLE
Pdhb -0.421138 0.041229 Pyruvate dehydrogenase complex catalyzes the overall conversion of pyruvate to acetyl CoA
Table 104: The down-regulated gene of the ‘formation of acetyl CoA’, in the LR vs. HR
comparison
We observe two genes showing contradictory expression patterns in the pyruvate
dehydrogenase complex, which converts pyruvate to acetyl-CoA. This suggests that
acetyl-CoA formation in the mitochondria of HR mouse line is misregulated.
Translation
Top five up-regulated and down-regulated genes in the translation function with
their roles are defined below in the tables 105 and 106 respectively.
GENE NAME LOG2FOLD P-VALUE ROLE
Kars 2.14 1,49E-14 Involved in the specific attachment of lysine aminoacid to its cognate tRNA
Tars2 1.58 0.0431267 Involved in the specific attachment of threonine aminoacid to its cognate tRNA
Mtif2 1.58 0.0000845711 Translation initiation factor could assist
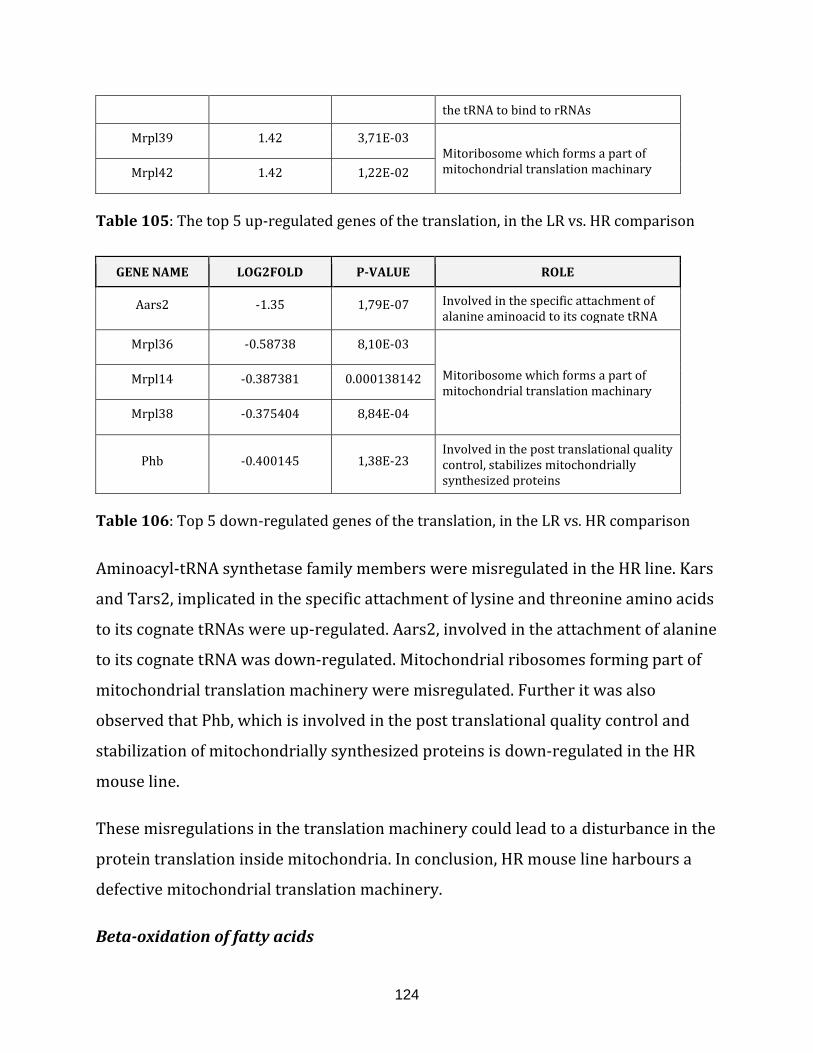
124
the tRNA to bind to rRNAs
Mrpl39 1.42 3,71E-03 Mitoribosome which forms a part of mitochondrial translation machinary Mrpl42 1.42 1,22E-02
Table 105: The top 5 up-regulated genes of the translation, in the LR vs. HR comparison
GENE NAME LOG2FOLD P-VALUE ROLE
Aars2 -1.35 1,79E-07 Involved in the specific attachment of alanine aminoacid to its cognate tRNA
Mrpl36 -0.58738 8,10E-03 Mitoribosome which forms a part of mitochondrial translation machinary
Mrpl14 -0.387381 0.000138142
Mrpl38 -0.375404 8,84E-04
Phb -0.400145 1,38E-23 Involved in the post translational quality control, stabilizes mitochondrially synthesized proteins
Table 106: Top 5 down-regulated genes of the translation, in the LR vs. HR comparison
Aminoacyl-tRNA synthetase family members were misregulated in the HR line. Kars
and Tars2, implicated in the specific attachment of lysine and threonine amino acids
to its cognate tRNAs were up-regulated. Aars2, involved in the attachment of alanine
to its cognate tRNA was down-regulated. Mitochondrial ribosomes forming part of
mitochondrial translation machinery were misregulated. Further it was also
observed that Phb, which is involved in the post translational quality control and
stabilization of mitochondrially synthesized proteins is down-regulated in the HR
mouse line.
These misregulations in the translation machinery could lead to a disturbance in the
protein translation inside mitochondria. In conclusion, HR mouse line harbours a
defective mitochondrial translation machinery.
Beta-oxidation of fatty acids
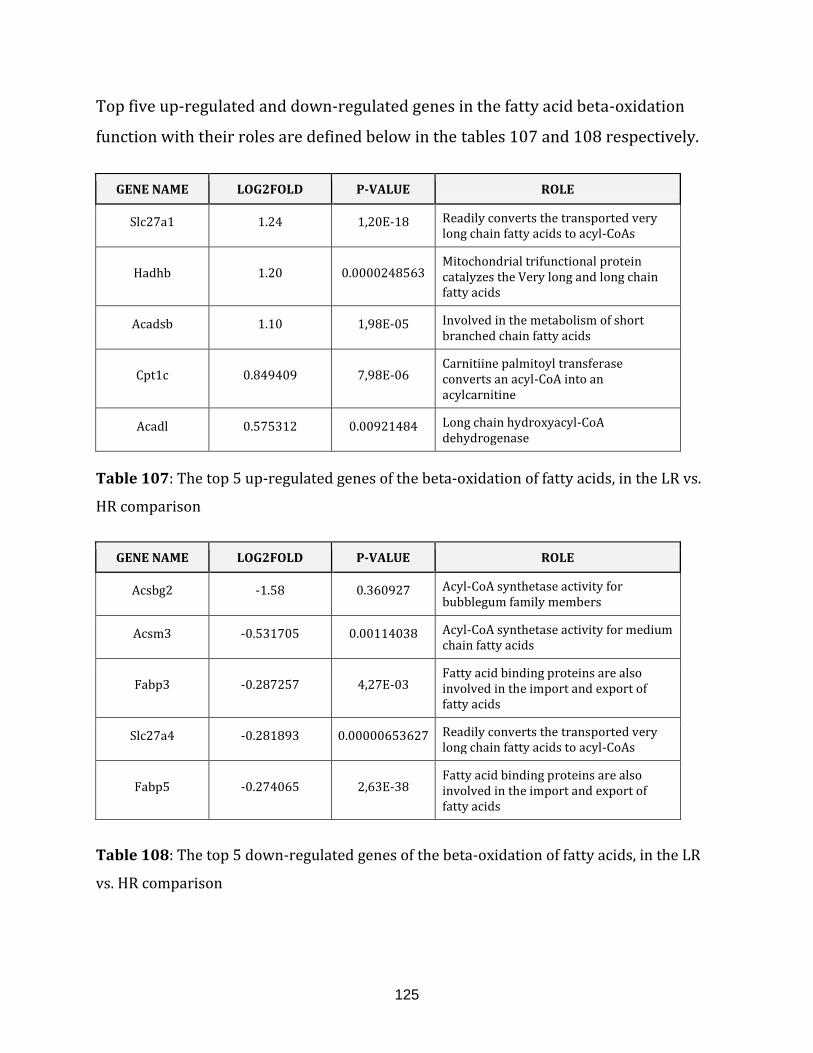
125
Top five up-regulated and down-regulated genes in the fatty acid beta-oxidation
function with their roles are defined below in the tables 107 and 108 respectively.
GENE NAME LOG2FOLD P-VALUE ROLE
Slc27a1 1.24 1,20E-18 Readily converts the transported very long chain fatty acids to acyl-CoAs
Hadhb 1.20 0.0000248563 Mitochondrial trifunctional protein catalyzes the Very long and long chain fatty acids
Acadsb 1.10 1,98E-05 Involved in the metabolism of short branched chain fatty acids
Cpt1c 0.849409 7,98E-06 Carnitiine palmitoyl transferase converts an acyl-CoA into an acylcarnitine
Acadl 0.575312 0.00921484 Long chain hydroxyacyl-CoA dehydrogenase
Table 107: The top 5 up-regulated genes of the beta-oxidation of fatty acids, in the LR vs.
HR comparison
GENE NAME LOG2FOLD P-VALUE ROLE
Acsbg2 -1.58 0.360927 Acyl-CoA synthetase activity for bubblegum family members
Acsm3 -0.531705 0.00114038 Acyl-CoA synthetase activity for medium chain fatty acids
Fabp3 -0.287257 4,27E-03 Fatty acid binding proteins are also involved in the import and export of fatty acids
Slc27a4 -0.281893 0.00000653627 Readily converts the transported very long chain fatty acids to acyl-CoAs
Fabp5 -0.274065 2,63E-38 Fatty acid binding proteins are also involved in the import and export of fatty acids
Table 108: The top 5 down-regulated genes of the beta-oxidation of fatty acids, in the LR
vs. HR comparison
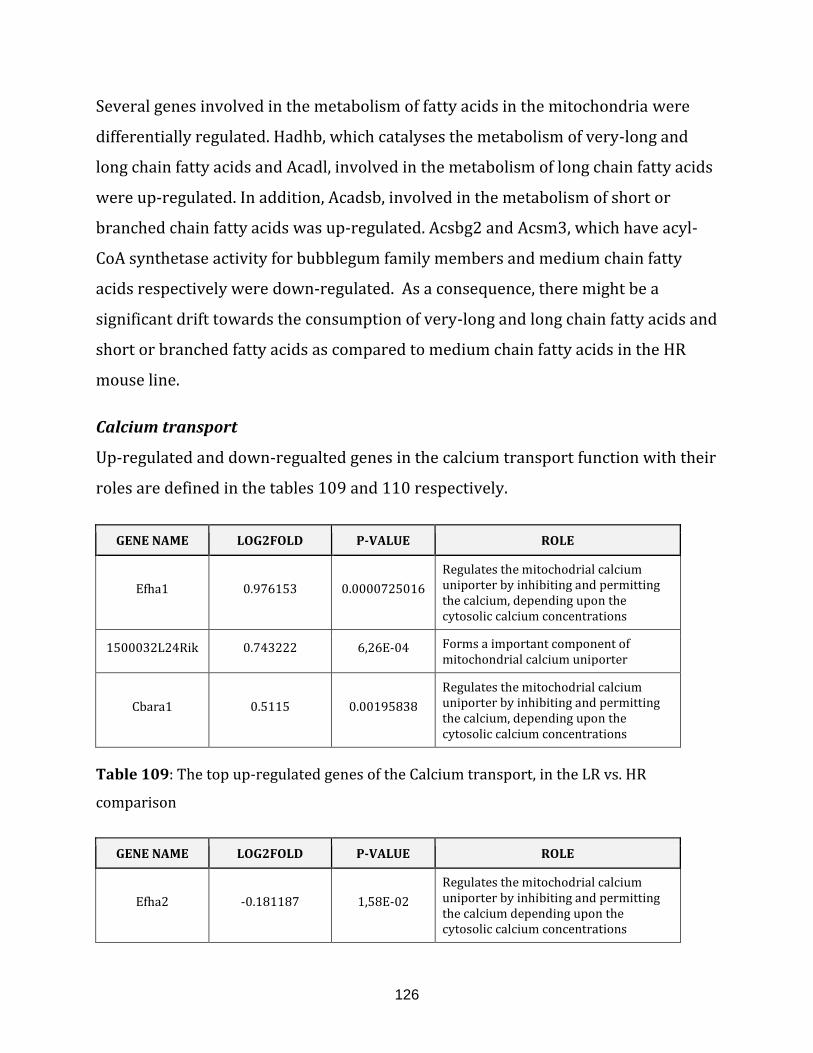
126
Several genes involved in the metabolism of fatty acids in the mitochondria were
differentially regulated. Hadhb, which catalyses the metabolism of very-long and
long chain fatty acids and Acadl, involved in the metabolism of long chain fatty acids
were up-regulated. In addition, Acadsb, involved in the metabolism of short or
branched chain fatty acids was up-regulated. Acsbg2 and Acsm3, which have acyl-
CoA synthetase activity for bubblegum family members and medium chain fatty
acids respectively were down-regulated. As a consequence, there might be a
significant drift towards the consumption of very-long and long chain fatty acids and
short or branched fatty acids as compared to medium chain fatty acids in the HR
mouse line.
Calcium transport
Up-regulated and down-regualted genes in the calcium transport function with their
roles are defined in the tables 109 and 110 respectively.
GENE NAME LOG2FOLD P-VALUE ROLE
Efha1 0.976153 0.0000725016
Regulates the mitochodrial calcium uniporter by inhibiting and permitting the calcium, depending upon the cytosolic calcium concentrations
1500032L24Rik 0.743222 6,26E-04 Forms a important component of mitochondrial calcium uniporter
Cbara1 0.5115 0.00195838
Regulates the mitochodrial calcium uniporter by inhibiting and permitting the calcium, depending upon the cytosolic calcium concentrations
Table 109: The top up-regulated genes of the Calcium transport, in the LR vs. HR
comparison
GENE NAME LOG2FOLD P-VALUE ROLE
Efha2 -0.181187 1,58E-02
Regulates the mitochodrial calcium uniporter by inhibiting and permitting the calcium depending upon the cytosolic calcium concentrations
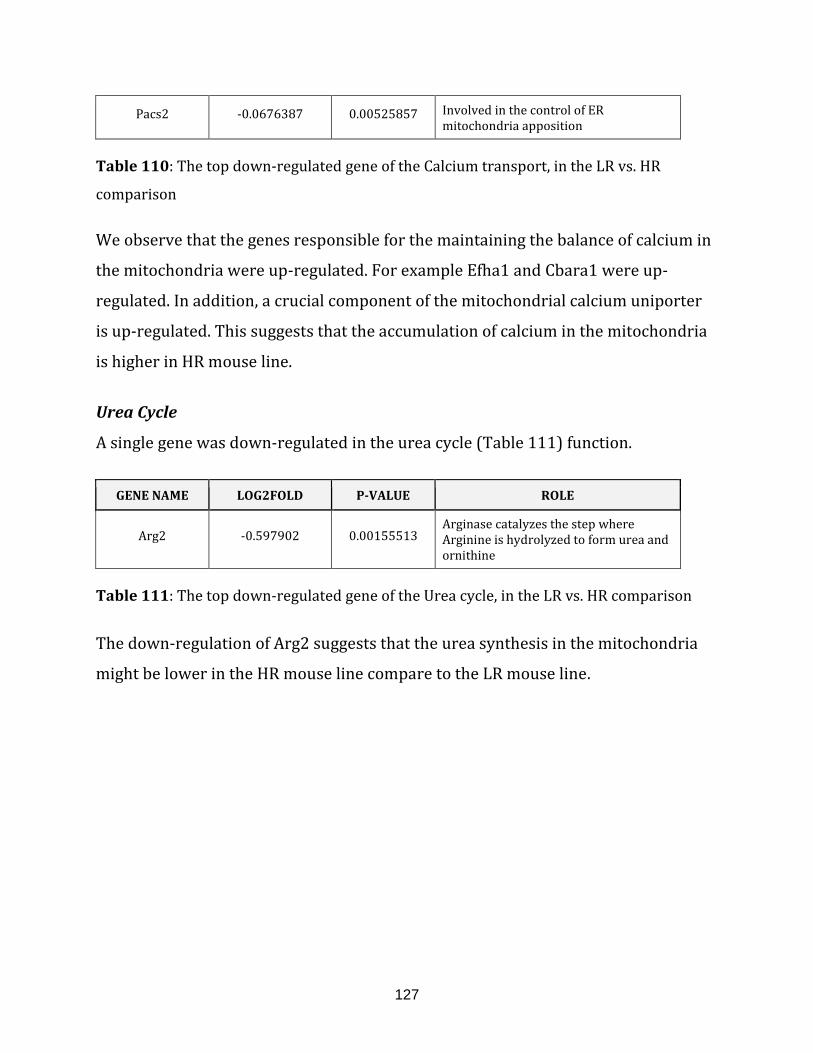
127
Pacs2 -0.0676387 0.00525857 Involved in the control of ER mitochondria apposition
Table 110: The top down-regulated gene of the Calcium transport, in the LR vs. HR
comparison
We observe that the genes responsible for the maintaining the balance of calcium in
the mitochondria were up-regulated. For example Efha1 and Cbara1 were up-
regulated. In addition, a crucial component of the mitochondrial calcium uniporter
is up-regulated. This suggests that the accumulation of calcium in the mitochondria
is higher in HR mouse line.
Urea Cycle
A single gene was down-regulated in the urea cycle (Table 111) function.
GENE NAME LOG2FOLD P-VALUE ROLE
Arg2 -0.597902 0.00155513 Arginase catalyzes the step where Arginine is hydrolyzed to form urea and ornithine
Table 111: The top down-regulated gene of the Urea cycle, in the LR vs. HR comparison
The down-regulation of Arg2 suggests that the urea synthesis in the mitochondria
might be lower in the HR mouse line compare to the LR mouse line.

128
129
CHAPTER 3.3
Representative MitoModel in 16 samples of primary colorectal cancer and liver metastases
Colorectal cancer (CRC) is one of the most diagnosed cancer in humans, with an
estimated death of about 600,000 to have occurred worldwide in 2008 [Jemal et al.,
2011]. CRC is primarily asymptomatic until it progresses to advanced stages and
hence numerous patients are diagnosed, when the cancer has grown large enough to
cause symptoms [Read & Kodner, 1999]. Liver forms a major common site of CRC
metastases [Sheth & Clary, 2005].
Sporadic genetic and /or epigenetic changes are observed in many cases of CRC.
Nevertheless, 10% to 20% cases might be familial [Gonzalez & Cruz, 2015]. Several
studies also highlight the diverse prognostic signatures for CRC with different
tumour behaviors [Kim et al., 2014].
Our interest was to understand the contribution of mitochondrial function on cancer
development and progression. To this end, we used 16 RNA-seq samples of matched
primary CRC and synchronous liver metastases histologically identified as
adenocarcinoma in addition to normal colonic epithelium [Kim et al., 2014].
We expected a general high variation between patients. As we already observed a
high divergence between aneuploid cell lines (Chapter 3.1.), the clonal nature of
cancer and metastasis will typically yield a diverse set of mutations present in
different patients. Therefore, we decided to identify representative groups of
patients, which could give us a general idea of the mitochondrial contribution to this
disease.
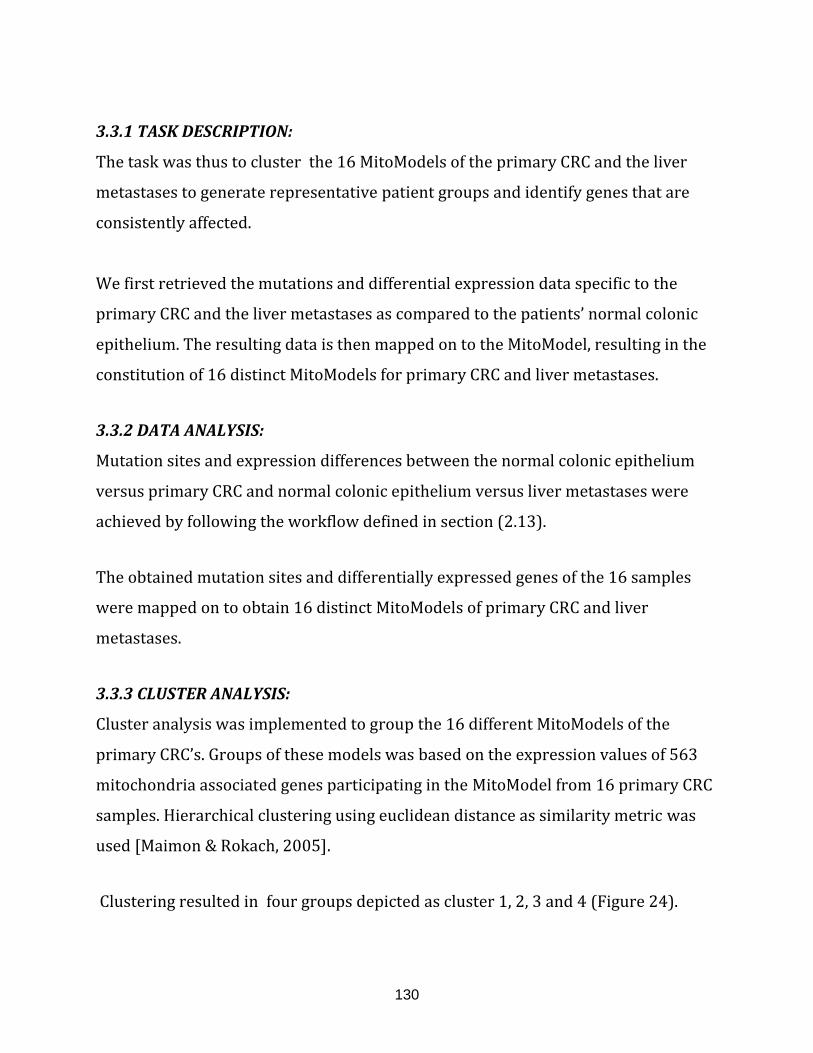
130
3.3.1 TASK DESCRIPTION:
The task was thus to cluster the 16 MitoModels of the primary CRC and the liver
metastases to generate representative patient groups and identify genes that are
consistently affected.
We first retrieved the mutations and differential expression data specific to the
primary CRC and the liver metastases as compared to the patients’ normal colonic
epithelium. The resulting data is then mapped on to the MitoModel, resulting in the
constitution of 16 distinct MitoModels for primary CRC and liver metastases.
3.3.2 DATA ANALYSIS:
Mutation sites and expression differences between the normal colonic epithelium
versus primary CRC and normal colonic epithelium versus liver metastases were
achieved by following the workflow defined in section (2.13).
The obtained mutation sites and differentially expressed genes of the 16 samples
were mapped on to obtain 16 distinct MitoModels of primary CRC and liver
metastases.
3.3.3 CLUSTER ANALYSIS:
Cluster analysis was implemented to group the 16 different MitoModels of the
primary CRC’s. Groups of these models was based on the expression values of 563
mitochondria associated genes participating in the MitoModel from 16 primary CRC
samples. Hierarchical clustering using euclidean distance as similarity metric was
used [Maimon & Rokach, 2005].
Clustering resulted in four groups depicted as cluster 1, 2, 3 and 4 (Figure 24).
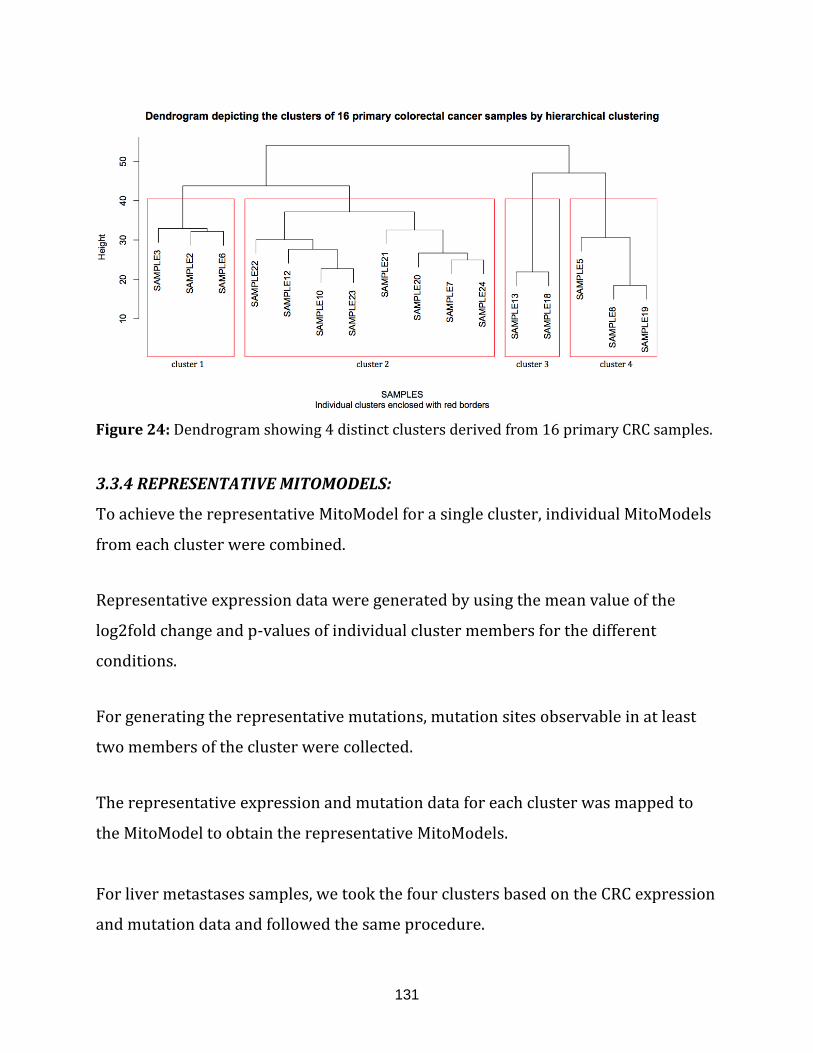
131
Figure 24: Dendrogram showing 4 distinct clusters derived from 16 primary CRC samples.
3.3.4 REPRESENTATIVE MITOMODELS:
To achieve the representative MitoModel for a single cluster, individual MitoModels
from each cluster were combined.
Representative expression data were generated by using the mean value of the
log2fold change and p-values of individual cluster members for the different
conditions.
For generating the representative mutations, mutation sites observable in at least
two members of the cluster were collected.
The representative expression and mutation data for each cluster was mapped to
the MitoModel to obtain the representative MitoModels.
For liver metastases samples, we took the four clusters based on the CRC expression
and mutation data and followed the same procedure.
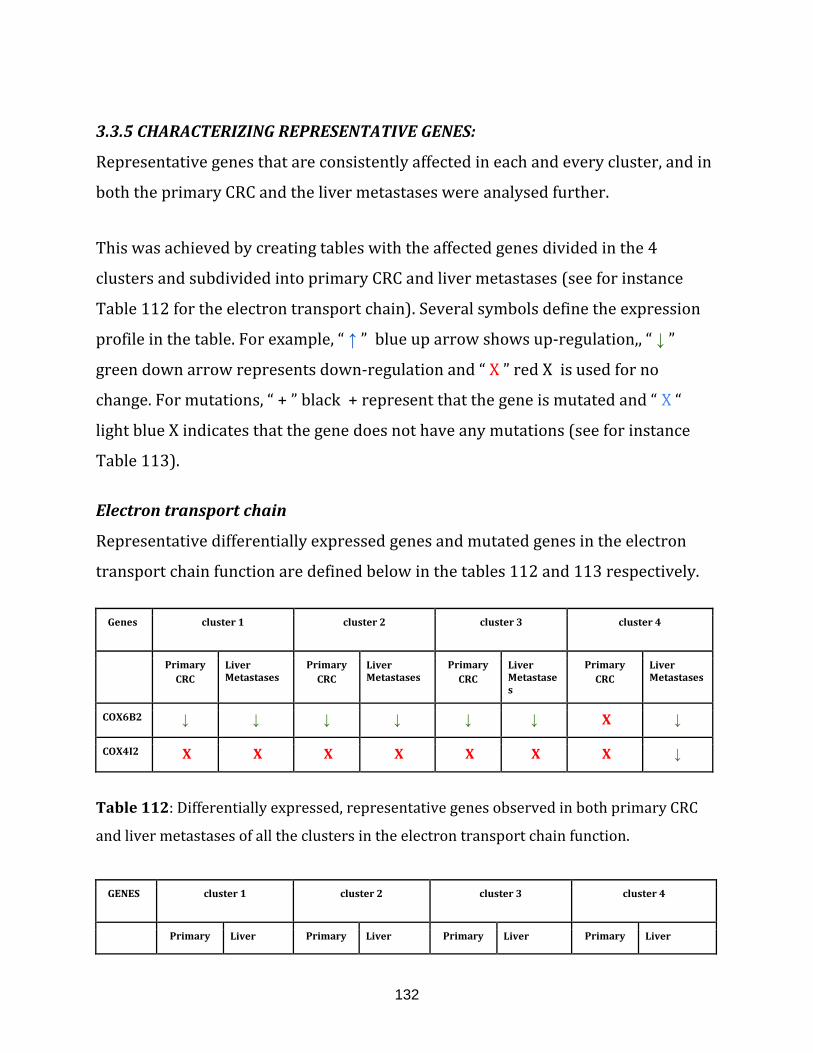
132
3.3.5 CHARACTERIZING REPRESENTATIVE GENES:
Representative genes that are consistently affected in each and every cluster, and in
both the primary CRC and the liver metastases were analysed further.
This was achieved by creating tables with the affected genes divided in the 4
clusters and subdivided into primary CRC and liver metastases (see for instance
Table 112 for the electron transport chain). Several symbols define the expression
profile in the table. For example, “ ↑ ” blue up arrow shows up-regulation,, “ ↓ ”
green down arrow represents down-regulation and “ X ” red X is used for no
change. For mutations, “ + ” black + represent that the gene is mutated and “ X “
light blue X indicates that the gene does not have any mutations (see for instance
Table 113).
Electron transport chain
Representative differentially expressed genes and mutated genes in the electron
transport chain function are defined below in the tables 112 and 113 respectively.
Genes cluster 1 cluster 2 cluster 3 cluster 4
Primary
CRC Liver Metastases
Primary
CRC Liver Metastases
Primary
CRC Liver Metastases
Primary CRC
Liver Metastases
COX6B2 ↓ ↓ ↓ ↓ ↓ ↓ X ↓
COX4I2 X X X X X X X ↓
Table 112: Differentially expressed, representative genes observed in both primary CRC
and liver metastases of all the clusters in the electron transport chain function.
GENES cluster 1 cluster 2 cluster 3 cluster 4
Primary Liver Primary Liver Primary Liver Primary Liver
133
CRC Metastases CRC Metastases CRC Metastases CRC Metastases
MT-ND5 + + X X X X X X
MT-CO1 X X + + X X X X
MT-CYB X X + X X X X X
COX4I1 X X X + X X X X
MT-CO2 X X X X X X X +
Table 113: Representative genes with mutation sites observed in both the primary CRC
and the liver metastases of all the clusters in the electron transport chain function.
COX6B2 expression was lower in the primary CRC and liver metastases samples of
all most all the clusters. COX6B2 is an essential component of cytochrome c
oxidase, complex IV in the electron transport chain [Hüttemann et al., 2003].
COX6B2 was also observed to be down-regulated in the rho(0) cell line
[Hashiguchi & Zhang-akiyama, 2009] devoid of mitochondrial DNA that exhibit
Warburg effect [Ayyasamy et al., 2011].
This study also revealed mutations in core subunits of the mitochondrial electron
transport chain. For example, mutated MT-ND5 was observed in both the primary
CRC and the liver metastases of cluster 1 and mutated MT-CO1 was observed in both
the primary CRC and liver metastases of cluster 2. Similarly, mutations in the coding
regions of MT-ND5 and MT-CO1 was observed in the human colorectal cancer cell
lines as well as human colon cancer [Chatterjee et al., 2006].
In conclusion, the misregulation of COX6B2 identified in multiple clusters both in
the primary CRC and the liver metastases and mutations in core subunits of the
electron transport chain, suggests a reduction in energy production via the electron
transport chain in most of the patient groups.
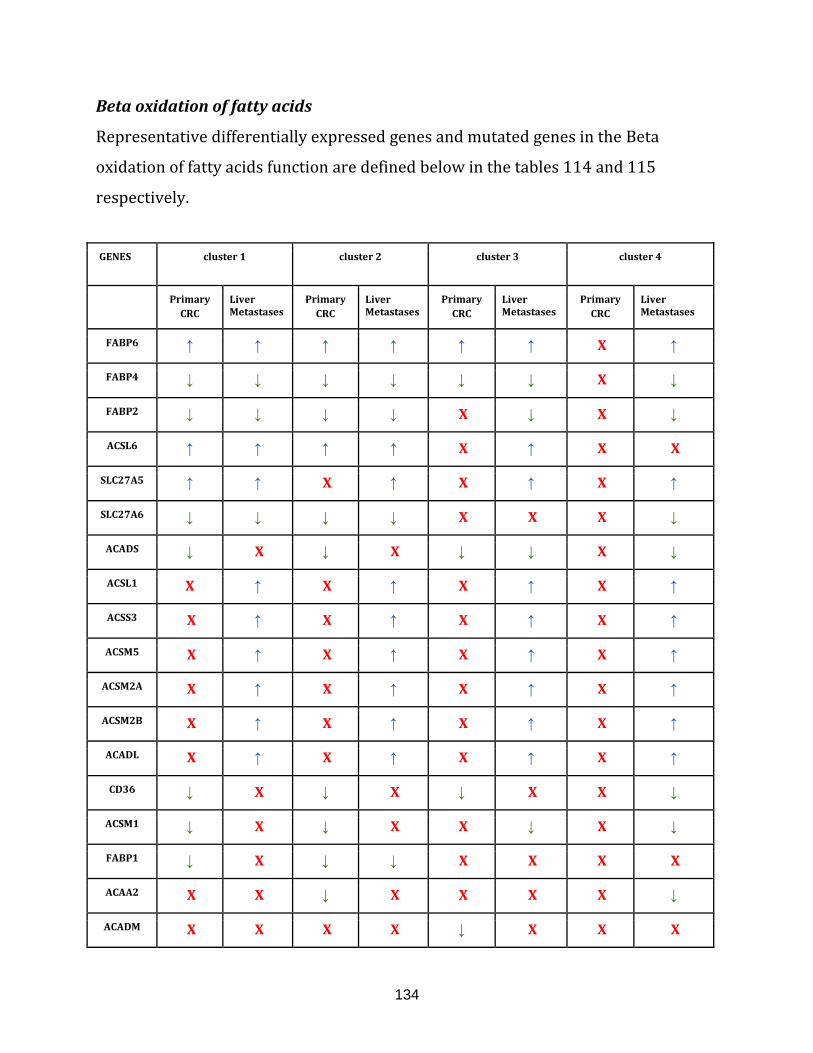
134
Beta oxidation of fatty acids
Representative differentially expressed genes and mutated genes in the Beta
oxidation of fatty acids function are defined below in the tables 114 and 115
respectively.
GENES cluster 1 cluster 2 cluster 3 cluster 4
Primary
CRC Liver Metastases
Primary
CRC Liver Metastases
Primary
CRC Liver Metastases
Primary CRC
Liver Metastases
FABP6 ↑ ↑ ↑ ↑ ↑ ↑ X ↑
FABP4 ↓ ↓ ↓ ↓ ↓ ↓ X ↓
FABP2 ↓ ↓ ↓ ↓ X ↓ X ↓
ACSL6 ↑ ↑ ↑ ↑ X ↑ X X
SLC27A5 ↑ ↑ X ↑ X ↑ X ↑
SLC27A6 ↓ ↓ ↓ ↓ X X X ↓
ACADS ↓ X ↓ X ↓ ↓ X ↓
ACSL1 X ↑ X ↑ X ↑ X ↑
ACSS3 X ↑ X ↑ X ↑ X ↑
ACSM5 X ↑ X ↑ X ↑ X ↑
ACSM2A X ↑ X ↑ X ↑ X ↑
ACSM2B X ↑ X ↑ X ↑ X ↑
ACADL X ↑ X ↑ X ↑ X ↑
CD36 ↓ X ↓ X ↓ X X ↓
ACSM1 ↓ X ↓ X X ↓ X ↓
FABP1 ↓ X ↓ ↓ X X X X
ACAA2 X X ↓ X X X X ↓
ACADM X X X X ↓ X X X
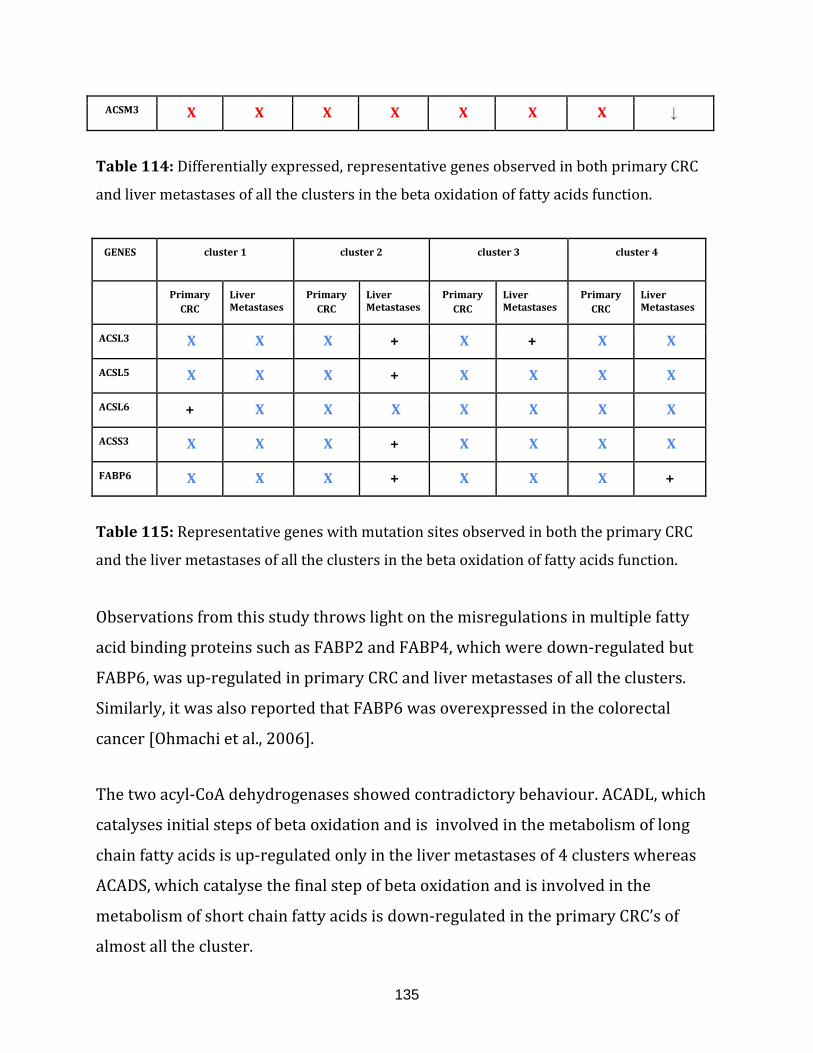
135
ACSM3 X X X X X X X ↓
Table 114: Differentially expressed, representative genes observed in both primary CRC
and liver metastases of all the clusters in the beta oxidation of fatty acids function.
GENES cluster 1 cluster 2 cluster 3 cluster 4
Primary
CRC Liver Metastases
Primary
CRC Liver Metastases
Primary
CRC Liver Metastases
Primary CRC
Liver Metastases
ACSL3 X X X + X + X X
ACSL5 X X X + X X X X
ACSL6 + X X X X X X X
ACSS3 X X X + X X X X
FABP6 X X X + X X X +
Table 115: Representative genes with mutation sites observed in both the primary CRC
and the liver metastases of all the clusters in the beta oxidation of fatty acids function.
Observations from this study throws light on the misregulations in multiple fatty
acid binding proteins such as FABP2 and FABP4, which were down-regulated but
FABP6, was up-regulated in primary CRC and liver metastases of all the clusters.
Similarly, it was also reported that FABP6 was overexpressed in the colorectal
cancer [Ohmachi et al., 2006].
The two acyl-CoA dehydrogenases showed contradictory behaviour. ACADL, which
catalyses initial steps of beta oxidation and is involved in the metabolism of long
chain fatty acids is up-regulated only in the liver metastases of 4 clusters whereas
ACADS, which catalyse the final step of beta oxidation and is involved in the
metabolism of short chain fatty acids is down-regulated in the primary CRC’s of
almost all the cluster.
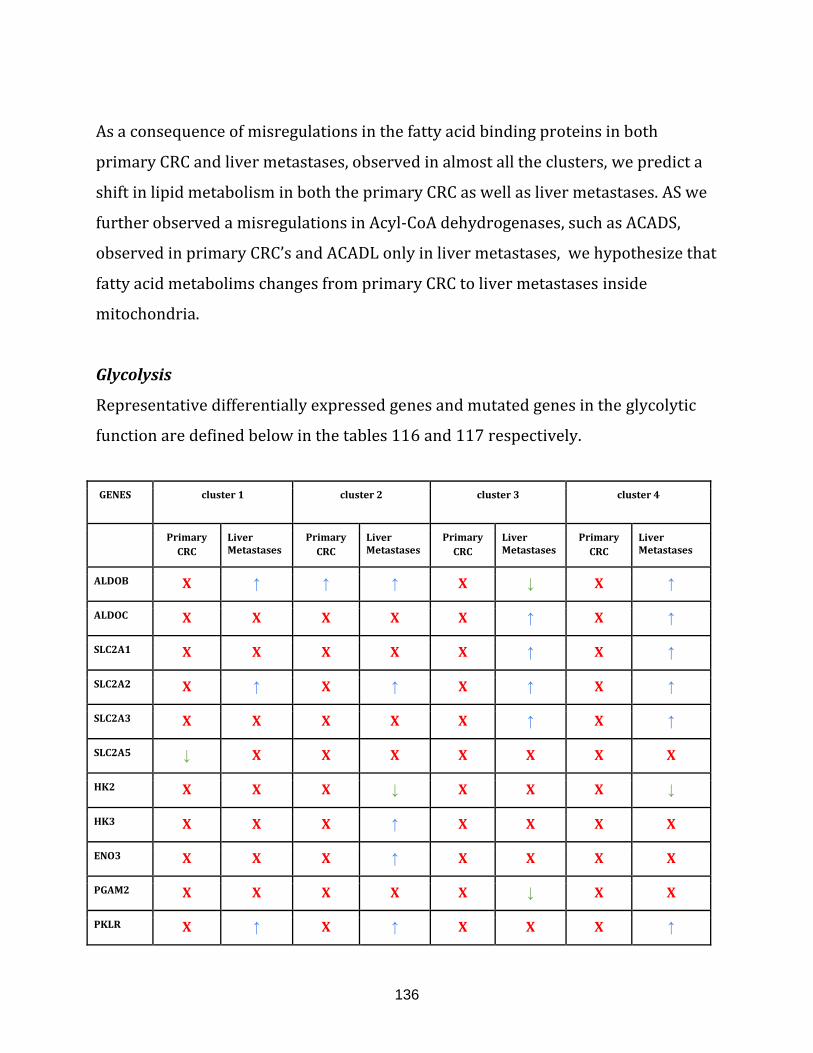
136
As a consequence of misregulations in the fatty acid binding proteins in both
primary CRC and liver metastases, observed in almost all the clusters, we predict a
shift in lipid metabolism in both the primary CRC as well as liver metastases. AS we
further observed a misregulations in Acyl-CoA dehydrogenases, such as ACADS,
observed in primary CRC’s and ACADL only in liver metastases, we hypothesize that
fatty acid metabolims changes from primary CRC to liver metastases inside
mitochondria.
Glycolysis
Representative differentially expressed genes and mutated genes in the glycolytic
function are defined below in the tables 116 and 117 respectively.
GENES cluster 1 cluster 2 cluster 3 cluster 4
Primary
CRC Liver Metastases
Primary
CRC Liver Metastases
Primary
CRC Liver Metastases
Primary CRC
Liver Metastases
ALDOB X ↑ ↑ ↑ X ↓ X ↑
ALDOC X X X X X ↑ X ↑
SLC2A1 X X X X X ↑ X ↑
SLC2A2 X ↑ X ↑ X ↑ X ↑
SLC2A3 X X X X X ↑ X ↑
SLC2A5 ↓ X X X X X X X
HK2 X X X ↓ X X X ↓
HK3 X X X ↑ X X X X
ENO3 X X X ↑ X X X X
PGAM2 X X X X X ↓ X X
PKLR X ↑ X ↑ X X X ↑
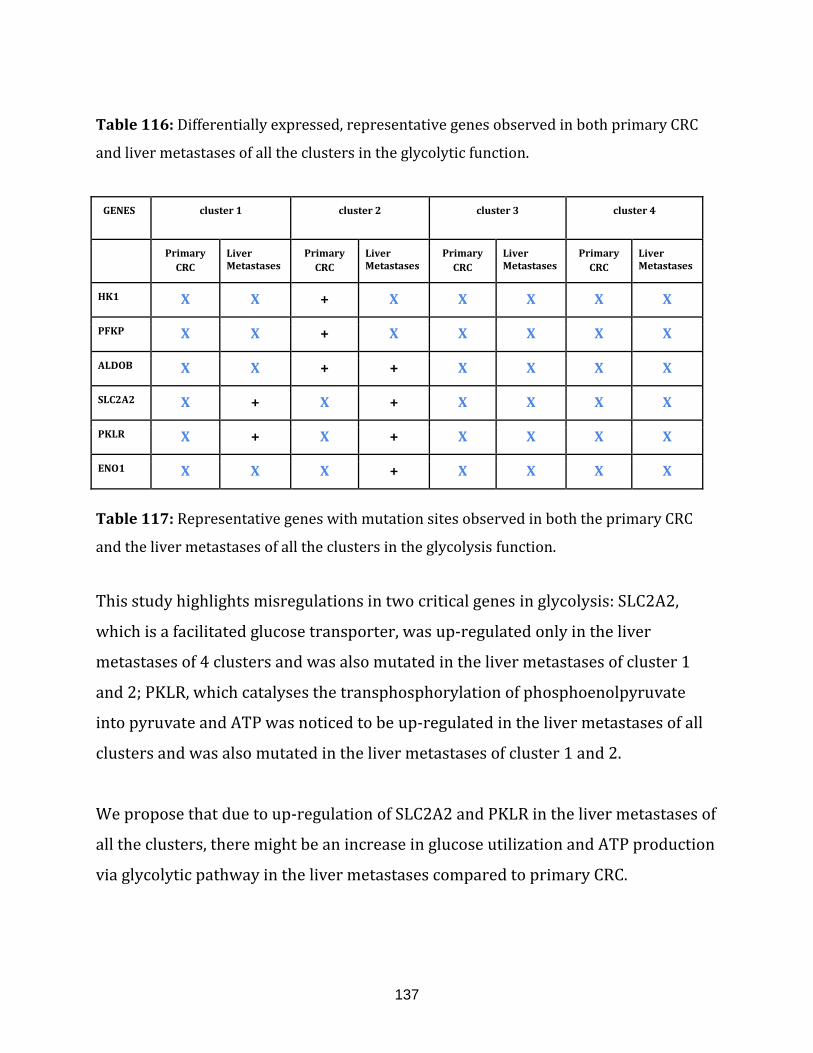
137
Table 116: Differentially expressed, representative genes observed in both primary CRC
and liver metastases of all the clusters in the glycolytic function.
GENES cluster 1 cluster 2 cluster 3 cluster 4
Primary
CRC Liver Metastases
Primary
CRC Liver Metastases
Primary
CRC Liver Metastases
Primary CRC
Liver Metastases
HK1 X X + X X X X X
PFKP X X + X X X X X
ALDOB X X + + X X X X
SLC2A2 X + X + X X X X
PKLR X + X + X X X X
ENO1 X X X + X X X X
Table 117: Representative genes with mutation sites observed in both the primary CRC
and the liver metastases of all the clusters in the glycolysis function.
This study highlights misregulations in two critical genes in glycolysis: SLC2A2,
which is a facilitated glucose transporter, was up-regulated only in the liver
metastases of 4 clusters and was also mutated in the liver metastases of cluster 1
and 2; PKLR, which catalyses the transphosphorylation of phosphoenolpyruvate
into pyruvate and ATP was noticed to be up-regulated in the liver metastases of all
clusters and was also mutated in the liver metastases of cluster 1 and 2.
We propose that due to up-regulation of SLC2A2 and PKLR in the liver metastases of
all the clusters, there might be an increase in glucose utilization and ATP production
via glycolytic pathway in the liver metastases compared to primary CRC.
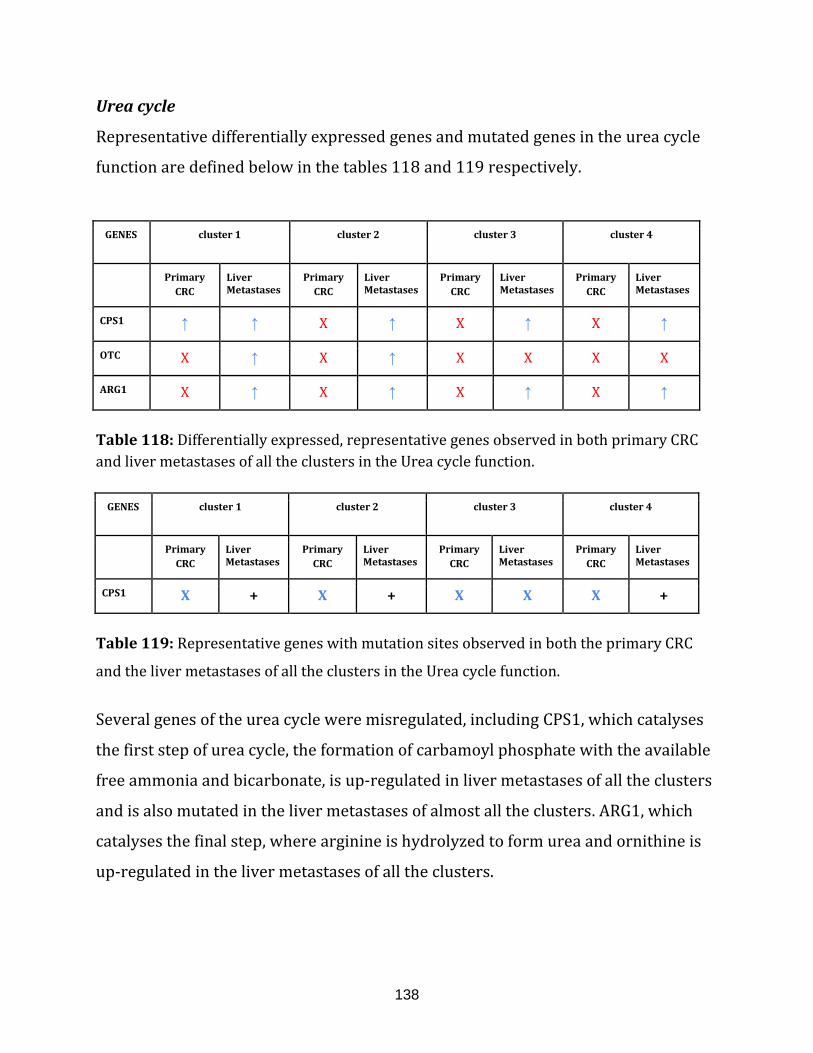
138
Urea cycle
Representative differentially expressed genes and mutated genes in the urea cycle
function are defined below in the tables 118 and 119 respectively.
GENES cluster 1 cluster 2 cluster 3 cluster 4
Primary
CRC Liver Metastases
Primary
CRC Liver Metastases
Primary
CRC Liver Metastases
Primary CRC
Liver Metastases
CPS1 ↑ ↑ X ↑ X ↑ X ↑
OTC X ↑ X ↑ X X X X
ARG1 X ↑ X ↑ X ↑ X ↑
Table 118: Differentially expressed, representative genes observed in both primary CRC
and liver metastases of all the clusters in the Urea cycle function.
GENES cluster 1 cluster 2 cluster 3 cluster 4
Primary
CRC Liver Metastases
Primary
CRC Liver Metastases
Primary
CRC Liver Metastases
Primary CRC
Liver Metastases
CPS1 X + X + X X X +
Table 119: Representative genes with mutation sites observed in both the primary CRC
and the liver metastases of all the clusters in the Urea cycle function.
Several genes of the urea cycle were misregulated, including CPS1, which catalyses
the first step of urea cycle, the formation of carbamoyl phosphate with the available
free ammonia and bicarbonate, is up-regulated in liver metastases of all the clusters
and is also mutated in the liver metastases of almost all the clusters. ARG1, which
catalyses the final step, where arginine is hydrolyzed to form urea and ornithine is
up-regulated in the liver metastases of all the clusters.
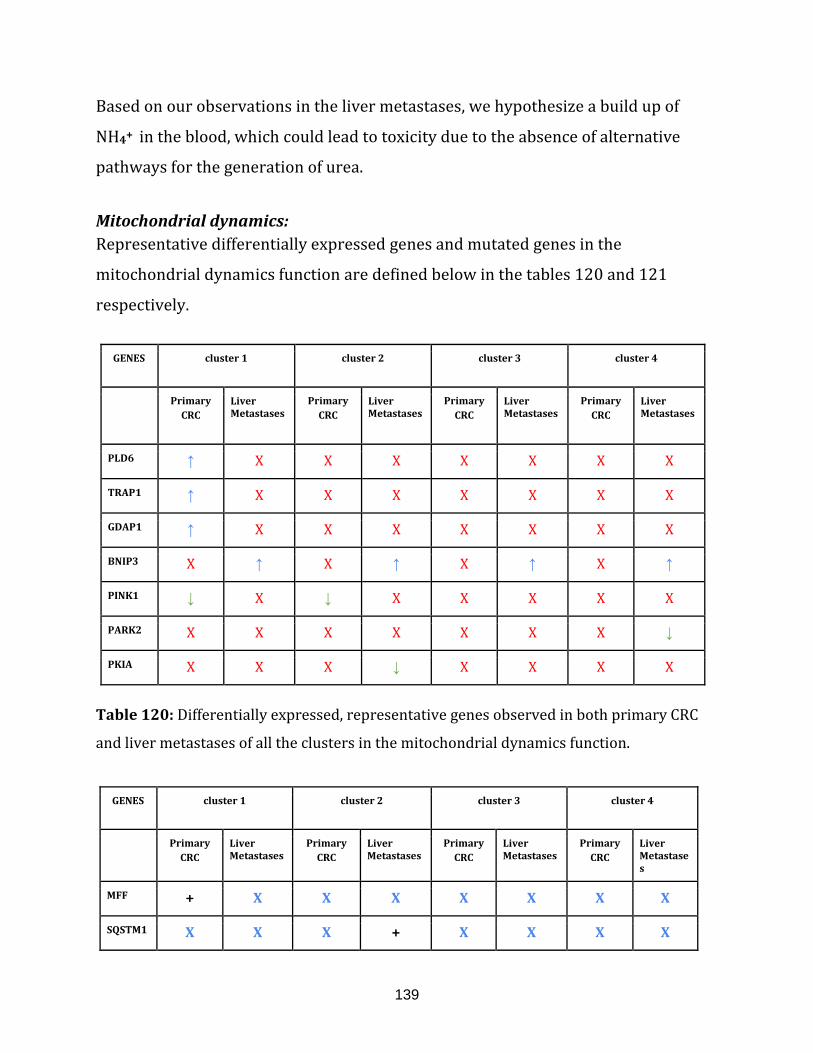
139
Based on our observations in the liver metastases, we hypothesize a build up of
NH4+ in the blood, which could lead to toxicity due to the absence of alternative
pathways for the generation of urea.
Mitochondrial dynamics:
Representative differentially expressed genes and mutated genes in the
mitochondrial dynamics function are defined below in the tables 120 and 121
respectively.
GENES cluster 1 cluster 2 cluster 3 cluster 4
Primary
CRC Liver Metastases
Primary
CRC Liver Metastases
Primary
CRC Liver Metastases
Primary CRC
Liver Metastases
PLD6 ↑ X X X X X X X
TRAP1 ↑ X X X X X X X
GDAP1 ↑ X X X X X X X
BNIP3 X ↑ X ↑ X ↑ X ↑
PINK1 ↓ X ↓ X X X X X
PARK2 X X X X X X X ↓
PKIA X X X ↓ X X X X
Table 120: Differentially expressed, representative genes observed in both primary CRC
and liver metastases of all the clusters in the mitochondrial dynamics function.
GENES cluster 1 cluster 2 cluster 3 cluster 4
Primary
CRC Liver Metastases
Primary
CRC Liver Metastases
Primary
CRC Liver Metastases
Primary CRC
Liver Metastases
MFF + X X X X X X X
SQSTM1 X X X + X X X X
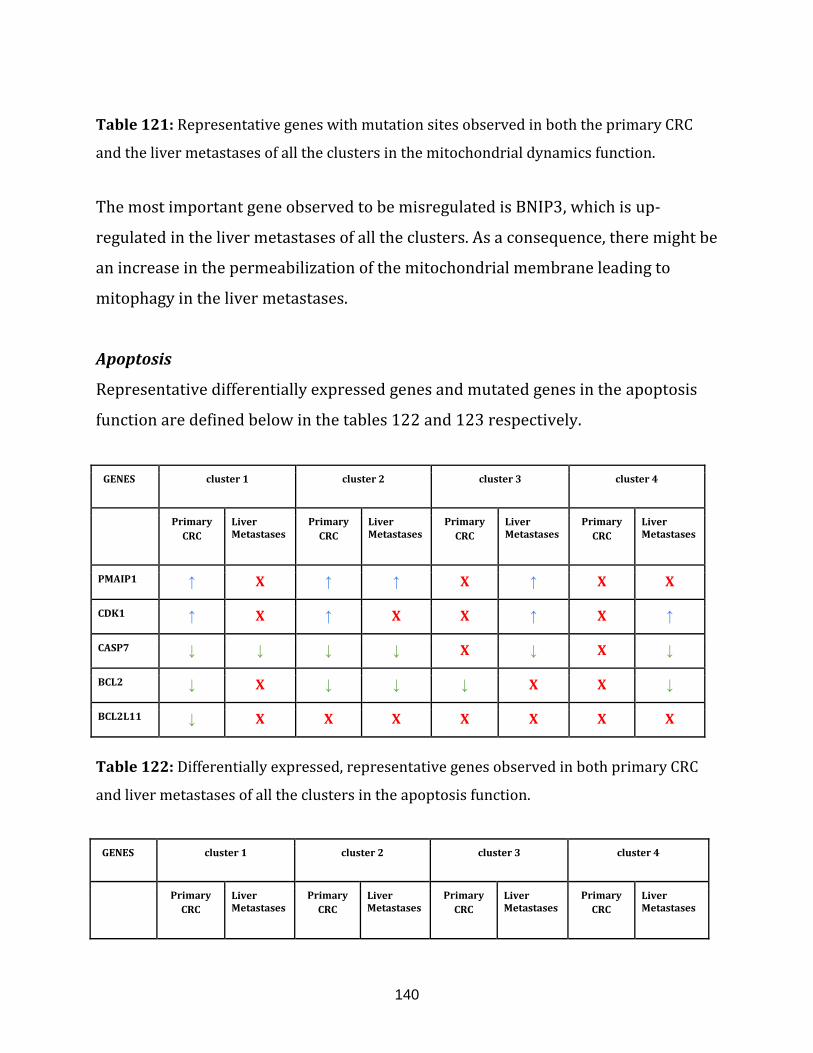
140
Table 121: Representative genes with mutation sites observed in both the primary CRC
and the liver metastases of all the clusters in the mitochondrial dynamics function.
The most important gene observed to be misregulated is BNIP3, which is up-
regulated in the liver metastases of all the clusters. As a consequence, there might be
an increase in the permeabilization of the mitochondrial membrane leading to
mitophagy in the liver metastases.
Apoptosis
Representative differentially expressed genes and mutated genes in the apoptosis
function are defined below in the tables 122 and 123 respectively.
GENES cluster 1 cluster 2 cluster 3 cluster 4
Primary
CRC Liver Metastases
Primary
CRC Liver Metastases
Primary
CRC Liver Metastases
Primary CRC
Liver Metastases
PMAIP1 ↑ X ↑ ↑ X ↑ X X
CDK1 ↑ X ↑ X X ↑ X ↑
CASP7 ↓ ↓ ↓ ↓ X ↓ X ↓
BCL2 ↓ X ↓ ↓ ↓ X X ↓
BCL2L11 ↓ X X X X X X X
Table 122: Differentially expressed, representative genes observed in both primary CRC
and liver metastases of all the clusters in the apoptosis function.
GENES cluster 1 cluster 2 cluster 3 cluster 4
Primary
CRC Liver Metastases
Primary
CRC Liver Metastases
Primary
CRC Liver Metastases
Primary CRC
Liver Metastases
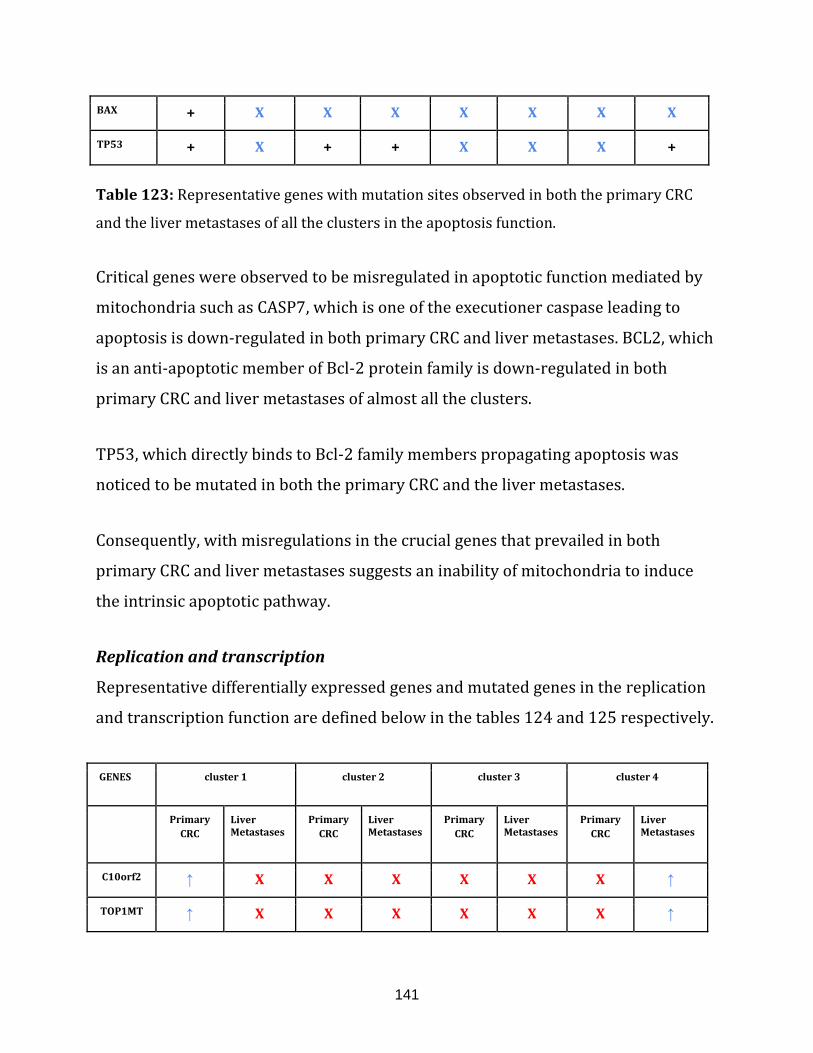
141
BAX + X X X X X X X
TP53 + X + + X X X +
Table 123: Representative genes with mutation sites observed in both the primary CRC
and the liver metastases of all the clusters in the apoptosis function.
Critical genes were observed to be misregulated in apoptotic function mediated by
mitochondria such as CASP7, which is one of the executioner caspase leading to
apoptosis is down-regulated in both primary CRC and liver metastases. BCL2, which
is an anti-apoptotic member of Bcl-2 protein family is down-regulated in both
primary CRC and liver metastases of almost all the clusters.
TP53, which directly binds to Bcl-2 family members propagating apoptosis was
noticed to be mutated in both the primary CRC and the liver metastases.
Consequently, with misregulations in the crucial genes that prevailed in both
primary CRC and liver metastases suggests an inability of mitochondria to induce
the intrinsic apoptotic pathway.
Replication and transcription
Representative differentially expressed genes and mutated genes in the replication
and transcription function are defined below in the tables 124 and 125 respectively.
GENES cluster 1 cluster 2 cluster 3 cluster 4
Primary
CRC Liver Metastases
Primary
CRC Liver Metastases
Primary
CRC Liver Metastases
Primary CRC
Liver Metastases
C10orf2 ↑ X X X X X X ↑
TOP1MT ↑ X X X X X X ↑
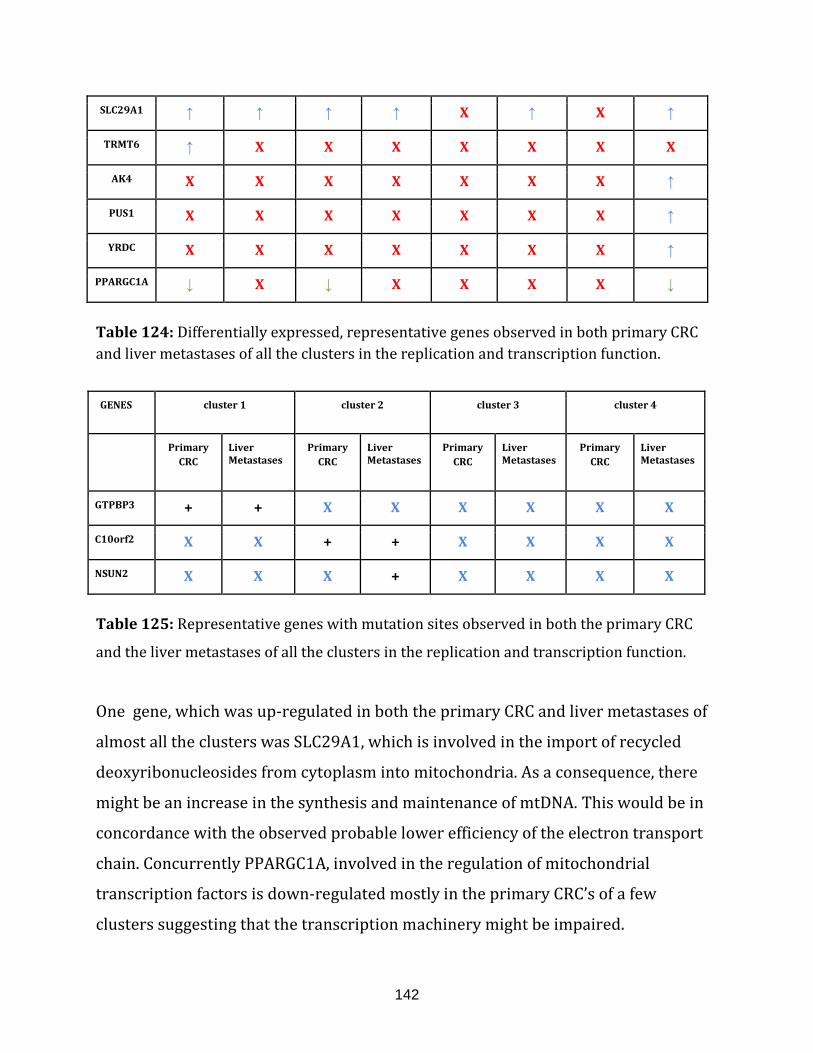
142
SLC29A1 ↑ ↑ ↑ ↑ X ↑ X ↑
TRMT6 ↑ X X X X X X X
AK4 X X X X X X X ↑
PUS1 X X X X X X X ↑
YRDC X X X X X X X ↑
PPARGC1A ↓ X ↓ X X X X ↓
Table 124: Differentially expressed, representative genes observed in both primary CRC
and liver metastases of all the clusters in the replication and transcription function.
GENES cluster 1 cluster 2 cluster 3 cluster 4
Primary
CRC Liver Metastases
Primary
CRC Liver Metastases
Primary
CRC Liver Metastases
Primary CRC
Liver Metastases
GTPBP3 + + X X X X X X
C10orf2 X X + + X X X X
NSUN2 X X X + X X X X
Table 125: Representative genes with mutation sites observed in both the primary CRC
and the liver metastases of all the clusters in the replication and transcription function.
One gene, which was up-regulated in both the primary CRC and liver metastases of
almost all the clusters was SLC29A1, which is involved in the import of recycled
deoxyribonucleosides from cytoplasm into mitochondria. As a consequence, there
might be an increase in the synthesis and maintenance of mtDNA. This would be in
concordance with the observed probable lower efficiency of the electron transport
chain. Concurrently PPARGC1A, involved in the regulation of mitochondrial
transcription factors is down-regulated mostly in the primary CRC’s of a few
clusters suggesting that the transcription machinery might be impaired.
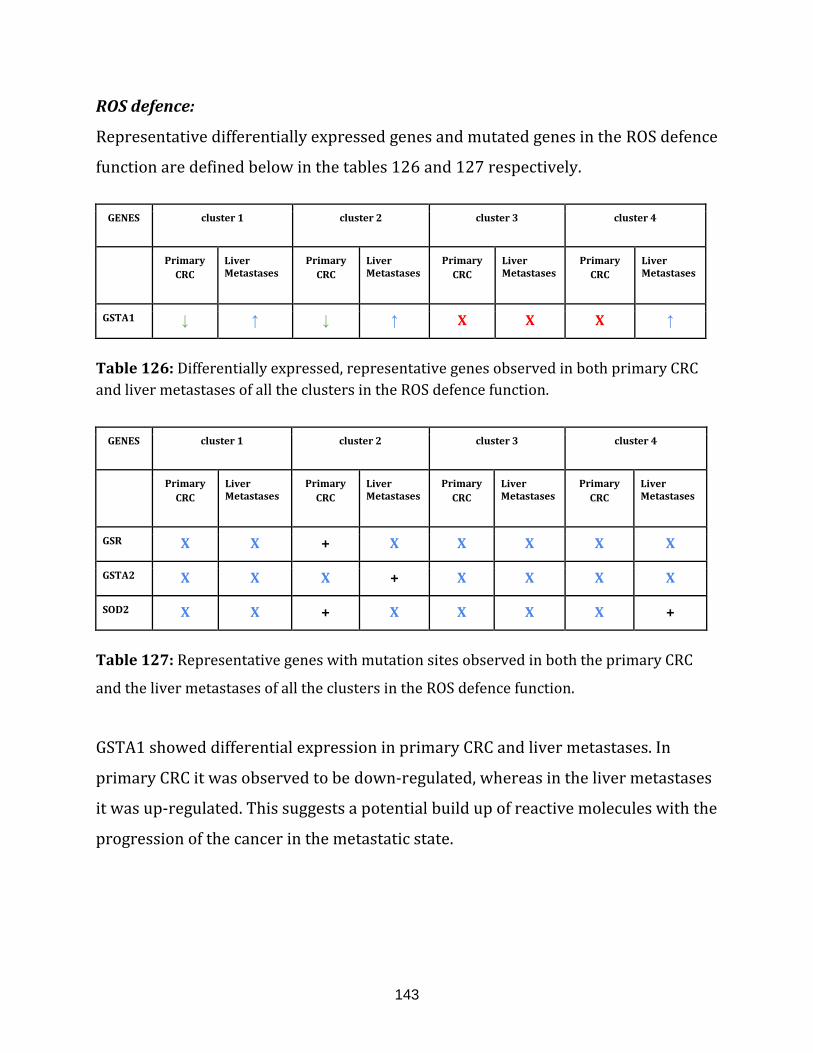
143
ROS defence:
Representative differentially expressed genes and mutated genes in the ROS defence
function are defined below in the tables 126 and 127 respectively.
GENES cluster 1 cluster 2 cluster 3 cluster 4
Primary
CRC Liver Metastases
Primary
CRC Liver Metastases
Primary
CRC Liver Metastases
Primary CRC
Liver Metastases
GSTA1 ↓ ↑ ↓ ↑ X X X ↑
Table 126: Differentially expressed, representative genes observed in both primary CRC
and liver metastases of all the clusters in the ROS defence function.
GENES cluster 1 cluster 2 cluster 3 cluster 4
Primary
CRC Liver Metastases
Primary
CRC Liver Metastases
Primary
CRC Liver Metastases
Primary CRC
Liver Metastases
GSR X X + X X X X X
GSTA2 X X X + X X X X
SOD2 X X + X X X X +
Table 127: Representative genes with mutation sites observed in both the primary CRC
and the liver metastases of all the clusters in the ROS defence function.
GSTA1 showed differential expression in primary CRC and liver metastases. In
primary CRC it was observed to be down-regulated, whereas in the liver metastases
it was up-regulated. This suggests a potential build up of reactive molecules with the
progression of the cancer in the metastatic state.

144
145
CHAPTER 4
DISCUSSION
Mitochondria are indispensable organelles present in the eukaryotic cell. They are
primarily involved in the energy production in the form of ATP through oxidative
phosphorylation. In addition, they are involved in diverse functions such as
beta oxidation of fatty acids, apoptosis, biosynthesis of heme, FE-S cluster
biosynthesis and calcium signalling. Mitochondrial disorders arise from defects in
mtDNA, encoding essential components of OXPHOS. The nuclear genome also
contributes the majority of the OXPHOS proteins and hence variations in the
proteins encoded by nuclear genome can also cause mitochondrial disorders.
The MitoModel server
In this study we have developed a web-based platform named “MitoModel” that has
brought together 659 mitochondria associated genes encoded by both mitochondria
and nuclear genomes. We classified them into 17 functional groups. All the genes in
the MitoModel are annotated for their role via comprehensive literature survey and
carefully put into their functional groups. MitoModel is designed as a web server,
which allows users to map mutation and differential expression data. The advantage
that MitoModel extends is the fact that it is highly interactive and enables users to
interpret their data in the functional context of mitochondria.
Compiling the genes to be part of a mitochondrial function included identifying the
investigated or well reviewed functions related to mitochondria and taking note of
all the genes and their roles. While the advantage of our approach was that we could
capture the mitochondria associated genes and their roles at a detailed level in each
146
function, the disadvantage was that it took a lot of time and effort to compile 659
genes. Though time consuming our approach appropriately pinpoints the roles of
genes, which was a primary requirement for us to achieve in conducting functional
studies of mitochondria.
Comparing our approach to other resources hosting mitochondria proteomics data,
it is evident that the inventory of the genes compiled by us had only literature
evidence compared to MitoCarta. This resource provides evidence through
literature, targetP signals for mitochondrial localization prediction, homologs of
yeast mitochondrial proteins, Rickettsia homologs, domains exclusive for
mitochondria, induction, coexpression and mass spectrometry, providing GO term
annotation for the genes [Pagliarini et al., 2008], whereas MitoMiner includes data
from 52 large-scale proteomic datasets of mitochondrial localisation from both
mass spectrometry and green fluorescent protein- (GFP-) tagging studies, providing
GO term annotations and functions curated by UniProt [Smith & Robinson, 2016].
The inventory of 659 genes was initially generated for Homo sapiens and further
extended to mouse, deriving 659 mouse orthologous genes from the human gene
set, using the HCOP’s human orthology prediction [Eyre et al., 2007]. The STRING
database [Szklarczyk et al. 2015] was used to derive the interactions for our gene
sets and for human and mouse genes we got 10985 and 12571 interactions,
respectively. Similar efforts were made to achieve mitochondrial interactome from
budding yeast, resulting in nearly 10000 interactions for 800 genes extracted from
24 published datasets [Perocchi et al., 2006].
A database was created for the gene catalog and the interactions of the MitoModel
web server. This enables the user to interact with user-provided variants data. The
disadvantage of MitoModel is that users cannot access the gene list and its functions
147
without providing input data from their side. The output text file generated by
MitoModel returns only the variant genes. This is not the case with MitoCarta and
MitoMiner, which allows users to query for individual or group of genes. The
advantages of MitoModel are that it is the only tool known to us until now, which
maps user-defined variation data of different diseases onto the mitochondria
associated genes. It is furthermore highly interactive, providing users with simple
visual cues, appropriate gene information and the mapped variants data
information. Similar web resource created by another study called MitoInteractome
allowed users to query for interacting partners, SNPs within proteins, the number of
SNPs, disease related proteins [Reja et al., 2009] but never allowed the analysis of
user data.
Though MitoModel is a robust, interactive network, it still lacks several aspects such
as providing the whole gene set and functions to the user, which limits the user
knowledge only to the variant genes. Second, the roles of the genes are manually
curated and are presently static, which means only database administrators can
curate it. At present MitoModel does not link to any other web resources, which
make its outcome specific only to variants data of the user-provided disease.
Use cases tested for MitoModel
We tested MitoModel on three different data sets: First, we used data from
aneuploid cell lines. In HCT116 5/4 aneuploid cell line, we identified PKM2 up-
regulated, which catalyzes the conversion of phosphoenolpyruvate to pyruvate,
resulting in the generation of glycolytic ATP. It was reported that chromosomally-
unstable cancer lines displayed increased glycolytic and TCA-cycle flux [Sheltzer,
2013], indicating that the generation of glycolytic energy might be higher in HCT116
5/4 cells compared to its wild type cell line. We also identified several genes down-
regulated, harboring mutation sites in electron transport chain, replication and
148
transcription, and translation functions. Thus we hypothesize that mitochondrial
biogenesis and energy production inside mitochondria are severely affected in
HCT116 5/4 cell line compared to its wild type cell line.
In RPE1 5/3 12/3 aneuploid cells, we identified several genes in electron transport
chain, replication and transcription, and translation up-regulated. In ROS defense,
we observe that several genes involved in the reducing the ROS elements to be up-
regulated. Thus we hypothesize that increased stress created during energy
production caused a buildup of ROS in RPE1 5/3 12/3 aneuploidy cell line
compared to its wild type cell line.
In RPE1H2B 21/3 aneuploidy cell line, we identified two up-regulated genes in
electron transport chain and two up-regulated genes in ROS defence such as SOD1,
which removes superoxides in the intermembrane space of mitochondria and GPX1,
which further reduces the hydrogen peroxide to water. It was reported that the
superoxide production and oxidative stress were observed to be 3 times higher in
Down Syndrome fibroblasts [Coskun & Busciglio, 2012], thus we hypothesize that a
mis-regulated mitochondrial OXPHOS leads to the buildup of mitochondrial ROS in
the RPE1H2B 21/3 aneuploidy cell line compared to its wild type cell line.
Comparing the MitoModels of three aneuploid cell lines throws light on the fact that
they were highly different from each other. Though we could observe that the
functions replication and transcription, translation and electron transport chain
were the most affected in the HCT116 5/4 and RPE1 5/3 12/3, they were showing
contradictory behaviors. RPE1H2B 21/3 cells compared to other aneuploidy cell
lines, accumulating only few variations in the mitochondria associated genes. Thus
using MitoModels we could show that each aneuploidy cell line behaves individually
when compared to each other.
149
Second, we tested MitoModel on the expression data of expression of high (HR) and
low (LR) stress resistance mouse line. Here we identified Atp5h, Atp5o and Atp5e
from the electron transport chain, which are three essential subunits of ATP
synthase complex V to be up-regulated, suggesting that there might be an increased
conversion of ADP to ATP in the HR mouse line. In glycolysis, Slc2a4, a facilitated
glucose transporter was up-regulated. In addition Pkm2, which is known to catalyse
the transphosphorylation of phosphoenolpyruvate into pyruvate and ATP was
upregulated. The hippocampal proteomic analysis identified several proteins
differentially expressed in HR and LR mice, including proteins involved in energy
metabolism [Knapman et al., 2012]. We hypothesize that there might be a increased
need of energy in HR mouse line, whereby glycolysis is also contributing to this.
Finally, we tested MitoModel on RNA-seq data of normal colon , primary Colorectal
cancer (CRC) and liver metastases from 16 patients [Kim et al., 2014]. 16
MitoModels of primary CRC and liver metastases were reduced to 4 representative
MitoModels representing clustering patient groups. We analysed those 4
representative groups for mitochondrial contribution. In the electron transport
chain, COX6B2 was down-regulated in both primary CRC and liver metastases of
most clusters. Interestingly, COX6B2 was also observed to be down-regulated in the
rho(0) cell line [Hashiguchi & Zhang-akiyama, 2009] devoid of mitochondrial DNA
that exhibit the Warburg effect [Ayyasamy et al., 2011]. This indicates that down-
regulation of COX6B2 may be involved in both the development and progression of
CRC. Mutations in MT-ND5 and MT-CO1 were observed in the primary CRC and liver
metastases of cluster 1 and 2. Similarly, mutations in the coding regions of MT-ND5
and MT-CO1 were observed in the human colorectal cancer cell line as well as
human colon cancer [Chatterjee et al., 2006]. This suggests that the mutations might
lead to changes in the OXPHOS process. In the beta oxidation of fatty acids, FABP6,
was up-regulated in both primary CRC and liver metastases of most clusters and it
150
was also reported to be overexpressed in the colorectal cancer [Ohmachi et al.,
2006]. In addition, we also identified ACADL, which catalyses the metabolism of long
chain fatty acids. This mRNA was up-regulated only in the liver metastases of all
clusters. ACADS, which catalyses the metabolism of short chain fatty acids was
down-regulated in primary CRC of all clusters. We therefore hypothesize that there
might be an up-regulated first step of beta oxidation in liver metastases due to
decrease in the catalysing ability of ACADS in primary CRC, which functions at the
tail end of the beta oxidation. In urea cycle, ARG1 was up-regulated only in the liver
metastases of all clusters. ARG1 is involved in catalysing the final step of urea cycle,
hydrolyzing arginine to urea and ornithine. It has been reported that there was a
buildup of urea cycle metabolites (purines, pyrimidines and amino acids) in colon
carcinoma [Denkert et al., 2008]. Thus we hypothesize that there might be an
increase in the intermediate products of urea cycle in liver metastases. In apoptosis,
CASP7 which is one of the executioner caspases leading to apoptosis, as well as
BCL2, which is an anti-apoptotic member of Bcl-2 protein family are down-
regulated in both primary CRC and liver metastases of most clusters. TP53, which
directly binds to Bcl-2 family members propagating apoptosis was noticed to be
mutated in both the primary CRC and the liver metastases. A study suggests that
BCL2 suppresses TP53 dependent apoptosis in colorectal cancer cells [Jiang and
Milner, 2003], and variations in both, the BCL2 and TP53 gene in both the primary
CRC and liver metastases indicates, that there might be an inability of mitochondria
to induce the intrinsic apoptotic pathway.
The above research findings demonstrates that with MitoModel, user can map their
variant data and efficiently describe mitochondria in a disease state. Thus
MitoModel is an infrastructure, which enables user to make primary hypothesis of
mitochondrial biology in the disease of interest. It should be noted that MitoModel

151
only enables hypothesis, which should be verified in the lab before making final
conclusions.

152
153
CHAPTER 5
Conclusions and future perspectives
5.1 CONCLUSION:
An array of human diseases are implicated to contain atypical mitochondria, which
not only have a pivotal role in efficient energy generation but also several other
important functions in the cell. Mutations in mtDNA and nDNA, both inherited and
spontaneous, and differential expression patterns of mitochondrial genes encoded
in mitochondria and the nucleus lead to altered mitochondrial functions, which has
a critical impact on cell physiology and survival.
The availability of large scale sequencing data of several disease samples has
opened up avenues to identify variants carried or developed during disease
progression. The advantage of analysing diseases with RNA-seq data, are two-fold: it
provides differential expression of genes, as well as efficient capture of mutations.
This study has established a mitochondria-based model in the form of the
MitoModel web-server, which is an program to efficiently comprehend the variants
carried by mitochondria in a disease state. This approach allows users to make a
primary hypothesis about the mitochondrial biology and physiology in disease by
mapping expression and mutation variants on to the MitoModel.
This work also highlights the applicability of MitoModel to various disease types. We
have used it to understand mitochondrial variants carried by different aneuploid
cell lines, highlighting the different mitochondrial variations observed in the
MitoModels for HCT116 5/4, RPE1 5/3 12/3 and RPE1H2B 21/3 cell lines. In a
154
second comparison, we have used a mouse MitoModel to analyse the differential
mitochondrial expression between high and low stress reactivity mouse lines. The
data mapped on the mouse MitoModel revealed that most of the mitochondrial
functions were up-regulated in the HR stress reactivity mice. It also showed a the
deviation in the energy production, which was increased in glycolysis due to a
potential damage to the efficient energy production by mitochondria.
Analysing the representative MitoModel genes accommodated by the 16 samples of
CRC and liver metastases identified numerous affected genes, that contribute to the
tweaking of the metabolic makeup of the mitochondria. For instance, PKLR which
catalyses the reaction producing glycolytic ATP was up-regulated only in the liver
samples; ACADS and ACADL contradictory misregulations inside mitochondria in
primary CRC’s and liver metastases samples might play an important role in
creating an imbalance in the generation of acetyl CoA. Due to this metabolic
imbalance, there might be an increased stress to the mitochondria leading to the
mitochondrial clearance via mitophagy, which was also observed only in the liver
metastases samples with an up-regulated BNIP3, causing the permeabilization of
the mitochondrial membrane during mitophagy.
Thus, MitoModel an interactive network with mitochondria associated genes
provides an infrastructure to the user to understand the biology of mitochondria
and the changes it accommodates in the different diseases.
5.2 FUTURE PERSPECTIVES:
Improvements to the existing MitoModel will be achieved by expansion of the model
to include additional genes and functions. A diverse set of mass-spec studies of
whole mitochondria from several organisms are available to date [Smith AC et al.,
2012]. One possibility is to built an extended MitoModel based on these
experimental data.
155
At present NCBI gene symbols are accepted by the MitoModel for mapping the
variants. Since NCBI gene symbols might have several synonyms but only a single
numeric ID, using in the future the numeric IDs would prevent the mismapping of
synonyms to their gene symbols in the database.
The MitoModel enables users store and interactively use their data. Hence a
mitochondrial disease database could prove as an important portal to store and
catalogue mitochondrial variants in different disease types. Users could control
public accessibility of their data, enabling a more comprehensive analysis of
mitochondrial variants.
The network framework of the MitoModel can be further explored. One easy to
establish improvement would be to give the user the options to view the first
interacting partners of the genes.

156
157
APPENDIX A
Bibliography
[Andrews et al., 1999] Andrews RM, Kubacka I, Chinnery PF, Lightowlers RN,
Turnbull DM, Howell N. Reanalysis and revision of the Cambridge reference
sequence for human mitochondrial DNA. Nat Genet. 1999;23(2):147
[Anesti & Scorrano, 2006] Anesti V, Scorrano L. The relationship between
mitochondrial shape and function and the cytoskeleton. Biochim Biophys
Acta. 2006;1757(5-6):692-9
[Ardail et al., 1990] Ardail D, Privat JP, Egret-charlier M, Levrat C, Lerme F,
Louisot P. Mitochondrial contact sites. Lipid composition and dynamics. J Biol
Chem. 1990;265(31):18797-802
[Ayyasamy et al., 2011] Ayyasamy V, Owens KM, Desouki MM, et al. Cellular
model of Warburg effect identifies tumor promoting function of UCP2 in
breast cancer and its suppression by genipin. PLoS ONE. 2011;6(9):e24792.
[Baertling et al., 2015] Baertling F, A m van den brand M, Hertecant JL, et al.
Mutations in COA6 cause cytochrome c oxidase deficiency and neonatal
hypertrophic cardiomyopathy. Hum Mutat. 2015;36(1):34-8
[Banci et al., 2011] Banci L, Bertini I, Cefaro C, Ciofi-baffoni S, Gallo A.
Functional role of two interhelical disulfide bonds in human Cox17 protein
from a structural perspective. J Biol Chem. 2011;286(39):34382-90.
[Battersby et al., 2003] Battersby BJ, Loredo-osti JC, Shoubridge EA. Nuclear
genetic control of mitochondrial DNA segregation. Nat Genet.
2003;33(2):183-6.
[Berg et al., 2002] Berg JM, Tymoczko JL, Stryer L. (2002). BIOCHEMISTRY. 5th
edition, W H Freeman, New York
158
[Bestwick et al., 2010] Bestwick M, Jeong MY, Khalimonchuk O, Kim H, Winge
DR. Analysis of Leigh syndrome mutations in the yeast SURF1 homolog
reveals a new member of the cytochrome oxidase assembly factor family. Mol
Cell Biol. 2010;30(18):4480-91.
[Biancotti & Benvenisty, 2011] Biancotti JC, Benvenisty N. Aneuploid human
embryonic stem cells: origins and potential for modeling chromosomal
disorders. Regen Med. 2011;6(4):493-503.
[Bricker et al., 2012] Bricker DK, Taylor EB, Schell JC, et al. A mitochondrial
pyruvate carrier required for pyruvate uptake in yeast, Drosophila, and
humans. Science. 2012;337(6090):96-100.
[Brown et al., 2001] Brown DT, Samuels DC, Michael EM, Turnbull DM,
Chinnery PF. Random genetic drift determines the level of mutant mtDNA in
human primary oocytes. Am J Hum Genet. 2001;68(2):533-6.
[Chatterjee et al., 2006] Chatterjee A, Mambo E, Sidransky D. Mitochondrial
DNA mutations in human cancer. Oncogene. 2006;25(34):4663-74.
[Chen & Chan, 2009] Chen H, Chan DC. Mitochondrial dynamics--fusion,
fission, movement, and mitophagy--in neurodegenerative diseases. Hum Mol
Genet. 2009;18(R2):R169-76.
[Chinnery, 2014] Chinnery PF. Mitochondrial Disorders Overview. 2000 Jun 8
[Updated 2014 Aug 14]. In: Pagon RA, Adam MP, Ardinger HH, et al., editors.
GeneReviews® [Internet]. Seattle (WA): University of Washington, Seattle;
1993-2015. Available from: http://www.ncbi.nlm.nih.gov/books/NBK1224/
[Coenen et al., 2004] Coenen MJ, Van den heuvel LP, Ugalde C, et al.
Cytochrome c oxidase biogenesis in a patient with a mutation in COX10 gene.
Ann Neurol. 2004;56(4):560-4.
[Coskun et al., 2012] Coskun PE, Busciglio J. Oxidative Stress and
Mitochondrial Dysfunction in Down's Syndrome: Relevance to Aging and
Dementia. Curr Gerontol Geriatr Res. 2012;2012:383170
159
[Cullis et al., 1986] Cullis PR, Hope MJ, Tilcock CP. Lipid polymorphism and
the roles of lipids in membranes. Chem Phys Lipids. 1986;40(2-4):127-44.
[Dailey, 1997] Dailey HA. Enzymes of heme biosynthesis. Journal of Biological
Inorganic Chemistry, 2 (1997), pp. 411–417.
[Denkert et al., 2008] Denkert C, Budczies J, Weichert W, et al. Metabolite
profiling of human colon carcinoma – deregulation of TCA cycle and amino
acid turnover. Molecular Cancer. 2008;7:72.
[Depristo et al., 2011] Depristo MA, Banks E, Poplin R, et al. A framework for
variation discovery and genotyping using next-generation DNA sequencing
data. Nat Genet. 2011;43(5):491-8.
[Dobin et al., 2013] Dobin A, Davis CA, Schlesinger F, et al. STAR: ultrafast
universal RNA-seq aligner. Bioinformatics. 2013;29(1):15-21
[Dolezal et al., 2006] Dolezal P, Likic V, Tachezy J, Lithgow T. Evolution of the
molecular machines for protein import into mitochondria. Science.
2006;313(5785):314-8.
[Dürrbaum et al., 2014] Dürrbaum M, Kuznetsova AY, Passerini V, Stingele S,
Stoehr G, Storchová Z. Unique features of the transcriptional response to
model aneuploidy in human cells. BMC Genomics. 2014;15:139
[Dyall et al., 2004] Dyall SD, Brown MT, Johnson PJ. Ancient invasions: from
endosymbionts to organelles. Science. 2004;304(5668):253-7.
[Ewing & Green, 1998] Ewing B, Green P. Base-calling of automated
sequencer traces using phred. II. Error probabilities. Genome Res.
1998;8(3):186-94.
[Eyre et al., 2007] Eyre TA, Wright MW, Lush MJ, Bruford EA. HCOP: a
searchable database of human orthology predictions. Brief Bioinformatics.
2007;8(1):2-5.
160
[Falkenberg et al., 2007] Falkenberg M, Larsson NG, Gustafsson CM. DNA
replication and transcription in mammalian mitochondria. Annu Rev
Biochem. 2007;76:679-99
[Formosa et al., 2015] Formosa LE, Mimaki M, Frazier AE, et al.
Characterization of mitochondrial FOXRED1 in the assembly of respiratory
chain complex I. Hum Mol Genet. 2015;24(10):2952-65.
[Gardner et al., 2011] Gardner A, Boles RG. Beyond the serotonin hypothesis:
mitochondria, inflammation and neurodegeneration in major depression and
affective spectrum disorders. Prog Neuropsychopharmacol Biol Psychiatry.
2011;35(3):730-43.
[Ghezzi et al., 2009] Ghezzi D, Goffrini P, Uziel G, et al. SDHAF1, encoding a
LYR complex-II specific assembly factor, is mutated in SDH-defective infantile
leukoencephalopathy. Nat Genet. 2009;41(6):654-6
[Ghezzi et al., 2011] Ghezzi D, Arzuffi P, Zordan M, et al. Mutations in TTC19
cause mitochondrial complex III deficiency and neurological impairment in
humans and flies. Nat Genet. 2011;43(3):259-63
[Giardine et al., 2005] Giardine B, Riemer C, Hardison RC, et al. Galaxy: a
platform for interactive large-scale genome analysis. Genome Res.
2005;15(10):1451-5
[Gisbergen et al., 2015] M.W. van Gisbergen,A.M. Voets,M.H.W. Starmans,I.F.M.
de Coo,R. Yadak, R.F. Hoffmann,P.C. Boutros,H.J.M. Smeets,L. Dubois,P.
Lambin. How do changes in the mtDNA and mitochondrial dysfunction
influence cancer and cancer therapy? Challenges, opportunities and models.
Mutation Research/Reviews in Mutation Research. Volume 764, 2015; 16–3
[Gonzalez & Cruz, 2015] Gonzalez-pons M, Cruz-correa M. Colorectal Cancer
Biomarkers: Where Are We Now?. Biomed Res Int. 2015;2015:149014.
[Gordon et al., 2012] Gordon DJ, Resio B, Pellman D. Causes and consequences
of aneuploidy in cancer. Nat Rev Genet. 2012;13(3):189-203.
161
[Goto et al., 2011] Goto H, Dickins B, Afgan E, et al. Dynamics of mitochondrial
heteroplasmy in three families investigated via a repeatable re-sequencing
study. Genome Biol. 2011;12(6):R59.
[Grada & Weinbrecht, 2013] Grada A, Weinbrecht K. Next-generation
sequencing: methodology and application. J Invest Dermatol.
2013;133(8):e11.
[Griffiths et al., 2000] Griffiths AJF, Miller JH, Suzuki DT, et al. An Introduction
to Genetic Analysis. 7th edition. New York: W. H. Freeman; 2000.
Aneuploidy. Available from:
http://www.ncbi.nlm.nih.gov/books/NBK21870/
[Hashiguchi & Zhang-akiyama, 2009] Hashiguchi K, Zhang-akiyama QM.
Establishment of human cell lines lacking mitochondrial DNA. Methods Mol
Biol. 2009;554:383-91
[Hales, 2010] Hales, K. G. Mitochondrial Fusion and Division. Nature
Education (2010);3(9):12
[Hao et al., 2009] Hao HX, Khalimonchuk O, Schraders M, et al. SDH5, a gene
required for flavination of succinate dehydrogenase, is mutated in
paraganglioma. Science. 2009;325(5944):1139-42
[Heide et al., 2012] Heide H, Bleier L, Steger M, et al. Complexome profiling
identifies TMEM126B as a component of the mitochondrial complex I
assembly complex. Cell Metab. 2012;16(4):538-49
[Heinzmann et al., 2014] Heinzmann et al. Mice selected for extremes in
stress reactivity reveal key endophenotypes of major depression: A
translational approach. Psychoneuroendocrinology (2014) 49, 229-243
[Houten & Wanders, 2010] Houten SM, Wanders RJ. A general introduction to
the biochemistry of mitochondrial fatty acid β-oxidation. J Inherit Metab Dis.
2010;33(5):469-77.
162
[Houtkooper & Vaz, 2008] Houtkooper RH, Vaz FM. Cardiolipin, the heart of
mitochondrial metabolism. Cell Mol Life Sci. 2008;65(16):2493-506.
[Huigsloot et al., 2011] Huigsloot M, Nijtmans LG, Szklarczyk R, et al. A
mutation in C2orf64 causes impaired cytochrome c oxidase assembly and
mitochondrial cardiomyopathy. Am J Hum Genet. 2011;88(4):488-93
[Hüttemann et al., 2003] Hüttemann M, Jaradat S, Grossman LI. Cytochrome c
oxidase of mammals contains a testes-specific isoform of subunit VIb--the
counterpart to testes-specific cytochrome c?. Mol Reprod Dev. 2003;66(1):8-
16.
[Janssen et al., 2002] Janssen R, Smeitink J, Smeets R, Van den heuvel L. CIA30
complex I assembly factor: a candidate for human complex I deficiency?. Hum
Genet. 2002;110(3):264-70
[Jemal et al., 2011] Jemal A, Bray F, Center MM, Ferlay J, Ward E, Forman D.
Global cancer statistics. CA Cancer J Clin. 2011;61(2):69-90.
[Jiang and Milner, 2003] Jiang M, Milner J. Bcl-2 constitutively suppresses
p53-dependent apoptosis in colorectal cancer cells. Genes & Development.
2003;17(7):832-837.
[Kiebish et al., 2008] Kiebish MA, Han X, Cheng H, Chuang JH, Seyfried TN.
Cardiolipin and electron transport chain abnormalities in mouse brain tumor
mitochondria: lipidomic evidence supporting the Warburg theory of cancer. J
Lipid Res. 2008;49(12):2545-56.
[Kim et al., 2013] Kim D, Pertea G, Trapnell C, Pimentel H, Kelley R, Salzberg
SL. TopHat2: accurate alignment of transcriptomes in the presence of
insertions, deletions and gene fusions. Genome Biol. 2013;14(4):R36.
[Kim et al., 2014] Kim SK, Kim SY, Kim JH, et al. A nineteen gene-based risk
score classifier predicts prognosis of colorectal cancer patients. Mol Oncol.
2014;8(8):1653-66.
163
[Knapman et al., 2012] Knapman A, Kaltwasser SF, Martins-de-souza D, et al.
Increased stress reactivity is associated with reduced hippocampal activity
and neuronal integrity along with changes in energy metabolism. Eur J
Neurosci. 2012;35(3):412-22.
[Kozjak-pavlovic et al., 2014] Kozjak-pavlovic V, Prell F, Thiede B, et al.
C1orf163/RESA1 is a novel mitochondrial intermembrane space protein
connected to respiratory chain assembly. J Mol Biol. 2014;426(4):908-20.
[Langmead & Salzberg, 2012] Langmead B, Salzberg SL: Fast gapped-read
alignment with Bowtie 2. Nat Methods 2012, 9:357-359
[Leary et al., 2007] Leary SC, Cobine PA, Kaufman BA, et al. The human
cytochrome c oxidase assembly factors SCO1 and SCO2 have regulatory roles
in the maintenance of cellular copper homeostasis. Cell Metab. 2007;5(1):9-
20.
[Li & Durbin, 2009] Li H, Durbin R. Fast and accurate short read alignment
with Burrows-Wheeler transform. Bioinformatics. 2009;25(14):1754-60.
[Li et al., 2008] Li H, Ruan J, Durbin R. Mapping short DNA sequencing reads
and calling variants using mapping quality scores. Genome Res.
2008;18(11):1851-8.
[Lill, 2009] Lill R. Function and biogenesis of iron-sulphur proteins. Nature.
2009;460(7257):831-8
[Lu & Claypool, 2015] Ya-Wen Lu and Steven M. Claypool. Disorders of
phospholipid metabolism: an emerging class of mitochondrial disease due to
defects in nuclear genes. Front Genet. 2015; 6: 3
[Lunt & Vander heiden, 2011] Lunt SY, Vander heiden MG. Aerobic glycolysis:
meeting the metabolic requirements of cell proliferation. Annu Rev Cell Dev
Biol. 2011;27:441-64
[Maimon & Rokach, 2005] Maimon OZ, Rokach L. Data Mining and Knowledge
Discovery Handbook. Springer Science & Business Media; 2005
164
[Man et al., 2003] Man PY, Griffiths PG, Brown DT, Howell N, Turnbull DM,
Chinnery PF. The epidemiology of Leber hereditary optic neuropathy in the
North East of England. Am J Hum Genet. 2003;72(2):333-9.
[Martin, 2011] Marcel Martin. Cutadapt removes adapter sequences from
high-throughput sequencing reads. EMBnet.journal. 2011;17(1):pp. 10-12.
[Mckenna et al., 2010] Mckenna A, Hanna M, Banks E, et al. The Genome
Analysis Toolkit: a MapReduce framework for analyzing next-generation DNA
sequencing data. Genome Res. 2010;20(9):1297-303.
[Mckenzie et al., 2011] Mckenzie M, Tucker EJ, Compton AG, et al. Mutations
in the gene encoding C8orf38 block complex I assembly by inhibiting
production of the mitochondria-encoded subunit ND1. J Mol Biol.
2011;414(3):413-26
[Meisinger et al., 2008] Meisinger C, Sickmann A, Pfanner N. The
mitochondrial proteome: from inventory to function. Cell. 2008;134(1):22-4
[Nouws et al., 2010] Nouws J, Nijtmans L, Houten SM, et al. Acyl-CoA
dehydrogenase 9 is required for the biogenesis of oxidative phosphorylation
complex I. Cell Metab. 2010;12(3):283-94
[Ogilvie et al., 2005] Ogilvie I, Kennaway NG, Shoubridge EA. A molecular
chaperone for mitochondrial complex I assembly is mutated in a progressive
encephalopathy. J Clin Invest. 2005;115(10):2784-92
[Ohmachi et al., 2006] Ohmachi T, Inoue H, Mimori K, et al. Fatty acid binding
protein 6 is overexpressed in colorectal cancer. Clin Cancer Res.
2006;12(17):5090-5.
[Pagliarini et al., 2008] Pagliarini DJ, Calvo SE, Chang B, et al. A mitochondrial
protein compendium elucidates complex I disease biology. Cell.
2008;134(1):112-23.
165
[Palmer et al., 2011] Palmer CS, Osellame LD, Stojanovski D, Ryan MT. The
regulation of mitochondrial morphology: intricate mechanisms and dynamic
machinery. Cell Signal. 2011;23(10):1534-45
[Perocchi et al., 2006] Perocchi F, Jensen LJ, Gagneur J, et al. Assessing
Systems Properties of Yeast Mitochondria through an Interaction Map of the
Organelle. Kim SK, ed.PLoS Genetics. 2006;2(10): e170.
[Petruzzella et al., 1998] Petruzzella V, Tiranti V, Fernandez P, Ianna P,
Carrozzo R, Zeviani M. Identification and characterization of human cDNAs
specific to BCS1, PET112, SCO1, COX15, and COX11, five genes involved in the
formation and function of the mitochondrial respiratory chain. Genomics.
1998;54(3):494-504.
[Piskol et al., 2013] Piskol R, Ramaswami G, Li JB. Reliable identification of
genomic variants from RNA-seq data. Am J Hum Genet. 2013;93(4):641-51.
[Pon et al., 1989] Pon LA, Vestweber D, Yang M, Schatz G. Interaction between
mitochondria and the nucleus. J Cell Sci Suppl. 1989;11:1-11.
[Ramos et al., 2015] Ramos AH, Lichtenstein L, Gupta M, et al. Oncotator:
cancer variant annotation tool. Hum Mutat. 2015;36(4):E2423-9.
[Ranieri et al., 2013] Ranieri M, Brajkovic S, Riboldi G, et al. Mitochondrial
fusion proteins and human diseases. Neurol Res Int. 2013;2013:293893.
[Read & Kodner, 1999] Read TE, Kodner IJ. Colorectal cancer: risk factors and
recommendations for early detection. Am Fam Physician. 1999;59(11):3083-
92.
[Reja et al., 2009] Rohit Reja, AJ Venkatakrishnan, Jungwoo Lee, Byoung-Chul
Kim, Jea-Woon Ryu, Sungsam Gong,Jong Bhak and Daeui Park.
MitoInteractome: Mitochondrial protein interactome database, and its
application in 'aging network' analysis. BMC Genomics 2009 10(Suppl 3): S20
166
[Rizzuto et al., 2012] Rizzuto R, De stefani D, Raffaello A, Mammucari C.
Mitochondria as sensors and regulators of calcium signalling. Nat Rev Mol Cell
Biol. 2012;13(9):566-78.
[Rossignol et al., 2003] Rossignol R, Faustin B, Rocher C, Malgat M, Mazat JP,
Letellier T. Mitochondrial threshold effects. Biochem J. 2003;370(Pt 3):751-
62.
[Rouault & Tong, 2005] Rouault TA, Tong WH. Iron-sulphur cluster
biogenesis and mitochondrial iron homeostasis. Nat Rev Mol Cell Biol.
2005;6(4):345-51
[Saada et al., 2009] Saada A, Vogel RO, Hoefs SJ, et al. Mutations in NDUFAF3
(C3ORF60), encoding an NDUFAF4 (C6ORF66)-interacting complex I
assembly protein, cause fatal neonatal mitochondrial disease. Am J Hum
Genet. 2009;84(6):718-27
[Sabharwal & Schumacker, 2014] Sabharwal SS, Schumacker PT.
Mitochondrial ROS in cancer: initiators, amplifiers or an Achilles' heel?. Nat
Rev Cancer. 2014;14(11):709-21
[Sacconi et al., 2005] Sacconi S, Trevisson E, Pistollato F, et al. hCOX18 and
hCOX19: two human genes involved in cytochrome c oxidase assembly.
Biochem Biophys Res Commun. 2005;337(3):832-9.
[Sanger et al., 1977] Sanger F, Nicklen S, Coulson AR. DNA sequencing with
chain-terminating inhibitors. Proc Natl Acad Sci USA. 1977;74(12):5463-7
[Schaffer & Suleiman, 2010] Schaffer SW, Suleiman MS. Mitochondria, The
Dynamic Organelle. Springer Science & Business Media; 2010.
[Schmidt et al., 2010] Schmidt O, Pfanner N, Meisinger C. Mitochondrial
protein import: from proteomics to functional mechanisms. Nat Rev Mol Cell
Biol. 2010;11(9):655-67
167
[Sheftel et al., 2009] Sheftel AD, Stehling O, Pierik AJ, et al. Human ind1, an
iron-sulfur cluster assembly factor for respiratory complex I. Mol Cell Biol.
2009;29(22):6059-73.
[Sheltzer, 2013] Sheltzer JM. A transcriptional and metabolic signature of
primary aneuploidy is present in chromosomally-unstable cancer cells and
informs clinical prognosis. Cancer research. 2013;73(21):6401-6412.
[Sherry et al., 2001] Sherry ST, Ward MH, Kholodov M, Baker J, Phan L,
Smigielski EM, Sirotkin K. dbSNP: the NCBI database of genetic variation.
Nucleic Acids Res. 2001 Jan 1;29(1):308-11
[Sheth & Clary, 2005] Sheth KR, Clary BM. Management of hepatic metastases
from colorectal cancer. Clin Colon Rectal Surg. 2005;18(3):215-23.
[Shimizu et al., 2010] Shimizu, S., Iida, S., Ishiguro, M., Uetake, H., Ishikawa, T.,
Takagi, Y. ... Sugihara, K. (2010). Methylated BNIP3 gene in colorectal cancer
prognosis . Oncology Letters, 1, 865-872.
[Smith et al., 2012] Smith PM, Fox JL, Winge DR. Biogenesis of the cytochrome
bc(1) complex and role of assembly factors. Biochim Biophys Acta.
2012;1817(2):276-86
[Smith AC et al., 2012] Smith AC, Blackshaw JA, Robinson AJ. MitoMiner: a
data warehouse for mitochondrial proteomics data. Nucleic Acids Res.
2012;40(Database issue):D1160-7.
[Smith & Robinson, 2016] Smith AC, Robinson AJ. MitoMiner v3.1, an update
on the mitochondrial proteomics database. Nucleic Acids Research.
2016;44(Database issue):D1258-D1261.
[Smits et al., 2010] Smits P, Smeitink J, Van den heuvel L. Mitochondrial
translation and beyond: processes implicated in combined oxidative
phosphorylation deficiencies. J Biomed Biotechnol. 2010;2010:737385.
168
[Stingele et al., 2012] Stingele S, Stoehr G, Peplowska K, Cox J, Mann M,
Storchova Z. Global analysis of genome, transcriptome and proteome reveals
the response to aneuploidy in human cells. Mol Syst Biol. 2012;8:608.
[Sugiana et al., 2008] Sugiana C, Pagliarini DJ, Mckenzie M, et al. Mutation of
C20orf7 disrupts complex I assembly and causes lethal neonatal
mitochondrial disease. Am J Hum Genet. 2008;83(4):468-78
[Szklarczyk et al., 2012] Szklarczyk R, Wanschers BF, Cuypers TD, et al.
Iterative orthology prediction uncovers new mitochondrial proteins and
identifies C12orf62 as the human ortholog of COX14, a protein involved in the
assembly of cytochrome c oxidase. Genome Biol. 2012;13(2):R12
[Szklarczyk et al., 2013] Szklarczyk R, Wanschers BF, Nijtmans LG, et al. A
mutation in the FAM36A gene, the human ortholog of COX20, impairs
cytochrome c oxidase assembly and is associated with ataxia and muscle
hypotonia. Hum Mol Genet. 2013;22(4):656-67
[Szklarczyk et al., 2015] Szklarczyk et al. STRING v10: protein–protein
interaction networks, integrated over the tree of life. Nucleic Acids Res. 2015
Jan 28; 43(Database issue): D447–D452
[Tait & Green, 2010] Tait SW, Green DR. Mitochondria and cell death: outer
membrane permeabilization and beyond. Nat Rev Mol Cell Biol.
2010;11(9):621-32
[Taylor & Turnbull, 2005] Taylor RW, Turnbull DM. Mitochondrial DNA
mutations in human disease. Nat Rev Genet. 2005;6(5):389-402.
[Thomas & Gustafsson, 2013] Thomas RL, Gustafsson AB. Mitochondrial
autophagy--an essential quality control mechanism for myocardial
homeostasis. Circ J. 2013;77(10):2449-54.
[Torraco et al., 2012] Torraco A, Verrigni D, Rizza T, et al. TMEM70: a
mutational hot spot in nuclear ATP synthase deficiency with a pivotal role in
complex V biogenesis. Neurogenetics. 2012;13(4):375-86
169
[Touma et al., 2008] Touma et al. Mice selected for high versus low stress
reactivity: A new animal model for affective disorders.
Psychoneuroendocrinology (2008) 33, 839–862
[Trapnell et al., 2009] Trapnell C, Pachter L, Salzberg SL. TopHat: discovering
splice junctions with RNA-Seq. Bioinformatics. 2009;25(9):1105-11
[Trapnell et al., 2010] Trapnell C, Williams BA, Pertea G, et al. Transcript
assembly and quantification by RNA-Seq reveals unannotated transcripts and
isoform switching during cell differentiation. Nat Biotechnol. 2010;28(5):511-
5.
[Trapnell et al., 2012] Trapnell C, Roberts A, Goff L, et al. Differential gene and
transcript expression analysis of RNA-seq experiments with TopHat and
Cufflinks. Nat Protoc. 2012;7(3):562-78.
[Tucker et al., 2013] Tucker EJ, Wanschers BF, Szklarczyk R, et al. Mutations
in the UQCC1-interacting protein, UQCC2, cause human complex III deficiency
associated with perturbed cytochrome b protein expression. PLoS Genet.
2013;9(12):e1004034
[Van der auwera et al., 2013] Van der auwera GA, Carneiro MO, Hartl C, et al.
From FastQ data to high confidence variant calls: the Genome Analysis Toolkit
best practices pipeline. Curr Protoc Bioinformatics. 2013;11(1110):11.10.1-
11.10.33.
[Velculescu et al., 1995] Velculescu VE, Zhang L, Vogelstein B, Kinzler KW.
Serial analysis of gene expression. Science. 1995;270(5235):484-7.
[Vogel et al., 2007] Vogel RO, Janssen RJ, Van den brand MA, et al. Cytosolic
signaling protein Ecsit also localizes to mitochondria where it interacts with
chaperone NDUFAF1 and functions in complex I assembly. Genes Dev.
2007;21(5):615-24
[Wallace, 2012] Wallace DC. Mitochondria and cancer. Nat Rev Cancer.
2012;12(10):685-98.
170
[Wanders et al., 2010] Wanders RJ, Ruiter JP, Ijlst L, Waterham HR, Houten
SM. The enzymology of mitochondrial fatty acid beta-oxidation and its
application to follow-up analysis of positive neonatal screening results. J
Inherit Metab Dis. 2010;33(5):479-94.
[Wang et al., 2001] Wang ZG, White PS, Ackerman SH. Atp11p and Atp12p are
assembly factors for the F(1)-ATPase in human mitochondria. J Biol Chem.
2001;276(33):30773-8.
[Wang et al., 2009] Wang Z, Gerstein M, Snyder M. RNA-Seq: a revolutionary
tool for transcriptomics. Nat Rev Genet. 2009;10(1):57-63.
[Xu et al., 2008] Xu F, Ackerley C, Maj MC, et al. Disruption of a mitochondrial
RNA-binding protein gene results in decreased cytochrome b expression and
a marked reduction in ubiquinol-cytochrome c reductase activity in mouse
heart mitochondria. Biochem J. 2008;416(1):15-26
[Zheng, 2012] Zheng J. Energy metabolism of cancer: Glycolysis versus
oxidative phosphorylation (Review). Oncol Lett. 2012;4(6):1151-1157.
[Zhu et al., 1998] Zhu Z, Yao J, Johns T, et al. SURF1, encoding a factor involved
in the biogenesis of cytochrome c oxidase, is mutated in Leigh syndrome. Nat
Genet. 1998;20(4):337-43
[Zsurka and Csordás, 2009] Zsurka, Gábor and Csordás, Attila. MitoWheel,
visualizing the human mitochondrial genome . Available from Nature
Precedings 2009 <http://dx.doi.org/10.1038/npre.2009.3167.1>
[Zurita rendón et al., 2014] Zurita rendón O, Silva neiva L, Sasarman F,
Shoubridge EA. The arginine methyltransferase NDUFAF7 is essential for
complex I assembly and early vertebrate embryogenesis. Hum Mol Genet.
2014;23(19):5159-70

171
APPENDIX B
Acknowledgements
I would like to thank my advisor Dr. Bianca Habermann, for giving me an
opportunity, and for being a tremendous mentor for me. I would like to thank you
for your help and support.
I would also like to thank my committee members, Professor. Dr. Barbara Conradt,
Professor. Dr. John Parsch, Professor. Dr. Wolfgang Enard, Professor. Dr. Jurgen Soll,
Prof. Dr. Thomas Cremer and Prof. Dr. Ute Vothknecht for serving as my committee
members even at hardship.
A special thanks to our collaborators from Max Planck institute of biochemistry and
Max Planck Institute of Psychiatry for kindly providing data. I also take this
opportunity to thank my colleague José Villaveces for kindly extending his support
to the MitoModel. I would also like to thank my colleagues who have been a great
support through the years of my reaserch.
A special thanks to my family. I am grateful to my mother, father, mother-in law,
wife and brothers for all of the sacrifices that you’ve made.
Finally I thank my God, In you I trust. Thank you.
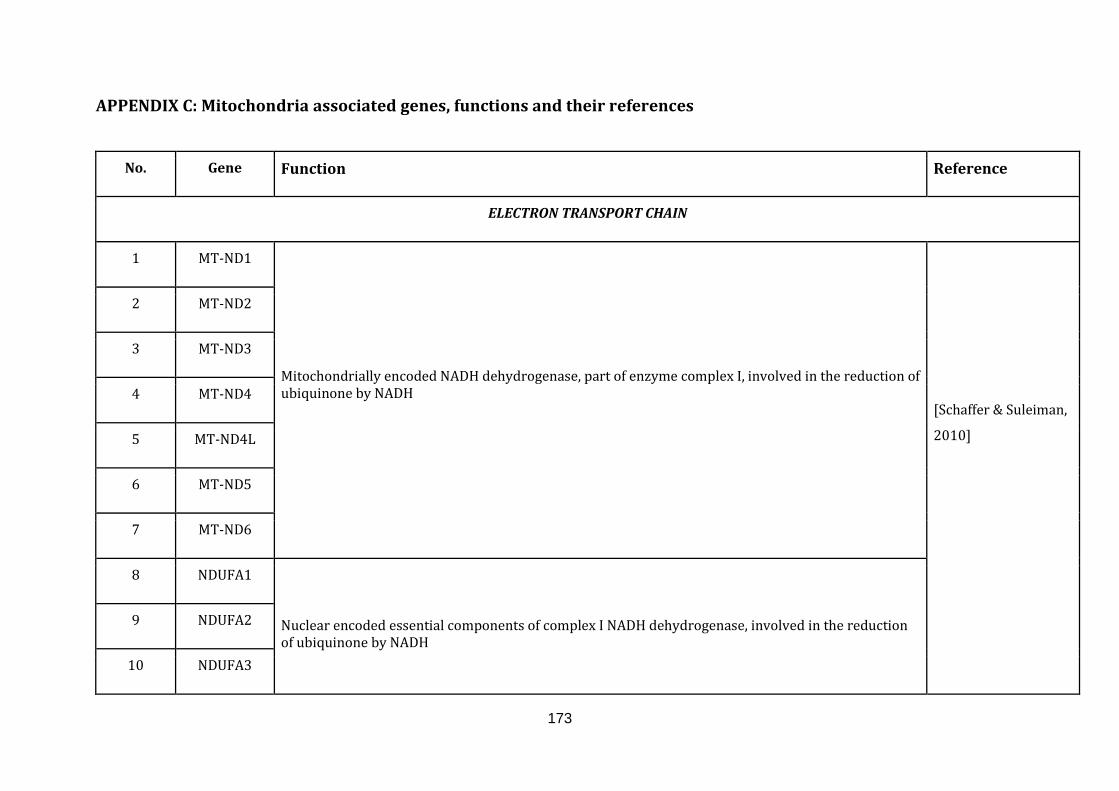
173
APPENDIX C: Mitochondria associated genes, functions and their references
No. Gene Function Reference
ELECTRON TRANSPORT CHAIN
1 MT-ND1 Mitochondrially encoded NADH dehydrogenase, part of enzyme complex I, involved in the reduction of ubiquinone by NADH
[Schaffer & Suleiman,
2010]
2 MT-ND2
3 MT-ND3
4 MT-ND4
5 MT-ND4L
6 MT-ND5
7 MT-ND6
8 NDUFA1
Nuclear encoded essential components of complex I NADH dehydrogenase, involved in the reduction of ubiquinone by NADH
9 NDUFA2
10 NDUFA3

174
11 NDUFA4
Nuclear encoded essential components of complex I NADH dehydrogenase, involved in the reduction of ubiquinone by NADH
[Schaffer & Suleiman,
2010]
12 NDUFA5
13 NDUFA6
14 NDUFA7
15 NDUFA8
16 NDUFA9
17 NDUFA10
18 NDUFA11
19 NDUFA12
20 NDUFA13
21 NDUFAB1
22 NDUFB1
23 NDUFB2
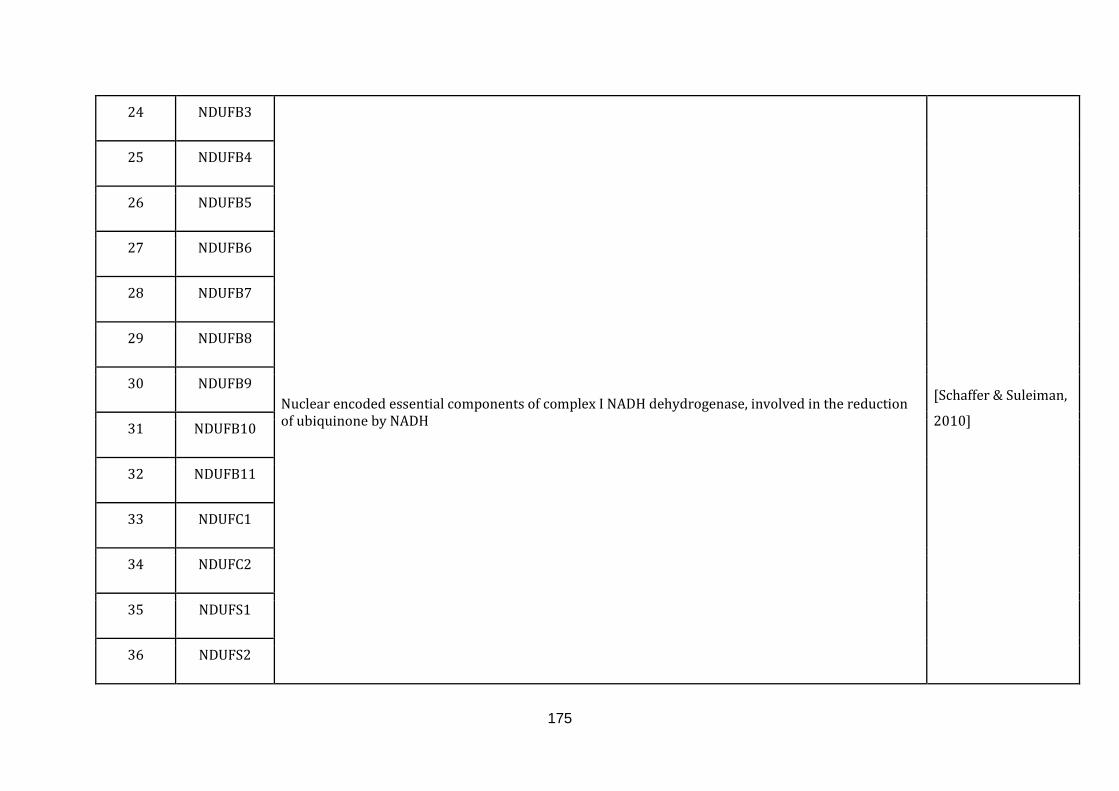
175
24 NDUFB3 Nuclear encoded essential components of complex I NADH dehydrogenase, involved in the reduction of ubiquinone by NADH
[Schaffer & Suleiman,
2010]
25 NDUFB4
26 NDUFB5
27 NDUFB6
28 NDUFB7
29 NDUFB8
30 NDUFB9
31 NDUFB10
32 NDUFB11
33 NDUFC1
34 NDUFC2
35 NDUFS1
36 NDUFS2
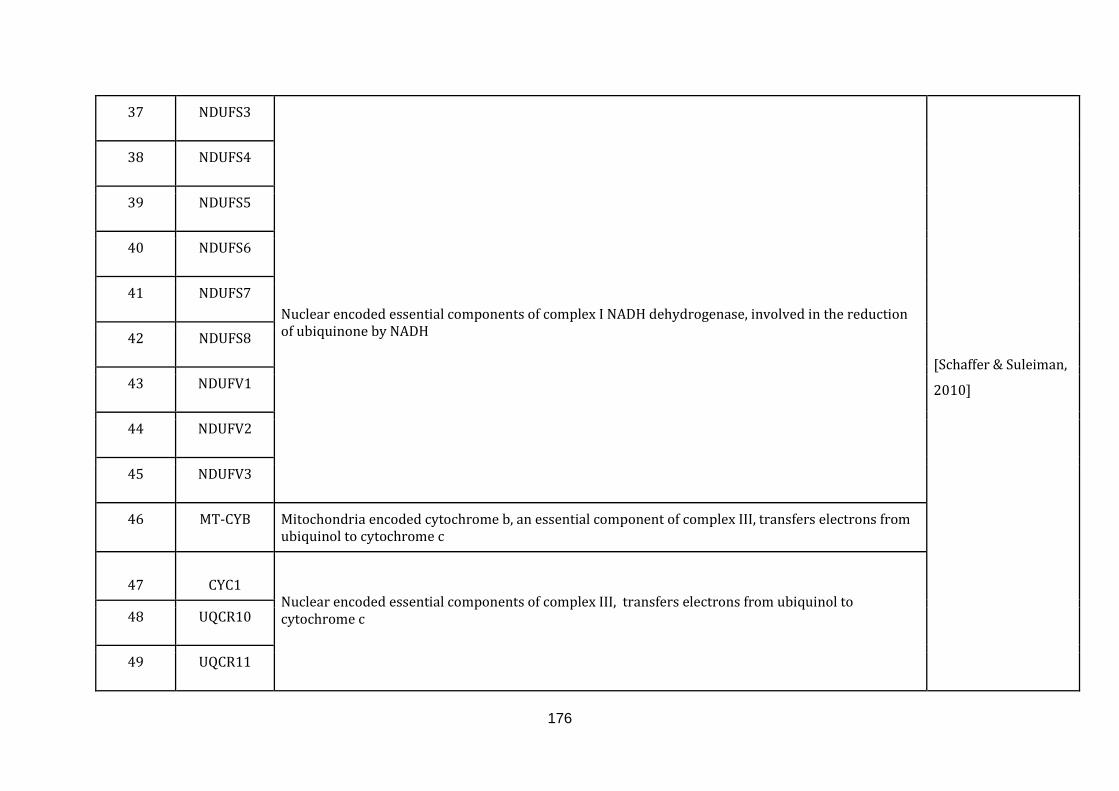
176
37 NDUFS3
Nuclear encoded essential components of complex I NADH dehydrogenase, involved in the reduction of ubiquinone by NADH
[Schaffer & Suleiman,
2010]
38 NDUFS4
39 NDUFS5
40 NDUFS6
41 NDUFS7
42 NDUFS8
43 NDUFV1
44 NDUFV2
45 NDUFV3
46 MT-CYB Mitochondria encoded cytochrome b, an essential component of complex III, transfers electrons from ubiquinol to cytochrome c
47
CYC1
Nuclear encoded essential components of complex III, transfers electrons from ubiquinol to cytochrome c 48 UQCR10
49 UQCR11
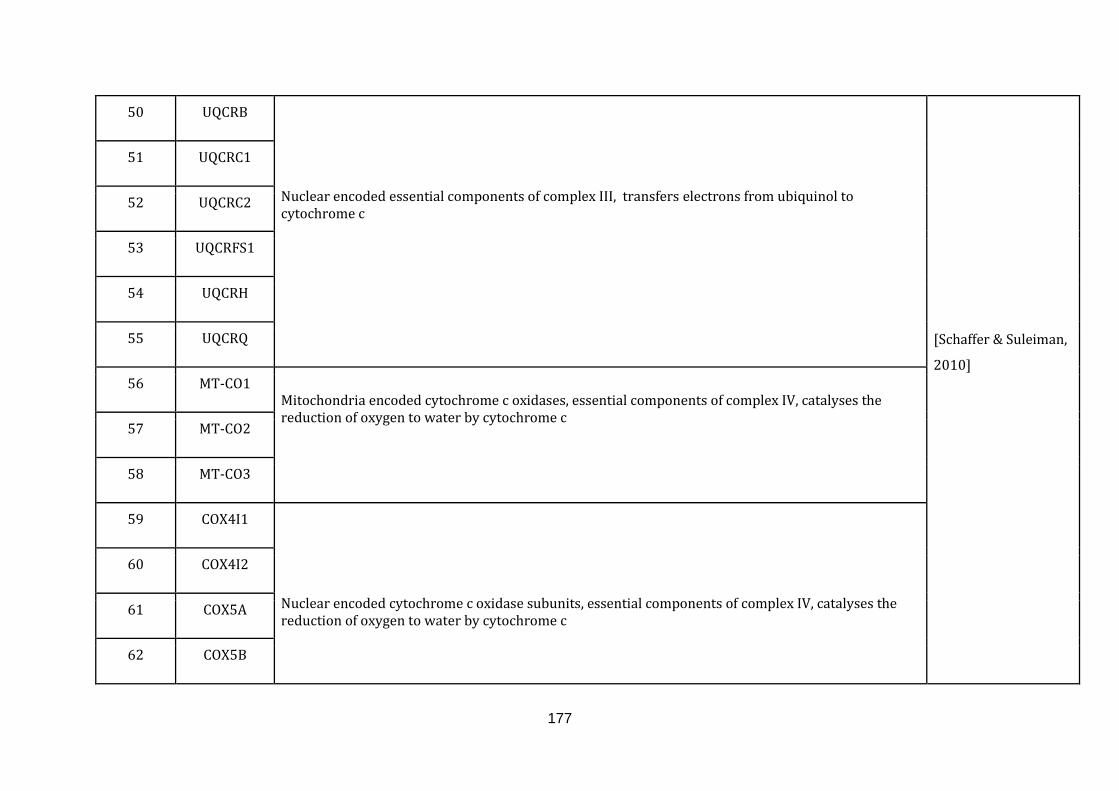
177
50 UQCRB Nuclear encoded essential components of complex III, transfers electrons from ubiquinol to cytochrome c
[Schaffer & Suleiman,
2010]
51 UQCRC1
52 UQCRC2
53 UQCRFS1
54 UQCRH
55 UQCRQ
56 MT-CO1 Mitochondria encoded cytochrome c oxidases, essential components of complex IV, catalyses the reduction of oxygen to water by cytochrome c 57 MT-CO2
58 MT-CO3
59 COX4I1 Nuclear encoded cytochrome c oxidase subunits, essential components of complex IV, catalyses the reduction of oxygen to water by cytochrome c
60 COX4I2
61 COX5A
62 COX5B
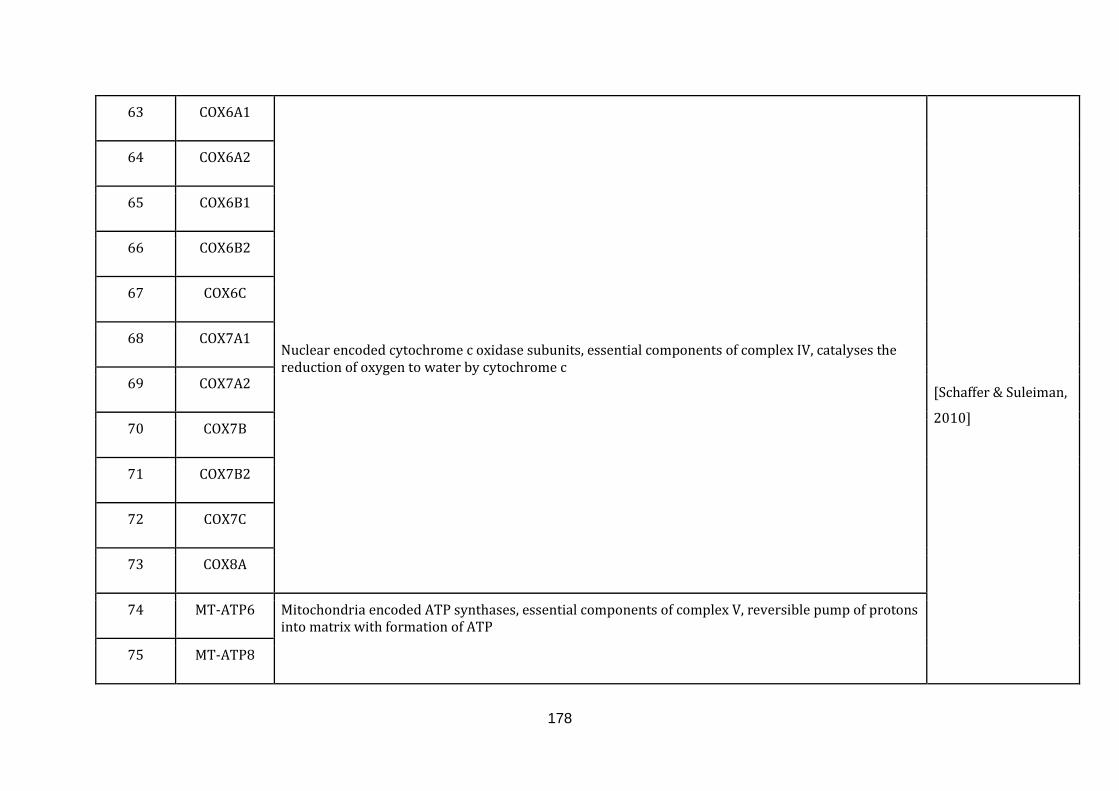
178
63 COX6A1 Nuclear encoded cytochrome c oxidase subunits, essential components of complex IV, catalyses the reduction of oxygen to water by cytochrome c
[Schaffer & Suleiman,
2010]
64 COX6A2
65 COX6B1
66 COX6B2
67 COX6C
68 COX7A1
69 COX7A2
70 COX7B
71 COX7B2
72 COX7C
73 COX8A
74 MT-ATP6 Mitochondria encoded ATP synthases, essential components of complex V, reversible pump of protons into matrix with formation of ATP
75 MT-ATP8
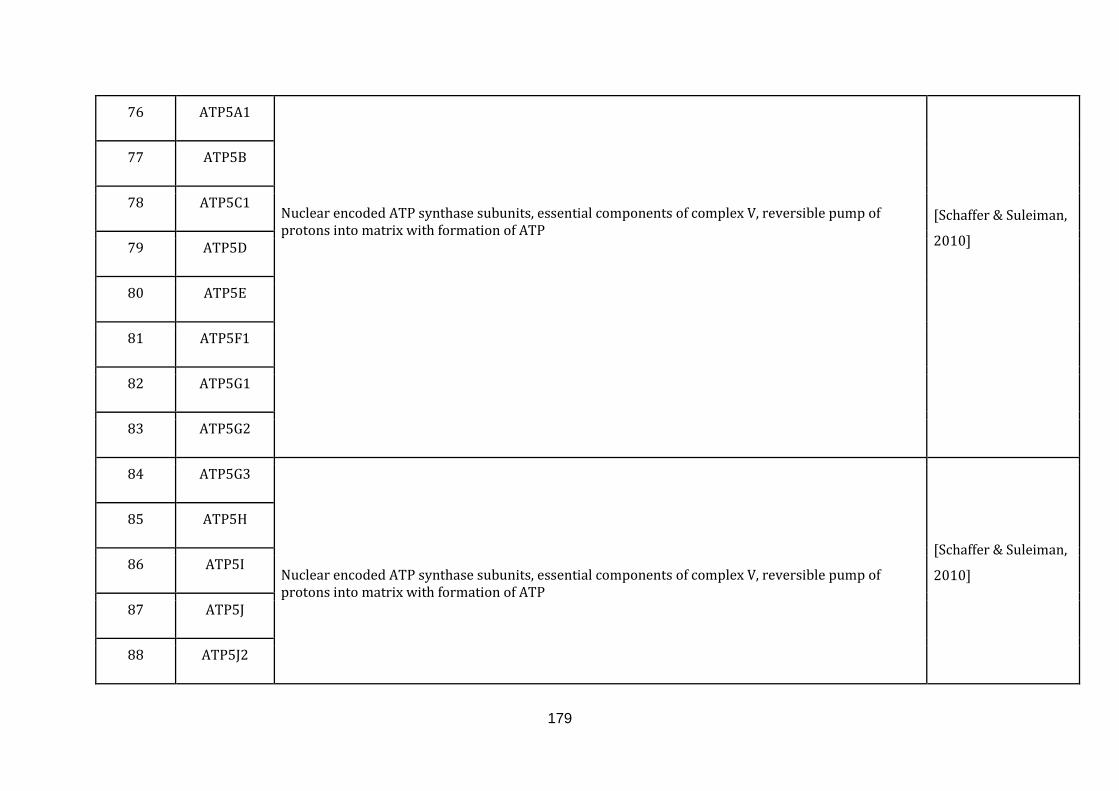
179
76 ATP5A1 Nuclear encoded ATP synthase subunits, essential components of complex V, reversible pump of protons into matrix with formation of ATP
[Schaffer & Suleiman,
2010]
77 ATP5B
78 ATP5C1
79 ATP5D
80 ATP5E
81 ATP5F1
82 ATP5G1
83 ATP5G2
84 ATP5G3 Nuclear encoded ATP synthase subunits, essential components of complex V, reversible pump of protons into matrix with formation of ATP
[Schaffer & Suleiman,
2010]
85 ATP5H
86 ATP5I
87 ATP5J
88 ATP5J2
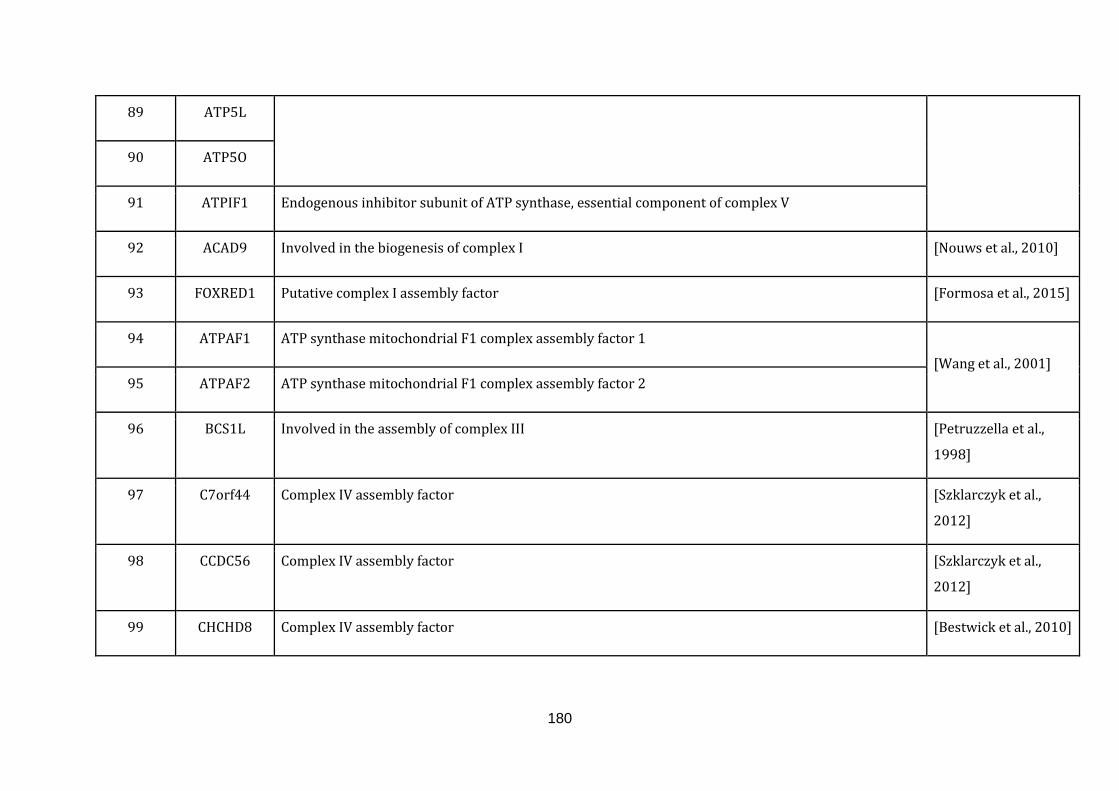
180
89 ATP5L
90 ATP5O
91 ATPIF1 Endogenous inhibitor subunit of ATP synthase, essential component of complex V
92 ACAD9 Involved in the biogenesis of complex I [Nouws et al., 2010]
93 FOXRED1 Putative complex I assembly factor [Formosa et al., 2015]
94 ATPAF1 ATP synthase mitochondrial F1 complex assembly factor 1
[Wang et al., 2001]
95 ATPAF2 ATP synthase mitochondrial F1 complex assembly factor 2
96 BCS1L Involved in the assembly of complex III [Petruzzella et al.,
1998]
97 C7orf44 Complex IV assembly factor [Szklarczyk et al.,
2012]
98 CCDC56 Complex IV assembly factor [Szklarczyk et al.,
2012]
99 CHCHD8 Complex IV assembly factor [Bestwick et al., 2010]
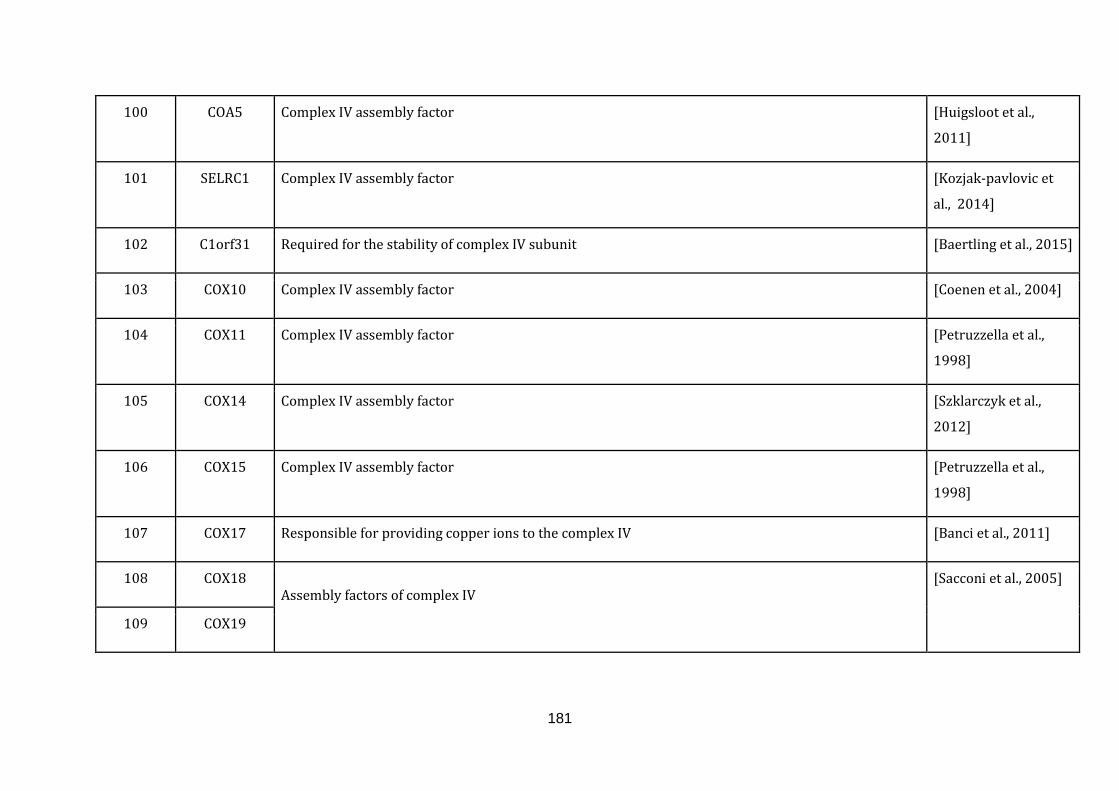
181
100 COA5 Complex IV assembly factor [Huigsloot et al.,
2011]
101 SELRC1 Complex IV assembly factor [Kozjak-pavlovic et
al., 2014]
102 C1orf31 Required for the stability of complex IV subunit [Baertling et al., 2015]
103 COX10 Complex IV assembly factor [Coenen et al., 2004]
104 COX11 Complex IV assembly factor [Petruzzella et al.,
1998]
105 COX14 Complex IV assembly factor [Szklarczyk et al.,
2012]
106 COX15 Complex IV assembly factor [Petruzzella et al.,
1998]
107 COX17 Responsible for providing copper ions to the complex IV [Banci et al., 2011]
108 COX18
Assembly factors of complex IV [Sacconi et al., 2005]
109 COX19
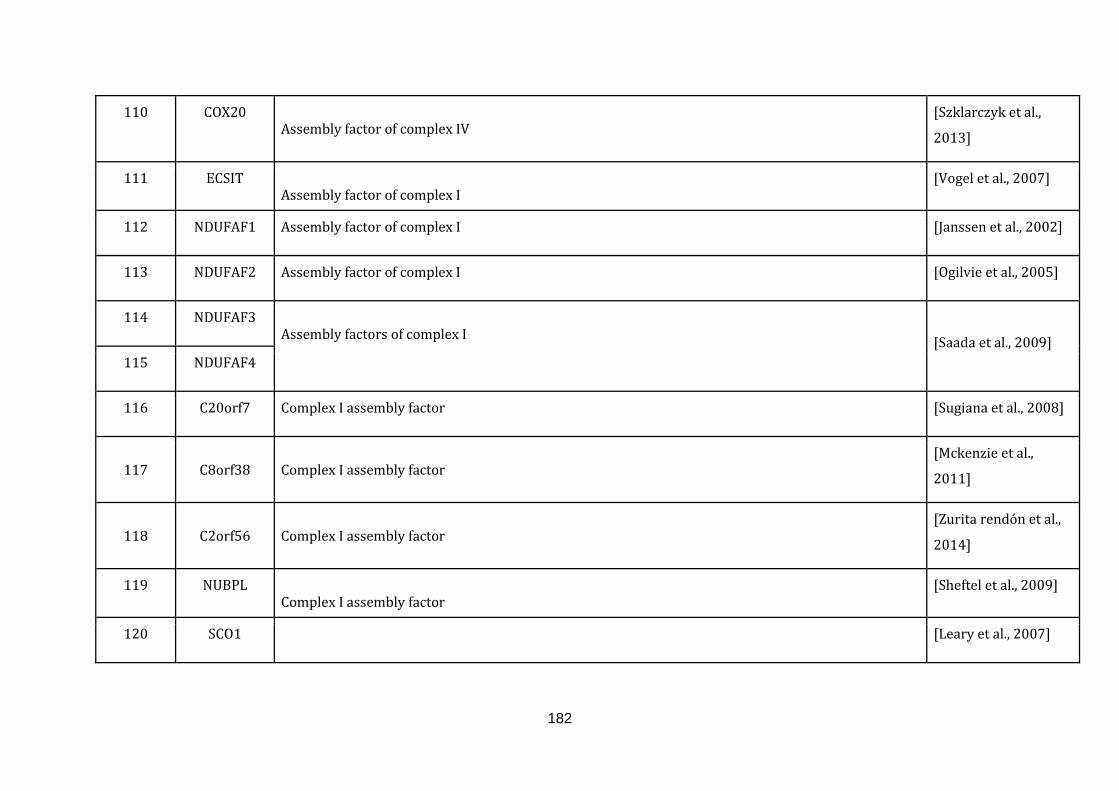
182
110 COX20 Assembly factor of complex IV
[Szklarczyk et al.,
2013]
111 ECSIT Assembly factor of complex I
[Vogel et al., 2007]
112 NDUFAF1 Assembly factor of complex I [Janssen et al., 2002]
113 NDUFAF2 Assembly factor of complex I [Ogilvie et al., 2005]
114 NDUFAF3
Assembly factors of complex I
[Saada et al., 2009]
115 NDUFAF4
116 C20orf7 Complex I assembly factor [Sugiana et al., 2008]
117
C8orf38
Complex I assembly factor [Mckenzie et al.,
2011]
118
C2orf56
Complex I assembly factor [Zurita rendón et al.,
2014]
119 NUBPL
Complex I assembly factor [Sheftel et al., 2009]
120 SCO1 [Leary et al., 2007]
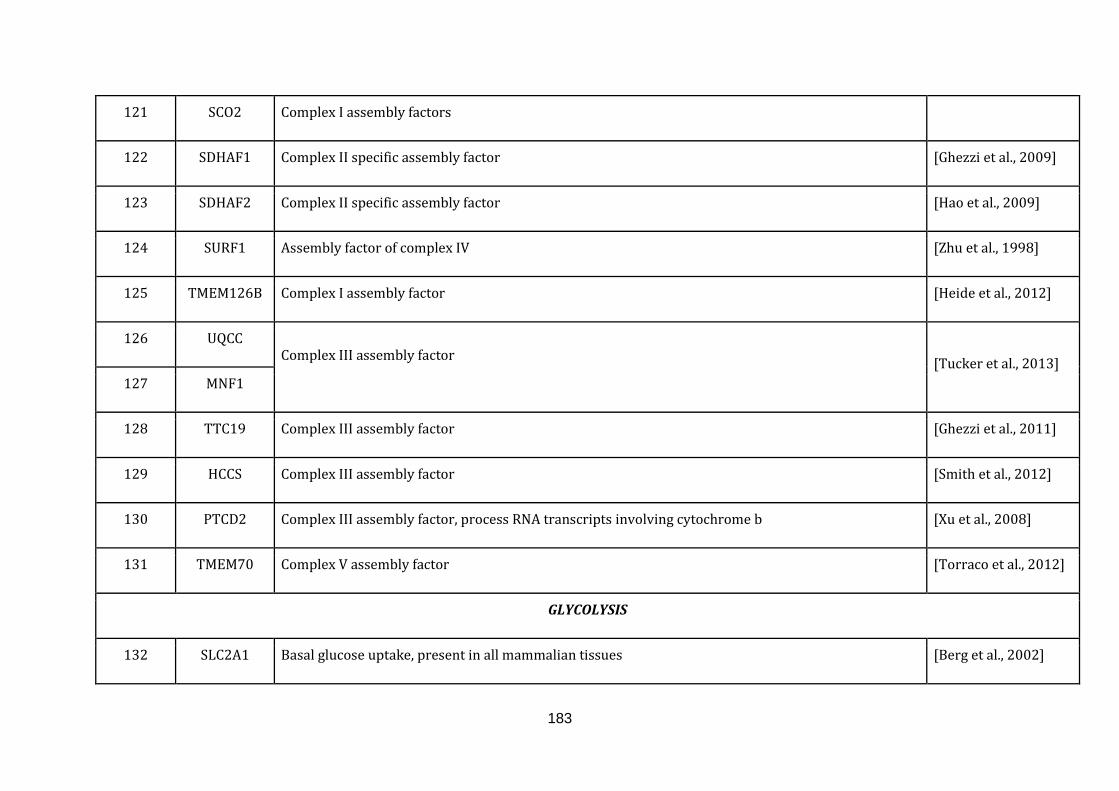
183
121 SCO2 Complex I assembly factors
122 SDHAF1 Complex II specific assembly factor [Ghezzi et al., 2009]
123 SDHAF2 Complex II specific assembly factor [Hao et al., 2009]
124 SURF1 Assembly factor of complex IV [Zhu et al., 1998]
125 TMEM126B Complex I assembly factor [Heide et al., 2012]
126 UQCC Complex III assembly factor
[Tucker et al., 2013]
127 MNF1
128 TTC19 Complex III assembly factor [Ghezzi et al., 2011]
129 HCCS Complex III assembly factor [Smith et al., 2012]
130 PTCD2 Complex III assembly factor, process RNA transcripts involving cytochrome b [Xu et al., 2008]
131 TMEM70 Complex V assembly factor [Torraco et al., 2012]
GLYCOLYSIS
132 SLC2A1 Basal glucose uptake, present in all mammalian tissues [Berg et al., 2002]
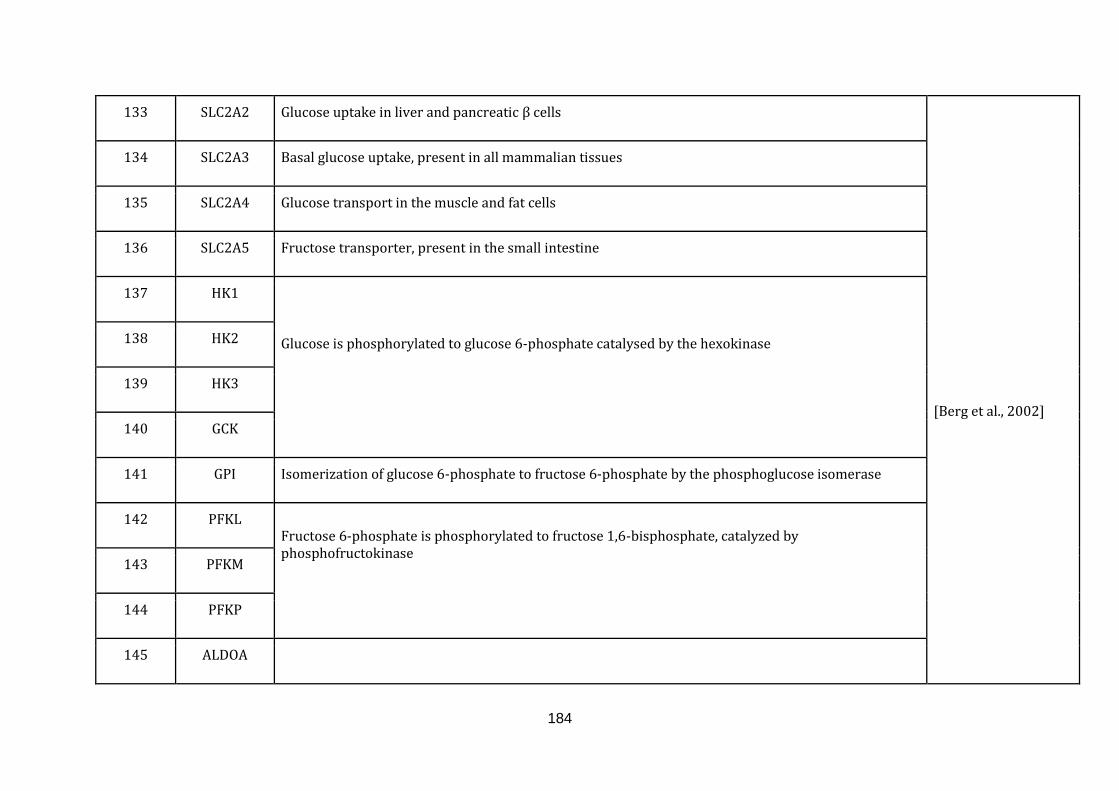
184
133 SLC2A2 Glucose uptake in liver and pancreatic β cells
[Berg et al., 2002]
134 SLC2A3 Basal glucose uptake, present in all mammalian tissues
135 SLC2A4 Glucose transport in the muscle and fat cells
136 SLC2A5 Fructose transporter, present in the small intestine
137 HK1
Glucose is phosphorylated to glucose 6-phosphate catalysed by the hexokinase 138 HK2
139 HK3
140 GCK
141 GPI Isomerization of glucose 6-phosphate to fructose 6-phosphate by the phosphoglucose isomerase
142 PFKL Fructose 6-phosphate is phosphorylated to fructose 1,6-bisphosphate, catalyzed by phosphofructokinase
143 PFKM
144 PFKP
145 ALDOA
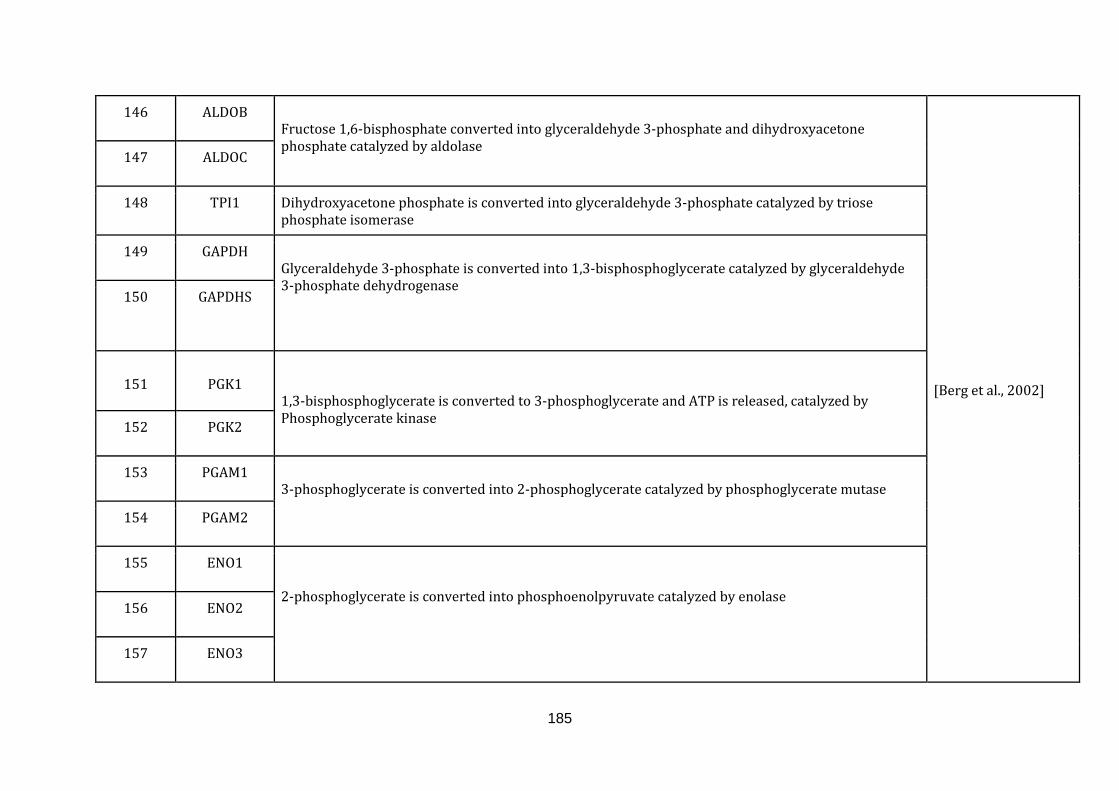
185
146 ALDOB Fructose 1,6-bisphosphate converted into glyceraldehyde 3-phosphate and dihydroxyacetone phosphate catalyzed by aldolase
[Berg et al., 2002]
147 ALDOC
148 TPI1 Dihydroxyacetone phosphate is converted into glyceraldehyde 3-phosphate catalyzed by triose phosphate isomerase
149 GAPDH
Glyceraldehyde 3-phosphate is converted into 1,3-bisphosphoglycerate catalyzed by glyceraldehyde 3-phosphate dehydrogenase
150 GAPDHS
151
PGK1
1,3-bisphosphoglycerate is converted to 3-phosphoglycerate and ATP is released, catalyzed by Phosphoglycerate kinase
152 PGK2
153 PGAM1 3-phosphoglycerate is converted into 2-phosphoglycerate catalyzed by phosphoglycerate mutase
154 PGAM2
155 ENO1 2-phosphoglycerate is converted into phosphoenolpyruvate catalyzed by enolase
156 ENO2
157 ENO3
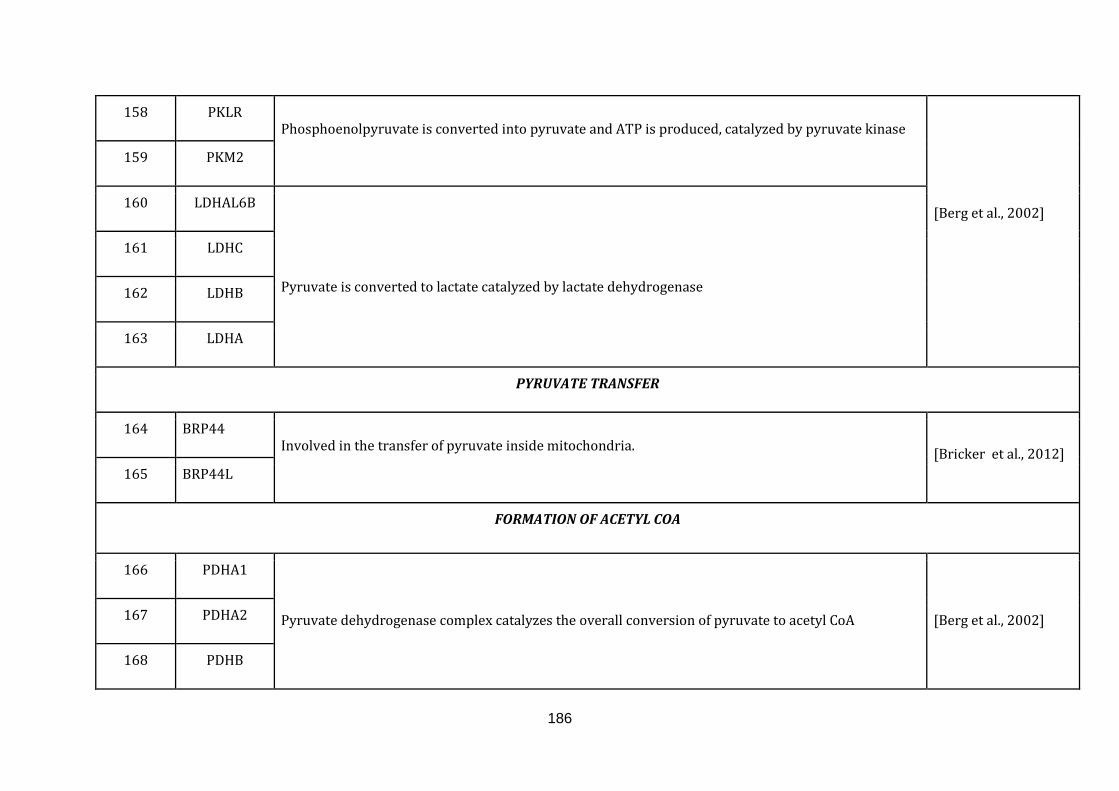
186
158 PKLR Phosphoenolpyruvate is converted into pyruvate and ATP is produced, catalyzed by pyruvate kinase
[Berg et al., 2002]
159 PKM2
160 LDHAL6B
Pyruvate is converted to lactate catalyzed by lactate dehydrogenase
161 LDHC
162 LDHB
163 LDHA
PYRUVATE TRANSFER
164 BRP44
Involved in the transfer of pyruvate inside mitochondria.
[Bricker et al., 2012]
165 BRP44L
FORMATION OF ACETYL COA
166 PDHA1
Pyruvate dehydrogenase complex catalyzes the overall conversion of pyruvate to acetyl CoA
[Berg et al., 2002]
167 PDHA2
168 PDHB
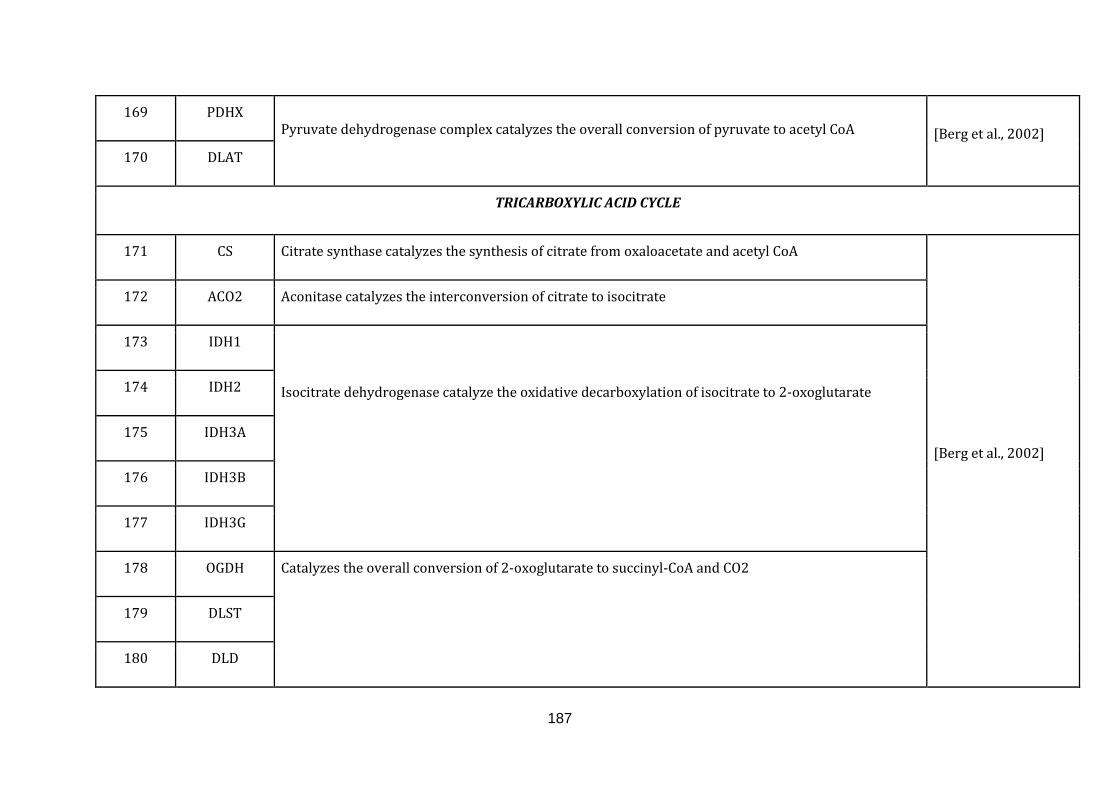
187
169 PDHX Pyruvate dehydrogenase complex catalyzes the overall conversion of pyruvate to acetyl CoA
[Berg et al., 2002]
170 DLAT
TRICARBOXYLIC ACID CYCLE
171 CS Citrate synthase catalyzes the synthesis of citrate from oxaloacetate and acetyl CoA
[Berg et al., 2002]
172 ACO2 Aconitase catalyzes the interconversion of citrate to isocitrate
173 IDH1 Isocitrate dehydrogenase catalyze the oxidative decarboxylation of isocitrate to 2-oxoglutarate 174 IDH2
175 IDH3A
176 IDH3B
177 IDH3G
178 OGDH Catalyzes the overall conversion of 2-oxoglutarate to succinyl-CoA and CO2
179 DLST
180 DLD
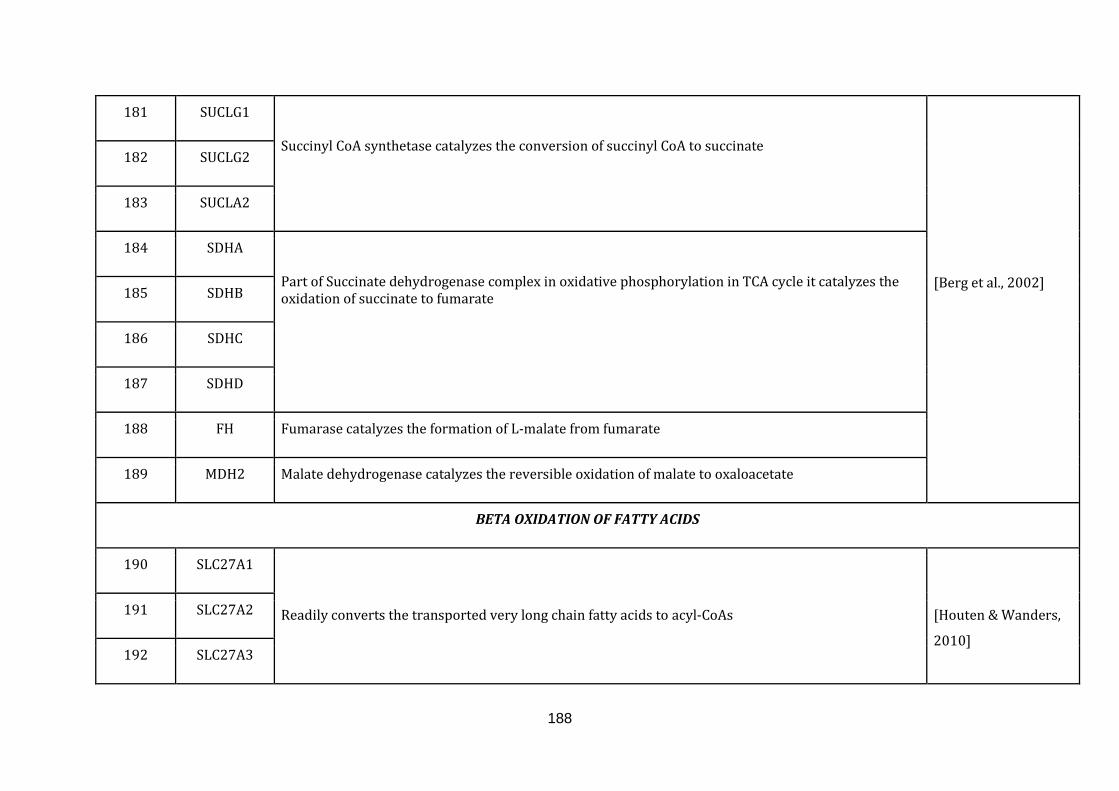
188
181 SUCLG1
Succinyl CoA synthetase catalyzes the conversion of succinyl CoA to succinate
[Berg et al., 2002]
182 SUCLG2
183 SUCLA2
184 SDHA
Part of Succinate dehydrogenase complex in oxidative phosphorylation in TCA cycle it catalyzes the oxidation of succinate to fumarate 185 SDHB
186 SDHC
187 SDHD
188 FH Fumarase catalyzes the formation of L-malate from fumarate
189 MDH2 Malate dehydrogenase catalyzes the reversible oxidation of malate to oxaloacetate
BETA OXIDATION OF FATTY ACIDS
190 SLC27A1
Readily converts the transported very long chain fatty acids to acyl-CoAs
[Houten & Wanders,
2010]
191 SLC27A2
192 SLC27A3
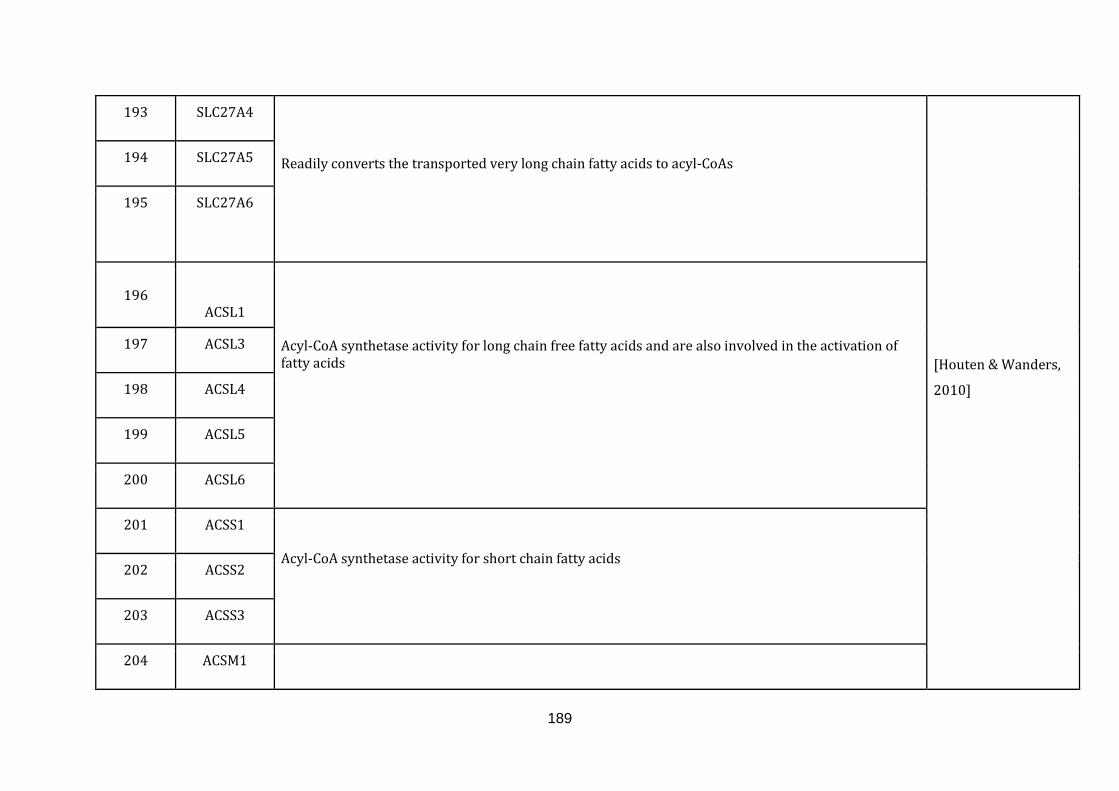
189
193 SLC27A4 Readily converts the transported very long chain fatty acids to acyl-CoAs
[Houten & Wanders,
2010]
194 SLC27A5
195 SLC27A6
196
ACSL1
Acyl-CoA synthetase activity for long chain free fatty acids and are also involved in the activation of fatty acids
197 ACSL3
198 ACSL4
199 ACSL5
200 ACSL6
201 ACSS1
Acyl-CoA synthetase activity for short chain fatty acids 202 ACSS2
203 ACSS3
204 ACSM1
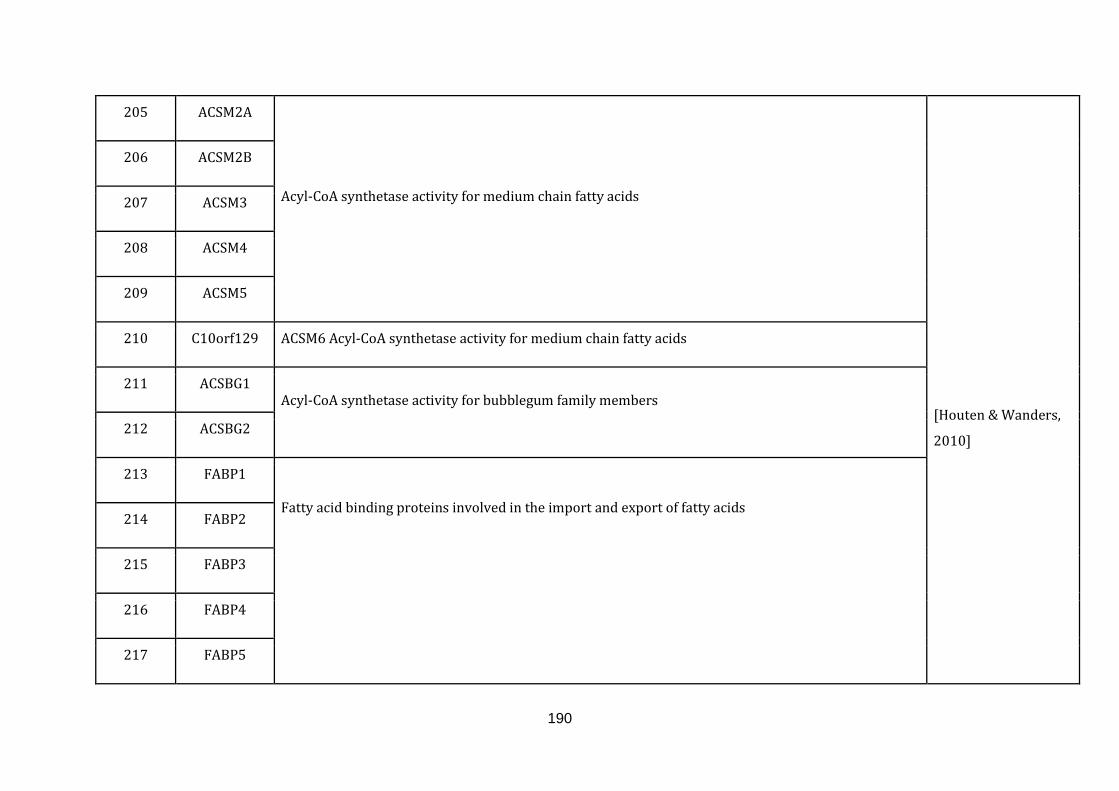
190
205 ACSM2A Acyl-CoA synthetase activity for medium chain fatty acids
[Houten & Wanders,
2010]
206 ACSM2B
207 ACSM3
208 ACSM4
209 ACSM5
210 C10orf129 ACSM6 Acyl-CoA synthetase activity for medium chain fatty acids
211 ACSBG1 Acyl-CoA synthetase activity for bubblegum family members
212 ACSBG2
213 FABP1 Fatty acid binding proteins involved in the import and export of fatty acids
214 FABP2
215 FABP3
216 FABP4
217 FABP5
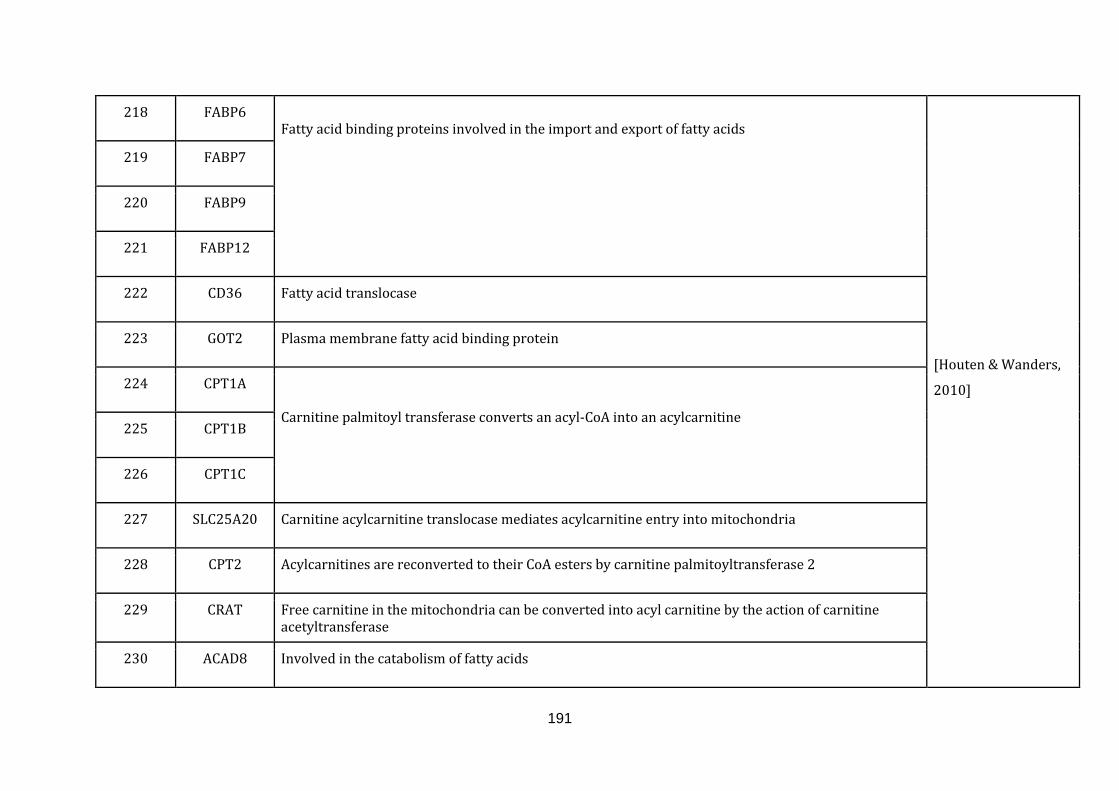
191
218 FABP6 Fatty acid binding proteins involved in the import and export of fatty acids
[Houten & Wanders,
2010]
219 FABP7
220 FABP9
221 FABP12
222 CD36 Fatty acid translocase
223 GOT2 Plasma membrane fatty acid binding protein
224 CPT1A
Carnitine palmitoyl transferase converts an acyl-CoA into an acylcarnitine 225 CPT1B
226 CPT1C
227 SLC25A20 Carnitine acylcarnitine translocase mediates acylcarnitine entry into mitochondria
228 CPT2 Acylcarnitines are reconverted to their CoA esters by carnitine palmitoyltransferase 2
229 CRAT Free carnitine in the mitochondria can be converted into acyl carnitine by the action of carnitine acetyltransferase
230 ACAD8 Involved in the catabolism of fatty acids
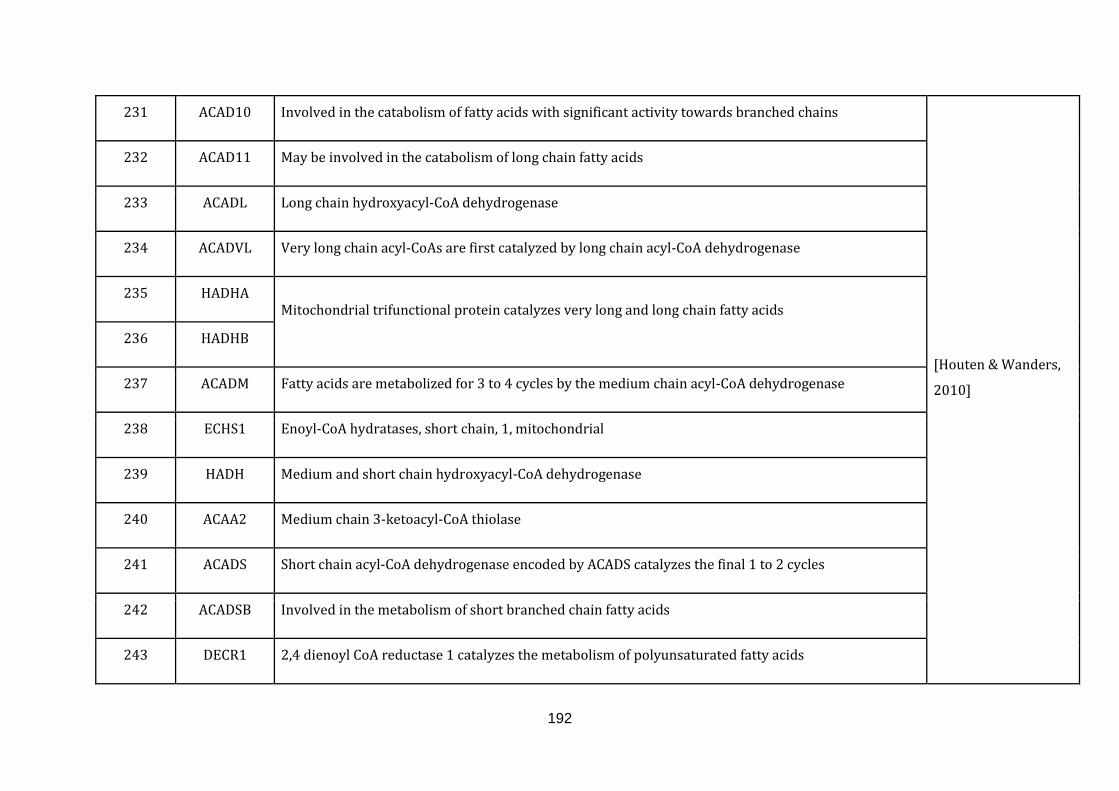
192
231 ACAD10 Involved in the catabolism of fatty acids with significant activity towards branched chains
[Houten & Wanders,
2010]
232 ACAD11 May be involved in the catabolism of long chain fatty acids
233 ACADL Long chain hydroxyacyl-CoA dehydrogenase
234 ACADVL Very long chain acyl-CoAs are first catalyzed by long chain acyl-CoA dehydrogenase
235 HADHA
Mitochondrial trifunctional protein catalyzes very long and long chain fatty acids
236 HADHB
237 ACADM Fatty acids are metabolized for 3 to 4 cycles by the medium chain acyl-CoA dehydrogenase
238 ECHS1 Enoyl-CoA hydratases, short chain, 1, mitochondrial
239 HADH Medium and short chain hydroxyacyl-CoA dehydrogenase
240 ACAA2 Medium chain 3-ketoacyl-CoA thiolase
241 ACADS Short chain acyl-CoA dehydrogenase encoded by ACADS catalyzes the final 1 to 2 cycles
242 ACADSB Involved in the metabolism of short branched chain fatty acids
243 DECR1 2,4 dienoyl CoA reductase 1 catalyzes the metabolism of polyunsaturated fatty acids
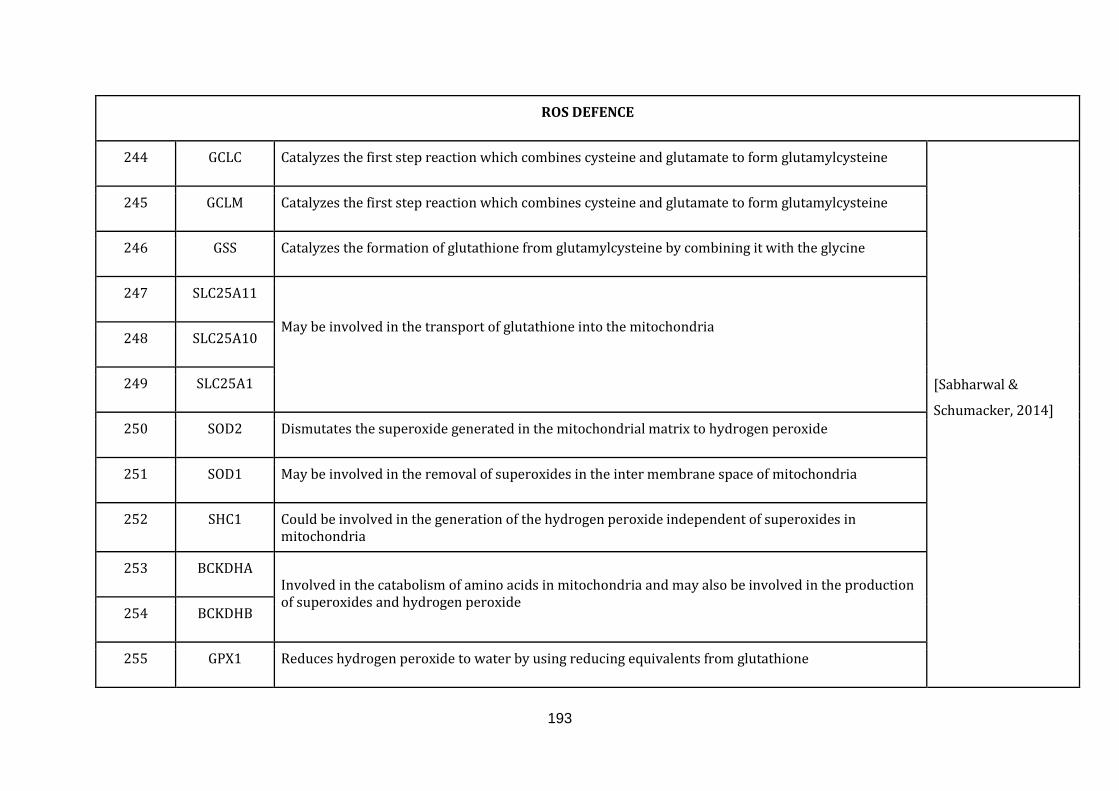
193
ROS DEFENCE
244 GCLC Catalyzes the first step reaction which combines cysteine and glutamate to form glutamylcysteine
[Sabharwal &
Schumacker, 2014]
245 GCLM Catalyzes the first step reaction which combines cysteine and glutamate to form glutamylcysteine
246 GSS Catalyzes the formation of glutathione from glutamylcysteine by combining it with the glycine
247 SLC25A11 May be involved in the transport of glutathione into the mitochondria
248 SLC25A10
249 SLC25A1
250 SOD2 Dismutates the superoxide generated in the mitochondrial matrix to hydrogen peroxide
251 SOD1 May be involved in the removal of superoxides in the inter membrane space of mitochondria
252 SHC1 Could be involved in the generation of the hydrogen peroxide independent of superoxides in mitochondria
253 BCKDHA Involved in the catabolism of amino acids in mitochondria and may also be involved in the production of superoxides and hydrogen peroxide
254 BCKDHB
255 GPX1 Reduces hydrogen peroxide to water by using reducing equivalents from glutathione
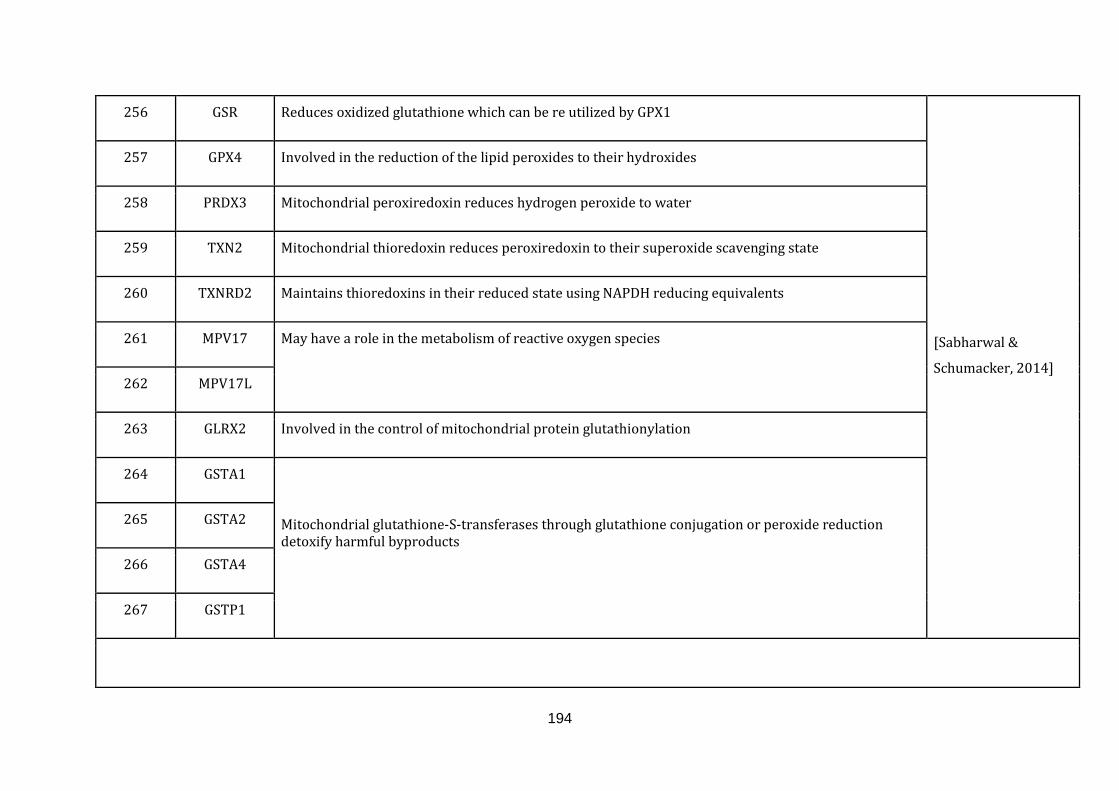
194
256 GSR Reduces oxidized glutathione which can be re utilized by GPX1
[Sabharwal &
Schumacker, 2014]
257 GPX4 Involved in the reduction of the lipid peroxides to their hydroxides
258 PRDX3 Mitochondrial peroxiredoxin reduces hydrogen peroxide to water
259 TXN2 Mitochondrial thioredoxin reduces peroxiredoxin to their superoxide scavenging state
260 TXNRD2 Maintains thioredoxins in their reduced state using NAPDH reducing equivalents
261 MPV17 May have a role in the metabolism of reactive oxygen species
262 MPV17L
263 GLRX2 Involved in the control of mitochondrial protein glutathionylation
264 GSTA1
Mitochondrial glutathione-S-transferases through glutathione conjugation or peroxide reduction detoxify harmful byproducts
265 GSTA2
266 GSTA4
267 GSTP1
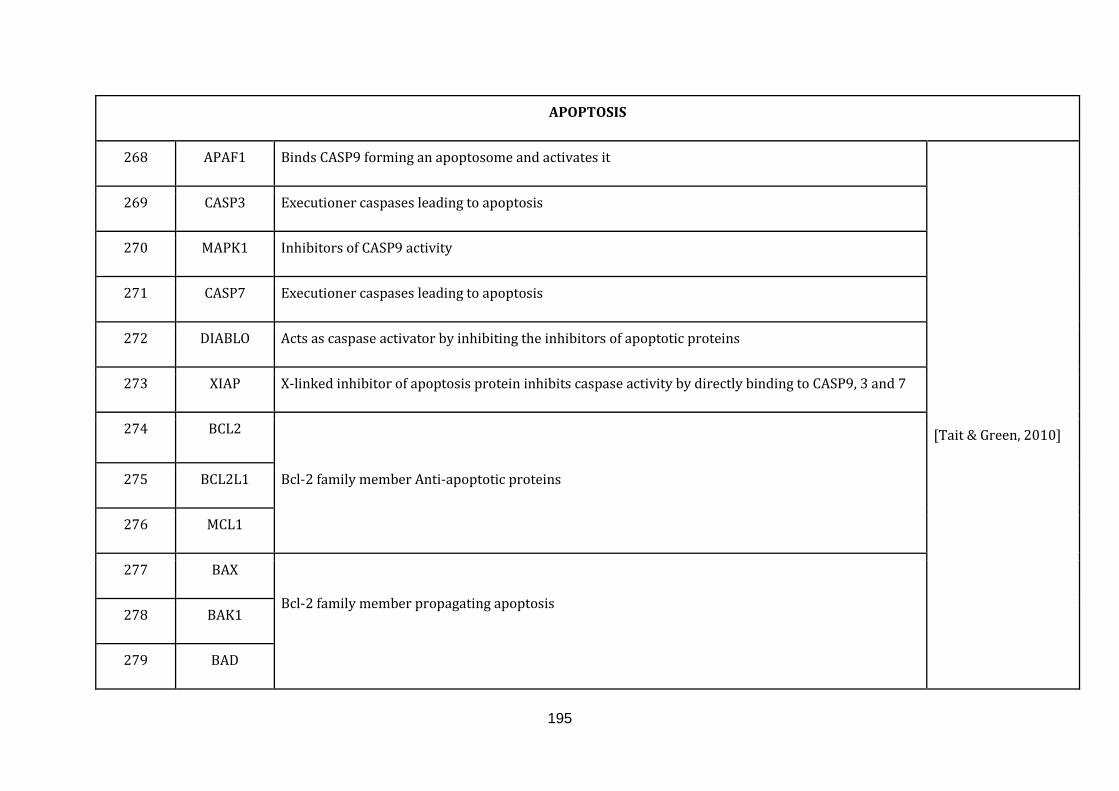
195
APOPTOSIS
268 APAF1 Binds CASP9 forming an apoptosome and activates it
[Tait & Green, 2010]
269 CASP3 Executioner caspases leading to apoptosis
270 MAPK1 Inhibitors of CASP9 activity
271 CASP7 Executioner caspases leading to apoptosis
272 DIABLO Acts as caspase activator by inhibiting the inhibitors of apoptotic proteins
273 XIAP X-linked inhibitor of apoptosis protein inhibits caspase activity by directly binding to CASP9, 3 and 7
274 BCL2
Bcl-2 family member Anti-apoptotic proteins 275 BCL2L1
276 MCL1
277 BAX Bcl-2 family member propagating apoptosis
278 BAK1
279 BAD
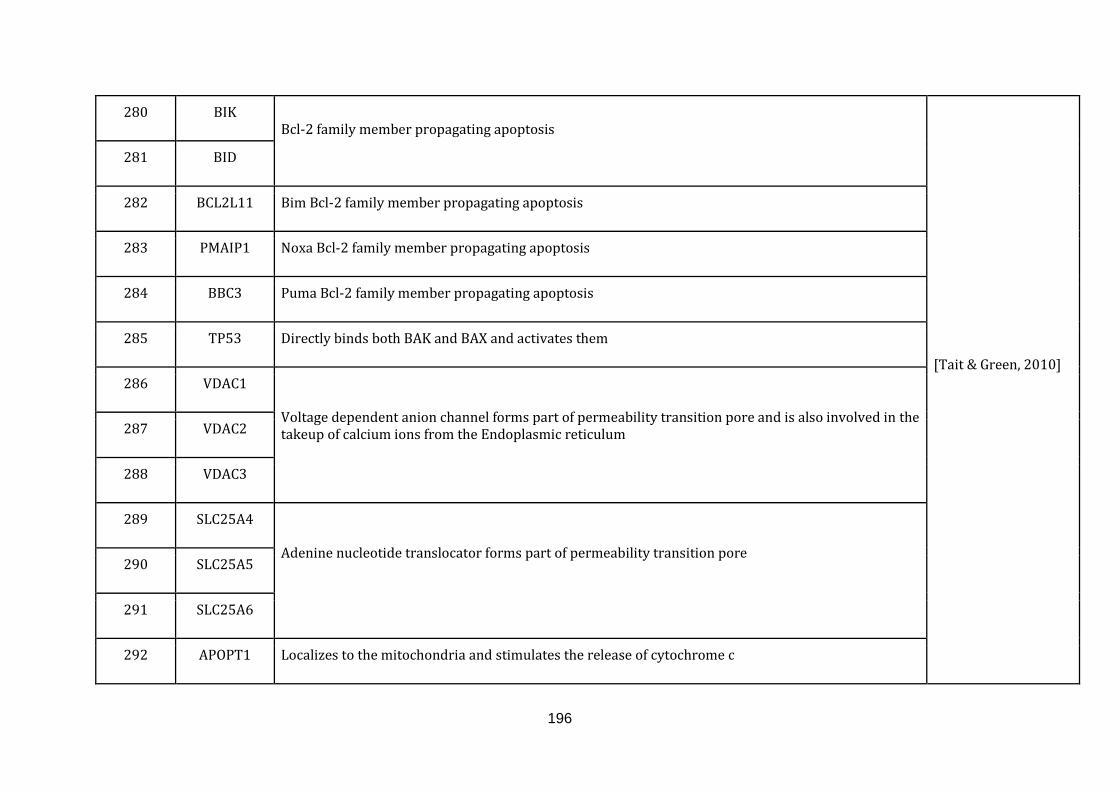
196
280 BIK Bcl-2 family member propagating apoptosis
[Tait & Green, 2010]
281 BID
282 BCL2L11 Bim Bcl-2 family member propagating apoptosis
283 PMAIP1 Noxa Bcl-2 family member propagating apoptosis
284 BBC3 Puma Bcl-2 family member propagating apoptosis
285 TP53 Directly binds both BAK and BAX and activates them
286 VDAC1
Voltage dependent anion channel forms part of permeability transition pore and is also involved in the takeup of calcium ions from the Endoplasmic reticulum 287 VDAC2
288 VDAC3
289 SLC25A4
Adenine nucleotide translocator forms part of permeability transition pore 290 SLC25A5
291 SLC25A6
292 APOPT1 Localizes to the mitochondria and stimulates the release of cytochrome c
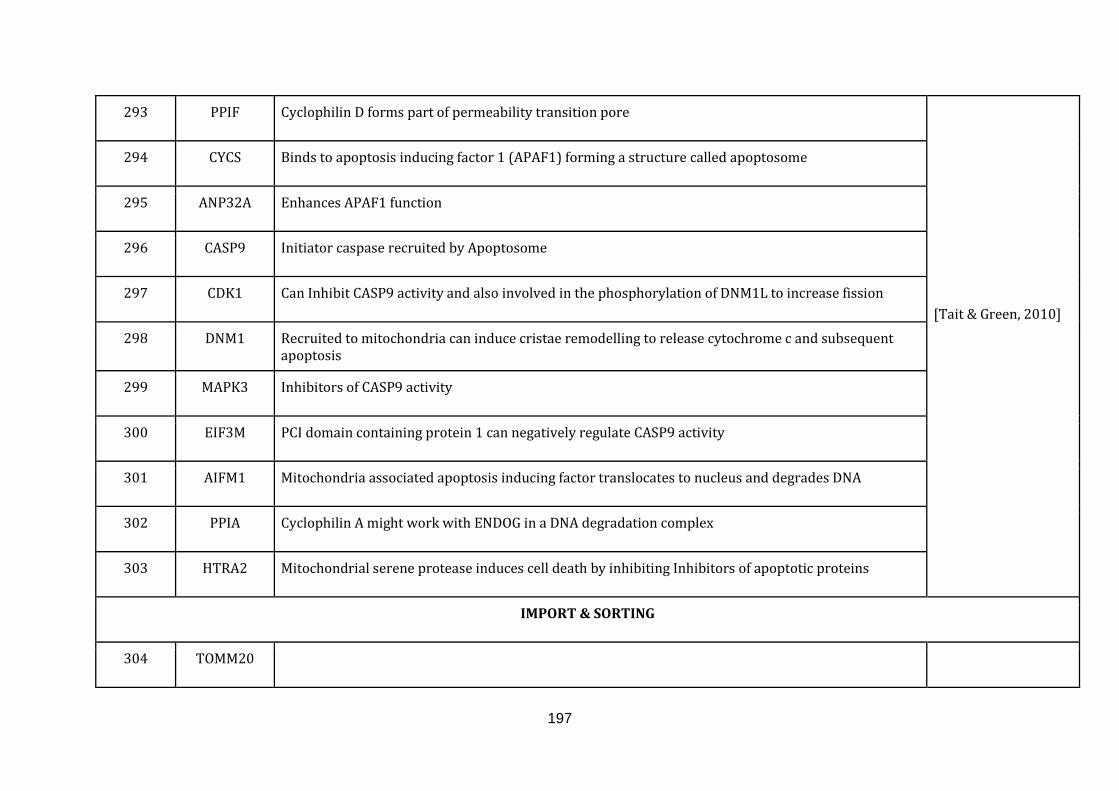
197
293 PPIF Cyclophilin D forms part of permeability transition pore
[Tait & Green, 2010]
294 CYCS Binds to apoptosis inducing factor 1 (APAF1) forming a structure called apoptosome
295 ANP32A Enhances APAF1 function
296 CASP9 Initiator caspase recruited by Apoptosome
297 CDK1 Can Inhibit CASP9 activity and also involved in the phosphorylation of DNM1L to increase fission
298 DNM1 Recruited to mitochondria can induce cristae remodelling to release cytochrome c and subsequent apoptosis
299 MAPK3 Inhibitors of CASP9 activity
300 EIF3M PCI domain containing protein 1 can negatively regulate CASP9 activity
301 AIFM1 Mitochondria associated apoptosis inducing factor translocates to nucleus and degrades DNA
302 PPIA Cyclophilin A might work with ENDOG in a DNA degradation complex
303 HTRA2 Mitochondrial serene protease induces cell death by inhibiting Inhibitors of apoptotic proteins
IMPORT & SORTING
304 TOMM20
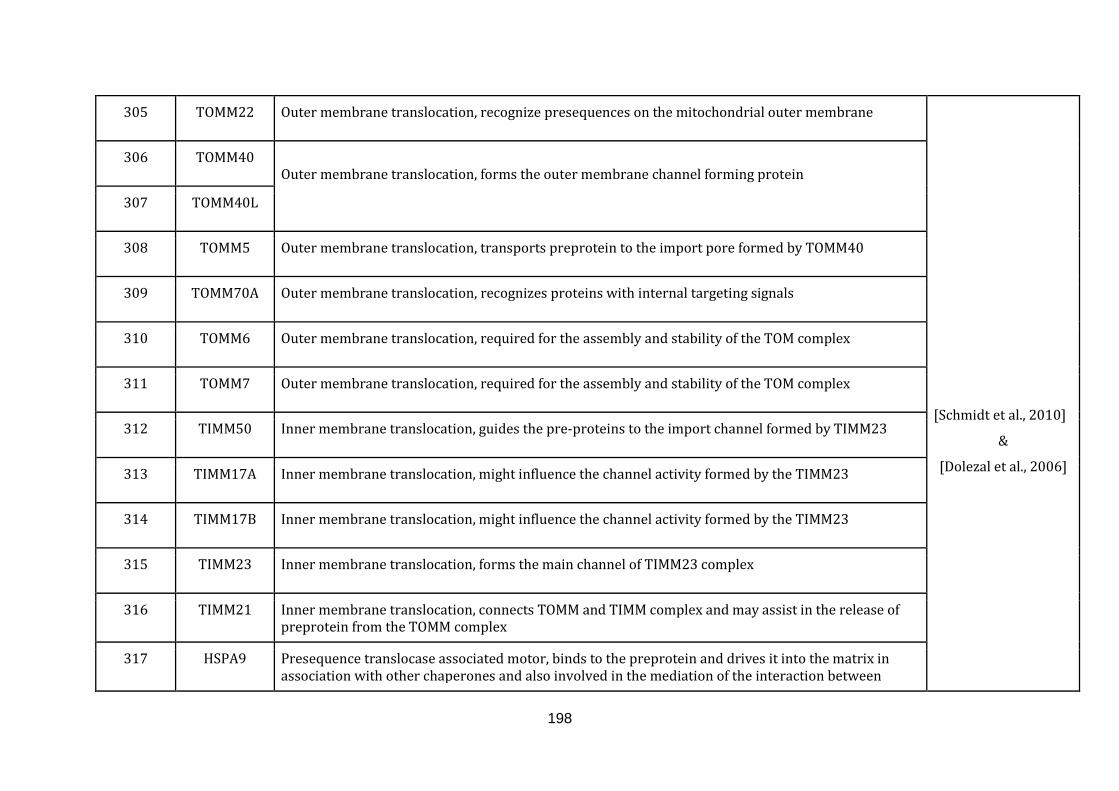
198
305 TOMM22 Outer membrane translocation, recognize presequences on the mitochondrial outer membrane
[Schmidt et al., 2010]
&
[Dolezal et al., 2006]
306 TOMM40
Outer membrane translocation, forms the outer membrane channel forming protein
307 TOMM40L
308 TOMM5 Outer membrane translocation, transports preprotein to the import pore formed by TOMM40
309 TOMM70A Outer membrane translocation, recognizes proteins with internal targeting signals
310 TOMM6 Outer membrane translocation, required for the assembly and stability of the TOM complex
311 TOMM7 Outer membrane translocation, required for the assembly and stability of the TOM complex
312 TIMM50 Inner membrane translocation, guides the pre-proteins to the import channel formed by TIMM23
313 TIMM17A Inner membrane translocation, might influence the channel activity formed by the TIMM23
314 TIMM17B Inner membrane translocation, might influence the channel activity formed by the TIMM23
315 TIMM23 Inner membrane translocation, forms the main channel of TIMM23 complex
316 TIMM21 Inner membrane translocation, connects TOMM and TIMM complex and may assist in the release of preprotein from the TOMM complex
317 HSPA9 Presequence translocase associated motor, binds to the preprotein and drives it into the matrix in association with other chaperones and also involved in the mediation of the interaction between
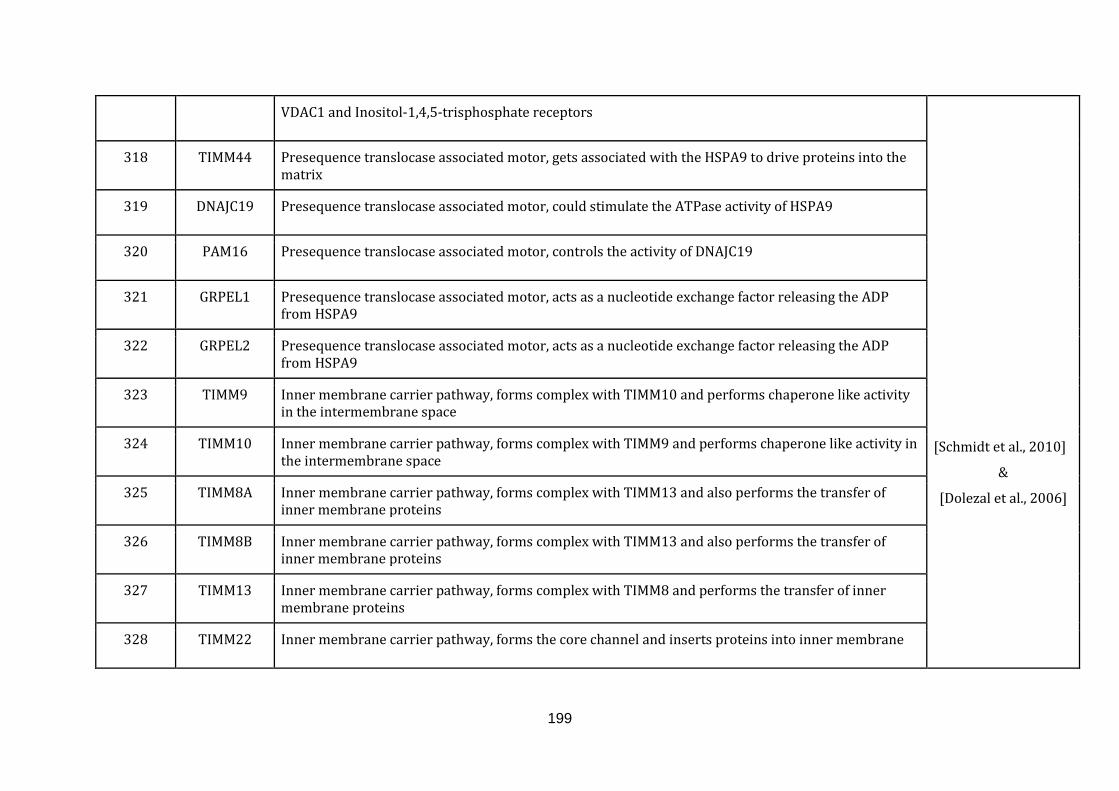
199
VDAC1 and Inositol-1,4,5-trisphosphate receptors
[Schmidt et al., 2010]
&
[Dolezal et al., 2006]
318 TIMM44 Presequence translocase associated motor, gets associated with the HSPA9 to drive proteins into the matrix
319 DNAJC19 Presequence translocase associated motor, could stimulate the ATPase activity of HSPA9
320 PAM16 Presequence translocase associated motor, controls the activity of DNAJC19
321 GRPEL1 Presequence translocase associated motor, acts as a nucleotide exchange factor releasing the ADP from HSPA9
322 GRPEL2 Presequence translocase associated motor, acts as a nucleotide exchange factor releasing the ADP from HSPA9
323 TIMM9 Inner membrane carrier pathway, forms complex with TIMM10 and performs chaperone like activity in the intermembrane space
324 TIMM10 Inner membrane carrier pathway, forms complex with TIMM9 and performs chaperone like activity in the intermembrane space
325 TIMM8A Inner membrane carrier pathway, forms complex with TIMM13 and also performs the transfer of inner membrane proteins
326 TIMM8B Inner membrane carrier pathway, forms complex with TIMM13 and also performs the transfer of inner membrane proteins
327 TIMM13 Inner membrane carrier pathway, forms complex with TIMM8 and performs the transfer of inner membrane proteins
328 TIMM22 Inner membrane carrier pathway, forms the core channel and inserts proteins into inner membrane
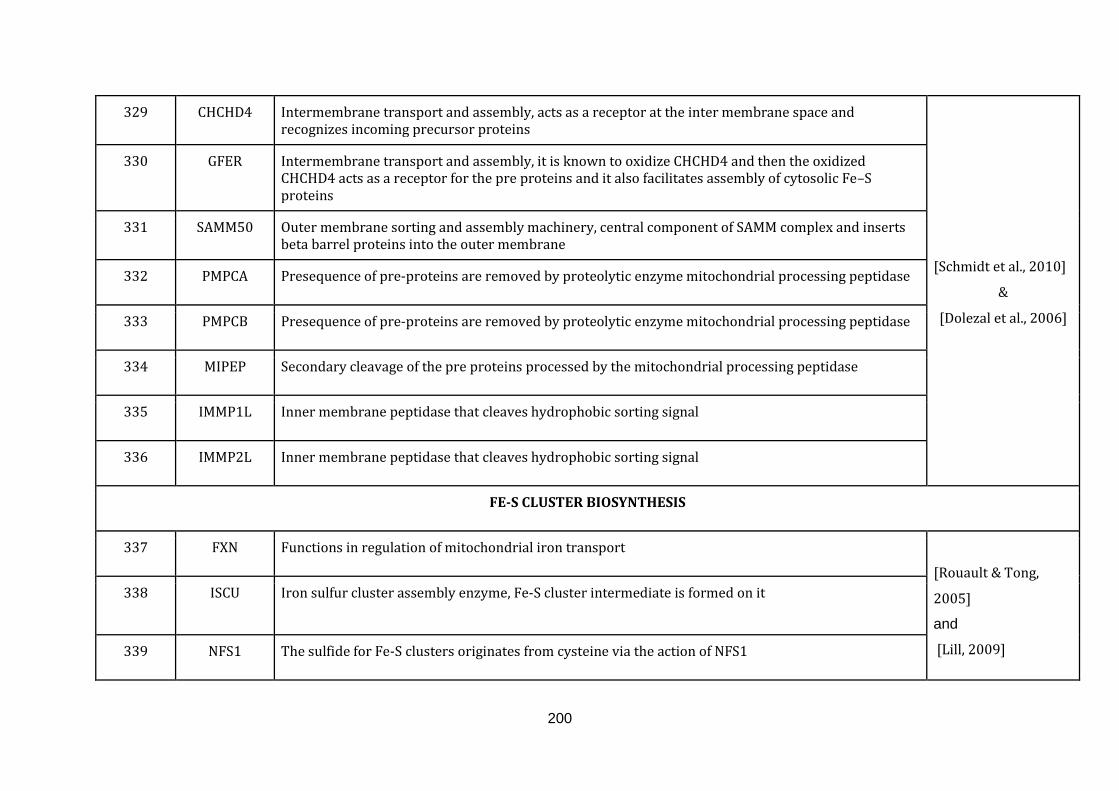
200
329 CHCHD4 Intermembrane transport and assembly, acts as a receptor at the inter membrane space and recognizes incoming precursor proteins
[Schmidt et al., 2010]
&
[Dolezal et al., 2006]
330 GFER Intermembrane transport and assembly, it is known to oxidize CHCHD4 and then the oxidized CHCHD4 acts as a receptor for the pre proteins and it also facilitates assembly of cytosolic Fe–S proteins
331 SAMM50 Outer membrane sorting and assembly machinery, central component of SAMM complex and inserts beta barrel proteins into the outer membrane
332 PMPCA Presequence of pre-proteins are removed by proteolytic enzyme mitochondrial processing peptidase
333 PMPCB Presequence of pre-proteins are removed by proteolytic enzyme mitochondrial processing peptidase
334 MIPEP Secondary cleavage of the pre proteins processed by the mitochondrial processing peptidase
335 IMMP1L Inner membrane peptidase that cleaves hydrophobic sorting signal
336 IMMP2L Inner membrane peptidase that cleaves hydrophobic sorting signal
FE-S CLUSTER BIOSYNTHESIS
337 FXN Functions in regulation of mitochondrial iron transport
[Rouault & Tong,
2005]
and
[Lill, 2009]
338 ISCU Iron sulfur cluster assembly enzyme, Fe-S cluster intermediate is formed on it
339 NFS1 The sulfide for Fe-S clusters originates from cysteine via the action of NFS1
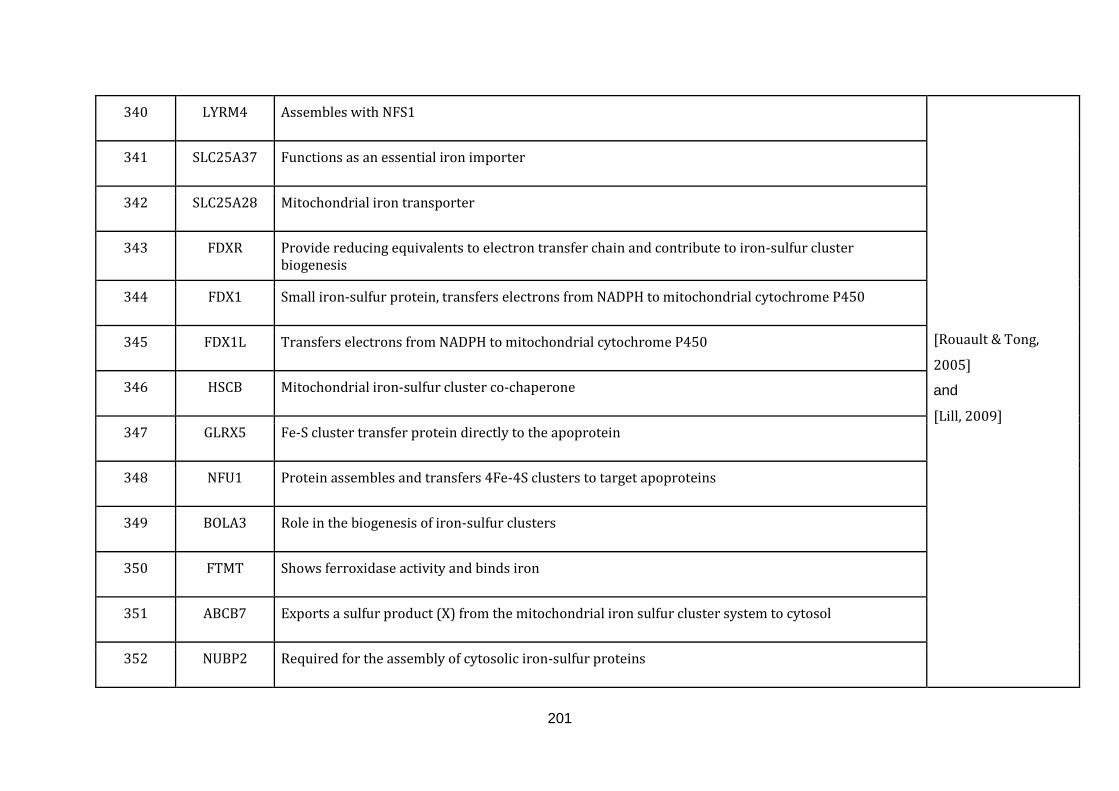
201
340 LYRM4 Assembles with NFS1
[Rouault & Tong,
2005]
and
[Lill, 2009]
341 SLC25A37 Functions as an essential iron importer
342 SLC25A28 Mitochondrial iron transporter
343 FDXR Provide reducing equivalents to electron transfer chain and contribute to iron-sulfur cluster biogenesis
344 FDX1 Small iron-sulfur protein, transfers electrons from NADPH to mitochondrial cytochrome P450
345 FDX1L Transfers electrons from NADPH to mitochondrial cytochrome P450
346 HSCB Mitochondrial iron-sulfur cluster co-chaperone
347 GLRX5 Fe-S cluster transfer protein directly to the apoprotein
348 NFU1 Protein assembles and transfers 4Fe-4S clusters to target apoproteins
349 BOLA3 Role in the biogenesis of iron-sulfur clusters
350 FTMT Shows ferroxidase activity and binds iron
351 ABCB7 Exports a sulfur product (X) from the mitochondrial iron sulfur cluster system to cytosol
352 NUBP2 Required for the assembly of cytosolic iron-sulfur proteins
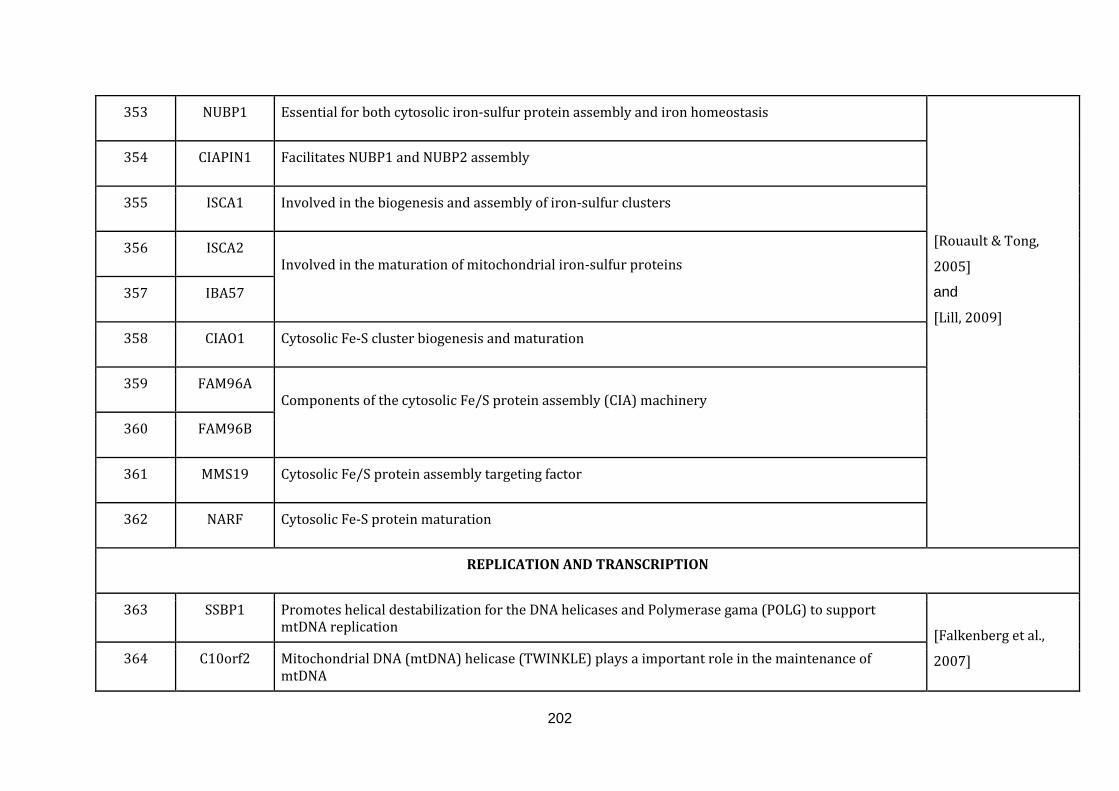
202
353 NUBP1 Essential for both cytosolic iron-sulfur protein assembly and iron homeostasis
[Rouault & Tong,
2005]
and
[Lill, 2009]
354 CIAPIN1 Facilitates NUBP1 and NUBP2 assembly
355 ISCA1 Involved in the biogenesis and assembly of iron-sulfur clusters
356 ISCA2 Involved in the maturation of mitochondrial iron-sulfur proteins
357 IBA57
358 CIAO1 Cytosolic Fe-S cluster biogenesis and maturation
359 FAM96A Components of the cytosolic Fe/S protein assembly (CIA) machinery
360 FAM96B
361 MMS19 Cytosolic Fe/S protein assembly targeting factor
362 NARF Cytosolic Fe-S protein maturation
REPLICATION AND TRANSCRIPTION
363 SSBP1 Promotes helical destabilization for the DNA helicases and Polymerase gama (POLG) to support mtDNA replication
[Falkenberg et al.,
2007] 364 C10orf2 Mitochondrial DNA (mtDNA) helicase (TWINKLE) plays a important role in the maintenance of mtDNA
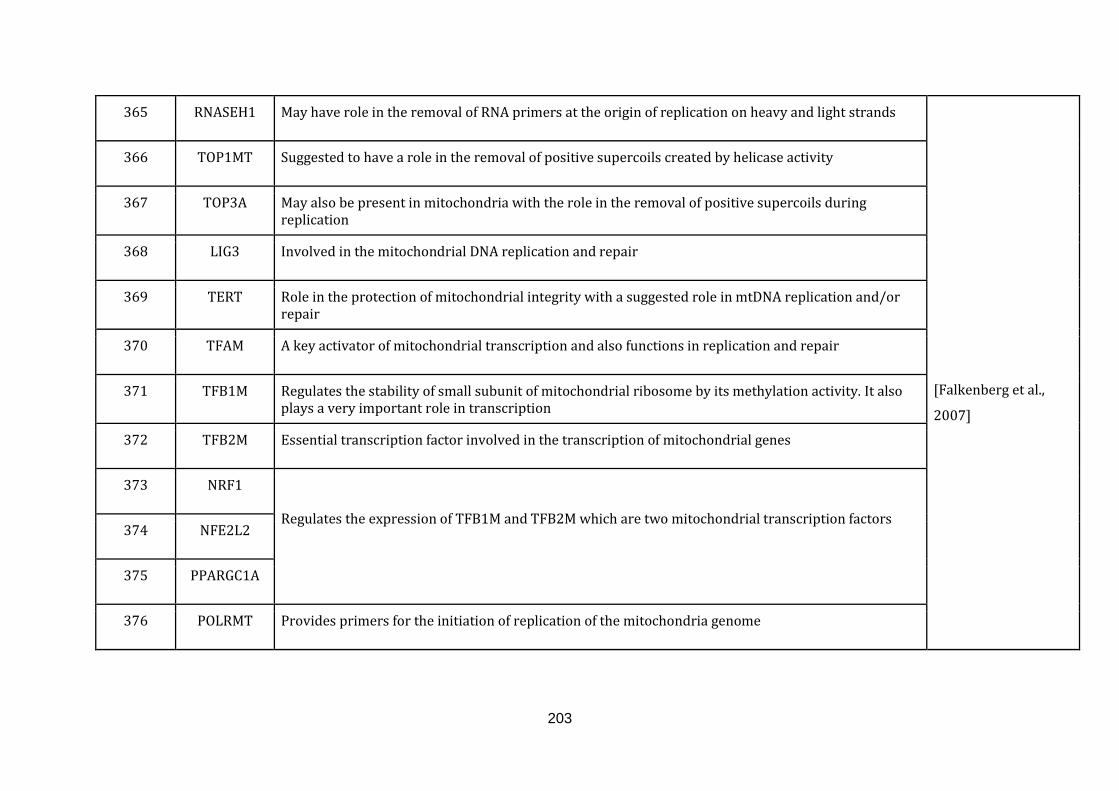
203
365 RNASEH1 May have role in the removal of RNA primers at the origin of replication on heavy and light strands
[Falkenberg et al.,
2007]
366 TOP1MT Suggested to have a role in the removal of positive supercoils created by helicase activity
367 TOP3A May also be present in mitochondria with the role in the removal of positive supercoils during replication
368 LIG3 Involved in the mitochondrial DNA replication and repair
369 TERT Role in the protection of mitochondrial integrity with a suggested role in mtDNA replication and/or repair
370 TFAM A key activator of mitochondrial transcription and also functions in replication and repair
371 TFB1M Regulates the stability of small subunit of mitochondrial ribosome by its methylation activity. It also plays a very important role in transcription
372 TFB2M Essential transcription factor involved in the transcription of mitochondrial genes
373 NRF1 Regulates the expression of TFB1M and TFB2M which are two mitochondrial transcription factors
374 NFE2L2
375 PPARGC1A
376 POLRMT Provides primers for the initiation of replication of the mitochondria genome
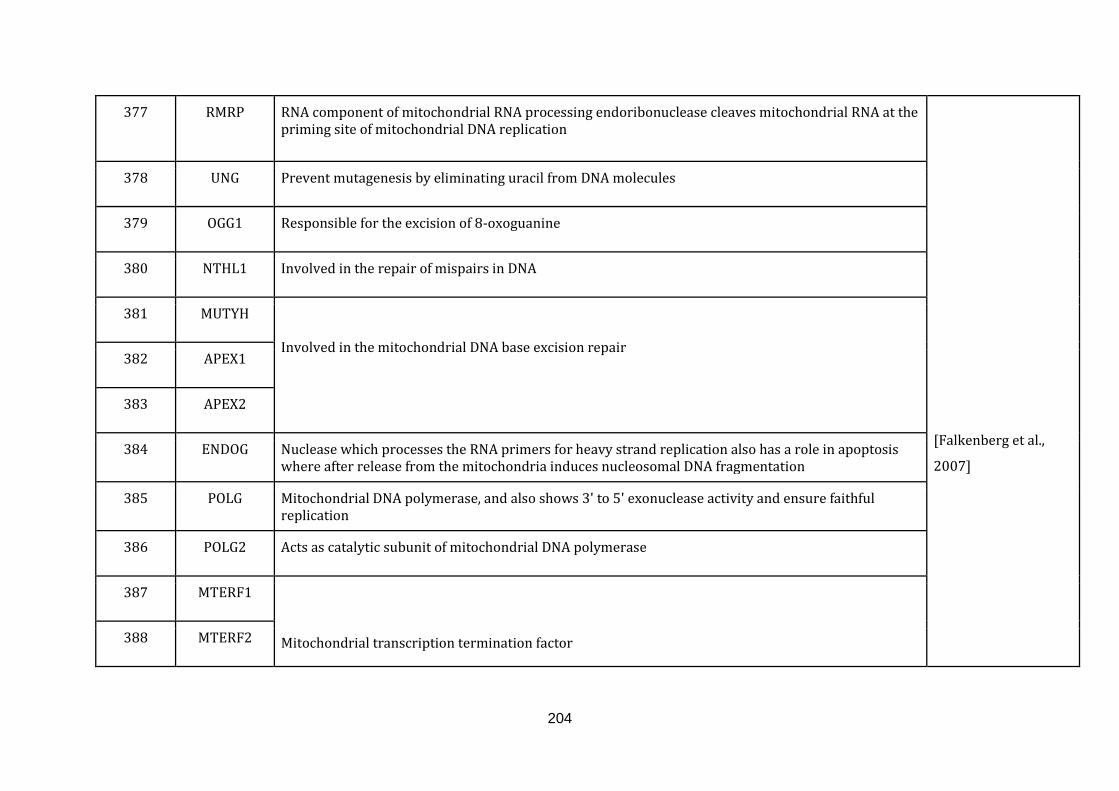
204
377 RMRP RNA component of mitochondrial RNA processing endoribonuclease cleaves mitochondrial RNA at the priming site of mitochondrial DNA replication
[Falkenberg et al.,
2007]
378 UNG Prevent mutagenesis by eliminating uracil from DNA molecules
379 OGG1 Responsible for the excision of 8-oxoguanine
380 NTHL1 Involved in the repair of mispairs in DNA
381 MUTYH
Involved in the mitochondrial DNA base excision repair 382 APEX1
383 APEX2
384 ENDOG Nuclease which processes the RNA primers for heavy strand replication also has a role in apoptosis where after release from the mitochondria induces nucleosomal DNA fragmentation
385 POLG Mitochondrial DNA polymerase, and also shows 3' to 5' exonuclease activity and ensure faithful replication
386 POLG2 Acts as catalytic subunit of mitochondrial DNA polymerase
387 MTERF1
Mitochondrial transcription termination factor 388 MTERF2
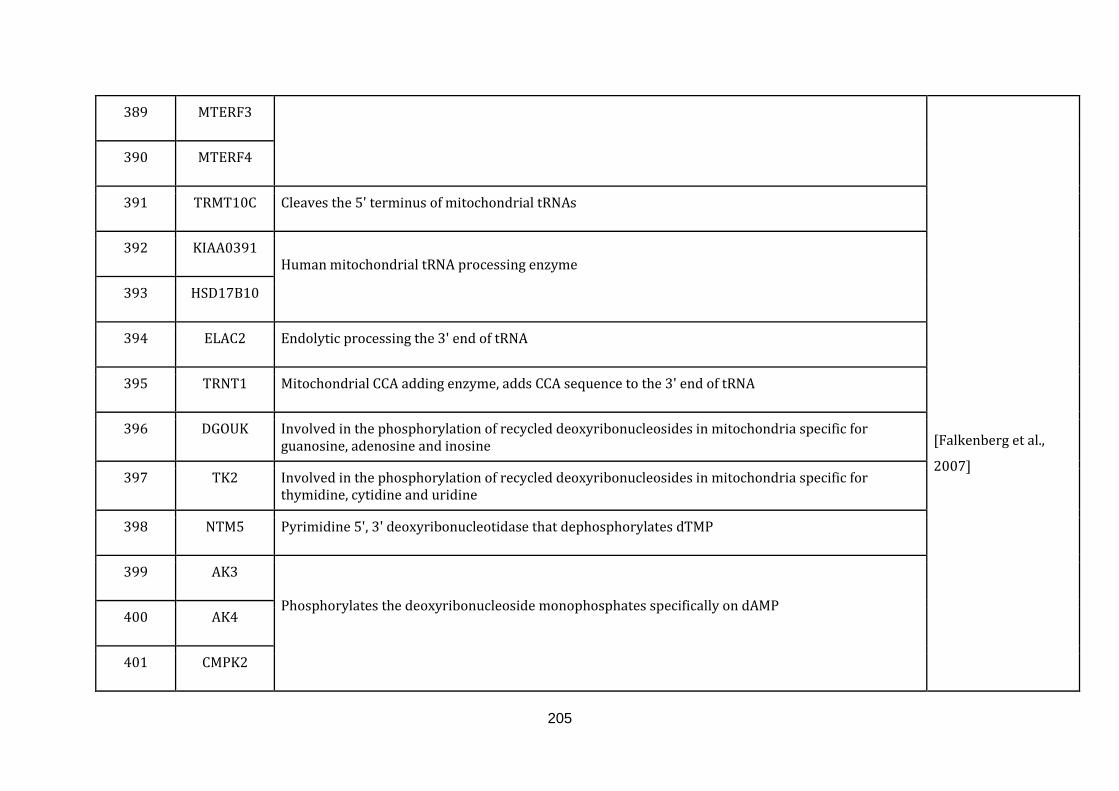
205
389 MTERF3
[Falkenberg et al.,
2007]
390 MTERF4
391 TRMT10C Cleaves the 5' terminus of mitochondrial tRNAs
392 KIAA0391 Human mitochondrial tRNA processing enzyme
393 HSD17B10
394 ELAC2 Endolytic processing the 3' end of tRNA
395 TRNT1 Mitochondrial CCA adding enzyme, adds CCA sequence to the 3' end of tRNA
396 DGOUK Involved in the phosphorylation of recycled deoxyribonucleosides in mitochondria specific for guanosine, adenosine and inosine
397 TK2 Involved in the phosphorylation of recycled deoxyribonucleosides in mitochondria specific for thymidine, cytidine and uridine
398 NTM5 Pyrimidine 5', 3' deoxyribonucleotidase that dephosphorylates dTMP
399 AK3
Phosphorylates the deoxyribonucleoside monophosphates specifically on dAMP 400 AK4
401 CMPK2
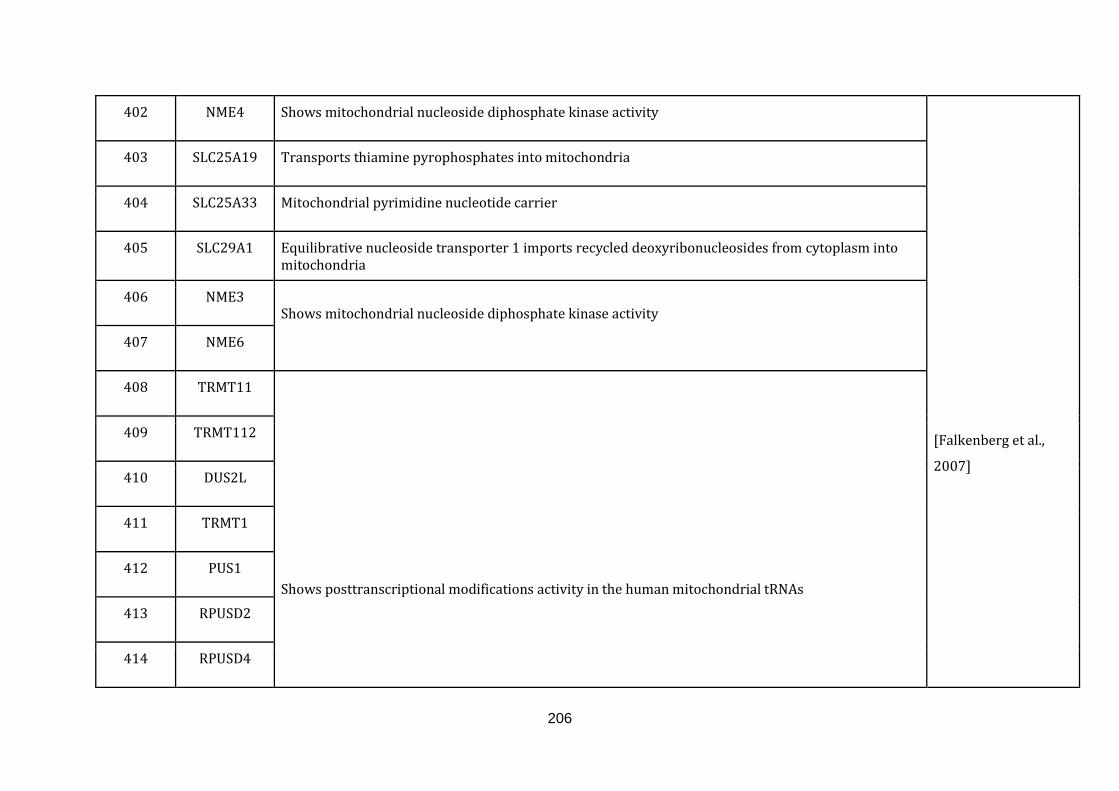
206
402 NME4 Shows mitochondrial nucleoside diphosphate kinase activity
[Falkenberg et al.,
2007]
403 SLC25A19 Transports thiamine pyrophosphates into mitochondria
404 SLC25A33 Mitochondrial pyrimidine nucleotide carrier
405 SLC29A1 Equilibrative nucleoside transporter 1 imports recycled deoxyribonucleosides from cytoplasm into mitochondria
406 NME3 Shows mitochondrial nucleoside diphosphate kinase activity
407 NME6
408 TRMT11 Shows posttranscriptional modifications activity in the human mitochondrial tRNAs
409 TRMT112
410 DUS2L
411 TRMT1
412 PUS1
413 RPUSD2
414 RPUSD4
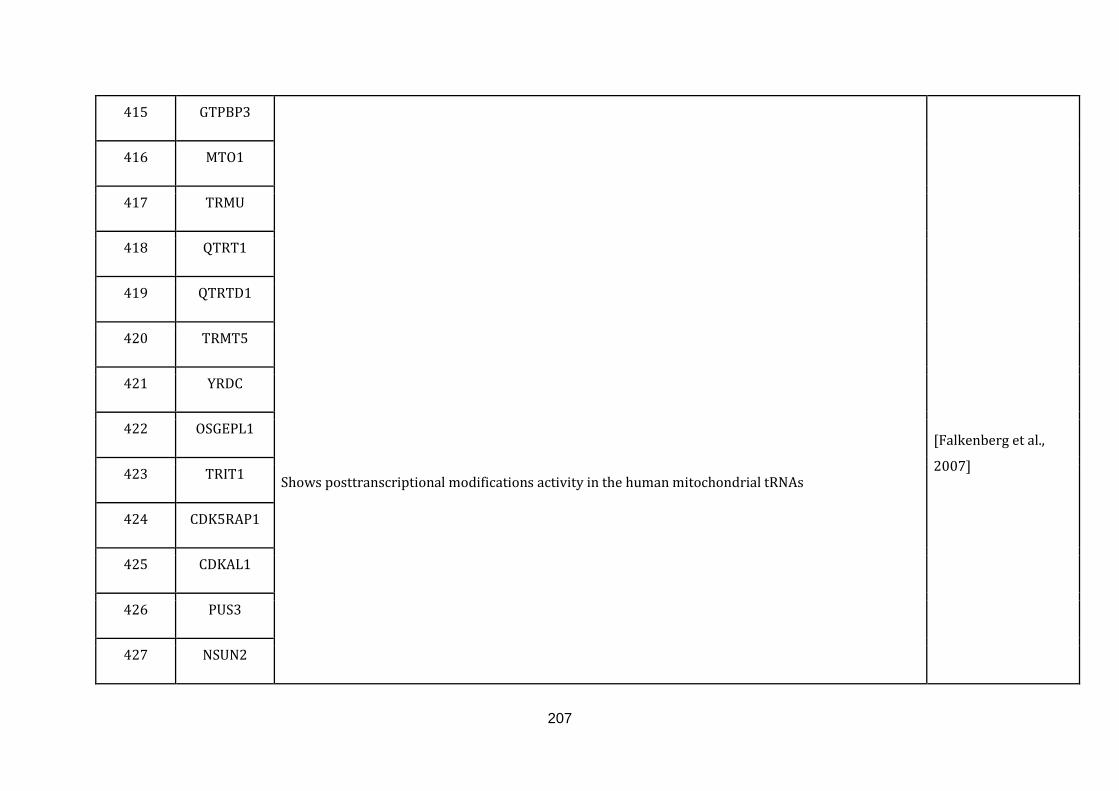
207
415 GTPBP3 Shows posttranscriptional modifications activity in the human mitochondrial tRNAs
[Falkenberg et al.,
2007]
416 MTO1
417 TRMU
418 QTRT1
419 QTRTD1
420 TRMT5
421 YRDC
422 OSGEPL1
423 TRIT1
424 CDK5RAP1
425 CDKAL1
426 PUS3
427 NSUN2
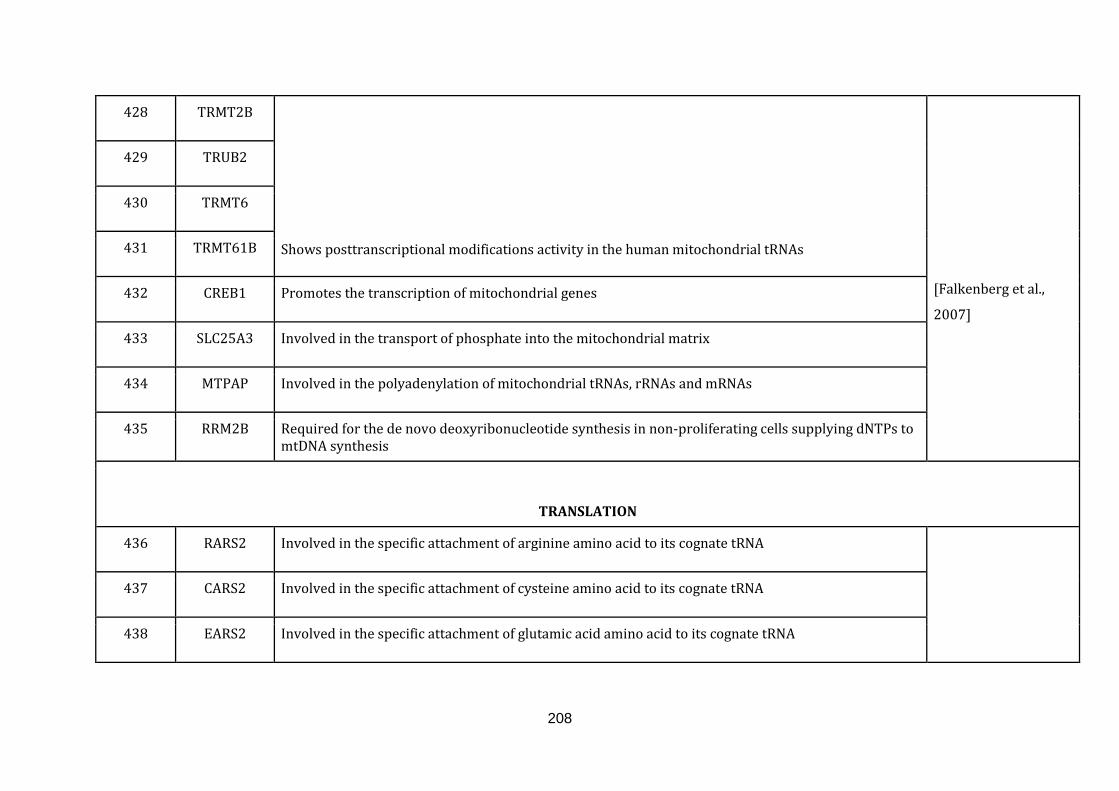
208
428 TRMT2B Shows posttranscriptional modifications activity in the human mitochondrial tRNAs
[Falkenberg et al.,
2007]
429 TRUB2
430 TRMT6
431 TRMT61B
432 CREB1 Promotes the transcription of mitochondrial genes
433 SLC25A3 Involved in the transport of phosphate into the mitochondrial matrix
434 MTPAP Involved in the polyadenylation of mitochondrial tRNAs, rRNAs and mRNAs
435 RRM2B Required for the de novo deoxyribonucleotide synthesis in non-proliferating cells supplying dNTPs to mtDNA synthesis
TRANSLATION
436 RARS2 Involved in the specific attachment of arginine amino acid to its cognate tRNA
437 CARS2 Involved in the specific attachment of cysteine amino acid to its cognate tRNA
438 EARS2 Involved in the specific attachment of glutamic acid amino acid to its cognate tRNA
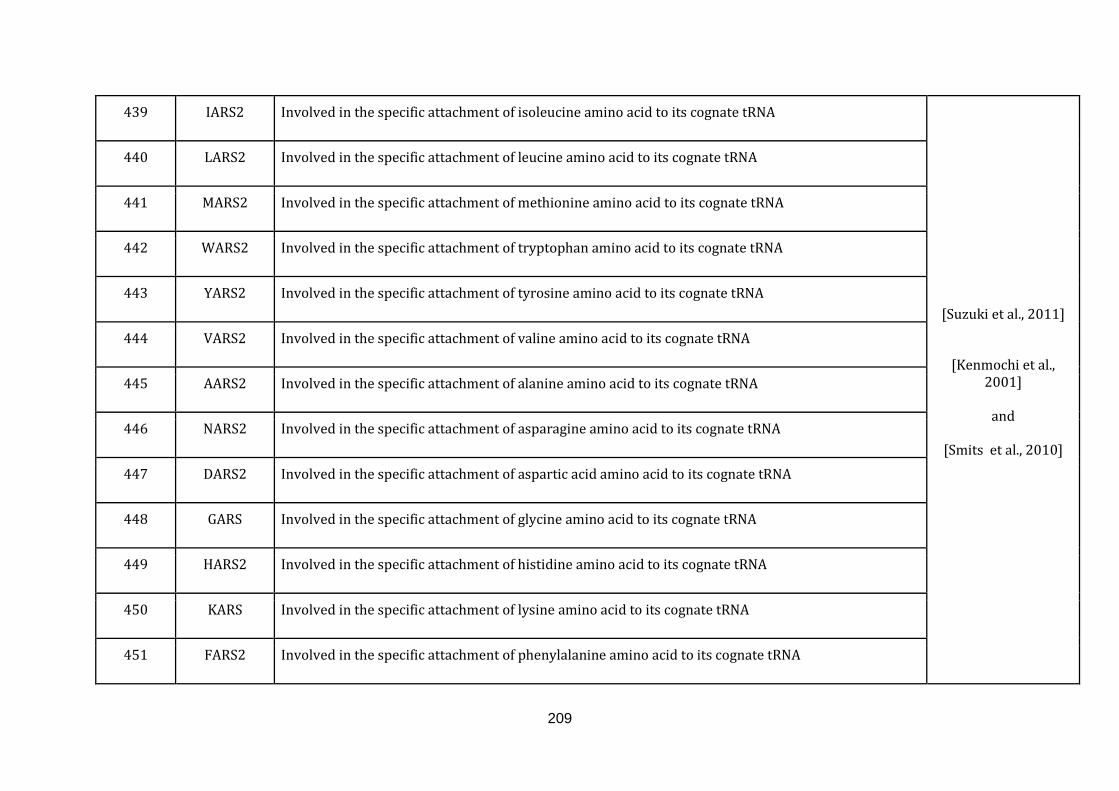
209
439 IARS2 Involved in the specific attachment of isoleucine amino acid to its cognate tRNA
[Suzuki et al., 2011]
[Kenmochi et al., 2001]
and
[Smits et al., 2010]
440 LARS2 Involved in the specific attachment of leucine amino acid to its cognate tRNA
441 MARS2 Involved in the specific attachment of methionine amino acid to its cognate tRNA
442 WARS2 Involved in the specific attachment of tryptophan amino acid to its cognate tRNA
443 YARS2 Involved in the specific attachment of tyrosine amino acid to its cognate tRNA
444 VARS2 Involved in the specific attachment of valine amino acid to its cognate tRNA
445 AARS2 Involved in the specific attachment of alanine amino acid to its cognate tRNA
446 NARS2 Involved in the specific attachment of asparagine amino acid to its cognate tRNA
447 DARS2 Involved in the specific attachment of aspartic acid amino acid to its cognate tRNA
448 GARS Involved in the specific attachment of glycine amino acid to its cognate tRNA
449 HARS2 Involved in the specific attachment of histidine amino acid to its cognate tRNA
450 KARS Involved in the specific attachment of lysine amino acid to its cognate tRNA
451 FARS2 Involved in the specific attachment of phenylalanine amino acid to its cognate tRNA
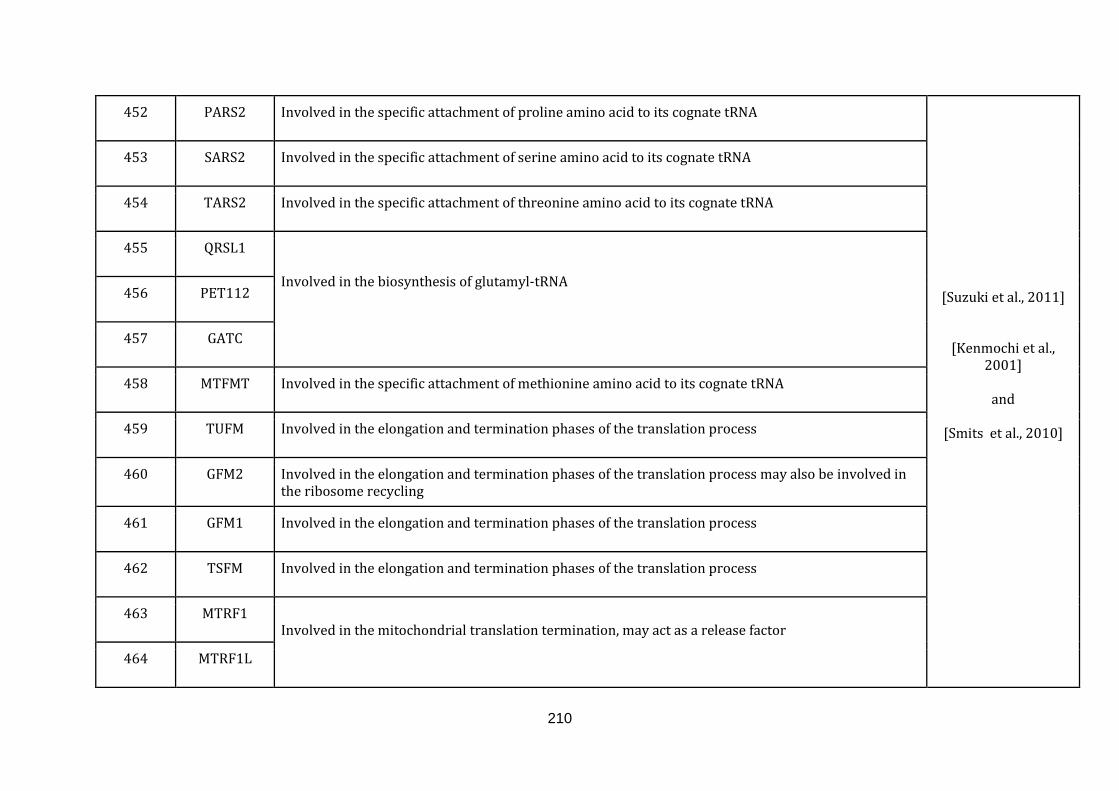
210
452 PARS2 Involved in the specific attachment of proline amino acid to its cognate tRNA
[Suzuki et al., 2011]
[Kenmochi et al., 2001]
and
[Smits et al., 2010]
453 SARS2 Involved in the specific attachment of serine amino acid to its cognate tRNA
454 TARS2 Involved in the specific attachment of threonine amino acid to its cognate tRNA
455 QRSL1
Involved in the biosynthesis of glutamyl-tRNA 456 PET112
457 GATC
458 MTFMT Involved in the specific attachment of methionine amino acid to its cognate tRNA
459 TUFM Involved in the elongation and termination phases of the translation process
460 GFM2 Involved in the elongation and termination phases of the translation process may also be involved in the ribosome recycling
461 GFM1 Involved in the elongation and termination phases of the translation process
462 TSFM Involved in the elongation and termination phases of the translation process
463 MTRF1 Involved in the mitochondrial translation termination, may act as a release factor
464 MTRF1L
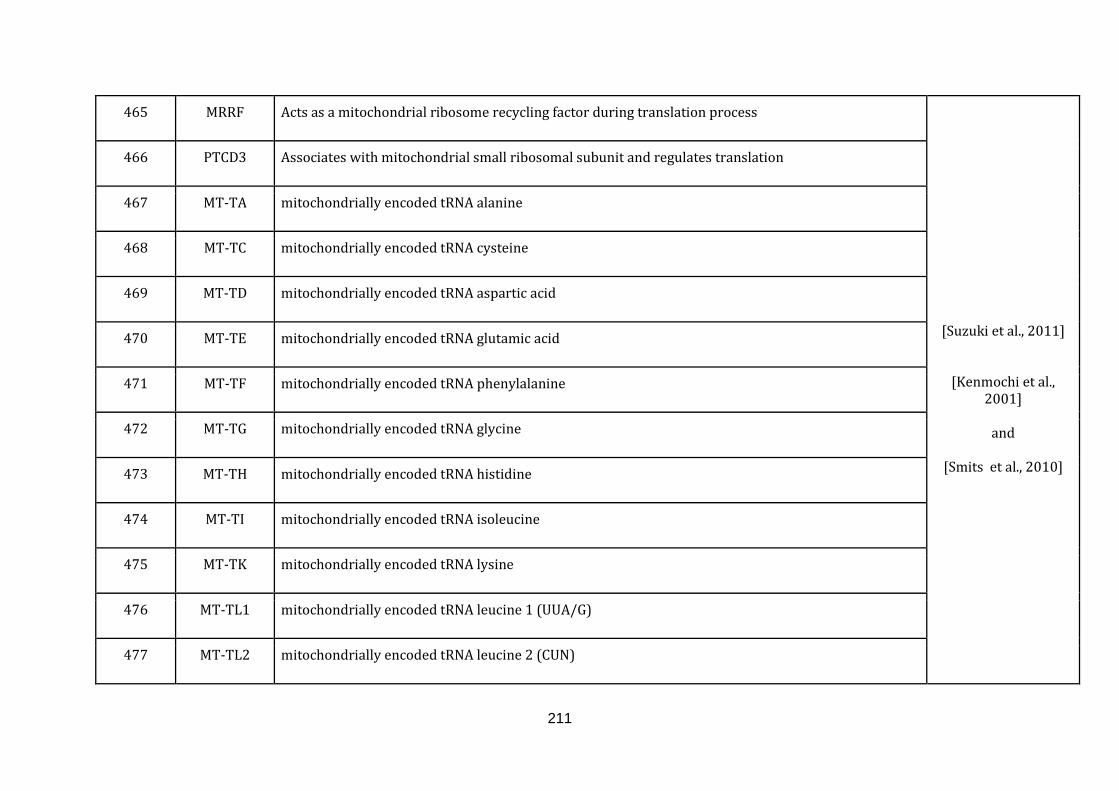
211
465 MRRF Acts as a mitochondrial ribosome recycling factor during translation process
[Suzuki et al., 2011]
[Kenmochi et al., 2001]
and
[Smits et al., 2010]
466 PTCD3 Associates with mitochondrial small ribosomal subunit and regulates translation
467 MT-TA mitochondrially encoded tRNA alanine
468 MT-TC mitochondrially encoded tRNA cysteine
469 MT-TD mitochondrially encoded tRNA aspartic acid
470 MT-TE mitochondrially encoded tRNA glutamic acid
471 MT-TF mitochondrially encoded tRNA phenylalanine
472 MT-TG mitochondrially encoded tRNA glycine
473 MT-TH mitochondrially encoded tRNA histidine
474 MT-TI mitochondrially encoded tRNA isoleucine
475 MT-TK mitochondrially encoded tRNA lysine
476 MT-TL1 mitochondrially encoded tRNA leucine 1 (UUA/G)
477 MT-TL2 mitochondrially encoded tRNA leucine 2 (CUN)
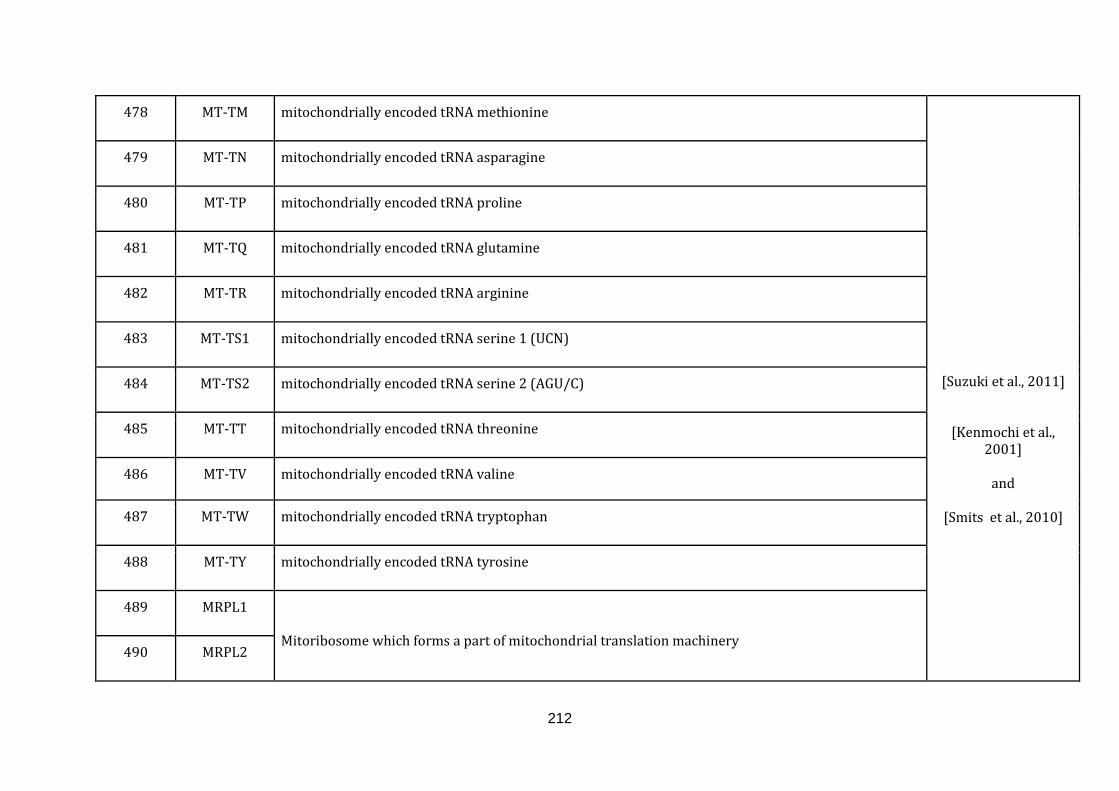
212
478 MT-TM mitochondrially encoded tRNA methionine
[Suzuki et al., 2011]
[Kenmochi et al., 2001]
and
[Smits et al., 2010]
479 MT-TN mitochondrially encoded tRNA asparagine
480 MT-TP mitochondrially encoded tRNA proline
481 MT-TQ mitochondrially encoded tRNA glutamine
482 MT-TR mitochondrially encoded tRNA arginine
483 MT-TS1 mitochondrially encoded tRNA serine 1 (UCN)
484 MT-TS2 mitochondrially encoded tRNA serine 2 (AGU/C)
485 MT-TT mitochondrially encoded tRNA threonine
486 MT-TV mitochondrially encoded tRNA valine
487 MT-TW mitochondrially encoded tRNA tryptophan
488 MT-TY mitochondrially encoded tRNA tyrosine
489 MRPL1
Mitoribosome which forms a part of mitochondrial translation machinery 490 MRPL2
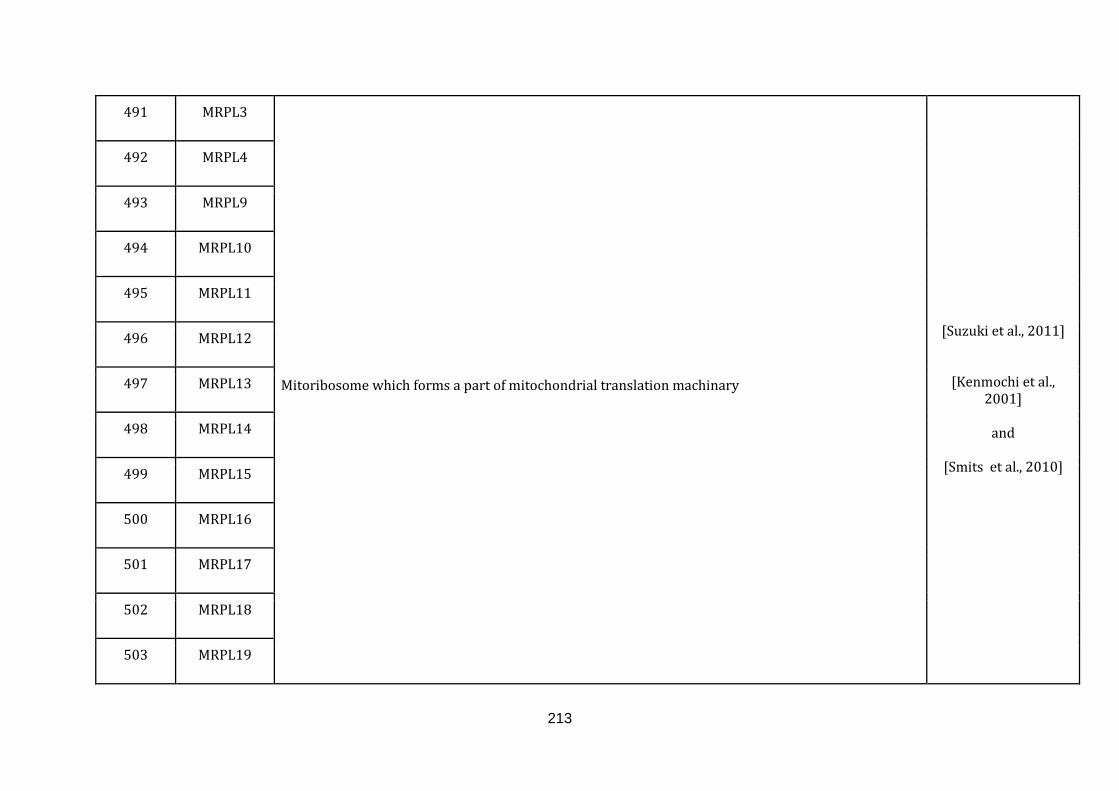
213
491 MRPL3 Mitoribosome which forms a part of mitochondrial translation machinary
[Suzuki et al., 2011]
[Kenmochi et al., 2001]
and
[Smits et al., 2010]
492 MRPL4
493 MRPL9
494 MRPL10
495 MRPL11
496 MRPL12
497 MRPL13
498 MRPL14
499 MRPL15
500 MRPL16
501 MRPL17
502 MRPL18
503 MRPL19
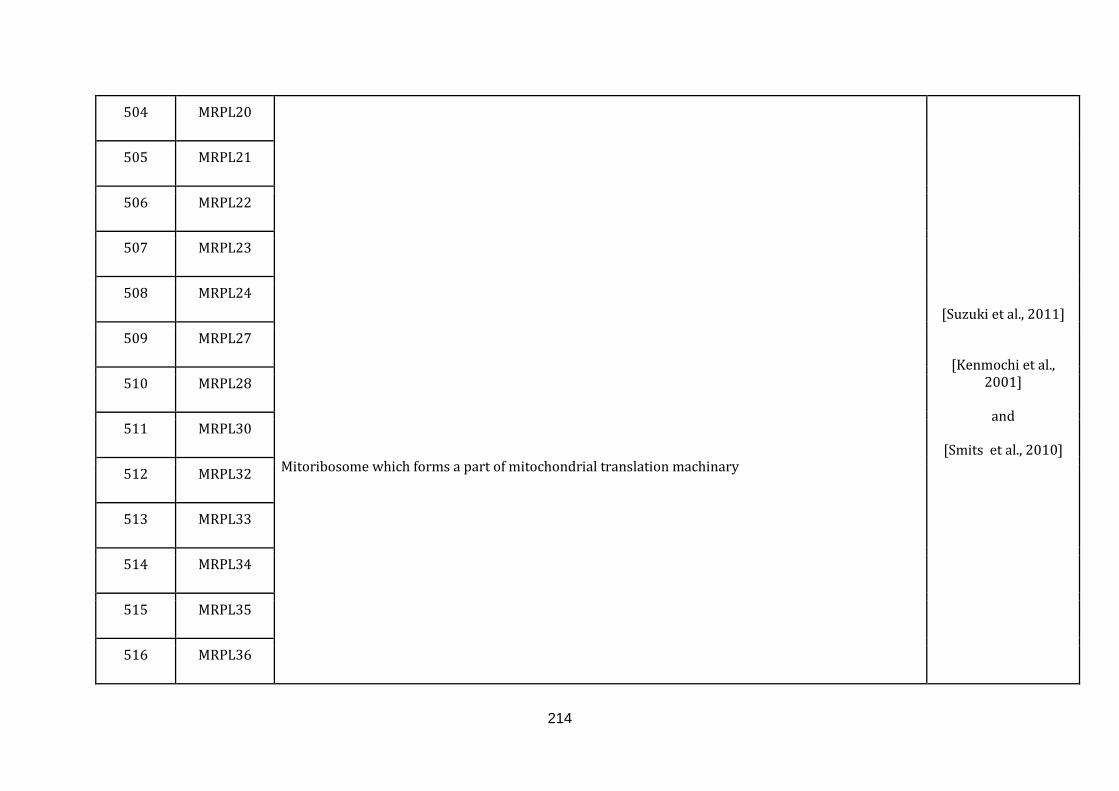
214
504 MRPL20
Mitoribosome which forms a part of mitochondrial translation machinary
[Suzuki et al., 2011]
[Kenmochi et al., 2001]
and
[Smits et al., 2010]
505 MRPL21
506 MRPL22
507 MRPL23
508 MRPL24
509 MRPL27
510 MRPL28
511 MRPL30
512 MRPL32
513 MRPL33
514 MRPL34
515 MRPL35
516 MRPL36
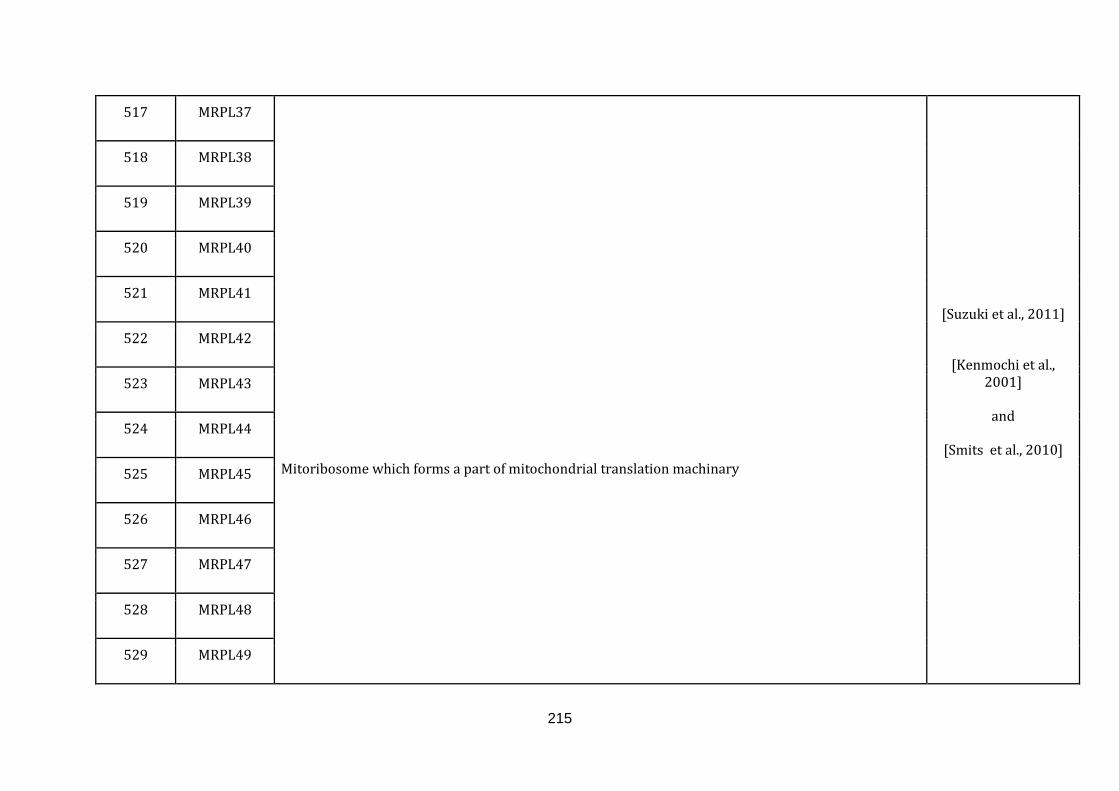
215
517 MRPL37 Mitoribosome which forms a part of mitochondrial translation machinary
[Suzuki et al., 2011]
[Kenmochi et al., 2001]
and
[Smits et al., 2010]
518 MRPL38
519 MRPL39
520 MRPL40
521 MRPL41
522 MRPL42
523 MRPL43
524 MRPL44
525 MRPL45
526 MRPL46
527 MRPL47
528 MRPL48
529 MRPL49
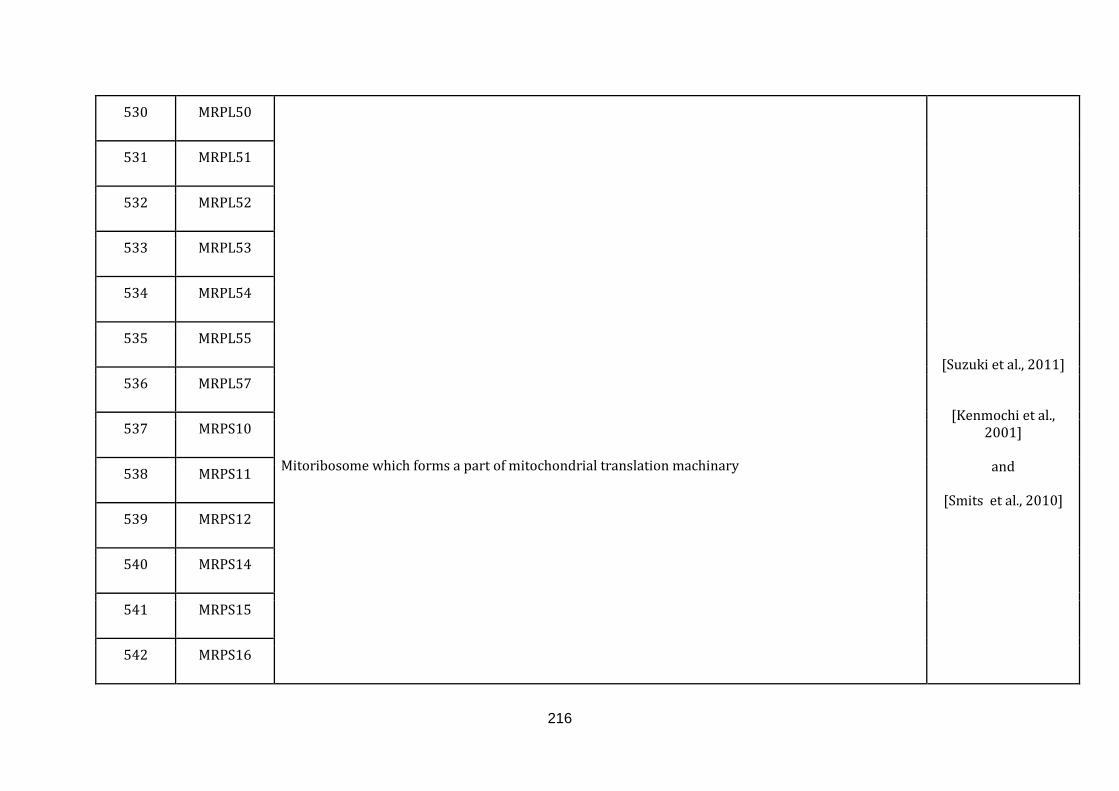
216
530 MRPL50
Mitoribosome which forms a part of mitochondrial translation machinary
[Suzuki et al., 2011]
[Kenmochi et al., 2001]
and
[Smits et al., 2010]
531 MRPL51
532 MRPL52
533 MRPL53
534 MRPL54
535 MRPL55
536 MRPL57
537 MRPS10
538 MRPS11
539 MRPS12
540 MRPS14
541 MRPS15
542 MRPS16
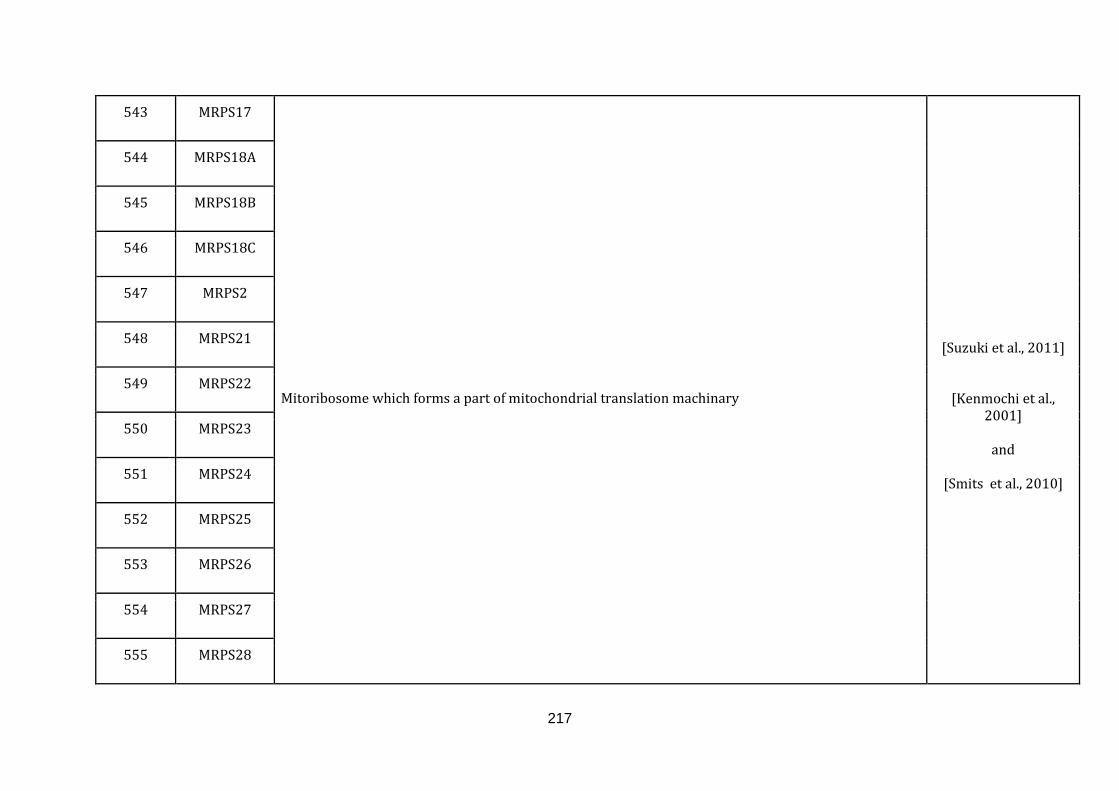
217
543 MRPS17 Mitoribosome which forms a part of mitochondrial translation machinary
[Suzuki et al., 2011]
[Kenmochi et al., 2001]
and
[Smits et al., 2010]
544 MRPS18A
545 MRPS18B
546 MRPS18C
547 MRPS2
548 MRPS21
549 MRPS22
550 MRPS23
551 MRPS24
552 MRPS25
553 MRPS26
554 MRPS27
555 MRPS28
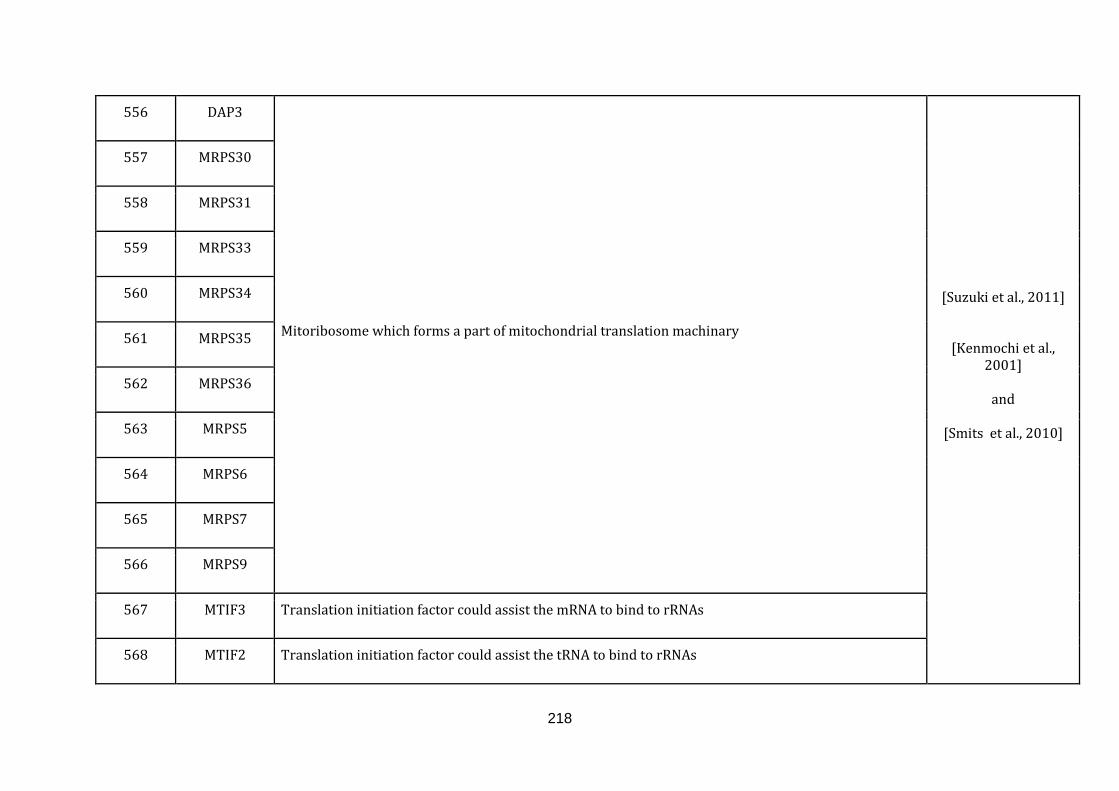
218
556 DAP3 Mitoribosome which forms a part of mitochondrial translation machinary
[Suzuki et al., 2011]
[Kenmochi et al., 2001]
and
[Smits et al., 2010]
557 MRPS30
558 MRPS31
559 MRPS33
560 MRPS34
561 MRPS35
562 MRPS36
563 MRPS5
564 MRPS6
565 MRPS7
566 MRPS9
567 MTIF3 Translation initiation factor could assist the mRNA to bind to rRNAs
568 MTIF2 Translation initiation factor could assist the tRNA to bind to rRNAs
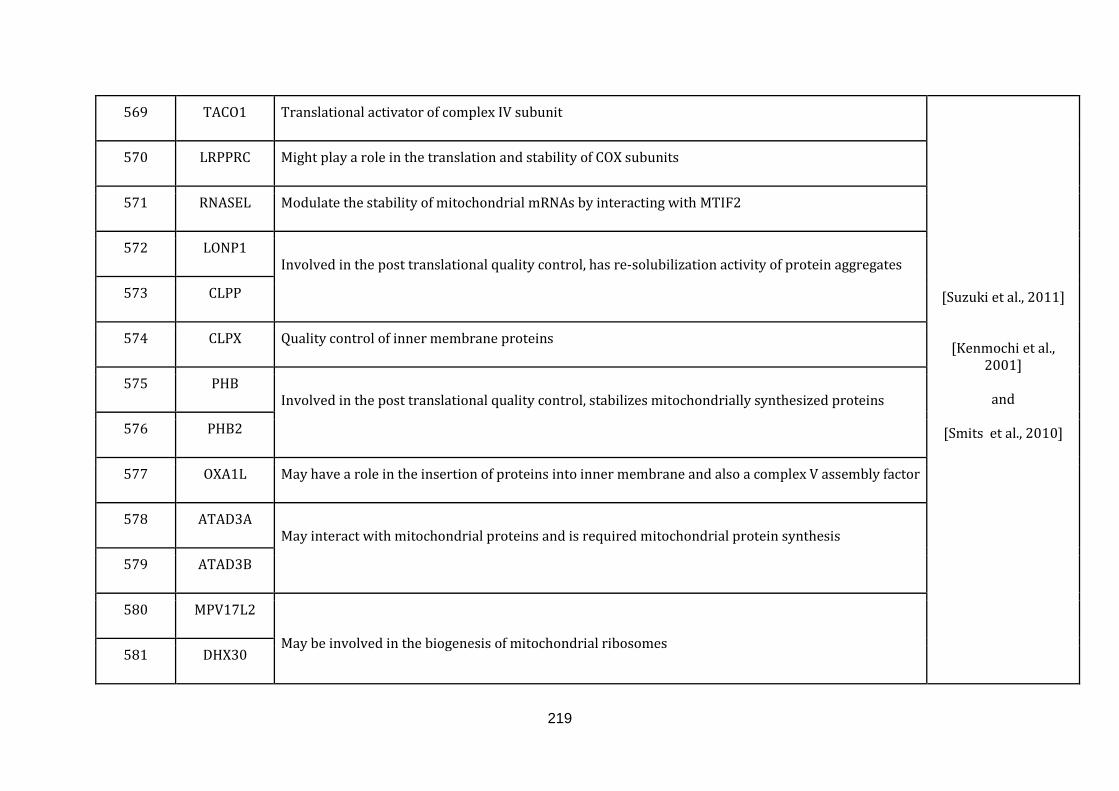
219
569 TACO1 Translational activator of complex IV subunit
[Suzuki et al., 2011]
[Kenmochi et al., 2001]
and
[Smits et al., 2010]
570 LRPPRC Might play a role in the translation and stability of COX subunits
571 RNASEL Modulate the stability of mitochondrial mRNAs by interacting with MTIF2
572 LONP1 Involved in the post translational quality control, has re-solubilization activity of protein aggregates
573 CLPP
574 CLPX Quality control of inner membrane proteins
575 PHB Involved in the post translational quality control, stabilizes mitochondrially synthesized proteins
576 PHB2
577 OXA1L May have a role in the insertion of proteins into inner membrane and also a complex V assembly factor
578 ATAD3A May interact with mitochondrial proteins and is required mitochondrial protein synthesis
579 ATAD3B
580 MPV17L2 May be involved in the biogenesis of mitochondrial ribosomes
581 DHX30
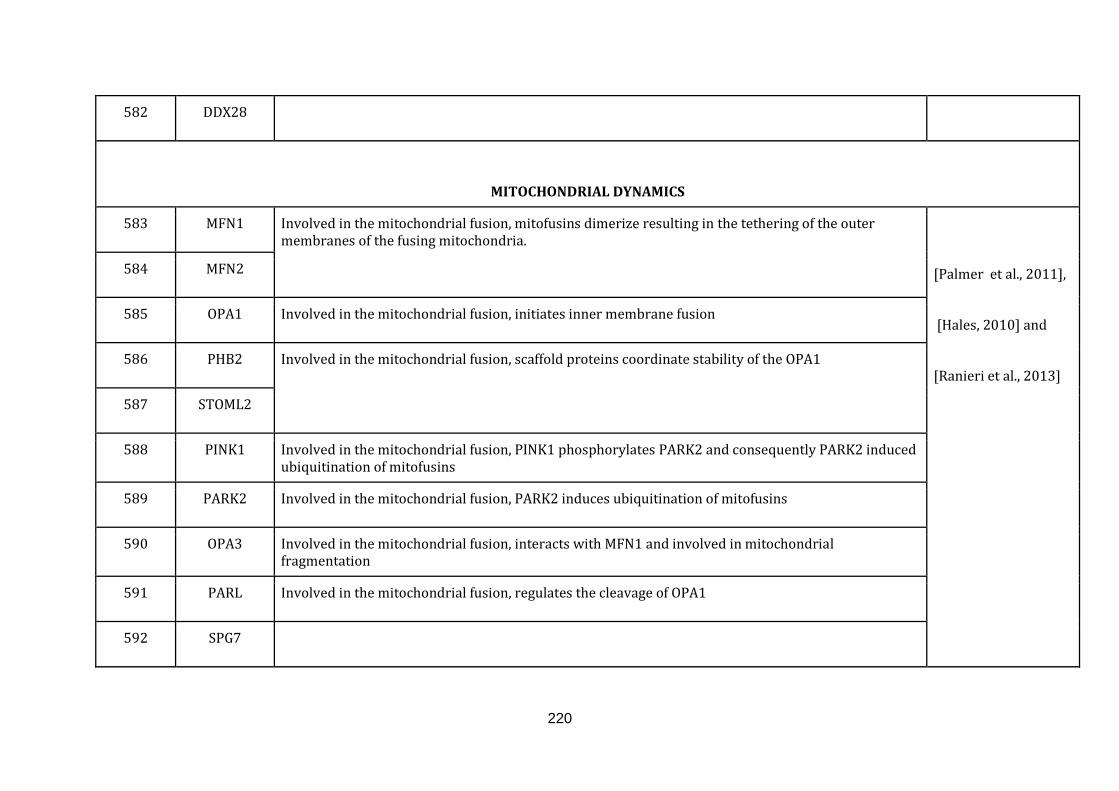
220
582 DDX28
MITOCHONDRIAL DYNAMICS
583 MFN1 Involved in the mitochondrial fusion, mitofusins dimerize resulting in the tethering of the outer membranes of the fusing mitochondria.
[Palmer et al., 2011],
[Hales, 2010] and
[Ranieri et al., 2013]
584 MFN2
585 OPA1 Involved in the mitochondrial fusion, initiates inner membrane fusion
586 PHB2 Involved in the mitochondrial fusion, scaffold proteins coordinate stability of the OPA1
587 STOML2
588 PINK1 Involved in the mitochondrial fusion, PINK1 phosphorylates PARK2 and consequently PARK2 induced ubiquitination of mitofusins
589 PARK2 Involved in the mitochondrial fusion, PARK2 induces ubiquitination of mitofusins
590 OPA3 Involved in the mitochondrial fusion, interacts with MFN1 and involved in mitochondrial fragmentation
591 PARL Involved in the mitochondrial fusion, regulates the cleavage of OPA1
592 SPG7

221
593 AFG3L2 Involved in the mitochondrial fusion, known to maintain the OPA1 isoforms
[Palmer et al., 2011],
[Hales, 2010] and
[Ranieri et al., 2013]
594 OMA1 Involved in the mitochondrial fusion, known to induce proteolytic inactivation of OPA1
595 YME1L1 Involved in the mitochondrial fusion, known to cleave OPA1
596 PLD6 Involved in the mitochondrial fusion, promotes mitofusin-mediated fusion
597 MARCH5 Involved in the mitochondrial fusion and fission, control of mitochondrial morphology by regulating MFN2 and DNM1L
598 TRAP1 Involved in the mitochondrial fission, known to regulate fission proteins DNM1L and MFF
599 DNM1L Involved in the mitochondrial fission, mediates the division of mitochondria
600 MFF Involved in the mitochondrial fission, suggested to have roles in recruiting DNM1L 601 MIEF1
602 MIEF2
603 FIS1 Involved in the mitochondrial fission, facilitates binding and assembly of DNM1L
604 MTFP1 Involved in the mitochondrial fission, role in mitochondrial fragmentation and is dependent on DNM1L expression
605 GDAP1 Involved in the mitochondrial fission, know to have a role in the mitochondrial fragmentation
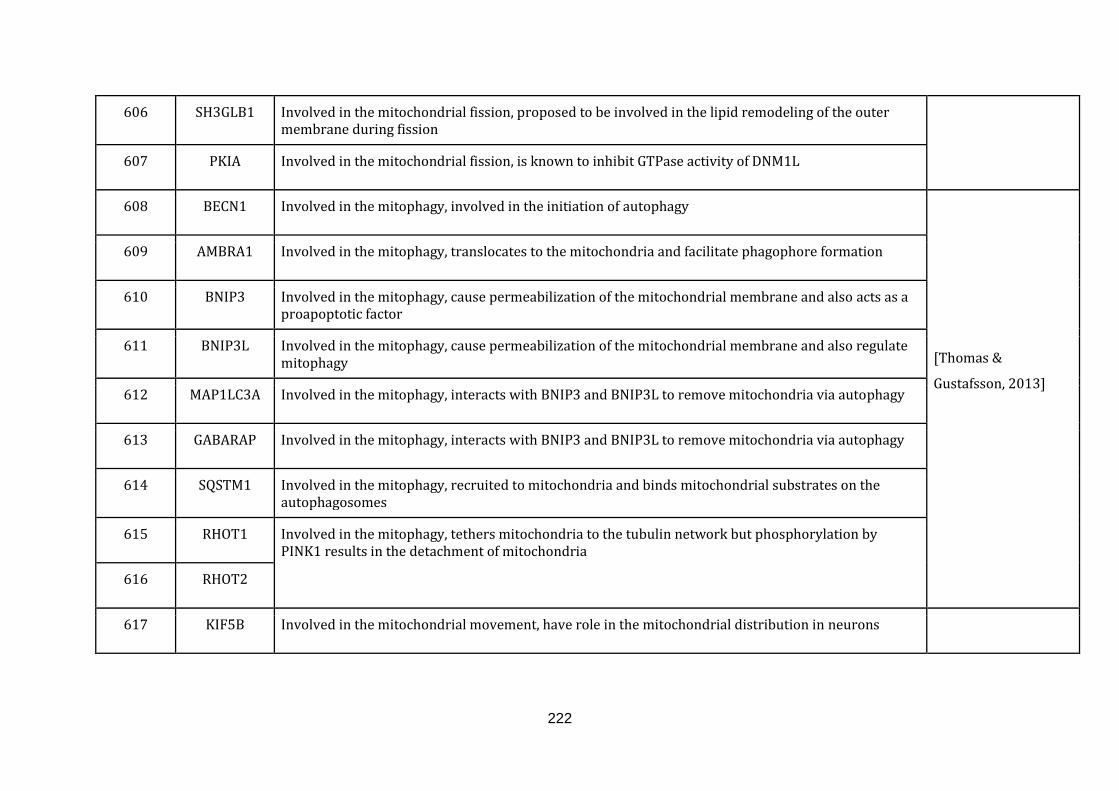
222
606 SH3GLB1 Involved in the mitochondrial fission, proposed to be involved in the lipid remodeling of the outer membrane during fission
607 PKIA Involved in the mitochondrial fission, is known to inhibit GTPase activity of DNM1L
608 BECN1 Involved in the mitophagy, involved in the initiation of autophagy
[Thomas &
Gustafsson, 2013]
609 AMBRA1 Involved in the mitophagy, translocates to the mitochondria and facilitate phagophore formation
610 BNIP3 Involved in the mitophagy, cause permeabilization of the mitochondrial membrane and also acts as a proapoptotic factor
611 BNIP3L Involved in the mitophagy, cause permeabilization of the mitochondrial membrane and also regulate mitophagy
612 MAP1LC3A Involved in the mitophagy, interacts with BNIP3 and BNIP3L to remove mitochondria via autophagy
613 GABARAP Involved in the mitophagy, interacts with BNIP3 and BNIP3L to remove mitochondria via autophagy
614 SQSTM1 Involved in the mitophagy, recruited to mitochondria and binds mitochondrial substrates on the autophagosomes
615 RHOT1 Involved in the mitophagy, tethers mitochondria to the tubulin network but phosphorylation by PINK1 results in the detachment of mitochondria
616 RHOT2
617 KIF5B Involved in the mitochondrial movement, have role in the mitochondrial distribution in neurons
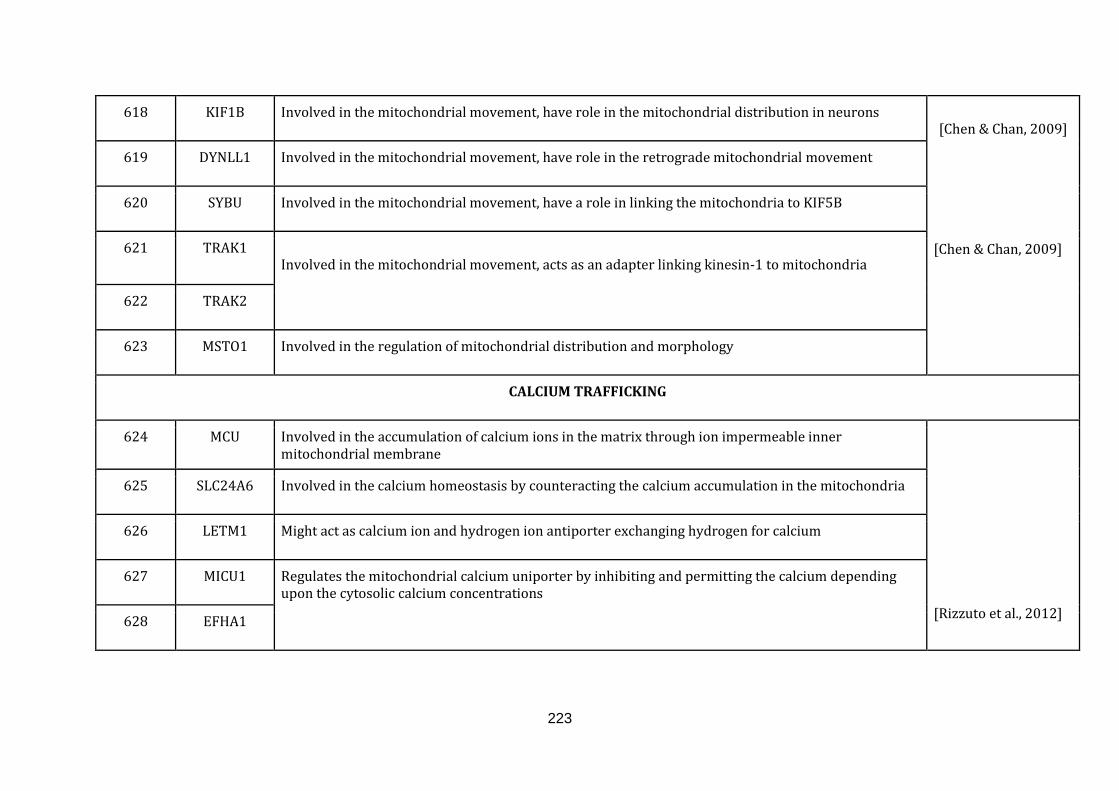
223
618 KIF1B Involved in the mitochondrial movement, have role in the mitochondrial distribution in neurons [Chen & Chan, 2009]
[Chen & Chan, 2009]
619 DYNLL1 Involved in the mitochondrial movement, have role in the retrograde mitochondrial movement
620 SYBU Involved in the mitochondrial movement, have a role in linking the mitochondria to KIF5B
621 TRAK1 Involved in the mitochondrial movement, acts as an adapter linking kinesin-1 to mitochondria
622 TRAK2
623 MSTO1 Involved in the regulation of mitochondrial distribution and morphology
CALCIUM TRAFFICKING
624 MCU Involved in the accumulation of calcium ions in the matrix through ion impermeable inner mitochondrial membrane
[Rizzuto et al., 2012]
625 SLC24A6 Involved in the calcium homeostasis by counteracting the calcium accumulation in the mitochondria
626 LETM1 Might act as calcium ion and hydrogen ion antiporter exchanging hydrogen for calcium
627 MICU1 Regulates the mitochondrial calcium uniporter by inhibiting and permitting the calcium depending upon the cytosolic calcium concentrations
628 EFHA1
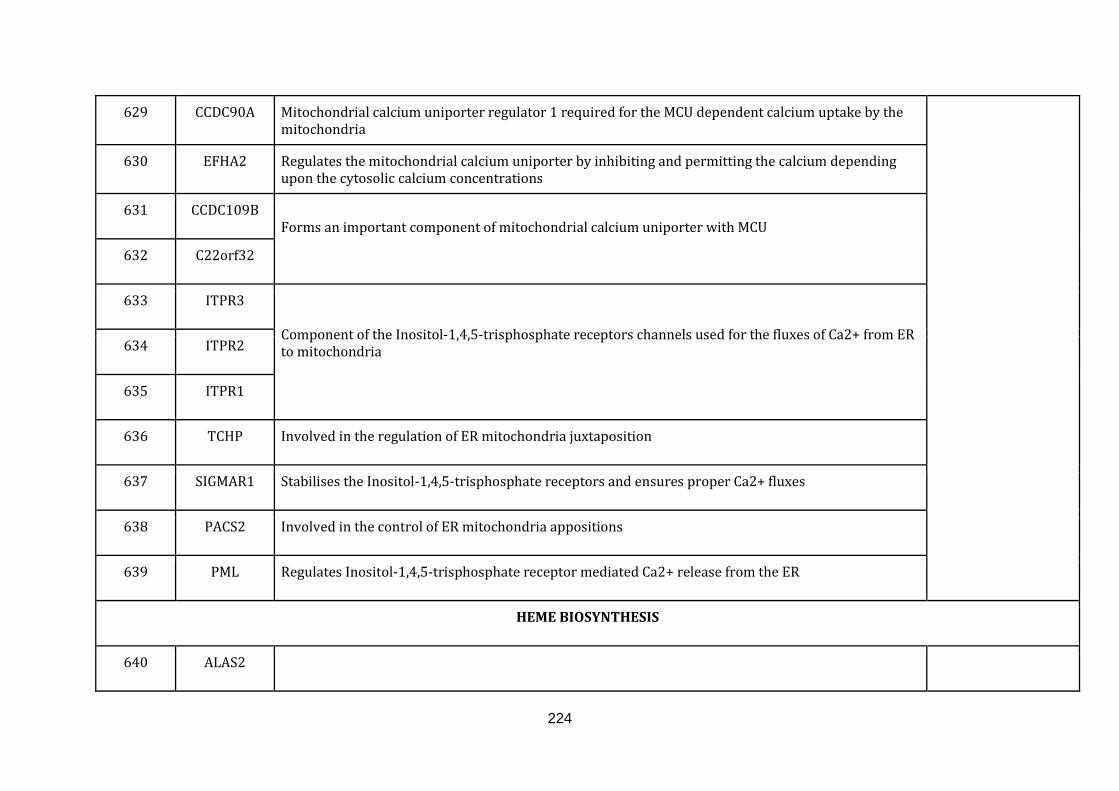
224
629 CCDC90A Mitochondrial calcium uniporter regulator 1 required for the MCU dependent calcium uptake by the mitochondria
630 EFHA2 Regulates the mitochondrial calcium uniporter by inhibiting and permitting the calcium depending upon the cytosolic calcium concentrations
631 CCDC109B Forms an important component of mitochondrial calcium uniporter with MCU
632 C22orf32
633 ITPR3 Component of the Inositol-1,4,5-trisphosphate receptors channels used for the fluxes of Ca2+ from ER to mitochondria 634 ITPR2
635 ITPR1
636 TCHP Involved in the regulation of ER mitochondria juxtaposition
637 SIGMAR1 Stabilises the Inositol-1,4,5-trisphosphate receptors and ensures proper Ca2+ fluxes
638 PACS2 Involved in the control of ER mitochondria appositions
639 PML Regulates Inositol-1,4,5-trisphosphate receptor mediated Ca2+ release from the ER
HEME BIOSYNTHESIS
640 ALAS2
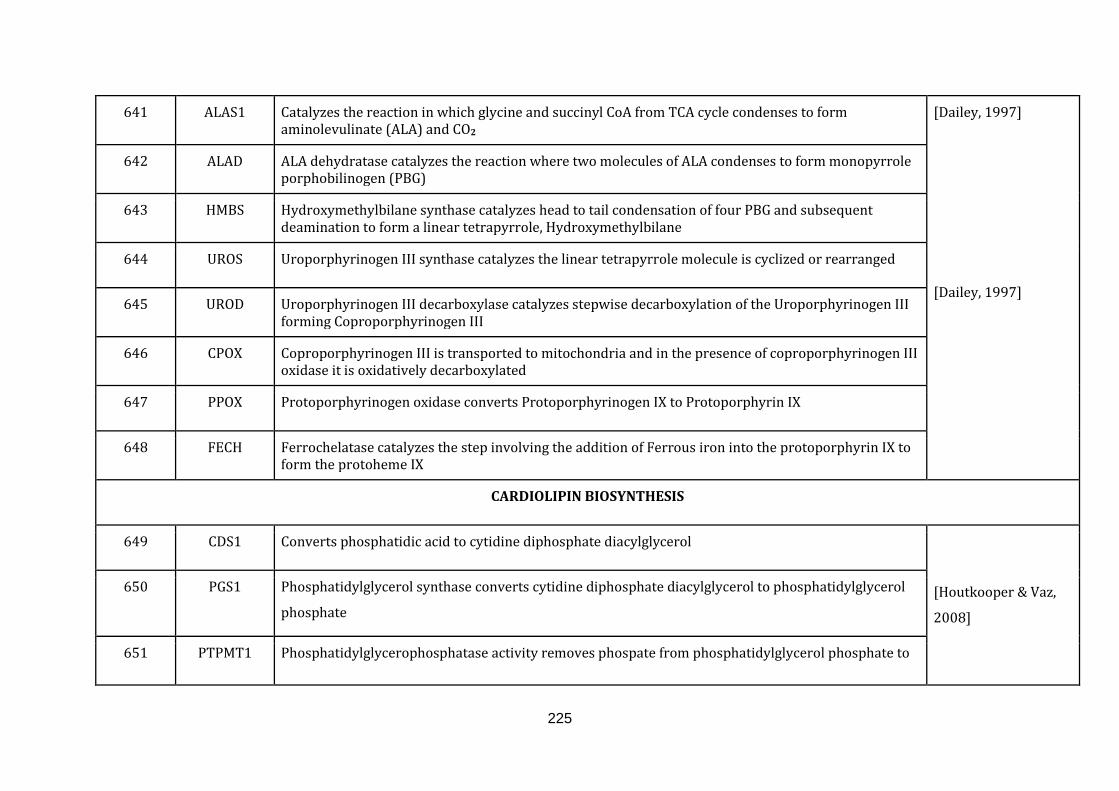
225
641 ALAS1 Catalyzes the reaction in which glycine and succinyl CoA from TCA cycle condenses to form aminolevulinate (ALA) and CO2
[Dailey, 1997]
[Dailey, 1997]
642 ALAD ALA dehydratase catalyzes the reaction where two molecules of ALA condenses to form monopyrrole porphobilinogen (PBG)
643 HMBS Hydroxymethylbilane synthase catalyzes head to tail condensation of four PBG and subsequent deamination to form a linear tetrapyrrole, Hydroxymethylbilane
644 UROS Uroporphyrinogen III synthase catalyzes the linear tetrapyrrole molecule is cyclized or rearranged
645 UROD Uroporphyrinogen III decarboxylase catalyzes stepwise decarboxylation of the Uroporphyrinogen III forming Coproporphyrinogen III
646 CPOX Coproporphyrinogen III is transported to mitochondria and in the presence of coproporphyrinogen III oxidase it is oxidatively decarboxylated
647 PPOX Protoporphyrinogen oxidase converts Protoporphyrinogen IX to Protoporphyrin IX
648 FECH Ferrochelatase catalyzes the step involving the addition of Ferrous iron into the protoporphyrin IX to form the protoheme IX
CARDIOLIPIN BIOSYNTHESIS
649 CDS1 Converts phosphatidic acid to cytidine diphosphate diacylglycerol
[Houtkooper & Vaz,
2008]
650 PGS1 Phosphatidylglycerol synthase converts cytidine diphosphate diacylglycerol to phosphatidylglycerol
phosphate
651 PTPMT1
Phosphatidylglycerophosphatase activity removes phospate from phosphatidylglycerol phosphate to
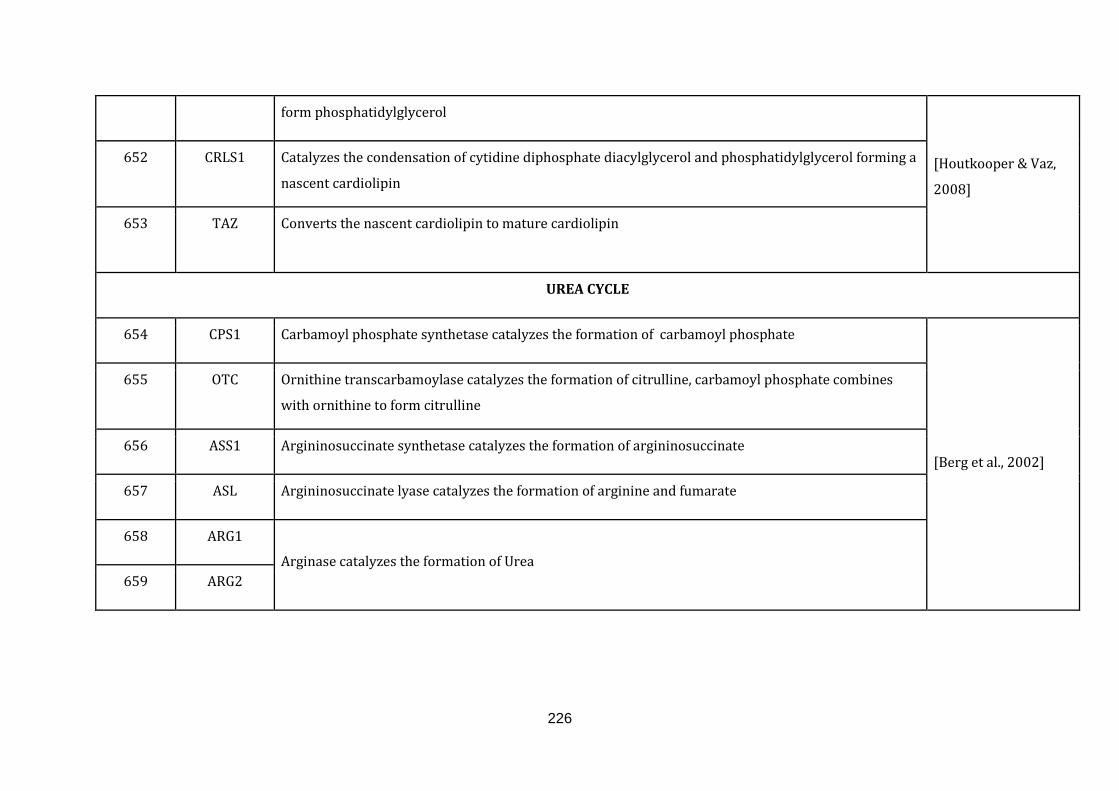
226
form phosphatidylglycerol
[Houtkooper & Vaz,
2008]
652 CRLS1 Catalyzes the condensation of cytidine diphosphate diacylglycerol and phosphatidylglycerol forming a
nascent cardiolipin
653 TAZ Converts the nascent cardiolipin to mature cardiolipin
UREA CYCLE
654 CPS1 Carbamoyl phosphate synthetase catalyzes the formation of carbamoyl phosphate
[Berg et al., 2002]
655 OTC Ornithine transcarbamoylase catalyzes the formation of citrulline, carbamoyl phosphate combines
with ornithine to form citrulline
656 ASS1 Argininosuccinate synthetase catalyzes the formation of argininosuccinate
657 ASL Argininosuccinate lyase catalyzes the formation of arginine and fumarate
658 ARG1
Arginase catalyzes the formation of Urea
659 ARG2
Top Related