-PDBMJUZ1PQVMBUJPO4OBQTIPU 8FTUVDLMBOE...Auckland Whānau Direct area’s population has been...
64
Te Pou Matakana COMMISSIONING AGENCY West Auckland Locality Population Snapshot
Transcript of -PDBMJUZ1PQVMBUJPO4OBQTIPU 8FTUVDLMBOE...Auckland Whānau Direct area’s population has been...

Level 4, Whānau Centre I 6-8 Pioneer Steet, Henderson, Auckland, New ZealandPostal I PO Box 21 081, Henderson, Auckland 0650. New Zealand I Phone 0800 929 282
www.tepoumatakana.com
Te Pou Matakana COMMISSIONING AGENCY
Te Pou Matakana
STAND TALL - STAND STRONG - STAND VIGILANT
KIA TU - KIA OHO - KIA MATAARA
COMMISSIONING AGENCY W
est Auckland Locality Population SnapshotTE PO
U M
ATAKANA
West AucklandLocality Population Snapshot
Locality Population SnapshotWest Auckland
© 2014 Te Pou MatakanaALL RIGHTS RESERVED. Any unauthorised copy, reprint or use of this material is prohibited. No part of this content may be reproduced or transmitted in any form or by any means, electronic or mechanical, including photocopying, recording, or by any information storage and retrieval system without express written permission fromTe Pou Matakana.
ISBN 978-0-473-31576-4 July 2014
Locality Population Snapshot West Auckland Produced by:
Dr John HuakauWaipareira TuararoTe Whānau o Waipareira, Research Unit.
First printed July 2014Second edition July 2016

LOCALITY POPULATION SNAPSHOT WEST AUCKLAND - 1 -
Te Pou Matakana STAND TALL - STAND STRONG - STAND VIGILANT
KIA TU - KIA OHO - KIA MATAARACOMMISSIONING AGENCY
Table of Contents
SECTION 1. EXECUTIVE SUMMARY 3
Introduction...................................................................................................................................3
Demographics ..............................................................................................................................3
Socioeconomics Status .............................................................................................................4
Health Status .................................................................................................................................5
Cigarette smoking ...........................................................................................................5
Mortality ..............................................................................................................................5
Hospitalisations ................................................................................................................5
SECTION 2. DEMOGRAPHICS 7
2.1 Introduction .......................................................................................................................7
2.2 Definition of the Whānau Direct Population ........................................................7
2.3 Whānau Direct Population by Local Board Area .................................................8
2.4 Māori Descent ...................................................................................................................8
2.5 Languages Spoken, Te Reo Māori ..............................................................................9
2.6 Iwi Affiliation ......................................................................................................................9 a. West Auckland .......................................................................................................9 b. Whānau Direct Total .........................................................................................10
2.7 Māori Ethnicity, Census 2013 ...................................................................................10
2.8 Whānau Direct Population by Ethnic groups, 2006 and 2013 ....................12 a. West Auckland ....................................................................................................12 b. Whānau Direct Total .........................................................................................12
2. 9 Population by Age Group and Ethnicity ..............................................................13 a. West Auckland ....................................................................................................13 b. Whānau Direct Total .........................................................................................14
SECTION 3. SOCIOECONOMIC STATUS 17
3.1 Education – No Qualification ...................................................................................17
3.2 Education – Bachelor Degree or Higher ..............................................................17
3.3 Unemployment..............................................................................................................18
3.4 Personal Income ............................................................................................................18
3.5 People Receiving Unemployment Benefit .........................................................19
3.6 People Receiving Domestic Purposes Benefit (DPB) ......................................19
3.7 People Receiving Sickness Benefit .........................................................................20
3.8 Nature of Occupancy of Households ....................................................................20
3.9 Households without a Car .........................................................................................21

- 2 - LOCALITY POPULATION SNAPSHOT WEST AUCKLAND
Te Pou Matakana STAND TALL - STAND STRONG - STAND VIGILANT
KIA TU - KIA OHO - KIA MATAARACOMMISSIONING AGENCY
3.10 Households without any Telecommunication Access ...................................21
3.11 Households with Telephone Access ......................................................................22
3.12 Households with Mobile Access .............................................................................22
3.13 Households with Internet Access ...........................................................................23
3.14 Household Income .......................................................................................................23
3.15 Heating Fuels Used .......................................................................................................24
3.16 Unpaid Activity ..............................................................................................................24
3.17 Population by Deprivation ........................................................................................25 a. West Auckland ....................................................................................................25 b. Whānau Direct Total .........................................................................................27
SECTION 4. HEALTH STATUS 31
4.1 Regular Smokers, Census 2006 and 2013 ...........................................................31
4.2 Mortality, 2008 to 2010 ...............................................................................................32 a. West Auckland ....................................................................................................32 b. Whānau Direct Total .........................................................................................34
4.3 Potentially Avoidable Mortality (PAM), 2008 to 2010 .....................................36 a. West Auckland ....................................................................................................36 b. Whānau Direct Total .........................................................................................39
4.4 Hospital Utilisation, 2012 to 2013 ..........................................................................42 a. West Auckland ....................................................................................................42 b. Whānau Direct Total .........................................................................................44
4.5 Potentially Avoidable Hospitalisation (PAH), 2012 to 2013 .........................46 a. West Auckland ....................................................................................................46 b. Whānau Direct Total .........................................................................................49
APPENDIX A: POPULATION BY AGE AND ETHNICITY FOR NEW ZEALAND, CENSUS 2013 53
APPENDIX B: POPULATION BY AGE AND ETHNICITY FOR THE WHĀNAU DIRECT AREA, CENSUS 2013 55
APPENDIX C: POPULATION BY AGE AND ETHNICITY FOR WEST AUCKLAND WHĀNAU DIRECT AREA, CENSUS 2013 57
APPENDIX D: POPULATION BY AGE AND ETHNICITY FOR SOUTH AUCKLAND WHĀNAU DIRECT AREA, CENSUS 2013 59
Table of Contents continued

LOCALITY POPULATION SNAPSHOT WEST AUCKLAND - 3 -
Te Pou Matakana STAND TALL - STAND STRONG - STAND VIGILANT
KIA TU - KIA OHO - KIA MATAARACOMMISSIONING AGENCY
Section 1. Executive Summary
Introduction
The goal of the Whānau Direct programme was to develop an agile and responsive initiative, capable
of meeting whānau-determined need and /or opportunity in a timely fashion and to support growth in
whānau’s own unique trajectories on the Whānau Ora continuum. A test of the Whānau Direct programme
took place within the two geographical areas of West Auckland and South Auckland. The West Auckland
area was defined as the combined populations of the Henderson-Massey, Waitakere Ranges and Whau
Local Board areas and the South Auckland area was defined as the combined populations of the Mangere-
Otahuhu, Manurewa, Otara-Papatoetoe and Papakura Local Board areas.
This demographic profile and health status snapshot of the West Auckland Whānau Direct area’s population
describes the demographics, socioeconomics and health status as reported by the usually resident
population from the 2013 Census. A separate demographic profile and health status snapshot of the South
Auckland Whānau Direct area’s population has been produced as a companion to this document.
Demographics
In 2013:
• 45%(228,675)ofthetotalWhānauDirectpopulationlivedintheWestAucklandarea,withthe
Henderson-MasseyLocalBoardhavingthelargestpopulation(107,682or21%)ofallLocalBoardsinthe
Whānau Direct area.
• Aroundoneintwenty(5%or30,654)ofthetotalNewZealandMāoridescentpopulation(668,721)
wereresidentintheWestAucklandWhānauDirectareaandone-quarter(25%or167,262)oftotalNew
ZealandMāoridescentpopulationwereresidentintheAucklandregion.
• ForMāoriintheWestAucklandWhānauDirectareathefivemostcommoniwiaffiliationswerewith
Ngāpuhi(34.5%),NgātiPorou(9.2%),TeRarawa(6.2%),NgātiWhātua(5.2%)andWaikato(5%).
• Around3%(5,880)oftheWestAucklandWhānauDirectpopulationspokeTeReoMāoricomparedwith
2%(31,590)and4%(148,395)fortheAucklandregionandtotalNewZealandpopulation.
• Around12%(27,396)oftheWestAucklandWhānauDirectareapopulationidentifiedwithMāori
ethnicity,14%(32,193)withPacificethnicgroups,21%(48,399)withAsianethnicgroups,44%(99,903)
withEuropeanethnicgroupsand9%(20,784)withOtherethnicgroups.
• Aroundoneinfive(22%)oftheWestAucklandWhānauDirectareapopulationwerechildrenaged14
yearsandunder.Olderpeopleaged65yearsandovermadeup11%ofthepopulation.
- 4 - LOCALITY POPULATION SNAPSHOT WEST AUCKLAND
Te Pou Matakana STAND TALL - STAND STRONG - STAND VIGILANT
KIA TU - KIA OHO - KIA MATAARACOMMISSIONING AGENCY
Section 1. Executive Summary continued
Socioeconomics Status
In 2013:
• Māori(28%)andPacific(26%)adultsintheWestAucklandWhānauDirectareahadhigherproportions
withnoformalqualificationcomparedtoadultsfromAsian(12%),European(19%)andOther(14%)
ethnic groups.
• Māori(16%)andPacific(12%)adultsintheWestAucklandWhānauDirectareahadlowerproportions
withaBachelordegreeorhighercomparedtoadultsfromAsian(38%),European(27%)andOther(31%)
ethnic groups.
• Māori(11%)andPacific(10%)adultswithintheWestAucklandWhānauDirectareahadhigherratesof
unemploymentcomparedtoadultsfromAsian(6%),European(5%)andOther(9%)ethnicgroups.
• Māori(43%)withintheWestAucklandWhānauDirectareahadalowerproportionofadultswith
personalincomeof$30,000ormoreperannumcomparedtoadultsfromEuropean(52%)andOther
(44%)ethnicgroups.
• WestAucklandWhānauDirectarearatesofdwellingnon-ownershipwerehigherforMāori(56%)and
Pacific(60%)householdscomparedtoAsian(33%),European(29%)andOther(50%)ethnicgroup
households.
• WestAucklandWhānauDirectarearatesof‘noaccesstoamotorvehicle’werehigherforMāori(8%)
andPacific(6%)householdscomparedtoAsian(3%),European(4%)andOther(4%)ethnicgroup
households.
• WestAucklandWhānauDirectarearatesof‘noaccesstotelecommunications’werehigherforMāori
(3%)andPacific(2%)householdscomparedtoAsian(1%),European(1%)andOther(1%)ethnicgroup
households.
• WestAucklandWhānauDirectareaMāori(54%)andPacific(51%)householdshadlowerproportions
ofhouseholdswithanincomeof$50,000ormoreperannumcomparedtoAsian(60%)andEuropean
(67%)households.
• IntheWestAucklandWhānauDirectareatheproportionsofMāori(45%)andPacific(43%)peoplewho
reported undertaking the unpaid activities of looking after a child, or someone who was ill, or someone
whohadadisabilitywereslightlyhigherthanforAsian(33%),European(38%)andOther(38%)ethnic
group households.
• In2006and2013,morethanaquarter(26%inbothyears)oftheMāoripopulationandmorethan
one-third(36%and34%)ofthePacificpopulationwereresidentinthemostdeprived(quintilefive(Q5))
mesh blocks of the West Auckland Whānau Direct area.

LOCALITY POPULATION SNAPSHOT WEST AUCKLAND - 5 -
Te Pou Matakana STAND TALL - STAND STRONG - STAND VIGILANT
KIA TU - KIA OHO - KIA MATAARACOMMISSIONING AGENCY
Health status
Cigarette smoking
In2013,withintheWestAucklandWhānauDirectarea,Māori(30%)andPacific(20%)adultshadhigherrates
ofregularcigarettesmokingcomparedwithAsian(7%),European(15%)andOther(12%)ethnicgroups.
Mortality
For the three years from 2008 to 2010:
• ForthetotalWestAucklandWhānauDirectareapopulationtherewere3,509deathsinthethreeyears
from2008to2010.Ofthesedeaths,closetosixoutoften(57%)wereelderlypeopleaged75yearsand
overandonly3%wereyoungpeopleaged24yearsandunder.
• FortheMāoriWestAucklandWhānauDirectareapopulationinthethreeyearsfrom2008to2010,there
were285deaths.Ofthesedeaths,aroundoneinfive(22%)wereelderlypeopleaged75yearsandover
and13%wereyoungpeopleaged24yearsandunder.
• ForthePacificWestAucklandWhānauDirectareapopulationinthethreeyearsfrom2008to2010,there
were407deaths.Ofthese,morethanone-third(36%)wereelderlypeopleaged75yearsandoverand
6%wereyoungpeopleaged24yearsandunder.
• ForthetotalWestAucklandWhānauDirectareapopulationthetopthreecausesofPotentiallyAvoidable
Mortality(PAM)werecoronaryheartdisease(27%),cerebrovasculardiseases(10%)andsuicide(10%).
• FortheWestAucklandMāoripopulationthetopthreecausesofPotentiallyAvoidableMortality(PAM)
werecoronaryheartdisease(27%),chronicobstructivepulmonarydisease(10%)anddiabetes(10%).
• ForthePacificWestAucklandWhānauDirectareapopulationthetopthreePAMconditionswere
coronaryheartdisease(30%),diabetes(15%)andcerebrovasculardiseases(13%).
Hospitalisations
For the two years from 2012 to 2013 there were 131,218 public hospital admissions in the West Auckland
Whānau Direct area:
• Ofthesehospitaladmissionsaroundthreeinten(29%)wereforyoungpeopleaged24yearsandunder
and15%wereforelderlypeopleaged75yearsandover.
• FortheMāoriWestAucklandWhānauDirectareapopulationinthetwoyearsfrom2012to2013there
were18,119admissionstohospital.Ofthesehospitaladmissions,almosthalf(47%)wereyoungpeople
aged24yearsandunderandonly3%wereforelderlypeopleaged75yearsandover.
• ForthePacificWestAucklandWhānauDirectareapopulationinthetwoyearsfrom2012to2013there
were22,218admissionstohospital.Ofthese,fouroutoften(40%)wereyoungpeopleaged24yearsand
underandonly7%wereforelderlypeopleaged75yearsandover.

- 6 - LOCALITY POPULATION SNAPSHOT WEST AUCKLAND
Te Pou Matakana STAND TALL - STAND STRONG - STAND VIGILANT
KIA TU - KIA OHO - KIA MATAARACOMMISSIONING AGENCY
• ForthetotalWestAucklandWhānauDirectareapopulationthetopthreecausesofPotentiallyAvoidable
Hospitalisations(PAH)wereAnginaandchestpain(15%),cellulitis(10%)andgastroenteritis(8%).
• FortheMāoriWestAucklandWhānauDirectareapopulationthetopthreecausesofPotentially
AvoidableHospitalisations(PAH)werecellulitis(14%),anginaandchestpain(9%)andasthma(8%).
• ForthePacificWestAucklandWhānauDirectareapopulationthetopthreePAHconditionswerecellulitis
(12%),anginaandchestpain(11%)andpneumonia(9%).
Section 1. Executive Summary continued

LOCALITY POPULATION SNAPSHOT WEST AUCKLAND - 7 -
Te Pou Matakana STAND TALL - STAND STRONG - STAND VIGILANT
KIA TU - KIA OHO - KIA MATAARACOMMISSIONING AGENCY
2.1 Introduction
This demographic profile and health status snapshot of the West Auckland Whānau Direct area’s population
describes the demographics, socioeconomic and health status using 2013 Census data on the usually
resident population was well as national mortality data for 2008 to 2010 and national hospital discharge data
for 2012 to 2013.
Within this snapshot the comparison populations include the total Whānau Direct population, the Auckland
regionpopulationandthetotalNewZealandpopulation.TheAucklandregionwithinthissnapshothas
been defined as the combined population of the three Auckland Metro District Health Boards (DHBs):
Waitemata DHB, Auckland DHB and Counties Manukau DHB.
A separate demographic profile and health status snapshot of the South Auckland Whānau Direct
population has been produced as a companion to this document and follows an identical format.
2.2 Definition of the Whānau Direct Population
The geographical region referred to as Whānau Direct in this report is defined as the combined boundaries
of the following seven Auckland Council Local Board Areas: Henderson-Massey, Waitakere Ranges, Whau,
Mangere-Otahuhu, Manurewa, Otara-Papatoetoe and Papakura.
The West Auckland Whānau Direct area is defined as the combined populations of Henderson-Massey,
Waitakere Ranges and Whau. Local Boards. The South Auckland Whānau Direct area is defined as the
combined populations of Mangere-Otahuhu, Manurewa, Otara- Papatoetoe and Papakura Local Boards.
The map below (Figure 1) shows the Whānau Direct area split by West Auckland (green) and South Auckland
(yellow).
Section 2. Demographics
9 | P a g e
The map below (Figure 1) shows the Whānau Direct area split by South Auckland (yellow) and West Auckland (green).
Figure 1: Whānau Direct Area Definition
2.3 WhānauDirectPopulationbyLocalBoardArea
Table 1 shows the number and percent of Whānau Direct population by Local Board Area in Whānau Direct. The South Auckland area made up around 55% of Whānau Direct population and the West Auckland area 45%. In the South Auckland Whānau Direct area, Manurewa had the largest proportion (with over 16%) of the Whānau Direct population.
Table 1: Number of Population by Local Board Area, Census 2013
Area Local Board Area Total %
West Henderson-Massey 107,682 21.4% Waitakere Ranges 48,399 9.6% Whau 72,594 14.4%
West Total 228,675 45.4%
South
Mangere-Otahuhu 70,959 14.1% Manurewa 82,242 16.3% Otara-Papatoetoe 75,660 15.0% Papakura 45,633 9.1%
South Total 274,494 54.6% Whānau Direct Total 503,169 100.0%
Figure 1: Whānau
Direct Area Definition

- 8 - LOCALITY POPULATION SNAPSHOT WEST AUCKLAND
Te Pou Matakana STAND TALL - STAND STRONG - STAND VIGILANT
KIA TU - KIA OHO - KIA MATAARACOMMISSIONING AGENCY
2.3 Whānau Direct Population by Local Board Area
Table 1 shows the number and percent of Whānau Direct population by Local Board Area in Whānau Direct.
TheWestAucklandareamadeup45.4%ofWhānauDirectpopulationandtheSouthAucklandareamadeup
54.6%.IntheWestAucklandWhānauDirectarea,Henderson-MasseyLocalBoardhadthelargestproportion
(withover21%)oftheWhānauDirectpopulation.
Table 1: Number of Population by Local Board Area, Census 2013
Area Local Board Area Total %
West
Henderson-Massey 107,682 21.4%
Waitakere Ranges 48,399 9.6%
Whau 72,594 14.4%
West Total 228,675 45.4%
South
Mangere-Otahuhu 70,959 14.1%
Manurewa 82,242 16.3%
Otara-Papatoetoe 75,660 15.0%
Papakura 45,633 9.1%
South Total 274,494 54.6%
Whānau Direct Total 503,169 100.0%
2.4 Māori Descent
13.4%oftheWestAucklandand16.7%ofthetotalWhānauDirectpopulationwereofMāoridescent(30,654
and84,099respectively);comparedwith11.7%and15.8%fortheAucklandregionandtotalNewZealand
population (167,262 and 668,721 respectively). Note that these numbers are based on total responses.
Table 2: Population of Māori Descent by Whānau Direct Area, 2013
Area Total %
West Auckland 30,654 13.4%
South Auckland 53,445 19.5%
Whānau Direct Total 84,099 16.7%
Auckland Region 167,262 11.7%
NZ 668,721 15.8%
Section 2. Demographics continued

LOCALITY POPULATION SNAPSHOT WEST AUCKLAND - 9 -
Te Pou Matakana STAND TALL - STAND STRONG - STAND VIGILANT
KIA TU - KIA OHO - KIA MATAARACOMMISSIONING AGENCY
2.5 Languages Spoken, Te Reo Māori
2.8%oftheWestAucklandand4.0%oftheWhānauDirectpopulationspokeTeReoMāori(5,880and18,552
respectively);comparedwith2.4%and3.7%fortheAucklandregionandtotalNewZealandpopulation
(31,590 and 148,395 respectively). Note that these numbers are based on total responses.
Table 3: Te Reo Māori Spoken, by Whānau Direct Area, 2013
Area Total %
West Auckland 5,880 2.8%
South Auckland 12,672 5.1%
Whānau Direct Total 18,552 4.0%
Auckland Region 31,590 2.4%
NewZealand 148,395 3.7%
2.6 Iwi Affiliation
The tables below show the top ten iwi affiliations reported by respondents who lived in the West Auckland
and total Whānau Direct areas at the 2013 Census. Note that the numbers in this table represent not the
number of people, but rather the total number of affiliations recorded. This is because people can choose to
affiliate with more than one iwi.
a. West Auckland
The iwi affiliation reported by the largest number of Māori in West Auckland Whānau Direct area
wasNgāpuhi(34.5%),followedbyNgātiPorou(9.2%),TeRarawa(6.2%),NgātiWhātua(5.2%)and
Waikato(5%).
Table 4: Top Ten Iwi Affiliations Reported by Māori, West Auckland, 2013
Iwi Total% of Total
Māori Descent
Ngāpuhi 10,581 34.5%
Ngāti Porou 2,817 9.2%
Te Rarawa 1,890 6.2%
Ngāti Whātua 1,584 5.2%
Waikato 1,521 5.0%
Ngāti Maniapoto 1,335 4.4%
Ngāi Tahu / Kāi Tahu 1,152 3.8%
Ngāti Tūwharetoa 1,140 3.7%
Tūhoe 1,083 3.5%
Te Arawa 813 2.7%
Total Māori Descent 30,654 100.0%
- 10 - LOCALITY POPULATION SNAPSHOT WEST AUCKLAND
Te Pou Matakana STAND TALL - STAND STRONG - STAND VIGILANT
KIA TU - KIA OHO - KIA MATAARACOMMISSIONING AGENCY
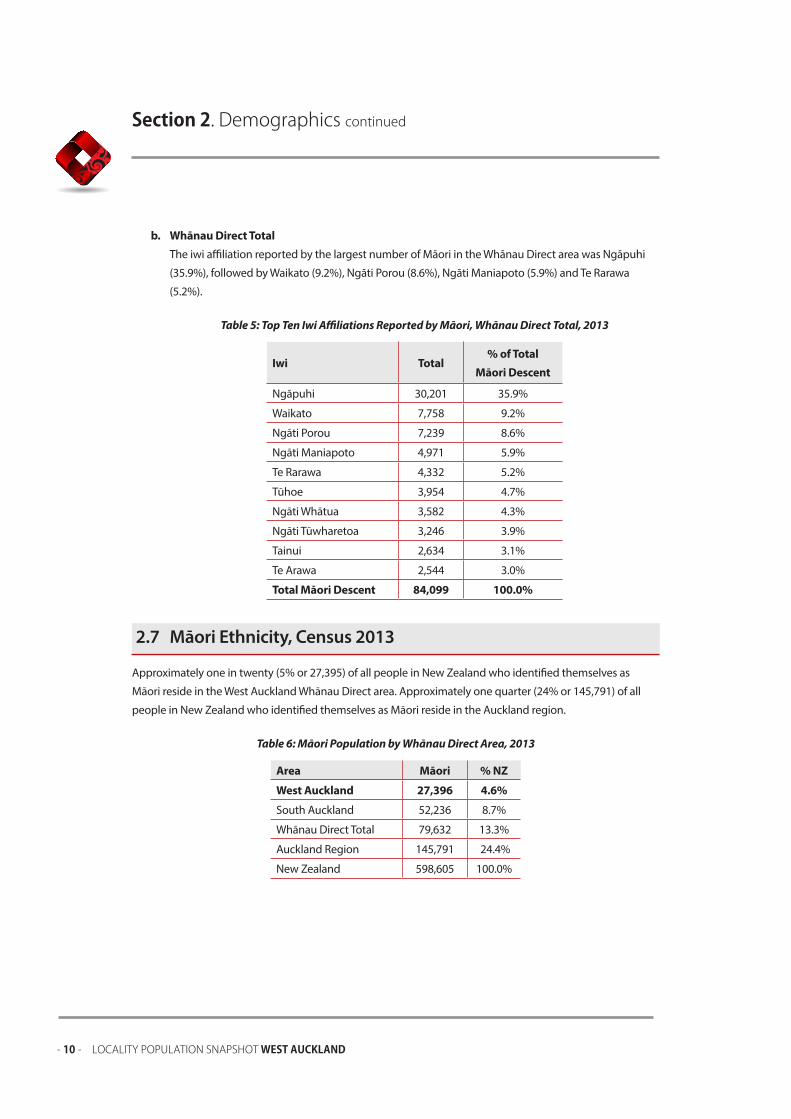
b. Whānau Direct Total
The iwi affiliation reported by the largest number of Māori in the Whānau Direct area was Ngāpuhi
(35.9%),followedbyWaikato(9.2%),NgātiPorou(8.6%),NgātiManiapoto(5.9%)andTeRarawa
(5.2%).
Table 5: Top Ten Iwi Affiliations Reported by Māori, Whānau Direct Total, 2013
Iwi Total% of Total
Māori Descent
Ngāpuhi 30,201 35.9%
Waikato 7,758 9.2%
Ngāti Porou 7,239 8.6%
Ngāti Maniapoto 4,971 5.9%
Te Rarawa 4,332 5.2%
Tūhoe 3,954 4.7%
Ngāti Whātua 3,582 4.3%
Ngāti Tūwharetoa 3,246 3.9%
Tainui 2,634 3.1%
Te Arawa 2,544 3.0%
Total Māori Descent 84,099 100.0%
2.7 Māori Ethnicity, Census 2013
Approximatelyoneintwenty(5%or27,395)ofallpeopleinNewZealandwhoidentifiedthemselvesas
MāoriresideintheWestAucklandWhānauDirectarea.Approximatelyonequarter(24%or145,791)ofall
peopleinNewZealandwhoidentifiedthemselvesasMāoriresideintheAucklandregion.
Table 6: Māori Population by Whānau Direct Area, 2013
Area Māori % NZ
West Auckland 27,396 4.6%
South Auckland 52,236 8.7%
Whānau Direct Total 79,632 13.3%
Auckland Region 145,791 24.4%
NewZealand 598,605 100.0%
Section 2. Demographics continued

LOCALITY POPULATION SNAPSHOT WEST AUCKLAND - 11 -
Te Pou Matakana STAND TALL - STAND STRONG - STAND VIGILANT
KIA TU - KIA OHO - KIA MATAARACOMMISSIONING AGENCY
The map below shows the population density of Māori in Whānau Direct and the surrounding areas.
Figure 2: Māori Population Distribution in Whānau Direct and Surrounding Area, 2013
12 | P a g e
2.7 MāoriEthnicity,Census2013
Almost one in ten (9% or 52,236) of all people in New Zealand who identified themselves as Māori reside in the South Auckland Whānau Direct area. Approximately one quarter (24% or 145,791) of all people in New Zealand who identified themselves as Māori reside in the Auckland Region.
Table 6: Māori Population by Whānau Direct Area, 2013
Area Māori % NZ West Auckland 27,396 4.6% South Auckland 52,236 8.7% Whānau Direct Total 79,632 13.3% Auckland Region 145,791 24.4% New Zealand 598,605 100.0%
The map below shows the population density of Māori in Whānau Direct and the surrounding areas.
Figure 2: Māori Population Distribution in Whānau Direct and Surrounding Area, 2013
- 12 - LOCALITY POPULATION SNAPSHOT WEST AUCKLAND
Te Pou Matakana STAND TALL - STAND STRONG - STAND VIGILANT
KIA TU - KIA OHO - KIA MATAARACOMMISSIONING AGENCY
2006 Census = 472,686 2013 Census = 503,169
Section 2. Demographics continued
2006 Census = 213,456 2013 Census = 228,675Other14.1%
Paci�c13.8%
Asian17.6%
European42.8%
Maori11.7%
Other9.1%
Paci�c14.1%
Asian21.2%
European43.7%
Maori12.0%
Other12.8%
Paci�c23.8%
Asian15.3%
European31.5%
Maori16.7%
Other9.4%
Paci�c24.4%
Asian19.5%
European30.8%
Maori15.8%
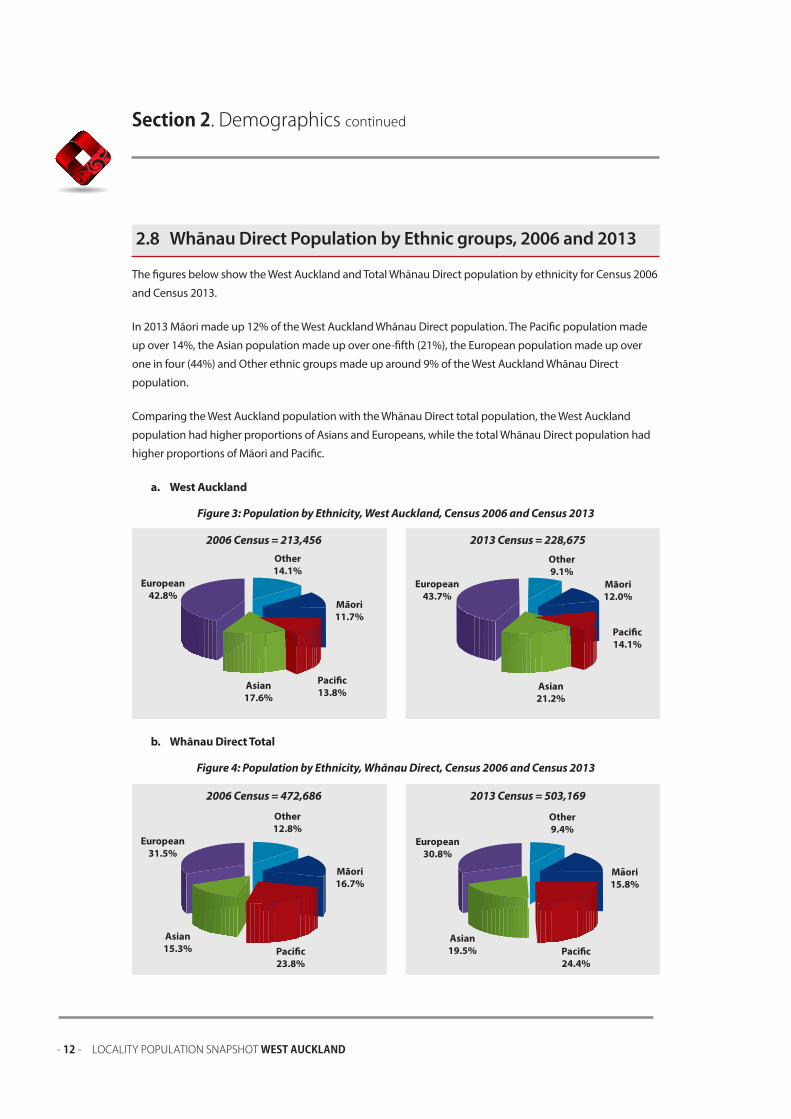
2.8 Whānau Direct Population by Ethnic groups, 2006 and 2013
The figures below show the West Auckland and Total Whānau Direct population by ethnicity for Census 2006
and Census 2013.
In2013Māorimadeup12%oftheWestAucklandWhānauDirectpopulation.ThePacificpopulationmade
upover14%,theAsianpopulationmadeupoverone-fifth(21%),theEuropeanpopulationmadeupover
oneinfour(44%)andOtherethnicgroupsmadeuparound9%oftheWestAucklandWhānauDirect
population.
Comparing the West Auckland population with the Whānau Direct total population, the West Auckland
population had higher proportions of Asians and Europeans, while the total Whānau Direct population had
higher proportions of Māori and Pacific.
a. West Auckland
Figure 3: Population by Ethnicity, West Auckland, Census 2006 and Census 2013
b. Whānau Direct Total
Figure 4: Population by Ethnicity, Whānau Direct, Census 2006 and Census 2013
LOCALITY POPULATION SNAPSHOT WEST AUCKLAND - 13 -
Te Pou Matakana STAND TALL - STAND STRONG - STAND VIGILANT
KIA TU - KIA OHO - KIA MATAARACOMMISSIONING AGENCY
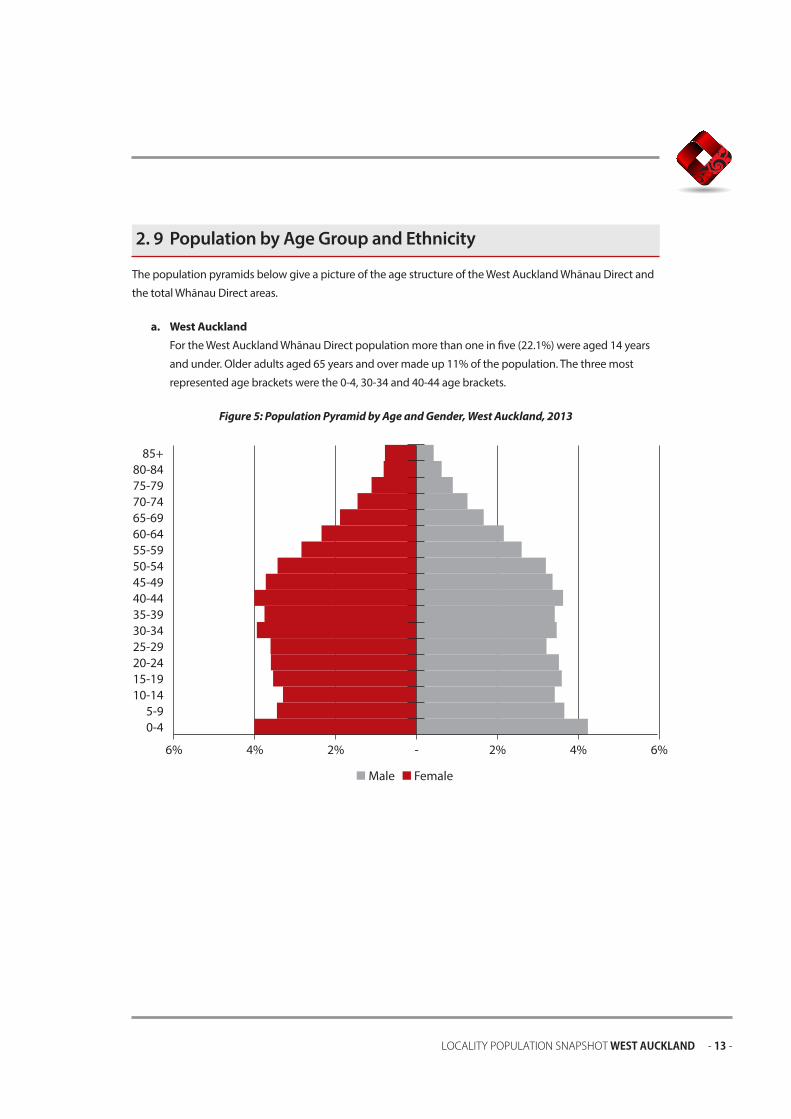
2. 9 Population by Age Group and Ethnicity
The population pyramids below give a picture of the age structure of the West Auckland Whānau Direct and
the total Whānau Direct areas.
a. West Auckland
FortheWestAucklandWhānauDirectpopulationmorethanoneinfive(22.1%)wereaged14years
andunder.Olderadultsaged65yearsandovermadeup11%ofthepopulation.Thethreemost
represented age brackets were the 0-4, 30-34 and 40-44 age brackets.
Figure 5: Population Pyramid by Age and Gender, West Auckland, 2013
- 14 - LOCALITY POPULATION SNAPSHOT WEST AUCKLAND
Te Pou Matakana STAND TALL - STAND STRONG - STAND VIGILANT
KIA TU - KIA OHO - KIA MATAARACOMMISSIONING AGENCY
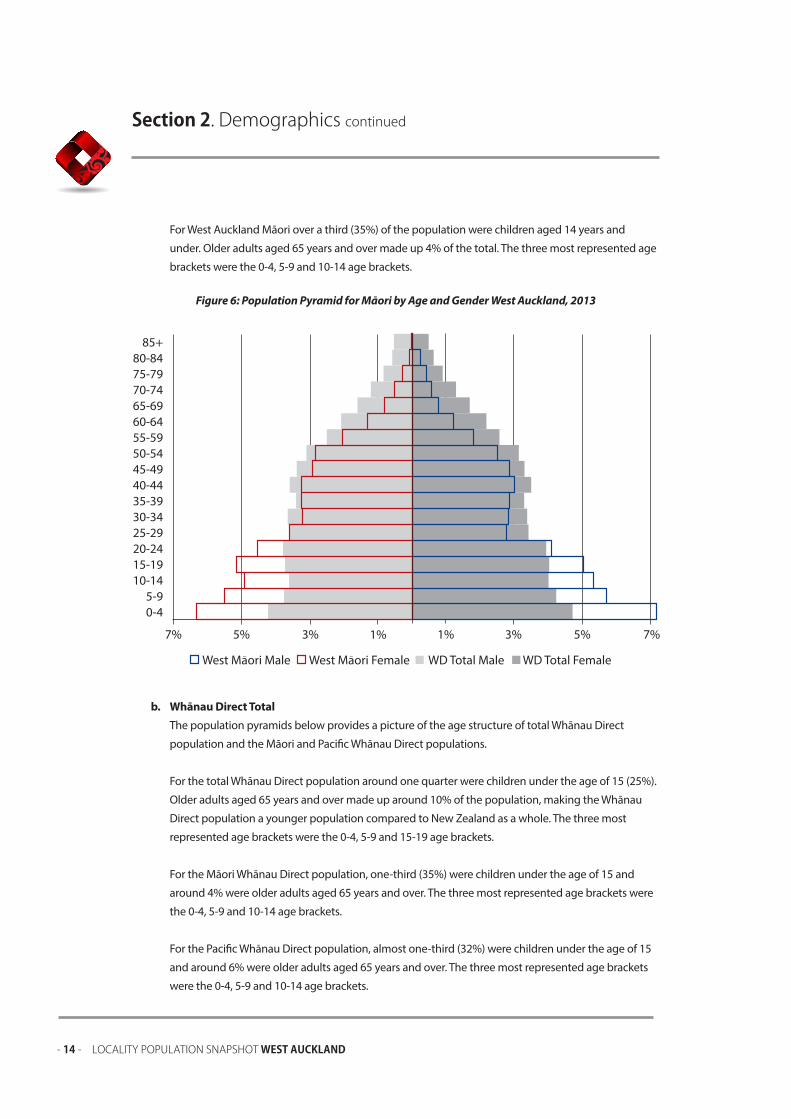
ForWestAucklandMāorioverathird(35%)ofthepopulationwerechildrenaged14yearsand
under.Olderadultsaged65yearsandovermadeup4%ofthetotal.Thethreemostrepresentedage
brackets were the 0-4, 5-9 and 10-14 age brackets.
Figure 6: Population Pyramid for Māori by Age and Gender West Auckland, 2013
b. Whānau Direct Total
The population pyramids below provides a picture of the age structure of total Whānau Direct
population and the Māori and Pacific Whānau Direct populations.
ForthetotalWhānauDirectpopulationaroundonequarterwerechildrenundertheageof15(25%).
Olderadultsaged65yearsandovermadeuparound10%ofthepopulation,makingtheWhānau
DirectpopulationayoungerpopulationcomparedtoNewZealandasawhole.Thethreemost
represented age brackets were the 0-4, 5-9 and 15-19 age brackets.
FortheMāoriWhānauDirectpopulation,one-third(35%)werechildrenundertheageof15and
around4%wereolderadultsaged65yearsandover.Thethreemostrepresentedagebracketswere
the 0-4, 5-9 and 10-14 age brackets.
ForthePacificWhānauDirectpopulation,almostone-third(32%)werechildrenundertheageof15
andaround6%wereolderadultsaged65yearsandover.Thethreemostrepresentedagebrackets
were the 0-4, 5-9 and 10-14 age brackets.
Section 2. Demographics continued

LOCALITY POPULATION SNAPSHOT WEST AUCKLAND - 15 -
Te Pou Matakana STAND TALL - STAND STRONG - STAND VIGILANT
KIA TU - KIA OHO - KIA MATAARACOMMISSIONING AGENCY
Figure 7: Population Pyramid by Age and Gender Total Whānau Direct, 2013
Figure 8: Population Pyramid for Māori by Age and Gender Total Whānau Direct, 2013

- 16 - LOCALITY POPULATION SNAPSHOT WEST AUCKLAND
Te Pou Matakana STAND TALL - STAND STRONG - STAND VIGILANT
KIA TU - KIA OHO - KIA MATAARACOMMISSIONING AGENCY
Figure 9: Population Pyramid for Pacific by Age and Gender Whānau Direct, 2013
Section 2. Demographics continued

LOCALITY POPULATION SNAPSHOT WEST AUCKLAND - 17 -
Te Pou Matakana STAND TALL - STAND STRONG - STAND VIGILANT
KIA TU - KIA OHO - KIA MATAARACOMMISSIONING AGENCY
Section 3. Socioeconomic Status
3.1 Education – No Qualification
Approximatelyoneinfive(19%)peopleaged15yearsandoverintheWestAucklandWhānauDirectarea
hadnoformalqualification.ThisproportionwasslightlyhigherthanthatfortheAucklandregion(16%)
butslightlylessthanthenationalfigure(20%).Māori(28%)andPacific(26%)adultsintheWestAuckland
Whānau Direct area had higher proportions with no formal qualification compared to adults from Asian
(12%),European(19%)andOther(14%)ethnicgroups.
Table 7: No Formal Qualification by Ethnicity, Census 2013
% People With No formal Qualification
Ethnicity West South WD Total Auckland NZ
Māori 28.2% 35.6% 33.0% 28.5% 30.2%
Pacific 26.3% 28.5% 27.9% 26.9% 26.4%
Asian 11.6% 16.7% 14.2% 10.8% 11.2%
European 18.7% 24.7% 21.0% 14.4% 19.0%
Other 13.7% 20.9% 16.8% 10.9% 12.9%
Total 18.7% 26.0% 22.6% 15.9% 19.6%
3.2 Education – Bachelor Degree or Higher
Overaquarter(27.1%)oftheWestAucklandWhānauDirectpopulationaged15yearsandoverhada
Bachelor degree or higher. This proportion was slightly lower than that for the Auckland region but higher
thanthenationalfigure.Māori(16%)andPacific(12%)adultsintheWestAucklandWhānauDirectareahad
lowerproportionswithaBachelordegreeorhighercomparedtoadultsfromAsian(38%),European(27%)
andOther(31%)ethnicgroups.
Table 8: Bachelor Degree or Above by Ethnicity, Census 2013
% People with Tertiary Degree
Ethnicity West South WD Total Auckland NZ
Māori 15.6% 10.3% 12.1% 16.7% 14.8%
Pacific 11.9% 9.2% 9.9% 11.4% 11.9%
Asian 38.3% 26.8% 32.4% 39.2% 39.0%
European 26.9% 19.5% 24.0% 33.8% 28.0%
Other 30.5% 23.1% 27.3% 38.0% 33.4%
Total 27.1% 16.6% 21.6% 31.8% 27.5%

- 18 - LOCALITY POPULATION SNAPSHOT WEST AUCKLAND
Te Pou Matakana STAND TALL - STAND STRONG - STAND VIGILANT
KIA TU - KIA OHO - KIA MATAARACOMMISSIONING AGENCY
3.3 Unemployment
TheunemploymentratefortheWestAucklandWhānauDirectareapopulationwas6%;higherthanthe
Aucklandregionandthenationalrates(botharound5%).Māori(11%)andPacific(10%)adultswithinthe
WestAucklandWhānauDirectareahadhigherratesofunemploymentcomparedtoadultsfromAsian(6%),
European(5%)andOther(9%)ethnicgroups.
Table 9: Unemployment by Ethnicity, Census 2013
% Unemployed
Ethnicity West South WD Total Auckland NZ
Māori 11.1% 13.6% 12.7% 10.8% 10.4%
Pacific 10.0% 10.8% 10.6% 10.2% 10.0%
Asian 6.2% 6.9% 6.6% 6.0% 5.7%
European 4.6% 5.6% 5.0% 3.9% 3.7%
Other 8.7% 7.1% 8.0% 6.9% 5.5%
Total 6.0% 8.4% 7.3% 5.4% 4.8%
3.4 Personal Income
Lessthanhalf(47%)oftheWestAucklandWhānauDirectareapopulationaged15yearsandoverhada
personalincomeof$30,000ormoreperannum,whichwasslightlylessthantheAucklandregion(50%)and
national(48%)rates.Māori(43%)withintheWestAucklandWhānauDirectareahadalowerproportionof
adultswithpersonalincomeof$30,000ormoreperannumcomparedtoadultsfromEuropean(52%)and
Other(44%)ethnicgroups.
Table 10: Personal Income $30,000+, Census 2013
% Personal Income 30,000+
Ethnicity West South WD Total Auckland NZ
Māori 42.6% 38.0% 39.6% 43.3% 39.5%
Pacific 38.5% 34.4% 35.5% 36.3% 36.9%
Asian 39.3% 38.8% 39.1% 38.8% 38.7%
European 52.1% 50.2% 51.3% 56.4% 51.1%
Other 43.9% 39.0% 41.8% 48.0% 50.6%
Total 46.8% 41.2% 43.9% 49.6% 48.1%
Section 3. Socioeconomic Status continued

LOCALITY POPULATION SNAPSHOT WEST AUCKLAND - 19 -
Te Pou Matakana STAND TALL - STAND STRONG - STAND VIGILANT
KIA TU - KIA OHO - KIA MATAARACOMMISSIONING AGENCY
3.5 People Receiving Unemployment Benefit
Around3%oftheWestAucklandWhānauDirectareapopulationaged15yearsandoverreceivedthe
unemployment benefit, which was slightly higher than the comparable Auckland region and national
rates(bothat2.9%).Māori(6.4%)andPacific(5.9%)adultswithintheWestAucklandWhānauDirectarea
hadhigherproportionsreceivingtheunemploymentbenefitcomparedtoadultsfromAsian(3.3%)and
European(2.5%)ethnicgroups.
Table 11: Unemployment Benefit by Ethnicity, Census 2013
% Unemployment Benefit
Ethnicity West South WD Total Auckland NZ
Māori 6.4% 8.2% 7.6% 6.5% 7.2%
Pacific 5.9% 6.6% 6.4% 6.3% 6.4%
Asian 3.3% 3.8% 3.6% 2.8% 2.9%
European 2.5% 3.2% 2.8% 1.9% 2.2%
Other 7.4% 9.5% 8.3% 5.3% 4.2%
Total 3.4% 5.2% 4.3% 2.9% 2.9%
3.6 People Receiving Domestic Purposes Benefit (DPB)
Around3%oftheWestAucklandWhānauDirectareapopulationaged15yearsandoverreceivedthe
domesticpurposesbenefit,whichwasslightlyhigherthanthecomparableAuckland(2.6%)andnational
(2.8%)rates.Māori(9.9%)andPacific(5.6%)adultswithintheWestAucklandWhānauDirectareahadhigher
proportionsreceivingthedomesticpurposesbenefitcomparedtoadultsfromAsian(1.5%),European(3.2%)
andOther(3.4%)ethnicgroups.
Table 12: Domestic Purposes Benefit by Ethnicity, Census 2013
% Domestic Purposes Benefit
Ethnicity West South WD Total Auckland NZ
Māori 9.9% 13.5% 12.3% 9.4% 8.8%
Pacific 5.6% 6.9% 6.6% 6.2% 5.9%
Asian 1.5% 2.1% 1.8% 1.3% 1.2%
European 3.2% 4.4% 3.7% 2.0% 2.3%
Other 3.4% 2.7% 3.1% 1.9% 2.0%
Total 3.4% 5.6% 4.5% 2.6% 2.8%

- 20 - LOCALITY POPULATION SNAPSHOT WEST AUCKLAND
Te Pou Matakana STAND TALL - STAND STRONG - STAND VIGILANT
KIA TU - KIA OHO - KIA MATAARACOMMISSIONING AGENCY
3.7 People Receiving Sickness Benefit
Around4%oftheWestAucklandWhānauDirectareapopulationaged15yearsandoverreceivedthe
sickness benefit, which was slightly higher than the comparable Auckland and national rates (both at
around3%).Māori(6.1%)andPacific(4.5%)adultswithintheWestAucklandWhānauDirectareahadhigher
proportionsreceivingthesicknessbenefitcomparedtoadultsfromAsian(3.7%)andEuropean(3.2%)ethnic
groups.
Table 13: Sickness Benefit by Ethnicity, Census 2013
% Sickness Benefit
Ethnicity West South WD Total Auckland NZ
Māori 6.1% 6.0% 6.1% 5.5% 5.0%
Pacific 4.5% 5.2% 5.0% 4.9% 4.4%
Asian 3.7% 5.5% 4.6% 2.9% 2.5%
European 3.2% 3.2% 3.2% 2.1% 2.1%
Other 5.9% 9.5% 7.4% 4.8% 3.4%
Total 3.7% 4.9% 4.3% 2.8% 2.5%
3.8 Nature of Occupancy of Households
Closetofourinten(37%)WestAucklandWhānauDirectareahouseholdsdidnotownorpartiallyown
theirdwellingofoccupancy,whichwasslightlyhigherthanthecomparableAuckland(36%)andnational
(35%)rates.WestAucklandWhānauDirectratesofdwellingnon-ownershipwerehigherforMāori(56%)
andPacific(60%)householdscomparedtoAsian(33%),European(29%)andOther(50%)ethnicgroup
households.
Table 14: Nature of Occupancy by Ethnicity, Census 2013
% Dwelling Not Owned
Ethnicity West South WD Total Auckland NZ
Māori 55.5% 64.0% 61.1% 55.5% 55.0%
Pacific 59.6% 63.9% 62.7% 63.6% 63.3%
Asian 32.8% 39.1% 36.0% 39.4% 40.2%
European 29.2% 35.0% 31.5% 29.5% 29.4%
Other 49.8% 48.5% 49.3% 43.0% 41.3%
Total 36.5% 50.1% 43.8% 35.9% 35.1%
Section 3. Socioeconomic Status continued

LOCALITY POPULATION SNAPSHOT WEST AUCKLAND - 21 -
Te Pou Matakana STAND TALL - STAND STRONG - STAND VIGILANT
KIA TU - KIA OHO - KIA MATAARACOMMISSIONING AGENCY
3.9 Households without a Car
Around4%ofWestAucklandWhānauDirectareahouseholdshadnoaccesstoamotorvehicle;thiswas
slightlylowerthantheAucklandandnationalrates(bothapproximately5%).WestAucklandWhānauDirect
arearatesof‘noaccesstoamotorvehicle’werehigherforMāori(8%)andPacific(6%)householdscompared
toAsian(3%),European(4%)andOther(4%)ethnicgrouphouseholds.
Table 15: Households without a Car, Census 2013
% Households with no Motor Vehicle
Ethnicity West South WD Total Auckland NZ
Māori 8.3% 12.8% 11.2% 9.8% 10.0%
Pacific 5.7% 7.4% 7.0% 7.4% 8.2%
Asian 2.6% 2.6% 2.6% 4.6% 5.0%
European 3.9% 5.9% 4.7% 3.6% 4.3%
Other 3.7% 5.5% 4.4% 5.6% 5.1%
Total 4.2% 6.7% 5.5% 4.8% 5.2%
3.10 Households without any Telecommunication Access
Around1%ofWestAucklandWhānauDirectareahouseholdsdidnothaveaccesstoalandline,mobile
phone, fax or internet which was the same as the Auckland region and similar to national rate. West
AucklandWhānauDirectarearatesof‘noaccesstotelecommunications’werehigherforMāori(3%)and
Pacific(2%)householdscomparedtoAsian(1%),European(1%)andOther(1%)ethnicgrouphouseholds.
Table 16: Households without Telecommunication Access by Ethnicity, Census 2013
% No Access to Telecommunications
Ethnicity West South WD Total Auckland NZ
Māori 2.8% 4.7% 4.0% 3.2% 3.5%
Pacific 2.1% 3.1% 2.8% 2.6% 2.6%
Asian 0.9% 1.5% 1.2% 0.9% 1.0%
European 0.8% 1.5% 1.1% 0.7% 0.9%
Other 0.9% 1.6% 1.2% 1.1% 1.3%
Total 1.2% 2.6% 1.9% 1.2% 1.3%

- 22 - LOCALITY POPULATION SNAPSHOT WEST AUCKLAND
Te Pou Matakana STAND TALL - STAND STRONG - STAND VIGILANT
KIA TU - KIA OHO - KIA MATAARACOMMISSIONING AGENCY
3.11 Households with Telephone Access
Closetonineoutoften(87%)WestAucklandWhānauDirectareahouseholdshadaccesstoatelephone;
thiswasslightlyhigherthantheAucklandregionandnationalrates.Aroundthree-quarter(75%)ofWest
AucklandWhānauDirectareaMāorihouseholdsandclosetoeightoutoften(78%)ofWestAuckland
Whānau Direct area Pacific households had access to a telephone.
Table 17: Households with Telephone Access by Ethnicity, Census 2013
% Access to Telephone
Ethnicity West South WD Total Auckland NZ
Māori 74.6% 64.8% 68.2% 71.7% 69.9%
Pacific 77.5% 71.1% 72.8% 73.8% 72.9%
Asian 91.5% 88.9% 90.2% 89.5% 88.3%
European 89.4% 85.2% 87.7% 88.6% 87.9%
Other 87.4% 87.8% 87.6% 85.9% 85.8%
Total 87.2% 78.3% 82.4% 85.8% 85.3%
3.12 Households with Mobile Access
Overeightoutoften(85%)WestAucklandWhānauDirectareahouseholdshadmobilephoneaccess;
thisratewasslightlylowerthanthecomparableAucklandregion(85%)andnational(86%)rates.ForWest
AucklandWhānauDirectareaMāoriandPacifichouseholdstheproportionswerearound85%and82%
respectively.
Table 18: Households with Mobile Phone Access by Ethnicity, Census 2013
% Access to Mobile Phone
Ethnicity West South WD Total Auckland NZ
Māori 84.8% 81.1% 82.4% 84.3% 83.7%
Pacific 81.9% 78.4% 79.3% 80.0% 81.2%
Asian 84.1% 80.9% 82.4% 83.5% 83.4%
European 86.6% 84.5% 85.7% 88.2% 87.1%
Other 82.5% 80.3% 81.6% 83.7% 84.7%
Total 84.7% 80.4% 82.4% 85.4% 85.5%
Section 3. Socioeconomic Status continued

LOCALITY POPULATION SNAPSHOT WEST AUCKLAND - 23 -
Te Pou Matakana STAND TALL - STAND STRONG - STAND VIGILANT
KIA TU - KIA OHO - KIA MATAARACOMMISSIONING AGENCY
3.13 Households with Internet Access
Overeightoutoften(82%)ofWestAucklandWhānauDirectareahouseholdshadaccesstotheinternet;
thiswasslightlylowerthanthecomparableAucklandrate(83%)butslightlyhigherthanthecomparable
nationalrate(81%).ForWestAucklandWhānauDirectareaMāoriandPacifichouseholdstheproportions
werearound72%and67%respectively.
Table 19: Households with Internet Access by Ethnicity, Census 2013
% Access to Internet
Ethnicity West South WD Total Auckland NZ
Māori 71.8% 58.2% 62.9% 69.1% 65.2%
Pacific 66.6% 55.8% 58.7% 61.2% 62.0%
Asian 89.3% 82.7% 85.9% 88.9% 88.0%
European 85.1% 77.7% 82.1% 87.8% 83.8%
Other 85.6% 81.7% 83.9% 87.6% 86.4%
Total 82.0% 67.7% 74.3% 83.2% 80.8%
3.14 Household Income
Morethansixoutoften(61%)WestAucklandWhānauDirectareahouseholdshadahouseholdincomeof
$50,000ormoreperannum;thiswasslightlylowerthanthecomparableAucklandrate(64%)butsimilar
tothecomparablenationalrate(62%).WestAucklandWhānauDirectareaMāori(54%)andPacific(51%)
households had lower proportions of households with an income of $50,000 or more per annum compared
toAsian(60%)andEuropean(67%)households.
Table 20: Household Income $50,000+ by Ethnicity, Census 2013
% Household Income $50,000+
Ethnicity West South WD Total Auckland NZ
Māori 54.1% 46.0% 48.8% 54.6% 50.0%
Pacific 51.3% 43.8% 45.8% 47.4% 47.8%
Asian 59.6% 57.3% 58.4% 58.8% 58.3%
European 67.0% 62.5% 65.2% 72.2% 65.2%
Other 54.4% 50.2% 52.6% 59.7% 60.3%
Total 61.4% 51.7% 56.2% 64.4% 61.5%

- 24 - LOCALITY POPULATION SNAPSHOT WEST AUCKLAND
Te Pou Matakana STAND TALL - STAND STRONG - STAND VIGILANT
KIA TU - KIA OHO - KIA MATAARACOMMISSIONING AGENCY
3.15 Heating Fuels Used
Aroundoneintwenty(5%)WestAucklandWhānauDirectareahouseholdsusednoheatingfuels;thisrate
wasslightlylowerthanthecomparableAucklandrate(6%)buthigherthanthecomparablenationalrate
(3%).ForWestAucklandWhānauDirectareaMāoriandPacifichouseholdstheproportionswerearound7%
and12%respectively.
Table 21: Heating Fuel used by Ethnicity, Census 2013
% of Household with No Heating Fuels Used
Ethnicity West South WD Total Auckland NZ
Māori 6.6% 9.9% 8.8% 7.7% 4.2%
Pacific 11.9% 16.0% 14.9% 14.0% 10.8%
Asian 6.0% 7.2% 6.7% 7.3% 5.7%
European 3.1% 4.6% 3.7% 3.2% 1.8%
Other 4.5% 3.8% 4.2% 4.8% 2.8%
Total 5.4% 10.2% 8.0% 5.9% 3.1%
3.16 Unpaid Activity
The below table is based not on a proportion of total people but a proportion of total responses to unpaid
work categories. For adults (aged 15 years and over) in West Auckland Whānau Direct area around four in
ten(38%)reportedundertakingtheunpaidactivitiesoflookingafterachild,orsomeonewhowasill,or
someone who had a disability. This rate was slightly higher than the comparable Auckland and national
rates.IntheWestAucklandWhānauDirectareatheproportionsofMāori(45%)andPacific(43%)people
who reported undertaking the unpaid activities of looking after a child, or someone who was ill, or someone
whohadadisabilitywereslightlyhigherthanforAsian(33%),European(38%)andOther(38%)ethnicgroup
households.
Table 22: Unpaid Activity by Ethnicity, Census 2013
% looking after child or someone who is sick or
someone who has a disability
Ethnicity West South WD Total Auckland NZ
Māori 45.3% 46.5% 46.1% 44.3% 44.4%
Pacific 42.8% 42.2% 42.4% 42.3% 42.3%
Asian 32.6% 32.9% 32.7% 31.0% 30.9%
European 38.1% 38.0% 38.1% 36.4% 36.3%
Other 38.1% 37.4% 37.8% 35.5% 36.9%
Total 37.8% 39.3% 38.6% 36.3% 36.7%
Section 3. Socioeconomic Status continued
LOCALITY POPULATION SNAPSHOT WEST AUCKLAND - 25 -
Te Pou Matakana STAND TALL - STAND STRONG - STAND VIGILANT
KIA TU - KIA OHO - KIA MATAARACOMMISSIONING AGENCY
26 | P a g e
3.17 PopulationbyDeprivation NZDep2013 is an index of deprivation combining key socioeconomic variables from the 2013 census which reflect aspects of material and social deprivation. The index applies to an area, rather than to individual people. The scale of deprivation ranges from 1 to 10, where 1 represents the least deprived areas and 10 represents the most deprived areas in New Zealand. The term “Quintile 5” (Q5) refers to Deciles 9 and 10, which represent the most disadvantaged fifth of areas in New Zealand.
a. WestAuckland
The map below show NZDep2013 by mesh block (smallest geographical unit for statistical purposes) in the West Auckland Whānau Direct area for 2013.
Figure 10: NZDep2013, West Auckland Whanau Direct area
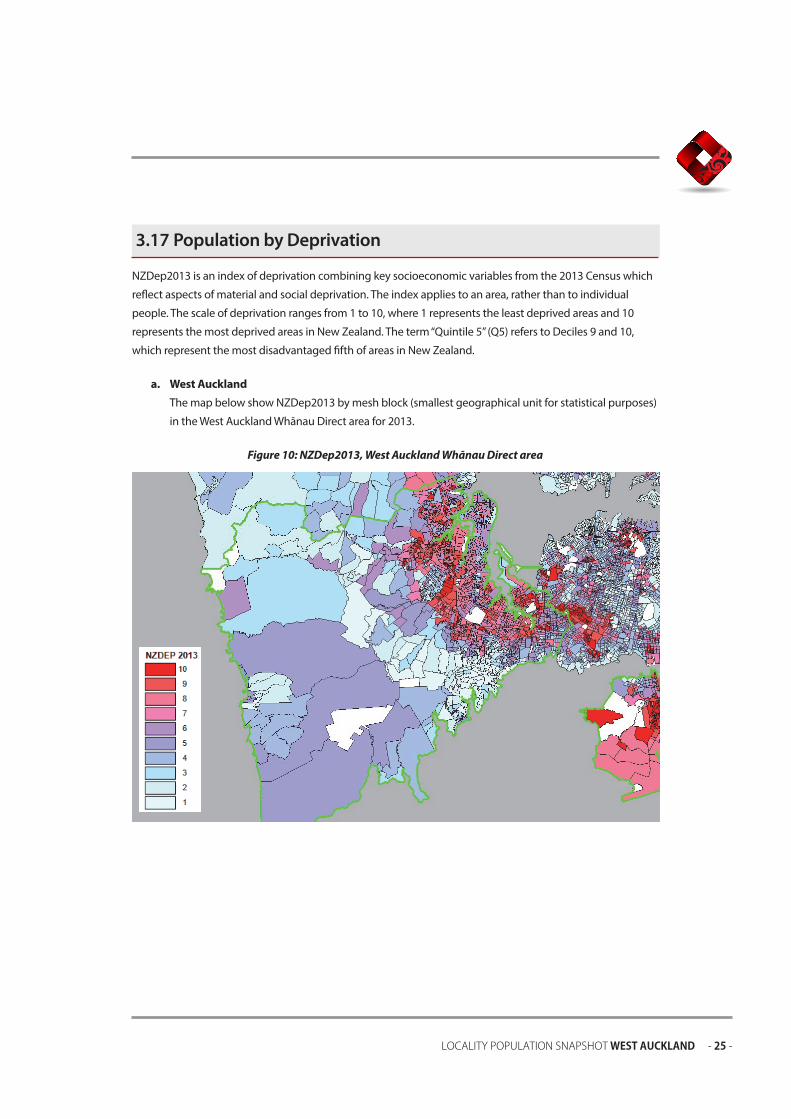
3.17 Population by Deprivation
NZDep2013isanindexofdeprivationcombiningkeysocioeconomicvariablesfromthe2013Censuswhich
reflect aspects of material and social deprivation. The index applies to an area, rather than to individual
people. The scale of deprivation ranges from 1 to 10, where 1 represents the least deprived areas and 10
representsthemostdeprivedareasinNewZealand.Theterm“Quintile5”(Q5)referstoDeciles9and10,
whichrepresentthemostdisadvantagedfifthofareasinNewZealand.
a. West Auckland
ThemapbelowshowNZDep2013bymeshblock(smallestgeographicalunitforstatisticalpurposes)
in the West Auckland Whānau Direct area for 2013.
Figure 10: NZDep2013, West Auckland Whānau Direct area
- 26 - LOCALITY POPULATION SNAPSHOT WEST AUCKLAND
Te Pou Matakana STAND TALL - STAND STRONG - STAND VIGILANT
KIA TU - KIA OHO - KIA MATAARACOMMISSIONING AGENCY
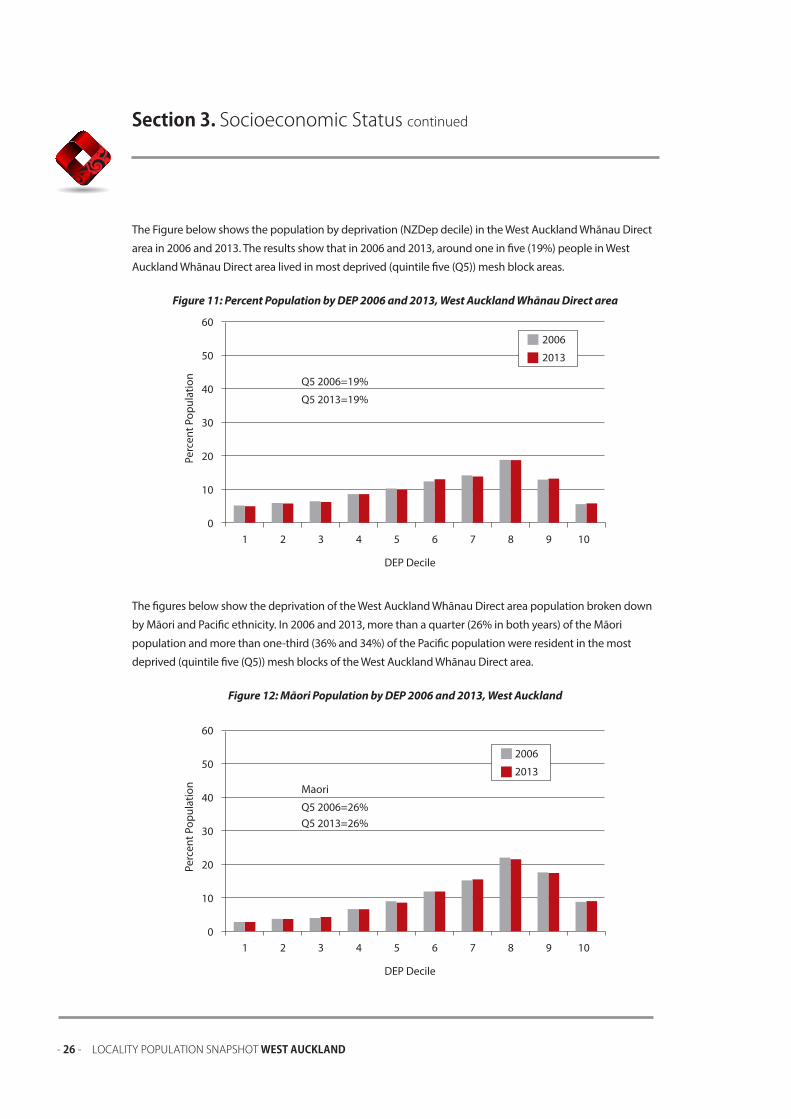
TheFigurebelowshowsthepopulationbydeprivation(NZDepdecile)intheWestAucklandWhānauDirect
areain2006and2013.Theresultsshowthatin2006and2013,aroundoneinfive(19%)peopleinWest
Auckland Whānau Direct area lived in most deprived (quintile five (Q5)) mesh block areas.
Figure 11: Percent Population by DEP 2006 and 2013, West Auckland Whānau Direct area
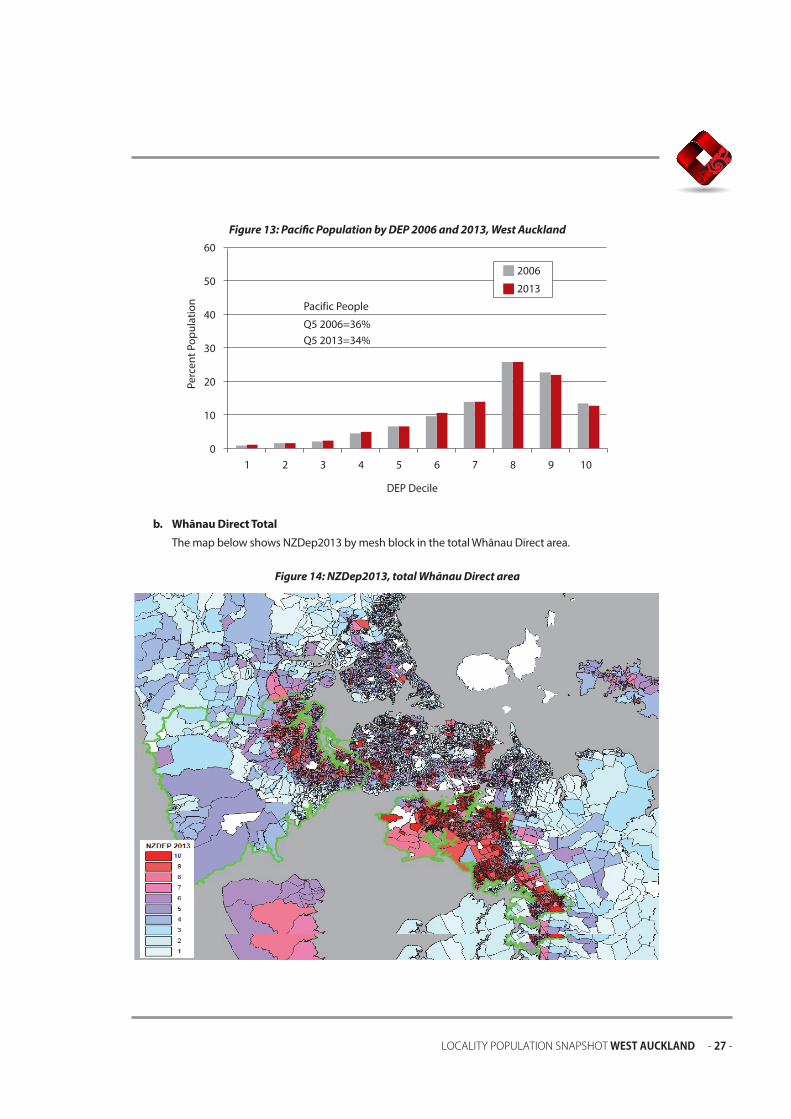
The figures below show the deprivation of the West Auckland Whānau Direct area population broken down
byMāoriandPacificethnicity.In2006and2013,morethanaquarter(26%inbothyears)oftheMāori
populationandmorethanone-third(36%and34%)ofthePacificpopulationwereresidentinthemost
deprived (quintile five (Q5)) mesh blocks of the West Auckland Whānau Direct area.
Figure 12: Māori Population by DEP 2006 and 2013, West Auckland
Section 3. Socioeconomic Status continued
LOCALITY POPULATION SNAPSHOT WEST AUCKLAND - 27 -
Te Pou Matakana STAND TALL - STAND STRONG - STAND VIGILANT
KIA TU - KIA OHO - KIA MATAARACOMMISSIONING AGENCY
Figure 13: Pacific Population by DEP 2006 and 2013, West Auckland
b. Whānau Direct Total
ThemapbelowshowsNZDep2013bymeshblockinthetotalWhānauDirectarea.
Figure 14: NZDep2013, total Whānau Direct area
28 | P a g e
Figure 13: Pacific Population by DEP 2006 and 2013, South Auckland
b. WhānauDirectTotal
The map below shows NZDep2013 by mesh block in the total Whānau Direct area.
Figure 14: NZDep2013, total Whānau Direct area

- 28 - LOCALITY POPULATION SNAPSHOT WEST AUCKLAND
Te Pou Matakana STAND TALL - STAND STRONG - STAND VIGILANT
KIA TU - KIA OHO - KIA MATAARACOMMISSIONING AGENCY
Figure15showsthepopulationbyNZDep2013decileintheWhānauDirectarea;comparing2013with2006.
Theresultsshowsthatin2006and2013,approximatelyfourinten(44%and43%)peoplelivedinthemost
deprived (quintile 5) mesh blocks in the Whānau Direct area.
Figure 15: Percent Population by DEP 2006 and 2013, Whānau Direct
The figures below show the deprivation of the Whānau Direct population broken down by ethnicity for
MāoriandPacific.In2013,aroundsixofoutten(57%)oftheMāoripopulationandclosetosevenoutof
ten(69%)ofthePacificpopulationwereresidentinthemostdeprived(quintile5)meshblocksofWhānau
Direct area.
Figure 16: Māori Population by DEP 2006 and 2013, Whānau Direct
Section 3. Socioeconomic Status continued

LOCALITY POPULATION SNAPSHOT WEST AUCKLAND - 29 -
Te Pou Matakana STAND TALL - STAND STRONG - STAND VIGILANT
KIA TU - KIA OHO - KIA MATAARACOMMISSIONING AGENCY
Figure 17: Pacific Population by DEP 2006 and 2013, Whānau Direct

- 30 - LOCALITY POPULATION SNAPSHOT WEST AUCKLAND
Te Pou Matakana STAND TALL - STAND STRONG - STAND VIGILANT
KIA TU - KIA OHO - KIA MATAARACOMMISSIONING AGENCY

LOCALITY POPULATION SNAPSHOT WEST AUCKLAND - 31 -
Te Pou Matakana STAND TALL - STAND STRONG - STAND VIGILANT
KIA TU - KIA OHO - KIA MATAARACOMMISSIONING AGENCY
Section 4. Health Status
4.1 Regular Smokers, Census 2006 and 2013
Smoking rates for all ethnicities in the Whānau Direct area, in the Auckland region and nationally decreased
between Census 2006 and Census 2013. In the West Auckland Whānau Direct area, around one in seven
(14.5%)adults(aged15yearsandover)wereregularsmokers.ThisratewashigherthantheAucklandrate
(12.4%)butsimilartonationalrate(14.4%).Whenbrokendownbyethnicitytheseratesshowthatwithin
theWestAucklandWhānauDirectarea,Māori(30%)andPacific(20%)adultsweremorelikelytoberegular
smokersthanadultsfromAsian(7%),European(15%)andOther(12%)ethnicgroups.
Table 23: Regular Smokers, by Ethnicity, Census 2013
% Smoking 2013
Ethnicity West South WD Total Auckland NZ
Māori 30.0% 36.6% 34.3% 29.3% 30.9%
Pacific 20.0% 22.0% 21.5% 20.8% 21.6%
Asian 7.4% 7.2% 7.3% 7.1% 7.2%
European 14.9% 18.6% 16.4% 11.5% 13.4%
Other 11.9% 13.1% 12.4% 10.4% 12.5%
Total 14.5% 19.3% 17.0% 12.4% 14.4%
Table 24: Regular Smokers, by Ethnicity, Census 2006
% Smoking 2006
Ethnicity West South WD Total Auckland NZ
Māori 39.0% 46.5% 44.1% 39.2% 39.5%
Pacific 24.9% 27.2% 26.6% 26.1% 26.9%
Asian 9.8% 8.9% 9.4% 9.6% 9.8%
European 18.9% 21.4% 19.9% 15.5% 17.4%
Other 16.5% 18.4% 17.3% 13.7% 15.4%
Total 18.7% 24.3% 21.7% 16.8% 18.9%
- 32 - LOCALITY POPULATION SNAPSHOT WEST AUCKLAND
Te Pou Matakana STAND TALL - STAND STRONG - STAND VIGILANT
KIA TU - KIA OHO - KIA MATAARACOMMISSIONING AGENCY
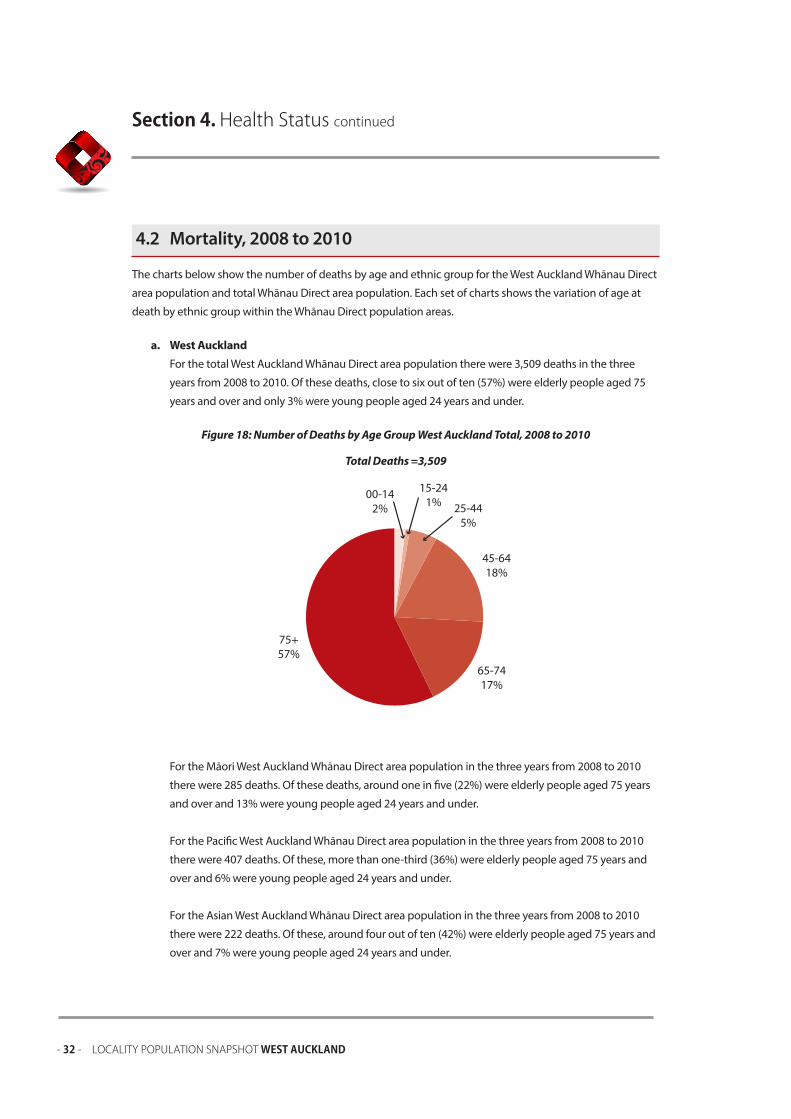
4.2 Mortality, 2008 to 2010
The charts below show the number of deaths by age and ethnic group for the West Auckland Whānau Direct
area population and total Whānau Direct area population. Each set of charts shows the variation of age at
death by ethnic group within the Whānau Direct population areas.
a. West Auckland
For the total West Auckland Whānau Direct area population there were 3,509 deaths in the three
yearsfrom2008to2010.Ofthesedeaths,closetosixoutoften(57%)wereelderlypeopleaged75
yearsandoverandonly3%wereyoungpeopleaged24yearsandunder.
Figure 18: Number of Deaths by Age Group West Auckland Total, 2008 to 2010
Total Deaths =3,509
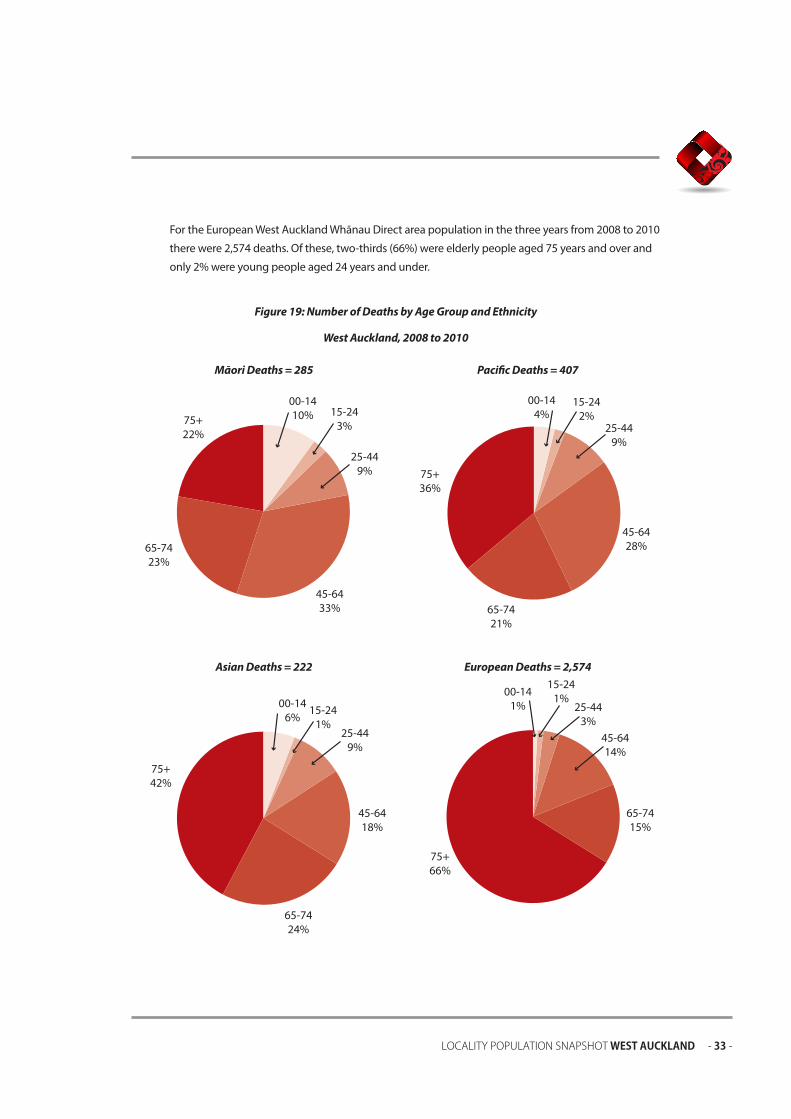
For the Māori West Auckland Whānau Direct area population in the three years from 2008 to 2010
therewere285deaths.Ofthesedeaths,aroundoneinfive(22%)wereelderlypeopleaged75years
andoverand13%wereyoungpeopleaged24yearsandunder.
For the Pacific West Auckland Whānau Direct area population in the three years from 2008 to 2010
therewere407deaths.Ofthese,morethanone-third(36%)wereelderlypeopleaged75yearsand
overand6%wereyoungpeopleaged24yearsandunder.
For the Asian West Auckland Whānau Direct area population in the three years from 2008 to 2010
therewere222deaths.Ofthese,aroundfouroutoften(42%)wereelderlypeopleaged75yearsand
overand7%wereyoungpeopleaged24yearsandunder.
75+57%
65-7417%
45-6418%
25-445%
00-142%
15-241%
Section 4. Health Status continued
LOCALITY POPULATION SNAPSHOT WEST AUCKLAND - 33 -
Te Pou Matakana STAND TALL - STAND STRONG - STAND VIGILANT
KIA TU - KIA OHO - KIA MATAARACOMMISSIONING AGENCY
For the European West Auckland Whānau Direct area population in the three years from 2008 to 2010
therewere2,574deaths.Ofthese,two-thirds(66%)wereelderlypeopleaged75yearsandoverand
only2%wereyoungpeopleaged24yearsandunder.
Figure 19: Number of Deaths by Age Group and Ethnicity
West Auckland, 2008 to 2010
75+22%
65-7423%
45-6433%
25-449%
00-1410% 15-24
3%
75+36%
65-7421%
45-6428%
25-449%
00-144%
15-242%
75+42%
65-7424%
45-6418%
25-449%
00-146%
15-241%
75+66%
65-7415%
45-6414%
25-443%
00-141%
15-241%
Pacific Deaths = 407Māori Deaths = 285
European Deaths = 2,574Asian Deaths = 222
- 34 - LOCALITY POPULATION SNAPSHOT WEST AUCKLAND
Te Pou Matakana STAND TALL - STAND STRONG - STAND VIGILANT
KIA TU - KIA OHO - KIA MATAARACOMMISSIONING AGENCY
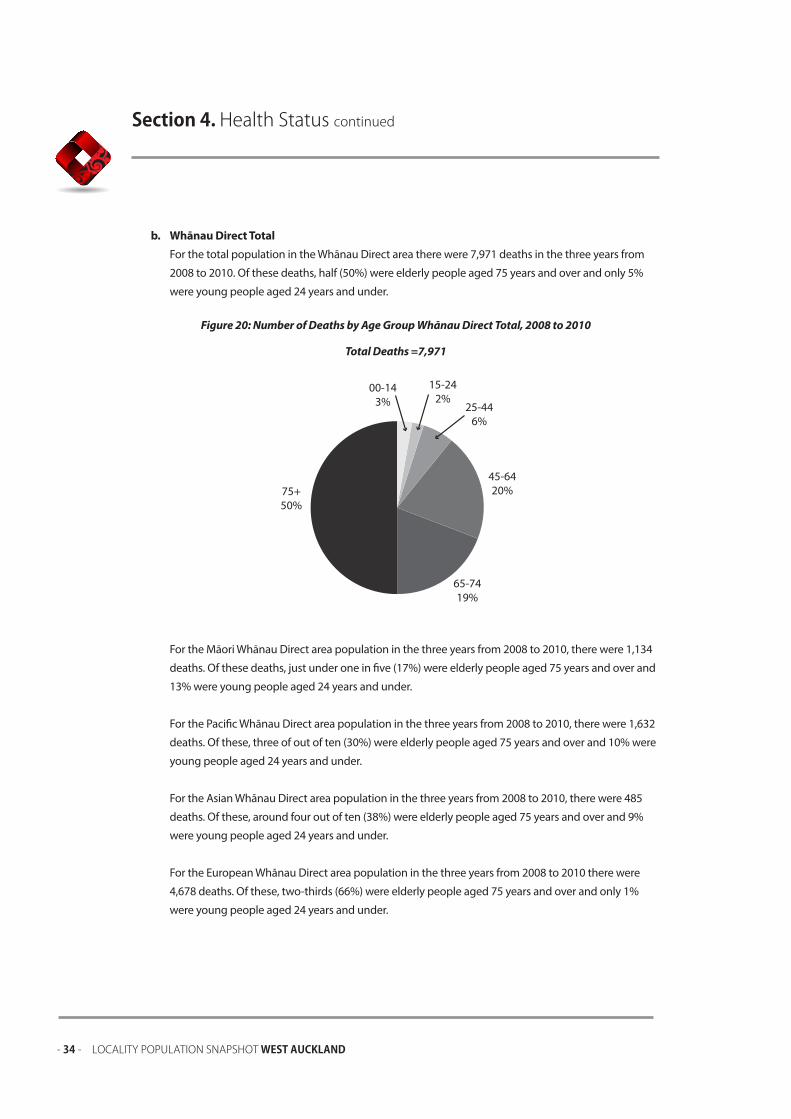
b. Whānau Direct Total
For the total population in the Whānau Direct area there were 7,971 deaths in the three years from
2008to2010.Ofthesedeaths,half(50%)wereelderlypeopleaged75yearsandoverandonly5%
were young people aged 24 years and under.
Figure 20: Number of Deaths by Age Group Whānau Direct Total, 2008 to 2010
Total Deaths =7,971
For the Māori Whānau Direct area population in the three years from 2008 to 2010, there were 1,134
deaths.Ofthesedeaths,justunderoneinfive(17%)wereelderlypeopleaged75yearsandoverand
13%wereyoungpeopleaged24yearsandunder.
For the Pacific Whānau Direct area population in the three years from 2008 to 2010, there were 1,632
deaths.Ofthese,threeofoutoften(30%)wereelderlypeopleaged75yearsandoverand10%were
young people aged 24 years and under.
For the Asian Whānau Direct area population in the three years from 2008 to 2010, there were 485
deaths.Ofthese,aroundfouroutoften(38%)wereelderlypeopleaged75yearsandoverand9%
were young people aged 24 years and under.
For the European Whānau Direct area population in the three years from 2008 to 2010 there were
4,678deaths.Ofthese,two-thirds(66%)wereelderlypeopleaged75yearsandoverandonly1%
were young people aged 24 years and under.
75+50%
65-7419%
45-6420%
25-446%
00-143%
15-242%
Section 4. Health Status continued

LOCALITY POPULATION SNAPSHOT WEST AUCKLAND - 35 -
Te Pou Matakana STAND TALL - STAND STRONG - STAND VIGILANT
KIA TU - KIA OHO - KIA MATAARACOMMISSIONING AGENCY
Figure 21: Number of Deaths by Age Group and Ethnicity
Whānau Direct Total, 2008 to 2010
75+17%
65-7422%
45-6438%
25-4410%
00-1410% 15-24
3%
75+30%
65-7422%
45-6427%
25-4411%
00-146%
15-244%
75+38%
65-7422%
45-6422%
25-449%
00-147%
15-242%
75+66%
65-7416%
45-6414%
25-443%
00-140%
15-241%
Pacific Deaths = 1,632Māori Deaths =1,134
European Deaths = 4,678Asian Deaths =485

- 36 - LOCALITY POPULATION SNAPSHOT WEST AUCKLAND
Te Pou Matakana STAND TALL - STAND STRONG - STAND VIGILANT
KIA TU - KIA OHO - KIA MATAARACOMMISSIONING AGENCY
4.3 Potentially Avoidable Mortality (PAM), 2008 to 2010
Theconceptof“PotentiallyAvoidableMortality”isawayofidentifyingprematuredeathswhichcould
have been prevented by effective health interventions. Potentially Avoidable Mortality is based on a list of
conditions which are considered either preventable or treatable. Within this definition, all deaths after the
age of 75 are considered unavoidable.
a. West Auckland
The table below shows the top ten causes of PAM for people in the West Auckland Whānau Direct
area. Coronary heart disease was the most frequent cause of PAM, accounting for around three in ten
(27%)ofpreventabledeaths.Followingthis,cerebrovasculardiseases(10%)andsuicide(9%)were
the biggest contributors.
Table 25: Top Ten PAM Causes for West Auckland Total, 2008 to 2010
PAM Category Deaths % PAM
Coronary heart disease 204 27.0%
Cerebrovascular diseases 74 9.8%
Suicide 66 8.7%
Chronic obstructive pulmonary disease (COPD) 62 8.2%
Diabetes 58 7.7%
Female breast cancer 55 7.3%
Road traffic accidents 30 4.0%
Complications of the perinatal period 29 3.8%
Colon cancer 27 3.6%
Prostate cancer 23 3.0%
Other PAM 127 16.8%
PAM Total 755 100.0%
Section 4. Health Status continued

LOCALITY POPULATION SNAPSHOT WEST AUCKLAND - 37 -
Te Pou Matakana STAND TALL - STAND STRONG - STAND VIGILANT
KIA TU - KIA OHO - KIA MATAARACOMMISSIONING AGENCY
For the Māori West Auckland Whānau Direct area population the top three PAM conditions were
coronaryheartdisease(27%),chronicobstructivepulmonarydisease(10%)anddiabetes(10%).
Table 26: Top Ten PAM Causes for West Auckland Māori, 2008 to 2010
PAM Category Deaths % PAM
Coronary heart disease 32 26.7%
Chronic obstructive pulmonary disease (COPD) 12 10.0%
Diabetes 12 10.0%
Complications of the perinatal period 11 9.2%
Cerebrovascular disease 8 6.7%
Road traffic accidents 8 6.7%
Suicide 8 6.7%
Female breast cancer 5 4.2%
Rheumatic heart disease 4 3.3%
Stomach cancer 3 2.5%
Other PAM 17 14.2%
PAM Total 120 100.0%
For the Pacific West Auckland Whānau Direct area population the top three PAM conditions were
coronaryheartdisease(30%),diabetes(15%)andcerebrovasculardiseases(13%).
Table 27: Top Ten PAM Causes for West Auckland Pacific, 2008 to 2010
PAM Category Deaths % PAM
Coronary heart disease 43 30.3%
Diabetes 21 14.8%
Cerebrovascular diseases 18 12.7%
Female breast cancer 12 8.5%
Chronic obstructive pulmonary disease (COPD) 10 7.0%
Suicide 10 7.0%
Complications of the perinatal period 4 2.8%
Stomach cancer 4 2.8%
Hypertensive diseases 3 2.1%
Colon cancer 3 2.1%
Other PAM 14 9.9%
PAM Total 142 100.0%
- 38 - LOCALITY POPULATION SNAPSHOT WEST AUCKLAND
Te Pou Matakana STAND TALL - STAND STRONG - STAND VIGILANT
KIA TU - KIA OHO - KIA MATAARACOMMISSIONING AGENCY
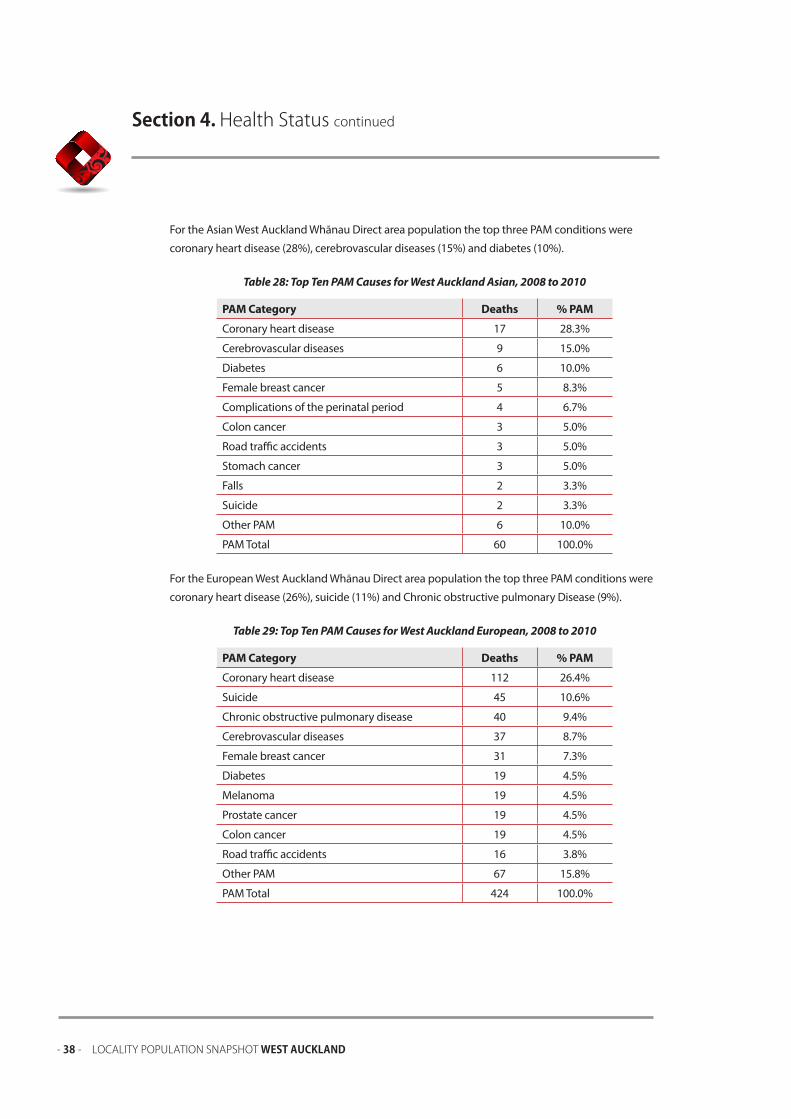
For the Asian West Auckland Whānau Direct area population the top three PAM conditions were
coronaryheartdisease(28%),cerebrovasculardiseases(15%)anddiabetes(10%).
Table 28: Top Ten PAM Causes for West Auckland Asian, 2008 to 2010
PAM Category Deaths % PAM
Coronary heart disease 17 28.3%
Cerebrovascular diseases 9 15.0%
Diabetes 6 10.0%
Female breast cancer 5 8.3%
Complications of the perinatal period 4 6.7%
Colon cancer 3 5.0%
Road traffic accidents 3 5.0%
Stomach cancer 3 5.0%
Falls 2 3.3%
Suicide 2 3.3%
Other PAM 6 10.0%
PAM Total 60 100.0%
For the European West Auckland Whānau Direct area population the top three PAM conditions were
coronaryheartdisease(26%),suicide(11%)andChronicobstructivepulmonaryDisease(9%).
Table 29: Top Ten PAM Causes for West Auckland European, 2008 to 2010
PAM Category Deaths % PAM
Coronary heart disease 112 26.4%
Suicide 45 10.6%
Chronic obstructive pulmonary disease 40 9.4%
Cerebrovascular diseases 37 8.7%
Female breast cancer 31 7.3%
Diabetes 19 4.5%
Melanoma 19 4.5%
Prostate cancer 19 4.5%
Colon cancer 19 4.5%
Road traffic accidents 16 3.8%
Other PAM 67 15.8%
PAM Total 424 100.0%
Section 4. Health Status continued

LOCALITY POPULATION SNAPSHOT WEST AUCKLAND - 39 -
Te Pou Matakana STAND TALL - STAND STRONG - STAND VIGILANT
KIA TU - KIA OHO - KIA MATAARACOMMISSIONING AGENCY
b. Whānau Direct Total
There were a total of 4,017 deaths before age of 75 years in the Whānau Direct area in the three years
2008to2010.Ofthese,overhalf(52.3%)or2,100deathswereconsideredavoidable.
FortheMāoripopulationinWhānauDirectareaoverhalf(53.3%)or946deathswereconsidered
potentiallyavoidable;forPacific,theproportionwasslightlyhigher,at58.2%(1,146deaths).
Table 30: Potentially Avoidable Mortality by Ethnicity Whānau Direct, 2008 to 2010
Ethnicity PAM Deaths (0-74)
Total Deaths (0-74) % PAM
Māori 504 946 53.3%
Pacific 667 1,146 58.2%
Asian 154 300 51.3%
European 756 1,595 47.4%
Other 19 30 63.3%
Total 2,100 4,017 52.3%
The table below shows the top ten causes of PAM for people in the Whānau Direct area. Coronary
heartdiseasewasthemostfrequentcauseofPAM,accountingforaroundonequarter(26%)of
preventabledeaths.Followingthis,diabetes(11%)andcerebrovasculardiseases(10%)werethe
biggest contributors.
Table 31: Top Ten PAM Causes for Whānau Direct Total, 2008 to 2010
PAM Category Deaths % PAM
Coronary heart disease 538 25.6%
Diabetes 229 10.9%
Cerebrovascular diseases 206 9.8%
Suicide 159 7.6%
Chronic obstructive pulmonary disease 149 7.1%
Female breast cancer 143 6.8%
Complications of the perinatal period 91 4.3%
Road traffic accidents 83 4.0%
Rheumatic heart disease 63 3.0%
Colon cancer 61 2.9%
Other PAM 378 18.0%
PAM Total 2,100 100.0%
- 40 - LOCALITY POPULATION SNAPSHOT WEST AUCKLAND
Te Pou Matakana STAND TALL - STAND STRONG - STAND VIGILANT
KIA TU - KIA OHO - KIA MATAARACOMMISSIONING AGENCY
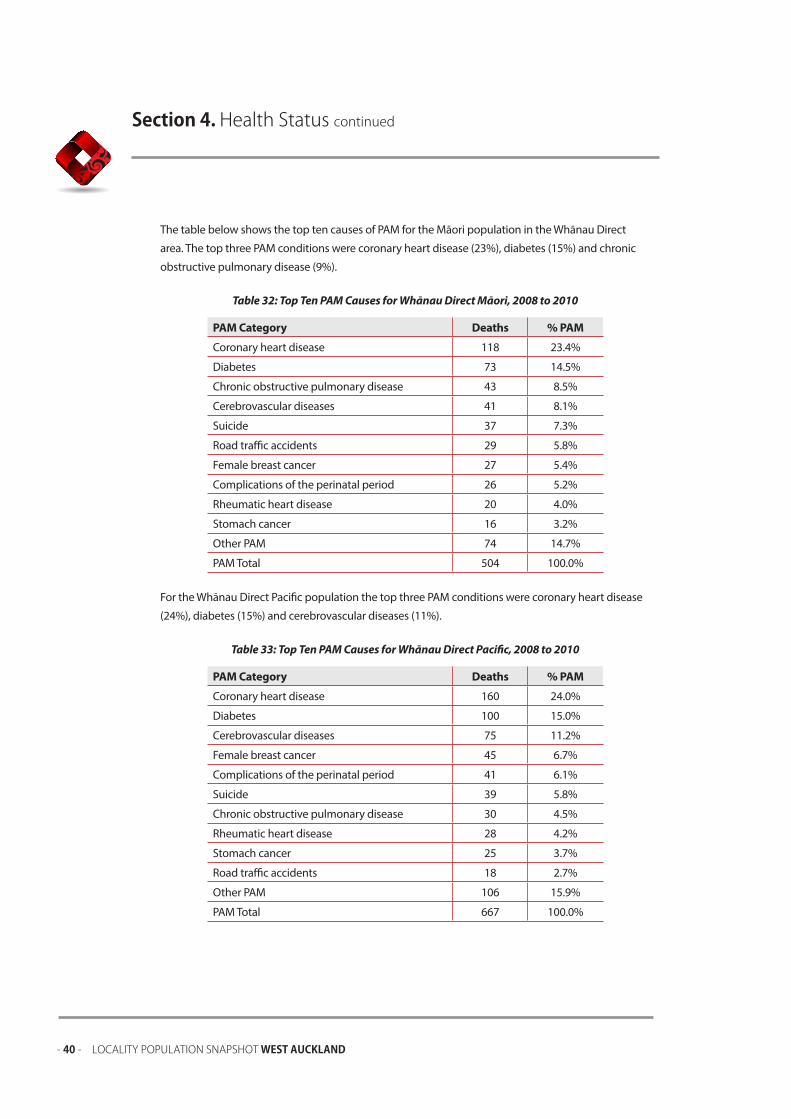
The table below shows the top ten causes of PAM for the Māori population in the Whānau Direct
area.ThetopthreePAMconditionswerecoronaryheartdisease(23%),diabetes(15%)andchronic
obstructivepulmonarydisease(9%).
Table 32: Top Ten PAM Causes for Whānau Direct Māori, 2008 to 2010
PAM Category Deaths % PAM
Coronary heart disease 118 23.4%
Diabetes 73 14.5%
Chronic obstructive pulmonary disease 43 8.5%
Cerebrovascular diseases 41 8.1%
Suicide 37 7.3%
Road traffic accidents 29 5.8%
Female breast cancer 27 5.4%
Complications of the perinatal period 26 5.2%
Rheumatic heart disease 20 4.0%
Stomach cancer 16 3.2%
Other PAM 74 14.7%
PAM Total 504 100.0%
For the Whānau Direct Pacific population the top three PAM conditions were coronary heart disease
(24%),diabetes(15%)andcerebrovasculardiseases(11%).
Table 33: Top Ten PAM Causes for Whānau Direct Pacific, 2008 to 2010
PAM Category Deaths % PAM
Coronary heart disease 160 24.0%
Diabetes 100 15.0%
Cerebrovascular diseases 75 11.2%
Female breast cancer 45 6.7%
Complications of the perinatal period 41 6.1%
Suicide 39 5.8%
Chronic obstructive pulmonary disease 30 4.5%
Rheumatic heart disease 28 4.2%
Stomach cancer 25 3.7%
Road traffic accidents 18 2.7%
Other PAM 106 15.9%
PAM Total 667 100.0%
Section 4. Health Status continued
LOCALITY POPULATION SNAPSHOT WEST AUCKLAND - 41 -
Te Pou Matakana STAND TALL - STAND STRONG - STAND VIGILANT
KIA TU - KIA OHO - KIA MATAARACOMMISSIONING AGENCY
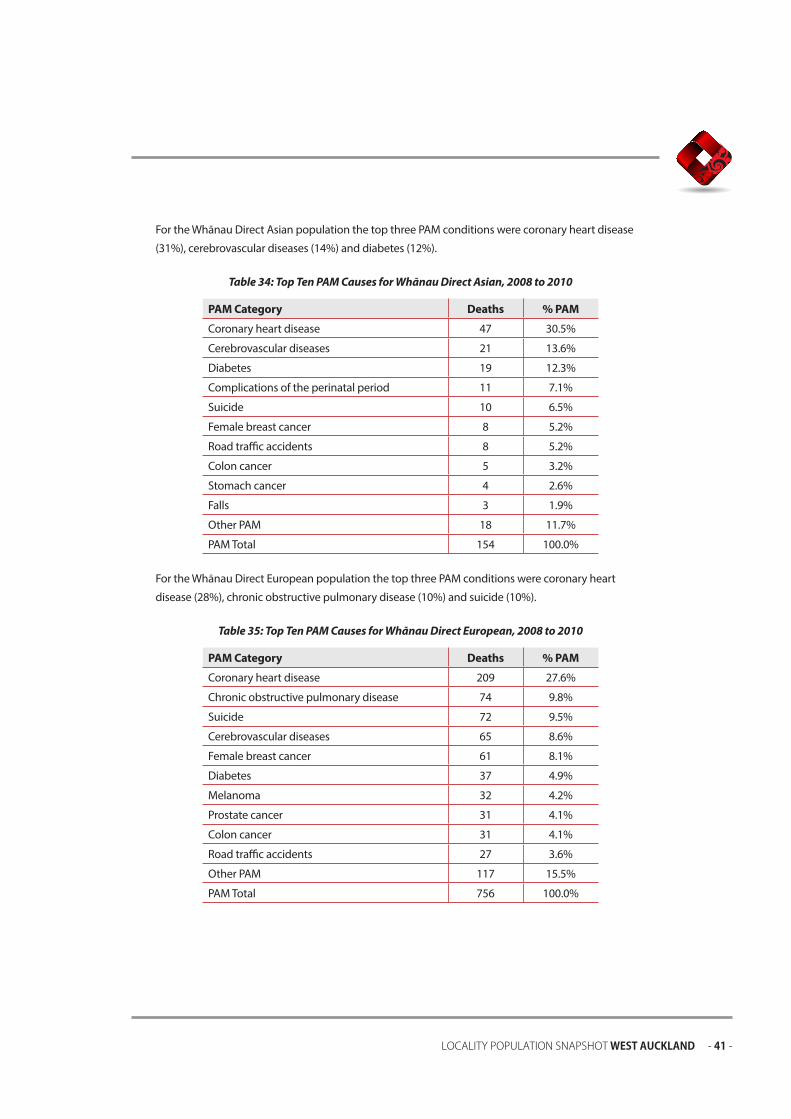
For the Whānau Direct Asian population the top three PAM conditions were coronary heart disease
(31%),cerebrovasculardiseases(14%)anddiabetes(12%).
Table 34: Top Ten PAM Causes for Whānau Direct Asian, 2008 to 2010
PAM Category Deaths % PAM
Coronary heart disease 47 30.5%
Cerebrovascular diseases 21 13.6%
Diabetes 19 12.3%
Complications of the perinatal period 11 7.1%
Suicide 10 6.5%
Female breast cancer 8 5.2%
Road traffic accidents 8 5.2%
Colon cancer 5 3.2%
Stomach cancer 4 2.6%
Falls 3 1.9%
Other PAM 18 11.7%
PAM Total 154 100.0%
For the Whānau Direct European population the top three PAM conditions were coronary heart
disease(28%),chronicobstructivepulmonarydisease(10%)andsuicide(10%).
Table 35: Top Ten PAM Causes for Whānau Direct European, 2008 to 2010
PAM Category Deaths % PAM
Coronary heart disease 209 27.6%
Chronic obstructive pulmonary disease 74 9.8%
Suicide 72 9.5%
Cerebrovascular diseases 65 8.6%
Female breast cancer 61 8.1%
Diabetes 37 4.9%
Melanoma 32 4.2%
Prostate cancer 31 4.1%
Colon cancer 31 4.1%
Road traffic accidents 27 3.6%
Other PAM 117 15.5%
PAM Total 756 100.0%

- 42 - LOCALITY POPULATION SNAPSHOT WEST AUCKLAND
Te Pou Matakana STAND TALL - STAND STRONG - STAND VIGILANT
KIA TU - KIA OHO - KIA MATAARACOMMISSIONING AGENCY
4.4 Hospital Utilisation, 2012 to 2013
The below charts show the number of admissions by age group and ethnicity for the West Auckland Whānau
Direct area and the total Whānau Direct area. Within each area there were variations in the number of
hospital admissions by age and ethnic group.
a. West Auckland
There were 131,218 public hospital admissions in the West Auckland Whānau Direct area over the
twoyearsfrom2012to2013.Ofthesehospitaladmissions,aroundthreeinten(29%)wereyoung
peopleaged24yearsandunderand15%wereforelderlypeopleaged75yearsandover.
Figure 22: Number of Hospital Admissions by Age Group West Auckland, 2012 and 2013
Total Admissions = 131,218
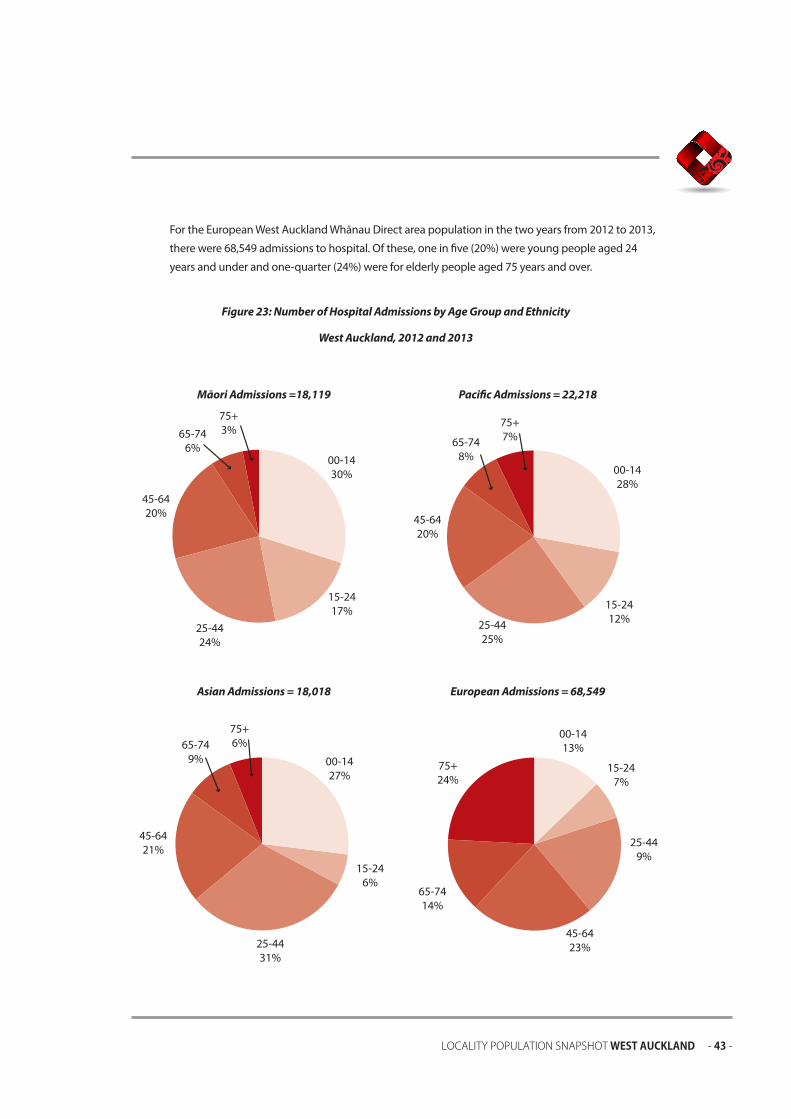
For the Māori West Auckland Whānau Direct area population in the two years from 2012 to 2013,
therewere18,119admissionstohospital.Ofthesehospitaladmissions,almosthalf(47%)were
youngpeopleaged24yearsandunderandonly3%wereforelderlypeopleaged75yearsandover.
For the Pacific West Auckland Whānau Direct area population in the two years from 2012 to 2013,
therewere22,218admissionstohospital.Ofthese,fouroutoften(40%)wereyoungpeopleaged24
yearsandunderandonly7%wereforelderlypeopleaged75yearsandover.
For the Asian West Auckland Whānau Direct area population in the two years from 2012 to 2013,
therewere18,018admissionstohospital.Ofthese,one-third(33%)wereyoungpeopleaged24
yearsandunderandonly6%wereforelderlypeopleaged75yearsandover.
75+15%
65-7411%
45-6422% 25-44
23%
00-1420%
15-249%
Section 4. Health Status continued
LOCALITY POPULATION SNAPSHOT WEST AUCKLAND - 43 -
Te Pou Matakana STAND TALL - STAND STRONG - STAND VIGILANT
KIA TU - KIA OHO - KIA MATAARACOMMISSIONING AGENCY
For the European West Auckland Whānau Direct area population in the two years from 2012 to 2013,
therewere68,549admissionstohospital.Ofthese,oneinfive(20%)wereyoungpeopleaged24
yearsandunderandone-quarter(24%)wereforelderlypeopleaged75yearsandover.
Figure 23: Number of Hospital Admissions by Age Group and Ethnicity
West Auckland, 2012 and 2013
75+3%65-74
6%
45-6420%
25-4424%
00-1430%
15-2417%
75+7%65-74
8%
45-6420%
25-4425%
00-1428%
15-2412%
75+6%65-74
9%
45-6421%
25-4431%
00-1427%
15-246%
75+24%
65-7414%
45-6423%
25-449%
00-1413%
15-247%
Pacific Admissions = 22,218Māori Admissions =18,119
European Admissions = 68,549Asian Admissions = 18,018

- 44 - LOCALITY POPULATION SNAPSHOT WEST AUCKLAND
Te Pou Matakana STAND TALL - STAND STRONG - STAND VIGILANT
KIA TU - KIA OHO - KIA MATAARACOMMISSIONING AGENCY
b. Whānau Direct Total
There were 306,189 public hospital admissions in the Whānau Direct area over the two years from
2012to2013.Ofthesehospitaladmissions,one-third(33%)wereyoungpeopleaged24yearsand
underand13%wereforelderlypeopleaged75yearsandover.
Figure 24: Number of Hospital Admissions by Age Group Whānau Direct Total, 2012 to 2013
Total Admissions = 306,189
For the Māori Whānau Direct area population in the two years from 2012 to 2013, there were 57,987
admissionstohospital.Ofthesehospitaladmissions,almosthalf(47%)wereyoungpeopleaged24
yearsandunderandonly3%wereforelderlypeopleaged75yearsandover.
For the Pacific Whānau Direct area population in the two years from 2012 to 2013, there were 88,885
admissionstohospital.Ofthese,aroundfouroutoften(44%)wereyoungpeopleaged24yearsand
underandonly5%wereforelderlypeopleaged75yearsandover.
For the Asian Whānau Direct area population in the two years from 2012 to 2013, there were 37,730
admissionstohospital.Ofthese,one-third(33%)wereyoungpeopleaged24yearsandunderand
only6%wereforelderlypeopleaged75yearsandover.
For the European Whānau Direct area population in the two years from 2012 to 2013, there were
112,954admissionstohospital.Ofthese,aroundoneinfive(19%)wereyoungpeopleaged24years
andunderandone-quarter(25%)wereforelderlypeopleaged75yearsandover.
75+13%
65-7410%
45-6421%
25-4423%
00-1422%
15-2411%
Section 4. Health Status continued

LOCALITY POPULATION SNAPSHOT WEST AUCKLAND - 45 -
Te Pou Matakana STAND TALL - STAND STRONG - STAND VIGILANT
KIA TU - KIA OHO - KIA MATAARACOMMISSIONING AGENCY
Figure 25: Number of Hospital Admissions by Age Group and Ethnicity
Whānau Direct Total, 2012 and 2013
75+3%
65-746%
45-6420%
25-4424%
00-1429%
15-2418%
75+5%65-74
8%
45-6419%
25-4424%
00-1430%
15-2414%
75+6%65-74
9%
45-6421%
25-4431%
00-1426%
15-247%
75+25%
65-7415%
45-6423%
25-4418%
00-1412%
15-247%
Pacific Admissions = 88,885Māori Admissions =57,987
European Admissions = 112,954Asian Admissions = 37,730

- 46 - LOCALITY POPULATION SNAPSHOT WEST AUCKLAND
Te Pou Matakana STAND TALL - STAND STRONG - STAND VIGILANT
KIA TU - KIA OHO - KIA MATAARACOMMISSIONING AGENCY
4.5 Potentially Avoidable Hospitalisation (PAH), 2012 to 2013
The concept of avoiding hospitalisation can be extended from fatal to non-fatal outcomes. A Potentially
Avoidable Hospitalisations (PAH) indicates the occurrence of an injury or severe illness that could,
theoretically, have been avoided through:
1. Population based health promotion strategies;
2. Intervention through primary health care setting.
Within this definition, all admissions after the age of 75 are considered unavoidable. Further, only acute
admissions (AA & AC) are counted as potentially avoidable except for dental conditions where elective
admissions (WN) are also included within the definition.
a. West Auckland
The table below shows the top ten causes of Potentially Avoidable Hospitalisations (PAH) for the
population of the West Auckland Whānau Direct area. Angina and chest pain was the most frequent
causeofPAH,accountingforaround15%ofpreventablehospitaladmissions.Followingthis,cellulitis
(10%)andgastroenteritis(8%)werethenextbiggestcontributorstoPAH.
Table 36: Top Ten PAH Causes for West Auckland Total, 2012 and 2013
PAH Category Admissions % PAH
Angina and chest pain 4,049 14.7%
Cellulitis 2,659 9.7%
Gastroenteritis 2,166 7.9%
Respiratory infections – Pneumonia 1,919 7.0%
Myocardial infarction 1,865 6.8%
Kidney/urinary infection 1,785 6.5%
Chronic obstructive respiratory disease 1,640 6.0%
Asthma 1,331 4.8%
Diabetes 1,072 3.9%
Congestive heart failure 972 3.5%
Other PAH 7,996 29.1%
PAH Total 38,214 100.0%
Section 4. Health Status continued
LOCALITY POPULATION SNAPSHOT WEST AUCKLAND - 47 -
Te Pou Matakana STAND TALL - STAND STRONG - STAND VIGILANT
KIA TU - KIA OHO - KIA MATAARACOMMISSIONING AGENCY
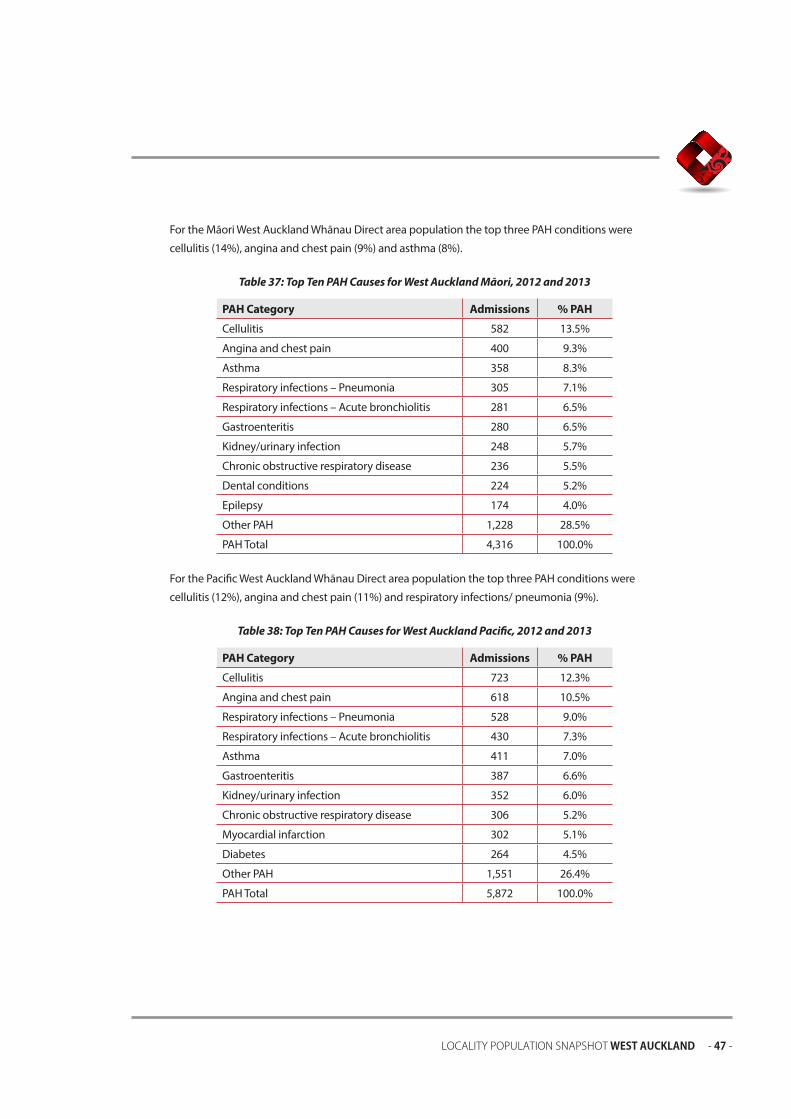
For the Māori West Auckland Whānau Direct area population the top three PAH conditions were
cellulitis(14%),anginaandchestpain(9%)andasthma(8%).
Table 37: Top Ten PAH Causes for West Auckland Māori, 2012 and 2013
PAH Category Admissions % PAH
Cellulitis 582 13.5%
Angina and chest pain 400 9.3%
Asthma 358 8.3%
Respiratory infections – Pneumonia 305 7.1%
Respiratory infections – Acute bronchiolitis 281 6.5%
Gastroenteritis 280 6.5%
Kidney/urinary infection 248 5.7%
Chronic obstructive respiratory disease 236 5.5%
Dental conditions 224 5.2%
Epilepsy 174 4.0%
Other PAH 1,228 28.5%
PAH Total 4,316 100.0%
For the Pacific West Auckland Whānau Direct area population the top three PAH conditions were
cellulitis(12%),anginaandchestpain(11%)andrespiratoryinfections/pneumonia(9%).
Table 38: Top Ten PAH Causes for West Auckland Pacific, 2012 and 2013
PAH Category Admissions % PAH
Cellulitis 723 12.3%
Angina and chest pain 618 10.5%
Respiratory infections – Pneumonia 528 9.0%
Respiratory infections – Acute bronchiolitis 430 7.3%
Asthma 411 7.0%
Gastroenteritis 387 6.6%
Kidney/urinary infection 352 6.0%
Chronic obstructive respiratory disease 306 5.2%
Myocardial infarction 302 5.1%
Diabetes 264 4.5%
Other PAH 1,551 26.4%
PAH Total 5,872 100.0%

- 48 - LOCALITY POPULATION SNAPSHOT WEST AUCKLAND
Te Pou Matakana STAND TALL - STAND STRONG - STAND VIGILANT
KIA TU - KIA OHO - KIA MATAARACOMMISSIONING AGENCY
For the Asian West Auckland Whānau Direct area population the top three PAH conditions were
anginaandchestpain(19%),gastroenteritis(10%)andmyocardialinfarction(7%).
Table 39: Top Ten PAH Causes for West Auckland Asian, 2012 and 2013
PAH Category Admissions % PAH
Angina and chest pain 606 18.7%
Gastroenteritis 334 10.3%
Myocardial infarction 230 7.1%
Kidney/urinary infection 203 6.3%
Cellulitis 201 6.2%
Respiratory infections – Pneumonia 175 5.4%
Asthma 174 5.4%
Dental conditions 144 4.4%
Respiratory infections – Other 132 4.1%
Diabetes 121 3.7%
Other PAH 925 28.5%
PAH Total 3,245 100.0%
For the European West Auckland Whānau Direct area population the top three PAH conditions were
anginaandchestpain(17%),myocardialinfarction(9%)andcellulitis(8%).
Table 40: Top Ten PAH Causes for West Auckland European, 2012 and 2013
PAH Category Admissions % PAH
Angina and chest pain 2,296 17.3%
Myocardial infarction 1,145 8.6%
Cellulitis 1,092 8.2%
Gastroenteritis 1,086 8.2%
Chronic obstructive respiratory disease 1,009 7.6%
Kidney/urinary infection 944 7.1%
Respiratory infections – Pneumonia 875 6.6%
Congestive heart failure 598 4.5%
Diabetes 510 3.8%
Stroke 474 3.6%
Other PAH 3,266 24.6%
PAH Total 13,295 100.0%
Section 4. Health Status continued

LOCALITY POPULATION SNAPSHOT WEST AUCKLAND - 49 -
Te Pou Matakana STAND TALL - STAND STRONG - STAND VIGILANT
KIA TU - KIA OHO - KIA MATAARACOMMISSIONING AGENCY
For the Other West Auckland Whānau Direct area population the top three PAH conditions were
anginaandchestpain(18%),gastroenteritis(11%)andcellulitis(8%).
Table 41: Top Ten PAH Causes for West Auckland Other, 2012 and 2013
PAH Category Admissions % PAH
Angina and chest pain 129 17.8%
Gastroenteritis 79 10.9%
Cellulitis 61 8.4%
Myocardial infarction 38 5.2%
Kidney/urinary infection 38 5.2%
Respiratory infections – Pneumonia 36 5.0%
Respiratory infections – Other 32 4.4%
Dental conditions 29 4.0%
Epilepsy 28 3.9%
ENT infections 25 3.4%
Other PAH 231 31.8%
PAH Total 726 100.0%
b. Whānau Direct Total
The below table, excludes elective dental conditions for the purposes of a consistent comparison
with total acute admissions. There were a total of 246,823 acute hospital admissions for patients
below the age of 75 years in the Whānau Direct area in the two years 2012 to 2013. Of these, just over
one-quarter(26%)or63,526acutehospitaladmissionswereconsideredavoidable.
FortheMāoripopulationinthetotalWhānauDirectareaslightlyoveraquarter(26%)of0-74year
old acute hospital admissions were considered potentially avoidable; for Pacific, the proportion was
slightlyhigheratclosertothreeinten(29%).
Table 42: Potentially Avoidable Hospitalisations by Ethnicity Whānau Direct Total, 2012 and 2013
EthnicityPAH
Admissions (0-74)
Total Acute Admissions
(0-74)% PAH
Māori 12,983 49,593 26.2%
Pacific 21,807 76,287 28.6%
Asian 6,525 30,413 21.5%
European 20,883 84,220 24.8%
Other 1,328 6,310 21.0%
Total 63,526 246,823 25.7%

- 50 - LOCALITY POPULATION SNAPSHOT WEST AUCKLAND
Te Pou Matakana STAND TALL - STAND STRONG - STAND VIGILANT
KIA TU - KIA OHO - KIA MATAARACOMMISSIONING AGENCY
The table below shows the top ten causes of PAH for people in the Whānau Direct area. Angina
andchestpainwasthemostfrequentcauseofPAH,accountingfor13%ofpreventablehospital
admissions.Followingthis,cellulitis(11%),gastroenteritis(8%)andRespiratoryinfections-
Pneumonia(7%)werethenextbiggestcontributorstoPAH.
Table 43: Top Ten PAH Causes for Whānau Direct Total, 2012 and 2013
PAH Category Admissions % PAH
Angina and chest pain 8,309 12.7%
Cellulitis 7,087 10.8%
Gastroenteritis 4,914 7.5%
Respiratory infections – Pneumonia 4,643 7.1%
Kidney/urinary infection 3,971 6.0%
Chronic obstructive respiratory disease 3,896 5.9%
Asthma 3,405 5.2%
Myocardial infarction 3,285 5.0%
Respiratory infections – Acute bronchiolitis 3,172 4.8%
Diabetes 2,754 4.2%
Other PAH 20,232 30.8%
PAH Total 65,668 100.0%
FortheWhānauDirectMāoripopulationthetopfourPAHconditionswerecellulitis(13%),angina
andchestpain(8%),asthma(8%)andRespiratoryinfections-Acutebronchiolitis(8%).
Table 44: Top Ten PAH Causes for Whānau Direct Māori, 2012 and 2013
PAH Category Admissions % PAH
Cellulitis 1,791 13.2%
Angina and chest pain 1,118 8.3%
Asthma 1,038 7.7%
Respiratory infections – Acute bronchiolitis 1,036 7.7%
Respiratory infections – Pneumonia 900 6.6%
Chronic obstructive respiratory disease 899 6.6%
Gastroenteritis 815 6.0%
Kidney/urinary infection 724 5.3%
Dental conditions 691 5.1%
Epilepsy 599 4.4%
Other PAH 3,929 29.0%
PAH Total 13,540 100.0%
Section 4. Health Status continued

LOCALITY POPULATION SNAPSHOT WEST AUCKLAND - 51 -
Te Pou Matakana STAND TALL - STAND STRONG - STAND VIGILANT
KIA TU - KIA OHO - KIA MATAARACOMMISSIONING AGENCY
FortheWhānauDirectPacificpopulationthetopthreePAHconditionswerecellulitis(13%),angina
andchestpain(10%)andrespiratoryinfections–pneumonia(8%).
Table 45: Top Ten PAH Causes for Whānau Direct Pacific, 2012 and 2013
PAH Category Admissions % PAH
Cellulitis 2,938 13.0%
Angina and chest pain 2,205 9.8%
Respiratory infections – Pneumonia 1,862 8.2%
Respiratory infections – Acute bronchiolitis 1,785 7.9%
Gastroenteritis 1,573 7.0%
Asthma 1,414 6.3%
Kidney/urinary infection 1,322 5.8%
Respiratory infections – Other 1,116 4.9%
Chronic obstructive respiratory disease 1,084 4.8%
Diabetes 1,021 4.5%
Other PAH 6,281 27.8%
PAH Total 22,601 100.0%
For the Whānau Direct Asian population the top three PAH conditions were angina and chest pain
(18%),gastroenteritis(11%)andmyocardialinfarction(7%).
Table 46: Top Ten PAH Causes for Whānau Direct Asian, 2012 and 2013
PAH Category Admissions % PAH
Angina and chest pain 1,249 18.3%
Gastroenteritis 743 10.9%
Myocardial infarction 461 6.7%
Kidney/urinary infection 417 6.1%
Cellulitis 392 5.7%
Respiratory infections – Pneumonia 365 5.3%
Asthma 339 5.0%
Dental conditions 338 4.9%
Respiratory infections – Other 299 4.4%
Diabetes 263 3.8%
Other PAH 1,969 28.8%
PAH Total 6,835 100.0%

- 52 - LOCALITY POPULATION SNAPSHOT WEST AUCKLAND
Te Pou Matakana STAND TALL - STAND STRONG - STAND VIGILANT
KIA TU - KIA OHO - KIA MATAARACOMMISSIONING AGENCY
For the Whānau Direct European population the top three PAH conditions were angina and chest
pain(16%),cellulitis(9%)andchronicobstructiverespiratorydisease(8%).
Table 47: Top Ten PAH Causes for Whānau Direct European, 2012 and 2013
PAH Category Admissions % PAH
Angina and chest pain 3,491 16.4%
Cellulitis 1,852 8.7%
Chronic obstructive respiratory disease 1,705 8.0%
Gastroenteritis 1,643 7.7%
Myocardial infarction 1,600 7.5%
Kidney/urinary infection 1,440 6.8%
Respiratory infections - Pneumonia 1,438 6.7%
Congestive heart failure 1,029 4.8%
Stroke 847 4.0%
Diabetes 836 3.9%
Other PAH 5,429 25.5%
PAH Total 21,310 100.0%
FortheWhānauDirect‘Other’populationthetopthreePAHconditionswereanginaandchestpain
(18%),gastroenteritis(10%)andcellulitis(8%).
Table 48: Top Ten PAH Causes for Whānau Direct Other, 2012 and 2013
PAH Category Admissions % PAH
Angina and chest pain 246 17.8%
Gastroenteritis 140 10.1%
Cellulitis 114 8.2%
Respiratory infections - Pneumonia 78 5.6%
Myocardial infarction 72 5.2%
Respiratory infections - Other 68 4.9%
Kidney/urinary infection 68 4.9%
Dental conditions 62 4.5%
Diabetes 56 4.1%
Asthma 54 3.9%
Other PAH 424 30.7%
PAH Total 1,382 100.0%
Section 4. Health Status continued

LOCALITY POPULATION SNAPSHOT WEST AUCKLAND - 53 -
Te Pou Matakana STAND TALL - STAND STRONG - STAND VIGILANT
KIA TU - KIA OHO - KIA MATAARACOMMISSIONING AGENCY
Appendix A: Population by Age and Ethnicity for New Zealand, Census 2013
Female Māori Pacific Asian European MELAA Other & NEI Total
0-4 34,653 12,858 15,858 67,890 1,914 9,570 142,7435-9 32,739 12,309 13,677 71,121 1,623 9,087 140,556
10-14 31,209 12,369 13,821 72,642 1,476 8,643 140,16015-19 28,911 12,420 16,935 75,450 1,677 9,456 144,84620-24 25,464 11,292 20,994 74,010 1,887 11,451 145,09525-29 20,388 8,856 24,786 66,939 2,316 9,894 133,17630-34 18,864 8,361 24,141 71,490 2,598 9,204 134,65235-39 19,521 8,271 18,882 83,577 2,043 8,862 141,15640-44 20,526 8,409 19,473 101,307 1,662 10,302 161,67645-49 18,624 7,926 17,475 101,649 1,413 10,221 157,30250-54 17,721 6,441 14,880 105,003 1,056 10,323 155,41855-59 13,452 4,851 12,195 94,086 765 8,574 133,92660-64 10,179 3,981 8,568 88,422 444 7,566 119,16365-69 6,876 2,829 5,487 78,774 294 6,210 100,46770-74 4,929 2,079 3,939 62,469 195 4,491 78,10275-79 3,102 1,380 2,589 46,923 129 2,889 57,01280-84 1,812 819 1,344 39,213 87 2,166 45,44485+ 996 540 843 42,534 75 2,142 47,130
Total 309,966 125,991 235,878 1,343,496 21,651 141,048 2,178,033
Male Māori Pacific Asian European MELAA Other & NEI Total
0-4 36,417 13,437 16,740 71,244 2,013 9,441 149,2985-9 34,404 12,834 14,505 73,611 1,716 9,132 146,202
10-14 32,889 12,825 14,505 76,125 1,626 8,697 146,67015-19 29,709 12,333 18,183 78,870 1,800 10,014 150,91220-24 22,917 10,563 23,712 73,278 2,235 12,894 145,59325-29 16,692 8,253 23,259 62,985 2,385 11,382 124,95630-34 15,453 7,743 21,636 64,305 2,478 10,284 121,89935-39 16,179 7,557 15,648 74,610 1,947 10,419 126,36340-44 17,316 7,710 14,613 90,714 1,779 11,949 144,07845-49 16,329 7,209 13,944 94,107 1,434 11,307 144,33350-54 15,204 5,892 12,048 98,706 1,134 11,592 144,57655-59 11,634 4,644 9,792 89,757 789 9,648 126,26160-64 9,021 3,789 7,428 84,792 540 8,430 114,00065-69 6,081 2,592 4,893 75,147 315 6,525 95,55670-74 4,299 1,725 3,528 57,618 189 4,644 72,00975-79 2,424 993 2,496 40,677 111 2,841 49,54580-84 1,167 498 1,170 30,693 75 1,983 35,58385+ 498 225 531 23,427 48 1,458 26,184
Total 288,636 120,825 218,628 1,260,663 22,608 152,649 2,064,018

- 54 - LOCALITY POPULATION SNAPSHOT WEST AUCKLAND
Te Pou Matakana STAND TALL - STAND STRONG - STAND VIGILANT
KIA TU - KIA OHO - KIA MATAARACOMMISSIONING AGENCY
Total Māori Pacific Asian European MELAA Other & NEI Total
0-4 71,073 26,298 32,598 139,137 3,927 19,008 292,0445-9 67,143 25,140 28,182 144,732 3,339 18,219 286,758
10-14 64,098 25,197 28,326 148,767 3,105 17,340 286,83015-19 58,623 24,750 35,118 154,317 3,477 19,473 295,75820-24 48,378 21,855 44,703 147,288 4,122 24,345 290,69125-29 37,077 17,109 48,045 129,927 4,701 21,270 258,13230-34 34,317 16,107 45,777 135,792 5,073 19,488 256,55435-39 35,703 15,828 34,527 158,187 3,990 19,278 267,51940-44 37,845 16,116 34,086 192,021 3,438 22,251 305,75745-49 34,953 15,135 31,422 195,753 2,847 21,531 301,63550-54 32,925 12,333 26,925 203,709 2,190 21,915 299,99455-59 25,083 9,492 21,990 183,843 1,551 18,222 260,18760-64 19,200 7,770 15,996 173,217 981 15,999 233,16365-69 12,957 5,421 10,380 153,921 609 12,732 196,02070-74 9,228 3,804 7,467 120,090 384 9,141 150,11475-79 5,526 2,376 5,082 87,600 243 5,733 106,55780-84 2,979 1,320 2,514 69,906 159 4,149 81,02785+ 1,494 768 1,374 65,958 120 3,603 73,317
Total 598,602 246,816 454,509 2,604,162 44,259 293,697 4,242,051
Note:thesenumberswerebasedonthe“Censususuallyresidentpopulationcount”.TheCensus‘usually
resident population’ count includes all residents of a given area counted by the five-yearly Census of
PopulationandDwellings,irrespectiveofwhereinNewZealandthoseresidentswerecounted.TheCensus
‘usuallyresidentpopulation’countdoesnotincludeadjustmentsfornetCensusundercountorNewZealand
residentstemporarilyoverseas.OverseasvisitorsinNewZealandonCensusnightareexcluded.
NEI = Not Elsewhere Included
MELAA = Middle Eastern / Latin American / African
Appendix A: Population by Age and Ethnicity for New Zealand, Census 2013 continued
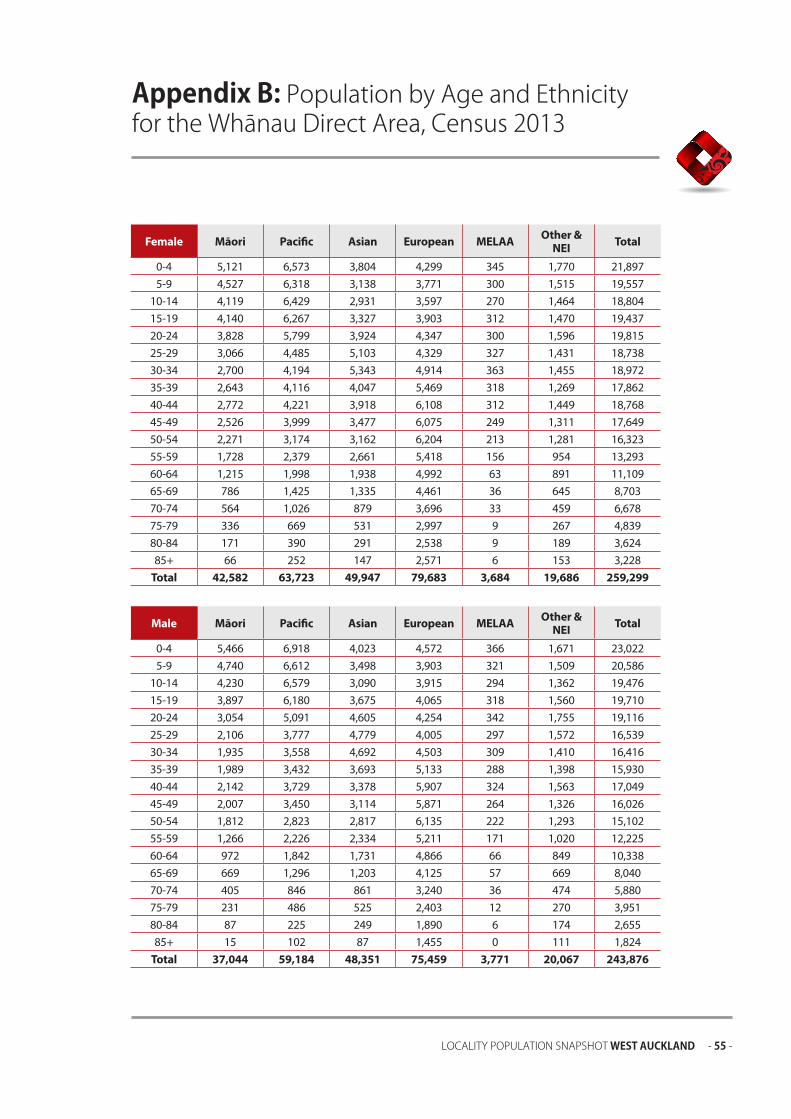
LOCALITY POPULATION SNAPSHOT WEST AUCKLAND - 55 -
Te Pou Matakana STAND TALL - STAND STRONG - STAND VIGILANT
KIA TU - KIA OHO - KIA MATAARACOMMISSIONING AGENCY
Appendix B: Population by Age and Ethnicity for the Whānau Direct Area, Census 2013
Female Māori Pacific Asian European MELAA Other & NEI Total
0-4 5,121 6,573 3,804 4,299 345 1,770 21,8975-9 4,527 6,318 3,138 3,771 300 1,515 19,557
10-14 4,119 6,429 2,931 3,597 270 1,464 18,80415-19 4,140 6,267 3,327 3,903 312 1,470 19,43720-24 3,828 5,799 3,924 4,347 300 1,596 19,81525-29 3,066 4,485 5,103 4,329 327 1,431 18,73830-34 2,700 4,194 5,343 4,914 363 1,455 18,97235-39 2,643 4,116 4,047 5,469 318 1,269 17,86240-44 2,772 4,221 3,918 6,108 312 1,449 18,76845-49 2,526 3,999 3,477 6,075 249 1,311 17,64950-54 2,271 3,174 3,162 6,204 213 1,281 16,32355-59 1,728 2,379 2,661 5,418 156 954 13,29360-64 1,215 1,998 1,938 4,992 63 891 11,10965-69 786 1,425 1,335 4,461 36 645 8,70370-74 564 1,026 879 3,696 33 459 6,67875-79 336 669 531 2,997 9 267 4,83980-84 171 390 291 2,538 9 189 3,62485+ 66 252 147 2,571 6 153 3,228
Total 42,582 63,723 49,947 79,683 3,684 19,686 259,299
Male Māori Pacific Asian European MELAA Other & NEI Total
0-4 5,466 6,918 4,023 4,572 366 1,671 23,0225-9 4,740 6,612 3,498 3,903 321 1,509 20,586
10-14 4,230 6,579 3,090 3,915 294 1,362 19,47615-19 3,897 6,180 3,675 4,065 318 1,560 19,71020-24 3,054 5,091 4,605 4,254 342 1,755 19,11625-29 2,106 3,777 4,779 4,005 297 1,572 16,53930-34 1,935 3,558 4,692 4,503 309 1,410 16,41635-39 1,989 3,432 3,693 5,133 288 1,398 15,93040-44 2,142 3,729 3,378 5,907 324 1,563 17,04945-49 2,007 3,450 3,114 5,871 264 1,326 16,02650-54 1,812 2,823 2,817 6,135 222 1,293 15,10255-59 1,266 2,226 2,334 5,211 171 1,020 12,22560-64 972 1,842 1,731 4,866 66 849 10,33865-69 669 1,296 1,203 4,125 57 669 8,04070-74 405 846 861 3,240 36 474 5,88075-79 231 486 525 2,403 12 270 3,95180-84 87 225 249 1,890 6 174 2,65585+ 15 102 87 1,455 0 111 1,824
Total 37,044 59,184 48,351 75,459 3,771 20,067 243,876

- 56 - LOCALITY POPULATION SNAPSHOT WEST AUCKLAND
Te Pou Matakana STAND TALL - STAND STRONG - STAND VIGILANT
KIA TU - KIA OHO - KIA MATAARACOMMISSIONING AGENCY
Total Māori Pacific Asian European MELAA Other & NEI Total
0-4 10,584 13,488 7,833 8,868 714 3,441 44,9225-9 9,267 12,936 6,627 7,674 630 3,018 40,143
10-14 8,349 13,011 6,024 7,509 567 2,823 38,28015-19 8,037 12,447 7,005 7,974 636 3,054 39,15320-24 6,891 10,887 8,529 8,604 648 3,378 38,93125-29 5,175 8,262 9,885 8,325 624 3,015 35,28930-34 4,632 7,758 10,026 9,420 675 2,874 35,38535-39 4,632 7,557 7,737 10,602 606 2,658 33,80140-44 4,908 7,941 7,287 12,012 636 3,024 35,81445-49 4,539 7,449 6,594 11,943 522 2,640 33,68150-54 4,089 6,000 5,982 12,342 426 2,577 31,41955-59 2,994 4,602 4,995 10,635 333 1,959 25,51860-64 2,184 3,837 3,666 9,852 153 1,758 21,45065-69 1,455 2,721 2,538 8,589 105 1,323 16,73470-74 969 1,866 1,737 6,942 72 951 12,55875-79 561 1,152 1,056 5,406 39 546 8,78780-84 273 621 534 4,425 15 375 6,27985+ 111 357 246 4,026 18 270 5,055
Total 79,632 122,910 98,292 155,136 7,455 39,741 503,169
Note:thesenumberswerebasedonthe“Censususuallyresidentpopulationcount”.TheCensus‘usually
resident population’ count includes all residents of a given area counted by the five-yearly Census of
PopulationandDwellings,irrespectiveofwhereinNewZealandthoseresidentswerecounted.TheCensus
‘usuallyresidentpopulation’countdoesnotincludeadjustmentsfornetCensusundercountorNewZealand
residentstemporarilyoverseas.OverseasvisitorsinNewZealandonCensusnightareexcluded.
NEI = Not Elsewhere Included
MELAA = Middle Eastern / Latin American / African
Appendix B: Population by Age and Ethnicity for the Whānau Direct Area, Census 2013 continued

LOCALITY POPULATION SNAPSHOT WEST AUCKLAND - 57 -
Te Pou Matakana STAND TALL - STAND STRONG - STAND VIGILANT
KIA TU - KIA OHO - KIA MATAARACOMMISSIONING AGENCY
Appendix C: Population by Age and Ethnicity for West Auckland Whānau Direct Area, Census 2013
Female Māori Pacific Asian European MELAA Other & NEI Total
0-4 1,767 1,575 1,908 3,036 198 654 9,1265-9 1,539 1,533 1,482 2,577 168 558 7,854
10-14 1,386 1,575 1,389 2,442 180 546 7,50915-19 1,458 1,653 1,629 2,634 195 516 8,09120-24 1,275 1,476 1,845 2,820 171 642 8,23225-29 1,020 1,089 2,481 2,856 183 591 8,22330-34 915 1,113 2,685 3,390 228 657 9,00035-39 924 1,116 1,992 3,813 195 555 8,59240-44 924 1,110 2,094 4,170 186 660 9,12945-49 837 1,125 1,845 3,990 147 579 8,53250-54 807 918 1,635 3,846 105 531 7,85155-59 588 696 1,359 3,354 72 420 6,48360-64 396 588 957 2,991 30 396 5,36165-69 249 390 675 2,661 12 291 4,28470-74 183 300 453 2,139 6 222 3,30675-79 108 195 297 1,779 0 138 2,52680-84 51 105 138 1,470 0 81 1,86685+ 30 69 81 1,515 0 75 1,776
Total 14,472 16,629 24,936 51,468 2,094 8,133 117,732
Male Māori Pacific Asian European MELAA Other & NEI Total
0-4 1,926 1,782 2,013 3,141 207 645 9,7115-9 1,536 1,716 1,686 2,736 177 546 8,397
10-14 1,425 1,617 1,464 2,676 165 504 7,84815-19 1,350 1,614 1,776 2,685 201 600 8,22920-24 1,083 1,284 2,001 2,808 192 699 8,07325-29 729 987 2,238 2,607 180 648 7,38930-34 738 957 2,328 3,039 192 648 7,90535-39 750 969 1,812 3,543 171 624 7,86940-44 783 1,005 1,662 3,984 183 711 8,32845-49 750 942 1,509 3,762 150 582 7,69550-54 648 783 1,404 3,822 117 579 7,34755-59 459 627 1,188 3,141 69 480 5,96760-64 300 489 840 2,877 33 393 4,93265-69 177 345 591 2,400 36 291 3,85270-74 126 219 447 1,893 9 222 2,92275-79 87 135 309 1,410 0 126 2,07380-84 36 63 153 1,092 0 75 1,43185+ 9 27 45 834 0 48 981
Total 12,921 15,561 23,460 48,441 2,118 8,448 110,946

- 58 - LOCALITY POPULATION SNAPSHOT WEST AUCKLAND
Te Pou Matakana STAND TALL - STAND STRONG - STAND VIGILANT
KIA TU - KIA OHO - KIA MATAARACOMMISSIONING AGENCY
Total Māori Pacific Asian European MELAA Other & NEI Total
0-4 3,693 3,354 3,924 6,171 408 1,293 18,8375-9 3,075 3,255 3,165 5,310 351 1,101 16,251
10-14 2,814 3,198 2,853 5,109 345 1,044 15,35715-19 2,808 3,267 3,405 5,322 402 1,119 16,32020-24 2,361 2,757 3,849 5,628 363 1,347 16,30525-29 1,752 2,079 4,719 5,457 357 1,242 15,60930-34 1,656 2,070 5,007 6,432 423 1,308 16,89935-39 1,680 2,088 3,801 7,350 360 1,179 16,46740-44 1,704 2,109 3,750 8,148 363 1,371 17,45445-49 1,593 2,070 3,357 7,746 300 1,167 16,23350-54 1,458 1,701 3,039 7,674 219 1,107 15,19855-59 1,050 1,320 2,547 6,501 141 891 12,45060-64 693 1,074 1,800 5,862 69 801 10,29665-69 429 738 1,266 5,061 60 585 8,13070-74 309 513 897 4,029 15 450 6,22875-79 192 327 606 3,192 9 261 4,59680-84 99 165 288 2,562 0 162 3,29785+ 45 96 129 2,349 6 120 2,757
Total 27,396 32,193 48,399 99,903 4,212 16,572 228,675
Note:thesenumberswerebasedonthe“Censususuallyresidentpopulationcount”.TheCensus‘usually
resident population’ count includes all residents of a given area counted by the five-yearly Census of
PopulationandDwellings,irrespectiveofwhereinNewZealandthoseresidentswerecounted.TheCensus
‘usuallyresidentpopulation’countdoesnotincludeadjustmentsfornetCensusundercountorNewZealand
residentstemporarilyoverseas.OverseasvisitorsinNewZealandonCensusnightareexcluded.
NEI = Not Elsewhere Included
MELAA = Middle Eastern / Latin American / African
Appendix C: Population by Age and Ethnicity for West Auckland Whānau Direct Area, Census 2013 continued

LOCALITY POPULATION SNAPSHOT WEST AUCKLAND - 59 -
Te Pou Matakana STAND TALL - STAND STRONG - STAND VIGILANT
KIA TU - KIA OHO - KIA MATAARACOMMISSIONING AGENCY
Appendix D: Population by Age and Ethnicity for South Auckland Whānau Direct Area, Census 2013
Female Māori Pacific Asian European MELAA Other & NEI Total
0-4 3,354 4,998 1,896 1,263 147 1,116 12,7715-9 2,988 4,785 1,656 1,194 132 957 11,703
10-14 2,733 4,854 1,542 1,155 90 918 11,29515-19 2,682 4,614 1,698 1,269 117 954 11,34620-24 2,553 4,323 2,079 1,527 129 954 11,58325-29 2,046 3,396 2,622 1,473 144 840 10,51530-34 1,785 3,081 2,658 1,524 135 798 9,97235-39 1,719 3,000 2,055 1,656 123 714 9,27040-44 1,848 3,111 1,824 1,938 126 789 9,63945-49 1,689 2,874 1,632 2,085 102 732 9,11750-54 1,464 2,256 1,527 2,358 108 750 8,47255-59 1,140 1,683 1,302 2,064 84 534 6,81060-64 819 1,410 981 2,001 33 495 5,74865-69 537 1,035 660 1,800 24 354 4,41970-74 381 726 426 1,557 27 237 3,37275-79 228 474 234 1,218 9 129 2,31380-84 120 285 153 1,068 9 108 1,75885+ 36 183 66 1,056 6 78 1,452
Total 28,110 47,094 25,011 28,215 1,590 11,553 141,567
Male Māori Pacific Asian European MELAA Other & NEI Total
0-4 3,540 5,136 2,010 1,431 159 1,026 13,3115-9 3,204 4,896 1,812 1,167 144 963 12,189
10-14 2,805 4,962 1,626 1,239 129 858 11,62815-19 2,547 4,566 1,899 1,380 117 960 11,48120-24 1,971 3,807 2,604 1,446 150 1,056 11,04325-29 1,377 2,790 2,541 1,398 117 924 9,15030-34 1,197 2,601 2,364 1,464 117 762 8,51135-39 1,239 2,463 1,881 1,590 117 774 8,06140-44 1,359 2,724 1,716 1,923 141 852 8,72145-49 1,257 2,508 1,605 2,109 114 744 8,33150-54 1,164 2,040 1,413 2,313 105 714 7,75555-59 807 1,599 1,146 2,070 102 540 6,25860-64 672 1,353 891 1,989 33 456 5,40665-69 492 951 612 1,725 21 378 4,18870-74 279 627 414 1,347 27 252 2,95875-79 144 351 216 993 12 144 1,87880-84 51 162 96 798 6 99 1,22485+ 6 75 42 621 0 63 843
Total 24,123 43,623 24,891 27,018 1,653 11,619 132,930

- 60 - LOCALITY POPULATION SNAPSHOT WEST AUCKLAND
Te Pou Matakana STAND TALL - STAND STRONG - STAND VIGILANT
KIA TU - KIA OHO - KIA MATAARACOMMISSIONING AGENCY
Total Māori Pacific Asian European MELAA Other & NEI Total
0-4 6,891 10,134 3,909 2,697 306 2,148 26,0855-9 6,192 9,681 3,462 2,364 279 1,917 23,892
10-14 5,535 9,813 3,171 2,400 222 1,779 22,92315-19 5,229 9,180 3,600 2,652 234 1,935 22,83320-24 4,530 8,130 4,680 2,976 285 2,031 22,62625-29 3,423 6,183 5,166 2,868 267 1,773 19,68030-34 2,976 5,688 5,019 2,988 252 1,566 18,48635-39 2,952 5,469 3,936 3,252 246 1,479 17,33440-44 3,204 5,832 3,537 3,864 273 1,653 18,36045-49 2,946 5,379 3,237 4,197 222 1,473 17,44850-54 2,631 4,299 2,943 4,668 207 1,470 16,22155-59 1,944 3,282 2,448 4,134 192 1,068 13,06860-64 1,491 2,763 1,866 3,990 84 957 11,15465-69 1,026 1,983 1,272 3,528 45 738 8,60470-74 660 1,353 840 2,913 57 501 6,33075-79 369 825 450 2,214 30 285 4,19180-84 174 456 246 1,863 15 213 2,98285+ 66 261 117 1,677 12 150 2,298
Total 52,236 90,717 49,893 55,233 3,243 23,169 274,494
Note:thesenumberswerebasedonthe“Censususuallyresidentpopulationcount”.TheCensus‘usually
resident population’ count includes all residents of a given area counted by the five-yearly Census of
PopulationandDwellings,irrespectiveofwhereinNewZealandthoseresidentswerecounted.TheCensus
‘usuallyresidentpopulation’countdoesnotincludeadjustmentsfornetCensusundercountorNewZealand
residentstemporarilyoverseas.OverseasvisitorsinNewZealandonCensusnightareexcluded.
NEI = Not Elsewhere Included
MELAA = Middle Eastern / Latin American / African
Appendix D: Population by Age and Ethnicity for South Auckland Whānau Direct Area, Census 2013 continued


Level 4, Whānau Centre I 6-8 Pioneer Steet, Henderson, Auckland, New ZealandPostal I PO Box 21 081, Henderson, Auckland 0650. New Zealand I Phone 0800 929 282
www.tepoumatakana.com
Te Pou Matakana COMMISSIONING AGENCY
Te Pou Matakana
STAND TALL - STAND STRONG - STAND VIGILANT
KIA TU - KIA OHO - KIA MATAARA
COMMISSIONING AGENCY
West Auckland Locality Population Snapshot
TE POU
MATAKAN
A
West AucklandLocality Population Snapshot
Locality Population SnapshotWest Auckland


![Emotionen erkennen, verstehen und verarbeitenubicomp/... Department Informatik Companion Technologie - Emotionen erkennen, verstehen und verarbeiten Kai Bielenberg Teilbereiche[3]](https://static.fdokument.com/doc/165x107/5af3f2997f8b9a95468d466d/emotionen-erkennen-verstehen-und-verarbeiten-ubicomp-department-informatik.jpg)