11장. 교통 -...
7
TRANSPORTATION 11장. 교통 168 11.1 도로시설 ROADS 170 11.2 통행속도 및 교통량 SPEED AND TRAFFIC VOLUME 172 11.3 교통수단 MEANS OF TRANSPORTATION 174 11.4 승용차 보유 PASSENGER CAR 176 11.5 통행 TRIPS
Transcript of 11장. 교통 -...
166 167
TRANSPORTATION
11장. 교통
168 11.1 도로시설 ROADS
170 11.2 통행속도 및 교통량 SPEED AND TRAFFIC VOLUME
172 11.3 교통수단 MEANS OF TRANSPORTATION
174 11.4 승용차 보유 PASSENGER CAR
176 11.5 통행 TRIPS
168 169
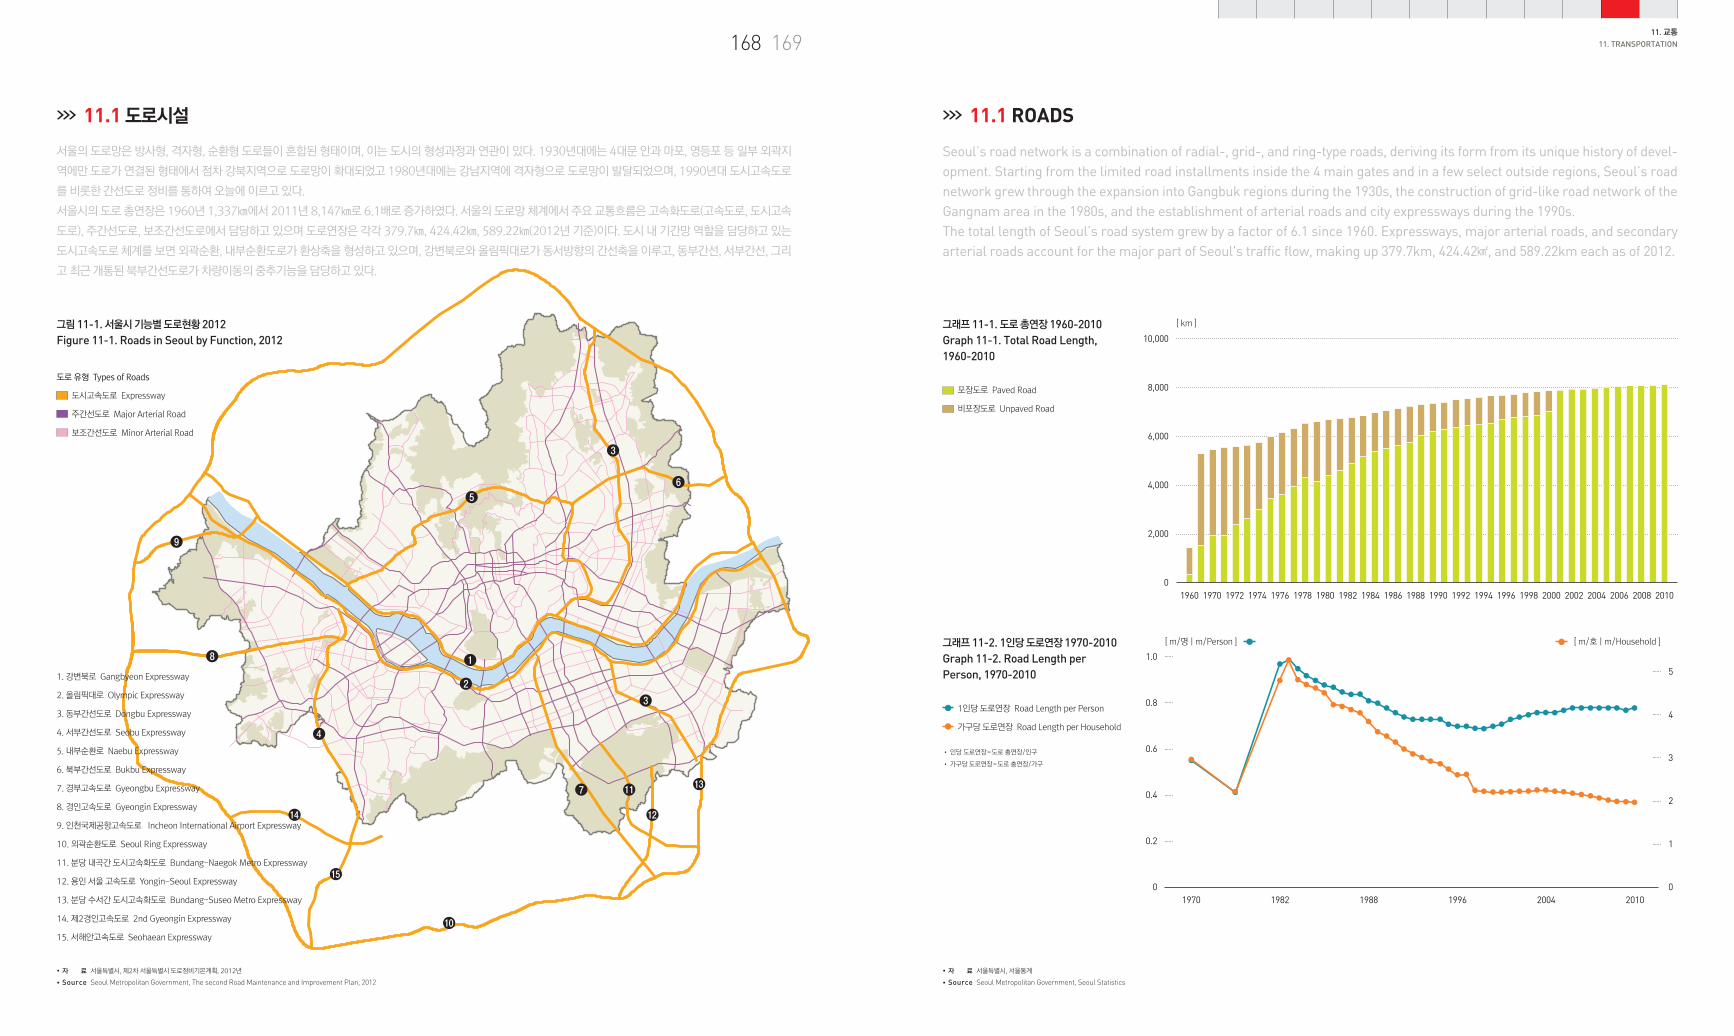
서울의 도로망은 방사형, 격자형, 순환형 도로들이 혼합된 형태이며, 이는 도시의 형성과정과 연관이 있다. 1930년대에는 4대문 안과 마포, 영등포 등 일부 외곽지
역에만 도로가 연결된 형태에서 점차 강북지역으로 도로망이 확대되었고 1980년대에는 강남지역에 격자형으로 도로망이 발달되었으며, 1990년대 도시고속도로
를 비롯한 간선도로 정비를 통하여 오늘에 이르고 있다.
서울시의 도로 총연장은 1960년 1,337㎞에서 2011년 8,147㎞로 6.1배로 증가하였다. 서울의 도로망 체계에서 주요 교통흐름은 고속화도로(고속도로, 도시고속
도로), 주간선도로, 보조간선도로에서 담당하고 있으며 도로연장은 각각 379.7㎞, 424.42㎞, 589.22㎞(2012년 기준)이다. 도시 내 기간망 역할을 담당하고 있는
도시고속도로 체계를 보면 외곽순환, 내부순환도로가 환상축을 형성하고 있으며, 강변북로와 올림픽대로가 동서방향의 간선축을 이루고, 동부간선, 서부간선, 그리
고 최근 개통된 북부간선도로가 차량이동의 중추기능을 담당하고 있다.
>>> 11.1 도로시설
•
•
자 료
Source
서울특별시, 제2차 서울특별시 도로정비기본계획, 2012년
Seoul Metropolitan Government, The second Road Maintenance and Improvement Plan, 2012
도시고속도로 Expressway
주간선도로 Major Arterial Road
보조간선도로 Minor Arterial Road
>>> 11.1 ROADS
11. 교통
11. TRANSPORTATION
그림 11-1. 서울시 기능별 도로현황 2012Figure 11-1. Roads in Seoul by Function, 2012
[ km ]
10,000
8,000
6,000
4,000
2,000
01960 1970 1972 1974 1976 1978 1980 1982 1984 1986 1988 1990 1992 1994 1996 1998 2000 2002 2006 20082004 2010
그래프 11-1. 도로 총연장 1960-2010Graph 11-1. Total Road Length, 1960-2010
1. 강변북로 Gangbyeon Expressway
2. 올림픽대로 Olympic Expressway
3. 동부간선도로 Dongbu Expressway
4. 서부간선도로 Seobu Expressway
5. 내부순환로 Naebu Expressway
6. 북부간선도로 Bukbu Expressway
7. 경부고속도로 Gyeongbu Expressway
8. 경인고속도로 Gyeongin Expressway
9. 인천국제공항고속도로 Incheon International Airport Expressway
10. 외곽순환도로 Seoul Ring Expressway
11. 분당 내곡간 도시고속화도로 Bundang-Naegok Metro Expressway
12. 용인 서울 고속도로 Yongin-Seoul Expressway
13. 분당 수서간 도시고속화도로 Bundang-Suseo Metro Expressway
14. 제2경인고속도로 2nd Gyeongin Expressway
15. 서해안고속도로 Seohaean Expressway
포장도로 Paved Road
비포장도로 Unpaved Road
그래프 11-2. 1인당 도로연장 1970-2010Graph 11-2. Road Length per Person, 1970-2010
[ m/명 | m/Person ] [ m/호 | m/Household ]
1.0
0.6
0.8
0.4
0.2
0
3
2
4
5
1
01970 1982 1988 1996 2004 2010
1인당 도로연장 Road Length per Person
가구당 도로연장 Road Length per Household
•
•
자 료
Source
서울특별시, 서울통계
Seoul Metropolitan Government, Seoul Statistics
• 인당 도로연장=도로 총연장/인구
• 가구당 도로연장=도로 총연장/가구
도로 유형 Types of Roads
Seoul’s road network is a combination of radial-, grid-, and ring-type roads, deriving its form from its unique history of devel-opment. Starting from the limited road installments inside the 4 main gates and in a few select outside regions, Seoul’s road network grew through the expansion into Gangbuk regions during the 1930s, the construction of grid-like road network of the Gangnam area in the 1980s, and the establishment of arterial roads and city expressways during the 1990s.The total length of Seoul’s road system grew by a factor of 6.1 since 1960. Expressways, major arterial roads, and secondary arterial roads account for the major part of Seoul's traffic flow, making up 379.7km, 424.42㎢, and 589.22km each as of 2012.
170 171
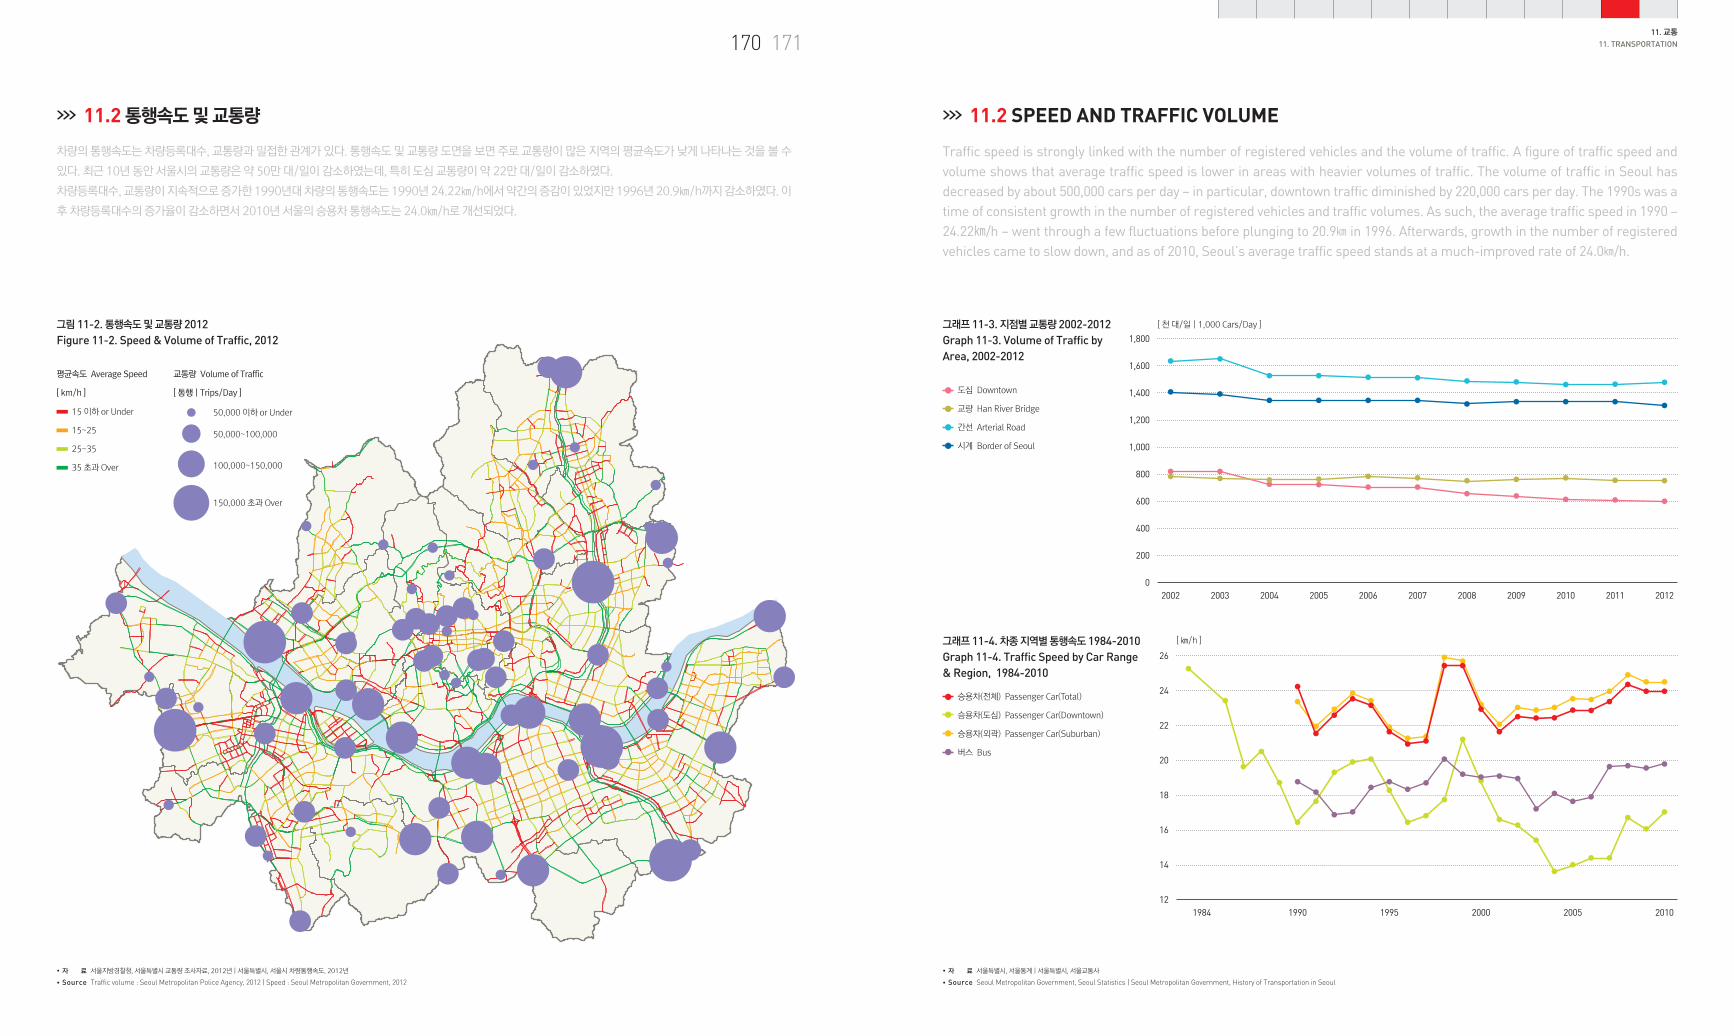
차량의 통행속도는 차량등록대수, 교통량과 밀접한 관계가 있다. 통행속도 및 교통량 도면을 보면 주로 교통량이 많은 지역의 평균속도가 낮게 나타나는 것을 볼 수
있다. 최근 10년 동안 서울시의 교통량은 약 50만 대/일이 감소하였는데, 특히 도심 교통량이 약 22만 대/일이 감소하였다.
차량등록대수, 교통량이 지속적으로 증가한 1990년대 차량의 통행속도는 1990년 24.22㎞/h에서 약간의 증감이 있었지만 1996년 20.9㎞/h까지 감소하였다. 이
후 차량등록대수의 증가율이 감소하면서 2010년 서울의 승용차 통행속도는 24.0㎞/h로 개선되었다.
>>> 11.2 통행속도 및 교통량 >>> 11.2 SPEED AND TRAFFIC VOLUME
11. 교통
11. TRANSPORTATION
[ 천 대/일 | 1,000 Cars/Day ]
1,800
1,200
1,000
1,600
1,400
800
400
600
200
02002 2003 2004 2005 2006 2007 2008 2009 2010 2011 2012
그래프 11-3. 지점별 교통량 2002-2012Graph 11-3. Volume of Traffic by Area, 2002-2012
•
•
자 료
Source
서울특별시, 서울통계 | 서울특별시, 서울교통사
Seoul Metropolitan Government, Seoul Statistics | Seoul Metropolitan Government, History of Transportation in Seoul
도심 Downtown
교량 Han River Bridge
간선 Arterial Road
시계 Border of Seoul
[ ㎞/h ]
26
20
24
16
22
14
18
121984 1990 1995 20052000 2010
그래프 11-4. 차종 지역별 통행속도 1984-2010Graph 11-4. Traffic Speed by Car Range & Region, 1984-2010
승용차(전체) Passenger Car(Total)
승용차(도심) Passenger Car(Downtown)
승용차(외곽) Passenger Car(Suburban)
버스 Bus
그림 11-2. 통행속도 및 교통량 2012 Figure 11-2. Speed & Volume of Traffic, 2012
평균속도 Average Speed
[ km/h ]
교통량 Volume of Traffic
[ 통행 | Trips/Day ]
150,000 초과 Over
100,000~150,000
50,000~100,000
50,000 이하 or Under15 이하 or Under
15~25
25~35
35 초과 Over
•
•
자 료
Source
서울지방경찰청, 서울특별시 교통량 조사자료, 2012년 | 서울특별시, 서울시 차량통행속도, 2012년
Traffic volume : Seoul Metropolitan Police Agency, 2012 | Speed : Seoul Metropolitan Government, 2012
Traffic speed is strongly linked with the number of registered vehicles and the volume of traffic. A figure of traffic speed and volume shows that average traffic speed is lower in areas with heavier volumes of traffic. The volume of traffic in Seoul has decreased by about 500,000 cars per day – in particular, downtown traffic diminished by 220,000 cars per day. The 1990s was a time of consistent growth in the number of registered vehicles and traffic volumes. As such, the average traffic speed in 1990 – 24.22㎞/h – went through a few fluctuations before plunging to 20.9㎞ in 1996. Afterwards, growth in the number of registered vehicles came to slow down, and as of 2010, Seoul’s average traffic speed stands at a much-improved rate of 24.0㎞/h.
172 173
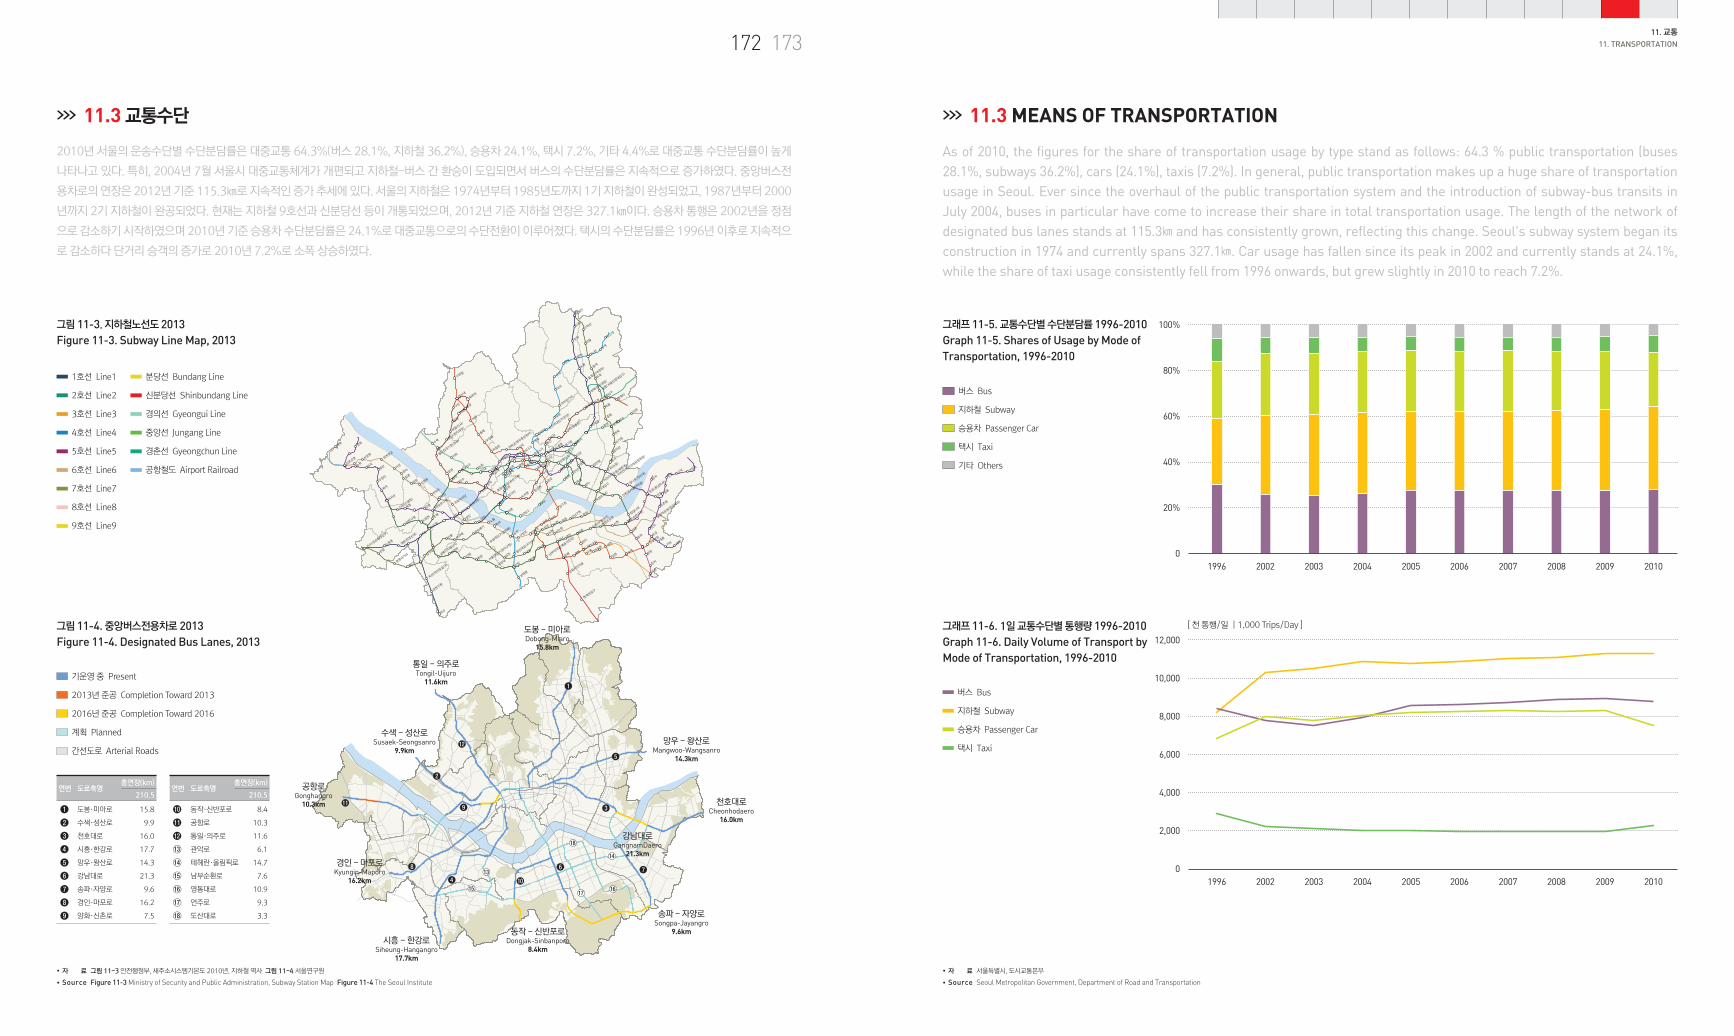
2010년 서울의 운송수단별 수단분담률은 대중교통 64.3%(버스 28.1%, 지하철 36.2%), 승용차 24.1%, 택시 7.2%, 기타 4.4%로 대중교통 수단분담률이 높게
나타나고 있다. 특히, 2004년 7월 서울시 대중교통체계가 개편되고 지하철-버스 간 환승이 도입되면서 버스의 수단분담률은 지속적으로 증가하였다. 중앙버스전
용차로의 연장은 2012년 기준 115.3㎞로 지속적인 증가 추세에 있다. 서울의 지하철은 1974년부터 1985년도까지 1기 지하철이 완성되었고, 1987년부터 2000
년까지 2기 지하철이 완공되었다. 현재는 지하철 9호선과 신분당선 등이 개통되었으며, 2012년 기준 지하철 연장은 327.1㎞이다. 승용차 통행은 2002년을 정점
으로 감소하기 시작하였으며 2010년 기준 승용차 수단분담률은 24.1%로 대중교통으로의 수단전환이 이루어졌다. 택시의 수단분담률은 1996년 이후로 지속적으
로 감소하다 단거리 승객의 증가로 2010년 7.2%로 소폭 상승하였다.
>>> 11.3 교통수단 >>> 11.3 MEANS OF TRANSPORTATION
11. 교통
11. TRANSPORTATION
그래프 11-5. 교통수단별 수단분담률 1996-2010Graph 11-5. Shares of Usage by Mode of Transportation, 1996-2010
1호선 Line1
2호선 Line2
3호선 Line3
4호선 Line4
5호선 Line5
6호선 Line6
7호선 Line7
8호선 Line8
9호선 Line9
분당선 Bundang Line
신분당선 Shinbundang Line
경의선 Gyeongui Line
중앙선 Jungang Line
경춘선 Gyeongchun Line
공항철도 Airport Railroad
그림 11-3. 지하철노선도 2013Figure 11-3. Subway Line Map, 2013
그림 11-4. 중앙버스전용차로 2013Figure 11-4. Designated Bus Lanes, 2013
기운영 중 Present
2013년 준공 Completion Toward 2013
2016년 준공 Completion Toward 2016
계획 Planned
간선도로 Arterial Roads
도봉·미아로
수색·성산로
천호대로
시흥·한강로
망우·왕산로
강남대로
송파·자양로
경인·마포로
양화·신촌로
15.8
9.9
16.0
17.7
14.3
21.3
9.6
16.2
7.5
동작·신반포로
공항로
통일·의주로
관악로
테헤란·올림픽로
남부순환로
영동대로
언주로
도산대로
8.4
10.3
11.6
6.1
14.7
7.6
10.9
9.3
3.3
개화
철산
도봉
방학마들
상계
노원
창동
쌍문
중계녹천
수유하계
미아
석계
구산 먹골불광
양원역촌
길음 중화녹번 망우응암
상봉중랑
홍제 면목
보문
혜화수색 창신방화
안국
용두
종각 신답가좌신당시청 중곡
용답송정 명동마곡 청구신촌가양발산 행당아현이대망원증미 고덕약수
명일등촌 응봉합정 암사금호상수 뚝섬염창
공덕 성수
화곡 남영 옥수마포 길동
강동당산
용산 한남
목동 양평
이촌
청담문래 신길 샛강 신사
학동노들 잠원 신천논현흑석
방이반포석촌
선릉사평동작구로 오금역삼 송파신풍
강남 개롱한티 마천대치 거여대청
서초 도곡
천왕 내방 구룡 수서 문정매봉양재남성 일원신림
봉천 방배
장지사당
복정
석수
도봉산
수락산
당고개
구파발
연신내
독바위
봉화산
돌곶이
외대앞
한성대
무악재
사가정
청량리
제기동
신설동
독립문
용마산
동묘앞
신방화
서대문
왕십리
장한평
충무로
서울역
상일동
한양대
애오개
서울역
우장산
신목동
한강진
선유도
삼각지
녹사평
까치산
둔촌동
압구정
여의도
서빙고
도림천
노량진
신도림
신논현
신반포
구반포
보라매
오류동
개포동
신대방
남구로
낙성대
남태령
태릉입구
종로3가
종로5가
양천향교
상왕십리
김포공항
동대입구
홍대입구
건대입구
여의나루
잠실나루
강남구청
양천구청
장승배기
경찰병원
금천구청
광명사거리
미아삼거리
뚝섬유원지
국회의사당
영등포구청
종합운동장
청계산입구
새절(신사)
군자(능동)
양재시민의숲
고려대(종암)
신정(은행정)
구로디지털단지
월계(인덕대학)
성북(광운대앞)
증산(명지대앞)
광나루(장신대)
천호(풍납토성)
잠실(송파구청)
삼성(무역센터)
개봉(한영신대)
총신대입구(이수)
독산(하안동입구)
성신여대입구(돈암)
월드컵경기장(성산)
강변(동서울터미널)
숭실대입구(살피재)
온수(성공회대입구)
공릉(서울산업대입구)
경복궁(정부중앙청사)
어린이대공원(세종대)
효창공원앞(용산구청)
올림픽공원(한국체대)
서울대입구(관악구청)
남부터미널(예술의전당)
아차산(어린이대공원후문)
도봉 - 미아로Dobong-Miaro
15.8km
망우 - 왕산로Mangwoo-Wangsanro
14.3km
통일 - 의주로Tongil-Uijuro
11.6km
수색 - 성산로Susaek-Seongsanro
9.9km
강남대로GangnamDaero
21.3km
동작 - 신반포로Dongjak-Sinbanporo
8.4km
경인 - 마포로Kyungin-Maporo
16.2km
공항로Gonghangro
10.3km
시흥 - 한강로Siheung-Hangangro
17.7km
천호대로Cheonhodaero
16.0km
송파 - 자양로Songpa-Jayangro
9.6km
버스 Bus
지하철 Subway
승용차 Passenger Car
택시 Taxi
기타 Others
100%
40%
60%
80%
20%
01996 2002 20042003 2005 2008 201020092006 2007
그래프 11-6. 1일 교통수단별 통행량 1996-2010
Graph 11-6. Daily Volume of Transport by Mode of Transportation, 1996-2010
버스 Bus
지하철 Subway
승용차 Passenger Car
택시 Taxi
[ 천 통행/일 | 1,000 Trips/Day ]
12,000
10,000
4,000
6,000
8,000
2,000
01996 2002 20042003 2005 2008 201020092006 2007
•
•
자 료
Source
서울특별시, 도시교통본부
Seoul Metropolitan Government, Department of Road and Transportation
•
•
자 료
Source
그림 11-3 안전행정부, 새주소시스템기본도 2010년, 지하철 역사 그림 11-4 서울연구원
Figure 11-3 Ministry of Security and Public Administration, Subway Station Map Figure 11-4 The Seoul Institute
연번 도로축명총연장(km)
210.5연번 도로축명
총연장(km)
210.5
As of 2010, the figures for the share of transportation usage by type stand as follows: 64.3 % public transportation (buses 28.1%, subways 36.2%), cars (24.1%), taxis (7.2%). In general, public transportation makes up a huge share of transportation usage in Seoul. Ever since the overhaul of the public transportation system and the introduction of subway-bus transits in July 2004, buses in particular have come to increase their share in total transportation usage. The length of the network of designated bus lanes stands at 115.3㎞ and has consistently grown, reflecting this change. Seoul's subway system began its construction in 1974 and currently spans 327.1㎞. Car usage has fallen since its peak in 2002 and currently stands at 24.1%, while the share of taxi usage consistently fell from 1996 onwards, but grew slightly in 2010 to reach 7.2%.
174 175
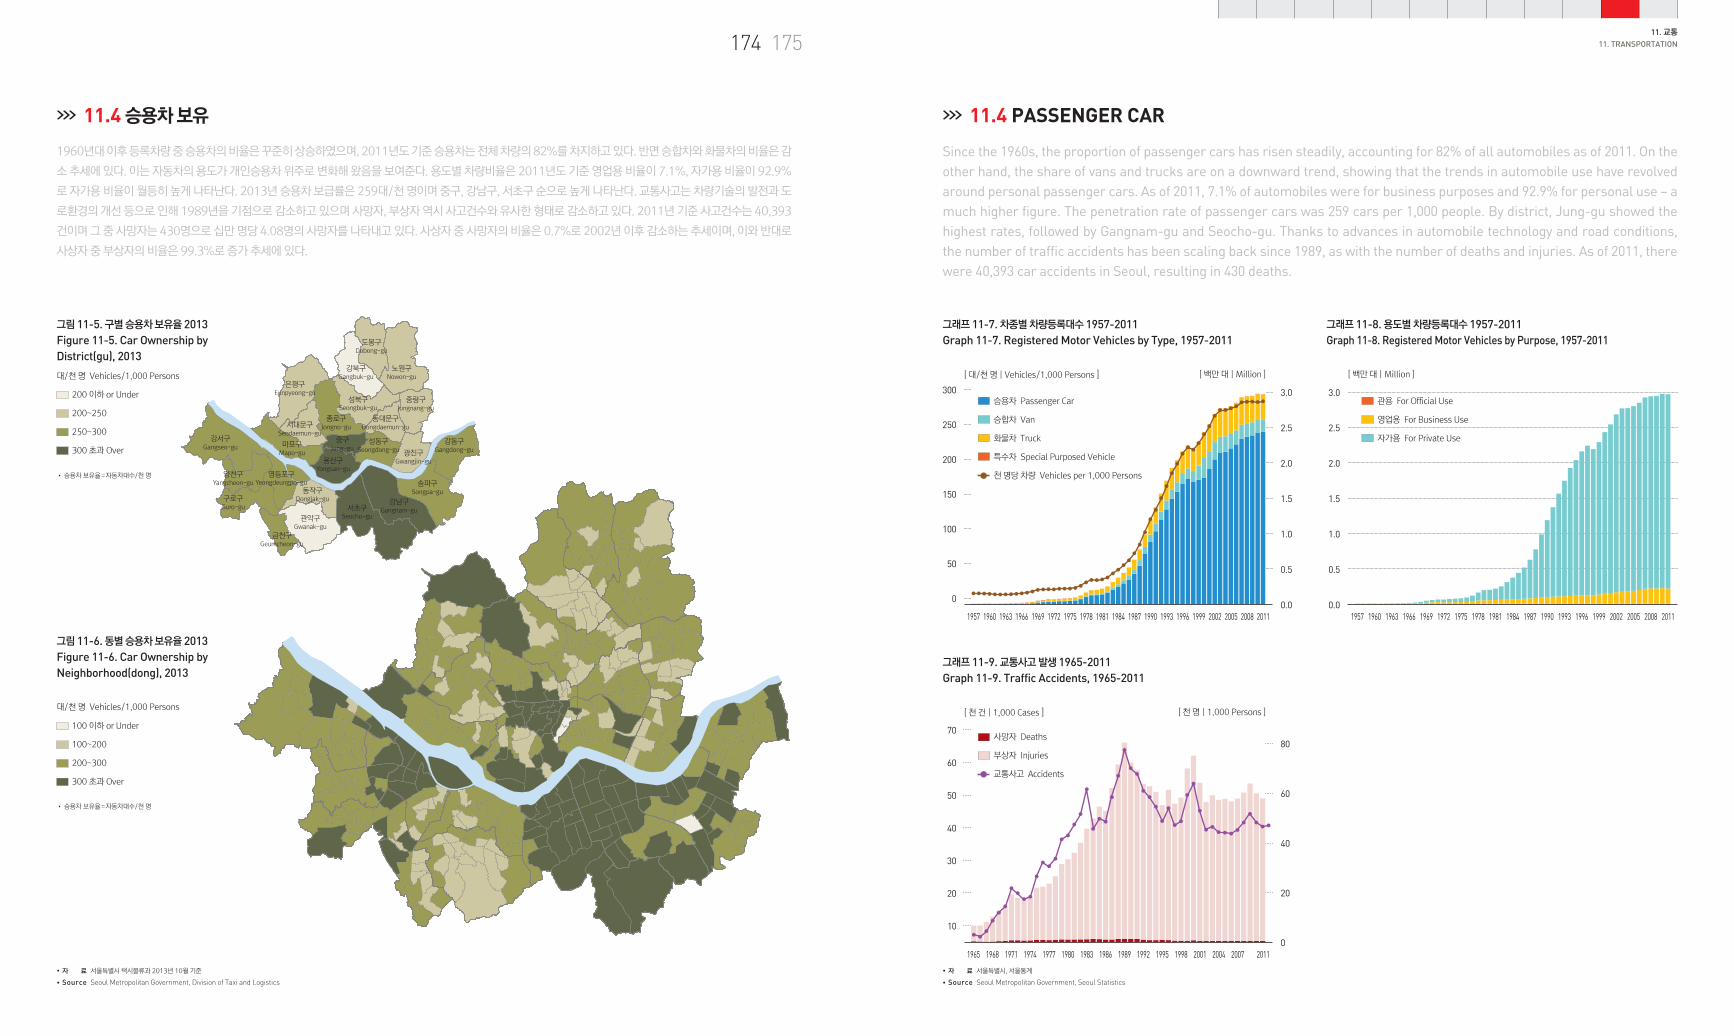
1960년대 이후 등록차량 중 승용차의 비율은 꾸준히 상승하였으며, 2011년도 기준 승용차는 전체 차량의 82%를 차지하고 있다. 반면 승합차와 화물차의 비율은 감
소 추세에 있다. 이는 자동차의 용도가 개인승용차 위주로 변화해 왔음을 보여준다. 용도별 차량비율은 2011년도 기준 영업용 비율이 7.1%, 자가용 비율이 92.9%
로 자가용 비율이 월등히 높게 나타난다. 2013년 승용차 보급률은 259대/천 명이며 중구, 강남구, 서초구 순으로 높게 나타난다. 교통사고는 차량기술의 발전과 도
로환경의 개선 등으로 인해 1989년을 기점으로 감소하고 있으며 사망자, 부상자 역시 사고건수와 유사한 형태로 감소하고 있다. 2011년 기준 사고건수는 40,393
건이며 그 중 사망자는 430명으로 십만 명당 4.08명의 사망자를 나타내고 있다. 사상자 중 사망자의 비율은 0.7%로 2002년 이후 감소하는 추세이며, 이와 반대로
사상자 중 부상자의 비율은 99.3%로 증가 추세에 있다.
>>> 11.4 승용차 보유
11. 교통
11. TRANSPORTATION
200 이하 or Under
200~250
250~300
300 초과 Over
100 이하 or Under
100~200
200~300
300 초과 Over
>>> 11.4 PASSENGER CAR
그림 11-6. 동별 승용차 보유율 2013
Figure 11-6. Car Ownership by Neighborhood(dong), 2013
그래프 11-7. 차종별 차량등록대수 1957-2011Graph 11-7. Registered Motor Vehicles by Type, 1957-2011
그래프 11-8. 용도별 차량등록대수 1957-2011Graph 11-8. Registered Motor Vehicles by Purpose, 1957-2011
[ 대/천 명 | Vehicles/1,000 Persons ] [ 백만 대 | Million ][ 백만 대 | Million ]
1.5
2.5
3.0
2.0
1.0
0.5
0.0
1.5
2.5
2.0
1.0
0.5
0.0
3.0
250
50
100
150
200
300
0
1957 1960 1963 1966 1969 1972 1975 1978 1981 1984 1987 1990 1993 1996 1999 2002 2005 2008 2011 1957 1960 1963 1966 1969 1972 1975 1978 1981 1984 1987 1990 1993 1996 1999 2002 2005 2008 2011
승용차 Passenger Car
승합차 Van
화물차 Truck
특수차 Special Purposed Vehicle
천 명당 차량 Vehicles per 1,000 Persons
관용 For Official Use
영업용 For Business Use
자가용 For Private Use
40
80
60
20
0
60
20
30
40
50
70
10
1965 1968 1971 1974 1977 1980 1983 1986 1989 1992 1995 1998 2001 2004 2007 2011
[ 천 건 | 1,000 Cases ] [ 천 명 | 1,000 Persons ]
그래프 11-9. 교통사고 발생 1965-2011Graph 11-9. Traffic Accidents, 1965-2011
•
•
자 료
Source
서울특별시 택시물류과 2013년 10월 기준
Seoul Metropolitan Government, Division of Taxi and Logistics
•
•
자 료
Source
서울특별시, 서울통계
Seoul Metropolitan Government, Seoul Statistics
사망자 Deaths
부상자 Injuries
교통사고 Accidents
그림 11-5. 구별 승용차 보유율 2013
Figure 11-5. Car Ownership by District(gu), 2013
대/천 명 Vehicles/1,000 Persons
• 승용차 보유율=자동차대수/천 명
대/천 명 Vehicles/1,000 Persons
• 승용차 보유율=자동차대수/천 명
Since the 1960s, the proportion of passenger cars has risen steadily, accounting for 82% of all automobiles as of 2011. On the other hand, the share of vans and trucks are on a downward trend, showing that the trends in automobile use have revolved around personal passenger cars. As of 2011, 7.1% of automobiles were for business purposes and 92.9% for personal use – a much higher figure. The penetration rate of passenger cars was 259 cars per 1,000 people. By district, Jung-gu showed the highest rates, followed by Gangnam-gu and Seocho-gu. Thanks to advances in automobile technology and road conditions, the number of traffic accidents has been scaling back since 1989, as with the number of deaths and injuries. As of 2011, there were 40,393 car accidents in Seoul, resulting in 430 deaths.
도봉구Dobong-gu
노원구Nowon-gu
강북구Gangbuk-gu
성북구Seongbuk-gu
종로구Jongno-gu
동대문구Dongdaemun-gu
중랑구Jungnang-gu
광진구Gwangjin-gu
성동구Seongdong-gu
용산구Yongsan-gu
중구Jung-gu
마포구Mapo-gu
은평구Eunpyeong-gu
서대문구Seodaemun-gu
강서구Gangseo-gu
양천구Yangcheon-gu
영등포구Yeongdeungpo-gu
동작구Dongjak-gu
관악구Gwanak-gu
구로구Guro-gu
금천구Geumcheon-gu
서초구Seocho-gu
강남구Gangnam-gu
송파구Songpa-gu
강동구Gangdong-gu
176 177
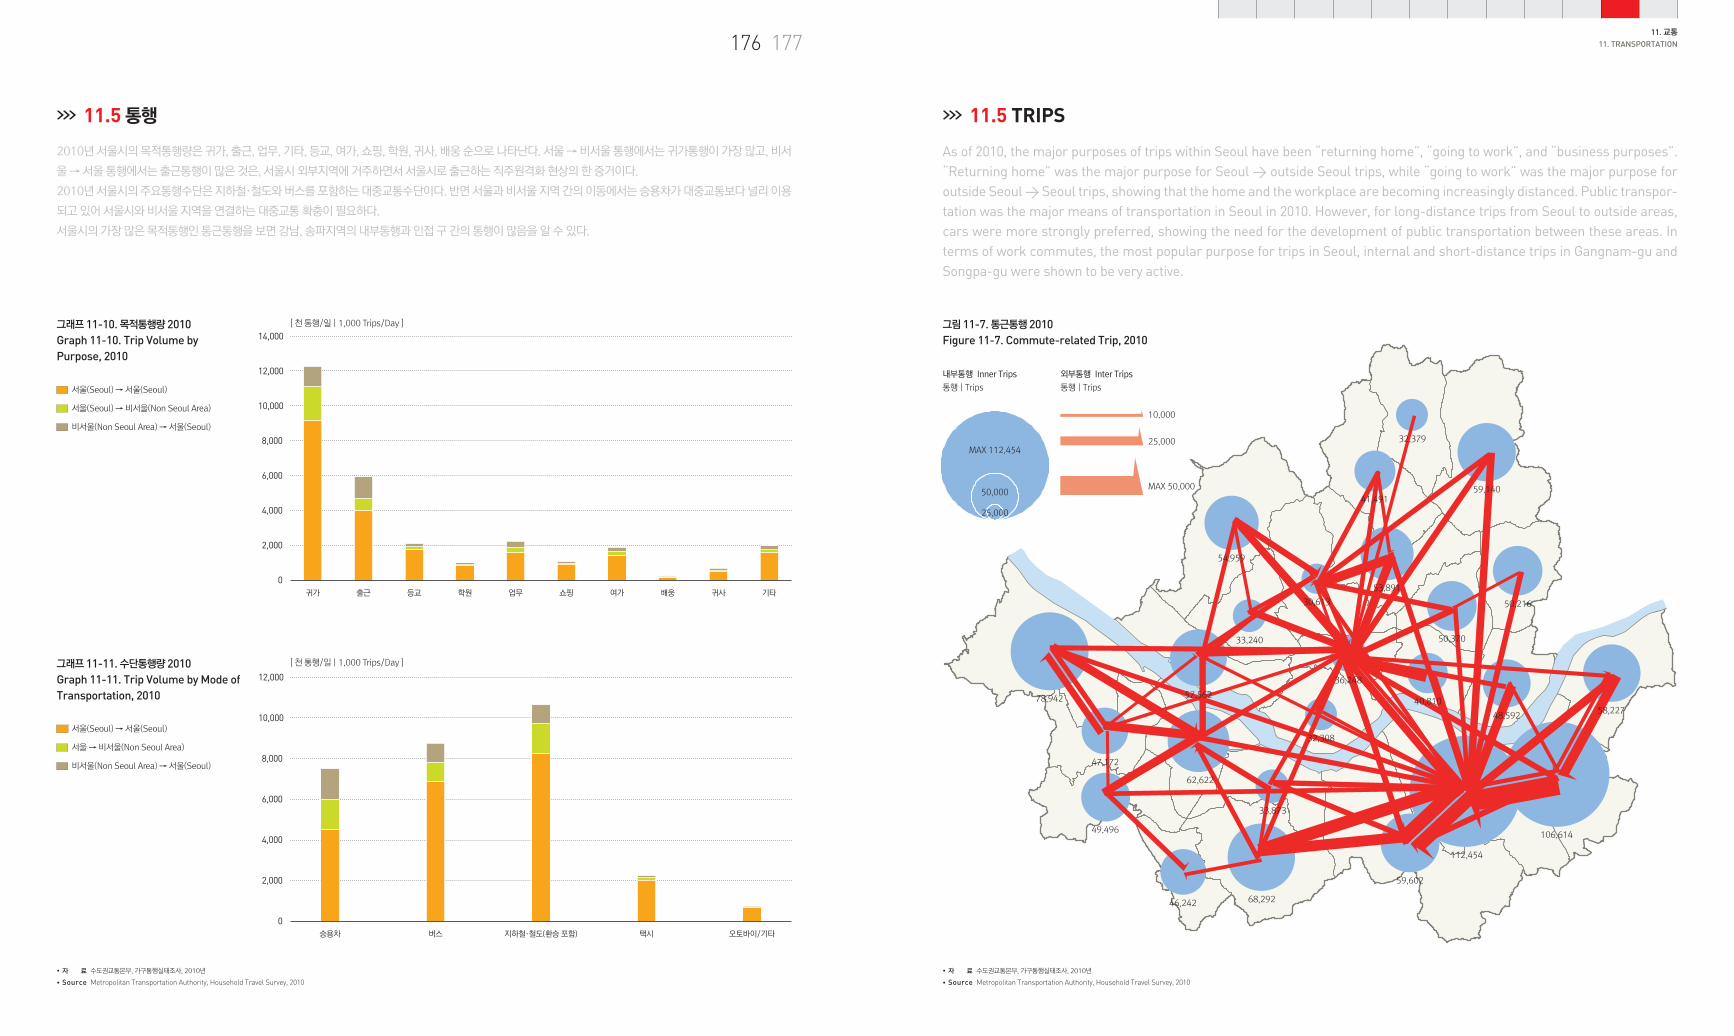
2010년 서울시의 목적통행량은 귀가, 출근, 업무, 기타, 등교, 여가, 쇼핑, 학원, 귀사, 배웅 순으로 나타난다. 서울 → 비서울 통행에서는 귀가통행이 가장 많고, 비서
울 → 서울 통행에서는 출근통행이 많은 것은, 서울시 외부지역에 거주하면서 서울시로 출근하는 직주원격화 현상의 한 증거이다.
2010년 서울시의 주요통행수단은 지하철·철도와 버스를 포함하는 대중교통수단이다. 반면 서울과 비서울 지역 간의 이동에서는 승용차가 대중교통보다 널리 이용
되고 있어 서울시와 비서울 지역을 연결하는 대중교통 확충이 필요하다.
서울시의 가장 많은 목적통행인 통근통행을 보면 강남, 송파지역의 내부통행과 인접 구 간의 통행이 많음을 알 수 있다.
>>> 11.5 통행
[ 천 통행/일 | 1,000 Trips/Day ]
[ 천 통행/일 | 1,000 Trips/Day ]
14,000
12,000
8,000
12,000
10,000
8,000
4,000
2,000
6,000
4,000
2,000
6,000
10,000
0
0
귀가
승용차
출근 등교 학원 업무 쇼핑 여가 배웅
버스
귀사
지하철·철도(환승 포함) 택시
기타
오토바이/기타
그래프 11-10. 목적통행량 2010Graph 11-10. Trip Volume by Purpose, 2010
그래프 11-11. 수단통행량 2010Graph 11-11. Trip Volume by Mode of Transportation, 2010
>>> 11.5 TRIPS
11. 교통
11. TRANSPORTATION
서울(Seoul) → 서울(Seoul)
서울(Seoul) → 비서울(Non Seoul Area)
비서울(Non Seoul Area) → 서울(Seoul)
서울(Seoul) → 서울(Seoul)
서울 → 비서울(Non Seoul Area)
비서울(Non Seoul Area) → 서울(Seoul)
그림 11-7. 통근통행 2010
Figure 11-7. Commute-related Trip, 2010
•
•
자 료
Source
수도권교통본부, 가구통행실태조사, 2010년
Metropolitan Transportation Authority, Household Travel Survey, 2010
•
•
자 료
Source
수도권교통본부, 가구통행실태조사, 2010년
Metropolitan Transportation Authority, Household Travel Survey, 2010
내부통행 Inner Trips
통행 | Trips
외부통행 Inter Trips
통행 | Trips
78,942
47,172
49,496
46,242 68,292
33,873
62,622
57,562
33,240
54,959
30,613
53,891
41,491
32,379
59,140
50,370
50,216
48,592
40,810
59,602
112,454
106,614
58,227
36,248
32,308
10,000
25,000MAX 112,454
50,000
25,000
MAX 50,000
As of 2010, the major purposes of trips within Seoul have been “returning home”, “going to work”, and “business purposes”. “Returning home” was the major purpose for Seoul > outside Seoul trips, while “going to work” was the major purpose for outside Seoul > Seoul trips, showing that the home and the workplace are becoming increasingly distanced. Public transpor-tation was the major means of transportation in Seoul in 2010. However, for long-distance trips from Seoul to outside areas, cars were more strongly preferred, showing the need for the development of public transportation between these areas. In terms of work commutes, the most popular purpose for trips in Seoul, internal and short-distance trips in Gangnam-gu and Songpa-gu were shown to be very active.
178 17911. 교통
11. TRANSPORTATION
그림 11-8. 업무통행 2010 Figure 11-8. Business-related Trip, 2010
그림 11-9. 쇼핑통행 2010
Figure 11-9. Shopping-related Trip, 2010
•
•
자 료
Source
수도권교통본부, 가구통행실태조사, 2010년
Metropolitan Transportation Authority, Household Travel Survey, 2010
•
•
자 료
Source
수도권교통본부, 가구통행실태조사, 2010년
Metropolitan Transportation Authority, Household Travel Survey, 2010
내부통행 Inner Trips
통행 | Trips
내부통행 Inner Trips
통행 | Trips
외부통행 Inter Trips
통행 | Trips
MAX 105,652
50,000
5,000
10,000
MAX 26,685
외부통행 Inter Trips
통행 | Trips
1,000
5,000
MAX 9,365
25,00023,082
10,890
15,740
18,515
16,921
21,076
28,343
7,504
28,906
50,500 16,141
22,563
19,41916,307
39,112
105,652
34,65818,151
11,013
16,40816,803
31,515
47,925
20,756
18,95437,123
27,123
23,609
38,113
17,536
14,567
25,882
7,319
17,537
22,45944,772
15,513
21,431
28,03134,677
41,642
40,582
25,285
14,970
11,586
20,017
10,937
11,554
28,24913,637
MAX 44,772
25,000
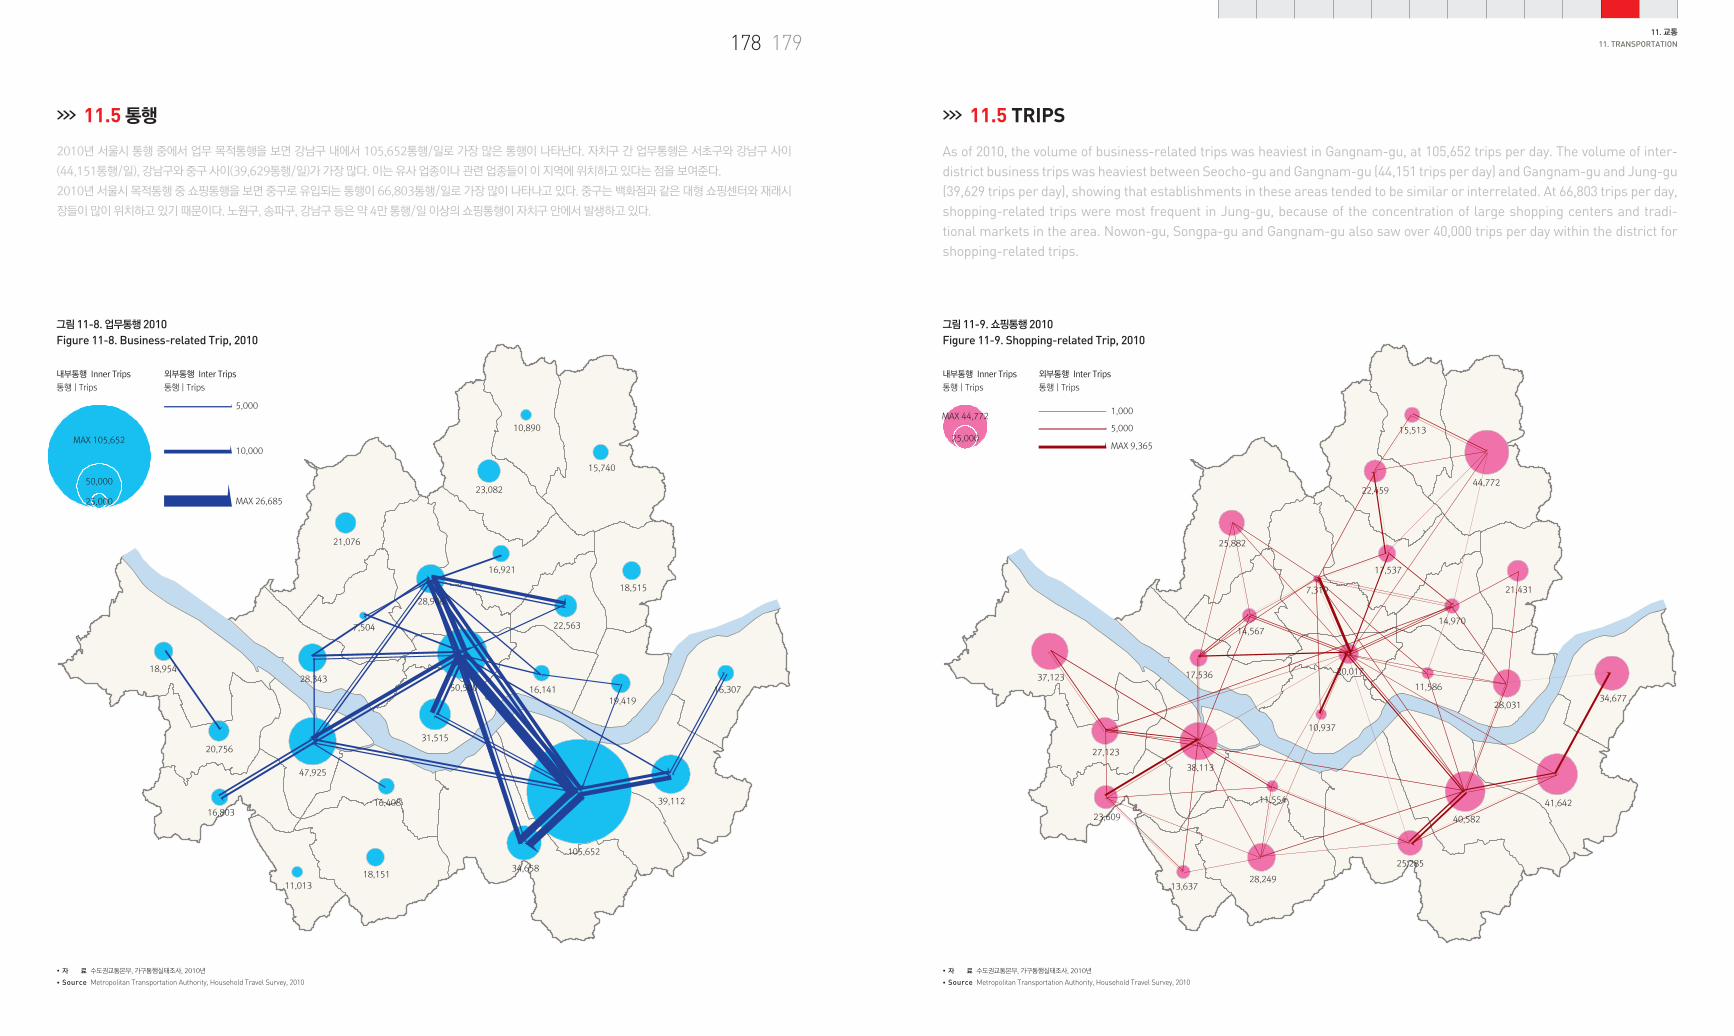
2010년 서울시 통행 중에서 업무 목적통행을 보면 강남구 내에서 105,652통행/일로 가장 많은 통행이 나타난다. 자치구 간 업무통행은 서초구와 강남구 사이
(44,151통행/일), 강남구와 중구 사이(39,629통행/일)가 가장 많다. 이는 유사 업종이나 관련 업종들이 이 지역에 위치하고 있다는 점을 보여준다.
2010년 서울시 목적통행 중 쇼핑통행을 보면 중구로 유입되는 통행이 66,803통행/일로 가장 많이 나타나고 있다. 중구는 백화점과 같은 대형 쇼핑센터와 재래시
장들이 많이 위치하고 있기 때문이다. 노원구, 송파구, 강남구 등은 약 4만 통행/일 이상의 쇼핑통행이 자치구 안에서 발생하고 있다.
As of 2010, the volume of business-related trips was heaviest in Gangnam-gu, at 105,652 trips per day. The volume of inter-district business trips was heaviest between Seocho-gu and Gangnam-gu (44,151 trips per day) and Gangnam-gu and Jung-gu (39,629 trips per day), showing that establishments in these areas tended to be similar or interrelated. At 66,803 trips per day, shopping-related trips were most frequent in Jung-gu, because of the concentration of large shopping centers and tradi-tional markets in the area. Nowon-gu, Songpa-gu and Gangnam-gu also saw over 40,000 trips per day within the district for shopping-related trips.
>>> 11.5 통행 >>> 11.5 TRIPS