
17. MAGDEBURGER LOGISTIKTAGE »SICHERE … · Mario Neugebauer, Stefan Linge ubigrate GmbH, Dresden...
15
TAGUNGSBAND 17. MAGDEBURGER LOGISTIKTAGE »SICHERE UND NACHHALTIGE LOGISTIK« 27. – 28. JUNI 2012 IM RAHMEN DER IFF-WISSENSCHAFTSTAGE
Transcript of 17. MAGDEBURGER LOGISTIKTAGE »SICHERE … · Mario Neugebauer, Stefan Linge ubigrate GmbH, Dresden...
TAGUNGSBAND
17. MAGDEBURGER LOGISTIKTAGE»SICHERE UND NACHHALTIGE LOGISTIK«
27. – 28. JUNI 2012
IM RAHMEN DER IFF-WISSENSCHAFTSTAGE
17. Magdeburger Logistiktage
SICHERE UND NACHHALTIGE LOGISTIK
Herausgeber: Prof. Dr.-Ing. habil. Prof. E. h. Dr. h.c. mult. Michael Schenk, Prof. Dr.-Ing. Hartmut Zadek, Prof. E. h. Dr.-Ing. Gerhard Müller, Prof. Dr.-Ing. Klaus Richter, Dipl.-Ing. Holger Seidel
Eine gemeinsame Initiative von:
Medienpartner:
INHALTSVERZEICHNIS
Vorwort Seite 11 Prof. Dr.-Ing. habil. Prof. E. h. Dr. h. c. mult. Michael Schenk, Institut für Logistik und Materialflusstechnik, Otto-von-Guericke-Universität Magdeburg Institutsleiter des Fraunhofer-Instituts für Fabrikbetrieb und -automatisierung IFF, Magdeburg Grußwort Seite 13 Dipl.-Ing. Thomas Webel Minister für Landesentwicklung und Verkehr des Landes Sachsen-Anhalt Grußwort Seite 15 Prof. Dr. phil. habil. Klaus Erich Pollmann Rektor der Otto-von-Guericke-Universität Magdeburg
Impulsvortrag Trans Austria – Nachhaltige Logistik durch europaweite Kooperationen Seite 17 Univ.-Prof. Prof. eh. Dipl.-Wirtsch.-Ing. Dr.-Ing. Dr. h.c. Wilfried Sihn Fraunhofer Austria Research GmbH, Wien, Österreich Institut für Managementwissenschaften, Technische Universität Wien, Österreich MBE Martin Riester, DI Markus Florian Fraunhofer Austria Research GmbH, Wien, Österreich
Parallelsequenz 1 – Mobilität der Zukunft Gebündelter KEP-Transport mit Elektrofahrzeugen Seite 27 M. Sc. Wi.-Ing. Aydin Karakaya, M. Sc. Mario Simons, Prof. Dr.-Ing. Bernd Noche Universität Duisburg-Essen Method to determine and quantify changes in value chains caused by e-mobility Seite 35 Dipl.-Ing. oec. Henrik Gommel, Dipl.-Ing. Daniel Palm Univ.-Prof. Prof. eh. Dipl.-Wirtsch.-Ing. Dr.-Ing. Dr. h.c. Wilfried Sihn Fraunhofer Austria Research GmbH, Wien, Österreich Entscheidungsprozesse in heterarchischen Transportnetzwerken Seite 43 Dipl.-Ing. Yasanur Kayikci M.A., Univ.-Prof. Dr. Helmut Zsifkovits Lehrstuhl Industrielogistik, Montanuniversität Leoben, Österreich Konzeption von IT-Bausteinen zur echtzeitnahen Steuerung von logistischen Prozessen in Supply Chains Seite 53 Dipl.-Ing. Gökhan Yüzgülec, Dr.-Ing. Katja Klingebiel, Dipl.-Wirt.-Ing. (FH) Sven Groß Fraunhofer-Institut für Materialfluss und Logistik IML, Dortmund
Parallelsequenz 2 – Energieeffiziente Infrastrukturen und nachhaltige Kooperationen Energieeffiziente Intralogistik auf Geräteebene – Beispiel Regalbediengerät Seite 65 Dipl.-Ing. Rainer Ertl, Prof. Dr.-Ing. Dipl.-Wi.-Ing. Willibald A. Günthner, Dipl.-Ing. Gabriel Fischer Technische Universität München Dipl.-Ing. Paul Hahn-Woernle viastore systems GmbH, Stuttgart
Analysen zur Energieeffizienz in ausgewählten Systemen der Intralogistik zur Unterstützung des Planungsprozesses Seite 73 Dipl.-Math. oec. Manuela Krones, Dipl.-Ing (FH) Hendrik Hopf, Dr.-Ing. Jörg Strauch, Prof. Dr.-Ing. Egon Müller Technische Universität Chemnitz Die grüne automatisierte Wäscherei – Energieeffizienz im Einklang mit Automatisierung Seite 83 Dipl. Ing. oec. Dipl. Ing. (FH) Lothar Kühne, B.A. Tobias Klehm Laundry Innovation Network, Berlin Hygiena Service GmbH, Berlin Ansätze zur Modellierung von Stoffströmen – Beispiele: Stahl und Holz Seite 93 Em. Univ.-Prof. Dipl.-Ing. Dr.-Ing. Dr. h.c. Albert F. Oberhofer, Logistik Club Leoben, Österreich M. Sc. Til Hennies , Otto-von-Guericke-Universität Magdeburg Dr.-Ing. Tobias Reggelin, Fraunhofer-Institut für Fabrikbetrieb und -automatisierung IFF, Magdeburg Otto-von-Guericke-Universität Magdeburg Univ.-Prof. Dr. Helmut Zsifkovits, Lehrstuhl Industrielogistik, Montanuniversität Leoben, Österreich Entwicklung einer kostenoptimalen Ersatzteillogistik eines Solartechnologieanbieters unter monetärer Berücksichtigung resultierender CO2-Emissionen Seite 105 Prof. Dr.-Ing. habil. Wilhelm Dangelmaier, Dr. Christoph Laroque, Dr. Robin Delius, B. Sc. Jenny Streichhan Heinz-Nixdorf Institut, Universität Paderborn
Parallelsequenz 3 – Intelligente Logistik Prozessunterstützung der Luftfrachtabfertigung durch AutoID – RFID-Konzepte zur Unterstützung der Luftfrachtabfertigungsprozesse Seite 115 Dipl.-Wi.-Ing. Pat.-Ing. Patrick Dittmer, M.Sc. Christian Gorldt BIBA – Bremer Institut für Produktion und Logistik GmbH Dipl.-Ing. (FH) Volker Hasbach Airbus Operations GmbH, Bremen Dipl.-Ing. (FH) Frank Neubauer EADS Deutschland GmbH, München GPS-gestützte Wegstreckenoptimierung im Crewtransport am Flughafen Frankfurt Rhein/Main Seite 127 Dipl. Ing. Thomas Killmaier Lufthansa Engineering and Operational Services LEOS, Frankfurt am Main Entwicklungstendenzen der Telematikanwendungen im ungarischen öffentlichen Personenverkehr Seite 135 Prof. Dr. habil. Béla Illés PhD Lehrstuhl für Fördertechnik und Logistik, Universität Miskolc, Ungarn Dr.-Ing. Dipl.-Ing., Dipl.-Wirtsch.-Ing., EUR-Ing. György Sárközi Borsod Volán AG, Miskolc, Ungarn Standardisierter Informationsaustausch in Wertschöpfungsnetzwerken der Automobilindustrie Seite 143 Dipl.-Wi.-Ing. Dirk Werthmann, Carmen Ruthenbeck, Prof. Dr.-Ing. Bernd Scholz-Reiter BIBA – Bremer Institut für Produktion und Logistik GmbH
Echtzeitfähigkeit durch Business Activity Monitoring in Produktion und Logistik Seite 153 Dr.-Ing. Mario Neugebauer, Stefan Linge ubigrate GmbH, Dresden Innovative Konzepte zur Überwachung von Warenketten auf Grundlage einer erweiterten Sendungs- und Kontrollhistorie Seite 161 M. Sc. Christian Schäfer T-Systems Multimedia Solutions GmbH, Dresden Dipl.-Sporting. Dipl.-Ing. Hagen Borstell, Dipl. Ing. Liu Cao, Prof. Dr.-Ing. Klaus Richter Fraunhofer-Institut für Fabrikbetrieb und -automatisierung IFF, Magdeburg
Workshop 1 – Mobilität der Zukunft Flexible Fahrzeugkonzepte für die Mobilität der Zukunft Seite 167 Dipl.-Bw. Steffen Gänzle, Dipl.-Wirt.-Ing. Tobias Gefäller, Marc Schindler, Fabian Bez A.T. Kearney GmbH, Stuttgart Transport und Logistik der Zukunft: Das enorme Potenzial der Systemintegration Seite 171 Dipl.-Vw. Jens Zeller Daimler Fleetboard GmbH, Stuttgart-Vaihingen Elektromobilität als Motor der Lieferkonzepte der Zukunft Seite 177 Dipl.-Wirt.-Ing. Gerd Seber DPD GeoPost (Deutschland), Aschaffenburg Nutzungskonzepte für Elektrofahrzeuge am Beispiel des CarSharings Seite 183 Dipl. Kfm. Markus Spiekermann Move About GmbH, Bremen
Workshop 2 – Energieeffiziente Stadt Nutzungsanalyse und Einsatzkonzepte für die E-Lieferfahrzeuge beim außerbetrieblichen Transport im innerstädtischen Bereich Seite 189 M. Sc. Wi.-Ing. Aydin Karakaya, Henning Kuntze, Prof. Dr.-Ing. Bernd Noche Universität Duisburg-Essen Energieeffiziente Stadt Delitzsch als Chance zum nachhaltigen Stadtumbau Seite 197 Dipl.-Ing. Wirt.-Ing. M. Sc. Tillman Bruns Stadtverwaltung Delitzsch Dipl.-Region.-Wiss. LA Theresa Weinsziehr, MBA RM Mart Verhoog, Prof. Dr. Thomas Bruckner Universität Leipzig Leipzig auf dem Weg zur energieoptimierten Stadt Seite 207 Dipl.-Ing. Christian Strauß Leibniz-Zentrum für Agrarlandschaftsforschung (ZALF) e.V., Müncheberg Energie- und Materialeffizienz in Stadtplanung und Stadtentwicklung – Die Rolle der Information Seite 213 Dipl.-Ing. Ulrike Nestmann, M.Eng. Katharina Gebhardt, Prof. Dr.-Ing. Manfred Voigt Hochschule Magdeburg-Stendal
Workshop 3 – Intelligente Logistik Committed Service Description – Kernbestandteil der Dienstleisterauswahl im Rahmen des IMOTRIS-Konzepts für automatisierte Transportkettenzusammenstellung Seite 225 Dipl.-Wirt.-Ing. Hans-Christoph Burmeister, Prof. Dr.-Ing. Carlos Jahn Fraunhofer-Center für Maritime Logistik und Dienstleistungen, Hamburg Technische Universität Hamburg-Harburg IMOTRIS: Strategische Planung intermodaler Seehafenhinterland-Transportketten auf der Basis von Semantic Web-Technologien Seite 233 Dipl.-Inf. Thomas Ruth, Dipl.-Inf. Guntram Flach Fraunhofer-Institut für Graphische Datenverarbeitung IGD, Rostock Dipl.-Ing. Martin Weitzel EDV-Berater, Roßdorf Programmbeirat Seite 243 Autoren Seite 245 Impressum Seite 248
Parallelsequenz 1 – Mobilität der Zukunft
METHOD TO DETERMINE AND QUANTIFY CHANGES IN VALUE CHAINS CAUSED BY E-MOBILITY
- - - - - - - - - - - - - - - - - - - - - - - - - - - - - - - - - - - - - - - - - - - - - - - - - - - - - - - - -
Dipl.-Ing. oec. Henrik Gommel Dipl.-Ing. Daniel Palm Univ.-Prof. Prof. eh. Dipl.-Wirtsch.-Ing. Dr.-Ing. Dr. h.c. Wilfried Sihn Fraunhofer Austria Research GmbH, Wien, Österreich
35
LEBENSLAUF
Dipl.-Ing. oec. Henrik Gommel Fraunhofer Austria Research GmbH, Wissenschaftlicher Mitarbeiter
Bis 1997 1997 – 2004 2004 – 2008 2003 – 2009 Seit 2009 Seit 2009 Seit 2010
Maschinenbaustudium an der Universität Stuttgart. Mitarbeiter am Fraunhofer-Institut für Produktionstechnik und Automatisierung, IPA in Stuttgart im Bereich Unternehmensmanagement. Ab 2001 Gruppenleiter Supply Chain Management im Bereich Unternehmenslogistik. Aufbau und Leitung der neu gegründeten Fraunhofer-Projektgruppe für Produktions- und Logistikmanagement in Wien. Studium des Wirtschaftsingenieurwesens an der Hochschule für angewandte Wissenschaften Hamburg, der Universität Hamburg und der Technischen Universität Hamburg-Harburg mit den Schwerpunkt Produktionstechnik und Produktionswirtschaft, technische Logistik und Volkswirtschaftslehre. Kaufmännischer Leiter der Fraunhofer Austria Research GmbH und Leiter des Geschäftsbereichs Produktions- und Logistikmanagement. Wissenschaftlicher Mitarbeiter im Geschäftsbereich „Produktions- und Logistikmanagement“ der Fraunhofer Austria Research GmbH in Wien. Universitätsassistent am Institut für Managementwissenschaften, Bereich Betriebstechnik und Systemplanung, der Technischen Universität Wien.
36
METHOD TO DETERMINE AND QUANTIFY CHANGES IN VALUE CHAINS CAUSED BY E-MOBILITY Dipl.-Ing. oec. Henrik Gommel, Dipl.-Ing. Daniel Palm, Univ.-Prof. Prof. eh. Dipl.-Wirtsch.-Ing. Dr.-Ing. Dr. h.c. Wilfried Sihn
1 Introduction Increasing production and sales figures for electrically powered vehicles affect the medium term value chains of the automotive industry. Some components of vehicles with conventional internal combustion engines are expe-riencing declining demand and are being replaced by the electrification of the drivetrain, either partially or totally. This leads - in dependence of the unit numbers of indi-vidual drive concepts - to value added shifts for the com-panies involved or also for industries which are part of the development and production processes of drive compo-nents. Within the scope of this work, a methodology will be introduced that allows a forecast and quantification of the effects of electric mobility on vehicle-specific national value added chains. Previous approaches to determine and quantify changes in automotive value-chains caused by e-mobility are either rudimental, describing value-added shifts from mechani-cal to electric/electro-mechanic value added in a qualita-tive manner [e.g. 1, 2], or scientifically founded, using complex input-output-models to quantify the effects [3], or effects caused by other technology changes respective-ly [e.g. 4, 5]. The initially mentioned, general descriptions of the value-added shifts, however, permit no derivation of quantitative magnitudes for the description of the effects on domestic value added chains. Input-output tables, the database for input-output (IO) models, illus-trate the inter-industry relations within a national econo-my, and, hence, allow the description of the service rela-tionships of the respective sectors of a national economy to each other [6]. Meade [3] analyses the macroeconomic effects of electric mobility in the USA, using a model called INFORUM-LIFT (Long-term Interindustry Forecasting Tool), which is basically an input-output-model for the "bottom-up" analysis of the developments of the Ameri-can national economy. To this end, assumptions are made with regard to domestic market penetration and produc-tion of vehicles and charging stations in order to estimate the effects on the input-coefficients on the basis of the respective technical changes and to compute, finally, the macroeconomic effects. Meade arrives at the conclusion that electric mobility causes a low macroeconomic effect when using the assumed low market penetration as a basis. But, nevertheless, individual industry fields will be significantly influenced. A detailed analysis on industry sectors or components was not conducted.
The use of input-output models is principally suited for the analysis of the effects on the domestic value added chains. However, the determination of preferably exact and market based input-coefficients is crucial to the mod-els result. Hence, a higher level of granularity in respect of the technical analysis is necessary and was considered within the presented method. Using the example of Austria characterized by a high number of established automotive suppliers and no do-mestic OEM, the use of national total vehicle production numbers as model variable, as used in the model of Meade, would result in misleading effects. Therefore the presented model examines the national automotive pro-duction potential on the more detailed level of compo-nents and sub-components. The methodology thus de-veloped, therefore, allows for making a sound statement about extent and direction of electro-mobility related value added shifts, based on technological shifts and sub-component related market shares of the respective nation under investigation. The method presented in this paper has been developed in the course of a study assigned by the Austrian Federal Ministry of Economy, Family and Youth, the Austrian Economic Chambers and Federation of Austrian Industries [7]. 2 Problem formulation On account of the international integration of automotive value added chains and the focus of national value added chains on certain areas or sections of the value added, a uniform distribution of the national value added propor-tions in the global value added cannot be assumed across all the components of a given vehicle. Looking at the example of Austria, the nation holds 0.2% of the global market for total vehicles, but 2.5% of the world global for internal combustion engines or, more generally speak-ing, 0.25% of the global market for electronic compo-nents and 2% for mechanical components The neigh-bouring country of Germany, in comparison, already holds 9.5% of the global market share vehicles. Thus, a differentiated analysis of market shares at the component and part level is required. In order to determine the value added shifts for existing parts, mean production costs, mean national value added and value added depth, as well as mean value added per employee can be used as reference. A similar approach of using these mean statistics was used in [8] to determine the value added an employee effects of charging infra-
37
structures on Germany, or rather the region Baden-Württemberg. However, what is more difficult here is the forecast for components for which no statistical data is available yet. This encompasses all electric-mobile induced components. For their calculation and potential determination, there is a need to disassemble them into part components until an unequivocal assignment to a certain sector of industry is possible. Using the production costs resulting in this disassembled state as a basis, conclusions can be drawn in turn, with the help of the corresponding industry sec-tor’s key performance indicators, regarding the value added potentials and employee figures. With the help of the production figures of passenger cars and a predicted change across time, the national value added shift and number of employees can be determined, therefore. On this occasion, it is necessary - for certain, highly complicated parts - to consider existing production capacities and their capacity limits. Whether a new in-vestment is to be expected, for new capacities in the case of growth, is something that can only be assumed with a certain probability which orientates itself on general loca-tion factors and a mastering of technology by individual resident companies. Thus, for example, a maximum pro-duction capacity is installed in Austria of 250,000 units for complete vehicles - a further increase would be possi-ble only by means of a new construction of a passenger vehicle factory. The probability that this could be set up in Austria, however, seems to be very low. With general components in the area of electronics or mechanics, there is no need to assume a basic capacity bottleneck. 3 Approach The method is based on five defined passenger car-vehicle concepts which differ concerning drive, exhaust aftertreatment, power transmission and the energy stor-age; however, they are comparable in terms of road performance. Building on an analysis of the technological changes inside the vehicle, the vehicle components af-fected by this are evaluated according to production costs. Using an assignment of the components to the industry classification applied in the national accounts, the absolute value added potentials per vehicle can be determined from the production costs by using the as-signed industry key performance indicators. Furthermore, a market analysis, which is created in each case for the value added-driving components, is used to determine and predict just how strongly the international value added integration is coined in these areas and in which fields the national economy is at its strongest. Using this as a basis, it is possible to derive which respective propor-tions of the worldwide expected unit numbers will have a nationwide impact and, therefore, which direct value added effect this is going to entail at national level. Figure
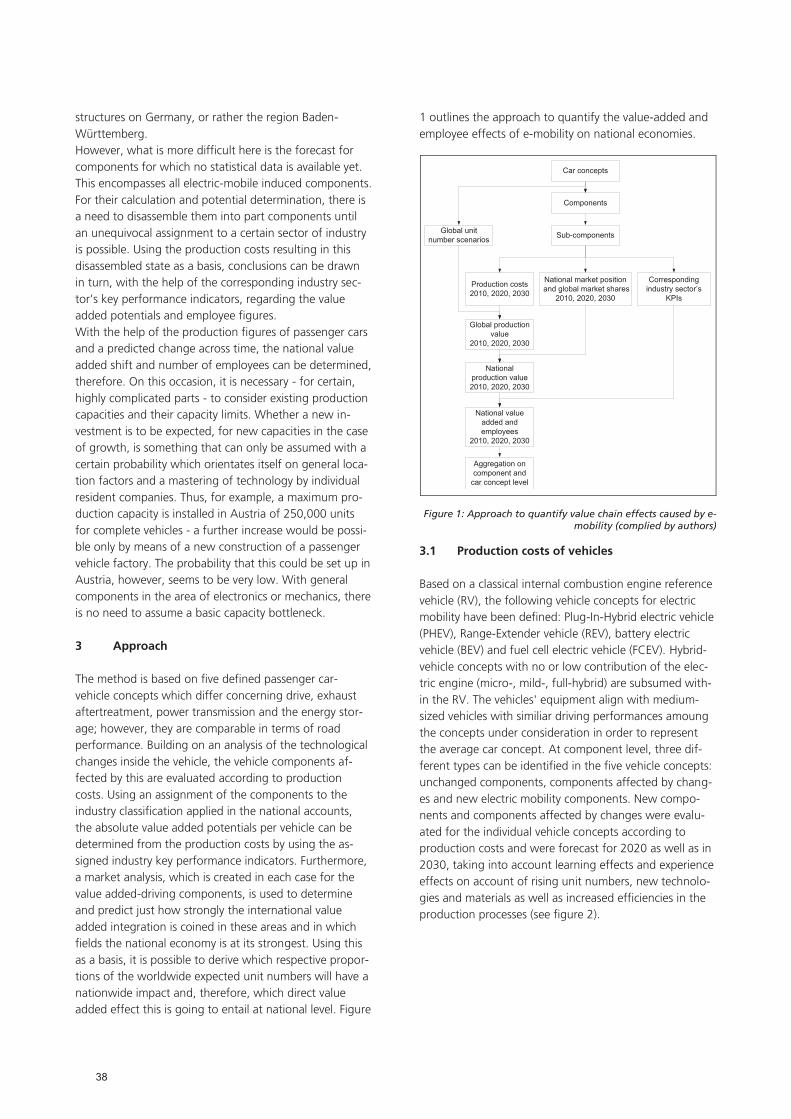
1 outlines the approach to quantify the value-added and employee effects of e-mobility on national economies.
Car concepts
Components
Sub-components
Production costs 2010, 2020, 2030
Global unit number scenarios
Corresponding industry sector’s
KPIs
National market position and global market shares
2010, 2020, 2030
Global production value
2010, 2020, 2030
National production value2010, 2020, 2030
National value added and employees
2010, 2020, 2030
Aggregation on component and
car concept level
Figure 1: Approach to quantify value chain effects caused by e-mobility (complied by authors)
3.1 Production costs of vehicles Based on a classical internal combustion engine reference vehicle (RV), the following vehicle concepts for electric mobility have been defined: Plug-In-Hybrid electric vehicle (PHEV), Range-Extender vehicle (REV), battery electric vehicle (BEV) and fuel cell electric vehicle (FCEV). Hybrid-vehicle concepts with no or low contribution of the elec-tric engine (micro-, mild-, full-hybrid) are subsumed with-in the RV. The vehicles' equipment align with medium-sized vehicles with similiar driving performances amoung the concepts under consideration in order to represent the average car concept. At component level, three dif-ferent types can be identified in the five vehicle concepts: unchanged components, components affected by chang-es and new electric mobility components. New compo-nents and components affected by changes were evalu-ated for the individual vehicle concepts according to production costs and were forecast for 2020 as well as in 2030, taking into account learning effects and experience effects on account of rising unit numbers, new technolo-gies and materials as well as increased efficiencies in the production processes (see figure 2).
38
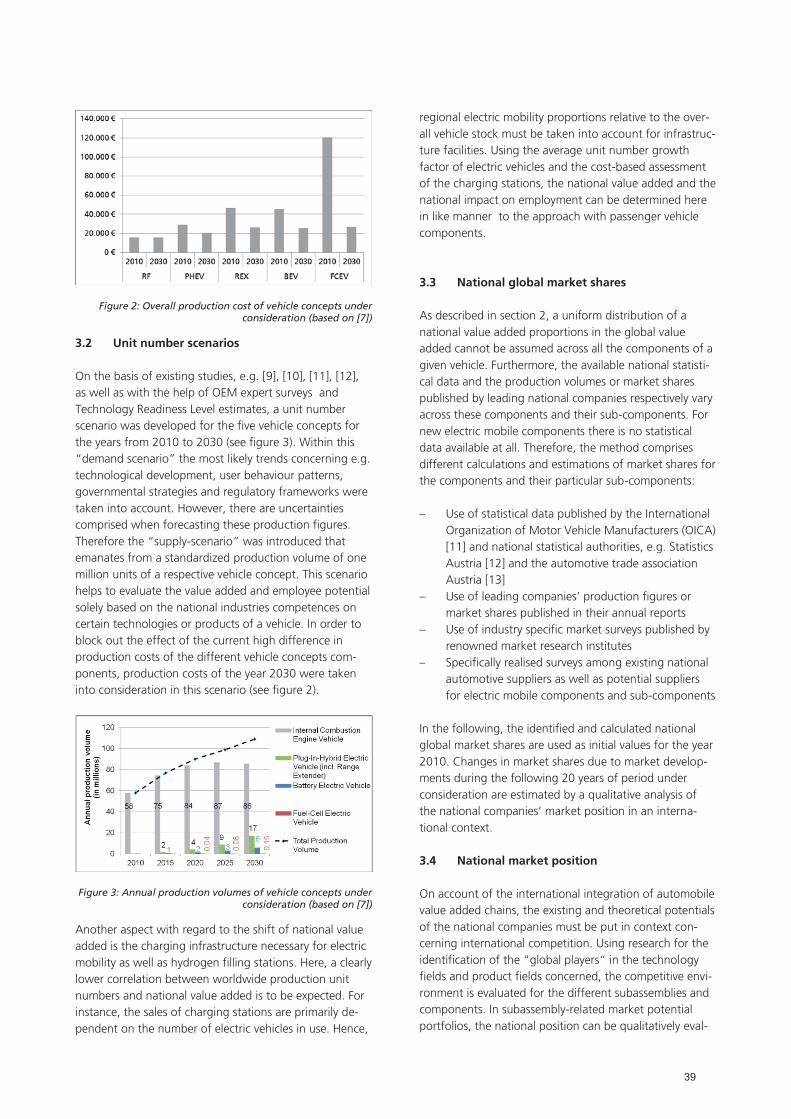
Figure 2: Overall production cost of vehicle concepts under consideration (based on [7])
3.2 Unit number scenarios On the basis of existing studies, e.g. [9], [10], [11], [12], as well as with the help of OEM expert surveys and Technology Readiness Level estimates, a unit number scenario was developed for the five vehicle concepts for the years from 2010 to 2030 (see figure 3). Within this “demand scenario” the most likely trends concerning e.g. technological development, user behaviour patterns, governmental strategies and regulatory frameworks were taken into account. However, there are uncertainties comprised when forecasting these production figures. Therefore the “supply-scenario” was introduced that emanates from a standardized production volume of one million units of a respective vehicle concept. This scenario helps to evaluate the value added and employee potential solely based on the national industries competences on certain technologies or products of a vehicle. In order to block out the effect of the current high difference in production costs of the different vehicle concepts com-ponents, production costs of the year 2030 were taken into consideration in this scenario (see figure 2).
Figure 3: Annual production volumes of vehicle concepts under consideration (based on [7])
Another aspect with regard to the shift of national value added is the charging infrastructure necessary for electric mobility as well as hydrogen filling stations. Here, a clearly lower correlation between worldwide production unit numbers and national value added is to be expected. For instance, the sales of charging stations are primarily de-pendent on the number of electric vehicles in use. Hence,
regional electric mobility proportions relative to the over-all vehicle stock must be taken into account for infrastruc-ture facilities. Using the average unit number growth factor of electric vehicles and the cost-based assessment of the charging stations, the national value added and the national impact on employment can be determined here in like manner to the approach with passenger vehicle components. 3.3 National global market shares As described in section 2, a uniform distribution of a national value added proportions in the global value added cannot be assumed across all the components of a given vehicle. Furthermore, the available national statisti-cal data and the production volumes or market shares published by leading national companies respectively vary across these components and their sub-components. For new electric mobile components there is no statistical data available at all. Therefore, the method comprises different calculations and estimations of market shares for the components and their particular sub-components: – Use of statistical data published by the International
Organization of Motor Vehicle Manufacturers (OICA) [11] and national statistical authorities, e.g. Statistics Austria [12] and the automotive trade association Austria [13]
– Use of leading companies’ production figures or market shares published in their annual reports
– Use of industry specific market surveys published by renowned market research institutes
– Specifically realised surveys among existing national automotive suppliers as well as potential suppliers for electric mobile components and sub-components
In the following, the identified and calculated national global market shares are used as initial values for the year 2010. Changes in market shares due to market develop-ments during the following 20 years of period under consideration are estimated by a qualitative analysis of the national companies’ market position in an interna-tional context. 3.4 National market position On account of the international integration of automobile value added chains, the existing and theoretical potentials of the national companies must be put in context con-cerning international competition. Using research for the identification of the "global players“ in the technology fields and product fields concerned, the competitive envi-ronment is evaluated for the different subassemblies and components. In subassembly-related market potential portfolios, the national position can be qualitatively eval-
39
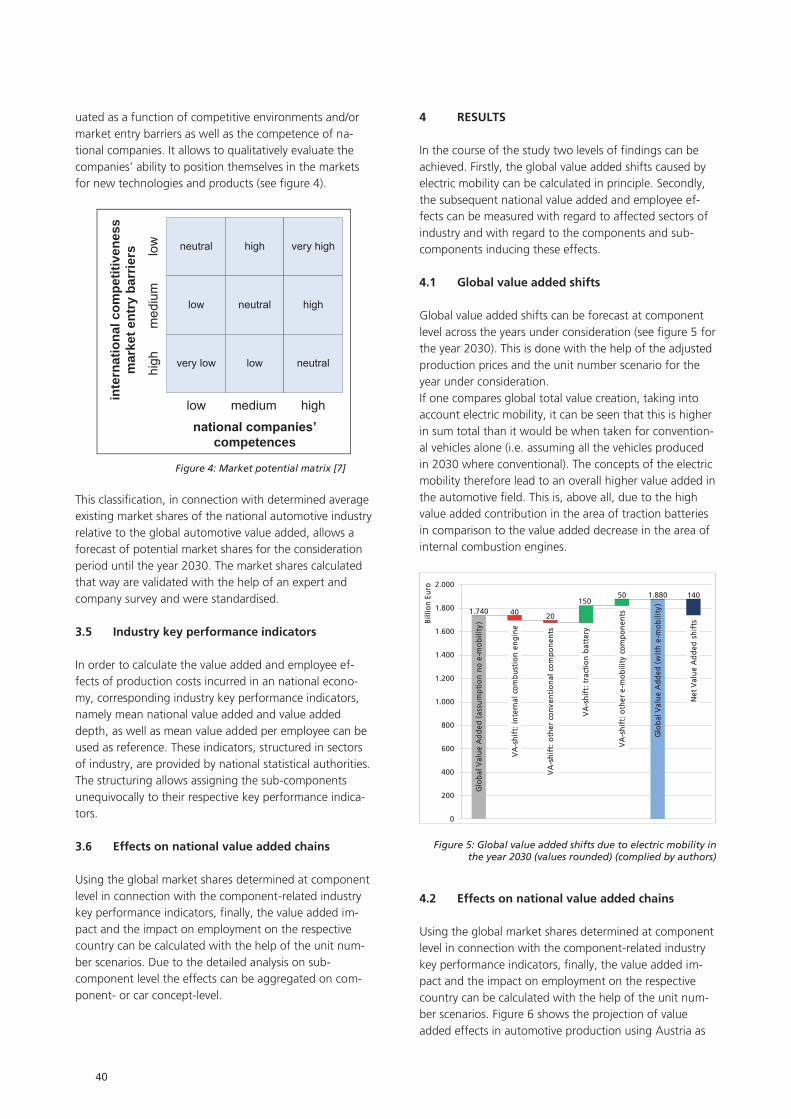
uated as a function of competitive environments and/or market entry barriers as well as the competence of na-tional companies. It allows to qualitatively evaluate the companies’ ability to position themselves in the markets for new technologies and products (see figure 4).
neutral high very high
low neutral high
very low low neutral
high
med
ium
low
highmediumlow
national companies’ competences
inte
rnat
iona
l com
petit
iven
ess
mar
ket e
ntry
bar
riers
This classification, in connection with determined average existing market shares of the national automotive industry relative to the global automotive value added, allows a forecast of potential market shares for the consideration period until the year 2030. The market shares calculated that way are validated with the help of an expert and company survey and were standardised. 3.5 Industry key performance indicators In order to calculate the value added and employee ef-fects of production costs incurred in an national econo-my, corresponding industry key performance indicators, namely mean national value added and value added depth, as well as mean value added per employee can be used as reference. These indicators, structured in sectors of industry, are provided by national statistical authorities. The structuring allows assigning the sub-components unequivocally to their respective key performance indica-tors. 3.6 Effects on national value added chains Using the global market shares determined at component level in connection with the component-related industry key performance indicators, finally, the value added im-pact and the impact on employment on the respective country can be calculated with the help of the unit num-ber scenarios. Due to the detailed analysis on sub-component level the effects can be aggregated on com-ponent- or car concept-level.
4 RESULTS In the course of the study two levels of findings can be achieved. Firstly, the global value added shifts caused by electric mobility can be calculated in principle. Secondly, the subsequent national value added and employee ef-fects can be measured with regard to affected sectors of industry and with regard to the components and sub-components inducing these effects. 4.1 Global value added shifts Global value added shifts can be forecast at component level across the years under consideration (see figure 5 for the year 2030). This is done with the help of the adjusted production prices and the unit number scenario for the year under consideration. If one compares global total value creation, taking into account electric mobility, it can be seen that this is higher in sum total than it would be when taken for convention-al vehicles alone (i.e. assuming all the vehicles produced in 2030 where conventional). The concepts of the electric mobility therefore lead to an overall higher value added in the automotive field. This is, above all, due to the high value added contribution in the area of traction batteries in comparison to the value added decrease in the area of internal combustion engines.
1.740150
50 1.880
40 20
140
0
200
400
600
800
1.000
1.200
1.400
1.600
1.800
2.000
Bill
ion
Eu
ro
Glo
bal
Val
ue
Ad
ded
(as
sum
pti
on
no
e-m
ob
ility
)
VA
-sh
ift:
in
tern
al c
om
bu
stio
n e
ng
ine
VA
-sh
ift:
oth
er c
on
ven
tio
nal
co
mp
on
ents
VA
-sh
ift:
tra
ctio
n b
atte
ry
VA
-sh
ift:
oth
er e
-mo
bili
ty c
om
po
nen
ts
Glo
bal
Val
ue
Ad
ded
(w
ith
e-m
ob
ility
)
Net
Val
ue
Ad
ded
sh
ifts
Figure 5: Global value added shifts due to electric mobility in the year 2030 (values rounded) (complied by authors)
4.2 Effects on national value added chains Using the global market shares determined at component level in connection with the component-related industry key performance indicators, finally, the value added im-pact and the impact on employment on the respective country can be calculated with the help of the unit num-ber scenarios. Figure 6 shows the projection of value added effects in automotive production using Austria as
Figure 4: Market potential matrix [7]
40
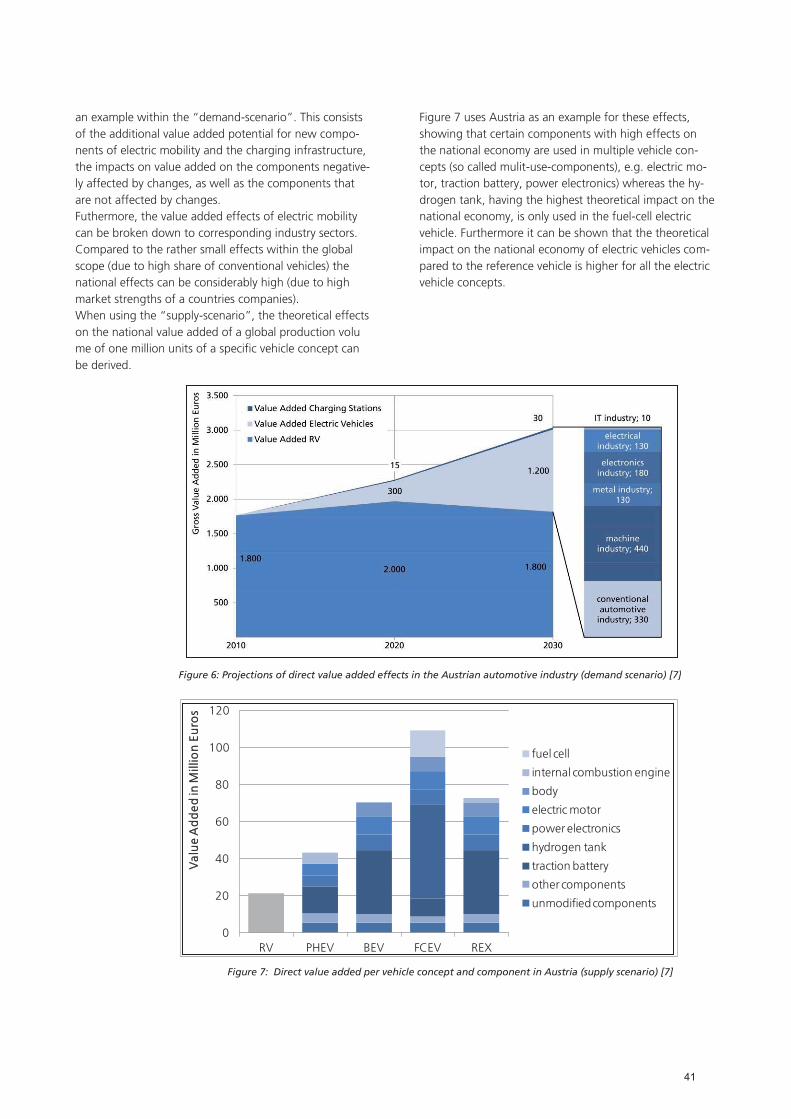
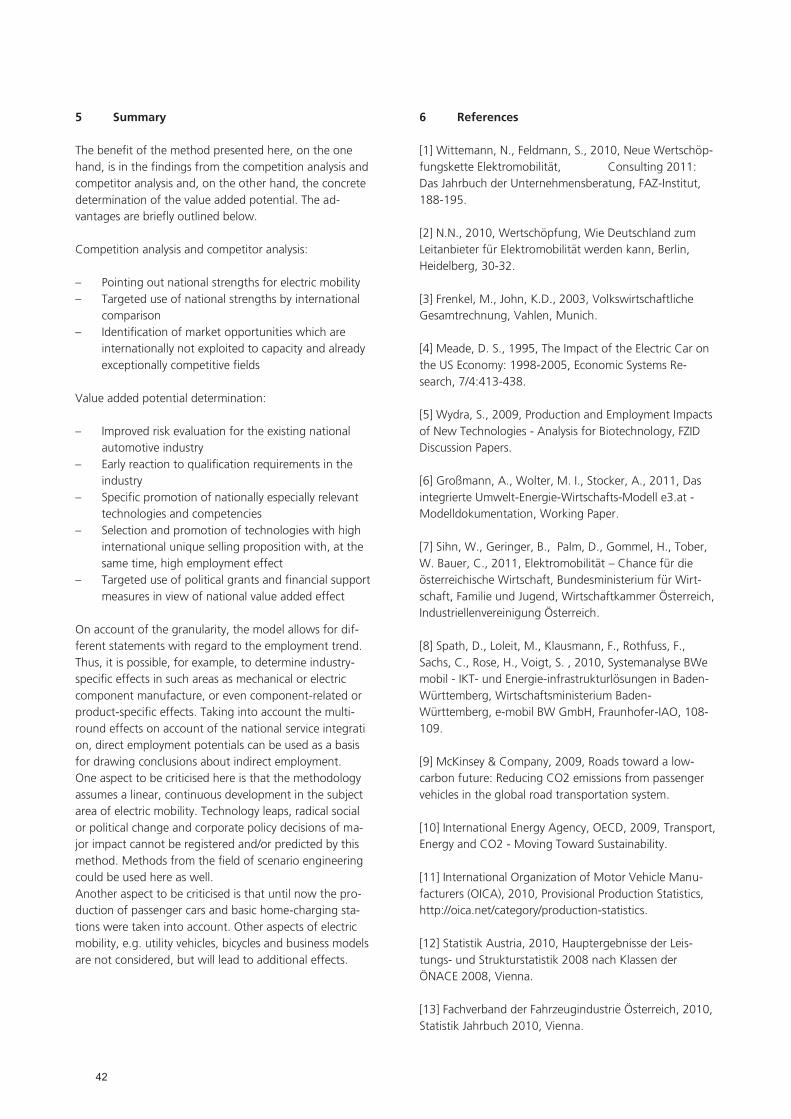
an example within the “demand-scenario”. This consists of the additional value added potential for new compo-nents of electric mobility and the charging infrastructure, the impacts on value added on the components negative-ly affected by changes, as well as the components that are not affected by changes. Futhermore, the value added effects of electric mobility can be broken down to corresponding industry sectors. Compared to the rather small effects within the global scope (due to high share of conventional vehicles) the national effects can be considerably high (due to high market strengths of a countries companies). When using the “supply-scenario”, the theoretical effects on the national value added of a global production volu me of one million units of a specific vehicle concept can be derived.
Figure 7 uses Austria as an example for these effects, showing that certain components with high effects on the national economy are used in multiple vehicle con-cepts (so called mulit-use-components), e.g. electric mo-tor, traction battery, power electronics) whereas the hy-drogen tank, having the highest theoretical impact on the national economy, is only used in the fuel-cell electric vehicle. Furthermore it can be shown that the theoretical impact on the national economy of electric vehicles com-pared to the reference vehicle is higher for all the electric vehicle concepts.
0
20
40
60
80
100
120
RV PHEV BEV FCEV REX
Val
ue
Ad
ded
in M
illio
n E
uro
s
fuel cell
internal combustion engine
body
electric motor
power electronics
hydrogen tank
traction battery
other components
unmodified components
Figure 6: Projections of direct value added effects in the Austrian automotive industry (demand scenario) [7]
Figure 7: Direct value added per vehicle concept and component in Austria (supply scenario) [7]
41
5 Summary The benefit of the method presented here, on the one hand, is in the findings from the competition analysis and competitor analysis and, on the other hand, the concrete determination of the value added potential. The ad-vantages are briefly outlined below. Competition analysis and competitor analysis: – Pointing out national strengths for electric mobility – Targeted use of national strengths by international
comparison – Identification of market opportunities which are
internationally not exploited to capacity and already exceptionally competitive fields
Value added potential determination: – Improved risk evaluation for the existing national
automotive industry – Early reaction to qualification requirements in the
industry – Specific promotion of nationally especially relevant
technologies and competencies – Selection and promotion of technologies with high
international unique selling proposition with, at the same time, high employment effect
– Targeted use of political grants and financial support measures in view of national value added effect
On account of the granularity, the model allows for dif-ferent statements with regard to the employment trend. Thus, it is possible, for example, to determine industry-specific effects in such areas as mechanical or electric component manufacture, or even component-related or product-specific effects. Taking into account the multi-round effects on account of the national service integrati on, direct employment potentials can be used as a basis for drawing conclusions about indirect employment. One aspect to be criticised here is that the methodology assumes a linear, continuous development in the subject area of electric mobility. Technology leaps, radical social or political change and corporate policy decisions of ma-jor impact cannot be registered and/or predicted by this method. Methods from the field of scenario engineering could be used here as well. Another aspect to be criticised is that until now the pro-duction of passenger cars and basic home-charging sta-tions were taken into account. Other aspects of electric mobility, e.g. utility vehicles, bicycles and business models are not considered, but will lead to additional effects.
6 References [1] Wittemann, N., Feldmann, S., 2010, Neue Wertschöp-fungskette Elektromobilität, Consulting 2011: Das Jahrbuch der Unternehmensberatung, FAZ-Institut, 188-195. [2] N.N., 2010, Wertschöpfung, Wie Deutschland zum Leitanbieter für Elektromobilität werden kann, Berlin, Heidelberg, 30-32. [3] Frenkel, M., John, K.D., 2003, Volkswirtschaftliche Gesamtrechnung, Vahlen, Munich. [4] Meade, D. S., 1995, The Impact of the Electric Car on the US Economy: 1998-2005, Economic Systems Re-search, 7/4:413-438. [5] Wydra, S., 2009, Production and Employment Impacts of New Technologies - Analysis for Biotechnology, FZID Discussion Papers. [6] Großmann, A., Wolter, M. I., Stocker, A., 2011, Das integrierte Umwelt-Energie-Wirtschafts-Modell e3.at - Modelldokumentation, Working Paper. [7] Sihn, W., Geringer, B., Palm, D., Gommel, H., Tober, W. Bauer, C., 2011, Elektromobilität – Chance für die österreichische Wirtschaft, Bundesministerium für Wirt-schaft, Familie und Jugend, Wirtschaftkammer Österreich, Industriellenvereinigung Österreich. [8] Spath, D., Loleit, M., Klausmann, F., Rothfuss, F., Sachs, C., Rose, H., Voigt, S. , 2010, Systemanalyse BWe mobil - IKT- und Energie-infrastrukturlösungen in Baden-Württemberg, Wirtschaftsministerium Baden-Württemberg, e-mobil BW GmbH, Fraunhofer-IAO, 108-109. [9] McKinsey & Company, 2009, Roads toward a low-carbon future: Reducing CO2 emissions from passenger vehicles in the global road transportation system. [10] International Energy Agency, OECD, 2009, Transport, Energy and CO2 - Moving Toward Sustainability. [11] International Organization of Motor Vehicle Manu-facturers (OICA), 2010, Provisional Production Statistics, http://oica.net/category/production-statistics. [12] Statistik Austria, 2010, Hauptergebnisse der Leis-tungs- und Strukturstatistik 2008 nach Klassen der ÖNACE 2008, Vienna. [13] Fachverband der Fahrzeugindustrie Österreich, 2010, Statistik Jahrbuch 2010, Vienna.
42
IMPRESSUM
17. Magdeburger Logistiktage »Sichere und nachhaltige Logistik« 27. Juni – 28. Juni 2012, Magdeburg Fraunhofer-Institut für Fabrikbetrieb und -automatisierung IFF Herausgeber: Prof. Dr.-Ing. habil. Prof. E. h. Dr. h. c. mult. Michael Schenk Sandtorstraße 22 | 39106 Magdeburg Telefon +49 391 4090-0 | Telefax +49 391 4090-596 [email protected] http://www.iff.fraunhofer.de Umschlaggestaltung: Bettina Rohrschneider | Martin Stiller Redaktion: Andreas Knittel Titelfoto: Viktoria Kühne Fotos, Bilder, Grafiken: Soweit nicht anders angegeben, liegen alle Rechte bei den Autoren der einzelnen Beiträge. Herstellung: docupoint GmbH Bibliografische Information der Deutschen Nationalbibliothek: Die Deutsche Nationalbibliothek verzeichnet diese Publikation in der Deutschen Nationalbibliografie; detaillierte bibliografische Daten sind im Internet über http://dnb.d-nb.de abrufbar. URN urn:nbn:de:0011-n-2055638 Alle Rechte vorbehalten Für den Inhalt der Vorträge zeichnen die Autoren verantwortlich. Dieses Werk ist einschließlich aller seiner Teile urheberrechtlich geschützt. Jede Verwertung, die über die engen Grenzen des Urheberrechtsgesetzes hinausgeht, ist ohne schriftliche Zustimmung des Verlages unzulässig und strafbar. Dies gilt insbesondere für Vervielfältigungen, Übersetzungen, Mikroverfilmungen sowie die Speicherung in elektronischen Systemen. Die Wiedergabe von Warenbezeichnungen und Handelsnamen in diesem Buch berechtigt nicht zu der Annahme, dass solche Bezeichnungen im Sinne der Warenzeichen- und Markenschutz-Gesetzgebung als frei zu betrachten wären und deshalb von jedermann benutzt werden dürften. Soweit in diesem Werk direkt oder indirekt auf Gesetze, Vorschriften oder Richtlinien (z.B. DIN, VDI) Bezug genommen oder aus ihnen zitiert worden ist, kann der Verlag keine Gewähr für Richtigkeit, Vollständigkeit oder Aktualität übernehmen. © 08/2012 Fraunhofer-Institut für Fabrikbetrieb und -automatisierung IFF