Soil- Testingproceduresandtestingequipment- Plateloadtest ...

A META-ANALYSIS OF SOIL EROSION RATES ACROSS THE
WORLD
José M. García-Ruiz1, Santiago Beguería2, Estela Nadal-Romero3, José C. González-
Hidalgo4, Noemí Lana-Renault5, Yasmina Sanjuán1
1 Instituto Pirenaico de Ecología (IPE-CSIC), Campus de Aula Dei, Apartado 13.034,
50.080-Zaragoza, Spain.
2Estación Experimental de Aula Dei (EEAD-CSIC), Campus de Aula Dei, Apartado
13.034, 50.080-Zaragoza, Spain.
3 Institute for Biodiversity and Ecosystem Dynamics. Earth Surface Science Research
Group, University of Amsterdam, 1098XH-Amsterdam, The Netherlands.
4 Department of Geography, University of Zaragoza, 50.009-Zaragoza, Spain.
5 Area of Physical Geography, Luis Vives Building, Luis de Ulloa Street, University of
La Rioja, 26006-Logroño, Spain.
Abstract
Over the last century extraordinary efforts have been devoted to determining soil
erosion rates (in units of mass per area and time) under a large range of climatic
conditions and land uses, and involving various measurement methods. We undertook a
meta-analysis of published data from more than 4000 sites worldwide. The results show
that there is extraordinarily high variability in erosion rates, with almost any rate
apparently possible irrespective of slope, climate, scale, land use/land cover and other
environmental characteristics. However, detailed analysis revealed a number of general
features including positive relationships of erosion rate with slope and annual
precipitation, and a significant effect of land use, with agricultural lands yielding the
highest erosion rates, and forest and shrublands yielding the lowest. Despite these
general trends, there is much variability that is not explained by this combination of
factors, but is related, at least partially, to the experimental conditions. Our analysis
revealed a negative relationship between erosion rate and the size of the study area
involved; significant differences associated with differing measurement methods, with
direct sediment measurement yielding the lowest erosion rates, and bathymetric,
radioisotope and modeling methods yielding the highest rates; and a very important
effect of the duration of the experiment. Our results highlight that, when interpreting
erosion rates, the experimental conditions involved must be taken into account. Even so,
the data suggest that only order of magnitude approximations of erosion rates are
possible, and these retain a very large degree of uncertainty. Consequently, for practical
purposes such as calculation of global sediment budgets, empirical equations are not a
substitute for direct measurements. Our results also show that a large proportion of the
experiments have been short-term (less than 3 years), which reduces dramatically the
reliability of the estimated erosion rates, given the highly non-normal behavior of soil
erosion (time-dependency). Despite the efforts already made, more long-term
measurement experiments need to be performed, especially in regions of the world that
are under-represented in global datasets. In addition, protocols need to be established
for standardizing the measurement methods and reporting the results, to enable data to
be compared among diverse sites.
Key words: Erosion rates, Sediment yield, Geomorphological methods, Experimental
plots, Experimental catchments, Scale-dependency
1. Introduction
Together with water and air, soil is a major natural resource for life on Earth. It
provides a large variety of goods and services (Verheijen et al., 2009), particularly in
relation to biodiversity, soil biota, plant composition, runoff control, water-holding
capacity, carbon sequestration and ecosystem productivity (Van Oost et al., 2000).
Consequently, soil degradation is one of the most important threats to soil productivity
and human welfare (Pimentel et al., 1976). Soil erosion is a major cause of soil
degradation because it involves removal of the most fertile topsoil, where organic
matter and nutrients are concentrated (Li et al., 2009). Given that in most cases the rate
of erosion occurring in agricultural areas is higher than the rate of soil formation
(Verheijen et al., 2009), several reports (e.g. Boardman, 2006) have highlighted a
decrease in soil quality in many areas worldwide. This in part explains increases in
production costs, declining crop yields, and in the worst cases, farmland abandonment
(Montgomery, 2007). In certain developing regions the combined effects of increasing
population, insufficient nutrition and poverty have resulted in the cultivation of
marginal lands and significant soil erosion (Tato and Hurni, 1992), following a similar
process that occurred in developed countries more than a century ago. As a

consequence, the agricultural land area per head of population is continuing to shrink
globally with increasing population growth (Pimentel et al., 1995). This is making soil
erosion a critical problem (Montgomery, 2007) that requires holistic solutions involving
physical and socio-economic approaches.
The measurement of soil erosion has been a major target of scientific research
and government programs since the beginning of the 20th century, and for a variety of
reasons remains one of the highest research priorities. For instance, de Vente et al.
(2013) stated the need for measurement “of soil erosion rates and sediment yield (SY)
at regional scales under present and future climate and land use scenarios”. According
to Toy et al. (2002), erosion should be measured to assess the environmental impacts of
erosion and conservation practices, the development of erosion prediction technologies,
and the implementation of conservation policies. Vanmaercke et al. (2011a) noted that
the specific sediment yield rate (the quantity of sediment reaching the catchment outlet
per unit time and per unit area) is central to many environmental processes, including
river delta formation and maintenance, sedimentation in harbors, reservoir and lake
silting, floodplain aggradation and instability, and riparian vegetation dynamics.
Perhaps the major reason justifying investment in studies of soil erosion is its enormous
indirect costs (Pimentel et al., 1995). This can be particularly significant in the case of
reservoir silting; reservoirs behave as large sediment traps, and siltation can cause a
rapid decline in capacity, reducing the life span of the reservoir and threatening the
sustainability of inland water storage. Knowledge of current soil erosion rates enables
comparison with tolerable soil erosion rates (Verheijen et al., 2009; Bilotta et al., 2012),
although this is difficult to assess.
The importance of soil erosion rates explains the large investments in time,
effort and funds to determine soil loss at scales ranging from very small plots (< 1 m2)
to large basins (> 1000 km2). Nevertheless, in analyzing the adequacy of erosion
measurements, Stroosnijder (2005) warned of a scientific and technical crisis because
“there are insufficient empirical data of adequate quality, a lack of funds to improve that
situation, a lack of development of new technologies and equipment, and a lack of
skilled personnel”. This commonly leads to the use of erroneous erosion prediction
models, usually calibrated using data collected at inappropriate scales (Poesen et al.,
1996, 2003). Boardman (2006) concluded that “for most areas in the World the erosion
data is woefully inadequate”. These reports have highlighted that little real progress has
been achieved despite decades of effort, and soil formation rates are even less well
understood, making assessment of sustainability extremely uncertain.
Some studies have reported limitations in the recent evolution of soil erosion
research (e.g. Parsons, 2011; Boardman, 2006; Parsons et al., 2006; de Vente et al.,
2007; Fryirs, 2013). Kirkby (2010) noted that “much progress has already been made
towards an improved understanding of soil erosion mechanisms, but a number of gaps
can still be identified”, including the evolution of threads into rills during an erosion
event, and the differentiation of transport and supply-limited removal of coarse and fine
material, respectively. Boardman (2006) was even more explicit in stating that “in soil
erosion science we seem to have avoided the ambitious questions in favor of more
limited, easy-to-answer ones”. With some notable exceptions, this explains the absence
of “seminal papers”, despite much effort still being invested in determining soil erosion
rates.
One of the problems in attempts to compare among published erosion rates is the
uncertainty created by the use of different erosion measurement methods. A clear
distinction must be made between erosion rate and sediment yield. Formally, an erosion
rate is the long-term balance between all processes that detach soil material and remove
it from a site, and those processes that deliver new material and deposit it at the site.
Thus, erosion rates can be negative (net mass loss) or positive (net mass gain). In
contrast, sediment yield refers to the mass that is exported from a given landscape unit,
and is always a positive quantity. While some methods (e.g. radioisotope surveys)
measure true erosion rates, others (e.g. plot or stream sediment monitoring) measure
sediment yields. However, it is easy to confuse the two measurements because they are
expressed in the same units (mass per unit time, or mass per unit surface and time).
Here we use the term ‘erosion rate’ in a general way to include both erosion rates and
sediment yields, enabling comparison of each measurement type, although we
distinguish between them where necessary.
In this review paper we analyzed: (i) the variability among published erosion
rates, and assessed the difficulties in finding useful relationships between the published
rates and environmental factors; (ii) the differences in erosion rates arising from non-
environmental factors, including the time and space conditions of the experiments, as
well as the measurement methods used; and (iii) the limitations in interpretation of the
results. This study seeks to reflect on the methods used in the estimation of erosion rates
and their validity for improving the theory and practice on soil erosion studies. To
achieve these objectives we constructed a meta-database based on erosion rates
published worldwide for studies undertaken at various spatial and temporal scales,
involving differing land uses and land covers, and using different methods. Statistical
analysis was used to identify the main strengths and drawbacks of the available
information.
2. Methods
2.1. Data collection
A dataset of erosion rate measurements was collected from scientific articles
published in international journals since 1981. We used two widely used bibliographic
databases (Scopus and ISI Web of Knowledge) to identify articles matching the
keywords: soil erosion and sediment yield. For each entry in the database, the following
information was collected (if available): (i) spatial location (country, name of the study
area, and coordinates); (ii) erosion rate (Mg km–2
yr–1
); (iii) study surface area (m2); (iv)
slope gradient (m m–1
); (v) measurement period (years); (vi) measurement method,
including direct measurement in runoff plots and gauging stations in catchments,
bathymetric surveys in reservoirs, modeling, radioisotope survey, or rainfall simulation;
(vii) land use/land cover type; and (viii) mean annual precipitation. This process
identified a total of 276 articles from which 1639 records from 62 countries were
obtained.
This dataset was merged with three additional sources: (i) the USLE dataset
provided by the United States Department of Agriculture and the National Soil Erosion
Research Laboratory (USDA-NSERL, 2014), which provided data from 635 erosion
plots; (ii) the suspended sediment database of the Unites States Geological Service
(USGS, 2014), which provided data from 1582 catchments; and (iii) the hydrometric
database of the Canadian Hydrological Service (HYDAT, 2014), which provided data
from 480 catchments. These data were derived from sites throughout North America,
spanning a large range of vegetation types, soils and land use conditions, together with
large variations in mid-latitude climate conditions (for more details see González-
Hidalgo et al., 2009, 2010, 2012, 2013).
The land uses/land covers were coded according to the following classes: (i)
agriculture (herbaceous plants, including cereals, sunflower, sugar cane, corn and
potato); (ii) agriculture (trees and shrubs), including olive orchards, and particularly
vineyards; (iii) forest (including forest crops such as eucalypts); (iv) shrubs and
rangeland; (v) mixed landscapes with crops, forest, shrubs and/or pastureland; (vi)
pastureland (natural herbs and some herbaceous crops such as lucerne); (vii) bare soil;
(viii) forest tracks, roads and urban areas; (ix) bench terraced fields; (x) areas affected
by wildfires; (xi) abandoned fields; (xii) fallow land; and (xiii) badlands. Only for
categories (i)–(vi) and (ix) were the sample sizes adequate for inclusion in the statistical
analysis.
The final dataset comprised 4377 data entries, although not every entry included
data for every variable. The full dataset is included as online supplementary material in
the digital version of this article.
2.2. Statistical analysis
Scatterplots were used to provide a visual relationship between erosion rates and
other continuous covariates including slope, annual precipitation, and catchment size.
To prevent excessive clustering of points because of large sample sizes, hexagonal
binning was used to represent the density of observations in the x–y space. A loess
(local polynomial regression) fitting was added as a piece-wise estimation of the mean
of the erosion rate conditioned to the covariates. A color ribbon was plotted around the
loess line, representing the 95% confidence interval of the mean. This confidence
interval is a model of the mean of the data, and not a model of the data itself; thus, it
tells nothing about where future observations of erosion rates are likely to fall, given a
particular covariate.
Probability density plots were used to compare the distribution of erosion rates
for different levels of factor covariates associated with different measurement methods
and land uses. The use of densities (summed to a value of 1) instead of frequencies
(number of observations) enabled comparisons among sets of different size.
Linear regression was used to determine the significance and effect of single
covariates on erosion rates. Multivariate regression was used to test the ability of a
combination of environmental factors (precipitation, slope and land use) to predict the
(logarithmic) erosion rates. Two alternative model configurations were tested: one using
the variables noted above, and another that also included the measurement method, the
catchment size and the experiment duration. These models were compared to assess
whether non-environmental factors related to the characteristics of the data collection
method had a significant influence on the reported erosion rates. A likelihood ratio test
based on the Akaike Information Criterion (AIC) was used for comparing the model
configurations. A sample of n = 274 observations was available for fitting the complete
model, as many data entries lacked data for at least one of the variables.
3. Results
Fig. 1 shows the spatial distribution of the sites included in the database. North
America and Europe comprised the largest number of study sites; other areas
represented in the dataset included Chile, China and some African countries. Little
information was available for large areas of South America, western Africa and the
Middle East. The map does not precisely reflect the regional importance of erosion
processes, but rather the presence of research groups in universities and research
institutions, and the availability of financial resources to carry out monitoring at
experimental stations and in catchments. However, in the case of Europe a large
proportion of the studies concerned the Mediterranean region (García-Ruiz et al., 2013),
because the variety of dramatic eroded landscapes in the region have attracted the
interest of local geomorphologists, and others from Germany, the United Kingdom,
Belgium and the Netherlands in particular.
The most outstanding feature of the data is the extraordinary variability in
erosion rates and environmental conditions, but also in relation to the measurement
techniques used. For instance, the size of the experimental sites varied by more than ten
orders of magnitude, and the duration of the studies ranged from minutes to several
decades. Similarly, experiments involving distinct land use/land covers involved a large
variety of slope gradients, and the methods used to determine erosion rates included
various levels of complexity and cost. In addition, there was variability among studies
in the quality of the reporting of information concerning the experimental area, making
comparison of the results and general conclusions difficult. Many authors did not
provide information on land cover, slope gradient, climate characteristics, or even the
size of the study area or its location (geographic coordinates). Particularly problematic
was the absence in some cases of data on the duration of the experiments, and only in a
few cases did the erosion rates reported include a standard deviation or variance statistic
in addition to the mean value. In studies spanning several years, only in a few cases was
information given about the interannual variability of erosion rates. In most cases the
rainfall characteristics during the study period were not compared with the longest
temporal context. Ideally, the climate characteristics during a study period should be
compared with the general climate of the region, based typically on data from at least 30
years.
Below we report the patterns of erosion rate in relation to independent
environmental variables including precipitation, slope gradient and land use/land cover,
and non-environmental variables including the measurement method, size of the study
area, and duration of the experiment. In the last section we present the results of a
multivariate analysis that included all factors.
3.1. Precipitation
Fig. 2 relates the erosion rate (Mg ha–1
yr–1
) to the mean annual precipitation
(mm yr–1
), based on data from 3431 records. Most of the studies were carried out in
areas having precipitation > 1500 mm yr–1
, but the dataset also included areas with
semi-arid climates (precipitation < 500 mm yr–1
). No studies involved regions with <
100 mm yr–1
(arid climates), probably because of the relative absence of water erosion
processes under conditions of very low mean annual precipitation. Nevertheless, very
high erosion rates (up to 10,000 Mg ha–1
yr–1
) have been recorded in semi-arid areas
(200–500 mm yr–1
) despite apparently very low levels of runoff. Few studies have been
performed in areas with rainfall > 2000 mm yr–1
.
Large variability in erosion rates is evident in Fig. 2, which shows that almost
any erosion rate is possible under almost any climatic condition. The loess smoother
line indicates an increase in the mean erosion rate with increasing precipitation, at least
until approximately 1400 mm yr–1
. The sudden increase in the slope of this relationship
between 1000 and 1400 mm yr–1
seems to be influenced by a cluster of records of very
high erosion rates coinciding with this level of precipitation. The relationship between
erosion rate and precipitation is less clear for precipitation levels > 1400 mm yr–1
,
probably because of the small sample size.
The linear regression analysis indicated a significant effect (= 0.05) of
precipitation on the erosion rate, although the effect size was very small (R2 = 0.013).
3.2. Slope gradient
The relationship between erosion rate and the slope gradient (m m–1
) is
represented in Fig. 3, based on data from 624 records. Slope gradient has consistently
been considered a critical factor explaining the variability of erosion rates under all
environmental conditions. However, as Fig. 3 shows, there was very high variability in
erosion rates associated with both gentle and steep slopes. The loess smoother line
suggests an increase in the mean erosion rate for gradients of 0–0.2 m m–1
(an angle of
approximately 11). Most of the studies involved slopes in this range, because of the
predominance of experimental plots in agricultural land, which is typically in that slope
gradient range. The confidence band of the loess smoother line became very wide for
slope gradients > 0.2, and consequently was unreliable.
The linear regression analysis indicated a significant effect (= 0.05) of slope
gradient on the erosion rate, although the effect size was again very small (R2 = 0.024).
3.3. Land use/land cover
Fig. 4 shows the erosion rates in relation to land use/land cover, from a total of
860 records. The sample size for each land cover type is given in parenthesis in the
figure legend. Although there is a relatively chaotic distribution of erosion rates, four
features are noteworthy: (i) among the highest erosion rates, studies involving
agricultural activities produced the highest values, although moderate erosion rates were
also evident; (ii) forest fires were associated with relatively low erosion rates, although
this interpretation is questionable because in many cases the occurrence of rainfall
immediately following the fires was not reported. This information is critical because of
the effect of rapid plant colonization and declining erosion following fire. In addition,
only ten studies were included in this analysis, which is too few for the results to be
representative of the diversity of forest fire sites; (iii) areas with shrubs tend to be
associated with low and moderate erosion rates, although high erosion rates are also
possible; and (iv) pasture areas tend to be associated with intermediate erosion rates. No
significant association was found for the other land use/land covers, particularly in the
case of forest environments. The linear regression analysis that included land use/land
cover types as a factor (equivalent to an ANOVA analysis, but also indicating the sign
of the difference in factor levels) yielded significant results (= 0.05), although the
effect size was very small (R2 = 0.052).
3.4. Measurement method
Fig. 5 relates the erosion rates to the measurement method used, from a total of
4165 records. The sample size for each factor level is given in parenthesis in the figure.
Erosion models, radioisotope and (to a lesser extent) bathymetric methods tended to
show a higher proportion of high erosion rates. Direct measurement of sediment yield in
the field (using experimental plots or monitored streams) was associated with
comparatively low erosion rates, although very high rates also occurred. Marked
differences were also found between plot and catchment studies, with a large proportion
of plots having the highest erosion rates (Fig. 6).
The linear regression analysis indicated significant differences (= 0.05) among
measurement methods, but the effect size was small (R2 = 0.077). The variance
explained increased for the distinction between plot and catchment studies, but not to
high levels (R2 = 0.106).
3.5. Size of the study area
The relationship between erosion rate and the size of the study area (m2) is
shown in Fig. 7, based on 3236 records. A large density of data points is evident around
60 m2, coinciding approximately with the area of the USLE plots, and around 1000 km
2,
coinciding with the typical size of many monitored catchments.
The most outstanding result is that a broad range of erosion rates is possible at
any spatial scale. However, the loess smoother line suggests an almost linear
relationship between erosion rate and study area size, in the double logarithmic scale of
the plot. This relationship was particularly evident for study area sizes of >10 m2, as the
line remains approximately flat for smaller sizes.
Fig. 8 shows the previous figure combined with information on the measurement
method used, based on 3207 records. A negative linear relationship between erosion
rate and area was more apparent for direct measurements. Only at the largest scales (>
10,000 m2) did modeling and bathymetric studies yield average erosion rates that were
higher than those from direct measurements. On the other hand, rainfall simulation and
radioisotope studies mainly occur in the smallest scales (less than 108 m
2). The linear
regression analysis confirmed a significant relationship between erosion rate and study
area size, with the effect of size increasing when the measurement method was also
included (from R2 = 0.158 to R
2 = 0.208, respectively).
3.6. Duration of the study
The duration of the study (the time period over which the measurements were
made) was primarily analyzed because of the importance of extreme events on erosion
rates. It was assumed that during short-term field experiments the probability of an
extreme event was less than during longer field experiments, so in the latter case erosion
rates more closely approximate the long term average. In addition, the occurrence of an
extreme event during a short-term field experiment greatly increases the estimated
erosion rate, confounding comparison between experiments of differing duration.
The probability distribution of the duration of the study (Fig. 9) shows a clear bi-
modal distribution, both for plot and catchment studies. A large proportion of studies
spanned only one year, which appears to be too short to obtain reliable estimates of
long-term erosion rates. The second peak occurred at approximately 10 years for plots,
and 2–10 years for catchments. Experiments longer than 10 years are in general rare,
and very few studies have exceeded 25 years in length.
The relationship between erosion rate and the duration of the study was based on
3053 records and is shown in Fig. 10, which indicates extremely high variability among
erosion rates. The loess smoothed line suggests increasing erosion rate with increasing
study duration; this relationship was significant, but the effect size was small (R2 =
0.027).
It is noteworthy that the standard error of the mean erosion rate (based on 2697
records) decreased markedly with the duration of the study (Fig. 11). This statistic
reflects the uncertainty related to estimation of mean erosion rates based on annual data.
The uncertainty was high for studies spanning < 10 years, and remained at relatively
high levels (0.25) up to 20 years. This demonstrates that in short-term experiments the
high interannual variability typical of erosion rates at any spatial scale can lead to
unreliable estimates of the erosion rate. This relationship was significant, with an effect
size of R2 = 0.1777.
The importance of the duration of the experiment can also be assessed for those
catchments for which interannual data were available (a total of 2697 records), by
considering the ratio between the maximum and mean annual erosion rates. This ratio is
an indicator of the weight of extreme events within the study period (Fig. 12). The ratio
increases progressively as the number of years of the study increases, up to
approximately 20 years, when the loess smoothed line flattened. Thus, a period of at
least 20 years of measurements seems to be optimal for obtaining reliable erosion rates.
The relationship was significant, with an effect size of R2 = 0.254.
3.7. Multivariate analysis
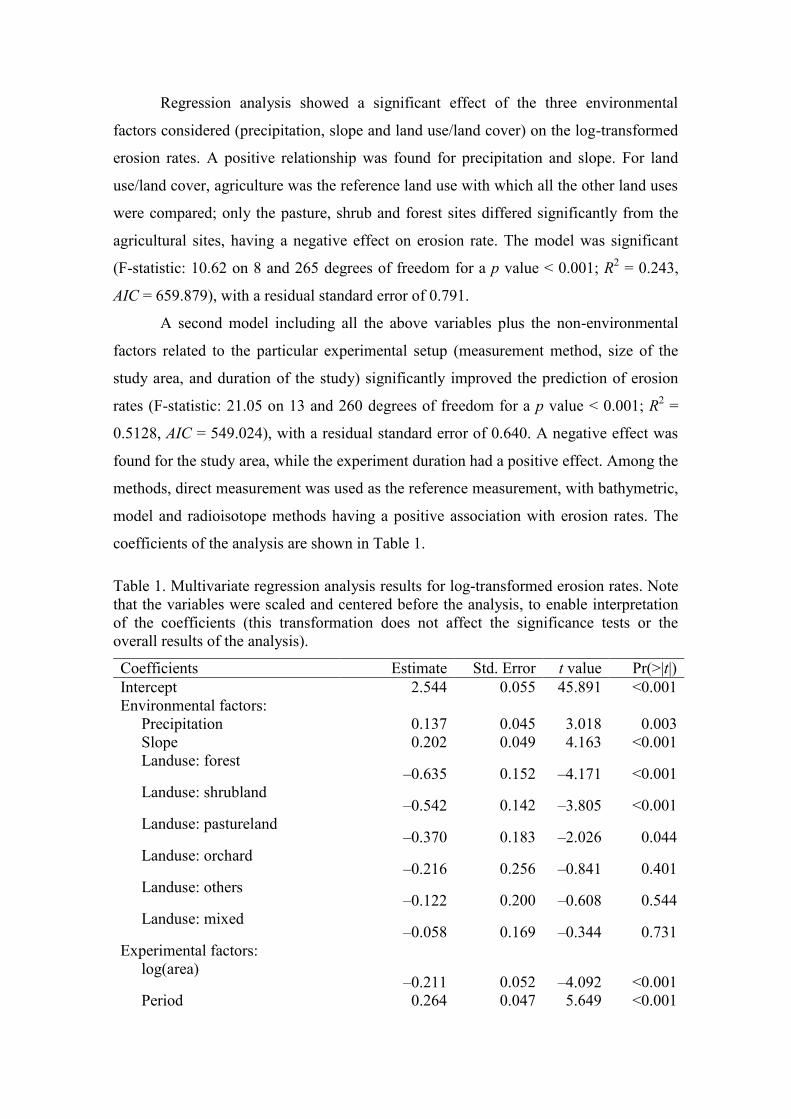
Regression analysis showed a significant effect of the three environmental
factors considered (precipitation, slope and land use/land cover) on the log-transformed
erosion rates. A positive relationship was found for precipitation and slope. For land
use/land cover, agriculture was the reference land use with which all the other land uses
were compared; only the pasture, shrub and forest sites differed significantly from the
agricultural sites, having a negative effect on erosion rate. The model was significant
(F-statistic: 10.62 on 8 and 265 degrees of freedom for a p value < 0.001; R2 = 0.243,
AIC = 659.879), with a residual standard error of 0.791.
A second model including all the above variables plus the non-environmental
factors related to the particular experimental setup (measurement method, size of the
study area, and duration of the study) significantly improved the prediction of erosion
rates (F-statistic: 21.05 on 13 and 260 degrees of freedom for a p value < 0.001; R2 =
0.5128, AIC = 549.024), with a residual standard error of 0.640. A negative effect was
found for the study area, while the experiment duration had a positive effect. Among the
methods, direct measurement was used as the reference measurement, with bathymetric,
model and radioisotope methods having a positive association with erosion rates. The
coefficients of the analysis are shown in Table 1.
Table 1. Multivariate regression analysis results for log-transformed erosion rates. Note
that the variables were scaled and centered before the analysis, to enable interpretation
of the coefficients (this transformation does not affect the significance tests or the
overall results of the analysis).
Coefficients Estimate Std. Error t value Pr(>|t|)
Intercept 2.544 0.055 45.891 <0.001
Environmental factors:
Precipitation 0.137 0.045 3.018 0.003
Slope 0.202 0.049 4.163 <0.001
Landuse: forest –0.635 0.152 –4.171 <0.001
Landuse: shrubland –0.542 0.142 –3.805 <0.001
Landuse: pastureland –0.370 0.183 –2.026 0.044
Landuse: orchard –0.216 0.256 –0.841 0.401
Landuse: others –0.122 0.200 –0.608 0.544
Landuse: mixed –0.058 0.169 –0.344 0.731
Experimental factors:
log(area) –0.211 0.052 –4.092 <0.001
Period 0.264 0.047 5.649 <0.001

Method: model 1.767 0.477 3.702 <0.001
Method: bathymetry 0.578 0.200 2.892 0.004
Method: radio isotope 0.549 0.135 4.069 <0.001
This confirms the importance of controlling for the measurement method and the
experiment duration in analysis of erosion rate data from different sources.
However, the predictive power of the model is limited, as shown in Fig. 13. The
scatterplot of predicted against observed erosion rates shows a good average
relationship, but the prediction interval (range that comprises 95% of the observations)
spans almost two orders of magnitude, while the entire range of the variable spans in
excess of four orders of magnitude.
4. Discussion: facing new challenges in estimating erosion rates
4.1. General trends: the role of environmental factors
The database used in this study was compiled from information published in
hundreds of studies from diverse countries worldwide, and included data for a number
of plots and experimental catchments from the USDA, the USGS and the Canadian
Hydrological Service. It was compiled from various data sources including reservoir
and lake bathymetries, radioisotope surveys, simulations and models. We believe it is
one of the most complete and up-to-date compilations for studying the occurrence of
erosion patterns at a worldwide scale, and for identifying the drivers that explain
erosion processes and rates.
Our analysis confirms that no general rule, normalized approach, or universal
criteria have been applied to the study of erosion processes and to determining erosion
rates. With the exception of the USLE experimental plots, field experiments have been
carried out under an extremely large variety of conditions, using diverse methods and at
various spatial scales. This variability in experimental conditions is a barrier to the
interpretation of the environmental factors influencing erosion rates.
Our results demonstrate that differing experimental conditions can be
successfully accounted for in a regression model as random factors (non-environmental
influences), thus allowing a better assessment of the environmental factors that are
really of interest. However, of great concern is that very few studies provide complete
information about the study area and/or the experiment characteristics, with relevant
data including the bedrock, climate characteristics, weather conditions during the study
period, topography, duration of the study, and plant cover and land use being very often
not reported. This severely restricts the potential for meta-analysis of data from different
experiments, and reduces the value of the efforts made in the field and laboratory. It
also reduces the potential to use most of the data in parameterization and validation of
models.
Analysis of the database identified some general trends in soil erosion rates:
(i) Erosion rates tend to increase with increasing slope in experiments below 0.2
m m-1, and no trend has been found over that threshold. This could be related to the
high variability of erosion rates reported in studies of low and moderate slopes. Band
(1985), Parsons and Abrahams (1986) and Abrahams et al. (1988), among others
suggested that the relationships among slope, runoff and erosion are complex.
(ii) Erosion rates tend to increase with increasing mean annual precipitation. The
erosion rates seem to be greater for mean annual precipitation between 1000 and 1400
mm yr–1
, but this may be the effect of a specific cluster of records in our dataset. The
small sample size prevented this relationship from being extended beyond 1500 mm yr–
1, although our data suggest that it becomes flat. This pattern is not the same as that
described by Langbein and Schumm (1958), probably because it is conditioned by
human activity and the associated disturbance to plant cover, which enhances soil
erosion with increasing precipitation. It is more consistent with the patterns suggested
by Walling and Kleo (1979), who identified three climatic zones where erosion rates
can be particularly high (Mediterranean, monsoonal and semiarid areas). Furthermore,
the extreme dependence of soil erosion on few annual events (e.g. Edwards and Owens,
1991; González-Hidalgo et al., 2009, 2010) shows that most precipitation does not
generate soil erosion, that the mean precipitation value is not a good predictor of soil
erosion, and that “caution should be taken when rainfall is considered in soil erosion
prediction by means of different rain erosivity indices” (González-Hidalgo et al., 2009).
(iii) In general, land use/land cover have a determining role in soil erosion rates
(Montgomery, 2007; Cerdan et al., 2010; García-Ruiz, 2010; Cerdà et al., 2012;
Dotterweich, 2013; Nadal-Romero et al., 2013), and there has been general agreement
about the protective effect of natural plant cover. Seminal papers on this topic by Elwell
and Stocking (1976) and Thornes (1987) have provided hypotheses about the effect of
plant cover and its vertical structure on erosion. In our compiled data the variability was
extremely high because of the diversity of land management systems and their complex
interactions with climate and slope; this causes thresholds and non-linearity (Thornes,

1987; García-Ruiz et al., 2013). Our results confirm that agricultural activity tended to
be associated with the highest erosion rates, although there was enormous variability.
The same occurred for the forest and shrubland areas, which showed moderate erosive
behavior, but high and very low erosion rates were possible. As suggested by
Armstrong and Mitchell (1988) and González-Hidalgo et al. (1997), splash, runoff and
soil erosion under shrub cover are strongly controlled by rainfall partitioning processes
(stemflow and throughfall), which in turn depend on shrub characteristics. Pastures also
showed a moderate relationship, whereas the areas affected by wildfires showed an
unexpected response, with a high concentration around relatively moderate erosion
rates, contradicting the idea that high erosion rates occur after fire. This is a
consequence of the lack of agreement concerning the study period following fires.
An important issue is why there is such high variability, and why the results are
so unclear despite the large investments of time, effort and funds. Boardman (1986,
1996, 2006) has analyzed periodically the problems affecting soil erosion studies. In
some cases it seems that there is an excess of improvisation, particularly in the case of
short-term field experiments, and that field monitoring is adjusted to financial
constraints and the need to rapidly obtain quantitative information enabling publication,
rather than addressing the most important erosion questions (Boardman, 2006).
Quantification of erosion rates is necessary, but it is critical to understand how to use
this information, what the data really represent, and what are the data limitations. Our
results confirm that, in addition to the environmental factors, there are factors related to
the experimental conditions that need to be accounted for when comparing erosion rates
among different studies. These non-environmental factors are described below.
4.2. Scale-dependency of soil erosion processes and rates
Cantón et al. (2011) noted that “the arbitrary choice of spatial and temporal
measurement scale significantly affects results”. This is because different erosion
processes are active at different spatial scales. For instance, sheet wash erosion and in
some cases rill erosion are the prevailing erosion processes studied in erosion plots,
whereas gullies and landslides can yield very large quantities of sediment in the case of
small- and medium-size catchments. Large basins are more related to long-term erosion
and storage processes (Kirkby et al., 2002; Lesschen et al., 2009).
In general, there is consensus on the scale-dependency of erosion processes
(Osterkamp and Toy, 1997; Poesen and Hooke, 1997; Cammeraat, 2002, 2004; de
Vente and Poesen, 2005; Stroosnijder, 2005; Parsons et al., 2006; de Vente et al., 2007;
Vanmaercke et al., 2011b), although the results obtained have been quite confusing.
Vanmaercke et al. (2011a) reported that the relationship between catchment area and
erosion rate throughout Europe is very weak “and subject to a lot of scatter”, with
statistically significant correlations only associated with temperate and relatively flat
regions. Vanmaercke et al. (2011b) found a negative relationship between catchment
area and erosion rate, because of the greater probability of occurrence of gentler slopes
in larger catchments, and the presence of areas of predominantly sediment deposition
(Walling, 1983). To explain these negative relationships, Vanmaercke et al. (2012)
argued that “the majority of sediments eroded from hillslopes are deposited at parcel
boundaries, footslopes and floodplains”. Boix-Fayos et al. (2006) pointed out that
erosion and sedimentation processes “change markedly downstream as watershed area
increases”. In the case of experimental plots, the sediment-contributing area becomes
proportionally smaller as the size of the plot enlarges (Rejman et al., 1999: de Luis et
al., 2003). Cantón et al. (2011) also found a decrease in erosion rate with increasing
catchment area, based on data for sedimentation in reservoirs. In Mediterranean badland
areas, Nadal-Romero et al. (2011, 2014) demonstrated that for areas of less than 10 ha,
erosion rates are very high because of the absence of sediment storage in badland areas,
whereas for catchment areas larger than 10 ha the erosion rate decreases non-linearly as
the area increases because sediment is trapped in the valley bottoms and in the
footslopes. Church et al. (1999) also found a negative relationship between these
parameters in basins of Canada, which was attributed to channel aggradation.
Conversely, de Vente et al. (2007) cited a study in a humid tropical basin of Costa Rica,
where erosion rates showed a positive relationship with the area. This was related to
land use, as dense forest covered the headwater and intensive agriculture dominated on
the alluvial fans.
The occurrence of thresholds in certain erosion and transport processes (gully
erosion, landslides, and bank erosion) can increase erosion rates as catchment area
enlarges until a new threshold, caused by the predominance of gentle slopes, leads to
transport-limited conditions. de Vente and Poesen (2005) presented a conceptual model
of the area–erosion relationship for Mediterranean environments. They argued that
erosion at small scales is caused mostly by splash, sheet wash erosion and rilling, which
lead to low erosion rates. With an increase in area, other more active processes
(gullying) are involved, and together with an increase in sediment connectivity they
result in high erosion rates. In drainage areas larger than 10 km2 a progressive decline in
erosion rates occurs because of the presence of large sediment sinks (footslopes and
alluvial plain). It is clear that a change in scale that incorporates gullies represents a
threshold in sediment yield, as gullies are the most effective link in the transfer of
sediment from the hillslopes to channels (Poesen et al., 2003; Bathurst et al., 2005;
Valentin et al., 2005; Tamene et al., 2006). Thus, the vast literature dealing with the
relationships between area and erosion confirms the importance of scale, and the
difficulties of comparing results from studies of experimental areas of differing size,
and extrapolating from one scale to another.
4.3. Influence of measurement methods
Erosion studies include a variety of methods leading to quantification of the
material that is removed from the hillslopes, transferred to the channel and transported
to other channels, lakes and oceans. The selection of method depends on the
characteristics of the research group (number of members and training capacity),
financial support, objectives, and size of the study area. However, the results obtained
have not been independent of the method used (de Vente et al., 2007), because each
method tends to be related to a spatial scale or a range of spatial scales, and
consequently each method is selected to measure particular erosion processes. The
methods used include experimental plots of distinct sizes, rainfall simulations, small
ponds, check dams and reservoirs to estimate the accumulated sediment, erosion pins
and profilometers, radioisotope surveys, experimental catchments, and models.
Nevertheless, most methods have been subject to substantial criticism.
Thus, for several decades experimental plots were a major source of information
on erosion under various land uses/land covers, but their use has recently been criticized
as a means of deriving erosion rates. Boix-Fayos et al. (2006) questioned the validity of
information obtained from experimental (closed) plots because of disturbance to part of
the hillslope caused by artificial drainage boundaries, the inadequate representation of
natural conditions, the exhaustion of sediment in the mid-term, and the problem of
extrapolating the erosion rates obtained to larger areas (Govers, 1991; Cammeraat,
2002, 2004; Leser et al., 2002; Parsons et al., 2006). Le Bissonnais et al. (1998)
concluded that even small differences in the size of the experimental plots cause large
differences in runoff and erosion, as a consequence of reduced flow velocities and lower
probabilities of infiltration in the smaller plots. In addition, most plot-based studies have
assumed that runoff and erosion are derived from the entire area enclosed in the plot,
but there is mounting evidence that the source area of water and sediment is relatively
small, and is usually located close to the plot outlet (Parsons, 2011). Furthermore, soil
exhaustion related to increasing stoniness has been described (Ollesch and Vacca,
2002), and results in changes in soil erosion processes from transport-limited to
detachment-limited. Consequently, it appears that little credence can be given to erosion
rates obtained from closed plots of several square meters, particularly when the area
actually producing the water and sediment is uncertain, and that results subsequently
extrapolated to large areas (Mg km2
yr–1
) are probably unreliable. Also of importance is
that large differences in erosion rates and runoff have been detected among replicate
experimental plots (Rüttiman et al., 1995; Nearing et al., 1999; de Luis et al., 2003).
Although experimental plots have contributed substantially to knowledge of infiltration,
runoff generation processes, rainfall–runoff–erosion relationships, and the relative
erosion rates from various land uses/land covers, it is not possible to extrapolate their
results to any other scale (Boardman, 2006; Boix-Fayos et al., 2006; Vanmaercke et al.,
2011b).
Rainfall simulation plots face greater criticism than experimental plots because
of their small area (commonly < 0.5 m2) and the particular characteristics of rainfall.
This does not invalidate rainfall simulation as a useful method for the study of a certain
erosion-related process such as infiltration, the evolution of the hydrological and
sedimentological response, and penetration of the wetting front (González-Hidalgo et
al., 2004). However, the values obtained for erosion (from the suspended sediment
concentration in runoff) are only of interest in relative comparisons of the response of
distinct soil types or plant covers. Besides, even in the latter case the spatial distribution
of plants within the rainfall simulation plot can condition the results (de Luis et al.,
2003). For these reasons, rainfall simulations can only be considered to be a
complementary method in soil erosion studies, although in some of them it was the
main research method used.
Other methods have been also questioned. Thus, erosion pins and profilometers,
commonly used in badland areas, have been shown to overestimate the erosion rates for
the entire area (Nadal-Romero et al., 2011). More complex infrastructure, such as
collecting tanks, is commonly destroyed during extreme events, and consequently data
on the most interesting rainstorm and sediment yield events are lost. Bathymetric
studies in reservoirs can provide information on sediment accumulation (and therefore
erosion rates) over long periods of time extending to decades, or centuries in the case of
ancient reservoirs (Molina-Navarro et al., 2014). For this reason it is arguably the best
way to determine erosion rates. Nevertheless, information from reservoir studies are
subject to five types of problems: (i) in some cases the trapping effectiveness of
reservoirs is unknown or of uncertain reliability, and this typically leads to
underestimates of erosion; Verstraeten and Poesen (2002) pointed out that estimates of
erosion rates from small ponds are subject to error, estimated to be between 40% and
50% for 21 catchments in central Belgium; (ii) establishing the temporal variability of
sedimentation and erosion rates is impossible unless a detailed analysis of sediment
cores is carried out; (iii) erosion rates determined from sedimentation in reservoirs
provides a value for a large catchment, although it is very difficult to know the location
of sediment sources; some attempts have been made to study this based on the sediment
composition in water from the main tributaries of the basin (Valero-Garcés et al., 1998);
(iv) the sediment management approaches vary among reservoirs, mainly depending on
the size of the reservoir in relation to annual discharge, and the characteristics of floods;
and (v) the organic fraction of sediment is often combusted or digested prior to
measurement of sediment, omitting an important fraction of the eroded soil that has a
biological impact in freshwater ecosystems (Bilotta and Brazier, 2008).
The use of radioisotope methods is a newly developing tool in soil erosion
studies (Navas et al., 2005). While most other methods can only measure the sediment
yield from a given closed area, radioisotope surveys can provide true erosion rates,
including intermediate deposition areas. At the field scale, radioisotope measurements
provide point estimates of soil erosion, as the sampling area is typically very small (in
the order of several square centimeters). Thus, spatial surveys must be very carefully
designed and executed to obtain a good representation of the erosion rates at the
landscape scale. The point estimates must then be transferred to the landscape scale
using one of several techniques, including spatial averaging or interpolation, statistical
analysis, or mechanistic models. Boardman (2006) noted that it is a time-consuming
method, and the assumptions on which it is based are debatable. Parsons (2011) and
Parsons and Foster (2011), argued that the loss of 137
Cs is not necessarily proportional
to the loss of soil. Furthermore, it is quite difficult to establish a site where no erosion or
accumulation has occurred in the last 60 years, to provide a reference for values of 137
Cs
determined for eroded soils. 137
Cs is preferentially adsorbed to clay particles and
organic matter, which are easily eroded (Stroosnijder, 2005), and this introduces bias

into soil erosion estimates. Parsons and Foster (2011) concluded that 137
Cs “cannot be
used to provide information about rates of erosion”. However, recent studies have
reaffirmed the usefulness and accuracy of radioisotope methods for soil erosion studies
(e.g. Mabit et al., 2013; Navas et al., 2013).
Simulation models have being widely used to predict soil erosion rates.
However, it is noteworthy that models are simply representations of reality (Kirkby et
al., 1993); they are not substitutes for field measurements, and their validation requires
high quality field data (Brazier, 2004). Several studies have criticized the perfunctory
use of simulation models (Trimble and Crosson, 2000; Kinnel, 2003, 2005). In general,
models have been used to estimate soil erosion under present and future land cover or
climate scenarios, or to predict erosion in areas for which little quantitative data are
available. For instance, Boix-Fayos et al. (2008) applied the WATEM-SEDEM model
to a semi-arid catchment in southeast Spain under six land use scenarios with and
without check dams. This simulation demonstrated the efficiency of check dams in
sediment control projects, and the consequences of increasing land cover density.
Similarly, Alatorre et al. (2010, 2012) forecasted sediment yields and developed
corresponding sediment delivery maps for the Arnás catchment, central Spanish
Pyrenees, under three temporal scenarios: past (with the entire catchment cultivated),
present (with the catchment covered by shrubs and some forest patches) and future
(with the catchment covered mainly by forest). These studies reflect that models are
crucial to forecasting reservoir siltation, alluvial plain sedimentation, future water
resources, and the hydrological and erosive response of catchments to extreme events.
Nevertheless, major improvements need to be made to model performance, to overcome
issues of data quality/availability and the inadequate representation of erosion and
sediment transport processes (de Vente et al., 2011). de Vente and Poesen (2005)
argued that large variations in catchment characteristics and the occurrence of non-
linear relationships between sediment yield and environmental variables reduces the
quality of the results. In evaluating the application of 14 models involving 700
catchments, de Vente et al. (2013) concluded that “it is easier to predict sediment yield
than to know where the sediment originates from and what the dominant erosion and
sediment transporting processes are”, and that “predictions for large catchments are
generally more accurate than for smaller catchments”. Boardman (2006) qualified
models as “a good thing”, although several problems reduce their applicability,
including complexity, data availability, and up-scaling from small to larger scales. This

author stressed that most erosion data are collected at inadequate scales for use in
models; thus, information from experimental plots has limited application in the
development of models for the landscape scale. Alatorre et al. (2012) stressed the need
for spatially-distributed soil erosion data in addition to catchment outlet sediment
yields, to enable calibration of soil erosion models.
4.4. Complex hydrological and geomorphological response and interactions of
hillslopes and catchments
In the last few decades much effort has been devoted to analyzing hydrological
and geomorphological processes at the catchment scale. Most of the conceptual
problems related to soil erosion need to be solved at this scale, because it integrates
hillslopes and channels, and encompasses sediment sources and sinks. Some years ago
the literature contained definitions of erosion, but it is now less clear what this term
means. Trimble (1975) defined soil erosion as “the total amount of soil material
dislocated and removed some distance by erosion within an area”. This seems sound,
but as pointed out by Parsons et al. (2006) it does not contain information about the
distance a soil particle must be moved to be considered “eroded”. For this reason,
geomorphologists and agronomists tend to use the term “erosion” in a general context,
and use the concept of “sediment yield” to refer to the material removed from a
hillslope or a catchment, which includes the erosion processes associated with the
hillslopes and channels, sedimentation at some sites, and delivery to the catchment
outlet (Walling, 1983; Parsons et al., 2006; de Vente et al., 2008).
The catchment scale integrates the geomorphic processes in a landscape
perspective, and provides information on “natural”, undisturbed situations. The
sediment carried by a stream to the catchment outlet provides information on the
seasonal variability of sediment yield; the relationships among rainfall events,
discharge, erosion and sediment transport; and the relationships between the height of
the water table and the hydromorphological response. However, the sediment yield
value, expressed as Mg km–2 yr–1, is like a black-box model that provides little
information on the internal processes, or on sediment sources and sinks within the
catchment. Consequently, few conclusions can be drawn from the sediment yield value
alone, and comparisons with other catchments lead to crucial geomorphological errors.
Some of the main sources of error are described below.

(i) Sediment yield data are not always representative of the intensity of erosion
processes on hillslopes, because of the occurrence of sediment sinks (e.g. footslopes,
alluvial plains, concavities, and small flat areas at mid slope) where the eroded material
accumulates. For instance, many hillslopes have unconfined debris flows for which the
runout distance is too short to connect with the stream, and consequently their
contribution to sediment yield is very limited (Bathurst et al., 2007). For this reason the
connectivity between eroded areas on hillslopes and the fluvial channel is a key aspect
of the problem. In fact, only a small proportion of the material removed from a hillslope
becomes sediment yield (Fryirs, 2013). Conversely, the protection conferred on a
catchment by a dense cover of forest or a shrub community does not ensure a low
sediment yield, as the presence of even a small number of gullies or landslides close to
the stream favors rapid connectivity and a relatively high sediment concentration.
(ii) Vanmaercke et al. (2011b) noted that sediment yield usually reflects “the
integrated effects of various processes over longer time periods”. Therefore, sediment
yield values cannot be considered to represent the current land use/land cover
characteristics (Trimble, 1999; Prosser et al., 2001). This issue was first identified by
Schumm (1977), who noted that sediment yield is not necessarily a consequence of
current erosion processes on hillslopes, but may be the effect of past erosion (see also
Richards, 2002; Phillips, 2003; Verstraeten et al., 2009). This incorporates the important
concept of inertia (similar to the concept of relaxation time, as suggested by Thornes
and Brunsden, 1977) in geomorphological research. Owens et al. (2010) referred to the
reaction time following a change in plant cover, and highlighted the occurrence of a
time lag between a disturbance and the corresponding reaction, with the latter being “a
function of the topography and size of the river basin”.
(iii) In many cases the estimates of sediment yield have not taken into account
the extremely influential effect of channels as sediment sinks and sources. For instance,
it has frequently been demonstrated that a natural or artificial increase in land cover in a
catchment following centuries of human activity does not result in a decline in sediment
yield because other areas (mainly the channel) become the principal sediment sources.
For instance, Trimble (1999) noted that “alluvial sediment storage has been greatly
reduced in the Coon Creek basin (Wisconsin, USA), but sediment yield from the basin
has remained constant”. In that catchment the introduction of conservation practices
reduced soil erosion, although sediment yield did not decline because of erosion of
sediment previously stored in the lower parts (Trimble, 2009). Trimble (1999) argued
that this demonstrated “the limited short-term diagnostic utility of sediment yields”. In a
small catchment affected by farmland abandonment and natural revegetation, Lana-
Renault and Regüés (2009) showed that the main sediment source areas were close to
the channel or in the channel itself. In a more recent report, Sanjuán et al. (2014)
confirmed that the channel and the riverbanks are now the main sediment source in the
Ijuez catchment in the Spanish Pyrenees, following rapid reforestation and the
consequent reduction of erosion on hillslopes. This resulted in a 3 m incision during the
last 50 years and an increase in sediment size in the channel (Gómez-Villar et al., 2004).
In a review of the hydrological and geomorphological consequences of farmland
abandonment in Europe, García-Ruiz and Lana-Renault (2011) cited many reports of
incision and riverbank erosion processes in Mediterranean and Alpine catchments,
associated with a decline of sediment supply from hillslopes (e.g., Liébault and Piégay,
2002; Piégay et al., 2004; Keesstra et al., 2009; Sanchis-Ibor and Segura-Beltrán, 2014).
Stroosnijder (2005) suggested that the “large sediment load in a stream may primarily
be due to bank erosion”. These results confirm “how poorly sediment yield can relate to
sediment fluxes within a basin and thus how reliance on sediment yield monitoring can
lead to erroneous conclusions about erosional processes within a basin” (Trimble,
1999).
Another source of uncertainty is that because of difficulties in measurement and
quantification, many catchment studies have not considered bedload in the estimation of
sediment budgets and yield (Parsons, 2011). This is a problem, because bedload is a
good indicator of the geomorphological behavior of hillslopes and channels, and can
represent a relatively high proportion of the total sediment yield. An associated issue is
that analysis of solutes is arbitrarily included in sediment yield studies, depending on
the availability of appropriate instruments in study catchments. The fact that some
suspended sediment or bedload is dissolved during transport introduces another variable
in estimating sediment yield.
4.5. Importance of long-term field experiments to increase the representativeness of
estimated soil erosion rates
Debate about the minimum time needed to achieve representative values of soil
erosion is not recent. A time span of 15–22 years was suggested by Rise et al. (1993),
and Lane and Kidwell (2003). A shorter period (3 years) was suggested by Ollesch and
Vacca (2002), while González-Hidalgo et al. (2009, 2012) suggested measurement of a
minimum number of daily erosive events instead of analysis over a number of years, for
both plots and catchments. Short-term studies produce varying results depending on the
study period selected (Hjelmfelt et al., 1986), and simple extrapolation is likely to
produce large errors (Kirkby, 1984). A consequence is that soil conservation
management practices based on average conditions can be adequate for erosion control
in most years, but not for conditions involving severe storms.
Our analysis of a large number of studies shows that a high proportion involved
periods of less than 5 years, with many of approximately 2 years. Studies of more than
10 years are exceptional, and only those undertaken by large institutional organizations
(e.g. USDA and USGS) have records for 20 years or more. This is a very important
problem that relates the continuity of records to the continuance of research groups and
the availability of research funds. We found a trend of increase in estimated erosion
rates with increasing duration of the record, and there was an associated reduction in the
standard error of the mean erosion rate (i.e. uncertainty in the estimated erosion rate
decreased). This is a consequence of the effect of rare or extreme events on erosion and
sediment yield, because the probability of their occurrence increases as the period of the
study increases. For this reason, the ratio between the maximum and the mean erosion
rate increases with time, whereas the standard error of the mean rapidly decreases. It is
noteworthy that in some studies the biggest erosion-producing events can account for >
60% of the total erosion (Edwards and Owens, 1991), and > 70% (Nadal-Romero et al.,
2012) over a long study period. This phenomenon, referred to by some as “time
compression”, is particularly high under Mediterranean climate conditions, where
rainstorms exceeding 200 mm in 24 h are relatively common, and the three largest
events each year are usually responsible for > 50% of the annual and interannual
sediment yield (González-Hidalgo et al., 2007). Based on information from 1800
catchments in the USA and Canada, González-Hidalgo et al. (2013) found that the 25
largest daily events yielded 46–63% of the total sediment load.. González-Hidalgo et al.
(2010) reported that 10% of daily events yielded 50% of the total soil eroded in USLE
plots. Boardman and Favis-Mortlock (1999) suggested that in a 10-year database having
information on erosion events, it is unlikely to record the large events that usually occur
over a longer period of records. The importance of extreme events is related to the
highly skewed nature of precipitation, but also to the occurrence of thresholds in erosion
and sediment transport processes, which are only triggered when a certain level of
precipitation is exceeded. Examples of such processes are incision in first and second
order channels, widening of alluvial plains, and landslides (García-Ruiz et al., 2013);
examples of these dramatic landscape changes have been provided by White et al.
(1997), Le Lay and Saulnier (2007), Ortega and Garzón Heydt (2009), and Serrano-
Muela et al. (2013).
These findings highlight the problems of comparing results among catchments
based on short-term studies. Stroosnijder (2005) and Vanmaercke et al. (2012) also
noted large interannual variability of erosion rates, related to precipitation variability
and the variable state of the soil (Schnabel and Gómez-Gutiérrez, 2013).
5. Conclusions
Our study provided the following nine conclusions:
(i) The construction of a large database of data from experimental stations and
catchments, rainfall simulation experiments, erosion rates from bathymetric and
radioisotope studies, and simulation models, enabled identification of a major problem
in soil erosion studies: variability in the procedures for data acquisition, particularly in
field studies, where the results have been based on different scales and methods. The
database is far from complete because of the lack of fundamental information provided
in many studies. This limits the application of some statistical analyses, reducing the
usefulness of many field experiments and the funds invested. The development of
models is particularly affected by the variability in the data.
(ii) The data includes extremely high variability in values for soil erosion rates,
with high variability possible for any slope, scale or land use/land cover.
(iii) In spite of this variability, some general trends were found including an
increase in erosion rates with increasing slope and annual precipitation, the association
of agricultural practices with the highest erosion rates, and a correlation between shrub
coverage and the lowest erosion rates.
(iv) A multivariate model including several basic environmental factors enabled
almost 50% of the variance in erosion rates to be explained. To achieve this, however, it
was necessary to account for non-environmental factors related to the experimental
conditions that produced those erosion rates, including the measurement method, the
size of the study area and the duration of the study. Although the results of such
analyses are significant, a large proportion of the variance remains unexplained,
highlighting the need for continuous, long-term erosion measurement studies.
(iv) Most studies are short-term, with most in the order of 2 years and few
extending beyond 10 years. The results suggest that the optimum study period is 20–25
years, with this period necessary to reduce the variability in erosion rates and to
incorporate the occurrence of extreme events that are responsible for the highest
sediment yields. Such studies highlight the problem that experimental plots tend to
show signs of exhaustion after 10–15 years of experimentation, and have to be
abandoned prior to the optimum study period being reached.
(v) A clear bias in the dataset was evident because of the use of various scales
and methods. Each measurement method is appropriate to address a particular scientific
question. Thus, rainfall simulations can provide information on infiltration rates and the
evolution of the wetting front. Studies using experimental plots are useful for the
identification of erosion and sediment transfer processes, establishing relationships
between precipitation, runoff, erosion and sediment outputs, identifying trends in runoff
and sediment yield under distinct land use changes, and assessing the variable response
of discharge and erosion to distinct rainstorm events. The resulting erosion rates can be
used to compare various land uses, providing the control area is of similar size.
Scientists need to be conscious of the limitations of experimental plots, as the results
cannot be extrapolated to other scales. Studies at the experimental catchment scale are
needed to identify runoff and sediment contributing areas and how they vary with the
characteristics of rainstorm events, the location of temporal sediment storage areas, the
hydrological and geomorphological consequences of different land covers, the temporal
variability of the various types of sediment, and the role of fluvial channels and
riverbanks in storing and delivering sediment.
(vi) The catchment is the optimum scale for obtaining information on erosion
processes and the relationships between hillslopes and channels. It is also the optimum
scale for studying the effects of landslides and gullies, and for analyzing the effects of
land use/land cover changes on erosion and sediment transport. However, sediment
yield results must be carefully interpreted in view of the complex response of
catchments, which are partially affected by past geomorphological processes. In many
cases, sediment yield values cannot be considered to represent the current land use/land
cover characteristics. Furthermore, sediment yield from catchments depends on a large
variety of factors, including the catchment size, location of the sediment sources,
connectivity, topography, spatial distribution of plant cover, and channel and riverbank
dynamics.

(vii) Bathymetry is probably the best approach for determining sediment yields
from evaluation of sediment accumulated in reservoirs, because of the long period
passed since the dam was constructed. This technique integrates all erosion and
sediment transport processes, although the internal functioning of the system is
unknown. In general, the area drained by a reservoir is very large, making interpretation
of the sediment yield difficult.
(viii) Models are a critical tool for forecasting the consequences of erosion and
sediment yield on sediment siltation, alluvial-plain sedimentation, evaluation of future
water resources, evolution of discharge and erosion according to land use/land cover
changes, and the effects of extreme events. Nevertheless, modelers need to be aware of
the limitations of the information available from plots and catchments. Plots can provide
data on infiltration, water storage and field capacity, although data on runoff and
erosion are of limited value for uses other than those for which the experiment was
planned. In the case of data from experimental catchments, modelers need substantial
geomorphological knowledge in interpreting the extremely high complexity of
catchments, their sediment sources and sinks, and the inertia of past erosion processes.
(ix) Determining long-term erosion rates characteristic of a variety of landscapes
and land uses/land covers is very relevant to soil erosion studies, since they allow
understanding the geomorphological and sediment transport dynamics at regional
scales. Nevertheless, their significance and representativeness of published erosion rates
must be carefully assessed on a case-by-case basis. Geomorphologists should be more
interested in processes, causes, internal relationships, and the role of stream channels
than in obtaining erosion rates, the interpretation of which can lead to numerous errors.
Acknowledgements
Support for this research was provided by the projects INDICA (CGL2011-27753-C02-
01 and -02) and HIDROCAES (CGL2011-27574-C02-C01), funded by the Spanish
Ministry of Economy and Competitiveness, and an agreement between the CSIC and
the Spanish Ministry of Environment (RESEL). The Geomorphology and Global
Change research group was financed by the Aragón Government and the European
Social Fund (ESF-FSE). Estela Nadal-Romero and Yasmina Sanjuán were the
recipients of a “Marie Curie-IEF” postdoctoral contract (Project 624974) and an FPI
pre-doctoral contract from the European Commission and the Spanish Ministry of
Economy and Competitiveness, respectively.

References
Abrahams, A., Parsons, A., Luk, S., 1988. Hydrologic and sediment response to
simulated rainfall on desert hillslopes in southern Arizona, Catena 15, 103-117.
Alatorre L.C., Beguería S., García-Ruiz J.M. 2010. Regional scale modelling of
hillslope sediment delivery: a case study in the Barasona Reservoir watershed
(Spain) using WATEM/SEDEM. Journal of Hydrology 391(1–2), 109–123.
Alatorre, L.C., Beguería, S., Lana-Renault, N., Navas, A., García-Ruiz, J.M., 2012. Soil
erosion and sediment delivery in a mountain catchment under scenarios of land use
using a spatially distributed numerical model. Hydrology and Earth System Sciences
16, 1321-1334.
Armstrong, C.L., Mitchell, J.K., 1988. Plant canopy characteristics and processes which
affect transformation of rainfall properties. Trans. ASAE 5, 1400-1409.
Band, L., 1985. Field parametrization of an empirical sheetwash transport equation.
Catena 12, 281-290.
Bathurst, J., Quinn, P., Gravier, J., Orange, J., Vivier, P., Vogel, S., 2005. Sediment
yield scale dependency in the River Eden basin, northwest England. IAHS Publ. 291,
339-346.
Bathurst, J.C., Moretti, G., El-Hames, A., Beguería, S., García-Ruiz, J.M., 2007.
Modelling the impact of forest loss on shallow landslide sediment yield, Ijuez
catchment, Spanish Pyrenees. Hydrology and Earth System Sciences 11 (1), 569-
583.
Bilotta, G.S., Brazier, R.E., 2008. Understanding the influence of suspended solids on
water quality and aquatic biota. Water Research 42 (12), 2849-2861.
Bilotta, G.S., Grove, M., Mudd, S.M., 2012. Assessing the significance of soil erosion.
Transactions of the Institute of British Geographers 37 (3), 342-345.º
Boardman, J., 1986. The context of soil erosion. SEESOIL 3, 2-13.
Boardman, J., 1996.Soil erosion by water: problems and prospects for research. In:
Anderson, M.G., Brooks, S.M. (Eds.), Advances in hillslope processes, vol.1, Wiley,
Chichester, UK, pp. 489-505.
Boardman, J., 2006. Soil erosion science: Reflections on the limitations of current
approaches. Catena 68, 73-86.

Boardman, J., Favis-Mortlock, D., 1999. Frequency-magnitude distributions for soil
erosion, runoff and rainfall – a comparative analysis. Zeitschrift für Geomorphologie
Suppl. Bd. 115, 51-70.
Boix-Fayos, C., Martínez-Mena, M., Arnau-Rosalén, E., Calvo-Cases, A., Castillo, V.,
Albaladejo, J., 2006. Measuring soil erosion by field plots: Understanding the
sources of variation. Earth-Science Reviews 78, 267-285.
Boix-Fayos, C., de Vente, J., Martínez-Mena, M., Barberá, G.G., Castillo, V., 2008.
The impact of land use change and check-dams on catchment sediment yield.
Hydrological Processes 22, 4922-4935.
Brazier, R., 2004. Quantifying soil erosion by water in the UK: a review of monitoring
and modelling approaches. Progress in Physical Geography 28, 340-365.
Cammeraat, L.H., 2002. A review of two strongly contrasting geomorphological
systems within the context of scale. Earth Surface Processes and Landforms 27,
1201-1222.
Cammeraat, E.L.H., 2004. Scale dependent thresholds in hydrological and erosion
response of a semi-arid catchment in Southeast Spain. Agriculture, Ecosystems and
Environment 104, 317-332.
Cantón, Y., Solé-Benet, A., de Vente, J., Boix-Fayos, C., Calvo-Cases, A., Asensio, C.,
Puigdefábregas, J., 2011. A review of runoff generation and soil erosion across
scales in semiarid south-eastern Spain. Journal of Arid Environments 75, 1254-1261.
Cerdà, A., Giménez Morera, A., Burguet, M., Arcenegui, V., González Peñaloza, A.,
García-Orenes, F., Pereira, P., 2012. El impacto del cultivo, el abandono y la
intensificación de la agricultura en la pérdida de agua y suelo. El ejemplo de la
vertiente norte de la Serra Grossa en el Este peninsular. Cuadernos de Investigación
Geográfica 38 (1), 75-94.
Cerdan, O., Govers, G., Le Bissonnais, Y., Van Oost, K., Poesen, J., Saby, N., Gobin,
A., Vacca, A., Quintan, J., Auerswald, K., Klik, A., Kwaad, F.J.P.M., Raclot, D.,
Ionita, I., Tejman, J., Rousseva, S., Muxart, T., Roxxo, M.J., Dostal, T., 2010. Rates
and spatial variations of soil erosion in Europe. A study based on erosion plot data.
Geomorphology 122, 167-177.
Church, M., Ham, D., Hassan, M., Slaymaker, H.O., 1999. Fluvial clastic sediment
yield in Canada: scaled analysis. Canadian Journal of Earth Sciences 36, 1267-1280.
De Luis, M., González-Hidalgo, J.C., Raventós, J., 2003. Effects of fire and torrential
rainfall on erosion in a Mediterranean gorse community. Land Degradation &
Development 14 (2), 203-213.
de Vente, J., Poesen, J., 2005. Predicting soil erosion and sediment yield at the basin
scale: Scale issues and semi-quantitative models. Earth-Science Reviews 71, 95-125.
de Vente, J., Poesen, J., Arabkhedri, M., Verstraeten, G., 2007. The sediment delivery
problem revisited. Progress in Physical Geography 31, 155-178.
de Vente, J., Poesen, J., Verstraeten, G., Van Rompaey, A., Govers, G., 2008. Spatially
distributed modelling of soil erosion and sediment yield at regional scales in Spain.
Global and Planetary Change 60, 393-415.
de Vente, J., Verduyn, R., Verstraeten, G., Vanmaercke, M., Poesen, J., 2011. Factors
controlling sediment yield at the catchment scale in NW Mediterranean
geoecosystems. Journal of Soils and Sediment 11, 690-707.
de Vente, J., Poesen, J., Verstraeten, G., Govers, G., Vanmaercke, M., Van Rompaey,
A., Arabkhedri, M., Boix-Fayos, C., 2013. Predicting soil erosion and sediment yield
at regional scales: Where do we stand? Earth-Science Reviews 127, 16-29.
Dotterweich, M., 2013. The history of human-induced soil erosion: Geomorphic
lagacies, early descriptions and research, and the development of soil conservation–
A global synopsis. Geomorphology 201, 1-34.
Edwards, W.M., Owens, L.B., 1991. Large storm effects on total soil-erosion. Journal
of Soil and Water Conservation 46 (1), 75-78.
Elwell, H., Stocking, M., 1976. Vegetal cover to estimate soil erosion hazard in
Rhodesia. Geoderma 15, 61-70.
Fryirs, K., 2013. (Dis)connectivity in catchment sediment cascades: a fresh look at the
sediment delivery problem. Earth Surface Processes and Landforms 38, 30-46.
García-Ruiz, J.M., 2010. The effects of land uses on soil erosion in Spain: A review.
Catena 81, 1-11.
García-Ruiz, J.M., Lana-Renault, N., 2011. Hydrological and erosive consequences of
farmland abandonment in Europe, with special reference to the Mediterranean region
– A review. Agriculture, Ecosystems and Environment 140, 317-338.
García-Ruiz, J.M., Nadal-Romero, E., Lana-Renault, N., Beguería, S., 2013. Erosion in
Mediterranean landscapes: Changes and future challenges. Geomorphology 198, 20-
36.

Gómez-Villar, A., Sanjuán, Y., García-Ruiz, J.M., Nadal-Romero, E., Álvarez-
Martínez, J., Arnáez, J., Serrano-Muela, M.P. 2014. Sediment organization and
adjustment in a torrential reach of the upper Ijuez river, central Spanish Pyrenees.
Cuadernos de Investigación Geográfica 40 (1), 191-214.º
González-Hidalgo, J.C., Raventós, J., Echeverría, M.T., 1997. Comparison of sediment
ratio curves for plants with different architecture. Catena 29, 333-340.
González-Hidalgo, J.C., de Luis, M., Raventós, J., Cortina, J., Sánchez, J.R. 2004.
Hydrological response of Mediterranean gorse shrubland under extreme rainfall
simulation events. Zeitschrift für Geomorphologie 48, 293-304.
González-Hidalgo, J.C., Peña-Monné, J.L., De Luis, M., 2007. A review of daily soil
erosion in Western Mediterranean areas. Catena 71, 193-199.
González-Hidalgo, J.C., de Luis, M., Batalla, R., 2009. Effects of the largest daily
events on total soil erosion by rainwater. An analysis of the USLE database. Earth
Surface Processes and Landforms 34, 2070-2077.
González-Hidalgo, J.C., Batalla, R.J., Cerdà, A., de Luis, M., 2010. Contribution of the
largest events of suspended sediment transport across the USA. Land Degradation
and Development 21, 83-91.
González-Hidalgo, J.C., Batalla, R.J., Cerdà, A., de Luis, M., 2012. A regional analysis
of the effects of largest events on soil erosion. Catena 95, 85-90.
González-Hidalgo, J.C., Batalla, R.J., Cerdà, A., 2013. Catchment size and largest daily
events contribution to suspended sediment load at continental scale. Catena 102, 40-
45.
Govers, G., 1991. A field study of topographical and topsoil effects on runoff
generation. Catena 18, 91-111.
Graf, W.L., 1988. Fluvial processes in dryland rivers. Berlin, Springer.
Hjelmfelt, A.T., Kramer, L.A., Sponer, R.G., 1986. Role of large events in average soil
loss. In: Proceedings of the 4th Federal Interagency Sedimentation Conference, 1,
USGS, Denver, CO, 3, 1-3.9.
HYDAT, 2014. Hydrometric database, http://www.ec.gc.ca/rhc-wsc/.
Keesstra, S.D., van Dan, O., Verstraeten, G., van Huissteden, J., 2009. Changing
sediment dynamics due to natural reforestation in the Dragonja catchment, SW
Slovenia. Catena 78, 60-71.
Kinnell, P.I.A., 2003. Event erosivity factors and errors in erosion predictions by some
empirical models. Australian Journal of Soil Research 41, 991-1003.
Kinnell, P.I.A., 2005. Why the Universal Soil Loss Equation and the revised version of
it do not predict event erosion well. Hydrological Processes 19, 851-854.
Kirkby, M.J., 2010. Distance, time and scale in soil erosion processes. Earth Surface
Processes and Landforms 35, 1621-1623.
Kirkby, M.J., 1984. The Hurst effect, its implications for extrapolating processes data.
Earth Surface Processes and Landforms 12, 57-67.
Kirkby, M.J., Baird, A.J., Lockwood, J.C., McMahon, M.D., Mitchell, P.J., Shao, J.,
Sheeny, J.C., Thornes, J.B., Woodward, F.I., 1993. MEDALUS Project A1:
Physically based models: Final Report. In: J.B. Thornes (Edr.), MEDALUS 1 Final
Report. Unpublished Report.
Kirkby, M.J., Bracken, L., Reany, S., 2002. The influence of land use, soils and
topography on the delivery of hillslope runoff to channels in SE Spain. Earth Surface
Processes and Landforms 27, 1459-1473.
Lana-Renault, N., Regüés, D., 2009. Seasonal pattern of suspended sediment transport
in an abandoned farmland catchment in the Central Pyrenees. Earth Surface
Processes and Landforms 34, 1291-1301.
Lane, L.J., Kidwell, M.R., 2003. Hydrology and soil erosion. USDA Forest Service
Proceedings RMRS-P-30, pp. 92-100.
Langbein, W.B., Schumm, S.A., 1958 Yield of sediment in relation to mean annual
precipitation. Transactions of the American Geophysical Union, 39 (6), 1076-1084.
Le Bisonnais, Y., Benkhadra, H., Chaplot, V., Fox, D., King, D., Daroussin, J., 1998.
Crusting, runoff and sheet erosion on silty loamy soils at various scales and
upscaling from m2 to small catchments. Soil and Tillage Research 46, 69-80.
Le Lay, M., Saulnier, G.M., 2007. Exploring the signature of climate and spatial
variabilities in flash flood events: case of the 8-9 September 2002 Cevennes-Viverais
catastrophic event. Geophysical Research Letters 34 (13).
http:dx.doi.org/10.1029/2007GL029746 [L13401]
Leser, H., Meier-Zielinski, S., Prasuhn, V., Seiberth, C., 2002. Soil erosion in
catchment areas of Northwestern Switzerland. Methodological conclusions from a
25-year research programme. Zeitschrift für Geomorphologie 46, 35-60.
Lesschen, J.P., Schoorl, J.M., Cammeraat, L.H., 2009. Modelling runoff and erosion for
a semiarid catchment using a multi-scale approach based on hydrological
connectivity. Geomorphology 109, 174-183.

Li, L., Du, S., Wu, L., Liu, G., 2009. An overview of soil loss tolerance. Catena 78, 93-
99.
Liébault, F., Piégay, H., 2002. Causes of the 20th century channel narrowing in
mountain and piedmont rivers of southeastern France. Earth Surface Processes and
Landforms 27, 425-444.
Mabit, L., Meusburger, K., Fulaitar, E., Alewell, C., 2013. The usefulness of 137Cs as a
tracer for soil erosion assessment: A critical reply to Parsons and Foster (2011).
Earth-Science Reviews 127, 300-307.
Molina-Navarro, E., Martínez-Pérez, S., Sastre-Merlín, A., Bienes-Salas, R., 2014.
Taking advantage of a new hydraulic infrastructure to study the sediment yield in a
small basin of central Spain. Cuadernos de Investigación Geográfica 40 (1), 213-225.
Montgomery, D.R., 2007. Soil erosion and agricultural sustainability. PNAS 104,
13268-13272.
Nadal-Romero, E., Martínez-Murillo, J.F., Vanmaercke, M., Poesen J., 2011. Scale-
dependency of sediment yield from badland areas in Mediterranean environments.
Progress in Physical Geography 35 (3), 297-332.
Nadal-Romero, E., Lasanta, T., González-Hidalgo, J.C., De Luis, M., García-Ruiz, J.M.,
2012. The effect of intense rainstorm events on the suspended sediment response
under various land uses: The Aísa Valley Experimental Station. Cuadernos de
Investigación Geográfica 38 (1), 27-47.
Nadal-Romero, E., Lasanta, T., García-Ruiz, J.M., 2013. Runoff and sediment yield
from land under various uses in a Mediterranean mountain area: long-term results
from an experimental station. Earth Surface Processes and Landforms 38, 346-355.
Nadal-Romero, E., Martínez-Murillo, J.F., Vanmaercke, M., Poesen, J., 2014.
Corrigendum to “Scale-dependency of sediment yield from badland areas in
Mediterranean environments” (Progress in Physical Geography 35 (3) (2011) 297-
332). Progress in Physical Geography 38 (3), 381-386.
Navas, A., Machín, J., Soto, J., 2005. Assessing soil erosion in a Pyrenean mountain
catchment using GIS and fallout 137
Cs. Agriculture, Ecosystems and Environments
105, 493-506.
Navas, A., López-Vicente, M., Gaspar, L., Machín, J., 2013. Assessing soil
redistribution in a complex karst catchment using fallout 137
Cs and GIS.
Geomorphology 196, 231-241.
Nearing, M.A., Govers, G., Norton, L.D., 1999. Variability in soil erosion data from
replicated plots. Soil Science Society of America Journal 63, 1829-1835.
Oesterkamp, W.R., Toy, T.J., 1997. Geomorphic considerations for erosion prediction.
Environmental Geology 29, 152-157.
Ollesch, G., Vacca, A., 2002. Influence of time on measurement results of erosion plot
studies. Soil and Tillage Research 67, 23-39.
Ortega, J.A., Garzón Heydt, G., 2009. Geomorphological and sedimentological analysis
of flash-flood deposits. The case of the 1997 Rivillas flood (Spain). Geomorphology
112, 1-14.
Owens, P.N., Petticrew, E.L., van der Perk, M., 2010 Sediment response to catchment
disturbances. J. Soils Sediments 10, 591-596
Parsons, A.J. 2011., How useful are catchment sediment budgets?. Progress in Physical
Geography 36, 60-71.
Parsons, A., Abrahams, A., 1986. Gradient-particle size relations on quartz monzonite
debris slopes in the Mojave desert. Journal of Geology 95, 423-452.
Parsons, A.J., Foster, I.D.L., 2011. What can we learn about soil erosion from the use of
137Cs? Earth-Science Reviews 108, 101-113.
Parsons, A.J., Wainwright, J., Brazier, R.E., Powell, D.M., 2006. Is sediment delivery a
fallacy?. Earth Surface Processes and Landforms 31, 1325-1328.
Phillips, J., 2003. Alluvial storage and the long-term stability of sediment yields. Basin
Research 15, 153-163.
Piégay, H., Walling, D.E., Landon, N., He, Q., Li-ebault, F., Petiot, R., 2004.
Contemporary changes in sediment yield in an alpine mountain basin due to
afforestation (the Upper Drôme in France). Catena 55, 183-212.
Pimentel, D., Harvey, C., Resosudarmo, P., Sinclair, K., Kirz, D., McNair, M., Crist, S.,
Shpritz, L. Fitton, L., Saffouri, R., Blair, R., 1995. Environmental and economic
costs of soil erosion and conservation benefits. Science 267, 1117-1123.
Pimentel, D., Terhune, E.C., Dyson-Hudson, R., Rochereau, S., Samis, R., Smith, E.A.,
Denman, D., Reifschneider, D., Shepard, M., 1976. Land degradation: effects on
food and energy resources. Science 194, 149-155.
Poesen, J., Hooke, J.M., 1997. Erosion, flooding and channel management in
Mediterranean environments of southern Europe. Progress in Physical Geography
21, 157-199.
Poesen, J., Boardman, J., Wilcox, B., Valentin, C., 1996. Water erosion monitoring and
experimentation for global change studies. Journal of Soil and Water Conservation
51, 386-390.
Poesen, J., Nachtergaele, J., Verstraeten, G., Valentin, C., 2003. Gully erosion and
environmental change: importance and research needs. Catena 50, 91-133.
Prosser, I.P., Rutherfurd, I.D., Olley, J.M., Young, W.J., Wallbrink, P.J., Moran, C.J.,
2001. Large-scale patterns of erosion and sediment transport in river networks, with
examples from Australia. Marine and Freshwater Research 52, 81-99.
Rejman, J., Usowicz, B., Debicki, R., 1999. Source of errors in predicting silt soil
erodibility with USLE. Polish Journal of Soil Science 32, 13-22.
Richards, K.S., 2002. Drainage basin structure, sediment delivery and the response to
environmental change. In: Jones, S.J., Frostick, L.E. (Eds.), Sediment flux to basins:
Causes, controls and consequences. Special Publications, London, pp.149-160.
Rise, L.M., Nearing, M.A.,Nicks, A.D., Laflen, J.M., 1993. Assessment of error in the
Universal Soil Loss Equation. Soil Science Society of America Journal 57, 825-833.
Rüttiman, M., Schaub, D., Prasuhn, V., Rüegg, V., 1995. Measurement of runoff and
soil erosion on regularly cultivated fields in Switzerland – some critical
considerations. Catena 25, 127-139.
Sanchis-Ibor, C., Segura-Beltrán, F., 2014. Spatial variability of channel changes in a
Mediterranean ephemeral stream in the last six decades (1946-2006). Cuadernos de
Investigación Geográfica 40, 87-116.
Sanjuán, Y., Gómez-Villar, A., Nadal-Romero, E., Álvarez-Martínez, J., Arnáez, J.,
Serrano-Muela, M.P., Rubiales, J.M., González-Sampériz, P., García-Ruiz, J.M.,
2014. Linking land cover changes in the subalpine and montane belts to changes in a
torrential river. Land Degradation & Development. Doi: 10.1002/ldr.2294.
Schnabel, S., Gómez-Gutiérrez, A., 2013. The role of interannual rainfall variability on
runoff generation in a small dry sub-humid watershed with disperse tree cover.
Cuadernos de Investigación Geográfica 39 (2), 259-285.
Schumm, S.A., 1977. The Fluvial System. Wiley, New York, 338 pp.
Serrano-Muela, M.P., Nadal-Romero, E., Lana-Renault, N., González-Hidalgo, J.C.,
López-Moreno, J.I., Beguería, S., Sanjuan, Y., García-Ruiz, J.M., 2013. An
exceptional rainfall event in the Central Western Pyrenees: Spatial patterns in
discharge and impact. Land Degradation & Development. Doi: 10.1002/ldr.2221.
Stroosnijder, L., 2005. Measurent of erosion: Is it possible?. Catena 64, 162-173.

Tamene, L., Park, S.J., Dikau, R., Vlek, P.L.G., 2006. Analysis of factors determining
sediment yield variability in the highlands of northern Ethiopia. Geomorphology 76,
76-91.
Tato, K., Hurni, H., eds., 1992. Soil conservation for survival. Soil and Water
Conservation Society, Ankeny, 419 pp.
Thornes, J.B., 1987. Erosional equilibria under grazing. In: D.A. Davidson, J.L. Bintiff,
E.G. Grant (Eds.), Conceptual issues in environmental archaeology. Elsevier,
Amsterdam, pp. 193-210.
Thornes, J.B., Brunsden, D., 1977. Geomorphology and time. Methuen, London, 208
pp.
Toy, T.J., Foster, G.R., Renard, K.G., 202. Soil erosion: Processes, prediction,
measurement and control. Wiley & Sons, USA.
Trimble, S.W., 1975. A volumetric estimate of man-induced soil erosion on the
Southern Piedmont Plateau. Present and prospective technology for predicting
sediment yields and sources. Publication ARS_S_40, US Department of Agriculture.
Trimble, S.A., 1999. Decreased rates of alluvial sediment storage in the Coon Creek
basin, Wisconsin, 1975-93. Science 285, 1244-1246.
Trimble, S.A., 2009. Fluvial processes, morphology and sediment budgets in the Coorn
Creek basin, WI, USA, 1975-1993. Geomorphology 108, 8-23.
Trimble, S.W., Crosson, P., 2000. U.S. soil erosion rates – Myth and reality. Science
289, 248-250.
USDA-NSERL, 2014. USLE database. http://topsoil.nserl.purdue.edu/usle/.
USGS, 2014. Suspended sediment databse, http://co.water.usgs.gov/sediment/.
Valentin, C., Poesen, J., Li, Y., 2005. Gully erosion: impacts, factors and control.
Catena 63, 132-153.
Valero-Garcés, B.L., Navas, A., Machín, J., Walling, D., 1998. Sediment sources and
siltation in mountain reservoirs: a case study from the Central Spanish Pyrenees.
Geomorphology 28, 23-41.
Van Oost, K., Govers, G., Desmet, P., 2000. Evaluating the effects of changes in
landscape structure on soil erosion by water and tillage. Landscape Ecology 15, 577-
589.
Vanmaercke, M., Poesen J., Verstraeten, G., de Vente, J., Ocakoglu, F., 2011a.
Sediment yield in Europe: Spatial patterns and scale dependency. Geomorphology
130, 142-161.
Vanmaercke, M., Poesen, J., Maetens, W., de Vente, J., Verstraeten, G,, 2011b.
Sediment yield as a desertification risk indicator. Science of the Total Environment
409, 1715-1725.
Vanmaercke, M., Maetens, W., Poesen, J., Jankauskas, B., Jankauskiene, G.,
Verstraeten, G., de Vente, J., 2012. A comparison of measured catchment sediment
yields with measured and predicted hillslope erosion rates in Europe. Journal of Soils
and Sediments 12, 586-602.
Verheijen, F.G.A., Jones, R.G.A., Rickson, R.J., Smith, C.J., 2009. Tolerable versus
actual soil erosion rates in Europe. Earth-Science Reviews 94, 23-38.
Verstraeten, G., Poesen J., 2002. Using sediment deposits in small ponds to quantify
sediment yield from small catchments: possibilities and limitations. Earth Surface
Processes and Landforms 27, 1425-1439.
Verstraeten, G., Lang, A., Houben, P., 2009. Human impact on sediment dynamics –
quantification and timing. Catena 77, 77-80.
Wainwright, J., Parsons, A.J., Mueller, E., Brazier, R., Powell, D.M., Fenti, B., 2008. A
transport-distance approach to scaling erosion rates: 1. Background and model
development. Earth Surface Processes and Landforms 33, 813-826.
Walling, D., 1983. The sediment delivery problem. Journal of Hydrology 65, 209-237.
Walling, D.E., Kleo, H.A., 1979. Sediment yield of rivers in areas of low precipitation:
a global view. IAHP Publ. 128, 479-493.
White, S., García-Ruiz, J.M., Martí, C., Valero, B., Errea, M.P., Gómez-Villar, A.,
1997. The 1996 Biescas campsite disaster in the Central Spanish Pyrenees, and its
temporal and spatial context. Hydrological Processes 11, 1797-1812.

FIGURE CAPTIONS
Fig. 1. Spatial distribution of the sites included in the database.
Fig. 2. Relationship between erosion rate and precipitation.

Fig. 3. Relationship between erosion rate and slope gradient.

Fig. 4. Erosion rate frequencies in relation to land use/land cover: agricultural uses, bare
soil, burnt areas, forest, mixed, orchards, others, pastures, and shrubs.
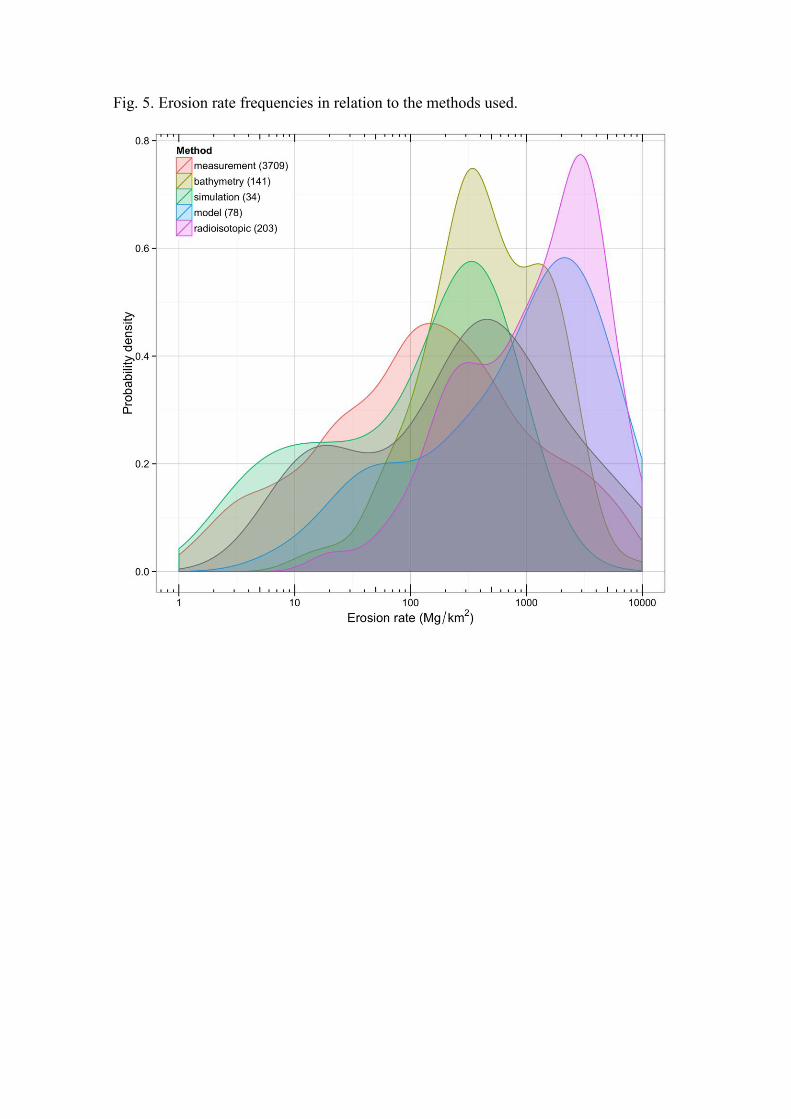
Fig. 5. Erosion rate frequencies in relation to the methods used.
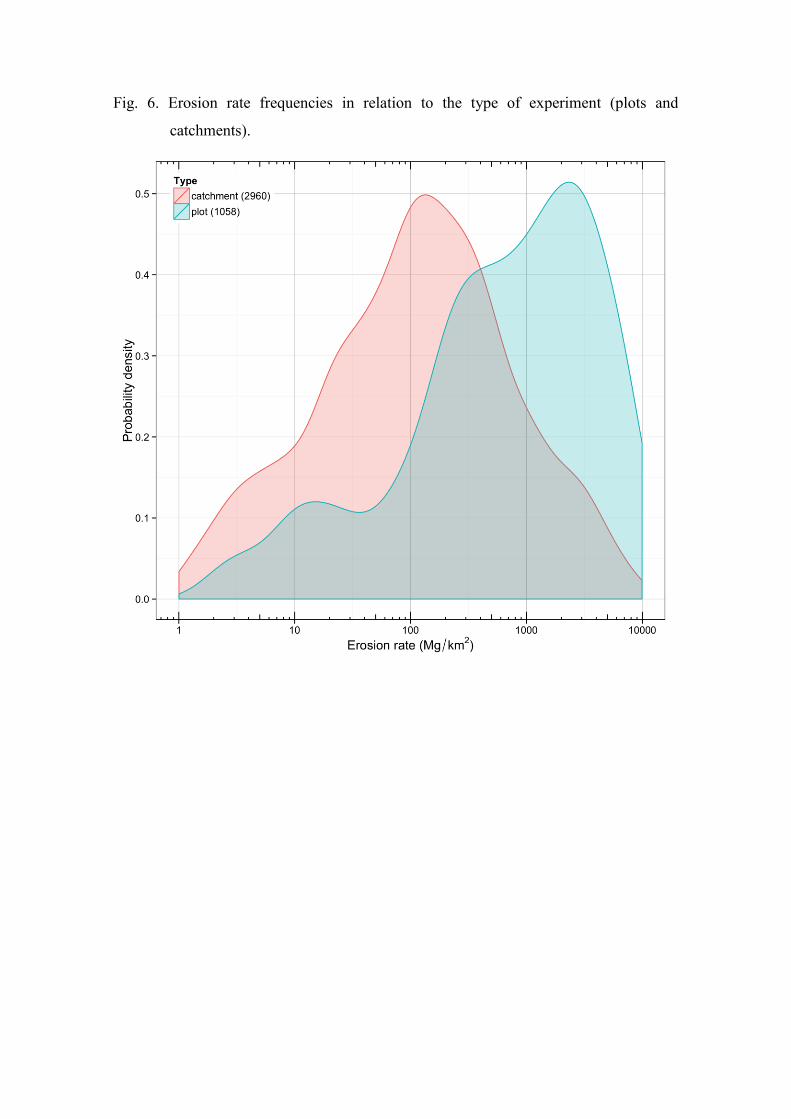
Fig. 6. Erosion rate frequencies in relation to the type of experiment (plots and
catchments).
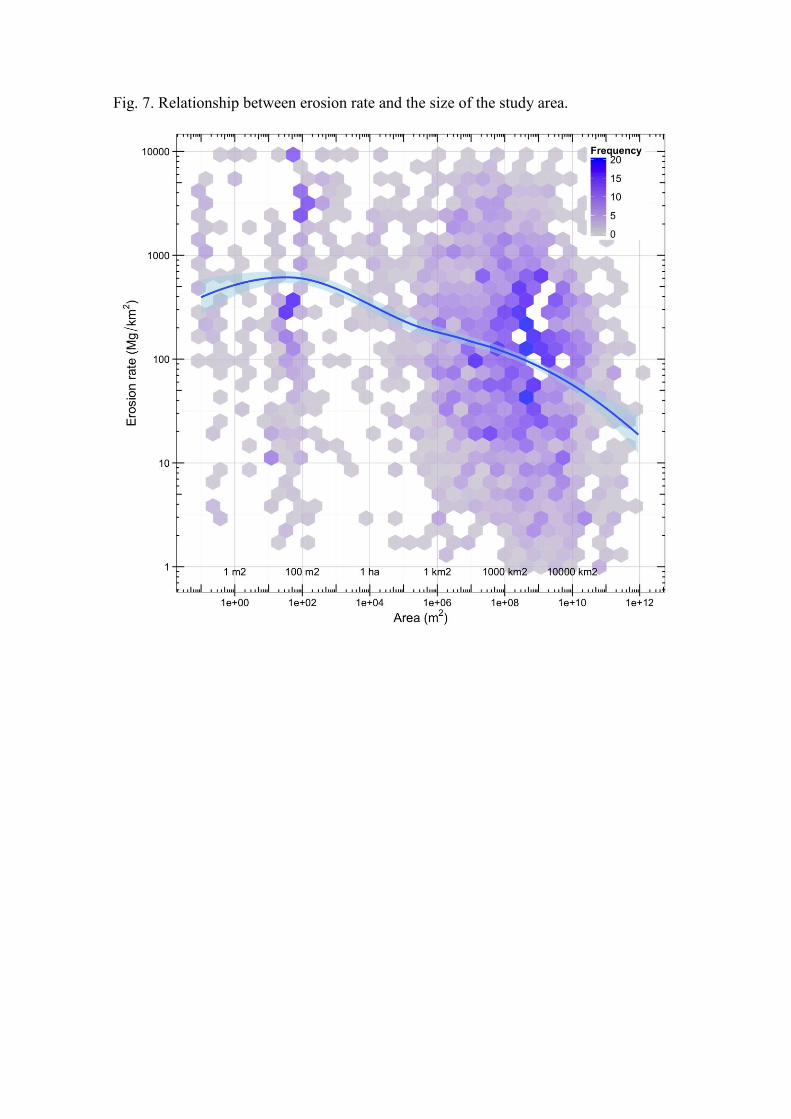
Fig. 7. Relationship between erosion rate and the size of the study area.

Fig. 8. Relationship between erosion rate and the size of the study area, according to the
study method used.
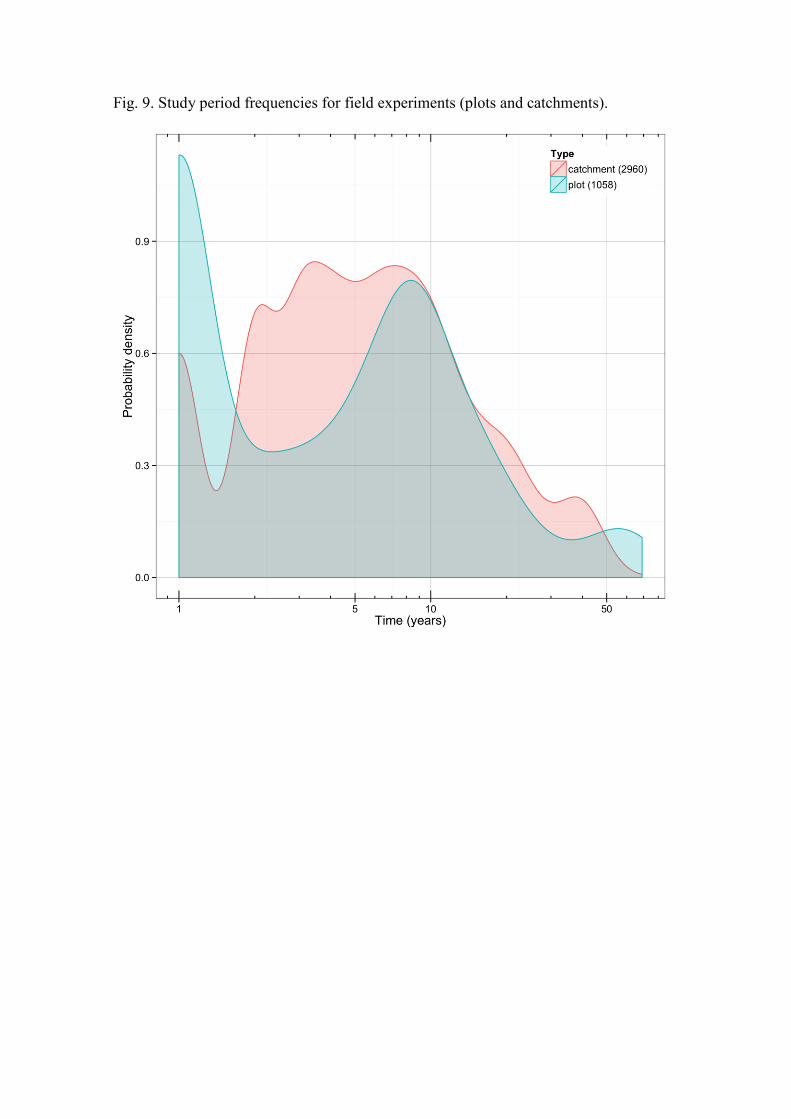
Fig. 9. Study period frequencies for field experiments (plots and catchments).

Fig. 10. Relationship between erosion rate and the duration of the study.

Fig. 11. Relationship between the standard error of the mean erosion rate and the
duration of the study.

Fig. 12. Relationship between the annual maximum/mean erosion rate and the duration
of the study.
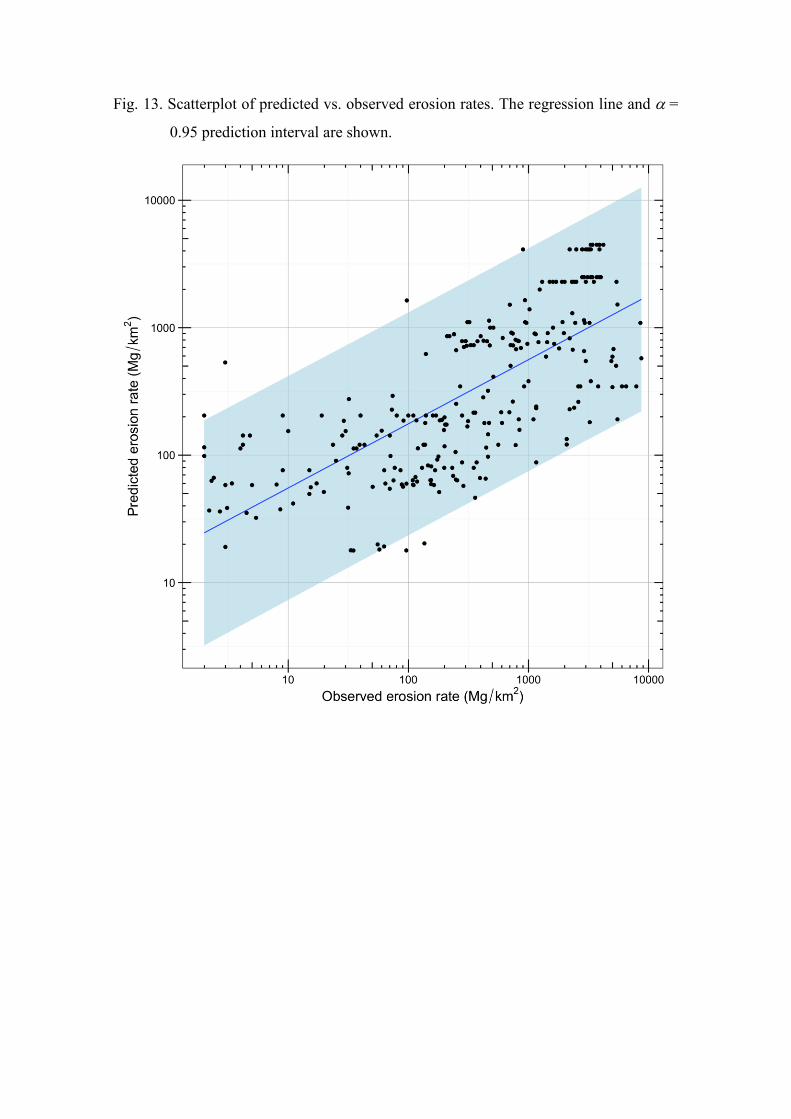
Fig. 13. Scatterplot of predicted vs. observed erosion rates. The regression line and =
0.95 prediction interval are shown.


![EVALUATION OF IMPACT OF SOIL COMPACTION IN DITCH …one of the main reasons that contribute to reduction of soil porosity [5]. Soil compaction intensity is directly dependent on the](https://static.fdokument.com/doc/165x107/6087fd86f3300b5ca742e69d/evaluation-of-impact-of-soil-compaction-in-ditch-one-of-the-main-reasons-that-contribute.jpg)