
Agilent Technologies - Test Equipment Center · The STM-1/OC-3 module for the Advisor has a...
20
Agilent Technologies Agilent Advisor - ATM No matter where you are in the process of bringing up your ATM network, the Agilent Advisor gives you visibility to help you know whats happening. The Advisor is the complete ATM troubleshooting tool. No other portable analyzer offers statistical performance measurements, stimulus and response testing, protocol decoding tools, and more. From installation, maintenance and troubleshooting to performance optimization and remote monitoring, the Advisor lets you connect anywhere on the network, capture all the necessary data, and comprehend that information as it reveals problems and suggests solutions. To install or troubleshoot an ATM link, you need to test for many things: physical errors, equipment interoperability, ATM cell congestion, and even LAN traffic problems. The Advisor offers integrated ATM, WAN, and LAN protocol analysis capabilities, along with BERT (bit error ratio testing), stimulus/ response measurements, and statistical analysis capability everything you require to get a good look at the physical layer, ATM layer, and the upper layer protocols. The monitoring and analysis capabilities for ATM are supported by an interface specific slide-in module or undercradle. This highly portable and economical package features a built-in, rugged personal computer with full keyboard, large display, pointing device, and Microsoft â Windows â 98 user interface. No matter what the traffic level, the Advisor will capture every cell on your full- duplex network connection. It non-intrusively monitors and decodes ATM data at full line speed. In addition, it can simulate either direction of a line and process previously captured data from the buffer or from a file. The analyzer doesnt just capture traffic when the network is working; it gives you information when the network is broken when you need it the most. Solve ATM Problems the First Time You Connect Product Overview ATM Testing Made Easy
Transcript of Agilent Technologies - Test Equipment Center · The STM-1/OC-3 module for the Advisor has a...

Agilent TechnologiesAgilent Advisor - ATM
No matter where you are in the process of bringing up your ATM network, theAgilent Advisor gives you visibility to help you know what�s happening. TheAdvisor is the complete ATM troubleshooting tool. No other portable analyzeroffers statistical performance measurements, stimulus and response testing,protocol decoding tools, and more. From installation, maintenance andtroubleshooting to performance optimization and remote monitoring, theAdvisor lets you connect anywhere on the network, capture all the necessarydata, and comprehend that information as it reveals problems and suggestssolutions.
To install or troubleshoot an ATM link, you need to test for many things:physical errors, equipment interoperability, ATM cell congestion, and even LANtraffic problems. The Advisor offers integrated ATM, WAN, and LAN protocolanalysis capabilities, along with BERT (bit error ratio testing), stimulus/response measurements, and statistical analysis capability � everything yourequire to get a good look at the physical layer, ATM layer, and the upper layerprotocols.
The monitoring and analysis capabilities for ATM are supported by an interfacespecific slide-in module or undercradle. This highly portable and economicalpackage features a built-in, rugged personal computer with full keyboard, largedisplay, pointing device, and MicrosoftâWindowsâ 98 user interface.
No matter what the traffic level, the Advisor will capture every cell on your full-duplex network connection. It non-intrusively monitors and decodes ATM dataat full line speed. In addition, it can simulate either direction of a line andprocess previously captured data from the buffer or from a file. The analyzerdoesn�t just capture traffic when the network is working; it gives youinformation when the network is broken � when you need it the most.
Solve ATM Problems the FirstTime You Connect
Product Overview
ATM Testing Made Easy

2
Isolating an ATM problem or testing a network often requires searchingthrough hundreds or thousands of captured frames and cells to decide what isimportant. Even a highly skilled troubleshooter can be quickly overwhelmed.The Vitals feature saves valuable time by automating this process, providing aquick view of overall network health (Figure 1). You can then drill down todetermine the problem. For instance, when utilization suddenly spikes to 100%,examine the Counts view. If the physical layer statistics (highlighted) revealsvalues other than zeros, check the Line Status view.
Values in the Vitals display are given in tabular form and are cumulative fromthe start of a test, except the instantaneous utilization, which is also displayedin graphical format for a quick look at overall usage of the network. Vitals dataare provided for both the line (network) side and the equipment (user) sideand include such statistics as average utilization in percent, instantaneousutilization in percent, total cells, idle cells, busy cells, header ("HEC") errors,code violations, and frame alignment errors.
Network Vitals
Simultaneous Measurements
Figure 1. The Vitals feature provides an instantaneous view of overall network health.
The user-interface of the Advisor is intuitive, simple, and extremely easy tolearn. Standard Windows capabilites allow you to mix and match varioussimultaneous measurements as you please (Figure 2).

3
Figure 2. Multiple views can be combined and customized by the user.
Unix-based data acquisition hardware makes the Advisor a true multi-taskinginstrument whose various measurements can be executed simultaneously, inreal time. You won�t have to choose between statistical performancemeasurements and frame capture, or between traffic generation and networkmonitoring. With the Advisor, you can simulate a network load and observe itseffect on the performance of a switch or on an individual conversation. You caneven actively verify station connectivity (PING) while still monitoring theperformance of the overall network (Figure 3).
True Multi-tasking
Figure 3. You can PING while still monitoring the performance of the overall network.

4
The STM-1/OC-3 module for the Advisor has a built-in opticalpower meter that allows you to check power levels, in addition to full ATManalysis. Optical power sensitivity is +/- 0.5 dB (Figure 4), and can also be usedfor power measurements at 622 Mb/s (STM-4c/OC-12). For most electrical ATMinterfaces, pulse amplitude measurements (mV
) are similarly available.
Optical Power andPulse Amplitude Meter
Figure 4. The STM-1/OC-3 module has a built-in optical power meter.
Visibility on the health of the physical interface is often critical in determiningthe cause of network problems. Therefore, the Advisor tracks errors at thephysical layer. Signal events are recorded on the display for both the line(network) side as well as the equipment (user) side. Events are time stampedand saved in the buffer and can be logged to disk.
To alert you immediately to problems at the physical link, critical parametersappear at the bottom of all screens -- whether you are looking at line status orother displays -- and these parameters are shown in red if a physical problemhas occured. They include such events as loss of signal, loss of frame, loss ofcell delineation and applicable parameters for the STM-1/OC-3, STM-1e/EC-3,UTP155, E3/T3, J2, and E1/T1 line interfaces currently supported by theAdvisor.
Get a Statistical Picture ofYour Network
The Advisor monitors the network, captures data, and decodes it in real time.Data capture can be started manually, or automatically by setting a trigger.The analyzer can selectively capture data using its 12 hardware capture filters,so that the memory buffer contains just the information you want to see.
The Advisor fully decodes frames and cells and displays all fields in summary,detail, or hexadecimal format (Figure 5). In addition, being MicrosoftWindows-based enables you to view different protocol decodes, vitals, statistics,and other displays simultaneously. Data can be printed, or stored to a file andretrieved for later analysis.
Monitor and Decode ATM andUpper Layer Protocols in RealTime
peak

5
Advisor users now have powerful, user-configurable time-stamp options asfollows:
� Delta � shows the time interval between adjacent cells; gives anotherview into delay and delay variation.
� Relative � shows the time difference between critical events and othercells in the traffic flow; for example, if a ping is considered time-zero,cells which arrived before or after will be time-stamped with theircorresponding relative arrival time.
� Absolute � actual time, with 100ns resolution.
Figure 5. Real-time decodes are customizable to suit your needs.
Post-processing display filters let you quickly zoom in on selected criteria,from the traffic passing between specific devices to individual conversations.
With post-processing you can:
�Search through the data by record or by time stamp�Search for events, strings or addresses�Verify event-to-event timing�View protocol errors�Print the current display or the entire buffer�Export data to other programs or reports�Analyze statistics from the buffer data
You�ll spend less time searching through frames, and more time focusing onproblems.
Powerful Post-processingCapability
Today�s Advisor has a very user-friendly, �one-line� read out in the summaryview. It also offers "Hex to detail mapping" by highlighting an element in thedetailed view, the corresponding hex element is highlighted in color in theheader 'Hex' section of the decodes. The reverse is also true.
Advanced Decode View

6
With the addition of the optional Advisor Reporter software you can generateunmatched reports and graphs to benchmark your network performance. TheAdvisor Reporter helps you optimize network elements to ensure peakperformance for mission-critical applications (Figure 6).
Expert Charts and Graphs
The Advisor provides decodes for every layer of the ATM protocol.
• ATM physical layer: IMA Control Protocol� ATM cell layer: cell header details� ATM adaptation layer: AAL-1, AAL-2, AAL-3/4, and AAL-5
(with complete reassembly)� Services layer:
- Encapsulated protocols such as frame relay, X.25, and LAN(using RFC 2684/1483, RFC 2225/1577 or LANE 1.0/2.0)
- MPEG-2 decode- Signaling: UNI 3.0, 3.1, 4.0 PNNI, B-1SUP, B-ICI, SPANS (Fore systems)
� All major protocol suites are supported, including TCP/IP, 3Com, AppleTalk,Banyan, Cisco, DECnet, H.323, IBM/SNA, LLC, Microsoft LAN manager, Novell,OSI, SUN, XNS, ISO, SIP, MEGACO, MGCP, SGCP, RTP, GPRS, W-CDMA, andmore.
The analyzer can capture all cells or filter certain cells, to maximize yourcapture buffer space. Events are time-stamped with 100 ns resolution. Protocoldecodes can run simultaneously over all active VP.VCs, allowing the analyzer todecode all channels in real-time or in post-process mode.
Decodes for All Layers ofthe ATM Protocol Stack
Many times problems on the network can be attributed to the transmissionmedium. Although the physical medium may be good for normal datatransmission, it may not be able to handle cell-based ATM data. That is why theAdvisor has a powerful, built-in bit error ratio tester that performs not onlyframe-based (physical layer) BERT, but also cell-based BERT, in which the bitpatterns are carried in the payload of the ATM cell (Figure 7).
Whether installing a new fiber or cable line, or troubleshooting an existingnetwork, the Advisor provides for all your test needs, under one handle.
BERT (Bit Error Ratio Testing)
Figure 6. Agilent Advisor Reporter Expert charts and graphs.

7
Figure 7. Verify link and ATM-layer integrity by using the BERT capability.
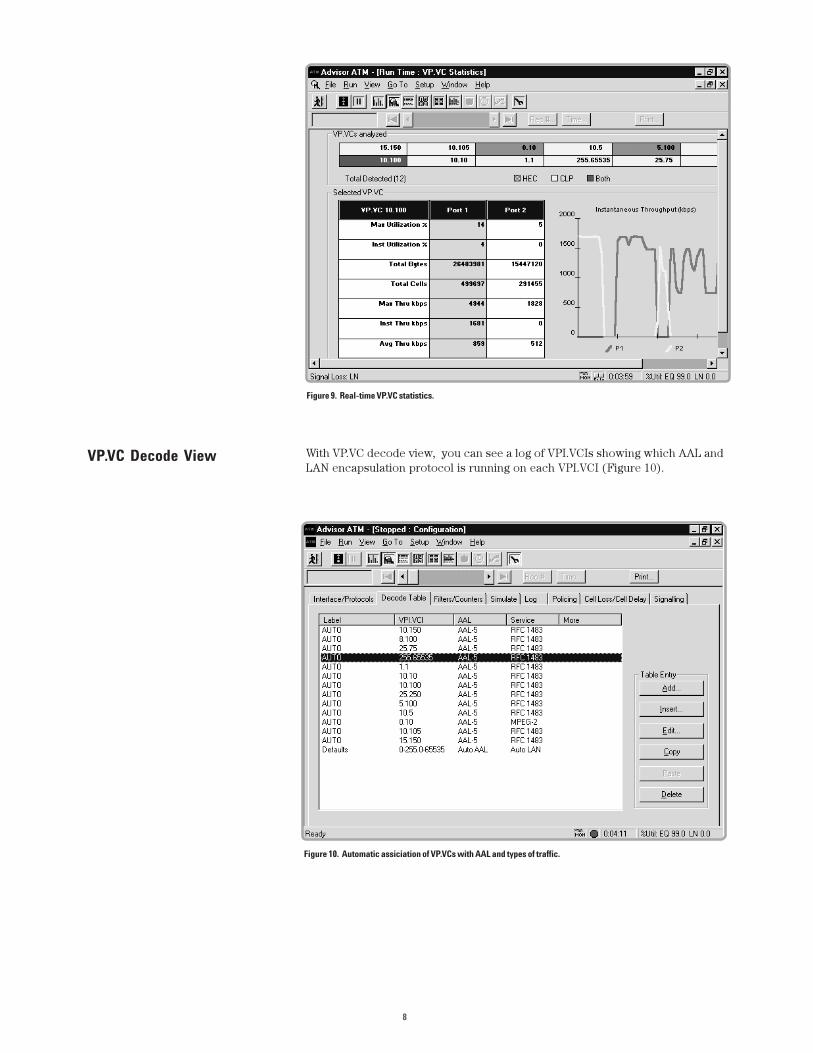
Whether you have PVCs or SVCs or both, you can select a VP.VC and viewstatistics on full duplex sampled data on that channel. You can also see in real-time a graph of that channel�s utilization (Figure 9). VPI/VCIs with header("HEC") errors, tagged cells (CLP ->1), or both, are color-coded for easyidentification.
VP.VC Autodiscoveryand Statistics
Figure 8. VPI.VCI Autodiscovery and statistics for each.
The Advisor can auto-discover up to 1024 virtual channels and for each collectand display VPI.VCI, maximum and instantaneous utilization (%) andthroughput (kb/s), cell and octet counts, header (�HEC�) errors and CLP status(Figure 8).
8
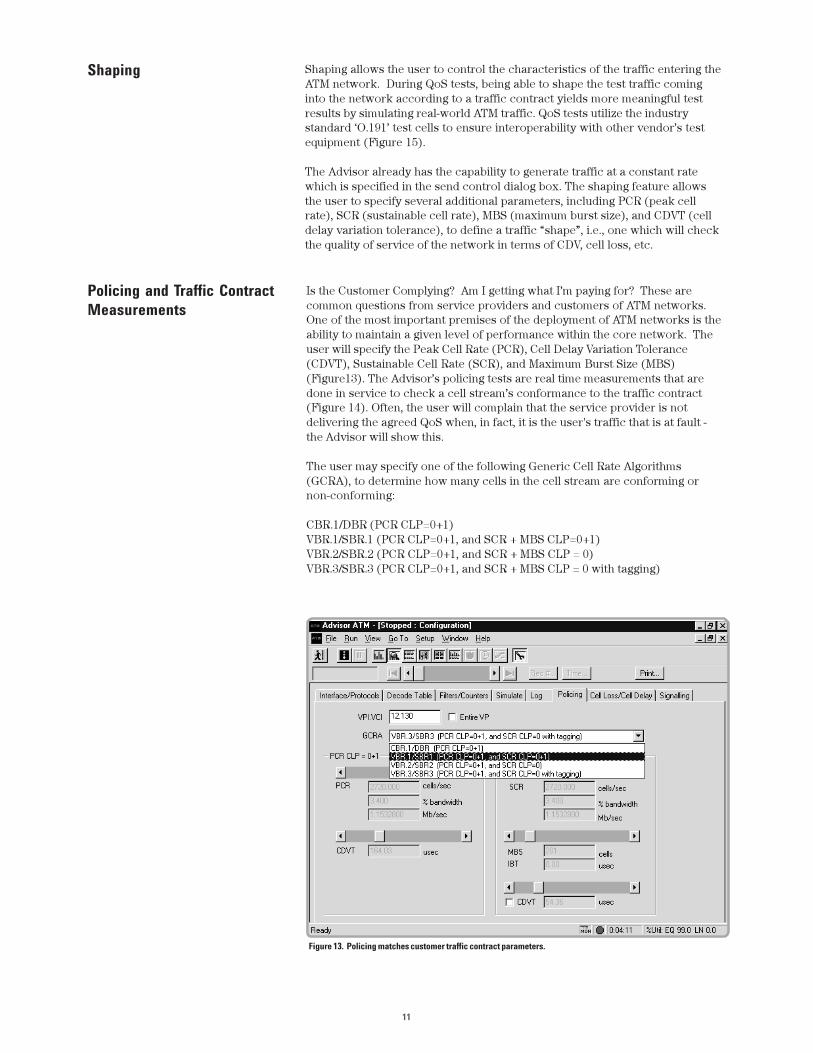
With VP.VC decode view, you can see a log of VPI.VCIs showing which AAL andLAN encapsulation protocol is running on each VPI.VCI (Figure 10).
VP.VC Decode View
Figure 10. Automatic assiciation of VP.VCs with AAL and types of traffic.
Figure 9. Real-time VP.VC statistics.

9
Using the cell generation editor or one of the many predefined quick tests, youcan create normal or abnormal protocol behavior on demand to help isolateprotocol implementation problems. For example, a quick test lets you send anATM ping to check for continuity. You simply enter the IP address and theanalyzer creates an ATM AAL-5 ICMP frame that uses IP addresses to testnetwork operation and connectivity.
Other quick tests provide traffic filters for OAM, ILMI, and various LAN stacks,IP filtering templates, all of which can generate traffic up to full bandwidth.Other tests focus on statistics for particular monitoring tests, such as signalingstatistics. Test scripts can be customized or created from scratch to a library oftest sequences tailored to your individual application.
Quick Tests
Network faults related to traffic levels are often difficult to isolate. Fewanalyzers can capture every packet, frame, or cell at wire speed, and suchproblems are often intermittent and difficult to recreate. With the Advisor, youwill never miss a cell, no matter what the data rate. You can also generate trafficand make measurements simultaneously, so that you can recreate problemsand analyze them for solutions.
Powerful traffic generation capabilities in the Advisor lets you transmit virtuallyany type of message or cell onto the network -- one time, a specified number oftimes, or continuously (Figure 10). To generate traffic for network simulation,you can leverage the many testing scenarios already defined in the analyzer.Previously captured cells in the capture buffer can be used toduplicate events or to create complex messages.
Traffic Generation
If you are using previously captured traffic, you can modify the VPI.VCI and/orthe payload (to change the IP addresses, for example) and the HEC and/orAAL-5 CRC-32 is automatically recalculated.
Figure 11. Traffic generation using user-defined or previously captured data.

10
Figure 12. Cell loss testing.
Service providers are very interested in maintaining a high level of �Quality ofService�. Large enterprise network operators are likewise interested inmaintaining a given level of service for the departments and applications theyare supporting. Unlike the traditional Internet, which suffers slow response andhigh packet loss under load, ATM networks are designed to control trafficbefore it is even allowed admission into the network, and to maintain highperformance characteristics at all times, while offering the benefit of differentservice level guarantees. In today�s increasingly competitive telecomenvironment, and with the rise of diverse traffic types like multi-media andvoice-over-IP, ATM networks need to be able to ensure a consistent quality of theservice being provided.
Quality of Service
Today�s Advisor has greatly enhanced Quality of Service (QoS)capabilities (Figure 12). QoS tests comprise a set of measurements designedto assess things like delay, delay variation, cell loss, and cell misinsertion. Thecore suite of QoS tests on the Advisor includes:
� Cell delay - including Cell Delay Variation (CDV) and Mean Cell Transfer Delay� Cell Loss Ratio (CLR)� Cell Misinsertion Rate (CMR)� Cell Error Ratio (CER)� Severely Errored Cell Block Ratio (SECBL)� Background traffic while running QoS
11
Shaping allows the user to control the characteristics of the traffic entering theATM network. During QoS tests, being able to shape the test traffic cominginto the network according to a traffic contract yields more meaningful testresults by simulating real-world ATM traffic. QoS tests utilize the industrystandard �O.191� test cells to ensure interoperability with other vendor�s testequipment (Figure 15).
The Advisor already has the capability to generate traffic at a constant ratewhich is specified in the send control dialog box. The shaping feature allowsthe user to specify several additional parameters, including PCR (peak cellrate), SCR (sustainable cell rate), MBS (maximum burst size), and CDVT (celldelay variation tolerance), to define a traffic �shape�, i.e., one which will checkthe quality of service of the network in terms of CDV, cell loss, etc.
Shaping
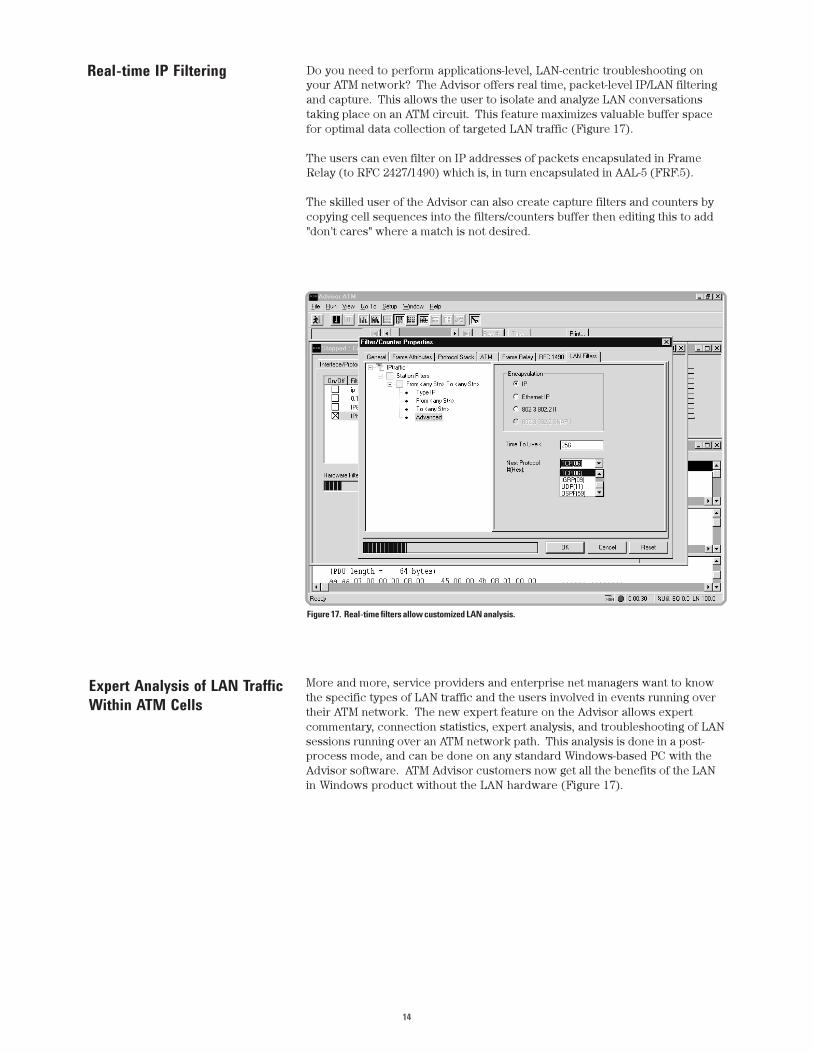
Is the Customer Complying? Am I getting what I�m paying for? These arecommon questions from service providers and customers of ATM networks.One of the most important premises of the deployment of ATM networks is theability to maintain a given level of performance within the core network. Theuser will specify the Peak Cell Rate (PCR), Cell Delay Variation Tolerance(CDVT), Sustainable Cell Rate (SCR), and Maximum Burst Size (MBS)(Figure13). The Advisor�s policing tests are real time measurements that aredone in service to check a cell stream�s conformance to the traffic contract(Figure 14). Often, the user will complain that the service provider is notdelivering the agreed QoS when, in fact, it is the user's traffic that is at fault -the Advisor will show this.
The user may specify one of the following Generic Cell Rate Algorithms(GCRA), to determine how many cells in the cell stream are conforming ornon-conforming:
CBR.1/DBR (PCR CLP=0+1)VBR.1/SBR.1 (PCR CLP=0+1, and SCR + MBS CLP=0+1)VBR.2/SBR.2 (PCR CLP=0+1, and SCR + MBS CLP = 0)VBR.3/SBR.3 (PCR CLP=0+1, and SCR + MBS CLP = 0 with tagging)
Policing and Traffic ContractMeasurements
Figure 13. Policing matches customer traffic contract parameters.

12
Figure 15. O.191 test cell customization.
Figure 14. Contract conformance and switch performance.

13
�Can I bring up a Switched Virtual Circuit (SVC)?� �Can I bring up a LANEsession?� This is very similar in concept to a PING, which has the function of�Can I reach an IP host?�
During initial service turn-up, service providers will benefit by being able toconfirm the ability to establish UNI 3.0, 3.1 or 4.0 connections, all whileemulating either the user device or the network equipment (the edgeswitch).
The Advisor includes Signaling and LANE emulation to provide connectivitytesting. The signaling and call placement feature supports UNI 3.0, 3.1, and 4.0.Users may specify the UNI that they wish to use in bringing up the SVC. Inaddition, the user will be able to specify and edit the Information Elementsplaced on Call Connect messages that specify what type of SVC to bring up andwith what level of service (Figure 16).
Note: While ITU-T Q.2931 signaling is not explicitly supported, the ATMForum's UNI 4.0 was derived from Q.2931 and Q.2971 and, with the exceptionof a few rarely used Information Elements, UNI 4.0 will work in most situationswhere ITU-T signaling is in use.
Signaling and Call Placement
Figure 16. Results of signaling emulation.
14
More and more, service providers and enterprise net managers want to knowthe specific types of LAN traffic and the users involved in events running overtheir ATM network. The new expert feature on the Advisor allows expertcommentary, connection statistics, expert analysis, and troubleshooting of LANsessions running over an ATM network path. This analysis is done in a post-process mode, and can be done on any standard Windows-based PC with theAdvisor software. ATM Advisor customers now get all the benefits of the LANin Windows product without the LAN hardware (Figure 17).
Expert Analysis of LAN TrafficWithin ATM Cells
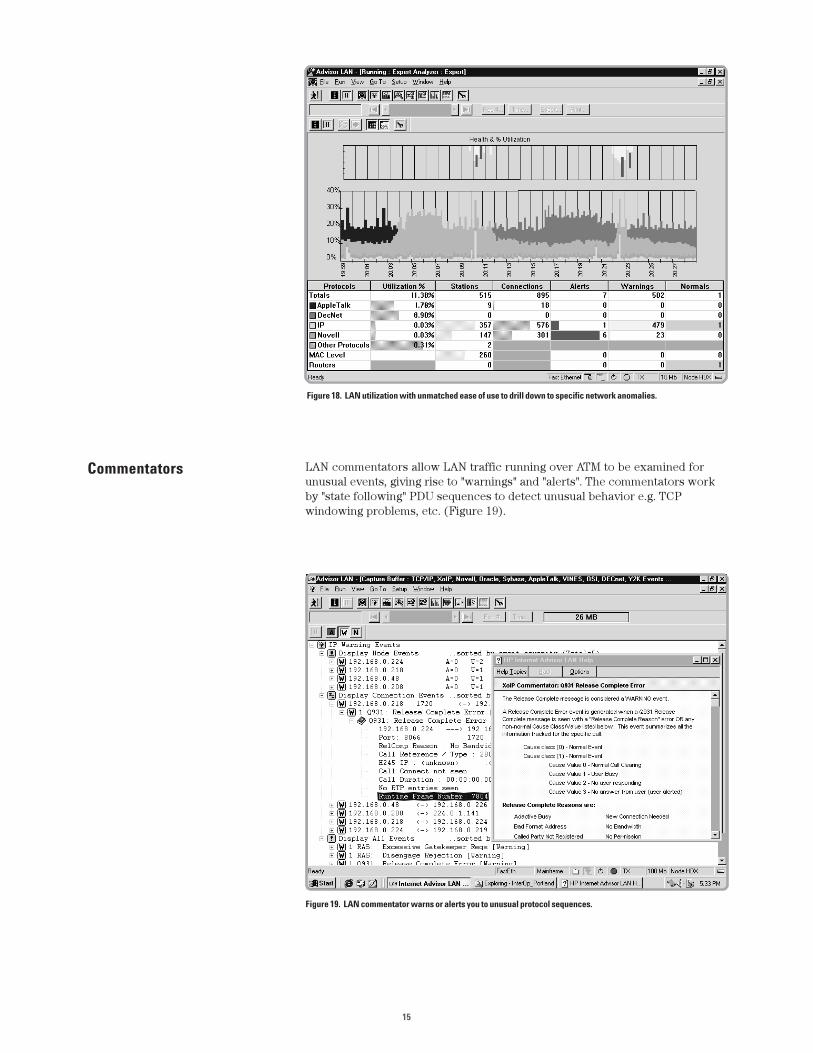
Do you need to perform applications-level, LAN-centric troubleshooting onyour ATM network? The Advisor offers real time, packet-level IP/LAN filteringand capture. This allows the user to isolate and analyze LAN conversationstaking place on an ATM circuit. This feature maximizes valuable buffer spacefor optimal data collection of targeted LAN traffic (Figure 17).
The users can even filter on IP addresses of packets encapsulated in FrameRelay (to RFC 2427/1490) which is, in turn encapsulated in AAL-5 (FRF.5).
The skilled user of the Advisor can also create capture filters and counters bycopying cell sequences into the filters/counters buffer then editing this to add"don't cares" where a match is not desired.
Real-time IP Filtering
Figure 17. Real-time filters allow customized LAN analysis.
15
Figure 18. LAN utilization with unmatched ease of use to drill down to specific network anomalies.
Commentators LAN commentators allow LAN traffic running over ATM to be examined forunusual events, giving rise to "warnings" and "alerts". The commentators workby "state following" PDU sequences to detect unusual behavior e.g. TCPwindowing problems, etc. (Figure 19).
Figure 19. LAN commentator warns or alerts you to unusual protocol sequences.
16
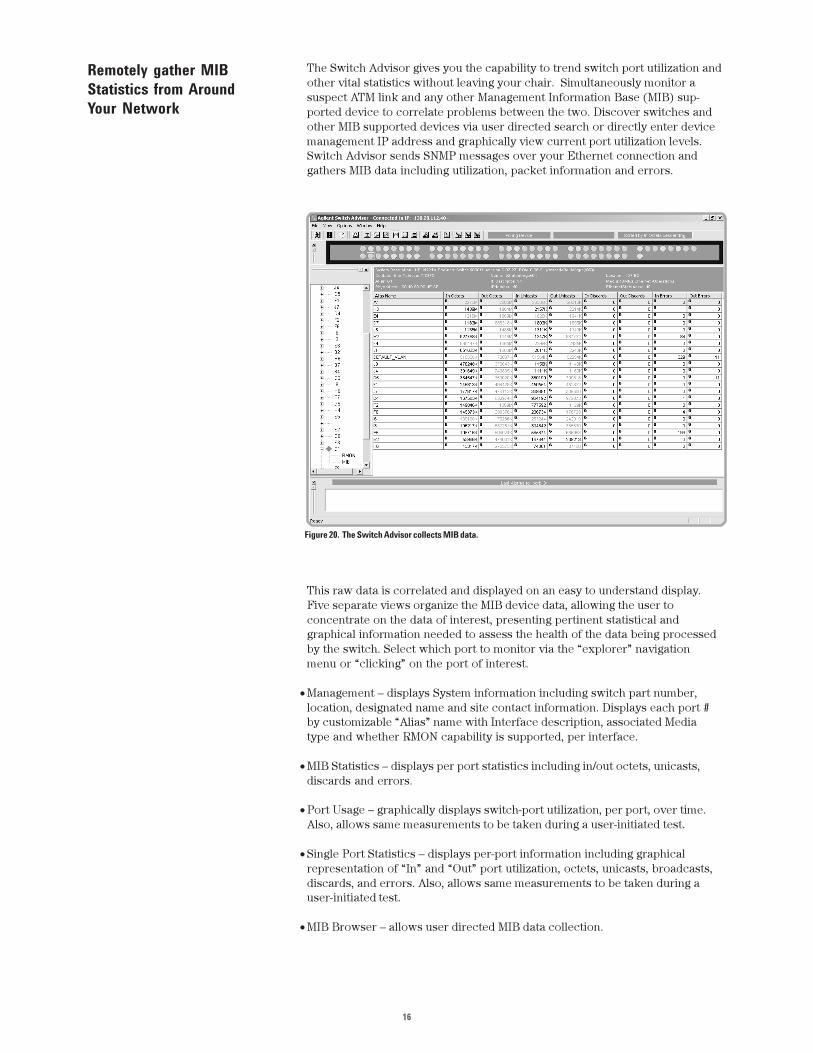
The Switch Advisor gives you the capability to trend switch port utilization andother vital statistics without leaving your chair. Simultaneously monitor asuspect ATM link and any other Management Information Base (MIB) sup-ported device to correlate problems between the two. Discover switches andother MIB supported devices via user directed search or directly enter devicemanagement IP address and graphically view current port utilization levels.Switch Advisor sends SNMP messages over your Ethernet connection andgathers MIB data including utilization, packet information and errors.
Remotely gather MIBStatistics from AroundYour Network
Figure 20. The Switch Advisor collects MIB data.
This raw data is correlated and displayed on an easy to understand display.Five separate views organize the MIB device data, allowing the user toconcentrate on the data of interest, presenting pertinent statistical andgraphical information needed to assess the health of the data being processedby the switch. Select which port to monitor via the �explorer� navigationmenu or �clicking� on the port of interest.
· Management � displays System information including switch part number,location, designated name and site contact information. Displays each port #by customizable �Alias� name with Interface description, associated Mediatype and whether RMON capability is supported, per interface.
· MIB Statistics � displays per port statistics including in/out octets, unicasts,discards and errors.
· Port Usage � graphically displays switch-port utilization, per port, over time.Also, allows same measurements to be taken during a user-initiated test.
· Single Port Statistics � displays per-port information including graphicalrepresentation of �In� and �Out� port utilization, octets, unicasts, broadcasts,discards, and errors. Also, allows same measurements to be taken during auser-initiated test.
· MIB Browser � allows user directed MIB data collection.

17
Microsoftâ is a U.S. registered trademark of Microsoft Corp.Windowsâ
is a U.S. registered trademark of Microsoft Corp.
Agilent Advisor Brochure 5980-1093EAgilent Advisor ATM/WAN Technical Specifications 5980-0786E
Hardware: standard 3-year (or optional 5-year).Software: 90 day replacement only
Related Literature
Warranty
A context-sensitive on-line help system is built into the Advisor. The helpsystem provides complete explanations of all measurements, as well as sugges-tions for troubleshooting and tutorials on networking topics. An acronymguide, tutorial, index, and glossary help you better understand the language ofATM.
Powerful as they are, the capabilities of the Advisor continue to expand withevery software release, ensuring that your investment in these testing tools willbe returned for many years to come. Agilent�s Software Upgrade SubscriptionService will keep you up-to-date on the very latest enhancements to theAdvisor.
Get On-Line Help
A Path to the Future

18
Notes

19
Agilent Technologies’ Test and Measurement Support, Services, and Assistance
Agilent Technologies aims to maximize the value you receive, while minimizing your risk and problems. We strive to ensurethat you get the test and measurement capabilities you paid for and obtain the support you need. Our extensive supportresources and services can help you choose the right Agilent products for your applications and apply them successfully.Every instrument and system we sell has a global warranty. Support is available for at least five years beyond theproduction life of the product. Two concepts underlie Agilent’s overall support policy: “Our Promise” and “Your Advantage.”
Our PromiseOur Promise means your Agilent test and measurement equipment will meet its advertised performance and functionality.When you are choosing new equipment, we will help you with product information, including realistic performancespecifications and practical recommendations from experienced test engineers. When you use Agilent equipment, we canverify that it works properly, help with product operation, and provide basic measurement assistance for the use ofspecified capabilities, at no extra cost upon request. Many self-help tools are available.
Your AdvantageYour Advantage means that Agilent offers a wide range of additional expert test and measurement services, which you canpurchase according to your unique technical and business needs. Solve problems efficiently and gain a competitive edge bycontracting with us for calibration, extra-cost upgrades, out-of-warranty repairs, and on-site education and training, as wellas design, system integration, project management, and other professional engineering services. Experienced Agilentengineers and technicians worldwide can help you maximize your productivity, optimize the return on investment of yourAgilent instruments and systems, and obtain dependable measurement accuracy for the life of those products.
*5968-1437E*5968-1437E
Online assistance:http://www.agilent .com/find/assist
United States:(Tel) 1 800 452 4844
Canada:(Tel) 1 877 894 4414(Fax) (905) 282 6495
China:(Tel) 800-810-0189(Fax) 1-0800-650-0121
Europe:(Tel) (31 20) 547 2323(Fax) (31 20) 547 2390
Japan:(Tel) (81) 426 56 7832(Fax) (81) 426 56 7840
Korea:(Tel) (82-2) 2004-5004(Fax) (82-2) 2004-5115
Latin America:(Tel) (305) 269 7500(Fax) (305) 269 7599
Taiwan:(Tel) 080-004-7866(Fax) (886-2) 2545-6723
Other Asia Pacific Countries:(Tel) (65) 375-8100(Fax) (65) 836-0252
Product specifications and descriptions in this documentsubject to change without notice.
ãAgilent Technologies, Inc. 2000-2002Printed in U.S.A. January 11, 2002
By internet, phone or fax, get assistance with allyour Test and Measurement needs.
www.agilent.com
http://www.agilent.com/comms/onenetworksUse this link to go directly to our network troubleshooting solutions:
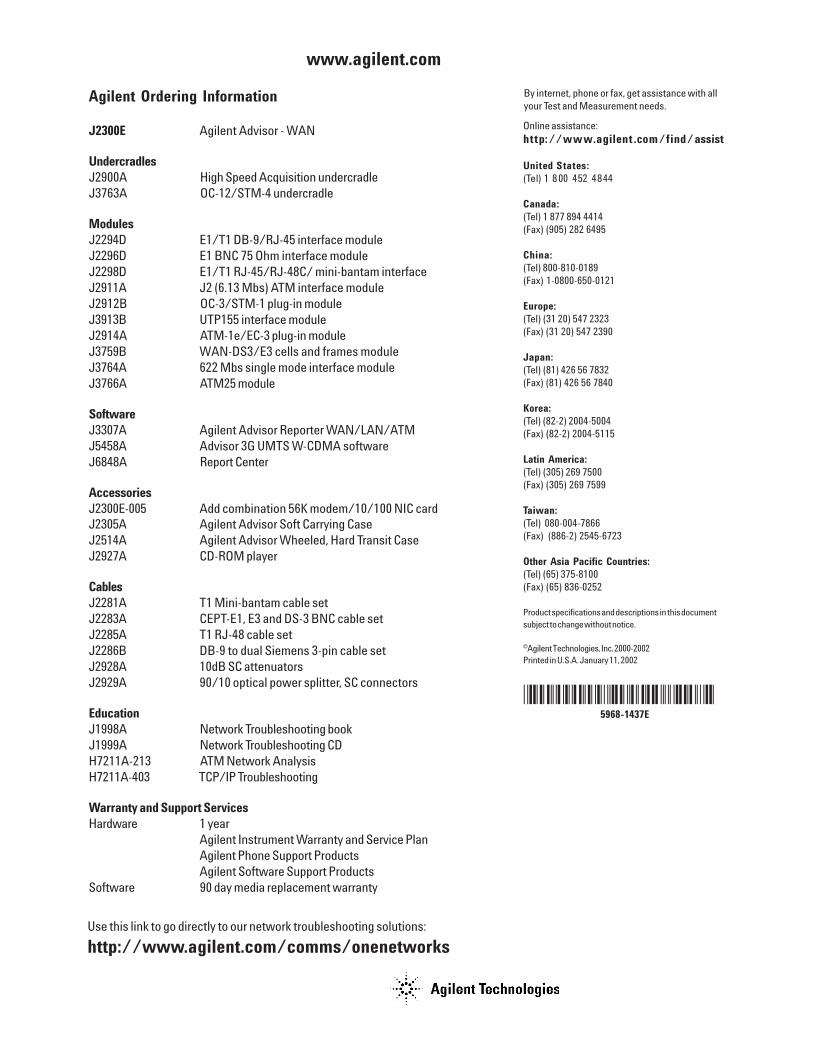
Agilent Ordering Information
J2300E Agilent Advisor - WAN
UndercradlesJ2900A High Speed Acquisition undercradleJ3763A OC-12/STM-4 undercradle
ModulesJ2294D E1/T1 DB-9/RJ-45 interface moduleJ2296D E1 BNC 75 Ohm interface moduleJ2298D E1/T1 RJ-45/RJ-48C/ mini-bantam interfaceJ2911A J2 (6.13 Mbs) ATM interface moduleJ2912B OC-3/STM-1 plug-in moduleJ3913B UTP155 interface moduleJ2914A ATM-1e/EC-3 plug-in moduleJ3759B WAN-DS3/E3 cells and frames moduleJ3764A 622 Mbs single mode interface moduleJ3766A ATM25 module
SoftwareJ3307A Agilent Advisor Reporter WAN/LAN/ATMJ5458A Advisor 3G UMTS W-CDMA softwareJ6848A Report Center
AccessoriesJ2300E-005 Add combination 56K modem/10/100 NIC cardJ2305A Agilent Advisor Soft Carrying CaseJ2514A Agilent Advisor Wheeled, Hard Transit CaseJ2927A CD-ROM player
CablesJ2281A T1 Mini-bantam cable setJ2283A CEPT-E1, E3 and DS-3 BNC cable setJ2285A T1 RJ-48 cable setJ2286B DB-9 to dual Siemens 3-pin cable setJ2928A 10dB SC attenuatorsJ2929A 90/10 optical power splitter, SC connectors
EducationJ1998A Network Troubleshooting bookJ1999A Network Troubleshooting CDH7211A-213 ATM Network AnalysisH7211A-403 TCP/IP Troubleshooting
Warranty and Support ServicesHardware 1 year
Agilent Instrument Warranty and Service PlanAgilent Phone Support ProductsAgilent Software Support Products
Software 90 day media replacement warranty