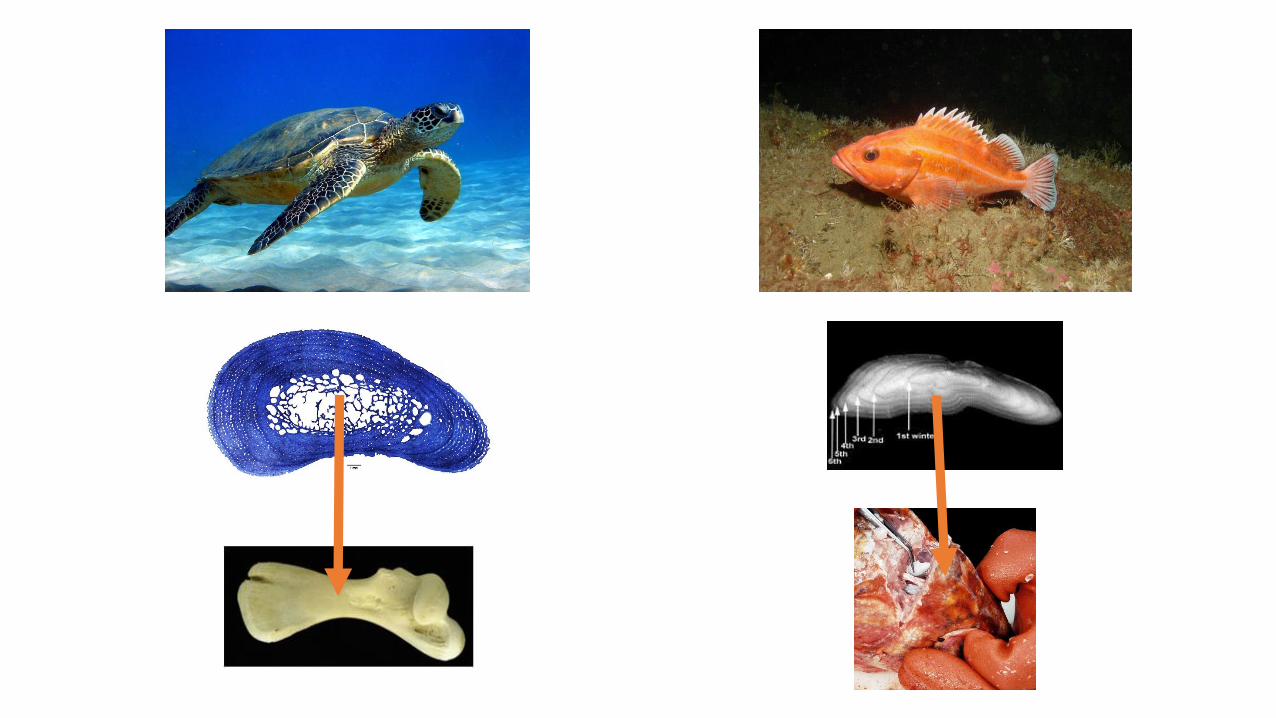
An integrative model of sea turtle growth based on ...
29
Brandon Chasco, Eric Ward, Larisa Avens, Lisa Goshe, Joanne McNeill, Alan Bolten, Karen Bjorndal, Selina Heppell, Melissa Snover, Tomo Eguchi, Eli Holmes, and Howard Coleman An integrative model of sea turtle growth based on recoveries and mark-recapture data
Transcript of An integrative model of sea turtle growth based on ...
Brandon Chasco, Eric Ward, Larisa Avens, Lisa Goshe, Joanne McNeill, Alan Bolten, Karen Bjorndal, Selina Heppell,
Melissa Snover, Tomo Eguchi, Eli Holmes, and Howard Coleman
An integrative model of sea turtle growth based on recoveries and
mark-recapture data
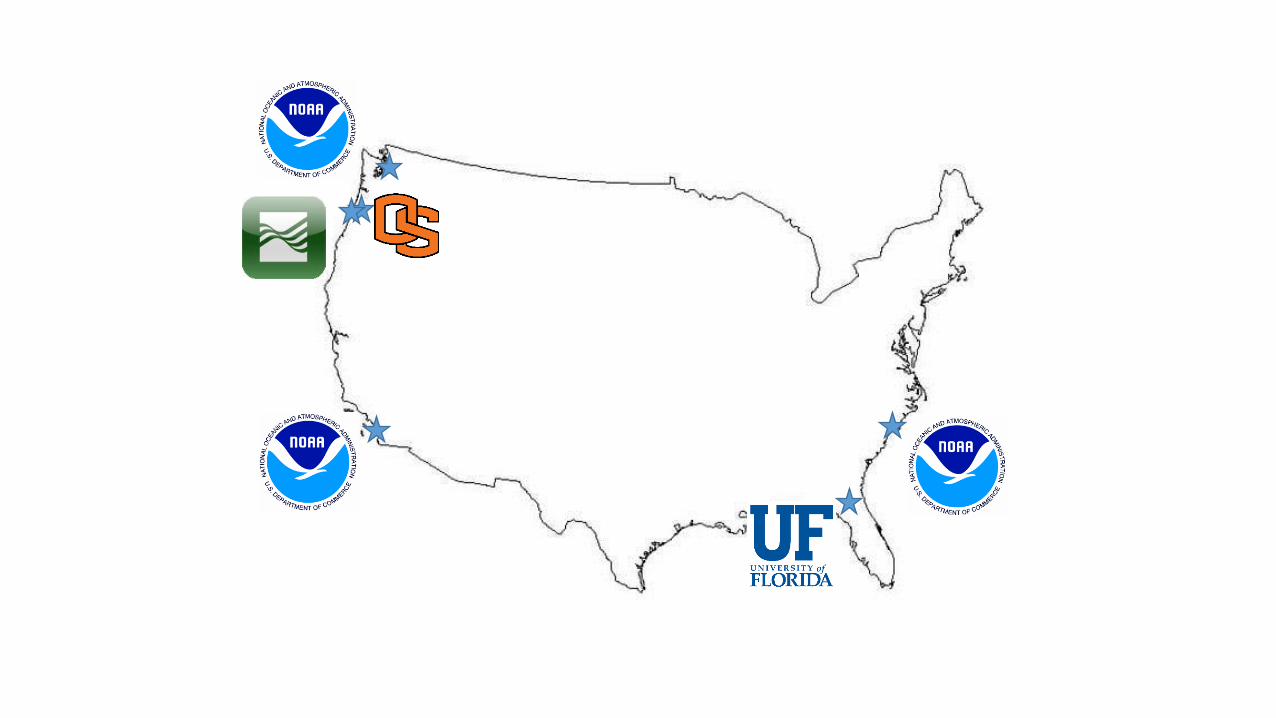
Integrated modeling
Stochastic processes
Evolution in Fisheries and Ecological Modeling
Isaac Kaplan
Integrated modeling
Stochastic processes
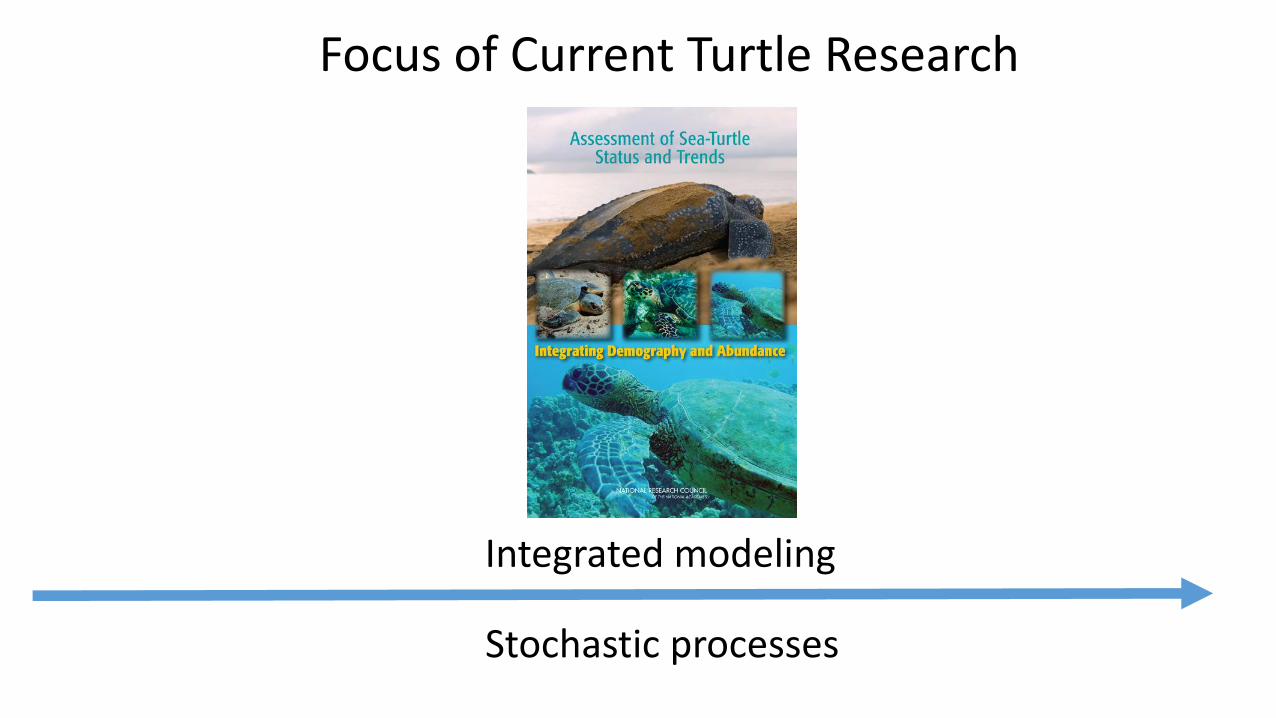
Focus of Current Turtle Research
Integrated modeling
Stochastic processes
50 60 70 80 90 100
0
10
20
30
40
50
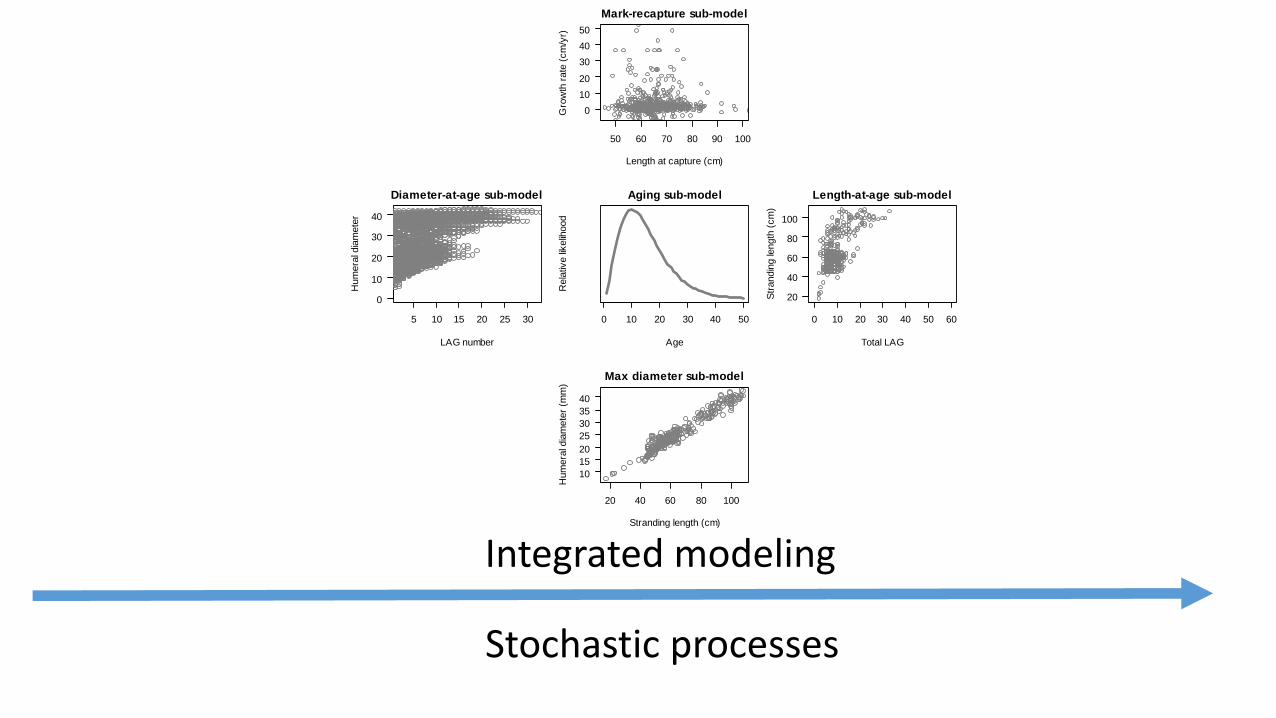
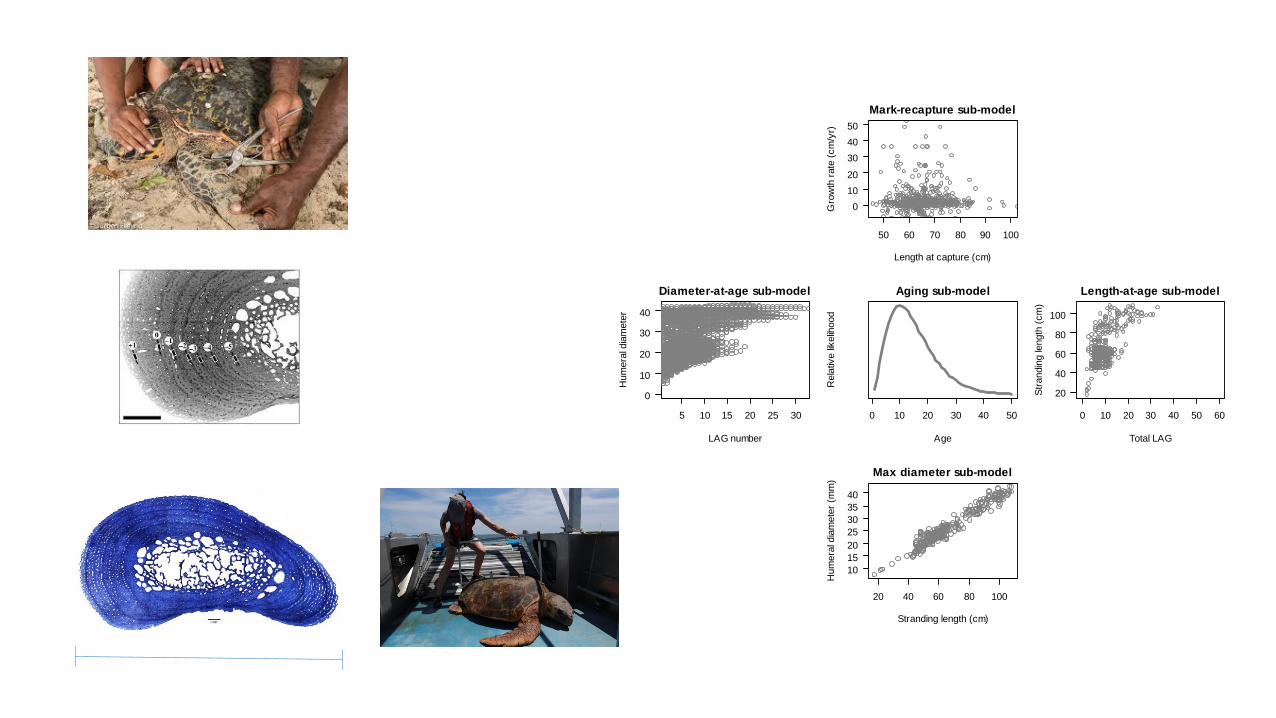
Mark-recapture sub-model
Length at capture (cm)
Gro
wth
rate
(cm
/yr)
5 10 15 20 25 30
0
10
20
30
40
Diameter-at-age sub-model
LAG number
Hum
era
l dia
mete
r
Aging sub-model
Age
Rela
tive li
kelih
ood
0 10 20 30 40 50 0 10 20 30 40 50 60
20
40
60
80
100
Length-at-age sub-model
Total LAG
Str
andin
g le
ngth
(cm
)
20 40 60 80 100
10
15
20
25
30
35
40
Max diameter sub-model
Stranding length (cm)
Hum
era
l dia
mete
r (m
m)
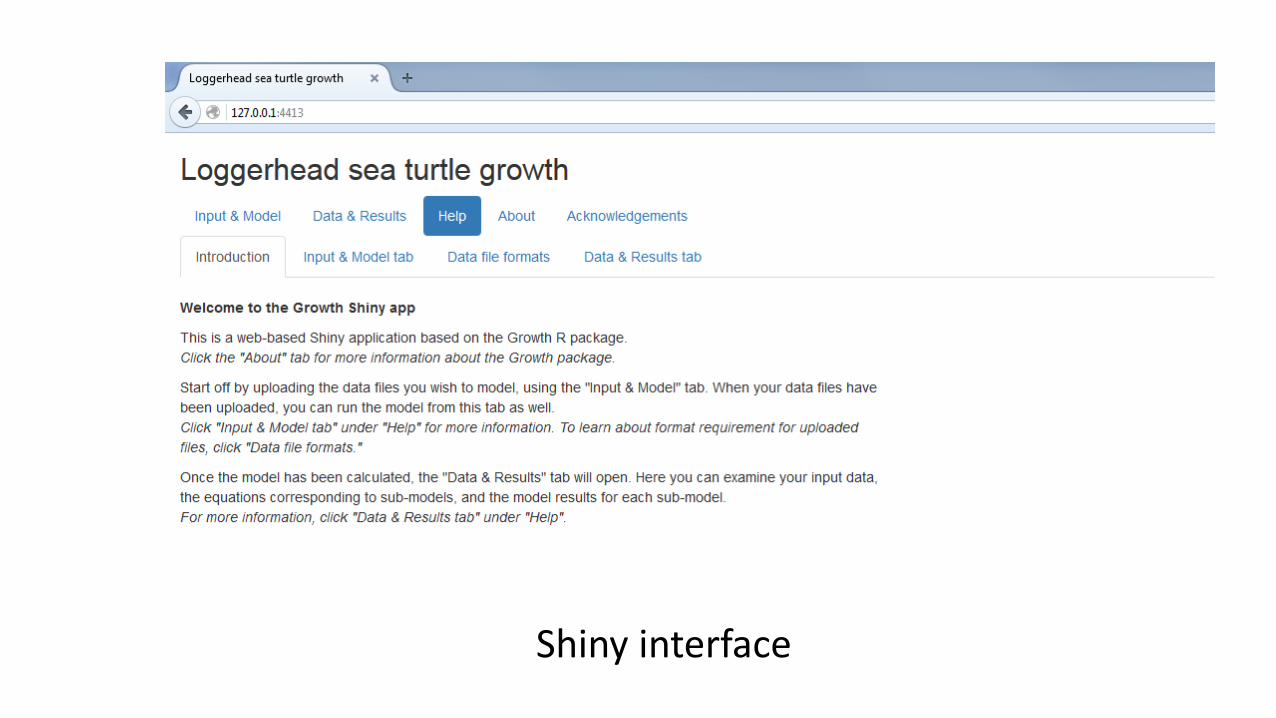
Shiny interface
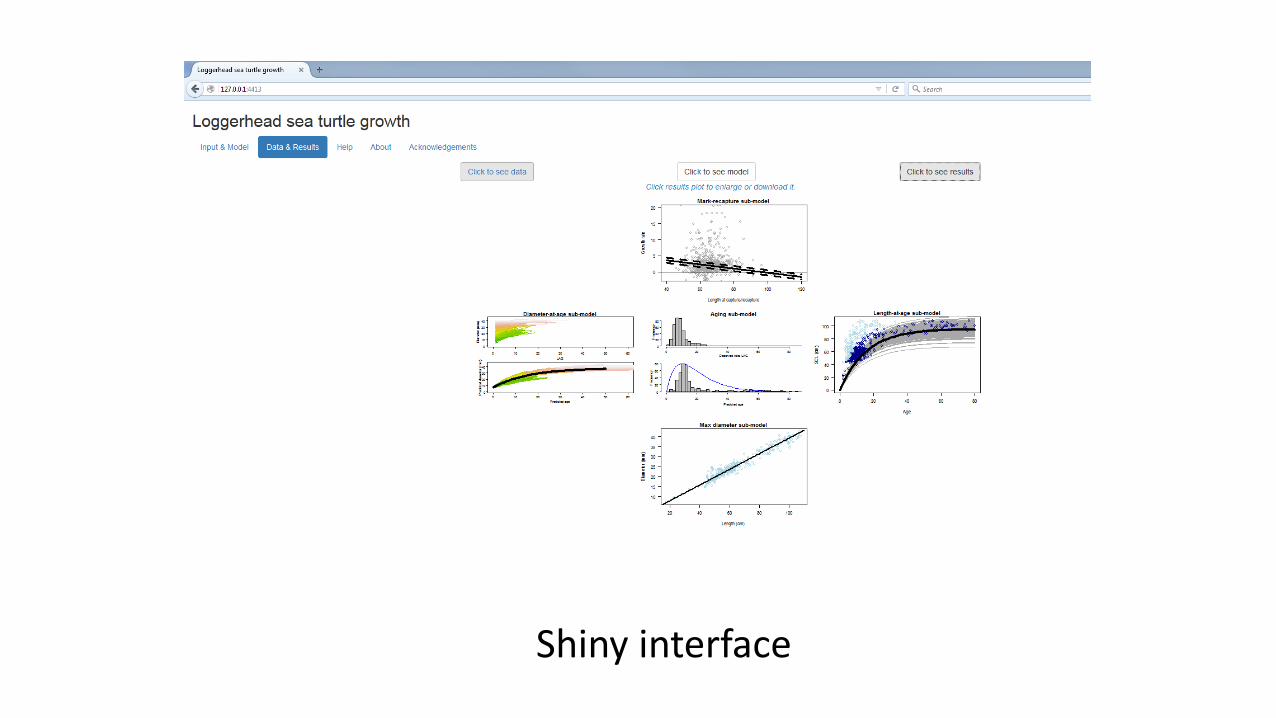
Shiny interface
An integrative model of sea turtle growth based on recoveries and
mark-recapture data

seaturtleexploration.com

Adult harvest Egg harvest
By-catch Habitat changes
Mortality
Dir
ect
In-d
irec
t
www.seagrasswatch.org www.hoax-slayer.com
news.nationalgeographic.com mic.com
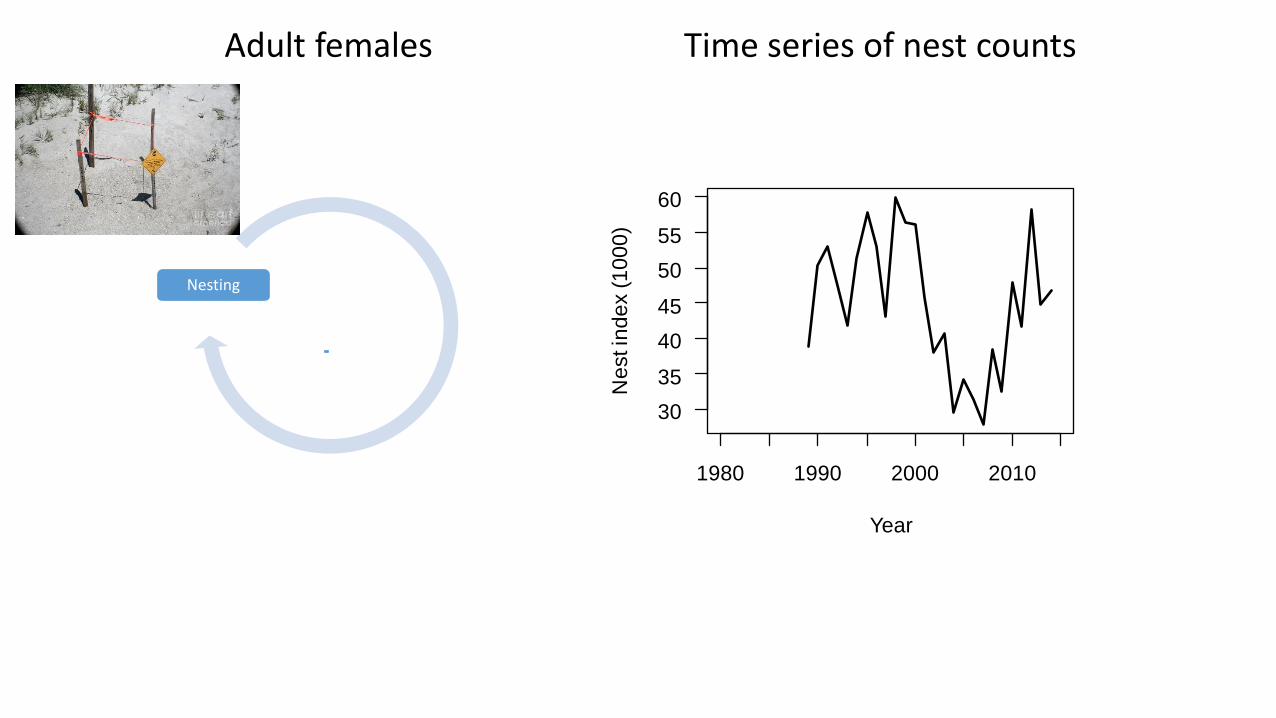
Nesting
1980 1990 2000 2010
30
35
40
45
50
55
60
Year
Ne
st in
de
x (
10
00
)
Time series of nest counts Adult females
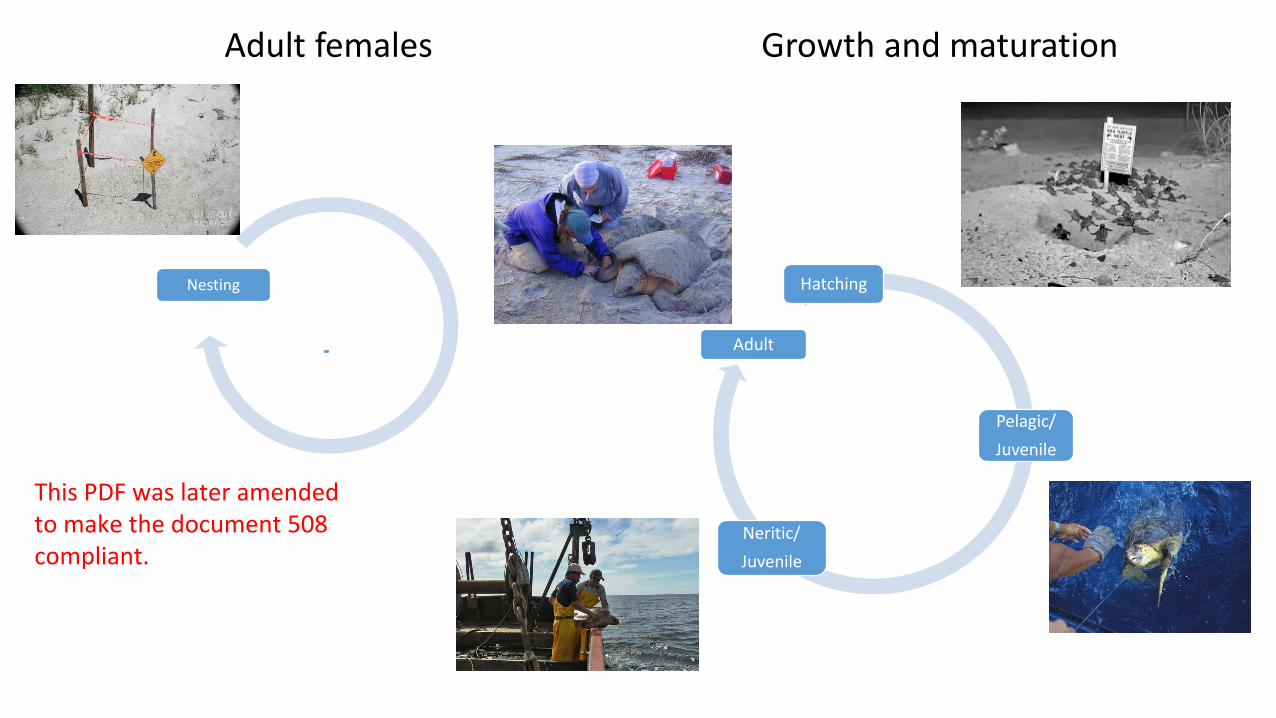
Nesting
Adult
Hatching
Pelagic/
Juvenile
Neritic/
Juvenile
Growth and maturation Adult females
This PDF was later amended to make the document 508 compliant.
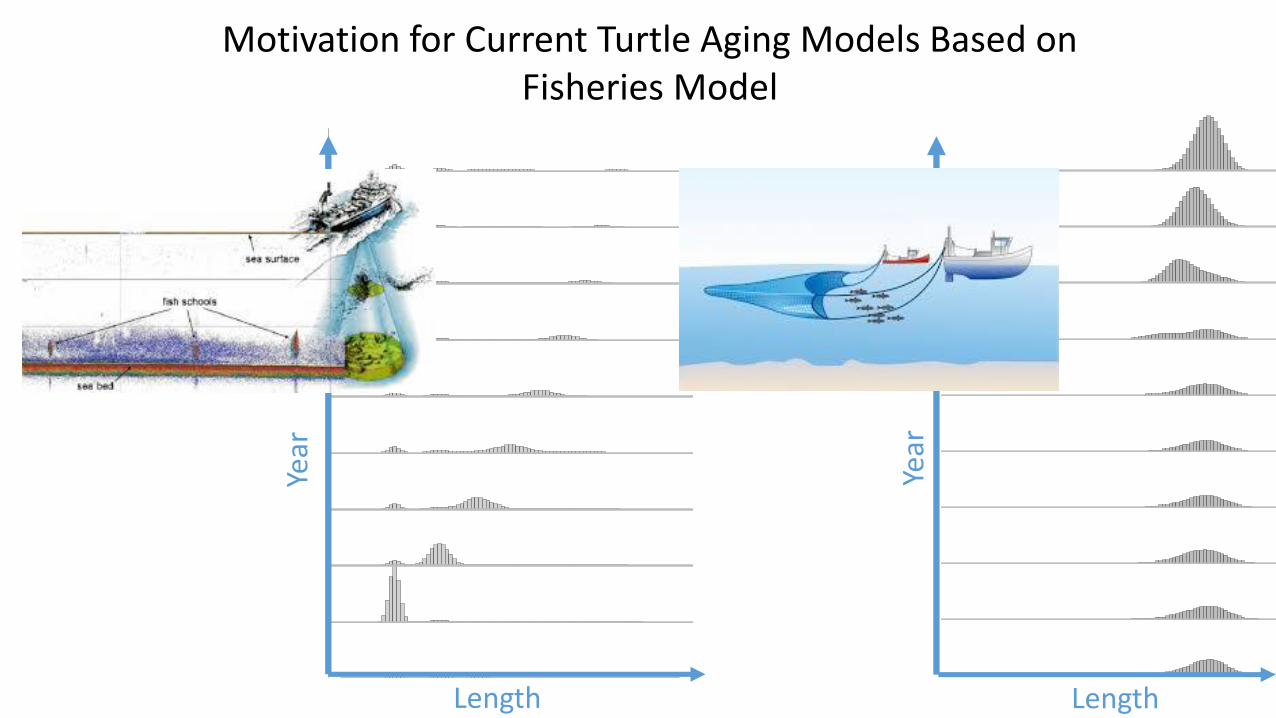
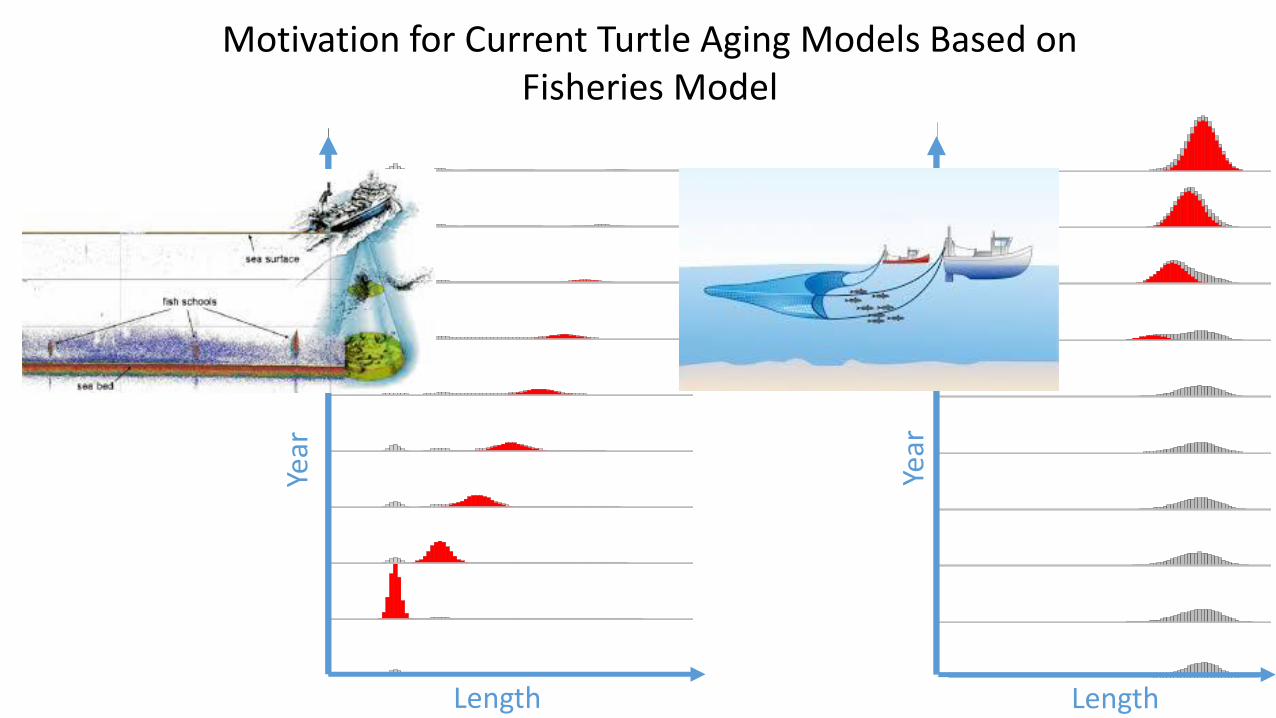
Motivation for Current Turtle Aging Models Based on Fisheries Model
Length Length
Year
Year
Motivation for Current Turtle Aging Models Based on Fisheries Model
Length Length
Year
Year
www.afsc.noaa.gov
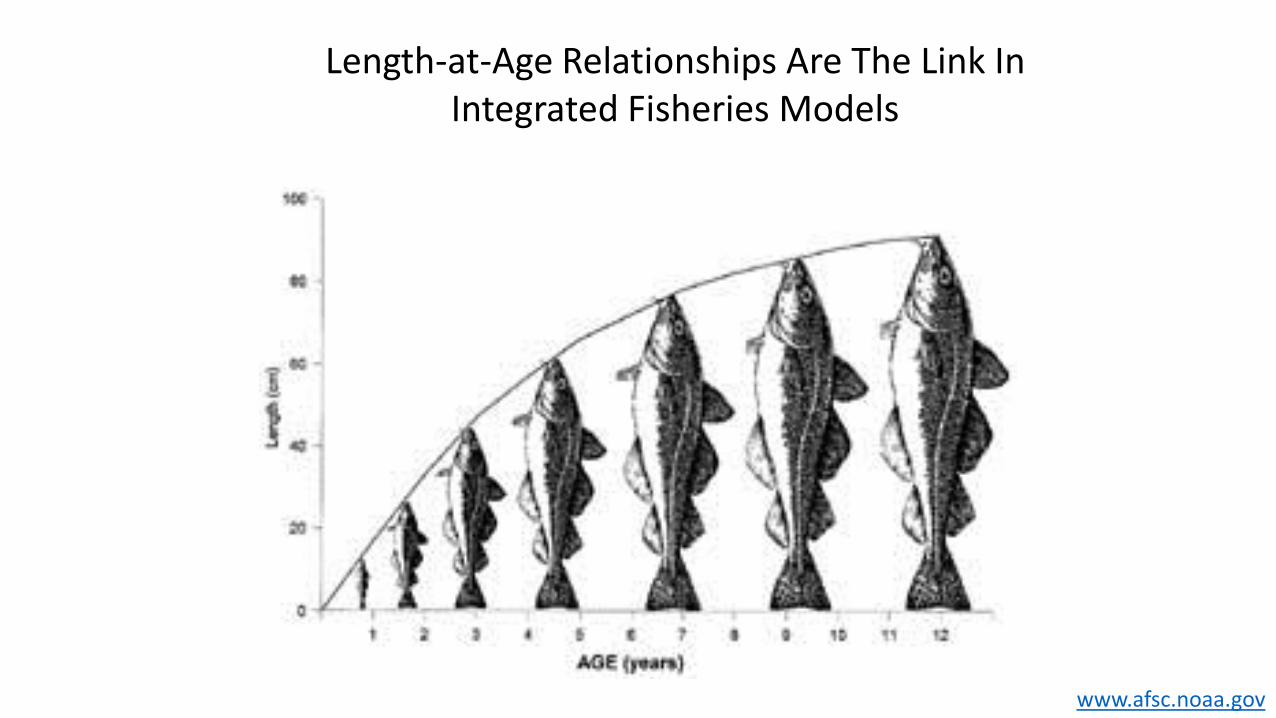
Length-at-Age Relationships Are The Link In Integrated Fisheries Models
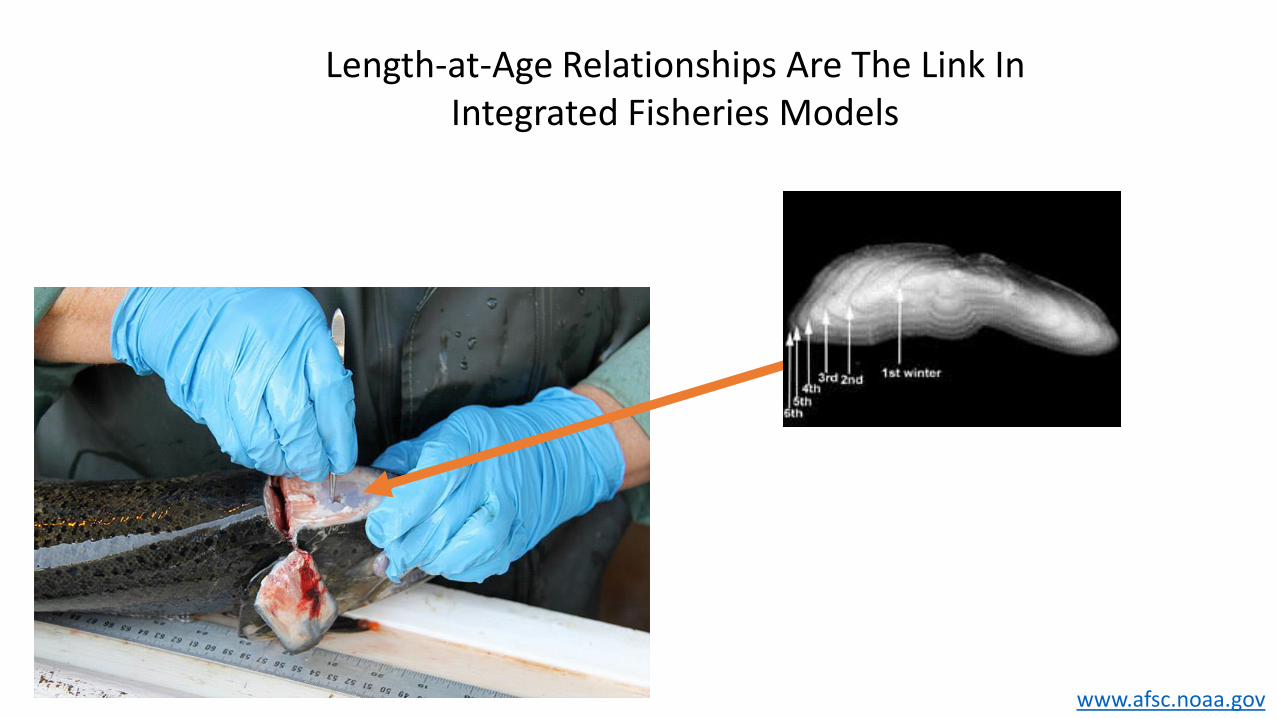
www.afsc.noaa.gov
Length-at-Age Relationships Are The Link In Integrated Fisheries Models

LengthG
row
th r
ate
0 20 40 60 80
-10
-5
0
5
10
15
20
Age
Le
ng
th
0 5 10 15 20 25 30 35
0
20
40
60
80
100
120

Ring count
Le
ng
th
0 5 10 15 20 25 30 35
0
20
40
60
80
100
120
LengthG
row
th r
ate
0 20 40 60 80
-10
-5
0
5
10
15
20
50 60 70 80 90 100
0
10
20
30
40
50
Mark-recapture sub-model
Length at capture (cm)
Gro
wth
rate
(cm
/yr)
5 10 15 20 25 30
0
10
20
30
40
Diameter-at-age sub-model
LAG number
Hum
era
l dia
mete
r
Aging sub-model
Age
Rela
tive li
kelih
ood
0 10 20 30 40 50 0 10 20 30 40 50 60
20
40
60
80
100
Length-at-age sub-model
Total LAG
Str
andin
g le
ngth
(cm
)
20 40 60 80 100
10
15
20
25
30
35
40
Max diameter sub-model
Stranding length (cm)
Hum
era
l dia
mete
r (m
m)
0 20 40 60
20
40
60
80
100
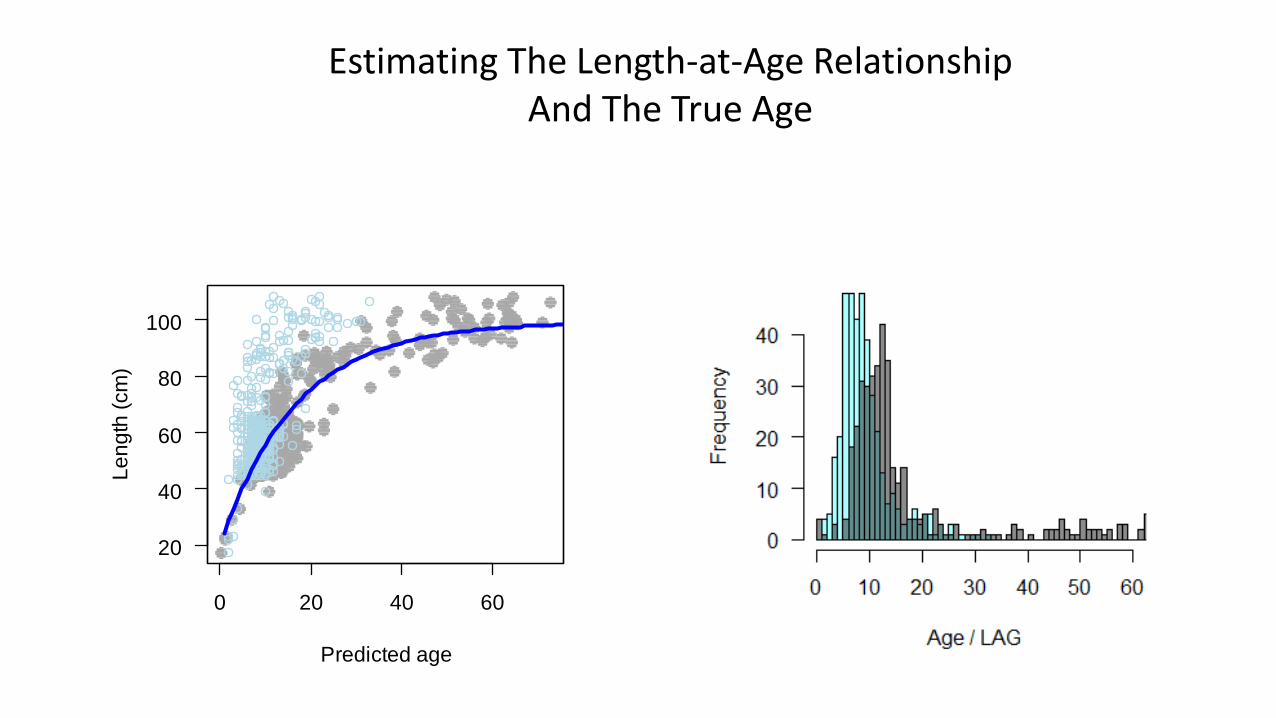
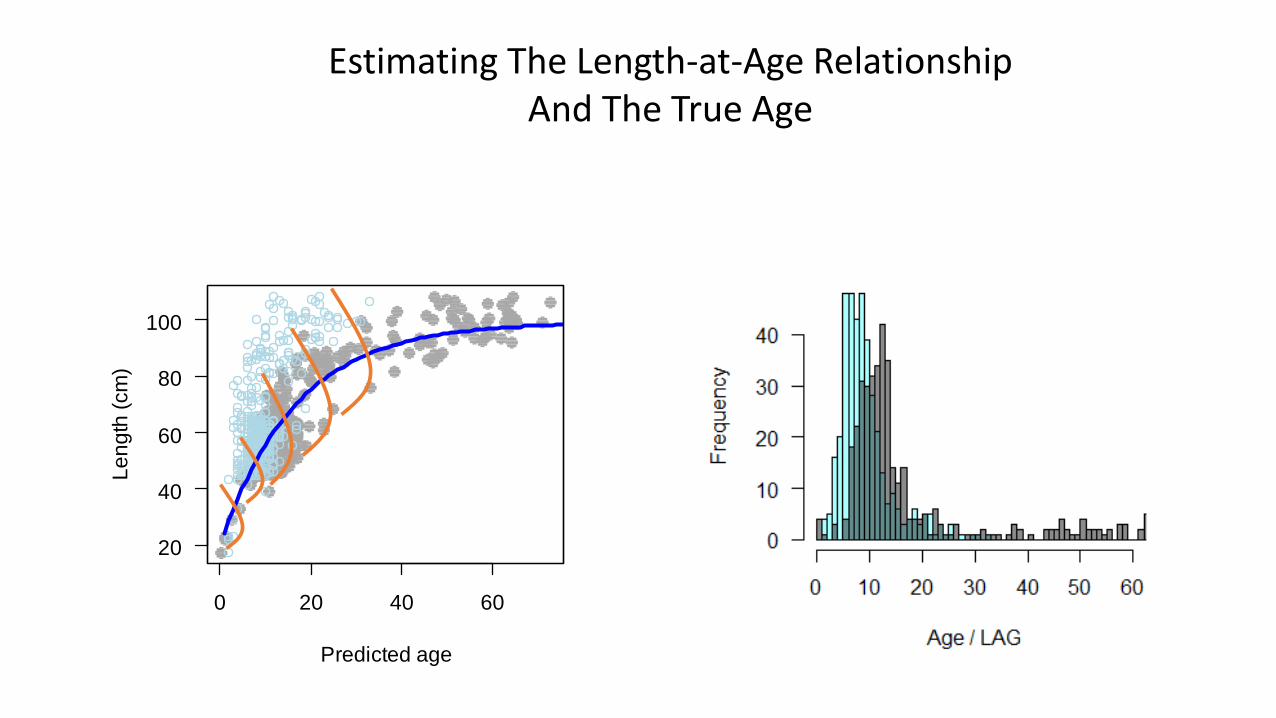
Predicted age
Le
ng
th (
cm
)
Estimating The Length-at-Age Relationship And The True Age
0 20 40 60
20
40
60
80
100
Predicted age
Le
ng
th (
cm
)
Estimating The Length-at-Age Relationship And The True Age

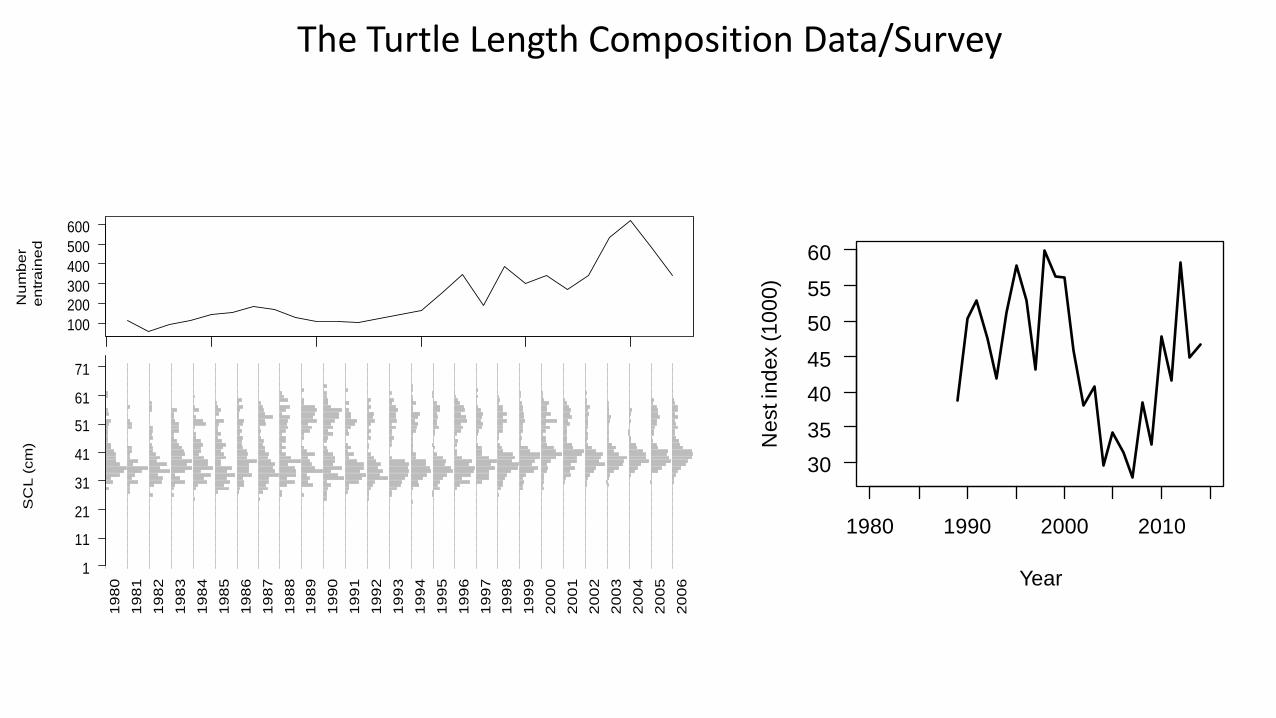
The Turtle Length Composition Data/Survey
1
11
21
31
41
51
61
71
SC
L (
cm
)
19
80
19
81
19
82
19
83
19
84
19
85
19
86
19
87
19
88
19
89
19
90
19
91
19
92
19
93
19
94
19
95
19
96
19
97
19
98
19
99
20
00
20
01
20
02
20
03
20
04
20
05
20
06
Nu
mb
er
en
tra
ine
d
Index
as.m
atr
ix(y
tab
)
100
200
300
400
500
600
1
11
21
31
41
51
61
71
SC
L (
cm
)
19
80
19
81
19
82
19
83
19
84
19
85
19
86
19
87
19
88
19
89
19
90
19
91
19
92
19
93
19
94
19
95
19
96
19
97
19
98
19
99
20
00
20
01
20
02
20
03
20
04
20
05
20
06
Nu
mb
er
en
tra
ine
d
Index
as.m
atr
ix(y
tab
)
100
200
300
400
500
600
1980 1990 2000 2010
30
35
40
45
50
55
60
Year
Ne
st in
de
x (
10
00
)
The Turtle Length Composition Data/Survey
• Characteristics of wild populations can be difficult to measure
Conclusions
• Characteristics of wild populations can
be difficult to measure • Integrated models can provide clarity
about the underlying process and uncertainty
Conclusions
• Characteristics of wild populations can
be difficult to measure • Integrated models can provide clarity
about the underlying process and uncertainty • This collaboration can provide
additional information to managers and researchers
Conclusions
• Incorporate stable isotope data •We want to incorporate juvenile
length based indices in the tool • Fishery dependent • Fishery independent
Next steps

Questions?
This PDF was later amended to make thedocument 508 compliant.