
Analysis of Simulation in Supply Chain Management Based on ...
8
Analysis of Simulation in Supply Chain Management Based on System Dynamics and SCOR Model (a Case Study : Newspaper Industry) Yasmine Husna Arsyifa 1, a , Yuniaristanto 2,b , I Wayan Suletra 3,c and Wahyudi Sutopo 4,d 1,2,3,4 Department of Industrial Engineering, Universitas Sebelas Maret, Surakarta, Indonesia a [email protected], b [email protected], c [email protected], d [email protected] Keywords: SCOR, System Dynamic, Performance, Newspaper Industry. Abstract. Supply Chain Management is a relationship between related components in a company. The relationship between the complex components of supply chain needs to be measured and evaluate the performance so it can be increased by effectively and the company can run the business properly. Case studies conducted in newspaper industry, supply chain cycle in the newspaper industry is less than 24 hours. In this research use simulation to supports making desicion through analyzing the system of the supply chain. The newspaper supply chain was simulated using the system dynamics software. SCOR model used as a tool to speed up the simulation modelling of supply chain. This research was conducted to make the model simulation of performance measurement in newspaper industry started in 2019 to 2022. The final results obtained for the Reliability attributes associated with Perfect Order Fulfillment is 99,59%. Responsiveness attributes associated with the Order Fulfillment Cycle Time about 3.3 hours from the target 4 hours. The Cost attributes was about 80.81% refers from total of material, production, and transportation cost divided by the sales. Agility attributes of upside flexibility about 3.3 hours and upside adaptability about 120.22% by the capacity of the machine. Assets Management attributes with cash to cash cycle time is about 27 days. Introduction Newspaper industry has unique supply chain characteristics, one of it is having a short cycle time or cycle time less than one day. The process source-make-deliver-return plan in the newspaper industry only lasts less than 24 hours. The process of preparation of production materials, pre-printed activities, production of making newspaper, distributing products and return of newspaper products is done with a limited time. At present, local newspaper companies have an average newspaper production of around 20,000 copies per day. The production has dropped to 10,000-20,000 from a decade ago. The presence of more than 10 local newspaper competitors also affects the interests and number of customers. Digitalization is also one of the main causes of the decline newspaper products until now. Newspaper industry system is a make-to-stock, but the number of products every day is based on agent requests every day and there are no newspapers stored or zero inventory. Fluctuations in product demand every day cause uncertainty over long-term raw material planning. This causes management in the newspaper industry supply chain not optimal. Several other causes decreased newspaper and various problems in the supply chain newspaper industry are caused by various cycles in the supply chain such as the customer oder cycle, replenishment cycle, manufacturing cycle, and procurement cycle. One of the way to optimize management supply chain recently is to take a performance measurement approach to the supply chain [2]. Analysis of performance measurement in a dynamic supply chain can be done with the SCOR (Supply Chain Operation Reference) model [6]. The SCOR model is divided into several processes such as Plan, Source, Make, Deliver, Return, and Enable and 1st International Conference on Engineering and Management in Industrial System (ICOEMIS 2019) Copyright © 2019, the Authors. Published by Atlantis Press. This is an open access article under the CC BY-NC license (http://creativecommons.org/licenses/by-nc/4.0/). Advances in Intelligent Systems Research, volume 173 212
Transcript of Analysis of Simulation in Supply Chain Management Based on ...
Analysis of Simulation in Supply Chain Management Based on System
Dynamics and SCOR Model (a Case Study : Newspaper Industry)
Yasmine Husna Arsyifa1, a, Yuniaristanto2,b, I Wayan Suletra3,c
and Wahyudi Sutopo4,d 1,2,3,4Department of Industrial Engineering, Universitas Sebelas Maret, Surakarta, Indonesia
[email protected], [email protected], [email protected],[email protected]
Keywords: SCOR, System Dynamic, Performance, Newspaper Industry.
Abstract. Supply Chain Management is a relationship between related components in a company.
The relationship between the complex components of supply chain needs to be measured and evaluate
the performance so it can be increased by effectively and the company can run the business properly.
Case studies conducted in newspaper industry, supply chain cycle in the newspaper industry is less
than 24 hours. In this research use simulation to supports making desicion through analyzing the
system of the supply chain. The newspaper supply chain was simulated using the system dynamics
software. SCOR model used as a tool to speed up the simulation modelling of supply chain. This
research was conducted to make the model simulation of performance measurement in newspaper
industry started in 2019 to 2022. The final results obtained for the Reliability attributes associated
with Perfect Order Fulfillment is 99,59%. Responsiveness attributes associated with the Order
Fulfillment Cycle Time about 3.3 hours from the target 4 hours. The Cost attributes was about 80.81%
refers from total of material, production, and transportation cost divided by the sales. Agility
attributes of upside flexibility about 3.3 hours and upside adaptability about 120.22% by the capacity
of the machine. Assets Management attributes with cash to cash cycle time is about 27 days.
Introduction
Newspaper industry has unique supply chain characteristics, one of it is having a short cycle time
or cycle time less than one day. The process source-make-deliver-return plan in the newspaper
industry only lasts less than 24 hours. The process of preparation of production materials, pre-printed
activities, production of making newspaper, distributing products and return of newspaper products is
done with a limited time. At present, local newspaper companies have an average newspaper
production of around 20,000 copies per day. The production has dropped to 10,000-20,000 from a
decade ago. The presence of more than 10 local newspaper competitors also affects the interests and
number of customers. Digitalization is also one of the main causes of the decline newspaper products
until now.
Newspaper industry system is a make-to-stock, but the number of products every day is based on
agent requests every day and there are no newspapers stored or zero inventory. Fluctuations in product
demand every day cause uncertainty over long-term raw material planning. This causes management
in the newspaper industry supply chain not optimal. Several other causes decreased newspaper and
various problems in the supply chain newspaper industry are caused by various cycles in the supply
chain such as the customer oder cycle, replenishment cycle, manufacturing cycle, and procurement
cycle.
One of the way to optimize management supply chain recently is to take a performance
measurement approach to the supply chain [2]. Analysis of performance measurement in a dynamic
supply chain can be done with the SCOR (Supply Chain Operation Reference) model [6]. The SCOR
model is divided into several processes such as Plan, Source, Make, Deliver, Return, and Enable and
1st International Conference on Engineering and Management in Industrial System (ICOEMIS 2019)
Copyright © 2019, the Authors. Published by Atlantis Press. This is an open access article under the CC BY-NC license (http://creativecommons.org/licenses/by-nc/4.0/).
Advances in Intelligent Systems Research, volume 173
212

the four main things are performance, process, practice, and people [14]. SCOR is also used to speed
up the simulations in the supply chain [8]. By conducting analysis of simulations on supply chain it
can function to design and planning supply chain performance [10]. Supply chain simulation is a tool
for designing, evaluating, and optimizing structures in the supply chain [20]. One goal in simulating
the supply chain is to evaluate performance and increase effectiveness in complex supply chains [19].
A few literature stating the system dynamics to simulation supply chain. Ozbayrak, Papadopoulou,
Akgun [12] used system dynamic modelling at manufacturing supply chain system. Ashayeri and
Lemmes [9] proposes a system dynamics simulation modeling framework which is has been tested,
validated with real-life case of LG. Philips Displays Europe. Georgiadis, Vlachos and Iakovou [13]
adopt the system dynamics methodology as a modeling and analysis tool to tackle strategic issues for
food supply chains. Higuchi and Troutt [16] use scneario based dynamic simulations in the case of
short product life cycle of the first of the virtual pet toys. Minegishi and Thiel [14] show how system
dynamics contribute to improving the complex behavior of an integrated food industry.
Persson and Olhager [7] present a supply chain simulation at manufacturing of mobile
communication system. Vlachos, Georgiadis and Iakovou [4] analyzed supply chain behavior
throught a simulation model based on the principles of the system dynamics methodology, which can
be used to evaluate alternative long-term capacity planning policies. Putri, Sutopo and Hisjam [1]
used SCOR simulation method in measuring supply chain performance in newspaper industry case.
Lestari et al [5] used simulation in supply chain in measure of performance at palm oil industy in
Malaysia with descrete-event simulation (DES). Immawan et al [17] used hybrid SCOR with System
Dynamics to measure the performance Make-To-Stock and Make-To-Order production in Batik
Industry.
The case of study of this research is related to newspaper industry. Unique industrial complexity
and characteristics, causing various problems to emerge in the newspaper industry supply chain cycle.
As well as newspaper industry supply chain management which is not optimal. For this reason,
research was conducted to measure the supply chain performance using the SCOR model and
dynamics simulation using powersim software.
Methodology
SCOR (Supply Chain Operation Reference) is one method used to measuring performance in the
manufacturing industry. In order to understand performance measurement at the company, it is
necessary to identify the system of supply chains the company first. In the identification of the
newspaper industry supply chain, each entity is represented in a box with each type of flow such as
material flow, information and data flow, and money flows between entities so that supply chains
occur in the supply chain industry. The data of this research was form February 2019 – April 2019.
And the attributes of performance measurement used SCOR version 11.0 with simulation using
powersim 10.
Newspaper supply chains have various entities involved, suppliers (suppliers of ink, plates, paper),
newspaper printing companies that carry out newspaper production processes, companies that make
newspaper content and publishers, newspaper agents and customers. The following is an illustration
of the newspaper supply chain in Fig.1:
Advances in Intelligent Systems Research, volume 173
213
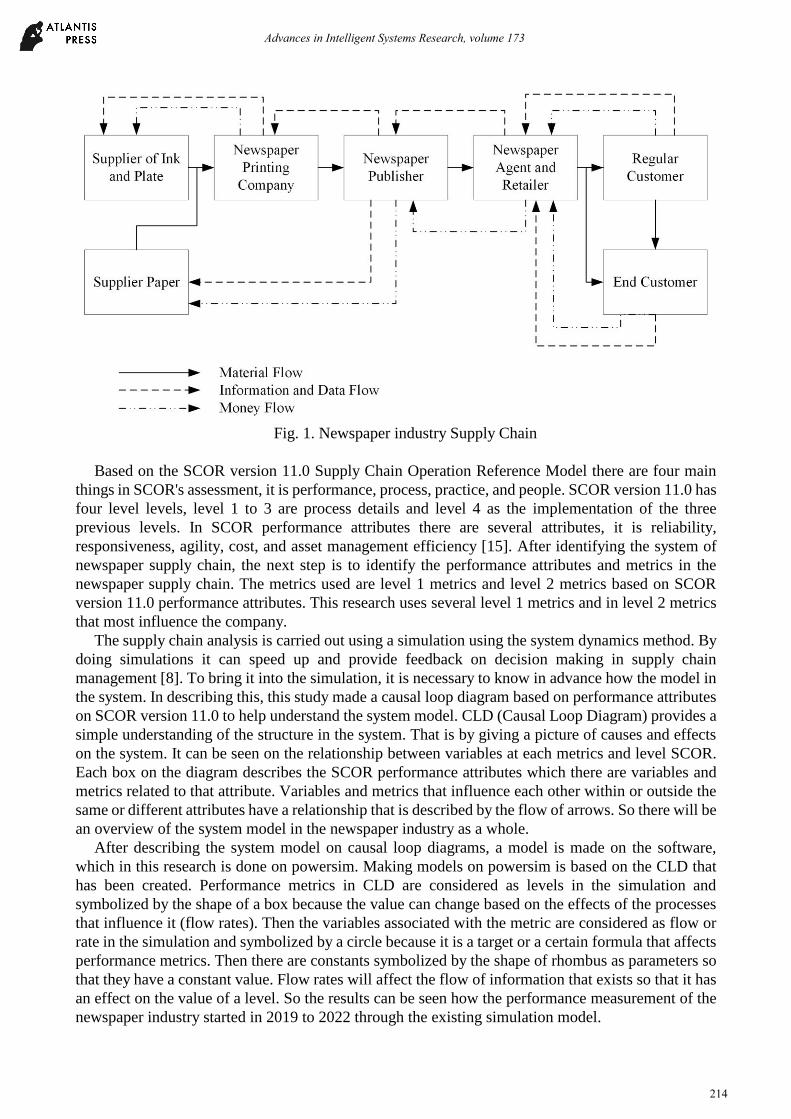
Fig. 1. Newspaper industry Supply Chain
Based on the SCOR version 11.0 Supply Chain Operation Reference Model there are four main
things in SCOR's assessment, it is performance, process, practice, and people. SCOR version 11.0 has
four level levels, level 1 to 3 are process details and level 4 as the implementation of the three
previous levels. In SCOR performance attributes there are several attributes, it is reliability,
responsiveness, agility, cost, and asset management efficiency [15]. After identifying the system of
newspaper supply chain, the next step is to identify the performance attributes and metrics in the
newspaper supply chain. The metrics used are level 1 metrics and level 2 metrics based on SCOR
version 11.0 performance attributes. This research uses several level 1 metrics and in level 2 metrics
that most influence the company.
The supply chain analysis is carried out using a simulation using the system dynamics method. By
doing simulations it can speed up and provide feedback on decision making in supply chain
management [8]. To bring it into the simulation, it is necessary to know in advance how the model in
the system. In describing this, this study made a causal loop diagram based on performance attributes
on SCOR version 11.0 to help understand the system model. CLD (Causal Loop Diagram) provides a
simple understanding of the structure in the system. That is by giving a picture of causes and effects
on the system. It can be seen on the relationship between variables at each metrics and level SCOR.
Each box on the diagram describes the SCOR performance attributes which there are variables and
metrics related to that attribute. Variables and metrics that influence each other within or outside the
same or different attributes have a relationship that is described by the flow of arrows. So there will be
an overview of the system model in the newspaper industry as a whole.
After describing the system model on causal loop diagrams, a model is made on the software,
which in this research is done on powersim. Making models on powersim is based on the CLD that
has been created. Performance metrics in CLD are considered as levels in the simulation and
symbolized by the shape of a box because the value can change based on the effects of the processes
that influence it (flow rates). Then the variables associated with the metric are considered as flow or
rate in the simulation and symbolized by a circle because it is a target or a certain formula that affects
performance metrics. Then there are constants symbolized by the shape of rhombus as parameters so
that they have a constant value. Flow rates will affect the flow of information that exists so that it has
an effect on the value of a level. So the results can be seen how the performance measurement of the
newspaper industry started in 2019 to 2022 through the existing simulation model.
Advances in Intelligent Systems Research, volume 173
214

Results and Discussion
Based on the identification of the newspaper industry supply chain that has been carried out, it is
known the SCOR process involved in each existing chain. It is necessary to identify performance
attributes on SCOR version 11.0 to find out what performance metrics are involved in the newspaper
industry. In research carried out, only use several level 1 metrics and level 2 metrics. The following is
metrics performance that will be used in simulation in Table 1:
Table 1. Metrics Performance Newspaper Industry
Attributes Metrics Level 1 Metrics Level 2 Item
Reliability Perfect Order Fulfillment Percentage
% of Order Delivered in Full
%
Delivery Performance to Customer Commit Date
%
Perfect Condition %
Responsiveness Order Fulfillment Cycle Time
Make Cycle Time Hour
Deliver Cycle Time Hour
Agility
Upside Supply Chain Flexibility
Upside Make Flexibility
%
Upside Adaptability
Upside Make Adaptability
%
Cost Total Cost to Serve
Purchased Material Cost
%
Production Cost % Transportation Cost
%
Asset Management Efficiency
Cash-to-Cash Cycle Time
Inventory Days of Supply
Days
Based on Table 1 can be seen that some metrics level 1 has been used. From reability attributes
there is one metric on level 1 is Perfect Order Fulfillment Presentase. Then on metrics level 2 used %
of Order Delivered in Full, Delivery Performance to Customer Commit Date and Perfect Condition.
The unit as percentage and the process involved in SCOR is Ship Product in the process
Make-To-Stock, Receive and verify Product by Customer and Load Product and Generate Shipping
Documents. The other attributes is responsiveness. On the responsiveness there is one metrics on
level 1 is Order Fulfillment Cycle Time. On responsiveness metrics level 2 used Make Cycle Time and
Deliver Cycle Time. The unit as hour and the process involed in SCOR is Make-To-Stock and Deliver
Stocked Product.
From agility attributes there are two metrics on level 2 , there are Upside Supply Chain Flexibility
and Upside Adaptability. Then on metrics level 2 used Upside Make Flexibility as the unit hour and
Upside Make Adaptability as the unit percentage. The process involved in SCOR is proces
Make-To-Stock. On the Cost attributes there is one metric on level 1, it is total cost to serve. On
metrics level 2 there are Purchased Material Cost, Production Cost and Transportation Cost. All the
unit as percentage and the process involved in SCOR is Source Stocked Product, Make-To-Stock and
Deliver Stocked Product. And on the Asset Management Efficiency attributes, there is one metrics
level 1 has been used. There is Cash-to-Cash Cycle Time and on level 2 metrics is Inventory Days of
Supply which is the unit as days. The process involved in SCOR are Identify, Prioritize and Aggregate
Advances in Intelligent Systems Research, volume 173
215

Supply Chain Resources, Balance Supply Chain Resources with Supply Chain Requirements,
Establish and Communicate Supply Chain Plans and Transfer Product.
Based on the identification metrics on newspaper industry in the table, hence a causal loop diagram
is made to describe the system model in the newspaper industry supply chain. The CLD has been
made based on five attributes on the SCOR versi 11.0. The others metrics and variabels involved in
case described the system model supply chain of newspaper industry. The following in Fig 2 is causal
loop diagram of in the newspaper industry that will be used as model system in a dynamic system
simulation :
Fig. 2. Causal Loop Diagram Model Newspaper Industry
Based on the CLD on the Fig 2, there is five attributes of the performance on the SCOR version
11.0. Every attributes involved each others and make the system on the supply chain of newspaper
industry. On the realibility attributes there is Perfect Order Fulfillment as the metrics level 1. Perfect
Order Fulfillment Rate be affected with Customer Complain. If the Customer Complain is high so
rate of Perfect Order Fulfillment will low and otherwise. Perfect Order Fulfillment be affected with
the Percentage of Schedule Order, Supplier Order Fulfillment and Customer Order Fulfillment. The
Percentage Schedule Order affected with Lot of Production which is affected with Upside Make
Adaptability. Upside Make Adaptability is the maximum sustainable percentage increase in
production that can be achieved in certain time with the assumption of no raw material constraints.
Then Supplier Order Fulfillment affected by Lot of Order which is affected by Inventory and the
others is Product Receipt which is affected by Material Cost. The Customer Order Fulfillment
affected by Demand,Verifying of Product Quality, Lot of Delivery and Delivery Performance. Which
is Demand is affected by the Percentage on Schedule Order. The Lot of Delivery also affected by
Delivery Cost and Delivery Performance affected by Due Time and Completion Time.
The Completion Time is affected by Make Cycle Time and Deliver Cycle Time on the other
attributes, it is responsiveness. The responsiveness atrtributes there is one metrics Order Fulfillment
Cycle Time. Order Fulfillment Cycle Time affected with Lot of Order. Which is if the order is high so
the cycle time is high too and it is affected the Total Cycle Time. The Total Cycle Time is included
Make Cycle Time and Deliver Cycle Time. The other attributes is cost. On the cost attributes there is
Advances in Intelligent Systems Research, volume 173
216

one metric, is Total Cost to Serve which affected with Cash owned by the company. Total Cost to
Serve affected by the outcomes. Besides, the Outcomes affected by Production Cost, Material Cost
and Delivery Cost. The Material Cost and Delivery Cost affected with several variables on the
realiability attribut, whereas Production Cost is affected by Upside Make Flexibility on the agility
attributes.
On the agility attributes, there are two metrics, upside supply chain flexibility and Upside
Adaptability. Upside Supply Chain Flexibility affected with Stock Of Materials and the Reduction
also Additional Production. Both of Additional and Reduction of the product will affect the Upside
Make Flexibility. Which is also affected the Production Cost on the cost attributes. Therefore, on the
Upside Adaptability Attributes affected with Capacity Machine and Additional of the products. And it
is affected to Upside Make Adaptability which is affected the Lot of Production on the reability
attributes. The last attributes is asset management efficiency. There is one metrics involved it is Cash
to Cash Cycle Time. Cash to Cash Cycle Time affected with the Sales of product. If the Sales is high
then the Cash to Cash Cycle Time also fast and the otherwise. Cash to Cash Cycle Time affected by
the Additional the production of the products. Which is will affects the Days of The Inventory Supply
and the Inventory. The Inventory of raw materials also will be affected the Lot of Orders of raw
materials.
Based on the CLD in Fig 2 can be described the newspaper industry supply chain model system
based on the identification of processes and metrics carried out based on SCOR version 11.0 on the
Table 1. Then, the system model is continued on the model in the software. This research will be done
using powersim software. The following are the models used in the software in this Fig 3 :
Fig, 3. Powersim Model Newspaper Industry
Based on the model on powersim in Fig 3 it can be done to provide feedback to the company with
running the simulation. The results of the simulation is on the Table 2.
Table 2. The Results of Simulation
No. Attributes Initial
Simulation Final Simulation Target
1 Reliability 99.25% 99.59% 99.50%
2 Responsiveness 4.7 hours 3.3 hours 4 hours
3 Agility 4.7 hours and
119%
3.3 hours and
120.22%
4.7 hours and
119%
4 Cost 81.76% 80.81% 80%
5 Asset Management 50 days 27 days 35 days
Advances in Intelligent Systems Research, volume 173
217

Based on the Table 2, the final results of simulation using powersim is the value of
performance measurement using SCOR model version 11.0 from realibility attributes the values is
about 99.59%, the attributes of responsiveness is 3.3 hours, the attributes of agility is 120.22%, the
attributes of the cost is 80.81%, and the attributes of asset mangement is 27 days. From the results the
attributes cost still below the target. With using simulations can issue performance value to the
company, the performance measurement in the newspaper industry like from the results above in
Table 2. The company also can looking for performance that is still belof from the target and in low
condition and make improvements so the supply chain in the newspaper industry can be done with
efficient and optimal.
Conclusion
The simulation model has been done in the real case of newspaper industry. The research can
provide the company to measure the perfomance in the company. Otherwise to know the performance
which has the low value and can affected the others chain on the whole supply chain of newspaper
industry. And the last to make improvements on the attributes or variables in the newspaper industry
supply chain so the industry can work optimal and efficiently. In the future, a research in newspaper
industry can be conducted with hybrid method of system dynamics and discrete event simulation on
the simulation of performance measurement so the results of performance measurement in newspaper
industry can be more optimal.
References
[1] A.S. Putri, W. Sutopo and M. Hisjam, in : Framework of Supply Chain Simulation using SCOR
Model in Newspaper Industry, Proceedings of the 2017 IEEE IEEM, p. 388-392.
[2] B. Kocaoglu, B. Gulsun and M. Tanyas, in : A SCOR Based Approach for Measuring a
Benchmarkable Supply Chain Performance, Journal Intell Manufacturing Vol 24 (2013),
springer, p. 113-132.
[3] C.E.V Daalen, M. Schaffernicht and I. Mayer, in : System Dynamics and Serious Games,
International Conference of the System Dynamics Society (2014).
[4] D. Vlachos, P. Georgiadis and E.Iakovou, in : A System Dynamics Model for Dynamic Capacity
Planning of Remanufacturing in Close-loop Supply Chains, Journal Computers and Operations
Reserach Vol 34 (2007), p. 367-394.
[5] F. Lestari, K. Ismail, A.A. Hamid, E. Supriyanto, N. Yanti and W. Sutopo, in : Supply Chain
Configuration Using Hybrid SCOR Model and Discrete Event Simulation, Proceedings of the
World Congress on Engineering 2014 Vol II .
[6] F. Persson, in : SCOR Template – A Simulation Based Dynamic Supply Chain Analysis Tool,
International Journal Production Economics Vol 131 (2011), p. 288-294.
[7] F. Persson and J. Olhager, in : Performance Simulation of Supply Chain Designs, International
Journal Production Economics Vol 77 (2002), p. 231-245.
[8] F. Persson and M. Nilsson, in : Supply Chain Dynamics in the SCOR Model – A Simulation
Modeling Approach, Proceedings of the 2012 Winter Simulation Conference (2012).
[9] J. Ashayeri and L. Lemmes, in : Economic Value Added of Supply Chain Demand Planning : A
System Dynamics Simulation, Journal of Robotics and Computer-Integrated Manufacturing Vol
22 (2006), p. 550-556.
Advances in Intelligent Systems Research, volume 173
218

[10] J.W. Herrmann, E. Lin and G. Pundoor, in : Supply Chain Simulation Modeling Using the Supply
Chain Operations Reference Model, Design Engineering Technical Conferences and Computers
and Information in Engineering Conference (2003).
[11]L.A. Malczynski, in : Best Practice for System Dynamics Model Design and Construction with
Powersim Studio, Sandia National Laboratories ,California (2011).
[12] M. Ozbayrak, T.C. Papadopoulou and M. Akgun, in: Systems Dynamics Modelling of a
Manufacturing Supply Chain System, Simulation Modelling Practice and Theory Vol 15 (2007),
p. 1338-1355.
[13] P. Georgiadis, D. Vlachos and E. Iakovou, in : A System Dynamics Modeling Framework for the
Strategic Supply Chain Management of Food Chains, Journal of Food Engineering Vol 70
(2005), p. 351-364.
[14] S. Minegishi and D. Thiel, in : System Dynamics Modeling and Simulation of a Particular Food
Supply Chain, Journal of Simulation Practice and Theory Vol 8 (2000), p. 321-339.
[15] Supply Chain Council, in : Supply Chain Operation Reference Model Revision 11.0 (2012).
[16] T. Higuchi and M.D. Troutt, in : Dynamic Simulation of the Supply Chain for a Short Life Cycle
Product – Lessons from the Tamagotchi Case, Journal of Computers and Operations Research
Vol 31 (2004), p. 1097-1114.
[17]T. Immawan, Marimin, Y. Arkeman and A. Maulana, in : Hybrid SCOR-SD Performance
Measurement MTS-MTO Production Typology for Batik Industry, Advanced Science Letters
Vol. 4 (2015), p. 400-407.
[18]T.W. Avianto, in : Tutorial Powersim, Kursus Analisis Kebijakan Menggunakan Model System
Dynamics, Laboratorium Pembangunan dan Lingkungan (2006).
[19]W. Kersten and M.A. Saeed, in : A SCOR Based Analysis of Simulation in Supply Chain
Management, Proceedings 28th European Conference on Modelling and Simulation.
[20]Y.H. Lee, M.K. Cho and Y.B. Kim, in : A Discrete-Continuous Combined Modeling Approach
for Supply Chain Simulation, SIMULATION Vol 78 Issue 5 (2002), p. 321-329.
Advances in Intelligent Systems Research, volume 173
219