
Annual report 2001 - HZDR · Annual Report 2001 Institute of Safety ... Thomas Höhne, Sören...
169
FORSCHUNGSZENTRUM ROSSENDORF WISSENSCHAFTLICH-TECHNISCHE BERICHTE FZR-342 Juni 2002 Annual Report 2001 Institute of Safety Research Editors: Prof. Frank-Peter Weiß Priv.-Doz. Dr. Udo Rindelhardt Mitglied der Wissenschaftsgemeinschaft Gottfried Wilhelm Leibniz
Transcript of Annual report 2001 - HZDR · Annual Report 2001 Institute of Safety ... Thomas Höhne, Sören...

FORSCHUNGSZENTRUM ROSSENDORF
WISSENSCHAFTLICH-TECHNISCHE BERICHTE
FZR-342Juni 2002
Annual Report 2001
Institute of Safety Research
Editors:Prof. Frank-Peter Weiß
Priv.-Doz. Dr. Udo Rindelhardt
Mitglied der Wissenschaftsgemeinschaft Gottfried Wilhelm Leibniz
CONTENTS
Preface
Selected Reports
Margitta Uhlemann, Jürgen Böhmert, Gudrun MüllerThe influence of hydrogen on the toughness of reactor pressure vessel steels 3
Andreas Ulbricht, Jürgen Böhmert, Hans-Werner ViehrigMicrostructural analysis of the reactor pressure vessel steel A533B C1.1 by smallangle neutron scattering 7
Hans-Georg Willschütz, Eberhard Altstadt, Frank-Peter Weiß, Bal Raj SehalScaled vessel failure experiment analysis and investigation of a possible vesselsupport 13
Horst-Michael Prasser, Arnd Böttger, Peter Schütz, Jochen Zschau,Albert Bschor, Joachim Henkel, Joseph HubensteinerLevel measurement system for boiling water reactors 18
Horst-Michael Prasser, Annalisa Manera, Arndt Böttger, Jochen ZschauFlow structure during flashing in the circus test facility modelling the start-up ofa boiling water reactor 26
Gerhard Grunwald, Thomas Höhne, Sören Kliem, Horst-Michael Prasser, Ulrich RohdeDensity effects on coolant mixing in pressurized water reactors 35
Sören Kliem, Siegfried Mittag, Reinhard KochAnalysis of a boron dilution transient using the code DYN3D coupled with thesemi-analytical coolant mixing model SAPR 41
Magarita KliemExperimental validation of crossflow in the reactor core geometry 45
Eckhard KrepperNumerical investigation and measurement of transient two-phase boiling in aheated pool 50
Bertram Böhmer, Gennady Borodkin, Jörg Konheiser, Gennadi ManturovTesting of neutron data libraries in application to reactor pressure vessel dosimetry 56
Roland Küchler, Klaus Noack, Torsten ZornResults of column and batch investigations of gypsum weathering 63
Eberhard Altstadt, Sven Eckert, Hartwig Freiesleben, Vladimir Galindo,Eckart Grosse, Bärbel Naumann, Klaus Seidel, Frank-Peter WeißDesign studies of a liquid lead neutron radiator for TOF experiments at ELBE 71
Günther Hessel, Jürgen Heidrich, Ralf Hilpert, Holger Kryk, Michael Roth,Wilfried Schmitt, Torsten Seiler, Frank-Peter WeißOn-line monitoring system for heterogeneous hydrogenation in stirred tank reactors 75
Tom Weier, Jürgen Hüller, Gunter GerbethMagnetic field influence on electrochemical processes 81
Olaf Pätzold, Ilmars Grants, Ulrike Wunderwald, Gunter GerbethInfluence of a rotating magnetic field on the crystal growth of GaAs 86
Andrey V. Anikeev, Petr A. Bagryansky, Alexander A. Ivanov, Alexander N. Karpushov,Klaus Noack, Svetlana L. StrogalovaUpgrade of the gas dynamic trap: physical concept and numerical models 91
Summaries of research activities 97
Publications 109
Publications in scientific and technical journals and in conference proceedings 111
Other oral presentations 121
FZR-Reports and other publications 124
Patents 127
Awards 131
Guests 135
Meetings and workshops 141
Seminars of the Institute 145
Lecture courses 151
Departments of the Institute 155
Personnel 159
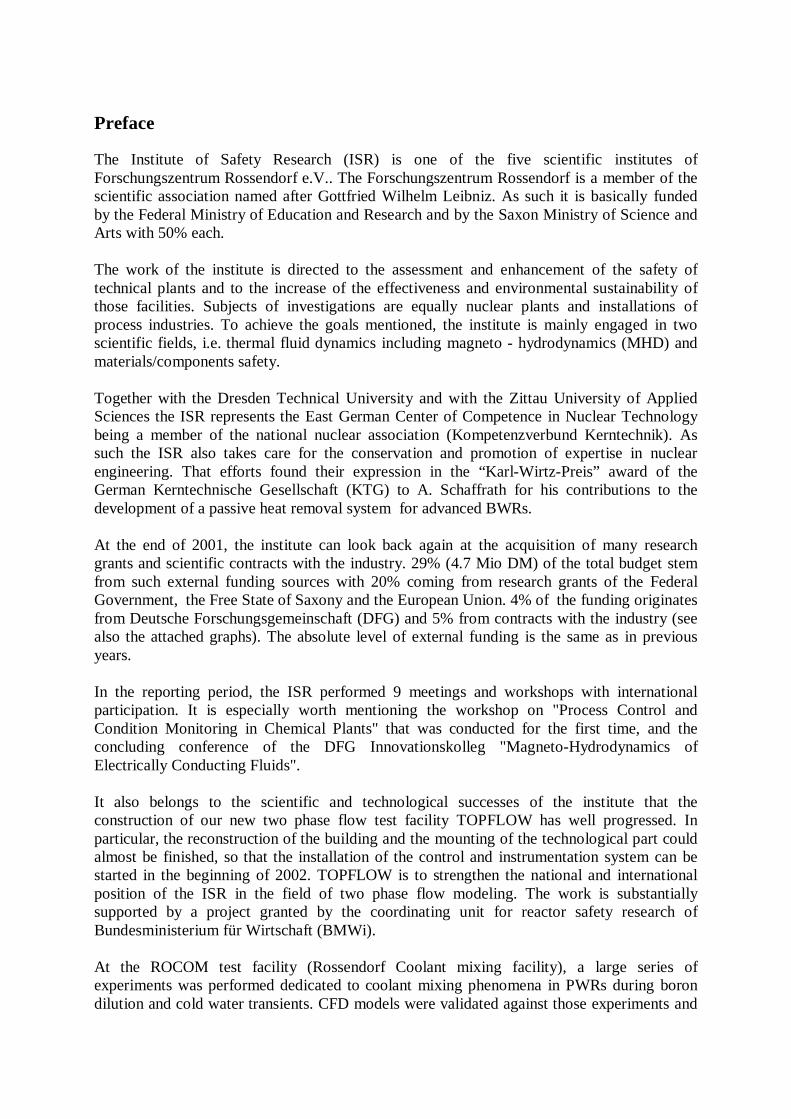
Preface
The Institute of Safety Research (ISR) is one of the five scientific institutes ofForschungszentrum Rossendorf e.V.. The Forschungszentrum Rossendorf is a member of thescientific association named after Gottfried Wilhelm Leibniz. As such it is basically fundedby the Federal Ministry of Education and Research and by the Saxon Ministry of Science andArts with 50% each.
The work of the institute is directed to the assessment and enhancement of the safety oftechnical plants and to the increase of the effectiveness and environmental sustainability ofthose facilities. Subjects of investigations are equally nuclear plants and installations ofprocess industries. To achieve the goals mentioned, the institute is mainly engaged in twoscientific fields, i.e. thermal fluid dynamics including magneto - hydrodynamics (MHD) andmaterials/components safety.
Together with the Dresden Technical University and with the Zittau University of AppliedSciences the ISR represents the East German Center of Competence in Nuclear Technologybeing a member of the national nuclear association (Kompetenzverbund Kerntechnik). Assuch the ISR also takes care for the conservation and promotion of expertise in nuclearengineering. That efforts found their expression in the “Karl-Wirtz-Preis” award of theGerman Kerntechnische Gesellschaft (KTG) to A. Schaffrath for his contributions to thedevelopment of a passive heat removal system for advanced BWRs.
At the end of 2001, the institute can look back again at the acquisition of many researchgrants and scientific contracts with the industry. 29% (4.7 Mio DM) of the total budget stemfrom such external funding sources with 20% coming from research grants of the FederalGovernment, the Free State of Saxony and the European Union. 4% of the funding originatesfrom Deutsche Forschungsgemeinschaft (DFG) and 5% from contracts with the industry (seealso the attached graphs). The absolute level of external funding is the same as in previousyears.
In the reporting period, the ISR performed 9 meetings and workshops with internationalparticipation. It is especially worth mentioning the workshop on "Process Control andCondition Monitoring in Chemical Plants" that was conducted for the first time, and theconcluding conference of the DFG Innovationskolleg "Magneto-Hydrodynamics ofElectrically Conducting Fluids".
It also belongs to the scientific and technological successes of the institute that theconstruction of our new two phase flow test facility TOPFLOW has well progressed. Inparticular, the reconstruction of the building and the mounting of the technological part couldalmost be finished, so that the installation of the control and instrumentation system can bestarted in the beginning of 2002. TOPFLOW is to strengthen the national and internationalposition of the ISR in the field of two phase flow modeling. The work is substantiallysupported by a project granted by the coordinating unit for reactor safety research ofBundesministerium für Wirtschaft (BMWi).
At the ROCOM test facility (Rossendorf Coolant mixing facility), a large series ofexperiments was performed dedicated to coolant mixing phenomena in PWRs during borondilution and cold water transients. CFD models were validated against those experiments and
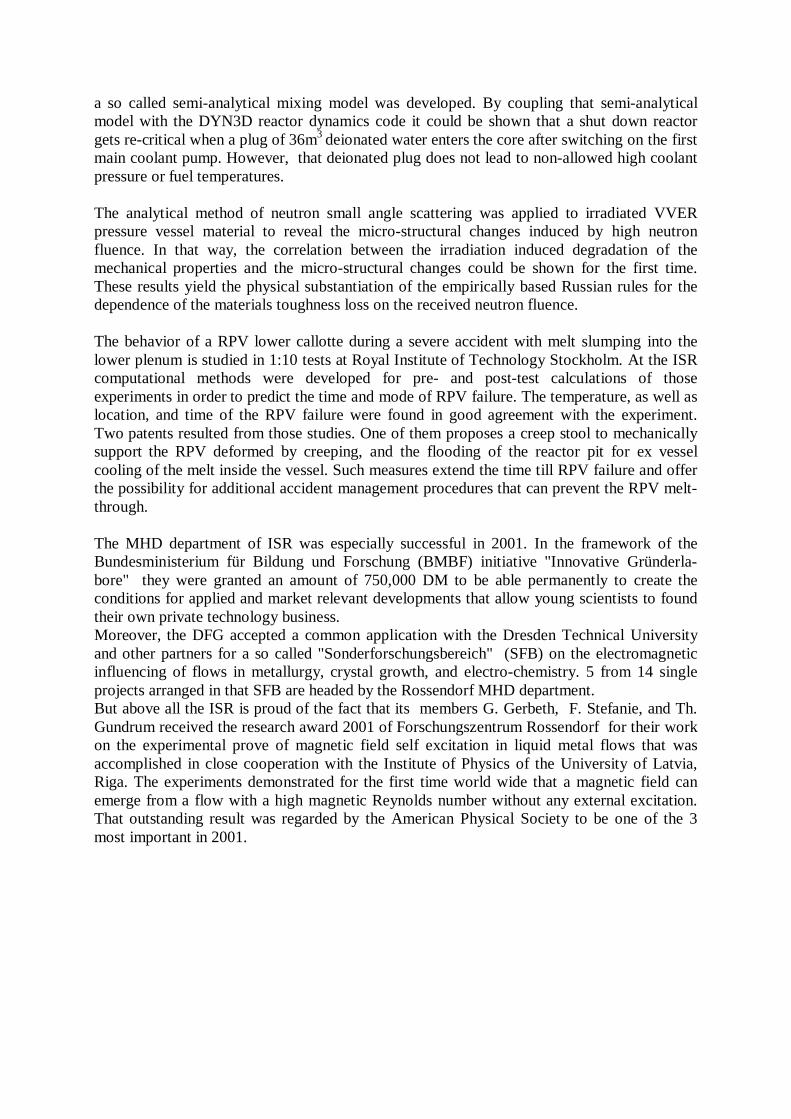
a so called semi-analytical mixing model was developed. By coupling that semi-analyticalmodel with the DYN3D reactor dynamics code it could be shown that a shut down reactorgets re-critical when a plug of 36m3 deionated water enters the core after switching on the firstmain coolant pump. However, that deionated plug does not lead to non-allowed high coolantpressure or fuel temperatures.
The analytical method of neutron small angle scattering was applied to irradiated VVERpressure vessel material to reveal the micro-structural changes induced by high neutronfluence. In that way, the correlation between the irradiation induced degradation of themechanical properties and the micro-structural changes could be shown for the first time.These results yield the physical substantiation of the empirically based Russian rules for thedependence of the materials toughness loss on the received neutron fluence.
The behavior of a RPV lower callotte during a severe accident with melt slumping into thelower plenum is studied in 1:10 tests at Royal Institute of Technology Stockholm. At the ISRcomputational methods were developed for pre- and post-test calculations of thoseexperiments in order to predict the time and mode of RPV failure. The temperature, as well aslocation, and time of the RPV failure were found in good agreement with the experiment.Two patents resulted from those studies. One of them proposes a creep stool to mechanicallysupport the RPV deformed by creeping, and the flooding of the reactor pit for ex vesselcooling of the melt inside the vessel. Such measures extend the time till RPV failure and offerthe possibility for additional accident management procedures that can prevent the RPV melt-through.
The MHD department of ISR was especially successful in 2001. In the framework of theBundesministerium für Bildung und Forschung (BMBF) initiative "Innovative Gründerla-bore" they were granted an amount of 750,000 DM to be able permanently to create theconditions for applied and market relevant developments that allow young scientists to foundtheir own private technology business.Moreover, the DFG accepted a common application with the Dresden Technical Universityand other partners for a so called "Sonderforschungsbereich" (SFB) on the electromagneticinfluencing of flows in metallurgy, crystal growth, and electro-chemistry. 5 from 14 singleprojects arranged in that SFB are headed by the Rossendorf MHD department.But above all the ISR is proud of the fact that its members G. Gerbeth, F. Stefanie, and Th.Gundrum received the research award 2001 of Forschungszentrum Rossendorf for their workon the experimental prove of magnetic field self excitation in liquid metal flows that wasaccomplished in close cooperation with the Institute of Physics of the University of Latvia,Riga. The experiments demonstrated for the first time world wide that a magnetic field canemerge from a flow with a high magnetic Reynolds number without any external excitation.That outstanding result was regarded by the American Physical Society to be one of the 3most important in 2001.
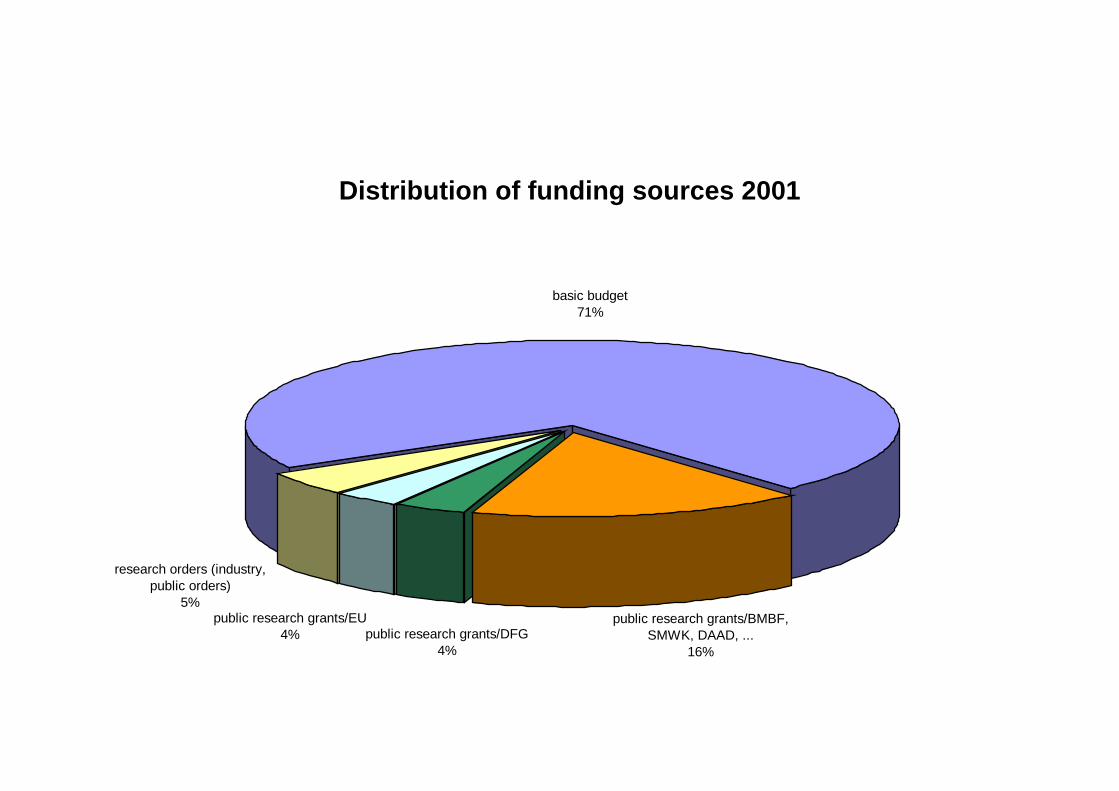
Distribution of funding sources 2001
public research grants/BMBF, SMWK, DAAD, ...
16%
research orders (industry, public orders)
5%
public research grants/DFG4%
public research grants/EU4%
basic budget71%

Deployment of funding on the task/projects 2001
materials and components safety14%
thermo-fluiddynamics44%
simulation of particle and radiation transport
6%
magneto-hydrodynamics of electrically conducting fluids
19%
accident analysis8%
safety and efficiency of chemical processes
9%

1
Selected reports

2

3
THE INFLUENCE OF HYDROGEN ON THE TOUGHNESS OFREACTOR PRESSURE VESSEL STEELS
Margitta Uhlemann1, Juergen Boehmert and Gudrun Mueller
1. Introduction
Low-alloyed ferritic steels are, just like high-alloyed austenitic steels, susceptible to H-embrittlement. In a nuclear reactor, corrosion or radiolysis lead to the formation of H-atomson the inner surface of the reactor pressure vessel and thus to a H-uptake during reactor op-eration.
In case the structural defects which arise as a result of irradiation become trapping centres forthe H-atoms, safety-affected synergisms between irradiation- and hydrogen-embrittlementneed to be considered.
Earlier investigations have shown that a H-content larger than 2.5 – 4 ppm effects a clear de-crease in toughness and above all causes total embrittlement for high strength steels (Rm ≥1200 MPa) [1]. After several years of exposure in the pressurized water of the reactor near thecore, these critical concentrations are not reached [2].
Pachur [3] developed a hypothesis which postulates an immediate link between radiation em-brittlement and the presence of hydrogen. Knowing that the phenomenon is not encompassedby the surveillance programmes, makes it of high relevance with regard to technical safety.Notwithstanding many findings which contradict Pachur’s hypothesis [4], the results de-scribed above should be seen as an incentive to reexamine earlier data on a more advancedexperimental basis.
The paper reports about new experiments in this field and portray data about hydrogen diffu-sion behaviour, the solubility of hydrogen and the influence of hydrogen on mechanical prop-erties. These data were taken from experiments on a variety of unirradiated pressure vesselsteels under conditions corresponding to those present in pressurized water reactors.
2. Experimental programme
The following reactor pressure vessel steels were investigated:
• A 508 Cl. 3 (Code: JFL)• A 533 B Cl. 1 (Code: JRQ)• 15 Xh2NMFAA (Code: WWER) and• 22NiMoCr 3.7 (Code: A2).
As was one weld material:
• 10XhMFT.
1 Institut für Festkörperphysik und Werkstoffforschung Dresden
4
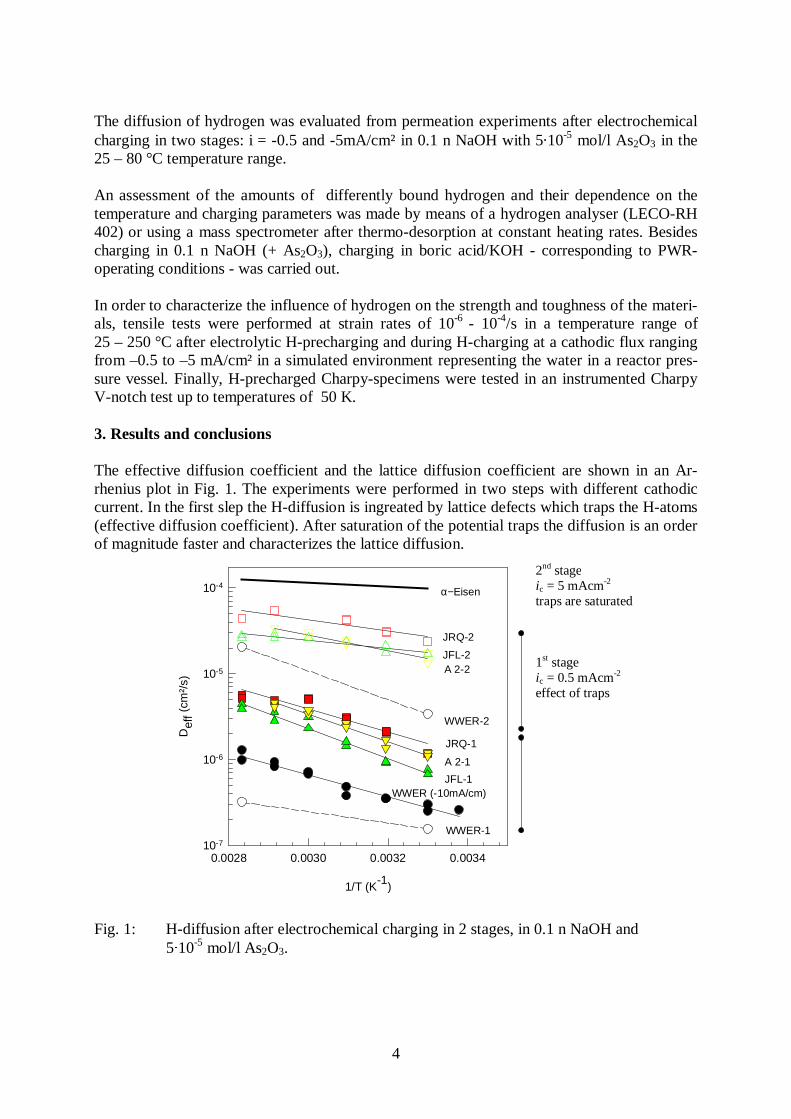
The diffusion of hydrogen was evaluated from permeation experiments after electrochemicalcharging in two stages: i = -0.5 and -5mA/cm² in 0.1 n NaOH with 510-5 mol/l As2O3 in the25 – 80 °C temperature range.
An assessment of the amounts of differently bound hydrogen and their dependence on thetemperature and charging parameters was made by means of a hydrogen analyser (LECO-RH402) or using a mass spectrometer after thermo-desorption at constant heating rates. Besidescharging in 0.1 n NaOH (+ As2O3), charging in boric acid/KOH - corresponding to PWR-operating conditions - was carried out.
In order to characterize the influence of hydrogen on the strength and toughness of the materi-als, tensile tests were performed at strain rates of 10-6 - 10-4/s in a temperature range of25 – 250 °C after electrolytic H-precharging and during H-charging at a cathodic flux rangingfrom –0.5 to –5 mA/cm² in a simulated environment representing the water in a reactor pres-sure vessel. Finally, H-precharged Charpy-specimens were tested in an instrumented CharpyV-notch test up to temperatures of 50 K.
3. Results and conclusions
The effective diffusion coefficient and the lattice diffusion coefficient are shown in an Ar-rhenius plot in Fig. 1. The experiments were performed in two steps with different cathodiccurrent. In the first slep the H-diffusion is ingreated by lattice defects which traps the H-atoms(effective diffusion coefficient). After saturation of the potential traps the diffusion is an orderof magnitude faster and characterizes the lattice diffusion.
1/T (K-1)
0.0028 0.0030 0.0032 0.0034
Def
f (cm
²/s)
10-7
10-6
10-5
10-4
WWER (-10mA/cm)JFL-1
JRQ-1
A 2-1
α−Eisen
WWER-2
JFL-2
JRQ-2
A 2-2
WWER-1
Fig. 1: H-diffusion after electrochemical charging in 2 stages, in 0.1 n NaOH and510-5 mol/l As2O3.
2nd stageic = 5 mAcm-2
traps are saturated
1st stageic = 0.5 mAcm-2
effect of traps
5
Table 1: H-concentration [ppm] in the initial condition and after charging and effusion atroom temperature and 250 °C (inaccuracy: ± 0.025 ppm)
Material Initialcondition
Boric acid / KOHic = -0.5 mA/cm²
solved + trappedtrappedRT 250°C
Boric acid / KOHic = -5 mA/cm²
solved + trapped
RT
0.1n NaOH + As2O3
ic = -5 mA/cm²solved + trappedtrappedRT RT
15Xh2NMFA 0.78 1.14 0.75 1.17 1.82 1.07
A533 - JRQ 0.39 0.64 0.5 0.81 0.81 1.21
A508 – JFL 0.90 1.47 0.74 0.81 1.36 1.36
22NiMoCr3.7 0.75 0.66 0.67 1.3 1.68 1.49
The JFL, JRQ and A2 steels show a diffusion behaviour which is comparable in both permea-tion steps. In the 15Xh2NMFAA (WWER) steel, however, the diffusion is clearly slower, inthe first, as well as in the second permeation step. This may be related to a higher defect con-centration and a different alloy composition (higher Cr-content) for this steel. The H-concentration after charging at room temperature and at 250 °C and the effusion at room tem-perature are given in table 1. Independently of the charging parameters and the material, theH-concentrations vary very little and remain well below the critical concentration of about 3ppm.
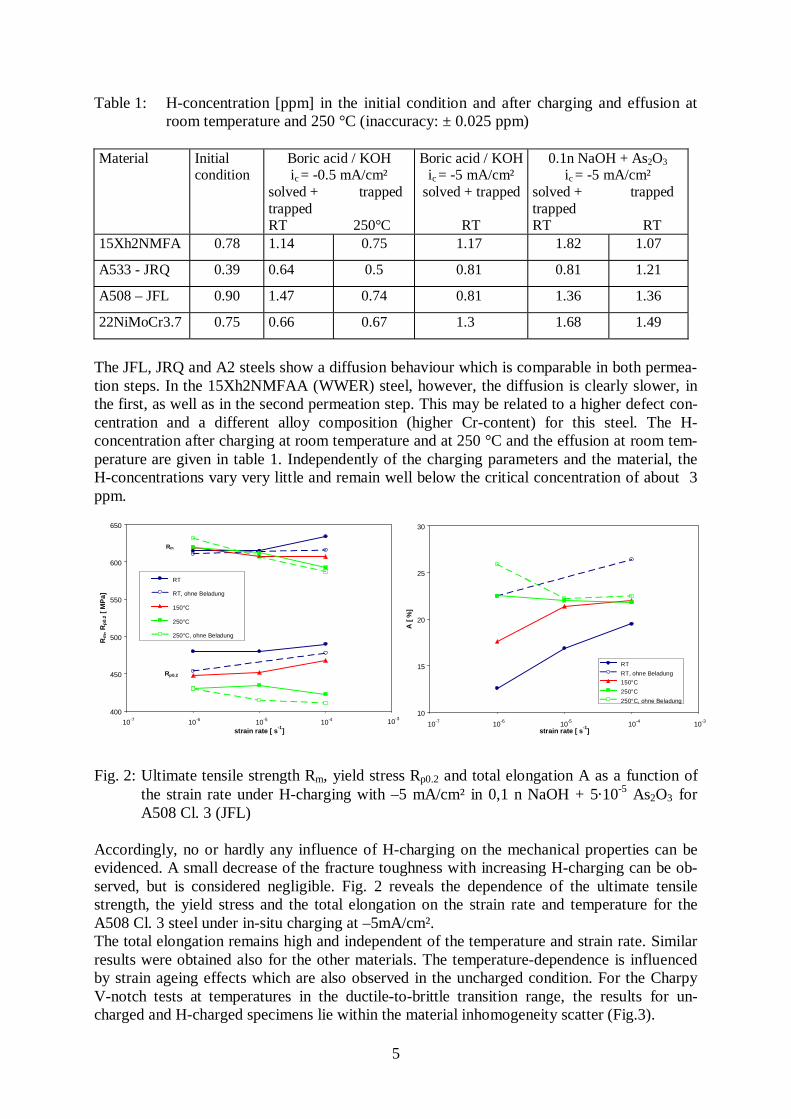
Fig. 2: Ultimate tensile strength Rm, yield stress Rp0.2 and total elongation A as a function ofthe strain rate under H-charging with –5 mA/cm² in 0,1 n NaOH + 510-5 As2O3 forA508 Cl. 3 (JFL)
Accordingly, no or hardly any influence of H-charging on the mechanical properties can beevidenced. A small decrease of the fracture toughness with increasing H-charging can be ob-served, but is considered negligible. Fig. 2 reveals the dependence of the ultimate tensilestrength, the yield stress and the total elongation on the strain rate and temperature for theA508 Cl. 3 steel under in-situ charging at –5mA/cm².The total elongation remains high and independent of the temperature and strain rate. Similarresults were obtained also for the other materials. The temperature-dependence is influencedby strain ageing effects which are also observed in the uncharged condition. For the CharpyV-notch tests at temperatures in the ductile-to-brittle transition range, the results for un-charged and H-charged specimens lie within the material inhomogeneity scatter (Fig.3).
400
450
500
550
600
650
34567
strain rate [ s-1
]
Rm
, Rp
0.2 [
MP
a]
RT
RT, ohne Beladung
150°C
250°C
250°C, ohne Beladung
Rm
10-7 10-6 10-5 10-4 10-3
Rp0.2
10
15
20
25
30
34567
strain rate [ s-1
]
A [
%]
RT
RT, ohne Beladung
150°C
250°C
250°C, ohne Beladung
10-7 10-6 10-5 10-4 10-3
6
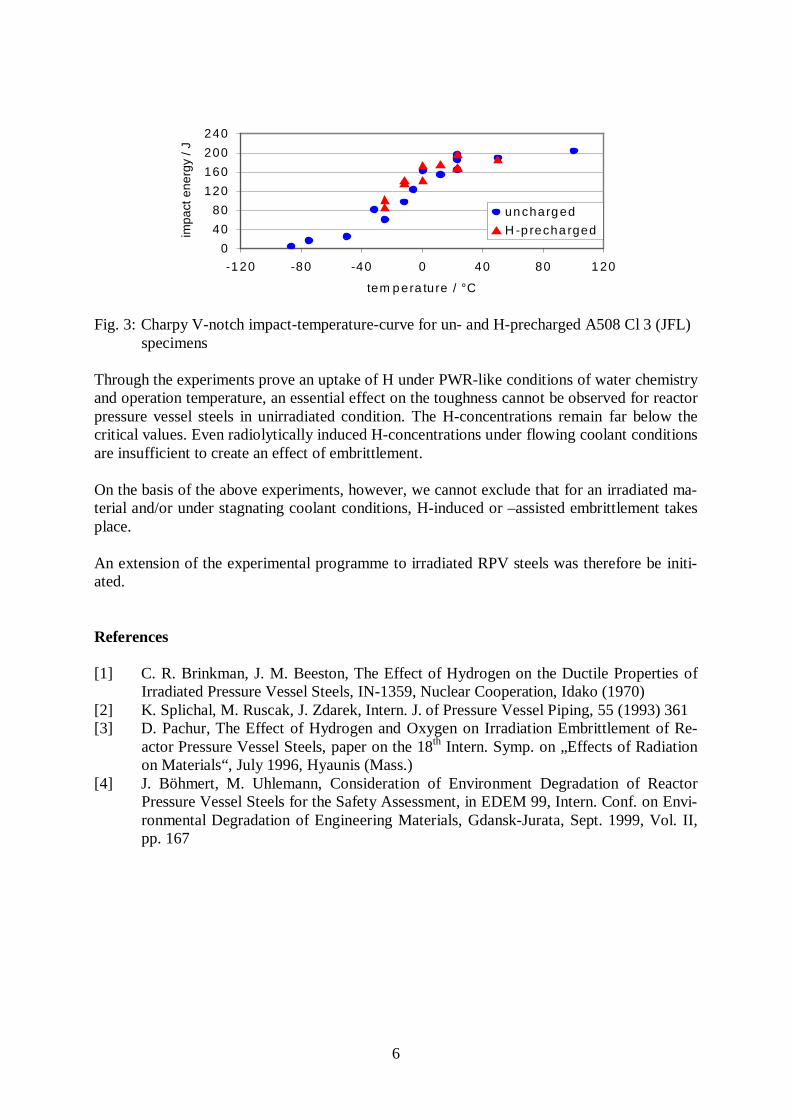
Fig. 3: Charpy V-notch impact-temperature-curve for un- and H-precharged A508 Cl 3 (JFL)specimens
Through the experiments prove an uptake of H under PWR-like conditions of water chemistryand operation temperature, an essential effect on the toughness cannot be observed for reactorpressure vessel steels in unirradiated condition. The H-concentrations remain far below thecritical values. Even radiolytically induced H-concentrations under flowing coolant conditionsare insufficient to create an effect of embrittlement.
On the basis of the above experiments, however, we cannot exclude that for an irradiated ma-terial and/or under stagnating coolant conditions, H-induced or –assisted embrittlement takesplace.
An extension of the experimental programme to irradiated RPV steels was therefore be initi-ated.
References
[1] C. R. Brinkman, J. M. Beeston, The Effect of Hydrogen on the Ductile Properties ofIrradiated Pressure Vessel Steels, IN-1359, Nuclear Cooperation, Idako (1970)
[2] K. Splichal, M. Ruscak, J. Zdarek, Intern. J. of Pressure Vessel Piping, 55 (1993) 361[3] D. Pachur, The Effect of Hydrogen and Oxygen on Irradiation Embrittlement of Re-
actor Pressure Vessel Steels, paper on the 18th Intern. Symp. on „Effects of Radiationon Materials“, July 1996, Hyaunis (Mass.)
[4] J. Böhmert, M. Uhlemann, Consideration of Environment Degradation of ReactorPressure Vessel Steels for the Safety Assessment, in EDEM 99, Intern. Conf. on Envi-ronmental Degradation of Engineering Materials, Gdansk-Jurata, Sept. 1999, Vol. II,pp. 167
0
40
80
120
160
200
240
-1 20 -80 -40 0 40 80 1 20
tem p era ture / °C
impa
ct e
nerg
y / J
un charg ed
H -p recha rged
7
MICROSTRUCTURAL ANALYSIS OF THE REACTOR PRESSUREVESSEL STEEL A533B Cl.1 BY SMALL ANGLE NEUTRON
SCATTERING
Andreas Ulbricht, Jürgen Böhmert, Hans-Werner Viehrig
1. Introduction
The microstructures that evolve in the reactor pressure vessel (RPV) steels during neutronirradiation, primarily as a consequence of radiation-enhanced diffusion and defect clustering,are extremely fine-scaled, i.e. in the magnitude of a few nanometres. Small angle neutronscattering (SANS) experiments are able to detect such small clusters and can provide not onlyqualitative but also quantitative information about the microstructure after neutron irradiationand so help to develop physical understanding of the irradiation-induced ageing mechanisms.
The following paper reports about results of SANS experiments on an A533B Cl.1-typereactor pressure vessel steel, designated JRQ. This steel has been used as IAEA referencesteel [1] and shows a high sensitivity against radiation embrittlement. Specimens from thismaterial were irradiated to three different levels of neutron fluences and then mechanicallytested by several testing methods. Thus, the investigation allows to realize the dependence ofthe microstructure and mechanical behaviour on the fluence. Similar investigations wereexecuted on VVER-type RPV steels, which differ from the Western RPV steel design [2, 3].The comparison of the irradiation behaviour of steels of both provenances is included.
2. Experimental
The investigated material comes from the 1/4 to 3/4 thickness location of the East Germancontribution of the 227 mm thick rolling plate JRQ ( 3JRQ 57) made by Nippon SteelCorporation. The material meets the ASTM A533B Cl.1 steel specification. The chemicalcomposition is given in Table 1.
Table 1: Chemical composition of the steel A533B Cl.1 (values in wt.-%, rest Fe).
C Si Mn Cr Mo Ni P Cu S Al
0.18 0.24 1.42 0.12 0.51 0.84 0.02 0.14 0.007 0.02
Charpy V-notched specimens according to the standard or modified for fracture mechanicstests (pre-cracked and side-grooved) and small-size tensile test specimens were machined andirradiated in the Rheinsberg VVER-2 prototype reactor. The reactor is equipped with twotypes of irradiation channels, core-near high flux channels (neutron flux: 1 - 4 ·1012 cm-2s-1)and core-far surveillance channels of lower neutron flux (1 - 2 ·1011 cm-2s-1, En > 1 MeV). Thehigh flux channels have a large cross section and, as the consequence of that, a large radialneutron flux gradient. Considering both the different channel types and the radial gradients, itwas possible to group three sets of specimens with three levels of neutron fluences. Theirradiation was accompanied by an extended spatial analysis of the neutron fluences based onsophisticated Monte Carlo calculation and neutron-dosimetry measurements. The details ofthe irradiation and the determination of the neutron fluences are presented in [4, 5].
8
Mechanical tests after irradiation comprise tensile tests, Charpy impact tests and 3-point bendtests for T0-determination according to the master-curve concept. Furthermore the Vickershardness HV 10 was determined. The results of the mechanical testing will be reportedelsewhere. Discs of thickness of about 0.8 mm were cut from tested Charpy specimens andused for SANS measurements.
The SANS measurements were carried out at the spectrometer V4 at HMI Berlin [6]. Thesamples were placed in a saturating magnetic field (B = 1.4 T) perpendicular to the neutronbeam direction (wavelength λ = 0.6 nm; beam diameter 7 mm). Two distances of 1.1 and 4 mbetween the 2-dimensional position sensitive detector consisting of 64×64 cells with a size of1×1 cm2 and the sample were adjusted, covering a range of the scattering vector Q from 0.2 to3.0 nm-1. A comprehensive description of the raw-data treatment formula, including the trans-mission measurement, background, sensitivity corrections and calibration, is given in [7].
Steel is a polydisperse system, i.e., the particles (defect clusters, precipitates, carbides etc.) inthe scattering volume (matrix) have several sizes, shapes and internal structures. Thus, thedifferential macroscopic scattering cross section separated in a coherent and incoherent termis given by
,d
dd,
d
d
INC0
23V Ω
ΣΩΣ
∞
+= RR)(QFR(R)Da(Q) (1)
where ( )αηη 22mag
2nucV sin∆∆
d
d +=R
c(R)(R)D (2)
is the size distribution function of particles with radius R and volume content c weighted withthe scattering contrast ∆η2. Here, nuclear (∆η2
nuc) and magnetic (∆η2mag) contributions are
distinguished. α is the angle between the scattering vector and magnetization direction of thesample. The value of the scattering vector is
2sin
π4 Θλ
=Q (3)
with the angle Θ between incident and scattered beam. F 2(Q, R) is the shape factor, where
( )33
cossin3,
RQ
QRQRQRR)F(Q
−= (4)
and the constant a = 4π/3 in the case of spherical particles. Generally, ∆η, the difference ofthe scattering length density of the particle and matrix, depends on R if the particles havedifferent internal structures. For particles with known and identical shape DV(R) can beestimated by the indirect Fourier transformation method derived by Glatter [8]. If thescattering contrast is known the absolute value of the size distribution relating to the numberdensity or the volume fraction of the particles can be calculated.
The irradiation-induced defect content is
∞∞
−=0 unirr0 irr
dd
dd
d
d∆ R
R
cR
R
cc . (5)
The so-called A-ratio, the ratio between the coherent SANS cross section perpendicular andparallel to the direction of magnetization, contains information about the chemicalcomposition or the structure of the particles respectively. It is a function of Q in the cases thatthere are particles of different types (internal structures) and sizes.
9
3. Results
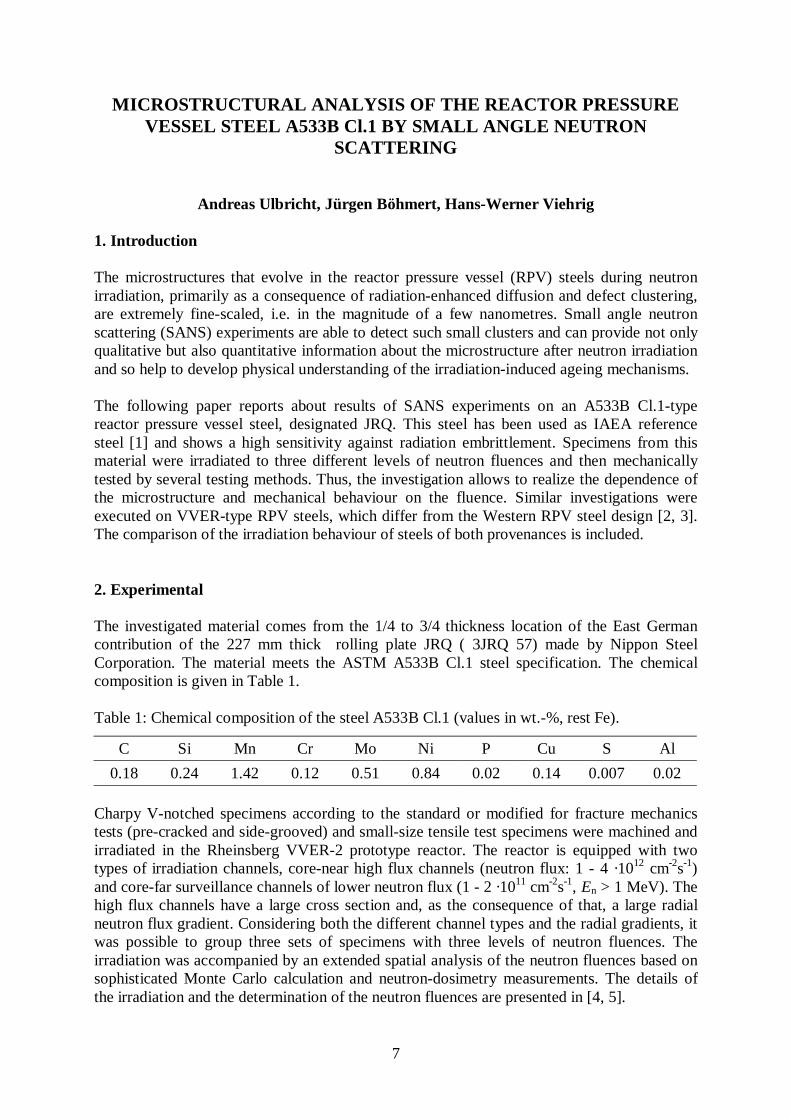
The total scattering intensity measured perpendicular to the direction of magnetization is de-picted in Fig. 1 for the unirradiated and the three irradiated samples. The dpa-values of 0.010,
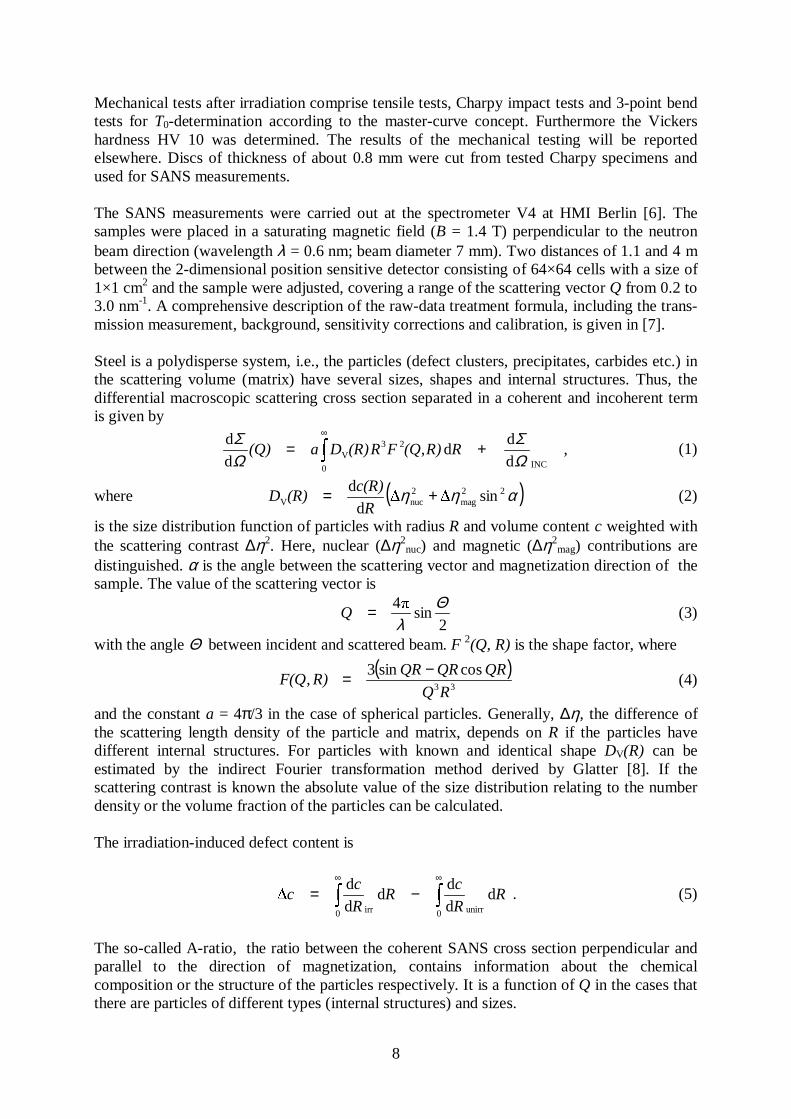
0.078 and 0.133 correspond to neutronfluences of 7 to 96 ·1018 cm-2 [En > 1 MeV].The scattering intensity contains a consider-able contribution of incoherent scatteringwhich mainly appears in the nuclear scat-tering and is caused by the different Feisotopes. The incoherent magnetic scatteringis approximately one order of magnitudelower. By means of the Porod law estab-lishing a dependence of Q-4 for the coherentscattering contribution, the incoherent onecan be determined and subtracted. The resultsof this operation are shown in Fig. 2.
0.001
0.01
0.1
1
10
0.001
0.01
0.1
1
10
1
0.001
0.01
0.1
1
10
a)
dΣ/d
Ω (
Q, α
= π
/2)
/ cm
-1sr
-1
b)
dΣ/d
Ω (
Q, α
= 0
) / c
m-1sr
-1
c)
irradiation0.133 dpa0.078 dpa0.010 dpaunirradiated
320.50.30.2Q / nm
-1
dΣ/d
Ω (
Q) m
ag
/ cm
-1sr
-1
Fig. 2: Coherent SANS cross section of thesteel A533B a) nucl.+mag. b) nucl.c) mag. scattering contribution.
0
2000
4000
6000
0
1000
2000
0 5 10 150.0
0.1
0.2
0.3
0.4
irradiation0.133 dpa0.078 dpa0.010 dpa
unirradiated
a)
DV (R
, α =
π/2
) / a
rbit
.u.
b)
DV (
R, α
= 0
) /
arbi
t.u.
c)irradiation induceddefect content ∆c0.133 dpa ∆c = 0.50 vol.%0.078 dpa ∆c = 0.34 vol.%0.010 dpa ∆c = 0.20 vol.%
R / nm
dc/d
R
/ vol
.% n
m-1
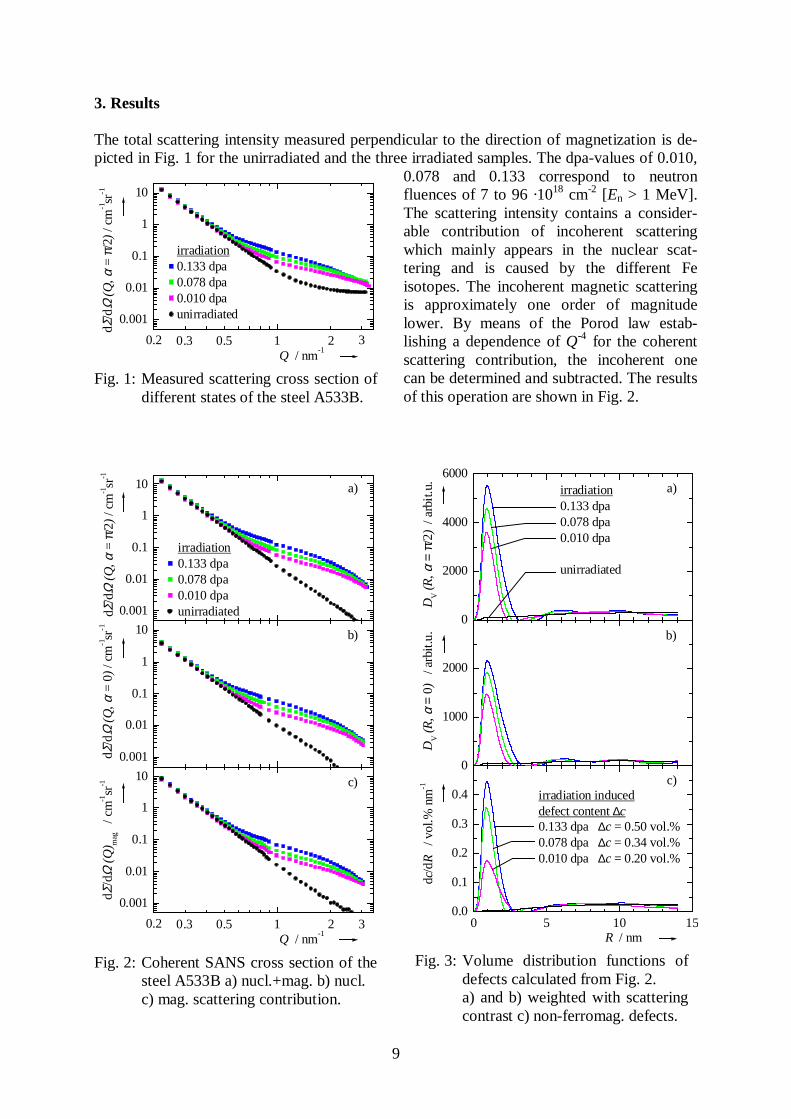
Fig. 3: Volume distribution functions ofdefects calculated from Fig. 2.a) and b) weighted with scatteringcontrast c) non-ferromag. defects.
1
0.001
0.01
0.1
1
10
irradiation0.133 dpa0.078 dpa0.010 dpaunirradiated
320.50.30.2Q / nm
-1
dΣ/d
Ω (
Q, α
= π
/2)
/ cm
-1sr
-1
Fig. 1: Measured scattering cross section ofdifferent states of the steel A533B.
10
Irradiation enhances the coherent scattering intensity for Q > about 0.4 nm-1 in every case.The effect increases with increasing neutron fluence. In the lower Q-range there are hardlydifferences between the different material conditions. The volume fraction-related sizedistributions calculated from the coherent SANS cross section curves are shown in Fig. 3. Asmentioned above the magnetic contribution provides absolute volume fractions. Bothmagnetic and nuclear SANS cross section provide similar size distribution functions. In theunirradiated state the size distribution possesses only a weak broad peak for particles with R >5 nm. This course is not affected by irradiation. Additionally and as a clearly distinguishingmark, the irradiation provokes a sharp peak between 0 < R < 3 nm with the maximum near R= 1 nm. The location of the maximum does not depend on the fluence within the accuracy.Instead, the height of the maximum clearly increases with increasing fluence. Furthermore, inthe case of size distribution calculated from the nuclear cross section the range of the peakshifts up to a larger radius. This can be interpreted as indication of irradiation-enhancedgrowth of the particles. The volume fraction adds up 0.01 % for the unirradiated state and0.21 %, 0.35 % and 0.51 % for the irradiated condition of dpa-values 0.010, 0.078 and 0.133.
The A-ratio varies between 2.2 and 3.1 in the Q-range from 0.2 to 3 nm-1 for all materialconditions. In the range between 0.8 and 2.5 nm-1, in which the particles of about 1 nm radiusspecially scatter, the A-ratio is nearly constant and amounts to 2.2 - 2.4.
4. Discussion
The evolution of nanoscaled microstruc-tural defects with a mean radius of about1 to 2 nm due to neutron irradiation isalso proven for other type of RPV steelsand in other investigations [9] and seemsto be a characteristic feature independentof composition and initial microstructure.
For the material investigated, there is areally strong effect that approximatelylinearly increases with the fluence for dpa> 0.01 as shown in Fig. 4. The materialhas a relatively high Cu content of 0.14wt.-% and should be specially sensibleagainst neutron embrittlement. At leastpartly, the high effect is caused by thelow irradiation temperature of about255°C.
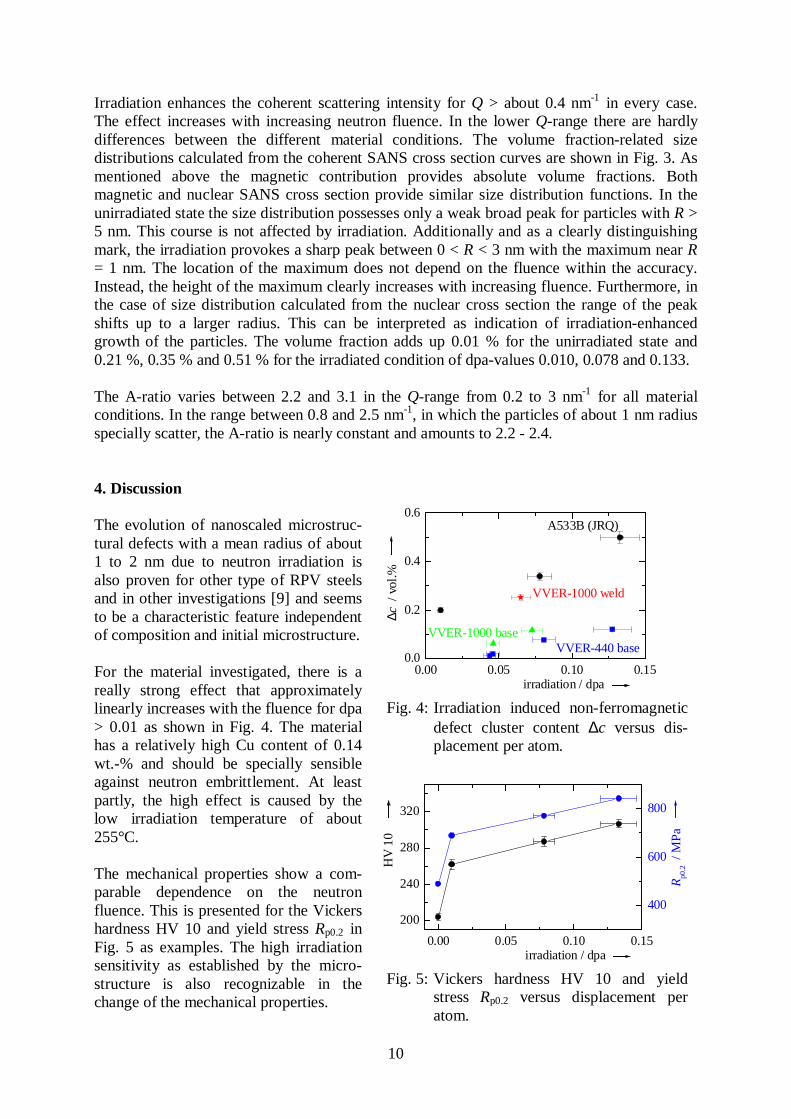
The mechanical properties show a com-parable dependence on the neutronfluence. This is presented for the Vickershardness HV 10 and yield stress Rp0.2 inFig. 5 as examples. The high irradiationsensitivity as established by the micro-structure is also recognizable in thechange of the mechanical properties.
0.00 0.05 0.10 0.15
200
240
280
320
400
600
800
irradiation / dpa
HV
10
Rp0
.2 /
MP
a
Fig. 5: Vickers hardness HV 10 and yieldstress Rp0.2 versus displacement peratom.
0.00 0.05 0.10 0.150.0
0.2
0.4
0.6
VVER-440 baseVVER-1000 base
VVER-1000 weld
A533B (JRQ)
irradiation / dpa
∆c /
vol
.%
Fig. 4: Irradiation induced non-ferromagneticdefect cluster content ∆c versus dis-placement per atom.
11
In comparison with the irradiation sensitivity of the JRQ material the VVER RPV steelsexhibit a clearly lower sensibility under identical irradiation condition and in spite ofcomparable Cu contents. This is evident from Fig. 4. Here the volume fractions of theirradiation-induced particles for several types or heats, respectively, of VVER RPV steels arealso presented and are considerably lower than the values for JRQ. The Cu content of theVVER heats amounts to 0.10 - 0.13 wt.-%. Only the Cu content of 0.04 % of the VVER-1000weld investigated is much lower. However, just this material has comparable radiationsensitivity.
The A-ratio of 2.2-2.4 is typical for RPV steels with not too high Cu content (< 0.20 %) andcannot be explained by pure Cu precipitates. It is in the same range as for the VVER steelsand rather indicates the formation of vacancy-rich foreign atom clusters or precipitates asfound by APFIM investigations [10].
Regarding the mean radius of the irradiation-induced nanoscaled particles instead of theposition of the peak maximum there is a weak growth of the particles with increasing fluencefor the JRQ material. The phenomenon is not observed at the VVER RPV steels. Particlegrowth is often found at steels with high Cu content [9] and seems to be connected with theirradiation-enhanced diffusion due to the production of vacancies and interstitials by theneutron impact.
5. Conclusion
SANS measurements prove a high microstructure-related radiation sensitivity of the IAEAreference material designated JRQ. The high sensitivity is confirmed by the change of themechanical properties. The effect is much higher than for VVER RPV steels. Up to now therehas been no explanation for this different response. The existing models do not offer para-meters which clearly differ for both types of material. Some details of the results point out todifferences in the role of copper. Apparently, copper is important for the nucleation of theirradiation-induced particles although there is no evidence for a higher Cu content within theparticles.
References
[1] M. Brumovsky, A. Kruykov, F. Gillemot, V. Levin: Results form the Phase III of theIAEA Coordinated Research Programme „Optimizing of Reactor Pressure VesselSurveillance Programmes and Their Analysis", Irradiation Embrittlement andMitigation, Proc. of an IAEA Specialists Meeting, Espoo (Finland), October 1995,IWG-LMNPP-95/5, Vol. II
[2] J. Böhmert, H.-W. Viehrig, A. Ulbricht: Irradiation effects on toughness behaviourand microstructure of VVER-type pressure vessel steels, J. Nucl. Mater. 297 (2001)251-261
[3] A. Ulbricht, J. Böhmert, H.-W. Viehrig: Beziehungen zwischen Mikrostruktur undZähigkeitseigenschaften an neutronenbestrahlten WWER-Reaktordruckbehälterstäh-len, Jahrestagung Kerntechnik 2001, Tagungsbericht, S. 697-700
[4] H. U. Barz, B. Böhmer, J. Konheiser, I. Stephan: Ermittlung der Neutronendosis vonbestrahlten WWER-Reaktordruckbehältermaterialien, Forschungszentrum Rossendorfe.V., Wissenschaftlich-technische Berichte, FZR-87, 1995
12
[5] H.-W. Viehrig, H. U. Barz, J. Böhmert, B. Böhmer: Consideration of Neutron FluxGradients for Sophisticated Evaluation of Irradiation Experiments, Irradiation Effectsand Mitigation, Proc. of a IAEA Specialists Meeting, Vladimir (Russia), September1997, IWG-LMNPP-97/2, pp. 230-239
[6] U. Keiderling, A. Wiedenmann: Physica B 213 & 214 (1995) 895[7] P. Strunz, J. Saroun, U. Keiderling, A. Wiedenmann, R. Przenioslo: J. Appl. Cryst. 33
(2000) 829[8] O. Glatter: J. Appl. Cryst. 13 (1980) 7[9] G. R. Odette: Radiation Induced Microstructural Evolution in Reactor Pressure Vessel
Steels, Mat. Res. Soc. Symp. Proc. Vol. 373 (1995), pp. 137-148[10] A. Gokhman, J. Böhmert, A. Ulbricht: Contribution to the Determination of
Microstruc-tural Parameters from Small Angle Scattering Experiments at ReactorPressure Vessel Steels, Forschungszentrum Rossendorf e.V., Wissenschaftlich-technische Berichte, FZR-288, Febr. 2000
13
SCALED VESSEL FAILURE EXPERIMENT ANALYSIS ANDINVESTIGATION OF A POSSIBLE VESSEL SUPPORT
Hans-Georg Willschütz, Eberhard Altstadt, Frank-Peter Weiß, and Bal Raj Sehgal 1
1. Introduction
Scaled coupled melt pool convection and vessel creep failure experiments are beingperformed in the FOREVER program at the Royal Institute of Technology, Stockholm. Theseexperiments are simulating the lower head of a pressurized reactor vessel under the thermalload of a melt pool with internal heat sources [1]. Due to the multi axial creep deformation ofthe three-dimensional vessel with a highly non-uniform temperature field these experimentsoffer an excellent opportunity to validate numerical creep models. A Finite Element model isdeveloped and using the Computational Fluid Dynamic module, the melt pool convection issimulated and the temperature field within the vessel wall is evaluated. The transientstructural mechanical calculations are then performed applying a new creep modelingprocedure. Additionally, the material damage is evaluated considering the creep deformationas well as the prompt plasticity [2, 3].
Pre- and post-test calculations of at least 4 FOREVER experiments have been performedsuccessfully [4]. Taking into account both - experimental and numerical results - gives a goodopportunity to improve the simulation and understanding of real accident scenarios. Afteranalyzing the calculations, it seems to be advantageous to introduce a vessel support whichcan unburden the vessel from a part of the mechanical load and, therefore, avoid the vesselfailure or at least prolong the time to failure. This can be a possible accident mitigationstrategy. Additionally, it is possible to install an absolutely passive automatic control deviceto initiate the flooding of the reactor pit to ensure external vessel cooling in the event of a coremelt down.
2. Experimental setup and status of simulation technique
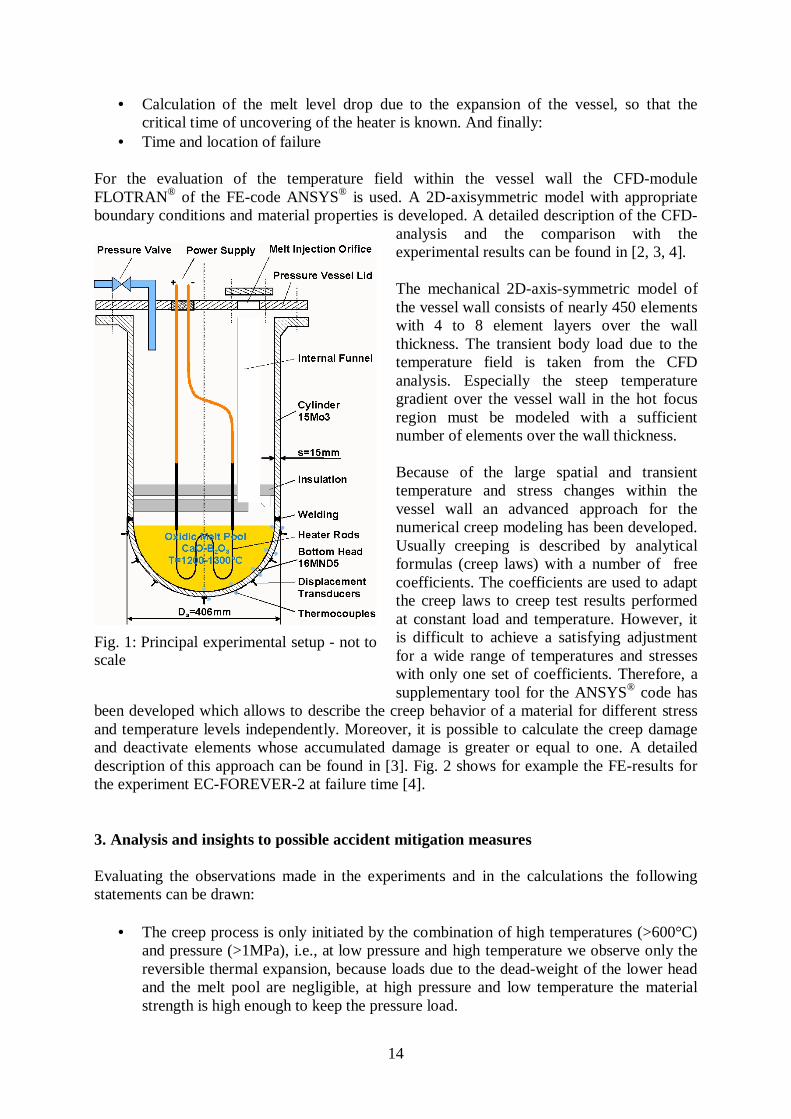
The hemispherical bottom head of the experiments considered here was made of the FrenchRPV steel 16MND5 with an internal diameter of 188mm and a wall thickness of 15 mm(Fig. 1). The applied oxidic melt was a CaO-B2O3 mixture (30-70 wt.-%), which has a solidustemperature of Ts = 1250 K. To model the internal decay heat generation special designedheater rods fixed to an internal insulation-reflector-lid are immersed into the melt from thetop. To initiate the creep process the vessel is pressurized by Argon.
According to the experience gained in the 3 prior experiments the following issues wererelated to the pre-test calculations:
• Evaluation of the temperature field, for assessment of the thermocouple readings.• Expected transient displacement at the positions where the displacement is measured.• Evaluation of the risk of a prompt plastic failure, due to high temperatures in the
welding between hemisphere and cylinder and the cylinder itself, especially at thepressurization beginning.
1 Royal Institute of Technology, Division of Nuclear Power Safety, Stockholm
14
• Calculation of the melt level drop due to the expansion of the vessel, so that thecritical time of uncovering of the heater is known. And finally:
• Time and location of failure
For the evaluation of the temperature field within the vessel wall the CFD-moduleFLOTRAN® of the FE-code ANSYS® is used. A 2D-axisymmetric model with appropriateboundary conditions and material properties is developed. A detailed description of the CFD-
analysis and the comparison with theexperimental results can be found in [2, 3, 4].
The mechanical 2D-axis-symmetric model ofthe vessel wall consists of nearly 450 elementswith 4 to 8 element layers over the wallthickness. The transient body load due to thetemperature field is taken from the CFDanalysis. Especially the steep temperaturegradient over the vessel wall in the hot focusregion must be modeled with a sufficientnumber of elements over the wall thickness.
Because of the large spatial and transienttemperature and stress changes within thevessel wall an advanced approach for thenumerical creep modeling has been developed.Usually creeping is described by analyticalformulas (creep laws) with a number of freecoefficients. The coefficients are used to adaptthe creep laws to creep test results performedat constant load and temperature. However, itis difficult to achieve a satisfying adjustmentfor a wide range of temperatures and stresseswith only one set of coefficients. Therefore, asupplementary tool for the ANSYS® code has
been developed which allows to describe the creep behavior of a material for different stressand temperature levels independently. Moreover, it is possible to calculate the creep damageand deactivate elements whose accumulated damage is greater or equal to one. A detaileddescription of this approach can be found in [3]. Fig. 2 shows for example the FE-results forthe experiment EC-FOREVER-2 at failure time [4].
3. Analysis and insights to possible accident mitigation measures
Evaluating the observations made in the experiments and in the calculations the followingstatements can be drawn:
• The creep process is only initiated by the combination of high temperatures (>600°C)and pressure (>1MPa), i.e., at low pressure and high temperature we observe only thereversible thermal expansion, because loads due to the dead-weight of the lower headand the melt pool are negligible, at high pressure and low temperature the materialstrength is high enough to keep the pressure load.
Fig. 1: Principal experimental setup - not toscale
15
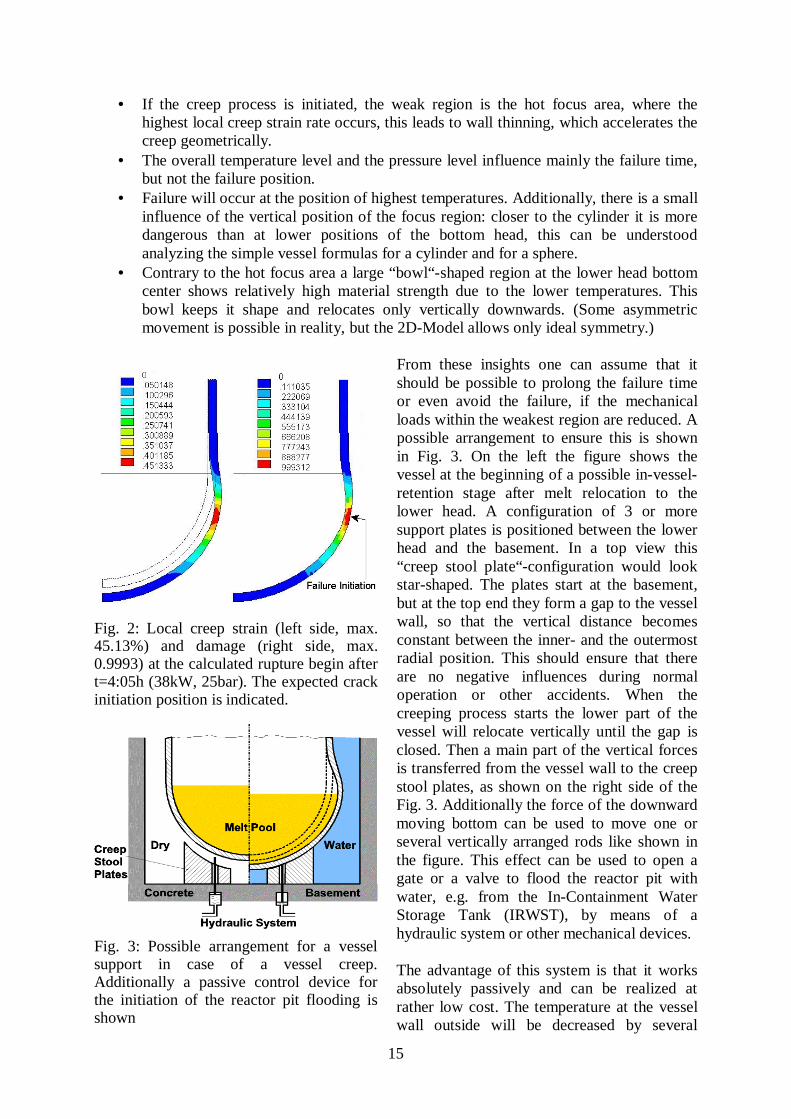
• If the creep process is initiated, the weak region is the hot focus area, where thehighest local creep strain rate occurs, this leads to wall thinning, which accelerates thecreep geometrically.
• The overall temperature level and the pressure level influence mainly the failure time,but not the failure position.
• Failure will occur at the position of highest temperatures. Additionally, there is a smallinfluence of the vertical position of the focus region: closer to the cylinder it is moredangerous than at lower positions of the bottom head, this can be understoodanalyzing the simple vessel formulas for a cylinder and for a sphere.
• Contrary to the hot focus area a large “bowl“-shaped region at the lower head bottomcenter shows relatively high material strength due to the lower temperatures. Thisbowl keeps it shape and relocates only vertically downwards. (Some asymmetricmovement is possible in reality, but the 2D-Model allows only ideal symmetry.)
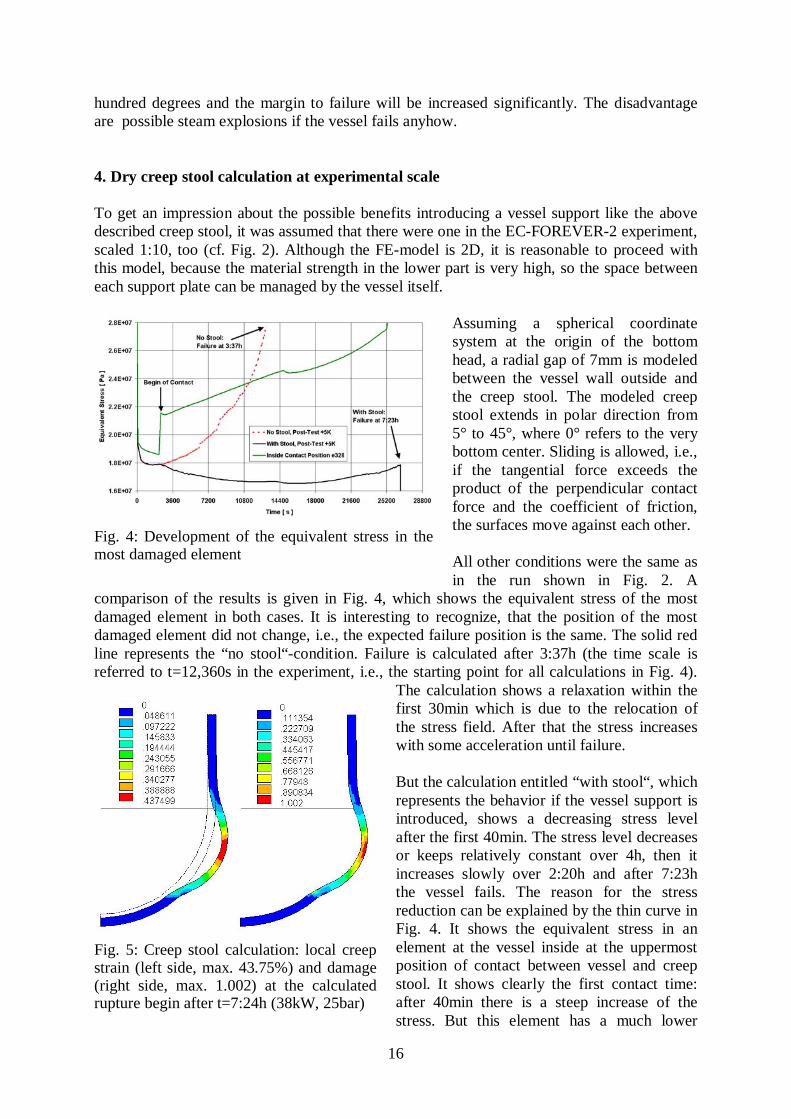
From these insights one can assume that itshould be possible to prolong the failure timeor even avoid the failure, if the mechanicalloads within the weakest region are reduced. Apossible arrangement to ensure this is shownin Fig. 3. On the left the figure shows thevessel at the beginning of a possible in-vessel-retention stage after melt relocation to thelower head. A configuration of 3 or moresupport plates is positioned between the lowerhead and the basement. In a top view this“creep stool plate“-configuration would lookstar-shaped. The plates start at the basement,but at the top end they form a gap to the vesselwall, so that the vertical distance becomesconstant between the inner- and the outermostradial position. This should ensure that thereare no negative influences during normaloperation or other accidents. When thecreeping process starts the lower part of thevessel will relocate vertically until the gap isclosed. Then a main part of the vertical forcesis transferred from the vessel wall to the creepstool plates, as shown on the right side of theFig. 3. Additionally the force of the downwardmoving bottom can be used to move one orseveral vertically arranged rods like shown inthe figure. This effect can be used to open agate or a valve to flood the reactor pit withwater, e.g. from the In-Containment WaterStorage Tank (IRWST), by means of ahydraulic system or other mechanical devices.
The advantage of this system is that it worksabsolutely passively and can be realized atrather low cost. The temperature at the vesselwall outside will be decreased by several
Fig. 2: Local creep strain (left side, max.45.13%) and damage (right side, max.0.9993) at the calculated rupture begin aftert=4:05h (38kW, 25bar). The expected crackinitiation position is indicated.
Fig. 3: Possible arrangement for a vesselsupport in case of a vessel creep.Additionally a passive control device forthe initiation of the reactor pit flooding isshown
16
hundred degrees and the margin to failure will be increased significantly. The disadvantageare possible steam explosions if the vessel fails anyhow.
4. Dry creep stool calculation at experimental scale
To get an impression about the possible benefits introducing a vessel support like the abovedescribed creep stool, it was assumed that there were one in the EC-FOREVER-2 experiment,scaled 1:10, too (cf. Fig. 2). Although the FE-model is 2D, it is reasonable to proceed withthis model, because the material strength in the lower part is very high, so the space betweeneach support plate can be managed by the vessel itself.
Assuming a spherical coordinatesystem at the origin of the bottomhead, a radial gap of 7mm is modeledbetween the vessel wall outside andthe creep stool. The modeled creepstool extends in polar direction from5° to 45°, where 0° refers to the verybottom center. Sliding is allowed, i.e.,if the tangential force exceeds theproduct of the perpendicular contactforce and the coefficient of friction,the surfaces move against each other.
All other conditions were the same asin the run shown in Fig. 2. A
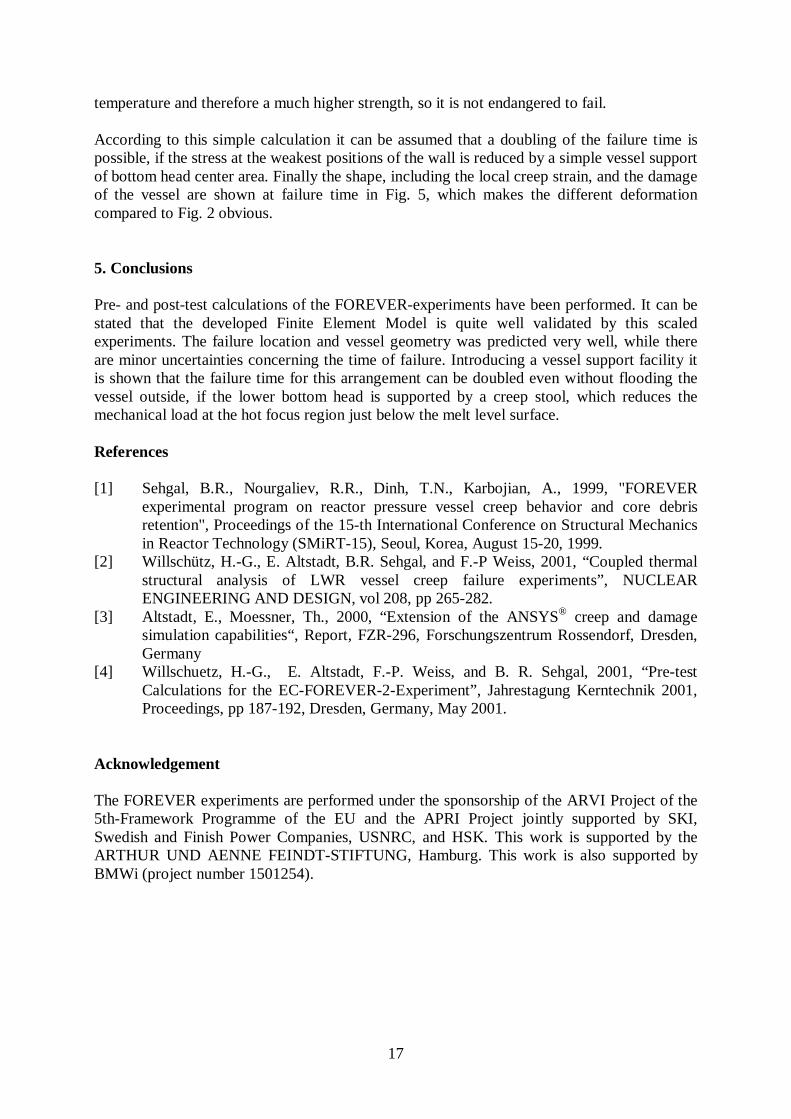
comparison of the results is given in Fig. 4, which shows the equivalent stress of the mostdamaged element in both cases. It is interesting to recognize, that the position of the mostdamaged element did not change, i.e., the expected failure position is the same. The solid redline represents the “no stool“-condition. Failure is calculated after 3:37h (the time scale isreferred to t=12,360s in the experiment, i.e., the starting point for all calculations in Fig. 4).
The calculation shows a relaxation within thefirst 30min which is due to the relocation ofthe stress field. After that the stress increaseswith some acceleration until failure.
But the calculation entitled “with stool“, whichrepresents the behavior if the vessel support isintroduced, shows a decreasing stress levelafter the first 40min. The stress level decreasesor keeps relatively constant over 4h, then itincreases slowly over 2:20h and after 7:23hthe vessel fails. The reason for the stressreduction can be explained by the thin curve inFig. 4. It shows the equivalent stress in anelement at the vessel inside at the uppermostposition of contact between vessel and creepstool. It shows clearly the first contact time:after 40min there is a steep increase of thestress. But this element has a much lower
Fig. 4: Development of the equivalent stress in themost damaged element
Fig. 5: Creep stool calculation: local creepstrain (left side, max. 43.75%) and damage(right side, max. 1.002) at the calculatedrupture begin after t=7:24h (38kW, 25bar)
17
temperature and therefore a much higher strength, so it is not endangered to fail.
According to this simple calculation it can be assumed that a doubling of the failure time ispossible, if the stress at the weakest positions of the wall is reduced by a simple vessel supportof bottom head center area. Finally the shape, including the local creep strain, and the damageof the vessel are shown at failure time in Fig. 5, which makes the different deformationcompared to Fig. 2 obvious.
5. Conclusions
Pre- and post-test calculations of the FOREVER-experiments have been performed. It can bestated that the developed Finite Element Model is quite well validated by this scaledexperiments. The failure location and vessel geometry was predicted very well, while thereare minor uncertainties concerning the time of failure. Introducing a vessel support facility itis shown that the failure time for this arrangement can be doubled even without flooding thevessel outside, if the lower bottom head is supported by a creep stool, which reduces themechanical load at the hot focus region just below the melt level surface.
References
[1] Sehgal, B.R., Nourgaliev, R.R., Dinh, T.N., Karbojian, A., 1999, "FOREVERexperimental program on reactor pressure vessel creep behavior and core debrisretention", Proceedings of the 15-th International Conference on Structural Mechanicsin Reactor Technology (SMiRT-15), Seoul, Korea, August 15-20, 1999.
[2] Willschütz, H.-G., E. Altstadt, B.R. Sehgal, and F.-P Weiss, 2001, “Coupled thermalstructural analysis of LWR vessel creep failure experiments”, NUCLEARENGINEERING AND DESIGN, vol 208, pp 265-282.
[3] Altstadt, E., Moessner, Th., 2000, “Extension of the ANSYS® creep and damagesimulation capabilities“, Report, FZR-296, Forschungszentrum Rossendorf, Dresden,Germany
[4] Willschuetz, H.-G., E. Altstadt, F.-P. Weiss, and B. R. Sehgal, 2001, “Pre-testCalculations for the EC-FOREVER-2-Experiment”, Jahrestagung Kerntechnik 2001,Proceedings, pp 187-192, Dresden, Germany, May 2001.
Acknowledgement
The FOREVER experiments are performed under the sponsorship of the ARVI Project of the5th-Framework Programme of the EU and the APRI Project jointly supported by SKI,Swedish and Finish Power Companies, USNRC, and HSK. This work is supported by theARTHUR UND AENNE FEINDT-STIFTUNG, Hamburg. This work is also supported byBMWi (project number 1501254).
18
LEVEL MEASUREMENT SYSTEM FOR BOILING WATER REACTORS
Horst-Michael Prasser, Arnd Böttger, Peter Schütz, Jochen Zschau
Albert Bschor1, Joachim Henkel1, Joseph Hubensteiner1 1. Introduction The coolant level in the reactor pressure vessel is a safety parameter of high relevance. In case of boiling water reactors the emergency core cooling injection systems are activated by level signals. Another important task of the level measurement is the prevention of the reactor overfeed. Stan-dard level measuring systems in light water reactors base on the hydrostatic method. The level is deduced from the reading of a differential pressure transducer connected to the reactor pressure vessel by pulse tubes at two different elevations. These systems deliver the so-called collapsed level within the measuring range given by the locations of the lower and upper connections of the pulse pipes to the vessel. In case of two-phase mixture in the vessel the collapsed level is a virtual water level, which would establish in case of a perfect stratification of water and steam. Its calcu-lation from the pressure difference requires a knowledge about the densities of both water and steam in the reactor, which are mostly calculated from pressure and temperature. Since the differential pressure is measured against a reference water column standing in the plus-line of the differential pressure transducer (reference leg), the system is sensible to failures lead-ing to density changes in the plus-line and/or to the depletion of it. This can happen, for example, as a consequence of evaporation of the water or a release if dissolved non-condensable gases (e.g. radiolysis gases) during a pressure decrease, or of a small leakage at the differential pressure transducer. Unfortunately, there are common-mode scenarios, where these effects can occur in redundant measuring points at the same time. This gave the reason for the German Reactor Safety Commission to issue a recommendation to develop diversified level measuring systems. Diversified means that the working principle is based on a different physical effect. VGB Power Tech Service asked the Institute of Safety Research to develop a level indication device using an electrical conductivity signal. Laboratory samples of the device were built and tested at an ex-perimental vessel in the Gundremmingen nuclear power station under conditions close to the working parameters at the reactor. The developed system has the potential to maintain function after pressure transients. 2. General requirements The parts of the measuring sensor, which are in contact with the measuring medium have to with-stand the nominal pressure and temperature of the reactor over a long period (typical parameters are 7 MPa, 286 °C). Degradation of the sensor materials must neither lead to a loss of the function nor to a coolant leakage. It was planned to achieve an operation duration of at least 5 years at nominal reactor parameters. It was furthermore determined to design the level monitor in accordance to the requirements for reactor safety instrumentation. This includes that the device must maintain function during design 1 Kernkraftwerke Gundremmingen Betriebsgesellschaft
19
base accidents. The conditions for a qualification as a reactor safety system are described in the KTA-rules 3505 in detail. In particular, the level monitor has to withstand
an environment of the containment atmosphere during a loss-of-coolant accident (10 Bar, 180 °C, 95 % relative humidity),
an integral radiation dose of 2.105 Gy, the mechanical vibration loads during earthquake and airplane crash.
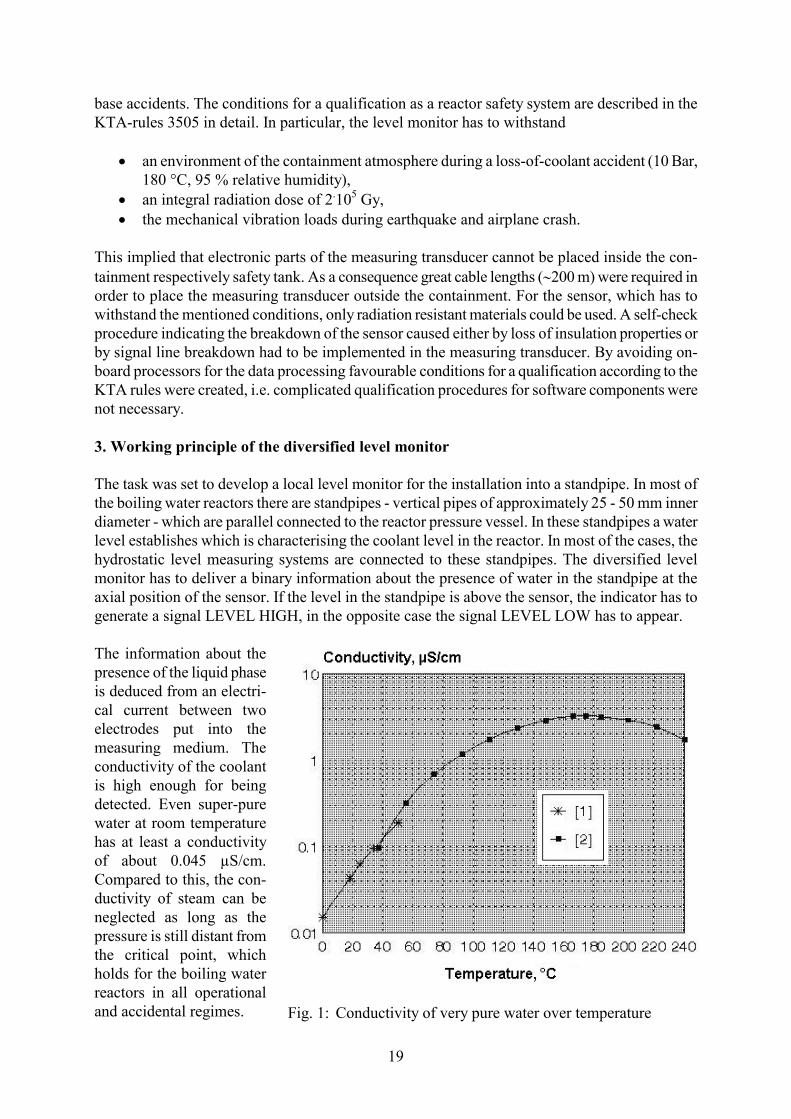
This implied that electronic parts of the measuring transducer cannot be placed inside the con-tainment respectively safety tank. As a consequence great cable lengths (200 m) were required in order to place the measuring transducer outside the containment. For the sensor, which has to withstand the mentioned conditions, only radiation resistant materials could be used. A self-check procedure indicating the breakdown of the sensor caused either by loss of insulation properties or by signal line breakdown had to be implemented in the measuring transducer. By avoiding on-board processors for the data processing favourable conditions for a qualification according to the KTA rules were created, i.e. complicated qualification procedures for software components were not necessary. 3. Working principle of the diversified level monitor The task was set to develop a local level monitor for the installation into a standpipe. In most of the boiling water reactors there are standpipes - vertical pipes of approximately 25 - 50 mm inner diameter - which are parallel connected to the reactor pressure vessel. In these standpipes a water level establishes which is characterising the coolant level in the reactor. In most of the cases, the hydrostatic level measuring systems are connected to these standpipes. The diversified level monitor has to deliver a binary information about the presence of water in the standpipe at the axial position of the sensor. If the level in the standpipe is above the sensor, the indicator has to generate a signal LEVEL HIGH, in the opposite case the signal LEVEL LOW has to appear. The information about the presence of the liquid phase is deduced from an electri-cal current between two electrodes put into the measuring medium. The conductivity of the coolant is high enough for being detected. Even super-pure water at room temperature has at least a conductivity of about 0.045 µS/cm. Compared to this, the con-ductivity of steam can be neglected as long as the pressure is still distant from the critical point, which holds for the boiling water reactors in all operational and accidental regimes. Fig. 1: Conductivity of very pure water over temperature
20
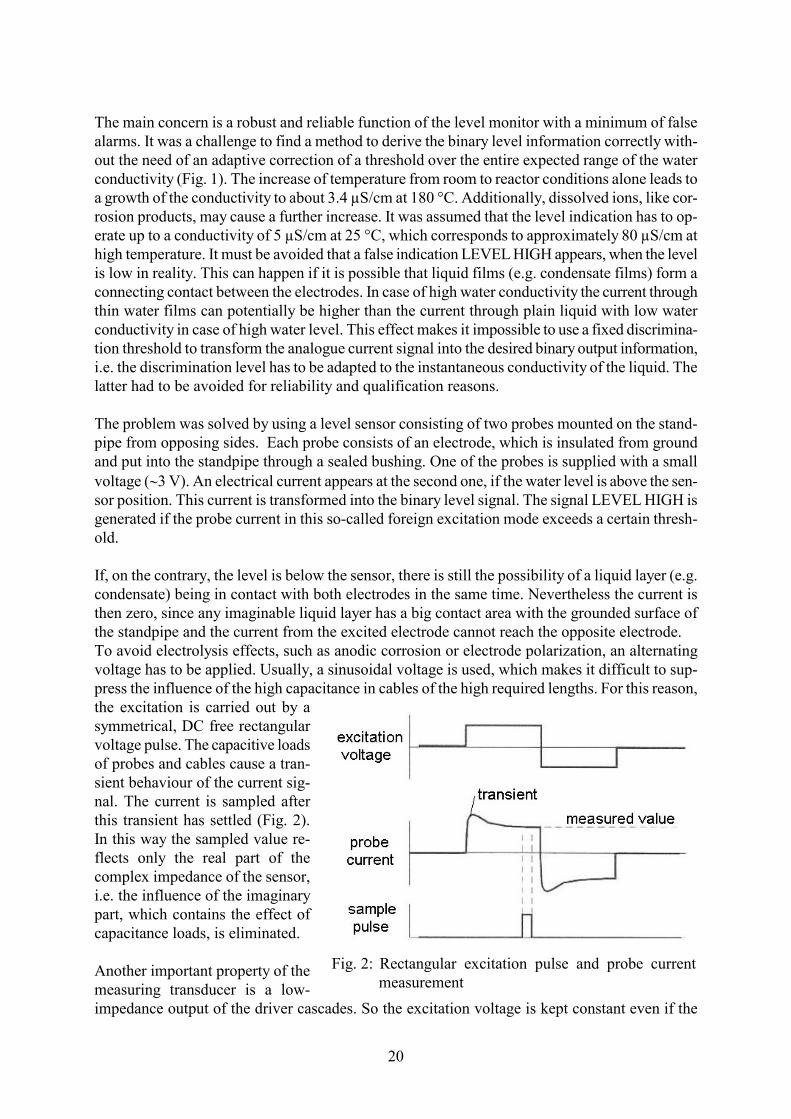
The main concern is a robust and reliable function of the level monitor with a minimum of false alarms. It was a challenge to find a method to derive the binary level information correctly with-out the need of an adaptive correction of a threshold over the entire expected range of the water conductivity (Fig. 1). The increase of temperature from room to reactor conditions alone leads to a growth of the conductivity to about 3.4 µS/cm at 180 °C. Additionally, dissolved ions, like cor-rosion products, may cause a further increase. It was assumed that the level indication has to op-erate up to a conductivity of 5 µS/cm at 25 °C, which corresponds to approximately 80 µS/cm at high temperature. It must be avoided that a false indication LEVEL HIGH appears, when the level is low in reality. This can happen if it is possible that liquid films (e.g. condensate films) form a connecting contact between the electrodes. In case of high water conductivity the current through thin water films can potentially be higher than the current through plain liquid with low water conductivity in case of high water level. This effect makes it impossible to use a fixed discrimina-tion threshold to transform the analogue current signal into the desired binary output information, i.e. the discrimination level has to be adapted to the instantaneous conductivity of the liquid. The latter had to be avoided for reliability and qualification reasons. The problem was solved by using a level sensor consisting of two probes mounted on the stand-pipe from opposing sides. Each probe consists of an electrode, which is insulated from ground and put into the standpipe through a sealed bushing. One of the probes is supplied with a small voltage (3 V). An electrical current appears at the second one, if the water level is above the sen-sor position. This current is transformed into the binary level signal. The signal LEVEL HIGH is generated if the probe current in this so-called foreign excitation mode exceeds a certain thresh-old. If, on the contrary, the level is below the sensor, there is still the possibility of a liquid layer (e.g. condensate) being in contact with both electrodes in the same time. Nevertheless the current is then zero, since any imaginable liquid layer has a big contact area with the grounded surface of the standpipe and the current from the excited electrode cannot reach the opposite electrode. To avoid electrolysis effects, such as anodic corrosion or electrode polarization, an alternating voltage has to be applied. Usually, a sinusoidal voltage is used, which makes it difficult to sup-press the influence of the high capacitance in cables of the high required lengths. For this reason, the excitation is carried out by a symmetrical, DC free rectangular voltage pulse. The capacitive loads of probes and cables cause a tran-sient behaviour of the current sig-nal. The current is sampled after this transient has settled (Fig. 2). In this way the sampled value re-flects only the real part of the complex impedance of the sensor, i.e. the influence of the imaginary part, which contains the effect of capacitance loads, is eliminated. Another important property of the measuring transducer is a low-impedance output of the driver cascades. So the excitation voltage is kept constant even if the
Fig. 2: Rectangular excitation pulse and probe current measurement
21
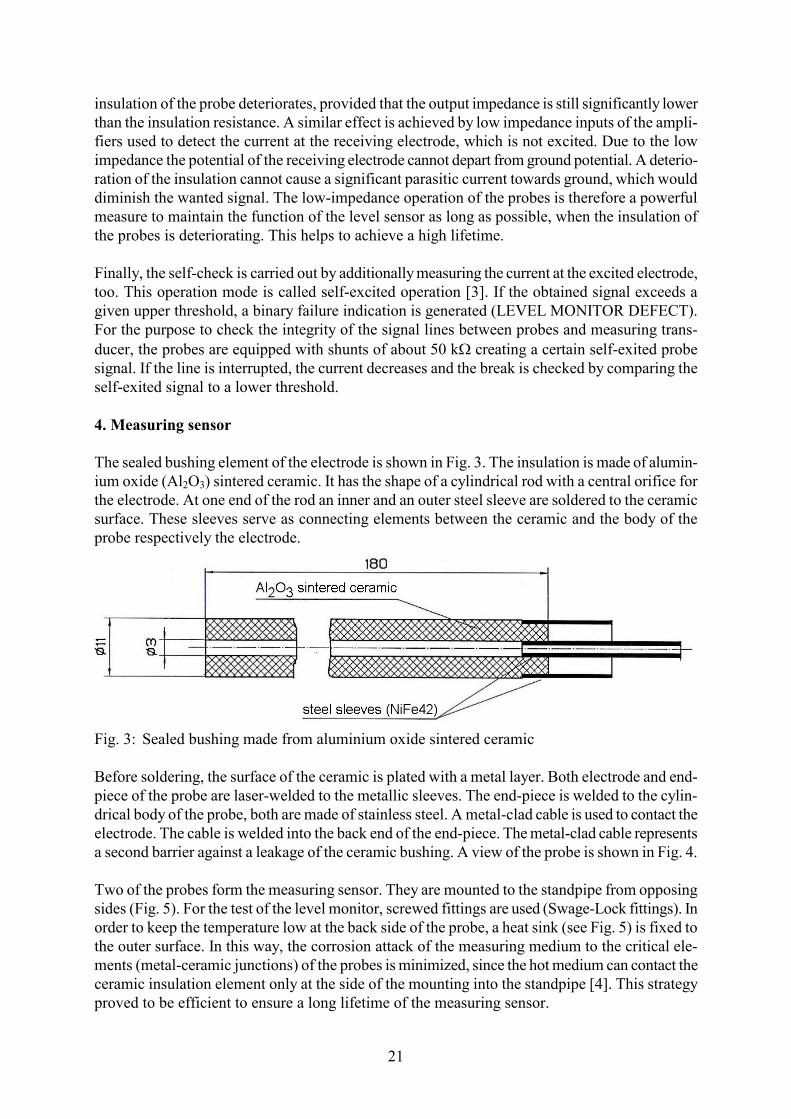
insulation of the probe deteriorates, provided that the output impedance is still significantly lower than the insulation resistance. A similar effect is achieved by low impedance inputs of the ampli-fiers used to detect the current at the receiving electrode, which is not excited. Due to the low impedance the potential of the receiving electrode cannot depart from ground potential. A deterio-ration of the insulation cannot cause a significant parasitic current towards ground, which would diminish the wanted signal. The low-impedance operation of the probes is therefore a powerful measure to maintain the function of the level sensor as long as possible, when the insulation of the probes is deteriorating. This helps to achieve a high lifetime. Finally, the self-check is carried out by additionally measuring the current at the excited electrode, too. This operation mode is called self-excited operation [3]. If the obtained signal exceeds a given upper threshold, a binary failure indication is generated (LEVEL MONITOR DEFECT). For the purpose to check the integrity of the signal lines between probes and measuring trans-ducer, the probes are equipped with shunts of about 50 k creating a certain self-exited probe signal. If the line is interrupted, the current decreases and the break is checked by comparing the self-exited signal to a lower threshold. 4. Measuring sensor The sealed bushing element of the electrode is shown in Fig. 3. The insulation is made of alumin-ium oxide (Al2O3) sintered ceramic. It has the shape of a cylindrical rod with a central orifice for the electrode. At one end of the rod an inner and an outer steel sleeve are soldered to the ceramic surface. These sleeves serve as connecting elements between the ceramic and the body of the probe respectively the electrode.
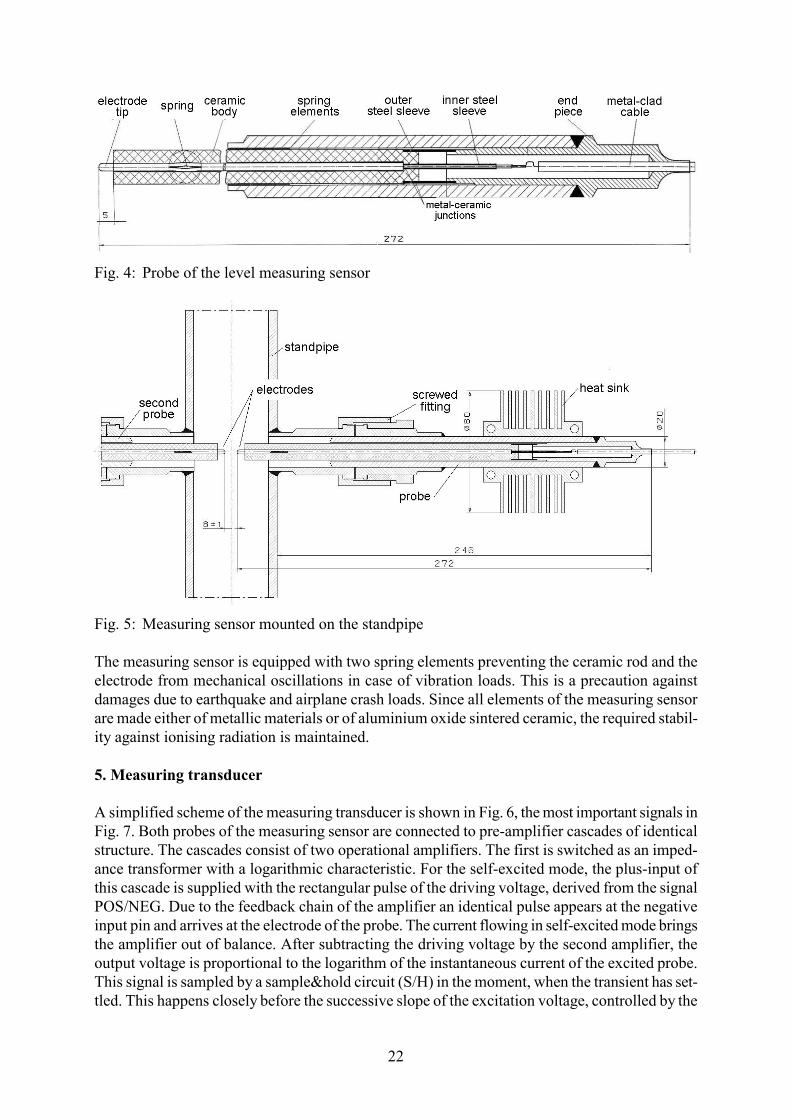
Fig. 3: Sealed bushing made from aluminium oxide sintered ceramic Before soldering, the surface of the ceramic is plated with a metal layer. Both electrode and end-piece of the probe are laser-welded to the metallic sleeves. The end-piece is welded to the cylin-drical body of the probe, both are made of stainless steel. A metal-clad cable is used to contact the electrode. The cable is welded into the back end of the end-piece. The metal-clad cable represents a second barrier against a leakage of the ceramic bushing. A view of the probe is shown in Fig. 4. Two of the probes form the measuring sensor. They are mounted to the standpipe from opposing sides (Fig. 5). For the test of the level monitor, screwed fittings are used (Swage-Lock fittings). In order to keep the temperature low at the back side of the probe, a heat sink (see Fig. 5) is fixed to the outer surface. In this way, the corrosion attack of the measuring medium to the critical ele-ments (metal-ceramic junctions) of the probes is minimized, since the hot medium can contact the ceramic insulation element only at the side of the mounting into the standpipe [4]. This strategy proved to be efficient to ensure a long lifetime of the measuring sensor.
22
Fig. 4: Probe of the level measuring sensor
Fig. 5: Measuring sensor mounted on the standpipe The measuring sensor is equipped with two spring elements preventing the ceramic rod and the electrode from mechanical oscillations in case of vibration loads. This is a precaution against damages due to earthquake and airplane crash loads. Since all elements of the measuring sensor are made either of metallic materials or of aluminium oxide sintered ceramic, the required stabil-ity against ionising radiation is maintained. 5. Measuring transducer A simplified scheme of the measuring transducer is shown in Fig. 6, the most important signals in Fig. 7. Both probes of the measuring sensor are connected to pre-amplifier cascades of identical structure. The cascades consist of two operational amplifiers. The first is switched as an imped-ance transformer with a logarithmic characteristic. For the self-excited mode, the plus-input of this cascade is supplied with the rectangular pulse of the driving voltage, derived from the signal POS/NEG. Due to the feedback chain of the amplifier an identical pulse appears at the negative input pin and arrives at the electrode of the probe. The current flowing in self-excited mode brings the amplifier out of balance. After subtracting the driving voltage by the second amplifier, the output voltage is proportional to the logarithm of the instantaneous current of the excited probe. This signal is sampled by a sample&hold circuit (S/H) in the moment, when the transient has set-tled. This happens closely before the successive slope of the excitation voltage, controlled by the
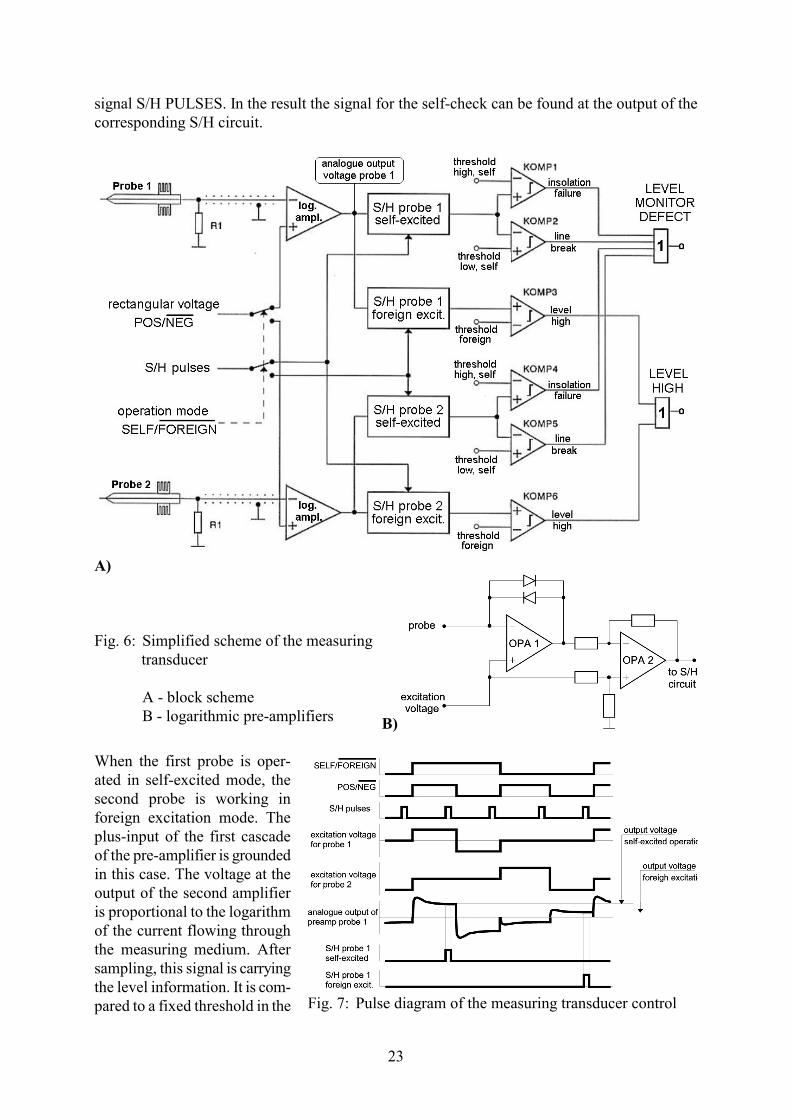
23
signal S/H PULSES. In the result the signal for the self-check can be found at the output of the corresponding S/H circuit.
A) Fig. 6: Simplified scheme of the measuring
transducer A - block scheme B - logarithmic pre-amplifiers B) When the first probe is oper-ated in self-excited mode, the second probe is working in foreign excitation mode. The plus-input of the first cascade of the pre-amplifier is grounded in this case. The voltage at the output of the second amplifier is proportional to the logarithm of the current flowing through the measuring medium. After sampling, this signal is carrying the level information. It is com-pared to a fixed threshold in the Fig. 7: Pulse diagram of the measuring transducer control
24
in the comparators COMP3 and COMP6. If the threshold is exceeded, the signal LEVEL HOGH is generated.
The operation mode of the two probes of the level sensor is periodically changed by the control signal SELF/ FOREIGN. There are in total four S/H circuits, two for each probe. One for each probe is activated during the self excited operation period of the corresponding probe, the second is activated during the for-eign excitation period. In this way, both probes undergo the self-check. The signal LEVEL MONITOR DEFECT is generated by comparing the self excited signal with an up-per and a lower threshold. The comparators COMP1 and COMP4 are responsible for the insulation check. COMP2 and COMP5 are detecting the line break. The signal LEVEL MONITOR DEFECT is generated if at least one of the four self test checks fail.
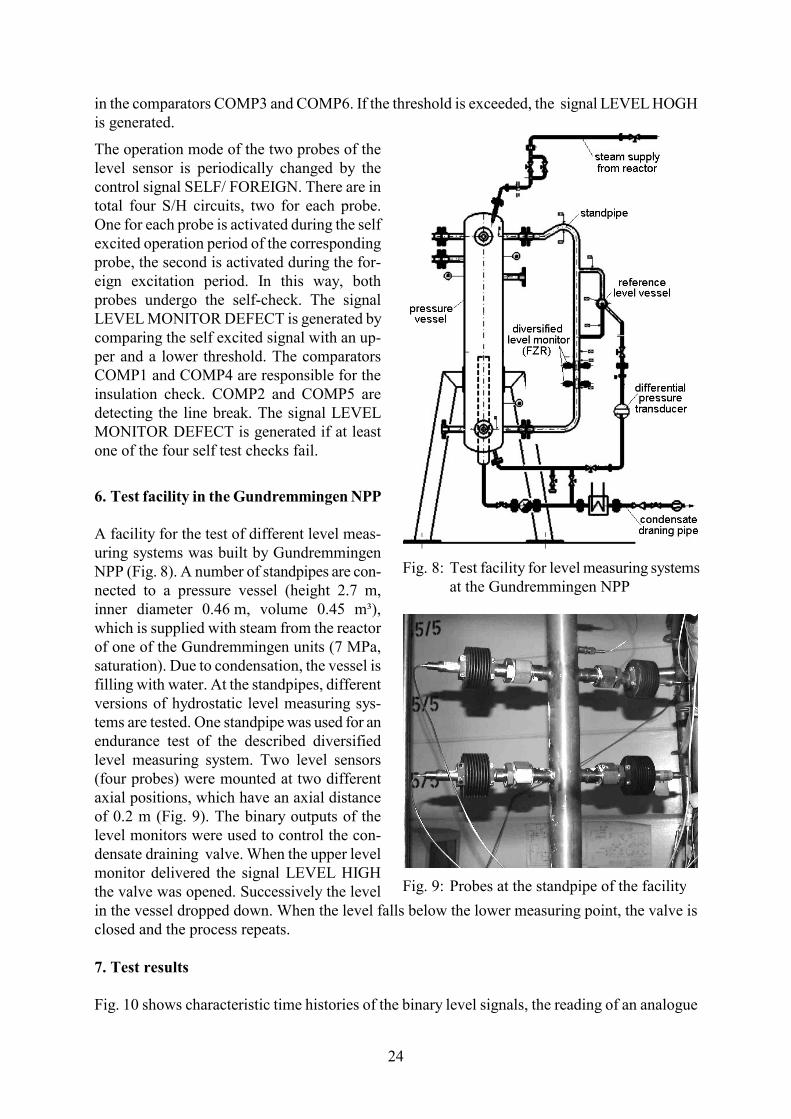
6. Test facility in the Gundremmingen NPP A facility for the test of different level meas-uring systems was built by Gundremmingen NPP (Fig. 8). A number of standpipes are con-nected to a pressure vessel (height 2.7 m, inner diameter 0.46 m, volume 0.45 m³), which is supplied with steam from the reactor of one of the Gundremmingen units (7 MPa, saturation). Due to condensation, the vessel is filling with water. At the standpipes, different versions of hydrostatic level measuring sys-tems are tested. One standpipe was used for an endurance test of the described diversified level measuring system. Two level sensors (four probes) were mounted at two different axial positions, which have an axial distance of 0.2 m (Fig. 9). The binary outputs of the level monitors were used to control the con-densate draining valve. When the upper level monitor delivered the signal LEVEL HIGH the valve was opened. Successively the level in the vessel dropped down. When the level falls below the lower measuring point, the valve is closed and the process repeats. 7. Test results Fig. 10 shows characteristic time histories of the binary level signals, the reading of an analogue
Fig. 8: Test facility for level measuring systems at the Gundremmingen NPP
Fig. 9: Probes at the standpipe of the facility
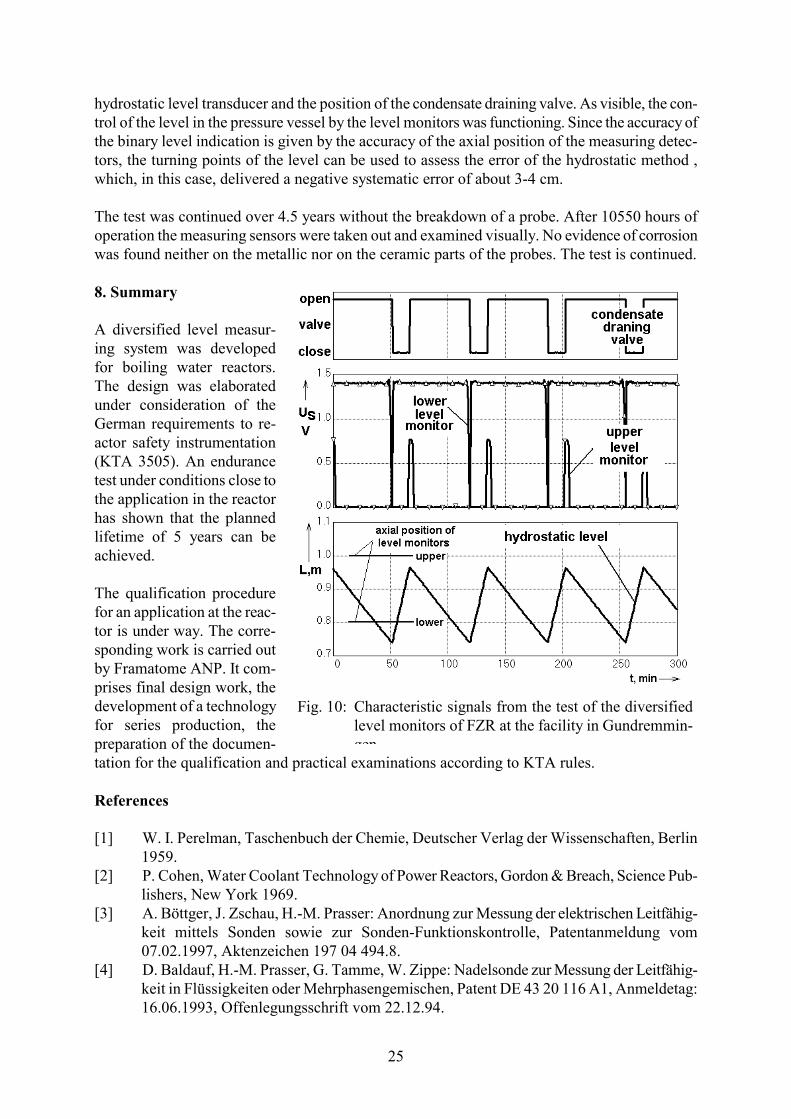
25
hydrostatic level transducer and the position of the condensate draining valve. As visible, the con-trol of the level in the pressure vessel by the level monitors was functioning. Since the accuracy of the binary level indication is given by the accuracy of the axial position of the measuring detec-tors, the turning points of the level can be used to assess the error of the hydrostatic method , which, in this case, delivered a negative systematic error of about 3-4 cm. The test was continued over 4.5 years without the breakdown of a probe. After 10550 hours of operation the measuring sensors were taken out and examined visually. No evidence of corrosion was found neither on the metallic nor on the ceramic parts of the probes. The test is continued. 8. Summary A diversified level measur-ing system was developed for boiling water reactors. The design was elaborated under consideration of the German requirements to re-actor safety instrumentation (KTA 3505). An endurance test under conditions close to the application in the reactor has shown that the planned lifetime of 5 years can be achieved. The qualification procedure for an application at the reac-tor is under way. The corre-sponding work is carried out by Framatome ANP. It com-prises final design work, the development of a technology for series production, the preparation of the documen-tation for the qualification and practical examinations according to KTA rules. References [1] W. I. Perelman, Taschenbuch der Chemie, Deutscher Verlag der Wissenschaften, Berlin
1959. [2] P. Cohen, Water Coolant Technology of Power Reactors, Gordon & Breach, Science Pub-
lishers, New York 1969. [3] A. Böttger, J. Zschau, H.-M. Prasser: Anordnung zur Messung der elektrischen Leitfähig-
keit mittels Sonden sowie zur Sonden-Funktionskontrolle, Patentanmeldung vom 07.02.1997, Aktenzeichen 197 04 494.8.
[4] D. Baldauf, H.-M. Prasser, G. Tamme, W. Zippe: Nadelsonde zur Messung der Leitfähig-keit in Flüssigkeiten oder Mehrphasengemischen, Patent DE 43 20 116 A1, Anmeldetag: 16.06.1993, Offenlegungsschrift vom 22.12.94.
Fig. 10: Characteristic signals from the test of the diversified level monitors of FZR at the facility in Gundremmin-gen
26
FLOW STRUCTURE DURING FLASHING IN THE CIRCUS TEST FACILITY MODELLING THE START-UP OF A BOILING WATER
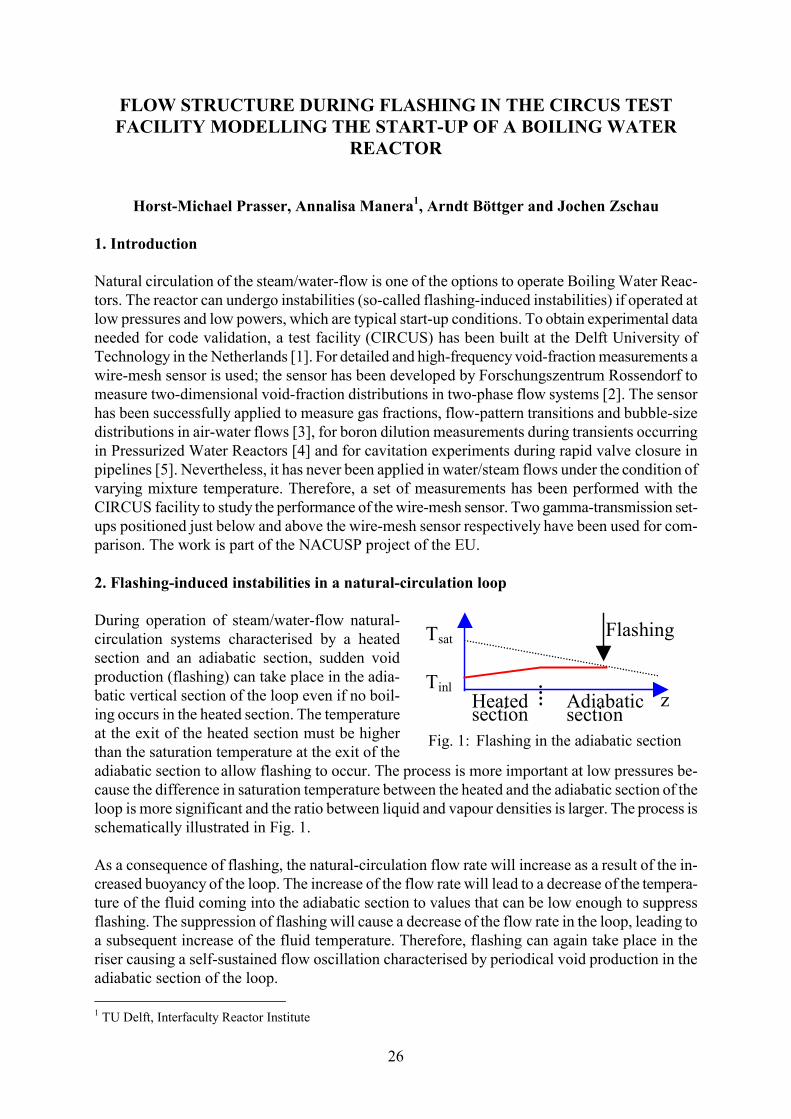
REACTOR Horst-Michael Prasser, Annalisa Manera1, Arndt Böttger and Jochen Zschau 1. Introduction Natural circulation of the steam/water-flow is one of the options to operate Boiling Water Reac-tors. The reactor can undergo instabilities (so-called flashing-induced instabilities) if operated at low pressures and low powers, which are typical start-up conditions. To obtain experimental data needed for code validation, a test facility (CIRCUS) has been built at the Delft University of Technology in the Netherlands [1]. For detailed and high-frequency void-fraction measurements a wire-mesh sensor is used; the sensor has been developed by Forschungszentrum Rossendorf to measure two-dimensional void-fraction distributions in two-phase flow systems [2]. The sensor has been successfully applied to measure gas fractions, flow-pattern transitions and bubble-size distributions in air-water flows [3], for boron dilution measurements during transients occurring in Pressurized Water Reactors [4] and for cavitation experiments during rapid valve closure in pipelines [5]. Nevertheless, it has never been applied in water/steam flows under the condition of varying mixture temperature. Therefore, a set of measurements has been performed with the CIRCUS facility to study the performance of the wire-mesh sensor. Two gamma-transmission set-ups positioned just below and above the wire-mesh sensor respectively have been used for com-parison. The work is part of the NACUSP project of the EU. 2. Flashing-induced instabilities in a natural-circulation loop During operation of steam/water-flow natural-circulation systems characterised by a heated section and an adiabatic section, sudden void production (flashing) can take place in the adia-batic vertical section of the loop even if no boil-ing occurs in the heated section. The temperature at the exit of the heated section must be higher than the saturation temperature at the exit of the adiabatic section to allow flashing to occur. The process is more important at low pressures be-cause the difference in saturation temperature between the heated and the adiabatic section of the loop is more significant and the ratio between liquid and vapour densities is larger. The process is schematically illustrated in Fig. 1. As a consequence of flashing, the natural-circulation flow rate will increase as a result of the in-creased buoyancy of the loop. The increase of the flow rate will lead to a decrease of the tempera-ture of the fluid coming into the adiabatic section to values that can be low enough to suppress flashing. The suppression of flashing will cause a decrease of the flow rate in the loop, leading to a subsequent increase of the fluid temperature. Therefore, flashing can again take place in the riser causing a self-sustained flow oscillation characterised by periodical void production in the adiabatic section of the loop. 1 TU Delft, Interfaculty Reactor Institute
Flashing
zHeatedsection
Tsat
TinlAdiabaticsection
Fig. 1: Flashing in the adiabatic section
27
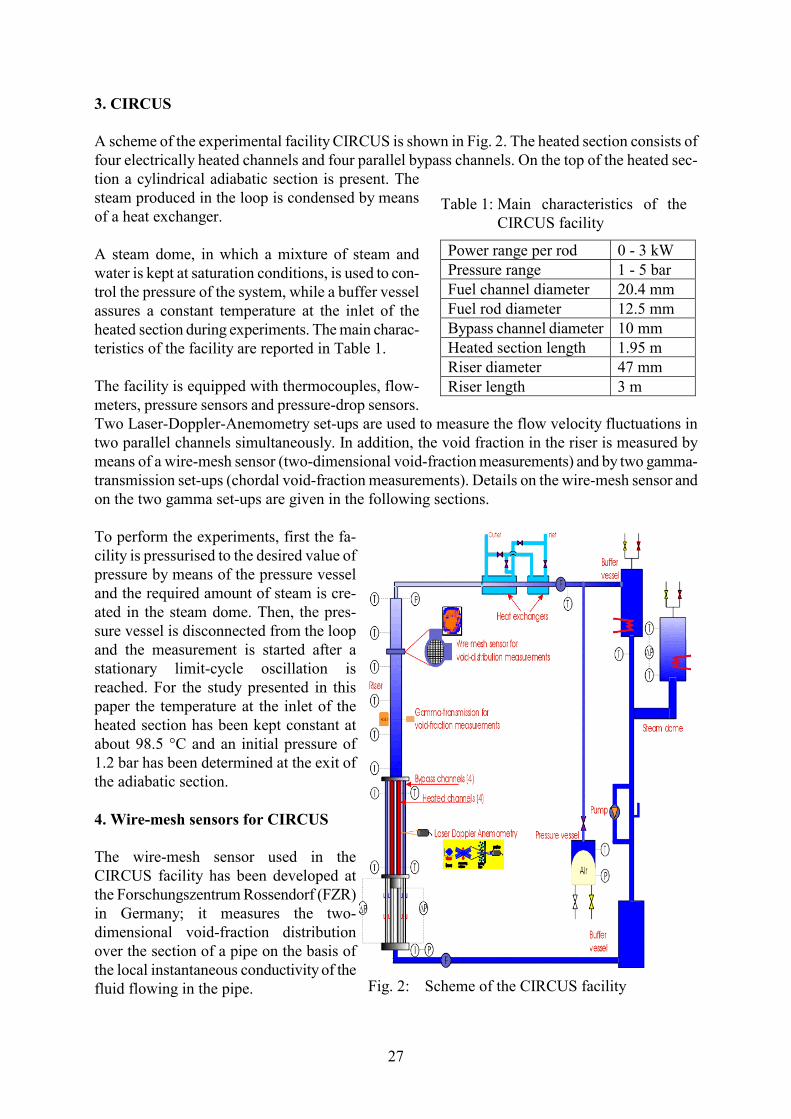
3. CIRCUS A scheme of the experimental facility CIRCUS is shown in Fig. 2. The heated section consists of four electrically heated channels and four parallel bypass channels. On the top of the heated sec-tion a cylindrical adiabatic section is present. The steam produced in the loop is condensed by means of a heat exchanger. A steam dome, in which a mixture of steam and water is kept at saturation conditions, is used to con-trol the pressure of the system, while a buffer vessel assures a constant temperature at the inlet of the heated section during experiments. The main charac-teristics of the facility are reported in Table 1. The facility is equipped with thermocouples, flow-meters, pressure sensors and pressure-drop sensors. Two Laser-Doppler-Anemometry set-ups are used to measure the flow velocity fluctuations in two parallel channels simultaneously. In addition, the void fraction in the riser is measured by means of a wire-mesh sensor (two-dimensional void-fraction measurements) and by two gamma-transmission set-ups (chordal void-fraction measurements). Details on the wire-mesh sensor and on the two gamma set-ups are given in the following sections. To perform the experiments, first the fa-cility is pressurised to the desired value of pressure by means of the pressure vessel and the required amount of steam is cre-ated in the steam dome. Then, the pres-sure vessel is disconnected from the loop and the measurement is started after a stationary limit-cycle oscillation is reached. For the study presented in this paper the temperature at the inlet of the heated section has been kept constant at about 98.5 °C and an initial pressure of 1.2 bar has been determined at the exit of the adiabatic section. 4. Wire-mesh sensors for CIRCUS The wire-mesh sensor used in the CIRCUS facility has been developed at the Forschungszentrum Rossendorf (FZR) in Germany; it measures the two-dimensional void-fraction distribution over the section of a pipe on the basis of the local instantaneous conductivity of the fluid flowing in the pipe.
Fig. 2: Scheme of the CIRCUS facility
Table 1: Main characteristics of the CIRCUS facility
Power range per rod 0 - 3 kW Pressure range 1 - 5 bar Fuel channel diameter 20.4 mm Fuel rod diameter 12.5 mm Bypass channel diameter 10 mm Heated section length 1.95 m Riser diameter 47 mm Riser length 3 m
28
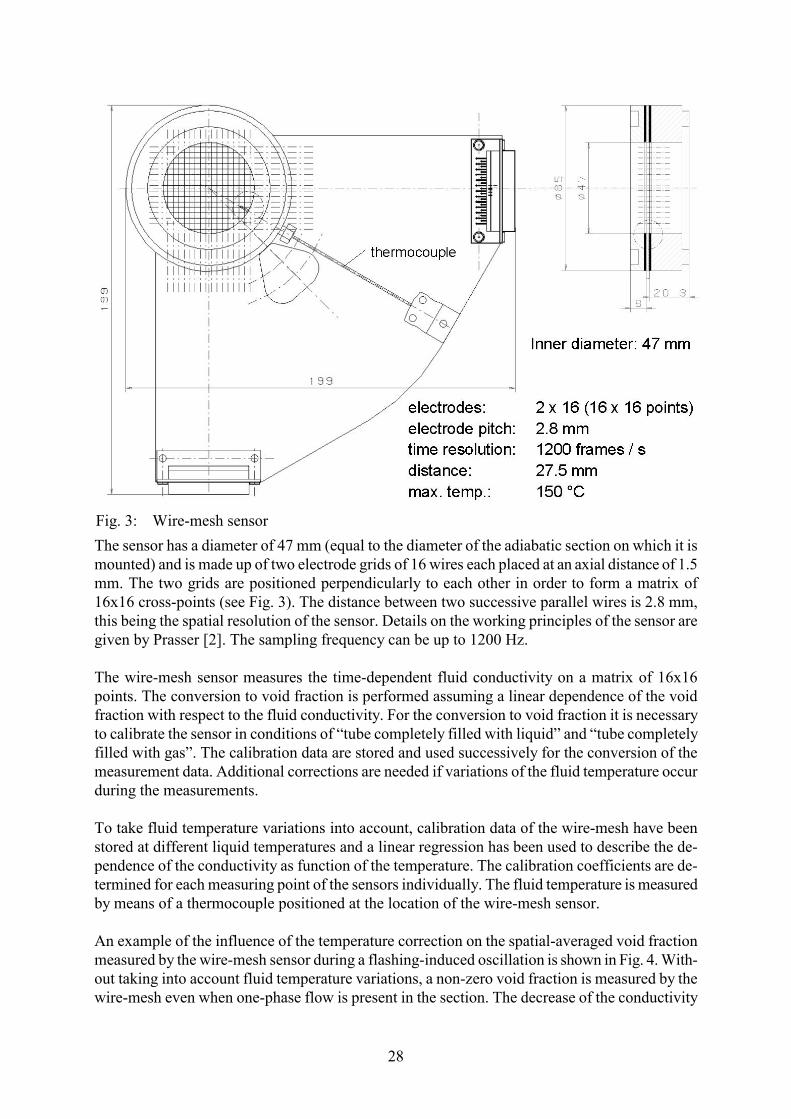
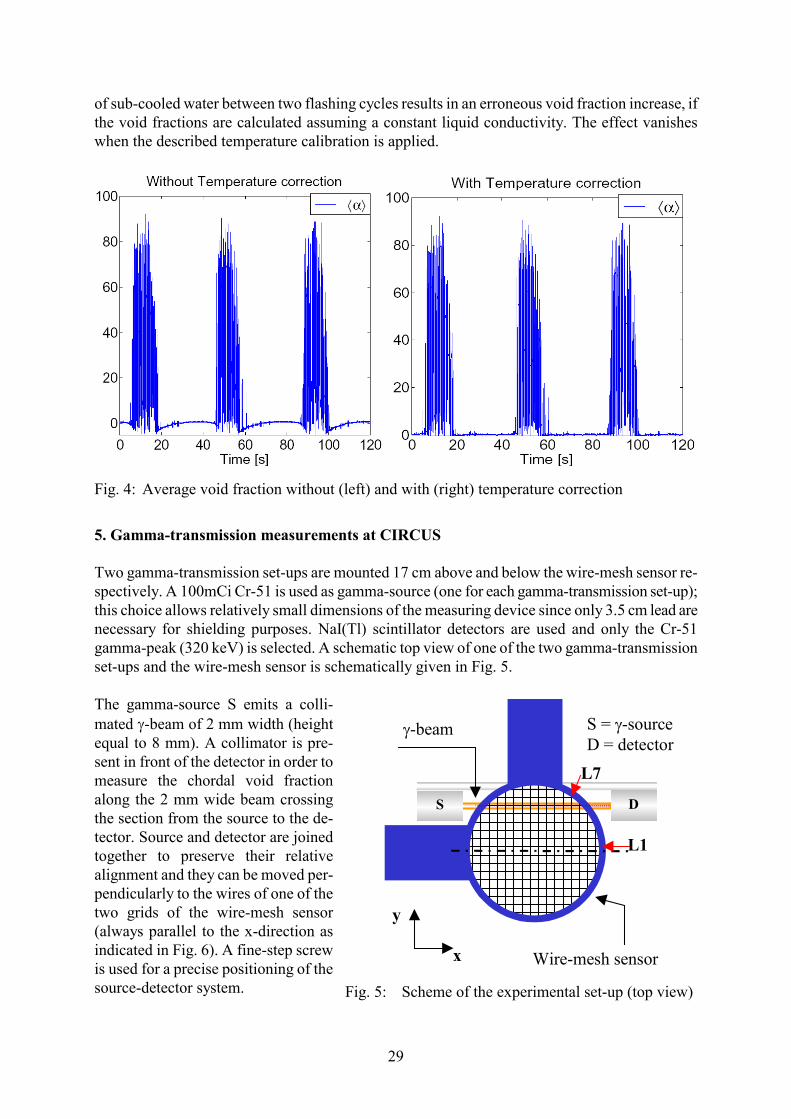
The sensor has a diameter of 47 mm (equal to the diameter of the adiabatic section on which it is mounted) and is made up of two electrode grids of 16 wires each placed at an axial distance of 1.5 mm. The two grids are positioned perpendicularly to each other in order to form a matrix of 16x16 cross-points (see Fig. 3). The distance between two successive parallel wires is 2.8 mm, this being the spatial resolution of the sensor. Details on the working principles of the sensor are given by Prasser [2]. The sampling frequency can be up to 1200 Hz. The wire-mesh sensor measures the time-dependent fluid conductivity on a matrix of 16x16 points. The conversion to void fraction is performed assuming a linear dependence of the void fraction with respect to the fluid conductivity. For the conversion to void fraction it is necessary to calibrate the sensor in conditions of “tube completely filled with liquid” and “tube completely filled with gas”. The calibration data are stored and used successively for the conversion of the measurement data. Additional corrections are needed if variations of the fluid temperature occur during the measurements. To take fluid temperature variations into account, calibration data of the wire-mesh have been stored at different liquid temperatures and a linear regression has been used to describe the de-pendence of the conductivity as function of the temperature. The calibration coefficients are de-termined for each measuring point of the sensors individually. The fluid temperature is measured by means of a thermocouple positioned at the location of the wire-mesh sensor. An example of the influence of the temperature correction on the spatial-averaged void fraction measured by the wire-mesh sensor during a flashing-induced oscillation is shown in Fig. 4. With-out taking into account fluid temperature variations, a non-zero void fraction is measured by the wire-mesh even when one-phase flow is present in the section. The decrease of the conductivity
Fig. 3: Wire-mesh sensor
29
of sub-cooled water between two flashing cycles results in an erroneous void fraction increase, if the void fractions are calculated assuming a constant liquid conductivity. The effect vanishes when the described temperature calibration is applied.
Fig. 4: Average void fraction without (left) and with (right) temperature correction
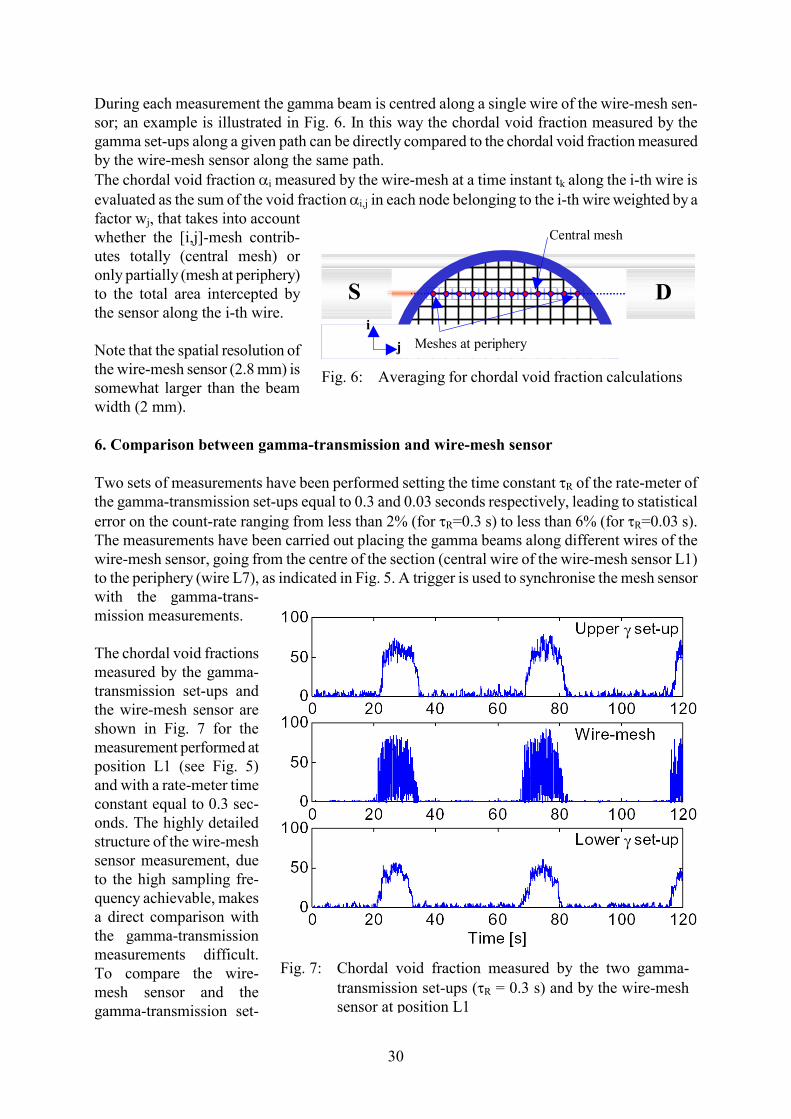
5. Gamma-transmission measurements at CIRCUS Two gamma-transmission set-ups are mounted 17 cm above and below the wire-mesh sensor re-spectively. A 100mCi Cr-51 is used as gamma-source (one for each gamma-transmission set-up); this choice allows relatively small dimensions of the measuring device since only 3.5 cm lead are necessary for shielding purposes. NaI(Tl) scintillator detectors are used and only the Cr-51 gamma-peak (320 keV) is selected. A schematic top view of one of the two gamma-transmission set-ups and the wire-mesh sensor is schematically given in Fig. 5. The gamma-source S emits a colli-mated -beam of 2 mm width (height equal to 8 mm). A collimator is pre-sent in front of the detector in order to measure the chordal void fraction along the 2 mm wide beam crossing the section from the source to the de-tector. Source and detector are joined together to preserve their relative alignment and they can be moved per-pendicularly to the wires of one of the two grids of the wire-mesh sensor (always parallel to the x-direction as indicated in Fig. 6). A fine-step screw is used for a precise positioning of the source-detector system.
DS
-beam
y
x
S = -sourceD = detector
Wire-mesh sensor
L1
L7
Fig. 5: Scheme of the experimental set-up (top view)
30
During each measurement the gamma beam is centred along a single wire of the wire-mesh sen-sor; an example is illustrated in Fig. 6. In this way the chordal void fraction measured by the gamma set-ups along a given path can be directly compared to the chordal void fraction measured by the wire-mesh sensor along the same path. The chordal void fraction i measured by the wire-mesh at a time instant tk along the i-th wire is evaluated as the sum of the void fraction i,j in each node belonging to the i-th wire weighted by a factor wj, that takes into account whether the [i,j]-mesh contrib-utes totally (central mesh) or only partially (mesh at periphery) to the total area intercepted by the sensor along the i-th wire. Note that the spatial resolution of the wire-mesh sensor (2.8 mm) is somewhat larger than the beam width (2 mm). 6. Comparison between gamma-transmission and wire-mesh sensor Two sets of measurements have been performed setting the time constant R of the rate-meter of the gamma-transmission set-ups equal to 0.3 and 0.03 seconds respectively, leading to statistical error on the count-rate ranging from less than 2% (for R=0.3 s) to less than 6% (for R=0.03 s). The measurements have been carried out placing the gamma beams along different wires of the wire-mesh sensor, going from the centre of the section (central wire of the wire-mesh sensor L1) to the periphery (wire L7), as indicated in Fig. 5. A trigger is used to synchronise the mesh sensor with the gamma-trans-mission measurements. The chordal void fractions measured by the gamma-transmission set-ups and the wire-mesh sensor are shown in Fig. 7 for the measurement performed at position L1 (see Fig. 5) and with a rate-meter time constant equal to 0.3 sec-onds. The highly detailed structure of the wire-mesh sensor measurement, due to the high sampling fre-quency achievable, makes a direct comparison with the gamma-transmission measurements difficult. To compare the wire-mesh sensor and the gamma-transmission set-
DS
j Meshes at periphery
Central mesh
i
Fig. 6: Averaging for chordal void fraction calculations
Fig. 7: Chordal void fraction measured by the two gamma-transmission set-ups (R = 0.3 s) and by the wire-mesh sensor at position L1
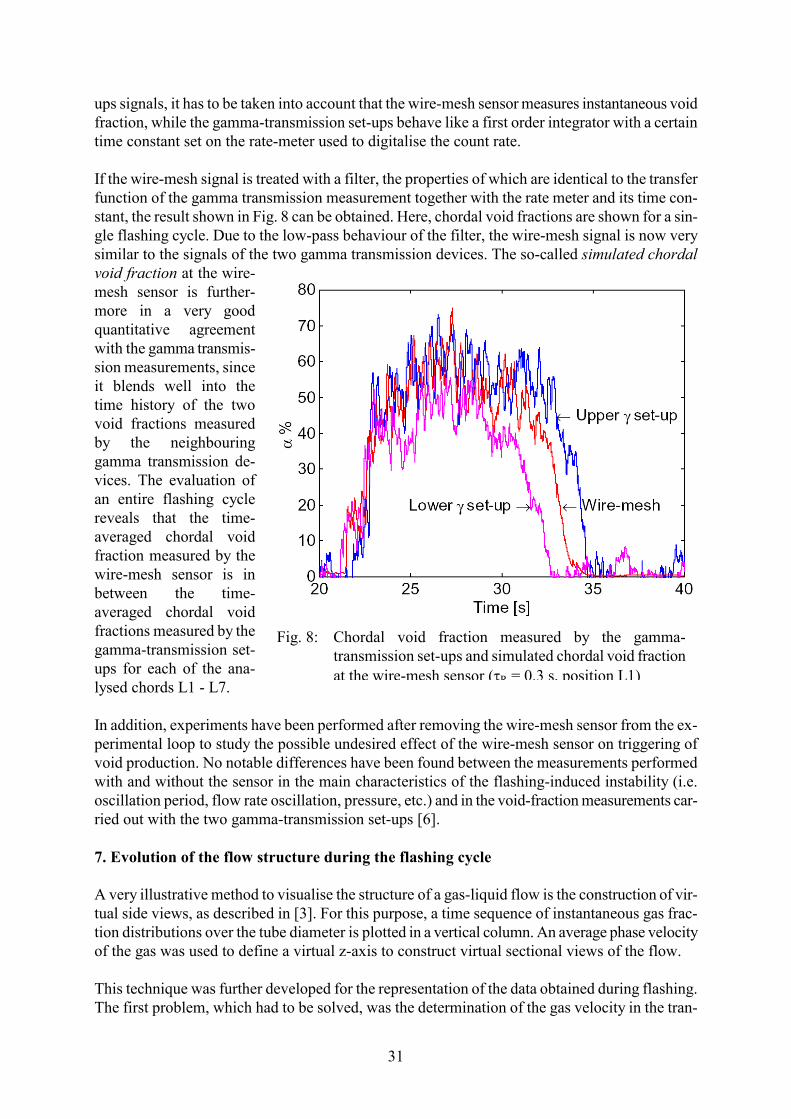
31
ups signals, it has to be taken into account that the wire-mesh sensor measures instantaneous void fraction, while the gamma-transmission set-ups behave like a first order integrator with a certain time constant set on the rate-meter used to digitalise the count rate. If the wire-mesh signal is treated with a filter, the properties of which are identical to the transfer function of the gamma transmission measurement together with the rate meter and its time con-stant, the result shown in Fig. 8 can be obtained. Here, chordal void fractions are shown for a sin-gle flashing cycle. Due to the low-pass behaviour of the filter, the wire-mesh signal is now very similar to the signals of the two gamma transmission devices. The so-called simulated chordal void fraction at the wire-mesh sensor is further-more in a very good quantitative agreement with the gamma transmis-sion measurements, since it blends well into the time history of the two void fractions measured by the neighbouring gamma transmission de-vices. The evaluation of an entire flashing cycle reveals that the time-averaged chordal void fraction measured by the wire-mesh sensor is in between the time-averaged chordal void fractions measured by the gamma-transmission set-ups for each of the ana-lysed chords L1 - L7. In addition, experiments have been performed after removing the wire-mesh sensor from the ex-perimental loop to study the possible undesired effect of the wire-mesh sensor on triggering of void production. No notable differences have been found between the measurements performed with and without the sensor in the main characteristics of the flashing-induced instability (i.e. oscillation period, flow rate oscillation, pressure, etc.) and in the void-fraction measurements car-ried out with the two gamma-transmission set-ups [6]. 7. Evolution of the flow structure during the flashing cycle A very illustrative method to visualise the structure of a gas-liquid flow is the construction of vir-tual side views, as described in [3]. For this purpose, a time sequence of instantaneous gas frac-tion distributions over the tube diameter is plotted in a vertical column. An average phase velocity of the gas was used to define a virtual z-axis to construct virtual sectional views of the flow. This technique was further developed for the representation of the data obtained during flashing. The first problem, which had to be solved, was the determination of the gas velocity in the tran-
Fig. 8: Chordal void fraction measured by the gamma-transmission set-ups and simulated chordal void fraction at the wire-mesh sensor (R = 0.3 s, position L1)
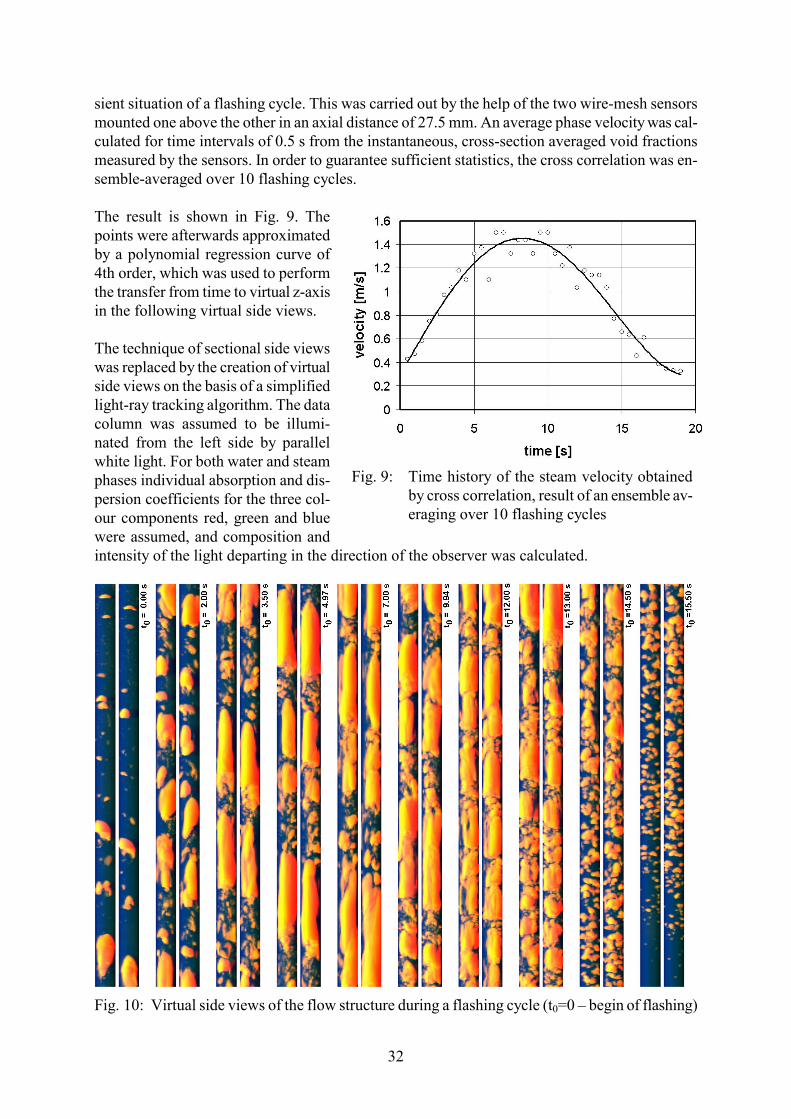
32
sient situation of a flashing cycle. This was carried out by the help of the two wire-mesh sensors mounted one above the other in an axial distance of 27.5 mm. An average phase velocity was cal-culated for time intervals of 0.5 s from the instantaneous, cross-section averaged void fractions measured by the sensors. In order to guarantee sufficient statistics, the cross correlation was en-semble-averaged over 10 flashing cycles. The result is shown in Fig. 9. The points were afterwards approximated by a polynomial regression curve of 4th order, which was used to perform the transfer from time to virtual z-axis in the following virtual side views. The technique of sectional side views was replaced by the creation of virtual side views on the basis of a simplified light-ray tracking algorithm. The data column was assumed to be illumi-nated from the left side by parallel white light. For both water and steam phases individual absorption and dis-persion coefficients for the three col-our components red, green and blue were assumed, and composition and intensity of the light departing in the direction of the observer was calculated.
Fig. 10: Virtual side views of the flow structure during a flashing cycle (t0=0 – begin of flashing)
Fig. 9: Time history of the steam velocity obtained by cross correlation, result of an ensemble av-eraging over 10 flashing cycles
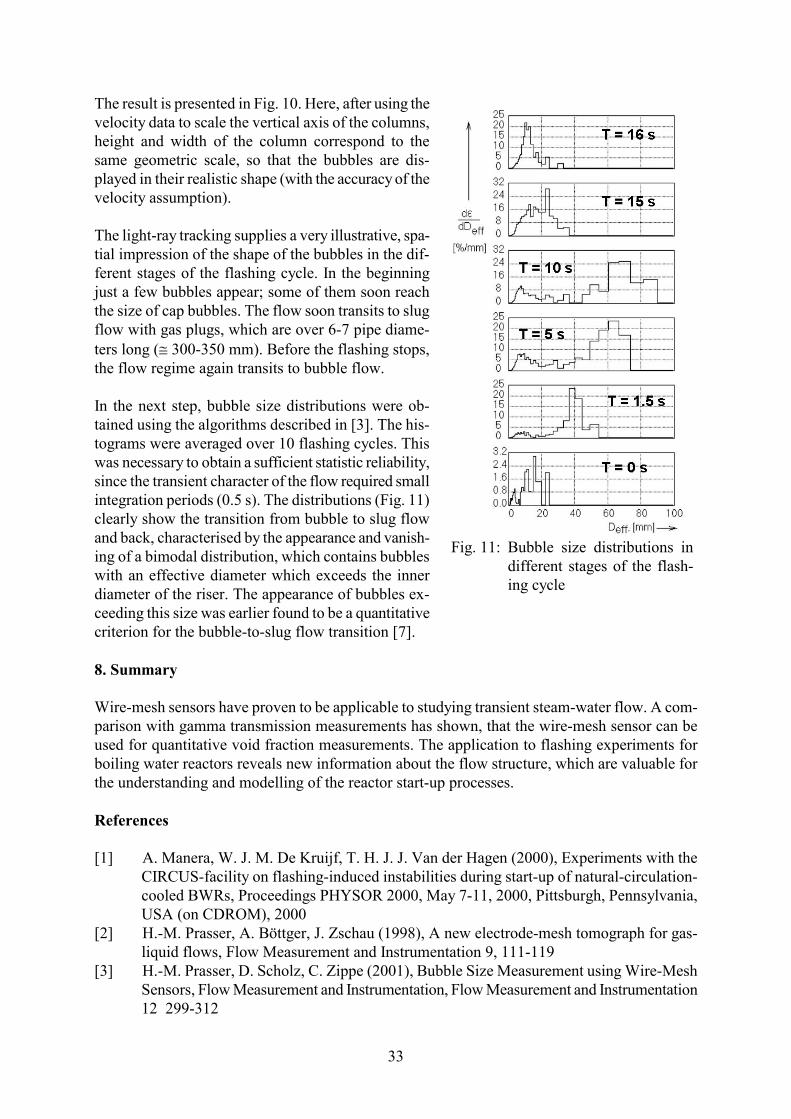
33
The result is presented in Fig. 10. Here, after using the velocity data to scale the vertical axis of the columns, height and width of the column correspond to the same geometric scale, so that the bubbles are dis-played in their realistic shape (with the accuracy of the velocity assumption). The light-ray tracking supplies a very illustrative, spa-tial impression of the shape of the bubbles in the dif-ferent stages of the flashing cycle. In the beginning just a few bubbles appear; some of them soon reach the size of cap bubbles. The flow soon transits to slug flow with gas plugs, which are over 6-7 pipe diame-ters long ( 300-350 mm). Before the flashing stops, the flow regime again transits to bubble flow. In the next step, bubble size distributions were ob-tained using the algorithms described in [3]. The his-tograms were averaged over 10 flashing cycles. This was necessary to obtain a sufficient statistic reliability, since the transient character of the flow required small integration periods (0.5 s). The distributions (Fig. 11) clearly show the transition from bubble to slug flow and back, characterised by the appearance and vanish-ing of a bimodal distribution, which contains bubbles with an effective diameter which exceeds the inner diameter of the riser. The appearance of bubbles ex-ceeding this size was earlier found to be a quantitative criterion for the bubble-to-slug flow transition [7]. 8. Summary Wire-mesh sensors have proven to be applicable to studying transient steam-water flow. A com-parison with gamma transmission measurements has shown, that the wire-mesh sensor can be used for quantitative void fraction measurements. The application to flashing experiments for boiling water reactors reveals new information about the flow structure, which are valuable for the understanding and modelling of the reactor start-up processes. References [1] A. Manera, W. J. M. De Kruijf, T. H. J. J. Van der Hagen (2000), Experiments with the
CIRCUS-facility on flashing-induced instabilities during start-up of natural-circulation-cooled BWRs, Proceedings PHYSOR 2000, May 7-11, 2000, Pittsburgh, Pennsylvania, USA (on CDROM), 2000
[2] H.-M. Prasser, A. Böttger, J. Zschau (1998), A new electrode-mesh tomograph for gas-liquid flows, Flow Measurement and Instrumentation 9, 111-119
[3] H.-M. Prasser, D. Scholz, C. Zippe (2001), Bubble Size Measurement using Wire-Mesh Sensors, Flow Measurement and Instrumentation, Flow Measurement and Instrumentation 12 299-312
Fig. 11: Bubble size distributions in
different stages of the flash-ing cycle

34
[4] G. Grunwald, T. Höhne, H.-M. Prasser, H.-M. (2000), Experimental investigations on the four-loop test facility ROCOM, Kerntechnik 65, 5-6
[5] Dudlik, A., Prasser, H.-M., Schlüter, S. (1999), Visualization of cavitating liquid flow behind fast acting valves, Second European Congress of Chemical Engineering - Montpel-lier 5-7 October (on CD-ROM)
[6] A. Manera, H.-M. Prasser, T.H.J.J. van der Hagen, R.F. Mudde, W.J.M. de Kruijf (2001), A comparison of void-fraction measurements during flashing-induced instabilities ob-tained with a wire-mesh sensor and a gamma-transmission set-up, ICMF-2001, New Or-leans, May 27 - June 1, proceedings on CD-ROM, paper 463
[7] A.-K. Krüssenberg, H.-M. Prasser, A. Schaffrath, (2000), A new criterion for identifica-tion of the bubble slug transition in vertical tubes, Kerntechnik 65, 1
35
DENSITY EFFECTS ON COOLANT MIXING IN PRESSURIZEDWATER REACTORS
Gerhard Grunwald, Thomas Höhne, Sören Kliem, Horst-Michael Prasser, and UlrichRohde
1. Introduction
During emergency core cooling (ECC) injection into the cold leg of a PWR, an incompletemixing with the natural circulation flow in the loop takes place. Due to the higher density ofthe ECC water, a streak of cold water is flowing downwards the downcomer. This causesthermal loads on the reactor pressure vessel (RPV). Furthermore, in the case of inadvertentinjection of low borated ECC water, a boron dilution transient would be initiated. Thetransient is determined by the resulting boron concentration distribution at the core inlet. Forthe investigation of the influence of density effects, generic experiments have been carried outat the ROCOM (Rossendorf Coolant Mixing Model) [1-3] test facility. ROCOM is a 1:5scaled model of a German KONVOI type 1300 MW PWR with controllable pumps in allloops, so that a wide range of flow conditions between natural circulation and nominal flowcan be simulated. Previous investigations have been done on coolant mixing with operatingpumps and during the start-up of coolant circulation in the primary circuit without densitydifferences in the fluid [1-3]. It is expected, that density differences can be neglected, if theflow rates are sufficiently high, that means, if mixing is momentum controlled. To find theconditions for transition to buoyancy controlled mixing, generic experiments with densitydifferences were performed. To investigate the mixing of the ECC water, an exactly modelledECC injection nozzle has been connected to one of the cold legs of ROCOM.
Investigations on density effects in coolant mixing have been performed earlier at differentexperimental facilities (i.e. HDR [4], UPTF [5], University of Maryland [6, 7]). However, inthe experiments presented in this paper, a significantly higher spatial resolution of the tracerconcentration measurements is achieved.
2. Boundary conditions of the experiments
Due to the fact, that the test facility cannot be heated up, the necessary density differenceswere simulated by adding sugar (glucose) to the water that is injected into the cold leg. Toobserve the mixing of the ECC water, this water was tracered by small amounts of sodiumchloride, enhancing the conductivity. Generating density differences by high saltconcentrations is not possible, because the measurement system is very sensitive and wouldbe saturated at high salt concentrations.
The test facility is equipped with wire mesh sensors for high resolution measurement of thetransient concentration of the tracer in space and time. They are based on the measurement ofthe electrical conductivity. One sensor is located in the cold leg inlet nozzle of the loop withthe ECC injection nozzle, two in the downcomer just below the inlet nozzles and before theentrance into the lower plenum, respectively. Each of the downcomer sensors has ameasurement grid consisting of 64 angular and 4 radial points. The fourth sensor is integratedinto the lower core support plate and has one measurement position at each fuel element inlet[2]. Dimensionless mixing scalars were derived from the data provided by the sensors with atime resolution of 0.05 s. These scalars are defined as follows:
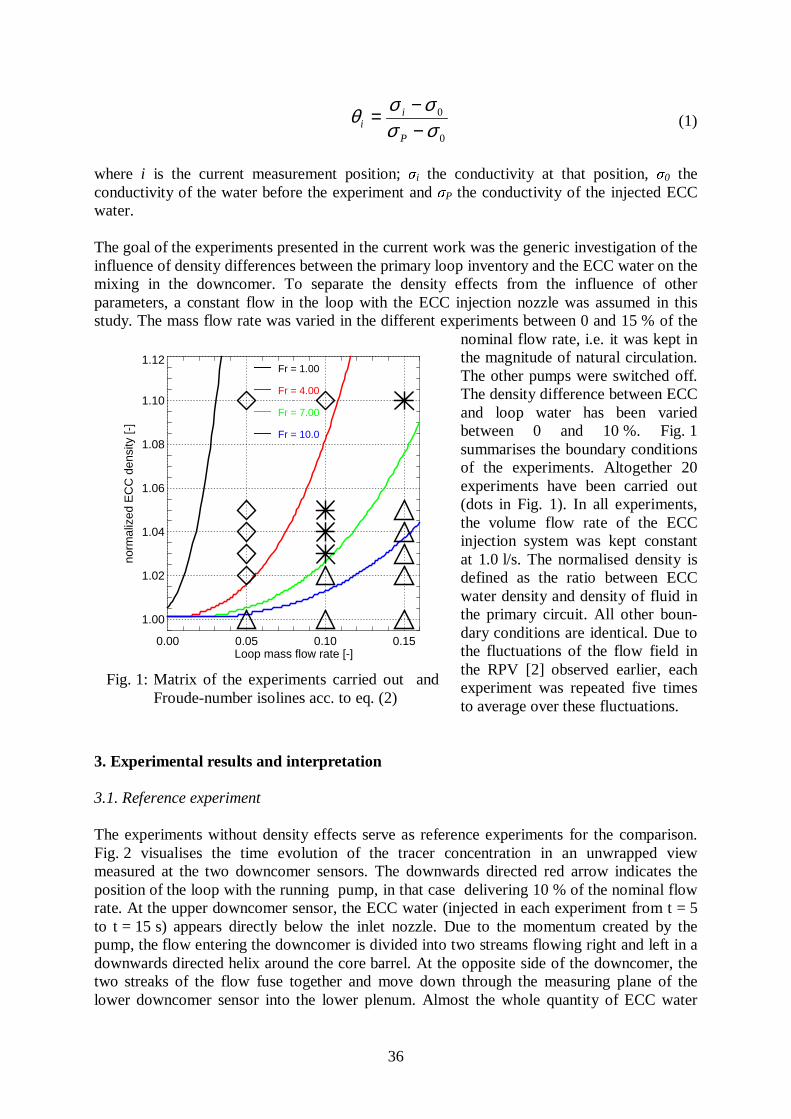
36
0
0
σσσσθ
−−=
P
ii (1)
where i is the current measurement position; σi the conductivity at that position, σ0 theconductivity of the water before the experiment and σP the conductivity of the injected ECCwater.
The goal of the experiments presented in the current work was the generic investigation of theinfluence of density differences between the primary loop inventory and the ECC water on themixing in the downcomer. To separate the density effects from the influence of otherparameters, a constant flow in the loop with the ECC injection nozzle was assumed in thisstudy. The mass flow rate was varied in the different experiments between 0 and 15 % of the
nominal flow rate, i.e. it was kept inthe magnitude of natural circulation.The other pumps were switched off.The density difference between ECCand loop water has been variedbetween 0 and 10 %. Fig. 1summarises the boundary conditionsof the experiments. Altogether 20experiments have been carried out(dots in Fig. 1). In all experiments,the volume flow rate of the ECCinjection system was kept constantat 1.0 l/s. The normalised density isdefined as the ratio between ECCwater density and density of fluid inthe primary circuit. All other boun-dary conditions are identical. Due tothe fluctuations of the flow field inthe RPV [2] observed earlier, eachexperiment was repeated five timesto average over these fluctuations.
3. Experimental results and interpretation
3.1. Reference experiment
The experiments without density effects serve as reference experiments for the comparison.Fig. 2 visualises the time evolution of the tracer concentration in an unwrapped viewmeasured at the two downcomer sensors. The downwards directed red arrow indicates theposition of the loop with the running pump, in that case delivering 10 % of the nominal flowrate. At the upper downcomer sensor, the ECC water (injected in each experiment from t = 5to t = 15 s) appears directly below the inlet nozzle. Due to the momentum created by thepump, the flow entering the downcomer is divided into two streams flowing right and left in adownwards directed helix around the core barrel. At the opposite side of the downcomer, thetwo streaks of the flow fuse together and move down through the measuring plane of thelower downcomer sensor into the lower plenum. Almost the whole quantity of ECC water
0.00 0.05 0.10 0.15Loop mass flow rate [-]
1.00
1.02
1.04
1.06
1.08
1.10
1.12
norm
aliz
ed E
CC
den
sity
[-]
Fr = 1.00
Fr = 4.00
Fr = 7.00
Fr = 10.0
Fig. 1: Matrix of the experiments carried out andFroude-number isolines acc. to eq. (2)
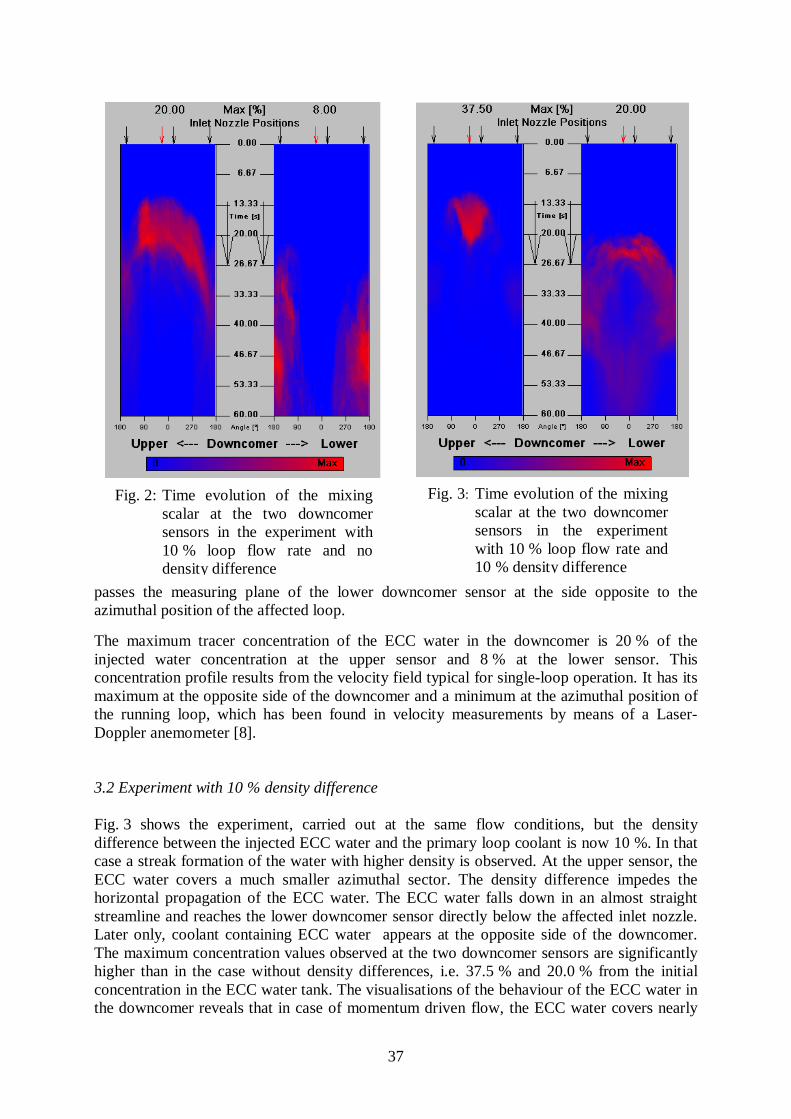
37
passes the measuring plane of the lower downcomer sensor at the side opposite to theazimuthal position of the affected loop.
The maximum tracer concentration of the ECC water in the downcomer is 20 % of theinjected water concentration at the upper sensor and 8 % at the lower sensor. Thisconcentration profile results from the velocity field typical for single-loop operation. It has itsmaximum at the opposite side of the downcomer and a minimum at the azimuthal position ofthe running loop, which has been found in velocity measurements by means of a Laser-Doppler anemometer [8].
3.2 Experiment with 10 % density difference
Fig. 3 shows the experiment, carried out at the same flow conditions, but the densitydifference between the injected ECC water and the primary loop coolant is now 10 %. In thatcase a streak formation of the water with higher density is observed. At the upper sensor, theECC water covers a much smaller azimuthal sector. The density difference impedes thehorizontal propagation of the ECC water. The ECC water falls down in an almost straightstreamline and reaches the lower downcomer sensor directly below the affected inlet nozzle.Later only, coolant containing ECC water appears at the opposite side of the downcomer.The maximum concentration values observed at the two downcomer sensors are significantlyhigher than in the case without density differences, i.e. 37.5 % and 20.0 % from the initialconcentration in the ECC water tank. The visualisations of the behaviour of the ECC water inthe downcomer reveals that in case of momentum driven flow, the ECC water covers nearly
Fig. 2: Time evolution of the mixingscalar at the two downcomersensors in the experiment with10 % loop flow rate and nodensity difference
Fig. 3: Time evolution of the mixingscalar at the two downcomersensors in the experimentwith 10 % loop flow rate and10 % density difference
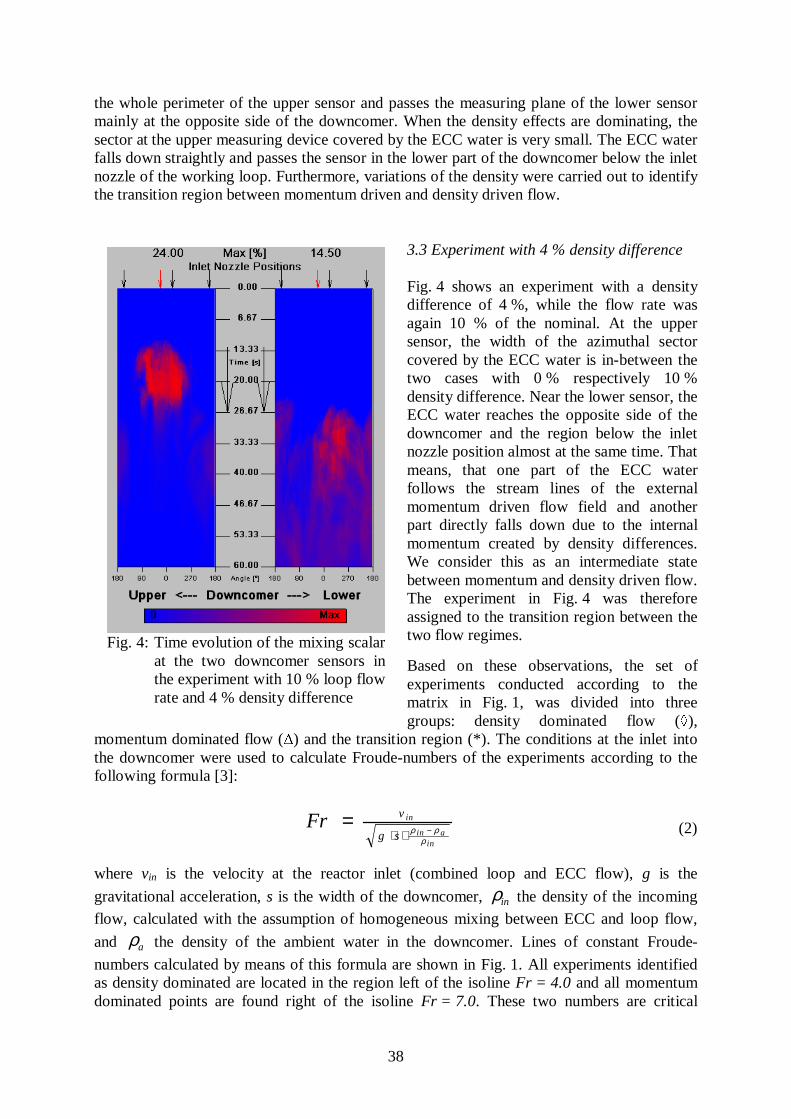
38
the whole perimeter of the upper sensor and passes the measuring plane of the lower sensormainly at the opposite side of the downcomer. When the density effects are dominating, thesector at the upper measuring device covered by the ECC water is very small. The ECC waterfalls down straightly and passes the sensor in the lower part of the downcomer below the inletnozzle of the working loop. Furthermore, variations of the density were carried out to identifythe transition region between momentum driven and density driven flow.
3.3 Experiment with 4 % density difference
Fig. 4 shows an experiment with a densitydifference of 4 %, while the flow rate wasagain 10 % of the nominal. At the uppersensor, the width of the azimuthal sectorcovered by the ECC water is in-between thetwo cases with 0 % respectively 10 %density difference. Near the lower sensor, theECC water reaches the opposite side of thedowncomer and the region below the inletnozzle position almost at the same time. Thatmeans, that one part of the ECC waterfollows the stream lines of the externalmomentum driven flow field and anotherpart directly falls down due to the internalmomentum created by density differences.We consider this as an intermediate statebetween momentum and density driven flow.The experiment in Fig. 4 was thereforeassigned to the transition region between thetwo flow regimes.
Based on these observations, the set ofexperiments conducted according to thematrix in Fig. 1, was divided into threegroups: density dominated flow (◊),
momentum dominated flow (∆) and the transition region (*). The conditions at the inlet intothe downcomer were used to calculate Froude-numbers of the experiments according to thefollowing formula [3]:
inain
in
sg
vFrρ
ρρ −⋅⋅= (2)
where vin is the velocity at the reactor inlet (combined loop and ECC flow), g is the
gravitational acceleration, s is the width of the downcomer, inρ the density of the incoming
flow, calculated with the assumption of homogeneous mixing between ECC and loop flow,
and aρ the density of the ambient water in the downcomer. Lines of constant Froude-
numbers calculated by means of this formula are shown in Fig. 1. All experiments identifiedas density dominated are located in the region left of the isoline Fr = 4.0 and all momentumdominated points are found right of the isoline Fr = 7.0. These two numbers are critical
Fig. 4: Time evolution of the mixing scalarat the two downcomer sensors inthe experiment with 10 % loop flowrate and 4 % density difference
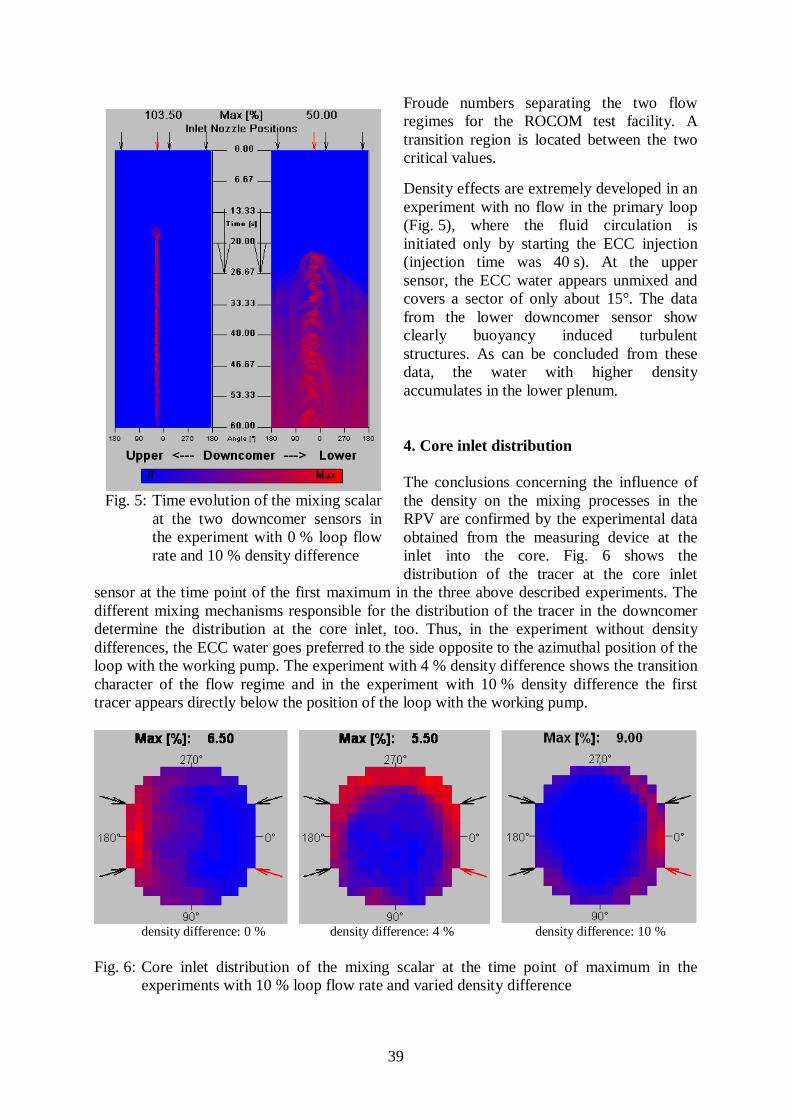
39
Froude numbers separating the two flowregimes for the ROCOM test facility. Atransition region is located between the twocritical values.
Density effects are extremely developed in anexperiment with no flow in the primary loop(Fig. 5), where the fluid circulation isinitiated only by starting the ECC injection(injection time was 40 s). At the uppersensor, the ECC water appears unmixed andcovers a sector of only about 15°. The datafrom the lower downcomer sensor showclearly buoyancy induced turbulentstructures. As can be concluded from thesedata, the water with higher densityaccumulates in the lower plenum.
4. Core inlet distribution
The conclusions concerning the influence ofthe density on the mixing processes in theRPV are confirmed by the experimental dataobtained from the measuring device at theinlet into the core. Fig. 6 shows thedistribution of the tracer at the core inlet
sensor at the time point of the first maximum in the three above described experiments. Thedifferent mixing mechanisms responsible for the distribution of the tracer in the downcomerdetermine the distribution at the core inlet, too. Thus, in the experiment without densitydifferences, the ECC water goes preferred to the side opposite to the azimuthal position of theloop with the working pump. The experiment with 4 % density difference shows the transitioncharacter of the flow regime and in the experiment with 10 % density difference the firsttracer appears directly below the position of the loop with the working pump.
density difference: 0 % density difference: 4 % density difference: 10 %
Fig. 6: Core inlet distribution of the mixing scalar at the time point of maximum in theexperiments with 10 % loop flow rate and varied density difference
Fig. 5: Time evolution of the mixing scalarat the two downcomer sensors inthe experiment with 0 % loop flowrate and 10 % density difference
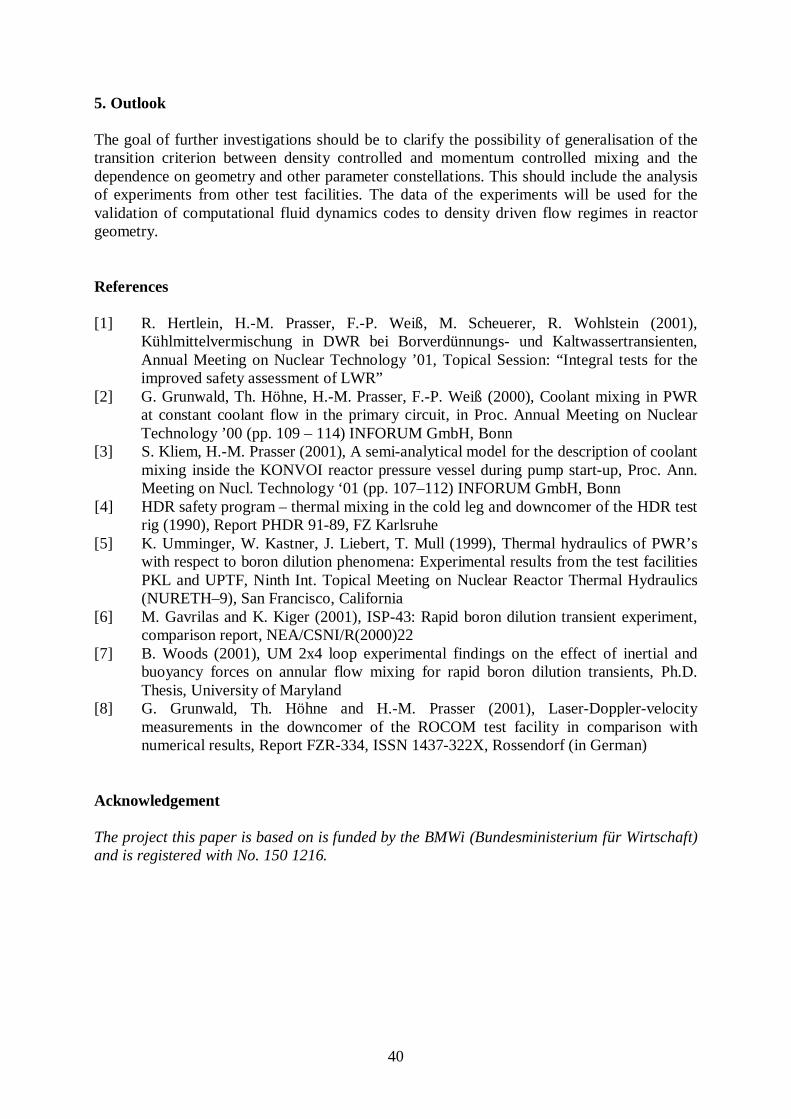
40
5. Outlook
The goal of further investigations should be to clarify the possibility of generalisation of thetransition criterion between density controlled and momentum controlled mixing and thedependence on geometry and other parameter constellations. This should include the analysisof experiments from other test facilities. The data of the experiments will be used for thevalidation of computational fluid dynamics codes to density driven flow regimes in reactorgeometry.
References
[1] R. Hertlein, H.-M. Prasser, F.-P. Weiß, M. Scheuerer, R. Wohlstein (2001),Kühlmittelvermischung in DWR bei Borverdünnungs- und Kaltwassertransienten,Annual Meeting on Nuclear Technology ’01, Topical Session: “Integral tests for theimproved safety assessment of LWR”
[2] G. Grunwald, Th. Höhne, H.-M. Prasser, F.-P. Weiß (2000), Coolant mixing in PWRat constant coolant flow in the primary circuit, in Proc. Annual Meeting on NuclearTechnology ’00 (pp. 109 – 114) INFORUM GmbH, Bonn
[3] S. Kliem, H.-M. Prasser (2001), A semi-analytical model for the description of coolantmixing inside the KONVOI reactor pressure vessel during pump start-up, Proc. Ann.Meeting on Nucl. Technology ‘01 (pp. 107–112) INFORUM GmbH, Bonn
[4] HDR safety program – thermal mixing in the cold leg and downcomer of the HDR testrig (1990), Report PHDR 91-89, FZ Karlsruhe
[5] K. Umminger, W. Kastner, J. Liebert, T. Mull (1999), Thermal hydraulics of PWR’swith respect to boron dilution phenomena: Experimental results from the test facilitiesPKL and UPTF, Ninth Int. Topical Meeting on Nuclear Reactor Thermal Hydraulics(NURETH–9), San Francisco, California
[6] M. Gavrilas and K. Kiger (2001), ISP-43: Rapid boron dilution transient experiment,comparison report, NEA/CSNI/R(2000)22
[7] B. Woods (2001), UM 2x4 loop experimental findings on the effect of inertial andbuoyancy forces on annular flow mixing for rapid boron dilution transients, Ph.D.Thesis, University of Maryland
[8] G. Grunwald, Th. Höhne and H.-M. Prasser (2001), Laser-Doppler-velocitymeasurements in the downcomer of the ROCOM test facility in comparison withnumerical results, Report FZR-334, ISSN 1437-322X, Rossendorf (in German)
Acknowledgement
The project this paper is based on is funded by the BMWi (Bundesministerium für Wirtschaft)and is registered with No. 150 1216.
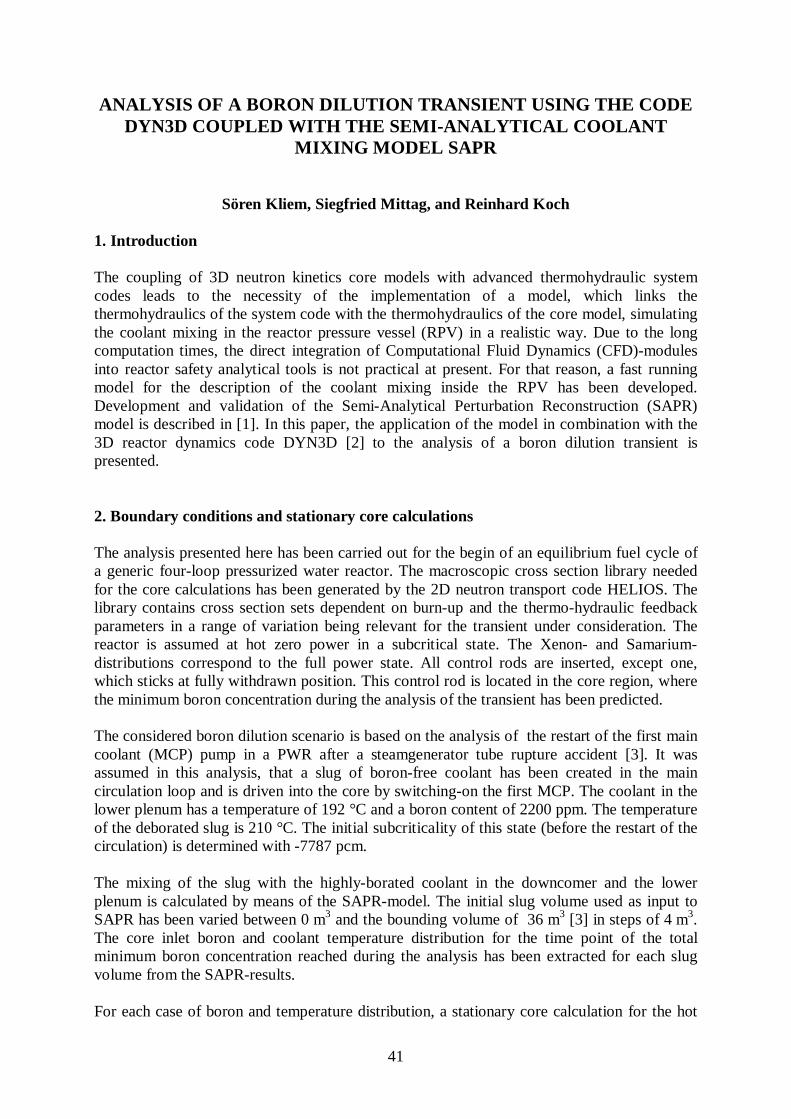
41
ANALYSIS OF A BORON DILUTION TRANSIENT USING THE CODEDYN3D COUPLED WITH THE SEMI-ANALYTICAL COOLANT
MIXING MODEL SAPR
Sören Kliem, Siegfried Mittag, and Reinhard Koch
1. Introduction
The coupling of 3D neutron kinetics core models with advanced thermohydraulic systemcodes leads to the necessity of the implementation of a model, which links thethermohydraulics of the system code with the thermohydraulics of the core model, simulatingthe coolant mixing in the reactor pressure vessel (RPV) in a realistic way. Due to the longcomputation times, the direct integration of Computational Fluid Dynamics (CFD)-modulesinto reactor safety analytical tools is not practical at present. For that reason, a fast runningmodel for the description of the coolant mixing inside the RPV has been developed.Development and validation of the Semi-Analytical Perturbation Reconstruction (SAPR)model is described in [1]. In this paper, the application of the model in combination with the3D reactor dynamics code DYN3D [2] to the analysis of a boron dilution transient ispresented.
2. Boundary conditions and stationary core calculations
The analysis presented here has been carried out for the begin of an equilibrium fuel cycle ofa generic four-loop pressurized water reactor. The macroscopic cross section library neededfor the core calculations has been generated by the 2D neutron transport code HELIOS. Thelibrary contains cross section sets dependent on burn-up and the thermo-hydraulic feedbackparameters in a range of variation being relevant for the transient under consideration. Thereactor is assumed at hot zero power in a subcritical state. The Xenon- and Samarium-distributions correspond to the full power state. All control rods are inserted, except one,which sticks at fully withdrawn position. This control rod is located in the core region, wherethe minimum boron concentration during the analysis of the transient has been predicted.
The considered boron dilution scenario is based on the analysis of the restart of the first maincoolant (MCP) pump in a PWR after a steamgenerator tube rupture accident [3]. It wasassumed in this analysis, that a slug of boron-free coolant has been created in the maincirculation loop and is driven into the core by switching-on the first MCP. The coolant in thelower plenum has a temperature of 192 °C and a boron content of 2200 ppm. The temperatureof the deborated slug is 210 °C. The initial subcriticality of this state (before the restart of thecirculation) is determined with -7787 pcm.
The mixing of the slug with the highly-borated coolant in the downcomer and the lowerplenum is calculated by means of the SAPR-model. The initial slug volume used as input toSAPR has been varied between 0 m3 and the bounding volume of 36 m3 [3] in steps of 4 m3.The core inlet boron and coolant temperature distribution for the time point of the totalminimum boron concentration reached during the analysis has been extracted for each slugvolume from the SAPR-results.
For each case of boron and temperature distribution, a stationary core calculation for the hot
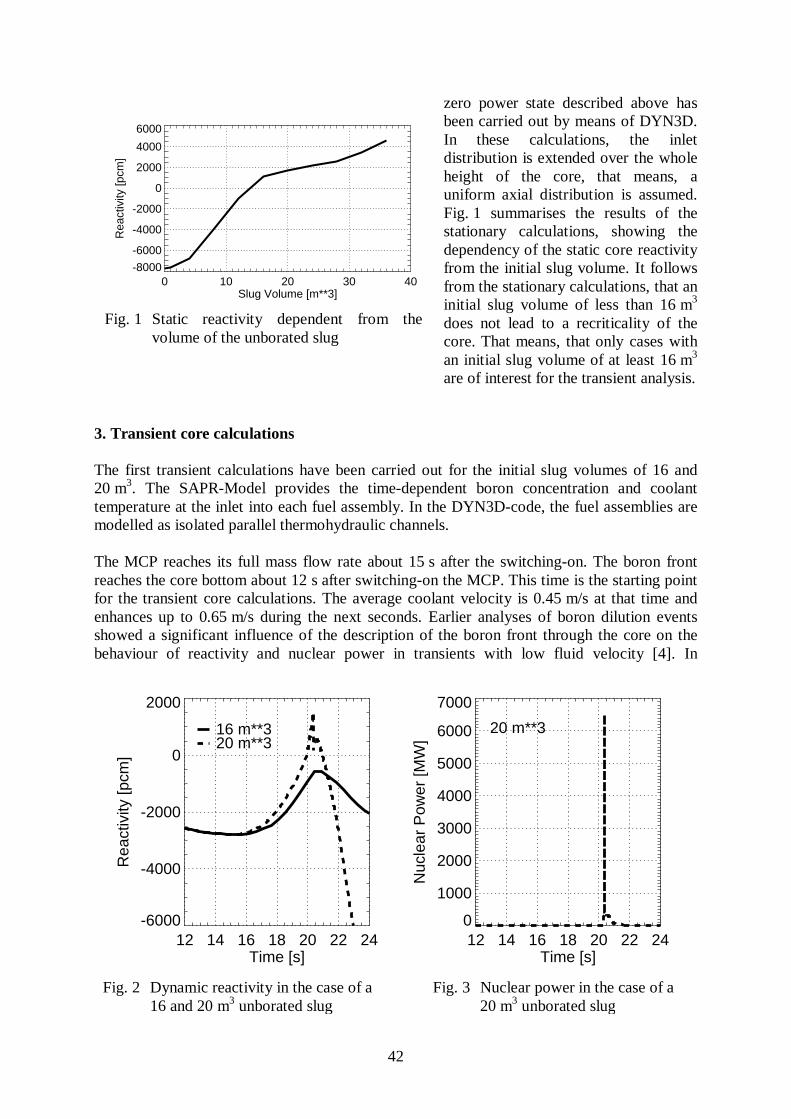
42
zero power state described above hasbeen carried out by means of DYN3D.In these calculations, the inletdistribution is extended over the wholeheight of the core, that means, auniform axial distribution is assumed.Fig. 1 summarises the results of thestationary calculations, showing thedependency of the static core reactivityfrom the initial slug volume. It followsfrom the stationary calculations, that aninitial slug volume of less than 16 m3
does not lead to a recriticality of thecore. That means, that only cases withan initial slug volume of at least 16 m3
are of interest for the transient analysis.
3. Transient core calculations
The first transient calculations have been carried out for the initial slug volumes of 16 and20 m3. The SAPR-Model provides the time-dependent boron concentration and coolanttemperature at the inlet into each fuel assembly. In the DYN3D-code, the fuel assemblies aremodelled as isolated parallel thermohydraulic channels.
The MCP reaches its full mass flow rate about 15 s after the switching-on. The boron frontreaches the core bottom about 12 s after switching-on the MCP. This time is the starting pointfor the transient core calculations. The average coolant velocity is 0.45 m/s at that time andenhances up to 0.65 m/s during the next seconds. Earlier analyses of boron dilution eventsshowed a significant influence of the description of the boron front through the core on thebehaviour of reactivity and nuclear power in transients with low fluid velocity [4]. In
0 10 20 30 40Slug Volume [m**3]
-8000
-6000
-4000
-2000
0
2000
4000
6000R
eact
ivity
[pcm
]
Fig. 1 Static reactivity dependent from thevolume of the unborated slug
12 14 16 18 20 22 24Time [s]
-6000
-4000
-2000
0
2000
Rea
ctiv
ity [p
cm]
16 m**320 m**3
12 14 16 18 20 22 24Time [s]
0
1000
2000
3000
4000
5000
6000
7000
Nuc
lear
Pow
er [M
W]
20 m**3
Fig. 2 Dynamic reactivity in the case of a Fig. 3 Nuclear power in the case of a16 and 20 m3 unborated slug 20 m3 unborated slug
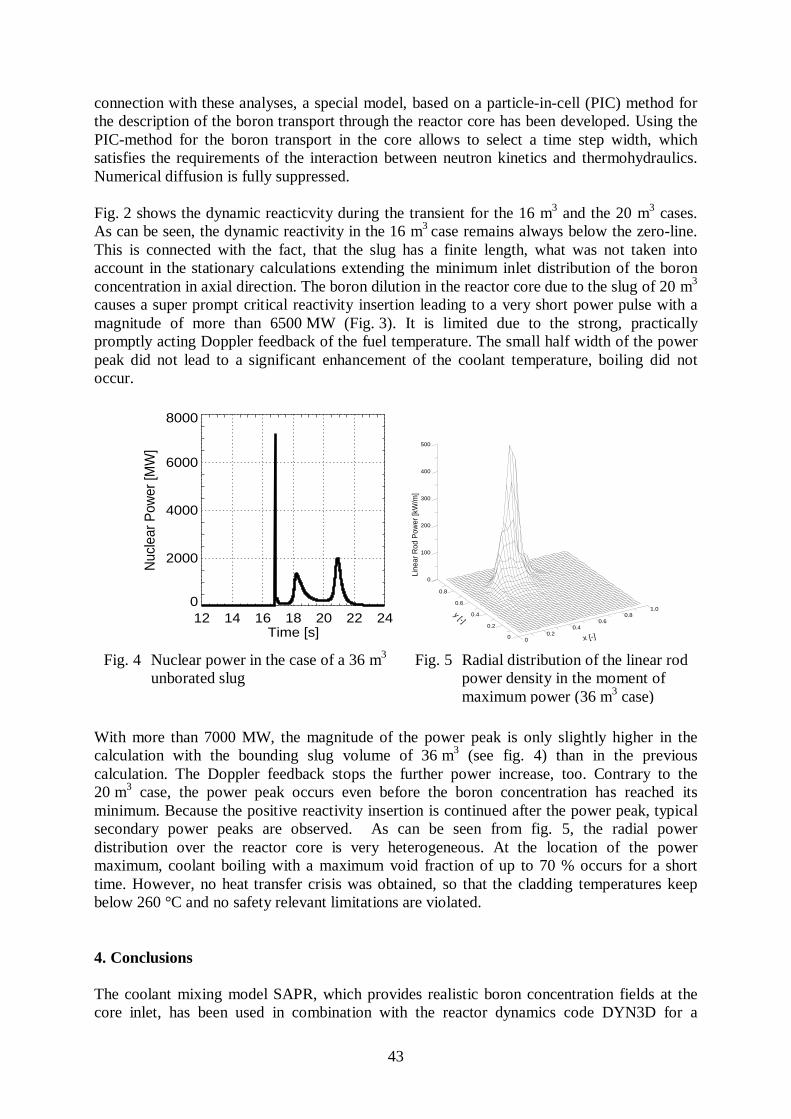
43
connection with these analyses, a special model, based on a particle-in-cell (PIC) method forthe description of the boron transport through the reactor core has been developed. Using thePIC-method for the boron transport in the core allows to select a time step width, whichsatisfies the requirements of the interaction between neutron kinetics and thermohydraulics.Numerical diffusion is fully suppressed.
Fig. 2 shows the dynamic reacticvity during the transient for the 16 m3 and the 20 m3 cases.As can be seen, the dynamic reactivity in the 16 m3 case remains always below the zero-line.This is connected with the fact, that the slug has a finite length, what was not taken intoaccount in the stationary calculations extending the minimum inlet distribution of the boronconcentration in axial direction. The boron dilution in the reactor core due to the slug of 20 m3
causes a super prompt critical reactivity insertion leading to a very short power pulse with amagnitude of more than 6500 MW (Fig. 3). It is limited due to the strong, practicallypromptly acting Doppler feedback of the fuel temperature. The small half width of the powerpeak did not lead to a significant enhancement of the coolant temperature, boiling did notoccur.
With more than 7000 MW, the magnitude of the power peak is only slightly higher in thecalculation with the bounding slug volume of 36 m3 (see fig. 4) than in the previouscalculation. The Doppler feedback stops the further power increase, too. Contrary to the20 m3 case, the power peak occurs even before the boron concentration has reached itsminimum. Because the positive reactivity insertion is continued after the power peak, typicalsecondary power peaks are observed. As can be seen from fig. 5, the radial powerdistribution over the reactor core is very heterogeneous. At the location of the powermaximum, coolant boiling with a maximum void fraction of up to 70 % occurs for a shorttime. However, no heat transfer crisis was obtained, so that the cladding temperatures keepbelow 260 °C and no safety relevant limitations are violated.
4. Conclusions
The coolant mixing model SAPR, which provides realistic boron concentration fields at thecore inlet, has been used in combination with the reactor dynamics code DYN3D for a
12 14 16 18 20 22 24Time [s]
0
2000
4000
6000
8000
Nuc
lear
Pow
er [M
W]
00.2
0.40.6
0.81.0
0
0.2
0.4
0.6
0.8
0
100
200
300
400
500
L
inea
r Rod
Pow
er [k
W/m
]
x [-]
y [-]
Fig. 4 Nuclear power in the case of a 36 m3 Fig. 5 Radial distribution of the linear rodunborated slug power density in the moment of
maximum power (36 m3 case)
44
parameter study of a hypothetical boron dilution event. By varying the initial slug volume itwas found, that for the given core configuration slugs of less than 16 m3 did not lead tosupercriticality in static calculations. Transient calculations revealed a further conservatism ofthe static analysis. Only an initial slug volume of 20 m3 leads to a power increase of the shut-off reactor in the calculation. According to these calculations, even a reactivity insertion up to2 $ connected with the 36 m3 slug did not lead to safety relevant consequences. The powerexcursion is controlled by the Doppler feedback.
The consideration of realistic assumptions concerning the coolant mixing in the RPVpreserves a great amount of inherent safety of the reactor. Earlier analyses with conservativecoolant mixing assumptions provide supercriticality even for smaller slug volumes.
A proper description of the boron transport through the core in case of transients with lowcoolant velocity is absolutely necessary to calculate the neutron kinetic behaviour of the corein a right manner. Otherwise the numerical diffusion distorts the boron front and the reactivityinsertion is smoothed artificially.
This parameter study performed for a generic PWR is a demonstration of the capabilities ofthe mixing model SAPR in combination with the neutron kinetic core model DYN3D In caseof the application of the mixing model to a certain reactor, the bounding initial slug volumefor a specific scenario has to be determined and then used as input to the mixing model.
In the near future, the model is to be implemented into the coupled code DYN3D/ATHLET.That would allow to carry out analyses of the whole plant behaviour. This is especiallyimportant during steam line break analyses, where the core behaviour is influenced by thewhole primary circuit and even the steamgenerator secondary side must be considered overseveral hundred seconds.
References
[1] S. Kliem, H.-M. Prasser (2001), A semi-analytical model for the description of coolantmixing inside the KONVOI reactor pressure vessel during pump start-up, Proc. Ann.Meeting on Nucl. Technology ‘01 (pp. 107–112) INFORUM GmbH, Bonn
[2] U. Grundmann, U. Rohde (1996), DYN3D – A 3-dimensional core model for steady-state and transient analysis in thermal reactors , Proc. Int. Conf. on the Physics ofReactors PHYSOR’96 (pp. J70 – J79)
[3] R. Reinders (1998), Dreidimensionale Berechnung der Borkonzentration im RDB nacheinem DE-Heizrohrleck, in Proc. Annual Meeting on Nuclear Technology ’98 (pp. 107– 110) INFORUM GmbH, Bonn
[4] U. Rohde, D. Lucas (1998), Solution of the 4th AER Dynamic Benchmark by use ofthe code DYN3D with a Particle-in-Cell method for the description of boron transport,Proc. 7th Symposium of AER (p. 387) KFKI Atomic Energy Research Institute,Budapest
Acknowledgement
The project this paper is based on is funded by the BMWi (Bundesministerium für Wirtschaft)and is registered with No. 150 1225.The authors thank Dr. D. Lucas (FZR) for implementing the PIC-Method into the core modelDYN3D.
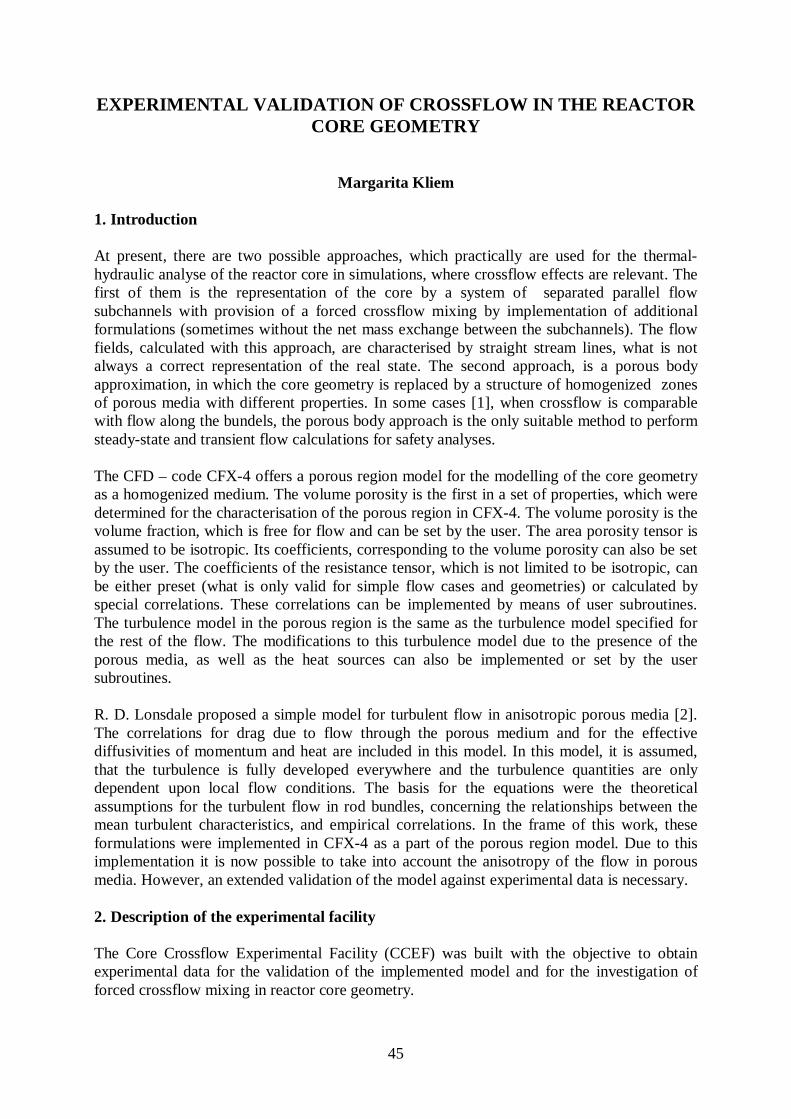
45
EXPERIMENTAL VALIDATION OF CROSSFLOW IN THE REACTORCORE GEOMETRY
Margarita Kliem
1. Introduction
At present, there are two possible approaches, which practically are used for the thermal-hydraulic analyse of the reactor core in simulations, where crossflow effects are relevant. Thefirst of them is the representation of the core by a system of separated parallel flowsubchannels with provision of a forced crossflow mixing by implementation of additionalformulations (sometimes without the net mass exchange between the subchannels). The flowfields, calculated with this approach, are characterised by straight stream lines, what is notalways a correct representation of the real state. The second approach, is a porous bodyapproximation, in which the core geometry is replaced by a structure of homogenized zonesof porous media with different properties. In some cases [1], when crossflow is comparablewith flow along the bundels, the porous body approach is the only suitable method to performsteady-state and transient flow calculations for safety analyses.
The CFD – code CFX-4 offers a porous region model for the modelling of the core geometryas a homogenized medium. The volume porosity is the first in a set of properties, which weredetermined for the characterisation of the porous region in CFX-4. The volume porosity is thevolume fraction, which is free for flow and can be set by the user. The area porosity tensor isassumed to be isotropic. Its coefficients, corresponding to the volume porosity can also be setby the user. The coefficients of the resistance tensor, which is not limited to be isotropic, canbe either preset (what is only valid for simple flow cases and geometries) or calculated byspecial correlations. These correlations can be implemented by means of user subroutines.The turbulence model in the porous region is the same as the turbulence model specified forthe rest of the flow. The modifications to this turbulence model due to the presence of theporous media, as well as the heat sources can also be implemented or set by the usersubroutines.
R. D. Lonsdale proposed a simple model for turbulent flow in anisotropic porous media [2].The correlations for drag due to flow through the porous medium and for the effectivediffusivities of momentum and heat are included in this model. In this model, it is assumed,that the turbulence is fully developed everywhere and the turbulence quantities are onlydependent upon local flow conditions. The basis for the equations were the theoreticalassumptions for the turbulent flow in rod bundles, concerning the relationships between themean turbulent characteristics, and empirical correlations. In the frame of this work, theseformulations were implemented in CFX-4 as a part of the porous region model. Due to thisimplementation it is now possible to take into account the anisotropy of the flow in porousmedia. However, an extended validation of the model against experimental data is necessary.
2. Description of the experimental facility
The Core Crossflow Experimental Facility (CCEF) was built with the objective to obtainexperimental data for the validation of the implemented model and for the investigation offorced crossflow mixing in reactor core geometry.
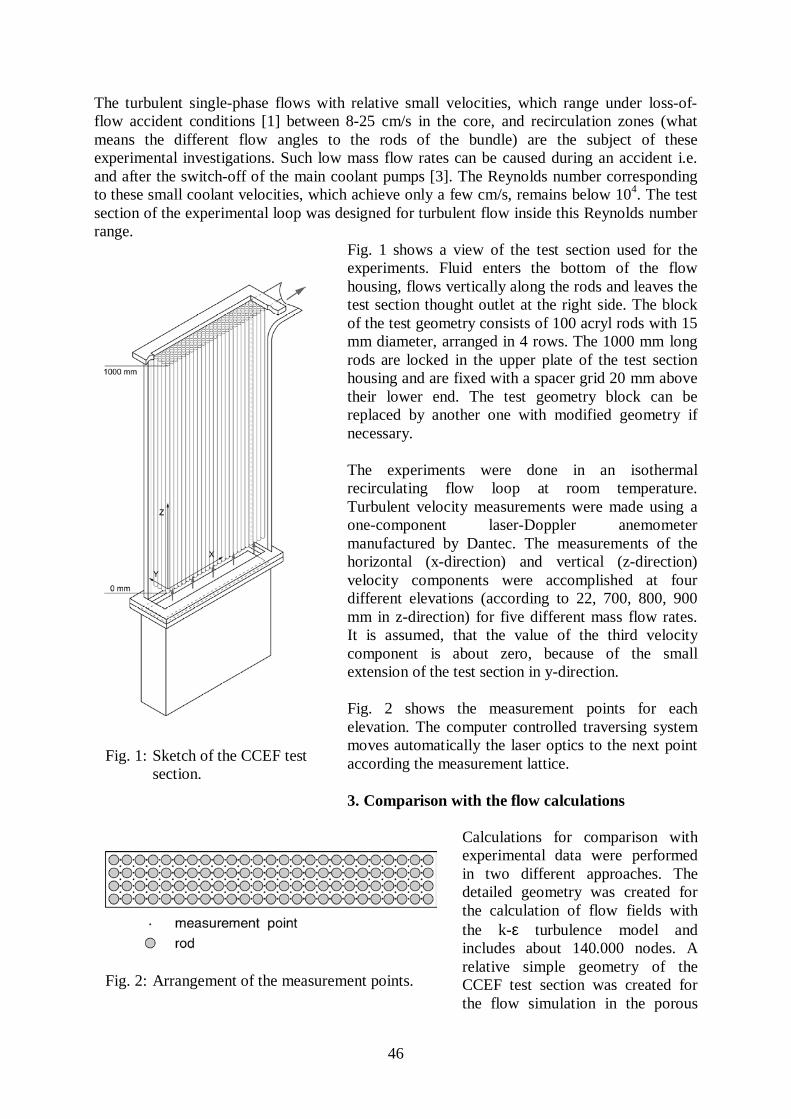
46
The turbulent single-phase flows with relative small velocities, which range under loss-of-flow accident conditions [1] between 8-25 cm/s in the core, and recirculation zones (whatmeans the different flow angles to the rods of the bundle) are the subject of theseexperimental investigations. Such low mass flow rates can be caused during an accident i.e.and after the switch-off of the main coolant pumps [3]. The Reynolds number correspondingto these small coolant velocities, which achieve only a few cm/s, remains below 104. The testsection of the experimental loop was designed for turbulent flow inside this Reynolds numberrange.
Fig. 1 shows a view of the test section used for theexperiments. Fluid enters the bottom of the flowhousing, flows vertically along the rods and leaves thetest section thought outlet at the right side. The blockof the test geometry consists of 100 acryl rods with 15mm diameter, arranged in 4 rows. The 1000 mm longrods are locked in the upper plate of the test sectionhousing and are fixed with a spacer grid 20 mm abovetheir lower end. The test geometry block can bereplaced by another one with modified geometry ifnecessary.
The experiments were done in an isothermalrecirculating flow loop at room temperature.Turbulent velocity measurements were made using aone-component laser-Doppler anemometermanufactured by Dantec. The measurements of thehorizontal (x-direction) and vertical (z-direction)velocity components were accomplished at fourdifferent elevations (according to 22, 700, 800, 900mm in z-direction) for five different mass flow rates.It is assumed, that the value of the third velocitycomponent is about zero, because of the smallextension of the test section in y-direction.
Fig. 2 shows the measurement points for eachelevation. The computer controlled traversing systemmoves automatically the laser optics to the next pointaccording the measurement lattice.
3. Comparison with the flow calculations
Calculations for comparison withexperimental data were performedin two different approaches. Thedetailed geometry was created forthe calculation of flow fields withthe k-ε turbulence model andincludes about 140.000 nodes. Arelative simple geometry of theCCEF test section was created forthe flow simulation in the porous
Fig. 1: Sketch of the CCEF testsection.
Fig. 2: Arrangement of the measurement points.
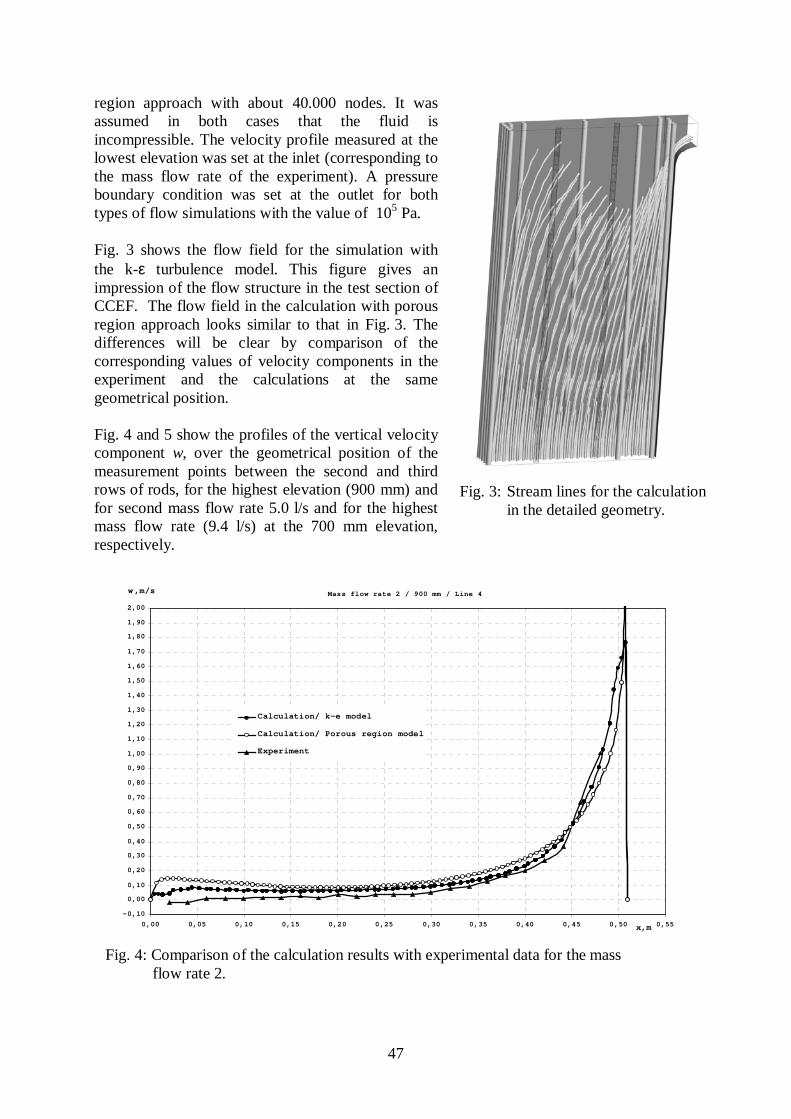
47
region approach with about 40.000 nodes. It wasassumed in both cases that the fluid isincompressible. The velocity profile measured at thelowest elevation was set at the inlet (corresponding tothe mass flow rate of the experiment). A pressureboundary condition was set at the outlet for bothtypes of flow simulations with the value of 105 Pa.
Fig. 3 shows the flow field for the simulation withthe k-ε turbulence model. This figure gives animpression of the flow structure in the test section ofCCEF. The flow field in the calculation with porousregion approach looks similar to that in Fig. 3. Thedifferences will be clear by comparison of thecorresponding values of velocity components in theexperiment and the calculations at the samegeometrical position.
Fig. 4 and 5 show the profiles of the vertical velocitycomponent w, over the geometrical position of themeasurement points between the second and thirdrows of rods, for the highest elevation (900 mm) andfor second mass flow rate 5.0 l/s and for the highestmass flow rate (9.4 l/s) at the 700 mm elevation,respectively.
Fig. 3: Stream lines for the calculationin the detailed geometry.
Fig. 4: Comparison of the calculation results with experimental data for the massflow rate 2.
Mass flow rate 2 / 900 mm / Line 4
-0,10
0,00
0,10
0,20
0,30
0,40
0,50
0,60
0,70
0,80
0,90
1,00
1,10
1,20
1,30
1,40
1,50
1,60
1,70
1,80
1,90
2,00
0,00 0,05 0,10 0,15 0,20 0,25 0,30 0,35 0,40 0,45 0,50 0,55x,m
w,m/s
Calculation/ k-e model
Calculation/ Porous region model
Experiment
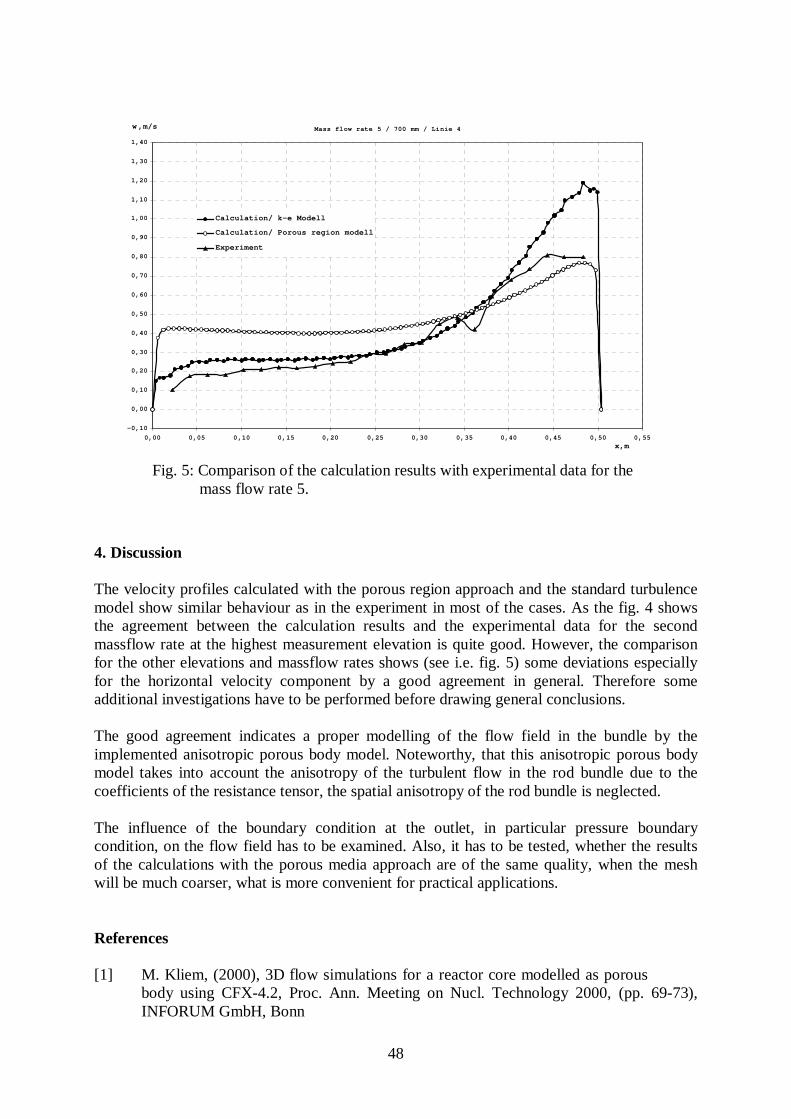
48
4. Discussion
The velocity profiles calculated with the porous region approach and the standard turbulencemodel show similar behaviour as in the experiment in most of the cases. As the fig. 4 showsthe agreement between the calculation results and the experimental data for the secondmassflow rate at the highest measurement elevation is quite good. However, the comparisonfor the other elevations and massflow rates shows (see i.e. fig. 5) some deviations especiallyfor the horizontal velocity component by a good agreement in general. Therefore someadditional investigations have to be performed before drawing general conclusions.
The good agreement indicates a proper modelling of the flow field in the bundle by theimplemented anisotropic porous body model. Noteworthy, that this anisotropic porous bodymodel takes into account the anisotropy of the turbulent flow in the rod bundle due to thecoefficients of the resistance tensor, the spatial anisotropy of the rod bundle is neglected.
The influence of the boundary condition at the outlet, in particular pressure boundarycondition, on the flow field has to be examined. Also, it has to be tested, whether the resultsof the calculations with the porous media approach are of the same quality, when the meshwill be much coarser, what is more convenient for practical applications.
References
[1] M. Kliem, (2000), 3D flow simulations for a reactor core modelled as porousbody using CFX-4.2, Proc. Ann. Meeting on Nucl. Technology 2000, (pp. 69-73),INFORUM GmbH, Bonn
Fig. 5: Comparison of the calculation results with experimental data for themass flow rate 5.
Mass flow rate 5 / 700 mm / Linie 4
-0,10
0,00
0,10
0,20
0,30
0,40
0,50
0,60
0,70
0,80
0,90
1,00
1,10
1,20
1,30
1,40
0,00 0,05 0,10 0,15 0,20 0,25 0,30 0,35 0,40 0,45 0,50 0,55x,m
w,m/s
Calculation/ k-e Modell
Calculation/ Porous region modell
Experiment

49
[2] R. D. Lonsdale (1984), A simple turbulence model for flow in anisotropic porousmedia, Internal report, AEA Technology, ND-M-2947(D)
[3] S. Kliem, U. Grundmann, U. Rohde, (1998), Main Steam Line Break analysis of aNPP with VVER by means of the coupled code DYN3D/ATHLET, Proc. Ann.Meeting on Nucl. Technology 1998, (pp. 15-19), INFORUM GmbH, Bonn
50
NUMERICAL INVESTIGATION AND MEASUREMENT OF TRANSIENT TWO-PHASE BOILING IN A HEATED POOL
Eckhard Krepper
1. Introduction
The present paper was originated by safety assessments of dangerous liquids storage tanksagainst an external fire. As a consequence of an external heat source, the heat-up of theinventory may lead to the evaporation of the liquid and to release of significant quantities ofdangerous gases into the environment. The liquid inventory behaves very differently dependingon the mode of heating. Heating from the bottom of the tank leads to an irregularthermoconvective motion of the liquid, which causes good mixing, so that saturation is reachedat all locations inside the tank approximately at the same time. If the tank is heated from theside however, a stable temperature stratification is observed leading to large temperaturegradients. Evaporation at the surface can start much earlier than the average temperaturereaches saturation. The scenario is very realistic for cylindrical barrels, which in verticalposition stand on the bottom and are exposed to an external fire.
In the Forschungszentrum Rossendorf a lot of experiments of a bottom and of a side wallheated water tank, having a diameter of 0.25 m and a height of 0.21 m were performed. Atdifferent locations in the tank the temperature and the void fraction were measured (see [1],[2]). In order to clarify the physical nature of the heating up process in simple geometricalboundary conditions, first a two dimensional mathematical model was developed, which alsoincludes evaporation and two phase flow (see [3]). The present paper deals with calculationsusing the CFD code CFX-4 which were performed recently (see [4]). The simulation comprisestwo phase flow, subcooled boiling at the heated side wall and steam release at the watersurface.
2. CFX-boiling model
The subcooled boiling model, implemented into CFX-4 (see [5]) assumes incompressible flowat a fixed absolute pressure. The saturation temperature Tsat and the latent heat of evaporationHlg are specified at this pressure. Constant properties at the saturation temperature are assumedfor the steam and the liquid. Related to the liquid temperature Tl, the liquid subcooling
and the liquid superheating are defined.
The heat source is assumed to be a heated wall. The boiling model calculates the partition of thegiven total heat flux Q into three parts:
(1)
where = heat transfer rate due to convection, = heattransfer due to quenching, when a bubble detaches the wall and is replaced by subcooled waterand Qe = heat transfer due to evaporation; with Tw being the wall temperature, Tl the liquidtemperature in the cell next to the wall and hf and hQ as the corresponding heat transfer
Tsub Tsat Tl–= Tsup Tl Tsat–=
Q Qf QQ Qe+ +=
Qf hf Tw Tl–( )= QQ hQ Tw Tl–( )=
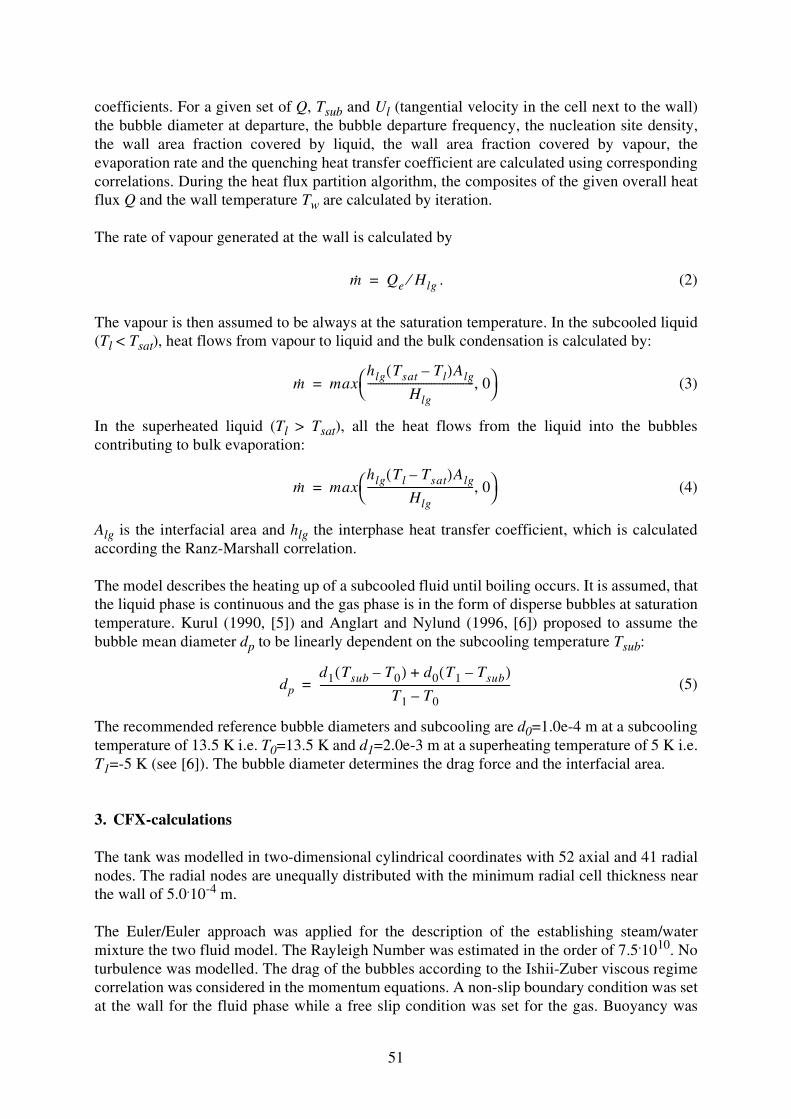
51
coefficients. For a given set of Q, Tsub and Ul (tangential velocity in the cell next to the wall)the bubble diameter at departure, the bubble departure frequency, the nucleation site density,the wall area fraction covered by liquid, the wall area fraction covered by vapour, theevaporation rate and the quenching heat transfer coefficient are calculated using correspondingcorrelations. During the heat flux partition algorithm, the composites of the given overall heatflux Q and the wall temperature Tw are calculated by iteration.
The rate of vapour generated at the wall is calculated by
. (2)
The vapour is then assumed to be always at the saturation temperature. In the subcooled liquid(Tl < Tsat), heat flows from vapour to liquid and the bulk condensation is calculated by:
(3)
In the superheated liquid (Tl > Tsat), all the heat flows from the liquid into the bubblescontributing to bulk evaporation:
(4)
Alg is the interfacial area and hlg the interphase heat transfer coefficient, which is calculatedaccording the Ranz-Marshall correlation.
The model describes the heating up of a subcooled fluid until boiling occurs. It is assumed, thatthe liquid phase is continuous and the gas phase is in the form of disperse bubbles at saturationtemperature. Kurul (1990, [5]) and Anglart and Nylund (1996, [6]) proposed to assume thebubble mean diameter dp to be linearly dependent on the subcooling temperature Tsub:
(5)
The recommended reference bubble diameters and subcooling are d0=1.0e-4 m at a subcoolingtemperature of 13.5 K i.e. T0=13.5 K and d1=2.0e-3 m at a superheating temperature of 5 K i.e.T1=-5 K (see [6]). The bubble diameter determines the drag force and the interfacial area.
3. CFX-calculations
The tank was modelled in two-dimensional cylindrical coordinates with 52 axial and 41 radialnodes. The radial nodes are unequally distributed with the minimum radial cell thickness nearthe wall of 5.0.10-4 m.
The Euler/Euler approach was applied for the description of the establishing steam/watermixture the two fluid model. The Rayleigh Number was estimated in the order of 7.5.1010. Noturbulence was modelled. The drag of the bubbles according to the Ishii-Zuber viscous regimecorrelation was considered in the momentum equations. A non-slip boundary condition was setat the wall for the fluid phase while a free slip condition was set for the gas. Buoyancy was
m· Qe Hlg⁄=
m· maxhlg Tsat Tl–( )Alg
Hlg---------------------------------------- 0,
=
m· maxhlg Tl Tsat–( )Alg
Hlg---------------------------------------- 0,
=
dp
d1 Tsub T0–( ) d0 T1 Tsub–( )+
T1 T0–------------------------------------------------------------------------=
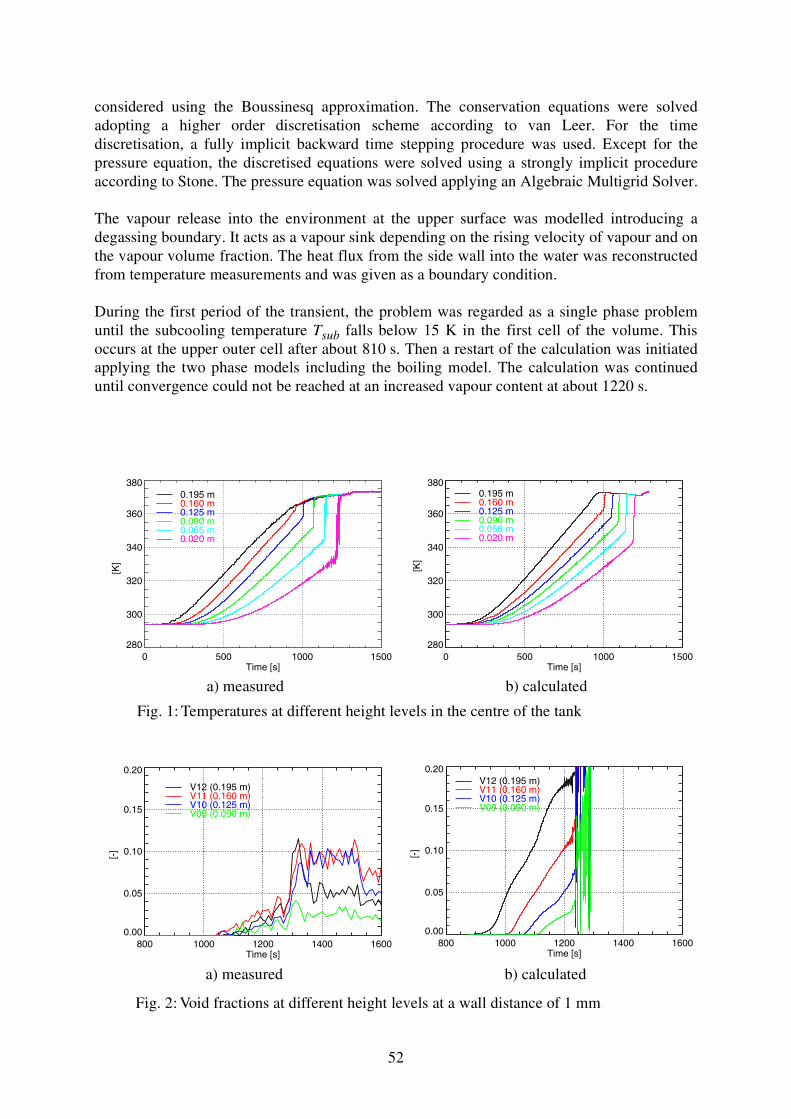
52
0 500 1000 1500 Time [s]
280
300
320
340
360
380
[K]
0.195 m0.160 m0.125 m0.090 m0.065 m0.020 m
0 500 1000 1500 Time [s]
280
300
320
340
360
380
[K]
0.195 m0.160 m0.125 m0.090 m0.055 m0.020 m
800 1000 1200 1400 1600 Time [s]
0.00
0.05
0.10
0.15
0.20
[-]
V12 (0.195 m)V11 (0.160 m)V10 (0.125 m)V09 (0.090 m)
800 1000 1200 1400 1600 Time [s]
0.00
0.05
0.10
0.15
0.20
[-]
V12 (0.195 m)V11 (0.160 m)V10 (0.125 m)V09 (0.090 m)
considered using the Boussinesq approximation. The conservation equations were solvedadopting a higher order discretisation scheme according to van Leer. For the timediscretisation, a fully implicit backward time stepping procedure was used. Except for thepressure equation, the discretised equations were solved using a strongly implicit procedureaccording to Stone. The pressure equation was solved applying an Algebraic Multigrid Solver.
The vapour release into the environment at the upper surface was modelled introducing adegassing boundary. It acts as a vapour sink depending on the rising velocity of vapour and onthe vapour volume fraction. The heat flux from the side wall into the water was reconstructedfrom temperature measurements and was given as a boundary condition.
During the first period of the transient, the problem was regarded as a single phase problemuntil the subcooling temperature Tsub falls below 15 K in the first cell of the volume. Thisoccurs at the upper outer cell after about 810 s. Then a restart of the calculation was initiatedapplying the two phase models including the boiling model. The calculation was continueduntil convergence could not be reached at an increased vapour content at about 1220 s.
a) measured b) calculated
a) measured b) calculated
Fig. 1: Temperatures at different height levels in the centre of the tank
Fig. 2: Void fractions at different height levels at a wall distance of 1 mm
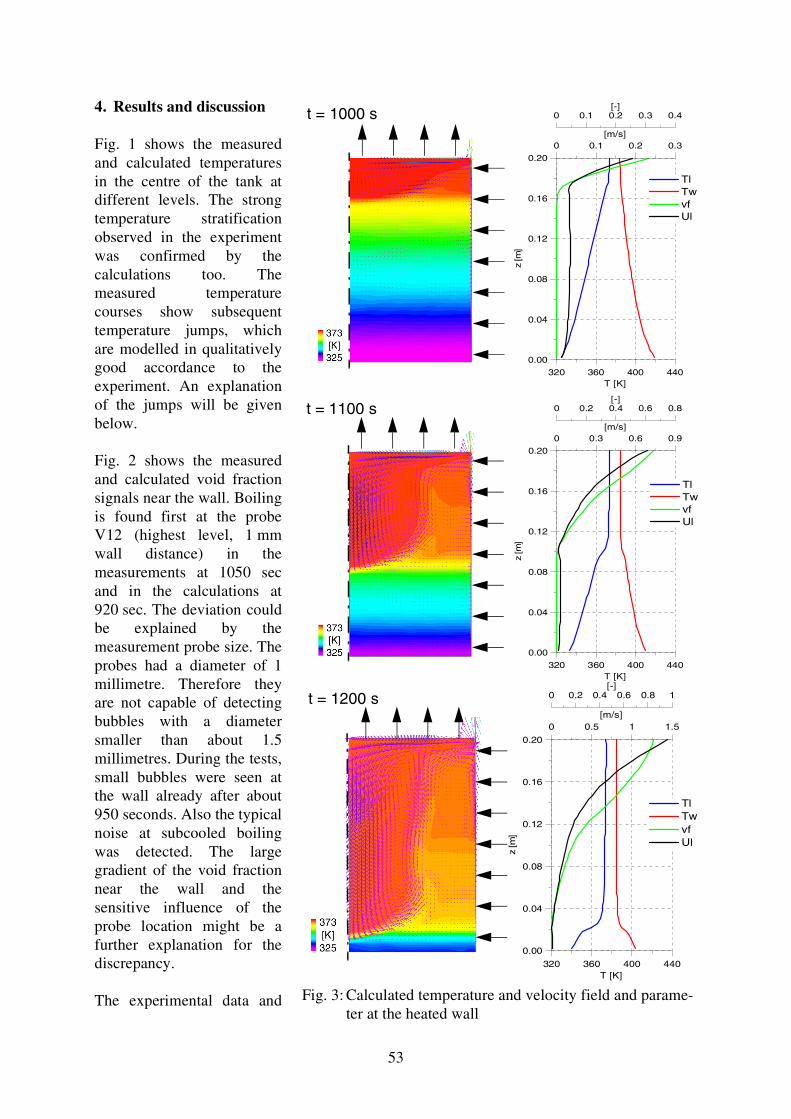
53
320 360 400 440T [K]
0.00
0.04
0.08
0.12
0.16
0.20
z [m
]
0 0.2 0.4 0.6 0.8 1[-]
0 0.5 1 1.5[m/s]
TlTwvfUl
4. Results and discussion
Fig. 1 shows the measuredand calculated temperaturesin the centre of the tank atdifferent levels. The strongtemperature stratificationobserved in the experimentwas confirmed by thecalculations too. Themeasured temperaturecourses show subsequenttemperature jumps, whichare modelled in qualitativelygood accordance to theexperiment. An explanationof the jumps will be givenbelow.
Fig. 2 shows the measuredand calculated void fractionsignals near the wall. Boilingis found first at the probeV12 (highest level, 1 mmwall distance) in themeasurements at 1050 secand in the calculations at920 sec. The deviation couldbe explained by themeasurement probe size. Theprobes had a diameter of 1millimetre. Therefore theyare not capable of detectingbubbles with a diametersmaller than about 1.5millimetres. During the tests,small bubbles were seen atthe wall already after about950 seconds. Also the typicalnoise at subcooled boilingwas detected. The largegradient of the void fractionnear the wall and thesensitive influence of theprobe location might be afurther explanation for thediscrepancy.
The experimental data and
320 360 400 440T [K]
0.00
0.04
0.08
0.12
0.16
0.20
z [m
]
0 0.1 0.2 0.3 0.4[-]
0 0.1 0.2 0.3[m/s]
TlTwvfUl
320 360 400 440T [K]
0.00
0.04
0.08
0.12
0.16
0.20
z [m
]
0 0.2 0.4 0.6 0.8[-]
0 0.3 0.6 0.9[m/s]
TlTwvfUl
Fig. 3: Calculated temperature and velocity field and parame-ter at the heated wall
t = 1000 s
t = 1100 s
t = 1200 s
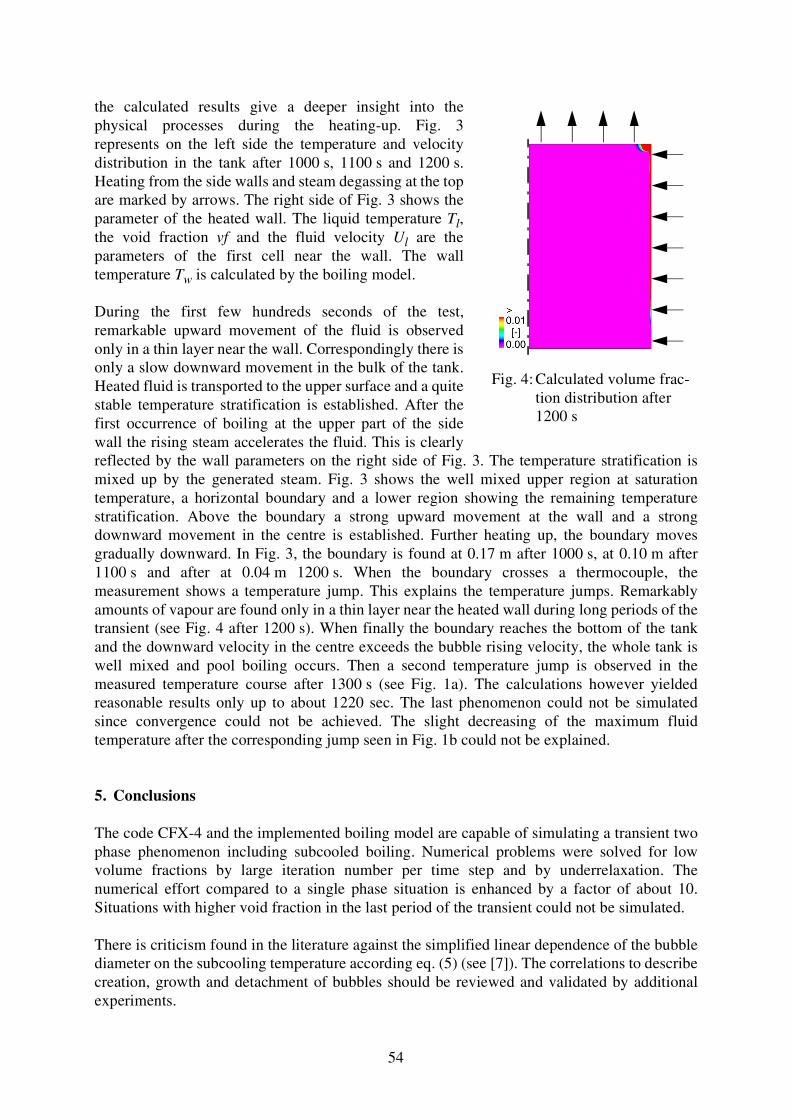
54
the calculated results give a deeper insight into thephysical processes during the heating-up. Fig. 3represents on the left side the temperature and velocitydistribution in the tank after 1000 s, 1100 s and 1200 s.Heating from the side walls and steam degassing at the topare marked by arrows. The right side of Fig. 3 shows theparameter of the heated wall. The liquid temperature Tl,the void fraction vf and the fluid velocity Ul are theparameters of the first cell near the wall. The walltemperature Tw is calculated by the boiling model.
During the first few hundreds seconds of the test,remarkable upward movement of the fluid is observedonly in a thin layer near the wall. Correspondingly there isonly a slow downward movement in the bulk of the tank.Heated fluid is transported to the upper surface and a quitestable temperature stratification is established. After thefirst occurrence of boiling at the upper part of the sidewall the rising steam accelerates the fluid. This is clearlyreflected by the wall parameters on the right side of Fig. 3. The temperature stratification ismixed up by the generated steam. Fig. 3 shows the well mixed upper region at saturationtemperature, a horizontal boundary and a lower region showing the remaining temperaturestratification. Above the boundary a strong upward movement at the wall and a strongdownward movement in the centre is established. Further heating up, the boundary movesgradually downward. In Fig. 3, the boundary is found at 0.17 m after 1000 s, at 0.10 m after1100 s and after at 0.04 m 1200 s. When the boundary crosses a thermocouple, themeasurement shows a temperature jump. This explains the temperature jumps. Remarkablyamounts of vapour are found only in a thin layer near the heated wall during long periods of thetransient (see Fig. 4 after 1200 s). When finally the boundary reaches the bottom of the tankand the downward velocity in the centre exceeds the bubble rising velocity, the whole tank iswell mixed and pool boiling occurs. Then a second temperature jump is observed in themeasured temperature course after 1300 s (see Fig. 1a). The calculations however yieldedreasonable results only up to about 1220 sec. The last phenomenon could not be simulatedsince convergence could not be achieved. The slight decreasing of the maximum fluidtemperature after the corresponding jump seen in Fig. 1b could not be explained.
5. Conclusions
The code CFX-4 and the implemented boiling model are capable of simulating a transient twophase phenomenon including subcooled boiling. Numerical problems were solved for lowvolume fractions by large iteration number per time step and by underrelaxation. Thenumerical effort compared to a single phase situation is enhanced by a factor of about 10.Situations with higher void fraction in the last period of the transient could not be simulated.
There is criticism found in the literature against the simplified linear dependence of the bubblediameter on the subcooling temperature according eq. (5) (see [7]). The correlations to describecreation, growth and detachment of bubbles should be reviewed and validated by additionalexperiments.
Fig. 4: Calculated volume frac-tion distribution after 1200 s

55
References
[1] A. Aszódi, E. Krepper and H.-M. Prasser (2000), Experimental and numericalinvestigations of one and two phase natural circulation in storage tanks, Heat and MassTransfer 36, 497-504
[2] A. Aszódi, E. Krepper, H.-M. Prasser (1999), Investigation of heating up andevaporation processes in storage tanks by experiments and by numerical investigations,Proceedings of the Second International Symposium on Two-Phase Flow Modeling andExperimentation Pisa, Vol. III, pp. 1667
[3] A. Aszódi (1997), Modelling of transient natural convection – Thermal-hydraulicanalysis for an accident of dangerous fluid storage tanks, PhD. Thesis, TechnicalUniversity Budapest
[4] E. Krepper, A. Aszódi, H.-M. Prasser (2001), Experimental and numericalinvestigations of one and two phase natural circulation in storage tanks, 4th InternationalConference on Multiphase Flow, New Orleans, May 2001, paper 515
[5] Kurul, N., M. Z. Podowski (1990), Multidimensional effects in sub-cooled boiling, Proc.of 9’th Heat Transfer Conference
[6] H. Anglart, O. Nylund (1996), CFD Application to prediction of void distribution intwo-phase bubbly flows in rod bundles, Nuclear Science and Engineering 163, 81-98
[7] J. Y. Tu (1999), Improvement of a two-fluid model for predicting subcooled flowboiling at low pressure, NURETH-9, San Francisco, October 1999
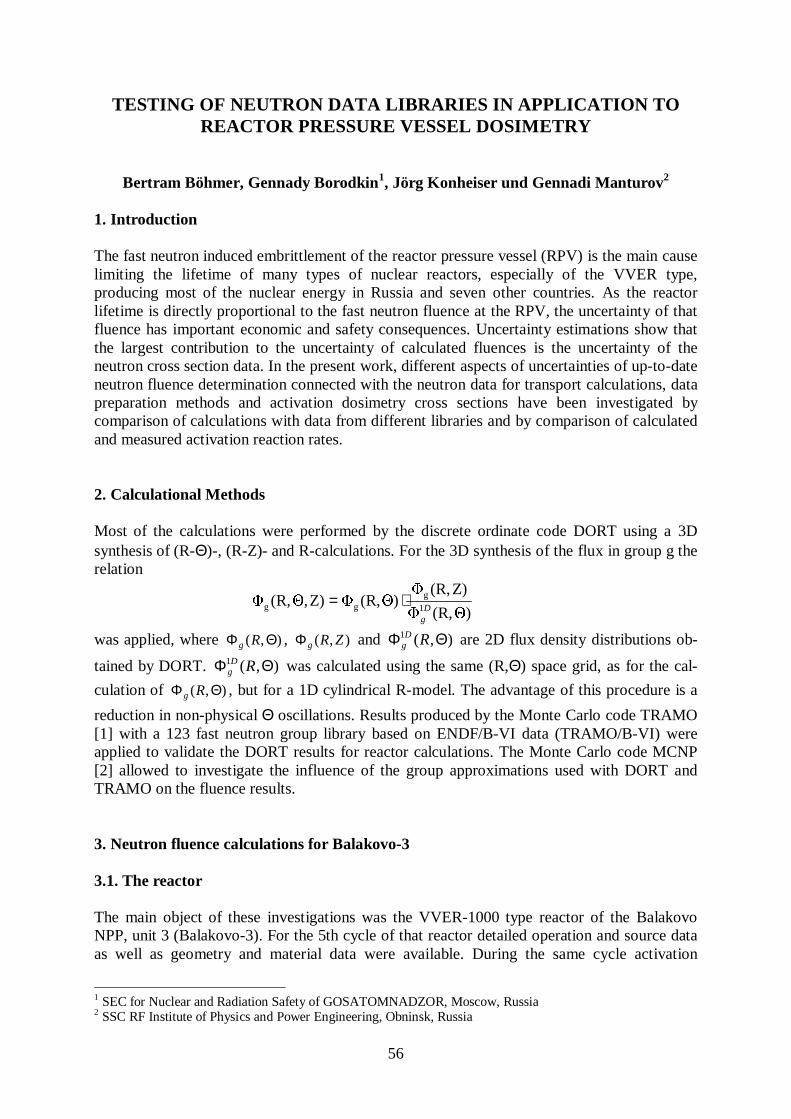
56
TESTING OF NEUTRON DATA LIBRARIES IN APPLICATION TOREACTOR PRESSURE VESSEL DOSIMETRY
Bertram Böhmer, Gennady Borodkin1, Jörg Konheiser und Gennadi Manturov2
1. Introduction
The fast neutron induced embrittlement of the reactor pressure vessel (RPV) is the main causelimiting the lifetime of many types of nuclear reactors, especially of the VVER type,producing most of the nuclear energy in Russia and seven other countries. As the reactorlifetime is directly proportional to the fast neutron fluence at the RPV, the uncertainty of thatfluence has important economic and safety consequences. Uncertainty estimations show thatthe largest contribution to the uncertainty of calculated fluences is the uncertainty of theneutron cross section data. In the present work, different aspects of uncertainties of up-to-dateneutron fluence determination connected with the neutron data for transport calculations, datapreparation methods and activation dosimetry cross sections have been investigated bycomparison of calculations with data from different libraries and by comparison of calculatedand measured activation reaction rates.
2. Calculational Methods
Most of the calculations were performed by the discrete ordinate code DORT using a 3Dsynthesis of (R-Θ)-, (R-Z)- and R-calculations. For the 3D synthesis of the flux in group g therelation
Θ)(R,Φ
Z)(R,ΦΘ)(R,ΦZ)Θ,(R,Φ
1
ggg D
g
⋅=
was applied, where ),( ΘΦ Rg , ),( ZRgΦ and ),(1 ΘΦ RDg are 2D flux density distributions ob-
tained by DORT. ),(1 ΘΦ RDg was calculated using the same (R,Θ) space grid, as for the cal-
culation of ),( ΘΦ Rg , but for a 1D cylindrical R-model. The advantage of this procedure is a
reduction in non-physical Θ oscillations. Results produced by the Monte Carlo code TRAMO[1] with a 123 fast neutron group library based on ENDF/B-VI data (TRAMO/B-VI) wereapplied to validate the DORT results for reactor calculations. The Monte Carlo code MCNP[2] allowed to investigate the influence of the group approximations used with DORT andTRAMO on the fluence results.
3. Neutron fluence calculations for Balakovo-3
3.1. The reactor
The main object of these investigations was the VVER-1000 type reactor of the BalakovoNPP, unit 3 (Balakovo-3). For the 5th cycle of that reactor detailed operation and source dataas well as geometry and material data were available. During the same cycle activation
1 SEC for Nuclear and Radiation Safety of GOSATOMNADZOR, Moscow, Russia2 SSC RF Institute of Physics and Power Engineering, Obninsk, Russia
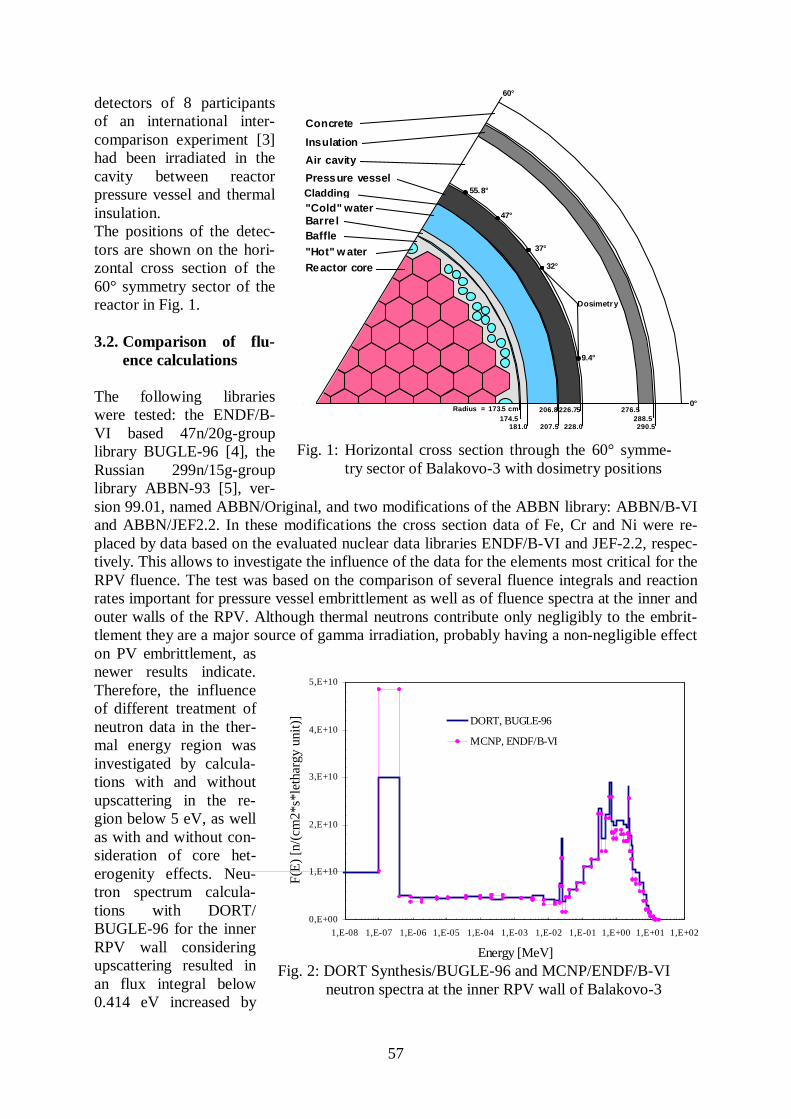
57
detectors of 8 participantsof an international inter-comparison experiment [3]had been irradiated in thecavity between reactorpressure vessel and thermalinsulation.The positions of the detec-tors are shown on the hori-zontal cross section of the60° symmetry sector of thereactor in Fig. 1.
3.2. Comparison of flu-ence calculations
The following librarieswere tested: the ENDF/B-VI based 47n/20g-grouplibrary BUGLE-96 [4], theRussian 299n/15g-grouplibrary ABBN-93 [5], ver-sion 99.01, named ABBN/Original, and two modifications of the ABBN library: ABBN/B-VIand ABBN/JEF2.2. In these modifications the cross section data of Fe, Cr and Ni were re-placed by data based on the evaluated nuclear data libraries ENDF/B-VI and JEF-2.2, respec-tively. This allows to investigate the influence of the data for the elements most critical for theRPV fluence. The test was based on the comparison of several fluence integrals and reactionrates important for pressure vessel embrittlement as well as of fluence spectra at the inner andouter walls of the RPV. Although thermal neutrons contribute only negligibly to the embrit-tlement they are a major source of gamma irradiation, probably having a non-negligible effecton PV embrittlement, asnewer results indicate.Therefore, the influenceof different treatment ofneutron data in the ther-mal energy region wasinvestigated by calcula-tions with and withoutupscattering in the re-gion below 5 eV, as wellas with and without con-sideration of core het-erogenity effects. Neu-tron spectrum calcula-tions with DORT/BUGLE-96 for the innerRPV wall consideringupscattering resulted inan flux integral below0.414 eV increased by
Reactor core
Dosimetry
Baffle"Hot" w ater
Barrel"Cold" waterLinerPressure vessel
Air cavity
Insulation
Concrete
Radius = 173.5 cm174.5
181.0
206.8
207.5
226.75
228.0
276.5288.5290.5
37°
55.8°
47°
32°
9.4°
0°
60°
Fig. 1: Horizontal cross section through the 60° symme-try sector of Balakovo-3 with dosimetry positions
0,E+00
1,E+10
2,E+10
3,E+10
4,E+10
5,E+10
1,E-08 1,E-07 1,E-06 1,E-05 1,E-04 1,E-03 1,E-02 1,E-01 1,E+00 1,E+01 1,E+02
Energy [MeV]
F(E
) [n
/(cm
2*s*
leth
argy
uni
t)] DORT, BUGLE-96
MCNP, ENDF/B-VI
Fig. 2: DORT Synthesis/BUGLE-96 and MCNP/ENDF/B-VI neutron spectra at the inner RPV wall of Balakovo-3
Cladding
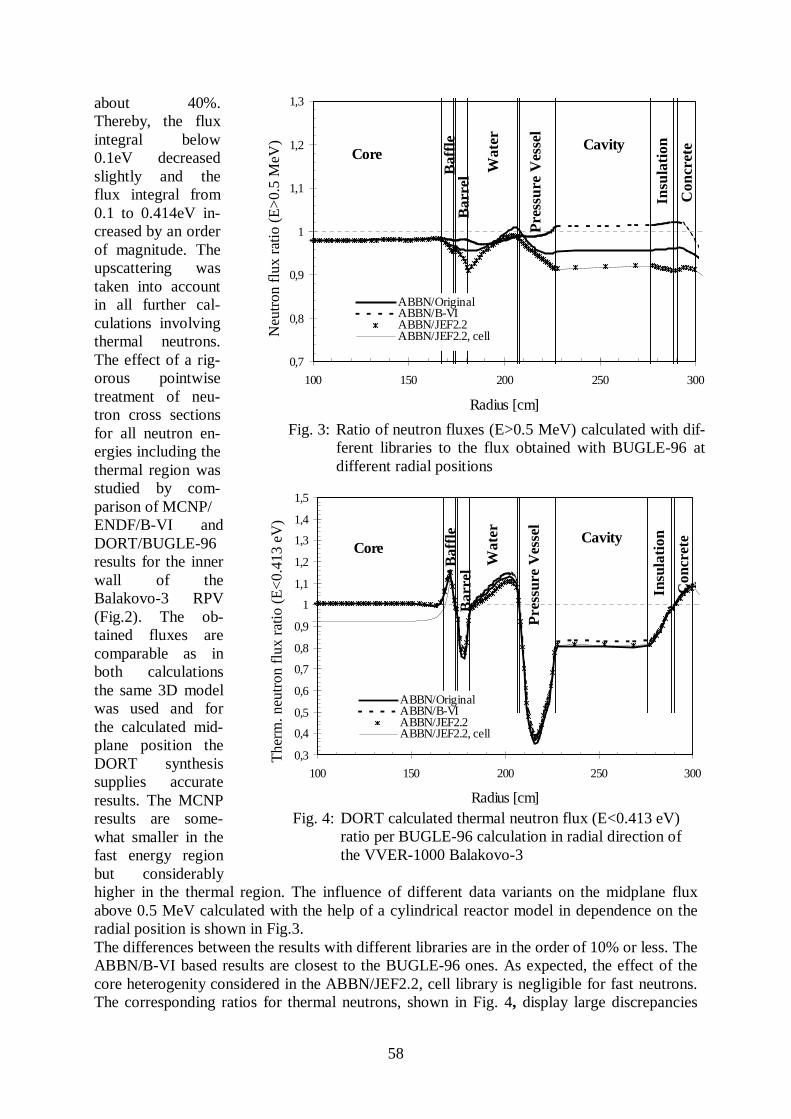
58
about 40%.Thereby, the fluxintegral below0.1eV decreasedslightly and theflux integral from0.1 to 0.414eV in-creased by an orderof magnitude. Theupscattering wastaken into accountin all further cal-culations involvingthermal neutrons.The effect of a rig-orous pointwisetreatment of neu-tron cross sectionsfor all neutron en-ergies including thethermal region wasstudied by com-parison of MCNP/ENDF/B-VI andDORT/BUGLE-96results for the innerwall of theBalakovo-3 RPV(Fig.2). The ob-tained fluxes arecomparable as inboth calculationsthe same 3D modelwas used and forthe calculated mid-plane position theDORT synthesissupplies accurateresults. The MCNPresults are some-what smaller in thefast energy regionbut considerablyhigher in the thermal region. The influence of different data variants on the midplane fluxabove 0.5 MeV calculated with the help of a cylindrical reactor model in dependence on theradial position is shown in Fig.3.The differences between the results with different libraries are in the order of 10% or less. TheABBN/B-VI based results are closest to the BUGLE-96 ones. As expected, the effect of thecore heterogenity considered in the ABBN/JEF2.2, cell library is negligible for fast neutrons.The corresponding ratios for thermal neutrons, shown in Fig. 4, display large discrepancies
0,7
0,8
0,9
1
1,1
1,2
1,3
100 150 200 250 300
Radius [cm]
Neu
tron
flu
x ra
tio (
E>
0.5
MeV
) .
ABBN/OriginalABBN/B-VIABBN/JEF2.2ABBN/JEF2.2, cell
Baf
fle
Core
Bar
rel
Pre
ssur
e V
esse
l
Cavity
Insu
lati
on
Con
cret
e
Wat
er
Fig. 3: Ratio of neutron fluxes (E>0.5 MeV) calculated with dif-ferent libraries to the flux obtained with BUGLE-96 atdifferent radial positions
0,3
0,4
0,5
0,6
0,7
0,8
0,9
1
1,1
1,2
1,3
1,4
1,5
100 150 200 250 300
Radius [cm]
The
rm. n
eutr
on f
lux
ratio
(E
<0.
413
eV)
.
ABBN/OriginalABBN/B-VIABBN/JEF2.2ABBN/JEF2.2, cell
Baf
fle
Core
Bar
rel
Pre
ssur
e V
esse
lCavity
Insu
lati
on
Con
cret
e
Wat
er
Fig. 4: DORT calculated thermal neutron flux (E<0.413 eV)ratio per BUGLE-96 calculation in radial direction ofthe VVER-1000 Balakovo-3
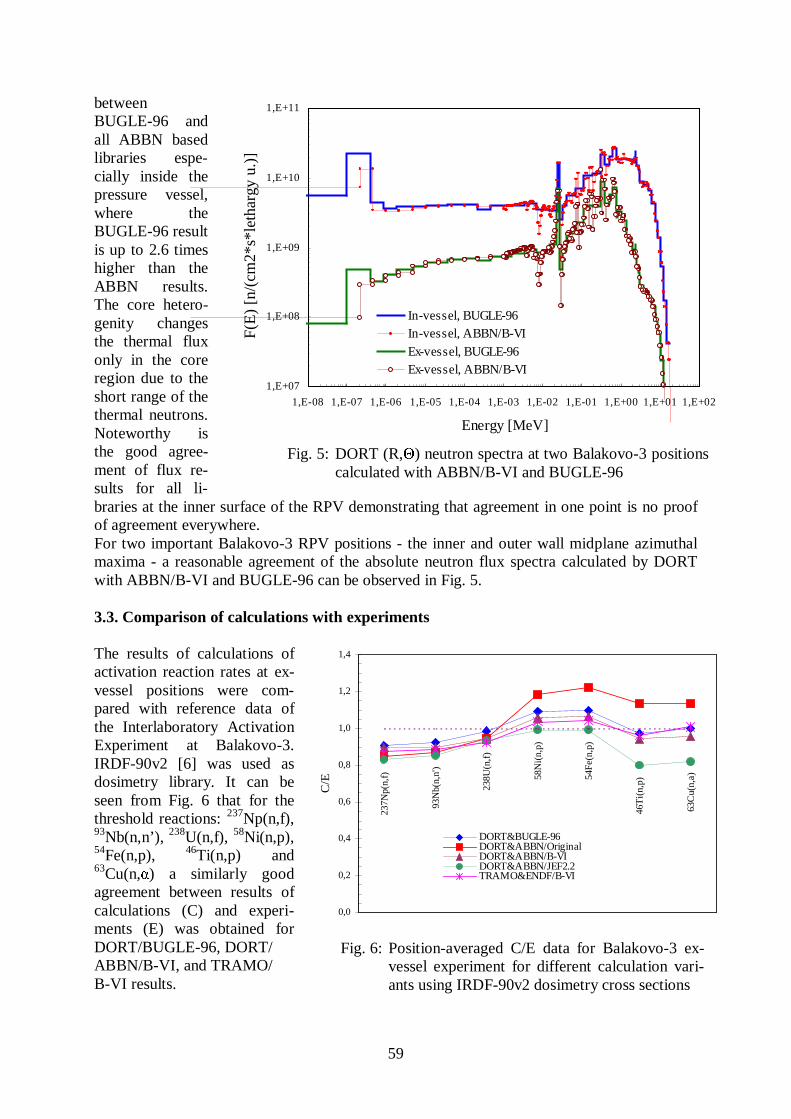
59
betweenBUGLE-96 andall ABBN basedlibraries espe-cially inside thepressure vessel,where theBUGLE-96 resultis up to 2.6 timeshigher than theABBN results.The core hetero-genity changesthe thermal fluxonly in the coreregion due to theshort range of thethermal neutrons.Noteworthy isthe good agree-ment of flux re-sults for all li-braries at the inner surface of the RPV demonstrating that agreement in one point is no proofof agreement everywhere.For two important Balakovo-3 RPV positions - the inner and outer wall midplane azimuthalmaxima - a reasonable agreement of the absolute neutron flux spectra calculated by DORTwith ABBN/B-VI and BUGLE-96 can be observed in Fig. 5.
3.3. Comparison of calculations with experiments
The results of calculations ofactivation reaction rates at ex-vessel positions were com-pared with reference data ofthe Interlaboratory ActivationExperiment at Balakovo-3.IRDF-90v2 [6] was used asdosimetry library. It can beseen from Fig. 6 that for thethreshold reactions: 237Np(n,f),93Nb(n,n’), 238U(n,f), 58Ni(n,p),54Fe(n,p), 46Ti(n,p) and63Cu(n,α) a similarly goodagreement between results ofcalculations (C) and experi-ments (E) was obtained forDORT/BUGLE-96, DORT/ABBN/B-VI, and TRAMO/B-VI results.
1,E+07
1,E+08
1,E+09
1,E+10
1,E+11
1,E-08 1,E-07 1,E-06 1,E-05 1,E-04 1,E-03 1,E-02 1,E-01 1,E+00 1,E+01 1,E+02
Energy [MeV]
F(E
) [n
/(cm
2*s*
leth
argy
u.)
]
In-vessel, BUGLE-96In-vessel, ABBN/B-VI
Ex-vessel, BUGLE-96Ex-vessel, ABBN/B-VI
Fig. 5: DORT (R,Θ) neutron spectra at two Balakovo-3 positionscalculated with ABBN/B-VI and BUGLE-96
237N
p(n,
f)
93N
b(n,
n')
238U
(n,f
)
58N
i(n,
p)
54Fe
(n,p
)
46T
i(n,
p)
63C
u(n,
a)
0,0
0,2
0,4
0,6
0,8
1,0
1,2
1,4
C/E
DORT&BUGLE-96DORT&ABBN/OriginalDORT&ABBN/B-VIDORT&ABBN/JEF2.2TRAMO&ENDF/B-VI
Fig. 6: Position-averaged C/E data for Balakovo-3 ex-vessel experiment for different calculation vari-ants using IRDF-90v2 dosimetry cross sections
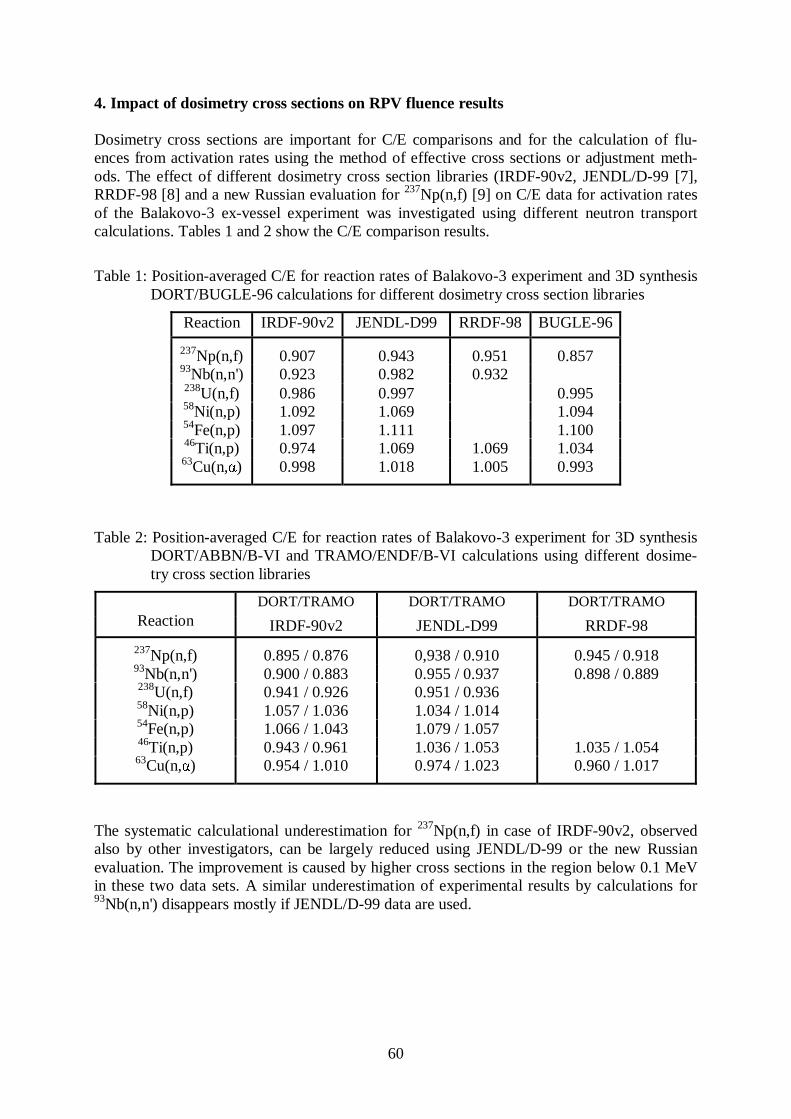
60
4. Impact of dosimetry cross sections on RPV fluence results
Dosimetry cross sections are important for C/E comparisons and for the calculation of flu-ences from activation rates using the method of effective cross sections or adjustment meth-ods. The effect of different dosimetry cross section libraries (IRDF-90v2, JENDL/D-99 [7],RRDF-98 [8] and a new Russian evaluation for 237Np(n,f) [9] on C/E data for activation ratesof the Balakovo-3 ex-vessel experiment was investigated using different neutron transportcalculations. Tables 1 and 2 show the C/E comparison results.
Table 1: Position-averaged C/E for reaction rates of Balakovo-3 experiment and 3D synthesisDORT/BUGLE-96 calculations for different dosimetry cross section libraries
Reaction IRDF-90v2 JENDL-D99 RRDF-98 BUGLE-96
237Np(n,f) 0.907 0.943 0.951 0.85793Nb(n,n') 0.923 0.982 0.932238U(n,f) 0.986 0.997 0.99558Ni(n,p) 1.092 1.069 1.09454Fe(n,p) 1.097 1.111 1.10046Ti(n,p) 0.974 1.069 1.069 1.03463Cu(n,α) 0.998 1.018 1.005 0.993
Table 2: Position-averaged C/E for reaction rates of Balakovo-3 experiment for 3D synthesisDORT/ABBN/B-VI and TRAMO/ENDF/B-VI calculations using different dosime-try cross section libraries
DORT/TRAMO DORT/TRAMO DORT/TRAMOReaction IRDF-90v2 JENDL-D99 RRDF-98
237Np(n,f) 0.895 / 0.876 0,938 / 0.910 0.945 / 0.91893Nb(n,n') 0.900 / 0.883 0.955 / 0.937 0.898 / 0.889238U(n,f) 0.941 / 0.926 0.951 / 0.93658Ni(n,p) 1.057 / 1.036 1.034 / 1.01454Fe(n,p) 1.066 / 1.043 1.079 / 1.05746Ti(n,p) 0.943 / 0.961 1.036 / 1.053 1.035 / 1.05463Cu(n,α) 0.954 / 1.010 0.974 / 1.023 0.960 / 1.017
The systematic calculational underestimation for 237Np(n,f) in case of IRDF-90v2, observedalso by other investigators, can be largely reduced using JENDL/D-99 or the new Russianevaluation. The improvement is caused by higher cross sections in the region below 0.1 MeVin these two data sets. A similar underestimation of experimental results by calculations for93Nb(n,n') disappears mostly if JENDL/D-99 data are used.
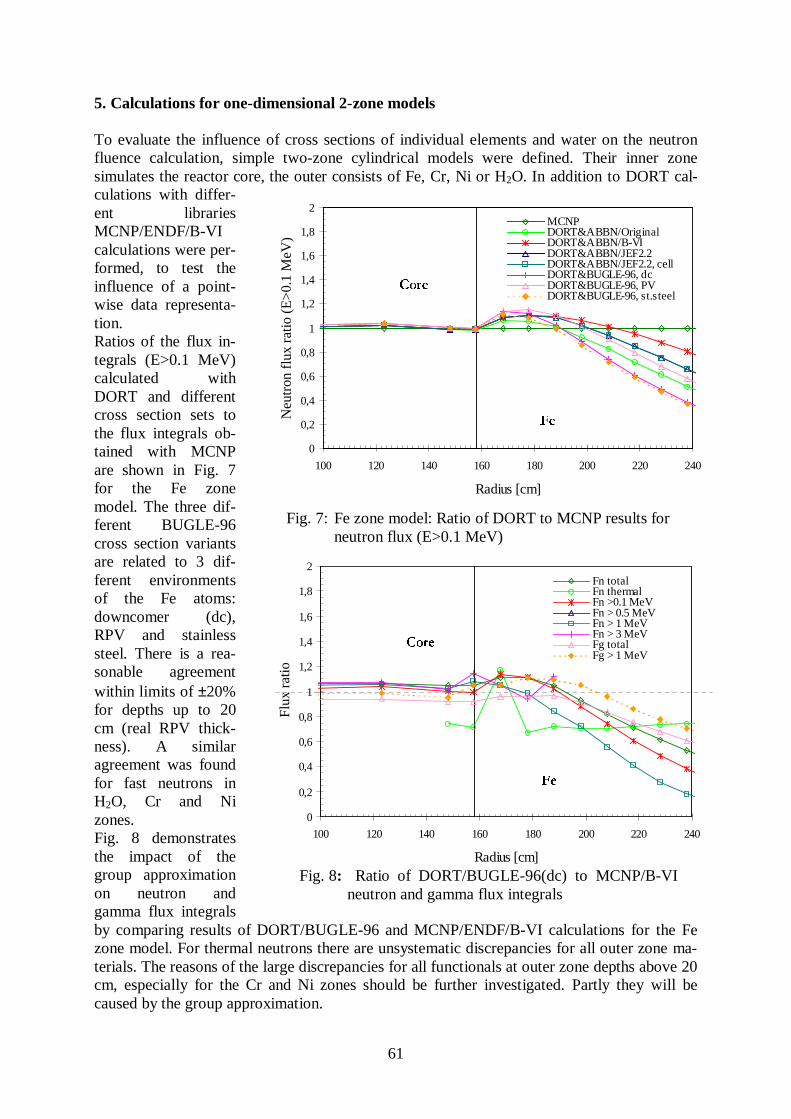
61
5. Calculations for one-dimensional 2-zone models
To evaluate the influence of cross sections of individual elements and water on the neutronfluence calculation, simple two-zone cylindrical models were defined. Their inner zonesimulates the reactor core, the outer consists of Fe, Cr, Ni or H2O. In addition to DORT cal-culations with differ-ent librariesMCNP/ENDF/B-VIcalculations were per-formed, to test theinfluence of a point-wise data representa-tion.Ratios of the flux in-tegrals (E>0.1 MeV)calculated withDORT and differentcross section sets tothe flux integrals ob-tained with MCNPare shown in Fig. 7for the Fe zonemodel. The three dif-ferent BUGLE-96cross section variantsare related to 3 dif-ferent environmentsof the Fe atoms:downcomer (dc),RPV and stainlesssteel. There is a rea-sonable agreementwithin limits of ±20%for depths up to 20cm (real RPV thick-ness). A similaragreement was foundfor fast neutrons inH2O, Cr and Nizones.Fig. 8 demonstratesthe impact of thegroup approximationon neutron andgamma flux integralsby comparing results of DORT/BUGLE-96 and MCNP/ENDF/B-VI calculations for the Fezone model. For thermal neutrons there are unsystematic discrepancies for all outer zone ma-terials. The reasons of the large discrepancies for all functionals at outer zone depths above 20cm, especially for the Cr and Ni zones should be further investigated. Partly they will becaused by the group approximation.
Fig. 7: Fe zone model: Ratio of DORT to MCNP results forneutron flux (E>0.1 MeV)
0
0,2
0,4
0,6
0,8
1
1,2
1,4
1,6
1,8
2
100 120 140 160 180 200 220 240
Radius [cm]
Neu
tron
flu
x ra
tio (
E>
0.1
MeV
)
MCNPDORT&ABBN/OriginalDORT&ABBN/B-VIDORT&ABBN/JEF2.2DORT&ABBN/JEF2.2, cellDORT&BUGLE-96, dcDORT&BUGLE-96, PVDORT&BUGLE-96, st.steel
Fe
Core
0
0,2
0,4
0,6
0,8
1
1,2
1,4
1,6
1,8
2
100 120 140 160 180 200 220 240
Radius [cm]
Flu
x ra
tio
Fn totalFn thermalFn >0.1 MeVFn > 0.5 MeVFn > 1 MeVFn > 3 MeVFg totalFg > 1 MeV
Fe
Core
Fig. 8: Ratio of DORT/BUGLE-96(dc) to MCNP/B-VIneutron and gamma flux integrals
62
6. Conclusions
Comparing results obtained with different basic nuclear data, data preparation methods, do-simetry cross sections and experiments, maximum discrepancies in the order of 20% wereobtained for fast neutron fluences in the reactor pressure vessel region. The ABBN/B-VI li-brary delivered similar results as BUGLE-96 and was found to be suitable for RPV dosimetryapplications. For low energy neutrons and deeper penetrations considerable discrepancieswere found requiring further investigations. There is an urgent necessity for new experimentalbenchmark data to check low energy neutron and gamma spectrum calculations in the ex-corereactor region.
References
[1] H.-U. Barz, B. Böhmer, J. Konheiser, I. Stephan, High-Precision Monte Carlo Calcu-lations, Experimental Verification and Adjustment of Fluences in the Pressure VesselCavity of a VVER-1000, Proc. 1998 ANS Radiation Protection and Shielding DivisionTopical Conference Technologies for the New Century, April 19-23, 1998, Nashville,Tennessee, USA, Vol. 1, p. 447-454
[2] J.F. Briesmeyer, MCNP - A general Monte Carlo n-particle transport code (Version4A), Manual, LA-12625-M (1993)
[3] Borodkin, G. I., Kovalevich, O. M., Barz, H.-U., Böhmer, B., Stephan, I., Ait Abder-rahim, H., Voorbraak, W., Hogel, J., Polke, E., Schweighofer, W., Seren, T., Borodin,A. V., Vikhrov, V. I., Lichadeev, V. V., Markina, N. V., Grigoriev, E. I., Troshin, V.S., Penev I., and Kinova, L., Balakovo-3 Ex-vessel Exercise: Intercomparison of Re-sults, Reactor Dosimetry: Radiation Metrology and Assessment, ASTM STP 1398,American Society for Testing and Materials, West Conshohoken, PA, 2001, pp. 320-327.
[4] J.E. White et al., BUGLE-96: A Revised Multigroup Cross Section Library for LWRApplications Based on ENDF/B-VI Release 3, ANS Rad. Prot. & Shielding TopicalMeeting, Falmouth (April 1996).
[5] G.N. Manturov, M.N. Nikolaev, A.M. Tsiboulya, BNAB-93 Group Data Library. PartI: Nuclear Data for the Calculation of Neutron and Photon Radiation Fields,INDC(CCP)-409/L, August 1997, p.65-110.
[6] N.P. Kocherov and P.K. McLaughlin, The International Reactor Dosimetry File(IRDF-90), Report IAEA-NDS-141, Rev.2, IAEA, Vienna, October 1993.
[7] JENDL Dosimetry File 99 (JENDL/D-99), JAERI, 1999, IAEA distributed nucleardata, (1999).
[8] S.A. Badikov, et al., Status of Russian Dosimetry File, Proc. of the 9th InternationalSymposium on Reactor Dosimetry, Sept. 2-6, 1996, Prague, Czech Republic. HamidAit Abderrahim et al. Eds., World Scientific Publishing Co. Pte. Ltd., 1998, pp. 480-488.
[9] S.A. Badikov, K.I. Zolotarev et al., Analysis of Discrepancies in Evaluated Data forNp-237 and Development of the Improved Evaluation, Voprosy Atomnoi Nauki iTekhniki, Seria: Yadernye Constanty, 1997, V. 3-4, p.59.
63
RESULTS OF COLUMN AND BATCH INVESTIGATIONS OFGYPSUM WEATHERING
Roland Kuechler, Klaus Noack and Torsten Zorn
1. Introduction
Often, chemically aggressive seepage water is the cause of the mobilisation of pollutants andradionuclides in the unsaturated zone. This results from the weathering of minerals whichform stronger acids or lyes. For the forecast of the groundwater pollution and contaminationof radionuclides it is therefore important to know the solution kinetic for decisive minerals inthe unsaturated zone. In the literature the dissolution of minerals is described with rate laws,usually determined with the rotating disk method under water saturated conditions. The veri-fication of this rate laws for the unsaturated transport by column experiments is an importanttask to come to a realistic modelling. This contribution reports on a gypsum weathering ex-periment, presents and discusses the most important experimental results and compares themwith results of computations.
2. Batch and column experiments with gypsum
The principles of the batch and column experiments are described in [1]. The gypsum used inthe experiments is a natural gypsum (Marienglas) from Rocastrada, Italy. To check the purityof the mineral the powder was investigated with Scanning Electron Microscopy/Energy Dis-persive Spectrometry (SEM/EDS) and X-ray Powder Diffraction (XRD). The gypsum solu-tion was analysed with Inductive Coupled Plasma-Mass Spectrometry (ICP/MS). TheICP/MS analyses showed small iron impurities in the gypsum, but no other noticeable impu-rities. The gypsum was prepared in the following way. After crushing and dry sieving thegrain size was in the range between 200-300 µm. Then the powder was washed with MilliQ-water and dried at a temperature of 50 °C to remove small particles. This gypsum powder wasused in the batch and the column experiment.
To observe the dissolution of gypsum in batch experiments a defined mass of a few grams ofthis powder was mixed with 400 mL MilliQ-water and the electrolytic conductivity κ wasmonitored. The conductivity is a combination of the several ion concentrations which the dis-solution process caused. Fig. 2 illustrates the influence of different masses of gypsum on thetime curve of the conductivity. The equilibrium values are close to each other: 2.11 mS/cmand 2.12 mS/cm for washed gypsum. They well agree with the calculated value of κ = 2.15mS/cm. The results of the chemical analyses of the solutions related to the pH-values, calciumand sulphate concentrations are summarized in Table 1. The solutions were filtered through afilter with 0.2 µm pore size. These results show the nearly neutral reaction of gypsum withMilliQ-water. The measured calcium and sulphate concentrations in the equilibrium wellagree with the measured calcium concentrations of Marienglas as published in [2]. The 1:1ratio of calcium and sulphate in the solution of gypsum was also found.
In the column experiments sea sand was used as matrix. To achieve inertness of the sandagainst the gypsum-water solution it was washed with MilliQ-water because the reaction ofthe gypsum solution will be neutral. The gypsum powder and the sand were mixed in the ratioof 2 g per 1 kg. Fig. 1 shows the results of electrolytic conductivity and pH measurements of
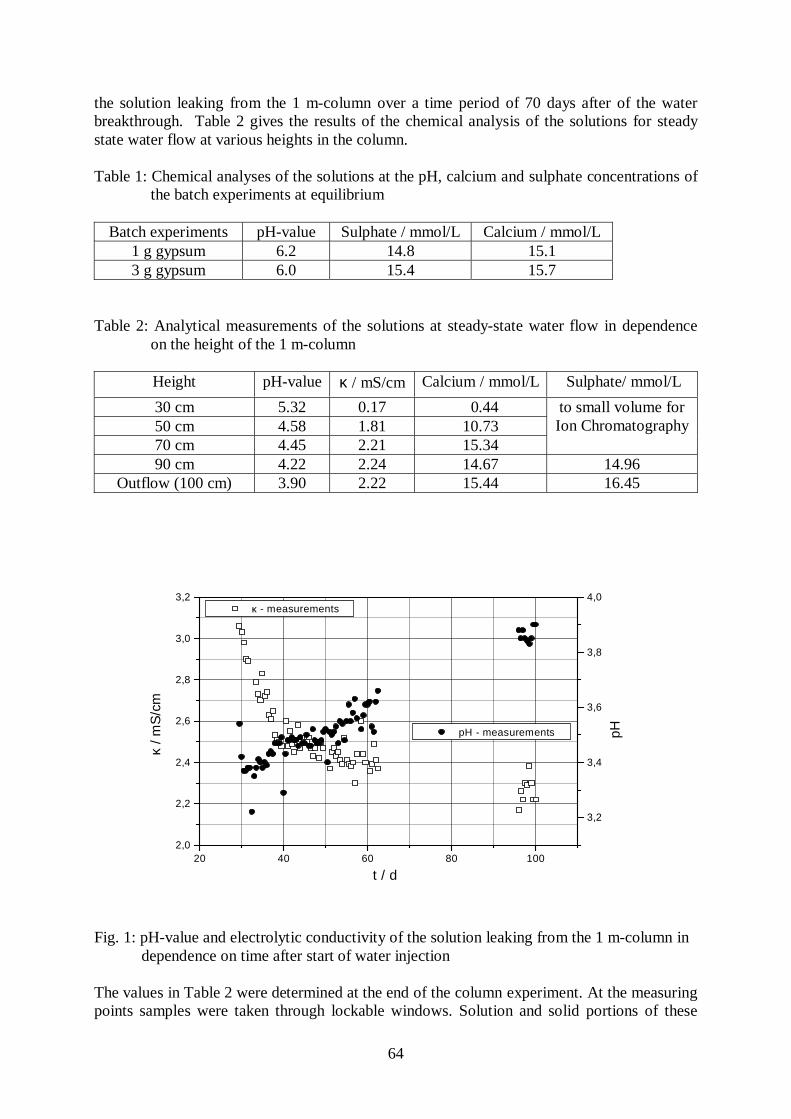
64
the solution leaking from the 1 m-column over a time period of 70 days after of the waterbreakthrough. Table 2 gives the results of the chemical analysis of the solutions for steadystate water flow at various heights in the column.
Table 1: Chemical analyses of the solutions at the pH, calcium and sulphate concentrations ofthe batch experiments at equilibrium
Batch experiments pH-value Sulphate / mmol/L Calcium / mmol/L1 g gypsum 6.2 14.8 15.13 g gypsum 6.0 15.4 15.7
Table 2: Analytical measurements of the solutions at steady-state water flow in dependenceon the height of the 1 m-column
Height pH-value κ / mS/cm Calcium / mmol/L Sulphate/ mmol/L
30 cm 5.32 0.17 0.4450 cm 4.58 1.81 10.7370 cm 4.45 2.21 15.34
to small volume forIon Chromatography
90 cm 4.22 2.24 14.67 14.96Outflow (100 cm) 3.90 2.22 15.44 16.45
Fig. 1: pH-value and electrolytic conductivity of the solution leaking from the 1 m-column independence on time after start of water injection
The values in Table 2 were determined at the end of the column experiment. At the measuringpoints samples were taken through lockable windows. Solution and solid portions of these
20 40 60 80 1002,0
2,2
2,4
2,6
2,8
3,0
3,2
t / d
κ/m
S/c
m
κ - measurements
3,2
3,4
3,6
3,8
4,0
pHpH - measurements
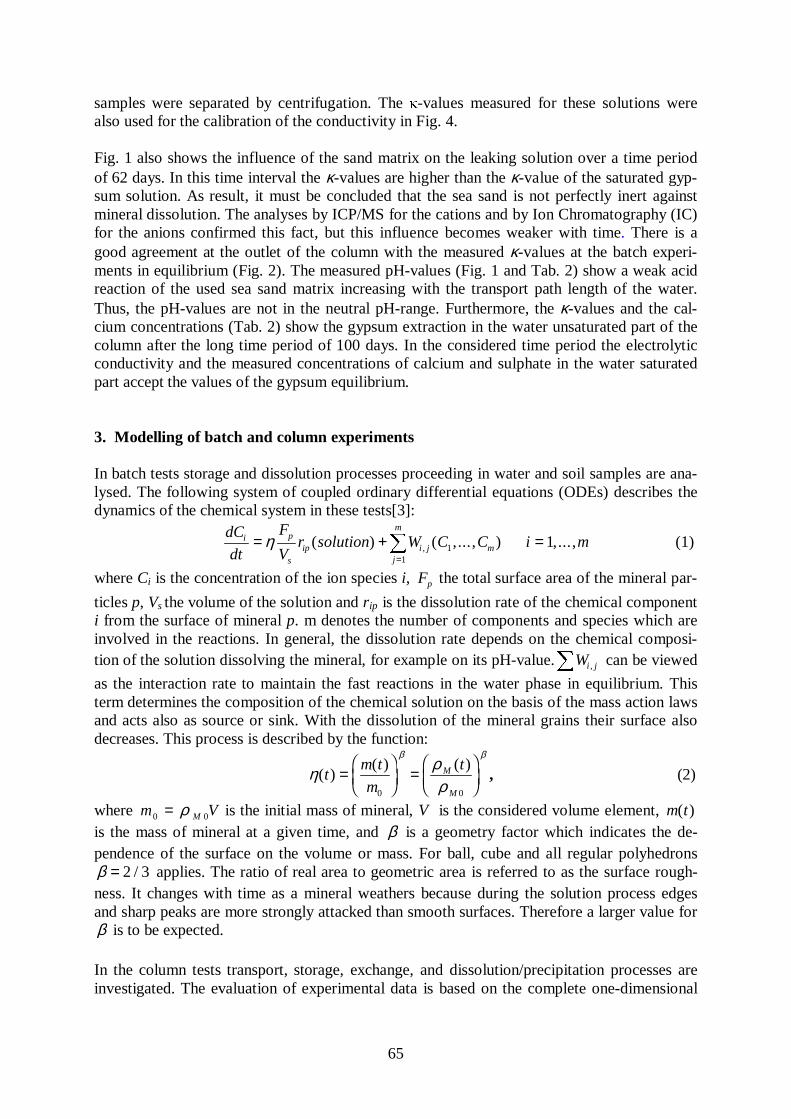
65
samples were separated by centrifugation. The κ-values measured for these solutions werealso used for the calibration of the conductivity in Fig. 4.
Fig. 1 also shows the influence of the sand matrix on the leaking solution over a time periodof 62 days. In this time interval the κ-values are higher than the κ-value of the saturated gyp-sum solution. As result, it must be concluded that the sea sand is not perfectly inert againstmineral dissolution. The analyses by ICP/MS for the cations and by Ion Chromatography (IC)for the anions confirmed this fact, but this influence becomes weaker with time. There is agood agreement at the outlet of the column with the measured κ-values at the batch experi-ments in equilibrium (Fig. 2). The measured pH-values (Fig. 1 and Tab. 2) show a weak acidreaction of the used sea sand matrix increasing with the transport path length of the water.Thus, the pH-values are not in the neutral pH-range. Furthermore, the κ-values and the cal-cium concentrations (Tab. 2) show the gypsum extraction in the water unsaturated part of thecolumn after the long time period of 100 days. In the considered time period the electrolyticconductivity and the measured concentrations of calcium and sulphate in the water saturatedpart accept the values of the gypsum equilibrium.
3. Modelling of batch and column experiments
In batch tests storage and dissolution processes proceeding in water and soil samples are ana-lysed. The following system of coupled ordinary differential equations (ODEs) describes thedynamics of the chemical system in these tests[3]:
dC
dt
F
Vr solution W C C i mi p
sip i j m
j
m
= + ==η ( ) ( ,..., ) ,...,, 1
1
1 (1)
where Ci is the concentration of the ion species i, Fp the total surface area of the mineral par-
ticles p, Vs the volume of the solution and rip is the dissolution rate of the chemical componenti from the surface of mineral p. m denotes the number of components and species which areinvolved in the reactions. In general, the dissolution rate depends on the chemical composi-tion of the solution dissolving the mineral, for example on its pH-value. Wi j, can be viewed
as the interaction rate to maintain the fast reactions in the water phase in equilibrium. Thisterm determines the composition of the chemical solution on the basis of the mass action lawsand acts also as source or sink. With the dissolution of the mineral grains their surface alsodecreases. This process is described by the function:
η ρρ
β β
( )( ) ( )
tm t
m
tM
M
=FHG
IKJ
=FHG
IKJ0 0
, (2)
where m VM0 0= ρ is the initial mass of mineral, V is the considered volume element, m t( )is the mass of mineral at a given time, and β is a geometry factor which indicates the de-pendence of the surface on the volume or mass. For ball, cube and all regular polyhedronsβ = 2 3/ applies. The ratio of real area to geometric area is referred to as the surface rough-ness. It changes with time as a mineral weathers because during the solution process edgesand sharp peaks are more strongly attacked than smooth surfaces. Therefore a larger value forβ is to be expected.
In the column tests transport, storage, exchange, and dissolution/precipitation processes areinvestigated. The evaluation of experimental data is based on the complete one-dimensional
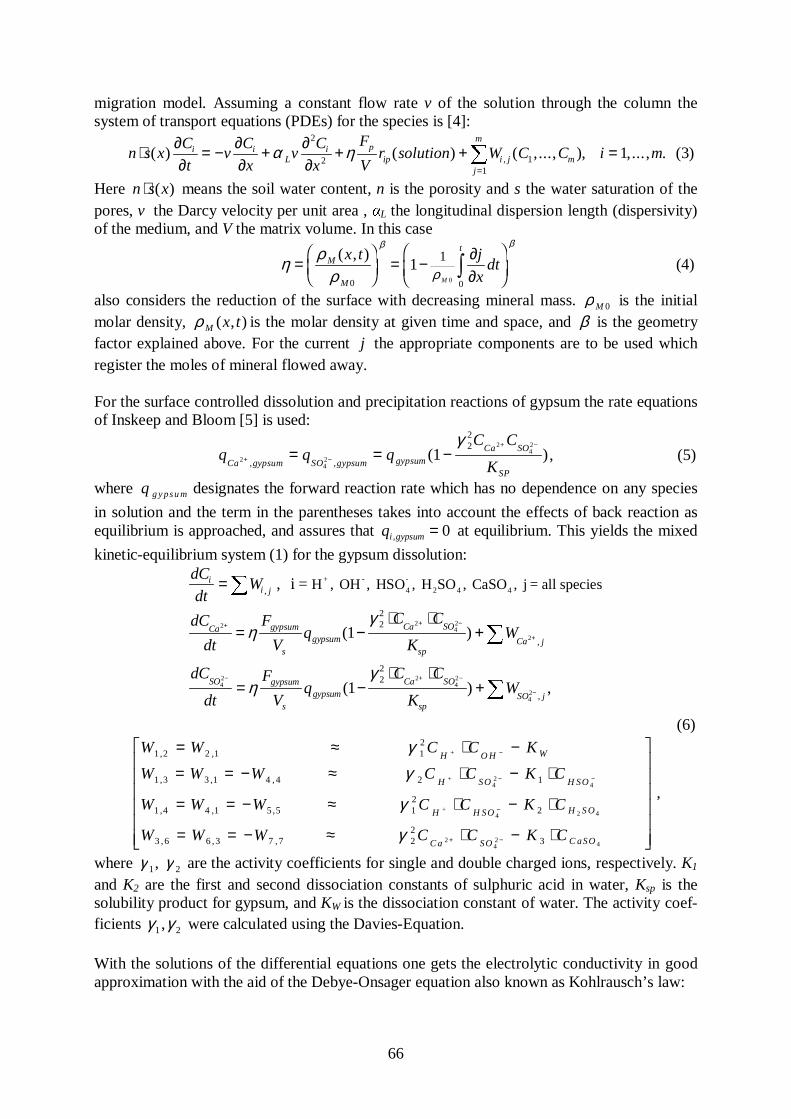
66
migration model. Assuming a constant flow rate v of the solution through the column thesystem of transport equations (PDEs) for the species is [4]:
n s xC
tv
C
xv
C
x
F
Vr solution W C C i mi i
Li p
ip i j mj
m
⋅ ∂∂
= − ∂∂
+ ∂∂
+ + ==( ) ( ) ( ,..., ), ,..., .,α η
2
2 11
1 (3)
Here n s x⋅ ( ) means the soil water content, n is the porosity and s the water saturation of thepores, v the Darcy velocity per unit area , αL the longitudinal dispersion length (dispersivity)of the medium, and V the matrix volume. In this case
η ρρ
β β
ρ=FHG
IKJ
= − ∂∂
F
HGI
KJzM
M
tx t j
xdt
M
( , )
0 0
11
0
(4)
also considers the reduction of the surface with decreasing mineral mass. ρ M 0 is the initialmolar density, ρ M x t( , ) is the molar density at given time and space, and β is the geometryfactor explained above. For the current j the appropriate components are to be used whichregister the moles of mineral flowed away.
For the surface controlled dissolution and precipitation reactions of gypsum the rate equationsof Inskeep and Bloom [5] is used:
q q qC C
KCa gypsum SO gypsum gypsumCa SO
SP
242
242
122
+ −
+ −
= = −, ,
( )γ
, (5)
where q g y ps u m designates the forward reaction rate which has no dependence on any species
in solution and the term in the parentheses takes into account the effects of back reaction asequilibrium is approached, and assures that qi gypsum, = 0 at equilibrium. This yields the mixed
kinetic-equilibrium system (1) for the gypsum dissolution:dC
dtW
dC
dt
F
Vq
C C
KW
dC
dt
F
Vq
C C
KW
ii j
Ca gypsum
sgypsum
Ca SO
spCa j
SO gypsum
sgypsum
Ca SO
spSO j
=
= −⋅ ⋅
+
= −⋅ ⋅
+
+ + −
+
− + −
−
,
,
,
, ,
( )
( ) ,
, i = H OH , HSO , H SO , CaSO j = all species+
4
-
2 4 4
-
2 242
2
42 2
42
42
1
1
22
22
ηγ
ηγ
(6)
W W C C K
W W W C C K C
W W W C C K C
W W W C C K C
H O H W
H SO H SO
H H SO H S O
C a SO C aSO
1 2 2 1 12
1 3 3 1 4 4 2 1
1 4 4 1 5 5 12
2
3 6 6 3 7 7 22
3
42
4
4 2 4
242
4
, ,
, , ,
, , ,
, , ,
= ≈ ⋅ −
= = − ≈ ⋅ − ⋅
= = − ≈ ⋅ − ⋅
= = − ≈ ⋅ − ⋅
L
N
MMMMMM
O
Q
PPPPPP
−
− −
−
+ −
+
+
+
γγ
γ
γ
,
where γ γ1, 2 are the activity coefficients for single and double charged ions, respectively. K1
and K2 are the first and second dissociation constants of sulphuric acid in water, Ksp is thesolubility product for gypsum, and KW is the dissociation constant of water. The activity coef-ficients 21 ,γγ were calculated using the Davies-Equation.
With the solutions of the differential equations one gets the electrolytic conductivity in goodapproximation with the aid of the Debye-Onsager equation also known as Kohlrausch’s law:
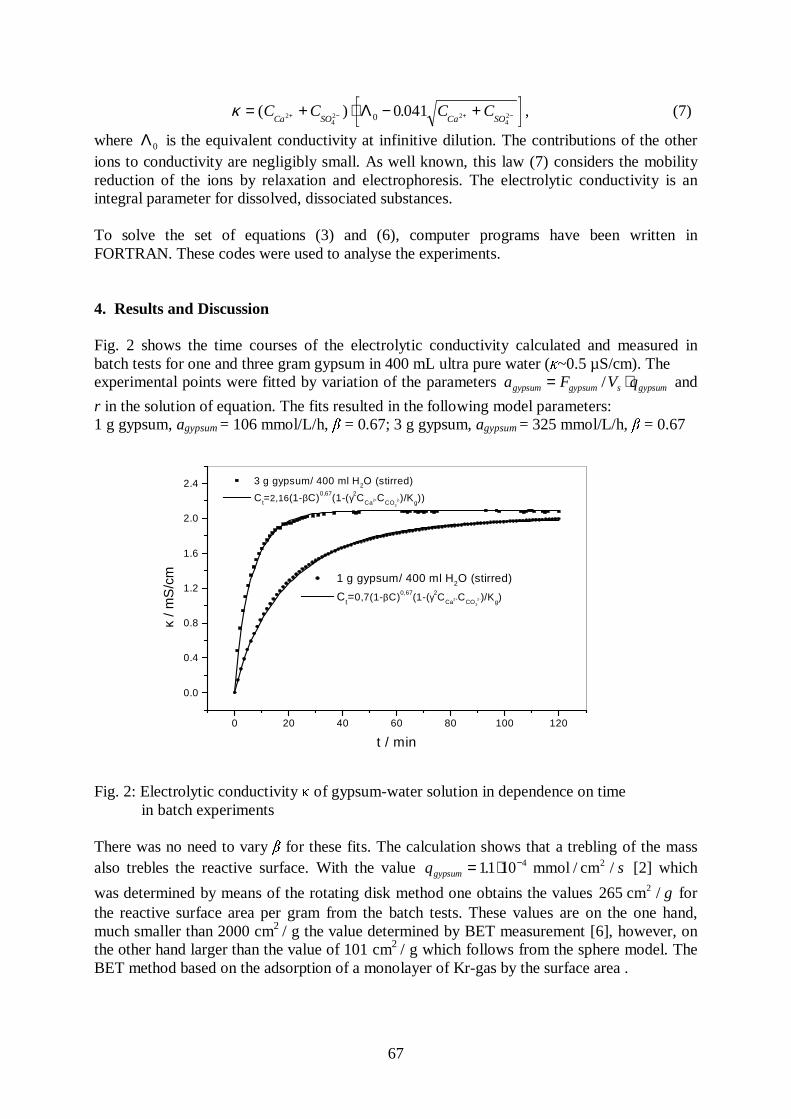
67
κ = + ⋅ − ++ − + −( ) .C C C CCa SO Ca SO2
42 2
420 0 041Λ , (7)
where Λ 0 is the equivalent conductivity at infinitive dilution. The contributions of the otherions to conductivity are negligibly small. As well known, this law (7) considers the mobilityreduction of the ions by relaxation and electrophoresis. The electrolytic conductivity is anintegral parameter for dissolved, dissociated substances.
To solve the set of equations (3) and (6), computer programs have been written inFORTRAN. These codes were used to analyse the experiments.
4. Results and Discussion
Fig. 2 shows the time courses of the electrolytic conductivity calculated and measured inbatch tests for one and three gram gypsum in 400 mL ultra pure water (κ~0.5 µS/cm). Theexperimental points were fitted by variation of the parameters a F V qgypsum gypsum s gypsum= ⋅/ and
r in the solution of equation. The fits resulted in the following model parameters:1 g gypsum, agypsum = 106 mmol/L/h, β = 0.67; 3 g gypsum, agypsum = 325 mmol/L/h, β = 0.67
Fig. 2: Electrolytic conductivity κ of gypsum-water solution in dependence on timein batch experiments
There was no need to vary β for these fits. The calculation shows that a trebling of the massalso trebles the reactive surface. With the value q sgypsum = ⋅ −11 10 4. /mmol / cm2 [2] which
was determined by means of the rotating disk method one obtains the values 265 cm2 / g forthe reactive surface area per gram from the batch tests. These values are on the one hand,much smaller than 2000 cm2 / g the value determined by BET measurement [6], however, onthe other hand larger than the value of 101 cm2 / g which follows from the sphere model. TheBET method based on the adsorption of a monolayer of Kr-gas by the surface area .
0 20 40 60 80 100 120
0.0
0.4
0.8
1.2
1.6
2.0
2.4
1 g gypsum/ 400 ml H2O (stirred)
Ct=0,7(1-βC)0,67(1-(γ2CCa2+CCO3
2-)/Kg)
3 g gypsum/ 400 ml H2O (stirred)
Ct=2,16(1-βC)0,67(1-(γ2CCa2+CCO3
2-)/Kg))
κ/m
S/c
m
t / min
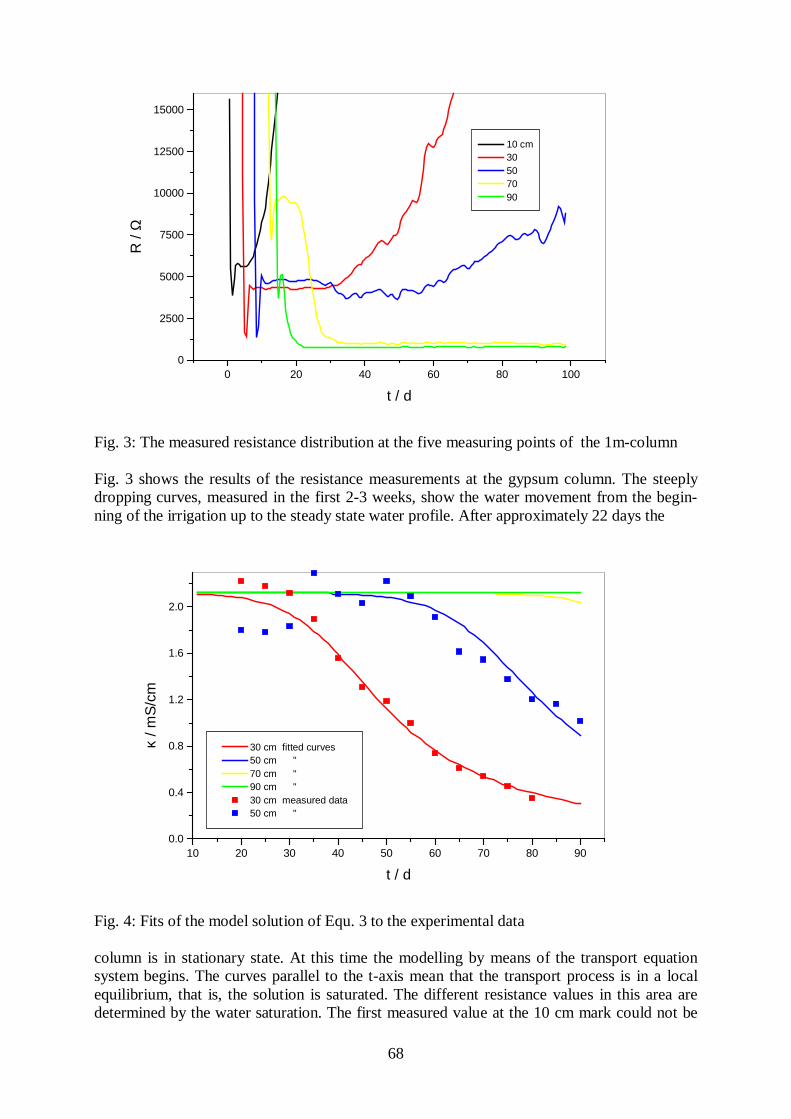
68
Fig. 3: The measured resistance distribution at the five measuring points of the 1m-column
Fig. 3 shows the results of the resistance measurements at the gypsum column. The steeplydropping curves, measured in the first 2-3 weeks, show the water movement from the begin-ning of the irrigation up to the steady state water profile. After approximately 22 days the
Fig. 4: Fits of the model solution of Equ. 3 to the experimental data
column is in stationary state. At this time the modelling by means of the transport equationsystem begins. The curves parallel to the t-axis mean that the transport process is in a localequilibrium, that is, the solution is saturated. The different resistance values in this area aredetermined by the water saturation. The first measured value at the 10 cm mark could not be
10 20 30 40 50 60 70 80 900.0
0.4
0.8
1.2
1.6
2.0
30 cm fitted curves50 cm "70 cm "90 cm "30 cm measured data50 cm "
κ/m
S/c
m
t / d
0 20 40 60 80 1000
2500
5000
7500
10000
12500
15000
10 cm30507090
R/Ω
t / d
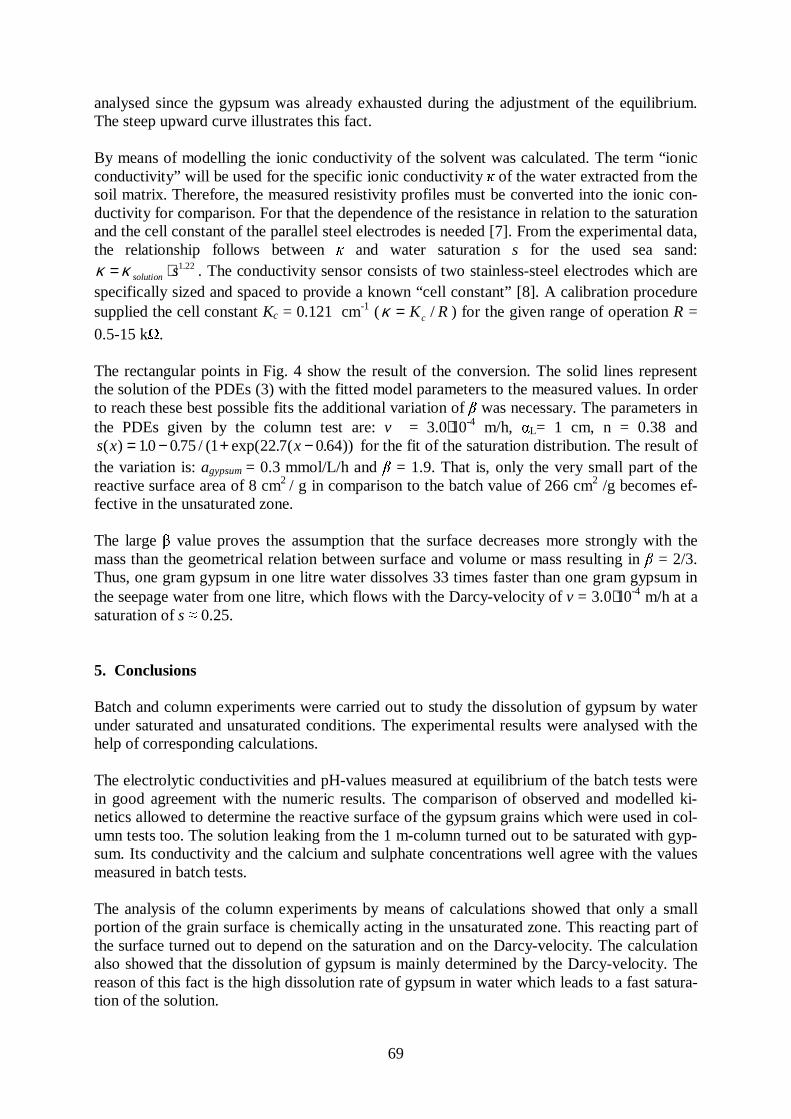
69
analysed since the gypsum was already exhausted during the adjustment of the equilibrium.The steep upward curve illustrates this fact.
By means of modelling the ionic conductivity of the solvent was calculated. The term “ionicconductivity” will be used for the specific ionic conductivity ĸ of the water extracted from thesoil matrix. Therefore, the measured resistivity profiles must be converted into the ionic con-ductivity for comparison. For that the dependence of the resistance in relation to the saturationand the cell constant of the parallel steel electrodes is needed [7]. From the experimental data,the relationship follows between κ and water saturation s for the used sea sand:κ κ= ⋅solution s1 22. . The conductivity sensor consists of two stainless-steel electrodes which arespecifically sized and spaced to provide a known “cell constant” [8]. A calibration proceduresupplied the cell constant Kc = 0.121 cm-1 ( RKc /=κ ) for the given range of operation R =
0.5-15 kΩ.
The rectangular points in Fig. 4 show the result of the conversion. The solid lines representthe solution of the PDEs (3) with the fitted model parameters to the measured values. In orderto reach these best possible fits the additional variation of β was necessary. The parameters inthe PDEs given by the column test are: v = 3.0⋅10-4 m/h, αL= 1 cm, n = 0.38 ands x x( ) . . / ( exp( . ( . ))= − + −10 0 75 1 22 7 0 64 for the fit of the saturation distribution. The result ofthe variation is: agypsum = 0.3 mmol/L/h and β = 1.9. That is, only the very small part of thereactive surface area of 8 cm2 / g in comparison to the batch value of 266 cm2 /g becomes ef-fective in the unsaturated zone.
The large β value proves the assumption that the surface decreases more strongly with themass than the geometrical relation between surface and volume or mass resulting in β = 2/3.Thus, one gram gypsum in one litre water dissolves 33 times faster than one gram gypsum inthe seepage water from one litre, which flows with the Darcy-velocity of v = 3.0⋅10-4 m/h at asaturation of s ≈ 0.25.
5. Conclusions
Batch and column experiments were carried out to study the dissolution of gypsum by waterunder saturated and unsaturated conditions. The experimental results were analysed with thehelp of corresponding calculations.
The electrolytic conductivities and pH-values measured at equilibrium of the batch tests werein good agreement with the numeric results. The comparison of observed and modelled ki-netics allowed to determine the reactive surface of the gypsum grains which were used in col-umn tests too. The solution leaking from the 1 m-column turned out to be saturated with gyp-sum. Its conductivity and the calcium and sulphate concentrations well agree with the valuesmeasured in batch tests.
The analysis of the column experiments by means of calculations showed that only a smallportion of the grain surface is chemically acting in the unsaturated zone. This reacting part ofthe surface turned out to depend on the saturation and on the Darcy-velocity. The calculationalso showed that the dissolution of gypsum is mainly determined by the Darcy-velocity. Thereason of this fact is the high dissolution rate of gypsum in water which leads to a fast satura-tion of the solution.
70
References
[1] R. Kuechler, K. Noack and T. Zorn (2001), Investigation of calcite dissolution undersaturated and unsaturated water conditions, Rossendorf, Report FZR-316
[2] A. A. Jeschke, K. Vosbeck and W. Dreybrodt (2001), Surface controlled dissolutionrates of gypsum in aqueous solutions exhibit nonlinear dissolution kinetics, Geo-chimica et Cosmochimica Acta, 65, 27
[3] L. Luckner and W. M. Schestakow (1991), Migration Processes in the Soil andGroundwater Zone, Leipzig, Verlag für Grundstoffindustrie
[4] P. C. Lichtner (1996), Continuum Formulation of Multicomponent – MultiphaseReactive Transport, in P. C. Lichtner, C. I. Steefel and E. H. Oelkers (Eds.), ReactiveTransport in porous Media, Reviews in Mineralogy, Vol. 34
[5] W. P. Inskeep and P. R. Bloom (1985), An evaluation of rate equation for calcite pre-cipitation kinetics at pCO2 less then 0.01 atm and pH greater than 8, Geochim Cosmo-chim Acta 49, pp. 2165-2180
[6] A. W. Adamson (1982), Physical chemistry of Surfaces, New York , Wiley & Sons[7] M. A. Hilhorst (1998), Dielectric characterisation of soil, Wageningen Agriculture
University[8] C. H. Haman and W. Vielstich (1984), Elektrochemie I, Weinheim, VCH Verlagsge-
sellschaft
Acknowledgement
This work was made with the kind support of the Institute of Radiochemistry of Forschungs-zentrum Rossendorf.
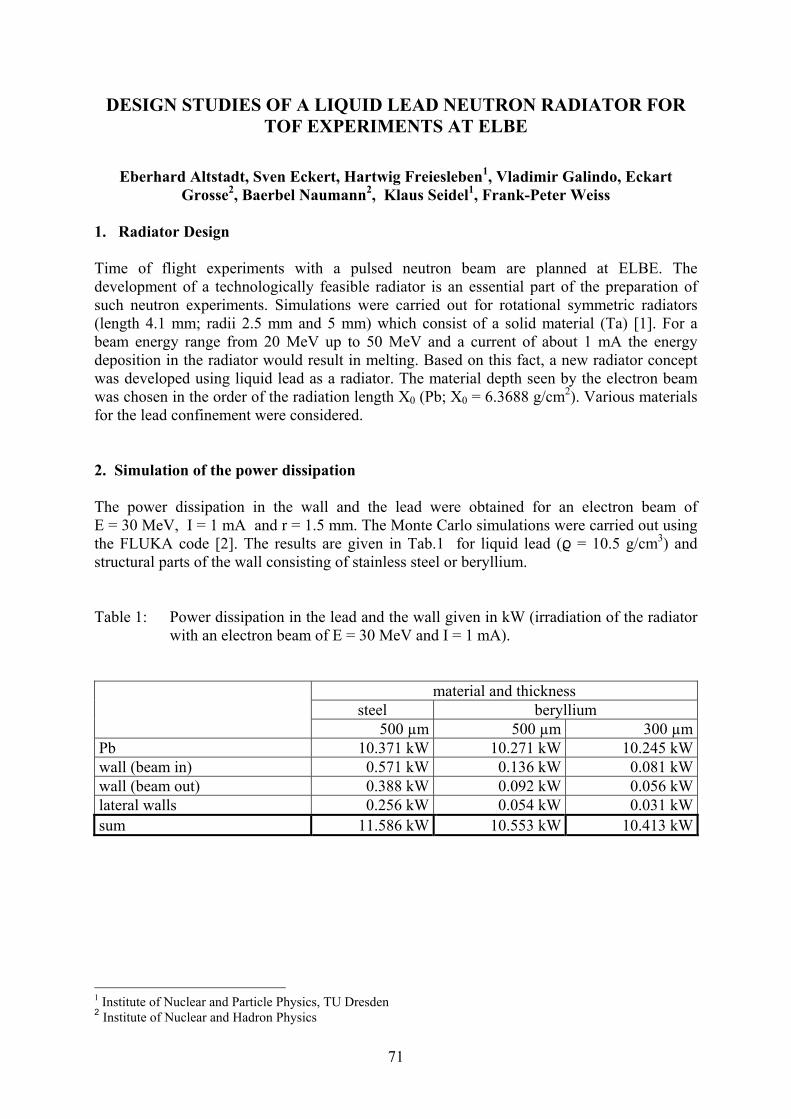
71
DESIGN STUDIES OF A LIQUID LEAD NEUTRON RADIATOR FOR TOF EXPERIMENTS AT ELBE
Eberhard Altstadt, Sven Eckert, Hartwig Freiesleben1, Vladimir Galindo, Eckart Grosse2, Baerbel Naumann2, Klaus Seidel1, Frank-Peter Weiss
1. Radiator Design Time of flight experiments with a pulsed neutron beam are planned at ELBE. The development of a technologically feasible radiator is an essential part of the preparation of such neutron experiments. Simulations were carried out for rotational symmetric radiators (length 4.1 mm; radii 2.5 mm and 5 mm) which consist of a solid material (Ta) [1]. For a beam energy range from 20 MeV up to 50 MeV and a current of about 1 mA the energy deposition in the radiator would result in melting. Based on this fact, a new radiator concept was developed using liquid lead as a radiator. The material depth seen by the electron beam was chosen in the order of the radiation length X0 (Pb; X0 = 6.3688 g/cm2). Various materials for the lead confinement were considered. 2. Simulation of the power dissipation The power dissipation in the wall and the lead were obtained for an electron beam of E = 30 MeV, I = 1 mA and r = 1.5 mm. The Monte Carlo simulations were carried out using the FLUKA code [2]. The results are given in Tab.1 for liquid lead (k = 10.5 g/cm3) and structural parts of the wall consisting of stainless steel or beryllium. Table 1: Power dissipation in the lead and the wall given in kW (irradiation of the radiator
with an electron beam of E = 30 MeV and I = 1 mA).
material and thickness steel beryllium
500 µm 500 µm 300 µmPb 10.371 kW 10.271 kW 10.245 kWwall (beam in) 0.571 kW 0.136 kW 0.081 kWwall (beam out) 0.388 kW 0.092 kW 0.056 kWlateral walls 0.256 kW 0.054 kW 0.031 kWsum 11.586 kW 10.553 kW 10.413 kW
1 Institute of Nuclear and Particle Physics, TU Dresden 2 Institute of Nuclear and Hadron Physics
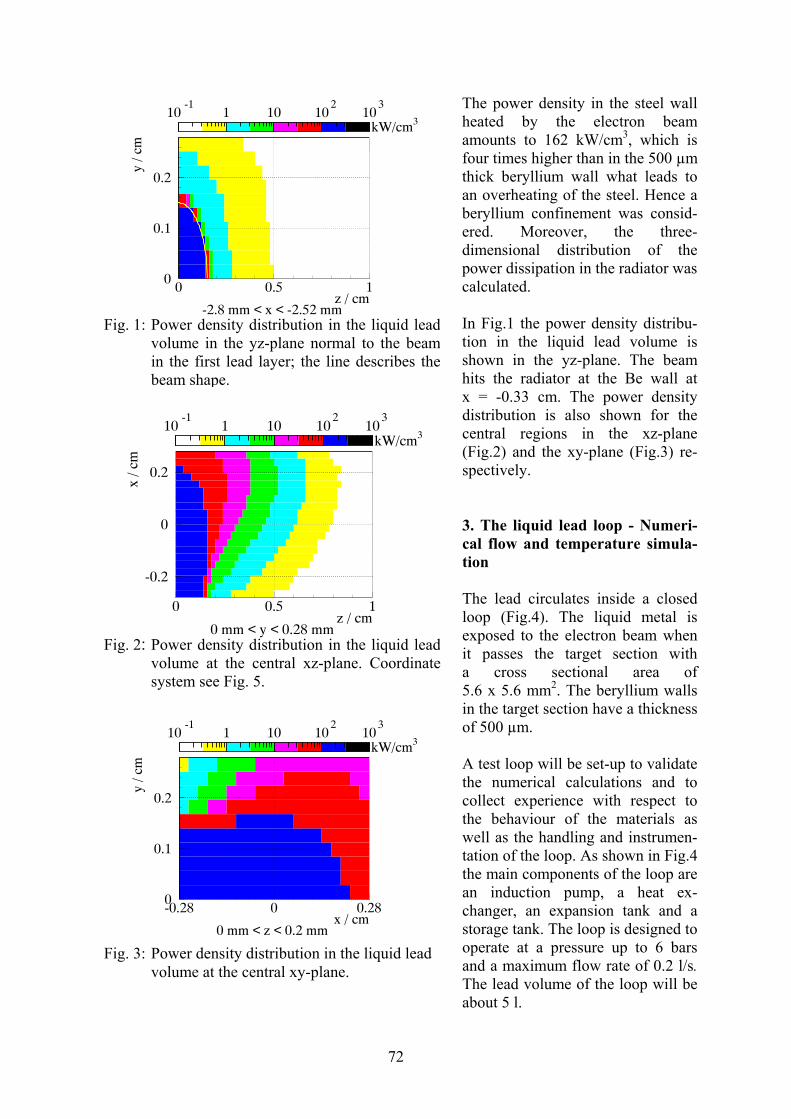
72
The power density in the steel wall heated by the electron beam amounts to 162 kW/cm3, which is four times higher than in the 500 µm thick beryllium wall what leads to an overheating of the steel. Hence a beryllium confinement was consid-ered. Moreover, the three-dimensional distribution of the power dissipation in the radiator was calculated. In Fig.1 the power density distribu-tion in the liquid lead volume is shown in the yz-plane. The beam hits the radiator at the Be wall at x = -0.33 cm. The power density distribution is also shown for the central regions in the xz-plane (Fig.2) and the xy-plane (Fig.3) re-spectively. 3. The liquid lead loop - Numeri-cal flow and temperature simula-tion The lead circulates inside a closed loop (Fig.4). The liquid metal is exposed to the electron beam when it passes the target section with a cross sectional area of 5.6 x 5.6 mm2. The beryllium walls in the target section have a thickness of 500 µm. A test loop will be set-up to validate the numerical calculations and to collect experience with respect to the behaviour of the materials as well as the handling and instrumen-tation of the loop. As shown in Fig.4 the main components of the loop are an induction pump, a heat ex-changer, an expansion tank and a storage tank. The loop is designed to operate at a pressure up to 6 bars and a maximum flow rate of 0.2 l/s. The lead volume of the loop will be about 5 l.
0
0.1
0.2
0 0.5 1
10-1
1 10 102
103
z / cm
y / c
mkW/cm3
-2.8 mm < x < -2.52 mm Fig. 1: Power density distribution in the liquid lead
volume in the yz-plane normal to the beamin the first lead layer; the line describes thebeam shape.
-0.2
0
0.2
0 0.5 1
10-1
1 10 102
103
z / cm
x / c
m
kW/cm3
0 mm < y < 0.28 mm Fig. 2: Power density distribution in the liquid lead
volume at the central xz-plane. Coordinatesystem see Fig. 5.
0
0.1
0.2
-0.28 0 0.28
10-1
1 10 102
103
x / cm
y / c
m
kW/cm3
0 mm < z < 0.2 mm Fig. 3: Power density distribution in the liquid lead
volume at the central xy-plane.
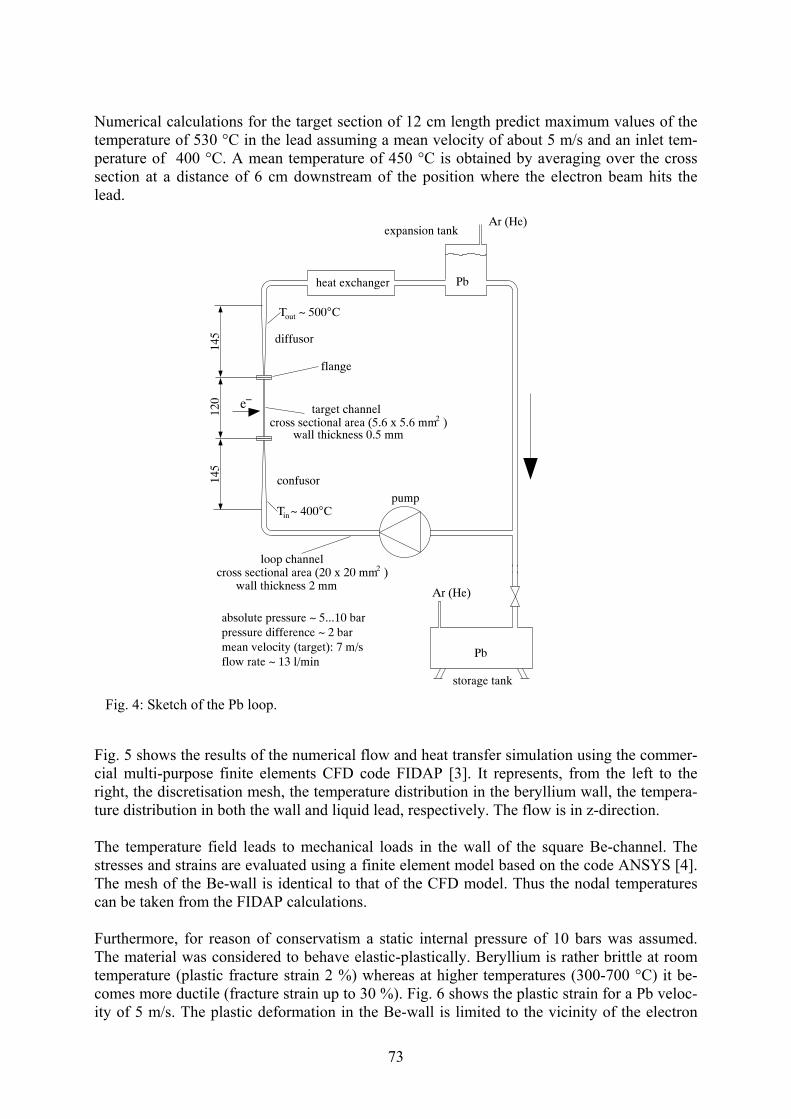
73
Numerical calculations for the target section of 12 cm length predict maximum values of the temperature of 530 °C in the lead assuming a mean velocity of about 5 m/s and an inlet tem-perature of 400 °C. A mean temperature of 450 °C is obtained by averaging over the cross section at a distance of 6 cm downstream of the position where the electron beam hits the lead.
Fig. 5 shows the results of the numerical flow and heat transfer simulation using the commer-cial multi-purpose finite elements CFD code FIDAP [3]. It represents, from the left to the right, the discretisation mesh, the temperature distribution in the beryllium wall, the tempera-ture distribution in both the wall and liquid lead, respectively. The flow is in z-direction. The temperature field leads to mechanical loads in the wall of the square Be-channel. The stresses and strains are evaluated using a finite element model based on the code ANSYS [4]. The mesh of the Be-wall is identical to that of the CFD model. Thus the nodal temperatures can be taken from the FIDAP calculations. Furthermore, for reason of conservatism a static internal pressure of 10 bars was assumed. The material was considered to behave elastic-plastically. Beryllium is rather brittle at room temperature (plastic fracture strain 2 %) whereas at higher temperatures (300-700 °C) it be-comes more ductile (fracture strain up to 30 %). Fig. 6 shows the plastic strain for a Pb veloc-ity of 5 m/s. The plastic deformation in the Be-wall is limited to the vicinity of the electron
expansion tankAr (He)
Ar (He)
pump
heat exchanger
confusor
wall thickness 0.5 mmcross sectional area (5.6 x 5.6 mm )2
−e
120
145
145
loop channelcross sectional area (20 x 20 mm )2
wall thickness 2 mm
Pb
outT ~ 500°C
inT ~ 400°C
Pb
storage tank
target channel
diffusor
flange
mean velocity (target): 7 m/spressure difference ~ 2 barabsolute pressure ~ 5...10 bar
flow rate ~ 13 l/min
Fig. 4: Sketch of the Pb loop.

74
beam. The maximum plastic equivalent strain is about 0.48 % occurring at the wall which is hit by the beam. This is far below the fracture strain even at room temperature. However, con-sidering a large number of temperature cycles (heat-up, cool down), material fatigue could be a problem.
References [1] B. Naumann et al., FZ Rossendorf, Wiss.-Techn. Berichte FZR-271 (1999) 35 [2] A. Fasso, A. Ferrari and P.R. Sala, Proc. of the Monte Carlo 2000 Conference, Lisbon,
23-26 Oct., (2000) [3] Fluent Inc.: FIDAP 8 theory manual, Lebanon, NH, USA (1998) [4] ANSYS User's Manual for Rev. 5.6., Swansons Analysis Systems, Inc. (1999)
Fig. 5: Temperature distribution. Mean Pb velocity: 5 m/s . Maximum temperature: 530°C.
Fig. 6: Plastic equivalent strain in the beryllium wall.
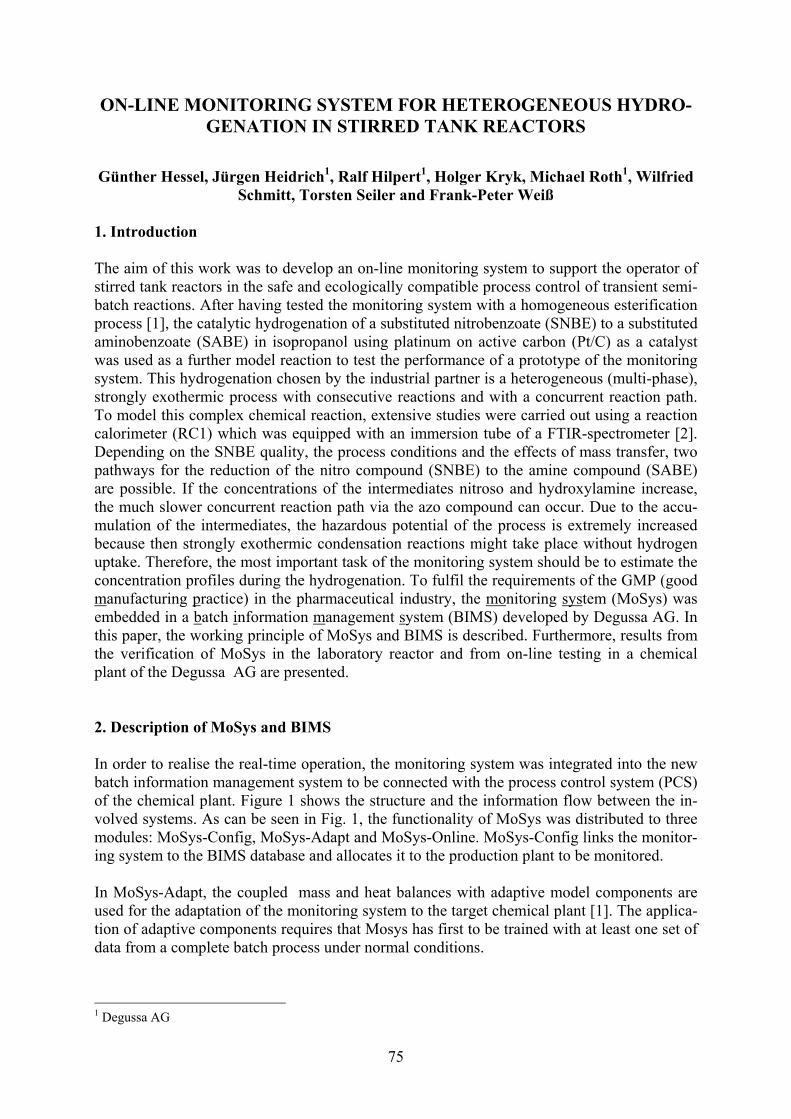
75
ON-LINE MONITORING SYSTEM FOR HETEROGENEOUS HYDRO-GENATION IN STIRRED TANK REACTORS
Günther Hessel, Jürgen Heidrich1, Ralf Hilpert1, Holger Kryk, Michael Roth1, Wilfried
Schmitt, Torsten Seiler and Frank-Peter Weiß 1. Introduction The aim of this work was to develop an on-line monitoring system to support the operator of stirred tank reactors in the safe and ecologically compatible process control of transient semi-batch reactions. After having tested the monitoring system with a homogeneous esterification process [1], the catalytic hydrogenation of a substituted nitrobenzoate (SNBE) to a substituted aminobenzoate (SABE) in isopropanol using platinum on active carbon (Pt/C) as a catalyst was used as a further model reaction to test the performance of a prototype of the monitoring system. This hydrogenation chosen by the industrial partner is a heterogeneous (multi-phase), strongly exothermic process with consecutive reactions and with a concurrent reaction path. To model this complex chemical reaction, extensive studies were carried out using a reaction calorimeter (RC1) which was equipped with an immersion tube of a FTIR-spectrometer [2]. Depending on the SNBE quality, the process conditions and the effects of mass transfer, two pathways for the reduction of the nitro compound (SNBE) to the amine compound (SABE) are possible. If the concentrations of the intermediates nitroso and hydroxylamine increase, the much slower concurrent reaction path via the azo compound can occur. Due to the accu-mulation of the intermediates, the hazardous potential of the process is extremely increased because then strongly exothermic condensation reactions might take place without hydrogen uptake. Therefore, the most important task of the monitoring system should be to estimate the concentration profiles during the hydrogenation. To fulfil the requirements of the GMP (good manufacturing practice) in the pharmaceutical industry, the monitoring system (MoSys) was embedded in a batch information management system (BIMS) developed by Degussa AG. In this paper, the working principle of MoSys and BIMS is described. Furthermore, results from the verification of MoSys in the laboratory reactor and from on-line testing in a chemical plant of the Degussa AG are presented. 2. Description of MoSys and BIMS In order to realise the real-time operation, the monitoring system was integrated into the new batch information management system to be connected with the process control system (PCS) of the chemical plant. Figure 1 shows the structure and the information flow between the in-volved systems. As can be seen in Fig. 1, the functionality of MoSys was distributed to three modules: MoSys-Config, MoSys-Adapt and MoSys-Online. MoSys-Config links the monitor-ing system to the BIMS database and allocates it to the production plant to be monitored. In MoSys-Adapt, the coupled mass and heat balances with adaptive model components are used for the adaptation of the monitoring system to the target chemical plant [1]. The applica-tion of adaptive components requires that Mosys has first to be trained with at least one set of data from a complete batch process under normal conditions.
1 Degussa AG
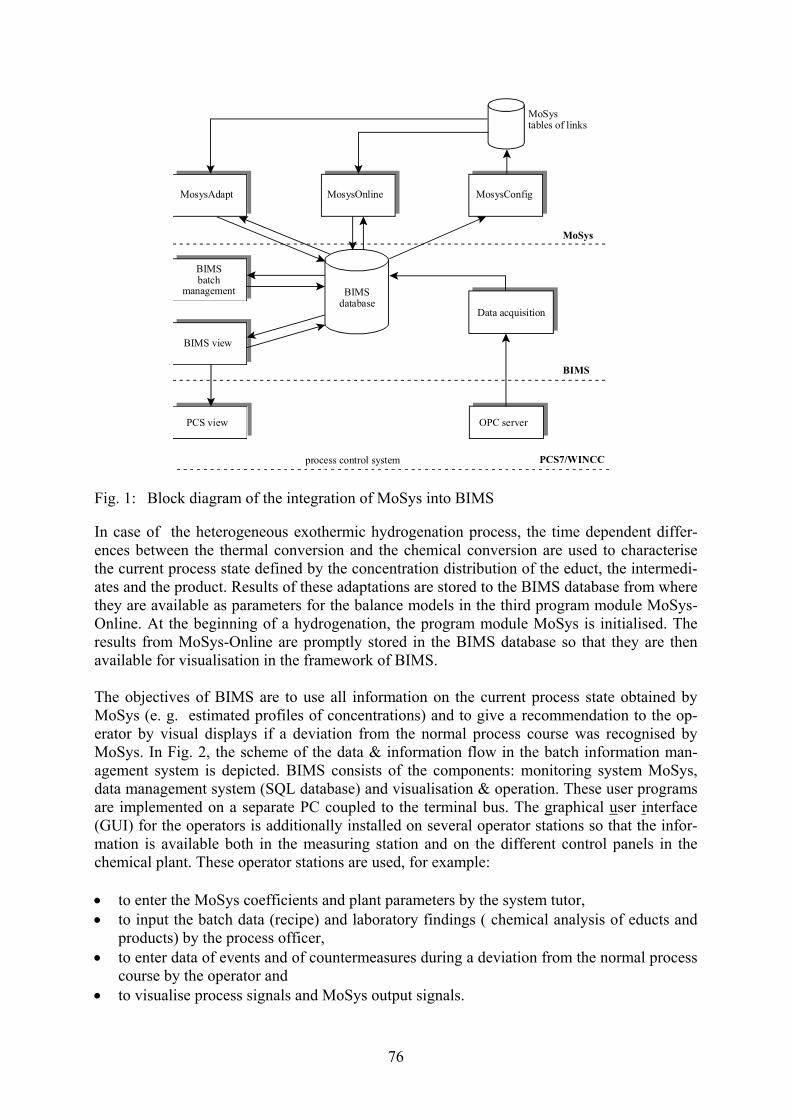
76
Fig. 1: Block diagram of the integration of MoSys into BIMS In case of the heterogeneous exothermic hydrogenation process, the time dependent differ-ences between the thermal conversion and the chemical conversion are used to characterise the current process state defined by the concentration distribution of the educt, the intermedi-ates and the product. Results of these adaptations are stored to the BIMS database from where they are available as parameters for the balance models in the third program module MoSys-Online. At the beginning of a hydrogenation, the program module MoSys is initialised. The results from MoSys-Online are promptly stored in the BIMS database so that they are then available for visualisation in the framework of BIMS. The objectives of BIMS are to use all information on the current process state obtained by MoSys (e. g. estimated profiles of concentrations) and to give a recommendation to the op-erator by visual displays if a deviation from the normal process course was recognised by MoSys. In Fig. 2, the scheme of the data & information flow in the batch information man-agement system is depicted. BIMS consists of the components: monitoring system MoSys, data management system (SQL database) and visualisation & operation. These user programs are implemented on a separate PC coupled to the terminal bus. The graphical user interface (GUI) for the operators is additionally installed on several operator stations so that the infor-mation is available both in the measuring station and on the different control panels in the chemical plant. These operator stations are used, for example: • to enter the MoSys coefficients and plant parameters by the system tutor, • to input the batch data (recipe) and laboratory findings ( chemical analysis of educts and
products) by the process officer, • to enter data of events and of countermeasures during a deviation from the normal process
course by the operator and • to visualise process signals and MoSys output signals.
MosysAdapt MosysOnline MosysConfig
BIMSbatch
management
BIMS view
PCS view OPC server
Data acquisition
MoSystables of links
MoSys
BIMS
process control system PCS7/WINCC
BIMSdatabase
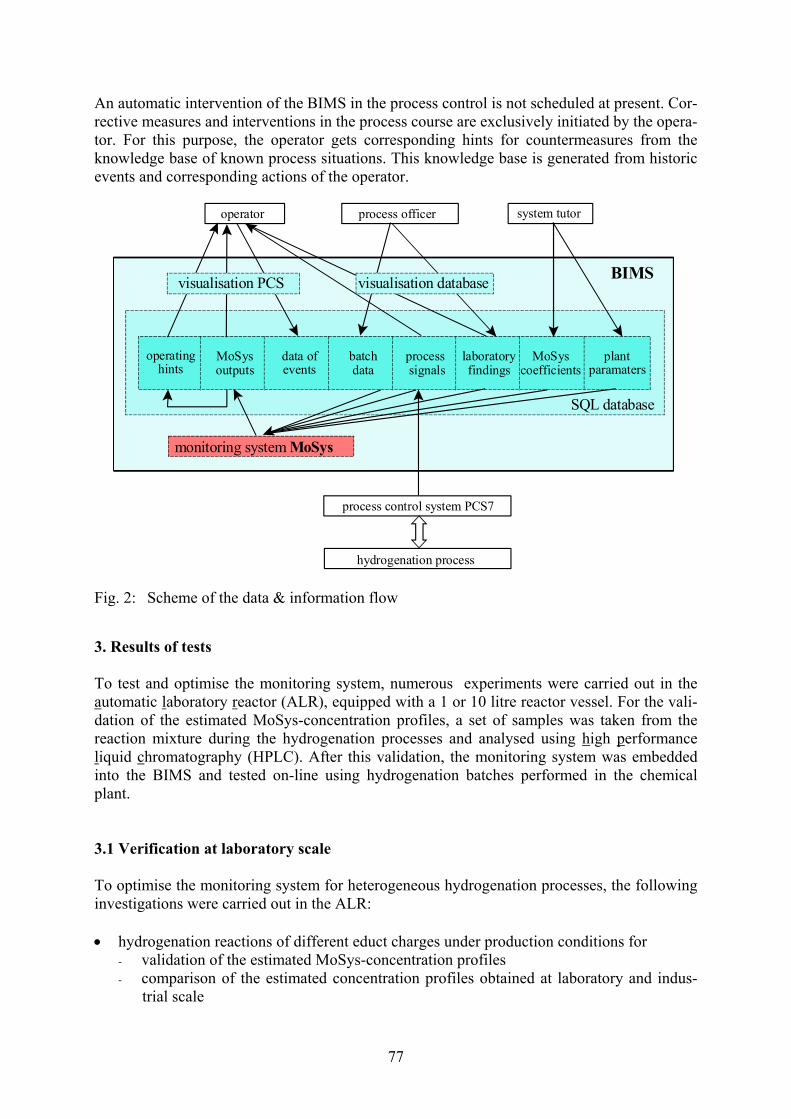
77
An automatic intervention of the BIMS in the process control is not scheduled at present. Cor-rective measures and interventions in the process course are exclusively initiated by the opera-tor. For this purpose, the operator gets corresponding hints for countermeasures from the knowledge base of known process situations. This knowledge base is generated from historic events and corresponding actions of the operator.
Fig. 2: Scheme of the data & information flow 3. Results of tests To test and optimise the monitoring system, numerous experiments were carried out in the automatic laboratory reactor (ALR), equipped with a 1 or 10 litre reactor vessel. For the vali-dation of the estimated MoSys-concentration profiles, a set of samples was taken from the reaction mixture during the hydrogenation processes and analysed using high performance liquid chromatography (HPLC). After this validation, the monitoring system was embedded into the BIMS and tested on-line using hydrogenation batches performed in the chemical plant. 3.1 Verification at laboratory scale To optimise the monitoring system for heterogeneous hydrogenation processes, the following investigations were carried out in the ALR: • hydrogenation reactions of different educt charges under production conditions for
- validation of the estimated MoSys-concentration profiles - comparison of the estimated concentration profiles obtained at laboratory and indus-
trial scale
operator process officer system tutor
MoSysoutputs
data ofevents
batchdata
process signals
laboratoryfindings
MoSyscoefficients
plantparamaters
monitoring system MoSys
SQL database
BIMS
process control system PCS7
hydrogenation process
visualisation database
operatinghints
visualisation PCS
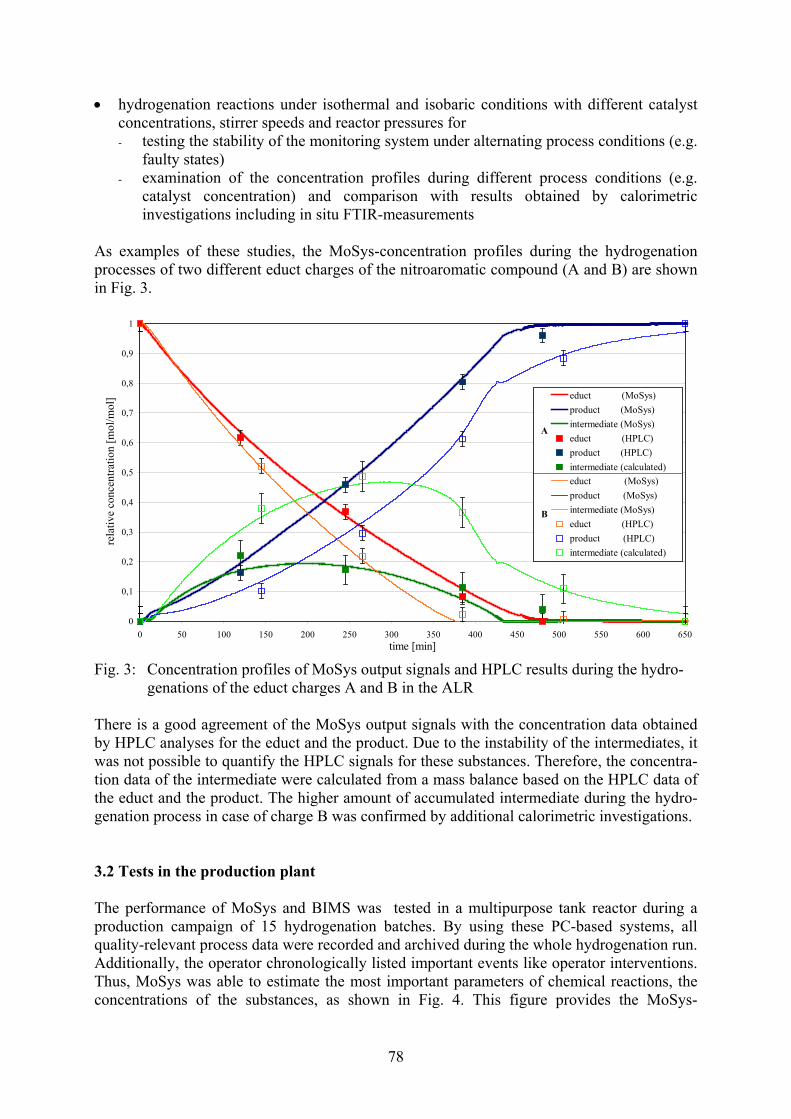
78
• hydrogenation reactions under isothermal and isobaric conditions with different catalyst concentrations, stirrer speeds and reactor pressures for - testing the stability of the monitoring system under alternating process conditions (e.g.
faulty states) - examination of the concentration profiles during different process conditions (e.g.
catalyst concentration) and comparison with results obtained by calorimetric investigations including in situ FTIR-measurements
As examples of these studies, the MoSys-concentration profiles during the hydrogenation processes of two different educt charges of the nitroaromatic compound (A and B) are shown in Fig. 3.
0
0,1
0,2
0,3
0,4
0,5
0,6
0,7
0,8
0,9
1
0 50 100 150 200 250 300 350 400 450 500 550 600 650time [min]
rela
tive
conc
entra
tion
[mol
/mol
] educt (MoSys)product (MoSys)intermediate (MoSys)educt (HPLC)product (HPLC)intermediate (calculated)educt (MoSys)product (MoSys)intermediate (MoSys)educt (HPLC)product (HPLC)intermediate (calculated)
A
B
Fig. 3: Concentration profiles of MoSys output signals and HPLC results during the hydro-
genations of the educt charges A and B in the ALR There is a good agreement of the MoSys output signals with the concentration data obtained by HPLC analyses for the educt and the product. Due to the instability of the intermediates, it was not possible to quantify the HPLC signals for these substances. Therefore, the concentra-tion data of the intermediate were calculated from a mass balance based on the HPLC data of the educt and the product. The higher amount of accumulated intermediate during the hydro-genation process in case of charge B was confirmed by additional calorimetric investigations. 3.2 Tests in the production plant The performance of MoSys and BIMS was tested in a multipurpose tank reactor during a production campaign of 15 hydrogenation batches. By using these PC-based systems, all quality-relevant process data were recorded and archived during the whole hydrogenation run. Additionally, the operator chronologically listed important events like operator interventions. Thus, MoSys was able to estimate the most important parameters of chemical reactions, the concentrations of the substances, as shown in Fig. 4. This figure provides the MoSys-
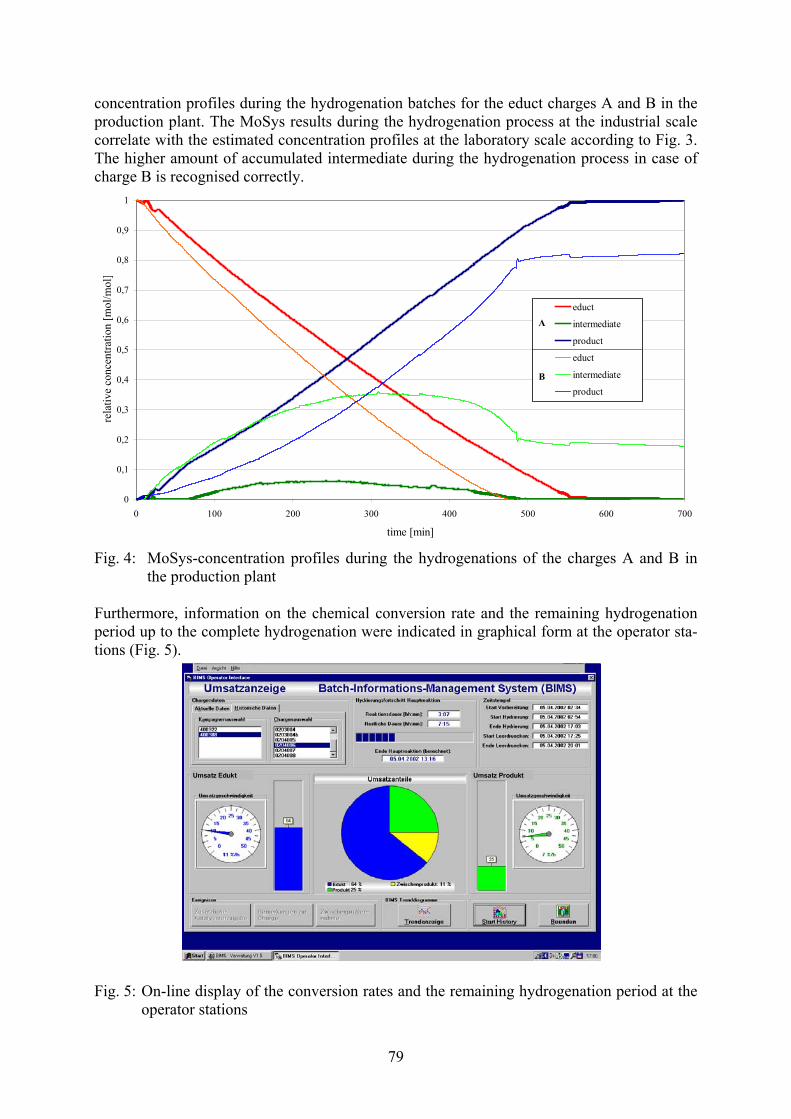
79
concentration profiles during the hydrogenation batches for the educt charges A and B in the production plant. The MoSys results during the hydrogenation process at the industrial scale correlate with the estimated concentration profiles at the laboratory scale according to Fig. 3. The higher amount of accumulated intermediate during the hydrogenation process in case of charge B is recognised correctly.
0
0,1
0,2
0,3
0,4
0,5
0,6
0,7
0,8
0,9
1
0 100 200 300 400 500 600 700
time [min]
rela
tive
conc
entra
tion
[mol
/mol
]
educt
intermediate
product
educt
intermediate
product
A
B
Fig. 4: MoSys-concentration profiles during the hydrogenations of the charges A and B in
the production plant Furthermore, information on the chemical conversion rate and the remaining hydrogenation period up to the complete hydrogenation were indicated in graphical form at the operator sta-tions (Fig. 5).
Fig. 5: On-line display of the conversion rates and the remaining hydrogenation period at the
operator stations
Umsatz Edukt Umsatz Produkt
EduktProdukt
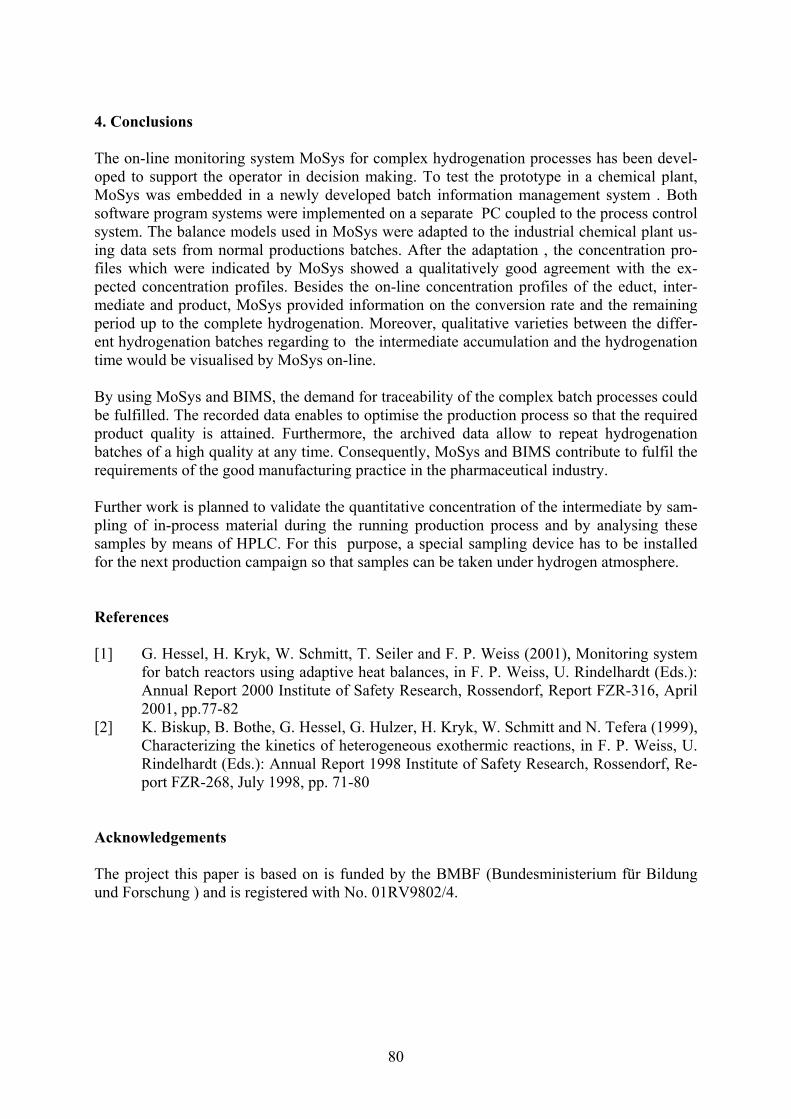
80
4. Conclusions The on-line monitoring system MoSys for complex hydrogenation processes has been devel-oped to support the operator in decision making. To test the prototype in a chemical plant, MoSys was embedded in a newly developed batch information management system . Both software program systems were implemented on a separate PC coupled to the process control system. The balance models used in MoSys were adapted to the industrial chemical plant us-ing data sets from normal productions batches. After the adaptation , the concentration pro-files which were indicated by MoSys showed a qualitatively good agreement with the ex-pected concentration profiles. Besides the on-line concentration profiles of the educt, inter-mediate and product, MoSys provided information on the conversion rate and the remaining period up to the complete hydrogenation. Moreover, qualitative varieties between the differ-ent hydrogenation batches regarding to the intermediate accumulation and the hydrogenation time would be visualised by MoSys on-line. By using MoSys and BIMS, the demand for traceability of the complex batch processes could be fulfilled. The recorded data enables to optimise the production process so that the required product quality is attained. Furthermore, the archived data allow to repeat hydrogenation batches of a high quality at any time. Consequently, MoSys and BIMS contribute to fulfil the requirements of the good manufacturing practice in the pharmaceutical industry. Further work is planned to validate the quantitative concentration of the intermediate by sam-pling of in-process material during the running production process and by analysing these samples by means of HPLC. For this purpose, a special sampling device has to be installed for the next production campaign so that samples can be taken under hydrogen atmosphere. References [1] G. Hessel, H. Kryk, W. Schmitt, T. Seiler and F. P. Weiss (2001), Monitoring system
for batch reactors using adaptive heat balances, in F. P. Weiss, U. Rindelhardt (Eds.): Annual Report 2000 Institute of Safety Research, Rossendorf, Report FZR-316, April 2001, pp.77-82
[2] K. Biskup, B. Bothe, G. Hessel, G. Hulzer, H. Kryk, W. Schmitt and N. Tefera (1999), Characterizing the kinetics of heterogeneous exothermic reactions, in F. P. Weiss, U. Rindelhardt (Eds.): Annual Report 1998 Institute of Safety Research, Rossendorf, Re-port FZR-268, July 1998, pp. 71-80
Acknowledgements The project this paper is based on is funded by the BMBF (Bundesministerium für Bildung und Forschung ) and is registered with No. 01RV9802/4.
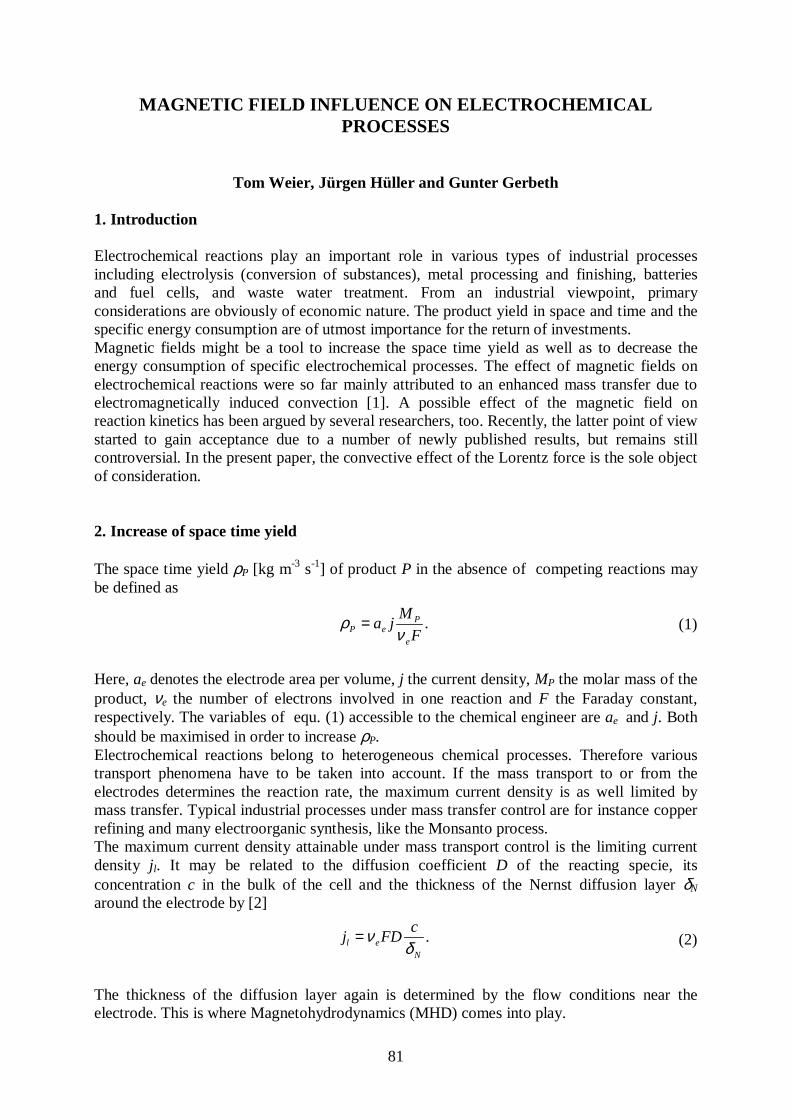
81
MAGNETIC FIELD INFLUENCE ON ELECTROCHEMICALPROCESSES
Tom Weier, Jürgen Hüller and Gunter Gerbeth
1. Introduction
Electrochemical reactions play an important role in various types of industrial processesincluding electrolysis (conversion of substances), metal processing and finishing, batteriesand fuel cells, and waste water treatment. From an industrial viewpoint, primaryconsiderations are obviously of economic nature. The product yield in space and time and thespecific energy consumption are of utmost importance for the return of investments.Magnetic fields might be a tool to increase the space time yield as well as to decrease theenergy consumption of specific electrochemical processes. The effect of magnetic fields onelectrochemical reactions were so far mainly attributed to an enhanced mass transfer due toelectromagnetically induced convection [1]. A possible effect of the magnetic field onreaction kinetics has been argued by several researchers, too. Recently, the latter point of viewstarted to gain acceptance due to a number of newly published results, but remains stillcontroversial. In the present paper, the convective effect of the Lorentz force is the sole objectof consideration.
2. Increase of space time yield
The space time yield ρP [kg m-3 s-1] of product P in the absence of competing reactions maybe defined as
(1)
Here, ae denotes the electrode area per volume, j the current density, MP the molar mass of theproduct, νe the number of electrons involved in one reaction and F the Faraday constant,respectively. The variables of equ. (1) accessible to the chemical engineer are ae and j. Bothshould be maximised in order to increase ρP.Electrochemical reactions belong to heterogeneous chemical processes. Therefore varioustransport phenomena have to be taken into account. If the mass transport to or from theelectrodes determines the reaction rate, the maximum current density is as well limited bymass transfer. Typical industrial processes under mass transfer control are for instance copperrefining and many electroorganic synthesis, like the Monsanto process.The maximum current density attainable under mass transport control is the limiting currentdensity jl. It may be related to the diffusion coefficient D of the reacting specie, itsconcentration c in the bulk of the cell and the thickness of the Nernst diffusion layer δN
around the electrode by [2]
(2)
The thickness of the diffusion layer again is determined by the flow conditions near theelectrode. This is where Magnetohydrodynamics (MHD) comes into play.
.F
Mja
e
PeP ν
ρ =
.N
el
cFDj
δν=
82
BjF ×=
The Lorentz force
(3)
is the vector product of a current density j and a magnetic field B. This Lorentz forcerepresents a body force inside the electrolyte able to influence its flow. Since the currentdensity is an inherent feature of electrochemical processes, only a suitable magnetic field hasto be added to generate a Lorentz force. In economic terms, no running costs are added to theprocess, provided the magnetic field originates from permanent magnets.Fig. 1 shows the anodic limiting current density in a small cell with vertical electrodes for theclassical K4[Fe(CN)6]/ K3[Fe(CN)6]-redox system under different conditions in terms of themagnetic field influence. A permanent magnet has been placed behind the anode of the cell insuch a way, that the main field component was parallel to the electrode surface. By changingthe orientation of the permanent magnet Lorentz forces either in upward or downwarddirection could be imposed on the electrolyte. At the anode [Fe(CN)6]
4- is oxidised to[Fe(CN)6]
3-, which has a smaller density than the former complex. Therefore in the unforcedcase, a natural convection develops, which is directed upwards at the anode and downwards atthe cathode. If a steady state is reached, a limiting current given by this natural convection isestablished. The limiting current increases with the concentration as it would be expectedfrom equ. (2), although this simplified relation hides the nonlinearities caused by the flow in
Fig. 1: Limiting current density versus concen- tration for a permanent magnet behind the working electrode.
Fig 2: Shadowgraph pictures of the electrolyte flow under several magnetic field con- figurations. The arrows denote the direct- ion of the Lorentz force near the electrodes.
δN. In Fig. 2 four shadowgraphs of the electrolytic solution in the cell are given. The arrowsdenote the direction of the Lorentz forces near the electrode. Both images in the upper part ofFig. 2 show configurations, where only the anode is equipped with a permanent magnet. It is
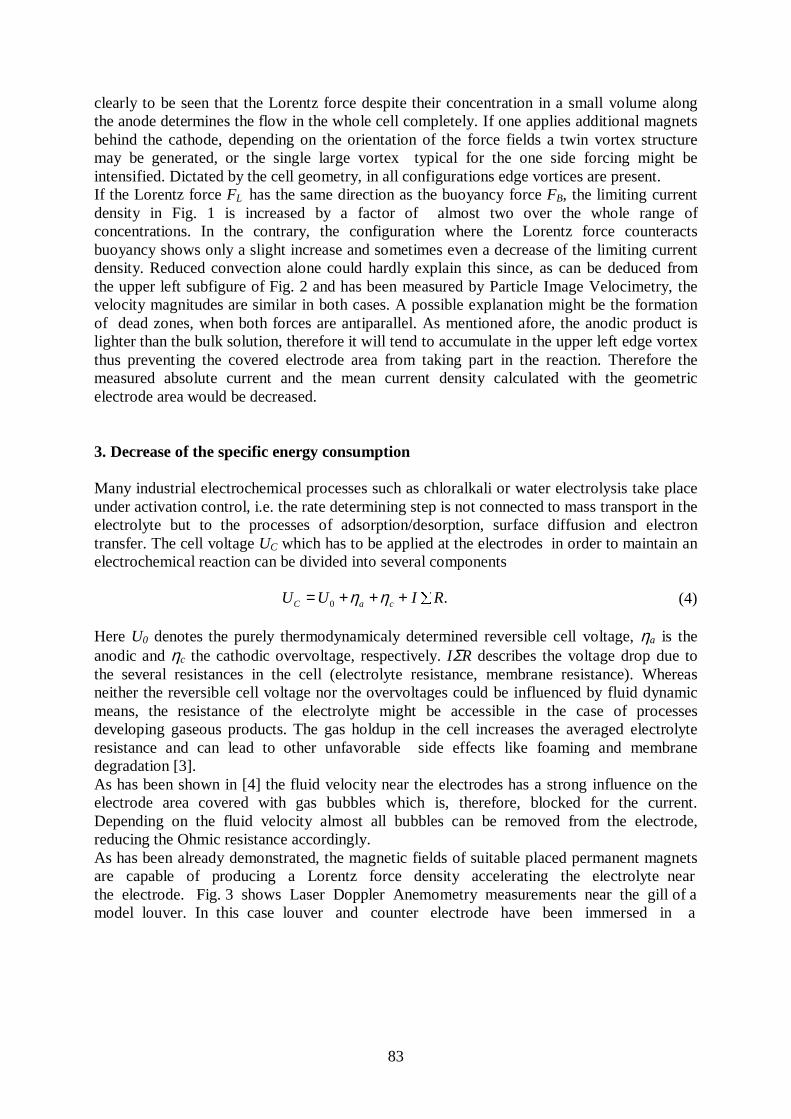
83
clearly to be seen that the Lorentz force despite their concentration in a small volume alongthe anode determines the flow in the whole cell completely. If one applies additional magnetsbehind the cathode, depending on the orientation of the force fields a twin vortex structuremay be generated, or the single large vortex typical for the one side forcing might beintensified. Dictated by the cell geometry, in all configurations edge vortices are present.If the Lorentz force FL has the same direction as the buoyancy force FB, the limiting currentdensity in Fig. 1 is increased by a factor of almost two over the whole range ofconcentrations. In the contrary, the configuration where the Lorentz force counteractsbuoyancy shows only a slight increase and sometimes even a decrease of the limiting currentdensity. Reduced convection alone could hardly explain this since, as can be deduced fromthe upper left subfigure of Fig. 2 and has been measured by Particle Image Velocimetry, thevelocity magnitudes are similar in both cases. A possible explanation might be the formationof dead zones, when both forces are antiparallel. As mentioned afore, the anodic product islighter than the bulk solution, therefore it will tend to accumulate in the upper left edge vortexthus preventing the covered electrode area from taking part in the reaction. Therefore themeasured absolute current and the mean current density calculated with the geometricelectrode area would be decreased.
3. Decrease of the specific energy consumption
Many industrial electrochemical processes such as chloralkali or water electrolysis take placeunder activation control, i.e. the rate determining step is not connected to mass transport in theelectrolyte but to the processes of adsorption/desorption, surface diffusion and electrontransfer. The cell voltage UC which has to be applied at the electrodes in order to maintain anelectrochemical reaction can be divided into several components
(4)
Here U0 denotes the purely thermodynamicaly determined reversible cell voltage, ηa is theanodic and ηc the cathodic overvoltage, respectively. IΣR describes the voltage drop due tothe several resistances in the cell (electrolyte resistance, membrane resistance). Whereasneither the reversible cell voltage nor the overvoltages could be influenced by fluid dynamicmeans, the resistance of the electrolyte might be accessible in the case of processesdeveloping gaseous products. The gas holdup in the cell increases the averaged electrolyteresistance and can lead to other unfavorable side effects like foaming and membranedegradation [3].As has been shown in [4] the fluid velocity near the electrodes has a strong influence on theelectrode area covered with gas bubbles which is, therefore, blocked for the current.Depending on the fluid velocity almost all bubbles can be removed from the electrode,reducing the Ohmic resistance accordingly.As has been already demonstrated, the magnetic fields of suitable placed permanent magnetsare capable of producing a Lorentz force density accelerating the electrolyte nearthe electrode. Fig. 3 shows Laser Doppler Anemometry measurements near the gill of amodel louver. In this case louver and counter electrode have been immersed in a
.0 RIUU caC +++= ηη
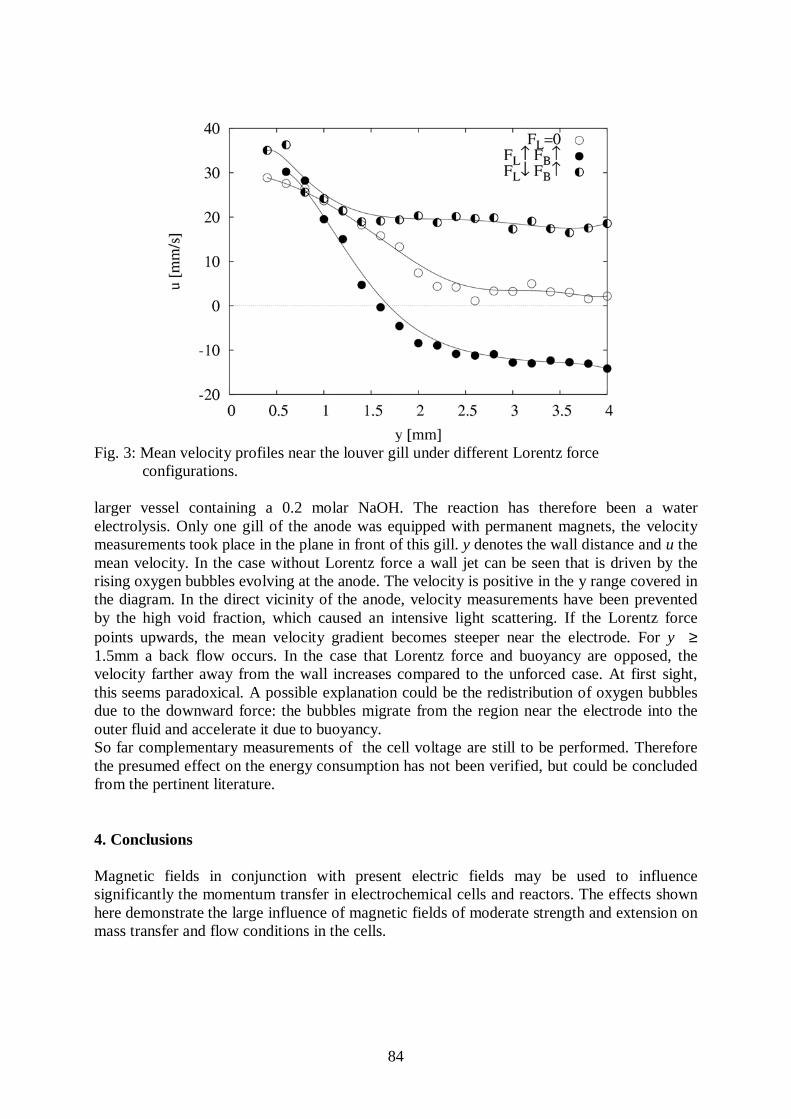
84
Fig. 3: Mean velocity profiles near the louver gill under different Lorentz force configurations.
larger vessel containing a 0.2 molar NaOH. The reaction has therefore been a waterelectrolysis. Only one gill of the anode was equipped with permanent magnets, the velocitymeasurements took place in the plane in front of this gill. y denotes the wall distance and u themean velocity. In the case without Lorentz force a wall jet can be seen that is driven by therising oxygen bubbles evolving at the anode. The velocity is positive in the y range covered inthe diagram. In the direct vicinity of the anode, velocity measurements have been preventedby the high void fraction, which caused an intensive light scattering. If the Lorentz forcepoints upwards, the mean velocity gradient becomes steeper near the electrode. For y ≥1.5mm a back flow occurs. In the case that Lorentz force and buoyancy are opposed, thevelocity farther away from the wall increases compared to the unforced case. At first sight,this seems paradoxical. A possible explanation could be the redistribution of oxygen bubblesdue to the downward force: the bubbles migrate from the region near the electrode into theouter fluid and accelerate it due to buoyancy.So far complementary measurements of the cell voltage are still to be performed. Thereforethe presumed effect on the energy consumption has not been verified, but could be concludedfrom the pertinent literature.
4. Conclusions
Magnetic fields in conjunction with present electric fields may be used to influencesignificantly the momentum transfer in electrochemical cells and reactors. The effects shownhere demonstrate the large influence of magnetic fields of moderate strength and extension onmass transfer and flow conditions in the cells.

85
References
[1] Fahidy, T. Z. (1999), The effect of magnetic fields on electrochemical processes, in:B.E . Conway (Ed.): Modern Aspects of Electrochemistry, Nr. 32 (pp.333-354),New York, Kluwer/Plenum
[2] E. Heitz, G. Kreysa (1986), Principles of Electrochemical Engineering, Weinheim,VCH
[3] C. Schneider (1997), Fluid Mechanics of Electrolytic Cells, in F.P. Weiß, U.Rindelhardt (Eds.): Annual Report 1997 Institute of Safety Research, Rossendorf,Report FZR-238
[4] C. W. M. P. Sillen (1983), The effect of gas bubble evolution on the energy efficiencyin water-electrolysis, PhD thesis, Tech. Hogeschool Eindhoven
Acknowledgements
We are very grateful to Alexander Grahn for the possibility to use his shadograph and videoequipment.
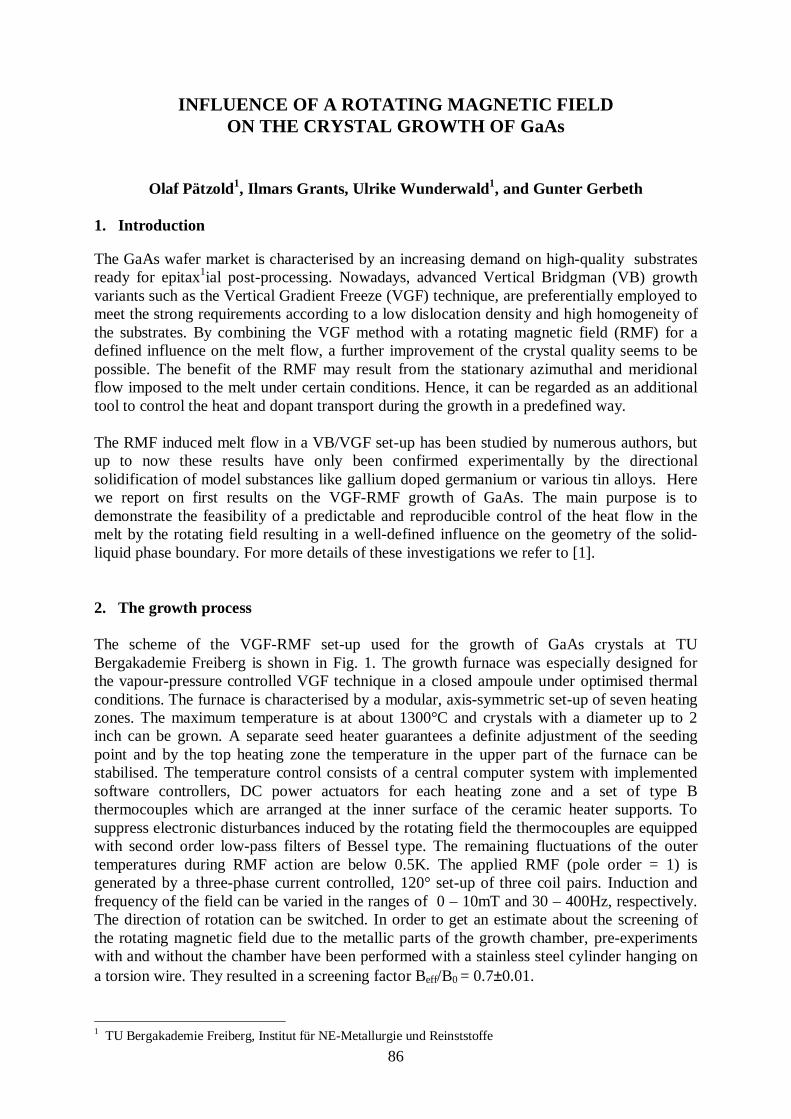
86
INFLUENCE OF A ROTATING MAGNETIC FIELDON THE CRYSTAL GROWTH OF GaAs
Olaf Pätzold1, Ilmars Grants, Ulrike Wunderwald1, and Gunter Gerbeth
1. Introduction
The GaAs wafer market is characterised by an increasing demand on high-quality substratesready for epitax1ial post-processing. Nowadays, advanced Vertical Bridgman (VB) growthvariants such as the Vertical Gradient Freeze (VGF) technique, are preferentially employed tomeet the strong requirements according to a low dislocation density and high homogeneity ofthe substrates. By combining the VGF method with a rotating magnetic field (RMF) for adefined influence on the melt flow, a further improvement of the crystal quality seems to bepossible. The benefit of the RMF may result from the stationary azimuthal and meridionalflow imposed to the melt under certain conditions. Hence, it can be regarded as an additionaltool to control the heat and dopant transport during the growth in a predefined way.
The RMF induced melt flow in a VB/VGF set-up has been studied by numerous authors, butup to now these results have only been confirmed experimentally by the directionalsolidification of model substances like gallium doped germanium or various tin alloys. Herewe report on first results on the VGF-RMF growth of GaAs. The main purpose is todemonstrate the feasibility of a predictable and reproducible control of the heat flow in themelt by the rotating field resulting in a well-defined influence on the geometry of the solid-liquid phase boundary. For more details of these investigations we refer to [1].
2. The growth process
The scheme of the VGF-RMF set-up used for the growth of GaAs crystals at TUBergakademie Freiberg is shown in Fig. 1. The growth furnace was especially designed forthe vapour-pressure controlled VGF technique in a closed ampoule under optimised thermalconditions. The furnace is characterised by a modular, axis-symmetric set-up of seven heatingzones. The maximum temperature is at about 1300°C and crystals with a diameter up to 2inch can be grown. A separate seed heater guarantees a definite adjustment of the seedingpoint and by the top heating zone the temperature in the upper part of the furnace can bestabilised. The temperature control consists of a central computer system with implementedsoftware controllers, DC power actuators for each heating zone and a set of type Bthermocouples which are arranged at the inner surface of the ceramic heater supports. Tosuppress electronic disturbances induced by the rotating field the thermocouples are equippedwith second order low-pass filters of Bessel type. The remaining fluctuations of the outertemperatures during RMF action are below 0.5K. The applied RMF (pole order = 1) isgenerated by a three-phase current controlled, 120° set-up of three coil pairs. Induction andfrequency of the field can be varied in the ranges of 0 – 10mT and 30 – 400Hz, respectively.The direction of rotation can be switched. In order to get an estimate about the screening ofthe rotating magnetic field due to the metallic parts of the growth chamber, pre-experimentswith and without the chamber have been performed with a stainless steel cylinder hanging ona torsion wire. They resulted in a screening factor Beff/B0 = 0.7±0.01.
1 TU Bergakademie Freiberg, Institut für NE-Metallurgie und Reinststoffe
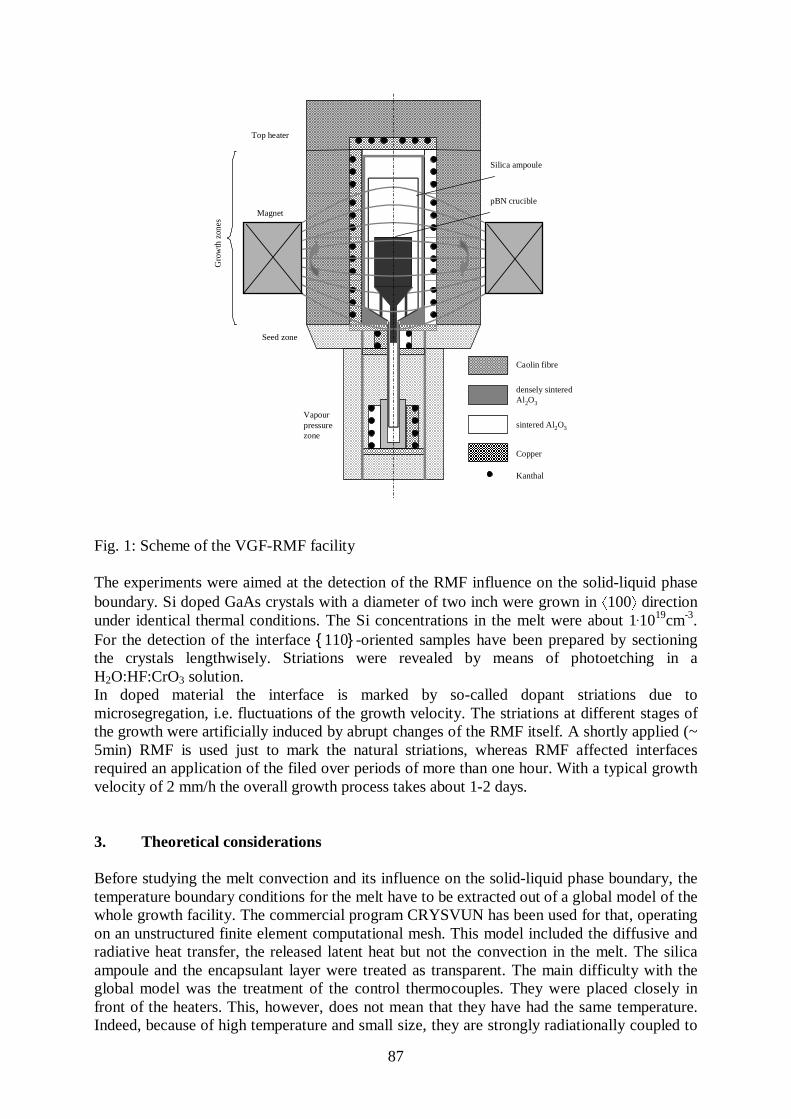
87
Caolin fibre
densely sinteredAl2O3
sintered Al2O3
Copper
Kanthal
Vapourpressurezone
Seed zone
MagnetG
row
th z
ones
Top heater
Silica ampoule
pBN crucible
Fig. 1: Scheme of the VGF-RMF facility
The experiments were aimed at the detection of the RMF influence on the solid-liquid phaseboundary. Si doped GaAs crystals with a diameter of two inch were grown in 100 directionunder identical thermal conditions. The Si concentrations in the melt were about 1•1019cm-3.For the detection of the interface 110 -oriented samples have been prepared by sectioningthe crystals lengthwisely. Striations were revealed by means of photoetching in aH2O:HF:CrO3 solution.In doped material the interface is marked by so-called dopant striations due tomicrosegregation, i.e. fluctuations of the growth velocity. The striations at different stages ofthe growth were artificially induced by abrupt changes of the RMF itself. A shortly applied (~5min) RMF is used just to mark the natural striations, whereas RMF affected interfacesrequired an application of the filed over periods of more than one hour. With a typical growthvelocity of 2 mm/h the overall growth process takes about 1-2 days.
3. Theoretical considerations
Before studying the melt convection and its influence on the solid-liquid phase boundary, thetemperature boundary conditions for the melt have to be extracted out of a global model of thewhole growth facility. The commercial program CRYSVUN has been used for that, operatingon an unstructured finite element computational mesh. This model included the diffusive andradiative heat transfer, the released latent heat but not the convection in the melt. The silicaampoule and the encapsulant layer were treated as transparent. The main difficulty with theglobal model was the treatment of the control thermocouples. They were placed closely infront of the heaters. This, however, does not mean that they have had the same temperature.Indeed, because of high temperature and small size, they are strongly radiationally coupled to
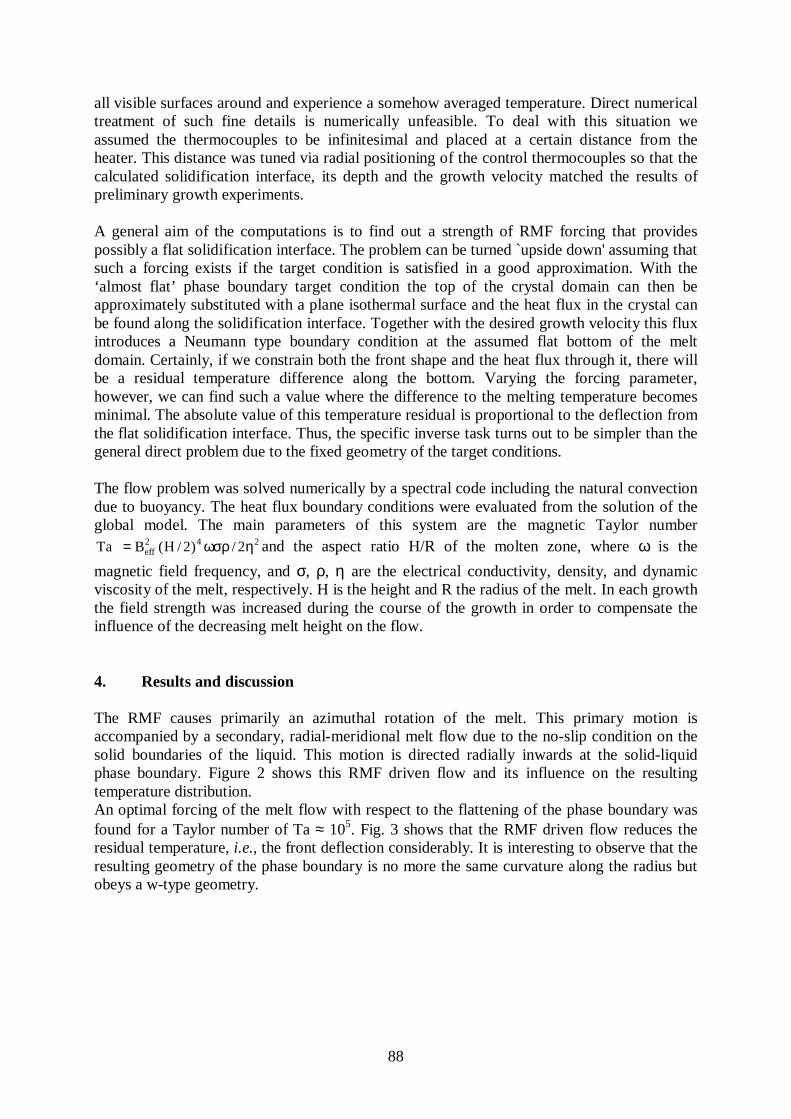
88
all visible surfaces around and experience a somehow averaged temperature. Direct numericaltreatment of such fine details is numerically unfeasible. To deal with this situation weassumed the thermocouples to be infinitesimal and placed at a certain distance from theheater. This distance was tuned via radial positioning of the control thermocouples so that thecalculated solidification interface, its depth and the growth velocity matched the results ofpreliminary growth experiments.
A general aim of the computations is to find out a strength of RMF forcing that providespossibly a flat solidification interface. The problem can be turned `upside down' assuming thatsuch a forcing exists if the target condition is satisfied in a good approximation. With the‘almost flat’ phase boundary target condition the top of the crystal domain can then beapproximately substituted with a plane isothermal surface and the heat flux in the crystal canbe found along the solidification interface. Together with the desired growth velocity this fluxintroduces a Neumann type boundary condition at the assumed flat bottom of the meltdomain. Certainly, if we constrain both the front shape and the heat flux through it, there willbe a residual temperature difference along the bottom. Varying the forcing parameter,however, we can find such a value where the difference to the melting temperature becomesminimal. The absolute value of this temperature residual is proportional to the deflection fromthe flat solidification interface. Thus, the specific inverse task turns out to be simpler than thegeneral direct problem due to the fixed geometry of the target conditions.
The flow problem was solved numerically by a spectral code including the natural convectiondue to buoyancy. The heat flux boundary conditions were evaluated from the solution of theglobal model. The main parameters of this system are the magnetic Taylor number
242eff 2/)2/H(BTa ηωσρ= and the aspect ratio H/R of the molten zone, where ω is the
magnetic field frequency, and σ, ρ, η are the electrical conductivity, density, and dynamicviscosity of the melt, respectively. H is the height and R the radius of the melt. In each growththe field strength was increased during the course of the growth in order to compensate theinfluence of the decreasing melt height on the flow.
4. Results and discussion
The RMF causes primarily an azimuthal rotation of the melt. This primary motion isaccompanied by a secondary, radial-meridional melt flow due to the no-slip condition on thesolid boundaries of the liquid. This motion is directed radially inwards at the solid-liquidphase boundary. Figure 2 shows this RMF driven flow and its influence on the resultingtemperature distribution.An optimal forcing of the melt flow with respect to the flattening of the phase boundary wasfound for a Taylor number of Ta ≈ 105. Fig. 3 shows that the RMF driven flow reduces theresidual temperature, i.e., the front deflection considerably. It is interesting to observe that theresulting geometry of the phase boundary is no more the same curvature along the radius butobeys a w-type geometry.
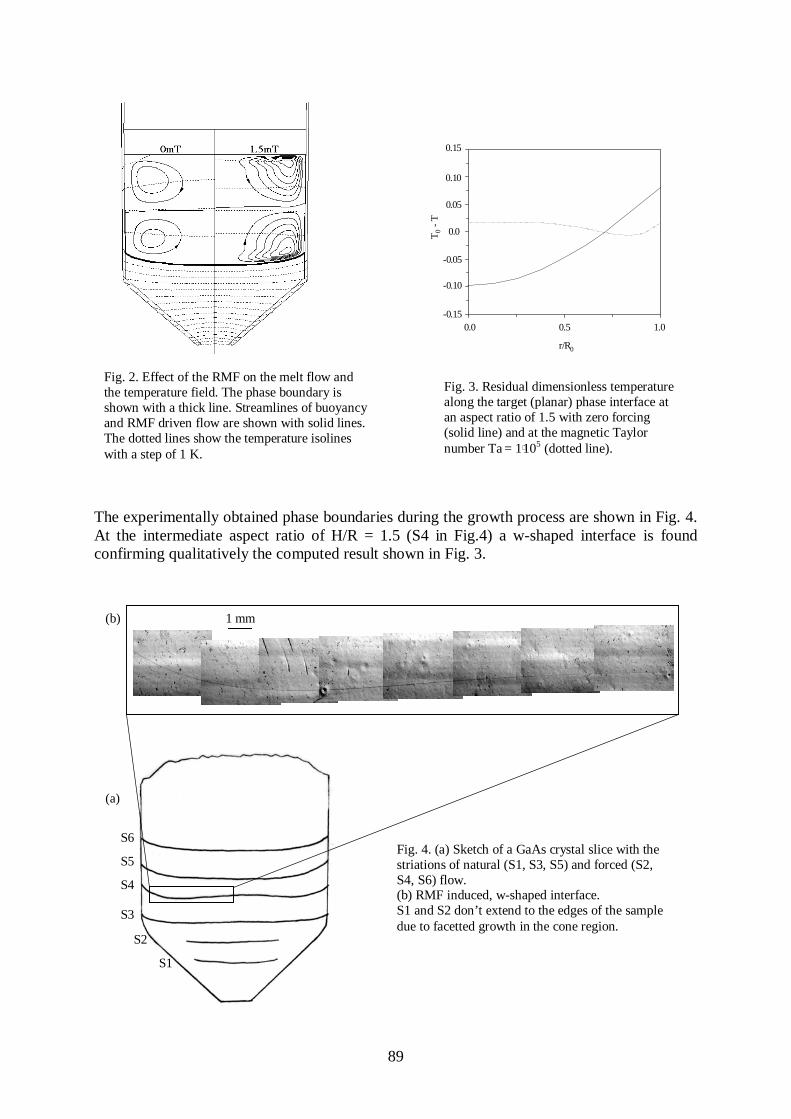
89
0.0 1.00.5
r/R0
T0
- T
-0.15
-0.10
-0.05
0.0
0.05
0.10
0.15
The experimentally obtained phase boundaries during the growth process are shown in Fig. 4.At the intermediate aspect ratio of H/R = 1.5 (S4 in Fig.4) a w-shaped interface is foundconfirming qualitatively the computed result shown in Fig. 3.
The striations in the upper part of the cylinder (S5/S6 in Fig. 4) show a monotonously concave bending. The
(a)
S1
S2
S3
S4
S5
S6
(b) 1 mm
Fig. 4. (a) Sketch of a GaAs crystal slice with thestriations of natural (S1, S3, S5) and forced (S2,S4, S6) flow.(b) RMF induced, w-shaped interface.S1 and S2 don’t extend to the edges of the sampledue to facetted growth in the cone region.
Fig. 3. Residual dimensionless temperaturealong the target (planar) phase interface atan aspect ratio of 1.5 with zero forcing(solid line) and at the magnetic Taylornumber Ta = 1⋅105 (dotted line).
Fig. 2. Effect of the RMF on the melt flow andthe temperature field. The phase boundary isshown with a thick line. Streamlines of buoyancyand RMF driven flow are shown with solid lines.The dotted lines show the temperature isolineswith a step of 1 K.
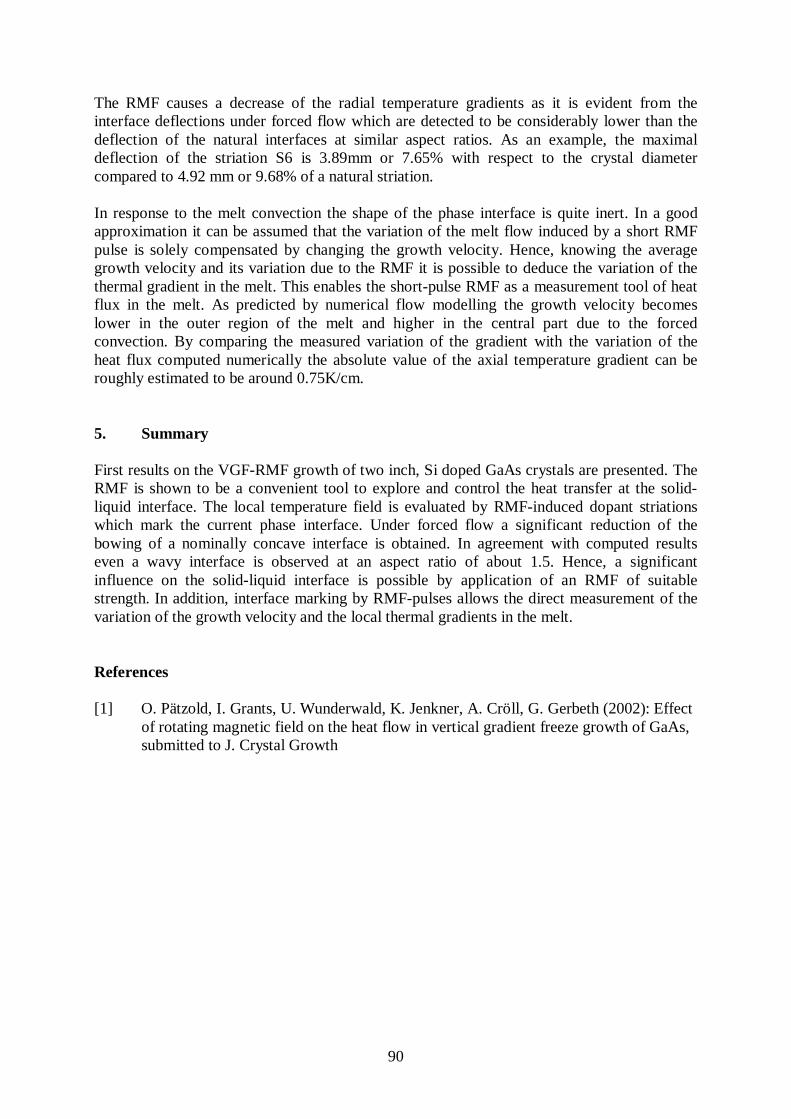
90
The RMF causes a decrease of the radial temperature gradients as it is evident from theinterface deflections under forced flow which are detected to be considerably lower than thedeflection of the natural interfaces at similar aspect ratios. As an example, the maximaldeflection of the striation S6 is 3.89mm or 7.65% with respect to the crystal diametercompared to 4.92 mm or 9.68% of a natural striation.
In response to the melt convection the shape of the phase interface is quite inert. In a goodapproximation it can be assumed that the variation of the melt flow induced by a short RMFpulse is solely compensated by changing the growth velocity. Hence, knowing the averagegrowth velocity and its variation due to the RMF it is possible to deduce the variation of thethermal gradient in the melt. This enables the short-pulse RMF as a measurement tool of heatflux in the melt. As predicted by numerical flow modelling the growth velocity becomeslower in the outer region of the melt and higher in the central part due to the forcedconvection. By comparing the measured variation of the gradient with the variation of theheat flux computed numerically the absolute value of the axial temperature gradient can beroughly estimated to be around 0.75K/cm.
5. Summary
First results on the VGF-RMF growth of two inch, Si doped GaAs crystals are presented. TheRMF is shown to be a convenient tool to explore and control the heat transfer at the solid-liquid interface. The local temperature field is evaluated by RMF-induced dopant striationswhich mark the current phase interface. Under forced flow a significant reduction of thebowing of a nominally concave interface is obtained. In agreement with computed resultseven a wavy interface is observed at an aspect ratio of about 1.5. Hence, a significantinfluence on the solid-liquid interface is possible by application of an RMF of suitablestrength. In addition, interface marking by RMF-pulses allows the direct measurement of thevariation of the growth velocity and the local thermal gradients in the melt.
References
[1] O. Pätzold, I. Grants, U. Wunderwald, K. Jenkner, A. Cröll, G. Gerbeth (2002): Effectof rotating magnetic field on the heat flow in vertical gradient freeze growth of GaAs,submitted to J. Crystal Growth
91
UPGRADE OF THE GAS DYNAMIC TRAP:PHYSICAL CONCEPT AND NUMERICAL MODELS
Andrey V. Anikeev1, Petr A. Bagryansky1, Alexander A. Ivanov1,Alexander N. Karpushov1, Klaus Noack and Svetlana L. Strogalova1
1. Introduction
The Budker Institute of Nuclear Physics Novosibirsk develops a project of an intense 14 MeVneutron source (NS) based on a gas dynamic trap (GDT) which is mainly intended for fusionmaterial irradiation. Its actual disadvantage is the lack of data for the parameter range of theprojected GDT-NS which does not yet allow a reliable interpolation from the parameters of theexisting GDT experimental facility to the neutron source. At present, experimental and com-putational researches are carried out to complete the required data base.
So far, rather promising results have been achieved concerning the main plasma-physical issueslike MHD stability, longitudinal confinement, cross-field transport and the fast ion behaviour[1,2]. For the investigations in the latter field the Integrated Transport Code System (ITCS)has been used [3,4]. These investigations must be extended to a higher level of plasma pa-rameters. To this end a substantial upgrade of the GDT facility is planned. The main subsys-tems which are to be upgraded are the neutral beam injection (NBI) system and the magneticfield power supply. The higher power and the longer duration of the injection will provide asubstantially higher energy content of the fast ions and, consequently, will increase the electrontemperature.
In recent years several transport codes have been developed and applied for computationalstudies in parallel to the experimental research. They have been coupled by appropriate datafile transfers to the ITCS. The report is focused on the application of the code system to studypossible operation regimes of the upgraded GDT. The results of numerical simulations enableus to conclude that an electron temperature of 250-300 eV can be achieved in the GDT-Upgrade with a NBI of 10 MW and a duration of 3-6 ms. The maximum fast ion density in theregion of their turning points is estimated at ~5x1013 cm-3.
2. Physical Concept of GDT-Upgrade
The two-component hydrogen plasma consists of a warm target plasma and a fast ion popula-tion which is produced by a high-energetic NBI. The target plasma is composed of electronsand low-energetic ions both with isotropic Maxwellian distributions because their behaviour iscollision dominated. The electron temperature during a shot lies between 3-120 eV and theplasma density is in the range of (1-20)×1013 cm-3. The target plasma is produced by a plasmagun and/or by gas puffing. Different methods of cold-gas fuelling have been proposed and wereexperimentally tested at the GDT [5]. The NBI consists of six injectors with injection energiesin the range of 12.5-17.5 keV. The duration of the NBI pulse is 1.0-1.2 ms, the total injectedpower exceeds 4 MW. The neutral beams are partly trapped by the target plasma as results ofcharge-exchange and ionisation processes by target plasma ions and electrons. The ionised partof the neutral beams represents the source of the fast ions. The energy relaxation of the fast
1 Budker Institute of Nuclear Physics, Novosibirsk, Russia
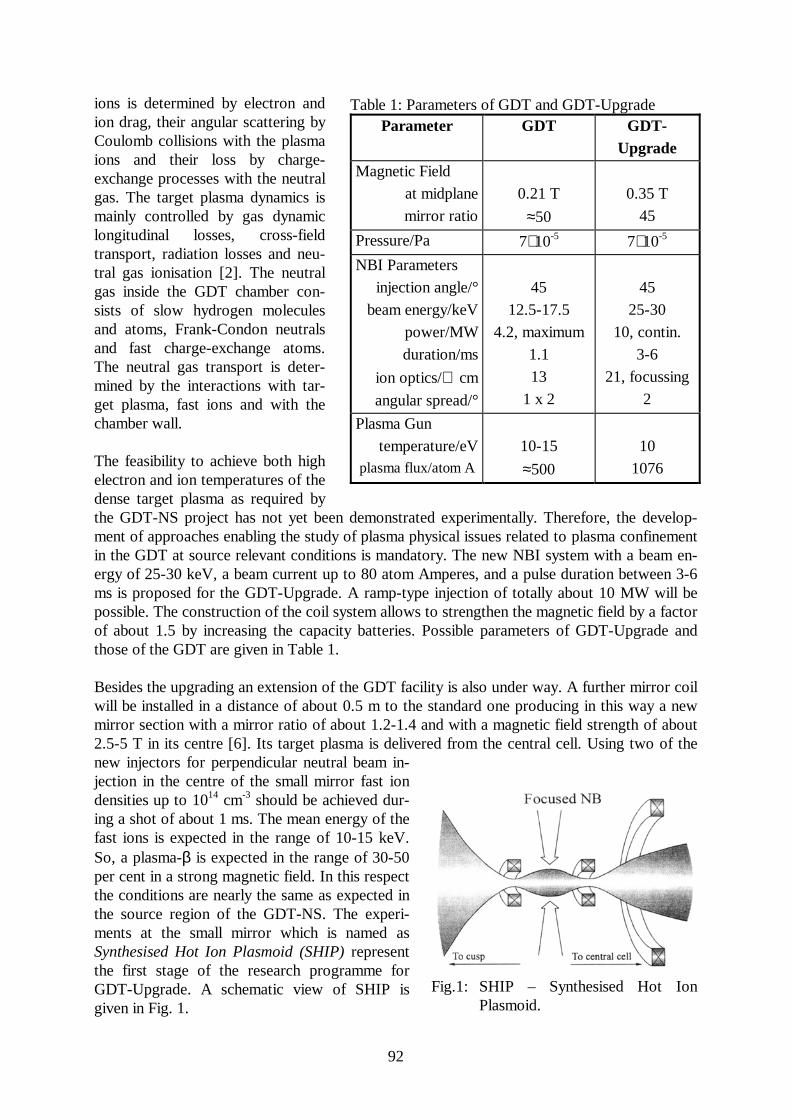
92
ions is determined by electron andion drag, their angular scattering byCoulomb collisions with the plasmaions and their loss by charge-exchange processes with the neutralgas. The target plasma dynamics ismainly controlled by gas dynamiclongitudinal losses, cross-fieldtransport, radiation losses and neu-tral gas ionisation [2]. The neutralgas inside the GDT chamber con-sists of slow hydrogen moleculesand atoms, Frank-Condon neutralsand fast charge-exchange atoms.The neutral gas transport is deter-mined by the interactions with tar-get plasma, fast ions and with thechamber wall.
The feasibility to achieve both highelectron and ion temperatures of thedense target plasma as required bythe GDT-NS project has not yet been demonstrated experimentally. Therefore, the develop-ment of approaches enabling the study of plasma physical issues related to plasma confinementin the GDT at source relevant conditions is mandatory. The new NBI system with a beam en-ergy of 25-30 keV, a beam current up to 80 atom Amperes, and a pulse duration between 3-6ms is proposed for the GDT-Upgrade. A ramp-type injection of totally about 10 MW will bepossible. The construction of the coil system allows to strengthen the magnetic field by a factorof about 1.5 by increasing the capacity batteries. Possible parameters of GDT-Upgrade andthose of the GDT are given in Table 1.
Besides the upgrading an extension of the GDT facility is also under way. A further mirror coilwill be installed in a distance of about 0.5 m to the standard one producing in this way a newmirror section with a mirror ratio of about 1.2-1.4 and with a magnetic field strength of about2.5-5 T in its centre [6]. Its target plasma is delivered from the central cell. Using two of thenew injectors for perpendicular neutral beam in-jection in the centre of the small mirror fast iondensities up to 1014 cm-3 should be achieved dur-ing a shot of about 1 ms. The mean energy of thefast ions is expected in the range of 10-15 keV.So, a plasma-β is expected in the range of 30-50per cent in a strong magnetic field. In this respectthe conditions are nearly the same as expected inthe source region of the GDT-NS. The experi-ments at the small mirror which is named asSynthesised Hot Ion Plasmoid (SHIP) representthe first stage of the research programme forGDT-Upgrade. A schematic view of SHIP isgiven in Fig. 1.
Table 1: Parameters of GDT and GDT-UpgradeParameter GDT GDT-
UpgradeMagnetic Field
at midplane
mirror ratio
0.21 T
≈50
0.35 T
45
Pressure/Pa 7∗ 10-5 7∗ 10-5
NBI Parameters
injection angle/°
beam energy/keV
power/MW
duration/ms
ion optics/∅ cm
angular spread/°
45
12.5-17.5
4.2, maximum
1.1
13
1 x 2
45
25-30
10, contin.
3-6
21, focussing
2
Plasma Gun
temperature/eV plasma flux/atom A
10-15
≈500
10
1076
Fig.1: SHIP – Synthesised Hot IonPlasmoid.
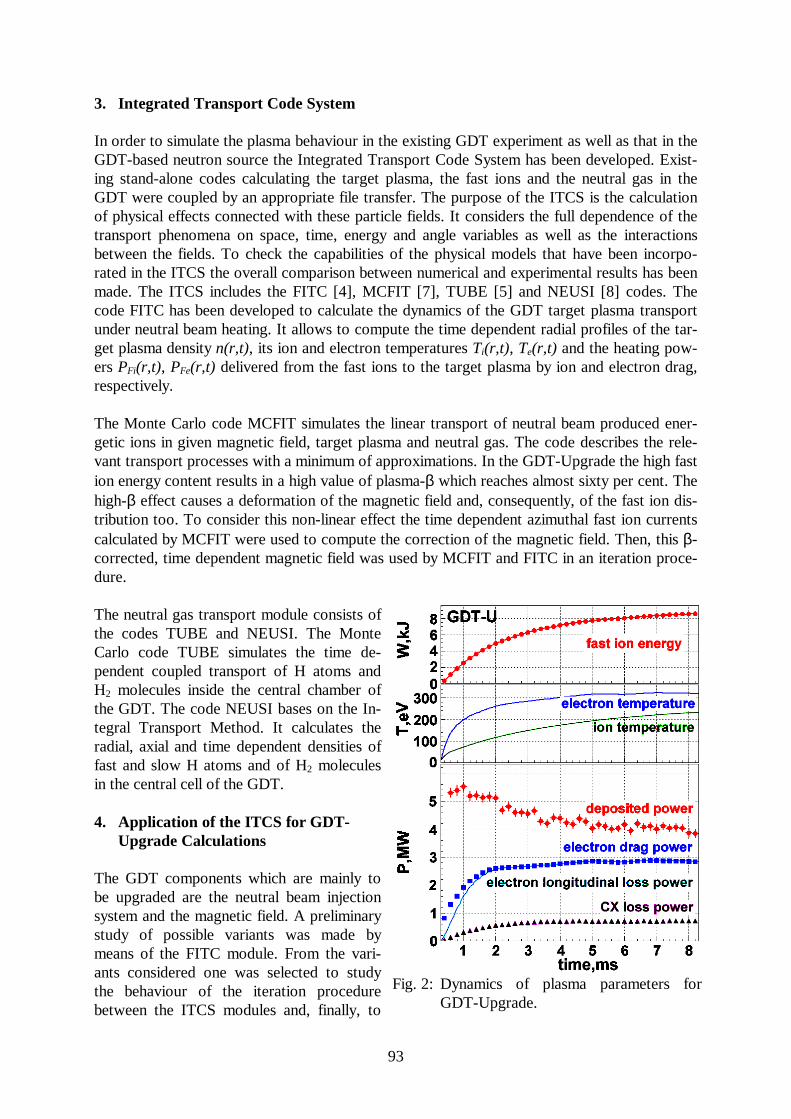
93
3. Integrated Transport Code System
In order to simulate the plasma behaviour in the existing GDT experiment as well as that in theGDT-based neutron source the Integrated Transport Code System has been developed. Exist-ing stand-alone codes calculating the target plasma, the fast ions and the neutral gas in theGDT were coupled by an appropriate file transfer. The purpose of the ITCS is the calculationof physical effects connected with these particle fields. It considers the full dependence of thetransport phenomena on space, time, energy and angle variables as well as the interactionsbetween the fields. To check the capabilities of the physical models that have been incorpo-rated in the ITCS the overall comparison between numerical and experimental results has beenmade. The ITCS includes the FITC [4], MCFIT [7], TUBE [5] and NEUSI [8] codes. Thecode FITC has been developed to calculate the dynamics of the GDT target plasma transportunder neutral beam heating. It allows to compute the time dependent radial profiles of the tar-get plasma density n(r,t), its ion and electron temperatures Ti(r,t), Te(r,t) and the heating pow-ers PFi(r,t), PFe(r,t) delivered from the fast ions to the target plasma by ion and electron drag,respectively.
The Monte Carlo code MCFIT simulates the linear transport of neutral beam produced ener-getic ions in given magnetic field, target plasma and neutral gas. The code describes the rele-vant transport processes with a minimum of approximations. In the GDT-Upgrade the high fastion energy content results in a high value of plasma-β which reaches almost sixty per cent. Thehigh-β effect causes a deformation of the magnetic field and, consequently, of the fast ion dis-tribution too. To consider this non-linear effect the time dependent azimuthal fast ion currentscalculated by MCFIT were used to compute the correction of the magnetic field. Then, this β-corrected, time dependent magnetic field was used by MCFIT and FITC in an iteration proce-dure.
The neutral gas transport module consists ofthe codes TUBE and NEUSI. The MonteCarlo code TUBE simulates the time de-pendent coupled transport of H atoms andH2 molecules inside the central chamber ofthe GDT. The code NEUSI bases on the In-tegral Transport Method. It calculates theradial, axial and time dependent densities offast and slow H atoms and of H2 moleculesin the central cell of the GDT.
4. Application of the ITCS for GDT-Upgrade Calculations
The GDT components which are mainly tobe upgraded are the neutral beam injectionsystem and the magnetic field. A preliminarystudy of possible variants was made bymeans of the FITC module. From the vari-ants considered one was selected to studythe behaviour of the iteration procedurebetween the ITCS modules and, finally, to
Fig. 2: Dynamics of plasma parameters forGDT-Upgrade.
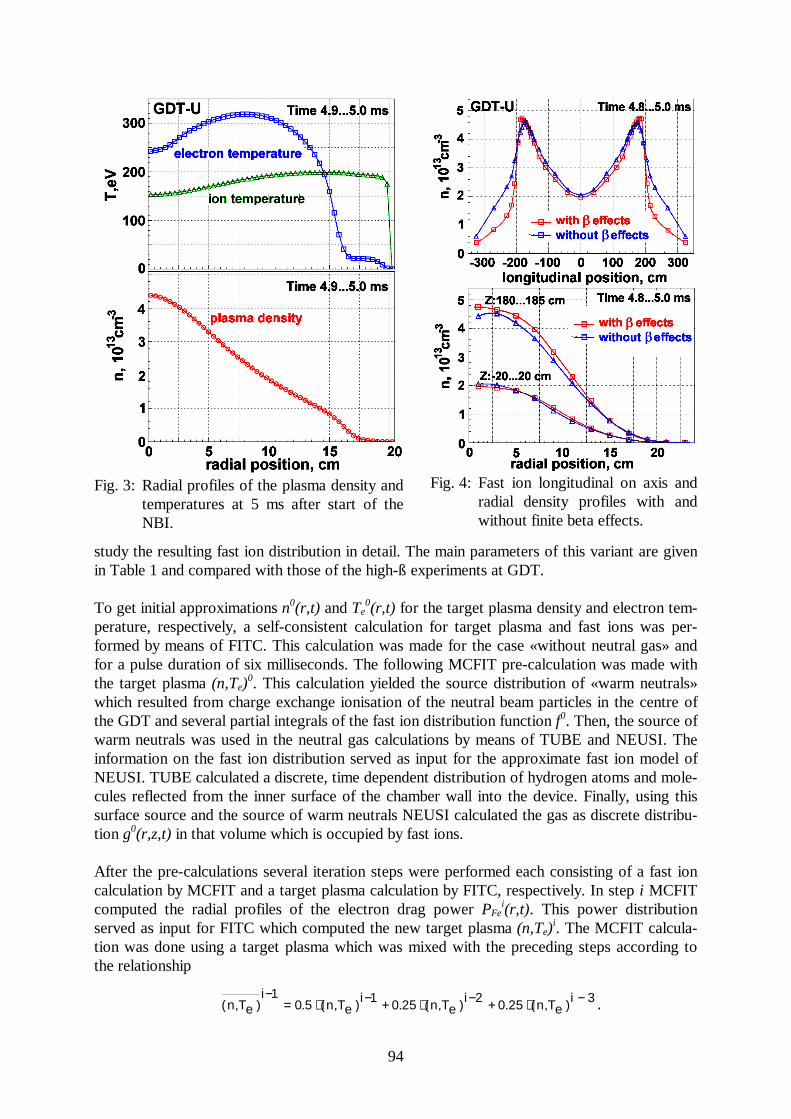
94
study the resulting fast ion distribution in detail. The main parameters of this variant are givenin Table 1 and compared with those of the high-ß experiments at GDT.
To get initial approximations n0(r,t) and Te0(r,t) for the target plasma density and electron tem-
perature, respectively, a self-consistent calculation for target plasma and fast ions was per-formed by means of FITC. This calculation was made for the case «without neutral gas» andfor a pulse duration of six milliseconds. The following MCFIT pre-calculation was made withthe target plasma (n,Te)
0. This calculation yielded the source distribution of «warm neutrals»which resulted from charge exchange ionisation of the neutral beam particles in the centre ofthe GDT and several partial integrals of the fast ion distribution function f0. Then, the source ofwarm neutrals was used in the neutral gas calculations by means of TUBE and NEUSI. Theinformation on the fast ion distribution served as input for the approximate fast ion model ofNEUSI. TUBE calculated a discrete, time dependent distribution of hydrogen atoms and mole-cules reflected from the inner surface of the chamber wall into the device. Finally, using thissurface source and the source of warm neutrals NEUSI calculated the gas as discrete distribu-tion g0(r,z,t) in that volume which is occupied by fast ions.
After the pre-calculations several iteration steps were performed each consisting of a fast ioncalculation by MCFIT and a target plasma calculation by FITC, respectively. In step i MCFITcomputed the radial profiles of the electron drag power PFe
i(r,t). This power distributionserved as input for FITC which computed the new target plasma (n,Te)
i. The MCFIT calcula-tion was done using a target plasma which was mixed with the preceding steps according tothe relationship
Fig. 3: Radial profiles of the plasma density andtemperatures at 5 ms after start of theNBI.
Fig. 4: Fast ion longitudinal on axis andradial density profiles with andwithout finite beta effects.
.3i)eT,n(25.02i)eT,n(25.01i)eT,n(5.01i
)eT,n( −⋅+−⋅+−⋅=−
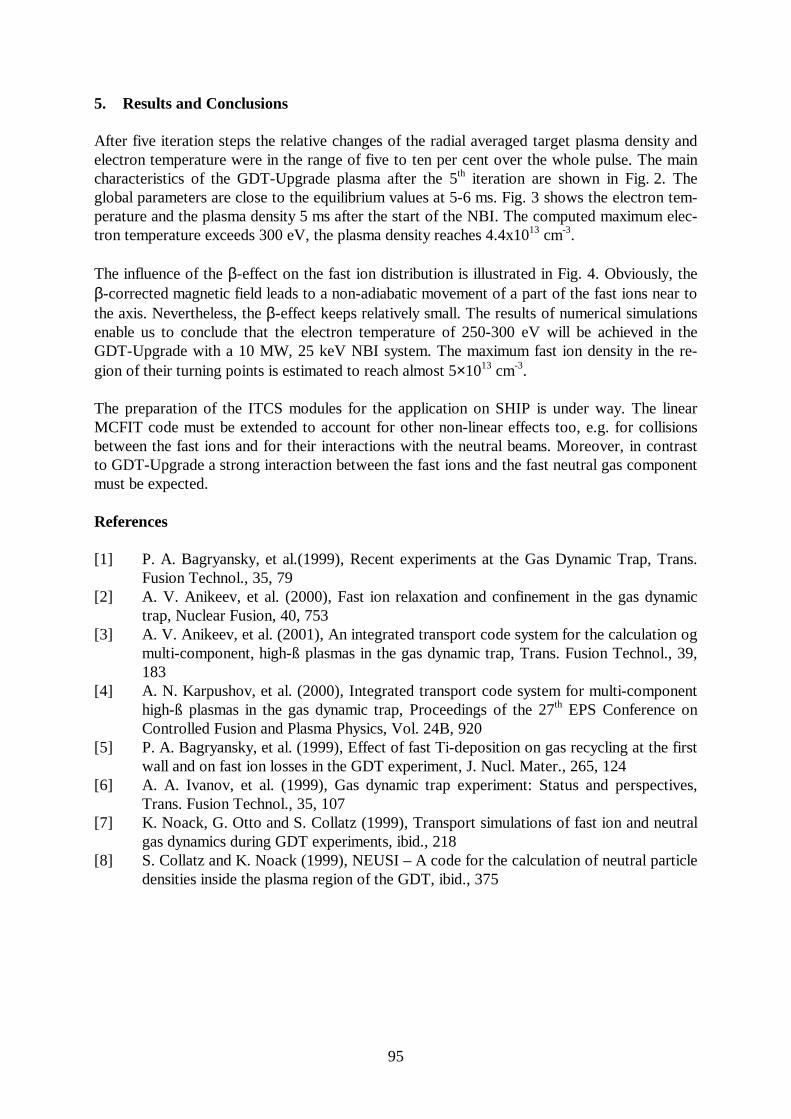
95
5. Results and Conclusions
After five iteration steps the relative changes of the radial averaged target plasma density andelectron temperature were in the range of five to ten per cent over the whole pulse. The maincharacteristics of the GDT-Upgrade plasma after the 5th iteration are shown in Fig. 2. Theglobal parameters are close to the equilibrium values at 5-6 ms. Fig. 3 shows the electron tem-perature and the plasma density 5 ms after the start of the NBI. The computed maximum elec-tron temperature exceeds 300 eV, the plasma density reaches 4.4x1013 cm-3.
The influence of the β-effect on the fast ion distribution is illustrated in Fig. 4. Obviously, theβ-corrected magnetic field leads to a non-adiabatic movement of a part of the fast ions near tothe axis. Nevertheless, the β-effect keeps relatively small. The results of numerical simulationsenable us to conclude that the electron temperature of 250-300 eV will be achieved in theGDT-Upgrade with a 10 MW, 25 keV NBI system. The maximum fast ion density in the re-gion of their turning points is estimated to reach almost 5×1013 cm-3.
The preparation of the ITCS modules for the application on SHIP is under way. The linearMCFIT code must be extended to account for other non-linear effects too, e.g. for collisionsbetween the fast ions and for their interactions with the neutral beams. Moreover, in contrastto GDT-Upgrade a strong interaction between the fast ions and the fast neutral gas componentmust be expected.
References
[1] P. A. Bagryansky, et al.(1999), Recent experiments at the Gas Dynamic Trap, Trans.Fusion Technol., 35, 79
[2] A. V. Anikeev, et al. (2000), Fast ion relaxation and confinement in the gas dynamictrap, Nuclear Fusion, 40, 753
[3] A. V. Anikeev, et al. (2001), An integrated transport code system for the calculation ogmulti-component, high-ß plasmas in the gas dynamic trap, Trans. Fusion Technol., 39,183
[4] A. N. Karpushov, et al. (2000), Integrated transport code system for multi-componenthigh-ß plasmas in the gas dynamic trap, Proceedings of the 27th EPS Conference onControlled Fusion and Plasma Physics, Vol. 24B, 920
[5] P. A. Bagryansky, et al. (1999), Effect of fast Ti-deposition on gas recycling at the firstwall and on fast ion losses in the GDT experiment, J. Nucl. Mater., 265, 124
[6] A. A. Ivanov, et al. (1999), Gas dynamic trap experiment: Status and perspectives,Trans. Fusion Technol., 35, 107
[7] K. Noack, G. Otto and S. Collatz (1999), Transport simulations of fast ion and neutralgas dynamics during GDT experiments, ibid., 218
[8] S. Collatz and K. Noack (1999), NEUSI – A code for the calculation of neutral particledensities inside the plasma region of the GDT, ibid., 375

96

97
Summaries of research activities

98
99
Thermo-fluiddynamics
M. BeyerH. CarlH.-M. PrasserU. RindelhardtH. RußigA. SchaffrathP. SchützM. TammeS. WeicheltW. Zimmermann
Thermo hydraulic test facility TOPFLOWTOPFLOW is a large-scale high-temperature and high-pressure testfacility for generic research in the field of transient two-phase flow andfor studies of safety relevant fluid-dynamic problems in components ofnuclear power plants and chemical installations. The design project ofthe facility is completed. The new facility will be built usingcomponents of the former NOKO test facility of the Research CentreJülich, which helped to reduce costs to 9 - 10 million DM. Theparameters allow experiments with steam-water mixture at saturationpressures of up to 10 MPa. The facility disposes of an electrical heatingpower of 4 MW. The construction work of the building is completed,major parts of the equipment are installed. The commissioning isexpected for the second half of 2002.
A. BöttgerG. GrunwaldT. HöhneS. KliemH.-M. PrasserK.-H. Richter U. RohdeM. TammeJ. Zschau
Supported byBMWi and VGB
Coolant mixing in pressurised water reactorsThe work aims at the measurement of temperature and boronconcentration distributions at the core entrance during main steam-linebreak and boron dilution transients. Experiments were carried out at themixing test facility ROCOM modelling the German KONVOI typepressurised water reactor in the scale of 1:5. The disturbance is modelledby injecting salt water as a tracer into the affected loop. A new quality oftests is achieved by using wire mesh-sensors with about 1000 measuringpositions in the downcomer and at the core entrance, the high measuringfrequency (up to 200 Hz), the variability of the four-loop test facility andthe direct comparison to CFD calculations. In the reported periodexperiments on the mixing of ECC water injected into the cold leg wereperformed. For creating the characteristic density difference betweencoolant inventory and ECC water, sugar (glucose) was added to theinjected plug. The results show different flow and mixing patterns forlarge and small Froude numbers. A flow chart with critical boundariesbetween momentum driven and gravity driven flow as a function of theFroude number was obtained. The results are relevant for theunderstanding of the pre-stressed thermal shock (PTS) phenomenon aswell as for the coupling between neutron kinetics and thermo hydrauliccodes.
A. BöttgerJ. FietzH. FutterschneiderD. HoppeH.-M. PrasserJ. ZschauC. ZippeW. Zippe
Development and calibration of two-phase flow measurementtechniquesThe qualification of the diversified level indication system for boilingwater reactors developed by FZR was continued according to theGerman reactor safety regulations. The qualification procedure and theseries production will be accomplished by an industrial supplier ofreactor instrumentation. FZR contributes as a scientific consultant andperformed finalising development tasks.The first electrode-mesh sensor for high temperature and pressure wassuccessfully tested during condensation experiments carried out in co-
100
Supported by DFG
operation with the University of Applied Sciences Zittau/Görlitz. Theconstruction is based on a complicated sensor body with hidden coolingchannels and blind holes for the fixing of the electrodes. It wasmanufactured by laser sintering, which is a computer-controlled rapid-prototyping technique.For the calibration of two-phase instrumentation as well as for thecontactless measuring of phase and concentration distributions with ahigh resolution in space and time, a pulsed X-ray tomograph was builtand put into operation. The multi-purpose device is located in a leadtunnel. It consists of a source with a maximum acceleration voltage of150 kV, a pulse length of 0.3 ms and a pulse current of about 300-500mA.For the investigation of transport processes in bubble columns and foamlayers, a PET detector is under construction. The scanner will allow tomeasure the distribution of a tracer marked by a positron emittingnuclide with a time resolution of better than 1 s. It consists of 8 axiallayers with 16 BGO detectors each. The spatial resolution will be in therange of a centimetre. The mechanical construction of the detectorarrays and the development of the signal acquisition circuitry wasfinished.
A. Grahn Thermoconvection and instabilities at the boundary layer of twonon-miscible liquid reacting componentsAfter completion of the experiments the work was concentrated onmodelling. The developed 2D CFD code for the numerical investigationof the flow instabilities was extended by a model for the chemicalreactions in the liquid bulks of the two reacting non-misciblecomponents distant from the interphase boundary. Previously, thetheoretical model only allowed chemical reactions at the contactboundary. In this way, the accuracy of the model was increased. This isespecially important, if the reaction goes slower than the mass transfer.
D. BaldaufD. LucasE. KrepperH.-M. PrasserC. ZippeW. Zippe
Transient two-phase flows in pipelinesIn the frame of a project sponsored by BMWi flow patterns and theirevolution in a vertical tube are investigated. In the last year, theexperiments on flow pattern evolution along the vertical pipe of 51.2mm inner diameter were repeated with improved instrumentation. Thewire-mesh sensor with 1200 frames per second and 16 x 16 measuringpoints was replaced by a second generation device consisting of twosensors with 24 x 24 points, mounted in a short distance above eachother. The measuring frequency was increased to 2500 frames persecond. The data base for model development was significantlyextended in this way. An important new quality is given by thepossibility to measure the gas phase velocity distribution over the crosssection. Based on this data modelling efforts were continued to describethe evolution of bubble size specific radial gas fraction profiles.Local void probes with integrated micro-thermocouple were used in atransient condensation experiment performed in co-operation with theUniversity of Applied Sciences Zittau/Görlitz. A slightly inclinedhorizontal heat exchanger pipe of the emergency condenser for BWRs
101
Supported byBMWiCo-operation withUniversity ofApplied SciencesZittau/Görlitz
(NOKO) was placed in a cooling basin and connected to a pressurevessel. The pipe was either evacuated or filled with a non-condensiblegas (air) at a given pressure. The probes recorded the process ofcondensation after the steam injection from the pressure vessel into theexperimental pipe. They show the fill-up of the pipe with condensateand the replacement of the non-condensible gas. For this purpose theconductivity and temperature signals of the new type of probes arecorrelated.
Safety and effectiveness of chemical processes
G. HesselH. KrykW. SchmittT. SeilerF.-P. Weiß
Supported byBMBF
Environmentally safe process control and condition monitoring inchemical plants using neural networksIn this interdisciplinary project, the Fraunhofer Institute forEnvironmental, Safety, and Energy Technology UMSICHT, the DegussaAG Radebeul, and the Institute of Safety Research of Forschungs-zentrum Rossendorf have collaborated since August 1998. The projectaims at the development of neural networks for the diagnostics ofdiscontinuous chemical processes and their test application in aproduction plant. It is the goal to achieve an early detection of deviationsfrom the optimum, environmentally safe operation of a chemical plant.In the framework of the project, an online-monitoring system wasdeveloped for hydrogenation reactors working in semi-batch mode. Thesystem was integrated in a Batch Information Management System,which was implemented in the process control system of an industrialmulti-purpose reactor. The on-line capability of the new system wasdemonstrated in a series of 15 batches.
G. HesselH. KrykW. SchmittN. TeferaF.-P. WeißT. Willms
Supported byindustry
Experiments and numerical simulations of exothermic chemicalreactionsThe detailed knowledge of the reaction kinetics including intermediateproducts and side reactions with an accuracy as good as possible is abasis for a safe and environmentally compatible process control. Thework is concentrated at the hydrogenation of nitro-aromatic compounds.The reaction calorimeter was equipped with a high-accuracy reactionheat measurement based on a heat carrier temperature measurement atthe inlet and the outlet of the heating jacket. A Fourier-TransformInfrared Spectrometer (FTIR) was applied for in-situ and on-lineconcentration measurements inside the calorimeter. An HighPerformance Liquid Chromatograph (HPLC) unit was used for thecalibration of the FTIR. A simplified HPLC analysis method wasdeveloped and transferred to the industrial partner.
102
Accident Analysis
U. GrundmannS. KliemS. MittagU. Rohde
Supported byBMWi
Development, Validation and Application of the Code ComplexDYN3D – ATHLETNew macroscopic cross section libraries generated by the 2D neutrontransport codes HELIOS and CASMO for a standard loading of aGerman reference PWR have been connected to DYN3D. Burn-upcalculations from the beginning to the end of a typical loading cyclewere carried out. Control rod efficiencies and reactivity coefficientswere determined to obtain reactor-physical initial conditions fortransient analyses.The validation of the coupled code DYN3D/ATHLET for BWRapplications is carried out by means of an OECD/NRC Benchmarkcomprising a turbine trip transient at the reactor Peach Bottom 2. In thesecond phase of the benchmark, three-dimensional core simulation forgiven thermal-hydraulic boundary conditions had to be performed. TheDYN3D results for steady-state reactor physical parameters (eigenvalue,power distribution) and for the power peak initiated by pressure increasedue to the turbine valve closing show good agreement with the results ofthe other codes and measurement data.The semi-analytical perturbation re-construction model (SAPR) for thedescription of the coolant mixing inside the reactor pressure vesselduring pump start-up was implemented into DYN3D. The code complexSAPR-DYN3D was used to perform generic boron dilution analyseswith realistic description of coolant mixing. First, the minimum volumeof a slug of deborated water was determined, which can cause re-criticality of the scrammed reactor. Further, the analysis of a borondilution scenario with a maximum slug volume of 36 m³ with a pumpstart-up after steam generator tube break was performed. The borondilution in the reactor core causes a super prompt critical reactivityinsertion leading to a very short power pulse with a magnitude of morethan 7000 MW. The power peak is limited due to the strong Dopplerfeedback of the fuel temperature. The radial power distribution over thereactor core is very heterogeneous. At the location of the powermaximum, coolant boiling with a maximum void fraction of up to 70 %occurs for a short time. However, no increase of fuel claddingtemperatures due to the occurrence of heat transfer crisis was obtainedand no safety relevant limitations are violated.
E. KrepperM. Kliem
Computational fluid dynamics simulations of one and two-phaseflowTo identify weak points of actual CFD-codes, international benchmarkproblems have been solved. Calculations were performed and comparedwith experiments to investigate natural convection in a cube with heatedand cold wall at different orientation and for different RayleighNumbers. Further calculations were performed experiments at theNOKO test facility modelling an emergency condenser of a BWR powerplant, and for side wall heated tanks. Modelling the sub-cooled boiling
103
Partially funded byBMWi
near the heated walls, the flow phenomena in the heated tank have beensimulated in qualitatively good agreement with the experiments. Theformation of sharp layers with different temperature has been observed,which break up suddenly if boiling becomes more intensive.An experimental set-up (CCEF) has been constructed to validate theporous body model for rod bundles with an-isotropic friction againstflow measurements. The set-up consists of a transparent test section(made from plexiglass), were an asymmetric water flow is induced (inletat the bottom and outlet on the side of the bundle). Velocity fields aremeasured by LDA, the results are compared with CFD calculations.
Materials and components safety
I. StephanB. BöhmerJ. Konheiser
Neutron dosimetryAfter dismantling of the last irradiation capsules from the irradiationexperiment Rheinsberg, all neutron detectors from the experiments RH 5to 8 were available and were evaluated by gamma spectroscopicmeasurements. The types of the used detectors permitted to investigatethe following reactions: Fe-54 (n, p) → Mn-54, Nb-93 (n, n) → Nb-93m,Nb-93 (n, ) → Nb-94, Co- 59 (n, ) → Co-60, Ag-107 (n, ) Ag-108m.The parameters of the neutron field (thermal and fast neutron fluences,dpa) were determined from the measured reaction rates using thespectrum adjustment programme COSA and were compared with theresults of the Monte Carlo neutron field calculation programmeTRAMO. In this way a detailed and highly reliable assessment of theneutron fluences was achieved and, thus, an essential condition wascreated for the evaluation of the neutron effects on the mechanicalproperties.
H.-W. ViehrigS. Schneider
Radioisotope laboratory for the machining of specimens formechanical testingThe licence procedure for the extension of the radioisotope laboratoryfor material testing is underway. It is planned to reconstitute specimensfrom broken half Charpy V-notch specimens in order to use theavailable irradiated material more intensively. The technique is alreadydeveloped for non-radioactive materials. It uses a stud arc welding set-up. Technology, operation conditions and handling were adapted to hotcell conditions. Therefore, new assemblies and auxiliaries weredesigned, built and successfully tested. The introduction of thereconstitution technique allows to execute an additional researchprogramme on the effect of annealing using the already tested specimensfrom the Rheinsberg irradiation programme.
H.-W. ViehrigJ. Böhmert
Toughness characterization based on the dynamic master curveapproachThe master curve approach allows to quantify the variation of fracturetoughness with the temperature in the lower ductile-to-brittle transition
104
temperature range. The approach was recently standardised in ASTMbut is only applicable for quasi-static loading conditions. The use of theinstrumented Charpy impact tests has been investigated deeply for themaster curve concept. A study was concerned with dynamic testing ofspecimens from different thickness layers of a thick rolling plate madefrom ASTM A 533 B cl. 1 reactor pressure vessel steel. In principle, thestudy proved the suitability of the master curve approach to describe thematerial behaviour in the lower transition region under dynamic loadingconditions. The dynamically measured reference temperature To isclearly higher than the quasi-static one, but there is a good correlationbetween both parameters. However, the fracture toughness valuesdetermined under dynamic loading do not strictly follow the course ofthe master curve. Instead, characteristic deviations were observed. Underdynamic loading conditions special attention has to be paid to censoringof the specimens and the limitation of the measuring capacity.Eventually, the reliable measurement of the J-integral was found to be aproblem at the onset of cleavage fracture using instrumented Charpyimpact tests.
G.MüllerJ. Böhmert
Co-operation withInstitut fürFestkörperphysikund Werkstoff-forschungSupported byBMWi
Effect of hydrogen on the toughness of reactor pressure vesselsThe influence of hydrogen on the Charpy V-notch impact toughness wasinvestigated as contribution to the BMWi project “Effect of hydrogen ontoughness of reactor pressure vessels”. Charpy standard specimens fromdifferent types or heats of reactor pressure vessel steel were pre-chargedby hydrogen up to saturation and tested with a Charpy impact tester. Thehydrogen charging condition was chosen in such way that the realcondition in the PWR coolant system was simulated. The dependence ofthe Charpy impact energy on the temperature was compared with thetemperature dependence of uncharged specimens from the same heat.Definitely, there are no systematic deviations between both materialconditions. Thus, an embrittlement effect due to hydrogen uptake israther improbable for unirradiated materials and under dynamic loading.Furthermore the results of irradiation experiments and of post-irradiationinvestigations of aged RPVs were analysed for a potential hydrogeneffect. Under the condition of a flowing coolant and, thus, a lowhydrogen activity no hydrogen-induced embrittlement can be observed.A stagnant coolant, however, can produce high hydrogen concentrationand strong embrittlement. Under this circumstance a synergisticinfluence of the hydrogen content on the radiation embrittlement andvice versa cannot be excluded.
J. BöhmertA. GokhmannA. Ulbricht
Modelling of neutron embrittlement mechanismsThe evolution of both the vacancy clusters and copper-rich precipitatesin a neutron-irradiated reactor pressure vessel steel was investigatedstarting at nucleation stage and ending in the coarsening stage. For this,characteristic VVER-type reactor conditions were considered. Vacancycluster evolution in the nucleation stage was analysed by on computersimulation. During the deterministic and coarsening stage elastic
105
Supported byBMWiCo-operation withthe RRC KurchatovInstitute and theSouth UkrainianPedagogicalUniversity Odessa
interaction between the iron matrix and vacancy clusters was taken intoaccount and provided the stability of the peak of the size distributionfunction with increasing neutron fluence. That was also observedexperimentally. Clusters dynamic approach was used to analyse theevolution of copper precipitates. Here, the size distribution function,mean radius, number density of copper precipitates, and theconcentration of free Cu atoms were calculated in dependence on theirradiation time.The results of the kinetic models were compared with SANSexperiments which were carried out with specimens irradiated atsurveillance positions of VVER reactors. There is sufficientcorrespondence between experiment and model. In case the evolution ofthe copper precipitates the correspondence is only sufficient if theevolution kinetics is assumed to be of intermediated type. This meansthat the kinetic is not only controlled by diffusion but also by interfacialprocesses.
H.-G. Willschüz,E. Altstadt
Supported byBMWiCo-operation withthe KTH Stockholm
In-vessel corium retention in LWRsConsidering the hypothetical core melt down scenario for a light waterreactor (LWR) the failure mode of the reactor pressure vessel (RPV) hasto be investigated to determine the possible loads on the containment.The FOREVER-experiments, currently underway at the KTH Stockholm(Sweden), are simulating the thermal and pressure loads on the lowerhead for a corium melt pool with internal heat sources. Due to the multi-axial creep deformation of the vessel with a non-uniform temperaturefield these experiments are an excellent source of data for the validationof numerical creep models. Therefore, a 2D Finite Element model hasbeen developed based on a commercial multi-purpose code ANSYS.Using the CFD module the temperature field within the vessel wall iscalculated.The transient structural mechanical calculations consider the visco-plastic material behaviour of the French pressure vessel steel 16MND5.The vessel failure prediction is based on a damage criterion which wasintegrated into the ANSYS code. The creeping and thereby the failure ofthe vessel sensitively depends on the temperature. Considering theFOREVER-EC2 experiment, a good prediction of the vessel failure timeand an accurate prediction of the failure location seems to be possible.For experiments with INCONEL 600 penetrations a 3D-model wasdeveloped and the according material and creep data basis has beengenerated.After analysing the calculations, it seems to be advantageous tointroduce a vessel support, which can unburden the vessel from a part ofthe mechanical load and, so, avoid the vessel failure or at least prolongthe time to failure. This can be a possible accident mitigation strategy.Additionally, it is possible to install an absolutely passive automaticcontrol device to initiate the flooding of the reactor pit to ensure externalvessel cooling in the event of a core melt down.
106
E. AltstadtH. CarlR. Weiss
Supported by EU
Water hammers in pipelinesWater hammers can occur in case of an inflow of sub-cooled water intopipes or other parts of the equipment, which are filled with steam orsteam-water mixture. They also may appear as the consequence of valveclosing or opening actions or of breaks in pipelines, with single phase ortwo-phase flow. In the latter case, shock waves in two-phase flow mustbe expected. In all cases, strong dynamic stresses are induced in the wallof the piping system.The influence of the fluid-structure interaction on the magnitude of theloads on pipe walls and support structures has not yet been completelyunderstood. In case of a dynamic load caused by a pressure wave, thestresses in pipe walls, especially in bends, are different from the staticcase. On the one hand the propagating pressure wave may causeadditional non-symmetric deformations that increase the equivalentstresses in comparison to the symmetric load created by a static internalpressure. On the other hand, fluid-structure interaction causes thestructure to deform, which leads to a decrease of the resulting stresses.The lack of experimental data obtained at well defined geometricboundary conditions is a significant obstacle for the validation of codeswhich consider fluid-structure interaction. Furthermore, up to now thefeedback from structural deformations to the fluid mechanics has notfully been implemented in existing codes. Therefore, at FZR a coldwater hammer test facility (CWHTF) was designed and built up in 2000.An experimental programme covering pressure amplitudes up to 106bars has been realised. The dependence of the maximum pressure on theresidual air, the bouncing velocity and on the valve opening time wasinvestigated.
M. WernerE. Altstadt
Finite Element-Modelling of crack propagationA 3-dimensional FE-Model of a Charpy specimen is used to simulate thecrack propagation. This model includes the kinematics of the rollbearings as well as the crack opening mechanism. The plastic materialbehaviour is considered. The crack propagation is controlled by a strainbased damage criterion which was integrated into the finite element codeANSYS. The numerical stability could be improved in this way.However, the crack length achieved till the failure of the specimen isunderestimated in case of very ductile materials.
Particle and radiation transport
B. BöhmerJ. Konheiser
Neutron and gamma dosimetry of reactor pressure vesselsThe EU TACIS project SRR2/95/Part2 "Development of AdvancedMethods for Evaluation of Irradiation Embrittlement of WWER-1000/230 Type RPV`s" was completed with several improvements ofneutron data and theoretical methods for the computation of reactorpressure vessel neutron load.
107
Supported byBMWi, EU
Neutron data libraries frequently used in reactor pressure vesseldosimetry were compared and tested using activation measurement datafrom the international ex-vessel inter-comparison experiment at theVVER-1000 Balakovo-3. Besides different data for neutron transportcalculations also different detector cross section data files wereinvestigated. At simple testing models the impact of frequently usedgroup approximations on neutron and photon fluence parameters wasstudied by comparison of DORT and MCNP calculation results. The fastneutron results relevant for pressure vessel embrittlement agreereasonably well for different libraries and calculation methods but theresults for low energy neutrons and photons as well as for deeppenetrations differ strongly in many cases.
B. BöhmerJ. KonheiserH. KumpfK. NoackI. Stephan
Supported by DFG
Increasing the accuracy of neutron and gamma fluencedeterminationThe TRAMO code was qualified to an improved treatment of thethermal neutron region and for coupled neutron-gamma transportproblems. Thermal neutron results for core and water zones of an one-dimensional reactor model were verified by comparison with MCNPresults using different thermal scattering models. Measurements ofneutron and gamma spectra were performed in cooperation with theTechnical University Dresden and the University of Applied SciencesZittau/Görlitz at the reactors AKR and ZLFR. Similar measurementswere accomplished at the exits of the horizontal experimental channelsof both reactors behind and inside different combinations of steel-, ironand water modules. To facilitate the absolute calibration of the reactorpower reaction rates of activation and fission detectors were measured inthe reactor cores. Calculations with the code MCNP based on a detailedmodel of the AKR core were used to provide calculated reaction ratesneeded for the AKR power calibration.
R. KüchlerK. NoackT. Zorn
Transport of radio-nuclides in the water unsaturated zoneThe verification of mathematical models of the dissolution of mineralsin the unsaturated zone is underway. For that batch and columnexperiments are carried out and modelled by means of numerical codes.Concerning the dissolution of gypsum it turned out, that the electrolyticconductivity and pH-value measured in the equilibrium state in the batchtest were in good agreement with numeric results. The solution leakingfrom the 1 m-column turned out to be saturated with gypsum. Thecalculated conductivity and the calcium and sulphate concentrations wellagree with the values measured in batch tests. Comparing the dissolutionof gypsum in batch and column experiments one can state that underunsaturated conditions only a very small part of the grain surface ischemically active. The model shows that the water saturation and theDarcy-velocity mainly determine the extent of this active surface part.
108
C. BeckertK. Noack
Supported by DFG
Photo-neutron source at ELBEAt the radiation source ELBE a photo-neutron source for time-of-flightexperiments is developed to measure neutron cross sections ofconstruction materials of fusion and fission reactors and of radioactivewaste. For the design calculations of this photo-neutron source theMonte Carlo code MCNP4C2 was used. The considered componentswere the beam line, the photo-neutron target and the beam dump insidethe neutron laboratory, and the collimator in the concrete wall. At first,electron, photon and neutron fluxes were calculated for lead andmercury targets. The results were compared with those obtained by thecode FLUKA, which is used at the Institute for Nuclear and HadronPhysics. The values for the electrons and photons showed a goodagreement, but the neutron spectra distinguished remarkably regardingthe form and the location of the maximum. The wide spreading of theelectron beam behind the target demands to install a beam dump as nearas possible to the target and to enlarge the front target surface. With acorresponding beam dump model and two different collimatorconfigurations calculations of the time dependent neutron flux weredone for the planned measuring position. The calculation results showfor the standard pulse frequency of 13 MHz, that not every electronpulse can be used for neutron production because of the relatively shortflight path from the source to the detector.
Liquid metal magnetohydrodynamics
G. GerbethS. EckertV. GalindoA. CramerW. Witke
Supported bySMWK, DFG,BMBF
Crystal Growth and MetallurgyFirst GaAs crystals have been grown at the new Vertical GradientFreeze facility of Bergakademie Freiberg. A rotating magnetic field(RMF) is applied there in order to control the heat transfer in the melt bya tailored flow structure. The RMF action on the melt flow wasespecially designed in order to obtain an almost flat phase boundaryduring the growth process. The experiments confirmed the numericalresults, in particular with respect to the occurrence of wavy-shapedsolid-liquid phase boundaries at intermediate aspect ratios of the moltenzone. In a good agreement between theory and experiment the RMFoffers a significant influence on the geometry of the phase boundary. Inaddition, short pulses of the RMF can be used to mark striation lines inthe grown crystal.The investigations for the metallic fibre production by melt extractionlead to the proposal of a crucible-free technology by feeding theinductor from above with a plate of the base material. The key point wasto find some solution that the highest temperature develops at the lowerplate end and not in the mid-plane of the inductor. This was solved by aspecial inductor design. For the fine-casting of aluminium calculationsand model experiments with a cold eutectic melt provide sufficientevidence that the filling velocity of the melt can be reduced by theapplication of an external steady magnetic field.
109
T. WeierG. MutschkeJ. HüllerU. FeyG. Gerbeth
Supported byBMBF-VDI
Boundary layer control in electrolytesIn order to continue the experimental programme on the electromagneticinfluence of lift- and drag coefficients a large NACA 0015 profile hasbeen equipped with surface covering electrodes and permanent magnets.Related flow measurements have been performed at HSVA Hamburg.They revealed the strong effect of the electromagnetic forces on the liftenhancement and allowed to extract the relevant scaling laws. Numericalsimulations confirm the found dependencies. The obtained influences onlift and drag values are of relevance for applications at ship componentslike stabilising foils or rudders. However, the energetic effort for thisflow control turned out to become high for velocities above 10m/s.Further studies are focused on the reduction of this energetic effort butkeeping the obtained flow effects.
S. EckertW. WitkeTh. GundrumJ. HüllerF. StefaniG. Gerbeth
Supported by EU,DFG
Measuring TechniquesThe ultrasonic Doppler velocimetry (UDV) provides a full profile of thevelocity field. Applications to liquid metals, however, are limited by themaximum temperature of about 150°C of the ultrasonic transducers.Therefore, ultrasonic wave-guides have been developed and tested inorder to overcome the temperature limitations. Successful test have beenperformed for flows of sodium and lead-bismuth up to temperatures of400°C. The integrated system of wave-guides, transducers and theDoppler system worked stable and robust. The wetting between thewave-guide and the melt turned out to be of crucial importance for thesystem.The idea of a magnetic tomografie, i.e. reconstruction of the flow fieldout of external magnetic field measurements, has been furtherdeveloped. The demonstration experiment was designed and built up. Itrequired a series of water pre-experiments in order to design a fullythree-dimensional flow structure.
F. StefaniTh. GundrumG. Gerbeth
Supported byDFG, EU
Dynamo EffectThere was not yet any new measuring campaign at the Riga dynamofacility. Nevertheless, the work in this field received a major impulse bygetting a European dynamo project funded from Brussels. Only thisenables us to intensify these activities in the future. The theoreticalanalysis of the available data provided a clear evidence for a non-trivialback-reaction of the magnetic field on the flow. Besides the overallbreaking of the flow rate due to the induced magnetic field, there is asignificant change of the velocity profile leading to the measureddifferences between the magnetic field distributions in the self-excitedand the saturated regimes. The available results of the Riga dynamohave been summarised as an invited review paper for the journal“Reviews of Modern Physics”.

110

111
Publications

112
113
Publications in scientific and technical journals and in conference proceedings, monographs
Altstadt, E.; Willschuetz, H.-G.Pre-test Calculations for a Core Meltdown Experiment19. CAD-FEM Users´ Meeting, 17.-19. Oktober 2001, Berlin, Potsdam, Germany,Proceedings Vol. 1, 1.6.9
Anikeev, A.; Karpushov, A.; Collatz, S.; Noack, K.; Otto, G.; Strogalova, S.An Integrated Transport Code System for the Calculation of Multi-Component, High-ßPlasmas in the Gas Dynamic Trap3rd International Conference on Open Magnetic Systems for Plasma Confinement, July 3-6,2000, Tsukuba, Japan; Proc. published in Transactions of Fusion Technology, Vol 39, p. 183(2001)
Anikeev, A. V.; Bagryansky, P. A.; Ivanov, A. A.; Karpushov, A. N.; Noack, K.; Strogalova,S. L.Upgrade of the Gas Dynamic Trap: Physical Concepts and Numerical Models28th EPS Conference on Plasma Physics and Controlled Fusion, Madeira, Portugal, 18-22June 2001, Proceedings, Poster P1.026
Beckert, C.TransRay - ein dreidimensionaler Zellcode auf der Grundlage der Ray-Tracing TechnikJahrestagung Kerntechnik 2001, Dresden, 15.-17. Mai 2001, Tagungsbericht S. 51-54
Beyer, M.; Carl, H.Unterstützung der ukrainischen Aufsichtsbehörde beim Aufbau einer modernen KKW-ÜberwachungJahrestagung Kerntechnik 2001, Dresden, 15.-17. Mai 2001, Tagungsbericht, S. 463-466
Böhmer, B.; Konheiser, J.; Brodkin, E.; Egorov, A.; Vikhrov, V.; Zaritsky, S.; Polke, E.Verification of neutron transport calculations for nonstandard pressure vesselsurveillance positions in the VVER-1000 Novovoronesh-5Jahrestagung Kerntechnik 2001, Dresden, 15.-17. Mai 2001, Proceedings pp. 37-42
Böhmert, J.; Ulbricht, A.; Kruykov, A.; Nikolaev, Y.; Dmitry, E.Composition Effects on the Radiation Embrittlement of Iron AlloysEffects of Radiation on Materials: 20th International Symposium, ASTM STP 1405, S.T.Rosinski, M. L. Grossbeck, T. R. Allen and A. S. Kumar, Eds., American Society for Testingand Materials, West Conshohocken, PA, 2001, pp. 383-398
Böhmert, J.; Viehrig, H.-W.; Ulbricht, A.Irradiation effects on toughness behaviour and microstructure of VVER-type PressureVessel SteelsJournal of Nuclear Materials 297 (2001) 251-261
114
Böhmert, J.; Weiß, R.; Webersinke, W.Anwendung eines Laserextensometers zur Ermittlung von RisswiderstandskurvenVortrag auf 1. Anwendersymposium Laserextensometrie, Merseburg, Juni 2001,Tagungsband, S. 516-524
Cumblidge, Stephen E.; Catchen, Gary L.; Motta, Arthur T.; Brauer, G.; Böhmert, J.Effects of Neutron Irradiation and Thermal Annealing on Model Alloys using PositronAnnihilation TechniquesEffects of Radiation on Materials: 20th International Symposium, ASTM STP 1405, S. T.Rosinski, M. L. Grossbeck, T. R. Allen and A. S. Kumar (Eds.), American Society for Testingand Materials, West Conshohocken, PA, 2001, pp. 247-261
Eckert, S.; Gerbeth, G.; Witke, W.; Langenbrunner, H.MHD Turbulence Measurements in a Sodium Channel Flow Exposed to a TransverseMagnetic FieldInternational Journal of Heat and Fluid Flow, Vol. 22/3, 2001, 358-364
Ezsöl, G.; Szabados, L.; Prasser, H.-M.Local void measurements in integral-type experiments simulating nuclear power planttransients5th World Conference on Experimental Heat Transfer, Fluid Mechanics andThermodynamics, Thessalonoki, Greece, 24-28 September 2001, Vol. 2, pp. 1637 - 1641.
Gailitis, A.; Lielausis, O.; Platacis, E.; Dement'ev, S.; Cifersons, A.; Gerbeth, G.; Gundrum,T.; Stefani, F.; Christen, M.; Will, G.Magnetic Field Saturation in the Riga Dynamo ExperimentPhysical Review Letters 86 (2001) 3024-3027
Gailitis, A.; Lielausis, O.; Platacis, E.; Gerbeth, G.; Stefani, F.On the results of the Riga dynamo experimentsMagnetohydrodynamics 37, No. 1/2 (2001) 71-79
Gailitis, A.; Lielausis, O.; Platacis, E.; Gerbeth, G.; Stefani, F.Riga Dynamo ExperimentDynamo and Dynamics, a Mathematical Challenge, NATO Science Series II: Mathematics,Physics and Chemistry, Vol. 26, Edited by P. Chossat, D. Armbruster, I. Oprea, Kluwer,Dordrecht, 2001, pp. 9-16
Grants, I.; Gerbeth, G.Stability of axially symmetric flow driven by a rotating magnetic field in a cylindricalcavityJournal of Fluid Mechanics (2001), Vo. 431, pp 407-426
Grundmann, U.; Kliem, S.Analyses of the OECD - MSLB Benchmark with the Codes DYN3D andDYN3D/ATHLETTransactions of the American Nuclear Society, June 2001, Volume 84, page 23 - 25
115
Hainoun, A.; Schaffrath, A.Simulation of subcooled flow instability for high flux research reactors using theextended code ATHLETNuclear Engineering and Design 207 (2001) 2, 163-180
Hainoun, A.; Schaffrath, A.Simulation of subcooled flow instability for high flux research reactors with ATHLETKerntechnik 66 (2001) 4,214-216
Hermann, R.; Priede, J.; Behr, G.; Gerbeth, G.; Schultz, L.Influence of growth parameters and melt convection on the solid-liquid interface duringRF-floating zone crystal growth of intermetallic compoundsJournal of Crystal Growth 223 (2001) 577-587
Hessel, G.; Hulzer, G.; Kryk, H.; Schmitt, W.Investigation for Safer Initiation of Grignard ReactionsProceedings of the 3rd European Congress of Chemical Engineering, Nuremberg 26-28 June2001, on ECCE-CD / Contents / 2. Sustainable Development, 2.2 Chemical Risk Management
Hicken, Enno F.; Dreier, J.; Meseth, J.; Schaffrath, A.Erprobung passiver Komponenten für den SWR 1000 - Ergebnisse von Experimentenan den Versuchsanlagen PANDA und NOKOJahrestagung Kerntechnik 2001, 15.-17. Mai 2001, Dresden, Berichtsheft der Fachsitzung"Grossversuche zur verbesserten Sicherheitsbewertung von LWR", S. 137-167
Höhne, T.; Rohde, U.; Prasser, H.-M.Post Test CFD Calculations of Experiments at the ROCOM Mixing Test Facility relatedto Boron Dilution and Cold Water TransientsCFX Users Conference 2001,28-30 May 2001, Berchtesgaden
Kliem, S.; Prasser, H.-M.A semi-analytical model for the description of coolant mixing inside the KONVOIreactor pressure vessel during pump start-upJahrestagung Kerntechnik 2001, Dresden, 15.-17. Mai 2001, Tagungsbericht, S. 107-112
Kliem, S.; Prasser, H.-M.; Höhne, T.; Rohde, U.Development and Application of a Fast Running Model for the Description of CoolantMixing Inside the Pressure Vessel of Pressurized Water Reactors11. AER Symposium on VVER Reactor Physics and Reactor Safety, Csopak, Hungary,September 24-28, 2001, Proceedings pp. 449-463
Kliem, S.; Seidel, A.Comparison of the Results of the 6. Dynamic AER Benchmark - Main Steam Line Breakin a NPP with VVER-44011. AER Symposium on VVER Reactor Physics and Reactor Safety, Csopak, Hungary,September, 24-28, 2001, Proceedings pp. 295-329
Kozmenkov, Y.; Orekhov, Y.; Grundmann, U.; Kliem, S.; Rohde, U.; Seidel, A.Development and Benchmarking of the DYN3D/RELAP5 Code SystemJahrestagung Kerntechnik 2001, Dresden, 15 - 17 Mai 2001, Tagungsbericht S. 15 - 18.
116
Krepper, E.CHT'01 validation exercise: Natural convection in an air filled cavityInt. Conf. on "Advances in computational heat transfer", Palm Cove, Australien Mai 2001,Proc. Vol. 2, pp. 1351-1356
Krepper, E.; Aszodi, A.; Prasser, H.-M.Experimental and numerical investigation of one and two phase natural convection instorage tanks4th International Conference on Multiphase Flow, New Orleans, Lousiana, USA - May 27 toJune 1, 2001, Conference-CD, Paper 515
Krepper, E.; Hicken, E. F.; Jaegers, H.Investigation of natural convection in large pools on the example of heating up thesecondary side of an emergency condenserInt. Conf. on "Advances in computational heat transfer", Palm Cove, Australien Mai 2001,Proc. Vol. 2, pp. 835-842
Krepper, E.; Hicken, E.-F.; Jaegers, H.Investigations of natural convection in large pools during the heating up of thesecondary side of an emergency condenserJahrestagung Kerntechnik 2001, Dresden 15-17 Mai 2001, Tagungsband S. 99-102
Li, W.; Hicken, Enno F.; David, Paul H.; Prasser, H.-M.; Baldauf, D.; Zschau, J.Messung der Kondensatfilmdicken in einem dampfdurchströmten horizontalen RohrJahrestagung Kerntechnik 2001, Dresden, 15./17. Mai 2001, Tagungsbericht S. 103-106.
Lucas, D.; Krepper, E.; Prasser, H.-M.Bubble Size Distributions and Radial Profiles in Vertical Pipe Flow3rd European Congress of Chemical Engineering, Nuremberg, 26 - 28 June, 2001,Conference-CD, File 532.htm; Abstract in Chemie Ingenieur Technik 73 (2001) 640
Lucas, D.; Krepper, E.; Prasser, H.-M.Development of bubble size distributions in vertical pipe flow by consideration of radialgas fraction profiles4th International Conference on Multiphase Flow, New Orleans, May 27 - June 1, 2001,Conference-CD, Paper 378
Lucas, D.; Krepper, E.; Prasser, H.-M.Model for radial gas fraction profiles in vertical pipe flowJahrestagung Kerntechnik 2001, Dresden, 15.-17. Mai 2001, Tagungsband, S. 83-86
Lucas, D.; Krepper, E.; Prasser, H.-M.Modeling of radial gas fraction profiles for bubble flow in vertical pipesNinth International Conference On Nuclear Engineering - ICONE-9, Nice, France, April 8-12, 2001, Conference-CD, Paper 279
Lucas, D.; Krepper, E.; Prasser, H.-M.Prediction of radial gas profiles in vertical pipe flow on basis of the bubble sizedistributionInternational Journal of Thermal Sciences 40 (2001) 217-225
117
Manera, A.; Prasser, H.-M.; van der Hagen, Tim H. J. J.; Mudde, R. F.; Kruijf, Willi J. M. deA comparison of void-fraction measurements during flashing-induced instabilitiesobtained with a wire-mesh sensor and a gamma-transmission set-up4th International Conference on Multiphase Flow, New Orleans, Lousiana, USA - May 27 toJune 1, 2001. Proc. CD-ROM, paper 436.
Mittag, S.; Kliem, S.; Weiß, F.-P.; Kyrki-Rajamäki, R.; Hämäläinen, A.; Langenbuch, S.;Danilin, S.; Hadek, J.; Hegyi, G.; Kuchin, A.; Panayotov, D.Validation of Coupled Codes for VVERs by Analysis of Plant TransientsProceedings of OECD / CSNI workshop on Advanced Thermal--hydraulic and NeutronicCodes - Current and Future Applications, Barcelona (Spain), 10-13 April, 2000,NEA/CSNI/R(2001)2/VOL1 309-324
Mittag, S.; Kliem, S.; Weiß, F.-P.; Kyrki-Rajamäki, R.; Hämäläinen, A.; Langenbuch, S.;Danilin, S.; Hadek, J.; Hegyi, G.; Kuchin, A.; Panayotov, D.Validation of coupled neutron kinetic / thermal-hydraulic codes Part 1: Analysis of aVVER-1000 transient (Balakovo-4)Annals of Nuclear Energy 28/9 (2001) 857-873
Mutschke, G.; Gerbeth, G.; Shatrov, V.; Tomboulides, A.The scenario of three-dimensional instabilities of the cylinder wake in an externalmagnetic field. A linear stability analysisPhysics of Fluids Vol. 13, No 3, (March 2001) pp 723-734
Prasser, H.-M.; Dudlik, A.; Schönfeld, S. B. H.; Fahlenkamp, H.; Schlüter, S.Prevention of Water Hammer in Pipelines in Case of Emergency Shut-Off by FastActing ValvesECCE-3, 3rd European Congress on Chemical Engineering, Nürnberg, 26.-28. Juni 2001,Proc. on CD-ROM, Poster P2 - 60.
Prasser, H.-M.; Krepper, E.; Lucas, D.Fast wire-mesh sensors for gas-liquid flows and decomposition of gas fraction profilesaccording to bubble size classes5th World Conference on Experimental Heat Transfer, Fluid Mechanics andThermodynamics, Thessalonoki, Greece, 24-28 September 2001, Vol. 2, pp. 1135 - 1140.
Prasser, H.-M.; Lucas, D.; Krepper, E.Decomposition of gas fraction profiles according to bubble size classes4th International Conference on Multiphase Flow, New Orleans, Lousiana, USA - May 27 toJune 1, 2001, proc. CD-ROM, paper 159.
Prasser, H.-M.; Scholz, D.; Zippe, C.Bubble size measurement using wire-mesh sensorsFlow Measurement and Instrumentation 12/4 (2001) 299-312
Prasser, H.-M.; Zschau, J.; Peters, D.; Pietzsch, G.; Taubert, W.; Trepte, M.Fast Wire-Mesh Sensor for Two-Phase Flow Visualisation with 10 000 Frames perSecondECCE-3, 3rd European Congress on Chemical Engineering, Nürnberg, 26.-28. Juni 2001,Proc. on CD-ROM, poster P16 - 1.
118
Richter, S.; Aritomi, M.; Prasser, H.-M.; Hampel, R.Methods for studies on bubbly flow characteristics applying an electrode-meshtomograph4th International Conference on Multiphase Flow, New Orleans, Lousiana, USA - May 27 toJune 1, 2001. Proc. CD-ROM, paper 848.
Rindelhardt, U.Nutzung erneuerbarer Energien zur Stromerzeugung in den neuen Bundesländern3. Energietechnisches Kolloquium der BTU Cottbus, 6.9.2001, in: BTU ForschungshefteEnergie(Hrg. B. Schieferdecker, Ch. Fünfgeld): Energietag Brandenburg 2001, Beitrag 12
Rindelhardt, U.Photovoltaische StromversorgungB. G. Teubner Stuttgart-Leipzig-Wiesbaden
Rindelhardt, U.Stromerzeugung aus erneuerbaren Energien in OstdeutschlandElektrizitätswirtschaft 100, Heft 25, S.30-39
Rindelhardt, U.Windenergie - heute und morgen6. Symposium "Energie und Energieversorgungssysteme der Zukunft", Lauta, 18. Mai 2001,Tagungsband Beitrag 12
Rohde, U.The Modeling of Fuel Rod Behaviour under RIA Conditions in the Code DYN3DJahrestagung Kerntechnik 2001, Dresden, Deutschland, 15.-17.5.2001, Tagungsband S. 339-344, Inforum Verlags- und Verwaltungsgesellschaft mbH, Bonn 2001
Schäfer, F.Investigations of Natural Circulation Instabilities in VVER-type Reactors at LOCAConditions4th International Symposium on Safety and Reliability Systems of PWRs/VVER, 2001 May 14-17, Brno, Czech Republic
Schäfer, F.; Krepper, E.Verification of the code ATHLET by post-test analysis of two experiments performed atthe integral test facility CCTFAnnual Meeting on Nuclear Technology, Dresden, May 15-17 2001,Proc. p. 87-90
Schäfer, F.; Krepper, E.; Weiß, F.-P.Post-test analysis of two accident management experiments performed at the Bethsy testfacility using the code ATHLETICONE - Ninth International Conference on Nuclear Engineering, Nice, France, April 8-122001
119
Schaffrath, A.; Krüssenberg, A.; Weiß, F.-P.; Hicken, E.-F.; Beyer, M.; Carl, H.; Prasser, H.-M.; Schuster, J.; Schütz, P.; Tamme, M.TOPFLOW - a new multipurpose thermalhydraulic test facility for the investigation ofsteady state and transient two phase flow phenomenaKerntechnik 66 (2001) 4 209-212
Schaffrath, A.; Krüssenberg, A.-K.; Fjodorow, A.; Gocht, U.; Lischke, W.Modeling of Condensation in Horizontal TubesNuclear Engineering and Design 204 Issue 1-3 (2001) 251-265
Schaffrath, A.; Krüssenberg, A.-K.; Weiß, F.-P.; Carl, H.TOPFLOW - eine neue Mehrzweck-Thermohydraulik-Versuchsanlage zurUntersuchung stationärer und transienter ZweiphasenströmungenJahrestagung Kerntechnik 2001, Dresden, 15.-17. Mai 2001, Tagungsbericht S. 125-131
Seidel, A.; Kliem, S.Solution of the 6. Dynamic AER Benchmark Using the Coupled Code DYN3D/ATHLET11. AER Symposium on VVER Reactor Physics and Reactor Safety, Csopak, Hungary,September 24-28, 2001, Proceedings pp. 251-267
Stefani, F.; Gerbeth, G.A toy model for inverse dynamo theoryPhysics of the Earth and Planetary Interiors 128, No. 1-4 (2001), pp. 109-124
Ulbricht, A.; Böhmert, J.; Viehrig, H.-W.Beziehungen zwischen Mikrostruktur und Zähigkeitseigenschaften vonneutronenbestrahlten WWER-ReaktordruckbehälterstählenJahrestagung Kerntechnik 2001, Dresden, Germany, 15.-17. Mai 2001, S. 697-700
Viehrig, H.-W.; Böhmert, J.; Dzugan, J.Anwendung des Instrumentierten Kerbschlagbiegeversuch zur Ermittlung vonReferenztemperaturen nach dem Master-Curve-KonzeptMaterialwissenschaft und Werkstofftechnik, Vol. 32, No. 6, June 2001, pp. 568-573
Viehrig, H.-W.; Böhmert, J.; Dzugan, J.; Richter, H.Master Curve Evaluation of Irradiated Russian VVER Type Reactor Pressure VesselSteelsEffects of Radiation on Materials: 20th International Symposium, June 2000, ASTM STP1405, S.T. Rosinski, M.L. Grossbeck, T.R. Allen, and A.S. Kumar, Eds., American Society forTesting and Materials, West Conshohocken, pp. 109-124
Werner, M.; Altstadt, E.; Perov, S.Schwingungsmodellierung von WWER-Reaktoren zur Untersuchung vonStörfallszenarien27. MPA-Seminar, Sicherheit und Verfügbarkeit in der Energietechnik, Band 1 und 2,Stuttgart, 4 .- 5. 10. 2001, Artikel 9
120
Willschuetz, H.-G.; Altstadt, E.; Weiss, F.-P.; Sehgal, B. R.Simulation of Scaled Core-Meltdown-Experiments and Investigation of a Possible VesselSupport against Failure16th International Conference on Structural Mechanics in Reactor Technology SMiRT16,Washington, DC, USA, August 12-17, 2001, Paper No. 1145
Willschuetz, H.-G.; Sehgal, B. R.The EC-FOREVER-2 experiment: the pre-test analysis and comparisons with theexperimentOECD LOWER HEAD FAILURE, 4th Program Committee Meeting, March 5-7, 2001,Sandia National Laboratories, Albuquerque, New Mexico, USA, Proceedings Paper No 8.6
Willschütz, H.-G.; Altstadt, E.; Sehgal, B. R.; Weiß, F.-P.Coupled Thermal Structural Analysis of LWR Vessel Creep Failure ExperimentsNuclear Engineering and Design, Elsevier, 208 (2001)265-282
Willschütz, H.-G.; Altstadt, E.; Weiss, F.-P.; Sehgal, B. R.Pre-Test Calculations for the EC-FOREVER-2-ExperimentJahrestagung Kerntechnik 2001, Dresden, 15.-17. Mai, Tagungsband S. 187-192
Yeoh, G. H.; Tu, J. Y.; Krepper, E.; Prasser, H.-M.Numerical investigation and measurement of transient two-phase boiling flow14th Australasian Fluid Mechanics Conference, Adelaide Australia, 10-14 December 2001,Proceedings pp. 865-868
121
Other oral and poster presentations
Böhmer, B.; Borodkin, G.; Kumpf, H.Dort-MCNP Discrepancies for a Simple Testing Model - Proposal of a CalculationalNeutron-Gamma Benchmark.WGRD VVER Meeting, April 23 -25, 2001, Rez, Czech Republic
Böhmer, B.; Hansen, W.; Konheiser, J.; Mehner, H.-C.; Noack, K.; Unholzer, S.Information About a New Neutron-Gamma Reactor ExperimentWGRD VVER Meeting, April 23 -25, 2001, Rez, Czech Republic
Böhmert, J.; Müller, G.; Willschütz, H.-G.; Sehgal, B. R.Analyse der Schädigung eines Druckbehälters in Simulationsexperimenten vonnuklearen KernschmelzunfällenDGM-Tagung Werkstoffprüfung 2001, Bad Nauheim, 6. - 7. 12. 2001
Bojarevics, A.; Gelfgat, Yu.; Gerbeth, G.; Cramer, A.Effect of a superimposed DC magnetic field on the melt flow in an induction furnaceexperimental modelLecture at: International Scientific Colloquium "Modelling for Saving Resources" Riga, May17-18, 2001
Eckert, S.Behavior of gas bubbles in liquid metalsLecture series 'Fluid Dynamics in Continous Casting', von Karman Institute for FluidDynamics, Brüssel, 23-27 April 2001
Gailitis, A.; Lielausis, O.; Platacis, E.; Gerbeth, G.; Stefani, F.Riga Dynamo ExperimentLecture at European Geophysical Society, XXVI General Assembly, Nice (France), March 25-30, 2001
Gailitis, A.; Lielausis, O.; Platacis, E.; Gerbeth, G.; Stefani, F.The Saturation Regime of the Riga Dynamo Experiment: Observational Facts and theirInterpretation4. MHD-Tage, Ruhr-Universität Bochum, 01-02 Oktober 2001
Gerbeth, G.Magnetofluiddynamik - Beeinflussung metallischer Schmelzen mittelselektromagnetischer FelderEinladungsvortrag im Kolloquium "Physik amorpher und flüssiger Legierungen", TUChemnitz, 24.04.2001
Gerbeth, G.Tailored magnetic fields in industrial crystal growth, levitation, and melt extractionLecture at: Int. Seminar on "Electromagnetic Control of Liquid Metal Processes" Coventry,UK, June 27-29, 2001
122
Gerbeth, G.The inverse approach to MagnetofluiddynamicsLecture at ABB Process Industries, Västeras, Sweden, 27.03.2001
Gokhman, A.; Böhmert, J.; Ulbricht, A.Elastic effect on the evolution of cluster ensembles in irradiated reactor pressure vesselsteelsV. Research Workshop Nucleation Theory and Applications, Dubna, April 2-28, 2001
Höhne, T.Kühlmittelvermischung in DruckwasserreaktorenJahrestagung Kerntechnik 15.-17. Mai 2001, Dresden, Poster
Schaffrath, A.; Hicken, E. F.; Prasser, H.-M.; Palavecino, C.Experimental Investigation of the Emergency Condenser of the SWR1000Centro Atomico Bariloche, Argentinien, 28.11. - 04.12.2001
Schaffrath, A.; Krüssenberg, A.-K.; Alt, S.Modeling of Condensation inside Horizontal TubesCentro Atomico Bariloche, Argentinien, 28.11.-04.12.2001
Schaffrath, A.; Krüssenberg, A.-K.; Prasser, H.-M.Investigation of Two Phase Flow in Vertical PipesCentro Atomico Bariloche, Argentinien, 28.11.-04.12.2001
Schaffrath, A.; Krüssenberg, A.-K.; Prasser, H.-M.; Lucas, D.Untersuchung von Zweiphasenströmungen in vertikalen RohrenSeminar des Lehrstuhls Nukleare und Neue Energiesysteme, Ruhr-Universität Bochum03.07.2001
Schaffrath, A.; Krüssenberg, A.-K.; Weiß, F.-P.; Hicken, E. F.TOPFLOW - eine neue Mehrzweckthermohydraulikversuchsanlage zur Untersuchungtransienter ZweiphasenströmungenSeminar des Lehrstuhls für Nukleare und Neue Energiesysteme, Ruhr-Universität Bochum,03.07.2001
Schaffrath, A.; Krüssenberg, A.-K.; Weiß, F.-P.; Prasser, H.-M.TOPFLOW - a new multipurpose test facility for the investigation of transient twophase flowsCentro Atomico Bariloche, Argentinien, 26.11. - 04.12.2001
Schmitt, W.Fehlerermittlung mit neuronalen NetzenDECHEMA-Kursus "Sicherheitstechnik in der chemischen Industrie", 17.09. - 21.09.2001,Universität Dortmund, in Modul II: Methoden der Schwachstellen und Risikoanalyse, S. 1-20
Stefani, F.; Gerbeth, G.; Gailitis, A.; Lielausis, O.; Platacis, E.Das Rigaer Dynamoexperiment: Wie man ein Magnetfeld aufrührtVortrag im "Geophysikalischen Institutsseminar" der Uni Göttingen, 19. Juni 2001

123
Stefani, F.; Gerbeth, G.; Gailitis, A.; Lielausis, O.; Platacis, E.Wie man ein Magnetfeld aufrührt: Zu den Ergebnissen des Rigaer DynamoexperimentsVortrag im Seminar "Nichtlinearität und Unordnung in komplexen Systemen" der UniversitätMagdeburg, 18. Juni 2001
Ulbricht, A.; Böhmert, J.; Strunz, P.; Dewhurst, C.; Mathon, M. H.Structure Investigations on Russian Reactor Pressure Vessel Steels by Small AngleNeutron ScatteringInternational Conference on Neutron Scattering 2001, München, September 9-13, 2001
124
FZR-Reports and other publications
Baldauf, D.; Christen, M.; Fietz, J.; Hampel, U.; Hoppe, D.; Prasser, H.-M.; Will, G.; Zippe,C.; Zschau, J.Tomographisches Messverfahren für die Gasverteilung in einer Axialpumpe beiZweiphasenbetriebWissenschaftlich-Technische Berichte / Forschungszentrum Rossendorf; FZR-336, November2001
Bergmann, U.Ultraschallverfahren zur Rissfortschrittsmessung für die Ermittlung vonRisswiderstandskurvenWissenschaftlich-Technische Berichte / Forschungszentrum Rossendorf, FZR-330, September2001
Beyer, M.; Carl, H.Unterstützung der ukrainischen Behörden beim Ausbau der verbesserten betrieblichenÜberwachung für die KKW Rovno und SaporoshjeWissenschaftlich-Technische Berichte / Forschungszentrum Rossendorf; FZR-332 September2001
Gavrilas, M.; Höhne, T.OECD/CSNI ISP NR. 43 Rapid Boron Dilution Transient Tests For Code VerificationPost Test Calculation With CFX-4Wissenschaftlich-Technische Berichte / Forschungszentrum Rossendorf; FZR-325 Juli 2001
Gerbeth, G.; Eckert, S.; Stefani, F.; Cramer, A.; Weier, T.Innovationskolleg "Magnetofluiddynamik elektrisch leitfähiger Flüssigkeiten"Abschlußbericht, Juli 2001 zu den FRZ-Teilprojekten A3,A4,B1,B3,C4,D3
Grundmann, U.; Kliem, S.; Mittag, S.; Rohde, U.; Seidel, A.; Panayotov, D.; Ilieva, B.Adaption, Validierung und Anwendung fortgeschrittener Störfallanalysecodes mit 3DNeutronenkinetik - WTZ mit BulgarienWissenschaftlich-Technische Berichte / Forschungszentrum Rossendorf; FZR-328 August2001
Grunwald, G.; Höhne, T.; Prasser, H.-M.; Rohde, U.Kühlmittelvermischung in Druckwasserreaktoren Teil 1: Möglichkeiten geschlosseneranalytischer Lösungen und Simulation der Vermischung mit CFX-4Wissenschaftlich-Technische Berichte / Forschungszentrum Rossendorf; FZR-335 Oktober2001
Höhne, T.; Grunwald, G.; Prasser, H.-M.Geschwindigkeitsmessungen im Downcomer der ROCOM Versuchsanlage mittelsLaser-Doppler Anemometrie im Vergleich mit numerischen BerechnungenWissenschaftlich-Technische Berichte / Forschungszentrum Rossendorf; FZR-334 Oktober2001
125
Krüssenberg, A.-K.; Schaffrath, A.Modellierung des Kernkraftwerks Stade Vorarbeiten für Rechnung mit dem ProgrammRALOC Mod4.0AG Teil2: Rekombinatoren, Eingabedatensatz, RechnungenFWS 01-2, Februar 2001
Mössner, T.; Altstadt, E.; Böhmert, J.; Weiß, R.Erwärmung des Reaktordruckbehälters des Blocks 8 des KKW Greifswald bei derZerlegung mittels SägetechnikWissenschaftlich-Technische Berichte / Forschungszentrum Rossendorf, FZR-310, Januar2001
Prasser, H.-M. (Editor)4. Workshop "Measurement techniques for stationary and transient multiphase flows",Rossendorf, November 16 - 17, 2000Wissenschaftlich-Technische Berichte / Forschungszentrum Rossendorf; FZR-320, Mai 2001
Weiß, F.-P.; Rindelhardt, U. (Editors)Annual report 2000 Institute of Safety ResearchWissenschaftlich-Technische Berichte / Forschungszentrum Rossendorf; FZR-316 April 2001

126

127
Patents

128

129
Patents
Lielausis, O.; Eckert, S.; Gerbeth, G.Verfahren und Anordnung zur Steuerung der Gasblasenbildung in elektrisch leitfähigenFlüssigkeitenPatentschrift DE 199 48 879 C1
Prasser, H.-M.; Schlüter, S.; Dudlik, A.Anordnung zur Verhinderung unerwünschter Drücke beim Absperren oder Drosselnder Flüssigkeitsförderung in einer RohrleitungOffenlsgungsschrift DE 199 40 096 A1Patentschrift DE 199 40 096 C2Europäische Patentanmeldung EP 1079161 A2

130

131
Awards

132
133
Awards
Andreas Schaffrath:
Karl-Wirtz-Preis der Deutschen Kerntechnischen Gesellschaft
für Arbeiten zu "Innovativen Reaktorkonzepten, passiven Sicherheitssystemensowie Zweiphasenströmungen im Allgemeinen"
Gunther Gerbeth, Frank Stefani, Thomas Gundrum:
Forschungspreis des FZR 2001
für ihre Beiträge zum Rigaer Dynamo-Experiment

134

135
Guests

136
137
Guests
Prof. Dr. Gailitis, AgrisInstitute of Physics Riga, Latvia08.01.2001 - 07.04.2001
Dr. Priede, JanisInstitute of Physics Riga, Latvia23.04.2001 – 26.05.2001
Dr. Karpuchov, AlexandreBudker-Institute Novosibirsk, Russia05.05.2001 – 26.05.2001
Borodkin, GennadiSEC NRS of GOSATOMNADZOR Moskau, Russia06.05.2001 – 17.06.200104.11.2001 – 25.11.2001
Davidovsky, OlegUmweltministerium der Ukraine, Ukraina08.05.2001 – 11.05.2001
Tkach, AnatoliyKernkraftwerk Saporoshje, Uikrainia08.05.2001 – 11.05.2001
Lebedyev, AndriyKernkraftwerk Saporoshje, Uikrainia08.05.2001 – 11.05.2001
Chornousova, LyubovUmweltministerium der Ukraine, Ukraina08.05.2001 – 11.05.2001
Dr. Anikeev, AndreyBudker Institut Novosibirsk, Russia20.05.2001 – 17.06.2001
Prof. Alian, AtifEmeritus Professor, Kairo, Egypt28.05.2001 – 07.06.2001
Prof. Martemianov, SergeiESIP University of Poitiers, France11.06.2001 – 16.06.2001
138
Dr. Chrainer, KarlBudker Institut Novosibirsk, Russia01.07.2001 – 15.07.2001
Prof. Melnikov, VladimirovCenter of Scientific and Technical Services NUKLID Ltd., Russia10.09.2001 – 21.09.2001
Dr. Dountzev, AndreiNovgorod Technical University, Russia10.09.2001 – 21.09.2001
Dr. Ivanov, AlexandreBudker Institut Novosibirsk, Russia28.09.2001 – 12.10.2001
Dr. Bagryansky, PetrBudker Institut Novosibirsk, Russia01.10.2001 – 13.10.2001
Dr. Khalimonchuk, VladimirScientific-Technical Centre for Nuclear and Radiation Safety of the Ukraine, Kiew, Ukrainia18.11.2001 – 01.12.2001
Kuchin, AlexanderScientific-Technical Centre for Nuclear and Radiation Safety of the Ukraine, Kiew, Ukrainia,Kiew, Ukrainia18.11.2001 – 01.12.2001
Prof. Slavtchev, SlavchoInstitut of Mechanics Sofia, Bulgaria19.01.2001 – 24.01.2001
Dr. Feynberg, OlgaKurchatov Institut Moskau, Russia17.02.2001 – 21.02.2001
Dr. Ignatiev, ViktorKurchatov Institut Moskau, Russia17.02.2001 – 21.02.2001
Dr. van Outsel, KristelNuclear Research Institute, Studie Centrum voor Kernenergie Mol, Belgium22.02.2001 – 25.02.2001
Dr. Kozmenkov, YaroslavInstitute of Physics and Power Engineering Obninsk, Russia14.05.2001 – 02.06.2001
139
Prof. Gokhman, AlexanderSouth Ukrainian Pedagocical University K.D. Ushinski Odessa, Ukrainia07.07.2001 – 03.09.2001
Dr. Dahlkild, AndersKTH Stockholm, Schweden12.07.2001 – 14.07.2001
Prof. Hicken, Enno-FrerichForchungszentrum Jülich15.07.2001 – 03.08.200126.09.2001 – 04.10.2001
Myasnikov, AndreyKurchatov Institute Moskau, Russia01.09.2001 – 30.11.2001
Prof. Melnikov, VladimirovNovgorod Technical University, Russia10.09.2001 – 21.09.2001
Dr. Lavrentev, OlgaChemical Engineering Technion Haifa, Israel16.09.2001 – 20.09.2001
Peinberg, JanisInstitute of Physics Riga, Latvia12.10.2001 – 20.10.2001
Dr. Shisko, AndreyInstitute of Physics Riga, Latvia12.10.2001 – 20.10.2001
Dr. Perov, SergeyETC Orgtechdiagnostika, Russia05.11.2001 – 02.12.2001
D. Bezrukov, YuriEngineering and design organisation GIDROPRESS Podolsk, Russia17.11.2001 – 21.11.2001

140

141
Meetings und Workshops

142

143
Meetings und Workshops
3. Sitzung des Kompetenzverbundes KerntechnikRossendorf, 23. - 24.01.2001
Workshop „Prozessführung und Zustandserkennung in Chemieanlagen“Rossendorf, 01.02.2001
Arbeitstreffen „Molten Salt Reactor“Rossendorf, 17. – 21. 02.2001
Meeting des Sub-Committees „On Dynamic Testing at Intermediate Strain Rates (TC5) derEuropean Structural Integrity Society (ESIS)“Rossendorf, 30.03.2001
Workshop „Betriebliche Überwachung ukrainischer KKW“Rossendorf, 08. – 11.05.2001
Abschlußkonferenz des Innovationskollegs "Magnetofluiddynamik elektrisch leitfähigerFlüssigkeiten"Rossendorf, 17.08.2001
Meeting zum EU-Projekt „Ultraschallmessungen an flüssigen Metallen (HITUV)“Rossendorf, 23.08.-24.08.2001
Workshop zum EU-Projekt „WAHALoads“Rossendorf, 04. – 05.10.2001
Kick-off-Meeting zum EU-Projekt FLOMIXRossendorf, 19. –20.11.2001

144

145
Seminars

146
147
SEMINARS
Dr. U. Fischer (FZ Karlsruhe)Fusionsneutronik – Methoden und Anwendungen18.01.2001
Dr. A. CramerMagnetfeldbeeinflussung der Schmelzeextraktion metallischer Fasern01.02.2001
Dr. E. KrepperCFD-Simulation der Naturkonvektion in lokal beheizten Behältern15.02.2001
Dr. H.-M. PrasserBewertung der Genauigkeit von Blasengrößenmessungen mit Gittersensoren01.03.2001
Dr. M. WernerModellierung des Risswachstums in 3-Punktbiegeproben mit einem Finite-Elemente-Code15.03.2001
Dr. U. RohdeModellierung des transienten Brennstabverhaltens bei reaktivitätsinduzierten Störfällen05.04.2001
T. Seiler, Dr. H. KrykOnline-Monitoring stark exothermer Reaktionen mit adaptiven Wärmebilanzen19.04.2001
Dr. E. AltstadtModelle für die Werkstoffschädigung bei viskoplastischer Verformung03.05.2001
Dr. Uhlemann (IFW Dresden)Wasserstoff als potentielle Versprödungsursache von Reaktordruckbehältern31.05.2001
Dr. R. Küchler, Dr. T. ZornBatch- und Säulenexperimente zur Chemie in der ungesättigten Zone07.06.2001
Dr. F. Lapicque (Institut National Polytechniue de Lorraine)Investigation routes for the improvement of Gas-evolving electrochemical cells29.06.2001
148
M. KliemStrömungssimulation im Reaktorkern in der Näherung eines porösen Körpers05.07.2001Dr. A. Dahlkild (KTH Stockholm)Elektrochemistry and fluid mechnics at Faxén Laboratoriet13.07.2001
Prof. M. Hinze (TU Dresden)Mathematische Optimierung für Strömungsprobleme07.08.2001
Dr. C. ZippeVisualisierung von periodisch veränderlichen Gasgehaltsfeldern in einer Axialpumpe mitGamma-Tomografie30.08.2001
J. Krepel (TU Prag)Neutron kinetics of reactors with fluid fuel13.09.2001
Prof. E. Hicken (FZ Jülich)Sicherheitsphilosophien neuer Reaktorkonzepte I27.09.2001
Prof. E. Hicken (FZ Jülich)Sicherheitsphilosophien neuer Reaktorkonzepte II04.10.2001
S. KliemEin semi-analytisches Modell zur Kühlmittelvermischung und seine Anwendung für dieAnalyse von Borverdünnungsstörfällen mit DYN3D11.10.2001
Prof. S. Grossmann (Philipps Universität Marburg)Scherströmungs-Turbulenz trotz laminarer Stabilität25.10.2001
Dr. H.-M. PrasserExperimente zur transienten Kondensation von Dampf bei hohen Wärmeströmen und beiVorhandensein von nichtkondensierbarem Gas08.11.2001
Prof. Lischke (Hochschule Zittau/Görlitz)Reaktorsicherheitsforschung an der Hochschule Zittau/Görlitz22.11.2001
Dr. R. Voskoboinikov (KI Moskau)Potential Microstructural Mechanisms of the Radiation Embrittlement of Reactor PressureVessel Steels07.12.2001

149
B. BöhmerReaktordosimetrie – Übersicht über aktuelle Ergebnisse und Probleme19.12. 2001

150

151
Lecture courses

152

153
Lectures
Frank-Peter WeißZuverlässigkeit und Sicherheit technischer SystemeTU Dresden, Fakultät MaschinenwesenSS 2000 und WS 2000
Udo RindelhardtErneuerbare Energien I und IIUniversität Leipzig, Fakultät für Physik und GeowissenschaftenSS 2000 und WS 2000

154

155
Departments of the Institute

156
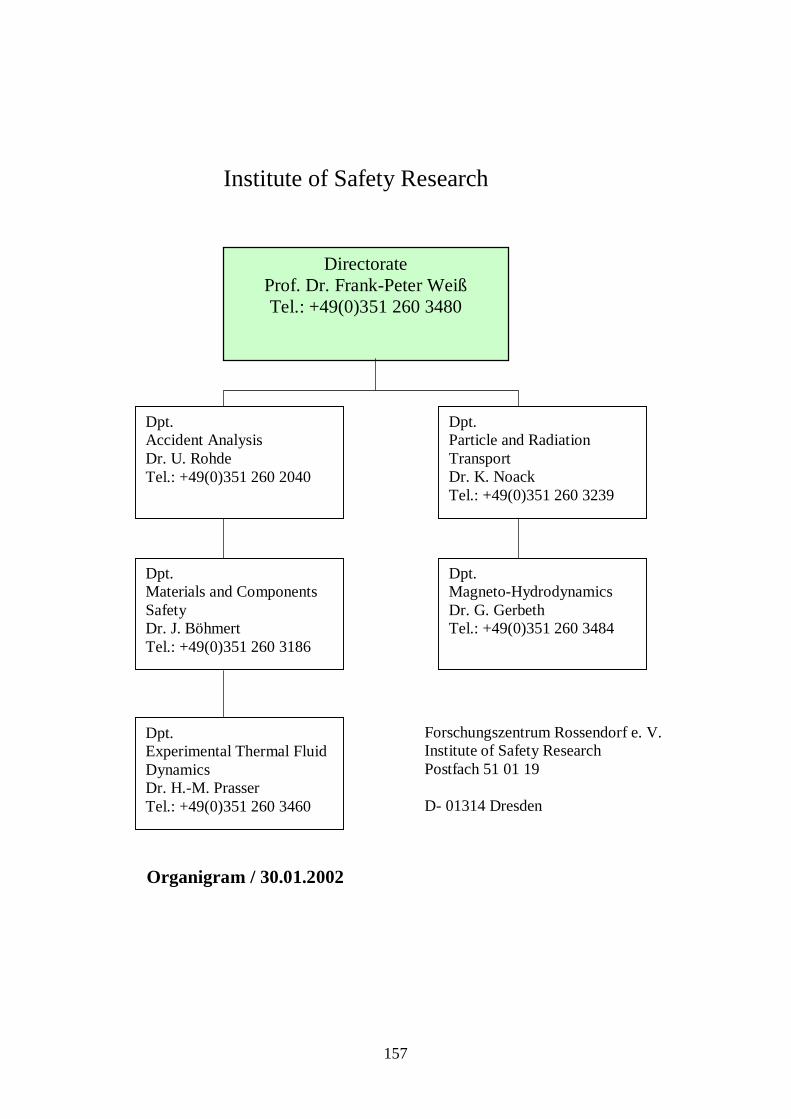
157
Institute of Safety Research
Dpt.Accident AnalysisDr. U. RohdeTel.: +49(0)351 260 2040
Dpt.Particle and RadiationTransportDr. K. NoackTel.: +49(0)351 260 3239
Dpt.Materials and ComponentsSafetyDr. J. BöhmertTel.: +49(0)351 260 3186
Dpt.Magneto-HydrodynamicsDr. G. GerbethTel.: +49(0)351 260 3484
Dpt.Experimental Thermal FluidDynamicsDr. H.-M. PrasserTel.: +49(0)351 260 3460
DirectorateProf. Dr. Frank-Peter WeißTel.: +49(0)351 260 3480
Forschungszentrum Rossendorf e. V.Institute of Safety ResearchPostfach 51 01 19
D- 01314 Dresden
Organigram / 30.01.2002

158

159
Personnel

160

161
Director: Prof. Dr. F.-P. Weiß
Scientific Staff Technical StaffAltstadt, Eberhard Dr. Schaffrath, Andreas Dr. Baldauf, DieterBeyer, Matthias Schäfer, Frank Dr. Behrens, SieglindeBöhmer, Bertram Schmitt, Wilfried Dr. Bombis, DorisBöhmert, Jürgen Dr. Schütz, Peter Eichhorn, ChristineBöttger, Arnd Seidel, André Forker, KlausCarl, Helmar Dr. Stefani, Frank Dr Futterschneider, HeinCramer, Andreas Dr. Stephan, Ingrid Dr. Gundrum, ThomasEckert, Sven Dr. Viehrig, Hans-Werner Dr. Kunadt, HeikoErlebach, Stephan Werner, Matthias Dr. Leonhardt, Wolf-DietrichFey, Uwe, Dr. Willschütz, Hans-Georg Leuner, BerndFietz, Jürgen Dr. Witke, Willy Losinski, ClaudiaGalindo, Vladimir Dr. Zschau, Jochen Dr. Mansel, CatrinGerbeth, Günter Dr. Zippe, Cornelius Dr. Nowak, BerndGrants, Ilmars Dr. Zippe, Winfried Dr. Opitz, RuthGrundmann, Ulrich Dr. Otto, GerlindGrunwald, Gerhard Dr. Pietzsch, JensGünther, Uwe Dr. PhD Students Richter, AnnettHessel, Günter Beckert, Carsten Richter, HenryHoppe, Dietrich Dr. Grahn, Alexander Richter, JoachimHüller, Jürgen Dr. Höhne, Thomas Richter, PetraKliem, Sören Kern, Tommy Rott, SonjaKoch, Reinhard Dr. Kliem, Margarita Russig, HeikoKonheiser, Jörg Ulbricht, Andreas Schleßiger, HeikeKrepper, Eckhard Dr. Weier, Tom Schneider, GiselaKrüssenberg, Anne-Kathrin Dr. Seidler, ChristaKryk, Holger Dr. Seiler, TorstenKüchler, Roland Dr. Skorupa, UlrichLindau, Bernd Dr. Tamme, GüntherLucas, Dirk Dr. Tamme, MarkoMittag, Siegfried Dr. Webersinke, SteffenMüller, Gudrun, Dr. Weiß, RainerMutschke, Gerd Zimmermann, WilfriedNeumann, Hartmut Dr.Noack, Klaus Dr.Prasser, Horst-Michael Dr.Rindelhardt, Udo PD Dr.Rohde, Ulrich Dr.

162