
Antoine de Saint-Exupery (Le Petit Prince) Die Bibel...
360
Adieu, dit le renard. Voici mon secret. Il est très simple: On ne voit qu'avec le coeur. L'essentiel est invisible pour les yeux. Antoine de Saint-Exupery (Le Petit Prince) Der Mensch sieht, was vor Augen ist, Gott aber sieht das Herz an. Die Bibel (Jahreslosung 2003, 1. Samuel 16, 7)
Transcript of Antoine de Saint-Exupery (Le Petit Prince) Die Bibel...

Adieu, dit le renard. Voici mon secret. Il est très simple:
On ne voit qu'avec le coeur. L'essentiel est invisible pour les yeux.
Antoine de Saint-Exupery (Le Petit Prince)
Der Mensch sieht, was vor Augen ist, Gott aber sieht das Herz an.
Die Bibel (Jahreslosung 2003, 1. Samuel 16, 7)
Sustained-Release Formulations
for Compounds Underlying
Intestinal Drug Efflux
Dissertation zur Erlangung des Grades
„Doktor der Naturwissenschaften“
am Fachbereich Chemie und Pharmazie
der Johannes Gutenberg-Universität
in Mainz
Daniel Wagner
geb. in Bad Marienberg (Westerwald)
Mainz 2003

Jahr der mündlichen Prüfung: 2003

Table of contents
I
Table of contents … … … … … … … … … … … … … … … … … … … … ..............I – VII
Abbreviations … … … … … ................................................................................. 1
Chapter I: Introduction and aims of the doctoral thesis.............................. 5
I.1 The phenomenon of intestinal drug efflux 7
I.2 Carriers involved in intestinal drug efflux 9
I.2.1 The intestinal efflux pump P-glycoprotein 10
I.2.2 Other transporters involved in intestinal drug efflux 12
I.3 Models for the investigation of intestinal drug absorption and absorption sites 15
I.4 Regional differences in drug absorption 19
I.5 Sources of regional differences in drug absorption 20
I.5.1 Passive diffusion 21
I.5.2 Paracellular absorption 21
I.5.3 Active transport processes 22
I.6 Consequences for dosage form design 24
I.6.1 Gastroretentive dosage forms 24
I.6.2 Drug delivery to the small intestine 25
I.6.3 Targeted colon delivery 26
I.6.4 Dosage form design for drugs undergoing intestinal drug efflux 28
I.7 Aim of the thesis 31
I.8 Talinolol as model compound for drugs that are subject to intestinal drug
efflux 34
Chapter II: Effective permeabilities of talinolol in different regions of
the rat intestine .......................................................................... 41
II.1 Introduction 41
II.1.2 Dose-dependence of talinolol bioavailability 42
II.1.3 Intestinal perfusion studies in rats 45

Table of contents
II
II.2 Materials and methods 47
II.2.1 Materials 47
II.2.2 Animals 47
II.2.3 Instrumentation 47
II.2.4 Quantitative analysis of talinolol from intestinal perfusate solutions 48
II.2.5 Perfusion of rat small and large intestine 48
II.2.6 Net water absorption / secretion during perfusion 49
II.2.7 Intestinal permeability 50
II.2.8 Experimental determination of carrier-mediated and passive components
of drug permeability 50
II.2.9 Theoretical model describing the concentration-dependence of flux and
permeability across membranes for substrates undergoing passive
absorption and Michaelis-Menten type carrier-mediated secretion 51
II.3 Results 55
II.3.1 Analysis of talinolol from perfusate samples 55
II.3.2 Influence of co-administration of P-gp inhibitors on intestinal permeability
of talinolol 59
II.3.3 Estimation of parameters for passive and carrier-mediated membrane
permeability 61
II.4 Discussion and conclusions 63
Chapter III: Development of peroral talinolol controlled-release
dosage forms.............................................................................. 67
III.1 Introduction 67
III.1.1 The need of a controlled-release dosage form for talinolol 70
III.1.2 Technological aspects 71
III.1.3 Properties of excipients used in the formulation of sustained-release
dosage forms for talinolol 73
III.1.3.1 Eudragit polymers 73
III.1.3.2 Ethocel® (Ph. Eur., USP/NF, JPE) 78
Table of contents
III
III.2 Materials and methods 79
III.2.1 Chemicals and other materials 79
III.2.2 Preparation of sustained-release matrix granules 79
III.2.3 Preparation of coated sustained-release granules 80
III.2.4 Preparation of sustained-release matrix tablets 81
III.2.5 Pharmaceutical characterization 82
III.2.5.1 Dissolution 82
III.2.5.1.1 Assays 83
III.2.5.1.2 Dissolution media 84
III.2.5.1.3 Stability of talinolol in dissolution media 86
III.2.5.2 Uniformity of mass and content 88
III.2.5.3 Size of tablets 88
III.2.5.4 Crushing strength 89
III.2.5.5 Friability 89
III.2.6 Statistical analysis of dissolution data 90
III.3 Results and discussion 91
III.3.1 Granules and hard gelatin capsules 91
III.3.1.1 Determination of the appropriate capsule size based on bulk density
measurements 91
III.3.1.2 Talinolol granule formulations 94
III.3.1.2.1 Granule formulation with Eudragit® RSPO, calcium hydrogen
phosphate and magnesium stearate 94
III.3.1.2.2 Granule formulation with Eudragit® RSPO and Eudragit RS 12.5 95
III.3.1.2.3 Granule formulation with Eudragit® RSPO, corn starch and
gelatin 97
III.3.1.2.4 Granules coated with Eudragit® L 12.5 100
III.3.1.2.5 Granule formulation with ethylcellulose 102
III.3.2 Influence of the pH on talinolol dissolution 106
III.3.2.1 Dissolution study with capsules containing pure talinolol dry
substance 106
III.3.2.2 Dissolution study with talinolol immediate-release tablets 108
III.3.2.3 Dissolution study with tablets formulated with talinolol and corn
starch 109
Table of contents
IV
III.3.3 Final discussion on hard gelatin capsule preparations 111
III.3.4 Matrix tablets 113
III.3.4.1 Powder losses during the manufacturing process of matrix tablets 113
III.3.4.2 Parameters with potential influence on the drug release from matrix
tablets 115
III.3.4.2.1 Compression force 115
III.3.4.2.2 Compression time 118
III.3.4.2.3 Rotational speed of the paddles in the dissolution apparatus 119
III.3.4.3 Matrix tablets formulated with Eudragit® RSPO, Eudragit® S 100,
Eudragit® RLPO and Ethocel® 121
III.3.4.4 Matrix tablets formulated with Eudragit® S 100 and corn starch 124
III.3.4.5 Influence of pore formers on the dissolution of talinolol matrix tablets 125
III.3.4.6 Matrix tablets formulated with a combination of Eudragit® RSPO and
Eudragit® S 100 130
III.3.4.7 Matrix tablets formulated with Eudragit® L 100-55 132
III.3.4.8 Matrix tablets formulated with Eudragit® L 100-55 and different pore
formers 136
III.3.4.8.1 Corn starch 136
III.3.4.8.2 Polyethylene glycol 4000 140
III.3.4.8.3 Glucose 140
III.3.4.8.4 Mannitol 141
III.3.4.9 Considerations on the appropriate talinolol dose per tablet 145
III.3.4.10 Talinolol matrix tablets with a drug content of 100 mg 147
III.3.4.11 Formulation optimization of talinolol matrix tablets with a drug
content of 100 mg 152
III.3.4.12 Summary of talinolol matrix formulations 157
III.3.4.13 Pharmaceutical characterization of talinolol sustained-release
tablets formulated with 40 % Eudragit® L 100-55 and 20 % mannitol 158
III.3.4.13.1 Tablet thickness 159
III.3.4.13.2 Uniformity of mass 160
III.3.4.13.3 Crushing strength 161
III.3.4.14 Final discussion on matrix tablets 163
III.4 Conclusions 169
Table of contents
V
Chapter IV: Considerations on in vitro dissolution test methods .......... 172
IV.1 Introduction 172
IV.2 Materials and methods 174
IV.2.1 Chemicals and other materials 174
IV.2.2 Solubility studies 174
IV.2.3 Preparation of controlled-release dosage forms 175
IV.2.4 Dissolution studies 175
IV.2.5 Preparation of talinolol crystal forms 176
IV.2.6 Light microscopy 176
IV.2.7 Fourier Transform Infrared Spectroscopy (FT-IR) 176
IV.2.8 Differential Scanning Calorimetry (DSC) 177
IV.2.9 X-Ray Powder Diffraction (XRPD) 177
IV.3 Results 178
IV.3.1 Solubility in aqueous media 178
IV.3.2 Dissolution 182
IV.3.3 Crystal structures 187
IV.3.4 Fourier Transform Infrared Spectroscopy 189
IV.3.5 Differential Scanning Calorimetry 190
IV.3.6 X-Ray Powder Diffraction 192
IV.4 Discussion and conclusions 193
Chapter V: In silico evaluation of talinolol sustained-release tablets.... 196
V.1 Introduction 196
V.2 Materials and methods 199
V.2.1 Computer hardware and software 199
V.2.2 Input parameters for simulations of talinolol IR and CR dosage forms 199
V.2.2.1 Compound properties 199

Table of contents
VI
V.2.2.2 Physiology of the gastrointestinal tract 201
V.2.2.3 Pharmacokinetic properties of the compound 203
V.2.2.4 Drug release profile of controlled-release dosage forms 205
V.2.3 Evaluation of the software 208
V.3 Results and discussion 209
V.3.1 Selection of an adequate compartment model 209
V.3.2 Optimization of clearance, volume of central compartment and effective
permeability 210
V.3.3 Optimization of the transporter parameters Km and Vmax 211
V.3.4 Simulations with immediate-release dosage forms containing 25 mg,
50 mg, 100 mg, and 400 mg talinolol 213
V.3.5 Simulations for talinolol controlled-release dosage forms 218
V.4 Conclusions 223
Summary … … … … … … … … .......................................................................... 225
Zusammenfassung … … … ............................................................................ 227
Annex I: Production of clinical trial formulations according to the
rules of Good Manufacturing Practice (GMP) in university
laboratories ............................................................................. 230
AI.1 Introduction 230
AI.2 Regulatory aspects of manufacture and handling of drug products in
Germany 232
AI.3 Basic GMP principles 241
Table of contents
VII
AI.4 Precise steps for the implementation of GMP in university laboratories 247
AI.4.1 General considerations 247
AI.4.2 Documentation-related measures 247
AI.4.2.1 Room concept 247
AI.4.2.2 Personal structure 249
AI.4.2.3 Standard Operating Procedures (SOP`s) 251
AI.4.2.4 Manufacturing and testing instructions 255
AI.4.3 Personnel and education 256
AI.4.4 Specific requirements for the production and packaging room 257
AI.4.5 Analytical instruments and test apparatus 259
AI.5 Summary 260
AI.6 Appendix to Annex I 261
Annex II: Preparations for a human in vivo study with talinolol
sustained-release tablets........................................................ 283
Acknowledgements … … . ............................................................................. 315
References … … … … … … . ............................................................................. 316
Original Data … … … … … … ........................................................................... 343
List of publications, lectures and poster presentations........................... 348
Curriculum Vitae … … … … ............................................................................ 351
Abbreviations
1
Abbreviations
° C degree(s) Celsius
ABC ATP-binding cassette
ADP adenosine diphosphate
AMG Arzneimittelgesetz
(German law on
Pharmaceuticals)
approx. approximately
ATG atmosphere gauge
ATP adenosine triphosphate
AWD Arzneimittelwerk Dresden
BA bioavailability
BfArM Bundesinstitut für Arzneimittel
und Medizinprodukte
BBB blood brain barrier
CL clearance
Cmax maximum plasma concentration
CNS central nervous system
cp compare to / with
CR controlled-release
Da Dalton
e.g. example given, for example
EU European Union
Fa fraction absorbed
FaSSIF Fasted-State Simulated
Intestinal Fluid
FeSSIF Fed-State Simulated Intestinal
Fluid
FDA Food and Drug Administration
g gram(s)
GDR German Democratic Republic
GI-tract gastrointestinal tract
GMP Good Manufacturing Process

Abbreviations
2
h hour(s)
HPMC hydroxypropylmethylcellulose
i.e. which means (from lat.: id est)
IR immediate release
JPE Japanese Pharmaceutical
Excipients
Km Michaelis-Menten constant
l liter(s)
log P logarithm of the partition
coefficient P
MDR multi drug resistance
min minute(s)
mol mole, 6x10²³ particles
Mr molecular weight
MRT mean residence time
N Newton
n.a. not available
N.N. name not (yet) known
(from lat.: nomen nescio)
P partition coefficient
p.o. peroral, per os (lat.)
Peff effective permeability
PEI Paul Ehrlich Institut
P-gp P-glycoprotein
pH potentia hydrogenii (lat.)
PharmBetrV Betriebsverordnung für
Pharmazeutische Unternehmer
(German ordinance for
Pharmaceutical entrepreneurs)
Ph.Eur. European Pharmacopeia
PIC Pharmaceutical Inspection
Convention
pKa coefficient for the acidity of a
substance

Abbreviations
3
p.a. pro analysi
R2 coefficient of determination
resp. respectively
SD standard deviation
SDS sodium dodecylsulfate
sec second(s)
SOP Standard Operating Procedure
t1/2 half-life
tmax time until Cmax is reached
US(A) United States (of America)
USP United States Pharmacopeia
Vc / VD Volume of distribution
Vmax maximum velocity
WHO World Health Organisation

Chapter I: Introduction and aim of the thesis
4
Chapter I

Chapter I: Introduction and aim of the thesis
5
Chapter I
Introduction and aims of the doctoral thesis
Peroral administration has been the most common route for the application of drugs
for decades and continues to be at present time. Obvious advantages of peroral
dosage forms are the high patient compliance in combination with a simple, cost-
efficient manufacturing process. As a consequence, the design of a peroral dosage
form is the first choice for most new chemical entities to be introduced to the market.
Besides the development of formulations for newly developed drugs, the optimization
of dosage forms for well-established drugs is another goal for the design of new
peroral drug products. Such optimizations can include an improvement of
bioavailability, a reduction of side-effects or a decrease in the frequency of
administration. Generally, the design of new dosage forms should be based on the
pharmacokinetic and pharmacodynamic properties of the drug. Information should be
provided on the absorption mechanism, which can be a source of insufficient
bioavailability. Passive diffusion through biological membranes has been adressed as
one important mechanism in drug absorption. Besides passive absorption, active
transport processes mediated by transporters and pumps play an important role in
the absorption of nutrients from the intestine into the blood circulation. This may as
well be applicable for the absorption of drugs, which show affinity to intestinal
transporters.
A considerable number of transporters may increase the absorption of drugs, in
particular those compounds, for which passive diffusion is too low to be of relevance,
due to e.g. a large molecular weight or low partition coefficient. Moreover, a number
of transporters are described, that facilitate transport in the opposite direction, by
secretion of drug molecules from the interior of enterocytes back into the intestinal
lumen. This phenomenon is also refered to as intestinal drug efflux. The best-known
efflux pump in the human intestine is P-glycoprotein (P-gp). This transporter has
originally been studied due to its high expression in cancer cells, where it acts as a
mediator for multi-drug resistance (MDR). Two clinically relevant aspects should be
considered for drugs that are substrates of P-glycoprotein: On the one hand,

Chapter I: Introduction and aim of the thesis
6
intestinal secretion may result in a decreased bioavailability, and on the other hand,
the transporters mediating the intestinal drug efflux are saturable, which can result in
a dose-dependent, non-linear absorption. Such phenomena should be addressed for
in the design of oral dosage forms for P-glycoprotein substrates.
Chapter I: Introduction and aim of the thesis
7
I.1 The phenomenon of intestinal drug efflux
The cascade of events determining the systemic availability of drugs following peroral
administration has been studied extensively in the past. Although many aspects are
well-known today, for some drugs, the process leading to drug absorption and
bioavailability needs further examination since it is relatively complex. Some of the
mechanisms may involve poor compound solubility in the gastrointestinal fluids, poor
permeability across the gastrointestinal epithelium, insufficient stability in some
gastrointestinal segments including enzymatic and non-enzymatic degradation,
complexation, as well as, in some cases, pronounced hepatic first-pass extraction.
The possible mechanisms involved in the permeation of drugs across the intestinal
epithelium have in many cases been well defined. These include paracellular and
transcellular pathways of membrane permeation, whereby the contribution of the
paracellular pathway to the total transmembraneous drug flux is regarded as being of
limited relevance in most cases. The transcellular pathway involves partitioning of
drugs into the lipophilic epithelium and diffusion across the membrane, a process
which has already been described 100 years ago by the classical works of E.
Overton and H. Meyer [Kleinzeller (1999)]. It is also well recognized that forces
generated by transport systems intrinsic to the membrane can drive the epithelial
transport of several drugs [Tsuji, A. and I. Tamai (1996)]. In these cases, a substance
appears to permeate a biological membrane at a different rate than anticipated from
its molecular size and hydrophobicity alone, when employing the relationship
between permeability and hydrophobicity. Such stoichiometric transport systems are
carriers and pumps. Carriers may be involved in three kinds of transport processes:
facilitated diffusion, cotransport (symport) and countertransport (antiport).
Cotransporters and countertransporters can perform “secondary active transport” by
using energy from the downhill transport of one transported substrate to drive the
uphill transport of another transported substrate. Pumps are distinguished from
carriers by the linkage of transport to an external source of energy, provided by the
hydrolysis of a phosphate bond and leading to the generation of ADP from ATP.
Pumps perform “primary active transport”.
Chapter I: Introduction and aim of the thesis
8
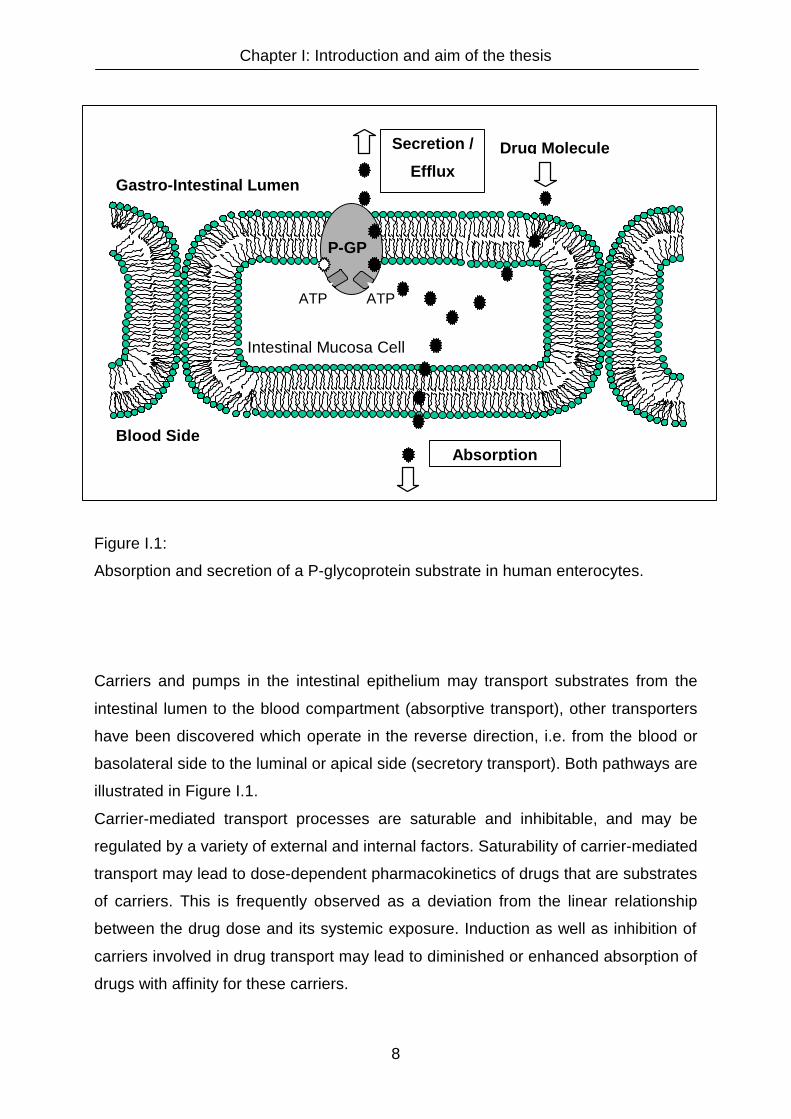
Figure I.1:
Absorption and secretion of a P-glycoprotein substrate in human enterocytes.
Carriers and pumps in the intestinal epithelium may transport substrates from the
intestinal lumen to the blood compartment (absorptive transport), other transporters
have been discovered which operate in the reverse direction, i.e. from the blood or
basolateral side to the luminal or apical side (secretory transport). Both pathways are
illustrated in Figure I.1.
Carrier-mediated transport processes are saturable and inhibitable, and may be
regulated by a variety of external and internal factors. Saturability of carrier-mediated
transport may lead to dose-dependent pharmacokinetics of drugs that are substrates
of carriers. This is frequently observed as a deviation from the linear relationship
between the drug dose and its systemic exposure. Induction as well as inhibition of
carriers involved in drug transport may lead to diminished or enhanced absorption of
drugs with affinity for these carriers.
P-GP
Gastro-Intestinal Lumen
Blood Side
Intestinal Mucosa Cell
ATP ATP
Drug Molecule
Absorption
Secretion /
Efflux

Chapter I: Introduction and aim of the thesis
9
I.2 Carriers involved in intestinal drug efflux
More than 25 years ago, the existence of carriers involved in the secretion of organic
molecules from the blood into the intestinal lumen was described for the first time. In
1975, Lauterbach [Lauterbach, F. (1975)] reported of intestinal carrier-mediated
secretion of cardiac glycosides and the organic cations tetraethylammonium bromide,
N-methylnicotinamide and N-methylscopolamine. It was also pointed out, that
sulfanilic acid at low concentrations is preferentially transported in the secretory
direction, a process which can be inhibited by toluene sulfonate and metabolic
inhibitors. In principle, it has become clear that the intestine, primarily being regarded
as an absorptive organ, is as well prepared for elimination of certain organic acids,
bases and neutral compounds, depending on their affinity to intestinal carrier systems
[Schwenk, M. (1987)]. The reason for that is the fact that several of the transport
systems known to mediate efflux in the major clearing organs - liver and kidney - are
also expressed in the intestine [Arimori, K. and M. Nakano (1998)].

Chapter I: Introduction and aim of the thesis
10
I.2.1 The intestinal efflux pump P-glycoprotein
The best characterized example for an efflux pump located in the intestine is P-
glycoprotein, a glycosylated membrane protein consisting of 1280 amino acids with
12 hydrophobic, helical transmembrane segments, two intracellular ATP binding sites
and a molecular weight (Mr) of 170 Da. Its structure is depicted in Figure I.2.
Figure I.2:
Structure of P-glycoprotein.
P-glycoprotein is physiologically expressed in the apical membrane of mucosal cells
of the small and large intestine as well as at the luminal membrane of proximal
tubular cells in the kidney, the biliary canalicular membrane of hepatocytes, at the
blood-brain barrier (BBB), in capillary endothelial cells of testis, the adrenal gland,
and the endometrium of the pregnant uterus. P-glycoprotein plays a role in the
excretion of toxic substances in the kidneys and in the liver. At the blood-brain-
barrier, it prevents entrance of drugs to the central nervous system (CNS). In the
intestine the P-glycoprotein mediated efflux can reduce the bioavailability of drugs
that are administered perorally. Additionally, P-glycoprotein is discussed as a source
for a number of interactions between different P-glycoprotein substrates due to a
displacement from the carrier [Gramatté, T. and R. Oertel (1999), Westphal, K., A.
Weinbrenner, et al. (2000a), Westphal, K., A. Weinbrenner, et al. (2000b)]. Besides
Chapter I: Introduction and aim of the thesis
11
drug-drug interactions, also interactions with food components, e.g. ingredients of
grapefruit juice [Kane, G. C. and J. J. Lipsky (2000), Spahn-Langguth, H. and P.
Langguth (2001)] or apricot extract [Deferme, S., R. Mols, et al. (2002)], have been
discussed. A recent review on interactions mediated by inhibition and induction of P-
glycoprotein was published by Lin [Lin, J. H. (2003)].
Before becoming an issue for biopharmaceutics, research in the area of P-
glycoprotein-related drug efflux was to a large part related to its involvement in the
development of multidrug-resistance in cancer chemotherapy [Sikic, B. I. (1999)]. P-
glycoprotein (Multidrug resistance protein) like the multidrug resistance associated
proteins (MRP´s) belong to the family of ATP-binding cassette (ABC) transporters,
members of which are also involved in the resistance of plasmodium falciparum to
chloroquine and the development of resistance towards antibiotics to prokaryotic as
well as eukaryotic cells [Van Bambeke, F., E. Balzi, et al. (2000)]. The biochemistry,
pharmacology and structure-activity relationships of P-glycoprotein and its substrates
have been described in a number of publications [Ambudkar, S. V., S. Dey, et al.
(1999), Chin, J. E., R. Soffir, et al. (1989), Hrycyna, C. A., M. Ramachandra, et al.
(1999), Leveille-Webster, C. R. and I. M. Arias (1995), Neuhoff, S., P. Langguth, et
al. (2000), Schinkel, A. H., E. Wagenaar, et al. (1995), Seelig, A., X. L. Blatter, et al.
(2000), Seelig, A. and E. Landwojtowicz (2000), Wacher, V. J., C. Y. Wu, et al.
(1995)].
Presumably due to its very broad substrate “specificity”, P-gp-mediated transport
processes have been reported for a variety of drugs including e.g., vincristine,
vinblastine, doxorubicin, daunorubicin, etoposide, paclitaxel, cyclosporine A,
ketoconazole, verapamil, digoxin, aldosterone, cortisole, dexamethasone, cimetidine,
ranitidine, salbutamol, talinolol, celiprolol, domperidone, phenytoin, ondansetron,
loperamide, morphine, atorvastatin, fexofenadine, trospium. Clearly it can be seen
that P-glycoprotein does not discriminate between substrates carrying different
charges, since e.g., trospium, talinolol and cimetidine are either completely (trospium)
or in part (talinolol, cimetidine) positively charged at physiological pH, fexofenadine
and atorvastatin carry negatively charged carboxyl groups and also neutral
compounds may show affinity (e.g., digoxin, cyclosporine A).

Chapter I: Introduction and aim of the thesis
12
I.2.2 Other transporters involved in intestinal drug efflux
The transport of several organic anions is mediated by members of the multidrug
resistance protein family (MRP). This family contains at minimum six members
(MRP1-MRP6) [Borst, P., R. Evers, et al. (1999)], and has previously been described
to show ATP-dependent, primary active transport of various glutathione, sulphate and
glucuronide conjugates and organic anions, for example quercetin 4'-β-glucoside
[Walgren, R. A., K. J. Karnaky, Jr., et al. (2000)], methotrexate [Bakos, E., R. Evers,
et al. (2000)], pravastatin [Yamazaki, M., S. Akiyama, et al. (1997)], etoposide
[Wijnholds, J., E. C. deLange, et al. (2000)] and cisplatin following complexation with
glutathione [Kool, M., M. de Haas, et al. (1997)]. MRP can even extrude neutral and
basic organic compounds if the cells contain normal levels of glutathione [Loe, D. W.,
R. G. Deeley, et al. (1998), Renes, J., E. G. de Vries, et al. (1999)]. MRP1, MRP4
and MRP5 RNAs are widely distributed in the body, whereas MRP2, MRP3 and
MRP6 appear mainly in the liver, kidney and gut [Borst, P., R. Evers, et al. (1999)]. Of
these, MRP1 and MRP2, like P-glycoprotein, are expressed at the apical membrane
of polarized monolayers, whereas MRP3 is located at the basolateral membrane,
transporting compounds from the cell interior to the blood compartment. Significant
tissue distribution of MRP1-RNA has been demonstrated in human stomach,
duodenum and colon [Kool, M., M. de Haas, et al. (1997)].
Intestinal secretion of phase II metabolites may also be subject to binding and
transport via the breast cancer resistance protein (BRCP), which is an ATP-binding
cassette “half-transporter” responsible for the cellular extrusion of some compounds
such as topotecan. It is located on the luminal membrane of the small intestine
[Allikmets, R., L. M. Schriml, et al. (1998), Ross, D. D., W. Yang, et al. (1999),
Suzuki, H. and Y. Sugiyama (2000)].
Unlike P-glycoprotein and MRP´s, which are ATP dependent extrusion pumps, the
organic cation transporter (OCT) family includes OCT´s which represent an
electrogenic import system for organic cations from the aqueous phase of the
extracellular fluid into cells. Members of this family currently include OCT1, OCT2,
OCT3 and OCTN1 and OCTN2. In the intestine, rOCT1 has been found to be
localized at the basolateral membrane of small intestinal enterocytes [Koepsell, H.
(1998)] mediating the facilitated transport of substrates into enterocytes. In addition,
OCTN2 has been mentioned to be expressed in the intestine [Wu, X., W. Huang, et

Chapter I: Introduction and aim of the thesis
13
al. (1999)] among other tissues such as the kidney, the myocardium, the placenta
and in the cortex, hioppocampus, and cerebellum in the brain [Wu, X., W. Huang, et
al. (1999)]. rOCT1 accepts a variety of cationic substrates including 1-methyl-4-
phenylpyridinium acetate (MPP), N-1-methylnicotinamide (NMN), and choline (type 1
cations). OCTN2 is known as the sodium-dependent carnitine-transporter, which also
accepts tetraethylammonium (TEA) as a substrate and which may be inhibited by a
variety of organic cations, including desipramine, cimetidine, and clonidine [Wu, X.,
W. Huang, et al. (1999)]. Recently, it has been shown that several β-lactam
antibiotics carrying a quaternary nitrogen atom, e.g., cephaloridine, cefoselis,
cefepime and cefluprenam, are able to inhibit OCTN2, leading to carnitine deficiency
in patients [Ganapathy, M. E., W. Huang, et al. (2000)].
The intestinal secretion of organic anions has been demonstrated in several
laboratories e.g., recently, with β-lactam antibiotics [Saitoh, H., C. Gerard, et al.
(1996)], calcein [Fujita, T., H. Yamada, et al. (1997)] and furosemide [Flanagan, S. D.
and L. Z. Benet (1999)].
It is known that, in addition to MRP´s, other efflux transporters exist that can mediate
intestinal secretory transport of anions. The organic anion polypeptide (OATP) family
includes also a prostaglandin transporter (PGT) [Lu, R., N. Kanai, et al. (1996),
Tamai, I., J. Nezu, et al. (2000)]. From hydropathy analysis, all of these proteins are
predicted to have a twelve-transmembrane domain structure, which is a common
structural feature of transporter proteins [Tamai, I., J. Nezu, et al. (2000)]. Of these,
OATP-B, OATP-D, OATP-E and PGT have been found to be expressed in the human
small intestine and colon by RT-PCR. The range of substrates accepted is rather
broad and includes conjugated metabolites of steroid hormones (e.g., estrone-3-
sulfate), prostaglandins, bile acids, and anionic drugs. Recently, it was even reported,
that the polyspecific human organic anion transporting polypeptide (OATP-A), which
is predominantly found in liver and brain tissue, is able to transport type II organic
cations such as N-methyl-quinine and N-methyl-quinidine [van Montfoort, J. E., B.
Hagenbuch, et al. (1999)], indicating that the substrate specificity of these
transporters appears to extend beyond organic anions.
Besides the OATP-family, a possible role of anion exchanger AE2 as the intestinal
monocarboxylic acid/anion antiporter and its bi-directional functionality in facilitating
also the secretion of monocarboxylic acids from enterocytes to lumen has been
discussed [Yabuuchi, H., I. Tamai, et al. (1998)].
Chapter I: Introduction and aim of the thesis
14
Carrier-mediated transport processes of drugs may be further complicated by the fact
that substrates exist which show affinities to multiple carrier systems. This has been
described for the HMG-CoA reductase inhibitor atorvastatin which is secreted from
the enterocytes by P-glycoprotein and taken up by the H+-monocarboxylic acid
cotransporter (MCT) [Wu, X., L. R. Whitfield, et al. (2000)]. Similarly, fexofenadine
shows affinity to both, P-glycoprotein and OATP, thus providing an explanation for
the interaction of the antihistamine with other organic anions and cations [Cvetkovic,
M., B. Leake, et al. (1999)]. A significant number of bisubstrates, that interact with
renal contraluminal organic anion and organic cation transport systems, has been
published before [Ullrich, K. J., G. Rumrich, et al. (1993)].

Chapter I: Introduction and aim of the thesis
15
I.3 Models for the investigation of intestinal drug absorption and absorption
sites
To investigate drug absorption from the gastrointesinal tract, several models have
been established. The different approaches can be classified into in vitro, in situ and
in vivo models [Lennernas, H. (1998)]. Common in vitro techniques utilize everted gut
sacs, Ussing chambers or cell cultures.
As for cell cultures, the Caco-2 cell line, a human colonic adenocarcinoma cell line
expressing brush border membrane hydrolases and several transporters including P-
glycoprotein [Mohrmann, I., M. Mohrmann, et al. (1986), Inui, K., M. Yamamoto, et al.
(1992), Hunter, J., M. A. Jepson, et al. (1993)] is prevalently used [Hunter, J., B. H.
Hirst, et al. (1993), Hilgers, A. R., R. A. Conradi, et al. (1990), Artursson, P. and J.
Karlsson (1991)]. Although the cell line is derived from colonic tissue, it is applicable
for studying drug absorption from the small intestine due its predominating small
intestinal cell properties [Hunter, J., B. H. Hirst, et al. (1993)]. However, drawbacks of
the model are that it is static, paracellular absorption might be underestimated and
very low transport rates compared to the human small intestine are suggested
[Barthe, L., J. Woodley, et al. (1999)].
Ussing chambers were introduced by Ussing & Zehran in 1951 for studying the active
transport of sodium as a source of electric current in short-circuited, isolated frog skin
[Ussing, H. H. and K. Zerahn (1999)]. Later, these chambers were extensively used
for the study of ion transport across membranes. The Ussing chamber system uses
animal mucosal membranes mounted in diffusion cells [Larsen, E. H. (2002),
Tsutsumi, K., S. K. Li, et al. (2003), Soderholm, J. D., L. Hedman, et al. (1998)]. This
model can be useful to measure bidirectional transport, but sometimes tissue viability
is uncertain [Soderholm, J. D., L. Hedman, et al. (1998), Barthe, L., J. Woodley, et al.
(1999)].
Everted gut sacs of rats incubated in tissue culture media are employed in another
model for drug absorption studies. Results are reported to have a better
reproducibility compared to data obtained in Ussing chamber experiments. Other
advantages are the relatively large surface area available for absorption and the
presence of mucus and unstirred water layers. However, similar to the Ussing
chamber, the tissue viability is limited to approximately 2 hours. [Maurer, H. H. and A.
F. Rump (1991), Bouer, R., L. Barthe, et al. (1999), Sharma, P., H. Chawla, et al.

Chapter I: Introduction and aim of the thesis
16
(2002)]. A potential disadvantage of this approach is the presence of the muscularis
mucosa, which is usually not removed from everted sac preparations. This might
evoke an underestimation of the transport of compounds with a tendency to bind to
muscle cells [Le Ferrec, E., C. Chesne, et al. (2001)].
For investigations on the sites of absorption, cell cultures and everted sac models are
not suitable [Rouge, N., P. Buri, et al. (1996)]. Ussing chamber experiments can
provide limited information on altering permeabilities in different intestinal regions by
mounting tissues of specific gastrointestinal regions into the diffusion cells [Ungell, A.
L., S. Nylander, et al. (1998)]. However, conclusions from such in vitro experiments
on absorption sites in vivo may not be conclusive, especially when active transport
processes are involved in drug absorption. For a determination of absorption sites of
drugs, in situ and in vivo methods should be favoured.
In situ methods include single-pass perfusion, recirculating perfusion, oscillating
perfusion and closed-loop models [Doluisio, J. T., N. F. Billups, et al. (1969),
Schurgers, N., J. Bijdendijk, et al. (1986)]. A predetermined gastrointestinal segment
of a laboratory animal, such as a rat, rabbit, dog or monkey, is perfused with a drug
solution of known concentration. The absorbed fraction of a drug can be determined
either by measuring the concentration of the drug and its respective metabolites in
the blood or by measuring the amount of drug that has disappeared from the
perfusion solution during the perfusion experiment [Lennernas, H. (1998)]. By
calculation of permeability values for different perfused segments, in situ perfusion
studies can provide information on absorption sites of a drug [Langguth, P., H. P.
Merkle, et al. (1994)]. Due to interindividual differences from animal to animal it is
recommendable to determine permeability values for all potential absorption sites
simultaneously within the same animal [Lu, H. H., J. Thomas, et al. (1992), Hanafy,
A., P. Langguth, et al. (2001)]. Perfusion models are also suitable to detect saturable
transport mechanisms such as active transport in the absorptive and secretory
direction or gut wall metabolism [Sanchez-Pico, A., J. E. Peris-Ribera, et al. (1989)].
However, drawbacks of these animal models are the differences in anatomy and
physiology compared to humans. A review on pharmacokinetic differences and
similarities between typical laboratory animals and humans was published by Lin [Lin,
J. H. (1995)]. Comparisons between perfusion data obtained from jejunum and ileum
of rats and humans were reported by Sutcliffe et al. [Sutcliffe, F. A., S. A. Riley, et al.
(1988)]. When comparing human in vivo permeabilities in the jejunum with data

Chapter I: Introduction and aim of the thesis
17
obtained from several different preclinical models, Lennernas came to the conclusion
that in situ rat perfusion is an appropriate method for predicting human in vivo
permeability [Lennernas, H. (1997)].
In vivo methods established for the investigation of drug absorption sites in humans
feature the advantage of an optimal presence of all physiological factors with impact
on drug absorption. A disadvantage can be that results obtained from in vivo studies
do not provide sufficient mechanistic information on the absorption process due to a
complex overlapping of numerous factors influencing the drug absorption [Rouge, N.,
P. Buri, et al. (1996)]. A well established method to gain information on both, the
absorption process and the site of absorption, is the human intestinal perfusion
method. This technique uses a multiluminal tube which is placed in particular
segments of the gastrointestinal tract [Godbillon, J., D. Evard, et al. (1985), Gramatté,
T., E. el Desoky, et al. (1994), Gramatté, T. and K. Richter (1994), Gramatté, T., R.
Oertel, et al. (1996)]. Similar to the in situ perfusion in laboratory animals, the tube is
flushed with a solution of the test drug. The tube is also used to reaspirate the
perfusion solution, which can then be analysed in appropriate drug assays. The
disappearance of the drug from the solution as well as the drug concentration in
blood samples can be used to determine the amount of drug absorbed. To avoid
reflux of the drug solution beyond the desired segment and to exclude the contact
with enzymes or other secretions of segments distal to the prefused segment,
occlusive balloons can be employed [d'Agay-Abensour, L., A. Fjellestad-Paulsen, et
al. (1993), Lennernas, H. (1997), Vidon, N., D. Evard, et al. (1985)]. While human
perfusion experiments are well established for the detection of regional differences of
permeability in the small intestine, a perfusion of the colon is hardly feasible by an
intubation from the oral end. This is due to the enormous length of the tube
necessary to reach the colon, and the high viscosity of the luminal content that
hinders an aspiration of the perfusion solution from this segment.
Another method to examine regional differences in the absorption of a drug is its local
instillation to a specific site of the gastrointestinal tract via a catheter [Williams, M. F.,
G. E. Dukes, et al. (1992), Brockmeier, D., H. G. Grigoleit, et al. (1986a), Brockmeier,
D., H. G. Grigoleit, et al. (1986b)]. The site of instillation can be controlled either by
endoscopy, fluoroscopy or pH-monitoring. By this means absorption of the drug from
regions distal to the site of administration can be excluded [Rouge, N., P. Buri, et al.
(1996)]. This method provides only little mechanistic information on the absorption

Chapter I: Introduction and aim of the thesis
18
process, when only the final concentration of the drug in the blood is measured.
Conclusions regarding intestinal drug efflux or gut wall metabolism are hardly
possible. Another drawback is that an endoscopic localisation of the tube is generally
combined with a cleansing of the large intestine, resulting in non-physiological
experimental conditions [Gleiter, C. H., K. H. Antonin, et al. (1985)].
The administration of a drug to a specific site of the gastrointestinal tract can also be
performed using a high-frequency (HF) capsule. This capsule with a size of 12 mm
by 28 mm contains a latex balloon with a dissolved or suspended drug, that is
ruptured by a high-frequency signal, as soon as the capsule has reached the desired
site of drug administration [Staib, A. H., D. Beermann, et al. (1989), Harder, S., U.
Fuhr, et al. (1990), Fuhr, U., A. H. Staib, et al. (1994)]. The location of the capsule
during its transit through the gastrointestinal tract is traced by X-ray. This method is
also not adequate for mechanistic studies of the absorption process for the same
reason described under local instillation via catheters.
Another method used for investigations on the absorption site of drugs is to trace an
administered controlled-release dosage form via pharmacoscintigraphy [Kenyon, C.
J., F. Brown, et al. (1998), Kenyon, C. J., R. V. Nardi, et al. (1997), Wilding, I. R., J.
G. Hardy, et al. (1991), Wilding, I. R., S. S. Davis, et al. (1995)]. The gamma radiation
emitted by tracers incorporated within the preparation (e.g. indium-111 [Wilding, I. R.,
S. S. Davis, et al. (1991)], samarium-153 or erbium-171 [Wilding, I. R., S. S. Davis, et
al. (1995)]), without having an apparent impact on the formulation properties, allows
one to observe the transit of the controlled-release product. Such studies provide an
insight into the fate and integrity of delivery systems and enable the detection of the
site of drug release from the dosage form [Wilding, I. R., A. J. Coupe, et al. (2001)].
In combination with measurements of drug concentrations in the blood, regional
differences in drug absorption can be demonstrated.
However, all in vivo methods described are not practical for screenings or routine
use, since the complex techniques are cost-intensive, time-restrictive, and require
approval by ethics commitees [Ungell, A.-L. (1997), Le Ferrec, E., C. Chesne, et al.
(2001)].

Chapter I: Introduction and aim of the thesis
19
I.4 Regional differences in drug absorption
In 1985 Brockmeier et al. stated that little was known about the local absorption
characteristics along the gastrointestinal tract for most drugs [Brockmeier, D., H. G.
Grigoleit, et al. (1985)]. In the meantime, numerous studies have been published
using the different techniques desribed in the last section. For several drugs no
relevant differences between the observed gastrointestinal segments could be
demonstrated: In human perfusion studies, for example, Gramatté et al. found that
absorption of paracetamol was similar from the proximal and distal small intestine
[Gramatté, T. and K. Richter (1994)]. With the same technique, Delchier et al. found
similar absorption rates for nicardipine from the jejunum and ileum [Delchier, J. C., M.
Guerret, et al. (1988)]. By means of the local instillation technique, Tay et al.
demonstrated a consistent absorption of gepirone throughout all parts of the small
intestine [Tay, L. K., F. Dixon, Jr., et al. (1992)]. However, in a number of studies
published, more or less distinct site specific differences of drug absorption have been
demonstrated. Amongst others, d'Agay-Abensour et al. found in human perfusion
experiments that the absorption of 1-deamino-8-D-arginine vasopressin decreased in
the order of stomach, duodenum and jejunum > distal ileum > proximal colon
[d'Agay-Abensour, L., A. Fjellestad-Paulsen, et al. (1993)]. Barr et al. reported a
decreased absorption of amoxicillin from the ileum compared to jejunum and ileum.
In colon no amoxicillin absorption could be observed [Barr, W. H., E. M. Zola, et al.
(1994)]. Jobin et al. and Godbilon et al. demonstrated that metoprolol was absorbed
similarly from jejunum and colon but no absorption was observed from the stomach
[Jobin, G., A. Cortot, et al. (1985), Godbillon, J., D. Evard, et al. (1985)]. Ranitidine
also shows site dependent differences in drug absorption, as reported by Williams et
al. and Gramatté et al. [Williams, M. F., G. E. Dukes, et al. (1992), Gramatté, T., E. el
Desoky, et al. (1994)]. Williams et al. reported a similar absorption after local
instillation of ranitidine into the stomach and the ileum, but slower absorption when
the drug was instilled into the caecum. The results were confirmed and specified by
the in vivo human perfusion studies performed by Gramatté et al., who found that the
absorption rate of ranitidine decreased with the distance of the perfusion site from the
mouth. Other examples of drugs with regional differences in rate and extent of
absorption are allopurinol [Schuster, O., M. Haertel, et al. (1985)], benazepril [Chan,
K. K., A. Buch, et al. (1994)], ciclosporine [Drewe, J., C. Beglinger, et al. (1992)],

Chapter I: Introduction and aim of the thesis
20
ciprofloxacin [Staib, A. H., D. Beermann, et al. (1989), Harder, S., U. Fuhr, et al.
(1990)], glibenclamide [Brockmeier, D., H. G. Grigoleit, et al. (1985)], piretanide
[Brockmeier, D., H. G. Grigoleit, et al. (1986a), Brockmeier, D., H. G. Grigoleit, et al.
(1986b)], and sumatriptan [Warner, P. E., K. L. Brouwer, et al. (1995)].
The observed regional differences in drug absorption can be associated with different
phenomena. Generally, the extent of drug absorption in a particular gastrointestinal
segment is determined by the rate of absorption, the available surface area and the
transit time through the segment. Due to its large surface area, the small intestine is
expected to be the primary absorption site for many drugs [Davis, S. S., J. G. Hardy,
et al. (1986)]. However, there are examples of drugs reported in literature that are
absorbed from the colon to a relevant extent, e.g. glibenclamide [Brockmeier, D., H.
G. Grigoleit, et al. (1985)], theophylline [Yuen, K. H., A. A. Desmukh, et al. (1993)],
acetaminophen and phenylpropanolamine [Ishibashi, T., K. Ikegami, et al. (1999)]. In
this case the high residence time in the large intestine compared to the small
intestine might compensate for the less optimal surface area available for absorption
in the large intestine [Waterman, K. C. and S. C. Sutton (2003)].
I.5 Sources of regional differences in drug absorption
Different mechanisms can be involved in the absorption of drugs from the
gastrointestinal tract, including passive transcellular diffusion, paracellular diffusion,
endocytosis and active transport, both in the absorptive and the secretory direction.
For some drugs absorption is mediated by one of these routes exclusively, for others
two or more mechanisms overlap.
Some absorption mechanisms provide potential explanations for regional differences
in the rate and extent of drug absorption.

Chapter I: Introduction and aim of the thesis
21
I.5.1 Passive diffusion
As for passive diffusion, the pH partition hypothesis [Crevoisier, C. and P. Buri
(1976)] suggests a preferred absorption of acidic drugs in proximal regions of the
gastrointestinal tract and an increased absorption of basic drugs in more distal
regions. This is due to the pH gradient in the gastrointestinal fluids which alters the
ratio between the protonated and unprotonated form of acidic and basic drugs. Since
an absorption of ionized compounds is assumed to be negligible in most cases, this
ratio determines the amount of drug absorbed in a specific region of the
gastrointestinal tract. Examples for this phenomenon are the basic β-adrenoceptor
antagonists metoprolol (pKa: 9.5) and oxprenolol (pKa: 9.7) that are well absorbed
from duodenum and jejunum but show no apparent absorption from the acidic milieu
of the stomach [Jobin, G., A. Cortot, et al. (1985), Vidon, N., R. Palma, et al. (1986)].
However, these effects are based on pH-dependent differences in the lipid solubility
of ionizable drugs and are not due to altered permeabilities of a specific substance in
different segments of the gastrointestinal tract. Therefore, regional differences in the
absorption of acidic and basic drugs will predominantly follow the rule described
above, as long as the solubility and octanol-water partitioning remain sufficiently high
over the physiological pH range of the gastrointestinal tract. For many drugs,
however, this is not a realistic assumption [Brockmeier, D., H. G. Grigoleit, et al.
(1985)].
I.5.2 Paracellular absorption
Another possible source for regional differences in the absorption of drugs is the
paracellular route. Instead of crossing the epithelial cells of the gastrointestinal
tissues, substances can migrate across pores between the cells to be absorbed. This
process is limited by transmembraneous proteins that are located between epithelial
cells. These so-called tight junctions decrease the porosity of the epithelial cell
layers, such that the paracellular route is only accesible to water and small
hydrophilic molecules. This absorption mechanism is assumed to be of minor
importance for the absorption of most drugs. However, it is considered to have a
relevance for the absorption of hydrochlorothiazide, cimetidine, 5-amino salicylic acid,
Chapter I: Introduction and aim of the thesis
22
small peptides and nucleoside analogues [Zhou, S. Y., N. Piyapolrungroj, et al.
(1999), Thwaites, D. T., B. H. Hirst, et al. (1993), He, Y. L., S. Murby, et al. (1996),
Lang, V. B., P. Langguth, et al. (1997), Park, G. B. and A. K. Mitra (1992)]. As the
junctions between the epithelial cells become progressively tighter from the small
intestine to the colon, the paracellular permeability decreases in that direction. This
phenomenon is reported as an explanation for the decreasing permeability from
jejunum to colon for hydrophilic β-adrenoceptor antagonists such as atenolol [Sasaki,
H., Y. Igarashi, et al. (1994)].
I.5.3 Active transport processes
For several drugs carrier-mediated transport is the major mechanism of absorption,
for others it provides an additional absorption or secretion pathway. In both cases the
saturability of the transporter can result in non-linear pharmacokinetics and dose-
dependent absorption. When the transporter carries the drug from the luminal side of
the gastrointestinal tract to the blood side, a saturation of the carrier system might
result in decreasing absorption with increasing doses, as described for cefatrizine
[Yu, L. X. and G. L. Amidon (1998)]. In case of drug efflux carriers, increased
absorption is assumed for increasing doses, as found for talinolol [Wetterich, U., H.
Spahn-Langguth, et al. (1996)]. For compounds undergoing carrier-mediated active
transport in the absorptive direction, differences in the expression of the particular
transporters throughout the gastrointestinal tract account for altered absorption from
the respective region. When mechanisms apart from active transport play a negligible
role in the overall absorption of a drug, any lack of expression of the carrier will result
in the occurrence of so-called absorption windows. Absorption windows related to
varying carrier expression have been been reported for furosemide [Ritschel, W. A.,
A. Menon, et al. (1991)], riboflavin [Levy, G. and W. J. Jusko (1966), Klausner, E. A.,
E. Lavy, et al. (2002)], levodopa [Deleu, D., M. G. Northway, et al. (2002), Klausner,
E. A., S. Eyal, et al. (2003)] and several β-lactam antibiotics [Barr, W. H., E. M. Zola,
et al. (1994), Sanchez-Pico, A., J. E. Peris-Ribera, et al. (1989), Li, Y. H., K. Ito, et al.
(1999), Yu, L. X. and G. L. Amidon (1998), Bretschneider, B., M. Brandsch, et al.
(1999), Terada, T., H. Saito, et al. (1997a), Terada, T., H. Saito, et al. (1997b)], such
Chapter I: Introduction and aim of the thesis
23
as amoxicillin, carindacillin, cefadroxil and cefatrizine. These drugs show site-specific
absorption in upper parts of the gastrointestinal tract due to a lack of respective
carriers (i.e. the amino acid transport systems LAT-2 and b0+ for levodopa [Gomes,
P. and P. Soares-da-Silva (2002)], and the peptide transporters PEPT-1 and PEPT-2
for β-lactam antibiotics [Bretschneider, B., M. Brandsch, et al. (1999)]) in lower
intestinal segments [Sanchez-Pico, A., J. E. Peris-Ribera, et al. (1989), Ziegler, T. R.,
C. Fernandez-Estivariz, et al. (2002)].
For active transport processes in the secretory direction (i.e. intestinal drug efflux) no
information is available in the literature dealing with a potential correlation between
regional differences in the expression of the efflux pump P-glycoprotein within the
gastrointestinal tract and regional differences in the absorption of P-glycoprotein
substrates. However, opposite to the findings reported for substances transported by
carriers from the luminal side to the blood side, the absorption of P-glycoprotein
substrates must be assumed to decrease in regions with higher carrier expression.
Reports on the distribution of P-glycoprotein are controversial. In a permeation study
of the rat intestine Saitoh et al. found indications for a greater efflux in duodenum and
jejunum compared to ileum and colon [Saitoh, H. and B. J. Aungst (1995)]. Other rat
experiments published by Nakayama et al. suggested the highest efflux in jejunum
[Nakayama, A., H. Saitoh, et al. (2000)]. The results from rat studies published by
Tamura, et al. and Makhey et al. are in contrast to these findings. Both working
groups found that the P-glycoprotein function in ileum and colon was higher than in
more proximal parts of the gastrointestinal tract [Tamura, S., A. Ohike, et al. (2002),
Makhey, V. D., A. Guo, et al. (1998)]. These findings are in accordance with studies
in catfish, reported by Kleinow et al., who observed increasing P-glycoprotein levels
from proximal to distal regions of the intestine [Kleinow, K. M., A. M. Doi, et al.
(2000)]. Finally, these results are in agreement with the PCR experiments published
by Brady et al., who found that mdr1-mRNA levels in rat intestinal tissues increased
from duodenum to jejunum and ileum. The highest mRNA levels were reported for
the large intestine [Brady, J. M., N. J. Cherrington, et al. (2002)]. The protein
expression of P-glycoprotein in micropigs, however, was reported to be higher in
proximal parts of the intestine than in more distal parts [Tang, H., Y. Pak, et al.
(2002)]. The inconsistent results underline the demand for further investigations in
this field.
Chapter I: Introduction and aim of the thesis
24
I.6 Consequences for dosage form design
For several drugs regional differences in drug absorption result in decreased
bioavailabilities. Therefore, one argument for the design of new controlled-release
(CR) dosage forms can be an optimization of the drug delivery on the basis of the
knowledge on preferred absorption sites for a specific drug [Klausner, E. A., S. Eyal,
et al. (2003)]. When the occurrence of an absorption window limits the bioavailability
of a drug, the goal for the design of an optimized dosage form is to increase the
residence time within the gastrointestinal segment of preferred absorption. In
literature, dosage forms are described that provide a targeted delivery of a drug to
any of the three segments of the gastrointestinal tract, namely the stomach, the small
and the large intestine [Rouge, N., P. Buri, et al. (1996)].
I.6.1 Gastroretentive dosage forms
Transit times of dosage forms through the gastrointestinal tract are variable. In case
of site-specific absorption the residence times at the prefered absorption sites may
be too short for a complete absorption of a drug. In these instances, site-specific
controlled-release formulations can improve the bioavailabilty of a drug. For drugs
with absorption windows in the upper gastrointestinal tract one approach is to
increase the gastric residence time by administration of gastroretentive dosage
forms. Such formulations are also suitable to increase the bioavailability of drugs that
are hardly soluble in intestinal fluids, but dissolve in the acidic gastric juice, e.g.
diazepam, chlordiazepoxide, verapamil or cinnarizine [Sawicki, W. (2002), Machida,
Y., K. Inouye, et al. (1989)]. Gastroretentive dosage forms are retained in the
stomach. From there, the incorporated drug can be either absorbed directly, when
the stomach is the prefered absorption site, or, the dissolving drug in the stomach
provides a continuous supply of dissolving drug for the small intestinal absorption
sites, when the site of prefered absorption is located in the upper small intestine
[Hoffman, A. and D. Stepensky (1999)].
Different approaches have been reported to achieve gastroretentivity of a dosage
form. Swelling-controlled [Shalaby, W. S. and K. Park (1990)], buoyant [Hwang, S. J.,
Chapter I: Introduction and aim of the thesis
25
H. Park, et al. (1998), Sawicki, W. (2002), Baumgartner, S., J. Kristl, et al. (2000)],
and bioadhesive systems [Lehr, C. M. (1994)] are described. Other preparations
described in literature unfold to a size that prevents its passage through the pyloric
sphincter [Cargill, R., L. J. Caldwell, et al. (1988), Klausner, E. A., S. Eyal, et al.
(2003)]. For example, gastroretentive systems have been developed and tested for
verapamil [Sawicki, W. (2002)], furosemide [Menon, A., W. A. Ritschel, et al. (1994)]
and levodopa [Klausner, E. A., S. Eyal, et al. (2003), ]. Verapamil was a candidate for
a gastroretentive dosage form because of its higher solubility in the acidic pH of the
stomach, whereas for furosemide and levodopa the low absorbability in lower regions
of the gastrointestinal tract caused by the lack of carrier expression gave reason to
the development of gastroretentive preparations. However, it is necessary to
mention, that gastroretentive formulations are not recommendable for drugs that are
well absorbed along the entire gastrointestinal tract and undergo a significant gut wall
metabolism, such as nifedipine. The slow and consistent release from the dosage
form located in the stomach exposes the drug to a higher degree to metabolic
enzymes in enterocytes. The slow drug release leads to a drop of the drug
concentration in the gastrointestinal fluids below the saturation level of metabolising
enzymes. This can result in an increased first-pass metabolism and a reduced
bioavailability [Wilding, I. R., R. A. Sparrow, et al. (1992)].
I.6.2 Drug delivery to the small intestine
A targeted drug release in the small intestine may be achieved by enteric coatings
with excipients that dissolve in the upper small intestine. Such coatings may be
necessary when a drug is unstable in the gastric juices because of the acidity or the
presence of pepsin. Another reason for enteric coatings can be to prevent irritations
of the gastric mucosa caused by drugs such as non-steroidal anti-inflammatory drugs
(NSAIDs) [Gamst, O. N. (1992), Bechgaard, H., R. R. Brodie, et al. (1982)]. However,
absorption from enteric coated tablets is erratic and to a high degree dependent on
the gastric residence time [Ritschel, W. A., A. Menon, et al. (1991)]. Therefore, the
efficacy of enteric coatings is sometimes unreliable [Davies, N. M. (1999)].
Bioadhesive drug delivery systems have been developed to obtain a prolonged
contact with the mucosa of the small intestine and to improve the bioavailability of

Chapter I: Introduction and aim of the thesis
26
drugs with poor absorption in more distal parts of the gastrointestinal tract [Lehr, C.
M., J. A. Bouwstra, et al. (1992)]. However, a site specific adhesion of these systems
in a particular region of the gastrointestinal tract has not yet been demonstrated.
An example for the design of a controlled-release formulation for an actively
transported drug based on the knowledge on absorption windows, was published by
Hoffman et al.. In their development of an amoxicillin matrix tablet, designed to
minimize the administration frequency, the absorption window in the upper
gastrointestinal tract [Barr, W. H., E. M. Zola, et al. (1994)] was taken into account:
Compared to typical sustained-release formulations for other drugs, the drug release
from these matrix tablets was accelerated (50 % within 3 hours), as a tribute to the
higher expression of the peptide carrier in the upper small intestine. [Hoffman, A., H.
D. Danenberg, et al. (1998)].
I.6.3 Targeted colon delivery
A targeted delivery to the colon may be advantageous for the local treatment of
colonic diseases such as colitis ulcerosa, Crohn`s disease or colon cancer, to
prevent an absorption of the drug before the site of action is reached and / or to
minimize local adverse effects in more proximal regions of the gastrointestinal tract.
Furthermore, a targeted drug delivery to the colon may result in an improved
bioavailability for peptides and protein drugs that undergo acidic or enzymatic
degradation in the small intestine. For these drugs the colon is thought to be a
suitable absorption site due to its lower proteolytic activity [Rubinstein, A., B. Tirosh,
et al. (1997), Ishibashi, T., K. Ikegami, et al. (1999), Ritschel, W. A. (1991)].
Additionally, a few drugs are reported to be preferentially absorbed from the colon.
Examples for such drugs that are hence candidates for a site-specific drug release in
the colon are nisoldipine and dilazep [Rouge, N., P. Buri, et al. (1996)]. There are
different approaches to achieve a targeted colon delivery with peroral dosage forms.
Physiological specifities such as pH, gastrointestinal transit time and the typical
colonic microflora are utilized to release the drug in the colon. Due to high inter- and
intraindividual variabilities of the pH along the gastrointestinal tract and the
similarities between the pH of the small and the large intestine [Rouge, N., P. Buri, et
Chapter I: Introduction and aim of the thesis
27
al. (1996)], coatings that dissolve at pH values greater than 7.0 are not suitable to
ensure a targeted delivery to the colon [Ashford, M. and J. T. Fell (1994)]. Systems
featuring a combination of pH- and time-controlled release are assumed to be more
effective to prevent an early drug release in the small intestine. Such drug delivery
systems can be formulated as capsules or tablets. Ishibashi et al. described a
dosage form based on a common hard gelatin capsule, filled with the drug and
succinic acid as a pH adjusting agent. The capsule is triple coated with an acid
soluble layer based on Eudragit® E, a hydrophilic layer based on hydroxypropyl-
methylcellulose and an enteric layer based on hydroxypropyl-methylcellulose acetate
succinate. The three layers were designed to prevent a dissolution of the capsule
during the transit time through the stomach and the small intestine. By variation of the
thickness of the coating layers an onset time of three hours for the drug release after
leaving the stomach was achieved, which was in accordance with reported transit
times through the small intestine [Davis, S. S., J. G. Hardy, et al. (1986)]. The
formulation was assumed to be appropriate for a site-specific release in the colon
[Ishibashi, T., K. Ikegami, et al. (1999)]. A similar capsule-based formulation is the
Pulsincap system: An enteric coating enables an unaffected passage of the capsule
through the stomach. The water soluble cap of the capsule dissolves In the upper
small intestine, whereas the water insoluble body of the capsule that is filled with the
drug and sealed with a water swellable hydrogel plug does not dissolve. The onset
time for the drug release is determined by the water swellable plug [Wilding, I. R., S.
S. Davis, et al. (1992), Stevens, H. N., C. G. Wilson, et al. (2002)]. The coated core
tablet described by Gazzaniga et al. acts on a similar principle. The drug-containing
core is coated with two layers featuring different dissolution properties. The outer
enteric layer dissolves in the upper small intestine, the medium layer is water
swellable and determines the lag-time until the drug release starts. As for the
systems described before this lag-time is adopted to the small intestinal transit time
to ensure a site-specific delivery in the colon.
Other approaches utilize the increased number of microorganisms in the colon for
drug targeting. In a prodrug approach azo-, glucuronide- or dextran-conjugates of a
drug can be synthesized. After oral administration the active drug is released in the
colon after cleavage by azoreductases or polysacharidases that are produced by the
colonic microflora [McLeod, A. D., D. R. Friend, et al. (1994), Haeberlin, B., W.
Rubas, et al. (1993)]. On the other hand, a combination of an outer enteric coating

Chapter I: Introduction and aim of the thesis
28
layer with a second layer that is susceptible to bacterial degradation can be used to
deliver drugs to the colon. Such coatings can be based on azo-linked polymers [Van
den Mooter, G., C. Samyn, et al. (1995)] or lauric acid dextran esters [Kesslhut, J. F.
and K. H. Bauer (1994)]. A more detailed insight into targeted drug delivery to the
colon is given in a review published by Yang et al. [Yang, L., J. S. Chu, et al. (2002)].
I.6.4 Dosage form design for drugs undergoing intestinal drug efflux
As described in the last sections, several publications focus on the consequences of
carrier-mediated transport of drugs on the design of optimal dosage forms (e.g. β-
antibiotics and levodopa). In spite of the large number of P-glycoprotein substrates
reported in literature, until today no publication is dealing with the consequences of
intestinal P-gp-mediated efflux on dosage form design. Additionally, reports on the
distribution of P-glycoprotein throughout the gastrointestinal tract are controversial. A
lack of P-glycoprotein expression within a specific segment of the gastrointestinal
tract would suggest the development of controlled-release dosage forms targeted to
this specific region in order to avoid the absorption-limiting efflux. However, all
reports agree, that the efflux pump is expressed throughout the whole intestine, only
the findings concerning the ratio of the P-glycoprotein expression between different
segments vary. Therefore, P-glycoprotein substrates are no typical candidates for a
site-specific drug delivery in the intestine. Rather, the lack of P-glycoprotein
expression in the stomach suggests advantageous bioavailabilities for gastroretentive
dosage forms, provided that the respective drug can be sufficiently absorbed from the
stomach. Another drawback of this suggestion is that the active transport mediated
by P-glycoprotein is saturable. Therefore, a rapid exposure of the drug from a rapidly
dissolving immediate-release dosage form may result in high drug concentrations in
the intestine that exceed the saturation level of the transporter. In consequence, the
amount of drug undergoing an intestinal efflux is reduced. On the other hand, the
decreased drug release rate from a gastroretentive dosage form results in lower drug
concentrations in the gastrointestinal fluids. The dissolved drug leaves the stomach
and enters the small intestine where the drug undergoes P-glycoprotein mediated
efflux. When the decreased release rate from the gastroretentive dosage form lowers

Chapter I: Introduction and aim of the thesis
29
the concentrations below the saturation level of the transporter, an increased
contribution of the drug efflux to the overall absorption can be expected. As a result,
the bioavailability for such a dosage form might be decreased instead of increased.
This assumption is similar to the effect described by Wilding et al. who described a
decreased bioavailability for a gastroretentive nifedipine formulation. In this case, the
saturable process, limiting the bioavailability was gut wall metabolism. The slow drug
release lowered the concentrations below the saturation level of the metabolic
enzymes, resulting in an increase of the first-pass metabolism in the gut wall and a
decrease of the bioavailability [Wilding, I. R., R. A. Sparrow, et al. (1992)].
Another interesting approach for optimized dosage forms of P-glycoprotein
substrates with the aim of an increase in bioavailability is the incorporation of P-
glycoprotein inhibitors within the formulation. Substances such as PSC 833
(valspodar), VX-710 (biricodar), GF 120918 (elacridar), LY335979 (zosuquidar) or XR
9576 (tariquidar), that have been developed to overcome the multidrug resistance in
the therapy of cancer and that have proven a potent ability to inhibit P-glycoprotein in
clinical studies [Dantzig, A. H., D. P. de Alwis, et al. (2003)], could be considered for
this purpose. A relevant drawback of such an approach is the lack of specifity of most
of these substances which can result in an increased toxicity and the occurrence of
serious side effects. The inhibition of other active transport proteins might suppress
the absorption of vital food compounds or prevent the excretion of toxic substances.
In addition, the inhibition of metabolic enzymes has to be considered. An example for
the toxic potential of these strong P-glycoprotein inhibitors is reported by Huisman et
al.. In studies on the co-administration of saquinavir, ritonavir and elacridar using a
mouse model, he reported an increased mortality of the mice under treatment with
the P-glycoprotein inhibitor [Huisman, M. T., J. W. Smit, et al. (2003)]. As a safe
alternative, plant extracts, e.g. from apricots, grapefruits or green tea, could be
employed, that were shown to inhibit P-glycoprotein efflux. Various in vitro and in situ
experiments have indicated their potential to increase the absorption of P-
glycoprotein substrates [Deferme, S., R. Mols, et al. (2002), Spahn-Langguth, H. and
P. Langguth (2001), Jodoin, J., M. Demeule, et al. (2002)]. Moreover, there are
reports on P-glycoprotein inhibiting effects of pharmaceutical excipients, such as
polyethylene glycols, Cremophor EL® and Tween 80® [Hugger, E. D., B. L. Novak, et
al. (2002)]. However, these P-glycoprotein modulating properties were only
Chapter I: Introduction and aim of the thesis
30
demonstrated in in vitro studies with cell cultures, whether these excipients show
notable P-glycoprotein inhibiting effects in vivo has not yet been demonstrated.
Chapter I: Introduction and aim of the thesis
31
I.7 Aim of the thesis
The design of gastroretentive controlled-release dosage forms for P-glycoprotein
substrates is not considered suitable to decrease the influence of the intestinal drug
efflux and improve the bioavailability, as described in the last section. Nevertheless,
the general advantages of sustained-release dosage forms, such as better
compliance, reduced frequency of administration, reduction of side effects, etc., are
undoubted, for P-glycoprotein substrates as well as for many other drugs (cp.
introduction to Chapter III).
It was demonstrated in the last sections that specific absorption mechanisms, in
particular active transport processes, should be addressed in the design of optimized
dosage forms. This also applies to sustained-release dosage forms for P-glycoprotein
substrates. In their design, the intestinal drug efflux should be taken into account.
However, information on the impact of a sustained drug release on the intestinal
secretion does not exist.
The aim of this doctoral thesis was to characterize the influence of the decreased
drug release rate from sustained-release dosage forms on the intestinal drug efflux.
To reach this aim,
• the contribution of the intestinal drug efflux to the overall absorption in different
segments of the intestine should be determined,
• a sustained-release dosage form for a P-glycoprotein substrate should be
developed to enable an evaluation in a human in vivo study, and
• the newly developed sustained-release dosage form should be evaluated in
silico.
The variety of different transporters involved in intestinal drug efflux, with their
different, in some cases overlapping, substrate-specifities, as pointed out at the
beginning of this chapter, complicates the projected investigations. To reduce this
complexity, one transporter was selected to focus on in the projected studies. P-gp,

Chapter I: Introduction and aim of the thesis
32
as the most frequently described and best characterized carrier involved in intestinal
drug efflux, was chosen for this purpose. All experiments were carried out using a
suitable P-gp substrate as model substance.
An in situ rat perfusion model was chosen to determine the contribution of the
intestinal drug efflux to the overall absorption. This model enables investigations on
the absorption from different intestinal segments, and as an in situ method in living
anaesthetized animals, the results are expected to correlate better to the in vivo
situation in humans than any in vitro model. Another reason for the choice of the rat
perfusion model was that the performance of rat studies is less complicated and cost-
intensive than the performance of human in vivo studies, and, contrary to human
perfusion studies, experiments on colonic absorption are easily practicable. Since
anatomy and physiology of the gastrointestinal tract of rats are similar to humans,
which includes the expression of P-glycoprotein, this species was considered
adequate for the targeted aim.
Based on the results from perfusion studies, the determination of effective
permeabilities of different intestinal regions (jejunum, ileum and colon) should detect
potential differences in the absorption of the model compound from different parts of
the gastrointestinal tract. A comparison between results from perfusion experiments
performed with and without P-glycoprotein inhibitors should enable an estimation of
differences in the regional distribution of the expression of the efflux pump P-
glycoprotein. Finally, the contribution of the active efflux process to the overall
absorption should be evaluated on the basis of the results from rat perfusion studies.
Increasing drug concentrations in the perfusion solutions should demonstrate the
saturability of intestinal drug efflux combined with a potential concentration-
dependence of the intestinal permeability (cp. Chapter II).
The development of a sustained-release dosage form for a drug undergoing intestinal
efflux was focused on capsule and tablet formulations. The projected sustained-
release preparation was to show a consistent drug release within the gastrointestinal
tract over eight hours, without being relevantly affected by altering pH values in
different gastrointestinal sections. Furthermore, the sustained-release dosage form
should feature adequate technological properties. An overview on formulations for a
sustained drug release is presented in the introduction to Chapter III.
Chapter I: Introduction and aim of the thesis
33
Since dissolution media have a pronounced influence on the in vitro drug release, in
particular for sustained-release dosage forms, suitable dissolution fluids had to be
selected and characterized (cp. Chapter IV).
Another goal was to obtain approval for the production of drug products for an
application in humans within a university laboratory. Therefore, a manufacturing
process complying with current GMP standards had to be established (cp. Annex I).
Additionally, the performance of a human clinical study with the developed sustained-
release dosage forms should be prearranged (cp. Annex II).
Finally the newly developed sustained-release dosage form should be evaluated in
silico. The term “in silico” testing refers to a simulation of pharmacokinetic parameters
(e.g. bioavailability, AUC, Cmax, tmax) employing a computer software program that is
able to predict bioavailabilities and other parameters on the basis of well-known
characteristics of a drug, in combination with in vitro dissolution data of the particular
drug product. An overview on advantages of in silico tests and software programs
available is given in the introduction to Chapter V.

Chapter I: Introduction and aim of the thesis
34
I.8 Talinolol as model compound for drugs that are subject to intestinal drug
efflux
For the projected studies, a model compound had to be selected. There were several
aspects supporting the choice of talinolol, a compound suggested by Spahn-
Langguth et al. as a model substance for drugs that are subject to intestinal secretion
[Spahn-Langguth, H., G. Baktir, et al. (1998)]. Talinolol is a β1-specific adrenoceptor
antagonist. Its binding to the intestinal efflux pump P-glycoprotein has been proven in
vitro and in vivo [Gramatté, T., R. Oertel, et al. (1996), Wetterich, U., H. Spahn-
Langguth, et al. (1996)]. The most relevant advantage over other P-glycoprotein
substrates for an employment in mechanistic studies is that talinolol undergoes no
relevant biotransformation. The metabolic rate of less than 1 % of the administered
dose ensures that the intestinal drug efflux can be studied without an interference
with biotransformation processes [Oertel, R., K. Richter, et al. (1994), Oertel, R. and
K. Richter (1995), Spahn-Langguth, H., G. Baktir, et al. (1998)]. This is of particular
importance, since an overlapping substrate specifity has been reported for P-
glycoprotein and the CYP3A4 isoform of the cytochrome P 450 enzyme system that
is located, amongst others, in human intestinal cells and mediates gut wall
metabolism [Schuetz, E. G., A. H. Schinkel, et al. (1996), Wacher, V. J., C. Y. Wu, et
al. (1995), ]. Additionally, many inducers and inhibitors of P-glycoprotein also modify
the CYP3A4-mediated metabolism. Therefore, results from inhibition and induction
experiments with substances such as ciclosporine, that undergo both, P-glycoprotein
secretion and CYP3A4 metabolism, are difficult to interpret [Hsiu, S. L., Y. C. Hou, et
al. (2002)]. A review on the overlapping effects of metabolic enzymes and efflux
transporters on the absorption of drugs from the gastrointestinal tract was recently
published by Suzuki et al. [Suzuki, H. and Y. Sugiyama (2000)]. In general,
overlappings between metabolism and efflux are an obstacle for mechanistic
investigations on the drug absorption process, since any effect detected cannot be
definitely attributed to either of the two processes. For investigations on the influence
of a sustained drug release rate on the intestinal drug efflux, metabolism as
additional influencing factor would complicate the interpretation of data obtained, or
even make it impossible. For predictions of bioavailabilities and other
pharmacokinetic parameters, metabolism means an additional unknown parameter
which can hardly be separated from intestinal drug efflux.

Chapter I: Introduction and aim of the thesis
35
Another argument in favour of talinolol as model drug for the projected investigations
is its moderate passive membrane permeability which prevents rapid passive
absorption of the drug such that an apparent secretion back into the intestinal lumen
can not be observed [Spahn-Langguth, H., G. Baktir, et al. (1998)].
Properties of talinolol
The chemical structure of talinolol ((1-(4-cyclohexylureidophenoxy)-2-hydroxy-3-tert-
butylaminopropane) is depicted in Figure I.3. The basic structure typical for all β-
adrenoceptor antagonists is pointed out by the grey frame. Within this basic structure
an asymmetrically substituted carbon atom is located, which results in chirality of the
molecule. In the figure this carbon atom is marked with a grey star:
NH
OH
NH
O
NH
O
Figure I.3:
Chemical structure of RS-talinolol.
Like acebutolol, atenolol, celiprolol, betaxolol, bisaprolol and metoprolol, talinolol
belongs to the class of β1-specific adrenoceptor antagonists. The specifity of these β-
adrenoceptor antagonists is only relative, i.e. they show affinity to both, β1- and β2-
receptors, with an apparently higher affinity towards β1-receptors. Talinolol is used in
the treatment of arterial hypertension, acute and chronic tachycardic heart arrhythmia
and hyperkinetic heart syndrome. Furthermore it is used in prophylaxis of myocardial
infarction, as well as after an acute infarction to avoid reinfarction. In the treatment of
∗
pKa = 9.4
Chapter I: Introduction and aim of the thesis
36
coronary heart disease and unstable angina pectoris it is administered in prophylaxis
of anginal attacks.
In Tables I.1 to I.3 relevant physico-chemical and pharmacokinetic properties of
talinolol are summarized. The basicity of the weak base talinolol refers to a
secondary amino functional group. Since the nitrogen of this amino group can be
protonated, talinolol features a pH-dependent solubility, which decreases with
increasing pH values [Avdeef, A. (2001)]. The log P of 3.2 indicates a moderate
lipophilicity, compared to other common β-adrenoceptor antagonists. It is less
lipophilic than propranolol (log P: 4.6) and more lipophilic than atenolol (log P: 0.2)
[Caron, G., Steyaert, G., et al (1999)].
Talinolol was introduced into clinical practice in 1975 in the former German
Democratic Republic (GDR) by AWD (Dresden, Germany) under the trade mark
Cordanum. Talinolol is available on the German market in tablet form (immediate
release tablets) and as solution for injection. The film-coated Cordanum immediate-
release tablets are available with drug contents of 50 and 100 mg RS-talinolol.
Recommended daily doses range from 100 to 300 mg, in healthy volunteers safety of
the drug was proven up to single doses of 400 mg [Wetterich, U., H. Spahn-
Langguth, et al. (1996)]. Composition of the tablets includes magnesium stearate,
talcum, sodium carboxymethyl starch, titanium dioxide, polyethylene glycol 35000,
potato starch, microcrystalline cellulose, hydroxypropylmethylcellulose, pyrogenic
silica (Aerosil) and polyethylene glycol 6000 as excipients, iron oxides are added
additionally only in 50 mg tablets. Furthermore, Cordanum is available in Germany as
solution for injection in ampoules containing 10 mg RS-talinolol dissolved in 5 ml of
solvent.

Chapter I: Introduction and aim of the thesis
37
Table I.1:
Physico-chemical properties of talinolol.
Molecular weight (M.W.) 363.5 Da
pKa 9.4
Partition coefficient (n-octanol / water, at pH 7.0) 0.74
log P 3.2
Solubility in water (pH 7.0) 0.2 mg/ml
Melting point (M.P.) 143° Celsius
[Wetterich, U., H. Spahn-Langguth, et al. (1996), AWD talinolol product information
(2000)]

Chapter I: Introduction and aim of the thesis
38
Table I.2:
Pharmacokinetic properties of talinolol after peroral administration (50 mg).
AUC0-36h 1180 ng•h/ml (SD: 337)
Cmax 168 ng/l (SD: 47)
tmax 3.2 h (SD: 0.8)
Elimination half life (t1/2) 11.9 h (SD: 2.4)
Biotransformation < 1 %
Renal excretion 28.1 % (SD: 6.8)
of the administered dose
Extrarenal excretion 40 % (SD: 6.8)
of the bioavailable dose
Bioavailability (fasted state) 55 % (SD: 22, dose-dependent)
Bioavailability (fed state) 45 % (dose-dependent)
[Trausch, B., R. Oertel, et al. (1995a), Trausch, B., R. Oertel, et al. (1995b), Oertel,
R., K. Richter, et al. (1994), Oertel, R. and K. Richter (1995), Abda Drug Data Base
Version 4.2.0 (1998)]

Chapter I: Introduction and aim of the thesis
39
Table I.3:
Pharmacokinetic properties of talinolol after intravenous infusion (30 mg)
Mean residence time (MRT) 11.6 h (range: 8.1 – 20.0 h)
Volume of distribution (VD) 3.3 l/kg (range: 2.5 – 4.3 l/kg)
Total body clearance (CLtot) 4.9 ml/min•kg (SD: 0.6))
Renal clerance (CLren) 2.8 ml/min•kg (SD: 0.7)
Metabolic clearance (CLmet) 0.017 ml/min•kg (SD: 0.01)
Non-renal clearance (CLnonren) 2.1 ml/min•kg (SD: 0.7)
Biliary clearance (Clbil) 0.71 ml/min•kg (range: 0.22 –3.53 ml/min•kg)
Plasma protein binding 60.9 % (range: 50-70 %)
[Trausch, B., R. Oertel, et al. I (1/1995), Trausch, B., R. Oertel, et al. II (5/1995),
Terhaag, B., T. Gramatté, et al. (1989), Abda Drug Data Base, Version 4.2.0 (1998)]

Chapter II: Effective permeabilities in different regions of the rat intestine
40
Chapter II
Chapter II: Effective permeabilities in different regions of the rat intestine
41
Chapter II
Effective permeabilities of talinolol in different regions of the rat
intestine
II.1 Introduction
Whereas the affinity of a compound to absorptive carriers may considerably enhance
its bioavailability, affinity to secretory carriers may show the opposite effect, i.e., a
diminution of the transmembraneous flux in the absorptive direction leading to a
reduction of the absorptive intestinal permeability. This may limit the fraction of the
administered dose absorbed. In that case, enhancement of absorption and
bioavailability is to be expected when higher doses of the same drug are
administered (saturation) or in the case of competitive or non-competitive inhibition of
the carrier.
To elucidate the relevance of intestinal efflux processes for the absorption of drugs,
rat intestinal perfusion studies were performed using talinolol as a model substance
[Spahn-Langguth, H., G. Baktir, et al. (1998)]. Talinolol is secreted by a carrier-
mediated process from the enterocyte into the intestinal lumen following intravenous
or peroral administration. In human small intestinal perfusion studies performed with
a modified triple lumen technique [Cooper, H., R. Levitan, et al. (1966), Gramatté, T.
(1994), Gramatté, T., E. el Desoky, et al. (1994), Gramatté, T. and K. Richter (1994)]
Gramatté et al. found that talinolol absorption is higher in proximal regions of the
small intestine than in more distal regions [Gramatté, T., R. Oertel, et al. (1996)]. It is
assumed that differences in intestinal drug efflux within the gastrointestinal tract
provoke these findings. To elucidate the involvement of P-gp in intestinal drug
absorption perfusion studies were performed in different segments of the rat intestine
(jejunum, ileum, and colon). Additionally, it was tested whether intestinal secretion
was saturable and whether it could be inhibited by co-administering the P-gp
modulators vinblastine and rhodamine 123. A further task was to determine the
fraction of the intestinal permeability of the drug which is undergoing carrier-mediated
efflux. Therefore, coefficients expressing the contribution of the actively secreted and
the passively absorbed talinolol were calculated. These coefficients include Peff passive,

Chapter II: Effective permeabilities in different regions of the rat intestine
42
the membrane permeability given by the diffusion of the compound across the
membrane, Peff max, the maximum transport rate for the carrier-mediated process
(equivalent to Vmax in a Michaelis-Menten equation), Km, the Michaelis-Menten
constant, and Peff transporter, the drug flux resulting from the activity of the carrier,
differentiated with respect to the drug concentration.
II.1.2 Dose-dependence of talinolol bioavailability
Due to its affinity to intestinal transporters and the saturability of carrier-mediated
transport systems, the dose to plasma concentration ratio of talinolol is expected to
be non-linear. A dose-dependence of talinolol absorption was reported by Wetterich
et al. [Wetterich, U., H. Spahn-Langguth, et al. (1996)]. To further prove this
phenomenon, additional data from clinical studies in humans available from literature
were reviewed. The results are presented in Table II.1.

Chapter II: Effective permeabilities in different regions of the rat intestine
43
Table II.1:
Compilation of systemic exposure following peroral administration of talinolol in
clinical studies in humans.
Author, Year of
Publication
Dose [mg] Remarks Number of
volunteers Mean AUC [ng•h/ml]
SD of AUC
[ng•h/ml]
SD rel [%]
AUC/Dose (SD)
25 12 500 45 9,0 20,0 (1,8)
50 12 1238 127 10,3 24,8 (2,5)
100 12 3282 227 6,9 32,8 (2,3)
Wetterich et
al., 1996
400 12 14693 893 6,1 36,7 (2,2)
50 fasted 11 1374 (range:
944-1882) 27,5 (n.a.)
Terhaag et
al., 1991
50 fed 11 776 (range:
300-1151) 15,5 (n.a.)
Trausch et
al., 1995 50 12 1321 382 28,9 26,4 (7,6)
100 Capsule fasted 8 2570 795 30,9 25,7 (8,0) Giessmann
et al. , 2001
100 Capsule fed 8 2010 541 26,9 20,1 (5,4)
Schwarz et
al. , 1999 50 9 945 188 19,9 18,9 (3,8)
Westphal et
al., 2000 100 10 2970 486 16,4 29,7 (4,9)
The ratio of AUC to dose displayed in the last column of the table is a measure for
the linearity between the dose administered and the systemic exposure of the drug. If
there was no dose-dependence, the values of this ratio should remain constant.
The data are displayed in Figure II.1:

Chapter II: Effective permeabilities in different regions of the rat intestine
44
20,0
24,729,4
36,7
0
5
10
15
20
25
30
35
40
45
25 (n=12) 50 (n=44) 100 (n=30) 400 (n=12)
Dose (mg)
AU
C /
Dos
e
Figure II.1:
Compilation of talinolol clinical studies in humans: AUC / dose ratios versus dose as
an indicator for a dose dependent absorption.
It becomes obvious that the AUC increases more than proportional with increasing
doses, leading to higher fractions absorbed and hence higher AUC / dose ratios of
higher doses. Thus, the absorption of talinolol is non linear and shows the expected
dose-dependence. Biotransformation as a potential source for this non-linearity can
be excluded, since it accounts for less than 1 % of the administered talinolol dose.
Neither is non-linear elimination an adequate explanation, because the elimination
half-life (t1/2) remains unchanged for increasing doses in the range from 25 to 400 mg
[Wetterich, U., H. Spahn-Langguth, et al. (1996)]. Hence, the dose dependence must
be due to the saturability of the intestinal efflux process. At higher doses the
transporter system responsible for the intestinal secretion is reaching a saturation
level, such that further increases in dose, will not lead to increases in secretion. On
the other hand, when only passive diffusion processes are governing the absorption,
it is expected that the AUC will increase proportionally with dose. A combination of
Chapter II: Effective permeabilities in different regions of the rat intestine
45
carrier-mediated and passive transport processes will lead to a disproportionality
between dose and exposure at low doses and virtually dose-proportional changes in
exposure at higher doses.
II.1.3 Intestinal perfusion studies in rats
Differences between the intestinal permeability in different regions of the intestine as
a function of talinolol perfusate concentrations were evaluated using the model of rat
intestinal perfusion.
This model was found appropriate for the determination of effective permeabilities
with relevance for the absorption in humans [Lennernas, H. (1997), Fagerholm, U.,
M. Johansson, et al. (1996)]. Although the permeabilities determined by in situ rat
perfusion were not equal to the permeabilities found in human studies, the rank order
of numerous drugs tested was the same. By means of appropriate scaling factors the
rat perfusion model can predict the human in vivo situation very well [Lennernas, H.
(1998)]. Cell culture models like the common Caco-2 model could not be used for the
projected study, since there is no possibility to distinguish between different intestinal
sections.
The perfusions were performed as single-pass studies, i.e. talinolol solutions were
pumped through the different sections of the rat intestine, namely jejunum, ileum and
colon with a constant flow rate and samples of the solutions having passed the rat
intestine were collected in five minute intervals.
The actual experimental setup and a summarizing scheme of the experiment are
depicted in Figure II.2.
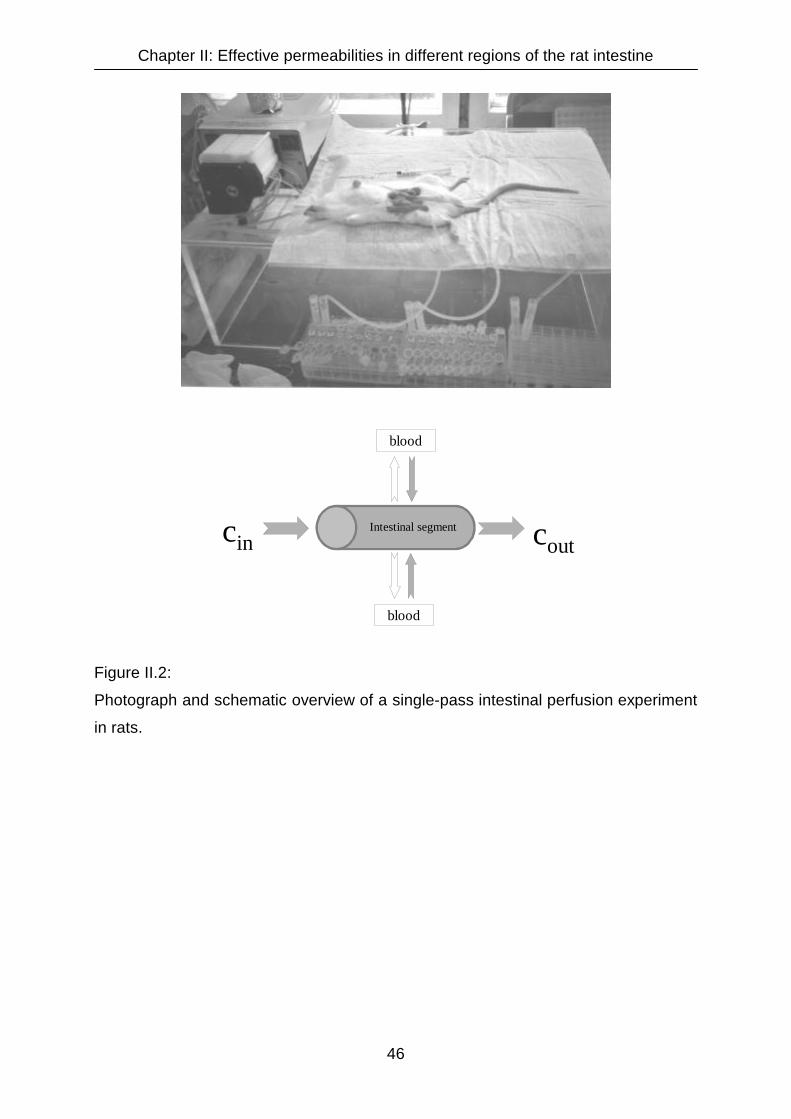
Chapter II: Effective permeabilities in different regions of the rat intestine
46
Intestinal segment
blood
blood
cin cout
Figure II.2:
Photograph and schematic overview of a single-pass intestinal perfusion experiment
in rats.

Chapter II: Effective permeabilities in different regions of the rat intestine
47
II.2 Materials and methods
II.2.1 Materials
All chemicals were supplied by E. Merck (Darmstadt, Germany) with the exception of
vinblastine, which was purchased from GRY Pharma GmbH (Kirchzarten, Germany),
talinolol, which was a grateful gift of AWD Pharma (Dresden, Germany) and the
solvents for HPLC analytics, which were purchased from C. Roth (Karlsruhe,
Germany).
II.2.2 Animals
Male Wistar rats were purchased from Charles River Germany (Sulzfeld, Germany).
When perfusion was performed the rats weighed between 274 and 307g. The animal
study protocol was approved by the Committee for Animal Studies of the Martin
Luther-University Halle-Wittenberg and the State of Sachsen-Anhalt. The studies
complied with governmental requirements for animal studies.
II.2.3 Instrumentation
Intestinal perfusions were performed using an Ismatec MC-MS CA 8/6 peristaltic
pump (Glattbrugg-Zürich, Switzerland) with silicone tubes with an inner diameter of 2
mm. For HPLC analytics a computer programmable Beckman HPLC device “System
Gold” was used, consisting of a pump module Type 126, an UV-Vis detector module
Type 166 and an automatic sampler Type 507.
Graphical, statistical and pharmacokinetic evaluation were performed using S-Plus
2000 (Math Soft, Seattle, USA).
Chapter II: Effective permeabilities in different regions of the rat intestine
48
II.2.4 Quantitative analysis of talinolol from intestinal perfusate solutions
The assay developed by Wetterich et al. [Wetterich, U., H. Spahn-Langguth, et al.
(1996)] was used with slight modifications for the quantitative analysis of talinolol in
the intestinal perfusate samples: Talinolol was isolated by liquid-liquid extraction of
100 µl of each perfusate sample with 2 ml dichloromethane / isopropanol (95:5) after
addition of 100 µl 1M sodium hydroxide, which adjusts the pH to values of 12 to 13
and hence leads to a deprotonation of talinolol. Racemic pindolol was used as
internal standard. After evaporation of the solvent, the samples were reconstituted in
methanol and analysed by HPLC using a 250 x 4 mm ChiraSpher NT column (Merck,
Darmstadt, Germany) and ethanol with 0.05 % (v/v) triethylamine added as mobile
phase at a flow rate of 0.45 ml/min. The talinolol and pindolol concentrations in the
eluate were analysed by measuring the UV-absorption at 245 nm. Talinolol
concentrations (i.e. the concentrations of the racemic RS-talinolol) were calculated by
addition of the concentrations determined for the R- and the S-enantiomer. Neither
vinblastine nor rhodamine 123, the two inhibitors of the intestinal drug efflux tested,
did interfere with the assay. The accuracy of the flow rate of the HPLC pump was
determined as > 98 %. The limit of quantification was 30 ng/ml for each enantiomer.
Interday- and intraday-variabilities were determined in the concentration range from 1
to 200 µg/l. The deviations from the mean were less than 10 %. The coefficients of
determination (R2) determined for the calibration curves were 0.999 or better.
II.2.5 Perfusion of rat small and large intestine
Perfusion studies with vinblastine as P-gp-inhibitor were performed in four rats with
each of the following five talinolol concentrations: 0.025, 0.05, 0.1, 0.25 and 0.5
mmol/l. For the studies with rhodamine 123 as P-gp-inhibitor, also four rats were
used for each talinolol concentration, however, only the following three
concentrations were examined: 0.025, 0.05 and 0.1 mmol/l. The rats were fasted 18
h before the study with free access to water. After inhalation of ether they were
anaesthetized by an intraperitoneal injection of 50 mg/kg ketamin and 10 mg/kg
rompun®. The intestine was exposed by a four to five cm midline abdominal incision,
then tubes were attached to the three different intestinal segments to be perfused

Chapter II: Effective permeabilities in different regions of the rat intestine
49
(jejunum, ileum and colon). The lengths of the perfused segments in jejunum were
4.0 to 10.0 cm, in ileum 3.0 to 4.8 cm and in colon 2.0 to 3.0 cm. The average radius
of the segments measured in jejunum and ileum was 0.18 cm, while it was 0.20 cm in
colon. In order to maintain the rats` body temperatures they were placed on a heating
pad at 37°C.
For the studies with vinblastine as inhibitor, 0.025, 0.05, 0.1, 0.25 and 0.5 mmol/l RS-
talinolol were dissolved in Tyrode`s buffer, (8.0 g/l NaCl, 1.0 g/l NaHCO3, 1.0 g/l
glucose, 0.2 g/l KCl, 0.2 g/l CaCl2, 0.1 g/l MgCl2, and 0.04 g/l NaH2PO4 dissolved in
distilled water). The studies with rhodamine 123 as inhibitor were performed with
0.025, 0.05 and 0.1 mmol/l RS-talinolol solutions also in Tyrode`s buffer. Perfusion
solutions were maintained at 37°C and pumped through jejunum, ileum and colon
simultaneously at a flow rate of 0.2 ml/min. Outlet perfusate solutions were collected
in predefined intervals and frozen at –24°C until analysis. Each rat was perfused for
120 minutes. After an equilibration period of 30 minutes the three intestinal segments
were perfused for 30 minutes with the talinolol buffer solutions. Then either 0.1
mmol/l vinblastine or 0.05 mmol/l rhodamine 123 were added to the perfusion
solution and after another equilibration period of 30 minutes perfusion was continued
for another 30 minutes. Perfusate samples were collected and analysed in five
minute intervals.
II.2.6 Net water absorption / secretion during perfusion
Water absorption or secretion processes may falsify the determination of drug
permeability. Therefore, water fluxes were monitored and talinolol concentrations
were corrected for water fluxes.
Water fluxes were calculated according to equation [1]:
% Water transport = 100m
mm
in
outin ⋅− [1]
minis the mass of the inlet perfusion solution, mout the mass of the outlet perfusate
solution.
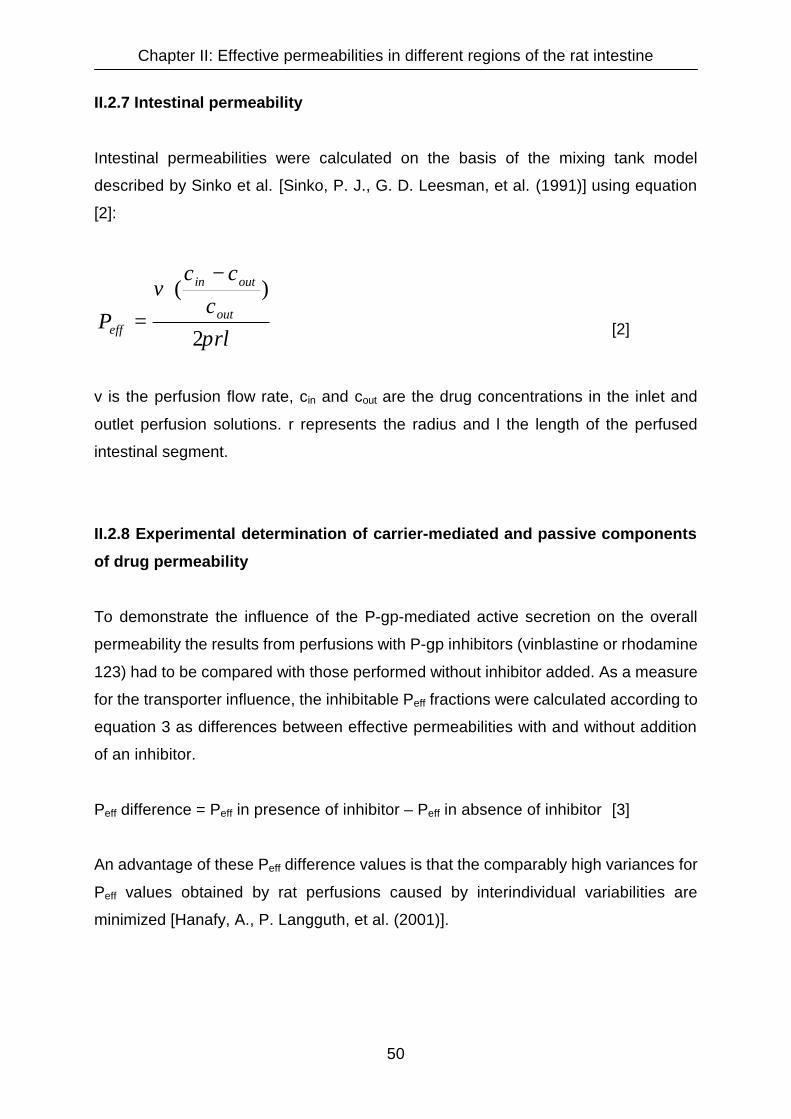
Chapter II: Effective permeabilities in different regions of the rat intestine
50
II.2.7 Intestinal permeability
Intestinal permeabilities were calculated on the basis of the mixing tank model
described by Sinko et al. [Sinko, P. J., G. D. Leesman, et al. (1991)] using equation
[2]:
rlc
ccv
P out
outin
eff π2
)(−⋅
= [2]
v is the perfusion flow rate, cin and cout are the drug concentrations in the inlet and
outlet perfusion solutions. r represents the radius and l the length of the perfused
intestinal segment.
II.2.8 Experimental determination of carrier-mediated and passive components
of drug permeability
To demonstrate the influence of the P-gp-mediated active secretion on the overall
permeability the results from perfusions with P-gp inhibitors (vinblastine or rhodamine
123) had to be compared with those performed without inhibitor added. As a measure
for the transporter influence, the inhibitable Peff fractions were calculated according to
equation 3 as differences between effective permeabilities with and without addition
of an inhibitor.
Peff difference = Peff in presence of inhibitor – Peff in absence of inhibitor [3]
An advantage of these Peff difference values is that the comparably high variances for
Peff values obtained by rat perfusions caused by interindividual variabilities are
minimized [Hanafy, A., P. Langguth, et al. (2001)].
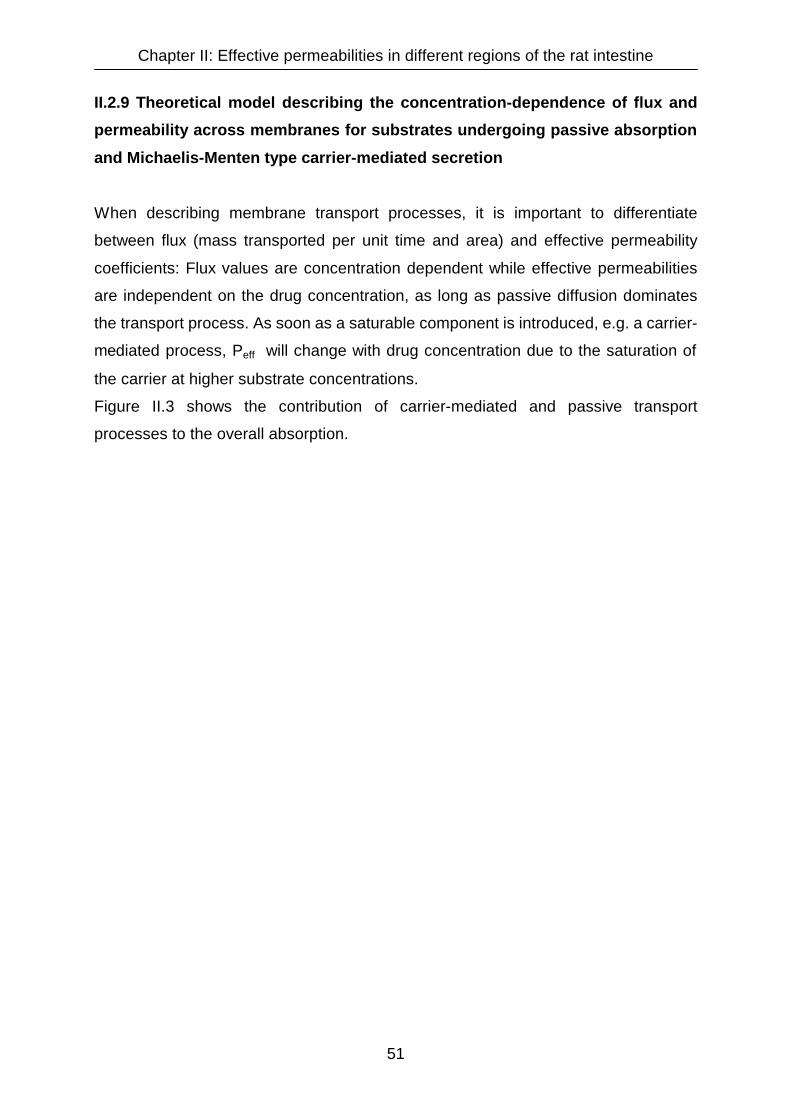
Chapter II: Effective permeabilities in different regions of the rat intestine
51
II.2.9 Theoretical model describing the concentration-dependence of flux and
permeability across membranes for substrates undergoing passive absorption
and Michaelis-Menten type carrier-mediated secretion
When describing membrane transport processes, it is important to differentiate
between flux (mass transported per unit time and area) and effective permeability
coefficients: Flux values are concentration dependent while effective permeabilities
are independent on the drug concentration, as long as passive diffusion dominates
the transport process. As soon as a saturable component is introduced, e.g. a carrier-
mediated process, Peff will change with drug concentration due to the saturation of
the carrier at higher substrate concentrations.
Figure II.3 shows the contribution of carrier-mediated and passive transport
processes to the overall absorption.
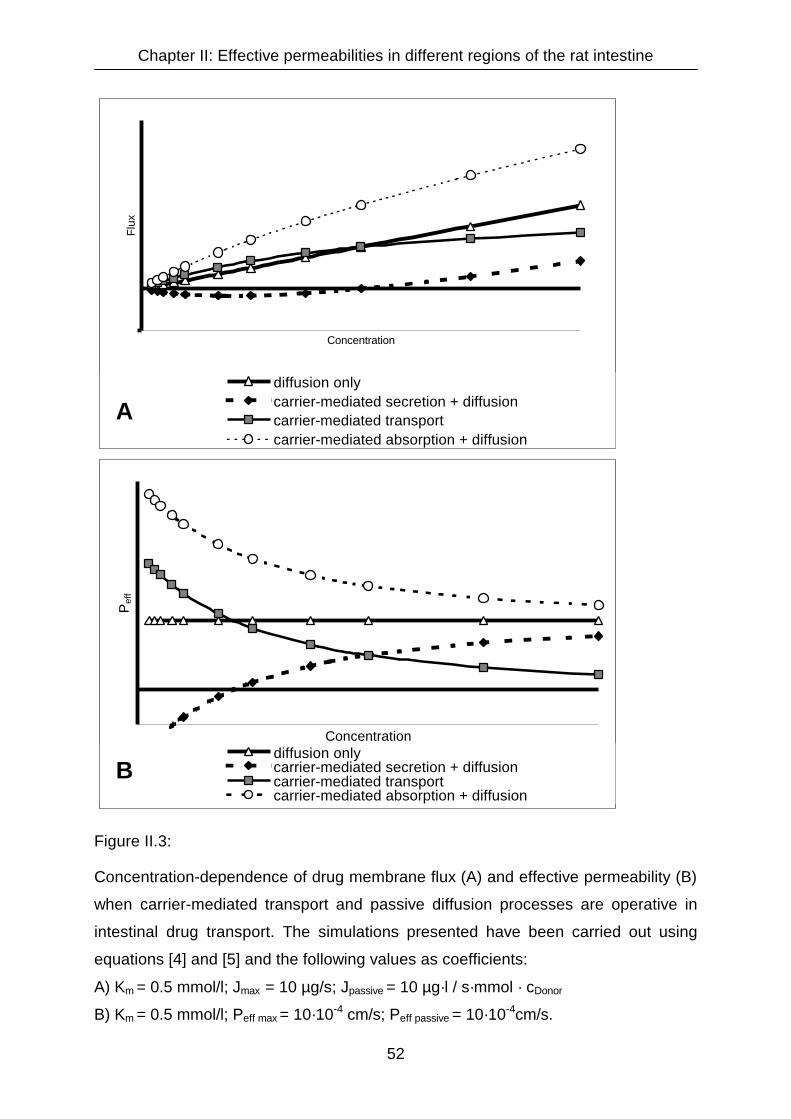
Chapter II: Effective permeabilities in different regions of the rat intestine
52
Concentration
Flux
diffusion onlycarrier-mediated secretion + diffusioncarrier-mediated transportcarrier-mediated absorption + diffusion
Concentration
Pef
f
diffusion onlycarrier-mediated secretion + diffusioncarrier-mediated transportcarrier-mediated absorption + diffusion
Figure II.3:
Concentration-dependence of drug membrane flux (A) and effective permeability (B)
when carrier-mediated transport and passive diffusion processes are operative in
intestinal drug transport. The simulations presented have been carried out using
equations [4] and [5] and the following values as coefficients:
A) Km = 0.5 mmol/l; Jmax = 10 µg/s; Jpassive = 10 µg·l / s·mmol · cDonor
B) Km = 0.5 mmol/l; Peff max = 10·10-4 cm/s; Peff passive = 10·10-4cm/s.
A
B

Chapter II: Effective permeabilities in different regions of the rat intestine
53
In Figure II.3A fluxes (J) are considered and in Figure II.3B effective permeabilities
(Peff).
For the simulations in the figures above demonstrating the concentration-
dependence of drug membrane flux, a value of 0.5 mmol/l was assumed for Km.
Fmax, the maximum drug flux mediated by the carrier was assumed to be 10 µg/s, the
passive drug flux was fixed at 10 times the drug concentration in the donor solution.
For the simulation demonstrating the concentration-dependence of drug effective
permeability, Km was set to 0.5 mmol/l, Peff max was 10·10-4 cm/s and Peff passive was
10·10-4 cm/s.
Assumed that membrane permeation of a drug is composed of a carrier-mediated
and a passive transport process, its total flux (J) is given by equation 4, its total
effective permeability (Peff,) by equation 5:
CKCJ
passive mJJ +
⋅+= max [4]
2
max,
)(, CK
KPpassiveeffeff
m
meffPP+
⋅+= [5]
J passive and Peff passive represent the fractions of the total flux or total effective
permeability which are due to diffusion. The second term in each equation represents
the contribution of the carrier to the overall transport. When fluxes are considered,
the carrier-mediated fraction (f(c)) can be expressed by the Michaelis-Menten
equation:
CKCV
mcf +
⋅= max)( [6]
In terms of permeability the Michaelis-Menten equation has to be differentiated with
respect to C. The derivation of equation 6 leads to equation 7:

Chapter II: Effective permeabilities in different regions of the rat intestine
54
2max
2 )(
)(
)(
)1()](1[max)´(
CK
KV
CK
CCK
m
m
m
mVcf+⋅
+⋅−+⋅ ==
[7]
Equation 7 was used to express the fraction of permeability values which is due to
carrier-mediated transport.
Since xenobiotics can be actively transported from the gut lumen to the blood side as
well as in the reverse direction, the term in equation 7 may become positive or
negative. Consequently, the total effective permeability is composed of a term
expressing the fraction of total drug transported by diffusion which is either enlarged
or diminished by the contribution of the carrier-mediated transport process. As far as
drug efflux processes are concerned the total transport is passive transport
diminished by the contribution of carrier-mediated secretion, leading to total
permeabilities that are lower than passive diffusion alone.
Equation 5 was used to estimate the carrier-mediated and passively transported
fractions of the total permeabilities that were determined in rat perfusion experiments.
The estimations were performed using the S-Plus 2000 software package (Math Soft,
Seattle, USA).
Chapter II: Effective permeabilities in different regions of the rat intestine
55
II.3 Results
II.3.1 Analysis of talinolol from perfusate samples
A typical chromatogram of talinolol derived from the stereospecific HPLC assay is
shown in Figure II.4:
Figure II.4:
HPLC-chromatogram of RS-talinolol (0.025 mM in perfusate buffer) and RS-pindolol
(0.08 mM) as internal standard obtained by the stereospecific HPLC assay. UV
detection was at 245 nm, the injection volume was 50 µl. Talinolol concentrations
were calculated by addition of the peaks for the R- and the S-enantiomer.

Chapter II: Effective permeabilities in different regions of the rat intestine
56
Typical outflow concentration patterns from individual animals are demonstrated in
Figure II.5:
Corrected perfusate concentrations of talinolol in rat 4
0.0
0.2
0.4
0.6
0.8
1.0
1.2
1.4
0 5 10 15 20 25 30Perfusion duration (min)
Per
fusa
te c
once
ntra
tion
(mg/
100m
l, co
rrec
ted
)
talinolol only talinolol + vinblastine
Corrected perfusate concentrations of talinolol in rat 14
0.0
2.0
4.0
6.0
8.0
10.0
12.0
0 5 10 15 20 25 30Perfusion duration (min)
Per
fusa
te c
once
ntra
tion
(mg/
100m
l, co
rrec
ted
)
talinolol only talinolol + vinblastine
Figure II.5:
Corrected jejunal outflow concentrations of talinolol in single rats with and without co-
perfusion of vinblastine as P-gp inhibitor. A: Rat 4 (talinolol perfusion concentration
0.025 mmol/l); B: Rat 14 (talinolol perfusion concentration 0.25 mmol/l).
A
B
Chapter II: Effective permeabilities in different regions of the rat intestine
57
Figure II.5A shows a distinct difference between the talinolol concentrations in the
perfusate with (black line) and without (grey line) vinblastine as P-gp inhibitor.
In contrast in Figure II.5B a difference can not be observed. This matches the
expectations, since Figure II.5A points out the perfusion results of a rat, that was
perfused with a solution containing only 0.025 mmol/l talinolol, while Figure II.5B
displays the results of a rat perfused with a ten times higher concentrated talinolol
solution.
In the case of the lower talinolol concentration, P-gp driven secretion of the drug that
has already passed the apical membrane of intestinal cells back into the intestinal
lumen contributes notably to the overall absorption process, such that an inhibition of
the secretion process by adding vinblastine to the perfusion solution leads to a higher
total absorption and hence to lower talinolol concentrations in the perfusate.
Contrarily, in case of higher talinolol concentrations in the perfusate, the transporter
system responsible for the secretion is saturated, such that the contribution of the
secretion process to the overall absorption is neglible and an inhibition of P-gp by
vinblastine does not show any remarkable effect on talinolol perfusate
concentrations.
In Figure II.6 the effective permeabilities of talinolol in three different intestinal
sections (jejunum, ileum and ascending colon) are depicted as function of different
perfusion rates. The perfusion rate is the product of the talinolol concentration in the
perfusion solution (0.025, 0.05, 0.1, 0.25 and 0.5 mmol/l) and the perfusion flow (0.2
ml/min). Permeabilities are calculated from the perfusate concentrations and are
mean values from four or eight rats each.
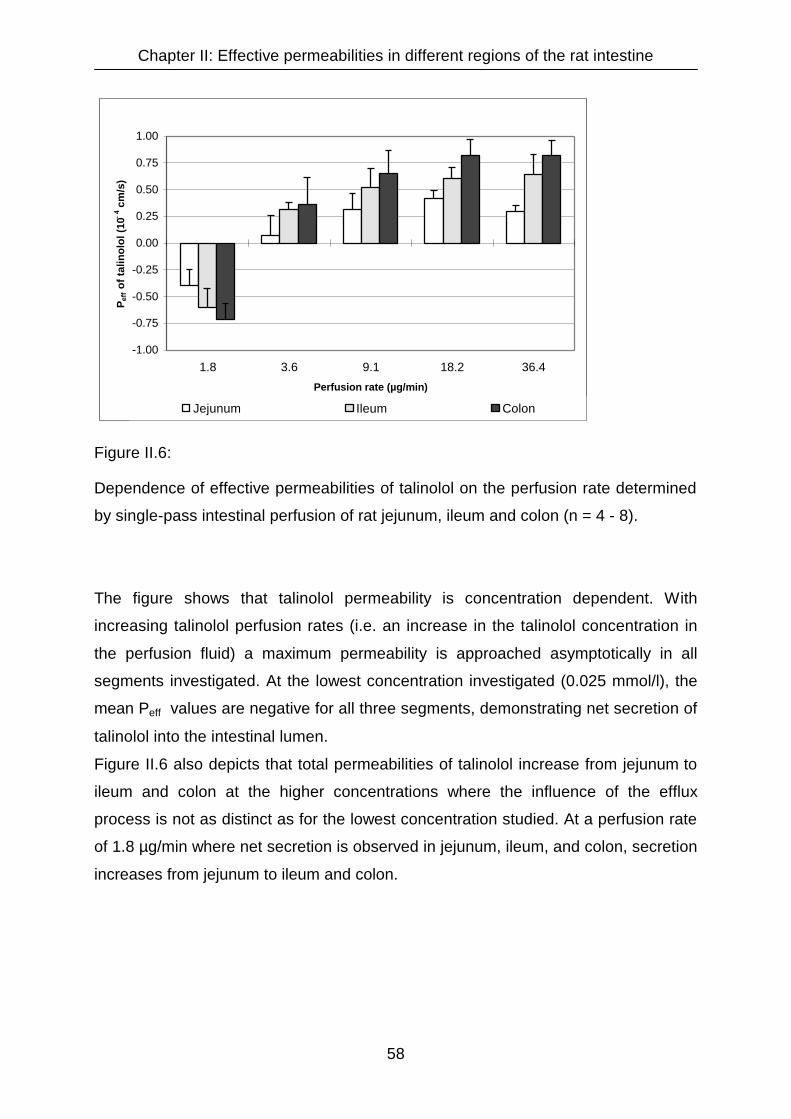
Chapter II: Effective permeabilities in different regions of the rat intestine
58
-1.00
-0.75
-0.50
-0.25
0.00
0.25
0.50
0.75
1.00
1.8 3.6 9.1 18.2 36.4
Perfusion rate (µg/min)
Pef
f of
talin
olol
(10- 4
cm
/s)
Jejunum Ileum Colon
Figure II.6:
Dependence of effective permeabilities of talinolol on the perfusion rate determined
by single-pass intestinal perfusion of rat jejunum, ileum and colon (n = 4 - 8).
The figure shows that talinolol permeability is concentration dependent. With
increasing talinolol perfusion rates (i.e. an increase in the talinolol concentration in
the perfusion fluid) a maximum permeability is approached asymptotically in all
segments investigated. At the lowest concentration investigated (0.025 mmol/l), the
mean Peff values are negative for all three segments, demonstrating net secretion of
talinolol into the intestinal lumen.
Figure II.6 also depicts that total permeabilities of talinolol increase from jejunum to
ileum and colon at the higher concentrations where the influence of the efflux
process is not as distinct as for the lowest concentration studied. At a perfusion rate
of 1.8 µg/min where net secretion is observed in jejunum, ileum, and colon, secretion
increases from jejunum to ileum and colon.

Chapter II: Effective permeabilities in different regions of the rat intestine
59
II.3.2 Influence of co-administration of P-gp inhibitors on intestinal permeability
of talinolol
The effect of vinblastine (100 µmol/l) on the intestinal permeability of talinolol
decreases with increasing talinolol concentrations in the perfusion solution. At the
lowest concentration examined (0.025 mmol/l) vinblastine addition has a strong
influence on talinolol permeability. In jejunum, the effective permeability shifted from
-0.37•10-4cm/s to -0.03•10-4cm/s after addition of vinblastine. In ileum and colon the
shift was even more pronounced (-0.7•10-4cm/s to +0.18•10-4cm/s in ileum and
-0.85•10-4cm/s to +0.11•10-4cm/s in colon). Net secretion was inhibited in all three
intestinal segments.
At 0.05 mmol/l the influence of vinblastine is only marginal and at even higher
concentrations of talinolol the permeabilities were not influenced relevantly by the
addition of vinblastine.
Figure II.7 demonstrates the concentration-dependent effect of vinblastine by
outlining the difference values between the effective permeabilities with and without
the addition of vinblastine.

Chapter II: Effective permeabilities in different regions of the rat intestine
60
-0.50
-0.25
0.00
0.25
0.50
0.75
1.00
0.025 0.05 0.1 0.25 0.5
Talinolol concentration in the perfusion solution (mmol/l)
Pef
f diff
eren
ce (1
0- 4 c
m/s
)
jejunum ileum colon
Figure II.7:
The presence of 100 µmol/l vinblastine as P-gp inhibitor in the perfusion solution
minimizes the differences in permeability of talinolol between perfusions with and
without inhibitor. The effect of vinblastine is clearly dependent on the talinolol
concentration in the perfusion solution. Only at low concentrations of talinolol a net
secretion is inhibited by the presence of vinblastine, whereas at higher talinolol
concentrations the effect of the inhibitor is negligible.
The higher Peff differences at lower talinolol concentrations show evidence for a
pronounced effect of vinblastine, while Peff differences close to zero demonstrate no
apparent effect of the inhibitor.
Relevant differences between the Peff values with and without inhibitor were only
observed at low talinolol concentrations in the perfusate. At higher talinolol
concentrations, most probably due to saturation of carrier-mediated secretion by
talinolol itself, the effect of vinblastine was negligible.
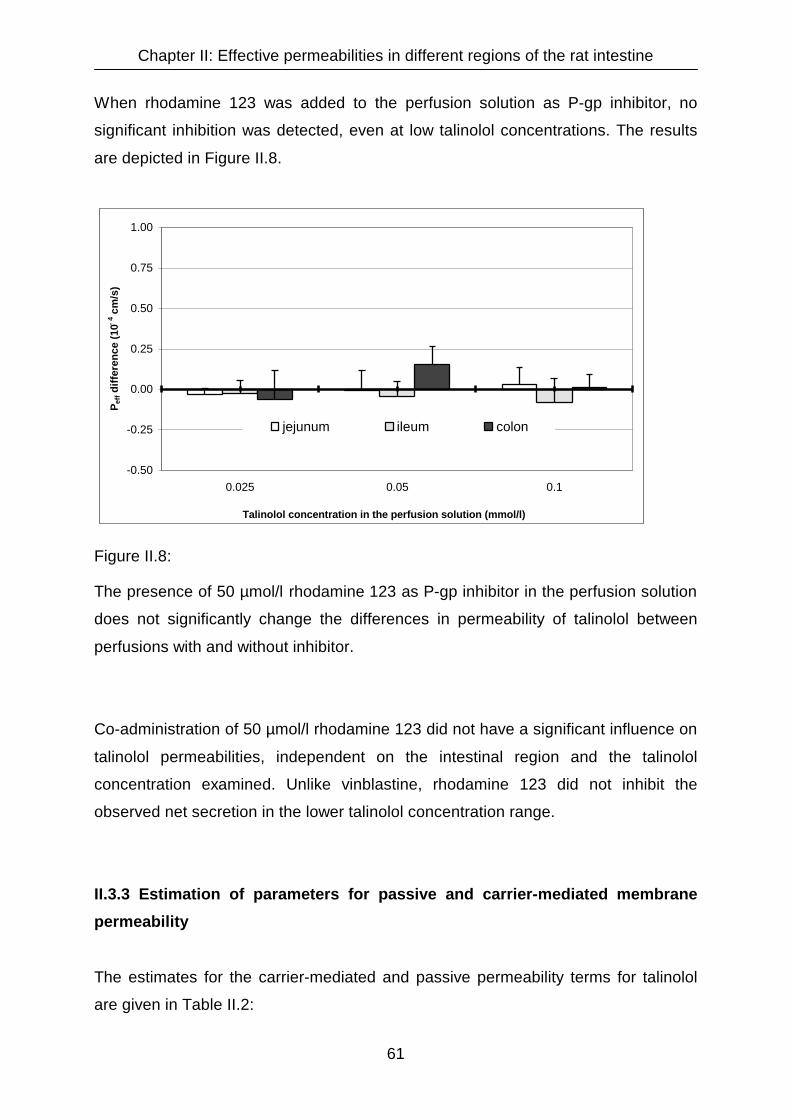
Chapter II: Effective permeabilities in different regions of the rat intestine
61
When rhodamine 123 was added to the perfusion solution as P-gp inhibitor, no
significant inhibition was detected, even at low talinolol concentrations. The results
are depicted in Figure II.8.
-0.50
-0.25
0.00
0.25
0.50
0.75
1.00
0.025 0.05 0.1
Talinolol concentration in the perfusion solution (mmol/l)
Pef
f diff
eren
ce (1
0- 4 c
m/s
)
jejunum ileum colon
Figure II.8:
The presence of 50 µmol/l rhodamine 123 as P-gp inhibitor in the perfusion solution
does not significantly change the differences in permeability of talinolol between
perfusions with and without inhibitor.
Co-administration of 50 µmol/l rhodamine 123 did not have a significant influence on
talinolol permeabilities, independent on the intestinal region and the talinolol
concentration examined. Unlike vinblastine, rhodamine 123 did not inhibit the
observed net secretion in the lower talinolol concentration range.
II.3.3 Estimation of parameters for passive and carrier-mediated membrane
permeability
The estimates for the carrier-mediated and passive permeability terms for talinolol
are given in Table II.2:
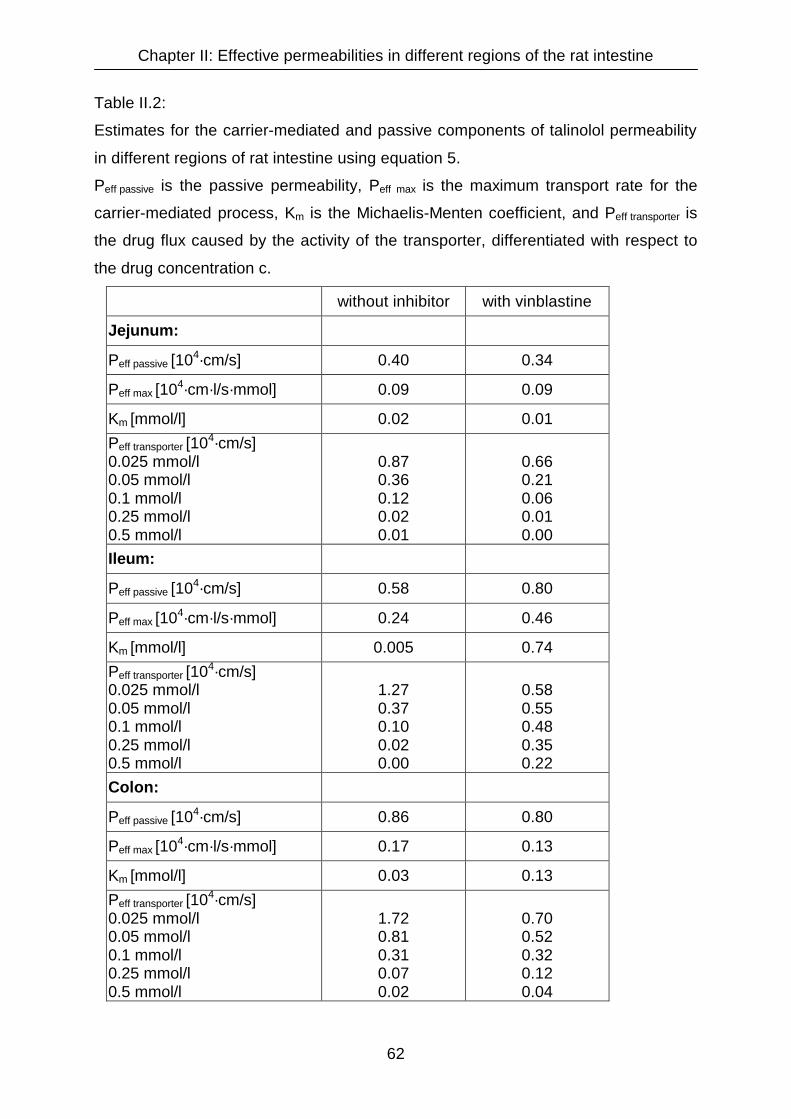
Chapter II: Effective permeabilities in different regions of the rat intestine
62
Table II.2:
Estimates for the carrier-mediated and passive components of talinolol permeability
in different regions of rat intestine using equation 5.
Peff passive is the passive permeability, Peff max is the maximum transport rate for the
carrier-mediated process, Km is the Michaelis-Menten coefficient, and Peff transporter is
the drug flux caused by the activity of the transporter, differentiated with respect to
the drug concentration c.
without inhibitor with vinblastine
Jejunum:
Peff passive [104·cm/s] 0.40 0.34
Peff max [104·cm·l/s·mmol] 0.09 0.09
Km [mmol/l] 0.02 0.01 Peff transporter [104·cm/s] 0.025 mmol/l 0.05 mmol/l 0.1 mmol/l 0.25 mmol/l 0.5 mmol/l
0.87 0.36 0.12 0.02 0.01
0.66 0.21 0.06 0.01 0.00
Ileum:
Peff passive [104·cm/s] 0.58 0.80
Peff max [104·cm·l/s·mmol] 0.24 0.46
Km [mmol/l] 0.005 0.74 Peff transporter [104·cm/s] 0.025 mmol/l 0.05 mmol/l 0.1 mmol/l 0.25 mmol/l 0.5 mmol/l
1.27 0.37 0.10 0.02 0.00
0.58 0.55 0.48 0.35 0.22
Colon:
Peff passive [104·cm/s] 0.86 0.80
Peff max [104·cm·l/s·mmol] 0.17 0.13
Km [mmol/l] 0.03 0.13 Peff transporter [104·cm/s] 0.025 mmol/l 0.05 mmol/l 0.1 mmol/l 0.25 mmol/l 0.5 mmol/l
1.72 0.81 0.31 0.07 0.02
0.70 0.52 0.32 0.12 0.04

Chapter II: Effective permeabilities in different regions of the rat intestine
63
In jejunum, for example, at talinolol concentrations of 0.025 mmol/l in the perfusate,
the carrier-mediated permeability was approximately twice as high as compared to
the passive permeability. When vinblastine was added to the perfusate, a reduction in
the contribution of carrier-mediated permeability was noticeable. At 0.1 mmol/l,
carrier-mediated secretory permeability of talinolol was merely 1/3 of the absorptive
permeability and at 0.5 mmol/l the contribution of the Peff transporter to the overall drug
flux across the intestine was negligible. These results are in accordance with the
predictions of the model as depicted in Figure II.3.
II.4 Discussion and conclusions
The perfusion studies demonstrate that intestinal efflux may have a pronounced
influence on drug absorption. Since the efflux system can be saturated, its effect is
concentration dependent and may play an important role only at lower substrate
concentrations.
Similar to rhodamine 123 an unexpected lack of inhibitor effect was also found for
verapamil in human in vivo experiments by Schwarz et al [Schwarz, U. I., T.
Gramatté, et al. (1999)] and in in situ intestinal perfusion experiments in rats by
Spahn-Langguth et al., although verapamil shows good P-gp inhibiting activity in vitro
[Spahn-Langguth, H., G. Baktir, et al. (1998)]. It may be possible that this observation
is due to the high inhibitor permeability leading to a rapid absorption of the inhibitor
from the perfusate.
For the development of peroral controlled-release dosage forms for a particular drug,
it is of considerable importance to be aware of the permeability characteristics of the
drug in different segments along the GI tract. For drugs undergoing significant efflux,
it is important to realize, whether the contribution of carrier mediated secretion to the
overall permeability is similar in the different intestinal segments.
These questions have been addressed for talinolol in a series of experiments using
the single-pass perfused rat intestine, as described above.
Compared with Peff values of other ß-adrenoceptor antagonists, the Peff for talinolol is
higher than for atenolol (jejunum 0.06⋅10-4 cm/s, ileum 0.01⋅10-4 cm/s, colon 0.02⋅10-4

Chapter II: Effective permeabilities in different regions of the rat intestine
64
cm/s), [Fagerholm, U., A. Lindahl, et al. (1997)], which is to be expected. Without the
contribution of the secretory carriers the simulations show that talinolol has a higher
passive permeability (Peff jejunum 0.40·10-4 cm/s, ileum 0.58·10-4 cm/s, colon
0.86·10-4 cm/s). Considering its physico-chemical properties this behaviour is not
unexpected, since the lipophilicity increases from atenolol (log D = -1.8) to talinolol
(log D = 0.7) [Fagerholm, U., A. Lindahl, et al. (1997), Narawane, M., S. K. Podder, et
al. (1993), Schmidt, J. (1995)].
In in vitro studies with excised intestinal tissues from jejunum, ileum and colon of rats
mounted in Ussing-chambers, Ungell et al. [Ungell, A. L., S. Nylander, et al. (1998)]
found that permeability coefficients of low permeability drugs with Peff coefficients
<10⋅10-6 cm/s having negative log D values such as atenolol, decrease in
permeability from jejunum to ileum and colon, while an increase in the same order is
reported for high permeability drugs (> 10⋅10-6 cm/s) with log D values ≥0, e.g., for
metoprolol and propranolol. The estimation results of the in situ rat perfusion studies
presented here correspond well to the in vitro findings of Ungell et al. according to
which talinolol would have to be placed into the group of lipophilic/high permeable
compounds based on its passive permeability behaviour. However, due to the
efficiency of the secretory carrier, this high passive permeability is considerably
reduced by efflux mechanisms under non-saturating conditions of the carrier.
Another interesting fact is the tendency towards an increase in P-gp-mediated
talinolol secretion in more distal intestinal segments. At the lowest perfusate
concentration studied, the Peff transporter increased from 0.87·10-4 cm/s in jejunum to
1.27·10-4 cm/s in ileum and 1.72·10-4 cm/s in colon. This might indicate either
increased expression levels of P-glycoprotein or alternatively higher activity of
secretory carriers in the lower GI-tract.
This observation also implicates that targeting the release of drugs with affinity to P-
gp from their dosage form to the lower GI tract, in order to avoid P-gp-mediated
secretion, will probably not become a successful strategy for bioavailability
enhancement.
A newer source for drug-drug interactions that has been reported a few times is that
a concomitant administration of two drugs with affinity to P-glycoprotein can modify
the pharmacokinetics of one or both drugs [Wakasugi, H., I. Yano, et al. (1998), Yu,

Chapter II: Effective permeabilities in different regions of the rat intestine
65
D. K. (1999), Greiner, B., M. Eichelbaum, et al. (1999), Westphal, K., A.
Weinbrenner, et al. (2000), Johne, A., J. Brockmoller, et al. (1999)].
The rat studies support these findings and suggest a potential interaction between
vinblastine and talinolol, which might also have a certain clinical relevance.

Chapter III: Development of talinolol controlled-release dosage forms
66
Chapter III

Chapter III: Development of talinolol controlled-release dosage forms
67
Chapter III
Development of peroral talinolol controlled-release dosage forms
III.1 Introduction
For acute diseases in most cases the onset of drug action is required to be rapid. In
the case of peroral administration for systemic treatment a fast dissolution of the drug
from the tablet or capsule is the first prerequisite. Such drug products are termed
immediate release (IR) dosage forms.
Drug products in this category include soft gelatin capsules which are filled with
solutions or dispersions to ensure rapid drug dissolution. For tablets, disintegration
and dissolution rates can be enhanced by the addition of starch, modified starches,
polyvinyl pyrrolidon (PVP) or a combination of carbonates with weak acids, e.g. citric
acid or tartaric acid [Hartke, K. et al. (2002)].
On the other hand, in several cases rapid dissolution rates may not be desirable. For
the treatment of many chronic diseases plasma drug levels should be maintained
constant. This is hardly achievable with immediate-release dosage forms, except for
the cases when the half-life of the drug itself is long.
In all other cases drug elimination leads to a more or less rapid decrease of the
plasma levels of the drug and hence a drop below the minimum therapeutic
concentration. In order to compensate for the eliminated drug, another dosage form
has to be administered if drug action shall endure. At the same time this procedure
includes the risk of entering the toxic concentration range and it can result in
accumulated plasma peaks instead of constant plasma levels as outlined in Figure
III.1.
In order to avoid these fluctuations and to minimize the frequency of dosage form
intake for the patient, sustained-release dosage forms have been developed. They
release the drug continuously, resulting in more constant plasma levels.
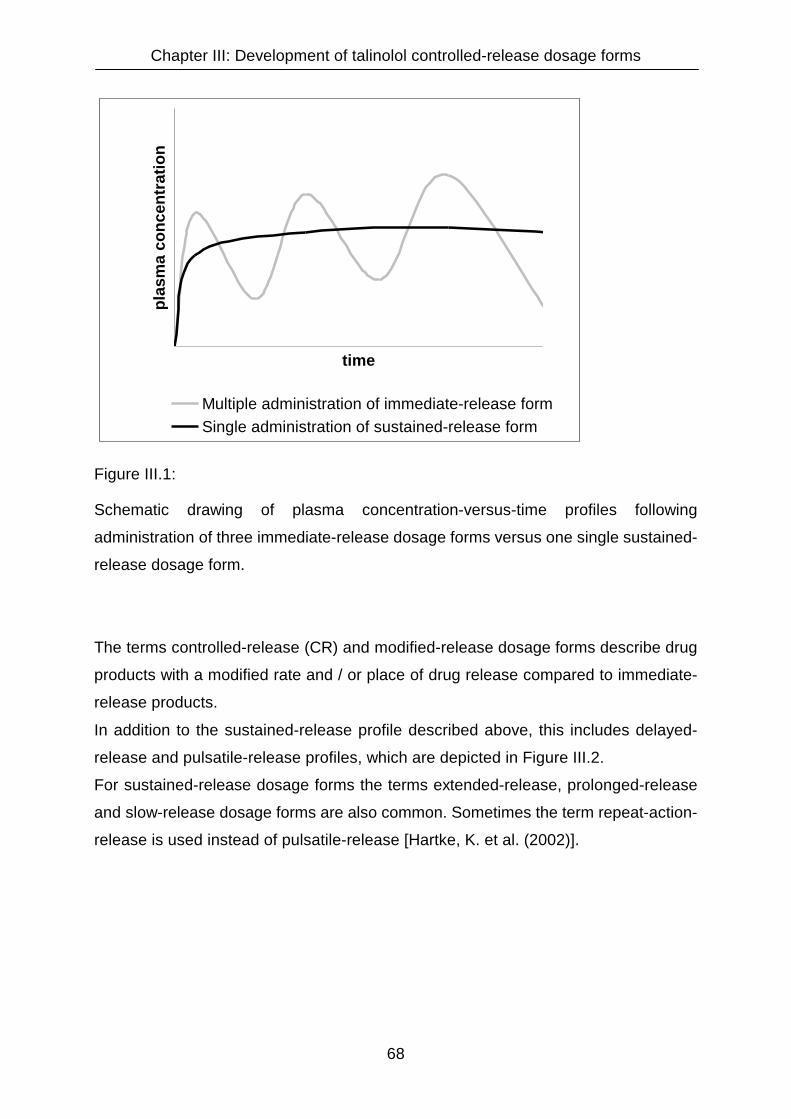
Chapter III: Development of talinolol controlled-release dosage forms
68
time
plas
ma
conc
entr
atio
n
Multiple administration of immediate-release formSingle administration of sustained-release form
Figure III.1:
Schematic drawing of plasma concentration-versus-time profiles following
administration of three immediate-release dosage forms versus one single sustained-
release dosage form.
The terms controlled-release (CR) and modified-release dosage forms describe drug
products with a modified rate and / or place of drug release compared to immediate-
release products.
In addition to the sustained-release profile described above, this includes delayed-
release and pulsatile-release profiles, which are depicted in Figure III.2.
For sustained-release dosage forms the terms extended-release, prolonged-release
and slow-release dosage forms are also common. Sometimes the term repeat-action-
release is used instead of pulsatile-release [Hartke, K. et al. (2002)].

Chapter III: Development of talinolol controlled-release dosage forms
69
time
plas
ma
conc
entr
atio
n
Delayed-release Sustained-release Pulsatile-release
Figure III.2:
Schematic drawing of plasma concentration-versus-time profiles following
administration of different types of controlled-release dosage forms: delayed,
sustained and pulsatile-release.
A delayed-release profile is for example typical for enteric-coated tablets, that do not
release drug within the stomach. Following stomach emptying, they dissolve rapidly
in the small intestine. Such a profile is desirable when drugs are instable in the acidic
gastric fluid, when they irritate the stomach mucosa or when a local drug action in a
certain part of the intestine shall be attained.
Sustained-release dosage forms are useful to maintain drug concentrations in
plasma above the minimum effective concentration over a prolonged period of time.
In an ideal case, the plasma concentration-versus-time profile following
administration of a sustained-release dosage form is similar to the one during an
infusion.
In some cases, however, a constant plasma level is not desirable, e.g. when a
circadian rhythm has to be imitated. In theses cases, a CR dosage form with a
pulsatile-release profile can help to minimize the frequency of drug intake and thus
significantly improve the compliance.
Chapter III: Development of talinolol controlled-release dosage forms
70
III.1.1 The need of a controlled-release dosage form for talinolol
The model compound talinolol is available on the German market as film-coated
immediate-release tablets containing 50 or 100 mg of the drug (Cordanum 50 and
100 Filmtabletten) and in 5 ml vials filled with a solution for injection containing 10 mg
talinolol (Cordanum Injektionslösung).
A controlled-release dosage form is not available, because talinolol has a mean
elimination half life of 11.9 hours [Trausch, B., R. Oertel, et al. (1995)], such that once
or twice daily dosing of the IR tablets is sufficient to maintain the plasma
concentrations within the therapeutic range.
The recommended daily dosage ranges from 50 to 300 mg, which can be
administered either completely in the morning or subdivided to half or three third of
the dose in the morning and the residual dose in the evening.
Although no therapeutic benefit for a talinolol controlled-release dosage form is to be
expected, its development is useful, in order to investigate the influence of the drug
release rate from a dosage form on the intestinal secretion mediated by P-
glycoprotein (P-gp) or other secretory transporters.
As discussed more extensively in chapter I, the phenomenon also described as
intestinal drug efflux, may influence the fraction of drug absorbed (Fa) and hence the
bioavailability (BA).
Since quite a large number of drugs have been reported to be substrate to P-gp, e.g.
numerous anti cancer drugs, aldosterone, atorvastatin, celiprolol, cimetidine,
cortisole, cyclosporine A, dexamethasone, digoxin, domperidone, fexofenadine,
ketoconazole, loperamide, morphine, ondansetron, phenytoin, ranitidine, salbutamol
trospium and verapamil, it is important for the development of controlled-release
dosage forms for such drugs to know how and how far changes in the drug release
from a dosage form may influence the carrier-mediated secretion and consequently
the bioavailability of these drugs.
Talinolol is employed as model drug, since it is proven to be substrate to intestinal
secretory transporters and its biotransformation is negligible (< 1 % of the
administered dose) [Spahn-Langguth, H., G. Baktir, et al. (1998), Trausch, B., R.
Oertel, et al. (1995)]. The neglible biotransformation reduces the number of unknown
factors with impact on the talinolol blood concentration, such that the factors intestinal
Chapter III: Development of talinolol controlled-release dosage forms
71
secretion and drug release from the dosage form do not interfere with the factor
biotransformation. This is of particular importance since gut metabolism in the
intestine mediated by the cytochrome P 450 isoform CYP3A4 often interferes with the
intestinal secretion mediated by P-gp, because many drugs metabolized by CYP3A4
are also substrates for P-gp and have the same inducers and inhibitors [Schuetz, E.
G., A. H. Schinkel, et al. (1996), Wacher, V. J., C. Y. Wu, et al. (1995)].
The aim of this project was not the development of a CR dosage form for one specific
drug which could eventually be brought to the market. Rather, the impact of the drug
release rate on intestinal secretion and absorption for P-gp substrates in general
should be studied.
The target release rate for the peroral talinolol sustained-release dosage form to be
developed was a continuous drug release for approximately eight hours, which
should be as much as possible independent of the pH value of the dissolution
medium.
III.1.2 Technological aspects
For the development of peroral controlled-release dosage forms a number of different
manufacturing methods can be used. Most common dosage forms are tablets and
capsules.
As for tablets standard procedures to modify the drug release are coatings [Rhodes,
C. T. and S. C. Porter (1998), Fan, T. Y., S. L. Wei, et al. (2001), Leopold, C. S. and
D. Eikeler (1998), Parikh, N. H., S. C. Porter, et al. (1993)], multi-layer or core tablets
consisting of different powder mixtures [al-Gohary, O. M. and R. S. al-Kassas (2000),
Bettini, R., D. Acerbi, et al. (2002), Conte, U. and L. Maggi (1996), Genc, L., H. Bilac,
et al. (1999), Krishnaiah, Y. S., R. S. Karthikeyan, et al. (2002), Streubel, A., J.
Siepmann, et al. (2000)], matrix systems [Boza, A., I. Caraballo, et al. (1999),
Jovanovic, M., G. Jovicic, et al. (1997), Neau, S. H., M. A. Howard, et al. (1999),
Sanchez-Lafuente, C., M. Teresa Faucci, et al. (2002)] or oral osmotic systems
(OROS) [(Godbillon, J., A. Gerardin, et al. (1985), Good, W., L. J. Leeson, et al.
(1985), McInnes, G. T. and M. J. Brodie (1988)].
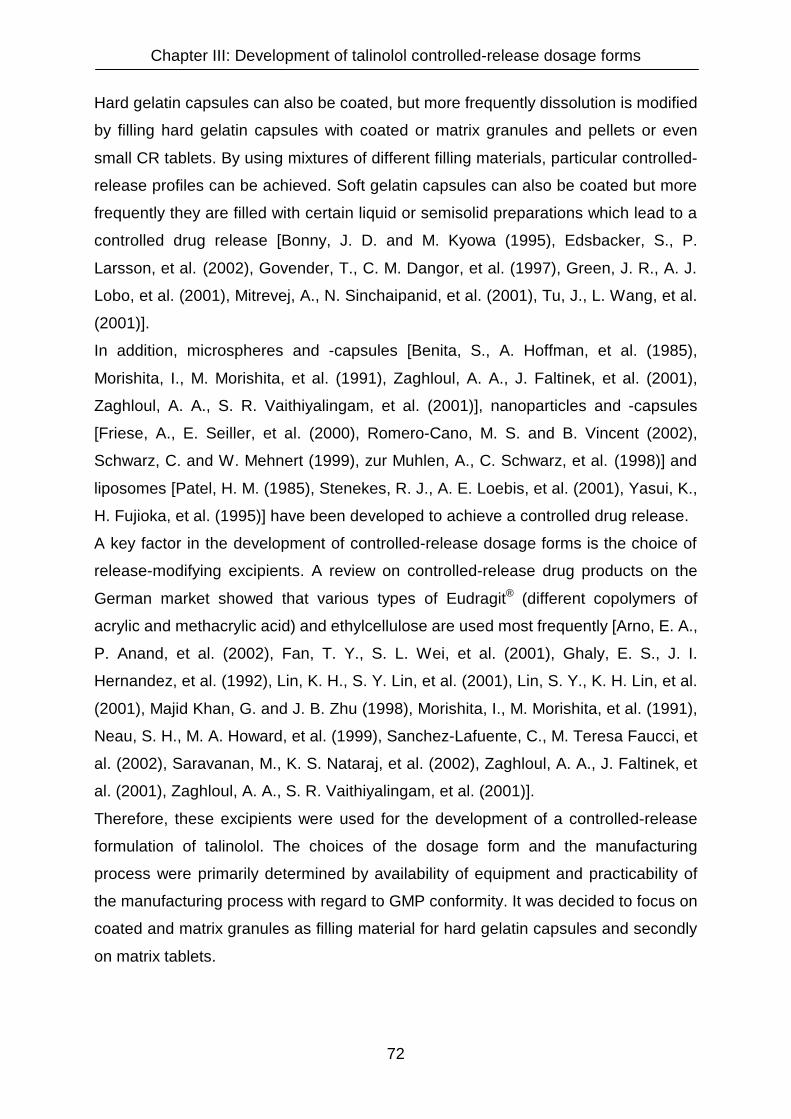
Chapter III: Development of talinolol controlled-release dosage forms
72
Hard gelatin capsules can also be coated, but more frequently dissolution is modified
by filling hard gelatin capsules with coated or matrix granules and pellets or even
small CR tablets. By using mixtures of different filling materials, particular controlled-
release profiles can be achieved. Soft gelatin capsules can also be coated but more
frequently they are filled with certain liquid or semisolid preparations which lead to a
controlled drug release [Bonny, J. D. and M. Kyowa (1995), Edsbacker, S., P.
Larsson, et al. (2002), Govender, T., C. M. Dangor, et al. (1997), Green, J. R., A. J.
Lobo, et al. (2001), Mitrevej, A., N. Sinchaipanid, et al. (2001), Tu, J., L. Wang, et al.
(2001)].
In addition, microspheres and -capsules [Benita, S., A. Hoffman, et al. (1985),
Morishita, I., M. Morishita, et al. (1991), Zaghloul, A. A., J. Faltinek, et al. (2001),
Zaghloul, A. A., S. R. Vaithiyalingam, et al. (2001)], nanoparticles and -capsules
[Friese, A., E. Seiller, et al. (2000), Romero-Cano, M. S. and B. Vincent (2002),
Schwarz, C. and W. Mehnert (1999), zur Muhlen, A., C. Schwarz, et al. (1998)] and
liposomes [Patel, H. M. (1985), Stenekes, R. J., A. E. Loebis, et al. (2001), Yasui, K.,
H. Fujioka, et al. (1995)] have been developed to achieve a controlled drug release.
A key factor in the development of controlled-release dosage forms is the choice of
release-modifying excipients. A review on controlled-release drug products on the
German market showed that various types of Eudragit® (different copolymers of
acrylic and methacrylic acid) and ethylcellulose are used most frequently [Arno, E. A.,
P. Anand, et al. (2002), Fan, T. Y., S. L. Wei, et al. (2001), Ghaly, E. S., J. I.
Hernandez, et al. (1992), Lin, K. H., S. Y. Lin, et al. (2001), Lin, S. Y., K. H. Lin, et al.
(2001), Majid Khan, G. and J. B. Zhu (1998), Morishita, I., M. Morishita, et al. (1991),
Neau, S. H., M. A. Howard, et al. (1999), Sanchez-Lafuente, C., M. Teresa Faucci, et
al. (2002), Saravanan, M., K. S. Nataraj, et al. (2002), Zaghloul, A. A., J. Faltinek, et
al. (2001), Zaghloul, A. A., S. R. Vaithiyalingam, et al. (2001)].
Therefore, these excipients were used for the development of a controlled-release
formulation of talinolol. The choices of the dosage form and the manufacturing
process were primarily determined by availability of equipment and practicability of
the manufacturing process with regard to GMP conformity. It was decided to focus on
coated and matrix granules as filling material for hard gelatin capsules and secondly
on matrix tablets.

Chapter III: Development of talinolol controlled-release dosage forms
73
III.1.3 Properties of excipients used in the formulation of sustained-release
dosage forms for talinolol
In the following section, properties of the excipients used to sustain the release rate
of talinolol from tablet and capsule formulations are composed [Eudragit® technical
bulletin, Röhm (Darmstadt, Germany), Ethocel® product information, Dow (Midland,
MI, USA)]:
III.1.3.1 Eudragit polymers
Eudragit® polymers are copolymers of acrylic and methacrylic acid or their esters.
They all have the same basic structure, as shown in Figure III.3. Their specific
properties are determined by different functional groups R1 to R3 and different ratios
acrylic to methacrylic acid on the one hand, and free acids to esters on the other
hand.
R3
C CH2
C
O
R1
O
C CH2
C
CH3
O
O
R2
n
Figure III.3:
Basic structure of Eudragit® polymers.

Chapter III: Development of talinolol controlled-release dosage forms
74
Eudragit® RS 12.5 (USP/NF)
Eudragit® RS 12.5 is a 12.5 % organic solution of a copolymer of acrylate and
methacrylate with 4 to 7 % of quaternary ammonium groups.
CH3
C CH2
C
O
CH2
O
C CH2
C O
O
CH2
n
R1CH2
N CH3
CH3
CH3
R1
Cl
+
R = H or CH3
The polymer is insoluble in water, independent of the pH of the solution. Drug release
is enabled by swelling of the polymer which enables drugs incorporated in
formulations with Eudragit® RS 12.5 to diffuse through the swollen matrix.
Eudragit® RSPO (USP/NF, JPE)
Eudragit® RSPO is also a copolymer of acrylate and methacrylate with 4 to 7 % of
quaternary ammonium groups. The chemical structure is identical to Eudragit® RS
12.5, but it is supplied in powder form instead of an organic solution in order to be
used for directly compressible matrix formulations.
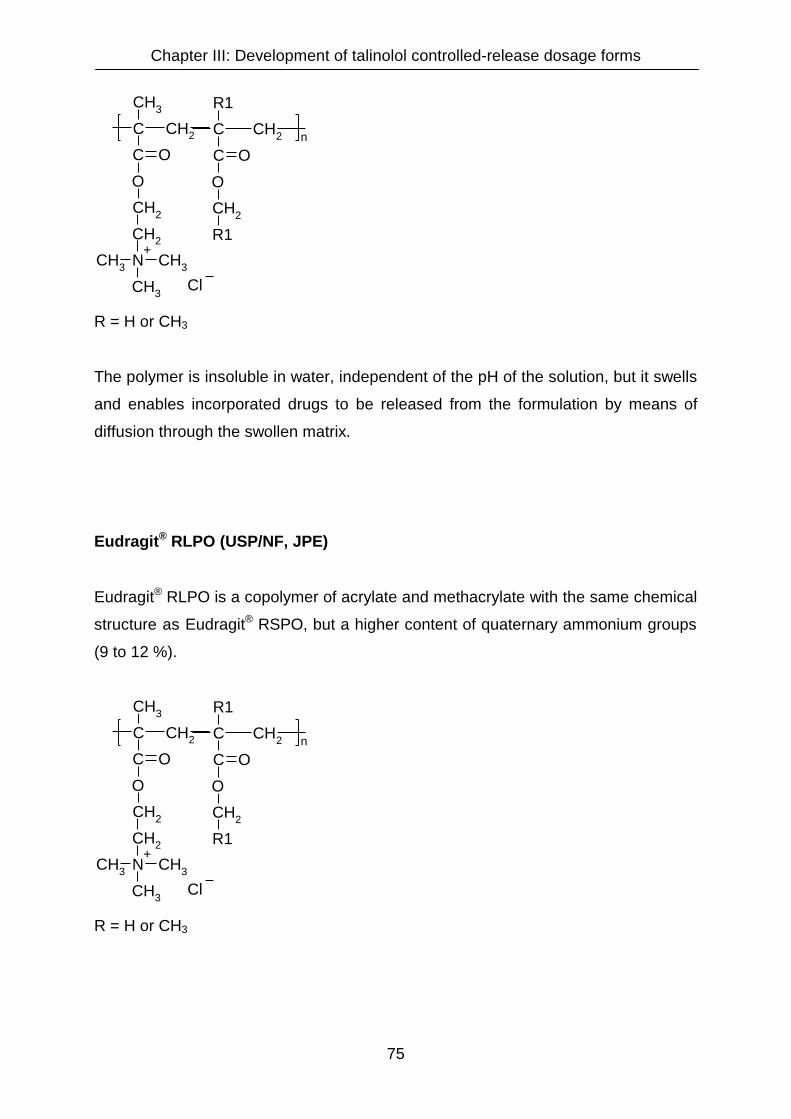
Chapter III: Development of talinolol controlled-release dosage forms
75
CH3
C CH2
C
O
CH2
O
C CH2
C O
O
CH2
n
R1CH2
N CH3
CH3
CH3
R1
Cl
+
R = H or CH3
The polymer is insoluble in water, independent of the pH of the solution, but it swells
and enables incorporated drugs to be released from the formulation by means of
diffusion through the swollen matrix.
Eudragit® RLPO (USP/NF, JPE)
Eudragit® RLPO is a copolymer of acrylate and methacrylate with the same chemical
structure as Eudragit® RSPO, but a higher content of quaternary ammonium groups
(9 to 12 %).
CH3
C CH2
C
O
CH2
O
C CH2
C O
O
CH2
n
R1CH2
N CH3
CH3
CH3
R1
Cl
+
R = H or CH3
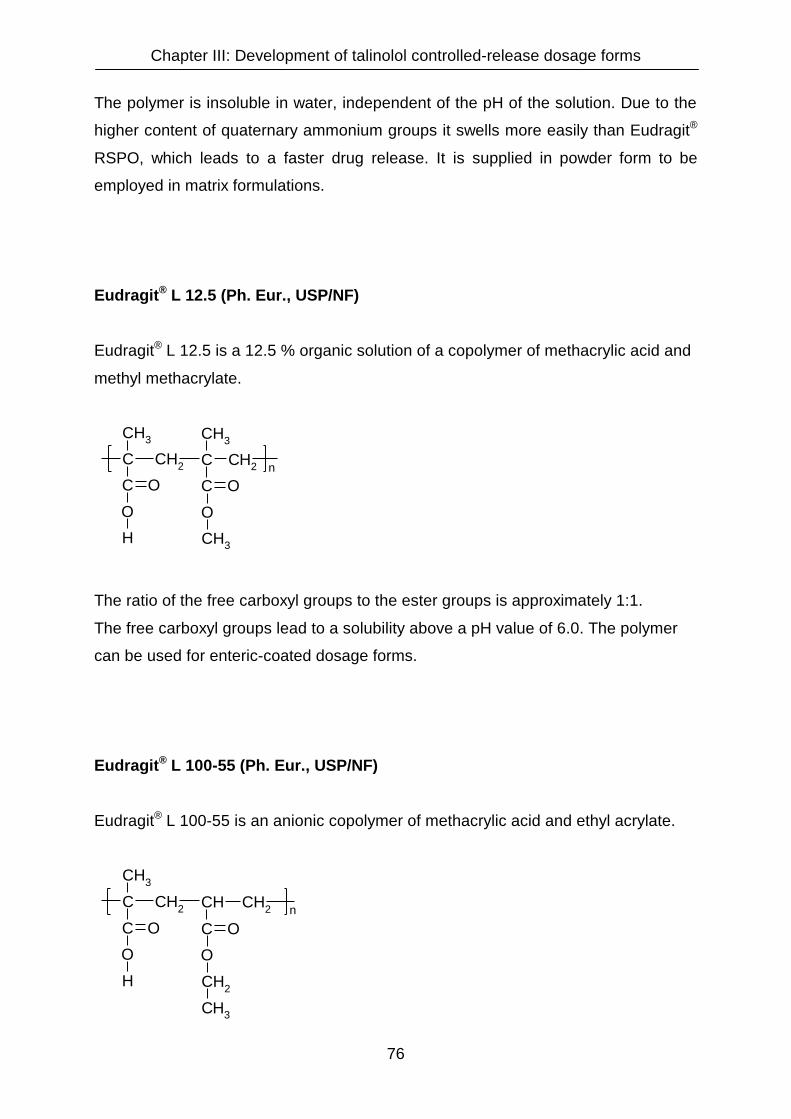
Chapter III: Development of talinolol controlled-release dosage forms
76
The polymer is insoluble in water, independent of the pH of the solution. Due to the
higher content of quaternary ammonium groups it swells more easily than Eudragit®
RSPO, which leads to a faster drug release. It is supplied in powder form to be
employed in matrix formulations.
Eudragit® L 12.5 (Ph. Eur., USP/NF)
Eudragit® L 12.5 is a 12.5 % organic solution of a copolymer of methacrylic acid and
methyl methacrylate.
CH3
C CH2
C
O
H
O
C CH2
C
CH3
O
O
CH3
n
The ratio of the free carboxyl groups to the ester groups is approximately 1:1.
The free carboxyl groups lead to a solubility above a pH value of 6.0. The polymer
can be used for enteric-coated dosage forms.
Eudragit® L 100-55 (Ph. Eur., USP/NF)
Eudragit® L 100-55 is an anionic copolymer of methacrylic acid and ethyl acrylate.
CH3
C CH2
C
O
H
O
CH CH2
C O
O
CH2
n
CH3

Chapter III: Development of talinolol controlled-release dosage forms
77
The ratio of the free carboxyl groups to the ester groups is approximately 1:1.
Due to the altered chemical structure compared to Eudragit® L 12.5 (ethyl acrylate
copolymer instead of methyl methacrylate coplymer), the polymer starts to dissolve in
water already at pH values of 5.5 and above. It is supplied in spray-dried powder
form and can be used for enteric coatings and a targeted delivery in the duodenum or
jejunum.
Eudragit® S 100 (Ph. Eur., USP/NF, JPE)
Eudragit® S 100 is an anionic copolymer of methacrylic acid and methyl methacrylate
with free carboxyl groups in powder form.
CH3
C CH2
C
O
H
O
C CH2
C
CH3
O
O
CH3
n
The ratio of the free carboxyl groups to the ester groups is approximately 1:2.
The polymer is soluble in water above pH values of 6.0, but due to the lower content
of free carboxyl groups, it dissolves less rapidly than Eudragit® L 12.5 and Eudragit®
L 100-55. It can be used for a targeted delivery in the ileum or colon. The site of drug
release and the release-rate of drug from the dosage form can be altered by a
combination with different Eudragit® L types.
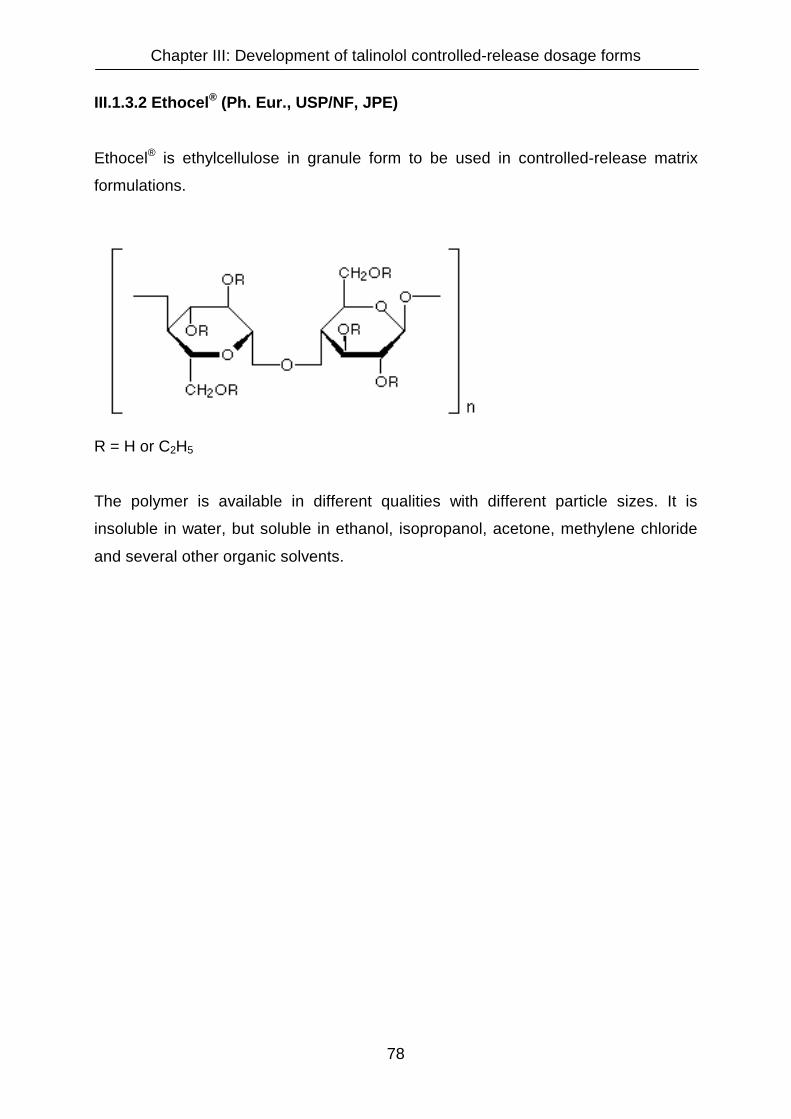
Chapter III: Development of talinolol controlled-release dosage forms
78
III.1.3.2 Ethocel® (Ph. Eur., USP/NF, JPE)
Ethocel® is ethylcellulose in granule form to be used in controlled-release matrix
formulations.
R = H or C2H5
The polymer is available in different qualities with different particle sizes. It is
insoluble in water, but soluble in ethanol, isopropanol, acetone, methylene chloride
and several other organic solvents.

Chapter III: Development of talinolol controlled-release dosage forms
79
III.2 Materials and methods
III.2.1 Chemicals and other materials
Talinolol was a gift from AWD Pharma (Dresden, Germany). Its purity was
determined as 100.1 %. The loss on drying was 0.1 %. The particle size did not
exceed 103 µm, 90 % of the particles were smaller than 71 µm. The substance
complied in all parameters with the demands of the specifications of the manufacturer
(AWD Pharma, Dresden).
The different Eudragit® polymers were received as free samples from Röhm
(Darmstadt, Germany), Ethocel® was received as free sample from Dow (Midland,
USA), Lipoxol 4000 (polyethylene glycol 4000) was obtained from Sasol (Marl,
Germany). Theophylline monohydrate, magnesium stearate, corn starch and
mannitol were purchased in Ph.Eur. quality from Caelo (Hilden, Germany). Buffer
salts and other chemicals were ordered at Merck (Darmstadt, Germany) and were at
least of p.a. grade. The pH test sticks were also received from Merck (Darmstadt,
Germany). Empty hard gelatin capsules were ordered from Wepa (Hillscheid,
Germany).
III.2.2 Preparation of sustained-release matrix granules
Sustained-release granules were produced by premixing theophylline or talinolol with
the particular excipients in a 1000 ml beaker with a stainless steel spoon. After a
sufficient amount of liquid was added to the mixing chamber to perform a wet
granulation, mixing was continued in an IKA paddle mixer LR 250 (IKA, Staufen,
Germany) for 20 minutes. Unless stated otherwise in the results section, the
granulation liquid was water. The mixing rate of approximately 120 rpm fluctuated
since the viscosity within the chamber varied during the mixing process. The mixture
was pressed through a sieve with a mesh size of 2000 µm and subsequently dried in
a Binder FED 53 oven (WTB Binder, Tuttlingen, Germany) at 50°C for 24 hours. To
destroy larger agglomerates, the dry granules were sieved again through a 2000 µm
sieve. To remove the fine powder fraction, a 355 µm sieve was used subsequently.
Chapter III: Development of talinolol controlled-release dosage forms
80
The bulk densities of the ready-to-fill granules were determined in a 250 ml glass
cylinder. The granules were filled into hard gelatin capsules of the sizes 000 (filling
volume: 1.37 ml), 0 (0.68 ml) or 3 (0.30 ml) using an Aponorm capsule filling and
closure device (Wepa, Hillscheid, Germany) equipped with the suitable inlays for the
different capsule sizes. The filling machine allowed to fill 60 capsules at a time. For
those instances when less capsules had to be prepared, the superfluous holes in the
upper inlay of the apparatus were sealed with adhesive tape.
A formulation number (Form no.) consisiting of 6 numbers and one letter was used to
distinguish between different granule formulations. The number refers to the date on
which the particular formulation was manufactured for the first time. The first two
digits represent the year, the second two digits represent the month plus 1 and the
third two digits the manufacturing day plus two for a particular formulation. The
following letter is used to distinguish between different formulations manufactured on
the same day (e.g.: A refers to the first formulation manufactured at a specific day, B
to the second, C to the third formulation, etc.).
III.2.3 Preparation of coated sustained-release granules
To sustain the release rate of talinolol from capsules filled with modified-release
granules, granules were film coated with Eudragit® L 12.5.
The organic solution was sprayed onto the granules with a twin fluid spraying nozzle
connected to a flexible-tube pump operating with compressed air at a pressure of 1.0
bar (atmosphere gauge ATG) in a copper dragée pan (Erweka, Heusenstamm,
Germany) running at a rotational speed of 20 rpm. To accelerate the evaporation of
the liquid and to favour the formation of a film around the granules, warm air was
blown into the pan.
Each spraying phase (10 to 25 seconds) was followed by a drying phase lasting until
the granules ceased sticking together. During the drying phase (1 to 10 minutes) no
new polymer was applied to the granule particles. To deagglomerate agglomerated
granules, the rotational speed was occasionally increased up to 35 rpm during the
drying periods.

Chapter III: Development of talinolol controlled-release dosage forms
81
The thickness of the film-layer on the granules was varied by changing the ratio
between the amount of granule in the pan and the amount of polymer solution or
dispersion sprayed onto the granule.
After termination of the spraying process the granules were dried in a Binder FED 53
oven (WTB Binder, Tuttlingen, Germany) at 50°C for 24 hours. The bulk density of
the ready-to-fill granules was determined in a 250 ml glass cylinder.
The coated granules were labeled according to the formulation number format
described for the matrix granules.
III.2.4 Preparation of sustained-release matrix tablets
Sustained-release matrix tablets were produced by mixing talinolol drug substance
with different amounts of the particular excipients in a mortar for five minutes before
grinding the mixture to a fine powder with a pestle for another five minutes. The
appropriate amount of this powder mixture required to obtain a tablet containing 100
or 200 mg of active drug substance was weighed in 50 ml glass containers on a
Mettler AG 285 scale (Mettler Toledo, Greifensee, Switzerland) and then filled into
the 13 mm die of a PW 20 GS manual tablet press (Paul Weber, Remshalden-
Grumbach, Germany). In those instances when the powders tended to stick to the
punch and die, a fine layer of magnesium stearate was applied with a small brush.
Unless stated otherwise, tablets were compressed with a compression force of 40 kN
applied for a duration of 30 seconds or 2 minutes in different test series. The tablets
were stored in 50 ml plastic containers with screw caps and labeled with the
formulation number according to the format described for the matrix granules.

Chapter III: Development of talinolol controlled-release dosage forms
82
III.2.5 Pharmaceutical characterization
III.2.5.1 Dissolution
In vitro dissolution was tested using “Apparatus 2” of the United States
Pharmacopeia (USP) [USP, 23rd edition, <711> “Dissolution”] which is identical to the
“Paddle Apparatus” of the European Pharmacopeia (Ph.Eur.) [Ph.Eur., 3rd edition,
<2.9.3> “Drug Release From Solid Dosage Forms”]. A Pharma Test PTWS III
(Pharma Test Apparatebau, Hainburg, Germany) and an Erweka DT7R (Erweka
GmbH, Heusenstamm, Germany) dissolution tester were used.
The apparatuses consist of six glass vessels having a volume of 1000 ml each
immersed in a water bath at 37°C ± 0.5°. Stirrers in paddle form are provided as part
of the dissolution tester. One (Erweka equipment) or two (Pharma Test equipment)
additional glass vessels are provided in order to appropriately heat the dissolution
fluids needed to replace the volumes of the samples collected. Both dissolution
testers were equipped with Hanson Research Dissoette II automatic samplers.
Each dissolution vessel was filled with 1000 ml of the respective dissolution medium.
Rotational speeds of the paddles were 50 or 100 min–1 in various phases of product
testing. Results are given as mean values of three vessels unless stated otherwise.
Standard deviations are outlined in the dissolution profile figures. Occasionally, they
are not visible in the figures since they are smaller than the icons of the particular
dissolution curves.
For capsules and 100 mg tablets sinkers were used to maintain the dosage forms at
the bottom of the dissolution test vessels and prevent their floating. Sinkers were
prepared by bowing stainless steel wire (3 cm of length and 1 mm of thickness) in a
shape that the particular dosage form could be fixed within.
5 ml samples were collected at the following sampling times: 15 min, 30 min, 1 h,
2 h, 3 h, 4 h, 6 h, 8 h and 24 h. The sample volumes were replaced by pure buffer. At
the end of a dissolution test series, the final pH value in each dissolution vessel was
measured by means of pH quick test sticks that allow to display differences of 0.2
units in pH.
In no case changes in pH of the dissolution fluids compared to the initial buffers were
detected. This may be due to the fact that the concentrations of theophylline and
talinolol were generally too low to exceed the buffer capacities.

Chapter III: Development of talinolol controlled-release dosage forms
83
III.2.5.1.1 Assays
Talinolol and theophylline concentrations were analysed by means of UV
spectroscopy using a Lamda 20 UV-VIS spectrophotometer (Perkin Elmer,
Überlingen, Germany) at a wavelength of 240 nm for talinolol and 270 nm for
theophylline. The samples were diluted such that their absorbances were in the linear
range of the Lambert-Beer law.
For talinolol, calibration curves with concentrations from 2 to 20 mg/l were recorded
in all different dissolution media employed. The differences between calibration
curves obtained from the different media were only marginal. This is displayed in
Figure III.4. All curves showed linearity in the concentration range investigated with a
R2 value (coefficient of determination) of at least 0.999.
0
0.2
0.4
0.6
0.8
1
0 5 10 15 20
concentration (mg/l)
abso
rban
ce (U
V, 2
40 n
m)
0.1 N hydrochloric acid pH 1.0
acetate buffer pH 4.5
acetate buffer pH 6.0
phosphate buffer pH 3.2
phosphate buffer pH 5.5
phosphate buffer pH 6.0
phosphate buffer pH 6.8
Figure III.4:
Calibration curves for the UV assay of talinolol in different dissolution media in the
concentration range between 2 and 20 mg/l.

Chapter III: Development of talinolol controlled-release dosage forms
84
III.2.5.1.2 Dissolution media
The most frequently used dissolution media were 0.1 N hydrochloric acid (pH 1.0) to
mimic the gastric pH in the fasted state, acetate buffer pH 4.5 USP to mimic the pH
value in the upper small intestine and phosphate buffer pH 6.8 USP for the imitation
of lower small intestinal regions [Efentakis, M. and J. B. Dressman (1998), Russell, T.
L., R. R. Berardi, et al. (1993), Youngberg, C. A., R. R. Berardi, et al. (1987)]. To test
the drug release at intermediate pH values phosphate buffers with pH values of 3.2,
5.5 and 6.0 were used. Additionally, acetate buffer pH 6.0 and citrate buffer pH 6.8
were employed to test the influence of different buffer salts on the drug dissolution
from talinolol dosage forms.
A more detailed discussion on the importance of a careful selection of appropriate
media for dissolution testing is presented in chapter IV.
The composition of the buffers used as media in dissolution tests with various
talinolol formulations is given in Table III.1.
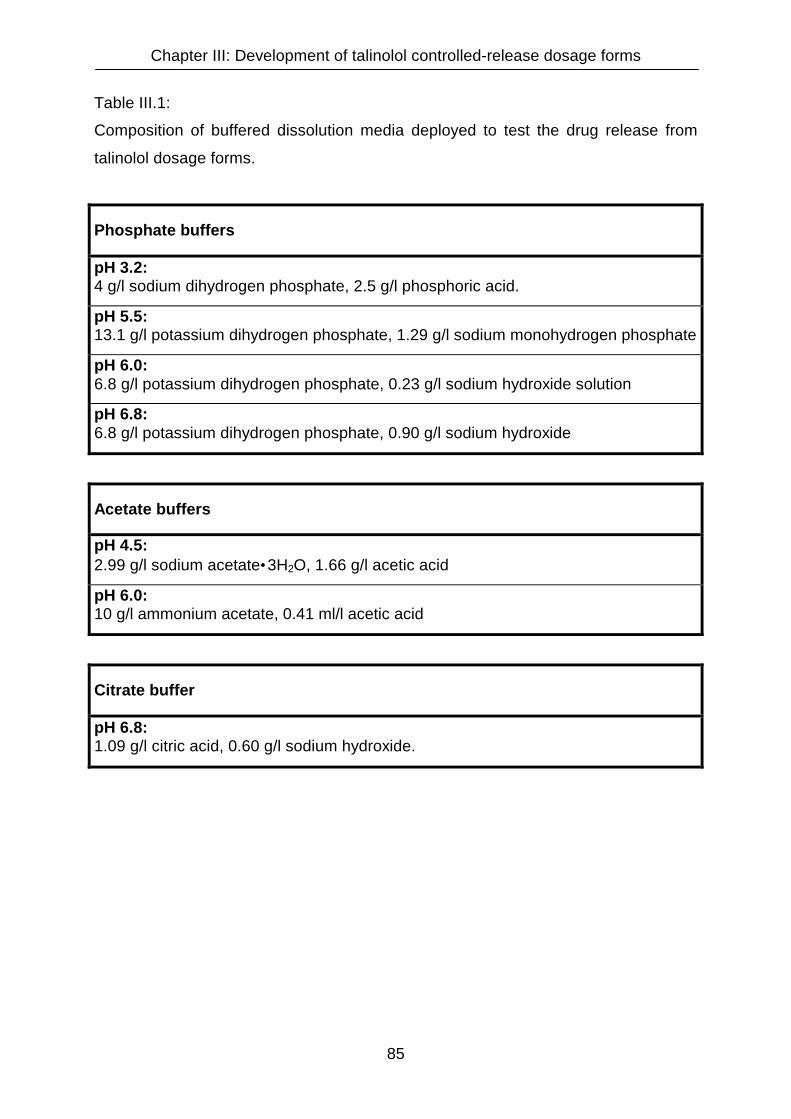
Chapter III: Development of talinolol controlled-release dosage forms
85
Table III.1:
Composition of buffered dissolution media deployed to test the drug release from
talinolol dosage forms.
Phosphate buffers
pH 3.2: 4 g/l sodium dihydrogen phosphate, 2.5 g/l phosphoric acid.
pH 5.5: 13.1 g/l potassium dihydrogen phosphate, 1.29 g/l sodium monohydrogen phosphate
pH 6.0: 6.8 g/l potassium dihydrogen phosphate, 0.23 g/l sodium hydroxide solution
pH 6.8: 6.8 g/l potassium dihydrogen phosphate, 0.90 g/l sodium hydroxide
Acetate buffers
pH 4.5: 2.99 g/l sodium acetate•3H2O, 1.66 g/l acetic acid
pH 6.0: 10 g/l ammonium acetate, 0.41 ml/l acetic acid
Citrate buffer
pH 6.8: 1.09 g/l citric acid, 0.60 g/l sodium hydroxide.

Chapter III: Development of talinolol controlled-release dosage forms
86
III.2.5.1.3 Stability of talinolol in dissolution media
The stability of talinolol in various dissolution media was tested by remeasuring
calibration solutions containing 4, 6, 10 and 20 mg/l talinolol following their storage in
tightly closed, colourless glass flasks at room temperature and normal day light over
a time period up to six weeks. The results are presented in Table III.2:

Chapter III: Development of talinolol controlled-release dosage forms
87
Table III.2:
Stability of talinolol solutions in different dissolution media.
0.1 N HCl Absorbance
conc. (mg/l) at time 0 after 2 weeks shift (%) after 5 weeks shift (%) after 6 weeks shift (%)
4 0.1730 0.1836 6.1 0.1655 -4.3 0.1718 -0.7
6 0.2582 0.2702 4.6 0.2531 -2.0 0.2565 -0.7
10 0.4363 0.4466 2.4 0.4283 -1.8 0.4331 -0.7
20 0.9252 0.9341 1.0 0.9168 -0.9 0.9208 -0.5
phosphate
buffer pH 3.2 Absorbance
conc. (mg/l) at time 0 after 2 weeks shift (%) after 6 weeks shift (%)
4 0.1505 0.1462 -2.9 0.1476 -1.9
6 0.2433 0.2337 -3.9 0.2315 -4.8
10 0.4153 0.4113 -1.0 0.4116 -0.9
20 0.8157 0.8468 3.8 0.8480 4.0
phosphate
buffer pH 5.5 Absorbance
conc. (mg/l) at time 0 after 2 weeks shift (%) after 4 weeks shift (%) after 5 weeks shift (%)
4 0.1738 0.1883 8.3 0.1668 -4.0 0.1630 -6.2
6 0.2574 0.2823 9.7 0.2582 0.3 0.2486 -3.4
10 0.4454 0.4604 3.4 0.4386 -1.5 0.4240 -4.8
20 0.8816 0.8988 2.0 0.8834 0.2 0.8624 -2.2
phosphate
buffer pH 6.8 Absorbance
conc. (mg/l) at time 0 after 2 weeks shift (%) after 6 weeks shift (%)
4 0.1537 0.1526 -0.7 0.1585 3.1
6 0.2293 0.2392 4.3 0.2382 3.9
10 0.3972 0.3911 -1.5 0.3986 0.4
20 0.8076 0.8154 1.0 0.8059 -0.2
citrate
buffer pH 6.8 Absorbance
conc. (mg/l) at time 0 after 2 weeks shift (%)
4 0.1754 0.1777 1.3
6 0.3417 0.3425 0.2
10 0.4306 0.4334 0.7
20 0.8412 0.8403 -0.1

Chapter III: Development of talinolol controlled-release dosage forms
88
All solutions showed a sufficient stability for the performance of dissolution tests and
the use of automatic samplers. Deviations did not exceed ten percent, even at
storage times of six weeks. This allows samples drawn automatically overnight to be
analysed the next day. All samples were measured within 48 hours, a time period in
which considerable degradation could not beobserved.
III.2.5.2 Uniformity of mass and content
Uniformity of tablet and capsule mass and uniformity of drug content were
determined according to the methods described in the European Pharmacopeia
[Ph.Eur., 3rd edition, <2.9.5>: “Uniformity of mass of single dose preparations” and
<2.9.6>: “Uniformity of content of single dose preparations”]. For the uniformity of
mass tests, capsules were weighed on a Mettler scale model AG 285 (Mettler
Toledo, Greifensee, Switzerland). For the content uniformity tests, drug contents in
the capsules were determined by means of UV spectroscopy as described in the
dissolution section.
III.2.5.3 Size of tablets
The diameter of all tablets was predefined by the punch and die of the tablet press
(13 mm). Tablet thickness varied depending on the compression force and the
amount of powder compressed. For the final tablet formulation designated for an in
vivo evaluation, the thickness of ten randomly selected matrix tablets was measured
with a micrometer (Mitutoyo M 320-25A, Kawasaki, Japan). The mean value and
standard deviation were calculated.

Chapter III: Development of talinolol controlled-release dosage forms
89
III.2.5.4 Crushing strength
The matrix tablets that matched the projected drug release profiles, were
characterized in terms of their crushing strength using a Schleuniger tablet crushing
strength tester model 6D (Schleuniger - Pharmatron AG, Solothurn, Switzerland).
The test was performed with twelve tablets. The mean value and the standard
deviation were calculated.
III.2.5.5 Friability
Friability is defined as the loss of mass during the rotation in the test apparatus
expressed as percentage of the initial mass. Friability of tablets was tested using a
Pharma Test friability tester PTF R (Pharma Test Apparatebau, Hainburg, Germany)
complying with the specifications of the European Pharmacopeia. The test was
performed according to the method described in the Ph.Eur. [Ph.Eur., 3rd edition,
<2.9.7>: “Friablity of uncoated tablets”]. The test was performed three times with 20
tablets each. Only the final tablet formulation that showed appropriate drug release
profiles was tested.

Chapter III: Development of talinolol controlled-release dosage forms
90
III.2.6 Statistical analysis of dissolution data
To investigate the mechanism of drug release, dissolution data of the final
formulation was fitted to the square root of time relationship published by Higuchi and
the equation of Ritger and Peppas [Higuchi, T. (1963), Ritger, P. L. and N. A. Peppas
(1984)]. Both relationships are commonly used to describe drug release kinetics from
matrix formulations and to detect release mechanisms, such as diffusion-, erosion-,
or swelling-controlled drug release.
Higuchi: Q = K • t ½
(Q: cumulative drug release from matrix tablets, K: dissolution rate constant, t: time)
Ritger and Peppas: Mt / Mi = K • tn
(Mt: amount of drug released at time t, Mi: amount of drug released at infinity
K: release rate constant, n: diffusional exponent, characteristic for the drug release
mechanism)
Linear and non-linear regression analysis (Higuchi and Ritger Plots) of the drug
release profiles was performed using Prism, version 3.0 (GraphPad Software Inc.,
San Diego, USA).
Chapter III: Development of talinolol controlled-release dosage forms
91
III.3 Results and discussion
III.3.1 Granules and hard gelatin capsules
III.3.1.1 Determination of the appropriate capsule size based on bulk density
measurements
These tests were performed in a preliminary study with theophylline as active agent
instead of talinolol to define the capsule size suitable to accommodate a drug content
of 100 or 200 mg per capsule. Theophylline was chosen in replacement of talinolol
because it was easy accessible in larger amounts.
The following theophylline granule formulation was prepared:
Eudragit® RSPO 15.0 g
Theophylline monohydrate 60.0 g
Calcium hydrogen phosphate dihydrate 24.3 g
Magnesium stearate 0.7 g
Form. no. 001030A
The bulk density was determined as 520 mg/ml such that 1 ml of the granule refers to
312 mg theophylline since the content of drug in the formulation is 60 %. The granule
was filled in capsules of size 3 with a volume of 0.30 ml, resulting in an estimated
drug content of 94 mg per capsule. The actual content was determined for 6 capsules
spectrophotometrically at a wavelength of 270 nm after the capsule was stirred for 24
hours in 0.1 N HCl on a magnet stirrer to release the drug as completely as possible.
The measured drug contents were 80.5 mg, 81.4 mg, 80.1 mg, 79.4 mg, 81.8 mg,
and 80.8 mg with a mean of 80.7 mg and a standard deviation (SD) of 0.86.
This meant a deviation of the mean content measured from the estimated content of -
14.2 %.
To estimate the drug content in the capsules from the capsule weights without the
effort of spectrophotometric analysis, three random sample groups of 60 empty
capsules were weighed. The masses of 60 empty capsules were determined as
3.03 g, 3.00 g, and 2.97 g, respectively. The mean value of 3.00 g was divided by 60,

Chapter III: Development of talinolol controlled-release dosage forms
92
the number of capsules per group. This resulted in a mean weight of 50 mg for one
capsule shell of size 3 (3.00 g : 60 = 0.05 g).
Then 60 filled capsules were weighed separately to perform a uniformity of mass test.
The single weights of the capsules, their means and standard deviations are given in
Table III.3.
Table III.3:
Uniformity of mass of theophylline capsules (Form. no. 001030A, size 3).
Nr. 1-10
(mg)
Nr. 11-20
(mg)
Nr. 21-30
(mg)
Nr. 31-40
(mg)
Nr. 41-50
(mg)
Nr. 51-60
(mg)
179 181 182 180 175 184
174 185 170 166 186 179
165 184 179 183 186 184
172 176 184 173 175 178
178 181 181 181 177 175
188 173 172 176 174 179
179 186 180 184 186 183
186 180 172 187 174 175
173 180 167 180 175 181
180 176 183 175 180 180
Mean 1 - 20:
178.8
SD 1 - 20:
5.7
Mean 21 - 40:
177.8
SD 21 - 40:
6.0
Mean 41 - 60:
179.3
SD 41 - 60:
4.3
Mean (1 - 60): 178.6 mg, SD (1 - 60): 5.3 mg
The ±10% limits, according to the uniformity of mass test of the European
Pharmacopeia [Ph.Eur., 3rd edition, <2.9.5>: “Uniformity of mass of single dose
preparations”], allow capsule masses in the range from 161 to 197 mg. All of the 60
measured capsules are thus conform to the specifications of the Ph. Eur. in terms of
mass uniformity.
Chapter III: Development of talinolol controlled-release dosage forms
93
When the mean mass of a capsule shell (i.e. 50 mg) is deducted from the mean total
mass of a filled capsule (i.e. 178.6 mg), the average mass of the capsule content is
calculated as 128.6 mg. Under the premise of a drug content of 60 % in the granules,
the amount of theophylline per capsule is estimated as 77.2 mg. That is a deviation
from the spectrophotometrically measured value described above (80.7 mg) of -3.7 %
and from the value estimated initially from the bulk density (94 mg) of -17.9 %. These
high deviation can be explained by different filling properties between a capsule and
a 250 ml glass cylinder. The wide diameter of the glass cylinder used for the
determination of the bulk density allows a free flow of the granules and a consistent
filling, whereas a capsule with its small diameter can easily be blocked by single
granules resulting in larger cavities and thus lower drug contents.
It is thus demonstrated that hard gelatin capsules of size 3 (filling volume 0.30 ml)
cannot accommodate a minimum dose of 100 mg of active in the form of controlled-
release granules. These findings can be extrapolated to other drugs such as talinolol.
A key parameter for the amount of granules that can be accommodated in a capsule,
is the total bulk density of the filling material. To this parameter the density of the
active substance contributes only to a smaller extent. When the same excipients and
same sieves are used, the bulk densities of the resulting granules will be similar
independent of the incorporated drug, especially if little amounts of active drug are
incorporated in large amounts of excipients. But it is also true for high
drug : excipients ratios. In part this is due to the high contribution of between-granule
volume to the total bulk density, in part it is also due to the fact that the densities of
crystalline drugs only vary to a limited extent.
As a result of these findings, capsules of size 0, accommodating a higher filling
volume of 0.68 ml, were selected to be filled with sustained-release granules in the
following test formulations with talinolol.
Chapter III: Development of talinolol controlled-release dosage forms
94
III.3.1.2 Talinolol granule formulations
III.3.1.2.1 Granule formulation with Eudragit® RSPO, calcium hydrogen
phosphate and magnesium stearate
The first test formulation with talinolol had a drug content of 40 % and was adopted
from a theophylline sustained-release granule formulation [Eudragit® application
brochure, Röhm (Darmstadt, Germany)]:
Talinolol 60.0 g
Eudragit® RSPO 60.0 g
Calcium hydrogen phosphate dihydrate 29.3 g
Magnesium stearate 0.7 g
Form. no. 010528A
The powder mixture was kneaded with 65.0 ml of demineralised water and
granulated as described in the “materials and methods” section. After drying the
granules had a relative humidity of 42.5 % at 20° C. The bulk density of the granules
was 0.36 g/ml. The dissolution of 500 mg of granules, containing 200 mg of talinolol,
was tested in 0.1 N HCl. The drug product was floating on top of the dissolution
medium and talinolol was released very rapidly in the acidic medium (Figure III.7).
This was rather unexpected, since the formulation contained as much as 40 % of
release-controlling polymer.
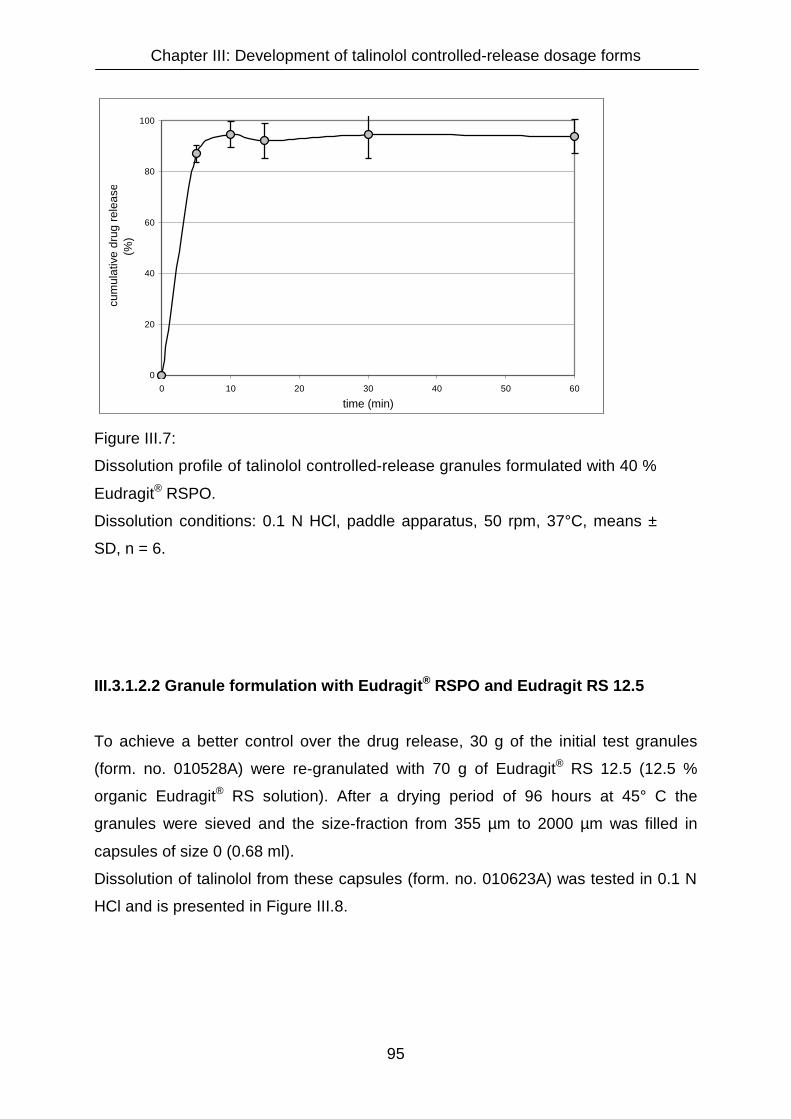
Chapter III: Development of talinolol controlled-release dosage forms
95
0
20
40
60
80
100
0 10 20 30 40 50 60
time (min)
cum
ulat
ive
drug
rele
ase
(%)
Figure III.7:
Dissolution profile of talinolol controlled-release granules formulated with 40 %
Eudragit® RSPO.
Dissolution conditions: 0.1 N HCl, paddle apparatus, 50 rpm, 37°C, means ±
SD, n = 6.
III.3.1.2.2 Granule formulation with Eudragit® RSPO and Eudragit RS 12.5
To achieve a better control over the drug release, 30 g of the initial test granules
(form. no. 010528A) were re-granulated with 70 g of Eudragit® RS 12.5 (12.5 %
organic Eudragit® RS solution). After a drying period of 96 hours at 45° C the
granules were sieved and the size-fraction from 355 µm to 2000 µm was filled in
capsules of size 0 (0.68 ml).
Dissolution of talinolol from these capsules (form. no. 010623A) was tested in 0.1 N
HCl and is presented in Figure III.8.

Chapter III: Development of talinolol controlled-release dosage forms
96
0
10
20
30
40
50
60
70
80
90
100
0 60 120 180 240 300 360 420 480
time (min)
cum
ulat
ive
drug
rele
ase
(%)
Figure III.8
Dissolution profile of talinolol sustained-release granules filled into hard
gelatin capsules. Granulation with 40 % Eudragit® RSPO was followed
by a second granulation with 70 % Eudragit RS 12.5.
Dissolution conditions: 0.1 N HCl, paddle apparatus 50 rpm, 37°C,
means ± SD, n = 3.
It was observed that control over the drug release was from zero to four hours.
On the other hand the granules were hard to handle since the product was resin-like.
Larger particles could hardly be crushed, a diminution of larger particles by pressing
them through a sieve was not possible. A consistent filling of capsules was barely
feasible.
High variations of the granule particle size led to particular differences in the release
rates between different capsules tested. This is indicated by the high standard
deviations in the amounts dissolved at given times. Because of these problems, wet
granulations with organic solutions of Eudragit® were not followed further.

Chapter III: Development of talinolol controlled-release dosage forms
97
III.3.1.2.3 Granule formulation with Eudragit® RSPO, corn starch and gelatin
In another attempt to decrease the dissolution velocity, 50 g of the initial test granules
(form. no. 010528A) were re-granulated with 10 grams of Eudragit® RSPO, 20 g corn
starch and 40 g of a 6% aqueous gelatin solution. In this case, the dissolution should
be decelerated by the increased Eudragit® RSPO fraction in the formulation and by
the stronger bonds within the granules as a result of the glue effect of gelatin. Drying
was for 24 hours at 40° C. Thereafter the granules were sieved.
To additionally test the impact of the granule particle size on the dissolution profile,
two different sieve fractions, namely the fractions with diameters between 355 µm
and 2000 µm (formulation number 010624B, 14 capsules) and with more than 2000
µm (formulation number 010624A, 42 capsules), were filled in capsules of size 0
(0.68 ml).). Their mass uniformity was tested (Table III.4), as well as their dissolution
in 0,1 N HCl and phosphate buffer pH 6.8 (Figure III.9).

Chapter III: Development of talinolol controlled-release dosage forms
98
Table III.4:
Mass Uniformity of talinolol capsules (Form. no. 010624A and B, size 0)
lot 010624A
(1-20)
lot 010624B
(1-14)
286.1 mg 294.6 mg
287.1 mg 284.9 mg
273.2 mg 288.5 mg
279.1 mg 305.0 mg
290.1 mg 296.2 mg
297.6 mg 279.6 mg
300.9 mg 301.0 mg
298.1 mg 303.8 mg
297.2 mg 290.5 mg
307.3 mg 300.1 mg
313.3 mg 306.3 mg
278.9 mg 318.0 mg
314.3 mg 291.6 mg
309.0 mg 302.9 mg
295.6 mg - )*
300.4 mg - )*
291.5 mg - )*
282.8 mg - )*
274.9 mg - )*
289.9 mg - )* mg
mean 293.4 mg 297.4 mg
S.D. 12.2 mg 10.0 mg
upper limit (mean + 10 %) 322.7 mg 327.1 mg
lower limit (mean - 10 %) 264.0 mg 267.6 mg
maximum value 314.3 mg 318.0 mg
minimal value 273.2 mg 279.6 mg
)*:only 14 capsules filled
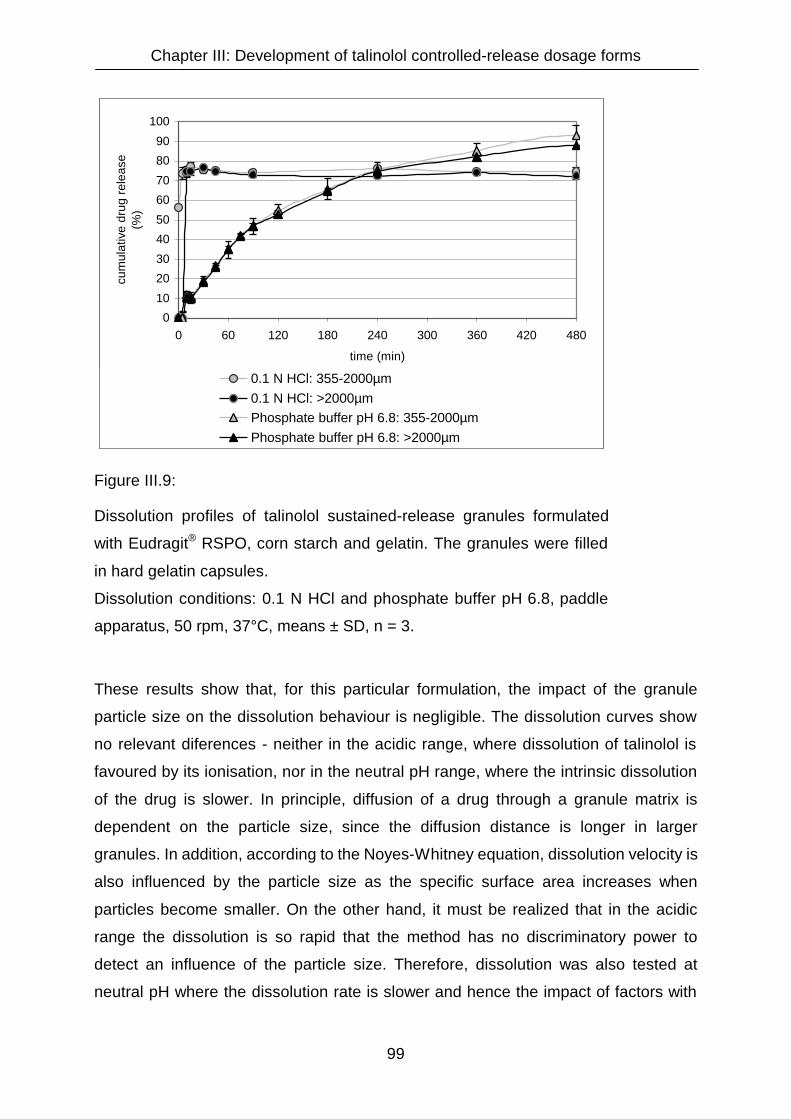
Chapter III: Development of talinolol controlled-release dosage forms
99
0
10
20
30
40
50
60
70
80
90
100
0 60 120 180 240 300 360 420 480
time (min)
cum
ulat
ive
drug
rele
ase
(%)
0.1 N HCl: 355-2000µm0.1 N HCl: >2000µmPhosphate buffer pH 6.8: 355-2000µmPhosphate buffer pH 6.8: >2000µm
Figure III.9:
Dissolution profiles of talinolol sustained-release granules formulated
with Eudragit® RSPO, corn starch and gelatin. The granules were filled
in hard gelatin capsules.
Dissolution conditions: 0.1 N HCl and phosphate buffer pH 6.8, paddle
apparatus, 50 rpm, 37°C, means ± SD, n = 3.
These results show that, for this particular formulation, the impact of the granule
particle size on the dissolution behaviour is negligible. The dissolution curves show
no relevant diferences - neither in the acidic range, where dissolution of talinolol is
favoured by its ionisation, nor in the neutral pH range, where the intrinsic dissolution
of the drug is slower. In principle, diffusion of a drug through a granule matrix is
dependent on the particle size, since the diffusion distance is longer in larger
granules. In addition, according to the Noyes-Whitney equation, dissolution velocity is
also influenced by the particle size as the specific surface area increases when
particles become smaller. On the other hand, it must be realized that in the acidic
range the dissolution is so rapid that the method has no discriminatory power to
detect an influence of the particle size. Therefore, dissolution was also tested at
neutral pH where the dissolution rate is slower and hence the impact of factors with
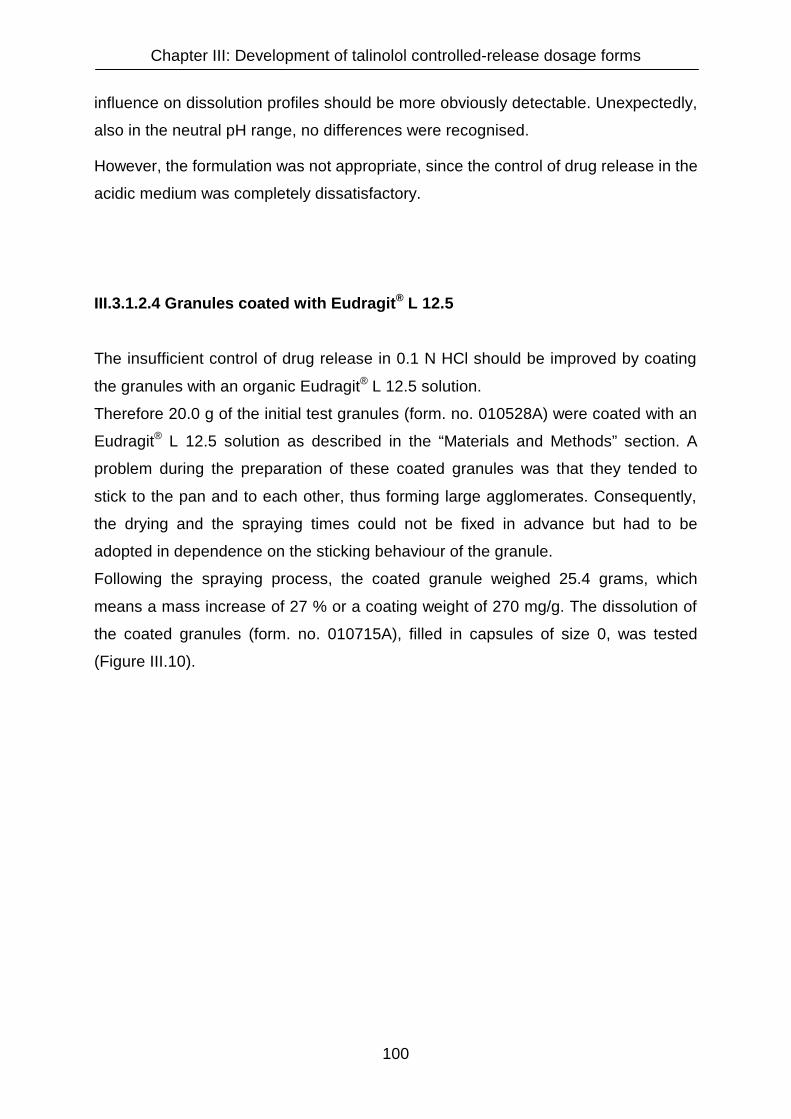
Chapter III: Development of talinolol controlled-release dosage forms
100
influence on dissolution profiles should be more obviously detectable. Unexpectedly,
also in the neutral pH range, no differences were recognised.
However, the formulation was not appropriate, since the control of drug release in the
acidic medium was completely dissatisfactory.
III.3.1.2.4 Granules coated with Eudragit® L 12.5
The insufficient control of drug release in 0.1 N HCl should be improved by coating
the granules with an organic Eudragit® L 12.5 solution.
Therefore 20.0 g of the initial test granules (form. no. 010528A) were coated with an
Eudragit® L 12.5 solution as described in the “Materials and Methods” section. A
problem during the preparation of these coated granules was that they tended to
stick to the pan and to each other, thus forming large agglomerates. Consequently,
the drying and the spraying times could not be fixed in advance but had to be
adopted in dependence on the sticking behaviour of the granule.
Following the spraying process, the coated granule weighed 25.4 grams, which
means a mass increase of 27 % or a coating weight of 270 mg/g. The dissolution of
the coated granules (form. no. 010715A), filled in capsules of size 0, was tested
(Figure III.10).

Chapter III: Development of talinolol controlled-release dosage forms
101
0
20
40
60
80
100
0 60 120 180 240 300 360 420 480
time (min)
cum
ulat
ive
drug
rele
ase
(%)
0.1 N HCl phosphate buffer pH 6.8
Figure III.10:
Dissolution profiles of talinolol sustained-release capsules filled with Eudragit® L 12.5
coated granules.
Dissolution conditions: 0.1 N HCl and phosphate buffer pH 6.8, paddle apparatus, 50
rpm, 37°C, means ± SD, n = 3.
Similar to the granules prepared by wet granulation with the organic Eudragit®
solution RS 12.5 (form. no. 010623A), variations in the amounts dissolved at given
times between capsules were extraordinarily high. In this case, the variances in the
neutral pH range were higher than in the acidic medium. A possible explanation for
the high variabilities are the resin-like consistency of the granules and their irregular
shapes that lead to an inconsistent filling of the capsules.
Furthermore, for this formulation dissolution was not complete within eight hours. For
sustained-release peroral formulations, a control of drug release beyond eight to
twelve hours is not advisable, due to the fact that in case of rapid intestinal transit
times relevant parts of the dose may not have been dissolved and may be excreted
with the faeces. In order to accelerate the drug release and achieve a complete
dissolution within eight hours, the spraying time and thus the thickness of the
Eudragit® film around the granules could be reduced.

Chapter III: Development of talinolol controlled-release dosage forms
102
However, due to the additional problems with the standardisation of the spraying
process combined with a low homogeneity within one lot and an insufficient lot-to-lot
conformity caused by inconsistencies of the capsule contents, methods apart from
film-coating were favoured in the further development of an appropriate talinolol
sustained-release formulation.
III.3.1.2.5 Granule formulation with ethylcellulose
In another granule formulation, ethylcellulose was tested as release-sustaining
excipient. The composition of the granule was as follows:
Ethylcellulose (Ethocel®) 5.0 g
Acetone 55.0 g
Talinolol 5.0 g
Form. no. 010728A
Ethylcellulose was dissolved in acetone, then talinolol powder was added in small
amounts and finely dispersed. The mixture was stored in a fume hood for 15 minutes.
During this time the acetone had evaporated to a large extent and the consistency of
the formulation was suitable to be granulated through a sieve. After drying, the
granule was filled in capsules of size 0 (0.68 ml).
The masses of six empty capsule shells and the total masses of these six capsules
after filling were determined. The granule mass for one capsule was calculated as
difference between the total mass and the mass of the shell. The mass of drug per
capsule was calculated as mass of the granule multiplied by 0.5, according to the
fraction of active ingredient in the formulation after evaporation of acetone. The
results of the mass uniformity test are presented in Table III.5.

Chapter III: Development of talinolol controlled-release dosage forms
103
Table III.5:
Mass uniformity and drug content of talinolol capsules (form. no. 010728A).
mass of capsule shell
in mg (tara)
total mass of filled
capsule in mg (brutto)
mass of granule
in mg (netto)
mass of drug
in mg
106 200 94 47
107 168 61 31
96 181 85 43
95 192 97 49
99 180 81 41
100 168 68 34
mean: 101 mean: 182 mean: 81 mean: 41
S.D.: 5 S.D.: 13 S.D.: 14 S.D.: 7
The number of capsules produced was not sufficient to perform a mass uniformity
test according to the European Pharmacopeia [Ph.Eur., 3rd edition, <2.9.5>:
“Uniformity of mass of single dose preparations”]. For this purpose, a number of 20
units of dosage forms would have been necessary. The observed variations and
deviations from the mean values displayed in Table III.5 demonstrate that the filling of
the capsules was not homogeneous.
The dissolution of talinolol from these capsules was tested in 0.1 N hydrochloric acid
and a phosphate buffer pH 6.8. The results are presented in Figure III.11.
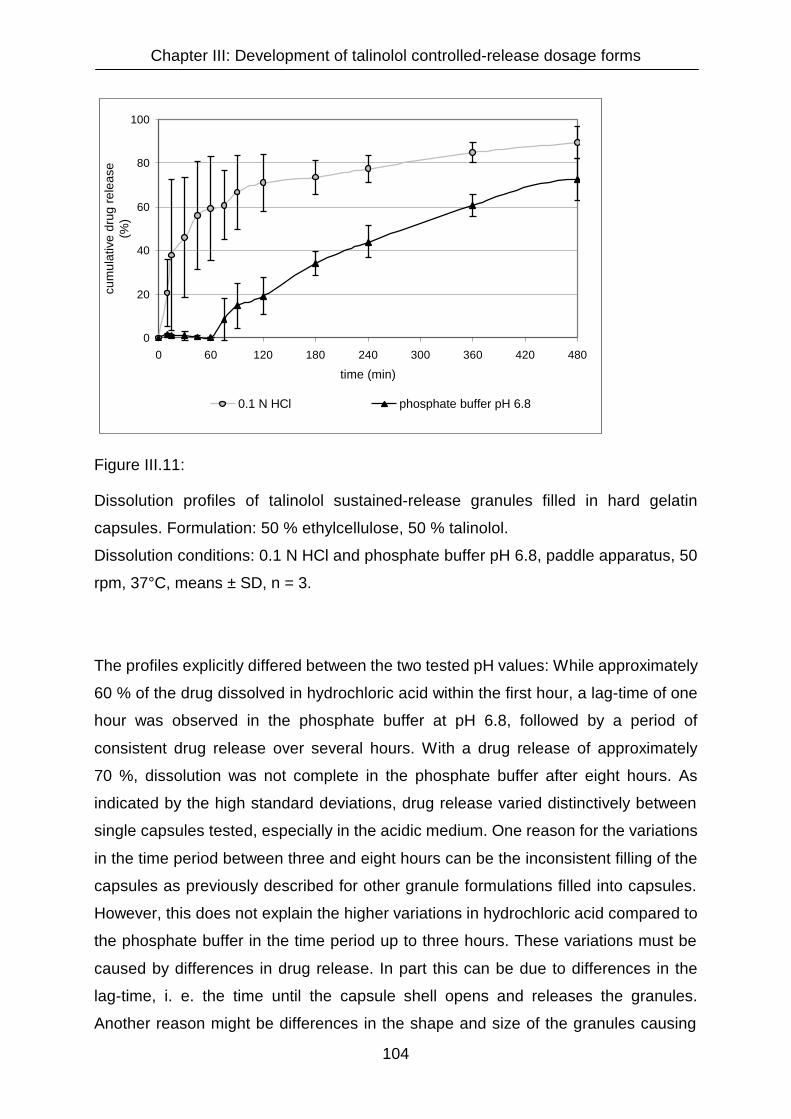
Chapter III: Development of talinolol controlled-release dosage forms
104
0
20
40
60
80
100
0 60 120 180 240 300 360 420 480
time (min)
cum
ulat
ive
drug
rele
ase
(%)
0.1 N HCl phosphate buffer pH 6.8
Figure III.11:
Dissolution profiles of talinolol sustained-release granules filled in hard gelatin
capsules. Formulation: 50 % ethylcellulose, 50 % talinolol.
Dissolution conditions: 0.1 N HCl and phosphate buffer pH 6.8, paddle apparatus, 50
rpm, 37°C, means ± SD, n = 3.
The profiles explicitly differed between the two tested pH values: While approximately
60 % of the drug dissolved in hydrochloric acid within the first hour, a lag-time of one
hour was observed in the phosphate buffer at pH 6.8, followed by a period of
consistent drug release over several hours. With a drug release of approximately
70 %, dissolution was not complete in the phosphate buffer after eight hours. As
indicated by the high standard deviations, drug release varied distinctively between
single capsules tested, especially in the acidic medium. One reason for the variations
in the time period between three and eight hours can be the inconsistent filling of the
capsules as previously described for other granule formulations filled into capsules.
However, this does not explain the higher variations in hydrochloric acid compared to
the phosphate buffer in the time period up to three hours. These variations must be
caused by differences in drug release. In part this can be due to differences in the
lag-time, i. e. the time until the capsule shell opens and releases the granules.
Another reason might be differences in the shape and size of the granules causing

Chapter III: Development of talinolol controlled-release dosage forms
105
different diffusion properties. These lead to a more or less rapid release of the drug
incorporated in a granule. This effect can be observed especially at intermediate drug
release rates as detected for the ethylcellulose-based granules in hydrochloric acid
within the first three hours. When the drug release is more rapid, no matrix effects
can be observed. The granules disintegrate and dissolve rapidly and no diffusion of
the drug through the matrix is recognizable. On the other hand, when the drug
release is slower, as detected for the same granules in the phosphate buffer, the
amount of drug released within a particular time intervall is smaller and consequently
detectable variations due to different diffusion properties are not so pronounced.

Chapter III: Development of talinolol controlled-release dosage forms
106
III.3.2 Influence of the pH on talinolol dissolution
III.3.2.1 Dissolution study with capsules containing pure talinolol dry substance
For all granule formulations dissolution of talinolol was more rapid at pH 1.0
(hydrochloric acid) than at pH 6.8 (phosphate buffer). This could be due to dissolution
properties of the active drug itself or it could be caused by other excipients in the
formulation. To investigate the pH-dependence of the dissolution of the pure active
drug substance, capsules of size 0 (0.68 ml) were filled with 200 mg talinolol each,
without any further excipients added. A capsule filling machine could not be used,
because this requires a higher volume of filling material. Instead, a funnel was
employed to fill each single capsule manually with 200 mg of exactly weighed
talinolol.
Dissolution of these capsules was tested in 0.1 N hydrochloric acid and in three
different phosphate buffers with pH values of 3.2, 5.5 and 6.8. The results are
presented in Figure III.12.

Chapter III: Development of talinolol controlled-release dosage forms
107
0
20
40
60
80
100
0 120 240 360 480 600 720 840 960 1080 1200 1320 1440
time (min)
cum
ulat
ive
drug
rele
ase
(%)
pH 1.0 pH 3.2 pH 5.5 pH 6.8
Figure III.12:
Dissolution profiles of capsules filled with 200 mg of pure talinolol.
Dissolution conditions: 0.1 N HCl and phosphate buffers pH 3.2, 5.5 and 6.8, paddle
apparatus, 50 rpm, 37°C, means ± SD, n = 3.
The dissolution rate is decreasing with increasing pH values. This is not unexpected,
since the solubility of talinolol increases with decreasing pH values, caused by the
basic nitrogen (cp. Figure I.2) that is protonated to a higher extent at lower pH values.
Furthermore, due to the lack of any excipients increasing the wettability of the
talinolol powder, the drug can form agglomerates when it is exposed to the
dissolution medium. The low wettability of these agglomerates can explain the
unexpectedly slow drug release rates observed in all dissolution media tested. It is
assumed that the formation of irregular drug agglomerates largely contributes to the
high variability of talinolol dissolution from the different units.
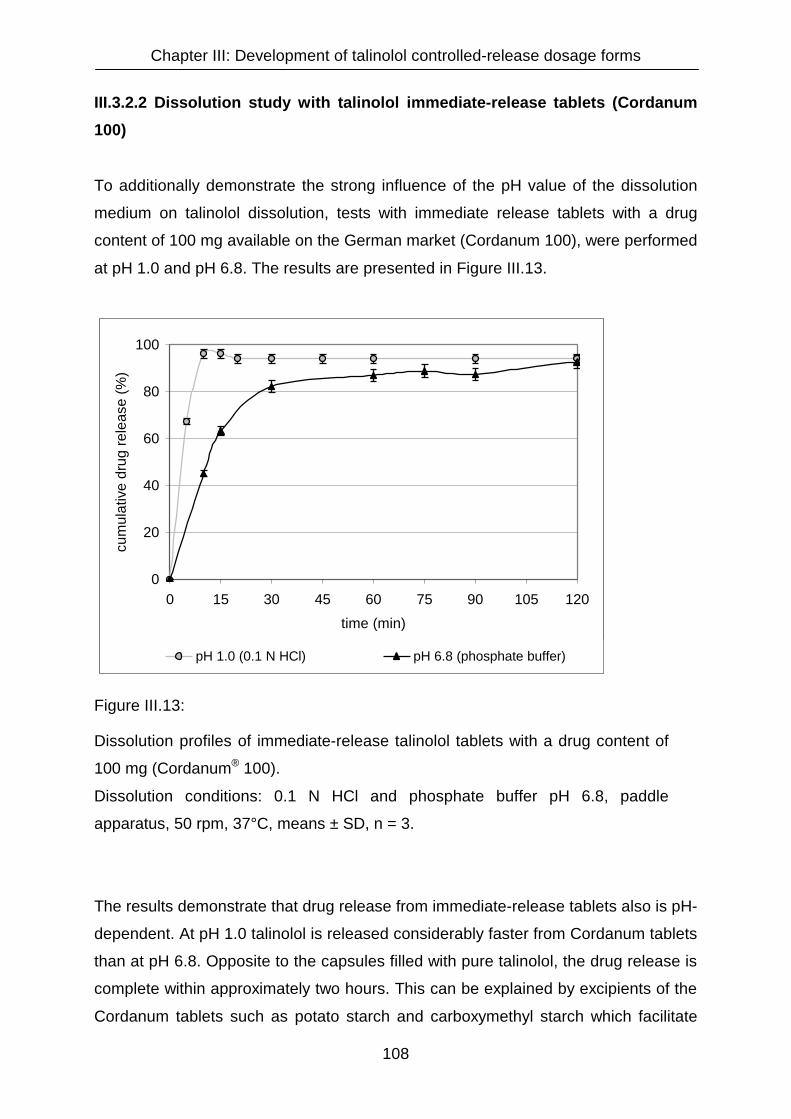
Chapter III: Development of talinolol controlled-release dosage forms
108
III.3.2.2 Dissolution study with talinolol immediate-release tablets (Cordanum
100)
To additionally demonstrate the strong influence of the pH value of the dissolution
medium on talinolol dissolution, tests with immediate release tablets with a drug
content of 100 mg available on the German market (Cordanum 100), were performed
at pH 1.0 and pH 6.8. The results are presented in Figure III.13.
0
20
40
60
80
100
0 15 30 45 60 75 90 105 120
time (min)
cum
ulat
ive
drug
rele
ase
(%)
pH 1.0 (0.1 N HCl) pH 6.8 (phosphate buffer)
Figure III.13:
Dissolution profiles of immediate-release talinolol tablets with a drug content of
100 mg (Cordanum® 100).
Dissolution conditions: 0.1 N HCl and phosphate buffer pH 6.8, paddle
apparatus, 50 rpm, 37°C, means ± SD, n = 3.
The results demonstrate that drug release from immediate-release tablets also is pH-
dependent. At pH 1.0 talinolol is released considerably faster from Cordanum tablets
than at pH 6.8. Opposite to the capsules filled with pure talinolol, the drug release is
complete within approximately two hours. This can be explained by excipients of the
Cordanum tablets such as potato starch and carboxymethyl starch which facilitate

Chapter III: Development of talinolol controlled-release dosage forms
109
disintegration, improve the wettability of talinolol and prevent the formation of hardly
soluble agglomerates.
III.3.2.3 Dissolution study with tablets formulated with talinolol and corn starch
In another study to demonstrate a pH-dependent dissolution for talinolol, immediate-
release tablets were prepared containing 85 % talinolol and 15 % corn starch.
Dissolution of talinolol from these tablets was tested in five different media from pH
1.0 to pH 6.8. The results are given in Figure III.14.
0
20
40
60
80
100
120
0 60 120 180 240 300 360 420 480
time (min)
cum
ulat
ive
drug
rele
ase
(%)
pH 1.0 pH 3.2 pH 4.5 pH 5.5 pH 6.8
Figure III.14:
Dissolution profiles of talinolol immediate-release tablets.
Formulation: 85 % talinolol, 15 % corn starch. Dissolution conditions: paddle
apparatus, 50 rpm, 37°C, means ± SD, n = 3.
Chapter III: Development of talinolol controlled-release dosage forms
110
Again, a pH-dependence of the talinolol dissolution is obvious. The drug release rate
increases with decreasing pH values.
However, at pH 4.5 the drug release was faster and higher than expected. An
obvious difference towards the other buffers was, that for pH 4.5 an acetate buffer
was used, whereas for pH values of 3.2, 5.5, and 6.8 phosphate buffers were
employed. In spite of the higher pH value, the drug dissolved faster in this acetate
buffer than at pH 3.2 in a phosphate buffer. Definitely, dissolution in this acetate
buffer was rather similar to dissolution in 0.1 N hydrochloric acid at pH 1.0. The
reason for this is that in phosphate buffers talinolol forms structurally different crystals
with other physico-chemical properties than in acetate buffers. This aspect is
described and discussed in more detail in chapter IV.
Chapter III: Development of talinolol controlled-release dosage forms
111
III.3.3 Final discussion on hard gelatin capsule preparations
None of the formulations tested, neither with matrix nor with coated granules as filling
material for hard gelatin capsules, showed the desired dissolution behaviour.
Three major problems emerged:
1) Dissolution differed between the acidic (pH 1.0) and the neutral pH range (pH 6.8).
All tests demonstrated that drug release was considerably faster in acidic versus
neutral pH dissolution media. Even when excipients were used which claim to yield
pH- independent drug release profiles, the properties of the active drug predominated
in the present case.
2) Size and shape of the granules showed a high variability. By separation into
different sieve classes variations in size could be reduced but not completely
eliminated. Together with the irregular shapes of the granules this caused variations
in dose uniformity and drug release properties as well. Inhomogeneities in the drug
content were caused by an inconsistent filling of the capsules. Variations in the drug
release rate were due to differences in the diffusion and dissolution properties
between differently sized and shaped granules.
3) The volumetric dosing of the capsules provoked the problem that a specified drug
content could never be exactly achieved. Since only a limited number of defined
capsule sizes is available and the granules were rather voluminous, capsules with a
drug content of 100 or even 200 mg could not be prepared with the typically used
capsule sizes. Capsules of the largest size available (000) have a filling volume of
1.37 ml. Preliminary tests and calculations had shown that even these capsules could
hardly be filled with a granule containing 100 mg talinolol. This was due to the need
of a relatively high percentage of excipients for a sufficient control of the drug
release. Furthermore, capsules of size 000 are hard to swallow because of their size.
Since exact dosing and a good within-lot and lot-to-lot homogeneity are important
requirements for the sustained-release dosage form projected, and the technical
equipment and methods available showed only limited possibilities to improve these
parameters, the production of matrix tablets was assumed to be more appropriate as
Chapter III: Development of talinolol controlled-release dosage forms
112
method for the manufacturing of dosage forms with a sustained talinolol release than
formulations with granules and capsules.
Chapter III: Development of talinolol controlled-release dosage forms
113
III.3.4 Matrix tablets
III.3.4.1 Powder losses during the manufacturing process of matrix tablets
As an alternative to the capsule formulations, matrix tablets were prepared. During
the compression process of tablets particular amounts of powder get lost. These
losses can be compensated by weighing an adequate amount of powder additionally
to the amount theoretically needed to compress one tablet. To determine the powder
losses during the compression process of matrix tablets, 20 sample tablets with a
labelled mass of 500 mg were weighed. The differences between the labelled and
the measured masses were determined. The results are presented in Table III.6.

Chapter III: Development of talinolol controlled-release dosage forms
114
Table III.6:
Masses of differently formulated tablets demonstrating losses during the compression
process.
Theoretical mass (mg)
Measured mass (mg)
Difference (mg)
500 497 3
500 498 2
500 488 12
500 485 15
500 493 7
500 497 3
500 500 0
500 492 8
500 496 4
500 496 4
500 496 4
500 500 0
500 495 5
500 490 10
500 495 5
500 490 10
500 495 5
500 495 5
500 496 4
500 495 5
The medium loss was 5.6 ± 3.8 mg (mean ± SD). For a total tablet mass of 500 mg
this means a mean deviation from the labelled mass of 1.1 %. The maximum
deviation was 15 mg, i.e. 3 %. Although these deviations comply with the
requirements of the European Pharmacopeia in terms of mass uniformity [Ph.Eur., 3rd
edition, <2.9.5>: “Uniformity of mass of single dose preparations”], the fact that all
deviations are negative suggests that the deviations are due to losses during the

Chapter III: Development of talinolol controlled-release dosage forms
115
tablet compression process. To compensate for these losses, the total tablet mass to
be compressed was increased by 1 % for the production of matrix tablets. For
example, 505 mg of a powder mixture were compressed to obtain a 500 mg tablet.
III.3.4.2 Parameters with potential influence on the drug release from matrix
tablets
III.3.4.2.1 Compression force
Dissolution tests with identically formulated matrix tablets compressed with different
compression forces were performed in order to investigate the impact of the
compression force on dissolution profiles. The tablets used for these tests consisted
of 40 % talinolol, 40 % Eudragit® S 100 and 20 % Eudragit® RSPO. Compression
forces of 15 and 40 kN were compared. In both cases the compression time was 30
seconds. Dissolution was tested in 0.1 N hydrochloric acid. Within this medium the
drug release rate was expected to be most susceptible to a decrease in compression
force. In preliminary experiments, insufficient amounts of release-controlling
excipients in tablet formulations resulted in instable matrices that eroded rapidly. The
most pronounced accelerations of talinolol release from such instable matrices, that
can also be expected when compression forces are too low, were observed in 0.1 N
hydrochloric acid, due to the high solubility and rapid dissolution of talinolol in this
medium.
Figure III.15 compares the dissolution of talinolol from tablets compressed with
compression forces of 15 kN and 40 kN.
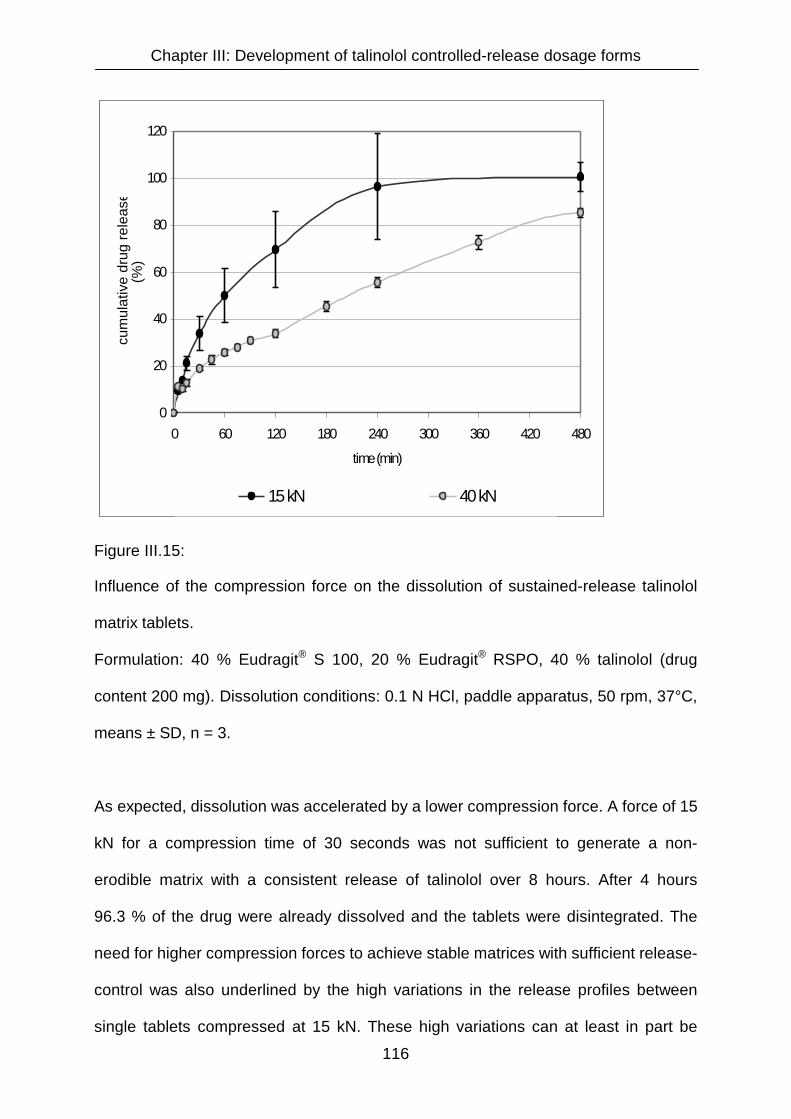
Chapter III: Development of talinolol controlled-release dosage forms
116
0
20
40
60
80
100
120
0 60 120 180 240 300 360 420 480
time (min)
cum
ulat
ive
drug
rele
ase
(%)
15 kN 40 kN
Figure III.15:
Influence of the compression force on the dissolution of sustained-release talinolol
matrix tablets.
Formulation: 40 % Eudragit® S 100, 20 % Eudragit® RSPO, 40 % talinolol (drug
content 200 mg). Dissolution conditions: 0.1 N HCl, paddle apparatus, 50 rpm, 37°C,
means ± SD, n = 3.
As expected, dissolution was accelerated by a lower compression force. A force of 15
kN for a compression time of 30 seconds was not sufficient to generate a non-
erodible matrix with a consistent release of talinolol over 8 hours. After 4 hours
96.3 % of the drug were already dissolved and the tablets were disintegrated. The
need for higher compression forces to achieve stable matrices with sufficient release-
control was also underlined by the high variations in the release profiles between
single tablets compressed at 15 kN. These high variations can at least in part be

Chapter III: Development of talinolol controlled-release dosage forms
117
explained by the differences in the erosion and disintegration of the tablets
manufactured with the lower compression force. This is in accordance with studies of
sustained-release matrix tablets formulated with hydroxypropylmethylcellulose
(HPMC) reported by Velasco et al. and Kabanda et al. [Velasco, M. V., J. L. Ford, et
al. (1999), Kabanda, L., R. A. Lefebvre, et al. (1994)]. They found that low
compression forces can lead to burst effects that are due to erosion and
disintegration of the matrices. However, Velasco et al. also reported that the
influence of the compression force on drug release becomes neglectable as soon as
the compression force is sufficient to achieve a stable, non-disintegrating matrix. For
the specific HPMC tablets in their test series, a compression force as low as 6 kN
was adequate to achieve that aim. Apart from the differences in the composition of
the matrix, the different shape of the HPMC matrix tablets causes the need for higher
compression forces for the talinolol matrix tablets: The tablets tested by Velasco et al.
were only 6 mm in diameter and were thicker than the talinolol tablets. Thus, the
matrix was more compact with a relatively smaller surface and less tendencies
towards disintegration and erosion. In another study with HPMC sustained-release
tablets Nokhodchi et al. investigated the influence of different compression forces
between 5 and 20 kN on the porosity of the matrix [Nokhodchi, A., J. L. Ford, et al.
(1996)]. They reported that the porosity decreases with increasing compression
forces until a minimum value is reached. It can be assumed that this minimum
porosity and hence a particular minimum compression force is necessary to achieve
stable matrices that show an appropriate control of the drug release.
According to these findings, all test formulations for talinolol matrix tablets were
compressed with a force of 40 kN.

Chapter III: Development of talinolol controlled-release dosage forms
118
III.3.4.2.2 Compression time
To examine the influence of the compression time on the drug release from matrix
tablets, tablets were compressed from the same powder mixture for 30 seconds and
for 2 minutes. The powder mixture consisted of 60 % Eudragit® S 100 and 40 %
talinolol.
The differences in drug release at pH 6.8 between the matrix tablets with different
compression times are presented in Figure III.16.
0
20
40
60
80
100
0 60 120 180 240 300 360 420 480
time (min)
cum
ulat
ive
drug
rele
ase
(%)
30 sec. compression time 2 min. compression time
Figure III.16:
Influence of the compression time on the dissolution of talinolol from sustained-
release matrix tablets.
Formulation: 60 % Eudragit® S 100, 40 % talinolol (drug content: 200 mg).
Dissolution conditions: phosphate buffer pH 6.8, paddle apparatus, 50 rpm, 37°C,
means ± SD, n = 3. For a compression time of 30 seconds standard deviations were
smaller than sizes of the rectangles.
Chapter III: Development of talinolol controlled-release dosage forms
119
The amount of drug released from the tablets compressed for two minutes was
approximately 5 to 10 % lower at all time points. It can be concluded that longer
compression times lead to a slower dissolution. However, this effect was not very
pronounced. Due to the advantageous time-saving effect of shorter compression
times, matrix tablets were compressed for 30 seconds, unless stated otherwise.
III.3.4.2.3 Rotational speed of the paddles in the dissolution apparatus
To test the influence of the stirring velocity in the dissolution vessels on the drug
release profiles, dissolution tests with matrix tablets consisting of 40 % talinolol, 40 %
Eudragit® S 100 and 20 % Eudragit® RSPO were performed. The drug release
profiles from tests with paddle rotational speeds of 50 and 100 rounds per minute
were compared. 0.1 N HCl was selected as dissolution medium, since in this medium
matrix tablets are due to be most susceptible to changes, also with respect to
rotational speed. The results are presented in Figure III.17.

Chapter III: Development of talinolol controlled-release dosage forms
120
0
20
40
60
80
100
0 60 120 180 240 300 360 420 480
time (min)
cum
ulat
ive
drug
rele
ase
(%)
100 rpm 50 rpm
Figure III.17:
Influence of the rotational speed on the dissolution of talinolol from sustained-release
matrix tablets.
Formulation: 40 % Eudragit® S 100, 20 % Eudragit® RSPO, 40 % talinolol.
Dissolution conditions: 0.1 N HCl, paddle apparatus, 37°C, means ± SD, n = 6.
Drug release from this specific matrix was not notably influenced by the higher
rotational speed and the modified hydrodynamics. Furthermore, the release of
talinolol from single dosage forms did not show increased variations. This proved that
stable and robust matrices that are relatively resistant to abrasion can be produced
by direct compression with the equipment and the release-sustaining excipients
employed. A relative independence of the drug release from the rotational speed
demonstrates the stability of a matrix [Majid Khan, G. and J. Bi Zhu (1998)].
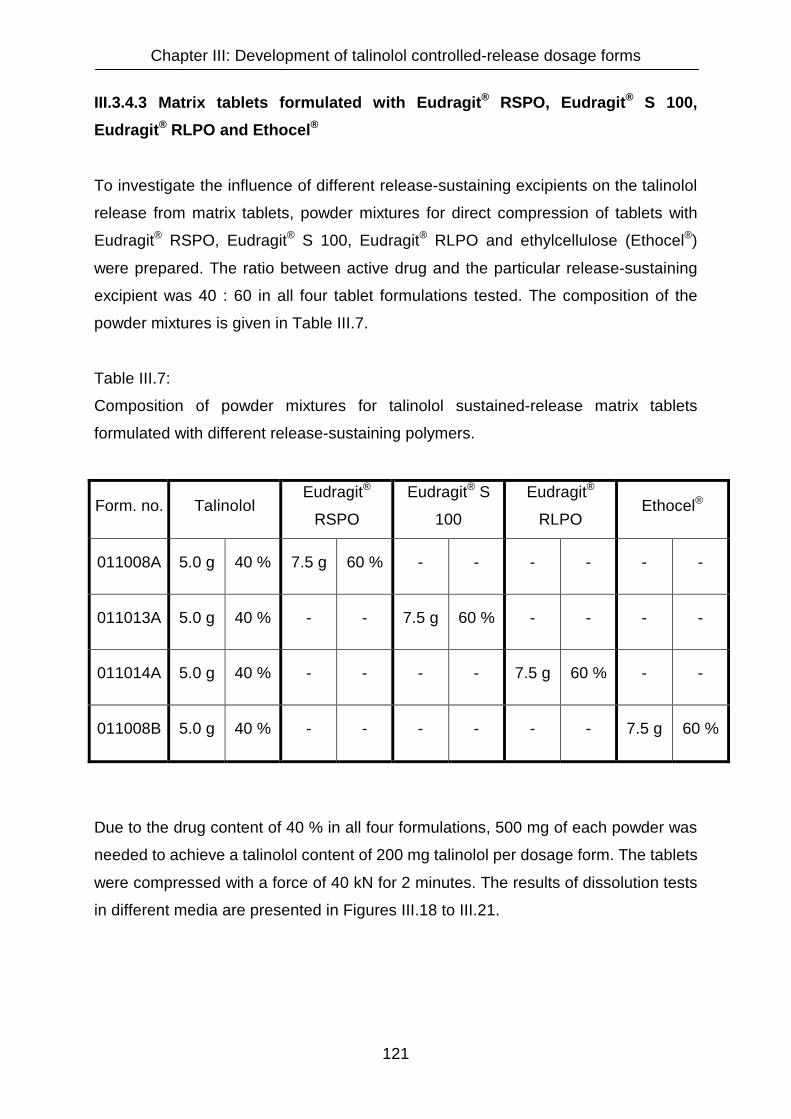
Chapter III: Development of talinolol controlled-release dosage forms
121
III.3.4.3 Matrix tablets formulated with Eudragit® RSPO, Eudragit® S 100,
Eudragit® RLPO and Ethocel®
To investigate the influence of different release-sustaining excipients on the talinolol
release from matrix tablets, powder mixtures for direct compression of tablets with
Eudragit® RSPO, Eudragit® S 100, Eudragit® RLPO and ethylcellulose (Ethocel®)
were prepared. The ratio between active drug and the particular release-sustaining
excipient was 40 : 60 in all four tablet formulations tested. The composition of the
powder mixtures is given in Table III.7.
Table III.7:
Composition of powder mixtures for talinolol sustained-release matrix tablets
formulated with different release-sustaining polymers.
Form. no. Talinolol Eudragit®
RSPO
Eudragit® S
100
Eudragit®
RLPO Ethocel®
011008A 5.0 g 40 % 7.5 g 60 % - - - - - -
011013A 5.0 g 40 % - - 7.5 g 60 % - - - -
011014A 5.0 g 40 % - - - - 7.5 g 60 % - -
011008B 5.0 g 40 % - - - - - - 7.5 g 60 %
Due to the drug content of 40 % in all four formulations, 500 mg of each powder was
needed to achieve a talinolol content of 200 mg talinolol per dosage form. The tablets
were compressed with a force of 40 kN for 2 minutes. The results of dissolution tests
in different media are presented in Figures III.18 to III.21.
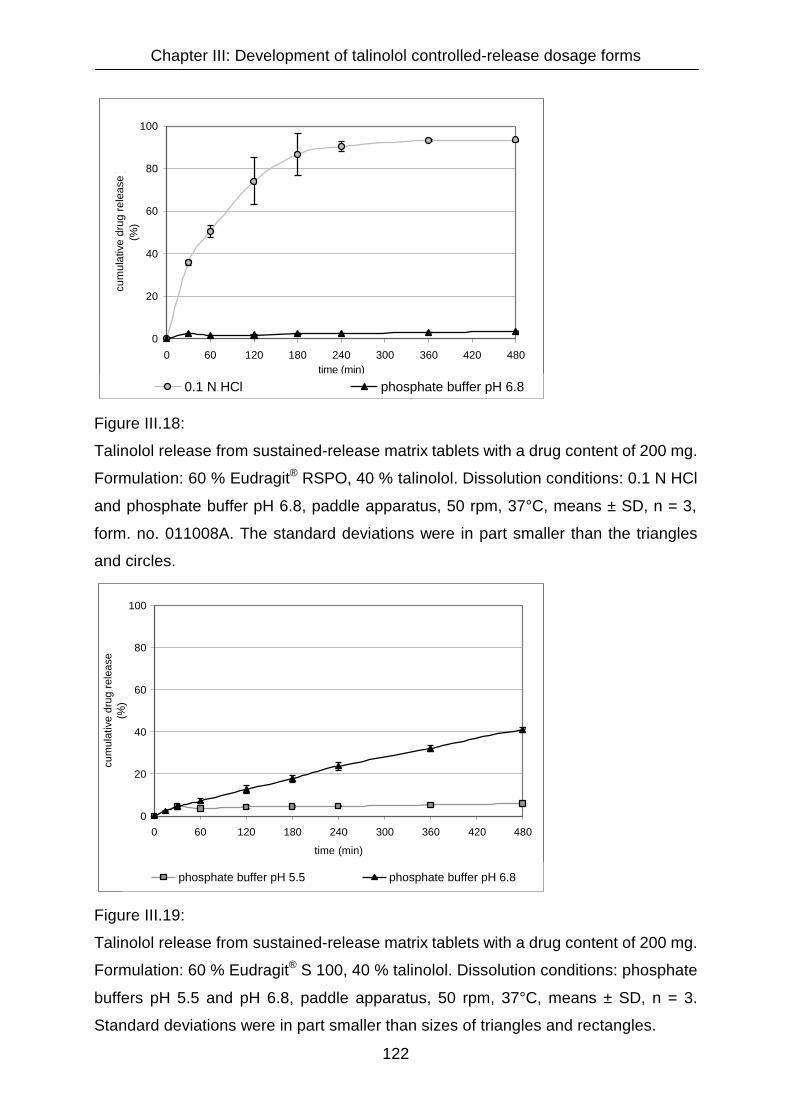
Chapter III: Development of talinolol controlled-release dosage forms
122
0
20
40
60
80
100
0 60 120 180 240 300 360 420 480time (min)
cum
ulat
ive
drug
rele
ase
)(%
)
0.1 N HCl phosphate buffer pH 6.8
Figure III.18:
Talinolol release from sustained-release matrix tablets with a drug content of 200 mg.
Formulation: 60 % Eudragit® RSPO, 40 % talinolol. Dissolution conditions: 0.1 N HCl
and phosphate buffer pH 6.8, paddle apparatus, 50 rpm, 37°C, means ± SD, n = 3,
form. no. 011008A. The standard deviations were in part smaller than the triangles
and circles.
0
20
40
60
80
100
0 60 120 180 240 300 360 420 480
time (min)
cum
ulat
ive
drug
rele
ase
(%)
phosphate buffer pH 5.5 phosphate buffer pH 6.8
Figure III.19:
Talinolol release from sustained-release matrix tablets with a drug content of 200 mg.
Formulation: 60 % Eudragit® S 100, 40 % talinolol. Dissolution conditions: phosphate
buffers pH 5.5 and pH 6.8, paddle apparatus, 50 rpm, 37°C, means ± SD, n = 3.
Standard deviations were in part smaller than sizes of triangles and rectangles.

Chapter III: Development of talinolol controlled-release dosage forms
123
0
20
40
60
80
100
0 60 120 180 240 300 360 420 480
time (min)
cum
ulat
ive
drug
rele
ase
(%)
phosphate buffer pH 6.8
Figure III.20:
Dissolution profile of sustained-release matrix tablets with a drug content of 200 mg.
Formulation: 60 % Eudragit® RLPO, 40 % talinolol. Dissolution conditions: phosphate
buffer pH 6.8, paddle apparatus, 50 rpm, 37°C, means ± SD, n = 3. Standard
deviations were smaller than sizes of triangles.
0
20
40
60
80
100
0 60 120 180 240 300 360 420 480
time (min)
cum
ulat
ive
drug
rele
ase
(%)
0.1 N HCl phosphate buffer pH 6.8
Figure III.21:
Talinolol release from sustained-release matrix tablets with a drug content of 200 mg.
Formulation: 60 % Ethocel®, 40 % talinolol. Dissolution conditions: 0.1 N HCl and
phosphate buffer pH 6.8, paddle apparatus, 50 rpm, 37°C, means ± SD, n = 3.
Standard deviations were smaller than sizes of triangles and circles.

Chapter III: Development of talinolol controlled-release dosage forms
124
None of the four formulations matched the required dissolution properties. From the
formulation using Eudragit® RSPO as single release-controlling excipient talinolol
dissolved too fast at acidic pH. At pH 6.8 the drug release was less than 5 % within
eight hours. The formulation with Eudragit® S 100 only released 40 % talinolol over
eight hours at pH 6.8 and less than 10 % at pH 5.5 in the same time interval.
Similarly, less than 10 % were released from the formulation with Eudragit® RLPO at
pH 6.8. Finally, the tablets based on Ethocel® showed dissolution profiles similar to
those of the formulation with Eudragit® RSPO. Drug release was relatively fast in the
acidic milieu and at pH 6.8 nearly no release was observed.
However, the standard deviations in the figures demonstrate that the within-batch
variability of the drug release was significantly reduced compared to the capsule and
granule formulations.
III.3.4.4 Matrix tablets formulated with Eudragit® S 100 and corn starch
In preliminary studies the drug release from matrix tablets formulated with Eudragit®
S 100 was too slow at pH 5.5 and pH 6.8. In order to accelerate the talinolol
dissolution rate, the fraction of the release-sustaining polymer in the matrix was
reduced. A reduction of the percentage of Eudragit® S 100 from 60 % to 50 % (form.
no. 011016B) accelerated the dissolution rate of talinolol in phosphate buffer of pH
6.8. After eight hours, 69.0 % of the active drug were released. However, the
decreased Eudragit® S 100 fraction did not lead to an appropriate acceleration of the
drug release in phosphate buffer of pH 5.5. In this medium, drug release after eight
hours was merely 9.1 %.
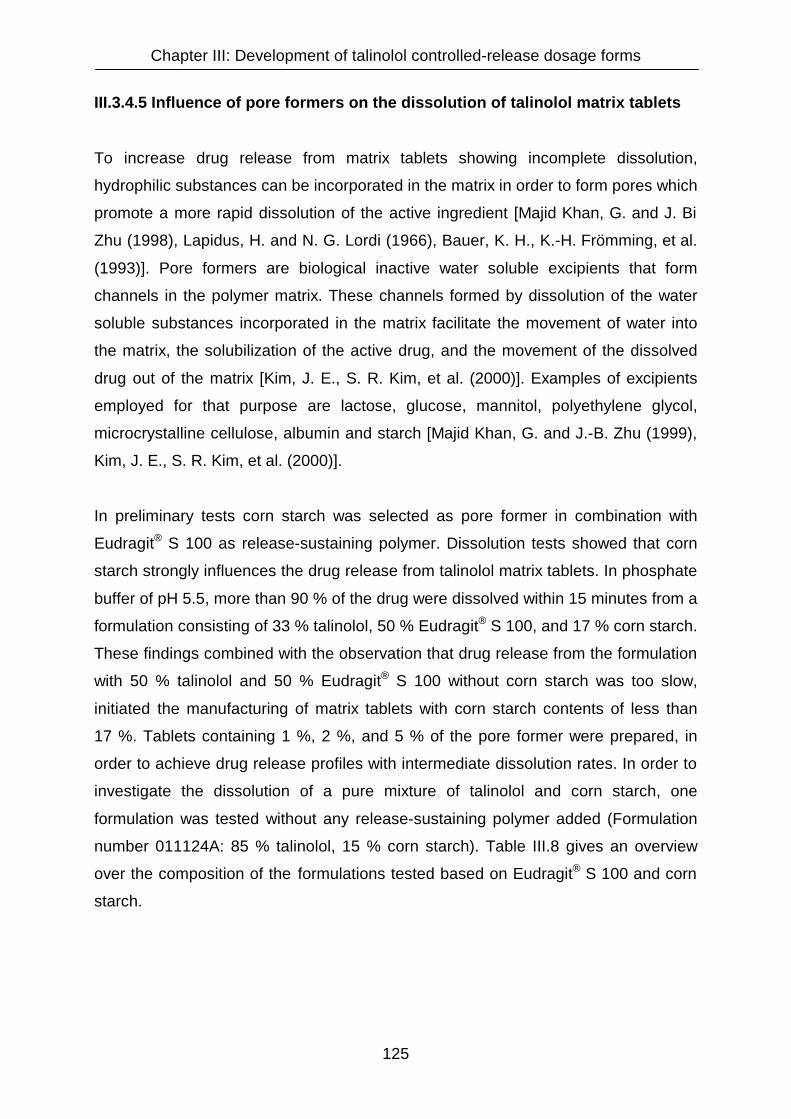
Chapter III: Development of talinolol controlled-release dosage forms
125
III.3.4.5 Influence of pore formers on the dissolution of talinolol matrix tablets
To increase drug release from matrix tablets showing incomplete dissolution,
hydrophilic substances can be incorporated in the matrix in order to form pores which
promote a more rapid dissolution of the active ingredient [Majid Khan, G. and J. Bi
Zhu (1998), Lapidus, H. and N. G. Lordi (1966), Bauer, K. H., K.-H. Frömming, et al.
(1993)]. Pore formers are biological inactive water soluble excipients that form
channels in the polymer matrix. These channels formed by dissolution of the water
soluble substances incorporated in the matrix facilitate the movement of water into
the matrix, the solubilization of the active drug, and the movement of the dissolved
drug out of the matrix [Kim, J. E., S. R. Kim, et al. (2000)]. Examples of excipients
employed for that purpose are lactose, glucose, mannitol, polyethylene glycol,
microcrystalline cellulose, albumin and starch [Majid Khan, G. and J.-B. Zhu (1999),
Kim, J. E., S. R. Kim, et al. (2000)].
In preliminary tests corn starch was selected as pore former in combination with
Eudragit® S 100 as release-sustaining polymer. Dissolution tests showed that corn
starch strongly influences the drug release from talinolol matrix tablets. In phosphate
buffer of pH 5.5, more than 90 % of the drug were dissolved within 15 minutes from a
formulation consisting of 33 % talinolol, 50 % Eudragit® S 100, and 17 % corn starch.
These findings combined with the observation that drug release from the formulation
with 50 % talinolol and 50 % Eudragit® S 100 without corn starch was too slow,
initiated the manufacturing of matrix tablets with corn starch contents of less than
17 %. Tablets containing 1 %, 2 %, and 5 % of the pore former were prepared, in
order to achieve drug release profiles with intermediate dissolution rates. In order to
investigate the dissolution of a pure mixture of talinolol and corn starch, one
formulation was tested without any release-sustaining polymer added (Formulation
number 011124A: 85 % talinolol, 15 % corn starch). Table III.8 gives an overview
over the composition of the formulations tested based on Eudragit® S 100 and corn
starch.

Chapter III: Development of talinolol controlled-release dosage forms
126
Table III.8:
Composition of powder mixtures for direct compression of talinolol sustained-release
matrix tablets formulated with Eudragit® S 100 and corn starch.
Form. no. Talinolol Eudragit® S 100 Corn starch Mass per tablet
011021A 2.40 g 33.3 % 3.60 g 50.0 % 1.2 g 16.7 % 0.600 g
011023A 4.95 g 49.5 % 4.95 g 49.5 % 0.1 g 1 % 0.404 g
011023B 4.90 g 49.0 % 4.90 g 49.0 % 0.2 g 2 % 0.408 g
011023C 4.75 g 47.5 % 4.75 g 47.5 % 0.5 g 5 % 0.421 g
011124A 4.25 g 85.0 % - - 0.75 g 15 % 0.235 g
The different total masses per tablet as shown in Table III.8 arise from the demand to
achieve a content of 200 mg talinolol per tablet.
Dissolution of these tablets was tested in media of different pH values (pH 1.0, 3.2,
5.5, and 6.8). The profiles are displayed in Figures III.22 to III.25. Standard deviations
were in part smaller than the particular icons of the dissolution curves.
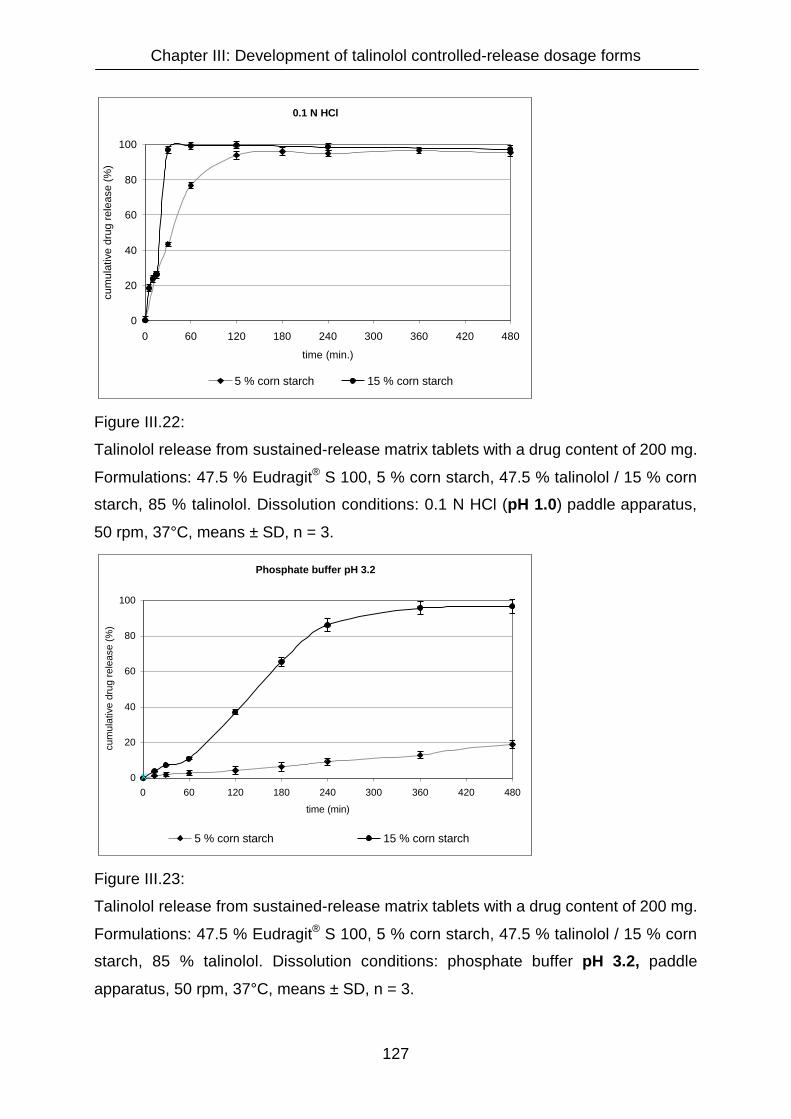
Chapter III: Development of talinolol controlled-release dosage forms
127
0.1 N HCl
0
20
40
60
80
100
0 60 120 180 240 300 360 420 480
time (min.)
cum
ulat
ive
drug
rele
ase
(%)
5 % corn starch 15 % corn starch
Figure III.22:
Talinolol release from sustained-release matrix tablets with a drug content of 200 mg.
Formulations: 47.5 % Eudragit® S 100, 5 % corn starch, 47.5 % talinolol / 15 % corn
starch, 85 % talinolol. Dissolution conditions: 0.1 N HCl (pH 1.0) paddle apparatus,
50 rpm, 37°C, means ± SD, n = 3.
Phosphate buffer pH 3.2
0
20
40
60
80
100
0 60 120 180 240 300 360 420 480
time (min)
cum
ulat
ive
drug
rele
ase
(%)
5 % corn starch 15 % corn starch
Figure III.23:
Talinolol release from sustained-release matrix tablets with a drug content of 200 mg.
Formulations: 47.5 % Eudragit® S 100, 5 % corn starch, 47.5 % talinolol / 15 % corn
starch, 85 % talinolol. Dissolution conditions: phosphate buffer pH 3.2, paddle
apparatus, 50 rpm, 37°C, means ± SD, n = 3.
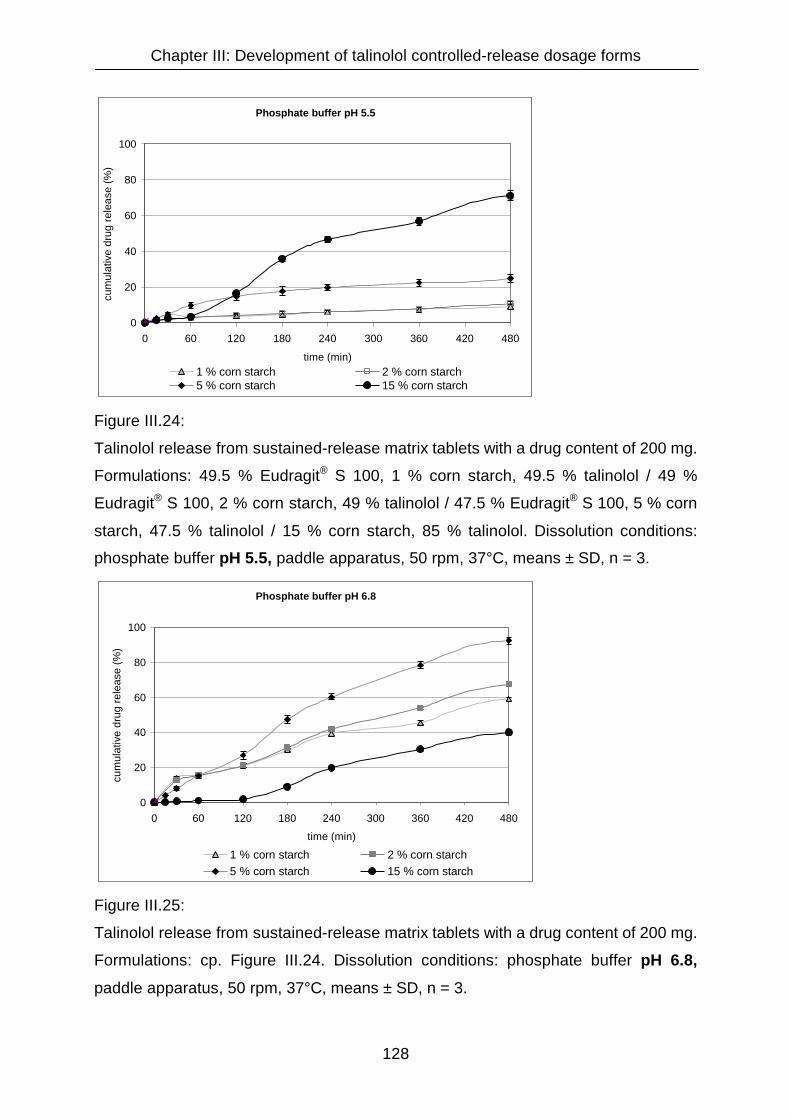
Chapter III: Development of talinolol controlled-release dosage forms
128
Phosphate buffer pH 5.5
0
20
40
60
80
100
0 60 120 180 240 300 360 420 480
time (min)
cum
ulat
ive
drug
rele
ase
(%)
1 % corn starch 2 % corn starch5 % corn starch 15 % corn starch
Figure III.24:
Talinolol release from sustained-release matrix tablets with a drug content of 200 mg.
Formulations: 49.5 % Eudragit® S 100, 1 % corn starch, 49.5 % talinolol / 49 %
Eudragit® S 100, 2 % corn starch, 49 % talinolol / 47.5 % Eudragit® S 100, 5 % corn
starch, 47.5 % talinolol / 15 % corn starch, 85 % talinolol. Dissolution conditions:
phosphate buffer pH 5.5, paddle apparatus, 50 rpm, 37°C, means ± SD, n = 3.
Phosphate buffer pH 6.8
0
20
40
60
80
100
0 60 120 180 240 300 360 420 480
time (min)
cum
ulat
ive
drug
rele
ase
(%)
1 % corn starch 2 % corn starch5 % corn starch 15 % corn starch
Figure III.25:
Talinolol release from sustained-release matrix tablets with a drug content of 200 mg.
Formulations: cp. Figure III.24. Dissolution conditions: phosphate buffer pH 6.8,
paddle apparatus, 50 rpm, 37°C, means ± SD, n = 3.

Chapter III: Development of talinolol controlled-release dosage forms
129
In hydrochloric acid at pH 1.0 the formulation with 5 % corn starch, which showed the
most appropriate dissolution behaviour in phosphate buffer of pH 6.8, failed. The
drug release was nearly 80 % within the first hour. As expected, the tablets consisting
of corn starch and talinolol only, without any Eudragit® added, dissolved even faster.
More than 90 % of the drug was released within 30 minutes. As the drug release
properties of the formulations containing only 1 and 2 % corn starch were inferior to
the one containing 5 % corn starch at pH values of 5.5 and 6.8, these formulations
were not tested at pH values of 1.0 and 3.2.
Also at pH 3.2 the dissolution of talinolol from tablets containing only drug and corn
starch was too rapid (more than 85 % within four hours), whereas the formulation
containing Eudragit® S 100 and 5 % corn starch demonstrated inadequate drug
release (less than 50 % and less than 20 % release within eight hours).
At pH 5.5 the drug release from all formulations was too slow and incomplete within
eight hours. Even the tablets containing only talinolol and corn starch without any
release-sustaining excipient added showed a drug release of merely 70 % after eight
hours.
At pH 6.8 the tablets containing 5 % corn starch consistently released more than
90 % of the drug within eight hours, which matched the requested profile. The
dissolution profiles of the tablets containing only 1 and 2 % corn starch were not
adequate but still rather close to the requested profile with a consistent release of 60
to 70 % over eight hours. Solely the drug release from the tablets containing only
talinolol and corn starch was much too slow and incomplete. In spite of the high
percentage of corn starch, less than 40 % of the drug were released after eight
hours. This unexpected effect can be explained by the decreased solubility of
talinolol at pH 6.8 in combination with the lack of the release-sustaining polymer.
Eudragit® S 100 swells and dissolves at this pH value and hence facilitates the
intrusion of buffer and the wetting of the drug. Since the formulation with a corn
starch content of 15 % did not contain any of this polymer, the lack of these two
effects led to a decreased drug release rate.
Summarizing the results for the four test formulations it can be stated that the main
problem was the strong pH influence on the dissolution. When the drug release
profile was adequate at one particular pH, it was either too slow or too fast at one of
the other pH values.

Chapter III: Development of talinolol controlled-release dosage forms
130
Drug release independent of the pH could not be achieved with any of the
formulations containing Eudragit® S 100 and corn starch. Thus adequate release
profiles were not expected from other formulations with the same ingredients in
different ratios, since any increase of the starch fraction would lead to rapid drug
release in the acidic pH-range. On the other hand, increases in the amount of
Eudragit® S 100 could decelerate talinolol dissolution in the acidic pH-range, but
would at the same time cause decelerations at higher pH values, resulting in an
incomplete drug release after eight hours, in particular at pH 3.2 and pH 5.5.
III.3.4.6 Matrix tablets formulated with a combination of Eudragit® RSPO and
Eudragit® S 100
The desired dissolution profiles of sustained-release talinolol matrix tablets should be
as much as possible independent of the pH of the dissolution medium. Formulations
with either Eudragit® RSPO or Eudragit® S 100 did not match this aim. Therefore,
matrix tablets containing a combination of both polymers were prepared.
The following thoughts guided this formulation selection:
1) Eudragit® S 100 as anionic polymer delays the drug release in 0.1 N HCl. Due
to its insolubility in the acidic pH range, it prevents the formulation from
releasing the drug rapidly in the stomach. At pH values larger than 6.5 the
polymer dissolves.
2) Eudragit® RSPO ensures constant, pH-independent drug release.
3) Talinolol itself as a weak base dissolves more rapidly in the acidic pH range
than at the physiological pH values of lower intestinal regions. This rapid
release should be compensated by the addition of a polymer with acidic
functional groups (Eudragit® S 100).
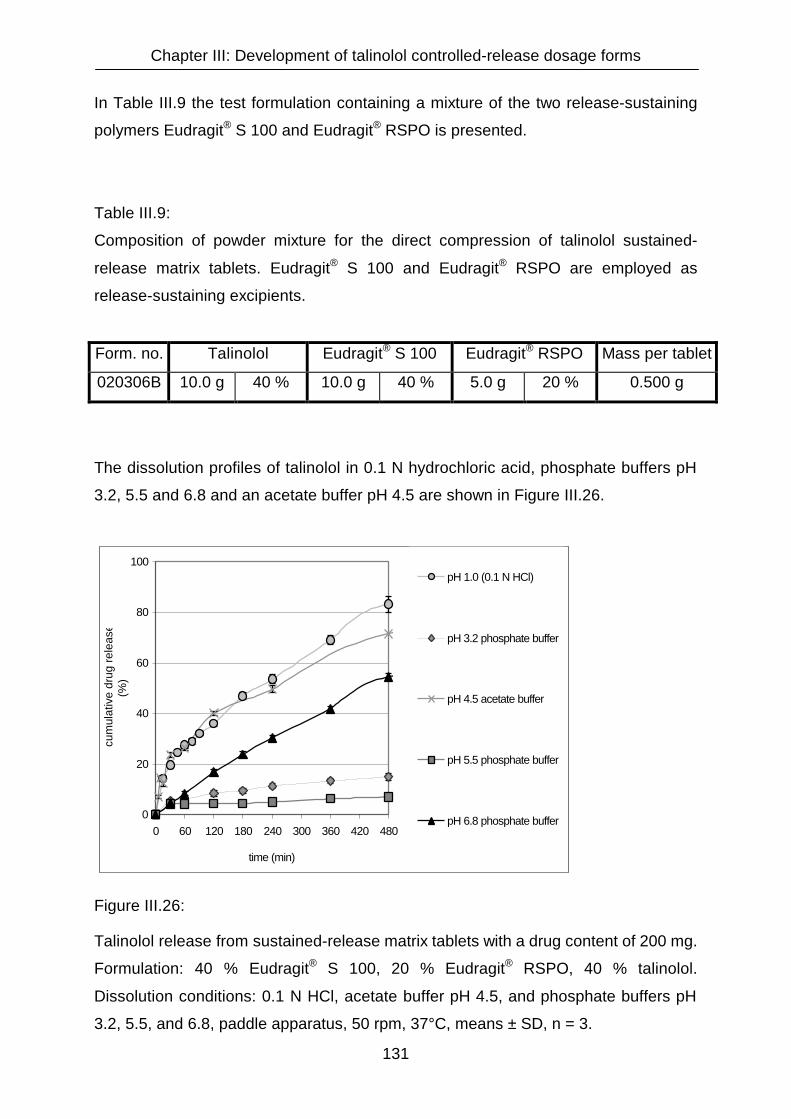
Chapter III: Development of talinolol controlled-release dosage forms
131
In Table III.9 the test formulation containing a mixture of the two release-sustaining
polymers Eudragit® S 100 and Eudragit® RSPO is presented.
Table III.9:
Composition of powder mixture for the direct compression of talinolol sustained-
release matrix tablets. Eudragit® S 100 and Eudragit® RSPO are employed as
release-sustaining excipients.
Form. no. Talinolol Eudragit® S 100 Eudragit® RSPO Mass per tablet
020306B 10.0 g 40 % 10.0 g 40 % 5.0 g 20 % 0.500 g
The dissolution profiles of talinolol in 0.1 N hydrochloric acid, phosphate buffers pH
3.2, 5.5 and 6.8 and an acetate buffer pH 4.5 are shown in Figure III.26.
0
20
40
60
80
100
0 60 120 180 240 300 360 420 480
time (min)
cum
ulat
ive
drug
rele
ase
(%)
pH 1.0 (0.1 N HCl)
pH 3.2 phosphate buffer
pH 4.5 acetate buffer
pH 5.5 phosphate buffer
pH 6.8 phosphate buffer
Figure III.26:
Talinolol release from sustained-release matrix tablets with a drug content of 200 mg.
Formulation: 40 % Eudragit® S 100, 20 % Eudragit® RSPO, 40 % talinolol.
Dissolution conditions: 0.1 N HCl, acetate buffer pH 4.5, and phosphate buffers pH
3.2, 5.5, and 6.8, paddle apparatus, 50 rpm, 37°C, means ± SD, n = 3.
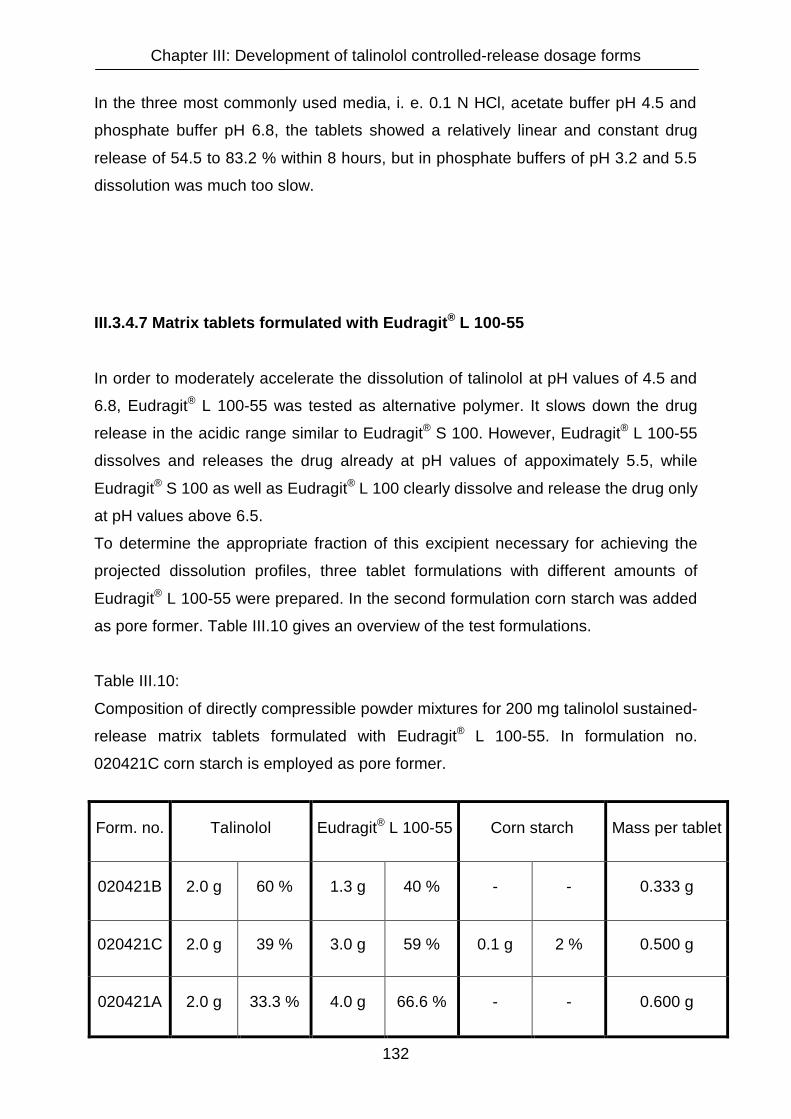
Chapter III: Development of talinolol controlled-release dosage forms
132
In the three most commonly used media, i. e. 0.1 N HCl, acetate buffer pH 4.5 and
phosphate buffer pH 6.8, the tablets showed a relatively linear and constant drug
release of 54.5 to 83.2 % within 8 hours, but in phosphate buffers of pH 3.2 and 5.5
dissolution was much too slow.
III.3.4.7 Matrix tablets formulated with Eudragit® L 100-55
In order to moderately accelerate the dissolution of talinolol at pH values of 4.5 and
6.8, Eudragit® L 100-55 was tested as alternative polymer. It slows down the drug
release in the acidic range similar to Eudragit® S 100. However, Eudragit® L 100-55
dissolves and releases the drug already at pH values of appoximately 5.5, while
Eudragit® S 100 as well as Eudragit® L 100 clearly dissolve and release the drug only
at pH values above 6.5.
To determine the appropriate fraction of this excipient necessary for achieving the
projected dissolution profiles, three tablet formulations with different amounts of
Eudragit® L 100-55 were prepared. In the second formulation corn starch was added
as pore former. Table III.10 gives an overview of the test formulations.
Table III.10:
Composition of directly compressible powder mixtures for 200 mg talinolol sustained-
release matrix tablets formulated with Eudragit® L 100-55. In formulation no.
020421C corn starch is employed as pore former.
Form. no. Talinolol Eudragit® L 100-55 Corn starch Mass per tablet
020421B 2.0 g 60 % 1.3 g 40 % - - 0.333 g
020421C 2.0 g 39 % 3.0 g 59 % 0.1 g 2 % 0.500 g
020421A 2.0 g 33.3 % 4.0 g 66.6 % - - 0.600 g

Chapter III: Development of talinolol controlled-release dosage forms
133
Dissolution behaviour of the three tablet formulations was tested in 0.1 N HCl,
acetate buffer pH 4.5 and phosphate buffer pH 6.8, the media that were found most
suitable for dissolution tests with talinolol in previous investigations. Additionally,
dissolution was tested in phosphate buffer pH 4.5 to allow a comparison between the
dissolution in a phosphate buffer and an acetate buffer of the same pH.
Furthermore, dissolution tests were performed in Tris (i. e. Tris-(hydroxymethyl)-
aminomethane) buffer of pH 6.8 to investigate whether dissolution in this buffer
differs markedly from that in phosphate buffer of pH 6.8. Tris buffer is commonly used
as physiological buffer in particular in cell culturing and biochemical experiments.
Figures III.27 to III.31 depict the drug release profiles for these formulations and
buffer systems, respectively.
0.1 N HCl
0
20
40
60
80
100
0 60 120 180 240 300 360 420 480
time (min)
cum
ulat
ive
drug
rele
ase
(%)
40% E. L100-55 60% E. L100-55 + 2% corn starch 66% E. L100-55
Figure III.27:
Dissolution of talinolol from sustained-release matrix tablets with a drug content of
200 mg.
Formulations: 40 % Eudragit® L 100-55, 60 % talinolol / 60 % Eudragit® L 100-55,
2 % corn starch, 38 % talinolol / 66 % Eudragit® L 100-55, 34 % talinolol. Dissolution
conditions: 0.1 N HCl, paddle apparatus, 37°C, means ± SD, n = 3.

Chapter III: Development of talinolol controlled-release dosage forms
134
Acetate buffer pH 4.5
0
20
40
60
80
100
0 60 120 180 240 300 360 420 480
time (min)
cum
ulat
ive
drug
rele
ase
(%)
40% E. L100-55 60% E. L100-55 + 2% corn starch 66% E. L100-55
Figure III.28:
Dissolution of talinolol from sustained-release matrix tablets with a drug content of
200 mg.
Formulations: 40 % Eudragit® L 100-55, 60 % talinolol / 60 % Eudragit® L 100-55,
2 % corn starch, 38 % talinolol / 66 % Eudragit® L 100-55, 34 % talinolol. Dissolution
conditions: acetate buffer pH 4.5, paddle apparatus, 37°C, means ± SD, n = 3.
Phosphate buffer pH 4.5
0
20
40
60
80
100
0 60 120 180 240 300 360 420 480
time (min)
cum
ulat
ive
drug
rele
ase
(%)
40% E. L100-55 60% E. L100-55 + 2% corn starch 66% E. L100-55
Figure III.29:
Dissolution of talinolol from sustained-release matrix tablets with a drug content of
200 mg.
Formulations: cp Figure III.28. Dissolution conditions: phosphate buffer pH 4.5,
paddle apparatus, 37°C, means ± SD, n = 3.

Chapter III: Development of talinolol controlled-release dosage forms
135
Phosphate buffer pH 6.8
0
20
40
60
80
100
0 60 120 180 240 300 360 420 480
time (min)
cum
ulat
ive
drug
rele
ase
(%)
40% E. L100-55 60% E. L100-55 + 2% corn starch 66% E. L100-55
Figure III.30:
Dissolution of talinolol from sustained-release matrix tablets with a drug content of
200 mg.
Formulations: 40 % Eudragit® L 100-55, 60 % talinolol / 60 % Eudragit® L 100-55,
2 % corn starch, 38 % talinolol / 66 % Eudragit® L 100-55, 34 % talinolol. Dissolution
conditions: phosphate buffer pH 6.8, paddle apparatus, 37°C, means ± SD, n = 3.
Tris buffer pH 6.8
0
20
40
60
80
100
0 60 120 180 240 300 360 420 480
time (min)
cum
ulat
ive
drug
rele
ase
(%))
40% E. L100-55 60% E. L100-55 + 2% corn starch 66% E. L100-55
Figure III.31:
Dissolution of talinolol from sustained-release matrix tablets with a drug content of
200 mg.
Formulations: cp Figure III.30. Dissolution conditions: Tris buffer pH 6.8, paddle
apparatus, 37°C, means ± SD, n = 3.

Chapter III: Development of talinolol controlled-release dosage forms
136
The impact of changes in the formulation on dissolution profiles was most
discriminating for hydrochloric acid as dissolution medium, as can be seen in Figure
III.27. Changes of the formulation had neglible impact on the dissolution of talinolol in
phosphate buffers pH 4.5 and 6.8, in Tris buffer pH 6.8 and in acetate buffer pH 4.5
as well. In hydrochloric acid a reduction of the fraction of Eudragit® L 100-55 led to a
faster dissolution. For example, the cumulative drug release after 4 hours raised from
6.7 and 8.7 % for the formulations containing 60 and 66 % Eudragit® L 100-55 up to
88.7 % for the formulation containing only 40 % of this polymer.
In general, none of the three formulations tested matched the desired release
properties. Except for the formulation containing only 40 % Eudragit® L 100-55, that
showed a too rapid dissolution at pH 1.0, drug release was too slow and incomplete
after 8 hours in all dissolution media tested.
Furthermore, distinct differences between the dissolution profiles in acetate and
phosphate buffers at pH 4.5 were detected, whereas a switch from phosphate buffer
pH 6.8 to a Tris buffer of the same pH did not lead to relevant changes of the
dissolution profiles of the formulations tested.
III.3.4.8 Matrix tablets formulated with Eudragit® L 100-55 and different pore
formers (corn starch, PEG 4000, glucose, and mannitol)
Corn starch, polyethylene glycol 4000 (PEG 4000), glucose, and mannitol were
tested as hydrophilic pore formers to increase the dissolution rates of talinolol from
tablets formulated with Eudragit® L 100-55.
III.3.4.8.1 Corn starch
Corn starch was successfully employed previously to accelerate talinolol release in
formulations with Eudragit® S 100. Table III.11 presents four test formulations with
different fractions of corn starch in combination with Eudragit® L 100-55.
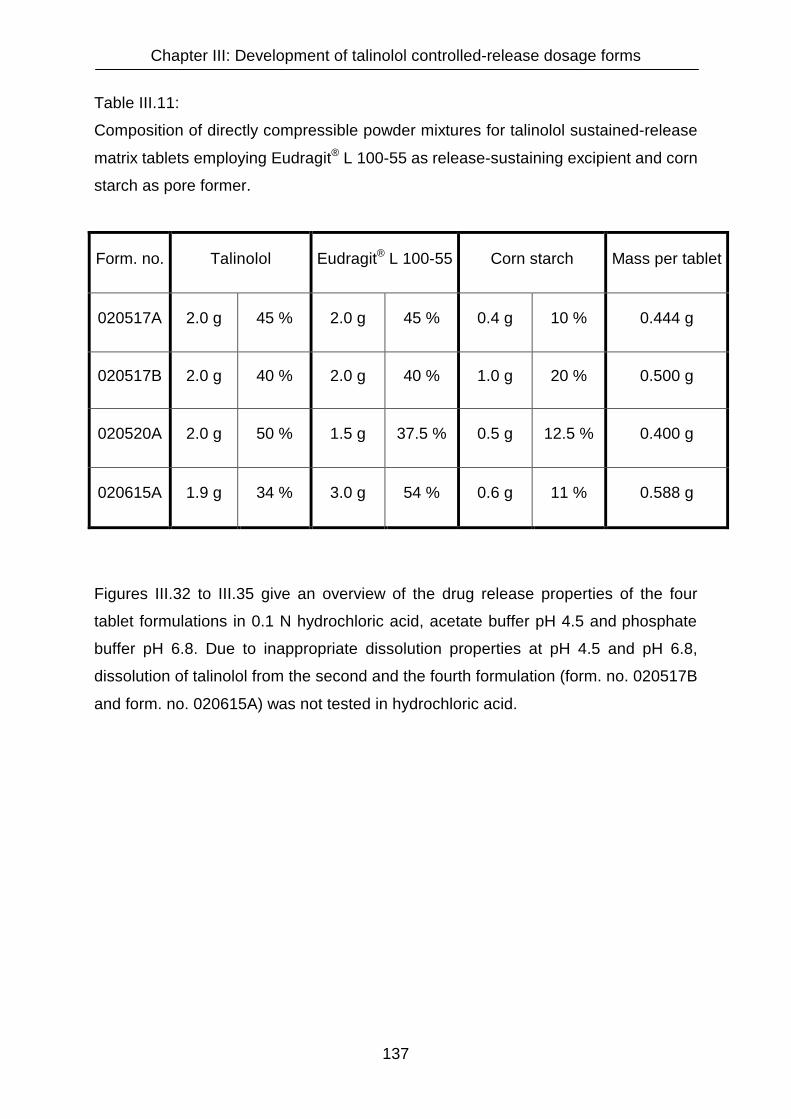
Chapter III: Development of talinolol controlled-release dosage forms
137
Table III.11:
Composition of directly compressible powder mixtures for talinolol sustained-release
matrix tablets employing Eudragit® L 100-55 as release-sustaining excipient and corn
starch as pore former.
Form. no. Talinolol Eudragit® L 100-55 Corn starch Mass per tablet
020517A 2.0 g 45 % 2.0 g 45 % 0.4 g 10 % 0.444 g
020517B 2.0 g 40 % 2.0 g 40 % 1.0 g 20 % 0.500 g
020520A 2.0 g 50 % 1.5 g 37.5 % 0.5 g 12.5 % 0.400 g
020615A 1.9 g 34 % 3.0 g 54 % 0.6 g 11 % 0.588 g
Figures III.32 to III.35 give an overview of the drug release properties of the four
tablet formulations in 0.1 N hydrochloric acid, acetate buffer pH 4.5 and phosphate
buffer pH 6.8. Due to inappropriate dissolution properties at pH 4.5 and pH 6.8,
dissolution of talinolol from the second and the fourth formulation (form. no. 020517B
and form. no. 020615A) was not tested in hydrochloric acid.
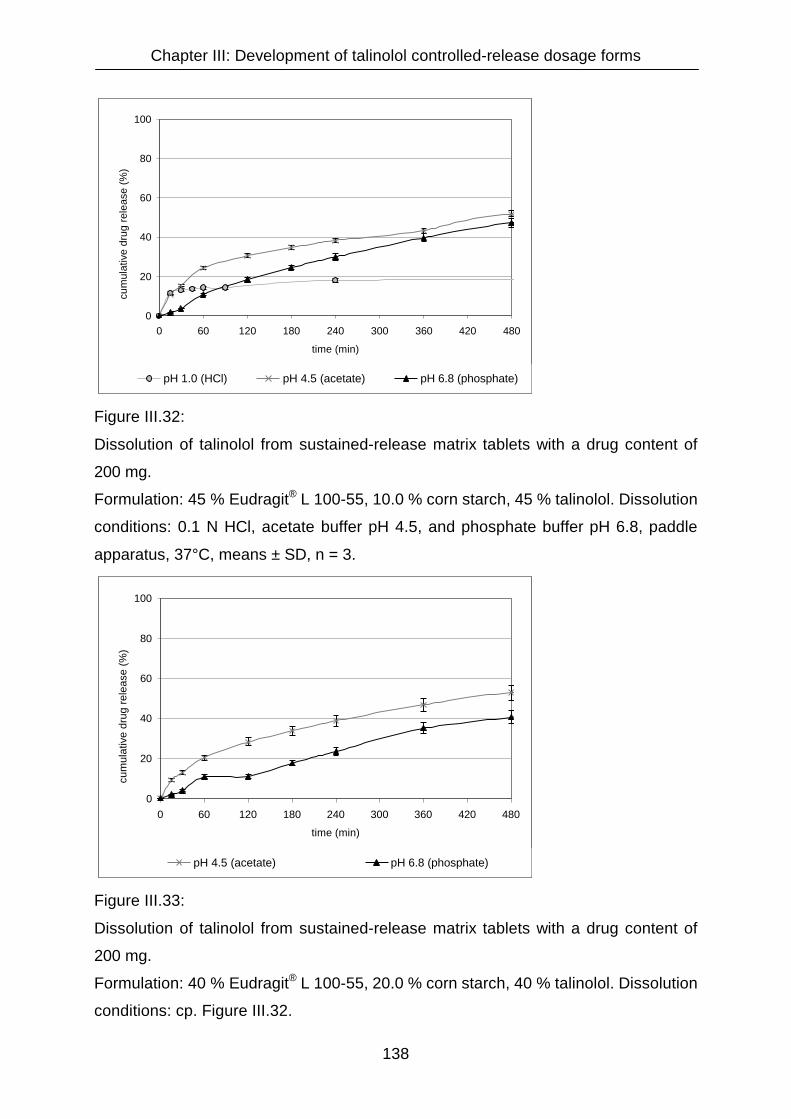
Chapter III: Development of talinolol controlled-release dosage forms
138
0
20
40
60
80
100
0 60 120 180 240 300 360 420 480
time (min)
cum
ulat
ive
drug
rele
ase
(%)
pH 1.0 (HCl) pH 4.5 (acetate) pH 6.8 (phosphate)
Figure III.32:
Dissolution of talinolol from sustained-release matrix tablets with a drug content of
200 mg.
Formulation: 45 % Eudragit® L 100-55, 10.0 % corn starch, 45 % talinolol. Dissolution
conditions: 0.1 N HCl, acetate buffer pH 4.5, and phosphate buffer pH 6.8, paddle
apparatus, 37°C, means ± SD, n = 3.
0
20
40
60
80
100
0 60 120 180 240 300 360 420 480
time (min)
cum
ulat
ive
drug
rele
ase
(%)
pH 4.5 (acetate) pH 6.8 (phosphate)
Figure III.33:
Dissolution of talinolol from sustained-release matrix tablets with a drug content of
200 mg.
Formulation: 40 % Eudragit® L 100-55, 20.0 % corn starch, 40 % talinolol. Dissolution
conditions: cp. Figure III.32.
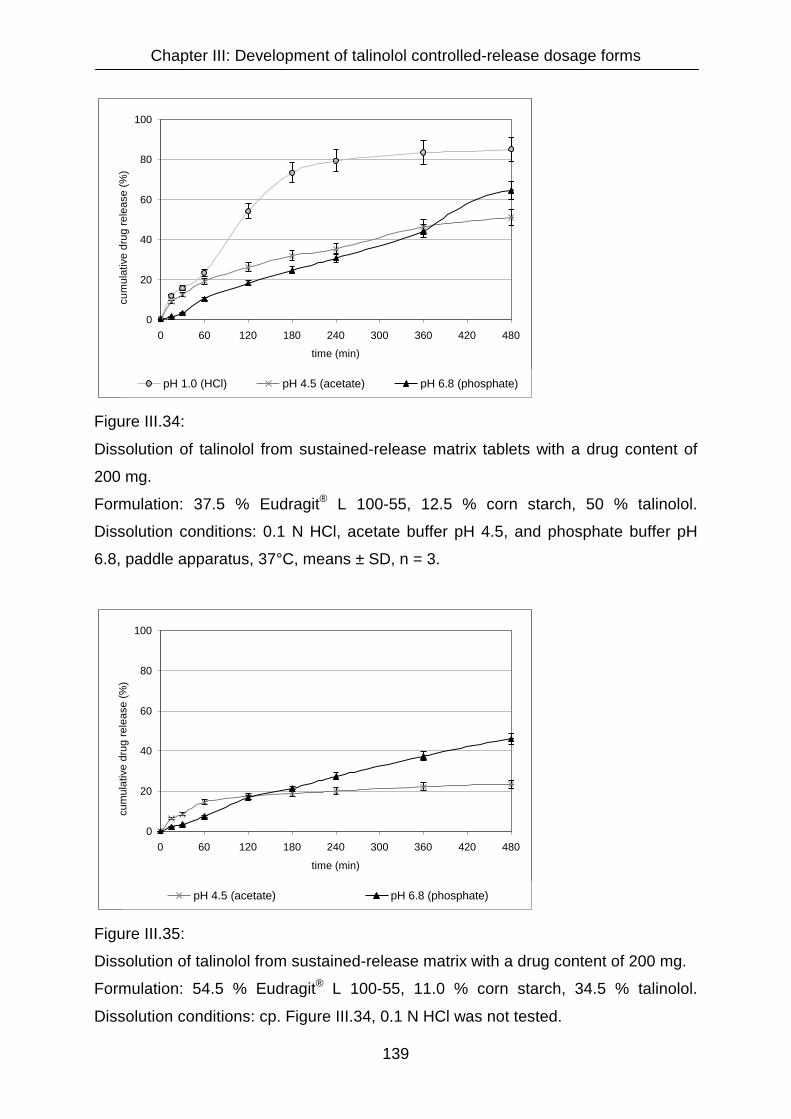
Chapter III: Development of talinolol controlled-release dosage forms
139
0
20
40
60
80
100
0 60 120 180 240 300 360 420 480
time (min)
cum
ulat
ive
drug
rele
ase
(%)
pH 1.0 (HCl) pH 4.5 (acetate) pH 6.8 (phosphate)
Figure III.34:
Dissolution of talinolol from sustained-release matrix tablets with a drug content of
200 mg.
Formulation: 37.5 % Eudragit® L 100-55, 12.5 % corn starch, 50 % talinolol.
Dissolution conditions: 0.1 N HCl, acetate buffer pH 4.5, and phosphate buffer pH
6.8, paddle apparatus, 37°C, means ± SD, n = 3.
0
20
40
60
80
100
0 60 120 180 240 300 360 420 480
time (min)
cum
ulat
ive
drug
rele
ase
(%)
pH 4.5 (acetate) pH 6.8 (phosphate)
Figure III.35:
Dissolution of talinolol from sustained-release matrix with a drug content of 200 mg.
Formulation: 54.5 % Eudragit® L 100-55, 11.0 % corn starch, 34.5 % talinolol.
Dissolution conditions: cp. Figure III.34, 0.1 N HCl was not tested.

Chapter III: Development of talinolol controlled-release dosage forms
140
None of the drug release profiles of the four test formulations was appropriate.
Dissolution of talinolol from the formulation consisting of 12.5 % corn starch and
37.5 % Eudragit® L 100-55 (form. no. 020520A) was too fast. In hydrochloric acid,
73.4 % talinolol were dissolved after 3 hours. On the other hand, the formulations
with higher release-sustaining Eudragit® fractions (forms. no. 020517A, 020517B,
and 020615A) released the drug too slowly and incompletely. In all media tested drug
release was lower than 60 % after 8 hours.
III.3.4.8.2 Polyethylene glycol 4000
A formulation containing 33 % talinolol, 50 %Eudragit® L 100-55, and 16.6 % PEG
4000 (Lipoxol 4000) (form. no. 020430C) was prepared to test the pore-forming
properties of PEG 4000 in matrix tablets. According to disslution data published by
Breitkreutz who investigated the influence of PEG 400 and PEG 4000 on Eudragit®
based film coatings in modified-release tablets [Breitkreutz, J. (2000)], an
acceleration of the drug release would have been expected. In his study, an addition
of polyethylene glycol to acidic dissolution and disintegration media caused an
acceleration of disintegration and dissolution of the active drug from tablets film-
coated with Eudragit®. In spite of these findings, talinolol release from the matrix
formulation tested was too slow and not complete within eight hours in all three
media tested (24.8 % cumulative drug release in 0.1 N HCl, 23.1 % in acetate buffer
pH 4.5, and 34.3 % in phosphate buffer pH 6.8 after eight hours).
III.3.4.8.3 Glucose
The drug release from a formulation employing glucose monohydrate (Cerestar CL)
as hydrophilic pore former in matrix tablets formulated with Eudragit® L 100-55 (45 %
talinolol, 45 % Eudragit® L 100-55, 10 % glucose, form. no. 020617B) was tested in
0.1 N hydrochloric acid, acetate buffer pH 4.5 and phosphate buffer pH 6.8. Similar to
the results from the tablets employing polyethylene glycol 4000 as pore former (form.
no. 020430C), dissolution was too slow and incomplete. In all three test media, less
than 60 % of the drug were dissolved after 8 hours.

Chapter III: Development of talinolol controlled-release dosage forms
141
III.3.4.8.4 Mannitol
The hydrophilic six carbon sugar alcohol mannitol was successfully tested to
accelerate the drug release from matrix formulations by Kim et al. [Kim, J. E., S. R.
Kim, et al. (2000)]. To investigate its influence on the drug release from talinolol
matrix tablets formulated with Eudragit® L 100-55, different formulations with varying
mannitol fractions were prepared. Table III.12 shows the composition of the powder
mixtures.
Table III.12:
Composition of powder mixtures for 200 mg talinolol sustained-release matrix tablets
formulated with Eudragit® L 100-55 and mannitol.
Form.
no. Talinolol Eudragit® L 100-55 Mannitol Mass per tablet
A 020706B 2.0 g 62.5 % 0.96 g 30 % 0.24 g 7.5 % 0.320 g
B 020617A 2.0 g 45 % 2.0 g 45 % 0.44 g 10 % 0.444 g
C 020726A 10.0 g 50 % 7.0 g 35 % 3.0 g 15 % 0.400 g
Dissolution of the tablets was tested in 0.1 N hydrochloric acid, acetate buffer pH 4.5
and phosphate buffer pH 6.8. The results are presented in Figure III.36.

Chapter III: Development of talinolol controlled-release dosage forms
142
A: 30.0 % Eudragit® L 100-55 / 7.5 % mannitol(200 mg talinolol per tablet)
0
20
40
60
80
100
120
0 60 120 180 240 300 360 420 480
time (min)
cum
ulat
ive
drug
rele
ase
(%))
pH 1.0 (HCl) pH 4.5 (acetate) pH 6.8 (phosphate)
B: 45.0 % Eudragit® L 100-55 / 10.0 % mannitol(200 mg talinolol per tablet)
0
20
40
60
80
100
0 60 120 180 240 300 360 420 480
time (min)
cum
ulat
ive
drug
rele
ase
(%))
pH 1.0 (HCl) pH 4.5 (acetate) pH 6.8 (phosphate)
C: 35.0 % Eudragit® L 100-55 / 15.0 % mannitol(200 mg talinolol per tablet)
0
20
40
60
80
100
0 60 120 180 240 300 360 420 480
time (min)
cum
ulat
ive
drug
rele
ase
(%))
pH 1.0 (HCl) pH 4.5 (acetate) pH 6.8 (phosphate)

Chapter III: Development of talinolol controlled-release dosage forms
143
Figure III.36 (on previous page):
Dissolution of sustained-release matrix tablets with a drug content of 200 mg.
Formulations: A: 30 % Eudragit® L 100-55, 7.5 % mannitol, 62.5 % talinolol / B: 45 %
Eudragit® L 100-55, 10 % mannitol, 45 % talinolol / C: 35 % Eudragit® L 100-55, 15 %
mannitol, 50 % talinolol. Dissolution conditions: 0.1 N HCl, acetate buffer pH 4.5, and
phosphate buffer pH 6.8, paddle apparatus, 37°C, means ± SD, n = 3.
Figure III.36 A shows that a portion of 30 % Eudragit® L 100-55 was not sufficient to
achieve a suitable control over the drug release at pH 1.0. After 30 minutes, the
complete dose of talinolol was already dissolved.
On the other hand, Figure III.36 B outlines that tablets formulated with a combination
of 45 % Eudragit® L 100-55 and 10 % mannitol (formulation B, form. no. 020617A)
release the drug too slowly. In all three dissolution media the cumulative drug release
was lower than 65 % after 8 hours.
As expected, the reduced Eudragit® content (35 % Eudragit®) in formulation C (form.
no. 020726A) in combination with the increased mannitol fraction (15 % mannitol)
compared to formulation B (form. no. 020617A) lead to an acceleration of the drug
release in all three test media (Figure III.36 C). The effect can be observed most
explicitly at pH 1.0: Here the drug release was faster than in the two other media,
whereas for formulation B it was just the other way round. This can be explained by
the different Eudragit® contents. In the acidic pH range, the drug release from
formulation B (form. no. 020617A) is slow due to the high fraction (45 %) of Eudragit®
L 100-55 that is insoluble at pH values below 5.5. The high polymer concentration
enables the formation of a stronger polymer network than in formulation C where the
polymer content is lower (35 %) [Krajacic, A. and I. G. Tucker (2003)]. The drug
release is accelerated, since the polymer network in this matrix is not that strong. At
pH 6.8, this effect plays a minor role since the polymer swells and dissolves in this
pH range and the release-sustaining properties of Eudragit® L 100-55 are not that
pronounced. Therefore, at a pH value of 6.8, the lower Eudragit® content in
formulation C (form. no. 020726A) leads to a less pronounced acceleration of the
drug release than at a pH value of 1.0.
However, when compared with formulations A and B, the acceleration of the
dissolution of talinolol from formulation C is still obvious at pH 6.8, whereas the
Chapter III: Development of talinolol controlled-release dosage forms
144
release profile at pH 4.5 differs only marginally from the one of formulation B. After 8
hours the cumulative drug release at that pH was incomplete for both formulations
(43.0 % for formulation B versus 52.1 % for formulation C).
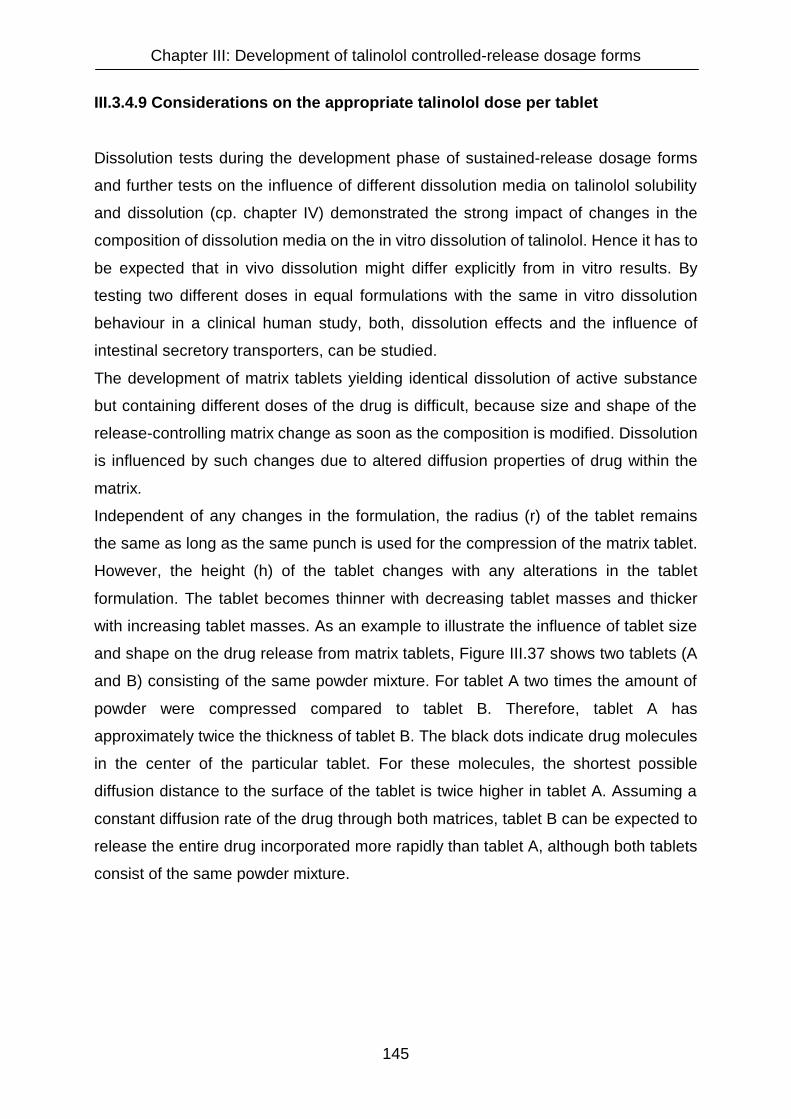
Chapter III: Development of talinolol controlled-release dosage forms
145
III.3.4.9 Considerations on the appropriate talinolol dose per tablet
Dissolution tests during the development phase of sustained-release dosage forms
and further tests on the influence of different dissolution media on talinolol solubility
and dissolution (cp. chapter IV) demonstrated the strong impact of changes in the
composition of dissolution media on the in vitro dissolution of talinolol. Hence it has to
be expected that in vivo dissolution might differ explicitly from in vitro results. By
testing two different doses in equal formulations with the same in vitro dissolution
behaviour in a clinical human study, both, dissolution effects and the influence of
intestinal secretory transporters, can be studied.
The development of matrix tablets yielding identical dissolution of active substance
but containing different doses of the drug is difficult, because size and shape of the
release-controlling matrix change as soon as the composition is modified. Dissolution
is influenced by such changes due to altered diffusion properties of drug within the
matrix.
Independent of any changes in the formulation, the radius (r) of the tablet remains
the same as long as the same punch is used for the compression of the matrix tablet.
However, the height (h) of the tablet changes with any alterations in the tablet
formulation. The tablet becomes thinner with decreasing tablet masses and thicker
with increasing tablet masses. As an example to illustrate the influence of tablet size
and shape on the drug release from matrix tablets, Figure III.37 shows two tablets (A
and B) consisting of the same powder mixture. For tablet A two times the amount of
powder were compressed compared to tablet B. Therefore, tablet A has
approximately twice the thickness of tablet B. The black dots indicate drug molecules
in the center of the particular tablet. For these molecules, the shortest possible
diffusion distance to the surface of the tablet is twice higher in tablet A. Assuming a
constant diffusion rate of the drug through both matrices, tablet B can be expected to
release the entire drug incorporated more rapidly than tablet A, although both tablets
consist of the same powder mixture.
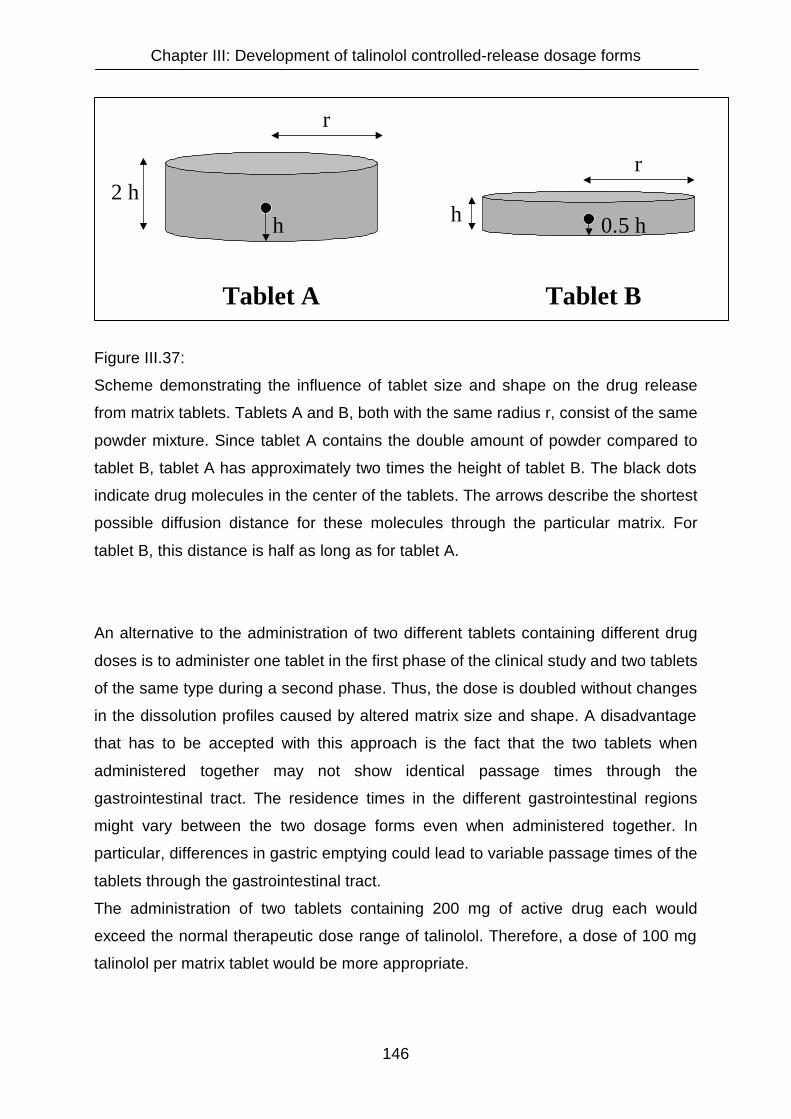
Chapter III: Development of talinolol controlled-release dosage forms
146
Figure III.37:
Scheme demonstrating the influence of tablet size and shape on the drug release
from matrix tablets. Tablets A and B, both with the same radius r, consist of the same
powder mixture. Since tablet A contains the double amount of powder compared to
tablet B, tablet A has approximately two times the height of tablet B. The black dots
indicate drug molecules in the center of the tablets. The arrows describe the shortest
possible diffusion distance for these molecules through the particular matrix. For
tablet B, this distance is half as long as for tablet A.
An alternative to the administration of two different tablets containing different drug
doses is to administer one tablet in the first phase of the clinical study and two tablets
of the same type during a second phase. Thus, the dose is doubled without changes
in the dissolution profiles caused by altered matrix size and shape. A disadvantage
that has to be accepted with this approach is the fact that the two tablets when
administered together may not show identical passage times through the
gastrointestinal tract. The residence times in the different gastrointestinal regions
might vary between the two dosage forms even when administered together. In
particular, differences in gastric emptying could lead to variable passage times of the
tablets through the gastrointestinal tract.
The administration of two tablets containing 200 mg of active drug each would
exceed the normal therapeutic dose range of talinolol. Therefore, a dose of 100 mg
talinolol per matrix tablet would be more appropriate.
2 h
r
h
r
0.5 hh
Tablet BTablet A
Chapter III: Development of talinolol controlled-release dosage forms
147
III.3.4.10 Talinolol matrix tablets with a drug content of 100 mg
As a consequence of the considerations on the appropriate dose for talinolol
sustained-release dosage forms, matrix tablets with a talinolol content of 100 mg
were compressed. The same powder mixtures containing Eudragit® L 100-55 and
mannitol (forms. no. 020706B, 020617A, and 020726B) were used as for the
previously manufactured 200 mg talinolol tablets. The resulting total tablet masses for
the formulations A, B, and C were 160 mg, 222 mg, and 200 mg, respectively. Due to
the lower weight of the tablets containing only 100 mg talinolol in combination with
their rather large diameter, the dosage forms did not sink to the bottom of the
dissolution vessels but floated. This phenomenon made it necessary to use sinkers in
order to maintain the tablets at the bottom of the vessels.
In Figure III.38 the dissolution profiles of talinolol matrix tablets formulated with
different fractions of Eudragit® L 100-55 and mannitol (cp. Table III.12) containing
100 mg talinolol are presented. Dissolution tests were performed using the same
dissolution media as for the tablets containing 200 mg talinolol (0.1 N hydrochloric
acid, acetate buffer pH 4.5, phosphate buffer pH 6.8).

Chapter III: Development of talinolol controlled-release dosage forms
148
A: 30.0 % Eudragit® L 100-55 / 7.5 % mannitol(100 mg talinolol per tablet)
0
20
40
60
80
100
120
0 60 120 180 240 300 360 420 480
time (min)
cum
ulat
ive
drug
rele
ase
(%)x
pH 1.0 (HCl) pH 4.5 (acetate) pH 6.8 (phosphate)
B: 45.0 % Eudragit® L 100-55 / 10.0 % mannitol(100 mg talinolol per tablet)
0
20
40
60
80
100
0 60 120 180 240 300 360 420 480
time (min)
cum
ulat
ive
drug
rele
ase
(%)x
pH 1.0 (HCl) pH 4.5 (acetate)
C: 35.0 % Eudragit® L 100-55 / 15.0 % mannitol(100 mg talinolol per tablet)
0
20
40
60
80
100
0 60 120 180 240 300 360 420 480
time (min)
cum
ulat
ive
drug
rele
ase
(%)x
pH 1.0 (HCl) pH 4.5 (acetate) pH 6.8 (phosphate)

Chapter III: Development of talinolol controlled-release dosage forms
149
Figure III.38 (on previous page):
Dissolution of sustained-release matrix tablets with a drug content of 100 mg.
Formulations: A: 30 % Eudragit® L 100-55, 7.5 % mannitol, 62.5 % talinolol / B: 45 %
Eudragit® L 100-55, 10 % mannitol, 45 % talinolol / C: 35 % Eudragit® L 100-55, 15 %
mannitol, 50 % talinolol. Dissolution conditions: 0.1 N HCl, acetate buffer pH 4.5, and
phosphate buffer pH 6.8, paddle apparatus, 37°C, means ± SD, n = 3.
The altered tablet thickness resulted in the expected changes of the dissolution
profiles: The thinner matrix with a diminished diffusion distance caused an
accelerated drug release rate.
Exemplarily, the dissolution profiles of tablets containing 100 mg and 200 mg talinolol
formulated with 30 % Eudragit L 100-55 and 7.5 % mannitol (Formulation A) are
compared in Figure III.39.
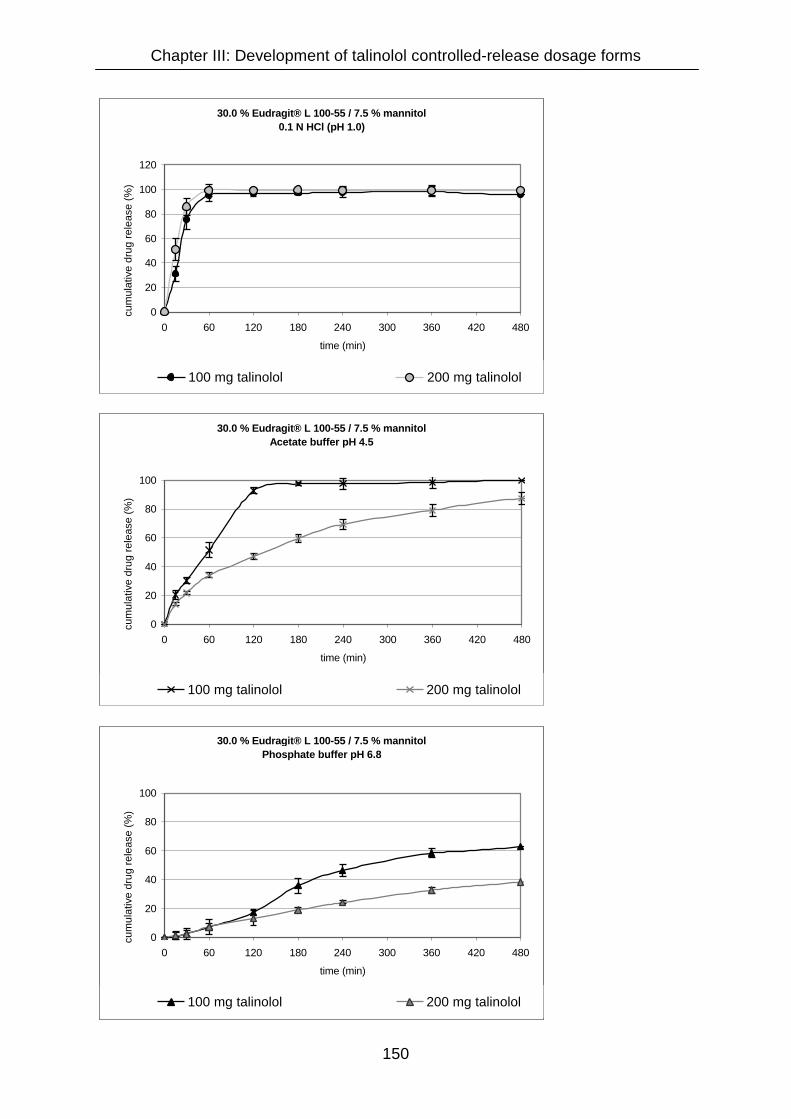
Chapter III: Development of talinolol controlled-release dosage forms
150
30.0 % Eudragit® L 100-55 / 7.5 % mannitol 0.1 N HCl (pH 1.0)
0
20
40
60
80
100
120
0 60 120 180 240 300 360 420 480
time (min)
cum
ulat
ive
drug
rele
ase
(%))
100 mg talinolol 200 mg talinolol
30.0 % Eudragit® L 100-55 / 7.5 % mannitol Acetate buffer pH 4.5
0
20
40
60
80
100
0 60 120 180 240 300 360 420 480
time (min)
cum
ulat
ive
drug
rele
ase
(%))
100 mg talinolol 200 mg talinolol
30.0 % Eudragit® L 100-55 / 7.5 % mannitol Phosphate buffer pH 6.8
0
20
40
60
80
100
0 60 120 180 240 300 360 420 480
time (min)
cum
ulat
ive
drug
rele
ase
(%))
100 mg talinolol 200 mg talinolol
Chapter III: Development of talinolol controlled-release dosage forms
151
Figure III.39 (on previous page):
Comparison of talinolol dissolution from sustained-release matrix tablets containing
100 mg and 200 mg talinolol, both.
Formulation: 30 % Eudragit® L 100-55, 7.5 % mannitol, 62.5 % talinolol. Dissolution
conditions: 0.1 N HCl, acetate buffer pH 4.5, and phosphate buffer pH 6.8, paddle
apparatus, 37°C, means ± SD, n = 3.
At pH 1.0 no apparent differences between the dissolution of talinolol from 100 mg
versus 200 mg could be observed. Due to the rapid drug release from both tablets
the discriminatory power gets lost. At pH values of 4.5 and 6.8, apparent differences
between the cumulative drug release of 100 mg and 200 mg tablets were detected.
For example, at pH 4.5 approximately 45 % of the talinolol dose were released from
the tablets containing 200 mg after two hours whereas more than 90 % of the
incorporated dose were dissolved from the tablets containing 100 mg within the same
time interval. The differences are so pronounced that not only the previously
described phenomenon of decreased diffusion distances for the thinner tablets
containing 100 mg talinolol (cp Fig. III.37) may play a role. In addition, it must be
assumed that abrasion and superficial matrix erosion are relatively higher for the
thinner 100 mg talinolol tablets. Since the radius for the 100 mg and 200 mg tablets
is equal, the surface area differs only slightly between the two dosage forms. This
means that the working surface for abrasion processes is similar for both tablets,
though drug content is doubled for the 200 mg tablets. Consequently, relative to the
total amount of drug molecules incorporated, more drug molecules are located in
marginal regions in the 100 mg tablets and are thus exposed to abrasion of outer
layers of the matrix. This leads to a more rapid release of talinolol from the thinner
tablets containing only 100 mg talinolol.

Chapter III: Development of talinolol controlled-release dosage forms
152
III.3.4.11 Formulation optimization of talinolol matrix tablets with a drug content
of 100 mg
The dissolution properties of the matrix tablets formulated with 35 % Eudragit® L 100-
55 and 15 % mannitol (form. no. 020726A2) and a talinolol content of 100 mg
presented in Figure III.36 (Formulation C) were rather close to the required criteria for
an appropriate talinolol sustained-release dosage form. In all three test media 80 to
100 % of the drug were released continuously over 8 hours, though the dissolution
profiles were not identical.
However, the burst effect with a drug release rate of more than 50 % within the first
hour in hydrochloric acid, demanded an optimization of the formulation. Apparently,
the reason for the burst effect, that was even more pronounced for formulation A with
a polymer content of merely 30 %, is that a polymer fraction of 35 % or less is not
sufficient to obtain a stable, non-eroding matrix. This assumption is supported by the
findings of Boza et al. who postulated the existence of a percolation treshold, i.e. a
minimum amount of polymer necessary to obtain stable matrices [Boza, A., I.
Caraballo, et al. (1999)]. Below these concentrations the insoluble polymer forms
only finite clusters, without a coherent structure. In consequence, when drug
molecules dissolve within such a matrix, the tablet tends to disintegrate. Since burst
effects were observed when formulations contained less than 40 % Eudragit® L 100-
55, a threshold similar to the one reported for Eudragit® RSPO (i. e. between 40 and
50 % [Boza, A., I. Caraballo, et al. (1999)]) can be assumed for this polymer.
To optimize the drug release, further formulations had to be tested. Based on the
results from dissolution tests with the formulations presented in Table III.12
(A - C), two more powder mixtures containing Eudragit® L 100-55 and mannitol were
prepared (D and E).
Compared to formulation B (Eudragit content: 45 %) the drug release rate had to be
accelerated and compared to formulations A (Eudragit content: 30 %) and C
(Eudragit content: 35 %) it had to be decelerated in the acidic pH range. Therefore,
an intermediate Eudragit content of 40 % was chosen for the new test formulations,
combined with relatively high mannitol fractions to prevent incomplete drug release,
in particular at pH 6.8.
The composition of the formulations is given in Table III.13.
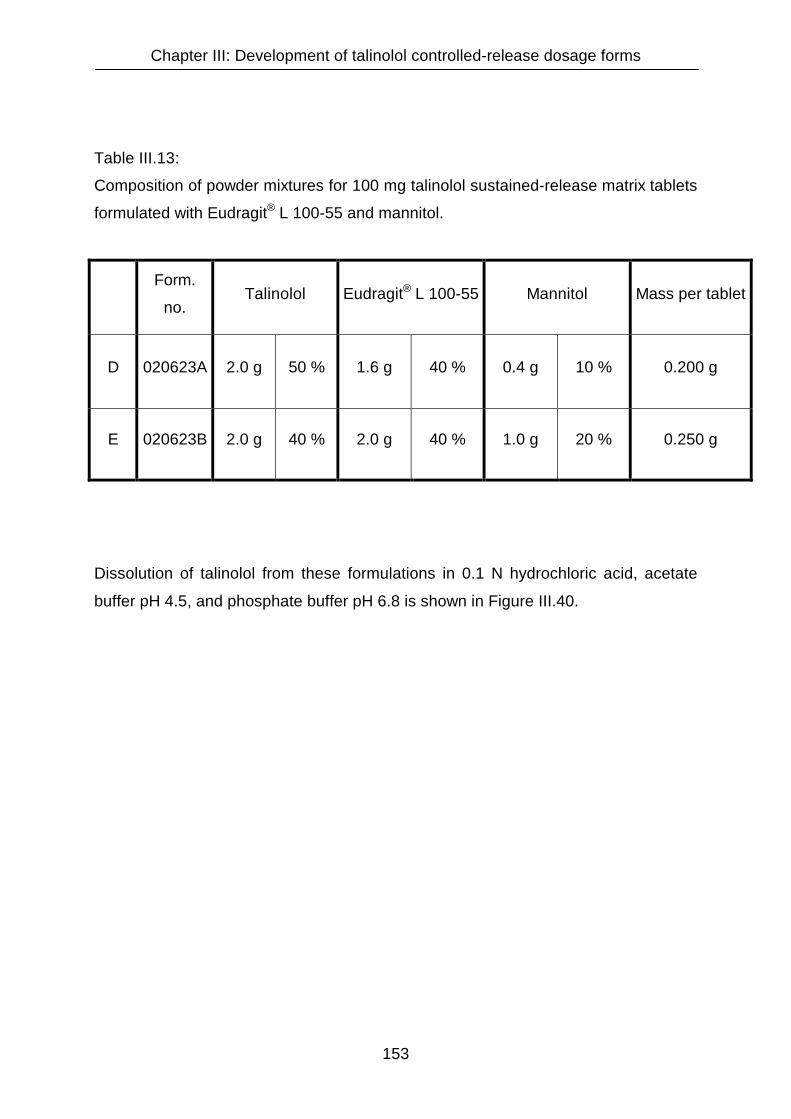
Chapter III: Development of talinolol controlled-release dosage forms
153
Table III.13:
Composition of powder mixtures for 100 mg talinolol sustained-release matrix tablets
formulated with Eudragit® L 100-55 and mannitol.
Form.
no. Talinolol Eudragit® L 100-55 Mannitol Mass per tablet
D 020623A 2.0 g 50 % 1.6 g 40 % 0.4 g 10 % 0.200 g
E 020623B 2.0 g 40 % 2.0 g 40 % 1.0 g 20 % 0.250 g
Dissolution of talinolol from these formulations in 0.1 N hydrochloric acid, acetate
buffer pH 4.5, and phosphate buffer pH 6.8 is shown in Figure III.40.
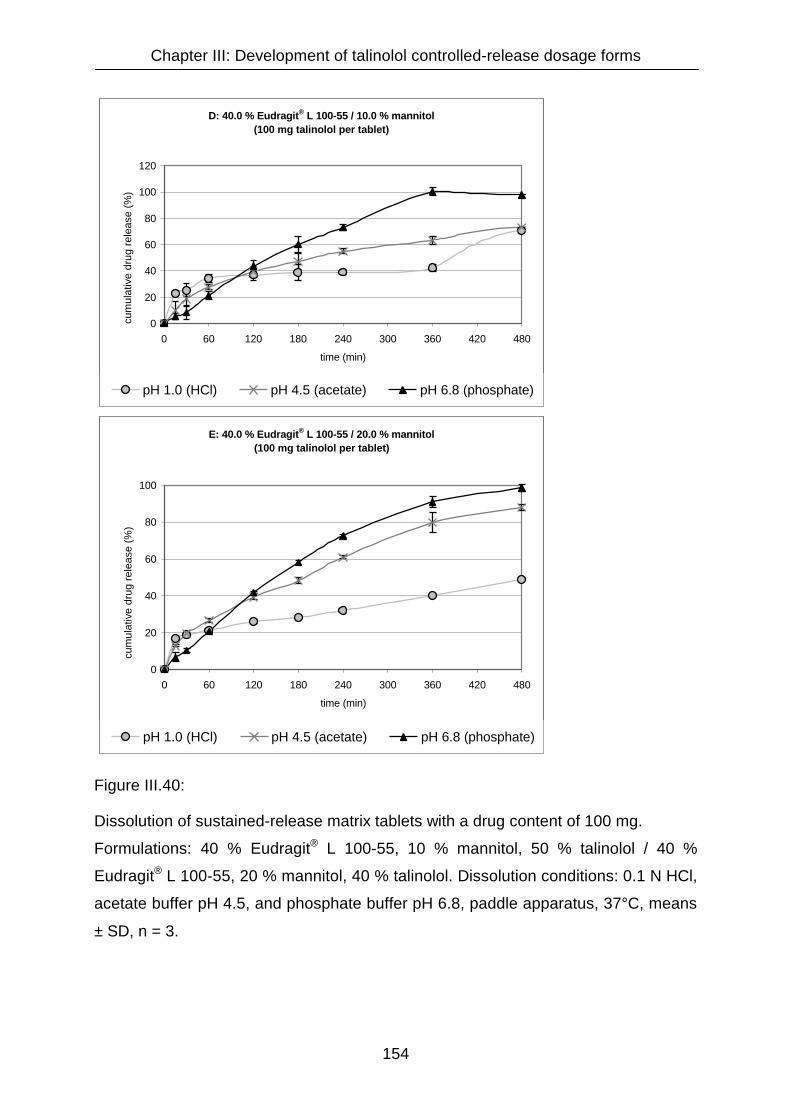
Chapter III: Development of talinolol controlled-release dosage forms
154
D: 40.0 % Eudragit® L 100-55 / 10.0 % mannitol(100 mg talinolol per tablet)
0
20
40
60
80
100
120
0 60 120 180 240 300 360 420 480
time (min)
cum
ulat
ive
drug
rele
ase
(%))
pH 1.0 (HCl) pH 4.5 (acetate) pH 6.8 (phosphate)
E: 40.0 % Eudragit® L 100-55 / 20.0 % mannitol(100 mg talinolol per tablet)
0
20
40
60
80
100
0 60 120 180 240 300 360 420 480
time (min)
cum
ulat
ive
drug
rele
ase
(%))
pH 1.0 (HCl) pH 4.5 (acetate) pH 6.8 (phosphate)
Figure III.40:
Dissolution of sustained-release matrix tablets with a drug content of 100 mg.
Formulations: 40 % Eudragit® L 100-55, 10 % mannitol, 50 % talinolol / 40 %
Eudragit® L 100-55, 20 % mannitol, 40 % talinolol. Dissolution conditions: 0.1 N HCl,
acetate buffer pH 4.5, and phosphate buffer pH 6.8, paddle apparatus, 37°C, means
± SD, n = 3.
Chapter III: Development of talinolol controlled-release dosage forms
155
Formulation D with a higher content of Eudragit® and a lower mannitol fraction
compared to formulation C did not show an improved dissolution behaviour. At pH
6.8 the complete drug was released after 6 hours, whereas drug release at the lower
pH values was incomplete after 8 hours.
At pH 4.5 and pH 6.8, the dissolution profiles of formulation E with both, a higher
Eudragit® and a higher mannitol content compared to formulation C, were similar to
those of formulation C with a continuous drug release within eight hours, whereas at
pH 1.0 only approximately 50 % were dissolved after eight hours.
In spite of the incomplete dissolution in the acidic pH, formulation E is more
appropriate for an in vivo investigation than formulation C. According to Lindahl et al.
who have reported a median pH of 1.8 in the human stomach in the fasted state
[Lindahl, A., A. L. Ungell, et al. (1997)], hydrochloric acid is a relevant dissolution
medium to mimic the gastric residence time of the matrix tablet. The time the tablet
remains in the stomach can vary [Davis, S. S., J. G. Hardy, et al. (1986)]. Average
residence times for solid substances are reported to be 30 to 40 minutes in the fasted
state [Wagner, J. G. (1971)]. Therefore, in in vitro dissolution tests in 0.1 N
hydrochloric acid, the drug release rate within the initial period is decisive for the
decision on an appropriate sustained-release formulation. Due to the burst effect
described previously for formulation C with a drug release of more than 50 % within
the first hour at pH 1.0, this formulation is inappropriate. On the other hand,
dissolution of talinolol from formulation E is adequate at pH 1.0 within the first two
hours (20.9 % after one hour, 25.9 % after two hours).
After leaving the stomach, the tablet enters the upper small intestine. For jejunum,
Mahe et al. reported an average physiological pH of 5.1 under fasted conditions
[Mahe, S., J. F. Huneau, et al. (1992)], Lindahl et al. reported a relevantly higher
mean pH value of 7.1 for the same intestinal segment in the fasted state [Lindahl, A.,
A. L. Ungell, et al. (1997)]. However, both working groups suggest pH values far
beyond 1.0 for the upper small intestine. Since an appropriate drug release from the
matrix tablets of formulation E was shown at pH values of 4.5 and 6.8, their
incomplete dissolution at pH 1.0 after 8 hours in vitro is not relevant for the in vivo
situation, because the tablets do not reside at an acidic pH for long time periods.
Hence, it was decided to use formulation E (40 % Eudragit® L 100-55 and 20 %
mannitol) to manufacture 100 mg talinolol matrix tablets for the projected in vivo
study in humans. More detailed information about this clinical study investigating the

Chapter III: Development of talinolol controlled-release dosage forms
156
influence of a decelerated drug release rate from the sustained-release matrix tablet
on the P-glycoprotein mediated secretion in the gastrointestinal tract is given in
Annex II.
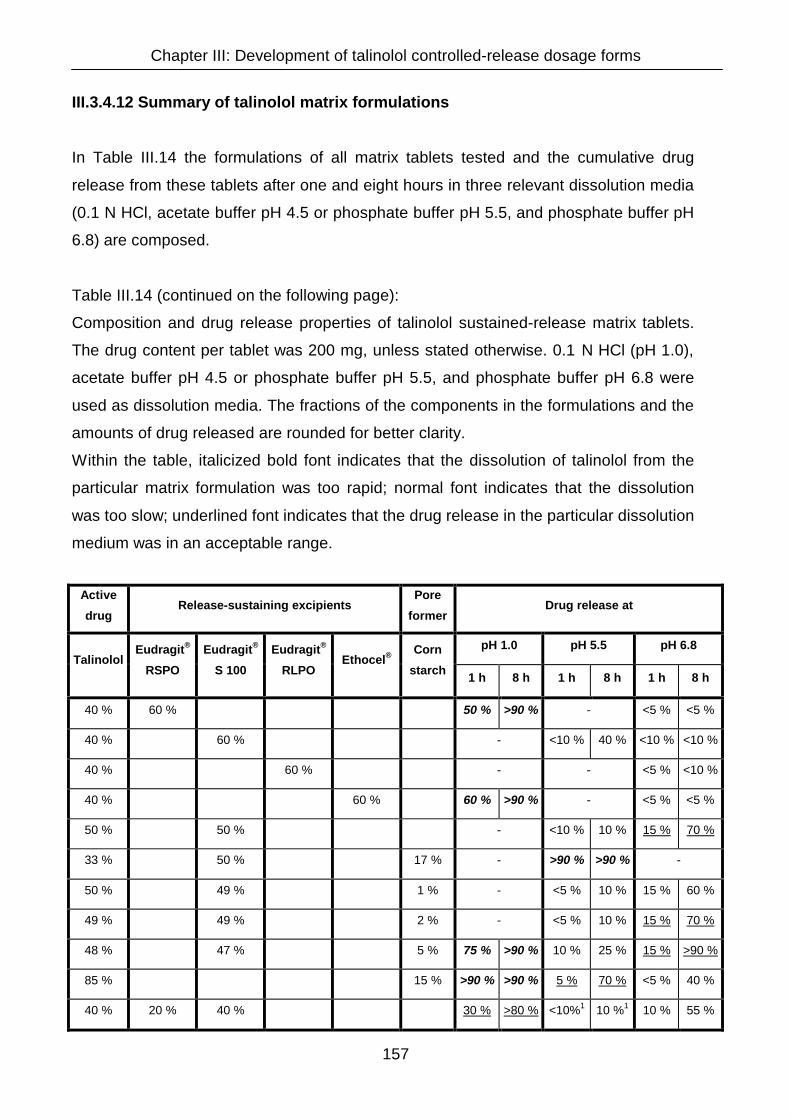
Chapter III: Development of talinolol controlled-release dosage forms
157
III.3.4.12 Summary of talinolol matrix formulations
In Table III.14 the formulations of all matrix tablets tested and the cumulative drug
release from these tablets after one and eight hours in three relevant dissolution media
(0.1 N HCl, acetate buffer pH 4.5 or phosphate buffer pH 5.5, and phosphate buffer pH
6.8) are composed.
Table III.14 (continued on the following page):
Composition and drug release properties of talinolol sustained-release matrix tablets.
The drug content per tablet was 200 mg, unless stated otherwise. 0.1 N HCl (pH 1.0),
acetate buffer pH 4.5 or phosphate buffer pH 5.5, and phosphate buffer pH 6.8 were
used as dissolution media. The fractions of the components in the formulations and the
amounts of drug released are rounded for better clarity.
Within the table, italicized bold font indicates that the dissolution of talinolol from the
particular matrix formulation was too rapid; normal font indicates that the dissolution
was too slow; underlined font indicates that the drug release in the particular dissolution
medium was in an acceptable range.
Active
drug Release-sustaining excipients
Pore
former Drug release at
pH 1.0 pH 5.5 pH 6.8 Talinolol
Eudragit®
RSPO
Eudragit®
S 100
Eudragit®
RLPO Ethocel®
Corn
starch 1 h 8 h 1 h 8 h 1 h 8 h
40 % 60 % 50 % >90 % - <5 % <5 %
40 % 60 % - <10 % 40 % <10 % <10 %
40 % 60 % - - <5 % <10 %
40 % 60 % 60 % >90 % - <5 % <5 %
50 % 50 % - <10 % 10 % 15 % 70 %
33 % 50 % 17 % - >90 % >90 % -
50 % 49 % 1 % - <5 % 10 % 15 % 60 %
49 % 49 % 2 % - <5 % 10 % 15 % 70 %
48 % 47 % 5 % 75 % >90 % 10 % 25 % 15 % >90 %
85 % 15 % >90 % >90 % 5 % 70 % <5 % 40 %
40 % 20 % 40 % 30 % >80 % <10%1 10 %1 10 % 55 %

Chapter III: Development of talinolol controlled-release dosage forms
158
1 drug release tested at pH 4.5. 2 100 mg talinolol content per tablet. 3 cp. discussion on the relevance of an incomplete drug release in 0.1 N HCl.
Active
drug
Rel. sust.
excip. Pore formers Drug release at
pH 1.0 pH 4.5 pH 6.8 Talinolol
Eudragit®
L 100-55
Corn
starch
PEG
4000 Glucose Mannitol
1 h 8 h 1 h 8 h 1 h 8 h
60 % 40 % 30 % >90 % 20 % 45 % <5 % 10 %
67 % 33 % <10 % 10 % 10 % 20 % <5 % 10 %
33 % 50 % 17 % 10 % 25 % 15 % 25 % 10 % 35 %
45 % 45 % 10 % 20 % 40 % 20 % 45 % 10 % 55 %
39 % 59 % 2 % <10 % 10 % 10 % 30 % <5 % 15 %
45 % 45 % 10 % 15 % 20 % 25 % 50 % 10 % 50 %
34 % 54 % 11 % - 15 % 20 % <10 % 45 %
50 % 38 % 12 % 20 % >80 % 20 % 50 % 10 % 65 %
40 % 40 % 20 % - 20 % 55 % 10 % 40 %
63 % 30 % 7 % >90 % >90 % 35 % >80 % 10 % 40 %
45 % 45 % 10 % 15 % 20 % 15 % 40 % 15 % 60 %
50 % 35 % 15 % 30 % >90 % 20 % 50 % 20 % >90 %
63 %2 30 %2 7 %2 >90 % >90 % 50 % >90 % <10 % 60 %
50 %2 40 %2 10 %2 35 % 70 % 25 % 70 % 20 % >90 %
45 %2 45 %2 10 %2 30 % 55 % 25 % 70 % -
50 %2 35 %2 15 %2 50 % >80 % 30 % 80 % 20 % >90 %
40 %2 40 %2 20 %2 20 % 50 %3 25 % >80 % 20 % >90 %

Chapter III: Development of talinolol controlled-release dosage forms
159
III.3.4.13 Pharmaceutical characterization of 100 mg talinolol sustained-release
tablets formulated with 40 % Eudragit® L 100-55 and 20 % mannitol
Apart from drug release tests, the tablet formulation selected for an in vivo evaluation
(Formulation E, form. no. 020623B) was characterized in terms of tablet thickness,
uniformity of mass, crushing strength and friability.
III.3.4.13.1 Tablet thickness
The average thickness of the tablets was 1.29 mm. Table III.15 presents the results
of the single measurements.
Table III.15:
Thickness of ten randomly selected 100 mg sustained-release tablets (40 % talinolol,
40 % Eudragit® L 100-55, 20 % mannitol).
Thickness
1.30 mm
1.30 mm
Mean:
1.29 mm
1.15 mm
1.28 mm
Standard deviation (S.D.):
0.077 mm
1.40 mm
1.34 mm
Highest value measured:
1.40 mm
1.27 mm
1.30 mm
Lowest value measured:
1.15 mm
1.19 mm
1.38 mm
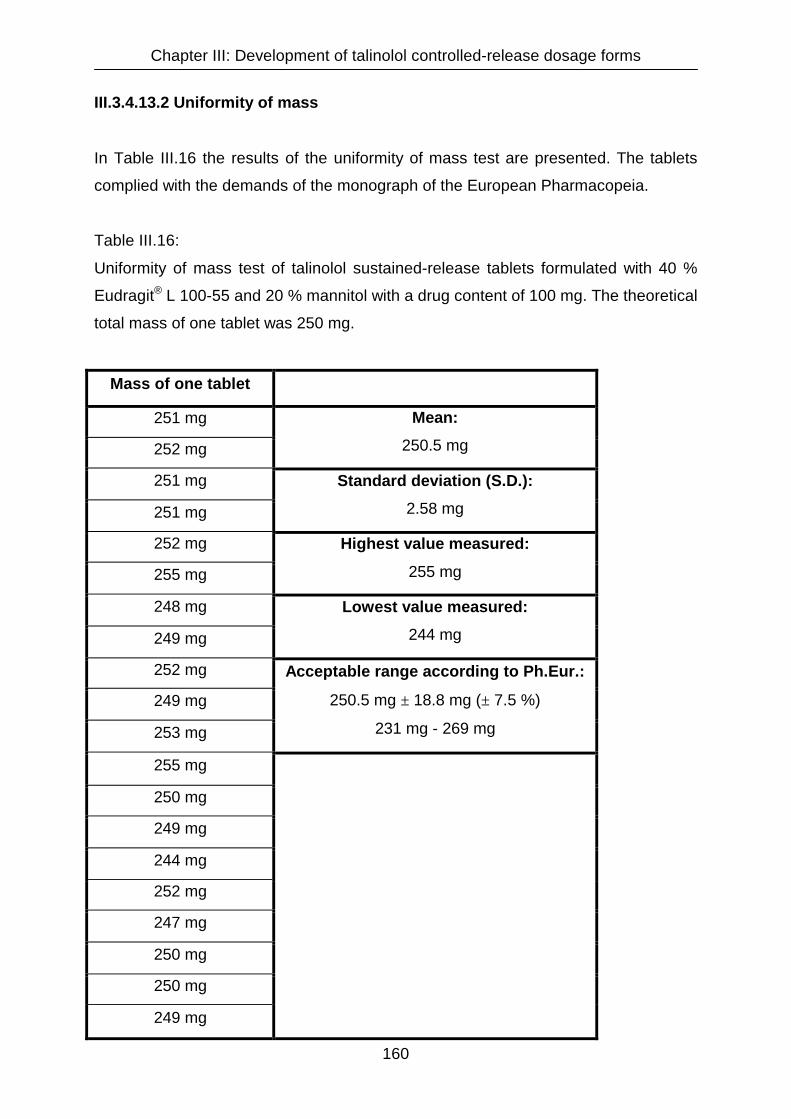
Chapter III: Development of talinolol controlled-release dosage forms
160
III.3.4.13.2 Uniformity of mass
In Table III.16 the results of the uniformity of mass test are presented. The tablets
complied with the demands of the monograph of the European Pharmacopeia.
Table III.16:
Uniformity of mass test of talinolol sustained-release tablets formulated with 40 %
Eudragit® L 100-55 and 20 % mannitol with a drug content of 100 mg. The theoretical
total mass of one tablet was 250 mg.
Mass of one tablet
251 mg
252 mg
Mean:
250.5 mg
251 mg
251 mg
Standard deviation (S.D.):
2.58 mg
252 mg
255 mg
Highest value measured:
255 mg
248 mg
249 mg
Lowest value measured:
244 mg
252 mg
249 mg
253 mg
Acceptable range according to Ph.Eur.:
250.5 mg ± 18.8 mg (± 7.5 %)
231 mg - 269 mg
255 mg
250 mg
249 mg
244 mg
252 mg
247 mg
250 mg
250 mg
249 mg

Chapter III: Development of talinolol controlled-release dosage forms
161
III.3.4.13.3 Crushing strength
The results of the measurements of the crushing strength are presented in Table
III.17.
Table III.17:
Crushing strength of 100 mg talinolol sustained-release tablets formulated with 40 %
Eudragit® L 100-55 and 20 % mannitol. The values given represent the force at which
the tablets crushed.
Crushing strength
106 N
86 N
Mean:
96 N
93 N
94 N
Standard deviation (S.D.):
12.1 N
78 N
78 N
Highest value measured:
118 N
118 N
91 N
Lowest value measured:
78 N
104 N
96 N
101 N
108 N
The crushing strength of the tablets was sufficient for the projected purpose. All
tablets measured resisted at least a force of 78 N before crushing. Crushing strength
reported for tablets in literature vary to a large extent. This is in part due to the
different instruments used for the measurement of the crushing strength. Additionally
the crushing strendth is strongly influenced by the composition of the particular
tablets and the compression force applied during their manufacturing process.
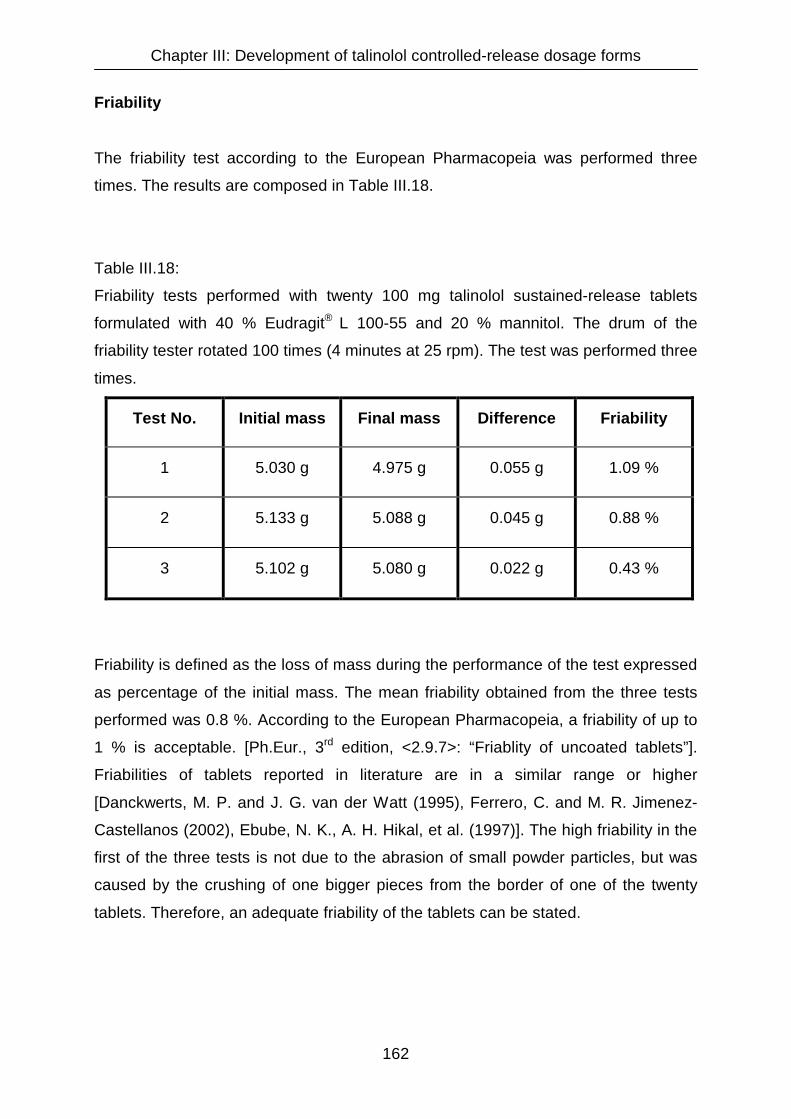
Chapter III: Development of talinolol controlled-release dosage forms
162
Friability
The friability test according to the European Pharmacopeia was performed three
times. The results are composed in Table III.18.
Table III.18:
Friability tests performed with twenty 100 mg talinolol sustained-release tablets
formulated with 40 % Eudragit® L 100-55 and 20 % mannitol. The drum of the
friability tester rotated 100 times (4 minutes at 25 rpm). The test was performed three
times.
Test No. Initial mass Final mass Difference Friability
1 5.030 g 4.975 g 0.055 g 1.09 %
2 5.133 g 5.088 g 0.045 g 0.88 %
3 5.102 g 5.080 g 0.022 g 0.43 %
Friability is defined as the loss of mass during the performance of the test expressed
as percentage of the initial mass. The mean friability obtained from the three tests
performed was 0.8 %. According to the European Pharmacopeia, a friability of up to
1 % is acceptable. [Ph.Eur., 3rd edition, <2.9.7>: “Friablity of uncoated tablets”].
Friabilities of tablets reported in literature are in a similar range or higher
[Danckwerts, M. P. and J. G. van der Watt (1995), Ferrero, C. and M. R. Jimenez-
Castellanos (2002), Ebube, N. K., A. H. Hikal, et al. (1997)]. The high friability in the
first of the three tests is not due to the abrasion of small powder particles, but was
caused by the crushing of one bigger pieces from the border of one of the twenty
tablets. Therefore, an adequate friability of the tablets can be stated.

Chapter III: Development of talinolol controlled-release dosage forms
163
III.3.4.14 Final discussion on matrix tablets
Among different approaches for oral sustained-release dosage forms for commercial
marketing, matrix tablets have been gaining increasing attention because of the
simple and low-cost manufacturing process [Ferrero, C. and M. R. Jimenez-
Castellanos (2002)]. Colombo et al. reported in the year 2000 that the majority of all
oral drug delivery systems were matrix-based [Colombo, P., R. Bettini, et al. (2000)].
In the developmental phase of a talinolol sustained-release dosage form, apparent
advantages of matrix tablets, when compared to granule formulations tested, were a
constant within-lot and lot-to-lot homogeneity as well as a good mass and content
uniformity. The manufacturing process was easy to handle and compliance with GMP
standards was achieveable.
Embedding a drug within an insoluble matrix is a convenient way of controlling the
drug release. In such a system, drug release is preceded by the penetration of the
dissolution medium into the porous matrix to dissolve the drug, followed by diffusion
of the dissolved molecules out of the matrix. Drug molecules located on the surface
of the matrix will be dissolved first. Upon exhaustion of the surface, the drug depleted
zone will increase progressively as the solid drug front recedes into the matrix
[Azarmi, S., J. Farid, et al. (2002)], as illustrated in Figure III.41.
Drug depleted zone Water molecule
Drug containing zone Drug molecule
Figure III.41:
Drug release from a non-eroding matrix tablet. The left tablet represents the
beginning diffusion from the matrix. In the right tablet the drug depleted zone has
increased notably. The black arrows indicate the increase of the diffusion distance for
water and drug molecules [Modified from Pather, S. I., I. Russell, et al. (1998)].
Chapter III: Development of talinolol controlled-release dosage forms
164
Due to the elongated diffusion distances for the penetration of water and drug
molecules throughout the matrix, drug release from the tablet becomes progressively
slower with time. In 1963 Higuchi published a theoretical analysis of the dissolution of
drugs from matrices [Higuchi, T. (1963)]. He found a linear relationship between the
cumulative drug release from matrix tablets (Q) and the square root of time (t ½):
Q = K • t ½ [1]
In this equation the slope K is the dissolution rate constant. The Higuchi relationship
is applicable in praxis as long as drug release from the dosage form is strictly driven
by Fickian diffusion. When disintegration, erosion or swelling occur, deviations from
the relationship can be observed. In this context, erosion means the slow removal of
particles from the surface of a tablet. The process is similar to disintegration, except
that erosion is slow and occurs only at surfacial layers of the tablet [Pather, S. I., I.
Russell, et al. (1998)].
Another deviation from the theoretical considerations of Higuchi observed in practical
dissolution tests with matrix formulations is that the Higuchi equation assumes a
y-intercept of zero in drug release versus root of time profiles, whereas the immediate
dissolution of drug molecules located at the surface of a matrix can result in non-zero
y-intercepts [Katikaneni, P. R., S. M. Upadrashta, et al. (1995)].
Figure III.42 presents a Higuchi plot (Cumulative drug release versus square root of
time profile) of the talinolol matrix tablet formulation selected for the application in a
human in vivo study.

Chapter III: Development of talinolol controlled-release dosage forms
165
Figure III.42:
Cumulative drug release versus square root of time profile derived from dissolution
studies with 100 mg talinolol sustained-release matrix tablets. The lines show the
best fits obtained by linear regression analysis.
Formulation: 40 % Eudragit® L 100-55, 20 % mannitol, 40 % talinolol. Dissolution
conditions: 0.1 N HCl, acetate buffer pH 4.5, and phosphate buffer pH 6.8, paddle
apparatus, 37°C, means, n = 3, standard deviations were omitted to maintain clarity.
The Higuchi plots indicate that the dissolution rates are similar in acetate buffer pH
4.5 and phosphate buffer pH 6.8. The calculated dissolution rate constants (K) were
in a similar range (4.1 and 5.1, rerspectively). The apparently lower dissolution rate
constant of merely 1.9 in 0.1 N HCl is an expression of the slower dissolution in this
medium. However, on the basis of drug release data from 0 to 60 min only (i.e. t1/2 =
0 - 7.7 min½), a higher dissolution rate constant of 3.1 is obtained. These findings
reemphasize that in the initial dissolution period, which is of particular relevance for
the in vivo situation, adequate dissolution of talinolol occurs in 0.1 N HCl.
A linear regression analysis of the drug release data can be used as indicator for the
release mechanism from the matrix. If the drug is released from the matrix by Fickian
Higuchi Plots
0 10 20 300
20
40
60
80
100
pH 1.0 pH 4.5 pH 6.8
square root of time (min1/2)
Cum
ulat
ive
drug
rel
ease
(%)

Chapter III: Development of talinolol controlled-release dosage forms
166
diffusion alone, the relationship between square root of time and cumulative drug
release is linear [Higuchi, T. (1963)]. The involvement of other release mechanisms
apart from diffusion results in non-linear Higuchi plots. For the drug release profiles of
the talinolol test formulation dedicated for an in vivo evaluation the goodness of fit to
the Higuchi equation varied dependent on the pH of the dissolution test medium. For
pH 4.5 and 6.8 coefficients of determination (R2) of 0.9919 and 0.9743 indicate a
good fit to the Higuchi equation, wheras at pH 1.0 the fit was not that good (R2 =
0.9522). The explanation for this is that an initial phase with a relatively high drug
release rate is followed by a phase in which the decrease of the release rate is more
pronounced than proposed by the theoretical considerations of Higuchi.
When factors apart from diffusion contribute to the drug release from a matrix, the
model described by Ritger an Peppas [Ritger, P. L. and N. A. Peppas (1984)] is in
many cases more appropriate for fitting dissolution data than the Higuchi model:
Mt / Mi = K • tn [2]
In this equation Mt and Mi are the amounts of drug released at time t and infinity, K is
the release rate constant and n is the diffusional exponent. This exponent n is
characteristic for the mechanism of the drug release. With an n value of 0.5, this
equation is equal to the square root model described by Higuchi, which means that
drug release from the matrix is driven by Fickian diffusion. For n > 0.5, an anomalous
non-Fickian drug diffusion occurs, that can be due to swelling of the matrix. For n = 1,
non-Fickian, case II, erosion-controlled or zero-order release kinetics can be
observed [Majid Khan, G. and J.-B. Zhu (1999), Colombo, P., R. Bettini, et al.
(2000)].
To describe the release kinetics from the sustained-release talinolol matrix tablet
developed, the dissolution data was fitted to the equation of Ritgers and Peppas. The
results are presented graphically and numerically in Figure III.43 and Table III.15.

Chapter III: Development of talinolol controlled-release dosage forms
167
0 60 120 180 240 300 360 420 4800
50
100
150
pH 1.0 pH 4.5 pH 6.8
time (min)
Cum
ulat
ive
drug
rel
ease
(%)
Figure III.43:
Talinolol release from sustained-release matrix tablets. The lines illustrate the best fit
to the model of Ritgers and Peppas [Ritger, P. L. and N. A. Peppas (1984)]. Mi, i.e.
the amount of drug released at infinity, is assumed to be 100 %.
Formulation: 40 % Eudragit® L 100-55, 20 % mannitol, 40 % talinolol. Dissolution
conditions: 0.1 N HCl, acetate buffer pH 4.5, and phosphate buffer pH 6.8, paddle
apparatus, 37°C, means, n = 3, error bars were omitted for the sake of clarity.

Chapter III: Development of talinolol controlled-release dosage forms
168
Table III.19:
Model parameters for the drug release characteristics from talinolol sustained-release
matrix tablets. Dissolution data was fitted to the model published by Ritger and
Peppas [Ritger, P. L. and N. A. Peppas (1984)]. K is the release rate constant, n is
the diffusional exponent, which is characteristic for the mechanism of the drug
release. Mi, i.e. the amount of drug released at infinity, is assumed to be 100 %.
Formulation: 40 % Eudragit® L 100-55, 20 % mannitol, 40 % talinolol. Dissolution
conditions: 0.1 N HCl, acetate buffer pH 4.5, and phosphate buffer pH 6.8, paddle
apparatus, 37°C, means ± SD, n = 3.
Dissolution medium Parameter Best-fit
value (± S.D.) R2
K 0.052 (± 0.01) pH 1.0
n 0.35 (± 0.04) 0.9639
K 0.025 (± 0.003) pH 4.5
n 0.56 (± 0.02) 0.9960
K 0.016 (± 0.005) pH 6.8
n 0.68 (± 0.06) 0.9827
The estimated values for the diffusional exponent n vary in media with different pH
values. This is in accordance with observations of other working groups, that also
found altered values for n at different pH values [Rao, V. M., K. Engh, et al. (2003)].
These differences can be explained by the altered solubility of the drug that also can
alter the release mechanism from matrix formulations [Tahara, K., K. Yamamoto, et
al. (1996)]. At pH 4.5 the estimated parameter n is close to 0.5, which means that the
drug release from the matrix is predominantly controlled by diffusion and follows the
release kinetics described by Higuchi. This assumption is in accordance with the
results of the linear regressions presented in Figure III.42, where the best coefficient
of determination was found for the fit of the dissolution data at pH 4.5 (R2 = 0.9919).
At a pH value of 6.8, the parameter n increases to 0.68. This increase can be due to
two different changes in the release mechanism: Tahara et al. reported, that a
Chapter III: Development of talinolol controlled-release dosage forms
169
decreased solubility, as observed for talinolol at this pH value, can lead to an erosion-
controlled release mechanism [Tahara, K., K. Yamamoto, et al. (1996)]. A second
explanation for the increased value of n at pH 6.8 can be a shift from diffusion-
controlled towards swelling-controlled drug release [Majid Khan, G. and J.-B. Zhu
(1999)]. Since Eudragit L 100-55 as release-sustaining excipient, swells at pH values
of 5.5 and above, swelling controlled release kinetics can be assumed. This
assumption is supported by the fact that 0.68 as estimated value for n is not close to
1.0, the value suggested for formulations with an erosion-controlled drug release
[Colombo, P., R. Bettini, et al. (2000)]. The low value calculated for n at pH 1.0 can
be explained by the slow drug release in the time window between two and eight
hours. The higher dissolution rate in the initial phase is assumed to be due to the
dissolution of talinolol from superficial layers of the matrix tablet [Pather, S. I., I.
Russell, et al. (1998)]. In the following period, medium infiltration into the matrix and
drug diffusion through the matrix are hindered by the polymer that is insoluble at that
pH. This results in the pronounced decrease of the drug release rate in 0.1 N HCl.
III.4 Conclusions
The production of directly compressible matrix tablets was evaluated as an
appropriate method to sustain the drug release of talinolol. The solubility of talinolol is
strongly dependent on the pH value, which results in pronounced alterations of the
dissolution of talinolol in media of different pH values. A sustained-release matrix
tablet formulation with a talinolol content of 100 mg was developed. The drug release
rate from these tablets can be assumed to be similar during the passage of the
gastrointestinal tract, in spite of differing pH values. The matrix tablets formulated
with 40 % talinolol, 40 % Eudragit® L 100-55 as release-sustaining polymer and 20 %
mannitol as hydrophilic pore former showed a consistent drug release of more than
80 % within eight hours in acetate buffer of pH 4.5 and phosphate buffer of pH 6.8. At
pH 1.0, the drug release within the initial two hours, which are relevant for the in vivo
situation, was 26 %.

Chapter III: Development of talinolol controlled-release dosage forms
170
The technological characterization of the newly developed matrix tablets in terms of
uniformity of mass, crushing strength, and friability demonstrated adequate
properties.
The mechanisms of drug release from the matrix tablets were investigated by fitting
the dissolution data to the models described for matrix systems by Higuchi and Ritger
and Peppas. It was detected that the mechanism of drug release was pH-dependent.
At pH 1.0 free dissolution was hindered by Eudragit ® L 100-55 which is insoluble at
that pH value. At pH 4.5, the drug release was predominated by Fickian diffusion
through the matrix and at a pH value of 6.8, talinolol dissolution was influenced by
the swelling of the release-sustaining polymer (Eudragit® L 100-55), resulting in
deviations from the linear Higuchi relationship.
Chapter IV: Considerations on in vitro dissolution test methods
171
Chapter IV
Chapter IV: Considerations on in vitro dissolution test methods
172
Chapter IV
Considerations on in vitro dissolution test methods
IV.1 Introduction
In dissolution tests performed during the development of talinolol sustained-release dosage
forms described in chapter III a pronounced influence of different dissolution media on
talinolol solubility and dissolution was detected. These observations gave reason for further
examinations on this topic.
In addition to the incomplete and variable bioavailability of talinolol (Trausch et al. reported
an absolute bioavailability of 55 %, with a 95 % confidence interval ranging from 36 to 69 %
after administration of 50 mg talinolol in an immediate release formulation in the fasted
state [Trausch, B., R. Oertel, et al. (1995)]), plasma concentration time curves frequently
display ”double peak phenomena” rather than one single Cmax value, indicating
discontinuities in drug absorption profiles [Wetterich, U., H. Spahn-Langguth, et al. (1996)].
Food diminishes the bioavailability of talinolol even further. The AUC values in the fed state
decrease to 43.5 % [Terhaag, B., H. Sahre, et al. (1991)] and 21.8 % [Giessmann, T., M.
Zschiesche, et al. (2001)] of the AUC values in the fasted state, respectively.
Biotransformation does not contribute to the peculiarities of the drug input process, since it
is lower than 1 % for talinolol [Oertel, R., K. Richter, et al. (1994), Oertel, R. and K. Richter
(1995)]. As described in chapter I, one reason is that talinolol is substrate to the efflux pump
P-glycoprotein (P-gp) in the intestine [Gramatté, T., R. Oertel, et al. (1996), Wagner, D., H.
Spahn-Langguth, et al. (2001)]. As such, the drug molecules are secreted back into the
intestinal lumen before reaching the basolateral membrane of the enterocytes and hence
the blood circulation [Suzuki, H. and Y. Sugiyama (2000), Preiss, R. (1998), Hunter, J., B.
H. Hirst, et al. (1993)]. Furthermore, intestinal secretion is to a smaller extent a clearance
pathway for talinolol from the systemic circulation [Wetterich, U., H. Spahn-Langguth, et al.
(1996)]. Since it is discussed that the expression of carriers varies between individuals and
between different regions of the gastrointestinal tract [Wagner, D., H. Spahn-Langguth, et
al. (2001), Ungell, A. L., S. Nylander, et al. (1998), Fagerholm, U., A. Lindahl, et al. (1997)],
the variable bioavailability of talinolol is explainable.
Chapter IV: Considerations on in vitro dissolution test methods
173
Physicochemical matters as a source of variability in the absorption of talinolol have not
been addressed thus far. In particular, solubility and dissolution issues have not been
reported. For the weak base talinolol (pKa 9.4) the solubility is high in acidic media, but
quite poor at pH values above four. Thus it can be assumed, that the drug, when
administered as immediate-release dosage form, will dissolve completely in the stomach
but may precipitate again when entering the intestine. Since the intestinal pH values are
subject to considerable inter- and intraindividual fluctuations in particular after ingestion of a
meal [Dressman, J. B., G. L. Amidon, et al. (1998)], the rate and extent of dissolution can
also be expected to fluctuate, resulting in diminished bioavailabilities with high variabilities.
This chapter deals with the aqueous solubility of talinolol and its in vitro dissolution
behaviour. Results are discussed with respect to an in vivo relevance of the in vitro data.
The dissolution of talinolol immediate and controlled-release tablets was tested in several
media, such as 0.1 N HCl, acetate buffers pH 4.5 and 6.0, phosphate buffers pH 3.2, 5.5,
6.0, 6.8, citrate buffer pH 6.8, TRIS buffer pH 6.8 and buffers supplemented with sodium
dodecylsulfate, cholic acid, Tween 80, Cremophor RH 40 or cetylpyridinium chloride as
surfactants. By adding 0.4 to 1.25 % sodium chloride to the dissolution medium a salt effect
was investigated.
It was found that pH, ionic strength and surface tension of the dissolution medium had a
pronounced influence on its dissolution profiles. However, there were conspicuities that
could not be explained by these parameters alone: The dissolution profiles differed
completely when the type of the buffer was changed although the other parameters were
kept constant.
The underlying mechanism was detected in the formation of different talinolol crystal
structures when different buffers were used. It was attempted to characterize the
modifications with the aid of light microscopy, fourier transform infrared spectroscopy (FT-
IR), differential scanning calorimetry (DSC) and x-ray powder diffraction (XRPD).
In addition, solubility tests were performed to demonstrate differences in the
physicochemical properties of the talinolol crystal forms investigated.
Chapter IV: Considerations on in vitro dissolution test methods
174
IV.2 Materials and methods
IV.2.1 Chemicals and other materials
Talinolol pure substance and Cordanum tablets containing 100 mg talinolol were generous
gifts from AWD Pharma, Dresden, Germany. Eudragit® polymers were received in powder
form as samples from Roehm (Darmstadt, Germany). The buffer salts and other chemicals
were purchased from Merck (Darmstadt, Germany), Grüssing (Filsum, Germany) and Caelo
(Hilden, Germany) and had at least p.a. or Ph.Eur. quality.
IV.2.2 Solubility studies
200 mg talinolol were weighed in 30 ml glass containers each with screw caps, and,
depending on the expected solubility, 10 to 20 ml of the test solvent were added. The
samples were shaken vigorously by hand and then by a thermostatically controlled shaker
(GFL 3032, Ges. für Labortechnik, Burgwedel, Germany) with 185 rpm at a temperature of
37°C for 30 h until an equilibrium was reached. The samples were filtered through a
0.45µm filter, diluted approximately with the particular test solvent so that the absorbance
was in the range between 0.2 and 0.8 and analysed with a UV-Vis Spectrophotometer
Perkin Elmer Lamda 20 (Perkin Elmer GmbH, Überlingen, Germany). When buffers were
used as solvents the final pH values were measured after saturation with talinolol. Since the
buffer capacities were in most cases exceeded by the high concentrations of the basic
talinolol, the measured pH values were in most cases higher than the initial buffer pH
values. Comparisons between the solubilities in different buffers were performed formulated
with the final pH values. Adjustment of ionic strengths was performed by diluting the
solutions showing the higher ionic strengths with demineralised water. The common
method to achieve higher ionic strengths by adding sodium chloride was desisted since it
was found that an addition of sodium chloride by itself influenced the solubility.

Chapter IV: Considerations on in vitro dissolution test methods
175
IV.2.3 Preparation of controlled-release dosage forms
The drug release was controlled by addition of Eudragit® S 100, a 1:2 methacrylic acid -
methyl methacrylate copolymer, and Eudragit® RS PO, an ethyl acrylate - methyl
methacrylate - trimethyl ammonioethyl methacrylate chlorid copolymer, both in powder form
suitable for direct compression (cp. Chapter V). The mixtures were vigorously ground with
the drug substance talinolol. Then controlled-release matrix tablets containing 100 or 200
mg of talinolol were compressed on a PW 20 GS tablet press (Paul Weber, Remshalden-
Grumbach, Germany) in a 13 mm die with a compression force of 40 kN.
IV.2.4 Dissolution studies
The dissolution of talinolol tablets was tested on a Pharma Test PTWS III (Pharma Test
Apparatebau, Hainburg, Germany) and an Erweka DT7R (Erweka GmbH, Heusenstamm,
Germany) dissolution tester complying with USP standards (Apparatus II, paddles) and
equipped with Hanson Research Dissoette II automatic samplers. The water bath
temperature was 37° ± 0.5° C, rotational speed 50 min–1, volume of dissolution media 1000
ml. The final pH values in the dissolution vessels after 24 hours were measured in order to
detect an overload of the buffer capacities. Contrary to the solubility studies, changes in the
pH of the buffer after the tests were not detected on any occasion, due to the fact that the
talinolol concentrations reached in these studies were much lower than in the solubility
studies.
The amount of drug released after specific times was analysed by means of UV
spectroscopy with a Lamda 20 UV-VIS Spectrophotometer (Perkin Elmer, Überlingen,
Germany) at a wavelength of 240 nm.

Chapter IV: Considerations on in vitro dissolution test methods
176
IV.2.5 Preparation of talinolol crystal forms
1.3 g of talinolol was mixed with 50 ml of the different dissolution media (water and
miscellaneous buffer solutions) in 100 ml tubes with screw caps. The suspensions were
shaken at 37°C in a thermostatically controlled shaker (GFL 3032, Ges. für Labortechnik,
Burgwedel, Germany). Thereafter the samples were centrifuged at 5000 min-1 for 5 minutes
and the supernatant was removed. The powders were dried in an oven (B28, BTW Binder,
Tuttlingen, Germany) for 72 hours at 40°C. Then these samples were observed under a
light-microscope and analysed by FT-IR, DSC and XRPD.
IV.2.6 Light microscopy
The crystal structures of the different talinolol salts and modifications were observed under
a Hund Wilovert S (Hund, Wetzlar, Germany) light microscope equipped with a Kodak
Digital Science DC 120 Zoom Digital Camera. Digital photographs of the crystals were
taken with a magnification factor of 1:500.
IV.2.7 Fourier Transform Infrared Spectroscopy (FT-IR)
3 mg of each sample was vigorously ground in an agate mortar and triturated with 250 mg
of dried, finely powdered potassium bromide. Disks of 13 mm diameter were compressed
with a compression force of 30 kN. Spectra were recorded between wavenumbers of 400
and 4000 cm-1 with a Nicolet Impact 400 FT-IR Spectrometer (Nicolet, Madison, USA). To
exclude influences of impurities of pure buffer salts used for the preparation of the
dissolution media, spectra of these salts were also recorded and compared with the
different talinolol spectra.
Chapter IV: Considerations on in vitro dissolution test methods
177
IV.2.8 Differential Scanning Calorimetry (DSC)
Thermograms were measured with a differential scanning calorimeter Mettler DSC 30
connected to a TC 11 TA Processor (Mettler, Greifensee, Switzerland). The instrument was
calibrated with 6.55 mg indium in a temperature range between 20 and 600°C at a heating
rate of 10°C/min (Onset temperature: 155.8°C, peak temperature: 156.6°C). Between 1.2
and 1.8 mg of the powdered samples were exactly weighed and their thermal behaviour
was studied in sealed pans with a pinhole under nitrogen purge. Thermograms were taken
between 40 and 300°C at a heating rate of 10°C/min.
IV.2.9 X-Ray Powder Diffraction (XRPD)
X-ray powder diffractograms were recorded on a Siemens D8 x-ray diffractometer working
in the reflection mode using CuKα radiation with a wavelength of 1.54 nm. The
measurements were carried out using 40 kV voltage and 20 mA current. 1 g of the finely
ground sample powders were packed into standard sample holders and measured at room
temperature under the following conditions: start angle 3° 2θ, end angle 40° 2θ, step 0.02°
2θ, step time 5.0 s.

Chapter IV: Considerations on in vitro dissolution test methods
178
IV.3 Results
IV.3.1 Solubility in aqueous media
The general dependence of the solubility of a monobasic drug such as talinolol from the pH
of the medium is [Avdeef, A (2001)]:
s = s0 · (1+10 (pKa-pH))
with s as the solubility at a certain pH and s0 as the intrinsic solubility, i.e. the theoretical
solubility of the uncharged substance. The theoretical solubility – pH profile for talinolol
referring to this equation is shown in Figure IV.1, taking 9.4 as pKa and 200 mg/l as
solubility at pH 7.0.
0
10
1,000
100,000
10,000,000
1,000,000,000
0 2 4 6 8 10 12 14pH
solu
bilit
y (m
g/l)
(log
scal
e)
Figure IV.1:
Calculated pH - solubility profile of talinolol, a monobasic compound with a pKa of 9.4.
However, this profile could not be observed in practice as the influence of the pH was
superimposed by other factors that have a more pronounced impact on talinolol solubility.
Variation of the ionic strength of a certain buffer system, for example, led to distinct
changes which is outlined in Table IV.1:
pKa: 9.4
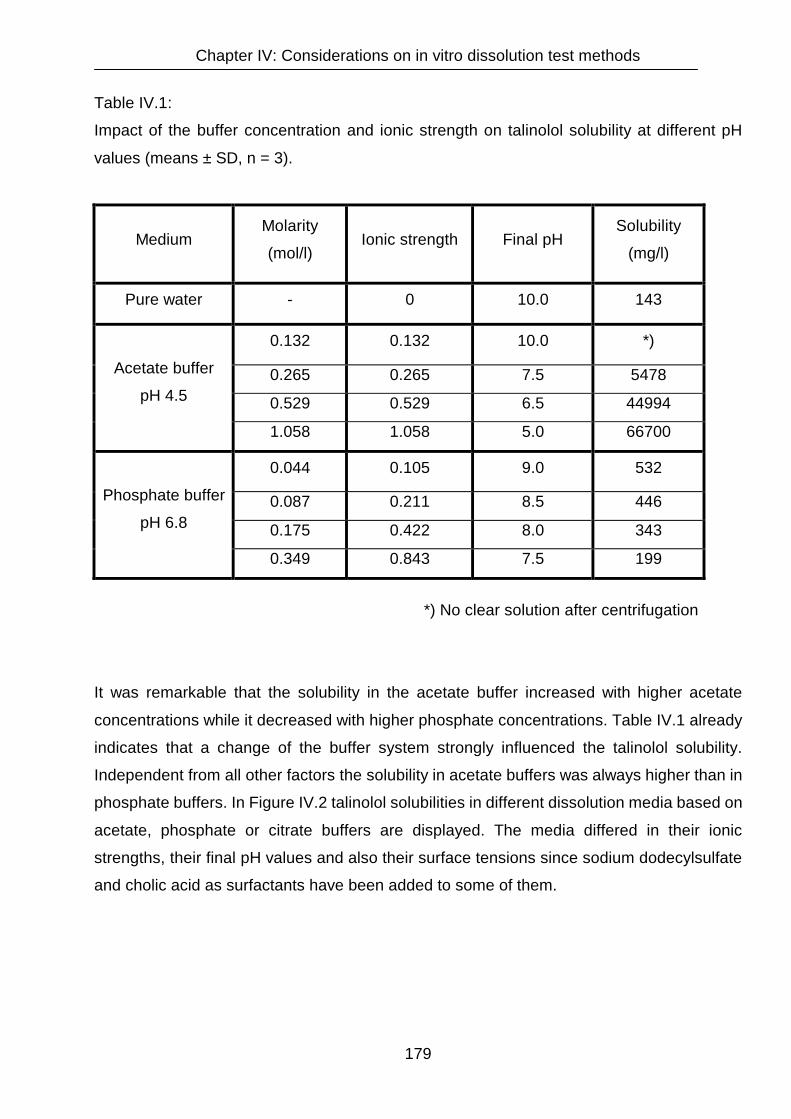
Chapter IV: Considerations on in vitro dissolution test methods
179
Table IV.1:
Impact of the buffer concentration and ionic strength on talinolol solubility at different pH
values (means ± SD, n = 3).
Medium Molarity
(mol/l) Ionic strength Final pH
Solubility
(mg/l)
Pure water - 0 10.0 143
0.132 0.132 10.0 *)
0.265 0.265 7.5 5478
0.529 0.529 6.5 44994
Acetate buffer
pH 4.5
1.058 1.058 5.0 66700
0.044 0.105 9.0 532
0.087 0.211 8.5 446
0.175 0.422 8.0 343
Phosphate buffer
pH 6.8
0.349 0.843 7.5 199
*) No clear solution after centrifugation
It was remarkable that the solubility in the acetate buffer increased with higher acetate
concentrations while it decreased with higher phosphate concentrations. Table IV.1 already
indicates that a change of the buffer system strongly influenced the talinolol solubility.
Independent from all other factors the solubility in acetate buffers was always higher than in
phosphate buffers. In Figure IV.2 talinolol solubilities in different dissolution media based on
acetate, phosphate or citrate buffers are displayed. The media differed in their ionic
strengths, their final pH values and also their surface tensions since sodium dodecylsulfate
and cholic acid as surfactants have been added to some of them.

Chapter IV: Considerations on in vitro dissolution test methods
180
1
10
100
1000
10000
100000
4 5 6 7 8 9 10pH
solu
bilit
y (m
g/l)
(log
scal
e)
calculated
pure water
acetate buffers
phosphate buffers
citrate buffer
Figure IV.2:
Solubilities of talinolol in different dissolution media based on phosphate buffers (white
diamonds), acetate buffers (grey squares), a citrate buffer (black circle) and pure water
(black triangle) (Mean values of n = 3).
The bold line indicates the theoretically calculated solubility at certain pH values without
respect to any other influencing factors. The chart shows that all the solubilities in
phosphate buffers as well as all those in acetate buffers are located within similar regions,
independent of the pH, the ionic strength and the addition of the surfactants. This
demonstrates the predominant impact of the choice of the buffer type on the solubility. For
example, talinolol solubility in a phosphate buffer at a final pH of 7.0 was about 5 times
lower than in an acetate buffer of the same pH and ionic strength. The impact of the
addition of different concentrations of sodium dodecylsulfate and cholic acid as surfactants
to the diverse buffers was not as distinct as the choice of the buffer type. Depending on the
concentration of the surfactant, the talinolol solubility did not always increase as it would be
expected. For sodium dodecylsulfate (SDS) the talinolol solubility decreased when less
than 0.75 % SDS were added, only with SDS concentrations above 1 %, i.e. about four
times higher than the critical micelle concentration (CMC) of 0.23 %, a pronounced
improvement of the solubility could be achieved, which is shown in Figure IV.3.
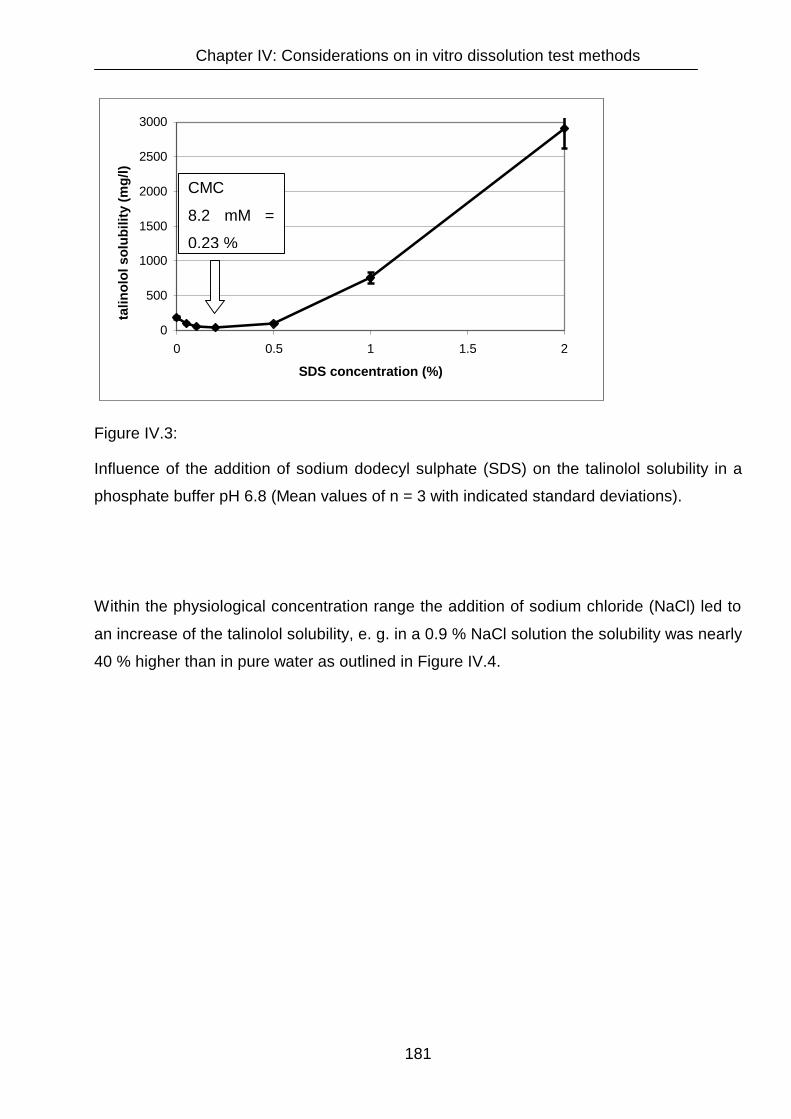
Chapter IV: Considerations on in vitro dissolution test methods
181
0
500
1000
1500
2000
2500
3000
0 0.5 1 1.5 2
SDS concentration (%)
talin
olol
sol
ubili
ty (m
g/l)
Figure IV.3:
Influence of the addition of sodium dodecyl sulphate (SDS) on the talinolol solubility in a
phosphate buffer pH 6.8 (Mean values of n = 3 with indicated standard deviations).
Within the physiological concentration range the addition of sodium chloride (NaCl) led to
an increase of the talinolol solubility, e. g. in a 0.9 % NaCl solution the solubility was nearly
40 % higher than in pure water as outlined in Figure IV.4.
CMC
8.2 mM =
0.23 %
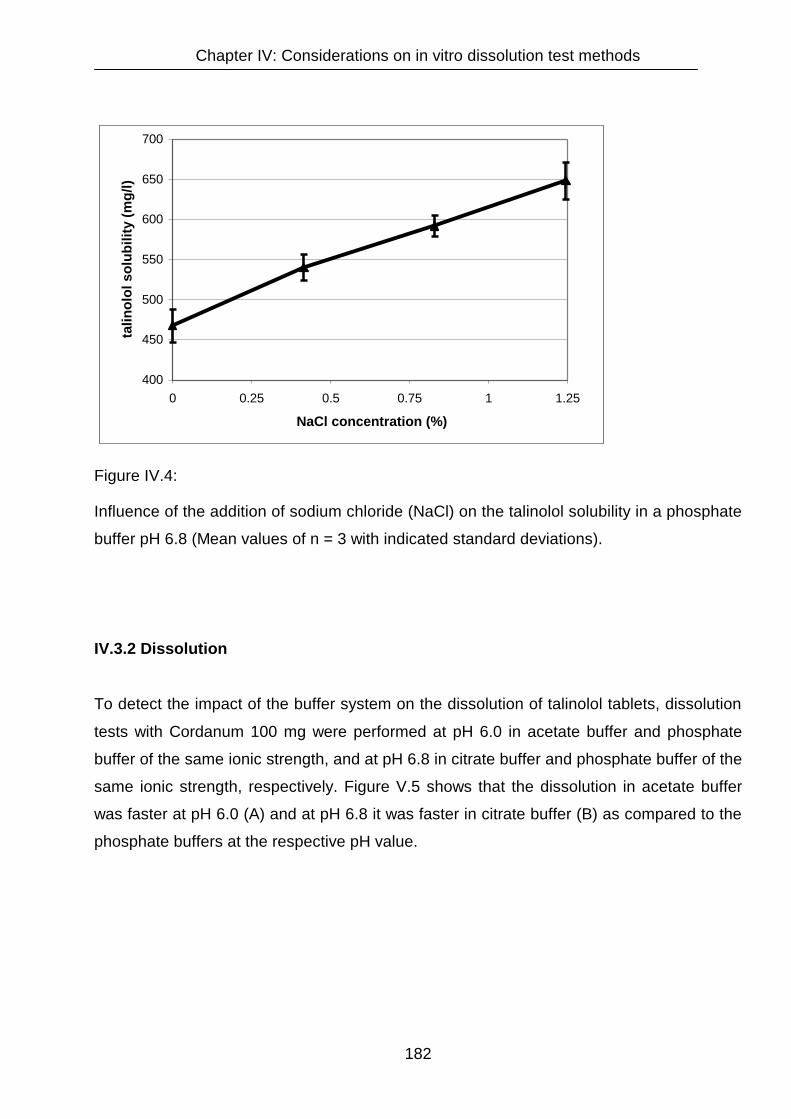
Chapter IV: Considerations on in vitro dissolution test methods
182
400
450
500
550
600
650
700
0 0.25 0.5 0.75 1 1.25
NaCl concentration (%)
talin
olol
sol
ubili
ty (m
g/l)
Figure IV.4:
Influence of the addition of sodium chloride (NaCl) on the talinolol solubility in a phosphate
buffer pH 6.8 (Mean values of n = 3 with indicated standard deviations).
IV.3.2 Dissolution
To detect the impact of the buffer system on the dissolution of talinolol tablets, dissolution
tests with Cordanum 100 mg were performed at pH 6.0 in acetate buffer and phosphate
buffer of the same ionic strength, and at pH 6.8 in citrate buffer and phosphate buffer of the
same ionic strength, respectively. Figure V.5 shows that the dissolution in acetate buffer
was faster at pH 6.0 (A) and at pH 6.8 it was faster in citrate buffer (B) as compared to the
phosphate buffers at the respective pH value.

Chapter IV: Considerations on in vitro dissolution test methods
183
0
20
40
60
80
100
120
0 30 60 90 120 150 180 210 240
time (minutes)
cum
ulat
ive
drug
rele
ase
(%)
acetate buffer pH 6.0
phosphate buffer pH 6.0
0
20
40
60
80
100
120
0 30 60 90 120 150 180 210 240
time (minutes)
cum
ulat
ive
drug
rele
ase
(%)
citrate buffer pH 6.8
phosphate buffer pH 6.8
Figure V.5:
Dissolution profiles of talinolol immediate release tablets (Cordanum 100 mg) in
A) acetate versus phosphate buffer at pH 6.0
B) citrate versus phosphate buffer at pH 6.8
(Dissolution conditions: paddle apparatus, 50 rpm, 37°C, 1000 ml, , means ± SD, n = 3).
B
A

Chapter IV: Considerations on in vitro dissolution test methods
184
For controlled-release matrix tablets consisting of 40 % talinolol, 40 % Eudragit® S 100 and
20 % Eudragit® RSPO the results of the dissolution experiments in several different media
with and without addition of surfactants are outlined in Table IV.2.

Chapter IV: Considerations on in vitro dissolution test methods
185
Table IV.2:
Dissolution of talinolol sustained-release matrix tablets in different media.
(Mean values of n = 3, standard deviations in brackets)
(Formulation: Talinolol 40 %, Eudragit® S 100 40 %, Eudragit® RSPO 20 %)
Medium Dissolution after 1 hour
% (S.D.)
Dissolution after 2 hours
% (S.D.)
Dissolution after 4 hours
% (S.D.)
Dissolution after 8 hours
% (S.D.)
Dissolution after 24 hours
% (S.D.) pH 1.0,
0.1 N HCl 25.4 (1.3) 33.7 (1.3) 56.0 (1.8) 85.6 (2.0) 95.6 (1.9)
pH 3.2, phosphate buffer 5.4 (0.6) 7.4 (0.8) 10.5 (1.0) 15.2 (0.9) 27.8 (1.3)
pH 4.5 acetate buffer 26.5 (3.2) 40.1 (3.9) 49.8 (4.1) 71.6 (4.9) 97.7 (3.0)
pH 5.5 phosphate buffer 3.7 (0.4) 4.2 (0.5) 5.1 (0.5) 7.0 (0.7) 13.6 (2.5)
pH 6.8 phosphate buffer 7.7 (0.8) 15.6 (1.2) 30.0 (2.4) 59.4 (6.3) 84.4 (4.4)
pH 6.8 citrate buffer 3.6 (0.2) 6.1 (0.4) 7.5 (0.4) 10.7 (0.4) 20.3 (1.2)
pH 6.8 TRIS buffer 5.3 (0.2) 8.6 (0.5) 13.5 (1.6) 19.4 (1.8) 32.2 (2.0)
pH 6.8 phosphate buffer +0.1% sodium dodecylsulfate
10.4 (0.6) 13.2 (0.8) 15.3 (0.9) 17.8 (2.1) 17.6 (1.8)
pH 6.8 phosphate buffer
+0.43% cholic acid 24.4 (0.4) 26.1 (0.4) 27.4 (0.7) 35.4 (0.8) 57.3 (8.6)
pH 6.8 phosphate buffer +1.0% cholic acid
24.4 (0.7) 26.7 (0.7) 27.0 (1.7) 36.4 (0.3) 40.9 (0.9)
pH 6.8 phosphate buffer +1.0% Tween 80
10.9 (1.0) 11.2 (2.6) 12.3 (0.4) 14.3 (0.5) 22.5 (4.7)
pH 6.8 phosphate buffer
+1.0% Cremophor RH 40 4.3 (0.1) 5.4 (0.2) 6.3 (0.3) 19.0 (4.6) 76.7 (4.8)
pH 6.8 phosphate buffer +0.5% cetylpyridinium chloride
5.7 (1.9) 14.1 (2.1) 20.7 (2.7) 33.9 (4.7) 90.4 (3.0)
Composition of buffers: 1) Phosphate buffer pH 3.2: 4 g/l sodium dihydrogen phosphate, 2.5 g/l phosphoric acid. 2) Acetate buffer pH 4.5: 2.99 g/l sodium acetate •3H2O, 1.66 g/l acetic acid 3) Phosphate buffer pH 5.5: 13.1 g/l potassium dihydrogen phosphate, 1.29 g/l sodium monohydrogen phosphate 4) Phosphate buffer pH 6.8: 6.8 g/l potassium dihydrogen phosphate, 0.90 g/l sodium hydroxide 5) Citrate buffer pH 6.8: 1.09 g/l citric acid, 0.60 g/l sodium hydroxide. 6) TRIS buffer pH 6.8: 6.0 g/l tris (hyroxymethyl) aminomethane, 47.5 ml/l 1N hydrochloric acid

Chapter IV: Considerations on in vitro dissolution test methods
186
When the buffer type is altered, the dissolution profiles change significantly. As
demonstrated for the immediate release tablets, the influence of the buffer type on the
dissolution of the sustained-release tablets also exceeds the pH influence by far. In spite of
a pH difference of 3.5, dissolution in an acetate buffer pH 4.5 is nearly as fast as in 0.1 N
hydrochloric acid. Furthermore, compared to a phosphate buffer pH 6.8, dissolution is
decelerated in citrate and TRIS buffers of the same pH. Surfactants modified the dissolution
of talinolol in different ways. Cholic acid in concentrations of 0.43 and 1.0 % led to an
increased dissolution in the first hours, thereafter the dissolution rate decreased so that the
amount of drug released after 24 hours was significantly lower than without an surfactant
added. Cremophor RH 40 and Tween 80 at concentrations of 1.0 % and sodium
dodecylsulfate of a concentration of 0.1 % decreased both rate and extent of drug release
from the matrix tablets. Only cetylpyridinium chloride (0.5 %) accelerated the dissolution
and increased the amount of drug released after 24 hours.
Furthermore, it was demonstrated in phosphate buffer at pH 6.8 that under addition of
sodium chloride (NaCl) rate and extent of talinolol dissolution increased. The higher the
NaCl concentration the faster was the dissolution in the observed concentration range up to
1.25 % NaCl.

Chapter IV: Considerations on in vitro dissolution test methods
187
0
10
20
30
40
50
60
70
80
90
100
0 120 240 360 480 600 720 840 960 1080 1200 1320 1440
time (min)
cum
ulat
ive
drug
rele
ase
(%)
no NaCl added + 0.415% NaCl + 0.83% NaCl + 1.245% NaCl
Figure V.6:
Dissolution profiles of talinolol sustained-release tablets in a phosphate buffer at pH 6.8
under addition of different amounts of sodium chloride.
(Dissolution conditions: paddle apparatus, 50 rpm, 37°C, 1000 ml, means ± SD, n = 3).
(Formulation: Talinolol 40 %, Eudragit® S 100 40 %, Eudragit® RSPO 20 %)
IV.3.3 Crystal structures
Under a light microscope the shape and the mean size of the crystals obtained following
crystallization from pure water and from phosphate buffers at pH 6.0 and 6.8 were similar.
Under all three conditions cubic crystal structures were observed, whereas the shape of the
powders obtained following precipitation in acetate buffers pH 4.5 and 6.0 was different:
their crystal size was considerably smaller and no cuboids were observed as can be seen
in Figure IV.7.

Chapter IV: Considerations on in vitro dissolution test methods
188
Figure IV.7:
Crystal shapes of talinolol modifications or salts obtained by precipitation in different
dissolution media under a light microscope (Magnification 1:500).
pure water
acetate buffer pH 6.0 phosphate buffer pH 6.8
acetate buffer pH 4.5 phosphate buffer pH 4.5
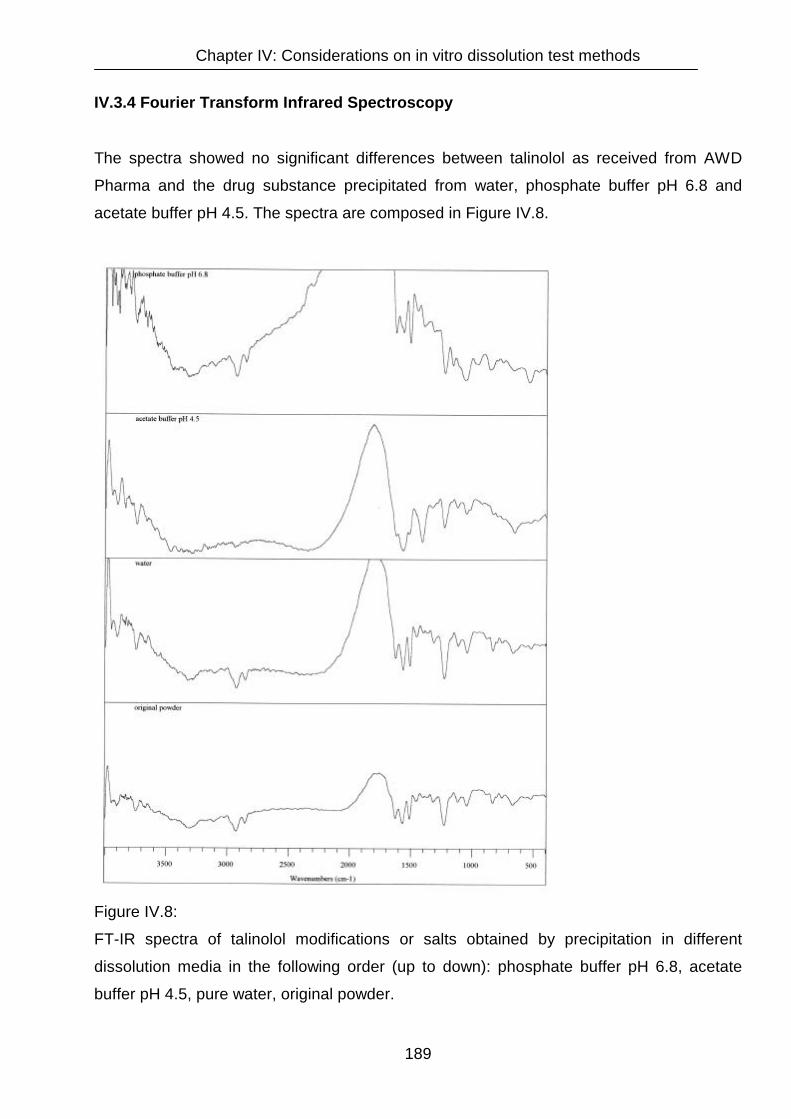
Chapter IV: Considerations on in vitro dissolution test methods
189
IV.3.4 Fourier Transform Infrared Spectroscopy
The spectra showed no significant differences between talinolol as received from AWD
Pharma and the drug substance precipitated from water, phosphate buffer pH 6.8 and
acetate buffer pH 4.5. The spectra are composed in Figure IV.8.
Figure IV.8:
FT-IR spectra of talinolol modifications or salts obtained by precipitation in different
dissolution media in the following order (up to down): phosphate buffer pH 6.8, acetate
buffer pH 4.5, pure water, original powder.
Chapter IV: Considerations on in vitro dissolution test methods
190
The main peaks remained unchanged, only some peak ratios differed slightly. Impurities of
remaining buffer salts were detected by comparison of the different talinolol spectra with
those of the pure buffer components. For example, the loss of the triplet between 1500 and
1600 cm-1 in the IR-spectrum of talinolol that was observed following crystallization from the
acetate buffer was caused by impurities of sodium acetate. The latter showed only one
broad peak in this area and also the peak at 1400 cm-1 in this spectrum, that did not occur
in the other spectra, had its origin in sodium acetate left-overs. The peak between 500 and
600 cm-1 in the spectrum of talinolol precipitated out of the phosphate buffer was due to
traces of sodium dihydrogen phosphate, that were not removed completely.
IV.3.5 Differential Scanning Calorimetry
Unlike the FT-IR spectra, the DSC spectra showed significant differences for the test
samples: Pure talinolol and the powder re-crystallised from water had nearly identical
spectra showing a pair of two peaks, the first one between 126 and 131°C and the second
one between139 and 152°C. That is in the range of the melting point of talinolol reported in
literature (143°C). The samples crystallized out of acetate and phosphate buffers showed
only one peak. This single peak was in the range between 156 and 163°C for acetate and
between 200 and 204°C for phosphate, respectively. The spectra are presented in Figure
IV.9.

Chapter IV: Considerations on in vitro dissolution test methods
191
Figure IV.9:
DSC spectra of talinolol modifications or salts obtained by precipitation in different
dissolution media in the following order: 1) original powder, 2) pure water, 3) acetate buffer
pH 4.5, 4) phosphate buffer pH 6.8.
1
4
3
2
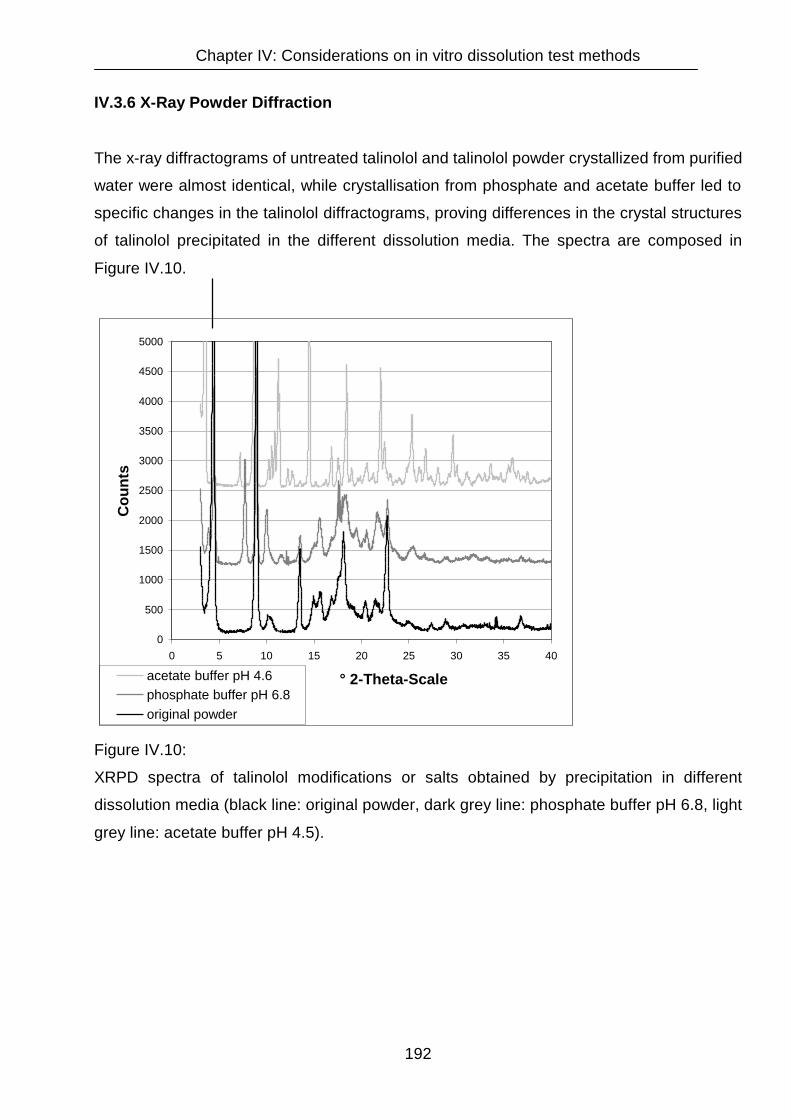
Chapter IV: Considerations on in vitro dissolution test methods
192
IV.3.6 X-Ray Powder Diffraction
The x-ray diffractograms of untreated talinolol and talinolol powder crystallized from purified
water were almost identical, while crystallisation from phosphate and acetate buffer led to
specific changes in the talinolol diffractograms, proving differences in the crystal structures
of talinolol precipitated in the different dissolution media. The spectra are composed in
Figure IV.10.
0
500
1000
1500
2000
2500
3000
3500
4000
4500
5000
0 5 10 15 20 25 30 35 40
° 2-Theta-Scale
Cou
nts
acetate buffer pH 4.6phosphate buffer pH 6.8original powder
Figure IV.10:
XRPD spectra of talinolol modifications or salts obtained by precipitation in different
dissolution media (black line: original powder, dark grey line: phosphate buffer pH 6.8, light
grey line: acetate buffer pH 4.5).
Chapter IV: Considerations on in vitro dissolution test methods
193
IV.4 Discussion and conclusions
The results reemphasize that media used for dissolution tests have to be chosen with care.
The effect – discovered in the studies - that different media may lead to different crystal
structures of solutes with varying physicochemical properties may not be restricted to the
studied compound talinolol but likewise may play an important role for the dissolution of
other drugs as well.
For various immediate-release formulations, drug dissolution tests in media simulating the
gastric fluid are appropriate, since many drugs completely dissolve before leaving the
stomach and show little tendencies towards precipitation in the intestine. For such drug
products, 0.1 molar hydrochloric acid or simulated gastric fluid (USP), a solution of 0.2 %
sodium chloride and 0.32 % pepsin in hydrochloric acid, can be used.
If dissolution in middle and lower parts of the gastrointestinal tract needs to be simulated,
as for the characterization of controlled-release products, acetate buffers with a pH of 4.5
are commonly used to simulate the pH of the upper small intestine in the fasted state.
Phosphate buffers of pH 6.8 and 7.4 as well as the simulated intestinal fluid of the USP,
based on a phosphate buffer pH 7.5 to which 1 % pancreatin is added, are common for the
lower intestinal regions.
To simulate the physiological appearance of surfactants in the gastrointestinal fluids and
particularly for dissolution tests with formulations containing low-solubility drugs, either 0.1
to 2 % sodium dodecylsulfate or the more physiological cholic acid or sodium cholate can
be added to the buffer solutions at concentrations of 0.1 to 1 %.
To improve the in vivo relevance of dissolution tests two simulated intestinal fluids have
been proposed, that mimic the presence of surfactants and enzymes in the intestine
[Dressman, J. B., G. L. Amidon, et al. (1998), Galia, E., E. Nicolaides, et al. (1998)]: One for
the simulation of the fasted state (FaSSIF, Fasted-State Simulated Intestinal fluid) and one
for the simulation of the fed state (FeSSIF, Fed-State Simulated Intestinal fluid). FaSSIF is
based on a phosphate buffer pH 6.5, whereas FeSSIF basically consists of an acetate
buffer with a pH of 5.0. This switch from phosphate to acetate has no in vivo counterpart
and might lead to misinterpretations for drugs that – like talinolol - form different salts or
modifications with different physicochemical properties: When dissolution tests are
performed in FaSSIF and FeSSIF to investigate the influence of the ingestion of food on the
drug release, changes in the dissolution profiles may hence not only be due to the
differences in lecithin and cholate concentrations and different pH values which shall imitate
Chapter IV: Considerations on in vitro dissolution test methods
194
the fasted and fed state, but can also be caused by the change of the buffer type from
phosphate to acetate.
With respect to the type of buffer used, none of the media discussed above reflects the
actual composition of the intestinal fluids in vivo correctly. Carbonate buffers, that
physiologically regulate the pH in the intestine are inapplicable for in vitro tests because of
the evaporation of carbon dioxide and the resulting changes in the pH of the dissolution
media.
Apart from the buffer type, the effect of sodium chloride on the solubility and dissolution rate
o ftalinolol show that the concentrations of other ionic constituents that appear
physiologically in the gastrointestinal fluids such as sodium, potassium or calcium chloride
may also influence both the solubility of drugs and the dissolution of drug products, which
could, at least partly, be caused by changes in the crystal structures of the drugs as well.
With respect to the in vivo relevance, the investigations on talinolol dissolution show that, in
addition to P-gp-mediated intestinal secretion [Spahn-Langguth, H., G. Baktir, et al. (1998),
Gramatte, T., R. Oertel, et al. (1996)], differences in the composition of gastrointestinal
fluids may also contribute to the relatively poor and variable bioavailability of talinolol. It can
be assumed that the decrease in bioavailability after ingestion of a meal may also be due to
changes in the composition of the gastrointestinal fluids.
Since the in vitro dissolution tests showed that up to a specific level the addition of
surfactants can diminish or at least decelerate talinolol dissolution, it may well be possible
that the physiological surfactants such as bile salts that are secreted after ingestion of food
could be held responsible for the decrease in bioavailability as well. An explanation for both,
the in vitro and the in vivo phenomenon, could be a complexation between talinolol and the
surfactants as it is reported for pafenolol, another beta-adrenoceptor antagonist with a
similar chemical structure [Lennernas, H. and C. G. Regardh (1993a, b and c)].
The findings presented in chapter IV were submitted as paper and accepted for publication
in “Drug Development and Industrial Pharmacy” in revised form in March 2003.
Chapter V: In silico evaluation of talinolol sustained-release tablets
195
Chapter V
Chapter V: In silico evaluation of talinolol sustained-release tablets
196
Chapter V
In silico evaluation of talinolol sustained-release tablets
V.1 Introduction
In chapter III the development of sustained-release talinolol matrix tablets with a
modified drug release rate was described. The final formulation showed a rather
consistent drug release over a period of approximately eight hours in the respective
dissolution media.
To investigate the interaction between the P-gp-mediated drug efflux in the GI-tract
and the decelerated drug release, in silico tests were projected.
The term in silico refers to the estimation of certain parameters with the aid of
computer-based software programs. Terstappen and Reggiani give an overview of
the different areas in drug discovery, in which in silico approaches are used
[Terstappen, G. C. and A. Reggiani (2001)]. Among other methods, computer-based
programs are employed for the discovery of new drug targets, the analysis of gene-
expression, the search for new lead substances and the prediction of physico-
chemical properties of drugs such as solubility and lipophilicity [Engkvist, O. and P.
Wrede (2002), Huuskonen, J., J. Rantanen, et al. (2000), Peterson, D. L. and S. H.
Yalkowsky (2001), Tetko, I. V., V. Y. Tanchuk, et al. (2001), Tetko, I. V., V. Y.
Tanchuk, et al. (2001)]. In addition, several approaches regarding the in silico
modeling of the pharmacokinetic behaviour of drugs in the human body have been
reported [Beresford, A. P., H. E. Selick, et al. (2002), Butina, D., M. D. Segall, et al.
(2002), Smith, D. A. and H. van de Waterbeemd (1999)]. These approaches are
based on the ADME model, a model which describes the route of a drug through the
human body in four steps: absorption (A), distribution (D), metabolism (M) and
excretion (E).
For perorally administered drugs, absorption means the transition of dissolved drug
molecules from the lumen of the GI-tract into the systemic circulation. The second
step describes the distribution of the drug to different compartments, including blood,
brain, fat and body water. Metabolism is the process of chemical alteration of a drug.
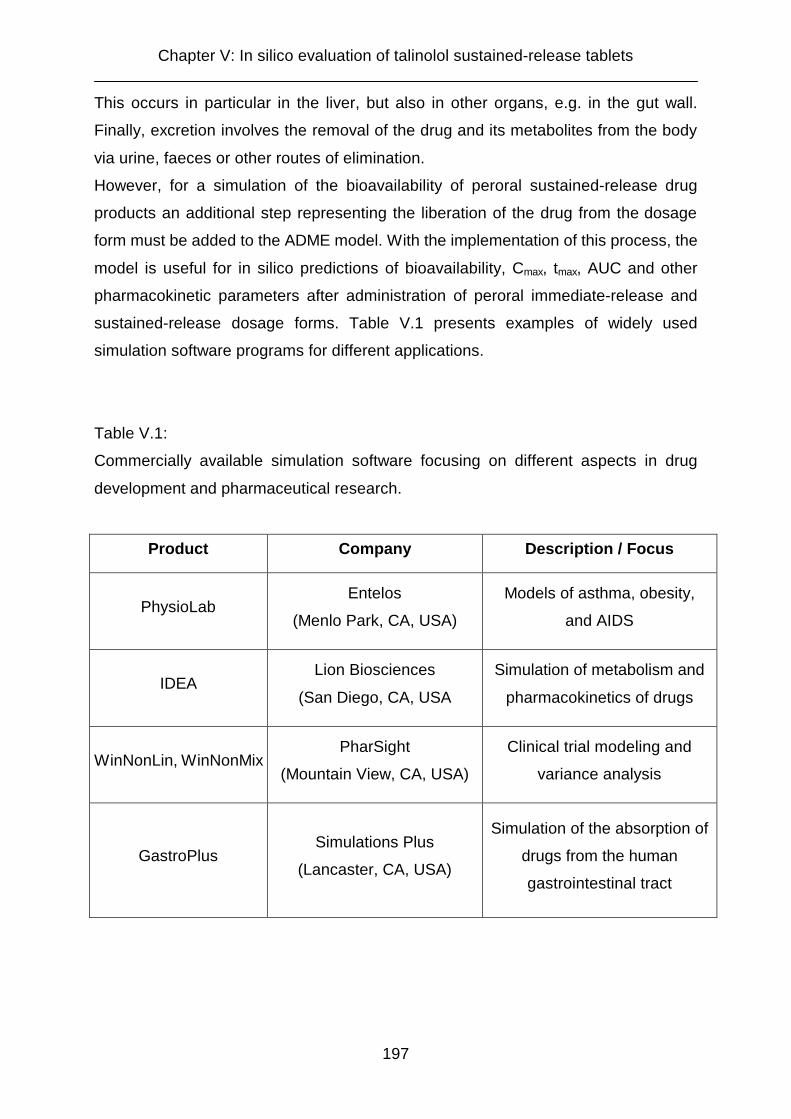
Chapter V: In silico evaluation of talinolol sustained-release tablets
197
This occurs in particular in the liver, but also in other organs, e.g. in the gut wall.
Finally, excretion involves the removal of the drug and its metabolites from the body
via urine, faeces or other routes of elimination.
However, for a simulation of the bioavailability of peroral sustained-release drug
products an additional step representing the liberation of the drug from the dosage
form must be added to the ADME model. With the implementation of this process, the
model is useful for in silico predictions of bioavailability, Cmax, tmax, AUC and other
pharmacokinetic parameters after administration of peroral immediate-release and
sustained-release dosage forms. Table V.1 presents examples of widely used
simulation software programs for different applications.
Table V.1:
Commercially available simulation software focusing on different aspects in drug
development and pharmaceutical research.
Product Company Description / Focus
PhysioLab Entelos
(Menlo Park, CA, USA)
Models of asthma, obesity,
and AIDS
IDEA Lion Biosciences
(San Diego, CA, USA
Simulation of metabolism and
pharmacokinetics of drugs
WinNonLin, WinNonMix PharSight
(Mountain View, CA, USA)
Clinical trial modeling and
variance analysis
GastroPlus Simulations Plus
(Lancaster, CA, USA)
Simulation of the absorption of
drugs from the human
gastrointestinal tract
Chapter V: In silico evaluation of talinolol sustained-release tablets
198
A more detailed description of six different software programs for in silico predictions
of ADME and pharmacokinetics and an evaluation of these programs is reported by
Boobis et al. [Boobis, A., U. Gundert-Remy, et al. (2002)].
Of outstanding importance for the goodness of predictions performed in silico is the
model the simulation software uses for gastrointestinal absorption. Drug absoption
from the gastrointestinal tract can be very complex. It is influenced by numerous
factors that can be classified into the categories physiochemical, physiological and
formulation-related. Due to this complexity, simple models often fail to characterize
the absorption process exactly. Models suggested for the simulation of the
gastrointestinal tract in the past are the dispersion model [Ho, N. F., W. I. Higuchi, et
al. (1972)], homogenous [Sinko, P. J., G. D. Leesman, et al. (1991)] and
heterogenous [Kalampokis, A., P. Argyrakis, et al. (1999a), Kalampokis, A., P.
Argyrakis, et al. (1999b)] tube model and compartmental absorption and transit (CAT)
model [Yu, L. X. and G. L. Amidon (1999), Yu, L. X., J. R. Crison, et al. (1996)].
However, for simulations of the absorption of drugs undergoing active transport,
including both, uptake and efflux processes, a model may not focus on passive
diffusion alone, but must provide simulation steps for the transporters involved. The
advanced compartmental absorption and transit (ACAT) model used by the software
program Gastro Plus® is able to simulate such active transport processes [Agoram,
B., W. S. Woltosz, et al. (2001)]. In addition, the ACAT model accounts for factors
such as variations in pH along the gastrointestinal tract, physicochemical parameters
of the drug molecule that affect dissolution and absorption, variations in effective
permeability and structure in the intestine, physical formulation properties, and
saturable first-pass extraction and biotransformation.
For a simulation of the bioavailability of talinolol sustained-release tablets formulated
as described in chapter III, both, formulation properties and intestinal drug efflux
mediated by P-glycoprotein must be considered. The ACAT model is appropriate for
such simulations, since simulation steps for both, the sustained drug release and the
drug efflux, can be included. Therefore, Gastro Plus® was selected for the in silico
evaluation of the talinolol sustained-release matrix tablets developed.
Chapter V: In silico evaluation of talinolol sustained-release tablets
199
V.2 Materials and methods
V.2.1 Computer hardware and software
The simulations were performed on a Siemens Xpert Pentium III computer (500 MHz)
using the Gastro Plus® software. The program was developed at Simulations Plus
(Lancaster, California, USA) under the direction of Michael B. Bolger in collaboration
with Gordon L. Amidon. Besides common estimations of pharmacokinetic parameters
this software package allows simulations of non-linear kinetics and non-standard
absorption patterns. The program enables predictions of rate and extent of drug
absorption from the gastrointestinal tract. Transporter and metabolism data can be
included in these predictions.
The program allows to consider modified release of the drug from the dosage form as
well as intestinal drug efflux in its predictions of pharmacokinetic parameters. Both
are necessary for reliable simulations of the bioavailability of the talinolol sustained-
release matrix tablets developed.
Only a few basic parameters are initially required to run a simulation with Gastro
Plus®. However, there is a large number of input parameters that are not essential for
a simulation but can enhance the quality of the results. The more properties of a drug
and its particular dosage form are included in a simulation, the more valid and
reliable results can be expected.
V.2.2 Input parameters for simulations of talinolol IR and CR dosage forms
V.2.2.1 Compound properties
Figure V.1 displays the basic compound parameter input screen of the Gastro Plus®
program. The parameters available for talinolol are filled in. When no information was
available concerning a certain input parameter, default settings proposed by the
program were used.
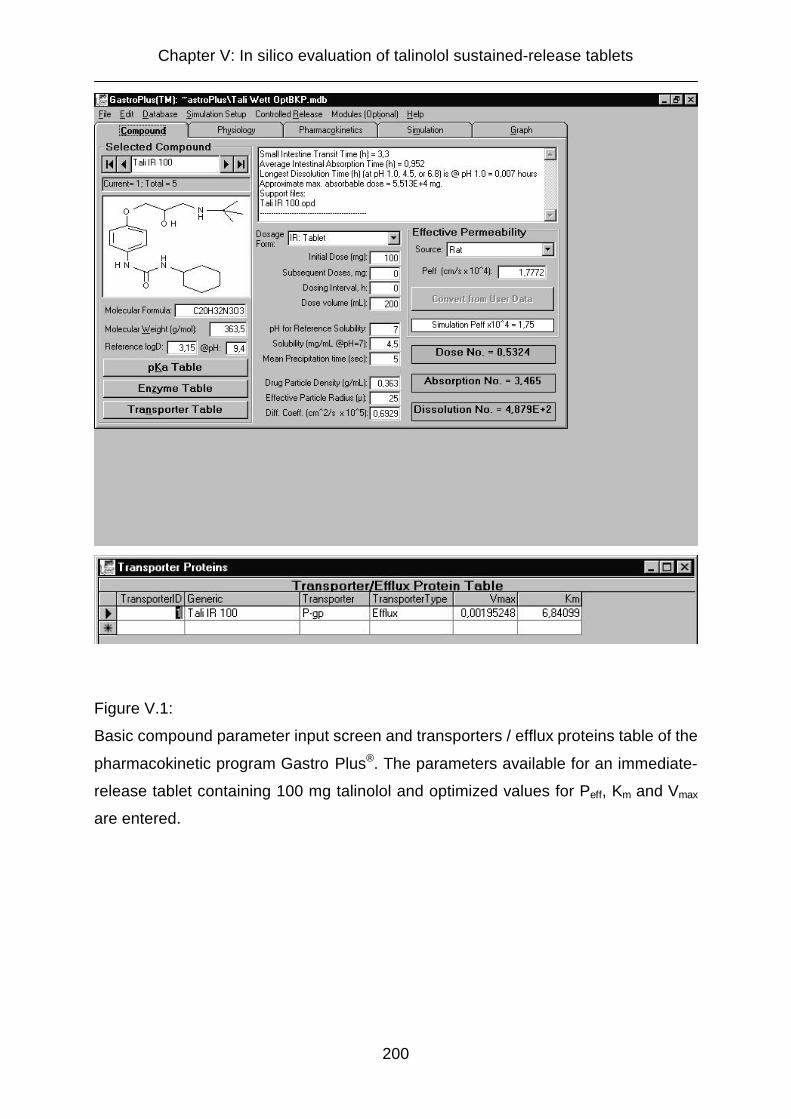
Chapter V: In silico evaluation of talinolol sustained-release tablets
200
Figure V.1:
Basic compound parameter input screen and transporters / efflux proteins table of the
pharmacokinetic program Gastro Plus®. The parameters available for an immediate-
release tablet containing 100 mg talinolol and optimized values for Peff, Km and Vmax
are entered.

Chapter V: In silico evaluation of talinolol sustained-release tablets
201
Table V.2 displays the parameters entered in the basic compound parameter input
screen of the Gastro Plus® software package.
Table V.2:
Parameters used in computer simulations with different talinolol dosage forms with
the pharmacokinetic software program Gastro Plus®.
Drug properties:
Molecular formula C20H32N3O3
Molecular weight (Mr) 363.5 g/mol
Reference logD 3.14 at pH 9.4
Solubility at pH 7.0 4.5 mg/ml
Dosage form properties:
Dosage form IR Tablet
CR Integral Tablet i.v. Bolus
Initial dose p.o.: 25 mg, 50 mg,
100 mg, 400 mg i.v.: 30 mg
Subsequent doses none
Dose volume )* 200 ml
Mean precipitation time )* Default (5 sec)
Drug particle density )* Default (0.363 g/ml)
Effective particle radius )* Default (25 µm)
Diffusion coefficient )* Default (0.6929•10-5 cm2/s)
)*: only used in simulations for peroral dosage forms
Chapter V: In silico evaluation of talinolol sustained-release tablets
202
V.2.2.2 Model of the physiology of the gastrointestinal tract
The “Physiology” screen displayed in Figure V.2 allows to define physiological
parameters of the gastrointestinal tract such as pH, Peff or transit times for particular
regions. However, default physiological conditions are proposed by the program for
both, the fasted and fed state. In all simulations with varying talinolol dosage forms,
default conditions of the fasted state proposed by the software program were used,
except for the P-gp distribution. As a result of the perfusion studies in different
regions of the rat intestine (cp. chapter II) the scaling factors for the P-gp distribution
were adopted. Increasing expressions of P-gp from jejunum to ileum and colon were
reflected by scaling factors increasing from 1 for the jejunum to 3 for the ileum to 5 for
the colon (cp. Figure V.2). As the transporter effect in the duodenum was not tested
in the rat studies and reports in literature are controversial and propose higher as well
as lower P-gp expressions than in more distal intestional regions [Saitoh, H. and B. J.
Aungst (1995), Tang, H., Y. Pak, et al. (2002), Brady, J. M., N. J. Cherrington, et al.
(2002), Tamura, S., A. Ohike, et al. (2002), Makhey, V. D., A. Guo, et al. (1998)], a
medium scaling factor of 3 was selected for the duodenum.

Chapter V: In silico evaluation of talinolol sustained-release tablets
203
Figure V.2:
Physiological compartmental parameters for the fasted state in humans proposed by
the Gastro Plus® simulation program. Scaling factors for the P-gp distribution were
adopted on the basis of the results from rat perfusion studies presented in chapter II.
V.2.2.3 Pharmacokinetic properties of the compound
Additional pharmacokinetic parameters can be employed for Gastro Plus®
simulations, as displayed in Figure V.3. The most adequate compartment model for
the simulations was selected on the basis of data from a human study with 30 mg
talinolol administered intravenously. For predictions of bioavailability and plasma
profiles, clearance (CL) and the volume of the central compartment (Vc) are of
particular importance, since they determine the elimination rate of a drug. Assuming
a one-compartment model, the elimination rate constant ke can be calculated as:
Chapter V: In silico evaluation of talinolol sustained-release tablets
204
ke = CL / Vc [1]
The clearance (CL) is determined taking into consideration the fraction that is
bioavailable (Fb), multiplied by the administered dose (D) and divided by the area
under the curve (AUC) of the plasma concentration-versus-time profile:
CL = Fb · D / AUC [2]
Since the values reported in literature for clearance and volume of the central
compartment of talinolol vary considerably, these parameters were estimated using
the optimization module of Gastro Plus®. Additionally, preliminary simulations
demonstrated that the Peff values derived from the rat perfusion studies led to
underestimated plasma levels when used as input for simulations in humans.
Therefore this parameter was also subject to an optimization step. Constraints were
set to assure that the estimated values for CL (0.01 to 10 l/h/kg), Vc (0.01 to 50 l/kg)
and Peff (0.01 to 2 · 10-4 cm/s) lie within a reasonable range.
The optimization module of Gastro Plus® can calculate the most probable value for
any unknown parameter on the basis of oral plasma concentration-versus-time or
other in vivo data. The optimization is based on the search for the minimum sum of
squared errors (SSE). The program calculates the square of the deviations between
all calculated and observed values using one specific value for the parameter to be
optimized and sums them up. This procedure is repeated numerous times employing
altering values for the parameter to be optimized. Finally, the value leading to the
lowest sum of squared errors is proposed as optimized parameter.
For the optimization of CL, Vc, Peff and the P-gp transporter parameters Km and Vmax,
data from a human in vivo study with different doses of talinolol (25 mg, 50 mg, 100
mg, and 400 mg p.o. and 30 mg i.v.) administered as immediate-release dosage
forms and bolus injection published by Wetterich et al. were used [Wetterich, U., H.
Spahn-Langguth, et al. (1996)]. The original data were taken from the doctoral thesis
of U. Wetterich [Wetterich, U. (1995)].
Due to the fact that the biotransformation of talinolol accounts for less than 1 %
[Oertel, R., K. Richter, et al. (1994), Oertel, R. and K. Richter (1995)], the parameter
for the first-pass extraction was set to 0 %. The unbound fraction in plasma was
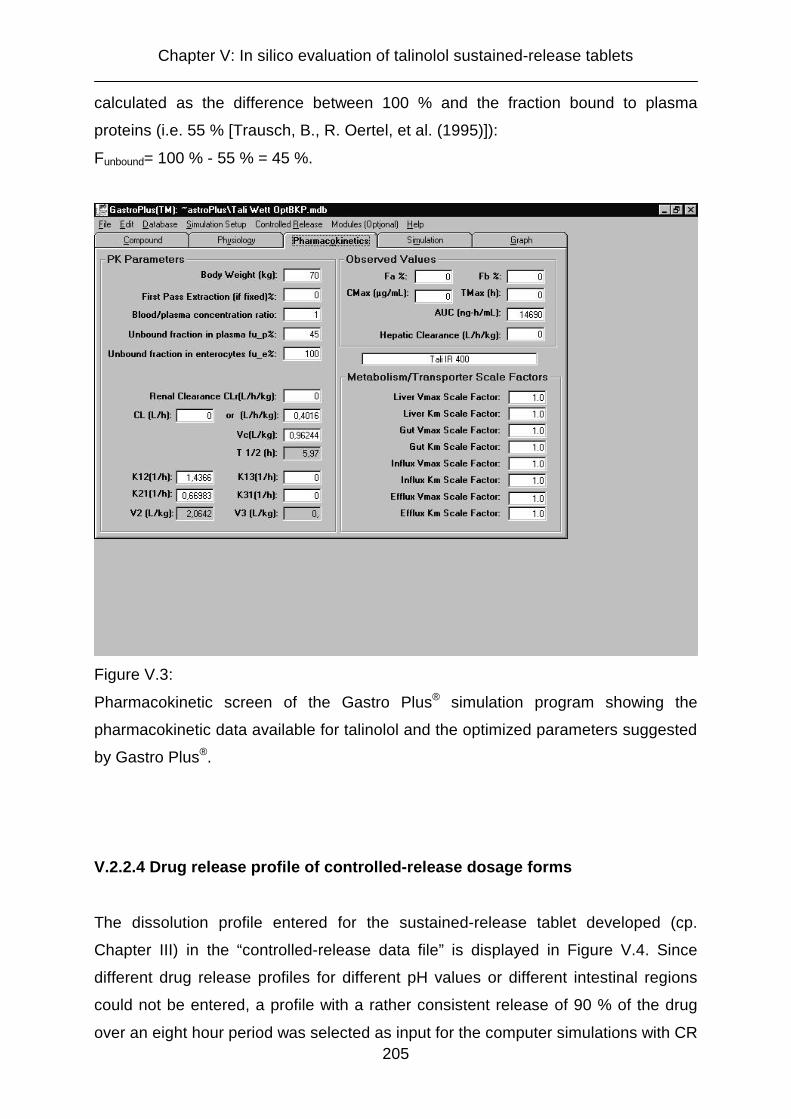
Chapter V: In silico evaluation of talinolol sustained-release tablets
205
calculated as the difference between 100 % and the fraction bound to plasma
proteins (i.e. 55 % [Trausch, B., R. Oertel, et al. (1995)]):
Funbound= 100 % - 55 % = 45 %.
Figure V.3:
Pharmacokinetic screen of the Gastro Plus® simulation program showing the
pharmacokinetic data available for talinolol and the optimized parameters suggested
by Gastro Plus®.
V.2.2.4 Drug release profile of controlled-release dosage forms
The dissolution profile entered for the sustained-release tablet developed (cp.
Chapter III) in the “controlled-release data file” is displayed in Figure V.4. Since
different drug release profiles for different pH values or different intestinal regions
could not be entered, a profile with a rather consistent release of 90 % of the drug
over an eight hour period was selected as input for the computer simulations with CR
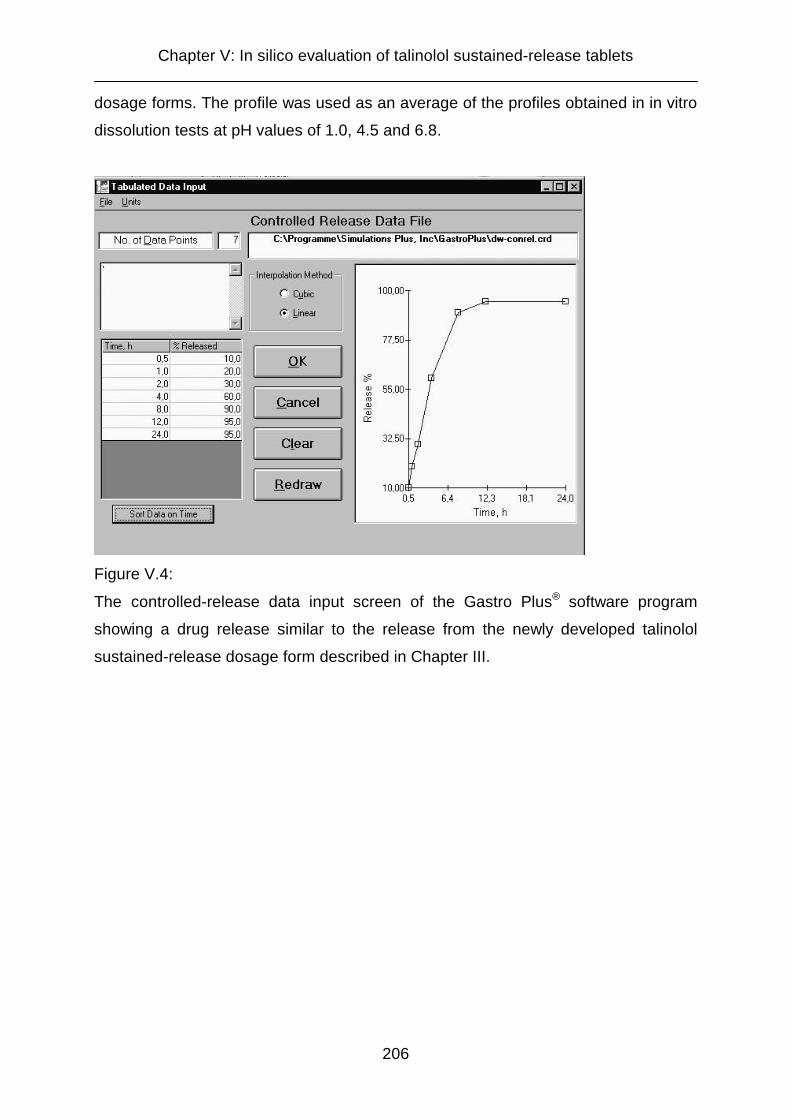
Chapter V: In silico evaluation of talinolol sustained-release tablets
206
dosage forms. The profile was used as an average of the profiles obtained in in vitro
dissolution tests at pH values of 1.0, 4.5 and 6.8.
Figure V.4:
The controlled-release data input screen of the Gastro Plus® software program
showing a drug release similar to the release from the newly developed talinolol
sustained-release dosage form described in Chapter III.
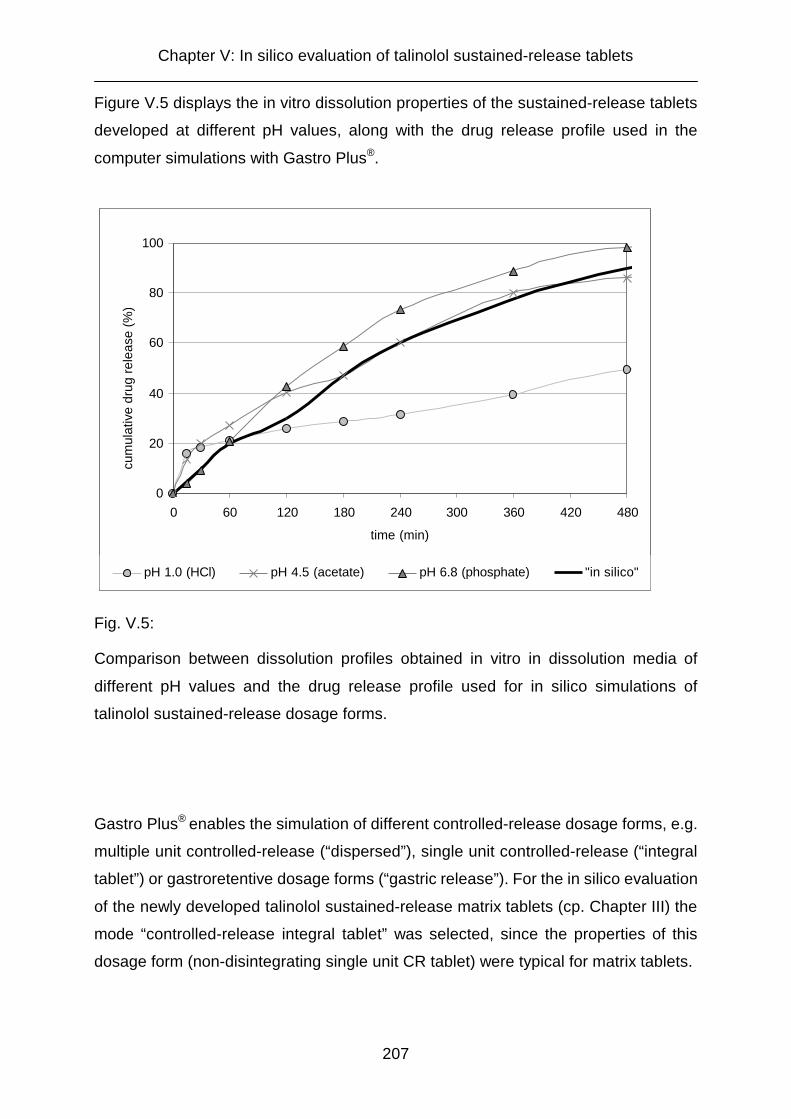
Chapter V: In silico evaluation of talinolol sustained-release tablets
207
Figure V.5 displays the in vitro dissolution properties of the sustained-release tablets
developed at different pH values, along with the drug release profile used in the
computer simulations with Gastro Plus®.
0
20
40
60
80
100
0 60 120 180 240 300 360 420 480
time (min)
cum
ulat
ive
drug
rele
ase
(%)
pH 1.0 (HCl) pH 4.5 (acetate) pH 6.8 (phosphate) "in silico"
Fig. V.5:
Comparison between dissolution profiles obtained in vitro in dissolution media of
different pH values and the drug release profile used for in silico simulations of
talinolol sustained-release dosage forms.
Gastro Plus® enables the simulation of different controlled-release dosage forms, e.g.
multiple unit controlled-release (“dispersed”), single unit controlled-release (“integral
tablet”) or gastroretentive dosage forms (“gastric release”). For the in silico evaluation
of the newly developed talinolol sustained-release matrix tablets (cp. Chapter III) the
mode “controlled-release integral tablet” was selected, since the properties of this
dosage form (non-disintegrating single unit CR tablet) were typical for matrix tablets.

Chapter V: In silico evaluation of talinolol sustained-release tablets
208
V.2.3 Evaluation of the software
To evaluate the Gastro Plus® software program, simulations were performed for
talinolol immediate-release tablets containing 25, 50, 100 and 400 mg talinolol and
an intravenous bolus injection of 30 mg talinolol. The results were compared with the
original data published by Wetterich [Wetterich, U. (1995), Wetterich, U., H. Spahn-
Langguth, et al. (1996)] The simulations should demonstrate the capability of the
software program to simulate intestinal efflux effects. Thereafter, bioavailability and
plasma concentration-versus-time profiles were estimated for sustained-release
tablets with a drug content of 100 and 200 mg.
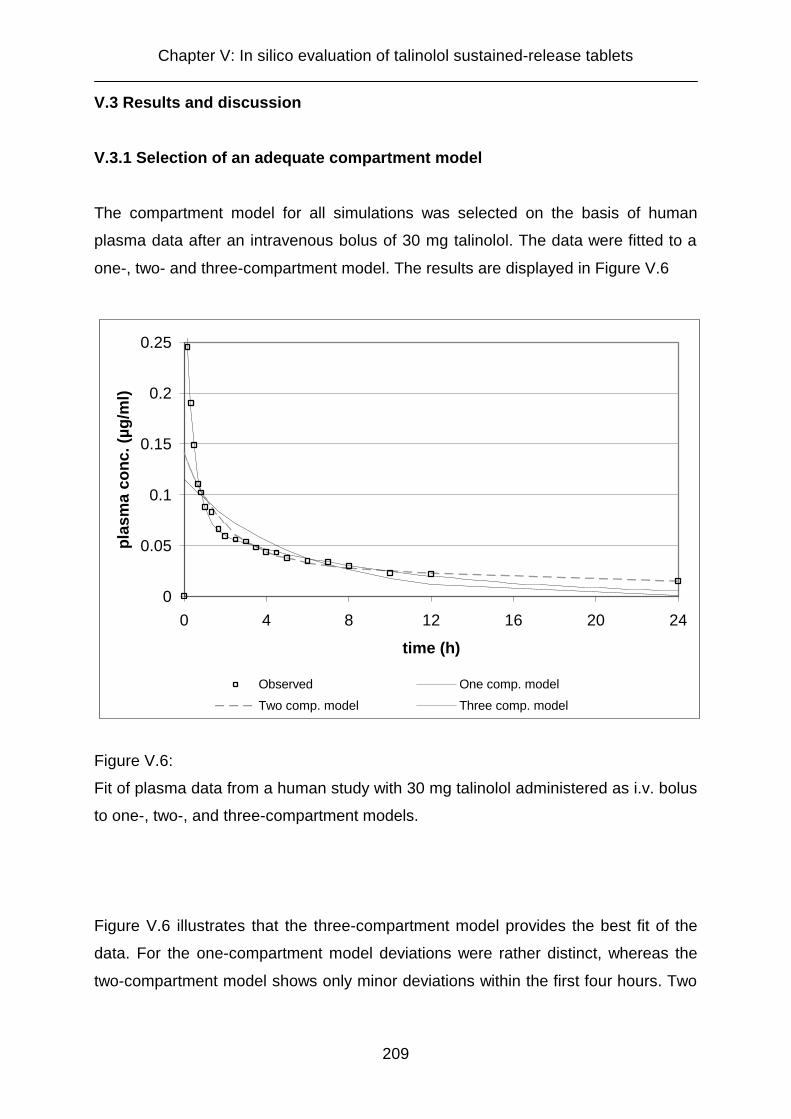
Chapter V: In silico evaluation of talinolol sustained-release tablets
209
V.3 Results and discussion
V.3.1 Selection of an adequate compartment model
The compartment model for all simulations was selected on the basis of human
plasma data after an intravenous bolus of 30 mg talinolol. The data were fitted to a
one-, two- and three-compartment model. The results are displayed in Figure V.6
0
0.05
0.1
0.15
0.2
0.25
0 4 8 12 16 20 24
time (h)
plas
ma
conc
. (µg
/ml)
Observed One comp. model
Two comp. model Three comp. model
Figure V.6:
Fit of plasma data from a human study with 30 mg talinolol administered as i.v. bolus
to one-, two-, and three-compartment models.
Figure V.6 illustrates that the three-compartment model provides the best fit of the
data. For the one-compartment model deviations were rather distinct, whereas the
two-compartment model shows only minor deviations within the first four hours. Two

Chapter V: In silico evaluation of talinolol sustained-release tablets
210
different initial distribution phases can be observed, arguing for the three-
compartment model.
However, when two models lead to similar fits the less complicated model generally
should be preferred. For predictions of peroral dosage forms the initial distribution
phase that is described better in the fit to the three-compartment model can be
neglected, because the drug release from the dosage form and the absorption
process have a stronger impact on the plasma levels in the initial phase. Therefore
the implication of a third compartment is not expected to improve the predictions, but
complicates the model and the calculations notedly. Consequently, the two-
compartment model was selected for the following simulations.
Compared to the simple one-compartment model, the assumption of a two-
compartment model requires three further parameters, k12, k21 and V2. K12 and k21
describe the exchange rate between the two compartments: k12 determines the flow
rate from the central compartment 1 to compartment 2 and k21 determines the flow
rate from compartment 2 back to the central compartment 1. V2 represents the
volume of the second compartment. The intercompartmental exchange rate
constants k12 and k21 and the volume of the second compartment V2 were estimated
using the optimization module of the Gastro Plus® software program. K12 and k21
were predicted as 1.4366 h-1 and 0.66983 h-1, for V2 a value of 2.0642 l/kg was
calculated.
V.3.2 Optimization of clearance, volume of central compartment and effective
permeability
For the clearance (CL) and the volume of the central compartment (Vc) the
optimization suggested 0.402 l/h/kg and 0.962 l/kg, respectively. The value for the
clearance lies within the range reported by Wetterich et al. (0.253 to 0.811 l/h/kg),
whereas the value suggested for the volume of the central compartment is higher
than reported (0.2 to 0.5 l/kg) [Wetterich, U. (1995)]. As for the effective permeability,
the optimization estimated an approximately three times higher value than suggested
by the rat studies (1.777 instead of 0.58). These deviations can be explained by
apparent differences between the two species. Although Gastro Plus® tries to adopt

Chapter V: In silico evaluation of talinolol sustained-release tablets
211
rat data to the human physiology by means of a scaling factor, such adaptions may
not result in perfectly matching permeability values.
V.3.3 Optimization of the transporter parameters Km and Vmax
Preliminary simulations demonstrated that the transporter parameters Km and Vmax
(Michaelis-Menten parameters) have a pronounced influence on the in silico results.
This is due to the fact that these parameters determine the extent of the intestinal
drug efflux as well as the saturation level of the efflux pump.
In order to obtain good correlations between in silico estimations and in vivo data,
appropriate values for Km and Vmax had to be selected. The optimization performed
using the Gastro Plus® optimization module suggested 6.841 µg/ml for Km and
0.00195 mg/s for Vmax. These results are realistic considering potential talinolol
concentrations in the gastrointestinal fluids after peroral administration of 25 mg to
400 mg talinolol.
For the interpretation of the parameter optimization results, it is important to keep in
mind the meaning of the parameters Km and Vmax. Figure V.7 shows the general
Michaelis-Menten kinetic model including the definition of the parameters Km and
Vmax.
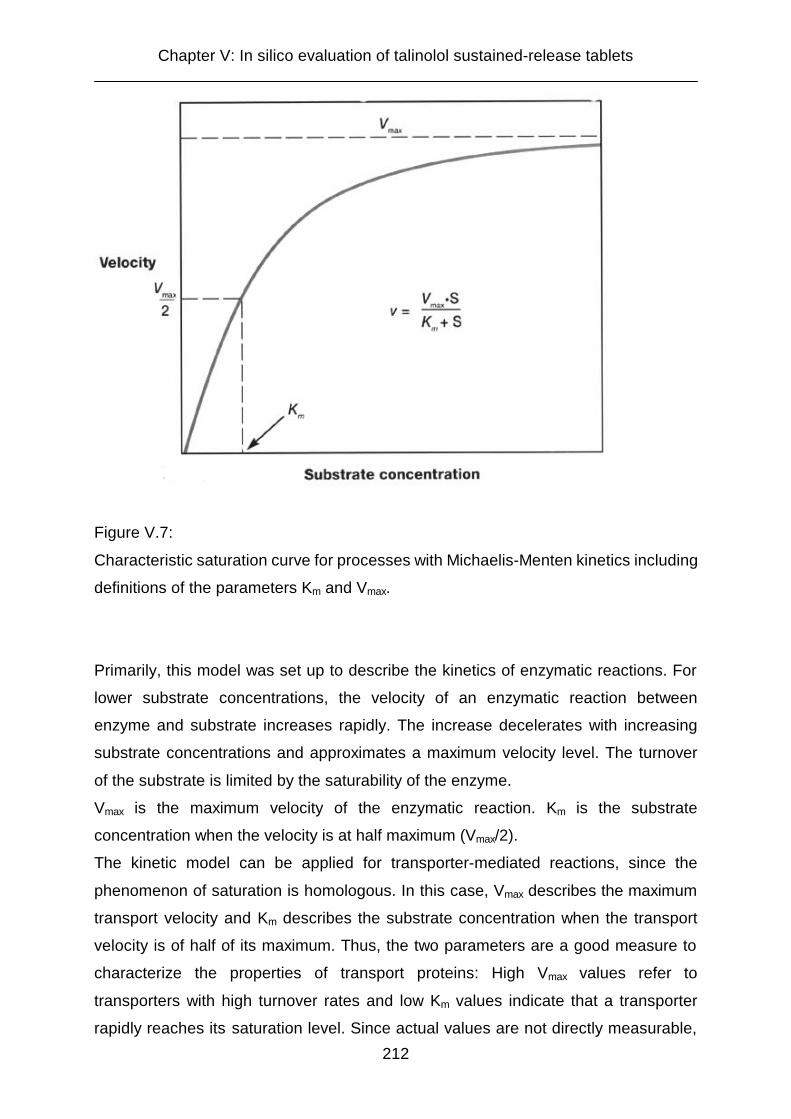
Chapter V: In silico evaluation of talinolol sustained-release tablets
212
Figure V.7:
Characteristic saturation curve for processes with Michaelis-Menten kinetics including
definitions of the parameters Km and Vmax.
Primarily, this model was set up to describe the kinetics of enzymatic reactions. For
lower substrate concentrations, the velocity of an enzymatic reaction between
enzyme and substrate increases rapidly. The increase decelerates with increasing
substrate concentrations and approximates a maximum velocity level. The turnover
of the substrate is limited by the saturability of the enzyme.
Vmax is the maximum velocity of the enzymatic reaction. Km is the substrate
concentration when the velocity is at half maximum (Vmax/2).
The kinetic model can be applied for transporter-mediated reactions, since the
phenomenon of saturation is homologous. In this case, Vmax describes the maximum
transport velocity and Km describes the substrate concentration when the transport
velocity is of half of its maximum. Thus, the two parameters are a good measure to
characterize the properties of transport proteins: High Vmax values refer to
transporters with high turnover rates and low Km values indicate that a transporter
rapidly reaches its saturation level. Since actual values are not directly measurable,
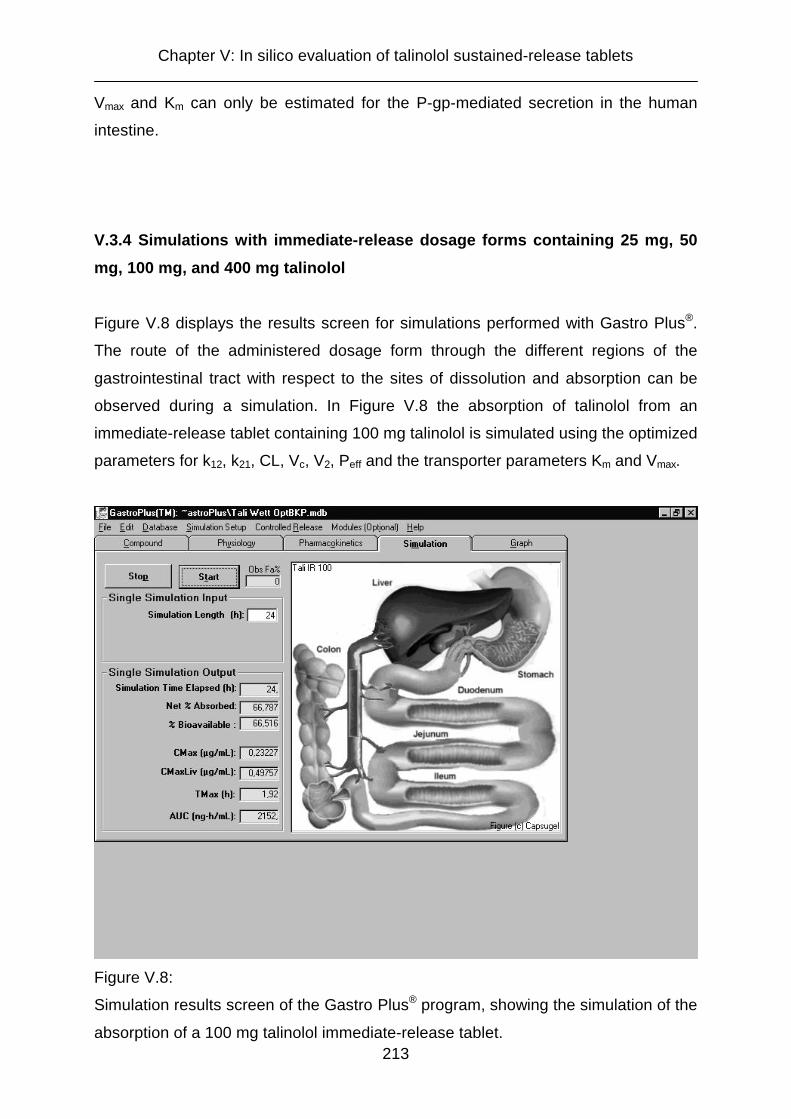
Chapter V: In silico evaluation of talinolol sustained-release tablets
213
Vmax and Km can only be estimated for the P-gp-mediated secretion in the human
intestine.
V.3.4 Simulations with immediate-release dosage forms containing 25 mg, 50
mg, 100 mg, and 400 mg talinolol
Figure V.8 displays the results screen for simulations performed with Gastro Plus®.
The route of the administered dosage form through the different regions of the
gastrointestinal tract with respect to the sites of dissolution and absorption can be
observed during a simulation. In Figure V.8 the absorption of talinolol from an
immediate-release tablet containing 100 mg talinolol is simulated using the optimized
parameters for k12, k21, CL, Vc, V2, Peff and the transporter parameters Km and Vmax.
Figure V.8:
Simulation results screen of the Gastro Plus® program, showing the simulation of the
absorption of a 100 mg talinolol immediate-release tablet.
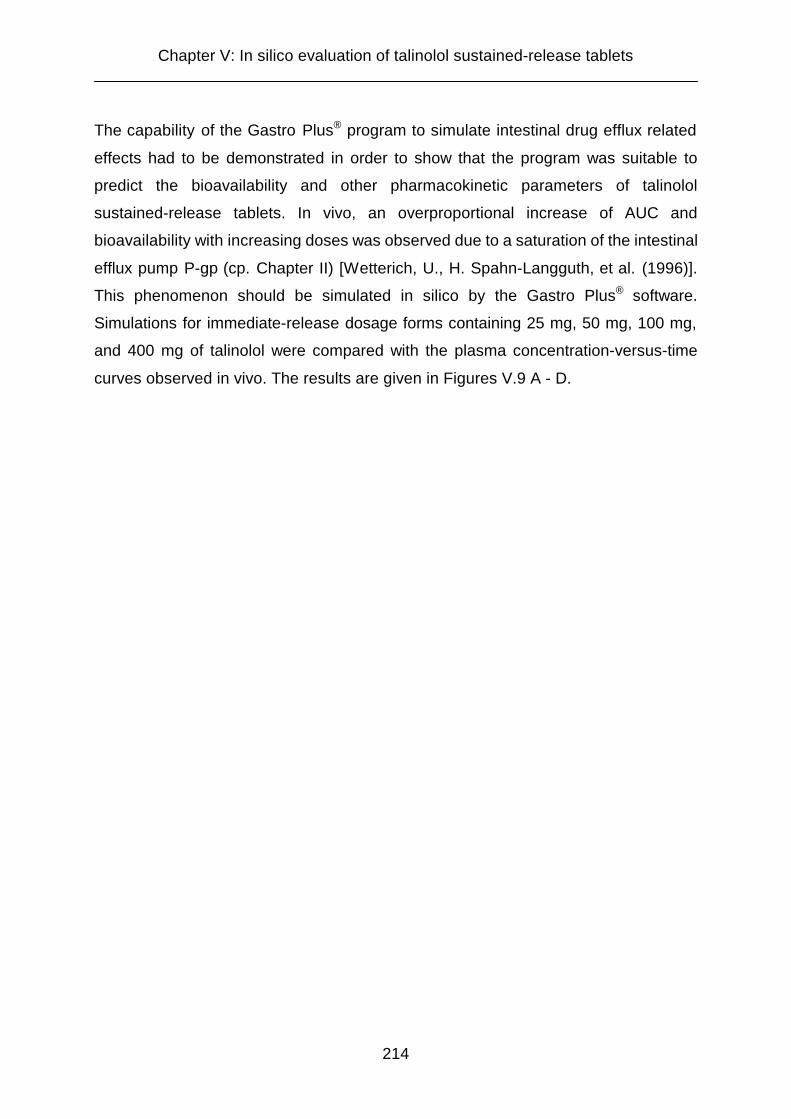
Chapter V: In silico evaluation of talinolol sustained-release tablets
214
The capability of the Gastro Plus® program to simulate intestinal drug efflux related
effects had to be demonstrated in order to show that the program was suitable to
predict the bioavailability and other pharmacokinetic parameters of talinolol
sustained-release tablets. In vivo, an overproportional increase of AUC and
bioavailability with increasing doses was observed due to a saturation of the intestinal
efflux pump P-gp (cp. Chapter II) [Wetterich, U., H. Spahn-Langguth, et al. (1996)].
This phenomenon should be simulated in silico by the Gastro Plus® software.
Simulations for immediate-release dosage forms containing 25 mg, 50 mg, 100 mg,
and 400 mg of talinolol were compared with the plasma concentration-versus-time
curves observed in vivo. The results are given in Figures V.9 A - D.
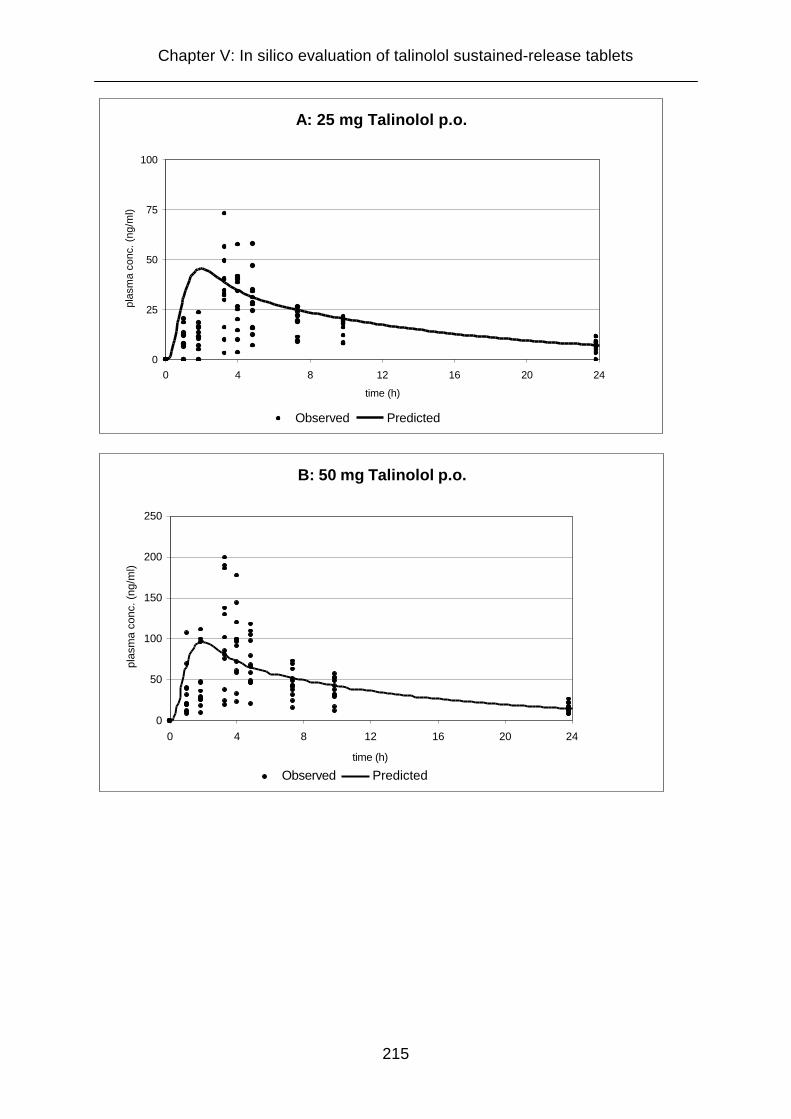
Chapter V: In silico evaluation of talinolol sustained-release tablets
215
A: 25 mg Talinolol p.o.
0
25
50
75
100
0 4 8 12 16 20 24
time (h)
plas
ma
conc
. (ng
/ml)
Observed Predicted
B: 50 mg Talinolol p.o.
0
50
100
150
200
250
0 4 8 12 16 20 24
time (h)
plas
ma
conc
. (ng
/ml)
Observed Predicted
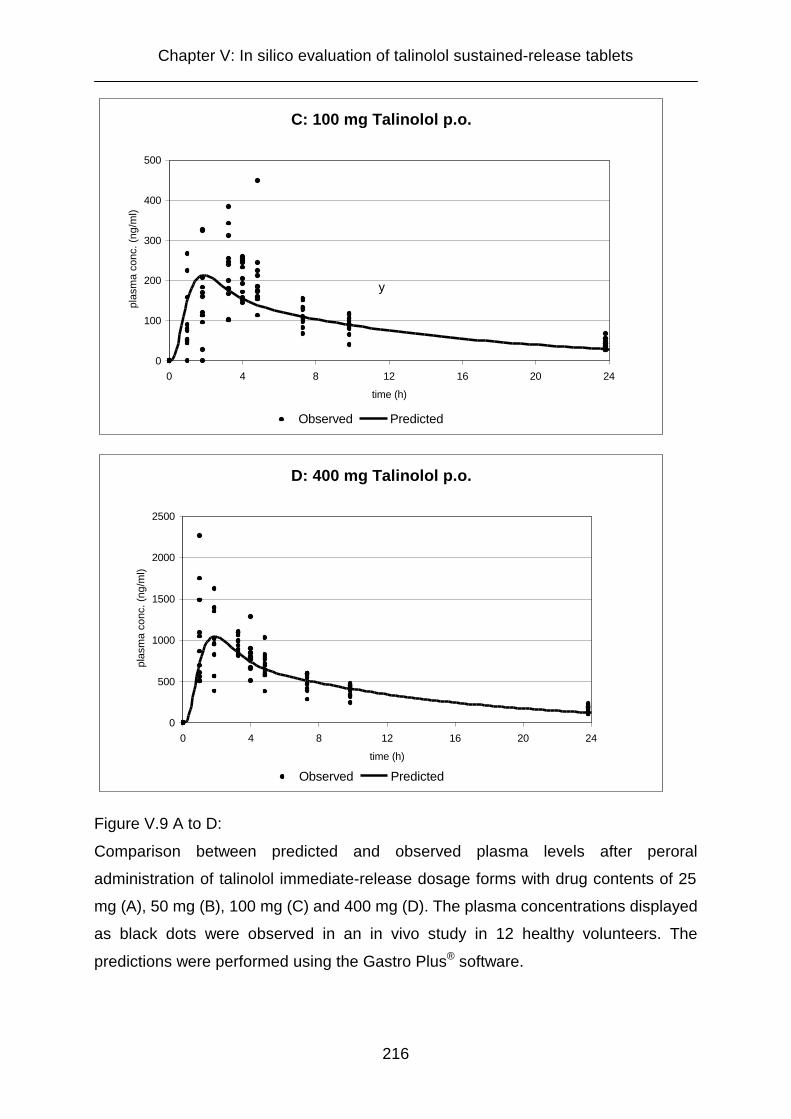
Chapter V: In silico evaluation of talinolol sustained-release tablets
216
C: 100 mg Talinolol p.o.
0
100
200
300
400
500
0 4 8 12 16 20 24
time (h)
plas
ma
conc
. (ng
/ml)
Observed Predicted
y
D: 400 mg Talinolol p.o.
0
500
1000
1500
2000
2500
0 4 8 12 16 20 24
time (h)
plas
ma
conc
. (ng
/ml)
Observed Predicted
Figure V.9 A to D:
Comparison between predicted and observed plasma levels after peroral
administration of talinolol immediate-release dosage forms with drug contents of 25
mg (A), 50 mg (B), 100 mg (C) and 400 mg (D). The plasma concentrations displayed
as black dots were observed in an in vivo study in 12 healthy volunteers. The
predictions were performed using the Gastro Plus® software.

Chapter V: In silico evaluation of talinolol sustained-release tablets
217
The simulation results demonstrate acceptable predictions of the in vivo plasma
profiles. Most of the predicted plasma concentrations lie in the range between the
minimum and maximum plasma levels obtained in the in vivo study. The predicted
values are similar to the mean values obtained from the 12 plasma concentration-
versus-time curves.
The results given in Table V.3 demonstrate that it is possible to simulate dose
dependent absorption. Bioavailability relevantly increases with higher doses and the
AUC-dose ratio increases notably. These findings are important to demonstrate that
the program is capable of simulating effects caused by intestinal drug efflux. As the
program can simulate the P-gp effect for immediate-release dosage forms, it can also
be assumed to predict P-gp effects for sustained-release dosage forms reliably. The
deviations between the AUC-dose ratios calculated from the in silico simulations and
from the in vivo data are not astonishing, since the absorption and elimination
process in vivo is so complex that the model used in silico can not consider all factors
exactly.
Table V.3:
Simulation results for immediate-release formulations containing 25 mg, 50 mg, 100
mg, and 400 mg talinolol. The increases in bioavailability and the AUC / dose-ratio
demonstrate a dose dependence caused by the saturability of the intestinal drug
efflux. For comparison AUC / dose-ratios (Means ± S.D.) observed in vivo are added
[Wetterich, U., H. Spahn-Langguth, et al. (1996)].
Dosage
Form
Bioavailability
(%)
AUC
(ng h/ml)
AUC / Dose
AUC / Dose
In vivo study
IR 25 mg 63.2 560 22.4 20.0 ± 6.32
IR 50 mg 65.4 1160 23.2 24.8 ± 8.8
IR 100 mg 68.8 2440 24.4 32.8 ± 7.9
IR 400 mg 78.0 11100 27.8 36.7 ± 7.7
Chapter V: In silico evaluation of talinolol sustained-release tablets
218
V.3.5 Simulations for talinolol controlled-release dosage forms
Simulations of bioavailability and plasma concentration-versus-time curves for
sustained-release dosage forms containing 100 mg and 200 mg talinolol were
performed using the optimized parameters evaluated in the simulations with different
doses of talinolol immediate-release dosage forms. To demonstrate the pronounced
effect of intestinal drug efflux, the simulations were repeated omitting the influence of
the intestinal efflux pump P-gp (CR 100 / 200 mg Integral Tablet - P-gp). For these
estimations the transporter data set was deleted. All other parameters were kept
constant. The estimation results are presented in Table V.4. For better visualization
of the differences between IR and CR dosage forms, simulation results for 100 mg
and 200 mg IR tablets are presented together with the results for the CR
formulations.
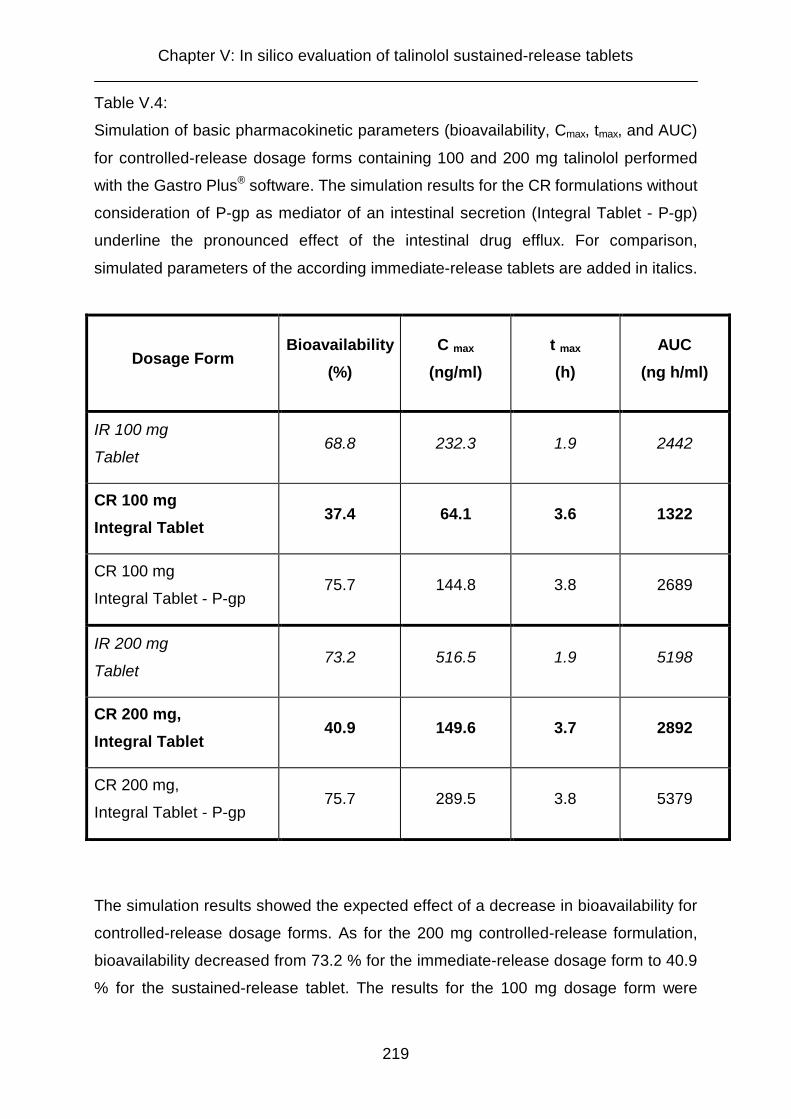
Chapter V: In silico evaluation of talinolol sustained-release tablets
219
Table V.4:
Simulation of basic pharmacokinetic parameters (bioavailability, Cmax, tmax, and AUC)
for controlled-release dosage forms containing 100 and 200 mg talinolol performed
with the Gastro Plus® software. The simulation results for the CR formulations without
consideration of P-gp as mediator of an intestinal secretion (Integral Tablet - P-gp)
underline the pronounced effect of the intestinal drug efflux. For comparison,
simulated parameters of the according immediate-release tablets are added in italics.
Dosage Form Bioavailability
(%)
C max
(ng/ml)
t max
(h)
AUC
(ng h/ml)
IR 100 mg
Tablet 68.8 232.3 1.9 2442
CR 100 mg
Integral Tablet 37.4 64.1 3.6 1322
CR 100 mg
Integral Tablet - P-gp 75.7 144.8 3.8 2689
IR 200 mg
Tablet 73.2 516.5 1.9 5198
CR 200 mg,
Integral Tablet 40.9 149.6 3.7 2892
CR 200 mg,
Integral Tablet - P-gp 75.7 289.5 3.8 5379
The simulation results showed the expected effect of a decrease in bioavailability for
controlled-release dosage forms. As for the 200 mg controlled-release formulation,
bioavailability decreased from 73.2 % for the immediate-release dosage form to 40.9
% for the sustained-release tablet. The results for the 100 mg dosage form were

Chapter V: In silico evaluation of talinolol sustained-release tablets
220
similar. The biovailability of 68.8 % estimated for the IR tablet was reduced to 37.4 %
for the CR tablet.
The lower values for the CR dosage forms can be explained by differences in the
contribution of the P-gp-mediated drug efflux to the overall absorption. In CR drug
products the talinolol release from the dosage form is decelerated. Thus, the drug
concentrations in the GI tract are maintained below the saturation level of the efflux
pump. As a result, the amount of talinolol secreted back into the gastrointestinal
lumen by P-gp increases. This leads to a decrease of the overall absorption and to
reduced bioavailabilities.
In addition, the Gastro Plus® simulations assumed higher P-gp expression levels in
lower gastrointestinal regions, especially in the colon, which is in accordance with the
results of the intestinal rat perfusion studies presented in chapter II and intestinal P-
gp distribution data from rats reported in the literature [Tamura, S., A. Ohike, et al.
(2002), Makhey, V. D., A. Guo, et al. (1998)]. This also factors into the increased
drug efflux, since the decelerated dissolution of the drug from CR dosage forms
displaces the drug release to lower regions of the GI tract. This in turn leads to
diminished estimates for the bioavailability.
The decrease in bioavailability goes in parallel with a reduction of the maximum
plasma concentration (Cmax) for the CR formulations to less than one third of the Cmax
of the IR dosage forms. Furthermore, the time until this maximum plasma
concentration is reached (t max) is approximately doubled after administration of the
CR tablet. Generally, decreases in Cmax and increases in tmax are not uncommon for
CR dosage forms and can also be observed for other controlled-release dosage
forms that are not subject to intestinal drug efflux.
Figure V.10 compares the plasma concentration-versus-time profiles simulated for
100 mg talinolol immediate-release and controlled-release tablets as displayed by the
Gastro Plus® program.
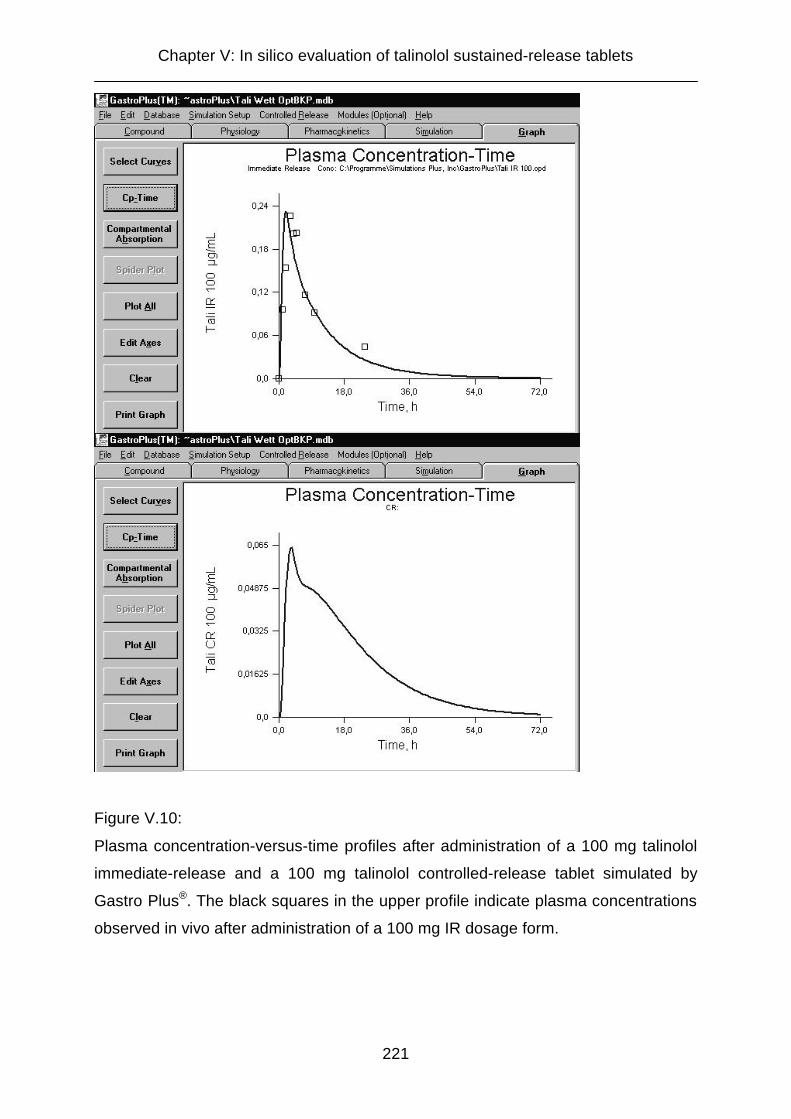
Chapter V: In silico evaluation of talinolol sustained-release tablets
221
Figure V.10:
Plasma concentration-versus-time profiles after administration of a 100 mg talinolol
immediate-release and a 100 mg talinolol controlled-release tablet simulated by
Gastro Plus®. The black squares in the upper profile indicate plasma concentrations
observed in vivo after administration of a 100 mg IR dosage form.
Chapter V: In silico evaluation of talinolol sustained-release tablets
222
The simulated plasma profile after administration of the CR formulation shows three
phases. In the first phase (0 – 4 h) the drug concentration in the blood is persistently
and rapidly increasing. In the following phase (4 – 6 h) a rapid decrease can be
observed. Finally, in the third phase (> 6 h) the decrease of the plasma levels is
decelerated.
These phases can be explained by the changes in the ratio between release of the
drug from the dosage form, absorption, distribution and elimination: Within the first
phase, drug release and absorption markedly exceed distribution to the second
compartment and elimination, provoking the steep rise of the talinolol plasma
concentrations. In the second phase, the drug release rate from the tablet decreases
due to the longer diffusion distances from the inner regions of the matrix tablet.
Additionally the drug is notably distributed into the second compartment. In
combination with a more or less unchanged absorption and elimination this leads to
the rapidly decreasing plasma concentrations. In the third phase, this decrease is
decelerated by the redistribution of drug from the second compartment.

Chapter V: In silico evaluation of talinolol sustained-release tablets
223
V.4 Conclusions
Computer simulations are a helpful tool to estimate the in vivo absorption of drugs.
For simulations with drugs exhibiting non-linear absorption patterns, it is necessary to
utilize software programs that are able to employ estimation steps that simulate the
particular mechanisms responsible for the non-linearities. Gastro Plus® is considered
to be an appropriate program to simulate the absorption of drugs that undergo
carrier-mediated transport or intestinal biotransformation. These observations are in
accordance with the assessment of Parrott and Lave, who found that Gastro Plus®
was a powerful tool in the predictions of intestinal absorption in humans [Parrott, N.
and T. Lave (2002)]. In their assessment, Gastro Plus® was compared to IDEA®,
another commercially available simulation program described in literature by Grass et
al [Grass, G. M. (1997), Norris, D. A., G. D. Leesman, et al. (2000)]. According to
Parrott et al., the advantages of Gastro Plus® include the possibility to easily adjust
model parameters and to integrate available in vitro or in vivo data to increase the
reliability of the predictions. In a test series employing 28 drugs, 70 % of the drugs
were classified correctly in terms of their fractions absorbed [Parrott, N. and T. Lave
(2002)].
For simulations of pharmacokinetic parameters of talinolol the P-gp-mediated
intestinal drug efflux plays an important role. In this case, Gastro Plus® simulations
can be optimized by employing data on the transporter properties on the one hand
and the distribution of the transporter throughout the gastrointestinal tract on the
other hand. Data on the distribution of P-gp in different sections of the
gastrointestinal tract is reported from rats [Wagner, D., H. Spahn-Langguth, et al.
(2001), Tamura, S., A. Ohike, et al. (2002), Makhey, V. D., A. Guo, et al. (1998)],
catfish [Kleinow, K. M., A. M. Doi, et al. (2000)], and micropigs [Tang, H., Y. Pak, et
al. (2002)]. However, the conclusions are controversial. Rat data suggests increasing
P-gp levels in the ileum and colon, which is in accordance with the observations in
catfish. However, in micropigs P-gp expression is reported to be higher in proximal
parts of the small intestine as compared to distal portions.
As long as reliable in vivo data from humans are not available, neither for the
transporter parameters, Km and Vmax, nor for the distribution of P-gp in the
gastrointestinal tract, simulations are to some extent uncertain.

Chapter V: In silico evaluation of talinolol sustained-release tablets
224
Overall, it can be concluded that in silico estimations can not completely replace in
vivo tests. Even complex models are not able to reflect the in vivo situation
completely. A clinical study in humans is useful to confirm the estimates of the
simulations.
Therefore, prearrangements for a clinical study with the newly developed sustained-
release tablets (cp. chapter III) are in progress. The study protocol and the request
for approval of the study by the local ethics committee are attached in Annex II.
Finally, a comparison between the results of the in vivo study and the in silico
simulations will determine the quality of the in silico predictions. Furthermore, an in
vivo evaluation of talinolol controlled-release dosage forms can be helpful to further
optimize parameters (e.g. Km and Vmax for the P-gp efflux) used as input for the in
silico predictions and thus minimize uncertainties of in silico simulations for P-gp
substrates in the future.

Summary
225
Summary
Intestinal drug efflux mediated by transporters located in the gastrointestinal tract,
such as P-glycoprotein (P-gp), is a known source of incomplete and variable
bioavailability, as well as of interactions with other drugs and food components.
However, there are no publications, which deal with arising consequences for the
design of new peroral formulations. The aim of this doctoral thesis was to point out
that the occurrence of intestinal secretion has to be accounted for in the development
of controlled-release dosage forms.
For this purpose, effective permeabilities of the model compound talinolol were
determined for different intestinal segments (jejunum, ileum and colon) employing an
intestinal perfusion model in rats. Increasing passive permeabilities were detected
from jejunum to ileum and colon. Perfusion experiments with P-gp inhibitors added to
the perfusion solutions suggested an increasing role of the P-gp mediated drug efflux
in more distal parts of the gastrointestinal tract (jejunum < ileum < colon).
Furthermore, a sustained-release formulation was developed for the model drug
talinolol. The matrix tablet releases the drug rather consistently within approximately
eight hours, without being relevantly affected by changing pH values within the
gastrointestinal tract. In this context, it was demonstrated that the selection of the
type of buffer used as media in dissolution tests had a pronounced influence on the
drug release. The formation of different talinolol crystal structures in different buffers
was detected as source for this unexpected phenomenon.
The newly developed sustained-release matrix tablets were evaluated in silico, i.e.
with the aid of a suitable computer software program with which pharmacokinetic
parameters and plasma levels can be predicted. Amongst others, the use of Gastro
Plus®, the software employed, enables to simulate both, a modified drug release from
the dosage form and a saturable intestinal drug efflux mediated by transporters such
as P-gp.
The interplay between decelerated drug release from the dosage form and intestinal
drug efflux led to a considerably decreased bioavailability of the model drug talinolol
from sustained-release tablets in the in silico predictions compared to immediate-
release dosage forms. This decrease in bioavailability can be explained by the slower
exposure of the intestinal lumen to the drug. As a consequence, the saturation level
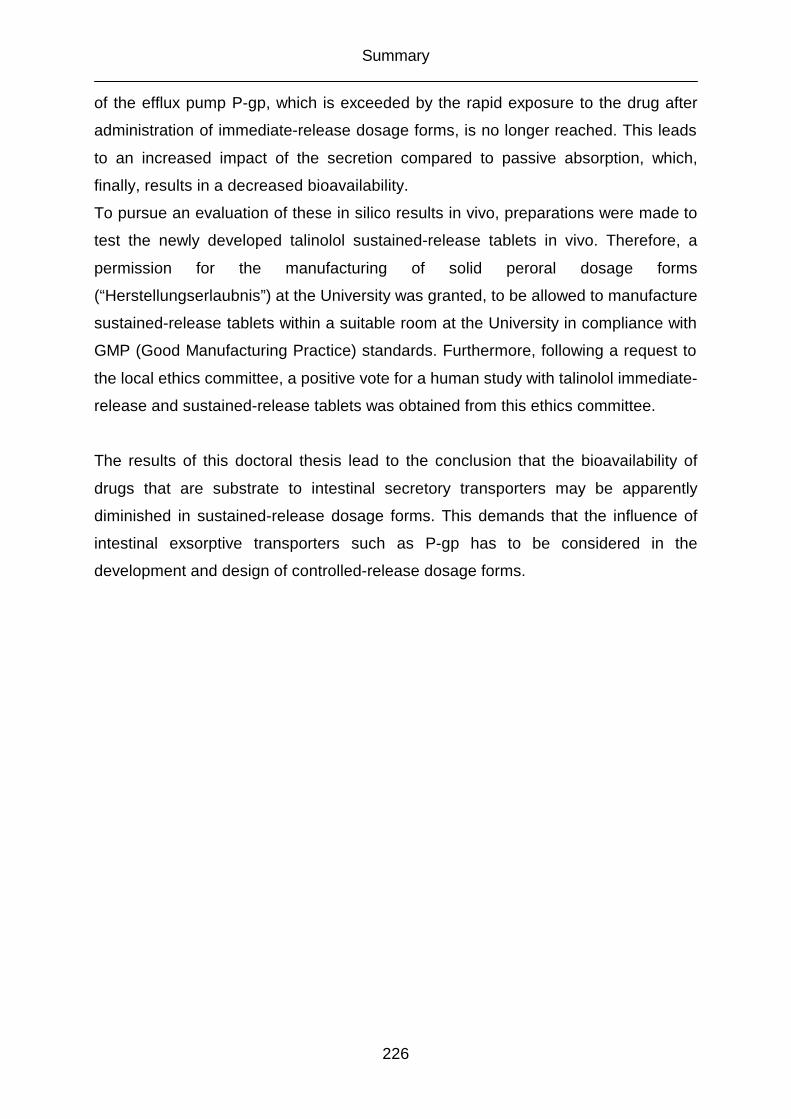
Summary
226
of the efflux pump P-gp, which is exceeded by the rapid exposure to the drug after
administration of immediate-release dosage forms, is no longer reached. This leads
to an increased impact of the secretion compared to passive absorption, which,
finally, results in a decreased bioavailability.
To pursue an evaluation of these in silico results in vivo, preparations were made to
test the newly developed talinolol sustained-release tablets in vivo. Therefore, a
permission for the manufacturing of solid peroral dosage forms
(“Herstellungserlaubnis”) at the University was granted, to be allowed to manufacture
sustained-release tablets within a suitable room at the University in compliance with
GMP (Good Manufacturing Practice) standards. Furthermore, following a request to
the local ethics committee, a positive vote for a human study with talinolol immediate-
release and sustained-release tablets was obtained from this ethics committee.
The results of this doctoral thesis lead to the conclusion that the bioavailability of
drugs that are substrate to intestinal secretory transporters may be apparently
diminished in sustained-release dosage forms. This demands that the influence of
intestinal exsorptive transporters such as P-gp has to be considered in the
development and design of controlled-release dosage forms.

Zusammenfassung
227
Zusammenfassung
Die Sekretion von Arzneistoffen aus Darmzellen zurück ins Darmlumen, die durch im
Gastrointestinaltrakt lokalisierte Transporter wie P-Glykoprotein (P-GP) vermittelt
wird, stellt eine bekannte Quelle sowohl für unvollständige und variable
Bioverfügbarkeiten, als auch für Interaktionen mit anderen Arzneimitteln und
Nahrungsbestandteilen dar. Dennoch liegen bisher keine Veröffentlichungen vor, die
sich mit daraus resultierenden Konsequenzen für die Entwicklung neuer peroraler
Darreichungsformen befassen. Ziel der vorliegenden Arbeit war es, deutlich zu
machen, dass dem Auftreten von intestinalen Sekretionsphänomenen bei der
Entwicklung von Retardarzneimitteln Rechnung getragen werden muss.
Dazu wurden anhand eines Rattendarmperfusionsmodells effektive Permeabilitäten
für den Modellarzneistoff Talinolol in unterschiedlichen Darmabschnitten (Jejunum,
Ileum und Colon) bestimmt. Die effektive passive Permeabilität stieg vom Jejunum
über das Ileum zum Colon an. Versuche unter Zusatz von P-GP-Hemmern in den
Perfusionslösungen deuteten auf eine stärkere Rolle der intestinalen Sekretion in
tieferen Darmabschnitten hin (Jejunum < Ileum < Colon).
Des weiteren wurde eine Retardmatrixtablette für den Modellarzneistoff Talinolol
entwickelt, die den Wirkstoff über ca. acht Stunden relativ unabhängig von den
wechselnden pH Werten im Gastrointestinaltrakt freigibt. Dabei wurde gezeigt, dass
die Auswahl der Pufferart für die Prüfflüssigkeiten entscheidenden Einfluss auf die
Wirkstofffreisetzung hat. Als Ursache für diesen unerwarteten Effekt konnte die
Ausbildung unterschiedlicher Talinolol-Kristallstrukturen in verschiedenen Puffern
ausgemacht werden.
Die neu entwickelten Retardmatrixtabletten wurde in silico, das heißt mit Hilfe eines
geeigneten Computersoftwareprogrammes, mit dem pharmakokinetische Parameter
sowie Blutspiegelkurven vorhergesagt werden können, evaluiert. Unter Verwendung
des Computerprogramms Gastro Plus® war es möglich, sowohl veränderte
Wirkstofffreigabegeschwindigkeiten aus einer Arzneiform als auch eine sättigbare
intestinale Sekretion durch Transporter wie P-GP zu simulieren.
Die Computersimulationen mit schnell- und langsamfreisetzenden
Talinololzubereitungen ergaben eine verringerte Bioverfügbarkeit bei verlangsamter
Wirkstofffreigabe. Die erniedrigte Bioverfügbarkeit kann dadurch erklärt werden, dass

Zusammenfassung
228
die verringerte Wirkstofffreigabegeschwindigkeit zu einem langsameren Anfluten des
Arzneistoffs und damit zu niedrigeren Arzneistoffkonzentrationen in den intestinalen
Flüssigkeiten führt. Dies hat zur Folge, dass die Sättigungsgrenze des sekretorischen
Transporters P-GP, die beim raschen Anfluten des Wirkstoffs nach Gabe
schnellfreisetzender Arzneiformen überschritten wird, nicht mehr erreicht wird.
Dadurch steigt der Einfluss der Sekretion im Vergleich zur passiven Absorption an
und die insgesamt in den Blutkreislauf absorbierte Menge an Arzneistoff sinkt.
Um eine Bestätigung dieser Hypothese in vivo zu ermöglichen, wurden im Rahmen
dieses Dissertationsprojekts die Voraussetzungen dafür geschaffen, die entwickelte
Talinolol-Retardformulierung in vivo zu testen. Dazu wurde eine
Herstellungserlaubnis von der zuständigen Landesbehörde erhalten, um die
Retardtabletten in einem geeigneten Herstellungsraum an der Universität unter GMP
(Good Manufacturing Practice) konformen Bedingungen produzieren zu können.
Außerdem wurde das Einverständnis der zuständigen Ethik-Kommission für eine
klinische Studie mit schnell- und retardiert-freisetzenden Talinololtabletten erhalten.
Für die Entwicklung von Retardarzneiformen ergibt sich aus der vorliegenden Arbeit,
dass beim Auftreten von intestinaler Sekretion die Bioverfügbarkeit entsprechender
Retardpräparate entscheidend absinken kann. Daher sollte bei Arzneistoffen, für die
Retardarzneiformen entwickelt werden sollen, der Einfluß intestinaler sekretorischer
Transporter wie P-GP unbedingt berücksichtigt werden.

Annex I: Production of clinical trial formulations according to the rules of Good
Manufacturing Practice (GMP) in university laboratories
229
Annex I

Annex I: Production of clinical trial formulations according to the rules of Good
Manufacturing Practice (GMP) in university laboratories
230
Annex I
Production of clinical trial formulations according to the rules of
Good Manufacturing Practice (GMP) in university laboratories
AI.1 Introduction
The manufacture of dosage forms to be used either for the treatment of diseases or
the testing of dosage forms to be used in clinical trials requires a prescription by an
authorized medical doctor which is subsequently filled by a pharmacist in a public or
hospital pharmacy. Alternatively, the drug product may be manufactured by a
pharmaceutical manufacturer (“Pharmazeutischer Unternehmer”) under the
conditions and rules of the principles of Good Manufacturing Practice. A
pharmaceutical manufacturer must have been approved and - in most cases -
inspected by the regulatory authorities of his country of origin and / or by the
authorities of the country the pharmaceutical product shall be exported to. Since a
university laboratory cannot be accredited as a public or hospital pharmacy, the only
feasible alternative in order to produce formulations to be evaluated in clinical trials is
to seek for regulatory approval as pharmaceutical manufacturer and to obtain official
permission of manufacture (“Herstellungserlaubnis”) for defined dosage forms in the
university laboratories.
The permission implies that its holder assures that all products manufactured at his
site comply with the three basic requirements for pharmaceuticals: quality, efficacy
and safety.
Efficacy and safety of a drug substance have to be proven in clinical studies. In the
present project, efficacy and safety of the investigated drug talinolol have been
shown in several clinical studies. The drug has been approved by regulatory
authorities [de Mey, C., V. Schroeter, et al. (1995), Fachinformation Cordanum, AWD
Pharma Dresden, (2001)].
Quality has to be ensured by the manufacturer for all drug products produced at his
manufacturing sites.
Annex I: Production of clinical trial formulations according to the rules of Good
Manufacturing Practice (GMP) in university laboratories
231
Figure A.1 points out different aspects of quality, efficacy and safety of drug products
and describes the respective responsibilities. The duties of the authorities include the
surveillance of all parties involved in any process of the development, the
manufacturing and the dispensary of drug products.
Surveillance of the manufacturer
Quality of the product
Manufacturer
Approval Holder
Pharmacist
Approval
Safety of the dispensary
Efficacy and safety of the drug substance
Surveillance of pharmacies
Authorities
Allowance for production
Figure A.1:
Different aspects of quality, efficacy and safety of pharmaceuticals and
responsibilities of parties involved in the processes.
Annex I: Production of clinical trial formulations according to the rules of Good
Manufacturing Practice (GMP) in university laboratories
232
AI.2 Regulatory aspects of manufacture and handling of drug products in
Germany
A regulatory basis for the production and handling of pharmaceutical products in
Germany is the German law on pharmaceuticals (Arzneimittelgesetz, AMG) passed
in 1976. After fundamental revisions the version published December 11, 1998 is still
valid with several modifications, the latest being published August 21, 2002.
The law is structured in 18 sections with 98 paragraphs and several additional
transition regulations [Paul-Ehrlich-Institut, 10. Arzneimittelgesetz, (2002),
www.pei.de/downloads/10amg.pdf].
Of special interest in this context are the second, the third and the eighth section.
The second section including paragraphs 5 to 12 is dealing with requirements for
drug products, including rules for their labelling.
In the third section (§§ 13 to 20a) regulations for the production of pharmaceuticals
are published and section eight (§§ 54 to 55a) includes the aspects of quality
assurance and quality control of drug products.
In paragraph 13 it is determined that - apart from pharmacies, hospitals and
veterinaries – an institution which intends to produce pharmaceuticals will have to
have a particular permission from the responsible authorities.
In the case of the University of Mainz, for example, the responsibility lies with the
Department of Social Affairs, Youth and Provision, a Division of the Federal
Administration of Rheinland-Pfalz (Landesamt für Soziales, Jugend und Versorgung,
Schießgartenstraße 6, D-55116 Mainz).
Annex I: Production of clinical trial formulations according to the rules of Good
Manufacturing Practice (GMP) in university laboratories
233
Paragraph 14 describes the requirements mandatory to receive this permission:
• A production manager and a quality control manager, both with certain
expertises (cp. paragraph 15), as well as a marketing manager, need to be
nominated.
• The production and quality control manager both must demonstrate reliability
and personal integrity by an official certificate (“Polizeiliches
Führungszeugnis”) stating that they did not seriously violate German laws
previously.
• The production and quality control manager have to fulfill their duties
permanently.
• Production and control laboratories have to fulfill certain standards.
The expertises needed for the position of a production manager and a quality control
manager are outlined in paragraph 15:
• They need to be either approbated pharmacists by training or, in case they
have obtained a university degree in chemistry, biology, human medicine or
veterinary medicine, they have to demonstrate additional university training on
twelve particular pharmacy-related topics, e.g. pharmaceutical chemistry,
microbiology, pharmacology and pharmaceutical technology.
• They need to demonstrate practical experience during a minimum of two years
in the production or quality testing of pharmaceuticals.
Paragraph 54 authorizes the German Ministry of Health to enact ordinances that
assure the proper handling and the required quality of drugs and drug products.
According to this paragraph the Ordinance for Pharmaceutical Entrepreneurs
(Betriebsverordnung für Pharmazeutische Unternehmer, PharmBetrV), including 20
paragraphs, was enacted in 1985. It is still valid today with several modifications
[Bundesgesundheitsministerium, Betriebsverordnung für Pharmazeutische
Unternehmer, (1998), www.bmgesundheit.de/downloads-gesetze/arzneimittel/
pharma/pharma.pdf]. It is of vital importance for anyone who wants to produce
pharmaceuticals.
Annex I: Production of clinical trial formulations according to the rules of Good
Manufacturing Practice (GMP) in university laboratories
234
The following list presents an insight into the contents of this ordinance:
§1a Quality assurance system
§2 Staff
§3 Appearance, size and equipment of rooms
§ 4 Hygienic requirements
§ 5 Production
§ 6 Quality Testing
§ 8 Storage
§10 Packaging
§ 11 Labelling
§ 12 Production and quality testing by order
§ 14 Reclamations
§ 15 Documentation
§ 15a Self-inspection
In essence, this ordinance implements the basic principles of the Good
Manufacturing Practice (GMP) Guidelines into German law.
Already in 1968 the World Health Organisation (WHO) published GMP guidelines in
order to implement basic quality standards in the production of pharmaceuticals
worldwide. The GMP guidelines were revised and published by the WHO in 1992
[WHO, GMP Guidelines, (1992), www.who.int/medicines/organization/qsm/activities/
qualityassurance/gmp/gmpcover.html].
Also the European Union (EU) has published their own version of GMP guidelines in
1989. In addition, the Pharmaceutical Inspection Convention (PIC), an international
federation of authorities, dealing with the supervision of the production of drug
products, released the same EU-GMP guidelines with identical wording in the same
year. The underlying reason for publishing the identical guideline by two different
organisations was to broaden the basis for GMP rules since the PIC also includes
several non EU member states. The WHO and the EU / PIC versions of these
guidelines do not have the same wording, but the basic principles are identical, they
are so-called “consonant”.
The current member states of the European Union (EU) and the Pharmaceutical
Inspection Convention (PIC) are summarized in Table A.1:

Annex I: Production of clinical trial formulations according to the rules of Good
Manufacturing Practice (GMP) in university laboratories
235
Table A.1:
Comparison of the current member states of the EU and the PIC.
EU
member states
PIC
member states
Austria Australia
Belgium Austria
Denmark Belgium
Finland Canada
France Czech Republic
Germany Denmark
Greece Finland
Ireland France
Italy Germany
Luxembourg Greece
Portugal Hungary
Spain Iceland
Sweden Ireland
The Netherlands Italy
United Kingdom Liechtenstein
Malaysia
Norway
Portugal
Romania
Singapore
Slovak Republic
Spain
Sweden
Switzerland
The Netherlands
United Kingdom

Annex I: Production of clinical trial formulations according to the rules of Good
Manufacturing Practice (GMP) in university laboratories
236
A guideline which is released by an international organisation, such as the WHO or
PIC; represents initially only a recommendation without being legally binding for the
member states. However, as soon as a guideline is being translated into laws and
ordinances of a state, its content becomes legally binding within that particular state.
Ordinances usually are more precise than laws and can be enacted by the
administration whereas laws need to be enacted by the parliament as legislative. All
ordinances need to be authorised by a corresponding law.
The upper part of Figure A.2 describes the general procedure of implementing
international guidelines into national laws and ordinances, the special case of
implementing GMP into German law is shown below.

Annex I: Production of clinical trial formulations according to the rules of Good
Manufacturing Practice (GMP) in university laboratories
237
Legally binding
EU, PIC, WHO
Legislative
Ordinance
Law
Guideline
Executive
Legally binding
EU, PIC, WHO
Bundestag / Bundesrat
PharmBetrV
AMG (§ 54)
GMP Guideline
Ministry of Health(BMG)
Figure A.2:
The pathway during which a guideline is implemented into legally binding laws and
ordinances in general (upper figure) and with respect to the GMP guidelines (lower
figure).
Annex I: Production of clinical trial formulations according to the rules of Good
Manufacturing Practice (GMP) in university laboratories
238
Apart from guidelines, the European Union can also release directly legally binding
regulations that need no further implementation in national laws (e.g. Commission
Regulation 1964/2002/EC on marketing standards for olive oil, Commission
Regulation 1937/2002/EC on a procedure for the establishment of maximum residue
limits of veterinary medicinal products in foodstuffs of animal origin), decisions that
are binding for those to whom they are addressed (i.e. any or all EU member states,
enterprises or individuals) without the need of an implementation into national
legislation (e.g. Commission Decision 2002/75/EC on the import from third countries
of star anise), and directives that have to be implemented in national laws within a
specified time limit (e.g. Commission Directive 2002/67/EC on the labelling of
foodstuffs containing quinine, and of foodstuffs containing caffeine, Commission
Directive 2002/82/EC laying down specific purity criteria on food additives other than
colours and sweeteners). There are also EU guidelines which are not implemented in
national law and are as such not legally binding. However, since they describe the
current state of the scientific knowledge that authorities refer to during inspections
they need to be followed unless one has convincing justifications not to observe
these guidelines.
Table A.2 lists the index of the PIC / EU GMP guideline, which consists of 9 chapters
[Eudralex, EU GMP guidelines, (2002), http://pharmacos.eudra.org/F2/eudralex/vol-
4/home.htm].

Annex I: Production of clinical trial formulations according to the rules of Good
Manufacturing Practice (GMP) in university laboratories
239
Table A.2:
Index of the PIC / EU GMP guideline.
Chapter 1: Quality assurance system
Chapter 2: Staff
Chapter 3: Rooms and equipment
Chapter 4: Documentation
Chapter 5: Production
Chapter 6: Quality control
Chapter 7: Production and quality testing by order
Chapter 8: Reclamations and products recall
Chapter 9: Self-inspection
A comparison with the paragraphs of the ordinance for pharmaceutical entrepreneurs
(PharmBetrV) shows that all topics of the chapters of the GMP guideline are also
handled in this ordinance.
In addition to the basic GMP guideline several annexes dealing with specific drug
products and particular issues were published by EU and PIC. Table A.3 lists all
currently published annexes [Eudralex, EU GMP guidelines, (2002),
http://pharmacos.eudra.org/F2/eudralex/vol-4/home.htm].
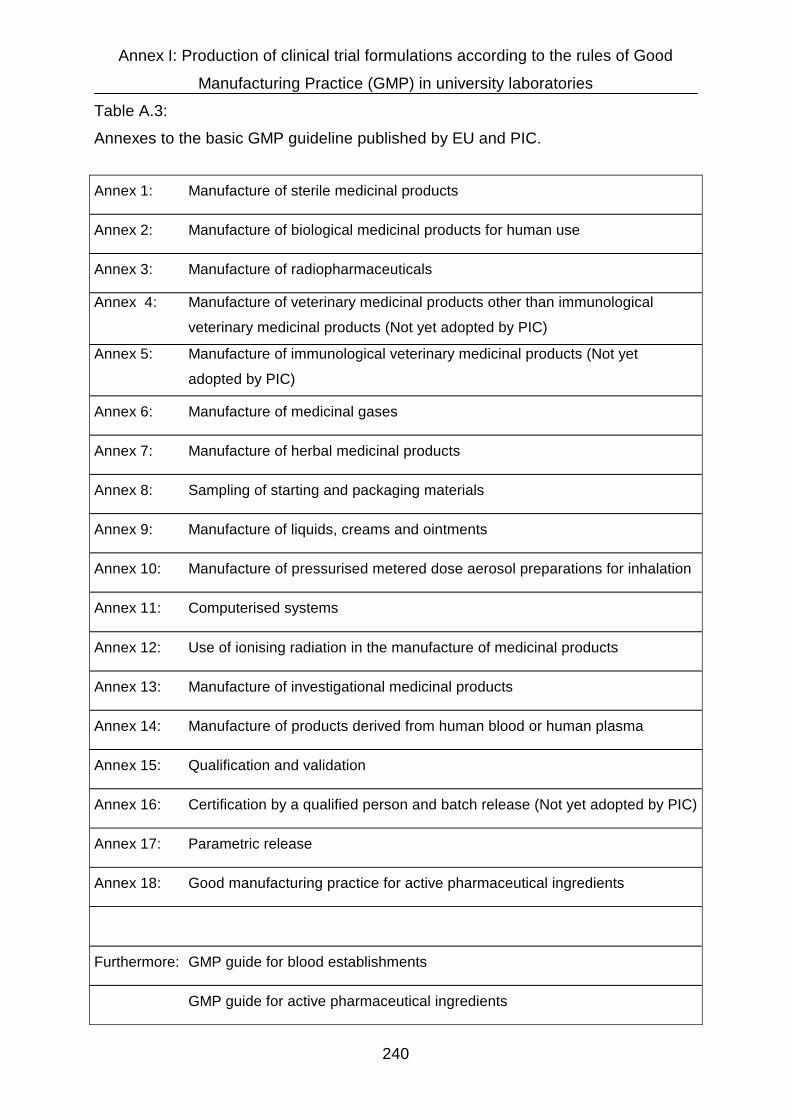
Annex I: Production of clinical trial formulations according to the rules of Good
Manufacturing Practice (GMP) in university laboratories
240
Table A.3:
Annexes to the basic GMP guideline published by EU and PIC.
Annex 1: Manufacture of sterile medicinal products
Annex 2: Manufacture of biological medicinal products for human use
Annex 3: Manufacture of radiopharmaceuticals
Annex 4: Manufacture of veterinary medicinal products other than immunological
veterinary medicinal products (Not yet adopted by PIC)
Annex 5: Manufacture of immunological veterinary medicinal products (Not yet
adopted by PIC)
Annex 6: Manufacture of medicinal gases
Annex 7: Manufacture of herbal medicinal products
Annex 8: Sampling of starting and packaging materials
Annex 9: Manufacture of liquids, creams and ointments
Annex 10: Manufacture of pressurised metered dose aerosol preparations for inhalation
Annex 11: Computerised systems
Annex 12: Use of ionising radiation in the manufacture of medicinal products
Annex 13: Manufacture of investigational medicinal products
Annex 14: Manufacture of products derived from human blood or human plasma
Annex 15: Qualification and validation
Annex 16: Certification by a qualified person and batch release (Not yet adopted by PIC)
Annex 17: Parametric release
Annex 18: Good manufacturing practice for active pharmaceutical ingredients
Furthermore: GMP guide for blood establishments
GMP guide for active pharmaceutical ingredients
Annex I: Production of clinical trial formulations according to the rules of Good
Manufacturing Practice (GMP) in university laboratories
241
Of particular interest for an implementation of GMP in university laboratories is Annex
15, which deals with basic principles of qualification and validation processes.
AI.3 Basic GMP principles
One fundamental issue of GMP is documentation. Every work that has been
performed has to be documented, otherwise it is regarded as if it had not occurred.
A close documentation is vital for the following reasons:
• Retraceability of all elements of the production and quality control process.
• Quality assurance of production, storage, labelling and laboratory controls.
• Control of the personell involved in the production and quality control process.
• Motivation of the staff.
• Proof that the production and all related processes were performed in
accordance to GMP rules and other regulations.
• Standardisation of the production and quality control processes.
• Ensure a regular education and training of all persons involved in production,
quality control, cleaning or maintenance processes.
An important module in the field of documentation is the so-called SOP. SOP stands
for Standard Operating Procedure and means a document that exactly describes an
operating sequence in written form. Such operating sequences can be, for example,
the handling of an instrument, a certain step in the production of pharmaceuticals or
a cleaning and sanitizing procedure.
Such SOPs should exist for all important steps connected with the production and
quality testing of a drug product. In one SOP the appearance of all SOPs and their
general structure should be settled.

Annex I: Production of clinical trial formulations according to the rules of Good
Manufacturing Practice (GMP) in university laboratories
242
Two further crucial aspects connected to GMP are qualification and validation.
Qualification means that all devices used for the production of pharmaceuticals
need to be qualified for their usage.
One differentiates between Design Qualification (DQ), Installation Qualification (IQ),
Operational Qualification (OQ), Performance Qualification (PQ) and Maintenance
Qualification (MQ).
• Design Qualification means to establish that equipment meets all requirements
for the predetermined process concerning technical as well as GMP and
regulatory aspects.
• Installation Qualification means to provide documented evidence that
equipment was installed according to its specifications.
• Operational Qualification means to provide documented evidence that
equipment performs according to vendor claims and purchase specifications.
• Performance Qualification means to provide documented evidence that a
system performs as designed and reproducibility of results is ensured. This
can also be called Process Qualification.
• Maintenance Qualification means to provide documented evidence of regular
maintenance, calibration and performance testing.
“To provide documented evidence” means that the person who has performed a
particular task documents everything he or she does. Certificates for standards and
references have to be attached to the document.
Performance qualification of a scale, for example, means that a person tests, whether
the scale determines weights correctly and reproducibly. It is necessary to measure a
series of weights to cover the whole mass range of the scale. To proof reproducibility,
the same weights must be weighed several times. The weights used for this test
series need to be reference weights, their exact weight must be certified by a bureau
of standards. Documented evidence for the proper function of the scale is provided
by setting up a document, in which the person who performed the qualification of the
scale, writes down all weighings he did. Deviations between the measured values
and the labelled values of the reference weights have to be reported and, if the
deviations do not succeed specified values, it can be stated that the scale is
qualified. The date of the qualification has to be reported within the document. All
Annex I: Production of clinical trial formulations according to the rules of Good
Manufacturing Practice (GMP) in university laboratories
243
inscriptions in the qualification document must be confirmed by the signature of the
respective person. Certificates for the reference weights must be attached to the
document.
Figure A.3 visualizes the life-cycle of an instrument with respect to the necessity of
qualification:

Annex I: Production of clinical trial formulations according to the rules of Good
Manufacturing Practice (GMP) in university laboratories
244
Delivery
Maintenance Qualification
Design Qualification
Installation Qualification
Operational Qualification
Performance Qualification
Validated
Use
Maintenance,
Repair
Out of
Commission
Figure A.3:
The life-cycle of an instrument demonstrating the different steps of qualification.
After a particular time of validated use the instrument has to be maintained. As long
as the instrument is still working within its specifications it can be used again after a
maintenance qualification, otherwise it is taken out of commission. In addition,
malfunction of the instrument can be a reason to take the instrument out of
commission, otherwise it has to be repaired. If successful repair is possible, the
instrument can be used again after a maintenance qualification, an operational
qualification and a performance qualification. In case of irreparability, the instrument
has to be taken out of commission.
Annex I: Production of clinical trial formulations according to the rules of Good
Manufacturing Practice (GMP) in university laboratories
245
Whereas qualification refers to equipment, validation mainly refers to procedures,
which includes the handling of equipment.
Validation generally means to provide documented evidence that a process
consistently leads to reliable results.
For the production process of pharmaceuticals the following definition issued by the
American Food and Drug Administration (FDA) is more precise [FDA, Guideline on
general principles of process validation, (1987), www.fda.gov/cdrh/ode/425.pdf].
Validation means “establishing documented evidence which provides a high degree
of assurance that a specific process will constantly produce a product meeting its
predetermined specifications and quality attributes.”
Inherent and implicit in this definition of validation is the concept of the proper
interpretation and applications of the GMP principles to each system or subsystem,
so that the facility, when fully operational, will consistently meet GMP requirements.
Validation applies to systems, processes, and programs that support the
manufacturing process. To exceed GMP requirements means that minimum
standards, described in the GMP guidelines, are more than fulfilled, e.g. when a
peroral drug product is manufactured under sterile conditions or when calibration or
education intervals are shorter than required.
Another term in this context important for the handling of measuring instruments is
calibration.
Calibration means the determination of the deviation of the value indicated by a
measuring instrument from the correct value. For this purpose, an object whose
values are exactly known, a so-called standard, is measured with the instrument to
be calibrated, and the deviation of the reading from the known value is determined.
The result and the respective uncertainty of measurement are recorded in a
calibration certificate.
Furthermore GMP makes high demands on the premises and personnel.
Premises must be located, designed, constructed, adapted and maintained to
minimize build-up of dirt, dust and cross-contamination. Effective cleaning has to be
permitted and any adverse effects on quality need to be eliminated.
Annex I: Production of clinical trial formulations according to the rules of Good
Manufacturing Practice (GMP) in university laboratories
246
Personnel has to be present in sufficient numbers to ensure that the quality of a drug
product is not endangered by an overburdened staff. People involved in any step of
the process of producing pharmaceuticals need to be qualified for their jobs, they
need to be educated in how to act conforming with GMP principles and need to meet
the hygienic requirements.
An organisation scheme should exist pointing out the tasks and responsibilities of
each staff member.
Closely connected to premises and personnel is the aspect of hygiene.
Hygiene is vital for the production of microbiologically unobjectionable drug products.
All hygienic measurements which have to be taken must be listed in a hygiene plan,
in which each task is described, as well as the frequency of its execution and the
persons responsible for it. Examples for such hygienic measurements are cleaning
and sanitizing of floors and instruments, hand washing and disinfection or waste
removal.
Annex I: Production of clinical trial formulations according to the rules of Good
Manufacturing Practice (GMP) in university laboratories
247
AI.4 Precise steps for the implementation of GMP in university laboratories
AI.4.1 General considerations
In order to implement GMP principles and practices in selected laboratories at the
Institute of Pharmacy of the University of Mainz and to receive a permission for the
production of defined pharmaceuticals, several measurements had to be taken.
Initially a decision had to be taken on the type of dosage forms intended to be
produced. Different requirements exist for various groups of dosage forms, such that
authorities grant permissions only restricted to one or more particular groups of
dosage forms.
These groups are generally based on the aggregate state of the dosage form, such
that subdivisions into solid, liquid, and semi-solid dosage forms are performed.
Furthermore, the production and handling of some pharmaceuticals requires special
attention with respect to safety and quality such as antibiotics, anti-cancer drug
products or injectibles. Therefore for these groups special permissions are needed.
Since it was planned to develop and produce peroral controlled-release dosage
forms, it was aimed at an allowance for the production of solid peroral
pharmaceuticals, which includes the permission for the production of powders,
granules, tablets and capsules.
AI.4.2 Documentation-related measures
AI.4.2.1 Room concept
For the elaboration of a suitable room concept, rooms had to be defined for the
preparation and quality control of ingredients and raw materials, for the actual
production of the pharmaceuticals and for the quality control of the finished product.
A flow chart had to be created outlining the material flow during these processes.

Annex I: Production of clinical trial formulations according to the rules of Good
Manufacturing Practice (GMP) in university laboratories
248
Room CProduction
Room AQuality Control
Room BQuality Control
Room AStorage of Product
Room CPackaging
Room BSubstance Tests
Room BSubstance Storage
Room ASubstance Receipt
Room ASubstance Tests
Room DSubstance Tests
Figure A.4 depicts this chart in a generalised version for four imaginary rooms A, B,
C, and D:
Figure A.4:
Material flow during the production and quality control of pharmaceuticals at the
University of Mainz, Institute of Pharmacy.
Annex I: Production of clinical trial formulations according to the rules of Good
Manufacturing Practice (GMP) in university laboratories
249
All raw materials, intermediate products and final products have to be transported
between the rooms outlined in Figure A.4 in a sealed box. A label must display the
date of the sealing and the name of the person that sealed the box. To exclude
opening and relocking of the seals, sealing pliers pressing the letters “JGU” for
Johannes Gutenberg-University on the seal are used. These pliers are locked up in a
steel locker inaccessible to unauthorized persons.
AI.4.2.2 Personal structure
An organigram describing the personal structure of all people involved in the
production and quality control processes had to be created. It is displayed in Figure
A.5 in anonymous form :

Annex I: Production of clinical trial formulations according to the rules of Good
Manufacturing Practice (GMP) in university laboratories
250
Production and Distribution Manager
Presidentof the Johannes Gutenberg University Mainz
Quality Control Manager
Quality Assurance Agent
Staff for Production and Quality Control of the Pharmaceuticals
Figure A.5:
Structure of personnel involved in production and quality control of pharmaceuticals
at the Institute of Pharmacy of the Johannes Gutenberg- University Mainz.
Key positions in this chart are the production manager and the quality control
manager that need to be independent of each other. The position of the distribution
manager was fulfilled by the production manager as well, which complies with the
regulations [AMG § 14 (2)].
Apart from the quality control manager according to AMG §§ 14 and 15, a quality
assurance agent had to be appointed. He / She is responsible for the implementation
and realisation of a quality assurance system according to PharmBetrV § 1a.
For a production company, an insurance would have to be named covering costs
arising from damages in connection with the produced pharmaceuticals. The
university, however, is a public body and therefore self-liable for losses, damages

Annex I: Production of clinical trial formulations according to the rules of Good
Manufacturing Practice (GMP) in university laboratories
251
and risks associated with the production of pharmaceuticals. Consequently, the
president of the Johannes Gutenberg-University, being its representative, is pointed
out at the head of the personal structure chart.
AI.4.2.3 Standard Operating Procedures (SOP`s)
Standard Operating Procedures (SOP´s) had to be written for all critical steps in the
production and quality control of the manufactured products. The SOP`s were
marked with letters and numbers to arrange them in proper order.
SOP`s dealing with the handling of instruments and devices were labelled with the
letter “G” (abbreviation of the German term “Geräte”) plus a two digit number
characteristic for the sequence of their appearance.
SOP`s with an initial letter “R” describe cleaning procedures, whereas an initial letter
“V” characterizes SOP`s associated with the production and quality control process of
pharmaceuticals. “R” refers to the German term for cleaning “Reinigung”. “V” stands
for “Verfahren”, the German word for processes or procedures.
Table A.4 lists the titles of currently available SOP`s and their identification codes:
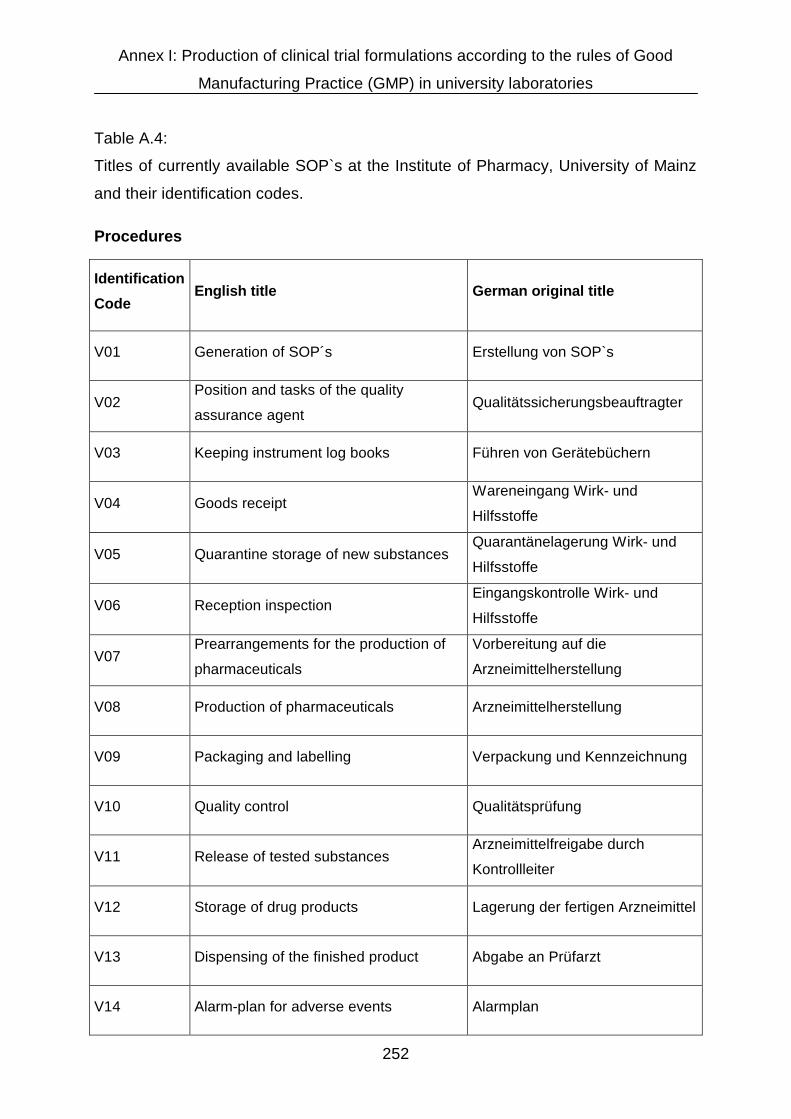
Annex I: Production of clinical trial formulations according to the rules of Good
Manufacturing Practice (GMP) in university laboratories
252
Table A.4:
Titles of currently available SOP`s at the Institute of Pharmacy, University of Mainz
and their identification codes.
Procedures
Identification
Code English title German original title
V01 Generation of SOP´s Erstellung von SOP`s
V02 Position and tasks of the quality
assurance agent Qualitätssicherungsbeauftragter
V03 Keeping instrument log books Führen von Gerätebüchern
V04 Goods receipt Wareneingang Wirk- und
Hilfsstoffe
V05 Quarantine storage of new substances Quarantänelagerung Wirk- und
Hilfsstoffe
V06 Reception inspection Eingangskontrolle Wirk- und
Hilfsstoffe
V07 Prearrangements for the production of
pharmaceuticals
Vorbereitung auf die
Arzneimittelherstellung
V08 Production of pharmaceuticals Arzneimittelherstellung
V09 Packaging and labelling Verpackung und Kennzeichnung
V10 Quality control Qualitätsprüfung
V11 Release of tested substances Arzneimittelfreigabe durch
Kontrollleiter
V12 Storage of drug products Lagerung der fertigen Arzneimittel
V13 Dispensing of the finished product Abgabe an Prüfarzt
V14 Alarm-plan for adverse events Alarmplan

Annex I: Production of clinical trial formulations according to the rules of Good
Manufacturing Practice (GMP) in university laboratories
253
Instruments
Code English title German original title
G01
Dissolution tester
Dissolutionstester PharmaTest
PTW S III
G02
Laboratory blender Laborreaktor IKA LR 250
G03
Scale Waage Sartorius Typ 2254
Cleaning
Code English title German original title
R01 Cleaning of the laboratory
blender
Laborreaktor-Reinigung (IKA
LR 250)
R02 Cleaning of glass ware and
sieves
Glasgeräte-, Siebe-,
Reibschalen-Reinigung
R03 Cleaning of drying ovens Trockenschrank Reinigung
R04 Extraordinary cleaning of the
production room
Generalreinigung nach
Praktikumsende
All SOP`s are stored in a lockable steel locker together with a list of all available
SOP`s. SOP`s that are needed on site to allow SOP-compliant operations are copied
and positioned at the specific sites. Such copies need to be authorised and itemised
in the list mentioned above.
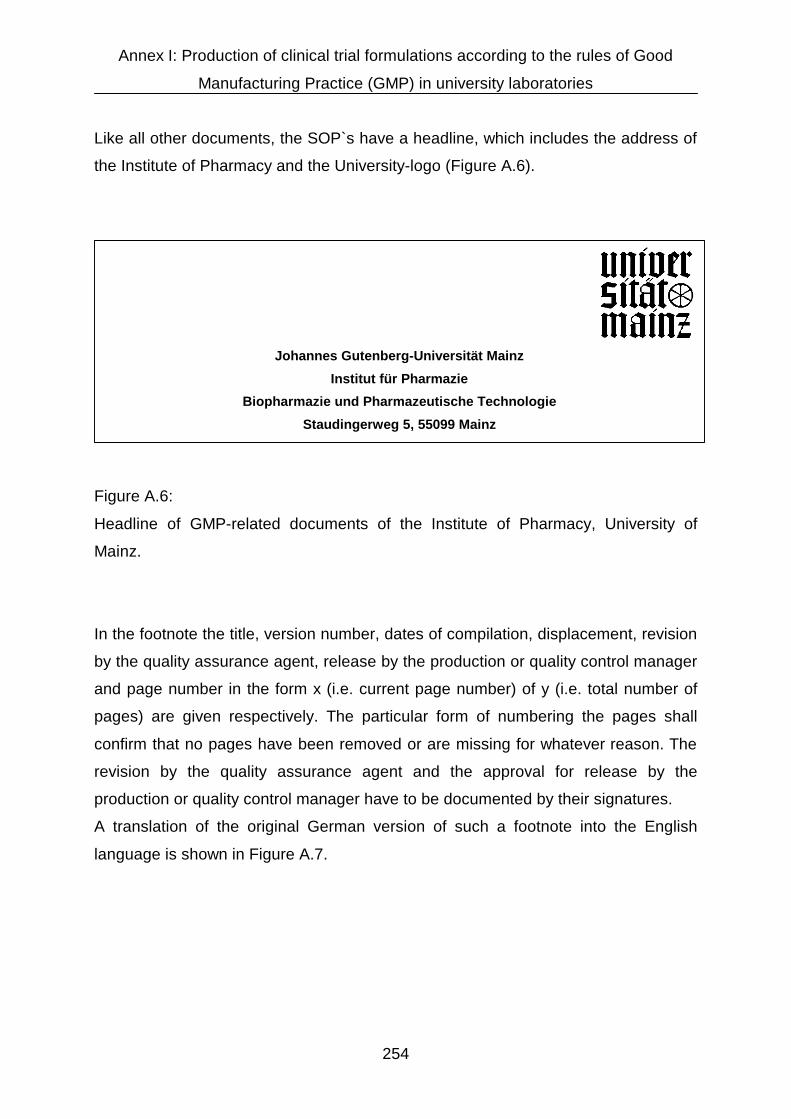
Annex I: Production of clinical trial formulations according to the rules of Good
Manufacturing Practice (GMP) in university laboratories
254
Johannes Gutenberg-Universität Mainz
Institut für Pharmazie
Biopharmazie und Pharmazeutische Technologie
Staudingerweg 5, 55099 Mainz
Like all other documents, the SOP`s have a headline, which includes the address of
the Institute of Pharmacy and the University-logo (Figure A.6).
Figure A.6:
Headline of GMP-related documents of the Institute of Pharmacy, University of
Mainz.
In the footnote the title, version number, dates of compilation, displacement, revision
by the quality assurance agent, release by the production or quality control manager
and page number in the form x (i.e. current page number) of y (i.e. total number of
pages) are given respectively. The particular form of numbering the pages shall
confirm that no pages have been removed or are missing for whatever reason. The
revision by the quality assurance agent and the approval for release by the
production or quality control manager have to be documented by their signatures.
A translation of the original German version of such a footnote into the English
language is shown in Figure A.7.
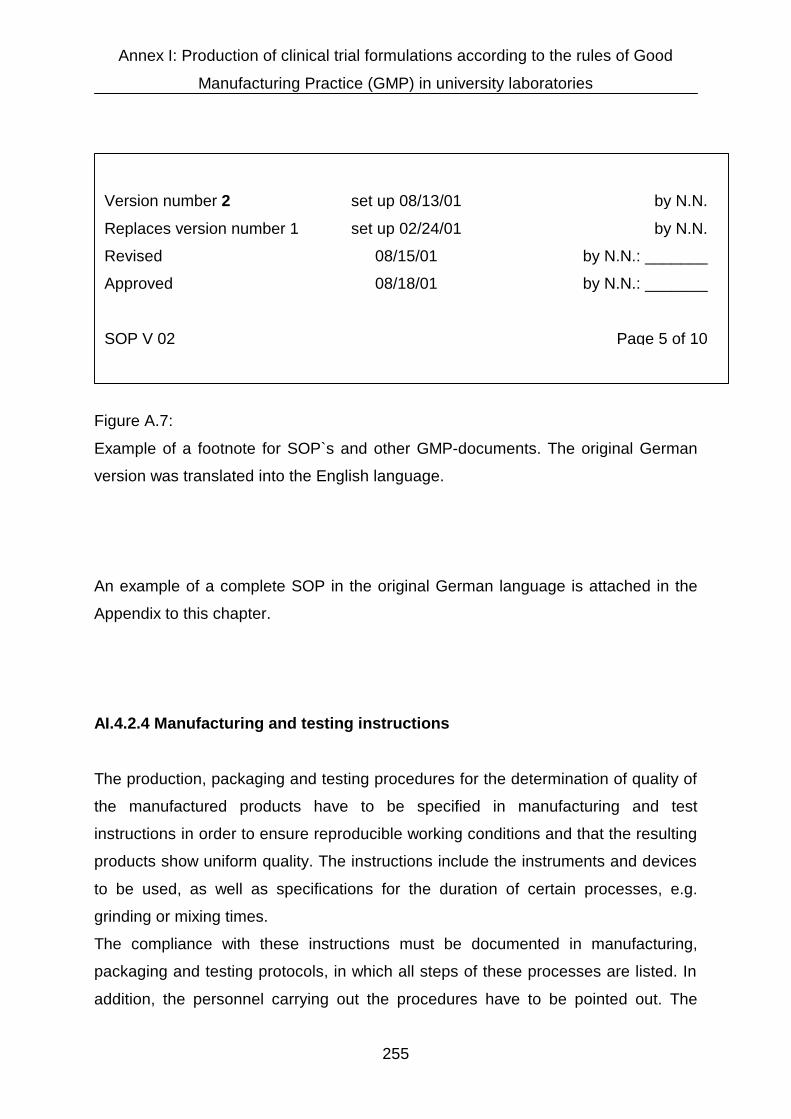
Annex I: Production of clinical trial formulations according to the rules of Good
Manufacturing Practice (GMP) in university laboratories
255
Version number 2 set up 08/13/01 by N.N.
Replaces version number 1 set up 02/24/01 by N.N.
Revised 08/15/01 by N.N.: _______
Approved 08/18/01 by N.N.: _______
SOP V 02 Page 5 of 10
Figure A.7:
Example of a footnote for SOP`s and other GMP-documents. The original German
version was translated into the English language.
An example of a complete SOP in the original German language is attached in the
Appendix to this chapter.
AI.4.2.4 Manufacturing and testing instructions
The production, packaging and testing procedures for the determination of quality of
the manufactured products have to be specified in manufacturing and test
instructions in order to ensure reproducible working conditions and that the resulting
products show uniform quality. The instructions include the instruments and devices
to be used, as well as specifications for the duration of certain processes, e.g.
grinding or mixing times.
The compliance with these instructions must be documented in manufacturing,
packaging and testing protocols, in which all steps of these processes are listed. In
addition, the personnel carrying out the procedures have to be pointed out. The
Annex I: Production of clinical trial formulations according to the rules of Good
Manufacturing Practice (GMP) in university laboratories
256
correct performance of each step needs to be documented by the person involved.
The person has to certify this in writing by stating the date and signature.
An example manufacturing instruction as well as a manufacturing protocol for talinolol
controlled-release tablets, both in German, can be found in the Appendix to this
chapter.
AI.4.3 Personnel and education
Only qualified personnel may be recruited for the production and testing of
pharmaceuticals. All members involved in the process need to be listed in a separate
document including their qualifications, areas of responsibility and their signatures.
Together with this document, copies of certificates proving the qualification of the
personnel employed are stored.
Semi-annual GMP educations were introduced in order to assure that persons in
contact with rooms and instruments for the production and quality control of
pharmaceuticals are informed about the basic GMP rules as well as the specific
requirements in conjunction with the production and testing of pharmaceuticals
intended for human use at the Institute of Pharmacy, Johannes Gutenberg-University
Mainz.
The participants of these educational training sessions have to be listed as well as
the topics of the particular educational exercise. The attendance of the participants
needs to be confirmed by their signature.
Besides the personnel directly involved in the manufacture and quality control of
pharmaceuticals, the cleaning personnel for the production and packaging rooms
needs to be educated regularly on the specific cleaning requirements for these rooms
and the documentation of the cleaning process.

Annex I: Production of clinical trial formulations according to the rules of Good
Manufacturing Practice (GMP) in university laboratories
257
AI.4.4 Specific requirements for the production and packaging room
The room for the production and packaging (Room C in Figure A.4) consists of an
anteroom and the actual production and packaging room, which are seperated by a
glass sliding door. The function of the anteroom is to act as a buffer zone between
the actual production and packaging room and the outside atmosphere. During the
transfer of material or personnel, this helps to keep the production and packaging
area free from infiltrating dirt.
Particular requirements with respect to the constructive elements of the room include
a coverage of the ceiling with flat, non porous material that can be cleaned with water
and a coverage of the ceiling lamp with a plastic chip guard to prevent particulate
material of the neon lamp from contaminating the drug product in case of lamp
malfunction (ex- or implosion).
According to the hygiene plan and the SOP “Prearrangements for the production of
pharmaceuticals”, which are both posted in the anteroom, persons who intend to
enter the actual production and packaging room have to change clothes and fulfil the
required sanitizing procedures within the anteroom.
Clothing requirements include a clean lab coat, a disposable facemask, a cap, gloves
and shoe covers. For the storage of street clothes a locker was positioned in the
anteroom.
Dispensers for hand disinfection solutions and soap were installed at the wash basin.
Only authorized persons are allowed to enter the production and packaging room,
consequently it has to be kept locked unless somebody is working inside. In addition,
a sign at the door has to point out that unauthorized persons may not enter. Another
sign indicates whether a production of pharmaceuticals takes place in the room at the
moment or not.
Authorized persons entering this room have to pay attention that the main entrance
door as well as the intermediate sliding door are closed directly after passing through.
Annex I: Production of clinical trial formulations according to the rules of Good
Manufacturing Practice (GMP) in university laboratories
258
In addition, the windows have to be kept closed at all times. Appropriate signs at the
doors and windows are pointing this out. It must be documented in the production
protocol that the windows were definitely closed during the entire production and
packaging process of pharmaceuticals. This also includes the preceding disinfection
process.
Persons performing work in this production and packaging area have to document
their presence with name, date, performed activities and signature in a room log
book, which is positioned in the anteroom of the production and packaging area. The
pages of this book must be numbered in order to prevent pages from being
unintentionally or intentionally removed.
For the production and packaging room a hygiene plan had to be set up, which
describes all cleaning and sanitizing procedures. The plan describes methods,
intervals, cleaning material and responsibilities for the different processes, e.g. hand
washing, disinfection of technical devices or the cleaning of the floor.
A copy of the original hygiene plan in German language is attached in the Appendix
to this chapter.
The hygienic status of the room including surfaces of instruments, furniture, walls and
windows is monitored regularly by means of surface sampling tests with Rodac
(Replicate Organism Detection And Counting) Plates (Becton Dickinson, Franklin
Lakes, USA) or Hygicult microbial indicators (Orion Diagnostica, Espoo, Finland).
Rodac plates are surface contact plates containing trypticase soy agar and
polysorbate 80. They are recommended for the detection of microorganisms on non-
porous surfaces. The microbiological status can be monitored by counting colony
forming units on the plates after a specified time of incubation.
Hygicult consists of plastic hinged slides covered on both sides with an agar growth
medium. Each slide is stored in its own sterile vial. Sampling and inoculation are
done by pressing the slide onto the surface to be tested, by transferring the sample
directly from sterile swabs or by dipping the slide into fluids. Following incubation, the
microbiological status of raw materials, production facilities or finished products can
Annex I: Production of clinical trial formulations according to the rules of Good
Manufacturing Practice (GMP) in university laboratories
259
be determined by comparing the colony density on the agar slide against the density
shown on a model chart provided with the Hygicult kit.
AI.4.5 Analytical instruments and test apparatus
For all instruments employed in the production and quality control process, log books
are established. In these log books all maintenance, repair and calibration work is
documented as well as all measurements or tests performed. The recordings need to
include the date and the name of the person fulfilling a particular task.
Analytical instruments such as UV-Vis spectrophotometer, IR spectrometer and
HPLC device must be calibrated.
The temperature of the water bath of the dissolution tester is calibrated against a
thermometer certified by a German bureau of standards. In accordance with the
instructions of the European Pharmacopeia, the position of the water bath and the
rotational speed and immersion depth of the paddles are calibrated regularly as well.
Scales are maintained by a service agent of the manufacturing company annually.
Monthly and before every use for the production of pharmaceuticals they are tested
for accuracy using a set of standard weights.

Annex I: Production of clinical trial formulations according to the rules of Good
Manufacturing Practice (GMP) in university laboratories
260
AI.5 Summary
To assure the quality of pharmaceuticals the manufacturer has to follow a number of
rules and regulations, amongst which the GMP rules are of particular importance.
The implementation of these basic rules of Good Manufacturing Practice at a
university laboratory is described in this chapter.
In addition to a number of constructional and technical measures, appropriate
documentation had to be established. Following several discussions with
representatives of the local authorities the allowance for the production of solid oral
dosage forms was granted on April 19, 2001. It is since then possible to produce
tablets and capsules to be used in clinical studies in the designated university
laboratories. A copy of the allowance certificate is attached in the Appendix to this
chapter.
Annex I: Production of clinical trial formulations according to the rules of Good
Manufacturing Practice (GMP) in university laboratories
261
AI.6 Appendix to Annex I
The following documents appear in this Appendix, all in the original German format:
Ø Example of an SOP (SOP V 01: SOP on how to set up SOP`s).
Ø Hygiene Plan for the production and packaging room.
Ø Manufacturing instruction for the production of talinolol controlled-release
tablets containing 100 mg talinolol (HV 001).
Ø Manufacturing protocol for the production of talinolol controlled-release tablets
containing 100 mg talinolol (HP 001).
Ø Certificate permitting the production of solid oral dosage forms at the Institute
of Pharmacy of the Johannes Gutenberg-University, Mainz, from the
authorities of Rheinland-Pfalz (copy, without attachments).

Johannes Gutenberg-Universität Mainz
Institut für Pharmazie
Biopharmazie und Pharmazeutische Technologie
Staudingerweg 5, 55099 Mainz
Version-Nr. 1 erstellt am 13.02.01 von D. Wagner
Ersetzt Version Nr. - erstellt am - von -
Geprüft am _______ von A. Braun _______
Freigegeben am _______ von P. Langguth _______
SOP V 01 Seite 1 von 4
SOP Standardarbeitsanweisung
SOP V 01
Titel:
SOP über die Verfahrensweise bei der Erstellung von
Standardarbeitsanweisungen (SOP`s)

Johannes Gutenberg-Universität Mainz
Institut für Pharmazie
Biopharmazie und Pharmazeutische Technologie
Staudingerweg 5, 55099 Mainz
Version-Nr. 1 erstellt am 13.02.01 von D. Wagner
Ersetzt Version Nr. - erstellt am - von -
Geprüft am _______ von A. Braun _______
Freigegeben am _______ von P. Langguth _______
SOP V 01 Seite 2 von 4
SOP über die Verfahrensweise bei der Erstellung von
Standardarbeitsanweisungen (SOP`s)
Zielsetzung:
Sicherstellung einer ordnungsgemäßen Erstellung und Aufbewahrung
von Standardarbeitsanweisungen (SOP`s).
Standardarbeitsanweisungen, im Folgenden als SOP`s bezeichnet, sind für alle
wichtigen Verfahrensschritte bei der Herstellung und Prüfung von Arzneimitteln,
sowie die dafür benötigten Geräte zu erstellen.
Die Kopfzeile besteht aus der Anschrift des Institutes für Pharmazie und dem Logo
der Johannes Gutenberg-Universität Mainz, die Fußzeile weist das Erstelldatum, das
Datum der letzten Änderung, das Datum der Prüfung sowie das der Freigabe der
SOP aus und die jeweils durchführende Person aus. Seitenzahlen werden
entsprechend dem Schema „Seite x von y“ in Bezugnahme auf die Gesamtseitenzahl
des Dokumentes angegeben Auf einem Deckblatt ist der Titel der SOP ersichtlich,
die Zielsetzung der SOP wird am Beginn der SOP kurz umrissen. In den Texten der
Johannes Gutenberg-Universität Mainz
Institut für Pharmazie
Biopharmazie und Pharmazeutische Technologie
Staudingerweg 5, 55099 Mainz
Version-Nr. 1 erstellt am 13.02.01 von D. Wagner
Ersetzt Version Nr. - erstellt am - von -
Geprüft am _______ von A. Braun _______
Freigegeben am _______ von P. Langguth _______
SOP V 01 Seite 3 von 4
SOP sind die durchzuführenden Tätigkeiten oder Benutzungsanweisungen klar und
eindeutig zu formulieren.
Jede SOP erhält eine Nummer, anhand derer sie – zusammen mit der
entsprechenden Versionsnummer – eindeutig identifizierbar ist.
Alle erstellten SOP`s werden zentral in einem Aktenschrank gelagert. Soweit
erforderlich befindet sich am Ort der Nutzung eines entsprechenden Gerätes bzw.
der Durchführung der beschriebenen Tätigkeit ein Duplikat der entsprechenden SOP.
Änderungen einer SOP bedürfen einer erneuten Prüfung durch den
Qualitätssicherungsbeauftragten sowie die Freigabe durch den Herstellungs- oder
Kontrollleiter. Wurde eine SOP überarbeitet, so ist dies im Änderungsindex, der jeder
SOP angefügt ist, unter Angabe des Änderungsgrundes und des Gültigkeitsbeginns
der neuen SOP zu dokumentieren. Nicht mehr gültige SOP`S werden nicht entsorgt,
sondern in einem Ordner mit der Aufschrift „Archivierung nicht mehr gültiger SOP`s“
katalogisiert.
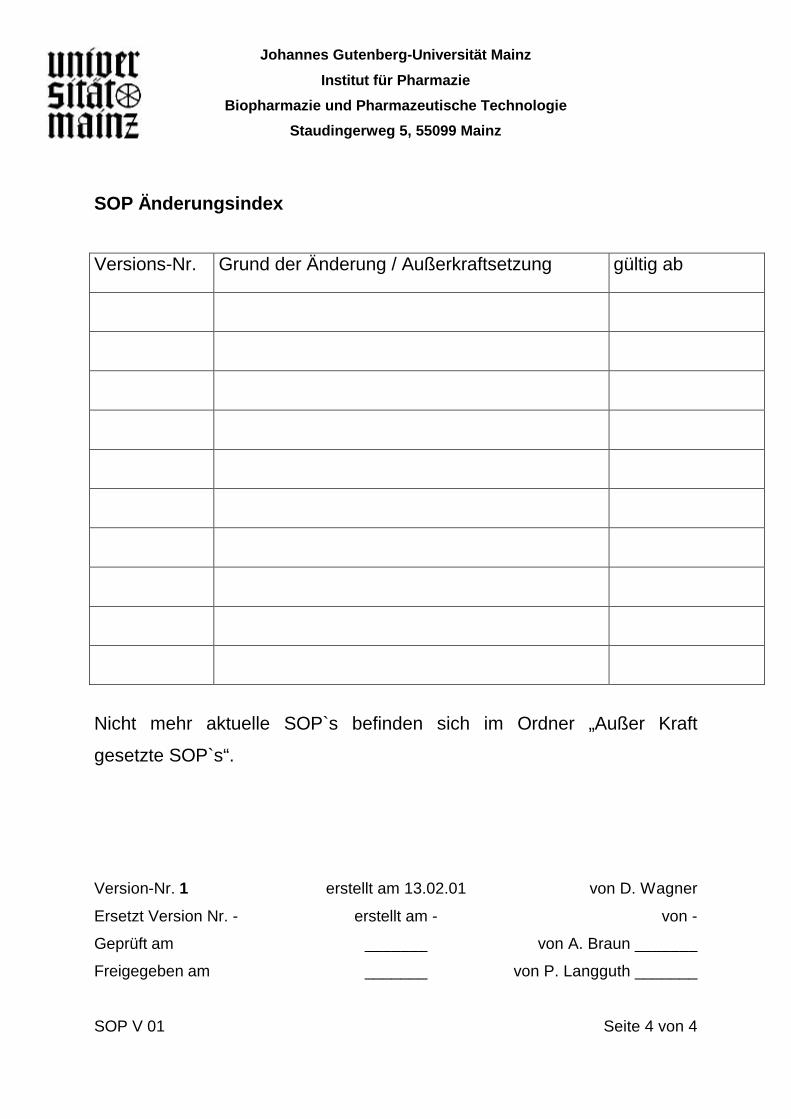
Johannes Gutenberg-Universität Mainz
Institut für Pharmazie
Biopharmazie und Pharmazeutische Technologie
Staudingerweg 5, 55099 Mainz
Version-Nr. 1 erstellt am 13.02.01 von D. Wagner
Ersetzt Version Nr. - erstellt am - von -
Geprüft am _______ von A. Braun _______
Freigegeben am _______ von P. Langguth _______
SOP V 01 Seite 4 von 4
SOP Änderungsindex
Versions-Nr. Grund der Änderung / Außerkraftsetzung gültig ab
Nicht mehr aktuelle SOP`s befinden sich im Ordner „Außer Kraft
gesetzte SOP`s“.
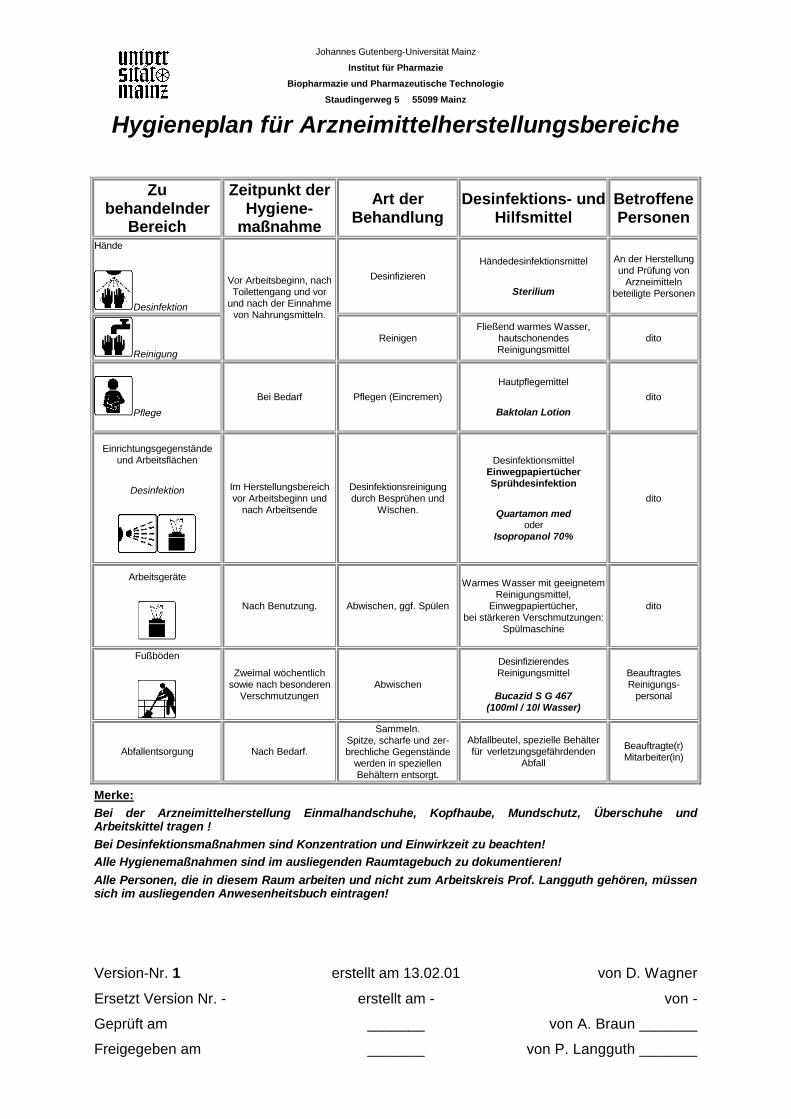
Johannes Gutenberg-Universität Mainz
Institut für Pharmazie
Biopharmazie und Pharmazeutische Technologie
Staudingerweg 5 55099 Mainz
Version-Nr. 1 erstellt am 13.02.01 von D. Wagner
Ersetzt Version Nr. - erstellt am - von -
Geprüft am _______ von A. Braun _______
Freigegeben am _______ von P. Langguth _______
Hygieneplan für Arzneimittelherstellungsbereiche
Zu behandelnder
Bereich
Zeitpunkt der Hygiene-
maßnahme
Art der Behandlung
Desinfektions- und Hilfsmittel
Betroffene Personen
Hände
Desinfektion
Desinfizieren Händedesinfektionsmittel
Sterilium
An der Herstellung und Prüfung von
Arzneimitteln beteiligte Personen
Reinigung
Vor Arbeitsbeginn, nach Toilettengang und vor
und nach der Einnahme von Nahrungsmitteln.
Reinigen Fließend warmes Wasser,
hautschonendes Reinigungsmittel
dito
Pflege Bei Bedarf Pflegen (Eincremen)
Hautpflegemittel
Baktolan Lotion dito
Einrichtungsgegenstände und Arbeitsflächen
Desinfektion
Im Herstellungsbereich vor Arbeitsbeginn und
nach Arbeitsende Desinfektionsreinigung durch Besprühen und
Wischen.
Desinfektionsmittel Einwegpapiertücher Sprühdesinfektion
Quartamon med oder
Isopropanol 70%
dito
Arbeitsgeräte
Nach Benutzung. Abwischen, ggf. Spülen Warmes Wasser mit geeignetem
Reinigungsmittel, Einwegpapiertücher,
bei stärkeren Verschmutzungen: Spülmaschine
dito
Fußböden
Zweimal wöchentlich sowie nach besonderen
Verschmutzungen Abwischen
Desinfizierendes Reinigungsmittel
Bucazid S G 467
(100ml / 10l Wasser)
Beauftragtes Reinigungs-
personal
Abfallentsorgung Nach Bedarf. Sammeln.
Spitze, scharfe und zer- brechliche Gegenstände
werden in speziellen Behältern entsorgt.
Abfallbeutel, spezielle Behälter für verletzungsgefährdenden
Abfall Beauftragte(r) Mitarbeiter(in)
Merke: Bei der Arzneimittelherstellung Einmalhandschuhe, Kopfhaube, Mundschutz, Überschuhe und Arbeitskittel tragen ! Bei Desinfektionsmaßnahmen sind Konzentration und Einwirkzeit zu beachten! Alle Hygienemaßnahmen sind im ausliegenden Raumtagebuch zu dokumentieren! Alle Personen, die in diesem Raum arbeiten und nicht zum Arbeitskreis Prof. Langguth gehören, müssen sich im ausliegenden Anwesenheitsbuch eintragen!
Johannes Gutenberg-Universität Mainz
Institut für Pharmazie
Biopharmazie und Pharmazeutische Technologie
Staudingerweg 5, 55099 Mainz
Herstellungsanweisung für klinische Prüfmuster
Präparat: Talinolol Retard-Matrix-Tabletten 100 mg
Version 1 erstellt am 20.06.02 von D. Wagner
Letzte Änderung vom - -
Geprüft am _______ von A. Braun _______
Freigegeben am _______ von P. Langguth _______
HV 001 Seite 1 von 6
Herstellvorschrift
HV 001
Talinolol Retard-Matrix-Tabletten 100 mg
Johannes Gutenberg-Universität Mainz
Institut für Pharmazie
Biopharmazie und Pharmazeutische Technologie
Staudingerweg 5, 55099 Mainz
Herstellungsanweisung für klinische Prüfmuster
Präparat: Talinolol Retard-Matrix-Tabletten 100 mg
Version 1 erstellt am 20.06.02 von D. Wagner
Letzte Änderung vom - -
Geprüft am _______ von A. Braun _______
Freigegeben am _______ von P. Langguth _______
HV 001 Seite 2 von 6
1. Zielsetzung
Diese Herstellungsanweisung beschreibt den Herstellvorgang von Talinolol Retard-
Matrix-Tabletten, mit einem Wirkstoffgehalt von 100 mg. Die Tabletten werden aus
einer Pulvermischung direkt verpresst.
2. Zusammensetzung
Für 500 Tabletten sind folgende Rohstoffe in entsprechender Menge bereitzustellen
und zu verwenden:
Pos.
Nr.
Rohstoff % Anteil g pro
Tablette
g (gesamt) Funktion
1 Talinolol 50 % 0,1 50,0 Wirkstoff
2 Eudragit® L 100-55 35 % 0,07 35 Retardierhilfsstoff:
Matrixbildner
3 Mannitol 15 % 0,03 15 Porenbildner für Matrix
Summe: 100 % 0,2 100,0
Die Bereitstellung und der Transport der benötigten Substanzen in den
Herstellungsraum hat in einer verschlossenen Box zu erfolgen. Durch eine
Johannes Gutenberg-Universität Mainz
Institut für Pharmazie
Biopharmazie und Pharmazeutische Technologie
Staudingerweg 5, 55099 Mainz
Herstellungsanweisung für klinische Prüfmuster
Präparat: Talinolol Retard-Matrix-Tabletten 100 mg
Version 1 erstellt am 20.06.02 von D. Wagner
Letzte Änderung vom - -
Geprüft am _______ von A. Braun _______
Freigegeben am _______ von P. Langguth _______
HV 001 Seite 3 von 6
Versiegelung dieser Box ist sicherzustellen, dass Manipulationen an den
Ausgangssubstanzen ausgeschlossen sind.
3. Herstellung
3.1.Rohstoffeinwaage / Einwaagekontrolle
Zu verwendende Geräte:
Waage Mettler PG 503 – SDR (Einstellung: 0,01 g Genauigkeit)
3 Kristallisierschalen aus Glas, 250 ml
Edelstahllöffel
Die Einwaagen sind nach dem Vier-Augen-Prinzip von einer zweiten Person zu
kontrollieren und gegenzeichnen zu lassen. Die Einwaage der Substanzen erfolgt in
die Kristallisierschalen.
3.2. Herstellung einer Pulvermischung
Zu verwendende Geräte:
Reibschale (25 cm Durchmesser), Kartenblatt (Kunststoff), Pistill,
Die Substanzen Pos. 1 bis 3 werden in der Reibschale vereinigt und zunächst mit
dem Kartenblatt durchmischt. Anschließend wird die Pulvermischung mit dem Pistill
verrieben.
• Mischzeit Pos. 1 bis 3 mit Kartenblatt: 7 min.
• Mischzeit Pos. 1 bis 3 mit Pistill: 7 min.
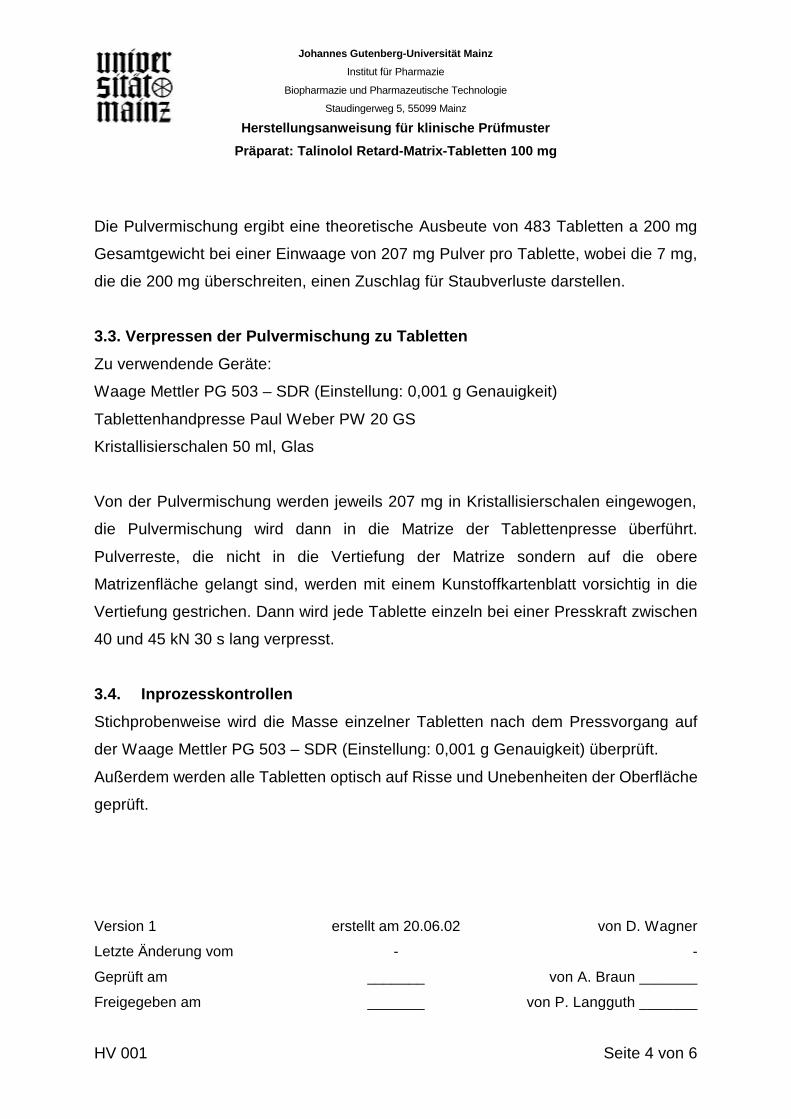
Johannes Gutenberg-Universität Mainz
Institut für Pharmazie
Biopharmazie und Pharmazeutische Technologie
Staudingerweg 5, 55099 Mainz
Herstellungsanweisung für klinische Prüfmuster
Präparat: Talinolol Retard-Matrix-Tabletten 100 mg
Version 1 erstellt am 20.06.02 von D. Wagner
Letzte Änderung vom - -
Geprüft am _______ von A. Braun _______
Freigegeben am _______ von P. Langguth _______
HV 001 Seite 4 von 6
Die Pulvermischung ergibt eine theoretische Ausbeute von 483 Tabletten a 200 mg
Gesamtgewicht bei einer Einwaage von 207 mg Pulver pro Tablette, wobei die 7 mg,
die die 200 mg überschreiten, einen Zuschlag für Staubverluste darstellen.
3.3. Verpressen der Pulvermischung zu Tabletten
Zu verwendende Geräte:
Waage Mettler PG 503 – SDR (Einstellung: 0,001 g Genauigkeit)
Tablettenhandpresse Paul Weber PW 20 GS
Kristallisierschalen 50 ml, Glas
Von der Pulvermischung werden jeweils 207 mg in Kristallisierschalen eingewogen,
die Pulvermischung wird dann in die Matrize der Tablettenpresse überführt.
Pulverreste, die nicht in die Vertiefung der Matrize sondern auf die obere
Matrizenfläche gelangt sind, werden mit einem Kunstoffkartenblatt vorsichtig in die
Vertiefung gestrichen. Dann wird jede Tablette einzeln bei einer Presskraft zwischen
40 und 45 kN 30 s lang verpresst.
3.4. Inprozesskontrollen
Stichprobenweise wird die Masse einzelner Tabletten nach dem Pressvorgang auf
der Waage Mettler PG 503 – SDR (Einstellung: 0,001 g Genauigkeit) überprüft.
Außerdem werden alle Tabletten optisch auf Risse und Unebenheiten der Oberfläche
geprüft.

Johannes Gutenberg-Universität Mainz
Institut für Pharmazie
Biopharmazie und Pharmazeutische Technologie
Staudingerweg 5, 55099 Mainz
Herstellungsanweisung für klinische Prüfmuster
Präparat: Talinolol Retard-Matrix-Tabletten 100 mg
Version 1 erstellt am 20.06.02 von D. Wagner
Letzte Änderung vom - -
Geprüft am _______ von A. Braun _______
Freigegeben am _______ von P. Langguth _______
HV 001 Seite 5 von 6
4. Reinigung und Reinigungskontrolle
Nach Gebrauch sind alle Geräte, die bei der Arzneimittelherstellung verwendet
wurden, gründlich entsprechend den jeweiligen Reinigungsanweisungen zu reinigen.
Die Reinigung ist zu protokollieren und optisch zu überprüfen (Akzeptanzkriterium:
optisch keine sichtbaren Rückstände erkennbar). Für die Reibschale und das Pistill
ist einmalig eine Reinigungsvalidierung durchzuführen, bei der das letzte
Waschwasser spektrophotometrisch auf den Restgehalt an Wirkstoff (Talinolol)
geprüft wird.
Gereinigte Geräte sind mit einem Aufkleber mit der Aufschrift „gereinigt“ zu versehen.
Der Aufklebende hat auf diesem Aufkleber das Datum des Anbringens und sein
Namenszeichen zu notieren.
Gereinigte Geräte sind ab dem Reinigungsdatum sieben Tage lang zur sofortigen
Benutzung freigegeben, werden sie erst zu einem späteren Zeitpunkt wieder
verwendet, ist eine erneute Reinigung vor einer Benutzung erforderlich.
Johannes Gutenberg-Universität Mainz
Institut für Pharmazie
Biopharmazie und Pharmazeutische Technologie
Staudingerweg 5, 55099 Mainz
Herstellungsanweisung für klinische Prüfmuster
Präparat: Talinolol Retard-Matrix-Tabletten 100 mg
Version 1 erstellt am 20.06.02 von D. Wagner
Letzte Änderung vom - -
Geprüft am _______ von A. Braun _______
Freigegeben am _______ von P. Langguth _______
HV 001 Seite 6 von 6
Liste der beigefügten Anlagen:
Titel und Thema der Anlage Beigelegt von

Johannes Gutenberg-Universität Mainz
Institut für Pharmazie
Biopharmazie und Pharmazeutische Technologie
Staudingerweg 5, 55099 Mainz
Herstellprotokoll für klinische Prüfmuster
Präparat: Talinolol Retard-Matrix-Tabletten 100 mg
HP 001 Version vom 26.06.02 Seite 1 von 8
Herstellprotokoll
HP 001
Talinolol Retard-Matrix-Tabletten 100 mg

Johannes Gutenberg-Universität Mainz
Institut für Pharmazie
Biopharmazie und Pharmazeutische Technologie
Staudingerweg 5, 55099 Mainz
Herstellprotokoll für klinische Prüfmuster
Präparat: Talinolol Retard-Matrix-Tabletten 100 mg
HP 001 Version vom 26.06.02 Seite 2 von 8
Die Herstellung erfolgt gemäß Herstellvorschrift HV 001 für Talinolol Retard-Matrix-
Tabletten 100 mg. Die Pulvermischung ergibt eine theoretische Ausbeute von 483
Tabletten a 200 mg Gesamtgewicht bei einer Einwaage von 207 mg Pulver pro
Tablette. Dabei stellen die 7 mg, die die 200 mg überschreiten, einen Zuschlag für
Staubverluste dar.
Datum der Herstellung: _______________
Chargen-Bezeichnung (Ch.-B.): _______________
1. Herstellung
1.1. Vorbereitung
Fenster und Glasschiebetür geschlossen?
ja / nein ________________
Namenszeichen
Kittel, Handschuhe, Mundschutz, Kopfhaube und Überschuhe angelegt?
ja / nein ________________
Namenszeichen
1.2. Rohstoffeinwaage für Pulvermischung
Zu verwendende Waage Letzte Kalibrierung
Mettler PG 503-SDR (0,01g)
Vorgeschriebene Waage verwendet: ______________________
Datum, Unterschrift
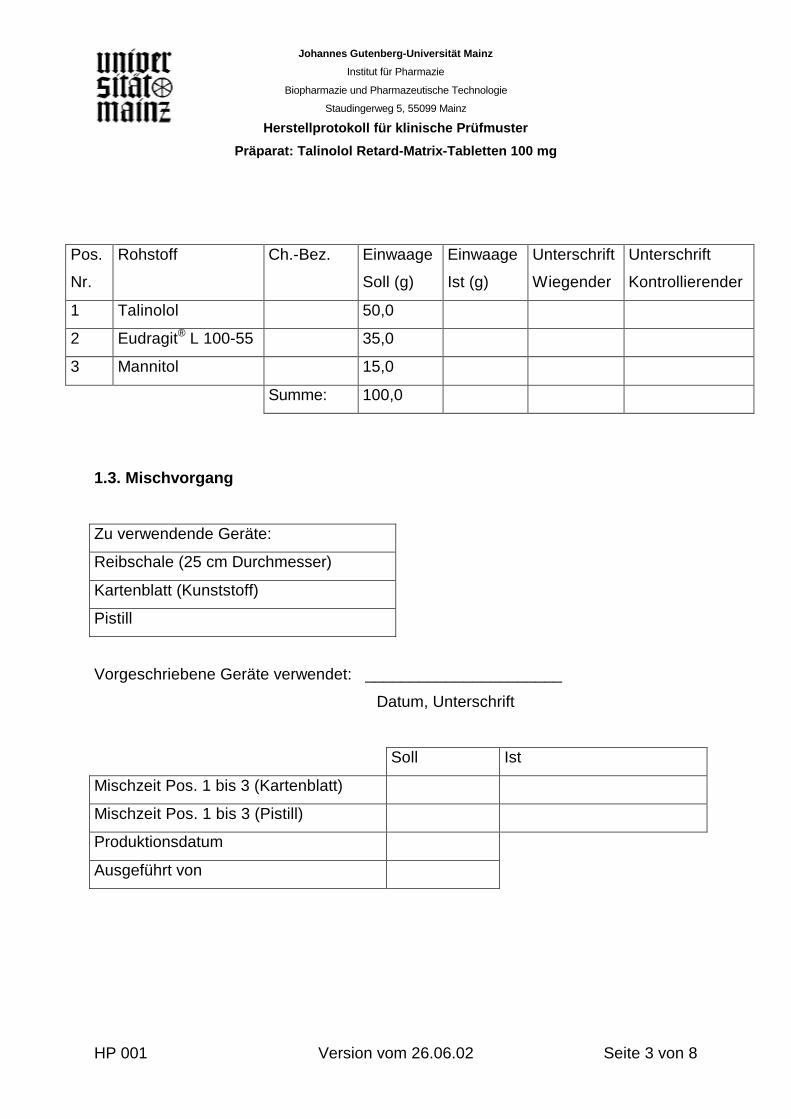
Johannes Gutenberg-Universität Mainz
Institut für Pharmazie
Biopharmazie und Pharmazeutische Technologie
Staudingerweg 5, 55099 Mainz
Herstellprotokoll für klinische Prüfmuster
Präparat: Talinolol Retard-Matrix-Tabletten 100 mg
HP 001 Version vom 26.06.02 Seite 3 von 8
Pos.
Nr.
Rohstoff Ch.-Bez. Einwaage
Soll (g)
Einwaage
Ist (g)
Unterschrift
Wiegender
Unterschrift
Kontrollierender
1 Talinolol 50,0
2 Eudragit® L 100-55 35,0
3 Mannitol 15,0
Summe: 100,0
1.3. Mischvorgang
Zu verwendende Geräte:
Reibschale (25 cm Durchmesser)
Kartenblatt (Kunststoff)
Pistill
Vorgeschriebene Geräte verwendet: ______________________
Datum, Unterschrift
Soll Ist
Mischzeit Pos. 1 bis 3 (Kartenblatt)
Mischzeit Pos. 1 bis 3 (Pistill)
Produktionsdatum
Ausgeführt von

Johannes Gutenberg-Universität Mainz
Institut für Pharmazie
Biopharmazie und Pharmazeutische Technologie
Staudingerweg 5, 55099 Mainz
Herstellprotokoll für klinische Prüfmuster
Präparat: Talinolol Retard-Matrix-Tabletten 100 mg
HP 001 Version vom 26.06.02 Seite 4 von 8
1.4. Verpressen der Pulvermischung zu Tabletten
Zu verwendende Geräte
Waage Mettler PG 503 – SDR
(Einstellung: 0,001 g Genauigkeit)
Tablettenhandpresse Paul Weber PW 20 GS
Kristallisierschalen 50 ml, Glas
Vorgeschriebene Geräte verwendet: ______________________
Datum, Unterschrift
Soll Ist
Anzahl zu verpressender Tabletten
Pulvermasse pro Tablette 207 +/- 1 mg
Masse fertige Tablette 200 +/- 7 mg
Produktionsdatum
Ausgeführt von
2. Inprozesskontrollen:
Stichproben Tablettenmassen:
Zu verwendende Waage Letzte Kalibrierung
Mettler PG 503-SDR
(0,001g)
Vorgeschriebene Waage verwendet: ______________________
Datum, Unterschrift
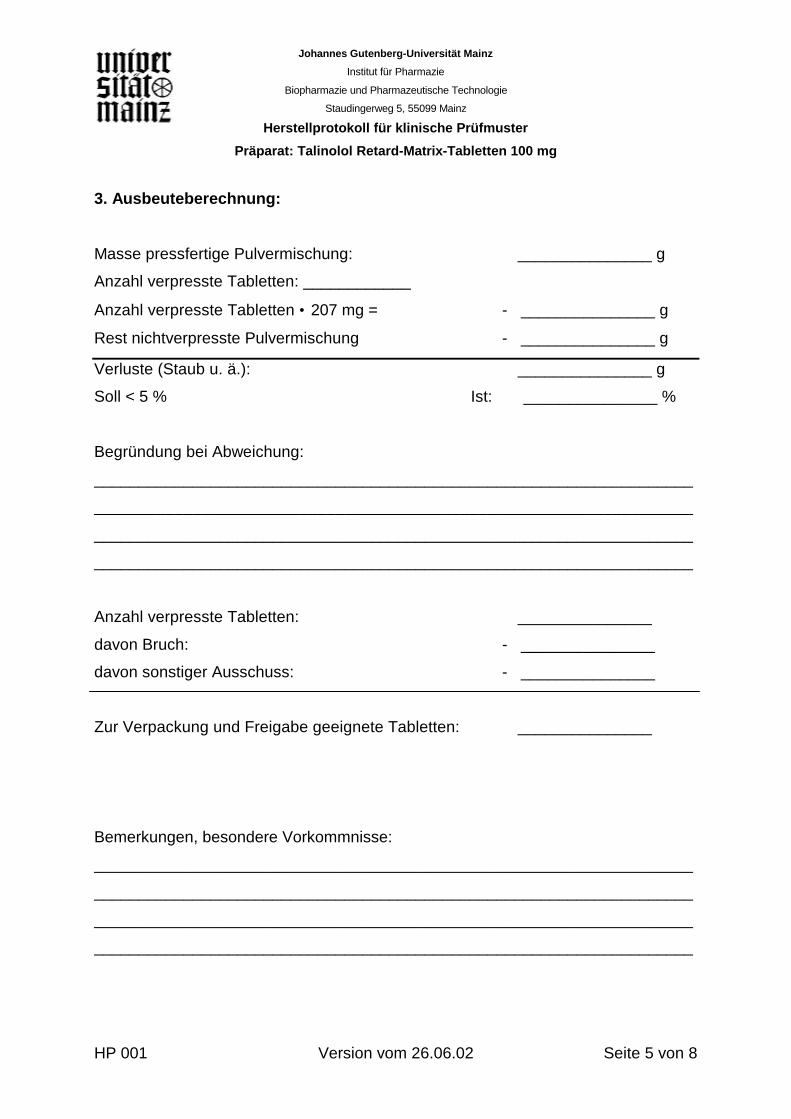
Johannes Gutenberg-Universität Mainz
Institut für Pharmazie
Biopharmazie und Pharmazeutische Technologie
Staudingerweg 5, 55099 Mainz
Herstellprotokoll für klinische Prüfmuster
Präparat: Talinolol Retard-Matrix-Tabletten 100 mg
HP 001 Version vom 26.06.02 Seite 5 von 8
3. Ausbeuteberechnung:
Masse pressfertige Pulvermischung: _______________ g
Anzahl verpresste Tabletten: ____________
Anzahl verpresste Tabletten • 207 mg = - _______________ g
Rest nichtverpresste Pulvermischung - _______________ g
Verluste (Staub u. ä.): _______________ g
Soll < 5 % Ist: _______________ %
Begründung bei Abweichung:
___________________________________________________________________
___________________________________________________________________
___________________________________________________________________
___________________________________________________________________
Anzahl verpresste Tabletten: _______________
davon Bruch: - _______________
davon sonstiger Ausschuss: - _______________
Zur Verpackung und Freigabe geeignete Tabletten: _______________
Bemerkungen, besondere Vorkommnisse:
___________________________________________________________________
___________________________________________________________________
___________________________________________________________________
___________________________________________________________________

Johannes Gutenberg-Universität Mainz
Institut für Pharmazie
Biopharmazie und Pharmazeutische Technologie
Staudingerweg 5, 55099 Mainz
Herstellprotokoll für klinische Prüfmuster
Präparat: Talinolol Retard-Matrix-Tabletten 100 mg
HP 001 Version vom 26.06.02 Seite 6 von 8
4. Reinigung und Reinigungskontrolle:
4.1. Reinigung der Geräte nach Gebrauch:
Gerät Nr. Gerät Gereinigt am Gereinigt von
1
2
3
4
5
6
7
8
4.2. Optische Prüfung der Geräte nach Reinigung:
Gerät Nr. Geprüft am Geprüft von
1
2
3
4
5
6
7
8
(Akzeptanzkriterium: optisch keine sichtbaren Rückstände erkennbar)

Johannes Gutenberg-Universität Mainz
Institut für Pharmazie
Biopharmazie und Pharmazeutische Technologie
Staudingerweg 5, 55099 Mainz
Herstellprotokoll für klinische Prüfmuster
Präparat: Talinolol Retard-Matrix-Tabletten 100 mg
HP 001 Version vom 26.06.02 Seite 7 von 8
Nachreinigung erforderlich: ja / nein )*
für Geräte Nr. _____________________
Anforderung erfüllt: ja / nein )*
für Geräte Nr._______________________________________
)* : Nichtzutreffendes streichen
Geräte freigegeben zur weiteren Verwendung:
Prüfer:______________________ Datum / Unterschrift: ______________________
Die o.g. Arzneimittel wurden gemäß der entsprechenden Herstellanweisung und
entsprechend § 5 PharmBetrV hergestellt.
Datum: _________________
Unterschrift Herstellungsleiter: ___________________________
Johannes Gutenberg-Universität Mainz
Institut für Pharmazie
Biopharmazie und Pharmazeutische Technologie
Staudingerweg 5, 55099 Mainz
Herstellprotokoll für klinische Prüfmuster
Präparat: Talinolol Retard-Matrix-Tabletten 100 mg
HP 001 Version vom 26.06.02 Seite 8 von 8
Liste der beigefügten Anlagen:
Titel und Thema der Anlage Beigelegt von


Annex II: Preparations for a human in vivo study
with talinolol sustained-release tablets
282
Annex II
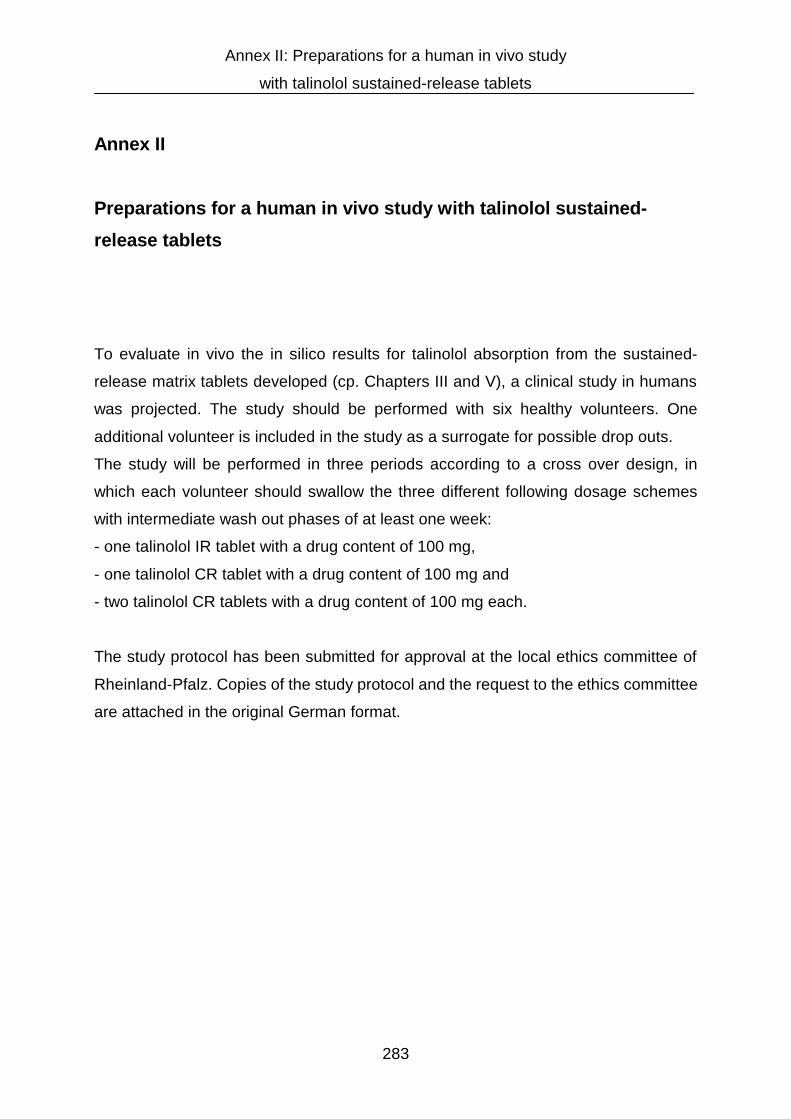
Annex II: Preparations for a human in vivo study
with talinolol sustained-release tablets
283
Annex II
Preparations for a human in vivo study with talinolol sustained-
release tablets
To evaluate in vivo the in silico results for talinolol absorption from the sustained-
release matrix tablets developed (cp. Chapters III and V), a clinical study in humans
was projected. The study should be performed with six healthy volunteers. One
additional volunteer is included in the study as a surrogate for possible drop outs.
The study will be performed in three periods according to a cross over design, in
which each volunteer should swallow the three different following dosage schemes
with intermediate wash out phases of at least one week:
- one talinolol IR tablet with a drug content of 100 mg,
- one talinolol CR tablet with a drug content of 100 mg and
- two talinolol CR tablets with a drug content of 100 mg each.
The study protocol has been submitted for approval at the local ethics committee of
Rheinland-Pfalz. Copies of the study protocol and the request to the ethics committee
are attached in the original German format.
Annex II: Preparations for a human in vivo study
with talinolol sustained-release tablets
284
Attachments
(in German original format)
- Request for approval of a clinical study with talinolol IR and CR dosage forms as
submitted to the ethics committee of Rheinland-Pfalz.
- Study protocol for a clinical study with talinolol IR and CR dosage forms.
Names, adresses and telephone numbers were partly omitted for privacy reasons.
Annex II: Preparations for a human in vivo study
with talinolol sustained-release tablets
285
Antrag an die Ethik-Kommission bei der Landesärztekammer Rheinland-
Pfalz
Allgemeine Angaben
1. Datum der Antragstellung:
12. November 2002
2. Titel des Forschungsvorhabens:
Untersuchung des Einflusses einer retardierten Freigabe auf die Absorption und
Bioverfügbarkeit intestinal sezernierter Arzneistoffe anhand von Talinolol als
Modellsubstanz
3. Verantwortlicher Studienleiter (LKP):
[Name, Funktion, Adresse]
4. Verantwortlicher Sponsor:
Eigeninitiierte und -finanzierte Studie der Universität
Initiator: Prof. Dr. P. Langguth, [Funktion, Adresse]
5. Handelt es sich um eine multizentrische Studie?
Nein
6. Sonstige Teilnehmer:
Prüfarzt:
[Name, Funktion, Adresse]
Wissenschaftliche Betreuung:
Prof. Dr. Peter Langguth, Apotheker, [Funktion, Adresse]
7. Ort(e) der Durchführung:
Institut für Pharmazie, Universität Mainz, [Adresse]
I. Medizinische Klinik und Poliklinik, Universität Mainz, [Adresse]
8. Finanzierung:
a) Eigenfinanzierte Studie der Universität
b) Die Probanden erhalten auf Wunsch ein Honorar von 300 €.
9. Wurde die Arzneimittelprüfung der zuständigen Behörde angezeigt?
Wird nach positivem Votum der Ethik-Kommission dem BfArM in Bonn und dem
Landesamt für Soziales, Jugend und Versorgung in Trier gemeldet.
10. Wurde das Forschungsvorhaben bereits einer Ethik-Kommission vorgelegt?
Nein

Annex II: Preparations for a human in vivo study
with talinolol sustained-release tablets
286
Begründung des Forschungsvorhabens
1. Ziel des Vorhabens:
Ziel der geplanten Studie ist es, die Pharmakokinetik und insbesondere Absorption
und Bioverfügbarkeit bei durch P-Glykoprotein intestinal sezernierten Arzneistoffen
am Beispiel des ß-Adrenozeptorenantagonisten Talinolol zu untersuchen. In dieser
Studie soll der Einfluss der Freigabegeschwindigkeit auf die Pharmakokinetik nach
peroraler Applikation untersucht werden.
2. Gründe für die Durchführung, Problemdarstellung:
Für die zukünftige Entwicklung retardierter Arzneiformen mit Wirkstoffen, die an
intestinale Carrier wie P-GP binden, ist es wichtig, den Einfluss einer veränderten
Freigabegeschwindigkeit auf die Absorption und Bioverfügbarkeit des Arzneistoffes
zu kennen. Talinolol hat sich als geeignete Modellsubstanz für P-GP Substrate
erwiesen (vgl. Lit. 4) und wird deshalb in dieser Studie verwendet.
3. Stand der Wissenschaft:
Die Beteiligung intestinaler Carrierproteine am Absorptionsprozess ist für zahlreiche
Arzneistoffe nachgewiesen. Dabei können Arzneistoffe sowohl in resorptiver
Richtung (z.B. einige Cephalosporine, Penicilline, ACE-Hemmer) als auch in
sekretorischer Richtung (z.B. verschiedene Betablocker und Antiarrhythmika sowie
Ofloxacin, Ciprofloxacin, Ciclosporin) transportiert werden. Für die Bioverfügbarkeit
haben carriervermittelte Absorptions- und Sekretionsprozesse insofern Bedeutung,
als intestinal absorbierte Substanzen zum Teil sehr effizient vom Darmlumen zur
Blutseite durch die Darmwand transportiert werden können, während
Sekretionsprozesse den gegenteiligen Effekt, d.h. einen effizienten Transport von der
Blut- zur Darmseite, bewirken. Damit führen Sekretionsprozesse im Allgemeinen zu
einer Verringerung des absorbierten Anteils einer Dosis und der Bioverfügbarkeit.
Bei der geplanten Studie soll der Einfluss der Freigabegeschwindigkeit aus der
Formulierung auf die Absorption und Bioverfügbarkeit des Betablockers Talinolol,
einer Modellsubstanz für carriervermittelte Sekretionsprozesse, beim Menschen
untersucht werden.
Dabei ist zu erwarten, dass durch eine verzögerte Freigabe des Wirkstoffs dessen
Konzentration im Darm gegenüber einer rasch freisetzenden Zubereitung

Annex II: Preparations for a human in vivo study
with talinolol sustained-release tablets
287
(Fertigarzneimittel Cordanum) verändert sein wird. Als Folge ist zu erwarten, dass
der durch Carrier sezernierte Anteil des Wirkstoffs bei den Retardzubereitungen
erhöht sein wird und damit die Bioverfügbarkeit mehr oder weniger stark und in
Abhängigkeit von der Freigabegeschwindigkeit absinken wird.
4. Pharmakologisch-toxikologische Eigenschaften des verwendeten
Arzneistoffs
Siehe Fachinformation Cordanum und vgl. Lit. 1
Annex II: Preparations for a human in vivo study
with talinolol sustained-release tablets
288
Literatur:
(1) de Mey, C., V. Schroeter, R. Butzer, P. Jahn, K. Weisser, U. Wetterich, B.
Terhaag, E. Mutschler, H. Spahn-Langguth, D. Palm and et al., 1995, Dose-
effect and kinetic-dynamic relationships of the beta-adrenoceptor blocking
properties of various doses of talinolol in healthy humans, J Cardiovasc
Pharmacol 26, 879.
(2) Gramatté, T. and R. Oertel, 1999, Intestinal secretion of intravenous talinolol is
inhibited by luminal R-verapamil, Clin Pharmacol Ther 66, 239.
(3) Gramatté, T., R. Oertel, B. Terhaag and W. Kirch, 1996, Direct demonstration
of small intestinal secretion and site-dependent absorption of the beta-blocker
talinolol in humans, Clin Pharmacol Ther 59, 541.
(4) Spahn-Langguth, H., G. Baktir, A. Radschuweit, A. Okyar, B. Terhaag, P.
Ader, A. Hanafy and P. Langguth, 1998, P-glycoprotein transporters and the
gastrointestinal tract: evaluation of the potential in vivo relevance of in vitro
data employing talinolol as model compound, Int J Clin Pharmacol Ther 36,
16.
(5) Wetterich, U., H. Spahn-Langguth, E. Mutschler, B. Terhaag, W. Rosch and P.
Langguth, 1996, Evidence for intestinal secretion as an additional clearance
pathway of talinolol enantiomers: concentration- and dose-dependent
absorption in vitro and in vivo, Pharm Res 13, 514.
(6) Wagner, D., H. Spahn-Langguth, A. Hanafy, A. Koggel, P. Langguth, 2001,
Intestinal drug efflux: formulation and food effects, Adv Drug Deliv Rev 50
Suppl. 1, 13

Annex II: Preparations for a human in vivo study
with talinolol sustained-release tablets
289
Allgemeine Planung
1. Zusammenfassende Darstellung des Prüfablaufs:
Die Studie ist auf 6 Probanden ausgelegt. Zur Kompensation möglicher Drop-Outs
werden jedoch 7 freiwillige Probanden in die Studie eingeschlossen. Diese erhalten
zunächst eine Einmaldosis von 100 mg Talinolol in Form einer schnellfreisetzenden
Cordanum 100 mg Tablette. Daraufhin werden über einen Zeitraum bis zu 48 h nach
der Applikation des Arzneimittels Blutproben von jeweils 7 ml aus einer
Unterarmvene zu folgenden definierten Zeitpunkten entnommen: 0; 1; 2; 3; 4; 5; 7;
10; 13; 24; 33; 48 Stunden. Die entnommenen Blutproben werden bei 600 g
zentrifugiert, dann wird das Plasma abgetrennt und bei –22° C bis zur Analyse
eingefroren. Die Analyse der Plasmaproben auf Talinolol erfolgt mittels eines
validierten HPLC Verfahrens. Nach einer Wash Out Phase von mindestens acht
Tagen wird denselben Probanden eine rezepturmäßig hergestellte Talinolol
Retardtablette, die ebenfalls 100 mg Wirkstoff enthält, verabreicht. Um das in vivo
Freisetzungsverhalten der Retardtabletten nachvollziehen und von P-GP
verursachten Effekten abgrenzen zu können, werden nach einer erneuten
mindestens achttägigen Wash Out Phase zwei derselben rezepturmäßig
hergestellten Retardtabletten mit jeweils 100 mg Wirkstoffgehalt gleichzeitig
verabreicht. Die Probennahme nach Gabe der retardierten Arzneiformen erfolgt
ebenso wie nach Einnahme der schnellfreisetzenden Tabletten. Des weiteren
werden in allen drei Phasen der Studie von den Probanden über 48 h
Sammelurinproben in definierten Intervallen gesammelt.
2. Geplanter Beginn:
Voraussichtlich Sommer 2003
voraussichtliche Dauer: ca. 4 Wochen
3. Gesunde Probanden
Es handelt sich um eine Untersuchung an gesunden Probanden, die ambulant
durchgeführt wird. Jeder Proband wird innerhalb von ca. vier Wochen dreimal zwei
Tage mit der Studie beschäftigt sein.
Annex II: Preparations for a human in vivo study
with talinolol sustained-release tablets
290
4. Patienten
Es werden keine Patienten in die Studie miteinbezogen.
5. Kategorisierung der Untersuchung und der Prüfsubstanz
Es handelt sich um eine für Forschung und Wissenschaft wichtige
pharmakokinetische Prüfung, bei der ein seit über 20 Jahren als Tablette auf dem
deutschen Markt befindlicher, gut verträglicher Arzneistoff verabreicht wird, so dass
unter Einhaltung der Ausschlusskriterien das Risiko für die Probanden als gering
eingestuft werden kann.
6. Studienart
Es handelt sich um eine offene Studie mit drei parallelen Gruppen und einem Cross
over-Design.
7. Auswahl der Probanden
Es werden gesunde Probanden rekrutiert. Hinsichtlich des Geschlechts bestehen
keine Einschränkungen, das Alter der Probanden ist auf 18 bis 50 Jahre festgelegt,
die Probanden sollen Angehörige der kaukasischen Rasse sein und keine
Arzneimittel mit Wirkung auf das Herz-Kreislaufsystem einnehmen.
In einer Voruntersuchung der Probanden wird neben Blut- und Urinuntersuchungen
auch ein Elektrokardiogramm (EKG) aufgenommen.
Ausschlusskriterien sind:
ein PQ-Intervall im Ruhe-EKG von mehr als 220 ms
eine Herzfrequenz in Ruhe von weniger als 45 min-1
ein systolischer Blutdruck von weniger als 100 mm Hg liegend
Neigung zu orthostatischer Dysregulation, Ohnmacht und Blackouts
klinisch relevante Erkrankungen des Herz-Kreislauf-Systems
Asthma (sowohl aktiv als auch in der Anamnese).
Es werden keine Probanden eingeschlossen, bei denen Zweifel an der
Einsichtsfähigkeit bestehen.
Voraussetzung für die Teilnahme an der Studie ist das schriftliche Einverständnis des
Probanden. Über den Zweck der Studie und die eventuell damit verbundenen
Risiken wird der Proband in Form eines Informationsblattes schriftlich aufgeklärt.
Annex II: Preparations for a human in vivo study
with talinolol sustained-release tablets
291
8. Behandlung
Jeder Proband erhält drei Medikationen, jeweils mit Talinolol als Wirkstoff:
a) eine schnellfreisetzende 100 mg Tablette
b) eine retardierte 100 mg Tablette
c) zwei gleichzeitig einzunehmende retardierte 100 mg Tabletten.
Zwischen den drei Medikationen wird eine Wash Out Phase von mindestens acht
Tagen eingehalten. Es werden Blut- und Sammelurinproben bis zu 48 Stunden nach
Einnahme des Medikamentes genommen.
Die Compliance wird durch den späteren Nachweis des Arzneistoffs im Blut belegt.
Sollten wider Erwarten schwerwiegende unerwünschte Wirkungen oder
Komplikationen auftreten, werden diese der Ethik-Kommission gemeldet. Sollten
diese ursächlich auf die Studienteilnahme zurückzuführen sein, werden die
betroffenen Probanden von der Studie ausgeschlossen. Sollten bei mehr als 2 der 7
Probanden schwerwiegende Komplikationen auftreten, wird die gesamte Studie
abgebrochen.
9. Feststellung der Wirksamkeit
Entfällt
10. Statistik und Auswertung
Die Ergebnisse werden entsprechend den datenschutzrechtlichen Bestimmungen in
anonymisierter Form protokolliert, gespeichert und ausgewertet.
Zwischenauswertungen sind nicht vorgesehen.
11. Ethisch - rechtliche Aspekte
Bestehende Gesetze und Richtlinien bezüglich der Herstellung der Arzneimittel, der
Durchführung der Studie und des Datenschutzes werden eingehalten.
Das Forschungsvorhaben dient der wissenschaftlichen Grundlagenforschung und
der zukünftigen Entwicklung retardierter peroraler Arzneiformen mit Wirkstoffen, die
intestinal sezerniert werden.
In der Studie wird ein Arzneistoff getestet, der seit über 20 Jahren auf dem
deutschen Markt etabliert ist und gut vertragen wird. Dies haben klinisch-
pharmakologische Studien gezeigt (vgl. II: Literatur (1)). Die Gefahr eines Dose
Dumpings, die allgemein bei Retardzubereitungen besteht, ist bei dieser Studie nicht

Annex II: Preparations for a human in vivo study
with talinolol sustained-release tablets
292
relevant, da die in den Retardformulierungen enthaltene Dosis die der
schnellfreisetzenden Tablette nicht übersteigt.
Durch Einhaltung der Ausschlusskriterien ist sichergestellt, dass das Risiko für die an
der Studie teilnehmenden Probanden gering ist. Unerwünschte Wirkungen, die über
die in der Fachinformation für Cordanum 100 mg Tabletten erwähnten hinausgehen,
sowie besondere Komplikationen sind nicht zu erwarten.
Seltene unerwünschte Wirkungen sind auf Grund der geringen Probandenzahl und
der nur dreimaligen Einnahme des Medikamentes mit entsprechenden Wash Out
Phasen kaum zu erwarten.
Bei wider Erwarten auftretenden schwerwiegenden unerwünschten Wirkungen oder
Komplikationen bei einzelnen Probanden werden die entsprechenden Probanden
von der weiteren Teilnahme an der Studie ausgeschlossen und ärztlich behandelt.
Als schwerwiegende unerwünschte Ereignisse werden neben dem Tod des
Probanden alle Krankheitsbilder definiert, die eine stationäre Behandlung bedingen
oder bleibende Schädigungen erwarten lassen. Solche Ereignisse werden der
zuständigen Ethik-Kommission innerhalb von 24 Stunden nach Bekanntwerden
durch den Prüfarzt gemeldet. Durch die regelmäßigen Blutentnahmen sind die
Probanden während der Studienphasen regelmäßig unter ärztlicher Kontrolle, so
dass eventuell auftretende Komplikationen umgehend erkannt werden und
Gegenmaßnahmen ergriffen werden können.
Um das Risiko unerwünschter Wirkungen zu minimieren werden die Probanden
verpflichtet, an den Versuchstagen keine schweren körperlichen Arbeiten zu
verrichten und besondere Anstrengungen zu vermeiden.
Eine Probandenversicherung nach §§ 40 / 41 ist abgeschlossen worden, die
Deckungsbestätigung ist beigefügt.
Der Leiter der Klinischen Prüfung ist über die rechtlichen Bestimmungen des AMG
und über die GCP Richtlinien der ICH informiert.
Ähnliche Forschungsvorhaben mit Talinolol in retardierten Arzneiformen sind unseres
Wissens nach bisher nicht durchgeführt worden.
Die Probanden erhalten eine schriftliche Probandeninformation und werden darüber
hinaus mündlich über Zweck, Art und Umfang der Studie sowie mögliche Risiken, die
mit einer Teilnahme an der Studie verbunden sind, aufgeklärt.
Es werden keine Probanden eingeschlossen, bei denen Zweifel an der Einsichts-
oder Einwilligungsfähigkeit bestehen.

Annex II: Preparations for a human in vivo study
with talinolol sustained-release tablets
293
Ein Probandenausweis wird nicht ausgestellt.
Eine offizielle Mitteilung an die Hausärzte der Probanden über deren Teilnahme an
dieser Studie ist nicht vorgesehen.
Der Prüfarzt verfügt über die notwendige fachliche und persönliche Qualifikation,
Erfahrung, Zeit und Einrichtung, um dieses Forschungsvorhaben durchzuführen (CV
ist beigefügt).
Mainz, den ______________
_______________________________

Annex II: Preparations for a human in vivo study
with talinolol sustained-release tablets
294
Probandeninformation und Einwilligungserklärung
Für die Studie:
Untersuchung des Einflusses einer retardierten Freigabe auf die Absorption und
Bioverfügbarkeit intestinal sezernierter Arzneistoffe anhand von Talinolol als
Modellsubstanz
Die Aufnahme von Arzneistoffen aus dem Magen-Darm-Trakt ins Blut geschieht auf
unterschiedliche Art und Weise. Im einfachsten Fall durchdringt der gelöste
Arzneistoff die Magen- bzw. Darmwand passiv, d. h. ohne Beteiligung von
Transportproteinen. Nicht wenige Arzneistoffe werden jedoch auch aktiv transportiert,
d. h. es existieren spezifische Transportermoleküle, die die Substanz gezielt ins Blut
schleusen. Wiederum andere Arzneistoffe werden von speziellen Transportern nach
einer passiven Aufnahme in Zellen der Darmwand wieder in das Innere des Magen-
Darm-Traktes zurückgeschleust, so dass der Anteil an Arzneistoff, der letztlich ins
Blut gelangt, verringert wird. Ein solcher Arzneistoff ist das in der Studie verwendete
Talinolol, ein ß-Blocker, der insbesondere bei Bluthochdruck und Angina pectoris
eingesetzt wird. Um überhaupt die Wand des Magen-Darm-Traktes durchdringen zu
können, muss jeder Arzneistoff zunächst in Lösung gehen. Die Geschwindigkeit, mit
der dies geschieht, lässt sich durch Hilfsstoffe, die einer Tablette zugesetzt werden,
verändern. Durch eine Verzögerung der Freisetzung von Talinolol aus der Tablette
wird auch der Einfluss des Transporters auf die Aufnahme ins Blut verändert. Für die
zukünftige Entwicklung neuer Retardarzneimittel (d.h. Arzneimittel mit verlängerter
bzw. verzögerter Wirkung) ist es wichtig, zu wissen, wie sich dieser Einfluss auswirkt,
und dazu ist es notwendig diese Studie durchzuführen.
Dazu sind zwei unterschiedliche Arzneiformen einzunehmen, die sich in der
Geschwindigkeit, mit der der Wirkstoff Talinolol in Lösung geht, unterscheiden. Um
den Lösungsvorgang des Wirkstoffes im Magen-Darm-Trakt genauer
charakterisieren zu können, wird von der langsam den Wirkstoff freigebenden
Tablette neben einer Einmaldosis von 100 mg durch Gabe einer Tablette auch noch
eine Einzeldosis von 200 mg in Form von zwei 100 mg Tabletten verabreicht. Jeder
Proband erhält somit jeweils drei mal eine Medikation, wobei zwischen diesen drei
Verabreichungen jeweils mindestens eine Woche liegt. Nach jeder Einnahme werden

Annex II: Preparations for a human in vivo study
with talinolol sustained-release tablets
295
zu 12 definierten Zeitpunkten Blutproben innerhalb von 48 h aus einer Armvene
entnommen sowie der Urin gesammelt.
Das mit der Teilnahme an der Studie verbundene Risiko ist gering, da sich der
Wirkstoff Talinolol in Tablettenform unter dem Handelsnamen Cordanum seit über 20
Jahren auf dem deutschen Markt befindet und allgemein gut vertragen wird. Da mit
einer Blutdrucksenkung zu rechnen ist, kann es jedoch vorübergehend zu Müdigkeit,
Schlappheitsgefühlen oder Schwindel kommen. Außerdem können die für die
Cordanum Tabletten beschriebenen Nebenwirkungen auftreten. Eine Kopie des
entsprechenden Beipackzettels wird jedem Probanden ausgehändigt.
Um das Risiko unerwünschter Wirkungen zu verringern sind an den Versuchstagen
nach Einnahme der Prüfmedikation schwere körperliche Arbeiten sowie größere
Anstrengungen zu vermeiden. Da eine Beeinträchtigung der aktiven
Teilnahmefähigkeit am Straßenverkehr möglich ist, wird außerdem empfohlen, 12 h
nach Einnahme der Prüfmedikation ohne Begleitung kein Kraftfahrzeug zu führen.
Die erhobenen Krankheitsdaten werden Dritten nicht zugänglich gemacht, d.h. die
wissenschaftliche Verwertung und ggf. eine Veröffentlichung der Daten erfolgt
ausschließlich in anonymisierter Form.
Für Schäden, die auf die Teilnahme an der Studie zurückzuführen sind, und für die
kein anderer haftbar ist, wurde eine Probandenversicherung mit einer
Schadenshöchstsumme von 500.000 Euro pro Proband bei folgender Versicherung
abgeschlossen:
Ecclesia Versicherungsdienst GmbH
[Adresse, Telefonnummer, Police-Nummer]
Die Obliegenheiten des Probanden sind als Anhang beigefügt.
Der Versicherungsschutz erlischt, wenn ausdrücklich gegen Anweisungen zuwider
gehandelt wird.
Ich erkläre hiermit, dass ich über Ziel, Ablauf und Durchführung des
Forschungsvorhabens aufgeklärt worden bin, dass ich die Erläuterungen verstanden
habe und meine Fragen zur Zufriedenheit beantwortet wurden. Ich weiß, dass ich
auch weiterhin jederzeit Fragen stellen kann. Ich wurde auch darüber aufgeklärt,
dass ich ohne persönliche Nachteile und ohne Angabe von Gründen nicht an der
Studie teilzunehmen brauche. Außerdem kann ich meine Teilnahme an der Studie
jederzeit ohne Angabe von Gründen durch schriftlichen oder mündlichen Widerruf
Annex II: Preparations for a human in vivo study
with talinolol sustained-release tablets
296
dieser Einwilligungserklärung ebenfalls ohne persönliche Nachteile abbrechen.
Einem Einblick in die Originalakte und einer eventuellen Weitergabe anonymisierter
Daten aus wissenschaftlichen Gründen stimme ich zu.
Die Versicherungsbedingungen der für diese Studie abgeschlossenen
Probandenversicherung sind mir bekannt.
Eine Kopie der Probandeninformation und Einwilligungserklärung wurde mir
ausgehändigt.
Name des aufklärenden Arztes: ____________________________
Ich werde innerhalb der letzten 60 Tage vor Beginn der Studie nicht an einer anderen
Studie teilgenommen haben und bestätige, dass meine Angaben zur Einnahme von
Medikamenten und Drogen der Wahrheit entsprechen.
Ich werde jeweils 12 h vor Einnahme der Prüfmedikation sowie bis 48 h danach
keinen Alkohol zu mir nehmen.
Ich bin bereit, freiwillig an der Studie teilzunehmen.
Mainz, den ___________ __________________ ___________________
Proband Arzt

Annex II: Preparations for a human in vivo study
with talinolol sustained-release tablets
297
Einwilligungserklärung zum Datenschutz (AMG)
Bei wissenschaftlichen Studien werden persönliche Daten und medizinische Befunde
über Sie erhoben. Die Weitergabe, Speicherung und Auswertung dieser
studienbezogenen Daten erfolgt nach gesetzlichen Bestimmungen und setzt vor
Teilnahme an der Studie folgende freiwillige Einwilligung voraus:
1. Ich erkläre mich damit einverstanden, dass im Rahmen dieser Studie erhobene
Daten / Krankheitsdaten auf Fragebögen und elektronischen Datenträgern
aufgezeichnet und ohne Namensnennung weitergegeben werden können an
a) Mitarbeiter des Institutes für Pharmazie der Johannes Gutenberg-
Universität, [Adresse] als Auftraggeber der Studie zur wissenschaftlichen
Auswertung
b) an die zuständige Überwachungsbehörde (Landesamt, Trier) oder
Bundesoberbehörde (Bundesinstitut für Arzneimittel und
Medizinprodukte, Bonn) zur Überprüfung der ordnungsgemäßen
Durchführung der Studie.
2. Außerdem erkläre ich mich damit einverstanden, dass ein autorisierter und zur
Verschwiegenheit verpflichteter Beauftragter des Auftraggebers, der zuständigen
Überwachungsbehörde oder der Bundesoberbehörde in meine beim Prüfarzt
vorhandenen personenbezogenen Daten Einsicht nimmt, soweit dies für die
Überprüfung der Studie notwendig ist. Für diese Maßnahme entbinde ich den
Prüfarzt von der ärztlichen Schweigepflicht.
Name des Probanden:_______________________________________
______________ ___________________________________
Datum Unterschrift des Probanden
Annex II: Preparations for a human in vivo study
with talinolol sustained-release tablets
298
Allgemeine Versicherungsbedingungen
für klinische Prüfungen von Arzneimitteln
(Probandenversicherung)
Abschnitt 14 II: Obliegenheiten des Versicherten
(1) Während der Dauer der klinischen Prüfung darf sich die versicherte Person
einer anderen medizinischen Behandlung nur nach Rücksprache mit dem
klinischen Prüfer unterziehen. Dies gilt nicht in einem medizinischen Notfall;
der klinische Prüfer ist von einer Notfallbehandlung unverzüglich zu
unterrichten.
(2) Eine Gesundheitsschädigung, die als Folge der klinischen Prüfung eingetreten
sein könnte, ist dem Versicherer unverzüglich anzuzeigen.
(3) Der Versicherte hat alle zweckmäßigen Maßnahmen zu treffen, die der
Aufklärung der Ursache und des Umfanges des eingetretenen Schadens und
der Minderung dieses Schadens dienen.
(4) Auf Verlangen des Versicherers ist der behandelnde Arzt - als solcher gilt
auch ein Konsiliararzt oder ein gutachterlich tätiger Arzt- zu veranlassen,
einen Bericht über die Gesundheitsschädigung und, nach Abschluss der
ärztlichen Behandlung, einen Schlussbericht zu erstatten; außerdem ist dafür
Sorge zu tragen, dass alle etwa weiter noch von dem Versicherer geforderten
Berichte des behandelnden Arztes geliefert werden. Alternativ kann der
Versicherte den behandelnden Arzt von der ärztlichen Schweigepflicht
entbinden, damit der Versicherer die vorab genannten Berichte direkt beim
Arzt anfordern kann.
(5) Die behandelnden Ärzte, auch diejenigen, von denen der Versicherte aus
anderen Anlässen behandelt oder untersucht worden ist, und die
Sozialversicherungsträger sowie andere Versicherer, wenn dort die
Annex II: Preparations for a human in vivo study
with talinolol sustained-release tablets
299
Gesundheitsschädigung gemeldet ist, sind zu ermächtigen, dem Versicherer
auf Verlangen Auskunft zu erteilen.
(6) Hat der Versicherungsfall den Tod zu Folge, so ist dies unverzüglich
anzuzeigen, und zwar auch dann, wenn eine Meldung nach Abs. (2) bereits
erfolgt ist. Dem Versicherer ist das Recht zu verschaffen, eine Obduktion
durch einen von ihm beauftragten Arzt vornehmen zu lassen.
Annex II: Preparations for a human in vivo study
with talinolol sustained-release tablets
300
Untersuchung des Einflusses einer retardierten Freigabe
auf die Absorption und Bioverfügbarkeit intestinal
sezernierter Arzneistoffe anhand von Talinolol als
Modellsubstanz
Prüfplan

Annex II: Preparations for a human in vivo study
with talinolol sustained-release tablets
301
Synopsis
Titel:
Untersuchung des Einflusses einer retardierten Freigabe auf die Absorption und
Bioverfügbarkeit intestinal sezernierter Arzneistoffe anhand von Talinolol als
Modellsubstanz
Projektleiter:
Prof. Dr. P. Langguth
Multizenterstudie:
nein
Leiter der klinischen Prüfung:
[Name, Adresse]
Voten anderer Ethik-Kommissionen:
nein
Prüfzentren:
Institut für Pharmazie, Universität Mainz, [Adresse]
I. Medizinische Klinik und Poliklinik, Universität Mainz, [Adresse]
Prüfarzt:
[Name, Adresse]
Sponsor:
eigenfinanzierte Studie der Universität
Initiator: Prof. Dr. P. Langguth, [Adresse]
Studientyp / Studiendesign:
offene randomisierte Cross over-Studie in 3 Parallelgruppen

Annex II: Preparations for a human in vivo study
with talinolol sustained-release tablets
302
Zeitplan:
ca. 4 Wochen, voraussichtlich Sommer 2003
Probandenanzahl:
7
Geschlecht:
männlich oder weiblich
Alter:
18 bis 50 Jahre
Probandenversicherung:
Ecclesia Versicherungsdienst GmbH
[Adresse, Telefonnummer, Police-Nummer]
Verantwortlichkeiten und Anschriften:
Leiter der Klinischen Prüfung (gemäß § 40 AMG):
[Name, Funktion, Adresse, Telefonnummer]
Prüfzentrum:
I. Medizinische Klinik und Poliklinik, Universität Mainz
[Adresse]
Institut für Pharmazie, Universität Mainz
[Adresse]
Prüfarzt:
[Name, Funktion, Adresse, Telefonnummer]
Initiator:
Prof. Dr. P. Langguth
[Funktion, Adresse, Telefonnummer, private Telefonnummer]

Annex II: Preparations for a human in vivo study
with talinolol sustained-release tablets
303
Kurzfassung des Projekts
Titel:
Untersuchung des Einflusses einer retardierten Freigabe auf die Absorption und
Bioverfügbarkeit intestinal sezernierter Arzneistoffe anhand von Talinolol als
Modellsubstanz
Projektleiter:
Prof. Dr. P. Langguth, Professor für Biopharmazie und Pharm. Technologie
1. Wissenschaftlicher Hintergrund
Ziel der geplanten Studie ist es, die Pharmakokinetik, insbesondere die Absorption
und Bioverfügbarkeit bei durch P-Glykoprotein (P-GP) intestinal sezernierten
Arzneistoffen am Beispiel des ß-Adrenozeptorenantagonisten Talinolol zu
untersuchen. Weitere Beispiele für P-GP Substrate sind die Arzneistoffe Vincristin,
Vinblastin, Doxorubicin, Paclitaxel, Ciclosporin A, Ketoconazol, Verapamil, Digoxin,
Dexamethason, Cimetidin, Ranitidin, Salbutamol, Celiprolol, Phenytoin, Morphin und
Loperamid.
In dieser Studie soll der Einfluss der Freigabegeschwindigkeit auf die
Pharmakokinetik nach peroraler Applikation untersucht werden.
Für die zukünftige Entwicklung retardierter Arzneiformen mit Wirkstoffen, die an
intestinale Carrier wie P-GP binden, ist es wichtig, den Einfluss einer veränderten
Freigabegeschwindigkeit auf die Absorption und Bioverfügbarkeit des Arzneistoffes
zu kennen. Talinolol hat sich als geeignete Modellsubstanz für P-GP Substrate
erwiesen (vgl. Lit. 4) und wird deshalb in dieser Studie verwendet.

Annex II: Preparations for a human in vivo study
with talinolol sustained-release tablets
304
2. Studiendaten
Studienziel:
Ziel der geplanten Studie ist es, die Pharmakokinetik und insbesondere Absorption
und Bioverfügbarkeit bei durch P-Glykoprotein intestinal sezernierten Arzneistoffen
am Beispiel des ß-Adrenozeptorenantagonisten Talinolol zu untersuchen. In dieser
Studie soll der Einfluss der Freigabegeschwindigkeit auf die Pharmakokinetik nach
peroraler Applikation untersucht werden.
Es handelt sich um eine Experimentalstudie von wissenschaftlichem Interesse.
Studiendesign:
Es handelt sich bei dem geplanten Vorhaben um eine offene Studie mit drei
parallelen Gruppen und einem Cross over-Design.
Anzahl der Probanden: 7. Die Studie ist auf 6 Probanden ausgelegt, zur
Kompensation etwaiger Drop-Outs wird ein siebter Proband in die Studie
eingeschlossen.
Primäre Zielgrößen:
Konzentrationen des Arzneistoffs in Blut und Urin.
3. Probanden
Anzahl der Probanden:
7
Durchführung der Studie:
Voraussichtlich Anfang 2003
voraussichtliche Dauer: ca. 4 Wochen
Einschlusskriterien:
• Männliche und weibliche gesunde Probanden
• Alter: 18 bis 50 Jahre
• Keine regelmäßige Medikamenteneinnahme

Annex II: Preparations for a human in vivo study
with talinolol sustained-release tablets
305
Ausschlusskriterien:
• Teilnahme an einer anderen klinischen Prüfung innerhalb der letzten 3 Wochen
• gleichzeitige Teilnahme an einer anderen klinischen Prüfung
• Schwangerschaft oder Stillzeit
• Suchtkranke
• Bekannte Unverträglichkeit / Überempfindlichkeit gegen den Wirkstoff oder
Hilfsstoffe
• Q-Intervall im Ruhe-EKG von mehr als 220 ms
• Herzfrequenz in Ruhe von weniger als 45 min-1
• Systolischer Blutdruck von weniger als 100 mm Hg liegend
• Neigung zu orthostatischer Dysregulation, Ohnmacht und Blackouts
• Klinisch relevante Erkrankungen des Herz-Kreislauf-Systems
Asthma (sowohl aktiv als auch in der Anamnese)
Medizinisches Screening:
• Persönliche Daten, Klinische Anamnese
• Allgemeine Untersuchung
• Blut- und Urinuntersuchungen
• Elektrokardiogramm (EKG)
4. Prüfmedikation
Pharmakologisch-toxikologisches Gutachten
Entfällt, da Vergleichspräparat bereits seit 1975 am Markt und Retardtestpräparat in
gleicher Dosierung und Arzneiform vorliegt.
Pharmakologisch-toxikologische Angaben siehe Fachinformation Cordanum 100
Tabletten
Medikation A:
• Handelsname: Cordanum 100 Tabletten
• Substanzname: Talinolol 100 mg
• Zubereitungsform: Tabletten
• Hersteller: AWD Pharma, Dresden
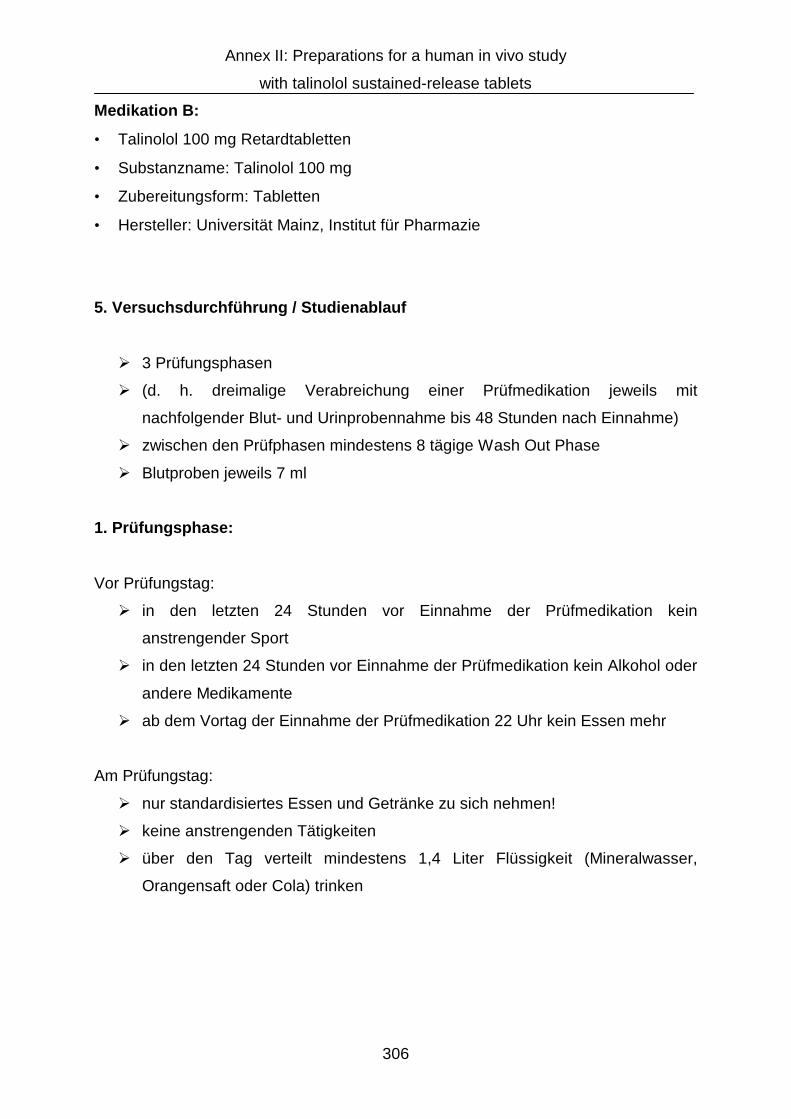
Annex II: Preparations for a human in vivo study
with talinolol sustained-release tablets
306
Medikation B:
• Talinolol 100 mg Retardtabletten
• Substanzname: Talinolol 100 mg
• Zubereitungsform: Tabletten
• Hersteller: Universität Mainz, Institut für Pharmazie
5. Versuchsdurchführung / Studienablauf
Ø 3 Prüfungsphasen
Ø (d. h. dreimalige Verabreichung einer Prüfmedikation jeweils mit
nachfolgender Blut- und Urinprobennahme bis 48 Stunden nach Einnahme)
Ø zwischen den Prüfphasen mindestens 8 tägige Wash Out Phase
Ø Blutproben jeweils 7 ml
1. Prüfungsphase:
Vor Prüfungstag:
Ø in den letzten 24 Stunden vor Einnahme der Prüfmedikation kein
anstrengender Sport
Ø in den letzten 24 Stunden vor Einnahme der Prüfmedikation kein Alkohol oder
andere Medikamente
Ø ab dem Vortag der Einnahme der Prüfmedikation 22 Uhr kein Essen mehr
Am Prüfungstag:
Ø nur standardisiertes Essen und Getränke zu sich nehmen!
Ø keine anstrengenden Tätigkeiten
Ø über den Tag verteilt mindestens 1,4 Liter Flüssigkeit (Mineralwasser,
Orangensaft oder Cola) trinken
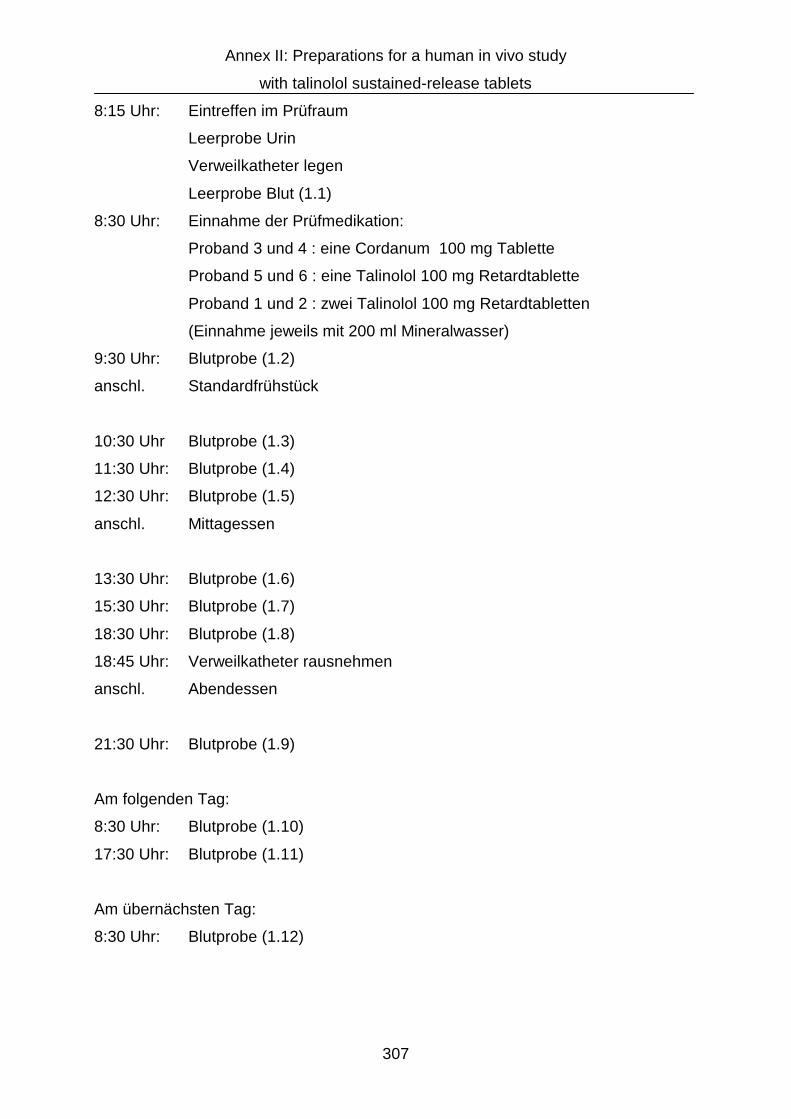
Annex II: Preparations for a human in vivo study
with talinolol sustained-release tablets
307
8:15 Uhr: Eintreffen im Prüfraum
Leerprobe Urin
Verweilkatheter legen
Leerprobe Blut (1.1)
8:30 Uhr: Einnahme der Prüfmedikation:
Proband 3 und 4 : eine Cordanum 100 mg Tablette
Proband 5 und 6 : eine Talinolol 100 mg Retardtablette
Proband 1 und 2 : zwei Talinolol 100 mg Retardtabletten
(Einnahme jeweils mit 200 ml Mineralwasser)
9:30 Uhr: Blutprobe (1.2)
anschl. Standardfrühstück
10:30 Uhr Blutprobe (1.3)
11:30 Uhr: Blutprobe (1.4)
12:30 Uhr: Blutprobe (1.5)
anschl. Mittagessen
13:30 Uhr: Blutprobe (1.6)
15:30 Uhr: Blutprobe (1.7)
18:30 Uhr: Blutprobe (1.8)
18:45 Uhr: Verweilkatheter rausnehmen
anschl. Abendessen
21:30 Uhr: Blutprobe (1.9)
Am folgenden Tag:
8:30 Uhr: Blutprobe (1.10)
17:30 Uhr: Blutprobe (1.11)
Am übernächsten Tag:
8:30 Uhr: Blutprobe (1.12)
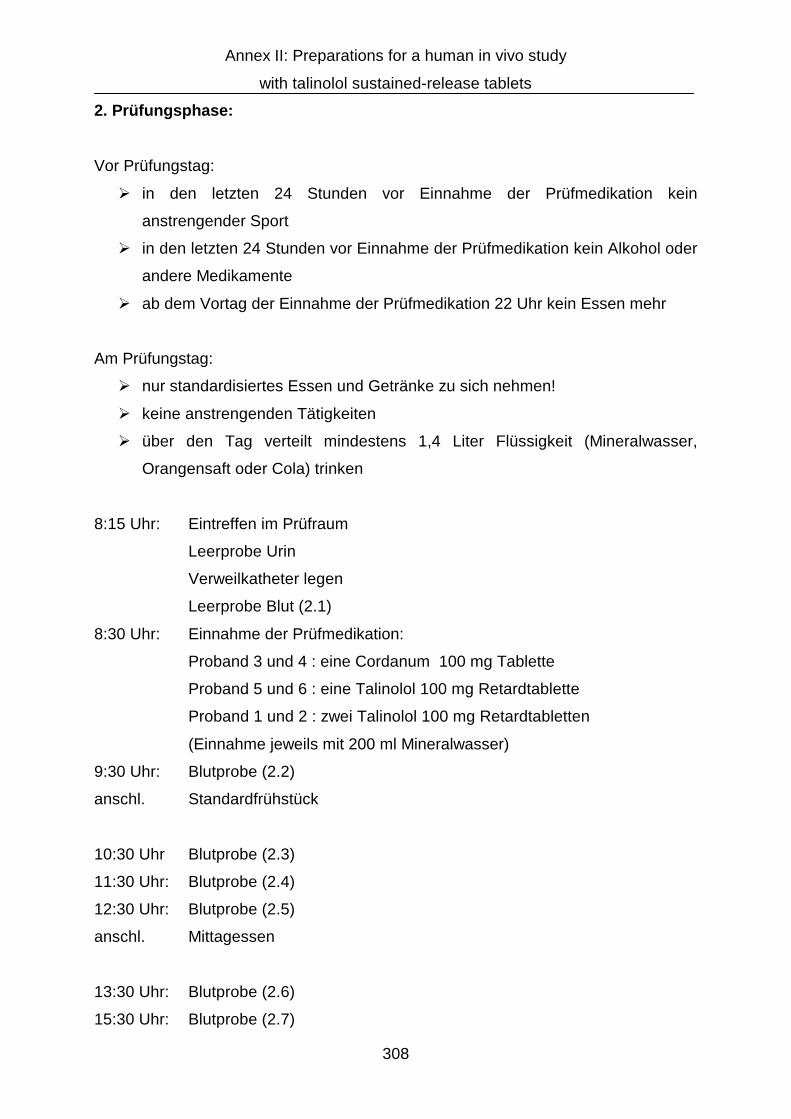
Annex II: Preparations for a human in vivo study
with talinolol sustained-release tablets
308
2. Prüfungsphase:
Vor Prüfungstag:
Ø in den letzten 24 Stunden vor Einnahme der Prüfmedikation kein
anstrengender Sport
Ø in den letzten 24 Stunden vor Einnahme der Prüfmedikation kein Alkohol oder
andere Medikamente
Ø ab dem Vortag der Einnahme der Prüfmedikation 22 Uhr kein Essen mehr
Am Prüfungstag:
Ø nur standardisiertes Essen und Getränke zu sich nehmen!
Ø keine anstrengenden Tätigkeiten
Ø über den Tag verteilt mindestens 1,4 Liter Flüssigkeit (Mineralwasser,
Orangensaft oder Cola) trinken
8:15 Uhr: Eintreffen im Prüfraum
Leerprobe Urin
Verweilkatheter legen
Leerprobe Blut (2.1)
8:30 Uhr: Einnahme der Prüfmedikation:
Proband 3 und 4 : eine Cordanum 100 mg Tablette
Proband 5 und 6 : eine Talinolol 100 mg Retardtablette
Proband 1 und 2 : zwei Talinolol 100 mg Retardtabletten
(Einnahme jeweils mit 200 ml Mineralwasser)
9:30 Uhr: Blutprobe (2.2)
anschl. Standardfrühstück
10:30 Uhr Blutprobe (2.3)
11:30 Uhr: Blutprobe (2.4)
12:30 Uhr: Blutprobe (2.5)
anschl. Mittagessen
13:30 Uhr: Blutprobe (2.6)
15:30 Uhr: Blutprobe (2.7)
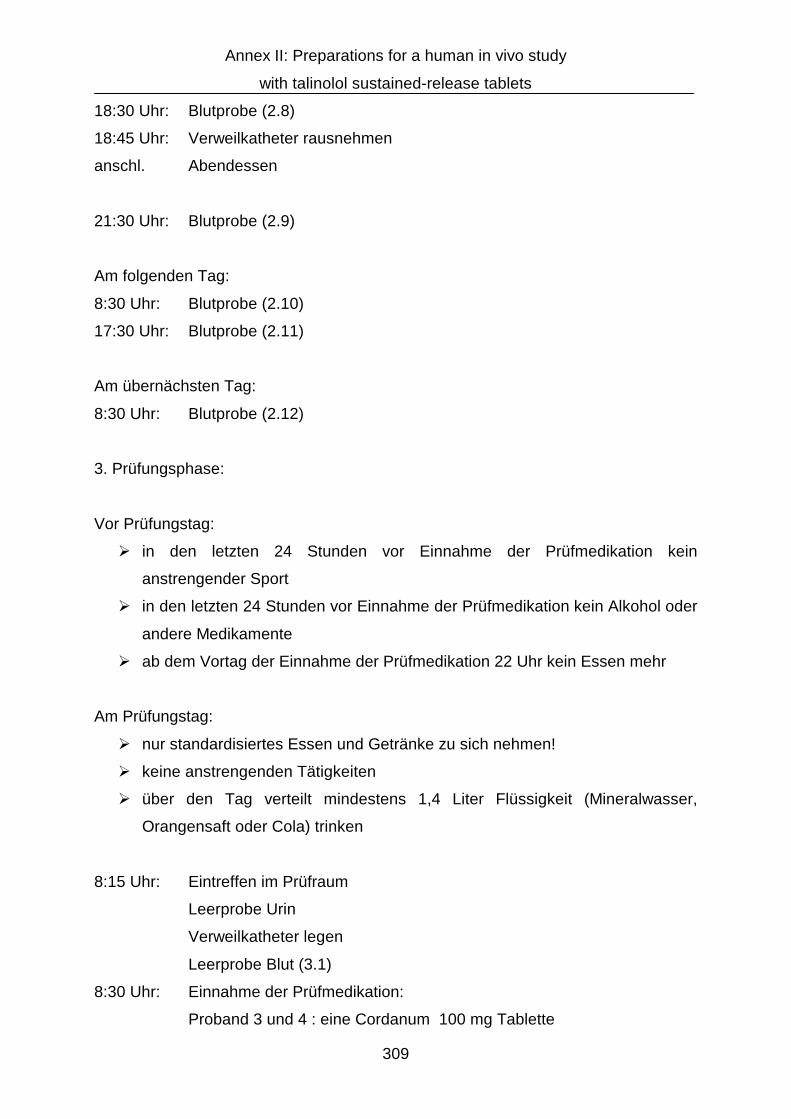
Annex II: Preparations for a human in vivo study
with talinolol sustained-release tablets
309
18:30 Uhr: Blutprobe (2.8)
18:45 Uhr: Verweilkatheter rausnehmen
anschl. Abendessen
21:30 Uhr: Blutprobe (2.9)
Am folgenden Tag:
8:30 Uhr: Blutprobe (2.10)
17:30 Uhr: Blutprobe (2.11)
Am übernächsten Tag:
8:30 Uhr: Blutprobe (2.12)
3. Prüfungsphase:
Vor Prüfungstag:
Ø in den letzten 24 Stunden vor Einnahme der Prüfmedikation kein
anstrengender Sport
Ø in den letzten 24 Stunden vor Einnahme der Prüfmedikation kein Alkohol oder
andere Medikamente
Ø ab dem Vortag der Einnahme der Prüfmedikation 22 Uhr kein Essen mehr
Am Prüfungstag:
Ø nur standardisiertes Essen und Getränke zu sich nehmen!
Ø keine anstrengenden Tätigkeiten
Ø über den Tag verteilt mindestens 1,4 Liter Flüssigkeit (Mineralwasser,
Orangensaft oder Cola) trinken
8:15 Uhr: Eintreffen im Prüfraum
Leerprobe Urin
Verweilkatheter legen
Leerprobe Blut (3.1)
8:30 Uhr: Einnahme der Prüfmedikation:
Proband 3 und 4 : eine Cordanum 100 mg Tablette
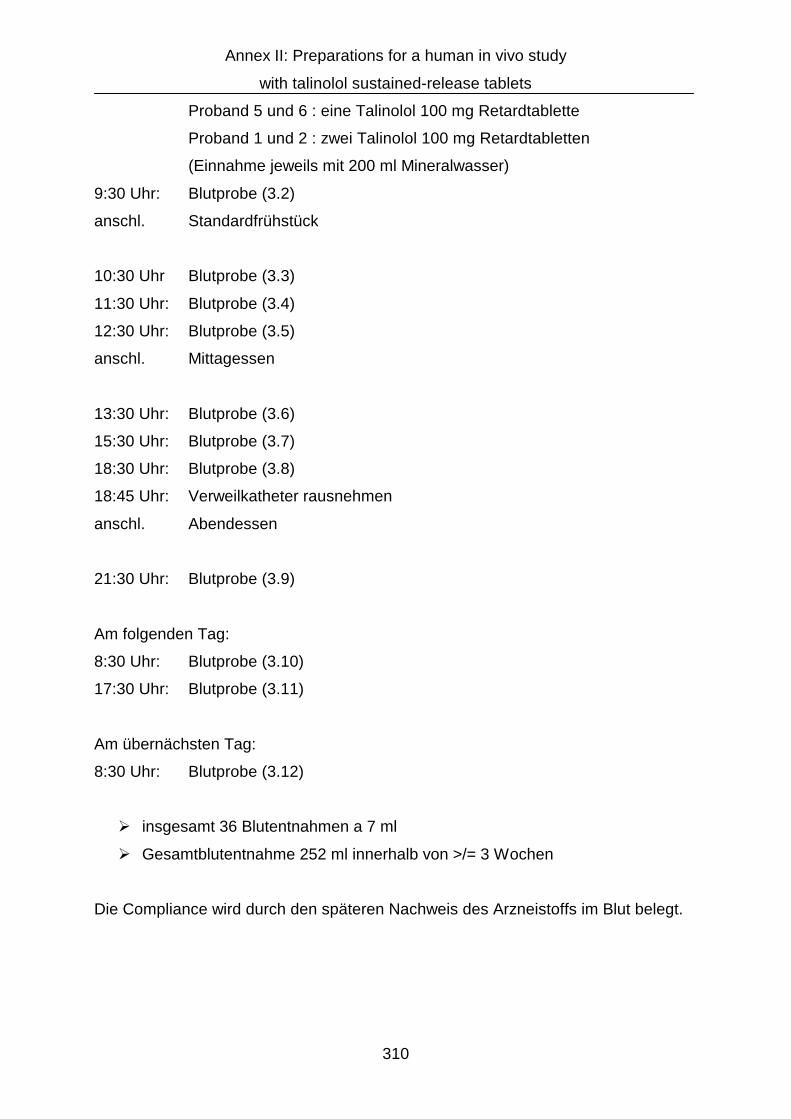
Annex II: Preparations for a human in vivo study
with talinolol sustained-release tablets
310
Proband 5 und 6 : eine Talinolol 100 mg Retardtablette
Proband 1 und 2 : zwei Talinolol 100 mg Retardtabletten
(Einnahme jeweils mit 200 ml Mineralwasser)
9:30 Uhr: Blutprobe (3.2)
anschl. Standardfrühstück
10:30 Uhr Blutprobe (3.3)
11:30 Uhr: Blutprobe (3.4)
12:30 Uhr: Blutprobe (3.5)
anschl. Mittagessen
13:30 Uhr: Blutprobe (3.6)
15:30 Uhr: Blutprobe (3.7)
18:30 Uhr: Blutprobe (3.8)
18:45 Uhr: Verweilkatheter rausnehmen
anschl. Abendessen
21:30 Uhr: Blutprobe (3.9)
Am folgenden Tag:
8:30 Uhr: Blutprobe (3.10)
17:30 Uhr: Blutprobe (3.11)
Am übernächsten Tag:
8:30 Uhr: Blutprobe (3.12)
Ø insgesamt 36 Blutentnahmen a 7 ml
Ø Gesamtblutentnahme 252 ml innerhalb von >/= 3 Wochen
Die Compliance wird durch den späteren Nachweis des Arzneistoffs im Blut belegt.
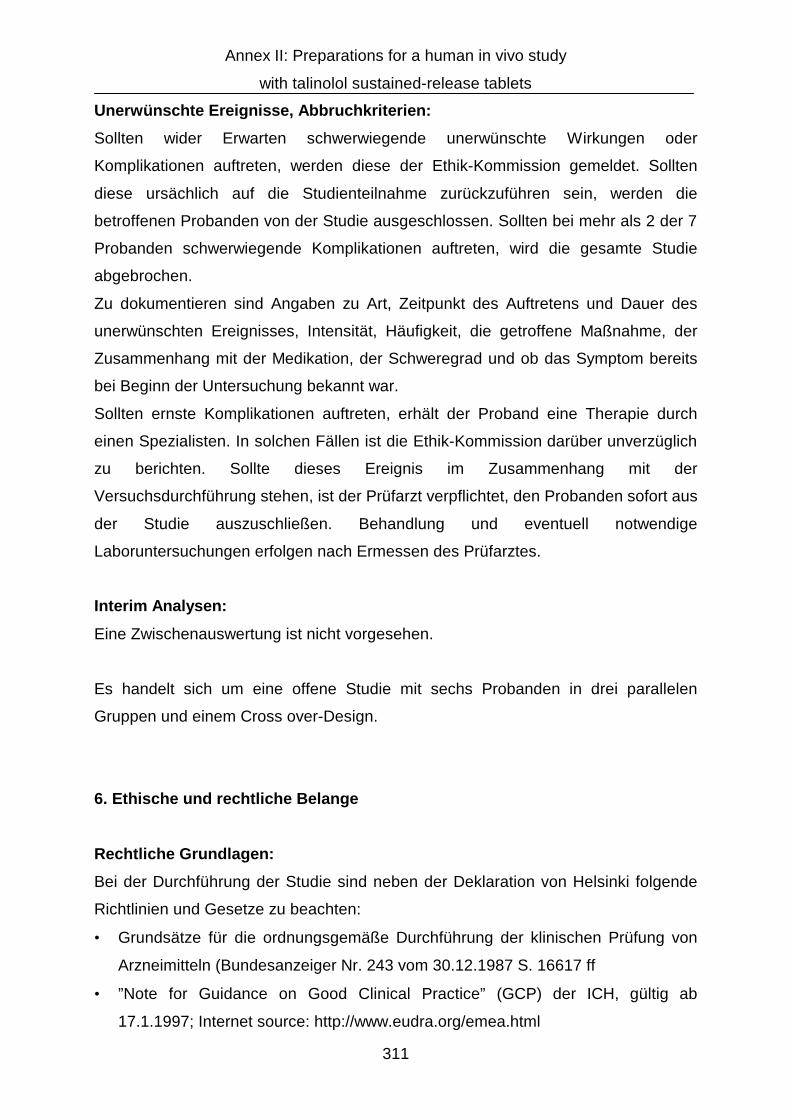
Annex II: Preparations for a human in vivo study
with talinolol sustained-release tablets
311
Unerwünschte Ereignisse, Abbruchkriterien:
Sollten wider Erwarten schwerwiegende unerwünschte Wirkungen oder
Komplikationen auftreten, werden diese der Ethik-Kommission gemeldet. Sollten
diese ursächlich auf die Studienteilnahme zurückzuführen sein, werden die
betroffenen Probanden von der Studie ausgeschlossen. Sollten bei mehr als 2 der 7
Probanden schwerwiegende Komplikationen auftreten, wird die gesamte Studie
abgebrochen.
Zu dokumentieren sind Angaben zu Art, Zeitpunkt des Auftretens und Dauer des
unerwünschten Ereignisses, Intensität, Häufigkeit, die getroffene Maßnahme, der
Zusammenhang mit der Medikation, der Schweregrad und ob das Symptom bereits
bei Beginn der Untersuchung bekannt war.
Sollten ernste Komplikationen auftreten, erhält der Proband eine Therapie durch
einen Spezialisten. In solchen Fällen ist die Ethik-Kommission darüber unverzüglich
zu berichten. Sollte dieses Ereignis im Zusammenhang mit der
Versuchsdurchführung stehen, ist der Prüfarzt verpflichtet, den Probanden sofort aus
der Studie auszuschließen. Behandlung und eventuell notwendige
Laboruntersuchungen erfolgen nach Ermessen des Prüfarztes.
Interim Analysen:
Eine Zwischenauswertung ist nicht vorgesehen.
Es handelt sich um eine offene Studie mit sechs Probanden in drei parallelen
Gruppen und einem Cross over-Design.
6. Ethische und rechtliche Belange
Rechtliche Grundlagen:
Bei der Durchführung der Studie sind neben der Deklaration von Helsinki folgende
Richtlinien und Gesetze zu beachten:
• Grundsätze für die ordnungsgemäße Durchführung der klinischen Prüfung von
Arzneimitteln (Bundesanzeiger Nr. 243 vom 30.12.1987 S. 16617 ff
• ”Note for Guidance on Good Clinical Practice” (GCP) der ICH, gültig ab
17.1.1997; Internet source: http://www.eudra.org/emea.html

Annex II: Preparations for a human in vivo study
with talinolol sustained-release tablets
312
• Bekanntmachung der Neufassung des Arzneimittelgesetzes (AMG) 19. Oktober
1994. Bundesgesetzblatt, Teil I, 1994:3018-67), geändert durch das 8. Gesetz zur
Änderung des AMG vom 7.9.1998
Die Studie wird nach erfolgtem Votum der Ethikkommission bei der
Bundesoberbehörde (BfArM in Bonn), sowie der zuständigen Landesbehörde
(Landesamt für Soziales, Jugend und Versorgung in Trier) angemeldet.
Votum der Ethik-Kommission:
Voraussetzung der klinischen Prüfung ist die Einhaltung der oben aufgeführten
Richtlinien und Gesetze. Der Beginn und die Durchführung der Studie sind an das
Votum der Ethik-Kommission gebunden. Im Falle des Auftretens schwerwiegender
Ereignisse , bei einem Studienabbruch sowie bei Prüfplanänderungen wird die Ethik-
Kommission umgehend informiert.
Versicherung:
Eine Probandenversicherung gemäß AMG ist abgeschlossen, ein Nachweis darüber
befindet sich im Anhang.
Die allgemeinen Versicherungsbedingungen werden den Probanden erläutert und
auf Wunsch zugänglich gemacht.
Leiter der klinischen Prüfung / des Forschungsvorhabens:
Der Leiter der klinischen Prüfung nach AMG bestätigt durch Unterschrift des
Prüfplans, dass er ein approbierter Arzt mit mindestens zweijähriger Erfahrung in der
Durchführung klinischer Studien ist. Die Mitteilung der ‘Arzneimittelkommission der
deutschen Ärzteschaft - Anforderungsprofil des Leiters der Klinischen Prüfung’ ist zu
beachten (Deutsches Ärzteblatt 94, Heft 41 vom 10.10.1997, S. C 2012).
Der Leiter der klinischen Prüfung kontrolliert den ordnungsgemäßen Verlauf des
Projekts. Er muss während der gesamten Prüfdauer erreichbar sein.

Annex II: Preparations for a human in vivo study
with talinolol sustained-release tablets
313
Prüfarzt:
Durch Unterzeichnung des Prüfplans bestätigt der Prüfarzt, dass er den Prüfplan
gelesen und verstanden hat sowie gemäß Prüfplan arbeiten wird.
Der Prüfarzt gewährleistet die Vertraulichkeit aller Informationen.
Archivierung und Datenschutz:
Alle im Rahmen der klinischen Prüfung anfallenden Daten unterliegen dem
Datenschutz. Personenbezogene Daten (außer Geburtsdatum, Alter, Geschlecht)
werden vom Leiter der klinischen Prüfung bzw. dem Prüfarzt nicht weitergegeben.
Die Weitergabe von Prüfbögen und die Datenspeicherung zur Auswertung erfolgt nur
mit anonymisierten Daten des Probanden. Eine Zuordnung der persönlichen Daten
zu den Studien-Daten darf nur der Prüfarzt vornehmen. Nach Abschluss der Studie
werden die Prüfungsunterlagen gemäß den Bestimmungen des Datenschutzes bzw.
des AMG verwaltet.
7. Unterschriften
_______________________________
LKP
_______________________________
Prüfarzt
_______________________________
Initiator

Annex II: Preparations for a human in vivo study
with talinolol sustained-release tablets
314
8. Literatur
1. de Mey, C., V. Schroeter, R. Butzer, P. Jahn, K. Weisser, U. Wetterich, B.
Terhaag, E. Mutschler, H. Spahn-Langguth, D. Palm and et al., 1995, Dose-
effect and kinetic-dynamic relationships of the beta-adrenoceptor blocking
properties of various doses of talinolol in healthy humans, J Cardiovasc
Pharmacol 26, 879.
2. Gramatté, T. and R. Oertel, 1999, Intestinal secretion of intravenous talinolol is
inhibited by luminal R-verapamil, Clin Pharmacol Ther 66, 239.
3. Gramatté, T., R. Oertel, B. Terhaag and W. Kirch, 1996, Direct demonstration
of small intestinal secretion and site-dependent absorption of the beta-blocker
talinolol in humans, Clin Pharmacol Ther 59, 541.
4. Spahn-Langguth, H., G. Baktir, A. Radschuweit, A. Okyar, B. Terhaag, P.
Ader, A. Hanafy and P. Langguth, 1998, P-glycoprotein transporters and the
gastrointestinal tract: evaluation of the potential in vivo relevance of in vitro
data employing talinolol as model compound, Int J Clin Pharmacol Ther 36,
16.
5. Wetterich, U., H. Spahn-Langguth, E. Mutschler, B. Terhaag, W. Rosch and P.
Langguth, 1996, Evidence for intestinal secretion as an additional clearance
pathway of talinolol enantiomers: concentration- and dose-dependent
absorption in vitro and in vivo, Pharm Res 13, 514.
6. Wagner, D., H. Spahn-Langguth, A. Hanafy, A. Koggel, P. Langguth, 2001,
Intestinal drug efflux: formulation and food effects, Adv Drug Deliv Rev 50
Suppl. 1, 13

Acknowledgements
315
Acknowledgements
Removed in the ArchiMed version for privacy reasons.
.

References
316
References
Agoram, B., Woltosz, W. S. , and Bolger, M. B. (2001). “Predicting the impact of
physiological and biochemical processes on oral drug bioavailability.” Adv Drug Deliv
Rev 50 Suppl 1: S41-67.
al-Gohary, O. M. and al-Kassas, R. S. (2000). “Stability studies of aspirin-
magaldrate double layer tablets.” Pharm Acta Helv 74(4): 351-360.
Allikmets, R., Schriml, L. M., Hutchinson, A., Romano-Spica, V. , and Dean, M.
(1998). “A human placenta-specific ATP-binding cassette gene (ABCP) on
chromosome 4q22 that is involved in multidrug resistance.” Cancer Res 58(23):
5337-5339.
Ambudkar, S. V., Dey, S., Hrycyna, C. A., Ramachandra, M., Pastan, I. , and
Gottesman, M. M. (1999). “Biochemical, cellular, and pharmacological aspects of the
multidrug transporter.” Annu Rev Pharmacol Toxicol 39: 361-398.
Arimori, K. and Nakano, M. (1998). “Drug exsorption from blood into the
gastrointestinal tract.” Pharm Res 15(3): 371-376.
Arno, E. A., Anand, P., Bhaskar, K., Ramachandran, S., Saravanan, M. , and
Vinod, R. (2002). “Eudragit® NE30D based Metformin/Gliclazide extended release
tablets: formulation, characterisation and in vitro release studies.” Chem Pharm Bull
(Tokyo) 50(11): 1495-1498.
Artursson, P. and Karlsson, J. (1991). “Correlation between oral drug absorption in
humans and apparent drug permeability coefficients in human intestinal epithelial
(Caco-2) cells.” Biochem Biophys Res Commun 175(3): 880-885.
Ashford, M. and Fell, J. T. (1994). “Targeting drugs to the colon: delivery systems
for oral administration.” J Drug Target 2(3): 241-257.
Avdeef, A. i. B. T., H. van de Waterbeemd, G. Folkers, R. Guy (Eds.) (2001).
“"High-Throughput Measurements of Solubility Profiles.".” Pharmacokinetic
Optimization in Drug Research: Biological, Physicochemical, and Computational
Strategies: 305-326.
Avdeef, A., Strafford, M.A., Artursson, P., Johansson, C. A. S., Luthman, K.,
Brownell, C. R. , and Lyon, R. (2000). “Determination of drug solubility using a
potentiometric acid-base titration method compared to the saturation shake-flask
method.” Poster at the Annual AAPS Meeting, October 29 to November 2, 2000,
Indianapolis.
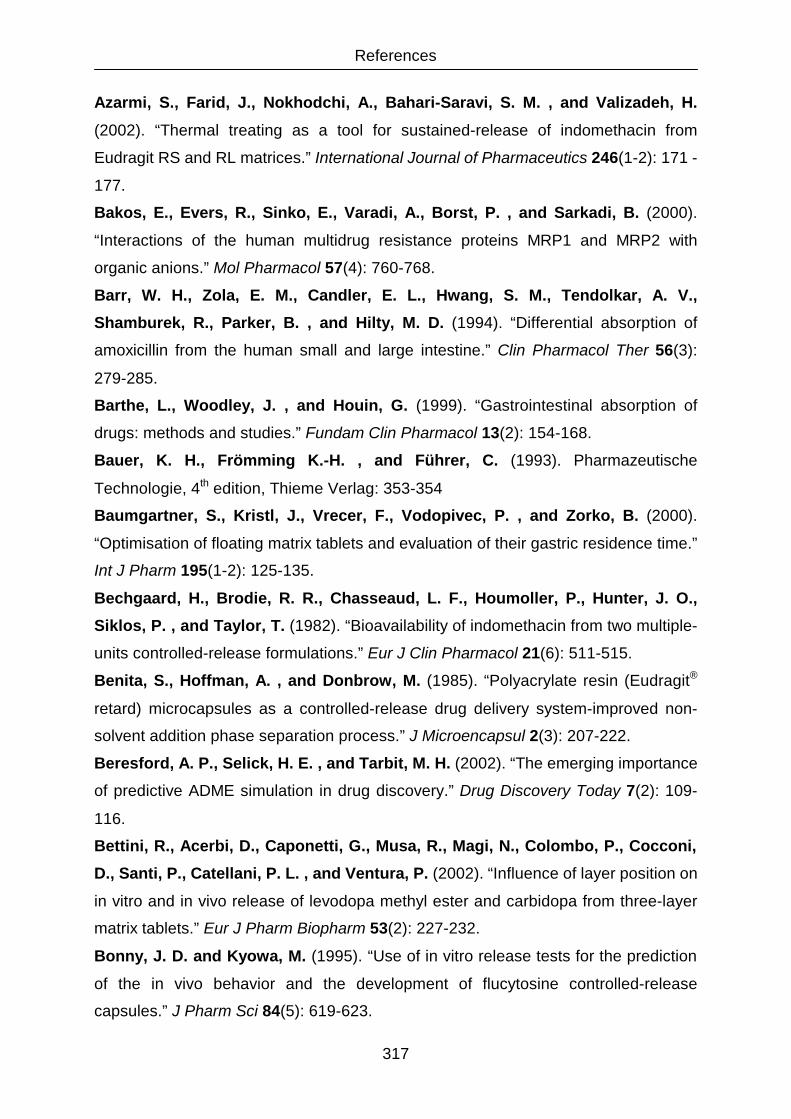
References
317
Azarmi, S., Farid, J., Nokhodchi, A., Bahari-Saravi, S. M. , and Valizadeh, H.
(2002). “Thermal treating as a tool for sustained-release of indomethacin from
Eudragit RS and RL matrices.” International Journal of Pharmaceutics 246(1-2): 171 -
177.
Bakos, E., Evers, R., Sinko, E., Varadi, A., Borst, P. , and Sarkadi, B. (2000).
“Interactions of the human multidrug resistance proteins MRP1 and MRP2 with
organic anions.” Mol Pharmacol 57(4): 760-768.
Barr, W. H., Zola, E. M., Candler, E. L., Hwang, S. M., Tendolkar, A. V.,
Shamburek, R., Parker, B. , and Hilty, M. D. (1994). “Differential absorption of
amoxicillin from the human small and large intestine.” Clin Pharmacol Ther 56(3):
279-285.
Barthe, L., Woodley, J. , and Houin, G. (1999). “Gastrointestinal absorption of
drugs: methods and studies.” Fundam Clin Pharmacol 13(2): 154-168.
Bauer, K. H., Frömming K.-H. , and Führer, C. (1993). Pharmazeutische
Technologie, 4th edition, Thieme Verlag: 353-354
Baumgartner, S., Kristl, J., Vrecer, F., Vodopivec, P. , and Zorko, B. (2000).
“Optimisation of floating matrix tablets and evaluation of their gastric residence time.”
Int J Pharm 195(1-2): 125-135.
Bechgaard, H., Brodie, R. R., Chasseaud, L. F., Houmoller, P., Hunter, J. O.,
Siklos, P. , and Taylor, T. (1982). “Bioavailability of indomethacin from two multiple-
units controlled-release formulations.” Eur J Clin Pharmacol 21(6): 511-515.
Benita, S., Hoffman, A. , and Donbrow, M. (1985). “Polyacrylate resin (Eudragit®
retard) microcapsules as a controlled-release drug delivery system-improved non-
solvent addition phase separation process.” J Microencapsul 2(3): 207-222.
Beresford, A. P., Selick, H. E. , and Tarbit, M. H. (2002). “The emerging importance
of predictive ADME simulation in drug discovery.” Drug Discovery Today 7(2): 109-
116.
Bettini, R., Acerbi, D., Caponetti, G., Musa, R., Magi, N., Colombo, P., Cocconi,
D., Santi, P., Catellani, P. L. , and Ventura, P. (2002). “Influence of layer position on
in vitro and in vivo release of levodopa methyl ester and carbidopa from three-layer
matrix tablets.” Eur J Pharm Biopharm 53(2): 227-232.
Bonny, J. D. and Kyowa, M. (1995). “Use of in vitro release tests for the prediction
of the in vivo behavior and the development of flucytosine controlled-release
capsules.” J Pharm Sci 84(5): 619-623.
References
318
Boobis, A., Gundert-Remy, U., Kremers, P., Macheras, P. , and Pelkonen, O.
(2002). “In silico prediction of ADME and pharmacokinetics. Report of an expert
meeting organised by COST B15.” Eur J Pharm Sci 17(4-5): 183-193.
Borst, P., Evers, R., Kool, M. , and Wijnholds, J. (1999). “The multidrug resistance
protein family.” Biochim Biophys Acta 1461(2): 347-357.
Bouer, R., Barthe, L., Philibert, C., Tournaire, C., Woodley, J. , and Houin, G.
(1999). “The roles of P-glycoprotein and intracellular metabolism in the intestinal
absorption of methadone: in vitro studies using the rat everted intestinal sac.”
Fundam Clin Pharmacol 13(4): 494-500.
Boza, A., Caraballo, I., Alvarez-Fuentes, J. , and Rabasco, A. M. (1999).
“Evaluation of Eudragit® RS-PO and Ethocel® 100 matrices for the controlled-release
of lobenzarit disodium.” Drug Dev Ind Pharm 25(2): 229-233.
Brady, J. M., Cherrington, N. J., Hartley, D. P., Buist, S. C., Li, N. , and Klaassen,
C. D. (2002). “Tissue distribution and chemical induction of multiple drug resistance
genes in rats.” Drug Metab Dispos 30(7): 838-844.
Breitkreutz, J. (2000). “Leakage of enteric (Eudragit L)-coated dosage forms in
simulated gastric juice in the presence of poly(ethylene glycol).” J Control Release
67(1): 79-88.
Bretschneider, B., Brandsch, M. , and Neubert, R. (1999). “Intestinal transport of
beta-lactam antibiotics: analysis of the affinity at the H+/peptide symporter (PEPT1),
the uptake into Caco-2 cell monolayers and the transepithelial flux.” Pharm Res
16(1): 55-61.
Brockmeier, D., Grigoleit, H. G. , and Leonhardt, H. (1985). “Absorption of
glibenclamide from different sites of the gastro-intestinal tract.” Eur J Clin Pharmacol
29(2): 193-197.
Brockmeier, D., Grigoleit, H. G., Heptner, H. , and Meyer, B. H. (1986a). “Kinetics
of piretanide absorption from the gastrointestinal tract.” Methods Find Exp Clin
Pharmacol 8(12): 731-739.
Brockmeier, D., Grigoleit, H. G. , and Leonhardt, H. (1986b). “The absorption of
piretanide from the gastro-intestinal tract is site-dependent.” Eur J Clin Pharmacol
30(1): 79-82.
Busch, A. E., Quester, S., Ulzheimer, J. C., Waldegger, S., Gorboulev, V., Arndt,
P., Lang, F. , and Koepsell, H. (1996). “Electrogenic properties and substrate
References
319
specificity of the polyspecific rat cation transporter rOCT1.” J Biol Chem 271(51):
32599-32604.
Butina, D., Segall, M. D. , and Frankcombe, K. (2002). “Predicting ADME
properties in silico: methods and models.” Drug Discovery Today 7(11): S83-S88.
Cargill, R., Caldwell, L. J., Engle, K., Fix, J. A., Porter, P. A. , and Gardner, C. R.
(1988). “Controlled gastric emptying. 1. Effects of physical properties on gastric
residence times of nondisintegrating geometric shapes in beagle dogs.” Pharm Res
5(8): 533-536.
Caron, G., Steyaert, G., Pagliara, A., Reymond, F., Crivori, P., Gaillard, P.,
Carrupt, P.-A., Avdeef, A., Comer, J., Box, K. J., Girault, H. H., and Testa, B.
(1999). “Structure-Lipophilicity Relationships of Neutral and Protonated Beta-
Blockers.” Helvetica Chimica Acta 82: 1211 - 1222.
Chan, K. K., Buch, A., Glazer, R. D., John, V. A. , and Barr, W. H. (1994). “Site-
differential gastrointestinal absorption of benazepril hydrochloride in healthy
volunteers.” Pharm Res 11(3): 432-437.
Chin, J. E., Soffir, R., Noonan, K. E., Choi, K. , and Roninson, I. B. (1989).
“Structure and expression of the human MDR (P-glycoprotein) gene family.” Mol Cell
Biol 9(9): 3808-3820.
Conte, U. and Maggi, L. (1996). “Modulation of the dissolution profiles from
Geomatrix multi-layer matrix tablets containing drugs of different solubility.”
Biomaterials 17(9): 889-896.
Cooper, H., Levitan, R., Fordtran, J. S. , and Ingelfinger, F. J. (1966). “A method
for studying absorption of water and solute from the human small intestine.”
Gastroenterology 50(1): 1-7.
Crevoisier, C. and Buri, P. (1976). “[Physico-chemical factors influencing
gastrointestinal absorption after dissolution of the active principles].” Pharm Acta Helv
51(7-8): 193-202.
Cvetkovic, M., Leake, B., Fromm, M. F., Wilkinson, G. R. , and Kim, R. B. (1999).
“OATP and P-glycoprotein transporters mediate the cellular uptake and excretion of
fexofenadine.” Drug Metab Dispos 27(8): 866-871.
d’Agay-Abensour, L., Fjellestad-Paulsen, A., Hoglund, P., Ngo, Y., Paulsen, O. ,
and Rambaud, J. C. (1993). “Absolute bioavailability of an aqueous solution of 1-
deamino-8-D-arginine vasopressin from different regions of the gastrointestinal tract
in man.” Eur J Clin Pharmacol 44(5): 473-476.

References
320
Danckwerts, M. P. and van der Watt, J. G. (1995). “The effect of processing
variables on the compression properties of controlled release core-in-cup
compressed tablets from a new adjustable punch.” International Journal of
Pharmaceutics 123(1): 85-94.
Dantzig, A. H., de Alwis, D. P. , and Burgess, M. (2003). “Considerations in the
design and development of transport inhibitors as adjuncts to drug therapy.” Adv
Drug Deliv Rev 55(1): 133-150.
Davies, N. M. (1999). “Sustained release and enteric coated NSAIDs: are they really
GI safe?” J Pharm Pharm Sci 2(1): 5-14.
Davis, S. S., Hardy, J. G. , and Fara, J. W. (1986). “Transit of pharmaceutical
dosage forms through the small intestine.” Gut 27(8): 886-892.
de Mey, C., Schroeter, V., Butzer, R., Jahn, P., Weisser, K., Wetterich, U.,
Terhaag, B., Mutschler, E., Spahn-Langguth, H., Palm, D., and Belz, G. G.
(1995). “Dose-effect and kinetic-dynamic relationships of the beta-adrenoceptor
blocking properties of various doses of talinolol in healthy humans.” J Cardiovasc
Pharmacol 26(6): 879-878.
Deferme, S., Mols, R., Driessche, W. V. , and Augustijns, P. (2002). “Apricot
extract inhibits the P-gp-mediated efflux of talinolol.” J Pharm Sci 91(12): 2539-2548.
Delchier, J. C., Guerret, M., Vidon, N., Dubray, C. , and Lavene, D. (1988).
“Influence of digestive secretions and food on intestinal absorption of nicardipine.”
Eur J Clin Pharmacol 34(2): 165-171.
Deleu, D., Northway, M. G. , and Hanssens, Y. (2002). “Clinical pharmacokinetic
and pharmacodynamic properties of drugs used in the treatment of Parkinson's
disease.” Clin Pharmacokinet 41(4): 261-309.
Doluisio, J. T., Billups, N. F., Dittert, L. W., Sugita, E. T. , and Swintosky, J. V.
(1969). “Drug absorption. I. An in situ rat gut technique yielding realistic absorption
rates.” J Pharm Sci 58(10): 1196-1200.
Dressman, J. B., Amidon, G. L., Reppas, C. , and Shah, V. P. (1998). “Dissolution
testing as a prognostic tool for oral drug absorption: immediate release dosage
forms.” Pharm Res 15(1): 11-22.
Drewe, J., Beglinger, C. , and Kissel, T. (1992). “The absorption site of cyclosporin
in the human gastrointestinal tract.” Br J Clin Pharmacol 33(1): 39-43.
References
321
Edsbacker, S., Larsson, P. , and Wollmer, P. (2002). “Gut delivery of budesonide,
a locally active corticosteroid, from plain and controlled-release capsules.” Eur J
Gastroenterol Hepatol 14(12): 1357-1362.
Efentakis, M. and Dressman, J. B. (1998). “Gastric juice as a dissolution medium:
surface tension and pH.” Eur J Drug Metab Pharmacokinet 23(2): 97-102.
Engkvist, O. and Wrede, P. (2002). “High-throughput, in silico prediction of aqueous
solubility based on one- and two-dimensional descriptors.” J Chem Inf Comput Sci
42(5): 1247-1249.
Fagerholm, U., Johansson, M. , and Lennernas, H. (1996). “Comparison between
permeability coefficients in rat and human jejunum.” Pharm Res 13(9): 1336-1342.
Fagerholm, U., Lindahl, A. , and Lennernas, H. (1997). “Regional intestinal
permeability in rats of compounds with different physicochemical properties and
transport mechanisms.” J Pharm Pharmacol 49(7): 687-690.
Fan, T. Y., Wei, S. L., Yan, W. W., Chen, D. B. , and Li, J. (2001). “An investigation
of pulsatile release tablets with ethylcellulose and Eudragit® L as film coating
materials and cross-linked polyvinylpyrrolidone in the core tablets.” J Control Release
77(3): 245-251.
Ferrero, C. and Jimenez-Castellanos, M. R. (2002). “The influence of carbohydrate
nature and drying methods on the compaction properties and pore structure of new
methyl methacrylate copolymers.” Int J Pharm 248(1-2): 157-171.
Flanagan, S. D. and Benet, L. Z. (1999). “Net secretion of furosemide is subject to
indomethacin inhibition, as observed in Caco-2 monolayers and excised rat jejunum.”
Pharm Res 16(2): 221-224.
Friese, A., Seiller, E., Quack, G., Lorenz, B. , and Kreuter, J. (2000). “Increase of
the duration of the anticonvulsive activity of a novel NMDA receptor antagonist using
poly(butylcyanoacrylate) nanoparticles as a parenteral controlled-release system.”
Eur J Pharm Biopharm 49(2): 103-109.
Fuhr, U., Staib, A. H., Harder, S., Becker, K., Liermann, D., Schollnhammer, G. ,
and Roed, I. S. (1994). “Absorption of ipsapirone along the human gastrointestinal
tract.” Br J Clin Pharmacol 38(1): 83-86.
Fujita, T., Yamada, H., Fukuzumi, M., Nishimaki, A., Yamamoto, A. , and
Muranishi, S. (1997). “Calcein is excreted from the intestinal mucosal cell membrane
by the active transport system.” Life Sci 60(4-5): 307-313.

References
322
Galia, E., Nicolaides, E., Horter, D., Lobenberg, R., Reppas, C. , and Dressman,
J. B. (1998). “Evaluation of various dissolution media for predicting in vivo
performance of class I and II drugs.” Pharm Res 15(5): 698-705.
Gamst, O. N. (1992). “Enteric coated naproxen tablets.” Eur J Rheumatol Inflamm
12(2): 5-8.
Ganapathy, M. E., Huang, W., Rajan, D. P., Carter, A. L., Sugawara, M., Iseki, K.,
Leibach, F. H. , and Ganapathy, V. (2000). “beta-lactam antibiotics as substrates for
OCTN2, an organic cation/carnitine transporter.” J Biol Chem 275(3): 1699-1707.
Genc, L., Bilac, H. , and Guler, E. (1999). “Studies on controlled-release
dimenhydrinate from matrix tablet formulations.” Pharm Acta Helv 74(1): 43-49.
Ghaly, E. S., Hernandez, J. I., Malave, A. , and Marti, A. (1992). “Ethylcellulose as
a carrier for controlled-release acetaminophen tablets.” P R Health Sci J 11(3): 159-
162.
Giessmann, T., Zschiesche, M., Modess, C., Tschuschke, A., Hartmann, V.,
Wegner, D., Weitschies, W., Siegmund, W. (2001). “Is the double peak
phenomenon of talinolol caused by lymphatic transport?” Poster at 5. EACPT
Congress, Odense, Denmark, 12.-15.09.2001.
Gleiter, C. H., Antonin, K. H., Bieck, P., Godbillon, J., Schonleber, W. , and
Malchow, H. (1985). “Colonoscopy in the investigation of drug absorption in healthy
volunteers.” Gastrointest Endosc 31(2): 71-73.
Godbillon, J., Evard, D., Vidon, N., Duval, M., Schoeller, J. P., Bernier, J. J. , and
Hirtz, J. (1985). “Investigation of drug absorption from the gastrointestinal tract of
man. III. Metoprolol in the colon.” Br J Clin Pharmacol 19(Suppl 2): 113S-118S.
Godbillon, J., Gerardin, A., Richard, J., Leroy, D. , and Moppert, J. (1985).
“Osmotically controlled-delivery of metoprolol in man: in vivo performance of Oros
systems with different durations of drug release.” Br J Clin Pharmacol 19(Suppl 2):
213S-218S.
Gomes, P. and Soares-da-Silva, P. (2002). “Na+-independent transporters, LAT-2
and b0,+, exchange L-DOPA with neutral and basic amino acids in two clonal renal
cell lines.” J Membr Biol 186(2): 63-80.
Good, W., Leeson, L. J., Zak, S. L., Wagner, W. E., Meeker, J. B. , and Arnold, J.
D. (1985). “Oros controlled-release formulations of metoprolol: an approach to the
development of a system for once daily administration.” Br J Clin Pharmacol
19(Suppl 2): 231S-238S.

References
323
Govender, T., Dangor, C. M. , and Chetty, D. J. (1997). “Microencapsulated
Eudragit® RS30D-coated controlled-release pellets: the influence of dissolution
variables and topographical evaluation.” J Microencapsul 14(1): 1-13.
Gramatté, T. (1994). “Griseofulvin absorption from different sites in the human small
intestine.” Biopharm Drug Dispos 15(9): 747-759.
Gramatté, T. and Oertel, R. (1999). “Intestinal secretion of intravenous talinolol is
inhibited by luminal R-verapamil.” Clin Pharmacol Ther 66(3): 239-245.
Gramatté, T. and Richter, K. (1994). “Paracetamol absorption from different sites in
the human small intestine.” Br J Clin Pharmacol 37(6): 608-611.
Gramatté, T., el Desoky, E. , and Klotz, U. (1994). “Site-dependent small intestinal
absorption of ranitidine.” Eur J Clin Pharmacol 46(3): 253-259.
Gramatté, T., Oertel, R., Terhaag, B. , and Kirch, W. (1996). “Direct demonstration
of small intestinal secretion and site-dependent absorption of the beta-blocker
talinolol in humans.” Clin Pharmacol Ther 59(5): 541-549.
Grass, G. M. (1997). “Simulation models to predict oral drug absorption from in vitro
data.” Adv. Drug Deliv. Rev. 23: 199-219.
Green, J. R., Lobo, A. J., Giaffer, M., Travis, S. , and Watkins, H. C. (2001).
“Maintenance of Crohn's disease over 12 months: fixed versus flexible dosing
regimen using budesonide controlled ileal release capsules.” Aliment Pharmacol Ther
15(9): 1331-1341.
Greiner, B., M. Eichelbaum, P. Fritz, H.-P. Kreichgauer, O. von Richter, J.
Zundler, H.K. Kroemer (1999). “The role of intestinal P-glycoprotein in the
interaction of digoxin and rifampin.” J. Clin. Invest. 104: 147-153.
Haeberlin, B., Rubas, W., Nolen, H. W., 3rd , and Friend, D. R. (1993). “In vitro
evaluation of dexamethasone-beta-D-glucuronide for colon-specific drug delivery.”
Pharm Res 10(11): 1553-1562.
Hanafy, A., Langguth, P. , and Spahn-Langguth, H. (2001). “Pretreatment with
potent P-glycoprotein ligands may increase intestinal secretion in rats.” Eur J Pharm
Sci 12(4): 405-415.
Harder, S., Fuhr, U., Beermann, D. , and Staib, A. H. (1990). “Ciprofloxacin
absorption in different regions of the human gastrointestinal tract. Investigations with
the hf-capsule.” Br J Clin Pharmacol 30(1): 35-39.
Hartke, K., Hartke, H., Mutschler, E., Rücker, G., Wichtl, M. (ed.) (2002).
“Kommentar zum Europäischen Arzneibuch.” 15. Lfg.: ZD 13.

References
324
Hartke, K., Hartke, H., Mutschler, E., Rücker, G., Wichtl, M. (ed.) (2002).
“Kommentar zum Europäischen Arzneibuch.” 15. Lfg.: ZD-G.
Higuchi, T. (1963). “Mechanism of sustained action medication.Theoretical analysis
of rate of release of solid drugs dispersed in solid matrices.” Journal of
Pharmaceutical Sciences 52: 1145-1148.
Hilgers, A. R., Conradi, R. A. , and Burton, P. S. (1990). “Caco-2 cell monolayers
as a model for drug transport across the intestinal mucosa.” Pharm Res 7(9): 902-
910.
Ho, N. F., Higuchi, W. I. , and Turi, J. (1972). “Theoretical model studies of drug
absorption and transport in the GI tract. 3.” J Pharm Sci 61(2): 192-197.
Hoffman, A. and Stepensky, D. (1999). “Pharmacodynamic aspects of modes of
drug administration for optimization of drug therapy.” Crit Rev Ther Drug Carrier Syst
16(6): 571-639.
Hoffman, A., Danenberg, H. D., Katzhendler, I., Shuval, R., Gilhar, D. , and
Friedman, M. (1998). “Pharmacodynamic and pharmacokinetic rationales for the
development of an oral controlled-release amoxicillin dosage form.” Journal of
Controlled Release 54(1): 29-37.
Hrycyna, C. A., Ramachandra, M., Germann, U. A., Cheng, P. W., Pastan, I. , and
Gottesman, M. M. (1999). “Both ATP sites of human P-glycoprotein are essential but
not symmetric.” Biochemistry 38(42): 13887-13899.
Hsiu, S. L., Hou, Y. C., Wang, Y. H., Tsao, C. W., Su, S. F. , and Chao, P. D.
(2002). “Quercetin significantly decreased cyclosporin oral bioavailability in pigs and
rats.” Life Sci 72(3): 227-235.
Hugger, E. D., Novak, B. L., Burton, P. S., Audus, K. L. , and Borchardt, R. T.
(2002). “A comparison of commonly used polyethoxylated pharmaceutical excipients
on their ability to inhibit P-glycoprotein activity in vitro.” J Pharm Sci 91(9): 1991-
2002.
Huisman, M. T., Smit, J. W., Wiltshire, H. R., Beijnen, J. H. , and Schinkel, A. H.
(2003). “Assessing safety and efficacy of directed P-glycoprotein inhibition to improve
the pharmacokinetic properties of saquinavir coadministered with ritonavir.” J
Pharmacol Exp Ther 304(2): 596-602.
Hunter, J., Hirst, B. H. , and Simmons, N. L. (1993). “Drug absorption limited by P-
glycoprotein-mediated secretory drug transport in human intestinal epithelial Caco-2
cell layers.” Pharm Res 10(5): 743-749.
References
325
Hunter, J., Jepson, M. A., Tsuruo, T., Simmons, N. L. , and Hirst, B. H. (1993).
“Functional expression of P-glycoprotein in apical membranes of human intestinal
Caco-2 cells. Kinetics of vinblastine secretion and interaction with modulators.” J Biol
Chem 268(20): 14991-14997.
Huuskonen, J., Rantanen, J. , and Livingstone, D. (2000). “Prediction of aqueous
solubility for a diverse set of organic compounds based on atom-type
electrotopological state indices.” Eur J Med Chem 35(12): 1081-1088.
Hwang, S. J., Park, H. , and Park, K. (1998). “Gastric retentive drug-delivery
systems.” Crit Rev Ther Drug Carrier Syst 15(3): 243-284.
Ishibashi, T., Ikegami, K., Kubo, H., Kobayashi, M., Mizobe, M. , and Yoshino, H.
(1999). “Evaluation of colonic absorbability of drugs in dogs using a novel colon-
targeted delivery capsule (CTDC).” J Control Release 59(3): 361-376.
Jobin, G., Cortot, A., Godbillon, J., Duval, M., Schoeller, J. P., Hirtz, J. , and
Bernier, J. J. (1985). “Investigation of drug absorption from the gastrointestinal tract
of man. I. Metoprolol in the stomach, duodenum and jejunum.” Br J Clin Pharmacol
19(Suppl 2): 97S-105S.
Jodoin, J., Demeule, M. , and Beliveau, R. (2002). “Inhibition of the multidrug
resistance P-glycoprotein activity by green tea polyphenols.” Biochim Biophys Acta
1542(1-3): 149-159.
Johne, A., J. Brockmoller, S. Bauer, A. Maurer, M. Langheinrich, I. Roots,
(1999). “Pharmacokinetic interaction of digoxin with an herbal extract from St. John´s
wort (Hypericum perforatum).” Clin. Pharmacol. Ther. 66: 338-345.
Jovanovic, M., Jovicic, G., Djuric, Z., Agbaba, D., Karljikovic-Rajic, K., Nikolic,
L. , and Radovanovic, J. (1997). “The influence of Eudragit® type on the dissolution
rate of acetylsalicylic acid from matrix tablets.” Acta Pharm Hung 67(6): 229-234.
Kabanda, L., Lefebvre, R. A., Van Bree, H. J. , and Remon, J. P. (1994). “In vitro
and in vivo evaluation in dogs and pigs of a hydrophilic matrix containing
propylthiouracil.” Pharm Res 11(11): 1663-1668.
Kalampokis, A., Argyrakis, P. , and Macheras, P. (1999). “A heterogeneous tube
model of intestinal drug absorption based on probabilistic concepts.” Pharm Res
16(11): 1764-1769.
Kalampokis, A., Argyrakis, P. , and Macheras, P. (1999). “Heterogeneous tube
model for the study of small intestinal transit flow.” Pharm Res 16(1): 87-91.

References
326
Kane, G. C. and Lipsky, J. J. (2000). “Drug-grapefruit juice interactions.” Mayo Clin
Proc 75(9): 933-942.
Katikaneni, P. R., Upadrashta, S. M., Neau, S. H. , and Mitra, A. K. (1995).
“Ethylcellulose matrix controlled release tablets of a water-soluble drug.” International
Journal of Pharmaceutics 123(1): 119-125.
Kenyon, C. J., Brown, F., McClelland, G. R. , and Wilding, I. R. (1998). “The use
of pharmacoscintigraphy to elucidate food effects observed with a novel protease
inhibitor (saquinavir).” Pharm Res 15(3): 417-422.
Kenyon, C. J., Nardi, R. V., Wong, D., Hooper, G., Wilding, I. R. , and Friend, D.
R. (1997). “Colonic delivery of dexamethasone: a pharmacoscintigraphic evaluation.”
Aliment Pharmacol Ther 11(1): 205-213.
Kesslhut, J. F. and Bauer, K. H. (1994). “Laurinic acid dextranesters for site specific
drug delivery to the human colon.” Eur. J. Pharm. Biopharm. 40: 38-47.
Kim, J. E., Kim, S. R., Lee, S. H., Lee, C. H. , and Kim, D. D. (2000). “The effect of
pore formers on the controlled release of cefadroxil from a polyurethane matrix.” Int J
Pharm 201(1): 29-36.
Klausner, E. A., Lavy, E., Stepensky, D., Friedman, M. , and Hoffman, A. (2002).
“Novel gastroretentive dosage forms: evaluation of gastroretentivity and its effect on
riboflavin absorption in dogs.” Pharm Res 19(10): 1516-1523.
Kleinow, K. M., Doi, A. M. , and Smith, A. A. (2000). “Distribution and inducibility of
P-glycoprotein in the catfish: immunohistochemical detection using the mammalian
C-219 monoclonal.” Mar Environ Res 50(1-5): 313-317.
Kleinzeller, A. (1999). “Charles Ernest Overton`s concept of a cell membrane.” In
Current Topics in Membranes Vol. 48 (editors: Deamer, D. W., Kleinzeller, A.,
Fambrough, D. M., Academic Press, San Diego): 1-22.
Koepsell, H. (1998). “Organic cation transporters in intestine, kidney, liver, and
brain.” Annu Rev Physiol 60: 243-266.
Kool, M., de Haas, M., Scheffer, G. L., Scheper, R. J., van Eijk, M. J., Juijn, J. A.,
Baas, F. , and Borst, P. (1997). “Analysis of expression of cMOAT (MRP2), MRP3,
MRP4, and MRP5, homologues of the multidrug resistance-associated protein gene
(MRP1), in human cancer cell lines.” Cancer Res 57(16): 3537-3547.
Krajacic, A. and Tucker, I. G. (2003). “Matrix formation in sustained-release tablets:
possible mechanism of dose dumping.” Int J Pharm 251(1-2): 67-78.
References
327
Krishnaiah, Y. S., Karthikeyan, R. S., Bhaskar, P. , and Satyanarayana, V.
(2002). “Bioavailability studies on guar gum-based three-layer matrix tablets of
trimetazidine dihydrochloride in human volunteers.” J Control Release 83(2): 231-
239.
Langguth, P., Merkle, H. P. , and Amidon, G. L. (1994). “Oral absorption of
peptides: the effect of absorption site and enzyme inhibition on the systemic
availability of metkephamid.” Pharm Res 11(4): 528-535.
Lapidus, H. and Lordi, N. G. (1966). “Some factors affecting the release of a water-
soluble drug from a compressed hydrophilic matrix.” J Pharm Sci 55(8): 840-843.
Larsen, E. H. (2002). “Hans H. Ussing— scientific work: contemporary significance
and perspectives.” Biochim Biophys Acta 1566(1-2): 2-15.
Lauterbach, F. (1975). “Resorption und Sekretion von Arzneistoffen durch die
Mukosaepithelien des Gastrointestinaltraktes.” Drug Research 25: 479-488.
Le Ferrec, E., Chesne, C., Artusson, P., Brayden, D., Fabre, G., Gires, P.,
Guillou, F., Rousset, M., Rubas, W. , and Scarino, M. L. (2001). “In vitro models of
the intestinal barrier. The report and recommendations of ECVAM Workshop 46.
European Centre for the Validation of Alternative methods.” Altern Lab Anim 29(6):
649-668.
Lehr, C. M. (1994). “Bioadhesion technologies for the delivery of peptide and protein
drugs to the gastrointestinal tract.” Crit Rev Ther Drug Carrier Syst 11(2-3): 119-160.
Lehr, C. M., Bouwstra, J. A., Kok, W., Noach, A. B., de Boer, A. G. , and
Junginger, H. E. (1992). “Bioadhesion by means of specific binding of tomato lectin.”
Pharm Res 9(4): 547-553.
Lennernas, H. (1997). “Human jejunal effective permeability and its correlation with
preclinical drug absorption models.” J Pharm Pharmacol 49(7): 627-638.
Lennernas, H. (1998). “Human intestinal permeability.” J Pharm Sci 87(4): 403-410.
Lennernas, H. and Regardh, C. G. (1993a). “Dose-dependent intestinal absorption
and significant intestinal excretion (exsorption) of the beta-blocker pafenolol in the
rat.” Pharm Res 10(5): 727-731.
Lennernas, H. and Regardh, C. G. (1993b). “Evidence for an interaction between
the beta-blocker pafenolol and bile salts in the intestinal lumen of the rat leading to
dose-dependent oral absorption and double peaks in the plasma concentration-time
profile.” Pharm Res 10(6): 879-883.
References
328
Lennernas, H. and Regardh, C. G. (1993c). “Regional gastrointestinal absorption of
the beta-blocker pafenolol in the rat and intestinal transit rate determined by
movement of 14C-polyethylene glycol (PEG) 4000.” Pharm Res 10(1): 130-135.
Leopold, C. S. and Eikeler, D. (1998). “Eudragit® E as coating material for the pH-
controlled drug release in the topical treatment of inflammatory bowel disease (IBD).”
J Drug Target 6(2): 85-94.
Leveille-Webster, C. R. and Arias, I. M. (1995). “The biology of the P-
glycoproteins.” J Membr Biol 143(2): 89-102.
Levy, G. and Jusko, W. J. (1966). “Factors affecting the absorption of riboflavin in
man.” J Pharm Sci 55(3): 285-289.
Li, Y. H., Ito, K., Tsuda, Y., Kohda, R., Yamada, H. , and Itoh, T. (1999).
“Mechanism of intestinal absorption of an orally active beta-lactam prodrug: uptake
and transport of carindacillin in Caco-2 cells.” J Pharmacol Exp Ther 290(3): 958-964.
Lin, J. H. (1995). “Species similarities and differences in pharmacokinetics.” Drug
Metab Dispos 23(10): 1008-1021.
Lin, J. H. (2003). “Drug-drug interaction mediated by inhibition and induction of P-
glycoprotein.” Adv Drug Deliv Rev 55(1): 53-81.
Lin, K. H., Lin, S. Y. , and Li, M. J. (2001). “Compression forces and amount of
outer coating layer affecting the time-controlled disintegration of the compression-
coated tablets prepared by direct compression with micronized ethylcellulose.” J
Pharm Sci 90(12): 2005-2009.
Lin, S. Y., Lin, K. H. , and Li, M. J. (2001). “Micronized ethylcellulose used for
designing a directly compressed time-controlled disintegration tablet.” J Control
Release 70(3): 321-328.
Lindahl, A., Ungell, A. L., Knutson, L. , and Lennernas, H. (1997).
“Characterization of fluids from the stomach and proximal jejunum in men and
women.” Pharm Res 14(4): 497-502.
Lippold, B. C. and Monells Pages, R. (2001). “Film formation, reproducibility of
production and curing with respect to release stability of functional coatings from
aqueous polymer dispersions.” Pharmazie 56(1): 5-17.
Loe, D. W., Deeley, R. G. , and Cole, S. P. (1998). “Characterization of vincristine
transport by the M(r) 190,000 multidrug resistance protein (MRP): evidence for
cotransport with reduced glutathione.” Cancer Res 58(22): 5130-5136.

References
329
Lu, R., Kanai, N., Bao, Y. , and Schuster, V. L. (1996). “Cloning, in vitro expression,
and tissue distribution of a human prostaglandin transporter cDNA(hPGT).” J Clin
Invest 98(5): 1142-1149.
Mahe, S., Huneau, J. F., Marteau, P., Thuillier, F. , and Tome, D. (1992).
“Gastroileal nitrogen and electrolyte movements after bovine milk ingestion in
humans.” Am J Clin Nutr 56(2): 410-416.
Majid Khan, G. and Zhu, J. B. (1998). “Ibuprofen release kinetics from controlled-
release tablets granulated with aqueous polymeric dispersion of ethylcellulose II:
influence of several parameters and coexcipients.” J Control Release 56(1-3): 127-
134.
Majid Khan, G. and Zhu, J.-B. (1999). “Studies on drug release kinetics from
ibuprofen–carbomer hydrophilic matrix tablets: influence of co-excipients on
release rate of the drug.” Journal of Controlled Release 57(2): 197-203.
Makhey, V. D., Guo, A., Norris, D. A., Hu, P., Yan, J. , and Sinko, P. J. (1998).
“Characterization of the regional intestinal kinetics of drug efflux in rat and human
intestine and in Caco-2 cells.” Pharm Res 15(8): 1160-1167.
Maurer, H. H. and Rump, A. F. (1991). “Intestinal absorption of gabapentin in rats.”
Arzneimittelforschung 41(2): 104-106.
McInnes, G. T. and Brodie, M. J. (1988). “Evaluation of two oxprenolol oral osmotic
(OROS) delivery systems in patients with essential hypertension.” Eur J Clin
Pharmacol 34(6): 605-611.
McLeod, A. D., Friend, D. R. , and Tozer, T. N. (1994). “Glucocorticoid-dextran
conjugates as potential prodrugs for colon-specific delivery: hydrolysis in rat
gastrointestinal tract contents.” J Pharm Sci 83(9): 1284-1288.
Menon, A., Ritschel, W. A. , and Sakr, A. (1994). “Development and evaluation of a
monolithic floating dosage form for furosemide.” J Pharm Sci 83(2): 239-245.
Mitrevej, A., Sinchaipanid, N., Rungvejhavuttivittaya, Y. , and Kositchaiyong, V.
(2001). “Multiunit controlled-release diclofenac sodium capsules using complex of
chitosan with sodium alginate or pectin.” Pharm Dev Technol 6(3): 385-392.
Morishita, I., Morishita, M., Machida, Y. , and Nagai, T. (1991). “Controlled-release
microspheres based on Eudragit® L100 for the oral administration of erythromycin.”
Drug Des Deliv 7(4): 309-319.
References
330
Munck, B. G. (1965). “Amino acid transport by the small intestine of the rat. The
effect of amino acid pre-loading on the trans-intestinal amino acid transport by the
everted sac preparation.” Biochim Biophys Acta 109(1): 142-150.
Nagel, G., Volk, C., Friedrich, T., Ulzheimer, J. C., Bamberg, E. , and Koepsell,
H. (1997). “A reevaluation of substrate specificity of the rat cation transporter rOCT1.”
J Biol Chem 272(51): 31953-31956.
Nakayama, A., Saitoh, H., Oda, M., Takada, M. , and Aungst, B. J. (2000).
“Region-dependent disappearance of vinblastine in rat small intestine and
characterization of its P-glycoprotein-mediated efflux system.” Eur J Pharm Sci 11(4):
317-324.
Narawane, M., Podder, S. K., Bundgaard, H. , and Lee, V. H. (1993). “Segmental
differences in drug permeability, esterase activity and ketone reductase activity in the
albino rabbit intestine.” J Drug Target 1(1): 29-39.
Neau, S. H., Howard, M. A., Claudius, J. S. , and Howard, D. R. (1999). “The effect
of the aqueous solubility of xanthine derivatives on the release mechanism from
ethylcellulose matrix tablets.” Int J Pharm 179(1): 97-105.
Neuhoff, S., Langguth, P., Dressler, C., Andersson, T. B., Regardh, C. G. , and
Spahn-Langguth, H. (2000). “Affinities at the verapamil binding site of MDR1-
encoded P-glycoprotein: drugs and analogs, stereoisomers and metabolites.” Int J
Clin Pharmacol Ther 38(4): 168-179.
Nokhodchi, A., Ford, J. L., Rowe, P. H. , and Rubinstein, M. H. (1996). “The
effects of compression rate and force on the compaction properties of different
viscosity grades of hydroxypropylmethylcellulose 2208.” International Journal of
Pharmaceutics 129(1-2): 21-31.
Norris, D. A., Leesman, G. D., Sinko, P. J. , and Grass, G. M. (2000).
“Development of predictive pharmacokinetic simulation models for drug discovery.” J
Control Release 65(1-2): 55-62.
Oertel, R. and Richter, K. (1995). “[The metabolism of the beta receptor blocker
talinolol in humans--relationship between structure, polarity and amount excreted].”
Pharmazie 50(9): 637-638.
Oertel, R., Richter, K., Trausch, B., Berndt, A., Gramatté, T. , and Kirch, W.
(1994). “Elucidation of the structure of talinolol metabolites in man. Determination of
talinolol and hydroxylated talinolol metabolites in urine and analysis of talinolol in
serum.” J Chromatogr B Biomed Appl 660(2): 353-363.
References
331
Parikh, N. H., Porter, S. C. , and Rohera, B. D. (1993). “Aqueous ethylcellulose
dispersion of ethylcellulose. I. Evaluation of coating process variables.” Pharm Res
10(4): 525-534.
Park, G. B. and Mitra, A. K. (1992). “Mechanism and site dependency of intestinal
mucosal transport and metabolism of thymidine analogues.” Pharm Res 9(3): 326-
331.
Parrott, N. and Lave, T. (2002). “Prediction of intestinal absorption: comparative
assessment of GASTROPLUS and IDEA.” Eur J Pharm Sci 17(1-2): 51-61.
Patel, H. M. (1985). “Liposomes as a controlled-release system.” Biochem Soc Trans
13(2): 513-516.
Pather, S. I., Russell, I., Syce, J. A. , and Neau, S. H. (1998). “Sustained-release
theophylline tablets by direct compression.” International Journal of Pharmaceutics
164(1-2): 1 - 10.
Peterson, D. L. and Yalkowsky, S. H. (2001). “Comparison of two methods for
predicting aqueous solubility.” J Chem Inf Comput Sci 41(6): 1531-1534.
Preiss, R. (1998). “P-glycoprotein and related transporters.” Int J Clin Pharmacol
Ther 36(1): 3-8.
Pritchard, J. B., Miller, D. S. (1997). “Renal secretion of anorganic cations: a
multistep process.” Advanced Drug Delivery Reviews 25: 231-242.
Rao, V. M., Engh, K. , and Qiu, Y. (2003). “Design of pH-independent controlled
release matrix tablets for acidic drugs.” International Journal of Pharmaceutics 252(1-
2): 81-86.
Renes, J., de Vries, E. G., Nienhuis, E. F., Jansen, P. L. , and Muller, M. (1999).
“ATP- and glutathione-dependent transport of chemotherapeutic drugs by the
multidrug resistance protein MRP1.” Br J Pharmacol 126(3): 681-688.
Rhodes, C. T. and Porter, S. C. (1998). “Coatings for controlled-release drug
delivery systems.” Drug Dev Ind Pharm 24(12): 1139-1154.
Ritger, P. L. and Peppas, N. A. (1984). “A simple equation for description of solute
release: I. Fickian and Non-Fickian release from non-swellable devices in the form of
slabs, spheres and cylinders.” J. Control Release 17: 329-331.
Ritschel, W. A. (1991). “Targeting in the gastrointestinal tract: new approaches.”
Methods Find Exp Clin Pharmacol 13(5): 313-336.
References
332
Ritschel, W. A., Menon, A. , and Sakr, A. (1991). “Biopharmaceutic evaluation of
furosemide as a potential candidate for a modified release peroral dosage form.”
Methods Find Exp Clin Pharmacol 13(9): 629-636.
Romero-Cano, M. S. and Vincent, B. (2002). “Controlled-release of 4-nitroanisole
from poly(lactic acid) nanoparticles.” J Control Release 82(1): 127-135.
Ross, D. D., Yang, W., Abruzzo, L. V., Dalton, W. S., Schneider, E., Lage, H.,
Dietel, M., Greenberger, L., Cole, S. P. , and Doyle, L. A. (1999). “Atypical
multidrug resistance: breast cancer resistance protein messenger RNA expression in
mitoxantrone-selected cell lines.” J Natl Cancer Inst 91(5): 429-433.
Rouge, N., Buri, P. , and Doelker, E. (1996). “Drug absorption sites in the
gastrointestinal tract and dosage forms for site-specific delivery.” International
Journal of Pharmaceutics 136(1-2): 117-139.
Rubinstein, A., Tirosh, B., Baluom, M., Nassar, T., David, A., Radai, R., Gliko-
Kabir, I. , and Friedman, M. (1997). “The rationale for peptide drug delivery to the
colon and the potential of polymeric carriers as effective tools.” Journal of Controlled
Release 46(1-2): 59-73.
Russell, T. L., Berardi, R. R., Barnett, J. L., Dermentzoglou, L. C., Jarvenpaa, K.
M., Schmaltz, S. P. , and Dressman, J. B. (1993). “Upper gastrointestinal pH in
seventy-nine healthy, elderly, North American men and women.” Pharm Res 10(2):
187-196.
Saitoh, H. and Aungst, B. J. (1995). “Possible involvement of multiple P-
glycoprotein-mediated efflux systems in the transport of verapamil and other organic
cations across rat intestine.” Pharm Res 12(9): 1304-1310.
Saitoh, H., Gerard, C. , and Aungst, B. J. (1996). “The secretory intestinal transport
of some beta-lactam antibiotics and anionic compounds: a mechanism contributing to
poor oral absorption.” J Pharmacol Exp Ther 278(1): 205-211.
Sanchez-Lafuente, C., Teresa Faucci, M., Fernandez-Arevalo, M., Alvarez-
Fuentes, J., Rabasco, A. M. , and Mura, P. (2002). “Development of sustained-
release matrix tablets of didanosine containing methacrylic and ethylcellulose
polymers.” Int J Pharm 234(1-2): 213-221.
Sanchez-Pico, A., Peris-Ribera, J. E., Toledano, C., Torres-Molina, F., Casabo,
V. G., Martin-Villodre, A. , and Pla-Delfina, J. M. (1989). “Non-linear intestinal
absorption kinetics of cefadroxil in the rat.” J Pharm Pharmacol 41(3): 179-185.
References
333
Saravanan, M., Nataraj, K. S. , and Ganesh, K. S. (2002). “The effect of tablet
formulation and hardness on in vitro release of cephalexin from Eudragit® L100
based extended release tablets.” Biol Pharm Bull 25(4): 541-545.
Sasaki, H., Igarashi, Y., Nishida, K. , and Nakamura, J. (1994). “Intestinal
permeability of ophthalmic beta-blockers for predicting ocular permeability.” J Pharm
Sci 83(9): 1335-1338.
Sawicki, W. (2002). “Pharmacokinetics of verapamil and norverapamil from
controlled release floating pellets in humans.” Eur J Pharm Biopharm 53(1): 29-35.
Schinkel, A. H., Wagenaar, E., van Deemter, L., Mol, C. A. , and Borst, P. (1995).
“Absence of the mdr1a P-Glycoprotein in mice affects tissue distribution and
pharmacokinetics of dexamethasone, digoxin, and cyclosporin A.” J Clin Invest 96(4):
1698-1705.
Schmidt, J. (1995). “Talinolol, ein klinisch bewährter b1-selektiver Betablocker - Eine
Übersicht zu pharmakokinetischen und pharmakodynamischen Eigenschaften.”
Perfusion 9: 291-296.
Schuetz, E. G., Schinkel, A. H., Relling, M. V. , and Schuetz, J. D. (1996). “P-
glycoprotein: a major determinant of rifampicin-inducible expression of cytochrome
P4503A in mice and humans.” Proc Natl Acad Sci U S A 93(9): 4001-4005.
Schurgers, N., Bijdendijk, J., Tukker, J. J. , and Crommelin, D. J. (1986).
“Comparison of four experimental techniques for studying drug absorption kinetics in
the anesthetized rat in situ.” J Pharm Sci 75(2): 117-119.
Schuster, O., Haertel, M., Hugemann, B., Gikalov, I., Schiemann, O. , and
Fenner, H. (1985). “[The clinical pharmacokinetics of allopurinol. 1. Allopurinol
absorption sites and dose proportionality of allopurinol/oxipurinol bioavailability].”
Arzneimittelforschung 35(4): 760-765.
Schwarz, C. and Mehnert, W. (1999). “Solid lipid nanoparticles (SLN) for controlled
drug delivery. II. Drug incorporation and physicochemical characterization.” J
Microencapsul 16(2): 205-213.
Schwarz, U. I., Gramatté, T., Krappweis, J., Berndt, A., Oertel, R., von Richter,
O. , and Kirch, W. (1999). “Unexpected effect of verapamil on oral bioavailability of
the beta-blocker talinolol in humans.” Clin Pharmacol Ther 65(3): 283-290.
Schwenk, M. (1987). “Drug transport in intestine, liver and kidney.” Arch Toxicol
60(1-3): 37-42.
References
334
Seelig, A. and Landwojtowicz, E. (2000). “Structure-activity relationship of P-
glycoprotein substrates and modifiers.” Eur J Pharm Sci 12(1): 31-40.
Seelig, A., Blatter, X. L. , and Wohnsland, F. (2000). “Substrate recognition by P-
glycoprotein and the multidrug resistance-associated protein MRP1: a comparison.”
Int J Clin Pharmacol Ther 38(3): 111-121.
Shalaby, W. S. and Park, K. (1990). “Biochemical and mechanical characterization
of enzyme-digestible hydrogels.” Pharm Res 7(8): 816-823.
Sharma, P., Chawla, H. , and Panchagnula, R. (2002). “Analytical method for
monitoring concentrations of cyclosporin and lovastatin in vitro in an everted rat
intestinal sac absorption model.” J Chromatogr B Analyt Technol Biomed Life Sci
768(2): 349-359.
Sikic, B. I. (1999). “Modulation of multidrug resistance: a paradigm for translational
clinical research.” Oncology (Huntingt) 13(5A): 183-187.
Sinko, P. J., Leesman, G. D. , and Amidon, G. L. (1991). “Predicting fraction dose
absorbed in humans using a macroscopic mass balance approach.” Pharm Res 8(8):
979-988.
Smith, D. A. and van de Waterbeemd, H. (1999). “Pharmacokinetics and
metabolism in early drug discovery.” Current Opinion in Chemical Biology 3(4): 373-
378.
Soderholm, J. D., Hedman, L., Artursson, P., Franzen, L., Larsson, J., Pantzar,
N., Permert, J. , and Olaison, G. (1998). “Integrity and metabolism of human ileal
mucosa in vitro in the Ussing chamber.” Acta Physiol Scand 162(1): 47-56.
Spahn-Langguth, H. and Langguth, P. (2001). “Grapefruit juice enhances intestinal
absorption of the P-glycoprotein substrate talinolol.” Eur J Pharm Sci 12(4): 361-367.
Spahn-Langguth, H., Baktir, G., Radschuweit, A., Okyar, A., Terhaag, B., Ader,
P., Hanafy, A. , and Langguth, P. (1998). “P-glycoprotein transporters and the
gastrointestinal tract: evaluation of the potential in vivo relevance of in vitro data
employing talinolol as model compound.” Int J Clin Pharmacol Ther 36(1): 16-24.
Staib, A. H., Beermann, D., Harder, S., Fuhr, U. , and Liermann, D. (1989).
“Absorption differences of ciprofloxacin along the human gastrointestinal tract
determined using a remote-control drug delivery device (HF-capsule).” Am J Med
87(5A): 66S-69S.
References
335
Stenekes, R. J., Loebis, A. E., Fernandes, C. M., Crommelin, D. J. , and Hennink,
W. E. (2001). “Degradable dextran microspheres for the controlled-release of
liposomes.” Int J Pharm 214(1-2): 17-20.
Stevens, H. N., Wilson, C. G., Welling, P. G., Bakhshaee, M., Binns, J. S.,
Perkins, A. C., Frier, M., Blackshaw, E. P., Frame, M. W., Nichols, D. J.,
Humphrey, M. J. , and Wicks, S. R. (2002). “Evaluation of Pulsincap to provide
regional delivery of dofetilide to the human GI tract.” Int J Pharm 236(1-2): 27-34.
Streubel, A., Siepmann, J., Peppas, N. A. , and Bodmeier, R. (2000). “Bimodal
drug release achieved with multi-layer matrix tablets: transport mechanisms and
device design.” J Control Release 69(3): 455-468.
Sutcliffe, F. A., Riley, S. A., Lynch, J., Taylor, D. C., Turnberg, L. A. , and
Rowland, M. (1988). “Comparative absorption of drugs from jejunum and ileum of rat
and human.” Abstract from the Third Conference on Drug Absorption, Edinburgh,
1988.
Suzuki, H. and Sugiyama, Y. (2000). “Role of metabolic enzymes and efflux
transporters in the absorption of drugs from the small intestine.” Eur J Pharm Sci
12(1): 3-12.
Tahara, K., Yamamoto, K. , and Nishihata, T. (1996). “Application of model-
independent and model analysis for the investigation of effect of drug solubility on its
release rate from hydroxypropyl methylcellulose sustained-release tablets.”
International Journal of Pharmaceutics 133(1-2): 17-27.
Tamai, I., Nezu, J., Uchino, H., Sai, Y., Oku, A., Shimane, M. , and Tsuji, A.
(2000). “Molecular identification and characterization of novel members of the human
organic anion transporter (OATP) family.” Biochem Biophys Res Commun 273(1):
251-260.
Tamura, S., Ohike, A., Ibuki, R., Amidon, G. L. , and Yamashita, S. (2002).
“Tacrolimus is a class II low-solubility high-permeability drug: the effect of P-
glycoprotein efflux on regional permeability of tacrolimus in rats.” J Pharm Sci 91(3):
719-729.
Tang, H., Pak, Y. , and Mayersohn, M. (2002). “P-glycoprotein (P-gp) mRNA and
protein expression pattern along the small intestine of the Yucatan micropig.” AAPS
PharmSci. 4(4): Abstract T2225.

References
336
Tay, L. K., Dixon, F., Jr., Sostrin, M. B., Barr, W. H., Farmen, R. H. , and Pittman,
K. A. (1992). “The site of gastrointestinal absorption of gepirone in humans.” J Clin
Pharmacol 32(9): 827-832.
Terada, T., Saito, H., Mukai, M. , and Inui, K. (1997a). “Characterization of stably
transfected kidney epithelial cell line expressing rat H+/peptide cotransporter PEPT1:
localization of PEPT1 and transport of beta-lactam antibiotics.” J Pharmacol Exp Ther
281(3): 1415-1421.
Terada, T., Saito, H., Mukai, M. , and Inui, K. (1997b). “Recognition of beta-lactam
antibiotics by rat peptide transporters, PEPT1 and PEPT2, in LLC-PK1 cells.” Am J
Physiol 273(5 Pt 2): F706-711.
Terhaag, B., Gramatté, T., Richter, K., Voss, J. , and Feller, K. (1989). “The biliary
elimination of the selective beta-receptor blocking drug talinolol in man.” Int J Clin
Pharmacol Ther Toxicol 27(4): 170-172.
Terhaag, B., Sahre, H., Lange, U., Richter, K. and Feller, K. (1991). “Zum Einfluß
der Nahrung auf die Absorption von Talinolol (Cordanum(R)) an gesunden
Probanden.” Z Klin Med 46(13): 1021-1023.
Terstappen, G. C. and Reggiani, A. (2001). “In silico research in drug discovery.”
Trends in Pharmacological Sciences 22(1): 23-26.
Tetko, I. V., Tanchuk, V. Y., Kasheva, T. N. , and Villa, A. E. (2001). “Estimation of
aqueous solubility of chemical compounds using E-state indices.” J Chem Inf Comput
Sci 41(6): 1488-1493.
Tetko, I. V., Tanchuk, V. Y., Kasheva, T. N. , and Villa, A. E. (2001). “Internet
software for the calculation of the lipophilicity and aqueous solubility of chemical
compounds.” J Chem Inf Comput Sci 41(2): 246-252.
Thwaites, D. T., Hirst, B. H. , and Simmons, N. L. (1993). “Passive transepithelial
absorption of thyrotropin-releasing hormone (TRH) via a paracellular route in cultured
intestinal and renal epithelial cell lines.” Pharm Res 10(5): 674-681.
Trausch, B., Oertel, R., Richter, K. , and Gramatté, T. (1995). “Disposition and
bioavailability of the beta 1-adrenoceptor antagonist talinolol in man.” Biopharm Drug
Dispos 16(5): 403-414.
Trausch, B., Oertel, R., Richter, K. , and Gramatté, T. (1995). “[The protein binding
of talinolol].” Pharmazie 50(1): 72.
Tsuji, A. and Tamai, I. (1996). “Carrier-mediated intestinal transport of drugs.”
Pharm Res 13(7): 963-977.
References
337
Tsutsumi, K., Li, S. K., Ghanem, A. H., Ho, N. F. , and Higuchi, W. I. (2003). “A
Systematic examination of the in vitro Ussing chamber and the in situ single-pass
perfusion model systems in rat ileum permeation of model solutes.” J Pharm Sci
92(2): 344-359.
Tu, J., Wang, L., Yang, J., Fei, H. , and Li, X. (2001). “Formulation and
pharmacokinetic studies of acyclovir controlled-release capsules.” Drug Dev Ind
Pharm 27(7): 687-692.
Ullrich, K. J., Rumrich, G., David, C. , and Fritzsch, G. (1993). “Bisubstrates:
substances that interact with both, renal contraluminal organic anion and organic
cation transport systems. II. Zwitterionic substrates: dipeptides, cephalosporins,
quinolone-carboxylate gyrase inhibitors and phosphamide thiazine carboxylates;
nonionizable substrates: steroid hormones and cyclophosphamides.” Pflugers Arch
425(3-4): 300-312.
Ungell, A. L., Nylander, S., Bergstrand, S., Sjoberg, A. , and Lennernas, H.
(1998). “Membrane transport of drugs in different regions of the intestinal tract of the
rat.” J Pharm Sci 87(3): 360-366.
Ungell, A.-L. (1997). “In vitro absorption studies and their relevance to absorption
from the GI tract.” Drug Development and Industrial Pharmacy 23: 879-892.
Ussing, H. H. and Zerahn, K. (1999). “Active transport of sodium as the source of
electric current in the short-circuited isolated frog skin. Reprinted from Acta. Physiol.
Scand. 23: 110-127, 1951.” J Am Soc Nephrol 10(9): 2056-2065.
Van Bambeke, F., Balzi, E. , and Tulkens, P. M. (2000). “Antibiotic efflux pumps.”
Biochem Pharmacol 60(4): 457-470.
Van den Mooter, G., Samyn, C. , and Kinget, R. (1995). “In vivo evaluation of a
colon-specific drug delivery system: an absorption study of theophylline from
capsules coated with azo polymers in rats.” Pharm Res 12(2): 244-247.
van Montfoort, J. E., Hagenbuch, B., Fattinger, K. E., Muller, M., Groothuis, G.
M., Meijer, D. K. , and Meier, P. J. (1999). “Polyspecific organic anion transporting
polypeptides mediate hepatic uptake of amphipathic type II organic cations.” J
Pharmacol Exp Ther 291(1): 147-152.
Velasco, M. V., Ford, J. L., Rowe, P. , and Rajabi-Siahboomi, A. R. (1999).
“Influence of drug:hydroxypropylmethylcellulose ratio, drug and polymer particle size
and compression force on the release of diclofenac sodium from HPMC tablets.” J
Control Release 57(1): 75-85.

References
338
Vidon, N., Evard, D., Godbillon, J., Rongier, M., Duval, M., Schoeller, J. P.,
Bernier, J. J. , and Hirtz, J. (1985). “Investigation of drug absorption from the
gastrointestinal tract of man. II. Metoprolol in the jejunum and ileum.” Br J Clin
Pharmacol 19(Suppl 2): 107S-112S.
Vidon, N., Palma, R., Godbillon, J., Franchisseur, C., Gosset, G., Bernier, J. J. ,
and Hirtz, J. (1986). “Gastric and intestinal absorption of oxprenolol in humans.” J
Clin Pharmacol 26(8): 611-615.
Wacher, V. J., Wu, C. Y. , and Benet, L. Z. (1995). “Overlapping substrate
specificities and tissue distribution of cytochrome P450 3A and P-glycoprotein:
implications for drug delivery and activity in cancer chemotherapy.” Mol Carcinog
13(3): 129-134.
Wagner, D., Spahn-Langguth, H., Hanafy, A., Koggel, A. , and Langguth, P.
(2001). “Intestinal drug efflux: formulation and food effects.” Adv Drug Deliv Rev 50
Suppl 1: S13-31.
Wagner, J. G. (ed.) (1971) Biopharmaceutics and Relevant Pharmacokinetics, Drug
Intelligence Publications, Hamilton, Illinois
Wakasugi, H., I. Yano, T. Ito, T. Hashida, T. Futami, R. Nohara, S. Sasayama, K.
Inui, (1998). “Effect of clarithromycin on renal excretion of digoxin: Interaction with P-
glycoprotein.” Clin. Pharmacol. Ther. 64: 123-128.
Walgren, R. A., Karnaky, K. J., Jr., Lindenmayer, G. E. , and Walle, T. (2000).
“Efflux of dietary flavonoid quercetin 4'-beta-glucoside across human intestinal Caco-
2 cell monolayers by apical multidrug resistance-associated protein-2.” J Pharmacol
Exp Ther 294(3): 830-836.
Walter, E., Kissel, T. , and Raddatz, P. (1995). “Transport of peptidomimetic renin
inhibitors across monolayers of a human intestinal cell line (Caco-2): evidence for
self-enhancement of paracellular transport route.” Pharm Res 12(11): 1801-1805.
Wang, E. J., Casciano, C. N., Clement, R. P. , and Johnson, W. W. (2001).
“Inhibition of P-glycoprotein transport function by grapefruit juice psoralen.” Pharm
Res 18(4): 432-438.
Warner, P. E., Brouwer, K. L., Hussey, E. K., Dukes, G. E., Heizer, W. D., Donn,
K. H., Davis, I. M. , and Powell, J. R. (1995). “Sumatriptan absorption from different
regions of the human gastrointestinal tract.” Pharm Res 12(1): 138-143.
Warrington, S. J., Barclay, S. P., John, V. A., Shotton, P. A., Wardle, H. M. , and
Good, W. (1985). “Influence of site of drug delivery on the systemic availability of

References
339
metoprolol: comparison of intragastric infusion and 14/190 Oros administration.” Br J
Clin Pharmacol 19(Suppl 2): 219S-224S.
Waterman, K. C. and Sutton, S. C. (2003). “A computational model for particle size
influence on drug absorption during controlled-release colonic delivery.” J Control
Release 86(2-3): 293-304.
Westphal, K., Weinbrenner, A., Giessmann, T., Stuhr, M., Franke, G.,
Zschiesche, M., Oertel, R., Terhaag, B., Kroemer, H. K. , and Siegmund, W.
(2000a). “Oral bioavailability of digoxin is enhanced by talinolol: evidence for
involvement of intestinal P-glycoprotein.” Clin Pharmacol Ther 68(1): 6-12.
Westphal, K., Weinbrenner, A., Zschiesche, M., Franke, G., Knoke, M., Oertel,
R., Fritz, P., von Richter, O., Warzok, R., Hachenberg, T., Kauffmann, H. M.,
Schrenk, D., Terhaag, B., Kroemer, H. K. , and Siegmund, W. (2000b). “Induction
of P-glycoprotein by rifampin increases intestinal secretion of talinolol in human
beings: a new type of drug/drug interaction [In Process Citation].” Clin Pharmacol
Ther 68(4): 345-355.
Wetterich, U., Spahn-Langguth, H., Mutschler, E., Terhaag, B., Rosch, W. , and
Langguth, P. (1996). “Evidence for intestinal secretion as an additional clearance
pathway of talinolol enantiomers: concentration- and dose-dependent absorption in
vitro and in vivo.” Pharm Res 13(4): 514-522.
Wijnholds, J., deLange, E. C., Scheffer, G. L., van den Berg, D. J., Mol, C. A.,
van der Valk, M., Schinkel, A. H., Scheper, R. J., Breimer, D. D. , and Borst, P.
(2000). “Multidrug resistance protein 1 protects the choroid plexus epithelium and
contributes to the blood-cerebrospinal fluid barrier.” J Clin Invest 105(3): 279-285.
Wilding, I. R., Coupe, A. J. , and Davis, S. S. (2001). “The role of gamma-
scintigraphy in oral drug delivery.” Adv Drug Deliv Rev 46(1-3): 103-124.
Wilding, I. R., Davis, S. S., Bakhshaee, M., Stevens, H. N., Sparrow, R. A. , and
Brennan, J. (1992). “Gastrointestinal transit and systemic absorption of captopril
from a pulsed-release formulation.” Pharm Res 9(5): 654-657.
Wilding, I. R., Davis, S. S., Hardy, J. G., Robertson, C. S., John, V. A., Powell, M.
L., Leal, M., Lloyd, P. , and Walker, S. M. (1991). “Relationship between systemic
drug absorption and gastrointestinal transit after the simultaneous oral administration
of carbamazepine as a controlled-release system and as a suspension of 15N-
labelled drug to healthy volunteers.” Br J Clin Pharmacol 32(5): 573-579.
References
340
Wilding, I. R., Davis, S. S., Sparrow, R. A., Ziemniak, J. A. , and Heald, D. L.
(1995). “Pharmacoscintigraphic evaluation of a modified release (Geomatrix)
diltiazem formulation.” Journal of Controlled Release 33(1): 89-97.
Wilding, I. R., Hardy, J. G., Davis, S. S., Melia, C. D., Evans, D. F., Short, A. H.,
Sparrow, R. A. , and Yeh, K. C. (1991). “Characterisation of the in vivo behaviour of
a controlled-release formulation of levodopa (Sinemet CR).” Clin Neuropharmacol
14(4): 305-321.
Wilding, I. R., Sparrow, R. A., Davis, S. S. , and Horton, R. J. (1992). “The role of
gastric emptying in the absorption and meatbolism of nifedipine given in a modified-
release pellet formulation.” Int. J. Pharm. 84: 59-67.
Williams, M. F., Dukes, G. E., Heizer, W., Han, Y. H., Hermann, D. J., Lampkin, T.
, and Hak, L. J. (1992). “Influence of gastrointestinal site of drug delivery on the
absorption characteristics of ranitidine.” Pharm Res 9(9): 1190-1194.
Wu, X., Huang, W., Prasad, P. D., Seth, P., Rajan, D. P., Leibach, F. H., Chen, J.,
Conway, S. J. , and Ganapathy, V. (1999). “Functional characteristics and tissue
distribution pattern of organic cation transporter 2 (OCTN2), an organic
cation/carnitine transporter.” J Pharmacol Exp Ther 290(3): 1482-1492.
Wu, X., Whitfield, L. R. , and Stewart, B. H. (2000). “Atorvastatin transport in the
Caco-2 cell model: contributions of P-glycoprotein and the proton-monocarboxylic
acid co-transporter.” Pharm Res 17(2): 209-215.
Yabuuchi, H., Tamai, I., Sai, Y. , and Tsuji, A. (1998). “Possible role of anion
exchanger AE2 as the intestinal monocarboxylic acid/anion antiporter.” Pharm Res
15(3): 411-416.
Yamazaki, M., Akiyama, S., Ni'inuma, K., Nishigaki, R. , and Sugiyama, Y.
(1997). “Biliary excretion of pravastatin in rats: contribution of the excretion pathway
mediated by canalicular multispecific organic anion transporter.” Drug Metab Dispos
25(10): 1123-1129.
Yang, L., Chu, J. S. , and Fix, J. A. (2002). “Colon-specific drug delivery: new
approaches and in vitro/in vivo evaluation.” Int J Pharm 235(1-2): 1-15.
Yasui, K., Fujioka, H. , and Nakamura, Y. (1995). “Controlled-release by Ca(2+)-
sensitive recombinant human tumor necrosis factor-alpha liposomes.” Chem Pharm
Bull (Tokyo) 43(3): 508-511.
References
341
Youngberg, C. A., Berardi, R. R., Howatt, W. F., Hyneck, M. L., Amidon, G. L.,
Meyer, J. H. , and Dressman, J. B. (1987). “Comparison of gastrointestinal pH in
cystic fibrosis and healthy subjects.” Dig Dis Sci 32(5): 472-480.
Yu, D. K. (1999). “The contribution of P-glycoprotein to pharmacokinetic drug-drug
interactions.” J Clin Pharmacol 39(12): 1203-1211.
Yu, L. X. and Amidon, G. L. (1999). “A compartmental absorption and transit model
for estimating oral drug absorption.” Int J Pharm 186(2): 119-125.
Yu, L. X., Crison, J. R. , and Amidon, G. L. (1996). “Compartmental transit and
dispersion model analysis of small intestinal transit flow in humans.” International
Journal of Pharmaceutics 140(1): 111-118.
Yuen, K. H., Desmukh, A. A. , and Newton, J. M. (1993). “In vivo/in vitro correlation
of experimental sustained-release theophylline formulations.” Pharm Res 10(4): 588-
592.
Zaghloul, A. A., Faltinek, J., Vaithiyalingam, S. R., Reddy, I. K. , and Khan, M. A.
(2001). “Naproxen-Eudragit® microspheres: screening of process and formulation
variables for the preparation of extended release tablets.” Pharmazie 56(4): 321-324.
Zaghloul, A. A., Vaithiyalingam, S. R., Faltinek, J., Reddy, I. K. , and Khan, M. A.
(2001). “Response surface methodology to obtain naproxen controlled-release
tablets from its microspheres with Eudragit® L100-55.” J Microencapsul 18(5): 651-
662.
Zhou, S. Y., Piyapolrungroj, N., Pao, L., Li, C., Liu, G., Zimmermann, E. , and
Fleisher, D. (1999). “Regulation of paracellular absorption of cimetidine and 5-
aminosalicylate in rat intestine.” Pharm Res 16(11): 1781-1785.
Ziegler, T. R., Fernandez-Estivariz, C., Gu, L. H., Bazargan, N., Umeakunne, K.,
Wallace, T. M., Diaz, E. E., Rosado, K. E., Pascal, R. R., Galloway, J. R., Wilcox,
J. N. , and Leader, L. M. (2002). “Distribution of the H+/peptide transporter PepT1 in
human intestine: up-regulated expression in the colonic mucosa of patients with
short-bowel syndrome.” Am J Clin Nutr 75(5): 922-930.
zur Muhlen, A., Schwarz, C. , and Mehnert, W. (1998). “Solid lipid nanoparticles
(SLN) for controlled drug delivery--drug release and release mechanism.” Eur J
Pharm Biopharm 45(2): 149-155.
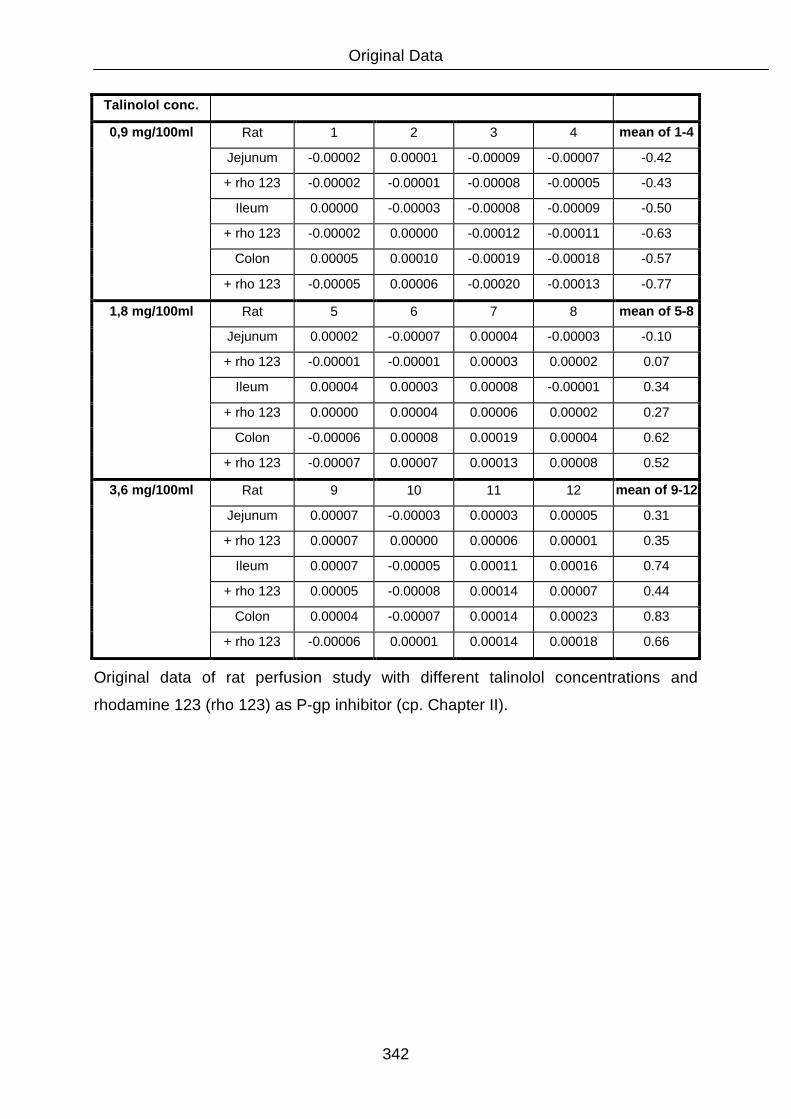
Original Data
342
Talinolol conc.
Rat 1 2 3 4 mean of 1-4
Jejunum -0.00002 0.00001 -0.00009 -0.00007 -0.42
+ rho 123 -0.00002 -0.00001 -0.00008 -0.00005 -0.43
Ileum 0.00000 -0.00003 -0.00008 -0.00009 -0.50
+ rho 123 -0.00002 0.00000 -0.00012 -0.00011 -0.63
Colon 0.00005 0.00010 -0.00019 -0.00018 -0.57
0,9 mg/100ml
+ rho 123 -0.00005 0.00006 -0.00020 -0.00013 -0.77
Rat 5 6 7 8 mean of 5-8
Jejunum 0.00002 -0.00007 0.00004 -0.00003 -0.10
+ rho 123 -0.00001 -0.00001 0.00003 0.00002 0.07
Ileum 0.00004 0.00003 0.00008 -0.00001 0.34
+ rho 123 0.00000 0.00004 0.00006 0.00002 0.27
Colon -0.00006 0.00008 0.00019 0.00004 0.62
1,8 mg/100ml
+ rho 123 -0.00007 0.00007 0.00013 0.00008 0.52
Rat 9 10 11 12 mean of 9-12
Jejunum 0.00007 -0.00003 0.00003 0.00005 0.31
+ rho 123 0.00007 0.00000 0.00006 0.00001 0.35
Ileum 0.00007 -0.00005 0.00011 0.00016 0.74
+ rho 123 0.00005 -0.00008 0.00014 0.00007 0.44
Colon 0.00004 -0.00007 0.00014 0.00023 0.83
3,6 mg/100ml
+ rho 123 -0.00006 0.00001 0.00014 0.00018 0.66
Original data of rat perfusion study with different talinolol concentrations and
rhodamine 123 (rho 123) as P-gp inhibitor (cp. Chapter II).

Original Data
343
Talinolol conc.
Rat. 1 2 3 4 mean of 1-4
Jejunum -0.00010 -0.00001 0.00001 -0.00005 -0.37
+ vinblastine -0.00008 0.00007 -0.00001 0.00000 -0.03
Ileum -0.00015 -0.00003 0.00000 -0.00010 -0.70
+ vinblastine -0.00010 0.00008 0.00013 -0.00004 0.18
Colon -0.00027 -0.00004 0.00006 -0.00010 -0.85
0,9 mg/100ml
+ vinblastine -0.00017 0.00010 0.00016 -0.00005 0.11
Rat 5 6 7 8 mean of 5-8
Jejunum 0.00008 -0.00006 0.00004 0.00004 0.25
+ vinblastine 0.00004 0.00000 0.00005 0.00005 0.33
Ileum 0.00005 0.00002 0.00002 0.00002 0.29
+ vinblastine 0.00005 0.00003 0.00003 0.00003 0.33
Colon 0.00004 0.00002 0.00007 -0.00009 0.10
1,8 mg/100ml
+ vinblastine 0.00003 0.00003 0.00003 0.00002 0.28
Rat 9 10 11 12 mean of 9-12
Jejunum 0.00011 0.00000 0.00004 -0.00003 0.33
+ vinblastine 0.00004 0.00002 0.00005 0.00004 0.36
Ileum 0.00009 0.00000 0.00007 -0.00004 0.30
+ vinblastine 0.00007 0.00005 0.00000 0.00003 0.38
Colon 0.00007 0.00010 0.00001 0.00000 0.47
3,6 mg/100ml
+ vinblastine 0.00004 0.00005 0.00005 0.00004 0.45
Original data of rat perfusion study with different talinolol concentrations and
vinblastine as P-gp inhibitor (cp. Chapter II).

Original Data
344
Talinolol conc.
Rat 13 14 15 16 mean of 13-16
Jejunum 0.00006 0.00002 0.00004 0.00005 0.42
+ vinblastine 0.00002 0.00002 0.00002 0.00008 0.36
Ileum 0.00008 0.00003 0.00002 0.00011 0.60
+ vinblastine 0.00005 0.00002 0.00005 0.00007 0.46
Colon 0.00008 0.00011 0.00001 0.00013 0.82
9,1 mg/100ml
+ vinblastine 0.00008 0.00005 0.00000 0.00016 0.74
Rat 17 18 19 20 mean of 17-20
Jejunum 0.00006 0.00002 0.00003 0.00001 0.30
+ vinblastine 0.00005 0.00003 0.00005 0.00002 0.38
Ileum 0.00009 0.00012 0.00000 0.00005 0.64
+ vinblastine 0.00002 0.00011 0.00002 0.00008 0.58
Colon 0.00008 0.00014 0.00005 0.00007 0.82
18,2 mg/100ml
+ vinblastine 0.00004 0.00016 0.00004 0.00005 0.72
Original data of rat perfusion study with different talinolol concentrations and
vinblastine as P-gp inhibitor (cp. Chapter II).

Original Data
345
0.1 N HCl
absorption dilution factor conc. (mg/l) drug released (%) mean S.D.
15min-1 0.2239 3 16.1 16.1
15min-2 0.2456 3 17.7 17.7
15min-3 0.2362 3 17.0 17.0
16.9 0.8
30min-1 0.2517 3 18.2 18.2
30min-2 0.2588 3 18.7 18.7
30min-3 0.2687 3 19.4 19.4
18.8 0.6
1h-1 0.2896 3 21.0 21.0
1h-2 0.2948 3 21.4 21.4
1h-3 0.2995 3 21.7 21.7
21.4 0.4
2h-1 0.3549 3 25.9 25.9
2h-2 0.3684 3 26.9 26.9
2h-3 0.3458 3 25.2 25.2
26.0 0.9
3h-1 0.391 3 28.6 28.6
3h-2 0.388 3 28.4 28.4
3h-3 0.3821 3 27.9 27.9
28.3 0.3
4h-1 0.43 3 31.5 31.5
4h-2 0.4421 3 32.4 32.4
4h-3 0.4358 3 32.0 32.0
32.0 0.5
6h-1 0.5372 3 39.6 39.6
6h-2 0.5487 3 40.4 40.4
6h-3 0.5478 3 40.4 40.4
40.1 0.5
8h-1 0.666 3 49.2 49.2
8h-2 0.6532 3 48.3 48.3
8h-3 0.6674 3 49.3 49.3
48.9 0.6
24h-1 0.3286 11 89.6 89.6
24h-2 0.3324 11 90.7 90.7
24h-3 0.3257 11 88.8 88.8
89.7 0.9
Drug release from the final talinolol sustained-release formulation in 0.1 N HCl (cp.
Chapter III).
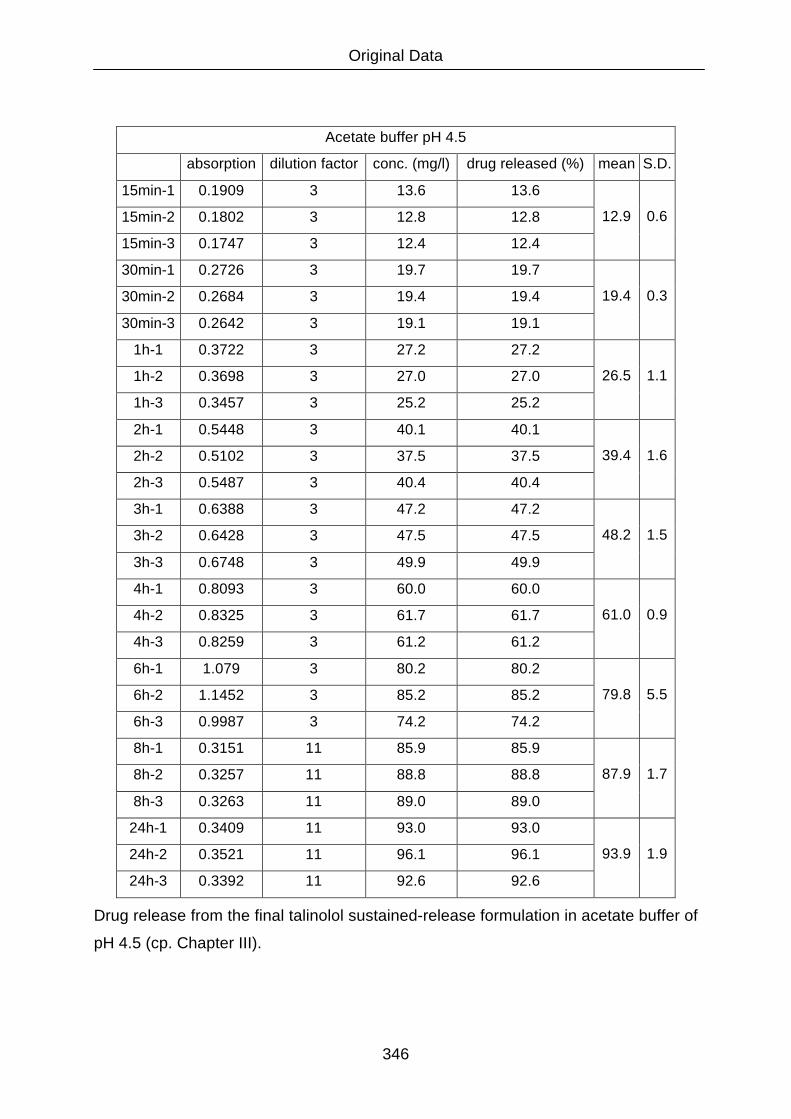
Original Data
346
Acetate buffer pH 4.5
absorption dilution factor conc. (mg/l) drug released (%) mean S.D.
15min-1 0.1909 3 13.6 13.6
15min-2 0.1802 3 12.8 12.8
15min-3 0.1747 3 12.4 12.4
12.9 0.6
30min-1 0.2726 3 19.7 19.7
30min-2 0.2684 3 19.4 19.4
30min-3 0.2642 3 19.1 19.1
19.4 0.3
1h-1 0.3722 3 27.2 27.2
1h-2 0.3698 3 27.0 27.0
1h-3 0.3457 3 25.2 25.2
26.5 1.1
2h-1 0.5448 3 40.1 40.1
2h-2 0.5102 3 37.5 37.5
2h-3 0.5487 3 40.4 40.4
39.4 1.6
3h-1 0.6388 3 47.2 47.2
3h-2 0.6428 3 47.5 47.5
3h-3 0.6748 3 49.9 49.9
48.2 1.5
4h-1 0.8093 3 60.0 60.0
4h-2 0.8325 3 61.7 61.7
4h-3 0.8259 3 61.2 61.2
61.0 0.9
6h-1 1.079 3 80.2 80.2
6h-2 1.1452 3 85.2 85.2
6h-3 0.9987 3 74.2 74.2
79.8 5.5
8h-1 0.3151 11 85.9 85.9
8h-2 0.3257 11 88.8 88.8
8h-3 0.3263 11 89.0 89.0
87.9 1.7
24h-1 0.3409 11 93.0 93.0
24h-2 0.3521 11 96.1 96.1
24h-3 0.3392 11 92.6 92.6
93.9 1.9
Drug release from the final talinolol sustained-release formulation in acetate buffer of
pH 4.5 (cp. Chapter III).
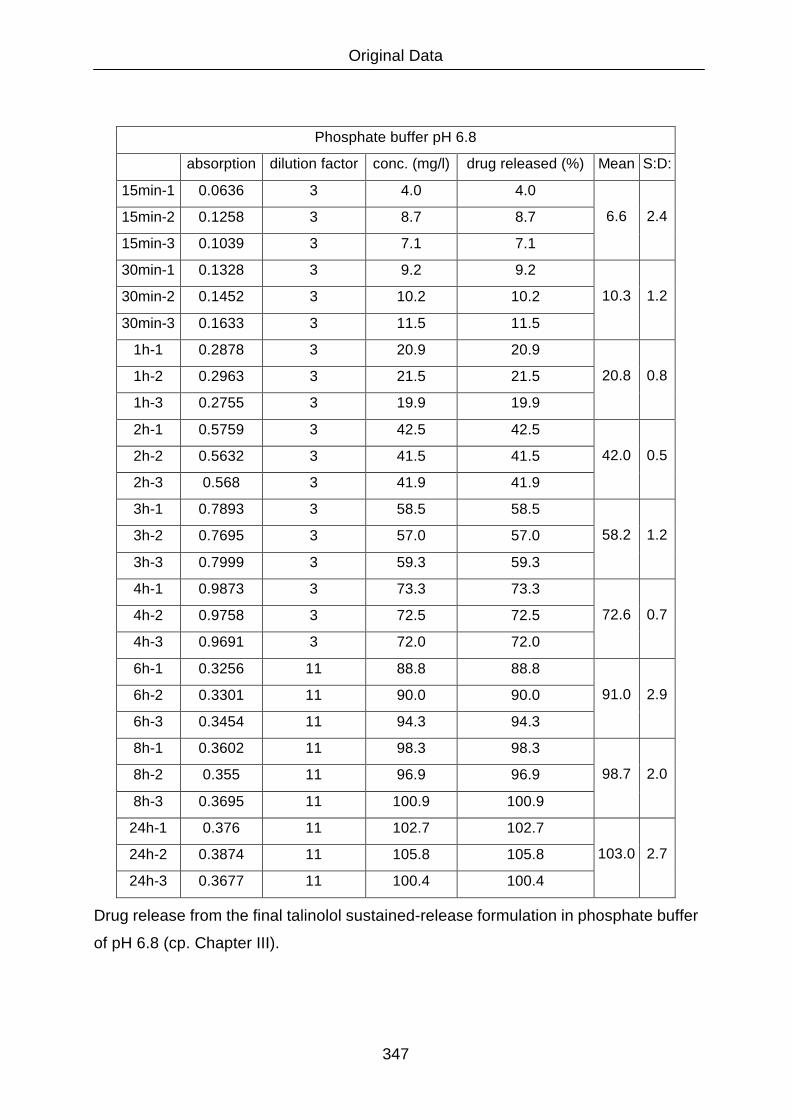
Original Data
347
Phosphate buffer pH 6.8
absorption dilution factor conc. (mg/l) drug released (%) Mean S:D:
15min-1 0.0636 3 4.0 4.0
15min-2 0.1258 3 8.7 8.7
15min-3 0.1039 3 7.1 7.1
6.6 2.4
30min-1 0.1328 3 9.2 9.2
30min-2 0.1452 3 10.2 10.2
30min-3 0.1633 3 11.5 11.5
10.3 1.2
1h-1 0.2878 3 20.9 20.9
1h-2 0.2963 3 21.5 21.5
1h-3 0.2755 3 19.9 19.9
20.8 0.8
2h-1 0.5759 3 42.5 42.5
2h-2 0.5632 3 41.5 41.5
2h-3 0.568 3 41.9 41.9
42.0 0.5
3h-1 0.7893 3 58.5 58.5
3h-2 0.7695 3 57.0 57.0
3h-3 0.7999 3 59.3 59.3
58.2 1.2
4h-1 0.9873 3 73.3 73.3
4h-2 0.9758 3 72.5 72.5
4h-3 0.9691 3 72.0 72.0
72.6 0.7
6h-1 0.3256 11 88.8 88.8
6h-2 0.3301 11 90.0 90.0
6h-3 0.3454 11 94.3 94.3
91.0 2.9
8h-1 0.3602 11 98.3 98.3
8h-2 0.355 11 96.9 96.9
8h-3 0.3695 11 100.9 100.9
98.7 2.0
24h-1 0.376 11 102.7 102.7
24h-2 0.3874 11 105.8 105.8
24h-3 0.3677 11 100.4 100.4
103.0 2.7
Drug release from the final talinolol sustained-release formulation in phosphate buffer
of pH 6.8 (cp. Chapter III).

List of Publications, Lectures and Poster Presentations
348
List of publications, lectures and poster presentations
D. Wagner, H. Spahn-Langguth, A. Hanafy, A. Koggel, P. Langguth (2001):
Intestinal drug efflux: formulation and food effects.
Adv Drug Deliv Rev 50 Suppl. 1, 13-31, (2001).
D. Wagner, N. Glube, N. Berntsen, W. Tremel and P. Langguth (2002):
Different dissolution media lead to different crystal structures of the basic compound
talinolol with impact on its dissolution and solubility.
Accepted for publication in Drug Development and Industrial Pharmacy in March
2003.
D. Wagner (2002):
Talinolol: Ursachen variabler intestinaler Absorption und Bioverfügbarkeit
Lecture at the Meeting of the Boehringer Ingelheim Advisory Board, Heiligkreuzthal,
February, 28., 2002.
D. Wagner, A. Hanafy, H. Spahn-Langguth, P. Langguth (2000):
Talinolol permeability in different regions of the rat intestine.
Poster at the annual meeting of the German Pharmaceutical Society (DPhG),
Münster, October, 4. - 7, 2000.
Abstract published in: Arch. Pharm. Pharm Med. Chem. 333, Suppl. 2, 67, (2000).
D. Wagner, A. Hanafy, H. Spahn-Langguth, P. Langguth (2001):
Nonlinear Model for intestinal absorption of actively and passively transported drugs
using talinolol as model compound.
Poster at the third European Graduate Student Meeting, Frankfurt / Main,
March, 23. - 25., 2001
Abstract published in: Arch. Pharm. Pharm Med. Chem. 333, Suppl. 1, 15, (2001).

List of Publications, Lectures and Poster Presentations
349
D. Wagner, N. Glube, P. Langguth (2002):
Different buffers affect the solubility of talinolol and its dissolution from solid peroral
dosage forms.
Poster at the annual meeting of the German Pharmaceutical Society (DPhG), Berlin,
October, 10. - 12., 2002.
Abstract published in: Arch. Pharm. Pharm Med. Chem. 335, Suppl. 1, 123, (2002).
D. Wagner, H. Spahn-Langguth, P. Langguth (2003):
Modeling the effective permeability and bioavailability of talinolol, a model compound
for P-glycoprotein mediated intestinal drug efflux.
Poster at the Molecular Biopharmaceutics Meeting of the Drug Delivery Foundation,
Honolulu, January, 22. - 24., 2003.
Curriculum Vitae
350
Curriculum Vitae - Daniel Wagner
Removed in the ArchiMed version for Privacy reasons.


![Friedrich Nietzsche Nietzsche Le Parole, Le Immagini 1995[1]](https://static.fdokument.com/doc/165x107/5695cf101a28ab9b028c72c3/friedrich-nietzsche-nietzsche-le-parole-le-immagini-19951.jpg)