Apis mellifera L.) auf den Reproduktionserfolg der...
66
Der Einfluss von Wirtsfaktoren der Honigbiene (Apis mellifera L.) auf den Reproduktionserfolg der parasitischen Milbe Varroa destructor (Anderson & Trueman) und die Auswirkungen einer horizontalen Verbreitung des Parasiten auf den Befall der Bienenvölker. Dissertation zur Erlangung des Grades eines Doktors der Allgemeinen Agrarwissenschaften Vorgelegt der Fakultät Agrarwissenschaften von Eva Frey aus Böblingen Hauptberichter: Prof. Dr. sc. agr. Dr. h.c. W. Bessei Mitberichter: Prof. Dr. Ute Mackenstedt Prof. Dr. Klaus Schmieder Tag der mündlichen Prüfung: 21.03.2014 Landesanstalt für Bienenkunde der Universität Hohenheim 2014
Transcript of Apis mellifera L.) auf den Reproduktionserfolg der...

Der Einfluss von Wirtsfaktoren der Honigbiene
(Apis mellifera L.) auf den Reproduktionserfolg der parasitischen
Milbe Varroa destructor (Anderson & Trueman) und die
Auswirkungen einer horizontalen Verbreitung des Parasiten auf den
Befall der Bienenvölker.
Dissertation zur Erlangung des Grades eines Doktors
der Allgemeinen Agrarwissenschaften
Vorgelegt
der Fakultät Agrarwissenschaften von
Eva Frey
aus Böblingen
Hauptberichter: Prof. Dr. sc. agr. Dr. h.c. W. Bessei
Mitberichter: Prof. Dr. Ute Mackenstedt
Prof. Dr. Klaus Schmieder
Tag der mündlichen Prüfung: 21.03.2014
Landesanstalt für Bienenkunde der Universität Hohenheim
2014

Inhaltsverzeichnis
1 Einleitung ......................................................................................................................1
1.1 Ziel der Arbeit .................................................................................................. 4
2 Veröffentlichungen ........................................................................................................6
Activation and interruption of the reproduction of Varroa destructor is triggered by host
signals (Apis mellifera).
Three QTL in the honey bee Apis mellifera L. suppress reproduction of the parasitic
mite Varroa destructor.
Invasion of Varroa destructor mites into mite-free honey bee colonies under controlled
conditions of a military training area.
Autumn Invasion Rates of Varroa destructor (Mesostigmata: Varroidae) Into Honey
Bee (Hymenoptera: Apidae) Colonies and the Resulting Increase in Mite Populations.
3 Allgemeine Diskussion und Schlussfolgerungen ....................................................... 31
4 Zusammenfassung .......................................................................................................41
4.1 Zusammenfasssung ......................................................................................... 41
4.2 Summary ......................................................................................................... 44
5 Literaturverzeichnis .....................................................................................................48
Kongresse, Forschungsaufenthalte, Projektbeteiligungen……………………….....…..57
Buchbeiträge und Artikel in Fachzeitschriften ………………………………………...60
Danksagung.....................................................................................................................61
II

Publikationsliste
Frey, E., Odemer, R., Blum, T., Rosenkranz, P., 2013. Activation and interruption of the
reproduction of Varroa destructor is triggered by host signals (Apis mellifera). Journal
of Invertebrate Pathology 133, 56-62.
Behrens, D., Huang, Q., Geßner, C., Rosenkranz, P., Frey, E., Locke, B., Moritz,
R.F.A., Kraus, F.B., 2011. Three QTL in the honey bee Apis mellifera L. suppress
reproduction of the parasitic mite Varroa destructor. Ecology and Evolution 1(4), 451-
458.
Frey, E., Schnell, H., Rosenkranz, P., 2011. Invasion of Varroa destructor mites into
mite-free honey bee colonies under controlled conditions of a military training area.
Journal of Apicultural Research 50(2), 138-144.
Frey, E., Rosenkranz, P. Autumn Invasion Rates of Varroa destructor (Mesostigmata:
Varroidae) Into Honey Bee (Hymenoptera: Apidae) Colonies and the Resulting Increase
in Mite Populations. Journal of Economic Entomology 107 (2), 508-515.

Einleitung
1 Einleitung Die parasitische Bienenmilbe Varroa destructor wird weltweit als Hauptursache für
periodisch auftretende Völkerverluste der westlichen Honigbiene Apis mellifera
angesehen (Boecking and Genersch, 2008; Brodschneider et al., 2010; Chauzat et al.,
2010; Guzmán-Novoa et al., 2010). Schon ein relativ geringer Varroabefall der Bienen
von ca. 6% im Spätherbst reicht aus, um die Überwinterung der Bienenvölker zu
gefährden (Genersch et al., 2010). Die Varroose stellt nicht nur ein wirtschaftliches
Problem für die Imkerei dar, sondern ist auch eine ökonomische und ökologische
Bedrohung für die Kulturlandschaft, da die Bestäubung vieler Nutz- und Wildpflanzen
direkt von der Honigbiene abhängt (Watanabe, 1994; Klein et al., 2007; Rucker et al.,
2012).
Das ursprüngliche Verbreitungsgebiet der Varroamilbe befindet sich in Südostasien, wo
sie in Völkern der östlichen Honigbiene Apis cerana vorkommt, hier jedoch keine
bedrohlichen Schäden verursacht. Ein Wirtswechsel von der asiatischen auf die
westliche Honigbiene (Oldroyd, 1999) und weiträumige Transporte der infizierten
Bienenvölker trugen zu einer globalen Verbreitung des Parasiten innerhalb einer kurzen
Zeitspanne bei und hatten zur Folge, dass V. destructor in den Siebzigerjahren des
letzten Jahrhunderts auch in Europa und Deutschland eingeführt wurde (Rosenkranz et
al., 2010). Dies hatte und hat dramatische Folgen für wildlebende und bewirtschaftete
A. mellifera Bienenvölker. Durch die rasche Verbreitung der Milbe und eine weitgehend
fehlende natürliche Selektion konnte sich in Europa bisher kein stabiles Wirt-Parasit-
System einstellen. Zudem fehlen nach wie vor Forschungsergebnisse der
Bienenwissenschaft und praktische Erfahrungen in der Imkerschaft, um diesen neuen
Parasiten nachhaltig zu kontrollieren. Die Bekämpfung von V. destructor wird nach wie
vor als größte Herausforderung der modernen Imkerei angesehen (Dietemann et al.,
2012), da weltweit nahezu kein varroafreies Volk mehr zu finden ist und zumindest in
den gemäßigten Breiten ein Bienenvolk ohne regelmäßige Varroabehandlung innerhalb
kurzer Zeit eingeht (Korpela et al., 1992). Eine wirtschaftliche Imkerei ist somit ohne
1

Einleitung
Varroabekämpfung nicht mehr möglich. Daraus ergeben sich für die Imker nun aber
ähnliche Probleme wie in der übrigen modernen Landwirtschaft: Hohe Kosten durch die
Behandlung, Resistenzentwicklung beim Parasiten und das Risiko der Belastung von
Bienenprodukten mit Akarizid-Rückständen (Wallner, 1999; Wallner and Fries, 2003).
Die Suche nach neuen Möglichkeiten zur Lösung des Varroaproblems ist daher ein
Schwerpunkt der aktuellen Honigbienenforschung.
Ein Ansatzpunkt ist die Suche nach einer varroatoleranten Honigbiene, jedoch hatten
alle Versuche einer diesbezüglichen Selektion und Zucht bisher keinen
durchschlagenden Erfolg (Büchler et al., 2010). Die natürliche Selektion spielt in den
gemäßigten Breiten bei der Etablierung eines stabilen Wirt-Parasit-Systems kaum eine
Rolle, da es so gut wie keine wildlebenden Honigbienenpopulationen gibt. Für die
Honigbienenvölker in Imkerhand fehlen klare und durchführbare Selektionskriterien. Es
gibt jedoch einige wenige Beispiele die zeigen, dass unter den Bedingungen einer
natürlichen Selektion Populationen von A. mellifera ohne Varroabekämpfung überleben
können (Büchler et al., 2010).
So hat sich nach über zehn Jahren natürlicher Selektion der Reproduktionserfolg der
Varroamilben in kleinen isolierten Bienenpopulationen auf der Insel Gotland
(Schweden) und in Südfrankreich im Vergleich zu nicht selektierten Bienenherkünften
signifikant reduziert (Locke et al., 2012). Diese Toleranz gegenüber der Varroamilbe ist
ein Merkmal des Honigbienenwirtes und keine Eigenschaft der lokalen
Milbenpopulation (Fries and Bommarco, 2007).
Entscheidend für ein ausgeglichenes Wirt-Parasit-Verhältnis ist letztendlich die enorme
Zunahme der Parasitenpopulation während der Saison zu unterbinden. Dabei spielen
sowohl die Reproduktion der Varroaweibchen innerhalb der Brutzellen als auch
Wechselwirkungen auf der Ebene des Bienenvolkes eine Rolle.
Der Lebenszyklus der weiblichen Milben ist in eine phoretische Phase auf den adulten
Bienen und eine reproduktive Phase in der verdeckelten Brutzelle unterteilt. Kurz vor
der Zellverdeckelung befällt die phoretische Milbe die Bienenbrutzellen und beginnt
wenige Stunden später ihren Reproduktionszyklus. Dabei legt sie im Allgemeinen ein
2

Einleitung
männliches und mehrere weibliche Eier. Innerhalb der Brutzelle kommt es dann zu
Bruder-Schwester-Paarungen der adulten Nachkommen (Rosenkranz et al., 2010).
Allerdings ist nicht bei allen Brutmilben die Reproduktion erfolgreich: Neben zu später
oder unvollständiger Eiablage gibt es auch Milbenweibchen, die zwar in Brutzellen
eindringen, aber überhaupt keine Eier legen. Eine solche Infertilität der Varroaweibchen
scheint der Hauptgrund für das stabile Wirt-Parasit-System beim ursprünglichen Wirt A.
cerana zu sein: In Völkern des asiatischen Ursprungswirtes kann sich V. destructor nur
in der Drohnenbrut vermehren (Boot et al., 1999; Rosenkranz et al., 2010).
Im Gegensatz dazu kann sich bei unseren Honigbienen (A. mellifera) die Varroamilbe
sowohl in der Drohnen- als auch der Arbeiterinnenbrut fortpflanzen. Dadurch steigt die
Milbenpopulation exponentiell an und der Milbenbefall kann sich infolge dessen im
Frühjahr und Frühsommer innerhalb eines Monats verdoppeln (Fries et al., 1994). Doch
auch bei A. mellifera sind 5-20 % der in die Brut eingedrungenen Milbenweibchen nicht
in der Lage, Eier zu legen. Es konnte gezeigt werden, dass es sich hier um eine
temporäre Infertilität der Varroaweibchen handelt, die wahrscheinlich durch
Wirtsfaktoren verursacht wird. Bei der Aktivierung und Steuerung der
Varroareproduktion spielen u.a. Substanzen der Wirtslarvenkutikula eine wichtige Rolle
(Garrido and Rosenkranz, 2004). Allerdings ist die chemische Natur dieser Stoffe bisher
noch nicht im Detail aufgeklärt. Die Kenntnis solcher Substanzen im Bienenvolk könnte
entscheidend zur Entwicklung biologischer Bekämpfungskonzepte, die auf der
Beeinflussung der Reproduktionssteuerung und Populationsentwicklung der
Varroamilbe basieren, beitragen. Solche biologischen Bekämpfungsansätze könnten in
Zukunft eine nachhaltige Alternative zu den momentan angewandten
Behandlungsmöglichkeiten darstellen.
Die Populationsdynamik der Milbe hängt aber nicht nur vom Reproduktionserfolg der
Varroaweibchen innerhalb der einzelnen Brutzellen ab; auch die Verbreitung der
Varroamilben zwischen den Bienenvölkern könnte das Wachstum der
Parasitenpopulation beeinflussen. Es gibt zwei grundsätzlich unterschiedliche
Übertragungswege eines Parasiten, die häufig eine entscheidende Rolle bei der
Etablierung eines stabilen Wirt-Parasit-Gleichgewichtes spielen (Fries and Camazine,
3
Einleitung
2001). Der vertikale Übertragungsweg (die Übertragung auf die Nachkommen) der
Varroamilben im Bienenvolk ist die Übertragung von Mutter- zu Tochtervolk, wenn
sich das Volk über das Schwärmen vermehrt. Unter natürlichen Bedingungen, ohne eine
Massenaufstellung von Bienenvölkern, dürfte sich die Varroamilbe vor allem vertikal,
also über den Schwarm, verbreiten. Dieser Übertragungsweg soll die Entwicklung hin
zu einem stabilen Wirt-Parasit-Verhältnis favorisieren, um den Wirt in seiner
Entwicklung nicht so einzuschränken, dass die weitere Verbreitung des Parasiten
unterbunden wird. Eine horizontale Übertragung tritt zum einen innerhalb des
Bienenvolkes auf, wenn die Varroamilben von Biene zu Bienen wechseln. Wichtiger ist
jedoch die horizontale Verbreitung zwischen verschiedenen Völkern, wenn der Parasit
durch Räuberei oder Verflug der Bienen von Volk zu Volk getragen wird.
In der heutigen Imkerei kommt es an attraktiven Standorten oft zu einer hohen Anzahl
von Bienenvölkern, wodurch die horizontale Ausbreitung der Varroamilbe erleichtert
wird (Greatti et al., 1992). Bisher fehlen allerdings belastbare Daten, um die Bedeutung
dieser horizontalen Verbreitung auf die Populationsdynamik unter realistischen
Feldbedingungen zu quantifizieren.
1.1 Ziel der Arbeit In dieser Arbeit sollen auf unterschiedlichen Ebenen Faktoren analysiert werden, die
einen Einfluss auf das Wachstum der Varroapopulation haben. Zunächst soll auf der
individuellen Ebene untersucht werden, wie die Reproduktion der Varroaweibchen
innerhalb der Brutzelle durch Faktoren der Wirtslarve beeinflusst wird. In einem neu
etablierten Biotest wurde in Ein- und Umsetzversuchen in und zwischen
Bienenbrutzellen in vivo untersucht, welche stadienspezifischen kutikulären Substanzen
der Wirtslarve die Reproduktion der Varroamilbe beeinflussen. Insbesondere sollten die
Ursachen für die „temporäre Infertilität“ der Varroaweibchen näher untersucht werden.
In einem weiteren Ansatz zum Thema „Varroainfertilität“ sollte in Kooperation mit dem
Partnerinstitut in Halle an der Saale geprüft werden, ob tatsächlich - wie vermutet -
genetisch determinierte Wirtsfaktoren für diese temporäre Infertilität verantwortlich
4

Einleitung
sind. Hierfür wurden in einem molekulargenetischen Ansatz mit Segregationsanalysen
bei den haploiden Drohnen nach Genregionen gesucht, die mit der Infertilität der
Varroaweibchen korreliert sind. Für die Analysen wurden Drohnen aus Hybridvölkern
der vorselektierten „Gotland-Population“ (siehe oben) und der unselektierten
Hohenheimer A. mellifera carnica Population verwendet. Das langfristige Ziel ist, über
eine Identifizierung und Charakterisierung von Resistenzgenen in der Honigbiene ein
DNA-basiertes Zuchtwerkzeug zu entwickeln, das es ermöglicht, präzise und mit
geringem Aufwand Bienenvölker mit solchen Varroaresistenzgenen zu selektieren.
Im zweiten Teil dieser Arbeit sollten die Effekte einer horizontalen Verbreitung der
Varroamilben auf die Populationsdynamik quantifiziert werden. Unter kontrollierten
sowie unter praxisnahen Bedingungen wurden dabei Umfang und zeitlicher Verlauf der
horizontalen Übertragung von Varroamilben („Varroainvasion“) in Abhängigkeit von
Entfernung und Anzahl befallener Bienenvölker sowie das Vermehrungspotential der
Milbe im Spätsommer und Herbst untersucht.
5

Veröffentlichungen
2 Veröffentlichungen
6

Journal of Invertebrate Pathology 113 (2013) 56–62
Veröffentlichungen
Contents lists available at SciVerse ScienceDirect
Journal of Invertebrate Pathology
journal homepage: www.elsevier .com/ locate / j ip
Activation and interruption of the reproduction of Varroa destructoris triggered by host signals (Apis mellifera)
Eva Frey a,⇑,1, Richard Odemer a,1, Thomas Blum b, Peter Rosenkranz a
a University of Hohenheim, Apicultural State Institute, 70593 Stuttgart, Germanyb Reutlingen University, Faculty of Applied Chemistry, 72762 Reutlingen, Germany
a r t i c l e i n f o a b s t r a c t
Article history:Received 26 October 2012Accepted 14 January 2013Available online 30 January 2013
Keywords:Varroa destructorHoney beeReproductionHost signalsGC–MS analysis
0022-2011/$ - see front matter � 2013 Elsevier Inc. Ahttp://dx.doi.org/10.1016/j.jip.2013.01.007
⇑ Corresponding author. Fax: +49 (0)711 459 22233E-mail addresses: [email protected] (E
hohenheim.de (R. Odemer), [email protected]@uni-hohenheim.de (P. Rosenkranz).
1 These authors contributed equally.
The reproductive cycle of the parasitic mite Varroa destructor is closely linked to the development of thehoney bee host larvae. Using a within colony approach we introduced phoretic Varroa females into broodcells of different age in order to analyze the capacity of certain stages of the honey bee larva to eitheractivate or interrupt the reproduction of Varroa females. Only larvae within 18 h (worker) and 36 h(drones), respectively, after cell capping were able to stimulate the mite’s oogenesis. Therewith we couldspecify for the first time the short time window where honey bee larvae provide the signals for the acti-vation of the Varroa reproduction. Stage specific volatiles of the larval cuticle are at least part of theseactivation signals. This is confirmed by the successful stimulation of presumably non-reproducing mitesto oviposition by the application of a larval extract into the sealed brood cells. According to preliminaryquantitative GC–MS analysis we suggest certain fatty acid ethyl esters as candidate compounds.
If Varroa females that have just started with egg formation are transferred to brood cells containinghost larvae of an elder stage two-thirds of these mites stopped their oogenesis. This confirms the pres-ence of an additional signal in the host larvae allowing the reproducing mites to adjust their own repro-ductive cycle to the ontogenetic development of the host. From an adaptive point of view that sort of astop signal enables the female mite to save resources for a next reproductive cycle if the own egg devel-opment is not sufficiently synchronized with the development of the host.
The results presented here offer the opportunity to analyze exactly those host stages that have thecapacity to activate or interrupt the Varroa reproduction in order to identify the crucial host signals.
� 2013 Elsevier Inc. All rights reserved.
1. Introduction
The reproduction of the honey bee mite Varroa destructor is acrucial point for the population dynamic of this parasite (Frieset al., 1994; Calis et al., 1999). The life cycle of the female mitesis subdivided into a phoretic phase on adult bees and a reproduc-tive phase within worker or drone brood cells. For reproduction,the female mite leaves the adult bee and enters a brood cell with5th instar larva shortly before the cell sealing and become stuckin the larval food at the bottom of the brood cell. Within a fewhours after cell capping the larvae consume the rest of the foodand set the mite free (reviewed in Rosenkranz et al. (2010)). At thattime the female mite has already started with oogenesis in the ter-minal oocyte (Steiner et al., 1994; Garrido et al., 2000). In labora-tory bioassays we have demonstrated that the first step of the
ll rights reserved.
.. Frey), [email protected] (T. Blum),
7
activation of the mite’s oogenesis is triggered by volatiles of thelarval cuticle independently from the uptake of hemolymph bythe mite (Garrido and Rosenkranz, 2004). The activating compo-nents are apparently in the polar fraction of the cuticular volatiles(Trouiller and Milani, 1999; Garrido and Rosenkranz, 2004). Addi-tionally, stage specific factors of the host larvae and pupae, respec-tively, influence the sex of the mite’s eggs (Garrido andRosenkranz, 2003). Obviously, the activation as well as the courseof the reproduction of V. destructor is closely correlated with thepreimaginal development of the honey bee host. This may be anadaptation to the relatively short capping period of the honeybee worker brood. The female mite lays the first male egg approx-imately 70 h after cell capping followed by 3–5 female eggs in 30 hintervals (Martin, 1994; Rehm and Ritter, 1989). As the success of areproductive cycle depends on the number of viable adult mateddaughter mites that leave the brood cell together with the hatchingyoung bee, the duration of the postcapping period is a limiting fac-tor and, therefore, the mother mite should start egg laying as soonas possible (Rosenkranz et al., 2010).
However, the dependence of the mite reproduction from spe-cific factors of the honey bee larvae offers possibilities for a host

E. Frey et al. / Journal of Invertebrate Pathology 113 (2013) 56–62 57
Veröffentlichungen
adaptation in order to limit the reproductive success of the para-site. So it is a long known phenomenon that a reasonable percent-age of female mites do not reproduce successfully after invading abrood cell. Some mites do not lay eggs at all (reviewed in Rosenk-ranz et al. (2010), Carneiro et al. (2007), Correa-Marques et al.(2003) and Garrido and Rosenkranz (2003)), others do lay maleor female eggs only or show delayed egg laying (Donzé et al.,1996; Martin et al., 1997; Locke and Fries, 2011). It is yet unknownto what degree host factors are responsible for those disorders inmite reproduction.
In our approach we focused on the phenomenon ‘‘non-repro-duction’’ in V. destructor. At first, we proved in detail which larvalinstars are capable to induce the reproduction in Varroa females.Using a new within-colony bioassay we tried to verify if larval vol-atiles can activate the reproduction in those V. destructor femaleswhich actually are considered infertile. In a further approach weexamined whether an already started oogenesis of Varroa femalescan be interrupted by the signals of certain host stages. Finally, weanalyzed the pattern of cuticular compounds of those larval stagesthat have an influence on the fertility of the mite.
These experiments were performed to specify the role of stagespecific signals of the host larvae for initiation and disruption ofVarroa reproduction.
2. Materials and methods
2.1. Reproduction of V. destructor after natural infestation of broodcells
We used A. mellifera carnica colonies from the apiary at the Uni-versity of Hohenheim headed by queens of our local breeding line.From June to September brood cells of drone and worker broodcombs were individually analyzed for infestation with V. destructor.Only single infested brood cells containing 8–9 day old pupae withdark eyes and yellow thorax (Martin, 1994) were used for furtheranalysis. Within those brood cells the female mites have alreadyterminated egg laying but the first daughter mite has not finishedthe adult molt and can therefore easily be distinguished from themother mite. All mites that have laid at least one egg were consid-ered ‘‘reproductive’’, the mites without egg laying were considered‘‘non-reproductive’’.
Fig. 1. Procedure of mite transfer among brood cells: phoretic mites wereintroduced into freshly capped brood cells and transferred after 24 and 48 h,respectively, into brood cells of different age. I (control, n = 30): Transfer from 24 hsealed brood cells to 24 h sealed brood cells. II (n = 36): Transfer from 24 h sealedbrood cells to 48 h sealed brood cells. III (n = 36): Transfer from 48 h sealed broodcells to 72 h sealed brood cells. IV (n = 29): Transfer from 24 h sealed brood cells to72 h sealed brood cells.
2.2. Artificial infestation of V. destructor into brood cells of differentage
To determine the exact relation between larval age and activa-tion of the Varroa reproduction, worker and drone brood cells weremarked shortly before sealing on transparency sheets (Aumeierand Rosenkranz, 2001). Two to six hours later, capped brood cellswere marked and considered ‘‘freshly capped’’. These markedbrood cells were used for artificial infestation with phoretic V.destructor mites (Garrido and Rosenkranz, 2004). Mite-free colo-nies were chosen as host colony for these experiments to preventthe transfer of mites to brood cells that are already infested.
Phoretic mites for the infestation of the brood cells were sam-pled randomly from hive bees of heavily infested colonies butwithout clinical symptoms of Varroosis (Rosenkranz et al., 2010).Within 1 h the mites were introduced into the chosen brood cells.For that purpose, the cell capping was carefully folded out with arazor blade and the mite was introduced with an insect pin. Thenthe cell capping was closed again. Phoretic mites were introducedinto freshly sealed brood cells and also into brood cells 6, 12, 18, 24and 30 h after cell capping (worker brood) and 12, 24, 36, 48 and60 h after cell capping (drone brood), respectively. The positionof the treated brood cells on the combs was marked on transpar-
8
ency sheets. After artificial infestation all test combs were returnedto the colony in order to guarantee the required temperature andhumidity inside the brood cells. The treated combs remained inthe colony for the entire duration of the experiment, because V.destructor mites introduced into brood cells and then kept in anincubator have lower reproduction rate compared to mites keptin the colony (Ibrahim and Spivak, 2006).
Eight days later the artificially infested brood cells were ana-lyzed for reproduction of the introduced V. destructor female.Again, a Varroa mite was considered ‘‘reproductive’’ when at leastone offspring (e.g. egg and/or nymphal stages) were present withinthe brood cell. Dead mites (in total <5% of the introduced mites)were not considered in the analysis.
2.3. Reproduction of Varroa mites that have been transferred intobrood cells of different ages after initiation of oogenesis
Phoretic V. destructor mites were introduced into freshly cappedworker brood cells (see Section 2.2 for details). 24 h after introduc-tion into brood cells, one portion of these mites were transferred tocells of the same larval age (control, Fig. 1I) or to brood cells con-taining larvae that were 24 h (i.e. 48 h after cell capping, Fig. 1II)and 48 h (i.e. 72 h after cell capping, Fig. 1IV), respectively, older.Another portion of mites were transferred 48 h after introductioninto freshly sealed brood cells to brood cells containing larvae thatwere 24 h older (i.e. 72 h after cell capping, Fig. 1III).
Only female mites which had already started with oogenesiswere transferred. The successful start of the oogenesis can easilyand clearly be defined by the swollen idiosoma of the introducedmother mite caused by the growth of the first oocyte (Martin,1994; Garrido and Rosenkranz, 2003; Steiner et al., 1995). The in-fested cells were examined 8 days after cell capping. All reproduc-tive stages, i.e. eggs, protonymphs, deutonymphs and males wererecorded.
58 E. Frey et al. / Journal of Invertebrate Pathology 113 (2013) 56–62
Veröffentlichungen
A subset of non-reproducing mites (n = 36) was dissected in or-der to prove the presence of spermatozoa in the spermatheca. Themites were dissected in PBS saline buffer by removing the dorsalshield to expose reproductive organs.
2.4. Application of 5th instar larval extracts into worker brood cells
The extraction was performed according to the method de-scribed by Garrido and Rosenkranz (2004). Briefly, non-infestedand freshly capped worker larvae (5th instar, 0 h, see Section 2.2)were carefully removed from the brood cells. The larvae were firstplaced on a filter paper to check if hemolymph was leaking out andonly non-injured larvae were used for the extraction. Groups of 10larvae were pooled within a clean Erlenmeyer flask, filled up with5 ml n-pentane (Uvasol) and extracted for 10 min at room temper-ature. Then the extract was removed from the larvae and concen-trated with nitrogen to about 1 ml and stored at �20 �C. Before thestart of the experiment the extract was further concentrated to 4 llin order to reduce the amount of solvent for the application in thebioassay. These 4 ll represent the extract of ten larvae and, there-fore, an application of 1 ll equals 2.5 larval equivalents.
To test the effect of these extracts on mite reproduction, weused marked worker brood cells which had already been sealedfor 24 h (see above). This larval stage is not able to activate miteoogenesis (see results in Section 3.1, Fig. 2). We introduced phoret-ic V. destructor females into these brood cells. Before the introduc-tion of the mites, we applied 2 ll of the larval extract (=5 larvalequivalent) topically on the larvae in the opened brood cell(n = 24). To the control cells, the same amount of solvent (pentane)was applied (n = 26). After 2 min of evaporation of the solvent, themite was introduced and the capping of the brood cell was closed.A third portion of the brood cells remained untreated (n = 30) be-fore the introduction of the mites. All applications and controlswere performed within the same colony during the same timeperiod.
2.5. Chemical analyses
Here we focus on the quantification of cuticular methyl andethyl esters because for these compounds a biological activityhas already been confirmed (reviewed in Dillier et al. (2006)).Drone and worker larvae of five different age groups (freshly
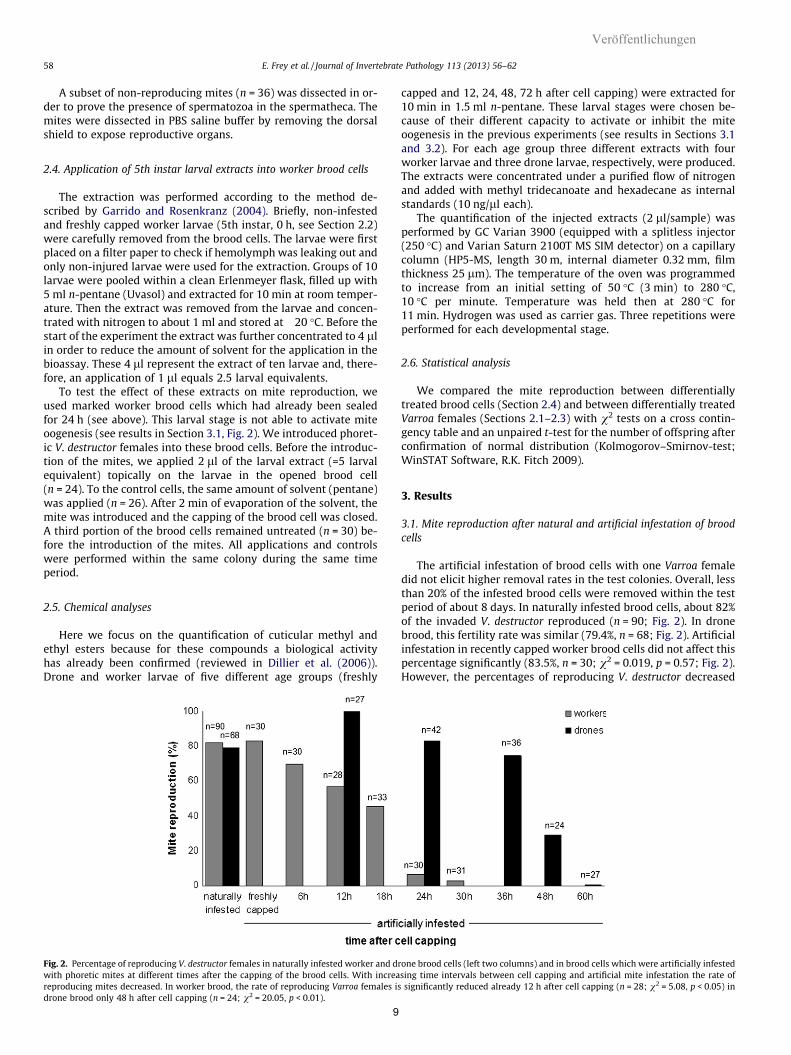
Fig. 2. Percentage of reproducing V. destructor females in naturally infested worker and drwith phoretic mites at different times after the capping of the brood cells. With increareproducing mites decreased. In worker brood, the rate of reproducing Varroa females isdrone brood only 48 h after cell capping (n = 24; v2 = 20.05, p < 0.01).
9
capped and 12, 24, 48, 72 h after cell capping) were extracted for10 min in 1.5 ml n-pentane. These larval stages were chosen be-cause of their different capacity to activate or inhibit the miteoogenesis in the previous experiments (see results in Sections 3.1and 3.2). For each age group three different extracts with fourworker larvae and three drone larvae, respectively, were produced.The extracts were concentrated under a purified flow of nitrogenand added with methyl tridecanoate and hexadecane as internalstandards (10 ng/ll each).
The quantification of the injected extracts (2 ll/sample) wasperformed by GC Varian 3900 (equipped with a splitless injector(250 �C) and Varian Saturn 2100T MS SIM detector) on a capillarycolumn (HP5-MS, length 30 m, internal diameter 0.32 mm, filmthickness 25 lm). The temperature of the oven was programmedto increase from an initial setting of 50 �C (3 min) to 280 �C,10 �C per minute. Temperature was held then at 280 �C for11 min. Hydrogen was used as carrier gas. Three repetitions wereperformed for each developmental stage.
2.6. Statistical analysis
We compared the mite reproduction between differentiallytreated brood cells (Section 2.4) and between differentially treatedVarroa females (Sections 2.1–2.3) with v2 tests on a cross contin-gency table and an unpaired t-test for the number of offspring afterconfirmation of normal distribution (Kolmogorov–Smirnov-test;WinSTAT Software, R.K. Fitch 2009).
3. Results
3.1. Mite reproduction after natural and artificial infestation of broodcells
The artificial infestation of brood cells with one Varroa femaledid not elicit higher removal rates in the test colonies. Overall, lessthan 20% of the infested brood cells were removed within the testperiod of about 8 days. In naturally infested brood cells, about 82%of the invaded V. destructor reproduced (n = 90; Fig. 2). In dronebrood, this fertility rate was similar (79.4%, n = 68; Fig. 2). Artificialinfestation in recently capped worker brood cells did not affect thispercentage significantly (83.5%, n = 30; v2 = 0.019, p = 0.57; Fig. 2).However, the percentages of reproducing V. destructor decreased
one brood cells (left two columns) and in brood cells which were artificially infestedsing time intervals between cell capping and artificial mite infestation the rate ofsignificantly reduced already 12 h after cell capping (n = 28; v2 = 5.08, p < 0.05) in

E. Frey et al. / Journal of Invertebrate Pathology 113 (2013) 56–62 59
Veröffentlichungen
clearly, if the mites were introduced in brood cells 18–60 h aftercell capping. In worker brood, mites that were introduced 12 hafter cell capping already showed a significantly lower rate ofreproduction compared to natural invaded mites (n = 28;v2 = 4.79, p < 0.05). And hardly any of the mites reproduced if theywere introduced 24 h and 30 h after cell capping (Fig. 2).
In drone brood, there was only a slight decrease in the rateof reproducing mites if they were introduced in brood cells upto 36 h after cell capping (at 36 h: n = 36; v2 = 0.27, p = 0.61). Asignificant decrease was only confirmed for those mites thatwere introduced in drone brood cells 48 h after cell capping(n = 24; v2 = 20.05, p < 0.001). After introduction into brood cells60 h after cell capping not a single V. destructor egg was laid(Fig. 2).
3.2. Reproduction of Varroa mites that have been transferred intobrood cells of different ages after initiation of oogenesis
The reproduction of mites that were treated twice (introducedand transferred) was not negatively affected by the handling pro-cess: 83.3% of the mites (n = 30) that were artificially introducedinto freshly capped brood cells and transferred 24 h postcapping
Table 1Reproduction of Varroa mites that have been introduced into freshly capped brood cells andto brood cells of different stages. Presented are the reproduction parameters (a) and the r
Trial Reproducing mites (fertility) (%) Avg. progen
a24 h ? 24 h (control, n = 30) 83.3 3.4 ± 1.424 h ? 48 h (n = 36) 36.1 2.5 ± 0.948 h ? 72 h (n = 36) 66.7 2.5 ± 1.124 h ? 72 h (n = 29) 65.5 2.3 ± 1.1
Trial 24 h ? 24 h (control)
b24 h ? 24 h (control) –24 h ? 48 h –48 h ? 72 h –24 h ? 72 h –
* p < 0.05.** p < 0.01.
Fig. 3. Effect of the application of a solvent extract from 5th instar worker larvae (five larbrood cells and freshly capped brood cells, artificially infested with a single mite, betweencell capping, less than 7% reproduced, but after the application of larval extract more thanother (a and b: v2 = 35.6, p < 0.001; b and c: v2 = 9.2, p < 0.01; a and c: v2 = 12.01, p < 0
10
to brood cells containing the same larval stage reproduced success-fully with an average number of 3.4 ± 1.4 offspring per mothermite (Table 1a). This is equal to the fertility rate to naturally in-vaded mites (82.2%; Fig. 2).
When mites were transferred from brood cells 24 h after cellcapping into cells 48 h after cell capping, the fertility decreasedhighly significant compared to the control (n = 36; v2 = 14.939,p < 0.001). However, the transfer of Varroa mites from brood cells24 h and 48 h after cell capping, respectively, to brood cells 72 hafter cell capping did not reveal a significant effect on the mite’sfertility (24–72 h: n = 29; v2 = 2.469, p = 0.116; 48–72 h: n = 36;v2 = 2.377, p = 0.123) albeit the number of mites with unsuccessfulreproduction (egg only or male only; Table 1) increasedsignificantly.
Compared to the control, the fecundity (=number of offspring)decreased in all experimental groups, however, only in the caseof 24–72 h transfer the differences were significant (t-test,p < 0.01; Table 1).
Non-reproduction of the introduced mites was not associatedwith a lack of stored spermatozoa in the spermatheca. In all ofthe 36 non-reproducing mites from the different approaches wecould verify microscopically the presence of sperms.
removed 24 h after cell capping. Mites with activated oogenesis were then transferredesults of v2-tests for differences in fertility between all groups (b).
y per mite (n) Incomplete reproduction of reproducing mites
Egg only (%) Daughter(s) only (%) Male only (%)
8.0 0 4.07.7 0 08.3 0 16.7
15.8 0 10.5
24 h ? 48 h 48 h ? 72 h 24 h ? 72 h
<0.001** 0.123 0.116– 0.009** 0.018*
– – 0.922– – –
vae equivalents) on the activation of V. destructor reproduction. In naturally invaded80% and 90% of the mites reproduced. From mites which were introduced 24 h after40% reproduced. Columns followed by different letters differ significantly from each
.01).

60 E. Frey et al. / Journal of Invertebrate Pathology 113 (2013) 56–62
Veröffentlichungen
3.3. Effect of the application of larval extract in worker brood cells
In an additional set of experimental setup we could at first con-firm the reproduction results presented in Section 3.1 (Fig. 2): Thefertility rate of natural invaded and in freshly capped brood cellsintroduced V. destructor females were 85.3% and 83.3%, respec-tively (Fig. 3). We also confirmed that only about 5% of the mitesdo reproduce if they were introduced in brood cells 24 h afterthe cell capping. However, if the larvae in these 24 h brood cellsare treated with five larval equivalent of a pentane extract offreshly capped larvae, the percentage of reproducing V. destructorincreased significantly (v2 = 9.2; p < 0.01) to more than 40%; theapplication of the solvent alone had no effect (Fig. 3).
Fig. 4. Comparative amounts of the different fatty acid esters present in the cuticle of fcapping. MP methyl palmitate, MS methyl stearate, MO methyl oleate, ML methyl linole
Fig. 5. Averages of total amounts (n = 3 for each larval stage) of FAME (Fatty Acid Methwithin the first 3 days after capping of the brood cells.
11
3.4. Chemical analysis of worker and drone larvae extracts
Five different fatty acid methyl esters (FAME: methyl palmitate,methyl stearate, methyl oleate, methyl linoleate, methyl linole-nate) and three fatty acid ethyl esters (FAEE: ethyl palmitate, ethylstearate, ethyl oleate) were quantified in the cuticular extractsfrom A. mellifera worker and drone larvae (Fig. 4). The amount ofthe single compounds varied among age and sex: in freshly sealeddrone larvae the total amount of methyl esters were about fourtimes higher compared to worker extracts, the total amount ofethyl esters were about two times higher (Fig. 5). Regarding thelarval age, the ratio between FAME and FAEE revealed considerabledifferences during the first 72 h after cell capping. While at the
reshly capped worker and drone larvae and in larvae 12, 24, 48 and 72 h after cellate, MLEN methyl linolenate, EP ethyl palmitate, ES ethyl stearate, EO ethyl oleate.
yl Ester) and FAEE (Fatty Acid Ethyl Ester) in worker (left) and drone (right) larvae
E. Frey et al. / Journal of Invertebrate Pathology 113 (2013) 56–62 61
Veröffentlichungen
beginning of the capping period FAME and FAEE were present insimilar proportions, the amount of FAEE decreased strikingly inworker larvae 24 h and drone larvae 48 h after cell capping. In lar-vae 72 h after cell capping only traces of FAEE were detectable inboth, worker and drone larvae (Figs. 4 and 5).
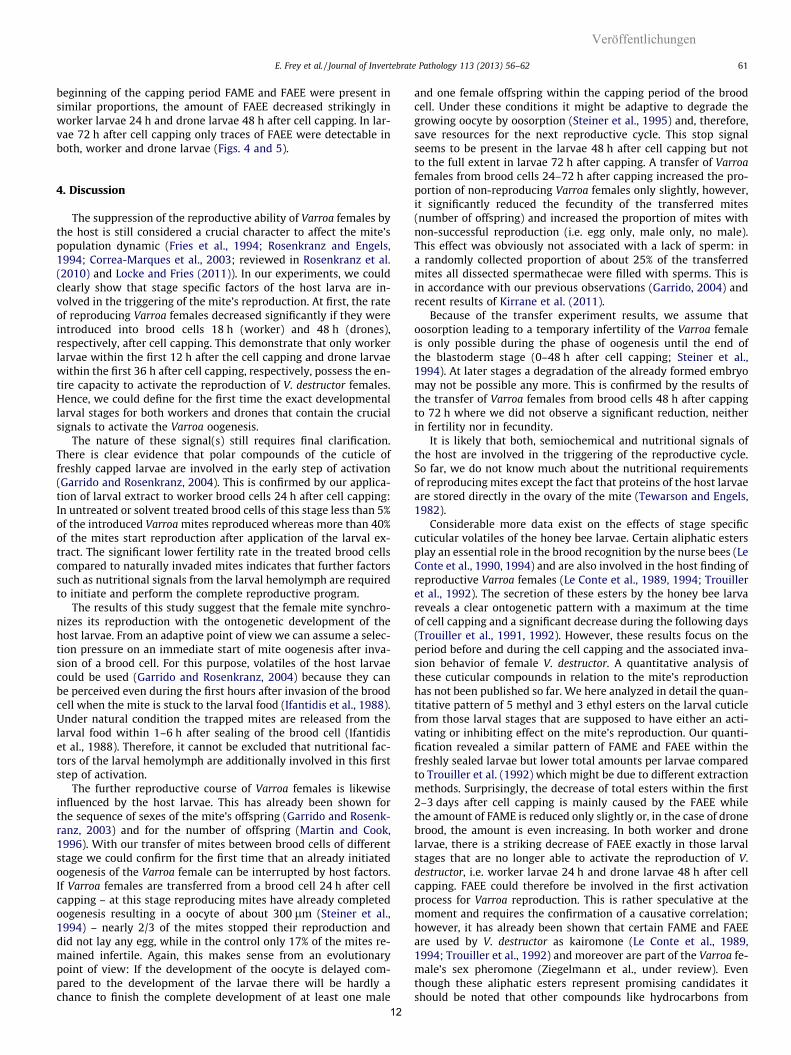
4. Discussion
The suppression of the reproductive ability of Varroa females bythe host is still considered a crucial character to affect the mite’spopulation dynamic (Fries et al., 1994; Rosenkranz and Engels,1994; Correa-Marques et al., 2003; reviewed in Rosenkranz et al.(2010) and Locke and Fries (2011)). In our experiments, we couldclearly show that stage specific factors of the host larva are in-volved in the triggering of the mite’s reproduction. At first, the rateof reproducing Varroa females decreased significantly if they wereintroduced into brood cells 18 h (worker) and 48 h (drones),respectively, after cell capping. This demonstrate that only workerlarvae within the first 12 h after the cell capping and drone larvaewithin the first 36 h after cell capping, respectively, possess the en-tire capacity to activate the reproduction of V. destructor females.Hence, we could define for the first time the exact developmentallarval stages for both workers and drones that contain the crucialsignals to activate the Varroa oogenesis.
The nature of these signal(s) still requires final clarification.There is clear evidence that polar compounds of the cuticle offreshly capped larvae are involved in the early step of activation(Garrido and Rosenkranz, 2004). This is confirmed by our applica-tion of larval extract to worker brood cells 24 h after cell capping:In untreated or solvent treated brood cells of this stage less than 5%of the introduced Varroa mites reproduced whereas more than 40%of the mites start reproduction after application of the larval ex-tract. The significant lower fertility rate in the treated brood cellscompared to naturally invaded mites indicates that further factorssuch as nutritional signals from the larval hemolymph are requiredto initiate and perform the complete reproductive program.
The results of this study suggest that the female mite synchro-nizes its reproduction with the ontogenetic development of thehost larvae. From an adaptive point of view we can assume a selec-tion pressure on an immediate start of mite oogenesis after inva-sion of a brood cell. For this purpose, volatiles of the host larvaecould be used (Garrido and Rosenkranz, 2004) because they canbe perceived even during the first hours after invasion of the broodcell when the mite is stuck to the larval food (Ifantidis et al., 1988).Under natural condition the trapped mites are released from thelarval food within 1–6 h after sealing of the brood cell (Ifantidiset al., 1988). Therefore, it cannot be excluded that nutritional fac-tors of the larval hemolymph are additionally involved in this firststep of activation.
The further reproductive course of Varroa females is likewiseinfluenced by the host larvae. This has already been shown forthe sequence of sexes of the mite’s offspring (Garrido and Rosenk-ranz, 2003) and for the number of offspring (Martin and Cook,1996). With our transfer of mites between brood cells of differentstage we could confirm for the first time that an already initiatedoogenesis of the Varroa female can be interrupted by host factors.If Varroa females are transferred from a brood cell 24 h after cellcapping – at this stage reproducing mites have already completedoogenesis resulting in a oocyte of about 300 lm (Steiner et al.,1994) – nearly 2/3 of the mites stopped their reproduction anddid not lay any egg, while in the control only 17% of the mites re-mained infertile. Again, this makes sense from an evolutionarypoint of view: If the development of the oocyte is delayed com-pared to the development of the larvae there will be hardly achance to finish the complete development of at least one male
12
and one female offspring within the capping period of the broodcell. Under these conditions it might be adaptive to degrade thegrowing oocyte by oosorption (Steiner et al., 1995) and, therefore,save resources for the next reproductive cycle. This stop signalseems to be present in the larvae 48 h after cell capping but notto the full extent in larvae 72 h after capping. A transfer of Varroafemales from brood cells 24–72 h after capping increased the pro-portion of non-reproducing Varroa females only slightly, however,it significantly reduced the fecundity of the transferred mites(number of offspring) and increased the proportion of mites withnon-successful reproduction (i.e. egg only, male only, no male).This effect was obviously not associated with a lack of sperm: ina randomly collected proportion of about 25% of the transferredmites all dissected spermathecae were filled with sperms. This isin accordance with our previous observations (Garrido, 2004) andrecent results of Kirrane et al. (2011).
Because of the transfer experiment results, we assume thatoosorption leading to a temporary infertility of the Varroa femaleis only possible during the phase of oogenesis until the end ofthe blastoderm stage (0–48 h after cell capping; Steiner et al.,1994). At later stages a degradation of the already formed embryomay not be possible any more. This is confirmed by the results ofthe transfer of Varroa females from brood cells 48 h after cappingto 72 h where we did not observe a significant reduction, neitherin fertility nor in fecundity.
It is likely that both, semiochemical and nutritional signals ofthe host are involved in the triggering of the reproductive cycle.So far, we do not know much about the nutritional requirementsof reproducing mites except the fact that proteins of the host larvaeare stored directly in the ovary of the mite (Tewarson and Engels,1982).
Considerable more data exist on the effects of stage specificcuticular volatiles of the honey bee larvae. Certain aliphatic estersplay an essential role in the brood recognition by the nurse bees (LeConte et al., 1990, 1994) and are also involved in the host finding ofreproductive Varroa females (Le Conte et al., 1989, 1994; Trouilleret al., 1992). The secretion of these esters by the honey bee larvareveals a clear ontogenetic pattern with a maximum at the timeof cell capping and a significant decrease during the following days(Trouiller et al., 1991, 1992). However, these results focus on theperiod before and during the cell capping and the associated inva-sion behavior of female V. destructor. A quantitative analysis ofthese cuticular compounds in relation to the mite’s reproductionhas not been published so far. We here analyzed in detail the quan-titative pattern of 5 methyl and 3 ethyl esters on the larval cuticlefrom those larval stages that are supposed to have either an acti-vating or inhibiting effect on the mite’s reproduction. Our quanti-fication revealed a similar pattern of FAME and FAEE within thefreshly sealed larvae but lower total amounts per larvae comparedto Trouiller et al. (1992) which might be due to different extractionmethods. Surprisingly, the decrease of total esters within the first2–3 days after cell capping is mainly caused by the FAEE whilethe amount of FAME is reduced only slightly or, in the case of dronebrood, the amount is even increasing. In both worker and dronelarvae, there is a striking decrease of FAEE exactly in those larvalstages that are no longer able to activate the reproduction of V.destructor, i.e. worker larvae 24 h and drone larvae 48 h after cellcapping. FAEE could therefore be involved in the first activationprocess for Varroa reproduction. This is rather speculative at themoment and requires the confirmation of a causative correlation;however, it has already been shown that certain FAME and FAEEare used by V. destructor as kairomone (Le Conte et al., 1989,1994; Trouiller et al., 1992) and moreover are part of the Varroa fe-male’s sex pheromone (Ziegelmann et al., under review). Eventhough these aliphatic esters represent promising candidates itshould be noted that other compounds like hydrocarbons from

62 E. Frey et al. / Journal of Invertebrate Pathology 113 (2013) 56–62
Veröffentlichungen
the non-polar fraction of the larval cuticle could be additionally in-volved in the chemotactic control of mite reproduction.
So far, we do not have a reliable suggestion for the nature of thestop signal. Heptadecene is the only semiochemical which is con-sidered to have a fecundity-reducing potential in V. destructor(Nazzi et al., 2002) and is obviously produced by the honey bee lar-vae under stress conditions. The results of our control experimentsdo not indicate a stress reaction of the larvae after the artificialintroduction of mites so that it is unlikely that this compound is in-volved in the here described interruption of mite’s reproduction.
Except for the suggestion of the FAEE as a potential initial acti-vator of the mite’s oogenesis, we cannot specify the signals in-volved in the host derived triggering of Varroa reproduction. Forfurther research, an in vitro system allowing artificial feeding ofreproducing mites is urgently needed. Since the work of Bruceet al. (1988, 1991) on artificial feeding of mites, no promising ap-proach has been undertaken.
Our experiments confirm once again that the reproduction ofthe parasitic mite V. destructor is activated by host factors of thehoney bee larva. This has already been assumed by Trouiller andMilani (1999) who stimulated the reproduction of Varroa withinartificial gelatin cells by application of an extract of 5th instar lar-vae. Later on, Garrido and Rosenkranz (2004) showed that volatilesemitted by the freshly capped larvae are involved in the activationof the mite’s oogenesis.
We here used a within colony approach to verify these resultsunder natural conditions. The introduction of mature Varroa fe-males into honey bee brood cells has been used successfully formany years at our lab. The introduction of phoretic mites – col-lected from nurse bees – into freshly sealed brood cells obviouslyresembles the situation of natural invaded mites. We did not re-cord any differences in the fertility of artificial introduced and nat-ural invaded mites. This confirms former results using this well-established technique (Rosenkranz and Stürmer, 1992; Rosenkranzand Bartalszky, 1996; Martin and Cook, 1996; Garrido and Rosenk-ranz, 2003) however it contradicts recent results from Kirrane et al.(2011) where nearly all of the introduced phoretic mites (and mostof the transferred brood mites) remained infertile. So far, we do nothave a satisfying explanation for these differences.
Our results provide an important tool for the further analysis ofthe crucial host signals by analyzing those host stages that havethe capacity to activate or inhibit the Varroa reproduction. Thismay also help to better understand the recently confirmed genet-ical basis of non-reproduction in V. destructor (Behrens et al., 2011).
Acknowledgments
Funded by the European Commission BEE DOC Project (EU Con-tract Number: FP7-KBBE-2009-3 244956 CP-FP) and by the Ger-man Ministry for Education and Science (BMBF) Project FUGAPIS(Project Number: 0315125A).
References
Aumeier, P., Rosenkranz, P., 2001. Scent or movement of Varroa destructor mitesdoes not elicit hygienic behaviour by Africanized and Carniolan honey bees.Apidologie 32, 253–263.
Behrens, D., Huang, Q., Geßner, C., Rosenkranz, P., Frey, E., Locke, B., Moritz, R.F.A.,Kraus, F.B., 2011. Three QTL in the honey bee Apis mellifera L. suppressreproduction of the parasitic mite Varroa destructor. Ecol. Evol. 1 (4), 451–458.
Bruce, W.A., Chiesa, F., Marchetti, S., Griffith, D.A., 1988. Laboratory feeding ofVarroa jacobsoni Oudemans on natural and artificial diets (Acari: Varroidae).Apidologie 19, 209–218.
Bruce, W.A., Henegar, R.B., Hackett, K.J., 1991. An artificial membrane for in vitrofeeding of Varroa jacobsoni and Acarapis woodi, mite parasites of honey bees.Apidologie 22, 503–507.
Calis, J.N.M., Fries, I., Ryrie, S.C., 1999. Population modeling of Varroa jacobsoni Oud.Apidologie 30, 111–124.
13
Carneiro, F.E., Torres, R.R., Strapazzon, R., Ramirez, S.A., Guerra, J.C.V., Koling, D.F.,Moretto, G., 2007. Changes in the reproductive ability of the mite Varroadestructor (Anderson and Trueman) in Africanized honey bees (Apis mellifera L.)(Hymenoptera: Apidae) colonies in southern Brazil. Neotrop. Entomol. 36 (6),949–952.
Correa-Marques, M.H., Medina Media, L., Martin, S.J., De Jong, D., 2003. Comparingdata on the reproduction of Varroa destructor. Genet. Mol. Res. 2, 1–6.
Dillier, F.-X., Fluri, P., Imdorf, A., 2006. Review of the orientation behaviour in thebee parasitic mite Varroa destructor: sensory equipment and cell invasionbehavior. Revue Suiesse de Zoologie 113 (4), 857–877.
Donzé, G., Herrmann, M., Bachofen, B., Guerin, P.M., 1996. Effect of matingfrequency and brood cell infestation rate on the reproductive success of thehoneybee parasite Varroa jacobsoni. Ecol. Entomol. 21, 17–26.
Fries, I., Camazine, S., Sneyd, J., 1994. Population dynamics of Varroa jacobsoni: amodel and a review. Bee World 75, 5–28.
Garrido, C., Rosenkranz, P., Stürmer, M., Rübsam, R., Büning, J., 2000. Toluidine bluestaining as a rapid measure for initiation of oocyte growth and fertility in Varroajacobsoni Oud. Apidologie 31, 559–566.
Garrido, C., Rosenkranz, P., 2003. The reproductive program of female Varroadestructor is triggered by its host, Apis mellifera. Exp. Appl. Acarol. 31, 269–273.
Garrido, C., 2004. Reproduktionssteuerung bei der parasitischen BienenmilbeVarroa destructor Anderson & Trueman 2000 (ehemals Varroa jacobsoniOudemans). Ph.D. Thesis, Universität Hohenheim, Stuttgart.
Garrido, C., Rosenkranz, P., 2004. Volatiles of the honey bee larva initiate oogenesisin the parasitic mite Varroa destructor. Chemoecology 14, 193–197.
Ifantidis, M.D., Thrashyvoulou, A., Pappas, M., 1988. Some aspects of the process ofVarroa jacobsoni mite entrance into honey bee (Apis mellifera) brood cells.Apidologie 19, 387–396.
Ibrahim, A., Spivak, M., 2006. The relationship between hygienic behaviour andsuppression of mite reproduction as honey bee (Apis mellifera) mechanisms ofresistance to Varroa destructor. Apidologie 379, 31–40.
Kirrane, M.J., De Guzman, L.I., Rinderer, T.E., Franke, A.M., Wagnitz, J., Whelan, P.M.,2011. Asynchronous development of honey bee host and Varroa destructor(Mesostigmata: Varroidae) influences reproductive potential of mites. J. Econ.Entomol. 104 (4), 1146–1152.
Le Conte, Y., Arnold, G., Trouiller, J., Masson, C., Chappe, B., Ourisson, G., 1989.Attraction of the parasitic mite Varroa to the drone larvae of honeybees bysimple aliphatic esters. Science 245, 638–639.
Le Conte, Y., Arnold, G., Trouiller, J., Masson, C., 1990. Identification of a broodpheromone in honeybees. Naturwissenschaften 77, 334–336.
Le Conte, Y., Sreng, L., Trouiller, J., 1994. The recognition of larvae by workerhoneybees. Naturwissenschaften 81, 462–465.
Locke, B., Fries, I., 2011. Characteristics of honey bee colonies (Apis mellifera) inSweden surviving Varroa destructor infestation. Apidologie 42, 533–542.
Martin, S.J., 1994. Ontogenesis of the mite Varroa jaconsoni Oud in worker brood ofthe honeybee Apis mellifera L. under natural conditions. Exp. Appl. Acarol. 18,87–100.
Martin, S., Cook, C., 1996. Effect of host brood type on the number of offspring laidby the honeybee parasite Varroa jacobsoni. Exp. Appl. Acarol. 20, 387–390.
Martin, S., Holland, K., Murray, M., 1997. Non-reproduction in the honeybee miteVarroa jacobsoni. Exp. Appl. Acarol. 21, 539–549.
Nazzi, F., Milani, N., Della Vedova, G., 2002. (Z)-8-heptadecene from infested cellsreduces the reproduction of Varroa destructor under laboratory conditions. J.Chem. Ecol. 28, 2181–2190.
Rehm, S.M., Ritter, W., 1989. Sequence of the sexes in the offspring of Varroajacobsoni and resulting consequences fort he calculation of the developmentalperiod. Apidologie 20, 339–343.
Rosenkranz, P., Stürmer, M., 1992. Ernärungsabhägige Fertilität der Varroa-Weibchen in Arbeiterinnenbrut von Apis mellifera carnica und Apis melliferacapensis, vol. 47. Univ. Mariae Curie, Sklodowska, Lublin-Poland, pp. 55–60(Section DD).
Rosenkranz, P., Engels, W., 1994. Infertility of Varroa jacobsoni females afterinvasion into Apis mellifera worker brood as a tolerance factor againstvarroatosis. Apidologie 25, 402–411.
Rosenkranz, P., Bartalszky, H., 1996. Reproduction of Varroa females after longbroodless periods of the honey bee colony during summer. Apidologie 27, 288–289.
Rosenkranz, P., Aumeier, P., Ziegelmann, B., 2010. Biology and control of Varroadestructor. J. Invertebr. Pathol. 103, 96–119.
Steiner, J., Dittmann, F., Rosenkranz, P., Engels, W., 1994. The first gonocycle of theparasitic mite (Varroa jacobsoni) in relation to preimaginal development of itshost, the honey bee (Apis mellifera carnica). Invertebr. Rep. Dev. 25, 175–183.
Steiner, J., Diehl, P.A., Vlimant, M., 1995. Vitellogenesis on Varroa jacobsoni, aparasite of honey bees. Exp. Appl. Acarol. 19, 411–422.
Tewarson, N.C., Engels, W., 1982. Undigested uptake of non-host proteins by Varroajacobsoni. J. Apicult. Res. 21, 222–225.
Trouiller, J., Arnold, G., Le Conte, Y., Masson, C., 1991. Temporal pheromonal andkairomonal secretion in the brood of honeybees. Naturwissenschaften 78, 368–370.
Trouiller, J., Arnold, G., Chappe, B., Le Conte, Y., Masson, C., 1992. Semiochemicalbasis of infestation of honey bee brood by Varroa jacobsoni. J. Chem. Ecol. 18(11), 2041–2053.
Trouiller, J., Milani, N., 1999. Stimulation of Varroa jacobsoni Oud. Oviposition withsemiochemicals from honeybee brood. Apidologie 30, 3–12.
Three QTL in the honey bee Apis mellifera L. suppressreproduction of the parasitic mite Varroa destructorDieter Behrens1, Qiang Huang1,2, Cornelia Geßner1,3, Peter Rosenkranz4, Eva Frey4, Barbara Locke5,Robin F. A. Moritz1,6 & F. B. Kraus1
1Institute of Biology, Martin-Luther-University Halle-Wittenberg, Hoher Weg 4, 06099 Halle (Saale), Germany2Honeybee Research Institute, Jiangxi Agricultural University, Nanchang 330045, China3Department of Anatomy and Structural Biology, University of Otago, 270 Great King Street, 9016 Dunedin, New Zealand4Apicultural State Institute, University of Hohenheim, August-von-Hartmannstraße 13, 70599 Stuttgart, Germany5Department of Ecology, Swedish University of Agricultural Sciences, Ulls Vag 16, 750–07 Uppsala, Sweden6Department of Zoology and Entomology, University of Pretoria, Pretoria, South Africa
KeywordsDisease resistance, drones, microsatellites,quantitative trait loci.
CorrespondenceDieter Behrens, Institute of Biology,Martin-Luther-University Halle-Wittenberg,Hoher Weg 4, 06099 Halle (Saale), Germany.Tel: +49 345 5526235; Fax: +49 345 552726;E-mail: [email protected]
Funded by the European Commission BEE DOCproject (EU contract number: FP7-KBBE-2009-3244956 CP-FP) and by the German Ministry forEducation and Science (BMBF) project FUGAPIS(project number: 0315125A).
Received: 01 June 2011; Revised: 16 July 2011;Accepted: 19 July 2011
doi: 10.1002/ece3.17
Abstract
Varroa destructor is a highly virulent ectoparasitic mite of the honey bee Apismellifera and a major cause of colony losses for global apiculture. Typically, chemicaltreatment is essential to control the parasite population in the honey bee colony.Nevertheless a few honey bee populations survive mite infestation without anytreatment. We used one such Varroa mite tolerant honey bee lineage from theisland of Gotland, Sweden, to identify quantitative trait loci (QTL) controllingreduced mite reproduction. We crossed a queen from this tolerant populationwith drones from susceptible colonies to rear hybrid queens. Two hybrid queenswere used to produce a mapping population of haploid drones. We discriminateddrone pupae with and without mite reproduction, and screened the genome forpotential QTL using a total of 216 heterozygous microsatellite markers in a bulksegregant analysis. Subsequently, we fine mapped three candidate target regions onchromosomes 4, 7, and 9. Although the individual effect of these three QTL wasfound to be relatively small, the set of all three had significant impact on suppressionof V. destructor reproduction by epistasis. Although it is in principle possible to usethese loci for marker-assisted selection, the strong epistatic effects between the threeloci complicate selective breeding programs with the Gotland Varroa tolerant honeybee stock.
Introduction
The parasitic mite Varroa destructor is the most dangerousparasite of the western honey bee Apis mellifera (Rosenkranzet al. 2010). By feeding on the hemolymph of developing andadult bees, the mite damages the bees physically and physio-logically. The most devastating effects of the mite, however,are caused by its ability to vector several highly pathogenichoney bee viruses, dramatically increasing viral disease in thecolony and often leading to colony death (Bocking and Gen-ersch 2008). So far more than 18 honey bee viruses have beendescribed and many are associated with Varroa mite infes-tation, most notably deformed wing virus (Chen and Siede2007; Ribiere et al. 2008).
The problem arose four decades ago after the mite’s tran-sition from its original host, the eastern honey bee A. cerana(Oldroyd 1999). The mite spread across the globe within fewdecades and today only Australia (Oldroyd 1999; Andersonand Trueman 2000; Rosenkranz et al. 2010), northern Swedenand Norway (SJVFS 2010), some extremely isolated popula-tions on islands (e.g. Ile d’Ouessant: Tentcheva et al. 2004),and remote oases in deserts (Shaibi et al. 2010) have managedto remain free of Varroa infestations.
With the exceptions of Africanized and African bee races,apiculture with the western honey bee is nearly impossi-ble unless regular mite control treatments (usually chemi-cal acaricides) are used to control the parasite population(Rosenkranz et al. 2010). In temperate climates, a colony,
c© 2011 The Authors. Published by Blackwell Publishing Ltd. This is an open access article under the terms of the CreativeCommons Attribution Non Commercial License, which permits use, distribution and reproduction in any medium, providedthe original work is properly cited and is not used for commercial purposes.
451
Veröffentlichungen
14

QTL-Mapping of Varroa Resistance in Honeybees D. Behrens et al.
once it is infested with V. destructor, will collapse withoutmite control treatment within 2–3 years (Rosenkranz et al.2010; Bocking and Genersch 2008). In the past decades,several chemicals have been used to control V. destructorinfestations, but unfortunately the mite rapidly evolved re-sistance against these chemicals and their efficiency declined(Lodesani et al. 1995; Elzen and Westervelt 2004; Pettis 2004).In addition, control treatments often cause contaminationof the apicultural products including acaricide residues inhoney and pollen (Wallner 1999; Martel et al. 2007). It istherefore apparent that alternative strategies are needed tofight V. destructor that will neither facilitate resistance in theparasite populations nor contaminate bee products, thus en-suring both consumer health and customer trust in honeybee products.
In spite of the global Varroosis disaster, a few populationsof European honey bees have been identified to survive in-festations without any form of mite control treatment. Thesepopulations have not been managed by bee breeders butrather evolved tolerance through natural selection by miteinfestation (De Jong and Soares 1997; Kefuss et al. 2004; Frieset al. 2006; Le Conte et al. 2007; Seeley 2007). Varroa tolerancemay be based on very different traits, since the interaction be-tween the mite and the host is very complex. A particularlywell-studied behavioral trait that can lead to colony toleranceis the so-called hygienic behavior of the honey bee (Bockingand Spivak 1999). This trait is important for mite resistanceof the eastern honey bee A. cerana (Peng et al. 1987) and hasbeen in focus of various breeding programs in the westernhoney bee A. mellifera (Rinderer et al. 2010). Hygienic be-havior has been shown to be controlled by quantitative traitloci (QTL) (Lapidge et al. 2002; Oxley et al. 2010) influenc-ing the task thresholds for uncapping and removal of dead,diseased, or parasitized brood (Rothenbuhler 1964; Moritz1988).
However, a more direct path toward mite resistance is theability of the individual larva or pupa to prevent mite re-production in the brood cell (Fries et al. 1994). The mite’sreproduction is closely synchronized with that of the infesteddeveloping pupa, and different compounds of the larval cuti-cle are responsible for initiating egg laying by the mite (Gar-rido and Rosenkranz 2003, 2004).
After a decade of natural selection for survival withouttreatment, it has been demonstrated that mite reproductivesuccess is reduced to about 50% in the honey bee popula-tion on the island of Gotland (Locke and Fries 2011). Cross-infestation experiments with the honey bee population onGotland demonstrated that the observed mite tolerance inthis population is a trait of the bees, and not one of thelocal mite population (Fries and Bommarco 2007). Mite in-fertility was one of the parameters influencing the reducedreproductive success of the mite in this population (Lockeand Fries 2011) and is further a highly variable trait ranging
between 5 and 20% in worker brood of European honey bees(Rosenkranz et al. 2010).
In this study, we aim to identify genomic regions, whichinfluence the suppression of mite reproduction by honey beelarvae and pupae, to enable future marker-assisted breedingprograms for Varroa-resistant honey bee stock. The avail-ability of both the complete A. mellifera genome sequence(Weinstock et al. 2006) and the tolerant population on Got-land, provides an ideal setting to screen for QTL that interferewith V. destructor reproduction. Large sets of highly variablemicrosatellite markers covering the entire genome have beenestablished (Solignac et al. 2003, 2007) and novel markerscan be easily extracted from the genome sequence that canbe used for high-density fine-scale mapping (Lattorff et al.2007; Shaibi et al. 2008). In addition, because honey beeshave a haplodiploid sex determination, the haploid dronesprovide an extremely simple and highly efficient model sys-tem for genetic studies (Moritz and Evans 2007; Moritz et al.2010). Drones are also important for Varroa resistance froman epidemiological point of view, since Varroa mites prefer-entially reproduce in the drone brood of A. mellifera (Fuchs1990). In the adapted host A. cerana, the mite reproductionis even completely restricted to the drone brood (Boot et al.1999).
Here, we embark on using drones as a genetic model sys-tem to screen for QTL for suppression of Varroa mite re-production. Because drones only have a mother queen andno father, it requires only a single generation to establish amapping population of hundreds of individuals yielding anextremely powerful strategy for QTL identification.
Methods
Mapping population
The isolated honey bee population on the island of Gotlandin Sweden has been under natural selection for mite tolerancefor more than 10 years and has survived without any Varroatreatment (Fries et al. 2006; Locke and Fries 2011). Today, theGotland population shows clear signs of tolerance towardVarroa mites and a significant reduction in the reproductivesuccess of Varroa mites, whereas hygienic and grooming be-havior of the bees is not increased (Locke and Fries 2011). Aqueen of pure Gotland origin was naturally mated to dronesat the apiary of the University of Hohenheim, where the localpopulation does not show any signs of Varroa tolerance orresistance and is considered to be genetically Varroa suscep-tible. Two hybrid F1 daughter queens of the Gotland queen(queen A and B in the following) were naturally mated andintroduced into strong foster colonies with equally high Var-roa infestation levels. Empty drone brood frames were addedallowing the queens to produce a large drone mapping pop-ulation.
452 c© 2011 The Authors. Published by Blackwell Publishing Ltd.
Veröffentlichungen
15

D. Behrens et al. QTL-Mapping of Varroa Resistance in Honeybees
Phenotypic classification
Sealed drone brood cells were opened 15–18 days after egglaying and checked for Varroa infestation and reproductionof the mite. Pupae infested with only a single mite with nooffspring were classified either as (1) resistant (n = 144)and those with at least three viable offspring mites as (2)susceptible (n = 635). Drone pupae with intermediate re-productive success of the mite (one or two offspring mites,n = 107) were not included in the mapping population. Thisselective DNA pooling approach (Darvasi and Soller 1994)with a focus on the extreme phenotypes allows for obtain-ing a clear-cut segregation of individuals and alleles. Afterthe identification of the phenotype, all drone pupae weretransferred into 90% ethanol and stored at –20◦C until DNAextraction.
DNA extraction and bulk segregantanalysis (BSA)
Genomic DNA of all resistant (n = 144) and a subset of sus-ceptible (n = 128) drone pupae was extracted individuallyfrom a leg, each following a modified Chelex extraction pro-tocol (Biorad, Walsh et al. 1991). DNA concentrations weremeasured using the Nanodrop ND 1000 Spectrophotometer(peqlab, v 3.5.2) and equal amounts of DNA per individualwere pooled according to the defined resistance phenotypefrom hybrid queen A (resistant, n = 32; susceptible, n = 48).We then genotyped these pools in a BSA with a total of 488microsatellite markers distributed over all 16 chromosomesof the honey bee at 55◦C following standard multiplex poly-merase chain reaction (PCR) protocols (eight primer pairsper reaction; 35 cycles) (Michelmore et al. 1991; Solignacet al. 2003). Of these 488 microsatellite markers, 216 markerswere heterozygous in mother queen A resulting in a resolu-tion of one marker every 1 Mb or 19 cM on average. Themean distance between markers was 8.3 ± 0.3 cM, 78% ofthe genome was less than 5 cM and 96% less than 10 cMaway from a heterozygous marker tested in the BSA. Themarker coverage for each chromosome is illustrated in Fig-ure S1. The obtained microsatellite fragments were analyzedwith an automated DNA capillary sequencer (MegaBACE1000) and scored with the MegaBACE Fragment ProfilerVersion 1.2.
For all markers, which were heterozygous in the motherqueen, the fluorescence intensities (i.e., peak heights) of thetwo alleles (i.e., PCR products) were taken as an estimatorfor the allele frequencies in the DNA pools. In case of dif-ferent allele frequencies between the pools (i.e., one allelepredominant in one phenotypic pool, the alternative allelein the other), the ratios of the measured peak heights areexpected to differ in the two PCR reactions accordingly. Thisdifference was calculated as the sum of differences in the nor-malized fluorescence intensities of both alleles between the
two phenotypic pools (see equation in Fig. S2) and used toselect candidate regions for fine-mapping. All drones of thebulked DNA pools were then individually genotyped at thesemarkers to confirm or reject a biased allele distribution in thephenotypic pools.
Individual genotyping and QTL-mapping
Based on the results of the BSA, all individuals from hybridqueen A were individually genotyped at a total of 131 mi-crosatellite markers to verify the QTL candidate regions. In asingle marker analysis using the software Map manager QTX(Manly et al. 2001), we identified three candidate regions,where consecutive markers showed significant different fre-quencies in the two phenotypic pools (χ2-test, P < 0.05). Wethen genotyped 112 resistant and 80 susceptible individualsfrom hybrid sister queen B at 60 informative loci (Table S1)within these candidate regions identified in queen A to testwhether the identified regions also caused a phenotypic seg-regation in the second mapping population. Both datasetswere analyzed separately as well as pooled after reconstruc-tion of the maternal F1 chromosomes from the haploid F2drone offspring in both possible assignments (chromosome1 in queen A assigned to chromosome 1 in queen B and tochromosome 2, respectively). If markers were homozygousin one of the two sister queens, these were treated as missingvalues in the respective part of the dataset. Pooling of datasetswas done under the assumption that the resistance allele hadgone to fixation in the selected and inbred Gotland popula-tion. Hence, the mother of the two sister queens is assumedto be homozygous for this allele and it must be shared by thetwo half-sister hybrid queens. To confirm the Gotland ori-gin of the alleles in the resistant pool, we genotyped a pooledDNA sample of 74 drones caught at a drone congregation areaon Gotland in 2007 on 40 markers in the candidate regions,and screened for common alleles to identify the maternal F1chromosomes.
The genotypes and a binary trait value for each individ-ual (0 for susceptible and 1 for resistant) were then enteredinto the software Map manager QTX (Manly et al. 2001) tocalculate the suggestive and significant QTL thresholds sepa-rately for each candidate region (15,000 permutations) con-ducting single marker analysis and simple interval mapping.Marker positions were defined according to the genomic mapAmel 4.5 (NCBI Map viewer, www.ncbi.nlm.nih.gov) andindividuals were coded as double haploids. In addition, theR package R/qtl (Broman et al. 2003; R Development CoreTeam 2010) was used for simple interval mapping, to test fordifferences due to a software effect and for graphic display.Furthermore, the amount of phenotypic variance explainedby each QTL separately in a single-locus model, as well asby significant epistatic interactions in a two-locus model wascalculated using R/qtl. QTL regions were then screened for
c© 2011 The Authors. Published by Blackwell Publishing Ltd. 453
Veröffentlichungen
16

QTL-Mapping of Varroa Resistance in Honeybees D. Behrens et al.
Figure 1. Candidate regions on chromosomes 4, 7, and 9 with theirassociated LOD scores from simple interval mapping of the pooleddataset using R/qtl. The horizontal lines represent the QTL thresholds(blue dashed: suggestive, P < 0.63; red solid: significant, P < 0.05; greendashed: highly significant, P < 0.001) (15,000 permutations) [Correctionadded after online publication 1 Nov 2011: The word ‘vertical’ has beenreplaced by ‘horizontal’] . The asterisk (∗) on chromosome 7 indicatesthe approximate position of the “futsch” ortholog (GB11509).
annotated genes in the honey bee genome database (NCBIMap Viewer; Amel 4.5).
Results
QTL candidate regions
Based on the BSA and the subsequent individual genotyping,three regions of interest, located on chromosomes 4, 7, and 9,were identified showing linkage of one or more markers in thesingle marker analysis to the defined trait value of host resis-tance. Both softwares used for simple interval mapping gavenearly identical results, indicating that the mapping resultsare robust, irrespective of the software applied. The resultsfor the pooled dataset of the simple interval mapping in thethree candidate regions using R/qtl are shown in Figure 1.Whereas the QTL regions on chromosome 4 (ranging from2.1 to 4.3 Mb) and 9 (ranging from 1.0 to 3.5 Mb) were onlysuggestive in simple interval mapping and explained 5.3 and3.7% of the phenotypic variance, respectively, the region onchromosome 7 (ranging from 3.6 to 8.5 Mb) significantlyinfluenced the phenotype explaining 8.7% of the variancein a single-locus model. The majority of the designated “re-sistance” marker alleles in all three regions (62%, n = 80,Table S1) were also found in the drone sample from 2007suggesting that our marker assignment corresponded to thealleles present in the Gotland population. This was furtherconfirmed by the analysis of the alternative phase assignments
that caused a complete loss of all QTL signals. A list of the 17candidate genes located within a confidence interval aroundthe highest LOD (Logarithm of the odds) score on chromo-some 7 (LOD = 3.73 ± 1) is given in Table S2. The resultsfrom the simple interval mapping of the separate datasets forqueen A and B are given in Figure S4.
Interactions between QTL
Using R/qtl and a two-locus model, we found a significantepistatic interaction of the QTL regions on chromosome 4and 7 (markers UN071 and UN391). This interaction ex-plained 3.5% of the phenotypic variance in the pooled datasetby interaction alone. In total, the two-locus model using thesetwo markers explained 10.1% of the phenotypic variance inour dataset and was supported with a LOD score of 6.3. Aheat map visualizing epistasis in the two-locus model is givenin Figure S3. Figure 2 illustrates the epistatic effect on thephenotype and shows the frequency ratios between resistantand susceptible drone pupae within haplotype groups. Be-cause we use haploid genotypes (and only because of this), itis possible to directly visualize and determine epistatic effectson the resistance trait. Drone pupae with a single resistanceallele at one of the three loci did not significantly deviate fromthe triple susceptible haplotype. In contrast, the combinationof the resistant alleles on chromosome 4 and 7 as well as thetriple resistance haplotype have a more than fourfold increasein the likelihood to be resistant (two-tailed Fisher exact tests,Fig. 2). However, the interaction between the loci on chro-mosome 4 and 9 revealed no significant phenotypic effectand was not significant in the two-locus model. Since the in-dividual single resistance alleles do not change the phenotypeat all, but the combination of the three resistance alleles hasa drastic effect, this is clear evidence of epistasis. Given theweak additive effects and the strength of epistasis, it is notsurprising to see the LOD scores on chromosome 4 and 9 tobe just suggestive in the individual mapping analyses.
Discussion
The suppression of mite reproduction in the pupal stage ofthe host seems to be under significant control by three QTLlocated on chromosomes 4, 7, and 9. Although the individ-ual Gotland alleles at each identified QTL had a low effecton pupal Varroa resistance (Fig. 2), and two QTL were notsignificantly supported by simple interval mapping (Fig. 1),these loci had nevertheless highly significant impact due totheir epistatic interactions. The combination of the two Got-land alleles on chromosomes 4 and 7 ( ) provided almostthe same suppression of mite reproduction as the combina-tion of all three resistance alleles ( ) (Fig. 2). Hence, thecombination of the two QTL on chromosome 4 and 7 areof prime interest when selecting for pupal Varroa-resistantphenotypes in the Gotland stock. Because of the complete
454 c© 2011 The Authors. Published by Blackwell Publishing Ltd.
Veröffentlichungen
17

D. Behrens et al. QTL-Mapping of Varroa Resistance in Honeybees
Figure 2. Frequency ratios between thenumber of resistant (R; n = 144) andsusceptible (S; n = 128) individuals for allpossible haplotypes at the three identifiedQTL, normalized for the frequency ratio foundin the triple susceptible haplotype ( = 1).White numbers at the bottom of the barsindicate the number of individuals with therespective haplotype. Bold blue numbersrepresent the marker alleles associated withthe resistant phenotype, whereas small rednumbers denote those alleles associated withsusceptible pupae. For example, “ ”represents individuals with the “resistance”marker alleles at the QTL on chromosome 4and 7, but the alternative marker allele onchromosome 9 (∗P < 0.05; ∗∗P < 0.01,two-tailed Fisher exact test). Blue bars illustratethe phenotypic effect of QTL interactions.
lack of additive gene effects and the strong epistatic inter-action, we recommend to select for this marker combina-tion, although this complicates marker-assisted breeding at-tempts. The relevant alleles responsible for this particular tol-erance trait in the Gotland population are listed in Table S1.Only because we used the simple genetic make-up of haploiddrones, we have been able to detect the epistatic interactionas the main driver of suppression of Varroa mite reproduc-tion, which may have remained undetected in a diploid studypopulation.
Detection limit
Before embarking on an in-depth discussion, the readershould be aware of the various general limitations and pitfallsof the QTL methodology (Slate 2005) including overestima-tion of QTL effects especially due to selective genotyping.The BSA in our study had an average resolution of aboutone heterozygous marker every 19 cM. Although major QTLare expected to produce large sweeps and should be detectedeven with a low density of markers, we may have missedminor QTL because of the selective genotyping approach(Darvasi and Soller 1994) and the high recombination rateof the honey bee genome. Therefore, like in any QTL study,there is a bias toward detection of major QTL versus minorQTL (Beavis 1994; Zeng 1994). In addition, the intrinsic in-accuracies of the standard bulk DNA samples analyses maynot always reflect the actual genotype frequencies in the map-ping populations (Michelmore et al. 1991). This can resultin false positive or false negative signals and thus eventuallyto the nondetection of potential QTL. In spite of method-ological imprecision, we are nevertheless confident to haveidentified three regions containing QTL involved in pupal
Varroa resistance by suppressing mite reproduction. Clearly,we cannot exclude that additional loci that we have missed inthe mapping procedure may also have been involved in theVarroosis-resistance phenotype.
Candidate genes
The identification of functional genes in the identified targetregions is definitely premature for the regions on chromo-somes 4 and 9. Even, the significant QTL region on chromo-some 7 includes 125 annotated genes. Nevertheless, it may beworthwhile to mention two of them. One is located directly atthe LOD score peak on chromosome 7, which is the orthologof the “foxo” gene (GB11764; see Table S2), a transcriptionfactor of the insulin signaling pathway. This conserved path-way has been assigned to diverse functions in insect growthand body size development, immune response, longevity, nu-trition, cell death, and energy metabolism (Nijhout 2003a, b;Wu and Brown 2006), for example, in Drosophila (Jungeret al. 2003), the Culex mosquito (Sim and Denlinger 2008)but also in humans (Willcox et al. 2008). The foxo gene there-fore appears to be a suitable candidate gene to be involvedin a trait expressed during pupal development in honeybees.
The second is the ortholog to the Drosophila gene “futsch”(GB11509, approximate position marked with “∗” in Fig. 1).In a genome-wide expression study using microarrays, Nava-jas et al. (2008) found this gene to be significantly downreg-ulated (0.86-fold) in a Varroa-tolerant honey bee line com-pared to a susceptible line. In Drosophila, this gene has beenfound to be downregulated in nonneuronal tissue duringdevelopment (Hummel et al. 2000) and to be involved inphosphorylation and the induction of synaptic plasticity in
c© 2011 The Authors. Published by Blackwell Publishing Ltd. 455
Veröffentlichungen
18

QTL-Mapping of Varroa Resistance in Honeybees D. Behrens et al.
neurons. Interestingly, most differentially expressed genes be-tween the Varroa-tolerant and the susceptible line in the studyof Navajas et al. (2008) were involved in neuronal develop-ment and sensitivity. Although these two may be promis-ing candidate genes for a causative relationship, we cannotexclude this as pure coincidence or provide any biologicalexplanation at the present stage.
Impact on future breeding programs
The success of Varroa reproduction within the host broodcells is a crucial factor for a balanced host–parasite rela-tionship. The most striking example is the original host, A.cerana, where mite reproduction is restricted to the dronebrood (Boot et al. 1999) and where reproductive barriers ex-ist between different haplotypes of the host and the parasite(Navajas et al. 2010). Suppression of reproductive success ofVarroa females is considered as important tolerance factorin Africanized honey bees (Rosenkranz 1999) and has alsobeen shown to be present in the European population fromGotland used in this study (Locke and Fries 2011). This sug-gests that selection of this trait can be achieved within thegenomic architecture of the honey bee. A further advantageof the use of this trait in selection programs is that the effecton the phenotype can directly be controlled by analyzing theVarroa mite’s reproductive success in the honey bee brood.It may therefore be highly rewarding to select for this trait inbreeding programs for Varroa resistance. Because few genescan have major effects on this trait and individual genomescan be easily screened, marker-assisted selection (MAS) willfacilitate breeding efforts more easily than for other traits thatrely on complex behaviors of diploid workers (e.g., hygienicbehavior). We strongly recommend taking advantage of hap-loid drones in mapping studies and suggest using them as aroutine tool for implementing MAS in breeding programs ofthe honey bee. If we had not used haploid drones in this studybut diploid workers instead, we very likely would have missedthe significance of the strong epistatic interactions that drivethe phenotype for Varroa resistance.
Acknowledgments
We thank P. Leibe and D. Kleber for technical assistance inthe laboratory, R. Jaffe for providing the Gotland drones from2007, and I. Fries for comments on the manuscript. This workwas supported by the European Commission through the 7thframework collaborative project BEE DOC (Bees in Europeand the Decline of Honeybee Colonies; EU contract num-ber: FP7-KBBE-2009–3 244956 CP-FP) and by the GermanMinistry for Education and Science (BMBF) through theFUGATO-plus project FUGAPIS (Functional genome anal-ysis of disease resistance in honeybees, A. mellifera; projectnumber: 0315125A).
References
Anderson, D. L., and J. W. H. Trueman. 2000. Varroa jacobsoni
(Acari: Varroidae) is more than one species. Exp. Appl. Acarol.
24:165–189.
Beavis, W. D. 1994. The power and deceit of QTL experiments:
lessons from comparative QTL studies. 49th annual corn and
sorghum industry research conference. American Seed Trade
Association. Washington, DC, USA.
Bocking, O., and E. Genersch. 2008. Varroosis—the ongoing
crisis in bee keeping. Journal fur Verbraucherschutz und
Lebensmittelsicherheit 3:221–228.
Bocking, O., and M. Spivak. 1999. Behavioral defenses of honey
bees against Varroa jacobsoni Oud. Apidologie 30:141–158.
Boot, W. J., J. N. M. Calis, J. Beetsma, D. M. Hai, N. K. Lan, T. V.
Toan, L. Q. Trung, and N. H. Minh. 1999. Natural selection of
Varroa jacobsoni explains the different reproductive strategies
in colonies of Apis cerana and Apis mellifera. Exp. Appl. Acarol.
23:133–144.
Broman, K. W., H. Wu, S. Sen, and G. A. Churchill. 2003. R/qtl:
QTL mapping in experimental crosses. Bioinformatics
19:889–890.
Chen, Y. P., and R. Siede. 2007. Honey bee viruses. Vol. 70. Pp.
33–80 in K. Maramorosch, A. J. Shatkin, and F. A. Murphy,
eds. Advances in virus research. Academic Press, Salt Lake
CityUT.
Darvasi, A., and M. Soller. 1994. Selective DNA pooling for
determination of linkage between a molecular marker and a
quantitative trait locus. Genetics 138:1365–1373.
De Jong, D., and A. E. E. Soares. 1997. An isolated population of
Italian bees that has survived Varroa jacobsoni infestation
without treatment for over 12 years. Am. Bee J. 137:742–745.
Elzen, P., and D. Westervelt. 2004. A scientific note on reversion
of fluvalinate resistance to a degree of susceptibility in Varroa
destructor. Apidologie 35:519–520.
Fries, I., and R. Bommarco. 2007. Possible host-parasite
adaptations in honey bees infested by Varroa destructor mites.
Apidologie 38:525–533.
Fries, I., S. Camazine, and J. Sneyd. 1994. Population dynamics of
Varroa jacobsoni: a model and a review. Bee World 75:5–28.
Fries, I., A. Imdorf, and P. Rosenkranz. 2006. Survival of mite
infested (Varroa destructor) honey bee (Apis mellifera) colonies
in a Nordic climate. Apidologie 37:564–570.
Fuchs, S. 1990. Preference for drone brood cells by Varroa
jacobsoni Oud in colonies of Apis mellifera carnica. Apidologie
21:193–199.
Garrido, C., and P. Rosenkranz. 2003. The reproductive program
of female Varroa destructor mites is triggered by its host, Apis
mellifera. Exp. Appl. Acarol. 31:269–273.
Garrido, C., and P. Rosenkranz. 2004. Volatiles of the honey bee
larva initiate oogenesis in the parasitic mite Varroa destructor.
Chemoecology 14:193–197.
Hummel, T., K. Krukkert, J. Roos, G. Davis, and C. Klambt.
2000. Drosophila futsch/22C10 is a MAP1B-like protein
456 c© 2011 The Authors. Published by Blackwell Publishing Ltd.
Veröffentlichungen
19

D. Behrens et al. QTL-Mapping of Varroa Resistance in Honeybees
required for dendritic and axonal development. Neuron
26:357–370.
Junger, M., F. Rintelen, H. Stocker J. Wasserman, M. Vegh, T.
Radimerski, M. Greenberg, and E. Hafen. 2003. The
Drosophila Forkhead transcription factor FOXO mediates the
reduction in cell number associated with reduced insulin
signaling. J. Biol. 2:20.
Kefuss, J., J. Vanpouke, J. Ducos De Lahitte, and W. Ritter. 2004.
Varroa tolerance in France of Intermissa bees from Tunisia and
their naturally mated descendants: 1993–2004. Am. Bee J.
144:563–568.
Lapidge, K., B. Oldroyd, and M. Spivak. 2002. Seven suggestive
quantitative trait loci influence hygienic behavior of honey
bees. Naturwissenschaften 89:565–568.
Lattorff, H. M. G., R. F. A. Moritz, R. M. Crewe, and M. Solignac.
2007. Control of reproductive dominance by the thelytoky
gene in honeybees. Biol. Lett. 3:292–295.
Le Conte, Y., G. de Vaublanc, D. Crauser, F. Jeanne, J.-C.
Rousselle, and J. M. Becard. 2007. Honey bee colonies that
have survived Varroa destructor. Apidologie 38:566–572.
Locke, B., and I. Fries. 2011. Characteristics of honey bee colonies
(Apis mellifera) in Sweden surviving Varroa destructor
infestation. Apidologie 42:533–542.
Lodesani, M., M. Colombo, and M. Spreafico. 1995.
Ineffectiveness of Apistan R© treatment against the mite Varroa
jacobsoni Oud in several districts of Lombardy (Italy).
Apidologie 26:67–72.
Manly, K. F., J. Cudmore, and J. M. Meer. 2001. Map Manager
QTX, cross-platform software for genetic mapping. Mamm.
Genome 12:930–932.
Martel, A.-C., S. Zeggane, C. Aurieres, P. Drajnudel, J.-P. Faucon,
and M. F. A. Aubert. 2007. Acaricide residues in honey and
wax after treatment of honey bee colonies with Apivar R© or
Asuntol R©50. Apidologie 38:534–544.
Michelmore, R. W., I. Paran, and R. V. Kesseli. 1991.
Identification of markers linked to disease-resistance genes by
bulked segregant analysis: a rapid method to detect markers in
specific genomic regions by using segregating populations.
Proc. Nat. Acad. Sci. USA. 88:9828–9832.
Moritz, R. F. A. 1988. A reevaluation of the two-locus model for
hygienic behavior in honeybees (Apis mellifera L.). J. Hered.
79:257–262.
Moritz, R. F. A., and J. D. Evans. 2007. Honeybee breeding and
genomics for resistance to virus infections. Pp. 347–370 in M.
Aubert, B. Ball, I. Fries, R. F. A. Moritz, N. Milani, and I.
Bernadellie, eds. Virology and the honey bee. European
Commission, Brussels.
Moritz, R. F. A., J. R. de Miranda, I. Fries, Y. Le Conte, P.
Neumann, and R. J. Paxton. 2010. Research strategies to
improve honeybee health in Europe. Apidologie
41:227–242.
Navajas, M., A. Migeon, C. Alaux, M. L. Martin-Magniette, G. E.
Robinson, J. D. Evans, S. Cros-Arteil, D. Crauser, and Y. Le
Conte. 2008. Differential gene expression of the honey bee Apis
mellifera associated with Varroa destructor infection. BMC
Genomics 9:301.
Navajas, M., D. L. Anderson, L. I. de Guzman, Z. Y. Huang, J.
Clement, T. Zhou, and Y. Le Conte. 2010. New Asian types of
Varroa destructor: a potential new threat for world apiculture.
Apidologie 41:181–193.
Nijhout, H. F. 2003a. The control of growth. Development
130:5863–5867.
Nijhout, H. F. 2003b. The control of body size in insects. Dev.
Biol. 261:1–9.
Oldroyd, B. P. 1999. Coevolution while you wait: Varroa
jacobsoni, a new parasite of western honeybees. Trends Ecol.
Evol. 14:312–315.
Oxley, P. R., M. Spivak, and B. P. Oldroyd. 2010. Six quantitative
trait loci influence task thresholds for hygienic behaviour in
honeybees (Apis mellifera). Mol. Ecol. 19:1452–1461.
Peng, Y. S., Y. Fang, S. Xu, and L. Ge. 1987. The resistance
mechanism of the Asian honey bee, Apis cerana Fabr., to an
ectoparasitic mite, Varroa jacobsoni Oudemans. J. Invertebr.
Pathol. 49:54–60.
Pettis, J. S. 2004. A scientific note on Varroa destructor resistance
to coumaphos in the United States. Apidologie 35:91–92.
R Development Core Team. 2010. R: a language and environment
for statistical computing. R Foundation for Statistical
Computing, Vienna, Austria. ISBN 3-900051-07-0, Available at
http://www.R-project.org/.
Ribiere, M., B. V. Ball, and M. F. A. Aubert. 2008. Natural history
and geographical distribution of honey bee viruses. Pp. 15–84
in Virology and the honey bee, European Communities,
Luxembourg.
Rinderer, T. E., J. W. Harris, G. J. Hunt, and L. I. de Guzman.
2010. Breeding for resistance to Varroa destructor in North
America. Apidologie 41:409–424.
Rosenkranz, P. 1999. Honey bee (Apis mellifera L.) tolerance to
Varroa jacobsoni Oud. in South America. Apidologie
30:159–172.
Rosenkranz, P., P. Aumeier, and B. Ziegelmann. 2010. Biology
and control of Varroa destructor. J. Invertebr. Pathol.
103:S96–S119.
Rothenbuhler, W. C. 1964. Behaviour genetics of nest cleaning in
honey bees. I. Responses of four inbred lines to disease-killed
brood. Anim. Behav. 12:578–583.
Seeley, T. D. 2007. Honey bees of the Arnot Forest: a population
of feral colonies persisting with Varroa destructor in the
northeastern United States. Apidologie 38:19–29.
Shaibi, T., and R. F. A. Moritz. 2010. 10,000 years in isolation?
Honeybees (Apis mellifera) in Saharan oases. Conserv. Genet.
11:2085–2089.
Shaibi, T., H. M. G. Lattorff, and R. F. A. Moritz. 2008. A
microsatellite DNA toolkit for studying population structure
in Apis mellifera. Mol. Ecol. Resour. 8:1034–1036.
Sim, C., and D. L. Denlinger. 2008. Insulin signaling and FOXO
regulate the overwintering diapause of the mosquito Culex
pipiens. Proc. Nat. Acad. Sci. 105:6777–6781.
c© 2011 The Authors. Published by Blackwell Publishing Ltd. 457
Veröffentlichungen
20

QTL-Mapping of Varroa Resistance in Honeybees D. Behrens et al.
Slate, J. 2005. Quantitative trait locus mapping in natural
populations: progress, caveats and future directions. Mol. Ecol.
14:363–379.
Solignac, M., D. Vautrin, A. Loiseau, F. Mougel, E. Baudry, A.
Estoup, L. Garnery, M. Haberl, and J. M. Cornuet. 2003. Five
hundred and fifty microsatellite markers for the study of the
honeybee (Apis mellifera L.) genome. Mol. Ecol. Notes
3:307–311.
Solignac, M., F. Mougel, D. Vautrin, M. Monnerot, and J. M.
Cornuet. 2007. A third-generation microsatellite-based linkage
map of the honey bee, Apis mellifera, and its comparison with
the sequence-based physical map. Genome Biol. 8:R66.
Statens jordbruksverks forfattningssamling. 2010. Statens
jordbruksverks beslut om smittforklaring med anledning av
amerikansk yngelrota och varroasjuka hos bin. SJVFS 2010:57.
Tentcheva, D., L. Gauthier, N. Zappulla, B. Dainat, F. Cousserans,
M. E. Colin, and M. Bergoin. 2004. Prevalence and seasonal
variations of six bee viruses in Apis mellifera L. and Varroa
destructor mite populations in France. Appl. Environ.
Microbiol. 70:7185–7191.
Wallner, K. 1999. Varroacides and their residues in bee products.
Apidologie 30:235–248.
Walsh, P. S., D. A. Metzger, and R. Higuchi. 1991. Chelex 100 as a
medium for simple extraction of DNA for PCR-based typing
from forensic material. Biotechniques 10:506–513.
Weinstock, G. M., G. E. Robinson, R. A. Gibbs, K. C. Worley, J. D.
Evans, R. Maleszka, H. M. Robertson, D. B. Weaver, M. Beye, P.
Carninci, et al. 2006. Insights into social insects from the
genome of the honeybee Apis mellifera. Nature
443:931–949.
Willcox, B. J., T. A. Donlon, Q. He, R. Chen, J. S. Grove, K. Yano ,
K. H. Masaki, D. C. Willcox, B. Rodriguez, and J. D. Curb.
2008. FOXO3A genotype is strongly associated with human
longevity. Proc. Nat. Acad. Sci. 105:13987–13992.
Wu, Q., and M. R. Brown. 2006. Signaling and function of
insulin-like peptides in insects. Annu. Rev. Entomol. 51:1–24.
Zeng, Z.-B. 1994. Precision mapping of quantitative trait loci.
Genetics 136:1457–1468.
Supporting Information
Additional Supporting Information may be found online onWiley Online Library:
Figure S1 Marker coverage as the proportion (%) of the Apismellifera genome closer than 5, 10, 20, and 25 cM, respec-tively, to a heterozygous marker used in the BSA for eachchromosome and for the entire genome (�).Figure S2 Equation used for selection of candidate regionsfor fine-mapping.Figure S3 Heat map for the probability of epistatic interac-tions between two markers in our candidate regions for thepooled dataset.Figure S4 Candidate regions on chromosomes 4, 7, and 9 withtheir associated LOD scores from simple interval mappingusing R/qtl for queen A (A) and queen B (B).Table S1. Markers used for fine mapping.Table S2. Annotated genes in genomic region linked to thehighest LOD score (LOD = 3.73 ± 1) on chromosome 7.
Please note: Wiley-Blackwell is not responsible for the contentor functionality of any supporting materials supplied by theauthors. Any queries (other than missing material) should bedirected to the corresponding author for the article.
458 c© 2011 The Authors. Published by Blackwell Publishing Ltd.
Veröffentlichungen
21

ORIGINAL RESEARCH ARTICLE Invasion of Varroa destructor mites into mite-free
honey bee colonies under the controlled conditions of
a military training area
Eva Frey1*, Hanna Schnell1 and Peter Rosenkranz1 1Apicultural State Institute, University of Hohenheim, D-70593 Stuttgart, Germany. Received 27 April 2010, accepted subject to revision 30 November 2010, accepted for publication 1 March 2011. *Corresponding author: Email: [email protected]
Summary The honey bee mite Varroa destructor can be spread between colonies by vertical transmission, particularly when heavily infested colonies are
robbed by foraging bees from neighbouring hives. We quantified the invasion of V. destructor into mite free colonies on a military training
area not accessible to other beekeepers. Ten “mite receiver colonies” continuously treated against V. destructor were placed at distances of
one to 1.5 km from four heavily infested “mite donor colonies”. Over a two month period from August to October, the population of bees,
brood, and V. destructor in the donor colonies were estimated at three week intervals and the invasion of V. destructor into the receiver
colonies was recorded every 7-12 days. During the experimental period, between 85 and 444 mites per colony were introduced into the
receiver colonies. There were no significant differences in the invasion rates in relation to the distance between donor and receiver colonies.
In total, 2,029 mites were found in the 10 receiver colonies, but these only correspond to 2.5% of the total mite population in the donor
colonies at the start of the experiment. This means that the major part of the initial V. destructor population died together with the collapsed
host colonies. Under natural conditions, a more benign behaviour should therefore be an adaptive strategy for V. destructor. From a practical
perspective we could show that highly infested honey bee colonies present a substantial risk to already treated colonies up to distances of 1.5
km away.
Invasión de ácaros de Varroa destructor en colmenas de
abejas libres de ácaros bajo condiciones controladas de
una zona de entrenamiento militar
Resumen
El ácaro de la abeja de la miel Varroa destructor se puede trasmitir entre las colmenas por trasmisión vertical, en especial cuando las
colmenas con alta infestación sufren pillaje por abejas foráneas de colmenas vecinas. Se cuantificó la invasión de los ácaros de Varroa
destructor en colmenas libres de ácaros en una zona de entrenamiento militar no accesible a otros apicultores. Se situaron diez “colmenas
receptoras del ácaro”, continuamente tratadas contra la Varroosis, en distancias de uno a 1.5 km de cuatro “colmenas donantes del ácaro” my
infestadas. Durante un período de dos meses, entre agosto y octubre, se estimó la población de abejas, la cría, y la V. destructor de las
colmenas donantes en intervalos de 3 semanas y la invasión de V. destructor en las colmenas receptoras se registró cada 7-12 días. Durante
el período experimental, se introdujeron en las colmenas receptoras entre 85 y 444 ácaros por colmena. No hubo diferencias significativas en
las tasas de invasión en relación con la distancia entre las colmenas donantes y receptoras. En total, 2,029 ácaros Varroa fueron encontrados
en las 10 colmenas receptoras. Sin embargo, estos ácaros sólo corresponden al 2.5% de la población total de ácaros en las colmenas
donantes al inicio del experimento. Esto significa que la mayor parte de la población inicial de varroa murió junto con las colmenas
hospedadoras colapsadas. En condiciones naturales, el comportamiento más benigno, podría ser una estrategia adaptativa de V. destructor.
Desde una perspectiva práctica hemos podido demostrar que las colmenas de la abeja de miel con alta infestación presentan un riesgo
considerable a las colmenas tratadas que se encuentran hasta una distancia de 1.5 km.
Keywords: Honey bee, Varroa destructor, invasion rate, vertical transmission, host-parasite relationship, treatment concept
Journal of Apicultural Research 50(2): 138-144 (2011) © IBRA 2011 DOI 10.3896/IBRA.1.50.2.05
Veröffentlichungen
22

APICULTURE AND SOCIAL lNSECTS
Autumn Invasion Rates of Varroa destructor (Mesostigmata: Varroidae) Into Honey Bee (Hymenoptera: Apidae) Colonies and the Resulting
lncrease in Mite Populations
EVA FREY 1 AND PETER ROSENKRANZ
Apicultural State Institute, University of Hohenheim, D-70593 Stuttgart, Germany
]. Econ. Entomol. 107(2): 508-515 (2014); DOI: http://dx.doi.org/10.1603/EC13381
ABSTRACT The honey bee parasite Varroa destructor Anderson & Trueman can disperse and invade honey bee colonies by attaching to "drifting" and "robbing" honey bees that move into nonnatal colonies. We quantified the weekly invasion rates and the subsequent mite population growth from the end of July to November 2011 in 28 honey bee colonies kept in two apiaries that had high (HBD) and low (LBD) densities of neighboring colonies. At each apiary, half (seven) of the colonies were continuously treated with acaricides to kill all Varroa mites and thereby determirie the invasion rates. The other group of colonies was only treated before the beginning of the experiment and then left untreated to record Varroa population growth until a final treatment in November. The numbers of bees and brood cells of all colonies were estimated according to the Liebefeld evaluation method. The invasion rates varied among individual colonies but revealed highly significant differences between the study sites. The average invasion rate per colony over the entire 3.5-mo period ranged from 266 to 1,171 mites at the HBD site compared with only 72 to 248 mites at the LBD apiary. In the untreated colonies, the Varroa population reached an average final infestation in November of 2,082 mites per colony (HBD) and 340 mites per colony (LBD). All colonies survived the winter; however, the higher infested colonies lost about three times more bees compared with the lower infested colonies. Therefore, mite invasion and late-year population growth must be considered more carefully for future treatment concepts in temperate regions.
KEY WORDS honey bee, Varroa destructor, invasion rate, population growth, horizontal transmission
The parasitic mite Varroa destructor Anderson & Trueman is considered the most destructive threat of the honey Lee Apis mellifera L. Recently it has been identified as one of the major reasons for periodical colony losses worldwide (Boecking and Genersch 2008, Brodschneider et al. 2010, Chauzat et al. 2010, Guzman-Novoa et al. 2010). Even moderate Varroa infestation rates in autumn significantly increase the risk of colony losses during winter (Genersch et al. 2010). These results clearly indicate that the production of healthy and long-living winter bees (Amdam et al. 2004) is negatively affected by an infestation with V. destructor. Under temperate climatic conditions, long-living winter bees are produced in autumn when brood rearing is ceased for several months. These winter bees should not only survive the broodless period but also collect the first pollen and establish a new brood nest in spring.
This is already true at the level of the individual host bee where a Varroa infestation changes important physiological parameters of the winter bees (Amdam et al. 2004). At the colony level, the problem is inten-
1 Corresponding author, e-mail: [email protected]
sified through an inverse population dynamic of host and parasite in late summer and autumn: although the population of hees and brood decrease substantially during this time of the year, the total number of mites increases exponentially throughout the whole period when the colony has brood (Fries et al. 1994, Calis et al. 1999, Wilkinson and Smith, 2002, DeGrandi-Hoffman and Curry 2004). This leads to continuously increasing infestation rates in the remaining brood and consequently increases damage in the emerging winter bees.
Under temperate climatic conditions, yearly treatments against the parasite are therefore indispensable to prevent damage of infested honey bee colonies. The effective control of V. destructor after the honey yield, but before the production of winter bees, is a crucial element of sustainable treatment concepts (Imdorf et al. 1996, Rice et al. 2004, reviewed in Rosenkranz et al. 2010).
However, there are frequent reports from beekeepers who complain of colony damage and high numbers of VarToa mites during winter treatment, although the recommended treatment has been performed in late summer (Le Conte et al. 2010). Suchproblems might
0022-0493 / 14 /0508- 0515$04.00 / 0 © 2014 Entomological Society of America
Veröffentlichungen
23

April 2014 FREY AND RoSENKRA: z : V. destructor INVASION lNTo H o:--:EY BEE COLONIBS 509
in part be related to an insufficient efficacy of some treatments against mites that are protected within the capped bee brood cells (Sammataro et al. 2004) . But, even after an effective summer treatment, there remain certain risks of colony damage, mainly caused by two fac tors. First , Va1Toa mites from other infested colonies that are not yet treated might invade into the treated colonies. The invasion rates seem to depend on the robbing activity (i.e., internest thievery of honey) and bee density within and around the apiary (Sakofski et al. 1990, Greatti et al. 1992, Goodwin et al. 2006, Frey et al. 2011 ) . Secondly, the remaining and invading Varroa females will reproduce and might build a new parasite population that might reach the damage threshold before the wintering of the colony. There are few quantitative data concerning the interaction of Varroa invasion and the increase of mite population between summer treatment and wintering of the colony. Vetharaniam (2012) discussed the density effects on the mite population increase, i.e., a small Varroa starting population will show rapid growth rates compared \ ith situations where Varroa growth rate is uppressed by high Varroa infestation and therefore
limited availability of unparasitized brood cells. Therefore, we quantified the mite invasion rate and
the increase of Varroa population in nearly mite-free colonies between summer treatment and the start of the overwintering period. We made our observations in honey bee colonies at two apiaries situated in regions that had significant differences in the density of honey bee colonies. Because of"the different colony densities, we assume the invasion pressure of Varroa mites differed between the apiaries. Furthermore, we quantified the effect of mite infestation rates in late summer on the overwintering ability of the honey bee colonies.
Materials and Methods
~ltudy Sites. The expe1iment was conducted at two apiaries characterized by low and high bee densities in the southern part of the Baden state in southwest Germany, the region with the highest density ofhoney bee colonies in Germany ( 4.35 colonies per square kilometers; statistical information provided by the Baden State Beekeeping Association).
The study site with low bee density (LBD) was situated in the foothills of the Black Forest at 360 m above sea level ( 48° 6' l" N, 8° 3'21" 0). Because of the mountainous structure of the region and the usually long and snowy winter, there are few permanent apiaries. After the late nectar flow in July 2011 was completed , all migrating beekeepers left the valley and only · 50 nucleus colonies of one commercial beekeeper were left within the flight range (2.5 km) of our experimental colonies. These commercial colonies were treated twice with formic acid before the start of our experiment (two times 30 ml of formic acid 60% per colony, evaporated on a sponge), and therefore were considered as having a low mite infestation rate.
The study site with high bee density (HBD) was at the outskirts of the Upper Rhine Plain at 177 m above
sea level ( 48° 12' N, 7° 46' 0). As a result of the mild winter climate, this part of the Rhine Valley is apreferred region for overwintering of honey bee colonies and hosts a Jarge number of local and migratory beekeepers. According to the list of registered beekeepers from the Veterinary office where all beekeepers are obliged to register and an additional survey together with the local beekeeper organization of Emmendingen, we identified > 300 colonies with unknown status of Varroa treatment within the flight range of our experimental ·apiary.
Because of the abundance of lmpatiens glandulifera Royle (an annual invasive plant in southern Germany) and several Solidago species, the autumn pollen supply was sufficient at both study sites. Beginning in August, all colonies were provided with additional sugar syrup for winter stores. During the experimental period, the average temperature and precipitation were recorded 2 m above the ground for both study sites once a day at a nearby weather station (Center for Agriculture and Technology, Augustenberg).
Colony Setup and Experimental Groups. W e used 28 honey bee colonies of approximately the same population, headed by queens of the local Hohenheim breeding line (Apis mellifera camica Pollman) and kept in Hohenheim two-story standard hives with 10 Zander frames per storey. The hives were fitted with movable sticky bottom boards protected by a wire grid of 2 mm in diameter. Without opening the hives, dead mites could be counted on the bottom boards after falling down through the wire g1id. The boards were covered with an oil-soaked layer of paper towel that reliably prevents ants and earwigs from removing dead mites. To ensure equal start conditions, all colonies were treated before the experiment against Varroa with two highly effective acaricides: CheckMite (active ingredient: 1.36 mg coumaphos; Bayer HealthCarc r„G, Leverkusen, Germany) and Bayvarol (active ingredient: 4.0 mg flumethrin 90%; Bayer HealthCare AG) . One strip of each acaricide was used per storey of hive with brood.
The 28 colonies were divided randomly into four groups of seven colonies each . At each of the two study sites, two groups were established. In one group at each study site, the CheckMite and Bayvarol treatments were continued from the start of the experiment on 26th July until the winter treatment in December (hereafter referred to as "treated colonies") . The two different acaricides were applied simultaneously to ensure efficacy and to help prevent the development of acaricide resistance (Rice et al. 2004). This continuous application should have killed all invading mites before they were able to enter a brood cell for reproduction. In the other group at both study sites, the acaricides were removed after 2 wk of treatment ( = one sealed brood cycle) at the start of the experiment on 26th July (hereafter referred to as "nontreated colonies"). Therefore, invading mites should have been able to reproduce within these colonies. On 18th October, the nontreated colonies were again treated with CheckMite and Bayvarol for 3 wk to determine the mite invasion up to that time. At the
Veröffentlichungen
24

510 Jüvl\:-;AL OF ECONOMIC ENTOMOLOGY Vol. 107, no. 2
beginning of December, a final oxalic acid treatment ( trickling Oxuvar according to the manufacturer's recommendations; Andermatt BioVet GmbH, Lörrach, Gennany) was performed on all 28 colonies to remove an. remaining mites.
' aluation of Colony Development. At 3-wk inter' a1 (nontreated colonies) and 6-wk intervals ( treated colonie ) . the numbers of bees and brood cells of all colonie were estimated according to the Liebefeld method (Imdorf et al. 1987). In February 2012, the number of bees of all 28 colonies was estimated for the final time to identify the loss of the adult bee population over winter.
Two combs each from the colonies of the treated and nontreated groups were removed in September and analyzed for residues of coumaphos (LOQ 0.5 mg/ kg) and flumethrin (LOQ 1 mg/kg) in the beeswax according to the analytical method developed at our re idue laboratory ( accredited according to DIN EX 1 0 IEC 17025) .
Evaluation of Invasion and Infestation Rates of V. destructor. In the treated colonies, the invading mites that' ere killed by the acaricides were counted on the sticky bottom boards once a week from 26th July until 5th ovember. The expected mite-free status of these colonies was confirmed during the experiment by analyzing bee and brood samples taken every 6 wk. We quantified Varroa infestation by counting the adult female mites.
To estimate the growth of the Varroa infestation within the nontreated colonies, samples of adult worker bees ( = 150 bees per colony) and sealed brood ( =200 worker brood cells containing pink-eyed pupae) were analyzed at 3-wk intervals during the experiment. The final mite infestation was determined according to the number of mites killed by the treatments in October and December (see above).
Data Analysis. The nonparametric Kruskal-Wallü: test was used to compare bee and brood populations between groups at the start of the experiment. A re· peated-rrieasures analysis of vaiiance (ANOVA) was used to compare the amount of brood in the nontreated colonies between the LBD and HBD sites over the entire experimental period; sites was the independent factor in the AN OVA. The Mann-Whitney U test was used for the compa1isons of the weekly mite invasion rates in the treated groups. In October, the Varroa infestation levels of the nontreated colonies revealed !arge differences between the apiary sites. For the analysis of the decline of the bee population over winter (bee populations in October vs. bee populations in February), we used one-way ANOV A with repeated measures for the LBD and HBD sites separately. All tests were performed with the SPSS 20.0 statistics software.
Results
Climatic Conditions at Both Study Sites. The course of the average daily temperature did not differ between the areas with HBD and LBD, suggesting similar foraging conditions at both apiaries. The 2011
season was characterized by warm and stable weather conditions until mid-October followed by a short cold spell and a warm autumn. During the .100-d experimental period, on Day 92 (LBD) and Day 89 (HBD) the maximum daytime temperatures exceeded 12°C, which is considered the minimum threshold value for honey bee flight activity. On only Days 5 (LBD) and 2 (HBD) did the precipitation exceed 0.5 mm per hour, which might have prevented the bees from leaving their hives.
Colony Development. At the start of the experiment, the four experimental groups were homogenous in number of bees (P = 0.45; Kruskal-Wallis) and brood (P = 0.09; Kruskal-Wallis) with average bee populations ranging from = 17,000-22,000 for the different groups. By the end of the season and the start of the wintering period in October, the average adult bee populations decreased in all groups from =20,000 bees per colony to 10,000-14,000 bees per colony. Of the 28 experimental colonies, 25 had adult bee populations of >8,000 bees in October and only three colonies had populations between 7,000 and 8,000 bees per colony. Honey bee colonies with >8,000 bees in October are considered well-prepared for successful overwintering in temperate climates (Imdorf et al. 2008).
After the start of the experiment, the brood production was significantly greater at the HBD site than at the LBD site (F = 23.2; P < 0.01; repeated measures AN OVA) , probably due to a more varied range of pollen sources (Fig. 1). Overall averages of the number ofbrood cells in the nontreated colonies were 109,000 ± 4,471 brood cells per colony at the HBD site and 75,000 ±: 3,635 brood cells at the LBD site.
V. destructor Invasion Rates. The number of mites invading the treated colonies differed between the LBD and HBD sites (Fig. 2). During the entire experimental period, with the exception of the calendar Weeks 30, 31, and 33, the invasion rates into the HBD colonies wen~ significantly higher compared with the LBD colonies (P < 0.05 for calendar Weeks 32 and 34 and P< 0.01 for calendarWeeks 35-44; Utest). At the HBD apiary, a striking increase of the invasion rate was recorded after calendar Week 33, while at the LBD apiary, it remained continuously low over the whole period ( Fig. 2) .
The average invasion rates over the entire 3.5-mo pe1iod were 462 ±: 74 mites per colony with a range between 266 and 1,171 mites at the HBD apiary and 126 ± 16 mites per colony with a range between 72 and 248 mites per colony at the LBD apiary. The maximum number of invaded mites per colony in a week was 109 for HBD (calendar Week 35) and 47 for LBD (calendar Week 30). For all seven colonies at each of the two apiaries, these numbers add up to totals of 3,238 introduced mites at the HBD apiary compared with only 880 mites at the LBD apiary.
The analysis of bee and brood samples of the treated colonies ( taken three times during the experimental period in July, September, and October) confirmed the efficacy of the applied acaricides. W e found only
Veröffentlichungen
25

- - - -- -- - - - -------------------------- --- - --- - - -----
April 2014 FREY AND ROSENKRANZ: V. clestructor INVASION INTo HoNEY BEE CoLONIES 511
40000
30000
.!!!
~ 20000 "C 0 0 .Q
10000
0 Jul 26 Aug 16 Sep 05 Sep 26 Oct 17
Fig. 1. Average number of worker brood cells of the nontreated colonies at study sites with LBD and HBD ( means ±: SE) . In October, two of the LBD colonies were without brood. The differences in brood production were significant between the two sites (P < 0.01; repeated measures ANOVA).
eight mites in 5 of the 42 analyzed bee samples ( corresponding to 8,334 analyzed bees), and only 30 mites in 15 of the 41 examined brood samples ( corresponding to 7,606 analyzed worker brood cells).
V. destructor Infestation Rates of the Nontreated Colonies. The average V. clestructor infestation rate of adult bees at the LBD apiary increased from 0.0% at the start of the experiment to 4.3 ::!::: 1.1 % in midOctober (Table 1). The brood infestation rate increased from 1.1% in July to 16.0 :±:: 3.8% in October (Table 1). The colonies at the HBD apiary started with an average mite infestation on adult bees of 0.2% and reached a final bee infestation of 18.0 :±:: 3.7% 3 mo later. The brood infestation rate of this group revealed an extreme increase from 0.7% in July to 50.8 ::!::: 10.5% in October (Table 1).
The colonies of the nontreated groups received Varroa treatments with CheckMite and Bayvarol in October followed by a final oxalic acid treatment in December. As a result of mite in vasion and subsequent reproduction of those mites, the Varroa populations in these nontreated colonies reached av2rage final infestation levels of 864-6,028 mites per colony at the HBD apiary ( on average 2,028 mites per colony) but only 190-488 mites per colony at the LBD apiary (on average 340 mites per colony; Table 2). Thus, the numbers of Varroa mites per apiary (n = 7 colonies
100
80
each) added up to 14,577 (HBD) and 2,380 (LBD), respectively.
The final oxalic acid treatment of the treated colonies confirmed the efficacy of the combined Bayvarol and CheckMite treatment: very low numbers of mites (3, 3, and 5) recorded in only 3 of the 14 colonies.
In the beeswax of the treated colonies, residues of coumaphos were detected in low concentrations ( 6.6 and 7.5 mg/kg), whereas flumethrin was not detected. In the samples of the nontreated colonies none of these active ingredients were found, indicating that the possibility of a residual effect from the previous treatment was rather low.
Varroa Infestation and Overwintering. At the HBD site there was a significant difference between the treated and nontreated colony groups in the percentage loss of the adult bee population during the wintering period from October 2011 until the end of February 2012 (F = 91.7, df = 1, P < 0.001). The nontreated, highly rnite infested colonies lost 58. l % of their bee population, while the treated coL:mies with fewer mites lost only 24% (Fig. 3). However, at the LBD site the decline of the bee population was similar and not significantly different (F = 2.3, df = 1, P = 0.16) between the moderately infested nontreated group (36.0%, on average) and the treated group (39.8%, on average).
-..-LBD -- HB D
30 31 32 33 34 35 36 37 38 39 40 41 42 43 44
calendar week
Fig. 2. Average number of V. clestructor that invaded treated colonies at the LBD (n = 7) apiary and HBD (n = 7) apiary from the end of July until the beginning of November (means ±: SE).
Veröffentlichungen
26

512 JOURNAL OF ECONOMIC ENTOMOLOGY Vol. 107, no. 2
Table l. Average V. destmctorinfestalion rates (mites per 100 bees; mean ± SE) in sealecl broocl cells and on adult bees of the nontreated colonies at the LBO (11 = 7) apinry nncl the HBO (n = 7) apiary
LBD
Sampling Bees Brood Bees date
26 July 0.0 ::+:: 0.0 l.l ::+:: 0.1" 0.2 ::+:: 0.8 16Aug. 0.5 ::+:: 0.2 0.9 ::+:: 0.4" 0.9 ::+:: 0.5
05 Sept. 0.5 ::+:: 0.1 2.6 ::+:: 0.3 1.3 ::+:: 0.9 26 Sept. 1.2 ::+:: 0.3 8.5 ::+:: 1.1 6.5 ::+:: 2.0
17 Oct. 4.3 ::+:: 1.1 16.0 ::+:: 3.81' 18.0 ::+:: 3.7
" Brood samples taken from n = 6 colonies. "Brood samples take n from n = 3 colonies.
Discussion
HBD
Brood
0.7 ::+:: 0.4 0.8 ::+:: 0.3 6.5 ::+:: l.6
22.1 ::+:: 8.8 50.8 ::+:: 10.5
Under temperate climatic conditions, Varroa treatments have to be performed before the production of long-lived winter bees. Worker bees parasitized during development have a reduced life span (Amdam et al. 2004) and will presumably not survive until spring. In addition, a high Varroa infestation in the colony leads to a higher transmission of viruses among the bees (Francis et al. 2013). The close correlation between mite infestation in late autumn and winter mortality of honey bee colonies has also been confirmed by a large Germ an bee monitoring project ( Genersch et al. 2010). An effective Varroa control in late summer is crucial for the successful overwintering of honey bee colonies when mite infestations are threatening, and therefore is an indispensable part of an integrated pest management (IPM; Delaplane 2011, Dietemann et al. 2012).
However, the time window available for these late summer treatments is rather narrow because chemical treatments can only be started when the last honey harvest is completed (Curr;e and Gatien 2006) . Our study indicates that the h'Jrizontal transmission of Varroa mites could additio!rnlly jeopardize the IPM performed by the beekeepcrs. We used two neighboring study sites to quantify the invasion rates of Varroa mites in relation to the density of honey bee colonies. The two experimental apiaries were only 21 km apart and provided nearly identical conditions in terms of ambient temperature and rainfall. At both apiaries, the provision with nectar and pollen throughout the experimental period was sufficient to stimulate brodc! production and prevent robbing. The crucial difference between both apiaries was the number of honey bee colonies within the foraging range. The LBD apiary was situated within an isolated valley with a low number of treated nucleus colonies in the proximity. The HBD apiary was located within a region
preferred by beekeepers for overwintering their hives and represents a region with one of the highest density of honey bee colonies in Germany. Therefore, we assume a substantially higher invasion pressure of Varroa mites at the HBD site than at the LBD site. For the quantification of the weekly invasion rates into the experimental colonies, we used a continuous treatment with two different acaricides. The repeated sampling of adult bees and brood for Varroa and the nearly mite-free status of these colonies at the end of the experiment confirmed that Varroa mites were killed immediately after invading these colonies.
Over the entire 3.5-mo period, we recorded a total mite invasion rate of >3,200 mites into the seven treated colonies at the HBD site. This was a nearly fourfold higher number compared with the LBD apiary, although significant site-specific differences in the weekly invasion rates were identified only after midAugust. The latter confirms earlier studies assuming that Varroa invasion is triggered by cessation of the nectar flow in late summer and the subsequent increase in robbing among honey bee colonies (Sakofski et al. 1990, Greatti et al. 1992, Frey et al. 2011). However, our weekly invasion rates were clearly lower compared with the > 30 mites per day per colony described from Italy =20 yr ago ( Greatti et al. 1992). This difference might be explained by the fact that, in, our research area, there were no indications of feral bee colonies and that, during our experimental period, there were no reports of collapsing colonies. Furthermore, because of intensive extension services and the well-organized beekeeping association in this state, local beekeepers are very much aware of the need for late summer treatments and the vast majority try to follow these recommendations.
Despite these good advisory services and long-term expe1ience of beekeepers in treating Varroa, we still recorded a dangerously high iuvasion pressure at the HBD site from mid-August throcgh mid-October. This leads to reinvasion of mites in previously treated colonies as is demonstrated by our largely mite-free experimental colonies. One can assume that the invading Varroa mites come from more highly infested colonies of neighboring apiaries. Invasion, coupled with subsequent reproduction by invading mites, can be a substantial problem for beekeepers who treated their colonies earlier, giving them a false sense of security. lt also might explain, at least in part, unexpected winter mortality of colonies belonging to experienced beekeepers who have performed Varroa treatments according to recommendations (Le Conte et al. 2010).
At both our study sites, half of the colonies were only treated before the start of the experiment, and thereafter left untreated until a final treatment in
Table 2. Final nute infestation ofthe non-lreatecl colonies al the LBO apiary nncl the HBO npiary in November resulting from Varroa invasion and subsequent reproduclion during the experimental period
Colony no. Mites (n ) 342
2 319
3 488
LBD
4 449
5 292
6 300
7 190
l 933
2 1,412
3 1,846
HBD
4 1,232
5 864
6 2,262
7 6,028
Veröffentlichungen
27

April 2014 FREY AND ROSENKRA z: V. destructor INVASION INTO HONEY BEE COLONIES 513
20000
16000
:s 12000
"' CIJ CIJ aJ
8000
4000
0
• LBD treated
D LBD non-treated
• HBD treated
s HBD non~treated
Oct 17 Feb-28
Fig. 3. N umher of bees of the treated and nontreated colonies at the apiaries with LBD (moderate Varroa infestation) and HBD (high Varroa infestation) before and after overwintering (means ±SE).
ovember. Invaded mites could therefore reproduce over the entire 3.5-mo period. Because all experimental colonies had the same genetic background and were of similar size, we assume invasion rates in the nontreated colonies were similar to those in the continuously treated colonies in the same apiary.
There were !arge differences between the HBD and LBD sites for infestations of both brood and bees. At the HBD site, the average brood infestation exceeded 6% at the beginning of September. At the end of September, the average infestation rate exceeded 22%, meaning that a quarter of the hatching winter bees were already weakened. At the HBD site, the infestation level of the adult bees was comparatively low until mid-September but then clearly exceeded the autumn economic threshold of 3-5 mites per 100 adult bees suggested for the United States and Canada (Delaplane and Hood 1999, Strange and Sheppard 2001, Currie and Gatien 2006). At the LBD site, both the bee and brood infestations remained consistently below the damage threshold . However, at the last examination in October, the bee infestation was only slightly lower than the threshold level of 6 mites per 100 bees determined by the long-term monitoring of winter losses in Germany ( Genersch et al. 2010).
The site-specific differences in the final infestation, as determined by treatments starting at the beginning of November and performed with three different acaricidal compounds (flumethrin, coumaphos, and oxalic acid), were !arge. In the colonies at the HBD site, '"we recorded between 933 and 6,028 mites per colony, whereas at the LBD site, we found a clearly lower range of 190 and 488 mites per colony. These values d·emonstrate the !arge variation in the infestation levels of colonies kept und er identical beekeeping management conditions. In addition, it demonstrates the significant reproductive capacity of Varroa mites in autumn when environmental conditions allow brood rearing within the colonies. An exact calculation of the rate of Varroa reproduction in our colonies is not possible because invasion rates and subsequent reproduction cannot be separated within the same colony. However, if we compare the absolute number of invading mites with the average final infestation, we
see a large difference at both study sites: 126 versus 340 mites at the LBD and 462 versus 2,088 at the HBD site, indicating a substantial multiplication of the invading mites. The ratios between final infestation and invading mites (2.7 at the LBD and 4.5 at the HBD site) indicate that at the HBD site the mites invaded earlier, resulting in more reproductive cycles, or that these colonies provided better conditions for Varroa reproduction. As the availability of brood is a crucial factor for Varroa population growth (Wilkinson and Smith 2002, Vetharaniam 2012), a higher reproductive rate could at least partly be explained by the higher brood production of the HBD colonies during the experimental period. Daily mite population growth rates between 0.01and0.025 are suggested by models (Martin, 1998, Wilkinson and Smith, 2002). Such growth rates could explain our final infestation levels if we use the data on mite invasion from our experiment within a simple exponential model of Varroa reproduction.
In terms of relevance [Jr beekeeping practice, we could demonstrate that effective Varroa treatment at the end of July, when uwl.ertaken alone, is not sufficient for successful overwintering if the mite invasion pressure is high. lt is likely that a high density of Varroa infested honey bee colonies within flight range will increase the invasion pressure. However, other factors like ineffective Varroa treatments might also influence the invasion rates independently from the colony density. Even colonies that are largely mite-free at the beginning of August can build up threatening Varroa populations by the beginning of winter. Our data on overwintering also emphasize the risk of high Varroa infestations late in the year. At the LBD apiary, where both experimental groups were either noninfested ( continuously treated) or moderate infested, the average decline of the bee population from October till February was <40%. Such values are within the range reported from overwintering colonies in temperate regions (Free and Racey 1968, Imdorf et al. 2008). However, at the HBD site the heavily infested colonies lost, on average, nearly 60% of their bees, which represents a highly significant difference compared with the noninfested colonies at the same apiary. The reason that none of these highly infested colonies com-
Veröffentlichungen
28

514 JouR AL oF EcoNoMrc ENTOMOLOGY Vol. 107, no. 2
pletely collapsed overwinter might be due to the high number ofbees in October (> 14,000, on average) and the fact that the Varroa population increased at a time of the year when a proportion of winter bees has already been produced. According to Mattila et al. (2001), the first winter bees appear at the end of Augu t. t that time, none of the experimental colonies had a high Varroa infestation. Van Dooremalen et al. {2012 ) showed clearly that Varroa infested bees had a shorted lifespan and that successful overwintering depends strongly on the proportion of noninfested winter bees. Infested bees have a higher probability of being infected with bee viruses (Nguyen et al. 2011, Francis et al. 2013) , which may have additionally contributed to the weakening of our colonies. Comparative virus analysis on bees from the different experimental groups before and after overwintering supports this assumption (McMahon et al. 2014).
We assume that the situation within our research sites largely corresponds to other regions with a temperate climate and intensive beekeeping activities. Because of anticipated changes in climate leading to higher autumn and winter temperatures in temperate regions (Linderholm 2006), we will increasingly be faced with conditions that support reinvasion into colonies of Varroa mites in autumn and their reproduction therein. Therefore, our study points out some general aspects that should be considered for the implementation of Varroa treatment concepts. First, IPM programs should be coordinated region-wide to reduce the Varroa reinvasion pressure. Second, additional Varroa diagnostic measures are recommended dming the period after summer Varroa treatment. This is the only way for the beekeeper to detect and then react to unexpectedly high mite infestations.
Beside these practical recommendations, our results also point to a conflict between beekeeping practice and :·he selection of Varroa resistant honey bees. For manv selection programs, colonies should be allowed to host a number of mites sufficient to demonstrate the capacity of the wlony to control the growth of the mite population (Büchler et al. 2010). Therefore, Varroa treatments should not be performed too early and should depend on colony infestation levels. At least in regions with high bee densities, this will significantly increase the number of mites within the region and most likely, as a consequence, the Varroa reinvasion pressure and horizontal transmission of Varroa mites between colonies. Horizontal transmissiori of a pathogen is assumed to favor the development of a virulent host-parasite relationship (Fries and Camazine 2001). That is, Varroa mites that harm or even kill their colony have a realistic chance to 6.nd a new host colony for further reproduction. Hence, high bee densities combined with ineffective treatment will not only increase the risk of colony damage but might also select for more virulent Varroa mites.
Acknowledgments
We dedicate this article to Fritz Hug, chairman of the local beekeeping organization, who was one of the initiator of this
study and supported our work over the entire period. Unfortunately, he passed away much too early. We are grateful to Elmar Winterhalter who provided the HBD apiary and organized contacts to the local beekeepers. We highly appreciate the help of Claudia Häußermann, Nadirre Kunz, Bettina Ziegelmann, and Paul Trumpf for their assistance during data acquisition and colony transportation. We thank the Center for Agricultural Technology Augustenberg for providing climate data of the study sites and the president of the Baden State Beekeeping Association, Ekkehard Hülsmann, for providing statistical data on numbers of local beekeepers.
References Cited
Amdam, G V., K. Hartfelder, K. Norberg, A. Hagen, and S.W. Omholt. 2004. Altered physiology in worker honeybees (Hymenoptera: Apidae) infested with the mite Varroa clestructor (Acari: Varroidae): a factor in colony loss during overwintering? J. Econ. Entomol. 97: 741-747.
Boecking, 0., andE. Genersch. 2008. Varroosis-the ongoing crisis in bee keeping. J. Consum. Prot. Food Saf. 3: 221-228.
Brodschneider, R., R. Moosbeckhofer, and K. Crailsheim. 2010. Surveys as a tool to record winter losses of honeybee colonies: A two year case study in Austria and South Tyrol. J. Apic. Res. 49: 23-30.
Büchler, R., S. Berg, and Y. Le Conte. 2010. Breeding for resistance to Varroa destructor in Europe. Apidologie 41: 393-408.
Calis,J.N.M., 1. F~ies, and S. C. Ryrie. 1999. Population modelling of Varroajacobsoni Oud. Apidologie 30: 111-124.
Chauzat, M.-P., A.-C. Martel, S. Zeggane, P. Drajnudel, F. Schurr, M.-C. Clement, M. Ribiere-Chabert, M. Aubert, andJ.-P. Faucon. 2010. A case control study and a survey on rnortalities of honeybee colonies (Apis mellifera) in France during the winter of 2005-6. J. Apic. Res. 49: 40-51.
Currie, R. W., and P. (;atien. 2006. Timing acaricide treatments to i.revent Varroa clestructor (Acari: Varroidae) frorn causi:1g economic damage to honeybee colonies. Can. Entor-101. 138: 2.18-252.
DeGrandi-Hoffman, G., and R. Curry. 2004. A rnathernatical rnod0I of Varroa mite ( Varroa clestructor Anderson and Truernan) and honeybee (Apis mellifera L.) popuIation dynamics. Int. J. Acarol. 30: 259-274.
Delaplane, K. S. 2011. Integrated pest management in Varroa, pp. 43-51. In N. L. Carreck (ed.), Varroa - Still a Problem in the 2lst Century? International Bee Research Association, Cardiff, United Kingdom.
Delaplane, K. S„ and W. M. Hood. 1999. Economic threshold for Varroa jacobsoni Oud. in the southeastern USA. Apidologie 30: 383-395.
Dietemann, V.,J. Pflugfelder, D. Anderson ,J.-D. Charriere, N. Chejanovsky, B. Dainat, J. De Miranda, K. Delaplane, F.-X. Dillier, S. Fuchs, et al. 2012. Varroa destructor: Research avenues towards sustainable control. J. Apic. Res. 51: 125-132.
Francis, R. M., S. L. Nielsen, and P. Kryger. 2013. Varroavirus interaction in collapsing honeybee colonies. PLoS ONE 8: e57540.
Free, J. B., and P. A. Racey. 1968. The effect of the size of honeybee colonies on food consurnption, brood rearing and longevity of the bees during the winter. Entornol. Exp. Appl. 11: 241-249.
Frey, E„ H. Schnell, and P. Rosenkranz. 2011. Invasion of Varroa clestructor into mite-free honeybee colonies und er
Veröffentlichungen
29
April 2014 .f REY AND ROSENKRANZ: V. destructor INVASION lNTO HONEY BEE COLONIES 515
the controlled conditions of a military training area. J. Apic. Res. 50: 138-144.
Fries, 1„ and S. Camazine. 2001. Implications of horizontal and vertical pathogen transmission for honeybee epidemiology. Apidologie 32: 199-214.
Fries, 1„ S. Camazine, and J. Sneyd. 1994. Population dynamics of Varroa jacobsoni: a model and a review. Bee W orld 75: 5-28.
Genersch, E„ W. von Der Ohe, H. Kaatz, A. Schroeder, C. Otten, R. Büchle1·, S. Berg, W. Ritter, W. Muehlen, S. Gisder, et al. 2010. The German bee monitoring project: a long term study to understand periodically high winter losses of honeybee colonies. Apidologie 41: 332-352.
Goodwin, R. M„ M. A. Taylor, H. M. McBrydie, and H. M. Cox. 2006. Drift of Varroa destructor infested worker honeybees to neighbouring colonies. J. Apic. Res. 45: 155-156.
Greatti, M„ N. Milani, and F. Nazzi. 1992. Reinfestation of an acaricide-treated apiary by Varroa jacobsoni Oud. Exp. Appl. Acarol. 16: 279-286.
Guzman-Novoa, E„ L. Eccles, Y. Calvete, J. Mc Gowan, P. G. Kelly, and A. Correa-Benftez. 2010. Varroa destructor is the main culprit for the death and reduced populations of overwintered honeybee (Apis mellifera) colonies in Ontario, Canada. Apidologie 41: 443-450.
Imdorf, A„ G. Buehlmann, L. Gerig, V. Kilchenmann, and H. Wille. 1987. Überprüfung der Schätzmethode zur Ermittlung der Brutfläche und der Anzahl Arbeiterinnen in freifliegenden Bienenvölkern. Apidologie 18: 137-146. (doi: http://dx.doi.org/ 10.1051/ apido:l9870204).
Imdort: A„ J.-D. Charriere, C. Maquelin, V. Kilchenmann, and B. Bachofen. 1996. Alternative varroa control. Am. Bee J. 136: 189-193.
Imdorf, A„ K. Ruoff, and r: Fluri. 2008. Volksentwicklung bei der Honigbiene. ALP Forum. 68: 1-88.
Le Conte, Y. M. Ellis, and W. Ritter. 2010. Varroa mites and honeybee health: can Varroa explain part of the colony losses? Apidologie 41: 353-363.
Linderholm, H. W. 2006. Growing season changes in the last century. Agric. For. Meteorol. 137: 1-14.
Martin, S. 1998. A population model for the ectoparasitic m:te Varroajacobsoni in honeybee (Apis mellifera) colonies. Ecol. Modell. 109: 267-281.
Mattila, H. R„ J. L. Harris, and G. W. Otis. 2001. Timing of production of winter bees in honeybee (Apis mellifera) colonies. Insectes Soc. 48: 88-93.
McMahon, D„ M. E. Natsopoulou, V. Doublet, M. Fürst, J. Casper, E. Frey, P. Rosenkranz, M.J.F. Brown, and R. J. Paxton. 2014. More than a winter cold: an emerging virus drives elevated honeybee loss. Nat. Commun. (in press).
Nguyen, B. K„ M. Ribiere, D. vanEngelsdorp, C. Snoeck, C. Saegerman, A. L. Kalkstein, F. Schurr, Y. Brostaux, J.-P. Faucon, and E. Haubruge. 2011. Effects of honeybee virus prevalence, Varroa destructor load and queen condition on honeybee colony survival over the winter in Belgium. J. Apic. Res. 50: 195-202.
Rice, N. D„ M. L. Winston, and H. A. Higo. 2004. Integrated pest management for the parasitic mite Varroa destructor (Anderson and Trueman) in colonies ofhoneybees (Apis mellifera). Am. Bee J. 144: 791-795.
Rosenkranz, P„ P. Aumeier, and B. Ziegelmann. 2010. Biology and control of Varroa destructor. J. Invertebr. Pathol. 103: 96-119.
Sakofski, F„ N. Koeniger, and S. Fuchs. 1990. Seasonality of honeybee colony invasion by Varroajacobsoni Oud. Apidologie 21: 547-550.
Sammataro, D„ G. de Grandi-Hoffman, G. Wardell,J. Finley, and N. Ostiguy. 2004. Testing of a combination of control tactics to manage Varroa destructor (Acari:· Varroidae) population levels in honeybee (Hymenoptera: Apidae). Int. J. Acarol. 30: 71-76.
Strange, J„ and W. Sheppard. 2001. Optimum timing of miticide applications for control of Varroa destructor (Acari: Varroidae) in Apis mellifera (Hymenoptera: Apidae) in Washington State, USA. J. Econ. Entomol. 94: 1324-1331.
van Dooremalen, C„ L. Gerritsen, B. Cornelissen,J.J.M. van der Steen, F. van Langevelde, and T. Blacquiere. 2012. Winter survival of individual honeybees and honeybee colonies depends on level of Varroa destructor infestation. PLoS ONE 7: e36285.
Vetharaniam, 1. 2012. Predicting reproduction rate of varroa. Ecol. Modell. 224: 11-17.
Wilkinson, D„ and G. C. Smith. 2002. A model of the mite parasite, Varroa destructor, on honeybees (Apis mellifera) to investigate parameters important to mite population growth. Ecol. Modell. 148: 263-275.
Received 2 September 2013; accepted 24 ]anuary 2014.
Veröffentlichungen
30

Allgemeine Diskussion und Schlussfolgerungen
3 Allgemeine Diskussion und Schlussfolgerungen Varroa destructor ist durch die weltweite Verbreitung zu einem ubiquitären Parasiten
bei Honigbienen (Apis mellifera) geworden. Eine „Eliminierung“ des Parasiten
erscheint selbst auf regionaler Ebene aussichtslos (Dietemann et al., 2012). Aus
imkerlicher Sicht muss es daher vorrangiges Ziel sein, die Schäden beim
Honigbienenwirt unterhalb der wirtschaftlichen Schadensschwelle zu halten. Dies setzt
voraus, dass die während der Saison meist exponentiell anwachsende Varroapopulation
im Bienenvolk kontrolliert wird (Rosenkranz et al., 2010). Diese Zunahme der
Parasitenpopulation hängt von mehreren Faktoren ab, wobei es hier komplexe
Wechselwirkungen zwischen Parasit und Wirt sowohl auf der individuellen als auch der
Bienenvolk- bzw. Populationsebene gibt. In der vorliegenden Arbeit wurden einige
dieser Wirt-Parasit-Wechselwirkungen genauer untersucht und dabei auch neue Aspekte
bezüglich des Wirtseinflusses auf die Reproduktion der Milbe nachgewiesen.
Zunächst konnte auf der individuellen Ebene der Varroareproduktion der bereits von
Garrido und Rosenkranz (2003, 2004) beschriebene Einfluss der Bienenlarve auf
Aktivierung und Verlauf der Varroareproduktion konkretisiert und erweitert werden. In
einem neuen in vivo Ansatz unter kontrollierten Bedingungen wurden Varroaweibchen
in Brutzellen unterschiedlichen Alters eingesetzt bzw. nach bestimmten Zeiten wieder
in andere Brutzellen umgesetzt. Dadurch konnte der Effekt unterschiedlicher Larven-
und Puppenstadien auf die Varroareproduktion quantifiziert und erstmals klar gezeigt
werden, dass ausschließlich frisch verdeckelte Bienenlarven in der Lage sind, die
Varroaoogenese zu aktivieren (Frey et al., 2013). Bereits wenige Stunden nach
Verdeckelung der Brutzelle kann die Varroaoogenese nicht mehr aktiviert werden,
wobei diese Phase bei Drohnenlarven länger dauert als bei Arbeiterinnenlarven. Damit
besteht erstmals die Möglichkeit, durch Vergleich der unterschiedlichen Wirtsstadien
gezielt nach den Signalen zu suchen, die die Varroareproduktion aktivieren. Erste
Ansätze hierzu wurden in dieser Arbeit bereits durchgeführt: Als bisher einziger
konkreter Parameter von Seiten des Wirtes für die Stimulierung bzw. Hemmung der
31
Allgemeine Diskussion und Schlussfolgerungen
Varroareproduktion wurden kutikuläre Duftstoffe der Bienenlarve diskutiert, die
überwiegend zum Zeitpunkt der Zellverdeckelung gebildet werden (Garrido and
Rosenkranz, 2004). Die biologische Aktivität dieser Substanzen konnte erstmals durch
die Applikation von Kutikulaextrakten der entsprechenden Bienenlarvenstadien
bestätigt werden. Wir vermuten, dass es sich bei den gesuchten Substanzen um
Verbindungen aus der polaren Fraktion der volatilen Larvenduftstoffe handelt. Unsere
qualitativen und quantitativen GC-MS-Analysen von Larvenextrakten zeigen eine
relativ hohe Variation bei den polaren Fettsäuremethyl- und -ethylestern. So nimmt die
Menge an Ethylestern bei Arbeiterinnen- und Drohnenlarven exakt bei den
Larvenstadien deutlich ab, die keine aktivierende Wirkung mehr auf die
Varroaoogenese haben. Diese könnten damit als Wirtssignale am ersten
Aktivierungsprozess der Varroaoogenese beteiligt sein. Fettsäureester spielen somit
nicht nur bei der Wirtsfindung der Varroamilbe eine wichtige Rolle (Le Conte et al.,
1989; Dillier et al., 2006), sondern sind möglicherweise auch in die
Reproduktionssteuerung involviert. Diese Hypothese muss allerdings noch durch
weitere kausale Versuchsansätze überprüft werden, wie z.B. durch gezielte
Applikationen solcher Substanzen und Substanzgemische in unserem Testsystem.
Noch spannender ist die hier erstmals nachgewiesene Existenz eines „Stopp-Signals“,
das eine bereits begonnene Varroaoogenese offensichtlich wieder unterbrechen kann.
Vereinfacht ausgedrückt bedeutet dies, dass ein Varroaweibchen versucht, den Verlauf
seiner Oogenese mit der Ontogenese der Wirtslarve zu synchronisieren. Wenn die
Oogenese im Vergleich zur Entwicklung der Larve zu spät beginnt bzw. zu langsam
verläuft, wird die Oogenese wieder gestoppt. Dies macht aus evolutiver Sicht Sinn, da
eine erfolgreiche Varroareproduktion voraussetzt, dass sich mindestens ein männliches
und ein weibliches Ei bis zum Adultstadium entwickeln und noch vor dem Schlupf der
Bienen die Begattung der Milbennachkommen stattfinden kann (Rosenkranz et al.,
2010). Wenn die Muttermilbe „feststellt“, dass dies aufgrund verzögerten
Reproduktionsverlaufes nicht möglich ist, können durch den Abbruch der Oogenese
Ressourcen für den nächsten Reproduktionszyklus geschont werden. Dieses „Stopp-
Signal“ scheint vor allem in den seit 48 Stunden verdeckelten Larvenstadien vorhanden
32

Allgemeine Diskussion und Schlussfolgerungen
zu sein (siehe unten stehende Abbildung, online als „graphical abstract“ in Frey et al.,
2013 enthalten). Für die chemische Natur dieses Signals liefern die bisherigen
Duftstoffanalysen allerdings noch keine Hinweise.
Abb. 1: Umsetzexperimente von Varroamilben zwischen Brutzellen unterschiedlichen Alters, die zeigen, dass Varroaweibchen ihre Reproduktion unterbrechen, wenn sie vorzeitig in ein älteres Larvenstadium umgesetzt werden.
Unabhängig von der Analyse der physiologischen Details bzgl. der Steuerung der
Varroareproduktion ist es eine wichtige grundsätzliche Frage, ob es eine genetische
Grundlage des Bienenwirtes für die Beeinflussung der Varroafertilität gibt. Als
Merkmal verwendeten wir hierfür die „temporäre Infertilität“ der Varroaweibchen: Ein
Teil der in die Brut eingedrungenen Varroaweibchen legt keine Eier, obwohl sie dazu in
der Lage sind und in folgenden Brutzyklen auch häufig wieder erfolgreich
33

Allgemeine Diskussion und Schlussfolgerungen
reproduzieren (Rosenkranz and Engels, 1994; Correa-Marques et al., 2003). Auf der
Ebene der Einzelbiene wurde nun der genetische Hintergrund dieses möglichen
Resistenzparameters gegenüber der Varroamilbe analysiert. Hierbei bietet die haplo-
diploide Geschlechtsbestimmung bei Honigbienen besondere Möglichkeiten durch die
Verwendung haploider Drohnen, da Resistenzgene eher im Phänotyp sichtbar werden
und sich das Genom leichter genetisch charakterisieren lässt. Hierfür wurden
Hybridköniginnen aus der vorselektierten „Gotland-Population“, die seit über zehn
Jahren ohne Varroabekämpfung überlebt hatte, mit unserer nicht auf Varroaresistenz
selektierten Hohenheimer Zuchtlinie erstellt. Dabei musste beachtet werden, dass
aufgrund der haplo-diploiden Geschlechtsbestimmung bei Honigbienen die
entsprechenden männlichen F1-Phänotypen erst in der nächsten F2-Generation
auftreten. Die Phänotypisierung der Drohnen für die anschließende genetische Analyse
erfolgte anhand der Fertilität bzw. Infertilität der Varroaweibchen in individuellen
Drohnenbrutzellen. Die anschließende molekulargenetische Feinkartierung der Drohnen
zeigte, dass die Unterdrückung der Milbenreproduktion (= Infertilität) mit drei QTL
(Quantitative trait loci) auf den Chromosomen 4, 7 und 9 der untersuchten Wirts-DNA
korreliert ist.
Zwar haben die Allele an den jeweiligen QTL einzeln betrachtet nur einen relativ
geringen Effekt, doch haben die drei Loci zusammen aufgrund der epistatischen
Wechselwirkungen einen hochsignifikanten Effekt auf die Varroareproduktion.
Interessanterweise scheint es bei einem QTL eine Orthologie zum “foxo”-Gen zu geben,
dem Funktionen im Zusammenhang mit Immunantwort, Langlebigkeit, Zelltod und
Energiemetabolismus zugeschrieben werden (Nijhout, 2003; Wu and Brown, 2006). Es
werden aber dringend weitere Untersuchungen benötigt, um (a) die biologischen
Hintergründe für die postulierten genetischen Effekte zu verstehen und (b)
auszuschließen, dass es sich hier lediglich um „Koinzidenzen“ handelt. Die Tatsache,
dass wirtsabhängige Faktoren die Varroareproduktion auf individueller Ebene
beeinflussen und dass es hierfür offensichtlich eine genetische Grundlage gibt, ist
zunächst ermutigend für weitere Selektionsbemühungen hin zu varroatoleranten
Honigbienen.
34

Allgemeine Diskussion und Schlussfolgerungen
Die Versuche zur Populationsentwicklung auf Bienenvolkebene zeigen allerdings, dass
unter praktischen Bedingungen nicht nur die Wirt-Parasit-Wechselwirkungen auf
individueller Ebene eine Rolle spielen. Vielmehr hängt der saisonale Anstieg der
Varroapopulation stark von Anzahl und Befallsgrad der anderen Bienenvölker im
Flugradius ab. Das Problem der „Varroainvasion“ konnten wir erstmals unter klar
definierten Bedingungen quantifizieren. Wir machten uns hierfür den (inzwischen
ehemaligen) Truppenübungsplatz in Münsingen auf der Schwäbischen Alb zu Nutzen
(Frey et al., 2011). Durch die isolierten Bedingungen auf diesem Militärgelände (keine
anderen Bienenstände im Flugradius) konnten wir erstmals die Verbreitung von
Varroamilben zwischen Bienenvölkern ohne Beeinflussung durch andere Bienenvölker
und Imker aus der näheren Umgebung untersuchen. Wildlebende Honigbienenvölker,
die als Schwärme in das 7000 ha große Gelände eingeflogen sein könnten, wurden von
uns und den Verwaltern des ehemaligen Truppenübungsplatzes nicht beobachtet.
Während des Versuches im Spätsommer variierte der Milbeneintrag in die mit
Akariziden dauerbehandelten Versuchsvölker zwischen 85 und 444 Milben pro Volk.
Diese Zahl erscheint sehr hoch, da sich außer den von uns aufgestellten vier
„Milbenspendervölkern“ keine weiteren Honigbienen auf dem Gelände befanden.
Erstaunlicherweise hing der Umfang der eingetragenen Milben nicht von der
Entfernung zwischen den Bienenvölkern ab. Selbst eine Distanz von 1,5 km bot keinen
Schutz vor Milbeneintrag. Der wöchentliche Milbeneintrag war korreliert mit der
Tagestemperatur und damit der durchschnittlichen Dauer an potentiellen Flugstunden
der Bienen. Dieses Ergebnis bestätigt, dass die Invasionsrate durch die Aktivität
(vermutlich Räuberei) der Flugbienen begünstigt wird (Ritter and Leclercq, 1987;
Sakofski et al., 1990; Goodwin et al. 2006). Diese Räuberei würde in Phasen mit
geringem Nahrungsangebot für die Bienenvölker vermutlich noch ansteigen (Greatti et
al., 1992) und somit dürfte dann auch die Invasionsrate zunehmen.
Mit diesem Versuchsansatz konnte zwar sehr genau die Invasionsrate in Abhängigkeit
von Entfernung und Befallsgrad definierter „Milbenspendervölker“ quantifiziert
werden. Es war aber keine Aussage darüber möglich, welchen Effekt dieser
Milbeneintrag hätte, wenn sich die eingetragenen Milben noch zusätzlich reproduziert
35
Allgemeine Diskussion und Schlussfolgerungen
hätten. Nach Fries et al. (1994; 2003) kann sich der Varroabefall bei normaler
Reproduktion monatlich verdoppeln. Dieser Aspekt konnte im ersten Versuchsansatz
nicht erfasst werden, da alle Versuchsvölker mit Akariziden dauerbehandelt wurden und
somit alle eingetragenen Varroamilben sofort abgetötet wurden. Zudem hatten wir in
diesem Versuchsansatz die Milbeninvasion nur über eine relativ kurze Zeitspanne
erfasst und bei einer vergleichsweise geringen Bienendichte. Diese ist in vielen
Regionen mit bis zu 4,35 Völkern pro km2 sehr viel höher als auf dem isolierten
Gelände des Truppenübungsplatzes. In einem weiteren Experiment wurde daher das
Versuchsdesign verändert und stärker an den praktisch-imkerlichen Bedingungen
ausgerichtet (Frey and Rosenkranz, 2014). Der Umfang und zeitliche Verlauf der
Milbeninvasion im Spätsommer wurde an zwei Standorten untersucht, die sich durch
die Anzahl der Bienenvölker im Flugradius unserer Versuchsvölker unterschieden
(geringe und hohe Bienendichte). An beiden Standorten wurde aber nicht nur die
Milbeninvasion, sondern auch in einer weiteren Versuchsgruppe das
Vermehrungspotential der von außen eingetragenen Varroaweibchen erfasst. Damit
wurde eine Situation simuliert, wie sie in der imkerlichen Praxis häufig vorkommt:
Bienenvölker werden im Juli gegen die Varroose behandelt und bis zur
Winterbehandlung im November nicht mehr auf Varroabefall kontrolliert. In diesem
Versuch wurde nun der Anstieg der Varroapopulation durch Eintrag und anschließende
Vermehrung dieser Milben überprüft. Zusätzlich wurde die Populationsdynamik der
Bienenvölker (n gesamt = 28) von Juli bis zum darauffolgenden Frühjahr regelmäßig
nach der Liebefelder Schätzmethode erfasst (Imdorf et al., 1987).
Zwischen beiden Standorten, aber auch zwischen den einzelnen Völkern, variierte die
Anzahl der eingetragenen Milben stark. Aufgrund der guten Pollen- und
Nektarversorgung an beiden Versuchsstandorten kann dies hier jedoch nicht auf ein
mangelndes Nahrungsangebot für die Bienenvölker und eine damit verbundene,
verstärkt auftretende Räuberei zurückgeführt werden. Am Standort mit hoher
Bienendichte wurden zwischen 266 und 1171 Milben pro Volk über den gesamten
Versuch hinweg eingetragen, was einem Durchschnitt von > 450 Milben pro Volk
entspricht. In die Bienenvölker am Standort mit einer geringen Bienendichte in der
36

Allgemeine Diskussion und Schlussfolgerungen
Umgebung wurden dagegen insgesamt nur ca. 125 Milben pro Volk von außen
eingetragen. Diese unterschiedlichen Invasionsraten sind eindeutig durch die hohe
Bienendichte am ersten Standort zu erklären, an dem sich über 300 Bienenvölker mit
unbekanntem Varroabefallsgrad im Flugradius unserer Versuchsvölker befanden. Die
Invasionsraten sind insgesamt geringer als die zu Beginn der Varroaverbreitung von
Greatti et al. (1992) angegebenen Zahlen. Dies dürfte daran liegen, dass an unseren
Versuchsstandorten (a) es wohl keine wildlebenden Schwärme gab und (b) die meisten
Imker inzwischen eine Varroabekämpfung durchführen und damit extreme
Befallszahlen vermeiden.
Entsprechend des hohen Invasionsdruckes am Standort mit hoher Bienendichte stieg die
Varroapopulation um mehr als das 25-fache in einem Zeitraum von nur drei Monaten
an. Am Standort mit geringer Bienendichte nahm die Milbenpopulation im selben
Zeitraum dagegen nur um das 3,5-fache zu. In einem langjährigen bundesweiten
Monitoringprojekt, das die periodischen, hohen Verluste von Bienenvölkern während
des Winters untersucht, wurde bestätigt, dass ein Befallsgrad der Adultbienen von ca.
6% im Spätherbst - kurz vor der Einwinterung - ausreicht, um die Überwinterung der
Völker zu gefährden (Genersch et al., 2010). Dieser Schwellenwert, der auch von
anderen Autoren bestätigt wird (Delaplane and Hood 1999, Strange and Sheppard 2001,
Currie and Gatien 2006), wurde in den sieben Völkern am Standort mit hoher
Bienendichte bereits Ende September mit durchschnittlich 6,5 % Bienenbefall erreicht,
während die Völker am Standort mit geringer Bienendichte unterhalb der
Schadensschwelle blieben. Besonders interessant war, dass die stark parasitierten
Völker trotz der Entfernung nahezu aller Milben kurz vor der Einwinterung über 60%
ihrer Bienen während der Überwinterung verloren. Dieser Bienenverlust war signifikant
höher als bei den schwächer befallenen Versuchsvölkern. Die gute Volksentwicklung
aller vier Versuchsgruppen während des Spätsommers sowie der überdurchschnittlich
hohe Verlust an Bienenmasse während des Winters sind noch einmal in Tabelle I
dargestellt (nicht in der Veröffentlichung enthalten).
37

Allgemeine Diskussion und Schlussfolgerungen
Tab. I: Durchschnittliche Anzahl Bienen und Brutzellen der Versuchsvölker des zweiten Versuches zur Reinvasion (Frey and Rosenkranz, 2014). Die unbehandelte Versuchsgruppe am HBD-Bienenstand hatte den höchsten Varroabefall im Oktober und verlor danach überdurchschnittlich viele Bienen während der Überwinterung bis zum Februar.
Von unserem Kooperationspartner wurden die Bienen der verschiedenen
Versuchsgruppen vor und nach dem Winter auf Befall mit Bienenviren untersucht. Bei
den stark mit Varroa parasitierten Völkern waren vor dem Winter deutlich höhere
Virenbelastungen diagnostiziert als in den schwächer befallenen Völkern. Im Frühjahr
war allerdings nahezu kein Virusbefall mehr feststellbar (McMahon et al., in
Vorbereitung). Die wahrscheinlichste Erklärung dafür ist, dass die mit Viren belasteten
Winterbienen nicht wie üblich vier bis sechs Monate lebten (Mattila et al., 2001),
sondern deutlich früher abgingen. Dies bestätigt zum einen die Ergebnisse von Amdam
Datum
GBD HBD
behandelte Völker (n = 7)
unbehandelte Völker (n = 7)
behandelte Völker (n = 7)
unbehandelte Völker (n = 7)
26. Juli Bienen Brut
18.585 ± 4.120 25.971 ± 4.742
17.232 ± 6.050 19.000 ± 8.270
21.636 ± 7.142 30.686 ± 6.292
20.866 ± 6.175 31.486 ± 10.313
16. August BienenBrut - 17.488 ± 3.071
27.233 ± 7.734 - 25.350 ± 2.993 34.114 ± 5.306
05. September
BienenBrut
17.510 ± 3.645 17.857 ± 4.787
14.486 ± 4.205 14.886 ± 4.740
18.359 ± 3.718 15.143 ± 2.622
22.631 ± 3.506 22.400 ± 2.982
26. September
BienenBrut
-
13.464 ± 2.614 12.914 ± 3.951 - 17.696 ± 5.612
16.257 ± 2.973
17. Oktober Bienen Brut
12.639 ± 3823 3.400 ± 1.553
9.791 ± 1.906 857 ± 964
10.266 ± 2.249 3.400 ± 2.1791
14.176 ± 1.763 4.971 ± 2.570
28. Februar Bienen Brut
7.614 ± 4.103 2.800 ± 2.361
6.268 ± 9.80 2.314 ± 1.904
7.800 ± 1.892 3.686 ± 1.747
5.934 ± 1.382 2.943 ± 2.190
38
Allgemeine Diskussion und Schlussfolgerungen
et al. (2004) und Van Dooremalen et al. (2012), die für Varroa parasitierte Winterbienen
eine kürzere Lebensdauer nachwiesen, und unterstützt des Weiteren Vermutungen, dass
die Varroaschäden, insbesondere durch Varroa bedingte Winterverluste (Genersch et al.,
2010; Guzmán-Novoa et al., 2010), maßgeblich durch Virenbefall ausgelöst werden
(Nguyen et al. 2011, Francis et al. 2013).
Mit den Ergebnissen zur Milbeninvasion, der Varroapopulationsdynamik im
Spätsommer und Herbst sowie dem Einfluss des Varroabefalls auf die Überwinterung
von Bienenvölkern lassen sich zunächst klare Empfehlungen für die Imkerpraxis
ableiten: (1) Die Imker sollten alle Bienenvölker einer Region möglichst zur gleichen
Zeit behandeln, um den Invasionsdruck durch nicht behandelte Bienenvölker
(„Varroaspender“) zu vermeiden. (2) Der Imker darf sich auch nach einer korrekt
durchgeführten Varroabehandlung im Spätsommer nicht sicher sein, dass die Völker
gesund eingewintert werden; regelmäßige Befallsdiagnosen sind unbedingt notwendig.
(3) Die Aufstellung sehr vieler Bienenvölker in einer Region sollten wenn möglich
vermieden werden.
Darüber hinaus weisen diese Ergebnisse aber auch auf generelle Probleme bei der
Etablierung eines stabilen Parasit-Wirt-Verhältnisses hin, unabhängig davon, ob dies
durch natürliche Selektion (Fries et al, 2006) oder gezielte Zuchtauslese (Büchler at al.,
2010) erreicht werden soll. Der Superorganismus Honigbienenvolk vermehrt sich über
die Teilung des Volkes (Schwärmen), was von großer Bedeutung für die Fitness des
Bienenvolkes ist. Die Übertragung von Pathogenen kann entweder horizontal (zwischen
Individuen innerhalb einer Generation) oder vertikal (zwischen Individuen von einer
Generation zur nächsten) vonstattengehen. Im Bienenvolk laufen diese
Übertragungswege zusätzlich noch auf zwei Ebenen ab, innerhalb des Bienenvolkes und
zwischen benachbarten Bienenvölkern (Fries and Camazine, 2001). Über das
Schwärmen werden Pathogene, darunter auch die Varroamilbe, vertikal übertragen. Der
horizontale Übertragungsweg tritt innerhalb des Volkes durch den Wechsel von Biene
zu Biene oder von Biene zu Larve und zwischen den Völkern durch Verflug infizierter
Bienen oder Ausräubern befallener Völker auf. Im Bezug auf die Varroamilbe als neuer
Parasit unserer Bienenvölker ist vor allem die horizontale Übertragung von Bedeutung.
39
Allgemeine Diskussion und Schlussfolgerungen
Man geht davon aus, dass Pathogene, die vorwiegend an den horizontalen
Übertragungsweg gebunden sind, eine höhere Virulenz gegenüber ihres Wirtes
aufweisen und Pathogene mit überwiegend vertikaler Übertragung sich eher in Richtung
stabiler Wirt-Parasit-Systeme entwickeln (Fries and Camazine, 2001). Die hier
durchgeführten Versuche zeigen eindrucksvoll, dass die Imkerpraxis die horizontale
Verbreitung von Varroamilben fördert. Virulente Milben, die ihr Wirtsbienenvolk
umbringen, haben durch diesen Verbreitungsweg eine große Chance, benachbarte
Bienenvölker zu befallen. Varroamilben mit moderater Virulenz haben unter diesen
Bedingungen keinen Selektionsvorteil. Zudem wird durch die regelmäßige Bekämpfung
der Varroamilbe, die in Deutschland aus seuchenrechtlichen Gründen verpflichtend ist,
verhindert, dass anfällige Bienenvölker aus der Population ausselektiert werden.
Damit befindet sich die Bienenwissenschaft und Zuchtpraxis in einem Dilemma: Eine
Reduzierung der Bekämpfung dürfte zwar im Sinne einer natürlichen Selektion dazu
führen, dass anfällige Bienenvölker aus der Population verschwinden. Solange die
Imker aber für eine hohe Bienendichte und damit eine horizontale Verbreitung sorgen,
werden virulente Varroamilben weiterhin einen Selektionsvorteil besitzen.
Bezeichnenderweise werden langfristig stabile Wirt-Parasit-Beziehungen in gemäßigten
Klimazonen bisher lediglich in nicht imkerlich bewirtschafteten Honigbienen-
populationen bei relativ geringer Bienendichte beobachtet (Le Conte et al., 2007,
Seeley, 2007, Locke and Fries, 2011). Diese Populationen zeigen aber auch, dass stabile
Wirt-Parasit-Systeme grundsätzlich möglich sind. Meine Ergebnisse zeigen, dass auf
individueller Ebene die Steuerung der Varroafertilität einen potentiellen
Resistenzparameter des Wirtes mit einer genetischen Basis darstellt. Dies ist
vielversprechend und sollte intensiv auf physiologischer und genetischer Ebene weiter
bearbeitet werden. Für Selektionsprogramme, insbesondere mit Beteiligung von Imkern,
müssen die hier aufgezeigten Wechselwirkungen zwischen den Bienenvölkern einer
lokalen Population stärker als bisher berücksichtigt werden.
40

Zusammenfassung
4 Zusammenfassung
4.1 Zusammenfasssung Das Honigbienenvolk ist konfrontiert mit einer Vielzahl an Pathogenen, darunter Viren,
Bakterien, Pilze und Milben. Der weltweit bedeutendste Parasit der westlichen
Honigbiene ist dabei die ektoparasitische Bienenmilbe Varroa destructor. Entdeckt
wurde die Milbe zu Beginn des 20. Jahrhunderts in Südostasien in Völkern der östlichen
Honigbiene Apis cerana, ihrem ursprünglichen Wirt. Ab Mitte des letzten Jahrhunderts
wurde die Milbe dann durch Transporte infizierter A. mellifera Völker weltweit
verbreitet mit meist dramatischen Folgen für wildlebende und bewirtschaftete
Honigbienenvölker. Mittlerweile stellt der Parasit das größte wirtschaftliche Problem
für die globale Imkerei dar. So gibt es in den gemäßigten Breiten nahezu kein
varroafreies Volk mehr und ohne regelmäßige Bekämpfung der Varroose durch den
Imker gehen Bienenvölker innerhalb weniger Jahre ein. Dies bestätigt, dass sich bei A.
mellifera nach wie vor kein stabiles Wirt-Parasit-Verhältnis entwickelt hat und die
Bekämpfung von V. destructor nach wie vor die größte Herausforderung für die Imkerei
darstellt.
Die Hauptursache für die Wirtsschädigungen ist die enorme Zunahme der
Varroapopulation im Jahresverlauf, die offensichtlich durch das Bienenvolk nicht
ausreichend kontrolliert werden kann. Dieses Populationswachstum wird beeinflusst
durch Reproduktionsrate der Varroaweibchen innerhalb der einzelnen Brutzellen, durch
Parasit-Wirt-Wechselwirkungen auf der Ebene des Bienenvolkes und durch
Wechselwirkungen zwischen den Bienenvölkern.
Im Rahmen der vorliegenden Dissertation wurden Untersuchungen auf allen drei
Ebenen durchgeführt. Zunächst konnte auf der individuellen Ebene erstmals
nachgewiesen werden, dass Signale der Bienenlarve nicht nur die Reproduktion der
Varroaweibchen aktivieren, sondern eine begonnene Oogenese sogar wieder stoppen
können (Frey et al., 2013). Unter evolutiven Gesichtspunkten macht dies Sinn, da das
Varroaweibchen nur dann Ressourcen in die Eibildung investiert, wenn die
Bedingungen für eine erfolgreiche Reproduktion gegeben sind. Meine Ergebnisse lassen
41
Zusammenfassung
vermuten, dass kutikuläre altersabhängige Duftstoffe der Bienenlarve an der Steuerung
der Varroareproduktion maßgeblich beteiligt sind. Als Wirtssignale kommen dabei
bestimmte Fettsäureester in der polaren Fraktion des Kutikulaextraktes in Frage.
Im Rahmen eines Kooperationsprojektes konnten wir darüber hinaus zeigen, dass die
temporär auftretende Infertilität von Varroaweibchen signifikant mit drei QTL auf drei
Chromosomen der Wirtslarve korreliert ist, es also offensichtlich eine genetische Basis
für solche reproduktionshemmenden Resistenzfaktoren gibt (Behrens et al., 2012).
Hierfür machten wir uns die haplo-diploide Geschlechtsbestimmung bei Honigbienen
zunutze, da potentielle Resistenzgene eher im haploiden Phänotyp sichtbar werden und
sich das Genom leichter molekulargenetisch charakterisieren lässt.
Für Untersuchungen von Varroaresistenz auf der Ebene des Bienenvolkes sowie für die
Durchführung von Selektionsprogrammen ist ein weiterer Aspekt von enormer
Bedeutung. In zwei Versuchsansätzen konnte ich nachweisen, dass der Eintrag von
Varroamilben von benachbarten Völkern – oft als „Reinvasion“ bezeichnet - die
Populationsentwicklung des Parasiten im Volk nachhaltig beeinflusst. Zunächst wurde
unter den Bedingungen eines isolierten Truppenübungsplatzes der Eintrag von Milben
in Abhängigkeit vom Invasionsdruck (= Anzahl und Entfernung infizierter
Bienenvölker) quantifiziert. Hierfür wurden mit Akariziden dauerbehandelte Völker in
unterschiedlichen Abständen zu stark parasitierten Völkern aufgestellt und der
Milbeneintrag wöchentlich erfasst (Frey et al, 2011). In einem weiteren Versuch wurde
der Ansatz erweitert: Neben der Varroainvasion wurde nun auch die Vermehrung der
eingetragenen Milben quantifiziert. Unter praxisnahen Bedingungen konnte so
nachgewiesen werden, dass horizontale Verbreitung plus anschließende Vermehrung
der eingeschleppten Varroamilben zu einem exponentiellen Anstieg der
Varroapopulation führen können, der innerhalb von drei Monaten die Schadensschwelle
übersteigt (Frey and Rosenkranz, 2014) und dadurch die Überwinterung der
Bienenvölker gefährdet wird. Aus den Versuchsergebnissen werden Empfehlungen für
eine flächendeckende und zeitlich koordinierte Varroabekämpfung sowie für die
Selektion resistenter Bienenvölker abgeleitet.
42

Zusammenfassung
Mit meinen Versuchen konnte ich einige Mosaiksteine zum Verständnis der Varroa-
Reproduktionssteuerung innerhalb der individuellen Brutzelle und zur Varroa-
Populationsdynamik innerhalb des Bienenvolkes hinzufügen. Ein solches Verständnis
der Populationsdynamik und der zugrunde liegenden Wirtsfaktoren ist meiner Meinung
nach essentiell für die Selektion varroaresistenter Bienenvölker und darüber hinaus
wichtig für die Entwicklung von Varroa-Bekämpfungskonzepten.
43

Zusammenfassung
4.2 Summary
The honey bee colony is faced with a huge number of pathogens, including bee viruses,
bacteria, fungi and mites. Among these pathogens, the ectoparasitic mite Varroa
destructor is considered the most important parasite of the honey bee worldwide. This
mite was discovered at the beginning of the last century in South East Asia within
colonies of the original host, the Eastern honey bee Apis cerana. From the middle of the
last century the mite has been spread worldwide by transports of infested A. mellifera
colonies with dramatic consequences for both, feral and managed honey bee colonies. In
the meantime this parasite has become the most serious economic problem for global
beekeeping. In temperate climates nearly all honey bee colonies are infested and
without yearly Varroa treatments these colonies would collapse within a few years. This
confirms that a stable host parasite relationship has not been established yet. Therefore
the control of V. destructor still represents the main challenge for beekeeping.
The main reason for host damages is the dramatic increase of the Varroa population
during the season. Our honey bee colonies are obviously unable to control this
population dynamic of the parasite. The increase of the mite population is influenced by
the reproductive rate of Varroa females within individual brood cells, by host-parasite-
interactions on the colony level and by interactions among honey bee colonies on the
population level.
The dissertation at hand presents experimental approaches and results at all three levels.
On the individual level we were able to demonstrate that age-dependent signals of the
honey bee larvae not only activate the oogenesis of the Varroa females but even trigger
the further course of mite reproduction (Frey et al., 2013). Our studies on the activation
of the Varroa reproduction revealed that exclusively larvae within 18 h (worker) and 36
h (drones), respectively, after cell capping were able to stimulate the mite’s oogenesis.
Furthermore, we were able to confirm for the first time the presence of a signal in the
host larvae allowing the reproducing mites to adjust their own reproductive cycle to the
ontogenetic development of the host. Under certain conditions such host signals can
even stop an oogenesis of the female mite that has already been started. From an
44

Zusammenfassung
adaptive point of view that sort of a stop signal enables the female mite to save
resources for a next reproductive cycle if the own egg development is not sufficiently
synchronized with the development of the host. My results indicate that age specific
volatiles of the larval cuticle are involved in the regulation of mite reproduction.
According to preliminary quantitative GC–MS analysis we suggest certain fatty acid
ethyl esters as candidate compounds. These host signals – either involved in the
activation or in the interruption of the Varroa reproduction – offer possibilities to
influence the reproductive success of Varroa females and might therefore be used for
biological control in the future.
Within an EU cooperation project we could additionally demonstrate that the so called
temporary infertility of Varroa females is significantly correlated with three QTL of the
host larvae. This confirms a genetic basis for host resistance factors that inhibit the mite
reproduction (Behrens et al., 2012). For this study we made use of the fact that we had
access to a honey bee population at the island of Gotland, Sweden that has survived
mite infestation without any treatment for more than 10 years. We crossed a queen from
this tolerant population with drones from susceptible colonies to rear hybrid queens and
produced a mapping population of haploid drones from these hybrids. Because honey
bees have a haplodiploid sex determination, the haploid drones provide an extremely
simple and highly efficient model system for genetic studies. Subsequently, we mapped
three candidate target regions on chromosomes 4, 7, and 9. Although the individual
effect of these three QTL was found to be relatively small, the set of all three had
significant impact on the suppression of V. destructor reproduction by epistasis. The
detection of this epistatic interaction was only possible because we used the simple
genetic make-up of haploid drones.
For studies on Varroa resistance on the colony level and for selection programs the
interactions among the colonies of the local honey bee population have to be
considered. In two experimental approaches I was able to prove that the invasion of
Varroa mites from neighboring colonies – often called “reinvasion” – significantly
influences the population dynamic of the parasite within the colony. First, we quantified
the number of mites invading individual colonies in relation to the invasion pressure (=
45

Zusammenfassung
number and distance of infested colonies). For this approach we made use of an isolated
military training area near Münsingen at the Swabian Alb not accessible to other
beekeepers (Frey et al, 2011). We established ten “mite receiver colonies” continuously
treated against V. destructor and placed them at distances of 1m to 1.5 km from four
heavily infested “mite donor colonies”. In the donor colonies, we estimated the
population of bees, brood, and V. destructor at three week intervals. The invasion of
mites into the receiver colonies was recorded every 7-12 days. During the measurement
period of about two months, between 85 and 444 mites per colony were introduced into
the receiver colonies. Surprisingly, there were no significant differences in the invasion
rates in relation to the distance between donor and receiver colonies.
The second approach was performed under more realistic field conditions of two
experimental apiaries established in regions with high and low bee densities,
respectively. Additionally, in this experiment we analyzed the multiplication of the
invaded mites. Thereby we confirmed that horizontal transmission plus the reproduction
of the invaded Varroa mites can cause an exponential increase of the mite population
that may exceed the damage threshold within three months (Frey and Rosenkranz,
2014). We were further able to show that the invasion rates – and therefore the final
infestation – differ significantly according to the number of honey bee colonies in the
neighborhood of the apiary: At the site with a high bee density, the average invasion
rate per colony over the entire three and a half months period was 462 mites per colony
compared to only 126 mites per colony at the site with a low bee density. As a
consequence, the colonies of the apiary at the high bee density site revealed an average
final infestation in November of 2,082 mites per colony compared to 340 mites per
colony at the low bee density site. The highly infested colonies lost about three times
more bees compared to the lower infested colonies – obviously a result of Virus
infections transmitted by Varroa mites (McMahon et al., in preparation).
With my different approaches I was able to add further elements of knowledge for a
better understanding of how host factors and ambient conditions influence the Varroa
46

Zusammenfassung
reproduction within individual brood cells and the population dynamic within a honey
bee colony. A better knowledge of these host parasite interactions is essential for the
selection of mite resistant colonies and further more important for the development of
concepts for an effective Varroa treatment.
47

Literaturverzeichnis
5 Literaturverzeichnis Anderson D.L., Trueman J.W.H., 2000. Varroa jacobsoni (Acari: Varroidae) is more
than one species, Exp. Appl. Acarol. 24, 165-189.
Aumeier, P., Rosenkranz, P., 2001. Scent or movement of Varroa destructor mites does
not elicit hygienic behaviour by Africanized and Carniolan honey bees.
Apidologie 32, 253-263.
Amdam, G.V., Hartfelder, K.; Norberg, K.; Hagen, A.; Omholt, S.W., 2004. Altered
physiology in worker honey bees (Hymenoptera: Apidae) infested with the mite
Varroa destructor (Acari: Varroidae): a factor in colony loss during
overwintering? J. Econ. Entomol. 97 (3), 741–747.
ARBEITSGEMEINSCHAFT DER INSTITUTE FÜR BIENENFORSCHUNG E.V.,
2007. Varroa unter Kontrolle.
http://www.adiz online.de/online/102422/Varroa.pdf. Accessed on April 15th,
2010.
Behrens, D., Huang, Q., Geßner, C., Rosenkranz, P., Frey, E., Locke, B., Moritz,
R.F.A., Kraus, F.B., 2011. Three QTL in the honey bee Apis mellifera L.
suppress reproduction of the parasitic mite Varroa destructor. Ecol. Evol. 1(4):
451–458.
Boecking, O., Genersch, E., 2008. Varroosis – the ongoing crisis in bee keeping.
Journal of consumer protection and food safety 3 (2), 221-228.
Boot, W.J., Calis, J.N.M., Beetsma, J., Hai, D.M., Lan, N.K., Toan, T.V., Trung, L.Q.,
Minh, N.H.,1999. Natural selection of Varroa jacobsoni explains the different
reproductive strategies in colonies of Apis cerana and Apis mellifera. Exp. Appl.
Acarol. 23:133–144.
Brodschneider, R., Moosbeckhofer, R., Crailsheim, K., 2010. Surveys as a tool to
record winter losses of honey bee colonies: A two year case study in Austria and
South Tyrol. Journal of Apicultural Research 49: 23-30.
Bruce, W.A., Chiesa, F., Marchetti, S., Griffith, D.A., 1988. Laboratory feeding of
Varroa jacobsoni Oudemans on natural and artificial diets (Acari: Varroidae).
Apidologie 19, 209-218.
48

Literaturverzeichnis
Bruce, W.A., Henegar R.B., Hackett K.J., 1991. An artificial membrane for in vitro
feeding of Varroa jacobsoni and Acarapis woodi, mite parasites of honey bees.
Apidologie 22, 503-507.
Büchler R., Drescher, W., Tornier, I., 1992. Grooming behavior of Apis cerana, Apis
mellifera and Apisdorsata and its effect on the parasitic mites Varroa jacobsoni
and Tropilaelaps clareae, Exp. Appl. Acarol. 16, 313–319.
Büchler, R., Berg, S., Le Conte, Y., 2010. Breeding for resistance to Varroa destructor
in Europe. Apidologie 41: 393–408.
Calis, J.N.M., Fries, I., Ryrie, S.C., 1999. Population modeling of Varroa jacobsoni
Oud. Apidologie 30, 111-124.
Carneiro, F.E., Torres, R.R., Strapazzon, R., Ramirez, S.A., Guerra, J.C.V., Koling,
D.F., Moretto, G., 2007. Changes in the reproductive ability of the mite Varroa
destructor (Anderson and Trueman) in Africanized honey bees (Apis mellifera
L.) (Hymenoptera: Apidae) colonies in southern Brazil. Neotrop. Entomol. 36
(6), 949–952.
Chauzat, M.-P., A.-C Martel, S. Zeggane, P. Drajnudel, F. Schurr, M.-C. Clément, M.
Ribière-Chabert, M. Aubert, and J.-P. Faucon. 2010. A case control study and a
survey on mortalities of honey bee colonies (Apis mellifera) in France during the
winter of 2005-6. Journal of Apicultural Research 49: 40-51.
Correa-Marques, M.H., Media, L., Martin, S.J., De Jong, D., 2003. Comparing data on
the reproduction of Varroa destructor. Genet. Mol. Res. 2, 1–6.
Currie, R.W. and P. Gatien. 2006. Timing acaricide treatments to prevent Varroa
destructor (Acari: Varroidae) from causing economic damage to honey bee
colonies. Can. Entomol. 138: 238–252.
DeGrandi-Hoffman, G., and R. Curry. 2004. A mathematical model of Varroa mite
(Varroa destructor Anderson and Trueman) and honeybee (Apis mellifera L.)
population dynamics. Internat. J. Acarol., 30 (3): 259-274.
Delaplane, K.S. 2011. Integrated pest management in Varroa. In N.L. Carreck (Ed.).
Varroa - still a problem in the 21st Century? International Bee Research
Association; Cardiff, UK, pp. 43-51.
49

Literaturverzeichnis
Delaplane, K.S., and W.M. Hood. 1999. Economic threshold for Varroa jacobsoni Oud.
in the southeastern USA. Apidologie, 30: 383–395.
Dietemann, V., Pflugfelder, J., Anderson, D., Charrière, J.-D., Chejanovsky, N., Dainat,
B., De Miranda, J., Delaplane, K., Dillier, F.-X., Fuchs, S., Gallmann, P.,
Gauthier, L., Imdorf, A., Koeniger, N., Kralj, J., Meikle, W., Pettis, J.,
Rosenkranz, P., Sammataro, D., Smith, D., Yanez, O., Neumann, P., 2012.
Varroa destructor: Research avenues towards sustainable control. Journal of
Apicultural Research 51 (1): 125-132.
Dillier, F-X., Fluri, P., Imdorf, A., 2006. Review of the orientation behaviour in the bee
parasitic mite Varroa destructor: Sensory equipment and cell invasion behavior.
Revue Suiesse de Zoologie 113 (4): 857-877.
Donzé, G., Herrmann, M., Bachofen, B., Guerin, P.M., 1996. Effect of mating
frequency and brood cell infestation rate on the reproductive success of the
honeybee parasite Varroa jacobsoni. Ecol. Entomol. 21, 17–26.
Francis, R.M., S.L. Nielsen, S.L., and P. Kryger. 2013. Varroa-Virus Interaction in
Collapsing Honey Bee Colonies. PLoS ONE 8(3): e57540.
Free, J.B. and P.A. Racey. 1968. The effect of the size of honey bee colonies on food
consumption, brood rearing and longevity of the bees during the winter.
Entomologia exp. appl. 11: 241-249.
Frey, E., H. Schnell, and P. Rosenkranz. 2011. Invasion of Varroa destructor into mite-
free honey bee colonies under the controlled conditions of a military training
area. Journal of Apicultural Research 50 (2): 138-144.
Fries, I., Camazine, S., Sneyd, J., 1994. Population dynamics of Varroa jacobsoni: a
model and a review. Bee World 75, 5-28.
Fries, I., Huazhen,W., Jin, C.S.,Wie, S., 1996. Grooming behavior and damaged mites
(Varroa jacobsoni) in Apis cerana and Apis mellifera ligustica, Apidologie 27,
3–11.
Fries, I., Camazine, S., 2001. Implications of horizontal and vertical pathogen
transmission for honey bee epidemiology. Apidologie 32 (3), 199–214.
50

Literaturverzeichnis
Fries, I., Hansen, H., Imdorf, A., Rosenkranz, P., 2003. Swarming in honey bees (Apis
mellifera) and Varroa destructor population development in Sweden. Apidologie
34, 389-398.
Fries, I., Perez-Escala, S., 2001. Mortality of Varroa destructor in honey bee (Apis
mellifera) colonies during winter. Apidologie 32, 223–229.
Fries, I., Imdorf, A., Rosenkranz, P., 2006. Survival of mite infested (Varroa destructor)
honey bee (Apis mellifera) colonies in a Nordic climate. Apidologie 37, 564-
570.
Fries, I., Bommarco, R., 2007. Possible host-parasite adaptations in honey bees infested
by Varroa destructor mites. Apidologie 38:525–533.
Fuchs, S., 1990. Preference for drone brood cells by Varroa jacobsoni Oud in colonies
of Apis mellifera carnica. Apidologie 21:193–199.
Garrido, C., Rosenkranz, P., Stürmer, M., Rübsam, R., Büning, J., 2000. Toluidine blue
staining as a rapid measure for initiation of oocyte growth and fertility in Varroa
jacobsoni Oud. Apidologie 31, 559–566.
Garrido, C., Rosenkranz, P., 2003. The reproductive program of female Varroa
destructor is triggered by its host, Apis mellifera. Exp. Appl. Acarol. 31, 269–
273.
Garrido, C., 2004. Reproduktionssteuerung bei der parasitischen Bienenmilbe Varroa
destructor Anderson & Trueman 2000 (ehemals Varroa jacobsoni Oudemans),
Ph.D. Thesis, Universität Hohenheim, Stuttgart.
Garrido, C., Rosenkranz, P., 2004. Volatiles of the honey bee larva initiate oogenesis in
the parasitic mite Varroa destructor, Chemoecology 14, 193-197.
Genersch, E, and M. Aubert. 2010. Emerging and re-emerging viruses of the honey bee
(Apis mellifera L.). Veterinary Research. (2010) 41:54.
Genersch, E., Von der Ohe, W., Kaatz, H., Schroeder, A., Otten, C., Buechler, R., Berg,
S., Ritter, W., Muehlen, W., Gisder, S., Meixner, M., Liebig, G., Rosenkranz, P.,
2010. The German bee monitoring project: a long term study to understand
eriodically high winter losses of honey bee colonies. Apidologie 41
51

Literaturverzeichnis
Goodwin, R.M., Taylor, M.A., McBrydie, H.M., Cox, H.M., 2006. Drift of Varroa
destructor-infested worker honey bees to neighbouring colonies. J. Apicult. Res.
45 (3), 155–156.
Greatti, M., Milani, N., Nazzi, F., 1992. Reinfestation of an acaricide – treated apiary by
Varroa jacobsoni Oud. Experimental & Applied Acarology, 16, 279-286.
Guzmán-Novoa, E., L. Eccles, Y. Calvete , J. Mc Gowan , P.G. Kelly , and A. Correa-
Benítez. 2010. Varroa destructor is the main culprit for the death and reduced
populations of overwintered honey bee (Apis mellifera) colonies in Ontario,
Canada. Apidologie 41: 443-450.
Ibrahim, A., Spivak, M., 2006. The relationship between hygienic behaviour and
suppression of mite reproduction as honey bee (Apis mellifera) mechanisms of
resistance to Varroa destructor. Apidologie 379, 31-40.
Ifantidis, M.D., Thrashyvoulou, A., Pappas, M., 1988. Some aspects of the process of
Varroa jacobsoni mite entrance into honey bee (Apis mellifera) brood cells.
Apidologie 19, 387–396.
Imdorf, A., Buehlmann, G., Gerig, L., Kilchenmann, V., Wille, H., 1987. Überprüfung
der Schätzmethode zur Ermittlung der Brutfläche und der Anzahl Arbeiterinnen
in freifliegenden Bienenvölkern. Apidologie 18 (2), 137-146.
Imdorf, A., K. Ruoff, and P. Fluri. 2008. Volksentwicklung bei der Honigbiene. ALP
forum. (68), 2008, 1-88 (accessed on July 1st 2013), in German, French, Italian.
Kirrane, M.J., De Guzman, L.I., Rinderer, T.E., Franke, A.M., Wagnitz, J., Whelan,
P.M., 2011. Asynchronous Development of Honey Bee Host and Varroa
destructor (Mesostigmata: Varroidae) Influences Reproductive Potential of
Mites. J. Econ. Entomol. 104(4), 1146-1152.
Klein, A.M., Vaissière, B.E., Cane, J.H., Steffan-Dewenter, I., Cunningham, S.A.,
Kremen, C., Tscharntke, T., 2007. Importance of pollinators in changing
landscapes for world crops. Proc. R. Soc. B 274, 303–313.
Korpela, S., Aarhus, A., Fries, I., Hansen, H., 1992. Varroa jacobsoni Oud. in cold
climates: population growth, winter mortality and influence on the survival of
honey bee colonies. Journal of Apicultural Research 31: 157-164.
52

Literaturverzeichnis
Le Conte, Y., Arnold, G., Trouiller, J., Masson, C., Chappe, B., Ourisson, G., 1989.
Attraction of the parasitic mite Varroa to the drone larvae of honeybees by
simple aliphatic esters. Science 245, 638–639.
Le Conte, Y., Arnold, G., Trouiller, J., Masson, C., 1990. Identification of a brood
pheromone in honeybees. Naturwissenschaften 77, 334–336.
Le Conte, Y., Sreng, L., Trouiller, J., 1994. The recognition of larvae by worker
honeybees. Naturwissenschaften 81, 462–465.
Le Conte, Y., De Vaublanc, G., Crauser, D., Jeanne, F., Rousselle, J-C., Bécard, J-M.,
2007. Honey bee colonies that have survived Varroa destructor. Apidologie 38
(6), 566-572.
Le Conte, Y. M. Ellis, and W. Ritter. 2010. Varroa mites and honey bee health: can
Varroa explain part of the colony losses? Apidologie 41: 353–363.
Linderholm, H.W. 2006. Growing season changes in the last century. Agricultural and
Forest Meteorology 137: 1-14.
Locke, B., Fries, I., 2011. Characteristics of honey bee colonies (Apis mellifera) in
Sweden surviving Varroa destructor infestation. Apidologie 42, 533-542.
Martin, S.J., 1994. Ontogenesis of the mite Varroa jaconsoni Oud. in worker brood of
the honeybee Apis mellifera L. under natural conditions. Exp. Appl. Acarol. 18,
87-100.
Martin, S., Cook, C., 1996. Effect of host brood type on the number of offspring laid by
the honeybee parasite Varroa jacobsoni. Exp. Appl. Acarol. 20, 387-390.
Martin, S., Holland, K., Murray, M., 1997. Non-reproduction in the honeybee mite
Varroa jacobsoni. Exp. Appl. Acarol. 21, 539–549.
Martin, S. 1998. A population model for the ectoparasitic mite Varroa jacobsoni in
honey bee (Apis mellifera) colonies. Ecological Modelling 109(3): 267-281.
Mattila, H.R., J.L. Harris, and G.W. Otis. 2001. Timing of production of winter bees in
honey bee (Apis mellifera) colonies. Insectes Sociaux 48(2): 88–93.
Nazzi, F., Milani, N., Della Vedova, G., 2002. (Z)-8-Heptadecene from infested cells
reduces the reproduction of Varroa destructor under laboratory conditions, J.
Chem. Ecol. 28, 2181–2190.
53

Literaturverzeichnis
Nguyen, B.K., M. Ribière, D. vanEngelsdorp, C. Snoeck, C. Saegerman, A.L.
Kalkstein, F. Schurr, Y. Brostaux, J-P Faucon and E. Haubruge. 2011. Effects of
honey bee virus prevalence, Varroa destructor load and queen condition on
honey bee colony survival over the winter in Belgium. Journal of Apicultural
Research 50 (3): 195-202.
Nijhout, H. F. 2003. The control of growth. Development 130:5863–5867.
Oldroyd, B.P., 1999. Coevolution while you wait: Varroa jacobsoni, a new parasite of
western honeybees. Trends Ecol. Evol. 14:312–315.
Peng, Y.S., Fang, Y., Xu, S., Ge, L., 1987. The resistance mechanism of the Asian
honey bee, Apis cerana Fabr., to an ectoparasitic mite, Varroa jacobsoni
Oudemans. J. Invertebr. Pathol. 49:54–60.
Rehm, S.M., Ritter, W., 1989. Sequence of the sexes in the offspring of Varroa
jacobsoni and resulting consequences fort he calculation of the developmental
period. Apidologie 20, 339-343.
Renz, M, Rosenkranz, P., 2001. Infestation dynamics and reinvasion of Varroa
destructor mites in honey bee colonies kept isolated and in groups. Apidologie
32, 492–494.
Rice, N.D., Winston, M.L., Higo, H.A., 2004. Integrated pest management for the
parasitic mite Varroa destructor (Anderson and Trueman) in colonies of honey
bees (Apis mellifera). Am. Bee J. 144, 791–795.
Ritter, W., Leclercq, E.,1987. Entwicklung der Bienen- und Varroamilben-population
in Gebieten mit unterschiedlichen Möglichkeiten der Reinvasion. Tierärztliche
Umschau 42 (7), 548-551.
Rosenkranz, P., Stürmer, M., 1992. Ernärungsabhägige Fertilität der Varroa-Weibchen
in Arbeiterinnenbrut von Apis mellifera carnica und Apis mellifera capensis,
vol. 47. Univ. Mariae Curie, Sklodowska, Lublin-Poland, Sectio DD, pp. 55–60.
Rosenkranz, P., Engels, W.,1994. Infertility of Varroa jacobsoni females after invasion
into Apis mellifera worker brood as a tolerance factor against varroatosis.
Apidologie 25, 402–411.
54

Literaturverzeichnis
Rosenkranz, P., Bartalszky, H., 1996. Reproduction of Varroa females after long
broodless periods of the honey bee colony during summer. Apidologie 27, 288-
289.
Rosenkranz, P., Aumeier, P., Ziegelmann, B., 2010. Biology and control of Varroa
destructor. Journal of Invertebrate Pathology 103, 96- 119.
Rucker, R.R., Thurman, W.N., Burgett, M., 2012. Honey bee pollination markets and
the internalization of reciprocal benefits. Amer. J. Agr. Econ. 94(4): 956–977.
Sakofski, F., Koeniger, N., Fuchs, S., 1990. Seasonality of honey bee colony invasion
by Varroa jacobsoni Oud. Apidologie 21, 547-550.
Sammatoro, D., Hoffman, G.D., Wardell, G., Finley, J., Ostiguy, N., 2004. Testing of a
combination of control tactics to manage Varroa destructor (Acari: Varroidae)
population levels in honey bee (Hymenoptera: Apidae). Int. J. Acarol. 30, 71–76.
Seeley, T.D., 2007. Honey bees of the Arnot Forest: a population of feral colonies
persisting with Varroa destructor in the northeastern United States. Apidologie
38, 19-29.
Strange, J., and W. Sheppard. 2001. Optimum timing of miticide applications for
control of Varroa destructor (Acari: Varroidae) in Apis mellifera (Hymenoptera:
Apidae) in Washington State, USA. Journal of Economic Entomology, 94:
1324–1331.
Steiner, J., Dittmann, F., Rosenkranz, P., Engels, W., 1994. The first gonocycle of the
parasitic mite (Varroa jacobsoni) in relation to preimaginal development of its
host, the honey bee (Apis mellifera carnica). Invertebr. Rep. Develop. 25, 175-
183.
Steiner, J., Diehl, P.A., Vlimant, M., 1995. Vitellogenesis on Varroa jacobsoni, a
parasite of honey bees. Exp. Appl. Acarol. 19, 411-422.
Tewarson, N.C., Engels, W., 1982. Undigested uptake of non-host proteins by Varroa
jacobsoni. J. Apicult. Res. 21, 222–225.
Trouiller, J., Arnold, G., Le Conte, Y., Masson, C., 1991. Temporal Pheromonal and
Kairomonal Secretion in the Brood of Honeybees. Naturwissenschaften 78, 368-
370.
55

Literaturverzeichnis
Trouiller, J., Arnold, G., Chappe, B., Le Conte, Y., Masson, C., 1992. Semiochemical
basis of infestation of honey bee brood by Varroa jacobsoni. J. Chem. Ecol. 18
(11), 2041–2053.
Trouillier, J., Milani, N., 1999. Stimulation of Varroa jacobsoni Oud. Oviposition with
semiochemicals from honeybee brood. Apidologie 30, 3-12.
van Dooremalen, C., L. Gerritsen, B. Cornelissen, J. J. M. van der Steen, F. van
Langevelde, and T. Blacquière. 2012. Winter Survival of Individual Honey Bees
and Honey Bee Colonies Depends on Level of Varroa destructor Infestation.
PLoS ONE Volume:7, Issue: 4, e: 36285.
Vetharaniam, I. 2012. Predicting reproduction rate of varroa. Ecological Modelling 224:
11- 17.
Wallner, K., 1999. Varroacides and their residues in bee products. Apidologie 30:235–
248.
Wallner, K., Fries, I., 2003. Control of the mite Varroa destructor in honey bee
colonies. Pesticide Outlook 14(2): 80-84.
Watanabe, M.E., 1994. Pollination Worries Rise as Honey Bees Decline. Science, New
Series, Vol. 265, No. 5176, p. 1170.
Wilkinson, D and G.C. Smith. 2002. A model of the mite parasite, Varroa destructor, on
honeybees (Apis mellifera) to investigate parameters important to mite
population growth. Ecological Modelling 148: 263–275.
Wu, Q., and M.R. Brown, 2006. Signaling and function of insulin-like peptides in
insects. Annu. Rev. Entomol. 51:1-24.
56

Kongresse und Forschungsaufenthalte:
2006: 53. Jahrestagung der Arbeitsgemeinschaft der Institute für Bienenforschung e.V.,
28.-30.03.2006, Stuttgart-Hohenheim.
2nd European Conference of Apidology, 11.-14.09.2006, Prag, Tschechien.
2007: 54. Jahrestagung der Arbeitsgemeinschaft der Institute für Bienenforschung e.V.,
27.-29.03.2007, Veitshöchheim; E. Frey, H. Schnell, P. Rosenkranz: Test von
„Gotland-Königinnen“ nach 6 Jahren natürlicher Selektion auf Varroatoleranz in
einer geschlossenen Population.
2008: 55. Jahrestagung der Arbeitsgemeinschaft der Institute für Bienenforschung e.V.,
11.-13.03.2008, Hohen-Neuendorf; E. Frey, I. Fries, S. Weller, P. Rosenkranz:
Populationsdynamik und Varroabefall von „Gotland“-Bienenvölkern im
Vergleich zu nicht selektierten Bienenvölkern.
3rd European Conference of Apidology, 08.-11.09. 2008, Belfast, Irland; E.
Frey, S. Weller, R. Odemer, P. Rosenkranz: Comparison of population
dynamics, hygienic behaviour and mite reproduction in honey bee colonies
preselected for Varroa tolerance.
2009: Forschungsarbeiten im Bienengesundheitsdienst, Tierärztliches Untersuchungs-
amt, Aulendorf, 05.-08. 10.2009.
2010: 57. Jahrestagung der Arbeitsgemeinschaft der Institute für Bienenforschung e.V.,
27.-29.03.2010, Herne; E. Frey, R. Odemer, P. Rosenkranz: Varroa-
Reproduktion – Zeitlicher Verlauf und Suche nach den aktivierenden Substanzen
in der Bienenbrut.
Forschungsarbeiten im Bienengesundheitsdienst, Tierärztliches Untersuchungs-
amt, Aulendorf, 06.-14.05.2010.
2011: Forschungsaufenthalt an der Universität Chiang Mai, Thailand, 13.01–15.03.2011
58. Jahrestagung der Arbeitsgemeinschaft der Institute für Bienenforschung
e.V., 29.-31.03.2011, Berlin; E. Frey, P. Rosenkranz: Beeinflussung der Varroa-
Reproduktion durch Wirtsfaktoren.
2012: 59. Jahrestagung der Arbeitsgemeinschaft der Institute für Bienenforschung e.V.,
27.-29.03.2012, Bonn; E. Frey, P. Rosenkranz: Die Bienendichte beeinflusst die
57

Invasionsrate und Vermehrung der Varroapopulation (Varroa destructor) im
Spätsommer.
5th European Conference of Apidology, 04.–06.09.2012, Halle an der Saale; E.
Frey, P. Rosenkranz: Invasion rates and population growth of Varroa destructor
in regions with high and low numbers of honey bee colonies.
2013: 60. Jahrestagung der Arbeitsgemeinschaft der Institute für Bienenforschung e.V.,
19.-21.03.2013, Würzburg; E. Frey, R. Odemer, T. Blum, P. Rosenkranz:
Aktivierung und Unterbrechung der Reproduktion von Varroa destructor durch
Wirtsfaktoren (Apis mellifera).
58

Projekte:
2006-2009: EU-Projekt Bees in Europe and Sustainable Honey Production (BEE
SHOP); Contract No.: PL 022568.
2008-2010: Verbundprojekt FUGATO-plus - FUGAPIS - Funktionelle Genomanalyse
für Krankheitsresistenz bei der Honigbiene (Apis mellifera); Functional genome
analysis of disease resistance in honeybees (Apis mellifera); Förderkennzeichen:
0315125C.
2010-2013: EU-Projekt Bees in Europe and the Decline of Honeybee Colonies (BEE
DOC); Contract No: FP7-KBBE-2009-3 244956 CP-FP.
59

Buchbeiträge und Artikel in imkerlichen und landwirtschaftlichen
Fachzeitschriften:
Fries, I., Lindström, A., Rosenkranz, P., Frey, E., Odemer, R., Schroeder, A., De
Miranda, J., Yanez, O., Paxton, R. The principal parasites and pathogens of honeybees.
In: Bees in Europe and Sustainable Hoey Production (BEE SHOP), Results of a Pan-
European Research Network. Seite 49-107. Behrens, D., Moritz, R.F.A., (Eds) 2011;
Food Science and Technology, Nova Science Publishers, Inc. New York.
Rosenkranz, P., Frey, E., Odemer, R., Ziegelmann, B. Beiträge zu: Standard methods
for varroa research. In: COLOSS BEEBOOK Volume I. Dietemann, V., Ellis, J.D.,
Neumann, P. (Eds) 2013; Veröffentlicht in Journal of Apicultural Research 52 (1),
2013.
ADIZ, Ausgabe 7/2012. Milbeninvasion im Spätsommer. Vermehrung und Verbreitung
der Varroa.
Deutsches Bienenjournal Ausgabe, 7/2012. Fragen und Antworten: Benachbarte Milben
Badische Bauernzeitung, Nummer 30/2012. Möglichst gleichzeitig behandeln
Deutsches Bienenjournal, Ausgabe Nr. 9/2013. Die Re-Invasorinnen.
Laborjournal, Ausgabe 09/2013. Hohenheim: Bienen und Parasiten - Ausgetrickst.
60

Danksagung
Danken möchte ich…
Herrn Dr. Peter Rosenkranz für die Vergabe dieser Arbeit, die engagierte Betreuung und
gute Zusammenarbeit.
Herrn Prof. Dr. sc. agr. Dr. h.c. Werner Bessei, er übernahm freundlicherweise die
Betreuung dieser Arbeit.
Frau Prof. Dr. Ute Mackenstedt sei für die Zweitkorrektur dieser Arbeit gedankt sowie
Prof. Dr. Klaus Schmieder für die gute Zusammenarbeit.
Thomas Blum leistete wertvolle Hilfestellung bei den GC-MS-Analysen.
Danken möchte ich auch allen Mitarbeiterinnen und Mitarbeitern der Landesanstalt für
Bienenkunde für die Diskussionen zur Entwicklung von Problemlösungen sowie den
Informationsaustausch zu aktuellen Beobachtungen.
Für die tatkräftige Unterstützung bei der Vorbereitung und Durchführung von
Versuchen danke ich Anne Lindenmayer, Hanna Schnell, Richard Odemer, Paul
Trumpf, Jana Reetz, Claudia Häußermann, Bettina Ziegelmann und Nadine Kunz.
Fritz Hug und Elmar Winterhalter stellten mir in Südbaden Standorte für meine
Versuchsbienenvölker zur Verfügung und unterstützen mich tatkräftig vor Ort.
Der Verwaltung des ehemaligen Truppenübungsplatzes in Münsingen danke ich für die
kooperative Zusammenarbeit, dem LTZ Augustenberg für die Bereitstellung von
Wetterdaten.
Ingemar Fries, Robert Paxton und Barbara Locke sei für die sprachliche Prüfung meiner
englischen Manuskripte gedankt.
61

Eidesstattliche Versicherung gemäß § 8 Absatz 2 der Promotionsordnung der Universität Hohenheim zum Dr.sc.agr.
1. Bei der eingereichten Dissertation zum Thema
……………………………………………………………………………………………
…………………………………………………………………………………………....
handelt es sich um meine eigenständig erbrachte Leistung.
2. Ich habe nur die angegebenen Quellen und Hilfsmittel benutzt und mich keiner unzulässigen Hilfe Dritter bedient. Insbesondere habe ich wörtlich oder sinngemäß aus anderen Werken übernommene Inhalte als solche kenntlich gemacht.
3. Ich habe nicht die Hilfe einer kommerziellen Promotionsvermittlung oder -beratung in Anspruch genommen.
4. Die Bedeutung der eidesstattlichen Versicherung und der strafrechtlichen Folgen einer unrichtigen oder unvollständigen eidesstattlichen Versicherung sind mir bekannt.
Die Richtigkeit der vorstehenden Erklärung bestätige ich. Ich versichere an Eides Statt, dass ich nach bestem Wissen die reine Wahrheit erklärt und nichts verschwiegen habe.
Ort und Datum Unterschrift
Eidesstattliche Versicherung Belehrung
Die Universität Hohenheim verlangt eine Eidesstattliche Versicherung über die Eigenständigkeit der erbrachten wissenschaftlichen Leistungen, um sich glaubhaft zu versichern, dass die Promovendin bzw. der Promovend die wissenschaftlichen Leistungen eigenständig erbracht hat.
Weil der Gesetzgeber der Eidesstattlichen Versicherung eine besondere Bedeutung beimisst und sie erhebliche Folgen haben kann, hat der Gesetzgeber die Abgabe einer falschen eidesstattlichen Versicherung unter Strafe gestellt. Bei vorsätzlicher (also wissentlicher) Abgabe einer falschen Erklärung droht eine Freiheitsstrafe bis zu drei Jahren oder eine Geldstrafe.
Eine fahrlässige Abgabe (also Abgabe, obwohl Sie hätten erkennen müssen, dass die Erklärung nicht den Tatsachen entspricht) kann eine Freiheitsstrafe bis zu einem Jahr oder eine Geldstrafe nach sich ziehen.
Die entsprechenden Strafvorschriften sind in § 156 StGB (falsche Versicherung an Eides Statt) und in § 161 StGB (Fahrlässiger Falscheid, fahrlässige falsche Versicherung an Eides Statt) wiedergegeben.
§ 156 StGB: Falsche Versicherung an Eides Statt
Wer vor einer zur Abnahme einer Versicherung an Eides Statt zuständigen Behörde eine solche Versicherung falsch abgibt oder unter Berufung auf eine solche Versicherung falsch aussagt, wird mit Freiheitsstrafe bis zu drei Jahren oder mit Geldstrafe bestraft.
§ 161 StGB: Fahrlässiger Falscheid, fahrlässige falsche Versicherung an Eides Statt:
Abs. 1: Wenn eine der in den §§ 154 und 156 bezeichneten Handlungen aus Fahrlässigkeit begangen worden ist, so tritt Freiheitsstrafe bis zu einem Jahr oder Geldstrafe ein.
Abs. 2: Straflosigkeit tritt ein, wenn der Täter die falsche Angabe rechtzeitig berichtigt. Die Vorschriften des § 158 Absätze 2 und 3 gelten entsprechend.
Ich habe die Belehrung zur Eidesstattlichen Versicherung zur Kenntnis genommen.
Ort und Datum Unterschrift