Aus: Thommen/Grösser: Economy · Company · Management ...
43
Aus: Thommen/Grösser: Economy · Company · Management, 2014 1 © Versus Verlag 2019 Fig. 1 Classification of economic goods Economic goods Intangible goods Tangible goods (material goods) Consumer goods Production goods Services Rights (e. g., patents) Durable Non-durable Non-consumable factors of production Consumable factors of production Auxiliary Supplies Raw materials materials (immaterial goods) consumer goods consumer goods (capital goods) (materials)
Transcript of Aus: Thommen/Grösser: Economy · Company · Management ...
Aus: Thommen/Grösser: Economy · Company · Management, 2014 1
© Versus Verlag 2019
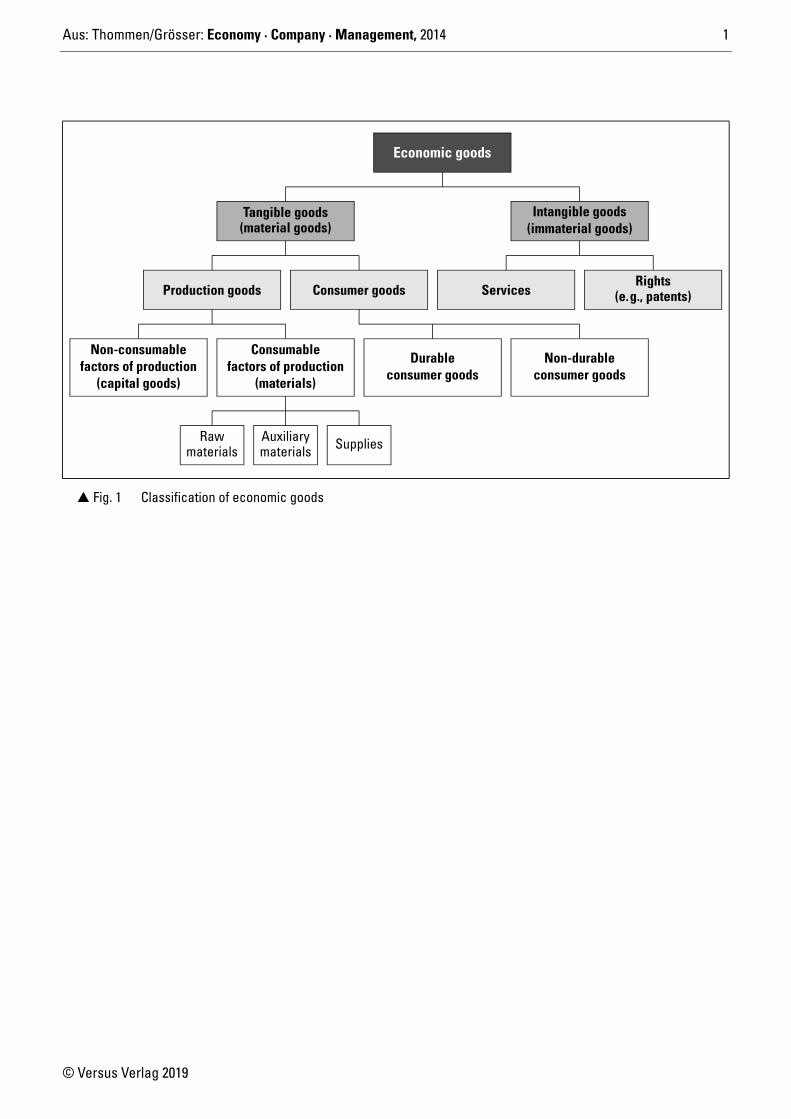
� Fig. 1 Classification of economic goods
Economic goods
Intangible goodsTangible goods(material goods)
Consumer goodsProduction goods ServicesRights
(e.g., patents)
Durable Non-durableNon-consumable
factors of productionConsumable
factors of production
Auxiliary SuppliesRawmaterials materials
(immaterial goods)
consumer goodsconsumer goods(capital goods) (materials)
Aus: Thommen/Grösser: Economy · Company · Management, 2014 2
© Versus Verlag 2019
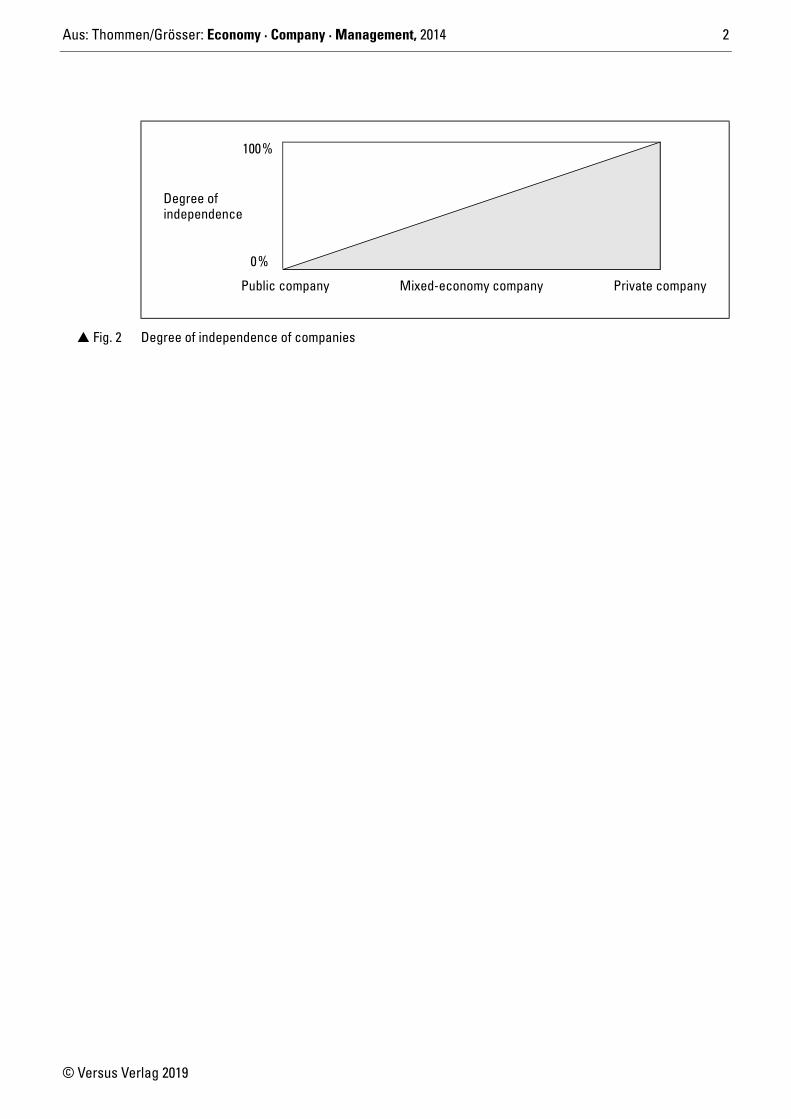
� Fig. 2 Degree of independence of companies
Degree of
100%
0%
Public company Mixed-economy company Private company
independence
Aus: Thommen/Grösser: Economy · Company · Management, 2014 3
© Versus Verlag 2019
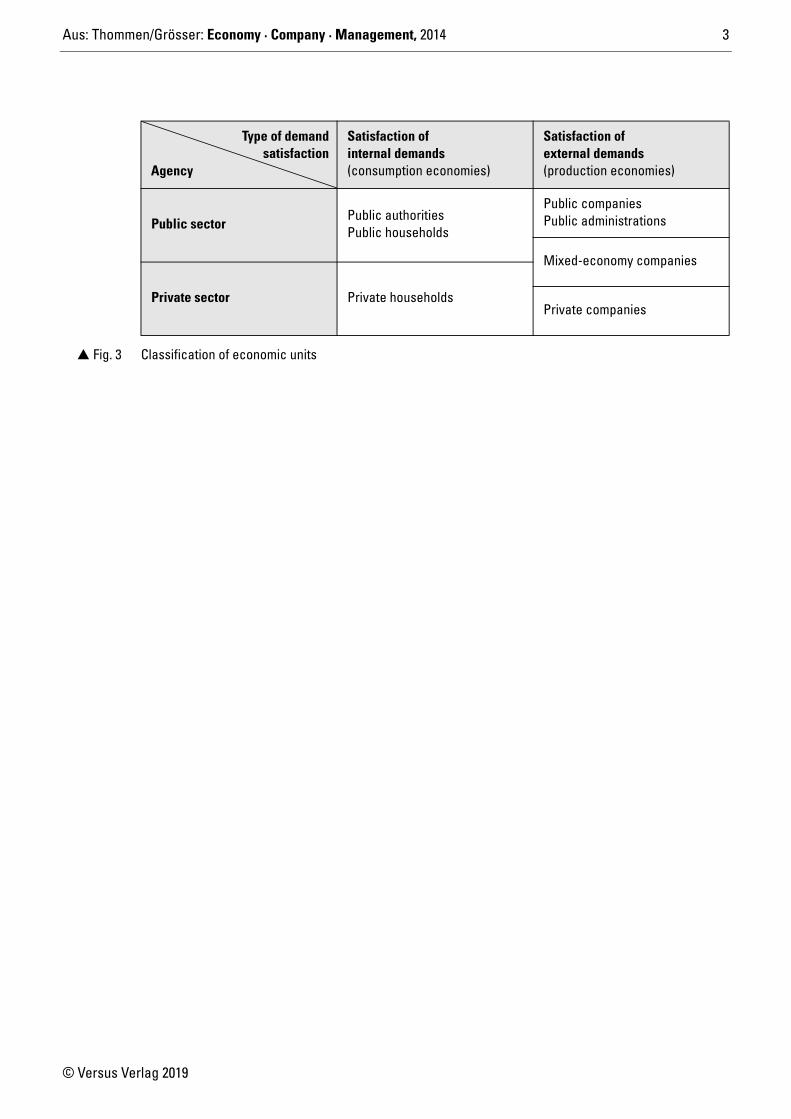
Satisfaction of internal demands(consumption economies)
Satisfaction of external demands(production economies)
Public sectorPublic authorities Public households
Public companiesPublic administrations
Mixed-economy companies
Private sector Private householdsPrivate companies
� Fig. 3 Classification of economic units
Type of demandsatisfaction
Agency
Aus: Thommen/Grösser: Economy · Company · Management, 2014 4
© Versus Verlag 2019
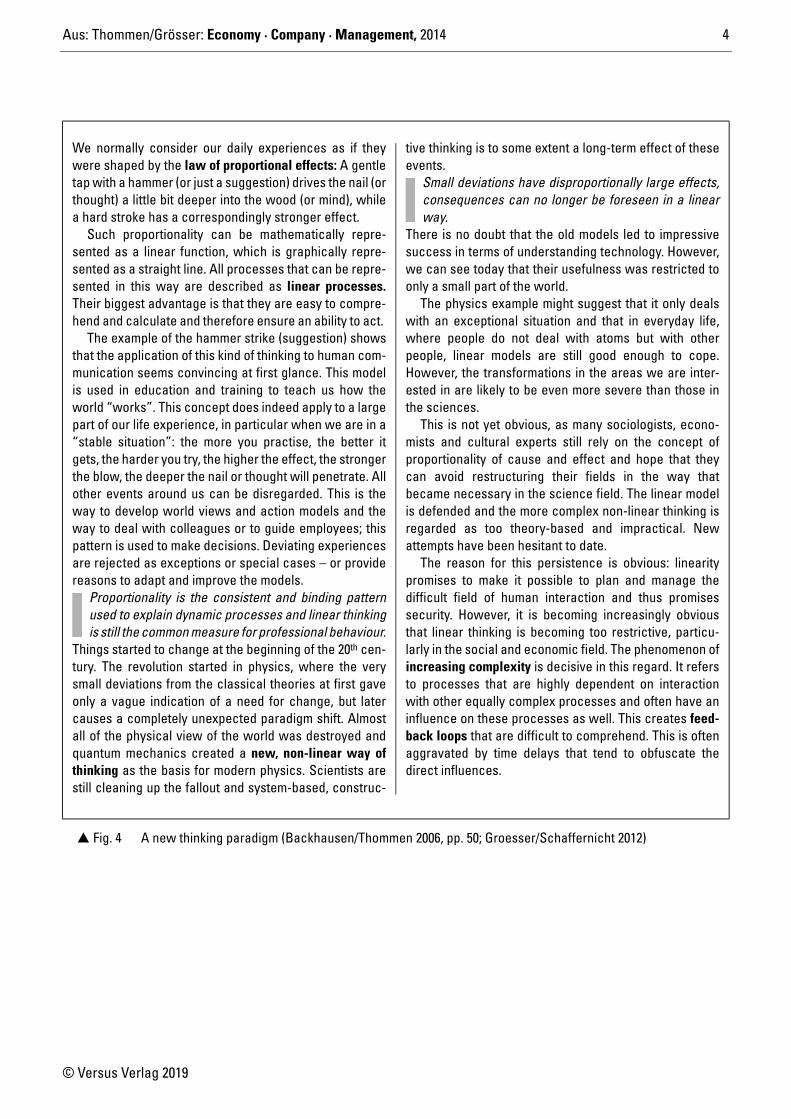
� Fig. 4 A new thinking paradigm (Backhausen/Thommen 2006, pp. 50; Groesser/Schaffernicht 2012)
We normally consider our daily experiences as if theywere shaped by the law of proportional effects: A gentletap with a hammer (or just a suggestion) drives the nail (orthought) a little bit deeper into the wood (or mind), whilea hard stroke has a correspondingly stronger effect.
Such proportionality can be mathematically repre-sented as a linear function, which is graphically repre-sented as a straight line. All processes that can be repre-sented in this way are described as linear processes.Their biggest advantage is that they are easy to compre-hend and calculate and therefore ensure an ability to act.
The example of the hammer strike (suggestion) showsthat the application of this kind of thinking to human com-munication seems convincing at first glance. This modelis used in education and training to teach us how theworld “works”. This concept does indeed apply to a largepart of our life experience, in particular when we are in a“stable situation”: the more you practise, the better itgets, the harder you try, the higher the effect, the strongerthe blow, the deeper the nail or thought will penetrate. Allother events around us can be disregarded. This is theway to develop world views and action models and theway to deal with colleagues or to guide employees; thispattern is used to make decisions. Deviating experiencesare rejected as exceptions or special cases – or providereasons to adapt and improve the models.
Proportionality is the consistent and binding patternused to explain dynamic processes and linear thinkingis still the common measure for professional behaviour.
Things started to change at the beginning of the 20th cen-tury. The revolution started in physics, where the verysmall deviations from the classical theories at first gaveonly a vague indication of a need for change, but latercauses a completely unexpected paradigm shift. Almostall of the physical view of the world was destroyed andquantum mechanics created a new, non-linear way ofthinking as the basis for modern physics. Scientists arestill cleaning up the fallout and system-based, construc-
tive thinking is to some extent a long-term effect of theseevents.
Small deviations have disproportionally large effects,consequences can no longer be foreseen in a linearway.
There is no doubt that the old models led to impressivesuccess in terms of understanding technology. However,we can see today that their usefulness was restricted toonly a small part of the world.
The physics example might suggest that it only dealswith an exceptional situation and that in everyday life,where people do not deal with atoms but with otherpeople, linear models are still good enough to cope.However, the transformations in the areas we are inter-ested in are likely to be even more severe than those inthe sciences.
This is not yet obvious, as many sociologists, econo-mists and cultural experts still rely on the concept ofproportionality of cause and effect and hope that theycan avoid restructuring their fields in the way thatbecame necessary in the science field. The linear modelis defended and the more complex non-linear thinking isregarded as too theory-based and impractical. Newattempts have been hesitant to date.
The reason for this persistence is obvious: linearitypromises to make it possible to plan and manage thedifficult field of human interaction and thus promisessecurity. However, it is becoming increasingly obviousthat linear thinking is becoming too restrictive, particu-larly in the social and economic field. The phenomenon ofincreasing complexity is decisive in this regard. It refersto processes that are highly dependent on interactionwith other equally complex processes and often have aninfluence on these processes as well. This creates feed-back loops that are difficult to comprehend. This is oftenaggravated by time delays that tend to obfuscate thedirect influences.
Aus: Thommen/Grösser: Economy · Company · Management, 2014 5
© Versus Verlag 2019
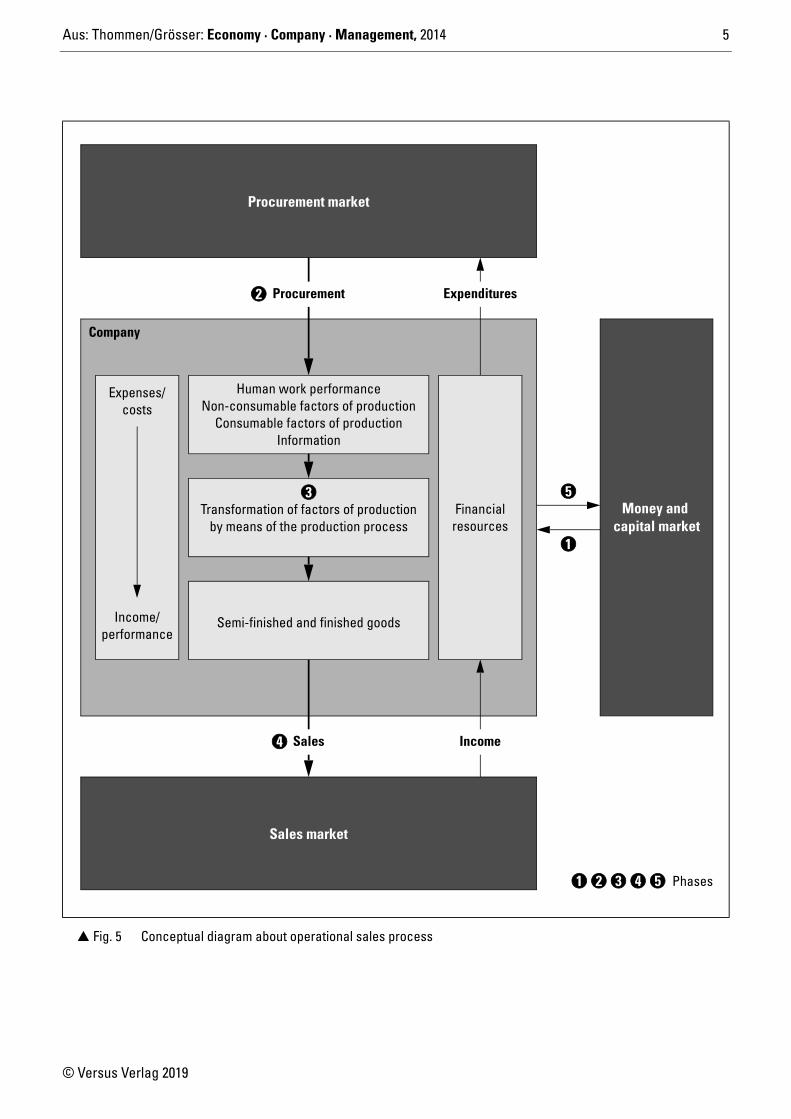
� Fig. 5 Conceptual diagram about operational sales process
Procurement market
Expenses/costs
Income/performance
Human work performanceNon-consumable factors of production
Consumable factors of productionInformation
Transformation of factors of productionby means of the production process
Semi-finished and finished goods
Financialresources
Money and
Sales Income
Sales market
Procurement Expenditures
capital market
Company
Phases1 2 3 4 5
1
2
4
53
Aus: Thommen/Grösser: Economy · Company · Management, 2014 6
© Versus Verlag 2019
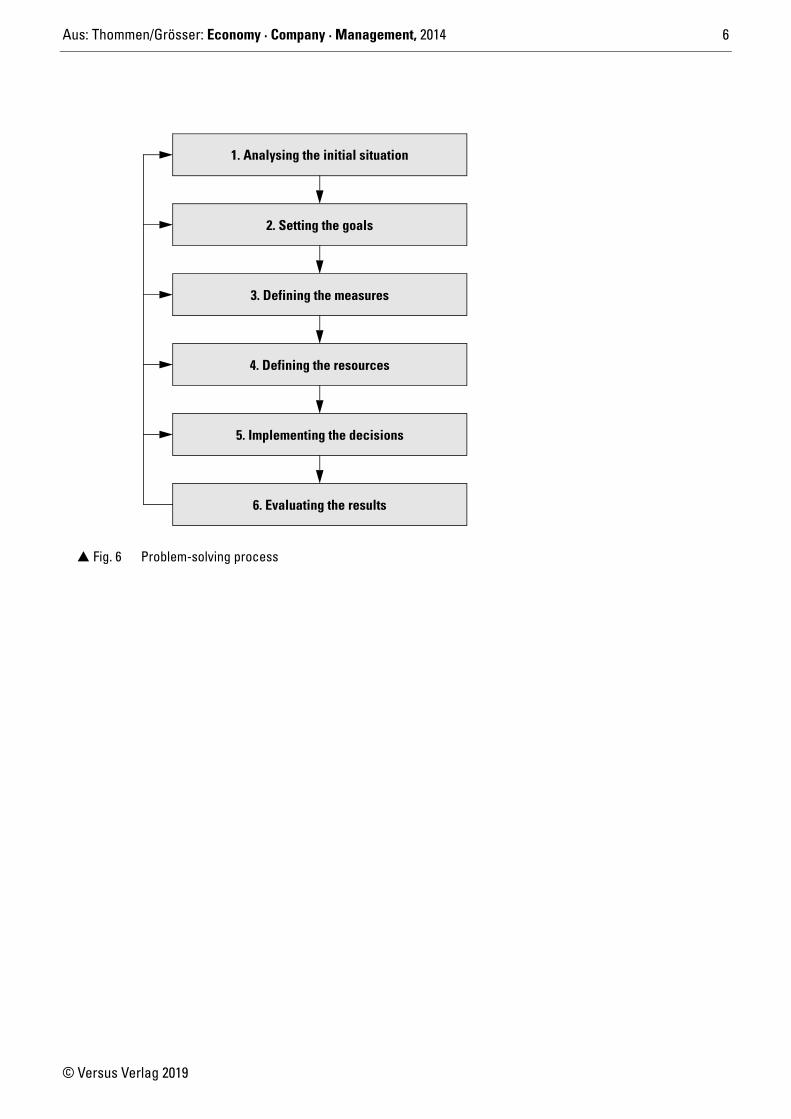
� Fig. 6 Problem-solving process
2. Setting the goals
6. Evaluating the results
5. Implementing the decisions
4. Defining the resources
3. Defining the measures
1. Analysing the initial situation
Aus: Thommen/Grösser: Economy · Company · Management, 2014 7
© Versus Verlag 2019
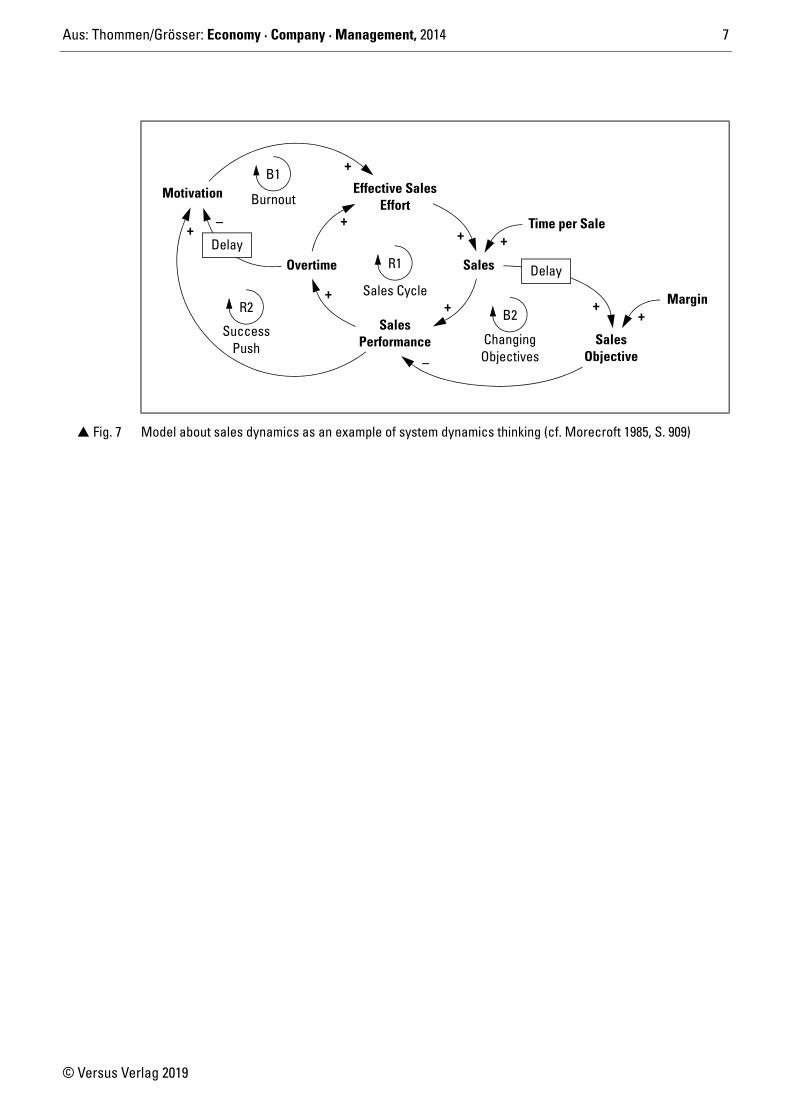
� Fig. 7 Model about sales dynamics as an example of system dynamics thinking (cf. Morecroft 1985, S. 909)
Effective SalesMotivation Burnout
Success
Overtime
SalesChangingObjectives
Sales
Sales
Margin
Time per Sale
Sales Cycle
Push
B1
R1
B2R2
Effort
Performance
++
++
Delay
+
+–
Objective
Delay
+
–
+
+

Aus: Thommen/Grösser: Economy · Company · Management, 2014 8
© Versus Verlag 2019
� Fig. 8 Linear model illustrating the influence of price, quality and functionality on operative cash flow
Product
Price
attractiveness +Quality
Functionality
Number ofproducts sold
Turnover fromsale of products
Operativecash flow+ +
+
+
–
Aus: Thommen/Grösser: Economy · Company · Management, 2014 9
© Versus Verlag 2019
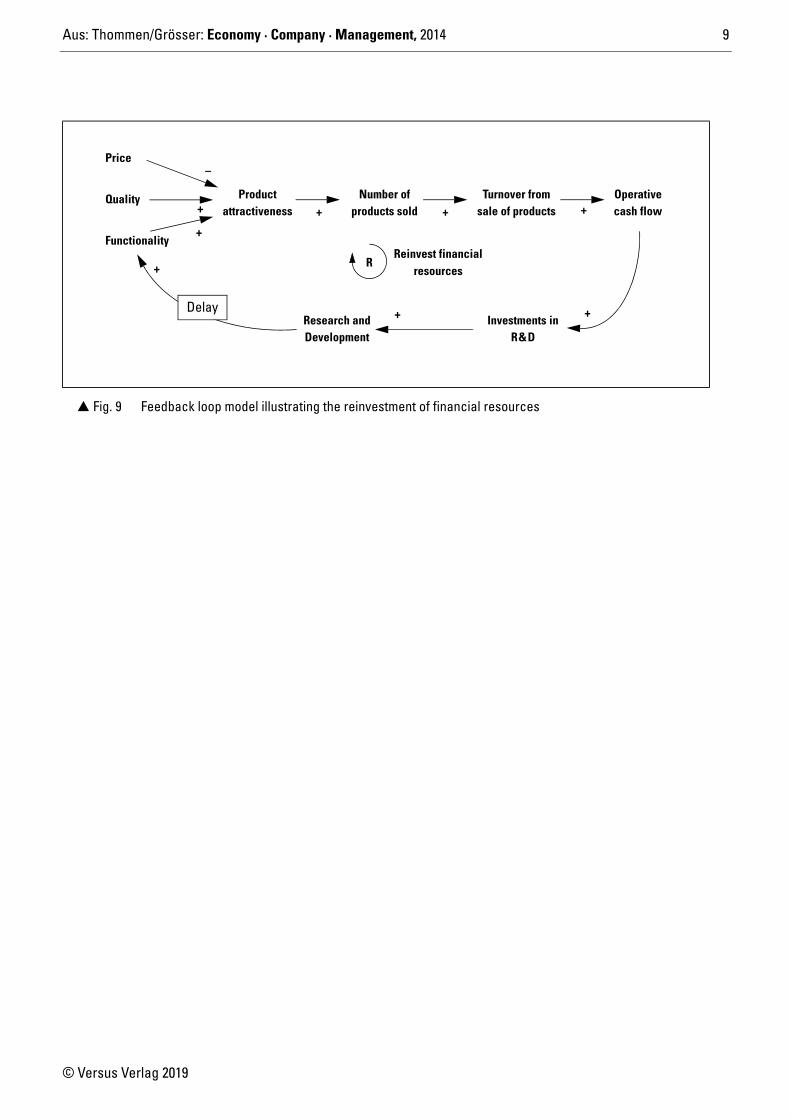
� Fig. 9 Feedback loop model illustrating the reinvestment of financial resources
Product
Price
attractiveness +Quality
Functionality
Number ofproducts sold
Turnover fromsale of products
Operativecash flow+ +
+
+
–
Reinvest financialresources
R
Investments inR&D
Research andDevelopment
+
+Delay +
Aus: Thommen/Grösser: Economy · Company · Management, 2014 10
© Versus Verlag 2019
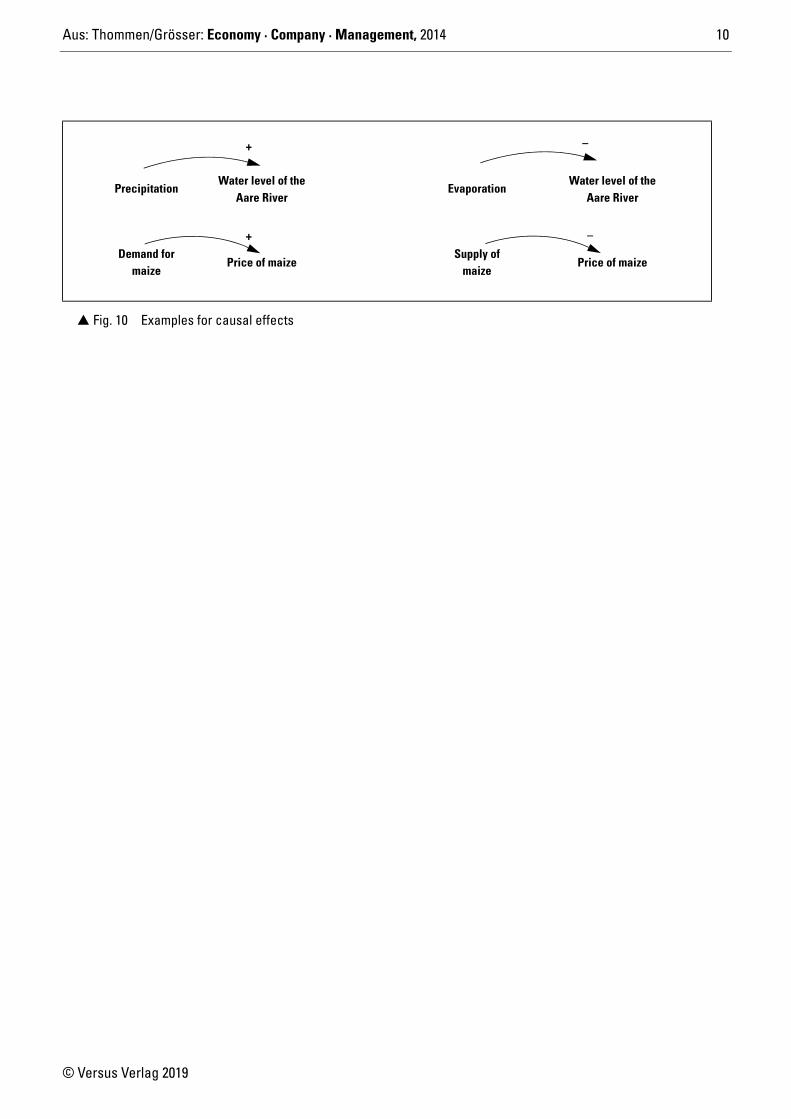
� Fig. 10 Examples for causal effects
Precipitation
Price of maizeDemand for
maize
Water level of theAare River
Evaporation
Supply ofmaize
Price of maize
Water level of theAare River
+
+ –
–
Aus: Thommen/Grösser: Economy · Company · Management, 2014 11
© Versus Verlag 2019
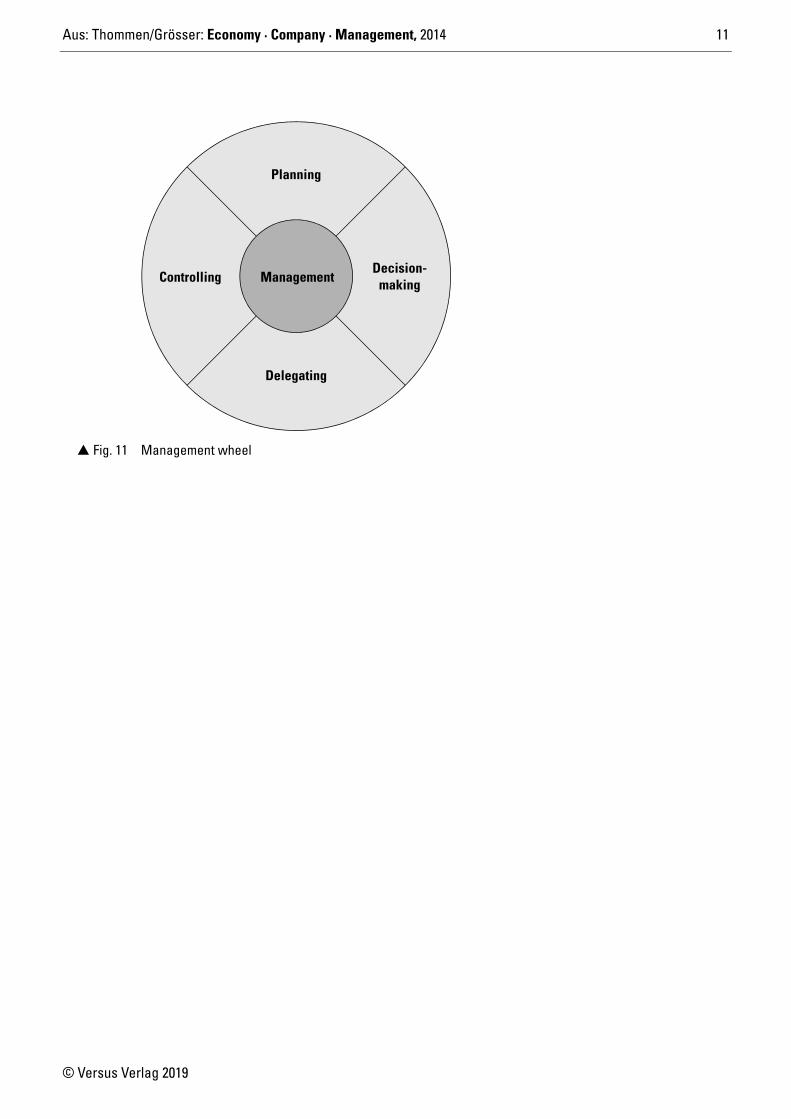
� Fig. 11 Management wheel
Management
Planning
Delegating
ControllingDecision-
making
Aus: Thommen/Grösser: Economy · Company · Management, 2014 12
© Versus Verlag 2019
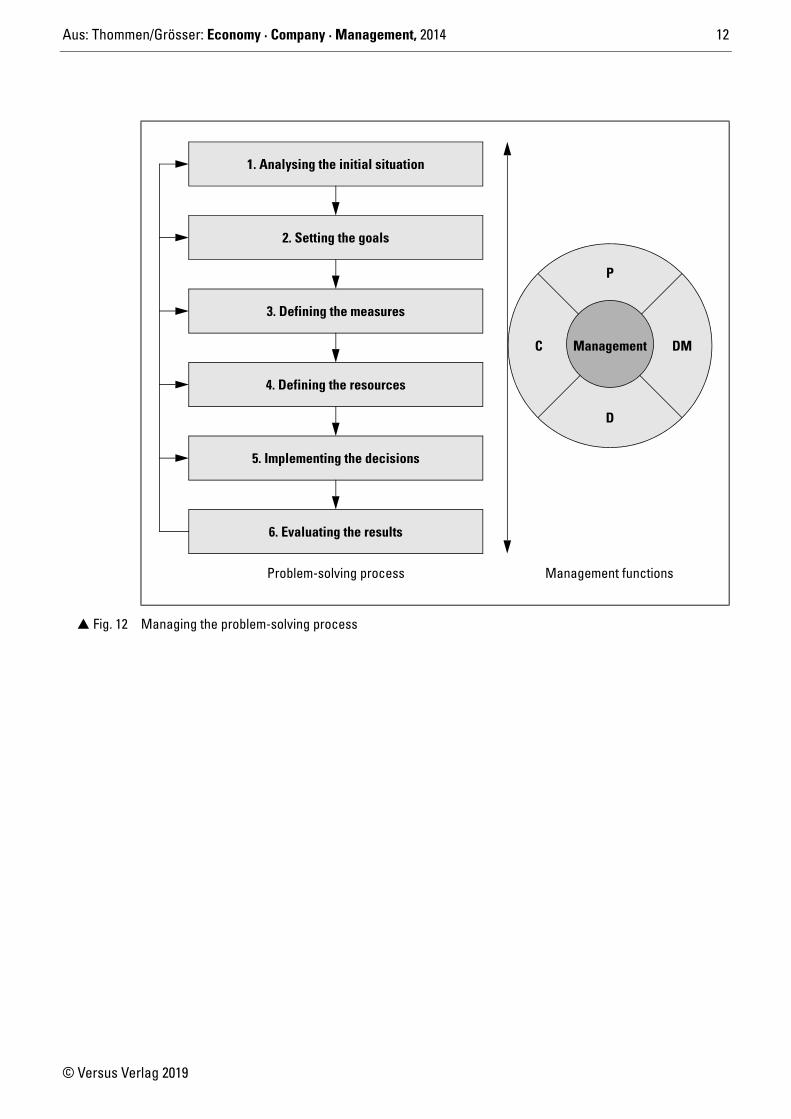
� Fig. 12 Managing the problem-solving process
Management
P
D
C DM
2. Setting the goals
6. Evaluating the results
5. Implementing the decisions
4. Defining the resources
3. Defining the measures
1. Analysing the initial situation
Problem-solving process Management functions
Aus: Thommen/Grösser: Economy · Company · Management, 2014 13
© Versus Verlag 2019
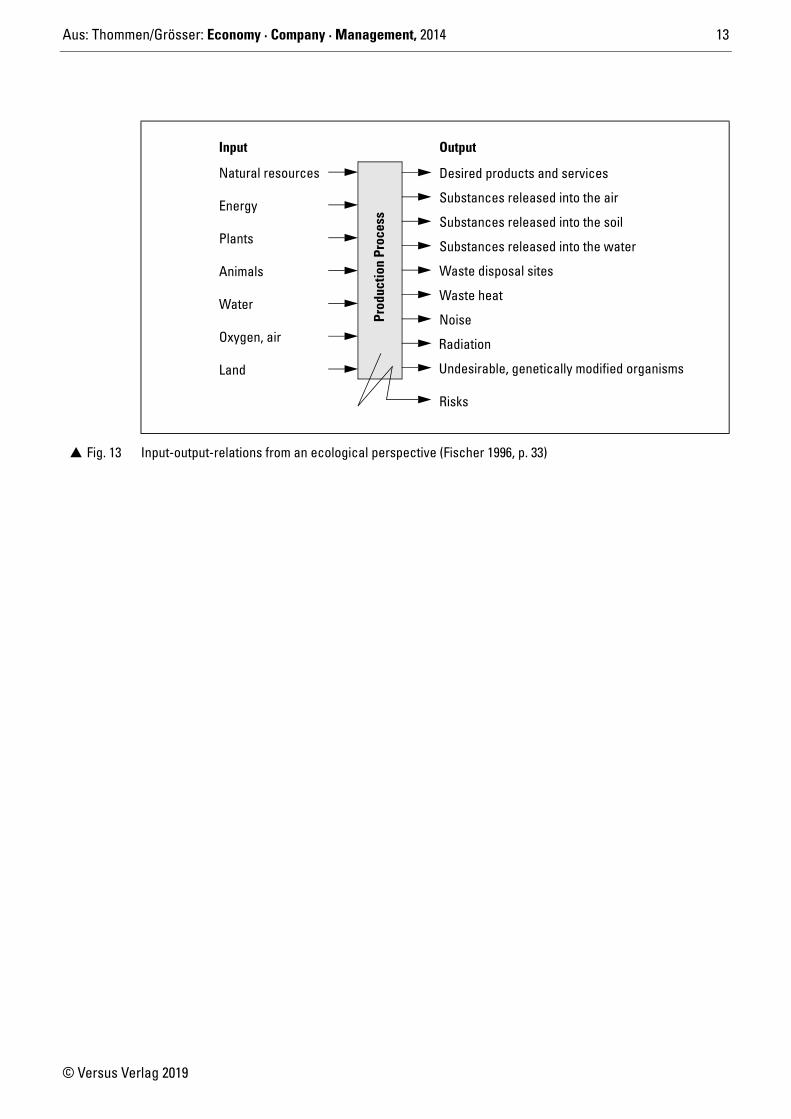
� Fig. 13 Input-output-relations from an ecological perspective (Fischer 1996, p. 33)
Input
Natural resources
Energy
Plants
Animals
Water
Oxygen, air
LandPr
oduc
tion
Proc
ess
Output
Desired products and services
Substances released into the air
Substances released into the soil
Substances released into the water
Waste disposal sites
Waste heat
Noise
Radiation
Undesirable, genetically modified organisms
Risks
Aus: Thommen/Grösser: Economy · Company · Management, 2014 14
© Versus Verlag 2019
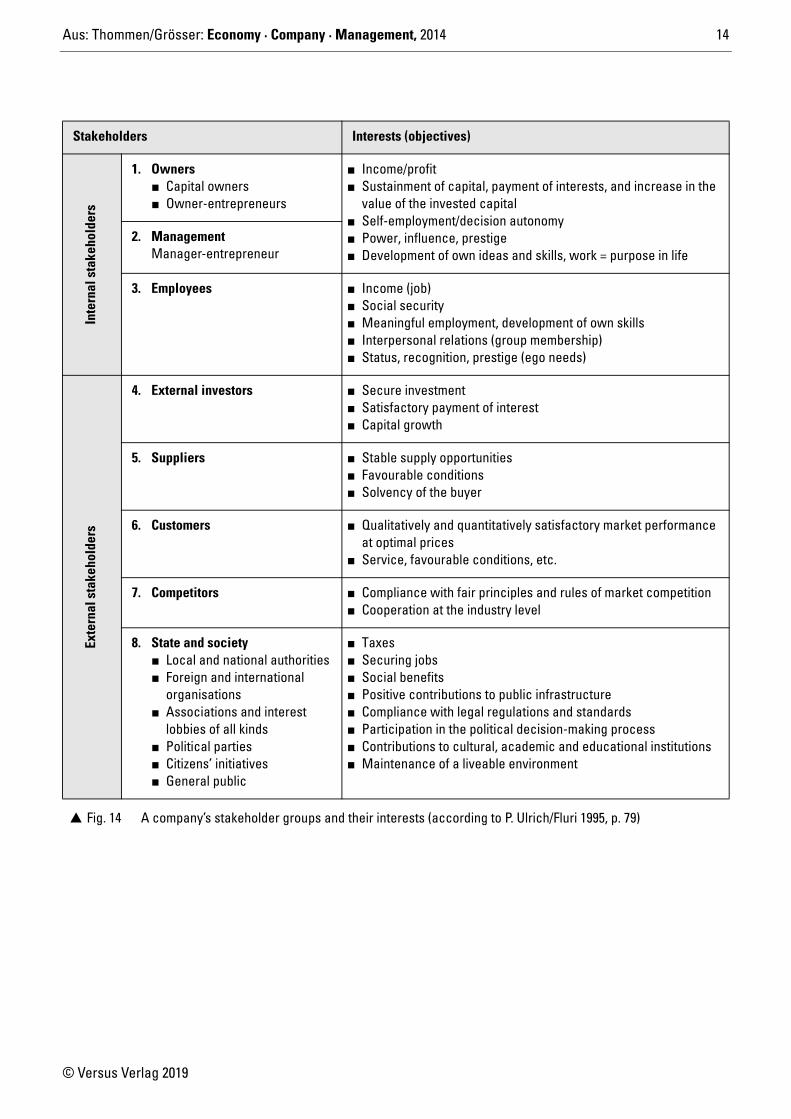
Stakeholders Interests (objectives)
Inte
rnal
sta
keho
lder
s
1. Owners� Capital owners� Owner-entrepreneurs
� Income/profit� Sustainment of capital, payment of interests, and increase in the
value of the invested capital� Self-employment/decision autonomy� Power, influence, prestige� Development of own ideas and skills, work = purpose in life
2. Management Manager-entrepreneur
3. Employees � Income (job)� Social security� Meaningful employment, development of own skills� Interpersonal relations (group membership)� Status, recognition, prestige (ego needs)
Exte
rnal
sta
keho
lder
s
4. External investors � Secure investment� Satisfactory payment of interest� Capital growth
5. Suppliers � Stable supply opportunities� Favourable conditions� Solvency of the buyer
6. Customers � Qualitatively and quantitatively satisfactory market performance at optimal prices
� Service, favourable conditions, etc.
7. Competitors � Compliance with fair principles and rules of market competition� Cooperation at the industry level
8. State and society� Local and national authorities� Foreign and international
organisations� Associations and interest
lobbies of all kinds� Political parties� Citizens’ initiatives� General public
� Taxes � Securing jobs� Social benefits� Positive contributions to public infrastructure� Compliance with legal regulations and standards� Participation in the political decision-making process� Contributions to cultural, academic and educational institutions� Maintenance of a liveable environment
� Fig. 14 A company’s stakeholder groups and their interests (according to P. Ulrich/Fluri 1995, p. 79)
Aus: Thommen/Grösser: Economy · Company · Management, 2014 15
© Versus Verlag 2019
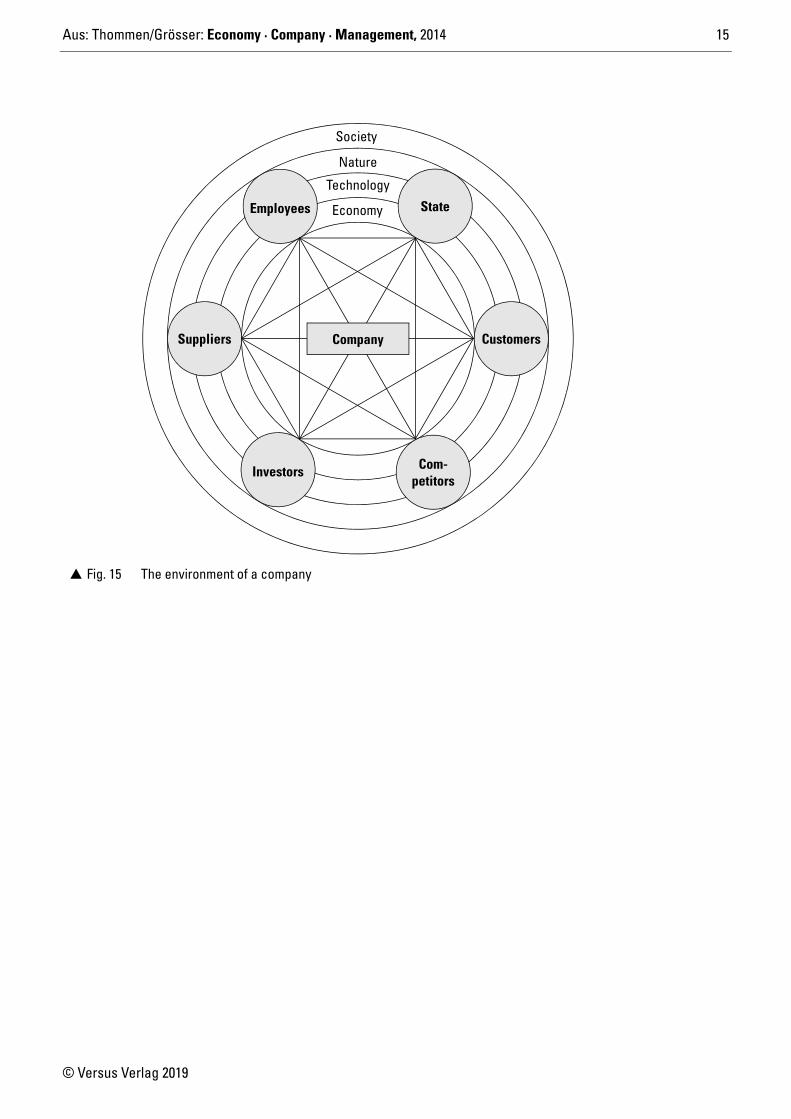
� Fig. 15 The environment of a company
Society
Nature
Technology
Economy State
Customers
Com-
Employees
Suppliers
Investors
Company
petitors
Aus: Thommen/Grösser: Economy · Company · Management, 2014 16
© Versus Verlag 2019
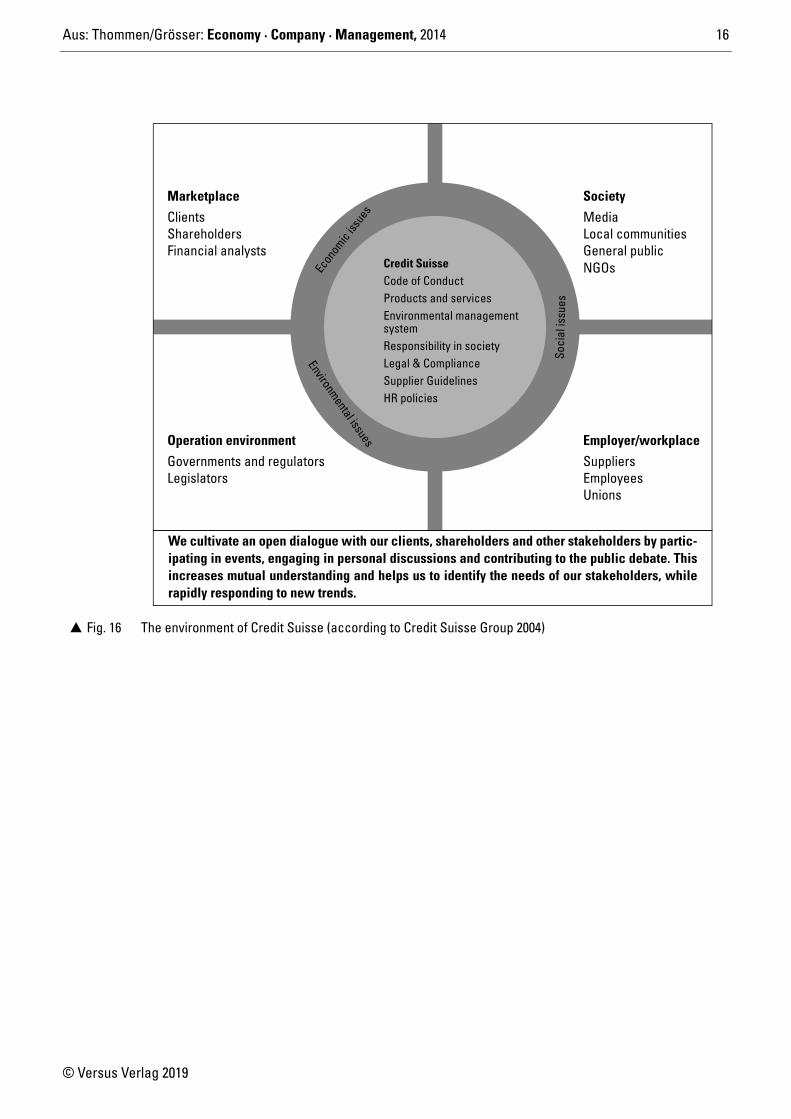
� Fig. 16 The environment of Credit Suisse (according to Credit Suisse Group 2004)
Credit Suisse
S oci
al is
sues
Environmental issues
Environmental managementsystem
Code of ConductProducts and services
Responsibility in societyLegal & ComplianceSupplier GuidelinesHR policies
Econ
omic
issue
s
SocietyMarketplace
Operation environment Employer/workplace
ShareholdersFinancial analysts
ClientsLocal communitiesGeneral public
Media
NGOs
LegislatorsGovernments and regulators
EmployeesUnions
Suppliers
We cultivate an open dialogue with our clients, shareholders and other stakeholders by partic-ipating in events, engaging in personal discussions and contributing to the public debate. Thisincreases mutual understanding and helps us to identify the needs of our stakeholders, whilerapidly responding to new trends.
Aus: Thommen/Grösser: Economy · Company · Management, 2014 17
© Versus Verlag 2019
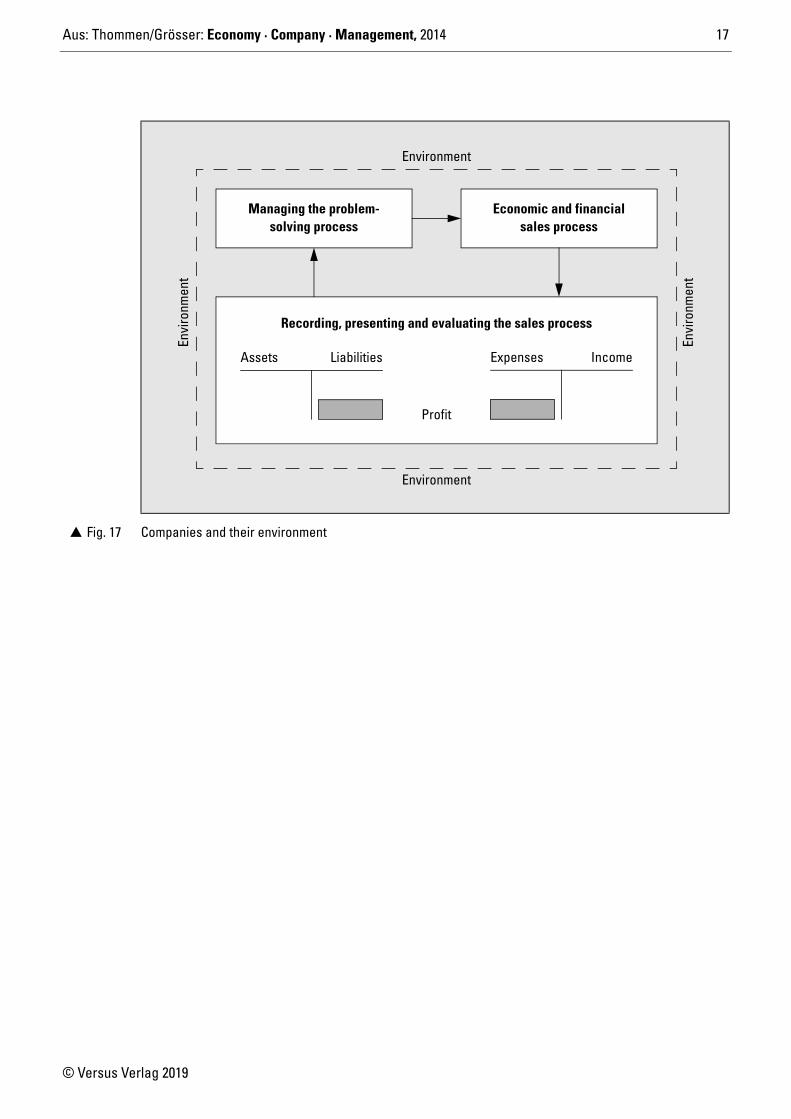
� Fig. 17 Companies and their environment
Environment
Envi
ronm
ent
Managing the problem-solving process
Economic and financialsales process
Recording, presenting and evaluating the sales process
Assets Liabilities
Profit
Expenses Income
Environment
Envi
ronm
ent
Aus: Thommen/Grösser: Economy · Company · Management, 2014 18
© Versus Verlag 2019
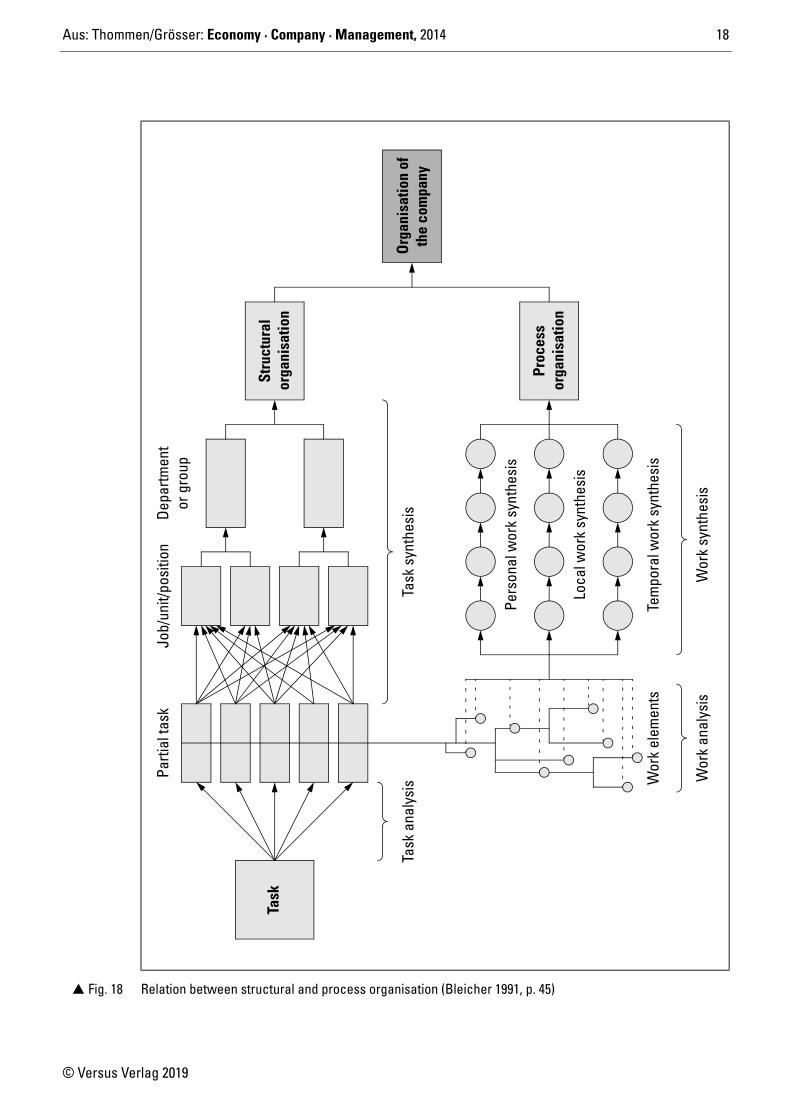
� Fig. 18 Relation between structural and process organisation (Bleicher 1991, p. 45)
Task
Org
anis
atio
n of
Stru
ctur
al
Depa
rtmen
tor
gro
upJo
b/un
it/po
sitio
nPa
rtial
task
Task
ana
lysi
sTa
sk s
ynth
esis
Pers
onal
wor
k sy
nthe
sis
Loca
l wor
k sy
nthe
sis
Tem
pora
l wor
k sy
nthe
sis
Wor
k el
emen
ts
Wor
k an
alys
isW
ork
synt
hesi
s
orga
nisa
tion
the
com
pany
Proc
ess
orga
nisa
tion
Aus: Thommen/Grösser: Economy · Company · Management, 2014 19
© Versus Verlag 2019
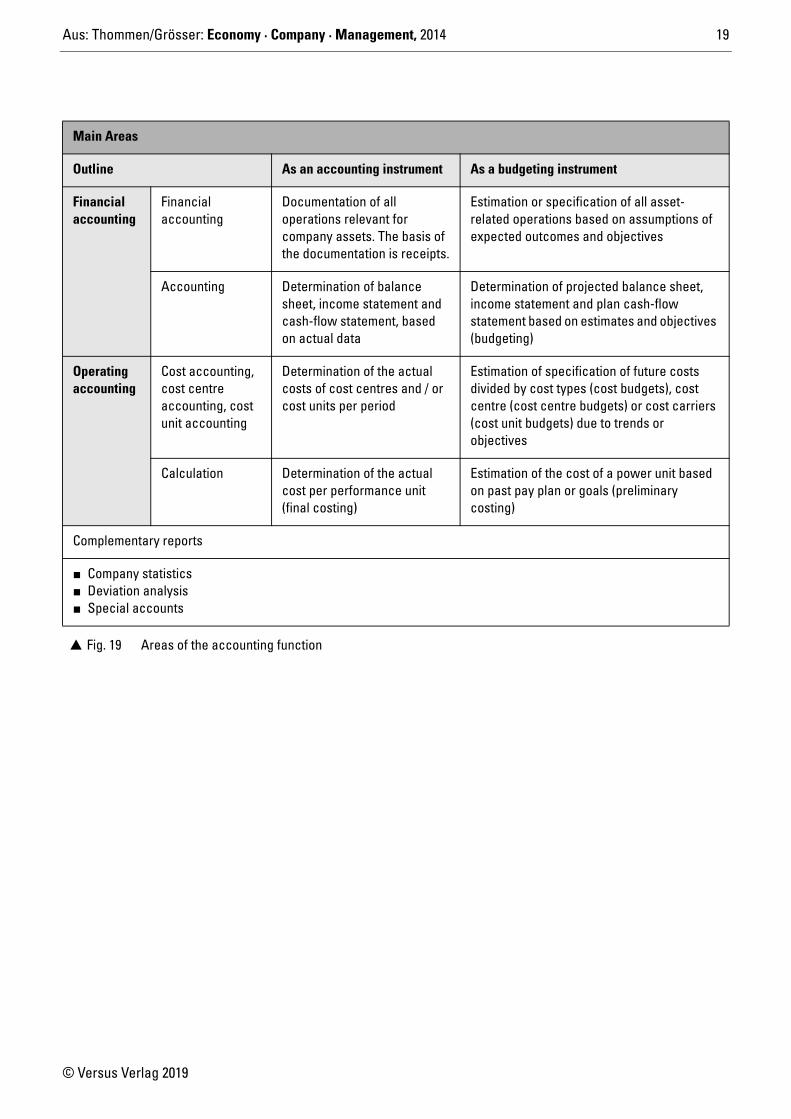
Main Areas
Outline As an accounting instrument As a budgeting instrument
Financial accounting
Financial accounting
Documentation of all operations relevant for company assets. The basis of the documentation is receipts.
Estimation or specification of all asset-related operations based on assumptions of expected outcomes and objectives
Accounting Determination of balance sheet, income statement and cash-flow statement, based on actual data
Determination of projected balance sheet, income statement and plan cash-flow statement based on estimates and objectives (budgeting)
Operating accounting
Cost accounting, cost centre accounting, cost unit accounting
Determination of the actual costs of cost centres and / or cost units per period
Estimation of specification of future costs divided by cost types (cost budgets), cost centre (cost centre budgets) or cost carriers (cost unit budgets) due to trends or objectives
Calculation Determination of the actual cost per performance unit (final costing)
Estimation of the cost of a power unit based on past pay plan or goals (preliminary costing)
Complementary reports
� Company statistics � Deviation analysis� Special accounts
� Fig. 19 Areas of the accounting function
Aus: Thommen/Grösser: Economy · Company · Management, 2014 20
© Versus Verlag 2019
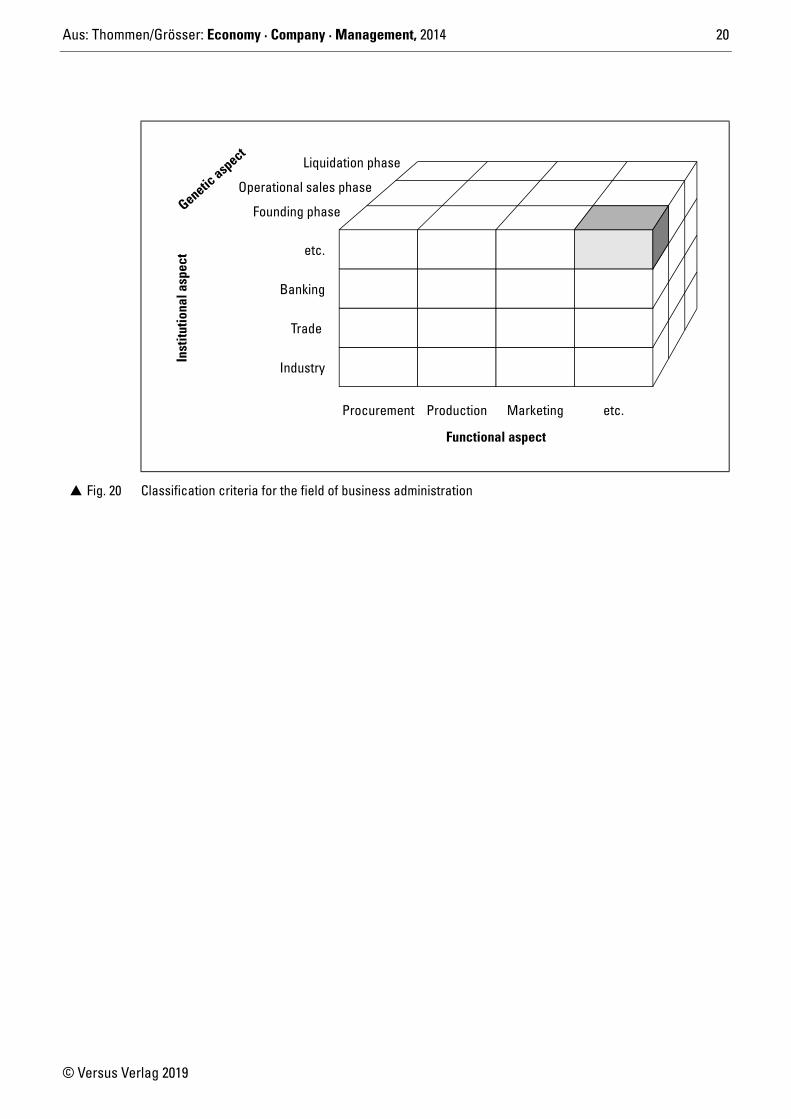
� Fig. 20 Classification criteria for the field of business administration
Procurement Production Marketing etc.
Inst
itutio
nal a
spec
t etc.
Banking
Trade
Industry
Liquidation phase
Operational sales phase
Founding phaseGenetic asp
ect
Functional aspect
Aus: Thommen/Grösser: Economy · Company · Management, 2014 21
© Versus Verlag 2019
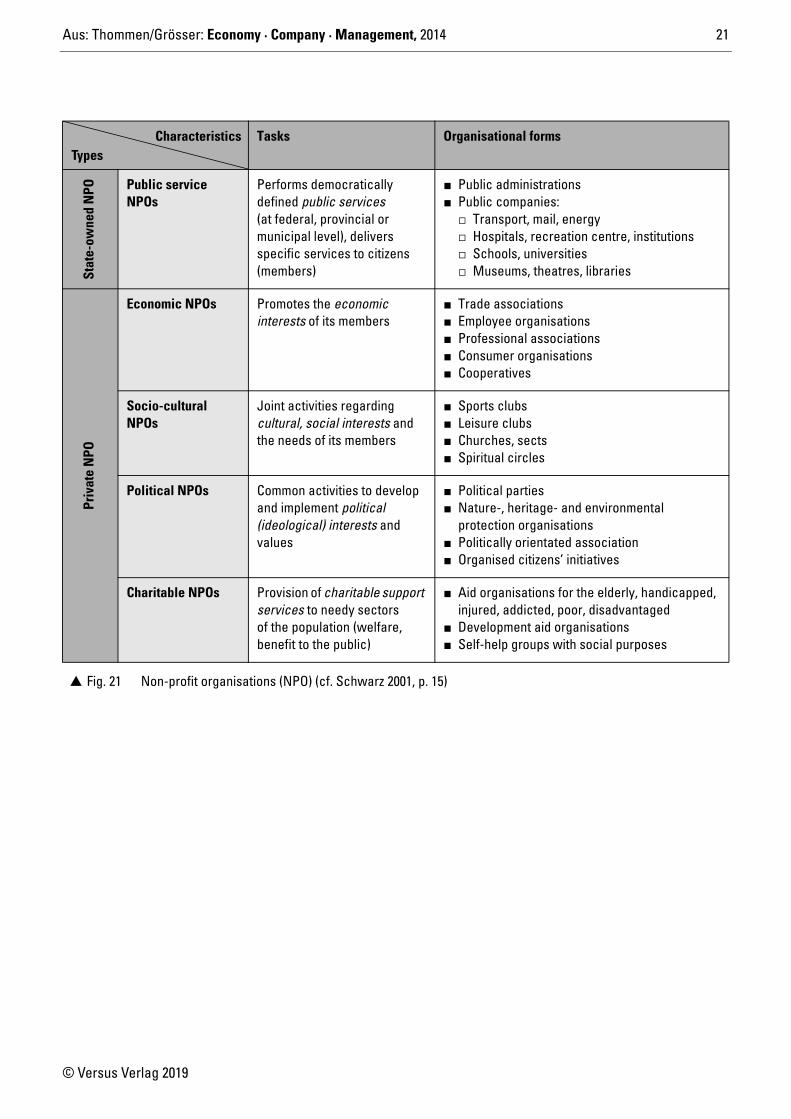
Tasks Organisational forms
Stat
e-ow
ned
NPO Public service
NPOsPerforms democratically defined public services (at federal, provincial or municipal level), delivers specific services to citizens (members)
� Public administrations� Public companies:
� Transport, mail, energy� Hospitals, recreation centre, institutions� Schools, universities� Museums, theatres, libraries
Priv
ate
NPO
Economic NPOs Promotes the economic interests of its members
� Trade associations� Employee organisations� Professional associations� Consumer organisations� Cooperatives
Socio-culturalNPOs
Joint activities regarding cultural, social interests and the needs of its members
� Sports clubs� Leisure clubs� Churches, sects� Spiritual circles
Political NPOs Common activities to develop and implement political (ideological) interests and values
� Political parties� Nature-, heritage- and environmental
protection organisations� Politically orientated association� Organised citizens’ initiatives
Charitable NPOs Provision of charitable support services to needy sectors of the population (welfare, benefit to the public)
� Aid organisations for the elderly, handicapped, injured, addicted, poor, disadvantaged
� Development aid organisations� Self-help groups with social purposes
� Fig. 21 Non-profit organisations (NPO) (cf. Schwarz 2001, p. 15)
CharacteristicsTypes
Aus: Thommen/Grösser: Economy · Company · Management, 2014 22
© Versus Verlag 2019
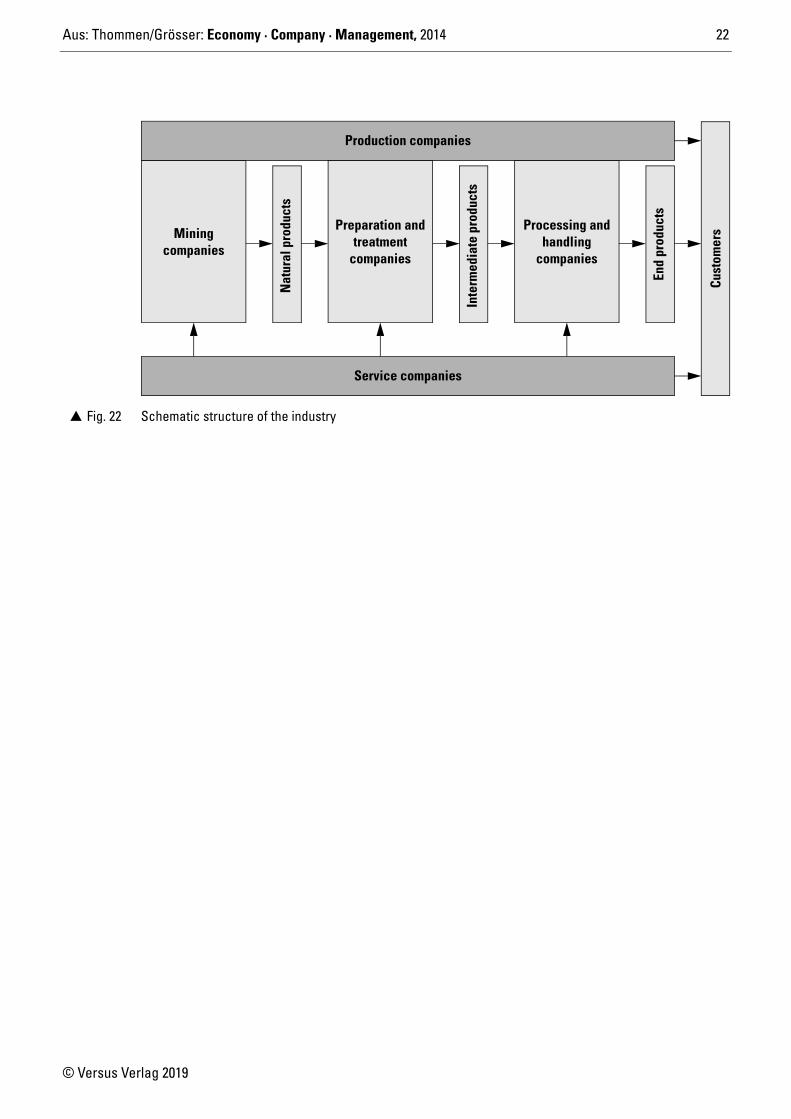
� Fig. 22 Schematic structure of the industry
Production companies
Miningcompanies
Nat
ural
pro
duct
s
Preparation andtreatment
Inte
rmed
iate
pro
duct
s
Processing andhandling
End
prod
ucts
Service companies
Cust
omer
s
companiescompanies
Aus: Thommen/Grösser: Economy · Company · Management, 2014 23
© Versus Verlag 2019
Economic sectors (divisions and groups) 2003 2004 2005 2006 2007 20081
01–95 Total 4 156 4 169 4 201 4 304 4 413 4 49501–05 Sector 1 169 159 160 162 172 17810–45 Sector 2 988 985 995 1 023 1 046 1 04910–1415–37
151617181920212223242526272829303132333435
36–3740–41
45
Mining and extraction of stone/soilIndustry; processing sectorProduction of food and beveragesTobacco processingTextile tradeProduction of clothing and fur productsProduction of leather goods and shoesMachining and processing of timberPaper and cardboard industryPublishing and printing industry, copyingCoking plants, crude oil processing, nuclear processingChemical industryProduction of rubber and plastic goodsProduction of other products from non-metallic mineralsProduction and processing of metalsManufacture of metal productsMachine constructionProduction of office machines, computers, etc.Production of devices for electricity generationProduction of Radio/TV/communication devicesProduction of medical devices, precision instruments; watchesVehicle productionProduction of other vehiclesOther processing industriesEnergy and water supplyConstruction industry
567161
313
62
361451
16524181583
1013
361776
5132925
288
5666603
1262
3714501
6525171483992
3518775
132925
289
5671
613
1152
3813491
6625181483992
3521794
132925
294
569060
311
52
381348
16826191687
1042
332285
5143025
303
5704603
1152
3913471
6826191690
1052
3422905
153026
310
5711603
1152
3912461
6825191691
1032
3823965
153025
30750–95 Sector 3 2 998 3 025 3 046 3 119 3 195 3 26950–52
50515255
60–646061626364
65–67656667
70–747071727374758085
90–939091929395
Trade; car repairs/durable consumer goodsTrade, car repairs; petrol stationsTrade brokering and wholesaleRetail; repair of durable consumer goodsHospitality sectorTraffic and data transmissionLand transport; transport in long-distance pipelinesShippingAviationAdditional activities associated with traffic; travel agenciesData transferCredit and insurance sectorCredit sectorInsurance sectorActivities associated with credit and insuranceReal estate; rental; computer services, R&DReal estate sectorRental of moveable goodsInformation technology servicesResearch and developmentProvision of services for companiesPublic administration; defence, social securityEducationHealth and social careProvision of other public and personal servicesWaste water cleaning, waste removal, etc.Representation of interests and other unionsentertainment, culture and sportPersonal servicesPrivate households
64892
201355241270101
3126292
2191346025
48433
56817
3611692744621761953574755
65295
203354242272102
3116592
2181325927
489335
6717
3671732724711802054594756
64897
204347241270105
39
6588
215129
5827
495335
6817
371178274486186
2057624853
65299
209344244274109
39
6588
2191345729
52037
57319
3871852804971952060664953
66699
217350249277111
3106787
2291415731
541405
7619
4011922845061992161665052
67199
222350257280113
3106985
2311425633
565445
7919
4181892895232032262675261
1 Provisional results
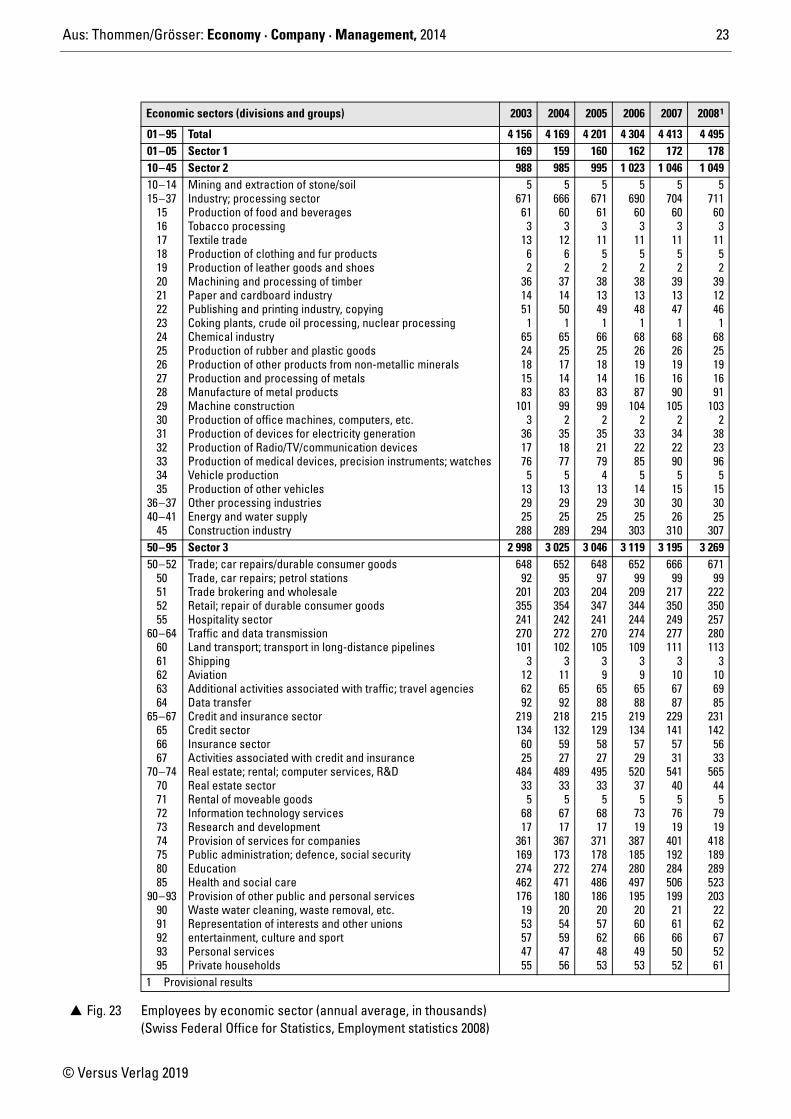
� Fig. 23 Employees by economic sector (annual average, in thousands) (Swiss Federal Office for Statistics, Employment statistics 2008)

Aus: Thommen/Grösser: Economy · Company · Management, 2014 24
© Versus Verlag 2019
Staff headcount
Annual turnover(in EUR)
Annual balance sheet total (in EUR)
Microenterprise fewer than 10 below 2 mio. below 2 mio.
Small enterprise fewer than 50 below 10 mio. below 10 mio.
Medium-sized enterprise fewer than 250 below 50 mio. below 43 mio.
� Fig. 24 Classification of companies by size (European Commission 2003)
CharacteristicsEnter-prise category
Aus: Thommen/Grösser: Economy · Company · Management, 2014 25
© Versus Verlag 2019
Rank2010
Rank2009
Company Consolidated turnover 2010(in millions of Swiss Francs)
Change(in %)
Percentage of turnoverabroad (in %)
Employees
1 1 Glencore International 144 978.0 36.3 – 54 8002 2 Nestlé 109 722.0 2.0 98 281 0003 3 Trafigura 79 200.0 52.2 – 4 0004 5 Novartis 52 682.0 9.8 79 119 4185 4 Roche 47 473.0 –3.2 – 80 6536 6 ABB 31 589.0 –0.6 – 116 5007 7 Xstrata 30 499.0 22.0 – –8 12 Mercuria Energy Trading 28 297.0 47.3 89 1919 9 Migros 25 040.0 0.4 – 61 783
10 10 Adecco 24 252.8 26.1 – 32 00011 8 Cargill lnternational 22 000.0 –26.7 – –12 11 Holcim 21 653.0 2.5 97 80 31013 15 Petroplus 20 735.0 40.1 – 2 57514 14 Kühne + Nagel International 20 261.0 16.4 – 57 53615 13 Coop 18 965.0 1.6 – 43 92516 16 Alpiq 14 104.0 –4.8 18 11 44317 17 Tetra Pak International 13 500.0 – – –18 21 Swisscom 11 988.0 –0.1 – 19 54719 20 Syngenta 11 641.0 5.9 – 26 17920 24 DKSH Holding 9 976.0 19.0 – 22 50021 22 Liebherr International 9 863.1 –4.8 – 32 97922 18 Transocean 9 576.0 –24.7 – 18 05023 26 Richemont 8 959.6 33.2 – 21 38724 23 Die Schweizerische Post 8 736.0 2.1 – 45 12925 30 Panalpina Welttransport 8 675.8 18.2 96 14 13626 19 Schindler 8 187.0 –1.1 90 43 01027 25 SBB 7 842.0 –0.1 – 28 14328 27 Clariant 7 120.0 7.7 – 16 17629 28 Globus Travel Services 6 500.0 – – –30 61 Axpo Holding 6 269.0 –17.0 57 4 45931 32 The Swatch Group 6 108.0 18.8 – 25 19732 31 Fenaco Genossenschaft 5 449.0 0.9 – 8 45333 33 Careal Holding 5 426.0 8.8 21 8 07134 34 Barry Callebaut 5 213.0 6.8 99 7 55035 37 Swiss International Air Lines 4 774.0 9.4 – 7 50636 35 SGS 4 757.0 1.0 – 63 22437 39 Pargesa Holding 4 625.4 10.4 – 738 40 Sika 4 416.0 6.3 – 13 48239 73 Kolmar Group 4 407.6 – – 14140 47 Amag-Gruppe 4 270.0 9.3 – 4 40241 42 Givaudan 4 239.0 7.1 – 8 61842 36 Also Holding 4 213.6 –4.5 – 1 47943 41 Omya 4 200.0 – – –44 687 Nycomed Pharma 4 121.0 –13.8 – 12 50645 54 Schmolz & Bickenbach 4 055.1 33.5 98 10 00046 45 Hilti 4 017.5 2.8 97 20 30547 38 Alstom (Schweiz) 4 000.0 – – –48 44 Kuoni Reisen Holding 3 983.6 2.3 – 8 72249 – Aryzta 3 913.0 –17.7 – –50 51 Rolex 3 800.0 – – 6 500
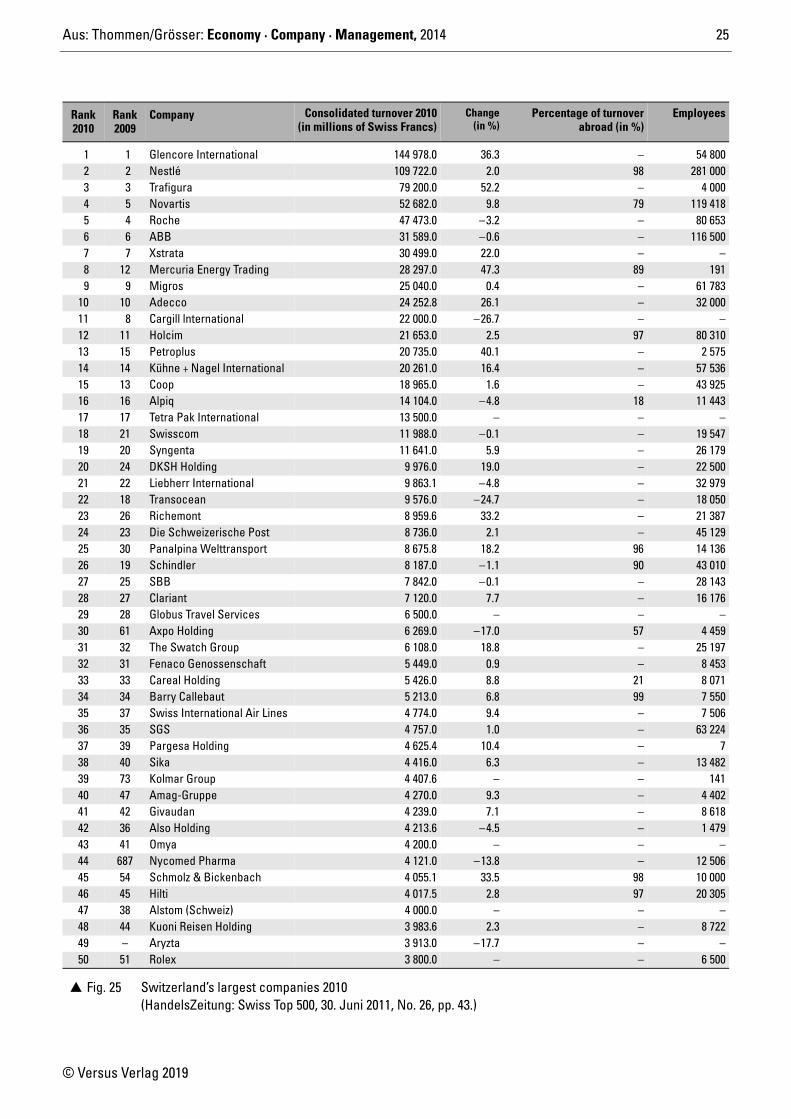
� Fig. 25 Switzerland’s largest companies 2010 (HandelsZeitung: Swiss Top 500, 30. Juni 2011, No. 26, pp. 43.)
Aus: Thommen/Grösser: Economy · Company · Management, 2014 26
© Versus Verlag 2019
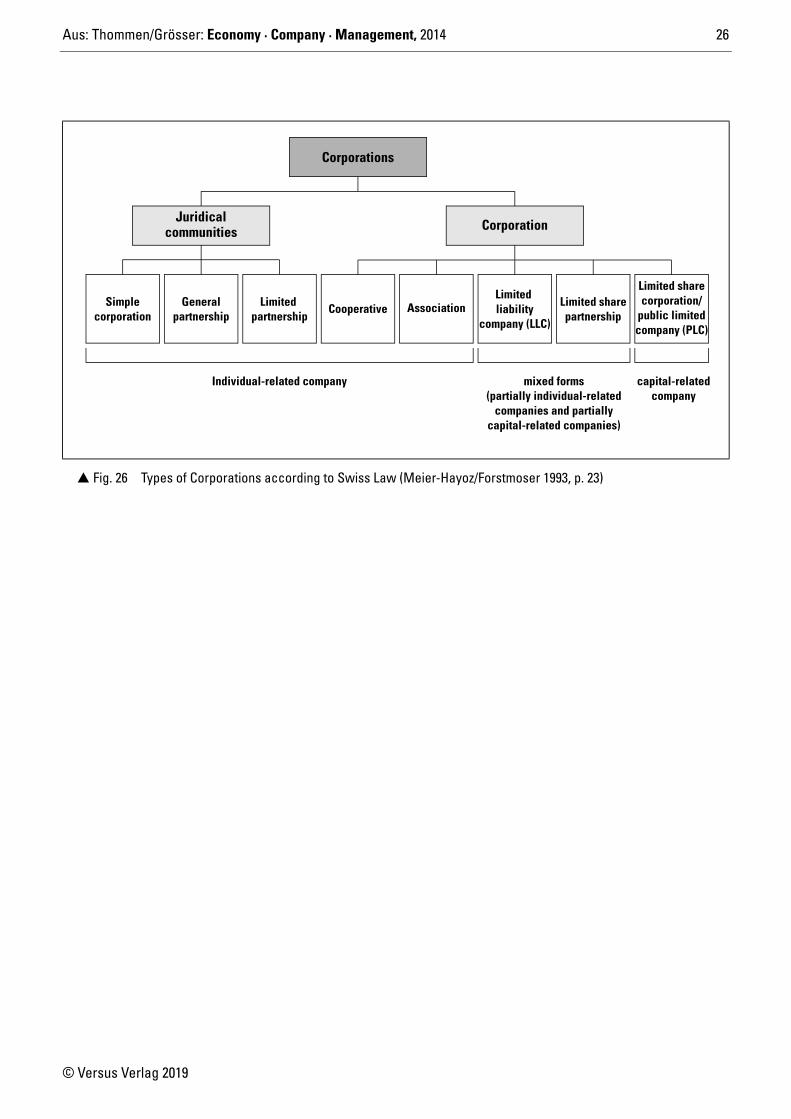
� Fig. 26 Types of Corporations according to Swiss Law (Meier-Hayoz/Forstmoser 1993, p. 23)
Corporations
CorporationJuridicalcommunities
Cooperative AssociationLimited liability
company (LLC)
Limited sharepartnership
Limited sharecorporation/
public limitedcompany (PLC)
Limited partnership
Generalpartnership
Simplecorporation
Individual-related company mixed forms(partially individual-related
companies and partiallycapital-related companies)
capital-relatedcompany
Aus: Thommen/Grösser: Economy · Company · Management, 2014 27
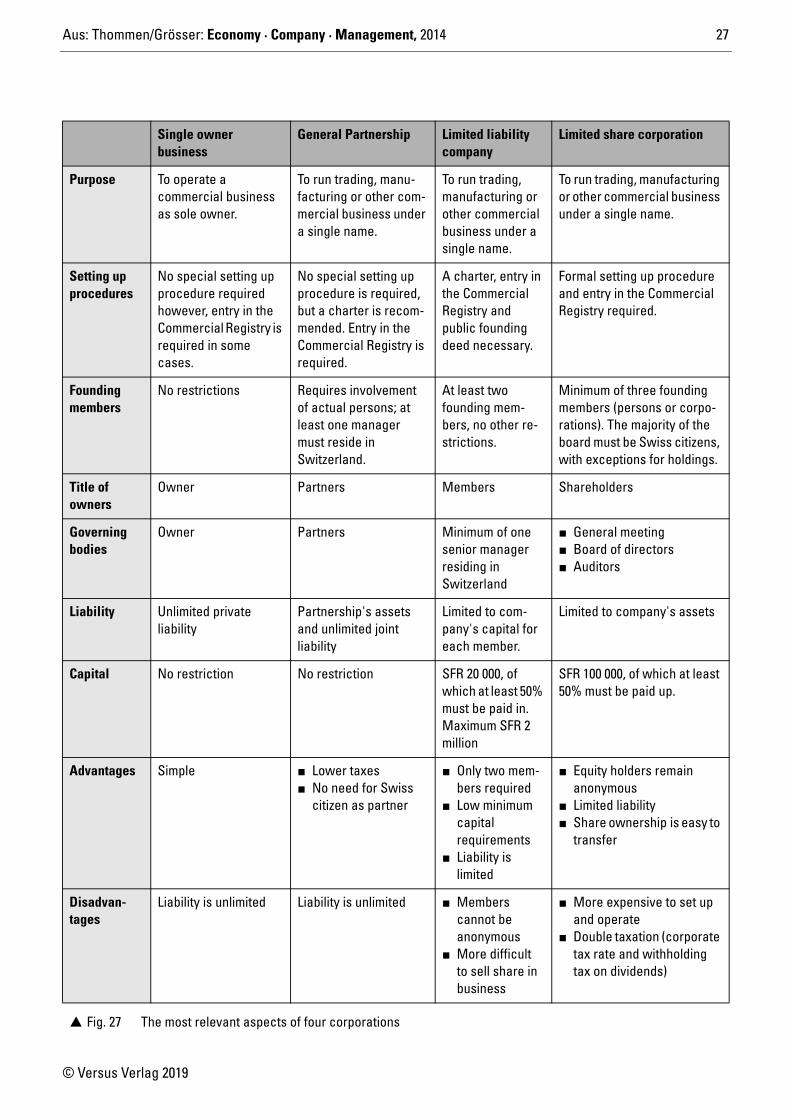
© Versus Verlag 2019
Single owner business
General Partnership Limited liability company
Limited share corporation
Purpose To operate a commercial business as sole owner.
To run trading, manu-facturing or other com-mercial business under a single name.
To run trading, manufacturing or other commercial business under a single name.
To run trading, manufacturing or other commercial business under a single name.
Setting up procedures
No special setting up procedure required however, entry in the Commercial Registry is required in some cases.
No special setting up procedure is required, but a charter is recom-mended. Entry in the Commercial Registry is required.
A charter, entry in the Commercial Registry and public founding deed necessary.
Formal setting up procedure and entry in the Commercial Registry required.
Founding members
No restrictions Requires involvement of actual persons; at least one manager must reside in Switzerland.
At least two founding mem-bers, no other re-strictions.
Minimum of three founding members (persons or corpo-rations). The majority of the board must be Swiss citizens, with exceptions for holdings.
Title of owners
Owner Partners Members Shareholders
Governing bodies
Owner Partners Minimum of one senior manager residing in Switzerland
� General meeting� Board of directors� Auditors
Liability Unlimited private liability
Partnership's assets and unlimited joint liability
Limited to com-pany's capital for each member.
Limited to company's assets
Capital No restriction No restriction SFR 20 000, of which at least 50% must be paid in. Maximum SFR 2 million
SFR 100 000, of which at least 50% must be paid up.
Advantages Simple � Lower taxes� No need for Swiss
citizen as partner
� Only two mem-bers required
� Low minimum capital requirements
� Liability is limited
� Equity holders remain anonymous
� Limited liability� Share ownership is easy to
transfer
Disadvan-tages
Liability is unlimited Liability is unlimited � Members cannot be anonymous
� More difficult to sell share in business
� More expensive to set up and operate
� Double taxation (corporate tax rate and withholding tax on dividends)
� Fig. 27 The most relevant aspects of four corporations
Aus: Thommen/Grösser: Economy · Company · Management, 2014 28
© Versus Verlag 2019
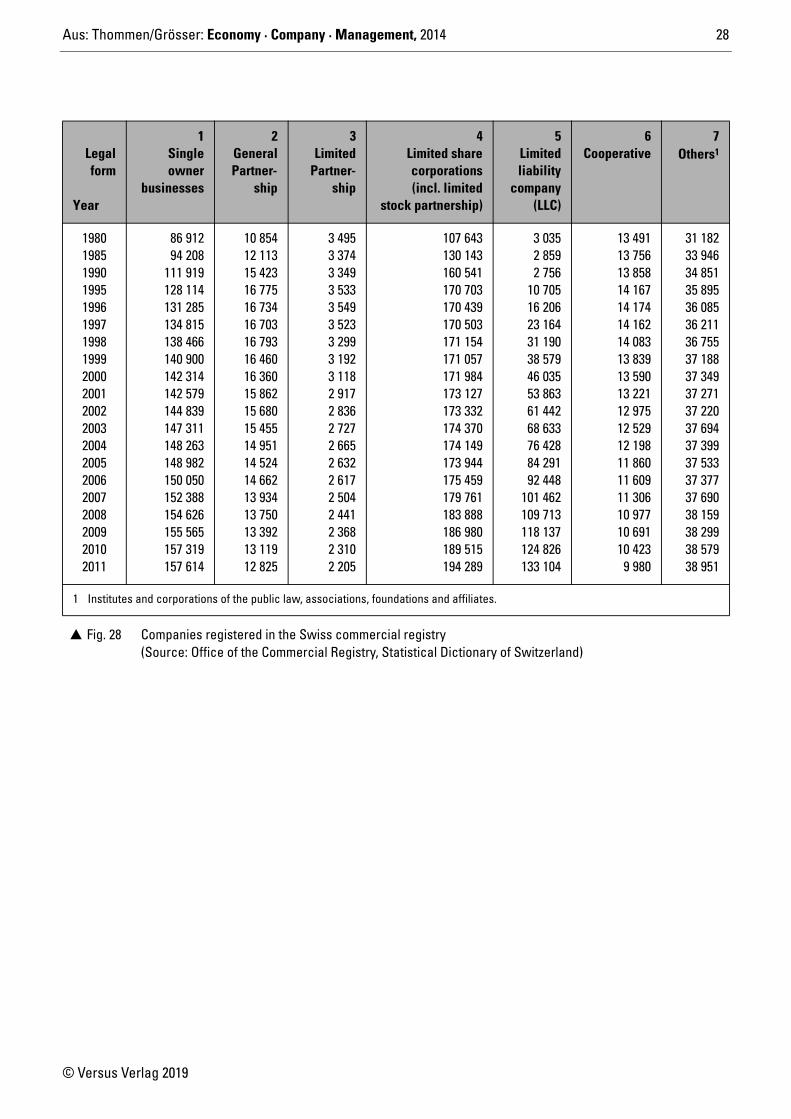
Legalform
Year
1Singleowner
businesses
2GeneralPartner-
ship
3Limited
Partner-ship
4Limited sharecorporations(incl. limited
stock partnership)
5Limitedliability
company(LLC)
6Cooperative
7Others1
19801985199019951996199719981999200020012002200320042005200620072008200920102011
86 91294 208
111 919128 114131 285134 815138 466140 900142 314142 579144 839147 311148 263148 982150 050152 388154 626155 565157 319157 614
10 85412 11315 42316 77516 73416 70316 79316 46016 36015 86215 68015 45514 95114 52414 66213 93413 75013 39213 11912 825
3 4953 3743 3493 5333 5493 5233 2993 1923 1182 9172 8362 7272 6652 6322 6172 5042 4412 3682 3102 205
107 643130 143160 541170 703170 439170 503171 154171 057171 984173 127173 332174 370174 149173 944175 459179 761183 888186 980189 515194 289
3 0352 8592 756
10 70516 20623 16431 19038 57946 03553 86361 44268 63376 42884 29192 448
101 462109 713118 137124 826133 104
13 49113 75613 85814 16714 17414 16214 08313 83913 59013 22112 97512 52912 19811 86011 60911 30610 97710 69110 423
9 980
31 18233 94634 85135 89536 08536 21136 75537 18837 34937 27137 22037 69437 39937 53337 37737 69038 15938 29938 57938 951
1 Institutes and corporations of the public law, associations, foundations and affiliates.
� Fig. 28 Companies registered in the Swiss commercial registry (Source: Office of the Commercial Registry, Statistical Dictionary of Switzerland)
Aus: Thommen/Grösser: Economy · Company · Management, 2014 29
© Versus Verlag 2019
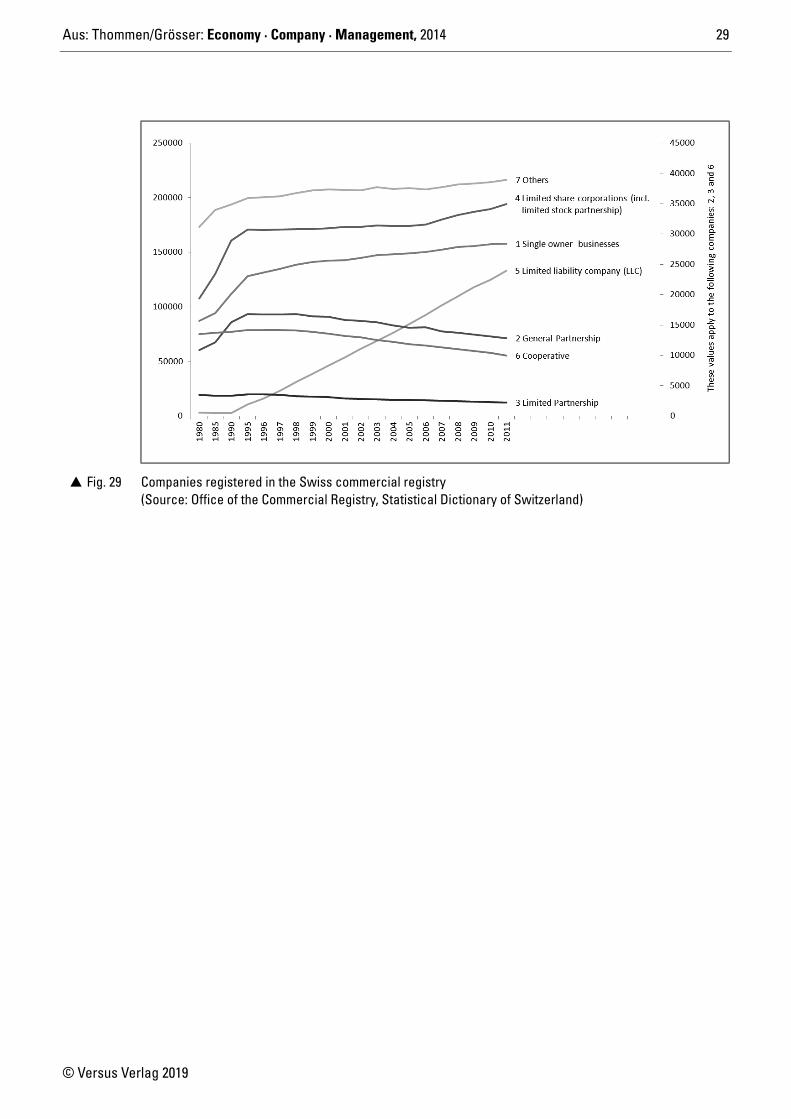
� Fig. 29 Companies registered in the Swiss commercial registry (Source: Office of the Commercial Registry, Statistical Dictionary of Switzerland)
Aus: Thommen/Grösser: Economy · Company · Management, 2014 30
© Versus Verlag 2019
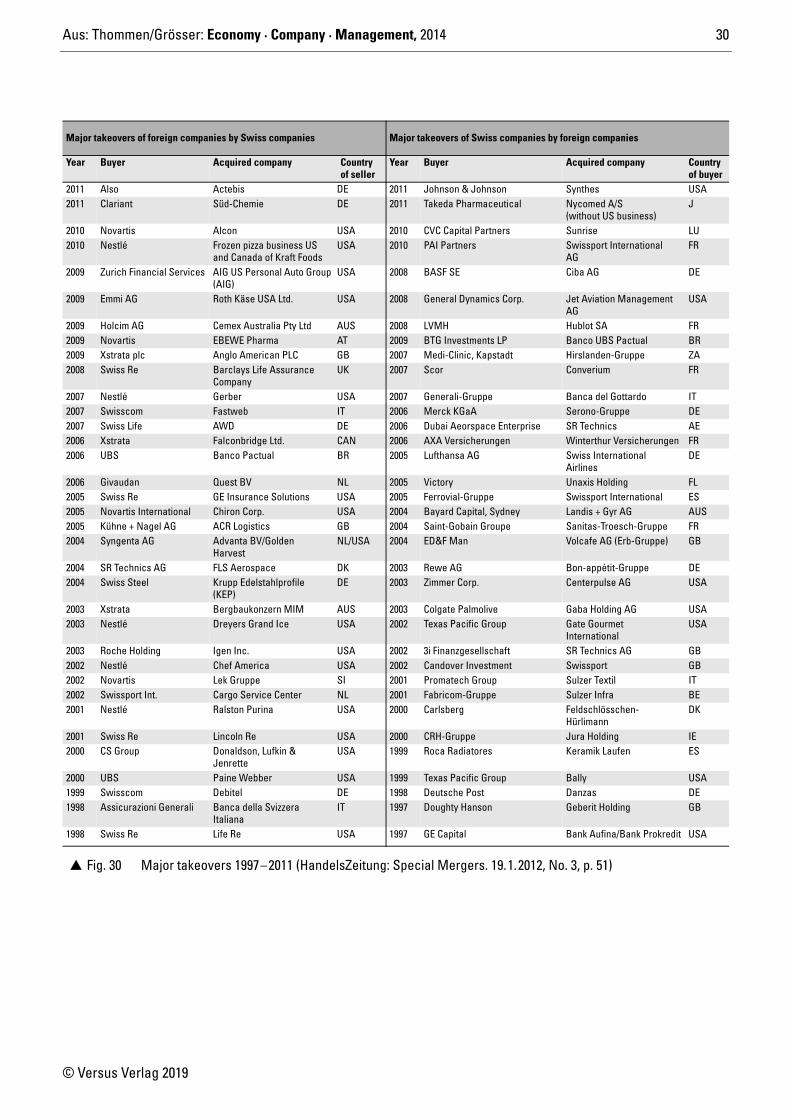
Major takeovers of foreign companies by Swiss companies Major takeovers of Swiss companies by foreign companies
Year Buyer Acquired company Country of seller
Year Buyer Acquired company Country of buyer
2011 Also Actebis DE 2011 Johnson & Johnson Synthes USA2011 Clariant Süd-Chemie DE 2011 Takeda Pharmaceutical Nycomed A/S
(without US business)J
2010 Novartis Alcon USA 2010 CVC Capital Partners Sunrise LU2010 Nestlé Frozen pizza business US
and Canada of Kraft FoodsUSA 2010 PAI Partners Swissport International
AGFR
2009 Zurich Financial Services AIG US Personal Auto Group (AIG)
USA 2008 BASF SE Ciba AG DE
2009 Emmi AG Roth Käse USA Ltd. USA 2008 General Dynamics Corp. Jet Aviation ManagementAG
USA
2009 Holcim AG Cemex Australia Pty Ltd AUS 2008 LVMH Hublot SA FR2009 Novartis EBEWE Pharma AT 2009 BTG Investments LP Banco UBS Pactual BR2009 Xstrata plc Anglo American PLC GB 2007 Medi-Clinic, Kapstadt Hirslanden-Gruppe ZA2008 Swiss Re Barclays Life Assurance
CompanyUK 2007 Scor Converium FR
2007 Nestlé Gerber USA 2007 Generali-Gruppe Banca del Gottardo IT2007 Swisscom Fastweb IT 2006 Merck KGaA Serono-Gruppe DE2007 Swiss Life AWD DE 2006 Dubai Aeorspace Enterprise SR Technics AE2006 Xstrata Falconbridge Ltd. CAN 2006 AXA Versicherungen Winterthur Versicherungen FR2006 UBS Banco Pactual BR 2005 Lufthansa AG Swiss International
AirlinesDE
2006 Givaudan Quest BV NL 2005 Victory Unaxis Holding FL2005 Swiss Re GE Insurance Solutions USA 2005 Ferrovial-Gruppe Swissport International ES2005 Novartis International Chiron Corp. USA 2004 Bayard Capital, Sydney Landis + Gyr AG AUS2005 Kühne + Nagel AG ACR Logistics GB 2004 Saint-Gobain Groupe Sanitas-Troesch-Gruppe FR2004 Syngenta AG Advanta BV/Golden
HarvestNL/USA 2004 ED&F Man Volcafe AG (Erb-Gruppe) GB
2004 SR Technics AG FLS Aerospace DK 2003 Rewe AG Bon-appétit-Gruppe DE2004 Swiss Steel Krupp Edelstahlprofile
(KEP)DE 2003 Zimmer Corp. Centerpulse AG USA
2003 Xstrata Bergbaukonzern MIM AUS 2003 Colgate Palmolive Gaba Holding AG USA2003 Nestlé Dreyers Grand Ice USA 2002 Texas Pacific Group Gate Gourmet
InternationalUSA
2003 Roche Holding Igen Inc. USA 2002 3i Finanzgesellschaft SR Technics AG GB2002 Nestlé Chef America USA 2002 Candover Investment Swissport GB2002 Novartis Lek Gruppe SI 2001 Promatech Group Sulzer Textil IT2002 Swissport Int. Cargo Service Center NL 2001 Fabricom-Gruppe Sulzer Infra BE2001 Nestlé Ralston Purina USA 2000 Carlsberg Feldschlösschen-
HürlimannDK
2001 Swiss Re Lincoln Re USA 2000 CRH-Gruppe Jura Holding IE2000 CS Group Donaldson, Lufkin &
JenretteUSA 1999 Roca Radiatores Keramik Laufen ES
2000 UBS Paine Webber USA 1999 Texas Pacific Group Bally USA1999 Swisscom Debitel DE 1998 Deutsche Post Danzas DE1998 Assicurazioni Generali Banca della Svizzera
ItalianaIT 1997 Doughty Hanson Geberit Holding GB
1998 Swiss Re Life Re USA 1997 GE Capital Bank Aufina/Bank Prokredit USA
� Fig. 30 Major takeovers 1997–2011 (HandelsZeitung: Special Mergers. 19.1.2012, No. 3, p. 51)
Aus: Thommen/Grösser: Economy · Company · Management, 2014 31
© Versus Verlag 2019
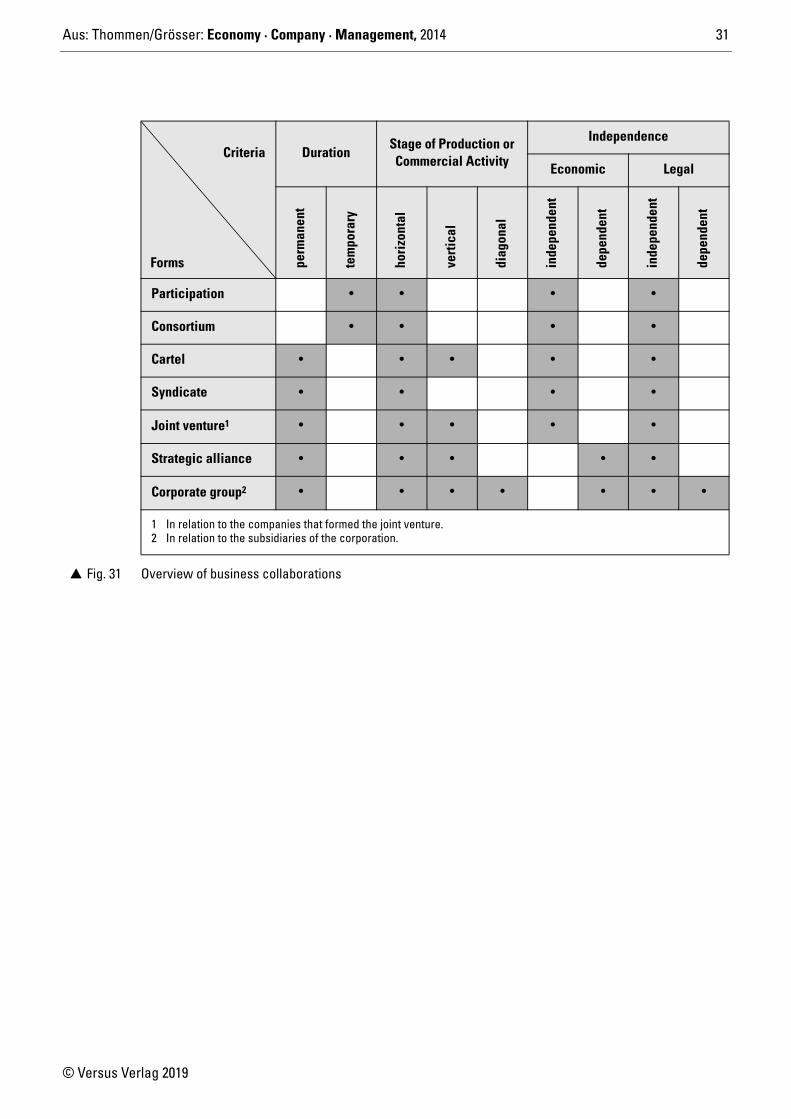
DurationStage of Production or Commercial Activity
Independence
Economic Legal
perm
anen
t
tem
pora
ry
hori
zont
al
vert
ical
diag
onal
inde
pend
ent
depe
nden
t
inde
pend
ent
depe
nden
t
Participation • • • •
Consortium • • • •
Cartel • • • • •
Syndicate • • • •
Joint venture1 • • • • •
Strategic alliance • • • • •
Corporate group2 • • • • • • •
1 In relation to the companies that formed the joint venture.2 In relation to the subsidiaries of the corporation.
� Fig. 31 Overview of business collaborations
Criteria
Forms
Aus: Thommen/Grösser: Economy · Company · Management, 2014 32
© Versus Verlag 2019
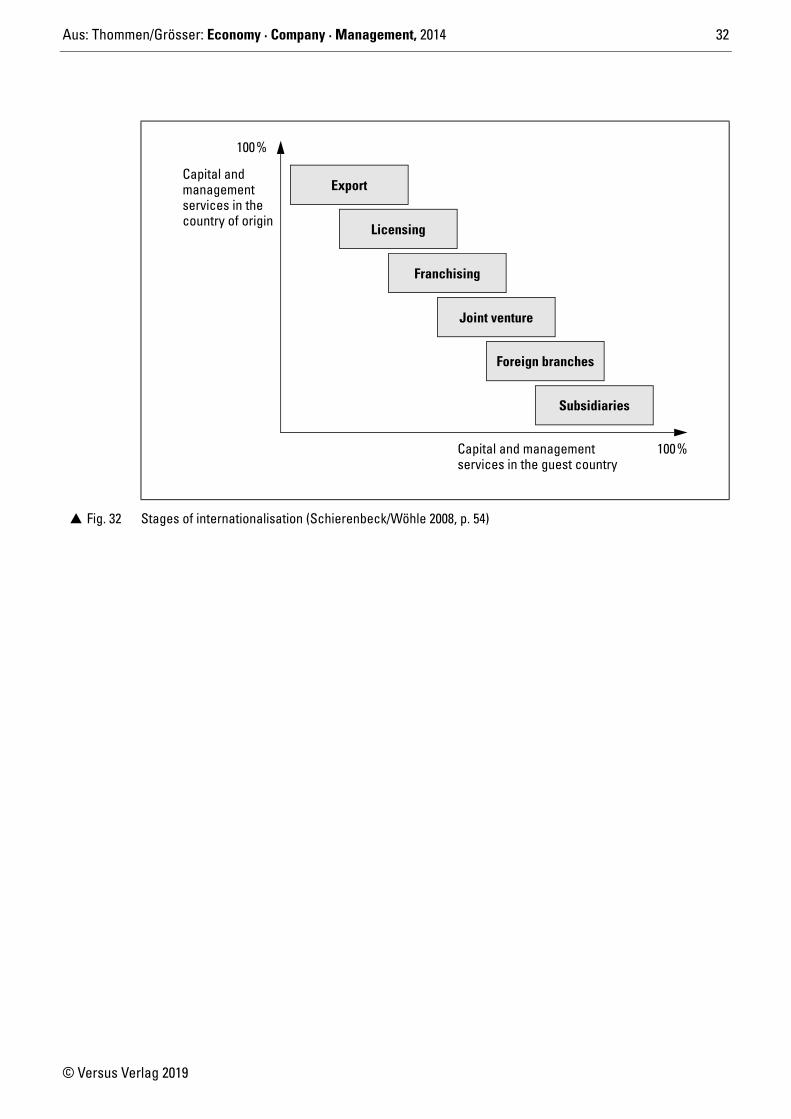
� Fig. 32 Stages of internationalisation (Schierenbeck/Wöhle 2008, p. 54)
100%
Capital andmanagementservices in thecountry of origin
Capital and managementservices in the guest country
Export
Licensing
Franchising
Joint venture
Foreign branches
Subsidiaries
100%
Aus: Thommen/Grösser: Economy · Company · Management, 2014 33
© Versus Verlag 2019
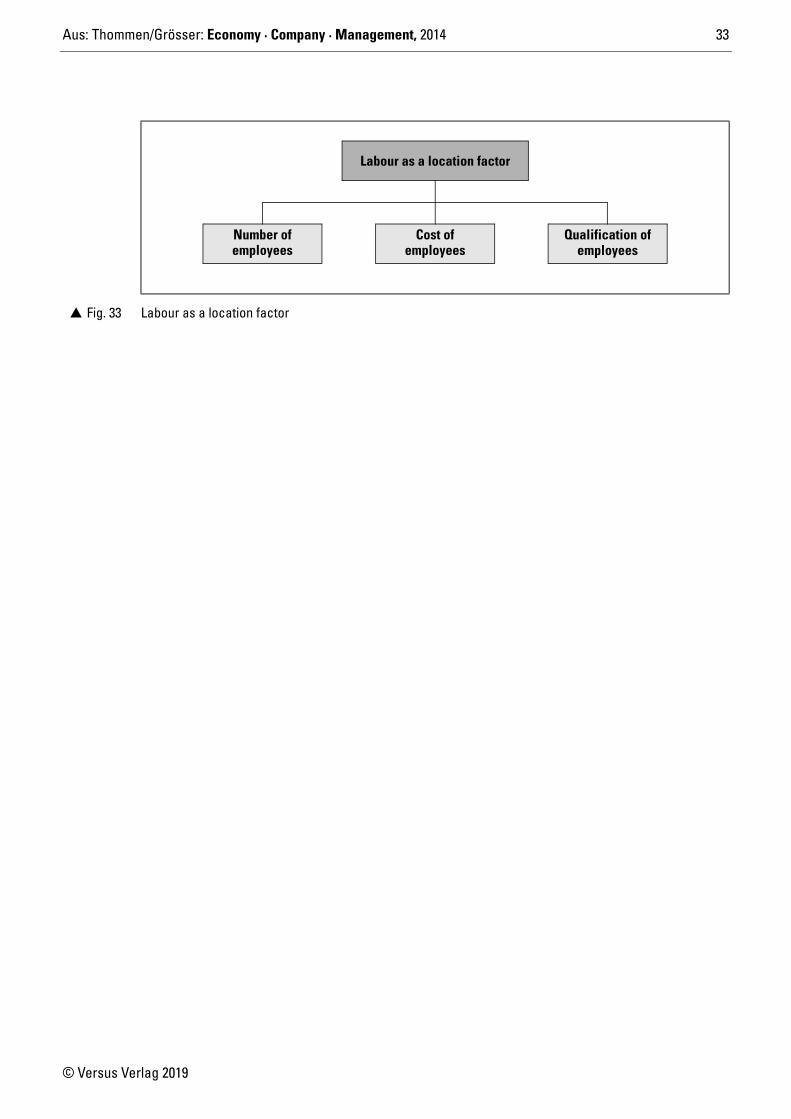
� Fig. 33 Labour as a location factor
Labour as a location factor
Number of Cost of Qualification ofemployeesemployees employees
Aus: Thommen/Grösser: Economy · Company · Management, 2014 34
© Versus Verlag 2019
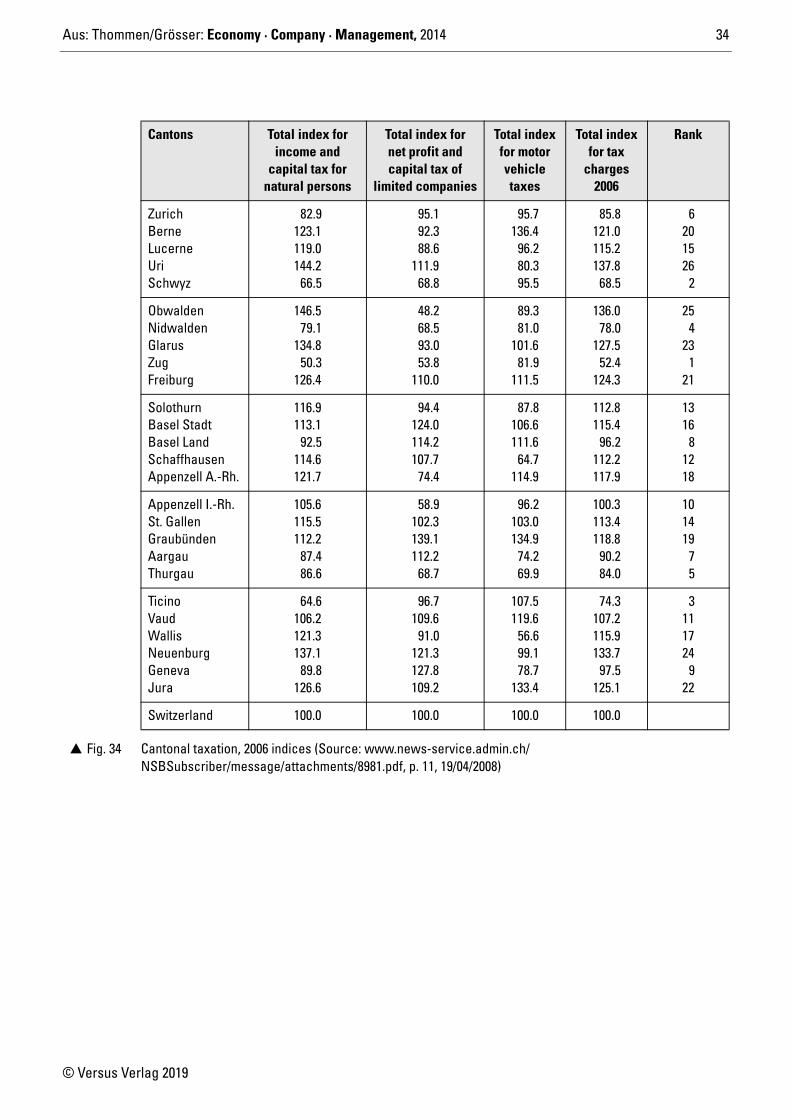
Cantons Total index for income and
capital tax fornatural persons
Total index for net profit and capital tax of
limited companies
Total index for motor vehicle taxes
Total index for tax
charges 2006
Rank
ZurichBerneLucerneUriSchwyz
82.9123.1119.0144.2
66.5
95.192.388.6
111.968.8
95.7136.4
96.280.395.5
85.8121.0115.2137.8
68.5
6201526
2
ObwaldenNidwaldenGlarusZugFreiburg
146.579.1
134.850.3
126.4
48.268.593.053.8
110.0
89.381.0
101.681.9
111.5
136.078.0
127.552.4
124.3
254
231
21
SolothurnBasel StadtBasel LandSchaffhausenAppenzell A.-Rh.
116.9113.1
92.5114.6121.7
94.4124.0114.2107.7
74.4
87.8106.6111.6
64.7114.9
112.8115.4
96.2112.2117.9
1316
81218
Appenzell I.-Rh.St. GallenGraubündenAargauThurgau
105.6115.5112.2
87.486.6
58.9102.3139.1112.2
68.7
96.2103.0134.9
74.269.9
100.3113.4118.8
90.284.0
101419
75
TicinoVaudWallisNeuenburgGenevaJura
64.6106.2121.3137.1
89.8126.6
96.7109.6
91.0121.3127.8109.2
107.5119.6
56.699.178.7
133.4
74.3107.2115.9133.7
97.5125.1
3111724
922
Switzerland 100.0 100.0 100.0 100.0
� Fig. 34 Cantonal taxation, 2006 indices (Source: www.news-service.admin.ch/NSBSubscriber/message/attachments/8981.pdf, p. 11, 19/04/2008)
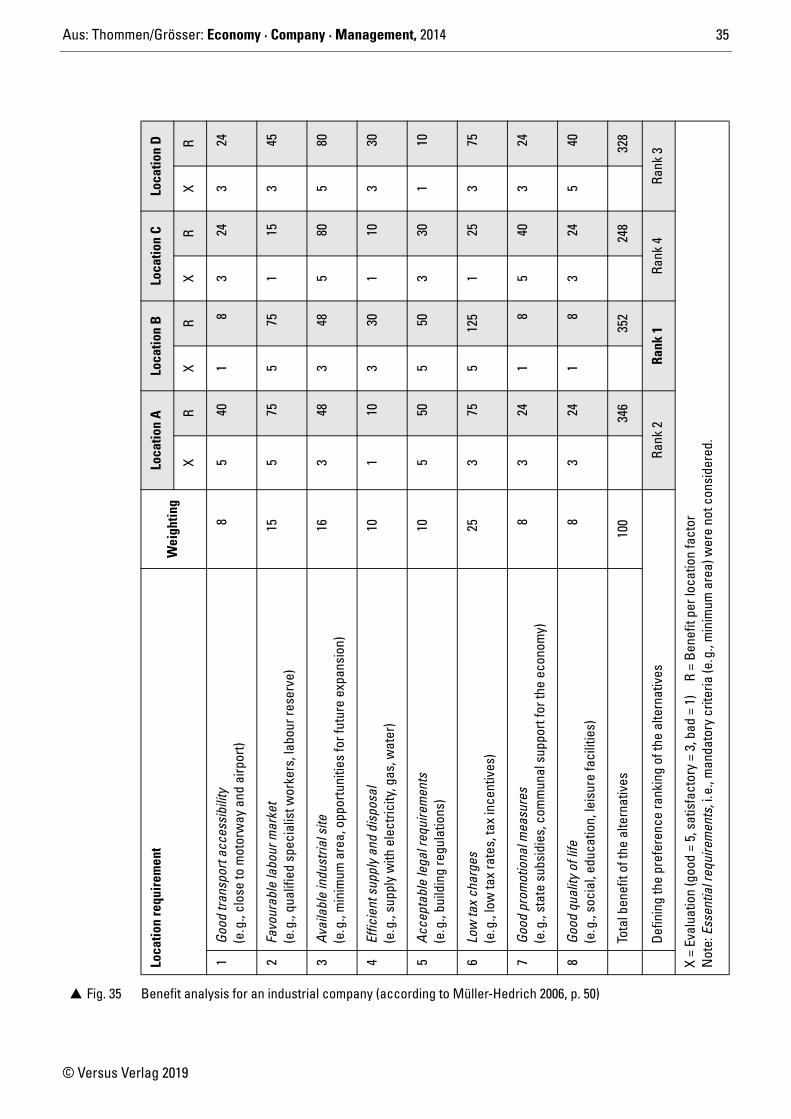
Aus: Thommen/Grösser: Economy · Company · Management, 2014 35
© Versus Verlag 2019
Loca
tion
D R 24 45 80 30 10 75 24 40 328
Rank
3
X=
Eval
uatio
n (g
ood
= 5,
sat
isfa
ctor
y =
3, b
ad =
1)
R =
Bene
fit p
er lo
catio
n fa
ctor
Not
e: E
ssen
tial r
equi
rem
ents
, i.e
., m
anda
tory
crit
eria
(e.g
., m
inim
um a
rea)
wer
e no
t con
side
red.
X 3 3 5 3 1 3 3 5
Loca
tion
C R 24 15 80 10 30 25 40 24 248
Rank
4
X 3 1 5 1 3 1 5 3
Loca
tion
B R 8 75 48 30 50 125 8 8
352
Rank
1
X 1 5 3 3 5 5 1 1
Loca
tion
A R 40 75 48 10 50 75 24 24 346
Rank
2
X 5 5 3 1 5 3 3 3
Wei
ghtin
g
8 15 16 10 10 25 8 8
100
Defin
ing
the
pref
eren
ce ra
nkin
g of
the
alte
rnat
ives
Loca
tion
requ
irem
ent
Good
tran
spor
t acc
essi
bilit
y(e
.g.,
clos
e to
mot
orw
ay a
nd a
irpor
t)
Favo
urab
le la
bour
mar
ket
(e.g
., qu
alifi
ed s
peci
alis
t wor
kers
, lab
our r
eser
ve)
Avai
labl
e in
dust
rial s
ite(e
.g.,
min
imum
are
a, o
ppor
tuni
ties
for f
utur
e ex
pans
ion)
Effic
ient
sup
ply
and
disp
osal
(e.g
., su
pply
with
ele
ctric
ity, g
as, w
ater
)
Acce
ptab
le le
gal r
equi
rem
ents
(e.g
., bu
ildin
g re
gula
tions
)
Low
tax
char
ges
(e.g
., lo
w ta
x ra
tes,
tax
ince
ntiv
es)
Good
pro
mot
iona
l mea
sure
s(e
.g.,
stat
e su
bsid
ies,
com
mun
al s
uppo
rt fo
r the
eco
nom
y)
Good
qua
lity
of li
fe(e
.g.,
soci
al, e
duca
tion,
leis
ure
faci
litie
s)
Tota
l ben
efit
of th
e al
tern
ativ
es
1 2 3 4 5 6 7 8
� Fig. 35 Benefit analysis for an industrial company (according to Müller-Hedrich 2006, p. 50)
Aus: Thommen/Grösser: Economy · Company · Management, 2014 36
© Versus Verlag 2019
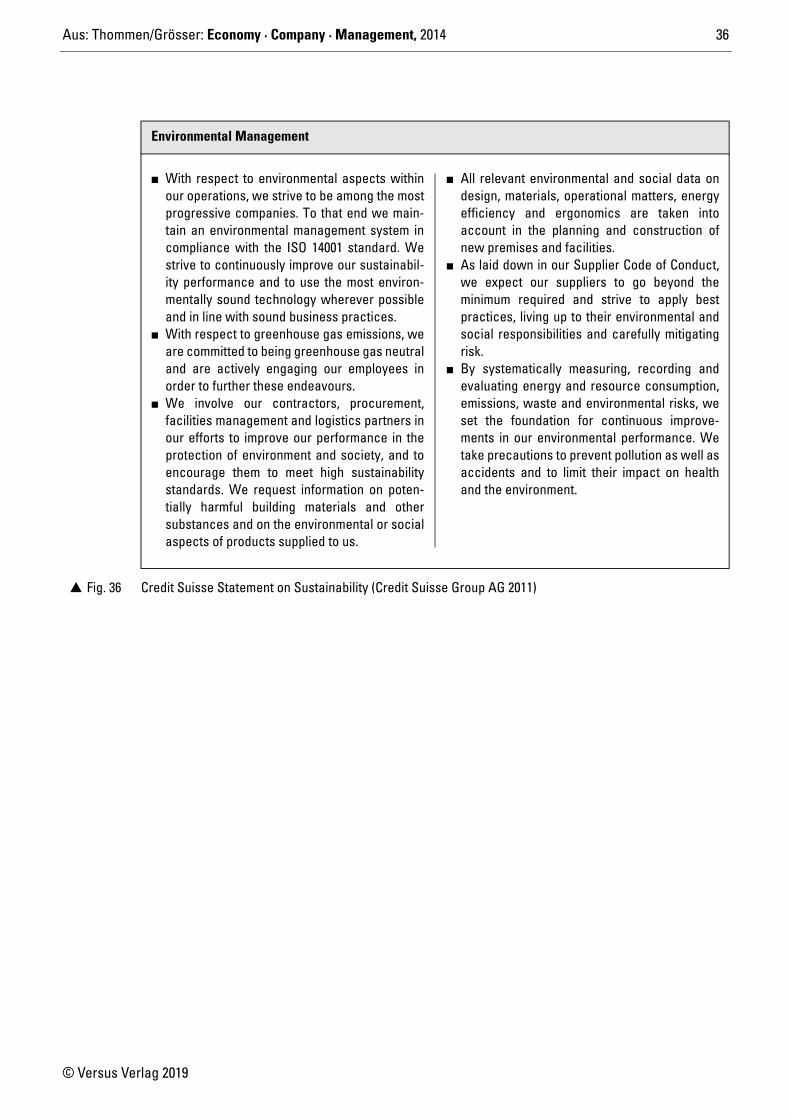
Environmental Management
� Fig. 36 Credit Suisse Statement on Sustainability (Credit Suisse Group AG 2011)
� With respect to environmental aspects withinour operations, we strive to be among the mostprogressive companies. To that end we main-tain an environmental management system incompliance with the ISO 14001 standard. Westrive to continuously improve our sustainabil-ity performance and to use the most environ-mentally sound technology wherever possibleand in line with sound business practices.
� With respect to greenhouse gas emissions, weare committed to being greenhouse gas neutraland are actively engaging our employees inorder to further these endeavours.
� We involve our contractors, procurement,facilities management and logistics partners inour efforts to improve our performance in theprotection of environment and society, and toencourage them to meet high sustainabilitystandards. We request information on poten-tially harmful building materials and othersubstances and on the environmental or socialaspects of products supplied to us.
� All relevant environmental and social data ondesign, materials, operational matters, energyefficiency and ergonomics are taken intoaccount in the planning and construction ofnew premises and facilities.
� As laid down in our Supplier Code of Conduct,we expect our suppliers to go beyond theminimum required and strive to apply bestpractices, living up to their environmental andsocial responsibilities and carefully mitigatingrisk.
� By systematically measuring, recording andevaluating energy and resource consumption,emissions, waste and environmental risks, weset the foundation for continuous improve-ments in our environmental performance. Wetake precautions to prevent pollution as well asaccidents and to limit their impact on healthand the environment.
Aus: Thommen/Grösser: Economy · Company · Management, 2014 37
© Versus Verlag 2019
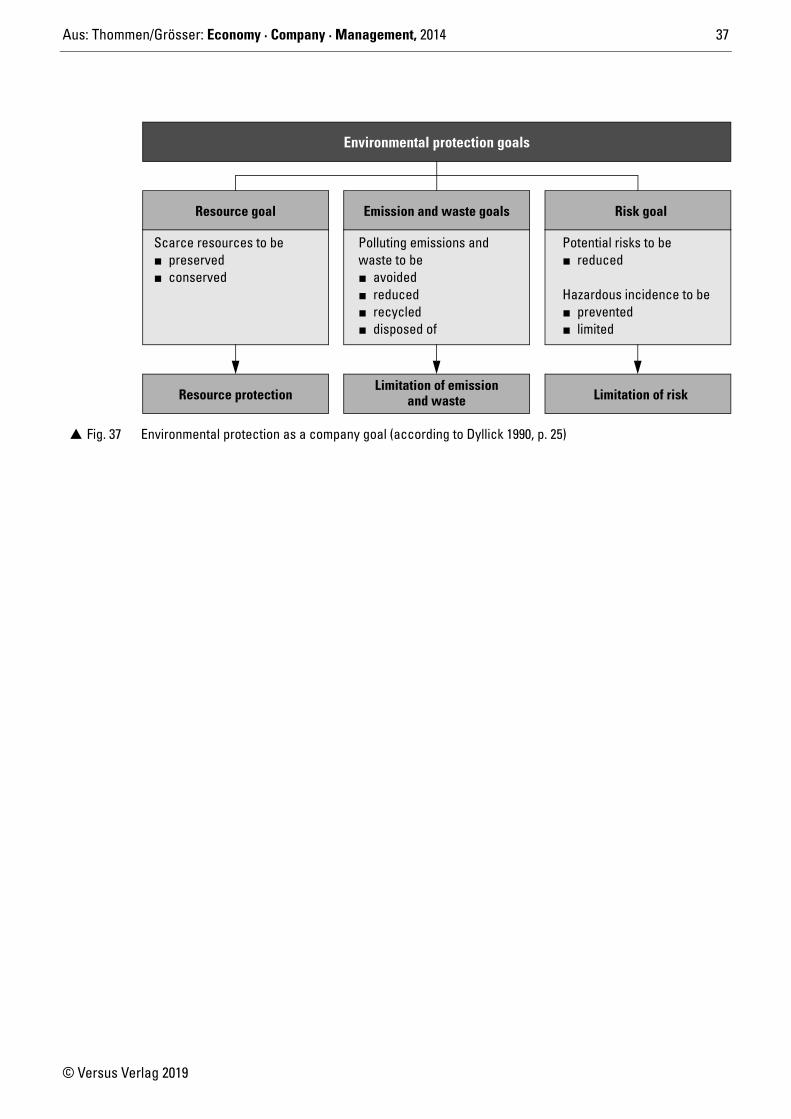
� Fig. 37 Environmental protection as a company goal (according to Dyllick 1990, p. 25)
Resource goal Emission and waste goals Risk goal
Resource protectionLimitation of emission
and waste Limitation of risk
Scarce resources to be� preserved� conserved
Polluting emissions and waste to be� avoided� reduced� recycled� disposed of
Potential risks to be� reduced
Hazardous incidence to be� prevented� limited
Environmental protection goals
Aus: Thommen/Grösser: Economy · Company · Management, 2014 38
© Versus Verlag 2019
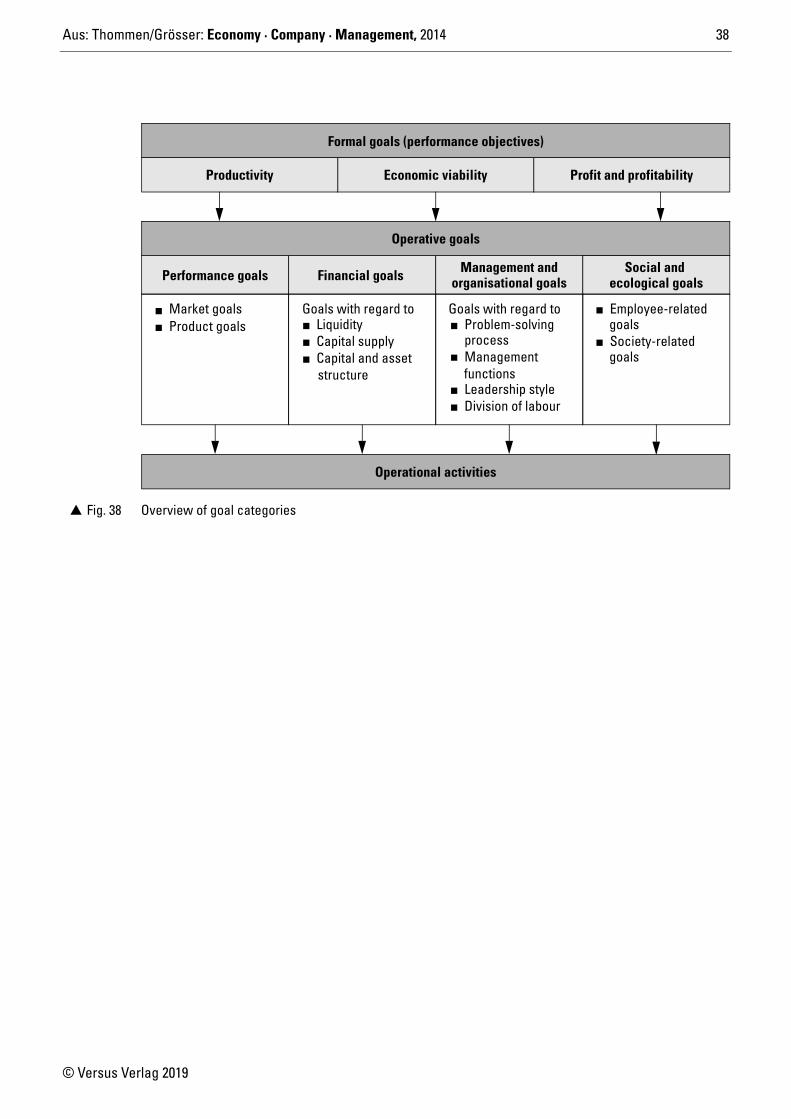
� Fig. 38 Overview of goal categories
Operative goals
Performance goals
� Market goals� Product goals
Financial goals
Goals with regard to
� Capital supply� Liquidity
� Capital and asset
Management and
Goals with regard to� Problem-solving
� Managementprocess
functions� Leadership style� Division of labour
Social and
� Employee-related
� Society-related
Formal goals (performance objectives)
Operational activities
organisational goals ecological goals
structure
goals
goals
Productivity Economic viability Profit and profitability
Aus: Thommen/Grösser: Economy · Company · Management, 2014 39
© Versus Verlag 2019
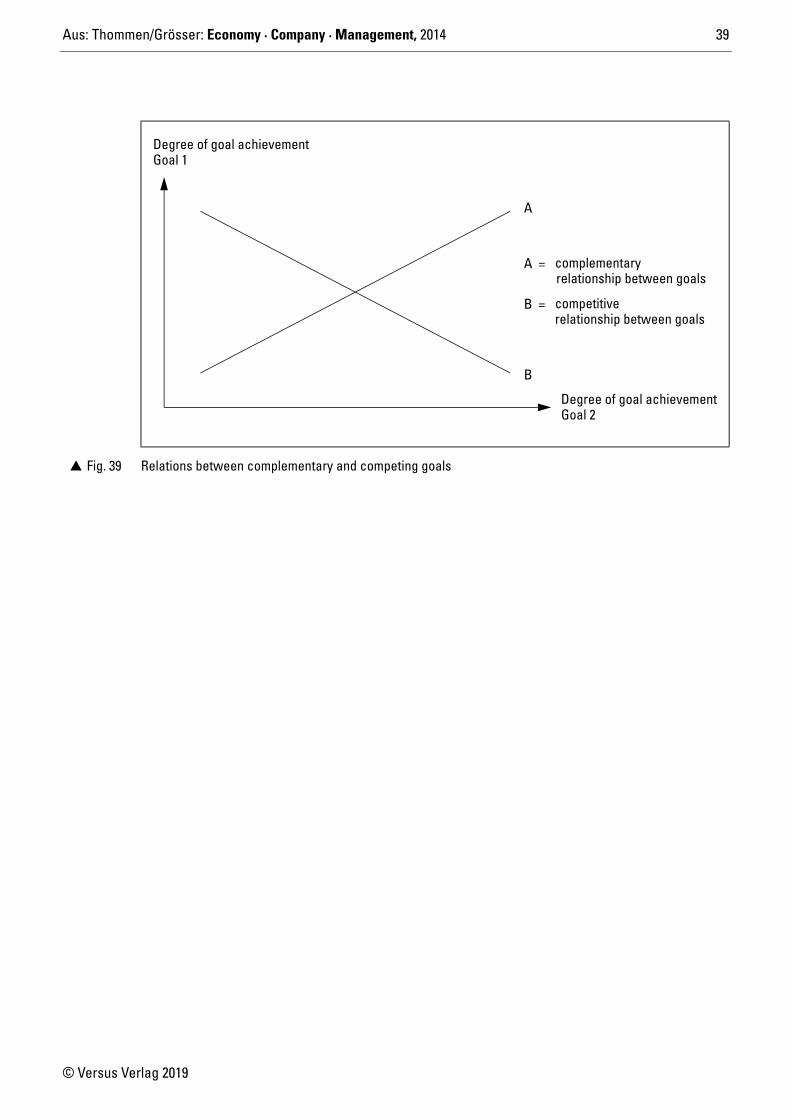
� Fig. 39 Relations between complementary and competing goals
Degree of goal achievementGoal 1
A
B
A =
B =
Degree of goal achievementGoal 2
relationship between goals
relationship between goals
complementary
competitive
Aus: Thommen/Grösser: Economy · Company · Management, 2014 40
© Versus Verlag 2019
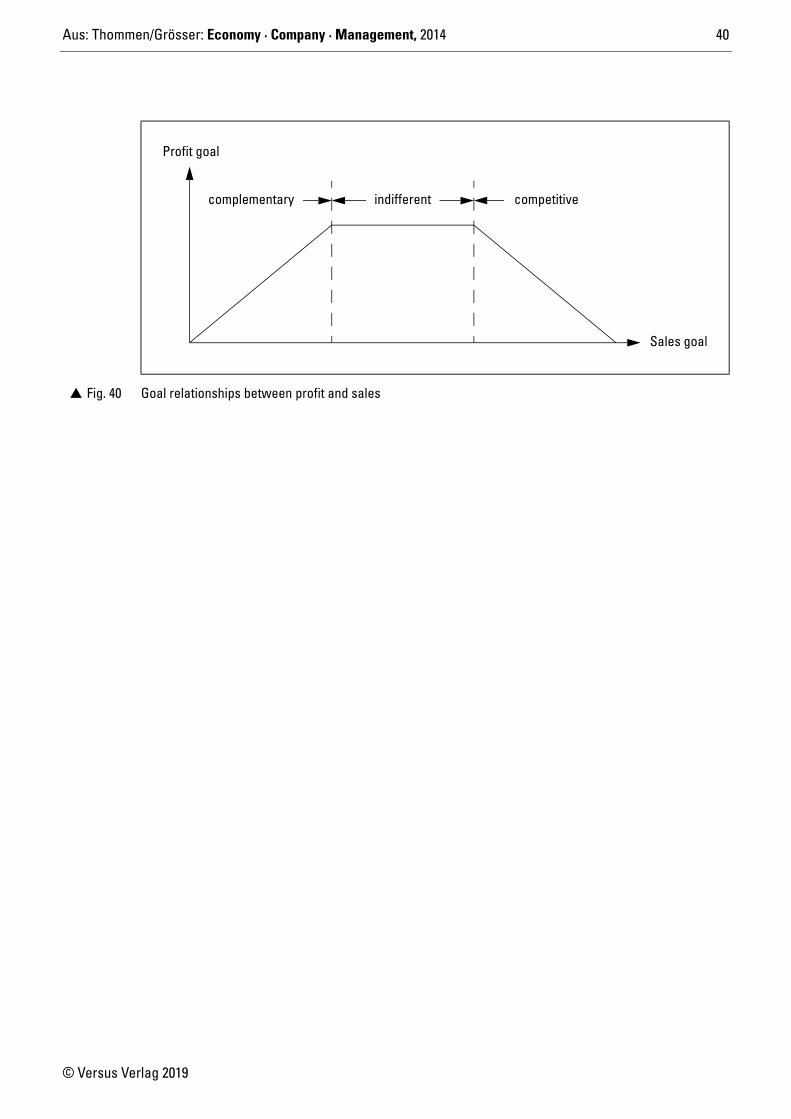
� Fig. 40 Goal relationships between profit and sales
Profit goal
complementary
Sales goal
indifferent competitive

Aus: Thommen/Grösser: Economy · Company · Management, 2014 41
© Versus Verlag 2019
System-oriented(economy as a system)
Culture-oriented (economy as a sphere of life)
Harmonists Economists Conventionalists
Conflict conscious Reformers Idealists
� Fig. 41 Types of ethical behaviours in management
Form of perceptionProblemawareness
Aus: Thommen/Grösser: Economy · Company · Management, 2014 42
© Versus Verlag 2019
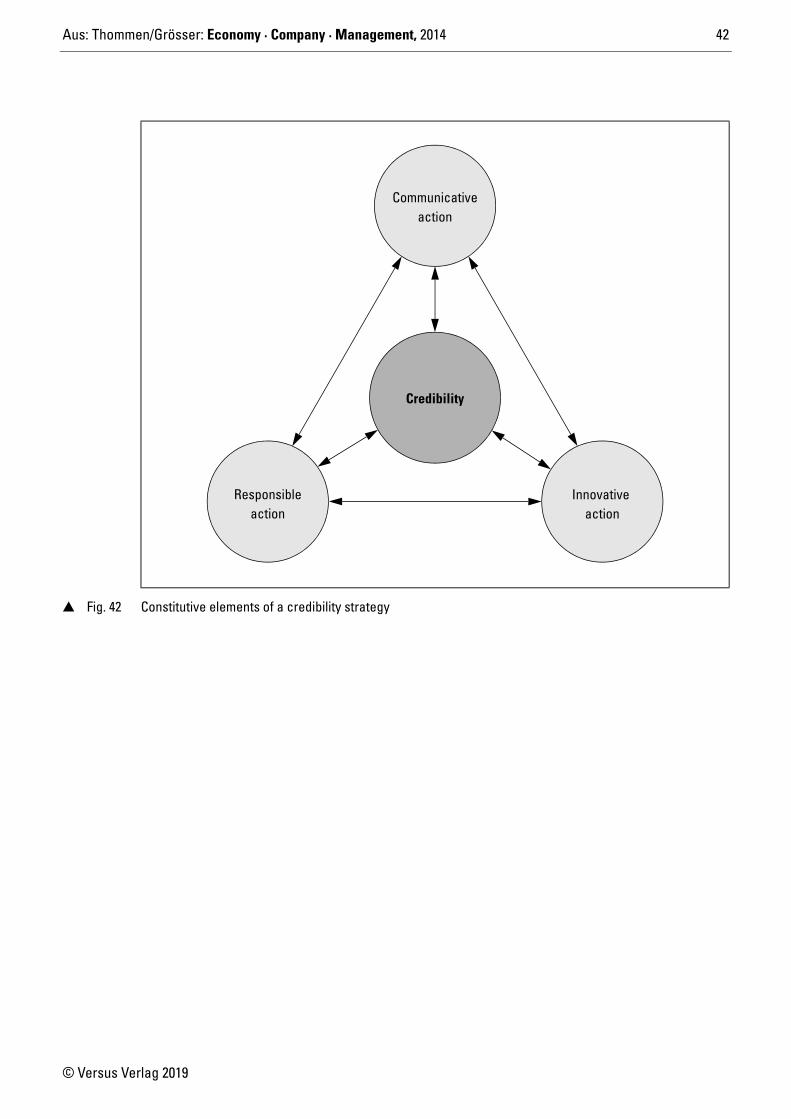
� Fig. 42 Constitutive elements of a credibility strategy
Credibility
Communicativeaction
Responsibleaction
Innovative action
Aus: Thommen/Grösser: Economy · Company · Management, 2014 43
© Versus Verlag 2019
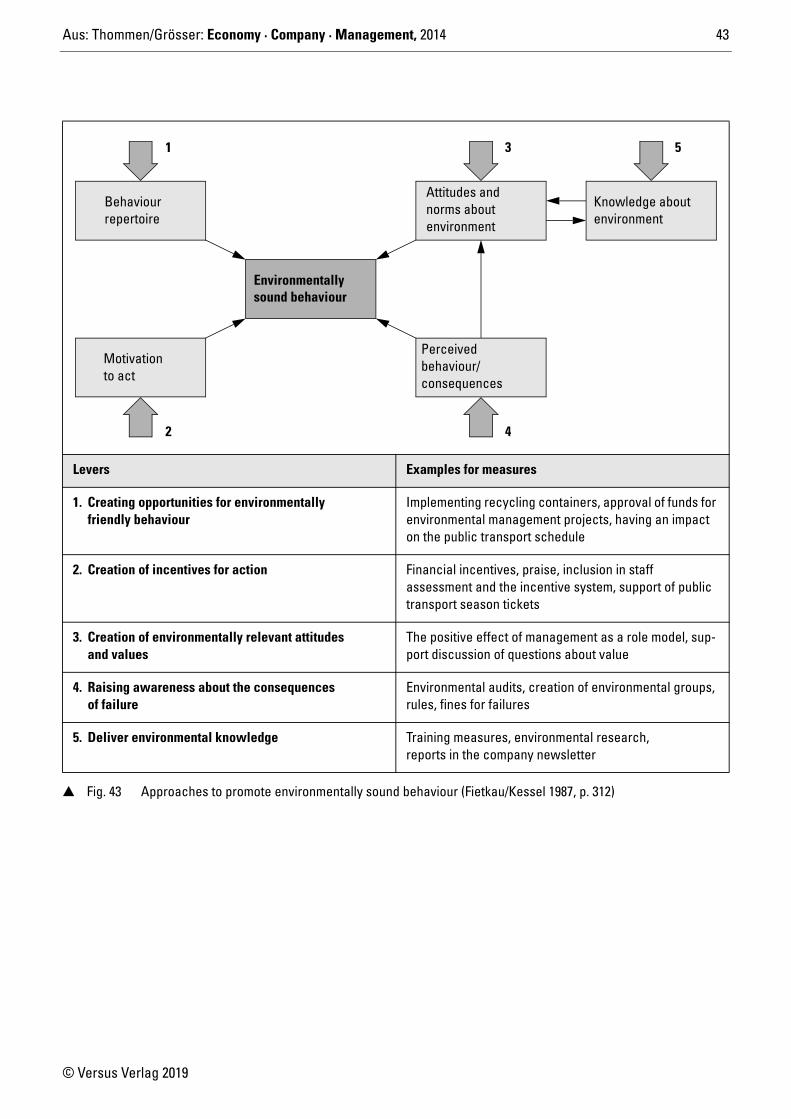
Levers Examples for measures
1. Creating opportunities for environmentally friendly behaviour
Implementing recycling containers, approval of funds for environmental management projects, having an impact on the public transport schedule
2. Creation of incentives for action Financial incentives, praise, inclusion in staff assessment and the incentive system, support of public transport season tickets
3. Creation of environmentally relevant attitudes and values
The positive effect of management as a role model, sup-port discussion of questions about value
4. Raising awareness about the consequences of failure
Environmental audits, creation of environmental groups, rules, fines for failures
5. Deliver environmental knowledge Training measures, environmental research, reports in the company newsletter
� Fig. 43 Approaches to promote environmentally sound behaviour (Fietkau/Kessel 1987, p. 312)
Motivationto act
Behaviourrepertoire
Environmentallysound behaviour
Attitudes andnorms aboutenvironment
Perceived behaviour/consequences
Knowledge aboutenvironment
1
2
3 5
4