
© 2009 HORIBA, Ltd. All rights reserved. © 2010 HORIBA, Ltd. All rights reserved.

8/6/2019 Babyboom All
http://slidepdf.com/reader/full/babyboom-all 1/56
FEATURES:Global Household Product Sales
Employee Empowerment
Cracking the Retail C.O.D.E.
Tune Into Teens:Test Your TeenAptitude
Fall/Winter 2006
CONSUMER
I n s i g h t s t o d a y f o r t o m o r r o w ’ s d e c i s i o n s
Baby BoomerSegmentation:
Eight Is Enough
8/6/2019 Babyboom All
http://slidepdf.com/reader/full/babyboom-all 2/56
Seeing Tomorrow…Today
ConsumerInsight:
In every issue…Volume 8, No. 3
TrendwatchWalk-In Retail Clinics: A Healthy Savings Idea
Publisher ACNielsen
EditorsLaurel Kennedy
Kathy Mancini
Design & LayoutBlue Lemon Design
Editorial BoardJoe BuchererCarolyn CalzavaraMark Chesney Tiffany Graves Todd HaleLaurel KennedyDan LymanKathy Mancini Troy NobleDanell O’Neill
Tom PirovanoLori Tanking
Contributing WritersDoug AndersonResearch & Development ACNielsen Homescan & Spectra
Joe BuchererSegmentation Analytics ACNielsen Homescan & Spectra
Jon BusmanMarketing ACNielsen Homescan & Spectra
Mark ChesneyCommunications
ACNielsen Global ServicesRussell EvansBusiness Technology Solutions ACNielsen
Todd Hale Thought Leadership ACNielsen Homescan & Spectra
Laurel KennedyMarketing Strategy Age Lessons
Jane PerrinCommunications ACNielsen Global Services
Tom Pirovano
Retailing Insights ACNielsen
Bill RouseWal-Mart Analytics ACNielsen Homescan & Spectra
Copyright © 2006 ACNielsen. Printed in USA. All rights reserved. ACNielsen, ACNielsen with
globe design, ACNielsen Answers, Homescan, LabelTrends and Scantrack are trademarks or
registered trademarks of ACNielsen (US), Inc. Spectra and Consumer Trade Areas are trade-
marks or registered trademarks of Spectra Marketing Systems, Inc. Other brand, product or
service names are trademarks or registered trademarks of their respective companies.
For More Information
ACNielsen U.S.
150 North Martingale Road
Schaumburg, IL 60173
800.988.4ACN
www.acnielsen.com/ci
8/6/2019 Babyboom All
http://slidepdf.com/reader/full/babyboom-all 3/56
contents
4
On the Cover:Baby Boomer
Segmentation
28
20
12
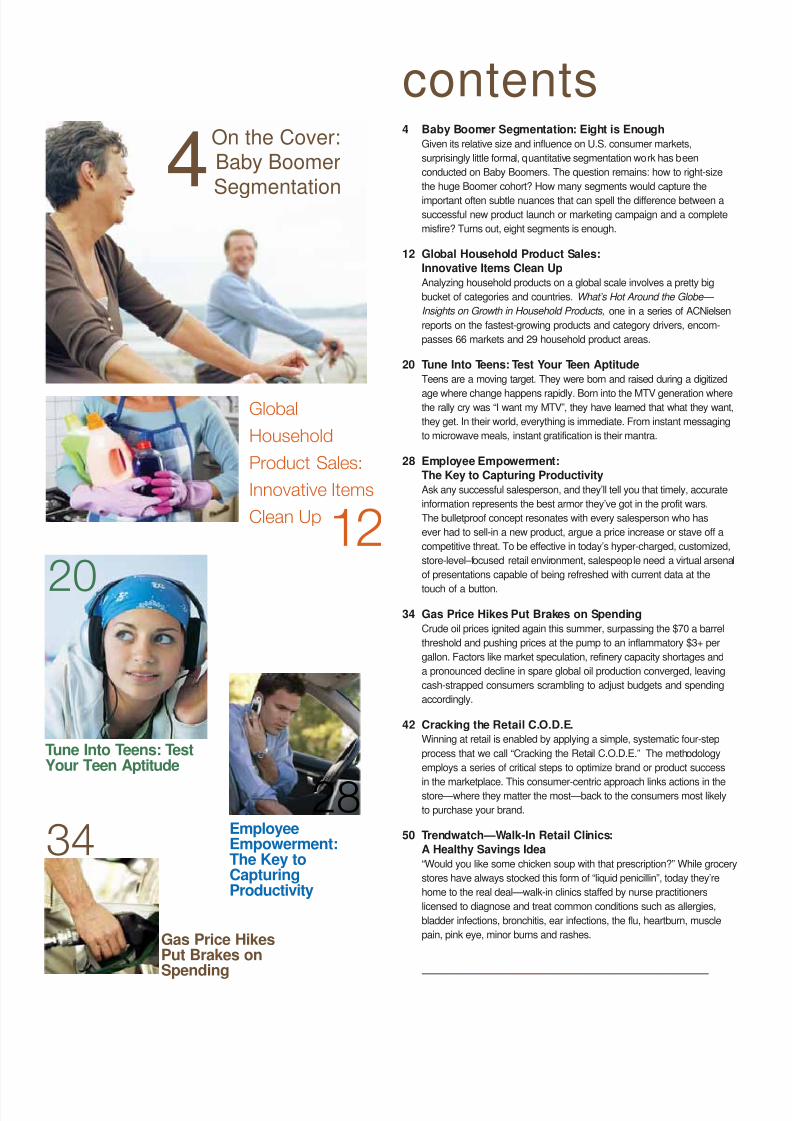
4 Baby Boomer Segmentation: Eight is Enough
Given its relative size and influence on U.S. consumer markets,
surprisingly little formal, quantitative segmentation work has been
conducted on Baby Boomers. The question remains: how to right-size
the huge Boomer cohort? How many segments would capture the
important often subtle nuances that can spell the difference between a
successful new product launch or marketing campaign and a complete
misfire? Turns out, eight segments is enough.
12 Global Household Product Sales:
Innovative Items Clean Up
Analyzing household products on a global scale involves a pretty big
bucket of categories and countries. What’s Hot Around the Globe—
Insights on Growth in Household Products, one in a series of ACNielsen
reports on the fastest-growing products and category drivers, encom-
passes 66 markets and 29 household product areas.
20 Tune Into Teens: Test Your Teen Aptitude
Teens are a moving target. They were born and raised during a digitized
age where change happens rapidly. Born into the MTV generation wherethe rally cry was “I want my MTV”, they have learned that what they want,
they get. In their world, everything is immediate. From instant messaging
to microwave meals, instant gratification is their mantra.
28 Employee Empowerment:
The Key to Capturing Productivity
Ask any successful salesperson, and they’ll tell you that timely, accurate
information represents the best armor they’ve got in the profit wars.
The bulletproof concept resonates with every salesperson who has
ever had to sell-in a new product, argue a price increase or stave off a
competitive threat. To be effective in today’s hyper-charged, customized,
store-level–focused retail environment, salespeople need a virtual arsenal
of presentations capable of being refreshed with current data at the
touch of a button.
34 Gas Price Hikes Put Brakes on Spending
Crude oil prices ignited again this summer, surpassing the $70 a barrel
threshold and pushing prices at the pump to an inflammatory $3+ per
gallon. Factors like market speculation, refinery capacity shortages and
a pronounced decline in spare global oil production converged, leaving
cash-strapped consumers scrambling to adjust budgets and spending
accordingly.
42 Cracking the Retail C.O.D.E.
Winning at retail is enabled by applying a simple, systematic four-step
process that we call “Cracking the Retail C.O.D.E.” The methodology
employs a series of critical steps to optimize brand or product success
in the marketplace. This consumer-centric approach links actions in thestore—where they matter the most—back to the consumers most likely
to purchase your brand.
50 Trendwatch—Walk-In Retail Clinics:
A Healthy Savings Idea
“Would you like some chicken soup with that prescription?” While grocery
stores have always stocked this form of “liquid penicillin”, today they’re
home to the real deal—walk-in clinics staffed by nurse practitioners
licensed to diagnose and treat common conditions such as allergies,
bladder infections, bronchitis, ear infections, the flu, heartburn, muscle
pain, pink eye, minor burns and rashes.
Global
Household
Product Sales:
Innovative Items
Clean Up
Tune Into Teens: TestYour Teen Aptitude
Gas Price HikesPut Brakes onSpending
EmployeeEmpowerment:The Key toCapturingProductivity
34
8/6/2019 Babyboom All
http://slidepdf.com/reader/full/babyboom-all 4/562 Fall/Winter 2006
OverviewACNielsen recently completed the 15th edition of its annual
Trade Promotion Practices Study which has traced industry
promotion budget and allocation trends on the manufacturer
side for 15 years, and corresponding retailer practices for nine
years. The longitudinal view of spending habits and preferences
affords unique insights into the ebb and flow of promotional
methods through time, and an enlightened look at the similari-
ties and differences between these trade partners.
Conducted via the Internet, the online survey polled senior sales
and marketing executives from 61 manufacturers and 38 retail-
er organizations. The electronic field work was supplemented
with in-depth telephone interviews to more fully develop areas
of special interest. The Trade Promotion Practices Study has
been distributed to ACNielsen clients and is available for pur-
chase on our website at http://www.acnielsen.com/store.
Benchmarking performance
Perennial favorite topics up for debate include the efficacy of frequent shopper programs and an assessment of which ele-
ments in the category management tool kit (assortment plan-
ning, promotional planning, shelf management, category busi-
ness planning, everyday low pricing, frequent shopper/loyalty
programs, micro-merchandising and micro-marketing) have
gained or lost favor in the calendar year.
A matter of opinionWhile retailers and manufacturers disagreed on any number of
issues ranging from the sufficiency of trade promotion dollars
to the effectiveness of shelf management, there were five areas
of accord. The following topics were identified by both groups
as critical success factors important to their business:
1. understanding consumers
2. new product introductions/implementation
3. category management
4. promotion efficiency/effectiveness
5. variety and assortment
Additionally, each faction identified important subjects specific
to their operations. In the case of retailers, those subjects
included private label activities and customer loyalty/retention
programs. In the case of manufacturers, those subjects included
trade partners, vendor relationships and category management.
Tailoring content
With study input available to guide editorial selections, theFall/Winter issue of Consum er Insight magazine serves up a
number of articles that directly address the top-ranked concerns
of retailers and manufacturers. When it comes to understand-
ing consumers (factor 1), the publication places the two largest
age cohorts in the U.S. squarely in the crosshairs—Baby
Boomers and Millennials.
The article titled “Baby Boomer Segmentation: Eight is
Enough” introduces a robust segmentation model from
ACNielsen Homescan & Spectra, based on the single
most influential determinant of consumer purchase behavior—
household composition, and in particular, presence of
children in the home.
The mantra “it’s all good” describes the teen scene in the article
titled “Tune into Teens” for marketers who take the time to
understand the zeitgeist of Millennials and their propensity for
electronic multi-tasking. While teens may not have the bank
accounts to purchase big ticket items, their influence over
household spending decisions is undeniable.
New product introsOpening a window onto the global new product scene
(factor 2), the article titled “Global Household Product Sales:
Innovative Items Clean Up” analyzes the packaging, ingredient
and social trends that contribute to successful new productuptake. Cleaning products with oxidizing properties swept
the worldwide sales ratings, along with so-called system
approaches to cleaning like the innovative Swiffer line.
C.O.D.E. breakersFor a comprehensive view of consumer-driven micro-
marketing, readers will want to spend time with the ar ticle
titled “Cracking the Retail C.O.D.E.”, which touches on
each of the critical success factors from the Trade Prom otion
Practices Study. Expanded, the acronym C.O.D.E. stands for
8/6/2019 Babyboom All
http://slidepdf.com/reader/full/babyboom-all 5/563
1. Consumer Profiling—accurately captures the
demographic profile of the brand’s consumer.
2. Opportunity Gapping—quantifies store-level
opportunities based on consumer demand potential
and diagnoses the prospect.
3. Dynamic Clustering—groups similar stores usingmultiple store a ttributes, including shopper demo-
graphics, the competitive set, and upside opportunity.
4. Executing for the Consumer—takes findings from steps
1–3 and develops store-level tactical plans, giving
the field force the right information to optimize
in-store presence.
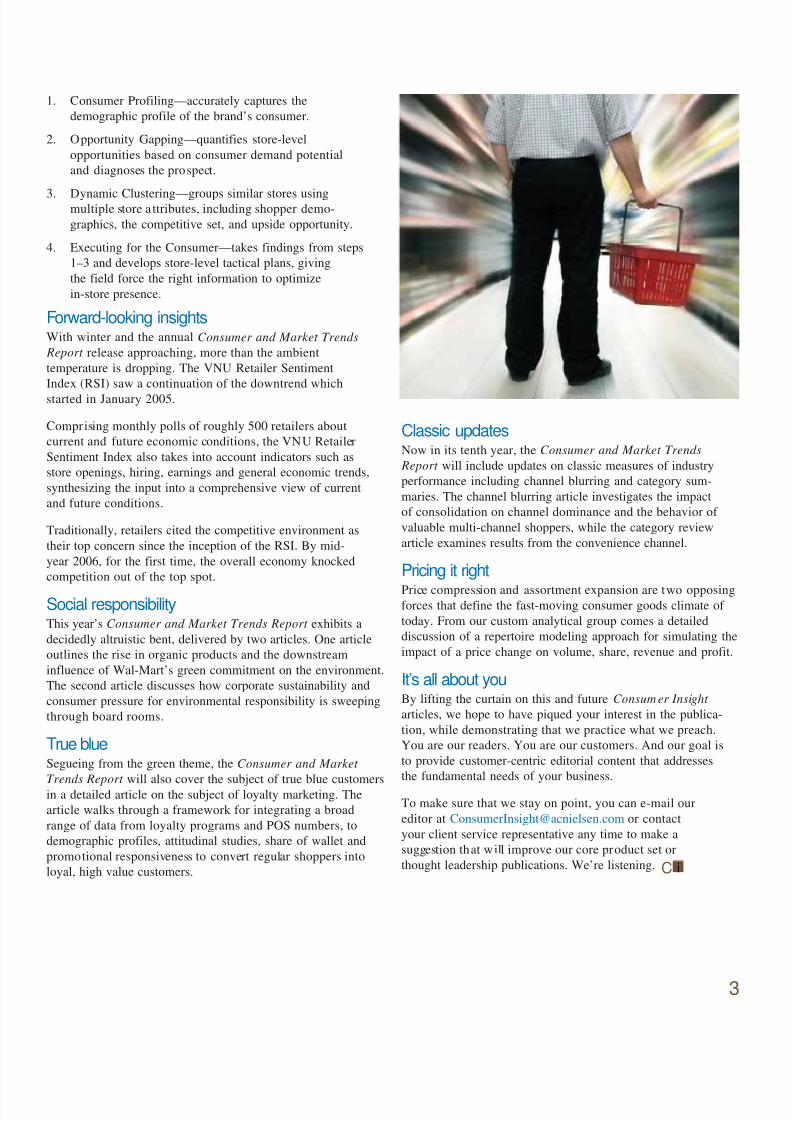
Forward-looking insightsWith winter and the annual Consumer and Market Trends
Report release approaching, more than the ambient
temperature is dropping. The VNU Retailer Sentiment
Index (RSI) saw a continuation of the downtrend which
started in January 2005.
Comprising monthly polls of roughly 500 retailers about
current and future economic conditions, the VNU Retailer
Sentiment Index also takes into account indicators such as
store openings, hiring, earnings and general economic trends,
synthesizing the input into a comprehensive view of current
and future conditions.
Traditionally, retailers cited the competitive environment as
their top concern since the inception of the RSI. By mid-
year 2006, for the first time, the overall economy knocked
competition out of the top spot.
Social responsibilityThis year’s Consumer and Market Trends Report exhibits a
decidedly altruistic bent, delivered by two articles. One article
outlines the rise in organic products and the downstream
influence of Wal-Mart’s green commitment on the environment.
The second article discusses how corporate sustainability and
consumer pressure for environmental responsibility is sweeping
through board rooms.
True blueSegueing from the green theme, the Consumer and Market
Trends Report will also cover the subject of true blue customersin a detailed article on the subject of loyalty marketing. The
article walks through a framework for integrating a broad
range of data from loyalty programs and POS numbers, to
demographic profiles, attitudinal studies, share of wallet and
promotional responsiveness to convert regular shoppers into
loyal, high value customers.
Classic updatesNow in its tenth year, the Consumer and Market Trends
Report will include updates on classic measures of industry
performance including channel blurring and category sum-
maries. The channel blurring article investigates the impact
of consolidation on channel dominance and the behavior of
valuable multi-channel shoppers, while the category review
article examines results from the convenience channel.
Pricing it right
Price compression and assortment expansion are two opposingforces that define the fast-moving consumer goods climate of
today. From our custom analytical group comes a detailed
discussion of a repertoire modeling approach for simulating the
impact of a price change on volume, share, revenue and profit.
It’s all about youBy lifting the curtain on this and future Consum er Insight
articles, we hope to have piqued your interest in the publica-
tion, while demonstrating that we practice what we preach.
You are our readers. You are our customers. And our goal is
to provide customer-centric editorial content that addresses
the fundamental needs of your business.
To make sure that we stay on point, you can e-mail our
editor at [email protected] or contact
your client service representative any time to make a
suggestion that will improve our core product set or
thought leadership publications. We’re listening. C i
8/6/2019 Babyboom All
http://slidepdf.com/reader/full/babyboom-all 6/564 Fall/Winter 2006
Baby Boomer
Segmentation:Eight Is Enough
“The most important thing to remember about Boomers is
that they are rule breakers. Individuality over conformity is
a consistent Boomer pattern. They always have done it
differently than the way it was done before, and as they
get older, they will continue to demand products that fittheir individuality.”
– From Rocking The Ages:
The Yankelovich Report on Generational Marketing
by J. Walker Smith & Ann Clurman
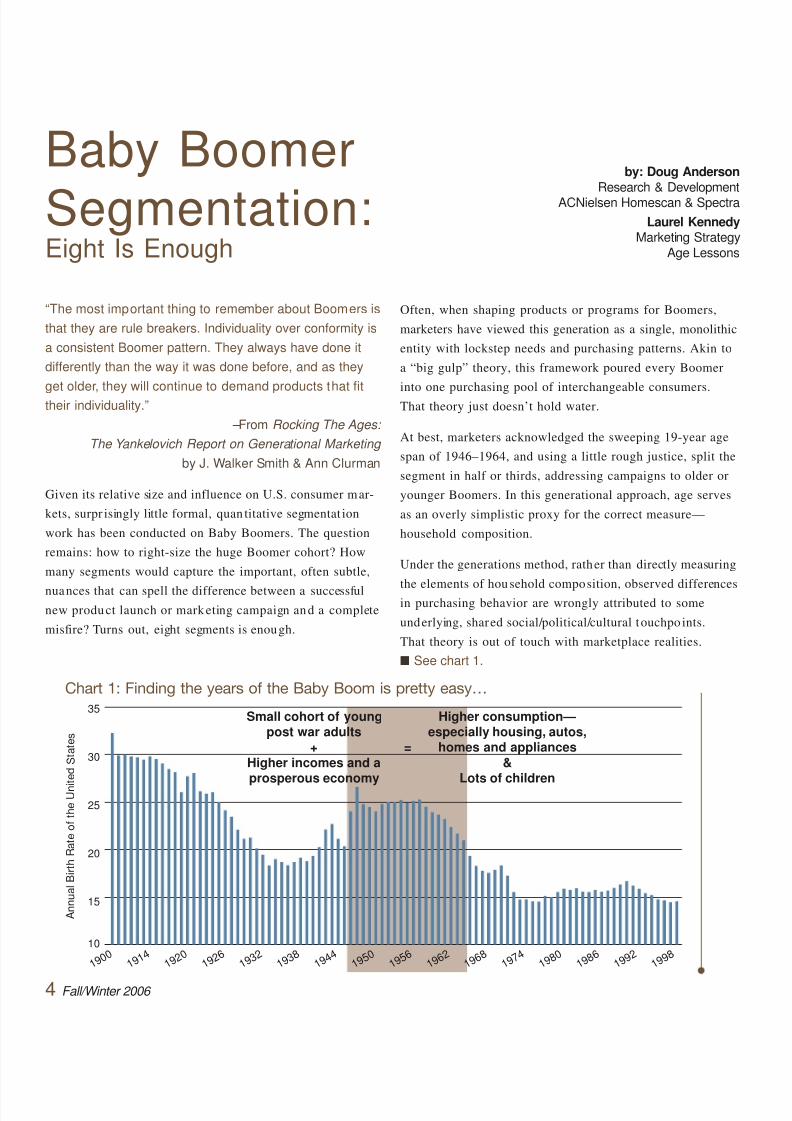
Given its relative size and influence on U.S. consumer mar-
kets, surpr isingly little formal, quan titative segmentat ion
work has been conducted on Baby Boomers. The question
remains: how to right-size the huge Boomer cohort? How
many segments would capture the important, often subtle,
nuances that can spell the difference between a successful
new product launch or marketing campaign and a complete
misfire? Turns out, eight segments is enough.
Often, when shaping products or programs for Boomers,
marketers have viewed this generation as a single, monolithic
entity with lockstep needs and purchasing patterns. Akin to
a “big gulp” theory, this framework poured every Boomer
into one purchasing pool of interchangeable consumers.That theory just doesn’t hold water.
At best, marketers acknowledged the sweeping 19-year age
span of 1946–1964, and using a little rough justice, split the
segment in half or thirds, addressing campaigns to older or
younger Boomers. In this generational approach, age serves
as an overly simplistic proxy for the correct measure—
household composition.
Under the generations method, rather than directly measuring
the elements of household composition, observed differencesin purchasing behavior are wrongly attributed to some
underlying, shared social/political/cultural touchpo ints.
That theory is out of touch with marketplace realities.
■ See chart 1.
by: Doug Anderson
Research & DevelopmentACNielsen Homescan & Spectra
Laurel KennedyMarketing Strategy
Age Lessons
Chart 1: Finding the years of the Baby Boom is pretty easy…
A n n u a l B i r t h R a t e o f t h e U n i t e d S t a t e s
35
30
25
20
15
10
1 9 0 0
1 9 1 4
1 9 2 0
1 9 2 6
1 9 3 2
1 9 3 8
1 9 4 4
1 9 5 0
1 9 5 6
1 9 6 2
1 9 6 8
1 9 7 4
1 9 8 0
1 9 8 6
1 9 9 2
1 9 9 8
Small cohort of youngpost war adults
+
Higher incomes and aprosperous economy
Higher consumption—especially housing, autos,
homes and appliances
&Lots of children
=

8/6/2019 Babyboom All
http://slidepdf.com/reader/full/babyboom-all 7/56
8/6/2019 Babyboom All
http://slidepdf.com/reader/full/babyboom-all 8/566 Fall/Winter 2006
Simply put, there is no shared cultural milieu that resonates
with all Baby Boomers. Many age cohort members were nei-
ther born in the United States, nor grew up here, leaving the
shared culture concept significantly d iluted.
Size mattersWhen people hear the term Baby Boom generation, the first
thing that comes to mind is its massive size. The second
thing is its unabated appetite for conspicuous consumption.
Boomers have been tagged with superlatives since birth,
re-shaping American culture and institutions to reflect their
unique zeitgeist. Today, this age cohort is defined as follows:
• The biggest age band in history, numbering some 77
million persons
• The highest earners, with a median household income of
$54,170; 55% greater than post-Boomers and 61% more
than pre-Boomers
• The best educated of any group before it, with 28.5%
holding a bachelor’s degree or higher and 45 million
boasting some college
• The most influential investing group, with 40% of the
U.S. population age 50+ controlling 75% of financial assets
• The deepest pockets, responsible for more than half of all
consumer spending
• The preferred safe harbor for returning college grads (2/3
support an adu lt child) and their aging parents (25% live
with a parent)
• The largest homeowner group; 80% of Boomers vs. 69%
of the general population own a home; 25% own a t least
one property in addition to their primary residence
according to the National Association of Realtors.
More alike than differentWhile neither the one- nor the two-tier segmentation
approach is accurate, it’s easy to understand how this
convention emerged. As a group, Baby Boomer households
exhibit the least behaviorally differentiated purchasing
patterns of any generation. Th is apparent behavioral
flatness is due to the fact that there is often more behavioral
variation between different groups of Boomers than between
Boomers overall and the pre- and post-Boom populations
which bracket them.
Any segmentation structure assumes that there are behav-
ioral or other key differences within the group to be seg-
mented. As behaviorists, we believe that segments generated
should show differences in real, measurable consumer
behavior. In the case of Boomers, much of the intra-genera-
tional variation observed has more to do with household
composition, and less to do with membership in simplistic,
age-based cohorts.
Slicing the pieThe overriding factor dictating Boomer consumer segments
proved to be the presence of children in the home. In 2000,
65% of elementary and high school students had Baby
Boomer parents, and high school enrollments reached their
highest level since 1979. Nearly one in five school-age
children had at least one foreign-born parent, and their
ethnicity reflects the diversity of the Boomer band: 63%
non-Hispanic White, 16% African-American, 15%
Hispanic and 4% Asian.
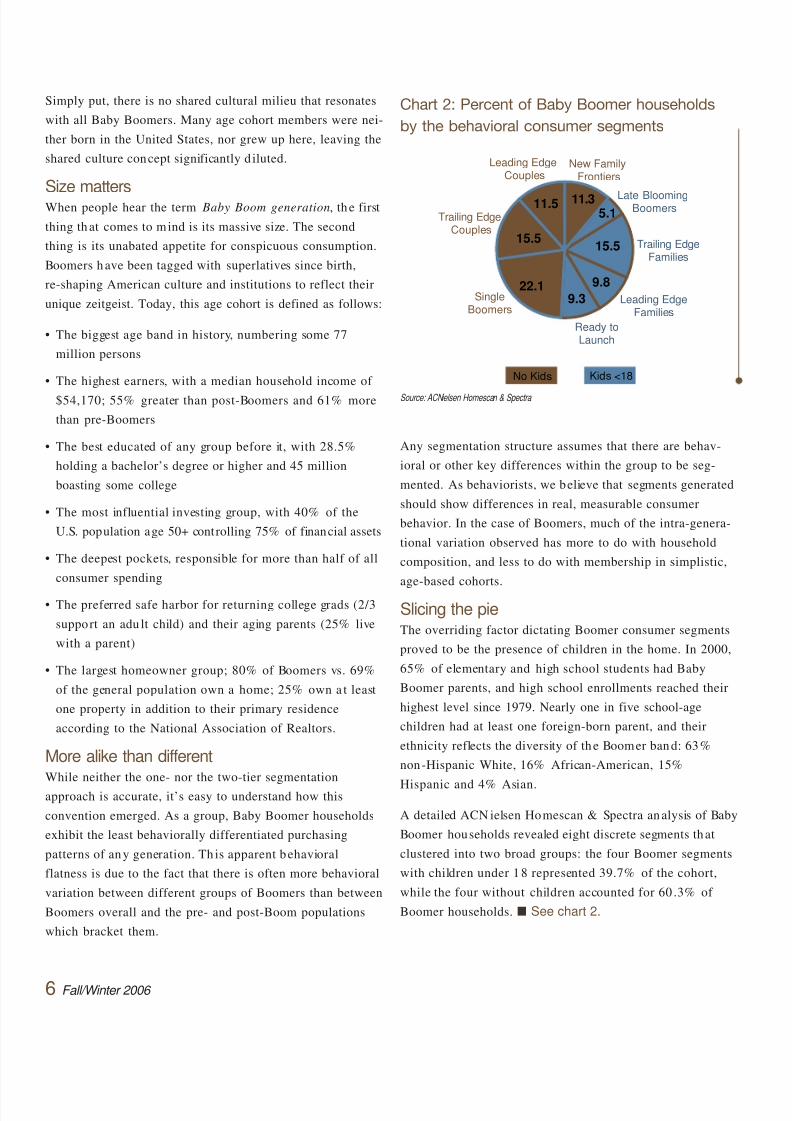
A detailed ACN ielsen Homescan & Spectra analysis of Baby
Boomer households revealed eight discrete segments that
clustered into two broad groups: the four Boomer segments
with children under 18 represented 39.7% of the cohort,
while the four without children accounted for 60 .3% of
Boomer households. ■ See chart 2.
Chart 2: Percent of Baby Boomer households
by the behavioral consumer segments
SingleBoomers
Kids <18
New FamilyFrontiers
Ready toLaunch
No Kids
Late BloomingBoomers
Trailing EdgeFamilies
Leading EdgeFamilies
Leading EdgeCouples
Trailing EdgeCouples
11.35.1
15.5
9.8
9.322.1
15.5
11.5
Source: ACNielsen Homescan & Spectra

8/6/2019 Babyboom All
http://slidepdf.com/reader/full/babyboom-all 9/567
Kid stuffMarketing to the Boomer segments with children is anything
but child’s play. It requires an understanding of the nuances
between the four groups. For example, highly educated Late
Blooming Boomers may have made the choice to start fami-
lies later in life or are the by-product of divorce. As a result,
Late Blooming Boomers have smaller, younger families com-
prising one to two children under the age of 12. A single
parent heads fully one-third of Late Blooming households,
which also index above average for African-American and
Asian ethnicities, but below average for Hispanics.
Late Blooming heads of household span the entire Baby
Boomer age group. Since education correlates strongly with
income, any attempt to divide Boomers on the basis of age
alone would clearly miss the mark here, and leave out a
significant number of a ffluent Lat e Blooming households.
■ See chart 3.
Trailing Edge Families comprise larger, stable households
of 4+ persons who have lived at the same address for more
than five years. Unlike Late Blooming Boomers, Trailing
Edge heads of household fall into a narrow age parameter,
sharing a birth date between the years 1958 and 1964.
Averaging 2.5 children per household, they have far fewer
(less than half as many) adult children than Leading Edge
families, which appears to be a direct function of
parental age.
The least educated of any Boomer group, Trailing Edgers
are even less educated than the post-Baby Boom cohort.
Another note of internal segment consistency demarcating
Trailing Edgers is the above average concentration of
Hispanics populating the group, the most of any Boomer
sub-segment.
Older, not necessarily wiser, kidsLeading Edge Families feature older parents born between
1946 and 1957, large households averaging 2.4 children,
with approximately one “adult child” for every four chil-dren under age 18. As one might expect from the doting
parents who pioneered those ubiquitous baby-on-board
signs, the apron strings are proving hard to cut—or perhaps
just more elastic—as young adult children bounce back to
the security of home.
The purse strings to Junior are even harder to untie. As a
consequence, Boomer offspring are returning to the nest
after college in record numbers, or remaining at home while
getting their start in the working world. According to 2000
U.S. Census figures, 56% of men and 43% of women in the
18–24 age bracket reside with a parent, and 65% of recent
college grads enjoy the largesse of Mom & Dad’s hospitality.
While better educated than pre-and post-Boomers, Leading
Edge Families fall into the lower tier of academic accom-
plishment compared with other Boomer segments. After
Trailing Edge Families, Leading Edge Families are the most
Hispanic-dominant of any Boomer group and far and away
the “most married.” Seven in ten Leading Edge Family
households are headed by married couples.
Chart 3: Segmenting Baby Boomer households with
children less than 18
YoungerChildren
< 12 Only
OlderChildren
12 +
Trailing EdgeHOH
Age 42–48
Leading EdgeHOH
Age 49–60
Smaller FamiliesSize 2–3
Larger FamiliesSize 4+
Total BabyBoomer HHswith Children
Late BloomingBoomers
Ready toLaunch
Trailing EdgeFamilies
Leading EdgeFamilies
Source: ACNielsen Homescan & Spectra
8/6/2019 Babyboom All
http://slidepdf.com/reader/full/babyboom-all 10/568 Fall/Winter 2006
Working
RetirementsWork long and prosper. That’s the new mantra of the Boomer
generation as it edges toward Social Security eligibility and
retirement age. So hold on to those gold watches, because the
Boomers plan on retiring the traditional concept of retirement
with a characteristically bold move that will surprise detractors
and benefit—rather than hijack—the economic future of the
generations that follow.
The idea is simplicity itself: keep on working, earning and
contributing to the economy for as long as one is able and
enabled. Driven by a host of motivations ranging from self-
actualization to financial need, many Boomers reject the idea of
a leisurely retirement and plan to work well into their 70s and
beyond. In a 2006 Merrill Lynch study, 71% of adults envision
working in retirement, and half of those said they intended to
work as long as they were physically and intellectually able.
Companies need the workersWhile the statistics vary dramatically (estimates of a labor short-
age as early as 2010 range from 800,000 workers to almost
10 million), the inescapable fact remains that the “baby bust”
generation numbers 11 million fewer bodies than the Boomers.
Even with productivity gains, process changes, outsourcing
options and immigration inflows, there simply may not be
enough workers to fill available jobs. The obvious solution:
retain the ones you’ve got.
Progressive employers are experimenting with any number of
riffs on the traditional consulting contracts or part-time posi-
tions available to retired employees. Among the more innova-
tive working retirement ideas:
• capability-specific personnel banks of skilled temporaryworkers;
• roadblocking schedules, where retirees rotate between timeon/off the job for a pre-determined time increment (e.g.,three months on/off);
• job sharing, reviving what Boomer women elevated to an artform; two individuals sharing a job, salary and performanceexpectations;
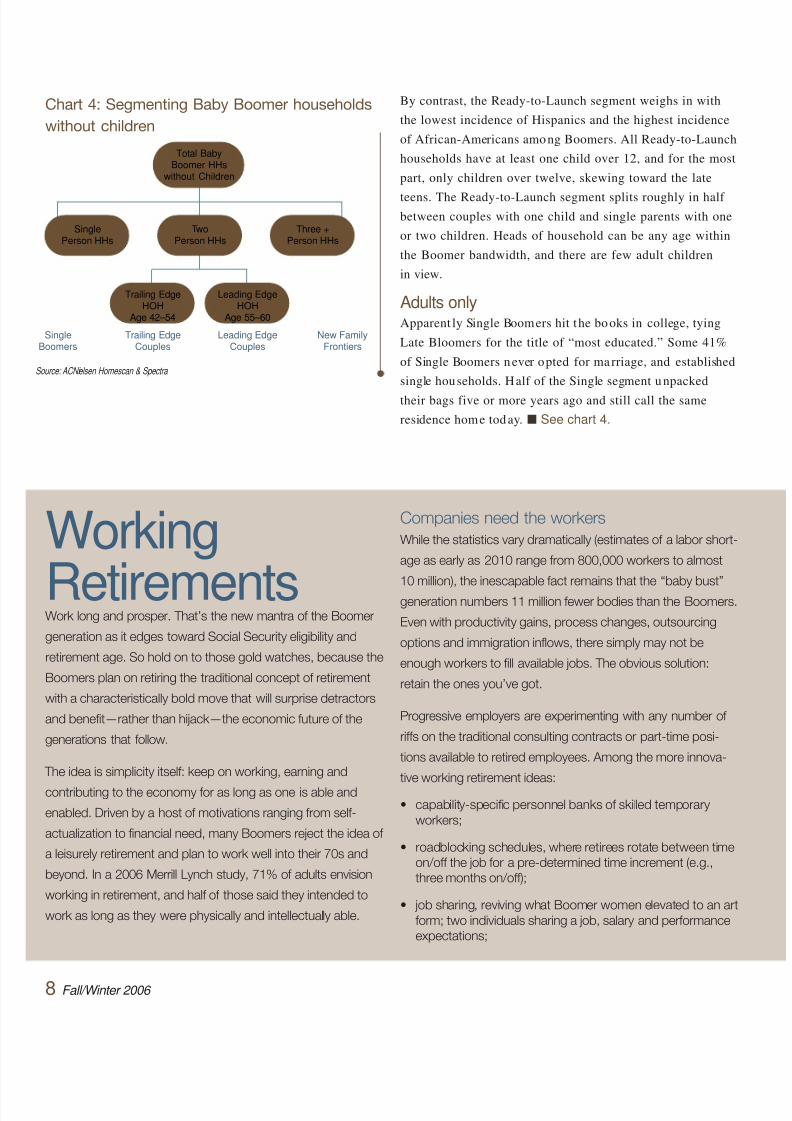
By contrast, the Ready-to-Launch segment weighs in with
the lowest incidence of Hispanics and the highest incidence
of African-Americans among Boomers. All Ready-to-Launch
households have at least one child over 12, and for the most
part, only children over twelve, skewing toward the late
teens. The Ready-to-Launch segment splits roughly in half between couples with one child and single parents with one
or two children. Heads of household can be any age within
the Boomer bandwidth, and there are few adult children
in view.
Adults onlyApparent ly Single Boomers hit the books in college, tying
Late Bloomers for the title of “most educated.” Some 41%
of Single Boomers never opted for marriage, and established
single households. Half of the Single segment unpacked
their bags five or more years ago and still call the same
residence home today. ■ See chart 4.
Chart 4: Segmenting Baby Boomer households
without children
Trailing EdgeHOH
Age 42–54
Leading EdgeHOH
Age 55–60
SinglePerson HHs
TwoPerson HHs
Three +Person HHs
Total BabyBoomer HHs
without Children
SingleBoomers
Trailing EdgeCouples
Leading EdgeCouples
New FamilyFrontiers
Source: ACNielsen Homescan & Spectra

8/6/2019 Babyboom All
http://slidepdf.com/reader/full/babyboom-all 11/569
• seasonal positions that follow employees who split timebetween two geographical locations (e.g., New York andFlorida);
• sampling arrangements that enable a worker to move
across departments for a new challenge.
Boomers need the moneyIt’s a good thing that Boomers say they want to work, because
it’s clear that many will have to work for financial reasons. One
factor that impacted even diligent savers was the stock market
decline of 2001–2003 that eradicated roughly $7–8 trillion in
shareholder wealth, much of it held by Boomers.
In the process, the dot-com crash ate away some $279 billion
in 401(k) assets and huge chunks of other retirement savings.Boomers dialed-in to the nuances of finance recognize that
401(k) and IRA/retirement money statements can create a false
sense of wealth, since these amounts will be federally taxed on
withdrawal (with the exception of Roth IRAs).
Everybody winsWorking Boomer retirees will have more discretionary income
to continue fueling the economic engine, less need to draw
down savings and liquidate investments, and can readily fill the
emerging labor gap by staying employed. Meaningful employ-
ment enables critical knowledge transfer from highly skilled
Boomers to other workers, and keeps older employees men-
tally and physically engaged.
At the same time, employers access a labor pool of proven
workers with the flexibility to calibrate hours to match demand.
In a Center for Retirement Research survey, older workers
earned consistently higher marks than younger counterparts
from employers for their “knowledge of procedures and other
job aspects” and “ability to interact with customers”. Overall,
older workers were seen as more productive based on their
accumulated institutional knowledge and efficient work habits.
Retailers like CVS Pharmacy, Home Depot and Borders have
already tapped the retiree talent vein with outstanding results.
When it comes to the workplace, some things apparently do
get better with age.
Trailing Edge Couples carved their own path on the matri-
monial front, and report the highest rate of unmarried
partners living together. Trailing Edge Couples typically
are headed by a person born in the 1952–1964 period,
who have occupied the same house for the past five years,
find themselves situated in the bottom Boomer tier on theeducation dimension, and have fewer than expected
Hispanic and African-American members.
The social vanguardLeading Edge Couples, with a head of household born
between 1946 and 1951, represent the first group of the
Boomer generation to serve as social change agents. One
of the top three best-educated Boomer segments, Leading
Edge Couples exhibit just half the unmarried rate of Trailing
Edge Couples and two-thirds have shared a residence for
five or more years. Less ethnically diverse than o ther
Boomer strata, Leading Edge Couples report a low incidence
of Hispanics and the lowest African-American incidence of
all Boomer groups.
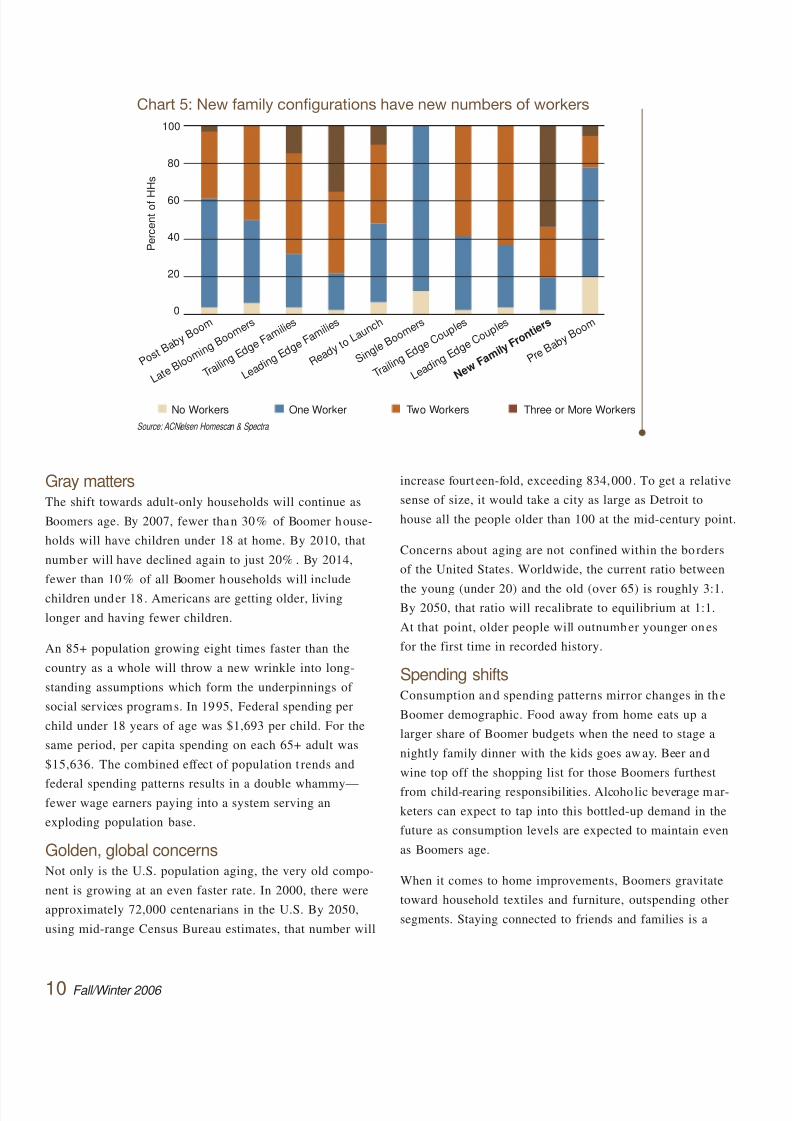
One of the most interesting segments to emerge from the
Boomer study was the New Family Frontiers faction, char-
acterized by three or more adults sharing a household. The
typical New Family Frontiers household encompasses 1.1
children between the ages of 18 and 24, with 40% claiming
another resident relative such as a parent (1/3 of such family
units) or adult siblings.
From an economic perspective, it is worthwhile to note that
54% of New Family Front iers households have three or
more employed workers in the home. Among the highest
earning households, New Family Frontiers do a pretty
good job of hanging on t o wha t they make, second onlyto Leading Edge Couples on the savings front.
■ See chart 5 on page 10.
8/6/2019 Babyboom All
http://slidepdf.com/reader/full/babyboom-all 12/56
Gray mattersThe shift towards adult-only households will continue as
Boomers age. By 2007, fewer than 30% of Boomer house-
holds will have children under 18 at home. By 2010, that
number will have declined again to just 20% . By 2014,
fewer than 10% of all Boomer households will include
children under 18 . Americans are getting older, living
longer and having fewer children.
An 85+ population growing eight times faster than the
country as a whole will throw a new wrinkle into long-
standing assumptions which form the underpinnings of
social services programs. In 1995, Federal spending per
child under 18 years of age was $1,693 per child. For the
same period, per capita spending on each 65+ adult was
$15,636. The combined effect of population t rends and
federal spending patterns results in a double whammy—fewer wage earners paying into a system serving an
exploding population base.
Golden, global concernsNot only is the U.S. population aging, the very old compo-
nent is growing at an even faster rate. In 2000, there were
approximately 72,000 centenarians in the U.S. By 2050,
using mid-range Census Bureau estimates, that number will
increase fourt een-fold, exceeding 834,000. To get a relative
sense of size, it would take a city as large as Detroit to
house all the people older than 100 at the mid-century point.
Concerns about aging are not confined within the bo rders
of the United States. Worldwide, the current ratio between
the young (under 20) and the old (over 65) is roughly 3:1.By 2050, that ratio will recalibrate to equilibrium at 1:1.
At that point, older people will outnumber younger ones
for the first time in recorded history.
Spending shiftsConsumption and spending patterns mirror changes in the
Boomer demographic. Food away from home eats up a
larger share of Boomer budgets when the need to stage a
nightly family dinner with the kids goes away. Beer and
wine top off the shopping list for those Boomers furthest
from child-rearing responsibilities. Alcoholic beverage mar-
keters can expect to tap into this bottled-up demand in the
future as consumption levels are expected to maintain even
as Boomers age.
When it comes to home improvements, Boomers gravitate
toward household textiles and furniture, outspending other
segments. Staying connected to friends and families is a
10 Fall/Winter 2006
Chart 5: New family configurations have new numbers of workers
P e r c e n t o f H
H s
100
80
60
40
20
0
No Workers One Worker Two Workers Three or More Workers
P o s t B
a b y B
o o m
L a t e B
l o o m i n
g B o o
m e r s
T r a i l i n
g E d g
e F a m
i l i e s
L e a d i n
g E d g
e F a m i l i e
s
R e a d y t o
L a u n c h
S i n g l e
B o o m
e r s
T r a i l i n
g E d g
e C o u
p l e s
L e a d i n g
E d g e
C o u p l e s
N e w F a
m i l y F
r o n t i e
r s
P r e B a b y
B o o m
Source: ACNielsen Homescan & Spectra

8/6/2019 Babyboom All
http://slidepdf.com/reader/full/babyboom-all 13/5611
Boomer imperat ive, accounting for their 50% higher spend-
ing rate on cellular phones and pagers. Plugged in to elec-
tronic entertainment media, Boomer spending rates outpacethe average for audio equipment, televisions and radios.
The Boomer obsession with health and wellness extends to
their extended family—including the four-footed, finned and
winged members. Boomers willingly open their wa llets for
veterinary care and other pet services such as grooming and
doggie day care.
Family financesThe Boomer relationship with money is complicated and
convoluted. Shaped by parental stories of the Depressionand WWII deprivation, Boomers learned to respect money,
save money, value work over leisure and savings over debt.
They look askance at credit issuers who mail out unsolicited
cards to college students, in the hopes they’ll be used. All
in all, one could say Boomers are a fiscally conservative
bunch—except when it comes to their kids.
It is not uncommon to find a Boomer parent liquidating
retirement savings or mortgaging their home to subsidize
their child’s college tuition. Despite years of denying them-
selves luxuries, they will indulge an offspring’s demands for
a car, expensive vacation or the latest and greatest in con-
sumer electronics.
A perfect stormThe graying of America presents a number of questions such
as the prospective impact of impending retirements on:
1. financial markets, as Boomers prepare to liquidate equity
holdings and supplement retirement savings;
2. real estate markets, as Boomers prepare to trade down
from large homes—a flurry of sales may add momentum
to the imploding housing market;
3. employment issues, as Boomers exit the workplace and
the baby bust generation comes up 11 million people
short of available openings;
4. consumer spending, as Boomers retire or are forced into
second careers, part-time or lower paying positions;
5. healthcare system, as Boomers begin to experience the
inevitable decline of physical vigor and the onset of
chronic illnesses like high blood pressure and diabetes.
An uncertain outcomeSome pundits ponder these issues and see the makings of
a perfect storm capable of capsizing the U.S. economy.
Others see the opportunity to extend the consumer use-life
by extending the Boomer work-life from an arbitrary retire-
ment at age 65, to an open-ended employment contract that
keeps people working, and earning, for as long as they are
physically able. ■ See sidebar on “Working Retirements”
on pages 8 and 9.
Society has never been asked t o solve a socioeconomic equa-
tion with so many unknown variables before. There simply
have never been so many old people, living so long and
staying so healthy.
From a marketing perspective, one thing is certain. Older
Boomers represent both a viable market and one too large
to ignore. C i
8/6/2019 Babyboom All
http://slidepdf.com/reader/full/babyboom-all 14/5612 Fall/Winter 2006
by: Jane PerrinCommunications
ACNielsen Global Services
Mark Chesney
CommunicationsACNielsen Global Services
Global Household
Product Sales:Innovative Items Clean Up
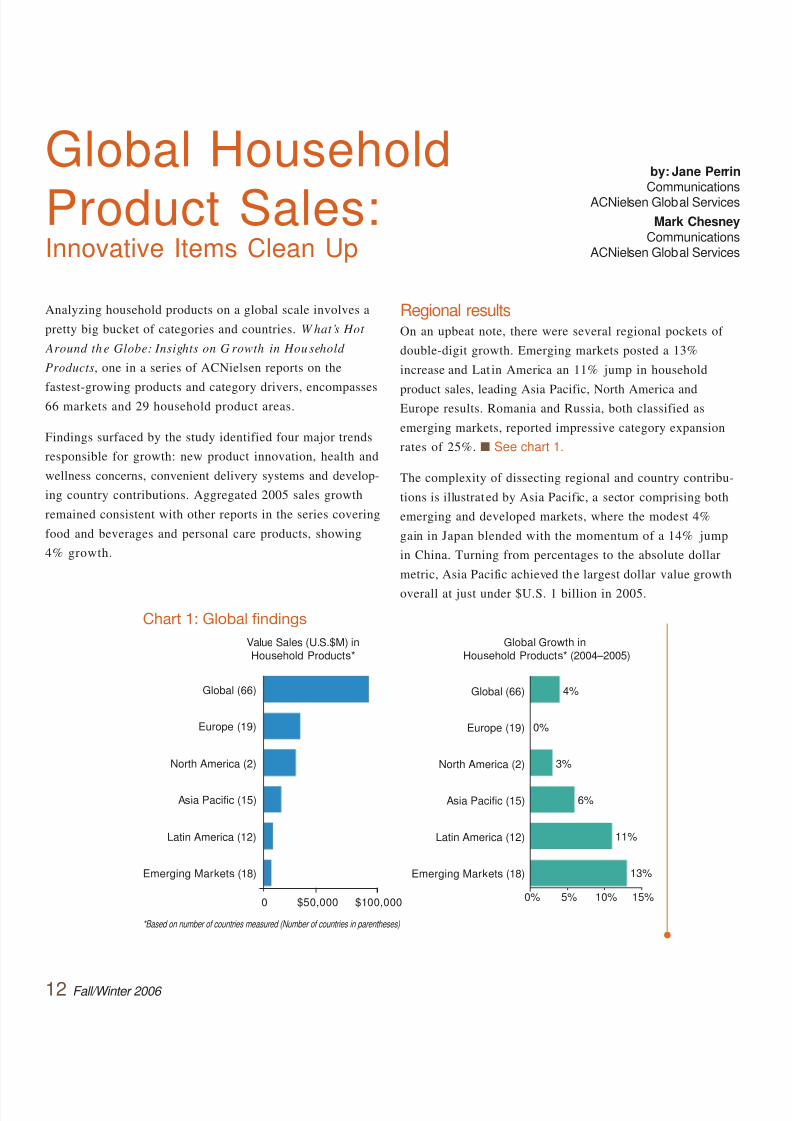
Analyzing household products on a global scale involves a
pretty big bucket of categories and countries. W hat’s Hot
Around the Globe: Insights on G rowth in Household
Products, one in a series of ACNielsen reports on the
fastest-growing products and category drivers, encompasses66 markets and 29 household product areas.
Findings surfaced by the study identified four major trends
responsible for growth: new product innovation, health and
wellness concerns, convenient delivery systems and develop-
ing country contributions. Aggregated 2005 sales growth
remained consistent with other reports in the series covering
food and beverages and personal care products, showing
4% growth.
Regional resultsOn an upbeat note, there were several regional pockets of
double-digit growth. Emerging markets posted a 13%
increase and Lat in America an 11% jump in household
product sales, leading Asia Pacific, North America andEurope results. Romania and Russia, both classified as
emerging markets, reported impressive category expansion
rates of 25%. ■ See chart 1.
The complexity of dissecting regional and country contribu-
tions is illustrated by Asia Pacific, a sector comprising both
emerging and developed markets, where the modest 4%
gain in Japan blended with the momentum of a 14% jump
in China. Turning from percentages to the absolute dollar
metric, Asia Pacific achieved the largest dollar value growth
overall at just under $U.S. 1 billion in 2005.
Chart 1: Global findings
Global (66)
Europe (19)
North America (2)
Asia Pacific (15)
Latin America (12)
Emerging Markets (18)
4%
0%
3%
6%
11%
13%
Global (66)
Europe (19)
North America (2)
Asia Pacific (15)
Latin America (12)
Emerging Markets (18)
15%10%5%0%
Value Sales (U.S.$M) inHousehold Products*
Global Growth inHousehold Products* (2004–2005)
0 $50,000 $100,000
*Based on number of countries measured (Number of countries in parentheses)

8/6/2019 Babyboom All
http://slidepdf.com/reader/full/babyboom-all 15/56

8/6/2019 Babyboom All
http://slidepdf.com/reader/full/babyboom-all 16/5614 Fall/Winter 2006
Leading categoriesAmong the 29 categories studied, only nine grew faster than
the global average, five paced the 4% rate; and t he rest
lagged behind. In prior studies, the fastest-growing categories
were also among the smallest in dollar sales. That was not
the case in 2005. Five categories in the fastest-growing top
nine—garbage bags, household cleaners, air fresheners,
insect control and fabric softener—also registered among
the top 10 categories in value sales. ■ See chart 2.
The remaining top performers included abrasive cleaning
pads, which shared top b illing with disinfectants at 13% ,
laundr y stain removers/boosters at 6% and plastic storage
bags at 5% .
Performance enhancersOn closer examination, specific sub-segments accounted for
the strong overall showing in some categories. For example,
battery-operated freshening systems powered up a 191%
sales increase, and air sanitizing sprays vaporized the
category with their supercharged growth in sales of 36% .
Similarly, the power cleaning sub-segment o f household
cleaners (75% ) and those products with oxidizing ingredi-
ents for stain removal (11% ) wiped up the rest of the category.
The cleaning system concept debuted by Swiffer, comprising
a re-useable element such as a handle with disposable
cloths, sponges or brushes, has been syndicated to other cat-
egories including bathroom cleaners, toilet bowl cleaners,
dusters, air care and insect control. The jury is still out on
whether or no t the consumer uptake on systems and one-
step, multi-use products will successfully cross category
boundaries.
Worthy of considerationConsumer health concerns gave a shot in the arm to house-
hold cleaner and disinfectant category results. Both recorded
higher than average growth rates, which may indicate a shift
in the type of products used to clean around the world.
While the discussion to date has surrounded growth rates, it
is worthwhile to note that even though laundry detergent
only expanded at the average pace, it represents the largest
category overall and contributed more than any other cate-
gory to global growth.
EuropeTotal Household Care (0%)
Brooms, Brushes, Mops (10%)
Disinfectants (3%)
Household Cleaners (3%)
Laundry Stain Remover (3%)
Garbage Bags (3%)
Auto Dish Detergent (2%)
Auto Dish Additives (2%)
Plastic Storage Bags (2%)
Batteries (2%)
Waste Pipe Openers (2%)
North AmericaTotal Household Care (3%)
Disinfectants (23%)
Laundry Stain Remover (12%)
Garbage Bags (12%)
Abrasive Cleaning Pads (7%)
Toilet Care (7%)
Kitchen Paper/Towel (7%)
Air Fresheners (5%)
Plastic Storage Bags (5%)
Household Cleaners (5%)
Aluminum Foil (4%)
Asia PacificTotal Household Care (6%)
Auto Dish Detergent (17%)
Auto Dish Additives (16%)
Abrasive Cleaning Pads (14 %)
Fabric Fresheners (10%)
Air Fresheners (10%)
Plastic Storage Bags (9%)
Fabric Softener (9%)
Batteries (8%)
Garbage Bags (8%)
Brooms, Brushes, Mops (8%)
Latin AmericaTotal Household Care (11%)
Abrasive Cleaning Pads (74%)
Laundry Stain Remover (36%)
Air Fresheners (16%)
Bleach/Ammonia (15%)
Plastic Storage Bags (14%)
Fabric Softener (14%)
Insect Control (13%)
Aluminum Foil (13%)
Toilet Care (12%)
Household Cleaners (11%)
Emerging MarketsTotal Household Care (13%)
Fabric Fresheners (277%)
Carpet/Rug Cleaner (37%)
Waste Pipe Openers (37%)
Air Fresheners (23%)
Laundry Water Softeners (21%)
Auto Dish Detergent (20%)
Cleaning Cloths/Sponges (19%)
Household Cleaners (17%)
Fabric Softener (16%)
Laundry Stain Remover (16%)
Chart 2: Only nine categories grew
faster than 4%Top No. of Markets Category CategoryGrowing Growing/ Growth Rate Growth Value
Categories Measured 04–05 $000
1. Abrasive Cleaning Pads 13 of 23 13% 129,2 15
2. Disinfectants 18 of 26 13% 81,1 483. Garbage Bags* 15 of 19 8% 209 ,806
4. Laundry Stain Remover/Booster 30 of 37 6% 82,87 6
5. Household Cleaners* 55 of 65 6% 338 ,553
6. Air Fresheners* 50 of 61 5% 244 ,081
7. Insect Control* 28 of 47 5% 168 ,489
8. Plastic Storage Bags 28 of 34 5% 78,04 0
9. Fabric Softener* 44 of 58 5% 255 ,008
*Also among the largest 10 categories in value sales
Chart 3: Top 10 categories and growth rate by region
continued on page 16

8/6/2019 Babyboom All
http://slidepdf.com/reader/full/babyboom-all 17/56
Stepping Outside Your
Own Borders?
Use the right marketing information tomake your expansion decisions.
Contact ACNielsen Global Services at 847-605-5904.
Global Services

8/6/2019 Babyboom All
http://slidepdf.com/reader/full/babyboom-all 18/5616 Fall/Winter 2006
Different strokesThe t op ten categories within each region d iffer significantly,
and none of the overall fastest-growing products shows up
in every regional ranking. In Europe, only the leading cate-
gory— brooms, brushes and mops—charted 2005 results
that bettered the global average. ■ See chart 3, page 14.
In North America, disinfectants killed off any competition
in the top ten with a 23% annual growth rate. Only the
laundry stain remover and garbage bag categories also posted
double digit regional growth at 12% .
Automatic dish detergents and automatic dish additives
floated to the top of the Asia Pacific top ten list. In Latin
America, every top ten contender boasted double-digit
growth, but abrasive cleaning pad results scoured all comers
with a whopping 74% . Laundry stain removers were a
distant second in the line-up at 36% .
The Emerging M arkets’ winning entr y, fabric fresheners,
was in a class by itself with a 277% annual growth rate.
Carpet/rug cleaners and waste pipe openers trailed with
strong 37% increases.
Coming cleanAbrasive cleaning pads, the runaway category growth winner
in Latin America, owes its phenomenal success to a single
country: Brazil. This one country accounted for more
than 95% of category sales, divided among three brands.
Aggressive media suppor t generated a 45% increase for the
leading brand, with the number two and three brands each
expanding by more than 200% .
Global brand dominance was more diffused than in Latin
America, with the top th ree brands comprising 65% of
category sales and private label brands absorbing an addi-
tional 16% .
Hygienic habitsGerm-aphobic Americans kicked their cleaning standards
up a notch, striving for a sanitized—versus merely clean—
household. This microbe-free goal resulted in a 23% regional
category sales increase. As always, convenience played into
consumer decision-making, explaining why 80% of the
absolute dollar growth in U.S. sales (excluding Wal-Mart)
derived from a 60% increase in wipes.
Disinfectant wipes, measured in only five markets, mopped
up consumer dollars on a global basis for a 35% growth in
sales. Their counterpart, disinfectant sprays, expanded at
an average 10% rate in 12 of 19 markets measured. Brand
sales are so heavily concentrated in this category that three
brands accounted for 71% of dollar sales on a globa l basis.
It’s worthy of note that a lthough only 8% of sales can be
ascribed to private label brands, their sales expanded by
26% in 2005.
Tying up salesGarbage bag sales expanded at an 8% annual rate, twice the
global tempo, with North America the sole region to wrap the
year with double digit growth (12% ). For such a seemingly
mundane category, garbage bags represent an endless sourceof innovative benefits from anti-odor attributes to a host of
tying options to stretch-and-flex fabrics that won’t rip.
New features, coupled with raw material cost increases for
the oil-based resins used in manufacturing, combined to
justify the higher reta il prices that raised dollar value sales.
Private label products captured a significant share of
Global Household Product Trends continued from page 14
8/6/2019 Babyboom All
http://slidepdf.com/reader/full/babyboom-all 19/5617
garbage bag sales (40% ), almost enveloping the 49% sales
component contributed by the top three brands. Both private
label and branded offerings increased by 8% .
Spotless outcomesBoth t he pre-wash and in-wash products that compose the
laundry stain remover category captured double-digit sales
in three of five regions, with four of five regions ranking
the category among the top ten. Tepid Asia Pacific results
of 1% growth dampened the overall category average.
“Oxi” products cleaned up in the category, spreading in
seven of the 10 markets measured at an 11% overall rate.
No-wash stain removers, including pen delivery systems,
achieved explosive sales of 200% over the pr ior year. Key
manufacturers virtually own the category, with the top three
brands accounting for 72% of sales.
Shipshape resultsConvenient, effective household cleaners were swept off
shelves by tidy consumers, with Emerging Market and
Latin America households setting the pace. The two
attributes dominating product selection were convenience
and effectiveness.
Major multinationals entered the power cleaning competi-
tive fray, where sales velocity reached 75% last year. Spray-
ons earned high marks on the convenience criteria, and at11% represented one of the fastest-growing segments.
Product proliferation served to modulate the trend toward
brand dominance observed in other categories, with the top
three branded household cleaners garnering 43% , pr ivate
label 9% and other products 48% of sales.
Something in the airAir freshener sales caught a favorable updraft in Emerging
Markets, Latin America and Asia Pacific, where 2005 con-
sumption increased by 23% , 16% and 10% , respectively.Recent new product entries have kept sales aloft and in the
top-ten tiers for four of five regions studied.
Battery a ir fresheners, unveiled just last year, saw 2005 sales
rocket into the stratosphere at a 150% rate. Air sanitizers
eliminated odors and obstacles to consumer trial, hitting a
respectable 36% growth number. Air freshener candle sales,
reinvigorated by the introduction of scented oils, achieved
an 8% growth rate, doub le that of the global average.
Abuzz with potentialInsect control, the eighth fastest-growing category, ow ed
its 5% expansion to Latin America, a region where bugs
are more than a nuisance; they carry potentially harmful
diseases such as dengue fever and malaria. Product refine-
ments, such as electrically-powered items, command a price
premium reflected in sales results.
The North American no-growth scenario masks a 7% spike
from Canada, possibly reflecting that country’s concern with
the mosquito-borne West Nile virus. Private Label products
barely show up on the radar screen in the insect control
Chart 4: Private Label growth by categoryPrivate Label Private Label Manufacturer
Product Area Share Growth Growth
1 Aluminum Foil 43% 0% 3%
2 Plastic Storage Bags* 41 % 8% 3%
3 Garbage Bags* 40% 8% 8%
4 Kitchen Paper/Towel 28 % 5% 3%
5 Cleaning Cloths/Sponges 26 % 7% 1%
6 Auto Dish Additives 22% 1% 4%
7 Plastic Wrap 19% 4% -3 %
8 Auto Dish Detergent 18% 4% 4%
9 Bleach/Ammonia 17% 4% 5%
10 Abrasive Cleaning Pads* 16 % 4% 15 %
11 Laundry Water Softeners 16% -18% 6%12 Toilet Care 12% 4% 2%
13 Brooms, Brushes, Mops 11% 18% 1%
14 Fabric Softener* 11% 4% 5%
15 Batteries 10% 3% 2%
16 Hand Dish Detergent 10% 5% 4%
17 Household Cleaners* 9% 5% 6%
18 Disinfectant* 8% 26 % 12%
19 Oven Cleaners 7% 5% -1 %
20 Laundry Starch 7% -16% 0%
21 Carpet/Rug Cleaner 6% 6% -4 %
22 Laundry Detergent 6% 1% 4%
23 Air Fresheners* 6% 1% 6%24 Laundry Stain Remover* 5% 16 % 6%
25 Fabric Fresheners 5% -5% -8 %
26 Furniture Polish 5% 6% -4 %
27 Waste Pipe Openers 4% 13 % 2%
28 Floor Polish/Wax 2% -12% -2 %
29 Insect Control* 2% -4% 5%
*Fastest Growing Categories
Manufacturer brands growing faster than Private Label
8/6/2019 Babyboom All
http://slidepdf.com/reader/full/babyboom-all 20/5618 Fall/Winter 2006
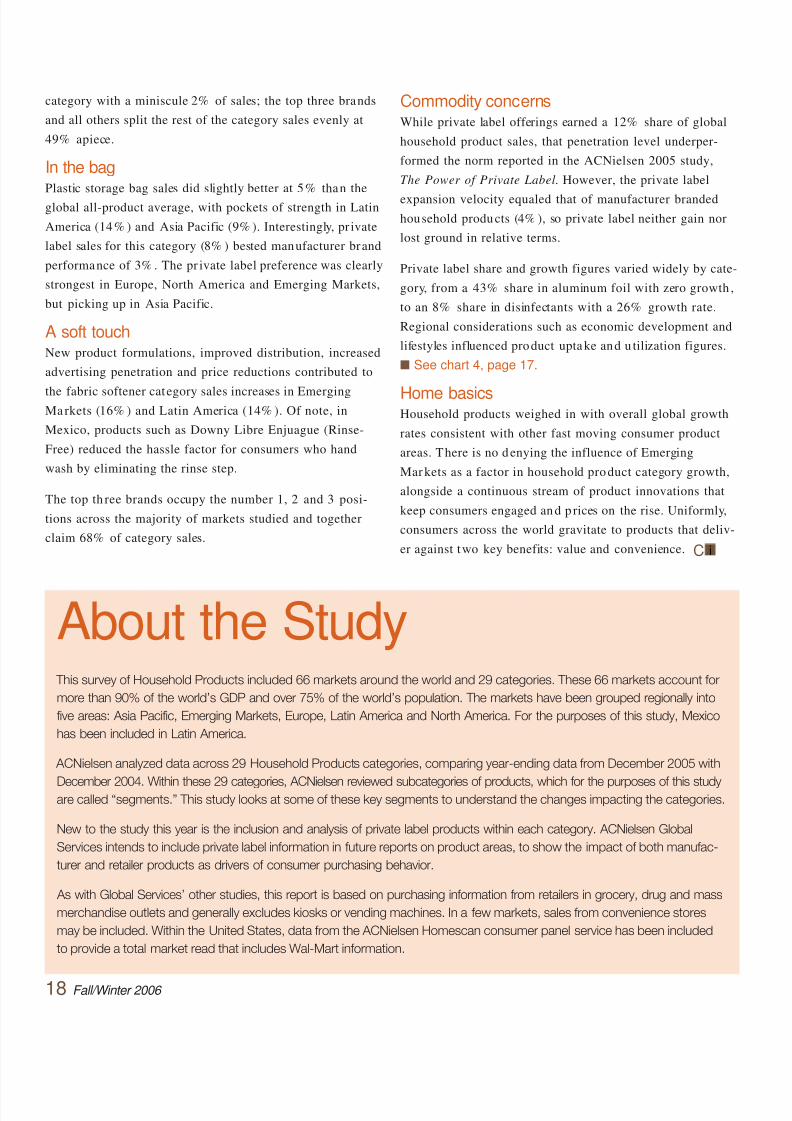
About the Study This survey of Household Products included 66 markets around the world and 29 categories. These 66 markets account for
more than 90% of the world’s GDP and over 75% of the world’s population. The markets have been grouped regionally into
five areas: Asia Pacific, Emerging Markets, Europe, Latin America and North America. For the purposes of this study, Mexico
has been included in Latin America.
ACNielsen analyzed data across 29 Household Products categories, comparing year-ending data from December 2005 with
December 2004. Within these 29 categories, ACNielsen reviewed subcategories of products, which for the purposes of this studyare called “segments.” This study looks at some of these key segments to understand the changes impacting the categories.
New to the study this year is the inclusion and analysis of private label products within each category. ACNielsen Global
Services intends to include private label information in future reports on product areas, to show the impact of both manufac-
turer and retailer products as drivers of consumer purchasing behavior.
As with Global Services’ other studies, this report is based on purchasing information from retailers in grocery, drug and mass
merchandise outlets and generally excludes kiosks or vending machines. In a few markets, sales from convenience stores
may be included. Within the United States, data from the ACNielsen Homescan consumer panel service has been included
to provide a total market read that includes Wal-Mart information.
category with a miniscule 2% of sales; the top three brands
and all others split the rest of the category sales evenly at
49% apiece.
In the bagPlastic storage bag sales did slightly better at 5% than the
global all-product average, with pockets of strength in Latin
America (14% ) and Asia Pacific (9% ). Interestingly, pr ivate
label sales for this category (8% ) bested manufacturer brand
performance of 3% . The pr ivate label preference was clearly
strongest in Europe, North America and Emerging Markets,
but picking up in Asia Pacific.
A soft touchNew product formulations, improved distribution, increased
advertising penetration and price reductions contributed to
the fabric softener category sales increases in EmergingMarkets (16% ) and Latin America (14% ). Of note, in
Mexico, products such as Downy Libre Enjuague (Rinse-
Free) reduced the hassle factor for consumers who hand
wash by eliminating the rinse step.
The top th ree brands occupy the number 1, 2 and 3 posi-
tions across the majority of markets studied and together
claim 68% of category sales.
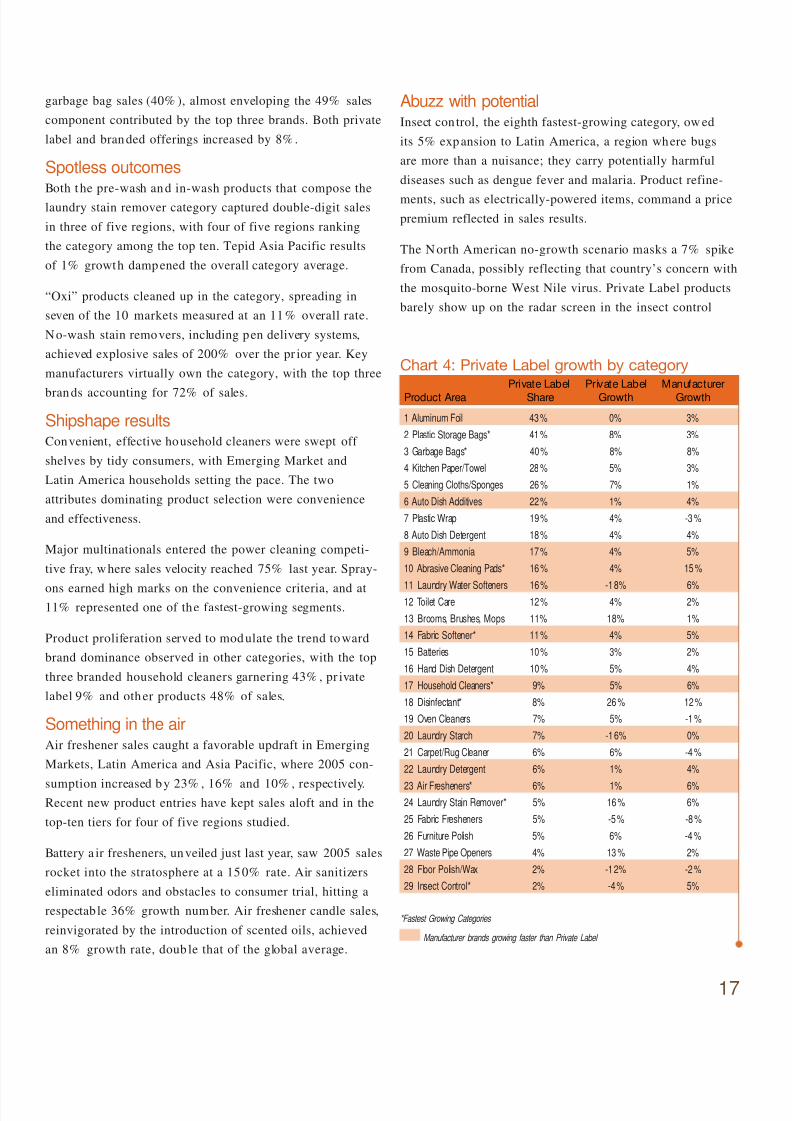
Commodity concernsWhile private label offerings earned a 12% share of global
household product sales, that penetration level underper-
formed the norm reported in the ACNielsen 2005 study,
The Power of Private Label. However, the private label
expansion velocity equaled that of manufacturer branded
household products (4% ), so private label neither gain nor
lost ground in relative terms.
Private label share and growth figures varied widely by cate-
gory, from a 43% share in aluminum foil with zero growth ,
to an 8% share in disinfectants with a 26% growth rate.
Regional considerations such as economic development and
lifestyles influenced product uptake and u tilization figures.
■ See chart 4, page 17.
Home basicsHousehold products weighed in with overall global growth
rates consistent with other fast moving consumer product
areas. There is no denying the influence of Emerging
Mar kets as a factor in household product category growth,
alongside a continuous stream of product innovations that
keep consumers engaged and p rices on the rise. Uniformly,
consumers across the world gravitate to products that deliv-
er against two key benefits: value and convenience. C i
8/6/2019 Babyboom All
http://slidepdf.com/reader/full/babyboom-all 21/56
The Beauty Care Panel will help you:
• Identify high opportunity distribution channels and quantify the
sales opportunity of gaining distribution there.
• Identify “white space” in the marketplace and quantify new prod-
uct development opportunities.
• Evaluate new product performance and quantify cannibalization.
• Target high opportunity consumers and monitor your performance
across all channels.
The Beauty Care Panel gives you:
• The most comprehensive measurement of Beauty Care purchase
behavior across all channels in 32 beauty care categories, including:
–Make-up/Color Cosmetics
–Facial Skin Care
–Hand & Body Skin Care
–Self-Tanning
–Bath & Shower
–Men’s & Women’s Fragrance
• The Spectra BehaviorScape™ Framework, which helps you
increase the effectiveness of your marketing dollars.
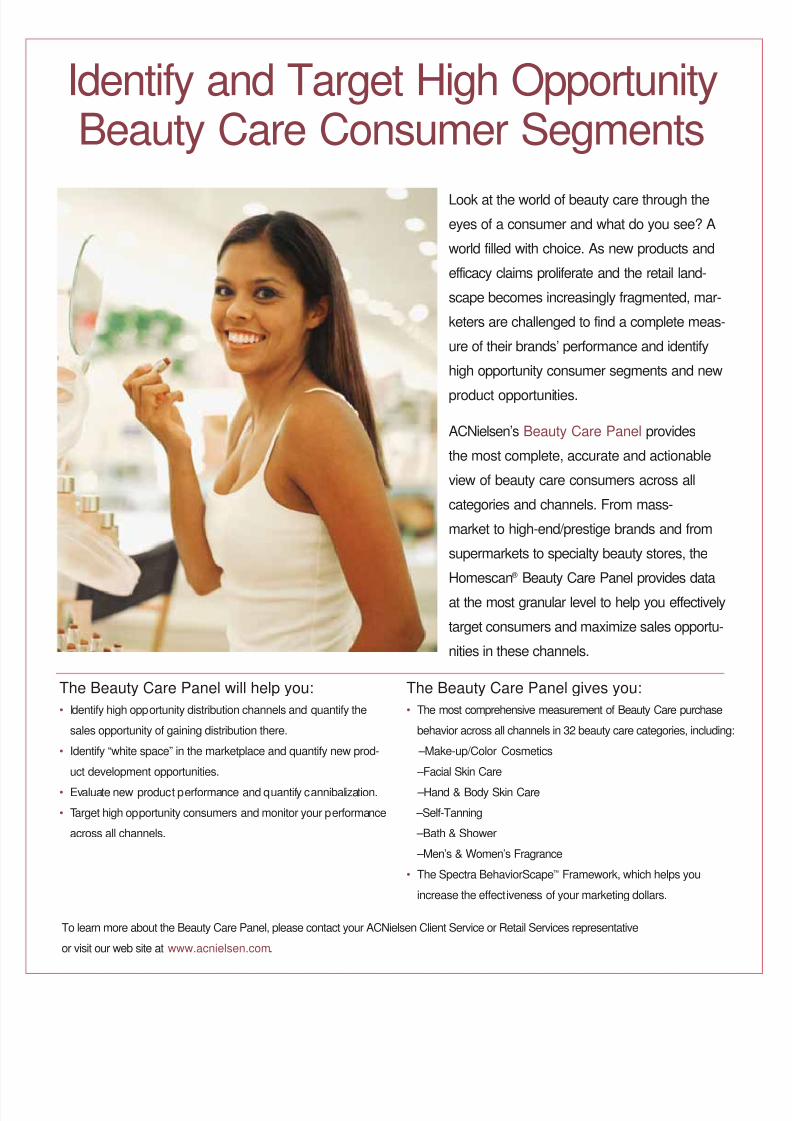
Identify and Target High OpportunityBeauty Care Consumer Segments
Look at the world of beauty care through the
eyes of a consumer and what do you see? A
world filled with choice. As new products and
efficacy claims proliferate and the retail land-
scape becomes increasingly fragmented, mar-
keters are challenged to find a complete meas-
ure of their brands’ performance and identify
high opportunity consumer segments and new
product opportunities.
ACNielsen’s Beauty Care Panel provides
the most complete, accurate and actionable
view of beauty care consumers across all
categories and channels. From mass-
market to high-end/prestige brands and from
supermarkets to specialty beauty stores, the
Homescan ® Beauty Care Panel provides data
at the most granular level to help you effectively
target consumers and maximize sales opportu-
nities in these channels.
To learn more about the Beauty Care Panel, please contact your ACNielsen Client Service or Retail Services representative
or visit our web site at www.acnielsen.com.
8/6/2019 Babyboom All
http://slidepdf.com/reader/full/babyboom-all 22/56
Tune Into Teens:Test Your Teen Aptitude
If you’ve never visited YouTube.com, listened to Gnarls
Barkley or used the acronym ROTFL while instant messag-
ing, then find yourself a teenager and get educated. Today’s
younger generation , typically called M illennials (born
between 1980 and 2000), represent a group of well-connected, over-stimulated, media-savvy consumers who
are open-minded, optimistic and well-educated. They
represent the future. Tune in to what drives this very diverse
group of consumers and you will not only score points on
the “uber-cool” chart, but will also deliver messaging that
resonates with the world they live in.
Test your teen aptitudeIf you are thinking that teens do as teens did, then think
again. While it is true that all teens go through the same
growing pains, history tells us that each generation leavesbehind its own distinctive mark (see U.S. Teens Through
the Decades on page 24). To test your knowledge of today’s
teen market, see if you can answer the following questions:
1. Who is one of the lead singers for the Black Eyed Peas?
2. Who said, “Don’t be jealous that I’ve been chatting
online with babes all day”?
3. Who hosted MTV’s 2006 Video Music Awards?
4. What is an emoticon?5. Who is known for the phrase, “That’s Hot”?
6. What is the starting price for a Tracfone?
7. Billie Joe Armstrong is the lead singer of which band?
8. What is Naruto?
9. Who is Shiloh?
10.Who are two ma in characters on “Degrassi the N ext
Generation”?
So how did you do? If you were able to answer 8 out of
the 10 questions, then you are either: a) the parent of a
teenager, b) an actual teenager, c) a teenager wannabe, or
d) a superbly in-sync teen marketer. However, if you are
like most of us and had some trouble, then it is time tobrush up your knowledge of this influential and lucrative
market segment.
A moving targetTeens are a moving target. They were born and raised during
a digitized age where change happens rapidly. Born into the
MTV generation where the rally cry was “I want my MTV”,
they have learned that what they want, they get. In their
world, everything is immediate. From instant messaging to
microwave meals, instant gratification is their mantra.
Millennials are the first generation of true multi-taskers,
easily balancing e-mail, text messaging, music downloads,
homework and a strict schedule of sporting and other
activities, simultaneously. Th is generation is more adept at
communications than any of its predecessors. The wireless
Internet is their central nervous system, and simply put, they
just don’t need much else.
If they’re that connected, then connecting with teens should
be simple, right? Not necessarily. While it may seem easy to
develop a systematic marketing plan (if teens = computers,then website advertising = success), connecting in t he right
places at the right time to the right audience is a challenge
at best.
20 Fall/Winter 2006
by: Tom PirovanoRetailing Insights
ACNielsen
A n s w e r s : 1 . W i l l . I . A m o r F e r g i e ; 2 . K i p D y n a m i t e ; 3 . J a c k B l a c k ; 4 . E m o t i o n I c o n = ) m a d e u s i n g p u n c t u a t i o n o r t y p e ; 5 . P a r i s H i l t o n ; 6 . $ 2 9 . 9 9 ; 7 . G r e e n D a y ; 8 . J a p a n e s e a n i m e s e r i e s ; 9 . D a u g h t e r o f B r a d P i t t a n d A n g e l i n a J o l i e ; 1 0 . E m m a N e l s o n , J i m m y B r o o k s .

8/6/2019 Babyboom All
http://slidepdf.com/reader/full/babyboom-all 23/56

8/6/2019 Babyboom All
http://slidepdf.com/reader/full/babyboom-all 24/56
Equally differentAll teens are not alike, and grouping them together could be
a roadmap for disaster. Take, for example, a typical eighth
grader compared with a college student. While Disney’s
“High School Musical” is all the rage for one, the other is
much more engaged by the latest drama on MTV’s “The
Real World.”
And don’t discount the hugely important gender differences.
Anybody with kids knows how different boys are from girls.
Therefore, when analyzing teens, boys and girls need to be
viewed separately. For example, girls believe that they are
more grown-up than boys, and spend their money on very
different things, such as jewelry and clothing, while boys’
interests trend toward games and electronics. However, both
spend money on music and movies, which increases as kids
shift from the 12–14 age bracket to the 15–17 one.
It is also important to realize that “what’s hot” can be
polarizing, because for each teen fad with adoring fans,
there is a subset of teens who simply hate it. Finding a teen
idol as a spokesperson for a brand could divide an audience.
For each loyal fan of Justin Timberlake, there is another
teen who simply abhors h im. Interestingly, th is love/hate
relationship seems to be more common with the “beautiful
people” than with stars like John Heder or Jack Black, who
garner more universal appeal.
Stay ahead of the curveFor the most part, young people take their cues from those
a few years older than themselves for trends. This may be
why the Harry Potter books and movies which feature teens
have their strongest appeal to younger children. Or why
movies with a PG-13 rating are more enticing to teens. Or
why Paris Hilton, who is in her mid-twenties, is a fashion
icon for m any teenage girls.
Whether the new fashion is Crocs or Lacoste, whether the
latest video craze is Nintendo DS Lite or GameTap, you
can be sure of one thing: what’s hot today is not tomorrow.
Rather than focusing on what’s hot right now, it is more
important to develop too ls and approaches to monitor and
anticipate changes.
For example, tap into the fickle world of teen trends by
checking out websites such as Billboard.com for the most
popular ringtones, which btw, as of this writing, is the
Nintendo Super Mario Brothers Theme by Koji Kondo, or
the hottest d igital songs (Fergie’s London Bridge), or num-
ber one album (the self-named Danity Kane), or top single
(Justin Timberlake’s “SexyBack” ). Another popular teen
website is MySpace.com, where teens connect with others,
blog, rank music, and much more.
Cash or creditThe fact of the matter is, teenagers represent a powerful
buying force in the U.S. market. According to the 2005
Roper Youth Report, kids are earning $29.20 per week, two
dollars more than in 2004, with 29% of their money com-
ing straight from parents. Chores (37% ) and gifts (23% )
account for other popular sources of teen income. Nearly
one-third (30% ) of 8–17-year-olds say they are involved in
making family purchase decisions, up four percentage points
from last year, as parents increasingly turn to their kids for
advice on what to buy. Teens also indicate that they influ-
ence purchase decisions on everything from cell phone serv-
ice to the right cable provider.
For better or worse (probably the latter), teens are also
enamored by the magic of credit. According to the
Jump$tart Coalition for Personal Financial Literacy, an edu-
cational organization, nearly a third of high school seniors
reported having a credit card of their own or one co-signed
by a parent.
22 Fall/Winter 2006
8/6/2019 Babyboom All
http://slidepdf.com/reader/full/babyboom-all 25/5623
Products with appealIf you live in a household with a teen, get ready to stock
up on deodorants, grooming aids, acne remedies and
other personal care products, instant meals and school
supplies—in that order. According to information from
ACNielsen Homescan, categories such as these are greatly
overdeveloped for the teen market.
While that may not come as a complete shocker, consider
the fact that many of the brands that have risen to t he top
of this typical list are those that cater to this trend-conscious
segment by offering something new, different or cutting
edge. Take for example Unilever’s AXE deodorant for men.
Appealing to the raging hormones of boys (and young men),
the product comes complete with its own risqué website
where the “AXE effect” promises to attract the opposite sex
“when used responsibly.” AXE now generates $269 million
per year in the food, drug and mass merchandiser channels
(including Wal-Mart).
Another product high on the dollar volume index scale pur-
chased by households with teens offering a unique edge is
Hershey’s Ice Breakers gum that explodes with a burst of
mouth-freshening extra mint taste. Cutesy advertising fea-
turing Hilary and Haylie Duff appeals like a gem to their
target audience.
While these products get high marks for originality, there is
a t remendous untapped opportunity to cross-merchandise.
For example, most cereals are marketed to either young
children or adults, but not teens. Offering a free iTune
download on t he package would certainly have more appeal
to this audience than would an action figure from the latest
kid movie.
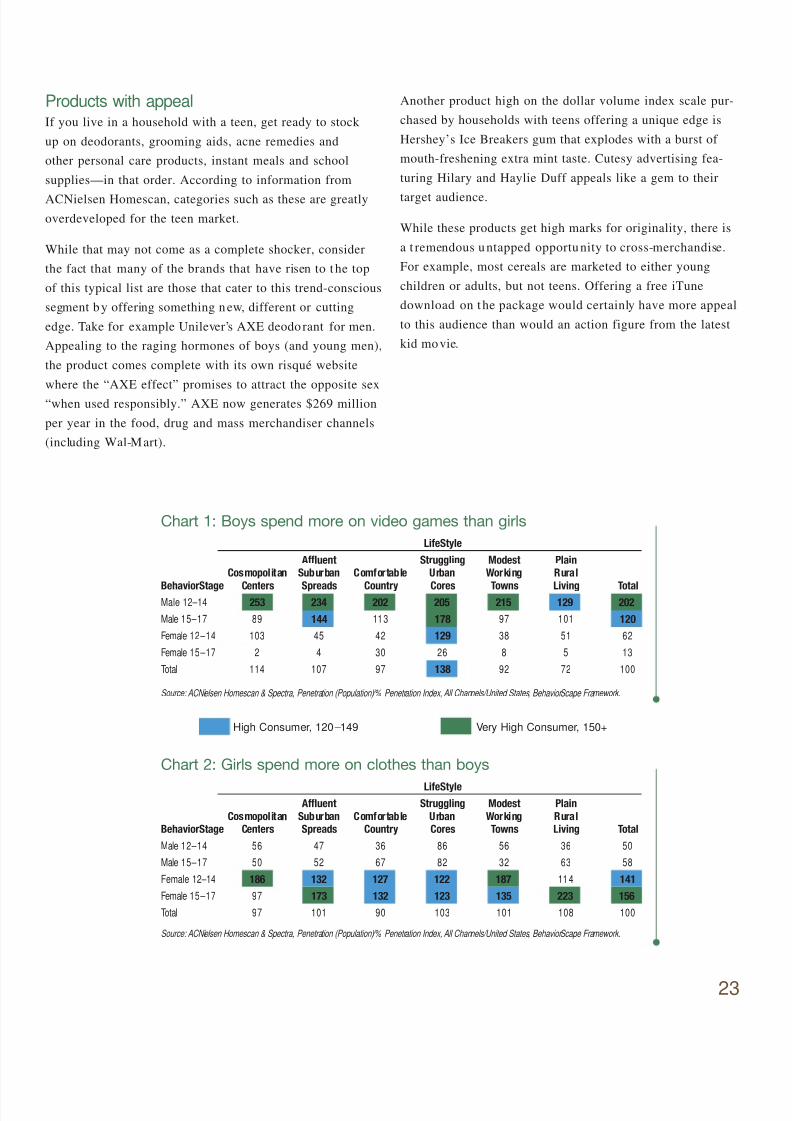
Chart 1: Boys spend more on video games than girls
LifeStyle
Affluent Struggling Modest PlainCosmopolitan Suburban Comfortable Urban Working Rural
BehaviorStage Centers Spreads Country Cores Towns Living TotalMale 12–14 253 234 202 205 215 129 202
Male 15–17 89 144 113 178 97 101 120
Female 12–14 103 45 42 129 38 51 62
Female 15–17 2 4 30 26 8 5 13
Total 114 107 97 138 92 72 100
Source: ACNielsen Homescan & Spectra, Penetration (Population)/% Penetration Index, All Channels/United States, BehaviorScape Framework.
Chart 2: Girls spend more on clothes than boys
LifeStyleAffluent Struggling Modest Plain
Cosmopolitan Suburban Comfortable Urban Working RuralBehaviorStage Centers Spreads Country Cores Towns Living Total
Male 12–14 56 47 36 86 56 36 50
Male 15–17 50 52 67 82 32 63 58
Female 12–14 186 132 127 122 187 11 4 141
Female 15–17 97 173 132 123 135 223 156
Total 97 101 90 103 101 108 100
Source: ACNielsen Homescan & Spectra, Penetration (Population)/% Penetration Index, All Channels/United States, BehaviorScape Framework.
High Consumer, 120–149 Very High Consumer, 150+
8/6/2019 Babyboom All
http://slidepdf.com/reader/full/babyboom-all 26/56
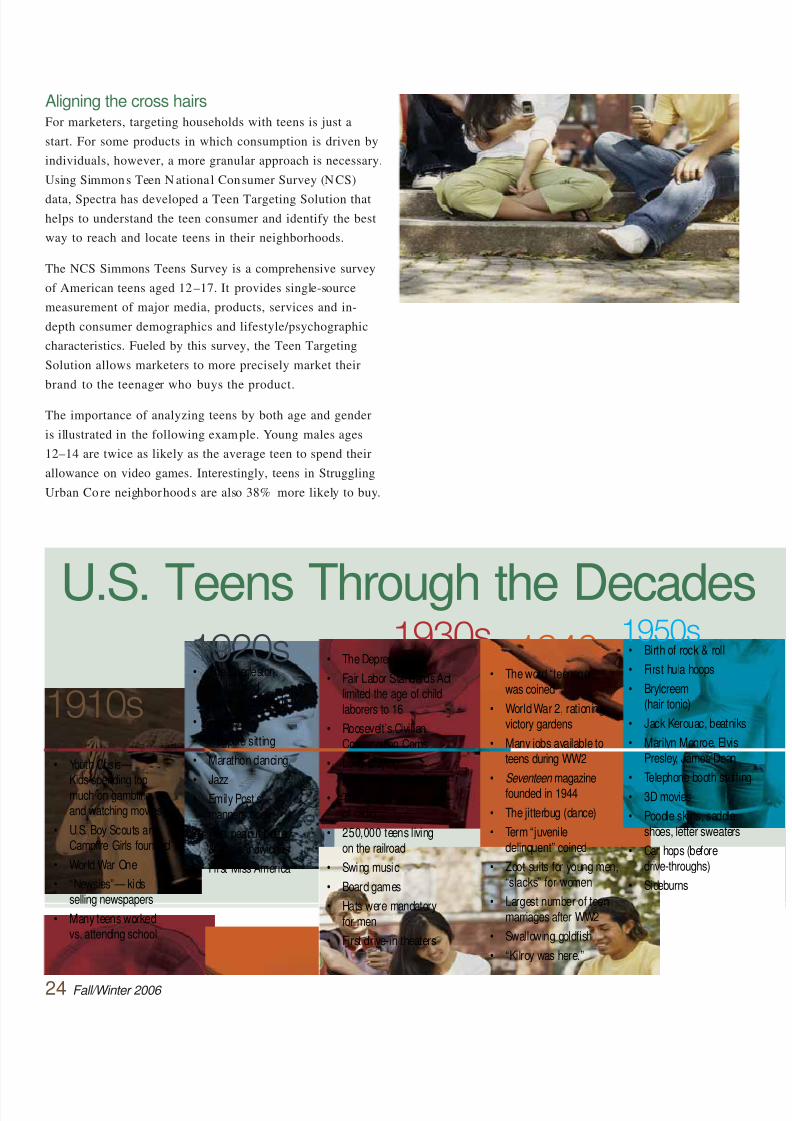
Aligning the cross hairsFor marketers, targeting households with teens is just a
start. For some products in which consumption is driven by
individuals, however, a more granular approach is necessary.
Using Simmons Teen N ationa l Consumer Survey (NCS)
data, Spectra has developed a Teen Targeting Solution that
helps to understand the teen consumer and identify the best
way to reach and locate teens in their neighborhoods.
The NCS Simmons Teens Survey is a comprehensive survey
of American teens aged 12–17. It provides single-source
measurement of major media, products, services and in-
depth consumer demographics and lifestyle/psychographic
characteristics. Fueled by this survey, the Teen Targeting
Solution allows marketers to more precisely market their
brand to the teenager who buys the product.
The importance of analyzing teens by both age and gender
is illustrated in the following example. Young males ages
12–14 are twice as likely as the average teen to spend their
allowance on video games. Interestingly, teens in Struggling
Urban Core neighborhoods are also 38% more likely to buy.
24 Fall/Winter 2006
U.S. Teens Through the Decades1920s 1930s 1940s
• Youth Crisis—
Kids spending toomuch on gamblingand watching movies
• U.S. Boy Scouts andCampfire Girls founded
• World War One
• “Newsies”— kidsselling newspapers
• Many teens workedvs. attending school
• The Charleston,fox-trot andshimmy (dances)
• Flappers
• Flagpole sitting
• Marathon dancing
• Jazz• Emily Post’s
manners book
• First peanut butter
& jelly sandwiches
• First Miss America
• The Depression
• Fair Labor Standards Actlimited the age of child
laborers to 16
• Roosevelt’s Civilian
Conservation Corps
• Long-playing
phonograph records• The “golden age”
of radio
• 250,000 teens living
on the railroad
• Swing music
• Board games
• Hats were mandatory
for men
• First drive-in theaters
• The word “teenager”was coined
• World War 2, rationing,victory gardens
• Many jobs available toteens during WW2
• Seventeen magazinefounded in 1944
• The jitterbug (dance)
• Term “juvenile
delinquent” coined
• Zoot suits for young men,
“slacks” for women
• Largest number of teen
marriages after WW2
• Swallowing goldfish
• “Kilroy was here.”
1950s• Birth of rock & roll
• First hula hoops
• Brylcreem(hair tonic)
• Jack Kerouac, beatnik
• Marilyn Monroe, Elvis
Presley, James Dean
• Telephone booth stuffi
• 3D movies
• Poodle skirts, saddle
shoes, letter sweaters
• Car hops (before
drive-throughs)
• Sideburns
1910s

8/6/2019 Babyboom All
http://slidepdf.com/reader/full/babyboom-all 27/5625
By contrast, female teens are much more interested in the
fashion scene, spending far more than average on clothing.
Thus, marketing programs designed only for the household
or for the adult consumer will not offer the most effective
way to reach heavy teen consumers. ■ See charts 1 and 2,
page 23.
Zooming inOnce the teen consumer has been identified, direct market-
ing can begin. Using the Spectra system, a t argeted profile of
the Brand A teen consumer is devised to reveal what maga-
zines they read, what TV shows they watch, what websites
they surf, how they spend their free time and where they shop.
In addition, subtle neighborhood differences are also
exposed. For example, in the upscale urban areas character-
ized by Cosmopolitan Centers, teens are more likely to beachievers. They have good access to home computers, are
savvy with money, and are less likely to watch TV. Teens in
more downscale areas, Struggling Urban Cores, are more
likely to access the Internet at school, and are very music
oriented. They know what songs are in the Top 10, wear
clothes that reflects their musical tastes and are likely to
characterize themselves as rebels.
Understanding the unique demographic nuances of teen con-
sumers allows the execution of a precise marketing strategy
among all the consumer segments that purchase the brand.
In addition, not only do teens represent a large share of
some product’s volume, they also are the next generation of
consumers who will fuel growth for all brands in the CPGindustry. A successful marketing campaign to teens will pro-
vide the foundation for brand loyalty and growth among
this generation well into the future.
The next big thingKeeping abreast of the next big thing on the horizon is criti-
cal. Think back to when the iPod Nano was introduced in
September 2005 and the Video iPod in October 2005. At
that time, Apple discontinued their older models, but several
mainstream retailers continued to advertise these models
while selling the incompatible accessories. Only a very few
nimble retailers were quick to align themselves with the new
iPod models by including photos and information on the
front page of their websites.
1960s 1970s1980s
1990s• 40% of the U.S.
population was under20 years old in 1965
• Woodstock
• Protests, civil rights,
Vietnam
• British invasion, Beatles
• Bell bottoms, miniskirts, turtlenecks
• The twist (dance)
• Love beads
• Surfing
• Tie-dyed shirts
• Bouffant hairdos,hair ironing, Afros
• Go-go boots
• Hippies, counter-culture
or “ alternative” culture
• Recreational drugs
• Voting aged dropped
to 18
• The draft ended
• 8-track tapes
• Streaking
• Feminism
• Punk rock
• Mopeds• Platform shoes,
earth shoes
• Disco
• First video games
• Rocky Horror Picture Show
• Ecology
• MTV goes on the air
• Latchkey kids
• Jelly shoes
• Video arcades
• Rubik’s Cube
• Boom boxes
• Rap, hip-hop,break-dancing
• Hacky sack
• Trivial Pursuit• Madonna, Miami Vice,
Michael Jackson
• The Breakfast Club ,and other John Hughes
movies
• Big hair
• Live Aid
• Music on CDs
• Mullet haircuts
what’s next?
2000s• The Worldwide Web,
online chat rooms
• Beanie babies
• Piercings, tattoos
• Boy bands— Backstreet
Boys, N Sync, O-town,98 Degrees
• Grunge• The Macarena
• Extreme sports
• Christian music
• “Seinfeld,” “Friends,” “Simpsons”
• DVDs
• iPod, MP3 players
• Mobile phones for teens,
text messaging,camera phones
• Xbox, Playstation 2,Gameboy
• Rubber wristbands
• Reality TV shows• Tivo, DVRs
• MySpace.com
• Low-rise jeans
• Napoleon Dynamite
• Sports gambling,fantasy leagues
• Body sprays
• September 11th
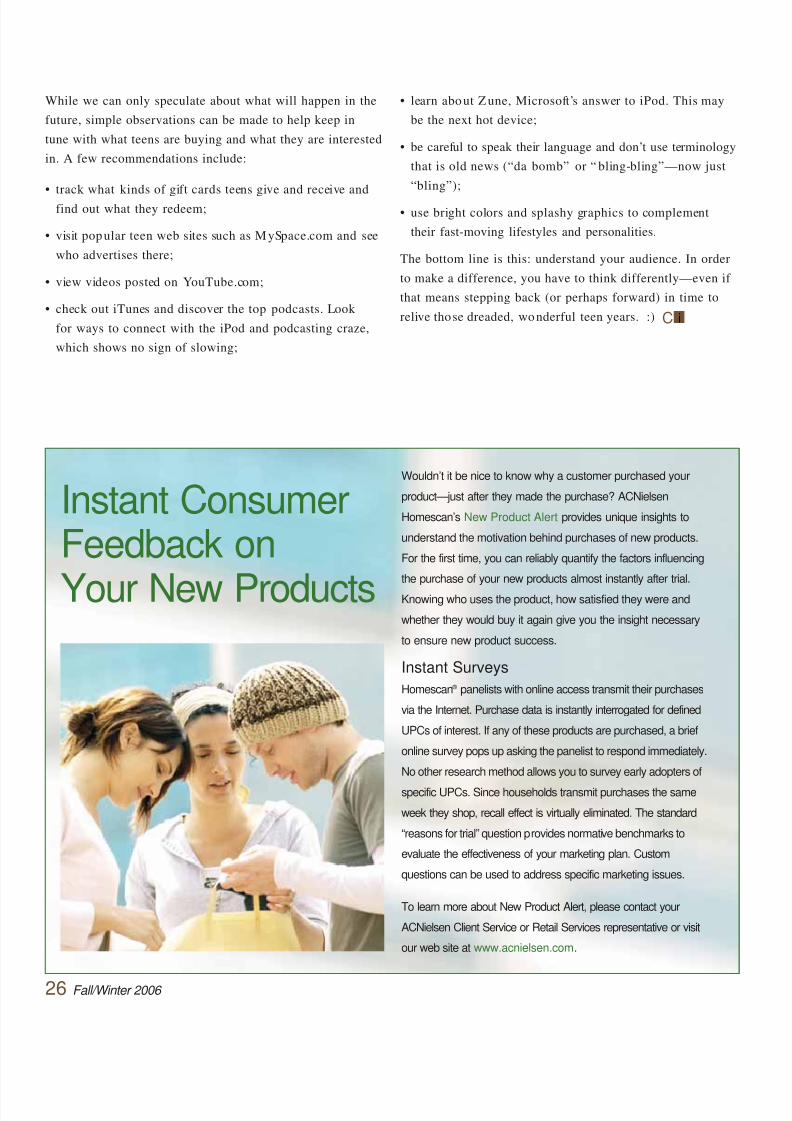
8/6/2019 Babyboom All
http://slidepdf.com/reader/full/babyboom-all 28/5626 Fall/Winter 2006
Wouldn’t it be nice to know why a customer purchased your
product—just after they made the purchase? ACNielsen
Homescan’s New Product Alert provides unique insights to
understand the motivation behind purchases of new products.
For the first time, you can reliably quantify the factors influencing
the purchase of your new products almost instantly after trial.
Knowing who uses the product, how satisfied they were and
whether they would buy it again give you the insight necessary
to ensure new product success.
Instant Surveys
Homescan ® panelists with online access transmit their purchases
via the Internet. Purchase data is instantly interrogated for defined
UPCs of interest. If any of these products are purchased, a brief
online survey pops up asking the panelist to respond immediately.
No other research method allows you to survey early adopters of
specific UPCs. Since households transmit purchases the same
week they shop, recall effect is virtually eliminated. The standard
“reasons for trial” question provides normative benchmarks to
evaluate the effectiveness of your marketing plan. Custom
questions can be used to address specific marketing issues.
To learn more about New Product Alert, please contact your
ACNielsen Client Service or Retail Services representative or visit
our web site at www.acnielsen.com.
Instant ConsumerFeedback on
Your New Products
C i
While we can only speculate about what will happen in the
future, simple observations can be made to help keep in
tune with what teens are buying and what they are interested
in. A few recommendations include:
• track what kinds of gift cards teens give and receive and
find out what they redeem;
• visit popular teen web sites such as M ySpace.com and see
who advertises there;
• view videos posted on YouTube.com;
• check out iTunes and discover the top podcasts. Look
for ways to connect with the iPod and podcasting craze,
which shows no sign of slowing;
• learn about Z une, Microsoft’s answer to iPod. This may
be the next hot device;
• be careful to speak their language and don’t use terminology
that is old news (“da bomb” or “ bling-bling”—now just
“bling”);
• use bright colors and splashy graphics to complement
their fast-moving lifestyles and personalities.
The bottom line is this: understand your audience. In order
to make a difference, you have to think differently—even if
that means stepping back (or perhaps forward) in time to
relive those dreaded, wonderful teen years. :)

8/6/2019 Babyboom All
http://slidepdf.com/reader/full/babyboom-all 29/56
All teens are not alike. Individual purchasing behavior, media expo-
sure, attitudes and opinions can vary greatly by age, gender and
lifestyles—especially when it comes to categories such as snacks,
beverages, consumer electronics, apparel and personal grooming
products.
Understanding the unique nuances of your teen consumer allows you
to execute a marketing strategy among all the consumer segments
that purchase your brand. In addition, not only do teens represent a
key driver for many brands, they also represent the next generationof consumers who will fuel growth for all brands in the CPG industry.
A successful teen marketing program will provide the foundation for
brand loyalty and growth among this generation well into the future.
SolutionUsing Simmons Market Research Teen Survey, ACNielsen Homescan
& Spectra has developed a Teen Targeting Solution, which helps
you understand the teen consumer, identify the best way to reach
teens and locate teens in their neighborhoods.
The Simmons Market Research Teen Survey is a comprehensive
survey of American teens aged 12–17. It provides single-source
measurement of major media, products, services, and in-depth
consumer demographic and lifestyle/psychographic characteristics.
Fueled by this survey, the Teen Targeting Solution allows marketers
to more precisely market their brand to the teenager who buys
their product.
The Teen Targeting Solution helps you:• Evaluate brand opportunities among different teen consumer
segments for household products.
• Compare teen profiles to the adult’s consumption for products
purchased for individual consumption.
• Create a teen profile for your brand.
• Identify media outlets to reach your teen consumer.
• Locate teens in the neighborhoods they live and go to school.
For more information, please contact Sean Jafar at
Individual Targeting Solutions for Teens
8/6/2019 Babyboom All
http://slidepdf.com/reader/full/babyboom-all 30/56
Employee
Empowerment:The Key to Capturing Productivity
No discussion of productivity would be complete without a
reference to employee empowerment and the policies and
tools that make it possible. Any number of factors play into
empowerment—for example:
• whether it has been embraced as a corporat e value and
validated from the CEO office on down;
• whether policies and procedures exist to define and shape
empowered behaviors;
• whether review systems capture, measure and mete out
rewards for taking action;
• whether support mechanisms are in place to initialize or
enable field decisions;
• whether information technology facilitates ready access to
needed data , be it about product, p ricing, distribution o r
other issues.
For each employee to serve as a self-actualized unit, there
must be organic, seamless connectivity to all parts of the
organization.
Get connectedIn the knowledge economy, everything revolves around the
concept of connectivity, and Metcalf’s Law serves as the
behavioral guideline.
Metcalf’s Law:
The value of a computer is
proportional to the square of the
number of connections it makes.
Few jobs require as much independent thinking and employee
empowerment as sales. Empowered salespeople represent
the forward line, the guardians of differentiation, the cus-
tomer touchpoint in every marketing equation. They are
the u ltimate players in the so-called know ledge economy.
Unlike employees in silo or niche areas, salespeople need to
reach out and connect disparate information from diverse
sources in quick time to effectively address customer needs.
Their knowledge base reaches across the enterprise from an
understanding of customers to products and services,
processes and systems, the competitive set, and the arcane
combinat ion o f psychological and social skills necessary to
close a deal.
Technology to the rescueAsk any successful salesperson, and they’ll tell you that
timely, accurate information represents the best armor
they’ve got in the profit wars. The bulletproof concept
resonates with every salesperson who has ever had to
sell-in a new product, argue a price increase or stave off a
competitive threat. To be effective in today’s hyper-charged,
customized, store-level–focused retail environment, sales-
people need a virtual arsenal of presentations capable of
being refreshed with current data at the touch of a bu tton.
That need spawned the fast-track development of ACNielsen Answers® Presentation Builder, a best practices
solution that automates and standardizes the development
of data-driven presentation decks. Custom-designed to your
unique specifications by ACNielsen consultants, the applica-
tion automatically populates templates using the data calcu-
lations and benchmark metrics you choose. The look, feel,
reporting style and approach are exclusive to your company
28 Fall/Winter 2006
by: Russell EvansBusiness Technology Solutions
ACNielsen

8/6/2019 Babyboom All
http://slidepdf.com/reader/full/babyboom-all 31/5629
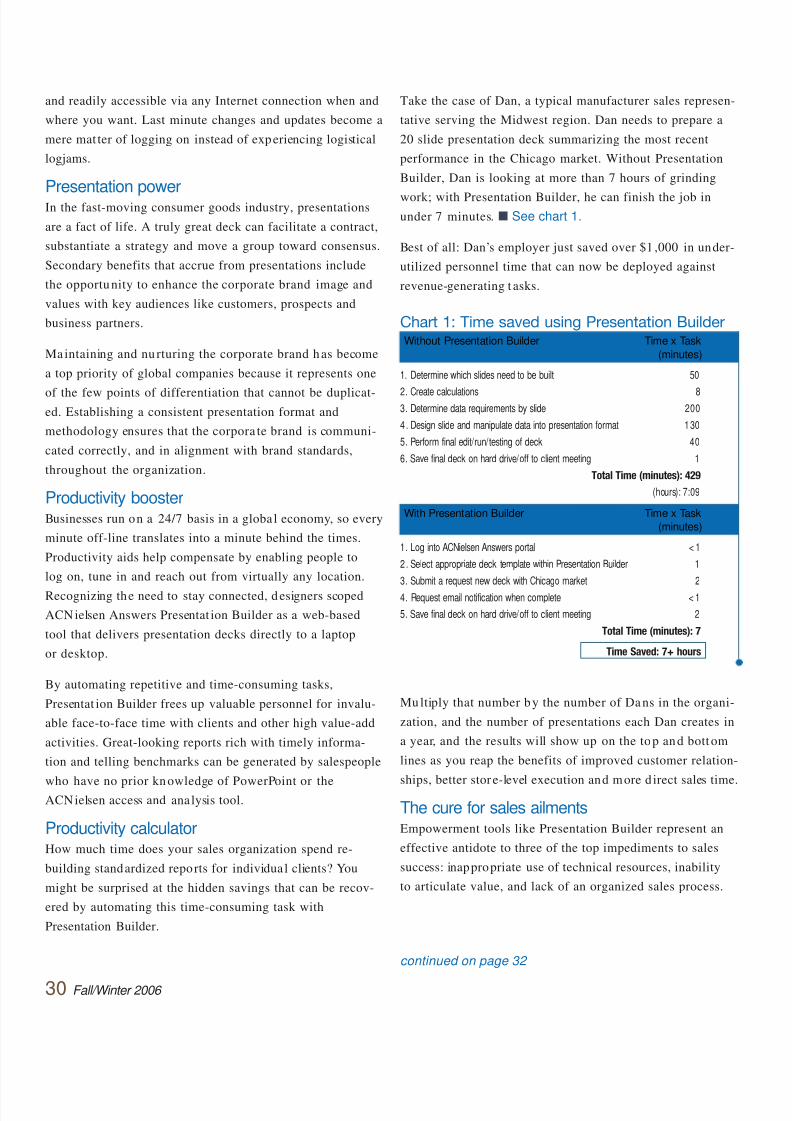
8/6/2019 Babyboom All
http://slidepdf.com/reader/full/babyboom-all 32/5630 Fall/Winter 2006
and readily accessible via any Internet connection when and
where you want. Last minute changes and updates become a
mere mat ter of logging on instead of experiencing logistical
logjams.
Presentation powerIn the fast-moving consumer goods industry, presentations
are a fact of life. A truly great deck can facilitate a contract,
substantiate a strategy and move a group toward consensus.
Secondary benefits that accrue from presentations include
the opportunity to enhance the corporate brand image and
values with key audiences like customers, prospects and
business partners.
Ma intaining and nu rturing the corporate brand has become
a top priority of global companies because it represents one
of the few points of differentiation that cannot be duplicat-ed. Establishing a consistent presentation format and
methodology ensures that the corpora te brand is communi-
cated correctly, and in alignment with brand standards,
throughout the organization.
Productivity boosterBusinesses run on a 24/7 basis in a globa l economy, so every
minute off-line translates into a minute behind the times.
Productivity aids help compensate by enabling people to
log on, tune in and reach out from virtually any location.
Recognizing the need to stay connected, designers scoped
ACNielsen Answers Presentat ion Builder as a web-based
tool that delivers presentation decks directly to a laptop
or desktop.
By automating repetitive and time-consuming tasks,
Presentat ion Builder frees up valuable personnel for invalu-
able face-to-face time with clients and other high value-add
activities. Great-looking reports rich with timely informa-
tion and telling benchmarks can be generated by salespeople
who have no prior knowledge of PowerPoint or theACNielsen access and ana lysis tool.
Productivity calculatorHow much time does your sales organization spend re-
building standardized reports for individual clients? You
might be surprised at the hidden savings that can be recov-
ered by automating this time-consuming task with
Presentation Builder.
Take the case of Dan, a typical manufacturer sales represen-
tative serving the Midwest region. Dan needs to prepare a
20 slide presentation deck summarizing the most recent
performance in the Chicago market. Without Presentation
Builder, Dan is looking at more than 7 hours of grinding
work; with Presentation Builder, he can finish the job inunder 7 minutes. ■ See chart 1.
Best of all: Dan’s employer just saved over $1 ,000 in under-
utilized personnel time that can now be deployed against
revenue-generating t asks.
Multiply that number by the number of Dans in the organi-
zation, and the number of presentations each Dan creates in
a year, and the results will show up on the top and bott om
lines as you reap the benefits of improved customer relation-
ships, better stor e-level execution and more d irect sales time.
The cure for sales ailmentsEmpowerment tools like Presentation Builder represent an
effective antidote to three of the top impediments to sales
success: inappropriate use of technical resources, inability
to articulate value, and lack of an organized sales process.
Chart 1: Time saved using Presentation BuilderWithout Presentation Builder Time x Task
(minutes)
1. Determine which slides need to be built 50
2. Create calculations 83. Determine data requirements by slide 200
4. Design slide and manipulate data into presentation format 130
5. Perform final edit/run/testing of deck 40
6. Save final deck on hard drive/off to client meeting 1
Total Time (minutes): 429
(hours): 7:09
With Presentation Builder Time x Task(minutes)
1. Log into ACNielsen Answers portal < 1
2 . Select appropriate deck template within Presentation Builder 1
3. Submit a request new deck with Chicago market 2
4. Request email notification when complete < 1
5. Save final deck on hard drive/off to client meeting 2
Total Time (minutes): 7
Time Saved: 7+ hours
continued on page 32

8/6/2019 Babyboom All
http://slidepdf.com/reader/full/babyboom-all 33/56
The Answer for Busy ProfessionalsStandardized client-ready presentations are a fundamental
necessity in today’s business environment. Countless hours are
spent building presentations. ACNielsen announces a way to
reduce your presentation building time significantly. Now you
can focus your time on adding value to your organization
with bottom-line results instead of countless hours creating
presentation decks each month.
Presentation Builder, delivered through ACNielsen Answers ® ,
eliminates the time-consuming task of pulling syndicated data
content into the right format for client-ready presentations.ACNielsen Business Technology Solutions consultants can
automate the creation of your standard business presentations
seamlessly. This intelligent solution uses advanced proprietary
processes to effortlessly create your presentation decks. You
design the presentation format and standard data calculations,
and our expert consulting teams do the rest.
Accessible from any Internet connection via ACNielsen Answers,
your presentation data is delivered directly to your desktop. This
time-saving solution is available when you need it, where you
need it.
ACNielsen Answers Presentation Builderallows you to:• Automate the process of creating standard business
presentations.
• Gain web-enabled access anywhere, anytime.
• Standardize the format in which content is presented to your
customers.
• Free up resources from the routine task of building
presentation slides.
Increase your productivity by having online access to key
information to manage your business.
One Click. One Place. All the Answers.
Contact your ACNielsen representative for more information,
call 800.988.4ACN or visit our web site at www.acnielsen.com.
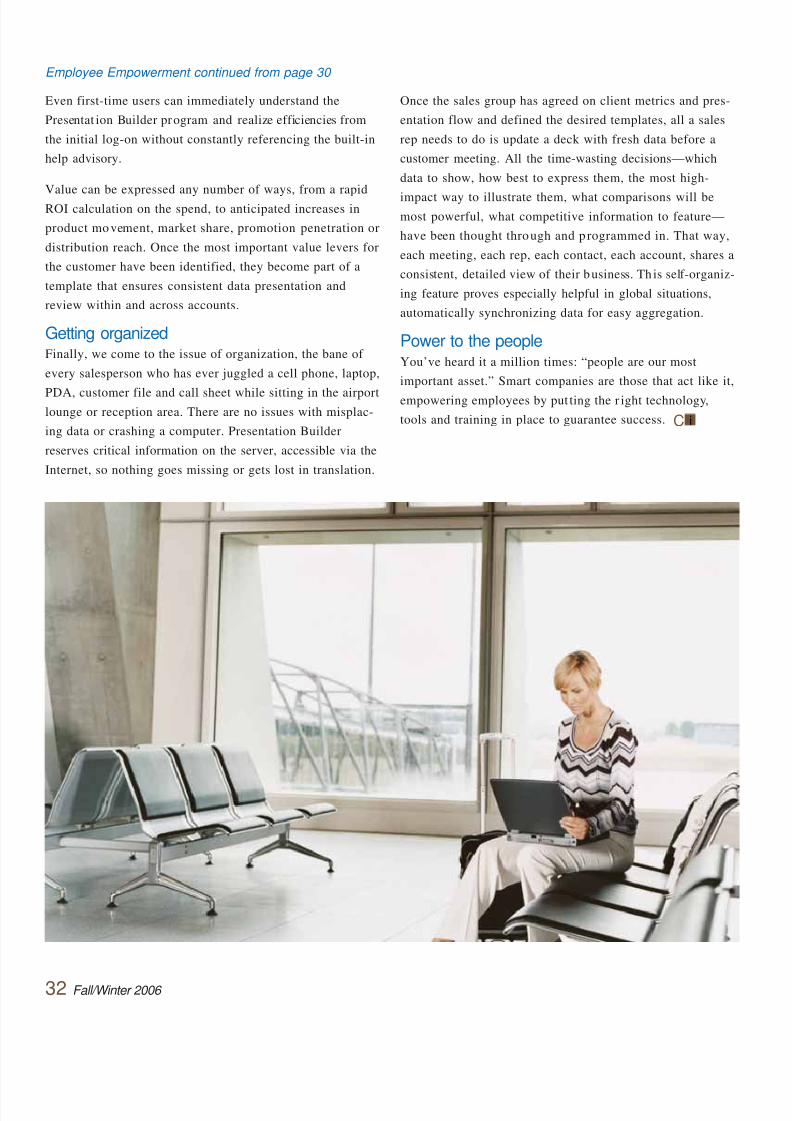
8/6/2019 Babyboom All
http://slidepdf.com/reader/full/babyboom-all 34/5632 Fall/Winter 2006
Even first-time users can immediately understand the
Presentat ion Builder program and realize efficiencies from
the initial log-on without constantly referencing the built-in
help advisory.
Value can be expressed any number of ways, from a rapid
ROI calculation on the spend, to anticipated increases in
product movement, market share, promotion penetration or
distribution reach. Once the most important value levers for
the customer have been identified, they become part of a
template that ensures consistent data presentation and
review within and across accounts.
Getting organizedFinally, we come to the issue of organization, the bane of
every salesperson who has ever juggled a cell phone, laptop,
PDA, customer file and call sheet while sitting in the airportlounge or reception area. There are no issues with misplac-
ing data or crashing a computer. Presentation Builder
reserves critical information on the server, accessible via the
Internet, so nothing goes missing or gets lost in translation.
Once the sales group has agreed on client metrics and pres-
entation flow and defined the desired templates, all a sales
rep needs to do is update a deck with fresh data before a
customer meeting. All the time-wasting decisions—which
data to show, how best to express them, the most high-
impact way to illustrate them, what comparisons will bemost powerful, what competitive information to feature—
have been thought through and p rogrammed in. That way,
each meeting, each rep, each contact, each account, shares a
consistent, detailed view of their business. Th is self-organiz-
ing feature proves especially helpful in global situations,
automatically synchronizing data for easy aggregation.
Power to the peopleYou’ve heard it a million times: “people are our most
important asset.” Smart companies are those that act like it,
empowering employees by put ting the r ight technology,
tools and training in place to guarantee success. C i
Employee Empowerment continued from page 30

8/6/2019 Babyboom All
http://slidepdf.com/reader/full/babyboom-all 35/56
One Click, One Place, All the Answers. Spend less time searching
for and organizing information and make fact-based decisions on
category business planning, forecasting, item assortment, pricing,
promotional programs, space management and replenishment.
ACNielsen Answers ® revolutionizes the way you make business
decisions by addressing your most pressing business issues in a
user-friendly, intuitive web-based environment.
Review personalized market information reports, headlines, alerts
and presentations over the Internet. Gain access to ACNielsen
Answers business-oriented solutions, such as CBP ® –Category
Business Planner, Sales Management Planner, and Homescan ®
& Spectra ® content. ACNielsen Answers enables you to access
and analyze mission-critical information to make educated, timely
decisions offering you the right information, in the right format,
at the right time, so that the right decision can be made in a
repeatable manner.
ACNielsen Answers helps you:
• Address critical business issues relating to brand/sales manage-
ment, category management, consumer management and retail
management.
• Make better decisions, faster, by collaborating with your service
team and using best demonstrated practices.
• Direct marketing and merchandising activities with on-the-fly,
fact-based solutions.
• Grow revenue, reduce costs of business and improve your
competitive position by converting all types of consumer
information into valued intelligence.
• Drive consumer-focused actions anytime and anywhere.
• Access business-critical information in a web-based environment
to make educated, timely decisions.
ACNielsen Answers gives you:
• Personalized “news” headlines answering key questions on
your category’s performance.
• Hyperlinks giving you drill-down, detailed information on
your category.
• Access to categories defined by a specific retailer—both in terms
of the category itself and the retailer’s trading areas.• Access to personalized, proprietary internal content and links to
other third-party content.
• Streamlined delivery of information and insights in a timely manner.
To learn more about ACNielsen Answers, please contact your
ACNielsen Client Service or Retail Services representative or visit
our web site at www.acnielsen.com.
Open your window to collaborative
business intelligence
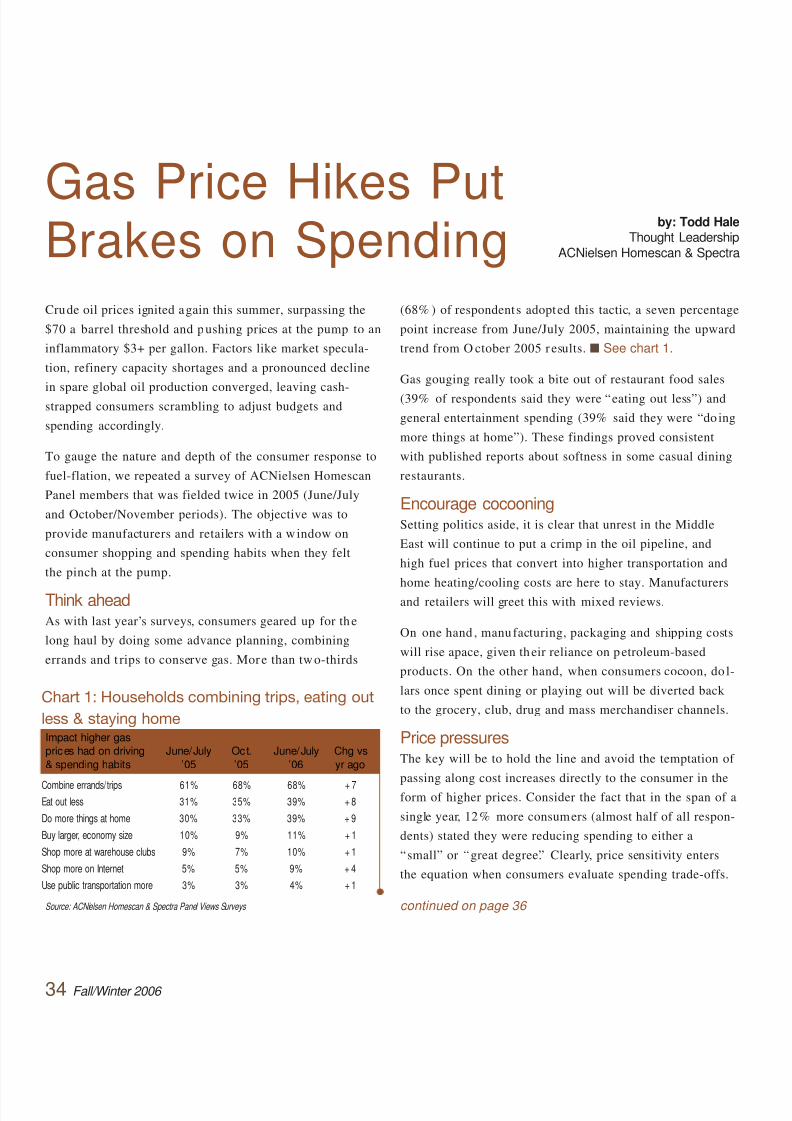
8/6/2019 Babyboom All
http://slidepdf.com/reader/full/babyboom-all 36/56
Gas Price Hikes PutBrakes on SpendingCrude oil prices ignited again this summer, surpassing the
$70 a barrel threshold and pushing prices at the pump to an
inflammatory $3+ per gallon. Factors like market specula-
tion, refinery capacity shortages and a pronounced decline
in spare global oil production converged, leaving cash-strapped consumers scrambling to adjust budgets and
spending accordingly.
To gauge the nature and depth of the consumer response to
fuel-flation, we repeated a survey of ACNielsen Homescan
Panel members that was fielded twice in 2005 (June/July
and October/November periods). The objective was to
provide manufacturers and retailers with a window on
consumer shopping and spending habits when they felt
the pinch at the pump.
Think aheadAs with last year’s surveys, consumers geared up for the
long haul by doing some advance planning, combining
errands and t rips to conserve gas. Mor e than two-thirds
(68% ) of respondents adopted this tactic, a seven percentage
point increase from June/July 2005, maintaining the upward
trend from O ctober 2005 r esults. ■ See chart 1.
Gas gouging really took a bite out of restaurant food sales
(39% of respondents said they were “eating out less”) and
general entertainment spending (39% said they were “do ing
more things at home”). These findings proved consistent
with published reports about softness in some casual dining
restaurants.
Encourage cocooningSetting politics aside, it is clear that unrest in the Middle
East will continue to put a crimp in the oil pipeline, and
high fuel prices that convert into higher transportation and
home heating/cooling costs are here to stay. Manufacturersand retailers will greet this with mixed reviews.
On one hand , manufacturing, packaging and shipping costs
will rise apace, given their reliance on petroleum-based
products. On the other hand, when consumers cocoon, do l-
lars once spent dining or playing out will be diverted back
to the grocery, club, drug and mass merchandiser channels.
Price pressuresThe key will be to hold the line and avoid the temptation of
passing along cost increases directly to the consumer in the
form of higher prices. Consider the fact that in the span of a
single year, 12% more consumers (almost half of all respon-
dents) stated they were reducing spending to either a
“small” or “great degree.” Clearly, price sensitivity enters
the equation when consumers evaluate spending trade-offs.
34 Fall/Winter 2006
by: Todd HaleThought Leadership
ACNielsen Homescan & Spectra
continued on page 36
Chart 1: Households combining trips, eating out
less & staying homeImpact higher gasprices had on driving June/July Oct. June/July Chg vs
& spending habits ’05 ’05 ’06 yr ago
Combine errands/trips 61% 68% 68% + 7Eat out less 31% 35% 39% + 8
Do more things at home 30% 33% 39% + 9
Buy larger, economy size 10% 9% 11% + 1
Shop more at warehouse clubs 9% 7% 10% + 1
Shop more on Internet 5% 5% 9% + 4
Use public transportation more 3% 3% 4% + 1
Source: ACNielsen Homescan & Spectra Panel Views Surveys

8/6/2019 Babyboom All
http://slidepdf.com/reader/full/babyboom-all 37/56
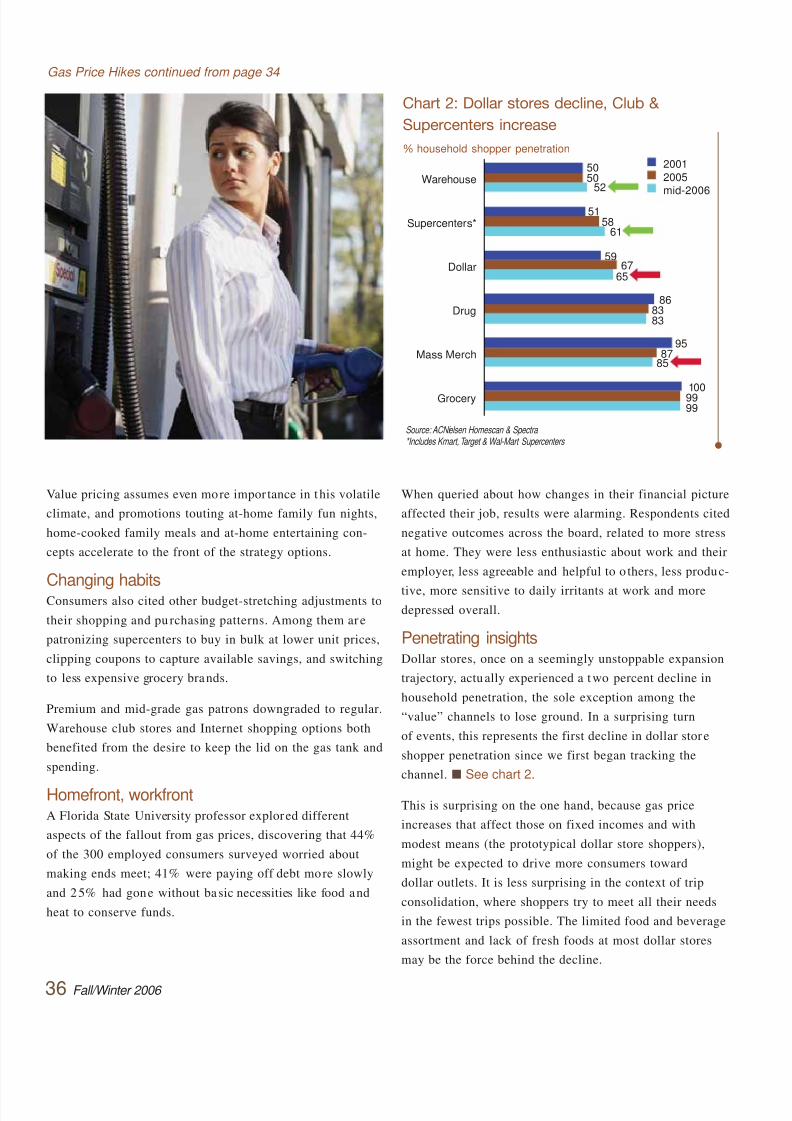
8/6/2019 Babyboom All
http://slidepdf.com/reader/full/babyboom-all 38/5636 Fall/Winter 2006
Value pricing assumes even more impor tance in t his volatile
climate, and promotions touting at-home family fun nights,
home-cooked family meals and at-home entertaining con-
cepts accelerate to the front of the strategy options.
Changing habitsConsumers also cited other budget-stretching adjustments to
their shopping and pu rchasing patterns. Among them ar e
patronizing supercenters to buy in bulk at lower unit prices,
clipping coupons to capture available savings, and switching
to less expensive grocery brands.
Premium and mid-grade gas patrons downgraded to regular.
Warehouse club stores and Internet shopping options both
benefited from the desire to keep the lid on the gas tank and
spending.
Homefront, workfrontA Florida State University professor explored different
aspects of the fallout from gas prices, discovering that 44%
of the 300 employed consumers surveyed worried about
making ends meet; 41% were paying off debt more slowly
and 25% had gone without ba sic necessities like food and
heat to conserve funds.
When queried about how changes in their financial picture
affected their job, results were alarming. Respondents cited
negative outcomes across the board, related to more stress
at home. They were less enthusiastic about work and their
employer, less agreeable and helpful to o thers, less produc-
tive, more sensitive to daily irritants at work and more
depressed overall.
Penetrating insightsDollar stores, once on a seemingly unstoppable expansion
trajectory, actually experienced a t wo percent decline in
household penetration, the sole exception among the
“value” channels to lose ground. In a surprising turn
of events, this represents the first decline in dollar stor e
shopper penetration since we first began tracking the
channel. ■ See chart 2.
This is surprising on the one hand, because gas price
increases that affect those on fixed incomes and with
modest means (the prototypical dollar store shoppers),
might be expected to drive more consumers toward
dollar outlets. It is less surprising in the context of trip
consolidation, where shoppers try to meet all their needs
in the fewest trips possible. The limited food and beverage
assortment and lack of fresh foods at most dollar stores
may be the force behind the decline.
Gas Price Hikes continued from page 34
Chart 2: Dollar stores decline, Club &
Supercenters increase
% household shopper penetration
Warehouse
Supercenters*
Dollar
Drug
Mass Merch
Grocery
5050
52
5158
61
5967
65
868383
9587
85
1009999
20012005
mid-2006
Source: ACNielsen Homescan & Spectra *Includes Kmart, Target & Wal-Mart Supercenters
8/6/2019 Babyboom All
http://slidepdf.com/reader/full/babyboom-all 39/56
Homescan ® Consumer & Shopping Insights provides
web access to the latest shopping insights available
across all major categories and channels of trade,
presented in an issue-oriented menu for simple
navigation to your most pressing business issue.
Get right to the subject. With Homescan Consumer &
Shopping Insights, you won’t waste time wading through
unnecessary data. Interested in a regional comparison
report of your brands? Want to know which retailers drive
category spending? Need to target the best demographic
match? Simply choose the business application to fit
your needs and view the results immediately.
Homescan Consumer & Shopping Insights gives you:
• Fastest access to the most recent data available.
• Issue-oriented navigation capabilities for easy drill down
to the information you need most.
• Interactive graphs to expedite analysis for presentation-
ready text and charts.
• Access to the full Consumer & Shopping Insights
Syndicated Suite: Consumer Facts, Channel Facts,
Account Shopper Profiler, Cross Outlet Facts and
Category Management Templates.
To learn more about Consumer & Shopping Insights,
please contact your ACNielsen Client Service or Retail
Services representative or visit our web site at
www.acnielsen.com.
Consumer &ShoppingInsights—Online!
Available in the U.S.
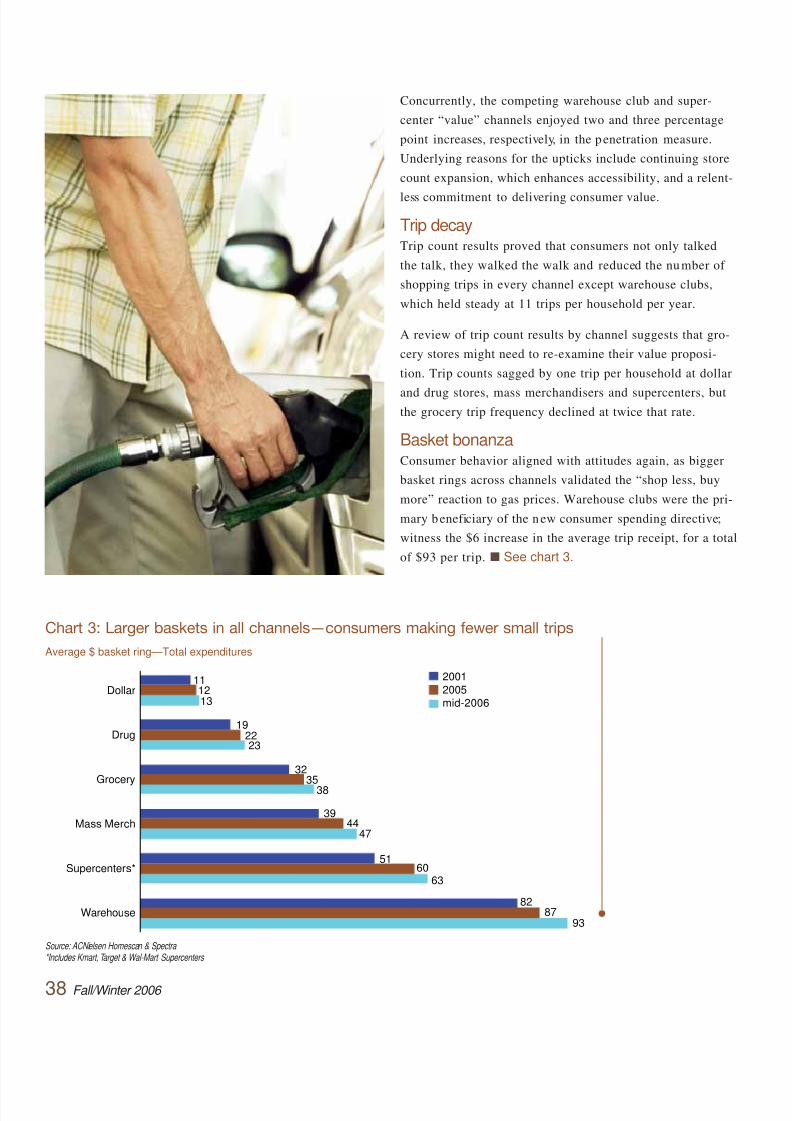
8/6/2019 Babyboom All
http://slidepdf.com/reader/full/babyboom-all 40/56
Concurrently, the competing warehouse club and super-
center “value” channels enjoyed two and three percentage
point increases, respectively, in the penetration measure.
Underlying reasons for the upticks include continuing store
count expansion, which enhances accessibility, and a relent-
less commitment to delivering consumer value.
Trip decayTrip count results proved that consumers not only talked
the talk, they walked the walk and reduced the number of
shopping trips in every channel except warehouse clubs,
which held steady at 11 trips per household per year.
A review of trip count results by channel suggests that gro-
cery stores might need to re-examine their value proposi-
tion. Trip counts sagged by one trip per household at dollar
and drug stores, mass merchandisers and supercenters, butthe grocery trip frequency declined at twice that rate.
Basket bonanzaConsumer behavior aligned with attitudes again, as bigger
basket rings across channels validated the “shop less, buy
more” reaction to gas prices. Warehouse clubs were the pri-
mary beneficiary of the new consumer spending directive;
witness the $6 increase in the average trip receipt, for a total
of $93 per trip. ■ See chart 3.
38 Fall/Winter 2006
Chart 3: Larger baskets in all channels—consumers making fewer small trips
Average $ basket ring—Total expenditures
Dollar
Drug
Grocery
Mass Merch
Supercenters*
Warehouse
111213
192223
32
3538
3944
47
5160
63
8287
93
20012005mid-2006
Source: ACNielsen Homescan & Spectra *Includes Kmart, Target & Wal-Mart Supercenters
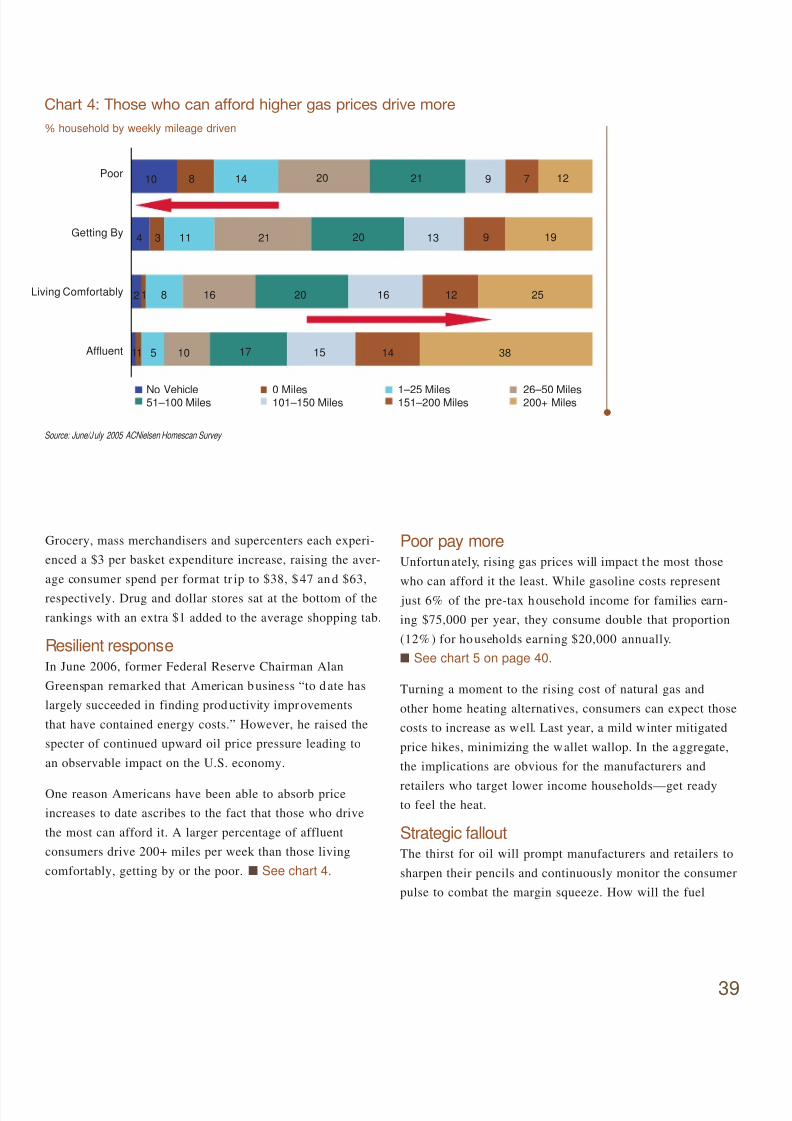
8/6/2019 Babyboom All
http://slidepdf.com/reader/full/babyboom-all 41/5639
Grocery, mass merchandisers and supercenters each experi-
enced a $3 per basket expenditure increase, raising the aver-
age consumer spend per format tr ip to $38, $47 and $63,
respectively. Drug and dollar stores sat at the bottom of the
rankings with an extra $1 added to the average shopping tab.
Resilient responseIn June 2006, former Federal Reserve Chairman Alan
Greenspan remarked that American business “to date has
largely succeeded in finding productivity improvements
that have contained energy costs.” However, he raised the
specter of continued upward oil price pressure leading to
an observable impact on the U.S. economy.
One reason Americans have been able to absorb price
increases to date ascribes to the fact that those who drive
the most can afford it. A larger percentage of affluent
consumers drive 200+ miles per week than those living
comfortably, getting by or the poor. ■ See chart 4.
Poor pay moreUnfortunately, rising gas prices will impact the most those
who can afford it the least. While gasoline costs represent
just 6% of the pre-tax household income for families earn-
ing $75,000 per year, they consume double that proportion
(12% ) for households earning $20,000 annually.
■ See chart 5 on page 40.
Turning a moment to the rising cost of natural gas and
other home heating alternatives, consumers can expect those
costs to increase as well. Last year, a mild winter mitigated
price hikes, minimizing the wallet wallop. In the aggregate,
the implications are obvious for the manufacturers and
retailers who target lower income households—get readyto feel the heat.
Strategic falloutThe thirst for oil will prompt manufacturers and retailers to
sharpen their pencils and continuously monitor the consumer
pulse to combat the margin squeeze. How will the fuel
Chart 4: Those who can afford higher gas prices drive more
% household by weekly mileage driven
Poor
Getting By
Living Comfortably
Affluent
1279212014810
1991320211134
2512162016812
3814151710511
No Vehicle51–100 Miles0 Miles101–150 Miles
1–25 Miles151–200 Miles26–50 Miles200+ Miles
Source: June/July 2005 ACNielsen Homescan Survey

8/6/2019 Babyboom All
http://slidepdf.com/reader/full/babyboom-all 42/5640 Fall/Winter 2006
Chart 5: Rising gas prices will impact low income
households and the retailers/manufacturers that
serve them
At $3 a gallon
Gasoline costs as % of pre-tax household income
Dollar Amount
12 $2,382
$2,820
$4,179
$4,647
$20,000
$25,000
$50,000
$75,000
11
8
6
A n n u a l I n c o m e
Source: Department of Energy, USA Today
crunch impact brand and format loyalty? How will
promotional strategies need to be adjusted in response?
What services could be added to make a store the winning
contender under the single-outlet, consolidation scenario?
Oil price pressures may precipitate any number of market
responses in the fast-moving consumer packaged goods
world, including:
• accelerated private label product growth;
• enhanced interest in large pack sales;
• broader assortments;
• value-based pricing;
• at-home entertainment focus in advertising and
promotions;
• added convenience store features, positionings;
• increased emphasis on trip capture.
Change in attitudeAs a country, the United States will need to wean itself from
oil dependency by developing viable alterna tive fuel opt ions
such as ethanol, moving to gas-saving hybrid vehicles like
the popular Toyota Prius, and re-evaluating our fundamen-
tal relationship with non-renewable energy sources.
As an industry, CPG manufacturers and retailers will need
to re-think the retail calculus and factor-in the impact of
higher transportation and heating costs on the brand buyer
and retail shopper mindsets. Even if the recently discovered
Gulf of Mexico oil field turns into a gusher, industry experts
predict it will be at least four years before that fuel supply
impacts consumers, and it will not be large enough to offset
the chronic and increasing U.S. demand. There is a real
opportunity for CPG industry leaders to convert a deep
understanding of the consumer response to persistent
gas shortages into a stra tegic lever that will drive sales
and profits. C i
8/6/2019 Babyboom All
http://slidepdf.com/reader/full/babyboom-all 43/56

8/6/2019 Babyboom All
http://slidepdf.com/reader/full/babyboom-all 44/56
Cracking theRetail C.O.D.E.You’re pretty good at Sudoku. You know how the DaVinci
code was solved. But do you know how to crack the retail
C.O.D.E.? Turns out, you held the key to unlock sales
potential at the store level all along: the consumer. As the
only common denominator across brand, product, accountand store activities, it is imperative that store-level strategies
and tactics begin and end with the consumer.
Two common factors often hinder the ability to take advan-
tage of store-by-store growth. First, consumer insights
alone, without resulting actions, simply turn into overhead.
Second, t reating an entire retail chain as if it served a single
shopper type often results in missed opportunities.
What’s needed, is to find an approach that enables scalable
action based on store-level insights to position a companyfor success with consumers. Store-level growth opportunities
exist, but they are often difficult to identify and procure
with a reasonable return. It takes the right tools to integrate
action and insight into a cohesive, repeatable framework
for success.
Getting startedThe first step into the new world of store-level marketing
begins by abandoning any preconceived notions about a
consumer-centric approach. There is no silver bullet report
with all the answers, no bedrock rule about how a categoryacts in response to consumers.
Realize that things are not always what they appear to be.
Narrowly focusing solely on category-specific action is no
better than looking down from a tall building and incorrect-
ly noting that all people are the same. Consumer-centric
planning is about analyzing specific groups of people and
identifying how to impact them where they shop—at ground
zero, the store level. It is a different way of looking at busi-
ness, one with an upside that pays off in sales and profits.
Winning at retail is enabled by applying a simple, systematic
four-step process that we call “Cracking the Retail
C.O.D.E.” The methodology employs a series of critical
steps to optimize brand or product success in the market-
place. This consumer-centric approach links actions in the
store—where they matter the most—back to the consumers
most likely to purchase your brand.
Four steps to successThe acronym C.O .D.E. summarizes a methodology that
begins with Consumer profiling, then moves to Opportunity
gapping, Dynamic clustering and Executing for the con-
sumer, the four steps to success in store-level marketing.
1. Consumer profiling—accurately captures the demographic
profile of the br and’s consumer.
2. Opportunity gapping—quantifies store-level opportunities
based on consumer demand potential and diagnoses the
prospect.
3. Dynamic clustering—groups similar stores using multiple
store attributes, including shopper demographics, the
competitive set, and upside opportunity.
4. Executing for the consumer—takes findings from steps
1–3 and develops store-level tactical plans, giving the
field force the right information to optimize in-store
presence.
This strategic approach provides a deeper understanding
of the consumers around a given store, measures the gap
between actual and potential demand, and offers an execu-
tion plan at the store and cluster level that fully addresses
42 Fall/Winter 2006
by: Bill RouseWal-Mart Analytics
ACNielsen Homescan & Spectra
Jon Busman
MarketingACNielsen Homescan & Spectra

8/6/2019 Babyboom All
http://slidepdf.com/reader/full/babyboom-all 45/56

8/6/2019 Babyboom All
http://slidepdf.com/reader/full/babyboom-all 46/56
the potential demand. The result is improved operat ional
execution, reduced out-of-stocks, fewer overstocks,
enhanced promotion performance and better inventory
management.
Step 1: Consumer profilingThe consumer should be the first and last consideration of
any consumer-centric initiative and the C.O .D.E. app roach
is no different. Products do not buy themselves, just as
shelves do not mysteriously empty by themselves. While
price reductions, competition, br and equity, slotting and the
like all influence purchasing, the common denominator is
the consumer.
It is only appropriate then, that the C.O.D.E. approach
starts with consumer profiling. There ar e various types
of consumer pr ofiling information available, from panel
purchase behavior to at titude and usage studies to focus
groups. Traditionally, point-of-sale (POS) data has been
utilized to tell us “what happened” but not who drove it.
Through consumer regression profiling, it becomes
possible to create a sales-weighted store profile by
estimating future consumer demand for products based
on historical sales data.
ACN ielsen Homescan & Spectra recommends utilizing
panel data to determine category and brand breaks, and
Opportunity Finder solutions to “consumerize” product
movement data, enabling retail-specific and item-specific
store profiles. This approach yields granular analyses down
to the SKU level. The ana lyses become reta il-specific, based
on t he retailer’s own d ata, w hich adds power to the recom-
mendations. Regardless of source, consumer profiles can be
used individually or in combination to formulate step one
of Cracking the Retail C.O.D.E.
Step 2: Opportunity gappingAre you leaving sales on the table? If so, how much? What
needs to change to convert potential and lost sales into reg-
ister rings? Op portunity gapping quantifies the opportunity
cost to each store for missing the mark two ways—either
with consumers or on the execution level. While fair share
gapping is a common practice to determine if a brand or
product is getting its expected share of the account or market
pie, what if you could estimate how big the slice would be?
Consumer profiling is the first step in executing the
C.O.D.E. approach, but without action it just becomes
“n ice to know.” In order to quantify opportunity, matchingthe consumer pro file to the known shoppers of an account
is critical. The degree of sophistication can vary from pr ofil-
ing your consumer and identifying a common trait within
a retailer (i.e., matching high income consumers to a high
income account like Whole Foods), to scoring an account
at the store level based on the most volume-predictive
consumers, also known as the Spectra Demand Index.
In essence, while Step One determines your consumer’s
fingerpr int, Step Two ma tches it to an account’s finger-
print—or even better, an account’s store-level fingerprint s.Now you have a basic roadmap for tomorrow’s volume.
44 Fall/Winter 2006
“Opportunity gapping provides
an indication of how much the
category could grow tomorrow if
I could fully execute, instead of only trying to
capture my fair share of yesterday’s volume.”
–Michael Himmelfarb, VP of Marke
ACNielsen Homescan & Spec

8/6/2019 Babyboom All
http://slidepdf.com/reader/full/babyboom-all 47/5645
Windshield vs. rear-view mirrorThe C.O.D.E. methodology puts marketers in the driver’s
seat, steering brands and products by looking through the
windshield instead of the rear-view mirror. This approach
focuses action on stores that show growth opportunity, and
suggests maintenance level support for those with lower
growth potential.
Execution opportunity gaps materialize based on the yin-
yang interaction of two opposing forces: demand drivers
and demand inhibitors. Demand drivers include activities
such as promotions, cross merchandising and correct shelv-
ing. Demand inhibitors include competition, out-of-stocks
(OOS), distribution voids, and incorrect shelving or space
allocation.
Case in pointIn a typical prom otion scenario, 16% of stores won’t have
available space, 22% won’t display the promotion signage,
33% will put up the displays too late and 42% won’t have
the skilled labor t o execute the promotion. Opportun ity
gapping identifies problem stores—those that should have
sold more based on the consumer fit and performance of
similar stores.
Promotions can then be adjusted to focus resources on areas
with the highest potential upside. In essence, opportunity
gapping acts like a forward-looking diagnosis that deter-
mines if the financial upside return from a promotion is
worth the effort of store checks, additional labor, or the
promotion itself.
“Retailers and manufacturers are becoming
more precise in their targeting of consumer
segments and wish to optimize store
conditions at the local level.”
–Paris Gogos, Director
ACNielsen Retail Execution Services
Step 3: Dynamic clusteringClustering, or localization, as the Harvard Business Review
calls it, is the cornerstone of scalability. More than a capa-
bility, clustering has become an operating necessity in
today’s fragmented marketplace.
Retailers and manufacturers are increasingly moving to
micro views of their business to identify opportunities
associated with the demand drivers and demand inhibitors
unique to each store. This is most clearly seen in the grow-ing number of retailers adopting local or neighborhood
marketing initiatives. Most recently, Wal-Mart announced
they were dropping their one-size-fits-all approach to stores.
Similarly, manufacturers are becoming more precise in t ar-
geting of consumer segments, and wish to optimize store
conditions a t the local level.
Clustering attributesWhile there is a virtua lly limitless set of criteria upon which
clusters can be based, most fall into four major groupings:
1. Consumer Attributes. These may be as simple as
grouping stores based on a common trait like ethnicity,
affluence of the shopper, or a volume-predictive measure
of consumer fit.
2. Organizational Attributes. These may include DSD sales
routes, warehouse locations, regions or districts, or
specific shelving sets.

8/6/2019 Babyboom All
http://slidepdf.com/reader/full/babyboom-all 48/56
3. Store Attributes. These may range from physical store
attr ibutes like size and presence of specific depar tments
to proximities to high traffic intersections or landmarks
like beaches or universities.
4. Performance Attributes. These can range from basic
sales rates to promotion response to consumer-driven
category opportunity gaps.
Dynamic clustering brings criteria together into a cohesive
framework that leverages critical differences within the store
segments. Some companies may be able to execute effectively
using just two clusters; others may require 200; but clustering
is a necessary prerequisite for integrating action to “crack
the retail C.O.D.E.”
Step 4: Executing for the consumerThe final step in the C.O.D.E. approach takes us full circle,
back to the consumer and how best to shape and direct
activities to each store or cluster’s shoppers. M erchandising
strategies based on item roles, promotional and sampling
programs, space and facing allocations—all tailored to
defined dynamic clusters—can now be managed by follow-
ing the four-step C.O.D.E.
The C.O .D.E. approach makes high definition marketing
possible, allowing marketers and retailers to zero in at themost granular level possible—the store. Working from a
shared viewpoint, with shared definitions for target clusters
or stores, manufacturers and retailers can collaborate on
promotional and assortment strategies with optimal appeal
to the right set of consumers, and operational strategies that
take cost out of the system by reducing inefficiencies such as
out-of-stocks and distribution voids.
The C.O.D.E. holds the secret to finding opportunity gaps,
making the most of consumer profile information, and
improving logistical execution to squeeze more bottom-line
profit out of even more top-line sales.
See pages 48 and 49 for a case study that illustrates the
C.O .D.E . process in action.
46 Fall/Winter 2006
C i

8/6/2019 Babyboom All
http://slidepdf.com/reader/full/babyboom-all 49/56
2007Consumer 360 Conference
May 14–17
The Westin Diplomat
Resort & Spa
3555 South Ocean DriveHollywood, Florida
The number one marketing
and information conference.
® presented by
Mark YourCalendars
www.consumer360.com

8/6/2019 Babyboom All
http://slidepdf.com/reader/full/babyboom-all 50/5648 Fall/Winter 2006
Cracking theC.O.D.E.A Case Study
Step 1: Consumer profilingJoe’s Cookies utilized a hybrid of ACNielsen Homescan
Panel data and POS-based profiles to identify its preferred
consumer. Since Joe’s Cookies had low penetration in the
marketplace, the company used panel data to profile the total
category, and then used Spectra Opportunity Finder Solutions
to profile individual SKUs.
The result of this analysis: Joe’s Cookies gained an under-
standing of how its brand consumers differed from the overall
cookie category and competitors. The typical Joe’s Cookies
buyer skewed to African-American and Hispanic ethnic make-
up, earned $50,000–$100,000 per year and lived in a house-
hold with children. ■ See chart 1.
Step 2: Opportunity gappingJoe’s Cookies then ranked retailer stores based on the “fit”
between the store consumer profile and the Joe’s Cookies
consumer profile, quantifying the consumer opportunity gap.
The analysis determined that store opportunity varied greatly
once the consumer was inserted into the equation.
For example, Joe’s Cookies found Store A and Store B identi-
cal in every transactional way. Joe’s Cookies had two facings in
each store, and the store shelf set and total sizes were virtually
identical. However, sales results for Joe’s Cookies were any-
thing but identical. Store A sold approximately $90 per week of
cookies, while Store B sold closer to $230 per week.
A consumer trade area analysis for each store uncovered very
different shopper bases. Store A was located in an urban set-ting with many households without kids in its consumer trade
area. Store B, on the other hand, was in a rural setting with
many households with kids in its consumer trade area. As a
result, Store A was not the underperforming store it initially
appeared to be, but in fact, had captured most, if not all, of its
opportunity. Store B, initially thought to be over-performing in
its trade area, was actually under-performing and should have
sold an incremental $130 more per week. ■ See chart 2.
Instead of allotting resources against a store that appeared tobe an under-performer, Joe’s Cookies targeted the real under-
performing store. Joe’s Cookies followed the C.O.D.E. method
and assessed the different demand drivers and demand
inhibitors affecting the store in order to chart a path for Store B
growth. This exercise was repeated for other chains to diag-
nose the amount of unconverted opportunity by account and
develop tactical plan for realizing untapped potential.
Chart 1: Cookie consumer profiles
Joe’s Jane’sCookie Cookies Cookies
Category 16 oz. 16 oz.
White Med. High Low High
African Am. Low High Very Low
Hispanic Low High Very Low
< $50K Low Low Low
$50K+ High Very High Medium
$100K+ High Low Very High
No Kids in HH Low Very Low Very High
Kids in HH High Very High Very Low
Source: ACNielsen Homescan & Spectra
Chart 2: Opportunity gapping
Store A: $90 in Sales Store B: $230 in Sales
Consumer Trade Area Consumer Trade AreaFew Kids— Urban Many Kids— Rural
Consumer Opportunity Gapping
Gap Upside: $8 Gap Upside: +$130!
Source: ACNielsen Homescan & Spectra

8/6/2019 Babyboom All
http://slidepdf.com/reader/full/babyboom-all 51/5649
Step 3: Dynamic clustering The next step for Joe’s Cookies was to make similar recom-
mendations to its retailer that could be executed in a scalable
manner. Joe’s Cookies clustered similar stores based on
consumer, store, and performance attributes including
consumer fit, opportunity gaps, competitive interaction
and existing store sales.
In doing so, Joe’s Cookies focused its efforts against several
types of consumers and enabled action that was scaled yet
appeared customized on the shelf. Dynamic Clustering also
identified which clusters were not only a strong fit, but quanti-
fied the upside opportunity. This approach allowed Joe’s
Cookies to take action where it was needed and to minimize
where it was meeting demand. Demonstrating the power of
Dynamic Clustering in action, when applied from the category
down to the SKU level, Joe’s Cookies executed against the
opportunity for its brand and the category. ■ See chart 3.
Step 4: Executing for the consumer Turning to tactical considerations, Joe’s first cluster (Blue Collar
Suburban) represented $2.7 million in sales, spread across 20
stores. It appears to be under-performing with respect to many
product types and within certain cookie sub-segments.
Joe’s Cookies implemented a dynamic clustering framework
and pursued tactics that included:
• identifying cluster potential to assist with assortmentdecisions;
• determining the competitive forces affecting each dynamiccluster to assist with tactics;
• assigning key merchandising roles to SKU-level items bydynamic clusters to determine the turf and image enhancers;
• allocating shelf size based on dynamic clusters;
• performing SKU-level rationalization based on consumerdemand and potential sales by cluster to put the rightproduct in the right store.
The Retail C.O.D.E framework has helped many manufacturers
and retailers unlock hidden sales opportunity previously
masked by results aggregated at the account, region or trade
area level. C.O.D.E. proponents integrate a variety of consumer
and retail information to de-code available opportunities and
implement comprehensive action plans designed to improveproduct and category performance. Are you ready to crack the
Retail C.O.D.E.? Your sales depend on it. Your consumers
demand it.
Category/Brand
Consumer Fit
20 Stores
$2.7 Million Gap
35 Stores$0.8 Million Gap
68 Stores$0.0 Million Gap
46 Stores$0.0 Million Gap
22 Stores$2.7 Million Gap
10 Stores
$1.1 Million Gap
Gapping
Opportunity
Competitive
Interactions
Sales Influencers
Chart 3: Dynamic consumer profiling—allows
you to take action where there is potential
Source: ACNielsen Homescan & Spectra
Clusters
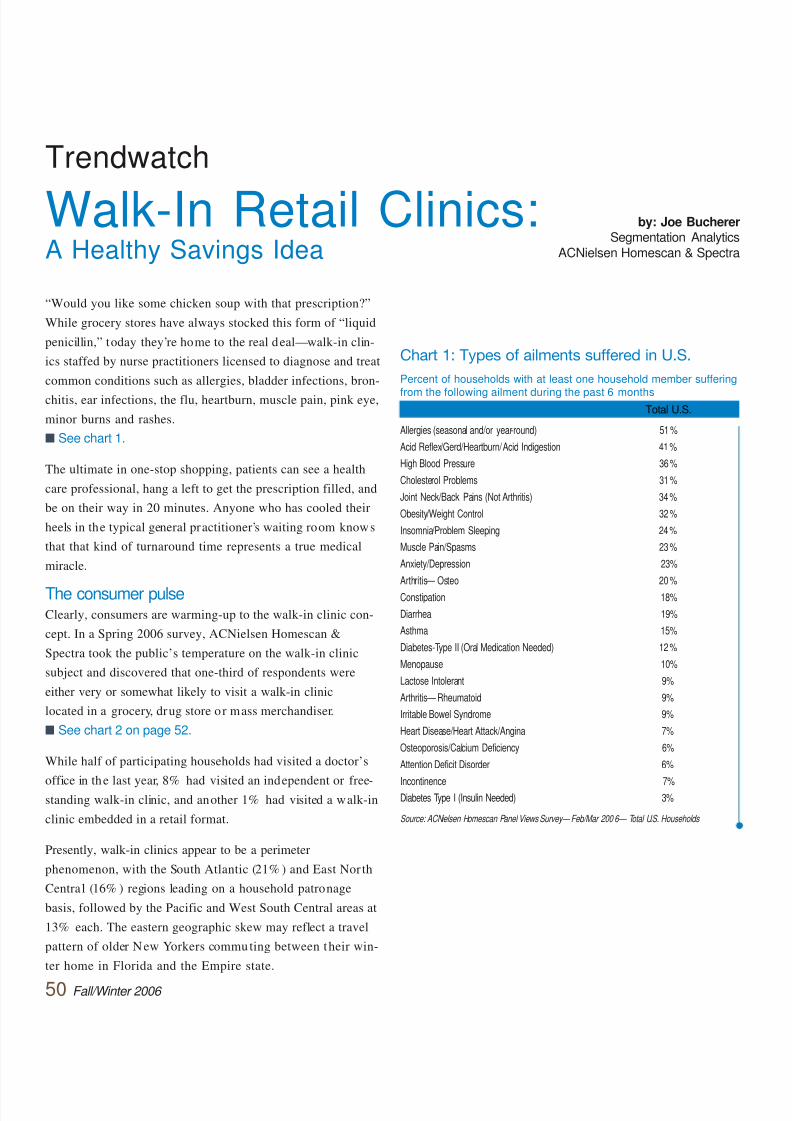
8/6/2019 Babyboom All
http://slidepdf.com/reader/full/babyboom-all 52/56
Trendwatch
Walk-In Retail Clinics:A Healthy Savings Idea
“Would you like some chicken soup with that prescription?”
While grocery stores have always stocked this form of “liquid
penicillin,” today they’re home to the real deal—walk-in clin-
ics staffed by nurse practitioners licensed to diagnose and treat
common conditions such as allergies, bladder infections, bron-
chitis, ear infections, the flu, heartburn, muscle pain, pink eye,
minor burns and rashes.
■ See chart 1.
The ultimate in one-stop shopping, patients can see a health
care professional, hang a left to get the prescription filled, and
be on their way in 20 minutes. Anyone who has cooled their
heels in the typical general practitioner’s waiting room knows
that that kind of turnaround time represents a true medical
miracle.
The consumer pulseClearly, consumers are warming-up to the walk-in clinic con-
cept. In a Spring 2006 survey, ACNielsen Homescan &
Spectra took the public’s temperature on the walk-in clinic
subject and discovered that one-third of respondents were
either very or somewhat likely to visit a walk-in clinic
located in a grocery, drug store or mass merchandiser.
■ See chart 2 on page 52.
While half of participating households had visited a doctor’s
office in the last year, 8% had visited an independent or free-standing walk-in clinic, and another 1% had visited a walk-in
clinic embedded in a retail format.
Presently, walk-in clinics appear to be a perimeter
phenomenon, with the South Atlantic (21% ) and East Nor th
Central (16% ) regions leading on a household patronage
basis, followed by the Pacific and West South Central areas at
13% each. The eastern geographic skew may reflect a travel
pattern of older New Yorkers commuting between their win-
ter home in Florida and the Empire state.
50 Fall/Winter 2006
by: Joe BuchererSegmentation Analytics
ACNielsen Homescan & Spectra
Chart 1: Types of ailments suffered in U.S.
Percent of households with at least one household member suffering
from the following ailment during the past 6 monthsTotal U.S.
Allergies (seasonal and/or year-round) 51 %
Acid Reflex/Gerd/Heartburn/Acid Indigestion 41 %
High Blood Pressure 36 %
Cholesterol Problems 31 %
Joint Neck/Back Pains (Not Arthritis) 34 %
Obesity/Weight Control 32 %
Insomnia/Problem Sleeping 24 %
Muscle Pain/Spasms 23 %
Anxiety/Depression 23%
Arthritis— Osteo 20 %
Constipation 18%
Diarrhea 19%
Asthma 15%
Diabetes-Type II (Oral Medication Needed) 12 %
Menopause 10%
Lactose Intolerant 9%
Arthritis— Rheumatoid 9%
Irritable Bowel Syndrome 9%
Heart Disease/Heart Attack/Angina 7%
Osteoporosis/Calcium Deficiency 6%
Attention Deficit Disorder 6%
Incontinence 7%Diabetes Type I (Insulin Needed) 3%
Source: ACNielsen Homescan Panel Views Survey— Feb/Mar 200 6— Total U.S. Households

8/6/2019 Babyboom All
http://slidepdf.com/reader/full/babyboom-all 53/56
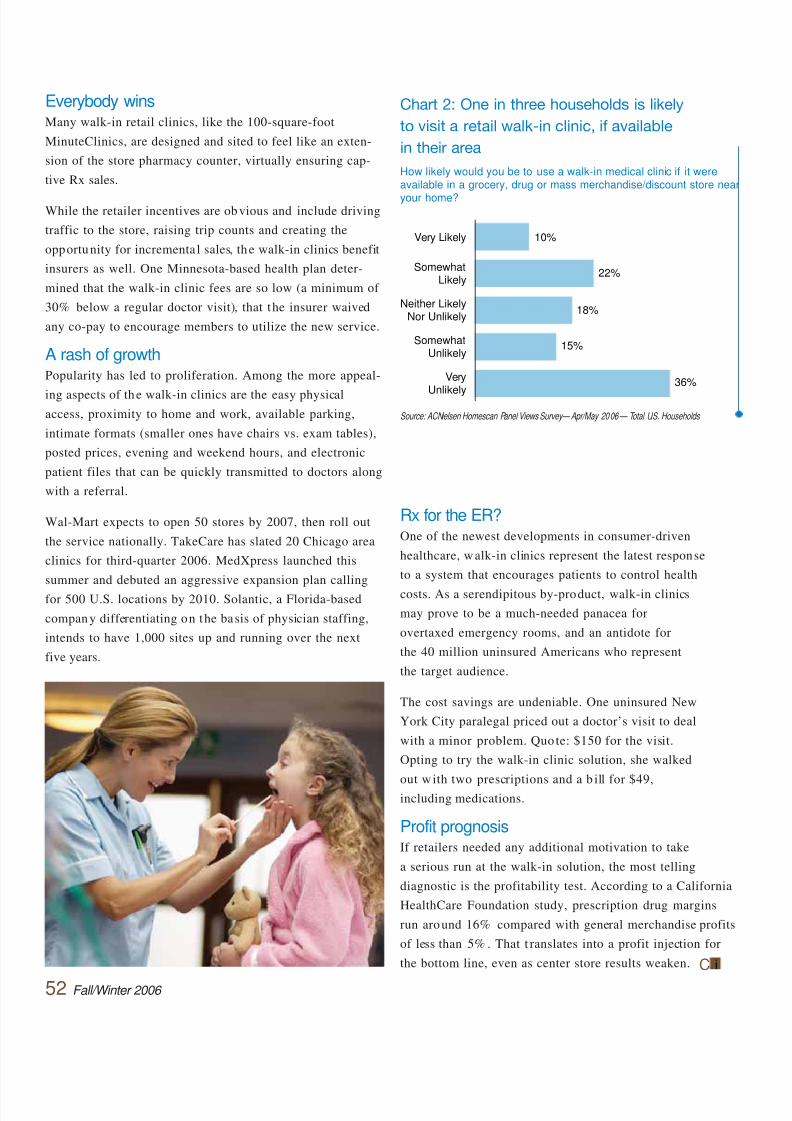
8/6/2019 Babyboom All
http://slidepdf.com/reader/full/babyboom-all 54/5652 Fall/Winter 2006
Everybody winsMany walk-in retail clinics, like the 100-square-foot
MinuteClinics, are designed and sited to feel like an exten-
sion of the store pharmacy counter, virtually ensuring cap-
tive Rx sales.
While the retailer incentives are obvious and include driving
traffic to the store, raising trip counts and creating the
opportunity for incrementa l sales, the walk-in clinics benefit
insurers as well. One Minnesota-based health plan deter-
mined that the walk-in clinic fees are so low (a minimum of
30% below a regular doctor visit), that the insurer waived
any co-pay to encourage members to utilize the new service.
A rash of growthPopularity has led to proliferation. Among the more appeal-
ing aspects of the walk-in clinics are the easy physical
access, proximity to home and work, available parking,
intimate formats (smaller ones have chairs vs. exam tables),
posted prices, evening and weekend hours, and electronic
patient files that can be quickly transmitted to doctors along
with a referral.
Wal-Mart expects to open 50 stores by 2007, then roll out
the service nationally. TakeCare has slated 20 Chicago area
clinics for third-quarter 2006. MedXpress launched this
summer and debuted an aggressive expansion plan calling
for 500 U.S. locations by 2010. Solantic, a Florida-based
company differentiating on the basis of physician staffing,
intends to have 1,000 sites up and running over the next
five years.
Rx for the ER?One of the newest developments in consumer-driven
healthcare, walk-in clinics represent the latest response
to a system that encourages patients to control health
costs. As a serendipitous by-product, walk-in clinics
may prove to be a much-needed panacea for
overtaxed emergency rooms, and an antidote for
the 40 million uninsured Americans who represent
the target audience.
The cost savings are undeniable. One uninsured New
York City paralegal priced out a doctor’s visit to deal
with a minor problem. Quo te: $150 for the visit.
Opting to try the walk-in clinic solution, she walked
out with two prescriptions and a b ill for $49,including medications.
Profit prognosisIf retailers needed any additional motivation to take
a serious run at the walk-in solution, the most telling
diagnostic is the profitability test. According to a California
HealthCare Foundation study, prescription drug margins
run around 16% compared with general merchandise profits
of less than 5% . That t ranslates into a profit injection for
the bottom line, even as center store results weaken.
Very Likely 10%
22%
18%
15%
36%
SomewhatLikely
Neither LikelyNor Unlikely
SomewhatUnlikely
Very
Unlikely
Source: ACNielsen Homescan Panel Views Survey— Apr/May 2006— Total U.S. Households
C i
Chart 2: One in three households is likely
to visit a retail walk-in clinic, if available
in their area
How likely would you be to use a walk-in medical clinic if it wereavailable in a grocery, drug or mass merchandise/discount store near
your home?

8/6/2019 Babyboom All
http://slidepdf.com/reader/full/babyboom-all 55/56
So what’s the new trend replacing “Low Carb”? There is much activity around Superfoods, as consumers are
looking for food and beverage products that enhance their active lifestyle. While these trends are small, they
are certainly something to closely watch. The mainstream trends like Whole Grain and Low/No Fat are still
popular as consumers are responding to a nationwide concern with obesity. Consumer food marketers are
flooding the market with a plethora of food products with health & wellness claims, but which ones are most suc-
cessful in capturing consumer sales? LabelTrends™ is a new service that monitors sales trends in 27 of the
hottest consumer packaged goods (CPG) product segments, such as low-carb, low-fat, organic and sugar-free.
With over two-thirds of Americans dealing with obesity and many individuals on some sort of diet regimen,
LabelTrends is well suited to help you evaluate new product opportunities to meet consumer demand and work
with your retailer partners in optimizing assortment at the shelf for fast turnover.
LabelTrends help you to:
• Understand the latest trends in the health & wellness arena and develop marketing strategies to
provide consumer solutions.
• Identify potential candidates for mergers and acquisitions.
• Understand which health & wellness claims are most successful in building brand loyalty.
• Assess competitor brand/item performance and develop counteractive strategies.
To learn more about LabelTrends, please contact your ACNielsen Client Service or Retail Services
representative or visit our web site at www.acnielsen.com.
Track the New Health& Wellness Trendswith a Few Clicks

8/6/2019 Babyboom All
http://slidepdf.com/reader/full/babyboom-all 56/56
It’s All About What’s Happening
at the Store LeveSuccess goes to the smart, the swift, and those who can manage through the complexity of today’s retail environment. Retailer
and Manufacturers strive to recognize the diverse and changing faces of consumers, focusing on what increases demand while
reducing what inhibits it. The store is where the best-laid plans shine or go awry.
ACNielsen Scantrack StoreView provides the clearest, most flexible and precise store level picture of what's selling where, why
and to whom. It provides a view that allows you to zero in on the store to understand demand drivers and demand inhibitors fro
different points of view. It allows for a new perspective, a more precise way to pinpoint consumer demand, focus on sales per-