Bovine pre-transfer endometrium and embryo transcriptome...
231
Institut für Tierwissenschaften, Abt. Tierzucht und Tierhaltung der Rheinischen Friedrich – Wilhelms – Universität Bonn Bovine pre-transfer endometrium and embryo transcriptome fingerprints as predictors of pregnancy success after embryo transfer I n a u g u r a l – D i s s e r t a t i o n zur Erlangung des Grades Doktor der Agrarwissenschaft (Dr. agr.) der Hohen Landwirtschaftlichen Fakultät der Rheinischen Friedrich – Wilhelms – Universität zu Bonn vorgelegt am 16. Juni 2010 von Dessie Salilew Wondim aus Gojjam, Äthiopien
Transcript of Bovine pre-transfer endometrium and embryo transcriptome...

Institut für Tierwissenschaften, Abt. Tierzucht und Tierhaltung
der Rheinischen Friedrich – Wilhelms – Universität Bonn
Bovine pre-transfer endometrium and embryo transcriptome fingerprints as predictors
of pregnancy success after embryo transfer
I n a u g u r a l – D i s s e r t a t i o n
zur Erlangung des Grades
Doktor der Agrarwissenschaft
(Dr. agr.)
der
Hohen Landwirtschaftlichen Fakultät
der
Rheinischen Friedrich – Wilhelms – Universität
zu Bonn
vorgelegt am 16. Juni 2010
von
Dessie Salilew Wondim
aus
Gojjam, Äthiopien

Diese Dissertation ist auf dem Hochschulschriftenserver der ULB Bonn
http://hss.ulb.uni-bonn.de/diss_online elektronisch publiziert
E-mail: [email protected]
Universitäts- und Landesbibliothek Bonn
Landwirtschaftliche Fakultät – Jahrgang 2010
Zugl.: ITW; Bonn, Univ., Diss., 2010
D 98
Referent: Prof. Dr. Karl Schellander
Korreferent: Prof. Dr. Brigitte Petersen
Tag der mündlichen Prüfung: 31.August 2010

Dedicated to my father Salilew Wondim, my mother Bizunesh Adela and my sister Emebet
Salilew Wondim


VII
Genexprssionsprofile von vor dem Transfer biopsierten bovinen Endometrien und Embryonen als Prädikator für den Trächtigkeitserfolg beim Rind.
Abweichende Genexpressionen sowohl des Embryos als auch des Endometriums sind ein
Grund für verminderte Trächtigkeitsraten nach dem Embryotransfer beim Rind. Die
Selektion der Embryonen einerseits und der Empfängertiere an Hand des Endometriums
andererseits basierend auf den Genexpressionsmustern, stellt eine große Herausforderung
dar. Um herauszufinden, ob Korrelationen zwischen der Genexpression des Endometriums
vor dem Transfer und der des Embryos auf der einen Seite und einer erfolgreichen
Trächtigkeit auf der anderen Seite, vorliegen, wurde eine globale Transkriptionsanalyse
der Biopsien des Endometriums und des Embryos mittels des GeneChip® Bovine Genome
Array und einem präimplantations spezifischen cDNA Arrays durchgeführt. Die
Biopsieproben des Endometriums wurden an Tag 7 und Tag 14 des Vorzykluses der
Versuchstiere (Simmental Färsen) genommen. Des Weitern wurden in vivo Blastozysten
am Tag 7 gespült, eine Biopsieprobe genommen (ca. 30-40%) und die Embryonen auf die
Empfängertiere übertragen. Diese Biopsieproben wurden nach der
Trächtigkeitsuntersuchung den Gruppen der trächtigen Färsen (rezeptives Endometrium)
und der nicht-trächtigen Färsen (nicht-rezeptives Endometrium) zugeordnet. Insgesamt
wurden 1126 unterschiedlich exprimierte Gene zwischen den rezeptiven und nicht-
rezeptiven Endometrien an Tag 7 detektiert. Des Weiteren zeigten sich qualitative und
quantitative Veränderungen in bedeutenden biologischen Prozessen und molekularen
Pathways, wie in der zellulären Anordnung, posttranskriptionalen Modifikation,
Signaltransduktion, Apoptose, im Zellzyklus und in der Imunantwort. Konträr zu diesen
Ergebnissen waren an Tag 14 nur 14 Gene zwischen den Endometrien unterschiedlich
reguliert. Im Bereich der Transkriptionsdynamik waren zwischen den Gruppen an Tag 7
1867 Gene und am Tag 14 254 Gene unterschiedlich exprimiert. Diese relativ große
Anzahl unterschiedlich regulierter Gene zeigt die Transkriptomplastizität des rezeptiven
Endometriums. Zwischen den Biopsieproben der Embryonen, die zu einer Trächtigkeit
führten und denen die keine Trächtigkeit induzierten zeigten 70 Gene eine unterschiedliche
Expression. In der ersten Gruppe wurden 32 Gene, darunter SPAG17, PF6, UBE2D3P,
DFNB31, AMD1, DTNBP1 und ARL8B expremiert und in der zweiten Gruppe 38 Gene
darunter SGK1, GBF1, KRT8, DTX2, RNF34, ARL8B, RYBP und EEF1. Die vorliegende
Arbeit zeigt demzufolge, dass das Genexpressionsprofil des Endometriums und der
Embryonen vor dem Transfer als Vorhersage für den Trächtigkeitserfolg dienen kann.
VIII
Bovine pre-transfer endometrium and embryo transcriptome fingerprints as predictors of pregnancy success after embryo transfer
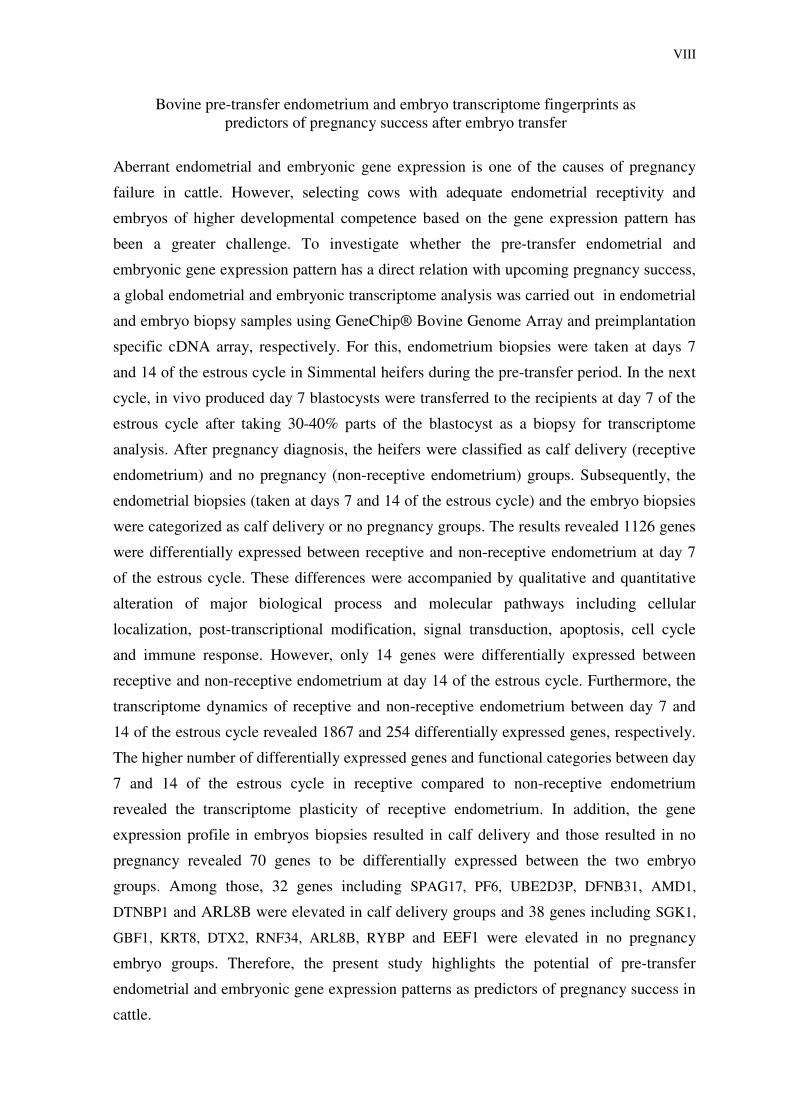
Aberrant endometrial and embryonic gene expression is one of the causes of pregnancy
failure in cattle. However, selecting cows with adequate endometrial receptivity and
embryos of higher developmental competence based on the gene expression pattern has
been a greater challenge. To investigate whether the pre-transfer endometrial and
embryonic gene expression pattern has a direct relation with upcoming pregnancy success,
a global endometrial and embryonic transcriptome analysis was carried out in endometrial
and embryo biopsy samples using GeneChip® Bovine Genome Array and preimplantation
specific cDNA array, respectively. For this, endometrium biopsies were taken at days 7
and 14 of the estrous cycle in Simmental heifers during the pre-transfer period. In the next
cycle, in vivo produced day 7 blastocysts were transferred to the recipients at day 7 of the
estrous cycle after taking 30-40% parts of the blastocyst as a biopsy for transcriptome
analysis. After pregnancy diagnosis, the heifers were classified as calf delivery (receptive
endometrium) and no pregnancy (non-receptive endometrium) groups. Subsequently, the
endometrial biopsies (taken at days 7 and 14 of the estrous cycle) and the embryo biopsies
were categorized as calf delivery or no pregnancy groups. The results revealed 1126 genes
were differentially expressed between receptive and non-receptive endometrium at day 7
of the estrous cycle. These differences were accompanied by qualitative and quantitative
alteration of major biological process and molecular pathways including cellular
localization, post-transcriptional modification, signal transduction, apoptosis, cell cycle
and immune response. However, only 14 genes were differentially expressed between
receptive and non-receptive endometrium at day 14 of the estrous cycle. Furthermore, the
transcriptome dynamics of receptive and non-receptive endometrium between day 7 and
14 of the estrous cycle revealed 1867 and 254 differentially expressed genes, respectively.
The higher number of differentially expressed genes and functional categories between day
7 and 14 of the estrous cycle in receptive compared to non-receptive endometrium
revealed the transcriptome plasticity of receptive endometrium. In addition, the gene
expression profile in embryos biopsies resulted in calf delivery and those resulted in no
pregnancy revealed 70 genes to be differentially expressed between the two embryo
groups. Among those, 32 genes including SPAG17, PF6, UBE2D3P, DFNB31, AMD1,
DTNBP1 and ARL8B were elevated in calf delivery groups and 38 genes including SGK1,
GBF1, KRT8, DTX2, RNF34, ARL8B, RYBP and EEF1 were elevated in no pregnancy
embryo groups. Therefore, the present study highlights the potential of pre-transfer
endometrial and embryonic gene expression patterns as predictors of pregnancy success in
cattle.

IX
Contents Page
Abstract VII-VIII
List of abbreviations XV
List of tables XIX
List of figures XXI
List of appendices XXVIII
1 Introduction 1
2 Literature review 3
2.1 Oocyte quality and its effect on pregnancy success 3
2.2 The role of oocyte mRNAs stores on oocyte quality 5
2.3 Oocyte specific transcripts and their effect on embryonic
development 6
2.4 Embryogenesis and gene expression 8
2.4.1 Preimplantation embryonic development 8
2.4.2 Preimplantation embryo losses 9
2.4.3 Embryonic genome activation and embryonic development 10
2.5 Transcripts required during blastocyst formation and differentiation 13
2.6 Estrous cycle and pregnancy establishment 15
2.6.1 Physiology of the estrous cycle and its implication in pregnancy
success 15
2.6.2 Hormonal events during the estrous cycle and its effect on
pregnancy establishment 17
2.6.3 Endometrial molecular events during the estrous cycle 19
2.7 Endometrial receptivity towards embryo implantation 20
X
2.7.1 Signaling pathways and molecules triggering endometrial
receptivity 21
2.7.1.1 The role of endometrial adhesion molecules in endometrial
receptivity 23
2.7.1.2 The role of cytokines in endometrial receptivity 24
2.7.1.3 The role of growth factors in endometrial receptivity 25
2.7.2 The role of hormones in endometrial receptivity 26
2.8 Embryo competency for implantation 27
2.9 Process of embryo implantation 31
3 Materials and methods 34
3.1 Materials 34
3.1.1 Animals 34
3.1.2 Embryo and endometrial biopsies 34
3.1.3 Materials for laboratory analysis 34
3.1.3.1 Chemicals, kits, biological and other materials 34
3.1.3.2 Reagents and media 39
3.1.4 Equipments 42
3.1.5 Programs (soft wares) and statistical packages used 43
3.2 Methods 44
3.2.1 Pre-transfer endometrial gene expression in relation to pregnancy
outcome 44
3.2.1.1 Endometrial biopsy collection 44
3.2.1.2 Superovulation and artificial insemination 45
3.2.1.3 Blastocyst recovery and embryo transfer 45
3.2.1.4 Pregnancy diagnosis and categorization of endometrial and embryo
biopsies 47
3.2.1.5 Total RNA isolation from endometrial biopsies 47

XI
3.2.1.6 DNase treatment of total RNA samples 48
3.2.1.7 RNA amplification from endometrial biopsies 49
3.2.1.7.1 First cycle first and second strand cDNA synthesis 49
3.2.1.7.2 First cycle, IVT amplification of cRNA 49
3.2.1.7.3 Second –cycle, first strand and double cDNA synthesis 50
3.2.1.7.4 Biotin labeling and fragmentation of cRNA 5
3.2.1.8 Target hybridization 51
3.2.1.9 Washing and staining probe arrays 51
3.2.1.10 Scanning the probe arrays 52
3.2.1.11 Affymetrix array data analysis 52
3.2.2 Expression profile of candidate genes during the estrous
cycle and early pregnancy 53
3.2.3 Immunohistochemical localization of candidate genes 54
3.2.4 Pre-transfer embryonic gene expression in relation
to pregnancy outcome 54
3.2.4.1 RNA isolation from embryo biopsies 54
3.2.4.2 RNA amplification from embryo biopsies 55
3.2.4.2.1 First and second stranded cDNA synthesis 55
3.2.4.2.2 In vitro transcription 56
3.2.4.3 Aminoallyl labeling and dye coupling 56
3.2.4.4 Hybridization to the target probes 57
3.2.4.4.1 Target clones 57
3.2.4.4.2 Probe preparation and hybridization 57
3.2.4.5 Image capture and quantification 58
3.2.4.6 Microarray data analysis from embryo biopsies 58
3.3 Validation of differentially expressed genes using
quantitative real time polymerase chain reaction (qPCR) 59

XII
3.3.1 Primer design and gene specific amplification 63
3.3.2 Gene cloning and Transformation 63
3.3.2.1 Blue/white screening of recombinants and colony picking 64
3.3.2.2 Plasmid isolation 65
3.3.2.3 Plasmid or M13 sequencing 65
3.3.2.4 Preparing serial dilution from plasmids 66
3.3.3 Transcript level quantification 66
4 Results 68
4.1 Embryo biopsy transfer and success rate 68
4.2 Pre-transfer gene expression in receptive and non-receptive
endometrium 68
4.2.1 Pre–transfer gene expression in receptive and non-receptive
endometrium at day 7 of the estrous cycle 68
4.2.1.1 Differentially expressed gene clusters between receptive
and non receptive endometrium at day 7 of the estrous cycle 71
4.2.1.2 Transcriptomic functional alteration in receptive and non-receptive
endometrium at day 7 of the estrous cycle 72
4.2.1.3 Molecular pathway identified in differentially expressed genes
between receptive and non-receptive endometrium at day 7 of the
estrous cycle 78
4.2.1.4 Molecular networks overrepresented in differentially expressed
genes between receptive and non receptive endometrium at day 7
of the estrous cycle
81
4.2.2 Pre-transfer gene expression of receptive and non-receptive
endometrium at day 14 of the estrous cycle 83
4.3 Diestrus transcriptome dynamics of receptive and non-receptive
endometrium 84
4.3.1 Diestrus transcriptome dynamics of receptive endometrium 84

XIII
4.3.1.1 Genes clusters identified between day 7 and day 14 of the estrous
cycle in receptive endometrium 85
4.3.1.2 Tanscriptomic functional alteration between day 7 and 14 of the
estrous cycle in receptive endometrium 86
4.3.1.3 Molecular pathway identified in differentially expressed genes
between day 7 and 14 of the estrous cycle in receptive
endometrium 88
4.3.2 Diestrus transcriptome dynamics of non-receptive endometrium 90
4.3.2.1 Transcriptomic functional alteration between day 7 and day 14 of
the estrous cycle in non receptive endometrium 90
4.3.3 Endometrial genes elevated at day 7 or 14 of the estrous cycle
irrespective of endometrial receptivity 91
4.4 Expression profile of selected candidate genes across the estrous
cycle and early gestation period 93
4.5 Protein expression of selected candidate genes 94
4.6 Progestrone level and mRNA expression of differentially expressed
genes 96
4.7 Gene expression difference between embryo biopsies that resulted
in calf delivery and no pregnancy 97
4.7.1 Functional classification of differentially expressed genes between
embryo biopsies resulted in calf delivery and no pregnancy 99
4.8 Validation of microarray data using real time quantitative PCR 103
4.8.1 Validation of differentially expressed genes between receptive and
non receptive endometrium at day 7 of the estrous cycle 103
4.8.2 Validation of differentially expressed genes between day 7 and 14
of the estrous cycle in receptive endometrium 104
4.8.3 Validation of differentially expressed genes between embryo
biopsies resulted in calf delivery and no pregnancy 105
5 Discussion 106

XIV
5 .1 Transcriptome difference between receptive and non-receptive
bovine endometrium 106
5.1.1 Differentially expressed gene clusters between receptive and non-
receptive endometrium at day 7 of the estrous cycle 107
5.1.1.1 The solute carriers and transmembrane proteins 108
5.1.1.2 Cargo protein sorters, transporter and neuro transmitter gene
clusters 109
5.1.1.3 The cell cycle, anti and pro apoptosis genes 110
5.1.1.4 The protein phosphatases and protein kinases 112
5.1.1.5 Cluster of differentiation (CD) and chemokine molecules gene
clusters 113
5.1.1.6 S100 gene clusters and endometrial receptivity 114
5.1.1.8 The extracellular matrix (ECM): The Collagens, TIMP3, TIMP1
and MMP2 115
5.1.1.9 Junctional adhesion, gap junction or connexin in receptive
endometrium 116
5.2 Diestrus dynamics of receptive and non-receptive endometrium 118
5.3 Transcriptome alternation in embryos resulted in calf delivery and
no pregnancy 120
6 Summary 122
7 Zusammenfassung 128
8 Reference 133
9 Appendices 171

XV
List of abbreviations
A Adenine
ACC. No Gene bank accession number
aRNA Amplified ribonucleic acid
dUTP 2'-Deoxyuridine 5'-Triphosphate
Affy Affymetrix
AI Artificial insemination
Annotate Annotation
ATP Adenosine tri phosphate
bIFN-τ Bovine interferon tau
BLAST Basic local alignment search
BME Basal medium eagle
BSA Bovine serum albumin
bTP-1 Bovine trophoblast protein-1
CD Cluster of differentiation
CDd14 calf delivery day 14
CDd7 calf delivery day 7
cDNA complementary deoxy ribonucleic acid
COCs Cumulus oocyte complex
CR1 Charles Rosenkrans medium
cRNA Complementary ribonucleic acid
Cy3 Cyanine 3
Cy5 Cyanine 5
DAPI 4’,6-Diamidin-2’-phenylindoldihydrochlorid
DAVID Database for annotation, visualization and integrated discovery
DE Differentially expressed genes
DEPC Diethylpyrocarbonate
DMSO Dimethyl sulfoxide
DNA Deoxyribonucleic acid
DNase Deoxyribonuclease
DNTP Deoxynucleotide triphosphate
DOP Degenerated oligonucleotide primer
XVI
DP Days postpartum
dscDNA Double stranded complementary deoxyribonucleic acid
DTCS Dye terminator cycle sequencing
DTT Dithiothreitol
E.coli Escherichia coli
E2 Estradiol
EDTA Ethylenediaminetetraacetic acid
ESTs Expressed sequence tags
FDR False discovery rate
FITC Fluoresceinisothiocyanat
FSH Follicle stimulating hormone
GCRMA Guanine cytokine multi array
GE Glandular epithelium
GEO Gene Expression Omnibus
GFP Green florescent protein
GnRH Gonadotropin-releasing hormone
GO Gene ontology
GOStats Gene ontology statistics
GTP Guanosine triphosphate
GV Germinal vesicle
h Hour
hCG Human chorionic gonadotropin
ICM Inner cell mass
IPA Ingenuity pathway analysis
IPTG Isopropyl β-D-1-thiogalactopyranoside
IVT In vitro transcription
KEGG Kyoto Encyclopedia of Genes and Genomes
LB Luria broth or Luria-Bertani broth
LE Luminal epithelium
LH Luteinizing hormone
LIMMA Linear models for microarray data
LOWESS Locally weighted scatter plot smoothing
Marray Microarray

XVII
MEM Minimum essential medium
MHz Mega Hertz
MIAME Minimum information about microarray experiment
min Minute
m Milli
MP Milk production
M Molar
mRNA Messenger ribonucleic acid
NAOAc Sodium oxaloacetic acid
NCBI National center for biotechnological information
NPd14 Non pregnant day 14
NPd7 Non pregnant day 7 oC Degree centigrade
oIFN-τ Ovine interferon tau
oTP-1 Ovine trophoblast protein-1
P Pregnant
P4 Progesterone
PBS Phosphate buffer saline
PCR Polymerase chain reaction
PGF2α Prostaglandin F2α
Pmole Pico mole
qPCR Quantitative polymerase chain reaction
r Correlation coefficient
RIN Ribonucleic acid integrity number
RNA Ribonucleic acid
RNase Ribonuclease
rpm Revolution per minute
RQ RNA qualified
S Stroma
s Seconds
SAS Statistical Analysis System
SCNT Somatic nuclear transfer
SDS Sodium dodecyl sulfate
XVIII
s.e.m Standard error of mean
SH Standing heat
SLC Solute carrier
SLS Sample loading solution
SSC Sodium chloride sodium citrate
ST Standing time
TAE Tris acetate ethylendiamin tetra acetat
TE Tris-ethylendiamin-tetra acetat
TIFF Tagged image file format
tRNA Transfer ribonucleic acid
US Ultasonography
UTP Uracil triphosphate
X-gal 5-bromo-4-chloro-3-indolyl-beta-D-galactopyranoside
µ Micro
l Litter
g Gram
α Alpha
β
Beta
XIX
List of tables Page
Table 1: Cattle embryo losses during different gestation period 10
Table 2: Differentially expressed genes between high and low
progesterone peaks in human endometrium (Wang and
Dey 2006) 22
Table 3: Pregnancy recognition factor in cattle and other species
(Senger 2003) 30
Table 4: Primers used for validation of DE genes between
endometrial biopsies 60-62
Table 5: Primers used for validation of DE genes between embryo
biopsies resulted in calf delivery and embryo biopsies
resulted in no pregnancy 63
Table 6: Molecular pathways containing genes elevated in
receptive (CDd7) and non-receptive endometrium (NPd7) 80
Table 7: List of molecular pathways containing DE genes enriched
in CDd7 and/or in CDd14 89
Table 8: Correlation between progestrone level and mRNA
expression of DE genes during the estrus cycle 96
Table 9: Molecular function and biological process of DE genes
between embryo biopsies resulted in calf delivery and no
pregnancy 100-102
Table 10: Validation of DE genes between receptive (CDd7) and
non-receptive (NPd7) endometrium at day 7 of the estrous 103

XX
cycle using qPCR
Table 11: Validation of DE genes between CDd7 and CDd14 in
receptive endometrium using qPCR 104
Table 12: Validation of DE genes between embryo biopsies resulted
in calf delivery and no pregnancy using qPCR 105

XXI
List of figures Page
Figure 1: Characteristics of estrus in high (black bar) and low milk
producing cows (white bar). Compiled from Lope et al. (2004) 17
Figure 2: Interferon tau production and maternal conceptus
communication. Adapted from Imakawa et al. (2004 ) 31
Figure 3: Phases of blastocyst implantation. Pre-attachment blastocysts
undergo shedding of the zona pellucida (Phase 1) and
precontact orientation (Phase 2). Phase 3 includes apposition
and transient attachment. Phase 4 marked by adhesion of
trophectoderm to endometrial LE. Phase 5 involves formation
of trophoblast giant binucleate cells that begin to differentiate
from mononuclear trophoblast cells and then migrate to and
fuse with the LE to form multinucleated syncytial plaques.
Adapted from Spencer et al.( 2007). 33
Figure 4: The overall experimental design applied in the study.
Endometrial biopsies were taken during the pre transfer period.
In the next cycle, blastocyst stage embryos were transferred to
the recipients after taking part of the embryo as a biopsy.
Following pregnancy diagnosis, the endometrial and embryo
biopsies were classified according to the pregnancy outcome.
Global transcription analysis was performed from embryo and
endometrial biopsies. Numbers 1 and 2 represent the
transcriptome analysis between receptive and non-receptive
endometrium at day 7 and 14 of the estrous cycle and 3 and 4
represent the transcriptome dynamic analysis of receptive and
non-receptive endometrium. 46

XXII
Figure 5: Pre-transfer endometrial transcriptome alteration between
receptive (CDd7) and non-receptive endometrium (NPd7) at
day 7 of the estrous cycle. (A): The number and fold change
distribution of genes elevated in CDd7 or NPd7. (B): The
heatmap and hierarchical clustering showing the expression
pattern of DE genes in CDd7 and NPd7 endometrial samples.
Labels in the horizontal axis of the heatmap, namely CDd7-1,
CDd7-2 and CDd7-3 represent independent biological
replicates from receptive endometrium and NPd7-1, NPd7-2
and NPd7-3 represent independent biological replicates from
non-receptive endometrium groups. The horizontal dendrogram
indicate the expression pattern of transcripts in CDd7 and
NPd7. The vertical dendrogram elucidates the similarities or
differences of transcript expression within the biological
replicates and between CDd7 and NPd7 endometrial samples.
Red and green colors indicate the high and low expression
level, respectively.
69
Figure 6: The expression pattern of DE genes exhibited ≥ 5 fold
differences between CDd7 and NPd7. Labels in the horizontal
axis of the heatmap, CDd7-1, CDd7-2 and CDd7-3 represent
independent biological replicates from receptive endometrium
and NPd7-1, NPd7-2 and NPd7-3 represent independent
biological replicates from non-receptive endometrium groups.
The red and green colors indicate high and low expression
pattern, respectively. 70
Figure 7: Genes clusters exhibited increased expression level in receptive
(CDd7) compared to non-receptive endometrium (NPd7) at day
7 of the estrous cycle. 71
Figure 8: Gene clusters exhibited reduced expression level in receptive
endometrium (CDd7) compared to non-receptive endometrium
(NPd7) at day 7 of the estrous cycle. 72

XXIII
Figure 9: Ontological classification of DE genes between CDd7 and
NPd7 according to their biological process. (A): Biological
processes overrepresented in genes elevated in CDd7. (B):
Biological process of overrepresented in genes elevated in
NPd7. The vertical axis indicates the biological processes and
the horizontal axis indicate the number of DE genes involved in
a specified biological process. DE = differentially expressed.
73
Figure 10: Representative biological processes overrepresented in DE
genes increased in receptive (CDd7) compared to non-receptive
(NPd7) endometrium. (A): Genes involved in gene
transcription. (B): Genes involved in protein localization or
transport. (C): Genes involved in cellular localization. (D):
Genes involved post-translational modification. (E): Genes
involved in anti-apoptosis. The number on top of each heatmap
indicates the gene ontology accession number. Red and green
colors reflect high and low gene expression levels, respectively. 74
Figure 11: Biological processes or molecular functions overrepresented in
genes exhibited increased transcript level in non-receptive
(NPd7) compared to receptive endometrium (CDd7) at day 7 of
the estrous cycle. (A): Genes involved in immune system. (B):
Genes involved in induction of apoptosis. (C): Genes involved
in transcription regulation. (D): Genes involved in chemokine
or cytokine activity. (E): Genes involved in extracellular
matrix. The number on top of each heatmap indicates the gene
ontology accession number. Red and green colors reflect the
high and low expression, respectively. 75
Figure 12: Molecular function overrepresented in genes enriched in
receptive (CDd7) (left) and non-receptive endometrium (NPd7)
(right) at day 7 of the estrous cycle. 76
XXIV
Figure 13: Representative molecular functions overrepresented in genes
enriched in CDd7 compared to NPd7. (A): Genes involved in
transporter activity. (B): Genes involved in calcium ion binding
activity. (C): Genes involved in magnesium ion binding. (D):
Genes involved in kinase activity. The number on top of each
heatmap indicates the gene ontology accession number. Red
and green colors reflect high and low expression, respectively. 77
Figure 14: Differentially expressed genes between CDd7 and NPd7
involved in tight junction pathway. The claudin and junctional
adhesion molecules (JAMs), which makeup the transmembrane
protein of this pathway, were increased in CDd7. In addition, in
the cytoplasmic plaque, aPRC, PP2A, PRKC, MYOSIN and
RHO contains differentially expressed genes. Genes elevated in
CDd7 are marked by red background and those elevated in
NPd7 are marked with blue background. 79
Figure 15: Cell cycle, cell death and reproductive system disease network.
Red and green backgrounds indicate the genes enriched in
CDd7 and NPd7, respectively. 82
Figure 16: The genetic disorder, lymphoid tissue structure and
development network. Red and green backgrounds indicate the
genes enriched in CDd7 and NPd7, respectively. 82
Figure 17: Pre-transfer transcriptome alteration between receptive
(CDd14) and non-receptive endometrium (NPd14) at day 14 of
the estrous cycle. (A): The number and fold change distribution
of DE genes that were increased in CDd14 or NPd14. (B): The
heatmap and hierarchical clustering describing the expressional
pattern of DE genes in CDd14 and NPd14. Labels on the
horizontal axis of the heatmap, CDd14-1, CDd14-2 and
CDd14-3 represent independent biological replicates from
receptive endometrium groups and NPd14-1. NPd14-2 and
NPd14-3 represent independent biological replicates from non-

XXV
receptive endometrium groups at day 14 of the estrous cycle.
The horizontal dendrogram indicates the expression patterns of
transcripts in CDd14 and NPd14. Red and green colors reflect
the high and low expression, respectively.
83
Figure 18: Pre-transfer transcriptome dynamics of the receptive
endometrium between day 7 and 14 of the estrous cycle. (A):
The number and fold change distribution of DE genes between
CDd7 and CDd14. (B): The heatmap describing the expression
pattern of DE genes between CDd7 and CDd14. Labels on the
horizontal axis of the heatmap, CDd7-1, CDd7-2 and CDd7-3
represent independent biological replicates from receptive
endometrium groups at day 7 of the estrous cycle. CDd14-1,
CDd14-2 and CDd14-3 represent independent biological
replicates from receptive endometrium groups at day 14 of the
estrous. Red and green colors reflect high and low expression,
respectively. 86
Figure 19: Biological processes overrepresented in DE genes enriched in
CDd7 (left) and CDd14 (right) as the receptive endometrium
proceeds from day 7 to day 14 of the estrous cycle. 87
Figure 20: The DE between CDd7 and CDd14 involved in Gonadotropin-
releasing hormone (GnRH) signaling events. The DE genes
(MMP2), G/q11 (GNAI1), PLCB, IP3R (ITPR1, ITPR3),
CAMK (CAMK2D), P38MAPK (MAPK13, MAPK12) are
located in the critical streams of the path indicating the change
in the activity of the GnRH pathway as the endometrium
proceeds from day 7 to 14 of the estrous cycle. Genes elevated
in CDd7 are marked by red background and those elevated in
CDd14 are marked with blue background. 88

XXVI
Figure 21: Pre-transfer transcriptome dynamics in non-receptive
endometrium between day 7 and 14 of the estrous cycle. (A):
The number and fold change distribution of DE genes
identified between NPd7 and NPd14. (B): The heatmap
describing the expression pattern of DE genes between NPd7
and NPd14. Labels on the horizontal axis of the heatmap,
NPd7-1, NPd7-2 and NPd7-3 represent independent biological
replicates from non-receptive endometrium groups at day 7 of
the estrous cycle. NPd14-1, NPd14-2 and NPd14-3 represent
independent biological replicates in non-receptive endometrium
groups at day 14 of the estrous. Red and green colors reflect
high and low expression, respectively. 91
Figure 22: Genes elevated at day 7 or day 14 of the estrous cycle both in
receptive and non-receptive endometrium. 92
Figure 23: The expression pattern of selected candidate genes across the
estrous cycle and at day 50 gestation period (P). The vertical
axis indicates the relative mRNA expression level of candidate
genes normalized to the mRNA level of GAPDH. Bars show
mean ± s.e.m. Bars with different letters are statistically
significant (p < 0.05). 94
Figure 24: Immunohistochemical localization of selected candidate genes
across the estrous cycle and day 50 gestation period (P). The
green and blue colors indicate the protein signal and nuclear
staining, respectively. NC = Negative control, sGE =
Superficial glandular epithelium, GE = Glandular epithelium,
LE = Luminal epithelium, S = stroma cells, D = day. 95
Figure 25: Hierarchical clustering of differentially expressed genes
between embryos resulted in calf delivery and in no pregnancy.
Embryo biopsies resulted in calf delivery were clustered in one
group (left), while the embryo resulted in no pregnancy were
clustered in the second group (left). A, B and C on the top of
XXVII
the heatmaps represent three biological replicates during
hybridization and D, E and F describe the dyeswap
hybridization for A, B and C replicates. Positive and negative
numbers indicate genes increased in embryo biopsies resulted
in calf delivery and no pregnancy groups, respectively. FC =
Fold change, ACC. No = Gene bank accession numbers.
98
Figure 26: List of molecular signaling and metabolic pathways involved
by differentially expressed genes between embryo biopsies
resulted in calf delivery and no pregnancy. Red and green
arrows indicated genes enriched and reduced, respectively in
embryo biopsies resulted in calf delivery compared to embryo
resulted in no pregnancy. 99

XXVIII
Appendix 1: The intensity distribution and uniformities between the
arrays after normalization. (A): Pearson correlation of
the arrays within and between the biological replicates.
The red and blue colors represent higher and lower
correlation, respectively. (B): Box-plots indicating
simple summary of the distribution of probe intensities
across all arrays. Each box corresponds to one array.
The boxes have similar size and Y position (median).
(C): Density estimates (smoothed histograms) of the
data showing similarities in shapes and ranges of the
arrays. 171
Appendix 2: List of top differentially expressed genes between
receptive (CDd7) and non-receptive (NPd7)
endometrium at day 7 of the estrous cycle. Negative
and positive fold changes (FC) describe genes
increased in CDd7 and NPd7, respectively. 172-182
Appendix 3: List of molecular networks containing genes elevated
(upward arrow) or reduced in (downward arrow) in
CDd7 compared to NPd7. 183-184
Appendix 4: List of top differentially expressed genes between day
7 and day 14 of the estrous cycle (CDd7 vs. CDd14) in
receptive endometrium. Negative and positive fold
changes (FC) describe genes increased in CDd7 and
CDd14, respectively.
185-194
List of appendices Page

XXIX
Appendix 5:
List of top differentially expressed genes between day
7 and 14 of the estrous cycle (NPd7 vs. NPd14) in non-
receptive endometrium.
195-198
Appendix 6: The spatio-temporal expression of selected candidate
genes at different region of the endometrium during the
estrous cycle and day 50 gestation period (P). 199
Appendix 7: Validation of differentially expressed genes between
receptive (CDd7) and non-receptive (NPd7)
endometrium at day 7 of the estrous cycle. (A): Genes
enriched in CDd7. (B): Genes enriched in NPd7. 200

Introduction _________________________________________________________________________
1
1 Introduction
Despite the wider application of embryo transfer technology in modern cattle breeding,
several transfers end up without pregnancy establishment. This pregnancy failure has
enormous economic implications by retarding genetic progress and increasing the cost of
maintaining recipients.
Pregnancy failure can be attributed to incompetency of the embryo and/or inadequate
endometrial receptivity. The implantation incompetency of the embryo can be caused by
poor quality oocytes associated with inadequate mRNA and protein storage during oocyte
maturation, inappropriate expression of genetic information derived from the embryonic
genome during embryonic genome activation or inability of the embryo to produce
sufficient pregnancy signals and secretion during perimplantation period (Bettegowda et
al. 2008, Kanka 2003, Latham and Schultz 2001, Schultz et al. 1999, Gandolfi et al. 2005,
Senger 2003). Thus, abnormal genetic constitutions of the blastocysts or unsuccessful
transitions from maternal to embryonic transcription could account for many failures of
early embryonic growth and implantation. Hence, for successful implantation to occur in
the receptive endometrium, the blastocysts must attain implantation competency through
accumulation of transcripts and secretions essential to control cell differentiation and
maternal recognition of pregnancy (Spencer et al. 2008). Successful pregnancy is therefore
the result of coordinated and synchronized crosstalk between the conceptus and the
receptive endometrium in a temporal and cell specific manner (Carson et al. 2000,
Gonzalez et al. 2000, Lim et al. 2002, Simon et al. 2001, Spell et al. 2001, Wolf et al.
2003).
Endometrial receptivity is the status of the endometrium to be ready to accept the embryo
for implantation (Swierz and Giudence 1997) and it comprises temporary and unique
sequence of events that makes the embryo to adapt to the new environment (Bergh and
Navot 1992). Thus, assessment of endometrial receptivity is required to identify
endometrium that will be suitable for assisted reproduction technology. Similar to
implantation competent embryos, the endometrial receptivity is also known to be affected
by certain genes whose expression is induced or reduced overtime. In this regard, different
sets of genes were reported to be expressed or suppressed during the window implantation
in human endometrium (Giudice et al. 2002, Giudice 2004, Kao et al. 2002, Lessey et al.
1996, Martin et al. 2002, Riesewijk et al. 2003). Thus, aberrant endometrial genes
expression during critical period of pregnancy establishment could result in implantation

Introduction _________________________________________________________________________
2
failure and infertility (Tabibzadeh and Babaknia 1995, Tapia et al. 2008). Therefore,
selecting cows having adequate endometrial receptivity and developmentally competent
embryos based on the gene expression pattern may increase the number of calves borne
following embryo transfer. Hence, investigating the endometrial and embryonic gene
expression during the time of embryo transfer and relating this information to pregnancy
outcome may provide a unique opportunity to generate molecular marker that are related to
endometrial receptivity and embryo implantation.
Despite enormous efforts in characterizing bovine endometrial gene expression during the
estrous cycle and early pregnancy (Bauersachs et al. 2005, Bauersachs et al. 2006,
Bauersachs et al. 2009, Mansouri-Attia et al. 2009, Mitko et al. 2008), the recipient
endometrial gene expression patterns during the estrous cycle and the subsequent effect on
the upcoming pregnancy outcome is not investigated. With regard to the embryo,
previously it has been shown the possibility of establishing a direct connection between
transcript abundance of in vitro produced bovine blastocyst biopsy and pregnancy success
after transfer of embryos (El-Sayed et al. 2006). However, no information is available on
the relationship between in vivo produced bovine embryo transcriptome profile and
pregnancy success. Thus, investigating the gene expression of the endometrium and in
vivo derived transferable embryos in relation to the pregnancy success can be useful in
developing molecular markers associated with establishment of successful pregnancy.
Therefore, this experiment was aimed at establishing a direct link between the pre-transfer
endometrial or in vivo derived embryo gene expression and pregnancy outcome using
endometrium and embryo biopsy technology in conjunction with the pregnancy outcome
information. To achieve the main objective, the specific objectives were
1. To identify pre-transfer cycle endometrial transcriptome profile changes and
transcriptomic functional and molecular signaling alterations in heifers that resulted
in calf delivery and heifers that resulted in no pregnancy.
2. To investigate the diestrus endometrial transcriptome dynamics of heifers that
result in calf delivery or heifers that resulted in no pregnancy.
3. Characterization of selected candidate genes during the estrous cycle and early
pregnancy period.
4. To identify transcriptome profile and molecular signaling alteration in in vivo
derived embryos that resulted in calf delivery and embryos resulted in no
pregnancy.
Literature review _________________________________________________________________________
3
2 Literature review 2.1 Oocyte quality and its effect on pregnancy success
Oocytes development is one of the main consequences of coordinated and complex events
of physiological events during the estrous cycle. Oocyte is a key regulator of multiple
aspects of female fertility, including ovarian follicular development and early
embryogenesis (Matzuk et al. 2002). Unlike spermatozoa, which are generated
continuously from puberty onwards, the population oocyte is limited during the life times.
Therefore, the number and developmental competence of oocytes reaching the ovulation
phase determine the number of offsprings the female animal produces during the
reproductive lifetime (Gandolfi et al. 2005). Thus, developmental competence of oocytes
is acquired when the oocyte achieves nuclear, plasma membrane and cytoplasmic changes
during the follicular phases of the estrous cycle (Albertini et al. 2003, Brackett 1985,
Eppig et al. 1996, Krisher 2004).
In vitro, the oocyte developmental process is dependant on many factors including
maturation or culture media (Fouladi Nashta et al. 1998). For instance, different add-ins in
the maturation and culture medium including fetal bovine serum, purified bovine LH
hormones, amino acid and retinoic acid were found to increase the developmental
competence of oocytes (Brackett et al. 1989, Hashimoto et al. 2002, Mohan et al. 2003,
Watson et al. 2000). Amino acid supplementation of oocyte maturation media may serve
as osmolytes, energy substrates, pH regulators and chelators of heavy metals and as
precursors for protein synthesis (Gardner 1994, Gardner et al. 1996, Lee and Fukui 1996).
In addition, embryonic development was reported from bovine oocytes aspirated from
follicles greater than 2-8 mm in diameter (Blondin and Sirard 1995, Kruip et al. 2000,
Lonergan et al. 1994, Yang et al. 1998). Similar studies in buffalo evidenced that the
fertilization rate, cleavage and embryo development were significantly higher in COC’s
aspirated from large follicles, followed by medium and small-sized normal follicles
(Raghu et al. 2002). Moreover, higher proportion of goat oocytes aspired from larger
follicles reached to MII stage and oocytes from small and medium follicles yielded
significantly lower proportion of hatched blastocysts than large follicles (Crozet et al.
1995). Thus, low developmental rates of oocytes from small follicles may be associated
with their inability to reach complete meiotic and/or cytoplasmic competence, or they are
from follicles already undergoing atresia.
Literature review _________________________________________________________________________
4
Unlike to the in vitro counterparts, in vivo developmental competence of oocytes depends
on the dietary system, ambient temperature, breed, parity and age of the animal.
Alterations in the quantity of food consumed or the composition of the diet imposed solely
during the pre-mating period can adversely affect oocyte maturity, blastocyst yield,
prenatal survival and the number of offspring born alive (Ashworth et al. 2009). For
instance, animals fed on rumen inert fat exhibited higher proportion of cleaved embryos
than soya or linseed fed animals (Fouladi-Nashta et al. 2007). However, increased protein
and urea intake may affect blastocyst development by elevating ammonia concentration in
the follicular fluid (Adamiak et al. 2005, McEvoy et al. 1997a, Powell et al. 2006). This
may adversely affect the oocyte developmental competence by inhibiting the growth and
metabolism of the oocyte-supporting granulosa cells (Rooke et al. 2001). Similarly, long
chain n-6 polyunsaturated fatty acid high density lipoprotein found to be resulted in
reduced embryo development in ewes (Wonnacott et al. 2010). Moreover, high fat feeding
can improve significantly the blastocyst production, total inner cell mass and
trophectoderm cells than the low-fat group (Fouladi-Nashta et al. 2007). Similarly,
(Mantovani et al. 1993) reported that the yield of transferable embryos after superovulation
in beef cattle was significantly reduced when heifers had access to concentrates ad libitum
compared with restricted concentrates. In addition, the dietary energy levels were found to
be affected both the morphology and the number follicle in ewes and heifers (Boland et al.
2001, O'Callaghan et al. 2000). The effect of feeding level on oocyte quality was reported
to be dependent on the body condition of the animal, with the high level of feeding being
beneficial to oocytes from animals of low body condition, but detrimental to oocytes from
animals of moderately high body condition (Adamiak et al. 2005).
Short time feed restriction and level of feeding can affect the oocyte quality and embryo
survival. For instance, restricting energy intake before slaughter can enhance subsequent
in-vitro development of the oocytes from small follicles (McEvoy et al. 1997b) and short-
term restrictions in dietary intake before mating increased subsequent pregnancy rates in
cattle (Dunne et al. 1997). Furthermore, restriction feed intake was found to reduce the
expression of glucose transporter 3 (SLC2A3), sodium/glucose co-transporter 1 (SLC5A1)
and Na+/K+ ATPase mRNA in oocytes, while expression of PTGS2, HAS2 and the leptin
receptor in granulosa cells was increased (Schmidt et al. 2009). Similarly, (Pisani et al.
2008) indicated that feeding ewes with 0.5 above maintenance requirements was found to
alter the relative abundance of transcripts involved in oocyte metabolic activity. This can
suggest that changes to the immediate environment surrounding oocytes and embryos can

Literature review _________________________________________________________________________
5
alter the pattern of genes expressed, or epigenetic modifications that is heritable changes in
gene function that occur without an alteration in DNA sequence in oocytes and embryos
which in turn contribute to altered developmental potential (Burdge et al. 2007).
The effect of season on oocytes developmental competence has been documented. The
oocyte or embryonic developmental competence found to be increased during the cold
seasons compared to the hot season (Rocha et al. 1998, Ryan et al. 1992, Zeron et al.
2001). This may be associated with modifications of the physical and chemical properties
of the membranes. For instance, heat stress induces apoptosis in bovine and rabbit embryos
increased the expression of heat shock proteins in porcine and mouse embryos, disrupts the
microtubule and microfilaments and alters the methylation status of imprinted genes
histocompatibility 9 (H19) and insulin-like growth factor 2 receptor (Igf2r) in mouse
embryos (Bernardini et al. 2004, Kim et al. 2002, Makarevich et al. 2007, Paula-Lopes and
Hansen 2002, Rivera et al. 2004, Zhu et al. 2008). Similarly, the heat stress during El Nino
periods was found to be associated with reduction in the average number of embryos
recovered from donor cows, the proportion of live embryos and the quality of live embryos
(Benyei et al. 2003). From this, it can be possible to summarize that inherent nature of the
animal (genetic makeup), the nutritional status, the feeding level and type of nutrient as
well as the seasonal variation in temperature can affect the developmental competence of
the oocyte, embryo survival or pregnancy rate in cattle and other domestic farm animals.
2.2 The role of oocyte mRNAs stores on oocyte quality Although the environmental conditions and the type of breed significantly influence the
oocyte quality, the earliest stages of embryogenesis in mammals are regulated by
maternally-inherited RNAs and proteins stored within the oocyte (Bachvarova 1985).
Transcription and storage of maternal mRNA occurs during follicular development in
which the oocyte synthesizes and accumulates large stores of the total RNAs and protein.
These stored mRNAs and proteins are essential for completion of the meiotic cell cycle, the
establishment of an embryonic genome and regulation of preimplantation embryo
development (Bachvarova 1985, Bachvarova et al. 1985, Bachvarova 1992, Betts and King
2001, De Sousa et al. 1998, Eichenlaub-Ritter and Peschke 2002, Kastrop et al. 1991,
Levesque and Sirard 1995, Lonergan et al. 2003, Piccioni et al. 2005)
The accumulated mRNA and protein by growing oocyte is followed by massive
destruction during oocyte maturation. For instance, an estimated 85 pg of mRNA is

Literature review _________________________________________________________________________
6
believed to be available in a GV-stage mouse oocyte, but polyadenylated mRNA declines
during oocyte maturation by about 50 pg and about 30% of the total mRNA undergoes
degradation (Paynton 1998). The polyadenylation may be associated with translational
activation, whereas deadenylation is associated with translational silencing (Piccioni et al.
2005). Further losses of maternal mRNA occur during early cleavage stages (Brevini-
Gandolfi et al. 1999, Brevini-Gandolfi et al. 2001, Piccioni et al. 2005).
Although, the RNA transcribed during the period of cytoplasm maturation is very stable,
the fates of different mRNA species are controlled at several levels (Wassarman 1996).
Different species of mRNA are polyadenylated in different degrees. Those mRNA
transcripts with long poly-A tails of ~150 A residues are utilized for immediate use and
those with shorter poly-A tails of 90 A are used only after elongation of the poly-A tail
(Bachvarova 1992). Therefore, the oocyte transcriptome is expected to reflect its potential
to develop into an embryo (Thelie et al. 2009). Thus, the oocytes intrinsic quality and
developmental competence is mainly influenced by the presence or absence of those
transcripts in the oocyte (Bilodeau-Goeseels 2003). This in turn can affect the ability of the
embryos further development and survival.
2.3 Oocyte specific transcripts and their effect on embryonic development
The stability of oocyte mRNA is crucial for normal development and any disturbance of
this process can negatively affect oocyte developmental competence and cause blockage of
further embryonic survival (Gandolfi et al. 2005). Although, the ability of an oocyte to
develop into embryo depends on the accumulation of specific information and molecules,
because of their importance role, more emphasis has been given to oocyte-specific
transcripts (Eichenlaub-Ritter and Peschke 2002). Oocyte specific transcripts may differ
between species and stage of pre-implantation development. Oocyte mRNAs with short
poly (A) tails are translationally inactive and are activated upon extension of the tail during
specific stages of embryo development (Brevini-Gandolfi et al. 2001). Many oocyte-
specific factors have been recognized to influence the acquisition of developmental
competence. Maternal effect genes produce transcripts that form a pool of mRNA in the
oocyte cytoplasm that can sustain post-fertilization development until the embryonic
genome is activated (Memili and First 1999).
The mammalian oocyte provides not only proteins that are essential for initial cell
divisions in the embryo but also proteins and RNAs that are implicated in regulating the

Literature review _________________________________________________________________________
7
paternal genome. Developmentally competent oocytes accumulate large pools of RNA in
the cytoplasm and nucleus which stops when the oocyte reaches of diameter of 110 µm
(Bachvarova 1992, Fair et al. 1996). The study in mouse oocyte indicated that mature
oocytes with the diameter of 100-120 µm have an estimated amount of 2.4 ng total RNA
and 40-60 pg mRNA (Bilodeau-Goeseels and Schultz 1997).
The genetic programs within the oocyte play an important role in orchestrating the
multiple events required for successful folliculogenesis, fertilization and early
development (Dean 2002). In addition, oocyte specific genes are important for the initial
cleavage divisions of embryonic development (Yao et al. 2004).
The mammalian oocyte expresses several genes specific to oocytes that can play a key
role in regulation of fertility in mammals (Bettegowda et al. 2007). Some of those genes
include growth differentiation factor 9 (GDF9), bone morphogenetic protein 15 (BMP15),
bone morphogenetic protein 6 (BMP6), zona pellucida (ZP) genes, MLF1-interacting
protein (MLF1IP), factor in the germline alpha (FIGα), B-cell translocation gene 4 (BTG4)
and phosphotyrosine-binding protein (xPTB), Mater and JY-1 (Elvin et al. 2000, Tong et
al. 2000, (Vallee et al. 2005). Among those, (FIGα) is required for expression of the zona
pellucida genes that encode ZP1, ZP2 and ZP3 (Liang et al. 2007). Mater is found to be
essential for embryonic development beyond the two-cell stage and females that lack the
maternal effect gene Mater are sterile (Tong et al. 2000).
In oocytes, some transcripts are required for oocyte-specific processes and metabolism,
while others are presumably stored for use during early embryonic development, prior to
the activation of zygotic expression (Li et al. 2006). For instance, the zona pellucida genes
(ZP1, ZP2 and ZP3) are required during folliculogenesis, species-specific fertilization and
passage of the early embryo down the oviduct (Rankin et al. 1996). Knockout mice lacking
oocyte-derived zona pellucida protein 3 (ZP3) or ZP2 display defects in early antral and
preovulatory follicle development, cumulus-oocyte complex formation, ovulation and
unable to form a zona matrix despite synthesis of ZP1 and ZP2 (Rankin et al. 2001, Zhao
and Dean 2002). Moreover, ZP1 null mice form zona pellucida with only ZP2 and ZP3,
but the matrix is structurally flawed and some growing follicles have ectopic granulosa
cells lodged between the oolemma and zona pellucida (Dean 2002). Later in
folliculogenesis, Zp1 null follicles can develop accentuated perivitelline space prior to
ovulation. Although, Zp1 null females are fertile, they have decreased fecundity due to
precocious hatching of early embryos from the structurally compromised zona matrix
(Rankin et al. 1999). Blastocysts derived from in vitro maturation and fertilization of eggs

Literature review _________________________________________________________________________
8
from Zp2 or Zp3 knockout females are not capable of completing development after
transfer to wild-type pseudo pregnant recipients (Zhao and Dean 2002).
Other group of oocyte specific genes is the transforming growth factor beta (TGF-beta)
members which are potent regulators of cell proliferation and differentiation. Three
members of TGF- beta, growth differentiation factor 9 (GDF9), bone morphogenetic
protein 15 (BMP15) and BMP6 are expressed by the oocyte and may mediate effects
attributed to the oocyte. GDF9 is absolutely required for pre-antral follicle development,
alters the periovulatory expression of granulosa cell genes and stimulates cumulus (Elvin
et al. 2000). For example, in the mouse, growth differentiation factor (GDF9), is expressed
only in oocytes and is required for early folliculogenesis and plays role in follicular
development after the primary follicle stage (Dong et al. 1996). Moreover, BMP15,
functions in a cooperative manner with GDF9 to govern ovulation and fertilization rates
(Yan et al. 2001). For instance, animals homozygous for the BMP15 or GDF9 mutations
are sterile due to arrested follicular development from the primary stage of growth. In
sheep, GDF9 mRNA is present in germ cells before and after ovarian follicular formation
as well as throughout follicular growth, whereas BMP15 mRNA is found in oocytes only
from the primary stage of growth (McNatty et al. 2003).
2.4 Embryogenesis and gene expression 2.4.1 Preimplantation embryonic development The process by which fertilized oocytes divide and ultimately result in specialized tissues
and organs of a mature organism is one of the greatest mysteries of life. To achieve this,
the oocytes must first attain the cytoplasmic and nuclear maturation and reach to the
metaphase II stage. Once the oocyte is matured, the process of fertilization starts when the
sperm cell binds to the zona pellucida and fuse with the cell membrane of the oocyte.
However, actual fertilization occurs when the sperm enter the oocyte cytoplasm and fuse
its pronucleus with the oocyte pronucleus restoring the number of chromosomes that is
typical of a given species. Since the resulting zygote is a large cell that has low nuclear to
cytoplasmic ratio, the zygote divides without an increase in cell mass. Thus, in the process
of its development to the blastocysts, the mammalian preimplantation embryo passes
through distinct metabolic phases including changes in protein synthesis, changes in
energy requirements and amino acid uptake. Apart from this, the preimplantation embryo
undergoes morphological changes including compaction, cavitation and hatching (Crosier

Literature review _________________________________________________________________________
9
et al. 2000, Crosier et al. 2001). Compaction is the first step in the process of
differentiation and is fundamentally important for the formation of viable blastocysts.
In cattle, early cleavage occurs on day 2 after fertilization and between day 3 and 4 the
embryo reaches to 8-16 cells stage (Morris et al. 2001). The embryo reaches compacted
morula or blastocyst stage 5-6 days after fertilization. One of the major event during
preimplantation development is the formation of blastocyst which later differentiated in to
two distinct cell lineages, the trophectoderm cells (TE) and the inner cell mass (ICM)
(Watson 1992). The ICM gives rise to the embryo, whereas the TE forms the placenta
(Goossens et al. 2007). The TE, the first differentiated cell type of development, is a
specialized tissue that initiates implantation or attachment and is the progenitor of the
placenta. The ICM is the pluripotent progenitor of the embryo proper (Rossant 2004,
Yamanaka et al. 2006). A blastocyst is therefore characterized by the presence of fluid
filled sac called blastocoels. Therefore, the body plan of the embryo proper is established
when the pluripotent epiblast gives rise to the germ layers ectoderm, mesoderm and
endoderm (Russ et al. 2000). Compaction is the first step in the process of differentiation
and is fundamentally important for the formation of viable blastocysts.
2.4.2 Preimplantation embryonic losses
Embryonic mortality significantly limits the success of establishment and maintenance of
pregnancy in cattle and it is a major impediment to the adoption of a range of assisted
reproductive technology in the cattle breeding industry. The higher proportion of embryo
loss occurs in the first 8-19 days after artificial insemination (AI) when early embryo is
completely dependent on the oviduct and uterine environment for its survival (Morris and
Diskin 2008).
Understanding the root causes of preimplantation and postimplantation fetal losses is
required to design strategies towards improving the efficiency of in vitro fertilization and
preimplantation genetic diagnosis. Embryo losses can be caused by several factors
including the maternal environment (hormonal, gene expression, production performance),
the intrinsic quality of the embryo including chromosomal abnormality and other
environmental factors. These factors can be grouped as those of genetic, physiological,
endocrine and environmental origin (Ashworth 1994 , Bazer 1994). Among these,
chromosomal abnormalities causes marked alterations in the genetic make up or genome
of the embryo and interferes with the course of embryo development during the embryo

Literature review _________________________________________________________________________
10
and the maternal communication. For instance, it is believed that about 50% of
postimplantation embryo losses are due to chromosomal abnormalities and that
cytogenetic abnormalities account for 23-71% of preimplantation losses (Plachot et al.
1988). In addition, the progesterone level is one of the determinants of embryo survival
and development. The level of progesterone has been implicated in embryonic deaths
during four phases of pregnancy, during the early postovulatory period (before day 6 after
mating), during days 4 to day 9 after mating, during maternal recognition of pregnancy
(day 14 to 17) and during the late embryonic period (day 28 to 42) when placentation and
attachment are in progress (Inskeep 2004). It has been suggested that the proportion of
pregnancy failure in cattle is due to failure of the embryo to produces adequate amounts of
interferon-τ (IFN-τ) to block uterine prostaglandin F2α production (Thatcher et al. 1989).
Table 1: Cattle embryo losses during different gestation periods
Fertili
zation
Cumulated loss (%) by
gestation week
1 2 3 4 5-8 Reference
Beef heifers AI 13 4 - 47 Diskin and Sreenan 1980
Beef heifers AI - 6 21 19 - Roche et al. 1981
Beef heifers AI 24 16 - - - Maurer and Chenault 1983
Beef cows AI 16 3 - - - Maurer and Chenault 1983
2.4.3 Embryonic genome activation and embryonic development
Fertilization brings together the haploid genomes of two highly differentiated cells into the
oocyte cytoplasm. After fertilization, the genome of the newly formed embryo is first
transcriptionally inactive and the embryo depends on the stored RNA and protein during
oocyte maturation (Jeanblanc et al. 2008b). Studies in cattle and mouse have shown that
cattle and mouse embryos are able to survive until 8-cell and 2-cell stage embryos,
respectively despite inhibition of polymerase dependent transcription by alpha-amanitin
during the earliest stages of embryo development (Memili and First 2000, Natale et al.
2000, Plante et al. 1994, Telford et al. 1990). However, after some stage of development,
the embryo depends on the newly synthesized RNA or protein as the maternal mRNA is

Literature review _________________________________________________________________________
11
rapidly degraded and < 30% of the original mRNA could be available until 2-cell stage
embryo (Clegg and Piko 1983b, Clegg and Piko 1983a). Hence, the embryo is dependent
on stored maternal mRNA until the maternal-zygotic transition. After this time, the new
genes are expressed by overcoming the transcriptional repression and embryonic
developmental program is guided by a new program (Gandolfi and Gandolfi 2001,
Meirelles et al. 2004). Thus, failure to initiate the embryonic genome transcription may
result in lower embryonic development. Study by Salilew-Wondim et al. (2007) have also
indicated that bovine zygotes exhibited better developmental competence to the blastocyst
stage were found to be enriched with AURKA, DDX10, NASP, DNMT1 and SMARCA5
genes compared to those that have lower developmental potential. This may suggest lower
genomic activation in lower developing groups compared to those exhibiting higher
developmental potential. The embryo then need to reprogram the newly formed embryonic
genome to a totipotent state (Duranthon et al. 2008). Hence, preimplantation embryo
development and differentiation, which results in the formation of a blastocyst, requires
the activation of the embryonic genome to become implantation competent (Dey et al.
2004). The key pre-implantation embryonic developmental process, compaction and
differentiation of the morula into the blastocyst stage are the results of embryonic genome
activation (Schultz et al. 1999).
Embryonic genome activation can be classified into as minor and major genome activation
depending on the species. During minor genomic activation, there is a reduced
transcriptional activity and it does not require any specific transcription factor. Unlike to
the minor genome activation, major genome activation is marked by rapid transcriptional
activity and newly synthesized RNA/proteins which are essential for further embryonic
development (Jeanblanc et al. 2008a). Moreover, major activation promotes a dramatic
reprogramming of gene expression pattern coupled with the generation of novel transcripts
that are not expressed in oocytes (Vallee et al. 2005). Therefore, as development proceeds
after fertilization, embryogenesis depends on the expression of genetic information derived
from the embryonic genome (Bettegowda et al. 2008, Kanka 2003, Latham and Schultz
2001, Schultz et al. 1999). During this time, several maternal mRNAs are degraded and
degradation eliminates gene products that might hinder further embryonic development.
Elimination and silencing of some gene can be processed by means of chromatin-mediated
repression, by limiting the transcription machinery and transcriptional repression (Schier
2007).

Literature review _________________________________________________________________________
12
Genome activation may occur in an orderly manner in which some genes being transcribed
before the beginning of major genome activation and other being transcribed after the
occurrence of major genome activation. The changes in chromatin protein content,
particularly histone proteins, chromatin structure and cytoplasmic macromolecular may
regulate the genome transcription and specificity of transcription (Latham 1999, Latham
and Schultz 2001).
The time of embryonic genome activation is species dependant (Misirlioglu et al. 2006).
For instance, it occurs at the 2-cell stage in mice (Kidder and McLachlin 1985), 4-cell
stage in humans, rats, pigs and 8- to 16-cell stage in cattle and sheep (Whitworth et al.
2004). Minor genome activation is initiated as early as the 1-cell zygotic stage in bovine
(Tesarik et al. 1987, Tesarik J 1987). It occurs at the 6- to 8-cell stage in monkeys
(Schramm and Bavister 1999) and in 4000 to 8000-cell embryos in Xenopus laevis (Etkin
and Balcells 1985).
In the absence of proper genome activation, the majority of bovine embryos stop
developing within a few cell cycles after initiating cleavage. This developmental block
arises in the bovine embryo at the eight-cell-stage (Whitworth et al. 2004).
Embryos that are able to transcribe their own genome are able to differentiate and implant
in the uterus due to its ability to overcome chromatin repression and/or ability to activate
transcription of important developmental genes (Betts and King 2001). For instance, genes
that are required for regulation of transcription, chromatin-structure, cell adhesion and
signal transduction were increased at the 8-cell stage compared with 8-cell embryos treated
with α-amanitin and MII oocytes (Misirlioglu et al. 2006). The situation of embryonic
genome activation in embryos produced by somatic cell nuclear transfer (SCNT) may be
different from those embryos produced by fertilization. In nuclear transfer embryos, the
somatic nucleus has to be reprogrammed it self to restart and continue the developmental
process. It is believed that the somatic nucleus substitute somatic gene expression program
with embryonic gene expression necessary for normal embryo development (Han et al.
2003). Generally, the early preimplantation bovine embryonic development (zygote to 8-
cell stage) largely depends on maternally derived mRNAs and proteins. However, when
the embryo reaches to the 8-cell stage, the embryo starts to rely on transcripts derived from
genome activation, afterwards the bovine embryo produces several transcripts that can be
required for further development and establishment of implantation (Memili et al. 1998,
Memili and First 1998, Memili and First 1999, Memili and First 2000, Telford et al. 1990).
Therefore, the pre-implantation period of embryonic development is manifested by

Literature review _________________________________________________________________________
13
dynamic quantitative and qualitative changes of mRNA and protein contents (Paynton
1998, Temeles et al. 1984). However, those embryos that are unable to initiate gene
transcription will fail to be implanted in the uterus and end up to demise.
2.5 Transcripts required during blastocyst formation and differentiation
Blastocyst formation is associated with trophectoderm cell differentiation, which arises
through fundamental biological processes that are related to establishment of cell polarity.
Blastocyst formation is required for implantation to occur and it is the most important
morphological determinant of embryo quality prior to embryo transfer.
Several physiological events and specific gene families are operating to regulate blastocyst
formation (Watson et al. 1999). Genes expressed in the blastocyst stage are therefore can
be candidates for controlling regulation processes that take place at the beginning of
cellular differentiation (Ponsuksili et al. 2002). Identification of those genes participating
in blastocyst formation and the analysis of their expression patterns may help to
understand the mechanisms that control blastocyst formation (Goossens et al. 2007). Those
gene families may include the E-cadherin-catenin cell adhesions, tight junction gene,
Na+/K+-ATPase gene family, the aquaporin gene families, gap junction (connexin 43),
transforming growth factor alpha (TGF-alpha) and epidermal growth factor (EGF)
(Watson 1992, Watson and Barcroft 2001, Watson et al. 2004). These genes may encode
different cellular activities such as cell polarity, active transport of Na+ and K+, cell
junction, cytoskeletal, ion transporter and water channel gene that could be required by
embryos during blastocyst formation (Watson et al. 2004).
Genes encoding for transcriptional factor activity are also expressed during blastocyst
formation. The expression of transcriptional factor genes may be required to during
embryos differentiation to the inner cell mass (ICM) and trophectoderm (Tr). Numerous
transcriptional factors including RNA exonuclease 1 (Rex1), GATA-binding protein 3
(GATA3), T-Box (eomesodermin), caudal type homeobox (CDX2), activating protein 2
gamma (AP2γ), basic helix loop-helix (bHLH) and Mash2 are expressed in trophectoderm
(Imakawa et al. 2004). Among those, the importance of eomesodermin (T-box) during
mouse embryo differentiation into trophoblast has been described in Russ et al. (2000).
Stage dependant expression of pattern of caudal type homeobox 2 (CDX2), OCT4, NANOG
homeobox (NANOG), GATA binding protein 3 (GATA3) and GATA binding protein 6
(GATA6) also found to be essential during the mouse embryonic development. For
Literature review _________________________________________________________________________
14
instance, OCT4 is expressed in all stages of embryos before the late morula and (NANOG)
is specifically induced during late morulae. Similar to NANOG, CDX2 is expressed in the
late morulae and is required for the repression of OCT4 and NANOG in the trophectoderm
of the blastocyst. On the other hand, GATA6 is expressed in the primitive endoderm of the
late blastocyst, when the expression of OCT4 and NANOG are repressed (Wang and Dey
2006). This may suggest the preimplantation embryo development and blastocyst
formation are triggered by induction and reduction of the expression pattern of certain
genes at temporal fashion. Furthermore, (Ho et al. 1995) also described the expression
Na+/K+-ATPase, Sp1 (Sp1 transcription factor), TATA box-binding protein (TBP), IGFI,
IGFII, IGFI receptor and IGFII receptor which are associated with blastocyst development,
blastocyst hatching. Apart from these, the importance of STA3 (Takeda et al. 1997), DNA
polymerase delta (Uchimura et al. 2009), Ped (Warner et al. 1987, Warner et al. 1988).
Gene targeted experiments in bovine embryo revealed several genes to be essential for
blastocyst formation. For instance, targeted knockdown of baculoviral inhibitors of
apoptosis repeat-containing 6 (BIRC6), survivin (BIRC5), KRT18, OCT4, MSX1 and E-
cadherin were associated with reduced blastocyst formation in vitro (Goossens et al. 2010,
Nganvongpanit et al. 2006, Salilew-Wondim et al. 2010, Tesfaye et al. 2010).
Genes that are required in blastocyst formation can vary depending on the culture
condition and the source of the embryo in vitro. For instance, nuclear transfer and
chromatin transfer are enriched with genes assumed to be involved in metabolism,
signaling and apoptosis compared to blastocysts derived from in vitro fertilized embryos
IVF (Zhou et al. 2008). In an attempt to investigate abnormal gene expression patterns in
embryos of SCNT blastocysts, a global gene expression analysis showed that 28 genes to
be differentially expressed between SCNT and AI blastocysts (Aston et al. 2009).
Furthermore, several studies demonstrated that in cloned bovine blastocysts, the
expression levels of specific genes including, DNA (cytosine-5)-methyltransferase 1
(DNMT1), fibroblast growth factor 4 (FGF4), fibroblast growth factor 2 (FGF2),
Interleukin 6 (IL6), heat shock protein (HSP) and interferon tau IFN τ are different from in
vivo developed embryos. This difference is mainly influenced by donor cells type (Daniels
et al. 2001) and cell fusion methods (Niemann et al. 2002, Wrenzycki et al. 2001).

Literature review _________________________________________________________________________
15
2.6 Estrous cycle and pregnancy establishment 2.6.1 Physiology of the estrous cycle and its implication in pregnancy success Although the transcripts stored during oocyte maturation, the status of embryo genome
activation, the type and nature gene expressed during blastocyst formation influence
embryo survival and implantation, the physiological phenomena that occur during the
estrous cycle is the backbone pregnancy establishment.
The average length of the bovine estrous cycle is 21 days for mature cows and 20 days for
heifers. According to the typical characteristics of uterine structure and function, the
estrous cycle can be divided into four stages: estrus, metestrus and diestrus, proestrus (Tan
et al. 2003). During estrus, the estrogen and FSH are declining accompanied by LH surges
during standing estrus. During this time, the theca cells start producing progesterone to
inhibit LH and FSH release and ovulation occurs 12-18 hours after the end of estrus.
Estrus phase is followed by metestrus which is the time of luteal development. The FSH
surge that occurs during this time may recruit the first follicular wave for the next cycle.
Diestrus is the longest phase of the estrous cycle. It lasts from days 5-17 of the estrous
cycle and is marked by the presence of the mature corpus luteum. Progesterone is
produced by large and small luteal cells. Corpus luteum is composed of small and large
luteal cells. The large luteal cells are derived from granulosa cells and the small luteal cells
are derived from the thecal cells. The large luteal cells produce most of the progesterone
and have the prostaglandin receptors, while the small luteal cells have LH receptors.
Nearly at the end of late luteal phase (day 17-18), in the absence of pregnancy recognition
signal, prostaglandin is released and causes luteal regression. With the loss of progesterone
inhibition, GnRH rises and causes stimulation of LH and FSH. The follicles mature by the
influence of FSH. The growing follicle produces estrogen in the granulosa cells to induce
signs of estrus in the cow. Inhibin is also produced by the growing follicle and prevents
other smaller follicles from growing. This inhibition of smaller follicles assures selection
of a single follicle to ovulate. The estrogen causes progesterone receptor synthesis, which
allows LH binding to luteal cells. Therefore during these different phases of the estrous
cycle, gonadotropins influence folliculogenesis, ovulation, corpus luteum function and
steroidogenesis in the ovary (Kojima 2003). The physiological and hormonal changes that
occur during the estrous cycle prepare the reproductive tract of the female animal for the
period of sexual receptivity, ovulation and implantation. Therefore, understanding the
biological mechanisms, the physiology, hormonal regulation and molecular events of the

Literature review _________________________________________________________________________
16
bovine estrous cycle is essential for increasing the pregnancy rates of farm animals. Thus,
estrous cycle has a direct impact on the reproductive performance of the cattle or other
farm animals as it gives repeated opportunities for female animal to become pregnant
throughout its productive lifespan.
The estrous cycle is marked by morphological, histological and hormonal changes of the
reproductive tracts. Among which, the uterine histology and morphological changes during
the estrous cycle has special association with pregnancy success. These may include
changes in the height of the surface epithelium, the height of the glandular epithelium, the
size of the gland lumen, the development of the gland, secretion in the gland lumen and
stromal edema (Marinov and Lovell 1968). The histological characteristic of the uterus
varies depending on the fertility status of the animal. For instance, the presence of uterine
histological differences between the normal cyclic cows and repeat breeders have been
described (Ohtani and Okuda 1995). The authors have indicated that on day 1 of the
estrous cycle, the uterus of repeat breeder exhibited glandular secretions and supranuclear
vacuolation that were not were not observed in the normal cows. Moreover, the stromal
indices, the stromal mitoses and pseudodecidual reaction were absent in the repeat
breeders during day 8 of the estrous cycle. Similarly, the histological changes of the uterus
during the estrous cycle including, the presence of metrorrhagia on days 0 to 1, mitoses in
glandular epithelium on day 5, basal vacuolation in the surface epithelium between day 5
to 6 and stromal mitoses on days 9 to 12 has been described (Ohtani et al. 1993). This may
suggest that the uterine morphology during the estrous cycle to be an indicator of fertility.
In addition to changes in histology and morphology, neutrophil concentration changes
have been observed in the uterus of dairy cows during the estrous cycle (Subandrio et al.
2000).
Estrous cycle irregularities and inadequate estrus detection has been one of the major cause
of reproductive wastage in cattle. In dairy cows, estrus detection is showing a declining
trend due to directional selection (Figure 1). A decrease in estrous detection rates in
Holstein and Jersey dairy herds has been reported (Harrison et al. 1989, Harrison et al.
1990, Washburn et al. 2002). Another study showed that higher yielding cows exhibit
weaker signs of estrus than lower yielding cows consequently resulted in longer calving
interval (Harrison et al. 1990). The physiological mechanism for negative correlation
between high milk production and estrus duration traits is not clear. However, the
hypothesis can goes to the relationship between feed consumption, energy allocation and
hormonal regulation. For instance, cows selected for high milk yield are more often prone

Literature review _________________________________________________________________________
17
0
20
40
60
80
100
120
MP DE SH ST DP
to negative energy balance as they spend a relatively large proportion of the available
nutrients on milk production, which can cause fertility problems during a period of
negative energy balance (Chagas et al. 2007). Thus, decrease estrus duration in high
producing cows may be related to the altered energy metabolism that can disturb the
endocrine signaling and circulating concentrations of estrogen that ultimately resulted in
inhibiting estrous behavior (Lopez et al. 2004, Roche 2006). Moreover, changes in
reproductive physiology that are associated with high milk production may in part be
explained by elevated progesterone and estrogen clearance rates he liver of a lactating cow
due to increased feed intake which can lead to an increased liver blood flow and metabolic
activity (Boer et al. 2010).
MP= Milk production (kg.day)
DE= Duration of estrus (hr)
SH= Standing heat (n)
ST= Standing time (s)
DP= Days postpartum (d)
Figure 1: Characteristics of estrus in high (black bar) and low milk producing cows
(white bar). Compiled from Lope et al. (2004).
2.6.2 Hormonal events during the estrous cycle and its effect on pregnancy establishment
The physiology of estrous cycle uncovers coordinated functional activities of different
segments of reproductive system, the nervous and endocrine systems (Jainudeen and Hafez
2000 ). The type and level of hormones participating in the regulation of the estrous cycle
and pregnancy has been indentified and characterized for several years. The measurements
of hormone levels in different parts of the uterine and ovarian vasculature revealed the
presence of regulating mechanism in the estrus cycle and pregnancy (Koziorowski and
Stanisława 2007).
The concentration and regulation of the ovarian and uterine hormones changes depending
on the phase of the estrous cycle via feed back mechanism of luteinizing hormone and
Literature review _________________________________________________________________________
18
follicle-stimulating hormone from the gonadotrophins of the anterior pituitary (Hewitt et
al. 2003, Kojima 2003, Richardson et al. 2006). For instance, on the onset of preovulatory
gonadotrophin surge, the number of LH and estrogen receptors increase in the theca and
granulosa cells accompanied reduction of FSH receptors. Thus, between days 3 and 7 of
the estrous cycle, a single estrogen-active follicle develops and peak estrogen can be
observed in plasma around this time (Glencross et al. 1973).
Estrogen is believed to increase the vascular growth of the endometrium and plays a major
role in triggering the gonadotropin surge. This increased level of estrogen maintains higher
estrogen/progesterone ratio and greater magnitude of uterine blood flow during the estrous
cycle (Ford et al. 1979, Ford 1982, Roman-Ponce et al. 1983). Progesterone is the major
hormone secreted by the corpus luteum in a pulsatile manner, pulses coinciding during the
luteal phase with those of follicle stimulating hormone (Walters et al. 1984). The level of
progesterone start to increase at day 5 and reach peak at day 14 of the estrous cycle (Diaz
et al. 1986) and high progesterone concentrations during the luteal phase inhibit the
estradiol-induced gonadotropin surge by reducing pituitary responsiveness to gonadotropin
releasing hormone (Attardi et al. 2007, Richter et al. 2005). Moreover, the presence and
the amplitude of progestrone in the luteal phase influences the time interval between rise
of estrogen levels and the induction of estrous behavior or the LH surge (Skinner et al.
2000). On the other hand, the level of progesterone decreases to basal concentrations
starting on days 17 to 18 (Schams et al. 1977). The decrease progestrone is associated with
the loss of progesterone receptor and increases in epithelial estrogen receptor and oxytocin
receptor in the endometrial cells (Goff 2004). Oxytocin from the pituitary and corpus
luteum, stimulates the pulsatile release of the prostaglandin F2α (PGF2α) via the oxytocin
receptor in the luminal epithelium of the endometrium, resulting in regression of the
corpus luteum (McCracken et al. 1999). On the other hand, during the time of low
progesterone, there is a pulse increase of estrogen concentration (Fata et al. 2001, Schedin
et al. 2000). On the other hand, PGF2α secreted from the uterus or particularly in the
endometrial luminal and superficial glandular epithelium resulted in the demise of the
corpus luteum (LaFrance and Goff 1990).
The trans-action of hormone of the ovary and uterine origin limits the number of off
springs the female animal can produce during its productive lifetime. However, it is
necessary to understand the mechanism how the hormones of the ovarian origin act on the
uterus and hormones of uterine origin acts on the ovary. As reviewed by (Koziorowski and
Stanisława 2007), in cow, the mesovarium venous vessels runs in a closer apposition to the

Literature review _________________________________________________________________________
19
ovarian artery. The majority of uterine and ovarian arteries and arterioles running in the
area of mesovarium are enmeshed by a dense net of venous vessels forming veno-venous
network. Moreover, the presence of lymphatic system structures in the mesovarium and
mesometrium may participate in the local hormones exchange and the estrous cycle
regulation. The concept of transfer of uterine PGF from the uterine vein to the ipsilateral
artery by a counter current exchange mechanism was also suggested (Peters 1985).
In uterus, the estrogen and progesterone receptor systems maintain the level of those
hormones and transmit information into timely relevant developmental responses. The
coordinated action of those entities resulted in follicular growth and development,
follicular atresia, estrous cycle functioning and ovulation, corpus luteum functioning or
pregnancy establishment. Thus, a better understanding of the physiology and
endocrinology of the estrous cycle will improve reproductive management of dairy cows
and facilitates the successful application of estrous synchronization and embryo transfer
technologies.
2.6.3 Endometrial molecular events during the estrous cycle
The bovine uterus walls consist of the endometrium tunica muscularis or myometrium and
the tunica serosa or perimetrium. The endometrium is the inner lining of the uterus
consisting of the luminal epithelium, uterine glands and connective tissue. The
endometrium is subdivided in caruncular and intercaruncular parts. The endometrium
prevents the adhesions of the opposite walls of the myometrium by maintaining the
patency of the uterine cavity. It is the main organ playing a crucial role in early embryo-
maternal communication and pregnancy establishment (Bauersachs et al. 2005).
During the estrous cycle, the endometrium exhibits substantial gene expression changes
that are associated with different functions. On this regard, the gene profile study indicated
that at late estrus of the estrous cycle, the bovine endometrium is enriched with transcripts
whose function is associated with cell-to-cell adhesion, cell motility and extracellular
matrix. However, at day 12 of the estrous cycle (luteal phase), the endometrium is enriched
with genes whose function is associated with transport proteins and ion (Bauersachs et al.
2005). Similar study also indicated that genes which are highly expressed at estrus are
related to extracellular matrix remodelling, transport and cell growth and morphogenesis,
whereas immune response and metabolic pathways were overrepresented in genes
increased at diestrus (Mitko et al. 2008). The study in human endometrium (Kao et al.

Literature review _________________________________________________________________________
20
2002) also revealed that those genes whose expression were increased during the secratory
phase were related to cholestrerol trafficking, signal transduction but genes which are
down regulated in proliferative phase are related to transcription factor activity and
immune modulating. Moreover, the endometrial gene expression between secratory and
proliferative phase of Rhesus monkey also indicated that the expression level of certain
genes including PLK, SAT2, SLPI and MT1G to be higher in proliferative phase, where as
the mRNA level of TGFBI or BIGH3, PENK, CSRP2, COL7A1, SFRP4, PGRMC1,
CXCL12 and BGN to be higher in secratory phase (Ace and Okulicz 2004). These
transcriptome abundance differences can be attributed to differences in the level of
progesterone or estrogen hormones. Estrogen is known to affect the gene repression and
gene stimulation by acting through its nuclear receptors. For instance estrogen has been
found to down regulate the expression of cyclin G2 (CCNG2) resulting in the recruitment
of the co-repressor N-CoR (NCOR1) and histone deacetylases leading to a hypo acetylated
state of the chromatin (Stossi et al. 2006). Similarly, others (Hewitt et al. 2003, Hong et al.
2004, Moggs et al. 2004, Watanabe et al. 2003), reported that cyclin-dependent kinase
inhibitor 1B (CDKN1B) and growth arrest specific 1 (GAS1) were down regulated during
the first 1–8 h after estrogen administration.
Despite the accumulated evidences that many endometrial or ovarian gene expression
changes during the estrous cycle are mainly regulated by progesterone and estrogen levels,
the progesterone level can be in turn regulated by other genes. For instance, the Booroola
(FecB) gene found to control the progesterone level during the estrous cycle and across
pregnancy (Xia et al. 2003). The Booroola phenotype is associated with a point mutation
in the kinase domain of the bone morphogenetic protein receptor 1 B (BMPR1B) and is
known to involve in differentiation of ovarian follicles leading to the production of large
numbers of ovulatory follicles that are smaller in diameter than wild-type follicles (Souza
et al. 2003).
2.7 Endometrial receptivity towards embryo implantation
Uterine or endometrial receptivity refers the status of the uterus or endometrium ready to
accept the blastocyst for implantation (Swierz and Giudence 1997). It comprises temporary
and unique sequence of events that makes the embryo to adapt to the new environment
(Bergh and Navot 1992).
Literature review _________________________________________________________________________
21
Assessment of endometrial receptivity is required to identify endometrium that will be
suitable for assisted reproduction technology. Therefore, identification of the receptive
endometrium may help to correlate the changing endocrine, biochemical and
morphological endometrial parameters with endometrial receptivity. Thus, understanding
the significance of endometrial receptivity helps to achieve a better understanding of its
relationship to fertility. Moreover, for optimal results in assisted reproductive technology,
it is critical to recognize the time of embryo transfer that would best corresponds with the
implantation time. However, the mechanism of uterine receptivity is a biological mystery
that remains unsolved despite enormous advancements in understanding its physiology,
structural, biochemical and molecular aspects associated with development and function
(Makker and Singh 2006).
In humans, in addition to Pinopodes, several non invasive assessment of endometrial
receptivity including high resolution transvaginal ultrasonography (US), three-dimensional
US, Doppler US, three-dimensional power Doppler US, magnetic resonance imaging and
endometrial tissue blood flow has been used to determine the endometrial receptivity
(Elnashar and Gamal 2004). Moreover, the dominant features of the receptive phase
endometrium can be marked by its plasma membrane transformation of luminal
epithelium, glandular secretion, stromal decidualization and changes of the immune cell
populations.
2.7.1 Signaling pathways and molecules triggering endometrial receptivity
Understanding the molecular changes that occur during the period of endometrial
receptivity may help to develop molecular markers associated with endometrial receptivity
and pregnancy success. The qualitative and quantitative measurement of endometrial
receptivity is lacking in cattle and other ruminants. However, the information from mice
with delayed implantation, (Reese et al. 2001), uterine gland knockout ewe (Gray et al.
2002, Spencer et al. 1999) and several gene targeted studies have contributed substantial
information to get insight into potential markers of uterine receptivity and molecular
mechanisms occurring during embryonic implantation into the maternal endometrium.
The receptive state of the endometrium may be characterized by the expression of genes
that permits endometrium to respond to the embryo and allow the attachment (Sharkey and
Smith 2003). The use of global gene expression approach such as microarrays and
proteomic methods in the endometrium provided enormous information regard to the

Literature review _________________________________________________________________________
22
endometrial receptivity at the molecular level. Recently, several molecules have been
reported whose function is essential for uterine receptivity in rodents and primates.
Differential expression of genes by uterine epithelial and stromal cells in response to
progesterone may influence uterine receptivity to implantation in mammals (Bazer et al.
2009b). From this standpoint, several human endometrial gene expression profiles have
performed to have a clue about the molecular mechanism endometrium during the
secratory or luteal phase. Wang and Dey (2006) have summarized the gene profile from
different experiment (table 2) and several commonly differentially expressed genes that
believed to involve in human endometrial receptivity. However, the higher progesterone
does not necessary indicate the endometrium is at receptive stage.
Table 2: Differentially expressed genes between high and low progesterone peaks in human endometrium
Comparison of five independent studies Gene LH+(8–10)
vs. LH-(4–6) LH+(7–9) vs.
LH+(2–4) LH+7 vs. LH+26
LH+(6–8) vs. LH-(3–5)
LH+8 vs. LH+3
ANXA4 + + + APOD + + + +
C1R + + + DAF + + + + DF + + + GBP3 + + +
IL15 + + + +
MAP3K5 + + + +
SERPING1 + + + SPP1 + + + + +
TGFB + + + CCNB + + + FRPHE + + +
GATA2 + + +
MSX1 + + +
MSX2 + + +
Upregulated genes during the time of high progesterone (Italics) and genes down regulated in low progesterone (Times New Roman)
Literature review _________________________________________________________________________
23
Temporal and spatial expression of specific endometrial genes may contribute for the
establishment uterine receptivity by making endometrium hospitable to the implanting
blastocyst (Lessey 1998). Many factors involve in preparation of endometrium to accept
the embryo. Among these, many genetic factors are likely to be involved in the success or
failure of implantation. The study from mouse model indicated that the biochemical
markers of endometrial receptivity may include endometrial adhesion molecules,
endometrial anti-adhesion molecules, endometrial cytokines, endometrial growth factors,
endometrial immune markers and others (Wang and Dey 2006). Therefore, the next
section of this review focuses on various biochemical and molecular events that occur in
the endometrium during its preparation for implantation.
2.7.1.1 The role of endometrial adhesion molecules in endometrial receptivity
Endometrial receptivity involves molecules that facilitate embryo adhesion to initiate the
window of receptivity and anti-adhesion molecules that close the widow implantation
(Tabibzadeh 1998). Several adhesion molecules include cadherins, selectins, members of
the immunoglobulin super family and integrins have been reviewed (Lessey and Young
1997). Among these, little is known about the role of cadherins or selectins in endometrial
receptivity.
The integrin family of cell adhesion molecules are a major class of receptors for the extra
cellular matrix and participate in cell-cell and cell-substratum interaction (Albelda and
Buck 1990) and they bind ligands found in the extracellular matrix (Lessey 1997).
Integrins are a family of transmembrane glycoproteins, formed by the association of two
different, non-covalently linked, α and ß subunits. Both α and β subunits contain two
separate tails, both of which penetrate the plasma membrane and possess small
cytoplasmic domains (Humphries 2000). The integrins including α1β1, α4β1and αvβ3 are
expressed during the secratory phase of human endometrium. Integrins are believed to be
involved in embryo-endometrial interaction at the time of implantation (Lessey 1998).
The spatial and temporal distribution of integrins in bovine endometrium showed that, the
luminal epithelium was found to express integrin subunits β1, α3, α6 and integrin αvβ3. Of
these, α6 and αvβ3 exhibited estrous cycle-dependent and strongest expression in the
luminal epithelium, basement membrane region and underlying sub epithelial stromal cells
at proestrus, estrus and metestrus. However, α3 and α4 exhibit estrous independent
expression distribution (Kimmins and MacLaren 1999).

Literature review _________________________________________________________________________
24
Integrins are largely accepted as markers of uterine receptivity in humans (Lessey 1998).
For instance biopsies from women with unexplained infertility had reduced significantly
beta 3 expression suggesting abnormal endometrial integrin expression can be associated
with unexplained infertility (Lessey et al. 1995 ). In the rabbit, the alpha (v) beta integrin
is expressed in the embryo and trophoblast and it may be involved in early embryo-
maternal interaction (Illera et al. 2003). In addition, the αvβ3 integrin appears implicated in
placental invasion into the maternal vasculature (Zhou et al. 1997).
2.7.1.2 The role of cytokines in endometrial receptivity
Early embryo signaling as the result of maternal hormonal or cytokine-mediated
preparation may be the step forward to permit adequate proliferation of the stroma for
successful implantation (Ledee et al. 2007). Cytokines comprise a group of proteins that
separately or in concert modulate a variety of cellular functions, such as cellular
proliferation and differentiation (Achache and Revel 2006). They are implicated in critical
reproductive events such as ovulation and implantation. Since implantation failure is a
major causes of pregnancy failure, a better understanding of the cytokine-receptor in
relation to pregnancy success may help to improve the diagnosis and treatment of
infertility (Kauma 2000). Cytokines are small glycoprotein that involve in several
activities including mediating communication between cells. Cytokines were discovered
and investigated in the immune and hematopoietic systems and they are produced and act
on in several cells of diverse lineages. Both pleiotropy and redundancy may exist within
the cytokine families, but all cytokines act by binding to specific receptors belonging to a
variety of classes that utilize different signal transduction pathways (Ledee et al. 2007,
Salamonsen et al. 2000).
The uterine glandular or luminal epithelium or in the decidualized stromal cells is believed
to be an important site for cytokines and cytokine receptors (Salamonsen et al. 2000).
Numerous cytokines and their receptors are implicated in mammalian implantation embryo
implantation (Lim et al. 2002). Among these, leukaemia inhibitory factor (LIF), interleukin
1 (IL1), interleukin-2 (IL2) interleukin 6 (IL6) interleukin 12 (IL12), interleukin 15 (IL15),
interleukin18 (IL18) hepatocyte growth factor (HGF), stem cell factor (SCF), macrophage
colony-stimulating factor (MCSF), colony stimulating factor 1 (CSF1), granulocyte-
macrophage colony-stimulating-factor (GMCSF) and insulin-like growth factors (IGF)
play a major role during implantation (Kauma 2000). Cytokines such as CSF1, GMCSF,

Literature review _________________________________________________________________________
25
IL1 and IL6 were found to be important for increasing the numbers of implantation sites or
litter sizes (Salamonsen et al. 2000). On the other hand, the expression of some specific
cytokines in the endometrium including IL12, IL15 and IL18 reported to be resulted in
abnormal uterine receptivity (Ledee et al. 2007).
Among the cytokine family, gene targeting, reciprocal embryo transfer and expression
studies show the essential role of maternal LIF in uterine preparation and blastocyst
attachment in mice (Lim et al. 2002, Stewart et al. 1992). (Stewart et al. 1992) using a
mouse model indicated that mouse lacking functional LIF protein appeared to be fertile,
but their blastocysts failed to implant (Lim et al. 2002). Inactivation of gp130, a signaling
partner for the LIF receptor, also results in implantation failure (Salamonsen et al. 2000).
Leukaemia inhibitory factor (LIF) is produced by the receptive phase endometrium (Chen
et al. 1995) and its expression can be reduced by antiprogestin, mifepristone (Danielsson et
al. 1997). The effect of LIF on rabbit endometrial receptivity and embryo implantation also
indicated that transfer of embryos to LIF treated rabbit recipients significantly increased
pregnancy rate compared to the control and significantly decreased when embryo transfer
was done to LIF and mifepristone-treated recipients (Liu et al. 2001). The mechanism by
which LIF participates in the endometrial receptivity and implantation events was
addressed using LIF-deficient mice (Song et al. 2000). The authors reported that although
the normal expression of genes related to uterine cell-specific proliferation, the epidermal
growth factor (EGF) including amphiregulin (Ar), heparin-binding EGF-like growth factor
(HBEGF) and epiregulin, were not expressed in LIF homozygous null uteri before and
during the time of implantation. This may suggest that dysregulation of specific EGF-like
growth factors in the uterus contributes to implantation failure in mice lacking LIF.
2.7.1.3 The role of growth factors in endometrial receptivity
The temporal and cell-specific manner expression of various growth factors and their
receptors in the uterus are important for implantation (Carson et al. 2000, Cross et al. 1994,
Lim et al. 2002, Norwitz et al. 2001, Paria et al. 2001a). The epidermal growth factor
(EGF) family of growth factors comprises several proteins including transforming growth
factor alpha (TGFα), heparin-binding EGF-like growth factor (HBEGF), amphiregulin,
betacellulin, epiregulin and neuregulins (Das et al. 1997, Lim et al. 1998). Among these,
HBEGF was found to be expressed in the uterus at the implantation sites in mice before
the time of implantation (Das et al. 1994) and the expression of betacellulin, epiregulin,

Literature review _________________________________________________________________________
26
neuregulin-1 and cyclooxygenase 2 (COX-2) were found to be detected around the time of
the attachment reaction of the implantation process (Chakraborty et al. 1996, Das et al.
1997, Lim et al. 1998). Furthermore, HBEGF influences blastocyst activities for
implantation in paracrine and juxtacrine manners (Raab et al. 1996).
2.7.2 The role of hormones in endometrial receptivity
Several endometrial factors controlled by ovarian steroid hormones, estrogen and
progesterone are known to regulate uterine receptivity resulting in successful implantation.
In rodents and primates, the implantation window is established when estrogen affects the
endometrium that has been under the influence of progesterone (Imakawa et al. 2004).
However, the requirement of ovarian hormones for endometrial receptivity may be species
dependant. For instance, estrogen is required for preparation of the progesterone-primed
uterus for implantation in mice and rats, but in other species estrogen alone does not lead
to the maturity of the endometrium(Yang et al. 2001). In addition, the study by (Levi et al.
2001) indicated that exposure of developing endometrium to higher level of estrogen may
result in loss of on endometrial receptivity. Similarly, excessive administration of estrogen
post ovulation found to hinder implantation (Morris and Van Wagenen 1973). Thus, the
low endometrial receptivity and embryo implantation in part may be caused by elevated
level of estrogen (altered estrogen to progesterone ratio) (Forman and Estilow 1988).
Unlike to estrogen, progesterone is believed to initiate implantation in hamster, guinea pig,
pig and rabbit (Paria et al. 2001a). Exogenous progesterone has been shown to exert utero-
relaxing effects and it has been hypothesized that progesterone supplementation before
embryo transfer may improve receptivity in IVF (de Ziegler et al. 1998) and progesterone
is one of the factor which influences the probability of success or failure. Lower
concentrations of progesterone 6 days after mating was associated with failed pregnancy in
cows (Henricks et al. 1971). The report of (Lamming and Darwash 1998) also
demonstrated increased progesterone level in cows that get pregnant compared to those
failed to be pregnant.
Not only the concentration but also the time of progesterone peak affects the pregnancy
success in cattle. Because delayed progesterone rise facilitates luteolysis at the normal time
resulting in a reduced length of the period of progesterone secretion and lower conception
rate in cattle. Lamming and Darwash (1995) reported that, after day 5 every one day delay

Literature review _________________________________________________________________________
27
in the time of the progesterone rise there is a 0.7 day shortening of the subsequent luteal
phase.
Progesterone, acts on the uterus to stimulate blastocyst preimplantation growth and
elongation and also regulates several genes (Mann and Lamming 2001). The study by
(Forde et al. 2009) indicated that P4 supplementation found to be altered the expression of
fatty acid binding protein (FABP), diacylglycerol O-acyltransferase 2 (DGAT2), myostatin
(MSTN) and crystalline gamma S (CRYGS) that are associated with triglyceride synthesis,
glucose transport that may contribute to the composition of histotroph. Moreover, other
study has also revealed that early P4 treatment increased blastocyst growth on days 9 and
12 accompanied by changes in the expression of genes involved in endometrial WNT
system (Satterfield et al. 2008). Although the effect of progesterone on the endometrium
is antagonistic to those of estrogen, both estrogen and progesterone are required to
maintain acceptable level of estrogen to progesterone ratio for embryo implantation may
required to maintain the adaptation of embryo in the new environment as deviations from
ideal values of this ratio might affect the chances for successful embryo implantation.
Therefore uterine differentiation to support embryo development and implantation is
coordinated by progesterone and estrogen in a spatiotemporal manner (Huet-Hudson et al.
1989).
In addition to the ovarian hormones, the gonadotropin hormones do have substantial
influence on endometrial or uterine preparation for receptivity. The increase in the uterine
LH receptors and LH level in the perimplantation period has been explained (Bonnamy et
al. 1993) suggesting the importance of LH in determining endometrial receptivity for
implantation and subsequent decidualization.
2.8 Embryo competency for implantation
Following embryonic genome activation, the embryo grows faster to form a blastocyst. In
bovine, blastocyst formation occurs seven days after fertilization (Guillomot 1995). By the
time the embryo reaches to the blastocyst stage, it sheds its zona pellucidae to gain
implantation competency. The differentiated and expanded blastocyst is composed the
outer polarized epithelial trophectoderm, the primitive endoderm and the pluripotent inner
cell mass which is the future cell lineages for the embryo proper (Dey et al. 2004). Within
two weeks after fertilization, trophoblast elongates from 150 µm to 300 mm (Guillomot
1995) and placentation is initiated with apposition to the uterus (Bertolini et al. 2002,

Literature review _________________________________________________________________________
28
Viebahn 1999). The process of trophoblast expansion depends on cell multiplication, cell
growth and cell shape remodeling and cellular differentiation (Wintenberger-Torres and
Flechon 1974). The formation of the trophectoderm and its subsequent development into
trophoblast tissue are crucial steps for the initiation of implantation and the establishment
of pregnancy. Trophoblast cells produce a variety of growth factors, cytokines and
hormones that influence the conceptus and maternal physiology in an autocrine, paracrine
and/or juxtacrine manner (Petraglia et al. 1998, Roberts et al. 1999). The blastocyst
intrinsic characteristics such as its genetic constitution, morphology and hatching ability
are one of the major components successful implantation. Abnormal genetic constitutions
or unsuccessful transitions from maternal to embryonic transcription could account for
many failures of early embryonic growth and implantation. Thus, successful implantation
to occur in the receptive endometrium, the blastocyst must attain implantation competency
and/or the blastocysts must be activated. For this, the blastocyst need to be enriched with
transcripts and molecular signaling required for controlling cell differentiation and
maternal recognition of pregnancy (Spencer et al. 2008). To this end, a global gene
expression study showed that implantation competent blastocysts could be molecularly
distinguishable from those which can not be activated for implantation. For instance,
increased expression level of Hgf1 (which encodes heparin-binding EGF-like growth
factor (HBEGF), ErbB1 and ErbB4 were found to be enriched in activated blastocysts
compared to the dormant mouse blastocysts (Wang and Dey 2006). In addition, the gene
expression analysis on elongated bovine blastocyst at day 17 after fertilization also
indicated that the expression level of OCT4, NANOG, IFN-τ, EOMES, FGF4, SOX2 and
CDX2 were found to be expressed in IVP embryos. However, NANOG, EOMES and
FGF4 were reduced and IFN-τ was found to be over expressed in cloned embryos
(Rodriguez-Alvarez et al. 2010). Similarly, TXN2 deficient mice embryos exhibited
markedly increased apoptosis and die during mid gestation around E10.5 (Yamamoto et al.
2003). Further more homozygous mutants for thioredoxin die shortly after implantation
and the conception were resorbed prior to gastrulation is associated with a dramatically
reduced proliferation of inner mass cells (Matsui et al. 1996). This may suggest that
cytosolic (TXN1) and mitochondrial (TXN2) thioredoxins are found to be essential during
embryonic development. Apart from those, disruption of p97, proteins involved in vesicle
and organelle biogenesis, cell-cycle regulators and transcription factors resulted in death
embryo at peri-implantation stage (Muller et al. 2007). Moreover, the study on
phospholipid hydroperoxide glutathione peroxidase (PHGPx), an intracellular antioxidant
Literature review _________________________________________________________________________
29
enzyme that can directly reduce lipid hydroperoxide in membrane, indicated that mouse
embryos homozygous for PHGPx-null die between 7.5 and 8.5 days post coitum
suggesting the importance of PHGPx in early gastrulation stage and for normal mouse
development (Imai et al. 2003). Similarly, the coordinated expression of uterine
polyamine-related genes may also be important for embryo implantation. The study by
(Zhao et al. 2008) showed that embryo implantation was significantly inhibited by α-
difluoromethylornithine, an ODC inhibitor due to by the up-regulation of S-
adenosylmethionine decarboxylase gene expression. In addition, in an attempt to
investigate the gene expression pattern of blastocyst that develop to terms, (El-Sayed et al.
2006), identified some genes including COX2, CDX2, ALOX15, BMP15, PLAU and
PLAC8 to be associated with embryos resulted in calf delivery. On the other hand, genes
including KRT8, OCLN, PGK1 and AKR1B1 were enriched in embryos resulted in
resorption and EEF1A1, MSX1, PTTG1, PGK1, AKR1B1 and CD9 were found to be
enriched in embryos resulted in no pregnancy at all.
In addition to several molecules, the role of endocannabinoids, a group of lipid mediators
that are ligands for the cannabinoid receptors CB1 and CB2 and N-
arachidonoylethanolamine (anandamide) are also required during the mammalian embryo
implantation process (Mechoulam et al. 1998). The reduced level of endometrial
anandamide and embryo/blastocyst CB1 levels during the commencement of implantation
may suggest its role in regulating implantation process (Lim et al. 2002). Therefore, low
levels of anandamide are stimulatory and high levels of anandamide inhibit blastocyst
growth and induce spontaneous abortions (Lim et al. 2002, Paria et al. 2001b). The
blastocyst competency for implantation can be facilitated by its own secretions. Those
secretions are species dependant and they are required to establish maternal recognition of
the presence of the embryo the secretion (Table 3).
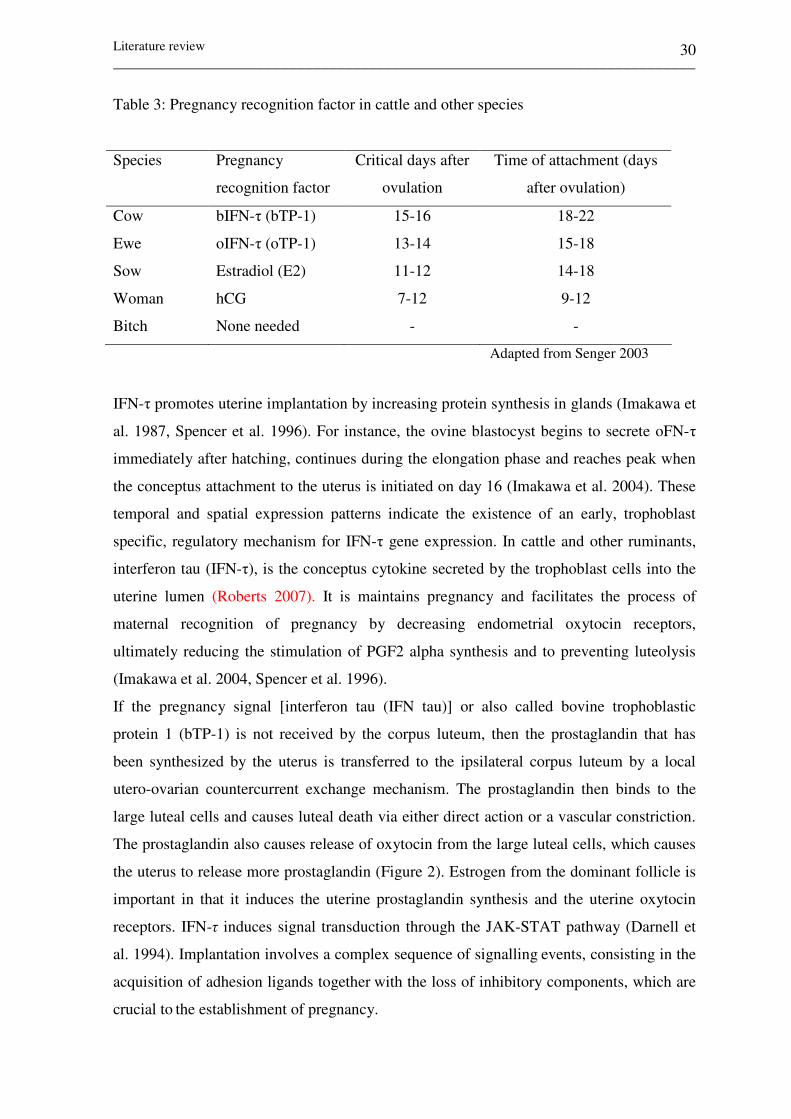
Literature review _________________________________________________________________________
30
Table 3: Pregnancy recognition factor in cattle and other species
Species Pregnancy
recognition factor
Critical days after
ovulation
Time of attachment (days
after ovulation)
Cow bIFN-τ (bTP-1) 15-16 18-22
Ewe oIFN-τ (oTP-1) 13-14 15-18
Sow Estradiol (E2) 11-12 14-18
Woman hCG 7-12 9-12
Bitch None needed - -
Adapted from Senger 2003
IFN-τ promotes uterine implantation by increasing protein synthesis in glands (Imakawa et
al. 1987, Spencer et al. 1996). For instance, the ovine blastocyst begins to secrete oFN-τ
immediately after hatching, continues during the elongation phase and reaches peak when
the conceptus attachment to the uterus is initiated on day 16 (Imakawa et al. 2004). These
temporal and spatial expression patterns indicate the existence of an early, trophoblast
specific, regulatory mechanism for IFN-τ gene expression. In cattle and other ruminants,
interferon tau (IFN-τ), is the conceptus cytokine secreted by the trophoblast cells into the
uterine lumen (Roberts 2007). It is maintains pregnancy and facilitates the process of
maternal recognition of pregnancy by decreasing endometrial oxytocin receptors,
ultimately reducing the stimulation of PGF2 alpha synthesis and to preventing luteolysis
(Imakawa et al. 2004, Spencer et al. 1996).
If the pregnancy signal [interferon tau (IFN tau)] or also called bovine trophoblastic
protein 1 (bTP-1) is not received by the corpus luteum, then the prostaglandin that has
been synthesized by the uterus is transferred to the ipsilateral corpus luteum by a local
utero-ovarian countercurrent exchange mechanism. The prostaglandin then binds to the
large luteal cells and causes luteal death via either direct action or a vascular constriction.
The prostaglandin also causes release of oxytocin from the large luteal cells, which causes
the uterus to release more prostaglandin (Figure 2). Estrogen from the dominant follicle is
important in that it induces the uterine prostaglandin synthesis and the uterine oxytocin
receptors. IFN-τ induces signal transduction through the JAK-STAT pathway (Darnell et
al. 1994). Implantation involves a complex sequence of signalling events, consisting in the
acquisition of adhesion ligands together with the loss of inhibitory components, which are
crucial to the establishment of pregnancy.

Literature review _________________________________________________________________________
31
Figure 2: Interferon tau production and maternal conceptus communication. IL3 and
GMCSF exhibited increased expression by estrogen and progesterone,
respectively. As the result, these cytokines increase the expression of interferon
tau through their respective receptors by intra cellular signaling pathway
through the protein kinase C system (PKC). Adapted from Imakawa et al.
(2004)
2.9 Process of embryo implantation
The blastocyst stage embryo and uterine differentiation to the receptive phase are the
major requirement for successful establishment of the embryo-uterine communication
during embryo implantation processes (Paria et al. 2001a). The bidirectional interaction
between embryo and endometrium is mediated by paracrine signals that pass from
endometrial tissue to the embryo and vice versa. Therefore, successful implantation
requires a receptive endometrium, implantation competent blastocyst and a synchronized
dialogue between maternal and embryonic tissues (Aplin 2000). During this period,
various cellular activities like elongation of embryonic tissues, cell-cell contact between
the mother and the embryo and various molecular changes take place (Ushizawa et al.

Literature review _________________________________________________________________________
32
2004). Implantation therefore, involves a series of steps leading to an effective reciprocal
signaling between the blastocyst and the uterus. It requires the trophoblast attachment via
its apical plasma membrane to the apical plasma membrane of the uterine epithelium
(Denker 1993).
The implantation processes is variable depending on the species and this difference is one
of the causes to formulate a unifying theme for the molecular basis of embryo
implantation. The process and phases of embryo implantation in ruminants and other
animal is described by several authors (Aplin 2000, Bazer et al. 2009a, Spencer et al. 1996,
Spencer et al. 2007). According to these authors, the process of implantation has 5 phases.
In phase 1, the blastocyst sheds its zona pellucida and the spherical blastocyst continues to
expand. Afterwards, the elongated blastocyst migrates and changes its from a spherical to
tubular and filamentous form (ruminants) or remain spherical prior to implantation. In
phase 2, the blastocysts migrate and undergo orientation without apparent cellular contact
between the trophectoderm and endometrial epithelia. Phase 3 is the apposition phase
during which the conceptus trophectoderm associates closely with endometrial luminal
epithelium for unstable adhesion. In ruminants, the conceptus develops papillae that extend
into the superficial ducts of the uterine glands for adhesion and absorption of histotroph
(Figure 3). Phase 4 is the adhesion phase characterized by the trophectoderm becoming
firmly adhered to endometrial luminal epithelium. In ruminants, this is the period of inter
digitation of trophectoderm and endometrial luminal epithelium. During this phase, several
molecules secreted by the endometrial epithelia, including glycosylated cell adhesion
molecule (GLYCAM1), galectin 15 (LGALS15) and secreted phosphoprotein 1 (SPP1 or
osteopontin), interact with receptors (integrins and glycoconjugates) on the apical surface
of trophectoderm and LE to facilitate adhesion. In cattle implantation is non-invasive and
exhibits an extended preimplantation period and during this time the endometrium secretes
histotroph (proteins, carbohydrates, sugars, lipids and ions (Burghardt et al. 2002). During
phase 5, trophoblast giant binucleate cells are formed that begin to differentiate from
mononuclear trophoblast cells and then migrate to and fuse with the luminal epithelium to
form multinucleated syncytial plaques.
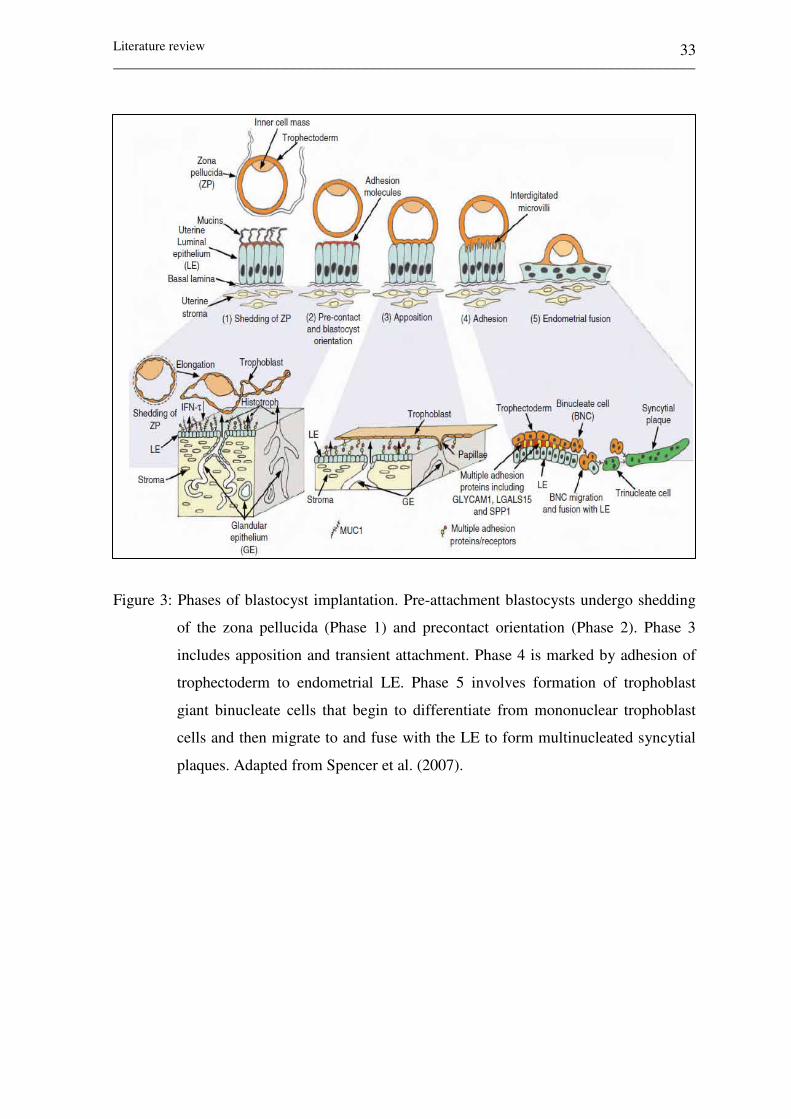
Literature review _________________________________________________________________________
33
Figure 3: Phases of blastocyst implantation. Pre-attachment blastocysts undergo shedding
of the zona pellucida (Phase 1) and precontact orientation (Phase 2). Phase 3
includes apposition and transient attachment. Phase 4 is marked by adhesion of
trophectoderm to endometrial LE. Phase 5 involves formation of trophoblast
giant binucleate cells that begin to differentiate from mononuclear trophoblast
cells and then migrate to and fuse with the LE to form multinucleated syncytial
plaques. Adapted from Spencer et al. (2007).

Materials and methods _________________________________________________________________________
34
3 Materials and methods 3.1 Materials 3.1.1 Animals
During the experimental period, 54 Simmental cyclic heifers were used for endometrial
sample collection and embryo transfer. Ten Simmental cows were used for superovulation
and in vivo embryo production. Eighteen cyclic Simmental heifers were slaughtered at
different days of the estrous cycle and three heifers were slaughtered at day 50 of gestation
period. All animals were selected based on general clinical examination and normal
ovarian cyclicity and housed in a free-stall barn with slotted floors and cubicles, lined with
rubber mats and they were fed a total mixed ration. Animal handling and management was
adhered to the rules and regulations of the German law of animal protection
3.1.2 Embryos and endometrial biopsies
Day 7 blastocysts produced by superovulation and the endometrial biopsies collected at
day 7 and 14 of the estrous cycle were used for the study.
3.1.3 Materials for laboratory analysis 3.1.3.1 Chemicals, kits, biological and other materials
During this experiment, the following chemicals and biological materials from various
manufacturers were used.
Chemicals or biological materials Manufacturer/Supplier
4', 6'-diamidino-2-phenylindole hydrochloride
(DAPI)
Burlingame, CA, USA
10x PCR buffer Promega, WI, USA
2x rapid ligation buffer Promega, WI, USA
2-Mercaptoethanol Sigma-Aldrich Chemie GmbH,
Munich, Germany
E. coli competent cells Stratagene, Amsterdam, The

Materials and methods _________________________________________________________________________
35
Neatherlands
5x First-Stand buffer Invitrogen Life Technologies,
Karlsruhe
Acetic acid Roth, Karlsruhe, Germany
Agar-Agar Roth, Karlsruhe, Germany
Agarose Sigma-Aldrich Chemie GmbH,
Munich
Ampicillin Roth , Karlsruhe
BME (essential amino acids) Gibco BRL, life technologies,
Karlsruhe
Boric acid Roth , Karlsruhe, Germany
Bovine serum ablbumin (BSA) Promega, Mannheim, Germany
Calcium chloride Sigma-Aldrich Chemie GmbH,
Munich, Germany
Cy3 conjugated Goat anti-mouse lgG + lgM (H+L) Jackson ImmunoResearch
Laboratories, PA, USA
Chloroform Roth , Karlsruhe, Germany
Dimethyl sulfoxide (DMSO) Roth , Karlsruhe, Germany
dNTPs Roth , Karlsruhe, Germany
DTT Invitrogen Life Technologies,
Karlsruhe, Germany
Dye terminator cycle sequencing (DTCS) Beckman Coulter, Krefeld,
Germany
Ethanol Roth, Karlsruhe, Germany
Ethidium bromide Roth, Karlsruhe, Germany
ExoSAP-IT USB, Ohio, USA
Ethylenediaminetetra acetic acid Roth , Karlsruhe, Germany

Materials and methods _________________________________________________________________________
36
Formaldehyde Sigma-Aldrich Chemie GmbH,
Munich, Germany
Fluorescein isothiocyanate (FITC) Conjugated
goat anti-rabbit secondary antibody Lifespan Biosciences, WA, USA
Glycogen for sequencing Beckman Coulter, Krefeld,
Germany
Hemi-calcium lactate Promega, WI, USA
Hydrochloric acid Roth, Karlsruhe
Hepes Sigma-Aldrich Chemie GmbH,
Munich
Hydroxylamine Sigma-Aldrich Chemie GmbH,
Munich, Germany
Hypotaurin Sigma-Aldrich Chemie GmbH,
Taufkirchen, Germany
Isopropyl -D-thiogalactoside (IPTG) Roth, Karlsruhe, Germany
Igepal Roth, Karlsruhe, Germany
Isopropyl β-D-thiogalactoside (IPTG) Roth, Karlsruhe, Germany
L-Glutamine Sigma-Aldrich, Germany
Magnesium chloride Sigma-Aldrich Chemie GmbH,
Munich, Germany
MEM (non essential amino acids) Gico BRL, life technologies,
Karlsruhe
Mineral oil Sigma-Aldrich Chemie GmbH,
Munich, Germany
Mous anti-human monoclonal antibody against
TIMP3
LifeSpan biosciences inc, WA,
USA
Oligonucleotide primers MWG Biotech, Eberberg,
Germany
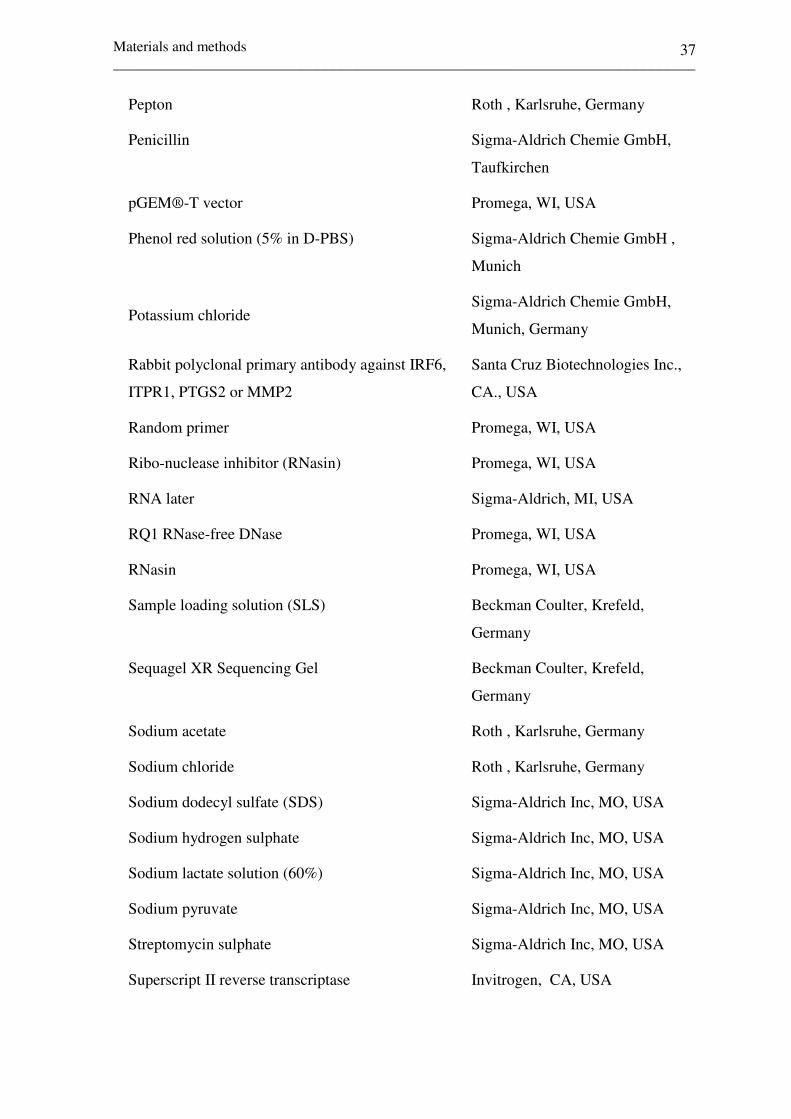
Materials and methods _________________________________________________________________________
37
Pepton Roth , Karlsruhe, Germany
Penicillin Sigma-Aldrich Chemie GmbH,
Taufkirchen
pGEM®-T vector Promega, WI, USA
Phenol red solution (5% in D-PBS) Sigma-Aldrich Chemie GmbH ,
Munich
Potassium chloride Sigma-Aldrich Chemie GmbH,
Munich, Germany
Rabbit polyclonal primary antibody against IRF6,
ITPR1, PTGS2 or MMP2
Santa Cruz Biotechnologies Inc.,
CA., USA
Random primer Promega, WI, USA
Ribo-nuclease inhibitor (RNasin) Promega, WI, USA
RNA later Sigma-Aldrich, MI, USA
RQ1 RNase-free DNase Promega, WI, USA
RNasin Promega, WI, USA
Sample loading solution (SLS) Beckman Coulter, Krefeld,
Germany
Sequagel XR Sequencing Gel Beckman Coulter, Krefeld,
Germany
Sodium acetate Roth , Karlsruhe, Germany
Sodium chloride Roth , Karlsruhe, Germany
Sodium dodecyl sulfate (SDS) Sigma-Aldrich Inc, MO, USA
Sodium hydrogen sulphate Sigma-Aldrich Inc, MO, USA
Sodium lactate solution (60%) Sigma-Aldrich Inc, MO, USA
Sodium pyruvate Sigma-Aldrich Inc, MO, USA
Streptomycin sulphate Sigma-Aldrich Inc, MO, USA
Superscript II reverse transcriptase Invitrogen, CA, USA

Materials and methods _________________________________________________________________________
38
iTaq SYBR Green Supermix with ROX Bio-Rad laboratories, Munich,
Germany
T4 DNA ligase Promega, WI, USA
Taq DNA polymerase Sigma-Aldrich Inc, MO, USA
Tris Roth ,Karlsruhe, Germany
Triton X-100 Roche Diagnostics GmbH,
Mannheim, Germany
Yeast extract Roth, Karlsruhe, Germany
yeast tRNA Sigma-Aldrich Chemie GmbH,
Munich
X-Gal (5-bromo-4-chloro-3-indolylbeta-D-
galactopyranoside) Roth, Karlsruhe, Germany
RNeasy mini kit Qiagen, Hiden, Germany
RNA 6000 Nano LabChip® Kit Agilent Technologies Inc, CA,
USA
MEGAscript® T7 Kit Applied Biosystems, CA, USA
Eukaryotic poly-A RNA control kit Affymetrix, CA, USA
AmpliScribe T7 transcription kit Epicentre technologies, WI, USA
CyScribeTM GFXTM Purification kit Amersham Biosciences,
Freiburg, Germany
Amersham post-labelling kit Amersham Bioscience, Freiburg,
Germany
CyScribeTM GFXTM Purification kit Amersham Biosciences,
Freiburg, Germany
(DOP)-PCR master kit Roche Diagnostics GmbH,
Mannheim, Germany
QIAquick PCR Purification Quigen, Hiden, Germany
PicoPureTM RNA isolation kit Arcturs, CA, USA.
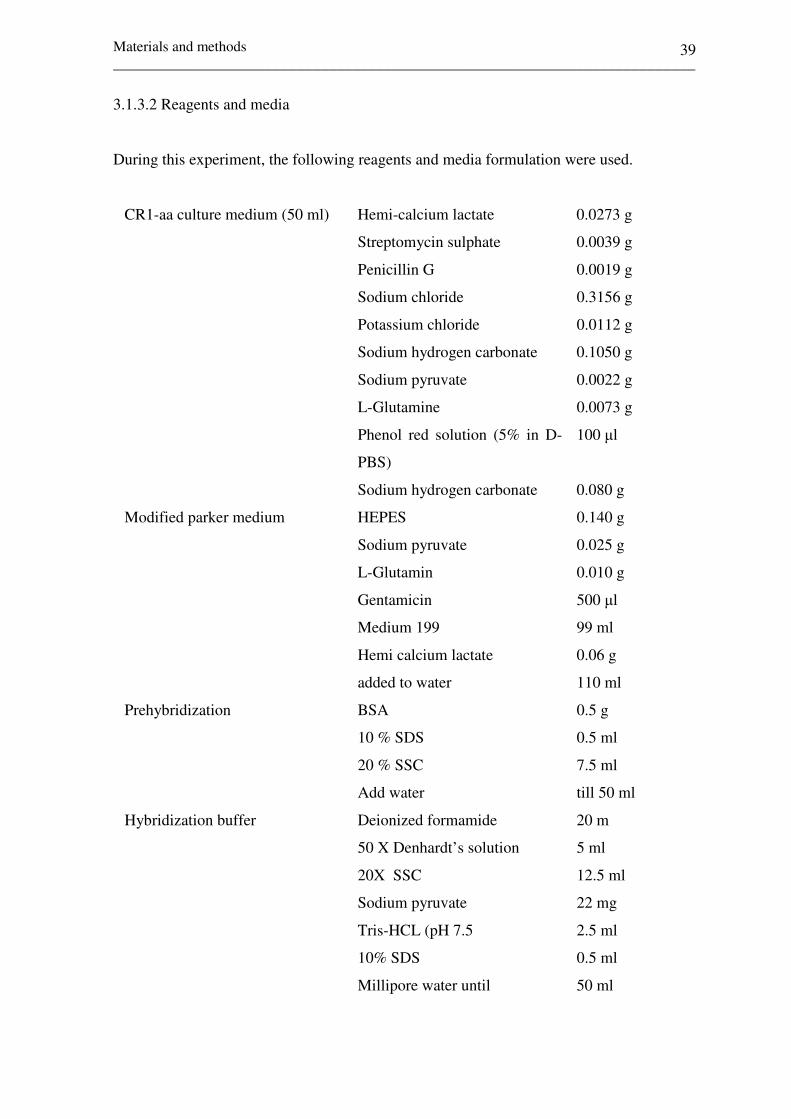
Materials and methods _________________________________________________________________________
39
3.1.3.2 Reagents and media
During this experiment, the following reagents and media formulation were used.
CR1-aa culture medium (50 ml) Hemi-calcium lactate 0.0273 g
Streptomycin sulphate 0.0039 g
Penicillin G 0.0019 g
Sodium chloride 0.3156 g
Potassium chloride 0.0112 g
Sodium hydrogen carbonate 0.1050 g
Sodium pyruvate 0.0022 g
L-Glutamine 0.0073 g
Phenol red solution (5% in D-
PBS)
100 µl
Sodium hydrogen carbonate 0.080 g
Modified parker medium HEPES 0.140 g
Sodium pyruvate 0.025 g
L-Glutamin 0.010 g
Gentamicin 500 µl
Medium 199 99 ml
Hemi calcium lactate 0.06 g
added to water 110 ml
Prehybridization BSA 0.5 g
10 % SDS 0.5 ml
20 % SSC 7.5 ml
Add water till 50 ml
Hybridization buffer Deionized formamide 20 m
50 X Denhardt’s solution 5 ml
20X SSC 12.5 ml
Sodium pyruvate 22 mg
Tris-HCL (pH 7.5 2.5 ml
10% SDS 0.5 ml
Millipore water until 50 ml

Materials and methods _________________________________________________________________________
40
LB-agar Sodium chloride 8.0 g
Peptone 8.0 g
Yeast extract 4.0 g
Agar-Agar 12.0 g
Sodium hydroxide (40 mg/ml) 480.0 µl
ddH2O added to 800.0 ml
LB-broth Sodium chloride 8.0 g
Peptone 8.0 g
Yeast extract 4.0 g
Sodium hydroxide (40 mg/ml) 480.0 µl
ddH2O added to 800.0 ml
BSA (3%) Bovine serum albumin 0.15 g
added to PBS+PVA 5 ml
DEPC-treated water (1000 ml) DEPC 1 ml
added to water 1000 ml
Lysis buffer (100 µl) Igepal (0.8%) 0.8 µl
RNasin 5 µl
DTT 5 µl
added to water 100 µl
TAE (50x) buffer, pH 8.0 Tris 242.0 mg0
Acetic acid 57.1 ml
EDTA (0.5 M) 100.0 ml00
ddH2O added to 1000.0 ml
TE (1x) buffer Tris (1 M) 10.0 ml
EDTA (0.5 M) 2.0 ml
X-gal ddH2O added to 1000.0 ml
X-gal 50.0 mg
(16%) Para formaldehyde (10 ml) N, N’-dimethylformamide 1.0 ml
Para formaldehyde 1.6 g
added to water 10 ml
PBS + PVA (50 ml) Polyvinyl alcohol (PVA)
PBS added to
300 mg
50 ml
Permeabilizing solution (10 ml) Triton X-100 5 µl

Materials and methods _________________________________________________________________________
41
Glycine + PBS added 10 ml
Physiological saline solution Sodium chloride 9 g
added to water 1000 ml
Agarose loading buffer Bromophenol blue 0.0625 g
Xylencyanol 0.0625 g
Glycerol 7.5 ml
ddH2O added to 25 ml
dNTP solution dATP (100 mM) 10.0 µl
dCTP (100 mM) 10.0 µl
dGTP (100 mM) 10.0 µl
dTTP (100 mM) 10.0 µl
ddH2O added to 400.0 µl
IPTG solution IPTG 1.2 g
ddH2O added to 10.0 µl
3M Sodium Acetate, pH 5.2 Sodium Acetate 123.1 g
ddH2O added to 500 ml
1M EDTA, pH 8.0 EDTA 37.3 g
ddH2O added to 1000 ml
Phenol Chloroform Phenol : Chloroform 1 : 1 (v/v)
0.2% Triton-X100: Triton 2 ml
10x PBS : added to 1,000.0ml
0.3% BSA in PBS BSA 3 g
10x PBS : added to 1,000.0 ml
3% BSA in PBS BSA 30g
10x PBS : added to 1,000.0 ml

Materials and methods _________________________________________________________________________
42
3.1.4 Equipements
During this experiment, the following reagents and media formulation were used.
Equipment Manufacturer
Ultrasonography (Pie Medical, 5 MHz) Pie Medical
Bovine preimplantation embryo specific
cDNA array Laval University
ApoTome microscope Carl Zeiss MicroImaging, Germany
Cytobrush Gynobrush, Hamburg, Germany
CH15 embryo flushing Cather Immuno Systems
Inverted fluorescence microscope DM IRB Leica, Germany
Stereomicroscope SMZ 645 Nikon, Japan
Centrifuge Hermel, Wehing
Electrophoresis BoRad, Munich
My Cycler Thermal cycler Bio-RadLaboratories, CA, USA
SHKE6000-8CE refrigerated Stackable Shaker Thermoscinentific, IWA, USA
CEQTM 8000 Genetic Analysis BeckmanCoulter,Krefeld, Germany
ABI PRISM® 7000 SDS Applied Bio systems
Affymetrix®GeneChip™3000 scanner Affymetrix, CA, USA
Affymetrix®GeneChip Fluidics Station 450 Affymetrix, CA, USA
Affymetrix®GeneChip Hybridization oven
640 Affymetrix, CA, USA
Agilent 2100 bioanalyzer Agilent Technologies , CA, USA
GAPSII Corning (Amsterdam)
Nanodrop 8000 Spectrophotometer Thermo Fisher Scientific, DE, USA
Axon GenePix 4000B scanner Axon Instruments, Foster City, CA
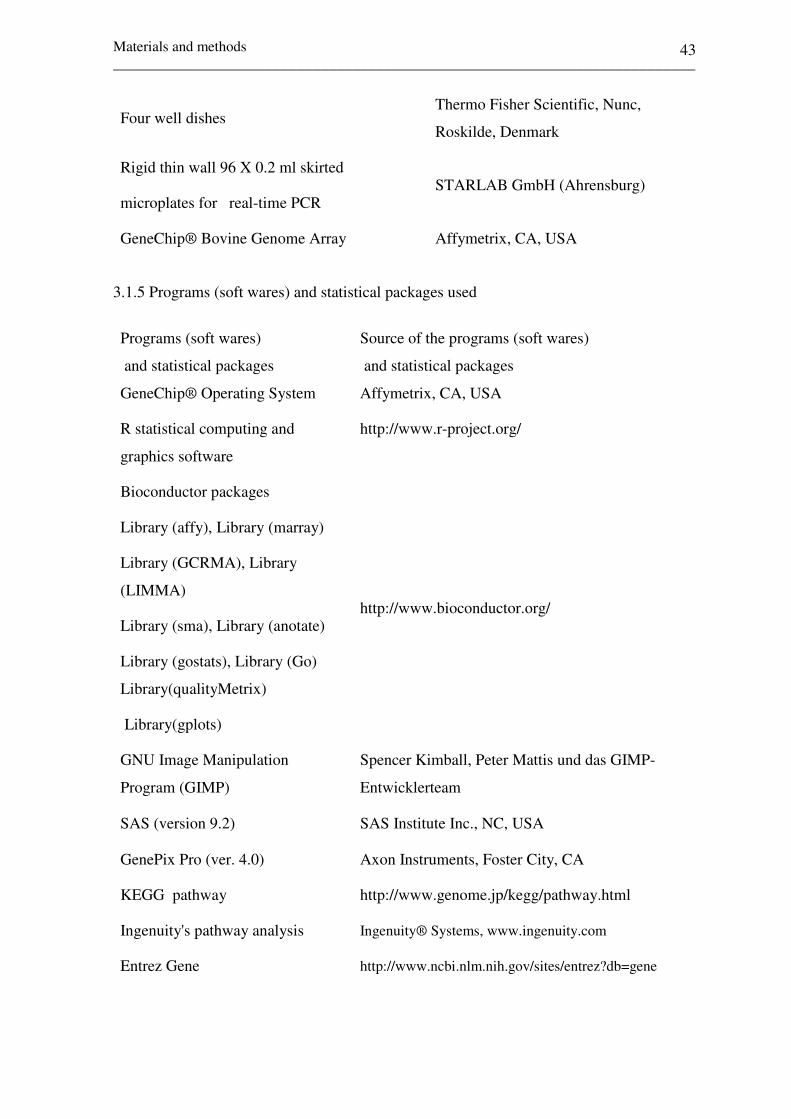
Materials and methods _________________________________________________________________________
43
Four well dishes Thermo Fisher Scientific, Nunc,
Roskilde, Denmark
Rigid thin wall 96 X 0.2 ml skirted
microplates for real-time PCR STARLAB GmbH (Ahrensburg)
GeneChip® Bovine Genome Array Affymetrix, CA, USA
3.1.5 Programs (soft wares) and statistical packages used
Programs (soft wares)
and statistical packages
Source of the programs (soft wares)
and statistical packages
GeneChip® Operating System Affymetrix, CA, USA
R statistical computing and
graphics software
http://www.r-project.org/
Bioconductor packages
Library (affy), Library (marray)
Library (GCRMA), Library
(LIMMA)
Library (sma), Library (anotate)
Library (gostats), Library (Go)
Library(qualityMetrix)
Library(gplots)
http://www.bioconductor.org/
GNU Image Manipulation
Program (GIMP)
Spencer Kimball, Peter Mattis und das GIMP-
Entwicklerteam
SAS (version 9.2) SAS Institute Inc., NC, USA
GenePix Pro (ver. 4.0) Axon Instruments, Foster City, CA
KEGG pathway http://www.genome.jp/kegg/pathway.html
Ingenuity's pathway analysis Ingenuity® Systems, www.ingenuity.com
Entrez Gene http://www.ncbi.nlm.nih.gov/sites/entrez?db=gene

Materials and methods _________________________________________________________________________
44
AxioVision Carl Zeiss International
EndNote X1 Thomoson
Primer Express ® software Applied Biosystems, Foster city, CA, USA
Primer 3 (version 4) http://frodo.wi.mit.edu/primer3/
BLAST program http://blast.ncbi.nlm.nih.gov/Blast.cgi
Prism for windows (ver.5.0) GraphPad software, Inc.
3.2 Methods 3.2.1 Pre-transfer endometrial gene expression in relation to pregnancy outcome 3.2.1.1 Endometrial biopsy collection
The design and experimental setup of the present study is indicated in Figure 4. Prior to
endometrial biopsy collection, experimental heifers were estrous synchronized by intra
muscular administration of 500 mg of the prostaglandin F2α (PGF2α) analogue
cloprostenol (Estrumate, Munich, Germany) twice within 11 days. Two days after each of
the PGF2α treatments, animals received 0.02 mg GnRH-analogue buserelin (Receptal)
(Intervet, Boxmeer, the Netherlands). Two PGF2α treatments were performed on day 14
and 17 followed by administration of 0.02 mg GnRH at day 18 to induce ovulation.
Common signs of estrus were monitored by visual observation three times per day
followed by careful palpation of ovaries to check the presence of corpus luteum. Following
this, endometrial biopsies were collected from experimental animals using a cytobrush
technique. Cytobrush technique is a consistent and reliable method for obtaining
endometrial samples for cystologic examination and gene expression analysis from dairy
cows (Gabler et al. 2009, Kasimanickam et al. 2005, Kaufmann et al. 2009). For collecting
the endometrial samples, 20 mm in length and 6 mm in diameter brush (Gynobrush, Heinz
Herenz, Hamburg, Germany) protected by a one-way catheter was inserted via the cervix
into the uterine body. Inside the uterus, the brush was pushed gently out of the catheter and
rolled along the uterine wall. Thereafter, the brush was retracted into the catheter to protect
it from contamination during the passage through the genital tract. For each animal,
endometrial samples were collected at days 7 and 14 of the estrous cycle during the pre-

Materials and methods _________________________________________________________________________
45
transfer cycle (one cycle prior to embryo transfer). The endometrial samples were stored in
RNA later (Sigma-Aldrich, Mi, USA) until further use. Day 7 and 14 of the estrous cycle
were chosen for two main reasons. Firstly, most often embryo transfer in cattle is
performed using blastocyst stage embryo at day 7 of the estrous cycle (Bauersachs et al.
2009, Hill et al. 2000, Mansouri-Attia et al. 2009, Rodriguez-Alvarez et al., Rodriguez-
Alvarez et al. 2010) or in case of artificial insemination, most of the embryos reach to the
uterus and develop to the blastocyst stage at day 7 of the estrous cycle. Moreover, day 7 of
the estrous cycle is marked by formation of corpus luteum. Secondly, in the absence of
embryo in the uterus, the uterine prostaglandin F2α (PGF2α) increases at day 14 of the
estrous cycle leading to corpus luteum regression (Shemesh and Hansel 1975).
3.2.1.2 Superovulation and artificial insemination
Pre-synchronization was performed by i.m. administration of 500 mg of the prostaglandin
F2α (PGF2α) analogue cloprostenol (Estrumate; Munich, Germany) twice within 11 days.
Two days after each of the PGF2α treatments, animals received 0.02 mg of GnRH-analogue
buserelin (Receptal) (Intervet, Boxmeer, The Netherlands). Twelve days after the last
GnRH injection, cows received the first of eight consecutive FSH-injections over 4 days in
decreasing dose. Two PGF2α treatments were performed 60 and 72 h after the initial FSH
administration. Finally, 48 h after the first PGF2α application, ovulation was induced by
administration of 0.02 mg of buserelin and three artificial inseminations were performed
within 12 h interval. The time of the second insemination (60 h after the first PGF2α
application) was defined as Day 0.
3.2.1.3 Blastocyst recovery and embryo transfer
Blastocysts embryos were flushed 7 days after insemination by draining each uterine horn
with 500 ml phosphate buffer saline solution (PBS) using CH15 embryo-flushing catheter
(Wörrlein, Ansbach, Germany) connected to an embryo filter (Immuno Systems Inc., WI,
USA). Good quality blastocysts were subjected to biopsying using a beaver micro blade
(Minitüb, Tiefenbach, Germany) fixed to a micromanipulator under inverse microscope
(Leica Camera Inc., Solms, Germany). Following biopsying, 60-70% portion of the
blastocyst containing both inner cell mass (ICM) and trophectoderm cells (TE) was
cultured in vitro in CR1 medium supplemented with amino acid for 2 h and transferred to

Materials and methods _________________________________________________________________________
46
54 synchronized Simmental heifers as indicated above. The remaining 30-40% of the
embryo biopsy containing both ICM and TE was washed twice in PBS and snap frozen in
cryo-tubes, containing minimal amounts of lysis buffer [0.8% Igepal (Sigma-Aldrich, MO,
USA), 40 U ml-1 RNasin (Promega, WI, USA), 5 mM dithiothreitol (DTT) (Promega, WI,
USA)]. All frozen embryos were stored at -80 oC until RNA isolation.
Figure 4: The overall experimental design applied in the study. Endometrial biopsies were
taken during the pre transfer period. In the next cycle, blastocyst stage embryos
were transferred to the recipients after part of the embryo as a biopsy. Following
pregnancy diagnosis, the endometrial and embryo biopsies were classified
according to the pregnancy outcome. Global transcription analysis was
performed from embryo and endometrial biopsies. Numbers 1 and 2 represent
the transcriptome analysis between receptive and non-receptive endometrium at
day 7 and 14 of the estrous cycle whereas 3 and 4 represent the transcriptome
dynamic analysis of receptive and non-receptive endometrium.

Materials and methods _________________________________________________________________________
47
3.2.1.4 Pregnancy diagnosis and categorization of endometrial and embryo biopsies
Pregnancy diagnosis was performed at days 28 and 42 using ultrasonography (Pie Medical,
5 MHz) and at day 56 by rectal palpation. Those heifers returning to heat at day 21 were
categorized as non pregnant or considered as non-receptive endometrium. Those heifers
resulted in calf delivery were categorized as the calf delivery group or considered as
receptive endometrium. At the end of gestation, the endometrial and embryo biopsies
collected during the pre-transfer period were classified according to the pregnancy
outcome information (Figure 4). Those endometrial biopsies collected at days 7 and 14 of
the estrous cycle from calf delivery groups (receptive endometrium) were designated as
CDd7 and CDd14, respectively. Endometrial biopsies taken at days 7 and 14 of the estrous
cycle from those subsequently resulted in no pregnancy (non-receptive endometrium) were
designated as NPd7 and NPd14, respectively. Similarly, the embryo biopsies were
classified according to the pregnancy outcome information. Each embryo biopsied from
blastocysts transferred to the recipients was snap frozen and stored separately. Following
pregnancy diagnosis, the embryo biopsies were classified as those embryo biopsies
resulted in calf delivery or resulted in no pregnancy group (Figure 4). During RNA
isolation those embryo biopsies resulted in calf delivery were pooled in three replicates
and those embryo biopsies resulted in no pregnancy were pooled in three other replicates.
3.2.1.5 Total RNA isolation from endometrial biopsies
Total RNA was extracted from three pools of endometrial sample from each category
using RNeasy mini kit (Qiagen, Hilden, Germany) with slight modification. Briefly, three
pools of endometrial cytobrush samples from each group, namely: CDd7, CDd14, NPd7 or
NPd14 were transferred in 2 ml Eppendorf tube filled with 500 µl of RLT buffer
containing 10% 14.3 M βeta mercaptoethanol (β-ME) (Thermo Fisher Scientific Inc., IL,
USA). The samples were then vortexed for 10 minutes. Complete retrieval of the
cytobrush contents were performed by three consecutive washings in 500 µl of RLT- β-
ME buffer. The samples were then centrifuged at 12575 rpm. The clear lysate was then
retrieved to which 1 volume of 70% ethanol was added. After mixing, 700 µl of the
sample was then transferred to RNeasy spin column and centrifuged in refrigerated
universal centrifuge Z233MK (Hermle Labortechnik, Wehingen, Germany) for 15 s at
12575 rpm. The supernatant was discarded. Since the sample volume was exceeding 700

Materials and methods _________________________________________________________________________
48
µl, successive aliquots were centrifuged in the same spin column. Following this, 700 µl
RW1 buffer was added to the samples in the spin column and centrifuged for 15 s at 12575
rpm. After removing the supernatant, 500 µl RPE buffer was added to the spin column
followed by 15 s centrifugation 12575 rpm. This step was repeated for the second time and
centrifuged at the same speed for 2 min. The spin column was then transferred to a new 2
ml collection tube and centrifuged at full speed for 1 min to eliminate any possible
carryover of RPE buffer and residual flow-through remained on the spin column.
Following this, the RNeasy spin column was transferred to a new 1.5 ml collection tube
and 40 µl RNase-free water was added directly to the spin column membrane. The spin
column membrane was then centrifuged for 1 min at 12575 rpm to elute the RNA. One
micro litter of the RNA was used to measure the concentration and quality using Nanodrop
8000 Spectrophotometer (Thermo Fisher Scientific Inc, DE, USA).
3.2.1.6 DNase treatment of total RNA samples
Prior to subsequent application, the RNA samples were freed from any DNA
contamination using RNA-qualified (RQ1) RNase-free DNase I (Promega, WI, USA). One
unit of RQ1 RNase-free DNase and 1µl RQ1 RNase-free DNase 10x reaction buffers were
used per 1 µg of total RNA. To this, RNase-free water was added to reach the required
volume and incubated at 37 oC for 1 h. At the end of the incubation time, the reaction was
purified using RNeasy mini kit (Qiagen, Hilden, Germany) following the manufacture’s
recommendation. Briefly, the samples were first adjusted to 100 µl with RNase-free water
and to this, 350 µl RLT buffer and 250 µl 100% ethanol were added. The samples were
then transferred to RNeasy mini spin column placed in a 2 ml and centrifuged at 12575
rpm for 15 s. After decanting the flow-through, 500 µl RPE buffer was added to the
samples and centrifuged at 12575 rpm for 15 s. After the final wash with 500 µl RPE for 2
min at 12575 rpm, any possible carryover of RPE buffer and residual flow-through
remained on the RNeasy spin column was eliminated by centrifugation the spin column for
2 min at full speed. Afterwards, 30 µl RNase-free water was directly added to the spin
column membrane fixed in a new RNase free 2 ml collection tube and centrifuged at
12575 rpm for 1 min. The RNA concentration and quality was analyzed using Nanodrop
8000 Spectrophotometer (Thermo Fisher Scientific Inc, DE, USA). RNA integrity was
evaluated using Agilent 2100 bioanalyzer with RNA 6000 Nano LabChip® Kit (Agilent

Materials and methods _________________________________________________________________________
49
Technologies Inc, CA, USA). The ribosomal RNA ratio (28S to 18S) of the RNA samples
was between 1.9 and 2.1 and the RNA integrity number (RIN) was between 7.5 and 8.4.
3.2.1.7 RNA amplification from endometrial biopsies 3.2.1.7.1 First cycle first and second strand cDNA synthesis
Two cycles eukaryotic target labeling assay was performed following the recommendation
of the GeneChip® expression analysis technical manual (P/N 702232). For this, 100 ng of
total RNA isolated from endometrial biopsies resulted in calf delivery or no pregnancy was
used as a starting material. The eukaryotic poly-A RNA control kit was used as a SPIKE-
IN control to monitor the entire target labeling process, The controls were then amplified
and labelled together with the samples as each eukaryotic GeneChip® probe array contains
probesets for several B. subtilis genes (lys, phe, thr and dap) that are absent in eukaryotic
samples. Prior to first strand cDNA synthesis, 2 µl of 50 µM T7-Oligo (dT) primer and 2
µl diluted eukaryotic poly–A RNA controls were mixed and 16 µl of RNase free water was
added to this mix to final volume 20 µl. From this, 2 µl was taken and added to the 100 ng
total RNA and RNase free water was added to final 5 µl volumes. This mix was incubated
for 6 min at 70 oC. After the end of the incubation period, 5 µl mix ( containing 2 µl 5x 1st
strand reaction mix, 1 µl 0.1M DTT, 0.5 µl RNase inhibitor, 0.5µl 10 mM dNTP, 1 µl
superscript II) was added to the reaction and incubated for 1 h at 42 oC. Afterwards, the
enzyme was deactivated by heating the reaction at 70 oC for 10 min followed by cooling at
4 oC for 2 min. Following the first cycle first strand cDNA synthesis, second strand cDNA
was synthesized from first strand cDNA. For this, a 10 µl first cycle second strand master
mix (4.8 µl RNase free water, 4 µl 17.5mM diluted MgCl2, 0.4 µl 10mM dNTP, 0.6 µl
E.coliDNA polymerase and 0.2 µl RNase H) was added to this 10 µl first stranded cDNA.
The reaction was incubated for 120 min at 16 oC and for 10 min at 75 oC.
3.2.1.7.2 First cycle, IVT amplification of cRNA
In vitro transcription (IVT) and RNA amplification was performed using MEGAscript®
T7 Kit (Applied Biosystems, CA, USA) using dsCDNA as a template. For this a 30 µ IVT
mix (5 µl each 10X reaction buffer, ATP solution, CTP solution, UTP solution GTP
solution and enzyme) was added to the double stranded cDNA. The reaction was incubated
at 37 oC for 16 h. At the end of the incubation period, the complementary RNA (cRNA)
Materials and methods _________________________________________________________________________
50
was purified using GeneChip® IVT cRNA cleanup kit (Affymetrix, CA, USA). At this
step, the concentration and quality of cRNA was determined using Nanodrop 8000
Spectrophotometer (Thermo Fisher Scientific Inc, DE, USA).
3.2.1.7.3 Second-cycle, first strand and double cDNA synthesis
Second –cycle, first strand cDNA synthesis was performed using 600 ng cRNA resulted in
first cycle of IVT amplification. For this, first 2 µl random primers (final concentration 0.2
µg/µl) was added to the cRNA and RNase free water was added to final volume of 11 µl.
This reaction was incubated for 10 min at 70 OC. Afterwards, 9 µl second–cycle, first-
strand master mix (containing 4 µl 5x 1st strand reaction buffer, 2 µl 0.1M DTT, 1 µl
RNase inhibitor, µl 10mM dNTP, µl superscript 11) was added to each sample and
incubated for 1 h at 42 OC. After cooling at 4 OC for 2 min, 1 µl of RNase H enzyme was
added to each sample. The reaction was incubated for 20 min at 37 OC followed by heating
at 95 OC for 5 min. Subsequently, the T7-Oligo (dT) promoter primer was used in the
second-strand cDNA synthesis to generate double-stranded cDNA template containing T7
promoter sequences. For this T7-oligo (dT) primer (5 µM of final concentration) was
added to the reaction and incubated for 6 min at 70 OC. After cooling at 4 OC for 2 min,
125 µl second cycle second strand master mix (containing 30 µl 5x 2nd strand reaction mix,
3 µl of 10 mM dNTP, 4 µl E.coli/DNA polymerase I) was added and incubated for 2 h at
16 OC. The reaction was terminated after incubating the sample with 2 µl T4 DNA
polymerase at the same temperature for 10 min. The samples were then purified using the
sample clean up module and the double-stranded cDNA was eluted in 12 µl RNase free
water.
3.2.1.7.4 Biotin labeling and fragmentation of cRNA
The resulting double-stranded cDNA was then in vitro transcribed and labeled using a 40
µl biotinylated nucleotide analog/ribonucleotide mix (4 µl 10X IVT labeling buffer, 12 µl
IVT labeling NTP mix, 4 µl IVT labeling enzyme mix, 8 µl RNase free water) in the
second IVT reaction using GeneChip IVT labeling kit (Affymetrix, CA, USA). The
reaction was incubated at 37 OC for 16 h. After the end of incubation period, the biotin
labeled cRNA was purified and eluted with 11 µl RNAse free water. The concentration
and quality of biotin labeled cRNA was determined using Nanodrop 8000

Materials and methods _________________________________________________________________________
51
Spectrophotometer (Thermo Fisher Scientific Inc, DE, USA). Fifteen microgram biotin
labeled cRNA was then fragmented at 94 OC for 35 min using 5x fragmentation buffer.
The size distribution of fragmented biotin labeled cRNA samples were analyzed using
Agilent 2100 bioanalyzer with RNA 6000 Nano LabChip® Kit (Agilent Technologies Inc,
CA, USA).
3.2.1.8 Target hybridization
The GeneChip® Bovine Genome Array (Affymetrix, CA, USA) was used for
hybridization. For this, a hybridization cocktail consisting of 10 µg fragmented and labeled
cRNA, control oligonucleotide B2 (3 nM), 20x eukaryotic hybridization controls (bioB,
bioC, bioD, cre) (Affymetrix, CA, USA), 2X hybridization mix, DMSO and RNAse free
water were mixed to a final volume of 200 µl. The mix was then heated at 99°C for 5 min
followed by 5 min incubation at 45°C. Meanwhile, the probe arrays were wetted with 1x
hybridization buffer and incubated at 45 °C for 10 min in hybridization oven with 60 rpm
rotation. After removing the hybridization buffer from each of the probe arrays, 130 µl
hybridization cocktail was filled to each probe array and placed in the hybridization oven
at 45 oC with 60 rpm rotation. Hybridization was performed for 16 h. Three biotin labeled
cRNA hybridizations were performed for endometrial samples of each category (CDd7,
CDd14, NPd7 and NPd14).
3.2.1.9 Washing and staining probe arrays
The probe arrays were washed and stained using the Fluidics Station 450/250 integrated
with GeneChip® Operating System as recommended in GeneChip® expression wash,
stain and scan user manual (P/N 702731 (Affymetrix) as recommended in GeneChip®
expression wash, stain and scan user manual (P/N 702731). Briefly, after 16 h of
hybridization, the hybridization cocktail was removed and the probe array cartridge was
filled with 160 µl wash buffer A. The probe arrays were then inserted in designated
module of the fluidic station. Meanwhile, each of the vials containing 600 µl stain cocktail
1 and 600 µl stain cocktail 2 were was placed in sample holder 1 and 2 of the Fluidics
Station 450/250, respectively. Similarly, a vial containing 800 µl array holding buffer was
placed in sample holder 3 in the fluidic station. Afterwards, the needle lever was pressed
down and the needles were snapped into position to start washing.
Materials and methods _________________________________________________________________________
52
3.2.1.10 Scanning the probe arrays
After washing, the probe arrays were scanned using affymetrix®GeneChip™3000
confocal slide scanner (Affymetrix, CA, USA) integrated with GeneChip® Operating
System as recommended in GeneChip® expression wash, stain and scan user manual (P/N
702731).
3.2.1.11 Affymetrix array data analysis
The microarray data normalization and background correction was performed using
guanine cytosine robust multi-array analysis (GCRMA) (Wu and Irizarry 2004). For this,
we used R software, (www.r-project.org) and bioconductor packages
(www.bioconductor.org). During normalization, the CEL files were first converted into
expression set using the guanine cytosine robust multi-array average (GCRMA)
considering probe sequence and the GC-content background correction. Starting with the
probe-level data from a set of GeneChips, the perfect-match values were background-
corrected, normalized and finally summarized resulting in a set of expression measures.
The raw and normalized data are available at Gene Expression Omnibus (GEO),
http://www.ncbi.nlm.nih.gov/geo/ with accession number GSE21049 or GSE20974. The
intensity distribution and uniformities between the arrays were evaluated by assessing
Pearson correlation and heatmap, MA plots and density plots (Appendix 1). Differentially
expressed (DE) genes were obtained using linear models for microarray data (LIMMA)
which quires two matrices namely the design matrix which provides a representation of the
different RNA targets which have been hybridized to the arrays and the contrast matrix
which allows the coefficients defined by the design matrix to be combined into contrasts of
interest (Smyth 2005). Genes were considered differentially expressed (DE) when the p <
0.05 and fold change ≥ 2, FDR ≤ 0.27. p-values were adjusted using the Benjamini–
Hochberg procedure that controls the false discovery rate (Benjamini and Hochberg 1995).
Differentially expressed genes were further classified according to their gene ontology
(GO) of molecular functions and biological processes using GO statistical analyses
(GOstats) (Falcon and Gentleman 2007). Moreover, molecular pathways participated by
DE genes were identified from the Kyoto Encyclopedia of Genes and Genomes (KEGG)
database (http://www.genome.jp/kegg/). The molecular networks involved by the
Materials and methods _________________________________________________________________________
53
differentially expresses genes was analyzed through the use of Ingenuity Pathways
Analysis (Ingenuity® Systems, www.ingenuity.com).
3.2.2 Expression profile of candidate genes during the estrous cycle and early pregnancy
Following identification of differentially expressed genes between the receptive and non-
receptive endometrium, the expression pattern of selected candidate genes were examined
at different phases of the estrous cycle and early gestation period. Candidate genes were
randomly selected among those whose expression was increased in receptive endometrium
[interferon regulatory factor 6 (IRF6), prostaglandin E receptor 4 (PTGER4), Inositol
1,4,5-trisphosphate receptor type 1 (ITPR1), adenosine A2B receptor (ADORA2B),
prostaglandin-endoperoxide synthase 2 (prostaglandin G/H synthase and cyclooxygenase
(PTGS2/ COX-2), tissue inhibitor of metalloproteinase 3 (TIMP3), cell division cycle 20
homolog (CDC20), wingless-type MMTV integration site family, member 11 (WNT11 ]
and 3 other genes whose expression was increased in non-receptive endometrium [signal
transducer and activator of transcription 5A (STAT5A), matrix metalloproteinase 2
(MMP2) and angiotensin II receptor, type 1 (AGTR1)]. This was aimed at evaluating the
pattern of those differentially expressed genes at different stage of the estrous cycle and to
assess whether the genes increased or reduced in receptive endometrium during the estrous
cycle will continue or decay during early gestation period. For this, endometrial samples
was collected from 18 normal cyclic heifers slaughtered at days 0, 3, 7, 14 and 19 of the
estrous cycle following standard synchronization protocol and 3 animals were slaughtered
at day 50 of the gestation period. Endometrial samples were collected from seven different
positions of the uterus by scraping, namely ipsilateral cranial, ipsilateral middle, ipsilateral
caudal, contralateral cranial, contralateral middle, contralateral caudal and corpus
(Bauersachs et al. 2005). Blood samples were collected from each animal before
slaughtering by jugular venipuncture. The blood samples were refrigerated at 4°C for 12-
24 hrs before being centrifuged at 1500 g at 4°C for 20 min. Serum was separated and
stored at -20°C until assayed to determine progesterone concentration by time-resolved
fluoroimmunoassay using an AutoDELFIA™ Progesterone kit (Perkin Elmer, Wallac Oy,
Turku, Finland).

Materials and methods _________________________________________________________________________
54
3.2.3 Immunohistochemical localization of candidate genes
The protein expressions of IRF6, ITPR1, PTGS2, MMP2 and TIMP3 were localized in the
ipsilateral middle part of the uterine tissue section at different days of the estrous cycle and
at day 50 of the gestation period. For this, the sections were washed in PBS and fixed in
4% (w/v) para formaldehyde overnight at 4°C. The fixed specimens were permeabilized in
0.5% (v/v) Triton-X100 (Sigma) in phosphate buffer saline solution (PBS) and blocked in
3% (w/v) bovine serum albumin (BSA) (Roche Diagnostics, Basel, Switzerland) in PBS.
The samples were incubated overnight using rabbit polyclonal primary antibody specific
IRF6, ITPR1, PTGS2 or MMP2 and mouse anti-human monoclonal antibody specific to
TIMP3. Rabbit polyclonal primary antibody (Santa Cruz Biotechnologies Inc., CA., USA)
against IRF6 and PTGS2 was diluted at 1:100 and rabbit polyclonal primary antibody
(Lifespan Biosciences, USA) against ITPR1 and MMP2 was diluted at 1:50 in blocking
solution. Mouse anti-human monoclonal antibody (LifeSpan biosciences, Inc, WA, USA)
against TIMP3 was diluted 1:100 in blocking solution. Fluorescein isothiocyanate (FITC)
conjugated goat anti-rabbit secondary antibody (Lifespan Biosciences, WA, USA) diluted
at 1:100 was used in all cases except TIMP3. Cy3 conjugated Goat anti-mouse secondary
antibody (Jackson ImmunoResearch Laboratories, Inc. PA, USA), diluted at 1:100 used for
TIMP3. Counterstaining was performed using 4', 6'-diamidino-2-phenylindole
hydrochloride (DAPI) (Burlingame, CA, USA). After the final wash in PBS, the sections
were mounted on glass slides and visualized on an ApoTome microscope (Carl Zeiss
MicroImaging Inc., Germany).
3.2.4 Pre-transfer embryonic gene expression in relation to pregnancy outcome
3.2.4.1 RNA isolation from embryo biopsies
Total RNA was extracted from 15 embryos that resulted in calf delivery or no pregnancy
in three pools each consisting of five embryos using PicoPureTM RNA isolation kit
(Arcturs, CA, USA). For this, 20 µl extraction buffer was added to each embryo biopsy
followed by incubation at 42° for 30 min. At the end of the incubation time, embryos from
the same treatment group were pooled together and 1 volume 70% ethanol was added to
the pooled samples. The samples were transferred to the pre conditioned purification
column. The RNA was then bind to the column by centrifugation for 2 min at 1057 rpm,
immediately followed by a centrifugation at 13500 rpm for 30 s. After washing with 100
Materials and methods _________________________________________________________________________
55
µl wash buffer 1 at 9475 for 1 min, on column DNase treatment was performed for 15 min
using RNase-fee DNase (Qiagen, CA, USA). Following this, the samples were washed for
15 s with 40 µl wash buffer followed 100 µl wash buffer 2 for one min at 9457 rpm. After
the second wash with 100 µl wash buffer 2 at 13500 rpm for 2 min, the purification
column was transferred to a new 0.5 ml microcentrifuge tube. The RNA was then eluted
using 12 µl elution buffers. One micro litter of the RNA was used to determine the
concentration and quality using Nanodrop 8000 Spectrophotometer.
3.2.4.2 RNA amplification from embryo biopsies
3.2.4.2.1 First and second stranded cDNA synthesis
First strand cDNA was synthesized from total RNA samples of embryo resulted in calf
delivery and no pregnancy group using T7 promoter attached oligo (dT)21, superscript
reverse transcriptase II (Invitrogen, CA, USA) and random hexamers as described
previously (El-Sayed et al. 2006, Ghanem et al. 2007, Salilew-Wondim et al. 2007).
Second strand cDNA was then synthesized using degenerated oligonucleotide primer
(DOP)-PCR master kit (Roche Diagnostics GmbH, Mannheim, Germany) according to the
manufacturer’s recommendation. Briefly, 1 µl DOP primer, 1 µl T7 primer, 40 µl 2xDOP
master mix and 16 µl RNasin were added to 20 µl first cDNA and incubated at 95 oC for 5
min, 94 oC for 1min and 30 oC for 2 min. Subsequently the temperature was increased at
the rate of 0.2 ˚C /s until it reaches 72 ˚C and incubated for 3 min at this temperature.
Afterwards, the global PCR amplification was continued for the rest of 10 cycles at 94 ˚C
for 30 s, 60 ˚C for 30 sec, 72 ˚C for 3 min. The reaction was terminated after final
extension at 72 oC for 7 min. Following this, the double stranded DNA (dscDNA) was
purified using phenol-chloroform extraction method. For this, 80 µl phenol-chloroform
was added to 80 µl dscDNA and centrifuged at 14000 rpm for 15 min. The aqua-phase was
transferred to 2 ml tube to which 1 µl glycogen, 40 µl 5 M ammonium acetate, 200 µl
100% ethanol were added. The samples were then kept at -20 oC over nigh. In the next
day, the samples were centrifuged using refrigerated universal centrifuge Z233MK
(Hermle Labortechnik, Wehingen, Germany) at 14000 rpm for 30 min. After removing the
supernatant, the dsCDNA pellets were washed in 500 µl 70% ethanol. After removing all
traces of ethanol, the pellets were dissolved in 10 µl of RNase free water.

Materials and methods _________________________________________________________________________
56
3.2.4.2.2 In vitro transcription
The double strand cDNA was in vitro transcribed and amplified using AmpliScribe T7
transcription kit (Epicentre technologies, WI, USA). For this, a 10 µl in vitro transcription
mix (2 µl 10x reaction buffer, 4µl dNTP mix [1 µl from each 0.1M ATP, 0.1M CTP, 0.1M
GTP and 0.1M UTP), 2 µl DTT and 2 µl T7 RNA polymerase] was added to the 10 µl
dscDNA. In vitro transcription and amplification was carried out at 42 oC for 3.5 h.
Following DNase treatment at 37 oC for 30 min, amplified RNA was purified using
RNeasy mini kit (Qiagen, Hilden, Germany). After the final wash, the aRNA was eluted in
30 µl RNase free water. The concentration and purity of the aRNA was evaluated using
Nanodrop 8000 Spectrophotometer (Thermo Fisher Scientific Inc, DE, USA).
3.2.4.3 Aminoallyl labeling and dye coupling
Minimum information about microarray experiments (MIAME) guidelines (Brazma et al.
2001) was adhered to the experimental design. Three micrograms of amplified RNA from
embryo resulted in calf delivery or no pregnancy was used as template in reverse
transcription reaction. Aminoallyl-modified dUTPs were incorporated into the cDNA
using the cyscribe post-labeling kit (Amersham Biosciences, Freiburg, Germany). The
aRNA, anchored oligo (dT) and random nanomer primers were co incubated at 70 ˚C for 5
min followed by 10 min incubation at room temperature. Following this, 10 µl reaction
mix (containing 4 µl of 5x first strand buffer, 2 µl of 0.1 M DTT, 1.5 µl of dNTP mix, 1.5
µl aminoallyl dUTP and 1µl CyScript reverse transcriptase) was added and incubated at 42
˚C for 90 min. At the end of this reaction, 2 µl of 2.5 M NaOH was added to hydrolyse any
rest of mRNA and incubated at 37 ˚C for 15 min. After adding 10 µl of 2 M HEPES,
aminoallyl labelled cDNA samples were purified using CyScribeTM GFXTM Purification
kit (Amersham Biosciences, Freiburg, Germany). The purified aminoallyl labelled cDNA
samples were then eluted in 60 µl 0.1 M sodium bicarbonate and immediately labelled by
CyTM fluorescent dyes using Amersham post-labeling kit (Amersham Bioscience,
Freiburg, Germany). For this, purified aminoallyl cDNA in (0.1M sodium carbonate) was
directly added into aliquot of CyTM fluorescent dyes using the cyscribe post-labeling kit
(Amersham Biosciences, Freiburg, Germany), dissolved in DMSO. Those aminoallyl
cDNA derived from those embryos resulted in calf delivery were labelled with N-
hydroxysuccinate-derived Cy5 dye and those samples of embryo resulted in no pregnancy

Materials and methods _________________________________________________________________________
57
were labelled with Cy3 dye. To avoid variation due to dye coupling, aminoallyl labelled
cDNA samples of the calf delivery group were labelled with Cy3 and no pregnancy groups
were labeled with Cy5 dyes. The dye labelled samples was then incubated for 15 min at
room temperature in dark. At the end of incubation, non reacting dyes were quenched by
adding 15 µl of 4 M hydroxylamine solution (Sigma-Aldrich Inc, MO, USA) and
incubated for 15 min at room temperature in dark. The reaction was then purified with
CyScribeTM GFXTM Purification kit (Amersham Biosciences, Freiburg, Germany) and
finally eluted in 60 µl elution buffer.
3.2.4.4 Hybridization to the target probes
3.2.4.4.1 Target clones
Ready made bovine cDNA array (BlueChip version 3, kindly provided by Prof. Marc-
André Sirard, (Laval University, Quebec, Canada) was used for hybridization. The
BlueChip array consisting of more than 3000 probesets (6766 spots) and about 2300
targets genes derived from subtraction suppressive hybridization of bovine embryo and
tissues. In addition to the target probesets, the BlueChip array consists of control clones.
The name of control clones include, alien1 (530 spots), alien2 (540 spots), GFP (4 spots),
Doublets (96), GFP (348 spots), GFP½ (30 spots), GFP1 (30 spots), GFP¼ (6 spots),
GFP1/8 (6 spots), GFP 1/16 (6 spots) and H2O/DMSO (380), Negative (6 spots), plant
(540 spots), vide (96 spots), tubulin (8 spots), ubiquitin (8 spots) and actin (12 spots).
3.2.4.4.2 Probe preparation and hybridization
Before hybridizing, the arrayed slides were placed in a corning GAPS II slide container
containing 50 ml pre-hybridization buffer [0.5 g bovine serum albumin (Roche
Diagnostics, Basel, Switzerland) + 0.5 ml 10% SDS + 7.5 ml 20% SSC + 42 ml sterile
water] and incubated for 20 min at 55 oC. After the end of incubation, the slides were
sequentially washed with boiled and cold water and isopropanol. The slides were then
centrifuged at 2000 rpm for 2 min. Immediately before hybridization, dye labelled probes
were dissolved in 55 µl formamid based buffer (15 µl hybridization buffer + 30 µl 100%
formamid + 10 µl distilled water) to which 2.5 µl yeast tRNA and 2.5 µl human cot-DNA
(Invitrogen, Karlsruhe, Germany) were added to avoid non specific hybridization. After
denaturing at 95 oC for 5 min, the mix was then hybridized to the array and covered with

Materials and methods _________________________________________________________________________
58
cover slips (ROTH, Karlsruhe, Germany). A total of six hybridizations (three biological
and three technical replicates as dyeswap) were carried out between the two sample
groups. The hybridized array slide was then placed in the hybridization chamber (GFL,
Dülmen, Germany) and incubated at 42 oC for 20 h in dark. At the end of the incubation,
the slides were sequentially washed for 10 min with 2x SSC plus 0.1% SDS, 5 min each
with 0.2x SSC and 0.1% SSC buffers, 1 min each with water and isopropanol and
centrifuged at 2000 rpm for 2 min.
3.2.4.5 Image capture and quantification
Microarray slides were scanned using Axon GenePix 4000B scanner (Axon Instruments,
Foster City, CA). The images of the spots were quantified to create reports of spot
intensity data using GenePix Pro analysis software (version 4.0) (Axon Instruments, Foster
City, CA). The images were saved as a multiple channel image and as a single image for
both channels (Cy3 and Cy5) in 16-bit tagged image file format (TIFF).
3.2.4.6 Microarray data analysis from embryo biopsies
The normal expression and offset method was used to correct the background (Ritchie et
al. 2007). LOESS normalization was applied to normalize within array variations (Smyth
and Speed 2003, Yang et al. 2002) and scale-normalization was used to normalize
differences between arrays due to changes in the photomultiplier tube setting of the
scanner. A mean log2 transformed value of (Cy5/Cy3) was calculated from three replicates
to obtain one value per clone. The raw and normalized data are available at Gene
Expression Omnibus (GEO), http://www.ncbi.nlm.nih.gov/geo/ with accession number
GSE21047 or GSE21049. Differentially expressed genes were obtained using linear
models for microarray data (LIMMA) (Smyth 2005). Those genes whose average
expression value ≥ 1.5 fold change and p < 0.05 were considered as differentially
expressed genes. The heatmap of differentially expressed genes was drawn using the
heatmap function of bioconductor.

Materials and methods _________________________________________________________________________
59
3.3 Validation of differentially expressed genes using quantitative real time polymerase
chain reaction (qPCR)
3.3.1 Primer design and gene specific PCR amplification
In the current study, qPCR was used to validate differentially expressed genes and to
quantify some candidate genes across the estrous cycle. For this, sequence specific primers
were designed using primer express v 2.0 (Applied Biosystems, Foster city, CA) or primer
3.0 online primer design tool (http://frodo.wi.mit.edu/primer3/) for candidate genes that
were differentially expressed in endometrial biopsies (Table1) and embryo biopsies (Table
2). All primers were purchased from Eurofins MWG synthesis GmbH (MWG Biotech,
Eberberg, Germany) and diluted at 100 pm stock solution. The PCR reaction was carried
out for each primer in 20µl reaction volume using 2 µl cDNA template, 4 µl of 10x PCR
buffer (Sigma-Aldrich), 0.5 µl of dNTP, 0.5 µl of each specific primer (10 pmole forward
and reverse), 0.5 µl of Taq polymerase (Sigma-Aldrich) and millipore water was added to
complete the rest of the volume. After the end of the reaction, 5 µl of the PCR product was
loaded onto ethidium bromide stained 2 % agarose gel run in 1xTAE buffer. The presence
and specificity of DNA bands were observed under BioRad Chemidoc XRS Gel
Documentation System (Biorad, Munchen, Germany). After confirmation of specific DNA
bands, the amplified PCR product was sequenced to verify the identity of the gene. For
this, the sequence reaction was carried out by using 2µl 10 pm reverse primer or forward
primer to 5 µl PCR product. Subsequently, 4 µl master mix (DTCS) and 9 µl Millipore
water was added to final volume of 20 µl. Afterwards, the sequence reaction was carried
out for 30 cycles at 96 oC for 20 s, 50 oC for 20 s and 60 oC for 4 min. Afterwards, the
sequencing reaction was transferred to a 5µl stop solution [1µl glycogen, 2 µl 3M NAOAc
(PH 5.2), 2 µl 0.1M EDTA (PH 8)]. The mixed was homogenized by vortexing. After
adding 60 µl 100% ethanol, the samples were centrifuged at 14000 rpm for 15 min at 4 oC
in refrigerated universal centrifuge Z233MK (Hermle Labortechnik, Wehingen, Germany).
After this, the supernatant was removed and again the samples were washed two times in
200 µl 70 % ethanol and dried in room temperature. Finally, the pellets were dissolved in
40 µl SLS and transferred to the sequencing plate, covered with mineral oil (Beckman
Coulter, Krefeld, Germany) and immediately loaded to CEQTM 8000 Genetic Analysis
(Beckman Coulter, Krefeld, Germany) sequencing machine. The similarity of the sequence
result to the original sequence was verified using the NCBI/BLAST search tool
(http://blast.ncbi.nlm.nih.gov/Blast.cgi).
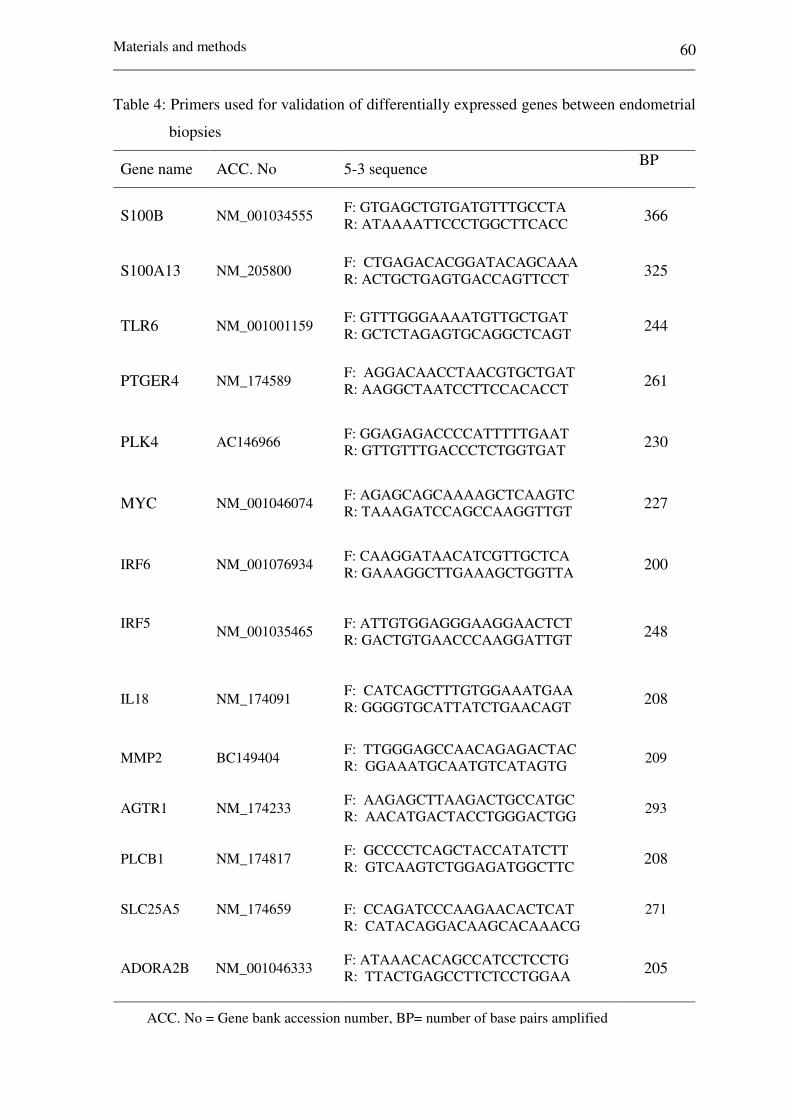
Materials and methods _________________________________________________________________________
60
Table 4: Primers used for validation of differentially expressed genes between endometrial
biopsies
Gene name ACC. No 5-3 sequence BP
S100B
NM_001034555 F: GTGAGCTGTGATGTTTGCCTA R: ATAAAATTCCCTGGCTTCACC 366
S100A13
NM_205800 F: CTGAGACACGGATACAGCAAA R: ACTGCTGAGTGACCAGTTCCT 325
TLR6
NM_001001159 F: GTTTGGGAAAATGTTGCTGAT R: GCTCTAGAGTGCAGGCTCAGT 244
PTGER4
NM_174589 F: AGGACAACCTAACGTGCTGAT R: AAGGCTAATCCTTCCACACCT 261
PLK4 AC146966
F: GGAGAGACCCCATTTTTGAAT R: GTTGTTTGACCCTCTGGTGAT
230
MYC
NM_001046074 F: AGAGCAGCAAAAGCTCAAGTC R: TAAAGATCCAGCCAAGGTTGT 227
IRF6
NM_001076934
F: CAAGGATAACATCGTTGCTCA R: GAAAGGCTTGAAAGCTGGTTA
200
IRF5
NM_001035465
F: ATTGTGGAGGGAAGGAACTCT R: GACTGTGAACCCAAGGATTGT
248
IL18 NM_174091
F: CATCAGCTTTGTGGAAATGAA R: GGGGTGCATTATCTGAACAGT
208
MMP2
BC149404 F: TTGGGAGCCAACAGAGACTAC R: GGAAATGCAATGTCATAGTG 209
AGTR1
NM_174233 F: AAGAGCTTAAGACTGCCATGC R: AACATGACTACCTGGGACTGG 293
PLCB1
NM_174817 F: GCCCCTCAGCTACCATATCTT R: GTCAAGTCTGGAGATGGCTTC 208
SLC25A5 NM_174659 F: CCAGATCCCAAGAACACTCAT R: CATACAGGACAAGCACAAACG
271
ADORA2B NM_001046333
F: ATAAACACAGCCATCCTCCTG R: TTACTGAGCCTTCTCCTGGAA
205
ACC. No = Gene bank accession number, BP= number of base pairs amplified

Materials and methods _________________________________________________________________________
61
Table 4: Cont.
Gene name ACC. No 5-3 sequence BP
CAMK2D
NM_001046333 F: TGCCTGCATAGCGTACATTAG R: AGGACCTTCACAACTTCATGC 229
FUT8
NM_177501 F: CTTGGTCAGCTGGACTACACA R: GTTCGAGGTTCGTGAGGATAA 252
B3GNT2
NM_001102497 F: AGTGACTGCTTTCCTGTTTCAG R: TCCCCCAAAAGAGAACAGAT 216
ALG8
NM_001076125 F: CGTACTGATTGACCCTCCTGT R: TATGGAGGACAAGTGGCTTCT 231
CDC2 NM_174016
F: TTTGGGCACTCCCAATAAT R: AACACAGGGAAACTGTCAGA
242
CCNB2
NM_174264 F: TGGAGCTGACTCTCGTTGAC R: CTGAGGAATCGTGCTGATCT 253
NGF
NM_001099362 F: GGGAGAGGTGAACATCAAC R: TCTTCCTGCTGAGCACAC 233
RPS6KA5
XM_580522 F: GCTTTTCCTCCTGTAGTCA R: ACTTCCTCTCTTGCATAGG 251
MAPK12
NM_001098953 F: ATGGAATCTCTCTTGGAAGC R: TCCTCAGCACAGTTCAG 241
MAP4K2
XM_869702
F: GCTCACAGCAACCTCTACAT R: TGACAGCAGCTTCTTCTGGT
264
SFRP1
NM_174460 F: CTCCCTAAGGCATCTTGTCTG R: CAGGAATCTCGTCTGTGTCC
213
PRKACB
BC149047 F: GTACGTCTTTGGCTGTCGAGT R: ATCAGCATGTTCTTGGGTCT 218
WNT11
NM_001082456 F: TTGTGCTTTGCCTCCACT R: ACAGAACATTCCGTTGAGGAC 266
NGF
NM_001099362 F: GGGAGAGGTGAACATCAAC R: TCTTCCTGCTGAGCACAC 233
WNT11
NM_001082456 F: TTGTGCTTTGCCTCCACT R: ACAGAACATTCCGTTGAGGAC 266
AURKB NM_183084
F: TTTCTGCTCTGGTGAGGATTT R: TCCAGTGGTTAGGACTCCAAG
181
ACC. No = Gene bank accession number, BP= number of base pairs amplified

Materials and methods _________________________________________________________________________
62
Table 4: Cont.
Gene name ACC. No 5-3 sequence BP
TIMP3 NM_174473 F: AGCCAGCAGATAGACTCAAGG R: GCTTGCTCCAGACTCAGAAAC
193
CLD23 XM_592516 F: GGAGAATGAAGGGACTAATGCT R: AACAGGTTCCATTTTGTTCCA
102
STAT5A
AJ237937
F: TGTCTCCAACCTTGCTCACTA R: AAGAGGCCCTATTCCAAGTTC
230
COLA2
NM_174520 F: TTGAAGGAGTAACCACCAAGG R: TGTCCAAAGGTGCAATATCAA 320
MAPK12
NM_001098953 F: ATGGAATCTCTCTTGGAAGC R: TCCTCAGCACAGTTCAG 241
MAP4K2
XM_869702 F: GCTCACAGCAACCTCTACAT R: TGACAGCAGCTTCTTCTGGT 264
SFRP1
NM_174460 F: CTCCCTAAGGCATCTTGTCTG R: CAGGAATCTCGTCTGTGTCC
213
ITPR1
NM_174841 F: GCGCTAAATTAGAGGCTCAGA R: GTAGCATGTTGGTTCCGATG
218
MYLK
NM_176636 F: AGCCCCATGTAAAACCCTACT R: GGCTTCTCCAAGACTGTTGAC
262
F2R NM_001103097
F: GACCAACATATGGTGTGGACAA R: CACAGGAAGCAGTAACCCAAA
135
PRKACB BC149047
F: GTACGTCTTTGGCTGTCGAGT R: ATCAGCATGTTCTTGGGTCT
218
RPS6KA5
XM_580522 F: GCTTTTCCTCCTGTAGTCA R: ACTTCCTCTCTTGCATAGG 251
ACC. No = Gene bank accession number, BP= number of base pairs amplified
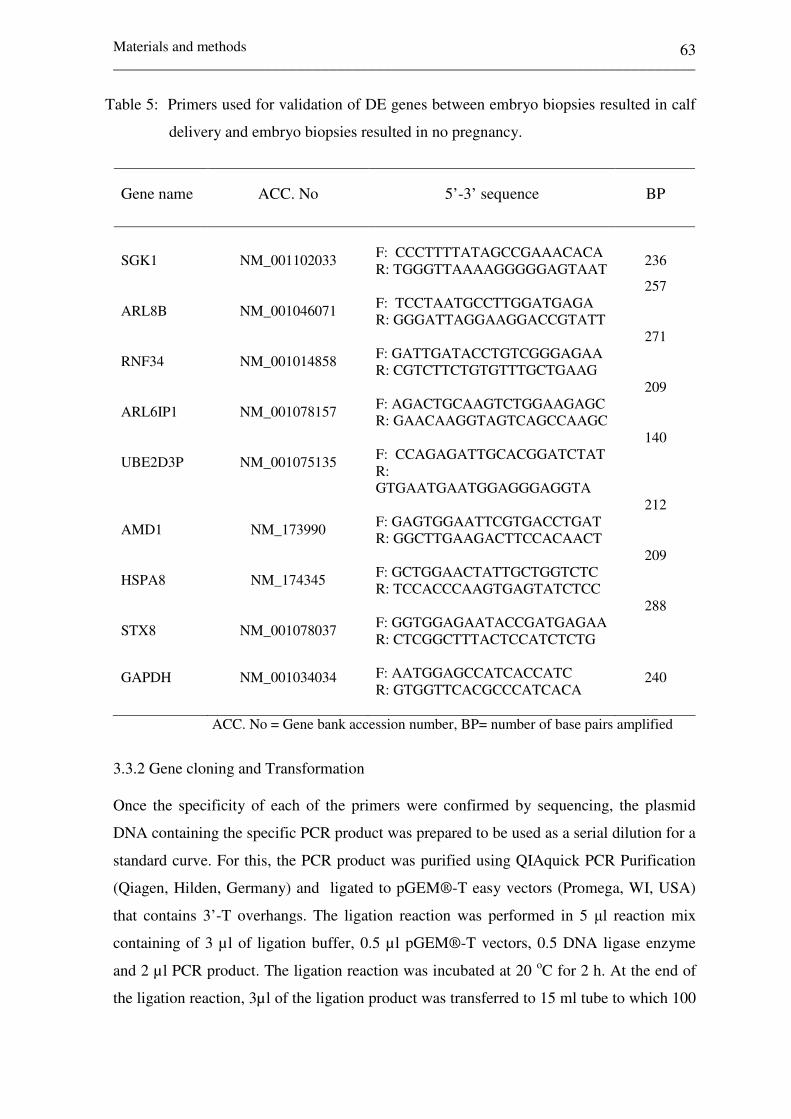
Materials and methods _________________________________________________________________________
63
Table 5: Primers used for validation of DE genes between embryo biopsies resulted in calf
delivery and embryo biopsies resulted in no pregnancy.
Gene name ACC. No 5’-3’ sequence BP
SGK1
NM_001102033
F: CCCTTTTATAGCCGAAACACA R: TGGGTTAAAAGGGGGAGTAAT
236
ARL8B
NM_001046071
F: TCCTAATGCCTTGGATGAGA R: GGGATTAGGAAGGACCGTATT
257
RNF34
NM_001014858
F: GATTGATACCTGTCGGGAGAA R: CGTCTTCTGTGTTTGCTGAAG
271
ARL6IP1
NM_001078157
F: AGACTGCAAGTCTGGAAGAGC R: GAACAAGGTAGTCAGCCAAGC
209
UBE2D3P
NM_001075135
F: CCAGAGATTGCACGGATCTAT R: GTGAATGAATGGAGGGAGGTA
140
AMD1
NM_173990
F: GAGTGGAATTCGTGACCTGAT R: GGCTTGAAGACTTCCACAACT
212
HSPA8
NM_174345
F: GCTGGAACTATTGCTGGTCTC R: TCCACCCAAGTGAGTATCTCC
209
STX8
NM_001078037
F: GGTGGAGAATACCGATGAGAA R: CTCGGCTTTACTCCATCTCTG
288
GAPDH NM_001034034
F: AATGGAGCCATCACCATC R: GTGGTTCACGCCCATCACA
240
ACC. No = Gene bank accession number, BP= number of base pairs amplified
3.3.2 Gene cloning and Transformation Once the specificity of each of the primers were confirmed by sequencing, the plasmid
DNA containing the specific PCR product was prepared to be used as a serial dilution for a
standard curve. For this, the PCR product was purified using QIAquick PCR Purification
(Qiagen, Hilden, Germany) and ligated to pGEM®-T easy vectors (Promega, WI, USA)
that contains 3’-T overhangs. The ligation reaction was performed in 5 µl reaction mix
containing of 3 µl of ligation buffer, 0.5 µl pGEM®-T vectors, 0.5 DNA ligase enzyme
and 2 µl PCR product. The ligation reaction was incubated at 20 oC for 2 h. At the end of
the ligation reaction, 3µl of the ligation product was transferred to 15 ml tube to which 100

Materials and methods _________________________________________________________________________
64
µl competent (E.coli, JM109 strain) was added. The competent cells and the ligation
product co incubated for 20 min in ice followed by 90 s heat shock at 42 oC and then 2 min
cold shock in ice. Afterwards, 700 µl of Luria-Bertani (LB) broth was added to the cells
and cultured at 37 oC in SHKE6000-8CE refrigerated Stackable Shaker
(Thermoscinentific, IWA, USA) for 90 min at 110 rpm speed. After 70 min, 20 µl of IPTG
and 20 µl of X-gal were uniformly distributed on the LB agar/ampicillin plate. After the
incubation period, the bacterial culture was plated onto pGEM®-T easy vectors LB
agar/ampicillin/IPTG/X-gal plate and incubated overnight at 37 oC.
3.3.2.1 Blue/white screening of recombinants and colony picking
Insertional inactivation of the α-peptide allows identification of recombinants by
blue/white screening on LB agar/ampicillin/IPTG/X-gal plate. Therefore, successful
cloning of an insert into pGEM®-T Easy vector interrupts the coding sequence of β-
galactosidase resulting recombinants in white colony formation. Following this, four
independent white colonies assumed to contain inserts were picked and inoculated to the
30 µl 1xPCR buffer and the same colony was inoculated to the 600 µl LB broth continuing
ampicillin. In addition, two independent blue colonies were picked and inoculated into the
PCR strip containing 30 µl 1xPCR to be used as a control. The inoculums in 600 µl LB
broth were incubated at 37 oC in SHKE6000-8CE refrigerated Stackable Shaker
(Thermoscinentific, IWA, USA) until the result of M13 product was known. The bacterial
suspension in the 30 µl 1xPCR was heated for 15 min at 95 oC. From this, 10 µl this lysate
was used as a template for M13 PCR reaction to which a mix consisting of 0.5 µl dNTP,
0.5 µl M13 forward primer (TTGTAAACGCGGCCAGT), 0.5 µl M13 reverse primer
(CAGGAAACAGCTATGACC), 2 µl 10x PCR reaction buffer was added. M13 PCR
reaction was carried out first by denaturing the at 95 oC for 3 min followed by 35 cycles
that repeated at 95 oC for 30 s, 59 oC for 30 s, 72 oC for 1 min. M13 PCR reaction was
termed after extension at 72 oC for 10 min. At the end of the reaction, 5µl of the M13
product mixed with 2 µl loading buffer was loaded to 2% agarose gel stained with
ethidium bromide. The colonies that contain PCR fragments (white colonies) were
identified depending the distance travelled by DNA fragment in 2% agarose gel
electrophoresis. The blue colonies were at lower position compared to the white colonies.
Following this, the colonies confirmed for the presence of PCR fragment were transferred
to 15 ml sterile tube and additional 5 LB broth/ampicillin was added. The bacterial

Materials and methods _________________________________________________________________________
65
suspension was further cultured over night at 37 oC to increase numbers and therefore the
amount of DNA.
3.3.2.2 Plasmid isolation
The plasmid was isolated using GenElute plasmid mini prep kit (Sigma-Aldreich, St.Lous,
USA) according to the manufacture’s recommendation. Briefly, overnight cultured
competent cells were pelleted by centrifuging at 13000 rpm for 1 min. The medium was
removed and the pellets were lysed with 200 µl lysis solution. Afterwards, the lysate was
incubated for 5 min at room temperature. Afterwards the cell debris were Precipitated by
adding 350 µl neutralization/binding solution and centrifuging at maximum speed for 10
minutes. Following this, the GenElute Miniprep binding column was inserted into a
provided microcentrifuge tube and 500 µl of the column preparation solution was added
followed by centrifugation at 13000 rpm for 30 s. The cleared lysate was then transferred
to the column and centrifuge at 13000 rpm for 30 s. The filtrate was decanted and 750 µl
of the diluted wash solution to was added to the column followed by centrifugation at
13000 for 30 s. The flow-through liquid was decanted and the column was centrifuged
again at maximum speed for 2 minutes without any additional wash Solution. Finally, the
spin column was transferred into a collection tube to which 50 µl of Millipore water was
added to the centre of the spin column membrane and centrifuged at speed of 13000 rpm
for 1 min. To confirm the presence of the plasmid DNA, 5 µl of the plasmid DNA was
analyzed in ethidium bromide stained 2% agarose gel electrophoresis running in 1x TAE
buffer. The concentration of the plasmid was determined using Nanodrop 8000
Spectrophotometer.
3.3.2.3 Plasmid or M13 sequencing
Although insertional inactivation of the α-peptide allows identification of recombinants
with on LB agar/ampicillin/IPTG/X-gal plate, the specificity of gene cloning was further
validated by sequencing of M13 PCR product or plasmids DNA isolated from overnight
cultured recombinant bacteria. A 15 µl mix consisting 2 µl M13 (1.6 pmol) reverse primer
or forward primer, 4 µl master mix (DTCS) and Millipore water was added to final volume
15 µl. The thermocyler program, post reaction clean and loading of the samples to CEQTM

Materials and methods _________________________________________________________________________
66
8000 Genetic Analysis sequencing machine was performed as indicated above for
sequencing PCR products.
3.3.2.4 Preparing serial dilution from plasmids
The serial dilution consisting of 101 to 109 copy number of molecules was prepared from
plasmid DNA using the online software, (http://molbiol.edu.ru/eng/scripts/h01_07.html),
which converts known DNA concentration to copy number of molecules. Briefly, to
determine the number of molecules, the plasmid concentration (ng/µl) and the nucleic acid
size (the size of the pGEM®-T easy vectors + PCR fragment of each gene) were submitted
to the software. The dilution that contains 109 molecules was then determined in 50 µl
volume based on the number of molecules obtained in 1 µl plasmid DNA. Following this
108 dilution was determined using 5 µl of 109 dilution and 45 µl Milipore water. The
remaining 107-101 dilutions were determined in the similar way using 5 µl of the higher
dilution and 45 µl of Millipore water.
3.3.3 Transcript level quantification
The minimum information for publication of quantitative real-time PCR experiments
(MIQE) guidelines were employed during measuring gene expression level using
quantitative real time PCR (Bustin et al. 2009). According to the guideline, qPCR was
used as abbreviation of quantitative real time PCR through the text. Following this, the
cDNA samples used for qPCR were synthesized by reverse transcription of total RNA
endometrial and embryo biopsy samples as described previously in our lab (El-Sayed et al.
2006, Ghanem et al. 2007, Salilew-Wondim et al. 2007). Prior to qPCR, the concentration
of the cDNA samples from each treatment group was determined using the Nanodrop 8000
Spectrophotometer (Biotechnology GMBH, Erlangen, Germany). Similar amount of
cDNA samples were used to compare samples from different treatment groups. The qPCR
was performed in 20 µl reaction volume containing iTaq SYBR Green Supermix with
ROX (Bio-Rad laboratories, Munich, Germany), the cDNA samples, the specific forward
and reverse primer in ABI PRISM® 7000 sequence detection system (Applied Biosystems,
Foster city, CA). The qPCR thermal cycling parameter was set as 95 oC for 3 min, 40
cycles of 15 sec at 95 oC and 45 sec at 60 oC. At the end of the qPCR reaction, the
specificity of amplification for each gene was evaluated by monitoring the dissociation
Materials and methods _________________________________________________________________________
67
(melting) curve. Transcript abundance of the samples was determined using the relative
standard curve method using a serial dilution of 101-109 copy numbers prepared from
plasmid DNA. The data generated was considered for further analysis provided that the
slope and the regression line (R2) of the standard curve were between (-3.2 to – 3.6) and >
0.99, respectively. Following this, the copy numbers of the target genes were normalized
against the housekeeping gene glyceraldehyde 3-phosphate dehydrogenase (GAPDH). The
expression of GAPDH was not significantly different between the samples to be compared.
The normal distribution was tested by the Kolmogorow–Smirnov method and those
skewed expression values were log2 transformed prior to statistical analysis. The Student’s
t-test or least significant difference test procedures of SAS version 9.2 (SAS Institute Inc.,
Cary, NC, USA) was used to determine mRNA differences between the samples.
Differences with p < 0.05 were considered as significant.

Results _________________________________________________________________________
68
4 Results
4.1 Embryo biopsy transfer and success rate
From 54 biopsied embryos transfers, 59% heifers returned to heat at day 21 and those
heifers were designated as non pregnant or non-receptive endometrium. The remaining
41% heifers were pregnant until day 56 and 27 % ended up with successful calf delivery.
Those heifers ended up with successful pregnancy and calf delivery were designated as
calf delivery group or receptive endometrium. Here the underline question was why some
transfers resulted in calf delivery and others not despite similarities in breed, age and
synchronization protocol. Thus, it was hypothesized that those two groups of heifers and
the corresponding transferred embryos may have different molecular enrichments that can
affect the embryo maternal communications for establishment pregnancy success.
Therefore, to investigate the molecular mechanism associated with the endometrial
receptivity and embryos implantation potential, the pre-transfer endometrial and
embryonic gene expression was investigated in relation to the pregnancy outcome using
endometrial and embryo biopsies techniques. The results of these comparisons are
presented as follows.
4.2 Pre-transfer gene expression in receptive and non-receptive endometrium
4.2.1 Pre–transfer gene expression in receptive and non-receptive endometrium at day 7 of
the estrous cycle
Using the GeneChip® Bovine Genome Array, consisting of over 23,000 bovine
transcripts, the gene expression differences were uncovered between the endometrium of
heifers that resulted in calf delivery and heifers resulted in no pregnancy at day 7 of the
estrous cycle during the pre-transfer period. For this, the gene expression profile of
biopsies taken at day 7 the estrus cycle from those subsequently resulted in calf delivery
[receptive endometrium (CDd7)] were compared to those endometrial samples taken at
day 7 of the estrous cycle from those subsequently resulted in no pregnancy [non-receptive
endometrium (NPd7)] following embryo transfer. The result revealed that from 8605
detected genes in both receptive (CDd7) and non-receptive endometrium (NPd7), a total of
1126 differentially expressed (DE) genes were identified between the two groups.

Results _________________________________________________________________________
69
B A
Figure 5: Pre-transfer endometrial transcriptome alteration between receptive (CDd7) and
non-receptive endometrium (NPd7) at day 7 of the estrous cycle. (A): The
number and fold change distribution of genes elevated in CDd7 or NPd7. (B):
The heatmap and hierarchical clustering showing the expression pattern of DE
genes in CDd7 and NPd7 endometrial samples. Labels in the horizontal axis of
the heatmap, CDd7-1, CDd7-2 and CDd7-3 represent independent biological
replicates in receptive endometrium and NPd7-1, NPd7-2 and NPd7-3 represent
independent biological replicates from non-receptive endometrium groups. The
horizontal dendrogram indicate the expression pattern of transcripts in CDd7 and
NPd7. The vertical dendrogram elucidates the similarities or differences of
transcript expression within the biological replicates and between CDd7 and
NPd7 endometrial samples. Red and green colors in (B) indicate the high and
low expression level, respectively.
From the total 1126 DE genes, the expression level of 612 genes was abundantly expressed
in receptive endometrium (CDd7) in which 81% exhibited 2 to 4 fold changes increase and
29% of them exhibited 4.1 to 23 fold change increased compared to NPd7 (Figure 5A).
The top abundantly expressed genes in CDd7 compared to NPd7 include CDC20, GCLC,

Results _________________________________________________________________________
70
PLLP, COL4A4, TMEM163, LOC510320, MTTP, NETO2, CDC2, COX6B2 and
PPP2R5A (Figure 6). On the other hand, the expression level of 514 DE genes was
reduced in CDd7, but abundantly expressed in NPd7. From those 88.3 % exhibited 2 to 4
and 10.7% showed 4.1 to 23 fold changes increases in NPd7 compared to CDd7 (Figure
5A).The top abundantly expressed genes in NPd7 compared to CDd7 include HOXA9,
COL1A2, NTRK2, COL3A1, GJA1, COL21A1, LHFP, IGJ, SPOP, OGN, COL6A1 and
PARC (Figure 6)
Figure 6: The expression pattern of DE genes exhibited ≥ 5 fold difference between CDd7
and NPd7. Labels in the horizontal axis of the heatmap, CDd7-1, CDd7-2 and
CDd7-3 represent independent biological replicates from receptive endometrium
and NPd7-1, NPd7-2 and NPd7-3 represent independent biological replicates
from non-receptive endometrium groups. The red and green colors indicate high
and low expression pattern, respectively.

Results _________________________________________________________________________
71
4.2.1.1 Differentially expressed gene clusters between receptive and non receptive
endometrium at day 7 of the estrous cycle
From the 1126, DE genes identified between receptive (CDd7) and non-receptive (NPd7)
endometrium, there were several gene clusters whose expression was elevated either in
CDd7 or in NPd7. Among those, the expression levels of solute carrier genes, cell division
or cell cycle related genes, adaptor related genes, kinesin genes, leucine rich repeats, coiled
domains, ATPases, protein kinases and phosphatase gene clusters, transmembrane
proteins, junctional adhesion molecules, integrins and WD repeats were higher in CDd7
(Figure 7). On the other hand, the expression levels of cluster of genes including cluster of
differentiation molecules (CD), chemokine molecules, homeobox genes, collagen families,
S100 calcium binding protein and zinc finger proteins were increased in (NPd7) (Figure
8). Apart from these, the fold changes, the UniGene ID, the gene symbol and full name of
the first 300 DE genes are described in appendix 2.
Figure 7: Genes clusters exhibited increased expression level in receptive (CDd7)
compared to non-receptive endometrium (NPd7) at day 7 of the estrous cycle.

Results _________________________________________________________________________
72
Figure 8: Gene clusters exhibited reduced expression level in receptive endometrium
(CDd7) but increased in non-receptive endometrium (NPd7) at day 7 of the
estrous cycle.
4.2.1.2 Transcriptomic functional alteration in receptive and non-receptive endometrium at
day 7 of the estrous cycle
To investigate the transcriptomic functional changes that have been occurred in receptive
and non-receptive endometrium at day 7 of the estrous cycle, the gene ontology (GO)
enrichment of biological process and molecular function was analyzed for those genes
differentially expressed between CDd7 and NPd7. Thus, 15 and 13 biological processes
were found to be overrepresented in those DE genes that were elevated in CDd7 and
NPd7, respectively (Figure 9). The biological process overrepresented in CDd7 include,
macro molecule localization or cellular material transport (FABP5, solute carrier genes,
ITPR1, VDAC1, adapter related proteins, KIF20A, KIF4A), regulation of transcription

Results _________________________________________________________________________
73
(PPARA, MYB, NR2F1, PPARGC1A, HEY1, TFDP2, ASF1B, MED27, IRF6), signal
transduction (PTGER4, F2RL1, ADORA2B, SPHK1, ADAM10, ITGA2, PLCB1, RPS6KA5,
RAB9B, WNT11), post translational modification (BMPR2, MAPK6, PLK1, MARK1, PPM1G,
PTPN3, RNF144B, UBE2S), cell cycle or cell division related process (CDC2, CCNA2,
CCNB2, AURKB, UBE2C, PTTG1, CDCA2, NUSAP1, CKS2, BIRC5) and apoptosis (BCL2,
CDC2, BIRC5, GCLC). The representative biological processes of GO terms and the
expression pattern of DE genes enriched in CDd7 is indicated in figure 10. On the other
hand, cellular metabolic processes, response to stimuli, immune response and induction of
apoptosis and chemokine activity were among the biological process overrepresented in
those genes whose transcript level was elevated in NPd7 compared to CDd7 (Figure 9B).
The representative GO terms and the expression patterns of DE genes enriched in NPd7
are indicated in figure 12.
Figure 9: Ontological classification of DE genes that were elevated in CDd7 or NPd7
according to their biological process. (A): Biological processes overrepresented
in genes elevated in CDd7. (B): Biological process of overrepresented in genes
elevated in NPd7. The vertical axis indicates biological processes and the
horizontal axis indicate the number of DE genes involved in a specified
biological process. DE = differentially expressed.
A B
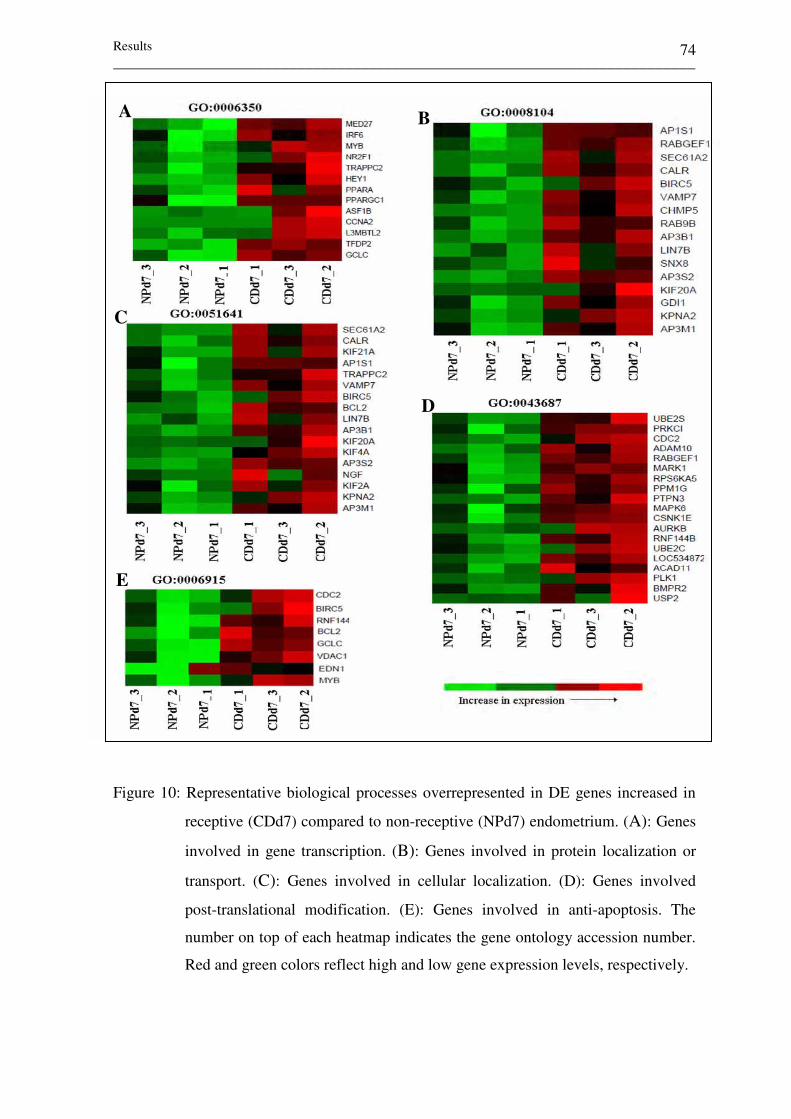
Results _________________________________________________________________________
74
Figure 10: Representative biological processes overrepresented in DE genes increased in
receptive (CDd7) compared to non-receptive (NPd7) endometrium. (A): Genes
involved in gene transcription. (B): Genes involved in protein localization or
transport. (C): Genes involved in cellular localization. (D): Genes involved
post-translational modification. (E): Genes involved in anti-apoptosis. The
number on top of each heatmap indicates the gene ontology accession number.
Red and green colors reflect high and low gene expression levels, respectively.
A B
C
D
E

Results _________________________________________________________________________
75
Figure 11: Biological processes or molecular functions overrepresented in genes exhibited
increased transcript level in non-receptive (NPd7) compared to receptive
endometrium (CDd7) at day 7 of the estrous cycle. (A): Genes involved in
immune system. (B): Genes involved in induction of apoptosis. (C): Genes
involved in transcription regulation. (D): Genes involved in chemokine or
cytokine activity. (E): Genes involved in extracellular matrix. The number on
top of each heatmap indicates the gene ontology accession number. Red and
green colors reflect the high and low expression, respectively.

Results _________________________________________________________________________
76
46%
11%9%
5%
4%
4%3%
3%3%
3%3%
3%3%
Chemokine activityChemokine receptor bindingG-protein-coupled receptor bindingEndopeptidase inhibitor activityGrowth factor activityCalmodulin binding
Protein bindingTranscription regulator activityReceptor bindingCytokine activityProtease inhibitor activityEnzyme inhibitor activityExtracellular matrix
In addition to the biological process, the DE genes were classified according to molecular
functions describing different activities that occurred at the molecular level. Thus, several
significant molecular functions were overrepresented in those genes elevated in CDd7 or
NPd7 (Figure 12). Some of molecular function overrepresented by those genes reduced in
CDd7 but elevated in NPd7 include protein binding, transcription factor activity
(CREB3L4, STAT5A, ELF1, FLI1, NFIB, MYC, IRF5, SIX1, HOPX and HOXA11),
kemokine activity (CXCL2, CXCL1, CXCL5, XCL1) (Figure 11D) extracellular matrix
structural constituent (COL1A1, COL1A2, COL3A1, COL27A1) (Figure 11E). On the
other hand, several molecular functions include binding activities (protein, ion, nucleic
acid and ATP binding), transferase activity, transmembrane transport (ITPR1, solute
carriers, transmembrane proteins, VDAC1), metal peptidase activities, symporter activity
and kinase activity were overrepresented in genes elevated in CDd7 compared to NPd7
(Figure 13).
.
`
Figure 12: Molecular function overrepresented in genes enriched in receptive (CDd7) (left)
and non-receptive endometrium (NPd7) (right) at day 7 of the estrous cycle.
17%
12%
11%
10%10%9%
7%
6%
5%4% 4% 2%2% 1%
Metal ion bindingNucleotide bindingPurine nucleotide bindingTransferase activityAdenyl nucleotide bindingATP bindingTransporter activityCalcium ion bindingKinase activityMagnesium ion bindingPhosphotransferase activityMetallopeptidase activityTransmembrane transporter activitySymporter activity

Results _________________________________________________________________________
77
Figure 13: Representative molecular functions overrepresented in genes enriched in CDd7
compared to NPd7. (A): Genes involved in transporter activity. (B): Genes
involved in calcium ion binding activity. (C): Genes involved in magnesium
ion binding. (D): Genes involved in kinase activity. The number on top of each
heatmap indicates the gene ontology accession number. Red and green colors
reflect high and low expression, respectively
D C
B A
C

Results _________________________________________________________________________
78
4.2.1.3 Molecular pathway identified in differentially expressed genes between receptive
and non-receptive endometrium at day 7 of the estrous cycle
To understand transcriptomic signaling and metabolic alteration in receptive and non-
receptive endometrium, the most important pathways involved by DE genes were
identified from the Kyoto Encyclopedia of Genes and Genomes (KEGG) database.
Accordingly, those genes that were differentially expressed between CDd7 and NPd7 were
found to be involved in 25 molecular pathways (Table 6). Functionally, those pathways
were classified broadly into 8 groups namely, cell communication (Integrin Signaling,
tight junction and focal adhesion), signaling molecules and interaction (ECM-receptor
interaction and cytokine-cytokine receptor interaction), signal transduction (MAPK
signaling pathway and calcium signaling pathway), cell growth and death (p53 signaling
pathway, cell cycle, apoptosis), nervous system (long-term potentiation), genetic
information processing (ubiquitin mediated proteolysis) and immune system (Toll receptor
pathway, hematopoietic cell lineage, antigen processing and presentation and T cell
receptor) and endocrine system (insulin signaling pathway, PPAR signaling pathway and
GnRH signaling pathway.
From these, the tight junction, integrin signalling, inositol phosphate metabolism, calcium
signalling pathway, glycan structures biosynthesis 1, focal adhesion, apoptosis, cell cycle,
vascular endothelial growth factor (VEGF), long term potentiation and PPAR signalling
pathways were enriched by genes increased in CDd7. The graphical illustration and the
number of DE genes involved in one of those with highest number of DE genes, tight
junction pathway is indicated in figure 14. Similarly, T cell receptor pathway, cytokine-
cytokine receptor, p53 signalling pathway, Jak-STAT signaling pathway and cell adhesion
pathways were dominated by DE genes whose expression was elevated in NPd7.

Results _________________________________________________________________________
79
Figure 14: Differentially expressed genes between CDd7 and NPd7 involved in tight
junction pathway. The claudin and junctional adhesion molecules (JAMs),
which makeup the transmembrane protein of this pathway, were increased in
CDd7. In the cytoplasmic plaque, aPRC, PP2A, PRKC, MYOSIN and RHO
contains differentially expressed genes. Genes elevated in CDd7 are marked
by red background and those elevated in NPd7 are marked with blue
background.

Results __________________________________________________________________________________________________________________
80
Table 6: Molecular pathways containing genes elevated in receptive (CDd7) and non-receptive endometrium (NPd7)
Name of molecular pathways Differentially expressed genes Pathway category
Tight junction TIAM1, F2RL2, PRKCI, CLDN23, CLDN5, JAM3, JAM2, CLDN7, ARHGEF2, PRKCQ, MRAS, MYLK Cell communication Focal adhesion ITGA2, ITGA6, VEGFB, COL4A4, COL6A2, COL6A3, PPP1CC, PPP1CB ,MYLK, COL1A1, COL1A2 Cell communication
Integrin Signaling ROCK1, PPP1CC, TSPAN7, DIRAS3, ITGA2, MRAS, ITGA6, PPP1CB, RND3, MYLK, BCAR Cell communication Inositol Phosphate metabolism PRKCQ, SGK1, MAPK6, CDK6, PLCB1, PLK1, IHPK2, ITPKA, PLCL2, CDC2, INPP1 Metabolism ECM-receptor interaction CD36, HMMR, ITGA2, COL4A4, COL6A2, COL6A3, AGRN,COL1A1, COL1A2, Signaling molecules Cytokine-cytokine receptor interaction VEGFB, BMPR2, CSF3, IL18, TNFSF13, SDF1, CXCL2, CXCL1, CXCL6, XCL1 Signaling molecules
MAPK signaling pathway NGF, RPS6KA5, MAPK12, MAPK6, NTRK2, MYC MRAS, MAPK13, PTPRR Signal Transduction
Apoptosis NGF, CDC2, CCNB2, DDB2, CDK6, BIRC5, FFA, BCL-2, TP53I3, SNAI2 Cell growth and death
Calcium signaling pathway SLC25A5, PLCB1, ITPR1, MYLK, F2R, ADORA2B, CAMK2D, AGTR1 Signal Transduction
Ubiquitin mediated proteolysis UBE2C, SYVN1, CDC20, DDB2, PIAS2, UBE2S, UBE2L6, UBE3B Genetic information processing
T cell receptor MAPK1, PRKCQ, LAT, CD247, CD8A, CD8B, LCK, MAPK132 Immune system p53 signaling pathway CDC2, CCNB2, DDB2, TIMP3, CDK6, TP53I3, SNAI2, SERPINB5 Cell growth and death Neuroactive ligand-receptor interaction PTGER4, F2RL2, ADORA2B, F2R F2RL1, CALCRL, AGTR1 Signaling molecules
GnRH signaling pathway PLCB1, ITPR1, MAPK12, ITGA6, CAMK2D, MAPK13, MMP2 Endocrine system Cell cycle CDC2, CCNA2, CCNB2, CDC20 , PLK1,CDK6 Cell growth and death
PPAR signaling pathway FABP5, PPARA, PLTP, SLC27A4, ACOX2, CD36, Endocrine system Insulin signaling pathway PPP1CC, PPARGC1A, PRKCI, PPP1CB, SOCS2 Endocrine system
Long-term potentiation PPP1CC, PLCB1, ITPR1, PPP1CB, CAMK2D Nervous System
Glycan structures biosynthesis FUT8, B4GALT4, B3GNT2, ALG8, ALG11 Metabolism Hematopoietic cell lineage ITGA2, ANPEP, CD8B, CD36, CD8A, CSF3 Immune system Antigen processing and presentation HSPA2, CD8B, LOC508720, CALR, CD8A Immune system
Jak-STAT signaling pathway PIAS2, CSF3, STAT5A, SOCS2, MYC Signal Transduction Cell adhesion molecules JAM2, PDCD1LG2, CD8A, CD8B Signaling molecules
VEGF signaling pathway VEGFB, MAPK12, PTGS2, MAPK13 Signal Transduction
Toll receptor pathway MAPK12, IKBKE, MAPK13, IRF5 Immune System Genes elevated in receptive (CDd7) are indicated in bold face and those enriched in non-receptive endometrium (NPd7) are lightfaced

Results _________________________________________________________________________
81
4.2.1.4 Molecular networks represented in differentially expressed genes between
receptive and non receptive endometrium at day 7 of the estrous cycle
In addition to ontological classification and KEGG pathway analysis, the biological
relationships between differentially expressed genes were also assessed using Ingenuity
Pathway Analysis (www.ingenuity.com). For this, differentially expressed genes were
uploaded into the program. The biologic relationship of uploaded genes was established
with IPA software into networks according to the published literature in the database. A
score was assigned to each network in the data set to estimate the relevance of the network
to the uploaded gene list. Accordingly, network eligible genes were found to be involved
in 34 different molecular networks (Appendix 3). The top molecular networks consisting
of several differentially expressed genes were the cell cycle, cell death or reproductive
system disease network, genetic disorder network, hematological system development and
function network, cell cycle, DNA replication, recombination and repair network, post-
translational modification network, endocrine system development and function network,
antigen presentation network, cell-to-cell signaling network and immune cell trafficking
network. The two molecular networks with highest score are described in figure 15 and 16.
The cycle, cell death or reproductive system disease network (Figure 15) consisted of 31
focus genes, out of which 22 genes were enriched in CDd7 and the central gene, v-myc
myelocytomatosis viral oncogene homolog (MYC), was reduced in CDd7. This network
involves two transcriptional regulators (MYC and SUPT3H) which were down regulated
in CDd7, but increased in NPd7. Apart from this, the enzyme molecules including GART,
IDH3A, UBE2C, IDH2 have a direct relation to MYC. In addition, this network showed
that reduced expression level of MYC in CDd7 was associated with reduction in the
expression of SUPTH3, TP53I3, PLA1A, PMP2, SFRP1 and TNFSF13. On the other
hand, a reduction of MYC gene expression was associated with increased expression of a
number of genes including IDH3A, UBE2C, IDH2, ITAG6, GPC1, CSK2, EMP1 and
PSAT1 (Figure 15).
Similarly, the genetic disorder, lymphoid tissue structure and development network
(Figure 16) was the second high score molecular network identified in differentially
expressed genes between CDd7 and NPd7. Genes including TIMP1, AP3B1, AP3S2, DST,
VAMP7 are located in the cytoplasmic vesicle of the cell and VDAC1 is located in
mitochondrial nucleoid and pore complex. Furthermore, AP3B1, AP3S2, AGTR1,
VDAC1 and COL18A1 were the central genes of this network.

Results _________________________________________________________________________
82
Figure 15: Cell cycle, cell death, reproductive system disease network. Genes in red and
green background indicated the genes enriched in CDd7 and NPd7, respectively
.
Figure 16: The genetic disorder, lymphoid tissue structure and development network. Red
and green backgrounds indicate the genes enriched in CDd7 and NPd7,
respectively.

Results _________________________________________________________________________
83
4.2.2 Pre-transfer gene expression of receptive and non-receptive endometrium at day 14
of the estrous cycle
In addition to day 7, the pre-transfer gene expression of receptive and non-receptive
endometrium was investigated at day 14 of the estrus cycle using endometrial samples
collected at day 14 of the estrous cycle from heifers resulted in calf delivery (CDd14) and
from those resulted in no pregnancy (NPd14). The results revealed that including 5 ESTs,
only 14 genes were differentially expressed between CDd14 and NPd14 (Figure 17).
Figure 17: Pre-transfer transcriptome alteration between receptive (CDd14) and non-
receptive endometrium (NPd14) at day 14 of the estrous cycle. (A): The
number and fold change distribution of DE genes that were increased in
CDd14 or NPd14. (B): The heatmap and hierarchical clustering describing the
expressional pattern of DE genes in CDd14 and NPd14. Labels on the
horizontal axis of the heatmap, CDd14-1, CDd14-2 and CDd14-3 represent
independent biological replicates in receptive endometrium groups and
NPd14-1, NPd14-2 and NPd14-3 represent independent biological replicates
from non-receptive endometrium groups at day 14 of the estrous cycle. The
horizontal dendrogram indicates the expression patterns of transcripts in
CDd14 and NPd14. Red and green colors reflect the high and low expression,
respectively.
A B

Results _________________________________________________________________________
84
From a total of 14 DE genes, 12 genes exhibited 2 to 4 fold change and 2 genes showed
above 10 fold change difference between CDd14 and NPd14 (Figure 10A). Among these,
the expression of C20ORF54 and frizzled homolog 8 (FZD8) was higher in CDd14, while
the expression of LOC786821, bromodomain and WD repeat domain containing 1
(BRWD1), ankyrin repeat domain 11 (ANKRD11), solute carrier family 25 (SLC25A12),
gap junction protein alpha 1 (GJA1), scavenger receptor class A member 5 (SCARA5),
immunoglobulin lambda-like polypeptide (IIGLL1) and other 5 ESTs was higher in
NPd14.
Ontological classification the DE genes showed that those genes were found to be involved
in G-protein coupled receptor protein signaling pathway and Wnt receptor signaling
pathway (FZD8), in utero embryonic development (BRWD1 and GJA1), transition metal
ion transport (SCARA5) and transmembrane transport (SLC25A12). However, the number
of differentially expressed and the transcriptomic function alteration detected between
CDd14 and NPd14 was significantly lower compared to the number of differentially
expressed genes and transcriptomic functional alteration that has been detected between
CDd7 and NPd7 (Figure 5). This difference indicates that remarkable molecular alteration
between the receptive and non-receptive endometrium at day 7 of the estrous cycle than
day 14 of the estrous cycle. This result also indicates the receptive and non-receptive
endometriums are molecularly distinguishable during day 7 than day 14 of the estrous
cycle.
4.3 Diestrus transcriptome dynamics of receptive and non-receptive endometrium
4.3.1 Diestrus transcriptome dynamics of receptive endometrium
To identify transcriptome profile changes that has been occurred in the receptive
endometrium between day 7 and day 14 of the estrous cycle, the gene expression pattern
was analyzed using CDd7 and CDd14 endometrial samples. The result indicated that from
17,368 detected transcripts both in CDd7 and CDd14, 1867 genes were differentially
expressed between the two groups. Of these, the transcript levels of 1014 genes were
higher in CDd7 and the transcript level of 853 were increased in CDd14 (Figure 11,
Appendix 4). The genes including, DGKI, EDN3, SVS8, SPC24, PRODH, PDZK1, PLLP,
CCNB1, LPL and GDPD1 exhibited a higher fold increase (54 to 397 fold) in CDd7, but the
transcript level of SLC39A2, DEFB1, TINAGL1, C15H11ORF34, LOC286871, IL8, GPLD1,
LYZ1 and IGFBP1 was found to be higher (45 to 418 fold) in CDd14. Therefore, the data
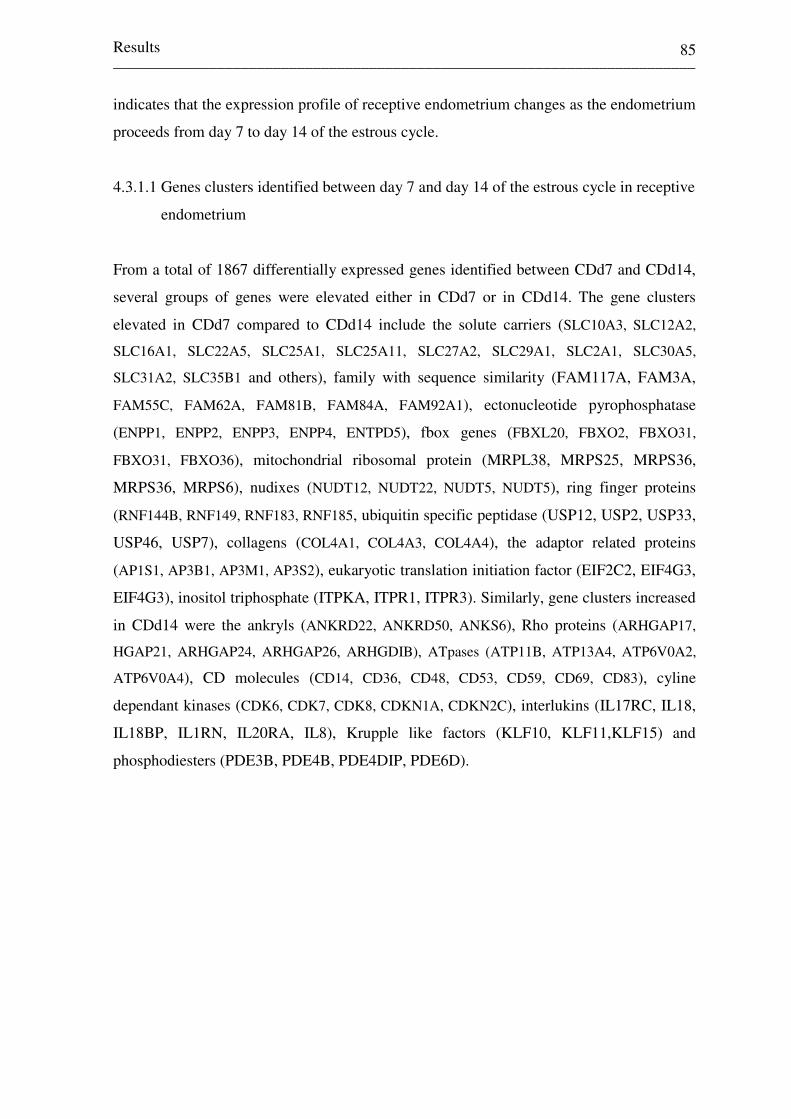
Results _________________________________________________________________________
85
indicates that the expression profile of receptive endometrium changes as the endometrium
proceeds from day 7 to day 14 of the estrous cycle.
4.3.1.1 Genes clusters identified between day 7 and day 14 of the estrous cycle in receptive
endometrium
From a total of 1867 differentially expressed genes identified between CDd7 and CDd14,
several groups of genes were elevated either in CDd7 or in CDd14. The gene clusters
elevated in CDd7 compared to CDd14 include the solute carriers (SLC10A3, SLC12A2,
SLC16A1, SLC22A5, SLC25A1, SLC25A11, SLC27A2, SLC29A1, SLC2A1, SLC30A5,
SLC31A2, SLC35B1 and others), family with sequence similarity (FAM117A, FAM3A,
FAM55C, FAM62A, FAM81B, FAM84A, FAM92A1), ectonucleotide pyrophosphatase
(ENPP1, ENPP2, ENPP3, ENPP4, ENTPD5), fbox genes (FBXL20, FBXO2, FBXO31,
FBXO31, FBXO36), mitochondrial ribosomal protein (MRPL38, MRPS25, MRPS36,
MRPS36, MRPS6), nudixes (NUDT12, NUDT22, NUDT5, NUDT5), ring finger proteins
(RNF144B, RNF149, RNF183, RNF185, ubiquitin specific peptidase (USP12, USP2, USP33,
USP46, USP7), collagens (COL4A1, COL4A3, COL4A4), the adaptor related proteins
(AP1S1, AP3B1, AP3M1, AP3S2), eukaryotic translation initiation factor (EIF2C2, EIF4G3,
EIF4G3), inositol triphosphate (ITPKA, ITPR1, ITPR3). Similarly, gene clusters increased
in CDd14 were the ankryls (ANKRD22, ANKRD50, ANKS6), Rho proteins (ARHGAP17,
HGAP21, ARHGAP24, ARHGAP26, ARHGDIB), ATpases (ATP11B, ATP13A4, ATP6V0A2,
ATP6V0A4), CD molecules (CD14, CD36, CD48, CD53, CD59, CD69, CD83), cyline
dependant kinases (CDK6, CDK7, CDK8, CDKN1A, CDKN2C), interlukins (IL17RC, IL18,
IL18BP, IL1RN, IL20RA, IL8), Krupple like factors (KLF10, KLF11,KLF15) and
phosphodiesters (PDE3B, PDE4B, PDE4DIP, PDE6D).
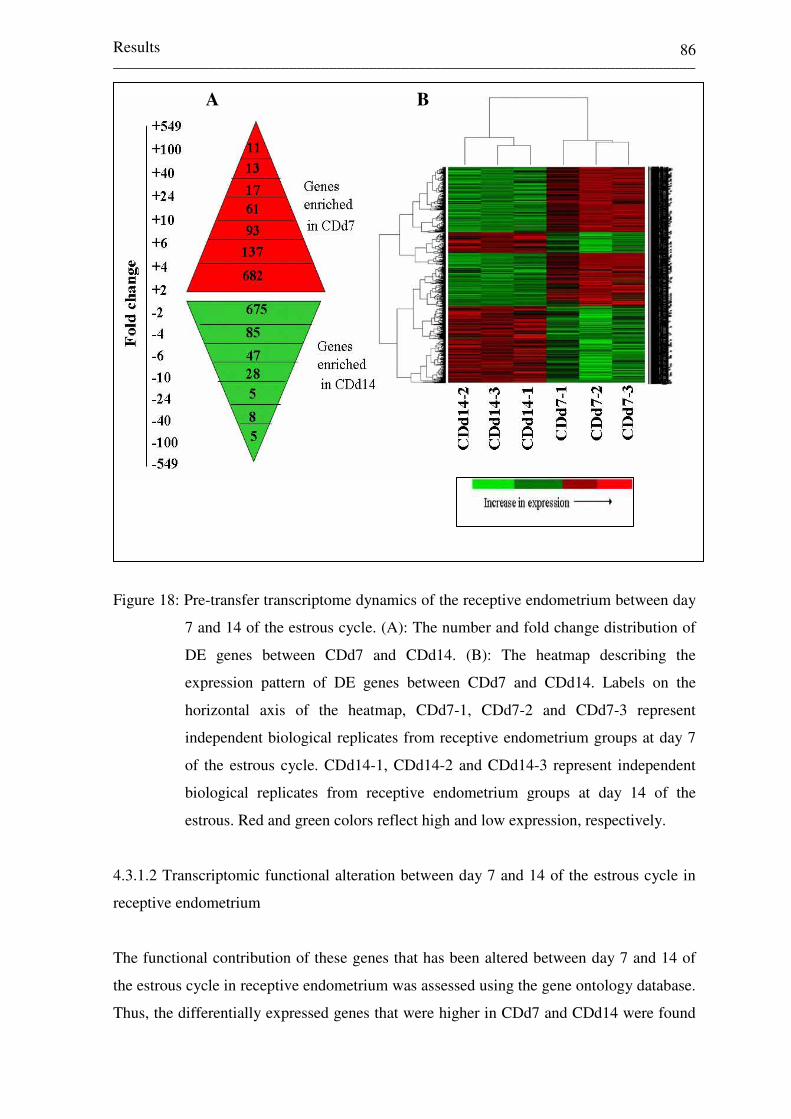
Results _________________________________________________________________________
86
Figure 18: Pre-transfer transcriptome dynamics of the receptive endometrium between day
7 and 14 of the estrous cycle. (A): The number and fold change distribution of
DE genes between CDd7 and CDd14. (B): The heatmap describing the
expression pattern of DE genes between CDd7 and CDd14. Labels on the
horizontal axis of the heatmap, CDd7-1, CDd7-2 and CDd7-3 represent
independent biological replicates from receptive endometrium groups at day 7
of the estrous cycle. CDd14-1, CDd14-2 and CDd14-3 represent independent
biological replicates from receptive endometrium groups at day 14 of the
estrous. Red and green colors reflect high and low expression, respectively.
4.3.1.2 Transcriptomic functional alteration between day 7 and 14 of the estrous cycle in
receptive endometrium
The functional contribution of these genes that has been altered between day 7 and 14 of
the estrous cycle in receptive endometrium was assessed using the gene ontology database.
Thus, the differentially expressed genes that were higher in CDd7 and CDd14 were found
A B

Results _________________________________________________________________________
87
16%15%
14%
6% 6% 6% 5%4%
4%4%
4%
7%
9%
Transport ( proteion, molecules , ions)protein metabolic processCellular protein metabolic processRegulation of cellular processPost-translational protein modificationResponse to stimulusCellular biosynthetic processPhosphate metabolic processPhosphorylationCarboxylic acid metabolic processLipid metabolic processOrganic acid metabolic processProtein amino acid phosphorylation
25%
21%12%
8%
7%
5%5% 4% 4% 3% 3% 3%
Signal transductionResponse to stimulusImmune system processPrograme cell deathDefense responseregulation of catalytic activityRegulation of a molecular functionResponse to biotic stimulusRegulation of growthDevelopmental processHydrolase activityCell cycle
to be involved in different functions (Figure 19). Those abundantly expressed in CDd7
were found to be involved in various biological processes including, cellular material
transport (solute carriers, AP1S1, AP3B1, AP3M1, AP3S2, FDX1, FUT8, GDI1, ITPR1, ITPR3,
KIF21A, KPNA2), metabolic process (PRODH, LPL, GDPD1, BDH1, PFKFB2, PHGDH),
phosphorylation, post-translational protein modification (USP2,UBL4A, UBE2S,
UBE2D4, UBE2A, SRPK2). On the other hand, immune responses (STAT5A, IL8,
LOC512486, IL1RN, C5, NDRG1, CXCL5, TLR5, HCLS1, SCIN, LCK, IL18, apoptotic process
(CASP4,LCK, MYC), signal transductions (KDR, RAB3B, F2RL2, NMB, PLAT, IFI6, PLEK,
ITGB5) were among the main biological processes overrepresented in those genes whose
transcript level was increased in CDd14.
Figure 19: Biological processes overrepresented in DE genes enriched in CDd7 (left) and
CDd14 (right) as the receptive endometrium proceeds from day 7 to day 14 of
the estrous cycle.

Results _________________________________________________________________________
88
4.3.1.3 Molecular pathway identified in differentially expressed genes between day 7 and
14 of the estrous cycle in receptive endometrium
Those differentially expressed genes between CDd7 and CDd14 were found to be involved
in 21 molecular pathways (Table 7). Among these, the MAPK signaling, Toll-like receptor
signalling, adipocytokine signaling, cell adhesion molecules and extra cellular matrix
receptor interaction pathways were enriched by those genes whose expression levels was
higher in CDd14. On the other hand, PPAR signaling pathway, calcium-signaling pathway,
neuroactive ligand-receptor interaction, GnRH signaling pathway, glycine, serine and
threonine metabolism were enriched by those genes whose transcript level was increased
in CDd7. Among those, the graphical representation of GnRH signaling pathway and the
number DE genes involved in this pathway is described in figure 20.
Figure 20: The DE genes between CDd7 and CDd14 are found to be involved in
Gonadotropin-releasing hormone (GnRH) signaling events. The DE genes
(MMP2), G/q11 (GNAI1), PLCB, IP3R (ITPR1, ITPR3), CAMK (CAMK2D),
P38MAPK (MAPK13, MAPK12) are located in the critical streams of the path
indicating the change in the activity of the GnRH pathway as the endometrium
proceeds from day 7 to 14 of the estrous cycle. Genes elevated in CDd7 are
marked by red background and those elevated in CDd14 are marked with blue
background.

Results __________________________________________________________________________________________________________________
89
Table 7: List of molecular pathways containing DE genes enriched in CDd7 and/or CDd14
Pathway list
Differentially expressed genes
MAPK signaling pathway
FLNA, MAPK12, ,NGF, RPS6KA5,CD14, ARRB1, FOS, PRKACB, PDGFB, PTPRR, MYC, NFKB1, MAPK13, IKBKB, MAP3K8, TGFBR2
Toll-like receptor signalling NFKBIA, IKBKE, MAPK12, IL8, CD14, IRF5, FOS, TLR5, NFKB1,MAPK13, IKBKB, TLR2, MAP3K8
Glycan structures- biosynthesis 1 B3GNT2, FUT8, ALG11, ALG8, B4GALT4, CSGALNACT2, MGAT4A CHST1, C1GALT1, HS6ST1
Adipocytokine signaling pathway ADIPOR2, PPARGC1A, NFKBIA, PPARA, ACSL5, IKBKB, NFKBIE, NFKB1, PRKAA2, CD36, SLC2A1
Insulin signaling pathway PPARGC1A, PRKAR2B, ARAF, PPP1CB, PFKM, IKBKB, PRKACB, PRKAA2, SOCS2 Calcium signaling pathway ITPR1, F2R, HRH1, SLC25A5, ITPR3, ADORA2B. CAMK2D, PRKACB, ADRB2
Regulation of actin cytoskeleton ITGA2, F2R, ARAF, LIMK2, WASF2, ARHGEF6, PDGFB, SCIN, CD14, ITGB5
Cell adhesion molecules (CAMs) VCAM1, JAM2, CLDN1, SDC1, BOLA-DMB, PVR, DCD1LG2, SDC2
Gap junction ITPR1, CDC2, ITPR3, GUCY1A3, TUBB6, GNAI1, PDGFB, PRKACB
Neuroactive ligand-receptor interaction PTGER4, F2RL1, F2R, HRH1, ADORA2B, PTGER2, ADRB2, F2RL2
GnRH signaling pathway ITPR1, MAPK12, MMP2, ITPR3, CAMK2D, MAPK13,PRKACB
Tryptophan metabolism ALDH3A2, HSD17B10, HSD17B4, WARS, WARS2, CYP1A1
PPAR signaling pathway LPL, SLC27A6, PLTP, FABP5, PPARA, ACSL5, CD36, SLC27A2
Focal adhesion ITGA2, VEGFB, FLNA, PPP1CB, PDGFB, ITGB5, MET, KDR
Jak-STAT signaling pathway IL6ST, IL20RA, STAT5A, SPRY2, MYC, PIM1, SOCS2
Glycan structures - biosynthesis 2 B4GALT4, FUT1, B3GNT2, UGCG, 3GALT2, ST3GAL6
Arginine and proline metabolism PRODH, ARG2, CKB, ASL, GLUD1, GATM, ASS1
ECM-receptor interaction ITGA2, HMMR, SDC1, AGRN, SDC2, CD36, ITGB5
Cytokine-cytokine receptor interaction IL6ST, TGFBR2, IL20RA, IL18, MET, KDR, IL8
Glycine, serine and threonine metabolism PHGDH, PSAT1, PEMT, CBS, GATM, PSPH
Urea cycle and metabolism of amino acid ARG2, ALDH3A2, SMS, ASL, GATM, ASS1
DE genes enriched in CDd7 are indicated in bold face and genes enriched in CDd14 are indicated in light face

Results _________________________________________________________________________
90
4.3.2 Diestrus transcriptome dynamics of non-receptive endometrium
The transcriptome dynamics of non-receptive endometrium between day 7 and 14 of the
estrous cycle was investigated by comparing the gene expression of endometrial samples
collected at day 7 (NPd7) and day 14 of the estrous cycle (NPd14) from heifers resulted in
no pregnancy. The result revealed that from 17,361 detected transcripts both in NPd7 and
NPd14, 254 genes were differentially expressed between the two groups (Figure 21).
Compared to the transcriptome dynamics of receptive endometrium (CDd7 vs. CDd14)
presented in figure 18, the number of differentially expressed genes detected between
NPd7 and NPd14 was lower by 1613 genes revealing the transcriptome plasticity of the
receptive endometrium during the diestrus phase of the estrous cycle. The most top
elevated genes in NPd7 compared to NPd14 includes, DGKI, SVS8, SPC24, SPOP,
COL6A1, TXNDC6, NTRK2, APOD and some of top genes down regulated in NPd7, but
increased in NPd14 include (PLEK, FMNL3, TLN2, CCL11, NPNT, SPP1, BNBD4, SDS, IL8,
SLC39A2). The description of 100 top differentially expressed genes is described in
appendix 5.
4.3.2.1 Transcriptomic functional alteration between day 7 and 14 of the estrous cycle in
non-receptive endometrium
The differentially expressed genes between NPd7 and NPd14 were found to be involved in
different biological and molecular functions. For instance, those which showed an increase
expression level in NPD7 compared to NPd14 were found to be involved in several
biological process including ion transport (CHRNE, KCNMA1, COL1A1, COL1A2, COL3A1,
COL6A1), cell cycle process (CDK5, SPC24, MLF1, Sep-04), nervous system development
(DPYSL2, CDK5, SERPINF1), phosphorelation (CDK5, PRKAR2B, MYLK, RPS6KA5,
MAPK10), transferase activity (NTRK2, DGKI, TXNDC6, RPS6KA5, MAPK10, MYLK,
CDK5). On the other hand, immune system (TLR2, IL8, IL1RN, GBP5), cytokine activity
(SPP1, IL1RN, IL8), transcriptional regulator (FOS. ELF1, BHLHB2, ATF3), pyrophosphate
activity (MX1, TUBB2A, GBP5, CFT, RNF213) were among the biological or molecular
functions overrepresented in genes elevated in NPd14.
The KEGG pathway analysis also indicated only three pathways to be significantly
affected by those genes. The DE genes that were increased in NPd7 compared to NPd14
were found to be involved in focal adhesion (COL1A2, MYLK, MAPK10 and COL1A1),
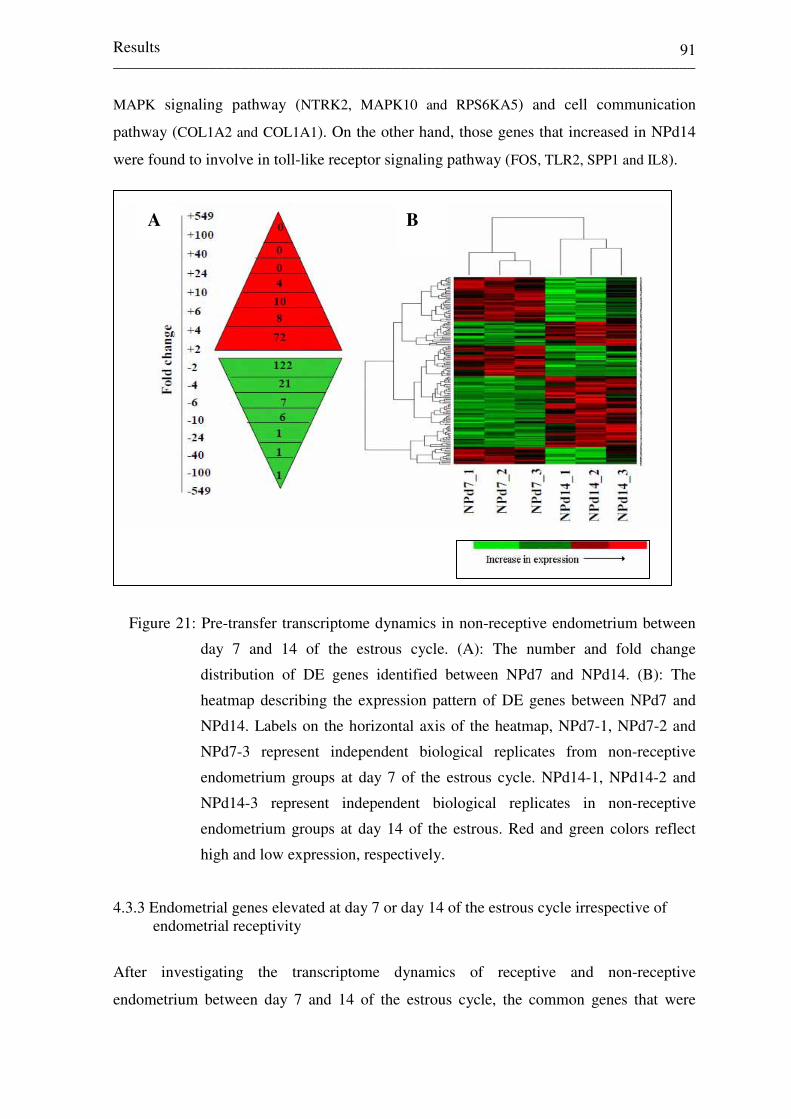
Results _________________________________________________________________________
91
B A
MAPK signaling pathway (NTRK2, MAPK10 and RPS6KA5) and cell communication
pathway (COL1A2 and COL1A1). On the other hand, those genes that increased in NPd14
were found to involve in toll-like receptor signaling pathway (FOS, TLR2, SPP1 and IL8).
Figure 21: Pre-transfer transcriptome dynamics in non-receptive endometrium between
day 7 and 14 of the estrous cycle. (A): The number and fold change
distribution of DE genes identified between NPd7 and NPd14. (B): The
heatmap describing the expression pattern of DE genes between NPd7 and
NPd14. Labels on the horizontal axis of the heatmap, NPd7-1, NPd7-2 and
NPd7-3 represent independent biological replicates from non-receptive
endometrium groups at day 7 of the estrous cycle. NPd14-1, NPd14-2 and
NPd14-3 represent independent biological replicates in non-receptive
endometrium groups at day 14 of the estrous. Red and green colors reflect
high and low expression, respectively.
4.3.3 Endometrial genes elevated at day 7 or day 14 of the estrous cycle irrespective of endometrial receptivity
After investigating the transcriptome dynamics of receptive and non-receptive
endometrium between day 7 and 14 of the estrous cycle, the common genes that were

Results _________________________________________________________________________
92
elevated at day 7 or 14 of the estrous cycle in both endometrial statuses were identified.
The result revealed that 121 genes were differentially expressed both in CDd7 vs. CDd14
and NPd7 vs. NPd14. Among those, 86 genes elevated at day 14 and 35 genes were
elevated at day 7 of the estrous (Figure 22). This result shows that the expression pattern of
121 genes between day 7 and 14 of the estrous cycle is independent of the endometrial
receptivity. Those genes that were elevated at day 7 were found to be involved in
regulation of transferase activity, protein kinase activity, phosphorylation, protein
metabolic process and phosphate metabolic process. However, those increased in day 14 of
the estrous cycle were found to be involved mainly in immune response, cytoskeleton
organization and biological adhesion.
Figure 22: Genes elevated at day 7 or 14 of the estrous cycle both in receptive and non
receptive endometrium.
DE genes in NPd7 vs NPd14
WTIP FGF2 SLC25A11 DPYSL2 TIPARP TST TMEM171 S100G CDK5 SPDEF ALKBH7 PRKAR2B CCDC104 RPS6KA5 C15H11orf60 SMOX
FRAT2 IER5 LOC507082 MUC13 LARS2 TLR2 ARHGAP17 MET DMBT1 SRGN ATF3 PDE4B ISG15 DMBT1 IL1RN CFTR
DGKI SVS8 SPC24 MMP2 MRPS36 CYB5B SCARA5 ANG CLDN5 FUT1 C21H14orf79 LOC507056 Sep 04 TSKU CDR2 AXIN2
SLMO1 CD53 AP1GBP1 BCAM LOC281812 XIST NFKBIZ LOC529052 ELF1 PLEKHA5 NOTCH2 TC2N MX1 FOS GON4L KLHL5
C616344 LOC614107 TBC1D5 Sep 11 ID1 SLC39A2 RSAD2 PLEK FMNL3 TLN2 WHSC1L1 NPNT IL8 PAN3 ISG12(A)
Common DE genes
DE genes in CDd7 vs CDd14
35 genes elevated at day 7 of the estrous cycle
76 genes elevated at day 14 of the estrous cycle

Results _________________________________________________________________________
93
4.4 Expression profile of selected candidate genes across the estrous cycle and early
gestation period
Following detection of differentially expressed genes between the receptive (CDd7) and
non-receptive (NPd7) endometrium, the genes involved in signal transduction (PTGER4,
AGTR1, ITPR1, ADORA2B and WNT11), metalloendopeptidase activity (MMP2 and
TIMP3), transcriptional factor activity (IRF6 and STAT5A), cell cycle (CDC20) and
prostaglandin-endoperoxide synthase activity (PTGS2/COX-2) were analyzed in the
endometrial samples collected from heifers slaughtered at different days of the estrous
cycle and at day 50 of gestation period. The expression profile of those genes across the
estrous cycle revealed that, the transcript level of IRF6, STAT5A, PTGER4, AGTR1,
ITPR1, ADORA2B, WNT11, MMP2 and TIMP3 was found to be higher (p < 0.05) at day 7
and 14, but was lower (p < 0.05) at day 19 and 0 of the estrous cycle (Figure 23). Unlike
other candidate genes, the expression pattern of PTGS2/COX-2 exhibited a dramatic
increased (p < 0.05) from day 19 to day 0 followed by a decrease at day 3 and after wards
it reached peak at day 7 and 14 of the estrous cycle ( Figure 23). On the other hand the
expression of CDC-20 was higher (p < 0.05) a day 3 of the estrous cycle. When the
expression profile was extended until day 50 gestation period, the IRF6, ITPR1, STAT5A
and AGTR1 exhibited an increase trend from proestrus to diestrus and reached peak in
pregnant endometrium, but the expression of PTGER4, PTGS2/COX-2, TIMP3 and
ADORAB2B was reduced in pregnant endometrium compared to the expression detected
at day 7 and 14 of the estrous cycle of cyclic heifers (Figure 23). This shows that those
genes exhibited higher or lower expression level during the estrous cycle can be further
enhanced or reduced following embryo implantation.
The spatio-temporal expression of those candidate genes at different region of the
endometrium also revealed lower expression (p < 0.05) in the corpus region compared to
other endometrial region during the estrous cycle (Appendix 6). In addition, the majority
of the candidate genes showed no significant difference between the ispislateral and contra
lateral position of the endometrium at each day of the estrous cycle and early pregnancy
(Appendix 6).
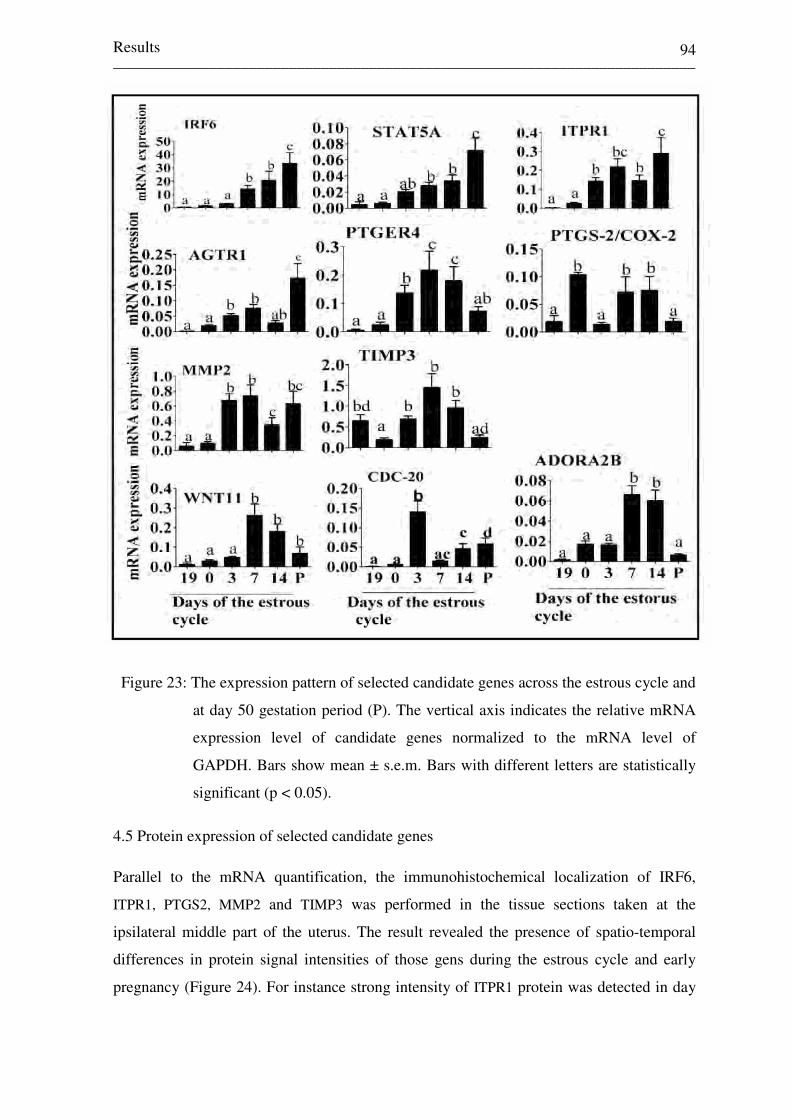
Results _________________________________________________________________________
94
Figure 23: The expression pattern of selected candidate genes across the estrous cycle and
at day 50 gestation period (P). The vertical axis indicates the relative mRNA
expression level of candidate genes normalized to the mRNA level of
GAPDH. Bars show mean ± s.e.m. Bars with different letters are statistically
significant (p < 0.05).
4.5 Protein expression of selected candidate genes Parallel to the mRNA quantification, the immunohistochemical localization of IRF6,
ITPR1, PTGS2, MMP2 and TIMP3 was performed in the tissue sections taken at the
ipsilateral middle part of the uterus. The result revealed the presence of spatio-temporal
differences in protein signal intensities of those gens during the estrous cycle and early
pregnancy (Figure 24). For instance strong intensity of ITPR1 protein was detected in day

Results _________________________________________________________________________
95
3, 7, 14 and pregnant endometrium. The PTGS2 protein revealed strong signals in luminal
epithelium (LE) and glandular epithelium (GE) at day 0 and 3. However, it was lower in
LE and higher in GE at day 7, 14 and pregnant endometrium. Similarly, stronger signal
MMP2 protein signal was detected in GE at day 0, 14 and pregnant endometrium.
However, at day 7 and 19 the MMP2 protein was stronger in LE and stroma cells of the
endometrium suggesting variation in expression in different layers of the endometrium.
Lower protein signals of TIMP3 were detected at day 0 and pregnant endometrium.
Moreover, except at day 0 and pregnant endometrium, strong signal was detected in LE,
GE and stroma cells of the endometrium (Figure 24).
Figure 24: Immunohistochemical localization of selected candidate genes across the
estrous cycle and day 50 gestation period (P). The green and red colors
indicate the protein signal and the blue colors describe nuclear staining,
respectively. NC = Negative control, sGE = Superficial glandular epithelium,
GE = Glandular epithelium, LE = Luminal epithelium, S = stroma cells, D =
day.
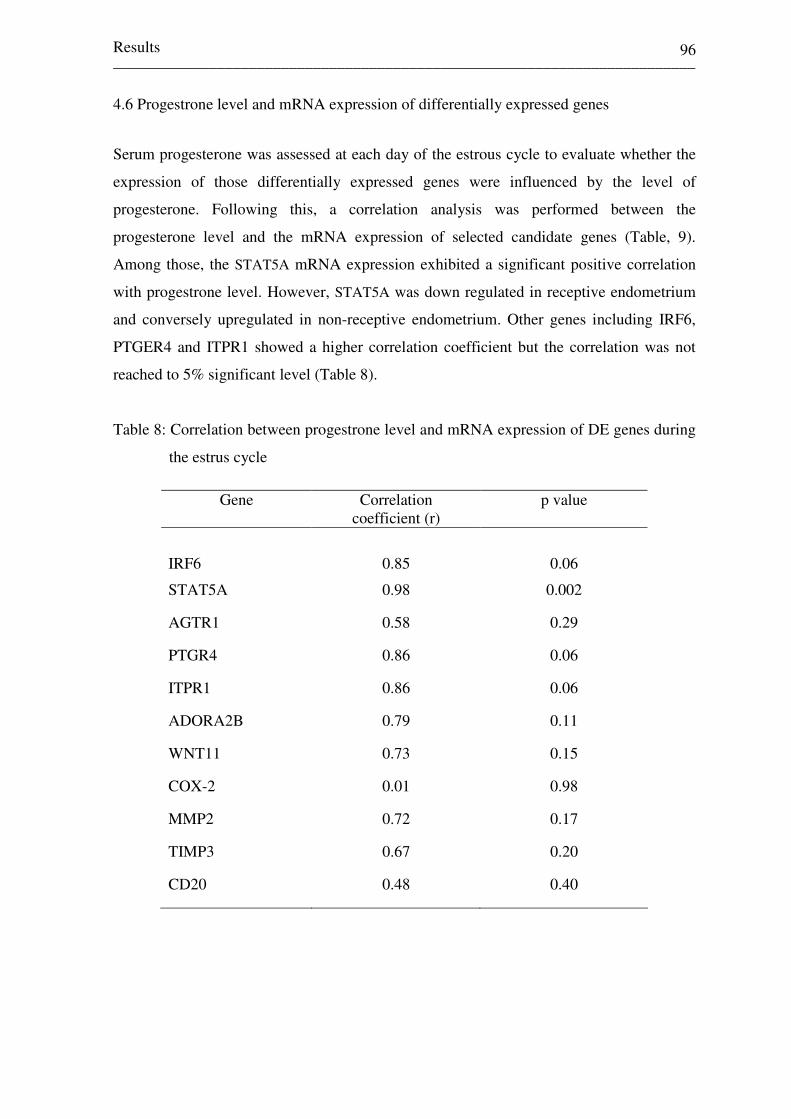
Results _________________________________________________________________________
96
4.6 Progestrone level and mRNA expression of differentially expressed genes
Serum progesterone was assessed at each day of the estrous cycle to evaluate whether the
expression of those differentially expressed genes were influenced by the level of
progesterone. Following this, a correlation analysis was performed between the
progesterone level and the mRNA expression of selected candidate genes (Table, 9).
Among those, the STAT5A mRNA expression exhibited a significant positive correlation
with progestrone level. However, STAT5A was down regulated in receptive endometrium
and conversely upregulated in non-receptive endometrium. Other genes including IRF6,
PTGER4 and ITPR1 showed a higher correlation coefficient but the correlation was not
reached to 5% significant level (Table 8).
Table 8: Correlation between progestrone level and mRNA expression of DE genes during
the estrus cycle
Gene Correlation coefficient (r)
p value
IRF6
0.85
0.06
STAT5A 0.98 0.002
AGTR1 0.58 0.29
PTGR4 0.86 0.06
ITPR1 0.86 0.06
ADORA2B 0.79 0.11
WNT11 0.73 0.15
COX-2 0.01 0.98
MMP2 0.72 0.17
TIMP3 0.67 0.20
CD20 0.48 0.40

Results _________________________________________________________________________
97
4.7 Gene expression difference between embryo biopsies that resulted in calf delivery and no pregnancy
In addition to endometrial gene expression, the transcriptome abundance difference
between embryo biopsies that resulted in calf delivery or no pregnancy was determined
using embryo biopsies that were retained prior to embryo transfer. For this, the
transcriptional differences of embryo biopsies resulted in calf delivery were compared with
those embryos biopsies resulted in no pregnancy using preimplantation embryo specific
cDNA array in a series of six hybridization experiments (three biological replicates with
dyeswap). The microarray data analysis using LIMMA revealed that including 9 ESTs, a
total of 70 genes were differentially expressed between the two embryo groups. The
average linkage clustering analysis (Figure 25) reveals that there were many subgroups
within the up or down regulated gene (or clusters) sharing similar expression patterns.
Such co-expressed genes may possibly sharing common biological function. Furthermore,
the expression of each gene in each biological replication remains uniform indicating the
reproducibility of the data (Figure 25).
The magnitude of differentially expressed (DE) genes showed that 20% of the of them
exhibited two or more fold change difference and 80 % showed 1.5-2 fold change
difference between the two embryo groups. Furthermore, the transcript level of 32 genes
including SPAG17 (PF6), UBE2D3P, DFNB31, AMD1, DTNBP1NUP35, GDE1 (MIR16),
ARL6IP, NUDT2, FAM161A, LGMN,LEO1, CCL16AP2B1, PTDSS1 and HSPA8 was
abundant in those embryos resulted in calf delivery (Figure 25). On the other hand, the
transcript level of 38 genes including SGK1, GBF1, FADS1, KRT8, RIF1, GART, DTX2,
WDR26, RNF34, KPNA4, ARL8B, RYBP and WDR13 was higher in embryos resulted in no
pregnancy. This differences indicated that the embryos that resulted in calf delivery are
molecularly distinguishable from those resulted in no pregnancy.

Results ________________________________________________________________________________________________________________
98
Figure 25: Hierarchical clustering of differentially expressed genes between embryo biopsies that resulted in calf delivery and no pregnancy.
Embryo biopsies resulted in calf delivery were clustered in one group (left), while the embryo resulted in no pregnancy were
clustered in the second group (left). A, B and C on the top of the heatmaps represent three biological replicates during hybridization
and D, E and F describe the dyeswap hybridization for A, B and C replicates. Positive and negative numbers indicate genes increased
in embryo biopsies resulted in calf delivery and no pregnancy groups, respectively. FC = Fold change, ACC. No = Gene bank
accession numbers.

Results _________________________________________________________________________
99
4.7.1 Functional classification of differentially expressed genes between embryo biopsies
resulted in calf delivery and no pregnancy
The functions and relevance of the differentially expressed genes between the two
embryo groups were assessed using the public databases, the gene ontology
http://www.geneontology.org/ and DAVID functional annotation bioinformatics
microarray analysis (http://david.abcc.ncifcrf.gov/). Thus, only 45 genes have known
ontological function. Those gene were found to be involved in different biological and
molecular functions (Table 9) including, protein binding, transferase activity,
chemokine activity and cell to cell signalling, signal transduction, physiological
response to stimulus, protein/mRNA transport, regulation of transcription,
adenosylmethionine decarboxylase activity and apoptosis. Moreover, 17 DE genes
were mapped to the known KEGG pathways (Figure 26).
Figure 26: List of molecular signaling and metabolic pathways involved by DE genes
between embryo biopsies resulted in calf delivery and no pregnancy. Red
and green arrows indicated genes enriched and reduced, respectively in
embryo biopsies resulted in calf delivery compared to embryo resulted in no
pregnancy.
Purine metabolism and one carbon pool by folate pathway
PPAR signaling pathway,
Glycerophospholipid metabolism pathway
Notch signaling pathway
Antigen processing and presentation pathway
Aminophosphonate and glycerophospholipid metabolism
Urea cycle and amino acid metabolism pathway
Purine metabolism pathway
Ribosome pathway
Oxidative phosphorylation pathway
Cell communication pathway
Cytokine-cytokine receptor interaction pathway
SNARE interactions in vesicular transport pathway
Pancreatic cancer pathway
Antigen processing and presentation pathway
Ubiquitin mediated proteolysis pathway
GART
FABP5
PTDSS1
DTX2
LGMN
CCT2
AMD1
NUDT2
RPL7A
NDUFS4
KRT8
CCL16
STX8
RALA
HSPA8
UBE2N

Results __________________________________________________________________________________________________________________
100
Table 9: Molecular function and biological process of DE genes between embryo biopsies resulted in calf delivery and no pregnancy
Acc. No Gene symbol
Gene bank name
Molecular function Biological process
XM_615649 SPAG17 Sperm associated antigen 17 Protein binding -
AL138895 DFNB31 Deafness, autosomal recessive 31 Protein binding Response to stimulus
NM_173990 AMD1 S-adenosylmethionine decarboxylase 1 Adenosylmethionine decarboxylase activity
Spermidine biosynthetic process
BC113232 DTNBP1 Dystrobrevin binding protein 1 Identical protein binding Response to stimulus
XM_588545 NUP35 Nucleoporin 35 - mRNA and protein transport
BC102273 GDE1 Glycerophosphodiester phosphodiesterase 1
Glycerophosphodiester Glycerol metabolic process
NM_015161 ARL6IP Adp-ribosylation factor-like 6 interacting protein
Protein binding
Co-translational protein targeting to membrane
BC114149 NUDT2 Nucleoside diphosphate linked moiety X GTP binding
Induction of apoptosis
BC111117 LGMN Legumain Protein serine/threonine kinase activity
Proteolysis
XM_865076 LEO1 Leo1, paf1/RNA polymerase II complex component, homolog
Protein binding Regulation of transcription
XM_868834 CCL16 Chemokine (C-C motif) ligand 16 Chemokine activity, cell-cell signaling
Immune response inflammatory response
NM_005402 RALA Ras-related protein GTP binding, signal transduction
Chemotaxis
BC105196 FABP5 Fatty acid binding protein 5 Fatty acid binding, protein binding, transporter activity
Lipid metabolic process transport

Results __________________________________________________________________________________________________________________
101
Acc. No Gene symbol Gene bank name Molecular function Biological process
XM_866869 AP2B1 Adaptor-related protein complex 2, beta 1 subunit
protein transporter activity -
XM_586866 PTDSS1 Phosphatidylserine synthase 1 Transferase activity -
BC102150 MS4A8B Membrane-spanning 4-domains, subfamily a, member 8B
Receptor activity -
BC105182 HSPA8 Heat shock 70kd protein 8 ATP and protein binding Protein folding
NM_015190 DNAJC9 DNAJ (HSP40) homolog, subfamily c, member 9
Heat shock protein binding -
XM_876108 RBMX RNA binding motif protein, X-linked RNA and protein binding, RNA splicing
Nuclear mRNA splicing
XM_861603 ZNF638 Zinc finger protein 638 DNA binding RNA splicing
BC102286 GNB2L1 Guanine nucleotide binding protein (G- protein), beta polypeptide 2-like 1
Receptor binding -
NM_004853 STX8 Syntaxin 8 - Transport
BC103298 CCT2 Chaperonin containing tcp1, subunit 2 ATP and unfolded protein binding
Protein folding
NM_001013599 TAGLN2 Transgelin 2 Protein binding -
NM_175800 NDUFS4 NADH dehydrogenase (ubiquinone) fe-s protein
NADH dehydrogenase activity
Electron transport
NM_001040520 RPL7A Ribosomal protein l7A RNA binidng Ribosome biogenesis translational elongation
XM_859286 HNRNPA2B1 Heterogeneous nuclear ribonucleoprotein A2/B1
RNA splicing factor activity RNA splicing and transport
AY610165 SFRS10 Splicing factor, arginine/serine-rich 10 RNA splicing factor activity RNA splicing
AF239741 SYT1 Synaptotagmin 1 Calcium and calmodulin binding Synaptic transmission
Table 9: Cont.
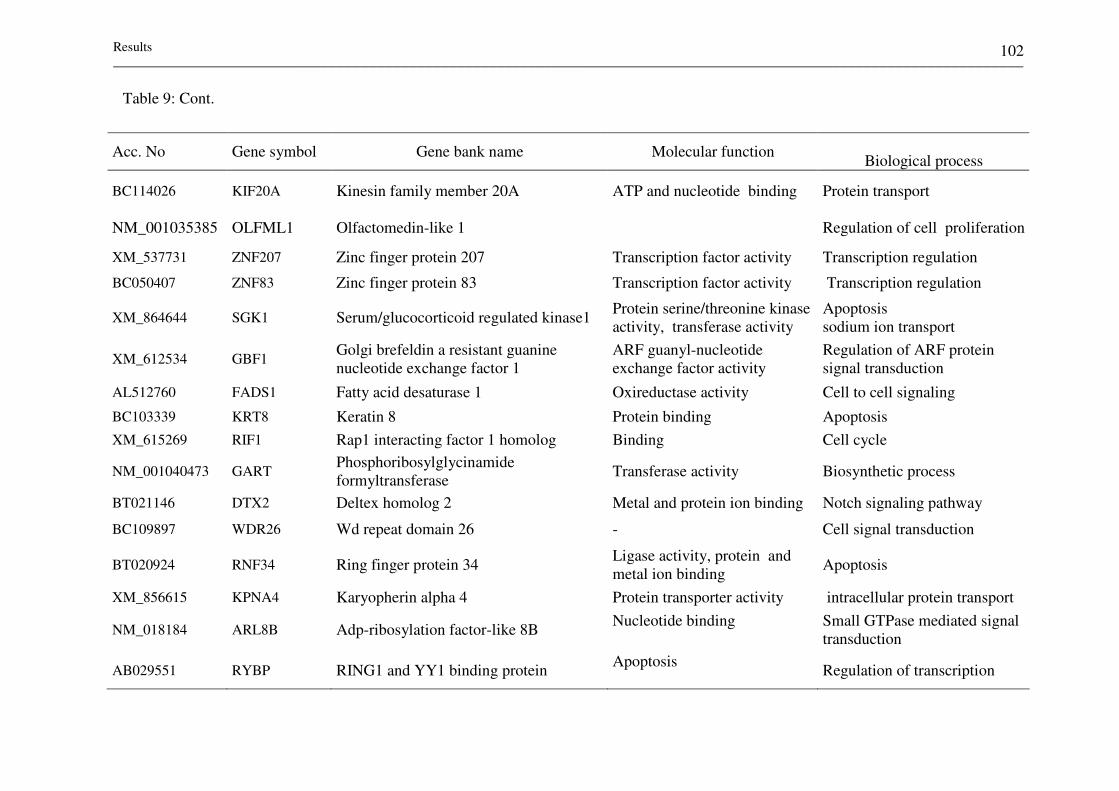
Results __________________________________________________________________________________________________________________
102
Acc. No Gene symbol Gene bank name Molecular function
Biological process
BC114026 KIF20A Kinesin family member 20A ATP and nucleotide binding Protein transport
NM_001035385 OLFML1 Olfactomedin-like 1 Regulation of cell proliferation
XM_537731 ZNF207 Zinc finger protein 207 Transcription factor activity Transcription regulation
BC050407 ZNF83 Zinc finger protein 83 Transcription factor activity Transcription regulation
XM_864644 SGK1 Serum/glucocorticoid regulated kinase1 Protein serine/threonine kinase activity, transferase activity
Apoptosis sodium ion transport
XM_612534 GBF1 Golgi brefeldin a resistant guanine nucleotide exchange factor 1
ARF guanyl-nucleotide exchange factor activity
Regulation of ARF protein signal transduction
AL512760 FADS1 Fatty acid desaturase 1 Oxireductase activity Cell to cell signaling
BC103339 KRT8 Keratin 8 Protein binding Apoptosis
XM_615269 RIF1 Rap1 interacting factor 1 homolog Binding Cell cycle
NM_001040473 GART Phosphoribosylglycinamide formyltransferase
Transferase activity Biosynthetic process
BT021146 DTX2 Deltex homolog 2 Metal and protein ion binding Notch signaling pathway
BC109897 WDR26 Wd repeat domain 26 - Cell signal transduction
BT020924 RNF34 Ring finger protein 34 Ligase activity, protein and metal ion binding
Apoptosis
XM_856615 KPNA4 Karyopherin alpha 4 Protein transporter activity intracellular protein transport
NM_018184 ARL8B Adp-ribosylation factor-like 8B Nucleotide binding
Small GTPase mediated signal transduction
AB029551 RYBP RING1 and YY1 binding protein Apoptosis
Regulation of transcription
Table 9: Cont.

Results _________________________________________________________________________
103
4.8 Validation of microarray data using real time quantitative PCR (qPCR)
4.8.1 Validation of differentially expressed genes between receptive and non receptive
endometrium at day 7 of the estrous cycle
A total of 36 DE genes between CDd7 and NPd7 were randomly selected. Hence, the
qPCR data revealed that 32 out of 36 DE genes (89%) to be according to the microarray
results (Table 10, Appendix 7). However, CAMK2D exhibited a reverse trend and NGF
and MYLK were not different between the two groups.
Table 10: Validation of DE genes between receptive (CDd7) and non-receptive (NPd7)
endometrium at day 7 of the estrous cycle using qPCR
Microarray results qPCR results Gene name ACC. No
FC p value FC p value
ADORA2B
NM_001075925
2.17
0.007
18.81
0.03
AGTR1 NM_174233 -4.0 0.004 -18.4 0.05
ALG8 NM_001076125 2.55 0.002 9.34 0.03
CNB2 NM_174264 4.88 0.02 6.94 0.02
CDC2 NM_174016 7.42 0.0017 23.84 0.01
COL1A2 NM_174520 9.18 0.001 5.24 0.09
FUT8 NM_177501 2.15 0.03 5.85 0.006
MAPK12 NM_001098953 2.97 0.03 11.17 0.04
PLCB1 NM_174817 3.24 0.017 8.61 0.05
PTGER4 NM_174589 2.72 0.01 4.94 0.05
WNT11 NM_001082456 5.99 0.04 176 0.02
IL18 NM_174091 -2.49 0.002 -2.95 0.12
TIMP3 NM_174473 5.32 0.015 5.3 0.03
MMP2 NM_174745 -2.58 0.014 -7.1 0.12
ITPR1 NM_174841 5.35 0.01 3.12 0.05
IRF6 NM_001076934 3.39 0.04 80 0.03
FC= Fold change, p value ≤ 0.05 considered as significant, positive and negative values indicate genes elevated in CDd7 and NPd7, respectively.

Results _________________________________________________________________________
104
4.8.2 Validation of differentially expressed genes between day 7 and 14 of the estrous
cycle in receptive endometrium
A total of 28 DE genes between day 7 (CDd7) and day 14 (CDd14) in receptive
endometrium were selected. These genes were also differentially expressed between CDd7
and NPd7. The qPCR data revealed 24 genes from 28 genes (85%) followed a similar
trend to microarray results, but four genes, namely IL18, S100A13, TLR6 and PLK4
showed no fold change difference between the two groups (Table 11).
Table 11: Validation of DE genes between CDd7 and CDd14 in receptive endometrium
using qPCR
Microarray results qPCR results
Gene symbol ACC. No FC p value FC p value
S100B
NM_001034555
3.14
0.009
14.5
0.05
MMP2 NM_174745 2.82 0.009 43.9 0.09
PTGS2 NM_174445 14.13 0.01 3.2 0.06
WNT11 NM_001082456 14.5 0.007 93.0 0.007
IFR6 NM_001076934 3.53 0.035 31.2 0.03
TIMP3 NM_174473 15.0 0.009 6.72 0.02
PTGER4 NM_174589 6.0 0.0003 4.0 0.05
CDC20 NM_001082436 16.0 0.005 130.0 0.01
ADORA2B NM_001075925 2.2 0.007 12.78 0.07
ALG8 NM_001076125 2.7 0.001 44.0 0.03
CDC2 NM_174016 2.88 0.007 38.3 0.04
FUT8 NM_177501 2.0 0.04 21.67 0.09
ITPR1 NM_174841 16.0 0.009 23.0 0.07
STAT5A NM_001012673 -2.59 0.02 -2.48 0.07
IL18 NM_174091 -2.45 0.0003 1.09 0.96
S100A3 NM_205800 -2.16 0.23 -1.16 0.84
TLR6 NM_001001159 -2.3 0.023 -1.15 0.94
FC= Fold change, p value ≤ 0.05 considered as significant, positive and negative values indicate genes elevated in CDd7 and CDd14, respectively

Results _________________________________________________________________________
105
4.8.3 Validation of differentially expressed genes between embryo biopsies resulted in calf
delivery and no pregnancy
Eight differentially expressed genes between the embryo biopsies resulted in calf delivery
and no pregnancy, namely AMD1, HSPA8, STX8, SGK1, DTX2, RNF34, ARL8B and
UBE3D2P were validated using qPCR and the results indicated that the microarray result
and the qPCR was fitting to each other (Table 12).
Table 12: Validation of DE genes between embryo biopsies resulted in calf delivery and
no pregnancy using qPCR
Microarray results qPCR results
Gene symbol ACC. No FC p value FC
p value
AMD1
NM_173990
2.35
0.03
3.22
0.02
HSPA8 BC105182 1.65 0.03 2.93 0.2
STX8 NM_004853 -1.5 0.02 -57.8 0.02
SGK1 XM_864644 -1.7 0.04 -2.59 0.05
DTX2 BT021146 -1.9 0.05 -1501 < 0.0001
RNF34 BT020924 -2.0 0.002 -55.1 0.02
ARL8B NM_018184 -2.5 0.028 -7.61 0.25
UBE3D2P XM_614356 2.6 0.01 83.7 0.4
FC= Fold change, p value ≤ 0.05 was considered as significantly different. Positive and negative values indicate genes enriched in embryos resulted in calf delivery and embryos resulted in no pregnancy, respectively.
Discussion _________________________________________________________________________
106
5 Discussion
5 .1 Transcriptome difference between receptive and non-receptive bovine endometrium
Although embryo transfer has been widely used to utilize genetically superior cows and
circumvent infertility, several recipients end up with no pregnancy after embryo transfer.
This pregnancy failure has been exerting a challenge on selecting and maintaining suitable
recipients for embryo transfer. Successful pregnancy is the result of coordinated and
synchronized crosstalk between the blastocyst and the endometrium in a temporal and cell
specific manner (Bowen and Burghardt 2000, Simon et al. 2000, Spell et al. 2001). The
dynamic interaction between the embryo and endometrium can be stimulated provided
both the endometrium and embryos are enriched with key molecular mediators and
signaling pathways at the time of arrival of the embryo into the uterus. Thus,
understanding the molecular changes that occur in endometrium and embryo during the
time of embryo transfer is fundamental to understand the molecular mechanisms related
establishment of pregnancy. Therefore, in the present study a direct connection was
established between the bovine pre-transfer endometrial and embryonic gene expression
and the pregnancy outcome to identifying maternal and embryonic genes that could
presumably associated with pregnancy success. For this, the pre-transfer endometrial
samples collected at day 7 and 14 of the estrous cycle were used to investigate the
endometrial genes associated with pregnancy establishment and the transcriptome of the
embryo biopsies retained from transferred embryos were analyzed to identify embryonic
genes associated with pregnancy establishment.
The gene expression from pre-transfer endometrial samples evidenced noticeable
endometrial gene expression differences between heifers that resulted in calf delivery
(receptive endometrium) and those resulted in no pregnancy (non-receptive endometrium)
at day 7 of the estrous cycle. Detailed bioinformatics and literature mining approach was
applied to characterize those differentially expressed genes with respect to bovine
endometrial receptivity and embryo implantation. Thus, KEGG pathway analysis,
biological processes and molecular functions analysis of gene ontology and molecular
network analysis using IPA evidenced the presence of transcriptomic functional alteration
between receptive and non-receptive endometrium at day 7 of the estrous cycle (Figures 9,
10, 11, 12, 13, Table 6, Appendix 3). However, the two groups of the endometrium tended
to exhibit minimum transcriptome expression profile and transcriptomic functional
Discussion _________________________________________________________________________
107
alteration at day 14 of the estrous cycle (Figure 17). Here the fundamental question to be
raised is what contributes for higher transcriptome profile and transcriptomic function
alteration in receptive and non receptive endometrium at day 7 than day 14 of the estrous
cycle. Although further experimentation is necessary to answer this question, the higher
gene expression differences between receptive and non-receptive endometrium at day 7
than day 14 of the estrous cycle may be attributed to the degree of endometrial response to
the circulating progesterone. The progressively increasing level of progestrone may induce
the expression of two sets of genes in receptive endometrium. One set to be those genes
triggered in the expectation of embryo and the second groups to be those associated with
induction of follicular waves. Therefore, unlike the non-receptive endometrium, at day 7 of
the estrous cycle, the receptive endometrium may be enriched with several molecules that
are associated with the establishment of pregnancy. However, from day 14 onwards, the
progesterone that regulates the uterine environment loses its ability to block formation of
oxytocin (Senger 2003). The endometrial PGF2α then starts to increase on day 14 and
reaches its peak from day 15 to day 17 of the estrous cycle consequently resulting in
luteolysis of corpus luteum (Shemesh and Hansel 1975). Therefore, those groups of genes
induced or reduced in receptive endometrium in the expectation of the incoming embryo
during day 7 of the estrous may gradually decline during day 14 of the estrous cycle. This
may consequently result in little or no gene expression differences between receptive and
non-receptive endometrium at day 14 of the estrous cycle. Thus, this result may suggest
that the receptive and non-receptive endometrium can be molecularly distinguishable at
day 7 than day 14 of the estrous cycle. Therefore, the discussion part of this finding mainly
focuses on transcriptional difference between the receptive and non-receptive
endometrium that has been occurred at day 7 of the estrous cycle where 1126 genes and
uncharacterized expresses sequences tags were exhibited difference in transcriptome
abundances between the two statuses of the endometrium. Therefore, in the following
section, the biological relevance of differentially expressed gene clusters in relation to
endometrial receptivity and embryo implantation is presented.
5.1.1 Differentially expressed gene clusters between receptive and non-receptive
endometrium at day 7 of the estrous cycle
Once the embryo reaches the uterus for implantation, the molecular dialogue between the
implanting conceptus and the endometrium is mediated by several molecules of

Discussion _________________________________________________________________________
108
endometrial and/or embryo origin (Dey et al. 2004, Paria et al. 2002, Tabibzadeh and
Babaknia 1995, Wang and Dey 2006, Wolf et al. 2003). Identifying those molecules in
endometrium and embryo prior to embryo transfer may help to select receptive
endometrium and embryos with higher implantation potential. In line to this, in the present
study 1126 genes consisting of several gene clusters were differentially expressed between
the receptive and non-receptive endometrium at day 7 of the estrous cycle (Figures 5, 6, 7
and 8, Appendix 2). This may suggest that the occurrence of different molecular events in
the endometrium whose expression is either induced or turned off in the expectation of
blastocysts arrival into the uterus.
5.1.1.1 The solute carriers and transmembrane proteins In the current study, 18 solute carrier (SLC) genes (SLC10A3, SLC16A13, SLC1A1,
SLC25A11, SLC25A13, SLC25A22, SLC25A29, SLC25A40, SLC25A5, SLC35B1, SLC38A7,
SLC39A8, SLC39A9, SLC4A8, SLC5A6, SLC6A20 ,SLC6A8, SLC7A5 and SLCO3A1) were
among several gene clusters that has been increased in receptive endometrium (CPd7)
compared to non-receptive endometrium (NPd7) (Figure 7). Among those, SLC1A1 was
found to be higher in pregnant compared to non-pregnant heifers (Bauersachs et al. 2006).
Moreover, SLC1A1 and SLC6A8 were reported to be up regulated in receptive human
endometrium (Riesewijk et al. 2003) and during window human implantation (Kao et al.
2002), respectively.
The gene ontological classification showed that the solute carriers (SLC) are involved in
transport of cellular materials across the cell membrane (Fig 13A). Furthermore, the SLC
genes are generally believed to be involved in transport of cellular materials across the cell
membrane (Ishida and Kawakita 2004, Kanai and Hediger 2004, McKie and Barlow 2004,
Palmieri 2004). This result may suggest the increased solute and protein transportation
across the cell membrane of the receptive endometrium compared to non-receptive
endometrium. In addition, other gene cluster with similar function to SLC, including
transmembrane proteins (TMEM141, TMEM144, TMEM163, TMEM16K, TMEM171
and TMEM79) and the voltage- dependant anion channel 1 (VDAC1) were enriched in
receptive endometrium. The report of (Abu-Hamad et al. 2006, Abu-Hamad et al. 2009)
also indicated that cells with low levels of VDAC1 were found to exhibit reduced ATP-
synthesis capacity and limited metabolite exchange between mitochondria and cytosol.
This in turn suggests increased level of solute carriers or transmembrane proteins or
gatekeepers genes are required to efficient removal or entrance of molecule from the cell.

Discussion _________________________________________________________________________
109
Therefore, the enrichment of solute carrier genes, transmembrane and other mitochondrial
gatekeeper genes in receptive compared to the non-receptive endometrium at day 7 of the
estrous cycle may suggest the presence of effective metabolite exchange between
mitochondria and cytoplasm in receptive endometrium.
5.1.1.2 Cargo protein sorters, transporter and neuro transmitter gene clusters
In addition to the SLC, transmembrane gene clusters, the transcript level of adaptor related
protein and their subunits (AP1-S1, AP3-B1, AP3-M1 and AP3-S2) were increased in the
receptive compared to the non-receptive endometrium (Figure 7). Among the four adapter
related proteins (AP1, AP3, AP2 and AP4) known in mammalian cells (Boehm and
Bonifacino 2001, Boehm and Bonifacino 2002), the current study identified the first two to
be higher in receptive compared to non-receptive bovine endometrium at day 7 of the
estrous cycle. Although their function contribution is not yet known in bovine endometrial
receptivity, ontological classification indicated that adaptor related protein and their
subunits were found to be involved in protein localization (transport) and cellular
localization (Figure 10B and C) and also they are central foucs genes in genetic disorder,
lymphoid tissue and development molecular network (Figure 16). Similarly, other authors
(Boehm and Bonifacino 2001, Newell-Litwa et al. 2007) indicated that adaptor related
proteins are required for protein cargo sorting, trafficking of integral membrane proteins
and neurotransmission. For instance, adapter related protein 1 (AP1) is reported to be
involved in the organization and transport of proteins within the cell (Montpetit et al.
2008). In addition, the AP-1 is associated with the trans-Golgi network for transport
proteins to the endosomal/lysosomal system and to the cell surface (Kim and Hersh 2004).
Furthermore, it also generates vesicles from the trans-Golgi network for transporting
cargoes to late-endosome and lysosome compartments, whereas AP-1 adaptors found in
endosomes generate vesicles transporting to the cell surface or back to the Golgi complex
(Newell-Litwa et al. 2007). Similarly, adapter related protein 3 (AP3) is believed to be
essential for neurotransmitting and ion transport (Newell-Litwa et al. 2007), trafficking
proteins to lysosomes and formation of lysosome-related organelles (Kantheti et al. 1998,
Newell-Litwa et al. 2007, Simpson et al. 1997). In addition, AP-3 is important in neuronal
protein trafficking and functions in the formation of synaptic vesicles from endosomes
(Kim and Hersh 2004).

Discussion _________________________________________________________________________
110
Similarly, the expression level of seven kinesin genes (KIF20A/MKLP2, KIF21A, KIF24,
KIF4A, KIF22/KID, KIF2A and KIF2C/MCAK) which have similar function to adapter
related proteins were found to be higher in receptive compared to non-receptive
endometrium (Figure 7). According to gene ontological classification, those kinesin gene
clusters were found to be involved in cellular localization (Figure 10C). Kinesins are
motor proteins required to regulate cargo transporting of intra cellular components,
vesicles and several organelles including mitochondria (Fisher and Kolomeisky 2001,
Hirokawa et al. 2009). For instance, kinesin family member 20A (KIF20A) is required to
control the intra-Golgi transport. Kinesin family member 4A (KIF4A) and kinesin family
member C2 (KIFC2) are implicated in neuron functioning in which the former is required
for transporting cell adhesion molecule required in axonal elongation (Peretti et al. 2000)
and the later may involve in transporting of multi vesicular body like (mvb-like)
organelles in dendrites (Saito et al. 1997). Therefore, it is possible to speculate that the
increased expression level of adapter related proteins and kinesin in receptive may
required to enhance neurotransmission or to increase accumulation and transduction of
energy by trafficking of integral membrane proteins and cellular materials including
adhesion molecule, organelles and vesicles. Apart from this, the increased level of adapter
related protein in receptive bovine endometrium might be associated with increased
number of lysosomes that could be required for uterine receptivity and embryo
implantation.
5.1.1.3 The cell cycle, anti and pro apoptosis genes
In the current study, the cell cycle gene clusters (CDC2, CDC20, CDC25C, CDC42SE2,
CDCA2 and CDCA4) and other cell cycle related genes CCNA2, CCNB2, AURKB,
CDCA2, NUSAP1, CKS2 and JAG2 were increased in receptive endometrium compared
to non receptive endometrium. The involvement of these genes during cell cycle has been
reported by different authors (Amabile et al. 2009, Borysov and Guadagno 2008, Ge et al.
2009, Katsuno et al. 2009, Turowski et al. 2003, Wolthuis et al. 2008, Yoon et al. 2004).
Therefore, the increased expression of cell cycle related genes in receptive endometrium
could be associated with increase in the size and development of luminal and glandular
epithelium of the receptive endometrium that may be required for preparing the uterus for
implantation.

Discussion _________________________________________________________________________
111
In the current study, the increased level of cell cycle related genes was accompanied by
increased expression level of anti apoptosis genes (BCL2, VEGFB, EDN1, MYB, CDC2,
BIRC5, VDAC1 and GCLC) and reduced expression level of the pro-apoptotic genes
(PRKRA, CASP4, PYCARD, LCK, TP53I3/PIG3 and MYC). Apoptosis normally involves
several biochemical events resulting in morphological changes to the cell membrane such
as loss of membrane asymmetry and attachment, cell shrinkage, nuclear fragmentation,
chromatin condensation and chromosomal DNA fragmentation. Although, the balance
between cell death and proliferation is not well known during the receptive phase of
bovine endometrium just before embryo implantation, the increase level of anti-apoptotic
and reduced level of pro-apoptotic genes in receptive endometrium may provide a specific
advantage for the epithelial cell of the receptive endometrium to escape the apoptosis
induced signals and consequently can exhibit lower frequency of apoptosis accompanied
by proliferation. For example, (Daikoku 1998) indicated that the BCL2 deficient mice
exhibited many apoptotic. Similarly, strong expression of BCL2 protein in the
endometrium glands was also reported (Gompel et al. 1994). Moreover, the BCL2 may be
an essential gene product for the survival of endometrial glandular cells (Tabibzadeh et al.
1995). Similarly, survivin (BIRC5) is required fore endometriotic implant growth
promotion (Tarkowski et al. 2001). Contradictory reports are available on the importance
of survivin during pregnancy and implantation. In one report, it has been described that
high survivin expression in abortion cases than the normal pregnancy in rats (Garcia et al.
2007). However, (Fest et al. 2008) reported similar survivin expression pattern between
non pregnant and aborted counter parts. Furthermore, these authors indicated a 5-fold
increase in the expression of survivin in pregnant compared to non-pregnant rat suggesting
the involvement of survivin during implantation. The vascular growth factor B (VGEFB),
which shares a high degree of sequence homology with vascular growth factor (VEGF)
and phosphatidylinositol glycan anchor biosynthesis class F (PIGF), is a potent apoptosis
inhibition by suppressing the expression of BH3 protein (Li et al. 2008). Increased level of
VEGFB stimulates endothelial cell growth and proliferation (Olofsson et al. 1998).
The pro-apoptotic genes may influence the preparation of the uterus for receptivity and
implantation by facilitating the death of cells than they divide ultimately leading to loss of
endometrial epithelial cells. This may in turn resulted in loss of endometrial receptivity for
implantation. Hence, in the current finding, the down-regulation of pro-apoptotic genes in
receptive endometrium may suggest faster proliferation than cell death in endometrial
cells. For instance, in the current result, one of the pro-apoptotic gene v-myc
Discussion _________________________________________________________________________
112
myelocytomatosis viral oncogene homolog (v-MYC) was down regulated in receptive
endometrium compared to non receptive endometrium. This gene is believed control
several genes in embryonic stem cells that function in biological processes (Kidder et al.
2008). Similarly, in the current study, MYC was found to be the central gene influencing
in the number genes involving in cell cycle, cell death and reproductive system diseases
network (Figure 15). Furthermore, in appropriate expression of MYC leads to enhanced
apoptosis or inappropriate expression is correlated with a wide array of human
malignancies (Askew et al. 1991, Evan et al. 1992, O'Connell et al. 2003, Shi et al. 1992)
due to accumulation of p53 (Tabibzadeh et al. 1995). Moreover, over-expression and
localization of the myc product may have an important role in the initiation, differentiation
and progression of endometrial carcinoma (Bai et al. 1994). Furthermore, elevated levels
of MYC gene expression in neoplastic cells from all seven bovine leukemia viruses
induced bovine tumors (Gupta et al. 1986). This may suggest that the reduced level of v-
MYC including other proapoptotic genes and increased level of anti-apoptotic genes in
receptive endometrium may suggest faster cellular proliferation and differentiation to
prepare the endometrium for substantial remodelling.
5.1.1.4 The protein phosphatases and protein kinases
The protein phosphatases (PPM1G/PP2CG, PPP1CB, PPP1R10/PNUT3 and PPP2R5A) and
protein kinases (PRKCQ, PRKCI, PRKAG2) (Figure 7) were among several clusters of
genes increased in receptive compared to endometrium. The functional contribution of
protein phosphatases and protein kinases in preparing mammalian endometrium for
receptivity and embryo implantation is not yet well documented. The protein phosphatases
and protein kinases gene clusters are believed to function together in a coordinated manner
to dictate the level of protein phosphorylation in the cell. The protein phosphatases
involves in protein phosphorylation and posttranslational modification and protein kinases
acts as effectors of phosphorylation (Eyster et al. 2007). The coordinated activity of
protein kinase C (PRKC) and protein phosphatases during the pregnancy period of rat have
been also documented by several authors (Eyster 1993, Eyster et al. 1998, Gibori et al.
1988). For example, the protein phosphatase gamma (PPM1G) regulates protein stability
(Suh et al. 2009) and smooth muscle cell survival (Tchivilev et al. 2008). On the other
hand, protein phosphatase 1 regulatory subunit 10 (PPP1R10) controls the expression of
genes that are critical for certain physiological and pathological processes including Rb-

Discussion _________________________________________________________________________
113
phosphatase activity and apoptosis (De Leon et al. 2008, Lee et al. 2009). Similarly,
among the protein kinases, kinase AMP-activated gamma 2 (PRKAG2) regulates chemical
pathways in restoring the balance of ATP during chemical reactions that require ATP and
protein kinase C (PKC) is known to be against apoptosis and required for cell proliferation
(Grossoni et al. 2007). Apart from this, those protein kinases and phosphatases enriched in
receptive endometrium were found to be the main constituent of the tight junction pathway
(Figure 14, table 6). Tight junction pathway involves in various signaling events including
controlling cell-to-cell-adhesion, cell signaling and membrane trafficking (Kohler and
Zahraoui 2005). Therefore, in figure 14, it has been implicated that the protein kinases
(aPKC) and protein phosphatases form the main components of the cytoplasmic plaque of
the pathway towards cell proliferation, regulation of actin cytoskeleton and regulation of
gene regulation. From this it is possible to speculate that although exact information is
lacking on the mechanism how those genes function in the endometrium during the bovine
implantation period, the simultaneous upregulation of those genes in receptive
endometrium may be useful in maintaining the balance of protein phosphorylation and
dephosphorylation in receptive endometrium for a wide range of cellular processes.
5.1.1.5 Cluster of differentiation (CD) and chemokine molecules gene clusters
The embryo during implantation and throughout pregnancy is considered as foreign and
unlikely to avoid the scrutiny of immune cells that continually infiltrate the endometrium
and scavenge the uterine lumen (Roberts et al. 1996). The high rate of early embryonic
mortality in cattle and other animals may be maternal immunological attack against
conceptus antigens of paternal origin (Thatcher et al. 1984). Therefore, reduced level of
immune response of the maternal environment may be required to maintain the conceptus
during the entire gestation period. In the present study, cluster of differentiation molecules
(CD247/CD3Z, CD36, CD8A, CD8B), chemokine molecules (XCL1, CCL28, CXCL2,
CXCL12, CXCL5), (Figure 11D) were found to be reduced in receptive compared to non-
receptive endometrium. Several authors (Patel et al. 2007, Walter and Santamaria 2005,
Whitcomb et al. 2007) have described the functional contribution of CD molecules in
immune system. For instance, CD36 has been found to be involved in innate immune
response in mouse (Patel et al. 2007, Silverstein and Febbraio 2009), it interacts with the
Toll-like receptors (TLR) to process the inflammatory responses (Erdman et al. 2009).
Lower level of CD247/CD3-zeta expression in maternal serum has been demonstrated in

Discussion _________________________________________________________________________
114
normal pregnancies (Lam et al. 2003). Similarly, CD8 believed to contribute to initiation,
progression and regulation of autoimmune responses (Walter and Santamaria 2005). In
addition, CD8A, CD8B and CD247 were found to be involved in T-receptor signaling
pathway (Table 6) and CD8A and CD8B were found to be involved in antigen presentation
network (Appendix 3). The importance of chemokine genes during immune response has
been previously described (Ogawa et al. 2004, Whitcomb et al. 2007). In addition, all
differentially expressed chemokine genes were found to be involved in cytokine-cytokine
receptor interaction pathway (table 6) suggesting their involvement in immune system.
Among them, elevated concentrations of CXCL5 had been associated with higher risk of
miscarriage in human (Whitcomb et al 2007).
Apart from those CD and kemokine molecules several DE genes related to the immune
system, colony stimulating factor 3 (CSF3), IL18, non-classical MHC class I antigen
(BOLA-NC1), tumor necrosis factor super family member 13 (TNFSF13), complement
factor D (CFD/DF) were reduced in the receptive endometrium. Previous reports also
indicated lower IL18 mRNA expression in pregnant compared with non-pregnant women
and reduced pregnancy rate was reported in IL18 positive women compared to IL18
negative group (Kruse et al. 2000, Ledee-Bataille et al. 2004). Moreover, detection of IL18
is suggested to be used as non-invasive and simple method to predicted inadequate uterine
receptivity, independent of embryo quality (Ledee-Bataille et al. 2004). Therefore, the
reduced level of CD molecules, kemokines and other immune related genes in receptive
compared to non- receptive endometrium may suggest that the receptive endometrium can
adjust the immune system to create conducive environment for immune tolerance of the
incoming embryo.
5.1.1.6 S100 gene clusters and endometrial receptivity
With the exception of S100B, the expression pattern of the S100 proteins including
S100A12, S100A13, S100A14, S100A16 and S100A8 was reduced in receptive
endometrium compared to the non-receptive endometrium. The contribution of S100 genes
in bovine endometrial receptivity and embryo implantation is not known. However, some
evidences indicate that S100 genes may be function in the immune system similar to
chemokine or CD molecules. For instance, S100 genes including S100A8, S100A9,
S100A12 and S100A13 are believed to function as a cytokine-like manner (Foell et al.
2007, Sedaghat and Notopoulos 2008). Similarly, the expression of S100A12 and S100A8

Discussion _________________________________________________________________________
115
were found to be higher in inflamed tissue, where neutrophils and monocytes belong to the
most abundant cell types (Foell et al. 2007). Moreover, 100% of homozygous null for
S100A8 gene in rats caused rapid and synchronous embryo resorption at day 9.5 embryo
development (Passey et al. 1999). This may suggest that the S100AB null embryos had lost
the immune system to overcome the mother immune scrutiny. Some of S100 proteins
down regulated in receptive endometrium (S100A13, S100A8, S100A14, S100A16) may
associated with endometriosis, tumorigenesis and progression and can be used as a marker
of actively progressing endometriotic process (Hayrabedyan et al. 2005, Yao et al. 2007a,
Yao et al. 2007b). Therefore, the reduced level of S100 those genes in receptive
endometrium may have two fold advantage, for one thing it may be associated with
suppression of tumerigenesis and secondly it may required for modulation of the maternal
immune system in the endometrium to be hospitable for the incoming embryo.
5.1.1.8 The extracellular matrix (ECM): The Collagens, TIMP3, TIMP1 and MMP2
The collagens, tissue inhibitors of matrix metalloproteinase (TIMP) and matrix
metalloproteinase (MMP) are among the main components of ECM and abnormalities in
those ECMs can be associated with implantation defects (Iwahashi et al. 1996b, Jokimaa et
al. 2002, Skinner et al. 1999). In current study, several collagens including, collagen type I
(COL1A1,COL1A2), collagen type VI (COL6A1), collagen type XII (COL12A1), collagen
type IVIII (COL18A1), collagen type XXI (COL21A1) and collagen type XXVII
(COL27A1) were reduced and collagen type IV alpha 3 and alpha 4 (COL4A3, COL4A4)
were increased in receptive compared to non-receptive endometrium (Figure 8). According
to the gene ontological classification, those DE collagens were involved in extra matrix
remodeling (Figure 11E). Moreover, COL1A1, COL1A2, COL4A4, COL6A2, COL6A3 were
found to be involved in focal adhesion and ECM receptor interaction pathway (Table 6).
Among these, collagen type I, IV, VI and collagen type XVIII have been detected in
human and bovine endometrium (Aplin et al. 1988, Boos 2000, Gaide Chevronnay et al.
2009, Iwahashi et al. 1996, Stovall et al. 1992). Similar to the current study, other report
also indicated very low collagen type VI in the decidual stroma indicating loss of stromal
type VI collagen contributes to the remodelling of the maternal extracellular matrix of
pregnancy (Mylona et al. 1995). Moreover, the expression level of collagen type I
(COL1A1, COL1A2) and collagen type VI (COL6A1) were reported to be higher in non
pregnant cow compared to pregnant cow (Bauersachs et al. 2006). The reduced level of
Discussion _________________________________________________________________________
116
collagen type I (COL1A1) may be associated with its minor role in the maintenance of
uterine tensile strength of the cyclic cow (Boos 2000).
Unlike other collagen families, the expression of collagen type IV alpha 3 (COL4A3) and
collagen type IV alpha 4 (COL4A4) were elevated in receptive compared to non- receptive
endometrium (Figure 11E). Collagen IV is a common constituent of basement membrane
(Boos 2000) and it has been suggested to enhance trophoblast invasion by providing a
substratum for cell migration (Aplin 1996, Irving et al. 1995). Besides collagen IV was
found to be detected in stromal cells and the basement membrane of glands and blood
vessels in fertile women and it was absent in women suffering from unexplained infertility
(Bilalis et al. 1996).
In addition to collagens abundances, the ECM is regulated by two groups of enzymes,
matrix metalloproteinases and their inhibitors, tissue inhibitors of metalloproteinases
(TIMP) and cystatins respectively (Jokimaa et al. 2002). Inline to this, the current study
identified the expression level of matrix metalloproteinase (MMP2) and tissue inhibitors of
metalloproteinases 1 (TIMP1) to be lower and tissue inhibitors of metalloproteinases 3
(TIMP3) to be higher in receptive compared to non- receptive endometrium. Higher mRNA
levels of TIMP1 and MMP2 were associated with unexplained infertility and recurrent
miscarriages in humans (Jokimaa et al. 2002). Therefore, higher expression of those genes
may be associated with infertility in both humans and cattle. Apart from this, higher TIMP3
expression level can be indicative of normal functioning endometrium while lower level of
TIMP3 was observed in endometriosis cases (Jokimaa et al. 2002). The expression of
TIMP3 may play an important role in regulating the depth of trophoblast invasion during
embryo implantation (Li et al. 2000). Moreover, higher expression of TIMP3 in maternal
cells surrounding invading embryonic tissue and absence of TIMP1 or TIMP2 in the
embryo proper, trophoblasts, or the area of the uterine decidual reaction was demonstrated
during mouse embryo implantation indicating the importance of TIMP3 in implantation
process (Reponen et al. 1995). Therefore, the increased or reduced expression of collagens,
TIMPs and MMP2 in the receptive endometrium may be associated with maintenance of
endometrial integrity by maintaining normal turnover of extracellular matrix proteins.
5.1.1.9 Junctional adhesion, gap junction or connexin in receptive endometrium
Junctional adhesion, gap junction or connexin expression are a biological marker for
endometrial receptivity in human (Grummer and Winterhager 1998). In this study, the

Discussion _________________________________________________________________________
117
mRNA level of junctional adhesion molecules 2 and 3 (JAM2/JAMB and JAM3/JAM-C)
was found to be increased in receptive compared to the non-receptive endometrium. The
higher expression of JAM3/JAM-C can be associated with increased in the number of
uterine natural killer cells that are required to enhance blood flow to the implantation site,
which may be required in the development of the placenta during implantation (Hanna et
al. 2006, Herington and Bany 2007, Herington and Bany 2006). Moreover, those genes are
believed to enhance cell-to-cell adhesion and control the flow of solutes and water between
cells of epithelium (Aurrand-Lions et al. 2000, Aurrand-Lions et al. 2001, Ueki et al.
2008). Moreover, the junctional genes along with claudins are the main components of the
transmembrane proteins of tight junctional pathway (Figure 14).
Among the gap junctional proteins, gap junction protein beta 5 (GJB5) or connexin-31
(CX31.1) and gap junction protein beta 6 (GJB6) or connexin-30 (CX30) were elevated
but gap junction protein alpha-1 or connexin 43 (GJA1/CX43) was reduced in receptive
compared to non- receptive endometrium. Among these, GJB5/CX31.1 is believed to be
required for normal placental development (Zheng-Fischhofer et al. 2006). GJB6/CX30 is
found to be abundant in late pregnant epithelium (Locke et al. 2007). Unlike other
connexins, connexin 43 (GJA1/CX43) was expressed at lower level in receptive
endometrium compared to the non- receptive endometrium. Similar to our result, the
expression of CX43 was found to be reduced in the receptive phase of the endometrium. A
decrease in CX43 gene expression in endometrium at the time of implantation may be
required to reduce cell-to-cell communication and to facilitate the invasion of
trophectoderm through the stroma cells (Granot et al. 2000). This may suggest that low
level of CX43 is required during the receptive period of the endometrium.
Other families of cell adhesion molecules which were increased in receptive compared to
non-receptive endometrium were the alpha integrin 2 (ITGA2) and alpha 6 integrin
(ITGA6). Similar reports in humans have shown increased expression of ITGA2 and
ITGA6 during window of implantation (Bischof et al. 1993, Lanteri et al. 1998).
Moreover, the up regulation of ITGA6 expression was speculated to be related to its
involvement in the attachment of cells to the extracellular matrix and induction of cell
migration and invasion (Vernet-Tomas Mdel et al. 2006). Therefore, the increased level of
these integrin in receptive endometrium compared to non-receptive endometrium may
suggest the importance of appropriate integrin expression for establishment of uterine
receptivity and embryo implantation.
Discussion _________________________________________________________________________
118
5.2 Diestrus dynamics of receptive and non- receptive endometrium
In addition to investigating transcriptome difference between receptive endometrium and
non-receptive endometrium, in the current study, the diestrus period transcriptome
dynamics of receptive or non-receptive endometrium was addressed to get insight into the
temporal transcriptome accumulation or degradation of the receptive and non-receptive
endometrium. Therefore, the transcriptome dynamics of receptive or non-receptive
endometrium was compiled between endometrial biopsies collected at day 7 and 14 post
estrus. The data showed that more than 1800 gene transcripts were differentially
expressed between day 7 and 14 in receptive endometrium, but only 254 transcripts were
differentially expressed between day 7 and 14 in non-receptive endometrium suggesting
mRNA dynamics (degradation or induction) is seven times higher in receptive
endometrium than the non-receptive endometrium. This can be related to the fact that, the
non-receptive endometrium has few or no genes that support the incoming embryo at any
stage of the estrous cycle. However, in receptive endometrium the expression level of
several genes that reached peak or reduced at day 7 of the estrous cycle in the expectation
of the incoming embryo alter their expression pattern at day 14 of the estrous cycle.
Therefore, unlike the non-receptive endometrium, the transcriptome abundance of those
genes that are associated with endometrial receptivity can be changed at day 14 post estrus
resulting in higher transcriptome abundance difference between day 7 and 14 in receptive
compared to non-receptive endometrium.
To understand the functional alteration changes that occured in the receptive endometrium
between day 7 and 14 of the estrous cycle, those genes which changed their expression
between the two time points were subjected to gene ontology for gene enrichment analysis.
Accordingly, the receptive endometrium at day 7 of the estrous cycle is mostly associated
with expression of genes that are responsible for cellular material transport, metabolic
process, phosphorylation, post-translational protein modification. However, as it reaches to
day 14 of the estrous cycle, the receptive endometrium starts to be enriched by genes,
which are responsible for the immune responses, apoptotic process and signal
transductions (Figure 9). Although no report is available on the transcriptome dynamics of
the receptive endometrium, the existing data on bovine endometrial gene expression also
indicated transcriptomic alteration changes of bovine, human and rabbit endometrium
during the different phases of the estrous cycle (Bauersachs et al. 2005, Kao et al. 2002,
Mitko et al. 2008). Moreover, changes in transcriptome alteration of the bovine receptive

Discussion _________________________________________________________________________
119
endometrium were also accompanied by changes in metabolic, cytokine and signaling
pathways. The enrichment of those molecular pathways varies whether the endometrium is
at day 7 or 14 of the estrous cycle (Table 7). For instance, the gonadotropin releasing
hormone pathway was among the 21 molecular pathways involved by those genes whose
expression level is variable as receptive endometrium is forwarding from day 7 to day 14
of the estrous cycle (Figure 20). This pathway is associated with in activation of
transcription factors gonadotropin expression and secretion that can regulate the
production and release of gonadotropins, LH and FSH. Moreover, this pathway has slots
towards other 3 signaling pathways, namely MAPK and cytokine-cytokine signaling
pathways (dominated by genes enriched in day 14) and nueroactive ligand receptor
interaction pathway (dominated by genes enriched at day 7 of the estrous cycle). This may
suggest that as the receptive endometrium proceeds from day 7 to day 14 of the estrous
cycle, the molecular pathways change towards the direction of transcription of genes
required for production of hormones, cell proliferation and differentiation.
Following global gene expression profiling between receptive and non-receptive
endometrium, or between day 7 and 14 of the estrous cycle in receptive or non-receptive
endometrium, the expression patterns of selected DE genes was determined across the
estrous cycle and at 50 days gestation period (P). These was aimed at investigating
whether up or down regulating genes in receptive endometrium during the estrous cycle
will continue or decay during early gestation period. The data on selected genes showed
that IRF6, ITPR1, STAT5A and AGTR1 exhibited an increase trend from proestrus to
diestrus and reached peak in pregnant endometrium (Figure 23), whereas the expressions
of PTGER4, PTGS2/COX-2, TIMP3 and ADORAB2B were reduced in during early
pregnancy period compared to day 7 and 14 of the estrous cycle. This may suggest that
those genes which were increased in receptive endometrium during the receptive phase of
the endometrium can be increased further or reduce their expression after embryo
implantation. For instance, interferon regulatory factor 6 (IRF6) was among the genes
increased during pregnancy. This gene is believed to play critical roles in endometrial gene
expression, conceptus trophectoderm growth and differentiation, regulator of keratinocyte
proliferation and differentiation during embryogenesis (Fleming et al. 2009). Therefore,
the increased level of IRF6 in pregnant endometrium may suggest the requirement of IRF6
during per and postimplantation periods. Similarly, the expression profile of STAT5A also
indicated an increase level in pregnant endometrium even if it was down regulated in
receptive endometrium. During early pregnancy in cattle and other ruminants,

Discussion _________________________________________________________________________
120
progesterone (P4) from the corpus luteum and interferon tau (IFNτ) from the conceptus act
on the endometrium regulate genes important uterine receptivity and conceptus growth
(Gray et al. 2006). STAT5A is one of the genes increased by IFNτ (Gray et al. 2006). The
increased level of STAT5A at pregnant endometrium might be then driven by activation of
IFNT on STAT5 gene during the implantation. Therefore, the down regulation of STAT5A
in receptive endometrium during the estrous cycle may be compensated by the time
embryo starts to produce IFNτ. On the other hand, cyclooxygenase-2 or PTGS2 was
upregulated in receptive endometrium and exhibited lower expression in pregnant
endometrium compared to the expression detected at day 7 and 14 of the estrous cycle
suggesting reduction of its expression after implantation. This can be also associated with
effect IFNτ. As described in several reports (Binelli et al. 2000, Pru et al. 2001, Xiao et al.
1999), the expression level of PTGS2 is reduced following IFNτ exposure. For instance,
the expression level of PTGS2 down-regulated at day 14 of pregnancy in sheep and by
treatment of ewes with IFNτ suggesting the effect of IFNτ on the reduction of PTGS2 gene
during pregnancy (Binelli et al. 2000, Chen et al. 2006, Xiao et al. 1999). This together
with the current result can suggest that the up-regulation of PTGS2 during the receptive
phase may be maintained to lower level by the effect of the embryo following during
implantation.
5.3 Transcriptome alternation in embryos resulted in calf delivery and no pregnancy
Embryo competency for implantation and uterine receptivity are two distinct processes that
are equally important for successful implantation (Carson et al. 2000, Dey et al. 2004,
Wang and Dey 2006). Thus the embryo can functions as an active unit with its own
molecular program of cell growth and differentiation (Carson et al. 2000, Dey et al. 2004).
Therefore, in the current study, in addition to endometrial gene expression, the
transcriptome differences between embryo biopsies resulted in calf delivery and biopsies
resulted in no pregnancy was analyzed to generate candidate genes associated with those
embryo implantation potential. Subsequently, significantly differentially expressed genes
between the two groups of embryo that were involved in several biological and molecular
functions have been identified (Figure 25, Figure 26, Table 9). This shows that embryos
that result in calf delivery can be molecularly distinguishable from embryos ended up in no
pregnancy. However, the number of differentially expressed genes and molecular
signatures derived from comparing the two groups of embryo biopsies was by far fewer

Discussion _________________________________________________________________________
121
compared to the differentially expressed genes obtained from comparing the endometrial
biopsies resulted in calf delivery and no pregnancy. This does not imply that the
endometrium or the maternal environment is more important than the embryo during
embryo pregnancy establishment. However, this was indeed related to differences in the
microarray platform utilized in the two experiments.
Among the DE genes that were identified between the two embryo groups, CXCL16,
AMD1, SPAG17, PF6, UBE2D3P, DFNB31, DTNBP1 and NUP35 were found to be higher in
embryo biopsies resulted in calf delivery compared to those resulted in no pregnancy.
Among these, reports have also shown the importance of CXCL16 and AMD1 in
cytotrophoblast invasion, placentation, cell migration and mouse embryo development
(Huang 2006, Lin et al. 2009, Nishimura et al. 2002). On the other hand, eukaryotic
translation elongation factor 1 alpha 1 (EEF1A1), was found to be higher in embryo
biopsies derived from blastocysts resulted in no pregnancy. Similar study in our lab (El-
Sayed et al. 2006), showed higher abundance of EEF1A1 expression in embryo biopsies
derived from in vitro produced blastocysts that resulted in no pregnancy. This shows the
presence of common genes related to the progressive development of embryo derived
either from in vivo or in vitro condition.
Collectively, the present data uncovered the pattern of the bovine pre-transfer endometrial
and embryo gene expression in relation to pregnancy establishment. To that end,
endometrium that resulted in calf delivery displayed different transcriptome profile
compared to the endometrium that resulted in no pregnancy at day 7 of the estrous cycle.
Those differences were accompanied by qualitative and quantitative alteration of major
biological processes and molecular pathways. Along with the endometrial gene expression,
the embryo that developed to term displayed different patterns of gene expression
compared to those embryos failed to establish pregnancy suggesting the potential
contribution of embryo transcripts during pregnancy establishment. Therefore, our data
provide a global perspective of the endometrium and embryo transcriptome in relation to
the possible pregnancy outcomes. The data generated in the present study can be utilized
for selecting candidate genes for further investigation aiming at developing molecular
markers related to endometrial receptivity and embryo competency. However, future
functional studies will be necessary to understand the key functional contribution of
differentially expressed genes with respect to pregnancy success. Apart from this, in-depth
investigation may be required to fully understand to what extent endometrial state can
repeat it self with regard to its molecular signatures during consecutive estrous cycles.

Summary _________________________________________________________________________
122
6 Summary
The intrinsic factors associated the aberrant gene expression in the uterine endometrium
and embryo has been one of the major causes of pregnancy failure in cattle. Therefore,
selecting cows with adequate endometrial receptivity and implantation competent embryos
based on gene expression pattern may increase the number of calves borne following
embryo transfer. Hence, investigating the endometrial and embryonic gene expression
before embryo transfer and relating this information to the pregnancy outcome provides a
unique opportunity for generating molecular marker that are associated with endometrial
receptivity and embryo implantation. Therefore, in the current study, a direct connection
has been established between pre-transfer endometrial and embryo gene expression and
pregnancy outcome using endometrial and embryo biopsy techniques. For this, 54
Simmental cyclic heifers were estrus synchronized and endometrium biopsies were taken
at day 7 and 14 of the estrous cycle during the pre-transfer period. In the next cycle, in
vivo produced day 7 blastocysts stage embryos were transferred to the recipients at day 7
of the estrous cycle after taking 30-40% parts of the blastocyst as a biopsy for
transcriptome analysis. After pregnancy diagnosis and at the end of gestation period,
heifers were grouped according to the pregnancy outcome. Those heifers returned to heat
after 21 days were classified as no pregnancy group (non-receptive endometrium) and
those heifers ended up with successful pregnancy were classified as calf delivery group
(receptive endometrium). The embryos that were biopsied from blastocysts transferred to
the recipients and endometrial biopsies collected during the pre-transfer period were then
categorized based on the pregnancy success. The embryo biopsies were classified as those
biopsies resulted in successful calf delivery and those resulted in no pregnancy. Similarly,
the endometrial biopsies taken at days 7 and 14 of the estrous cycle during the pre-
transferred period from heifers resulted in successful calf delivery were designated as
CDd7 and CDd14, respectively. Similarly, endometrial samples collected at days 7 and 14
of the estrous cycle from heifers resulted in no pregnancy groups were designated as NPd7
and NPd14, respectively. Following this, the gene expression difference between receptive
and endometrium during day 7 and 14 of the estrous cycle, the transcriptome dynamics of
receptive endometrium and non-receptive endometrium were established using
GeneChip® Bovine Genome Array. Furthermore, the transcriptome abundance difference
between the embryo biopsies resulted in calf delivery and those resulted in no pregnancy
were investigated using the bovine preimplantation specific cDNA array.
Summary _________________________________________________________________________
123
The pre-transfer endometrial gene expression difference between heifers resulted in calf
delivery (receptive endometrium) and heifers resulted no pregnancy (endometrium) at day
7 of the estrous cycle was investigated by comparing the transcriptome abundance of
CDd7 and NPd7. The result revealed that 1126 genes were differentially expressed
between the two groups of endometrium of which 612 genes were elevated in receptive
endometrium (CDd7) and 514 were elevated in non-receptive endometrium (NPd7). From
those, CDC20, GCLC, PLLP, COL4A4, TMEM163, MTTP, NETO2, CDC2, COX6B2
and PPP2R5A were strongly expressed in CDd7 whereas five or more folds in NPd7
elevated HOXA9, COL1A2, NTRK2, COL3A1, GJA1, COL21A1, LHFP, IGJ, SPOP,
OGN, COL6A1 and SPARC. In addition to individual genes, several gene clusters were
found to be differentially expressed between the two groups of endometrium. Among
those, the solute carrier gene cluster, cell division cycle clusters, adaptor related protein
complex, kinesin clusters, leucine rich repeats, coiled domains, ATPases, protein kinases
and phosphatase clusters, transmembrane proteins, junctional adhesion molecules and
integrins were abundantly expressed in receptive endometrium (CDd7) groups. However,
gene clusters including, cluster of differentiation molecules, chemokine molecules,
homeobox genes, collagen families, S100 calcium binding protein and zinc finger proteins
were enriched in endometrium (NPd7). Functional classification of the differentially
expressed genes indicated that those genes whose expression level was elevated in CDd7
groups were found to be involved several functions including macromolecule localization,
protein/cellular localization, transmembrane transport, post transcriptional modification,
binding activities (nucleotide, ion, ATP), signal transduction, metabolic process, anti-
apoptosis, gene transcription and cell cycle. However, the genes elevated in NPd7 were
mainly involved in cellular metabolic processes, responding to stimuli, immune response,
chemokine and cytokine activity and induction of apoptosis. Furthermore, the regulator
pathway annotation analysis performed based the Kyoto encyclopedia of genes and
genomes database revealed that the genes enriched in CDd7 mainly involve the tight
junction, integrin signalling, inositol phosphate metabolism, calcium signalling pathway,
focal adhesion, apoptosis, GnRH, VEGFB and PPAR signalling pathways. On the other
hand, the genes abundantly expressed in NPd7 were mainly found to involve in T cell
receptor pathway, cytokine–cytokine receptor, p53 signalling pathway and focal adhesion
pathways. Moreover, the Ingenuity Pathway Analysis revealed that, the differentially
expressed genes between CDd7 and NPd7 were grouped into a set of 34 different
molecular networks. The relevant functions that repeatedly appear in the different

Summary _________________________________________________________________________
124
molecular networks were cell cycle network, cell death, reproductive system disease,
genetic disorder, cellular movement, DNA replication recombination and repair network,
lipid metabolism, molecular transport network, antigen presentation network, post-
translational modification, cellular assembly and organization, cell signaling, cellular
movement, immune cell trafficking, neurological disease, RNA post-transcriptional
modification. Therefore, the differences in regulatory pathways and biological processes
and molecular functions evidenced the presence of transcriptomic functional and
molecular signaling alteration between receptive and non-receptive endometrium at day 7
of the estrous cycle during the pre-transfer period.
In addition to day 7 of the estrous cycle, the pre-transfer gene expression difference
between receptive endometrium and endometrium was investigated at day 14 of the
estrous cycle using endometrial biopsies taken during day 14 of the estrous from those
eventually resulted in calf delivery and from those resulted in no pregnancy groups. For
this, the transcriptome abundance of CDd14 and NPd14 was compared. The result showed
that only 14 DE genes between the two groups of the endometrium in which the expression
level of 2 genes (C20ORF54 and FZD8) to be higher in CDd14, while the expression of 12
genes (LOC786821, BRWD1, ANKRD11, SLC25A12, GJA1, SCARA5, IIGLL1 and
other 5 ESTs) to be higher in NPd14. Therefore, this result showed that the number of
genes and molecular signals altered between CDd14 and NPd14 was significantly lower
compared to the number of genes and molecular signals altered between CDd7 and NPd7.
This shows that minimum difference in transcriptomic functional alteration between
receptive and non-receptive endometrium at day 14 of the estrous cycle and pronounced
difference in day 7 of the estrous cycle. This remarkable difference in transcriptomic
functional alteration between receptive and non-receptive endometrium at day 7 of the
estrous cycle indicates the endometrium that eventually result in calf delivery and
endometrium result in no pregnancy can be molecularly distinguishable at day 7 than day
14 of the estrous cycle.
Following investigating the transcriptome difference between the receptive and non-
receptive endometrium at day 7 and 14 of the estrous cycle, the temporal transcriptome
dynamics of the receptive endometrium was examined to understand the transcriptome
changes that undergoes as the receptive endometrium proceeds from day 7 to day 14 of the
estrous cycle. For this, the endometrial gene expression was analyzed using day 7
endometrial samples (CDd7) and day 14 endometrial samples (CDd14) collected from
heifers resulted in calf delivery. The result indicated that 1867 genes were differentially

Summary _________________________________________________________________________
125
expressed between the CDd7 and CDd14. Of these the transcript level of 1014 genes was
elevated in CDd7 while the transcript level of 853 were increased in CDd14 indicating
pronounced transcriptome changes of the receptive endometrium between day 7 and 14 of
the estrous cycle. The functional classification also revealed that those genes elevated in
CDd7 were involved in various functions including, cellular material transport,
phosphorylation, post-translational protein modification. On the other hand, the immune
responses, apoptotic process and signal transductions were among the main biological
processes in those genes whose transcript level was increased in CDd14 compared to
CDd7. Moreover, 21 molecular pathways were affected as endometrium progresses from
day 7 to day 14 of the estrous cycle. The MAPK signaling, Toll-like receptor signalling,
adipocytokine signaling, cell adhesion molecules (CAMs) and extra cellular matrix
(ECM)-receptor interaction pathways were enriched by the genes abundantly expressed in
CDd7. On the other hand, the PPAR signaling, calcium signaling, neuroactive ligand-
receptor interaction, arginine and proline metabolism, GnRH signaling, urea cycle and
metabolism of amino acid, tryptophan metabolism, Glycine, serine and threonine
metabolism pathways were enriched by the genes abundantly expressed in CDd14.
Similar to the receptive endometrium, the transcriptome changes of the non-receptive
between day 7 and 14 of the estrous cycle was investigated by comparing NPd7 and
NPd14 endometrial biopsy samples. From this analysis, it was evidenced that 254 genes to
be differentially expressed between NPd7 and NPd14 groups. Compared to the
transcriptome dynamics of the receptive endometrium (CDd7 vs. CDd14), the number of
differentially expressed genes and functional categories identified in NPd7 vs. NPd14 was
lower by 1613 genes indicating the transcriptome plasticity of receptive endometrium
during the day 7 and 14 of the estrous cycle.
Once the pre-transfer endometrial gene expression of receptive and non-receptive
endometrium was uncovered, the mRNA and protein expression pattern of some selected
candidate genes were assessed at five different days of the estrous cycle (at days 19, 0 (21)
3, 7 and 14 of the estrous cycle and day 50 of the gestation period using endometrium
samples collected from targeted slaughtered heifers. For this, candidate genes that
exhibited an elevated expression in receptive endometrium (CDd7) namely, (IRF6,
PTGER-4, ITPR1, ADORA2B, PTGS2/ COX-2, WNT11, CDC20 and TIMP3) and others
(STAT5A, MMP2 and AGTR1) which were increased in non-receptive endometrium
(NPd7) were selected. The majority of those candidate genes showed higher expression
levels at day 7 and 14 of the estrous cycle. In addition, the expression pattern of IRF6,
Summary _________________________________________________________________________
126
ITPR1, STAT5A and AGTR1 exhibited an increase trend from proestus to diestrus and
reached peak in pregnant endometrium. However, the expression of PTGER4,
PTGS2/COX-2, TIMP3 and ADORAB2B was reduced in pregnant endometrium
compared to the expression observed at day 7 and 14 of the estrous cycle. In addition,
immunohistochemical localization of IRF6, ITPR1, PTGS2 and MMP2 revealed
differences in the protein signal intensities during the estrous cycle and early pregnancy in
superficial, luminal and glandular epithelial and stroma cells suggesting temporal and
special expression of those genes. Therefore, this may indicate those genes exhibited
higher or lower expression during the estrous cycle may induce or switch off their
expression following implantation.
The blastocyst competency for implantation is equally important as endometrial receptivity
to determine the pregnancy outcome. Thus, parallel to transcriptome analysis from the
endometrial biopsies, the transcriptome abundance differences between embryo biopsies
resulted in calf delivery and biopsies resulted in no pregnancy was analyzed to generate
candidate genes that are associated with the blastocysts competency for implantation. The
microarray data analysis revealed a total of 70 differentially expressed genes between the
two embryo groups involving in different function categories including gene expression,
cell signaling and cell communication, transport of macromolecules, transferase activity
and chemokine activity. Compared to the transcriptomic alteration difference that has been
occurred between receptive and non-receptive endometrium, the numbers of genes that
were differentially expressed and molecular signatures generated while between embryo
biopsies resulted in successful calf delivery and no pregnancy were by far fewer. However,
this difference does not guarantee that the endometrium or the maternal environment is
more important than the embryo for pregnancy establishment. This difference was indeed
related to differences in the microarray plat form used.
In conclusion, the present study provides significant mechanistic insight about pre-transfer
cattle endometrial and embryo gene expression in relation to the pregnancy success. The
data highlights the potential of pre-transfer endometrial and embryo biopsy transcripts for
predicting pregnancy success in cattle which is a step forward in developing molecular
markers for selecting embryos that are capable of developing further and recipient cows
that are presumably become pregnant. Apart from this, the results provided a long list of
several developmentally important genes that can be utilized for selecting candidate genes
for further investigation aiming at developing molecular markers for predicting pregnancy
success in cattle. However, future functional studies will be required to understand the

Summary _________________________________________________________________________
127
functional contribution of differentially expressed genes with respect to pregnancy success.
In addition, in-depth investigation may be essential to fully understand to what extent
endometrial state can repeat it self with regard to its molecular signatures during
consecutive cycles. Taken together, this data contributes substantial information towards
increasing pregnancy success in cattle using gene expression as predictor tool.

Summary _________________________________________________________________________
128
7 Zusammenfassung
Die Hauptgründe für die Trächtigkeitsverluste nach Embryotransfer beim Rind stellen
inhärente Faktoren verbunden mit der abberanten Genexpression im Endometrium und
Embryo dar. Durch die Selektion adäquater endometrialen Rezeptivität und Embryonen
mit hohem Entwicklungspotntial basierend auf dem Genexpressionsmuster, könnten die
Trächtigkeitsraten vermutlich gesteigert werden. Infolgedessen bietet die Analyse der
endometrialen und embryonalen Genexpression vor dem Transfer bezogen auf den
Trächtigkeitserfolg, eine einzigartige Möglichkeit zur Identfizierung molekularer Marker
für die Rezeptivität des Endometriums und der embryonalen Entwicklungskompetenz.
In der vorliegenden Arbeit wurde eine direkte Abhängigkeit der Expressionsprofile von
Endometrium und Embryo vor dem Transfer zum Trächtigkeitserfolg hergestellt. In
diesem Versuch wurden 54 Simmeltaler Färsen synchronisiert und deren Endometrium an
Tag 7 und 14 des Vorzykluses biopsiert. Im folgenden Zyklus wurden in vivo Blastozysten
an Tag 7 gespült und auf diese Empfängertiere übertragen, nachdem ca. 30 – 40% der
Blastozysten als Biopsieprobe für die Transkriptomanalyse entnommen wurden. Nach der
Trächtigkeitsuntersuchung und am Ende des Gestationszyklus wurden die Tiere bezüglich
des Trächtigkeitserfolgs klassifiziert. Färsen, die nach 21 Tagen wieder im Östrus waren
wurden in die Gruppe nicht Trächtiger (non-rezeptives Endometrium) eingeteilt, während
Färsen mit einer erfolgreichen Trächtigkeit der Kalb Liefernden Gruppe (rezeptives
Endometrium) zugeteilt. Die Embryonen wurden ebenfall basierend auf dem
Trächtigkeitserfolg kategorisiert. Die Biopsieproben der Endometrien gliederten sich
nochmals innerhalb der Gruppen bezüglich des Zeitpunktes der Probennahme in Tag 7 und
Tag 14 (CDd7 und CDd14 für die trächtigen Färsen und NPd7 und NPd14 für die nicht-
trächtigen Färsen). Der GeneChip® Bovine Genome Array diente dem Nachweis
unterschiedlicher Genexpressionen zwischen und innerhalb der Gruppen. Mittels eines
präimplantations spezifischen cDNA Arrays wurden Unterschiede in der Menge der
Transkriptome der Embryonen in Abhängigkeit des Trächtigkeitserfolgs untersucht. Der
Expressionsunterschied der pre-Transfer endometrial Gene zwischen der rezeptive
Endometrium Gruppe und der nicht-rezeptive Endrometrium Gruppe am Tag 7 des Östrus-
Zykluses wurde durch den Vergleich der Transcriptome von CDd7 und NPd7 untersucht.
Die Ergebnisse der Genexpressionsanalyse der Endometrien zeigen, dass insgesamt 1126
Gene unterschiedlich expremiert wurden, wobei 612 Gene im rezeptivem Endrometrium
(CDd7) und 517 im nicht – rezeptivem Endrometrium (NPd7) hoch reguliert waren. Von

Summary _________________________________________________________________________
129
diesen waren CDC20, GCLC, PLLP, COL4A4, TMEM163, MTTP, NETO2, CDC2,
COX6B2 und PPP2R5A sehr stark expremiert in CDd7, wohingegen in NPd7 die Gene
HOXA9, COL1A2, NTRK2, COL3A1, GJA1, COL21A1, LHFP, IGJ, SPOP, OGN,
COL6A1 und SPARC fünffach oder mehr hochreguliert waren. Zusätzlich zu den
einzelnen Genen fanden sich auch Unterschiede in einigen Genclustern, von denen der
Solute Carrier Gene Cluster, Zellteilungszyklus Cluster, Adaptor related Protein Komplex,
Kinesin Cluster, leucinreiche Repeats, coiled domains, ATPasen, Proteinkinasen und
Phosphatasen Cluster, Transmebrnproteine, junktionale Adhäsionsmoleküle, intergrins in
CDd7 hochexpremiert waren. Im Gegensatz dazu waren Gencluster, wie Cluster of
differentiation molecules, chemokine Moleküle, Homeobox Gene, Kollagenfamilien, S100
Calcium binding Protein und das Zinc finger Protein vermehrt in Endometrium von NPd7
angereichert. Betrachtet man die unterschiedlichen Expressionsmuster bezüglich einer
funktionalen Klassifizierung wird deutlich dass die hoch regulierten Gene der CDd7-
Gruppe in verschiedene Prozesse involviert sind, wie Lokalisierung von Makromolekülen,
Protein/ zelluläre Lokalisation, Transmembrantransport, posttranskriptionale Modifikation,
Anheftungsaktivitäten (Nukleotide, Ione, ATP), Signaltransduktion, metabolische
Prozesse, Anti-Apoptose, Gentranskription und Zellzyklus. Die hochregulierten Gene der
NPd7 Gruppe hingegen sind hauptsächlich an zellulären, metabolischen Prozessen,
Stimuliantwort, Immunantwort chemokine und cytokine Aktivitäten und Induktion der
Apoptose beteiligt.
Des Weiteren zeigte die Regulator Pathway Annotation Analyse, basierend auf dem Kyoto
Encyclopedia of genes and genomes database, dass die hochregulierten Gene in CDd7
haupsächlich in thight junction, Integrin Signalisierung, Inositol Phosphat Metabolismus,
Calcium signalling Pathway, fokale Adhäsion, Apoptose, GnRH, VEGFB und PPAR
signalling pathway, involviert ist. Die hochregulierten Gene in NPd7 waren größtenteils
am T cell Rezeptor Pathway, Cytokin-Cytokin Rezeptor, p53 signalling Pathway und an
fokalen Adhäsionspathways beteiligt. Darüber hinaus brachte die Ingenuity Pathway
Analyse (Meirelles et al.) hervor, dass die unterschiedlich expremierten Gene zwischen
CDd7 und NPd7 in eine Reihe von 34 verschiedenen molekularen Netzwerken gruppiert
werden konnten. Zu den relevanten Funktionen, die immer wieder in diesen Netzwerken
auftraten, gehören unter anderem, das Zellzyklus Netzwerk, Apoptose, Krankheiten im
Reproduktionssystem, genetische Fehlsteuerungen, zelluläre Bewegung, DNA-
replikations, rekombinations und repair Netzwerk, Fettstoffwechsel, molekulare Transport
Netzwerk, Antigen Presentation Netzwerk, posttranslationale Modifikationen, zelluläre

Summary _________________________________________________________________________
130
Anordnung und Organisation, Zellsignalisierung, Immunzellenaustausch, neurologische
Erkrankungen und RNA posttranskriptionale Modifikationen. Demzufolge bewiesen die
Unterschiede in regulatorischen Pathways, biologischen Prozessen und molekularen
Funktionen das Auftreten von transkriptomisch funktionalen und molekularen
Veränderungen zwischen einem rezeptiven und einem nicht-rezeptiven Endometrium an
Tag 7 des Zykluses in der Periode vor dem Embryotransfer. In einem weiteren Versuch
wurde auf gleiche Weise, die Genexpressionsprofile des Endometriums an Tag 14
untersucht. Hier waren konträr zu Tag 7 nur 14 Gene zwischen den Gruppen CDd14 und
NPd14 unterschiedlich expremiert. Zwei Gene (C20ORF54 und FZD8) waren in CDd14
hochreguliert, in NPd14 waren jedoch insgesamt 12 Gene hochreguliert, unter anderem
LOC786821, BRWD1, ANKRD11, SLC25A12, GJA1, SCARA5, IIGLL1 fünf weitere
ESTs. Insgesamt sind die Änderungen der Genexpressionsprofile zwischen CDd14 und
NPd14 signifikant geringer als die Unterschiede an Tag 7. Daraus lässt sich schließen, dass
an Hand der transkriptomisch funktionalen Änderungen an Tag 7 zwischen rezeptiven und
nicht – rezeptiven Endometrien der Trächtigkeitserfolg deutlich besser absehbar ist als an
Tag 14 des Östrus. Im Folgenden wurden die Unterschiede im Transkriptom der rezeptiven
und nicht-rezeptiven Endometrien an Tag 7 und 14 untersucht, wobei besonders die
temporäre Transkriptomdynamik des rezeptiven Endometiums betrachtet wurde, um die
Veränderungen im Endometrium, die zwischen Tag 7 und Tag 14 ablaufen, besser
verstehen zu können. Hierfür wurden die Genexpressionsprofile von CDd7 und CDd14
gegenübergestellt. Insgesamt wurden 1867 Gene unterschiedlich expremiert, davon waren
1014 Gene in CDd7 hochreguliert und 853 in CDd14. Eine funktionale Klassifikation der
hochregulierten Gene von CDd7 zeigt mannigfaltige Funktionen, wie
Zellmaterialtransport, Phosphorilierung und posttranslationale Proteinodifikationen. Auf
der anderen Seite konnten die Gene, die an Tag 14 hochreguliert waren mit Immunantwort,
Apoptose und Signaltransduktionen in Verbindung gebracht werden. Des Weiteren wurden
21 molekulare Pathways von den Veränderungen im Endometrium von Tag 7 zu Tag 14
beeinflusst. Gene der MAPK Signalisierung, Toll-like Rezeptor Signalisierung,
Adipocytokine Signalisierung, Zell Adhesion Moleküle (CAMs) und extra Zellulare
Matrix Rezeptoren waren stark bei der Expression im CDd7 Stadium vertreten. Auf der
anderen Seite, Gene der PPAR Signalisierung, der Kalzium Signalisierung, der
neuroactiven Ligand-Rezeptor Interaktion, des Arginin und Proline Metabolismus, der
GnRH Signalisierung, des Urea Zykluses und Metabolismus von Aminosäuren, des
Tryptophan Metabolismus, Glycine und des Serine und Threonine Metabolismus pathway,
Summary _________________________________________________________________________
131
waren am häufigsten in der CDd14 Gruppe vertreten. In ähnlicher Weise konnten
Veränderungen des Transcriptoms im nicht- rezeptiven Endometrium zwischen Tag 7 und
Tag 14 des Östrus, bei der vergleichenden Untersuchung von NPd7 und NPd14
Endumetrium Proben, festgestellt werden. Insgesamt wurden 254 Gene unterschiedlich
zwischen der NPd7 und der NPd14 Gruppe reguliert. Im Vergleich zur
Transkriptomdynamik der rezeptiven Endrometrium (CDd7 vs. CDd14), war die Anzahl
der unterschiedlich exprimierten gene und der funktionallen Kategorien die in NPd7 vs.
NPd14 identifiziert wurden mit 1613 Genen niedriger unter der Angabe der transkriptomen
Plastizität des rezeptivem Endrometrium während der Tage 7 und 14 des Östrus. Nachdem
die Genexpressionsprofile der rezeptiven und nicht- rezeptiven Endometrien entschlüsselt
waren, wurden die mRNA- und Proteinexpressionsprofile von einigen Kandidatengenen zu
fünf verschiedenen Zeitpunkten des Östruses (Tag 0, 3, 7, 14, 19) sowie an Tag 50 der
Trächtigkeit, von geschlachteten Färsen, gemessen. Dafür wurden sowohl Kadidatengene
die im rezeptivem Endrometrium (CDd7) hochreguliert waren (IRF6, PTGER-4, ITPR1,
ADORA2B, PTGS2/ COX-2, WNT11, CDC20 and TIMP3) sowie Gene (STAT5A,
MMP2 and AGTR1) die eine erhöhte Expression im nicht – rezeptivem Endrometrium
zeigten selektiert. Die Mehrheit dieser selektierten Kandidatengene wurde an Tag 7 und 14
des Östruszykluses hochreguliert. Zusätzlich wurden die Gene IRF6, ITPR1, STAT5A und
AGTR1 vom Proöstrus zum Diöstrus zunehmend stärker expremiert und erreichten ihren
Höhepunkt zur Zeit der Trächtigkeit. Im Gegensatz dazu nahm die Expression der Gene
PTGER4, PTGS2/COX-2, TIMP3 und ADORAB2B, die an Tag 7 und 14 hochreguliert
waren, mit der Trächtigkeit ab. Des Weiteren zeigte die immunhistologische Lokalisation
von IRF6, ITPR1, PTGS2 und MMP2 Unterschiede in den Proteinsignalintensitäten an der
Oberfläche im Verlauf des Östruszykluses und der frühen Trächtigkeit. Die Luminal- und
Drüsenepithelien sowie die Stromazellen lassen eine temporäre und räumliche Expression
dieser Gene vermuten. Demzufolge ist es möglich, dass Gene, die im Verlauf des
Östruszykluses stark oder schwach expremiert werden, die Implantation induzieren oder
währenddessen abgeschaltet werden. Die Entwicklungskompetenz der Blastozysten ist in
gleichem Maße entscheidend für den Trächtigkeitserfolg wie die Rezeptivität des
Endometriums. Neben der Analyse des Endometriums wurden ebenfalls die Unterschiede
in der Transkriptommenge der Embryobiopsien gemessen, gegliedert in Embryonen, die
eine Trächtigkeit induzierten und die, die nicht zu einer Trächtigkeit führten. Dadurch
konnten geeignete Kandidatengene gefunden werden die mit der Entwicklungskompetenz
der Blastocysten assoziiert werden können. Mittels der Microarray Data Analyse konnten

Summary _________________________________________________________________________
132
70 Gene detektiert werden, die in den beiden Gruppen unterschiedlich expremiert wurden.
Die Gene sind in verschieden funktionellen Kategorien wie, Genexpression,
Zellsignalisierung und Zellkommunikation, Transport von Macromolekülen, Transferase
und Chemokine Aktivität, involviert. Im Vergleich zur Expressionsanalyse der
Endometrien, waren die Unterschiede jedoch zwischen den Gruppen der Embryonen
deutlich geringer. Daraus lässt sich allerdings nicht schließen, dass das Endometrium und
die maternale Umgebung einen größeren Einfluss auf den Trächtigkeitserfolg haben, als
der Embryo selbst. Die Unterschiede resultieren vermutlich aus den verschiedenen
Microarray Platformen.
In der vorliegenden Arbeit wird ein deutlicher Zusammenhang zwischen den
Genexpressionprofilen des Endometriums und der Blastozysten zum Trächtigkeitserfolg
gezeigt. Die Daten heben besonders das Potential der endometrialen und embryonalen
Transkripte hervor, die als Prediktoren für eine erfolgreiche Trächtigkeit dienen und eine
Vorstufe für die Entwicklung von Kandidatengenen sind, die eine Selektion von optimalen
Empfängertieren und potenten Embryonen möglich machen. Es sind jedoch weitere
Untersuchungen erforderlich, um die exakte funktionale Wirkung der unterschiedlich
expremierten Gene, die eine Trächtigkeit induzieren, zu verstehen. Zusätzliche
Untersuchungen sind nötig, um zu verstehen, inwiefern sich die molekulare Signatur in
aufeinanderfolgenden Zyklen gleicht. Insgesamt bringen diese Daten beachtliche
Informationen hervor um die Trächtigkeitserfolge beim Rind mittels
Genexpressionsanalysen vorherzusagen.
.
References _________________________________________________________________________
133
8 References
Abu-Hamad S, Arbel N, Calo D, Arzoine L, Israelson A, Keinan N, Ben-Romano R,
Friedman O, Shoshan-Barmatz V (2009): The VDAC1 N-terminus is essential both for
apoptosis and the protective effect of anti-apoptotic proteins. J Cell Sci 122, 1906-1916
Abu-Hamad S, Sivan S, Shoshan-Barmatz V (2006): The expression level of the voltage-
dependent anion channel controls life and death of the cell. Proc Natl Acad Sci U S A 103,
5787-5792
Ace CI, Okulicz WC (2004): Microarray profiling of progesterone-regulated endometrial
genes during the rhesus monkey secretory phase. Reprod Biol Endocrinol 2, 54
Achache H, Revel A (2006): Endometrial receptivity markers, the journey to successful
embryo implantation. Hum Reprod Update 12, 731-746
Adamiak SJ, Mackie K, Watt RG, Webb R, Sinclair KD (2005): Impact of nutrition on
oocyte quality: cumulative effects of body composition and diet leading to
hyperinsulinemia in cattle. Biol Reprod 73, 918-926
Albelda SM, Buck CA (1990): Integrins and other cell adhesion molecules. FASEB J 4,
2868-2880
Albertini DF, Sanfins A, Combelles CM (2003): Origins and manifestations of oocyte
maturation competencies. Reprod Biomed Online 6, 410-415
Amabile G, D'Alise AM, Iovino M, Jones P, Santaguida S, Musacchio A, Taylor S,
Cortese R (2009): The Aurora B kinase activity is required for the maintenance of the
differentiated state of murine myoblasts. Cell Death Differ 16, 321-330
Aplin JD (2000): The cell biological basis of human implantation. Baillieres Best Pract
Res Clin Obstet Gynaecol 14, 757-764
Aplin JD (1996): The cell biology of human implantation. Placenta 17, 269-275
Aplin JD, Charlton AK, Ayad S (1988): An immunohistochemical study of human
endometrial extracellular matrix during the menstrual cycle and first trimester of
pregnancy. Cell Tissue Res 253, 231-240

References _________________________________________________________________________
134
Ashworth CJ (1994): Nutritional factors related to embryonic mortality in domestic species
In: Embryonic mortality in domestic species. Boca Raton, FL, pp. 179–194
Ashworth CJ, Toma LM, Hunter MG (2009): Nutritional effects on oocyte and embryo
development in mammals: implications for reproductive efficiency and environmental
sustainability. Philos Trans R Soc Lond B Biol Sci 364, 3351-3361
Askew DS, Ashmun RA, Simmons BC, Cleveland JL (1991): Constitutive c-myc
expression in an IL-3-dependent myeloid cell line suppresses cell cycle arrest and
accelerates apoptosis. Oncogene 6, 1915-1922
Aston KI, Li GP, Hicks BA, Sessions BR, Davis AP, Winger QA, Rickords LF, Stevens
JR, White KL (2009): Global gene expression analysis of bovine somatic cell nuclear
transfer blastocysts and cotyledons. Mol Reprod Dev 76, 471-482
Attardi B, Scott R, Pfaff D, Fink G (2007): Facilitation or inhibition of the oestradiol-
induced gonadotrophin surge in the immature female rat by progesterone: effects on
pituitary responsiveness to gonadotrophin-releasing hormone (GnRH), GnRH self-priming
and pituitary mRNAs for the progesterone receptor A and B isoforms. J Neuroendocrinol
19, 988-1000
Aurrand-Lions M, Duncan L, Ballestrem C, Imhof BA (2001): JAM-2, a novel
immunoglobulin superfamily molecule, expressed by endothelial and lymphatic cells. J
Biol Chem 276, 2733-2741
Aurrand-Lions MA, Duncan L, Du Pasquier L, Imhof BA (2000): Cloning of JAM-2 and
JAM-3: an emerging junctional adhesion molecular family? Curr Top Microbiol Immunol
251, 91-98
Bachvarova R (1985): Gene expression during oogenesis and oocyte development in
mammals. Dev Biol (N Y 1985) 1, 453-524
Bachvarova R, De Leon V, Johnson A, Kaplan G, Paynton BV (1985): Changes in total
RNA, polyadenylated RNA, and actin mRNA during meiotic maturation of mouse
oocytes. Dev Biol 108, 325-331
Bachvarova RF (1992): A maternal tail of poly(A): the long and the short of it. Cell 69,
895-897

References _________________________________________________________________________
135
Bai MK, Costopoulos JS, Christoforidou BP, Papadimitriou CS (1994):
Immunohistochemical detection of the c-myc oncogene product in normal, hyperplastic
and carcinomatous endometrium. Oncology 51, 314-319
Bauersachs S, Ulbrich SE, Gross K, Schmidt SE, Meyer HH, Einspanier R, Wenigerkind
H, Vermehren M, Blum H, Sinowatz F, Wolf E (2005): Gene expression profiling of
bovine endometrium during the oestrous cycle: detection of molecular pathways involved
in functional changes. J Mol Endocrinol 34, 889-908
Bauersachs S, Ulbrich SE, Gross K, Schmidt SE, Meyer HH, Wenigerkind H, Vermehren
M, Sinowatz F, Blum H, Wolf E (2006): Embryo-induced transcriptome changes in bovine
endometrium reveal species-specific and common molecular markers of uterine
receptivity. Reproduction 132, 319-331
Bauersachs S, Ulbrich SE, Zakhartchenko V, Minten M, Reichenbach M, Reichenbach
HD, Blum H, Spencer TE, Wolf E (2009): The endometrium responds differently to
cloned versus fertilized embryos. Proc Natl Acad Sci U S A 106, 5681-5686
Bazer FW (1994): New frontiers and approaches in the study of embryonic mortality in
domestic species. In: Geisert RD, Zavy MT (eds), Embryonic Mortality in Domestic
Species. CRC Press, Boca Raton, FL, pp. 195–210
Bazer FW, Spencer TE, Johnson GA, Burghardt RC, Wu G (2009a): Comparative aspects
of implantation. Reproduction 138, 195-209
Bazer FW, Wu G, Spencer TE, Johnson GA, Burghardt RC, Bayless K (2009b): Novel
pathways for implantation and establishment and maintenance of pregnancy in mammal.
Mol Hum Reprod 16, 135-152
Benjamini Y, Hochberg Y (1995): Controlling the false discovery rate: a practical and
powerful approach to multiple testing. Roy. Statist. Soc. Ser.B 57, 289–300
Benyei B, Gaspardy A, Cseh S (2003): Effect of the El Nino phenomenon on the ovarian
responsiveness and embryo production of donor cows. Acta Vet Hung 51, 209-218
Bergh PA, Navot D (1992): The impact of embryonic development and endometrial
maturity on the timing of implantation. Fertil Steril 58, 537-542

References _________________________________________________________________________
136
Bernardini C, Fantinati P, Zannoni A, Forni M, Tamanini C, Bacci ML (2004): Expression
of HSP70/HSC70 in swine blastocysts: effects of oxidative and thermal stress. Mol Reprod
Dev 69, 303-307
Bertolini M, Beam SW, Shim H, Bertolini LR, Moyer AL, Famula TR, Anderson GB
(2002): Growth, development, and gene expression by in vivo- and in vitro-produced day 7
and 16 bovine embryos. Mol Reprod Dev 63, 318-328
Bettegowda A, Yao J, Sen A, Li Q, Lee KB, Kobayashi Y, Patel OV, Coussens PM,
Ireland JJ, Smith GW (2007): JY-1, an oocyte-specific gene, regulates granulosa cell
function and early embryonic development in cattle. Proc Natl Acad Sci USA 104, 17602-
17607
Betts DH, King WA (2001): Genetic regulation of embryo death and senescence.
Theriogenology 55, 171-191
Bilalis DA, Klentzeris LD, Fleming S (1996): Immunohistochemical localization of
extracellular matrix proteins in luteal phase endometrium of fertile and infertile patients.
Hum Reprod 11, 2713-2718
Bilodeau-Goeseels S, Schultz GA (1997): Changes in ribosomal ribonucleic acid content
within in vitro-produced bovine embryos. Biol Reprod 56, 1323-1329
Binelli M, Guzeloglu A, Badinga L, Arnold DR, Sirois J, Hansen TR, Thatcher WW
(2000): Interferon-tau modulates phorbol ester-induced production of prostaglandin and
expression of cyclooxygenase-2 and phospholipase-A(2) from bovine endometrial cells.
Biol Reprod 63, 417-424
Bischof P, Redard M, Gindre P, Vassilakos P, Campana A (1993): Localization of alpha 2,
alpha 5 and alpha 6 integrin subunits in human endometrium, decidua and trophoblast. Eur
J Obstet Gynecol Reprod Biol 51, 217-226
Blondin P, Sirard MA (1995): Oocyte and follicular morphology as determining
characteristics for developmental competence in bovine oocytes. Mol Reprod Dev 41, 54-
62
Boehm M, Bonifacino JS (2001): Adaptins: the final recount. Mol Biol Cell 12, 2907-2920
References _________________________________________________________________________
137
Boehm M, Bonifacino JS (2002): Genetic analyses of adaptin function from yeast to
mammals. Gene 286, 175-186
Boer HMT, Veerkamp RF, Beerda B, Woelders H (2010): Estrous behavior in dairy cows:
identification of underlying mechanisms and gene functions. Animal 4, 446 - 453
Boland MP, Lonergan P, O'Callaghan D (2001): Effect of nutrition on endocrine
parameters, ovarian physiology, and oocyte and embryo development. Theriogenology 55,
1323-1340
Bonnamy PJ, Benhaim A, Leymarie P (1993): Uterine luteinizing hormone/human
chorionic gonadotropin-binding sites in the early pregnant rat uterus: evidence for total
occupancy in the periimplantation period. Endocrinology 132, 1240-1246
Boos A (2000): Immunohistochemical assessment of collagen types I, III, IV and VI in
biopsy samples of the bovine uterine wall collected during the oestrous cycle. Cells
Tissues Organs 167, 225-238
Borysov SI, Guadagno TM (2008): A novel role for Cdk1/cyclin B in regulating B-raf
activation at mitosis. Mol Biol Cell 19, 2907-2915
Bowen JA, Burghardt RC (2000): Cellular mechanisms of implantation in domestic farm
animals. Semin Cell Dev Biol 11, 93-104
Brackett BG (1985): In vitro oocyte maturation and fertilization. J Anim Sci 61 Suppl 3,
14-24
Brackett BG, Younis AI, Fayrer-Hosken RA (1989): Enhanced viability after in vitro
fertilization of bovine oocytes matured in vitro with high concentrations of luteinizing
hormone. Fertil Steril 52, 319-324
Brazma A, Hingamp P, Quackenbush J, Sherlock G, Spellman P, Stoeckert C, Aach J,
Ansorge W, Ball CA, Causton HC, Gaasterland T, Glenisson P, Holstege FC, Kim IF,
Markowitz V, Matese JC, Parkinson H, Robinson A, Sarkans U, Schulze-Kremer S,
Stewart J, Taylor R, Vilo J, Vingron M (2001): Minimum information about a microarray
experiment (MIAME)-toward standards for microarray data. Nat Genet 29, 365-371

References _________________________________________________________________________
138
Brevini-Gandolfi TA, Cillo F, Favetta LA, Montagna A, Motta M (2001): Somatostatin
up-regulates topoisomerase II alpha expression and affects LNCaP cell cycle. Mol Cell
Endocrinol 176, 103-110
Brevini-Gandolfi TA, Favetta LA, Mauri L, Luciano AM, Cillo F, Gandolfi F (1999):
Changes in poly(A) tail length of maternal transcripts during in vitro maturation of bovine
oocytes and their relation with developmental competence. Mol Reprod Dev 52, 427-433
Burdge GC, Hanson MA, Slater-Jefferies JL, Lillycrop KA (2007): Epigenetic regulation
of transcription: a mechanism for inducing variations in phenotype (fetal programming) by
differences in nutrition during early life? Br J Nutr 97, 1036-1046
Bustin SA, Benes V, Garson JA, Hellemans J, Huggett J, Kubista M, Mueller R, Nolan T,
Pfaffl MW, Shipley GL, Vandesompele J, Wittwer CT (2009): The MIQE guidelines:
minimum information for publication of quantitative real-time PCR experiments. Clin
Chem 55, 611-622
Carson DD, Bagchi I, Dey SK, Enders AC, Fazleabas AT, Lessey BA, Yoshinaga K
(2000): Embryo implantation. Dev Biol 223, 217-237
Chagas LM, Gore PJ, Meier S, Macdonald KA, Verkerk GA (2007): Effect of
monopropylene glycol on luteinizing hormone, metabolites, and postpartum anovulatory
intervals in primiparous dairy cows. J Dairy Sci 90, 1168-1175
Chakraborty I, Das SK, Wang J, Dey SK (1996): Developmental expression of the cyclo-
oxygenase-1 and cyclo-oxygenase-2 genes in the peri-implantation mouse uterus and their
differential regulation by the blastocyst and ovarian steroids. J Mol Endocrinol 16, 107-
122
Chen DB, Hilsenrath R, Yang ZM, Le SP, Kim SR, Chuong CJ, Poindexter AN, 3rd,
Harper MJ (1995): Leukaemia inhibitory factor in human endometrium during the
menstrual cycle: cellular origin and action on production of glandular epithelial cell
prostaglandin in vitro. Hum Reprod 10, 911-918
Chen Y, Green JA, Antoniou E, Ealy AD, Mathialagan N, Walker AM, Avalle MP,
Rosenfeld CS, Hearne LB, Roberts RM (2006): Effect of interferon-tau administration on
endometrium of nonpregnant ewes: a comparison with pregnant ewes. Endocrinology 147,
2127-2137

References _________________________________________________________________________
139
Clegg KB, Piko L (1983a): Poly(A) length, cytoplasmic adenylation and synthesis of
poly(A)+ RNA in early mouse embryos. Dev Biol 95, 331-341
Clegg KB, Piko L (1983b): Quantitative aspects of RNA synthesis and polyadenylation in
1-cell and 2-cell mouse embryos. J Embryol Exp Morphol 74, 169-182
Crosier AE, Farin PW, Dykstra MJ, Alexander JE, Farin CE (2001): Ultrastructural
morphometry of bovine blastocysts produced in vivo or in vitro. Biol Reprod 64, 1375-
1385
Crosier AE, Farin PW, Dykstra MJ, Alexander JE, Farin CE (2000): Ultrastructural
morphometry of bovine compact morulae produced in vivo or in vitro. Biol Reprod 62,
1459-1465
Cross JC, Werb Z, Fisher SJ (1994): Implantation and the placenta: key pieces of the
development puzzle. Science 266, 1508-1518
Crozet N, Ahmed-Ali M, Dubos MP (1995): Developmental competence of goat oocytes
from follicles of different size categories following maturation, fertilization and culture in
vitro. J Reprod Fertil 103, 293-298
Daikoku E, Ito, Y and Otsuki, Y (1998): The induction of apoptosis in ovaries and uteri
ofbcl-2-deficient mice. Med Electron Microsc 31, 68–376
Daniels R, Hall VJ, French AJ, Korfiatis NA, Trounson AO (2001): Comparison of gene
transcription in cloned bovine embryos produced by different nuclear transfer techniques.
Mol Reprod Dev 60, 281-288
Danielsson KG, Swahn ML, Bygdeman M (1997): The effect of various doses of
mifepristone on endometrial leukaemia inhibitory factor expression in the midluteal phase-
-an immunohistochemical study. Hum Reprod 12, 1293-1297
Darnell JE, Jr., Kerr IM, Stark GR (1994): Jak-STAT pathways and transcriptional
activation in response to IFNs and other extracellular signaling proteins. Science 264,
1415-1421
Das SK, Das N, Wang J, Lim H, Schryver B, Plowman GD, Dey SK (1997): Expression of
betacellulin and epiregulin genes in the mouse uterus temporally by the blastocyst solely at

References _________________________________________________________________________
140
the site of its apposition is coincident with the "window" of implantation. Dev Biol 190,
178-190
De Leon G, Sherry TC, Krucher NA (2008): Reduced expression of PNUTS leads to
activation of Rb-phosphatase and caspase-mediated apoptosis. Cancer Biol Ther 7, 833-
841
De Sousa PA, Caveney A, Westhusin ME, Watson AJ (1998): Temporal patterns of
embryonic gene expression and their dependence on oogenetic factors. Theriogenology 49,
115-128
de Ziegler D, Fanchin R, de Moustier B, Bulletti C (1998): The hormonal control of
endometrial receptivity: estrogen (E2) and progesterone. J Reprod Immunol 39, 149-166
Dean J (2002): Oocyte-specific genes regulate follicle formation, fertility and early mouse
development. J Reprod Immunol 53, 171-180
Denker HW (1993): Implantation: a cell biological paradox. J Exp Zool 266, 541-558
Dey SK, Lim H, Das SK, Reese J, Paria BC, Daikoku T, Wang H (2004): Molecular cues
to implantation. Endocr Rev 25, 341-373
Diaz T, Manzo M, Troconiz J, Benacchio N, Verde O (1986): Plasma progesterone levels
during the estrous cycle of Holstein and Brahman cows, Carora type and cross-bred
heifers. Theriogenology 26, 419-432
Diskin MG, Sreenan JM (1980): Fertilization and embryonic mortality rates in beef heifers
after artificial insemination. J Reprod Fertil 59, 463-468
Dong J, Albertini DF, Nishimori K, Kumar TR, Lu N, Matzuk MM (1996): Growth
differentiation factor-9 is required during early ovarian folliculogenesis. Nature 383, 531-
535
Dunne L, Diskin MG, Boland MP, O’Farrell KJ, Sreenan JM (1997): Nutrition and
embryo survival in cattle. Irish Journal of Agricultural and FoodResearch 36 95
Duranthon V, Watson AJ, Lonergan P (2008): Preimplantation embryo programming:
transcription, epigenetics, and culture environment. Reproduction 135, 141-150

References _________________________________________________________________________
141
Eichenlaub-Ritter U, Peschke M (2002): Expression in in-vivo and in-vitro growing and
maturing oocytes: focus on regulation of expression at the translational level. Hum Reprod
Update 8, 21-41
El-Sayed A, Hoelker M, Rings F, Salilew D, Jennen D, Tholen E, Sirard MA, Schellander
K, Tesfaye D (2006): Large-scale transcriptional analysis of bovine embryo biopsies in
relation to pregnancy success after transfer to recipients. Physiol Genomics 28, 84-96
Elnashar AM, Gamal A (2004): Endometrial receptivity. Middle East Fertility Society 9,
10-24
Elvin JA, Yan C, Matzuk MM (2000): Oocyte-expressed TGF-beta superfamily members
in female fertility. Mol Cell Endocrinol 159, 1-5
Eppig JJ, O'Brien M, Wigglesworth K (1996): Mammalian oocyte growth and
development in vitro. Mol Reprod Dev 44, 260-273
Erdman LK, Cosio G, Helmers AJ, Gowda DC, Grinstein S, Kain KC (2009): CD36 and
TLR interactions in inflammation and phagocytosis: implications for malaria. J Immunol
183, 6452-6459
Etkin LD, Balcells S (1985): Transformed Xenopus embryos as a transient expression
system to analyze gene expression at the midblastula transition. Dev Biol 108, 173-178
Evan GI, Wyllie AH, Gilbert CS, Littlewood TD, Land H, Brooks M, Waters CM, Penn
LZ, Hancock DC (1992): Induction of apoptosis in fibroblasts by c-myc protein. Cell 69,
119-128
Eyster KM (1993): Protein kinase C activity in the rat ovary: increasing enzyme activity
and presence of an endogenous inhibitor during pregnancy. Comp Biochem Physiol Comp
Physiol 105, 245-249
Eyster KM, Berger TL, Rodrigo MC, Sheth MV (1998): Protein phosphatase activity in
the rat ovary throughout pregnancy and pseudopregnancy. Biol Reprod 58, 338-345
Eyster KM, Klinkova O, Kennedy V, Hansen KA (2007): Whole genome
deoxyribonucleic acid microarray analysis of gene expression in ectopic versus eutopic
endometrium. Fertil Steril 88, 1505-1533

References _________________________________________________________________________
142
Fair T, Hyttel P, Greve T, Boland M (1996): Nucleus structure and transcriptional activity
in relation to oocyte diameter in cattle. Mol Reprod Dev 43, 503-512
Falcon S, Gentleman R (2007): Using GOstats to test gene lists for GO term association.
Bioinformatics 23, 257-258
Fata JE, Chaudhary V, Khokha R (2001): Cellular turnover in the mammary gland is
correlated with systemic levels of progesterone and not 17beta-estradiol during the estrous
cycle. Biol Reprod 65, 680-688
Fest S, Brachwitz N, Schumacher A, Zenclussen ML, Khan F, Wafula PO, Casalis PA, Fill
S, Costa SD, Mor G, Volk HD, Lode HN, Zenclussen AC (2008): Supporting the
hypothesis of pregnancy as a tumor: survivin is upregulated in normal pregnant mice and
participates in human trophoblast proliferation. Am J Reprod Immunol 59, 75-83.
Fisher ME, Kolomeisky AB (2001): Simple mechanochemistry describes the dynamics of
kinesin molecules. Proc Natl Acad Sci USA 98, 7748-7753
Fleming JA, Song G, Choi Y, Spencer TE, Bazer FW (2009): Interferon regulatory factor
6 (IRF6) is expressed in the ovine uterus and functions as a transcriptional activator. Mol
Cell Endocrinol 299, 252-260
Foell D, Wittkowski H, Vogl T, Roth J (2007): S100 proteins expressed in phagocytes: a
novel group of damage-associated molecular pattern molecules. J Leukoc Biol 81, 28-37
Ford SP (1982): Control of uterine and ovarian blood flow throughout the estrous cycle
and pregnancy of ewes, sows and cows. J Anim Sci 55 Suppl 2, 32-42
Ford SP, Chenault JR, Echternkamp SE (1979): Uterine blood flow of cows during the
oestrous cycle and early pregnancy: effect of the conceptus on the uterine blood supply. J
Reprod Fertil 56, 53-62
Forde N, Carter F, Fair T, Crowe MA, Evans AC, Spencer TE, Bazer FW, McBride R,
Boland MP, O'Gaora P, Lonergan P, Roche JF (2009): Progesterone-regulated changes in
endometrial gene expression contribute to advanced conceptus development in cattle. Biol
Reprod 81, 784-794
References _________________________________________________________________________
143
Forman LJ, Estilow S (1988): Estrogen influences the effect of immobilization stress on
immunoreactive beta-endorphin levels in the female rat pituitary. Proc Soc Exp Biol Med
187, 190-196
Fouladi-Nashta AA, Gutierrez CG, Gong JG, Garnsworthy PC, Webb R (2007): Impact of
dietary fatty acids on oocyte quality and development in lactating dairy cows. Biol Reprod
77, 9-17
Fouladi Nashta AA, Waddington D, Campbell KH (1998): Maintenance of bovine oocytes
in meiotic arrest and subsequent development In vitro: A comparative evaluation of antral
follicle culture with other methods. Biol Reprod 59, 255-262
Gabler C, Drillich M, Fischer C, Holder C, Heuwieser W, Einspanier R (2009):
Endometrial expression of selected transcripts involved in prostaglandin synthesis in cows
with endometritis. Theriogenology 71, 993-1004
Gaide Chevronnay HP, Galant C, Lemoine P, Courtoy PJ, Marbaix E, Henriet P (2009):
Spatiotemporal coupling of focal extracellular matrix degradation and reconstruction in the
menstrual human endometrium. Endocrinology 150, 5094-5105
Gandolfi F, Brevini TA, Cillo F, Antonini S (2005): Cellular and molecular mechanisms
regulating oocyte quality and the relevance for farm animal reproductive efficiency. Rev
Sci Tech 24, 413-423
Garcia MG, Tirado-Gonzalez I, Handjiski B, Tometten M, Orsal AS, Hajos SE, Fernandez
N, Arck PC, Blois SM (2007): High expression of survivin and down-regulation of Stat-3
characterize the feto-maternal interface in failing murine pregnancies during the
implantation period. Placenta 28, 650-657
Gardner DK (1994): Mammalian embryo culture in the absence of serum or somatic cell
support. Cell Biol Int 18, 1163-1179
Gardner DK, Lane M, Calderon I, Leeton J (1996): Environment of the preimplantation
human embryo in vivo: metabolite analysis of oviduct and uterine fluids and metabolism
of cumulus cells. Fertil Steril 65, 349-353
Ge S, Skaar JR, Pagano M (2009): APC/C- and Mad2-mediated degradation of Cdc20
during spindle checkpoint activation. Cell Cycle 8, 167-171

References _________________________________________________________________________
144
Ghanem N, Holker M, Rings F, Jennen D, Tholen E, Sirard MA, Torner H, Kanitz W,
Schellander K, Tesfaye D (2007): Alterations in transcript abundance of bovine oocytes
recovered at growth and dominance phases of the first follicular wave. BMC Dev Biol 7,
90
Gibori G, Khan I, Warshaw ML, McLean MP, Puryear TK, Nelson S, Durkee TJ, Azhar S,
Steinschneider A, Rao MC (1988): Placental-derived regulators and the complex control of
luteal cell function. Recent Prog Horm Res 44, 377-429
Giudice LC (2004): Microarray expression profiling reveals candidate genes for human
uterine receptivity. Am J Pharmacogenomics 4, 299-312
Giudice LC, Telles TL, Lobo S, Kao L (2002): The molecular basis for implantation
failure in endometriosis: on the road to discovery. Ann N Y Acad Sci 955, 252-264
Glencross RG, Munro IB, Senior BE, Pope GS (1973): Concentrations of oestradiol-17
beta, oestrone and progesterone in jugular venous plasma of cows during the oestrous
cycle and in early pregnancy. Acta Endocrinol (Copenh) 73, 374-384
Goff AK (2004): Steroid hormone modulation of prostaglandin secretion in the ruminant
endometrium during the estrous cycle. Biol Reprod 71, 11-16
Gompel A, Sabourin JC, Martin A, Yaneva H, Audouin J, Decroix Y, Poitout P (1994):
Bcl-2 expression in normal endometrium during the menstrual cycle. Am J Pathol 144,
1195-1202
Gonzalez RR, Caballero-Campo P, Jasper M, Mercader A, Devoto L, Pellicer A, Simon C
(2000): Leptin and leptin receptor are expressed in the human endometrium and
endometrial leptin secretion is regulated by the human blastocyst. J Clin Endocrinol Metab
85, 4883-4888
Goossens K, Tesfaye D, Rings F, Schellander K, Holker M, Van Poucke M, Van Zeveren
A, Lemahieu I, Van Soom A, Peelman LJ (2010): Suppression of keratin 18 gene
expression in bovine blastocysts by RNA interference. Reprod Fertil Dev 22, 395-404
Goossens K, Van Soom A, Van Poucke M, Vandaele L, Vandesompele J, Van Zeveren A,
Peelman LJ (2007): Identification and expression analysis of genes associated with bovine
blastocyst formation. BMC Dev Biol 7, 64

References _________________________________________________________________________
145
Granot I, Dekel N, Bechor E, Segal I, Fieldust S, Barash A (2000): Temporal analysis of
connexin43 protein and gene expression throughout the menstrual cycle in human
endometrium. Fertil Steril 73, 381-386
Gray CA, Abbey CA, Beremand PD, Choi Y, Farmer JL, Adelson DL, Thomas TL, Bazer
FW, Spencer TE (2006): Identification of endometrial genes regulated by early pregnancy,
progesterone, and interferon tau in the ovine uterus. Biol Reprod 74, 383-394
Gray CA, Burghardt RC, Johnson GA, Bazer FW, Spencer TE (2002): Evidence that
absence of endometrial gland secretions in uterine gland knockout ewes compromises
conceptus survival and elongation. Reproduction 124, 289-300
Grossoni VC, Falbo KB, Kazanietz MG, de Kier Joffe ED, Urtreger AJ (2007): Protein
kinase C delta enhances proliferation and survival of murine mammary cells. Mol
Carcinog 46, 381-390
Grummer R, Winterhager E (1998): Regulation of gap junction connexins in the
endometrium during early pregnancy. Cell Tissue Res 293, 189-194
Guillomot M (1995): Cellular interactions during implantation in domestic ruminants. J
Reprod Fertil Suppl 49, 39-51
Gupta P, Kashmiri SV, Erisman MD, Rothberg PG, Astrin SM, Ferrer JF (1986):
Enhanced expression of the c-myc gene in bovine leukemia virus-induced bovine tumors.
Cancer Res 46, 6295-6298
Han YM, Kang YK, Koo DB, Lee KK (2003): Nuclear reprogramming of cloned embryos
produced in vitro. Theriogenology 59, 33-34
Hanna J, Goldman-Wohl D, Hamani Y, Avraham I, Greenfield C, Natanson-Yaron S, Prus
D, Cohen-Daniel L, Arnon TI, Manaster I, Gazit R, Yutkin V, Benharroch D, Porgador A,
Keshet E, Yagel S, Mandelboim O (2006): Decidual NK cells regulate key developmental
processes at the human fetal-maternal interface. Nat Med 12, 1065-1074
Harrison RO, Ford SP, Young JW, Conley AJ, Freeman AE (1990): Increased milk
production versus reproductive and energy status of high producing dairy cows. J Dairy
Sci 73, 2749-2758

References _________________________________________________________________________
146
Harrison RO, Young JW, Freeman AE, Ford SP (1989): Effects of lactational level on
reactivation of ovarian function, and interval from parturition to first visual oestrus and
conception in high-producing Holstein cows. Amin. Prod. 49, 23-28
Hashimoto S, Minami N, Takakura R, Imai H (2002): Bovine immature oocytes acquire
developmental competence during meiotic arrest in vitro. Biol Reprod 66, 1696-1701
Hayrabedyan S, Kyurkchiev S, Kehayov I (2005): FGF-1 and S100A13 possibly
contribute to angiogenesis in endometriosis. J Reprod Immunol 67, 87-101
Henricks DM, Lamond DR, Hill JR, Dickey JF (1971): Plasma progesterone
concentrations before mating and in early pregnancy in the beef heifer. J Anim Sci 33,
450-454
Herington J, Bany BM ( 2006): Junctional Adhesion Molecule 3 may mediate mouse
uterine natural killer cell migration during early pregnancy Reprod Immunol 71, 164-165
Herington JL, Bany BM (2007): Effect of the conceptus on uterine natural killer cell
numbers and function in the mouse uterus during decidualization. Biol Reprod 76, 579-588
Hewitt SC, Deroo BJ, Hansen K, Collins J, Grissom S, Afshari CA, Korach KS (2003):
Estrogen receptor-dependent genomic responses in the uterus mirror the biphasic
physiological response to estrogen. Mol Endocrinol 17, 2070-2083
Hill JR, Burghardt RC, Jones K, Long CR, Looney CR, Shin T, Spencer TE, Thompson
JA, Winger QA, Westhusin ME (2000): Evidence for placental abnormality as the major
cause of mortality in first-trimester somatic cell cloned bovine fetuses. Biol Reprod 63,
1787-1794
Hirokawa N, Noda Y, Tanaka Y, Niwa S (2009): Kinesin superfamily motor proteins and
intracellular transport. Nat Rev Mol Cell Biol 10, 682-696
Ho Y, Wigglesworth K, Eppig JJ, Schultz RM (1995): Preimplantation development of
mouse embryos in KSOM: augmentation by amino acids and analysis of gene expression.
Mol Reprod Dev 41, 232-238
Hong SH, Nah HY, Lee JY, Gye MC, Kim CH, Kim MK (2004): Analysis of estrogen-
regulated genes in mouse uterus using cDNA microarray and laser capture
microdissection. J Endocrinol 181, 157-167

References _________________________________________________________________________
147
Huang Y, Zhu, XY, Du, MR, Wu, X, Wang, MY, Li DJ. (2006): Chemokine CXCL16, a
scavenger receptor, induces proliferation and invasion of first-trimester human trophoblast
cells in an autocrine manner. Hum Reprod 21, 1083-1091
Huet-Hudson YM, Andrews GK, Dey SK (1989): Cell type-specific localization of c-myc
protein in the mouse uterus: modulation by steroid hormones and analysis of the
periimplantation period. Endocrinology 125, 1683-1690
Humphries MJ (2000): Integrin structure. Biochem Soc Trans 28, 311-339
Illera MJ, Lorenzo PL, Gui YT, Beyler SA, Apparao KB, Lessey BA (2003): A role for
alphavbeta3 integrin during implantation in the rabbit model. Biol Reprod 68, 766-771
Imai H, Hirao F, Sakamoto T, Sekine K, Mizukura Y, Saito M, Kitamoto T, Hayasaka M,
Hanaoka K, Nakagawa Y (2003): Early embryonic lethality caused by targeted disruption
of the mouse PHGPx gene. Biochem Biophys Res Commun 305, 278-286
Imakawa K, Anthony RV, Kazemi M, Marotti KR, Polites HG, Roberts RM (1987):
Interferon-like sequence of ovine trophoblast protein secreted by embryonic
trophectoderm. Nature 330, 377-379
Imakawa K, Chang KT, Christenson RK (2004): Pre-implantation conceptus and maternal
uterine communications: molecular events leading to successful implantation. J Reprod
Dev 50, 155-169
Inskeep EK (2004): Preovulatory, postovulatory, and postmaternal recognition effects of
concentrations of progesterone on embryonic survival in the cow. J Anim Sci 82, E24-39
Irving JA, Lysiak JJ, Graham CH, Hearn S, Han VK, Lala PK (1995): Characteristics of
trophoblast cells migrating from first trimester chorionic villus explants and propagated in
culture. Placenta 16, 413-433
Ishida N, Kawakita M (2004): Molecular physiology and pathology of the nucleotide sugar
transporter family (SLC35). Pflugers Arch 447, 768-775
Iwahashi M, Muragaki Y, Ooshima A, Nakano R (1996): Decreased type IV collagen
expression by human decidual tissues in spontaneous abortion. J Clin Endocrinol Metab
81, 2925-2929
References _________________________________________________________________________
148
Jainudeen MR, Hafez ESE (2000 ): Cattle and buffalo. In: Hafez B, Hafez ESE (eds)
Reproduction in farm animals. Lippincott Williams & Wilkins, Maryland, USA, pp 159–
171
Jeanblanc M, Salvaing J, Mason K, Debey P, Beaujean N (2008a): Embryonic genome
activation. Gynecol Obstet Fertil 36, 1126-1132
Jeanblanc M, Salvaing J, Mason K, Debey P, Beaujean N (2008b): Embryonic genome
activation. Gynecol Obstet Fertil 36, 1126-1132
Jokimaa V, Oksjoki S, Kujari H, Vuorio E, Anttila L (2002): Altered expression of genes
involved in the production and degradation of endometrial extracellular matrix in patients
with unexplained infertility and recurrent miscarriages. Mol Hum Reprod 8, 1111-1116
Kanai Y, Hediger MA (2004): The glutamate/neutral amino acid transporter family SLC1:
molecular, physiological and pharmacological aspects. Pflugers Arch 447, 469-479
Kantheti P, Qiao X, Diaz ME, Peden AA, Meyer GE, Carskadon SL, Kapfhamer D,
Sufalko D, Robinson MS, Noebels JL, Burmeister M (1998): Mutation in AP-3 delta in the
mocha mouse links endosomal transport to storage deficiency in platelets, melanosomes,
and synaptic vesicles. Neuron 21, 111-122
Kao LC, Tulac S, Lobo S, Imani B, Yang JP, Germeyer A, Osteen K, Taylor RN, Lessey
BA, Giudice LC (2002): Global gene profiling in human endometrium during the window
of implantation. Endocrinology 143, 2119-2138
Kasimanickam R, Duffield TF, Foster RA, Gartley CJ, Leslie KE, Walton JS, Johnson WH
(2005): A comparison of the cytobrush and uterine lavage techniques to evaluate
endometrial cytology in clinically normal postpartum dairy cows. Can Vet J 46, 255-259
Kastrop PM, Bevers MM, Destree OH, Kruip TA (1991): Protein synthesis and
phosphorylation patterns of bovine oocytes maturing in vivo. Mol Reprod Dev 29, 271-
275
Katsuno Y, Suzuki A, Sugimura K, Okumura K, Zineldeen DH, Shimada M, Niida H,
Mizuno T, Hanaoka F, Nakanishi M (2009): Cyclin A-Cdk1 regulates the origin firing
program in mammalian cells. Proc Natl Acad Sci U S A 106, 3184-3189

References _________________________________________________________________________
149
Kaufmann TB, Drillich M, Tenhagen BA, Forderung D, Heuwieser W (2009): Prevalence
of bovine subclinical endometritis 4h after insemination and its effects on first service
conception rate. Theriogenology 71, 385-391
Kauma SW (2000): Cytokines in implantation. J Reprod Fertil Suppl 55, 31-42
Kidder BL, Yang J, Palmer S (2008): Stat3 and c-Myc genome-wide promoter occupancy
in embryonic stem cells. PLoS One 3, e3932
Kidder GM, McLachlin JR (1985): Timing of transcription and protein synthesis
underlying morphogenesis in preimplantation mouse embryos. Dev Biol 112, 265-275
Kim M, Geum D, Khang I, Park YM, Kang BM, Lee KA, Kim K (2002): Expression
pattern of HSP25 in mouse preimplantation embryo: heat shock responses during oocyte
maturation. Mol Reprod Dev 61, 3-13
Kim MH, Hersh LB (2004): The vesicular acetylcholine transporter interacts with clathrin-
associated adaptor complexes AP-1 and AP-2. J Biol Chem 279, 12580-12587
Kimmins S, MacLaren LA (1999): Cyclic modulation of integrin expression in bovine
endometrium. Biol Reprod 61, 1267-1274
Kohler K, Zahraoui A (2005): Tight junction: a co-ordinator of cell signalling and
membrane trafficking. Biol Cell 97, 659-665
Kojima FK (2003): Symposium paper: The Estrous Cycle in Cattle: Physiology,
Endocrinology and Follicular Waves. The professional Animal Scientitst 19, 83-93
Koziorowski M, Stanisława SK (2007): Local hormonal regulationsin female reproductive
organs of domestic animals. Pol. J. Natur. Sc 22, 742-752
Krisher RL (2004): The effect of oocyte quality on development. J Anim Sci 82, E14-23
Kruip TA, Bevers MM, Kemp B (2000): Environment of oocyte and embryo determines
health of IVP offspring. Theriogenology 53, 611-618
Kruse N, Greif M, Moriabadi NF, Marx L, Toyka KV, Rieckmann P (2000): Variations in
cytokine mRNA expression during normal human pregnancy. Clin Exp Immunol 119, 317-
322
References _________________________________________________________________________
150
LaFrance M, Goff AK (1990): Control of bovine uterine prostaglandin F2 alpha release in
vitro. Biol Reprod 42, 288-293
Lam GK, Whitecar PW, Orton S, Boggess KA, Taylor DD (2003): Differential expression
of TcR-CD3 zeta as evidence for altered immunoregulation in preeclamptic versus
normotensive women. Am J Obstet Gynecol 189, 843-847
Lamming GE, Darwash AO (1995): Effect of interluteal interval on subsequent luteal
phase length and fertility in post partum dairy cows. Biol Reprod 53, abstr
Lamming GE, Darwash AO (1998): The use of milk progesterone profiles to characterise
components of subfertility in milked dairy cows. Anim Reprod Sci 52, 175-190
Lanteri E, Pistritto M, Bartoloni G, Cordaro S, Stivala F, Montoneri C (1998): Expression
of alpha6 and beta4 integrin subunits on human endometrium throughout the menstrual
cycle and during early pregnancy. Fertil Steril 69, 37-40
Latham KE (1999): Mechanisms and control of embryonic genome activation in
mammalian embryos. Int Rev Cytol 193, 71-124
Latham KE, Schultz RM (2001): Embryonic genome activation. Front Biosci 6, D748-759
Ledee-Bataille N, Olivennes F, Kadoch J, Dubanchet S, Frydman N, Chaouat G, Frydman
R (2004): Detectable levels of interleukin-18 in uterine luminal secretions at oocyte
retrieval predict failure of the embryo transfer. Hum Reprod 19, 1968-1973
Ledee N, Dubanchet S, Oger P, Meynant C, Lombroso R, Ville Y, Chaouat G (2007):
Uterine receptivity and cytokines: new concepts and new applications. Gynecol Obstet
Invest 64, 138-143
Lee ES, Fukui Y (1996): Synergistic effect of alanine and glycine on bovine embryos
cultured in a chemically defined medium and amino acid uptake by vitro-produced bovine
morulae and blastocysts. Biol Reprod 55, 1383-1389
Lee SJ, Lee JK, Maeng YS, Kim YM, Kwon YG (2009): Langerhans cell protein 1 (LCP1)
binds to PNUTS in the nucleus: implications for this complex in transcriptional regulation.
Exp Mol Med 41, 189-200
References _________________________________________________________________________
151
Lessey BA (1998): Endometrial integrins and the establishment of uterine receptivity.
Hum Reprod 13, 259-261
Lessey BA (1997): Integrins and the endometrium: new markers of uterine receptivity.
Ann N Y Acad Sci 828, 111-122
Lessey BA, Castelbaum AJ, Sawin SW, Sun J (1995 ): Integrins as markers of uterine
receptivity in women with primary unexplained infertility. Fertil Steril 63, 535-542.
Lessey BA, Ilesanmi AO, Lessey MA, Riben M, Harris JE, Chwalisz K (1996): Luminal
and glandular endometrial epithelium express integrins differentially throughout the
menstrual cycle: implications for implantation, contraception, and infertility. Am J Reprod
Immunol 35, 195-204
Lessey BA, Young SL (1997): Integrins and other cell adhesion molecules in endometrium
and endometriosis. Semin Reprod Endocrinol 15, 291-299
Levesque JT, Sirard MA (1995): Effects of different kinases and phosphatases on nuclear
and cytoplasmic maturation of bovine oocytes. Mol Reprod Dev 42, 114-121
Levi AJ, Drews MR, Bergh PA, Miller BT, Scott RT, Jr. (2001): Controlled ovarian
hyperstimulation does not adversely affect endometrial receptivity in in vitro fertilization
cycles. Fertil Steril 76, 670-674
Li L, Chen S, Xing F (2000): Expression of matrix metalloproteinase-9 and tissue inhibitor
of metalloproteinase-3 protein in the implantation window phase of endometrium.
Zhonghua Fu Chan Ke Za Zhi 35, 544-546
Li SS, Liu YH, Tseng CN, Singh S (2006): Analysis of gene expression in single human
oocytes and preimplantation embryos. Biochem Biophys Res Commun 340, 48-53
Li Y, Zhang F, Nagai N, Tang Z, Zhang S, Scotney P, Lennartsson J, Zhu C, Qu Y, Fang
C, Hua J, Matsuo O, Fong GH, Ding H, Cao Y, Becker KG, Nash A, Heldin CH, Li X
(2008): VEGF-B inhibits apoptosis via VEGFR-1-mediated suppression of the expression
of BH3-only protein genes in mice and rats. J Clin Invest 118, 913-923
Liang CG, Su YQ, Fan HY, Schatten H, Sun QY (2007): Mechanisms regulating oocyte
meiotic resumption: roles of mitogen-activated protein kinase. Mol Endocrinol 21, 2037-
2055

References _________________________________________________________________________
152
Lim H, Das SK, Dey SK (1998): erbB genes in the mouse uterus: cell-specific signaling by
epidermal growth factor (EGF) family of growth factors during implantation. Dev Biol
204, 97-110
Lim H, Song H, Paria BC, Reese J, Das SK, Dey SK (2002): Molecules in blastocyst
implantation: uterine and embryonic perspectives. Vitam Horm 64, 43-76
Lin S, Sun L, Hu J, Wan S, Zhao R, Yuan S, Zhang L (2009): Chemokine C-X-C motif
receptor 6 contributes to cell migration during hypoxia. Cancer Lett 279, 108-117
Liu CQ, Yuan Y, Wang ZX (2001): Effects of leukaemia inhibitory factor on endometrial
receptivity and its hormonal regulation in rabbits. Cell Biol Int 25, 1029-1032
Locke D, Jamieson S, Stein T, Liu J, Hodgins MB, Harris AL, Gusterson B (2007): Nature
of Cx30-containing channels in the adult mouse mammary gland. Cell Tissue Res 328, 97-
107
Lonergan P, Monaghan P, Rizos D, Boland MP, Gordon I (1994): Effect of follicle size on
bovine oocyte quality and developmental competence following maturation, fertilization,
and culture in vitro. Mol Reprod Dev 37, 48-53
Lonergan P, Rizos D, Gutierrez-Adan A, Moreira PM, Pintado B, de la Fuente J, Boland
MP (2003): Temporal divergence in the pattern of messenger RNA expression in bovine
embryos cultured from the zygote to blastocyst stage in vitro or in vivo. Biol Reprod 69,
1424-1431
Lopez H, Satter LD, Wiltbank MC (2004): Relationship between level of milk production
and estrous behavior of lactating dairy cows. Anim Reprod Sci 81, 209-223
Makarevich AV, Olexikova L, Chrenek P, Kubovicova E, Freharova K, Pivko J (2007):
The effect of hyperthermia in vitro on vitality of rabbit preimplantation embryos. Physiol
Res 56, 789-796
Makker A, Singh MM (2006): Endometrial receptivity: clinical assessment in relation to
fertility, infertility, and antifertility. Med Res Rev 26, 699-746
Mann GE, Lamming GE ( 2001): Relationship between maternal endocrine environment,
early embryo development and inhibition of the luteolytic mechanism in cows.
Reproduction 121, 175–180
References _________________________________________________________________________
153
Mansouri-Attia N, Sandra O, Aubert J, Degrelle S, Everts RE, Giraud-Delville C, Heyman
Y, Galio L, Hue I, Yang X, Tian XC, Lewin HA, Renard JP (2009): Endometrium as an
early sensor of in vitro embryo manipulation technologies. Proc Natl Acad Sci USA 106,
5687-5692
Mantovani R, Enright WJ, Keane MG, Roche JF, Boland MP (1993): Effect of nutrition on
follicle stimulating hormone (FSH) on superovulatory response in beef heifers. In: Proc
9th AETE p. 234 abstr
Marinov U, Lovell JE (1968): Cytology of the bovine uterine epithelium during the estrous
cycle. Am J Vet Res 29, 13-30
Martin J, Dominguez F, Avila S, Castrillo JL, Remohi J, Pellicer A, Simon C (2002):
Human endometrial receptivity: gene regulation. J Reprod Immunol 55, 131-139
Matsui M, Oshima M, Oshima H, Takaku K, Maruyama T, Yodoi J, Taketo MM (1996):
Early embryonic lethality caused by targeted disruption of the mouse thioredoxin gene.
Dev Biol 178, 179-185
Matzuk MM, Burns KH, Viveiros MM, Eppig JJ (2002): Intercellular communication in
the mammalian ovary: oocytes carry the conversation. Science 296, 2178-2180
Maurer RR, Chenault JR (1983): Fertilization failure and embryonic mortality in parous
and nonparous beef cattle. J Anim Sci 56, 1186-1189
McCracken JA, Custer EE, Lamsa JC (1999): Luteolysis: a neuroendocrine-mediated
event. Physiol Rev 79, 263-323
McEvoy TG, Robinson JJ, Aitken RP, Findlay PA, Robertson IS (1997a): Dietary excesses
of urea influence the viability and metabolism of preimplantation sheep embryos and may
affect fetal growth among survivors. Anim Reprod Sci 47, 71-90
McEvoy TG, Sinclair KD, Staines ME, Robinson JJ, Armstrong DG, Webb R (1997b):
Invitro blastocyst production in relation to energy and protein intake prior to oocyte
collection. J. Repro. Fertil, 132, abst.
McKie AT, Barlow DJ (2004): The SLC40 basolateral iron transporter family
(IREG1/ferroportin/MTP1). Pflugers Arch 447, 801-806

References _________________________________________________________________________
154
McNatty KP, Juengel JL, Wilson T, Galloway SM, Davis GH, Hudson NL, Moeller CL,
Cranfield M, Reader KL, Laitinen MP, Groome NP, Sawyer HR, Ritvos O (2003):
Oocyte-derived growth factors and ovulation rate in sheep. Reprod Suppl 61, 339-351
Mechoulam R, Fride E, Di Marzo V (1998): Endocannabinoids. Eur J Pharmacol 359, 1-18
Meirelles FV, Caetano AR, Watanabe YF, Ripamonte P, Carambula SF, Merighe GK,
Garcia SM (2004): Genome activation and developmental block in bovine embryos. Anim
Reprod Sci 82-83, 13-20
Memili E, Dominko T, First NL (1998): Onset of transcription in bovine oocytes and
preimplantation embryos. Mol Reprod Dev 51, 36-41
Memili E, First NL (1999): Control of gene expression at the onset of bovine embryonic
development. Biol Reprod 61, 1198-1207
Memili E, First NL (1998): Developmental changes in RNA polymerase II in bovine
oocytes, early embryos, and effect of alpha-amanitin on embryo development. Mol Reprod
Dev 51, 381-389
Memili E, First NL (2000): Zygotic and embryonic gene expression in cow: a review of
timing and mechanisms of early gene expression as compared with other species. Zygote
8, 87-96
Misirlioglu M, Page GP, Sagirkaya H, Kaya A, Parrish JJ, First NL, Memili E (2006):
Dynamics of global transcriptome in bovine matured oocytes and preimplantation
embryos. Proc Natl Acad Sci USA 103, 18905-18910
Mitko K, Ulbrich SE, Wenigerkind H, Sinowatz F, Blum H, Wolf E, Bauersachs S (2008):
Dynamic changes in messenger RNA profiles of bovine endometrium during the oestrous
cycle. Reproduction 135, 225-240
Moggs JG, Tinwell H, Spurway T, Chang HS, Pate I, Lim FL, Moore DJ, Soames A,
Stuckey R, Currie R, Zhu T, Kimber I, Ashby J, Orphanides G (2004): Phenotypic
anchoring of gene expression changes during estrogen-induced uterine growth. Environ
Health Perspect 112, 1589-1606
References _________________________________________________________________________
155
Mohan M, Thirumalapura NR, Malayer J (2003): Bovine cumulus-granulosa cells contain
biologically active retinoid receptors that can respond to retinoic acid. Reprod Biol
Endocrinol 1, 104
Montpetit A, Cote S, Brustein E, Drouin CA, Lapointe L, Boudreau M, Meloche C, Drouin
R, Hudson TJ, Drapeau P, Cossette P (2008): Disruption of AP1S1, causing a novel
neurocutaneous syndrome, perturbs development of the skin and spinal cord. PLoS Genet
4, e1000296
Morris d, Diskin M (2008): Effect of progesterone on embryo survival. Animal 2, 1112–
1119
Morris DG, Grealy M, Leese HJ, Diskin MG, Sreenan JM. (2001): Cattle Embryo Growth,
Development and Viability, Dublin , pp 1-32
Morris JM, Van Wagenen G (1973): Interception: the use of postovulatory estrogens to
prevent implantation. Am J Obstet Gynecol 115, 101-106
Muller JM, Deinhardt K, Rosewell I, Warren G, Shima DT (2007): Targeted deletion of
p97 (VCP/CDC48) in mouse results in early embryonic lethality. Biochem Biophys Res
Commun 354, 459-465
Mylona P, Kielty CM, Hoyland JA, Aplin JD (1995): Expression of type VI collagen
mRNAs in human endometrium during the menstrual cycle and first trimester of
pregnancy. J Reprod Fertil 103, 159-167
Natale DR, Kidder GM, Westhusin ME, Watson AJ (2000): Assessment by differential
display-RT-PCR of mRNA transcript transitions and alpha-amanitin sensitivity during
bovine preattachment development. Mol Reprod Dev 55, 152-163
Newell-Litwa K, Seong E, Burmeister M, Faundez V (2007): Neuronal and non-neuronal
functions of the AP-3 sorting machinery. J Cell Sci 120, 531-541
Nganvongpanit K, Muller H, Rings F, Gilles M, Jennen D, Holker M, Tholen E,
Schellander K, Tesfaye D (2006): Targeted suppression of E-cadherin gene expression in
bovine preimplantation embryo by RNA interference technology using double-stranded
RNA. Mol Reprod Dev 73, 153-163

References _________________________________________________________________________
156
Niemann H, Wrenzycki C, Lucas-Hahn A, Brambrink T, Kues WA, Carnwath JW (2002):
Gene expression patterns in bovine in vitro-produced and nuclear transfer-derived embryos
and their implications for early development. Cloning Stem Cells 4, 29-38
Nishimura K, Nakatsu F, Kashiwagi K, Ohno H, Saito T, Igarashi K (2002): Essential role
of S-adenosylmethionine decarboxylase in mouse embryonic development. Genes Cells 7,
41-47
Norwitz ER, Schust DJ, Fisher SJ (2001): Implantation and the survival of early
pregnancy. N Engl J Med 345, 1400-1408
O'Callaghan D, Yaakub H, Hyttel P, Spicer LJ, Boland MP (2000): Effect of nutrition and
superovulation on oocyte morphology, follicular fluid composition and systemic hormone
concentrations in ewes. J Reprod Fertil 118, 303-313
O'Connell BC, Cheung AF, Simkevich CP, Tam W, Ren X, Mateyak MK, Sedivy JM
(2003): A large scale genetic analysis of c-Myc-regulated gene expression patterns. J Biol
Chem 278, 12563-12573
Ogawa H, Iimura M, Eckmann L, Kagnoff MF (2004): Regulated production of the
chemokine CCL28 in human colon epithelium. Am J Physiol Gastrointest Liver Physiol
287, G1062-1069
Ohtani S, Okuda K (1995): Histological observation of the endometrium in repeat breeder
cows. J Vet Med Sci 57, 283-286
Ohtani S, Okuda K, Nishimura K, Mohri S (1993): Histological changes in bovine
endometrium during the estrous cycle. Theriogenology 39, 1033-1042
Olofsson B, Korpelainen E, Pepper MS, Mandriota SJ, Aase K, Kumar V, Gunji Y, Jeltsch
MM, Shibuya M, Alitalo K, Eriksson U (1998): Vascular endothelial growth factor B
(VEGF-B) binds to VEGF receptor-1 and regulates plasminogen activator activity in
endothelial cells. Proc Natl Acad Sci USA 95, 11709-11714
Palmieri F (2004): The mitochondrial transporter family (SLC25): physiological and
pathological implications. Pflugers Arch 447, 689-709
Paria BC, Song H, Dey SK (2001a): Implantation: molecular basis of embryo-uterine
dialogue. Int J Dev Biol 45, 597-605

References _________________________________________________________________________
157
Paria BC, Song H, Wang X, Schmid PC, Krebsbach RJ, Schmid HH, Bonner TI, Zimmer
A, Dey SK (2001b): Dysregulated cannabinoid signaling disrupts uterine receptivity for
embryo implantation. J Biol Chem 276, 20523-20528
Paria BC, Wang H, Dey SK (2002): Endocannabinoid signaling in synchronizing embryo
development and uterine receptivity for implantation. Chem Phys Lipids 121, 201-210
Passey RJ, Xu K, Hume DA, Geczy CL (1999): S100A8: emerging functions and
regulation. J Leukoc Biol 66, 549-556
Patel SN, Lu Z, Ayi K, Serghides L, Gowda DC, Kain KC (2007): Disruption of CD36
impairs cytokine response to Plasmodium falciparum glycosylphosphatidylinositol and
confers susceptibility to severe and fatal malaria in vivo. J Immunol 178, 3954-3961
Paula-Lopes FF, Hansen PJ (2002): Heat shock-induced apoptosis in preimplantation
bovine embryos is a developmentally regulated phenomenon. Biol Reprod 66, 1169-1177
Paynton BV (1998): RNA-binding proteins in mouse oocytes and embryos: expression of
genes encoding Y box, DEAD box RNA helicase, and polyA binding proteins. Dev Genet
23, 285-298
Peretti D, Peris L, Rosso S, Quiroga S, Caceres A (2000): Evidence for the involvement of
KIF4 in the anterograde transport of L1-containing vesicles. J Cell Biol 149, 141-152
Peters AR (1985): Hormonal control of the bovine oestrous cycle. I. The natural cycle. Br
Vet J 141, 564-575
Petraglia F, Santuz M, Florio P, Simoncini T, Luisi S, Plaino L, Genazzani AR, Genazzani
AD, Volpe A (1998): Paracrine regulation of human placenta: control of hormonogenesis.
J Reprod Immunol 39, 221-233
Piccioni F, Zappavigna V, Verrotti AC (2005): Translational regulation during oogenesis
and early development: the cap-poly(A) tail relationship. C R Biol 328, 863-881
Pisani LF, Antonini S, Pocar P, Ferrari S, Brevini TA, Rhind SM, Gandolfi F (2008):
Effects of pre-mating nutrition on mRNA levels of developmentally relevant genes in
sheep oocytes and granulosa cells. Reproduction 136, 303-312

References _________________________________________________________________________
158
Plachot M, de Grouchy J, Junca AM, Mandelbaum J, Salat-Baroux J, Cohen J (1988):
Chromosome analysis of human oocytes and embryos: does delayed fertilization increase
chromosome imbalance? Hum Reprod 3, 125-127
Plante L, Plante C, Shepherd DL, King WA (1994): Cleavage and 3H-uridine
incorporation in bovine embryos of high in vitro developmental potential. Mol Reprod Dev
39, 375-383
Ponsuksili S, Tesfaye D, El-Halawany N, Schellander K, Wimmers K (2002): Stage-
specific expressed sequence tags obtained during preimplantation bovine development by
differential display RT-PCR and suppression subtractive hybridization. Prenat Diagn 22,
1135-1142
Powell K, Rooke JA, McEvoy TG, Ashworth CJ, Robinson JJ, Wilmut I, Young LE,
Sinclair KD (2006): Zygote donor nitrogen metabolism and in vitro embryo culture
perturbs in utero development and IGF2R expression in ovine fetal tissues.
Theriogenology 66, 1901-1912
Raab G, Kover K, Paria BC, Dey SK, Ezzell RM, Klagsbrun M (1996): Mouse
preimplantation blastocysts adhere to cells expressing the transmembrane form of heparin-
binding EGF-like growth factor. Development 122, 637-645
Raghu HM, Nandi S, Reddy SM (2002): Follicle size and oocyte diameter in relation to
developmental competence of buffalo oocytes in vitro. Reprod Fertil Dev 14, 55-61
Rankin T, Talbot P, Lee E, Dean J (1999): Abnormal zonae pellucidae in mice lacking
ZP1 result in early embryonic loss. Development 126, 3847-3855
Rankin TL, O'Brien M, Lee E, Wigglesworth K, Eppig J, Dean J (2001): Defective zonae
pellucidae in Zp2-null mice disrupt folliculogenesis, fertility and development.
Development 128, 1119-1126
Reese J, Das SK, Paria BC, Lim H, Song H, Matsumoto H, Knudtson KL, DuBois RN,
Dey SK (2001): Global gene expression analysis to identify molecular markers of uterine
receptivity and embryo implantation. J Biol Chem 276, 44137-44145

References _________________________________________________________________________
159
Reponen P, Leivo I, Sahlberg C, Apte SS, Olsen BR, Thesleff I, Tryggvason K (1995): 92-
kDa type IV collagenase and TIMP-3, but not 72-kDa type IV collagenase or TIMP-1 or
TIMP-2, are highly expressed during mouse embryo implantation. Dev Dyn 202, 388-396
Richardson RJ, Dixon J, Malhotra S, Hardman MJ, Knowles L, Boot-Handford RP, Shore
P, Whitmarsh A, Dixon MJ (2006): IRF6 is a key determinant of the keratinocyte
proliferation-differentiation switch. Nat Genet 38, 1329-1334
Richter TA, Robinson JE, Lozano JM, Evans NP (2005): Progesterone can block the
preovulatory gonadotropin-releasing hormone/luteinising hormone surge in the ewe by a
direct inhibitory action on oestradiol-responsive cells within the hypothalamus. J
Neuroendocrinol 17, 161-169
Riesewijk A, Martin J, van Os R, Horcajadas JA, Polman J, Pellicer A, Mosselman S,
Simon C (2003): Gene expression profiling of human endometrial receptivity on days
LH+2 versus LH+7 by microarray technology. Mol Hum Reprod 9, 253-264
Ritchie ME, Silver J, Oshlack A, Holmes M, Diyagama D, Holloway A, Smyth GK
(2007): A comparison of background correction methods for two-colour microarrays.
Bioinformatics 23, 2700-2707
Rivera RM, Kelley KL, Erdos GW, Hansen PJ (2004): Reorganization of microfilaments
and microtubules by thermal stress in two-cell bovine embryos. Biol Reprod 70, 1852-
1862
Roberts RM, Ealy AD, Alexenko AP, Han CS, Ezashi T (1999): Trophoblast interferons.
Placenta 20, 259-264
Roberts RM, Xie S, Mathialagan N (1996): Maternal recognition of pregnancy. Biol
Reprod 54, 294-302
Rocha A, Randel RD, Broussard JR, Lim JM, Blair RM, Roussel JD, Godke RA, Hansel
W (1998): High environmental temperature and humidity decrease oocyte quality in Bos
taurus but not in Bos indicus cows. Theriogenology 49, 657-665
Roche JF (2006): The effect of nutritional management of the dairy cow on reproductive
efficiency. Anim Reprod Sci 96, 282-296

References _________________________________________________________________________
160
Roche JF, Bolandl MP, McGeady TA (1981): Reproductive wastage following artificial
insemination of heifers. Vet Rec 109, 401-404
Rodriguez-Alvarez L, Sharbati J, Sharbati S, Cox JF, Einspanier R, Castro FO (2010):
Differential gene expression in bovine elongated (Day 17) embryos produced by somatic
cell nucleus transfer and in vitro fertilization.Theriogenology 74, 45-59.
Roman-Ponce H, Caton D, Thatcher WW, Lehrer R (1983): Uterine blood flow in relation
to endogenous hormones during estrous cycle and early pregnancy. Am J Physiol 245,
R843-849
Rooke JA, Shao CC, Speake BK (2001): Effects of feeding tuna oil on the lipid
composition of pig spermatozoa and in vitro characteristics of semen. Reproduction 121,
315-322
Rossant J (2004): Lineage development and polar asymmetries in the peri-implantation
mouse blastocyst. Semin Cell Dev Biol 15, 573-581
Russ AP, Wattler S, Colledge WH, Aparicio SA, Carlton MB, Pearce JJ, Barton SC,
Surani MA, Ryan K, Nehls MC, Wilson V, Evans MJ (2000): Eomesodermin is required
for mouse trophoblast development and mesoderm formation. Nature 404, 95-99
Ryan DP, Blakewood EG, Lynn JW, Munyakazi L, Godke RA (1992): Effect of heat-
stress on bovine embryo development in vitro. J Anim Sci 70, 3490-3497
Saito N, Okada Y, Noda Y, Kinoshita Y, Kondo S, Hirokawa N (1997): KIFC2 is a novel
neuron-specific C-terminal type kinesin superfamily motor for dendritic transport of
multivesicular body-like organelles. Neuron 18, 425-438
Salamonsen LA, Dimitriadis E, Robb L (2000): Cytokines in implantation. Semin Reprod
Med 18, 299-310
Salilew-Wondim D, Hölker M, Rings F, Phatsara C, Mohammadi-Sangcheshmeh A,
Tholen E, Schellander K, Tesfaye T (2010): Depletion of BIRC6 leads to retarded bovine
early embryonic development and blastocyst formation in vitro. Reproduction, Fertility
and Development 22, 564–579
Salilew-Wondim D, Rings F, Holker M, Gilles M, Jennen D, Tholen E, Havlicek V,
Besenfelder U, Sukhorukov VL, Zimmermann U, Endter JM, Sirard MA, Schellander K,
References _________________________________________________________________________
161
Tesfaye D (2007): Dielectrophoretic behavior of in vitro-derived bovine metaphase II
oocytes and zygotes and its relation to in vitro embryonic developmental competence and
mRNA expression pattern. Reproduction 133, 931-946
Satterfield MC, Song G, Hayashi K, Bazer FW, Spencer TE (2008): Progesterone
regulation of the endometrial WNT system in the ovine uterus. Reprod Fertil Dev 20, 935-
946
Schams D, Schallenberger E, Hoffmann B, Karg H (1977): The oestrous cycle of the cow:
hormonal parameters and time relationships concerning oestrus, ovulation, and electrical
resistance of the vaginal mucus. Acta Endocrinol (Copenh) 86, 180-192
Schedin P, Mitrenga T, Kaeck M (2000): Estrous cycle regulation of mammary epithelial
cell proliferation, differentiation, and death in the Sprague-Dawley rat: a model for
investigating the role of estrous cycling in mammary carcinogenesis. J Mammary Gland
Biol Neoplasia 5, 211-225
Schier AF (2007): The maternal-zygotic transition: death and birth of RNAs. Science 316,
406-407
Schmidt S, Hommel A, Gawlik V, Augustin R, Junicke N, Florian S, Richter M, Walther
DJ, Montag D, Joost HG, Schurmann A (2009): Essential role of glucose transporter
GLUT3 for post-implantation embryonic development. J Endocrinol 200, 23-33
Schramm RD, Bavister BD (1999): Onset of nucleolar and extranucleolar transcription and
expression of fibrillarin in macaque embryos developing in vitro. Biol Reprod 60, 721-728
Schultz RM, Davis W, Jr., Stein P, Svoboda P (1999): Reprogramming of gene expression
during preimplantation development. J Exp Zool 285, 276-282
Sedaghat F, Notopoulos A (2008): S100 protein family and its application in clinical
practice. Hippokratia 12, 198-204
Senger PL (2003): Pathways to pregnancy and parturition. Current conceptions , Inc.,
Pullman, Washington,
Sharkey AM, Smith SK (2003): The endometrium as a cause of implantation failure. Best
Pract Res Clin Obstet Gynaecol 17, 289-307

References _________________________________________________________________________
162
Shemesh M, Hansel W (1975): Levels of prostaglandin F (PGF) in bovine endometrium
uterine venous, ovarian arterial and jugular plasma during the estrous cycle. Proc Soc Exp
Biol Med 148, 123-126
Shi Y, Glynn JM, Guilbert LJ, Cotter TG, Bissonnette RP, Green DR (1992): Role for c-
myc in activation-induced apoptotic cell death in T cell hybridomas. Science 257, 212-214
Silverstein RL, Febbraio M (2009): CD36, a scavenger receptor involved in immunity,
metabolism, angiogenesis, and behavior. Sci Signal 2, re3
Simon C, Dominguez F, Remohi J, Pellicer A (2001): Embryo effects in human
implantation: embryonic regulation of endometrial molecules in human implantation. Ann
N Y Acad Sci 943, 1-16
Simon C, Martin JC, Pellicer A (2000): Paracrine regulators of implantation. Baillieres
Best Pract Res Clin Obstet Gynaecol 14, 815-826
Simpson F, Peden AA, Christopoulou L, Robinson MS (1997): Characterization of the
adaptor-related protein complex, AP-3. J Cell Biol 137, 835-845
Skinner DC, Harris TG, Evans NP (2000): Duration and amplitude of the luteal phase
progesterone increment times the estradiol-induced luteinizing hormone surge in ewes.
Biol Reprod 63, 1135-1142
Smyth GK ( 2005): Limma: linear models for microarray data In: Bioinformatics and
Computational Biology Solutions using R and Bioconductor, R. Gentleman, V. Carey, S.
Dudoit, R. Irizarry, W. Huber (eds.). Springer, . New York,.
Smyth GK, Speed T (2003): Normalization of cDNA microarray data. Methods 31, 265-
273
Song H, Lim H, Das SK, Paria BC, Dey SK (2000): Dysregulation of EGF family of
growth factors and COX-2 in the uterus during the preattachment and attachment reactions
of the blastocyst with the luminal epithelium correlates with implantation failure in LIF-
deficient mice. Mol Endocrinol 14, 1147-1161
Souza CJ, Campbell BK, McNeilly AS, Baird DT (2003): Bone morphogenetic proteins
and folliculogenesis: lessons from the Booroola mutation. Reprod Suppl 61, 361-370

References _________________________________________________________________________
163
Spell AR, Beal WE, Corah LR, Lamb GC (2001): Evaluating recipient and embryo factors
that affect pregnancy rates of embryo transfer in beef cattle. Theriogenology 56, 287-297
Spencer TE, Johnson GA, Bazer FW, Burghardt RC, Palmarini M (2007): Pregnancy
recognition and conceptus implantation in domestic ruminants: roles of progesterone,
interferons and endogenous retroviruses. Reprod Fertil Dev 19, 65-78
Spencer TE, Ott TL, Bazer FW (1996): tau-Interferon: pregnancy recognition signal in
ruminants. Proc Soc Exp Biol Med 213, 215-229
Spencer TE, Sandra O, Wolf E (2008): Genes involved in conceptus-endometrial
interactions in ruminants: insights from reductionism and thoughts on holistic approaches.
Reproduction 135, 165-179
Spencer TE, Stagg AG, Joyce MM, Jenster G, Wood CG, Bazer FW, Wiley AA, Bartol FF
(1999): Discovery and characterization of endometrial epithelial messenger ribonucleic
acids using the ovine uterine gland knockout model. Endocrinology 140, 4070-4080
Stewart CL, Kaspar P, Brunet LJ, Bhatt H, Gadi I, Kontgen F, Abbondanzo SJ (1992):
Blastocyst implantation depends on maternal expression of leukaemia inhibitory factor.
Nature 359, 76-79
Stossi F, Likhite VS, Katzenellenbogen JA, Katzenellenbogen BS (2006): Estrogen-
occupied estrogen receptor represses cyclin G2 gene expression and recruits a repressor
complex at the cyclin G2 promoter. J Biol Chem 281, 16272-16278
Stovall DW, Anners JA, Halme J (1992): Immunohistochemical detection of type I, III,
and IV collagen in endometriosis implants. Fertil Steril 57, 984-989
Subandrio AL, Sheldon IM, Noakes DE (2000): Peripheral and intrauterine neutrophil
function in the cow: the influence of endogenous and exogenous sex steroid hormones.
Theriogenology 53, 1591-1608
Suh EJ, Kim YJ, Kim SH (2009): Protein phosphatase 2Cgamma regulates the level of
p21Cip1/WAF1 by Akt signaling. Biochem Biophys Res Commun 386, 467-470
Swierz L, Giudence L (1997): Unexplained infrtility and the role of uterine recptivity.
Clinics North America 8, 523-543.

References _________________________________________________________________________
164
Tabibzadeh S (1998): Molecular control of the implantation window. Hum Reprod Update
4, 465-471
Tabibzadeh S, Babaknia A (1995): The signals and molecular pathways involved in
implantation, a symbiotic interaction between blastocyst and endometrium involving
adhesion and tissue invasion. Hum Reprod 10, 1579-1602
Tabibzadeh S, Zupi E, Babaknia A, Liu R, Marconi D, Romanini C (1995): Site and
menstrual cycle-dependent expression of proteins of the tumour necrosis factor (TNF)
receptor family, and BCL-2 oncoprotein and phase-specific production of TNF alpha in
human endometrium. Hum Reprod 10, 277-286
Takeda K, Noguchi K, Shi W, Tanaka T, Matsumoto M, Yoshida N, Kishimoto T, Akira S
(1997): Targeted disruption of the mouse Stat3 gene leads to early embryonic lethality.
Proc Natl Acad Sci U S A 94, 3801-3804
Tan YF, Li FX, Piao YS, Sun XY, Wang YL (2003): Global gene profiling analysis of
mouse uterus during the oestrous cycle. Reproduction 126, 171-182
Tapia A, Salamonsen LA, Manuelpillai U, Dimitriadis E (2008): Leukemia inhibitory
factor promotes human first trimester extravillous trophoblast adhesion to extracellular
matrix and secretion of tissue inhibitor of metalloproteinases-1 and -2. Hum Reprod 23,
1724-1732
Tarkowski R, Kotarski J, Polak G, Wojcierowski J (2001): Expression of the survivin gene
in the scar endometriosis and in normal human endometrium. Ginekol Pol 72, 1539-1542
Tchivilev I, Madamanchi NR, Vendrov AE, Niu XL, Runge MS (2008): Identification of a
protective role for protein phosphatase 1cgamma1 against oxidative stress-induced
vascular smooth muscle cell apoptosis. J Biol Chem 283, 22193-22205
Telford NA, Watson AJ, Schultz GA (1990): Transition from maternal to embryonic
control in early mammalian development: a comparison of several species. Mol Reprod
Dev 26, 90-100
Temeles GL, DeFeo-Jones D, Tatchell K, Ellinger MS, Scolnick EM (1984): Expression
and characterization of ras mRNAs from Saccharomyces cerevisiae. Mol Cell Biol 4,
2298-2305
References _________________________________________________________________________
165
Tesarik J, Kopecny V, Plachot M, Mandelbaum J (1987): High-resolution
autoradiographic localization of DNA-containing sites and RNA synthesis in developing
nucleoli of human preimplantation embryos: a new concept of embryonic nucleologenesis.
Development 101, 777-791
Tesfaye D, Regassa A, Rings F, Ghanem N, Phatsara C, Tholen E, Herwig R, Un C,
Schellander K, Hoelker M (2010): Suppression of the transcription factor MSX1 gene
delays bovine preimplantation embryo development in vitro. Reproduction139, 857-870
Thatcher WW, Bartol FF, Knickerbocker JJ, Curl JS, Wolfenson D, Bazer FW, Roberts
RM (1984): Maternal recognition of pregnancy in cattle. J Dairy Sci 67, 2797-2811
Thatcher WW, Macmillan KL, Hansen PJ, Drost M (1989): Concepts for regulation of
corpus luteum function by the conceptus and ovarian follicles to improve fertility.
Theriogenology 31, 149-164
Thelie A, Papillier P, Perreau C, Uzbekova S, Hennequet-Antier C, Dalbies-Tran R
(2009): Regulation of bovine oocyte-specific transcripts during in vitro oocyte maturation
and after maternal-embryonic transition analyzed using a transcriptomic approach. Mol
Reprod Dev 76, 773-782
Tong ZB, Gold L, Pfeifer KE, Dorward H, Lee E, Bondy CA, Dean J, Nelson LM (2000):
Mater, a maternal effect gene required for early embryonic development in mice. Nat
Genet 26, 267-268
Turowski P, Franckhauser C, Morris MC, Vaglio P, Fernandez A, Lamb NJ (2003):
Functional cdc25C dual-specificity phosphatase is required for S-phase entry in human
cells. Mol Biol Cell 14, 2984-2998
Uchimura A, Hidaka Y, Hirabayashi T, Hirabayashi M, Yagi T (2009): DNA polymerase
delta is required for early mammalian embryogenesis. PLoS One 4, e4184
Ueki T, Iwasawa K, Ishikawa H, Sawa Y (2008): Expression of junctional adhesion
molecules on the human lymphatic endothelium. Microvasc Res 75, 269-278
Ushizawa K, Herath CB, Kaneyama K, Shiojima S, Hirasawa A, Takahashi T, Imai K,
Ochiai K, Tokunaga T, Tsunoda Y, Tsujimoto G, Hashizume K (2004): cDNA microarray

References _________________________________________________________________________
166
analysis of bovine embryo gene expression profiles during the pre-implantation period.
Reprod Biol Endocrinol 2, 77
Vallee M, Gravel C, Palin MF, Reghenas H, Stothard P, Wishart DS, Sirard MA (2005):
Identification of novel and known oocyte-specific genes using complementary DNA
subtraction and microarray analysis in three different species. Biol Reprod 73, 63-71
Vernet-Tomas Mdel M, Perez-Ares CT, Verdu N, Fernandez-Figueras MT, Molinero JL,
Carreras R (2006): The depolarized expression of the alpha-6 integrin subunit in the
endometria of women with endometriosis. J Soc Gynecol Investig 13, 292-296
Viebahn C (1999): The anterior margin of the mammalian gastrula: comparative and
phylogenetic aspects of its role in axis formation and head induction. Curr Top Dev Biol
46, 63-103
Walter U, Santamaria P (2005): CD8+ T cells in autoimmunity. Curr Opin Immunol 17,
624-631
Walters DL, Schams D, Schallenberger E (1984): Pulsatile secretion of gonadotrophins,
ovarian steroids and ovarian oxytocin during the luteal phase of the oestrous cycle in the
cow. J Reprod Fertil 71, 479-491
Wang H, Dey SK (2006): Roadmap to embryo implantation: clues from mouse models.
Nat Rev Genet 7, 185-199
Warner CM, Brownell MS, Ewoldsen MA (1988): Why aren't embryos immunologically
rejected by their mothers? Biol Reprod 38, 17-29
Warner CM, Gollnick SO, Flaherty L, Goldbard SB (1987): Analysis of Qa-2 antigen
expression by preimplantation mouse embryos: possible relationship to the
preimplantation-embryo-development (Ped) gene product. Biol Reprod 36, 611-616
Washburn SP, Silvia WJ, Brown CH, McDaniel BT, McAllister AJ (2002): Trends in
reproductive performance in Southeastern Holstein and Jersey DHI herds. J Dairy Sci 85,
244-251
Wassarman PM (1996): Oogenesis. In: Reproductive Endocrinology, Surgery and
Technology, Adashi, E.Y., Rock, J.A. and Rosenwaks, Z. (eds). Lippincott–Raven,
Philadelphia, 341-357

References _________________________________________________________________________
167
Watanabe H, Suzuki A, Kobayashi M, Takahashi E, Itamoto M, Lubahn DB, Handa H,
Iguchi T (2003): Analysis of temporal changes in the expression of estrogen-regulated
genes in the uterus. J Mol Endocrinol 30, 347-358
Watson AJ (1992): The cell biology of blastocyst development. Mol Reprod Dev 33, 492-
504
Watson AJ, Barcroft LC (2001): Regulation of blastocyst formation. Front Biosci 6, D708-
730
Watson AJ, De Sousa P, Caveney A, Barcroft LC, Natale D, Urquhart J, Westhusin ME
(2000): Impact of bovine oocyte maturation media on oocyte transcript levels, blastocyst
development, cell number, and apoptosis. Biol Reprod 62, 355-364
Watson AJ, Natale DR, Barcroft LC (2004): Molecular regulation of blastocyst formation.
Anim Reprod Sci 82-83, 583-592
Watson AJ, Westhusin ME, De Sousa PA, Betts DH, Barcroft LC (1999): Gene expression
regulating blastocyst formation. Theriogenology 51, 117-133
Whitcomb BW, Schisterman EF, Klebanoff MA, Baumgarten M, Rhoton-Vlasak A, Luo
X, Chegini N (2007): Circulating chemokine levels and miscarriage. Am J Epidemiol 166,
323-331
Whitworth K, Springer GK, Forrester LJ, Spollen WG, Ries J, Lamberson WR, Bivens N,
Murphy CN, Mathialagan N, Green JA, Prather RS (2004): Developmental expression of
2489 gene clusters during pig embryogenesis: an expressed sequence tag project. Biol
Reprod 71, 1230-1243
Wintenberger-Torres S, Flechon JE (1974): Ultrastructural evolution of the trophoblast
cells of the pre-implantation sheep blastocyst from day 8 to day 18. J Anat 118, 143-153
Wolf E, Arnold GJ, Bauersachs S, Beier HM, Blum H, Einspanier R, Frohlich T, Herrler
A, Hiendleder S, Kolle S, Prelle K, Reichenbach HD, Stojkovic M, Wenigerkind H,
Sinowatz F (2003): Embryo-maternal communication in bovine - strategies for deciphering
a complex cross-talk. Reprod Domest Anim 38, 276-289

References _________________________________________________________________________
168
Wolthuis R, Clay-Farrace L, van Zon W, Yekezare M, Koop L, Ogink J, Medema R, Pines
J (2008): Cdc20 and Cks direct the spindle checkpoint-independent destruction of cyclin
A. Mol Cell 30, 290-302
Wonnacott KE, Kwong WY, Hughes J, Salter AM, Lea RG, Garnsworthy PC, Sinclair KD
(2010): Dietary omega-3 and -6 polyunsaturated fatty acids affect the composition and
development of sheep granulosa cells, oocytes and embryos. Reproduction 139, 57-69
Wrenzycki C, Wells D, Herrmann D, Miller A, Oliver J, Tervit R, Niemann H (2001):
Nuclear transfer protocol affects messenger RNA expression patterns in cloned bovine
blastocysts. Biol Reprod 65, 309-317
Wu Z, Irizarry RA (2004): Preprocessing of oligonucleotide array data. Nat Biotechnol 22,
656-658
Xia Y, O'Shea T, Murison R, McFarlane JR (2003): Concentrations of progesterone,
follistatin, and follicle-stimulating hormone in peripheral plasma across the estrous cycle
and pregnancy in merino ewes that are homozygous or noncarriers of the Booroola gene.
Biol Reprod 69, 1079-1084
Xiao CW, Murphy BD, Sirois J, Goff AK (1999): Down-regulation of oxytocin-induced
cyclooxygenase-2 and prostaglandin F synthase expression by interferon-tau in bovine
endometrial cells. Biol Reprod 60, 656-663
Yamamoto M, Yang G, Hong C, Liu J, Holle E, Yu X, Wagner T, Vatner SF, Sadoshima J
(2003): Inhibition of endogenous thioredoxin in the heart increases oxidative stress and
cardiac hypertrophy. J Clin Invest 112, 1395-1406
Yamanaka Y, Ralston A, Stephenson RO, Rossant J (2006): Cell and molecular regulation
of the mouse blastocyst. Dev Dyn 235, 2301-2314
Yan C, Wang P, DeMayo J, DeMayo FJ, Elvin JA, Carino C, Prasad SV, Skinner SS,
Dunbar BS, Dube JL, Celeste AJ, Matzuk MM (2001): Synergistic roles of bone
morphogenetic protein 15 and growth differentiation factor 9 in ovarian function. Mol
Endocrinol 15, 854-866

References _________________________________________________________________________
169
Yang JH, Chen HF, Lien YR, Chen SU, Ho HN, Yang YS (2001): Elevated E2: oocyte
ratio in women undergoing IVF and tubal ET. Correlation with a decrease in the
implantation rate. J Reprod Med 46, 434-438
Yang X, Kubota C, Suzuki H, Taneja M, Bols PE, Presicce GA (1998): Control of oocyte
maturation in cows--biological factors. Theriogenology 49, 471-482
Yang YH, Dudoit S, Luu P, Lin DM, Peng V, Ngai J, Speed TP (2002): Normalization for
cDNA microarray data: a robust composite method addressing single and multiple slide
systematic variation. Nucleic Acids Res 30, e15
Yao J, Ren X, Ireland JJ, Coussens PM, Smith TP, Smith GW (2004): Generation of a
bovine oocyte cDNA library and microarray: resources for identification of genes
important for follicular development and early embryogenesis. Physiol Genomics 19, 84-
92
Yao R, Davidson DD, Lopez-Beltran A, MacLennan GT, Montironi R, Cheng L (2007a):
The S100 proteins for screening and prognostic grading of bladder cancer. Histol
Histopathol 22, 1025-1032
Yao R, Lopez-Beltran A, Maclennan GT, Montironi R, Eble JN, Cheng L (2007b):
Expression of S100 protein family members in the pathogenesis of bladder tumors.
Anticancer Res 27, 3051-3058
Yoon YM, Baek KH, Jeong SJ, Shin HJ, Ha GH, Jeon AH, Hwang SG, Chun JS, Lee CW
(2004): WD repeat-containing mitotic checkpoint proteins act as transcriptional repressors
during interphase. FEBS Lett 575, 23-29
Zeron Y, Ocheretny A, Kedar O, Borochov A, Sklan D, Arav A (2001): Seasonal changes
in bovine fertility: relation to developmental competence of oocytes, membrane properties
and fatty acid composition of follicles. Reproduction 121, 447-454
Zhao M, Dean J (2002): The zona pellucida in folliculogenesis, fertilization and early
development. Rev Endocr Metab Disord 3, 19-26
Zheng-Fischhofer Q, Ghanem A, Kim JS, Kibschull M, Schwarz G, Schwab JO, Nagy J,
Winterhager E, Tiemann K, Willecke K (2006): Connexin31 cannot functionally replace
connexin43 during cardiac morphogenesis in mice. J Cell Sci 119, 693-701

References _________________________________________________________________________
170
Zhou W, Xiang T, Walker S, Farrar V, Hwang E, Findeisen B, Sadeghieh S, Arenivas F,
Abruzzese RV, Polejaeva I (2008): Global gene expression analysis of bovine blastocysts
produced by multiple methods. Mol Reprod Dev 75, 744-758
Zhou Y, Fisher SJ, Janatpour M, Genbacev O, Dejana E, Wheelock M, Damsky CH
(1997): Human cytotrophoblasts adopt a vascular phenotype as they differentiate. A
strategy for successful endovascular invasion? J Clin Invest 99, 2139-2151
Zhu JQ, Liu JH, Liang XW, Xu BZ, Hou Y, Zhao XX, Sun QY (2008): Heat stress causes
aberrant DNA methylation of H19 and Igf-2r in mouse blastocysts. Mol Cells 25, 211-215

Appendix __________________________________________________________________________________________________________________
171
9 Appendices
Appendix 1: The intensity distribution and uniformities between the arrays after normalization. (A): Pearson correlation of the arrays within
and between the biological replicates. The red and blue colors represent higher and lower correlation, respectively. (B): Box-
plots indicating simple summary of the distribution of probe intensities across all arrays. Each box corresponds to one array.
The boxes have similar size and Y position (median). (C): Density estimates (smoothed histograms) of the data showing
similarities in shapes and ranges of the arrays
A B C

Appendix _________________________________________________________________________
172
Appendix 2: List of top differentially expressed genes between receptive (CDd7) and non-
receptive (NPd7) endometrium at day 7 of the estrous cycle. Negative and
positive fold changes (FC) describe genes increased in CDd7 and NPd7,
respectively.
UniGene
ID
Gen title Gene symbol FC p value
Bt.639
Cell division cycle 20 homolog
CDC20
22.7
0.003
Bt.1522 Similar to hexokinase domain containing 1 LOC614824 17.2 0.022
Bt.54026 Glutamate-cysteine ligase, catalytic subunit GCLC 11.0 0.000
Bt.60335 Plasma membrane proteolipid (plasmolipin) PLLP 10.3 0.004
Bt.91476 Collagen, type iv, alpha 4 COL4A4 9.8 0.000
Bt.48435 Transmembrane protein 163 TMEM163 9.5 0.002
Bt.40997 Hypothetical protein loc510320 LOC510320 9.3 0.001
Bt.64166 Microsomal triglyceride transfer protein MTTP 9.3 0.001
Bt.25546 Neuropilin (nrp) and tolloid (tll)-like 2 NETO2 9.1 0.003
Bt.91771 Cell division cycle 2, g1 to s and g2 to m CDC2 7.4 0.002
Bt.29868 Cytochrome c oxidase subunit vib testes-
specific
COX6B2 7.4 0.002
Bt.47953 Protein phosphatase 2 PPP2R5A 7.3 0.009
Bt.24664 N-acetylated alpha-linked acidic dipeptidase 2 NAALAD2 7.2 0.012
Bt.101388 Polo-like kinase 4 PLK4 7.2 0.000
Bt.92053 Similar to cordon-bleu homolog (mouse) LOC505588 6.8 0.020
Bt.13670 Alkaline phosphatase, liver/bone/kidney ALPL 6.7 0.043
Bt.25034 Rab9b, member ras oncogene family RAB9B 6.5 0.000
Bt.12794 Collagen, type iv, alpha 3 (goodpasture antigen) COL4A3 6.5 0.003
Bt.20428 Protein regulator of cytokinesis 1 PRC1 6.3 0.002
Bt.15730 Kinesin family member 2c KIF2C 6.2 0.019
Bt.52359 Chromosome 9 open reading frame 30 ortholog C8H9orf30 6.2 0.025
Bt.18700 Chromosome 11 open reading frame 16 C11orf16 6.1 0.019
Bt.51579 Chromosome 14 open reading frame 37
ortholog
C10H14orf37 6.1 0.015
Bt.21876 Wingless-type mmtv integration site family,
member 11
WNT11 5.9 0.045
Bt.13057 Calcium channel, voltage-dependent, CACNA1H 5. 0.013

Appendix _________________________________________________________________________
173
Appendix 2: Cont.
UniGene ID Gen title Gene symbol FC p value
Bt.23453
Spindle and kt associated 1
SKA1
5.8
0.007
Bt.65598 Thyroid hormone responsive THRSP 5.8 0.000
Bt.6129 Ndc80 homolog, kinetochore complex
component (s. Cerevisiae)
NDC80 5.7 0.014
Bt.53123 Ubiquitin-conjugating enzyme e2c UBE2C 5.6 0.032
Bt.28359 Hypothetical loc616971 LOC616971 5.5 0.000
Bt.5578 Cytoskeleton associated protein 2-like CKAP2L 5.5 0.017
Bt.64294 Aldo-keto reductase family 1, member c4 AKR1C4 5.5 0.047
Bt.21924 Similar to dermatan/chondroitin sulfate 2-
sulfotransferase
LOC535975 5.5 0.022
Bt.26822 Similar to scl/tal1 interrupting locus LOC510012 5.4 0.001
Bt.22305 Inositol 1,4,5-triphosphate receptor, type 1 ITPR1 5.3 0.017
Bt.20340 Similar to myotonic dystrophy kinase LOC513675 5.3 0.046
Bt.10882 Timp metallopeptidase inhibitor 3 (sorsby
fundus dystrophy, pseudoinflammatory)
TIMP3 5.3 0.016
Bt.7037 Sphingosine kinase 1 SPHK1 5.2 0.002
Bt.16037 Globoside alpha-1,3-n-
acetylgalactosaminyltransferase 1
GBGT1 5.2 0.013
Bt.58521 Claudin 5 (transmembrane protein deleted in
velocardiofacial syndrome)
CLDN5 5.2 0.001
Bt.54858 Synovial sarcoma, x breakpoint 2 interacting
protein
SSX2IP 5.2 0.028
Bt.91910 Sorbin and sh3 domain containing 2 SORBS2 5.2 0.007
Bt.66560 Similar to map/microtubule affinity-
regulating kinase 3
LOC534872 5.2 0.000
Bt.48572 Guanine nucleotide binding protein (g
protein), beta 5
GNB5 5.1 0.000
Bt.27994 Alanyl (membrane) aminopeptidase
(aminopeptidase n, aminopeptidase m,
microsomal aminopeptidase, cd13, p150)
ANPEP 5.1 0.000
Bt.21924 Similar to dermatan/chondroitin sulfate 2-
sulfotransferase
LOC535975 5.0 0.000
Bt.12757 Nerve growth factor (beta polypeptide) NGF 5.0 0.042

Appendix _________________________________________________________________________
174
Appendix 2: Cont.
UniGene ID Gen title Gene symbol FC p value
Bt.101478
Granzyme k (granzyme 3; tryptase ii)
GZMK
4.9
0.012
Bt.38424 Dystonin DST 4.9 0.001
Bt.28324 Nucleolar and spindle associated protein 1 NUSAP1 4.9 0.017
Bt.41 Cyclin b2 CCNB2 4.9 0.023
Bt.27135 Cysteine conjugate-beta lyase CCBL1 4.8 0.034
Bt.16830 Leucine zipper, down-regulated in cancer 1 LDOC1 4.8 0.045
Bt.24872 Kinesin family member 4a KIF4A 4.8 0.000
Bt.64525 Similar to elongation factor 1 alpha EEF1A1 4.8 0.004
Bt.44919 Solute carrier family 6, member 20 SLC6A20 4.8 0.037
Bt.17189 Protein kinase c, theta PRKCQ 4.7 0.005
Bt.22869 Fatty acid binding protein 5 FABP5 4.7 0.005
Bt.35560 Glycine n-methyltransferase GNMT 4.6 0.038
Bt.34944 Phospholipid transfer protein PLTP 4.6 0.007
Bt.59609 Junctional adhesion molecule 3 JAM3 4.6 0.000
Bt.42379 Baculoviral iap repeat-containing 5
(survivin)
BIRC5 4.5 0.028
Bt.43706 Actin binding lim protein 1 ABLIM1 4.5 0.001
Bt.42997 Grancalcin, ef-hand calcium binding protein GCA 4.5 0.003
Bt.12781 V-myb myeloblastosis viral oncogene
homolog
MYB 4.5 0.012
Bt.12761 Integrin, alpha 2 (cd49b, alpha 2 subunit of
vla-2
ITGA2 4.5 0.014
Bt.7142 Similar to aim1 LOC526200 4.5 0.000
Bt.37590 Transketolase-like 1 TKTL1 4.5 0.010
Bt.74758 Similar to chromosome 1 open reading frame LOC520588 4.5 0.009
Bt.53189 Tudor and kh domain containing TDRKH 4.4 0.001
Bt.53256 Phospholipase c-like 2 PLCL2 4.4 0.017
Bt.35935 Gap junction protein, beta 6, 30kda GJB6 4.4 0.039
Bt.27397 Centrosomal protein 72kda CEP72 4.4 0.006
Bt.54995 Synovial apoptosis inhibitor 1, synoviolin SYVN1 4.3 0.008
Bt.10814 Coagulation factor ii (thrombin) receptor F2R 4.3 0.002
Bt.38709 Rev3-like, catalytic subunit of dna
polymerase
REV3L 4.3 0.001

Appendix _________________________________________________________________________
175
Appendix 2: Cont.
UniGene ID Gen title Gene symbol FC p value
Bt.49510
Inositol hexaphosphate kinase 2
IHPK2
4.3
0.003
Bt.13798 Hypothetical loc615685 LOC615685 4.3 0.008
Bt.19592 Aquaporin 9 AQP9 4.3 0.011
--- Rho-associated, coiled-coil containing
protein kinase 1
ROCK1 4.3 0.000
Bt.21912 Eukaryotic translation initiation factor 2c, 2 EIF2C2 4.3 0.001
Bt.30182 Chromosome 13 open reading frame 3
ortholog
H12C13ORF3 4.2 0.007
Bt.5091 Diacylglycerol kinase, alpha 80kda DGKA 4.2 0.008
Bt.76624 Cytoplasmic polyadenylation element
binding protein 1
CPEB1 4.1 0.014
Bt.20920 Peroxisome proliferator-activated receptor
gamma, coactivator 1 alpha
PPARGC1A 4.1 0.013
Bt.76544 Tumor necrosis factor receptor superfamily,
member 6b, decoy
TNFRSF6B 4.1 0.043
Bt.39403 Kn motif and ankyrin repeat domains 2 KANK2 4.1 0.034
Bt.100379 Non-smc condensin i complex, subunit g NCAPG 4.1 0.021
Bt.46419 Six transmembrane epithelial antigen of the
prostate 2
STEAP2 4.0 0.028
Bt.22046 Alpha-methylacyl-coa racemase AMACR 4.0 0.034
Bt.7331 Aurora kinase b AURKB 4.0 0.026
Bt.53247 Sushi domain containing 2 SUSD2 3.9 0.017
Bt.56648 Similar to piggybac transposable element
derived 5
LOC616498 3.9 0.037
Bt.66635 Ring finger 144b RNF144B 3.9 0.004
Bt.64036 Guanylate binding protein 4 GBP4 3.9 0.018
Bt.22054 Chromosome 20 open reading frame 7
ortholog
C13H20ORF7 3.82 0.004
Bt.29462 Cell division cycle associated 2 CDCA2 3.8 0.010
Bt.100721 Multiple c2 domains, transmembrane 1 MCTP1 3.8 0.022
Bt.4747 Nucleoporin 88kda NUP88 3.8 0.021
Bt.7490 Methylenetetrahydrofolate dehydrogenase MTHFD1L 3.7 0.026
Bt.20369 Proline dehydrogenase (oxidase) 1 PRODH 3.7 0.044

Appendix _________________________________________________________________________
176
Appendix 2: Cont.
UniGene ID Gen title Gene symbol FC p value
Bt.28617 Stomatin STOM 3.7 0.009
Bt.101348 Ddhd domain containing 2 DDHD2 3.7 0.001
Bt.44935 Lipase, endothelial LIPG 3.7 0.005
Bt.4084 Wd repeat domain 51a WDR51A 3.7 0.003
Bt.91990 Rho-related btb domain containing 1 RHOBTB1 3.7 0.016
Bt.13573 Cdc28 protein kinase regulatory subunit 2 CKS2 3.6 0.003
Bt.25030 Transmembrane 9 superfamily member 2 TM9SF2 3.6 0.016
Bt.25834 Maternal embryonic leucine zipper kinase MELK 3.6 0.018
Bt.16596 Leucine rich repeat containing 3 LRRC3 3.6 0.027
Bt.28443 Microtubule associated monoxygenase,
calponin and lim domain containing 2
MICAL2 3.6 0.000
Bt.90915 Sulfotransferase family, cytosolic, 2b,
member 1
SULT2B1 3.6 0.003
Bt.25541 Coiled-coil domain containing 135 CCDC135 3.6 0.003
Bt.14255 Farnesyl-diphosphate farnesyltransferase 1 FDFT1 3.6 0.039
Bt.9659 Ectonucleotide
pyrophosphatase/phosphodiesterase 3
ENPP3 3.6 0.027
Bt.8135 Lecithin retinol acyltransferase LRAT 3.6 0.017
Bt.25633 Regulator of g-protein signaling 22 RGS22 3.6 0.050
Bt.14403 Adaptor-related protein complex 3, sigma 2 AP3S2 3.6 0.000
Bt.8127 Heparanase HPSE 3.5 0.023
Bt.65104 Heat shock 70kda protein 5 (glucose-
regulated protein, 78kda)
HSPA5 3.5 0.001
Bt.58805 Pituitary tumor-transforming 1 PTTG1 3.5 0.039
Bt.28541 Shugoshin-like 1 (s. Pombe) SGOL1 3.5 0.023
Bt.5487 Aldehyde dehydrogenase 3 family, member
a2
ALDH3A2 3.5 0.007
Bt.39906 Hypoxia up-regulated 1 HYOU1 3.5 0.010
Bt.24640 Ilvb (bacterial acetolactate synthase)-like ILVBL 3.5 0.015
Bt.87527 Potassium channel tetramerisation domain
containing 17
KCTD17 3.5 0.037
Bt.65646 Chromosome 20 open reading frame 195
ortholog
C13H20orf19
5
3.4 0.025
Bt.16891 Serum/glucocorticoid regulated kinase 1 SGK1 3.4 0.002
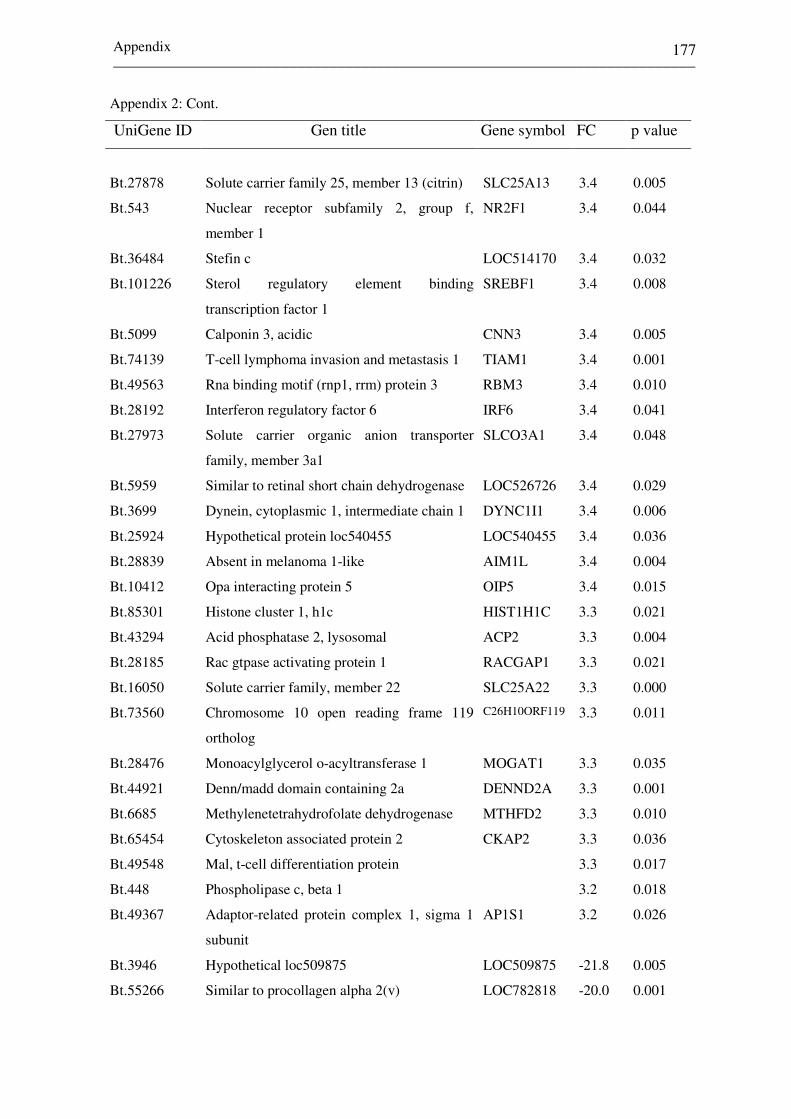
Appendix _________________________________________________________________________
177
Appendix 2: Cont.
UniGene ID Gen title Gene symbol FC p value
Bt.27878
Solute carrier family 25, member 13 (citrin)
SLC25A13
3.4
0.005
Bt.543 Nuclear receptor subfamily 2, group f,
member 1
NR2F1 3.4 0.044
Bt.36484 Stefin c LOC514170 3.4 0.032
Bt.101226 Sterol regulatory element binding
transcription factor 1
SREBF1 3.4 0.008
Bt.5099 Calponin 3, acidic CNN3 3.4 0.005
Bt.74139 T-cell lymphoma invasion and metastasis 1 TIAM1 3.4 0.001
Bt.49563 Rna binding motif (rnp1, rrm) protein 3 RBM3 3.4 0.010
Bt.28192 Interferon regulatory factor 6 IRF6 3.4 0.041
Bt.27973 Solute carrier organic anion transporter
family, member 3a1
SLCO3A1 3.4 0.048
Bt.5959 Similar to retinal short chain dehydrogenase LOC526726 3.4 0.029
Bt.3699 Dynein, cytoplasmic 1, intermediate chain 1 DYNC1I1 3.4 0.006
Bt.25924 Hypothetical protein loc540455 LOC540455 3.4 0.036
Bt.28839 Absent in melanoma 1-like AIM1L 3.4 0.004
Bt.10412 Opa interacting protein 5 OIP5 3.4 0.015
Bt.85301 Histone cluster 1, h1c HIST1H1C 3.3 0.021
Bt.43294 Acid phosphatase 2, lysosomal ACP2 3.3 0.004
Bt.28185 Rac gtpase activating protein 1 RACGAP1 3.3 0.021
Bt.16050 Solute carrier family, member 22 SLC25A22 3.3 0.000
Bt.73560 Chromosome 10 open reading frame 119
ortholog
C26H10ORF119 3.3 0.011
Bt.28476 Monoacylglycerol o-acyltransferase 1 MOGAT1 3.3 0.035
Bt.44921 Denn/madd domain containing 2a DENND2A 3.3 0.001
Bt.6685 Methylenetetrahydrofolate dehydrogenase MTHFD2 3.3 0.010
Bt.65454 Cytoskeleton associated protein 2 CKAP2 3.3 0.036
Bt.49548 Mal, t-cell differentiation protein 3.3 0.017
Bt.448 Phospholipase c, beta 1 3.2 0.018
Bt.49367 Adaptor-related protein complex 1, sigma 1
subunit
AP1S1 3.2 0.026
Bt.3946 Hypothetical loc509875 LOC509875 -21.8 0.005
Bt.55266 Similar to procollagen alpha 2(v) LOC782818 -20.0 0.001

Appendix _________________________________________________________________________
178
Appendix 2: Cont.
UniGene ID Gen title Gene symbol FC p value
Bt.48850
Secreted protein, acidic, cysteine-rich
SPARC
-15.6
0.001
Bt.23508 Collagen, type vi, alpha 1 COL6A1 -11.4 0.000
Bt.5341 Osteoglycin OGN -11.4 0.002
Bt.22571 Speckle-type poz protein SPOP -11.37 0.002
Bt.101852 Immunoglobulin j chain IGJ -11.21 0.026
Bt.61894 Lipoma hmgic fusion partner LHFP -10.8 0.001
Bt.21896 Collagen, type xxi, alpha 1 COL21A1 -10.6 0.000
Bt.15972 Gap junction protein, alpha 1, 43kda GJA1 -9.9 0.000
Bt.101209 Collagen, type iii, alpha 1 COL3A1 -9.8 0.003
Bt.64757 Neurotrophic tyrosine kinase, receptor, type
2
NTRK2 -9.6 0.000
Bt.39894 Myosin light chain kinase MYLK -9.4 0.001
Bt.53485 Collagen, type i, alpha 2 COL1A2 -9.2 0.001
Bt.27144 Homeobox a9 HOXA9 -8.8 0.001
Bt.39050 Cannabinoid receptor interacting protein 1 CNRIP1 -8.6 0.001
Bt.2452 Lumican LUM -8.3 0.001
Bt.101209 Collagen, type iii, alpha 1 COL3A1 -7.7 0.001
Bt.4565 Snail homolog 2 (drosophila) SNAI2 -7.3 0.002
Bt.4011 Transmembrane protein 120a TMEM120A -7.0 0.000
Bt.2750 Transcription factor ap-2 alpha TFAP2A -6.9 0.046
Bt.30575 Scavenger receptor class a, member 5 SCARA5 -6.8 0.000
Bt.42075 Udp glucuronosyltransferase 2 family UGT2A3 -6.4 0.026
Bt.357 S100 calcium binding protein a12 (calgranulin
c)
S100A12 -6.3 0.018
Bt.95150 Purinergic receptor p2y, g-protein coupled, 5 P2RY5 -6.3 0.000
Bt.68159 Collagen, type vi, alpha 3 COL6A3 -6.2 0.002
Bt.9360 S100 calcium binding protein a8 S100A8 -6.1 0.049
Bt.18710 Dickkopf homolog 3 (xenopus laevis) DKK3 -6.0 0.005
Bt.64757 Neurotrophic tyrosine kinase, receptor, type
2
NTRK2 -5.9 0.014
Bt.64625 Apolipoprotein d APOD -5.7 0.007
Bt.81912 Similar to ob-cadherin-1 CDH11 -5.5 0.001
Bt.23178 Decorin DCN -5.4 0.002

Appendix _________________________________________________________________________
179
Appendix 2: Cont.
UniGene ID Gen title Gene symbol FC p value
Bt.31739
Abi gene family, member 3 (nesh) binding
protein
ABI3BP
-5.4
0.005
Bt.2214 Insulin-like growth factor binding protein 7 IGFBP7 -5.1 0.017
Bt.11586 Pyd and card domain containing PYCARD -4.7 0.007
Bt.91101 Metallothionein 1e MT1E -4.7 0.004
Bt.8880 Sparc-like 1 (mast9, hevin) SPARCL1 -4.7 0.001
Bt.92589 Roundabout, axon guidance receptor,
homolog 1
ROBO1 -4.6 0.011
Bt.59000 Similar to calcium-activated chloride
channel-2
LOC534256 -4.6 0.016
Bt.2524 Stromal cell-derived factor 1 SDF1 -4.5 0.009
Bt.89332 Fibroblast growth factor-binding protein (fgf-
bp)
LOC281812 -4.5 0.000
Bt.51822 Collagen, type xvi, alpha 1 COL16A1 -4.3 0.020
Bt.5116 Hypothetical loc506831 LOC506831 -4.3 0.000
Bt.20385 Phospholipase a1 member a PLA1A -4.3 0.000
Bt.28406 Fc fragment of igg, low affinity iib, receptor FCGR2B -4.3 0.023
Bt.45949 Protein tyrosine phosphatase-like a domain
containing 2
PTPLAD2 -4.3 0.047
Bt.13484 Protein phosphatase 1, regulatory PPP1R3C -4.2 0.000
Bt.64897 Insulin-like growth factor binding protein 3 IGFBP3 -4.1 0.014
Bt.19195 Coagulation factor xiii, a1 polypeptide F13A1 -4.1 0.014
Bt.46205 Coiled-coil domain containing 68 CCDC68 -4.1 0.003
Bt.45446 Similar to nonclathrin coat protein zeta-cop LOC616222 -3.9 0.001
Bt.48113 Doublecortin-like kinase 1 DCLK1 -3.9 0.001
Bt.4539 Angiotensin ii receptor, type 1 AGTR1 -3.9 0.000
Bt.6728 Necdin homolog (mouse) NDN -3.9 0.002
Bt.26788 Hypothetical loc535329 LOC535329 -3.9 0.001
Bt.4492 Collectin sub-family member 12 COLEC12 -3.8 0.001
Bt.27022 Homeobox a11 HOXA11 -3.8 0.003
Bt.8106 Nidogen 1 NID1 -3.7 0.052
Bt.43948 Cd36 molecule (thrombospondin receptor) CD36 -3.6 0.010
Bt.9549 Hop homeobox HOPX -3.6 0.027

Appendix _________________________________________________________________________
180
Appendix 2: Cont.
UniGene ID Gen title Gene symbol FC p value
Bt.991
Collagen, type xxvii, alpha 1
COL27A1
-3.5
0.001
Bt.2717 Fibroblast activation protein, alpha FAP -3.5 0.021
Bt.17819 Sodium channel, nonvoltage-gated 1, gamma SCNN1G -3.5 0.035
Bt.28237 Similar to family with sequence similarity
114,
LOC511583 -3.4 0.001
Bt.55899 Solute carrier family 15 (h+/peptide
transporter
SLC15A2 -3.4 0.006
Bt.9675 Similar to extracellular proteinase inhibitor LOC787253 -3.4 0.049
Bt.47030 Similar to polydom LOC781282 -3.4 0.010
Bt.45145 Asporin ASPN -3.4 0.000
Bt.21035 S100 calcium binding protein a16 S100A16 -3.4 0.000
Bt.643 Similar to mpif-1 LOC508666 -3.3 0.013
Bt.29568 Ell associated factor 2 EAF2 -3.3 0.015
Bt.5226 Secreted frizzled-related protein 1 SFRP1 -3.3 0.008
Bt.48519 Rna binding protein with multiple splicing RBPMS -3.3 0.002
Bt.62191 Rab interacting lysosomal protein-like 2 RILPL2 -3.3 0.004
Bt.23618 Spondin 1, extracellular matrix protein SPON1 -3.2 0.007
Bt.50 Cd8a molecule CD8A -3.2 0.003
Bt.91540 Keratin 17 KRT17 -3.2 0.010
Bt.4886 Leucine rich repeat containing 17 LRRC17 -3.2 0.022
Bt.49620 Tnfrsf16 associated protein 1 NGFRAP1 -3.2 0.014
Bt.36848 8kda amlexanox-binding protein S100A13 -3.2 0.003
Bt.48875 Udp-gal:betaglcnac beta 1,3-
galactosyltransferase
B3GALT2 -3.1 0.020
Bt.25507 Meis homeobox 2 MEIS2 -3.1 0.012
Bt.24447 Coagulation factor II recptor-like 2 F2RL2 -3.1 0.008
Bt.33171 Methionine sulfoxide reductase b3 MSRB3 -3.1 0.018
Bt.8222 Transmembrane protein 139 TMEM139 -3.1 0.002
Bt.29642 Nitric oxide synthase 1 (neuronal) adaptor
protein
NOS1AP -3.1 0.006
Bt.9958 Insulin-like growth factor binding protein 6 IGFBP6 -3.1 0.007
Bt.207 Transthyretin type I TTR -3.1 0.042
Bt.65440 Hypothetical protein loc781372 LOC781372 -3.0 0.018

Appendix _________________________________________________________________________
181
Appendix 2: Cont.
UniGene ID Gen title Gene symbol FC p value
Bt.11286 Coiled-coil-helix-coiled-coil-helix domain
containing 6
CHCHD6 -3.0 0.034
Bt.9573 Fxyd domain containing ion transport
regulator 3
FXYD3 -3.0 0.001
Bt.78 Crystallin, beta b1 CRYBB1 -3.0 0.024
Bt.11446 Lim domain binding 2 LDB2 -3.0 0.032
Bt.62727 Transmembrane protein 204 TMEM204 -2.9 0.002
Bt.54851 Inhibitor of kappa light polypeptide gene
enhancer in b-cells, kinase epsilon
IKBKE -2.9 0.002
Bt.64122 Supervillin SVIL -2.9 0.013
Bt.45845 G protein-coupled receptor 77 GPR77 -2.9 0.002
Bt.14395 Hypothetical protein loc780785 C3orf57 -2.9 0.011
--- Frizzled homolog 2 (drosophila) FZD2 -2.9 0.008
Bt.611 Chemokine (c-x-c motif) ligand 2 CXCL2 -2.9 0.020
Bt.22323 Ras association (ralgds/af-6) domain family RASSF5 -2.9 0.017
Bt.1907 Similar to chromosome 11 open reading
frame 52
LOC614490 -2.9 0.004
Bt.3213 Chordin-like 1 CHRDL1 -2.9 0.003
Bt.2047 Adrenomedullin ADM -2.9 0.026
Bt.66957 Fibroblast growth factor 2 (basic) FGF2 -2.9 0.002
Bt.411 Neuregulin 1 NRG1 -2.8 0.031
Bt.8144 Chemokine (c motif) ligand 1 XCL1 -2.8 0.020
Bt.56229 T-cell receptor beta chain c region LOC509513 -2.8 0.014
Bt.10343 Palmdelphin PALMD -2.8 0.030
Bt.28814 Similar to sulfatase 1 LOC535166 -2.8 0.047
Bt.12414 CD8b molecule CD8B -2.8 0.000
Bt.47753 Six homeobox 1 SIX1 -2.8 0.008
Bt.22534 Peripheral myelin protein 22 PMP22 -2.8 0.031
Bt.1579 Polymerase i and transcript release factor PTRF -2.7 0.000
Bt.41201 Poly polymerase family, member 16 PARP16 -2.7 0.002
Bt.20613 Breast cancer anti-estrogen resistance 3 BCAR3 -2.7 0.006
Bt.3216 Armadillo repeat containing, x-linked 1 ARMCX1 -2.7 0.001
Bt.16029 Fucosyltransferase 1 FUT1 -2.7 0.002
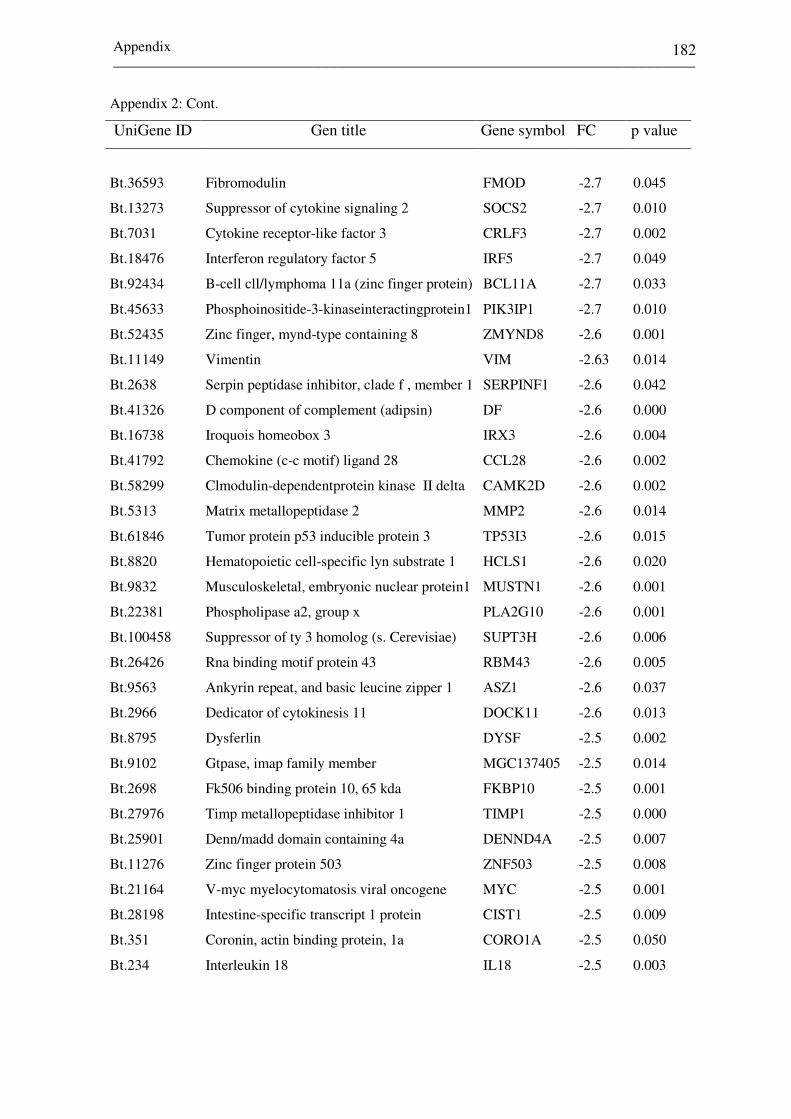
Appendix _________________________________________________________________________
182
Appendix 2: Cont.
UniGene ID Gen title Gene symbol FC p value
Bt.36593 Fibromodulin FMOD -2.7 0.045
Bt.13273 Suppressor of cytokine signaling 2 SOCS2 -2.7 0.010
Bt.7031 Cytokine receptor-like factor 3 CRLF3 -2.7 0.002
Bt.18476 Interferon regulatory factor 5 IRF5 -2.7 0.049
Bt.92434 B-cell cll/lymphoma 11a (zinc finger protein) BCL11A -2.7 0.033
Bt.45633 Phosphoinositide-3-kinaseinteractingprotein1 PIK3IP1 -2.7 0.010
Bt.52435 Zinc finger, mynd-type containing 8 ZMYND8 -2.6 0.001
Bt.11149 Vimentin VIM -2.63 0.014
Bt.2638 Serpin peptidase inhibitor, clade f , member 1 SERPINF1 -2.6 0.042
Bt.41326 D component of complement (adipsin) DF -2.6 0.000
Bt.16738 Iroquois homeobox 3 IRX3 -2.6 0.004
Bt.41792 Chemokine (c-c motif) ligand 28 CCL28 -2.6 0.002
Bt.58299 Clmodulin-dependentprotein kinase II delta CAMK2D -2.6 0.002
Bt.5313 Matrix metallopeptidase 2 MMP2 -2.6 0.014
Bt.61846 Tumor protein p53 inducible protein 3 TP53I3 -2.6 0.015
Bt.8820 Hematopoietic cell-specific lyn substrate 1 HCLS1 -2.6 0.020
Bt.9832 Musculoskeletal, embryonic nuclear protein1 MUSTN1 -2.6 0.001
Bt.22381 Phospholipase a2, group x PLA2G10 -2.6 0.001
Bt.100458 Suppressor of ty 3 homolog (s. Cerevisiae) SUPT3H -2.6 0.006
Bt.26426 Rna binding motif protein 43 RBM43 -2.6 0.005
Bt.9563 Ankyrin repeat, and basic leucine zipper 1 ASZ1 -2.6 0.037
Bt.2966 Dedicator of cytokinesis 11 DOCK11 -2.6 0.013
Bt.8795 Dysferlin DYSF -2.5 0.002
Bt.9102 Gtpase, imap family member MGC137405 -2.5 0.014
Bt.2698 Fk506 binding protein 10, 65 kda FKBP10 -2.5 0.001
Bt.27976 Timp metallopeptidase inhibitor 1 TIMP1 -2.5 0.000
Bt.25901 Denn/madd domain containing 4a DENND4A -2.5 0.007
Bt.11276 Zinc finger protein 503 ZNF503 -2.5 0.008
Bt.21164 V-myc myelocytomatosis viral oncogene MYC -2.5 0.001
Bt.28198 Intestine-specific transcript 1 protein CIST1 -2.5 0.009
Bt.351 Coronin, actin binding protein, 1a CORO1A -2.5 0.050
Bt.234 Interleukin 18 IL18 -2.5 0.003

Appendix _________________________________________________________________________
183
Appendix 3: List of molecular networks containing genes elevated (upward red arrow) or reduced (downward green arrow) in CDd7 compared to NPd7
1 2 3 4 5 6 7 8 9 10 11 12 13 14 15
Cell cycle Reproductive disease
Genetic disorder Lymphoid tissue structure and development
Cell cycle, DNA replication
Cellular assembly lipid metabolism
Cell death, cell-to-cell Signaling
Endocrine System development
Connective tissue Genetic disorder
Lipid Metabolism Molecular tansport
Immune cll trafficking lipid metabolism
Antigen presentation
Posttranscriptional modification
Cell signaling
Lipid metabolism Molecular transport
Cellular growth and proliferation
Differentially expressed genes Net work name
Cell death, tissue development

Appendix _________________________________________________________________________
184
16 17 18 19 20 21 22 23 24 25 26 27 28 29 30 31 32 33 34
Antigen Presentation
Protein degradation cell-to-cell signaling
Developmental disorder tissue morphology
Cell Death, RNA Post-transcriptional
Carbohydrate metabolism molecular transport
DNA replication
Metabolism Molecular transport
Cell signaling Molecular transport
Cellular development
DNA Replication, recombination
DNA replication, recombination
Cell signaling
Cellular development
Amino acid metabolism molecular transport
Cllular function and maintenance
Molecular transport
Genetic disorder, DNA replication
Amino acid metabolism, cell morphology
Cellular assembly and organization
Appendix 3: Cont

Appendix _________________________________________________________________________
185
Appendix 4: List of top differentially expressed genes between day 7 and day 14 of the
estrous cycle (CDd7 vs. CDd14) in receptive endometrium. Negative and
positive fold changes (FC) describe genes increased in CDd7 and CDd14,
respectively
UniGene ID Gene title Gene symbol FC p value
Bt.22642
Diacylglycerol kinase, iota
DGKI
396.8
0.000
Bt.74713 Hypothetical protein mgc127538 MGC127538 271.6 0.001
Bt.26462 Endothelin 3 EDN3 208.2 0.001
Bt.20340 Similar to myotonic dystrophy kinase LOC513675 158.7 0.000
--- Seminal vesicle secretion 8 SVS8 102.0 0.000
--- Similar to family with sequence similarity 43,
member a
LOC539374 100.4 0.000
Bt.51579 Chromosome 14 open reading frame 37
ortholog
C10H14orf37 83.5 0.000
Bt.60923 Spc24, ndc80 kinetochore complex
component, homolog
SPC24 82.9 0.000
Bt.20369 Proline dehydrogenase (oxidase) 1 PRODH 78.9 0.000
Bt.45257 Pdz domain containing 1 PDZK1 74.7 0.008
Bt.60335 Plasma membrane proteolipid (plasmolipin) PLLP 72.0 0.000
Bt.15980 Cyclin b1 CCNB1 66.6 0.000
Bt.5387 Lipoprotein lipase LPL 65.3 0.000
Bt.46878 Glycerophosphodiester phosphodiesterase
domain containing 1
GDPD1 53.5 0.001
Bt.9602 Death associated protein-like 1 DAPL1 53.3 0.000
Bt.53247 Sushi domain containing 2 SUSD2 52.7 0.000
Bt.1539 Gm2 ganglioside activator GM2A 38.9 0.000
Bt.24904 Adam metallopeptidase with thrombospondin
type 1 motif, 6
ADAMTS6 38.6 0.002
Bt.44919 Solute carrier family 6 (proline imino
transporter), member 20
SLC6A20 32.8 0.000
Bt.49607 3-hydroxybutyrate dehydrogenase, type 1 BDH1 31.5 0.002
Bt.60335 Plasma membrane proteolipid (plasmolipin) PLLP 29.3 0.001

Appendix _________________________________________________________________________
186
Appendix 4: Cont.
UniGene ID Gene title Gene symbol FC p value
Bt.1207
Solute carrier family 16, member 13
SLC16A13
28.4
0.002
Bt.16830 Leucine zipper, down-regulated in cancer 1 LDOC1 27.4 0.001
Bt.17189 Protein kinase c, theta PRKCQ 26.9 0.000
Bt.3949 6-phosphofructo-2-kinase PFKFB2 26.3 0.000
Bt.13588 Phosphoserine aminotransferase 1 PSAT1 26.1 0.001
Bt.35560 Glycine n-methyltransferase GNMT 25.3 0.001
Bt.35560 Glycine n-methyltransferase GNMT 25.1 0.001
Bt.5091 Diacylglycerol kinase, alpha 80kda DGKA 25.1 0.000
Bt.26921 Solute carrier family 27 (fatty acid
transporter), member 6
SLC27A6 23.9 0.004
Bt.22697 Solute carrier family 39 (zinc transporter SLC39A8 23.4 0.000
Bt.7037 Sphingosine kinase 1 SPHK1 23.3 0.000
Bt.13057 Calcium channel, voltage-dependent, t type,
alpha 1h subunit
CACNA1H 23.2 0.000
Bt.8135 Lecithin retinol acyltransferase
(phosphatidylcholine--retinol o-
acyltransferase)
LRAT 22.4 0.000
Bt.58521 Claudin 5 (transmembrane protein deleted in
velocardiofacial syndrome)
CLDN5 22.2 0.000
Bt.24664 N-acetylated alpha-linked acidic dipeptidase
2
NAALAD2 21.4 0.001
Bt.16037 Globoside alpha-1,3-n-
acetylgalactosaminyltransferase 1
GBGT1 21.3 0.000
Bt.27135 Cysteine conjugate-beta lyase loc781909 CCBL1 21.2 0.001
Bt.39860 Was interacting protein family, member 3 WIPF3 21.1 0.000
Bt.52359 Chromosome 9 open reading frame 30
ortholog
C8H9orf30 20.5 0.002
Bt.4844 Pleiotrophin (heparin binding growth factor 8 PTN 19.6 0.007
Bt.49548 Mal, t-cell differentiation protein /// similar to
mal, t-cell differentiation protein
MAL 17.5 0.000
Bt.53026 Phosphoglycerate dehydrogenase PHGDH 16.8 0.001
Bt.51909 Adiponectin receptor 2 ADIPOR2 16.7 0.002
Bt.22305 Inositol 1,4,5-triphosphate receptor, type 1 ITPR1 16.4 0.001

Appendix _________________________________________________________________________
187
Appendix 4: Cont.
UniGene ID Gene title Gene symbol FC p value
Bt.639
Cell division cycle 20 homolog
CDC20
16.3
0.005
Bt.25235 Mitochondrial ribosomal protein s36 MRPS36 15.3 0.000
Bt.53600 Cytochrome b5 type b CYB5B 15.2 0.000
Bt.10882 Timp metallopeptidase inhibitor 3 (sorsby
fundus dystrophy, pseudoinflammatory)
TIMP3 15.2 0.001
Bt.46878 Glycerophosphodiester phosphodiesterase
domain containing 1
GDPD1 15.2 0.002
Bt.46419 Six transmembrane epithelial antigen of the
prostate
STEAP2 15.0 0.001
Bt.39403 Kn motif and ankyrin repeat domains 2 KANK2 14.8 0.001
Bt.40997 Hypothetical protein loc510320 LOC510320 14.7 0.000
Bt.51709 Septin 4 Sep 04 14.6 0.000
Bt.22399 Arginase, type ii ARG2 14.6 0.002
Bt.21876 Wingless-type mmtv integration site family,
member 11
WNT11 14.5 0.007
Bt.22336 Teratocarcinoma-derived growth factor 1 TDGF1 14.2 0.005
Bt.75644 Membrane bound o-acyltransferase domain
containing 2
MBOAT2 14.0 0.016
Bt.52324 Nuclear protein 1 NUPR1 13.7 0.001
Bt.43717 Hydroxyprostaglandin dehydrogenase 15-
(nad)
HPGD 13.5 0.006
Bt.5487 Aldehyde dehydrogenase 3 family, member
a2
ALDH3A2 13.3 0.000
Bt.64525 Similar to elongation factor 1 alpha EEF1A1 12.7 0.000
Bt.53600 Cytochrome b5 type b CYB5B 12.3 0.000
Bt.91476 Collagen, type iv, alpha 4 COL4A4 11.6 0.000
Bt.54026 Glutamate-cysteine ligase, catalytic subunit GCLC 11.6 0.000
Bt.45508 Mucolipin 3 MCOLN3 11.4 0.047
Bt.25034 Rab9b, member ras oncogene family RAB9B 11.4 0.000
Bt.76544 Tumor necrosis factor receptor superfamily TNFRSF6B 11.2 0.003
Bt.92053 Similar to cordon-bleu homolog (mouse) LOC505588 11.0 0.006
Bt.48435 Transmembrane protein 163 TMEM163 10.6 0.002
Bt.38424 Dystonin DST 10.6 0.000

Appendix _________________________________________________________________________
188
Appendix 4: Cont.
UniGene ID Gene title Gene symbol FC p value
Bt.25525
Ectonucleotide phosphodiesterase 2
ENPP2
10.5
0.000
Bt.22046 Alpha-methylacyl-coa racemase AMACR 10.4 0.002
Bt.5193 Acid phosphatase 5, tartrate resistant ACP5 10.4 0.000
Bt.101236 Two pore segment channel 1 TPCN1 10.3 0.000
Bt.13798 Hypothetical loc615685 LOC615685 10.2 0.000
Bt.24640 Ilvb (bacterial acetolactate synthase)-like ILVBL 10.1 0.000
Bt.25546 Neuropilin (nrp) and tolloid (tll)-like 2 NETO2 10.1 0.003
Bt.9659 Ectonucleotide
pyrophosphatase/phosphodiesterase3
ENPP3 9.9 0.001
Bt.16596 Leucine rich repeat containing 3 LRRC3 9.9 0.001
Bt.64882 Dihydropyrimidinase-like 2 DPYSL2 9.8 0.000
Bt.7490 Methylenetetrahydrofolate dehydrogenase
(nadp+ dependent) 1-like
MTHFD1L 9.7 0.001
Bt.90915 Sulfotransferase family, cytosolic, 2b,
member 1
SULT2B1 9.5 0.000
Bt.87527 Potassium channel tetramerisation domain
containing 17
KCTD17 9.5 0.002
Bt.49702 Visinin-like 1 VSNL1 9.5 0.000
Bt.64166 Microsomal triglyceride transfer protein MTTP 9.3 0.001
Bt.92053 Similar to cordon-bleu homolog (mouse) LOC505588 9.2 0.010
Bt.66560 Similar to map/microtubule affinity-
regulating kinase 3
LOC534872 9.2 0.000
Bt.65258 Matrilin 2 MATN2 9.1 0.036
Bt.91589 Ero1-like ERO1L 9.1 0.002
Bt.18700 Chromosome 11 open reading frame 16 C11orf16 9.1 0.007
Bt.25235 Mitochondrial ribosomal protein s36 MRPS36 9.1 0.001
Bt.49610 S100 calcium binding protein b S100B 8.9 0.001
Bt.21924 Similar to dermatan/chondroitin sulfate 2-
sulfotransferase
LOC535975 8.8 0.007
Bt.7142 Similar to aim1 LOC526200 8.8 0.000
Bt.22054 Chromosome 20 open reading frame 7 C13H20ORF7 8.7 0.000
Bt.13798 Hypothetical loc615685 LOC615685 8.7 0.004

Appendix _________________________________________________________________________
189
Appendix 4: Cont.
UniGene ID Gene title Gene symbol FC p value
Bt.7043
Vascular cell adhesion molecule 1
VCAM1
8.6
0.007
Bt.101039 Similar to kiaa0672 gene product LOC509257 8.7 0.005
Bt.4998 Procollagen-lysine oxoglutarate dioxygenase PLOD1 8.5 0.000
Bt.28476 Monoacylglycerol o-acyltransferase 1 MOGAT1 8.5 0.002
Bt.2887 Nudix (nucleoside diphosphate linked moiety
x)-type motif 5
NUDT5 8.3 0.000
Bt.42906 Phosphoribosyl pyrophosphate synthetase-
associated protein 1
PRPSAP1 8.3 0.000
Bt.36484 Stefin c LOC514170 8.3 0.002
Bt.62758 Glucuronidase, beta GUSB 8.3 0.001
Bt.1207 Solute carrier family 16, member 13 SLC16A13 8.1 0.004
Bt.7142 Similar to aim1 LOC526200 8.0 0.000
Bt.51597 Thiosulfate sulfurtransferase (rhodanese) TST 8.0 0.000
Bt.46406 Oxoglutarate (alpha-ketoglutarate)
dehydrogenase
OGDH 8.0 0.000
Bt.91285 Gata binding protein 2 GATA2 7.9 0.000
Bt.41964 Methionyl aminopeptidase 1 METAP1 7.9 0.000
Bt.65743 Histamine n-methyltransferase HNMT 7.8 0.000
Bt.12794 Collagen, type iv, alpha 3 (goodpasture
antigen)
COL4A3 7.8 0.002
Bt.101388 Polo-like kinase 4 PLK4 7.8 0.000
Bt.3699 Dynein, cytoplasmic 1, intermediate chain 1 DYNC1I1 7.8 0.000
Bt.23641 Carbonic anhydrase xiii CA13 7.8 0.003
Bt.17182 Gap junction protein, beta 5, 31.1kda GJB5 7.7 0.000
Bt.88935 Creatine kinase, brain CKB 7.7 0.003
Bt.91302 Similar to enpp5 LOC512304 7.7 0.000
Bt.21101 Aminocarboxymuconate semialdehyde
decarboxylase
ACMSD 7.7 0.017
Bt.9850 Transmembrane protein 171 TMEM171 7.6 0.000
Bt.8091 Cell division cycle associated 4 CDCA4 7.6 0.000
Bt.13798 Hypothetical loc615685 LOC615685 7.6 0.002
Bt.9094 Unc-13 homolog d (c. Elegans) UNC13D 7.5 0.002
Bt.29868 Cytochrome c oxidase subunit vib COX6B2 7.4 0.002
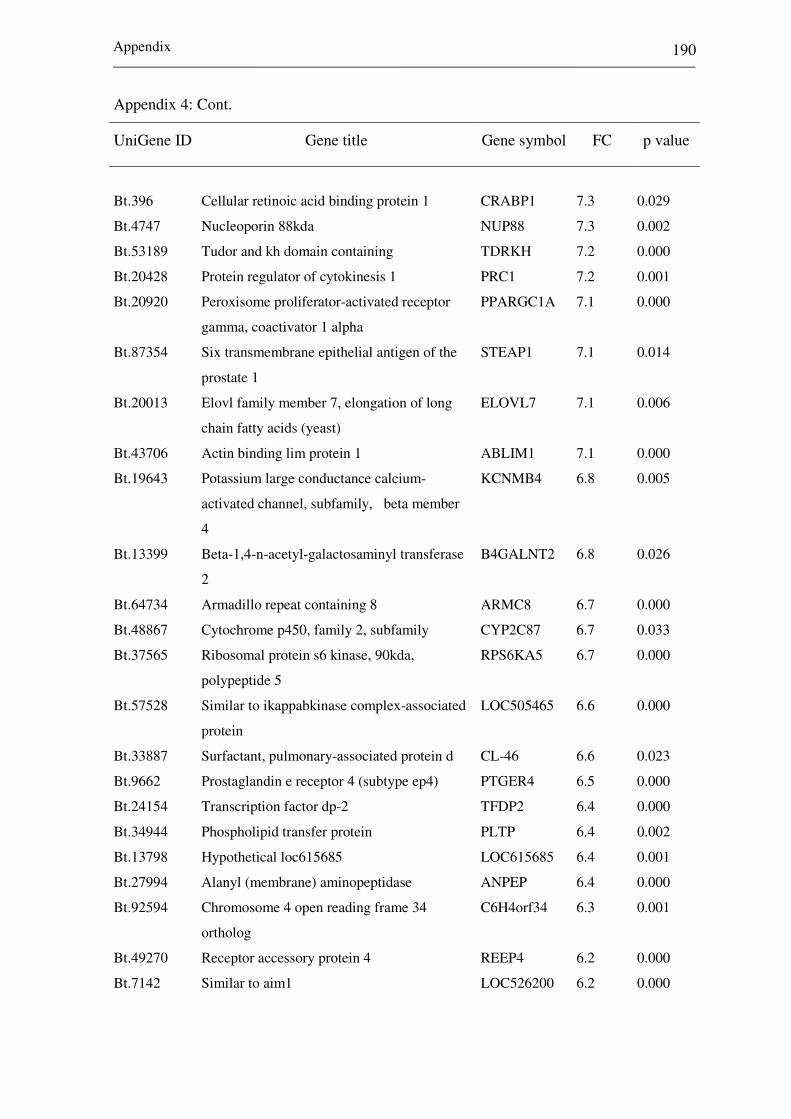
Appendix _________________________________________________________________________
190
Appendix 4: Cont.
UniGene ID Gene title Gene symbol FC p value
Bt.396
Cellular retinoic acid binding protein 1
CRABP1
7.3
0.029
Bt.4747 Nucleoporin 88kda NUP88 7.3 0.002
Bt.53189 Tudor and kh domain containing TDRKH 7.2 0.000
Bt.20428 Protein regulator of cytokinesis 1 PRC1 7.2 0.001
Bt.20920 Peroxisome proliferator-activated receptor
gamma, coactivator 1 alpha
PPARGC1A 7.1 0.000
Bt.87354 Six transmembrane epithelial antigen of the
prostate 1
STEAP1 7.1 0.014
Bt.20013 Elovl family member 7, elongation of long
chain fatty acids (yeast)
ELOVL7 7.1 0.006
Bt.43706 Actin binding lim protein 1 ABLIM1 7.1 0.000
Bt.19643 Potassium large conductance calcium-
activated channel, subfamily, beta member
4
KCNMB4 6.8 0.005
Bt.13399 Beta-1,4-n-acetyl-galactosaminyl transferase
2
B4GALNT2 6.8 0.026
Bt.64734 Armadillo repeat containing 8 ARMC8 6.7 0.000
Bt.48867 Cytochrome p450, family 2, subfamily CYP2C87 6.7 0.033
Bt.37565 Ribosomal protein s6 kinase, 90kda,
polypeptide 5
RPS6KA5 6.7 0.000
Bt.57528 Similar to ikappabkinase complex-associated
protein
LOC505465 6.6 0.000
Bt.33887 Surfactant, pulmonary-associated protein d CL-46 6.6 0.023
Bt.9662 Prostaglandin e receptor 4 (subtype ep4) PTGER4 6.5 0.000
Bt.24154 Transcription factor dp-2 TFDP2 6.4 0.000
Bt.34944 Phospholipid transfer protein PLTP 6.4 0.002
Bt.13798 Hypothetical loc615685 LOC615685 6.4 0.001
Bt.27994 Alanyl (membrane) aminopeptidase ANPEP 6.4 0.000
Bt.92594 Chromosome 4 open reading frame 34
ortholog
C6H4orf34 6.3 0.001
Bt.49270 Receptor accessory protein 4 REEP4 6.2 0.000
Bt.7142 Similar to aim1 LOC526200 6.2 0.000
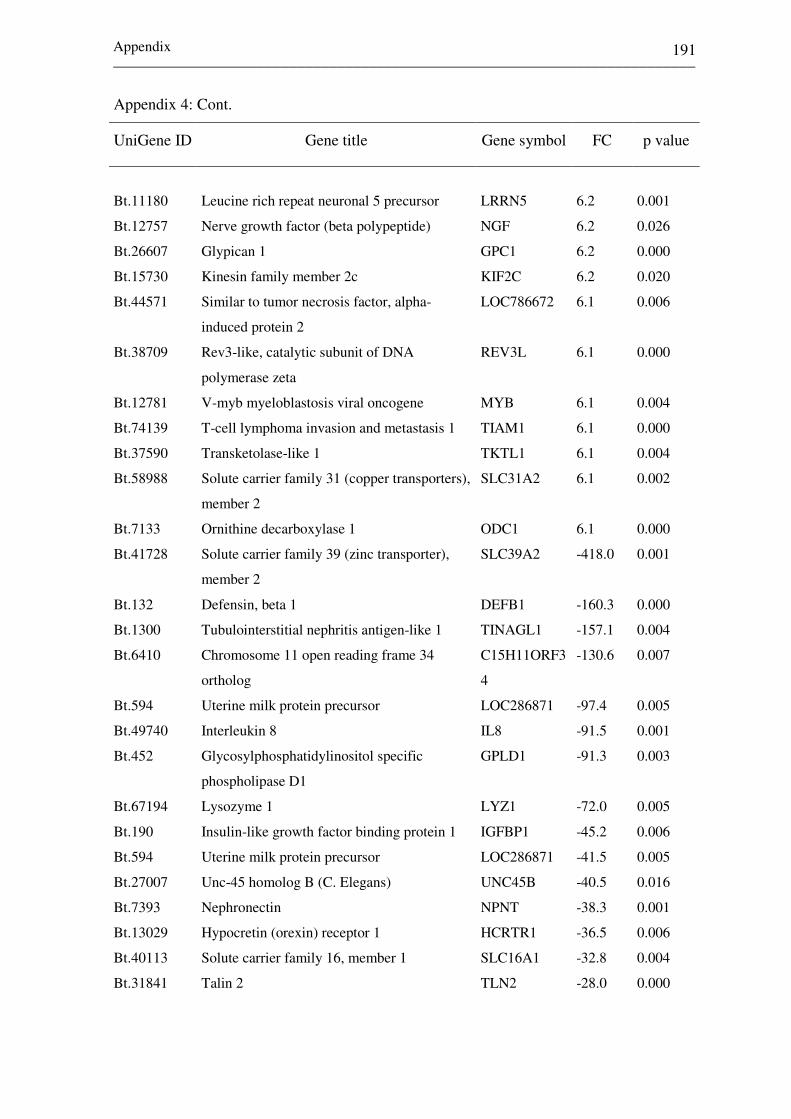
Appendix _________________________________________________________________________
191
Appendix 4: Cont.
UniGene ID Gene title Gene symbol FC p value
Bt.11180
Leucine rich repeat neuronal 5 precursor
LRRN5
6.2
0.001
Bt.12757 Nerve growth factor (beta polypeptide) NGF 6.2 0.026
Bt.26607 Glypican 1 GPC1 6.2 0.000
Bt.15730 Kinesin family member 2c KIF2C 6.2 0.020
Bt.44571 Similar to tumor necrosis factor, alpha-
induced protein 2
LOC786672 6.1 0.006
Bt.38709 Rev3-like, catalytic subunit of DNA
polymerase zeta
REV3L 6.1 0.000
Bt.12781 V-myb myeloblastosis viral oncogene MYB 6.1 0.004
Bt.74139 T-cell lymphoma invasion and metastasis 1 TIAM1 6.1 0.000
Bt.37590 Transketolase-like 1 TKTL1 6.1 0.004
Bt.58988 Solute carrier family 31 (copper transporters),
member 2
SLC31A2 6.1 0.002
Bt.7133 Ornithine decarboxylase 1 ODC1 6.1 0.000
Bt.41728 Solute carrier family 39 (zinc transporter),
member 2
SLC39A2 -418.0 0.001
Bt.132 Defensin, beta 1 DEFB1 -160.3 0.000
Bt.1300 Tubulointerstitial nephritis antigen-like 1 TINAGL1 -157.1 0.004
Bt.6410 Chromosome 11 open reading frame 34
ortholog
C15H11ORF3
4
-130.6 0.007
Bt.594 Uterine milk protein precursor LOC286871 -97.4 0.005
Bt.49740 Interleukin 8 IL8 -91.5 0.001
Bt.452 Glycosylphosphatidylinositol specific
phospholipase D1
GPLD1 -91.3 0.003
Bt.67194 Lysozyme 1 LYZ1 -72.0 0.005
Bt.190 Insulin-like growth factor binding protein 1 IGFBP1 -45.2 0.006
Bt.594 Uterine milk protein precursor LOC286871 -41.5 0.005
Bt.27007 Unc-45 homolog B (C. Elegans) UNC45B -40.5 0.016
Bt.7393 Nephronectin NPNT -38.3 0.001
Bt.13029 Hypocretin (orexin) receptor 1 HCRTR1 -36.5 0.006
Bt.40113 Solute carrier family 16, member 1 SLC16A1 -32.8 0.004
Bt.31841 Talin 2 TLN2 -28.0 0.000

Appendix _________________________________________________________________________
192
Appendix 4: Cont.
UniGene ID Gene title Gene symbol FC p value
Bt.13772
Cytochrome P450, subfamily I (aromatic
compound-inducible), polypeptide 1
CYP1A1
-23.0
0.017
Bt.13860 Kinase insert domain receptor (a type III
receptor tyrosine kinase)
KDR -22.1 0.005
Bt.23889 Microtubule-associated protein 2 MAP2 -20.2 0.011
Bt.6087 Transmembrane 4 L six family member 1 TM4SF1 -18.8 0.001
Bt.28230 Complement factor H-related 3 CFHR3 -17.5 0.011
Bt.6410 Chromosome 11 open reading frame 34
ortholog
H15C11ORF3
4
-17.4 0.031
Bt.49470 Solute carrier family 5 SLC5A11 -16.8 0.005
Bt.11462 Syndecan 2 SDC2 -15.9 0.001
Bt.27910 Chromosome 20 open reading frame 54 C20orf54 -14.8 0.000
Bt.468 Cystic fibrosis transmembrane conductance
regulator
CFTR -14.7 0.001
Bt.12967 Cadherin 16, KSP-cadherin CDH16 -14.2 0.010
Bt.15758 Prostaglandin-endoperoxide synthase 2
(prostaglandin G/H synthase and
cyclooxygenase)
PTGS2 -14.1 0.018
Bt.21896 Collagen, type XXI, alpha 1 COL21A1 -14.0 0.000
Bt.5318 Retinol binding protein 4, plasma RBP4 -13.8 0.008
Bt.6087 Transmembrane 4 L six family member 1 TM4SF1 -13.4 0.000
Bt.9632 Deleted in malignant brain tumors 1 DMBT1 -12.8 0.001
Bt.4645 Similar to c1orf24 LOC504817 -12.6 0.001
Bt.13860 Kinase insert domain receptor (a type III
receptor tyrosine kinase)
KDR -12.0 0.004
Bt.89332 Fibroblast growth factor-binding protein LOC281812 -12.0 0.000
Bt.26155 N-acetylneuraminate pyruvate lyase NPL -11.9 0.004
Bt.50127 Similar to RAD21-like 1 (S. Pombe) LOC512408 -11.5 0.001
Bt.357 S100 calcium binding protein A12 S100A12 -11.4 0.004
Bt.28620 Solute carrier family 27 SLC27A2 -10.8 0.022
Bt.31739 ABI gene family, member 3 binding protein ABI3BP -10.2 0.001
Bt.49731 Carbonic anhydrase II CA2 -10.0 0.029

Appendix _________________________________________________________________________
193
Appendix 4: Cont.
UniGene ID Gene title Gene symbol FC p value
Bt.88771
Transmembrane protein 45B
TMEM45B
-9.9
0.006
Bt.60687 Formin-like 3 FMNL3 -9.5 0.004
Bt.20477 Raftlin, lipid raft linker 1 RFTN1 -9.1 0.017
Bt.388 RAB3B, member RAS oncogene family RAB3B -9.0 0.033
Bt.64122 Supervillin SVIL -8.9 0.000
Bt.24447 Coagulation factor II (thrombin) receptor-like F2RL2 -8.8 0.000
Bt.49269 Myotubularin related protein 11 MTMR11 -8.7 0.002
Bt.42032 Cell division cycle associated 7 CDCA7 -8.7 0.041
Bt.62650 Ubiquitin D UBD -8.7 0.001
Bt.49579 Solute carrier family 29, member 1 SLC29A1 -8.5 0.018
Bt.9675 Similar to Extracellular proteinase inhibitor LOC787253 -8.3 0.004
Bt.35472 Tetratricopeptide repeat domain 21B SCN1A -8.3 0.013
Bt.15782 CD59 molecule, complement regulatory
protein
CD59 -8.2 0.015
Bt.5484 Very low density lipoprotein receptor vldlr -8.1 0.020
Bt.12140 Mucin 13, cell surface associated MUC13 -8.0 0.000
Bt.23497 Myosin, light chain 3, alkali; ventricular,
skeletal, slow
MYL3 -7.8 0.033
Bt.23889 Microtubule-associated protein 2 MAP2 -7.7 0.051
Bt.88773 Cystatin E/M CST6 -7.7 0.014
Bt.8282 Dipeptidyl-peptidase 4 (CD26, adenosine DPP4 -7.5 0.005
Bt.27973 Solute carrier organic anion transporter
family, member 3A1
SLCO3A1 -7.4 0.005
Bt.43651 SLAM family member 7 SLAMF7 -7.4 0.037
Bt.25099 Phosphoserine phosphatase PSPH -7.2 0.028
Bt.46545 Similar to putative ISG12(a) protein ISG12(A) -7.1 0.002
Bt.63426 UDP glucuronosyltransferase 2 family,
polypeptide B10
UGT2B10 -6.7 0.017
Bt.52393 Cathepsin H CTSH -6.6 0.007
Bt.25663 Copine VIII CPNE8 -6.4 0.004
Bt.56845 Cysteine rich transmembrane BMP regulator1 CRIM1 -6.3 0.004
Bt.16087 Nidogen 2 (osteonidogen) NID2 -6.2 0.024

Appendix _________________________________________________________________________
194
Appendix 4: Cont.
UniGene ID Gene title Gene symbol FC p value
Bt.10630
Neuromedin B
NMB
-6.2
0.024
Bt.19932 Similar to cystin cilia-associated protein LOC616812 -6.1 0.007
Bt.7724 Septin 11 Sep 11 -6.1 0.013
Bt.33922 Radical S-adenosyl methionine containing 2 RSAD2 -5.9 0.012
Bt.60918 Similar to Interferon-induced LOC512486 -5.8 0.030
Bt.62067 Folate receptor 1 (adult) FOLR1 -5.8 0.006
Bt.193 Mannosyl (alpha-1,3-)-glycoprotein beta-1,4-
N-acetylglucosaminyltransferase, isozyme A
MGAT4A -5.6 0.007
Bt.25459 Atpase type 13A4 ATP13A4 -5.6 0.010
Bt.91165 Similar to ATP-binding cassette transporter LOC617079 -5.5 0.008
Bt.12302 Plasminogen activator, tissue PLAT -5.5 0.000
Bt.25511 RAD51-like 1 (S. Cerevisiae) RAD51L1 -5.5 0.004
Bt.22624 Leucine rich repeat containing 8 family,
member D
LRRC8D -5.4 0.000
Bt.62794 Transmembrane protein 117 TMEM117 -5.4 0.003
Bt.4646 Solute carrier family 2, member 1 SLC2A1 -5.3 0.024
Bt.39963 Neurochondrin NCDN -5.3 0.014
Bt.12967 Cadherin 16, KSP-cadherin CDH16 -5.2 0.016
Bt.13456 Actin binding LIM protein family, member 3 ABLIM3 -5.1 0.028
Bt.95150 Purinergic receptor P2Y, G-protein coupled,5 P2RY5 -5.1 0.001
Bt.13084 Met proto-oncogene MET -5.0 0.000
Bt.53071 Phosphodiesterase 4B, camp-specific PDE4B -5.0 0.008
Bt.64706 Cold shock domain containing C2 CSDC2 -4.9 0.017
Bt.44795 Nuclear receptor coactivator 7 NCOA7 -4.9 0.001
Bt.92569 Solute carrier family 5, member 1 SLC5A1 -4.9 0.046
Bt.611 Chemokine (C-X-C motif) ligand 2 CXCL2 -4.8 0.002
Bt.1370 Argininosuccinate synthetase 1 ASS1 -4.8 0.018
Bt.411 Neuregulin 1 NRG1 -4.8 0.004
Bt.8544 CD69 molecule CD69 -4.7 0.014
Bt.2801 Leprecan 1 LOC539976 -4.7 0.002
Bt.52082 Arrestin, beta 1 ARRB1 -4.6 0.006
Bt.4199 Interleukin 1 receptor antagonist IL1RN -4.6 0.007
Bt.16118 Similar to C-type lectin domain family 2, LOC504309 -4.6 0.002
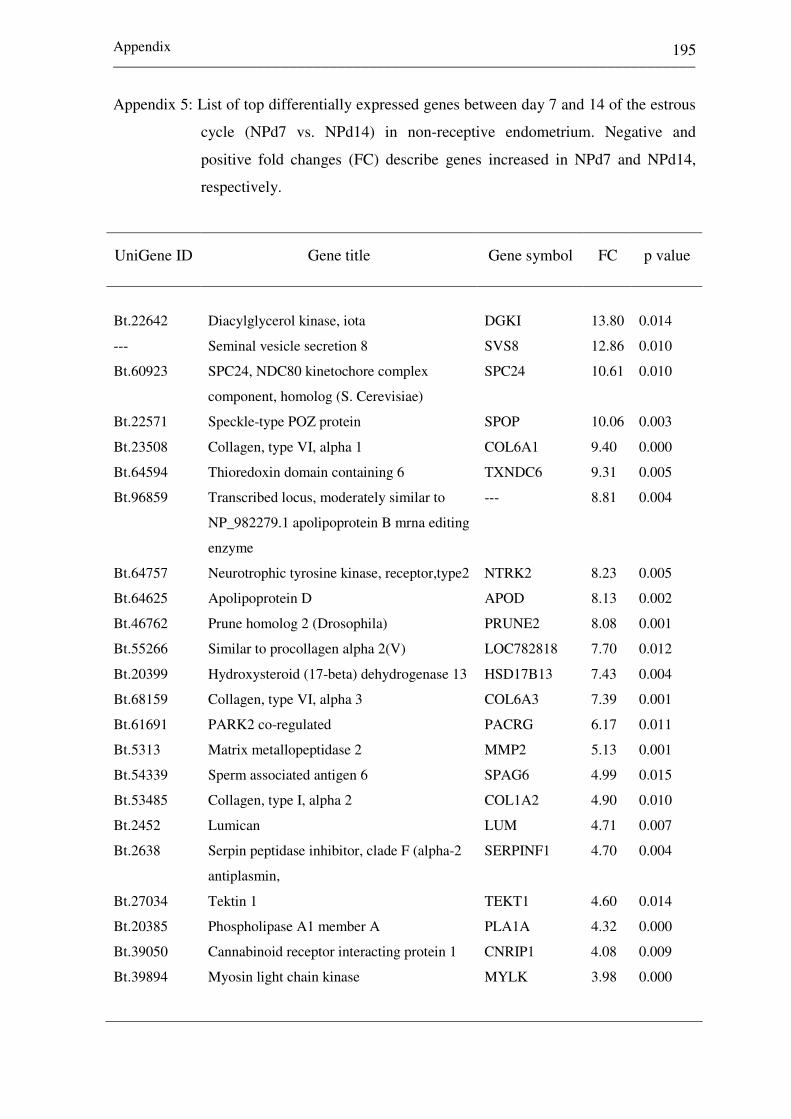
Appendix _________________________________________________________________________
195
Appendix 5: List of top differentially expressed genes between day 7 and 14 of the estrous
cycle (NPd7 vs. NPd14) in non-receptive endometrium. Negative and
positive fold changes (FC) describe genes increased in NPd7 and NPd14,
respectively.
UniGene ID Gene title Gene symbol FC p value
Bt.22642
Diacylglycerol kinase, iota
DGKI
13.80
0.014
--- Seminal vesicle secretion 8 SVS8 12.86 0.010
Bt.60923 SPC24, NDC80 kinetochore complex
component, homolog (S. Cerevisiae)
SPC24 10.61 0.010
Bt.22571 Speckle-type POZ protein SPOP 10.06 0.003
Bt.23508 Collagen, type VI, alpha 1 COL6A1 9.40 0.000
Bt.64594 Thioredoxin domain containing 6 TXNDC6 9.31 0.005
Bt.96859 Transcribed locus, moderately similar to
NP_982279.1 apolipoprotein B mrna editing
enzyme
--- 8.81 0.004
Bt.64757 Neurotrophic tyrosine kinase, receptor,type2 NTRK2 8.23 0.005
Bt.64625 Apolipoprotein D APOD 8.13 0.002
Bt.46762 Prune homolog 2 (Drosophila) PRUNE2 8.08 0.001
Bt.55266 Similar to procollagen alpha 2(V) LOC782818 7.70 0.012
Bt.20399 Hydroxysteroid (17-beta) dehydrogenase 13 HSD17B13 7.43 0.004
Bt.68159 Collagen, type VI, alpha 3 COL6A3 7.39 0.001
Bt.61691 PARK2 co-regulated PACRG 6.17 0.011
Bt.5313 Matrix metallopeptidase 2 MMP2 5.13 0.001
Bt.54339 Sperm associated antigen 6 SPAG6 4.99 0.015
Bt.53485 Collagen, type I, alpha 2 COL1A2 4.90 0.010
Bt.2452 Lumican LUM 4.71 0.007
Bt.2638 Serpin peptidase inhibitor, clade F (alpha-2
antiplasmin,
SERPINF1 4.70 0.004
Bt.27034 Tektin 1 TEKT1 4.60 0.014
Bt.20385 Phospholipase A1 member A PLA1A 4.32 0.000
Bt.39050 Cannabinoid receptor interacting protein 1 CNRIP1 4.08 0.009
Bt.39894 Myosin light chain kinase MYLK 3.98 0.000

Appendix _________________________________________________________________________
196
Appendix 5: Cont.
UniGene ID Gene title Gene symbol FC p value
Bt.26488
Transcribed locus
---
3.97
0.009
Bt.39738 Transcribed locus --- 3.97 0.015
Bt.8880 SPARC-like 1 (mast9, hevin) SPARCL1 3.88 0.003
Bt.53600 Cytochrome b5 type B CYB5B 3.87 0.012
Bt.25235 Mitochondrial ribosomal protein S36 MRPS36 3.87 0.014
Bt.98978 Transcribed locus --- 3.87 0.007
Bt.4539 Angiotensin II receptor, type 1 AGTR1 3.85 0.000
Bt.101209 Collagen, type III, alpha 1 COL3A1 3.77 0.013
Bt.26656 Mitogen-activated protein kinase 10 MAPK10 3.75 0.011
Bt.21766 Myeloid leukemia factor 1 MLF1 3.67 0.011
Bt.4011 Transmembrane protein 120A TMEM120A 3.61 0.007
Bt.68595 Transcribed locus --- 3.53 0.014
Bt.81912 Similar to OB-cadherin-1 /// cadherin 11,
type 2, OB-cadherin
CDH11 ///
LOC535363
3.47 0.008
Bt.45145 Asporin ASPN 3.42 0.000
Bt.23178 Decorin DCN 3.40 0.013
Bt.30575 Scavenger receptor class A, member 5 SCARA5 3.09 0.012
Bt.4210 Kininogen 1 KNG1 3.09 0.010
Bt.18339 Dynein, light chain, roadblock-type 2 DYNLRB2 3.06 0.015
Bt.23618 Spondin 1, extracellular matrix protein SPON1 3.06 0.009
Bt.4492 Collectin sub-family member 12 COLEC12 3.03 0.002
Bt.68368 Transcribed locus --- -2.86 0.001
Bt.22179 Similar to chromosome 1 open reading
frame
LOC507126 -2.87 0.013
Bt.54463 Early growth response 1 EGR1 -2.90 0.006
Bt.92871 Transcribed locus --- -2.94 0.001
Bt.1730 Inhibitor of DNA binding 1, dominant
negative helix-loop-helix protein
ID1 -3.00 0.005
Bt.93483 Transcribed locus --- -3.05 0.000
Bt.24872 Kinesin family member 4A KIF4A -3.07 0.004
Bt.24645 Hypothetical LOC613372 LOC613372 -3.08 0.005
--- Frequently rearranged in advanced T-cell FRAT2 -3.09 0.006
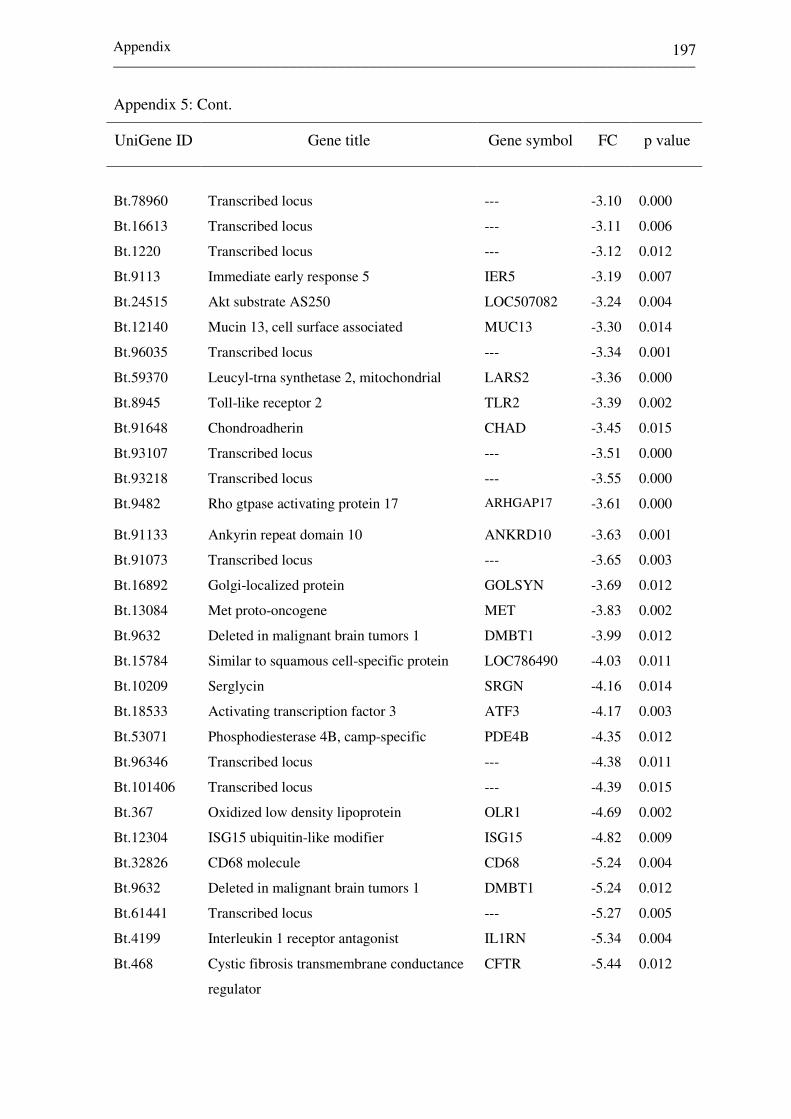
Appendix _________________________________________________________________________
197
Appendix 5: Cont.
UniGene ID Gene title Gene symbol FC p value
Bt.78960
Transcribed locus
---
-3.10
0.000
Bt.16613 Transcribed locus --- -3.11 0.006
Bt.1220 Transcribed locus --- -3.12 0.012
Bt.9113 Immediate early response 5 IER5 -3.19 0.007
Bt.24515 Akt substrate AS250 LOC507082 -3.24 0.004
Bt.12140 Mucin 13, cell surface associated MUC13 -3.30 0.014
Bt.96035 Transcribed locus --- -3.34 0.001
Bt.59370 Leucyl-trna synthetase 2, mitochondrial LARS2 -3.36 0.000
Bt.8945 Toll-like receptor 2 TLR2 -3.39 0.002
Bt.91648 Chondroadherin CHAD -3.45 0.015
Bt.93107 Transcribed locus --- -3.51 0.000
Bt.93218 Transcribed locus --- -3.55 0.000
Bt.9482 Rho gtpase activating protein 17 ARHGAP17 -3.61 0.000
Bt.91133 Ankyrin repeat domain 10 ANKRD10 -3.63 0.001
Bt.91073 Transcribed locus --- -3.65 0.003
Bt.16892 Golgi-localized protein GOLSYN -3.69 0.012
Bt.13084 Met proto-oncogene MET -3.83 0.002
Bt.9632 Deleted in malignant brain tumors 1 DMBT1 -3.99 0.012
Bt.15784 Similar to squamous cell-specific protein LOC786490 -4.03 0.011
Bt.10209 Serglycin SRGN -4.16 0.014
Bt.18533 Activating transcription factor 3 ATF3 -4.17 0.003
Bt.53071 Phosphodiesterase 4B, camp-specific PDE4B -4.35 0.012
Bt.96346 Transcribed locus --- -4.38 0.011
Bt.101406 Transcribed locus --- -4.39 0.015
Bt.367 Oxidized low density lipoprotein OLR1 -4.69 0.002
Bt.12304 ISG15 ubiquitin-like modifier ISG15 -4.82 0.009
Bt.32826 CD68 molecule CD68 -5.24 0.004
Bt.9632 Deleted in malignant brain tumors 1 DMBT1 -5.24 0.012
Bt.61441 Transcribed locus --- -5.27 0.005
Bt.4199 Interleukin 1 receptor antagonist IL1RN -5.34 0.004
Bt.468 Cystic fibrosis transmembrane conductance
regulator
CFTR -5.44 0.012

Appendix _________________________________________________________________________
198
Appendix 5: Cont.
UniGene ID Gene title Gene symbol FC p. valu
Bt.87242
Steroidogenic acute regulatory protein
STAR
-5.87
0.010
Bt.33922 Radical S-adenosyl methionine domain
containing 2
RSAD2 -6.18 0.010
Bt.46545 Similar to putative ISG12(a) protein ISG12(A) -5.65 0.005
Bt.65386 Pleckstrin PLEK -7.37 0.012
Bt.60687 Formin-like 3 FMNL3 -7.51 0.008
Bt.22477 Transcribed locus --- -8.69 0.002
Bt.93099 Transcribed locus --- -9.43 0.000
Bt.31841 Talin 2 TLN2 -11.6 0.002
Bt.2408 Chemokine (C-C motif) ligand 2 CCL11 -12.1 0.005
Bt.7393 Nephronectin NPNT -16.9 0.007
Bt.10536 Secreted phosphoprotein 1 (osteopontin,
bone sialoprotein I,
SPP1 -21.2 0.006
Bt.13125 Neutrophil beta-defensin 4 /// defensin, beta
5 /// similar to neutrophil beta-defensin 4
BNBD-4 -22.2 0.002
Bt.5878 Serine dehydratase SDS -23.5 0.013
Bt.49740 Interleukin 8 IL8 -51.9 0.003
Bt.41728 Solute carrier family 39 SLC39A2 -112 0.005
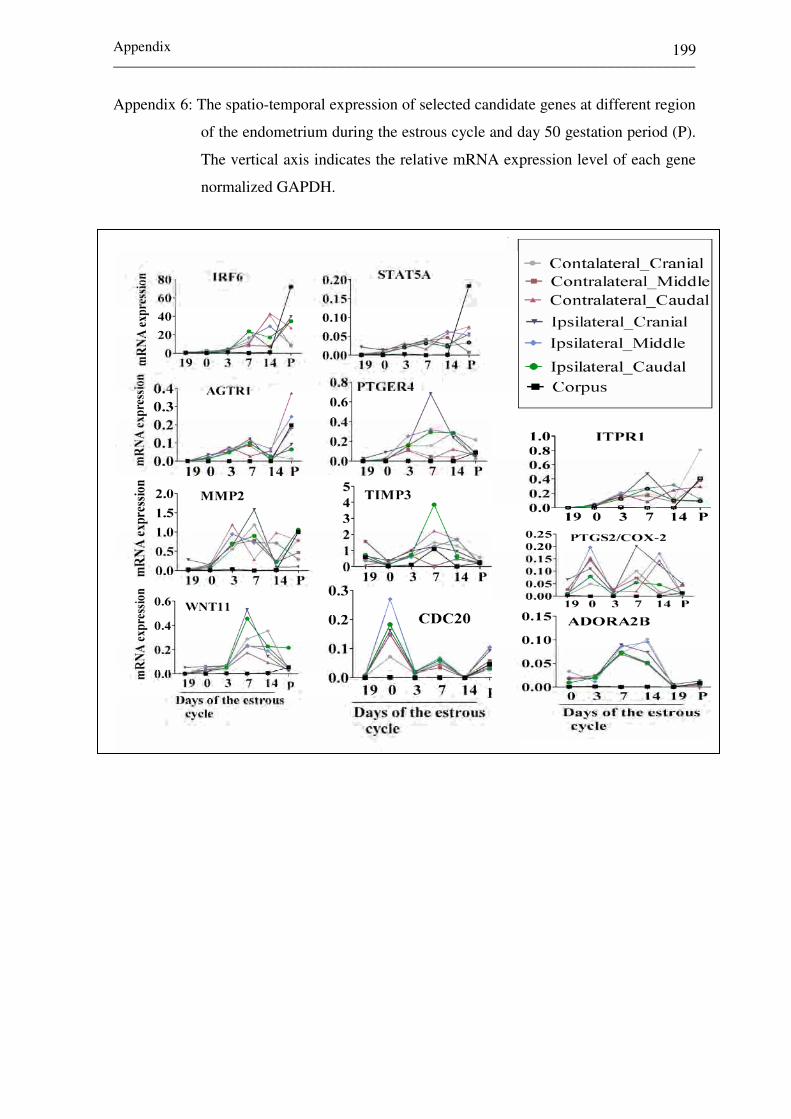
Appendix _________________________________________________________________________
199
Appendix 6: The spatio-temporal expression of selected candidate genes at different region
of the endometrium during the estrous cycle and day 50 gestation period (P).
The vertical axis indicates the relative mRNA expression level of each gene
normalized GAPDH.

Appendix _________________________________________________________________________
200
Appendix 7: Validation of differentially expressed genes between receptive (CDd7) and
non- receptive (NPd7) endometrium at day 7 of the estrous cycle.
(A): Genes enriched in CDd7. (B): Genes enriched in NPd7
A
B

201
Acknowledgment
During my doctoral study, I came across with several people who have helped and inspired
me. Therefore, using this great opportunity, I would like to thank all people who
contributed directly or indirectly to my study.
With a deep sense of gratitude, I wish to express my sincere thanks to Prof. Dr. Karl
Schellander for providing me a chance to do my Ph.D thesis in the Institute Of Animal
Breeding And Husbandry Group (University of Bonn, Germany). His perpetual energy and
enthusiasm in research had motivated me towards fruitful research. In addition, he was
always accessible and willing to help his students with their research. As a result, research
life became smooth and rewarding for me. Moreover, Prof. Dr. Karl Schellander is highly
acknowledged for his constant source of encouragement and support during my research
work. He was always there to listen and to give advice. He shaped my scientific thinking
and writing. In addition to his enormous help in the scientific matters, Prof. Dr. Karl
Schellander’s help in any problems related to social affairs will not be forgotten. Professor
Schellander remains printed in my mind and will be remembered in all walks of my life. I
am also thankful to Prof. Dr. Brigitte Petersen who has been my second supervisor for
reading the manuscript. My sincere thanks go to Dr. Dawit for his unlimited help, close
guidance, sustainable advice during the course of my thesis. His help was significant to
bring my work into reality. The conversations I have made with Dr. Dawit during the
period of data collection and during preparation of research articles were very valuable.
I am grateful to Dr. Micheal Hölker and Ms. Frnaka Rings for their enormous contribution
during data collection.
In the course of my work, I have been given a chance to visit Århus University, Denmark
to get insight into Affymetrix data analysis. On this occasion, it is my great pleasure to
express my special thanks to the cutting edges for sustainable Animal Breeding (SABRE)
for financing my short-term placement in Århus University. My sincere gratitude to Dr.
Peter Sørensen (Århus University/ Faculty of Agricultural Sciences/Department of
Genetics and Biotechnology, Denmark) for his enormous guidance and assistance during
the data analysis.
Many thanks go to all colleagues at the Institute of Animal Science for helping me in one
way or another to successfully accomplish this task, especially to Dr. Chiriwath
Phatsara, Dr. Elisabeth Jonas, Dr. Guisheng Liu, Dr. Ali Kpatcha Kadanga, Dr. Patricio

202
Ponce Barajas, Dr. Daghigh Kia, Mr. Dagnachew Hailemariam, Ms. Anke Brings, Ms.
Kanokwan Kaewmala, Ms Autschara Kayan, Ms. Christine Große-Brinkhaus, Ms. Walaa
Abd-El-Naby, Ms.Pritam Bala Sinha, Mr. Heiko Buschbell, Dr. Parinya Wilaiphan, Mr
Watchara. Laenoi, Mr Ulas Mehmet Cinar, Mr. Munir Hossain, Dr. Abdollah Mohammadi
Sangcheshmeh, Mr. Ahmed Yehia Gad, Dr.Nasser Ghanem, Ms.Eva Held, Ms. Christina
Behrendt, Ms. Maren Proell, Ms. Hanna Heidt, Mrs. Simret Weldenegodguad.
I would like to thank all administrative members of the Institute of Animal Science,
particularly Ms. Bianca Peters and Ms. Ulrike Schröter for their kind administrative
support during the course of my study. Thanks also go to Mr. Peter Müller for his useful
help in computer assistance.
I would like also to thank all the staffs of the Frankenforst research station, Institute of
Animal Genetic and Breeding Science, University of Bonn, for all their contributions in for
my thesis.
I would like to convoy my special thanks to Abigiya Zenebe who has been constantly
helping me through out my study. Her encouragements and consistent support has been
enormous. With out the help of Abigya Zenebe, this thesis could have been difficult and
her enormous help will never be forgotten.
My deepest gratitude goes to my family for their unflagging love and support throughout
my life. I am indebted to my father, Salilew Wondim, mother Bizunesh Adela and my
sisters and brothers, for their care and love. As a typical mother, she has put all her effort
to create the best possible environment for me to reach at this level. I have no suitable
word that can fully describe her everlasting effort. I remember many challenges she faced
while I was in high school and in the Universities. Whatsoever the circumstances she
faced, her help was very much consistent. Mother, I love you. I feel proud of you. Thank
you mother, Thank you!
Above all, many thanks to Almighty GOD with whom nothing is impossible.

204
3. Work experience
Aug.2001-Sept.2002: Graduate Assistant at Alemaya University, Alemaya, Ethiopia.
8th July -Sept.5/2000: Data collector for drought assessment and Evaluation at
Harrerghe Catholic Secretariat (HCS), Dire Dawa, Ethiopia.
8th July-30th sept.2000: Agricultural Development supervisor as a part time
employee by Ministry of Agriculture, Western Gojjam
Department of Agriculture, Bahirdar Zuria District
Agricultural Office, Ethiopia.
June 1993-Sept.1998: Agricultural Development Agent (DA), Ministry of
Agriculture, Western Gojjam Department of agriculture.
Bahirdar Zuria District Agricultural Office, Ethiopia.
4. Publication
Salilew-Wondim D, Hoelker M, Rings F, Ulas-Cinar M, Peippo J, Tholen E, Looft C,
Schellander K, Tesfaye D (2010): Bovine pre-transfer endometrium and embryo
transcriptome fingerprints as predictors of pregnancy success after embryo transfer.
Physiol Genomics. Physiological Genomics 42, 201-218
Salilew-Wondim D, Hölker M, Rings F, Phatsara C, Mohammadi-Sangcheshmeh A,
Tholen E, Schellander K, Tesfaye D (2010): Depletion of BIRC6 leads to retarded bovine
early embryonic development and blastocyst formation in vitro. Reprod Fertil Dev.22,
564-79
Salilew-Wondim D, Rings F, Hölker M, Gilles M, Jennen D, Tholen E, Havlicek V,
Besenfelder U, Sukhorukov VL, Zimmermann U, Endter JM, Sirard MA, Schellander K,
Tesfaye D 2007 Dielectrophoretic behavior of in vitro-derived bovine metaphase II
oocytes and zygotes and its relation to in vitro embryonic developmental competence and
mRNA expression pattern. Reproduction 133, 931-46
El-Sayed A, Hoelker M, Rings F, Salilew D, Jennen D, Tholen E, Sirard MA, Schellander
K, Tesfaye D (2006): Large-scale transcriptional analysis of bovine embryo biopsies in
relation to pregnancy success after transfer to recipients. Physiol Genomics 28, 84-96