CARBON TURNOVER IN SINKING PARTICLES IN THE MARINE ENVIRONMENTepic.awi.de/21214/1/Ive2009b.pdf ·...
168
CARBON TURNOVER IN SINKING PARTICLES IN THE MARINE ENVIRONMENT Dissertation Zur Erlangung des akademischen Grades eines Doktors der Naturwissenschaften -Dr. rer. Nat.- -DOCTOR OF PHILOSOPHY- Vorgelegt von Morten Hvitfeldt Iversen Bremen März 2009 Alfred Wegener Institute Max Planck Institute University of Bremen for Polar- and Marine Research for Marine Microbiology Fachbereicht II Biologie/Chemie Center for Marine Environmental Sciences
Transcript of CARBON TURNOVER IN SINKING PARTICLES IN THE MARINE ENVIRONMENTepic.awi.de/21214/1/Ive2009b.pdf ·...

CARBON TURNOVER IN SINKING PARTICLES
IN THE MARINE ENVIRONMENT
Dissertation
Zur Erlangung des akademischen Grades eines Doktors der Naturwissenschaften
-Dr. rer. Nat.-
-DOCTOR OF PHILOSOPHY-
Vorgelegt von
Morten Hvitfeldt Iversen
Bremen März 2009
Alfred Wegener Institute Max Planck Institute University of Bremen for Polar- and Marine Research for Marine Microbiology Fachbereicht II Biologie/Chemie
Center for Marine Environmental Sciences


Die vorliegende Arbeit wurde in der Zeit vom Januar 2006 bis März 2009 an der Universität Bremen durchgeführt. Die Untersuchungen fanden am Alfred-Wegener-Institut für Polar- und Meeresforschung in Bremerhaven statt.
1. Gutachter: Prof. Dr. Dieter Wolf-Gladrow
2. Gutachter: Prof. Dr. Thomas Kiørboe
weitere Prüfer:
1. Prof. Dr. Ulrich Bathmann
2. Dr. Helle Ploug
Tag des Promotionskolloqium:
5. Mai 2009


ACKNOWLEDGEMENTS
Several persons have contributed to this work, and I give my sincere thanks to all of
you. I would like to thank my thesis committee; Helle Ploug, Uta Passow, Dieter Wolf-
Gladrow, Thomas Kiørboe, and Dirk De Beer for guidance during the Ph.D. period. Thanks to
the members of my thesis defence committee for evaluating my dissertation and for valuable
discussions during the defence. I am indebted to the co-authors Louise Poulsen, Nicolas
Nowald, Gerhard Fischer, George Jackson, Maya Koski, Erik Buitenhuis, and Helle Ploug for
fruitful discussions, making good atmosphere during practical work, and good co-operation.
Thank to captain and crew of RV Poseidon and RV Maria S. Merian for successful research
cruises and to Thomas Kiørboe for welcoming me at the National Institute of Aquatic
Resources, DTU Aqua, Charlottenlund (DK). Thanks to friends, family, and closest
colleagues for their support and encouragement. A special thanks to Pelin and my friends and
family in Denmark who always provided a cozy home and a soft bed.
I acknowledge the financial support by Marum through the B3 workgroup in the
Research Center Ocean Margins and AWI through the BioGeoScience workgroup.
Bremen, February 2009
Morten Hvitfeldt Iversen

TABLE OF CONTENTS
LIST OF PAPERS 6
ZUSAMMENFASSUNG 9
SUMMARY 12
1 INTRODUCTION 15
1.1 Organic matter in the ocean 15
1.2 Large marine aggregates 17
1.3 Sinking of marine aggregates 28
1.3.1 Fecal pellet sinking speed 28
1.3.2 Marine snow sinking speed 21
1.4 Degradation of large aggregates 21
1.4.1 Why visit aggregates 23
1.4.2 Degradation in rates 24
1.4.2.1 Marine snow degradation rates 24
1.4.2.2 Fecal pellet degradation rates 25
1.5 Marine snow vs. fecal pellets in the vertical flux 26
1.6 Questions to be answered 27
2 RESULTS AND DISCUSSION 28
2.1 Carbon turnover in fecal pellets 32
2.1.1 Is Oithona sp. the main pellet degrader? 33
2.1.2 What is the degradation mechanism and impact from copepods on fecal pellets? 34
2.1.3 Are other organisms than copepods important for degradation of fecal pellets? 38
2.1.4 What is the influence from ballast minerals on aggregate sinking speed? 42
2.1.5 Can ballast minerals protect organic matter from microbial degradation? 43
2.2 Carbon turnover in aggregates 45

2.2.1 Can ballast minerals protect aggregates from microbial degradation? 46
2.2.2 What is the influence from ballast minerals on sinking speed? 48
2.2.3 What is the relative contribution from zooplankters and microbes to carbon removal, and how is this relationship at different depths? 51
3 CONCLUSIONS 54
4 OUTLOOK 55
5 REFERENCES 57
PAPERS
Paper I
Paper II
Paper III
Paper IV
Paper V
SPECIFIC CONTRIBUTION TO EACH PAPER
EIDESSTATTLICHE ERKLÄRUNG
6
LIST OF PAPERS
This thesis is based on the following papers. In the text they will be referred to by roman
numerals.
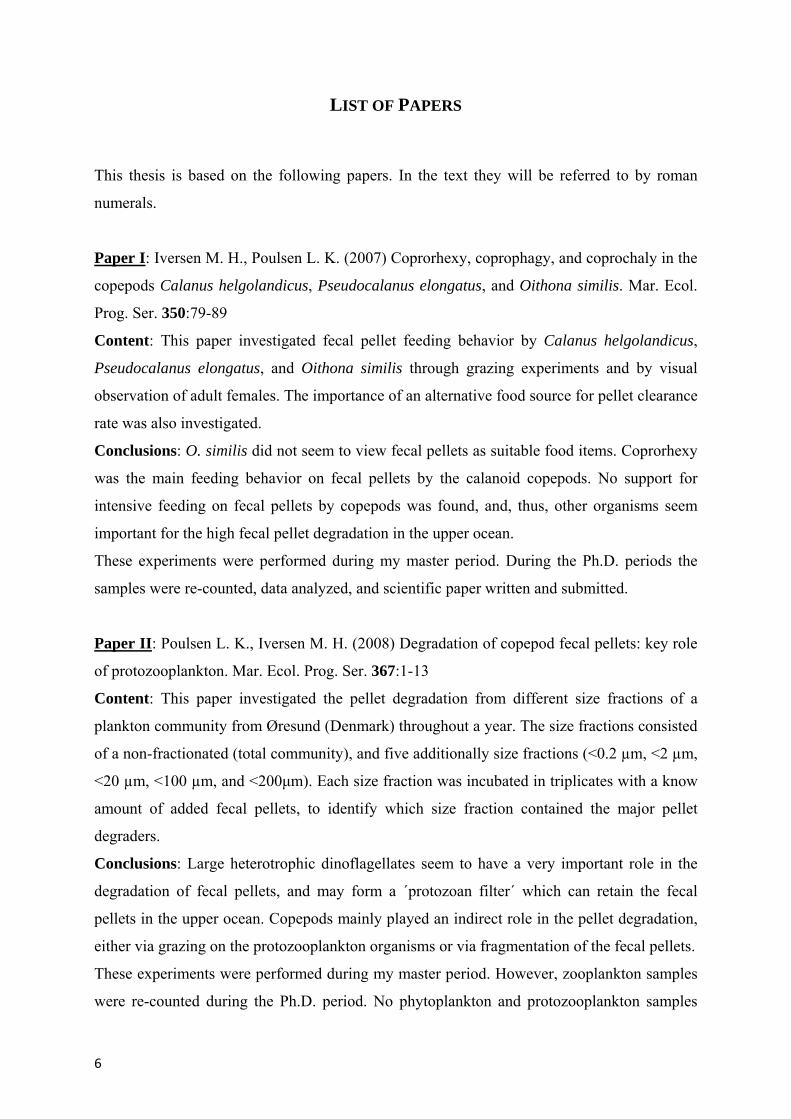
Paper I: Iversen M. H., Poulsen L. K. (2007) Coprorhexy, coprophagy, and coprochaly in the
copepods Calanus helgolandicus, Pseudocalanus elongatus, and Oithona similis. Mar. Ecol.
Prog. Ser. 350:79-89
Content: This paper investigated fecal pellet feeding behavior by Calanus helgolandicus,
Pseudocalanus elongatus, and Oithona similis through grazing experiments and by visual
observation of adult females. The importance of an alternative food source for pellet clearance
rate was also investigated.
Conclusions: O. similis did not seem to view fecal pellets as suitable food items. Coprorhexy
was the main feeding behavior on fecal pellets by the calanoid copepods. No support for
intensive feeding on fecal pellets by copepods was found, and, thus, other organisms seem
important for the high fecal pellet degradation in the upper ocean.
These experiments were performed during my master period. During the Ph.D. periods the
samples were re-counted, data analyzed, and scientific paper written and submitted.
Paper II: Poulsen L. K., Iversen M. H. (2008) Degradation of copepod fecal pellets: key role
of protozooplankton. Mar. Ecol. Prog. Ser. 367:1-13
Content: This paper investigated the pellet degradation from different size fractions of a
plankton community from Øresund (Denmark) throughout a year. The size fractions consisted
of a non-fractionated (total community), and five additionally size fractions (<0.2 µm, <2 µm,
<20 µm, <100 µm, and <200μm). Each size fraction was incubated in triplicates with a know
amount of added fecal pellets, to identify which size fraction contained the major pellet
degraders.
Conclusions: Large heterotrophic dinoflagellates seem to have a very important role in the
degradation of fecal pellets, and may form a ´protozoan filter´ which can retain the fecal
pellets in the upper ocean. Copepods mainly played an indirect role in the pellet degradation,
either via grazing on the protozooplankton organisms or via fragmentation of the fecal pellets.
These experiments were performed during my master period. However, zooplankton samples
were re-counted during the Ph.D. period. No phytoplankton and protozooplankton samples
7
were counted during the master work, and those data were not counted until the Ph.D. period.
Since the main pellet degraders were found within the protozooplankton organisms a
significant change in conclusions was made before the paper was written and submitted
during the Ph.D. period.
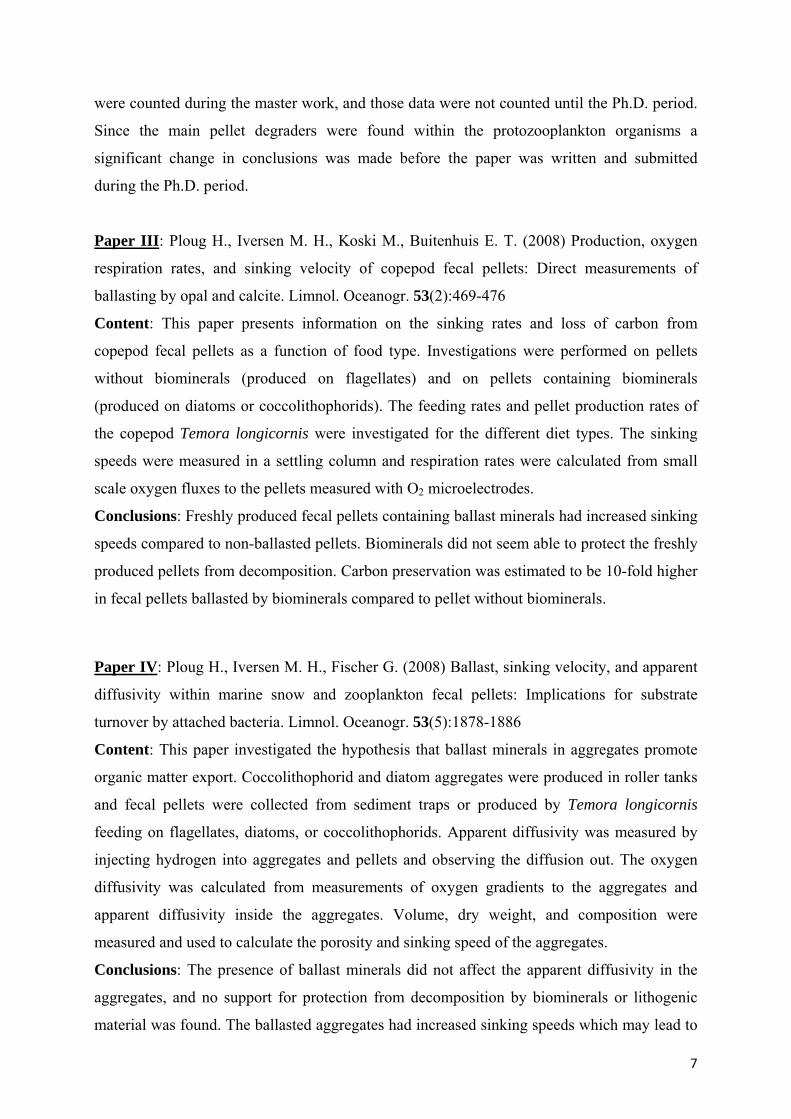
Paper III: Ploug H., Iversen M. H., Koski M., Buitenhuis E. T. (2008) Production, oxygen
respiration rates, and sinking velocity of copepod fecal pellets: Direct measurements of
ballasting by opal and calcite. Limnol. Oceanogr. 53(2):469-476
Content: This paper presents information on the sinking rates and loss of carbon from
copepod fecal pellets as a function of food type. Investigations were performed on pellets
without biominerals (produced on flagellates) and on pellets containing biominerals
(produced on diatoms or coccolithophorids). The feeding rates and pellet production rates of
the copepod Temora longicornis were investigated for the different diet types. The sinking
speeds were measured in a settling column and respiration rates were calculated from small
scale oxygen fluxes to the pellets measured with O2 microelectrodes.
Conclusions: Freshly produced fecal pellets containing ballast minerals had increased sinking
speeds compared to non-ballasted pellets. Biominerals did not seem able to protect the freshly
produced pellets from decomposition. Carbon preservation was estimated to be 10-fold higher
in fecal pellets ballasted by biominerals compared to pellet without biominerals.
Paper IV: Ploug H., Iversen M. H., Fischer G. (2008) Ballast, sinking velocity, and apparent
diffusivity within marine snow and zooplankton fecal pellets: Implications for substrate
turnover by attached bacteria. Limnol. Oceanogr. 53(5):1878-1886
Content: This paper investigated the hypothesis that ballast minerals in aggregates promote
organic matter export. Coccolithophorid and diatom aggregates were produced in roller tanks
and fecal pellets were collected from sediment traps or produced by Temora longicornis
feeding on flagellates, diatoms, or coccolithophorids. Apparent diffusivity was measured by
injecting hydrogen into aggregates and pellets and observing the diffusion out. The oxygen
diffusivity was calculated from measurements of oxygen gradients to the aggregates and
apparent diffusivity inside the aggregates. Volume, dry weight, and composition were
measured and used to calculate the porosity and sinking speed of the aggregates.
Conclusions: The presence of ballast minerals did not affect the apparent diffusivity in the
aggregates, and no support for protection from decomposition by biominerals or lithogenic
material was found. The ballasted aggregates had increased sinking speeds which may lead to
8
increased oxygen supply to the aggregates, benefitting the carbon-specific respiration from
the microbes associated with the aggregates.
Paper V: Iversen M. H., Nowald N., Ploug H., Jackson G. A., Fischer G. (submitted) High
resolution profiles of vertical particulate organic matter export off Cape Blanc, Mauritania:
degradation processes and ballasting effects. Manuscript submitted to Deep Sea Research I.
Content: In this paper vertical fluxes were calculated from in situ camera profiles of
aggregate size-specific abundances using estimated sinking speeds and aggregate masses. The
calculated fluxes were compared to deep ocean sediment trap data. Carbon consumption was
estimated from the fluxes and used to identify degradation processes at different depths. The
different carbon consumptions were compared with on board measurement of aggregate
associated microbial degradation rates and calculated copepod abundances. Both aggregate
sinking speeds and aggregate degradation were considered in relation to carbon export.
Conclusions: The majority of carbon removal occurred in the upper 220 m of the water
column. Mesozooplankton activity seemed dominant for aggregated carbon removal in the
depth layer between 20 and 80 m. Microbes dominated the aggregate carbon removal at
depths below 80 m. The microbial carbon removal seemed limited between 220 and 2500 m
depth. The presence of ballast minerals in aggregates increased their sinking speeds and, thus,
potentially reduced the retention time in the upper 220 meters. Hence, ballasting of aggregates
seemed an important parameter for vertical carbon export.

9
ZUSAMMENFASSUNG
Kotballen (´fecal pellets´) und Aggregate (´Marine Snow´) sind Bestandteile der
Biologischen Pumpe, die organischen Kohlenstoff vom Oberflächenozean in den tiefen Ozean
transportieren und damit CO2 über viele Jahre bis Jahrhunderte speichern können. Allerdings
sind die vielfältigen Mechanismen von Kohlenstoffexport und Transfer in die Tiefsee noch
weitgehend ungeklärt. Die Produktionsraten von Kotballen sind z.B. wesentlich höher als der
Kohlenstofffluss von Kotballen in der Tiefsee (sehen Turner, 2002). Dies wird durch hohen
Fraßdruck von Copepoden (Ruderfußkrebsen), besonders von cyklopoiden Arten der Gattung
Oithona sp. erklärt (Gonzalez und Smetacek 1994), direkte Beobachtungen dafür fehlen
jedoch.
Neuere Ergebnisse von Sinkstofffallen aus der Tiefsee haben gezeigt, dass Karbonat-
und die organischen Kohlenstoffflüsse gut korrelieren (z. B. Francois et al., 2002; Armstrong
et al. 2002). Dies führte zur so genannten Ballasthypothese, wobei das Vorhandensein
verschiedener Biominerale (z.B. Karbonat) im Oberflächenozean zu höheren
Kohlenstoffflüssen in der Tiefsee führen soll. Erhöhte Partikelsinkgeschwindigkeiten
aufgrund der höheren Dichte von Aggregaten, und/oder der Mineralschutz gegen den Abbau
der organischen Substanz in den Zellen kommen als mögliche Ursachen in Frage (Armstrong
et al. 2002; Francois et al. 2002; Klaas und Archer 2002). Der Einfluss verschiedener
Ballastminerale auf die Partikelsinkgeschwindigkeiten und den Kohlenstoffabbau in der
Wassersäule sind jedoch weitgehend ungeklärt.
Diese Dissertation hat den Kohlenstoffumsatz in Kotballen und
Phytoplanktonaggregaten zum Thema, um wichtige Prozessen zu identifizieren, die den
Abbau und Export von Kohlenstoff in der Wassersäule bestimmen. Fraßexperimente und
visuelle Beobachtungen der Copepoden Calanus helgolandicus, Pseudocalanus elongatus und
Oithona similis haben gezeigt, dass die meisten Kotballen nicht aufgenommen wurden, z. B.
bei C. helgolandicus und P. elongatus (Paper I). O. similis wurde als effektiver Kotballen-
Grazer in der Literatur angesehen (sehen Turner 2002), dies konnte hier jedoch nicht bestätigt
werden (Paper I). Das Vorkommen von Copepoden führte häufig zur
Kotballenfragmentierung (´coprorhexy´), jedoch sind sie nicht die wichtigsten Organismen
für die Kohlenstoffremineralisation in Kotballen (Paper I). Aus Fraßuntersuchungen mit
Kotballen verschiedener Größenfraktionen einer natürlichen Planktongemeinschaft aus dem
Øresund (Dänemark) wurde festgestellt, dass große Protozooplanktonorganismen (20 bis 100
μm) die wichtigsten Organismen für den Abbau von Kotballen waren (Paper II).

10
Die größte Bedeutung des Mesozooplanktons, neben der Produktion von Kotballen,
erscheint indirekter Art über das Grazing von Protozooplankton (potentielle Zunahme des
Exportes) und mittels Kotballenfragmentierung (´coprorhexy´; potentielle Abnahme des
Exportes) (Paper I; Paper II). Die Protozooplanktonorganismen können als wirksamer
"Protozoenfilter" funktionieren, die die Kotballen aus dem vertikalen Stofffluss weitgehend
entfernen (Paper II). Es wurde weiterhin festgestellt, dass Kotballen von Phytoplankton
durch den hohen Anteil an Biomineralen eine hohe Dichte und daher erhöhte
Sinkgeschwindigkeiten haben (Paper III; Paper IV). Es wurden keine Hinweise auf den
Schutz gegen mikrobiellen Abbau als Funktion der Biominerale in frisch produzierten
Kotballen gefunden (Paper III). Von Phytoplankton produzierte Kotballen mit Biomineralen
wurden 10-fach mehre Kohlenstoff exportiert als solche ohne Mineralanteile (Paper III).
Durch erhöhte Sinkgeschwindigkeiten in ballastreichen Kotballen war jedoch die
Sauerstoffzufuhr erhöht, da die Biominerale keinen Einfluss auf die scheinbare Sauerstoff-
Diffusivität in den Kotballen haben (Paper IV). Hiermit war viel Sauerstoff für den Abbau
labiler organischer Kohlenstoffverbindungen während der Sedimentation zur Verfügung.
Das Vorkommen von Biomineralen und lithogener Minerale (z.B. Tonminerale,
Quarz) konnte als wichtiger Faktor für die Partikelsinkgeschwindigkeiten in Aggregaten
bestimmt werden (Paper IV; Paper V). Die Sinkgeschwindigkeiten von Aggregaten sind
abhängig von der Aggregatquelle, der Dichte und vom Alter und weniger abhängig von der
Größe der Aggregate (Paper IV). Allerdings müssen die bestimmten Sinkgeschwindigkeiten
aus Laborexperimenten als Maximalwerte betrachtet werden, die in situ Werte sind sicherlich
geringer (Alldredge und Gotschalk 1988). Die Gründe für längere Verweilzeiten im
Oberflächenwasser sind physikalischer Natur (Strömungen, Turbulenz) sowie biologisch
bedingt z.B. durch Abbau, Lösung und Disaggregation.
Die biologisch bedingten größeren Verweilzeiten von Partikeln in der oberen
Wassersäule wurden durch die Veränderungen der Kohlenstoffflüsse mit zunehmender Tiefe
abgeschätzt (Paper V). Die größten Kohlenstoffabbauraten waren in den oberen 220 m zu
finden und konnten in zwei wichtige Prozesse mit Tiefenstufen aufgeteilt werden, zwischen
20 und 80 m und zwischen 80 und 220 m. In den oberen 20 bis 80 m war der Abbau von
Mesozooplanktonorganismen dominiert, unterhalb von 80 m waren die bakterielle Atmung
und die Hydrolyse die entscheidenden Faktoren. In Tiefen zwischen 220 und 2500 m wurden
sehr niedrige Kohlenstoffabbauraten durch bakteriellen Aktivität gefunden, begrenzt durch
niedrige Temperaturen, geringe Bakterienmengen bzw. geringe Bakterienmengen an den
Aggregaten (Paper V).
11
Daher wird der organische Kohlenstoff, der die Zone unterhalb 220 m erreicht, nur
noch wenig abgebaut und kann in die Sedimente gelangen. Eine kurze Verweilzeit von
organisch-reichen Partikeln in der oberen Wassersäule ist offenbar entscheidend für einen
erhöhten Kohlenstofftransfer und die Kohlenstoffspeicherung. Ballastminerale sind ein
wichtiger Faktor für die Partikelsinkgeschwindigkeiten und kann dadurch die biologische
Pumpe auch kontrollieren (Paper III; Paper IV; Paper V).

12
SUMMARY
Fecal pellets and marine snow aggregates drive the biological carbon pump via
sedimentation of organic matter from the surface ocean to the deep ocean where carbon can
be sequestered for hundreds to thousands of years. However, the controlling mechanisms for
carbon export from the surface ocean are still unclear. It is often observed that fecal pellet
fluxes comprise less of the POC flux than would be expected from their production rates (see
Turner 2002). This has been explained by high grazing on the fecal pellets by copepods,
especially the cyclopoid copepods Oithona sp. (Gonzalez and Smetacek 1994), but direct
evidence from the field is still missing. Recent observations have shown that carbonate and
organic carbon fluxes have close correlations in the bathypelagic zones of the ocean (e.g.,
Armstrong et al. 2002). This has lead to the hypothesis that biominerals in phytoplankton,
e.g., carbonate and opal, promote carbon preservation in the sinking flux either via increasing
the sinking velocity of aggregates due to increased aggregate densities and/or via protection of
the organic matter in the cells from degradation (Armstrong et al. 2002; Francois et al. 2002;
Klaas and Archer 2002). However, the effect of ballast minerals on sinking velocity and
degradation rates in sinking aggregates is still unclear.
This dissertation investigated carbon turnover in fecal pellets, marine snow, and
phytoplankton-derived aggregates to identify important processes promoting either retention
or export of aggregated organic carbon. The terms used for the different aggregate types are
defined as; fecal pellets: aggregates surrounded by a peritrophic membrane and produced via
excretion of ingested material by zooplankton organisms; marine snow: large aggregates
(>0.5 mm) formed in situ or from in situ collected material in roller tanks; phytoplankton-
derived aggregates: aggregates formed in roller tanks from phytoplankton cultures.
From grazing experiments and visual observations of the feeding behavior of the
copepods Calanus helgolandicus, Pseudocalanus elongates, and Oithona similis it was
observed that most encountered pellets were rejected by the calanoid copepods (C.
helgolandicus and P. elongatus) (Paper I). No pellet encounters were observed for the
cyclopoid copepods O. similis (Paper I), though O. similis have been suggested to be an
effective pellet grazer (see Turner 2002). Pellet rejections often caused damage to the pellets
and occasionally cut them in halfs. It was therefore concluded that the main impact of
copepods on pellet degradation is via coprorhexy (pellet fragmentation) and that copepods are
not the main pellet degraders (Paper I). From experiments with different size fractions of a
natural plankton community from Øresund (Denmark) incubated with a known amount of
pellets, large protozooplankton (20 to 100 µm) was found to be the main degraders of fecal

13
pellets (Paper II). Thus, the main impact from mesozooplankton organisms, apart from pellet
production, seemed indirect via grazing on the protozooplankton (potentially increasing
export) and via coprorhexy (potentially decreasing export) (Paper I; Paper II). The
protozooplankton organisms formed an effective ´protozoan filter´ which could remove fecal
pellets from the vertical flux (Paper II). It was further found that pellets produced from
phytoplankton containing biominerals became ballasted and experienced elevated sinking
speeds (Paper III; Paper IV). However, no indications of protection against microbial
degradation as a function of biominerals were observed in freshly produced pellets. Thus, it
was demonstrated that fresh fecal pellets produced from phytoplankton containing
biominerals potentially had 10-fold higher carbon preservation than pellets produced without
biominerals (Paper III). Further, the oxygen supply to the pellets was potentially increased
via the elevated sinking speeds of ballasted pellet, since ballasting had no influence on the
apparent diffusivities in the pellets (Paper IV). Hereby, high amounts of oxygen were
available for respiration of labile organic carbon during sedimentation.
The presence of biominerals and lithogenic material was indicated as an important
factor for the sinking speeds in marine snow and phytoplankton-derived aggregates (Paper
IV; Paper V). Sinking speeds of aggregates were found dependent on aggregate source,
density, and age, rather than on the size of the aggregates (Paper IV). However, sinking
speeds measured in laboratories indicate the potential maximum sinking speeds of aggregates
and the residence times of aggregates in situ will likely be much longer in the upper ocean
than estimated from laboratory experiments (Alldredge and Gotschalk 1988). This is due to
the increased retention times caused by physical processes, e.g., turbulence, and biological
processes, e.g., consumption, dissolution, and disaggregation. The biological retention
processes in the upper ocean was estimated from changes in carbon fluxes with increasing
depths (Paper V). These estimates revealed the main carbon removal occurred in the upper
220 m off Cape Blanc, and could be divided into two important processes, one between 20
and 80 m and one between 80 and 220 m. Mesozooplankton organisms dominated the carbon
removal in the depth layer between 20 and 80 m, and below 80 m the carbon removal was
dominated by bacterial respiration and hydrolysis. At depths between 220 and 2500 m very
low carbon removal rates were observed and assumed via bacterial activity which seemed
limited potentially due to temperature decrease, decrease in bacterial abundance and/or
activity, or detachment of bacteria (Paper V). This indicated that carbon escaping the upper
220 m was likely to settle to the deep ocean where it can be sequestered. Therefore, a short
residence time in the upper ocean seems important for carbon export and deep-ocean carbon

14
sequestration. Thus, ballast minerals was concluded an important factor controlling aggregate
sinking speed and carbon export in the ocean (Paper III; Paper IV; Paper V).
1 INTRODUCTION
1.1 Organic matter in the ocean
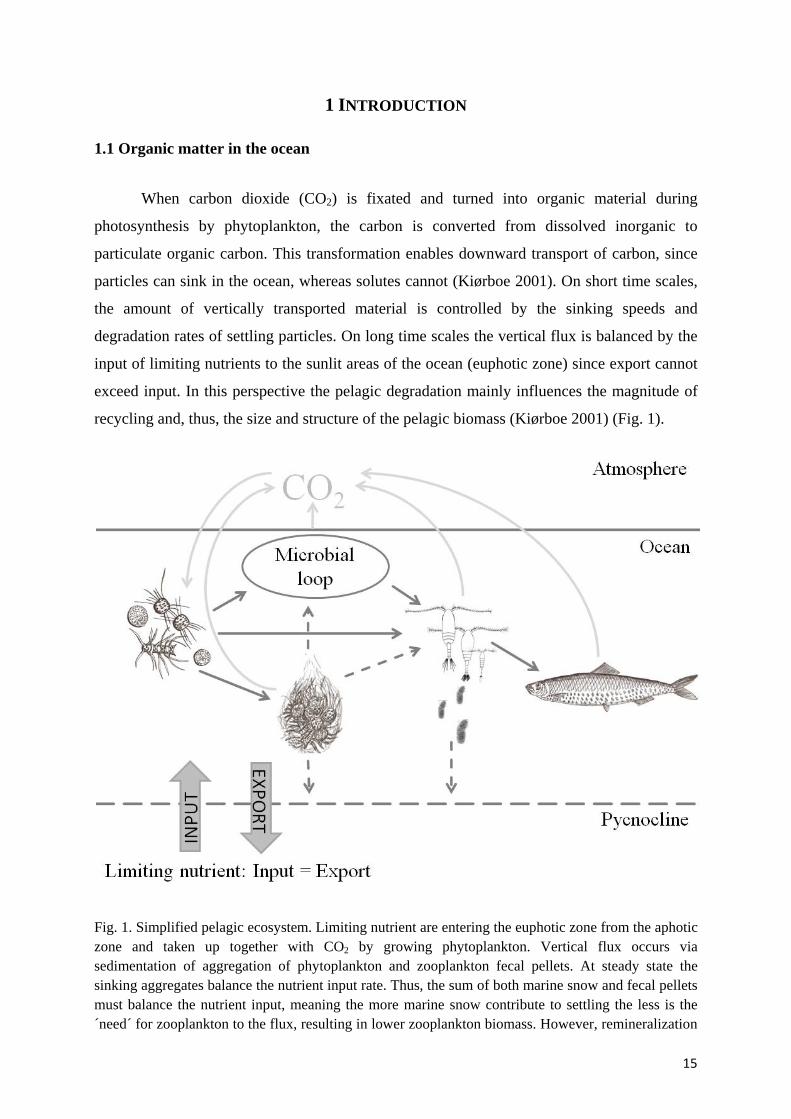
When carbon dioxide (CO2) is fixated and turned into organic material during
photosynthesis by phytoplankton, the carbon is converted from dissolved inorganic to
particulate organic carbon. This transformation enables downward transport of carbon, since
particles can sink in the ocean, whereas solutes cannot (Kiørboe 2001). On short time scales,
the amount of vertically transported material is controlled by the sinking speeds and
degradation rates of settling particles. On long time scales the vertical flux is balanced by the
input of limiting nutrients to the sunlit areas of the ocean (euphotic zone) since export cannot
exceed input. In this perspective the pelagic degradation mainly influences the magnitude of
recycling and, thus, the size and structure of the pelagic biomass (Kiørboe 2001) (Fig. 1).
Fig. 1. Simplified pelagic ecosystem. Limiting nutrient are entering the euphotic zone from the aphotic zone and taken up together with CO2 by growing phytoplankton. Vertical flux occurs via sedimentation of aggregation of phytoplankton and zooplankton fecal pellets. At steady state the sinking aggregates balance the nutrient input rate. Thus, the sum of both marine snow and fecal pellets must balance the nutrient input, meaning the more marine snow contribute to settling the less is the ´need´ for zooplankton to the flux, resulting in lower zooplankton biomass. However, remineralization
15
Introduction
16
of both aggregates and phytoplankton also occurs via the microbial loop and grazing. Remineralization retain the material in the upper ocean, governing increased aggregate formation or zooplankton biomass, if steady state between input and export of limiting nutrients are maintained. This increased biomass can benefit higher trophic levels as well. If remineralization of the sinking aggregates occurs below the euphotic zone, the net burial rate of carbon in the deep ocean is reduced. (The figure is modified from Kiørboe (2001)).
Recycling of organic material in the euphotic zone creates a temporary mismatch
between nutrient input and output (export) which eventually will be at steady state. However,
degradation of settling particles occurs throughout the whole water column and within the
sediment until the particles are finally buried and stored. These settling and degradation
processes maintain higher concentrations of biologically active elements and compounds at
depths compared to the ocean surface. This process is called ´the biological pump´, and when
focusing on carbon transformations it is called ´the biological carbon pump´ (Volk and
Hoffert 1985). When carbon is transported to the deep ocean via the biological carbon pump,
CO2 is removed from the surface ocean enable more CO2 absorbtion from the atmosphere
(Sarmiento and Bender 1994). Once the organic carbon reaches the deep ocean sediment it
can be sequestered for up to millions of years (Raven and Falkowski 1999). Thus, the
understanding of the biological carbon pump is very important for the global carbon cycle.
The efficiency of the biological carbon pump is determined by the processes taking place in
the time span between the fixation of carbon in the surface ocean and the burial of carbon in
the deep ocean. Simplified, the biological carbon pump can be divided into the production of
particulate organic carbon (POC), the settling of POC, and the decomposition of POC.
Photosynthesis is light-dependent and therefore spatially restricted to the euphotic zones in
the upper <200 meters of the water column. Below the euphotic zone, most ecosystems are
feed by export of organic matter produced via photosynthesis. This has been recognized since
Agassiz (1888):
“…deep-sea organisms are nourished by a ´rain´ of organic detritus from overlying
surface waters”
The amount of ´organic rain´ to the deep-sea is determined by settling and degradation of
organic matter (Alldredge and Gotschalk 1989; Fowler and Knauer 1986; Suess 1980).
Therefore a short transit time from the surface ocean to the sea floor, shortens the time
available for decomposition of the organic particles and, thus, enhances the organic carbon
export. If organic matter were to settle as individual phytoplankton cells they would need ~10
Introduction
17
years to reach the sea floor in the open ocean (Smayda 1969). Within that time the organic
matter would be grazed or remineralized by herbivores and microbes. Therefore, the sinking
flux mainly consists of fast-sinking, large aggregates such as marine snow and zooplankton
fecal pellets (Fowler and Knauer 1986), with sinking speeds greater than 100 m d-1 (e.g.,
Alldredge and Gotschalk 1988; Shanks and Trend 1980; Turner 2002).
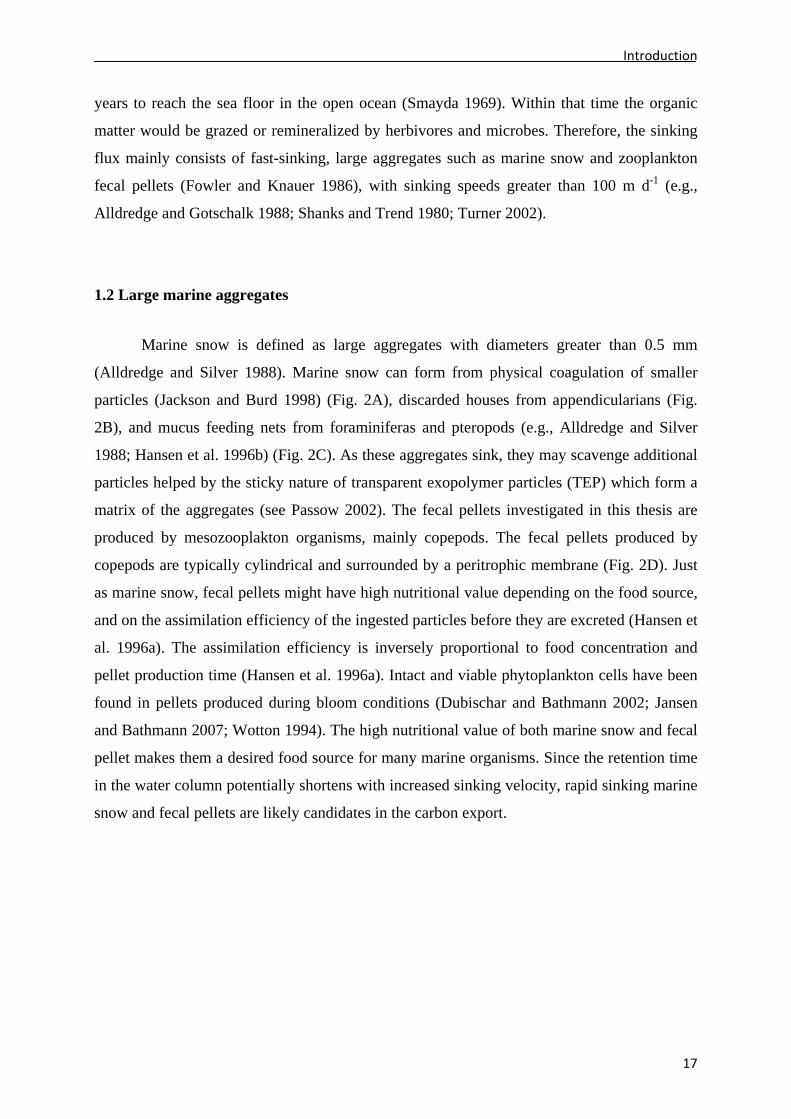
1.2 Large marine aggregates
Marine snow is defined as large aggregates with diameters greater than 0.5 mm
(Alldredge and Silver 1988). Marine snow can form from physical coagulation of smaller
particles (Jackson and Burd 1998) (Fig. 2A), discarded houses from appendicularians (Fig.
2B), and mucus feeding nets from foraminiferas and pteropods (e.g., Alldredge and Silver
1988; Hansen et al. 1996b) (Fig. 2C). As these aggregates sink, they may scavenge additional
particles helped by the sticky nature of transparent exopolymer particles (TEP) which form a
matrix of the aggregates (see Passow 2002). The fecal pellets investigated in this thesis are
produced by mesozooplakton organisms, mainly copepods. The fecal pellets produced by
copepods are typically cylindrical and surrounded by a peritrophic membrane (Fig. 2D). Just
as marine snow, fecal pellets might have high nutritional value depending on the food source,
and on the assimilation efficiency of the ingested particles before they are excreted (Hansen et
al. 1996a). The assimilation efficiency is inversely proportional to food concentration and
pellet production time (Hansen et al. 1996a). Intact and viable phytoplankton cells have been
found in pellets produced during bloom conditions (Dubischar and Bathmann 2002; Jansen
and Bathmann 2007; Wotton 1994). The high nutritional value of both marine snow and fecal
pellet makes them a desired food source for many marine organisms. Since the retention time
in the water column potentially shortens with increased sinking velocity, rapid sinking marine
snow and fecal pellets are likely candidates in the carbon export.

Introduction
18
Fig. 2. Photographs of (A) a marine snow aggregate formed in a roller tank from in situ material collected at the depth of fluorescence maximum, (B) a larvacean in its house (Photo: Alice Alldredge), (C) a pteropod (Gleba chordata) and its mucus feeding web (photo: Alice Alldredge), and (D) a copepod fecal pellet produced by Acartia tonsa feeding on Rhodomonas sp.
1.3 Sinking of marine aggregates
1.3.1 Fecal pellet sinking speed
A large range of sinking speeds for fecal pellets has been reported in the literature,
ranging from 5 to 220 m d-1 for copepods, from 16 to 862 m d-1 for euphausiids, and from 25
to 166 m d-1 for small appendicularians (see Table 2 in Turner 2002). Komar et al. (1981)
suggested a modified version of the Stokes equation to estimate sinking speed (w) of
cylindrical fecal pellets:
0.0790.
(1)

Introduction
19
where µ is the water dynamic viscosity (g cm-1 s-1), ρs is the pellet density (g cm-3), ρ is the
water density (g cm-3), g is the acceleration due to gravity (981 cm s-2), L is the pellet length
(cm), and D is the diameter (width, cm) of the pellet. Eq. 1 only apply for particles with a
cylindrical shape and within Stokes region (ρwL/µ < 2). According to Eq. 1 the sinking speed
of a fecal pellet increases with increasing length, width, and density. However, since food
type, quality, and quantity affect the pellet size and density (e.g., Bienfang 1980; Dagg and
Walser 1986; Turner 1977) the sinking speed is very difficult to predict at in situ conditions.
The pellet density depends on the density of the compounds contained within the pellet and on
the level of compaction of these compounds (Bienfang 1980; Urban et al. 1993). The pellet
size depends on food type and concentration (Dagg and Walser 1986; Feinberg and Dam
1998; Tsuda and Nemoto 1990). Sinking speeds of copepod fecal pellets show variations with
food conditions (Butler and Dam 1994) and size of the producing copepod (Harris 1994).
Therefore, a range of pellets with different sizes and densities, and, thus, different sinking
speeds, may be produced from a pelagic mesozooplankton community in a given ecosystem.
This implies that the characteristics of pellets may vary temporally and spatially according to
the species composition and the biomass of the plankton community.
Feinberg and Dam (1998) investigated the effects of diet type and concentration on
pellet length, width, and density. They identified pellet width as the most influential
parameter on sinking speed and pellet length as the least influential parameter. I compiled
settling speeds from three different studies and plotted them against length, width, and
equivalent spherical diameter (ESD) (Fig. 3).

Introduction
20
Fig. 3. Fecal pellet sinking speed plotted as a function of (A) equivalent spherical diameter (ESD), (B) width, and (C) length. Three data sets from the literature are plotted. Black circles indicate the data set from Smayda (1969), grey circles indicate the data set from Feinberg and Dam (1998), and the white circles indicate the data set from Harris (1994). The solid lines are linear regression to all three data sets in each plot.
I found the ESD (Fig. 3A) and width (Fig. 3B) of the pellets as the best general size
parameters in describing the sinking speeds of fecal pellets (R2 = 0.59 and R2 = 0.64,
respectively), while the pellet length (Fig. 3C) had very poor general correlation with sinking
speeds between the different studies (R2 = 0.04). When observing the pellets within the three
studies (Feinberg and Dam 1998; Harris 1994; Smayda 1969), a better correlation between
pellet length and sinking speed seemed to exist (Fig. 3C), indicating pellet length as a possible
describing parameter of sinking speeds for similar pellets, e.g., similar composition and /or
same producer. Pellet density may also be an important controlling parameter for sinking
speed since the pellets containing dense particles such as calcium carbonate producing
coccolithophorids (Harris 1994) and dense pellets possible containing minerals (Smayda
1969) had higher size-specific sinking speeds than the pellets produced from less dense
monocultures of either flagellates or diatoms (Feinberg and Dam 1998) (Fig. 3A). This
Introduction
21
indicates that both the shape and density of fecal pellets might be important parameters
controlling their sinking speeds.
1.3.2 Marine snow sinking speed
Marine snow aggregates are fractal (Logan and Wilkinson 1990) and therefore have
different scaling properties than assumed in settling speed calculations using Stokes’ law
(Johnson et al. 1996). The fractal nature of marine snow complicates the predictions of their
sinking speeds. However, direct studies of sinking speeds and sizes of marine snow can be
described using power relationships (Alldredge and Gotschalk 1988). Still, size-specific
sinking speeds found in different studies can vary largely (Alldredge and Gotschalk 1988;
Hamm 2002). This is likely due to the different types of particles within the aggregates
resulting in different densities and porosities of the aggregates. Therefore, the sinking speeds
of marine snow seems controlled by aggregate size, density, and porosity, making the in situ
conditions just as influential on the sinking speeds of marine snow as they are on the sinking
speeds of fecal pellets.
The sinking speeds of marine snow and fecal pellets are often measured under
controlled conditions without any changes in aggregate structure or water parameters. Such
measurements are maximum speeds and a similar sized and composed aggregate likely settle
at lower rate in situ due to changes in both aggregate characteristics, water turbulence, and
ocean currents (Alldredge and Gotschalk 1988). Thus, retention times of aggregates in the
water column may be longer than predicted from laboratory measurements. Since increased
retention times in the upper ocean potentially leads to increased degradation, it seems equally
important to identify key degradation processes and controlling mechanisms for the sinking
speed when attempting to determine the efficiency of the biological carbon pump.
1.4 Degradation of large aggregates
Vertical profiles of particulate organic carbon (POC) often show exponential decline
with increasing depth (Martin et al. 1987; Schlitzer 2000; Suess 1980), indicating that most of
the POC is decomposed in the surface ocean. Therefore, the surface ocean is likely to have the
most intensive degradation of marine aggregates. In fact less than half of the primary
production are exported out of the euphotic zone and only a few percent reach the deep ocean
and sediment (e.g., Martin et al. 1987) (Fig. 4).

Introduction
22
Fig. 4. Mean annual global POC flux at different depths in the ocean. The data is compiled from Martin et al. (1987), Suess et al. (1980), Lutz et al. (2002), Andersson et al. (2004) (Figure is modified from Lutz et al. (2002) by C. De La Rocha).
The actual shape of vertical POC profiles is determined by the settling, retention, and
removal processes of the organic carbon formed in the upper ocean (Buesseler et al. 2007).
Physical disaggregation from shear tearing the aggregates apart has been suggested important
for carbon degradation (Milligan and Hill 1998), but this process seems of little importance at
typical turbulent shear rates in the upper ocean (Alldredge et al. 1990). The high degradation
of organic carbon seems more likely via respiration and hydrolysis by bacteria attached on the
aggregates (e.g., Smith et al. 1992) and from fragmentation and consumption of the
aggregates by mesozooplankton (Dilling and Alldredge 2000; Kiørboe 2000; Steinberg 1995).
These processes convert the POC into CO2, dissolved organic carbon (DOC), and convert the
large, sinking aggregates into smaller aggregates with reduced sinking speeds. It has been
shown that attached bacteria have higher cell-specific hydrolytic enzyme activity, but not
elevated carbon demands, relative to the free-living bacteria (Cho and Azam 1988; Smith et
al. 1992). Therefore, it seems that a large part of the DOC produced from aggregated carbon
is leaking out of the aggregates and oxidized by free-living microbes (Kiørboe and Jackson
2001; Thor et al. 2003). The part of DOC leakage which is not oxidized by free-living
microbes may potentially remain within the water body until the overturning circulation
returns it to the upper ocean. The depth of DOC leakage determines the residence time of the

Introduction
23
DOC, with time scales of decades for the mesopelagic, and centuries for bathypelagic and
abyssal zones.
While microbes attached on marine snow mainly seem to colonize the aggregates after
they have formed and started to settle (Kiørboe et al. 2002), microbes on fecal pellets can both
have arrived from the surrounding water (Honjo and Roman 1978) and from the gut of the
zooplankton and packed within the pellet (Gowing and Silver 1983). This has raised the
question whether fecal pellets are degraded from the ´inside out´ or from the ´outside in´ (see
Turner 2002). Hansen et al. (1996a) have suggested that bacterial degradation of fecal pellets
depends on the diet on which the pellets are produced. Though both marine snow aggregates
and fecal pellets seem to be hotspots for bacterial abundances and growth (Alldredge and
Silver 1988; Azam and Long 2001; Jacobsen and Azam 1984) this high bacterial colonization
may not be the major remineralization pathway of the aggregates (Jacobsen and Azam 1984).
On average the bacteria have a net assimilation equivalent to 15% of the carbon fixed through
photosynthesis (Ducklow 2000). However, 97-99% of the net primary production is oxidized
back to CO2 (De La Rocha and Passow 2007), supporting that other degradation mechanisms,
in addition to bacterial remineralization, must be important. Therefore mesozooplankton
organisms have been suggested important in the degradation of both marine snow aggregates
(Kiørboe 2000; Lampitt et al. 1993; Steinberg et al. 1994) and fecal pellets (Gowing and
Silver 1983; Green et al. 1992; Paffenhöfer and Knowles 1979).
1.4.1 Why Visit aggregates
There may be many reasons why organisms settle on or visit marine aggregates.
Bacteria gain rich food supplies when attached to aggregates, but experience elevated
predation pressure and removal from the surface ocean as the aggregates sink. Protozoans are
abundant on aggregates where they are likely to feed on both bacteria and other particulate
constituents of the aggregate (Caron 1987; Tiselius and Kiørboe 1998). Bacteria that have
colonized an aggregate may detach again after ~3 hours, perhaps to avoid both predation and
removal from the surface ocean (Kiørboe et al. 2002). The high ecto-enzymatic activity
observed for attached bacteria (Smith et al. 1992) might also be a strategy to avoid both the
risk of predators and removal from the surface ocean. High rates of DOC leak from the
settling aggregates and create a plume in their wake (Kiørboe and Jackson 2001). The
colonizing bacteria may detach and feed in this plume where both the risk of removal and
predation is lowered. A side-effect of this high DOC production is the formation of important
growth habitats for free-living bacteria, whereby the once aggregated organic carbon may

Introduction
24
feed a significant proportion of the water column bacterial production (Kiørboe and Jackson
2001). The plume of DOC in the wake of an aggregate might also enable horizontal cruising
mesozooplankters to detect and encounter the aggregates via chemical perception (Kiørboe
and Thygesen 2001), bacteria have also been suggested to encounter aggregates using the
DOC plumes (Kiørboe and Jackson 2001). The numerous mesozooplankton species visiting
the aggregates may feed on the constituents and the microbes associated with the aggregate.
Some copepods explore settling aggregates so successfully that they have adapted to feeding
on solid surfaces, as aggregates, despite their pelagic lifestyle (Kiørboe 2001). Aggregates
also provide ´public transportation´ as observed for several invertebrate larvae, which appear
to use aggregates as sinking vehicles when they are ready to metamorphose and settle (Shanks
and Del Carmen 1997).
1.4.2 Degradation in rates
1.4.2.1 Marine snow degradation rates
The diverse group of organisms recycling the aggregates makes it difficult to
determine which fraction of the carbon removal is carried out by zooplankton and which
fraction is removed by bacteria. Average carbon specific respiration rates due to
microorganisms have been found at ~0.1 d-1 and seem size-independent in both natural and
laboratory made marine snow aggregates (Ploug and Grossart 2000; Ploug et al. 1999). It has
been shown that specific leakage of DOC are similar to the respiratory losses (Grossart and
Simon 1998; Kiørboe and Thygesen 2001; Smith et al. 1992), indicating specific carbon
removal rates by attached microbes in the order of ~0.2 d-1. The disaggregation of marine
snow by swimming zooplankton organisms (Dilling and Alldredge 2000; Graham et al. 2000;
Stemmann et al. 2004) may be important since it leads to longer residence times, and thereby
to further degradation of the marine snow in the upper ocean. Dilling and Alldredge (2000)
calculated that the euphasiid Euphausia pacifica at natural abundances could disrupt
aggregates contained in 3 – 33 % of the upper 100 m of the water column. Kiørboe (2000)
calculated that invertebrate zooplankters could degrade between 20 and 70 % of the
aggregates before they leave a 50 m deep euphotic zone. Thus, it seems that large parts of the
marine snow aggregates may be degraded within the euphotic zone due to activity from
microbes and zooplankters attaching to or visiting the aggregates.
Introduction
25
1.4.2.2 Fecal pellet degradation rates
Microbial carbon specific degradation of fecal pellets has suggested rates between
0.06 and 0.19 d-1 (Lee and Fisher 1992; Thor et al. 2003; Urban-Rich 1999). Even degradation
rates of 90% within the first 24 hours have been suggested for pellets produced at excess food
concentrations (Hansen et al. 1996a). Diffusion of DOC from pellets has been shown at rates
more than 50% of the total organic carbon in the pellet (Thor et al. 2003), reaching 28%
within the first 15 min (Møller et al. 2003). In addition to these high microbial degradation
and hydrolyzation rates, the pellets also seem an attractive food source for zooplankton.
Several mechanisms have been suggested as an outcome of the encounter between copepods
and fecal pellets. They can break up the pellets (coprorhexy) (Lampitt et al. 1991), ingest
parts of, or the whole pellet (coprophagy), and they can disrupt the peritrophic membrane
around the pellet (coprochaly) (Noji et al. 1991). Coprophagy removes the pellets and they
will not be part of the export flux. Coprorhexy converts large pellets into smaller pellet
fragments and coprochaly results in partial dispersal of fecal pellet contents into the water.
Both coprorhexy and coprochaly potentially increase the residence time of fecal material and
enhance the time for degradation in the upper water column. All encounters between
copepods and fecal pellets, thus, increase the recycling of fecal pellets in the upper ocean,
either directly via coprophagy or indirectly via coprorhexy or coprochaly. The cyclopoid
copepods Oithona spp. have been suggested as the main pellet grazer (Gonzalez and
Smetacek 1994; Svensen and Nejstgaard 2003). However, most of the conclusions for
copepod grazing behavior on pellets have been made without direct observations, and the
rates and triggering conditions for the different mechanisms are still unclear. It is, however,
know that the contribution from fecal pellets to the vertical flux of organic matter varies both
temporally and spatially (Poulsen and Kiørboe 2006; Wexel-Riser et al. 2001). Some studies
have reported increased pellet flux during bloom conditions (Wexel-Riser et al. 2002) while
other have observed maximum pellet degradation during bloom conditions (Dubischar and
Bathmann 2002; Sampei et al. 2004; Urban-Rich 2001). It therefore seems that an effective
pellet retention filter may prevent pellet export from the surface ocean (e.g., Wexel-Riser et
al. 2001), but the relative contributions to a retention filter by microbes and zooplankters are
still unclear.

Introduction
26
1.5 Marine snow vs. fecal pellets in the vertical flux
Though numerous studies of the POC flux exist, there is still no clear understanding
on the relative roles of marine snow aggregates and fecal pellets in the export of POC. At
times, fecal pellets seem to dominate in the POC flux and contribute with more than 70% to
the total carbon flux (e.g., Bishop et al. 1977; Gonzalez et al. 1994), while other studies
indicate that marine snow aggregates are dominant and fecal pellets contribute with less than
10% to the total carbon flux (e.g., Andreassen et al. 1996; Knauer et al. 1979; Lundsgaard et
al. 1999; Viitasalo et al. 1999).
Smetacek (1980) found low carbon contribution from pellet to the total POC flux
throughout a year in Kiel Bight, and observed the highest pellet removal rate during summer.
Sampei et al. (2004) also observed seasonal variation in the contribution of pellet to the total
POC flux, and found that 99% of the produced fecal pellets did not reach depths of 200 m
during the period with highest primary production. Landry et al. (1994) calculated that
grazing from mesozooplankton could remove between 16 to 44% of the primary production,
while only 23 to 32% of the pellets produced reached the deep ocean. Interestingly, the
highest percentage of the produced pellets often seems removed during periods with plenty of
food for the mesozooplankters, indicating that other degradation processes than coprophagy
may be important. This may even indicate other organisms than copepods as the major pellet
degraders.
The use of long term sediment traps has revealed that the deep ocean sedimentation is
highly variable. However, a linear relationship between surface primary production and POC
flux at 2000 m has been suggested (Lampitt and Antia 1997). Even so, it is unclear how much
of the primary production is exported, which aggregate types are responsible, and how this
changes with area, over time, and composition of pelagic communities (see Turner 2002). The
association with minerals have been suggested to ballast the aggregates and thereby increase
the POC flux by either protecting the organic matter from oxidation or by increasing the
sinking speed of the aggregates (Armstrong et al. 2002; Francois et al. 2002; Klaas and
Archer 2002). Good correlations between calcium carbonate and POC have suggested
calcium carbonate as the controlling ballast mineral for the POC flux (Francois et al. 2002;
Klaas and Archer 2002). This hypothesis has been termed the ballast hypothesis. However,
the actual mechanisms triggering the close correlation between fluxes of POC and minerals
are still unclear. Alternative suggestions are that the settling POC scavenge suspended
minerals which otherwise would not sink (Passow 2004; Passow and De La Rocha 2006).

Introduction
27
There is still no conclusive evidence for either protection of organic aggregates by minerals or
increased sinking velocity due to loading with mineral. Incorporation of minerals have been
suggested to decrease the porosity and increase the density, and thereby increase the sinking
speed of marine aggregates (De La Rocha and Passow 2007), despite the fact that the
presence of minerals seemed to fragment marine snow into smaller aggregate (Passow and De
La Rocha 2006).
1.6 Questions to be answered
Intense investigations of the processes controlling the vertical flux of organic carbon
through the water column have been made since Martin et al. (1987) observed rapid carbon
removal in the upper 1000 m. Despite numerous investigations, essential pieces of the puzzle
still need to be brought together before we have the whole picture. In this thesis I will attempt
to answer some of the open questions:
Is Oithona sp. the main pellet degrader?
What is the degradation mechanism and impact from copepods on fecal pellets?
Are other organisms than copepods important for degradation of fecal pellets?
What is the influence from ballast minerals on aggregate sinking speed?
Can ballast minerals protect aggregates from microbial degradation?
What is the relative contribution from zooplankters and microbes to carbon removal, and how
is this relationship at different depths?
28
2 RESULTS AND DISCUSSION
There exist only few investigations of the carbon flux above 200 to 500 m depth since
long-term sediment traps have limitations at these depths. Therefore we lack basic
understanding on how vertical carbon flux is regulated between the depth of primary
production and the depths where most carbon fluxes are measured. This has been described as
a hundreds of meter thick black box (Wassmann et al. 2003). However, it has been shown that
there is a rapid decrease in vertical POC flux in the twilight zone (Olli et al. 2001; Wassmann
et al. 2003). To get a better insight to the processes taking place in the twilight zone, a series
of investigations of processes important for carbon turnover and export of fecal pellets,
marine snow, and phytoplankton-derived aggregates were performed. The terms used for the
different aggregate types in the following discussion are defined as; fecal pellets: aggregates
surrounded by a peritrophic membrane and produced via excretion of ingested material by
zooplankton organisms; marine snow: large aggregates (>0.5 mm) formed in situ or from in
situ collected material in roller tanks; phytoplankton-derived aggregates: aggregates formed
in roller tanks from phytoplankton cultures. Table 1 provides an overview of the publications
based on these investigations.

Table 1: Overview of the conducted experiments. Objectives, applied methods, main results, and conclusions.
Experiment parameters
Objectives and questions
Method applied
Main results
Conclusions
• Copepods species: C. finmarchicus, P. elongatus, and O. similis. • Fecal pellets offered as sole food or together with an alternative food source. • Experiments were performed at in situ temperature and salinity.
• Investigations of copepod feeding behavior while grazing on fecal pellets. • Are copepods the main fecal pellet degraders?
• Grazing incubations and visual observations of copepod females offered pellets as sole food or together with an alternative food source. • Methods: plankton wheel incubations and video recordings.
• The calanoid copepods had high fragmentation rate of encountered pellets. • The calanoid copepods mainly ingested small fecal pellet and pellet fragments, large pellets were rejected. • The presence of an alternative food source increased the pellet encounter rate by calanoid copepods and, thus, the ingestion of fecal pellets by the calanoid copepods. • O. similis did not seem to have an efficient grazing on fecal pellets.
• Coprorhexy was the main feeding behavior by calanoid copepods. • Ingestion of fecal pellets by the calanoid copepods mainly seemed unintentional and increased when the pellets were offered together with an alternative food source. • O. similis did not seem important for fecal pellets retention in the upper ocean.
• Fecal pellets were offered to size a fractionated plankton community from Øresund (DK). • The incubations were performed app. every second month. • Incubated in laboratory at in situ conditions.
• Degradation of pellets by different size fractions of a natural plankton community from Øresund (DK). • Identify the most important organisms in pellet degradation and their seasonal effect.
• Grazing incubations on plankton wheel. • The natural plankton community was fractionated in <0.2 µm, <2 µm, <20 µm, <100 µm, <200 µm, and non-fractionated.
• Seasonality of pellet degradation followed the phytoplankton (high degradation during bloom etc.). • The highest fecal pellet degradation impact was observed in the 20 to 100 µm size fraction. • The abundance of the heterotrophic dinoflagellate G. spirale could be used as a predictor for the pellet degradation rate in the 20 to 100 µm size fraction.
• Large heterotrophic dinoflagellates were indicated as the main pellet degraders throughout the year. • Late stages of copepod nauplii may have an impact on pellet degradation in the >200 µm size-fraction. • Copepods may have high indirect influence on pellet degradation via grazing on the main pellet degraders (protozooplankters). • A ´protozoan filter´ seemed to retain pellets in the upper ocean.
Pap
er II
Pape
r I
29

Experiment parameters
Objectives and questions
Method applied
Main results
Conclusions
• Grazing incubations with T. longicornis feeding on either, Rhodomonas sp. (only organic matter), T. weissflogii (opal), or E. huxleyi (calcite).
• Microbial degradation and sinking speed measurements of fecal pellets produced on different food types. • Does ballasting of fecal pellets affect degradation and sinking speed?
• Direct measurements of high resolution small O2 fluxes to fecal pellets, sinking speed, density, and chemical composition. • Determination of grazing and pellet production rate.
• Fecal pellet production was significantly higher with T. weissflogii than with other food sources. • Pellets containing ballast minerals had significantly higher sinking speeds and densities as compared to pellets without ballast minerals. • No differences were observed in carbon-specific respiration rates between fecal pellet with and without ballast minerals.
• It was demonstrated that ballasting of fecal pellets increased the sinking speed of freshly produced pellets but could not protect the pellets from decomposition. • The presence of ballast minerals in freshly produced fecal pellets appeared to be an important factor controlling vertical carbon fluxes in the ocean.
• Measurements on field-sampled marine snow, laboratory-made aggregates from diatoms, coccolithophorids, or in situ collected material, small and large fecal pellets containing biogenic and/or lithogenic ballast minerals were investigated.
• Does ballasting increase carbon export via increased sinking speeds and/or protect from decomposition due to lowered apparent diffusivities in marine sinking aggregates?
• Direct measurements of high resolution small O2 fluxes to aggregates. • Diffusivity measurements within aggregates. • Direct measurements of aggregate sinking speed and density.
• Increased sinking speeds were observed for aggregates containing ballast minerals. • No significant change in apparent diffusivity was observed between aggregates with or without ballast minerals.
• Aggregates ballasted by biominerals and lithogenic material did not show any change in apparent diffusivity of solutes and oxygen. Therefore, no support for protection from decomposition by ballast minerals was found. • Increased sinking speeds of ballasted aggregates may even increase the oxygen supply to the aggregates as they settle and, thus, maintain carbon specific respiration in sinking aggregates as they settle.
Table 1 (continued): Overview of the conducted experiments. Objectives, applied methods, main results, and conclusions.
30
P
aper
IV
Pa
per
III
31
Table 1 (continued): Overview of the conducted experiments. Objectives, applied methods, main results, and conclusions.
Experiment parameters
Objectives and questions
Method applied
Main results Conclusions
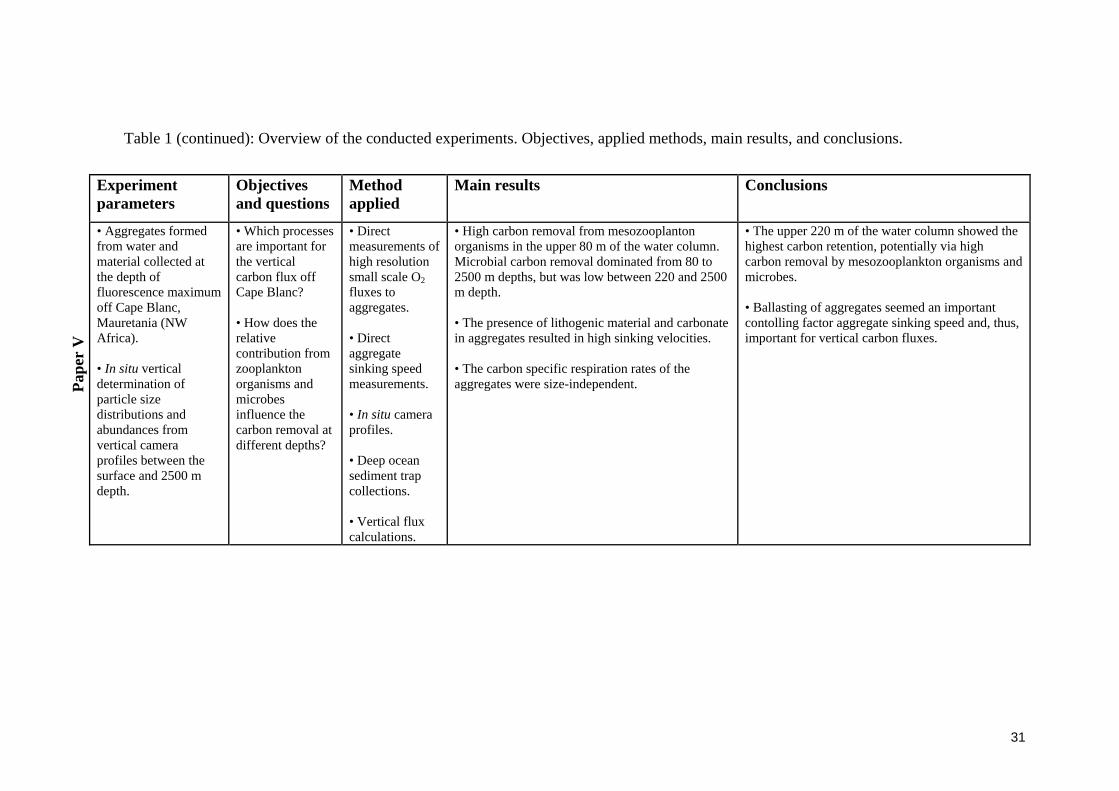
• Aggregates formed from water and material collected at the depth of fluorescence maximum off Cape Blanc, Mauretania (NW Africa). • In situ vertical determination of particle size distributions and abundances from vertical camera profiles between the surface and 2500 m depth.
• Which processes are important for the vertical carbon flux off Cape Blanc? • How does the relative contribution from zooplankton organisms and microbes influence the carbon removal at different depths?
• Direct measurements of high resolution small scale O2 fluxes to aggregates. • Direct aggregate sinking speed measurements. • In situ camera profiles. • Deep ocean sediment trap collections. • Vertical flux calculations.
• High carbon removal from mesozooplanton organisms in the upper 80 m of the water column. Microbial carbon removal dominated from 80 to 2500 m depths, but was low between 220 and 2500 m depth. • The presence of lithogenic material and carbonate in aggregates resulted in high sinking velocities. • The carbon specific respiration rates of the aggregates were size-independent.
• The upper 220 m of the water column showed the highest carbon retention, potentially via high carbon removal by mesozooplankton organisms and microbes. • Ballasting of aggregates seemed an important contolling factor aggregate sinking speed and, thus, important for vertical carbon fluxes.
P
aper
V
Results and Discussion
2.1 Carbon turnover in fecal pellets
The majority of the produced copepod fecal pellets seem recycled within the water
column (Smetacek 1980; Turner 2002) and often at shallow depths. Therefore, a large part of
the POC removal in the twilight zone may occur as fecal pellet recycling. Copepods have
been suggested as the main degraders of fecal pellets, and coprophagy are believed to be the
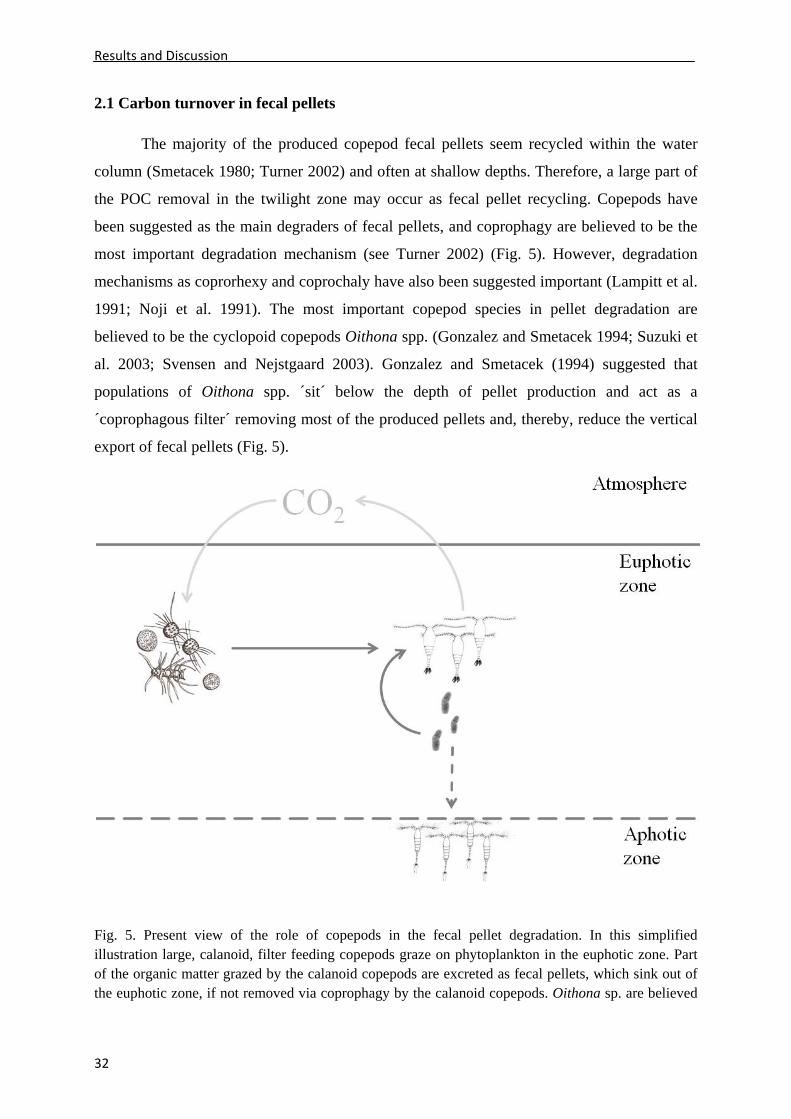
most important degradation mechanism (see Turner 2002) (Fig. 5). However, degradation
mechanisms as coprorhexy and coprochaly have also been suggested important (Lampitt et al.
1991; Noji et al. 1991). The most important copepod species in pellet degradation are
believed to be the cyclopoid copepods Oithona spp. (Gonzalez and Smetacek 1994; Suzuki et
al. 2003; Svensen and Nejstgaard 2003). Gonzalez and Smetacek (1994) suggested that
populations of Oithona spp. ´sit´ below the depth of pellet production and act as a
´coprophagous filter´ removing most of the produced pellets and, thereby, reduce the vertical
export of fecal pellets (Fig. 5).
Fig. 5. Present view of the role of copepods in the fecal pellet degradation. In this simplified illustration large, calanoid, filter feeding copepods graze on phytoplankton in the euphotic zone. Part of the organic matter grazed by the calanoid copepods are excreted as fecal pellets, which sink out of the euphotic zone, if not removed via coprophagy by the calanoid copepods. Oithona sp. are believed
32
Results and Discussion
33
to form a ´coprophagous filter´ at the base of the euphotic zone, whereby the fecal pellets are removed from the export flux at high rates (Gonzalez and Smetacek 1994).
Despite the general acceptance of copepods being the most important pellet degraders,
there exists no direct evidence supporting their role in pellet degradation. The coprophagous
behavior of Oithona sp. is only based on the study by Gonzalez and Smetacek (1994), who
conducted their experiments in upright bottles and reported Oithona similis to graze fecal
pellets from the bottom of these bottles. O. similis require a hydrodynamic signal from its
prey, either created from the swimming motion of the prey or from the sinking of fecal pellets
(Svensen and Kiørboe 2000). To detect pellets on the bottom of a bottle, chemosensory
detection is needed. Chemosensory detection requires a feeding current (Andrews 1983), and
since O. similis lacks the ability to filter feed (Svensen and Kiørboe 2000) it cannot detect
pellet from the bottom of a bottle.
To investigate the role of copepods in fecal pellet degradation, a series of experiments
were conducted to determine the fecal pellet feeding behavior of three common copepod
species in temperate areas (Calanus helgolandicus, Pseudocalanus elongatus, and O. similis)
(Paper I). By combining visual observations of feeding behavior with grazing rate
measurements, the mechanism and impact on pellet degradation from the copepods could be
measured. The copepods were offered fecal pellets as sole food and fecal pellets in
combination with an alternative food source. The copepod species were chosen due to their
different sizes and different feeding strategies. The calanoid copepods C. helgolandicus and
P. elongatus are suspension feeders and detect their food via chemosensory perception using a
feeding current while cruising slowly through the water (Andrews 1983). The cyclopoid O.
similis is an ambush feeder ´hanging´ in the water and only launching an attack when a prey
particle is detected via hydromechanical disturbances generated by the prey item (Kiørboe
and Visser 1999; Svensen and Kiørboe 2000).
2.1.1 Is Oithona sp. the main pellet degrader?
Despite the fact that O. similis seem unlikely to have grazed pellets from the bottom of
a bottle in the experiment by Gonzalez and Smetacek (1994), O. similis may still be the main
component of a ´coprophagous filter´. Supporting this, ingestion of fecal pellets was observed
from the grazing incubations (Paper I). However, the visual observations of the feeding
behavior of O. similis contradict that it forms a coprophagous filter, since no observations of
launched attacks on pellets were observed during 7 h of analyzed video recordings (Paper I).

Results and Discussion
34
The pellet ingestion increased when pellet were offered together with Rhodomonas salina,
indicating O. similis were triggered into a feeding mode by the presence of alternative food. In
this feeding mode O. similis seemed more likely to encounter pellets with pellet fragmentation
or ingestion as an outcome (Paper I). However, the apparent lack of launced attacks on
pellets during the visual observations, despite pellets being within detection distance (Kiørboe
and Visser 1999) and observed feeding on R. salina, indicates that O. similis does not view
pellets as suitable food items (Paper I). Thus, it does not seem likely that O. similis function
as a coprophagous filter in the upper ocean. This is supported by Paper II and other studies
(Poulsen and Kiørboe 2006; Reigstad et al. 2005; Sampei et al. 2004) in which Oithona sp.
did not seem to impact the pellet degradation. However, O. similis may be an indicator
species for high pellet degradation regimes, but does not necessarily degrade the pellets
themself (Reigstad et al. 2005; Paper I).
2.1.2 What is the degradation mechanism and impact from copepods on fecal pellets?
From the visual observations, it was observed that the calanoid copepods did not view
fecal pellets as a suitable food item. This was concluded since pellets caught in the feeding
current of the copepods were either avoided or rejected (Paper I). Pellets were avoided either
by pausing the filtration activity whereby the copepod settled away from the pellet, by
jumping away from the pellets, or by kicking with their swimming legs and, thus, creating a
small water thrust pushing the pellets away. For all avoidance occasions the copepods
detected the pellets via chemosensory perception before an actual encounter between copepod
and fecal pellet occurred. When the avoidance was performed by pausing the filtration
activity and by jumping away, the pellets were left ´unharmed´. However, when avoidance
occurred via generation of a water thrust, the pellets were occasionally observed to break
apart due to the physical stress from the water current. Rejections of pellets occurred when the
pellets reached the feeding appendages of the copepods. The rejections were performed via
continues jumps, kicks with the swimming legs, or rapid circular swimming. Often the pellets
were fragmented after such rejection episodes (Paper I). Actual pellet ingestions were mainly
observed when small pellet fragments were caught in the feeding current and ingested,
seemingly unintentionally, along with suitable food particles, indicating pellet size as a
controlling factor for the pellet ingestion. This lead to the conclusion that the calanoid
copepods did not view fecal pellets as suitable food items (Paper I). When pellets were
offered together with an alternative food source, a feeding response in the copepods was

Results and Discussion
35
induces, whereby suspension feeding activity was increased, leading to increased pellet
encounters. This indicates that pellets are mainly encountered as a side-effect of feeding
activity on other particles (Paper I).
The main fecal pellet degradation mechanism was rejection, which occasionally lead
to membrane rupture, opening and/or fragmentation of the pellets (Paper I). Hence, the main
degradation mechanism for calanoid copepods seems via coprorhexy. This has also been
observed in other studies (Lampitt et al. 1991; Noji et al. 1991; Paffenhöfer and Van Sant
1985; Poulsen and Kiørboe 2005). Paper I and Poulsen and Kiørboe (2005) observed that
copepods preying via ambush feeding (O.similis and Acartia tonsa) have little impact on
pellet degradation. It therefore seems that copepods in general have little direct impact on
fecal pellet degradation. However, the calanoid filter feeding copepods may have a large
indirect impact due to coprorhexy, whereby the pellets may be fragmented. Once fecal pellets
are fragmented, their sinking speeds may be reduced and the peritrophic membrane opened.
This potentially increases the retention time of pellets in the upper water column, and, thus,
increases the time for degradation processes to take place. Further, the smaller pellet size
enable grazing from smaller organisms (Fig. 6). Therefore copepods do not seem the main
pellet degraders and other organisms must play a crucial role in the pellet degradation in the
upper ocean.

Results and Discussion
36
Fig. 6. Modified simple illustration of the role of copepods for the fecal pellet degradation. It is observed that the main role in pellet degradation from copepods is via coprorhexy, fragmenting the pellets into smaller parts. This prolongs their residence time in the euphotic zone, and, thus, increases the impact via the microbial loop (pellet fragments bacteria nano-flagellates heterotrophic dinoflagellates). The heterotrophic dinoflagellates may then be grazed by copepods, adding to the pelagic biomass in the euphotic zone. Note that there no longer exists a coprophagous filter, and that Oithona similis do not seem to have a significant role in the degradation of fecal pellets (Paper I).
Careful estimations of the ecological impact from copepods on the fecal pellet export
can be made by assuming a simple system consisting only of fecal pellets and the two
copepods C. helgolandicus and P. elongatus. In the following estimations the two copepod
species are assumed to ´sit´ below fecal pellets which sink towards them. The concentration of
sinking fecal pellets is 300 L-1, equivalent to 0.3 pellet per ml (Emerson and Roff 1987). C.
helgolandicus are assumed to have an abundances of 1 L-1, which is higher than expected in
situ (Miralto et al. 2003) and the abundance of P. elongatus are assumed to be 3 L-1, which is
in the high end of in situ abundances (Paper II). We assume a pellet production rate of 20
pellet d-1 from both C. helgolandicus and P. elongatus (Huskin et al. 2000; Vargas et al.
2002). The encounter rate and feeding behavior is estimated according to the values found for
the low concentrations of pellets offered together with an alternative food source (Table 2 and

Results and Discussion
37
3, Paper I). The suspension feeding activity from Fig. 5 and 6 (Paper I) is used as a measure
for the filtration rate during an eight hour feeding period. The eight hours illustrate a feeding
period from ten o´clock in the evening until dawn (Fig. 7).
Fig. 7. Simple estimation of impact from copepods on fecal pellet export. Only the two copepod species Calanus helgolandicus and Pseudocalanus elongatus are considered in this estimation. Pellet encounter rate, ingestion rate, and rejection rate are from Paper I. See text above for explanaition. A concentration 300 fecal pellet L-1 are sinking towards the copepods. P. elongatus encounter 163 pellets and ingest 41 of those pellets while the rest are rejected. C. helgolandicus encounter 64 pellets and ingest 28 of those, rejecting 36 pellets. In addition, a total of 80 pellets are produced, assuming that the whole daily pellet production takes place during the 8 h feeding period. As an outcome it is observed the copepods only have little influence on the pellet removal, and may even cause an increase in pellet fluxes.
Despite the simplicity of this estimation (Fig. 7), it illustrates that copepods are unlikely to
have a large role in the high recycling of pellets in the upper ocean. It is even seen that
copepods potentially may increase the pellet concentration via their pellet production (Fig. 7).
Therefore, copepods do not seem to have a direct role in pellet degradation and, thus, other

Results and Discussion
38
organisms than copepods may be key players in the pellet degradation, but have been
overlooked so far.
2.1.3 Are other organisms than copepods important for degradation of fecal pellets?
To identify the key players responsible for the high retention rate of fecal pellets in the
upper ocean, experiments were conducted with incubations of different size fractions of a
natural plankton community (Paper II). Approximately every second month, throughout one
year, the whole plankton community from Øresund (Denmark) was sampled and divided into
5 size fractions (<0.2 µm, <2 µm, <20 µm, <100 µm, and <200 µm) and an unfractionated
fraction containing the whole plankton community. The different size fractions were
incubated with a known amount of fecal pellets. After incubation the pellet degradation from
each size fraction was determined, and the species composition of the plankton for each size
fraction identified. This investigation confirmed the finding in Paper I, and indicated that
copepods, and other large mesozooplankters, in general do not have a significant impact on
the pellet degradation (Paper II). This has also been found by Poulsen and Kiørboe (2006) in
the North Sea, where they indicated plankton organisms <200 µm to have an important role in
pellet recycling. Paper II was able to narrow the size range containing the key degraders
further, and found the major impact on pellet degradation from the microplankton organisms
between 20 and 100 µm. Therefore, protozooplankters seemed the likely candidates in pellet
recycling, and especially the presence of the heterotrophic dinoflagellate Gyrodinium spirale
seemed to explain the pellet removal (Paper II). Supporting this, G. spirale and
Protoperidinium spp. have been observed to feed on fecal pellets during microscopic
observations (pers. com. P. J. Hansen and L. K. Poulsen). Earlier studies have observed
protozooplankton associated with fecal pellets, but these observations were interpreted as
grazing on the microbes attached to the peritrophic membrane surrounding the pellet (Gowing
and Silver 1983).
It may seem surprising that protozooplankton within the size range of 20 to 100 µm
can have a huge impact on the fecal pellet removal. G. spirale normally have a length ranging
between 40 and 200 µm and a width between 20 to 45 µm, which is the same dimensions as
most fecal pellets produced by calanoid copepods in the Baltic (e.g., Temora longicornis,
Pseudocalanus elongatus, and Acartia tonsa). However, large heterotrophic dinoflagellates
have an optimum prey size similar to their own size, i.e., the predator to prey size ratio of 1:1
(Hansen 1992; Jacobsen and Hansen 1997), indicating that they may feed on both pellet

Results and Discussion
39
fragments and most intact pellets produced in the Baltic. Euplotes sp. which is a benthic
ciliate has been observed to degrade fecal pellets at high rates in Paper II and in a study by
Hansen et al. (1996). However, this does not seem a general behavior from ciliates since most
ciliates are smaller than fecal pellets and have an optimum prey size of 1:10, resulting in prey
sizes <20 µm (Jacobsen and Hansen 1997).
G. spirale have a pellet clearance rate of 1 ml cell-1 d-1 (Paper II). This may seem
rather low, but when considering that abundances of heterotrophic diniflagellates can reach
>1000 cells L-1 (Nakamura et al. 1995) it becomes likely that protozooplankton may be
important pellet degraders and could function as an effective ‘protozoan filter’ for fecal
pellets (Paper II). Kiørboe (2003) found a linear relationship between the abundances of the
heterotrophic dinoflagellate Noctiluca scintillans and specific fecal pellet remineralization
rates off the coast of Brazil, and suggested N. scintillans to clear the water for pellet at ~0.61
pellets cell-1 d-1. During a ship cruise in the North Sea in 2007, N. scintillans were measured
to clear fecal pellet at rates of 2.84 ± 0.35 pellets cell-1 d-1 at concentrations of 0.08 fecal
pellets ml-1 (unpublished data, M. H. Iversen). Microscopic observations often revealed
pellets within N. scintillans (Fig. 8). Thus, it seems that not only G. spirale are able to feed on
fecal pellets, but potentially more protozooplankters have adapted to exploit these sinking
food packages.
Fig. 8. Microscopic pictures of Noctiluca scintillans with a fecal pellet within them. The red arrows indicate the fecal pellets (Photo: M. H. Iversen).
It may be argued that the pellets used in Paper II provided more desired food items
than in situ produced pellets, since the experiments were performed with pellets produced on

Results and Discussion
40
excess food concentrations of Rhodomonas salina, and therefore likely to contain high
amounts of organic carbon. To investigate if the use of in situ pellets changes the degradation
patterns found between the size fractions of a plankton community offered laboratory
produced pellets in Paper II, a similar experiment was performed using in situ produced
pellets and a plankton community from the North Sea (2007) (unpublished data, M. H.
Iversen). These investigations supported the importance of plankton organisms <100 µm in
the recycling of fecal pellets (Fig. 9), and it seems confirmed that large (>20 µm to <100 µm)
protozooplankton organisms are the main pellet degraders. Thus, an effective protozoan filter
may prevent pellet export in both the Baltic, off the coast of Brazil, and in the North Sea.
Fig. 9. Fecal pellet degradation rate for each size fraction from a natural plankton community collected in the North Sea during a ship cruise in July 2007. The offered fecal pellets were produced by copepods feeding on the plankton community in situ. The pellets were collected by letting the copepods defecate one hour after they were collected with plankton net hauls. These pellets were incubated together with different size fractions of the natural plankton community (Unpublished data, M. H. Iversen).
Often maximum pellet degradation have been observed at bloom conditions, where
high concentrations of alternative food sources for copepods are available (Dubischar and
Bathmann 2002; Sampei et al. 2004; Urban-Rich 2001). With the introduction of a ´protozoan
filter´ instead of a ´coprophagous filter´ (Paper II) an explanation to the high pellet

Results and Discussion
41
degradation at bloom conditions may be provided, since the biomass of protozooplankton
seems closely related to the patterns of phytoplankton biomass (Fig. 3 in Paper II).
Therefore, the pellet degradation by protozoans is likely to reach its maximum during bloom
situations due to the concomitant peak in protozooplankton biomass. The suggestion of a
´protozoan filter´ complicates the role of mesozooplankton in the pellet degradation, since
mesozooplankton organisms can increase the pellet degradation via coprorhexy or decrease
the pellet degradation via grazing on the protozoan community. The impact of high grazing
pressure from copepods on protozooplankton was observed in July 2005 (Paper II), and lead
to a decrease in pellet degradation rate for the size fraction containing copepods (Fig. 5H in
Paper II). Finally, the ability of protozooplankton to graze directly on fecal pellets may
influence the pelagic biomass since the microbial loop may be short-circuited and the
respiration losses from bacteria and nanoflagellates may be avoided in situations with an
effective ´protozoan filter´. This provides a more efficient carbon transfer to the copepods
grazing on protozoans (Fig. 10).
Fig. 9. In this simple illustration, protozooplankton organisms are the main pellet degraders, and form a ´protozoan filter´ preventing high flux rates of fecal pellets. The copepods have a positive influence on the pellet degradation via coprorhexy. Coprorhexy transforms intact pellets into smaller pellet fragments, whereby pellet sinking speeds are reduced and their residence time in the upper ocean increased. The smaller pellet sizes enable small protozoans to graze on the pellets. The copepods also

Results and Discussion
42
graze on protozoans and, thus, reduce the impact of the ´protozoan filter´. When directly ingesting fecal pellets, the protozooplankton organisms short-circuit the microbial loop, and provide a food source for mesozooplankters without respiratory losses from the bacteria or the nanoflagellates.
The observations of protozooplankton organisms being the main pellet degraders
(Paper II) explain why the high turnover rates of organic matter within pellets in the upper
ocean are not matched by bacterial activity alone (Jacobsen and Azam 1984; Lampitt et al.
1991; Paper II; Paper III). Organic carbon degradation rates in copepod fecal pellets have
been measured to vary between 0.06 and 0.17 d-1 (Thor et al. 2003), which agree well with the
estimations of microbial degradation rates and respiratory turnover of carbon in pellets found
in Paper II and Paper III. The microbial carbon turnover time is therefore between 6 and 17
days. This would result in larger pellet fluxes from the upper ocean than observed, due to the
high sinking speeds of pellets. However, the activity from the bacteria associated with the
fecal pellets may still play a significant role in the pellet degradation, since attached bacteria
have high ecto-enzymatic hydrolysis activities (Smith et al. 1992; Thor et al. 2003; Ziervogel
and Arnosti 2008), which may be closely coupled to their respiration (Paper III). The
hydrolytic activity forms microenvironments within the pellets, with elevated concentrations
of dissolved organic carbon (DOC) relative to the surrounding water (Smith et al. 1992). As
the pellets sink, the DOC leaks away from the pellets and forms a plume in its wake extending
10 to 100 fold larger than the volume of the pellet (Kiørboe et al. 2001). It is due to the
formation of such plumes that bacteria may play an important role in the high fecal pellet
retention in the upper ocean, since zooplankters, protozooplankters, and detached bacteria
may use chemosensory behavior to detect the plumes and thereby encounter the pellets at high
rates (Kiørboe 2001; Kiørboe et al. 2002). Hereby, higher pellet ingestions by
protozooplankters (Paper II) and higher pellet fragmentation via coprorhexy (Paper I) are
promoted. Pellet fragmentation decreases the pellet size, and, thus, their sinking speeds
(Paper III) and increases the residence time in the upper ocean.
2.1.4 What is the influence from ballast minerals on aggregate sinking speed?
The residence time of fecal pellets in the upper ocean is influenced by the sinking
speed of the fecal pellets, affected by physical processes, e.g. turbulence, and biological
processes, e.g. coprohexy, in the upper ocean. Such processes often cause mesozooplanktonic
fecal pellets to remain in the upper ocean much longer than expected from their sinking
speeds (Alldredge et al. 1987). However, a fast-sinking fecal pellet is still more likely to reach
the deep ocean than a slow-sinking pellet. To investigate the influence of diet type on sinking
Results and Discussion
43
velocity, fecal pellets were produced from nanoflagellates (only organic matter), diatoms
(producing opal), and coccolithophorids (producing calcite) (Paper III).
When fecal pellets were produced on a diet containing biogenic ballast minerals (e.g.
diatoms and coccolithophorids) they had significant higher sinking speeds compared to pellets
produced on a diet without these ballast minerals (e.g. nanoflagellates) (Paper III). Very
dense appendicualrian pellets containing high amount of lithogenic material and carbonate
even had sinking speeds <1000 m d-1 (Paper IV). A significant increase in pellet density was
observed when ballast minerals were present as compared to pellets without ballast minerals,
indicating pellet density important for sinking speed (Paper III). It is therefore indicated that
biominerals within fecal pellets can be an important factor controlling pellet sinking speed,
and potentially induce 10-fold higher vertical pellet fluxes (Paper III).
2.1.5 Can ballast minerals protect organic matter from microbial degradation?
Bacterial degradation rates have been observed to differ with different food sources,
leading to higher microbial degradation rates for pellets produced on flagellates as compared
to diatoms (Hansen et al. 1996; Lee and Fisher 1992; Thor et al. 2003). Paper III showed
similar, or even higher, carbon specific respiration rates in fecal pellets produced on
coccolithophorids and diatoms compared to carbon specific respiration rates in fecal pellets
produced on flagellates. Hence, no evidence was found for higher microbial degradation rates
for pellets produced on a flagellate diet compared to a diatom or coccolithophorid diet (Paper
III). However, the pellets produced on a flagellate diet were two to four times smaller by
volume than those produced on diatoms and coccolithophorids, and had higher average
oxygen fluxes to the pellets. This resulted in two to six times higher volumetric respiration
rates in the flagellate pellets compared to the two other pellet types. Despite the differences in
volumetric respiration rates between the pellet types, we did not observe differences in the
carbon specific respiration rates. Hence the higher volume-specific O2 uptake reflected high
volume-specific carbon content in the flagellate pellets compared to the two other pellet types,
and there was a tight coupling between respiration rate and carbon content of the pellets.
Therefore, ballasting did not seem to protect freshly produced pellets against microbial
degradation (Paper III).
The findings in Paper III demonstrate that sinking speeds of fecal pellets were more
affected by the presence of biominerals than the specific carbon remineralization rates were. It
therefore appeared that ballast minerals (e.g., carbonate and opal) are important in controlling
the vertical carbon fluxes in the ocean. The promotion of carbon preservation in the presence

Results and Discussion
44
of biominerals was due to increasing sinking speeds of the pellet, caused from their higher
densities when produced on phytoplankton containing biominerals (Paper III) and/or on
lithogenic material (Paper IV). Within freshly produced pellets, no evidence for protection of
the organic matter by the presence of biominerals was found. Further, it was shown that
biominerals have little influence on apparent diffusivity within the fecal pellets (Paper IV). In
contrast, the potential oxygen flux to the pellets may increase as they settle due to the
increased sinking speeds. Thus, the presence of biominerals in pellets may even cause a more
efficient turnover of labile carbon at depths, since they maintain an oxic environment inside
the pellets at great depths (Paper IV).
In summary, the main role of copepods in the pellet degradation seems to be
fragmentation of the pellets via coprorhexy. This decreases the sinking speeds of the pellets
and, thus, increases their residence times in the upper ocean. Further, the small pellet size
makes them available for smaller grazing organisms. The main pellet degraders are
protozooplankters which form an effective protozoan filter removing the pellets from the
vertical POC flux. This protozoan filter decreases the respiratory losses by short-circuiting the
microbial food web. The main role of the bacterial remineralization seems to lie in the
formation of a DOC plume in the wake of the pellets, providing a signature trail behind them
and, thus, increasing the encounter rates from grazers detecting their prey via chemosensory
behavior. Incorporation of biominerals produced by diatoms and coccolithophorids and/or
lithogenic materials can increase the sinking speeds of fecal pellets, but does not protect
freshly produced pellets from decomposition. Hereby, either fast-sinking or slow-sinking
fecal pellets may be produced, depending on the type of phytoplankton the pellets are
produced from. Fast sinking fecal pellets may be transformed into slow sinking pellets via
coprorhexy from the copepods. The ballasting of the fecal pellets may potentially increase the
vertical flux of fecal pellets (Fig. 10).

Results and Discussion
45
Fig. 10. Simplified system only considering fecal pellet processes. It is assumed that the downward export of limiting elements equals their input. The degradation and remineralization of fecal pellets lead to recycling of the limiting elements in the euphotic zone. This may increase the phytoplankton biomass and thereby increase the copepod biomass and fecal pellet production. The copepods fragment pellets via coprorhexy, and, thus, increase their residence time in the upper ocean and enable small grazers to feed on the pellets. Protozooplankters form an effective protozoan filter which remove pellets from the vertical POC flux and decrease the respiratory losses by short-circuiting the microbial food web. Bacterial remineralization can form a DOC plume in the wake of the pellets. This DOC plume acts as a signature trail behind the pellets. Hereby encounter rates from grazers may be increased via chemosensory behavior. If the fecal pellets are produced on phytoplankton containing biominerals (e.g., diatoms and coccolithophorids) their sinking speeds are likely high compared to pellets produced on phytoplankton without biominerals (flagellates). Thus, biominerals from diatoms and coccolithophorids may increase the vertical flux of fecal pellets due to the ballasting of the pellets. However, if the fast-sinking pellets are fragmented via coprorhexy they may add to the pool of slow-sinking pellets.
2.2 Carbon turnover in aggregates
As observed in figure 4 there is a rapid decrease in carbon flux in the upper few
hundreds of meters of the surface ocean (see introduction, 1.4). This strongly indicates that
investigations of aggregate associated processes in the upper ocean are very important in
Results and Discussion
46
understanding the controls on the efficiency of particle transport between the surface and the
deep ocean. The discussion of fecal pellet fluxes already illustrated the complexity of the
processes controlling export and/or retention of pellets (see discussion, 2.1). Despite the fact
that pellets are easier to handle in experiments and collect in situ due to their more robust
nature compared to marine snow and phytoplankton-derived aggregates, the process leading
to the current understanding of the role of pellets in the POC flux has a long history and was
already reviewed three decades ago (Turner and Ferrante 1979). The role of particulate
organic matter in microbial decomposition and recycling of nutrient has been studied the last
four decades, but the intense study of marine snow and phytoplankton-derived aggregates
only started in the 1990s (see Simon et al. 2002). Still, more questions are often raised than
answered, and even for the role of fecal pellets in the vertical export recent studies has called
for a major revision of our understanding (e.g., Paper II).
To identify regulating processes for retention and export of marine snow and
phytoplankton-derived aggregates in the surface ocean a series of experiments were
conducted. These experiments included analysis of the influence from biominerals on sinking
speed, apparent diffusivity, and small scale oxygen fluxes to sinking aggregates. Further,
estimated vertical carbon fluxes between the surface ocean and 2500 m depth were used to
identify important degradation processes at different depths intervals. In the following
discussion I will focus on controlling processes for marine snow and phytoplankton-derived
aggregates in the vertical carbon flux. However, when appropriate I will include the role of
fecal pellets in the vertical flux.
2.2.1 Can ballast minerals protect aggregates from microbial degradation?
Concentrations of solutes within marine snow are significantly different from those of
the surrounding water (Alldredge 2000; Alldredge and Cohen 1987; Brzezinski et al. 1997;
Ploug et al. 1999). These concentration differences form steep gradients of gases, nutrients,
and other solutes in marine snow and have led to the speculations that diffusion may be slow
within these aggregates (Alldredge 2000; Brzezinski et al. 1997; Shanks and Reeder 1993).
However, a recent study by Ploug and Passow (2007) showed that apparent diffusivity of
gasses within diatom aggregates was close to that of (stagnant) seawater. This was explained
by high water content of the aggregates. Other studies have shown that mass transfer in
aggregates appears to be dominated by diffusion (Ploug 2001; Ploug et al. 1999; Ploug et al.
2002), indicating the advective flow within aggregates very low or absent (Ploug and Passow

Results and Discussion
47
2007). The high volume fraction of TEP may limit advective flow rather than diffusion rates
within marine snow (Ploug and Passow 2007). The apparent diffusivity in a wide range and
types of porous marine snow and phytoplankton-derived aggregates showed only slightly
lower values than that in (stagnant) sea water (Paper IV). Further, apparent diffusivity within
large fecal pellets with a high volume-specific content of carbonate and lithogenic material
was only approximately 25% lower than that in sea water, indicating high content of
biominerals in aggregates may limit advection rather than diffusion within aggregates (Paper
IV). Thus, the presence of biominerals in aggregates did not show evidence for protection
mechanisms against degradation of labile organic matter that might result from a lower
diffusivity (Paper IV). In fact, ballasting of aggregates may increase the total mass transfer of
oxygen to the sinking aggregates (Paper IV), via increased sinking speed of ballasted
aggregates (Paper III; Paper IV; Paper V).
Large variations in oxygen consumption across the aggregate size spectrum are
observed both for fecal pellets, marine snow, and phytoplankton-derived aggregates (Paper
III; Paper IV; Paper V). However, the respiration rate from the microbial community
associated with the aggregates seems closely connected to the content of aggregated POC.
This leads to relatively similar carbon specific respiration rates for different types and sizes of
aggregates (Paper III; Paper IV), and compares well with previous studies of in situ diatom
aggregates (Ploug et al. 1999) and aggregates formed on diatom detritus (Ploug and Grossart
2000). The influence of biominerals on the carbon specific respiration rate was investigated in
pure diatom aggregates, in pure coccolithophorid aggregates, and in aggregates formed from a
mixture of both diatoms and coccolithophorids. These measurements confirmed a tight
coupling between respiration rate and POC content of the aggregates, and the average carbon
specific respiration rate was similar to those measured for the aggregates in other studies
(Table 2) (unpublished data, M. H. Iversen and H. Ploug). Thus, it seems that carbon specific
respiration rates are relatively similar within fecal pellets, marine snow, and photyplankton-
derived aggregates irrespective of biogenic or lithogenic ballast material content, origin, and
size (Paper III; Paper IV; Paper V; unpublished data, M. H. Iversen and H. Ploug). The
carbon specific respiration rate ranged between 0.08 and 0.21 d-1 and averaged ~0.13 d-1
(Table 2). These rates were measured in relatively fresh aggregates with high hydrolysis rates
and high apparent diffusivities of solutes and oxygen supply for respiration (Paper IV). Thus,
the microbial community within the aggregates was not limited by oxygen availability and an
efficient carbon turnover was supported (Paper IV). Since all aggregate types and sizes seem
to be degraded at similar specific rates, the extent of carbon remineralization in the upper

Results and Discussion
48
ocean may be controlled by the residence times of the aggregates at these depths. Therefore,
sinking speeds of marine snow and phytoplankton-derived aggregates may be a controlling
factor for organic carbon export, as observed for fecal pellets.
Table 2. Carbon specific respiration rates of aggregates (agg) and fecal pellets (pellets) of different type, composition, and origin from five different studies. F-max indicates aggregates formed from water collected at the depth of fluorescence maximum off Cape Blanc. Unpub. indicates unpublished data. Aggregate composition
(type of aggregate)
C-specific resp. rate
(d-1)
Reference
F-max water Cape Blanc (agg) 0.13 ± 0.07 Paper V
Skeletonema costatum (agg) 0.13 ± 0.09 Unpub. Iversen and Ploug
E. huxleyi (agg) 0.13 ± 0.13 Unpub. Iversen and Ploug
S. costatum & E. huxleyi (agg) 0.12 ± 0.07 Unpub. Iversen and Ploug
Rhodomonas sp. (pellets) 0.16 Paper III
T. weissflogii (pellets) 0.20 Paper III
T. weissflogii (pellets) 0.12 Paper III
E. huxleyi (pellets) 0.21 Paper III
E. huxleyi (pellets) 0.08 Paper III
Diatoms & <80 µm Øresund water (agg) 0.08 ± 0.03 Ploug and Grossart 2000
In situ collected (California) (agg) 0.10 to 0.12 Ploug et al. 1999
2.2.2 What is the influence from ballast minerals on sinking speed?
To investigate if phytoplankton-derived aggregates experience the same elevated
sinking speeds when containing biominerals as observed for fecal pellets in Paper III,
sinking speeds were measured for aggregates formed from diatoms, from coccolithophorids,
and from a mixture of both diatoms and coccolithophorids (Fig. 11) (unpublished data, M. H.
Iversen and H. Ploug).

Results and Discussion
49
Fig. 11. Sinking speeds as a function of aggregate size for aggregates formed from Skeletonema costatum (black circles), Emiliania huxleyi (grey circles), and a mix of S. costatum and E. huxleyi (white circles). The lines represent a power fit to the measurements. Solid line (E. huxleyi): y = 176.3x0.47, R2 = 0.8; dashed line (mix of S. costatum and E. huxleyi): y = 75.8x0.64, R2 = 0.28; and dashed and dotted line (S. costatum): y = 56.6x0.72, R2 = 0.65.
The measurements in Fig. 11 show higher sinking speeds for aggregates formed from
coccolithophorids as compared to aggregates formed from either diatoms or a mix of diatoms
and coccolithophorods. The elevated sinking speeds were explained by higher densities of the
coccolithophorid aggregates. Two factors lead to higher densities in the coccolithophorid
aggregates; 1) a high content of calcium carbonate produced by the coccolithophorids, and 2)
the formation of more compact aggregates compared to aggregates containing diatoms since
the coccolithophorid aggregates mainly contained the small sized coccoliths (~2 µm). When
diatoms were present in the aggregates, spines from the diatoms maintained a more porous
aggregate structure which resulted in less compact, and, thus, less dense aggregates
(unpublished data, M. H. Iversen and H. Ploug).

Results and Discussion
50
Sinking speeds of aggregates depend on aggregate composition and density. Thus,
similar sized aggregates with different compositions may have very different sinking speeds.
In Paper IV the density of similar composed aggregates increased as they aged, leading to
elevated sinking speeds over time for individual aggregates. This may be explained by a
decrease in TEP to dry mass ratio in aging aggregates (Ploug and Passow 2007), likely due to
degradation of TEP. This may also explain observations of increasing particle sinking speeds
with depth in the ocean (Berelson 2002), but direct observations are still needed.
Measurements of high sinking speeds for aggregates formed off Cape Blanc (Paper
V) illustrates the difficulties of predicting sinking speeds from aggregate sizes alone. The
sinking speeds of aggregates off Cape Blanc (Paper V) were 5-10 times higher than previous
measurements for similar sized aggregates (Alldredge and Gotschalk 1988; Ploug et al. 1999).
This seemed due to high a content of carbonate and lithogenic material within the aggregates
off Cape Blanc, resulting in higher size specific densities as compared to previous
measurements (Alldredge and Gotschalk 1988). Therefore, ballasting of aggregates appears to
have a large influence on the sinking speeds of fecal pellets, marine snow, and phytoplankton-
derived aggregates, but hardly any effect on their carbon specific respiration rates and
apparent diffusivities. Thus, biominerals and lithogenic material seem an important factor
controlling aggregate sinking speed and, therefore, vertical carbon fluxes in the ocean (Paper
III; Paper IV; Paper V).
Though, the presence of biominerals and lithogenic material is indicated as an
important factor for the sinking speeds of aggregates, it does not simplify the estimations of
aggregate sinking speeds in situ. Illustrating this, the small sized fecal pellets investigated in
Paper III showed comparable sinking speeds to the much larger marine snow and
phytoplankton-derived aggregates (Fig. 12). From Fig. 12 it is also observed that sinking
speeds of similar-sized aggregates can vary greatly. Thus, sinking speeds of aggregates
depend on source, density, and age rather than size (Paper IV). Therefore, we have to deal
with similar-sized aggregates sinking at different speeds and/or different aggregate sizes
sinking at same speed, when attempting to predict carbon fluxes. Further, when measuring
sinking speeds in laboratories the potential maximum sinking speeds are observed, since
aggregates in situ potentially will have much longer residence times in the upper ocean
(Alldredge and Gotschalk 1988).

Results and Discussion
51
Fig. 12. Sinking speed as a function of aggregate size for a wide range of fecal pellets, marine snow, and phytoplankton-derived aggregates. See legend box for further information about the different aggregates.
2.2.3 What is the relative contribution from zooplankton organisms and microbes to carbon
removal, and how is this relationship at different depths?
To investigate the relative importance of zooplankton organisms and microbes for the
vertical flux down through the water column, carbon flux profiles were calculated and used to
identify important depths for carbon removal. The main carbon removal occurred in the upper
220 m and seemed divided into two important processes; one between 20 and 80 m and one
between 80 and 220 m. At greater depths only little carbon removal was observed (Paper V).
The upper 20 to 80 m was dominated by carbon removal from mesozooplankton organisms
(135 ± 69 µgC m-3 d-1) in combination with bacterial respiration and hydrolysis (60 ± 48 µgC
m-3 d-1). Below 80 m and down to 220 m the impact from zooplankton organisms seemed

Results and Discussion
52
absent and the carbon removal could be explained by the bacterial activity. The estimated
production of DOC from attached bacterial could not equal the measured respiration rates
from the free-living microbes and, thus, alternate DOC production may also have fed the free-
living bacteria; e.g., leakage and/or exudation from algae (Lignell 1990), release from
zooplankton feeding (Jumars et al. 1989; Møller et al. 2003), and diffusion out of fecal pellets
(Jumars et al. 1989). At depths between 220 m and 2500 m very low carbon removal rates
(2.5 ± 3.2 µgC m-3 d-1) were observed and presumably resulted from bacterial activity.
However, the low rates indicated that the bacterial activity is limited, i.e., due to temperature
decrease, decrease in bacterial abundance or activity, detachment of bacteria, etc. (Paper V).
Fig. 13 presents a simple overview of estimated aggregated carbon fluxes and estimated
carbon removal rates found during a ship cruise off Cape Blanc (Paper V).
Fig. 13. Simple overview based on the estimated carbon fluxes and carbon removal rates found for aggregated carbon during the cruise off Cape Blanc (Paper V). It is observed that two types of marine snow aggregates can be formed; fast-sinking ballasted aggregates and slow-sinking non-ballasted aggregates. In the upper 80 m of the water column mesozooplanktonic activity will dominate the carbon removal rates either via direct consumption of the aggregated carbon or by disaggregation whereby fast-sinking aggregates can be converted to slow-sinking aggregates. Microbial respiration and hydrolysis is rather high in the upper 220 m of the water column, and thus transform particulate organic carbon (POC) into dissolved organic carbon (DOC) and CO2. DOC can feed the free-living
Results and Discussion
53
bacteria and, thus, the microbial food web. However, it can also increase the encounter rates between chemosensory microbes and zooplankters via formation of a DOC plume in the wake of sinking aggregates. At greater depths than 220 m the microbial carbon removal decreases to very low levels. The black numbers indicate carbon removal rates (µgC m-3 d-1). The red numbers indicate carbon fluxes (µgC m-2 d-1). Both fluxes and removal rates are only given as rough estimates; see Paper V for more detailed information.
In summary, mesozooplankton organisms seem to dominate carbon removal in the
upper water column. In the deeper midwater zones microbial biota become more important
due to decreasing abundances of zooplankton organisms. However, the microbial degradation
seems limited at greater depths (Paper V). Similar tendencies for the relative importance of
zooplankton and microbes at different depths have been suggested by Stemmann et al. (2004).
Despite mesozooplankters have two times higher carbon turnover rates compared to the
microbial activity in the upper 80 m, the bacteria still account for twice as much carbon
removal per day compared to mesozooplankton, when considering the full depth range from
20 to 2500 m. The low carbon removal rates estimated below the upper 220 m indicate that
once the sinking carbon has traversed the upper few hundred meters it is likely to settle to the
deep ocean where it can be sequestered. Therefore, a short residence time in the upper ocean
seems important for carbon export and, thus, ballast minerals may be an important factor
controlling aggregate sinking speed and carbon export in the ocean.

54
3 CONCLUSIONS
Fecal pellets and marine snow remain much longer in the surface water than expected
from their sinking speeds alone. This is due to a series of complex retention processes taking
place in the surface ocean. The export of fecal pellets is retained by rapid degradation from
protozooplankton, fragmentation from copepods, and microbial decomposition. Marine snow
can disaggregate due to fragmentation by zooplankton, whereby their sinking speeds are
reduced. Bacteria associated with marine snow and fecal pellets are characterized by high
hydrolytic enzyme activities (Smith et al. 1992; Thor et al. 2003) forming microenvironments
with elevated concentrations of DOC relative to those of the surrounding water. These
microenvironments extent 10 to 100 fold larger than the volume of sinking aggregates
(Kiørboe et al. 2001). This enables organisms with chemosensory abilities to find and
encounter the aggregates (Kiørboe 2001; Kiørboe et al. 2002) whereby aggregates are
colonized at high rates leading to a significant carbon turnover of the aggregates in the surface
ocean. All these processes result in long residence times in the upper ocean and work against
vertical carbon export, indicating ballasting of aggregates as a main factor controlling carbon
export, due to its potential to increase the sinking speeds of aggregates and, thus, reduce the
residence times of aggregates in the surface ocean.

55
4 OUTLOOK
Though, this thesis provides some estimates of surface ocean degradation and export
processes there are still many unanswered questions. We know little about which large
plankton organisms feed on marine snow aggregates. We are still missing direct estimates of
the metazoan aggregate degradation and how this may change seasonally and spatially. The
relative importance of zooplankton organisms and microbes for aggregate degradation found
in this thesis also call for more direct measurements and investigations of how such
relationships change with composition of pelagic food webs. Understanding such processes
and knowing how they change with changing environments are essential for the
understanding of carbon export from the surface ocean. Additionally we need to obtain a good
understanding of the deep water aggregate processes before we can make realistic estimates of
the efficiency of the biological carbon pump and the sequestration of carbon in the deep
ocean. For instance, how does aging of aggregates influence the sinking speed and
degradation rates? Is it possible that ballast minerals can protect ´old´ aggregates from
degradation and which part of the organic matter would then be protected?
I have listed some of the questions that have puzzled me during the progress of this Ph.D.
work:
- How important is the degradation impact in the euphotic zone for the aggregate fluxes in the
deep ocean?
- To what extent does aggregate transformation occur down through the water column, and
which processes are important; e.g., repackaging, disaggregation, re-aggregation,
consumption, degradation, and solubilization?
- How does the changing community structure in different environments affect aggregate
fluxes?
- Does sedimentation proceed mainly by short episodic events or as continuous settling
during the productive period?
- How does season and region affect aggregate fluxes and the organisms important for
aggregate degradation?

56
- Are attached bacteria mainly degrading aggregated carbon via respiration or
solubilization?
- How does bacterial activity affect aggregate size, density, settling rate, and stickiness?
- Does bacterial activity and community change with depth?
- Does aggregate sinking speed change with depth, and if, why?

57
5 REFERENCES
Agassiz, A. 1888. Three cruises of the United States Coast and Geodetic Survey streamer
Blake in the Gulf of Mexico, in the Caribbean Sea, and along the Atlantic coast of the
United States from 1877 to 1880. Bull Mus Comp Zool Harvard 1: 1-314.
Alldredge, A., and Gotschalk, C. 1988. In situ settling behavior of marine snow. Limnol.
Oceanogr. 33: 339-351.
Alldredge, A. L. 2000. Interstitial dissolved organic carbon (DOC) concentrations within
sinking marine aggregates and their potential contribution to carbon flux. Limnol.
Oceanogr. 45: 1245-1253.
Alldredge, A. L., and Cohen, Y. 1987. Can microscale chemical patches persist in the sea?
Microelectrode study of marine snow, fecal pellets. Science 235: 689-693.
Alldredge, A. L., and Gotschalk, C. C. 1989. Direct observations of the mass flocculation of
diatom blooms: Characteristics, settling velocities and formation of diatom aggregates.
Deep-Sea Res. I 36: 159-171.
Alldredge, A. L., Gotschalk, C. C., and Macintyre, S. 1987. Evidence for sustained residence
of macrocrustacean fecal pellets in surface waters off Southern California. Deep-Sea
Res. I 34: 1641-1652.
Alldredge, A. L., Granata, T. C., Gotschalk, C. C., and Dickey, T. D. 1990. The physical
strength of marine snow and its implications for particle disaggregation in the ocean.
Limnol. Oceanogr. 35: 1415-1428.
Alldredge, A. L., and Silver, M. W. 1988. Characteristics, dynamics and significance of
marine snow. Prog. Oceanogr. 20: 41-82.
Andersson, J. H., Wijsman, J. W. M., Herman, P. J., Middelburg, J. J., Soetaert, K., and Heip,
K. 2004. Respiration patterns in the deep sea. Geophysical Research Letters 31.
Andreassen, I., Noethig, E. M., and Wassmann, P. 1996. Vertical particle flux on the shelf off
northern Spitsbergen, Norway. Mar. Ecol. Prog. Ser. 137: 215-228.
Andrews, J. C. 1983. Deformation of the active space in the low Reynolds number feeding
current of calanoid copepods. Can. J. Fish. Aquat. Sci. 40: 1293-1302.
Armstrong, R. A., Lee, C., Hedges, J. I., Honjo, S., and Wakeham, S. G. 2002. A new,
mechanistic model for organic carbon fluxes in the ocean based on the quantitative
association of POC with ballast minerals. Deep-Sea Res. II 49: 219-236.
Azam, F., and Long, R. A. 2001. Oceanography: Sea snow microcosms. Nature 414: 495-498.

58
Berelson, W. M. 2002. Particle settling rates increase with depth on the ocean. Deep Sea
Research II 49: 237-251.
Bienfang, P. K. 1980. Herbivore diet affects fecal pellet settling. Can. J. Fish. Aquat. Sci. 37:
1352-1357.
Bishop, J. K. B., Edmond, J. M., Ketten, D. R., Bacon, M. P., and Silker, W. B. 1977. The
chemistry, biologym and vertical flux of particulate matter from the upper 400 m of
the equatorial Atlantic Ocean. Deep-Sea Res. I 24: 511-548.
Brzezinski, M. A., Alldredge, A., and O´Bryan, L. M. 1997. Silica cycling within marine
snow. Limnol. Oceanogr. 42: 1706-1713.
Buesseler, K. O., Lamborg, C. H., Boyd, P. W., Lam, P. J., Trull, T. W., Bidigare, R. R.,
Bishop, J. K. B., Casciotti, K. L., Dehairs, F., Elskens, M., Honda, M., Karl, D. M.,
Siegel, D. A., Silver, M. W., Steinberg, D. K., Valdes, J., Van Mooy, B., and Wilson,
S. 2007. Revisiting Carbon Flux Through the Ocean's Twilight Zone. Science 316:
567-570.
Butler, M., and Dam, H. G. 1994. Production rates and characteristics of fecal pellets of the
copepod Acartia tonsa under simulated phytoplankton bloom conditions: Implications
for vertical fluxes. Mar. Ecol. Prog. Ser. 114: 81-91.
Caron, D. A. 1987. Grazing of attached bacteria by heterotrophic microflagellates. Microb.
Ecol. 13: 203-218.
Cho, B. C., and Azam, F. 1988. Major role of bacteria in biogeochemical fluxes in the ocean's
interior. Nature 332: 441-443.
Dagg, M. J., and Walser, W. E., Jr. 1986. The effect of food concentration on fecal pellet size
in marine copepods. Limnol. Oceanogr. 31: 1066-1071.
De La Rocha, C. L., and Passow, U. 2007. Factors influencing the sinking of POC and the
efficiency of the biological carbon pump. Deep-Sea Res. II 54: 639-658.
Dilling, L., and Alldredge, A. L. 2000. Fragmentation of marine snow by swimming
macrozooplankton: A new process impacting carbon cycling in the sea. Deep-Sea Res.
I 47: 1227-1245.
Dubischar, C. D., and Bathmann, U. V. 2002. The occurrence of faecal material in relation to
different pelagic systems in the Southern Ocean and its importance for vertical flux.
Deep-Sea Res. II 49: 3229-3242.
Ducklow, H. W. 2000. Bacterial production and biomass in the oceans, p. 85-120. In D. L.
Kirchman [ed.], Microbial Ecology of the Oceans. Wiley-Liss.
59
Emerson, C. W., and Roff, J. C. 1987. Implications of fecal pellet size and zooplankton
behaviour to estimates of pelagic-benthic carbon flux. Mar. Ecol. Prog. Ser. 35: 251-
257.
Feinberg, L. R., and Dam, H. G. 1998. Effects of diet on dimensions, density and sinking rates
of fecal pellets of the copepod Acartia tonsa. Mar. Ecol. Prog. Ser. 175: 87-96.
Fowler, S. W., and Knauer, G. A. 1986. The role of large particles in the transport of elements
and organic compounds through the oceanic water column. Prog. Oceanogr. 16: 147-
194.
Francois, R., Honjo, S., Krishfield, R., and Manganini, S. 2002. Factors controlling the flux of
organic carbon to the bathypelagic zone of the ocean. Global Biogeochem. Cycles 16:
doi:10.1029/2001GB001722.
Gonzalez, H. E., Gonzalez, S. R., and Brummer, G. J. 1994. Short-term sedimentation pattern
of zooplankton, faeces and microplankton at a permanent station in the Bjoernafjorden
(Norway) during April-May 1992. Mar, Ecol. Prog, Ser. 105: 31-45.
Gonzalez, H. E., and Smetacek, V. 1994. The possible role of the cyclopoid copepod Oithona
in retarding vertical flux of zooplankton faecal material. Mar. Ecol. Prog. Ser. 113:
233-246.
Gowing, M. M., and Silver, M. W. 1983. Origins and microenvironments of bacteria
mediating fecal pellet decomposition in the sea. Mar. Biol. 73: 7-16.
Graham, W. M., Macintyre, S., and Alldredge, A. L. 2000. Diel variations of marine snow
concentration in surface waters and implications for particle flux in the sea. Deep-Sea
Res. I 47: 367-395.
Green, E. P., Harris, R. P., and Duncan, A. 1992. The production and ingestion of faecal
pellets by nauplii of marine calanoid copepods. Journal of Plankton Research 14:
1631-1643.
Grossart, H. P., and Simon, M. 1998. Bacterial colonization and microbial decomposition of
limnetic organic aggregates (lake snow). Aquat. Microb. Ecol. 15: 127-140.
Hamm, C. E. 2002. Interactive aggregation and sedimentation of diatoms and clay-sized
lithogenic material. Limnol. Oceanogr. 47: 1790-1795.
Hansen, B., Fotel, F. L., Jensen, N. J., and Madsen, S. D. 1996a. Bacteria associated with a
marine planktonic copepod in culture. 2. Degradation of fecal pellets produced on a
diatom, a nanoflagellate or a dinoflagellate diet. Journal of Plankton Research 18:
275-288.

60
Hansen, J. L. S., Kiørboe, T., and Alldredge, A. L. 1996b. Marine snow derived from
abandoned larvacean houses: Sinking rates, particle content and mechanisms of
aggregate formation. Mar. Ecol. Prog. Ser. 141: 205-215.
Hansen, P. J. 1992. Prey size selection, feeding rates and growth dynamics of heterotrophic
dinoflagellates with special emphasis on Gyrodinium spirale. Mar. Biol 114: 327-334.
Harris, R. 1994. Zooplankton grazing on the coccolithophore Emiliania huxleyi and its role in
inorganic carbon flux. Mar. Biol. 119: 431-439.
Honjo, S., and Roman, M. R. 1978. Marine copepod fecal pellets: production, preservation
and sedimentation. J. Mar. Res. 36: 45-57.
Huskin, I., Anadon, R., Alvarez-Marques, F., and Harris, R. P. 2000. Ingestion, faecal pellet
and egg production rates of Calanus helgolandicus feeding coccolithophorid versus
non-coccolithophorid diets. J. Exp. Mar. Biol. Ecol. 248: 239-254.
Jackson, G. A., and Burd, A. B. 1998. Aggregation in the marine environment. Environmental
Science & Technology 32: 2805-2814.
Jacobsen, H. H., and Hansen, P. J. 1997. Prey size selection, grazing and growth response of
the small heterotrophic dinoflagellates Gymnodinium sp. and the ciliate Balanion
comatum - a comparative study. Mar. Ecol. Prog. Ser. 158: 75-86.
Jacobsen, T. R., and Azam, F. 1984. Role of bacteria in copepod fecal pellet decomposition:
Colonization, growth rates and mineralization. Bull. Mar. Sci. 35: 495-502.
Jansen, S., and Bathmann, U. 2007. Algae viability within copepod faecal pellets: evidence
from microscopic examinations. Mar. Ecol. Prog. Ser. 337: 145-153.
Johnson, C. P., Li, X., and Logan, B. E. 1996. Settling velocities of fractal aggregates.
Environ. Sci. Technol. 30: 1911-1918.
Jumars, P., A., Penry, D., L., Baross, J., A., Perry, M., J., and Frost, B. 1989. Closing the
microbial loop: dissolved carbon pathway to heterotrophic bacteria from incomplete
ingestion, digestion and absorption in animals. Deep-Sea Res. I 36: 483-495.
Kiørboe, T. 2000. Colonization of marine snow aggregates by invertebrate zooplankton:
Abundance, scaling, and possible role. Limnol. Oceanogr. 45: 479-484.
---. 2001. Formation and fate of marine snow: small-scale processes with large-scale
implications. Scientia Marina 65: 57-71.
---. 2003. High turnover rates of copepod fecal pellets due to Noctiluca scintillans grazing.
Mar. Ecol. Prog. Ser. 258: 181-188.
61
Kiørboe, T., Grossart, H. P., Ploug, H., and Tang, K. 2002. Mechanisms and Rates of
Bacterial Colonization of Sinking Aggregates. Appl. Environ. Microbiol. 68: 3996-
4006.
Kiørboe, T., and Jackson, G. A. 2001. Marine snow, organic solute plumes, and optimal
chemosensory behavior of bacteria. Limnol. Oceanogr. 46: 1309-1318.
Kiørboe, T., Ploug, H., and Thygesen, U. H. 2001. Fluid motion and solute distribution
around sinking aggregates. I. Small-scale fluxes and heterogeneity of nutrients in the
pelagic environment. Mar. Ecol. Prog. Ser. 211: 1-13.
Kiørboe, T., and Thygesen, U. H. 2001. Fluid motion and solute distribution around sinking
aggregates. II. Implications for remote detection by colonizing zooplankters. Mar.
Ecol. Prog. Ser. 211: 15-25.
Kiørboe, T., and Visser, A. W. 1999. Predator and prey perception in copepods due to
hydromechanical signals. Marine Ecology-Progress Series 179: 81-95.
Klaas, C., and Archer, D. E. 2002. Association of sinking organic matter with various types of
mineral ballast in the deep sea; implications for the rain ratio. Global Biogeochem.
Cycles 16: doi:10.1029/2001GB001765.
Knauer, G. A., Martin, J. H., and Bruland, K. W. 1979. Fluxes of particulate carbon, nitrogen,
and phosphorus in the upper water column of the northeast Pacific. Deep-Sea Res. I
26: 97-108.
Komar, P. D., Morse, A. P., Small, L. F., and Fowler, S. W. 1981. An Analysis of Sinking
Rates of Natural Copepod and Euphausiid Fecal Pellets. Limnol. Oceanogr. 26: 172-
180.
Lampitt, R. S., and Antia, A. N. 1997. Particle flux in deep seas: Regional characteristics and
temporal variability. Deep-Sea Res. I 44: 1377-1403.
Lampitt, R. S., Noji, T., and Bodungen, B. V. 1991. What happens to zooplankton fecal
pellets? Implications for material flux. Mar. Biol 104: 15-23.
Lampitt, R. S., Wishner, K. F., Turley, C. M., and Angel, M. V. 1993. Marine snow studies in
the Northeast Atlantic ocean: Distribution, composition and role as a food source for
migrating plankton. Mar. Biol. 116: 689-702.
Landry, M. R., Lorenzen, C. J., and Peterson, W. K. 1994. Mesozooplankton grazing in the
Southern California Bight. 2. Grazing impact and particulate flux. Mar. Ecol. Prog.
Ser. 115: 73-85.
Lee, B. G., and Fisher, N. S. 1992. Decomposition and release of elements from zooplankton
debris. Mar. Ecol. Prog. Ser. 88: 117-128.

62
Lignell, R. 1990. Excretion of Organic Carbon by Phytoplankton: Its Relation to Algal
Biomass, Primary Productivity and Bacterial Secondary Productivity in the Baltic Sea.
Mar. Ecol. Prog. Ser. 68: 85-99.
Logan, B. E., and Wilkinson, D. B. 1990. Fractal geometry of marine snow and other
biological aggregates. Limnol. Oceanogr 35: 130-136.
Lundsgaard, C., Olesen, M., Reigstad, M., and Olli, K. 1999. Sources of settling material;
aggregation and zooplankton mediated fluxes in the Gulf of Riga. J. Marine Syst. 23:
197-210.
Lutz, M., Dunbar, R., and Caldeira, K. 2002. Regional variability in the vertical flux of
particulate organic carbon in the ocean interior. Global Biogeochem. Cycles 16:
10.1029/2000GB001383.
Martin, J. H., Knauer, G. A., Karl, D. M., and Broenkow, W. W. 1987. VERTEX: carbon
cycling in the northeast Pacific. Deep-Sea Res. I 43: 267-285.
Milligan, T. G., and Hill, P. S. 1998. A laboratory assessment of the relative importance of
turbulence, particle composition, and concentration in limiting maximal floc size and
settling behaviour. J. Sea Res. 39: 227-241.
Miralto, A., Guglielmo, L., Zagami, G., Buttino, I., Granata, A., and Ianora, A. 2003.
Inhibition of population growth in the copepods Acartia clausi and Calanus
helgolandicus during diatom blooms. Mar. Ecol. Prog. Ser. 254: 253-268.
Møller, E. F., Thor, P., and Nielsen, T. G. 2003. Production of DOC by Calanus finmarchicus,
C. glacialis and C.hyperboreus through sloppy feeding and leakage from fecal pellets.
Mar. Ecol. Prog. Ser. 262: 185-191.
Nakamura, Y., Suzuki, S., and Hiromi, J. 1995. Population dynamics of heterotrophic
dinoflagellates during a Gymnodinium mikimotoi red tide in the Seto Inland Sea. Mar.
Ecol. Prog. Ser. 125: 269-277.
Noji, T. T., Estep, K. W., Macintyre, F., and Norrbin, F. 1991. Image analysis of faecal
material grazed upon by three species of copepods: Evidence for coprorhexy,
coprophagy and coprochaly. J. Mar. Biol. Assoc. UK 71: 465-480.
Olli, K., Riser, C. W., Wassmann, P., Ratkova, T., Arashkevich, E., and Pasternak, A. 2001.
Vertical flux of biogenic matter during a Lagrangian study off the NW Spanish
continental margin. Prog. Oceanogr. 51: 443-466.
Paffenhöfer, G. A., and Knowles, S. C. 1979. Ecological implications of fecal pellet size,
production and consumption by copepods. Journal of Marine Research 37: 35-49.

63
Paffenhöfer, G. A., and Van Sant, K. B. 1985. The feeding response of a marine planktonic
copepod to quantity and quality of particles. Mar. Ecol. Prog. Ser. 27: 55-65.
Passow, U. 2002. Transparent exopolymer particles (TEP) in aquatic environments. Prog.
Oceanogr. 55: 287-333.
---. 2004. Switching perspectives; do mineral fluxes determine particulate organic carbon
fluxes or vice versa? Geochemistry Geophysics Geosystems 5.
Passow, U., and De La Rocha, C. 2006. Accumulation of mineral ballast on organic
aggregates. Global Biogeochem. Cycles 20: 1-7.
Ploug, H. 2001. Small-scale oxygen fluxes and remineralization in sinking aggregates.
Limnol. Oceanogr. 46: 1624-1631.
Ploug, H., and Grossart, H. P. 2000. Bacterial growth and grazing on diatom aggregates:
Respiratory carbon turnover as a function of aggregate size and sinking velocity.
Limnol. Oceanogr. 45: 1467-1475.
Ploug, H., Grossart, H. P., Azam, F., and Jørgensen, B. B. 1999. Photosynthesis, respiration,
and carbon turnover in sinking marine snow from surface waters of Southern
California Bight: Implications for the carbon cycle in the ocean. Mar. Ecol. Prog. Ser.
179: 1-11.
Ploug, H., Hietanen, S., and Kuparinen, J. 2002. Diffusion and advection within and around
sinking, porous diatom aggregates. Limnol. Oceanogr. 47: 1129-1136.
Ploug, H., and Passow, U. 2007. Direct measurement of diffusivity within diatom aggregates
containing transparent exopolymer particles. Limnol. Oceanogr. 52: 1-6.
Poulsen, L. K., and Kiørboe, T. 2005. Coprophagy and coprorhexy in the copepods Acartia
tonas and Temora longicornis: clearance rates and feeding behaviour. Mar. Ecol. Prog.
Ser. 299: 217-227.
---. 2006. Vertical flux and degradation rates of copepod fecal pellets in a zooplankton
community dominated by small copepods. Mar. Ecol. Prog. Ser. 323: 195-204.
Raven, J. A., and Falkowski, P. G. 1999. Oceanic sinks for atmospheric CO2. Plant, Cell and
Environment 22: 741-755.
Reigstad, M., Riser, C. W., and Svensen, C. 2005. Fate of copepod faecal pellets and the role
of Oithona spp. Marine Ecology-Progress Series 304: 265-270.
Sampei, M., Sasaki, H., Hattori, H., Fukuchi, M., and Hargrave, B. T. 2004. Fate of sinking
particles, especially fecal pellets, within the epipelagic zone in the North Water
(NOW) polynya of northern Baffin Bay. Mar. Ecol. Prog. Ser. 278: 17-25.

64
Sarmiento, J. L., and Bender, M. 1994. Carbon biogeochemistry and climate change.
Photosynthesis Research 39: 209-234.
Schlitzer, R. 2000. Applying the adjoint method for biogeochemical modeling: Export of
particulate organic matter in the world ocean. Inverse Methods in Global
Biogeochemical Cycles 114: 107-124.
Shanks, A. L., and Del Carmen, K. A. 1997. Larval polychaetes are strongly associated with
marine snow. Mar. Ecol. Prog. Ser. 154: 211-221.
Shanks, A. L., and Reeder, M. L. 1993. Reducing microzones and sulfate reduction in marine
snow. Mar. Ecol. Prog. Ser. 96: 43-47.
Shanks, A. L., and Trend, J. D. 1980. Marine snow: sinking rates and potential role in vertical
flux. Deep-Sea Res. I 27: 137-144.
Simon, M., Grossart, H. P., Schweitzer, B., and Ploug, H. 2002. Microbial ecology of organic
aggregates in aquatic ecosystems. Aquat. Microb. Ecol. 28: 175-211.
Smayda, T. J. 1969. Some measurements of the sinking rate of fecal pellets. Limnol.
Oceanogr. 14: 621-625.
Smetacek, V. S. 1980. Zooplankton standing stock, copepod faecal pellets and particulate
detritus in Kiel Bight. Estuar. Coast. Mar. Sci. 11: 477-490.
Smith, D. C., Simon, M., Alldredge, A. L., and Azam, F. 1992. Intense hydrolytic enzyme
activity on marine aggregates and implications for rapid particle dissolution. Nature
359: 139-142.
Steinberg, D. K. 1995. Diet of copepods (Scolpalatum vorax) associated with mesopelagic
detritus (giant larvacean houses) in Monterey Bay, California. Mar. Biol 122: 571-
584.
Steinberg, D. K., Silver, M. W., Pilskaln, C. H., Coale, S. L., and Paduan, J. B. 1994.
Midwater zooplankton communities on pelagic detritus (giant larvacean houses) in
Monterey Bay, California. Limnol. Oceanogr. 39: 1606-1620.
Stemmann, L., Jackson, G. A., and Gorsky, G. 2004. A vertical model of particle size
distributions and fluxes in the midwater column that includes biological and physical
processes; Part II, Application to a three year survey in the NW Mediterranean Sea.
Deep-Sea Res. I 51: 885-908.
Suess, E. 1980. Particulate organic carbon flux in the oceans — surface productivity and
oxygen utilization. Nature 288: 260-263.
65
Suzuki, H., Sasaki, H., and Fukuchi, M. 2003. Loss processes of sinking fecal pellets of
zooplankton in the mesopelagic layers of the antarctic marginal ice zone. Journal of
Oceanography 59: 809-818.
Svensen, C., and Kiørboe, T. 2000. Remote prey detection in Oithona similis:
hydromechanical versus chemical cues. J. Plankton Res. 22: 1155-1166.
Svensen, C., and Nejstgaard, J. C. 2003. Is sedimentation of copepod faecal pellets
determined by cyclopoids? Evidence from enclosed ecosystems. J. Plankton Res. 25:
917-926.
Thor, P., Dam, H. G., and Rogers, D. R. 2003. Fate of organic carbon released from
decomposing copepod fecal pellets in relation to bacterial production and
ectoenzymatic activity. Aquat. Microb. Ecol. 33: 279-288.
Tiselius, P., and Kiørboe, T. 1998. Colonization of diatom aggregates by the dinoflagellate
Noctiluca scintillans. Limnol. Oceanogr. 43: 154-159.
Tsuda, A., and Nemoto, T. 1990. The effect of food concentration on the faecal pellet size of
the marine copepod, Pseudocalanus newmani Frost. Bull. Plankton Soc. Japan/Nihon
Purankton Gakkaiho. 37: 83-90.
Turner, J. T. 1977. Sinking rates of fecal pellets from the marine copepod Pontella meadii.
Mar. Biol. 40: 249-259.
---. 2002. Zooplankton fecal pellets, marine snow and sinking phytoplankton blooms. Aquat.
Microb. Ecol. 27: 57-102.
Turner, J. T., and Ferrante, J., G. 1979. Zooplankton fecal pellets in aquatic ecosystems.
BioScience 29: 670-677.
Urban-Rich, J. 1999. Release of dissolved organic carbon from copepod fecal pellets in the
Greenland Sea. J. Exp. Mar. Biol. Ecol. 232: 107-124.
---. 2001. Seston effects on faecal pellet carbon concentrations from a mixed community of
copepods in Balsfjord, Norway, and the Antarctic Polar Front. ICES J. Mar. Sci. 58:
700-710.
Urban, J., L., Deibel, D., and Schwinghamer, P. 1993. Seasonal variations in the densities of
fecal pellets produced by Oikopleura vanhoeffeni (C. Larvacea) and Calanus
finmarchicus (C. Copepoda). Mar. Biol. 117: 607-613.
Vargas, C. A., Toennesson, K., Sell, A., Maar, M., Moeller, E. F., Zervoudaki, T.,
Giannakourou, A., Christou, E., Satapoomin, S., Petersen, J. K., Nielsen, T. G., and
Tiselius, P. 2002. Importance of copepods versus appendicularians in vertical carbon
fluxes in a Swedish fjord. Mar. Ecol. Prog. Ser. 241: 125-138.
66
Viitasalo, M., Rosenberg, M., Heiskanen, A. S., and Kosi, M. 1999. Sedimentation of
copepod fecal material in the coastal northern Baltic Sea: Where did all the pellets go?
Limnol. Oceanogr. 44: 1388-1399.
Volk, T., and Hoffert, M. I. 1985. Ocean carbon pumps: analysis of relative strengths and
efficiencies in ocean-driven atmospheric CO2 changes, p. 99-110. In E. T. Sundquist
and W. S. Broecker [eds.], The Carbon Cycle and Atmospheric CO2: Natural
Variations Archean to Present. AGU.
Wassmann, P., Olli, K., Wexel Riser, C., and Svensen, C. 2003. Ecosystem function,
biodiversity and vertical flux regulation in the twillight zone, p. 279-287. In G. Wefer,
F. Lamy and F. Mantoura [eds.], Marine Science Frontiers for Europe. Springer-
Verlag.
Wexel-Riser, C. W., Wassmann, P., Olli, K., and Arashkevich, E. 2001. Production, retention
and export of zooplankton faecal pellets on and off the Iberian shelf, north-west Spain.
Prog. Oceanogr. 51: 423-441.
Wexel-Riser, C. W., Wassmann, P., Olli, K., Pasternak, A., and Arashkevich, E. 2002.
Seasonal variation in production, retention and export of zooplankton faecal pellets in
the marginal ice zone and Central Barents Sea. J. Mar. Syst. 38: 175-188.
Wotton, R. S. 1994. Particulate and dissolved organic matter as food, p. 235-288. In R. S.
Wotton [ed.], The biology of particles in aqautic systems. Lewis Publishers.
Ziervogel, K., and Arnosti, C. 2008. Polysaccharide hydrolysis in aggregates and free enzyme
activity in aggregate-free seawater from the north-eastern Gulf of Mexico.
Environmental Microbiology 10: 289-299.

Paper I


MARINE ECOLOGY PROGRESS SERIESMar Ecol Prog Ser
Vol. 350: 79–89, 2007doi: 10.3354/meps07095
Published November 22
INTRODUCTION
Fecal pellets in the sea are degraded by bacteria(Cho & Azam 1988) and possibly by zooplankton suchas copepods (Paffenhöfer & Strickland 1970). Cope-pods degrade pellets through coprophagy (ingestion ofpellets), coprorhexy (fragmentation of pellets), andcoprochaly (loosening of pellets) (Paffenhöfer & Strick-land 1970, Lampitt et al. 1990, Noji et al. 1991).Coprophagy is the best documented of the degradationprocesses. Paffenhöfer & Strickland (1970) observed
Calanus helgolandicus ingesting fecal pellets even inthe presence of algal food. This ability was also shownfor C. helgolandicus nauplii (Green et al. 1992). Fur-ther, grazing rates of fecal pellets have been obtainedfor many other species of copepods; for example, Acar-tia omorii ingests fecal pellets at high rates (Viitasalo etal. 1999), and Eucalanus pileatus consumes naupliifecal pellets at the same rate as algae of similar size(Paffenhöfer & Knowles 1979). Coprorhexy was sug-gested by Lampitt et al. (1990), who observed cope-pods to be highly adept at breaking up their own fecal
© Inter-Research 2007 · www.int-res.com*Email: [email protected]
Coprorhexy, coprophagy, and coprochaly in thecopepods Calanus helgolandicus, Pseudocalanus
elongatus, and Oithona similis
Morten H. Iversen1, 2,*, Louise K. Poulsen1
1Danish Institute for Fisheries Research, Department of Marine Ecology and Aquaculture, Kavalergården 6, 2920 Charlottenlund, Denmark
2Alfred Wegener Institute for Polar and Marine Research, Am Handelshafen 12, 27570 Bremerhaven, Germany
ABSTRACT: Studies of fecal pellet flux show that a large percentage of pellets produced in the upperocean is degraded within the surface waters. It is therefore important to investigate these degrada-tion mechanisms to understand the role of fecal pellets in the oceanic carbon cycle. Degradation ofpellets is mainly thought to be caused by coprophagy (ingestion of fecal pellets) by copepods, andespecially by the ubiquitous copepods Oithona spp. We examined fecal pellet ingestion rate andfeeding behavior of O. similis and 2 other dominant copepod species from the North Sea (Calanushelgolandicus and Pseudocalanus elongatus). All investigations were done with fecal pellets as thesole food source and with fecal pellets offered together with an alternative suitable food source. Theingestion of fecal pellets by all 3 copepod species was highest when offered together with an alterna-tive food source. No feeding behavior was determined for O. similis due to the lack of pellet capturein those experiments. Fecal pellets offered together with an alternative food source increased the fil-tration activity by C. helgolandicus and P. elongatus and thereby the number of pellets caught in theirfeeding current. However, most pellets were rejected immediately after capture and were often frag-mented during rejection. Actual ingestion of captured pellets was rare (<37% for C. helgolandicusand <24% for P. elongatus), and only small pellet fragments were ingested unintentionally alongwith alternative food. We therefore suggest coprorhexy (fragmentation of pellets) to be the maineffect of copepods on the vertical flux of fecal pellets. Coprorhexy turns the pellets into smaller,slower-sinking particles that can then be degraded by other organisms such as bacteria andprotozooplankton.
KEY WORDS: Fecal pellet · Grazing . Functional response · Visual observation · Video recording
Resale or republication not permitted without written consent of the publisher

Mar Ecol Prog Ser 350: 79–89, 2007
pellets while only ingesting small fragments. Noji et al.(1991) observed coprochaly in Acartia clausi, C. helgo-landicus, and Pseudocalanus elongatus.
Although these studies have indicated the existenceof fecal pellet grazing behavior by copepods, only 2studies have visually observed feeding behavior, inAcartia tonsa (Poulsen & Kiørboe 2005) and Eucalanuspileatus (Paffenhöfer & Van Sant 1985). Visual obser-vations of the feeding behavior of A. tonsa grazing onfecal pellets suggested that A. tonsa mainly degradesfecal pellets via coprorhexy (95%; Poulsen & Kiørboe2005). Paffenhöfer & Van Sant (1985) observed E.pileatus ingesting fewer fecal pellets than live anddead phytoplankton cells, indicating a preference forfood particles other than pellets. Furthermore, pelletsarriving at the mouth were opened or slightly macer-ated before ingestion when rejection did not occur(Paffenhöfer & Van Sant 1985), indicating coprorhex-ious feeding behavior for E. pileatus.
We investigated the feeding behavior of Calanushelgolandicus, Oithona similis, and Pseudocalanuselongatus on copepod fecal pellets produced by Acar-tia tonsa feeding on Rhodomonas salina. This was donethrough simultaneous incubation experiments andvideo recordings of feeding behavior in the presenceand absence of alternative food. The species investi-gated in this study were chosen due to their differ-ences in size and feeding behavior, and due to theircommon presence in temperate areas. C. helgolandi-cus and P. elongatus are suspension feeders that detecttheir food via chemosensory perception using a feed-ing current while cruising slowly through the water(Andrews 1983). O. similis is an ambush feeder that‘hangs’ in the water and only launches an attack whena prey particle is detected via hydromechanical distur-bances generated by the prey (Kiørboe & Visser 1999,Svensen & Kiørboe 2000).
MATERIALS AND METHODS
Phytoplankton. Thalassiosira weissflogii (a diatom),Rhodomonas salina (a cryptophyte), and Heterocapsatriquetra (a dinoflagellate) were maintained in expo-nential growth in f/2 medium (Guillard 1975). The cul-tures were kept at a constant light:dark cycle (12:12 h)in filtered (0.2 µm) seawater (~33‰) at 18°C and usedas food for zooplankton cultures. Only R. salina (9 ×12 µm in size) was used as a food item during the pro-duction of fecal pellets.
Zooplankton. Calanus helgolandicus females werecollected in October 2004 and August 2005 in thenorth-eastern North Sea and kept in culture in filtered(0.2 µm) seawater (~33‰) at 14°C, reared on a mixeddiet of Rhodomonas salina, Thalassiosira weissflogii,
and Heterocapsa triquetra. Oithona similis was col-lected in November 2004 in The Sound (Øresund, Den-mark) and kept in natural seawater from The Sound(~22‰) at 12°C. Pseudocalanus elongatus was col-lected in August 2003 in the North Sea, kept in culturein filtered seawater (~33‰) at 14°C, and reared on amixed diet of R. salina, T. weissflogii, and H. triquetra.Acartia tonsa was kept in a laboratory culture in fil-tered (0.2 µm) seawater (~33‰) at The Danish Institutefor Fisheries Research at 18°C and reared on R. salina(Støttrup et al. 1986). All copepods were acclimated tothe experimental conditions for >24 h prior to eachexperiment (Table 1). Fecal pellets offered as food forthe copepods in both grazing and behavior experi-ments were produced by adult A. tonsa grazing on R.salina at excess concentration (>713 µg C l–1; Kiørboeet al. 1985) for <18 h. This simulated pellets producedunder bloom conditions or when the copepod locates afood patch such as a subsurface bloom. Such pelletsmay be attractive food particles due to high pellet pro-duction rates, low gut passage times, and relativelylow assimilation efficiencies (Besiktepe & Dam 2002)resulting in fecal pellets of high nutritional value.Thus, fecal pellets were between 0.5 and 18 h old atthe start of the incubation. The average fecal pelletlength and width for pellets offered in the experimentswas (mean ± SD) 96 ± 26 and 28 ± 5 µm, respectively.
Grazing experiments. Fecal pellet clearance ratesand ingestion rates of adult females were determinedin both the presence and absence of alternative food(Table 1). Incubations were run for 24 h, in a 12:12 hlight:dark cycle, and on a plankton wheel rotating at~1 rpm. This rotation speed was chosen to keep thepellets suspended and to have minimum effect on thecopepods. Ploug et al. (in press) found sinking veloci-ties of 28 ± 3 m d–1 for similar sized pellets produced byTemora longicornis feeding on Rhodomonas salina. Ata rotation speed of 1 rpm, the experimental bottles(8 cm diameter) were in each position (upright, side-ways, and upside down) for ~15 s. The pellets sank0.5 ± 0.005 cm during 15 s; therefore, only pellets nearthe side of the vessel at the beginning of the experi-ment had their motion affected during incubation.When an alternative food source was present, it wasalways at a concentration of 3 × 10⁶ cells l–1 to ensurethe presence of alternative food during the whole incu-bation. A wide range of pellet concentrations was usedto determine the functional response in pellet clear-ance to pellet concentration (Table 1). Only pellet con-centrations <2 pellets ml–1 represent pellet concentra-tions found in situ. The pellets offered as food weredistinguished from the pellets produced during theexperiments due to a visually recognizable size differ-ence. However, when offering Pseudocalanus elonga-tus fecal pellets together with an alternative food
80

Iversen & Poulsen: Copepod fecal pellet feeding behavior
source, it was not possible to distinguish between ‘foodpellets’ and pellets produced by P. elongatus itself, andthus fecal pellet clearance and ingestion rates couldnot be estimated. It was possible to distinguish be-tween pellets produced by P. elongatus and food pel-lets in the absence of an alternative food source due tocolor and differences in structure. Ingestion and clear-ance rates were calculated using the equations of Frost(1972).
Behavior experiments. Grazing behavior was in-vestigated by filming adult females feeding on a rangeof fecal pellet concentrations in the presence andabsence of alternative food (Table 1). Filming was con-ducted in a cylindrical aquarium (Calanus helgolandi-cus: 10 cm diameter, 7.9 cm depth; Oithona similis andPseudocalanus elongatus: 7.9 cm diameter, 7.9 cmdepth). The aquarium was placed on a rolling tablethat was rotated at ~1 rpm to keep fecal pellets sus-pended. The rotation of the aquarium opposed thesinking velocity of the pellets, and they were not nearthe side of the rotating aquarium. The filming equip-ment consisted of a CCD video camera (Mintron MTV-1802CB) equipped with a 105 mm lens (Nikon MicroNikkor 1:2.8) and connected to a video cassetterecorder, a time-code generator, and a monitor.Infrared illumination was provided from behind by alight-emitting diode (LED), which was collimatedthrough a condenser. Females were acclimated to thefecal pellet concentration in the aquarium for 1 h priorto filming. Alternative food was added to the aquariumafter 40 min of filming, and the females were again
acclimated for 1 h prior to filming (Table 1). Fecalpellet concentrations were measured before and aftereach period of filming (40 min). The average fecal pel-let concentration during filming was used as the exper-imental concentration. One female at a time was keptin focus and followed for at least 1 min if possible. Thevideo tapes were analyzed frame by frame, and thefraction of time a female spent filtering, sinking, orjumping was recorded for approximately 1 min perfemale. The behavior of 4 females was analyzed ateach fecal pellet concentration, in the absence andpresence of alternative food. Periods when femaleswere close to the aquarium wall were excluded fromthe analysis. The numbers of rejected and ingestedfecal pellets observed during a total of 30 min of film-ing with a female in focus were recorded for each pel-let concentration in the presence and absence of alter-native food (half-hour analysis, see Tables 2 & 3).
Counting procedure. After incubation, the fecal pel-lets were collected on a 15 µm screen, preserved inacid Lugol’s solution, and counted under an invertedmicroscope. The filtrate from the 15 µm screen did notcontain pellets or recognizable fragments. Pellet frag-ments (end parts only) were counted as a half-pellet.The average volume and equivalent spherical dia-meter (ESD) of the pellets were calculated from mea-surements of length and width of at least 30 intact fecalpellets in each experiment.
Statistical analysis. Student’s t-test (SigmaStat ver-sion 3.1) was used to test for differences between treat-ments in fecal pellet clearance rates. The ingestion
81
Copepod species Alternative Female conc. Temp. Salinity Bottle ESD Fecal pellet conc.food source (ind. l–1) (°C) (‰) volume (ml) (µm) (pellets ml–1)
P P + alga
Grazing experimentC. helgolandicus T. weissflogii 1.6 14 32 615 50 0.2–4.8a
(5 rep., 5 con.)O. similis Natural plankton <20 µm 25 12 22 320 47 0.3–8a
R. salina (3 rep., 3 con.)
P. elongatus – 13 15 36 615 52 0.2–4.8 –(3 rep., 3 con.)
Behavior experimentC. helgolandicus T. weissflogii 7.8 14 33 637 45 0–11 0.3–9O. similis R. salina 29.4 14 21 408 50 0.1–10 0–9P. elongatus T. weissflogii 19.6 12 33 408 50 0–23 0.1–15aSame pellet concentration both with and without algae
Table 1. Experimental design. Copepod species (Calanus helgolandicus, Oithona similis, and Pseudocalanus elongatus), alterna-tive food source (Thalassiosira weissflogii, natural plankton <20 µm, and Rhodomonas salina), female concentration, equivalentspherical diameter (ESD), and concentrations of fecal pellets offered during the incubations. rep.: number of replicates at eachpellet concentration; con.: number of replicates of control bottles run in parallel with the experimental bottles at 3 differentconcentrations (low, intermediate, and high); P: fecal pellets as sole food source; P + alga: fecal pellets in the presence of an
alternative food source; –: not investigated

Mar Ecol Prog Ser 350: 79–89, 2007
rate, suspension feeding activity (%), feeding boutduration, number of jumps, jump duration, and sinkduration were tested for differences between treat-ments with an analysis of covariance (ANCOVA; SPSSversion 13.0), using the interactions between the treat-ments (absence/presence of alternative food) andaverage fecal pellet concentration (covariate). Suspen-sion feeding activity (%) was the percentage of time acopepod spent filtrating the water: (time spent filtrat-ing/sum of all activity) × 100.
RESULTS
Clearance and ingestion
Calanus helgolandicus
The clearance of fecal pellets was variable with noclear trend and was independent of pellet concentra-tion both with and without the alternative food (Tha-lassiosira weissflogii; Fig. 1A). Maximum pellet clear-ance (mean ± SD) was 172 ± 125 ml female–1 d–1 in thepresence of T. weissflogii and 205 ± 198 ml female–1 d–1
when pellets were offered alone (Fig. 1A). The inges-
tion rate increased with increasing pellet concentra-tion in the presence of alternative food to a level of671 ± 389 pellets female–1 d–1 (Fig. 1B), equivalent to43 ± 32 × 106 µm3 pellet material female–1 d–1. Whenoffered only pellets, however, the pellet ingestionreached a maximum (443 ± 242 pellets female–1 d–1) atfood concentrations of ~2 pellets ml–1, whereupon itdecreased again (Fig. 1B); the maximum ingestion was23 ± 16 × 106 µm3 female–1 d–1. Clearance and ingestionof fecal pellets by C. helgolandicus were statisticallyindependent of the presence or absence of T. weiss-flogii (clearance maximum: p = 0.757, Student’s t-test;ingestion rate p = 0.287, ANCOVA; Fig. 1).
Pseudocalanus elongatus
Clearance rate with pellets as the sole food forPseudocalanus elongatus was constant at pellet con-centrations from 0 to 1.5 pellets ml–1, whereupon itdecreased. Maximum clearance was 72 ± 14 mlfemale–1 d–1 (Fig. 2A).
The ingestion rate of fecal pellets increased asymp-totically with pellet concentration toward a maximumingestion rate of 121 ± 55 pellets female–1 d–1 at pelletconcentrations >1.5 pellets ml–1, resulting in a volumeingestion of 9 ± 5 × 106 µm3 female–1 d–1 (Fig. 2B).
82
0
200
400
600
800
1000
1200
0 1 3 42 5
0
100
200
300
400
500
B
Average pellet concentration (no. ml–1)
Cle
aran
ce
(ml f
emal
e–1 d
–1)
A
Inge
stio
n (p
elle
ts fe
mal
e–1 d
–1)
Fig. 1. Calanus helgolandicus. Average (A) clearance and (B)ingestion rates of fecal pellets with (d) or without (s) Thalas-siosira weissflogii as an alternative food source. Fecal pelletswere produced by Acartia tonsa adults feeding onRhodomonas salina. Fecal pellet clearance and ingestionrates were estimated according to Frost (1972). Error bars
indicate ±SD
0
40
80
120
160
0 1 2 3 4
0
20
40
60
80
100
B
A
Average pellet concentration (no. ml–1)
Cle
aran
ce
(ml f
emal
e–1 d
–1)
Inge
stio
n (p
elle
ts fe
mal
e–1 d
–1)
Fig. 2. Pseudocalanus elongatus. (A) Clearance and (B) inges-tion rates of fecal pellets offered as sole food source. Fecalpellets were produced by Acartia tonsa adults feeding onRhodomonas salina. Fecal pellet clearance and ingestionrates were estimated according to Frost (1972). Error bars
indicate ±SD

Iversen & Poulsen: Copepod fecal pellet feeding behavior
Oithona similis
The clearance rate of fecal pellets was dependent onpellet concentration in both the presence and absenceof an alternative food source (Fig. 3A). The presence ofa monoculture of Rhodomonas salina induced sig-nificantly higher maximum clearance rates than whenthe pellets were offered as the sole food (p = 0.007,Student’s t-test). No significant difference was foundbetween maximum clearance of pellets offered as thesole food and fecal pellets offered with a natural plank-ton assemblage (<20 µm), or between the 2 treat-ments with alternative food (p > 0.1, Student’s t-test;Fig. 3A,B). Maximum clearance rates (24 ± 1, 29 ± 17,and 9 ± 5 ml female–1 d–1 for pellets offered with R.salina, natural plankton <20 µm, and as the sole food,respectively) were reached at fecal pellet concentra-tions of ~0.5 pellets ml–1 in both the presence andabsence of alternative food.
The ingestion rates of fecal pellets by Oithona similisincreased with increasing pellet concentration in thepresence of alternative food (Fig. 3C,D). The maximumingestion in the presence of an alternative food sourcewas 0.9 ± 1.2 × 106 µm3 female–1 d–1 for the monocul-ture and 1.1 ± 1.3 × 106 µm3 female–1 d–1 for the naturalphytoplankton <20 µm at concentrations of 7 and 2.8pellets ml–1, respectively (Fig. 3C,D). When pellets
were offered as the sole food, high variation in inges-tion rates was observed. The maximum pellet inges-tion was found at 6 pellets ml–1, at which 0.6 ± 1 × 10⁶
µm3 female–1 d–1 was ingested (Fig. 3C). No significantdifference in the ingestion rates was found betweenthe different treatments (p > 0.1, ANCOVA), althoughhigher ingestions were observed at concentrations <4pellets ml–1 when an alternative food source was pre-sent (Fig. 3C,D).
Thus, the copepods cleared fecal pellets in both theabsence and presence of alternative food. Further, thepresence of an alternative food source seemed toincrease the clearance rates and ingestion rates of fecalpellets.
Feeding behavior
For all experiments, the suspended fecal pellets sankslowly, but as the aquarium turned, the pellets werekept suspended as did the animals when not moving.
Oithona similis is an ambush feeder and perceivesonly moving particles. It attacks a particle by jumpingtoward it and making a short burst of filtration uponencounter. Ambush feeding and ingestion of Rhodo-monas salina cells were observed during filming,but no pellets were ingested. Since O. similis is an
ambush feeder, its feeding activity wasrecorded as jump activity (jumpsmin–1; Fig. 4A). No observations ofencounters of fecal pellets wererecorded. Further, the presence orabsence of R. salina did not influencethe feeding behavior of O. similis, asno significant difference was observedin the number of jumps, jump dura-tion, and sink duration (p > 0.05,ANCOVA; Fig. 4). Clearly, O. similisviewed R. salina to be more attractivefood particles than fecal pellets, whichelicited no feeding response duringthe ~7 h of filming.
The feeding behavior of Calanushelgolandicus consisted of short con-tinuous feeding bouts interrupted bybrief periods of sinking. During thefeeding bouts, a feeding current wasgenerated, which pulled the copepodforward while it collected the particlescaught in the current (‘suspensionfeeding’). Pellet encounters occurredonly during suspension feeding andoften seemed unintentional with effortmade to reject the pellets (Table 2,Fig. 5). The rejection was made with a
83
0
10
20
30
40
Average pellet concentration (no. ml–1)
C
Inge
stio
n (p
elle
ts fe
mal
e–1 d
–1)
0
10
20
30
40
50
Cle
aran
ce
(ml f
emal
e–1 d
–1) A
8642086420
86420 0 1 4 5 62 3 7
B
D
0
Fig. 3. Oithona similis. (A,B) Clearance rate and (C,D) ingestion rate of fecalpellets by O. similis are measured with fecal pellets as the sole food (s), offeredtogether with Rhodomonas salina (d), and as pellets offered with a naturalplankton community (<20 µm) from The Sound (Øresund, Denmark; sd). Fecalpellets were produced by Acartia tonsa adults feeding on Rhodomonas salina.Fecal pellet clearance and ingestion rates were estimated according to Frost
(1972). Error bars indicate ±SD

Mar Ecol Prog Ser 350: 79–89, 2007
powerful water thrust created by kicking the swim-ming legs. Coprorhexious behavior was observed fromthe rupture of some pellets during rejection. C. hel-golandicus was also observed to feed coprochalouslybut only on large fecal pellets. In case of coprochaly,the pellet was handled by the feeding appendages forseveral seconds (5 to ≤20 s), whereupon it was re-jected. After rejection, the shape of the pellet wasclearly more fuzzy and ruptured due to apparentremoval of parts of the periotrophic membrane. Onlysmall or fragmented pellets were ingested, mainlyalong with the alternative food. Selective capture offecal pellets was observed on a few occasions. This wasseen as purposeful circling around a pellet while con-tinuously filtering in short bursts until the pellet wascaptured. However, this effort rarely resulted in actualpellet ingestion. More often the pellet was rejectedimmediately after capture.
The presence of Thalassiosira weissflogii as an alter-native food source induced a significant increase insuspension feeding activity of Calanus helgolandicus(>35%; p = 0.0001, ANCOVA) whereas the averagesuspension feeding activity was low (<21%) when itgrazed fecal pellets as the sole food source (Fig. 5A).No significant difference was found between the dura-tion of feeding bouts with or without T. weissflogii asan alternative food source (p > 0.1, ANCOVA; Fig. 5B).The sink duration was significantly higher when pel-lets were offered as the sole food (p = 0.006, ANCOVA;Fig. 5C). The increase in suspension feeding activitywhen T. weissflogii was present led to increasedencounters of fecal pellets. The percentage of rejec-tions of total encounters remained constant between75 and 90%, independent of the total number ofencounters, and the presence or absence of an alterna-tive food source.
Pseudocalanus elongatus is a suspension feeder,and encounters of fecal pellets were only observed
84
Average pellet concentration (no. ml–1)
Sin
k d
urat
ion
(s)
0
5
10
15
20
Jum
p d
urat
ion
(s)
0.00
0.05
0.10
0.15
0.20
0 2 4 6 8 10
Jum
ps
(no.
min
–1)
0
5
10
15
20
C
B
A
Fig. 4. Oithona similis. Female feeding behavior as a functionof fecal pellet concentration in the absence (s, dashed lines)and presence (d, solid lines) of an alternative food source(Rhodomonas salina). Average (A) number of jumps perminute, (B) jump duration in seconds, and (C) sink duration.Each point is the mean ± SD of the behavior of 3 females
analyzed for approximately 1 min each
Pellet conc. Rejection Avoidance Ingestion Encounter(pellets ml–1) Thrust Filtration–alga/+alga –alga +alga –alga +alga –alga +alga –alga +alga –alga +alga
0.25/0 0 0 0 0 0 0 0 0 0 02.25/2.38 2 4 9 9 1 2 9 10 24 40–/4 – 1 – – – 5 – 2 – 225.63/5.38 1 2 0 0 1 3 0 12 13 978.75/8.75 0 2 17 17 0 18 17 9 86 7911.25/– 2 – 5 5 4 – 5 – 38 –
Table 2. Calanus helgolandicus. Fecal pellet feeding behavior in the presence (+alga) or absence (–alga) of alternative food (Tha-lassiosira weissflogii at concentrations of 3 × 10⁶ cells l–1), during the half-hour analysis. Rejection—Thrust: when the pelletcaught in the feeding current was forcibly thrust away from the copepod; Filtration: when the pellet caught in the filtration cur-rent smoothly moved through the feeding appendages and out again. Avoidance: when the presence of the pellet induced anescape jump in the female. Ingestion: when the pellet was actually ingested. Encounter: number of observed encounters of fecal
pellets (rejection, avoidance, or ingestion) during the half-hour analysis. –: not investigated

Iversen & Poulsen: Copepod fecal pellet feeding behavior
during filtration bouts. Often the encounters withfecal pellets seemed unintentional, with efforts madeto reject the pellets. The rejection often involvedlarge bursts of water creating a strong current thatpushed the pellet away. At other times, the rejectionwas accomplished by swimming in circles while kick-ing with both feeding and swimming appendages inan attempt to reject the pellet, as if it caused han-dling problems. Rejection caused physical stress,which at times was observed to rupture and fragmentthe fecal pellets (coprorhexy). Only small pellets orpellet fragments were ingested, mainly along withalternative food.
The presence of Thalassiosira weissflogii induced asignificantly higher suspension feeding activity byPseudocalanus elongatus (p = 0.002, ANCOVA;Fig. 6A), although this difference was most pro-
nounced at low pellet concentrations of <2 pelletsml–1. No significant difference was observed in feed-ing bout duration in the presence of alternative food(p = 0.9, ANCOVA; Fig. 6B). Sink duration increasedsignificantly when pellets were offered as the solefood (p < 0.001, ANCOVA; Fig. 6C). A difference inthe number of pellet encounters was observeddepending on the presence or absence of phyto-plankton (Table 3).
Fecal pellet encounter and ingestion rates
The total number of encounters between fecal pel-lets and calanoid copepods (Calanus helgolandicusand Pseudocalanus elongatus) was estimated from thevideo observations (Tables 2 & 3). Fecal pellets were
85
Average pellet concentration (no. ml–1)
0
5
10
15
20
0
1
2
3
4
0 2 4 6 8 10 12
0
20
40
60
80
100
120A
B
C
Sin
k d
urat
ion
(s)
Feed
ing
bou
t d
urat
ion
(s)
Sus
pen
sion
feed
ing
activ
ity (%
)
Fig. 5. Calanus helgolandicus. Female feeding behavior as afunction of fecal pellet concentration in the absence (s,dashed lines) and presence (d, solid lines) of an alternativefood source (Thalassiosira weissflogii ). Average (A) suspen-sion feeding activity as a percentage of total activity, (B) feed-ing bout duration in seconds, and (C) sink duration inseconds. Each point is the mean ± SD of the behavior of 3
females analyzed for approximately 1 min each
0
5
10
15
20
250
2
4
6
8
0 3 6 9 12 15 18 21 24
0
20
40
60
80
100
120
C
B
A
Sin
k d
urat
ion
(s)
Feed
ing
bou
t d
urat
ion
(s)
Sus
pen
sion
feed
ing
activ
ity (%
)
Average pellet concentration (no. ml–1)
Fig. 6. Pseudocalanus elongatus. Female feeding behavior asa function of fecal pellet concentration in the absence (s,dashed lines) and presence (d, solid lines) of an alternativefood source (Thalassiosira weissflogii ). Average (A) suspen-sion feeding activity as a percentage of total activity, (B) feed-ing bout duration in seconds, and (C) sink duration in sec-onds. Each point is the mean ± SD of the behavior of 3 females
analyzed for approximately 1 min each

Mar Ecol Prog Ser 350: 79–89, 2007
encountered more frequently when an alternative foodsource was present. Less than 20% of the encounteredfecal pellets were ingested, independent of pellet con-centrations (calculated from Tables 2 & 3).
Ingestion rates were estimated from the observedingestions during the video recordings, assuming a
constant ingestion rate during 24 h.Daily ingestion was calculated fromthe percentage of ingestions of thetotal encounters. The ingestion ratesof Calanus helgolandicus and Pseudo-calanus elongatus estimated fromboth video observations and from thegrazing experiments (Figs. 1 & 2) werecompared by plotting them together(Fig. 7). No significant difference wasfound between the ingestion ratesestimated from the video recordingsand the grazing experiments for eitherC. helgolandicus or P. elongatus (p >0.5, ANCOVA). The ingestion ratesobtained from the video observationsshowed that pellet ingestion rates ofboth C. helgolandicus and P. elonga-tus increased by a factor of 1.4 and 2.8,respectively, in the presence of analternative food source. Further, theingestion of P. elongatus was 3.4 timeslower than the ingestion rate of C.helgolandicus in the presence of alter-native food and 7 times lower whenpellets were offered as the sole food(Fig. 7).
Thus, visual observation revealedthat the increased clearance of fecalpellets in the presence of alternativefood was caused by an increasedsuspension feeding activity by thecalanoid copepods. The presence ofalternative food induced uninten-
tional ingestion of small pellet fragments along withthe algae. Further, intact fecal pellets were avoided byboth calanoid species. No feeding response wasobserved for Oithona similis during 7 h of filming, indi-cating that fecal pellets were generally not viewed asattractive food particles by any of the copepods.
86
Pellet conc. Rejection Avoidance Ingestion Encounter(pellets ml–1) Thrust Filtration–alga/+alga –alga +alga –alga +alga –alga +alga –alga +alga –alga +alga
0/0.1 0 0 0 3 1 1 0 1 1 51.25/1.25 0 0 0 1 1 3 0 0 1 43.5/3.1 9 5 8 11 2 0 6 0 25 168.5/8.5 5 2 3 8 0 2 1 1 9 1310.75/11 11 5 16 49 1 2 1 7 29 6323.25/– 10 – 62 – 0 – 3 – 75 –
Table 3. Pseudocalanus elongatus. Fecal pellet feeding behavior in the presence (+alga) or absence (–alga) of alternative food (Thalassiosira weissflogii at concentrations of 3 × 10⁶ cells l–1), during the half-hour analysis. Further details as in Table 2
Average pellet concentration (no. ml–1)0 2 4 6 8 10 12 14 0 2 4 6 8 10 12 14
Inge
stio
n (p
elle
ts fe
mal
e–1 d
–1)
0
200
400
600
800
1000
0
200
400
600
800
1000C
A B
D
Fig. 7. (A,B) Calanus helgolandicus and (C,D) Pseudocalanus elongatus. Com-parison between the ingestion rates of fecal pellets obtained from grazingexperiments (d) and visual observations (s). Ingestion rates by C. helgolandicusand P. elongatus (B,D) with or (A,C) without an alternative food source (Thalas-siosira weissflogii ) are shown; ingestion rates from the visual observations werecalculated from the percentage of observed ingestions and the total encountersof fecal pellets. Each point was calculated from the analysis of 30 min of videorecording with a female in focus, assuming the behavior to be constant (half-hour analysis). Ingestion rates from the grazing experiments were estimated
according to Frost (1972). Error bars indicate ±SD

Iversen & Poulsen: Copepod fecal pellet feeding behavior
DISCUSSION
Fecal pellet degradation by calanoid copepods
The similarity of the ingestion rates obtained byvisual observations and incubation experiments dem-onstrates that these 2 methods are consistent for themeasurement of grazing rates.
Visual observations revealed that the presence of analternative food source increased the ingestion ratesof fecal pellets for both Calanus helgolandicus andPseudocalanus elongatus. The same tendency was ob-served in the grazing experiments, but not at signif-icant levels. The increased ingestion was due to in-creased suspension feeding activity initiated by thepresence of the alternative food source. Increasedfeeding activity resulted in higher encounter rates offecal pellets, and thus more modulation of the pellets.Other calanoid copepods (Acartia tonsa, Centropageshamatus, Eucalanus pileatus, and Temora longicornis)show similar increases in their functional response tofecal pellets in the presence of alternative algal food(Paffenhöfer & Van Sant 1985, Lampitt et al. 1990,Poulsen & Kiørboe 2005). Therefore, the degradation offecal pellets by these suspension feeding calanoidcopepod species is dependent on the feeding activityinduced by other food particles.
Calanus helgolandicus and Pseudocalanus elonga-tus were observed to reject large fecal pellets at highrates, seemingly due to handling difficulty of the largeparticle sizes. Poulsen & Kiørboe (2005) found that theclearance of pellets by calanoid copepods decreasedwith the relative increase in pellet size. Our pelletclearances obtained for the calanoid copepods fit wellwith the data from Poulsen & Kiørboe (2005) (Fig. 8).We therefore support the view that pellet size is a con-trolling factor for the ability of a copepod to recognizethe pellet as an unsuitable food particle. Further, pelletingestion occurred only when the fragments were sosmall that they were ingested unintentionally alongwith the alternative food particles.
The high rejection rate was independent of pellet con-centration or the presence or absence of an alternativefood source. The total number of rejections increasedwhen an alternative food source was present, due to in-creased pellet encounter rates. Often rejections led tomembrane rupture, opening, and/or fragmentation ofthe pellet. The most common degradation process byCalanus helgolandicus and Pseudocalanus elongatuswas therefore coprorhexy. Other investigators have alsoobserved that calanoid copepods damage fecal pelletsduring rejection (Paffenhöfer & Van Sant 1985, Noji et al.1991, Poulsen & Kiørboe 2005), supporting the view thatthe direct response to intact, large pellets from severalcalanoid copepods is rejection and coprorhexy.
Coprochaly may also be an important degradationmechanism for Calanus helgolandicus. This was evi-dent as females of this species were observed toremove and possibly ingest parts of the peritrophicmembrane. This behavior was also observed for C. hel-golandicus and Acartia clausi by Noji et al. (1991), whonamed the behavior coprochaly. It is therefore likelythat C. helgolandicus feeds on bacteria and otherorganisms, which rapidly colonize the peritrophicmembrane of fecal pellets after egestion (Hargrave1975, Tezuka 1990), increasing the nutritional value ofthe pellet (Turner & Ferrante 1979, Simon et al. 2002).The occurrence of coprochaly can be mistaken forcoprorhexy without the inclusion of direct observa-tions, since both coprochaly and coprorhexy imposephysical stress on the pellet, causing pellet looseningor fragmentation. In situ loosening or fragmentation ofpellets increases the residence time and thereby themicrobial degradation of fecal pellets within the watercolumn because the reduced particle size and/or den-sity decreases the sinking velocity of the pellets.Therefore, coprorhexy and coprochaly are importantdegradation processes, which seem to be more com-
87
Relative fecal pellet size (ESD/prosome length)0.01 0.1
Sca
led
feca
l pel
let
clea
ranc
e ra
te(c
lear
ance
/pro
som
e le
ngth
2 , m
l d–1
µm
–1)
1 x 10⁻⁷
1 x 10⁻⁶
1 x 10⁻⁵
1 x 10⁻⁴
1 x 10⁻³
1 x 10⁻²
1 x 10⁻¹
Gonzalez & Smetacek (1994)
Fig. 8. Copepod fecal pellet clearance rate (normalized bycopepod prosome length squared) as a function of relativepellet size (ESD/copepod prosome length) for calanoid cope-pods (y, z) and Oithona similis (s, d), in the absence (opensymbols) or presence (closed symbols) of alternative food.Clearance rates and pellet sizes for the calanoid copepodswere obtained from Table 5 in Poulsen & Kiørboe (2005) andfrom the present study. Clearance rates and pellet sizes for O.similis were obtained from González & Smetacek (1994) andthe present study. The data point obtained from González &Smetacek (1994) for O. similis is labeled with the reference.The regression for pellets as the sole food for the calanoidcopepods is: log(y) = –0.97log(x) –5.83, R2 = 0.39. The regres-sion for pellets offered together with an alternative foodsource for the calanoid copepods is: log(y) = –0.95log(x) –5.69,
R2 = 0.53
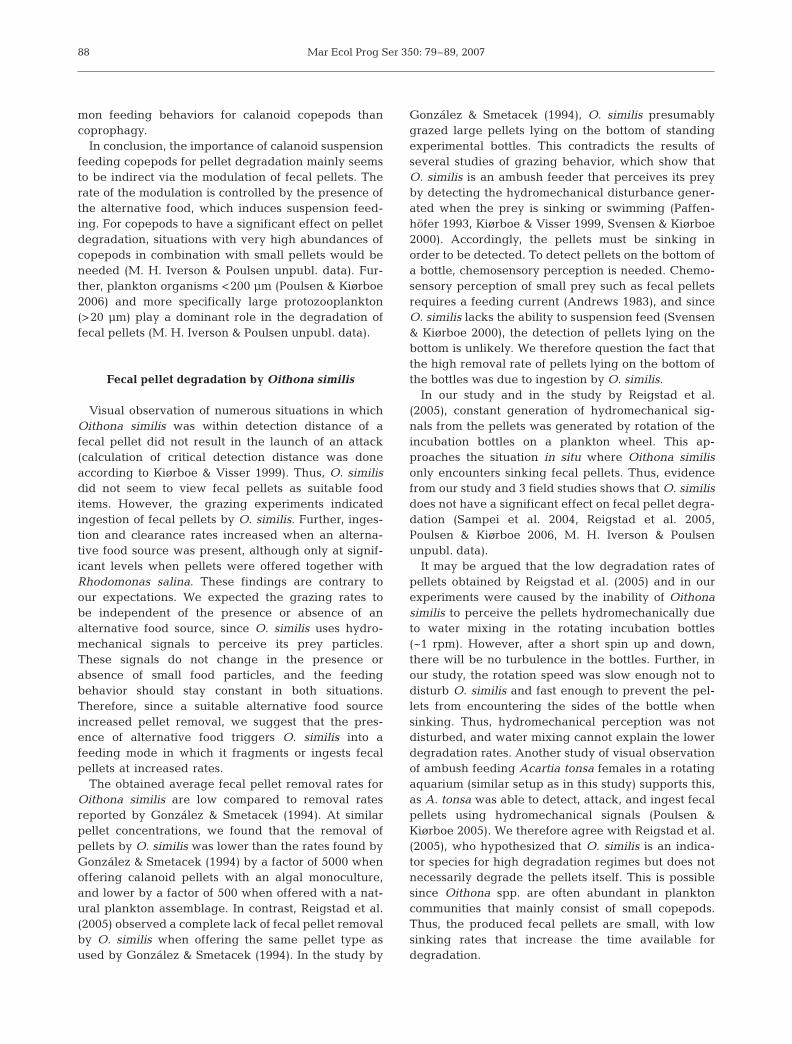
Mar Ecol Prog Ser 350: 79–89, 2007
mon feeding behaviors for calanoid copepods thancoprophagy.
In conclusion, the importance of calanoid suspensionfeeding copepods for pellet degradation mainly seemsto be indirect via the modulation of fecal pellets. Therate of the modulation is controlled by the presence ofthe alternative food, which induces suspension feed-ing. For copepods to have a significant effect on pelletdegradation, situations with very high abundances ofcopepods in combination with small pellets would beneeded (M. H. Iverson & Poulsen unpubl. data). Fur-ther, plankton organisms <200 µm (Poulsen & Kiørboe2006) and more specifically large protozooplankton(>20 µm) play a dominant role in the degradation offecal pellets (M. H. Iverson & Poulsen unpubl. data).
Fecal pellet degradation by Oithona similis
Visual observation of numerous situations in whichOithona similis was within detection distance of afecal pellet did not result in the launch of an attack(calculation of critical detection distance was doneaccording to Kiørboe & Visser 1999). Thus, O. similisdid not seem to view fecal pellets as suitable fooditems. However, the grazing experiments indicatedingestion of fecal pellets by O. similis. Further, inges-tion and clearance rates increased when an alterna-tive food source was present, although only at signif-icant levels when pellets were offered together withRhodomonas salina. These findings are contrary toour expectations. We expected the grazing rates tobe independent of the presence or absence of analternative food source, since O. similis uses hydro-mechanical signals to perceive its prey particles.These signals do not change in the presence orabsence of small food particles, and the feedingbehavior should stay constant in both situations.Therefore, since a suitable alternative food sourceincreased pellet removal, we suggest that the pres-ence of alternative food triggers O. similis into afeeding mode in which it fragments or ingests fecalpellets at increased rates.
The obtained average fecal pellet removal rates forOithona similis are low compared to removal ratesreported by González & Smetacek (1994). At similarpellet concentrations, we found that the removal ofpellets by O. similis was lower than the rates found byGonzález & Smetacek (1994) by a factor of 5000 whenoffering calanoid pellets with an algal monoculture,and lower by a factor of 500 when offered with a nat-ural plankton assemblage. In contrast, Reigstad et al.(2005) observed a complete lack of fecal pellet removalby O. similis when offering the same pellet type asused by González & Smetacek (1994). In the study by
González & Smetacek (1994), O. similis presumablygrazed large pellets lying on the bottom of standingexperimental bottles. This contradicts the results ofseveral studies of grazing behavior, which show thatO. similis is an ambush feeder that perceives its preyby detecting the hydromechanical disturbance gener-ated when the prey is sinking or swimming (Paffen-höfer 1993, Kiørboe & Visser 1999, Svensen & Kiørboe2000). Accordingly, the pellets must be sinking inorder to be detected. To detect pellets on the bottom ofa bottle, chemosensory perception is needed. Chemo-sensory perception of small prey such as fecal pelletsrequires a feeding current (Andrews 1983), and sinceO. similis lacks the ability to suspension feed (Svensen& Kiørboe 2000), the detection of pellets lying on thebottom is unlikely. We therefore question the fact thatthe high removal rate of pellets lying on the bottom ofthe bottles was due to ingestion by O. similis.
In our study and in the study by Reigstad et al.(2005), constant generation of hydromechanical sig-nals from the pellets was generated by rotation of theincubation bottles on a plankton wheel. This ap-proaches the situation in situ where Oithona similisonly encounters sinking fecal pellets. Thus, evidencefrom our study and 3 field studies shows that O. similisdoes not have a significant effect on fecal pellet degra-dation (Sampei et al. 2004, Reigstad et al. 2005,Poulsen & Kiørboe 2006, M. H. Iverson & Poulsenunpubl. data).
It may be argued that the low degradation rates ofpellets obtained by Reigstad et al. (2005) and in ourexperiments were caused by the inability of Oithonasimilis to perceive the pellets hydromechanically dueto water mixing in the rotating incubation bottles(~1 rpm). However, after a short spin up and down,there will be no turbulence in the bottles. Further, inour study, the rotation speed was slow enough not todisturb O. similis and fast enough to prevent the pel-lets from encountering the sides of the bottle whensinking. Thus, hydromechanical perception was notdisturbed, and water mixing cannot explain the lowerdegradation rates. Another study of visual observationof ambush feeding Acartia tonsa females in a rotatingaquarium (similar setup as in this study) supports this,as A. tonsa was able to detect, attack, and ingest fecalpellets using hydromechanical signals (Poulsen &Kiørboe 2005). We therefore agree with Reigstad et al.(2005), who hypothesized that O. similis is an indica-tor species for high degradation regimes but does notnecessarily degrade the pellets itself. This is possiblesince Oithona spp. are often abundant in planktoncommunities that mainly consist of small copepods.Thus, the produced fecal pellets are small, with lowsinking rates that increase the time available fordegradation.
88

Iversen & Poulsen: Copepod fecal pellet feeding behavior
Poulsen & Kiørboe (2006) found high degradation ofpellets (61 to 97%) in the upper 50 m of the watercolumn during a field study of vertical flux and pelletdegradation. However, they observed low pelletdegradation when incubating only large zooplanktonorganisms (>200 µm), indicating that copepods andother mesozooplankton did not affect pellet degrada-tion significantly. We previously investigated thedegradation of different size fractions of the planktoncommunity in The Sound (Denmark) in more detailand likewise found that copepods and other mesozoo-plankton did not affect pellet degradation significantly(M. H. Iverson & Poulsen unpubl. data). Further, we(unpubl. data) found protozooplankton and bacteria tobe the main degraders of fecal pellets in the sea. Wetherefore suggest that copepods play a minor role indirect pellet degradation in situ and mainly influencethe degradation through fragmentation of the pellets.However, via the grazing pressure imposed by thecopepods on the effective pellet degraders such aslarge protozooplankton (>20 µm) and possibly nauplii,they are indirectly very important for the downwardexport of fecal pellets (M. H. Iverson & Poulsenunpubl. data).
Acknowledgements. We thank Prof. T. Kiørboe, Danish Insti-tute for Fisheries Research, Department of Marine Ecologyand Aquaculture for comments and support during the exper-imental phase. L.K.P. was supported by the Scaling from Indi-vidual to Population (SLIP) research school under the DanishNetwork for Fisheries and Aquaculture Research financed bythe Danish Ministry for Food, Agriculture, and Fisheries andthe Danish Agricultural and Veterinary Research Council.M.H.I. was supported by the Danish Institute for FisheriesResearch, Department of Marine Ecology and Aquaculture.
LITERATURE CITED
Andrews JC (1983) Deformation of the active space in the lowReynolds-number feeding current of calanoid copepods.Can J Fish Aquat Sci 40:1293–1302
Besiktepe S, Dam HG (2002) Coupling of ingestion and defe-cation as a function of diet in the calanoid copepod Acar-tia tonsa. Mar Ecol Prog Ser 229:151–164
Cho BC, Azam F (1988) Major role of bacteria in biogeochem-ical fluxes in the ocean’s interior. Nature 332:441–443
Frost BW (1972) Effects of size and concentration of food par-ticles on the feeding behavior of the marine planktoniccopepod Calanus pacificus. Limnol Oceanogr 6:805–815
González HE, Smetacek V (1994) The possible role of thecyclopoid copepod Oithona in retarding vertical flux ofzooplankton fecal material. Mar Ecol Prog Ser 113:233–246
Green EP, Harris RP, Duncan A (1992) The production andingestion of fecal pellets by nauplii of marine calanoidcopepods. J Plankton Res 14:1631–1643
Guillard RRL (1975) Culture of phytoplankton for feedingmarine invertebrates. In: Smith WL, Chanley MH (eds)Culture of marine invertebrate animals. Plenum Press,London, p 29–60
Hargrave BT (1975) The central role of invertebrate faeces insediment decomposition. In: Anderson JM, Macfadyen A(eds) The role of terrestrial and aquatic organisms indecomposition processes. Blackwell Scientific Publica-tions, London, p 301–321
Kiørboe T, Visser AW (1999) Predator and prey perception incopepods due to hydromechanical signals. Mar Ecol ProgSer 179:81–95
Kiørboe T, Möhlenberg F, Riisgaard HU (1985) Bioenergeticsof the planktonic copepod Acartia tonsa: relation betweenfeeding, egg production and respiration, and compositionof specific dynamic action. Mar Ecol Prog Ser 26:85–97
Lampitt RS, Noji T, von Bodungen B (1990) What happens tozooplankton fecal pellets—implications for material flux.Mar Biol 104:15–23
Noji TT, Estep KW, MacIntyre F, Norrbin F (1991) Imageanalysis of fecal material grazed upon by three species ofcopepods: evidence for coprorhexy, coprophagy andcoprochaly. J Mar Biol Assoc UK 71:465–480
Paffenhöfer GA (1993) On the ecology of marine cyclopoidcopepods (Crustacea, Copepoda). J Plankton Res 15:37–55
Paffenhöfer GA, Knowles SC (1979) Ecological implications offecal pellet size, production and consumption by cope-pods. J Mar Res 37:35–49
Paffenhöfer GA, Strickland JDH (1970) A note on the feedingof Calanus helgolandicus on detritus. Mar Biol 5:97–99
Paffenhöfer GA, Van Sant KB (1985) The feeding response ofa marine planktonic copepod to quantity and quality ofparticles. Mar Ecol Prog Ser 27:55–65
Ploug H, Iversen MH, Koski M, Buitenhuis ET (in press) Pro-duction, oxygen respiration rates, and sinking velocities ofcopepod fecal pellets: direct measurements of ballastingby opal and calcite. Limnol Oceanogr
Poulsen LK, Kiørboe T (2005) Coprophagy and coprorhexy inthe copepods Acartia tonsa and Temora longicornis: clear-ance rates and feeding behavior. Mar Ecol Prog Ser 299:217–227
Poulsen LK, Kiørboe T (2006) Vertical flux and degradationrates of copepod fecal pellets in a zooplankton communityby small copepods. Mar Ecol Prog Ser 323:195–204
Reigstad M, Wexel-Riser C, Svensen C (2005) Fate of copepodfaecal pellets and the role of Oithona spp. Mar Ecol ProgSer 225:265–270
Sampei M, Sasaki H, Hattoi H, Fukuchi M, Hargrave BT(2004) Fate of sinking particles, especially fecal pellets,within the epipelagic zone in the North Water (NOW)polynya of northern Baffin Bay. Mar Ecol Prog Ser 278:17–25
Simon M, Grossart HP, Schweitzer B, Ploug H (2002) Micro-bial ecology of organic aggregates in aquatic ecosystems.Aquat Microb Ecol 28:175–211
Støttrup JG, Richardson K, Kirkegaard E, Pihl NJ (1986) Thecultivation of Acartia tonsa Dana for use as a live foodsource for marine fish larvae. Aquaculture 52:87–96
Svensen C, Kiørboe T (2000) Remote prey detection inOithona similis: hydromechanical versus chemical cues.J Plankton Res 22:1155–1166
Tezuka Y (1990) Bacterial regeneration of ammonium andphosphate as affected by the carbon-nitrogen-phosphorusratio of organic substrates. Microb Ecol 19:227–238
Turner JT, Ferrante JG (1979) Zooplankton fecal pellets inaquatic ecosystems. BioScience 29:670–677
Viitasalo M, Rosenberg M, Heiskanen AS, Koski M (1999)Sedimentation of copepod fecal material in the coastalnorthern Baltic Sea: Where did all the pellets go? LimnolOceanogr 44(6):1388–1399
89
Editorial responsibility: Otto Kinne (Editor-in-Chief),Oldendorf/Luhe, Germany
Submitted: August 29, 2006; Accepted: June 6, 2007Proofs received from author(s): November 1, 2007


Paper II

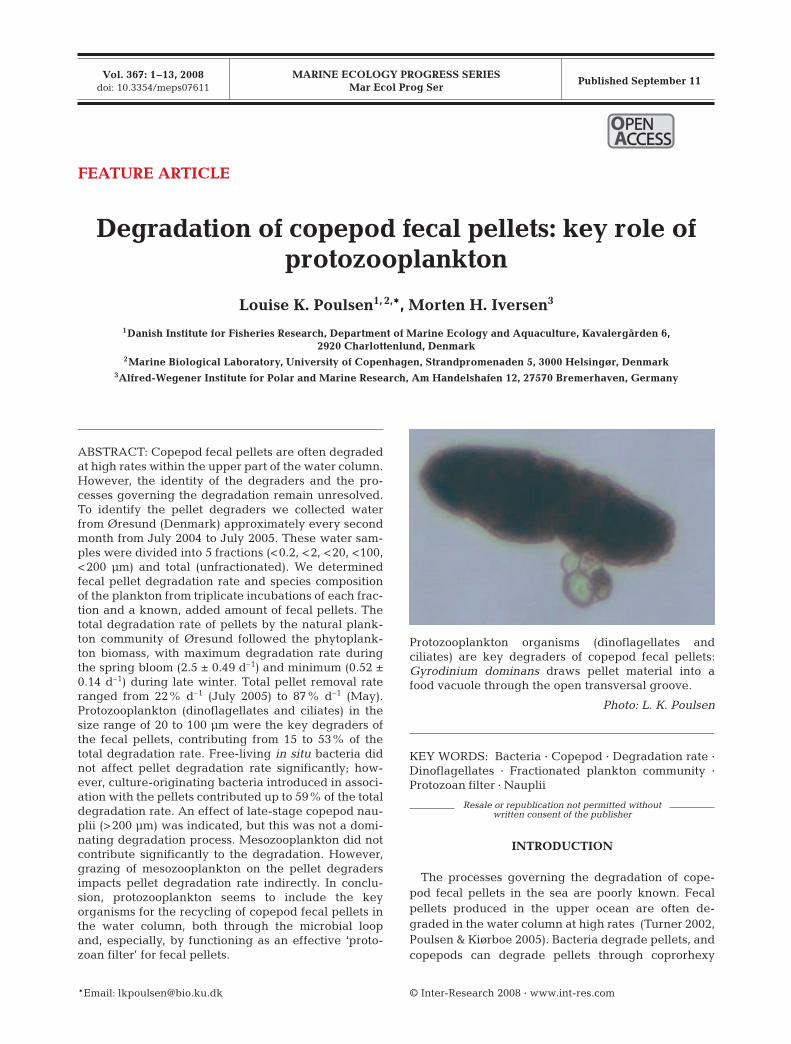
MARINE ECOLOGY PROGRESS SERIESMar Ecol Prog Ser
Vol. 367: 1–13, 2008doi: 10.3354/meps07611
Published September 11
INTRODUCTION
The processes governing the degradation of cope-pod fecal pellets in the sea are poorly known. Fecalpellets produced in the upper ocean are often de-graded in the water column at high rates (Turner 2002,Poulsen & Kiørboe 2005). Bacteria degrade pellets, andcopepods can degrade pellets through coprorhexy
© Inter-Research 2008 · www.int-res.com*Email: [email protected]
FEATURE ARTICLE
Degradation of copepod fecal pellets: key role ofprotozooplankton
Louise K. Poulsen1, 2,*, Morten H. Iversen3
1Danish Institute for Fisheries Research, Department of Marine Ecology and Aquaculture, Kavalergården 6, 2920 Charlottenlund, Denmark
2Marine Biological Laboratory, University of Copenhagen, Strandpromenaden 5, 3000 Helsingør, Denmark3Alfred-Wegener Institute for Polar and Marine Research, Am Handelshafen 12, 27570 Bremerhaven, Germany
ABSTRACT: Copepod fecal pellets are often degradedat high rates within the upper part of the water column.However, the identity of the degraders and the pro-cesses governing the degradation remain unresolved.To identify the pellet degraders we collected waterfrom Øresund (Denmark) approximately every secondmonth from July 2004 to July 2005. These water sam-ples were divided into 5 fractions (<0.2, <2, <20, <100,<200 μm) and total (unfractionated). We determinedfecal pellet degradation rate and species compositionof the plankton from triplicate incubations of each frac-tion and a known, added amount of fecal pellets. Thetotal degradation rate of pellets by the natural plank-ton community of Øresund followed the phytoplank-ton biomass, with maximum degradation rate duringthe spring bloom (2.5 ± 0.49 d–1) and minimum (0.52 ±0.14 d–1) during late winter. Total pellet removal rateranged from 22% d–1 (July 2005) to 87% d–1 (May).Protozooplankton (dinoflagellates and ciliates) in thesize range of 20 to 100 μm were the key degraders ofthe fecal pellets, contributing from 15 to 53% of thetotal degradation rate. Free-living in situ bacteria didnot affect pellet degradation rate significantly; how-ever, culture-originating bacteria introduced in associ-ation with the pellets contributed up to 59% of the totaldegradation rate. An effect of late-stage copepod nau-plii (>200 μm) was indicated, but this was not a domi-nating degradation process. Mesozooplankton did notcontribute significantly to the degradation. However,grazing of mesozooplankton on the pellet degradersimpacts pellet degradation rate indirectly. In conclu-sion, protozooplankton seems to include the keyorganisms for the recycling of copepod fecal pellets inthe water column, both through the microbial loopand, especially, by functioning as an effective ‘proto-zoan filter’ for fecal pellets.
Protozooplankton organisms (dinoflagellates andciliates) are key degraders of copepod fecal pellets:Gyrodinium dominans draws pellet material into afood vacuole through the open transversal groove.
Photo: L. K. Poulsen
OPENPEN ACCESSCCESS
KEY WORDS: Bacteria · Copepod · Degradation rate ·Dinoflagellates · Fractionated plankton community ·Protozoan filter · Nauplii
Resale or republication not permitted without written consent of the publisher

Mar Ecol Prog Ser 367: 1–13, 2008
(fragmentation of pellets), coprophagy (ingestion ofpellets) and coprochaly (loosening of pellets) (Lampittet al. 1990, Noji et al. 1991). Especially copepods havebeen proposed as the main degraders of copepod fecalpellets, since several copepods have been shown todegrade fecal pellets in the laboratory (Paffenhöfer &Strickland 1970, Paffenhöfer & Knowles 1979, Paffen-höfer & Van Sant 1985, Ayukai & Nishizawa 1986,Lampitt et al. 1990, Noji et al. 1991, González &Smetacek 1994, González et al. 1994). However, evi-dence for the major role of copepods in the field islacking. To our knowledge, copepod fecal pelletdegradation has only been investigated in one fieldstudy by Poulsen & Kiørboe (2006), who found thatcopepods were not important degraders of fecal pelletsand suggested that plankton organisms <200 μm werethe main degraders. Furthermore, recent studies com-bining grazing experiments and visual observation offeeding behavior have shown that some copepodsdo not view fecal pellets as attractive food particles,and actual ingestion by suspension-feeding calanoidsappears to consist of small fragments. These fragmentsare mainly ingested unintentionally along with foodparticles contained within the feeding current (Poulsen& Kiørboe 2005, Iversen & Poulsen 2007).
Evidence for fecal pellet degradation by planktonicorganisms other than adult copepods does exist butis very scarce. Nauplii of the hapacticoid copepodAmonardia normanni (Koski et al. 2005) and Calanushelgolandicus (Green et al. 1992) consume fecal pel-lets. Kiørboe (2003) found high clearance rates of theheterotrophic dinoflagellate Noctiluca scintillans onfecal pellets in an upwelling plume off the coast ofBrazil (~600 ml cell–1 d–1). Ciliates and heterotrophicflagellates may colonize fecal pellets and have beenobserved to increase pellet degradation (Hansen et al.1996).
This study investigates the degradation of copepodfecal pellets by the plankton community of Øresund(Denmark). The degradation rate of fecal pellets by theunfractionated plankton community, as well as of the5 size classes (ultra-, pico-, nano-, micro- and meso-plankton), was investigated through incubations offecal pellets with the total plankton community and the5 size fractions. The species composition of the plank-ton community was quantified to evaluate the degra-dation of specific plankton groups and species indetail. Our main goal was to pinpoint the planktonorganisms responsible for pellet degradation and toquantify the impact of these organisms throughout theyear. Thus, only 1 type of fecal pellets was used in thedegradation experiments, eliminating the influence ofother possible governing factors for pellet degradationrate, such as the food source of the pellets, pellet size,pellet age, etc.
MATERIALS AND METHODS
Sampling and location. Sampling for plankton wasconducted approximately every second month through-out a year in the narrow strait of Øresund, locatedbetween Denmark and Sweden (Fig. 1, Table 1). Øre-sund is characterized by a strong halocline throughoutthe year with low-saline (~10‰) surface water fromthe Baltic Sea and saline (~30‰) bottom water fromthe Kattegat (Lintrup & Jakobsen 1999). Strong windevents may break up the halocline periodically. Watersamples for experimentation were collected at thedepth of the fluorescence maximum in the lower part
2
0Helsing-borgHelsingørSkagerrak
Baltic Sea
Kattegat
Fig. 1. Sampling area. Sampling was conducted approximatelyevery second month during a year (2004/2005) in the strait ofØresund between Denmark and Sweden. Sampling of theplankton community was conducted at the depth of the
fluorescence maximum
Table 1. Sampling data. Sampling depth was the depth of the fluorescence maximum in the lower part of the halocline
Sampling Sampling Total Temperature Salinity date depth depth (°C) (‰)
(m) (m)
6 Jul 2004 9 20 16 2818 Aug 2004 12 25 16 288 Sep 2004 12 25 14 282 Nov 2004 9 20 12 2824 Feb 2005 19 35 5 2216 Mar 2005 8 20 4 2617 May 2005 15 25 7 1828 Jul 2005 16 39 14 33

Poulsen & Iversen: Pellet degradation by a plankton community
of the halocline (~8 to 19 m) (Table 1) by use of a waterpump. The fluorescence maximum was determinedthrough vertical profiles of temperature, salinity andfluorescence using a SeaBird SBE11 CTD equippedwith an in situ fluorometer. The water was immedi-ately transported to the laboratory in 30 l plastic con-tainers. In the laboratory the containers were kept atin situ temperature and gently aerated.
Cultures and pellet production. Rhodomonas salina(Wislouch) Hill & Wetherbee (a cryptophyte) wasmaintained in exponential growth in f/2 medium(Guillard 1975). The cultures were kept in a constantlight:dark cycle (12:12 h) in filtered seawater (~33‰) at18°C. Acartia tonsa was kept in culture at 18°C andreared on R. salina (Støttrup et al. 1986). The fecal pel-lets added in the degradation experiment of each sam-pling month were produced by 1 cohort of A. tonsafemales feeding on R. salina at saturating food concen-trations (>713 μgC l–1; Kiørboe et al. 1985). Screeninsets (180 μm) in the bottom of the pellet productioncontainers minimized coprophagous and coprorhexiousgrazing of the pellets by A. tonsa. The copepods wereallowed to feed for <18 h before the pellets were sepa-rated from phytoplankton and copepods by filtrationthrough a double filter with an upper 180 μm screen(removes copepods) and a lower 30 μm screen (collectspellets but not R. salina). The pellets were then gentlywashed and suspended in a single bottle with filteredseawater (<0.2 μm micropore filter), which was used asthe stock solution of pellets. The pellet concentration inthe stock solution was calculated from pellet counts(pellet fragments [end parts only] were counted asa one-half pellet). The average volume (cylindricalshape) of the pellets was calculated from measure-ments of length and width of at least 30 fecal pellets(Table 2). Subsamples were immediately transferred tothe incubation bottles containing the different plank-ton fractions (within 1 h of production) correspondingto a final fecal pellet concentration of ~0.5 pellets ml–1.
Degradation experiments. Water from the fluores-cence maximum of Øresund was fractionated into 5fractions (<0.2, <2, <20, <100, <200 μm) and total(unfractionated) to evaluate the pellet degradationrate attributable to the different plankton size groupsat in situ concentrations (0.2 to 2 μm = bacteria, 2 to20 μm = nanoplankton, 20 to 200 μm = microplanktonand >200 μm = mesozooplankton). The water was frac-tionated into the size classes <20, <100 and <200 μmby inverse filtration through 20, 100 and 200 μm filtersand into the <0.2 and <2 μm size fractions by useof, respectively, a 0.2 μm and 2 μm micropore filtermounted on a suction system. Water from each fractionand the unfractionated (total) sample was incubated intriplicate for 48 h (July and September 2004) or 24 h(other months) (Table 2) after addition of 300 fecalpellets from the pellet solution per 615 ml blue capincubation bottle (= 0.5 pellets ml–1). Control bottles(3 replicates), without addition of pellets, were madefor the size fractions containing in situ copepod fecalpellets and copepods: <20, <100, <200 μm and total.These controls were used to correct for in situ pelletsand pellets produced by copepods present in the watersamples during incubation. Bottles were incubated ona plankton wheel (1 rpm), kept at in situ temperatures(i.e. temperature at sampling depth; Table 1), and on a12 h light:12 h dark cycle. After incubation, fecal pel-lets and zooplankton were collected on a 15 μm filter,stored in 50 ml plastic containers and preserved byacid Lugol’s solution (1% final concentration) for latercounting.
The degradation experiment carried out in August2004 was contaminated by the mainly benthic ciliateEuplotes sp. (from the Rhodomonas salina culture), andtherefore discarded; in this experiment, all fecal pelletswere degraded within 48 h. Two degradation experi-ments (Expts a and b) were run in parallel in July 2004,with water from the same sample and same size frac-tions. The parallel experiments were conducted toinvestigate how the initial degree of pellet fragmenta-tion influenced the pellet degradation rate. The pelletswere produced by the same cohort of Acartia tonsafemales as described above. However, different pelletfragmentation percents were obtained by filtration,such that fragmentation was 44% in Expt a and 34%in Expt b (Table 2). Pellets for Expt a were filteredthrough a double filter with an upper 180 μm screen(removes copepods) and a lower 15 μm screen (collectspellets). Pellets for Expt b were filtered through a dou-ble filter with an upper 180 μm screen and a lower30 μm screen. The fragmentation percent (F) of thefecal pellets was calculated as:
(1)F = ×(fragments/2)
Intact + (fragments/2)100%%
3
Table 2. Experimental data and fecal pellet characteristics atincubation start. Pellet volume was calculated from measure-ments of pellet length and width. Pellet length and volume
(± SD) given as means
Sampling Incubation Length Volume Fragmenta-date time (h) (μm) (104 μm3) tion (%)
6 Jul 2004(a) 48 66 (±42) 3.4 (±5.4) 446 Jul 2004(b) 48 80 (±30) 6.0 (±4.8) 3418 Aug 2004 48 – – –8 Sep 2004 48 93 (±23) 5.2 (±2.0) 262 Nov 2004 24 91(±24) 7.4 (±3.9) 3424 Feb 2005 24 79 (±17) 5.5 (±2.5) 4516 Mar 2005 24 95 (±37) 9.1 (±5.6) 3917 May 2005 24 111 (±34)0 12.4 (±6.2)0 1928 Jul 2005 24 85 (±16) 8.2 (±4.2) 30
Mar Ecol Prog Ser 367: 1–13, 2008
where fragments are a one-half pellet (end parts only)and intact is whole pellets.
The fecal pellet degradation rate was calculatedfrom the loss of fecal pellet material described by:
Nt = N0e–rt (2)
where N is the total number of fecal pellets in the incu-bation bottle at incubation start (N0) and at the end ofincubation (Nt), t is incubation time (days) and r is thedegradation rate (d–1). The degradation rate estimatedin this study is a cumulative degradation rate in thesense that organisms present in the fraction <0.2 μmare also present in all other fractions, the organismspresent in the fraction <2 μm are present in all otherfractions except <0.2 μm and so forth. The degradationrate of fecal pellets in the unfractionated samples iscalled the total degradation rate.
Control experiments. A control experiment was con-ducted to ensure that the handling procedure did notaffect the pellet degradation rates. Two subsamples of5 ml were taken from a pellet stock solution. One of thesamples was placed directly in a Petri dish. The othersample was added to a Bluecap bottle filled with fil-tered seawater (<0.2 μm), collected on a 15 μm filterand flushed into a Petri dish, following the same proce-dure as in the degradation experiments of the presentstudy. The 2 subsamples were fixed with acid Lugol’ssolution simultaneously and counted. The procedurewas repeated 6 times with new subsamples from thepellet solution, and a t-test (SigmaStat 3.1) was con-ducted to test for significant differences between the2 treatments. No differences between the recoveredpellets in the 2 treatments were found (p > 0.05), i.e.the handling procedure did not affect the pellet degra-dation rate.
Counting. The total number of pellets in all size frac-tions and in the controls of the size fractions of <20,<100, <200 μm and total were counted after incubation(3 replicates in all size fractions). The concentration ofAcartia tonsa pellets after incubation was calculatedby subtracting the average number of pellets in thecontrol bottles (3 replicates) from the total number ofpellets left in each incubation bottle (3 replicates) ofthe corresponding size fraction. After incubation all 6size fractions (3 replicates in each fraction) were fix-ated with acid Lugol’s solution, and the zooplanktonspecies composition was assessed by use of a stereomicroscope. Thus, the zooplankton in each fractionrepresents the in situ concentration of the zooplankton.All animals were identified to species or genus level.Samples for enumeration and identification of phyto-plankton and protozooplankton were taken in each ofthe 6 size fractions prior to incubation and fixed in acidLugol’s solution (1% final concentration). Countingwas conducted in Utermöhl settling chambers (settling
time >24 h) (Utermöhl 1958). Only cells >10 μm werecounted, since smaller cells are not satisfactorily deter-mined with the Utermöhl method. At least 400 cellswere counted per sample. Biovolumes of protists wereestimated from linear dimensions using appropriategeometric shapes, and were converted to biomassusing 2 linear regression equations of carbon:volumerelationships, 1 for diatoms (Mullin et al. 1966):
logC = 0.76 logV – 0.29 (3)
and 1 for flagellates (autotrophic and heterotrophic)(Menden-Deuer & Lessard 2000):
logC = 0.94 logV – 0.6 (4)
where C is cell carbon mass in pg and V is cell volumein μm3.
Identification of ciliates to species, group, or morpho-type was based on Montagnes & Lynn (1991) andHansen & Nielsen (1999). Dinoflagellates were identi-fied according to Tomas (1997) and Thomsen (1992).No correction for cell shrinkage was applied. Protozoo-plankton was divided into the size classes <20 and>20 μm according to the shortest dimension. Separa-tion of autotrophic and heterotrophic dinoflagellateswas not complete, as this is only possible with 100%precision using epifluorescence microscopy.
Chlorophyll a. Samples (1 to 3 l) for chl a measure-ments of the unfractionated water were filtered ontoGF/F filters, extracted in 96% ethanol and measuredon a Perkin Elmer spectrophotometer. No chl a mea-surements were conducted in July 2004 and Septem-ber 2004.
Statistical analysis. The difference between the de-gradation rates of fecal pellets (dependent variable) inthe 5 size fractions and the unfractionated water sam-ple of each month (factor) was tested with 1-wayANOVA. The Tukey post hoc test was used for pair-wise comparisons (SigmaStat 3.1).
The importance of the initial degree of pellet frag-mentation for the pellet degradation rate of the parallelexperiments in July 2004 (Expts a and b; Table 2) wastested with a t-test comparing the average degradationrates (see Fig. 5A, B) of each of the 5 size fractions andtotal between Expts a and b (SigmaStat 3.1).
The correlation between temperature and averagebacterial degradation rate (<0.2 and <2 μm fractions)was determined through a Pearson product momentcorrelation (SigmaStat 3.1).
Stepwise linear regression was used to find the bestmodel describing the relationship between pellet de-gradation rate (dependent variable) and the abun-dance of different protozooplankton and zooplanktonorganisms (independent variables) in the size ranges of20 to 100 μm (microzooplankton) and ≥ 200 μm (meso-zooplankton). The degradation rate in the 2 size ranges
4

Poulsen & Iversen: Pellet degradation by a plankton community
was obtained by subtraction (r20–100 μm = r<100 μm – r<20 μm
and r≥ 200 μm = rtotal – r<200 μm); the same was done foranimal abundances. September was excluded from theanalysis due to contamination of the <0.2 and <2 μmfractions with protozooplankton, making it impossibleto separate the bacterial contribution from that of theother fractions. Linear regression was done for eachindependent variable, and significant variables (p <0.05) were investigated in all possible combinationsthrough stepwise linear regression (SigmaStat 3.1) tosearch for the best model, describing the dependenceof the degradation rate on the relevant independentvariables in the 2 size ranges. Residuals wereanalyzed to confirm that model assumptionswere satisfied, and the models were tested forautocorrelation and multicollinearity (correla-tion between independent variables).
RESULTS
Hydrography and plankton
A strong halocline was present at 10 to 20 mdepth, except in February, when strong windsbroke it up. The fluorescence maximum wasgenerally located in the lower part of the halo-cline (8 to 19 m; Table 1). Phytoplanktonblooms were observed, 1 in March, May andJuly 2005 (267 to 512 μgC l–1, 3 to 7 μg chl a l–1)and 1 in the autumn (September, 167 μgC l–1)(Figs. 2 & 3A). During the rest of the samplingmonths concentrations of 2 to 39 μgC l–1 and0.3 to 1.7 μg chl a l–1 prevailed in the subsur-face maximum.
The heterotrophic biomass was dominatedby protozooplankton (dinoflagellates and cili-ates) in all months and followed the seasonalvariation in phytoplankton biomass (Figs. 2 &3B). Dinoflagellates dominated the protozoo-plankton in all months (Fig. 3B). The large pro-tozooplankton groups (>20 μm) present in the<100 μm fraction included the autotrophic/mixotrophic dinoflagellates Ceratium spp. andDinophysis spp., heterotrophic dinoflagellates>20 μm, Gyrodinium spirale (Bergh) Kofoid& Swezy, Protoperidinium spp. and ciliates>20 μm.
The zooplankton community of Øresundconsisted of relatively few species, which weredominated by small copepods (Fig. 4). Cope-pod nauplii were found in the planktonthroughout the year, with a maximum abun-dance in July 2005 (65 ± 16 ind. l–1) and mini-mum in February (4 ± 3 ind. l–1). Maximum
copepod abundances of 22 to 60 ind. l–1 were found inJuly and September (Fig. 4). Oithona similis was pre-sent in all months except March and dominated thezooplankton community except in spring, when Acar-tia spp. dominated. Evidence of high grazing pressureexerted by the mesozooplankton during their maxi-mum abundance was observed in the degradationexperiment of July 2005. This was due to the generaldisruption and senescence of the phytoplankton, largeamounts of dead organic matter originating from dis-rupted fecal pellets, and to a low abundance of large(>20 μm) protozooplankton (Fig. 3B).
5
Month
July 2004
September
November
February
MarchMay
July 2005
Ab
und
ance
or
bio
mas
s
0
10
20
30
40
50
60
70
80
Deg
rad
atio
n ra
te (d
–1)
– 0.5
0.0
0.5
1.0
1.5
2.0
2.5
3.0
3.5
Phytoplankton biomass (10 µgC l–1)
Nauplii (ind. l–1)
Copepods (ind. l–1)
Large dinoflagellates (µgC l–1)
Large ciliates (102 cells l–1)
Total degradation rate
Corrected tot. degradation rate
no sd no sd
Fig. 2. Total degradation rate and plankton abundances in the unfrac-tionated water samples (total). The total degradation rate (d–1) and thecorrected total degradation rate (d–1) are presented in the upper panel.The corrected total degradation rate represents the total degrada-tion rate of the natural plankton community, from which the contributionof the culture-originating bacteria (<0.2 μm fraction) has been subtracted(excluding September). Phytoplankton biomass (×10 μgC l–1); biomass oflarge (>20 μm), heterotrophic dinoflagellates (μgC l–1); abundance oflarge (>20 μm) ciliates (×102 cells l–1); nauplii abundance (ind. l–1) andcopepod abundance (ind. l–1) are presented in the lower panel. Totaldegradation rate, nauplii and copepod abundances are represented as
the average (±SD) for July 2004 Expts a and b

Mar Ecol Prog Ser 367: 1–13, 2008
Degradation of fecal pellets
The results of the pellet degradation experiments inthe present study revealed that bacteria associatedwith the pellets and protozooplankton in the size rangeof 20 to 100 μm were the major plankton groupsresponsible for pellet degradation.
The degradation rate was not significantly dif-ferent between the <0.2, <2 and the <20 μm sizefractions, except in May (Fig. 5). Furthermore, thedegradation rate was significantly different fromzero in the 0.2 μm fraction (except in May). All insitu bacteria were removed from the seawater viafiltration in this fraction; we therefore suggestthat bacteria associated with the pellets (culture-originating) were responsible for the degradationrate in these size ranges. The degradation rateprovided by the naturally occurring bacteria wassmall, as seen from the insignificant contributionof the <2 μm size fraction compared to that of the<0.2 μm fraction. The average degradation con-tributed by the naturally occurring bacteria (thesize range of 0.2 to 2 μm) ranged from 15 to 4% ofthe total degradation rate in all months (Fig. 6),except in July 2005, when the contribution was29%, corresponding to a degradation rate of0.2 d–1 (Fig. 5H). The degradation rate of theculture-originating bacteria ranged from 0.05 to0.79 d–1 (<0.2 μm fraction) contributing from 2 to59% of the total degradation rate. September wasnot included, since the <0.2 and <2 μm fractionswere contaminated by protozooplankton. Therewas no correlation (p > 0.05) between tempera-ture and average degradation rate of pellets byin situ bacteria (<2 μm fraction).
In May, the significantly higher degradationrate in the <20 μm size fraction corresponded tothe unique presence of the large, heterotrophic,dinoflagellate Gyrodinium spirale. The absenceof nauplii and other zooplankton organisms(Fig. 5G) indicated that G. spirale had an impor-tant impact on pellet degradation rate.
Fecal pellet degradation rate was significantlyhigher in the <100 μm size fraction as comparedto the <20 μm fraction in all months (except Sep-tember). Additionally, the pellet degradationrates in the fractions <100 and <200 μm were notsignificantly different in any month (Fig. 5). Thus,microplankton organisms in the size range of 20to 100 μm had a major impact on the degradationrate of fecal pellets in all months (except Sep-tember) (Fig. 6). In September, the microplanktonpresumably had no impact (r20–100 μm = 0), butsince we do not know the size of the bacterialcontribution to the degradation rate we cannot
say whether this was caused by a high bacterial degra-dation rate or by a high contribution from organisms inthe <20 μm fraction (size range 2 to 20 μm). The pos-sible microplankton candidates for causing the signifi-cant degradation rate in the specific size range of 20 to100 μm were large (>20 μm) protozooplankton (dino-flagellates and ciliates) and nauplii, since copepods
6B
iom
ass
(µgC
l–1 )
0
100
200
300
400
500
600
Month
July 2004
September
November
February
MarchMay
July 2005
Pro
tozo
opla
nkto
n b
iom
ass
(µg
C l–
1 )
0
5
10
15
20
25
30
35
40
Het. flagellates >10 µm
Het. dinoflagellates >20 µm Thecate dinoflagellates Protoperidinium spp.Protoperidinium depressum
Gyrodinium spirale
Dinophysis spp.Prorocentrum micans
Ciliates <20 µm Ciliates >20 µm Tintinnids
Het. dinoflagellates <20 µm
Sceletonema costatum
Cyanobacteria Autotrophic flagellates >10 µmAutotrophic dinoflagellates Ceratium spp.Pennate diatoms Centric diatoms Chaetoceros spp.Guinardia flaccida
Rhizosolenia spp.
Thalassiosira spp. A
B
Fig. 3. Plankton biomass and species composition. (A) phytoplanktonand (B) protozooplankton in the unfractionated water samples of eachmonth. The phytoplankton community was dominated by Chaeto-ceros spp. and autotrophic flagellates > 10 μm in February. Onlyautotrophic flagellates >10 μm could be satisfactorily determinedwith the Utermöhl method. Cyanobacteria here are colonial forms.Dinoflagellates and ciliates were determined from shortest dimension

Poulsen & Iversen: Pellet degradation by a plankton community 7
A July 2004a
<20 <100 <200 Total0
10
20
30
40
50
0
5
10
15
20 B July 2004b
<20 <100 <200 Total
0
10
20
30
40
50
0
5
10
15
20
C September
<20 <100 <200 Total0
10
20
30
40
50
60
30
35
40
45
50
55
60
D November
<20 <100 <200 Total
0
2
4
6
8
10
12
14
0
10
20
30
40
50
60
70
E February
<20 <100 <200 Total0
1
2
3
4
5
-5
0
5
10
15
20
F March
<20 <100 <200 Total
0
2
4
6
8
10
-5
0
5
10
15
20
G May
<20 <100 <200 Total0
5
10
15
20
25
30
0
20
40
60
80
H July 2005
<20 <100 <200 Total0
20
40
60
80
Nau
plii
ab
und
ance
(ind
. l–1
)
0
20
40
60
80
100
120
Fraction (µm)
Zoo
pla
nkto
n ab
und
ance
(ind
. l–1
)
no sdno sd
Nauplii Pseudocalanus elongatus Acartia spp.
Centropages spp.
Microsetella norvegica
Microcalanus pusillus
Oithona similis
Oikopleura dioica
Veliger larvae (Bivalvia)
Echinodermata
Nematoda
Pisces larvae
Podon leuckarti
Decapod larvae
Fig. 4. Zooplankton. Abundance and species distribution of the dominating zooplankton groups and species in the 4 relevant frac-tions of each degradation experiment (mean of triplicate incubations) during different sampling months (A to H). No mesozoo-plankton organisms were found in the fractions <0.2 or <2 μm. Naupliar abundance is represented separately by dots. The 2 degra-dation experiments in July 2004 were conducted with the same plankton community and fecal pellets, but the fragmentationpercent F (see Eq. 1) was 44 and 34% in July 2004 Expt a and b, respectively. The ‘total’ fraction represents the complete planktoncommunity present in the unfractionated water samples. Note different scaling and different y-axes of nauplii and zooplankton

Mar Ecol Prog Ser 367: 1–13, 20088
start <0.2 <2 <20 <100 <200 Total0
100
200
300
400
500
600
0
1
2
3
4A July 2004a
start <0.2 <2 <20 <100 <200 Total
0
100
200
300
400
500
600
0
1
2
3
4
C September
Start <0.2 <2 <20 <100 <200 Total0
100
200
300
400
500
600
0
1
2
3
4D November
Start <0.2 <2 <20 <100 <200 Total
0
100
200
300
400
500
600
0
1
2
3
4
no sd
F March
Start <0.2 <2 <20 <100 <200 Total
0
100
200
300
400
500
600
0
1
2
3
4
Start <0.2 <2 <20 <100 <200 Total0
100
200
300
400
500
600
0
1
2
3
4
E February
Start <0.2 <2 <20 <100 <200 Total0
100
200
300
400
500
600
0
1
2
3
4
H July 2005
Start <0.2 <2 <20 <100 <200 Total
0
100
200
300
400
500
600
0
1
2
3
4
Fraction (µm)
Feca
l pel
let
conc
entr
atio
n (p
elle
ts l
–1)
Deg
rad
atio
n ra
te (d
–1)
G May
B July 2004b
Intact pelletsFragmented pellets Degradation rate (r)
no sd
Fig. 5. Fecal pellets. Initial fecal pellet concentration, pellet concentration in each fraction and in the unfractionated planktonsamples (total) after incubation during different sampling months (A to H; triplicate incubations). The fragmentation percent F(see Eq. 1) is the grey area of the columns and the white area represents the percentage of intact pellets. The degradation rateestimated in each fraction is represented separately by dots. The 2 degradation experiments in July 2004 were conducted withthe same plankton community and fecal pellets, but the fragmentation percentage F (see Eq. 1) was 44 and 34% in July 2004
Expt a and b, respectively. Note different y-axes

Poulsen & Iversen: Pellet degradation by a plankton community
and other zooplankton occurred in the <200 μm to totalfractions (Fig. 4). The microplankton in the size rangeof 20 to 100 μm contributed from 15 to 53% of the totaldegradation rate (r20–100 μm = 0.18 to 0.70 d–1), exclud-ing September. Linear regression showed that only theabundance of Gyrodinium spirale could be used as apredictor for the degradation rate in the 20 to 100 μmsize range (r2 = 0.88, p < 0.01). However, G. spirale wasnot present in all months (present in November, Marchand May) and was not abundant (40 to 600 cells l–1).Other protozooplankton species >20 μm were, there-fore, also important for the fecal pellet degradationrate, but could not be identified by the linear regres-sion.
Copepods and other mesozooplankton were notimportant for the fecal pellet degradation rate in thepresent study, since the <200 μm and total fractions,containing the main part of the copepods and otherzooplankton species, were not significantly differentfrom the <100 μm fraction in most months (July 2004a,September, November, February, July 2005), includingJuly 2004a and July 2005, when copepod abundancepeaked (Figs. 4 & 5). The total degradation rate of theunfractionated plankton (total) was significantly dif-ferent (p < 0.05) from the other fractions only in July2004b, March and May. In these months mesozoo-plankton (≥ 200 μm) contributed from 27 to 51% of the
total degradation rate (r(≥ 200 μm) = 0.25 to 1.3 d–1). Possi-ble mesozooplankton candidates for causing the sig-nificant degradation rate in this size range were largeprotozooplankton, nauplii, copepods and other zoo-plankton organisms ≥200 μm. Linear regression showedthat only the abundance of copepod nauplii could beused as a predictor for the degradation rate in thespecific size range of ≥ 200 μm, including all months(r2 = 0.98, p < 0.001).
The total degradation rate followed the phytoplank-ton biomass with a maximum in May (2.57 ± 0.49 d–1)and a minimum in February (0.64 ± 0.14 d–1), corre-sponding to a pellet removal rate of, on average, 42 to95% d–1 (Fig. 2). However, this rate included thedegradation rate provided by the <0.2 μm size fraction,which was caused by factors other than the naturalplankton community of Øresund. Correcting for thiscontribution (r(total*) = r(total) – r(<0.2 μm), excluding Sep-tember), the corrected total degradation rate of thenatural plankton community of Øresund ranged from0.52 to 2.53 d–1 (Fig. 2), corresponding to a pelletremoval rate of 22 to 87% d–1.
The degree of pellet fragmentation did not influencethe degradation rates of the parallel degradationexperiments in July 2004 (Table 2, Fig. 5A,B), since nosignificant difference was found between the degrada-tion rates of the different fractions in Expts a and b(t-test, p > 0.05).
DISCUSSION
Contrary to the general belief that copepods are themajor degraders of fecal pellets in the sea (see reviewby Turner 2002) recent studies have shown that theirrole is minor (Reigstad et al. 2005, Poulsen & Kiørboe2006, Iversen & Poulsen 2007). The present studyinvestigates the degradation rate of fecal pellets ina plankton community and reveals which planktonorganisms actually degrade fecal pellets.
The total degradation rate (corrected) of fecal pelletsby the natural plankton community of Øresund rangedfrom 0.42 to 2.53 d–1, corresponding to a pellet removalrate of 22 to 87% d–1, which is within the range foundin other field studies (Viitasalo et al. 1999, Wexels Riseret al. 2002, Sampei et al. 2004, Poulsen & Kiørboe2006), but lower than the maximum pellet degradationrates (12 to 13 d–1) found in Kiørboe (2003). The totaldegradation rate in the present study generally fol-lowed the seasonal variation of the phytoplankton.Maximum pellet degradation rates during maximumphytoplankton concentrations have been found inother studies in temperate and polar regions (Urban-Rich 2001, Dubischar & Bathmann 2002, Sampei et al.2004).
9
Size range (µm)<0.2 [0.2-2] [2-20] [20-100] [100-200] >200
% o
f tot
al d
egra
dat
ion
rate
–10
0
10
20
30
40
50
60
70
80
90
100
Bacteria from cultureNatural bacteriaProtozooplanktonProtozooplankton and nauplii
Fig. 6. Total degradation rate contributed by the different sizeranges. The total degradation rate is split into the differentsize ranges and each size range is represented as the average(±SD) of each month. September was not included in the cal-culation of the percent degradation due to the contaminationof the <0.2 and <2 μm fractions. The degradation rate in thesize ranges was calculated by subtracting the fractions fromeach other (e.g. r20–100 μm = r<100 μm – r< 20 μm). The planktonorganisms dominating the degradation in each size fractionare indicated by different patterns. Natural bacteria domi-nated the degradation in the <2 μm size fraction (this is
difficult to see due to the minuscule size of the bar)

Mar Ecol Prog Ser 367: 1–13, 2008
Bacteria
Bacterial degradation rates could be separated intothe degradation rate contributed by culture-originat-ing bacteria (<0.2 μm size fraction) and by free-livingbacteria from Øresund (<2 μm size fraction). Bacteriado not pass through a 0.2 μm filter, and the degrada-tion rates observed in this size fraction, therefore, orig-inate from possible mechanical stress and bacteriasupplied to the incubation bottles in association withthe Acartia tonsa fecal pellets. The pellet degradationrate of the <0.2 μm size fraction in May was nearly zero(0.05 ± 0.06 d–1; Fig. 6), the method used for handlingand incubation was the same for all months; hence, theimpact of mechanical stress in general was insignifi-cant. Supporting this handling of the pellets did notcause a significant increase in pellet degradation ratein a control experiment (see ‘Materials and methods’).We therefore conclude that the fecal pellet degrada-tion rate in the size fraction <0.2 μm was caused byculture-originating bacteria associated with the addedpellets.
The degradation rates were not significantly differ-ent in the <0.2, <2 and <20 μm fractions (except May),indicating that the culture-originating bacteria associ-ated with the fecal pellets were the main bacterialdegraders, whereas the contribution of the free-livingnaturally occurring bacteria was small. The bacterialdegradation rates supplied by the culture-originatingbacteria in the present study was an important part ofthe total degradation rate in some months, but highlyvariable. It ranged from approximately 0 to 0.031 h–1,which is within the range found in laboratory studiesfor flagellate-based pellets (Hansen et al. 1996, Thor etal. 2003, Olsen et al. 2005, Ploug et al. 2008).
Some impact of free-living bacteria in late-bloomsituations was indicated in July 2005, where the degra-dation rate of the free-living bacteria was within therange of bacterial degradation rates obtained in labora-tory studies for flagellate-based pellets (Hansen et al.1996, Thor et al. 2003, Olsen et al. 2005, Ploug et al. 2008).
The bacteria were not enumerated in this study, andwe are therefore unable to say whether or not theculture-originating bacteria were mainly attached tothe surface of the pellets (Honjo & Roman 1978), orwithin the pellets (Gowing & Silver 1983). Dense pop-ulations of bacteria seeded within copepod fecal pel-lets have been observed in several studies (Gowing &Silver 1983, Jacobsen & Azam 1984, Tang 2005). Bac-teria seeded within in situ fecal pellets may also beimportant for fecal pellet degradation in situ, and wecan therefore only conclude that free-living naturalbacteria did not have a significant impact in the pre-sent study. Further investigation into the bacterialdegradation of in situ fecal pellets is obviously needed.
Protozooplankton and nauplii
The major impact of microplankton organisms in thesize range of 20 to 100 μm corresponded to the pres-ence of large protozooplankton and early-stage nauplii(<100 μm). However, only the abundance of Gyro-dinium spirale could be used as a predictor for thedegradation rate in this size range (linear regression).The importance of the protozooplankton as opposed tothat of the mesozooplankton was supported by the factthat both the total degradation rate and corrected totaldegradation rate followed the abundance of the proto-zooplankton, and not that of nauplii or copepods. Thus,large protozooplankton (>20 μm) were the maindegraders of fecal pellets in this study. Plankton organ-isms <200 μm were also the main degraders of fecalpellets in a field study in the North Sea in August 2002(Poulsen & Kiørboe 2006) and in June 2007 (Iversenunpubl. data ), and Kiørboe (2003) found even higherdegradation rates (0.3 to 13 d–1) of the heterotrophicdinoflagellates Noctiluca scintillans on fecal pellets.Microscopic observations of Gyrodinium dominans, G.spirale and Protoperidinium spp. feeding on fecal pel-lets additionally confirm the ability of dinoflagellates tofeed on fecal pellets (L. K. Poulsen unpubl. data, P. J.Hansen pers. comm.). Pellet degradation by the mainlybenthic ciliate Euplotes sp. was directly observed inthe present study. Faster degradation of pellets due tocontamination with Euplotes sp. was also found byHansen et al. (1996); and Lampitt et al. (1990) men-tioned microscopic observations on ciliates with fecalpellets that suggested that they could cause substantialphysical damage to the pellet after the peritrophicmembrane was removed.
Taking the prey size spectrums into account, itbecomes clear that dinoflagellates, and not ciliates,were most likely the main degraders in this study. Cil-iates generally feed on prey <20 μm, corresponding toan optimum prey size of 1/10 of their own size (Hansen1992, Jakobsen & Hansen 1997). Large ciliates werepresent in all months except July 2004 and Novemberand were generally between 21 and 52 μm in length,making them likely degraders only of small pellet frag-ments. The ciliates present in this study would there-fore only be capable of degrading already fragmentedpellets. However, large heterotrophic dinoflagellatesare able to feed on particles many times larger thanthemselves with an optimum prey size of 1/1 (Hansen1992, Jakobsen & Hansen 1997). Large dinoflagellatesare therefore able to consume intact fecal pellets, andtheir feeding strategy of attaching themselves to thefood particle by a filament prior to consumptionthrough direct engulfment, pallium feeding, or pedun-cle feeding (Hansen 1992) enables them to tow thefecal pellet, thereby counteracting the sinking rate of
10

Poulsen & Iversen: Pellet degradation by a plankton community
the pellet (L. K. Poulsen unpubl. data). Chemosensorycapabilities and positive chemotaxis to food particleshas been shown for heterotrophic dinoflagellates(reviewed by Verity 1991, Martel 2006). Likewise het-erotrophic dinoflagellates detect fecal pellets by regis-tering the chemical trail released by the pellet (L. K.Poulsen unpubl. data). Heterotrophic dinoflagellatesare therefore easily able to detect, handle and con-sume copepod fecal pellets.
The optimum prey particle size for Gyrodinium spi-rale corresponds to its own size, and it is able to ingestprey that is 5.3 times its own volume with an efficiencyas high as 75% (Hansen 1992). Average pellet volumewas 1.2 to 4.1 times the average volume of G. spirale inthe relevant months, and, thus, within the optimumsize for G. spirale. The average fecal pellet clearancerate of G. spirale was approximately 1 ml ind.–1 d–1, asestimated from 2 separate sources. Linear regression inthe microplankton size range showed that the degra-dation rate increased at a rate of 0.0012 d–1 for everyincrease by 1 ind. l–1, corresponding to a clearance rate(FG.spirale) of 1.2 ml ind.–1 d–1. A similar clearance ratewas obtained from the <20 μm fraction in May byassuming that G. spirale was the main degrader(r2–20 μm = 0.34 d–1, G. spirale = 0.36 cells ml–1), yieldinga clearance of 0.95 ml cell–1 d–1 equal to a pellet volumeremoval of 4 times the volume of an average G. spiralecell per day. These estimates are realistic since G. spi-rale clear similar-sized algae (~50 μm equivalentspherical diameter) at a rate of approximately 3 mlind.–1 d–1 (Hansen 1992). Using the average clearancerate of 1 ml ind.–1 d–1, G. spirale contributed from 7 to52% of the corrected, cumulative degradation rate inthe <100, <200 μm and total fractions. Hence, G. spi-rale had a large impact on the degradation rate, butcould not alone explain the degradation rate in thesefractions. Other large dinoflagellates therefore alsocontributed.
The pellet degradation rate was dependent on cope-pod nauplii abundance in the total fraction (r≥ 200 μm),but not in the <100 or <200 μm fractions. This suggeststhat late stages of nauplii >200 μm contributed signifi-cantly to pellet degradation. However, the organismsof the >200 μm size range only contributed signifi-cantly to the total degradation rate in 3 months,whereas late-stage nauplii were present in all months,indicating a species-specific impact of nauplii. Nau-pliar consumption of fecal pellets is supported by 2other studies (Green et al. 1992, Koski et al. 2005).
Mesozooplankton
Copepods (adults and copepodite stages) and othermesozooplankton did not influence the degradation
rate significantly in the present study, since none of thecopepod species, individually or together, could beused as predictors of the degradation rate of fecal pel-lets. This contradicts the former paradigm stating thatcopepods are the main degraders of fecal pellets (seereview by Turner 2002). This paradigm was under-standably based on the fact that adults of several cope-pod species have been found to clear fecal pelletsin laboratory studies (Turner 2002). Likewise, Oithonasimilis females had clearance rates of 29 ml ind.–1 d–1 ina grazing experiment conducted in parallel with thedegradation experiment in November (see Iversen &Poulsen 2007). The cause of this seeming discrepancybetween the high impact in laboratory grazing experi-ments and the low impact of copepods in naturalplankton communities is that the laboratory studieshave been conducted only with C5 or adult copepods,whereas natural copepod communities consist of a mixof stages. The copepod clearance rate of fecal pellets issize dependent, and the clearance rate of a given pel-let size increases with increasing size of the copepodgrazer (Poulsen & Kiørboe 2005). Thus, the clearancerates of fecal pellets by in situ copepod communitiesconsisting of a mix of copepodite stages and adults willalways be much lower than those obtained for adultcopepods only in the laboratory, as supported by theinsignificant impact of copepods on pellet degradationrate found in recent studies (Reigstad et al. 2005,Poulsen & Kiørboe 2006, Iversen & Poulsen 2007).Behavioral studies of Acartia tonsa, Calanus hel-golandicus and Pseudocalanus elongatus have shownthat even the adult female copepods avoid or rejectfecal pellets when possible, and that ingestion by sus-pension feeders appears to consist mainly of smallfragments, which are ingested unintentionally alongwith food particles contained within the feeding cur-rent (Poulsen & Kiørboe 2005, Iversen & Poulsen 2007).
The direct impact of copepods on pellet degradationunder natural conditions is therefore insignificant.However, copepods may be important for pellet degra-dation rate indirectly, since they exert a high grazingpressure on the main pellet degraders, such as the pro-tozooplankton. This was illustrated in July 2005 whenpeak copepod abundances coincided with low abun-dances of large protozooplankton, and a correspond-ing decrease in the fecal pellet degradation rate inincubations with the total (unfractionated) planktoncommunity.
CONCLUSION
Large protozooplankton (ciliates and dinoflagel-lates), and likely mainly heterotrophic dinoflagellates,were the main degraders of fecal pellets in this study.
11
Mar Ecol Prog Ser 367: 1–13, 2008
Free-living bacteria present in the natural seawaterfrom Øresund did not have a significant impact on pel-let degradation rate; however, culture-originating bac-teria had a variable, but in some months importantimpact on the degradation rate of fecal pellets. Meso-zooplankton in general did not have a significantimpact on pellet degradation; however, an indirectimpact was apparent through their grazing on thepellet degraders.
To our knowledge, this is the first study to demon-strate a general importance of protozooplankton forfecal pellet degradation. Hence, the effective ‘copro-phagous filter’ responsible for the removal of fecalpellets within the water column (González & Smetacek1994) is more likely a ‘protozoan filter’. The presentstudy demonstrates that further investigation isrequired to identify the protozooplankton and naupliispecies that degrade fecal pellets. Also, further investi-gation into the processes governing their impact isneeded to fully understand and predict fecal pelletdegradation and vertical material flux in the oceans.
Acknowledgements. We thank Prof. Thomas Kiørboe for com-ments and support during the experimental phase and forcorrecting the language of the manuscript. We also thankDr. habil. Uta Passow from the Alfred-Wegener-Institute, andDr. Ellen Jackson from Texas University for statistical help.L.K.P. was supported by the Carlsberg Foundation (2007_01_0495); and by the SLIP research school under the Danish Net-work for Fisheries and Aquaculture Research financed by theDanish Ministry for Food, Agriculture and Fisheries and theDanish Agricultural and Veterinary Research Council. M.H.I.was supported by the Danish Institute for Fisheries Research,Dept. of Marine Ecology and Aquaculture.
LITERATURE CITED
Ayukai T, Nishizawa S (1986) Defecation rate as a possiblemeasure of ingestion rate of Calanus pacificus pacificus(Copepoda: Calanoida). Bull Plankton Soc Jpn 33(1):3–10
Dubischar CD, Bathmann UV (2002) The occurrence of faecalmaterial in relation to different pelagic systems in theSouthern Ocean and its importance for vertical flux. Deep-Sea Res II 49:3229–3242
González HE, Smetacek V (1994) The possible role of thecyclopoid copepod Oithona in retarding vertical flux ofzooplankton faecal material. Mar Ecol Prog Ser 113:233–246
González HE, González SR, Brummer GA (1994) Short-termsedimentation pattern of zooplankton, faeces and micro-plankton at a permanent station in the Bjørnafjorden(Norway) during April–May 1992. Mar Ecol Prog Ser 105:31–45
Gowing MM, Silver MW (1983) Organisms and microenviron-ments of bacteria mediating fecal pellet decomposition inthe sea. Mar Biol 73:7–16
Green EP, Harris RP, Duncan A (1992) The production andingestion of faecal pellets by nauplii of marine calanoidcopepods. J Plankton Res 14:1631–1643
Guillard RRL (1975) Culture of phytoplankton for feedingmarine invertebrates. In: Smith WL, Chanley MH (eds)
Culture of marine invertebrate animals. Plenum Press,New York, p 29–60
Hansen PJ (1992) Prey size selection, feeding rates andgrowth dynamics of heterotrophic dinoflagellates withspecial emphasis on Gyrodinium spirale. Mar Biol 114:327–334
Hansen PJ, Nielsen TG (1999) Dyreplankton i de danske far-vande. Tema-rapport fra DMU, 28/1999, Miljø- og Energi-ministeriet, Copenhagen
Hansen B, Fotel FL, Jensen NJ, Madsen SD (1996) Bacteriaassociated with a marine planktonic copepod in culture.II. Degradation of fecal pellets produced on a diatom, ananoflagellate or a dinoflagellate diet. J Plankton Res 18:275–288
Honjo S, Roman MR (1978) Marine copepod fecal pellets: pro-duction, preservation and sedimentation. J Mar Res 36:45–57
Iversen MH, Poulsen LK (2007) Coprorhexy, coprophagy,and coprochaly in the copepods Calanus helgolandicus,Pseudocalanus elongatus, and Oithona similis. Mar EcolProg Ser 350:79–89
Jacobsen TR, Azam F (1984) Role of bacteria in copepod fecalpellet decomposition: colonization, growth rates andmineralization. Bull Mar Sci 35:495–502
Jakobsen HH, Hansen PJ (1997) Prey size selection, grazingand growth response of the small heterotrophic dino-flagellates Gymnodinium sp. and the ciliate Balanioncomatum—a comparative study. Mar Ecol Prog Ser 158:75–86
Kiørboe T (2003) High turnover rates of copepod fecal pelletsdue to Noctiluca scintillans grazing. Mar Ecol Prog Ser258:181–188
Kiørboe T, Möhlenberg F, Riisgaard HU (1985) Bioenergeticsof the planktonic copepod Acartia tonsa: relation be-tween feeding, egg production and respiration, and com-position of specific dynamic action. Mar Ecol Prog Ser 26:85–97
Koski M, Kiørboe T, Takahashi K (2005) Benthic life in thepelagic: aggregate encounter and degradation rates bypelagic harpacticoid copepods. Limnol Oceanogr 50:1254–1263
Lampitt RS, Noji TT, von Bodungen B (1990) What happens tozooplankton faecal pellets? Implications for material flux.Mar Biol 104:15–23
Lintrup MJ, Jakobsen F (1999) The importance of Oresundand the Drogden Sill for Baltic inflow. J Mar Syst 18:345–354
Martel CM (2006) Prey location, recognition, and location bythe phagotrophic marine dinoflagellate Oxyrrish marina.J Exp Mar Biol Ecol 335:210–220
Menden-Deuer S, Lessard EJ (2000) Carbon to volumerelationship for dinoflagellates, diatoms, and other protistplankton. Limnol Oceanogr 45:569–579
Montagnes DJS, Lynn DH (1991) Taxonomy of choreotrichs,the major marine planktonic ciliates, with emphasis on thealoricate forms. Mar Microb Food Webs 5:59–74
Mullin MM, Sloan PR, Eppley RW (1966) Relationship betweencarbon content, cell volume, and area in phytoplankton.Limnol Oceanogr 11:307–311
Noji TT, Estep KW, MacIntyre F, Norrbin F (1991) Imageanalysis of faecal material grazed upon by three speciesof copepods: evidence for coprorhezy, coprophagy andcoprochaly. J Mar Biol Assoc UK 71:465–480
Olsen SN, Westh P, Hansen BW (2005) Real-time quantifica-tion of microbial degradation of copepod fecal pelletsmonitored by isothermal microcalorimetry. Aquat MicrobEcol 40:259–267
12

Poulsen & Iversen: Pellet degradation by a plankton community
Paffenhöfer GA, Knowles SC (1979) Ecological implications offecal pellet size, production and consumption by cope-pods. J Mar Res 37:35–49
Paffenhöfer GA, Strickland JDH (1970) A note on the feedingof Calanus helgolandicus on detritus. Mar Biol 5:97–99
Paffenhöfer GA, Van Sant KB (1985) The feeding response ofa marine planktonic copepod to quantity and quality ofparticles. Mar Ecol Prog Ser 27:55–65
Ploug H, Iversen MH, Koski M, Buitenhuis ET (2008) Pro-duction, oxygen respiration rates, and sinking velocity ofcopepod fecal pellets: direct measurements of ballastingby opal and calcite. Limnol Oceanogr 53:469–476
Poulsen LK, Kiørboe T (2005) Coprophagy and coprorhexyin the copepods Acartia tonsa and Temora longicornis:clearance rates and feeding behaviour. Mar Ecol Prog Ser299:217–227
Poulsen LK, Kiørboe T (2006) Vertical flux and degradationrates of copepod fecal pellets in a zooplankton communitydominated by small copepods. Mar Ecol Prog Ser 323:195–204
Reigstad M, Wexels Riser C, Svensen C (2005) Fate of cope-pod faecal pellets and the role of Oithona spp. Mar EcolProg Ser 304:265–270
Sampei M, Sasaki H, Hattori H, Fukuchi M, Hargrave BT(2004) Fate of sinking particles, especially fecal pellets,within the epipelagic zone in the North Water (NOW)polynya of northern Baffin Bay. Mar Ecol Prog Ser 278:17–25
Støttrup JG, Richardson K, Kirkegaard E, Pihl NJ (1986) Thecultivation of Acartia tonsa Dana for use as a live foodsource for marine fish larvae. Aquaculture 52:87–96
Tang KW (2005) Copepods as microbial hotspots in the ocean:effects of host feeding activities on attached bacteria.Aquat Microb Ecol 38:31–40
Thomsen HA (ed) (1992) Plankton i de indre danske farvande.Miljøstyrelsen, Copenhagen
Thor P, Dam HG, Rogers DR (2003) Fate of organic carbonreleased from decomposing copepod fecal pellets in rela-tion to bacterial production and ectoenzymatic activity.Aquat Microb Ecol 33:279–288
Tomas CR (ed) (1997) Identifying marine phytoplankton.Academic Press, San Diego, CA
Turner JT (2002) Zooplankton fecal pellets, marine snow andsinking phytoplankton blooms. Aquat Microb Ecol 27:57–102
Urban-Rich J (2001) Seston effects on faecal pellet carbonconcentrations from a mixed community of copepods inBalsfjord, Norway, and the Antartic Polar Front. ICES JMar Sci 58:700–710
Utermöhl H (1958) Zur Vervollkommung der quantitativenPhytoplankton-Methodik. Mitt Int Ver Theor AngewLimnol 9:1–38
Verity PG (1991) Feeding in planktonic protozoans: evidencefor non-random acquisition of prey. J Protozool 38:69–76
Viitasalo M, Rosenberg M, Heiskanen A, Koski M (1999)Sedimentation of copepod fecal material in the coastalnorthern Baltic Sea: where did all the pellets go? LimnolOceanogr 44:1388–1399
Wexels Riser C, Wassmann P, Olli K, Pasternak A, Arashke-vich E (2002) Seasonal variation in production, retentionand export of zooplankton faecal pellets in the marginalice zone and central Barents Sea. J Mar Syst 38:175–188
13
Editorial responsibility: Otto Kinne,Oldendorf/Luhe, Germany
Submitted: August 16, 2007; Accepted: June 16, 2008Proofs received from author(s): August 19, 2008


Paper III


Production, oxygen respiration rates, and sinking velocity of copepod fecal pellets:
Direct measurements of ballasting by opal and calcite
Helle Ploug1
Alfred Wegener Institute for Polar and Marine Research, Am Handelshafen 12, D - 27570 Bremerhaven, Germany;Max Planck Institute for Marine Microbiology, Celsiusstr. 1, D-28359 Bremen, Germany
Morten Hvitfeldt IversenAlfred Wegener Institute for Polar and Marine Research, Am Handelshafen 12, D - 27570 Bremerhaven, Germany
Marja KoskiDanish Institute for Fisheries Research, Kavalergarden 6, DK-2920 Charlottenlund, Denmark
Erik Theodoor BuitenhuisUniversity of East Anglia, NR4 7TJ Norwich, United Kingdom
Abstract
Production, oxygen uptake, and sinking velocity of copepod fecal pellets egested by Temora longicornis weremeasured using a nanoflagellate (Rhodomonas sp.), a diatom (Thalassiosira weissflogii), or a coccolithophorid(Emiliania huxleyi) as food sources. Fecal pellet production varied between 0.8 pellets ind21 h21 and 3.8 pelletsind21 h21 and was significantly higher with T. weissflogii than with the other food sources. Average pellet sizevaried between 2.2 3105 mm3 and 10.0 3105 mm3. Using an oxygen microsensor, small-scale oxygen fluxes andmicrobial respiration rates were measured directly with a spatial resolution of 2 mm at the interface of copepodfecal pellets and the surrounding water. Averaged volume-specific respiration rates were 4.12 fmol O2 mm23 d21,2.86 fmol O2 mm23 d21, and 0.73 fmol O2 mm23 d21 in pellets produced on Rhodomonas sp., T. weissflogii, and E.huxleyi, respectively. The average carbon-specific respiration rate was 0.15 d21 independent on diet (range: 0.08–0.21 d21). Because of ballasting of opal and calcite, sinking velocities were significantly higher for pelletsproduced on T. weissflogii (322 6 169 m d21) and E. huxleyi (200 6 93 m d21) than on Rhodomonas sp. (35 629 m d21). Preservation of carbon was estimated to be approximately 10-fold higher in fecal pellets producedwhen T. longicornis was fed E. huxleyi or T. weissflogii rather than Rhodomonas sp. Our study directlydemonstrates that ballast increases the sinking rate of freshly-produced copepod fecal pellets but does not protectthem from decomposition.
The biological carbon pump of the ocean is driven bysedimentation of phytoplankton aggregated in marinesnow and fecal pellets. Through this mechanism, a sub-stantial fraction of CO2 assimilated by phytoplankton isexported from the upper mixed surface waters into the deep
ocean and sediments (Turner 2002). Sinking velocities ofthese particles range between 5 m d21 and 400 m d21
(Alldredge and Gotschalk 1988; Turner 2002). Fecal pelletsinking velocity is largely determined by its compositionand size (Komar 1981). Fecal pellet size and density dependon copepod species, food concentrations, and food source(Feinberg and Dam 1998). The contribution of zooplank-ton fecal pellets to the overall vertical flux varies from a fewpercent up to 99% in the ocean (Turner 2002). A keyfeature determining potential vertical fluxes in the watercolumn is the carbon-specific degradation rate of organicmatter relative to its sinking velocity. Zooplankton fecalpellets produced on a dinoflagellate diet show highdegradation rates and low sinking velocities leading to fastturnover in the water column (Hansen et al. 1996; Thor etal. 2003). In contrast, pellets produced on coccolithophor-ids show high sinking velocities, and a large fraction ofthese pellets reach depths below 1,000 m in the ocean(Harris 1994; Knappertsbusch and Brummer 1995). Fecalpellet degradation rate and sinking velocity is thus largelydetermined by the phytoplankton available as food source.
Copepods are ubiquitous in the ocean and in neritic seas.Copepods play an important and dual role in mediatingvertical carbon flux as well as nutrient retention within the
1 To whom correspondence should be addressed. Presentaddress: Alfred Wegener Institute for Polar and Marine Research,Am Handelshafen 12, D - 27570 Bremerhaven, Germany.
AcknowledgmentsWe are grateful for advice from Dirk deBeer, Armin Giseke,
and Lubos Polerecky. We thank Gaby Eickert and KarinHohmann for constructing microsensors and Klaus-Uwe Richterfor measuring particulate organic carbon. The data acquisitioningprogram ‘‘m-profiler’’ has been developed by Lubos Polerecky.Thomas Kiørboe is thanked for providing laboratory facilities tomeasure fecal pellet sinking velocity.
This study was supported by the Alexander von HumboldtFoundation (DAN 1072992 STP to H.P.), the CarlsbergFoundation (to M.K.), the Max Planck Society, the HelmholtzAssociation (‘‘Wiedereinstiegsstelle’’ to H.P.), the Alfred WegenerInstitute for Polar and Marine Research, and the Research CenterOcean Margins ([RCOM] to H.P. and M.I.).
This is AWI publication No. 16636 and RCOM publicationNo. 0530.
Limnol. Oceanogr., 53(2), 2008, 469–476
E 2008, by the American Society of Limnology and Oceanography, Inc.
469
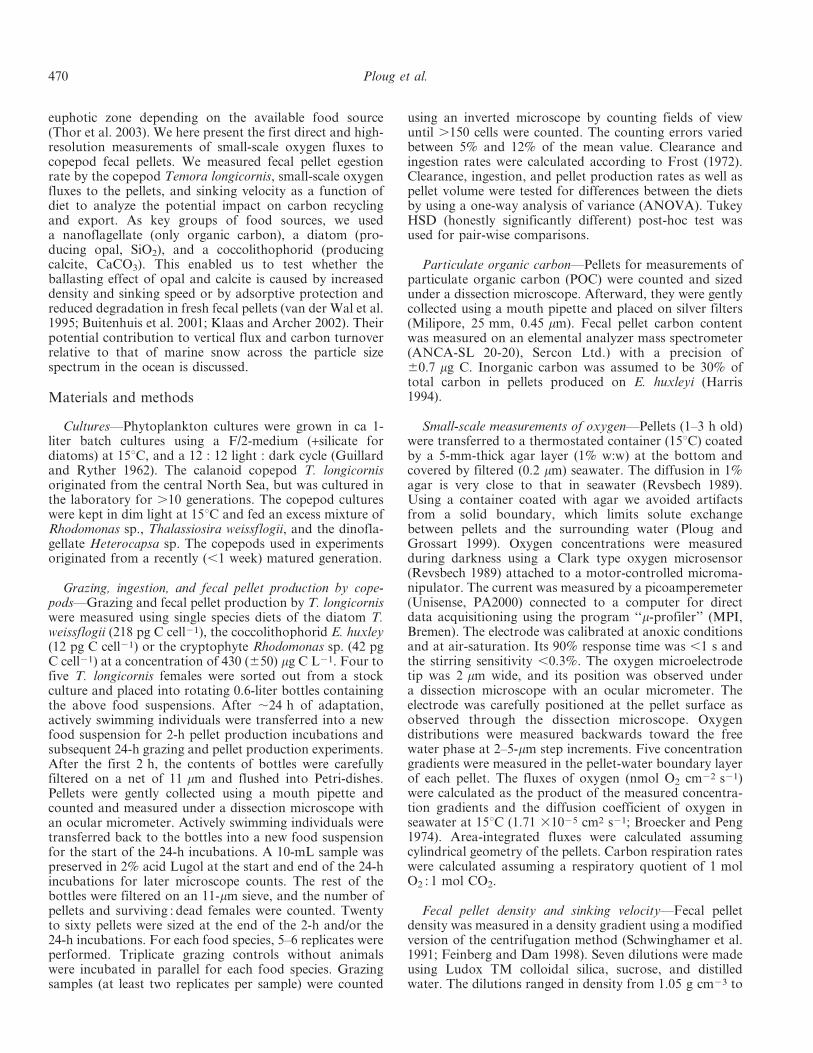
euphotic zone depending on the available food source(Thor et al. 2003). We here present the first direct and high-resolution measurements of small-scale oxygen fluxes tocopepod fecal pellets. We measured fecal pellet egestionrate by the copepod Temora longicornis, small-scale oxygenfluxes to the pellets, and sinking velocity as a function ofdiet to analyze the potential impact on carbon recyclingand export. As key groups of food sources, we useda nanoflagellate (only organic carbon), a diatom (pro-ducing opal, SiO2), and a coccolithophorid (producingcalcite, CaCO3). This enabled us to test whether theballasting effect of opal and calcite is caused by increaseddensity and sinking speed or by adsorptive protection andreduced degradation in fresh fecal pellets (van der Wal et al.1995; Buitenhuis et al. 2001; Klaas and Archer 2002). Theirpotential contribution to vertical flux and carbon turnoverrelative to that of marine snow across the particle sizespectrum in the ocean is discussed.
Materials and methods
Cultures—Phytoplankton cultures were grown in ca 1-liter batch cultures using a F/2-medium (+silicate fordiatoms) at 15uC, and a 12 : 12 light : dark cycle (Guillardand Ryther 1962). The calanoid copepod T. longicornisoriginated from the central North Sea, but was cultured inthe laboratory for .10 generations. The copepod cultureswere kept in dim light at 15uC and fed an excess mixture ofRhodomonas sp., Thalassiosira weissflogii, and the dinofla-gellate Heterocapsa sp. The copepods used in experimentsoriginated from a recently (,1 week) matured generation.
Grazing, ingestion, and fecal pellet production by cope-pods—Grazing and fecal pellet production by T. longicorniswere measured using single species diets of the diatom T.weissflogii (218 pg C cell21), the coccolithophorid E. huxley(12 pg C cell21) or the cryptophyte Rhodomonas sp. (42 pgC cell21) at a concentration of 430 (650) mg C L21. Four tofive T. longicornis females were sorted out from a stockculture and placed into rotating 0.6-liter bottles containingthe above food suspensions. After ,24 h of adaptation,actively swimming individuals were transferred into a newfood suspension for 2-h pellet production incubations andsubsequent 24-h grazing and pellet production experiments.After the first 2 h, the contents of bottles were carefullyfiltered on a net of 11 mm and flushed into Petri-dishes.Pellets were gently collected using a mouth pipette andcounted and measured under a dissection microscope withan ocular micrometer. Actively swimming individuals weretransferred back to the bottles into a new food suspensionfor the start of the 24-h incubations. A 10-mL sample waspreserved in 2% acid Lugol at the start and end of the 24-hincubations for later microscope counts. The rest of thebottles were filtered on an 11-mm sieve, and the number ofpellets and surviving : dead females were counted. Twentyto sixty pellets were sized at the end of the 2-h and/or the24-h incubations. For each food species, 5–6 replicates wereperformed. Triplicate grazing controls without animalswere incubated in parallel for each food species. Grazingsamples (at least two replicates per sample) were counted
using an inverted microscope by counting fields of viewuntil .150 cells were counted. The counting errors variedbetween 5% and 12% of the mean value. Clearance andingestion rates were calculated according to Frost (1972).Clearance, ingestion, and pellet production rates as well aspellet volume were tested for differences between the dietsby using a one-way analysis of variance (ANOVA). TukeyHSD (honestly significantly different) post-hoc test wasused for pair-wise comparisons.
Particulate organic carbon—Pellets for measurements ofparticulate organic carbon (POC) were counted and sizedunder a dissection microscope. Afterward, they were gentlycollected using a mouth pipette and placed on silver filters(Milipore, 25 mm, 0.45 mm). Fecal pellet carbon contentwas measured on an elemental analyzer mass spectrometer(ANCA-SL 20-20), Sercon Ltd.) with a precision of60.7 mg C. Inorganic carbon was assumed to be 30% oftotal carbon in pellets produced on E. huxleyi (Harris1994).
Small-scale measurements of oxygen—Pellets (1–3 h old)were transferred to a thermostated container (15uC) coatedby a 5-mm-thick agar layer (1% w:w) at the bottom andcovered by filtered (0.2 mm) seawater. The diffusion in 1%agar is very close to that in seawater (Revsbech 1989).Using a container coated with agar we avoided artifactsfrom a solid boundary, which limits solute exchangebetween pellets and the surrounding water (Ploug andGrossart 1999). Oxygen concentrations were measuredduring darkness using a Clark type oxygen microsensor(Revsbech 1989) attached to a motor-controlled microma-nipulator. The current was measured by a picoamperemeter(Unisense, PA2000) connected to a computer for directdata acquisitioning using the program ‘‘m-profiler’’ (MPI,Bremen). The electrode was calibrated at anoxic conditionsand at air-saturation. Its 90% response time was ,1 s andthe stirring sensitivity ,0.3%. The oxygen microelectrodetip was 2 mm wide, and its position was observed undera dissection microscope with an ocular micrometer. Theelectrode was carefully positioned at the pellet surface asobserved through the dissection microscope. Oxygendistributions were measured backwards toward the freewater phase at 2–5-mm step increments. Five concentrationgradients were measured in the pellet-water boundary layerof each pellet. The fluxes of oxygen (nmol O2 cm22 s21)were calculated as the product of the measured concentra-tion gradients and the diffusion coefficient of oxygen inseawater at 15uC (1.71 31025 cm2 s21; Broecker and Peng1974). Area-integrated fluxes were calculated assumingcylindrical geometry of the pellets. Carbon respiration rateswere calculated assuming a respiratory quotient of 1 molO2 : 1 mol CO2.
Fecal pellet density and sinking velocity—Fecal pelletdensity was measured in a density gradient using a modifiedversion of the centrifugation method (Schwinghamer et al.1991; Feinberg and Dam 1998). Seven dilutions were madeusing Ludox TM colloidal silica, sucrose, and distilledwater. The dilutions ranged in density from 1.05 g cm23 to
470 Ploug et al.
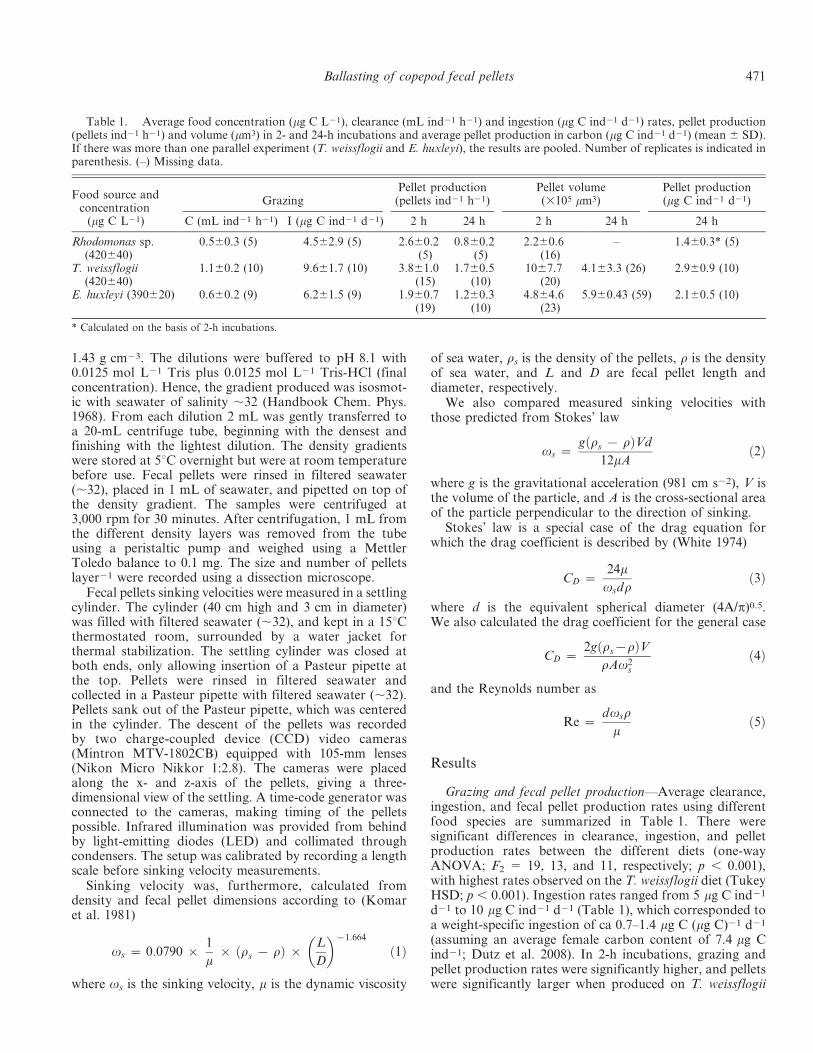
1.43 g cm23. The dilutions were buffered to pH 8.1 with0.0125 mol L21 Tris plus 0.0125 mol L21 Tris-HCl (finalconcentration). Hence, the gradient produced was isosmot-ic with seawater of salinity ,32 (Handbook Chem. Phys.1968). From each dilution 2 mL was gently transferred toa 20-mL centrifuge tube, beginning with the densest andfinishing with the lightest dilution. The density gradientswere stored at 5uC overnight but were at room temperaturebefore use. Fecal pellets were rinsed in filtered seawater(,32), placed in 1 mL of seawater, and pipetted on top ofthe density gradient. The samples were centrifuged at3,000 rpm for 30 minutes. After centrifugation, 1 mL fromthe different density layers was removed from the tubeusing a peristaltic pump and weighed using a MettlerToledo balance to 0.1 mg. The size and number of pelletslayer21 were recorded using a dissection microscope.
Fecal pellets sinking velocities were measured in a settlingcylinder. The cylinder (40 cm high and 3 cm in diameter)was filled with filtered seawater (,32), and kept in a 15uCthermostated room, surrounded by a water jacket forthermal stabilization. The settling cylinder was closed atboth ends, only allowing insertion of a Pasteur pipette atthe top. Pellets were rinsed in filtered seawater andcollected in a Pasteur pipette with filtered seawater (,32).Pellets sank out of the Pasteur pipette, which was centeredin the cylinder. The descent of the pellets was recordedby two charge-coupled device (CCD) video cameras(Mintron MTV-1802CB) equipped with 105-mm lenses(Nikon Micro Nikkor 1:2.8). The cameras were placedalong the x- and z-axis of the pellets, giving a three-dimensional view of the settling. A time-code generator wasconnected to the cameras, making timing of the pelletspossible. Infrared illumination was provided from behindby light-emitting diodes (LED) and collimated throughcondensers. The setup was calibrated by recording a lengthscale before sinking velocity measurements.
Sinking velocity was, furthermore, calculated fromdensity and fecal pellet dimensions according to (Komaret al. 1981)
vs ~ 0:0790 |1
m| rs { rð Þ| L
D
� �{1:664
ð1Þ
where vs is the sinking velocity, m is the dynamic viscosity
of sea water, rs is the density of the pellets, r is the densityof sea water, and L and D are fecal pellet length anddiameter, respectively.
We also compared measured sinking velocities withthose predicted from Stokes’ law
vs ~g rs { rð ÞVd
12mAð2Þ
where g is the gravitational acceleration (981 cm s22), V isthe volume of the particle, and A is the cross-sectional areaof the particle perpendicular to the direction of sinking.
Stokes’ law is a special case of the drag equation forwhich the drag coefficient is described by (White 1974)
CD ~24m
vsdrð3Þ
where d is the equivalent spherical diameter (4A/p)0.5.We also calculated the drag coefficient for the general case
CD ~2g rs{rð ÞV
rAv2s
ð4Þ
and the Reynolds number as
Re ~dvsr
mð5Þ
Results
Grazing and fecal pellet production—Average clearance,ingestion, and fecal pellet production rates using differentfood species are summarized in Table 1. There weresignificant differences in clearance, ingestion, and pelletproduction rates between the different diets (one-wayANOVA; F2 5 19, 13, and 11, respectively; p , 0.001),with highest rates observed on the T. weissflogii diet (TukeyHSD; p , 0.001). Ingestion rates ranged from 5 mg C ind21
d21 to 10 mg C ind21 d21 (Table 1), which corresponded toa weight-specific ingestion of ca 0.7–1.4 mg C (mg C)21 d21
(assuming an average female carbon content of 7.4 mg Cind21; Dutz et al. 2008). In 2-h incubations, grazing andpellet production rates were significantly higher, and pelletswere significantly larger when produced on T. weissflogii
Table 1. Average food concentration (mg C L21), clearance (mL ind21 h21) and ingestion (mg C ind21 d21) rates, pellet production(pellets ind21 h21) and volume (mm3) in 2- and 24-h incubations and average pellet production in carbon (mg C ind21 d21) (mean 6 SD).If there was more than one parallel experiment (T. weissflogii and E. huxleyi), the results are pooled. Number of replicates is indicated inparenthesis. (–) Missing data.
Food source andconcentration
(mg C L21)
GrazingPellet production
(pellets ind21 h21)Pellet volume(3105 mm3)
Pellet production(mg C ind21 d21)
C (mL ind21 h21) I (mg C ind21 d21) 2 h 24 h 2 h 24 h 24 h
Rhodomonas sp.(420640)
0.560.3 (5) 4.562.9 (5) 2.660.2(5)
0.860.2(5)
2.260.6(16)
– 1.460.3* (5)
T. weissflogii(420640)
1.160.2 (10) 9.661.7 (10) 3.861.0(15)
1.760.5(10)
1067.7(20)
4.163.3 (26) 2.960.9 (10)
E. huxleyi (390620) 0.660.2 (9) 6.261.5 (9) 1.960.7(19)
1.260.3(10)
4.864.6(23)
5.960.43 (59) 2.160.5 (10)
* Calculated on the basis of 2-h incubations.
Ballasting of copepod fecal pellets 471

compared to those measured using E. huxleyi or Rhodo-monas sp. as food sources (ANOVA; F2 5 25, p , 0.001;Tukey HSD; p , 0.01). No significant differences of thesevariables were found in 24-h incubations. The fraction of
organic carbon egested relative to organic carbon ingestedafter 24 hours was similar with Rhodomonas sp. and T.weissflogii as a diet (respectively, 0.48 6 0.3 and 0.49 60.2), but substantially lower with E. huxleyi diet (0.19 60.06).
Microbial respiration on fecal pellets—Fecal pellets weresurrounded by a thin diffusive boundary layer throughwhich all exchange of gases and nutrients occur. Theseboundary layers were only 10–30 mm wide, depending onthe pellet size. Pellets produced on Rhodomonas sp. were ca.two to four times smaller by volume compared to thoseproduced on T. weissflogii and E. huxleyi (Table 1).Examples of oxygen gradients measured in the boundarylayer of the three different pellet types are shown (Fig. 1).The average oxygen fluxes to the fecal pellets were0.043 nmol O2 cm22 s21, 0.032 nmol O2 cm22 s21, and0.011 nmol O2 cm22 s21 for pellets produced on Rhodo-monas sp., T. weissflogii, and E. huxleyi, respectively.Thus, the oxygen flux was four times higher to a pelletproduced on Rhodomonas sp. compared to that to a pelletproduced on E. huxleyi. Average values of O2-fluxes topellets and respiration rates are shown (Table 2). Thevolumetric respiration rate was up to 5.6 times higher inpellets produced on Rhodomonas sp. compared to that inpellets produced on E. huxleyi. The volumetric respirationrates were 4.12 fmol O2 mm23 d21, 1.64–2.86 fmol O2
mm23 d21, and 0.77–2.12 fmol O2 mm23 d21 in pelletsproduced on Rhodomonas sp., T. weissflogii, and E. huxleyi,respectively. These rates corresponded to average carbonrespiration rates ranging between 183 pg C pellet21 h21 and840 pg C pellet21 h21. Carbon-specific respiration rates,however, appeared to be relatively similar in pelletsproduced on different food sources. Pellets produced onE. huxleyi showed the highest variability in respirationrates.
Density and sinking velocity varied considerably inpellets produced on different food sources (Table 3).Density and sinking velocity of pellets produced onRhodomonas sp. were significantly lower than thosemeasured with T. weissflogii and E. huxleyi as food sources(Student’s t-test; p , 0.01). Measured sinking velocity of alltypes of pellets were higher than predicted from Eq. 1(Komar et al. 1981). Measured sinking velocity of pelletsproduced on Rhodomonas sp. was similar to that predictedby Stokes’ law, but Stokes’ law underestimated sinkingvelocities of pellets produced with T. weissflogii and E.huxleyi as food sources. We estimated the influence ofparticle shape and Reynolds number on the drag coefficientfor the fecal pellets measured in this study and fora compilation of marine particles from previous studies(Taghon et al. 1984, Alldredge and Gotschalk 1988; Fig. 2).The drag coefficient varied three orders of magnitude forparticles sinking with Reynolds numbers varying between0.01 and 100. The drag coefficient which encompassed fecalpellets was best described by Cd 5 2.2 3 Re21.63; R2 5 0.87(n 5 54). Whereas the drag coefficient appeared to behigher for marine snow than predicted by Stokes’ law forspheres with similar Re, that of fecal pellets was often lowerthan that predicted by Stokes’ law (Fig. 2).
Fig. 1. Oxygen concentration gradients measured at thepellet–water interface of pellets produced on (A) Rhodomonassp., (B) T. weissflogii, and (C) E. huxleyi as food sources. Thesymbols represent the mean value with the standard deviation ofthe mean value shown as bars (n 5 5).
472 Ploug et al.

The L-ratio (m21) is calculated as the ratio of thecarbon-specific degradation rate (d21) relative to measuredsinking velocity (m d21) (Feinberg and Dam 1998). It thusdescribes the carbon-specific degradation m21, and it canbe used as an index of the carbon degradation orpreservation in sinking organic matter. The L-ratio wasapproximately 10-fold lower for pellets produced on T.weissflogii and E. huxleyi as food sources compared to thatin pellets produced on Rhodomonas sp. (Table 3).
Discussion
Copepod feeding and pellet production rates on T.weissflogii and Rhodomonas sp. were similar to thosemeasured previously for T. longicornis females, confirmingthe generally highest proportional egestion on diatom diets(Besiktepe and Dam 2002, Dutz et al. 2008). Although dataon copepod feeding on coccolithophorids is relativelyscarce and restricted to a few copepod species of the genusCalanus and Pseudocalanus, substantial ingestion ratesseem to be generally observed only at high concentrationsof cells (Nejstgaard et al. 1995,1997). The clearance andingestion rates measured in this study were in the range ofthese previous observations of ca 5 mg C ind21 d21 forCalanus helgolandicus (Huskin et al. 2000), up to 20 mg Cind21 d21 for Calanus finmarchicus (Bamstedt et al. 1999)and 6.9 mg C ind21 d21 for Pseudocalanus elongatus (Harris1994) in corresponding food concentrations of $300 mg CL21. Similar ingestion rates of 6.3 6 2.3 mg C ind21 d21 (n5 5) were also measured for T. longicornis in previousincubations with E. huxleyi (J. Dutz, M. Koski, S.Jonasdottir, unpubl. data). Therefore, it seems that T.longicornis can use E. huxleyi as a food source, irrespectiveof the small size or coccolith cover of the cells.
The pellet production rates on E. huxleyi diet seem to bemore controversial: whereas some studies show moderateto high pellet production on E. huxleyi (Harris 1994;Bamstedt et al. 1999), nearly no pellets were produced inother studies, irrespective of ingestion (Huskin et al. 2000;Dutz, Koski, Jonasdottir, unpubl. data). In the presentstudy the lowest proportion of ingested carbon was egestedwith E. huxleyi diet, although there was no difference in thenumber of pellets produced between Rhodomonas sp. andE. huxleyi. This is similar to observations of Bamstedt et al.(1999), who, irrespective of a relatively high number ofpellets produced, observed a substantially lower propor-tional egestion by C. finmarchicus on E. huxleyi than onRhodomonas sp. diet. Harris (1994) suggested that the lowproportional egestion of coccolithophorids would be a re-sult of acid digestion in copepod gut because of gut pH,which may approach 6 depending on feeding conditions(Pond et al. 1995). In our study, however, pellet productionof T. longicornis on decalcified and half-decalcified E.huxleyi (1.6 6 0.5 and 1.4 6 0.4, respectively) was notdifferent from the untreated E. huxley (1.9 6 0.7), thusthere was no direct reason to suspect substantial dissolutionof coccolith calcite in copepod gut during the presentexperiments (data not shown).
This is the first study reporting direct measurements ofmicrobial respiration in copepod fecal pellet. Degradationof these small fecal pellets has been estimated fromrecordings of pellet volume over time (Hansen et al.1996), 14C-labeling, bacterial production, and dissolvedorganic carbon (DOC) production (Lee and Fischer 1992;Urban-Rich 1999; Thor et al. 2003), and by isothermalmicrocalorimetry (Olsen et al. 2005). Using 14C-labeling,total organic degradation rates in 0–3-day-old copepodfecal pellets vary between 0.06 d21 and 0.17 d21, which
Table 2. Size and respiration rate of pellets produced on different food sources. Number of replicates is indicated in parentheses.
Volume(3105 mm3)
O2-flux(nmol O2
cm22 s21)
Total O2-uptake(nmol O2
pellet21 d21)
VolumetricO2-uptake
(fmol O2 mm23 d21)
Carbon resp.rate (pg C
pellet21 h21)
C-specificresp. rate
(d21)
Rhodomonas sp.* 1.760.4 0.04860.016 (45) 0.6960.24 (9) 4.1161.42 (9) 3456119 0.16T. weissflogii* 3.061.7 0.03860.026 (60) 0.8660.55 (12) 2.8661.84 (12) 4286275 0.20T. weissflogii{ 1067.7 0.03260.014 (45) 1.6860.74 (9) 1.6860.74 (9) 8406370 0.12E. huxleyi* 2.661.7 0.03060.009 (55) 0.5560.16 (11) 2.1260.63 (11) 273681 0.21E. huxleyi{ 4.864.6 0.01460.004 (40) 0.3760.09 (8) 0.7760.19 (8) 183646 0.08
* Belong to the same experiment.{ Belong to the same experiment.
Table 3. Density, sinking velocity, and L-ratio (carbon-specific respiration rate: measured sinking velocity) of pellets. Number ofpellets indicated in parenthesis.
Density (g cm23) POC (g cm23)Komars’ settling*
(m d21)Stokes’ settling{
(m d21)Measured sinkingvelocity (m d21)
L-ratio(31023 m21)
Rhodomonas sp. 1.0860.01 (122) 0.34 (600) 1865 (19) 39618 (19) 35629 (19) 4.0T. weissflogii 1.1460.02 (56) 0.17 (600) 41624 (14) 86668 (14) 3226169 (14) 0.37–0.63E. huxleyi 1.1760.04 (46) 0.12 (600) 42620 (21) 94649 (21) 200693 (21) 0.38–1.0
* Calculated according to Komar et al. 1981 (Eq. 1).{ Calculated according to Stokes law (Eq. 2).
Ballasting of copepod fecal pellets 473
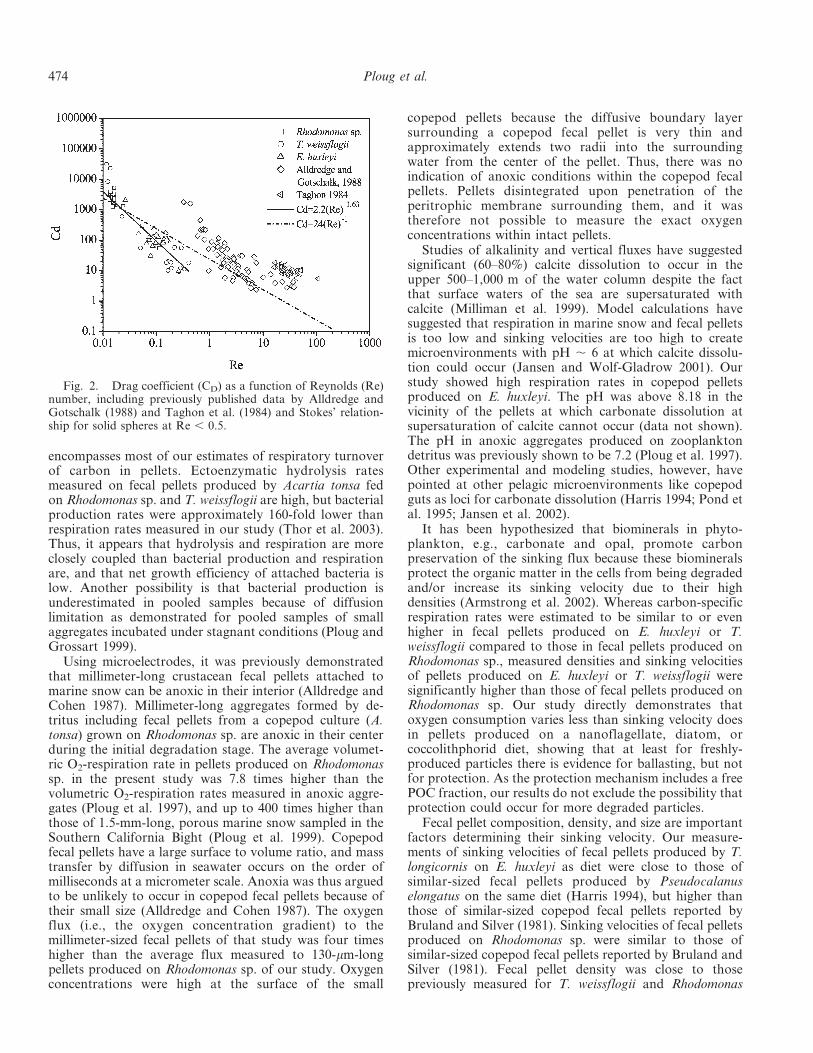
encompasses most of our estimates of respiratory turnoverof carbon in pellets. Ectoenzymatic hydrolysis ratesmeasured on fecal pellets produced by Acartia tonsa fedon Rhodomonas sp. and T. weissflogii are high, but bacterialproduction rates were approximately 160-fold lower thanrespiration rates measured in our study (Thor et al. 2003).Thus, it appears that hydrolysis and respiration are moreclosely coupled than bacterial production and respirationare, and that net growth efficiency of attached bacteria islow. Another possibility is that bacterial production isunderestimated in pooled samples because of diffusionlimitation as demonstrated for pooled samples of smallaggregates incubated under stagnant conditions (Ploug andGrossart 1999).
Using microelectrodes, it was previously demonstratedthat millimeter-long crustacean fecal pellets attached tomarine snow can be anoxic in their interior (Alldredge andCohen 1987). Millimeter-long aggregates formed by de-tritus including fecal pellets from a copepod culture (A.tonsa) grown on Rhodomonas sp. are anoxic in their centerduring the initial degradation stage. The average volumet-ric O2-respiration rate in pellets produced on Rhodomonassp. in the present study was 7.8 times higher than thevolumetric O2-respiration rates measured in anoxic aggre-gates (Ploug et al. 1997), and up to 400 times higher thanthose of 1.5-mm-long, porous marine snow sampled in theSouthern California Bight (Ploug et al. 1999). Copepodfecal pellets have a large surface to volume ratio, and masstransfer by diffusion in seawater occurs on the order ofmilliseconds at a micrometer scale. Anoxia was thus arguedto be unlikely to occur in copepod fecal pellets because oftheir small size (Alldredge and Cohen 1987). The oxygenflux (i.e., the oxygen concentration gradient) to themillimeter-sized fecal pellets of that study was four timeshigher than the average flux measured to 130-mm-longpellets produced on Rhodomonas sp. of our study. Oxygenconcentrations were high at the surface of the small
copepod pellets because the diffusive boundary layersurrounding a copepod fecal pellet is very thin andapproximately extends two radii into the surroundingwater from the center of the pellet. Thus, there was noindication of anoxic conditions within the copepod fecalpellets. Pellets disintegrated upon penetration of theperitrophic membrane surrounding them, and it wastherefore not possible to measure the exact oxygenconcentrations within intact pellets.
Studies of alkalinity and vertical fluxes have suggestedsignificant (60–80%) calcite dissolution to occur in theupper 500–1,000 m of the water column despite the factthat surface waters of the sea are supersaturated withcalcite (Milliman et al. 1999). Model calculations havesuggested that respiration in marine snow and fecal pelletsis too low and sinking velocities are too high to createmicroenvironments with pH , 6 at which calcite dissolu-tion could occur (Jansen and Wolf-Gladrow 2001). Ourstudy showed high respiration rates in copepod pelletsproduced on E. huxleyi. The pH was above 8.18 in thevicinity of the pellets at which carbonate dissolution atsupersaturation of calcite cannot occur (data not shown).The pH in anoxic aggregates produced on zooplanktondetritus was previously shown to be 7.2 (Ploug et al. 1997).Other experimental and modeling studies, however, havepointed at other pelagic microenvironments like copepodguts as loci for carbonate dissolution (Harris 1994; Pond etal. 1995; Jansen et al. 2002).
It has been hypothesized that biominerals in phyto-plankton, e.g., carbonate and opal, promote carbonpreservation of the sinking flux because these biomineralsprotect the organic matter in the cells from being degradedand/or increase its sinking velocity due to their highdensities (Armstrong et al. 2002). Whereas carbon-specificrespiration rates were estimated to be similar to or evenhigher in fecal pellets produced on E. huxleyi or T.weissflogii compared to those in fecal pellets produced onRhodomonas sp., measured densities and sinking velocitiesof pellets produced on E. huxleyi or T. weissflogii weresignificantly higher than those of fecal pellets produced onRhodomonas sp. Our study directly demonstrates thatoxygen consumption varies less than sinking velocity doesin pellets produced on a nanoflagellate, diatom, orcoccolithphorid diet, showing that at least for freshly-produced particles there is evidence for ballasting, but notfor protection. As the protection mechanism includes a freePOC fraction, our results do not exclude the possibility thatprotection could occur for more degraded particles.
Fecal pellet composition, density, and size are importantfactors determining their sinking velocity. Our measure-ments of sinking velocities of fecal pellets produced by T.longicornis on E. huxleyi as diet were close to those ofsimilar-sized fecal pellets produced by Pseudocalanuselongatus on the same diet (Harris 1994), but higher thanthose of similar-sized copepod fecal pellets reported byBruland and Silver (1981). Sinking velocities of fecal pelletsproduced on Rhodomonas sp. were similar to those ofsimilar-sized copepod fecal pellets reported by Bruland andSilver (1981). Fecal pellet density was close to thosepreviously measured for T. weissflogii and Rhodomonas
Fig. 2. Drag coefficient (CD) as a function of Reynolds (Re)number, including previously published data by Alldredge andGotschalk (1988) and Taghon et al. (1984) and Stokes’ relation-ship for solid spheres at Re , 0.5.
474 Ploug et al.

sp. (Feinberg and Dam 1998). In that study, the equationby Komar et al. (1981) was used to estimate sinkingvelocity of different types of pellets. However, our observedsinking velocities of fecal pellets were two to eight timeshigher than estimated by the relationship between sinkingvelocity and pellet dimensions and density reported byKomar et al. (1981), and 0.9–4 times higher than estimatedby Stokes’ law. This is in contrast to marine snowaggregates, which sink slower than predicted by Stokes’law (Alldredge and Gotschalk 1988). Fecal pellets are notspheres. Their orientation during sinking thus influencesthe drag considerably. Moreover, the equation by Komaret al. (1981) and Stokes’ law are formally only valid forReynolds numbers (Re) ,0.5. When either or both of theseconditions are not met, an empirical relationship betweenCD and Re must be derived. For the fecal pellets in thisstudy we derived the relationship CD 5 2.2 3 Re21.63 (R2 50.87, n 5 54; Fig. 2). Pellets produced on T. weissflogii andE. huxleyi had the highest Re and showed the highestdeviation from theoretical sinking velocities. Despite theirsmall size, sinking velocities of copepod fecal pellets can beas high as those of larger marine snow (200–400 m d21). Thedrag coefficients of sinking marine snow appear to be highercompared to those predicted for spheres by Stokes’ law aswell as to those of copepod fecal pellets with similar Re. Thisobservation may be explained by high porosities (.0.999) ofmarine snow (Alldredge and Gotschalk 1988). Dragcoefficients of sinking fecal pellets were often lower thanthose predicted by Stokes’ law, which may be explained bythe cylindrical shape of the fecal pellets and their orientationduring sedimentation. Sinking velocities of particles mea-sured in the laboratory, however, should be considered asmaximum sinking velocities. The residence time of sinkingparticles in the upper mixed layer in the sea is longer thanthat predicted by the sinking velocity measured in still water(Alldredge and Gotschalk 1988).
Fecal pellets and marine snow are important sites fornutrient recycling within the mixed layer in the ocean, aswell as comprising an important fraction of vertical carbonflux. A large fraction of fecal pellets does not leave theupper mixed layer of the ocean by sedimentation (Turner2002). Coprophagy and coprorhexy (fragmentation) havebeen considered as mechanisms responsible for thisobservation (Poulsen and Kiørboe 2005). However, it hasbeen shown that zooplankton .200 mm only play aninsignificant role in degradation of fecal pellets (Poulsenand Kiørboe 2006). Microbial food web interactions arecomplex, and coprorhexy by zooplankton results infragmentation of pellets, which may lead to increaseddegradation by bacteria and protozoa because of increasedsurface : volume ratio and increased leakage of DOC andnutrients. Many particle-attached bacteria are motile andcan actively search for particles. Substantial colonization ofparticles by pelagic bacteria thus occurs within minutes.Bacteria continuously attach to and detach from particleswith an average residence time of 3 h (Kiørboe et al. 2002).Hence, the interaction between bacteria and particles ismore complex than previously thought, leading to anefficient utilization of nutrients within the upper mixedlayer of the ocean.
Oxygen uptake on 0.5–10 mm large aggregates inaquatic systems varies two to three orders of magnitude(Ploug 2001). Measured carbon-specific respiration rates,however, appear to be relatively similar and high across theparticle spectrum in the sea. Carbon-specific respirationrates in 1–6-mm-sized diatom aggregates and other types ofmarine snow are 0.08–0.12 d21 (Ploug et al. 1999; Plougand Grossart 2000), similar to those in fecal pellets with anequivalent spherical diameter of ,100 mm of the presentstudy. Total oxygen consumption in 5–25 fecal pelletsequaled that of one 1.5-mm-large marine snow aggregatewith a similar carbon-specific respiration rate (Ploug et al.1999). Marine snow abundance often ranges between 0.1aggregates L21 and 10 aggregates L21 (Simon et al. 2002).Copepods are the most common metazoans in the pelagicocean, with a typical abundance of ,1 ind L21. Witha production rate of one pellet h21, the daily respiration onpellets produced by one copepod equals that on 1–5 single(1.5 mm large) marine snow aggregate. Thus, carbonremineralization can be quantitatively similar in copepodfecal pellets and marine snow in the ocean. The presentstudy demonstrates that sinking velocity varies much morethan the specific carbon remineralization rates in copepodfecal pellets and marine snow does. Ballast material (e.g.,opal and carbonate) indeed appears to be an importantfactor controlling particle sinking velocity and verticalcarbon fluxes in the ocean.
References
ALLDREDGE, A. L., AND Y. COHEN. 1987. Can microscale chemicalpatches persist in the sea? Microelectrode study of marinesnow and fecal pellets. Science 235: 689–691.
———, AND C. C. GOTSCHALK. 1988. In situ settling behavior ofmarine snow. Limnol. Oceanogr. 33: 339–351.
ARMSTRONG, R. A., C. LEE, J. I. HEDGES, S. HONJO, AND S. G.WAKEHAM. 2002. A new, mechanistic model for organiccarbon fluxes in the ocean based on the quantitativeassociation of POC with ballast minerals. Deep-Sea Res. I49: 219–236.
BESIKTEPE, S., AND H. G. DAM. 2002. Coupling of ingestion anddefecation as a function of diet in the calanoid copepodAcartia tonsa. Mar. Ecol. Prog. Ser. 229: 151–164.
BROECKER, W. S., AND T. H. PENG. 1974. Gas exchange ratesbetween air and sea. Tellus 26: 21–35.
BRULAND, K. W., AND M. SILVER. 1981. Sinking rates of fecalpellets from gelatinous zooplankton, slaps, pteropods dolio-lids. Mar. Biol. 63: 295–300.
BUITENHUIS, E. T., P. VAN DER WAL, AND H. J. W. BAAR. 2001.Blooms of Emiliania huxleyi are sinks of atmospheric carbondioxide: A field and mesocosm study derived simulation.Global Biogeochem. Cycles 15: 577–587.
BAMSTEDT, U., J. C. NEJSTGAARD, AND P. SOLBERG. 1999.Utilisation of small-sized food algae by Calanus finmarchicus(Copepoda: Calanoida) and the significance of feedinghistory. Sarsia 84: 19–38.
DUTZ, J., M. KOSKI, AND S. H. JONASDOTTIR. 2008. Copepodreproduction is unaffected by diatom aldehydes or lipidcomposition. Limnol. Oceanogr. 53: 225–235.
FEINBERG, L. R., AND H. G. DAM. 1998. Effects of diet ondimensions, density and sinking rates of fecal pellets ofthe copepod Acartia tonsa. Mar. Ecol. Prog. Ser. 175:87–96.
Ballasting of copepod fecal pellets 475

FROST, B. W. 1972. Effects of size and concentration of foodparticles on the feeding behavior of the marine planktoniccopepod Calanus pacificus. Limnol. Oceanogr. 6: 805–815.
GUILLARD, J. K., AND J. H. RYTHER. 1962. Studies of marineplanktonic diatoms. I. Cyclotella nana (Hustedt) and Detonulaconfervacea (Cleve) Gran. Can. J. Microbiol. 8: 229–239.
HARRIS, R. P. 1994. Zooplankton grazing on the coccolithophoreEmiliania huxleyi and its role in inorganic carbon flux. Mar.Biol. 119: 431–439.
HUSKIN, I., R. ANADON, F. ALVAREZ-MARQUES, AND R. P. HARRIS.2000. Ingestion, faecal pellet and egg production rates ofCalanus helgolandicus feeding coccolithophorid versus non-coccolithophorid diets. J. Exp. Mar. Biol. Ecol. 248: 239–254.
HANSEN, B., F. L. FOTEL, N. J. JENSEN, AND S. D. MADSEN. 1996.Bacteria associated with a marine planktonic copepod culture.II. Degradation of fecal pellets produced on a diatom,a nanoflagellate or a dinoflagellate diet. J. Plankton Res.18: 275–288.
JANSEN, H., AND D. A. WOLF-GLADROW. 2001. Carbonatedissolution in copepod guts: A numerical model. Mar. Ecol.Prog. Ser. 221: 199–207.
———, R. E. ZEEBE, AND D. A. WOLF-GLADROW. 2002. Modelingthe dissolution of settling CaCO3 in the ocean. GlobalBiogeochem. Cycles 16: 1027, doi: 10.1029/2000GB1001279.
KIØRBOE, T., H.-P. GROSSART, H. PLOUG, AND K. TANG. 2002.Mechanisms and rates of bacterial colonization of sinkingaggregates. Appl. Environ. Microbiol. 68: 3996–4006.
KLAAS, C., AND D. E. ARCHER. 2002. Association of sinkingorganic matter with various types of mineral ballast in thedeep sea: Implications for the rain ratio. Global Biogeochem.Cycles 16: 1116, doi: 10.1029/2001GB1001765.
KNAPPERTSBUSCH, M., AND G.-J. A. BRUMMER. 1995. A sedimenttrap investigation of sinking coccolithophorids in the NorthAtlantic. Deep-Sea Res. I 42: 1083–1109.
KOMAR, P. D., A. P. MORSE, L. F. SMALL, AND S. W. FOWLER.1981. An analysis of sinking rates of natural copepod andeuphausiid fecal pellets. Limnol. Oceanogr. 26: 172–180.
LEE, B-G., AND N. S. FISHER. 1992. Decomposition and release ofelements from zooplankton debris. Mar. Ecol. Prog. Ser. 88:117–128.
MILLIMAN, J. D., P. J. TROY, W. M. BALCH, A. K. ADAMS, Y.-H.LI, AND F. T. MACKENZIE. 1999. Biologically mediateddissolution of calcium carbonate above the chemical lyso-cline? Deep-Sea Res. I 46: 1653–1669.
NEJSTGAARD, J. C., U. BAMSTEDT, E. BAGØIEN, AND P. T. SOLBERG.1995. Algae constraints on copepod grazing. Growth state,toxicity, cell size, and season as regulating factors. ICES J.Mar. Sci. 52: 347–357.
———, I. GISMERVIK, AND P. T. SOLBERG. 1997. Feeding andreproduction by Calanus finmarchicus, and microzooplanktongrazing during mesocosm blooms of diatoms and thecoccolithophore Emiliania huxleyi. Mar. Ecol. Prog. Ser.147: 197–217.
OLSEN, S. N., P. WESTH, AND B. HANSEN. 2005. Real timequantification of microbial degradation of copepod fecalpellets monitored by isothermal microcalorimetry. Aquat.Microb. Ecol. 40: 259–267.
PLOUG, H. 2001. Small-scale oxygen fluxes and remineralization insinking aggregates. Limnol. Oceanogr. 46: 1624–1631.
———, AND H.-P. GROSSART. 1999. Bacterial production andrespiration in suspended aggregates—A matter of the in-cubation method. Aquat. Microb. Ecol. 20: 21–29.
———, AND ———. 2000. Bacterial growth and grazing ondiatom aggregates: Respiratory carbon turnover as a functionof size and sinking velocity. Limnol. Oceanogr. 45:1467–1475.
———, ———, F. AZAM, AND B. B. JØRGENSEN. 1999. Photosyn-thesis, respiration, and carbon turnover in sinking marinesnow from surface waters of Southern California Bight:Implications for the carbon cycle in the ocean. Mar. Ecol.Prog. Ser. 179: 1–11.
———, M. KUHL, B. BUCHOLZ, AND B. B. JØRGENSEN. 1997.Anoxic aggregates—An ephemeral phenomenon in thepelagic environment. Aquat. Microb. Ecol. 13: 285–294.
POND, D. W., R. P. HARRIS, AND C. BROWNLEE. 1995. Amicroinjection technique using a pH-sensitive dye to de-termine the gut pH of Calanus helgolandicus. Mar. Biol. 123:75–79.
POULSEN, L. K., AND T. KIØRBOE. 2005. Coprophagy andcoprorhexy in the copepods Arcartia tonsa and Temoralongicornis: clearance rates and feeding behaviour. Mar. Ecol.Prog. Ser. 299: 217–227.
———, AND ———. 2006. Vertical flux and degradation rates ofcopepod fecal pellets in a zooplankton community dominatedby small copepods. Mar. Ecol. Prog. Ser. 323: 195–204.
REVSBECH, N. P. 1989. An oxygen microelectrode with a guardcathode. Limnol. Oceanogr. 34: 474–478.
SCHWINGHAMER, P., D. M. ANDERSON, AND D. M. KULIS. 1991.Separation and concentration of living dinoflagellate restingcysts from marine sedimentation via density-gradient centri-fugation. Limnol. Oceanogr. 36: 588–592.
SIMON, M., H.-P. GROSSART, B. SCHWEITZER, AND H. PLOUG. 2002.Microbial ecology of organic aggregates in aquatic ecosys-tems. Aquat. Microbial. Ecol. 28: 175–211.
TAGHON, G. L., A. R. M. NOWELL, AND P. A. JUMARS. 1984.Transport and breakdown of fecal pellets: Biological andsedimentological consequences. Limnol. Oceanogr. 29: 64–72.
THOR, P., H. G. DAM, AND D. R. ROGERS. 2003. Fate of organiccarbon release from decomposing copepod fecal pellets inrelation to bacterial production and ectoenzymatic activity.Mar. Ecol. Prog. Ser. 33: 279–288.
TURNER, J. T. 2002. Zooplankton fecal pellets, marine snow andsinking phytoplankton blooms. Aquat. Microb. Ecol. 27:57–102.
URBAN-RICH, J. 1999. Release of dissolved organic carbon fromcopepod fecal pellets in the Greenland Sea. J. of Exp. Mar.Biol. Ecol. 232: 107–124.
VAN DER WAL, P., R. S. KEMPERS, AND M. J. W. VELDHUIS. 1995.Production and downward flux of organic matter and calcitein a North Sea bloom of the coccolithophore Emilianiahuxleyi. Mar. Ecol. Progr. Ser. 126: 247–265.
WEAST, R. C. [ed.] 1968. Handbook of chemistry and physics. 49thed. The Chemical Rubber Co., Cleveland.
WHITE, F. M. 1974. Viscous fluid flow. McGrawHill.
Received: 6 June 2007Accepted: 10 October 2007Amended: 19 October 2007
476 Ploug et al.

Paper IV


Ballast, sinking velocity, and apparent diffusivity within marine snow and zooplankton
fecal pellets: Implications for substrate turnover by attached bacteria
Helle Ploug1 and Morten Hvitfeldt IversenAlfred Wegener Institute for Polar and Marine Research, Am Handelshafen 12, D-27570 Bremerhaven, Germany
Gerhard FischerDept. of Geosciences, University of Bremen, Klagenfurther Str., D-28357 Bremen, Germany;Research Center Ocean Margins (RCOM), Leobener Str., D-28359 Bremen, Germany
Abstract
We analyzed size-specific dry mass, sinking velocity, and apparent diffusivity in field-sampled marine snow,laboratory-made aggregates formed by diatoms or coccolithophorids, and small and large zooplankton fecalpellets with naturally varying content of ballast materials. Apparent diffusivity was measured directly insideaggregates and large (millimeter-long) fecal pellets using microsensors. Large fecal pellets, collected in the coastalupwelling off Cape Blanc, Mauritania, showed the highest volume-specific dry mass and sinking velocities becauseof a high content of opal, carbonate, and lithogenic material (mostly Saharan dust), which together comprised,80% of the dry mass. The average solid matter density within these large fecal pellets was 1.7 g cm23, whereastheir excess density was 0.25 6 0.07 g cm23. Volume-specific dry mass of all sources of aggregates and fecalpellets ranged from 3.8 to 960 mg mm23, and average sinking velocities varied between 51 and 732 m d21.Porosity was .0.43 and .0.96 within fecal pellets and phytoplankton-derived aggregates, respectively. Averagedvalues of apparent diffusivity of gases within large fecal pellets and aggregates were 0.74 and 0.95 times that of thefree diffusion coefficient in sea water, respectively. Ballast increases sinking velocity and, thus, also potential O2
fluxes to sedimenting aggregates and fecal pellets. Hence, ballast minerals limit the residence time of aggregates inthe water column by increasing sinking velocity, but apparent diffusivity and potential oxygen supply withinaggregates are high, whereby a large fraction of labile organic carbon can be respired during sedimentation.
Marine snow and fecal pellets comprise a significantfraction of the sinking carbon flux in the ocean (Alldredgeand Silver 1988; Simon et al. 2002; Turner 2002). Hence,sedimentation of these particles into the bathypelagic zoneis important for the ocean’s capacity to sequester CO2 fromthe atmosphere, i.e., the ocean’s biological carbon pump(De La Rocha and Passow 2007). The recent observationthat carbonate and organic carbon fluxes show closecorrelations in the bathypelagic zone of the ocean has ledto the hypothesis that biominerals in phytoplankton, e.g.,carbonate and opal, promote carbon preservation of thesinking flux because these biominerals increase sinkingvelocity because of their high densities and/or protect afraction of the organic matter in the cells from beingdegraded in the deep ocean (Armstrong et al. 2002;Francois et al. 2002; Klaas and Archer 2002). The effect
of ballast minerals on sinking velocity relative to that onsmall-scale oxygen fluxes and degradation rates in sinkingparticles, however, is largely unknown.
The physical and chemical microenvironment of sinkingparticles is significantly different from that of the sur-rounding water. High concentrations of inorganic andorganic matter, ecto-enzymatic activities, and remineral-ization rates by attached bacteria lead to oxygen and pHgradients within sinking marine snow and fecal pellets(Alldredge and Cohen 1987; Smith et al. 1992; Ploug et al.1999). The observations that dissolved organic carbon(DOC), silicic acid, ammonium, and phosphate concentra-tions are higher inside marine snow compared to thesurrounding water have led to the hypothesis that diffusionwithin marine snow is significantly slower than in sea water(Shanks and Trent 1979; Brzezinski et al. 1997; Alldredge2000).
The flux of a solute within an aggregate equals theproduct of the apparent diffusivity and the radial concen-tration gradient of the solute, i.e., Fick’s first law ofdiffusion:
J ~ wDs
dC
drð1Þ
where J is the flux of the solute, w is the porosity, Ds is theeffective diffusion coefficient, and dC/dr is the radialconcentration gradient of the solute. The combinedparameter (wDs) is the apparent diffusivity of the solute.The effective diffusion coefficient is a function of porosity,
1 Corresponding author ([email protected]).
AcknowledgmentsThe oxygen microelectrodes were constructed by Gaby Eickert,
Ines Schroder, and Karin Hohmann, Max Planck Institute forMarine Microbiology, Bremen. We thank Thomas Kiørboe forproviding laboratory facilities to measure fecal pellet sinkingvelocity. We also thank Christine Klaas and two anonymousreviewers for critical comments that improved the manuscript.
This study was funded by the Helmholtz Association (to H.P.),the Alfred Wegener Institute for Polar and Marine Research, andthe Deutsche Forschungsgemeinschaft as part of the DFG-Research Center ‘‘Ocean Margins’’ of the University of BremenMARUM 0570.
Limnol. Oceanogr., 53(5), 2008, 1878–1886
E 2008, by the American Society of Limnology and Oceanography, Inc.
1878
tortuosity, and the free diffusion coefficient in water (D0).The tortuosity relates the actual distance a molecule or anion travels within an aggregate to the distance it travels inwater per unit length of the aggregate. Direct measure-ments of apparent diffusivity in marine snow are scarce.Recently, apparent diffusivity of gases was measureddirectly within diatom aggregates containing transparentexopolymer particles (TEP) using a microsensor (Ploug andPassow 2007). Apparent diffusivity of gases within theseaggregates was close to the free molecular diffusioncoefficient of these in the surrounding water, independentlyof size and age of the aggregates. Steep concentrationgradients of oxygen within diatom aggregates thus reflectedhigh biological activity (fluxes) within these aggregatesrather than low diffusivity.
In the present study, we analyze the effect that ballasthas on sinking velocity, apparent diffusivity, and small-scale oxygen fluxes to sinking particles of different sourceswith naturally varying content of ballast material, e.g.,field-sampled marine snow; laboratory-made aggregatesformed by diatoms or coccolithophorids; and small andlarge zooplankton fecal pellets, containing biogenic and/orlithogenic ballast minerals.
Methods
Aggregates and fecal pellets—Cultures of diatoms(Skeletonema costatum) and coccolithophorids (Emilianiahuxleyi) were grown at 15uC in F/2 medium in a 12 : 12light : dark cycle during 14–28 d (Guillard and Ryther1962). Aggregates of the respective cultures were formedin roller tanks rotating at 3 rounds min21 in darkness(Shanks and Edmonson 1989). Diatom aggregatesformed during the first day after the culture had beentransferred to roller tanks. Aggregates from the cocco-lithophorid culture formed only after 5 d of rotation.Large zooplankton fecal pellets, most probably producedby giant mesopelagic larvaceans (appendicularians), hadbeen collected in sediment traps from 1,296-m water depthfrom the eutrophic site CBi-2 off Cape Blanc, Mauritania,NW Africa (20u459N, 18u429W). The sample cups werefilled with filtered seawater and poisoned with HgCl2before deployment. The coastal upwelling area is charac-terized by high production of coccolithophorids anddiatoms, and a high input of dust from the Sahara (Fischeret al. in press). The fecal pellets (up to 1.5 mm in length)were pipetted individually from three sediment trapsamples collected from 10 November 2004 to 18 January2005 (sampling intervals 23 d each). Copepod fecal pelletswere produced in culture experiments using Temora long-icornis grown on E. huxleyi as previously described (Plouget al. 2008).
Size measurements—Aggregates and large fecal pelletswere placed on a net in a vertical flow system, and their sizewas determined under the dissection microscope using acalibrated ocular meter (Ploug and Jørgensen 1999). Theaggregate or fecal pellet was turned during measurement,which allowed for size determination of all three axes. Thedimensions of small fecal pellets were determined directly
under a dissection microscope. The volume of aggregateswas calculated assuming an ellipsoid, V 5 (1/6) p 3 length3 width 3 height, and that of fecal pellets was calculatedassuming cylindrical geometry.
Dry mass and fractal dimension—Single aggregates orsingle appendicularian fecal pellets with known volumeswere filtered onto preweighed 0.4-mm polycarbonate filters,washed and dried at 60uC for 48 h, and reweighed.Copepod fecal pellets were pooled in triplicate sampleswith 600 pellets filter21. The volume of 30 copepod fecalpellets was calculated from their dimensions. The sensitivityof the scale was 0.1 mg (Mettler Toledo, UMX 2). Thefractal dimension (D3) of aggregates was estimated fromthe relative distribution of mass in aggregates of differentsizes measured as equivalent spherical diameter (Logan andWilkinson 1990).
Sinking velocity—Aggregate sinking velocity was mea-sured in a vertical flow system wherein an upward-directedflow velocity was adjusted to balance the sinking velocity ofaggregates (Ploug and Jørgensen 1999). The sinkingvelocity was calculated from the volume of water passingthrough the flow chamber per unit time divided by thecross-sectional area of the flow chamber. An advantage ofthis method is that the aggregate is not destroyed and caneasily be collected for further analysis afterwards. Howev-er, a comparison of aggregate sinking velocities measuredwithin this flow system with those measured in asedimentation column have shown that sinking velocitiestend to be underestimated by 18% in the flow systemrelative to the values obtained in a sedimentation column(H. Ploug unpubl.). Sinking velocities were corrected bythis value in the present study to normalize sinking velocitydata to those measured in a sedimentation column (seebelow).
Fecal pellets do not disaggregate as easily as domarine snow and other porous aggregates. Sinkingvelocities of appendicularian fecal pellets were too high tobe measured in the flow system because of air-bubbleformation within the system at the high inflow rates neededto keep particles in suspension. Sinking velocities of fecalpellets were therefore measured in a sedimentation column.The column (40 cm high and 3 cm in diameter) was filledwith filtered seawater (,32) and kept in a 15uC thermo-stated room, surrounded by a water jacket for thermalstabilization. The settling column was closed at both ends,allowing only insertion of a Pasteur pipette at the top.Pellets were rinsed in filtered seawater and collected in aPasteur pipette with filtered seawater (,32). Pellets sankout of the Pasteur pipette, which was centered in thecolumn. The descent of the pellets was recorded by twocharge-coupled device video cameras (MTV-1802CB,Mintron) equipped with 105-mm lenses (Micro Nikkor1 : 2.8, Nikon). The cameras were placed along the x- andz-axes of the pellets, giving a three-dimensional view of thesettling. A time-code generator was connected to thecameras, making timing of the pellets possible. Infraredillumination was provided from behind by light-emittingdiodes and collimated through condensers. The setup was
Ballast within sinking particles 1879

calibrated by recording a length scale before sinkingvelocity measurements.
Theoretical sinking velocities of aggregates and fecalpellets were calculated from
U ~ 2gDrV�
rf CDA� �0:5 ð2Þ
where U is the sinking velocity, g is the acceleration causedby gravity, Dr is the excess density of the aggregates, and rf
is the density of sea water (1.02488 g at 15uC). CD is thedrag coefficient and A is the cross-sectional area of theparticle.
The Reynolds number was calculated as (White1974)
Re ~dU
nð3Þ
where d is the diameter and n is the kinematic viscosity ofsea water (1.19 3 1022 cm2 s21 at 15uC).
The drag coefficient for Re . 0.5 was calculated as(White 1974)
CD ~24
Rez
6
1 z Re0:5z 0:4 ð4Þ
Excess density and solid matter density—The excessdensity of aggregates was calculated from measured sinkingvelocities (Eq. 2) using the drag coefficient (Eq. 4). Thesolid matter density was calculated from Alldredge andGotschalk (1988):
Dr ~W
V| 1 {
rf
rs
� �ð5Þ
where W is the dry mass, rs the solid matter density, and Vthe volume of the aggregate.
The densities of fecal pellets were determined experi-mentally in a density gradient, using a modified versionof the centrifugation method (Schwinghamer et al.1991; Feinberg and Dam 1998). Seven dilutions weremade using Ludox TM colloidal silica, sucrose, anddistilled water. The dilutions ranged in density from 1.05to 1.43 g cm23. The dilutions were buffered to pH 8.1 with0.0125 mol L21 Tris plus 0.0125 mol L21 Tris-HCl (finalconcentration). Hence, the gradient produced was isosmot-ic with seawater of salinity ,32 (Weast 1968). Twomilliliters of each dilution was gently transferred to a 20-mL centrifuge tube, beginning with the densest andfinishing with the lightest dilution. The density gradientswere stored at 5uC overnight but were at room temperaturebefore use. Whole fecal pellets were rinsed in filteredseawater (,32), placed in 1 mL of seawater, and pipettedon top of the density gradient. The samples werecentrifuged at 3,000 rpm for 30 min. After centrifugation,1 mL from each of the different density layers was removedfrom the tube using a peristaltic pump and weighed using aMettler Toledo balance to 0.1 mg. The size and number ofpellets layer21 were recorded using a dissection microscope.No pellets were observed to be disrupted by the centrifu-gation process.
Porosity—The porosity of aggregates and fecal pelletswas calculated as (Alldredge and Gotschalk 1988):
p ~ 1 {W=rs
Vð6Þ
The calculated porosity in aggregates is relatively insensi-tive to the density of dry mass because aggregate porosity isvery high, as also previously noted by Alldredge andGotschalk (1988).
Scanning electron microscopy—Aggregate or fecal pelletcomposition was visually analyzed using scanning electronmicroscopy (SEM). Aggregates and fecal pellets werefiltered onto 0.4-mm polycarbonate filters, rinsed withdeionized water, and dried .24 h at 40uC. The filters werecovered with a 5-nm gold–palladium layer (SC500,Emscope). Random areas of the filters were chosen forvisual determination of the content. SEM analysis wasperformed using an FEI Quanta 200F scanning electronmicroscope together with xTmicroscope software.
Elemental analysis of fecal pellets—About 50 appendic-ularian pellets were collected with a pipette from the wetsplits (1/5) from three samples from the CBi-2 trappositioned at 1,296-m water depth. Pellets were freeze-dried and homogenized with a mortar. We performedorganic carbon, total nitrogen, and carbonate analysisusing a HERAEUS-CHN analyzer. Organic carbon wasmeasured using the freeze-dried material, from whichcalcium carbonate was removed with 6 mol L21 HCl insilver boats and dried on a hot plate prior to the analysis.Carbonate was determined from the difference betweennonacidified samples and acidified samples. Biogenic opalwas determined with a sequential leaching technique with1 mol L21 NaOH (Muller and Schneider 1993). Lithogenicmaterial was calculated according to: lithogenic 5 totalmass – opal – calcium carbonate – 2 3 organic carbon.Organic carbon was multiplied by a factor of 2 to estimatetotal organic matter (Wakeham et al. 1980).
Diffusivity—Apparent diffusivity was measured directlywithin aggregates or fecal pellets using a diffusivitymicrosensor (Unisense) connected to a picoammeter(PA2000, Unisense) and a strip chart recorder (Revsbechet al. 1998; Ploug and Passow 2007). The detectionprinciple is based on a tracer gas (hydrogen) diffusingaway from the microsensor tip. These sensors are verystable. Hydrogen, however, is not a completely inert gas inbiological systems. Production or consumption of hydro-gen can be recognized by non–steady-state signals withinbiological samples. Such signals were never observedduring our measurements. The microsensor was attachedto a micromanipulator. The tip diameter was 50 mm and itsposition was observed under a dissection microscope. Themicrosensor was calibrated in glass beads with a diameterof 5–20 mm, and in stagnant water in the boundary layer ofa piece of 1% agar (Revsbech et al. 1998; Ploug and Passow2007). Single aggregates or fecal pellets were placed on anet to ensure free diffusion in all dimensions duringmeasurements, i.e., to avoid wall effects (Ploug and
1880 Ploug et al.
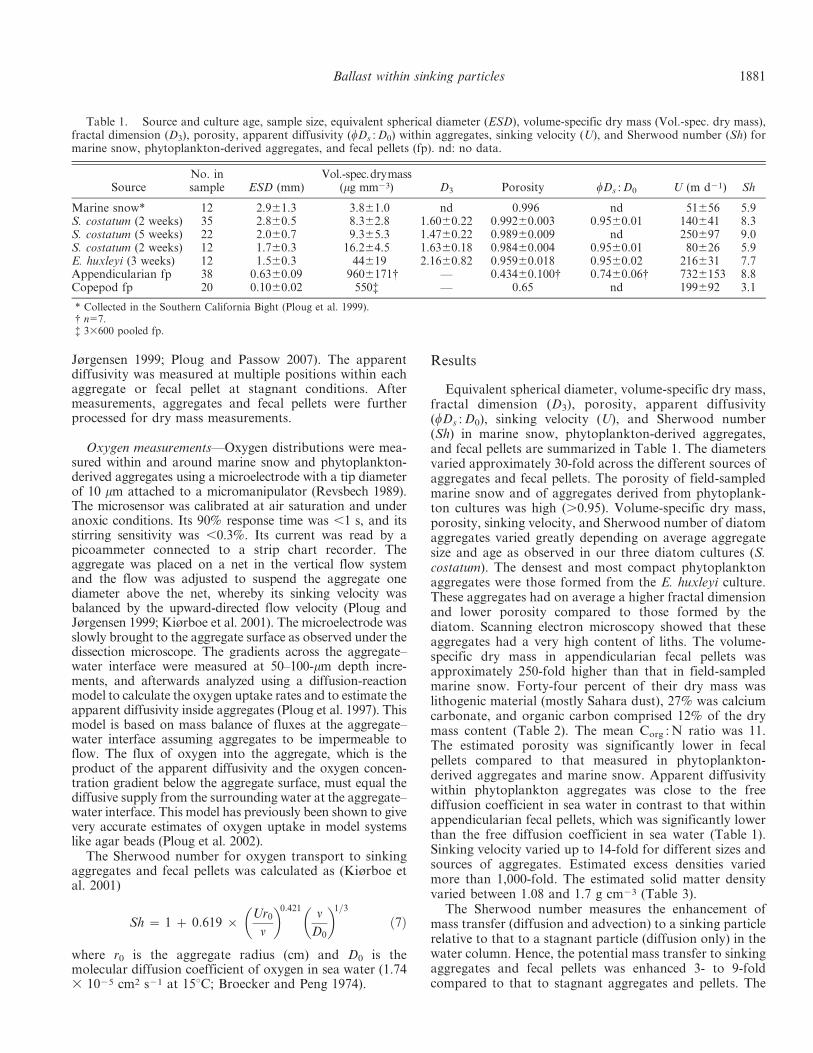
Jørgensen 1999; Ploug and Passow 2007). The apparentdiffusivity was measured at multiple positions within eachaggregate or fecal pellet at stagnant conditions. Aftermeasurements, aggregates and fecal pellets were furtherprocessed for dry mass measurements.
Oxygen measurements—Oxygen distributions were mea-sured within and around marine snow and phytoplankton-derived aggregates using a microelectrode with a tip diameterof 10 mm attached to a micromanipulator (Revsbech 1989).The microsensor was calibrated at air saturation and underanoxic conditions. Its 90% response time was ,1 s, and itsstirring sensitivity was ,0.3%. Its current was read by apicoammeter connected to a strip chart recorder. Theaggregate was placed on a net in the vertical flow systemand the flow was adjusted to suspend the aggregate onediameter above the net, whereby its sinking velocity wasbalanced by the upward-directed flow velocity (Ploug andJørgensen 1999; Kiørboe et al. 2001). The microelectrode wasslowly brought to the aggregate surface as observed under thedissection microscope. The gradients across the aggregate–water interface were measured at 50–100-mm depth incre-ments, and afterwards analyzed using a diffusion-reactionmodel to calculate the oxygen uptake rates and to estimate theapparent diffusivity inside aggregates (Ploug et al. 1997). Thismodel is based on mass balance of fluxes at the aggregate–water interface assuming aggregates to be impermeable toflow. The flux of oxygen into the aggregate, which is theproduct of the apparent diffusivity and the oxygen concen-tration gradient below the aggregate surface, must equal thediffusive supply from the surrounding water at the aggregate–water interface. This model has previously been shown to givevery accurate estimates of oxygen uptake in model systemslike agar beads (Ploug et al. 2002).
The Sherwood number for oxygen transport to sinkingaggregates and fecal pellets was calculated as (Kiørboe etal. 2001)
Sh ~ 1 z 0:619 |Ur0
n
� �0:421n
D0
� �1=3
ð7Þ
where r0 is the aggregate radius (cm) and D0 is themolecular diffusion coefficient of oxygen in sea water (1.743 1025 cm2 s21 at 15uC; Broecker and Peng 1974).
Results
Equivalent spherical diameter, volume-specific dry mass,fractal dimension (D3), porosity, apparent diffusivity(wDs : D0), sinking velocity (U), and Sherwood number(Sh) in marine snow, phytoplankton-derived aggregates,and fecal pellets are summarized in Table 1. The diametersvaried approximately 30-fold across the different sources ofaggregates and fecal pellets. The porosity of field-sampledmarine snow and of aggregates derived from phytoplank-ton cultures was high (.0.95). Volume-specific dry mass,porosity, sinking velocity, and Sherwood number of diatomaggregates varied greatly depending on average aggregatesize and age as observed in our three diatom cultures (S.costatum). The densest and most compact phytoplanktonaggregates were those formed from the E. huxleyi culture.These aggregates had on average a higher fractal dimensionand lower porosity compared to those formed by thediatom. Scanning electron microscopy showed that theseaggregates had a very high content of liths. The volume-specific dry mass in appendicularian fecal pellets wasapproximately 250-fold higher than that in field-sampledmarine snow. Forty-four percent of their dry mass waslithogenic material (mostly Sahara dust), 27% was calciumcarbonate, and organic carbon comprised 12% of the drymass content (Table 2). The mean Corg : N ratio was 11.The estimated porosity was significantly lower in fecalpellets compared to that measured in phytoplankton-derived aggregates and marine snow. Apparent diffusivitywithin phytoplankton aggregates was close to the freediffusion coefficient in sea water in contrast to that withinappendicularian fecal pellets, which was significantly lowerthan the free diffusion coefficient in sea water (Table 1).Sinking velocity varied up to 14-fold for different sizes andsources of aggregates. Estimated excess densities variedmore than 1,000-fold. The estimated solid matter densityvaried between 1.08 and 1.7 g cm23 (Table 3).
The Sherwood number measures the enhancement ofmass transfer (diffusion and advection) to a sinking particlerelative to that to a stagnant particle (diffusion only) in thewater column. Hence, the potential mass transfer to sinkingaggregates and fecal pellets was enhanced 3- to 9-foldcompared to that to stagnant aggregates and pellets. The
Table 1. Source and culture age, sample size, equivalent spherical diameter (ESD), volume-specific dry mass (Vol.-spec. dry mass),fractal dimension (D3), porosity, apparent diffusivity (wDs : D0) within aggregates, sinking velocity (U), and Sherwood number (Sh) formarine snow, phytoplankton-derived aggregates, and fecal pellets (fp). nd: no data.
SourceNo. insample ESD (mm)
Vol.-spec.drymass(mg mm23) D3 Porosity wDs : D0 U (m d21) Sh
Marine snow* 12 2.961.3 3.861.0 nd 0.996 nd 51656 5.9S. costatum (2 weeks) 35 2.860.5 8.362.8 1.6060.22 0.99260.003 0.9560.01 140641 8.3S. costatum (5 weeks) 22 2.060.7 9.365.3 1.4760.22 0.98960.009 nd 250697 9.0S. costatum (2 weeks) 12 1.760.3 16.264.5 1.6360.18 0.98460.004 0.9560.01 80626 5.9E. huxleyi (3 weeks) 12 1.560.3 44619 2.1660.82 0.95960.018 0.9560.02 216631 7.7Appendicularian fp 38 0.6360.09 9606171{ — 0.43460.100{ 0.7460.06{ 7326153 8.8Copepod fp 20 0.1060.02 550{ — 0.65 nd 199692 3.1
* Collected in the Southern California Bight (Ploug et al. 1999).{ n57.{ 33600 pooled fp.
Ballast within sinking particles 1881

potential mass transfer of oxygen to denser and faster-sinking aggregates was enhanced by 31–41% relative to thatto similar-sized aggregates with lower density and sinkingvelocity (Table 1). Diatom aggregates formed by an olderculture showed higher sinking velocities compared to thoseformed by the younger one, although the average dry mass(wet volume)21 was similar in aggregates of the twocultures.
The fluxes of oxygen to sinking aggregates are deter-mined by the potential mass transfer of oxygen by diffusionand/or advection and by the oxygen consumption rateswithin aggregates. The oxygen gradients within aggregates,which are not permeable to fluid flow, depend on aggregatesize, oxygen consumption rates, the apparent diffusivitywithin aggregates, and the concentration boundary layerthickness at the aggregate–water interface during sinking,i.e., the Sherwood number (Ploug et al. 1997; Ploug 2001).Here, we estimated the apparent diffusivity of oxygenwithin aggregates and marine snow from measured oxygengradients using a diffusion-reaction model assuming ouraggregates to be impermeable to flow. Three examples ofoxygen gradients measured in field-sampled marine snow(Ploug et al. 1999), diatom aggregates, and aggregatesformed by the E. huxleyi culture are shown in Fig. 1. Theoxygen consumption rates in the aggregates were calculatedfrom the oxygen gradient in the water phase immediatelyadjacent to the aggregate surface, i.e., they can bedetermined independently of the apparent diffusivity insidethe aggregates, because all oxygen being consumed insidethe aggregate must cross the aggregate–water interface. The
measured oxygen gradients were consistent with thosemodeled for similar-sized aggregates with an apparentdiffusivity of oxygen within the aggregate of 0.95 times thefree diffusion coefficient of oxygen in sea water in all threecases. The variation in oxygen gradients between aggre-gates was explained by variations in oxygen consumptionrates. The oxygen consumption rate in field-sampledmarine snow was 2.3 nmol O2 h21, whereas that of thediatom aggregate was 4.6 nmol O2 h21, and that of theaggregate formed by the E. huxleyi culture was 14.3 nmolO2 h21. Hence, aggregates formed by the E. huxleyi culturewere rich in liths as well as in labile organic matter.Assuming an apparent diffusivity of oxygen withinaggregates to be 0.1 or 0.01 times that of the free diffusioncoefficient in sea water resulted in significantly differentoxygen gradients compared to those measured within theaggregates (Fig. 2). The aggregates would have been anoxicif the apparent diffusivity had been only 1–10% of the freediffusion coefficient. Diffusion of oxygen, therefore, didnot limit the bacterial respiration of organic matter withinthese aggregates.
Discussion
Sinking velocity and remineralization rates of particlesare two major factors determining vertical carbon fluxesand the efficiency of the biological carbon pump in theocean (De La Rocha and Passow 2007). Phytoplankton-derived aggregates and zooplankton fecal pellets areimportant components in the vertical carbon flux to thedeep sea and sediments (Turner 2002). The present study isthe first to directly measure aggregate or fecal pelletcomposition, density, sinking velocity, apparent diffusivity,and O2 fluxes across a variety of particle sources occurringin the ocean. Hereby we could experimentally assess theeffect of ballast on sinking velocities and mineralizationrates of phytoplankton-derived aggregates and fecal pelletsin the upper ocean. We used volume-specific dry mass,excess density, and solid matter density as measures ofballast, where chemical composition was not measureddirectly. The volume-specific dry mass varied 250-foldacross the different particle and aggregate sources. It wasshown that ballast minerals have little influence on
Table 2. Average composition (in % of dry mass with thestandard deviation of the mean value; n53) of appendicularianfecal pellets collected in sediment traps (1,296-m water depths) offCape Blanc, Mauritania, from 10 November 2004 to 18 January2005.
Composition
Corg 1262.7Nitrogen 1.3160.37Calcium carbonate 2768Biogenic opal 8.860.4Lithogenic material 4466
Table 3. Source and culture age, excess density, solid matter density (rs), Reynolds number(Re), drag coefficient (CD), theoretical sinking velocity (Utheory), and the ratio between measuredand theoretical sinking velocity. fp: fecal pellet.
SourceExcess density
(mg cm23)rs
(g cm23) Re CD
Utheory
(m d21) U : Utheory
Marine snow* 0.19{ 1.08 1.43 20 52 0.98S. costatum (2 weeks) 0.63{ 1.11 3.81 3.8 139 1.00S. costatum (5 weeks) 2.23{ 1.35 4.86 4.9 243 1.03S. costatum (2 weeks) 0.83{ 1.08 1.32 1.3 79 1.01E. huxleyi (3 weeks) 3.36{ 1.11 3.15 3.2 217 0.99Appendicularian fp 250670 1.7 4.48 4.5 1,233 0.59Copepod fp 150640 1.6 0.19 0.20 105 1.88
{ Calculated from measured sinking velocity (Eq. 2).* Collected in the Southern California Bight (Ploug et al. 1999).
1882 Ploug et al.

Fig. 1. (A) Oxygen gradients measured (circles) and modeled(line) across the aggregate–water interface assuming an apparentdiffusivity of oxygen to be 0.95 times the free diffusion coefficientinside sea water in marine snow, (B) an aggregate formed by S.costatum, and (C) an aggregate formed by E. huxleyi. Thehorizontal dotted lines indicate the aggregate surface. See textfor details.
Fig. 2. (A) Oxygen gradients measured (circles) and modeled(line) across the aggregate–water interface assuming an apparentdiffusivity of oxygen to be 0.95, 0.10, or 0.01 times the freediffusion coefficient in sea water inside marine snow, (B) anaggregate formed by S. costatum, and (C) an aggregate formed byE. huxleyi. The horizontal dotted lines indicate the aggregatesurface. See text for details.
Ballast within sinking particles 1883

apparent diffusivity within aggregates, but these mineralsincrease sinking velocity and thereby also the potential O2
fluxes to sedimenting aggregates and fecal pellets.Sinking velocities of fecal pellets and marine snow
cannot be predicted by Stokes’ law, because theirReynolds numbers are well above 0.5, their geometry isnonspherical, and marine snow is porous. Furthermore,sinking velocities of similar-sized aggregates vary greatly(Alldredge and Gotschalk 1988; Khelifa and Hill 2007;Ploug et al. 2008). Our study demonstrates that sinkingvelocities of different particle types depend on source,density, and age rather than on size. Sinking velocity ofsimilar-sized aggregates and fecal pellets is largely con-trolled by excess density, which depends on solid matterdensity, i.e., composition of primary particles, porosity,and fractal dimension (Khelifa and Hill 2007). A highcontent of lithogenic material (mostly fine-grained dust)and calcium carbonate in zooplankton fecal pelletscoincides with high densities and sinking velocities of thesepellets. By comparison, the excess density of large, porousphytoplankton-derived aggregates is much lower than thatof fecal pellets. TEP are significant components inphytoplankton aggregates, where they occupy a highfraction of the aggregate volume but contribute little todry mass (Ploug and Passow 2007). TEP can diminishsinking velocity of aggregates because of low specificdensity of these particles (Engel and Schartau 1999; Azetsu-Scott and Passow 2004). The TEP : dry mass ratio tends todecrease in aging aggregates, which may partly explain theincreased sinking velocities and apparently higher solidmatter densities in older aggregates of the present study(Ploug and Passow 2007).
It has been argued that diffusivity of gases and soluteswithin marine snow may be significantly lower than therespective diffusion coefficients in water because of theirfractal geometry (Alldredge 2000). The fractal dimensionsof our aggregates were similar to those reported from thefield (Alldredge and Gotschalk 1988; Logan and Wilkinson1990), but the apparent diffusivity of gases within porousmarine snow and phytoplankton-derived aggregates wasonly slightly lower than that in (stagnant) sea water. Highconcentrations of cells, minerals, and TEP may limitadvection rather than diffusion within aggregates. Theapparent diffusivity in large fecal pellets with a very highvolume-specific content of carbonate and lithogenic mate-rial was only approximately 25% lower than that in seawater. Although ballast material had little influence onapparent diffusivity within aggregates and fecal pellets, ithad a large effect on sinking velocity and thus total masstransfer (diffusion and advection) of oxygen to sinkingparticles. Hence, our study provides no evidence forprotection mechanisms against degradation of labileorganic matter that might result from a lower diffusivitybecause of packaging of aggregates and fecal pellets duringsedimentation.
It has previously been shown that millimeter-longeuphausidian fecal pellets attached to marine snow can beanoxic (Alldredge and Cohen 1987). The aggregatesanalyzed in the present study were far from being anoxic.The half-saturation constant for oxygen uptake in bacteria
is approximately 1 mmol L21 (Fenchel and Finlay 1993),and bacterial respiration was thus not limited by oxygenavailability within aggregates. The oxygen gradients occur-ring within the aggregates of our study were explained by theoxygen consumption rates in combination with a highapparent diffusivity of oxygen. This was also the case inanoxic aggregates formed by zooplankton detritus producedon a nanoflagellate diet (Ploug et al. 1997). Anoxicaggregates and particles, however, may be common withinoxygen minimum zones with ,25 mmol O2 L21, rather thanin fully oxygenated sea water (Ploug 2001, 2008).
Production, degradation, and residence time of organiccarbon in sinking particles are complex processes thatdepend on physical processes, e.g. turbulence, as well as onchemical and biological processes in the upper mixed layerof the ocean. Macrocrustacean fecal pellets can remain insurface water much longer than could be expected fromtheir sinking velocity alone (Alldredge et al. 1987). Marinesnow and fecal pellets can disaggregate because offragmentation by zooplankton, leading to decreasedsinking velocities and increased substrate turnover withinthe upper mixed layer of the ocean (Dilling and Alldredge2000; Iversen and Poulsen 2007). Bacteria associated withmarine snow and fecal pellets are characterized by highenzymatic activities (Smith et al. 1992; Thor et al. 2003;Ziervogel and Arnosti 2008), leading to microenvironmentswith elevated concentrations of DOC, inorganic nutrients,and amino acids relative to those of the surrounding water(Smith et al. 1992; Brzezinski et al. 1997; Alldredge 2000).These microenvironments are 10- to 100-fold larger thanthe volume of sinking aggregates themselves because ofadvection and diffusion acting at the aggregate–waterinterface (Kiørboe et al. 2001; Ploug and Passow 2007).Chemosensory behavior has been demonstrated in marinebacteria as well as in zooplankton that feed on marine snow(Kiørboe 2001; Kiørboe et al. 2002). Hence, bacterialcolonization of sinking marine particles is a very fastprocess leading to a significant turnover of the aggregatecarbon and nitrogen pools in the surface ocean (Smith et al.1992; Ploug et al. 1999; Kiørboe et al. 2002). Carbon-specificrespiration rates are relatively similar within copepod fecalpellets, irrespective of biogenic ballast material content, andwithin marine snow (0.08 to 0.21 d21) (Ploug et al. 1999;Ploug and Grossart 2000; Ploug et al. 2008). Thisobservation may largely be explained by high hydrolysisrates combined with high apparent diffusivities of solutesand oxygen supply for respiration, which support anefficient turnover of labile carbon across different particlesources and sizes in the ocean.
References
ALLDREDGE, A. L. 2000. Interstitial dissolved organic carbon(DOC) concentrations within sinking marine aggregates andtheir potential contribution to carbon flux. Limnol. Ocea-nogr. 45: 1245–1253.
———, AND Y. COHEN. 1987. Can microscale chemical patchespersist in the sea? Microelectrode study of marine snow andfecal pellets. Science 235: 689–691.
———, AND C. C. GOTSCHALK. 1988. In situ settling behavior ofmarine snow. Limnol. Oceanogr. 33: 339–351.
1884 Ploug et al.

———, C. C. GOTSCHALK, AND S. MACINTYRE. 1987. Evidencefor sustained residence of macrocrustacean pellets in sur-face waters off southern California. Deep-Sea Res. 34:1641–1652.
———, AND M. SILVER. 1988. Characteristics, dynamics andsignificance of marine snow. Prog. Oceanog. 20: 41–82.
ARMSTRONG, R. A., C. LEE, J. I. HEDGES, S. HONJO, AND S. G.WAKEHAM. 2002. A new, mechanistic model for organiccarbon fluxes in the ocean based on the quantitativeassociation of POC with ballast minerals. Deep-Sea Res. I49: 219–236.
AZETSU-SCOTT, K., AND U. PASSOW. 2004. Ascending marineparticles: Significance of transparent exopolymer particles(TEP) in the upper ocean. Limnol. Oceanogr. 49: 741–748.
BROECKER, W. S., AND T. H. PENG. 1974. Gas exchange ratesbetween air and sea. Tellus 26: 21–35.
BRZEZINSKI, M. A., A. L. ALLDREDGE, AND L. M. O’BRYAN. 1997.Silica cycling within marine snow. Limnol. Oceanogr. 42:1706–1713.
DE LA ROCHA, C. L., AND U. PASSOW. 2007. Factors influencingthe sinking of POC and the efficiency of the biological carbonpump. Deep-Sea Res. II 54: 639–658.
DILLING, L., AND A. L. ALLDREDGE. 2000. Fragmentation ofmarine snow by swimming macrozooplankton: A new processimpacting carbon cycling in the sea. Deep-Sea Res. I 47:1227–1245.
ENGEL, A., AND M. SCHARTAU. 1999. Influence of transparentexopolymer particles on sinking velocity of Nitzschia clostrid-ium aggregates. Mar. Ecol. Prog. Ser. 182: 69–76.
FEINBERG, L. R., AND H. G. DAM. 1998. Effects of diet ondimensions, density and sinking rates of fecal pellets of thecopepod Acartia tonsa. Mar. Ecol. Prog. Ser. 175: 87–96.
FENCHEL, T., AND B. J. FINLAY. 1993. Ecology and evolution inanoxic worlds. Oxford Univ. Press.
FISCHER, G., AND oTHERS. In press. Control of ballast minerals onorganic carbon export in the Eastern Boundary CurrentSystem (EBCs) off NW Africa. In K.-K. Liu et al. [Eds.].Carbon and nutrient fluxes in continental margins: A globalsynthesis. Springer.
FRANCOIS, R., S. HONJO, R. KRISHFELD, AND S. MANGANINI. 2002.Factors controlling the flux of organic carbon to thebathypelagic zone of the ocean. Global Biogeochem. Cycles16: 1087, doi: 10.1029/2001GB00172.
GUILLARD, J. K., AND J. H. RYTHER. 1962. Studies of marineplanktonic diatoms. I. Cyclotella nana (Hustedt) and Detonulaconfervacea (Cleve) Gran. Can. J. Microbiol. 8: 229–239.
IVERSEN, M. H., AND L. POULSEN. 2007. Coprorhexy, coprophagy,and coprochaly in the copepods Calanus helgolandicus,Pseudocalanus elongatus, and Oithona similis. Mar. Ecol.Prog. Ser. 350: 79–89.
KHELIFA, A., AND P. S. HILL. 2007. Models for effective densityand settling velocity of flocs. J. Hydraul. Res. 44: 390–401.
KIØRBOE, T. 2001. Formation and fate of marine snow: Small-scale processes with large-scale implications. Sci. Mar. 65:57–71.
———, H.-P. GROSSART, H. PLOUG, AND K. TANG. 2002.Mechanisms and rates of bacterial colonization of sinkingaggregates. Appl. Environ. Microbiol. 68: 3996–4006.
———, H. PLOUG, AND U. H. THYGESEN. 2001. Fluid motion andsolute distribution around sinking aggregates. I. Small scalefluxes and heterogeneity of nutrients in the pelagic environ-ment. Mar. Ecol. Prog. Ser. 211: 1–13.
KLAAS, C., AND D. E. ARCHER. 2002. Association of sinkingorganic matter with various types of mineral ballast in thedeep sea: Implications for the rain ratio. Global Biogeochem.Cycles 16: 1116, doi: 10.1029/2001GB001765.
LOGAN, B. E., AND D. B. WILKINSON. 1990. Fractal geometry ofmarine snow and other biological aggregates. Limnol.Oceanogr. 35: 130–136.
MULLER, P. J., AND R. SCHNEIDER. 1993. An automated leachingmethod for the determination of opal in sediments andparticulate matter. Deep-Sea Res. I 40: 425–444.
PLOUG, H. 2001. Small-scale oxygen fluxes and reminerali-zation in sinking aggregates. Limnol. Oceanogr. 46:1624–1631.
———. 2008. Cyanobacterial aggregates formed by Aphanizome-non sp. and Nodularia spumigena in the Baltic Sea: Small-scalefluxes, pH and oxygen microenvironments. Limnol. Ocea-nogr. 53: 914–921.
———, AND H.-P. GROSSART. 2000. Bacterial growth and grazingon diatom aggregates: Respiratory carbon turnover as afunction of aggregate size and sinking velocity. Limnol.Oceanogr. 45: 1467–1475.
———, H.-P. GROSSART, F. AZAM, AND B. B. JØRGENSEN. 1999.Photosynthesis, respiration, and carbon turnover in sinkingmarine snow from surface waters of Southern CaliforniaBight: Implications for the carbon cycle in the ocean. Mar.Ecol. Prog. Ser. 179: 1–11.
———, S. HIETANEN, AND J. KUPARINEN. 2002. Diffusion andadvection within and around sinking, porous diatom aggre-gates. Limnol. Oceanogr. 47: 1129–1136.
———, M. H. IVERSEN, M. KOSKI, AND E. T. BUITENHUIS. 2008.Production, respiratory carbon turnover, and sinkingvelocity of copepod fecal pellets: Direct measurements ofballasting by opal and calcite. Limnol. Oceanogr. 53:469–476.
———, AND B. B. JØRGENSEN. 1999. A net-jet flow system for masstransfer and microelectrode studies in sinking aggregates.Mar. Ecol. Prog. Ser. 176: 279–290.
———, M. KUHL, B. BUCHOLZ, AND B. B. JØRGENSEN. 1997.Anoxic aggregates—an ephemeral phenomenon in thepelagic environment. Aquat. Microb. Ecol. 13: 285–294.
———, AND U. PASSOW. 2007. Direct measurements of diffusivityin diatom aggregates containing transparent exopolymerparticles (TEP). Limnol. Oceanogr. 52: 1–6.
REVSBECH, N. P. 1989. An oxygen microelectrode with a guardcathode. Limnol. Oceanogr. 34: 474–478.
———, L. P. NIELSEN, AND N. B. RAMSING. 1998. A novelmicrosensor for determination of apparent diffusivity insediments. Limnol. Oceanogr. 43: 986–992.
SCHWINGHAMER, P., D. M. ANDERSON, AND D. M. KULIS. 1991.Separation and concentration of living dinoflagellate restingcysts from marine sedimentation via density-gradient centri-fugation. Limnol. Oceanogr. 36: 588–592.
SHANKS, A. L., AND E. W. EDMONDSON. 1989. Laboratory-madeartificial marine snow: A biological model of the real thing.Mar. Biol. 101: 463–470.
———, AND J. D. TRENT. 1979. Marine snow: Microscale nutrientpatches. Limnol. Oceanogr. 24: 850–854.
SIMON, M., H.-P. GROSSART, B. SCHWEITZER, AND H. PLOUG. 2002.Microbial ecology of organic aggregates in aquatic ecosys-tems. Review. Aquat. Microb. Ecol. 28: 175–211.
SMITH, D. C., M. SIMON, A. L. ALLDREDGE, AND F. AZAM. 1992.Intense hydrolytic enzyme activity on marine aggregates andimplication for rapid particle dissolution. Nature 359:139–142.
THOR, P., H. G. DAM, AND D. R. ROGERS. 2003. Fate of organiccarbon release from decomposing copepod fecal pellets inrelation to bacterial production and ectoenzymatic activity.Mar. Ecol. Prog. Ser. 33: 279–288.
Ballast within sinking particles 1885

TURNER, J. T. 2002. Zooplankton fecal pellets, marine snow andsinking phytoplankton blooms. Aquat. Microb. Ecol. 27:57–102.
WAKEHAM, S. G., AND oTHERS. 1980. Organic-matter fluxes fromsediment traps in the equatorial Atlantic Ocean. Nature 286:798–800.
WEAST, R. C. 1968. Handbook of chemistry and physics, 49th ed.CRC Co.
WHITE, F. M. 1974. Viscous fluid flow. McGraw-Hill.
ZIERVOGEL, K., AND C. ARNOSTI. 2008. Polysaccharide hydrolysisin aggregates and free enzyme activity in aggregate-freeseawater from the north-eastern Gulf of Mexico. Environ.Microbiol. 10: 289–299.
Received: 14 November 2007Accepted: 28 February 2008
Amended: 10 April 2008
1886 Ploug et al.


Paper V

1
1
2
3
4
5
6
7
8
9
10
11
12
13
14
15
16
17
Submitted to Deep-Sea Res. I
High resolution profiles of vertical particulate organic matter export off Cape Blanc,
Mauritania: Degradation processes and ballasting effects
Morten Hvitfeldt Iversen1*, Nicolas Nowald2, Helle Ploug1, George A. Jackson3,
and Gerhard Fischer2
1Alfred Wegener Institute for Polar and Marine Research, Am Handelshafen 12,
D - 27570 Bremerhaven, Germany
2University of Bremen, Department of Geosciences, Klagenfurterstrasse, 28359 Bremen,
Marum, Leobener Strasse, 28359 Bremen, Germany
3Department of Oceanography, Texas A&G University, College Station, TX 77843, USA
Running head: Particle remineralization and sedimentation
*Corresponding author. E-mail: [email protected] 18
19
20
*Tel: +49 (0)471 4831 2093; Fax: +49 471 4831 2020

2
21
22
23
24
25
26
27
28
29
30
Acknowledgments
We thank Klaus-Uwe Richter and Christiane Lorenzen for assistance during POC
measurements. The oxygen microelectrodes were constructed by Gaby Eickert, Ines Schröder,
and Karin Hohmann, Max Planck Institute for Marine Microbiology, Bremen. Finally we
thank the captain and crew on the research vessel Maria S. Merian cruise leg MSM4/b,
March/April 2007. We also thank Uta Passow and Thomas Kiørboe for discussion.
This study was supported by the Helmholtz Association (to HP), the Alfred Wegener
Institute for Polar and Marine Research (to MHI and HP), and Marum (to MHI, NW, GF, and
HP). This is AWI publication no xxxxx and MARUM publication no xxxx.

3
31
32
33
34
35
36
37
38
39
40
41
42
43
44
45
46
47
48
49
50
51
Abstract
We estimated vertical carbon fluxes from in situ profiles of aggregate size-specific
abundances measured off Cape Blanc (Mauritania), using size-specific relationships of
aggregate sinking speeds and carbon content. Estimated carbon fluxes were compared with
fluxes measured by deep-ocean sediment traps for the same area and period. We estimated
carbon removal rates from vertical POC fluxes and identified the important degradation
processes at different depth intervals. Copepod grazing and bacterial activity were the
dominant degradation processes in the depth layer between 20 and 80 m. In water depths
between 80 and 220 m, the carbon removal rate was dominated by microbial activity. Below
220 m, the carbon removal rate was constantly low and likely limited by low bacterial activity
due to either abundance or physical parameters, e.g., temperature and pressure. Hence, most
carbon degradation occurred in the upper 220 meters and was mainly limited by aggregate
residence time at these depths. The aggregates off Cape Blanc contained high amounts of
ballast material due to the presence of coccolithophorid liths and presumably fine-grained
dust from the Sahara desert. Aggregate sinking velocities were high and increased with
increasing aggregate size. Hence, ballast minerals and aggregate sinking velocity appeared to
be important parameters controlling export of carbon to greater depths in the deep ocean and
the sediment.
Keywords: aggregate, flux, camera profile, respiration, sinking velocity, particle size
spectrum

4
52
53
54
55
56
57
58
59
60
61
62
63
64
65
66
67
68
69
70
71
72
73
74
75
1. Introduction
A significant fraction of organic carbon produced by photosynthesis in the surface
ocean is vertical transported to depth as large sinking aggregates and fecal pellets (Fowler and
Knauer 1986). This transfer of carbon from the surface ocean to the deep ocean is termed ´the
biological carbon pump´.
In order to predict the efficiency of the biological carbon pump in time and space it is
important to understand the controlling mechanisms for the export flux of organic carbon
from the euphotic zone to the mesopelagic and deep ocean (e.g., Boyd and Trull 2007;
Buesseler et al. 2007). Quantifying these processes is fundamental to understanding the global
cycling of carbon. The efficiency of the biological pump depends on the balance between
remineralization and sinking of aggregated particulate organic carbon (POC) (Sarmiento et al.
2004). Low sinking rates of aggregates increase their residence times and hence degradation
time in the upper ocean. Significant correlations between vertical fluxes of POC and inorganic
material in the deep ocean has lead to the suggestion that inorganic minerals (calcite, opal,
clay, and other lithogenic material) in aggregates may increase the organic carbon export by
production of dense aggregates with high sinking velocities (Klaas and Archer 2002) or by
providing protection from bacterial remineralization (Armstrong et al. 2002). These
mechanisms are known as the ballast effect or ballast hypothesis. Though rapid settling of
aggregates prevents significant dissolution of opal and calcite and significant
remineralization of organic carbon (Passow et al. 2003; Ragueneau et al. 2000), the
underlying mechanisms supporting the ballast effect are still unclear (see De La Rocha and
Passow 2007), and the relationship between organic carbon export and ballast minerals needs
further investigation with respect to the mechanisms involved.

5
76
77
78
79
80
81
82
83
84
85
86
87
88
89
90
91
92
93
94
95
96
97
98
99
100
One reason for our lack of knowledge about the underlying mechanisms for carbon
export is the fragile nature of large marine aggregates (marine snow), which makes them very
difficult to collect and study, particularly in deeper waters. Sediment traps are frequently used
to collect and estimate the vertical sinking particle flux. However, marine aggregates are often
transported laterally by currents as they fall, which makes the determination of their origins
difficult. Further, standard sediment traps can only be used to estimate the total flux because
they average over all sinking aggregates and particles. The problems of estimating size
distribution and abundance of the aggregates has partly been overcome by use of
polyacrylamide gel in the sediment trap collectors (Jannasch et al. 1980; Kiørboe et al. 1994)
and by the use of in situ camera systems (Asper 1987; Nowald et al. 2006). The use of in situ
camera systems has enabled measurements of high resolution depth profiles of aggregate size
distribution and abundances. However, neither the use of gel in sediment trap collectors nor
the use of in situ camera systems can provide detailed information on the chemical
composition or remineralization rates of the aggregates, which are needed to understand the
processes controlling the biological pump.
Several studies have combined the use of sediment traps and high resolution vertical
profiles of aggregate size distribution and abundances to estimate relationships between
physical properties and sizes of aggregates (e.g., Guidi et al. 2008b; Stemmann et al. 2002).
Models have been based on the combination of trap fluxes and in situ camera profiles to
investigate the role of physical coagulation, microbial activity, zooplankton grazing
(Stemmann et al. 2004a; Stemmann et al. 2004b), and to identify special flux patterns and the
importance of different abiotic and biotic factors on the export flux (Guidi et al. 2008a). These
studies as well as early studies of POC fluxes (e.g., Martin et al. 1987; Suess 1980) have all
shown that most carbon is remineralized in the upper ocean (<500 m). No studies, however,

6
101
102
103
104
105
106
107
108
109
110
111
112
113
114
115
have yet combined small scale direct measurements of settling velocities and carbon
degradation on aggregates with high resolution vertical fluxes from sediment traps and in situ
camera systems.
The aim of this study is to identify regulating processes for the export fluxes off Cape
Blanc and to identify important degradation processes at different depth intervals. We
estimated vertical carbon fluxes through the water column between the ocean surface and
2500 m depth by using particle size distributions determined by an in situ camera system in
combination with previous determined size-specific relationships of aggregate mass and
sinking velocity (Guidi et al. 2008b). We compared our estimated fluxes against fluxes
measured using deep-ocean sediment traps. Rates of carbon loss for different depth layers
were calculated and compared with on board measurements of size-specific O2-uptake,
sinking velocity, and composition of roller tank made surface aggregates. This enabled us to
identified depth-specific key degradation processes.
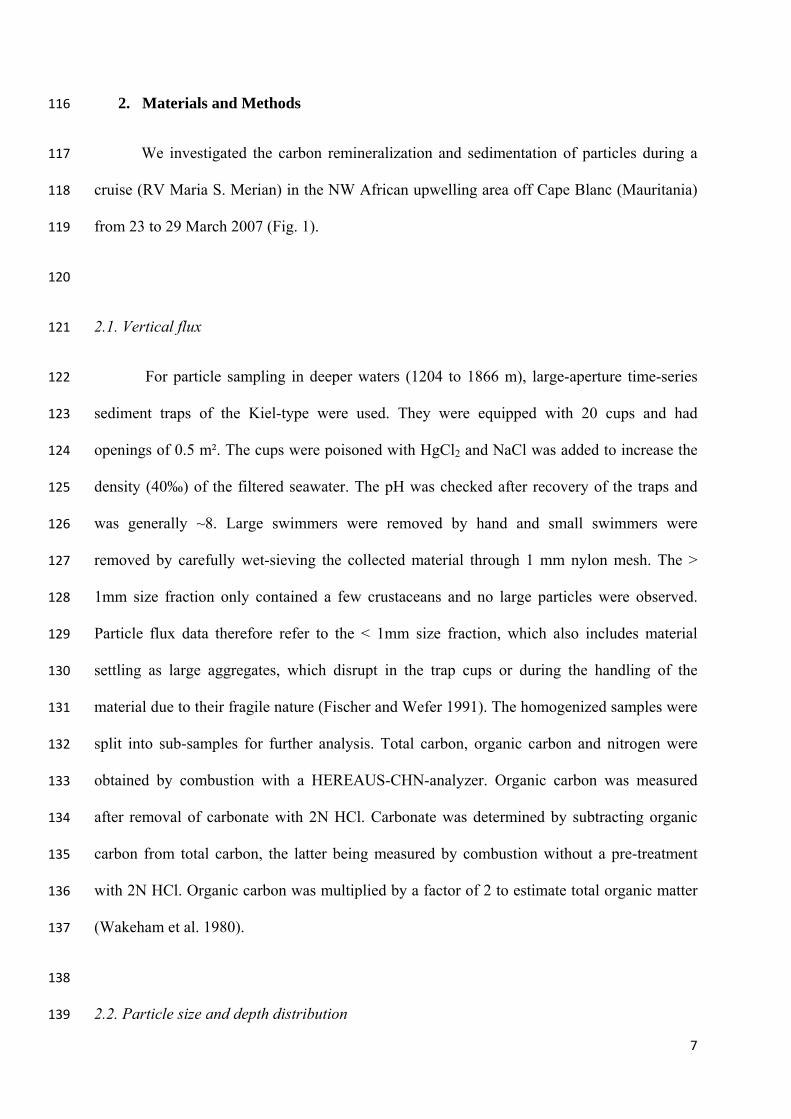
7
116
117
118
119
120
121
122
123
124
125
126
127
128
129
130
131
132
133
134
135
136
137
138
139
2. Materials and Methods
We investigated the carbon remineralization and sedimentation of particles during a
cruise (RV Maria S. Merian) in the NW African upwelling area off Cape Blanc (Mauritania)
from 23 to 29 March 2007 (Fig. 1).
2.1. Vertical flux
For particle sampling in deeper waters (1204 to 1866 m), large-aperture time-series
sediment traps of the Kiel-type were used. They were equipped with 20 cups and had
openings of 0.5 m². The cups were poisoned with HgCl2 and NaCl was added to increase the
density (40‰) of the filtered seawater. The pH was checked after recovery of the traps and
was generally ~8. Large swimmers were removed by hand and small swimmers were
removed by carefully wet-sieving the collected material through 1 mm nylon mesh. The >
1mm size fraction only contained a few crustaceans and no large particles were observed.
Particle flux data therefore refer to the < 1mm size fraction, which also includes material
settling as large aggregates, which disrupt in the trap cups or during the handling of the
material due to their fragile nature (Fischer and Wefer 1991). The homogenized samples were
split into sub-samples for further analysis. Total carbon, organic carbon and nitrogen were
obtained by combustion with a HEREAUS-CHN-analyzer. Organic carbon was measured
after removal of carbonate with 2N HCl. Carbonate was determined by subtracting organic
carbon from total carbon, the latter being measured by combustion without a pre-treatment
with 2N HCl. Organic carbon was multiplied by a factor of 2 to estimate total organic matter
(Wakeham et al. 1980).
2.2. Particle size and depth distribution
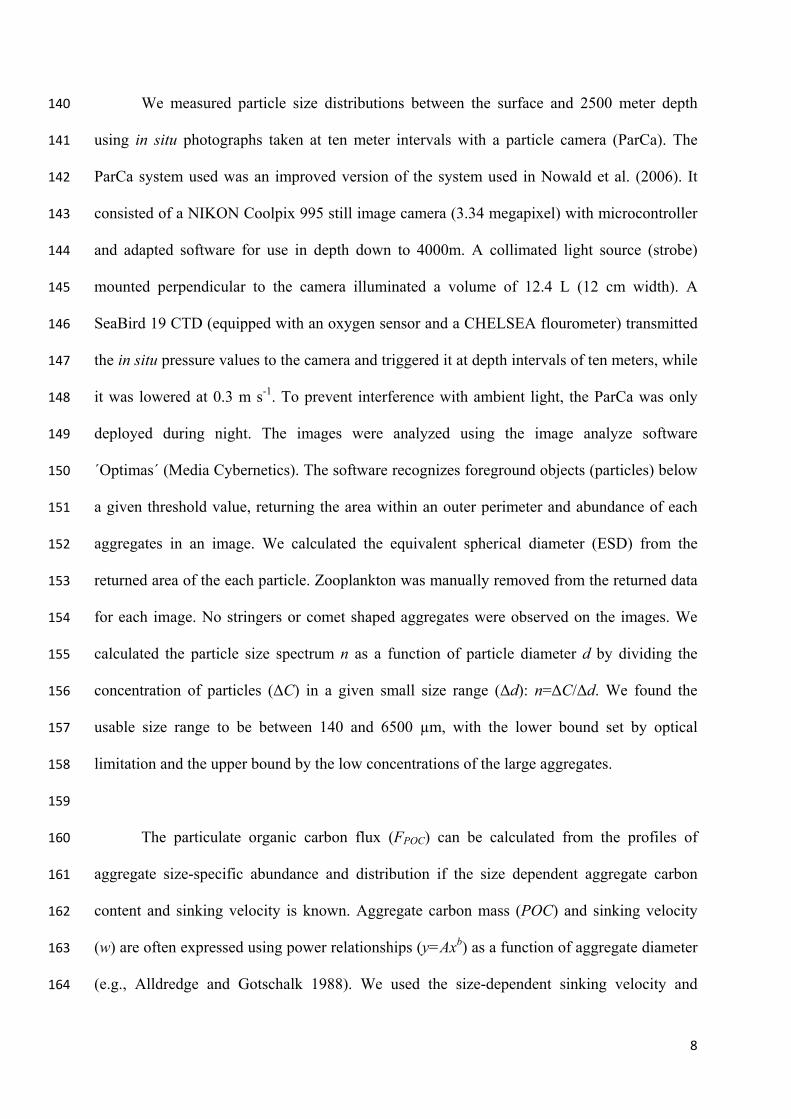
8
140
141
142
143
144
145
146
147
148
149
150
151
152
153
154
155
156
157
158
159
160
161
162
163
164
We measured particle size distributions between the surface and 2500 meter depth
using in situ photographs taken at ten meter intervals with a particle camera (ParCa). The
ParCa system used was an improved version of the system used in Nowald et al. (2006). It
consisted of a NIKON Coolpix 995 still image camera (3.34 megapixel) with microcontroller
and adapted software for use in depth down to 4000m. A collimated light source (strobe)
mounted perpendicular to the camera illuminated a volume of 12.4 L (12 cm width). A
SeaBird 19 CTD (equipped with an oxygen sensor and a CHELSEA flourometer) transmitted
the in situ pressure values to the camera and triggered it at depth intervals of ten meters, while
it was lowered at 0.3 m s-1. To prevent interference with ambient light, the ParCa was only
deployed during night. The images were analyzed using the image analyze software
´Optimas´ (Media Cybernetics). The software recognizes foreground objects (particles) below
a given threshold value, returning the area within an outer perimeter and abundance of each
aggregates in an image. We calculated the equivalent spherical diameter (ESD) from the
returned area of the each particle. Zooplankton was manually removed from the returned data
for each image. No stringers or comet shaped aggregates were observed on the images. We
calculated the particle size spectrum n as a function of particle diameter d by dividing the
concentration of particles (ΔC) in a given small size range (Δd): n=ΔC/Δd. We found the
usable size range to be between 140 and 6500 µm, with the lower bound set by optical
limitation and the upper bound by the low concentrations of the large aggregates.
The particulate organic carbon flux (FPOC) can be calculated from the profiles of
aggregate size-specific abundance and distribution if the size dependent aggregate carbon
content and sinking velocity is known. Aggregate carbon mass (POC) and sinking velocity
(w) are often expressed using power relationships (y=Axb) as a function of aggregate diameter
(e.g., Alldredge and Gotschalk 1988). We used the size-dependent sinking velocity and

9
165
166
167
168
169
170
171
172
173
174
175
176
177
178
179
180
181
182
183
184
185
186
187
188
189
carbon content to calculate the fluxes from our aggregate size distributions. The FPOC was
calculated by integrati the l particle sizes (Guidi et al. 2008b): ng f ux at a given size over all
(1)
where POC(d) is the carbon content of an individual aggregate of diameter d, and w(d) is its
sinking velocity.
We used two different relationships for sinking velocity and carbon content to test the
sensitivity of the results to the choice. One relationship for wPOC was developed by Guidi et
al. (2008b) from a large number of profiles made between the surface and 1000 m depth using
camera imaging at different seasons and locations. They used a minimization procedure to
find parameters for the power law relationships for POC(d) w(d)=Adb that provided the best
fits between the calculated fluxes and fluxes measured with sediment traps. Guidi et al.
(2008b) calculated A=12.5 x 10⁻³ gC m-3 mm-b d-1 and b=3.81.
The second relationship between wPOC and d was determined from measurements of
properties of aggregates formed in shipboard roller tanks (see section 2.6.). Carbon fluxes
were calculated using the two different relationships and the observed particle size
distributions between 140 to 6500 µm ESD and compared to concurrent sediment trap
collections.
2.3. Roller tank aggregates
We incubated water collected from the fluorescence maximum in shipboard roller
tanks. Fluorescence maximum was identified from a Seabird SBE CTD-O2 and chl-a-
fluorescence sensors, and particles at this depth were the expected source of sinking
aggregates. Water samples were collected at four stations (1, 2, 4, and 6) using a rosette water
sampler equipped with a SeaBird CTD (Table 1). Within one hour of collection the water was
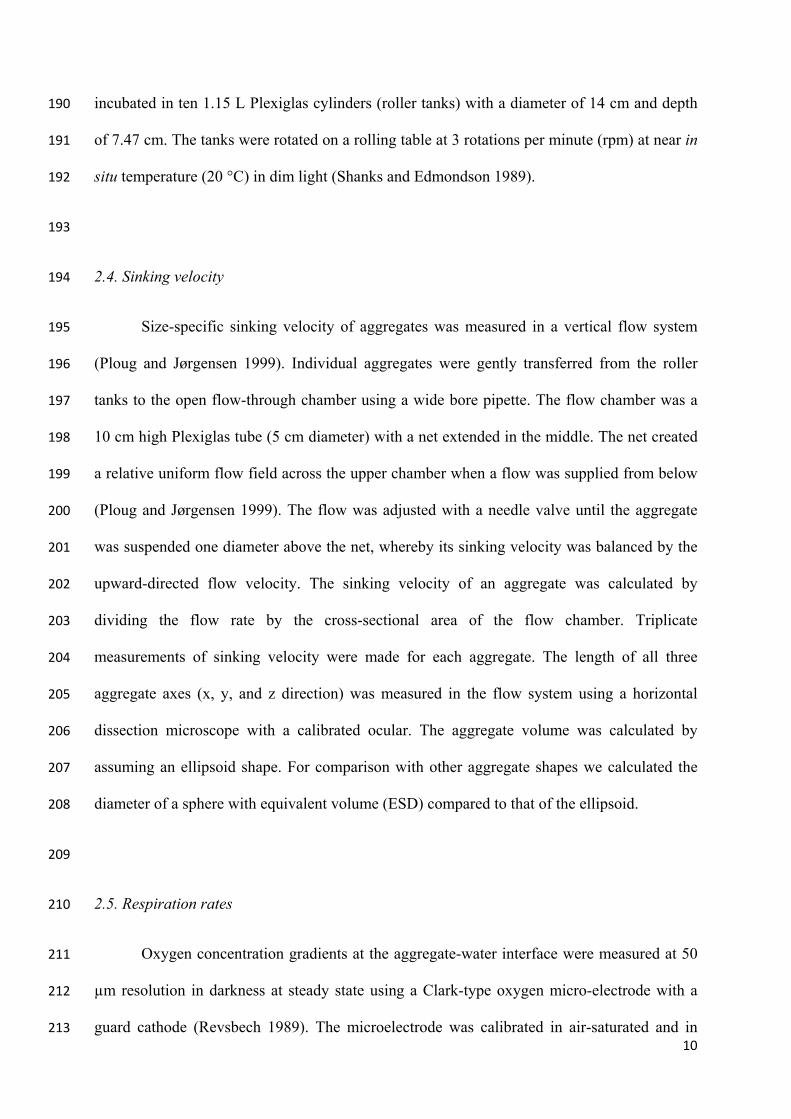
10
190
191
192
193
194
195
196
197
198
199
200
201
202
203
204
205
206
207
208
209
210
211
212
213
incubated in ten 1.15 L Plexiglas cylinders (roller tanks) with a diameter of 14 cm and depth
of 7.47 cm. The tanks were rotated on a rolling table at 3 rotations per minute (rpm) at near in
situ temperature (20 °C) in dim light (Shanks and Edmondson 1989).
2.4. Sinking velocity
Size-specific sinking velocity of aggregates was measured in a vertical flow system
(Ploug and Jørgensen 1999). Individual aggregates were gently transferred from the roller
tanks to the open flow-through chamber using a wide bore pipette. The flow chamber was a
10 cm high Plexiglas tube (5 cm diameter) with a net extended in the middle. The net created
a relative uniform flow field across the upper chamber when a flow was supplied from below
(Ploug and Jørgensen 1999). The flow was adjusted with a needle valve until the aggregate
was suspended one diameter above the net, whereby its sinking velocity was balanced by the
upward-directed flow velocity. The sinking velocity of an aggregate was calculated by
dividing the flow rate by the cross-sectional area of the flow chamber. Triplicate
measurements of sinking velocity were made for each aggregate. The length of all three
aggregate axes (x, y, and z direction) was measured in the flow system using a horizontal
dissection microscope with a calibrated ocular. The aggregate volume was calculated by
assuming an ellipsoid shape. For comparison with other aggregate shapes we calculated the
diameter of a sphere with equivalent volume (ESD) compared to that of the ellipsoid.
2.5. Respiration rates
Oxygen concentration gradients at the aggregate-water interface were measured at 50
µm resolution in darkness at steady state using a Clark-type oxygen micro-electrode with a
guard cathode (Revsbech 1989). The microelectrode was calibrated in air-saturated and in

11
214
215
216
217
218
219
220
221
222
223
224
225
226
227
228
229
230
231
232
233
234
235
236
237
238
anoxic seawater. The electrode current was measured by a pico-ammeter (Unisense, PA2000)
connected to a strip chart recorder (Kipp and Zonen). The tip of the micro-electrode was 2 µm
wide and was moved gently towards the surface of the aggregate. The aggregates appeared
highly porous, and we could not detect any oxygen gradients when they were suspended in
the flow field. Oxygen distributions were therefore measured at stagnant conditions at in situ
temperature in darkness. To avoid any limitation in oxygen diffusion due to wall effects, we
placed single aggregates on the net in the flow chamber while measuring oxygen
distributions, and no aggregate was anoxic in its interior (Ploug and Jørgensen 1999). Oxygen
flux was calculated from the measured oxygen gradient at the aggregate-water interface
(Ploug et al. 1997). We used a temperature and salinity corrected oxygen diffusion coefficient
of 1.95 x 10⁻⁵ cm2 s-1 in the calculations. The surface area of ellipsoids (Maas 1994) was used
to calculated total oxygen consumption. Oxygen consumption rate was converted to carbon
respiration assuming a respiratory quotient of 1.2 mol O2 to 1 mol CO2.
2.6. Aggregate dry mass and POC content
Two to five aggregates with known and similar volumes were filtered onto pre-
weighted 0.45 µm, 25 mm silver filters (Millipore, Bedford). The filters were gently rinsed
with de-ionized water, and dried at 40 °C (>48 hours) before being re-weighed on a Mettler
Toledo UMX2 balance (sensitivity: 0.1 µg). The total particulate organic carbon (POC)
content of the aggregates was then measured with an EA mass spectrometer (ANCA-SL 20-
20, Sercon Ltd. Crewe, UK) having a precision of ±0.7 µg C or 0.3 %. Half of the filters (total
of 15 filters) were fumed with hydrochloric acid (HCl) before the POC measurements. The
difference in POC content between the fumed and non-fumed samples was used to determine
the inorganic carbon content. The POC content of each aggregate was assumed to equal its
volume fraction times the total POC determined for the filter.

12
239
240
241
242
2.7. Density of aggregates
We used the Navier-Stokes drag equation to calculate the excess density (Δρ) of our
aggregates (Stokes 1851):
∆
(2) 243
244
245
246
247
where CD is the dimensionless drag force defined in equation (4), ρw is the density of the
ambient fluid in g cm-3, w is the measured sinking velocity in cm s-1, g is the gravitational
acceleration of 981 cm s-2, and ESD is the equivalent spherical diameter in cm. We calculated
CD using the drag equation for Re>1 given by White (1974):
. 0.4 (3) 248
249 where Reynolds number were defined as:
ŋ
(4) 250
251
252
253
254
255
256
257
258
259
260
261
262
263
where ŋ is the dynamic viscosity.
2.8. POC content of sea water
To determine the content of particulate organic carbon at the depth of fluorescence
maximum, we made five replicates of 2.5 L water filtered through pre-combusted (450°C, 12
h) and pre-weighed Whatman GF/F filters (diameter: 25 mm) at each investigated station
(Table 1). Additionally we treated three filters with milliQ water and used those as blanks.
Both the filters treated with sea water and milliQ water were dried at 40°C (>48 hours).
Before determination of the carbon content, the filters were re-weighed and the dry weight of
the suspended material in the sea water determined. The filters were fumed in hydrochloric
acid (HCl) before carbon analyses were performed on a EuroEA 3000 CN Element Analyzer.
2.9. Sea water respiration

13
264
265
266
267
268
269
270
271
272
Respiration at the depth of fluorescence maximum in the bulk water at station 2, 4, 5,
and 6 was measured by Winkler titration (Carignan et al. 1998; Carritt and Carpenter 1966).
Five replicates were used to measure the concentration of oxygen at time zero (t0) and five
replicates of both non-filtered sea water (test) and 0.2 µm filtered sea water (blank) were
incubated in 11 ml gas-tight glass vials with glass stoppers. The vials were kept dark at
constant temperature during the 24 hours incubation time. The accuracy of O2 determinations
was 0.1 µmol L-1, and the average total decrease in O2 concentration during the incubations
was 43.1 ± 16.2 µmol L-1 (range: 28 to 63.5 µmol L-1).

14
273
274
275
276
277
278
279
280
281
282
283
284
285
286
287
288
289
290
291
292
293
294
295
296
3. Results
3.1. Characteristics of roller tank aggregates
After 2.5 hours of incubation in the roller tanks the first macro aggregates (>0.5 mm in
diameter) appeared. The aggregate abundances increased during incubation period, reaching
2.2 ± 1.4 aggregates per rolling tank after 19 hours. The average ESD was 2.60 ± 1.18 mm
(SD). The ESD of collected aggregates ranged between 0.76 and 5.26 mm, limited by
difficulties of handling very small aggregates in our experimental setup and limitations on
maximum aggregate size from the incubation time and roller tank volume. The ratio of the
longest to the shortest axis was 5.7 ± 4.9. Because of the asymmetry, the aggregates were
treated as ellipsoids when calculating their volumes and surface areas.
The dry weight increased with increasing aggregate diameter, from 2.55 to 450.98 µg
per aggregate. One aggregate with dry weight (855.73 µg) more than twice that of other
aggregates in its size range (~5.2 mm ESD) was excluded in further data analyses (Fig. 2A).
Settling velocity increased with increasing aggregate sizes, from 87.6 to 568.8 m d-1 (Fig. 2B).
We observed no significant differences in aggregate sizes (p = 0.87, one-way ANOVA), dry
weights (p = 0.74, one-way ANOVA), or settling velocities (p = 0.09, one-way ANOVA)
between the four sampling stations and have therefore pooled all aggregates from the different
stations in subsequent analyses.
The excess densities (Δρ) of roller tank aggregates ranged from 0.68 to 5.6 mg cm-3
and decreased with increasing aggregate diameter (Fig. 2C). The largest variation occurred
among the small aggregates (d <1.6 mm ESD) (Fig. 2C). The average Δρ was 1.89 ± 1.09 mg
cm-3.

15
297
298
299
300
301
302
303
304
305
306
307
308
309
310
311
312
313
314
315
316
317
318
319
320
The material forming aggregates was dominated by diatoms, with Chaetoceros sp. as
the dominant species but Thallassiosira sp., Nitzschia sp., and pennate diatoms were also
present. Coccolithophores were abundant in the aggregates, but at lower abundances than
diatoms, with Emiliania huxley as the dominant species. The abundance of Chaetoceros sp.
was 2 x10⁴ to 30 x104 fold higher than that of E. huxley. Liths of E. huxley were 10 to 106
times more abundant in the aggregates than whole coccolithophorids. The liths inside the
aggregates appeared partly dissolved (Fig. 3C), unlike liths collected from water samples (Fig.
3D), but the dissolution was not quantified. The aggregates also contained empty frustules,
setae, phytoplankton detritus, copepod fecal pellets, clay minerals, small grains of quartz, and
unidentified lithogenic material. The aggregates appeared highly porous (Fig. 3A & B). The
aggregation potential of the suspended material in the water was found by dividing amount of
aggregated material with its start concentration in the roller tank. The aggregation potential
after 19 hours of incubation was 0.33 ± 0.58 for whole E. huxley cells, 0.44 ± 0.33 for E.
huxley liths, 0.07 ± 0.1 for Thallassiosira sp., 0.18 ± 0.32 for Chaetoceros sp. spines, and 0.65
± 0.42 for POC.
POC in aggregates ranged between 1.8 and 591.1 µgC agg-1. It increased with
increasing diameter of the aggregate (Fig. 4A) and was ~40 % of dry weight. No significant
differences were found for the POC content of the aggregates formed from water at the four
stations sampled (p = 0.4, Student´s t-test). The inorganic carbon to dry weight ratio was
0.075 ± 0.014; the CaCO3:POC ratio was 0.09. The respiration rate per aggregate ranged from
18.96 to 728.76 ngC h-1 (Fig. 4B) and increased with increasing aggregate size. One ~5 mm
aggregate had a very high respiration rate (1.66 µgC h-1) and was excluded from the analysis.
The POC-specific respiration rate (R) was 0.13 ± 0.07 d-1 and was independent on size (Fig.

16
321
322
323
324
325
326
327
328
329
330
331
332
333
334
335
336
337
338
339
340
341
342
343
4C). The carbon turnover times ranged between 2.8 and 45.9 days, with an average of 11.4 ±
8.9 days.
Because the aggregates are settling, the L-ratio (L-ration= R divided by w) expresses
the fractional degradation per meter settled, providing a different water column perspective of
the degradation (Fig. 4D). L-ratio ranged between 0.05 and 3.23 km-1 and decreased with
increasing aggregate size (Fig. 4D & Fig. 2B).
3.2. Suspended POC content and respiration in the bulk water
POC content and respiration in the bulk water at the depth of fluorescence maximum
was investigated at station 2, 4, 5, and 6 (Table 1). The POC content at the fluorescence
maximum was 253.78 ± 163.45 µgC L-1; C:N was 5.3 ± 0.36. The dry weight of particulate
material was 2.09 ± 0.62 mg L-1. The community respiration rate ranged between 163 and 467
µgC L-1 d-1, averaging 286 ± 130 µgC L-1 d-1.
3.3. ParCa profiles
ParCa profiles were collected at station 1, 2, 3, 4, and 6 (Table 1). There was a rapid
decrease in total aggregate volume in the upper 220 m at all stations (Fig. 5A). Between 220
and 1500 m there was relatively little variation in the integrated volume, but its value varied
among the stations, being largest at station 3 and smallest at station 2. For station 1, 3, and 6
there was a gradual increase in particles below 1500 m depth. This was most pronounced at
station 3. The profile at station 4 extended only to ~720 m depth because of its position close
to the continental slope.
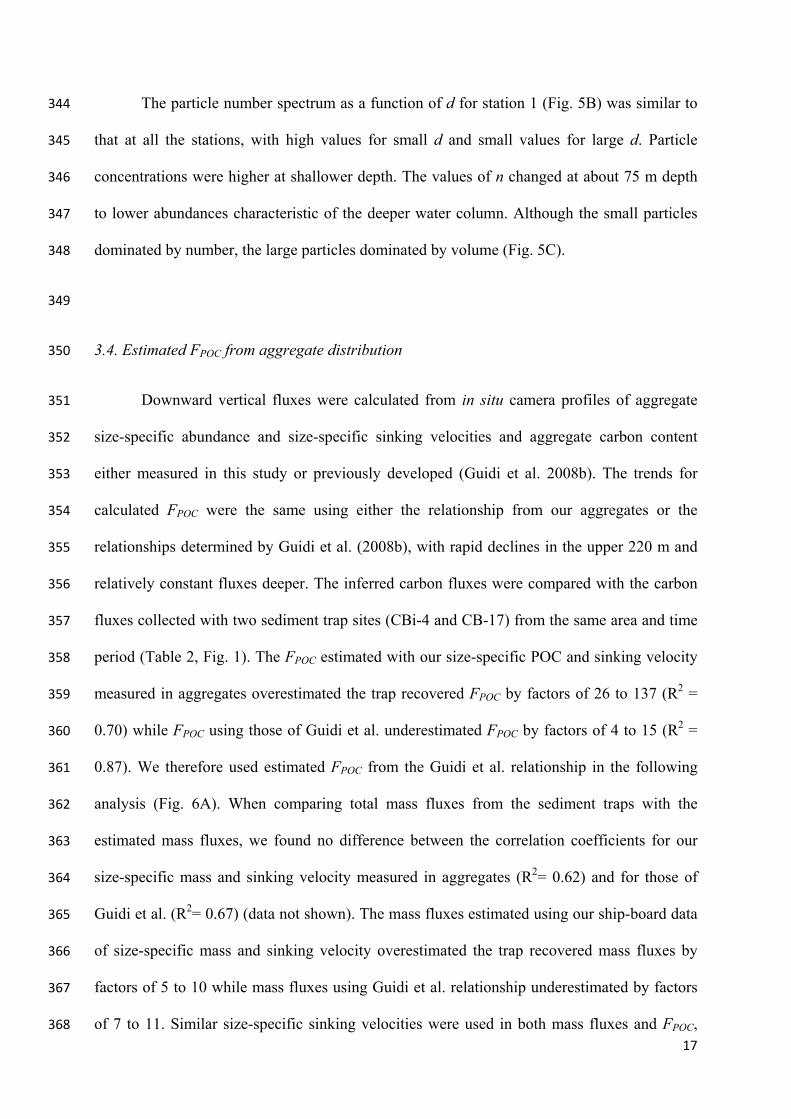
17
344
345
346
347
348
349
350
351
352
353
354
355
356
357
358
359
360
361
362
363
364
365
366
367
368
The particle number spectrum as a function of d for station 1 (Fig. 5B) was similar to
that at all the stations, with high values for small d and small values for large d. Particle
concentrations were higher at shallower depth. The values of n changed at about 75 m depth
to lower abundances characteristic of the deeper water column. Although the small particles
dominated by number, the large particles dominated by volume (Fig. 5C).
3.4. Estimated FPOC from aggregate distribution
Downward vertical fluxes were calculated from in situ camera profiles of aggregate
size-specific abundance and size-specific sinking velocities and aggregate carbon content
either measured in this study or previously developed (Guidi et al. 2008b). The trends for
calculated FPOC were the same using either the relationship from our aggregates or the
relationships determined by Guidi et al. (2008b), with rapid declines in the upper 220 m and
relatively constant fluxes deeper. The inferred carbon fluxes were compared with the carbon
fluxes collected with two sediment trap sites (CBi-4 and CB-17) from the same area and time
period (Table 2, Fig. 1). The FPOC estimated with our size-specific POC and sinking velocity
measured in aggregates overestimated the trap recovered FPOC by factors of 26 to 137 (R2 =
0.70) while FPOC using those of Guidi et al. underestimated FPOC by factors of 4 to 15 (R2 =
0.87). We therefore used estimated FPOC from the Guidi et al. relationship in the following
analysis (Fig. 6A). When comparing total mass fluxes from the sediment traps with the
estimated mass fluxes, we found no difference between the correlation coefficients for our
size-specific mass and sinking velocity measured in aggregates (R2= 0.62) and for those of
Guidi et al. (R2= 0.67) (data not shown). The mass fluxes estimated using our ship-board data
of size-specific mass and sinking velocity overestimated the trap recovered mass fluxes by
factors of 5 to 10 while mass fluxes using Guidi et al. relationship underestimated by factors
of 7 to 11. Similar size-specific sinking velocities were used in both mass fluxes and FPOC,

18
369
370
371
372
373
374
375
376
377
378
379
380
381
382
383
384
385
386
387
388
389
390
391
392
therefore, the better fit between sediment trap FPOC and the Guidi et al. relationship might be
due to high organic carbon content in our roller tank aggregates formed from particles in the
fluorescence maximum rather than high sinking velocities of these aggregates.
The highest flux was calculated at station 3 and lowest at station 1 (Fig. 6A). This was
observed from the sediment traps (Table 2). The depth profile of average carbon flux for all
stations could be divided into three parts (Fig. 6B); a fast carbon removal at 20 – 80 m, an
intermediate removal at 80 – 220 m, and a low carbon removal at 220 – 2500 m. We fitted
straight lines to the carbon concentrations in each depth interval for all the stations to estimate
the carbon removal rate within the three depth intervals (Fig. 6C). At station 3, the carbon flux
showed a large increase at depths deeper than 1500 m, likely due to advection (Karakas et al.
2006; Nowald et al. 2006). Therefore the linear fit for the deep layer at station 3 was only
performed between 220 and 1500 m. The layer between 20 and 80 m had a carbon removal
rate of 195.06 ± 77.73 µgC m-3 d-1. The carbon removal rate decreased with increasing depth
and was found at 59.85 ± 48.44 µgC m-3 d-1 for the middle layer between 80 and 220 m, and
2.11 ± 3.17 µgC m-3 d-1 for the deep layer between 220 and 2500 m. Hence, the upper 220 m
of the water column was most important for carbon removal, with the most intense removal in
the upper 80 meters. Once the settling organic carbon had reached depths below 220 meters, it
was only exposed to low removal rates and seemed likely to be exported to greater depths and
to the sea floor.
3.5. Impact of aggregate associated O2 consumption on the environment
The impact from aggregate associated O2 consumption on the O2 concentration in the
bulk water was estimated for the depth of fluorescence maximum (F-max) and for the oxygen

19
393
394
395
396
397
398
399
400
401
402
403
404
405
minimum zone (OMZ). The total respiration from the microbial community attached to
aggregates at F-max what calculated from the size-specific respiration rate (Fig. 4B) and the
size distribution and abundance of aggregates found from the ParCa images (Table 3). The
total aggregate associated respiration at F-max (microbial and mesozooplanktonic) and at the
OMZ (microbial) was found from the fitted carbon consumption rates (Fig. 6C), assuming a
respiratory quotient of 1.2 mol O2 to 1 mol CO2 (Table 3). The bulk respiration at F-max was
estimated from the Winkler titrations (see section 3.2.). By relating these O2 consumption
rates with the observed O2 concentration in the bulk water (from ParCa CTD profiles) at F-
max and at OMZ, we can express the percentage of O2 removed due to aggregate associated
processes (at F-max and OMZ) and due to bulk respiration (OMZ). Respiration on aggregates
was ~5 % of the total respiration (aggregate and bulk) at F-max, and it potentially had a trivial
impact, only, on O2 concentrations in the OMZ (Table 3).

20
406
407
408
409
410
411
412
413
414
415
416
417
418
419
420
421
422
423
424
425
426
427
428
429
430
4. Discussion
The average respiration rate in the roller tank-formed aggregates was proportional to
the aggregated particulate organic carbon. As a consequence, the carbon-specific respiration
rates of the aggregates were size-independent. This has also been found in previous studies of
diatom aggregates collected off the coastal California (Ploug et al. 1999) and aggregates
formed on diatom detritus (Ploug and Grossart 2000). The specific respiration rates in this
study and from Ploug et al. (1999) were both ~0.12 d-1. Since all aggregate sizes are degraded
at the same specific rates, the extent of their remineralization in the upper water column is
determined by their residence times, and sinking velocity may be a controlling factor for
organic carbon export.
To illustrate the importance of aggregate sinking velocities for carbon export, we
calculated the fate of aggregated POC in fast and slow settling aggregates. For simplicity, we
only considered degradation from aggregate community respiration. Slowly sinking
aggregates have long residence times in the upper water column. From the L-ratio (Fig. 4D),
we found a carbon specific degradation of 0.001 m-1 for aggregates with sinking velocities of
90 m d-1. Assuming a perfect vertical settling at a constant speed of 90 m d-1, half of the
aggregated POC was degraded at 480 m depth ( (ln 0.5)/(-0.001 m) = 480 m). Large
aggregates that settled with 570 m d-1 were exposed to a carbon specific degradation of
0.0002 m-1 (Fig. 4D). This implied that half of the aggregated POC was degraded at 3039 m
depth. However, when observing the modeled carbon flux (Fig. 6A), half of the sinking
carbon is degraded at much shallower depths than ~500 m. One reason for this rapid carbon
removal in the upper ~200 m may be that aggregates do not settle in a perfect vertical
direction at constant speed, but are retained by currents, turbulence, density gradients, and
carbon flux may be dominated by very small, slowly sinking aggregates in the upper water

21
431
432
433
434
435
436
437
438
439
440
441
442
443
444
445
446
447
448
449
450
451
452
453
454
455
column. Other degradation processes like ecto-enzymatic hydrolysis with a net release to the
surrounding water (Smith et al. 1992), and fragmentation and degradation by
mesozooplankton might also be important for the rapid carbon removal in the upper 500 m
(Banse 1990; Dilling and Alldredge 2000; Kiørboe 2000).
Calculated carbon flux profiles suggested that the majority of the carbon removal
occurred in the upper 220 m (Fig. 6C). Therefore, the carbon removal rate in the upper 220 m
was used to identify the importance of key processes (e.g., sinking velocity, respiration, and
zooplankton grazing and fragmentation) for the biological carbon pump in the coastal
upwelling area off Cape Blanc. The carbon removal rates varied largely between three major
depth intervals, with highest removal rate in the upper layer and lowest removal rate in the
deep layer; 20 to 80 m, 80 to 220 m, and 220 to 2500 m (Fig. 6B). Half of the carbon removal
rate in the layer between 80 and 220 m was accounted by respiration on aggregates. Attached
bacteria may have markedly higher cell-specific hydrolytic enzyme activity relative to the
free-living bacteria (Cho and Azam 1988; Grossart et al. 2007; Smith et al. 1992). Hence, the
other half of the carbon removal between 80 and 220 m may occur via rapid solubilization of
the aggregated organic matter by attached bacteria and net release to the bulk (Cho and Azam
1988). The dissolved organic carbon (DOC) released from the aggregates are then partly
assimilated and partly respired by free-living bacteria (Kiørboe and Jackson 2001; Thor et al.
2003). The measured respiration in bulk water (146 ± 284 µgC m-3 d-1) at the depth of
fluorescence maximum was much higher than the potential production of DOC by attached
bacteria (~25 µgC m-3 d-1). Therefore, alternate DOC production was also feeding the free-
living bacteria; e.g., leakage and/or exudation from algae (Lignell 1990), release from
zooplankton feeding (Jumars et al. 1989; Møller et al. 2003), and diffusion out of fecal pellets
(Jumars et al. 1989). At the depth of fluorescence maximum the microbial community in the

22
456
457
458
459
460
461
462
463
464
465
466
467
468
469
470
471
472
473
474
475
476
477
478
479
bulk water respired ~13% of the total O2 per day. This suggested the bulk microbial
community to be more important for the remineralization of organic matter than attached
biota on aggregates, since the latter only respired ~0.7% of the bulk O2 concentration per day.
Still, 65 ± 42% of the total POC was found as aggregated carbon, assuming 40% of the total
dry weight was POC in in situ aggregates.
Assuming the microbial community on the aggregates respired carbon at similar rate
in the upper layer as in the middle layer, there was an additional carbon removal rate of 135 ±
69 µgC m-3 d-1 between 20 and 80 m compared to the depth between 80 and 220 m. This
additional carbon removal may be explained by zooplankton activity (e.g., Banse 1990).
Several investigations have suggested copepods as degraders of marine aggregates (Green and
Dagg 1997; Koski et al. 2005; Steinberg et al. 1994). We calculated the copepod abundances
needed to remove the additional removed carbon in the upper layer. The equation for oxygen
consumption rate was used to estimate respiration of one epipelagic copepod (Ikeda et al.
2001):
μ 1.132 . . (5)
where B is the copepod mass (mg carbon) and T is the surface temperature (°C). We assumed
B = 1.5 µg carbon for a copepod colonizing an aggregate (Kiørboe 2000). The estimated
respiration rate of a single copepod was 0.394 µgC d-1. Assuming the grazing rate is about
three times the metabolic rate (Kiørboe 1989), a copepod abundance of 114 ± 41 copepods m-
3 was needed to remove carbon at similar rates as the estimated carbon removal. The reported
copepod abundance in the upper 100 meter depth off Cape Blanc in 1998 was 100 – 250
copepods m-3 (Somoue et al. 2005). Our estimations only indicate that the carbon removal
may be accounted for by realistic copepod abundances. Therefore, both attached microbes and

23
480
481
482
483
484
485
486
487
488
489
490
491
492
493
494
495
496
497
498
499
500
501
502
503
504
mesozooplankters appeared to play important roles in the degradation of aggregates in the
upper 80 meters of the water column. However, other zooplankton organisms and
mechanisms are possible (Dilling and Alldredge 2000; Kiørboe 2000; Shanks and Walters
1997). The aggregate associated respiration, including both attached microbial community
and potential mesozooplankton respiration, accounted for ~1% of the bulk O2 concentration
per day. Even when including mesozooplankton respiration it seems that the aggregate
associated respiration is small as compared to the total remineralization of organic matter in
the upper ocean. Hence, the free-living bacteria appear fueled via processes such as leakage
and exudation from algae (Lignell 1990) and sloppy feeding by zooplankton (Jumars et al.
1989; Møller et al. 2003).
We observed low carbon removal rates (2.5 ± 3.2 µgC m-3 d-1) below 220 m.
Consistent with bacterial activity, but the low rates indicate that such bacterial activity would
be limited, i.e., due to temperature decrease, bacterial abundance decrease, detachment of
bacteria, etc. Assuming all carbon was removed via respiration, the microbial community on
aggregates only consumed 0.03 ± 0.05% of the total O2 concentration per day in the oxygen
minimum zone.
The POC flux is determined by degradation processes, aggregation and
disaggregation, particle sinking velocity, and physical mixing processes in the water column.
The majority of the POC is remineralized in the upper ocean twilight zone > 1000 m (Martin
et al. 1987; Suess 1980). Our study and other studies by Stemmann et al. (2004a) in the
Mediterranean suggest that mesozooplankton dominated carbon removal in the upper water
column whereas microbial biota were more important in the deeper midwater zones where
zooplankton are rarer. Since high aggregate sinking velocities potentially shorten the
residence time in the upper ocean, sinking velocities may be an important controlling factor of
24
505
506
507
508
509
510
511
512
513
514
515
516
517
518
519
520
521
522
523
524
525
526
527
528
529
the carbon pump. The factors controlling the sinking velocity of aggregates in situ are
complex, as indicated by the large range of sinking rates observed for a given aggregate size
(Ploug et al. 2008a; Stemmann et al. 2004b; Trull et al. 2008).
Our study shows that, whereas our data derived from measurements of POC and
sinking velocity of single aggregates produced in surface waters generally overestimated
carbon flux, the relationship for sinking velocities of POC developed by Guidi et al. (2008b),
based on data from different seasons and locations, generally underestimated carbon flux at
the Cape Blanc region. Size-specific sinking velocities of our aggregates were 5-10 times
higher than previous measurements of sinking velocities for similar sized aggregates in other
regions, e.g., Southern California Bight (Alldredge and Gotschalk 1988; Ploug et al. 1999).
The area off Cape Blanc is characterized by high coccolithophorid production (Fischer and
Karakas 2009) and it receives large input of dust containing fine grained lithogenic
components from the Sahara desert (Chiapello et al. 1995). Previous studies have found that
incorporation of dust and coccolithophorids into fecal pellets and algae aggregates increase
their excess densities and thereby sinking rates (Fischer and Karakas 2009; Ploug et al.
2008b). We observed <10 times higher size-specific excess densities compared to those of
aggregates in the Southern California Bight (Alldredge and Gotschalk 1988). The study area
has low carbonate production and dust input. Therefore, the increased size-specific sinking
velocities in our study may partly be explained by the high amount of both carbonate and
lithogenic material found in our aggregates. However, a bottle effect originating from
interactions with the sides of the roller tank might also increase the aggregate density. The
incubation time in the roller tanks allowed the aggregates to collect high amounts of material
from the depth of fluorescence maximum which demonstrates the high aggregation potential
of particles in surface waters. However, aggregates may be less compact in the field because

25
530
531
532
533
534
535
536
537
538
539
540
541
542
543
544
545
546
these sink out to deeper waters where less material presumably is scavenged during descent.
Field studies have demonstrated high sinking velocities of large particles formed in carbonate-
dominated areas (Fischer and Karakas 2009). Sediment trap studies have shown correlations
between organic matter and mineral content (Armstrong et al. 2002; Francois et al. 2002;
Klaas and Archer 2002). Whether this correlation occurs via enhanced sinking velocities
(ballast hypothesis), as protection of organic matter against remineralization (ballast ratio
hypothesis) (Armstrong et al. 2002), from carrying capacity of minerals by organic matter
(see Passow and De La Rocha 2006) or vice versa (see Armstrong et al. 2002), is unclear. The
presence of ballast minerals potentially enhances carbon export via the higher sinking
velocities. Francois et al. (2002) suggested that the higher organic carbon transfer efficiency
in carbonate production systems compared to biogenic opal production systems reflects a
difference in the particle transport mode, with slow sinking diatom aggregates in opal
production systems and fast sinking fecal pellets in carbonate productive systems. Our study
shows that particle flux not only consist of fast sinking fecal pellets in the Cape Blanc region,
but potentially also of fast sinking diatom aggregates loaded with Saharan dust and carbonate
from liths.
26
547
548
549
550
551
552
553
554
555
556
557
558
559
560
561
562
563
564
565
566
567
568
569
5. References
Alldredge, A., and Gotschalk, C. 1988. In situ settling behavior of marine snow. Limnol.
Oceanogr. 33: 339-351.
Armstrong, R. A., Lee, C., Hedges, J. I., Honjo, S., and Wakeham, S. G. 2002. A new,
mechanistic model for organic carbon fluxes in the ocean based on the quantitative
association of POC with ballast minerals. Deep-Sea Res. II 49: 219-236.
Asper, V. L. 1987. Measuring the flux and sinking speed of marine snow aggregates. Deep-
Sea Res. I 34: 1-17.
Banse, K. 1990. New views on the degradation and disposition of organic particles as
collected by sediment traps in the open sea. Deep-Sea Res. I 37: 1177-1195.
Boyd, P. W., and Trull, T. W. 2007. Understanding the export of biogenic particles in oceanic
waters: Is there consensus? Prog. Oceanogr. 72: 276-312.
Buesseler, K. O., Lamborg, C. H., Boyd, P. W., Lam, P. J., Trull, T. W., Bidigare, R. R.,
Bishop, J. K. B., Casciotti, K. L., Dehairs, F., Elskens, M., Honda, M., Karl, D. M.,
Siegel, D. A., Silver, M. W., Steinberg, D. K., Valdes, J., Van Mooy, B., and Wilson,
S. 2007. Revisiting Carbon Flux Through the Ocean's Twilight Zone. Science 316:
567-570.
Carignan, R., Blain, A. M., and Vis, C. 1998. Measurements of primary production and
community respiration in oligotrophic lakes using Winkler method. Can. J. Fish.
Aquat. Sci. 55: 1078-1084.
Carritt, D. E., and Carpenter, J. H. 1966. Comparison and evaluation of currently employed
modifications of the Winkler method for determining dissolved oxygen in sea water. A
NASCO report. Journal of Marine Research 24: 286-318.

27
570
571
572
573
574
575
576
577
578
579
580
581
582
583
584
585
586
587
588
589
590
591
592
593
594
Chiapello, I., Bergametti, G., Gomes, L., Chatenet, B., Dulac, F., Pimenta, J., and Suares, E.
S. 1995. An Additional Low Layer Transport of Sahelian and Saharan Dust over the
North-Eastern Tropical Atlantic. Geophysical Research Letters 22: 3191-3194.
Cho, B. C., and Azam, F. 1988. Major role of bacteria in biogeochemical fluxes in the ocean's
interior. Nature 332: 441-443.
De La Rocha, C. L., and Passow, U. 2007. Factors influencing the sinking of POC and the
efficiency of the biological carbon pump. Deep-Sea Res. II 54: 639-658.
Dilling, L., and Alldredge, A. L. 2000. Fragmentation of marine snow by swimming
macrozooplankton: A new process impacting carbon cycling in the sea. Deep-Sea Res.
I 47: 1227-1245.
Fischer, G., and Karakas, G. 2009. Sinking rates and ballast composition of particles in the
Atlantic Ocean: implications for the organic carbon fluxes to the deep ocean.
Biogeosciences 6: 85-102.
Fischer, G., and Wefer, G. 1991. Sampling, preparation and analysis of marine particulate
matter, p. 391-397. In D. C. Hurd and D. W. Spencer [eds.], Marine Particles:
Analysis and Characterization. Geophysical Monograph.
Fowler, S. W., and Knauer, G. A. 1986. The role of large particles in the transport of elements
and organic compounds through the oceanic water column. Prog. Oceanogr. 16: 147-
194.
Francois, R., Honjo, S., Krishfield, R., and Manganini, S. 2002. Factors controlling the flux of
organic carbon to the bathypelagic zone of the ocean. Global Biogeochem. Cycles 16:
doi:10.1029/2001GB001722.
Green, E. P., and Dagg, M. J. 1997. Mesozooplankton associations with medium to large
marine snow aggregates in the northern Gulf of Mexico. Journal of Plankton Research
19: 435-447.
28
595
596
597
598
599
600
601
602
603
604
605
606
607
608
609
610
611
612
613
614
615
616
617
618
619
620
Grossart, H. P., Tang, K. W., Kiørboe, T., and Ploug, H. 2007. Comparison of cell-specific
activity between free-living and attached bacteria using isolates and natural
assemblages. Fems Microbiology Letters 266: 194-200.
Guidi, L., Gorsky, G., Claustre, H., Miquel, J. C., Picheral, M., and Stemmann, L. 2008a.
Distribution and fluxes of aggregates > 100 mu m in the upper kilometer of the South-
Eastern Pacific. Biogeosciences 5: 1361-1372.
Guidi, L., Jackson, G. A., Stemmann, L., Miquel, J. C., Picheral, M., and Gorsky, G. 2008b.
Relationship between particle size distribution and flux in the mesopelagic zone.
Deep-Sea Res. I 55: 1364-1374.
Ikeda, T., Kanno, Y., Ozaki, K., and Shinada, A. 2001. Metabolic rates of epipelagic marine
copepods as a function of body mass and temperature. Mar. Biol 139: 587-596.
Jannasch, H. W., Zafiriou, O. C., and Farrington, J. W. 1980. A sequencing sediment trap for
time-series studies of fragile particles. Limnol. Oceanogr. 25: 939-943.
Jumars, P., A., Penry, D., L., Baross, J., A., Perry, M., J., and Frost, B. 1989. Closing the
microbial loop: dissolved carbon pathway to heterotrophic bacteria from incomplete
ingestion, digestion and absorption in animals. Deep-Sea Res. I 36: 483-495.
Karakas, G., Nowald, N., Blaas, M., Marchesiello, P., Frickenhaus, S., and Schlitzer, R. 2006.
High-resolution modeling of sediment erosion and particle transport across the
northwest African shelf. Journal of Geophysical Research 111:
doi:10.1029/2005JC003296.
Kiørboe, T. 1989. Phytoplankton growth rate and nitrogen content: Implications for feeding
and fecundity in a herbivorous copepod. Mar. Ecol. Prog. Ser. 55: 229-234.
---. 2000. Colonization of marine snow aggregates by invertebrate zooplankton: Abundance,
scaling, and possible role. Limnol. Oceanogr. 45: 479-484.
Kiørboe, T., and Jackson, G. A. 2001. Marine snow, organic solute plumes, and optimal
chemosensory behavior of bacteria. Limnol. Oceanogr. 46: 1309-1318.

29
621
622
623
624
625
626
627
628
629
630
631
632
633
634
635
636
637
638
639
640
641
642
643
644
645
Kiørboe, T., Lundsgaard, C., Olesen, M., and Hansen, J. L. S. 1994. Aggregation and
sedimentation processes during a spring phytoplankton bloom: A field ecperiment to
test coagulation theory. Journal of Marine Research 52: 297-323.
Klaas, C., and Archer, D. E. 2002. Association of sinking organic matter with various types of
mineral ballast in the deep sea; implications for the rain ratio. Global Biogeochem.
Cycles 16: doi:10.1029/2001GB001765.
Koski, M., Kiørboe, T., and Takahashi, K. 2005. Benthic life in the pelagic: Aggregate
encounter and degradation rates by pelagic harpacticoid copepods. Limnol. Oceanogr.
50: 1254-1263.
Lignell, R. 1990. Excretion of Organic Carbon by Phytoplankton: Its Relation to Algal
Biomass, Primary Productivity and Bacterial Secondary Productivity in the Baltic Sea.
Mar. Ecol. Prog. Ser. 68: 85-99.
Maas, L. R. M. 1994. On the surface area of an ellipsoid and related integrals of elliptic
integrals. J. Comp. Appl. Math. 51: 237-249.
Martin, J. H., Knauer, G. A., Karl, D. M., and Broenkow, W. W. 1987. VERTEX: carbon
cycling in the northeast Pacific. Deep-Sea Res. I 43: 267-285.
Møller, E. F., Thor, P., and Nielsen, T. G. 2003. Production of DOC by Calanus finmarchicus,
C. glacialis and C.hyperboreus through sloppy feeding and leakage from fecal pellets.
Mar. Ecol. Prog. Ser. 262: 185-191.
Nowald, N., Karakas, G., Ratmeyer, V., Fischer, G., Schlitzer, R., Davenport, R., and Wefer,
G. 2006. Distribution and transport processes of marine particulate matter off Cape
Blanc (NW-Africa): results from vertical camera profiles. Ocean Sci. Discuss. 3: 903-
938.
Passow, U., and De La Rocha, C. 2006. Accumulation of mineral ballast on organic
aggregates. Global Biogeochem. Cycles 20: 1-7.

30
646
647
648
649
650
651
652
653
654
655
656
657
658
659
660
661
662
663
664
665
666
667
668
669
670
Passow, U., Engel, A., and Ploug, H. 2003. The role of aggregation for the dissolution of
diatom frustules. Fems Microbiol. Ecol. 46: 247-255.
Ploug, H., and Grossart, H. P. 2000. Bacterial growth and grazing on diatom aggregates:
Respiratory carbon turnover as a function of aggregate size and sinking velocity.
Limnol. Oceanogr. 45: 1467-1475.
Ploug, H., Grossart, H. P., Azam, F., and Jørgensen, B. B. 1999. Photosynthesis, respiration,
and carbon turnover in sinking marine snow from surface waters of Southern
California Bight: Implications for the carbon cycle in the ocean. Mar. Ecol. Prog. Ser.
179: 1-11.
Ploug, H., Iversen, M. H., and Fischer, G. 2008a. Ballast, sinking velocity, and apparent
diffusivity within marine snow and zooplankton fecal pellets: Implications for
substrate turnover by attached bacteria. Limnol. Oceanogr. 53: 1878-1886.
Ploug, H., Iversen, M. H., Koski, M., and Buitenhuis, E. T. 2008b. Production, oxygen
respiration rates, and sinking velocity of copepod fecal pellets: Direct measurements
of ballasting by opal and calcite. Limnol. Oceanogr. 53: 469-476.
Ploug, H., and Jørgensen, B. B. 1999. A net-jet flow system for mass transfer and microsensor
studies of sinking aggregates. Mar. Ecol. Prog. Ser. 176: 279-290.
Ploug, H., Kuehl, M., Buchholz-Cleven, B., and Jørgensen, B. B. 1997. Anoxic aggregates -
An ephemeral phenomenon in the pelagic environment? Aquat. Microb. Ecol. 13:
285-294.
Ragueneau, O., Treguer, P., Leynaert, A., Anderson, R. F., Brzezinski, M. A., Demaster, D.
J., Dugdale, R. C., Dymond, J., Fischer, G., Francois, R., Heinze, C., Maier-Reimer,
E., Martin-Jezequel, V., Nelson, D. M., and Queguiner, B. 2000. A review of the Si
cycle in the modern ocean: recent progress and missing gaps in the application of
biogenic opal as a paleoproductivity proxy. Global Planet Change 26: 317-365.

31
671
672
673
674
675
676
677
678
679
680
681
682
683
684
685
686
687
688
689
690
691
692
693
694
695
696
Revsbech, N. P. 1989. An oxygen microsensor with a guard cathode. Limnol. Oceanogr. 34:
474-478.
Sarmiento, J. L., Slater, R., Barber, R., Bopp, L., Doney, S. C., Hirst, A. C., Kleypas, J.,
Matear, R., Mikolajewicz, U., Monfray, P., Soldatov, V., Spall, S. A., and Stouffer, R.
2004. Response of ocean ecosystems to climate warming. Global Biogeochem. Cycles
18: doi:10.1029/2003GB002134.
Shanks, A. L., and Edmondson, E. W. 1989. Laboratory-made artificial marine snow: A
biological model of the real thing. Mar. Biol. 101: 463-470.
Shanks, A. L., and Walters, K. 1997. Holoplankton, meroplankton, and meiofauna associated
with marine snow. Mar. Ecol. Prog. Ser. 156: 75-86.
Smith, D. C., Simon, M., Alldredge, A. L., and Azam, F. 1992. Intense hydrolytic enzyme
activity on marine aggregates and implications for rapid particle dissolution. Nature
359: 139-142.
Somoue, L., Elkhiati, N., Ramdani, M., Lam Hoai, T., Ettahiri, O., Berraho, A., and Do Chi,
T. 2005. Abundance and structure of copepod communities along the Atlantic coast of
southern Morocco. Acta Adriat. 46: 63-76.
Steinberg, D. K., Silver, M. W., Pilskaln, C. H., Coale, S. L., and Paduan, J. B. 1994.
Midwater zooplankton communities on pelagic detritus (giant larvacean houses) in
Monterey Bay, California. Limnol. Oceanogr. 39: 1606-1620.
Stemmann, L., Gorsky, G., Marty, J. C., Picheral, M., and Miquel, J. C. 2002. Four-year study
of large-particle vertical distribution (0-1000 m) in the NW Mediterranean in relation
to hydrology, phytoplankton, and vertical flux. Deep-Sea Res. II 49: 2143-2162.
Stemmann, L., Jackson, G. A., and Gorsky, G. 2004a. A vertical model of particle size
distributions and fluxes in the midwater column that includes biological and physical
processes; Part II, Application to a three year survey in the NW Mediterranean Sea.
Deep-Sea Res. I 51: 885-908.
32
697
698
699
700
701
702
703
704
705
706
707
708
709
710
711
712
713
714
715
716
Stemmann, L., Jackson, G. A., and Ianson, D. 2004b. A vertical model of particle size
distributions and fluxes in the midwater column that includes biological and physical
processes; Part I, Model formulation. Deep Sea Research 51: 865-884.
Stokes, G. G. 1851. On the effect of the internal friction of fluids on the motion of pendulums.
Transaction of the Cambridge Philosophical Society 9: 8-106.
Suess, E. 1980. Particulate organic carbon flux in the oceans — surface productivity and
oxygen utilization. Nature 288: 260-263.
Thor, P., Dam, H. G., and Rogers, D. R. 2003. Fate of organic carbon released from
decomposing copepod fecal pellets in relation to bacterial production and
ectoenzymatic activity. Aquat. Microb. Ecol. 33: 279-288.
Trull, T. W., Bray, S. G., Buesseler, K. O., Lamborg, C. H., Manganini, S., Moy, C., and
Valdes, J. 2008. In situ measurement of mesopelagic particle sinking rates and the
control of carbon transfer to the ocean interior during the Vertical Flux in the Global
Ocean (VERTIGO) voyages in the North Pacific. Deep-Sea Res. II 55: 1684-1695.
Wakeham, S. G., Schaffner, C., and Giger, W. 1980. Polycyclic aromatic hydrocarbons in
Recent lake sediments - I. Compounds having anthropogenic origins. Geochimica et
Cosmochimica Acta 44: 403-413.
White, F. M. 1974. Viscous fluid flow, 2nd edition, McGraw-Hill ed. Inc. New York.

Table 1: Physical parameters and experiments for each station sampled. Depth of fluorescence maximum (F-max depth [m]), in situ temperature, in situ salinity, and experiments performed for the different stations. The parenthesis after roller tank shows the total number (N) of aggregates formed during the roller tank incubation. POC & Winkler indicate that the particulate organic carbon (POC) content and respiration in the sea water collected from F-max was measured. ParCa indicates that an image profile of particle size distribution was made at the station. The squared brackets below the station name indicate the position of the station given as longitude and longitude.
Station Number
Station Name [longitude, latitude]
F-max depth (m)
Temperature (°C)
Salinity (psu)
Experiments
1
GeoB-11833 Trap site CB-17
[21°17.170N, 20°48.223W]
48
20.4
36.6
Roller tank (N=17)
ParCa
2 GeoB-11834
[20°59.989N, 19°50.014W]
35
20
36.5
Roller tank (N=18) POC & Winkler
ParCa
3 GeoB-11835
Trap site CBi-4 [20°44.796N, 18°42.021W]
20
18.3
36.1
ParCa
4 GeoB-11836
[20°34.969N, 17°58.761W]
25
18
36.1
Roller tank (N=18) POC & Winkler
ParCa
5 GeoB-11838
[20°44.897N, 18°41.998W]
23
18.7
36.2
POC & Winkler
6
GeoB-11839
[21°19.997N, 18°50.475W]
25
19.1
36.5
Roller tank (N=16) POC & Winkler
ParCa
33
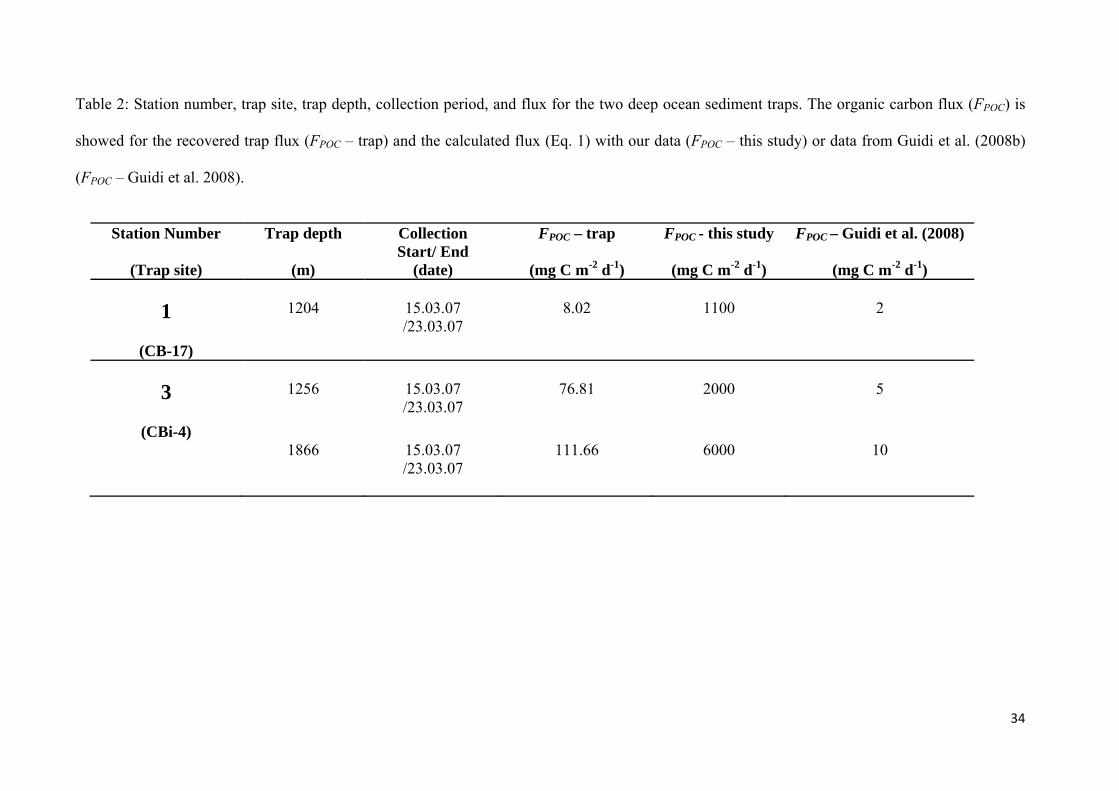
Table 2: Station number, trap site, trap depth, collection period, and flux for the two deep ocean sediment traps. The organic carbon flux (FPOC) is
showed for the recovered trap flux (FPOC – trap) and the calculated flux (Eq. 1) with our data (FPOC – this study) or data from Guidi et al. (2008b)
(FPOC – Guidi et al. 2008).
34
Station Number
(Trap site)
Trap depth
(m)
Collection Start/ End
(date)
FPOC – trap
(mg C m-2 d-1)
FPOC - this study
(mg C m-2 d-1)
FPOC – Guidi et al. (2008)
(mg C m-2 d-1) 1
(CB-17)
1204
15.03.07 /23.03.07
8.02
1100
2
3
(CBi-4)
1256
15.03.07 /23.03.07
76.81
2000
5
1866 15.03.07 /23.03.07
111.66 6000 10
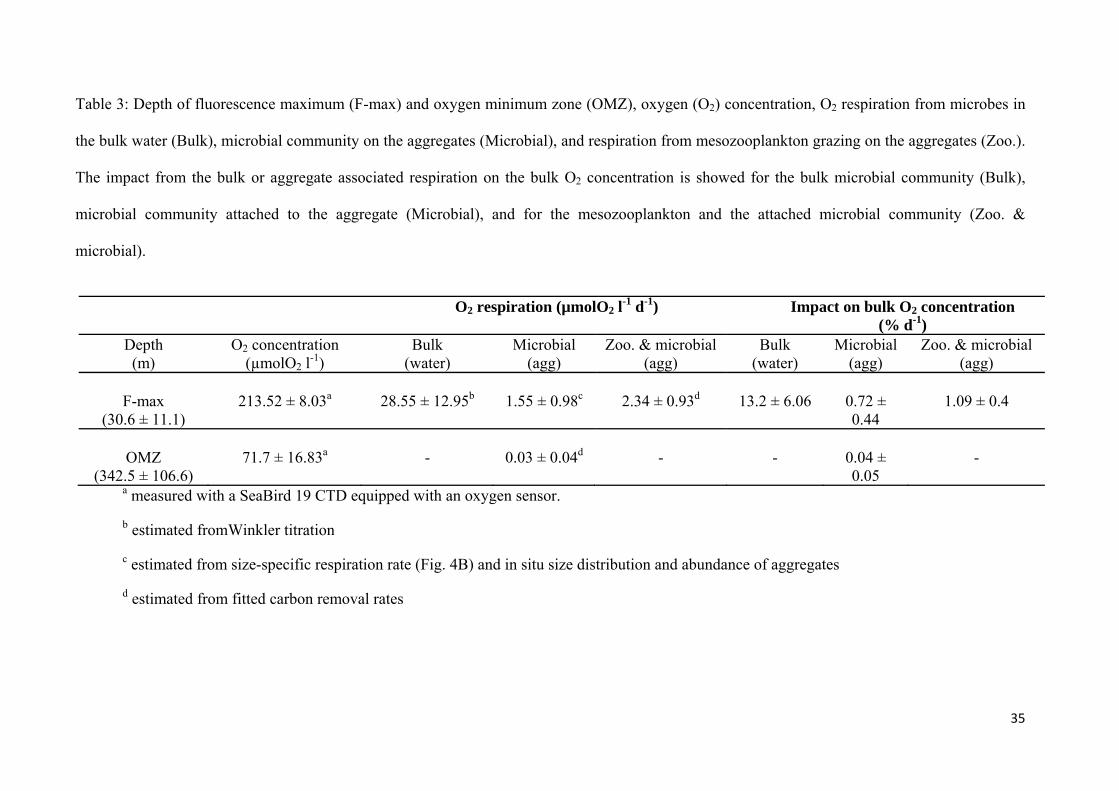
Table 3: Depth of fluorescence maximum (F-max) and oxygen minimum zone (OMZ), oxygen (O2) concentration, O2 respiration from microbes in
the bulk water (Bulk), microbial community on the aggregates (Microbial), and respiration from mesozooplankton grazing on the aggregates (Zoo.).
The impact from the bulk or aggregate associated respiration on the bulk O2 concentration is showed for the bulk microbial community (Bulk),
microbial community attached to the aggregate (Microbial), and for the mesozooplankton and the attached microbial community (Zoo. &
microbial).
easured with a SeaBird 19 CTD equipped with an oxygen sensor. a m
O2 respiration (µmolO2 l-1 d-1) Impact on bulk O2 concentration (% d-1)
Depth (m)
O2 concentration (µmolO2 l-1)
Bulk (water)
Microbial (agg)
Zoo. & microbial (agg)
Bulk (water)
Microbial (agg)
Zoo. & microbial (agg)
F-max
(30.6 ± 11.1)
213.52 ± 8.03a
28.55 ± 12.95b
1.55 ± 0.98c
2.34 ± 0.93d
13.2 ± 6.06
0.72 ± 0.44
1.09 ± 0.4
OMZ
(342.5 ± 106.6)
71.7 ± 16.83a
-
0.03 ± 0.04d
-
-
0.04 ± 0.05
-
b estimated fromWinkler titration
c estimated from size-specific respiration rate (Fig. 4B) and in situ size distribution and abundance of aggregates
d estimated from fitted carbon removal rates
35
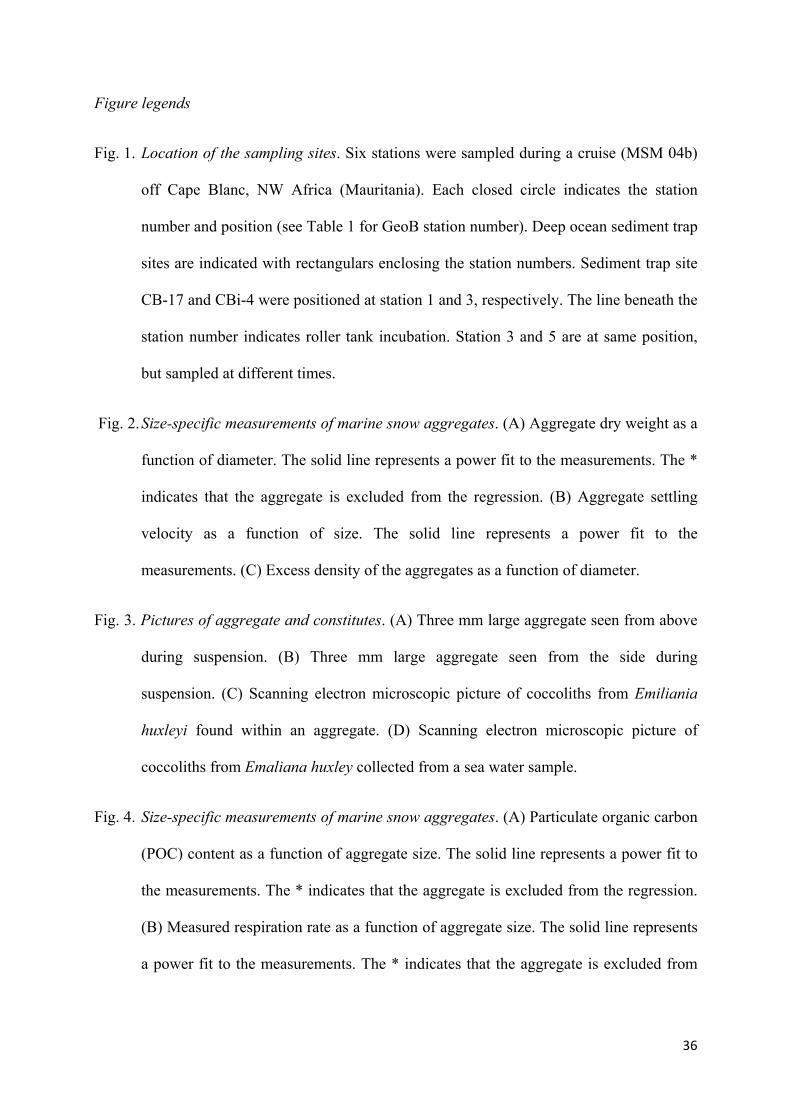
36
Figure legends
Fig. 1. Location of the sampling sites. Six stations were sampled during a cruise (MSM 04b)
off Cape Blanc, NW Africa (Mauritania). Each closed circle indicates the station
number and position (see Table 1 for GeoB station number). Deep ocean sediment trap
sites are indicated with rectangulars enclosing the station numbers. Sediment trap site
CB-17 and CBi-4 were positioned at station 1 and 3, respectively. The line beneath the
station number indicates roller tank incubation. Station 3 and 5 are at same position,
but sampled at different times.
Fig. 2. Size-specific measurements of marine snow aggregates. (A) Aggregate dry weight as a
function of diameter. The solid line represents a power fit to the measurements. The *
indicates that the aggregate is excluded from the regression. (B) Aggregate settling
velocity as a function of size. The solid line represents a power fit to the
measurements. (C) Excess density of the aggregates as a function of diameter.
Fig. 3. Pictures of aggregate and constitutes. (A) Three mm large aggregate seen from above
during suspension. (B) Three mm large aggregate seen from the side during
suspension. (C) Scanning electron microscopic picture of coccoliths from Emiliania
huxleyi found within an aggregate. (D) Scanning electron microscopic picture of
coccoliths from Emaliana huxley collected from a sea water sample.
Fig. 4. Size-specific measurements of marine snow aggregates. (A) Particulate organic carbon
(POC) content as a function of aggregate size. The solid line represents a power fit to
the measurements. The * indicates that the aggregate is excluded from the regression.
(B) Measured respiration rate as a function of aggregate size. The solid line represents
a power fit to the measurements. The * indicates that the aggregate is excluded from

37
the regression. (C) POC-specific respiration rate as a function of aggregate diameter.
(D) L-ratio as a function of aggregate size.
Fig. 5. Comparison of mass fluxes. (A) Mean vertical distribution of integrated particle
volume (cm3 per m3, ppm) from the particle camera profiles (ParCa) made at the
different stations. The integrated particle volume is calculated as average for 50 m bins
below the upper 50 m depth. (B) Observed mean particle number size spectra (n)
against aggregate equivalent spherical diameter (ESD, cm) for station 1 at different
depths, n = -(ΔN/ΔESD). N is the number of particle greater than a given size. The
particle number size spectrum is calculated as average for 50 m bins below the upper
50 m depth. (C) Average particle volume spectra (cm3 L-1 ESD-1) against equivalent
spherical diameter (ESD, cm) for different depths at station 1.
Fig. 6. Carbon fluxes. (A) The aggregated carbon fluxes (gC m-2 d-1) estimated from the
particle camera (ParCa) measurements of aggregates size distribution and abundance
and the size-specific relationship for aggregate carbon content and sinking velocity
provided by Guidi et al. (2008b). Measurements for the coastal station were only made
to a depth of 700 m due to shallower water depth. The dotted lines indicate the
position of the ParCa profile (in eastward direction: station 1, 2, 3, and 4). (B) Average
POC flux profile (gC m-2 d-1) of all calculated carbon fluxes against depths. The
carbon fluxes are calculated as 50 bins below the upper 50 m depth. (C) Average
carbon removal rate (gC m-3 d-1) for the three identified important depth intervals of
carbon loss. Error bars indicate standard deviation.

Fig. 1. Iversen et al.
38
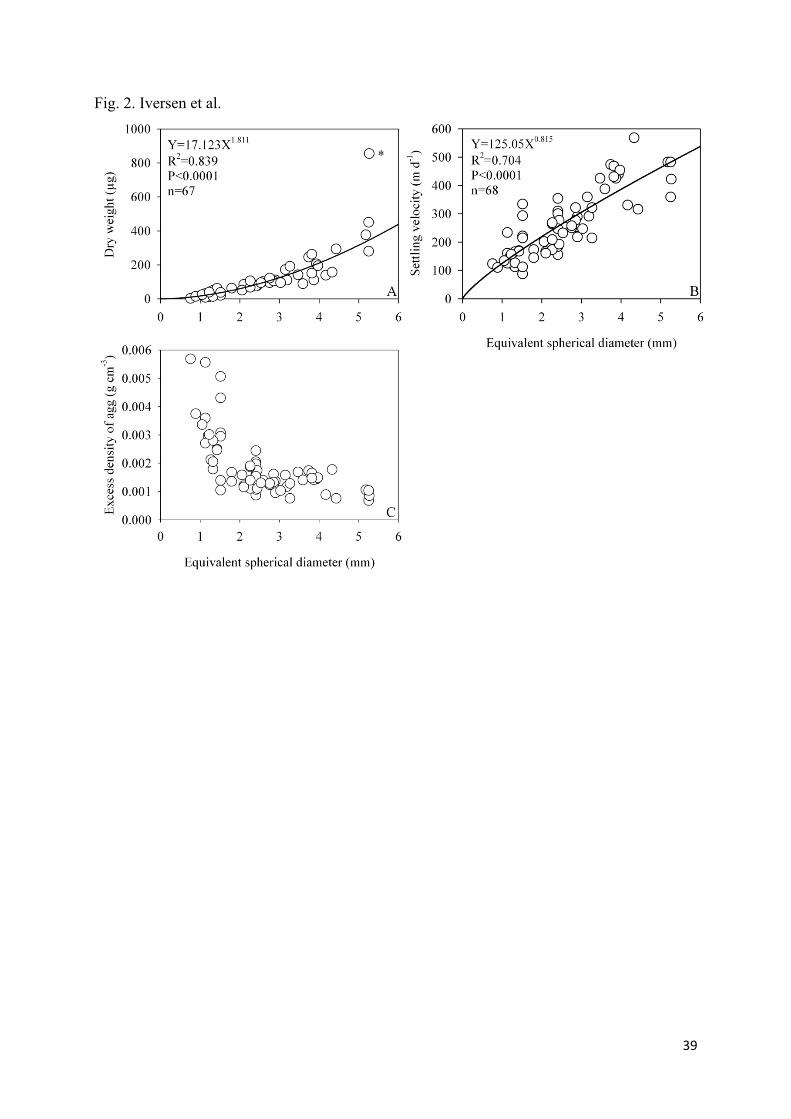
Fig. 2. Iversen et al.
39

Fig. 3. Iversen et al.
40

Fig. 4. Iversen et al.
41
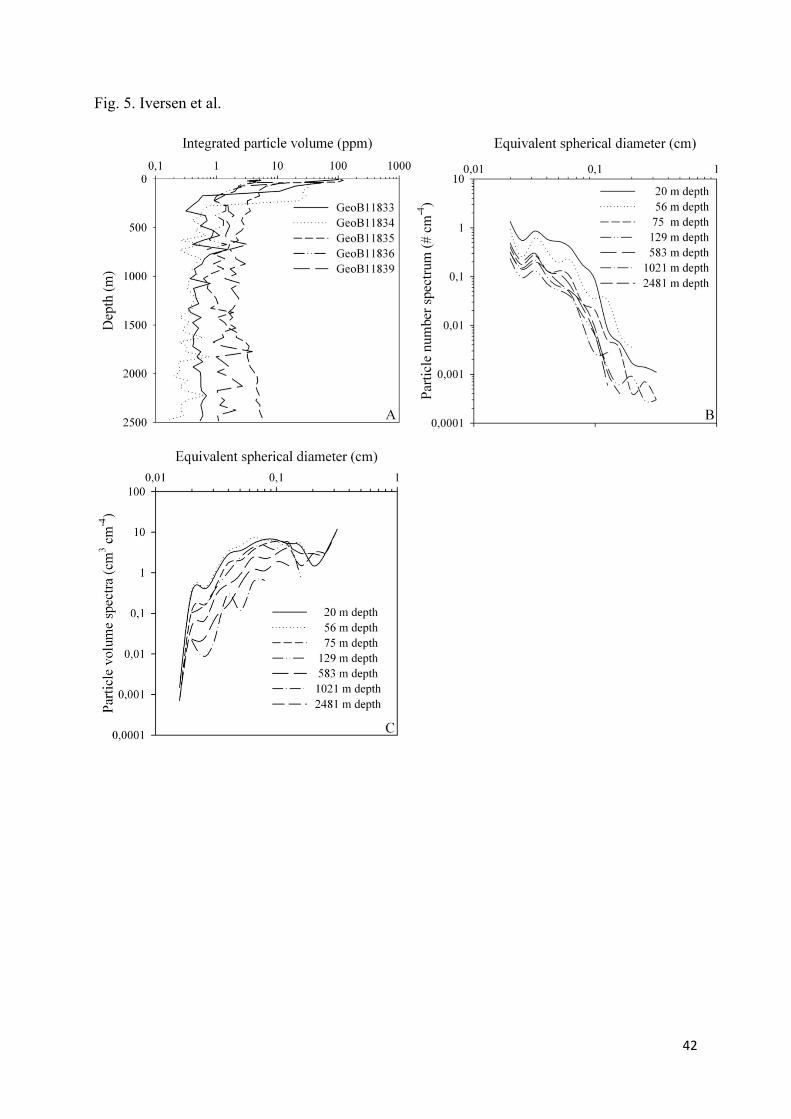
Fig. 5. Iversen et al.
42

Fig. 6. Iversen et al.
43

SPECIFIC CONTRIBUTION TO EACH PAPER
Paper I: Iversen M. H., Poulsen L. K. (2007) Coprorhexy, coprophagy, and coprochaly in the
copepods Calanus helgolandicus, Pseudocalanus elongatus, and Oithona similis. Mar. Ecol.
Prog. Ser. 350:79-89
Specific contribution: M. H. Iversen contributed to the planning, execution and publication
of the above named work. More specific; M. H. Iversen did most of the laboratory work, data
analysis, and data treatment. M. H. Iversen was the primary author and did most of the writing
and revision of the paper.
Paper II: Poulsen L. K., Iversen M. H. (2008) Degradation of copepod fecal pellets: key role
of protozooplankton. Mar. Ecol. Prog. Ser. 367:1-13
Specific contribution: M. H. Iversen contributed to the planning, execution and publication
of the above named work. More specific; M. H. Iversen and L. K. Poulsen contributed equal
to the experimental work in the period from July 2004 to November 2004. From February
2005 to July 2005 the experimental work was performed by M. H. Iversen. M. H. Iversen
contributed to the data analysis, data treatment, writing, and revision of the paper.
Paper III: Ploug H., Iversen M. H., Koski M., Buitenhuis E. T. (2008) Production, oxygen
respiration rates, and sinking velocity of copepod fecal pellets: Direct measurements of
ballasting by opal and calcite. Limnol. Oceanogr. 53(2):469-476
Specific contribution: M. H. Iversen contributed to the planning, execution and publication
of the above named work. More specific; M. H. Iversen did not participate in the quantitative
measurements of grazing and fecal pellet production rates. M. H. Iversen maintained plankton
cultures and performed pellet production incubations for the pellets used in small-scale
measurements of oxygen, particulate organic carbon content, pellet density, and pellet sinking
velocity. M. H. Iversen performed the measurement of fecal pellets sinking velocities,
densities, sizes, and volumes and made the preparations for the organic carbon content
measurements. M. H. Iversen contributed in the measurements of small-scale oxygen fluxes to

the pellets. M. H. Iversen contributed to the data analysis, data treatment, writing, and
revision of the paper.
Paper IV: Ploug H., Iversen M. H., Fischer G. (2008) Ballast, sinking velocity, and apparent
diffusivity within marine snow and zooplankton fecal pellets: Implications for substrate
turnover by attached bacteria. Limnol. Oceanogr. 53(5):1878-1886
Specific contribution: M. H. Iversen contributed to the planning, execution and publication
of the above named work. More specific; M. H. Iversen maintained plankton cultures and
performed pellet production and aggregate formation incubations. M. H. Iversen contributed
to the measurements of aggregate sizes, dry masses, sinking velocities, diffusivity, and
contributed to the oxygen measurements. M. H. Iversen contributed to the data analysis, data
treatment, writing, and revision of the paper.
Paper V: Iversen M. H., Nowald N., Ploug H., Jackson G. A., Fischer G. (submitted to Deep-
Sea Res. I) High resolution profiles of vertical particulate organic matter export off Cape
Blanc, Mauritania: degradation processes and ballasting effects. Manuscript submitted to
Deep-Sea Res. I.
Specific contribution: M. H. Iversen contributed to the planning, execution and publication
of the above named work. More specific; M. H. Iversen performed aggregate formation
incubations, measurements of dry mass and preparations for measurements of particulate
organic carbon (POC) content in the aggregates, measurements of respiration rates of POC
content in the bulk sea water, measured POC content in the bulk water, and contributed to
measurements of sinking velocities and small-scale oxygen fluxes to the aggregates. M. H.
Iversen contributed to the determination of particle size spectra, calculations of vertical
fluxes, and comparison of those to sediment trap data. M. H. Iversen did a large part of the
data analysis, most of the data treatment, writing, and revision of the submitted paper.

EIDESSTATTLICHE ERKLÄRUNG
Gem. §6(5) Nr. 1-3 PromoO
Hiermit erkläre ich, dass ich die vorliegende Arbeit ohne unerlaubte, fremde Hilfe
angefertigt habe und keine anderen als die von mir angegebenen Quellen und Hilfsmittel
benutzt habe. Die in den benutzen Werken wörtlich oder inhaltlich entnommenen Stellen sind
als solche kenntlich gemacht.
Bremen, 21.02.2009
Morten Hvitfeldt Iversen