Modification of Histidine Residues of Photosystem II by Diethyl ...
Surface Modification of Silica Particles and Upconverting Particles
Using Click Chemistry
DISSERTATION ZUR ERLANGUNG DES DOKTORGRADES DER
NATURWISSENSCHAFTEN (DR. RER. NAT.) DER FAKULTÄT
CHEMIE UND PHARMAZIE DER UNIVERSITÄT REGENSBURG
vorgelegt von
Heike Sabine Mader
aus Bietigheim-Bissingen
(Landkreis Ludwigsburg)
im April 2010

Surface Modification of Silica Particles and Upconverting Particles
Using Click Chemistry
Doctoral Thesis
by
Heike Sabine Mader
Diese Doktorarbeit entstand in der Zeit von Dezember 2006 bis März 2010 am
Institut für Analytische Chemie, Chemo- und Biosensorik an der Universität
Regensburg.
Die Arbeit wurde angeleitet von Prof. Dr. Otto S. Wolfbeis.
Promotionsgesuch eingereicht am: 15. April 2010
Kolloquiumstermin: 17. Mai 2010
Prüfungsausschuss:
Vorsitzender: Prof. Dr. Manfred Scheer
Erstgutachter: Prof. Dr. Otto S. Wolfbeis
Zweitgutachter: Prof. Dr. Hans-Achim Wagenknecht
Drittprüfer: Prof. Dr. Joachim Wegener
Acknowledgments
This work would not have been possible without the help and support of many people
whom I owe a great debt of gratitude.
First of all, I want to express my sincere gratitude to Prof. Otto S. Wolfbeis for
providing me with this interesting topic, for the opportunity to work independently,
valuable discussions and financial support.
I am very grateful to Dr. Tero Soukka of the Department of Biotechnology,
University of Turku, Finland for giving me the opportunity for an instructive and
interesting visit. I would like to thank all members of the institute for welcoming me so
warmly and for their help and support, especially Johanna Vuojola, Riikka Arppe,
Henna Päkkilä, Terhi Rantanen, and Timo Valta. Kiitos paljon!
Furthermore, I am grateful to Dr. Josef Schröder and Heiko Ingo Siegmund of
the Central Electron Microscopy Lab of the University Hospital, Regensburg and Dr.
Reinhard Rachel of the Institute of Molecular and Cellular Anatomy for the acquisition
of the TEM images. Additionally, I want to thank Dr. Martina Andratschke and
Thomas Rödl (Institute of Inorganic Chemistry) for recording the XRD data. Verena
Katzur and Björn Bartel (Institute of Physical Chemistry) are thanked for their help
with the IR and SEM measurements. I am further grateful to Dr. Oliver Zech (Institute
of Physical Chemistry) for his co-operation with the ionic liquids. Martin Meier
(Institute of Inorganic Chemistry) is thanked for his help with the tempering of the
upconverting nanoparticles. I would also like to thank Daniela Achatz for her
teamwork, many fruitful discussions and fresh ideas regarding nanoparticles. Martin
Link, Dr. Xiaohua Li, Dr. Peter Kele and Dominik Grögel are thanked for the synthesis
of the click dyes, Robert Meier for taking the photographs of the UCNPs and Judith
Stolwijk for performing the cell experiments.
Additionally, I would like to thank my former and present lab mates Dr. Xiaohua
Li, Dr. Peter Kele, Katrin Uhlmann, Sayed Saleh, Jana Kleim and Reham Ali for the
good collaboration and for teaching me “Guten Tag” in at least three different
languages.
I would also like to thank all members of the Institute of Analytical Chemistry,
Chemo- and Biosensors for the good atmosphere in both scientific and private
manner, the enjoyable coffee breaks, countless birthday cakes and barbecues.

Furthermore, I want to thank my friends and fellow board-gamers Dr. Doris Burger,
Corinna and Christian Spangler, Mark-Steven Steiner, Katrin Uhlmann, Rebekka
Scholz and Claudia Niegel for innumerable entertaining evenings and their tolerance
of my frequent attacks of “miss-smarty-pants” attitude. Mark-Steven Steiner is also
thanked for careful and critical reading of this thesis.
Finally, I am deeply grateful to my father Josef Mader and my brother Sebastian
Mader for their moral support and encouragement and especially to my mother
Ursula Mader. I am proud to be your daughter.
Table of Contents
1 Introduction and Aim of Work 1
1.1 References 5
2 Fundamentals 10
2.1 Upconversion 10
2.1.1 Mechanisms of Upconversion 10
2.1.2 Composition and Photoluminescent Properties of Upconverting
Materials 12
2.1.3 Synthesis of Upconverting Nanoparticles 15
2.1.4 Surface Modification of Upconverting Nanoparticles 17
2.2 Silica Nanoparticles and Coatings 19
2.2.1 Coating Process 19
2.2.2 Surface Modification and Bioconjugation 21
2.3 Click Chemistry 23
2.3.1. Definition of Click Chemistry 23
2.3.2 The 1,3-Dipolar Cycloaddition of Azides and Alkynes 24
2.4 References 26
3 Particle Synthesis and Characterization 31
3.1 Silica Nanoparticles (SiNPs) 31
3.2 Upconverting Microparticles (UCµPs) 31
3.3 Upconverting Nanoparticles (UCNPs) 33
3.3.1 Synthetic Procedure 33
3.3.2 NaYF4 Doped with Yb3+ and Er3+ 34
3.3.3 NaYF4 Doped with Yb3+ and Tm3+ 38
3.3.4 NaYF4 Doped with Yb3+ and Ho3+ 39
3.3.5 NaYF4 Doped with Yb3+ and Er3+ Synthesized in Ionic Liquids 41
3.4 Discussion 45
3.5 References 47
4 Surface Modification and Click Functionalization 49
4.1 Silanization and Coating of Particles 49
4.1.1 Click Functionalized SiNPs 49
4.1.2 Click Functionalized UCµPs 51
4.1.3 Silica Coated and Click Functionalized UCNPs 53
4.2 Click Labeling of the Particles with Biotin and Maleimide 61
4.2.1 Bioreactive SiNPs 61
4.2.2 Bioreactive UCµPs 62
4.2.3 Bioreactive UCNPs 63
4.3 Click Labeling of the Particles with Fluorescent Dyes 64
4.3.1 Fluorescently Labeled SiNPs 65
4.3.2 Fluorescently Labeled UCµPS 67
4.3.3 Fluorescently Labeled UCNPs 68
4.4 Discussion 70
4.5 References 72
5 Analytical Applications for UCNPs 75
5.1 UCNPs as Labels for Proteins and Oligonucleotides 75
5.2 pH Sensing using UCNPs 78
5.3 Ammonia Sensing using UCNPs 83
5.4 Cell Imaging Using UCNPs 86
5.5 Discussion 88
5.6 References 91
6 Experimental Section 93
6.1 Particle Synthesis 93
6.1.1 Silica Nanoparticles 93
6.1.2 Upconverting Microparticles (UCµPs) 93
6.1.3 Upconverting Nanoparticles (UCNPs) 93
6.2 Coating and Surface Modification 95
6.2.1 Reagents 95
6.2.2 Surface Modification of SiNPs 97
6.2.3 Surface Modification of UCµPs 97
6.2.4 Coating and Surface Modification of UCNPs 98
6.3 Click Reaction 99
6.4 UCNPs as Protein and Oligonucleotide Labels 99
6.4.1 Oligonucleotide Assay 99
6.4.2 Protein Assay 100
6.5 pH Sensing 101
6.6 Ammonia Sensor 101
6.7 Instrumental Techniques 101
6.8 References 102
7 Summary 104
7.1 In English 104
7.2 In German 105
8 Curriculum Vitae 108
1 Introduction and Aim of Work 1
1 Introduction and Aim of Work Fluorescence-based detection is still widely used in modern bioanalytical research
and routine applications. Commonly, organic fluorophores are employed as labels
and markers for trace amounts of analytes. Organic fluorophores are easily
accessible, versatile and simple to use but they do have considerable drawbacks.
Generally, only one or very few fluorophores can indicate one biomolecule
recognition event. As a consequence, the brightness of the label dictates the
detection limit of the analyte. Furthermore, organic fluorophores are susceptible to
photobleaching or even degradation in certain environments. In addition, background
fluorescence originating from the sample matrix may interfere with the measurement.
Even though the dyes may be easily conjugated to biomolecules such as DNA and
proteins, the determination of specific biomolecules of interest might lead to a
complex and time consuming conjugation chemistry that is not suitable for routine
analysis. These limitations have led to the increasing replacement of molecular tags
by nanoparticles (NPs)1,2. These particles with diameters from approximately 1 – 150
nm do have several advantages compared to classic fluorophores. With optimized
composition and surface modification, NPs grant an enhanced emission intensity
signal, increased sensitivity and better reproducibility in target detection. Generally,
they show a high surface to volume ratio, good biocompatibility and are stable
against degradation and photobleaching. Several different types of NPs have been
investigated for bioanalytical applications.
First of all, particles of the type quantum dot (QDs) are very small (1-10 nm in
diameter), up to 20x brighter than common organic fluorophores and extremely
photostable. Additionally, their emission color can be tuned by variation of their
diameter. However, the employment of QDs does have its limitations. Usually, the
QD’s core consists of toxic heavy metals such as cadmium or lead, making
cytotoxicity an issue for in vivo applications. Quantum dots are not dispersible in
aqueous solutions and they need to be polymer coated to allow their use in biological
applications. Furthermore, single QD crystals show discontinuous emission
(“blinking”) which is limiting their use for single particle tracking applications such as
flow cytometry.1,3,4
1 Introduction and Aim of Work 2
Dye doped polymer particles represent a second type of fluorescent nanobeads.
Micro- and nanoparticles composed of polystyrene, polyacrylonitrile (PAN),
polymethylmethacrylate (PMMA), and polylactic acid have been commercialized.
They are widely used in biological applications as cell tracers, immunofluorescent
reagents and standardization reagents in microscopy and flow cytometry. However,
polymer particles usually are hydrophobic and tend to swell in organic solvents
thereby causing dye leakage.1
Another class of NPs is silica nanoparticles doped or labeled with fluorescent
dyes. They represent a very robust group of particle markers. Silica NPs are easily
prepared, even commercially available and the silicium dioxide (SiO2) material
enables a diversity of chemical and physical modifications. The NPs are highly
hydrophilic, chemically and mechanically stable and their biocompatibility renders
them a fairly benign material regarding in vivo applications. Nanobeads made from
silica are not susceptible to microbial attack and they show no tendency to swelling
or porosity changes with varying pH. Additionally, dye doped silica NPs possess high
photostability and sensitivity.1,3,4 Due to these advantages doped silica NPs are
applied as labels in flow cytometry5, protein purification6, immuno7 and gene8,9
assays, or as biomarkers for scanning probe microscopy-based imaging10,11 and
sensing12 techniques. Besides they are used for gene13 or drug14,15 delivery, as
intracellular transporters16 or for multiplexed encoding.17
Lanthanide complexes have been widely used as dopants in various kinds of
NPs, in order to obtain biolabels with high photostability and long fluorescence
lifetimes.18,19 Lanthanide doped NPs possess unique luminescent properties such as
a large Stokes’ shift, distinct absorption and emission lines and a high quantum
yield.20 Nevertheless, lanthanide ions in complexes or chelates may still be prone to
quenching by water or hydroxy groups.
In the last decade, inorganic rare earth (RE) nanomaterials have been proposed
to be more suitable as optical biolabels, as the rigid crystal host lattice protects the
emitting RE dopants from environmental influences.21 Moreover, lanthanide ions are
known to exhibit not only downconversion (conventional Stokes) luminescence but
also efficient upconversion (anti-Stokes) fluorescence.22 Upconversion (UC)
describes the conversion of low energy near infrared (NIR) radiation to higher-energy
(visible) light by multi-photon absorption and subsequent emission of dopant-
1 Introduction and Aim of Work 3
dependent luminescence. This concept has been known since the 1960s23 but
primarily been exploited for the development of optical devices such as infrared
quantum counters, temperature sensors and solid-state lasers24. Thus, the use of the
UC effect has been limited to bulk glass or crystalline materials for more than 30
years. Only in the late 1990s and early 2000s, when nanoparticle research became
prevalent, the potential of UC materials for bioanalytical assays and imaging was
recognized. It was discovered that upconversion nanoparticles (UCNP) inherit the
unique optical properties of their bulk material. UCNPs have the advantage of being
photoexcitable in the NIR (around 980 nm) where the auto-absorption of any
biological matter is quite weak, thereby reducing background of both absorption and
luminescence (which would occur, along with Raman scatter, at wavelengths of >980
nm anyway) to virtually zero. The large anti-Stokes shift allows easy separation of the
discrete emission peaks from the excitation source. In addition, UCNPs are
chemically stable and do not bleach or blink. The luminescence emission wavelength
of the UCNPs is not size-dependent as it is for QDs and multicolor emission can
easily be accomplished by varying host crystal and RE dopant. Applications of
UCNPs (which are virtually invisible in low concentrations) include authentication in
general, in security,25,26 anti-counterfeit,27,28 brand protection,29 flow cytometry,30,31
photodynamic therapy,32 and point-of-care diagnostics33. In bioanalytical terms, they
have been demonstrated to be useful in immuno34,35,36 and gene37,38 assays, as
luminescent labels,21 in sensing pH,39 and in imaging of cells.40,41,42
Upconverting microparticles (UCµPs), as opposed to UCNPs, obviously are
much larger but more efficient in terms of upconversion. They are commercially
available and used, for example, in security inks or for visualization of IR radiation.43
UCµPs also have been employed in homogeneous immunoassays44,45,46 and
enzyme activity assays47 following bead-milling so to reduce the size to the sub-
micron range. Low energy laser diodes are adequate for photo-excitation, and their
(visible) emission is rather bright. Unlike UCNPs, they cannot be well suspended (as
a kind of colloidal dispersion) in aqueous or organic solutions.
For application in affinity assays (such as in high-throughput screening) and in
bioassays, the surface of UCNPs and UCµPs has to be functionalized in order to
covalently immobilize biomolecules on their surfaces. Such surface chemistries are
expected to be versatile so to enable immobilization of proteins, receptors, enzymes,
or nucleic acid oligomers, to mention a few. Moreover, UCNPs whose surface is not
1 Introduction and Aim of Work 4
appropriately modified can be suspended fairly well in certain organic solvents, but
not in water. This is crucial, however, with respect to many bioapplications.21 Only if
proper surface modification is accomplished, their bioanalytical potential can be fully
exploited.
The most common method to improve dispersibility involves the coating of NPs
with a thin layer of silica. The resulting silica coated NPs are chemically stable, fairly
biocompatible, nontoxic, and can be prepared in narrow size distribution. Silica is well
documented as a coating agent for quantum dots,48,49 metal oxides,50,51 lanthanide
nanoparticles,7 and even upconverting particles.21,35,52,53 Yet another benefit of silica
coated particles, as for pure silica NPs is based on the different types of functional
groups that can be attached to the particle surface using appropriate silane
reagents.3,54,55
The introduction of functional groups to the surface of almost any kind of micro-
and nanoparticles also is required to enable bioconjugation. Various kinds of
functionalized particles have been reported in the literature. Generally, linkers with
terminal amino, thiol or carboxy groups are prefered.1,21,56,57 However, the functional
groups required for these kinds of conjugation are quite abundant in proteinic
biomolecules, a fact that compromises selective conjugation. Moreover, amino
groups and carboxy groups are charged in pH 6 - 8 solution and thus give rise to
electrostatic (i.e. unspecific) interaction including adsorption and particle aggregation.
The so-called “click-chemistry” is an attractive alternative because the functional
groups involved (azido and alkyne) are hardly present in biomolecules including
proteins and oligomers. It is therefore said to be “bioorthogonal”.58
One of the so-called click reactions (see 2.3.1) involves the dipolar
cycloaddition of an organic azido group to an alkyne group, also known as the
Huisgen ligation.59 The catalytic effect of Cu+ on this cycloaddition was independently
discovered by the groups of Meldal60 and of Sharpless61. The reagents used often
are available in a reasonable number of synthetic steps. Cycloaddition proceeds in
high yields, occurs at room temperature in many organic solvents and – most notably
in terms of biological applications – also in aqueous solution at near-neutral pH.
Generally, simple purification steps are required only due to the almost complete and
regioselective conversion into the 1,4-disubstituted 1,2,3-triazole.62,63 Furthermore,
1 Introduction and Aim of Work 5
no protecting groups are required for the click reaction as it tolerates a variety of
functional groups and shows high kinetic stability.
The use of the “click” concept has spread into a variety of fields, such as drug
design,64 peptide65,66 or protein67,68 functionalization and fluorescent biolabeling,69
which is not surprising considering all its advantages. Yet, its main impact it may
have had in materials and polymer science. Applications of the click reaction lie in the
design of novel polymeric materials, macromolecular engineering, functionalization of
nanomaterials and bioconjugation.70 Its bioorthogonality and tolerance towards a
wide range of functional groups and reaction conditions particularly makes it an ideal
tool for the biofunctionalization of nanomaterials. So far, the click reaction has been
used do functionalize silica NPs,54,71 QDs,72 gold,73,74 and metal oxide75,76 nanobeads
and various polymeric77,78 particles. Combined with the benefits of upconverting and
silica NPs, click chemistry provides a versatile and powerful tool in the development
of new functional nanomaterials.
The aim of this work was to develop a new method for surface modification of
silica NPs, UCµPs and UCNPs based on the click chemistry concept. Commercially
available silica NPs and upconverting µPs as well as synthesized upconverting NPs
were to be functionalized with azido and alkyne groups using suitable silane
reagents. The particles functionalized in that manner were to be clicked to
biorecognition sites such as biotin and maleinimide as well as fluorescent dyes and
applied as biolabels and in sensor systems.
1.1 References
1 Wang L, Wang K, Santra S, Zhao X, Hilliard LR, Smith JE, Wu Y, Tan W (2006) Watching Silica Nanoparticles Glow in the Biological World, Anal. Chem. 78: 646-654.
2 Knopp D, Tang D, Niessner R (2009) Review: Bioanalytical Applications of Biomolecule-Functionalized Nanometer-Sized Doped Silica Particles, Anal. Chim. Acta 647: 14-30.
3 Wang L, Zhao W, Tan W (2008) Bioconjugated Silica Nanoparticles: Development and Applications, Nano Res. 1: 99-115
4 Yao G, Wang L, Wu Y, Smith J, Xu J, Zhao W, Lee E, Tan W (2006) FloDots: Luminescent Nanoparticles, Anal. Bioanal. Chem. 385: 518-524.
5 Wang L, Zhao W, O’Donoghue M, Tan WH (2007) Fluorescent Nanoparticles for Multiplexing Bacteria Monitoring, Bioconjugate Chem. 18: 297-301.
1 Introduction and Aim of Work 6
6 Kim SH, Jeyakumar M, Katzenellenbogen JA (2007) Dual-Mode Fluorophore-Doped Nickel Nitrilotriacetic Acid-Modified Silica Nanoparticles Combine Histidine-Tagged Protein Purification with Site-Specific Fluorophore Labeling, J. Am. Chem. Soc. 129: 13254-13264.
7 Ye, Z, Tan M, Wang G, Yuan J (2004) Preparation, Characterization, and Time-Resolved Fluorometric Application of Silica-Coated Terbium (III) Fluorescent Nanoparticles, Anal. Chem. 76: 513-518.
8 Zhao X, Tapec-Dytioco R, Tan W (2003) Ultrasensitive DNA Detection Using Highly Fluorescent Bioconjugated Nanoparticles, J. Am. Chem. Soc. 125: 11474-11475.
9 Zhao W, Wang L, Tan W (2007) Fluorescent Nanoparticle for Bacteria and DNA Detection, Bio-Applications of Nanoparticles, Springer Science+Business Media LLC, Landes Bioscience, Volume 620 edited by Chan, WCW pp 129-136.
10 Ow H, Larson DR, Srivastava M, Baird BA, Webb WW, Wiesner U (2005) Bright and Stable Core-Shell Fluorescent Silica Nanoparticles, Nano Lett. 5: 113-117.
11 Rieter WJ, Kim JS, Taylor KML, An H, Weili L, Tarrant T, Lin W (2007) Hybrid Silica Nanoparticles for Multimodal Imaging, Angew. Chem. Int. Ed. 46: 3680-3682, Angew. Chem. 119: 3754-3756.
12 Burns A, Sengupta P, Zedayko T, Baird B, Wiesner U (2006) Core/Shell Fluorescent Silica Nanoparticles for Chemical Sensing: Towards Single-Particle Laboratories, Small 2: 723-726.
13 Roy I, Ohulchanskyy TY, Bharali DJ, Pudavar HE, Mistretta RA, Kaur N, Prasad PN (2005) Optical Tracking of Organically Modified Silica Nanoparticles as DNA Carriers: A Nonviral, Nanomedicine Approach for Gene Delivery, P. Natl. Acad. Sci. USA 102: 279-284.
14 Slowing II, Trewyn BG, Giri S, Lin VSY (2007) Mesoporous Silica Nanoparticles for Drug Delivery and Biosensing Applications, Adv. Funct. Mater. 17: 1225-1236.
15 Slowing II, Vivero-Escoto JL, Wu CW, Lin VSY (2008) Mesoporous Silica Nanoparticles as Controlled Release Drug Delivery and Gene Transfection Carriers, Adv. Drug. Deliver. Rev. 60: 1278-1288.
16 Bottini M, Cerignoli F, Mills DM, D’Annibla F, Leone M, Rosato N, Magrini A, Pelecchia M, Bergamaschi A, Mustelin T (2007) Luminescent Silica Nanobeads: Characterization and Evaluation as Efficient Cytoplasmic Transporters for T-Lymphocytes, J. Am. Chem. Soc. 129: 7814-7823.
17 Wang L, Tan W (2006) Multicolor FRET Silica Nanoparticles by Single Wavelength Excitation, Nano Lett. 6: 84-88.
18 Eliseeva SV, Bünzli J-CG (2010) Lanthanide Luminescence for Functional Materials and Bio-Sciences, Chem. Soc. Rev. 39: 189-227.
19 Bünzli J-CG, Piguet C (2005) Taking Advantage of Luminescent Lanthanide Ions, Chem. Soc. Rev. 34: 1048-1077.
20 Sivakumar S, Diamente PR, van Veggel FCJM (2006) Silica-Coated Ln3+-Doped LaF3 Nanoparticles as Robust Down- and Upconverting Biolabels, Chem. Eur. J 12: 5878-5884.
21 Shen J, Sun L-D, Yan X-H (2008) Luminescent Rare Earth Nanomaterials for Bioprobe Applications, Dalton Trans. 5687-5697.
22 Escribano P, Julián-López B, Planelles-Aragó J, Cordoncillo E, Viana B, Sanchez C (2008) Photonic and Nanobiophotonic Properties of Luminescent Lanthanide-Doped Hybrid Organic-Inorganic Materials, J. Mater. Chem. 18: 23-40.
23 Auzel F (2004) Upconversion and Anti-Stokes Processes with f and d Ions in Solids, Chem. Rev. 104: 139-173.
24 Wang F, Liu X (2009) Recent Advances in the Chemistry of Lanthanide-Doped Upconversion Nanocrystals, Chem. Soc. Rev. 38: 976-989.
1 Introduction and Aim of Work 7
25 Muth O, Brockmann H, Schmidt W, Bailleu A, Brauer G, Paeschke M, Ahlers B, Franz-Burgholz A, Zerbel H (inv.) (2002) Eur. Pat. EP1241021.
26 Kim WJ, Nyk M, Prasad PN (2009) Color-Coded Multilayer Photopatterened Microstructures using Lanthanide (III) Ion Co-Doped NaYF4 Nanoparticles with Upconversion Luminescence for Possible Applications in Security, Nantechnology 20: 185301-185307.
27 Du H, Lan Y, Xia Z, Sun J (2009) Synthesis and Upconversion Luminescence Properties of Yb3+/Er3+ Codoped BaGd2(MoO4)4 Powder, Mat. Res. Bull. 44: 1660-1662.
28 http://www.tradekey.com/ks-anti-counterfeit. 29 http://www.packagedesignmag.com/brandprotection/files/BPS-Solutions.pdf]. 30 Corstjens PLAM, Chem Z, Zuiderwijk M, Bau HH; Abrams WR, Malamud D, Niedbala RS,
Tanke HJ (2007) Rapid Assay Format for Multiplex Detection of Humoral Immune Responses to Infectious Disease Pathogens (HIV, HCV and TB), Ann. N. Y. Acad Sci. 1098: 437-445.
31 Yan Z, Zhou L, Zhao Y, Wang J, Huang L, Hu K, Liu H (2006) Rapid Quantitative Detection of Yersinia Pestis by Lateral-Flow Immunoassay and Up-Converting Phosphor Technology-Based Biosensor, Sensor. Actuat. B-Chem. 119: 656-663.
32 Qian HS, Guo HC, Ho PC-L, Mahendran R, Zhang Y (2009) Mesoporous-Silica-Coated Up-Conversion Fluorescent Nanoparticles for Photodynamic Therapy, Small 5: 2285-2290.
33 Ouellette AL, Li JJ, Cooper DE, Ricco AJ, Kovacs GT (2009) Evolving Point-of-Care Diagnostics Using Up-Converting Phosphor Bioanalytical Systems, Anal. Chem. 81: 3216–3221.
34 Morgan CG, Dad S, Mitchell AC (2008) Present Status of, and Future Prospects for, Upconverting Phosphors in Proximity-Based Bioassays, J. Alloy. Compd. 451: 526-529.
35 Corstjens PLAM, Li S, Zuiderwijk M, Kardos K, Abrams WR, Niedbala RS, Tanke HJ (2005) Infrared Up-Converting Phosphors for Bioassays, IEE Proc.-Nanobiotechnol. 152: 64-72.
36 Wang M, Hou W, Mi C-C, Wang W-X, Xu Z-R, Teng H-H, Mao C-B, Xu S-K (2009) Immunoassay of Goat Antihuman Immunoglobulin G Antibody Based on Luminescence Resonance Energy Transfer between Near-Infrared Responsive NaYF4: Yb, Er Upconversion Fluorescent Nanoparticles and Gold Nanoparticles, Anal. Chem. 81: 8783-8789.
37 Van der Rijke F, Zijlmans H, Li S, Vail T, Raap AK, Niedbala RS, Tanke HJ (2001) Up-Converting Phosphor Reporters for Nucleic Acid Microarrays, Nat. Biotechnol. 19: 273-276).
38 Zhang P, Rogelj S, Nguyen K, Wheeler D (2006) Design of a Highly Sensitive and Specific Nucleotide Sensor Based on Photon Upconverting Particles, J. Am. Chem. Soc. 128: 12410-12411.
39 Sun L, Peng H, Stich MIJ, Achatz D, Wolfbeis OS (2009) pH Sensor Based on Upconverting Luminescent Lanthanide Nanorods, Chem. Comm. 5000-5002.
40 Chatterjee DK, Rufaihah AJ, Zhang Y (2008) Upconversion Fluorescence Imaging of Cells and Small Animals Using Lanthanide Doped Nanocrystals, Biomaterials. 29: 237-943.
41 Hu H, Xiong L, Zhou J, Li F, Cao T, Huang C (2009) Multimodal-Luminescence Core-Shell Nanocomposites for Targeted Imaging of Tumor Cells, Chem. Eur. J. 15: 3577-3584.
42 Jalil RA, Zhang Y (2008) Biocompatibility of Silica Coated NaYF4 Upconversion Fluorescent Nanocrystals, Biomaterials 29: 4122-4128.
43 www.sicpa.com 44 Kuningas K, Rantanen T, Karhunen U, Lövgren T, Soukka T (2005) Simultaneous Use of
Time-Resolved Fluorescence and Anti-Stokes Photoluminescence in a Bioaffinity Assay, Anal. Chem. 77: 2826-2834.
1 Introduction and Aim of Work 8
45 Kuningas K, Ukonaho T, Päkkilä H, Rantanen T, Rosenberg J, Lövgren T, Soukka T (2006) Upconversion Fluorescence Resonance Energy Transfer in a Homogeneous Immunoassay for Estradiol, Anal. Chem. 78: 1-57.
46 Soukka T, Rantanen T, Kuningas K (2008) Photon Upconversion in Homogeneous Fluorescence-based Bioanalytical Assays, Ann. N. Y. Acad. Sci. 1130: 188-200.
47 Rantanen T, Järvenpää ML, Vuojola J, Kuningas K, Soukka T (2008) Fluorescence-Quenching-Based Enzyme-Activity Assay by Using Photon Upconversion, Angew. Chem. Int. Ed. 47: 3811-3813, Angew. Chem. 120: 3871-3873.
48 Nann T, Mulvaney P (2004) Single Quantum Dots in Spherical Silica Particles, Angew. Chem. Int. Ed. 43: 5393-5396, Angew. Chem. 116: 5511-5514.
49 Selvan ST, Patra PK, Ang CY, Ying JY (2007) Synthesis of Silica-Coated Semiconductor and Magnetic Quantum Dots and Their Use in the Imaging of Live Cells, Angew. Chem. Int. Ed. 46: 1-6, Angew. Chem. 119: 2500-2504.
50 Ohmori M, Matijevic E (1993) Preparation and Properites of Uniform Coated Inorganic Colloidal Particles: 8. Silica on Iron, J. Colloid. Interf. Sci. 160: 288-292.
51 Yu SY, Zhang HJ, Yu JB, Wang C, Sun LN, Shi WD (2007) Bifunctional Magnetic-Optical Nanocomposites: Grafting Lanthanide Complex onto Core-Shell Magnetic Silica Nanoarchitecture, Langmuir 23: 7836-7840.
52 Li Z, Zhang Y (2006) Monodisperse Silica-Coated Polyvinylpyrrolidone/NaYF4 Nanocrystals with Multicolor Upconversion Fluorescence Emission, Angew. Chem. Int. Ed. 45: 7732-7735. Angew. Chem. 118: 7896-7899.
53 Li, Z, Zhang Y, Jiang S (2008) Multicolor Core/Shell-Structured Upconversion Fluorescent Nanoparticles, Adv. Mater. 20: 4765-4769.
54 Mader H, Li X, Saleh S, Link M, Kele P, Wolfbeis OS (2008) Fluorescent Silica Nanoparticles, Ann. N. Y. Acad. Sci. 1130: 213-223.
55 Liu S, Zhan HL, Liu TC, Liu B, Cao YC, Huang ZL, Zhao YD, Luo QM (2007) Optimization of the Methods for Introduction of Amine Groups onto the Silica Nanoparticle Surface, J. Biomed. Mater. Res. A. 80 A: 752-757.
56 Corstjens PLAM, Zuiderwijk M, Nilsson M, Feindt H, Niedbala RS, Tanke HJ (2003) Lateral-flow and Up-converting Phosphor Reporters to Detect Single-stranded Nucleic Acids in a Sandwich-hybridization Assay, Anal. Biochem. 312: 191-200.
57 Hermanson GT (2008) Bioconjugate Techniques, 2nd Edition, Elsevier Inc. London, Burlington, San Diego.
58 Kurpiers T, Mootz HD (2009) Bioorthogonal Ligation in the Spotlight, Angew. Chem. Int. Ed. 48: 1729-1731, Angew. Chem. 121: 1757-1760.
59 Wolfbeis OS (2007) The Click Reaction: Fluorescent Probing of a Metal Ion Using a Catalytic Reaction, and its Implications to Biolabeling Techniques, Angew. Chem. Int. Ed. 46: 2980-2982, Angew. Chem. 119: 3038-30470.
60 Tornøe CW, Christensen C, Meldal M (2002) Peptidotriazoles on Solid Phase: [1,2,3]-Triazoles by Regiospecific Copper(I)-Catalyzed 1,3-Dipolar Cycloaddition of Terminal Alkynes to Azides, J. Org. Chem. 67: 3057-3064.
61 Rostovtsev VV, Green LG, Fokin VV, Sharpless KB (2002) A Stepwise Huisgen Cycloaddition Process: Copper(I)-Catalyzed Regioselective “Ligation” of Azides and Terminal Alkynes, Angew. Chem. Int. Ed. 41: 2596-2599, Angew. Chem. 114: 2708-2711.
62 Himo F, Lovell T, Hilgraf R, Rostovtsev VV, Noodleman L, Sharpless KB, Fokin VV (2005) Copper(I)-Catalyzed Synthesis of Azoles. DFT Study Predicts Unprecedented Reactivity and Intermediates, J. Am. Chem. Soc. 127: 210-216.
63 Moses JE, Moorhouse AD (2007) The Growing Applications of Click Chemistry, Chem. Soc. Rev. 36: 1249-1262.
1 Introduction and Aim of Work 9
64 Lutz J-F, Zarafshani Z (2008) Efficient Construction of Therapeutics, Bioconjugates, Biomaterials and Bioactive Surfaces Using Azide-Alkyne “Click” Chemistry, Adv. Drug Deliver. Rev. 60: 958-970.
65 Gierlich J, Burley GA, Gramlich PME, Hammond DM, Carell T (2006) Click Chemistry as a Reliable Method fort he High-Density Postsynthetic Functionalization of Alkyne-Modified DNA, Org. Lett. 8: 3639-3642.
66 Berndl S, Herzig N, Kele P, Lachmann D, Li X, Wolfbeis OS, Wagenknecht H-A (2009) Comparison of a Nucleosidic vs Non-Nucleosidic Postsynthetic “Click“ Modification of DNA with Base-Labile Fluorescent Probes, Bioconjugate Chem. 20: 558-564.
67 Lin P-C, Ueng S-H, Tseng M-C, Ko J-L, Huang K-T, Yu S-C, Adak AK, Chen Y-J, Lin C-C (2006) Site-Specific Protein Modification trough CuI-Cataliyzed 1,2,3-Triazole Formationand Its Implementaion in Protein Microarray Fabrication, Angew. Chem. Int. Ed. 45: 4286-4290, Angew. Chem. 118: 4392-4396.
68 Hatzakis NS, Engelkamp H, Velonia K, Hofkens J, Christianen PCM, Svendsen A, Patkar SA, Vind J, Maan JC, Rowan AE, Nolte RJM (2006) Synthesis and Single Enzyme Activity of a Clicked Lipase-BSA Hetero-Dimer, Chem. Commun. 2012-2014
69 Kele P, Mezö G, Achatz D, Wolfbeis OS (2009) Dual Labeling of Biomolecules by Using Click Chemisty: A Sequential Approach, Angew. Chem. Int. Ed. 48: 344-347, Angew. Chem. 121: 350-353.
70 Lutz J-F (2007) 1,3-Dipolar Cycloadditions of Azides and Alkynes: A Universal Ligation Tool in Polymer and Materials Science, Angew. Chem. Int. Ed. 46: 1018-1025, Angew. Chem. 119: 1652-1654.
71 Zhan J, Wang X, Wu D, Liu L, Zhao H (2009) Bioconjugated Janus Particles Prepared by in Situ Click Chemistry, Chem. Mater. 21: 4012-4018.
72 Binder WH, Sachsenhofer R, Straif CJ, Zirbs R (2007) Surface-Modified Nanoparticles via Thermal and Cu(I)-mediated „Click“ Chemistry: Generation of Luminescent CdSe nanoparticles with Polar Ligands Guiding Supramolecular Recognition, J. Mater. Chem. 17: 2125-2132.
73 Zhou Y, Wang S, Zhang K, Jiang X (2008) Visual Detection of Copper(II) by Azide- and Alkyne-Functionalized Gold Nanoparticles Using Click Chemistry, Angew. Chem. Int. Ed. 47: 7454-7456, Angew. Chem. 120: 7564-7566.
74 Gole A, Murphy CJ (2008) Azide-Derivatized Gold nanorods: Functional Materials for “Click” Chemistry, Langmuir 24: 266-272.
75 Lin P-C, Ueng S-H, Yu S-C, Jan M-D, Adak AK, Yu C-C, Lin C-C (2007) Surface Modification of Magnetic Nanoparticle via Cu(I)-Catalyzed Alkyne-Azide [2+3] Cycloaddition, Org. Lett. 9: 2131-2134.
76 Von Maltzahn G, Ren Y, Park J-H, Min D-H, Kotamaraju VR, Jayakumar J, Fogal V, Sailor MJ, Ruoslahti E, Bhatia SN (2008) In Vivo Tumor Cell Targeting with “Click” Nanoparticles, Bioconjugate Chem. 19: 1570-1578.
77 Evans CE, Lovell PA (2009) Click Chemistry as a Route to Surface Functionalization of Polymer Particles Dispersed in Aqueous Media, Chem. Commun. 2305-2307.
78 Lu J, Shi M, Shoichet MS (2009) Click Chemistry Functionalized Polymeric Nanoparticles Target Corneal Epithelial Cells through RGD-Cell Surface Receptors, Bioconjugate Chem. 20: 87-94.
2 Fundamentals 10
2 Fundamentals
2.1 Upconversion
2.1.1 Mechanisms of Upconversion
The occurrence of upconversion (UC) luminescence can be ascribed to three main
processes: excited state absorption (ESA), energy transfer upconversion (ETU), and
photon avalanche (PA). All these processes are based on sequential absorption of
two or more photons, differentiating these from simultaneous multiphoton
absorption.1,2
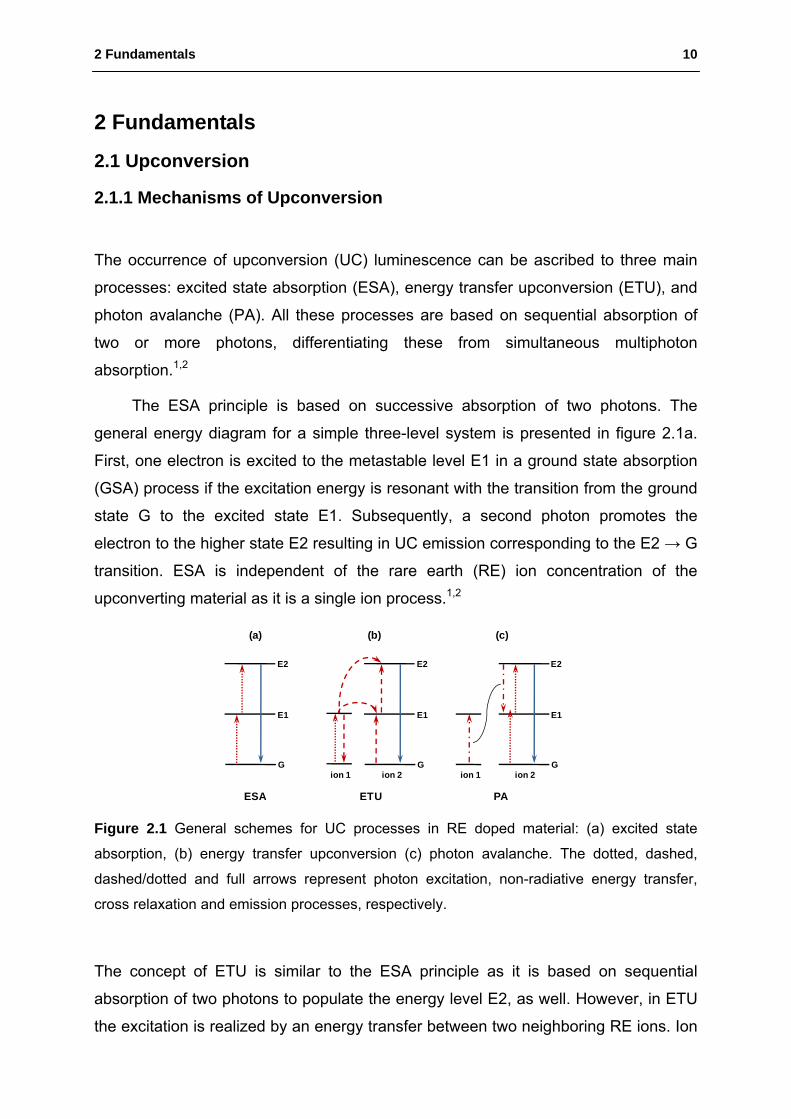
The ESA principle is based on successive absorption of two photons. The
general energy diagram for a simple three-level system is presented in figure 2.1a.
First, one electron is excited to the metastable level E1 in a ground state absorption
(GSA) process if the excitation energy is resonant with the transition from the ground
state G to the excited state E1. Subsequently, a second photon promotes the
electron to the higher state E2 resulting in UC emission corresponding to the E2 → G
transition. ESA is independent of the rare earth (RE) ion concentration of the
upconverting material as it is a single ion process.1,2
G
E1
E2
G
E1
E2
G
E1
E2
ion 1 ion 2 ion 1 ion 2
ESA ETU PA
(a) (b) (c)
Figure 2.1 General schemes for UC processes in RE doped material: (a) excited state
absorption, (b) energy transfer upconversion (c) photon avalanche. The dotted, dashed,
dashed/dotted and full arrows represent photon excitation, non-radiative energy transfer,
cross relaxation and emission processes, respectively.
The concept of ETU is similar to the ESA principle as it is based on sequential
absorption of two photons to populate the energy level E2, as well. However, in ETU
the excitation is realized by an energy transfer between two neighboring RE ions. Ion
2 Fundamentals 11
1 acts as sensitizer (or energy donor) and ion 2 as activator (energy acceptor). A
number of different mechanisms are known, in figure 2.1b the successive energy
transfer is depicted exemplarily. Hereby, only the sensitizer ion absorbs photons and
is excited to level E1. The activator is promoted to its excited state E1 by a first non-
radiative energy transfer while the sensitizer ion relaxes back to ground level G. A
second excitation of the activator and subsequent energy transfer enables the
population of the emitting state E2. The UC efficiency of an ETU process is
influenced by the dopant concentration which determines the average distance
between neighboring dopant ions.1,3
The third main UC luminescence process, the PA upconversion is based on an
unconventional pumping mechanism as it can produce strong emission from level E2
without any resonant GSA. The excited state E1 is populated by a non-resonant
weak GSA, followed by a resonant ESA to promote the ion to the emissive level E2
(figure 2.1c). Next, a cross relaxation energy transfer occurs between the excited ion
and a neighboring ion that is still in ground state. This results in both ions populating
the intermediary level E1. Subsequently, both ions can be promoted to level E2 by
resonant ESA again. This initiates further cross relaxation and exponentially
increases the population of E2 resulting in strong UC emission as an avalanche
process. A characteristic of the PA process is that the excitation intensity has to be
kept above a certain threshold value to enable efficient upconversion.1,3
The UC luminescence efficiency in these three processes differs substantially.
ESA generates the weakest UC luminescence and is only of interest in singly doped
crystals. In materials with metastable, intermediary energy levels that can function as
storage reservoir for pump energy efficient UC based on PA is viable. Though, the
PA process is disadvantageous because of its dependence on excitation power and
its slow response to excitation due to the numerous looping cycles of ESA and cross
relaxation processes. In contrast, ETU happens instantaneously, is independent of
excitation power, and produces UC emission two orders of magnitude higher than
ESA. Therefore, many UC materials with more than one dopant ion have been
developed, based on the ETU process.1
2 Fundamentals 12
2.1.2 Composition and Photoluminescent Properties of Upconverting Materials
Inorganic crystals in general do not display UC luminescence at room temperature.
The UC phenomenon typically occurs in singly or multiply doped host systems.
Hence, research concentrates on materials that consist of a crystalline host and RE
dopants added to the host lattice in low concentrations. For the development of micro
and nanoscale materials with distinct optical properties the exact composition is
particularly crucial. Two different RE ions need to be used as dopants to put into
effect a material emitting ETU-luminescence. 1,2
The dopants must exhibit multiple metastable energy states in order to enable
efficient UC. Thus, lanthanides (Ln) are perfectly suited for this purpose. They
basically exist in their most stable oxidation state as trivalent ions (Ln3+). The 4f
electrons of lanthanides are well shielded by the completely filled 5s2 and 5p6 shells
resulting in weak electron-phonon coupling. This effect is responsible for the sharp
and narrow f-f transition bands. Additionally, f-f transitions are Laporte forbidden,
resulting in low transition probabilities and long-lived excited states. Generally,
lanthanide ions possess more than one excited 4f energy state, except for La3+, Ce3+,
Yb3+ and Lu3+. Consequently, most Ln ions are able to exhibit UC luminescence.
However, excited and intermediary states have to be in energetical proximity to
enable photon absorption and energy transfer to produce efficient emission. Such a
ladder-like configuration of the energy levels is particularly featured by Er3+, Tm3+,
and Ho3+. Thus, these ions are frequently used as activators. Moreover, Er3+ and
Tm3+ possess relatively large energy gaps, resulting in low probabilities for non-
radiative multiphoton relaxations. Therefore, erbium and thulium doped crystals have
shown the most efficient UC luminescence to date.1
In singly doped UCNPs, the UC emission is mainly produced by ESA (figure
2.1a). Hence, the distance between two adjacent activator ions and the absorption
cross-section of the ions are the key parameters for efficient upconversion. High
concentrations of activator ions give rise to luminescence quenching due to
annihilating cross-relaxations. Thus, the doping level should be kept low.
Furthermore, most activator ions possess low absorption cross-sections resulting in
low ESA efficiency. So, the UC efficiency of mono-doped NPS is rather low in
general.1
2 Fundamentals 13
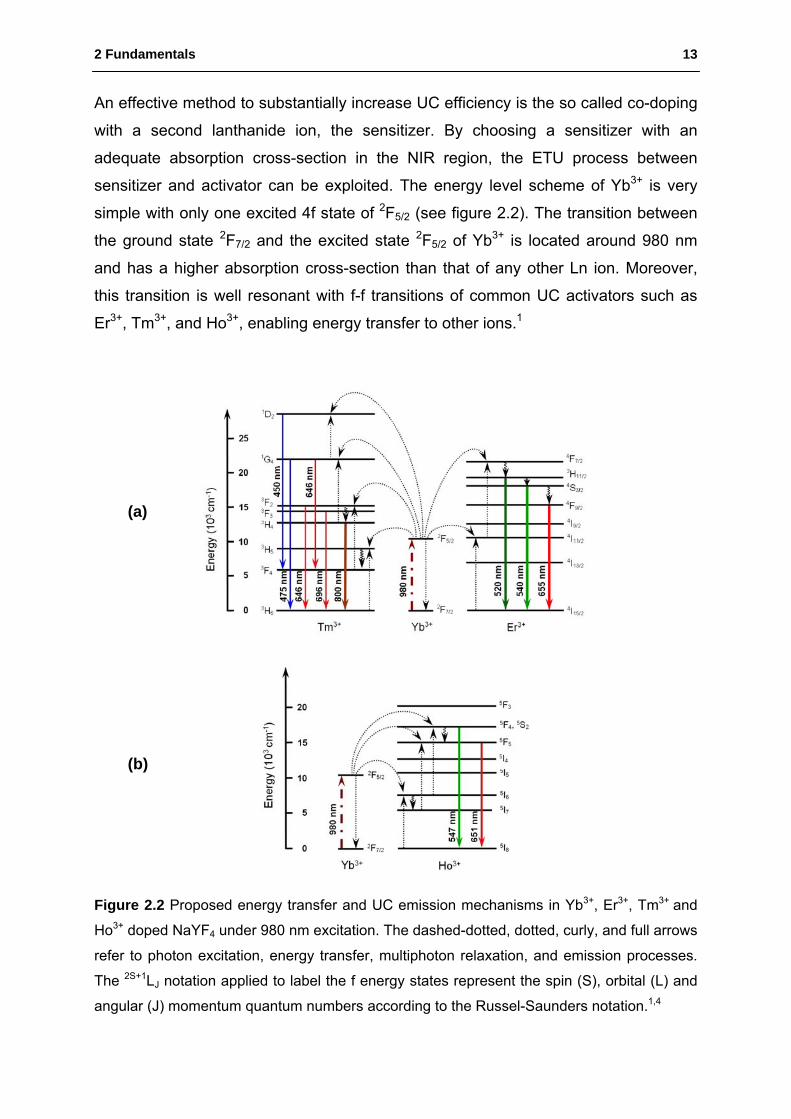
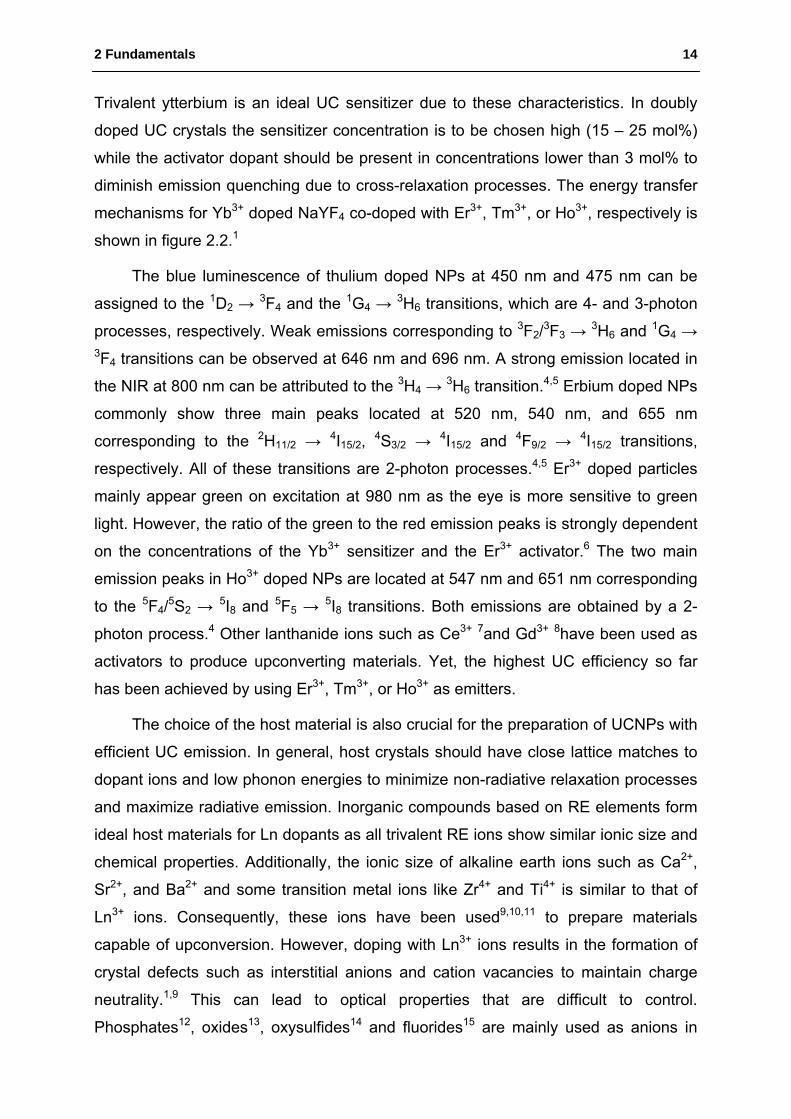
An effective method to substantially increase UC efficiency is the so called co-doping
with a second lanthanide ion, the sensitizer. By choosing a sensitizer with an
adequate absorption cross-section in the NIR region, the ETU process between
sensitizer and activator can be exploited. The energy level scheme of Yb3+ is very
simple with only one excited 4f state of 2F5/2 (see figure 2.2). The transition between
the ground state 2F7/2 and the excited state 2F5/2 of Yb3+ is located around 980 nm
and has a higher absorption cross-section than that of any other Ln ion. Moreover,
this transition is well resonant with f-f transitions of common UC activators such as
Er3+, Tm3+, and Ho3+, enabling energy transfer to other ions.1
Figure 2.2 Proposed energy transfer and UC emission mechanisms in Yb3+, Er3+, Tm3+ and
Ho3+ doped NaYF4 under 980 nm excitation. The dashed-dotted, dotted, curly, and full arrows
refer to photon excitation, energy transfer, multiphoton relaxation, and emission processes.
The 2S+1LJ notation applied to label the f energy states represent the spin (S), orbital (L) and
angular (J) momentum quantum numbers according to the Russel-Saunders notation.1,4
(a)
(b)
2 Fundamentals 14
Trivalent ytterbium is an ideal UC sensitizer due to these characteristics. In doubly
doped UC crystals the sensitizer concentration is to be chosen high (15 – 25 mol%)
while the activator dopant should be present in concentrations lower than 3 mol% to
diminish emission quenching due to cross-relaxation processes. The energy transfer
mechanisms for Yb3+ doped NaYF4 co-doped with Er3+, Tm3+, or Ho3+, respectively is
shown in figure 2.2.1
The blue luminescence of thulium doped NPs at 450 nm and 475 nm can be
assigned to the 1D2 → 3F4 and the 1G4 → 3H6 transitions, which are 4- and 3-photon
processes, respectively. Weak emissions corresponding to 3F2/3F3 → 3H6 and 1G4 → 3F4 transitions can be observed at 646 nm and 696 nm. A strong emission located in
the NIR at 800 nm can be attributed to the 3H4 → 3H6 transition.4,5 Erbium doped NPs
commonly show three main peaks located at 520 nm, 540 nm, and 655 nm
corresponding to the 2H11/2 → 4I15/2, 4S3/2 → 4I15/2 and 4F9/2 → 4I15/2 transitions,
respectively. All of these transitions are 2-photon processes.4,5 Er3+ doped particles
mainly appear green on excitation at 980 nm as the eye is more sensitive to green
light. However, the ratio of the green to the red emission peaks is strongly dependent
on the concentrations of the Yb3+ sensitizer and the Er3+ activator.6 The two main
emission peaks in Ho3+ doped NPs are located at 547 nm and 651 nm corresponding
to the 5F4/5S2 → 5I8 and 5F5 → 5I8 transitions. Both emissions are obtained by a 2-
photon process.4 Other lanthanide ions such as Ce3+ 7and Gd3+ 8have been used as
activators to produce upconverting materials. Yet, the highest UC efficiency so far
has been achieved by using Er3+, Tm3+, or Ho3+ as emitters.
The choice of the host material is also crucial for the preparation of UCNPs with
efficient UC emission. In general, host crystals should have close lattice matches to
dopant ions and low phonon energies to minimize non-radiative relaxation processes
and maximize radiative emission. Inorganic compounds based on RE elements form
ideal host materials for Ln dopants as all trivalent RE ions show similar ionic size and
chemical properties. Additionally, the ionic size of alkaline earth ions such as Ca2+,
Sr2+, and Ba2+ and some transition metal ions like Zr4+ and Ti4+ is similar to that of
Ln3+ ions. Consequently, these ions have been used9,10,11 to prepare materials
capable of upconversion. However, doping with Ln3+ ions results in the formation of
crystal defects such as interstitial anions and cation vacancies to maintain charge
neutrality.1,9 This can lead to optical properties that are difficult to control.
Phosphates12, oxides13, oxysulfides14 and fluorides15 are mainly used as anions in
2 Fundamentals 15
the crystal host. Phosphates and oxides are chemically stable but possess virtually
high phonon energies1,16, thus giving rise to non-radiative energy losses. In contrast,
oxysulfides are not stable against acids. Fluorides show low phonon energies and
high chemical stability. Therefore, they are widely used as host crystal for
upconverting NPs.
Not only has the choice of the host material large influence on the efficiency of
the UC emission but also the crystal structure. This is especially evident in sodium
yttrium fluoride (NaYF4). Hexagonal phase β-NaYF4 crystals exhibit a UC emission
an order of magnitude higher than α-NaYF4 particles.17 This effect is due to the
formation of different crystals fields around the dopant Ln ions in matrices with
diverse symmetry. In a highly symmetric cubic host material f-f transitions are
strongly parity forbidden and thus, the UC emission efficiency is rather weak. In a
host with lower symmetry, such as the hexagonal crystal system, there are more
uneven components surrounding the dopant ion, thus, enhancing f-f transition
probabilities.
The luminescence efficiency depends aside from matrix effects also on particle
size.18 Generally, bigger particles exhibit UC with higher intensity. Therefore, much
lower excitation energies are required when working with UCµPs. The effect of the
particle size on UC efficiency is not yet fully understood, but there might be a
correlation between the surface-volume-ratio and emission intensity.
2.1.3 Synthesis of Upconverting Nanoparticles
A variety of methods to prepare UCNPs in different sizes has been developed in
recent years.1 A very simple and convenient technique is the co-precipitation method,
permitting NP preparation in tunable sizes and narrow size distributions. In a typical
procedure, solutions of Ln salts are injected into a solution of the host material (such
as sodium fluoride to form NaYF4 or YF3 NPs or phosphoric acid to form LnPO4 NPs)
with subsequent spontaneous precipitation of the nanocrystals.12,19 The particle
growth can be tuned and stabilized by using capping ligands (ammonium di-n-
octadecyldithiophosphate)20 or chelating agents (ethylenediaminetetraacetic acid,
EDTA).19 For the preparation of NaYF4 in particular, a heat treatment or annealing
2 Fundamentals 16
process is required to obtain efficient UCNPs. Co-precipitation generally gives cubic
α-NaYF4. Calcination at high temperatures results in sharpening of the crystal
structure or even in an at least partial phase transfer to the hexagonal β-NaYF4,
which shows higher UC efficiency.19 The co-precipitation method does not demand
any costly apparatus, complex procedures, or harsh reaction conditions and is not
time consuming. Furthermore, the surface of the UCNPs prepared by this method is
hydrophilic, possibly due to coordination of EDTA.
Another technique for the preparation of upconverting particles is the thermal
decomposition method yielding highly monodisperse UCNPs.21,22 Metal
trifluoroacetate precursors are thermolyzed in the presence of oleic acid and 1-
octadecene. Octadecene acts as high boiling solvent (315°C), whereas oleic acid
serves as stabilizing agent to suppress particle agglomeration. In case of NaYF4, the
thermal decomposition method directly yields hexagonal β-NaYF4, with no need for
any annealing process. Drawbacks of this method are its expensive and air-sensitive
metal precursors, and the toxic byproducts. Furthermore, the oleic acid coordinates
to the particles surface rendering them hydrophobic as it is nearly impossible to
remove.23 Therefore, NPs synthesized with the thermal decomposition method are
well dispersible in organic solvents but hardly in aqueous solution.
The hydro(solvo)thermal method uses a pressurized solvent and reaction
temperatures above the critical point to improve the solubility of solids and to
accelerate reactions between solid states.24,25 This approach allows for the
preparation of highly crystalline material at much lower temperatures and without the
need for an annealing process. However, specialized reaction vessels, known as
autoclaves, which resist the high pressures during the reaction, are required. Crystal
size and morphology is tunable by polyol- or micelle-mediation.26,27 Recently, ionic
liquids have been used to prepare β-NaYF4 under relatively mild conditions.28
The sol-gel process provides UCNPs for applications such as thin film coating
or glass materials.1 The method is based on the hydrolysis and polycondensation of
metal alkoxide or acetate precursors.29 Usually, a post heat-treatment step is
required. NPs prepared with the sol-gel technique commonly are not suitable for
biological application and can not be dispersed in aqueous solutions due to
considerable particle aggregation.
2 Fundamentals 17
Summarized, sol-gel and solvothermal methods generally require long reaction times.
As opposed to this, UCNPs can be prepared within minutes with the combustion
method.1 Herein, oxidic nanoparticles are prepared in a highly exothermic reaction
that spreads through the reaction material in a self-sustained manner without the
need for additional heat after primarily initiated by a heat source. This makes the
method time and energy saving. The substantial particle aggregation and the
formation of amorphous material as side reaction are disadvantageous.30 Flame
synthesis represents another time saving method for the preparation of UCNPs.1
Yttrium oxides can be prepared by this continuous and easily scalable method.
Particle size and morphology as well as photoluminescent properties are strongly
dependent on flame temperature.31 In summary, choice of the appropriate synthesis
method allows for the development of readily tailored UCNPs whose properties can
be adjusted to the envisioned applications.
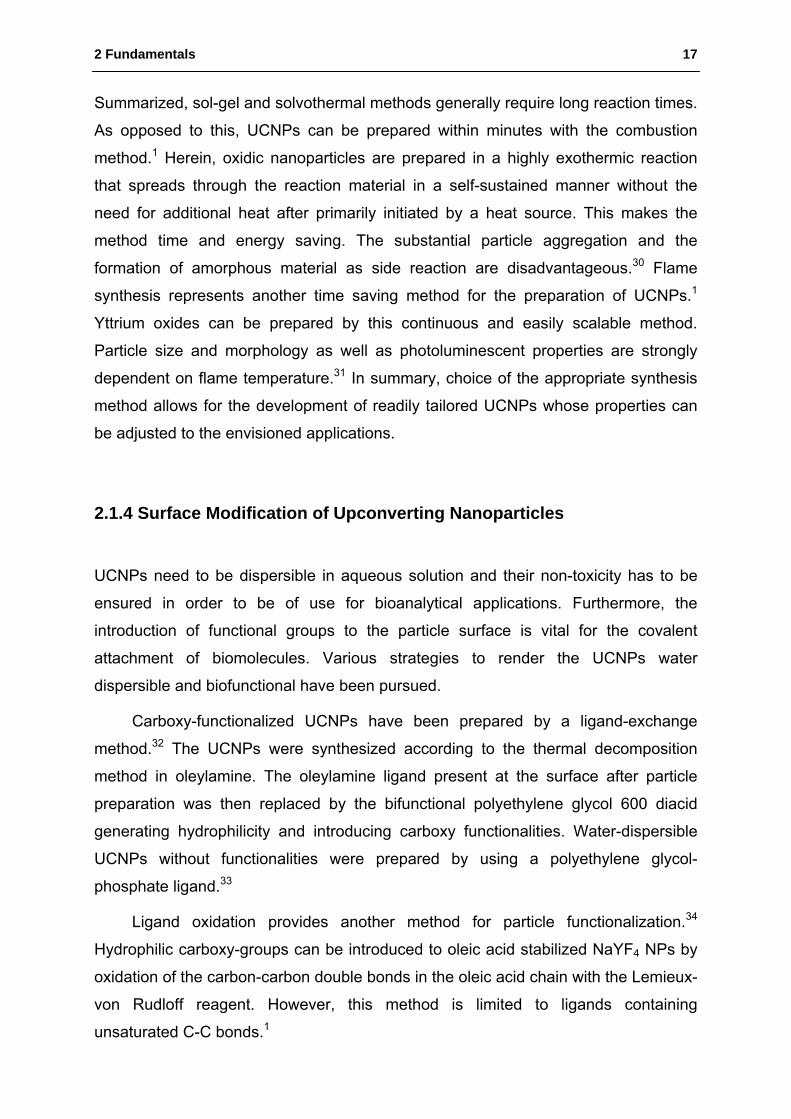
2.1.4 Surface Modification of Upconverting Nanoparticles
UCNPs need to be dispersible in aqueous solution and their non-toxicity has to be
ensured in order to be of use for bioanalytical applications. Furthermore, the
introduction of functional groups to the particle surface is vital for the covalent
attachment of biomolecules. Various strategies to render the UCNPs water
dispersible and biofunctional have been pursued.
Carboxy-functionalized UCNPs have been prepared by a ligand-exchange
method.32 The UCNPs were synthesized according to the thermal decomposition
method in oleylamine. The oleylamine ligand present at the surface after particle
preparation was then replaced by the bifunctional polyethylene glycol 600 diacid
generating hydrophilicity and introducing carboxy functionalities. Water-dispersible
UCNPs without functionalities were prepared by using a polyethylene glycol-
phosphate ligand.33
Ligand oxidation provides another method for particle functionalization.34
Hydrophilic carboxy-groups can be introduced to oleic acid stabilized NaYF4 NPs by
oxidation of the carbon-carbon double bonds in the oleic acid chain with the Lemieux-
von Rudloff reagent. However, this method is limited to ligands containing
unsaturated C-C bonds.1
2 Fundamentals 18
Oleylamine stabilized NaYF4 nanocrystals have also been modified by ligand
attraction of an additional amphiphilic block copolymer35 onto the particle surface.
The amphiphilic copolymer polyacrylic acid (PAA) attaches to the stabilized NPs by
hydrophobic van der Waals interactions. The carboxy groups of the PAA are directed
outwards from the particle surface after coating rendering the NPs water dispersible
and bioconjugatable.
Layer-by-layer assembly of oppositely-charged polyions36,37 to the particles
surface has also been used for biofunctionalization of UCNPs. Positively charged
poly(allylamine hydrochloride) (PAH) and negatively charged poly(sodium 4-
styrenesulfonate) (PSS) are subsequently adsorbed to the NPs forming a stable
amino functionalized shell. This method provides versatile, highly stable, and
biocompatible NPs with controllable shell thickness and charge. Drawbacks are the
required washing steps and the limitation of this process to hydrophilic UCNPs.1
Electrostatic immobilization of negatively charged poly(ethylene glycol)-b-
poly(acrylic acid)38 was also used to generate water dispersible nanocrystals.
Streptavidin could be coimmobilized to introduce biofunctionality to this type of
particle. A derivative of poly(acrylic acid) (PAA) was used to introduce carboxy
groups to bead-milled UCµPs and subsequently to attach streptavidin.39
All methods to coat UCNPs mentioned so far are based on non-covalent
attachment of polymers by electrostatic or hydrophobic interactions. The only
covalent coating method to date is the surface silanization technique.40 In this
approach the UCNPs are coated with a thin layer of silica (more precisely SiO2) by
the controlled hydrolysis and polycondensation of precursors such as tetraethyl
orthosilicate (TEOS). Functional groups can easily be introduced by the use of
organosilanes. Particularly aminosilanes have been used to modify the silica surface.
The aminomodified UCNPs can be further biofunctionalized by covalent attachment
of biomolecules such as biotin,40 folic acid,41 peptides,42 proteins,43 antibodies,44,45
and DNA.37,46 Silica coated UCNPs have also been directly linked to aminomodified
DNA47 without the use of organosilanes. Polymers such as poly(vinyl pyrrolidone)
(PVP)48 have been used to stabilize the silica shell and control its thickness. Benefits
of the silica coating technique are the applicability to both hydrophilic and
hydrophobic UCNPs and that entrapment of secondary reporters such as magnetic
NPs (Fe3O4)43,49 or organic dyes becomes possible.50 In addition, the resulting coated
2 Fundamentals 19
UCNPs are non-toxic,51 monodisperse and can be easily dispersed in aqueous
solution.
2.2 Silica Nanoparticles and Coatings
Silica nanoparticles have been commercialized and are available in various size
distributions. As mentioned, silica is a rather benign and biocompatible material.
Therefore, it represents an ideal construction tool for bioanalytical applicable
fluorescent reporter particles. Furthermore, it is suitable for the coating of
nanoparticles made from both organic and inorganic materials, UCNPs being only
one example. Additionally, functional groups can be easily introduced to silica
surfaces by using the appropriate silane reagents. The chemistry and properties of
silica surfaces and particles have been extensively studied in the past.52,53 Therefore,
the following section concentrates on the coating of UCNPs and the
biofunctionalization of the silica surface in general.
2.2.1 Coating Process
Two general synthetic routes are known to prepare silica coatings: The Stöber
process and the microemulsion process. In 1968, Stöber et al.54 introduced a method
for preparing monodisperse silica nanoparticles with diameters ranging from 50 nm to
2 µm. This technique can also be used for the coating of UCNPs with SiO2. In a
typical procedure, the UCNPs are dispersed in alcohol (ethanol or 1-propanol).
Subsequently, a silica alkoxide precursor (such as TEOS) is added, which hydrolyzes
to monosilicic acid in presence of ammonium hydroxide. Monosilicic acid is very
prone to intermolecular condensations as it is only stable in very low concentration in
alcoholic solutions. The catalyst ammonium hydroxide ensures that the concentration
of silicic acid is above its solubility and that the nucleation concentration is
consequently exceeded.55,56 Accordingly, the monosilicic acid undergoes a
homogeneous condensation process. First, disilicic acid is formed, followed by a
trimer et cetera, until a shell around the UCNP core is formed. A schematic
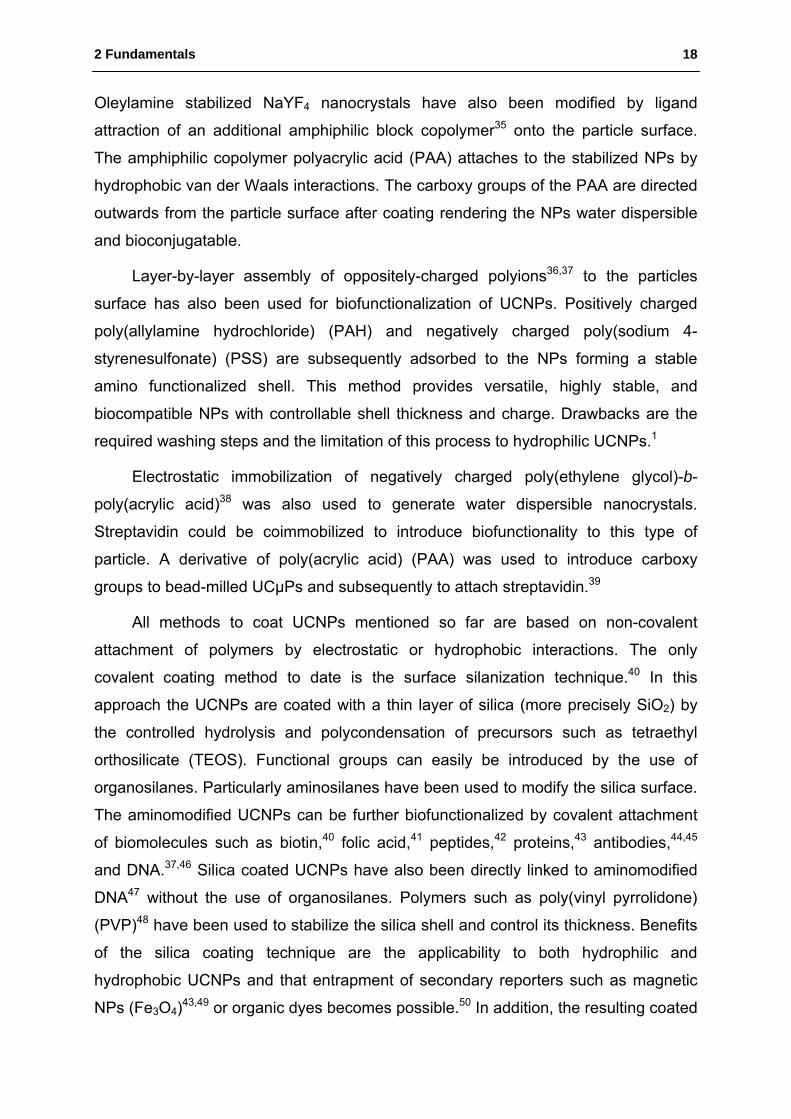
representation of the hydrolysis of TEOS is shown in figure 2.3.
2 Fundamentals 20
Figure 2.3 Hydrolysis of TEOS in presence of ammonium hydroxide as catalyst.
Generally, the Stöber process yields monodispersely coated particles with an evenly
distributed shell thickness. Nevertheless, the formation of pure silica particles besides
the coating of the UCNPs is always a side effect in coating processes. Therefore, it is
crucial to control the concentrations of both TEOS precursor and ammonia catalyst to
suppress the development of secondary nuclei. Silica coated NPs obtained by the
Stöber process can either be separated from the reaction solution via centrifugation
or via size exclusion chromatography. Keeping the particles in their colloidal state
should be preferred as silica coated NPs shows a tendency towards aggregation.
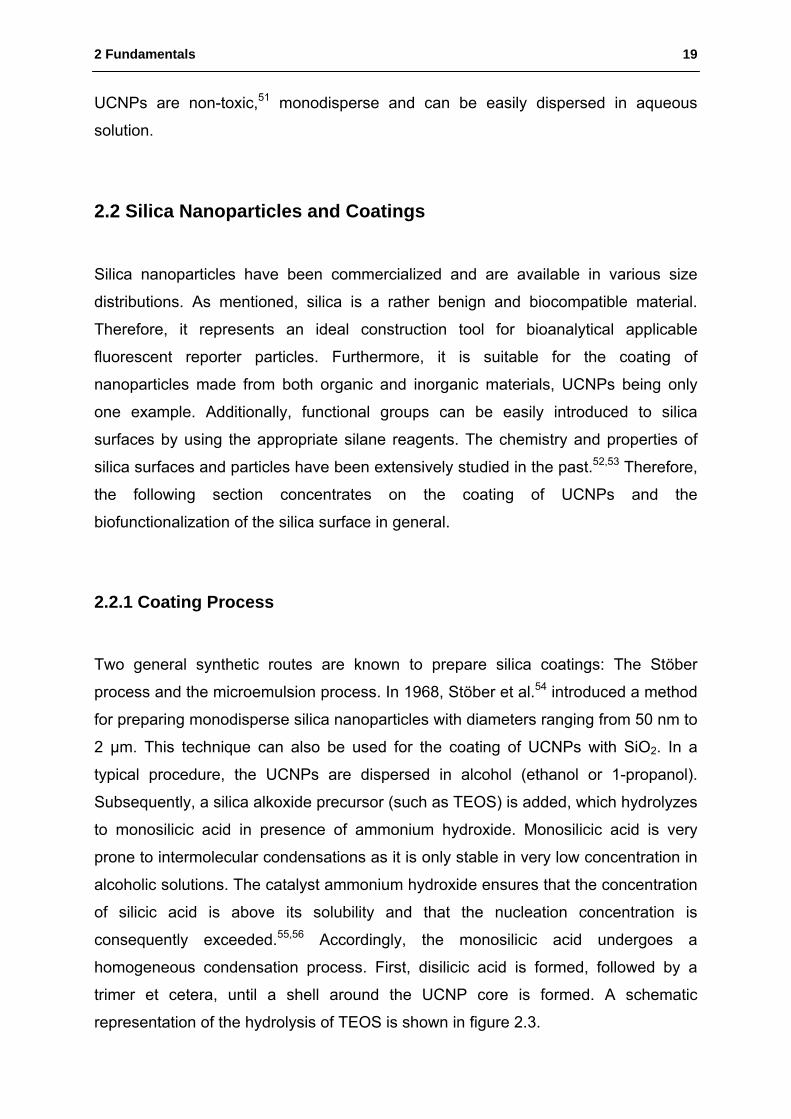
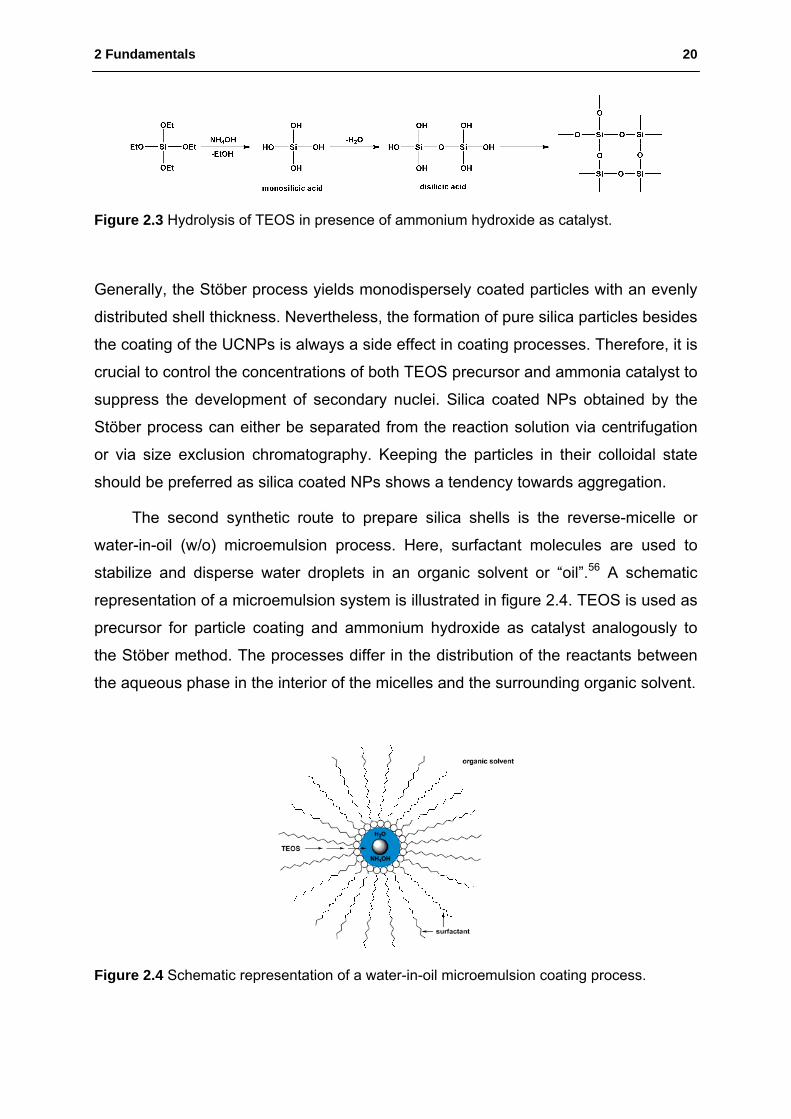
The second synthetic route to prepare silica shells is the reverse-micelle or
water-in-oil (w/o) microemulsion process. Here, surfactant molecules are used to
stabilize and disperse water droplets in an organic solvent or “oil”.56 A schematic
representation of a microemulsion system is illustrated in figure 2.4. TEOS is used as
precursor for particle coating and ammonium hydroxide as catalyst analogously to
the Stöber method. The processes differ in the distribution of the reactants between
the aqueous phase in the interior of the micelles and the surrounding organic solvent.
Figure 2.4 Schematic representation of a water-in-oil microemulsion coating process.
2 Fundamentals 21
The polar ammonium hydroxide is located in the water phase, whereas TEOS is
partitioned between aqueous and organic phase. Diffusion of the TEOS into the
micelles, which act as “nanoreactors”, promotes the coating reaction. The coated
UCNPs are separated from the reaction solution by breaking of the microemulsion via
addition of acetone. The size of the developing particles generally is determined by
the size of the water nanodroplets, which is controlled by the water-to-surfactant
molar ratio.55 However, the type of microemulsion system chosen also has an effect
on particle size. Furthermore, the ideal reaction conditions have to be specifically
adjusted to the type and size of the UCNPs that are to be coated. Another drawback
of the microemulsion method is that the coated NPs have to be precipitated and
centrifuged to isolate them. The particles cannot be kept in a colloidal state to
minimize aggregation effects. Moreover, it is virtually impossible to completely
remove the surfactant molecules by washing. Typically, the microemulsion process is
applied to UCNPs with a hydrophobic surface,51 whereas the Stöber method can be
used for both hydrophilic and hydrophobic UCNPs.43,57
2.2.2 Surface Modification and Bioconjugation
Particles with a silica surface need to be linked to biorecognition elements, such as
proteins, antibodies or DNA molecules, to be of use in bioanalysis or biotechnological
applications.56 Most of these molecules can be physically adsorbed onto the silica
surface. However, covalent linkage is to be preferred as it allows controlling the
number and orientation of the immobilized reporter molecules and avoids desorption
of these. Suitable functional groups need to be introduced to the particle surface to
enable covalent attachment. This is commonly done by applying organically modified
silanes (with carboxy, thiol, or amino groups) in a secondary silica coating process.
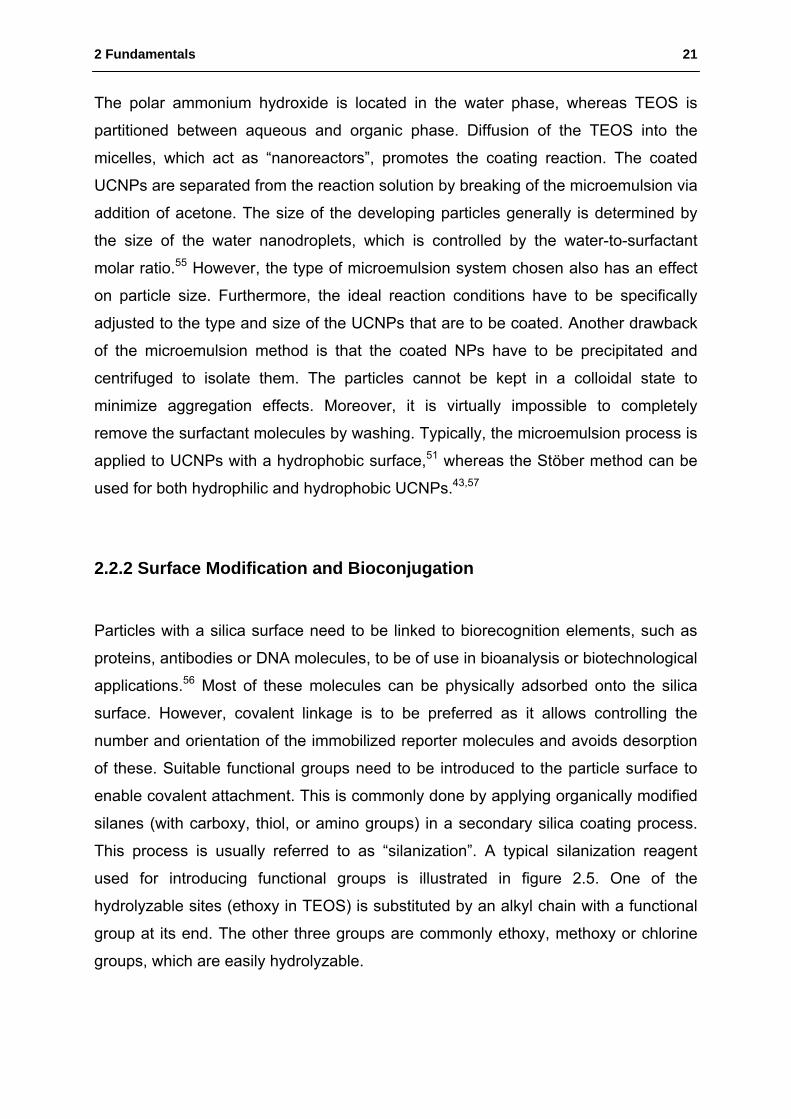
This process is usually referred to as “silanization”. A typical silanization reagent
used for introducing functional groups is illustrated in figure 2.5. One of the
hydrolyzable sites (ethoxy in TEOS) is substituted by an alkyl chain with a functional
group at its end. The other three groups are commonly ethoxy, methoxy or chlorine
groups, which are easily hydrolyzable.
2 Fundamentals 22
Figure 2.5 Typical structure of a silanization reagent with X representing a functional group
and R a hydrolyzable site.
The organically modified silanes react with the free hydroxy groups on the silica
surface analog to the hydrolysis and polycondensation process of TEOS described
before. Silanization can be performed in a post-coating step after the prior coating
with TEOS.56 However, it is much more practicable to use a mixture of TEOS and the
desired organosilane to attain a silica coating and functionalization in a one-pot
reaction as it requires only one separation step.49,58
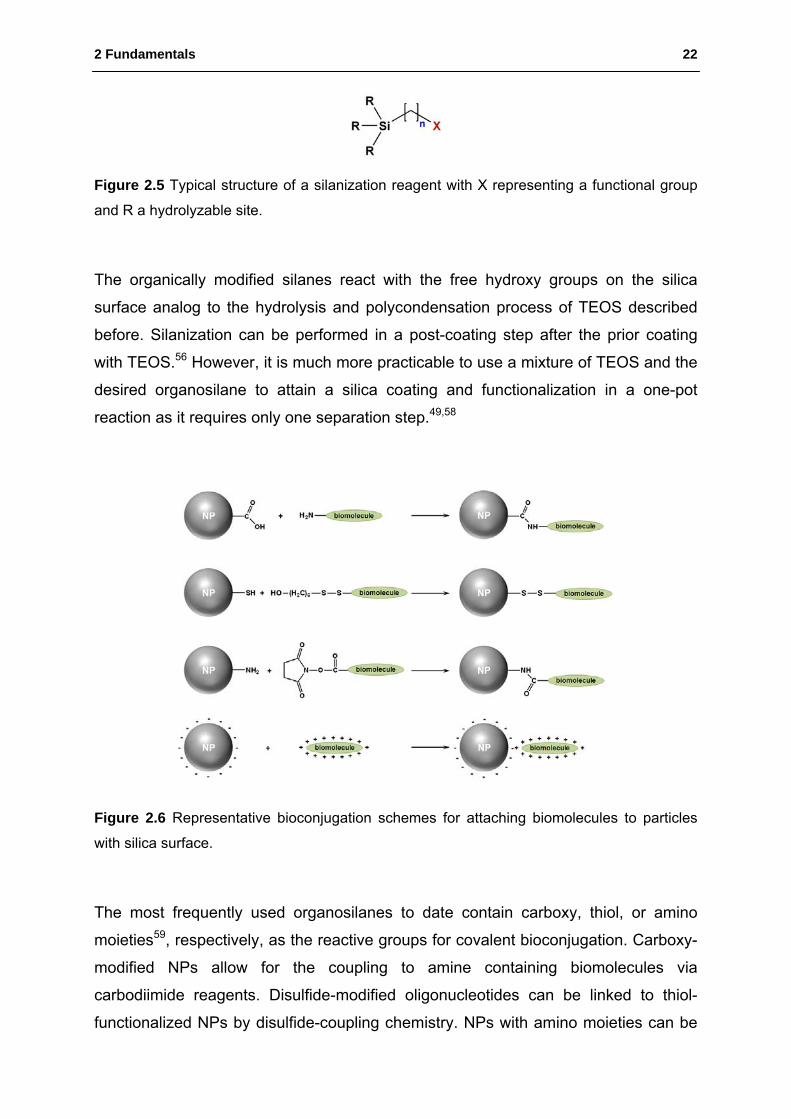
Figure 2.6 Representative bioconjugation schemes for attaching biomolecules to particles
with silica surface.
The most frequently used organosilanes to date contain carboxy, thiol, or amino
moieties59, respectively, as the reactive groups for covalent bioconjugation. Carboxy-
modified NPs allow for the coupling to amine containing biomolecules via
carbodiimide reagents. Disulfide-modified oligonucleotides can be linked to thiol-
functionalized NPs by disulfide-coupling chemistry. NPs with amino moieties can be
2 Fundamentals 23
attached to a large variety of amino reactive biological entities via succinimidyl esters
and iso(thio)cyanates.56,60 The most common bioconjugation schemes are illustrated
in figure 2.6 in comparison to the electrostatic adsorption process.
All functional groups used for these conjugations are abundant in proteinic
biomolecules giving rise to unspecific binding reactions. Furthermore, introduction of
amino or carboxy groups alters the overall charge of the particles surface. This can
lead to a decrease in the colloidal stability of the NPs and thus cause severe particle
aggregation. Therefore, other functional groups have been taken into account for the
modification of silica NPs. Among these, azido and alkyne have become very
popular,61,62,63 as they undergo a 1,3-dipolar cycloaddition also referred to as “click
reaction”.
2.3 Click Chemistry
2.3.1. Definition of Click Chemistry
In 2001, Sharpless et al,64 defined the term “click chemistry” for the development of
modular, easy-to-make building blocks in organic chemistry. A certain process must
meet specific criteria to be termed “click reaction”. The reaction must be modular, of
wide scope, and give high yields. It has to be carried out under simple reaction
conditions with readily available starting materials. The process must be insensitive
towards water or oxygen and should not require hazardous solvents. Characteristics
include stereospecifity and physiological stability of the product. Byproducts should
be inoffensive and reaction work-up and purification must be simple, without
chromatographic methods.64,65
A number of reactions have been found that meet this criteria. They usually rely
on carbon-heteroatom bond-formation. In general, the click chemistry family includes
cycloaddition reactions, particularly of the 1,3-dipolar type, and hetero-Diels-Alder
reactions. Additionally, nucleophilic substitution reactions, especially ring-openings of
strained heterocyclic electrophiles such as epoxides, or aziridines can be included to
this class. Furthermore, carbonyl reactions of the “non-aldol” kind (formation of ureas,
aromatic heterocycles) and additions to carbon-carbon multiple bonds (epoxidation,
dihydroxylation, but also specific Michael additions) can be termed click reactions.64
2 Fundamentals 24
However, the premier example of a click reaction, is the copper catalyzed azide-
alkyne cycloaddition (CuAAC).
2.3.2 The 1,3-Dipolar Cycloaddition of Azides and Alkynes
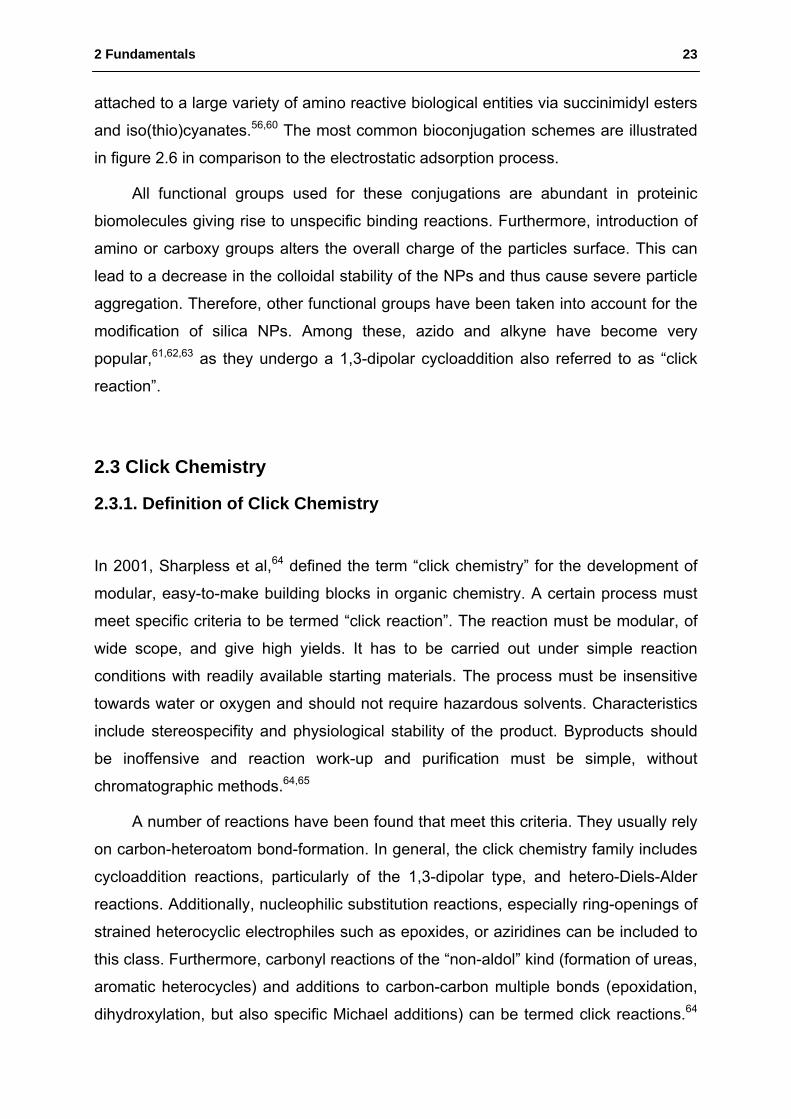
The 1,3-dipolar cycloaddition of azides and alkynes to give 1,2,3-triazoles has been
known for more than 100 years66 and has been extensively studied in the 1960s by
Rolf Huisgen.67 The reaction scheme is shown in figure 2.7.
Figure 2.7 The Huisgen 1,3-dipolar cycloaddition of alkynes and azides.
At first glance, the reaction does not seem to be suitable for click chemistry as it is
not regioselective and usually gives the 1,4-disubstituted 1,2,3-triazole and its 1,5-
regioisomer in equimolar mixtures. Additionally, the reaction only proceeds at
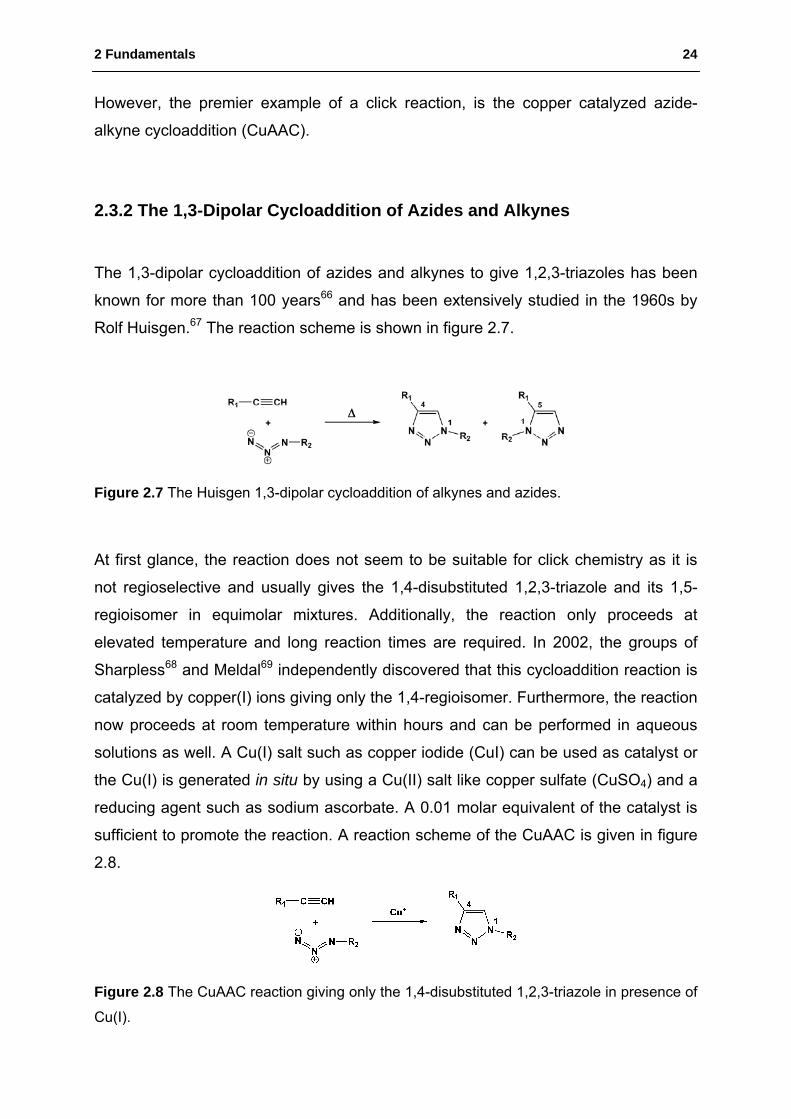
elevated temperature and long reaction times are required. In 2002, the groups of
Sharpless68 and Meldal69 independently discovered that this cycloaddition reaction is
catalyzed by copper(I) ions giving only the 1,4-regioisomer. Furthermore, the reaction
now proceeds at room temperature within hours and can be performed in aqueous
solutions as well. A Cu(I) salt such as copper iodide (CuI) can be used as catalyst or
the Cu(I) is generated in situ by using a Cu(II) salt like copper sulfate (CuSO4) and a
reducing agent such as sodium ascorbate. A 0.01 molar equivalent of the catalyst is
sufficient to promote the reaction. A reaction scheme of the CuAAC is given in figure
2.8.
Figure 2.8 The CuAAC reaction giving only the 1,4-disubstituted 1,2,3-triazole in presence of
Cu(I).
2 Fundamentals 25
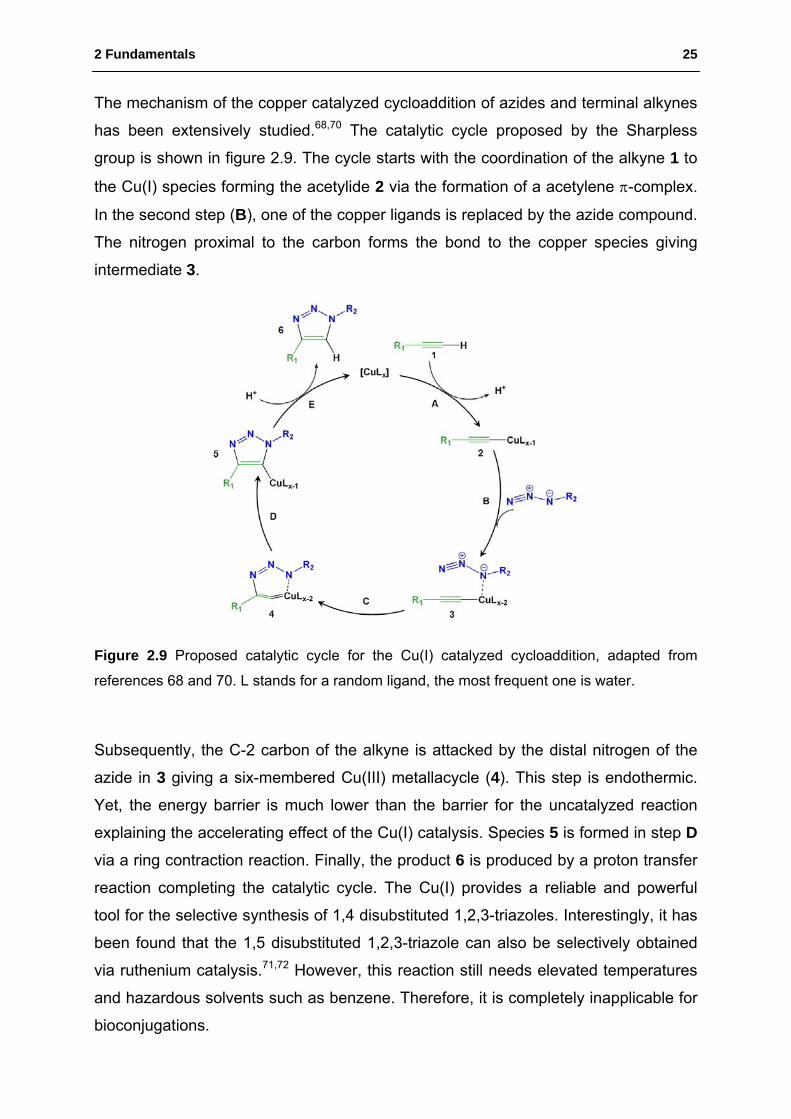
The mechanism of the copper catalyzed cycloaddition of azides and terminal alkynes
has been extensively studied.68,70 The catalytic cycle proposed by the Sharpless
group is shown in figure 2.9. The cycle starts with the coordination of the alkyne 1 to
the Cu(I) species forming the acetylide 2 via the formation of a acetylene π-complex.
In the second step (B), one of the copper ligands is replaced by the azide compound.
The nitrogen proximal to the carbon forms the bond to the copper species giving
intermediate 3.
Figure 2.9 Proposed catalytic cycle for the Cu(I) catalyzed cycloaddition, adapted from
references 68 and 70. L stands for a random ligand, the most frequent one is water.
Subsequently, the C-2 carbon of the alkyne is attacked by the distal nitrogen of the
azide in 3 giving a six-membered Cu(III) metallacycle (4). This step is endothermic.
Yet, the energy barrier is much lower than the barrier for the uncatalyzed reaction
explaining the accelerating effect of the Cu(I) catalysis. Species 5 is formed in step D
via a ring contraction reaction. Finally, the product 6 is produced by a proton transfer
reaction completing the catalytic cycle. The Cu(I) provides a reliable and powerful
tool for the selective synthesis of 1,4 disubstituted 1,2,3-triazoles. Interestingly, it has
been found that the 1,5 disubstituted 1,2,3-triazole can also be selectively obtained
via ruthenium catalysis.71,72 However, this reaction still needs elevated temperatures
and hazardous solvents such as benzene. Therefore, it is completely inapplicable for
bioconjugations.
2 Fundamentals 26
Azides and alkynes are among the least reactive functional groups in organic
chemistry even though they also belong to the most energetic species known. Their
stability, being merely of kinetic origin, is the main reason for the slow nature of the
cycloaddition reaction in the absence of a catalyst. Furthermore, it ensures inertness
towards biological molecules and towards the reaction conditions inside living
systems.65 Therefore, the CuAAC is one of only few reactions considered
bioorthogonal.73 There are certain applications, though, where the use of Cu(I) is not
desired. Even low concentrations of copper are cytotoxic, excluding the CuAAC from
all kinds of living cell labeling applications. In response to this, the so called Cu-free
click chemistry74 has been developed. Hereby, a strained cyclooctyne ring is used
instead of the terminal alkyne. The ring-strain promotes the cycloaddition reaction
and the Cu catalyst becomes redundant. This makes the Cu-free azide-alkyne
cycloaddition an ideal tool for bioorthogonal ligations in vivo.75,76 Combining the Cu-
free method with the Cu-mediated reaction enables specific double labeling in a so
called “sequential approach”.77 This is of interest especially for FRET-based
investigations.62
The Cu-catalyzed cycloaddition of azides and terminal alkynes is the only
process relying on the click concept used in this work. Therefore, the CuAAC will be
referred to as “the click reaction” in the following, which is in agreement with most
literature related to this topic.
2.4 References
1 Wang F, Liu X (2009) Recent Advances in the Chemistry of Lanthanide-Doped Upconversion Nanocrystals, Chem. Soc. Rev. 38: 976-989.
2 Auzel F (2004) Upconversion and Anti-Stokes Processes with f and d Ions in Solids, Chem. Rev. 104: 139-173.
3 Joubert M-F (1999) Photon Avalanche Upconversion in Rare Earth Laser Materials, Opt. Mater. 11: 181-203.
4 Yang LW, Han HL, Zhang YY, Zhong JX (2009) White Emission by Frequency Up-Conversion in Yb3+-Ho3+-Tm3+ Triply Doped Hexagonal NaYF4 Nanorods, J. Phys. Chem. C 113: 18995-18999.
5 Wang J, Liu X (2008) Upconversion Multicolor Fine-Tuning: Visible to Near-Infrared Emission from Lanthanide-Doped NaYF4 Nanoparticles, J. Am. Chem. Soc. 130: 5642-5643.
6 Mai H-X, Zhang Y-W, Sun L-D, Yan C-H (2007) Highly Efficient Multicolor Up-Conversion Emissions and Their Mechanisms of Monodisperse NaYF4: Yb, Er Core and Core/Shell Structured Nanocrystals, J. Phys. Chem. C 111: 13721-13729.
2 Fundamentals 27
7 Chen G, Liu H, Somesfalean G, Liang H, Zhang Z (2009) Upconversion Emission Tuning from Green to Red in Yb3+/Ho3+-codoped NaYF4 Nanocrystals by Tridoping with Ce3+ Ions, Nanotechnology 20: 385704-1 - 385704-6.
8 Mahalingam V, Naccache R, Vetrone F, Capobianco JA (2009) Sensitized Ce3+ and Gd3+ Ultraviolet Emissions by Tm3+ in Colloidal LiYF4 Nanocrystals, Chem. Eur. J. 15: 9660-9663
9 Wang G, Peng Q, Li Y (2009) Upconversion Luminescence of Monodisperse CaF2: Yb3+/Er3+ Nanocrystals, J. Am. Chem. Soc. 131: 14200-14201.
10 Patra A, Friend CS, Kapoor R, Prasad PN (2003) Fluorescence Upconversion Properties of Er3+-Doped TiO2 and BaTiO3 Nanocrystallites, Chem. Mater. 15: 3650-3655.
11 Hyppänen I, Hölsa J, Kankare J, Lastusaari M, Pihlgren L (2008) Preparation and Characterization of Nanocrystalline ZrO2: Yb3+, Er3+ Up-conversion Phosphors, Ann. N. Y. Acad. Sci. 1130: 267-271.
12 Heer S, Lehmann O, Haase M, Güdel H-U (2003) Blue, Green, and Red Upconversion Emission from Lanthanide-Doped LuPO4 and YbPO4 Nanocrystals in a Transparent Colloidal Solution, Angew. Chem. Int. Ed. 42: 3179-3182, Angew. Chem. 115: 3288-3291.
13 Lü Q, Gu JY, Sun L, Li AH, Zhao LC (2008) Silica-/Titania-coated Y2O3: Tm3+, Yb3+ Nanoparticles with Improvement in Upconversion Luminescence Induced by Different Thickness Shells, J. Appl. Phys. 103: 123533.
14 Hyppänen I, Hölsä J, Jouko K, Lastusaari M, Pihlgren L (2009) Up-conversion Luminescence Properties of Y2O2S: Yb3+, Er3+ Nanophosphors, Opt. Mater. 31: 1787-1790.
15 Aebischer A, Hostettler M, Hauser J, Krämer K, Weber T, Güdel HU, Bürgi H-B (2006) Structural and Spectroscopic Characterization of Active Sites in a Family of Light-Emitting Sodium Lanthanide Tetrafluorides, Angew. Chem. Int. Ed. 45: 2802-2806, Angew. Chem. 118: 2869-2873..
16 Zhang L, Hu H, Qi C, Lin F (2001) Spectroscopic Properties and Energy Transfer in Yb3+/Er3+-Doped Phosphate Glasses, Opt. Mater. 17: 371-377.
17 Krämer KW, Biner D, Frei G, Güdel HU, Hehlen MP, Lüthi SR (2004) Hexagonal Sodium Yttrium Fluoride Based Green and Blue Emitting Upconversion Phosphors, Chem. Mater. 16: 1244-1251.
18 Shan J, Ju Y (2009) A Single-Step Synthesis and the Kinetic Mechanism for Monodisperse and Hexagonal-Phase NaYF4: Yb, Er Upconversion Nanophosphors, Nanotechnology 20: 275603 (13 pp).
19 Yi G, Lu H, Zhao S, Ge Y, Yang W, Chen D, Guo L-H (2004) Synthesis, Characterization, and Biological Application of Size-Controlled Nanocrystalline NaYF4: Yb, Er Infrared-to-Visible Up-Conversion Phosphors, Nano Lett. 4: 2191-9196.
20 Yi G-S. Chow G-M (2005) Colloidal LaF3: Yb, Er, LaF3: Yb, Ho and LaF3: Yb, Tm Nanocrystals with Multicolor Upconversion Fluorescence, J. Mater. Chem. 15: 4460-4464.
21 Mai, H-X, Zhang Y-W, Sun L-D, Yan C-H (2007) Highly Efficient Multicolor Up-Conversion Emissions and Their Mechanisms of Monodisperse NaYF4: Yb, Er Core and Core/Shell-Structured Nanocrystals, J. Phys. Chem. C 111: 13721-13729.
22 Qian H-S, Zhang Y (2008) Synthesis of Hexagonal-Phase Core-Shell NaYF4 Nanocrystals with Tunable Upconversion Fluorescence, Langmuir 24: 12123-12125.
23 Boyer J-C, Vetrone F, Cuccia LA, Capobianco JA (2006) Synthesis of Colloidal Upconverting NaYF4 Nanocrystals Doped with Er3+, Yb3+ and Tm3+, Yb3+ via Thermal Decomposition of Lanthanide Trifluoroacetate Precursors, J. Am. Chem. Soc. 128: 7444-7445.
24 Wang F, Chatterjee DK, Li Z, Zhang Y, Fan X, Wang m (2006) Synthesis of Polyethylenimine/NaYF4 Nanoparticles with Upconversion Fluorescence, Nanotechnology 17: 5786-5791.
2 Fundamentals 28
25 Liu C, Chen D (2007) Controlled Synthesis of Hexagon Shaped Lanthanide-Doped LaF3 Nanoplates with Multicolor Upconversion Fluorescence, J. Mater. Chem. 17: 3875-3880.
26 Zhang F, Wang Y, Yu T, Zhang F, Shi Y, Xie S, Li Y, Xu L, Tu B, Zhao D (2007) Uniform Nanostructured Arrays of Sodium Rare-Earth Fluorides for Highly Efficient Multicolor Upconversion Luminescence, Angew. Chem. Int. Ed. 46: 7976-7979, Angew. Chem. 119: 8122-8125.
27 Zhang F, Li J, Shan J, Xu L, Zhao D (2009) Shape, Size, and Phase-Controlled Rare-Earth Fluoride Nanocrystals with Optical Up-Conversion Properties, Chem. Eur. J. 15: 11010-11019.
28 Liu X, Zhao J, Sun Y, Song K, Yu Y, Du C, Xianggui K, Zhang H (2009) Ionothermal Synthesis of Hexagonal Phase NaYF4: Yb3+, Er3+/Tm3+ Upconversion Nanophosphors, Chem. Commun. 6628-6630.
29 Patra A, Friend CS, Kapoor R, Prasad PN (2003) Fluorescence Upconversion Properties of Er3+-Doped TiO2 and BaTiO3 Nanocrystallites, Chem. Mater. 15: 3650-3655.
30 Pires AM, Serra OA, Davolos MR (2005) Morphological and Luminescent Studies on Nanosized Er, Yb-Yttrium Oxide Up-Converter Prepared from Different Precursors, J. Lumin. 113: 174-182.
31 Qin X, Yokomori T, Ju Y (2007) Flame Synthesis and Characterization of Rare-Earth (Er3+, Ho3+, and Tm3+) Doped Upconversion Nanophosphors, Appl. Phys. Lett. 90: 073104 (3pp)
32 Yi GS, Chow GM (2006) Synthesis of Hexagonal-Phase NaYF4: Yb, Er and NaYF4: Yb, Tm Nanocrystals with Efficient Up-Conversion Fluorescence, Adv. Funct. Mater. 16: 2324-2329.
33 Boyer JC, Manseau MP, Murray JI, van Veggel FCJM (2010) Surface Modification of Upconverting NaYF4 Nanoparticles with PEG-Phosphate Ligands for NIR (800 nm) Biolabeling within the Biological Window, Langmuir 26: 1157-1164.
34 Chen Z, Chen H, Hu H, Yu M, Li F, Zhang Q, Zhou Z, Yi T, Huang C (2008) Versatile Synthesis Strategy for Carboxylic Acid-Functionalized Upconverting Nanophosphors as Biological Labels, J. Am. Chem. Soc. 130: 3023-3029.
35 Yi GS, Chow GM (2007) Water-Soluble NaYF4: Yb, Er (Tm)/NaYF4/Polymer Core/Shell/Shell Nanoparticles with Significant Enhancement of Upconversion Fluorescence, Chem. Mater. 19: 341-343.
36 Wang L, Yan R, Huo Z, Wang L, Zeng J, Bao J, Wang X, Peng Q, Li Y (2005) Fluorescence Resonant Energy Transfer Biosensor Based on Upconversion-Luminescent Nanoparticles, Angew. Chem. Int. Ed. 44: 6054-6057, Angew. Chem. 117: 6208-6211.
37 Wang L, Li Y (2006) Green Upconversion Nanocrystals for DNA Detection, Chem. Commun. 2557-2559.
38 Kamimura M, Miyamoto K, Saito Y, Soga K, Nagasaki Y (2008) Design of Poly(ethylene glycol)/Streptavidin Coimmobilized Upconversion Nanophosphors and Their Application to Fluorescence Biolabeling, Langmuir 24: 8864-8870.
39 Kuningas K, Rantanen T, Karhunen U, Lövgren T, Soukka T (2005) Simultaneous Use of Time-Resolved Fluorescence and Anti-Stokes Photoluminescence in a Bioaffinity Assay, Anal. Chem. 77: 2826-2834.
40 Sivakumar S, Diamente PR, van Veggel FCJM (2006) Silica-Coated Ln3+-Doped LaF3 Nanoparticles as Robust Down- and Upconverting Biolabels, Chem. Eur. J 12: 5878-5884.
41 Hu H, Xiong L, Zhou J, Li F, Cao T, Huang C (2009) Multimodal-Luminescence Core-Shell Nanocomposites for Targeted Imaging of Tumor Cells, Chem. Eur. J. 15: 3577-3584.
42 Zako T, Nagata H, Terada N, Utsumi A, Sakono M, Yohda M, Ueda H, Soga K, Maeda M (2009) Cyclic RGD Peptide-Labeled Upconversion Nanophosphors for Tumor Cell-Targeted Imaging, Biochem. Biophys. Res. Commun. 381: 54-58.
2 Fundamentals 29
43 Lu H, Yi G, Zhao S, Chem D, Guo L-H, Cheng J (2004) Synthesis and Characterization of Multi-Functional Nanoparticles Possessing Magnetic. Up-Conversion Fluorescence and Bio-Affinity Properties, J. Mater. Chem. 14: 1336-1341.
44 Wang M, Hou W, Mi C-C, Wang W-X, Xu Z-R, Teng H-H, Mao C-B, Xu S-K (2009) Immunoassay of Goat Antihuman Immunoglobulin G Antibody Based on Luminescence Resonance Energy Transfer between Near-Infrared Responsive NaYF4: Yb, Er Upconversion Fluorescent Nanoparticles and Gold Nanoparticles, Anal. Chem. 81: 8783-8789.
45 Wang M, Mi C-C, Wang W-X, Liu C-H, Wu Y-F, Xu Z-R, Mao C-B, Xu S-K (2009) Immunolabeling and NIR-Excited Fluorescent Imaging of HeLa Cells by Using NaYF4: Yb, Er Upconversion Nanoparticles, ACS Nano 3: 1580-1586.
46 Jiang S, Zhang Y (2010) Upconversion Nanoparticles-Based FRET System for Study of siRNA in Live Cells, Langmuir published online DOI: 10.1021/la904011q
47 Zhang P, Rogelj S, Nguyen K, Wheeler D (2006) Design of a Highly Sensitive and Specific Nucleotide Sensor Based on Photon Upconverting Particles, J. Am. Chem. Soc. 128: 12410-12411.
48 Li Z, Zhang Y (2006) Monodisperse Silica-Coated Polyvinylpyrrolidone/NaYF4 Nanocrystals with Multicolor Upconversion Fluorescence Emission, Angew. Chem. Int. Ed. 45: 7732-7735, Angew. Chem. 118: 7896-7899.
49 Liu Z, Yi G, Zhang H, Ding J, Zhang Y, Xue J (2008) Monodisperse Silica Nanoparticles Encapsulating Upconversion Fluorescent and Superparamagnetic Nanocrystals, Chem. Commun. 694-696.
50 Li Z, Zhang Y, Jiang S (2008) Multicolor Core/Shell-Structured Upconversion Fluorescent Nanoparticles, Adv. Mater. 20: 4765-4769.
51 Jalil RA, Zhang Y (2008) Biocompatibility of Silica Coated NaYF4 Upconversion Fluorescent Nanocrystals, Biomat. 29: 4122-4128.
52 Iler RK (1979)The Chemistry of Silica: Solubility, Polymerization, Colloid and Surface Properties, and Biochemistry, John Wiley & Sons, New York
53 Bergna HE, Roberts WO (2005) Colloidal Silica: Fundamentals and Applications, Taylor & Francis Group, Boca Raton, FL
54 Stöber W, Fink A (1968) Controlled Growth of Monodisperse Silica Spheres in the Micron Size Range, J. Colloid. Interf. Sci. 26: 62-69.
55 Yao G, Wang L, Wu Y, Smith J, Xu J, Zhao W, Lee E, Tan W (2006) FloDots: Luminescent Nanoparticles, Anal. Bioanal. Chem. 385: 518-524.
56 Wang L, Wang K, Santra S, Zhao X, Hilliard LR, Smith JE, Wu Y, Tan W (2006) Watching Silica Nanoparticles Glow in the Biological World, Anal. Chem. 78: 646-654.
57 Wang M, Mi C, Zhang Y, Liu J, Li F, Mao C, Xu S (2009) NIR-Responsive Silica-Coated NaYbF4:/Er/Tm/Ho Upconversion Fluorescent Nanoparticles with Tunable Emission Colors and Their Applications in Immunolabeling and Fluorescent Imaging of Cancer Cells, J. Phys. Chem. C 113: 19021-19027.
58 Deng G, Markowitz MA, Kust PR, Gaber BP (2000) Control of Surface Expression of Functional Groups on Silica Particles, Mat. Sci. Eng. C-Bio. S 11: 165-172.
59 Petushkov A, Intra J, Graham JB, Larsen SC, Salem AK (2009) Effect of Crystal Size and Surface Functionalization on the Cytotoxicity of Silicalite-1 Nanoparticles, Chem. Res. Toxicol. 22: 1359–1368.
60 Knopp D, Tang D, Niessner R (2009) Review: Bioanalytical Applications of Biomolecule-Functionalized Nanometer-Sized Doped Silica Particles, Anal. Chim. Acta 647: 14-30.
61 Mader H, Li X, Saleh S, Link M, Kele P, Wolfbeis OS (2008) Fluorescent Silica Nanoparticles, Ann. N. Y. Acad. Sci. 1130: 213-223.
2 Fundamentals 30
62 Achatz DE, Mező G, Kele P, Wolfbeis OS (2009) Probing the Activity of Matrix Metallopreteinase II with a Sequentially Click-Labeled Silica Nanoparticle FRET Probe, ChemBioChem 10: 2316-2320.
63 Lin P-C, Ueng S-H, Yu S-C, Jan M-D, Adak AK, Yu C-C, Lien C-C (2007) Surface Modification of Magnetic Nanoparticle via Cu(I)-Catalyzed Alkyne-azide [2+3] Cycloaddition, Org. Lett. 9: 2131-2134.
64 Kolb HC, Finn MG, Sharpless KB (2001) Click Chemistry: Diverse Chemical Function from a Few Good Reactions, Angew. Chem. Int. Ed. 40: 2004-2021, Angew. Chem. 113: 1198-1220.
65 Kolb HC, Sharpless KB (2003) The Growing Impact of Click Chemistry on Drug Discovery, Drug Discov. Today 8: 1128-1137.
66 Michael A (1893) Über die Einwirkung von Diazobenzolimid auf Acetylendicarbonsäuremethylester, J. Prakt. Chem. 48: 94-95
67 Huisgen R (1963) 1,3-Dipolar Cycloadditions – Past and Future, Angew. Chem. Int. Ed. 2: 565-632, Angew. Chem. 75: 604-637.
68 Rostovtsev VV, Green LG, Fokin VV, Sharpless KB (2002) A Stepwise Huisgen Cycloaddition Process: Copper(I)-Catalyzed Regioselective “Ligation” of Azides and Terminal Alkynes, Angew. Chem. Int. Ed. 41: 2596-2599, Angew. Chem. 114: 2708-2711.
69 Tornøe CW, Christensen C, Meldal M (2002) Peptidotriazoles on Solid Phase: [1,2,3]-Triazoles by Regiospecific Copper(I)-Catalyzed 1,3-Dipolar Cycloaddition of Terminal Alkynes to Azides, J. Org. Chem. 67: 3057-3064.
70 Himo F, Lovell T, Hilgraf R, Rostovtsev VV, Noodleman L, Sharpless KB, Fokin VV (2005) Copper(I)-Catalyzed Synthesis of Azoles. DFT Study Predicts Unprecedented Reactivity and Intermediates, J. Am. Chem. Soc. 127: 210-216.
71 Zhang L, Chen X, Xue P, Sun HHY, Williams ID, Sharpless KB, Fokin VV, Jia G (2005) Ruthenium-Catalyzed Cycloaddition of Alkynes and Organic Azides, J. Am. Chem. Soc. 127: 15998-15999.
72 Boren BC, Narayan S, Rasmussen LK, Zhang L, Zhao H, Lin Z, Jia G, Fokin VV (2008) Ruthenium-Catalyzed Azide-Alkyne Cycloaddition: Scope and Mechanism, J. Am. Chem. Soc. 130: 8923-8930.
73 Kurpiers T, Mootz HD (2009) Bioorthogonal Ligation in the Spotlight, Angew. Chem. Int. Ed. 48: 1729-1731, Angew. Chem. 121: 1757-1760.
74 Agard NJ, Prescher JA, Bertozzi CR (2004) A Strain-Promoted [3+2] Azide-Alkyne Cycloaddition for Covalent Modification of Biomolecules in Living Systems, J. Am. Chem. Soc. 126: 15046-15047.
75 Baskin JM, Prescher JA, Laughlin ST, Agard NJ, Chang PV, Miller IA, Lo A, Codelli JA, Bertozzi CR (2007) Copper-free Click Chemistry for Dynamic in Vivo Imaging, P. Natl. Acad. Sci. 104: 16793-16797.
76 Chang PV, Prescher JA, Sletten EM; Baskin JM, Miller IA, Agard NJ, Lo A, Bertozzi CR (2010) Copper-free Click Chemisty in Living Animals, P. Natl. Acad. Sci, published online, DOI: 10.1073/pnas.0911116107.
77 Kele P, Mezö G, Achatz D, Wolfbeis OS (2009) Dual Labeling of Biomolecules by Using Click Chemisty: A Sequential Approach, Angew. Chem. Int. Ed. 48: 344-347, Angew. Chem. 121: 350-353.
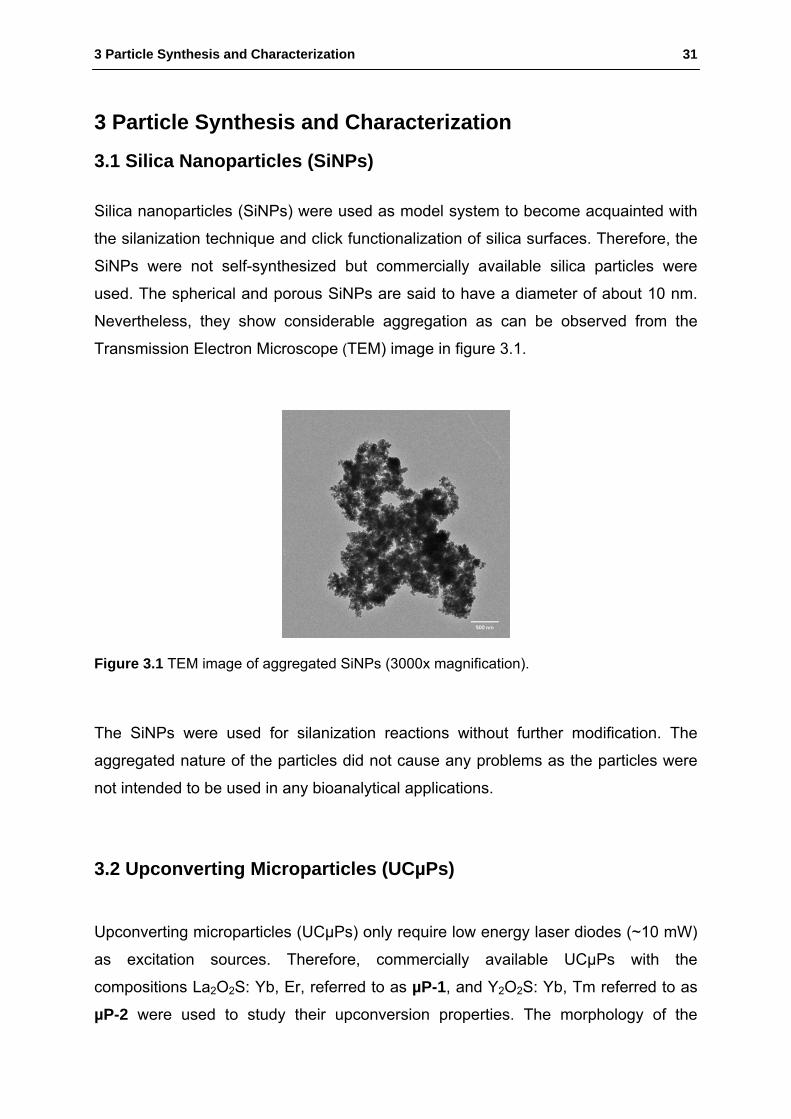
3 Particle Synthesis and Characterization 31
3 Particle Synthesis and Characterization
3.1 Silica Nanoparticles (SiNPs)
Silica nanoparticles (SiNPs) were used as model system to become acquainted with
the silanization technique and click functionalization of silica surfaces. Therefore, the
SiNPs were not self-synthesized but commercially available silica particles were
used. The spherical and porous SiNPs are said to have a diameter of about 10 nm.
Nevertheless, they show considerable aggregation as can be observed from the
Transmission Electron Microscope (TEM) image in figure 3.1.
Figure 3.1 TEM image of aggregated SiNPs (3000x magnification).
The SiNPs were used for silanization reactions without further modification. The
aggregated nature of the particles did not cause any problems as the particles were
not intended to be used in any bioanalytical applications.
3.2 Upconverting Microparticles (UCµPs)
Upconverting microparticles (UCµPs) only require low energy laser diodes (~10 mW)
as excitation sources. Therefore, commercially available UCµPs with the
compositions La2O2S: Yb, Er, referred to as µP-1, and Y2O2S: Yb, Tm referred to as
µP-2 were used to study their upconversion properties. The morphology of the
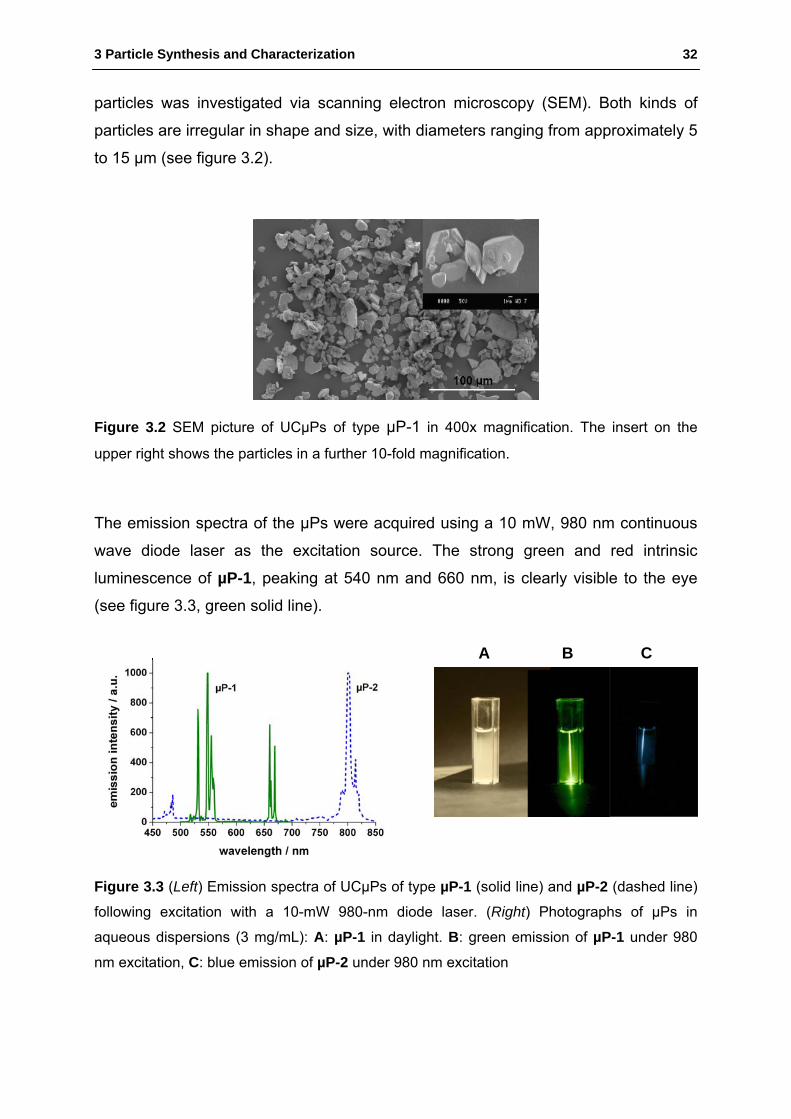
3 Particle Synthesis and Characterization 32
particles was investigated via scanning electron microscopy (SEM). Both kinds of
particles are irregular in shape and size, with diameters ranging from approximately 5
to 15 µm (see figure 3.2).
Figure 3.2 SEM picture of UCµPs of type µP-1 in 400x magnification. The insert on the
upper right shows the particles in a further 10-fold magnification.
The emission spectra of the µPs were acquired using a 10 mW, 980 nm continuous
wave diode laser as the excitation source. The strong green and red intrinsic
luminescence of µP-1, peaking at 540 nm and 660 nm, is clearly visible to the eye
(see figure 3.3, green solid line).
Figure 3.3 (Left) Emission spectra of UCµPs of type µP-1 (solid line) and µP-2 (dashed line)
following excitation with a 10-mW 980-nm diode laser. (Right) Photographs of µPs in
aqueous dispersions (3 mg/mL): A: µP-1 in daylight. B: green emission of µP-1 under 980
nm excitation, C: blue emission of µP-2 under 980 nm excitation
A B C
3 Particle Synthesis and Characterization 33
Strong blue (along with considerable near-infrared emission) is observed for
microparticles of type µP-2, with rather sharp and discrete peaks located at 475 nm
and 800 nm, respectively (figure 3.3, blue dotted line). These rather sharp lines of the
upconverters represent an attractive feature that has a large potential in terms of
multiplex signaling and sensing.
UCµPs are not dispersible in aqueous solution due to their large size.
Therefore, they are not well suitable for bioanalytical purposes. They may be bead-
milled to obtain sub-micron particles. However, grinding generates particles with even
larger variation of shape and size. Furthermore, UC emission is decreased due to the
reduced size as well as imperfections in the crystal structure caused by mechanical
shearing.1 There was a need for particles with smaller size, to address these
problems and limitations. Therefore, upconverting nanoparticles (UCNPs) were
synthesized as they are not commercially available.
3.3 Upconverting Nanoparticles (UCNPs)
3.3.1 Synthetic Procedure
The highest upconversion efficiencies to date have been observed in doped
hexagonal phase β-NaYF4.2 Therefore, NaYF4 was chosen as host material. The
strongest emission can be obtained by using Er3+, Tm3+ and Ho3+ as activator ions,
which were therefore selected as dopant ions (see chapter 2.1.1). The preparation
method of choice was the co-precipitation technique as it is reliable, fast, and does
not require any special laboratory equipment. Furthermore, the surface of the
resulting UCNPs is hydrophilic, facilitating their application in aqueous solutions.
The UCNPs were synthesized according to a method described by Yi et al.3
Solutions of the trichlorides of the ions Y3+ and Yb3+, along with either Er3+, Tm3+ or
Ho3+ were combined with an ethylenediaminetetraacetic acid (EDTA) solution to form
the respective EDTA complexes. This solution was injected quickly into a aqueous
solution of sodium fluoride. The resulting mixture was stirred for 1 h at room
temperature to give a colorless precipitate that was separated by centrifugation,
washed with water and finally with ethanol. The precipitate was dried in a drying
furnace and under vacuum. The colorless powder was annealed at 400 °C for 4.5 h
under argon atmosphere.
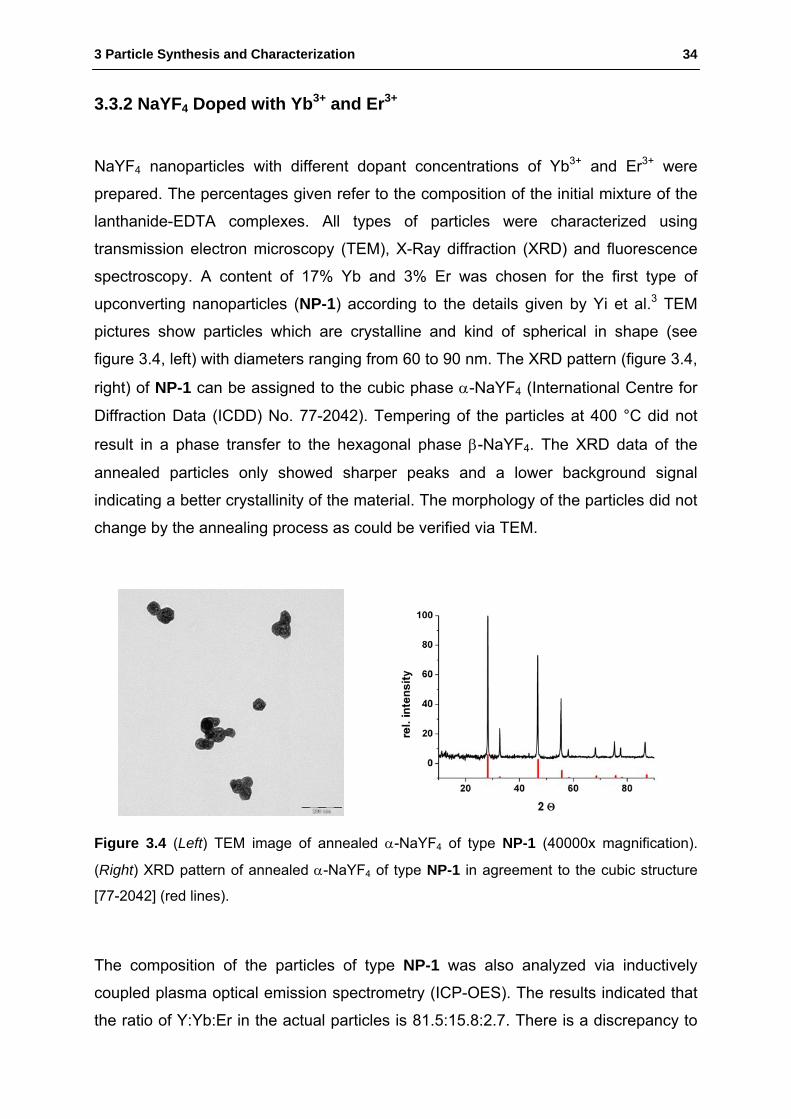
3 Particle Synthesis and Characterization 34
3.3.2 NaYF4 Doped with Yb3+ and Er3+
NaYF4 nanoparticles with different dopant concentrations of Yb3+ and Er3+ were
prepared. The percentages given refer to the composition of the initial mixture of the
lanthanide-EDTA complexes. All types of particles were characterized using
transmission electron microscopy (TEM), X-Ray diffraction (XRD) and fluorescence
spectroscopy. A content of 17% Yb and 3% Er was chosen for the first type of
upconverting nanoparticles (NP-1) according to the details given by Yi et al.3 TEM
pictures show particles which are crystalline and kind of spherical in shape (see
figure 3.4, left) with diameters ranging from 60 to 90 nm. The XRD pattern (figure 3.4,
right) of NP-1 can be assigned to the cubic phase α-NaYF4 (International Centre for
Diffraction Data (ICDD) No. 77-2042). Tempering of the particles at 400 °C did not
result in a phase transfer to the hexagonal phase β-NaYF4. The XRD data of the
annealed particles only showed sharper peaks and a lower background signal
indicating a better crystallinity of the material. The morphology of the particles did not
change by the annealing process as could be verified via TEM.
Figure 3.4 (Left) TEM image of annealed α-NaYF4 of type NP-1 (40000x magnification).
(Right) XRD pattern of annealed α-NaYF4 of type NP-1 in agreement to the cubic structure
[77-2042] (red lines).
The composition of the particles of type NP-1 was also analyzed via inductively
coupled plasma optical emission spectrometry (ICP-OES). The results indicated that
the ratio of Y:Yb:Er in the actual particles is 81.5:15.8:2.7. There is a discrepancy to
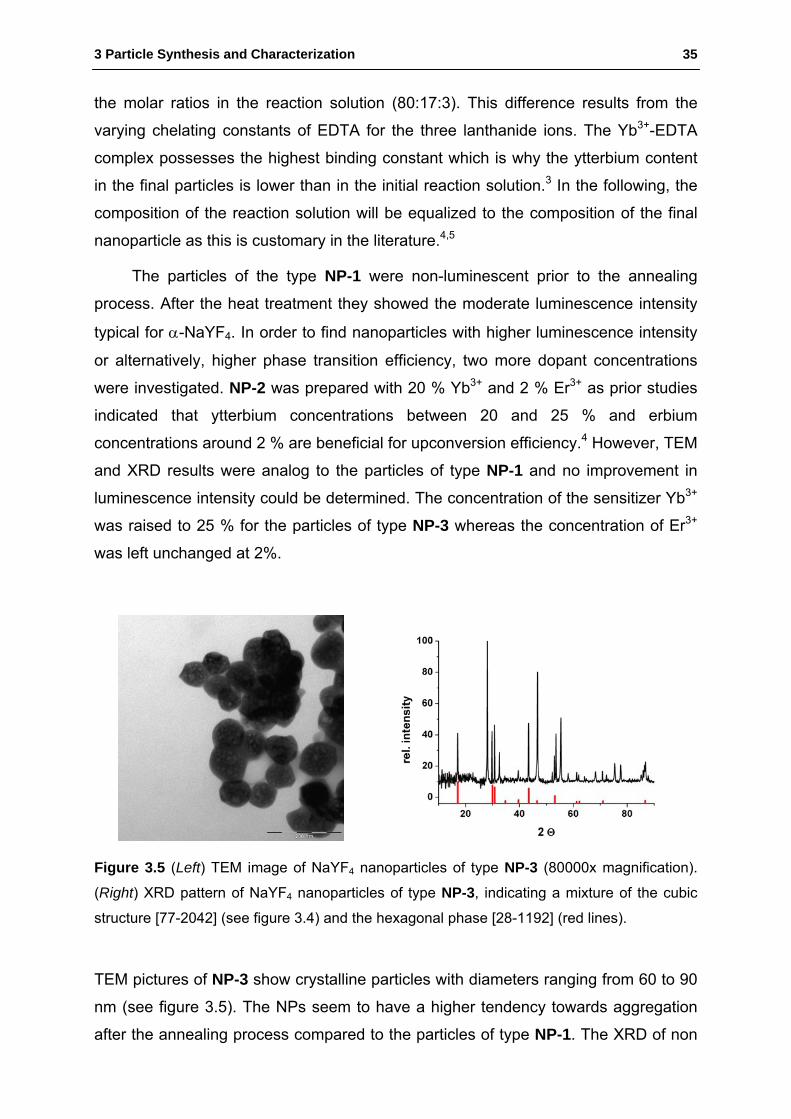
3 Particle Synthesis and Characterization 35
the molar ratios in the reaction solution (80:17:3). This difference results from the
varying chelating constants of EDTA for the three lanthanide ions. The Yb3+-EDTA
complex possesses the highest binding constant which is why the ytterbium content
in the final particles is lower than in the initial reaction solution.3 In the following, the
composition of the reaction solution will be equalized to the composition of the final
nanoparticle as this is customary in the literature.4,5
The particles of the type NP-1 were non-luminescent prior to the annealing
process. After the heat treatment they showed the moderate luminescence intensity
typical for α-NaYF4. In order to find nanoparticles with higher luminescence intensity
or alternatively, higher phase transition efficiency, two more dopant concentrations
were investigated. NP-2 was prepared with 20 % Yb3+ and 2 % Er3+ as prior studies
indicated that ytterbium concentrations between 20 and 25 % and erbium
concentrations around 2 % are beneficial for upconversion efficiency.4 However, TEM
and XRD results were analog to the particles of type NP-1 and no improvement in
luminescence intensity could be determined. The concentration of the sensitizer Yb3+
was raised to 25 % for the particles of type NP-3 whereas the concentration of Er3+
was left unchanged at 2%.
Figure 3.5 (Left) TEM image of NaYF4 nanoparticles of type NP-3 (80000x magnification).
(Right) XRD pattern of NaYF4 nanoparticles of type NP-3, indicating a mixture of the cubic
structure [77-2042] (see figure 3.4) and the hexagonal phase [28-1192] (red lines).
TEM pictures of NP-3 show crystalline particles with diameters ranging from 60 to 90
nm (see figure 3.5). The NPs seem to have a higher tendency towards aggregation
after the annealing process compared to the particles of type NP-1. The XRD of non
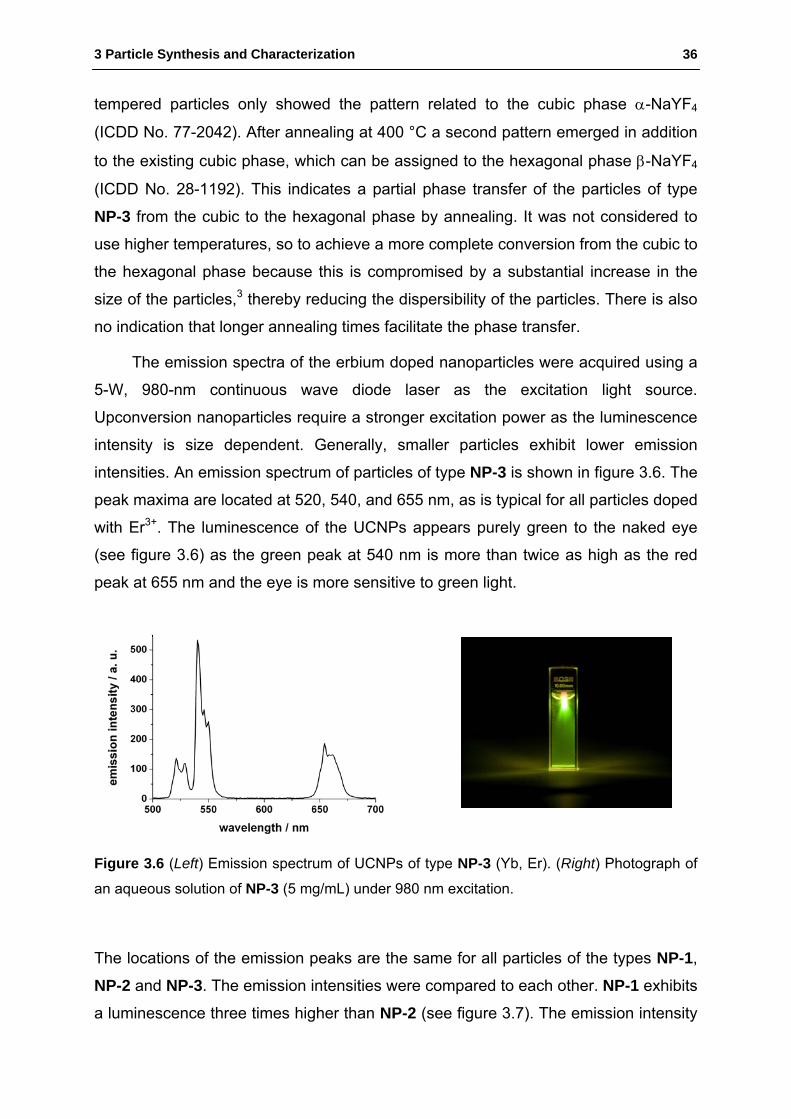
3 Particle Synthesis and Characterization 36
tempered particles only showed the pattern related to the cubic phase α-NaYF4
(ICDD No. 77-2042). After annealing at 400 °C a second pattern emerged in addition
to the existing cubic phase, which can be assigned to the hexagonal phase β-NaYF4
(ICDD No. 28-1192). This indicates a partial phase transfer of the particles of type
NP-3 from the cubic to the hexagonal phase by annealing. It was not considered to
use higher temperatures, so to achieve a more complete conversion from the cubic to
the hexagonal phase because this is compromised by a substantial increase in the
size of the particles,3 thereby reducing the dispersibility of the particles. There is also
no indication that longer annealing times facilitate the phase transfer.
The emission spectra of the erbium doped nanoparticles were acquired using a
5-W, 980-nm continuous wave diode laser as the excitation light source.
Upconversion nanoparticles require a stronger excitation power as the luminescence
intensity is size dependent. Generally, smaller particles exhibit lower emission
intensities. An emission spectrum of particles of type NP-3 is shown in figure 3.6. The
peak maxima are located at 520, 540, and 655 nm, as is typical for all particles doped
with Er3+. The luminescence of the UCNPs appears purely green to the naked eye
(see figure 3.6) as the green peak at 540 nm is more than twice as high as the red
peak at 655 nm and the eye is more sensitive to green light.
Figure 3.6 (Left) Emission spectrum of UCNPs of type NP-3 (Yb, Er). (Right) Photograph of
an aqueous solution of NP-3 (5 mg/mL) under 980 nm excitation.
The locations of the emission peaks are the same for all particles of the types NP-1,
NP-2 and NP-3. The emission intensities were compared to each other. NP-1 exhibits
a luminescence three times higher than NP-2 (see figure 3.7). The emission intensity
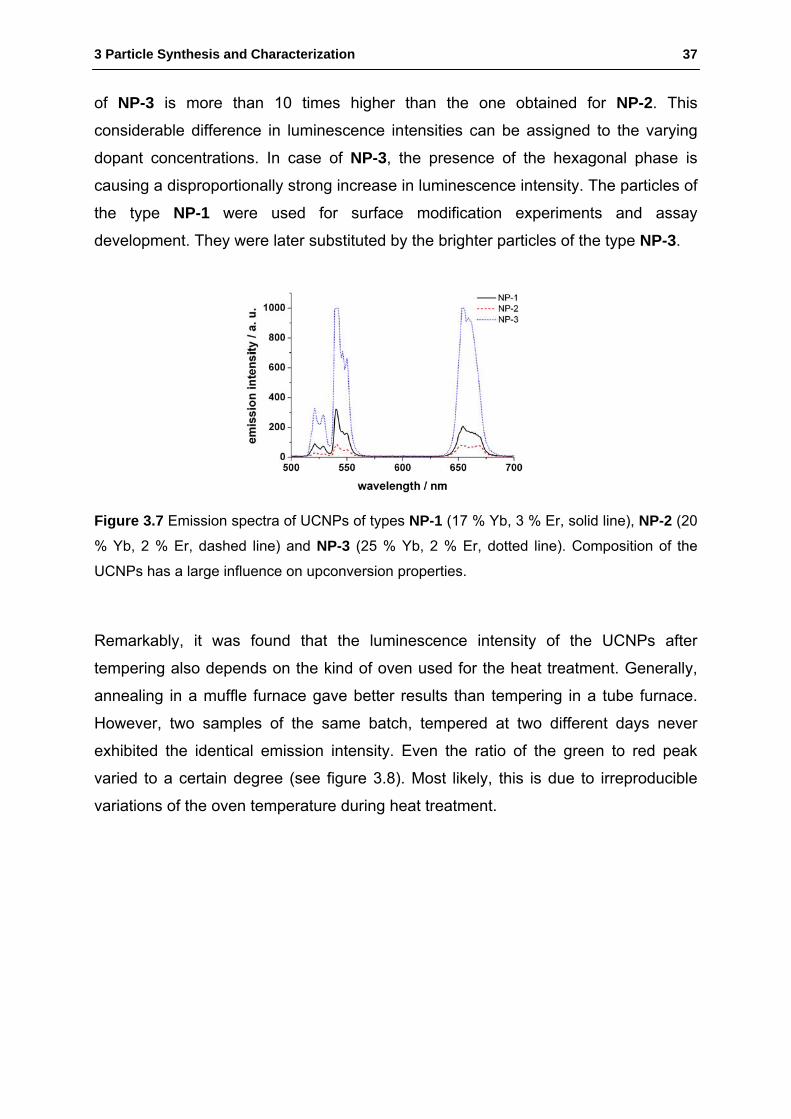
3 Particle Synthesis and Characterization 37
of NP-3 is more than 10 times higher than the one obtained for NP-2. This
considerable difference in luminescence intensities can be assigned to the varying
dopant concentrations. In case of NP-3, the presence of the hexagonal phase is
causing a disproportionally strong increase in luminescence intensity. The particles of
the type NP-1 were used for surface modification experiments and assay
development. They were later substituted by the brighter particles of the type NP-3.
Figure 3.7 Emission spectra of UCNPs of types NP-1 (17 % Yb, 3 % Er, solid line), NP-2 (20
% Yb, 2 % Er, dashed line) and NP-3 (25 % Yb, 2 % Er, dotted line). Composition of the
UCNPs has a large influence on upconversion properties.
Remarkably, it was found that the luminescence intensity of the UCNPs after
tempering also depends on the kind of oven used for the heat treatment. Generally,
annealing in a muffle furnace gave better results than tempering in a tube furnace.
However, two samples of the same batch, tempered at two different days never
exhibited the identical emission intensity. Even the ratio of the green to red peak
varied to a certain degree (see figure 3.8). Most likely, this is due to irreproducible
variations of the oven temperature during heat treatment.
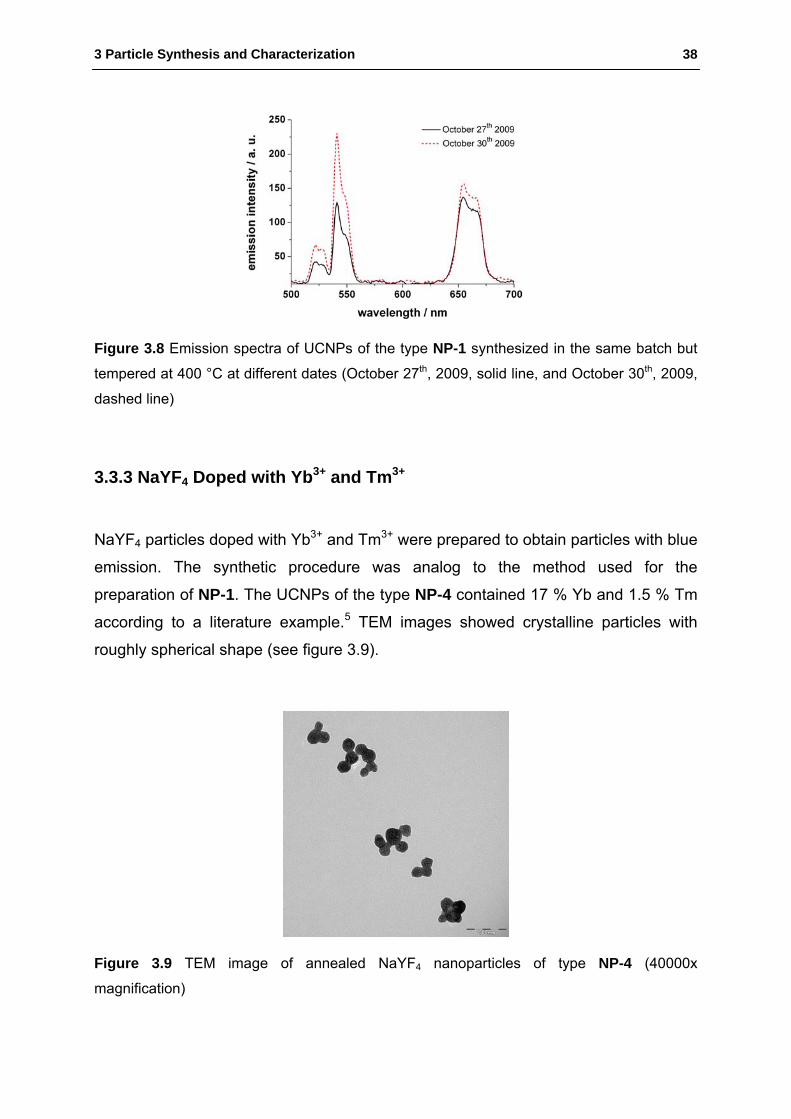
3 Particle Synthesis and Characterization 38
Figure 3.8 Emission spectra of UCNPs of the type NP-1 synthesized in the same batch but
tempered at 400 °C at different dates (October 27th, 2009, solid line, and October 30th, 2009,
dashed line)
3.3.3 NaYF4 Doped with Yb3+ and Tm3+
NaYF4 particles doped with Yb3+ and Tm3+ were prepared to obtain particles with blue
emission. The synthetic procedure was analog to the method used for the
preparation of NP-1. The UCNPs of the type NP-4 contained 17 % Yb and 1.5 % Tm
according to a literature example.5 TEM images showed crystalline particles with
roughly spherical shape (see figure 3.9).
Figure 3.9 TEM image of annealed NaYF4 nanoparticles of type NP-4 (40000x
magnification)
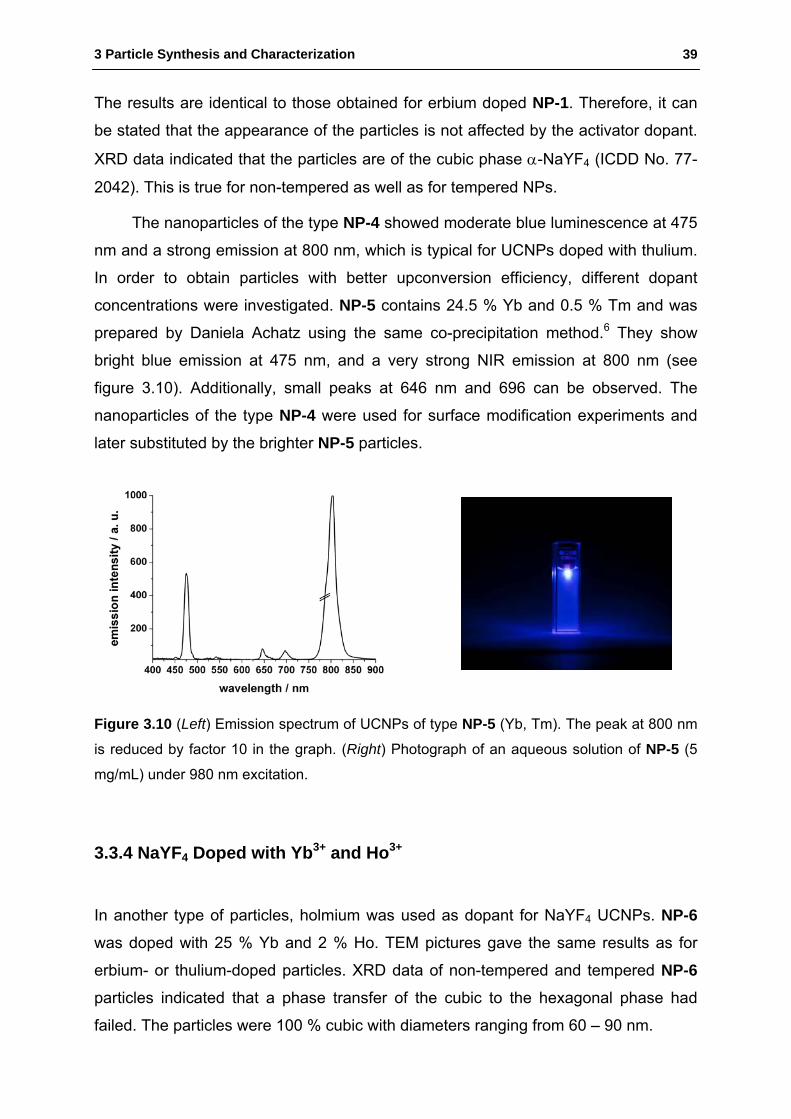
3 Particle Synthesis and Characterization 39
The results are identical to those obtained for erbium doped NP-1. Therefore, it can
be stated that the appearance of the particles is not affected by the activator dopant.
XRD data indicated that the particles are of the cubic phase α-NaYF4 (ICDD No. 77-
2042). This is true for non-tempered as well as for tempered NPs.
The nanoparticles of the type NP-4 showed moderate blue luminescence at 475
nm and a strong emission at 800 nm, which is typical for UCNPs doped with thulium.
In order to obtain particles with better upconversion efficiency, different dopant
concentrations were investigated. NP-5 contains 24.5 % Yb and 0.5 % Tm and was
prepared by Daniela Achatz using the same co-precipitation method.6 They show
bright blue emission at 475 nm, and a very strong NIR emission at 800 nm (see
figure 3.10). Additionally, small peaks at 646 nm and 696 can be observed. The
nanoparticles of the type NP-4 were used for surface modification experiments and
later substituted by the brighter NP-5 particles.
Figure 3.10 (Left) Emission spectrum of UCNPs of type NP-5 (Yb, Tm). The peak at 800 nm
is reduced by factor 10 in the graph. (Right) Photograph of an aqueous solution of NP-5 (5
mg/mL) under 980 nm excitation.
3.3.4 NaYF4 Doped with Yb3+ and Ho3+
In another type of particles, holmium was used as dopant for NaYF4 UCNPs. NP-6
was doped with 25 % Yb and 2 % Ho. TEM pictures gave the same results as for
erbium- or thulium-doped particles. XRD data of non-tempered and tempered NP-6
particles indicated that a phase transfer of the cubic to the hexagonal phase had
failed. The particles were 100 % cubic with diameters ranging from 60 – 90 nm.
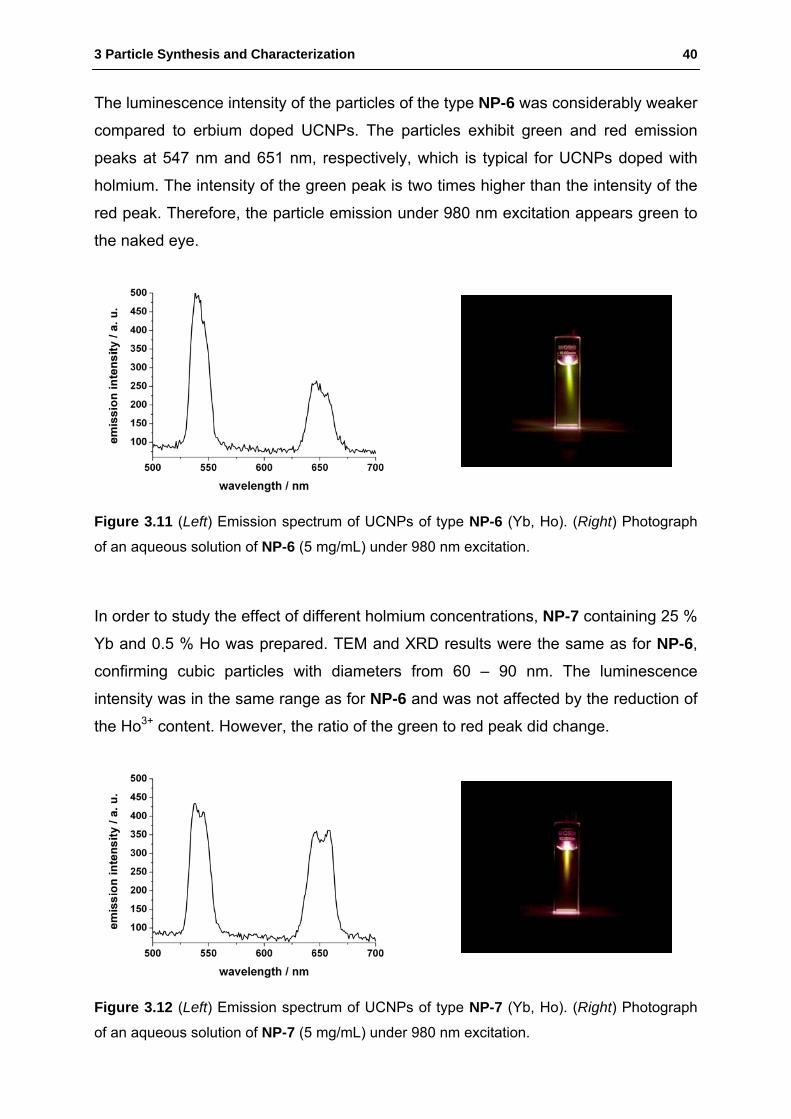
3 Particle Synthesis and Characterization 40
The luminescence intensity of the particles of the type NP-6 was considerably weaker
compared to erbium doped UCNPs. The particles exhibit green and red emission
peaks at 547 nm and 651 nm, respectively, which is typical for UCNPs doped with
holmium. The intensity of the green peak is two times higher than the intensity of the
red peak. Therefore, the particle emission under 980 nm excitation appears green to
the naked eye.
Figure 3.11 (Left) Emission spectrum of UCNPs of type NP-6 (Yb, Ho). (Right) Photograph
of an aqueous solution of NP-6 (5 mg/mL) under 980 nm excitation.
In order to study the effect of different holmium concentrations, NP-7 containing 25 %
Yb and 0.5 % Ho was prepared. TEM and XRD results were the same as for NP-6,
confirming cubic particles with diameters from 60 – 90 nm. The luminescence
intensity was in the same range as for NP-6 and was not affected by the reduction of
the Ho3+ content. However, the ratio of the green to red peak did change.
Figure 3.12 (Left) Emission spectrum of UCNPs of type NP-7 (Yb, Ho). (Right) Photograph
of an aqueous solution of NP-7 (5 mg/mL) under 980 nm excitation.
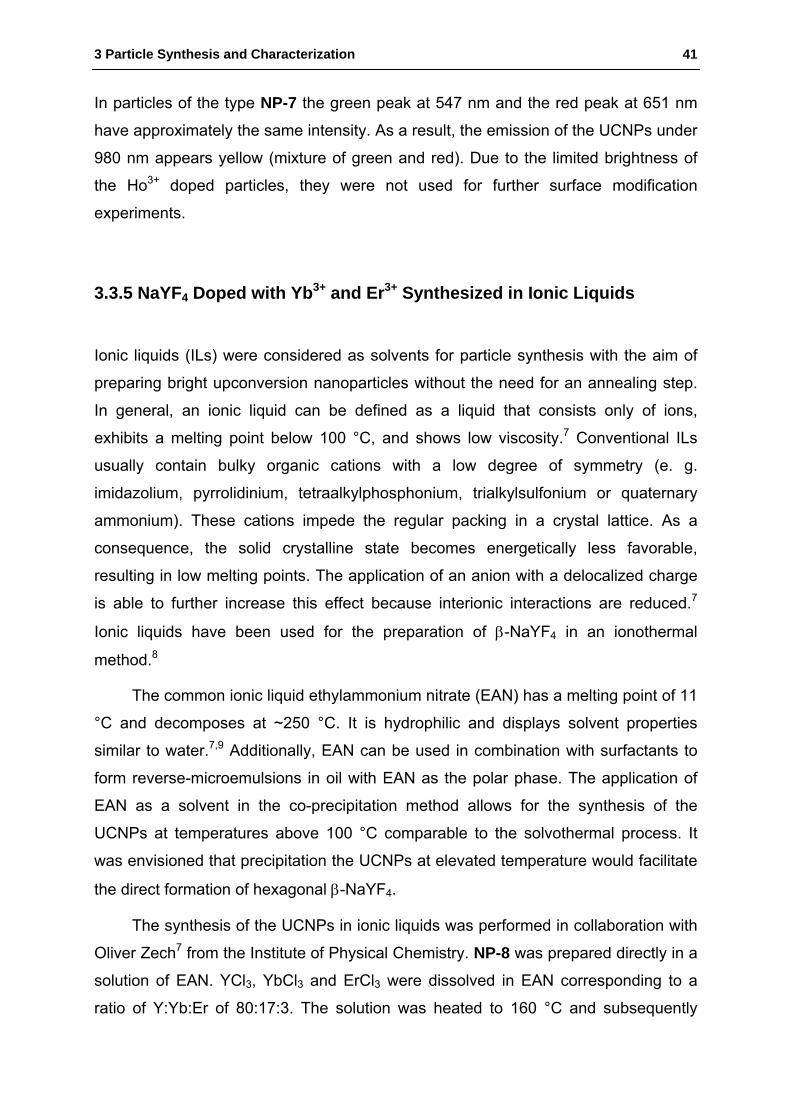
3 Particle Synthesis and Characterization 41
In particles of the type NP-7 the green peak at 547 nm and the red peak at 651 nm
have approximately the same intensity. As a result, the emission of the UCNPs under
980 nm appears yellow (mixture of green and red). Due to the limited brightness of
the Ho3+ doped particles, they were not used for further surface modification
experiments.
3.3.5 NaYF4 Doped with Yb3+ and Er3+ Synthesized in Ionic Liquids
Ionic liquids (ILs) were considered as solvents for particle synthesis with the aim of
preparing bright upconversion nanoparticles without the need for an annealing step.
In general, an ionic liquid can be defined as a liquid that consists only of ions,
exhibits a melting point below 100 °C, and shows low viscosity.7 Conventional ILs
usually contain bulky organic cations with a low degree of symmetry (e. g.
imidazolium, pyrrolidinium, tetraalkylphosphonium, trialkylsulfonium or quaternary
ammonium). These cations impede the regular packing in a crystal lattice. As a
consequence, the solid crystalline state becomes energetically less favorable,
resulting in low melting points. The application of an anion with a delocalized charge
is able to further increase this effect because interionic interactions are reduced.7
Ionic liquids have been used for the preparation of β-NaYF4 in an ionothermal
method.8
The common ionic liquid ethylammonium nitrate (EAN) has a melting point of 11
°C and decomposes at ~250 °C. It is hydrophilic and displays solvent properties
similar to water.7,9 Additionally, EAN can be used in combination with surfactants to
form reverse-microemulsions in oil with EAN as the polar phase. The application of
EAN as a solvent in the co-precipitation method allows for the synthesis of the
UCNPs at temperatures above 100 °C comparable to the solvothermal process. It
was envisioned that precipitation the UCNPs at elevated temperature would facilitate
the direct formation of hexagonal β-NaYF4.
The synthesis of the UCNPs in ionic liquids was performed in collaboration with
Oliver Zech7 from the Institute of Physical Chemistry. NP-8 was prepared directly in a
solution of EAN. YCl3, YbCl3 and ErCl3 were dissolved in EAN corresponding to a
ratio of Y:Yb:Er of 80:17:3. The solution was heated to 160 °C and subsequently
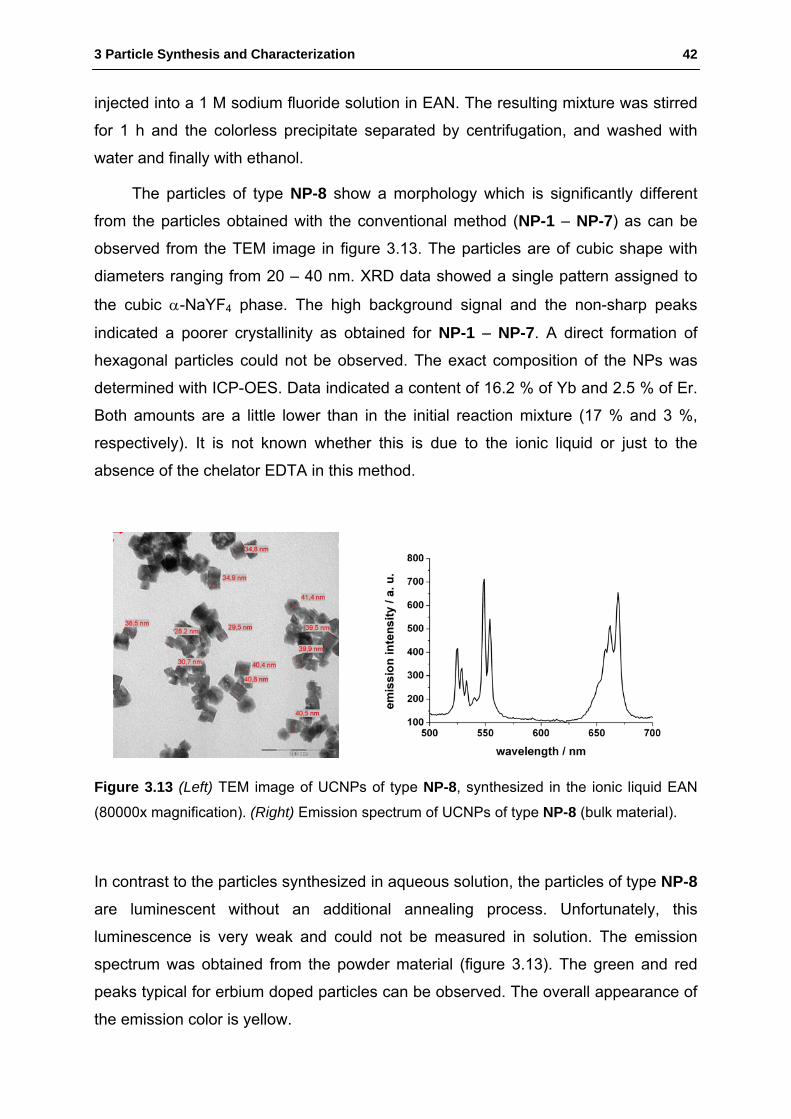
3 Particle Synthesis and Characterization 42
injected into a 1 M sodium fluoride solution in EAN. The resulting mixture was stirred
for 1 h and the colorless precipitate separated by centrifugation, and washed with
water and finally with ethanol.
The particles of type NP-8 show a morphology which is significantly different
from the particles obtained with the conventional method (NP-1 – NP-7) as can be
observed from the TEM image in figure 3.13. The particles are of cubic shape with
diameters ranging from 20 – 40 nm. XRD data showed a single pattern assigned to
the cubic α-NaYF4 phase. The high background signal and the non-sharp peaks
indicated a poorer crystallinity as obtained for NP-1 – NP-7. A direct formation of
hexagonal particles could not be observed. The exact composition of the NPs was
determined with ICP-OES. Data indicated a content of 16.2 % of Yb and 2.5 % of Er.
Both amounts are a little lower than in the initial reaction mixture (17 % and 3 %,
respectively). It is not known whether this is due to the ionic liquid or just to the
absence of the chelator EDTA in this method.
Figure 3.13 (Left) TEM image of UCNPs of type NP-8, synthesized in the ionic liquid EAN
(80000x magnification). (Right) Emission spectrum of UCNPs of type NP-8 (bulk material).
In contrast to the particles synthesized in aqueous solution, the particles of type NP-8
are luminescent without an additional annealing process. Unfortunately, this
luminescence is very weak and could not be measured in solution. The emission
spectrum was obtained from the powder material (figure 3.13). The green and red
peaks typical for erbium doped particles can be observed. The overall appearance of
the emission color is yellow.
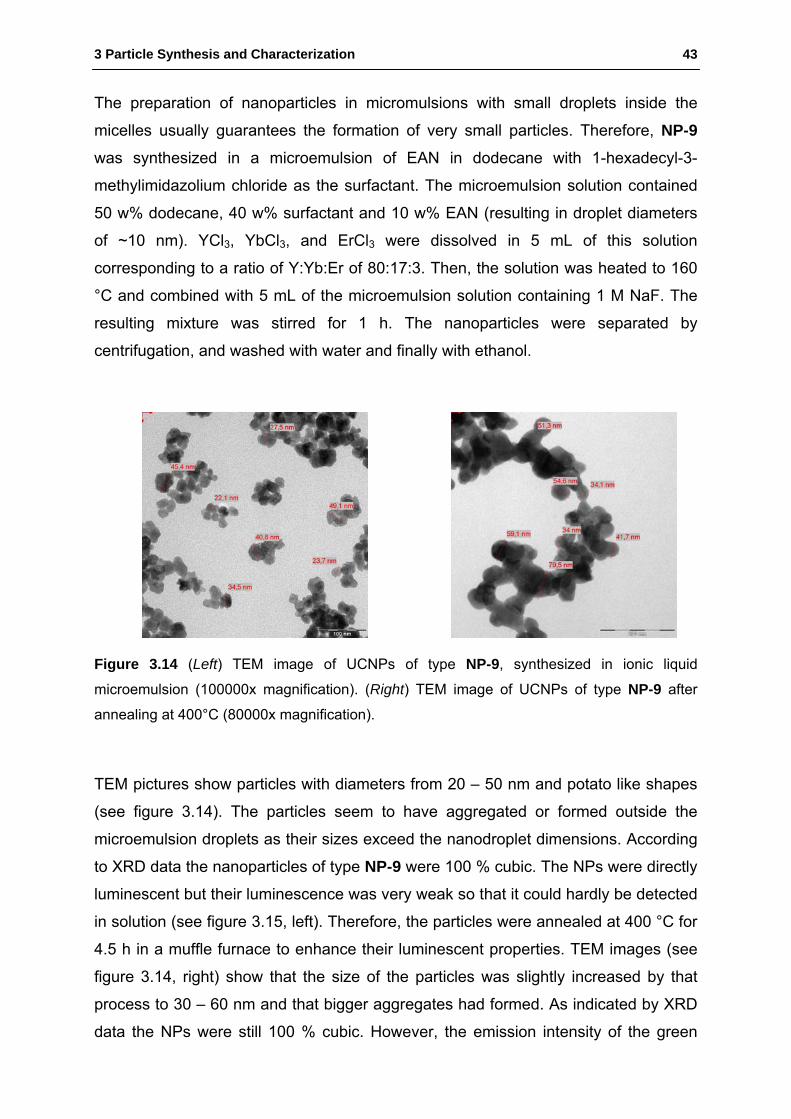
3 Particle Synthesis and Characterization 43
The preparation of nanoparticles in micromulsions with small droplets inside the
micelles usually guarantees the formation of very small particles. Therefore, NP-9
was synthesized in a microemulsion of EAN in dodecane with 1-hexadecyl-3-
methylimidazolium chloride as the surfactant. The microemulsion solution contained
50 w% dodecane, 40 w% surfactant and 10 w% EAN (resulting in droplet diameters
of ~10 nm). YCl3, YbCl3, and ErCl3 were dissolved in 5 mL of this solution
corresponding to a ratio of Y:Yb:Er of 80:17:3. Then, the solution was heated to 160
°C and combined with 5 mL of the microemulsion solution containing 1 M NaF. The
resulting mixture was stirred for 1 h. The nanoparticles were separated by
centrifugation, and washed with water and finally with ethanol.
Figure 3.14 (Left) TEM image of UCNPs of type NP-9, synthesized in ionic liquid
microemulsion (100000x magnification). (Right) TEM image of UCNPs of type NP-9 after
annealing at 400°C (80000x magnification).
TEM pictures show particles with diameters from 20 – 50 nm and potato like shapes
(see figure 3.14). The particles seem to have aggregated or formed outside the
microemulsion droplets as their sizes exceed the nanodroplet dimensions. According
to XRD data the nanoparticles of type NP-9 were 100 % cubic. The NPs were directly
luminescent but their luminescence was very weak so that it could hardly be detected
in solution (see figure 3.15, left). Therefore, the particles were annealed at 400 °C for
4.5 h in a muffle furnace to enhance their luminescent properties. TEM images (see
figure 3.14, right) show that the size of the particles was slightly increased by that
process to 30 – 60 nm and that bigger aggregates had formed. As indicated by XRD
data the NPs were still 100 % cubic. However, the emission intensity of the green
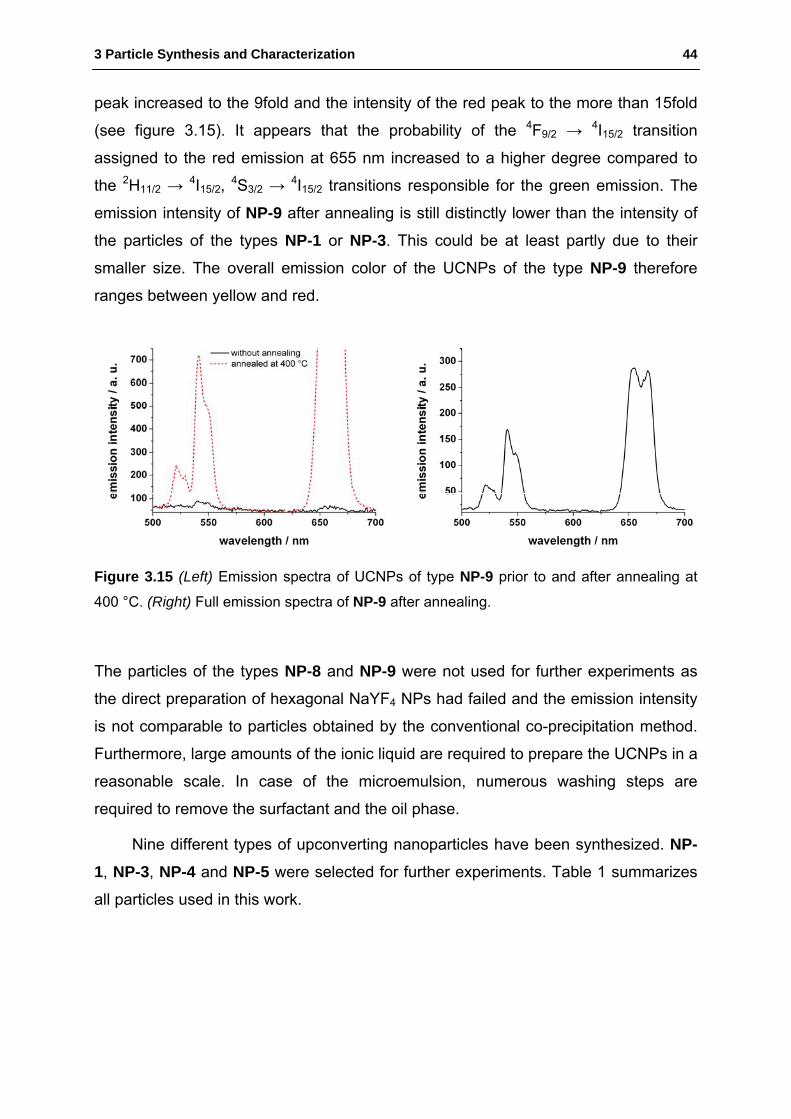
3 Particle Synthesis and Characterization 44
peak increased to the 9fold and the intensity of the red peak to the more than 15fold
(see figure 3.15). It appears that the probability of the 4F9/2 → 4I15/2 transition
assigned to the red emission at 655 nm increased to a higher degree compared to
the 2H11/2 → 4I15/2, 4S3/2 → 4I15/2 transitions responsible for the green emission. The
emission intensity of NP-9 after annealing is still distinctly lower than the intensity of
the particles of the types NP-1 or NP-3. This could be at least partly due to their
smaller size. The overall emission color of the UCNPs of the type NP-9 therefore
ranges between yellow and red.
Figure 3.15 (Left) Emission spectra of UCNPs of type NP-9 prior to and after annealing at
400 °C. (Right) Full emission spectra of NP-9 after annealing.
The particles of the types NP-8 and NP-9 were not used for further experiments as
the direct preparation of hexagonal NaYF4 NPs had failed and the emission intensity
is not comparable to particles obtained by the conventional co-precipitation method.
Furthermore, large amounts of the ionic liquid are required to prepare the UCNPs in a
reasonable scale. In case of the microemulsion, numerous washing steps are
required to remove the surfactant and the oil phase.
Nine different types of upconverting nanoparticles have been synthesized. NP-1, NP-3, NP-4 and NP-5 were selected for further experiments. Table 1 summarizes
all particles used in this work.
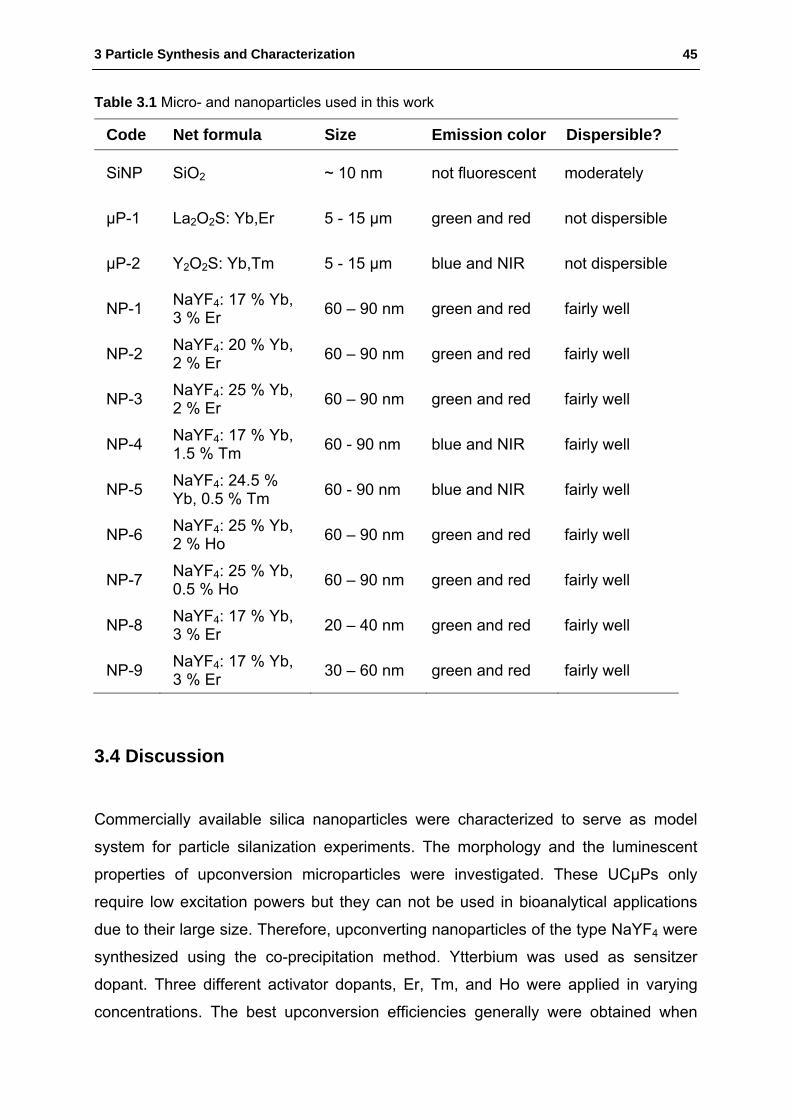
3 Particle Synthesis and Characterization 45
Table 3.1 Micro- and nanoparticles used in this work
Code Net formula Size Emission color Dispersible?
SiNP SiO2 ~ 10 nm not fluorescent moderately
µP-1 La2O2S: Yb,Er 5 - 15 µm green and red not dispersible
µP-2 Y2O2S: Yb,Tm 5 - 15 µm blue and NIR not dispersible
NP-1 NaYF4: 17 % Yb, 3 % Er 60 – 90 nm green and red fairly well
NP-2 NaYF4: 20 % Yb, 2 % Er 60 – 90 nm green and red fairly well
NP-3 NaYF4: 25 % Yb, 2 % Er 60 – 90 nm green and red fairly well
NP-4 NaYF4: 17 % Yb, 1.5 % Tm 60 - 90 nm blue and NIR fairly well
NP-5 NaYF4: 24.5 % Yb, 0.5 % Tm 60 - 90 nm blue and NIR fairly well
NP-6 NaYF4: 25 % Yb, 2 % Ho 60 – 90 nm green and red fairly well
NP-7 NaYF4: 25 % Yb, 0.5 % Ho 60 – 90 nm green and red fairly well
NP-8 NaYF4: 17 % Yb, 3 % Er 20 – 40 nm green and red fairly well
NP-9 NaYF4: 17 % Yb, 3 % Er 30 – 60 nm green and red fairly well
3.4 Discussion
Commercially available silica nanoparticles were characterized to serve as model
system for particle silanization experiments. The morphology and the luminescent
properties of upconversion microparticles were investigated. These UCµPs only
require low excitation powers but they can not be used in bioanalytical applications
due to their large size. Therefore, upconverting nanoparticles of the type NaYF4 were
synthesized using the co-precipitation method. Ytterbium was used as sensitzer
dopant. Three different activator dopants, Er, Tm, and Ho were applied in varying
concentrations. The best upconversion efficiencies generally were obtained when
3 Particle Synthesis and Characterization 46
using Er3+ as dopant. Holmium doped cubic NaYF4 only gave moderate
luminescence at 547 nm and 651 nm. A phase transfer to the higher luminescent
hexagonal NaYF4’ failed. The ratio of the green to red emission appears to depend
strongly on the Ho3+ concentration. UCNPs doped with thulium gave the strongest
blue emission at 475 nm with contents of 24.5 % of Yb3+, and 0.5 % of Tm3+. For
erbium doped NPs, a content of 25 % of Yb3+ and 2% of Er3+ was found to give the
highest upconversion luminescence (NP-3). The ratio of the green to red peak was
similar for all tested particles and did not appear to strongly relate to the dopant
concentrations. Emission intensities of all particles depended strongly on the oven
used for annealing and to some extent on the date of the annealing, indicating that
the temperature in the ovens is not stable at all times. This problem has not been
addressed in the literature so far. NP-3 was the only composition for all tested
UCNPs were a partial phase transfer from the cubic α-NaYF4 to the hexagonal β-
NaYF4 via annealing succeeded. As a consequence, the luminescence of NP-3 was
much brighter than for all other particles tested. It is not known whether the exact
particle composition has an influence on the phase transfer probability. An effect of
the inconsistent oven conditions can not be completely ruled out. Nevertheless, when
samples of NP-1, NP-2 and NP-3 were tempered in the same oven at the same date,
a phase transfer could only be determined for NP-3 suggesting that an actual
influence of the dopant concentrations is more likely. A further study on the fine-
tuning of the dopant concentrations or annealing temperatures and times was not
performed as the purpose of this work was to provide UCNPs of the type NaYF4 with
sufficient luminescence to be surface modified for further use in bioassays and
sensors.
It can be stated that a careful control of the oven temperature is crucial for
reproducible results regarding the luminescent intensity of the particles. However, the
tube furnace and the muffle furnace used in this work did not meet this necessity. An
oven fine-tuned for this purpose should be used in future works to ensure a constant
quality of the UCNPs.
Furthermore, it was shown, that NaYF4 UCNPs can also be synthesized via a
co-precipitation method in the ionic liquid EAN at elevated temperatures. This method
resulted in particles considerably smaller compared to the conventional co-
precipitation method which were already luminescent without the need for an
annealing step. However, the luminescence was very weak and not sufficient for the
3 Particle Synthesis and Characterization 47
application of the particles in assays or sensors. The envisioned direct synthesis of
hexagonal NaYF4 failed. It is assumed that higher temperatures or pressures (as in
the ionothermal method) are required to favor the generation of β-NaYF4. The
luminescence intensity could be highly enhanced by tempering even though no
phase transfer could be detected. In contrast to the particles of type NP-1 with nearly
the same composition the intensity of the red peak was much higher for the particles
of the types NP-8 and NP-9. This may be due to morphological differences in the
crystal host lattice or the volume-to-surface ratio. Ionic liquids represent an attractive
tool for the preparation of small hydrophilic UCNPs if higher temperatures can be
used to facilitate the formation of β-NaYF4.
Concluding, hydrophilic NaYF4 UCNPs with Yb and Er, Tm, or Ho, respectively
as dopants with narrow size distribution were synthesized with the aim to use them
for surface modification with click chemistry. NP-3 with a composition of 25 % of Yb3+
and 2% of Er3+ proved to have the best emission intensity. It was also shown that the
ionic liquid EAN is suitable for the preparation of small UCNPs but at the expense of
luminescence intensity.
3.5 References
1 Soukka T, Rantanen T, Kuningas K (2008) Photon Upconversion in Homogeneous Fluorescence-based Bioanalytical Assays, Ann. N. Y. Acad. Sci. 1130: 188-200.
2 Zhang F, Li J, Shan J, Xu L, Zhao D (2009) Shape, Size, and Phase-Controlled Rare-Earth Fluoride Nanocrystals with Optical Up-Conversion Properties, Chem. Eur. J. 15: 11010-11019.
3 Yi G, Lu H, Zhao S, Ge Y, Yang W, Chen D, Guo L-H (2004) Synthesis, Characterization, and Biological Application of Size-Controlled Nanocrystalline NaYF4: Yb, Er Infrared-to-Visible Up-Conversion Phosphors, Nano Lett. 4: 2191-9196.
4 Mai H-X, Zhang Y-W, Sun L-D, Yan C-H (2007) Highly Efficient Multicolor Up-Conversion Emissions and Their Mechanisms of Monodisperse NaYF4: Yb, Er Core and Core/Shell Structured Nanocrystals, J. Phys. Chem. C 111: 13721-13729.
5 Wei Y, Lu J, Zhang X, Chen D (2007) Synthesis and Characterization of Efficient Near-Infrared Upconversion Yb and Tm codoped NaYF4 Nanocrystal Reporter, J. Alloy. Compd. 427: 333-340.
6 Achatz DE, Meier RJ, Fischer LH, Wolfbeis OS (2010) Oxygen Sensor based on NaYF4:Yb, Tm Upconverting Nanoparticles, submitted
7 Zech O (2010) Ionic Liquids in Microemulsions – a Concept to Extend the Conventional Thermal Stability Range of Microemulsions, Dissertation, University of Regensburg

3 Particle Synthesis and Characterization 48
8 Liu X, Zhao J, Sun Y, Song K, Yu Y, Du C, Kong X, Zhang H (2009) Ionothermal Synthesis of Hexagonal-Phase NaYF4: Yb3+, Er3+/Tm3+ Upconversion Nanophosphors, Chem. Commun. 6628-6630.
9 Zech O, Thomaier S, Bauduin P, Rück T, Touraud D, Kunz W (2009) Microemulsions with an Ionic Liquid Surfactant and Room Temperature Ionic Liquids As Polar Pseudo-Phase, J. Phys. Chem. B 113: 465-473.
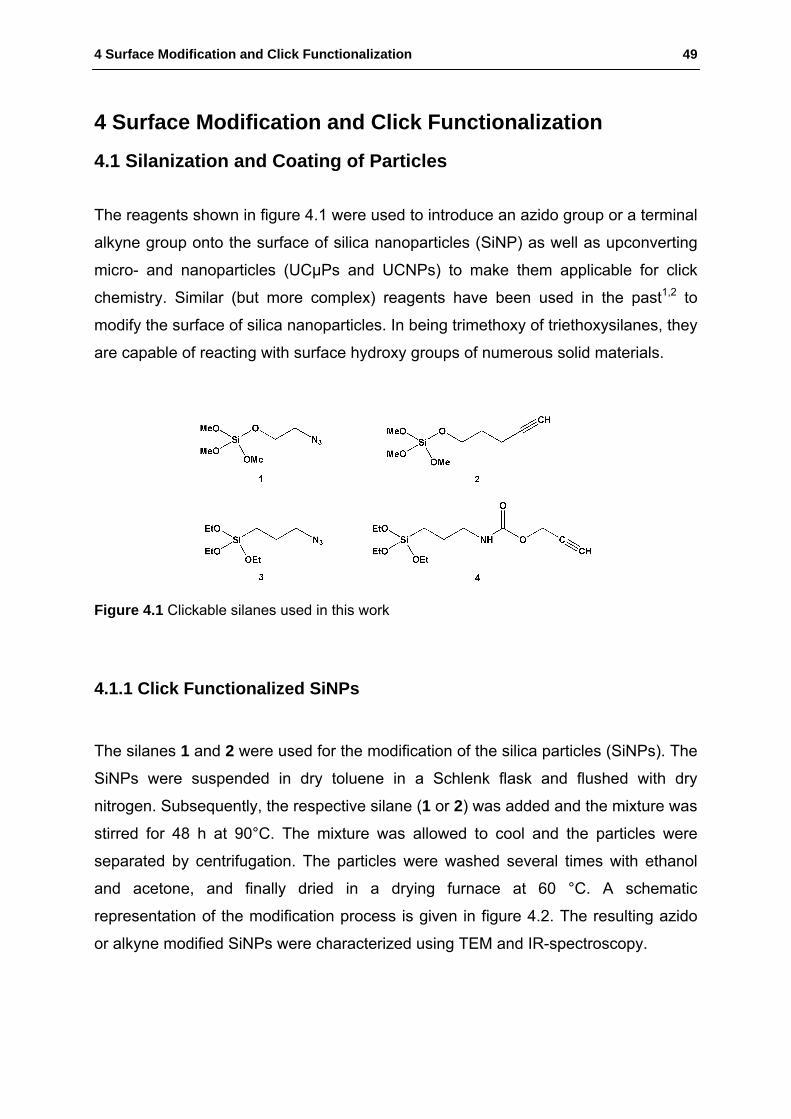
4 Surface Modification and Click Functionalization 49
4 Surface Modification and Click Functionalization
4.1 Silanization and Coating of Particles The reagents shown in figure 4.1 were used to introduce an azido group or a terminal
alkyne group onto the surface of silica nanoparticles (SiNP) as well as upconverting
micro- and nanoparticles (UCµPs and UCNPs) to make them applicable for click
chemistry. Similar (but more complex) reagents have been used in the past1,2 to
modify the surface of silica nanoparticles. In being trimethoxy of triethoxysilanes, they
are capable of reacting with surface hydroxy groups of numerous solid materials.
Figure 4.1 Clickable silanes used in this work
4.1.1 Click Functionalized SiNPs
The silanes 1 and 2 were used for the modification of the silica particles (SiNPs). The
SiNPs were suspended in dry toluene in a Schlenk flask and flushed with dry
nitrogen. Subsequently, the respective silane (1 or 2) was added and the mixture was
stirred for 48 h at 90°C. The mixture was allowed to cool and the particles were
separated by centrifugation. The particles were washed several times with ethanol
and acetone, and finally dried in a drying furnace at 60 °C. A schematic
representation of the modification process is given in figure 4.2. The resulting azido
or alkyne modified SiNPs were characterized using TEM and IR-spectroscopy.
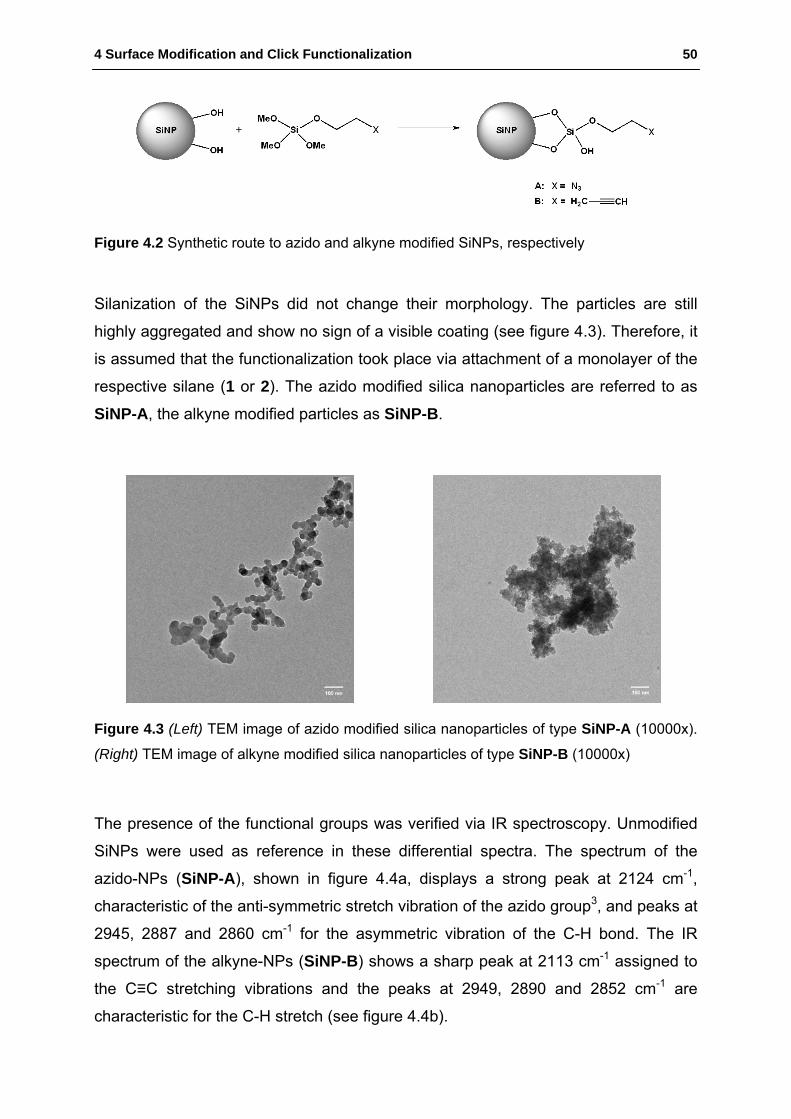
4 Surface Modification and Click Functionalization 50
Figure 4.2 Synthetic route to azido and alkyne modified SiNPs, respectively
Silanization of the SiNPs did not change their morphology. The particles are still
highly aggregated and show no sign of a visible coating (see figure 4.3). Therefore, it
is assumed that the functionalization took place via attachment of a monolayer of the
respective silane (1 or 2). The azido modified silica nanoparticles are referred to as
SiNP-A, the alkyne modified particles as SiNP-B.
Figure 4.3 (Left) TEM image of azido modified silica nanoparticles of type SiNP-A (10000x).
(Right) TEM image of alkyne modified silica nanoparticles of type SiNP-B (10000x)
The presence of the functional groups was verified via IR spectroscopy. Unmodified
SiNPs were used as reference in these differential spectra. The spectrum of the
azido-NPs (SiNP-A), shown in figure 4.4a, displays a strong peak at 2124 cm-1,
characteristic of the anti-symmetric stretch vibration of the azido group3, and peaks at
2945, 2887 and 2860 cm-1 for the asymmetric vibration of the C-H bond. The IR
spectrum of the alkyne-NPs (SiNP-B) shows a sharp peak at 2113 cm-1 assigned to
the C≡C stretching vibrations and the peaks at 2949, 2890 and 2852 cm-1 are
characteristic for the C-H stretch (see figure 4.4b).
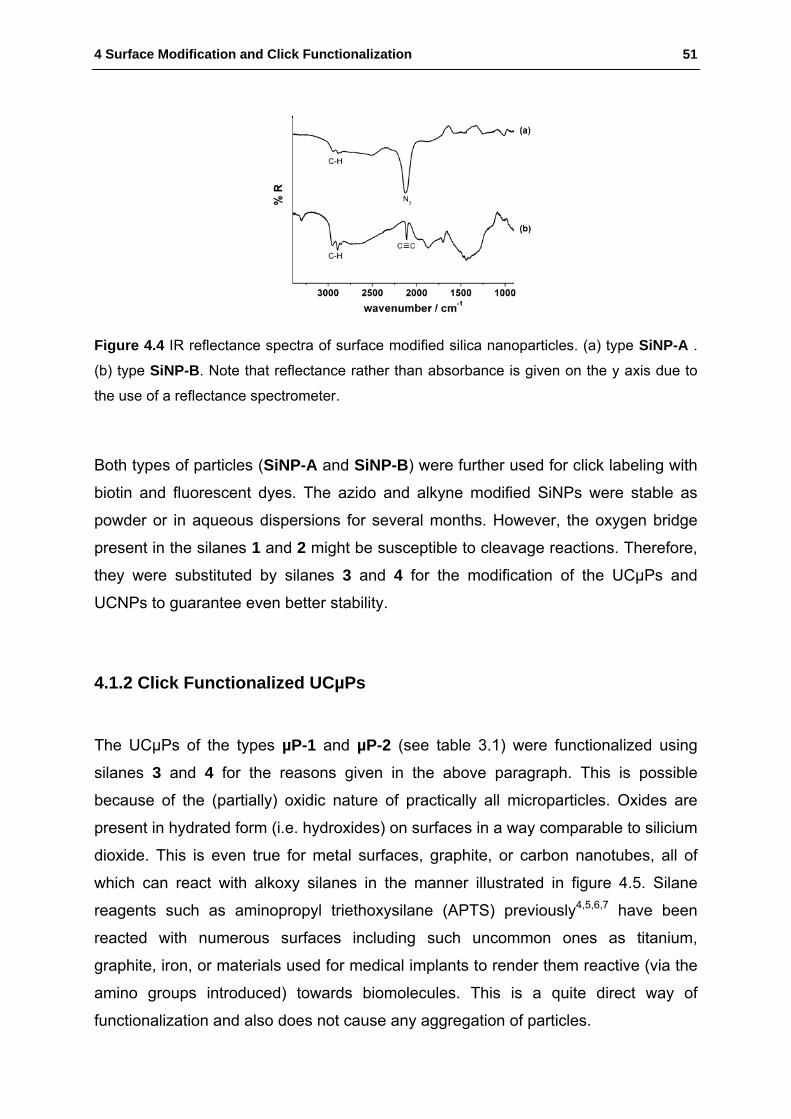
4 Surface Modification and Click Functionalization 51
Figure 4.4 IR reflectance spectra of surface modified silica nanoparticles. (a) type SiNP-A . (b) type SiNP-B. Note that reflectance rather than absorbance is given on the y axis due to
the use of a reflectance spectrometer.
Both types of particles (SiNP-A and SiNP-B) were further used for click labeling with
biotin and fluorescent dyes. The azido and alkyne modified SiNPs were stable as
powder or in aqueous dispersions for several months. However, the oxygen bridge
present in the silanes 1 and 2 might be susceptible to cleavage reactions. Therefore,
they were substituted by silanes 3 and 4 for the modification of the UCµPs and
UCNPs to guarantee even better stability.
4.1.2 Click Functionalized UCµPs
The UCµPs of the types µP-1 and µP-2 (see table 3.1) were functionalized using
silanes 3 and 4 for the reasons given in the above paragraph. This is possible
because of the (partially) oxidic nature of practically all microparticles. Oxides are
present in hydrated form (i.e. hydroxides) on surfaces in a way comparable to silicium
dioxide. This is even true for metal surfaces, graphite, or carbon nanotubes, all of
which can react with alkoxy silanes in the manner illustrated in figure 4.5. Silane
reagents such as aminopropyl triethoxysilane (APTS) previously4,5,6,7 have been
reacted with numerous surfaces including such uncommon ones as titanium,
graphite, iron, or materials used for medical implants to render them reactive (via the
amino groups introduced) towards biomolecules. This is a quite direct way of
functionalization and also does not cause any aggregation of particles.
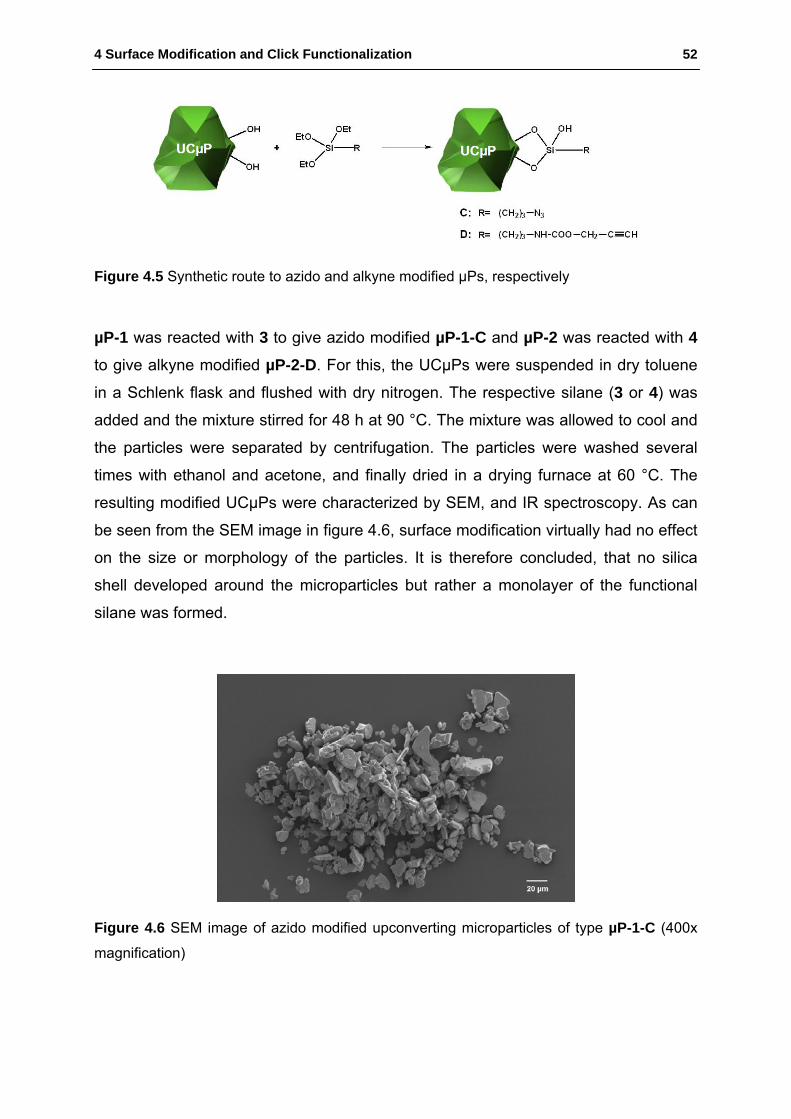
4 Surface Modification and Click Functionalization 52
Figure 4.5 Synthetic route to azido and alkyne modified µPs, respectively
µP-1 was reacted with 3 to give azido modified µP-1-C and µP-2 was reacted with 4
to give alkyne modified µP-2-D. For this, the UCµPs were suspended in dry toluene
in a Schlenk flask and flushed with dry nitrogen. The respective silane (3 or 4) was
added and the mixture stirred for 48 h at 90 °C. The mixture was allowed to cool and
the particles were separated by centrifugation. The particles were washed several
times with ethanol and acetone, and finally dried in a drying furnace at 60 °C. The
resulting modified UCµPs were characterized by SEM, and IR spectroscopy. As can
be seen from the SEM image in figure 4.6, surface modification virtually had no effect
on the size or morphology of the particles. It is therefore concluded, that no silica
shell developed around the microparticles but rather a monolayer of the functional
silane was formed.
Figure 4.6 SEM image of azido modified upconverting microparticles of type µP-1-C (400x
magnification)
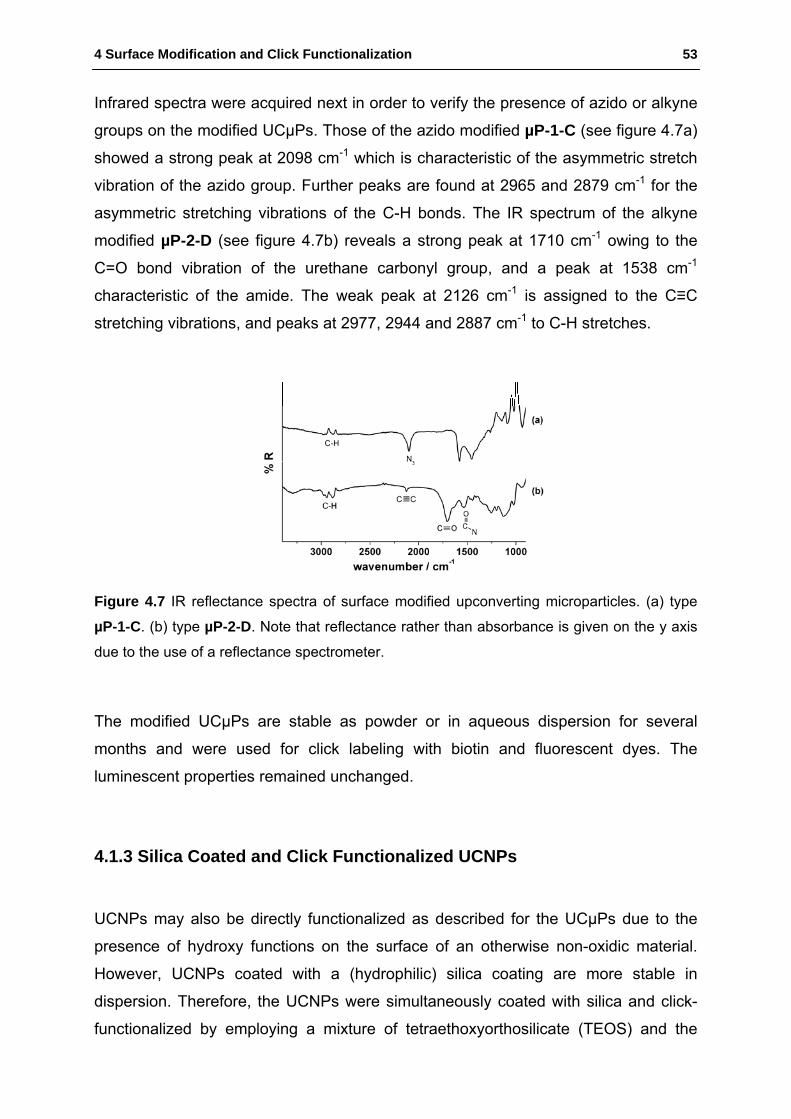
4 Surface Modification and Click Functionalization 53
Infrared spectra were acquired next in order to verify the presence of azido or alkyne
groups on the modified UCµPs. Those of the azido modified µP-1-C (see figure 4.7a)
showed a strong peak at 2098 cm-1 which is characteristic of the asymmetric stretch
vibration of the azido group. Further peaks are found at 2965 and 2879 cm-1 for the
asymmetric stretching vibrations of the C-H bonds. The IR spectrum of the alkyne
modified µP-2-D (see figure 4.7b) reveals a strong peak at 1710 cm-1 owing to the
C=O bond vibration of the urethane carbonyl group, and a peak at 1538 cm-1
characteristic of the amide. The weak peak at 2126 cm-1 is assigned to the C≡C
stretching vibrations, and peaks at 2977, 2944 and 2887 cm-1 to C-H stretches.
Figure 4.7 IR reflectance spectra of surface modified upconverting microparticles. (a) type
µP-1-C. (b) type µP-2-D. Note that reflectance rather than absorbance is given on the y axis
due to the use of a reflectance spectrometer.
The modified UCµPs are stable as powder or in aqueous dispersion for several
months and were used for click labeling with biotin and fluorescent dyes. The
luminescent properties remained unchanged.
4.1.3 Silica Coated and Click Functionalized UCNPs
UCNPs may also be directly functionalized as described for the UCµPs due to the
presence of hydroxy functions on the surface of an otherwise non-oxidic material.
However, UCNPs coated with a (hydrophilic) silica coating are more stable in
dispersion. Therefore, the UCNPs were simultaneously coated with silica and click-
functionalized by employing a mixture of tetraethoxyorthosilicate (TEOS) and the
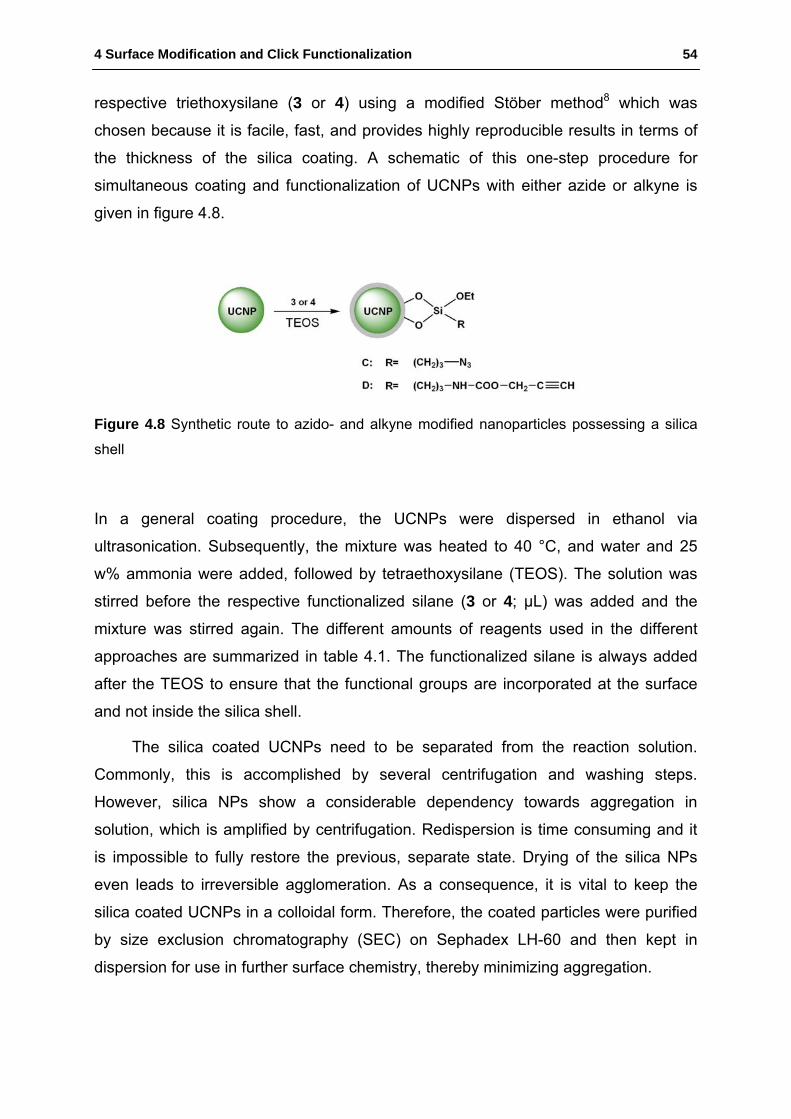
4 Surface Modification and Click Functionalization 54
respective triethoxysilane (3 or 4) using a modified Stöber method8 which was
chosen because it is facile, fast, and provides highly reproducible results in terms of
the thickness of the silica coating. A schematic of this one-step procedure for
simultaneous coating and functionalization of UCNPs with either azide or alkyne is
given in figure 4.8.
Figure 4.8 Synthetic route to azido- and alkyne modified nanoparticles possessing a silica
shell
In a general coating procedure, the UCNPs were dispersed in ethanol via
ultrasonication. Subsequently, the mixture was heated to 40 °C, and water and 25
w% ammonia were added, followed by tetraethoxysilane (TEOS). The solution was
stirred before the respective functionalized silane (3 or 4; µL) was added and the
mixture was stirred again. The different amounts of reagents used in the different
approaches are summarized in table 4.1. The functionalized silane is always added
after the TEOS to ensure that the functional groups are incorporated at the surface
and not inside the silica shell.
The silica coated UCNPs need to be separated from the reaction solution.
Commonly, this is accomplished by several centrifugation and washing steps.
However, silica NPs show a considerable dependency towards aggregation in
solution, which is amplified by centrifugation. Redispersion is time consuming and it
is impossible to fully restore the previous, separate state. Drying of the silica NPs
even leads to irreversible agglomeration. As a consequence, it is vital to keep the
silica coated UCNPs in a colloidal form. Therefore, the coated particles were purified
by size exclusion chromatography (SEC) on Sephadex LH-60 and then kept in
dispersion for use in further surface chemistry, thereby minimizing aggregation.
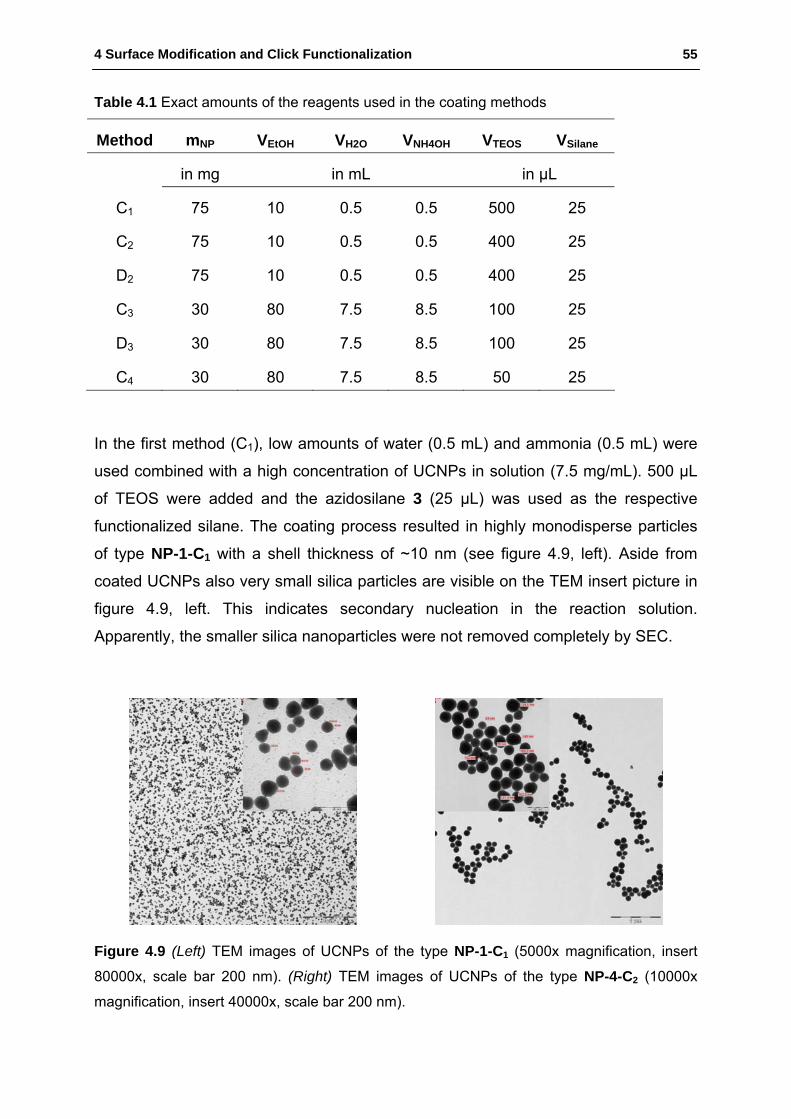
4 Surface Modification and Click Functionalization 55
Table 4.1 Exact amounts of the reagents used in the coating methods
Method mNP VEtOH VH2O VNH4OH VTEOS VSilane
in mg in mL in µL
C1 75 10 0.5 0.5 500 25
C2 75 10 0.5 0.5 400 25
D2 75 10 0.5 0.5 400 25
C3 30 80 7.5 8.5 100 25
D3 30 80 7.5 8.5 100 25
C4 30 80 7.5 8.5 50 25
In the first method (C1), low amounts of water (0.5 mL) and ammonia (0.5 mL) were
used combined with a high concentration of UCNPs in solution (7.5 mg/mL). 500 µL
of TEOS were added and the azidosilane 3 (25 µL) was used as the respective
functionalized silane. The coating process resulted in highly monodisperse particles
of type NP-1-C1 with a shell thickness of ~10 nm (see figure 4.9, left). Aside from
coated UCNPs also very small silica particles are visible on the TEM insert picture in
figure 4.9, left. This indicates secondary nucleation in the reaction solution.
Apparently, the smaller silica nanoparticles were not removed completely by SEC.
Figure 4.9 (Left) TEM images of UCNPs of the type NP-1-C1 (5000x magnification, insert
80000x, scale bar 200 nm). (Right) TEM images of UCNPs of the type NP-4-C2 (10000x
magnification, insert 40000x, scale bar 200 nm).
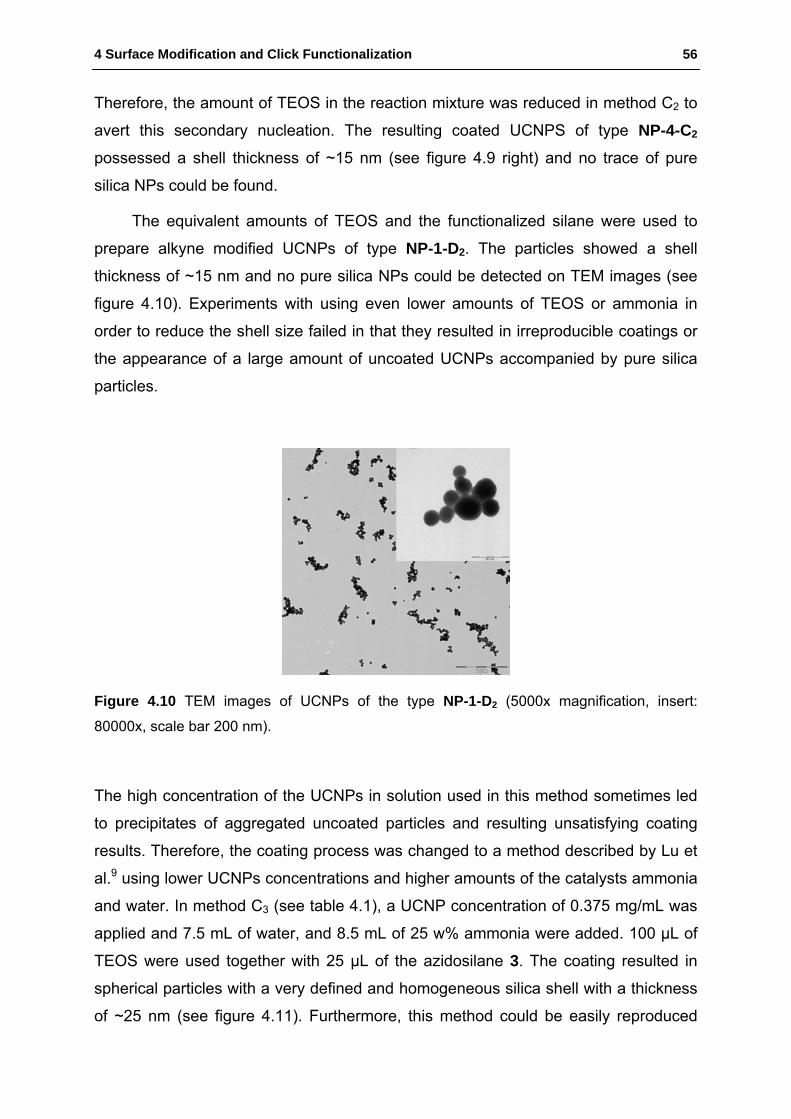
4 Surface Modification and Click Functionalization 56
Therefore, the amount of TEOS in the reaction mixture was reduced in method C2 to
avert this secondary nucleation. The resulting coated UCNPS of type NP-4-C2
possessed a shell thickness of ~15 nm (see figure 4.9 right) and no trace of pure
silica NPs could be found.
The equivalent amounts of TEOS and the functionalized silane were used to
prepare alkyne modified UCNPs of type NP-1-D2. The particles showed a shell
thickness of ~15 nm and no pure silica NPs could be detected on TEM images (see
figure 4.10). Experiments with using even lower amounts of TEOS or ammonia in
order to reduce the shell size failed in that they resulted in irreproducible coatings or
the appearance of a large amount of uncoated UCNPs accompanied by pure silica
particles.
Figure 4.10 TEM images of UCNPs of the type NP-1-D2 (5000x magnification, insert:
80000x, scale bar 200 nm).
The high concentration of the UCNPs in solution used in this method sometimes led
to precipitates of aggregated uncoated particles and resulting unsatisfying coating
results. Therefore, the coating process was changed to a method described by Lu et
al.9 using lower UCNPs concentrations and higher amounts of the catalysts ammonia
and water. In method C3 (see table 4.1), a UCNP concentration of 0.375 mg/mL was
applied and 7.5 mL of water, and 8.5 mL of 25 w% ammonia were added. 100 µL of
TEOS were used together with 25 µL of the azidosilane 3. The coating resulted in
spherical particles with a very defined and homogeneous silica shell with a thickness
of ~25 nm (see figure 4.11). Furthermore, this method could be easily reproduced
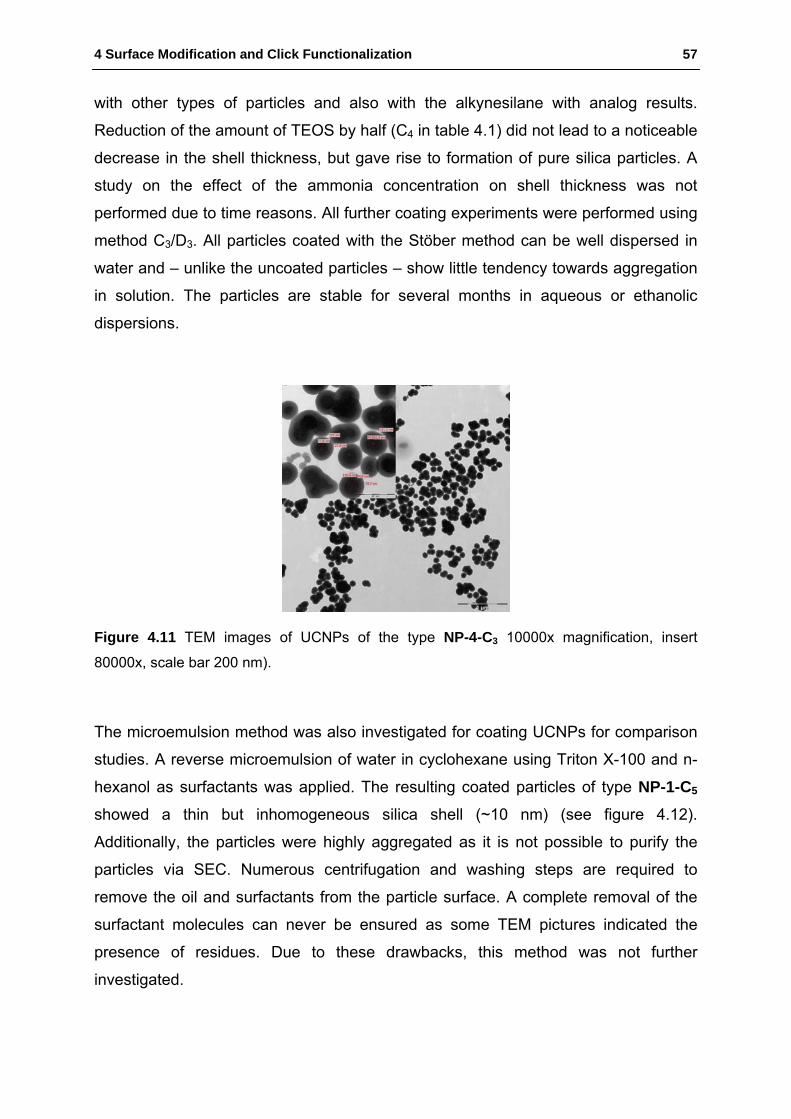
4 Surface Modification and Click Functionalization 57
with other types of particles and also with the alkynesilane with analog results.
Reduction of the amount of TEOS by half (C4 in table 4.1) did not lead to a noticeable
decrease in the shell thickness, but gave rise to formation of pure silica particles. A
study on the effect of the ammonia concentration on shell thickness was not
performed due to time reasons. All further coating experiments were performed using
method C3/D3. All particles coated with the Stöber method can be well dispersed in
water and – unlike the uncoated particles – show little tendency towards aggregation
in solution. The particles are stable for several months in aqueous or ethanolic
dispersions.
Figure 4.11 TEM images of UCNPs of the type NP-4-C3 10000x magnification, insert
80000x, scale bar 200 nm).
The microemulsion method was also investigated for coating UCNPs for comparison
studies. A reverse microemulsion of water in cyclohexane using Triton X-100 and n-
hexanol as surfactants was applied. The resulting coated particles of type NP-1-C5
showed a thin but inhomogeneous silica shell (~10 nm) (see figure 4.12).
Additionally, the particles were highly aggregated as it is not possible to purify the
particles via SEC. Numerous centrifugation and washing steps are required to
remove the oil and surfactants from the particle surface. A complete removal of the
surfactant molecules can never be ensured as some TEM pictures indicated the
presence of residues. Due to these drawbacks, this method was not further
investigated.
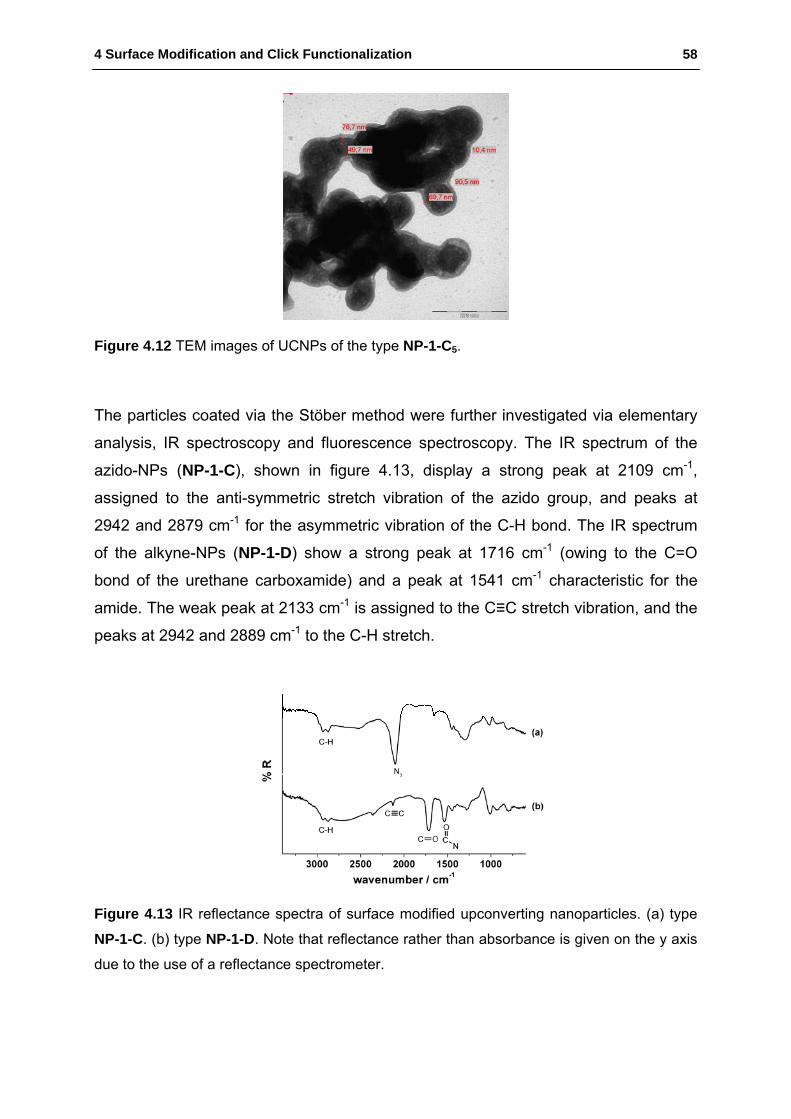
4 Surface Modification and Click Functionalization 58
Figure 4.12 TEM images of UCNPs of the type NP-1-C5.
The particles coated via the Stöber method were further investigated via elementary
analysis, IR spectroscopy and fluorescence spectroscopy. The IR spectrum of the
azido-NPs (NP-1-C), shown in figure 4.13, display a strong peak at 2109 cm-1,
assigned to the anti-symmetric stretch vibration of the azido group, and peaks at
2942 and 2879 cm-1 for the asymmetric vibration of the C-H bond. The IR spectrum
of the alkyne-NPs (NP-1-D) show a strong peak at 1716 cm-1 (owing to the C=O
bond of the urethane carboxamide) and a peak at 1541 cm-1 characteristic for the
amide. The weak peak at 2133 cm-1 is assigned to the C≡C stretch vibration, and the
peaks at 2942 and 2889 cm-1 to the C-H stretch.
Figure 4.13 IR reflectance spectra of surface modified upconverting nanoparticles. (a) type
NP-1-C. (b) type NP-1-D. Note that reflectance rather than absorbance is given on the y axis
due to the use of a reflectance spectrometer.
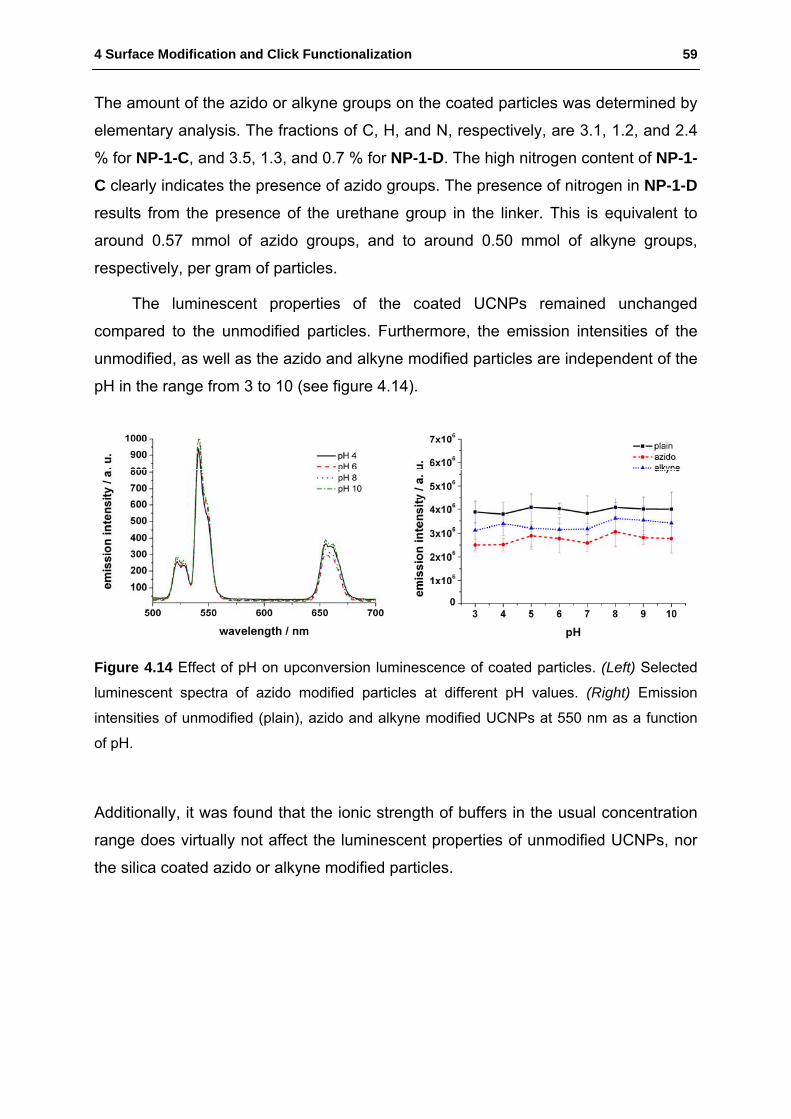
4 Surface Modification and Click Functionalization 59
The amount of the azido or alkyne groups on the coated particles was determined by
elementary analysis. The fractions of C, H, and N, respectively, are 3.1, 1.2, and 2.4
% for NP-1-C, and 3.5, 1.3, and 0.7 % for NP-1-D. The high nitrogen content of NP-1-C clearly indicates the presence of azido groups. The presence of nitrogen in NP-1-D
results from the presence of the urethane group in the linker. This is equivalent to
around 0.57 mmol of azido groups, and to around 0.50 mmol of alkyne groups,
respectively, per gram of particles.
The luminescent properties of the coated UCNPs remained unchanged
compared to the unmodified particles. Furthermore, the emission intensities of the
unmodified, as well as the azido and alkyne modified particles are independent of the
pH in the range from 3 to 10 (see figure 4.14).
Figure 4.14 Effect of pH on upconversion luminescence of coated particles. (Left) Selected
luminescent spectra of azido modified particles at different pH values. (Right) Emission
intensities of unmodified (plain), azido and alkyne modified UCNPs at 550 nm as a function
of pH.
Additionally, it was found that the ionic strength of buffers in the usual concentration
range does virtually not affect the luminescent properties of unmodified UCNPs, nor
the silica coated azido or alkyne modified particles.
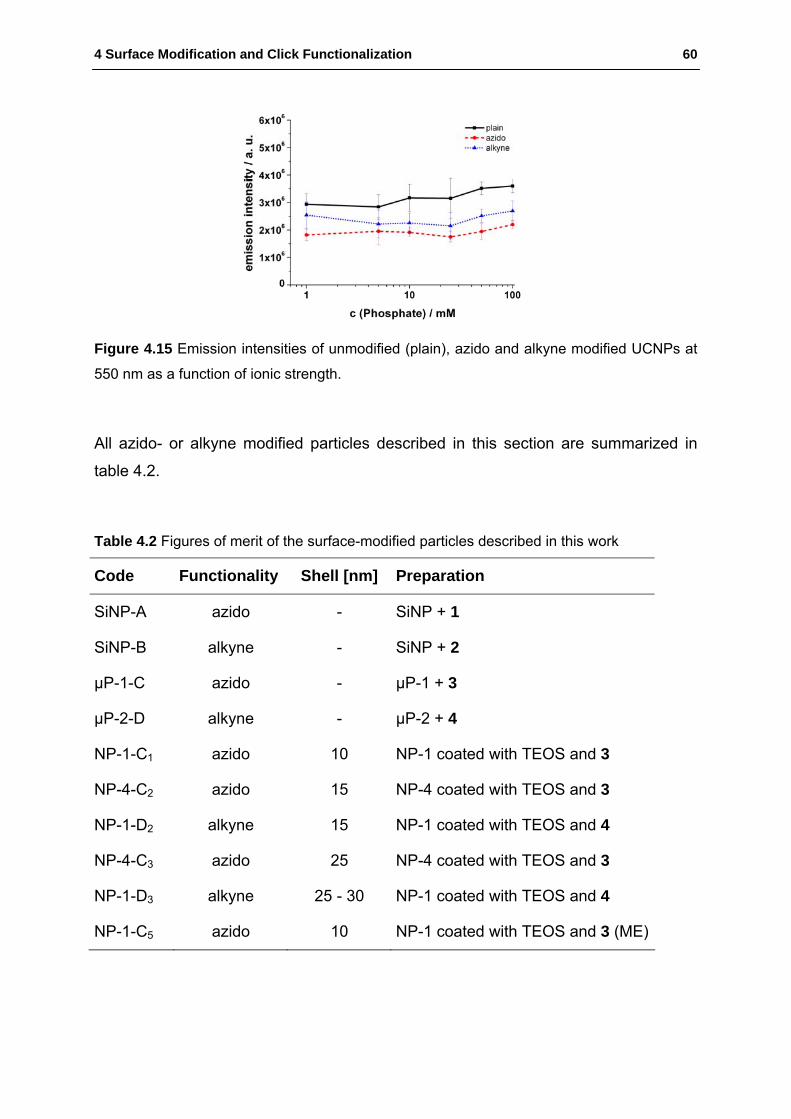
4 Surface Modification and Click Functionalization 60
Figure 4.15 Emission intensities of unmodified (plain), azido and alkyne modified UCNPs at
550 nm as a function of ionic strength.
All azido- or alkyne modified particles described in this section are summarized in
table 4.2.
Table 4.2 Figures of merit of the surface-modified particles described in this work
Code Functionality Shell [nm] Preparation
SiNP-A azido - SiNP + 1
SiNP-B alkyne - SiNP + 2
µP-1-C azido - µP-1 + 3
µP-2-D alkyne - µP-2 + 4
NP-1-C1 azido 10 NP-1 coated with TEOS and 3
NP-4-C2 azido 15 NP-4 coated with TEOS and 3
NP-1-D2 alkyne 15 NP-1 coated with TEOS and 4
NP-4-C3 azido 25 NP-4 coated with TEOS and 3
NP-1-D3 alkyne 25 - 30 NP-1 coated with TEOS and 4
NP-1-C5 azido 10 NP-1 coated with TEOS and 3 (ME)
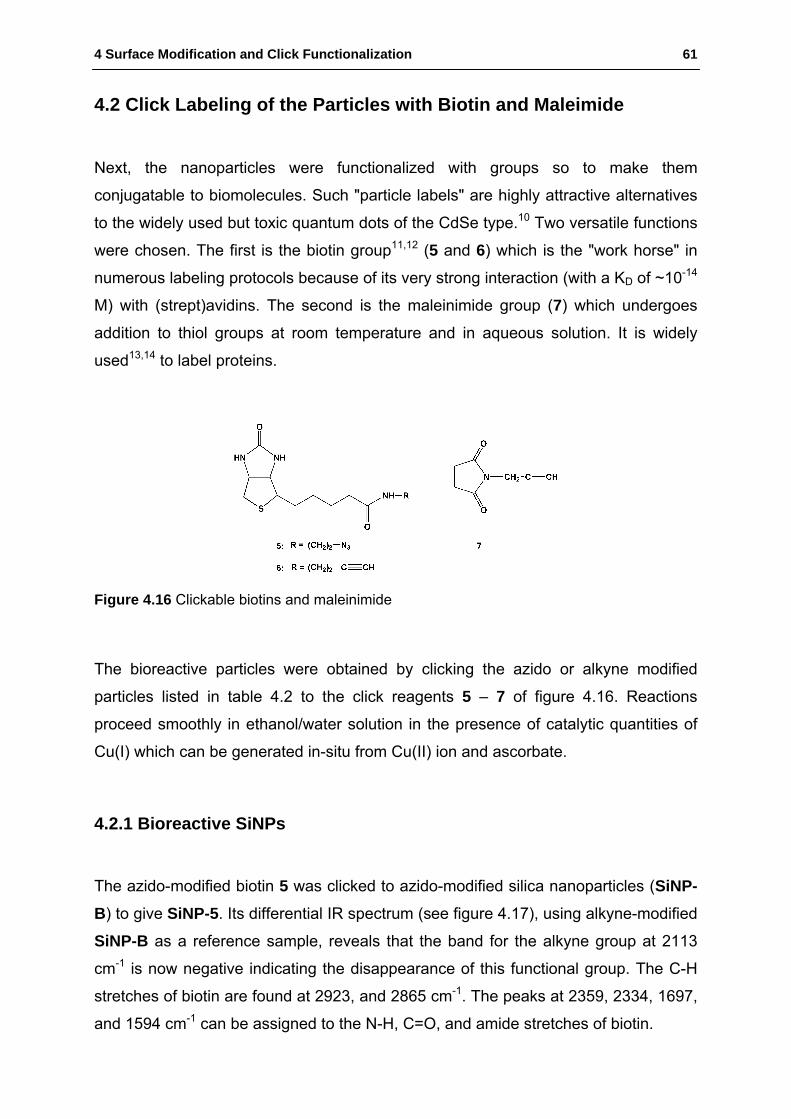
4 Surface Modification and Click Functionalization 61
4.2 Click Labeling of the Particles with Biotin and Maleimide
Next, the nanoparticles were functionalized with groups so to make them
conjugatable to biomolecules. Such "particle labels" are highly attractive alternatives
to the widely used but toxic quantum dots of the CdSe type.10 Two versatile functions
were chosen. The first is the biotin group11,12 (5 and 6) which is the "work horse" in
numerous labeling protocols because of its very strong interaction (with a KD of ~10-14
M) with (strept)avidins. The second is the maleinimide group (7) which undergoes
addition to thiol groups at room temperature and in aqueous solution. It is widely
used13,14 to label proteins.
Figure 4.16 Clickable biotins and maleinimide
The bioreactive particles were obtained by clicking the azido or alkyne modified
particles listed in table 4.2 to the click reagents 5 – 7 of figure 4.16. Reactions
proceed smoothly in ethanol/water solution in the presence of catalytic quantities of
Cu(I) which can be generated in-situ from Cu(II) ion and ascorbate.
4.2.1 Bioreactive SiNPs
The azido-modified biotin 5 was clicked to azido-modified silica nanoparticles (SiNP-B) to give SiNP-5. Its differential IR spectrum (see figure 4.17), using alkyne-modified
SiNP-B as a reference sample, reveals that the band for the alkyne group at 2113
cm-1 is now negative indicating the disappearance of this functional group. The C-H
stretches of biotin are found at 2923, and 2865 cm-1. The peaks at 2359, 2334, 1697,
and 1594 cm-1 can be assigned to the N-H, C=O, and amide stretches of biotin.
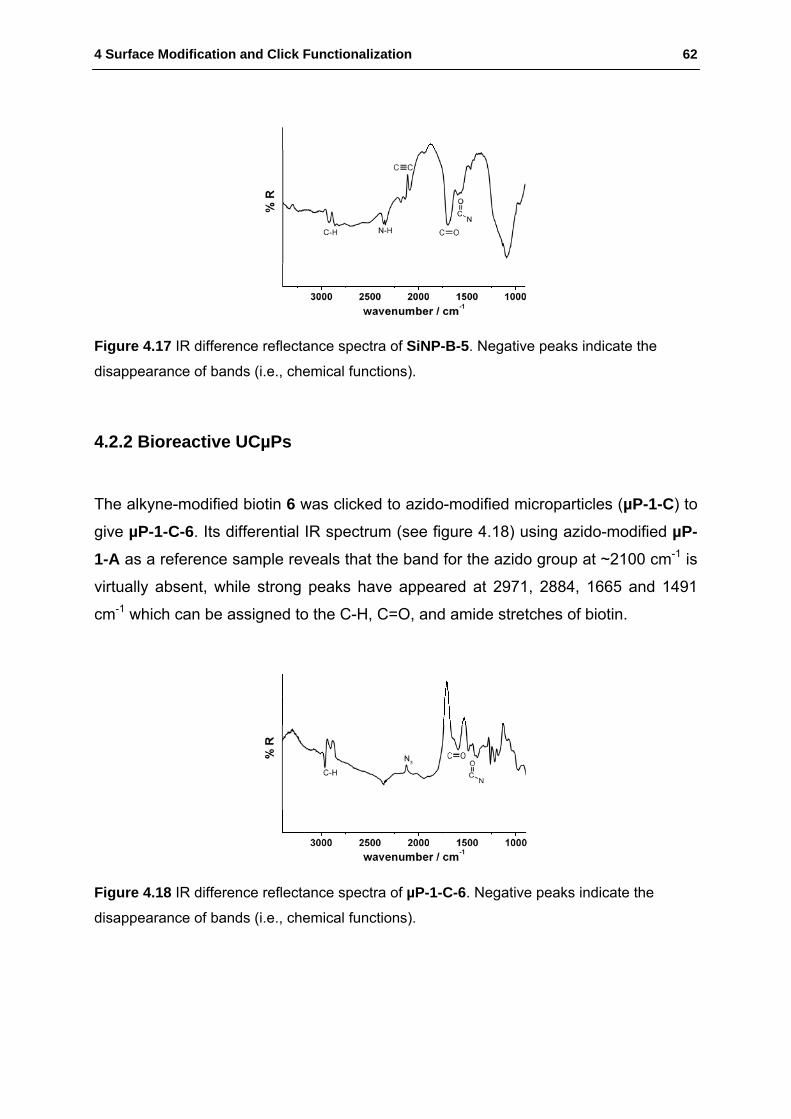
4 Surface Modification and Click Functionalization 62
Figure 4.17 IR difference reflectance spectra of SiNP-B-5. Negative peaks indicate the
disappearance of bands (i.e., chemical functions).
4.2.2 Bioreactive UCµPs
The alkyne-modified biotin 6 was clicked to azido-modified microparticles (µP-1-C) to
give µP-1-C-6. Its differential IR spectrum (see figure 4.18) using azido-modified µP-1-A as a reference sample reveals that the band for the azido group at ~2100 cm-1 is
virtually absent, while strong peaks have appeared at 2971, 2884, 1665 and 1491
cm-1 which can be assigned to the C-H, C=O, and amide stretches of biotin.
Figure 4.18 IR difference reflectance spectra of µP-1-C-6. Negative peaks indicate the
disappearance of bands (i.e., chemical functions).

4 Surface Modification and Click Functionalization 63
4.2.3 Bioreactive UCNPs
The azido-modified biotin (5) was clicked to alkyne modified NP-1-D to give NP-1-D-5. The presence of the functional groups was verified via diffuse reflectance FT-IR
spectroscopy as shown in figure 4.19. The spectra were acquired using the
respective alkyne- or azido modified NP-1 as a reference material. The negative peak
at 2131 cm-1 in the difference spectrum (figure 4.19a) indicates that the alkyne
functionality has disappeared. The C-H stretch vibration is visible at 2983 and 2908
cm-1. The peaks at 1665 and 1598 cm-1 are assigned to the C=O and C-N amide
stretches.
Figure 4.19 IR difference reflectance spectra of (a), NP-1-D-5; (b), NP-1-C-6; (c), NP-1-C-7.
Negative peaks indicate the disappearance of bands (i.e., chemical functions).
Alkyne-modified biotin (6), in turn, was clicked to azido-modified NP-1-C to give NP-1-C-6. The disappearance of the azido group is indicated by the negative peak at
2108 cm-1.The C-H stretches are found at 3003 and 2906 cm-1. The C=O stretch
vibration is located 1709 cm-1, and the C-N amide stretch at 1542 cm-1 (figure 4.19b).
Finally, the alkyne-modified maleinimide (7) was clicked to azido-modified NP-1-C to give NP-1-C-7. The absence of the azido functionality is indicated by the
negative peak at 2114 cm-1. The C-H stretches are located at 3998 and 2906 cm-1.
The maleinimidic C=O stretches are found at 1788 and 1724 cm-1. The C=C
stretching peak is located at 1582 cm-1 (figure 4.19c). All particles described in this
section functionalized with either biotin or maleinimide are summarized in table 4.3.
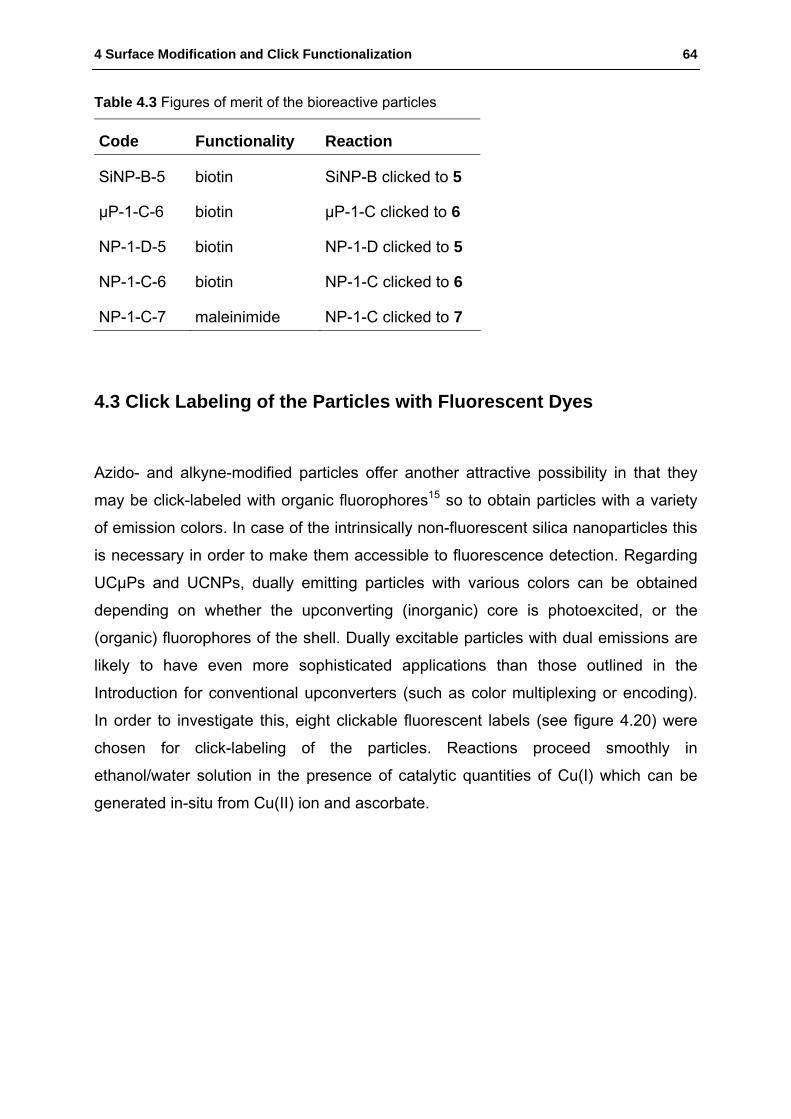
4 Surface Modification and Click Functionalization 64
Table 4.3 Figures of merit of the bioreactive particles
Code Functionality Reaction
SiNP-B-5 biotin SiNP-B clicked to 5
µP-1-C-6 biotin µP-1-C clicked to 6
NP-1-D-5 biotin NP-1-D clicked to 5
NP-1-C-6 biotin NP-1-C clicked to 6
NP-1-C-7 maleinimide NP-1-C clicked to 7
4.3 Click Labeling of the Particles with Fluorescent Dyes
Azido- and alkyne-modified particles offer another attractive possibility in that they
may be click-labeled with organic fluorophores15 so to obtain particles with a variety
of emission colors. In case of the intrinsically non-fluorescent silica nanoparticles this
is necessary in order to make them accessible to fluorescence detection. Regarding
UCµPs and UCNPs, dually emitting particles with various colors can be obtained
depending on whether the upconverting (inorganic) core is photoexcited, or the
(organic) fluorophores of the shell. Dually excitable particles with dual emissions are
likely to have even more sophisticated applications than those outlined in the
Introduction for conventional upconverters (such as color multiplexing or encoding).
In order to investigate this, eight clickable fluorescent labels (see figure 4.20) were
chosen for click-labeling of the particles. Reactions proceed smoothly in
ethanol/water solution in the presence of catalytic quantities of Cu(I) which can be
generated in-situ from Cu(II) ion and ascorbate.
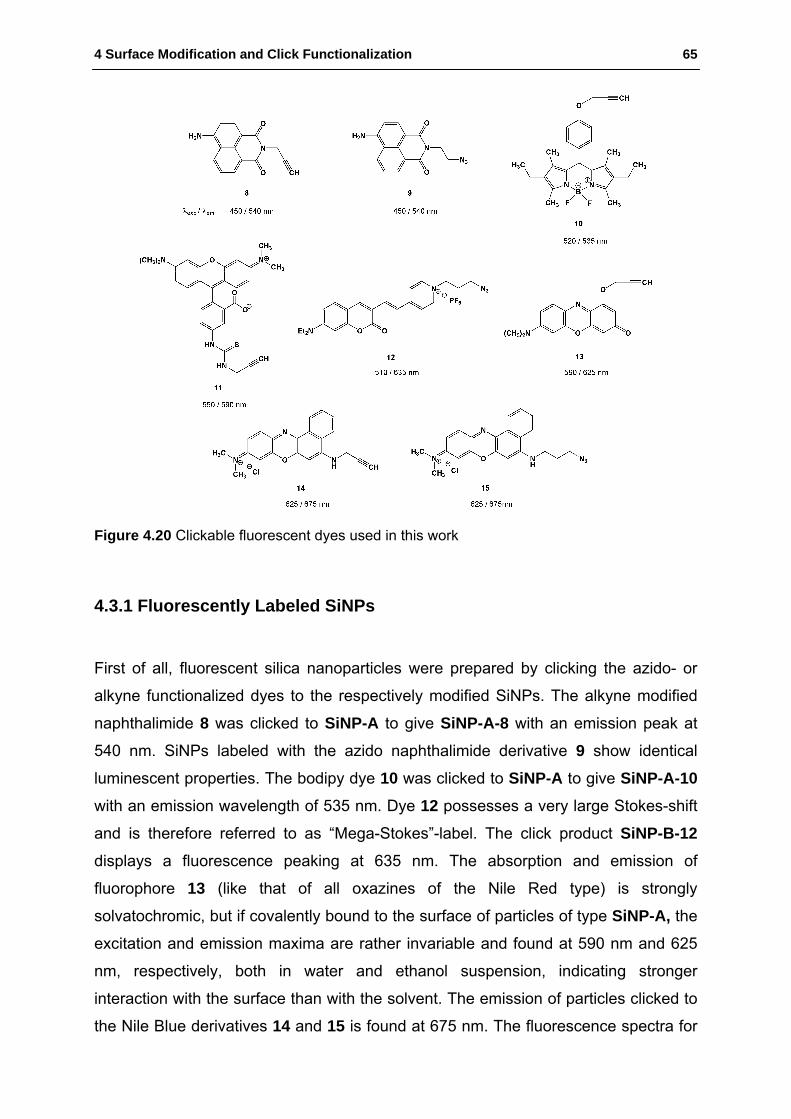
4 Surface Modification and Click Functionalization 65
Figure 4.20 Clickable fluorescent dyes used in this work
4.3.1 Fluorescently Labeled SiNPs
First of all, fluorescent silica nanoparticles were prepared by clicking the azido- or
alkyne functionalized dyes to the respectively modified SiNPs. The alkyne modified
naphthalimide 8 was clicked to SiNP-A to give SiNP-A-8 with an emission peak at
540 nm. SiNPs labeled with the azido naphthalimide derivative 9 show identical
luminescent properties. The bodipy dye 10 was clicked to SiNP-A to give SiNP-A-10
with an emission wavelength of 535 nm. Dye 12 possesses a very large Stokes-shift
and is therefore referred to as “Mega-Stokes”-label. The click product SiNP-B-12
displays a fluorescence peaking at 635 nm. The absorption and emission of
fluorophore 13 (like that of all oxazines of the Nile Red type) is strongly
solvatochromic, but if covalently bound to the surface of particles of type SiNP-A, the
excitation and emission maxima are rather invariable and found at 590 nm and 625
nm, respectively, both in water and ethanol suspension, indicating stronger
interaction with the surface than with the solvent. The emission of particles clicked to
the Nile Blue derivatives 14 and 15 is found at 675 nm. The fluorescence spectra for
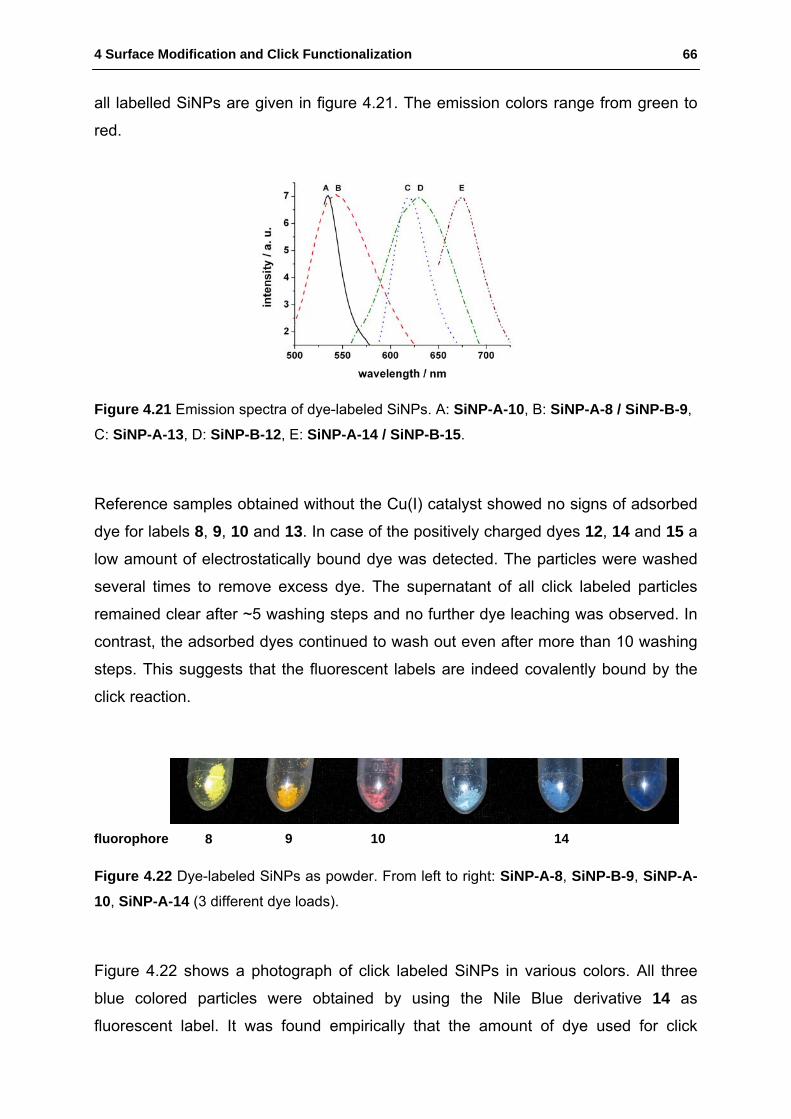
4 Surface Modification and Click Functionalization 66
all labelled SiNPs are given in figure 4.21. The emission colors range from green to
red.
Figure 4.21 Emission spectra of dye-labeled SiNPs. A: SiNP-A-10, B: SiNP-A-8 / SiNP-B-9,
C: SiNP-A-13, D: SiNP-B-12, E: SiNP-A-14 / SiNP-B-15.
Reference samples obtained without the Cu(I) catalyst showed no signs of adsorbed
dye for labels 8, 9, 10 and 13. In case of the positively charged dyes 12, 14 and 15 a
low amount of electrostatically bound dye was detected. The particles were washed
several times to remove excess dye. The supernatant of all click labeled particles
remained clear after ~5 washing steps and no further dye leaching was observed. In
contrast, the adsorbed dyes continued to wash out even after more than 10 washing
steps. This suggests that the fluorescent labels are indeed covalently bound by the
click reaction.
Figure 4.22 Dye-labeled SiNPs as powder. From left to right: SiNP-A-8, SiNP-B-9, SiNP-A-10, SiNP-A-14 (3 different dye loads).
Figure 4.22 shows a photograph of click labeled SiNPs in various colors. All three
blue colored particles were obtained by using the Nile Blue derivative 14 as
fluorescent label. It was found empirically that the amount of dye used for click
8 9 10 14 fluorophore
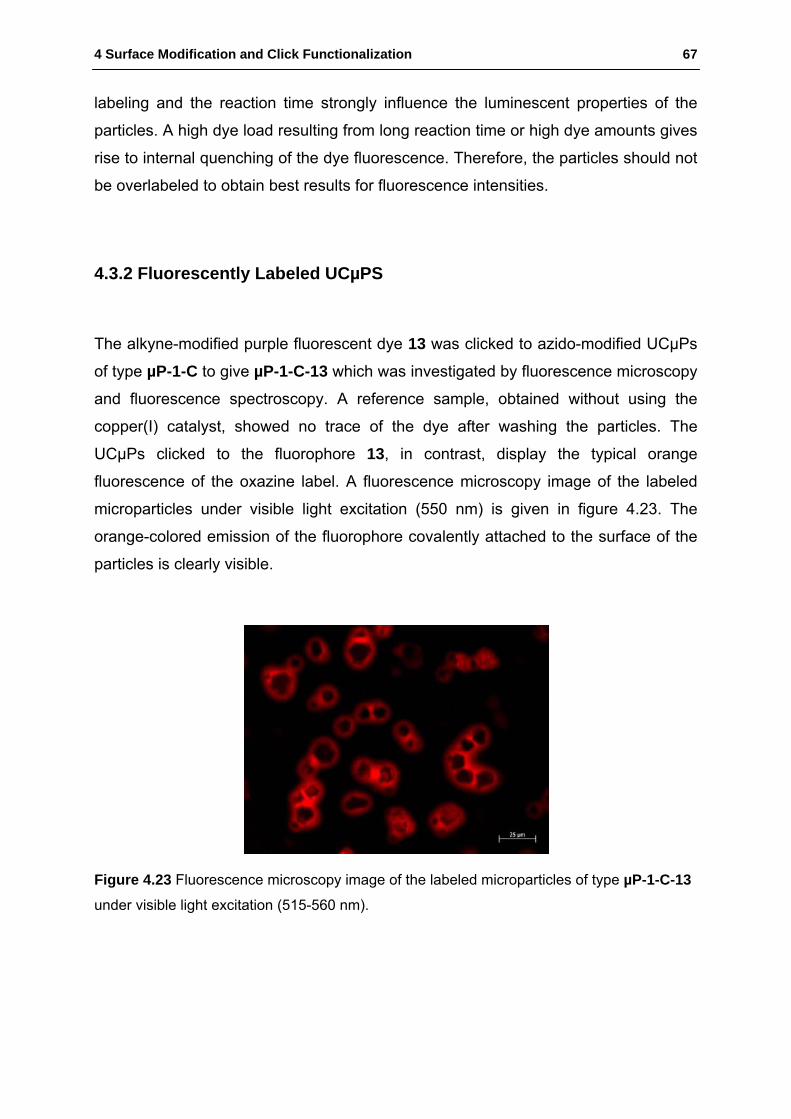
4 Surface Modification and Click Functionalization 67
labeling and the reaction time strongly influence the luminescent properties of the
particles. A high dye load resulting from long reaction time or high dye amounts gives
rise to internal quenching of the dye fluorescence. Therefore, the particles should not
be overlabeled to obtain best results for fluorescence intensities.
4.3.2 Fluorescently Labeled UCµPS
The alkyne-modified purple fluorescent dye 13 was clicked to azido-modified UCµPs
of type µP-1-C to give µP-1-C-13 which was investigated by fluorescence microscopy
and fluorescence spectroscopy. A reference sample, obtained without using the
copper(I) catalyst, showed no trace of the dye after washing the particles. The
UCµPs clicked to the fluorophore 13, in contrast, display the typical orange
fluorescence of the oxazine label. A fluorescence microscopy image of the labeled
microparticles under visible light excitation (550 nm) is given in figure 4.23. The
orange-colored emission of the fluorophore covalently attached to the surface of the
particles is clearly visible.
Figure 4.23 Fluorescence microscopy image of the labeled microparticles of type µP-1-C-13
under visible light excitation (515-560 nm).
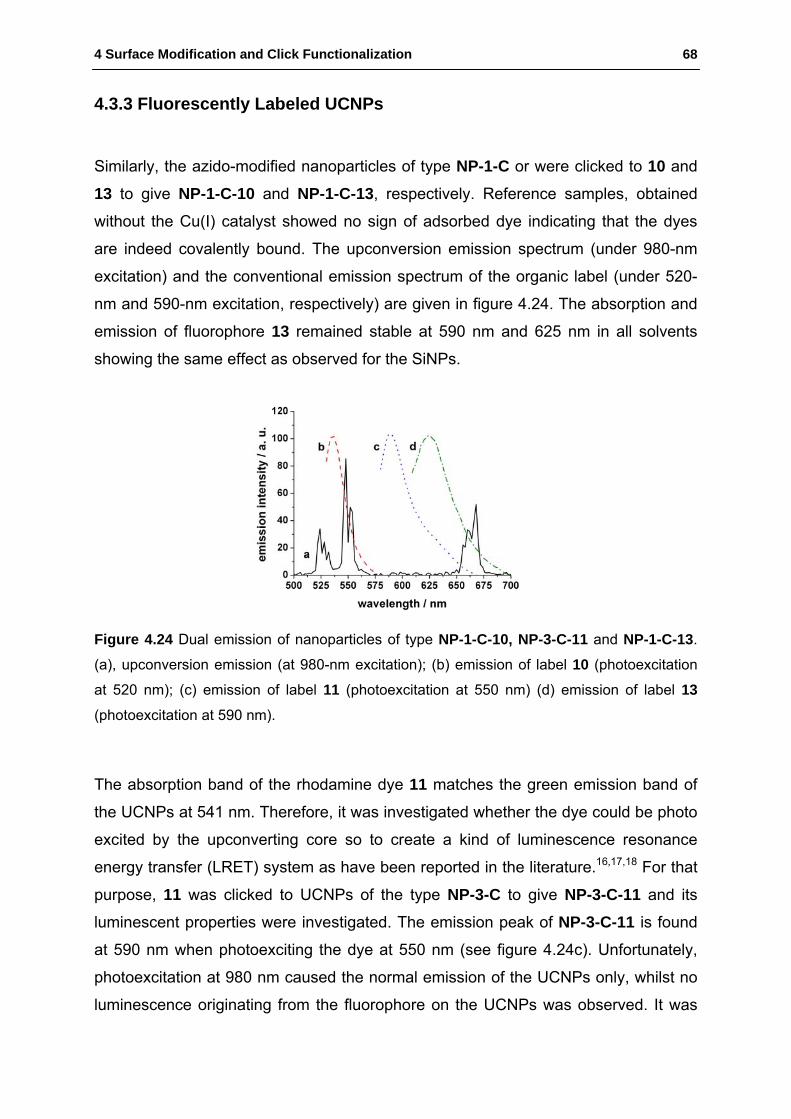
4 Surface Modification and Click Functionalization 68
4.3.3 Fluorescently Labeled UCNPs
Similarly, the azido-modified nanoparticles of type NP-1-C or were clicked to 10 and
13 to give NP-1-C-10 and NP-1-C-13, respectively. Reference samples, obtained
without the Cu(I) catalyst showed no sign of adsorbed dye indicating that the dyes
are indeed covalently bound. The upconversion emission spectrum (under 980-nm
excitation) and the conventional emission spectrum of the organic label (under 520-
nm and 590-nm excitation, respectively) are given in figure 4.24. The absorption and
emission of fluorophore 13 remained stable at 590 nm and 625 nm in all solvents
showing the same effect as observed for the SiNPs.
Figure 4.24 Dual emission of nanoparticles of type NP-1-C-10, NP-3-C-11 and NP-1-C-13.
(a), upconversion emission (at 980-nm excitation); (b) emission of label 10 (photoexcitation
at 520 nm); (c) emission of label 11 (photoexcitation at 550 nm) (d) emission of label 13
(photoexcitation at 590 nm).
The absorption band of the rhodamine dye 11 matches the green emission band of
the UCNPs at 541 nm. Therefore, it was investigated whether the dye could be photo
excited by the upconverting core so to create a kind of luminescence resonance
energy transfer (LRET) system as have been reported in the literature.16,17,18 For that
purpose, 11 was clicked to UCNPs of the type NP-3-C to give NP-3-C-11 and its
luminescent properties were investigated. The emission peak of NP-3-C-11 is found
at 590 nm when photoexciting the dye at 550 nm (see figure 4.24c). Unfortunately,
photoexcitation at 980 nm caused the normal emission of the UCNPs only, whilst no
luminescence originating from the fluorophore on the UCNPs was observed. It was
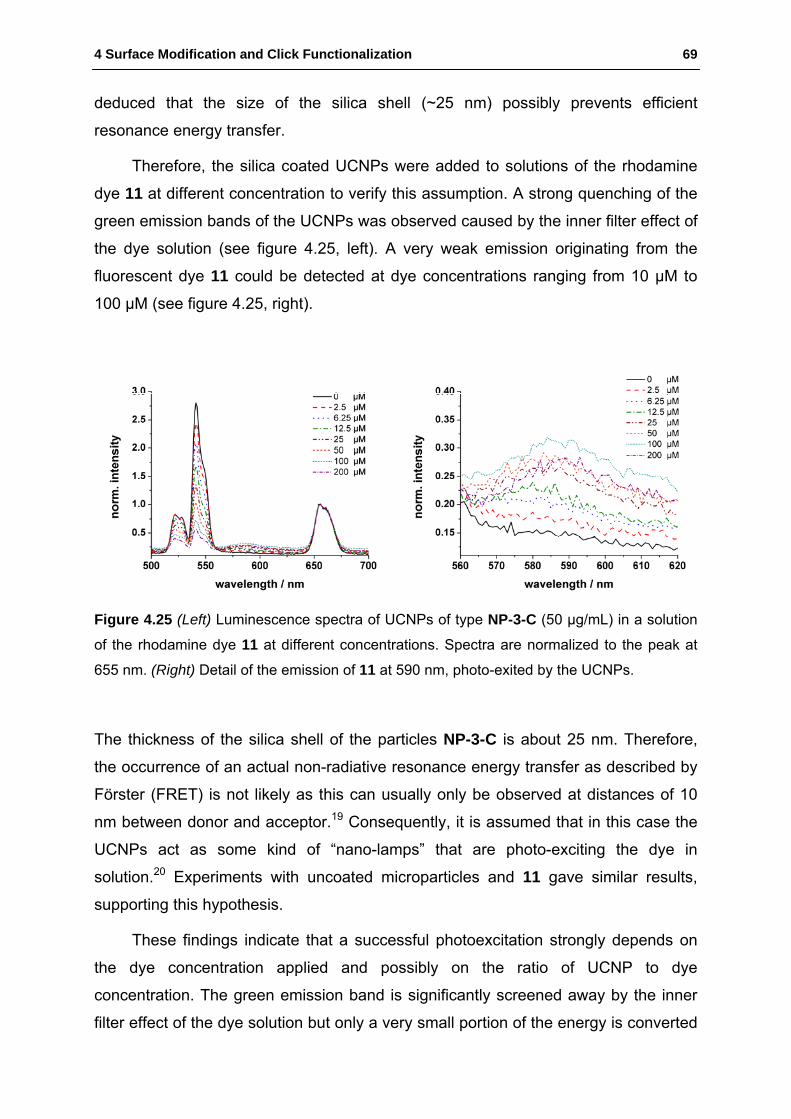
4 Surface Modification and Click Functionalization 69
deduced that the size of the silica shell (~25 nm) possibly prevents efficient
resonance energy transfer.
Therefore, the silica coated UCNPs were added to solutions of the rhodamine
dye 11 at different concentration to verify this assumption. A strong quenching of the
green emission bands of the UCNPs was observed caused by the inner filter effect of
the dye solution (see figure 4.25, left). A very weak emission originating from the
fluorescent dye 11 could be detected at dye concentrations ranging from 10 µM to
100 µM (see figure 4.25, right).
Figure 4.25 (Left) Luminescence spectra of UCNPs of type NP-3-C (50 µg/mL) in a solution
of the rhodamine dye 11 at different concentrations. Spectra are normalized to the peak at
655 nm. (Right) Detail of the emission of 11 at 590 nm, photo-exited by the UCNPs.
The thickness of the silica shell of the particles NP-3-C is about 25 nm. Therefore,
the occurrence of an actual non-radiative resonance energy transfer as described by
Förster (FRET) is not likely as this can usually only be observed at distances of 10
nm between donor and acceptor.19 Consequently, it is assumed that in this case the
UCNPs act as some kind of “nano-lamps” that are photo-exciting the dye in
solution.20 Experiments with uncoated microparticles and 11 gave similar results,
supporting this hypothesis.
These findings indicate that a successful photoexcitation strongly depends on
the dye concentration applied and possibly on the ratio of UCNP to dye
concentration. The green emission band is significantly screened away by the inner
filter effect of the dye solution but only a very small portion of the energy is converted
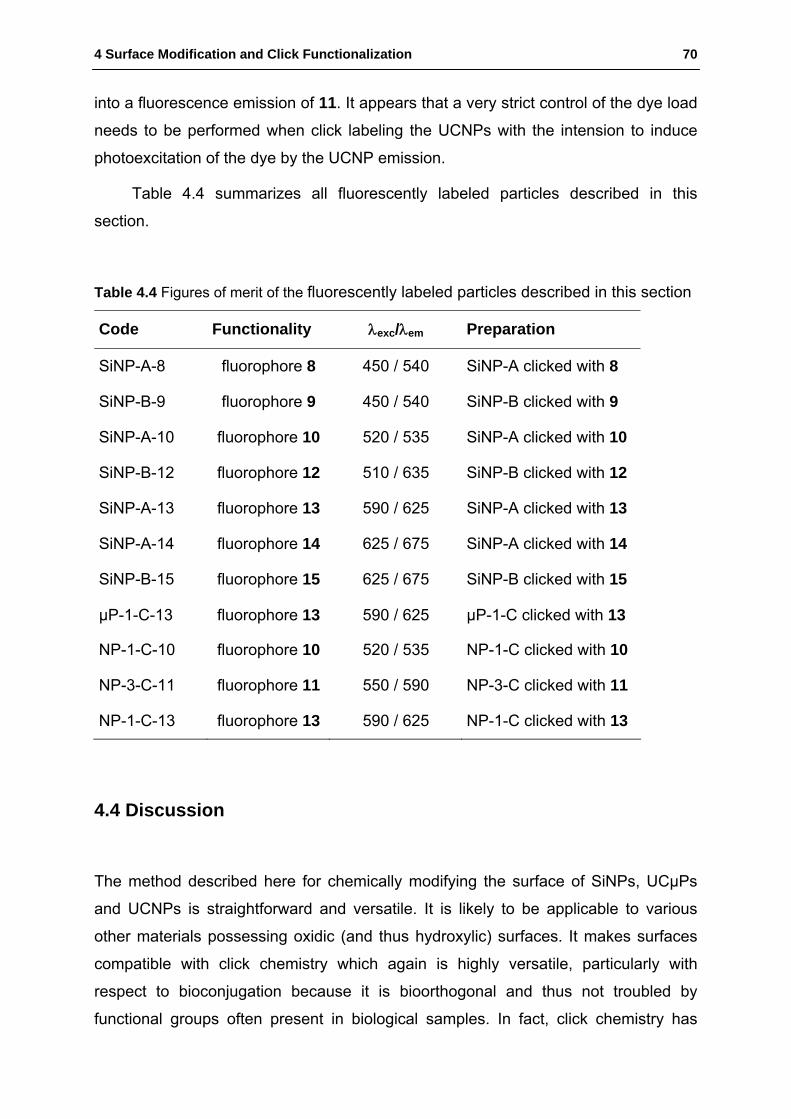
4 Surface Modification and Click Functionalization 70
into a fluorescence emission of 11. It appears that a very strict control of the dye load
needs to be performed when click labeling the UCNPs with the intension to induce
photoexcitation of the dye by the UCNP emission.
Table 4.4 summarizes all fluorescently labeled particles described in this
section.
Table 4.4 Figures of merit of the fluorescently labeled particles described in this section
Code Functionality λexc/λem Preparation
SiNP-A-8 fluorophore 8 450 / 540 SiNP-A clicked with 8
SiNP-B-9 fluorophore 9 450 / 540 SiNP-B clicked with 9
SiNP-A-10 fluorophore 10 520 / 535 SiNP-A clicked with 10
SiNP-B-12 fluorophore 12 510 / 635 SiNP-B clicked with 12
SiNP-A-13 fluorophore 13 590 / 625 SiNP-A clicked with 13
SiNP-A-14 fluorophore 14 625 / 675 SiNP-A clicked with 14
SiNP-B-15 fluorophore 15 625 / 675 SiNP-B clicked with 15
µP-1-C-13 fluorophore 13 590 / 625 µP-1-C clicked with 13
NP-1-C-10 fluorophore 10 520 / 535 NP-1-C clicked with 10
NP-3-C-11 fluorophore 11 550 / 590 NP-3-C clicked with 11
NP-1-C-13 fluorophore 13 590 / 625 NP-1-C clicked with 13
4.4 Discussion
The method described here for chemically modifying the surface of SiNPs, UCµPs
and UCNPs is straightforward and versatile. It is likely to be applicable to various
other materials possessing oxidic (and thus hydroxylic) surfaces. It makes surfaces
compatible with click chemistry which again is highly versatile, particularly with
respect to bioconjugation because it is bioorthogonal and thus not troubled by
functional groups often present in biological samples. In fact, click chemistry has
4 Surface Modification and Click Functionalization 71
been applied to NPs made from silica,21 gold,22,23 iron oxide,24,25 and various
polymers.26,27 The silica coating renders the UCNPs water dispersible and
biocompatible.28 The one-step method applied here is primarily intended for uses in
context with bioassays. It is much simpler than two-step methods29 such as those
used for modifying UCNPs with amino groups. The Stöber method gives coating
results considerably better reproducible and with a more homogeneous shell
compared to the microemulsion technique. Purification of the UCNPs by size
exclusion chromatography (SEC) is another attractive feature of the work presented
here. When applying SEC, the NPs can be kept in solution at any time and
aggregation is minimized. The thickness of the shell most likely can be reduced by
adjusting the TEOS to ammonia ratio. The luminescent properties of the surface
modified UCµPs and UCNPs were not altered. Moreover, varying pH values or buffer
concentrations do not influence the emission intensities.
Click reaction of the reactive SiNPs as well as upconverting micro- and
nanoparticles gave particles that can be conjugated to (a) (strept)avidin (via the
biotin30,31,32 group), and (b) thiols33 (via the maleinimide groups). Thiol labeling is
clearly to be favored in bioconjugation over amine labeling simply because most
proteins possess numerous free amino groups (this leading to random labeling and to
varying dye-to-protein ratios), but often only one to three thiol groups. Human serum
albumin (HSA), for example, has one free thiol group only, but more than 50 amino
groups that may be labeled.
In a further version, the click reaction leads to particles carrying organic
fluorescent labels. Fluorescent SiNPs can be prepared with emission colors ranging
from green to red. Longwave labels generally are to be favored as working at longer
wavelengths reduces the occurrence of background luminescence. The intensity of
the particles can be tuned by adjusting dye load and click reaction times. The
fluorescently labeled UCµPs and UCNPs in turn, have attractive spectral features in
giving dual emissions depending on the wavelength of excitation. If excited with near
infrared (NIR) light, dual emission of the inorganic core is observed (green and bright
red, or blue and NIR). If excited in the visible, the (single) emission of the organic
fluorophore (green, yellow or orange) is being seen. Moreover, by varying the
quantity of organic label, a wide range of intensities can be adjusted for both the
"inorganic" and "organic" emission, thus giving a 2-dimensional matrix of two (or
three) intensities (and possibly also lifetimes) that enables unambiguous encoding of
4 Surface Modification and Click Functionalization 72
particles. It is assumed that if organic dyes are used that absorb at one of the two
emission bands of the upconverters, various ratios of intensities of the dual emission
may be adjusted. Furthermore, by choosing a dye with a spectral overlap, high molar
absorptivity and a high quantum yield, a photoexcitation of the dye by the UCNPs
emission is possible. This paves the way for photoexciting organic fluorophores with
NIR laser light which otherwise is only accomplished by 2-photon absorption (with its
need for strong lasers and the associated risk of photodamage). However, the dye
load has to be strictly controlled for a successful photoexcitation of an organic dye via
IR.
Generally, click reactions with the alkyne derivative in solution and the azido
group on the particle surface worked faster and gave better results. This is in
agreement with the catalytic mechanism given in section 2.3.2. The coordination of
the copper ion is favored when the alkyne species is present in solution.34
4.5 References
1 Ortega-Muñoz M, Lopez-Jaramillo J, Hernandez-Mateo F, Santoyo-Gonzalez F (2006) Synthesis of Glyco-Silicas by Cu(I) Catalyzed Click-Chemistry, and their Applications in Affinity Chromatography, Adv. Synth. Catal. 348: 2410-2420.
2 Evans CE, Lovell PA (2009) Click Chemistry as a Route to Surface Functionalization of Polymer Particles Dispersed in Aqueous Media, Chem. Commun. 2305-2307.
3 Nakazawa J, Stack TDP (2008) Controlled Loadings in a Mesoporous Material: Click-on Silica, J. Am. Chem. Soc., 130, 14360-14361.
4 Puleo DA (1996) Retention of Enzymatic Activity Immobilized on Silanized Co-Cr-Mo and Ti-6Al-4V, J Biomed. Mater. Res. A. 37: 222-228.
5 Rezania A, Johnson R, Lefkow AR, Healy KE (1999) Bioactivation of Metal Oxide Surfaces. 1. Surface Characterization and Cell Response, Langmuir 15: 6931-6939.
6 Müller R, Abke J, Schnell E, Scharnweber D, Kujat R, Englert C, Taheri D, Nerlich M, Angele P (2006) Influence of Suface Pretreatment of Titanium- and Cobalt-based Biomaterials on Covalent Immobilization of Fibrillar Collagen, Biomaterials 27: 4059-4068.
7 Kim M, Hong J, Lee J, Hong CK, Shim SE (2008) Fabrication of Silica Nanotubes Using Silica Coated Multi-Walled Carbon Nanotubes as the Template, J Colloid Interf. Sci. 322: 321-326.
8 Stöber W, Fink A (1968) Controlled Growth of Monodisperse Silica Spheres in the Micron Size Range, J. Colloid. Interf. Sci. 26: 62-69.
9 Lu H, Yi G, Zhao S, Chen D, Guo L-H, Cheng J (2004) Synthesis and Characterization of multi-functional Nanoparticles possessing Magnetic, Up-conversion Fluorescence and Bio-affinity Properties, J. Mater. Chem. 14: 1336-1341.
4 Surface Modification and Click Functionalization 73
10 Hilderbrand SA, Shao F, Salthouse C, Mahmood U, Weissleder R (2009) Upconversion Luminescent Nanomaterials: Application to in vivo Bioimaging, Chem. Commun. 2009, 4188-4190.
11 Wang L, Zhao W, O’Donoghue MB, Tan W (2007) Fluorescent Nanoparticles for Multiplexed Bacteria Monitoring, Bioconjugate Chem. 18: 297-301.
12 Meier JL, Mercer AC, Rivera H, Burkart MD (2006) Synthesis and Evaluation of Bioorthogonal Pantetheine Analogues for in Vivo Protein Modification, J. Am. Chem. Soc. 128: 12474-12184.
13 Brinkley M (1992) A Brief Survey of Methods for Preparing Protein Conjugates with Dyes, Haptens, and Cross-Linking Reagents, Bioconjugate Chem. 3: 2-13.
14 Matsumoto T, Urano Y, Shoda T, Kojima H, Nagano T (2007) A Thiol-Reactive Fluorescence Probe Based on Donor-Excited Photoinduced Electron Transfer: Key Role of Ortho Substitution, Org. Lett. 9: 3375-3377.
15 Kele P, Li X, Link M, Nagy K, Herner A, Lőrincz, Béni S, Wolfbeis OS (2009) Clickable Fluorophores for Biological Labeling-With or Without Copper, Org. Biomol. Chem. 7: 3486-3490.
16 Sun LD, Gu JQ, Zhang SZ, Zhang YW, Yan CH (2009) Lminescence Resonance Energy Transfer Baseod on β-NaYF4: Yb, Er Nanoparticles and TRITC Dye, Sci. China Ser. B-Chem. 52: 1590-1595.
17 Li Z, Zhang Y, Jiang S (2008) Multicolor Core/Shell-Structured Upconversion Fluorescent Nanoparticles, Adv. Mater. 20: 4765-4769.
18 Soukka T, Rantanen T, Kuningas K (2008) Photon Upconversion in Homogeneous Fluorescence-based Bioanalytical Assays, Ann. N. Y. Acad. Sci. 1130: 188-200.
19 Miller JN (2005) Fluorescence Energy Transfer Methods in Bioanalysis, Analyst 130: 265-270.
20 Morgan CG, Dad S, Mitchell AC (2008) Present Status of, and Future Prospects for, Upconverting Phosphors in Proximity-Based Bioassays, J. Alloy. Compd. 451: 526-529.
21 Kele P, Mezö G, Achatz D, Wolfbeis OS (2009) Dual Labeling of Biomolecules by Using Click Chemistry: A Sequential Approach, Angew. Chem. Int. Ed. Engl. 48: 344-347, Angew. Chem. 121: 350-353.
22 Boisselier E, Salmon L, Ruiz J, Astruc D (2008) How to very Efficiently Functionalize Gold Nanoparticles by “Click” Chemistry, Chem. Commun. 5788-5790.
23 Zhou Y, Wang S, Zhang K, Jiang X (2008) Visual Detection of Copper(II) by Azide- and Alkyne-Functionalized Gold Nanoparticles Using Click Chemistry, Angew. Chem. Int. Ed. 47: 7454-7456, Angew. Chem. 120: 7564-7566.
24 V. Maltzahn G, Ren Y, Park J-H, Min D-H, Kotamraju VR, Jayakumar J, Fogal V, Sailor MJ, Ruoslahti E, Bhatia SN (2008) In Vivo Tumor Cell Targeting with “Click” Nanoparticles, Bioconjugate Chem. 19: 1570-1578.
25 He H, Zhang Y, Gao C, Wu J (2009) Clicked Magnetic Nanohybrids with a Soft Polymer Interlayer, Chem. Commun. 1655-1657.
26 Nicolas J, Bansaid F, Desmaële D, Grogna M, Detrembleur C, Andrieux K, Couvreur P (2008) Synthesis of Highly Functionalized Poly(alkyl cyanoacrylate) Nanoparticles by Means of Click Chemistry, Macromol. 41: 8418-8428.
27 Lu J, Shi M, Shoichet MS (2009) Click Chemistry Functionalized Polymeric Nanoparticles Target Corneal Epithelial Cells through RGD-Cell Surface Receptors, Bioconj. Chem. 20: 87-94.
28 Jalil RA, Zhang Y (2008) Biocompatibility of Silica Coated NaYF4 Upconversion Fluorescent Nanocrystals, Biomaterials 29: 4122-4128.
4 Surface Modification and Click Functionalization 74
29 Sivakumar S, Diamente PR, van Veggel FCJM (2006) Silica-Coated Ln3+-Doped LaF3 Nanoparticles as Robust Down- and Upconverting Biolabels, Chem. Eur. J 12: 5878-5884.
30 Kong D, Quan Z, Yang J, Yang P, Li C, Lin J (2009) Avidin Conjugation to Up-conversion Phosphor NaYF4:Yb3+, Er3+ by the Oxidation of the Oligosaccharide Chains J. Nanopart. Res. 11, 821-829.
31 Lu H, Yi G, Zhao S, Chen D, Guo LH, Cheng J (2004) Synthesis and Characterization of Multi-functional Nanoparticles Possessing Magnetic, Up-conversion Fluorescence and Bio-affinity Properties, J. Mater. Chem. 14, 1336 – 1341.
32 Wang M, Mi CC, Wang WX, Liu CH, Wu YF, Xu ZR, Mao CB, Xu SK Immunolabeling and NIR-Excited Fluorescent Imaging of HeLa Cells by Using NaYF4:Yb,Er Upconversion Nanoparticles, ACS Nano, 2009, 3, 1580-1586
33 Wang Y, Cai J, Rauscher H, Behm RJ, Goedel WA (2005) Maleimido-Terminated Self-Assembled Monolayers, Chem. Eur. J. 11, 3968-3978.
34 Lin P-C, Ueng S-H, Yu S-C, Jan M-D, Adak AK, Yu C-C, Lin C-C (2007) Surface Modification of Magnetic Nanoparticle via Cu(I)-Catalyzed Alkyne-Azide [2+3] Cycloaddition, Org. Lett. 9: 2131-2134.

5 Analytical Applications for UCNPs 75
5 Analytical Applications for UCNPs
5.1 UCNPs as Labels for Proteins and Oligonucleotides
It was envisioned to use upconverting nanoparticles (UCNPs) functionalized with
either biotin or maleinimide (see table 4.3) as labels in protein or gene assays. First
experiments were performed based on the well known interaction between the biotin
group and (strept)avidin. For this purpose, UCNPs of type NP-1-C-6 (azido modified
UCNPs clicked to alkyne-biotin) were incubated with avidin, which had been
fluorescently labeled with Cy-3. A schematic representation of the interaction
between the biotinylated UCNPs and the protein is shown in figure 5.1.
Figure 5.1 Schematic representation of biotinylated UCNPs bound to a fluorescently labeled
avidin.
The fluorescence of the avidin label (Cy-3) could be detected on the surface of the
particles after repeated washing steps to remove excess protein. However, reference
experiments using UCNPs without the biotin functionality (type NP-1-C) together with
the labeled avidin also gave high signals for Cy-3 on the particle surface caused by
electrostatically bound protein. This electrostatical adsorption could not be reduced
by addition of a surface blocking protein, such as bovine serum albumin (BSA).
Therefore, it could not be proven that the avidin is indeed bound to the particle
surface via the biotin-avidin interaction and not only via adsorption and this approach
was not further investigated.
In a second approach, maleinimide functionalized UCNPs were used to label
thiolated oligonucleotides (SH-oligos) for the development of a heterogeneous
oligonucleotide assay. UCNPs of type NP-1-C-7 (azido modified UCNPs clicked to
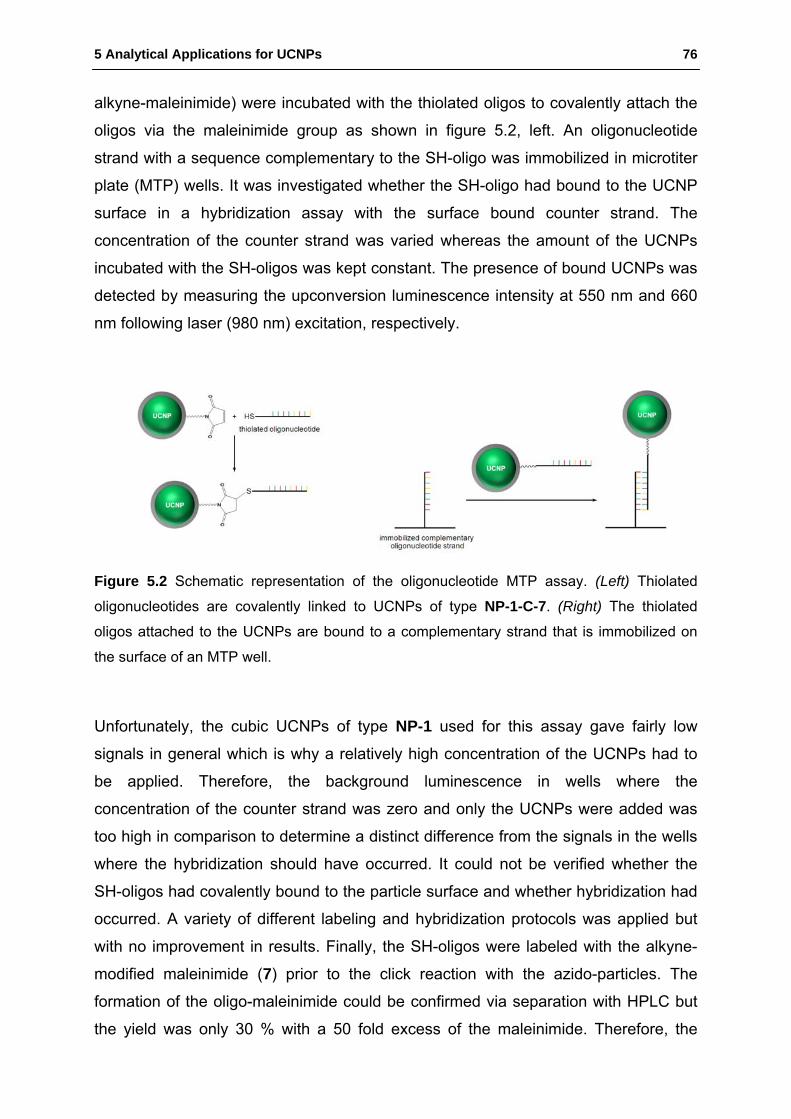
5 Analytical Applications for UCNPs 76
alkyne-maleinimide) were incubated with the thiolated oligos to covalently attach the
oligos via the maleinimide group as shown in figure 5.2, left. An oligonucleotide
strand with a sequence complementary to the SH-oligo was immobilized in microtiter
plate (MTP) wells. It was investigated whether the SH-oligo had bound to the UCNP
surface in a hybridization assay with the surface bound counter strand. The
concentration of the counter strand was varied whereas the amount of the UCNPs
incubated with the SH-oligos was kept constant. The presence of bound UCNPs was
detected by measuring the upconversion luminescence intensity at 550 nm and 660
nm following laser (980 nm) excitation, respectively.
Figure 5.2 Schematic representation of the oligonucleotide MTP assay. (Left) Thiolated
oligonucleotides are covalently linked to UCNPs of type NP-1-C-7. (Right) The thiolated
oligos attached to the UCNPs are bound to a complementary strand that is immobilized on
the surface of an MTP well.
Unfortunately, the cubic UCNPs of type NP-1 used for this assay gave fairly low
signals in general which is why a relatively high concentration of the UCNPs had to
be applied. Therefore, the background luminescence in wells where the
concentration of the counter strand was zero and only the UCNPs were added was
too high in comparison to determine a distinct difference from the signals in the wells
where the hybridization should have occurred. It could not be verified whether the
SH-oligos had covalently bound to the particle surface and whether hybridization had
occurred. A variety of different labeling and hybridization protocols was applied but
with no improvement in results. Finally, the SH-oligos were labeled with the alkyne-
modified maleinimide (7) prior to the click reaction with the azido-particles. The
formation of the oligo-maleinimide could be confirmed via separation with HPLC but
the yield was only 30 % with a 50 fold excess of the maleinimide. Therefore, the
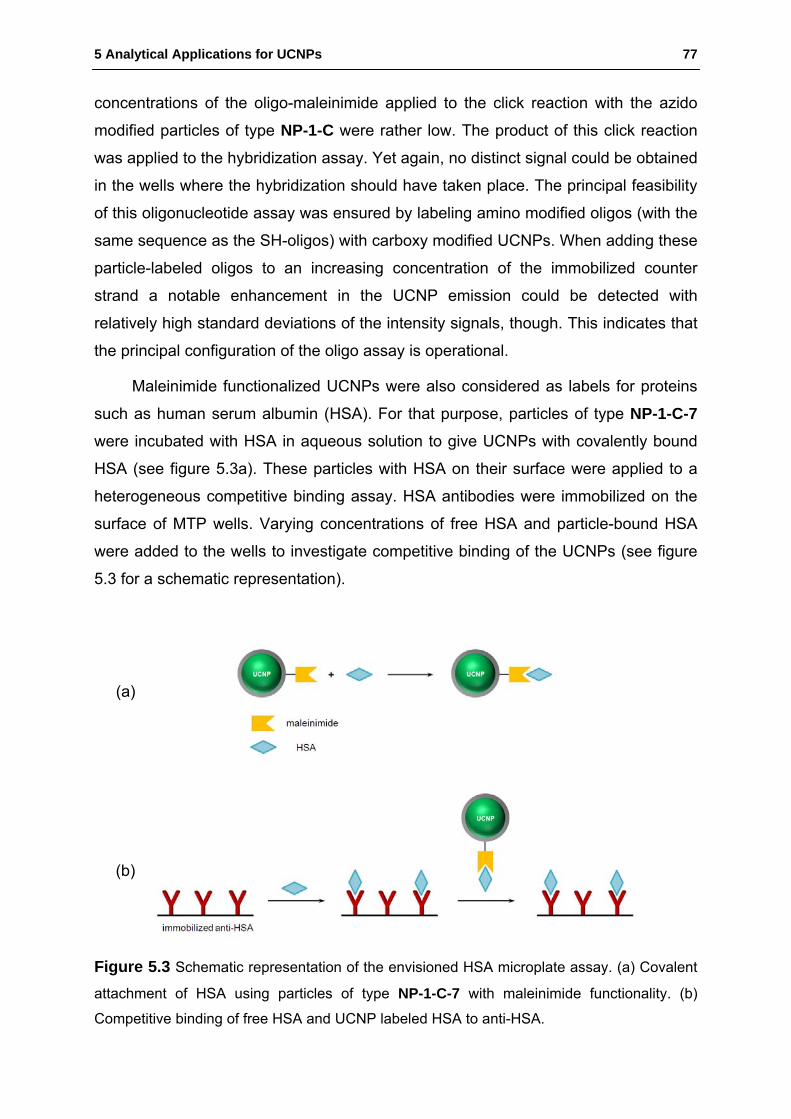
5 Analytical Applications for UCNPs 77
concentrations of the oligo-maleinimide applied to the click reaction with the azido
modified particles of type NP-1-C were rather low. The product of this click reaction
was applied to the hybridization assay. Yet again, no distinct signal could be obtained
in the wells where the hybridization should have taken place. The principal feasibility
of this oligonucleotide assay was ensured by labeling amino modified oligos (with the
same sequence as the SH-oligos) with carboxy modified UCNPs. When adding these
particle-labeled oligos to an increasing concentration of the immobilized counter
strand a notable enhancement in the UCNP emission could be detected with
relatively high standard deviations of the intensity signals, though. This indicates that
the principal configuration of the oligo assay is operational.
Maleinimide functionalized UCNPs were also considered as labels for proteins
such as human serum albumin (HSA). For that purpose, particles of type NP-1-C-7
were incubated with HSA in aqueous solution to give UCNPs with covalently bound
HSA (see figure 5.3a). These particles with HSA on their surface were applied to a
heterogeneous competitive binding assay. HSA antibodies were immobilized on the
surface of MTP wells. Varying concentrations of free HSA and particle-bound HSA
were added to the wells to investigate competitive binding of the UCNPs (see figure
5.3 for a schematic representation).
Figure 5.3 Schematic representation of the envisioned HSA microplate assay. (a) Covalent
attachment of HSA using particles of type NP-1-C-7 with maleinimide functionality. (b)
Competitive binding of free HSA and UCNP labeled HSA to anti-HSA.
(a)
(b)
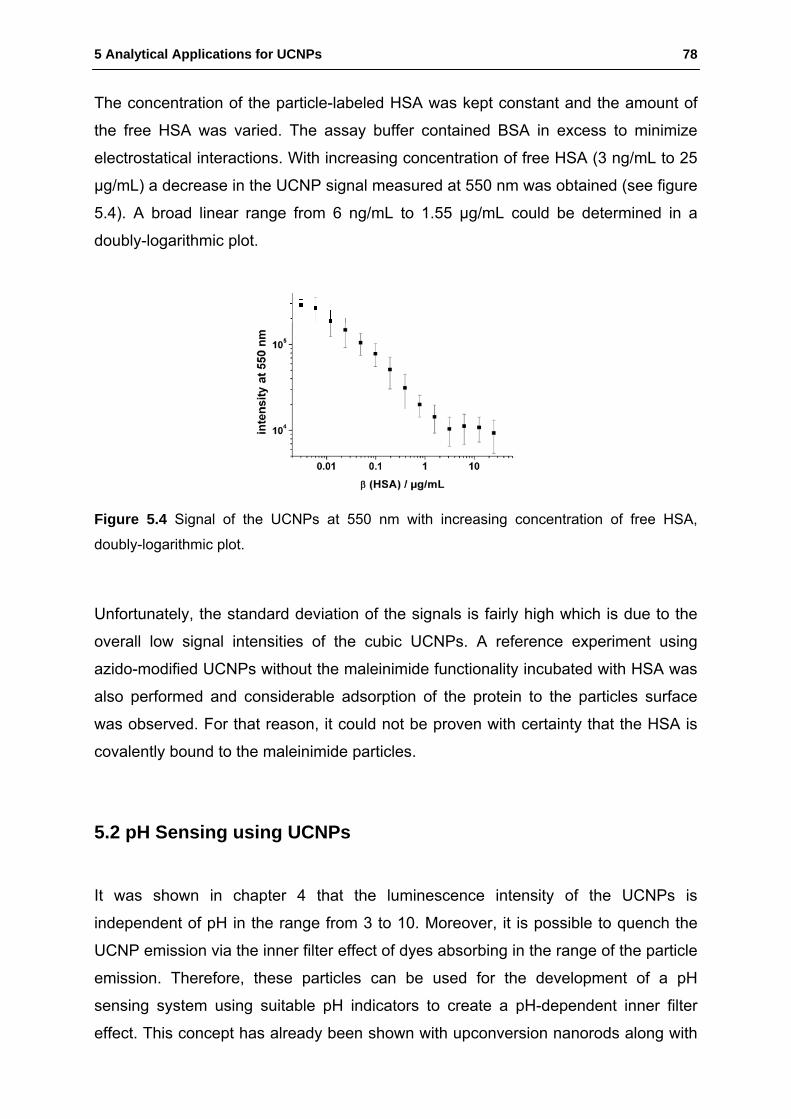
5 Analytical Applications for UCNPs 78
The concentration of the particle-labeled HSA was kept constant and the amount of
the free HSA was varied. The assay buffer contained BSA in excess to minimize
electrostatical interactions. With increasing concentration of free HSA (3 ng/mL to 25
µg/mL) a decrease in the UCNP signal measured at 550 nm was obtained (see figure
5.4). A broad linear range from 6 ng/mL to 1.55 µg/mL could be determined in a
doubly-logarithmic plot.
Figure 5.4 Signal of the UCNPs at 550 nm with increasing concentration of free HSA,
doubly-logarithmic plot.
Unfortunately, the standard deviation of the signals is fairly high which is due to the
overall low signal intensities of the cubic UCNPs. A reference experiment using
azido-modified UCNPs without the maleinimide functionality incubated with HSA was
also performed and considerable adsorption of the protein to the particles surface
was observed. For that reason, it could not be proven with certainty that the HSA is
covalently bound to the maleinimide particles.
5.2 pH Sensing using UCNPs
It was shown in chapter 4 that the luminescence intensity of the UCNPs is
independent of pH in the range from 3 to 10. Moreover, it is possible to quench the
UCNP emission via the inner filter effect of dyes absorbing in the range of the particle
emission. Therefore, these particles can be used for the development of a pH
sensing system using suitable pH indicators to create a pH-dependent inner filter
effect. This concept has already been shown with upconversion nanorods along with
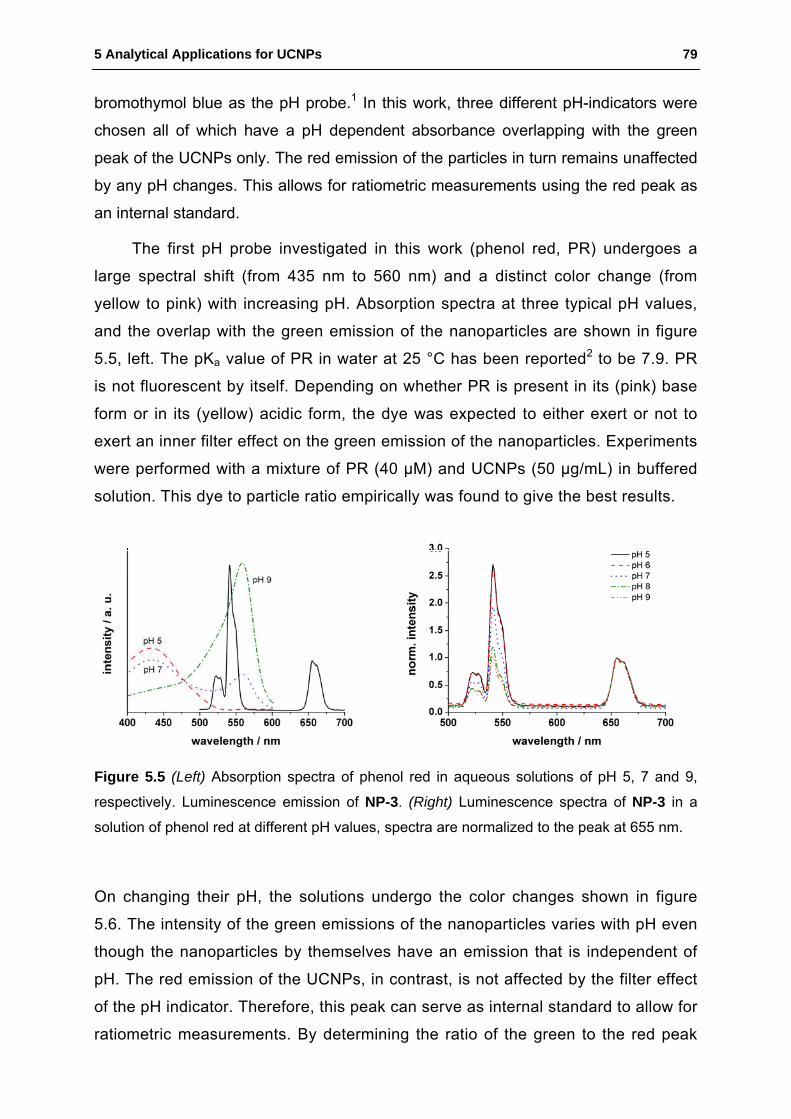
5 Analytical Applications for UCNPs 79
bromothymol blue as the pH probe.1 In this work, three different pH-indicators were
chosen all of which have a pH dependent absorbance overlapping with the green
peak of the UCNPs only. The red emission of the particles in turn remains unaffected
by any pH changes. This allows for ratiometric measurements using the red peak as
an internal standard.
The first pH probe investigated in this work (phenol red, PR) undergoes a
large spectral shift (from 435 nm to 560 nm) and a distinct color change (from
yellow to pink) with increasing pH. Absorption spectra at three typical pH values,
and the overlap with the green emission of the nanoparticles are shown in figure
5.5, left. The pKa value of PR in water at 25 °C has been reported2 to be 7.9. PR
is not fluorescent by itself. Depending on whether PR is present in its (pink) base
form or in its (yellow) acidic form, the dye was expected to either exert or not to
exert an inner filter effect on the green emission of the nanoparticles. Experiments
were performed with a mixture of PR (40 µM) and UCNPs (50 µg/mL) in buffered
solution. This dye to particle ratio empirically was found to give the best results.
Figure 5.5 (Left) Absorption spectra of phenol red in aqueous solutions of pH 5, 7 and 9,
respectively. Luminescence emission of NP-3. (Right) Luminescence spectra of NP-3 in a
solution of phenol red at different pH values, spectra are normalized to the peak at 655 nm.
On changing their pH, the solutions undergo the color changes shown in figure
5.6. The intensity of the green emissions of the nanoparticles varies with pH even
though the nanoparticles by themselves have an emission that is independent of
pH. The red emission of the UCNPs, in contrast, is not affected by the filter effect
of the pH indicator. Therefore, this peak can serve as internal standard to allow for
ratiometric measurements. By determining the ratio of the green to the red peak
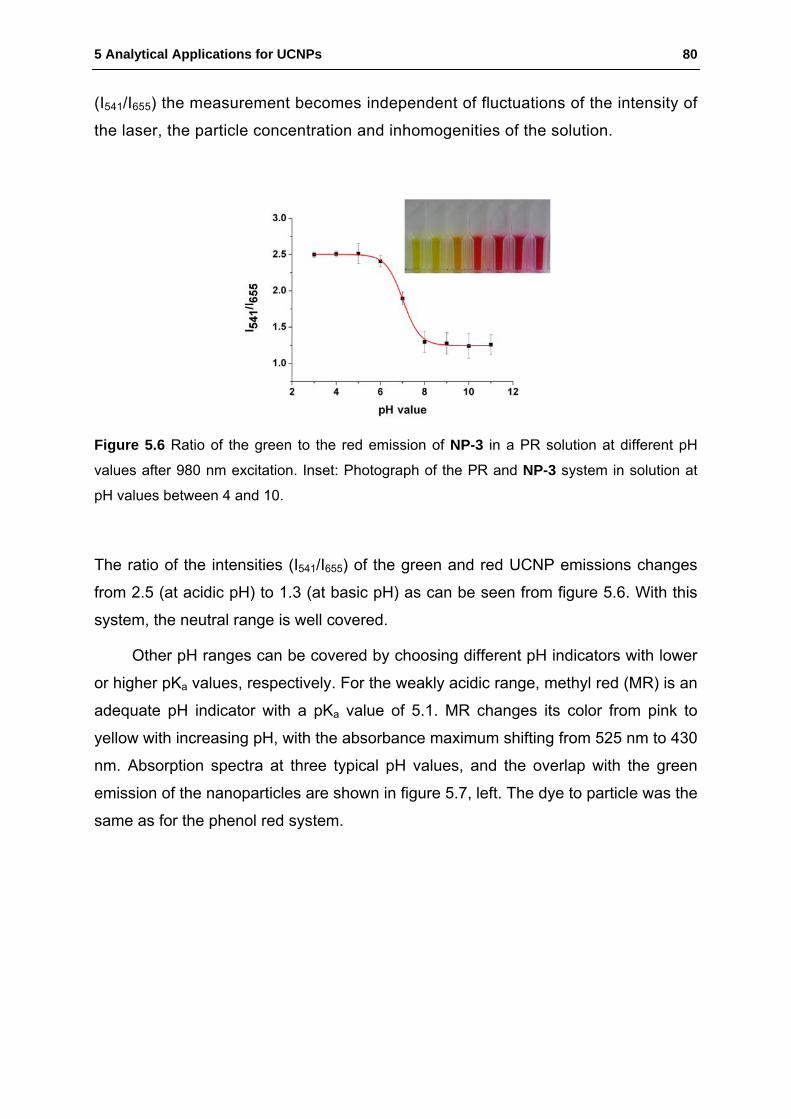
5 Analytical Applications for UCNPs 80
(I541/I655) the measurement becomes independent of fluctuations of the intensity of
the laser, the particle concentration and inhomogenities of the solution.
Figure 5.6 Ratio of the green to the red emission of NP-3 in a PR solution at different pH
values after 980 nm excitation. Inset: Photograph of the PR and NP-3 system in solution at
pH values between 4 and 10.
The ratio of the intensities (I541/I655) of the green and red UCNP emissions changes
from 2.5 (at acidic pH) to 1.3 (at basic pH) as can be seen from figure 5.6. With this
system, the neutral range is well covered.
Other pH ranges can be covered by choosing different pH indicators with lower
or higher pKa values, respectively. For the weakly acidic range, methyl red (MR) is an
adequate pH indicator with a pKa value of 5.1. MR changes its color from pink to
yellow with increasing pH, with the absorbance maximum shifting from 525 nm to 430
nm. Absorption spectra at three typical pH values, and the overlap with the green
emission of the nanoparticles are shown in figure 5.7, left. The dye to particle was the
same as for the phenol red system.
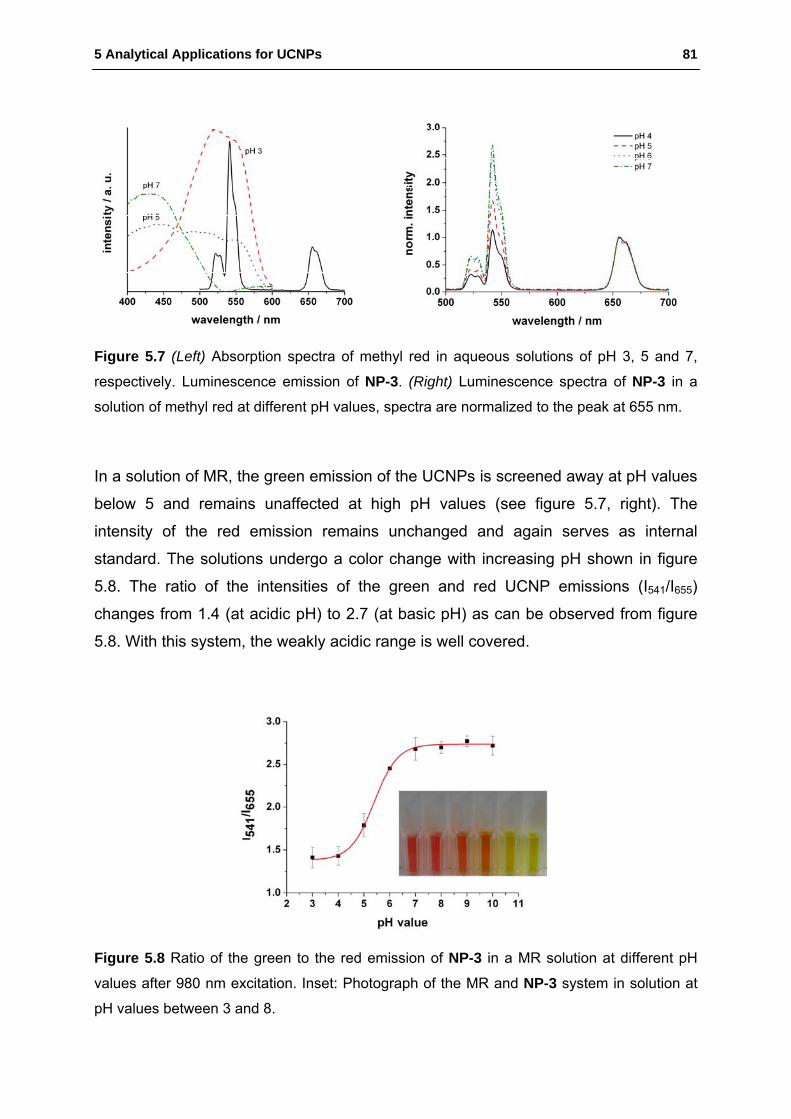
5 Analytical Applications for UCNPs 81
Figure 5.7 (Left) Absorption spectra of methyl red in aqueous solutions of pH 3, 5 and 7,
respectively. Luminescence emission of NP-3. (Right) Luminescence spectra of NP-3 in a
solution of methyl red at different pH values, spectra are normalized to the peak at 655 nm.
In a solution of MR, the green emission of the UCNPs is screened away at pH values
below 5 and remains unaffected at high pH values (see figure 5.7, right). The
intensity of the red emission remains unchanged and again serves as internal
standard. The solutions undergo a color change with increasing pH shown in figure
5.8. The ratio of the intensities of the green and red UCNP emissions (I541/I655)
changes from 1.4 (at acidic pH) to 2.7 (at basic pH) as can be observed from figure
5.8. With this system, the weakly acidic range is well covered.
Figure 5.8 Ratio of the green to the red emission of NP-3 in a MR solution at different pH
values after 980 nm excitation. Inset: Photograph of the MR and NP-3 system in solution at
pH values between 3 and 8.
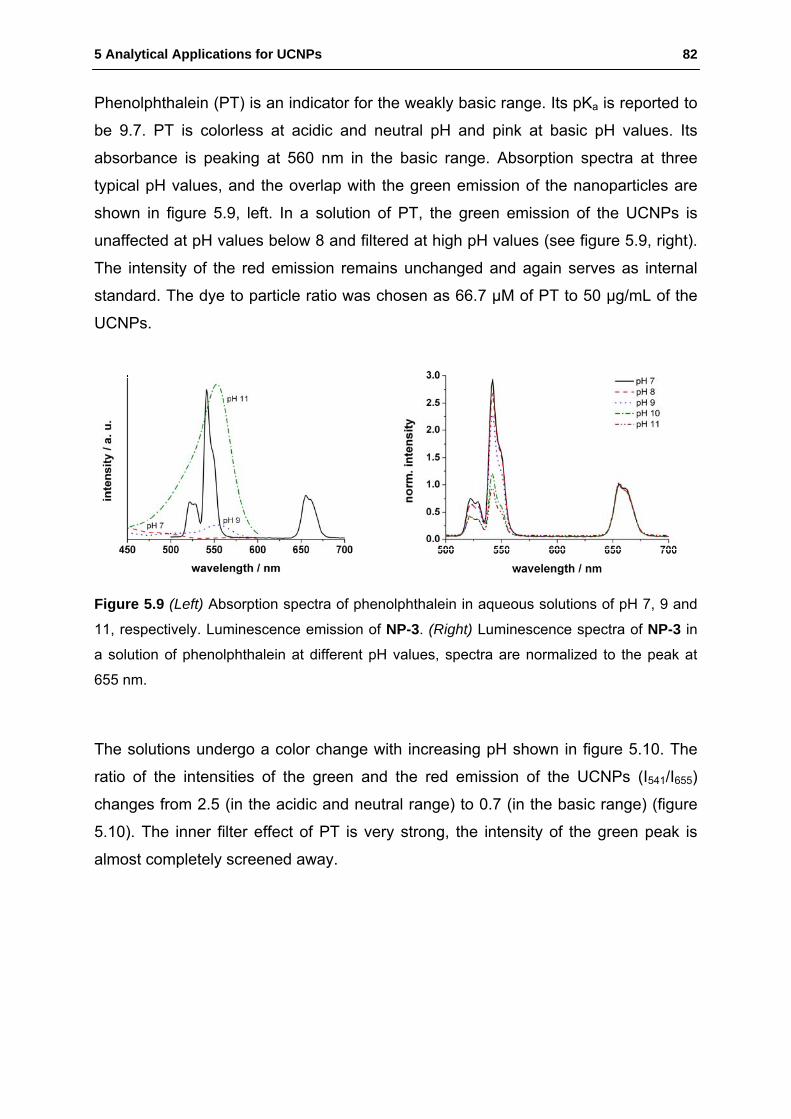
5 Analytical Applications for UCNPs 82
Phenolphthalein (PT) is an indicator for the weakly basic range. Its pKa is reported to
be 9.7. PT is colorless at acidic and neutral pH and pink at basic pH values. Its
absorbance is peaking at 560 nm in the basic range. Absorption spectra at three
typical pH values, and the overlap with the green emission of the nanoparticles are
shown in figure 5.9, left. In a solution of PT, the green emission of the UCNPs is
unaffected at pH values below 8 and filtered at high pH values (see figure 5.9, right).
The intensity of the red emission remains unchanged and again serves as internal
standard. The dye to particle ratio was chosen as 66.7 µM of PT to 50 µg/mL of the
UCNPs.
Figure 5.9 (Left) Absorption spectra of phenolphthalein in aqueous solutions of pH 7, 9 and
11, respectively. Luminescence emission of NP-3. (Right) Luminescence spectra of NP-3 in
a solution of phenolphthalein at different pH values, spectra are normalized to the peak at
655 nm.
The solutions undergo a color change with increasing pH shown in figure 5.10. The
ratio of the intensities of the green and the red emission of the UCNPs (I541/I655)
changes from 2.5 (in the acidic and neutral range) to 0.7 (in the basic range) (figure
5.10). The inner filter effect of PT is very strong, the intensity of the green peak is
almost completely screened away.
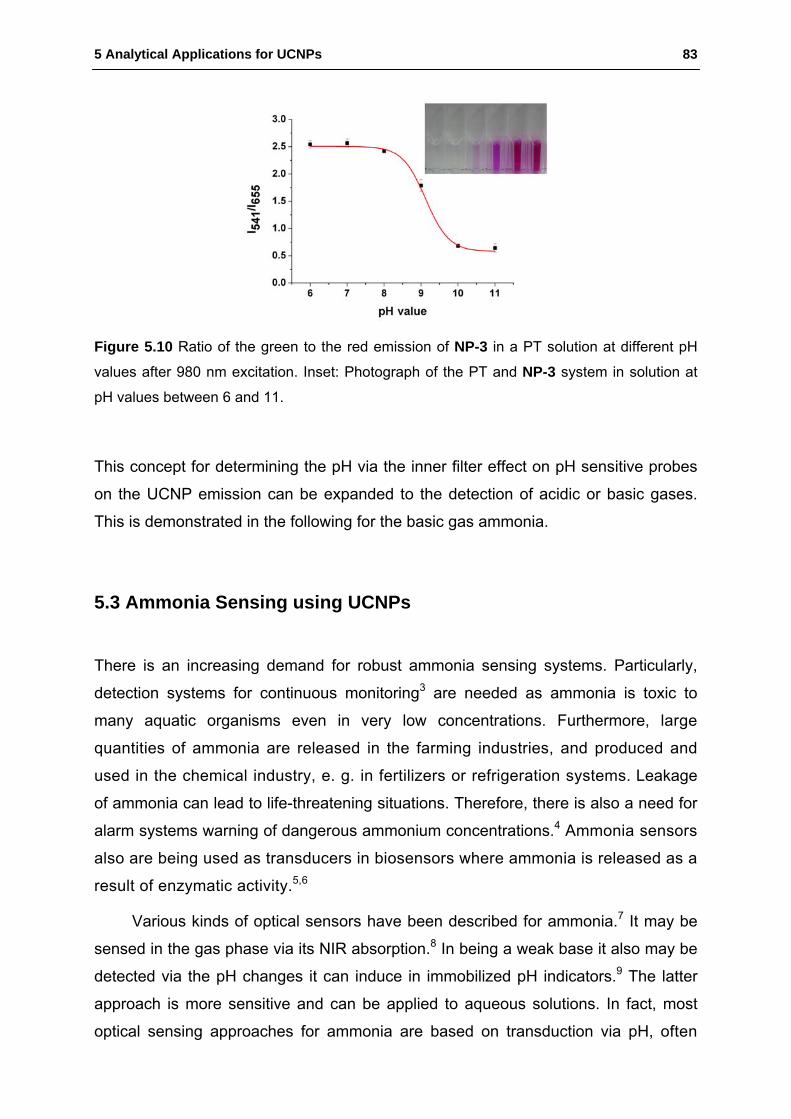
5 Analytical Applications for UCNPs 83
Figure 5.10 Ratio of the green to the red emission of NP-3 in a PT solution at different pH
values after 980 nm excitation. Inset: Photograph of the PT and NP-3 system in solution at
pH values between 6 and 11.
This concept for determining the pH via the inner filter effect on pH sensitive probes
on the UCNP emission can be expanded to the detection of acidic or basic gases.
This is demonstrated in the following for the basic gas ammonia.
5.3 Ammonia Sensing using UCNPs
There is an increasing demand for robust ammonia sensing systems. Particularly,
detection systems for continuous monitoring3 are needed as ammonia is toxic to
many aquatic organisms even in very low concentrations. Furthermore, large
quantities of ammonia are released in the farming industries, and produced and
used in the chemical industry, e. g. in fertilizers or refrigeration systems. Leakage
of ammonia can lead to life-threatening situations. Therefore, there is also a need for
alarm systems warning of dangerous ammonium concentrations.4 Ammonia sensors
also are being used as transducers in biosensors where ammonia is released as a
result of enzymatic activity.5,6
Various kinds of optical sensors have been described for ammonia.7 It may be
sensed in the gas phase via its NIR absorption.8 In being a weak base it also may be
detected via the pH changes it can induce in immobilized pH indicators.9 The latter
approach is more sensitive and can be applied to aqueous solutions. In fact, most
optical sensing approaches for ammonia are based on transduction via pH, often

5 Analytical Applications for UCNPs 84
along with fiber optics.10,11 Usually, a pH indicator dissolved in a buffer solution12 is
entrapped in a gas-permeable polymer. Ammonia, on penetrating the polymer,
causes the pH to change, this resulting in a change in color or fluorescence of the
indicator dye.4,13
Therefore, the effect observed for the NP-3 and PR system was exploited to
build an ammonia sensing system. A sensor film was designed composed of (a)
NP-3 (b) the pH indicator probe PR; and (c) a proton impermeable polystyrene
matrix that hosts the NPs and retains the pH indicator. The resulting "cocktail" (a
solution of all components in chloroform) was spread onto an inert and optically
transparent polyester support made from poly(ethylene terephthalate) to form a
film with a thickness of ~12 µm after evaporation of the solvents. This film, a cross
section of which is shown in figure 5.11, is insensitive to pH changes in
surrounding solutions because the polystyrene matrix is impermeable to protons.
Ammonia, on the other hand, is capable of penetrating polystyrene and inducing
an increase in the pH and thus induce the (expected) color change of the sensor
foil from yellow to pink.
Figure 5.11 Cross-section of the sensor membrane
At low pH, the upconversion emission of NP-3 is not affected as the sensor film
does not show any absorbance between 500 and 700 nm. With increasing
concentrations of ammonia and an associated rise of the pH, the absorbance of
the film between 500 and 600 nm (with its peak at 560 nm) increases
substantially, thus screening off the green emission of the UCNPs. The red
emission of the UCNPs, in contrast, is not affected by the filter effect of the pH
indicator. Therefore, this peak can serve as internal standard to allow for
ratiometric measurements. By determining the intensity ratio of green to red peak
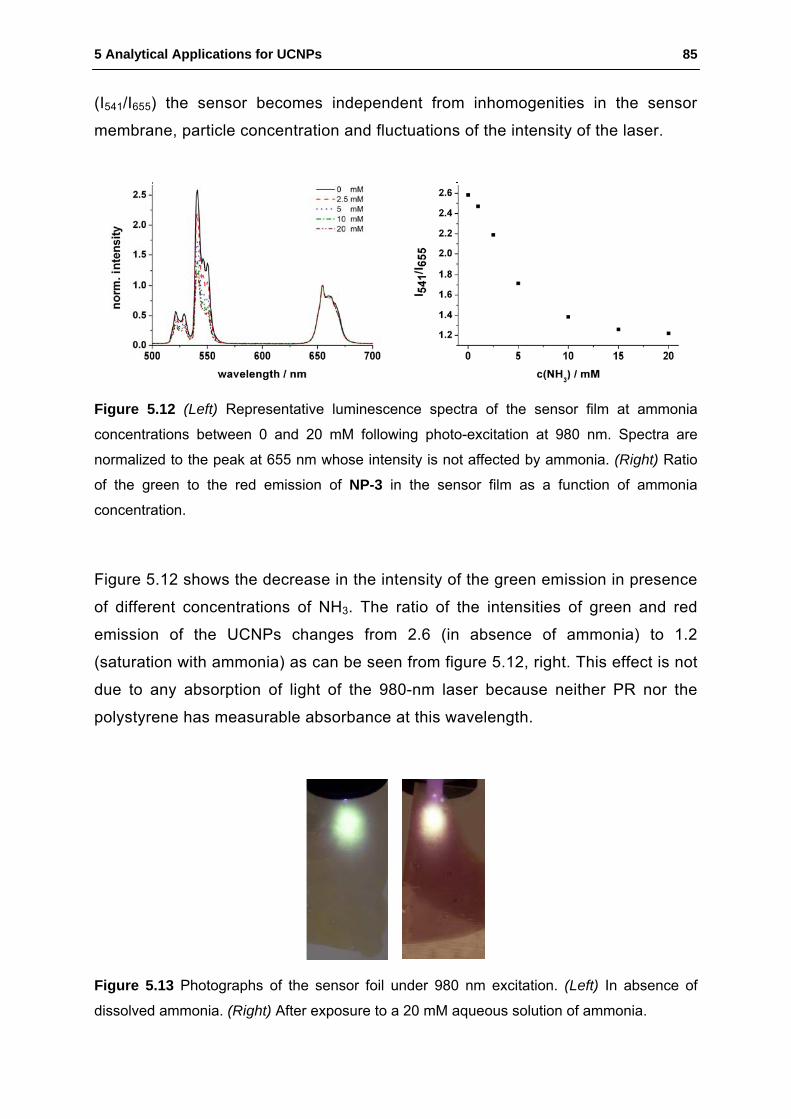
5 Analytical Applications for UCNPs 85
(I541/I655) the sensor becomes independent from inhomogenities in the sensor
membrane, particle concentration and fluctuations of the intensity of the laser.
Figure 5.12 (Left) Representative luminescence spectra of the sensor film at ammonia
concentrations between 0 and 20 mM following photo-excitation at 980 nm. Spectra are
normalized to the peak at 655 nm whose intensity is not affected by ammonia. (Right) Ratio
of the green to the red emission of NP-3 in the sensor film as a function of ammonia
concentration.
Figure 5.12 shows the decrease in the intensity of the green emission in presence
of different concentrations of NH3. The ratio of the intensities of green and red
emission of the UCNPs changes from 2.6 (in absence of ammonia) to 1.2
(saturation with ammonia) as can be seen from figure 5.12, right. This effect is not
due to any absorption of light of the 980-nm laser because neither PR nor the
polystyrene has measurable absorbance at this wavelength.
Figure 5.13 Photographs of the sensor foil under 980 nm excitation. (Left) In absence of
dissolved ammonia. (Right) After exposure to a 20 mM aqueous solution of ammonia.
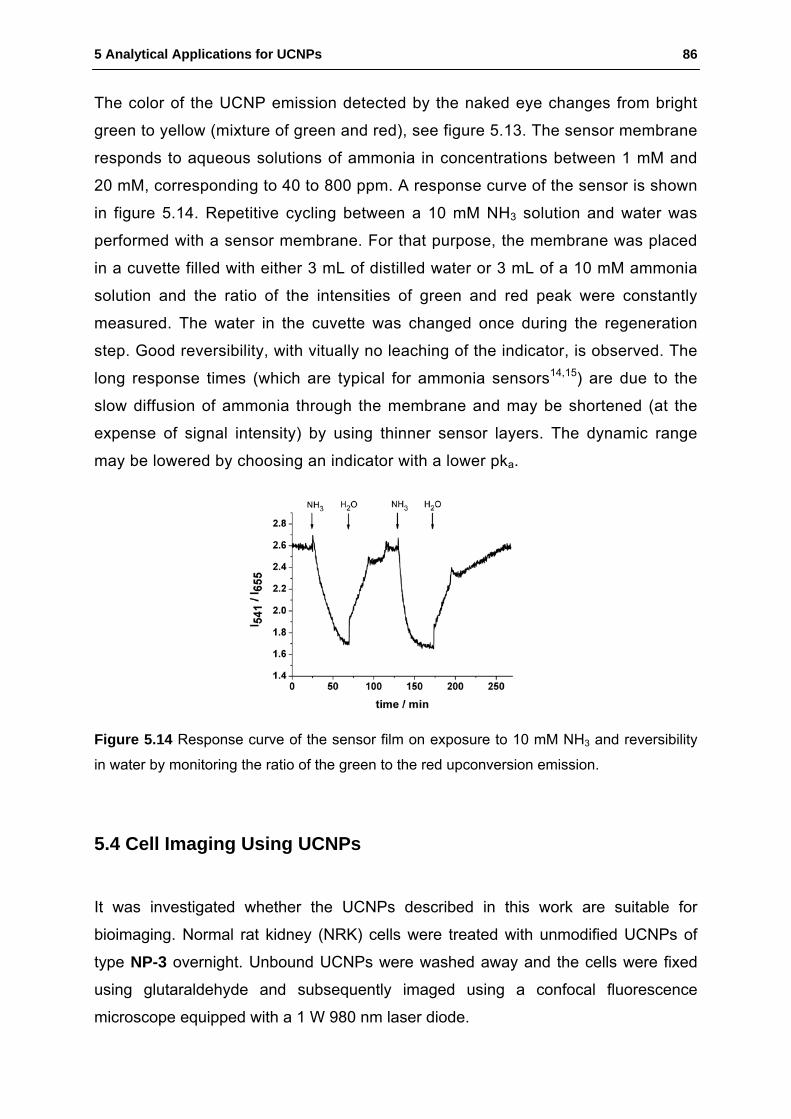
5 Analytical Applications for UCNPs 86
The color of the UCNP emission detected by the naked eye changes from bright
green to yellow (mixture of green and red), see figure 5.13. The sensor membrane
responds to aqueous solutions of ammonia in concentrations between 1 mM and
20 mM, corresponding to 40 to 800 ppm. A response curve of the sensor is shown
in figure 5.14. Repetitive cycling between a 10 mM NH3 solution and water was
performed with a sensor membrane. For that purpose, the membrane was placed
in a cuvette filled with either 3 mL of distilled water or 3 mL of a 10 mM ammonia
solution and the ratio of the intensities of green and red peak were constantly
measured. The water in the cuvette was changed once during the regeneration
step. Good reversibility, with vitually no leaching of the indicator, is observed. The
long response times (which are typical for ammonia sensors14,15) are due to the
slow diffusion of ammonia through the membrane and may be shortened (at the
expense of signal intensity) by using thinner sensor layers. The dynamic range
may be lowered by choosing an indicator with a lower pka.
Figure 5.14 Response curve of the sensor film on exposure to 10 mM NH3 and reversibility
in water by monitoring the ratio of the green to the red upconversion emission.
5.4 Cell Imaging Using UCNPs
It was investigated whether the UCNPs described in this work are suitable for
bioimaging. Normal rat kidney (NRK) cells were treated with unmodified UCNPs of
type NP-3 overnight. Unbound UCNPs were washed away and the cells were fixed
using glutaraldehyde and subsequently imaged using a confocal fluorescence
microscope equipped with a 1 W 980 nm laser diode.
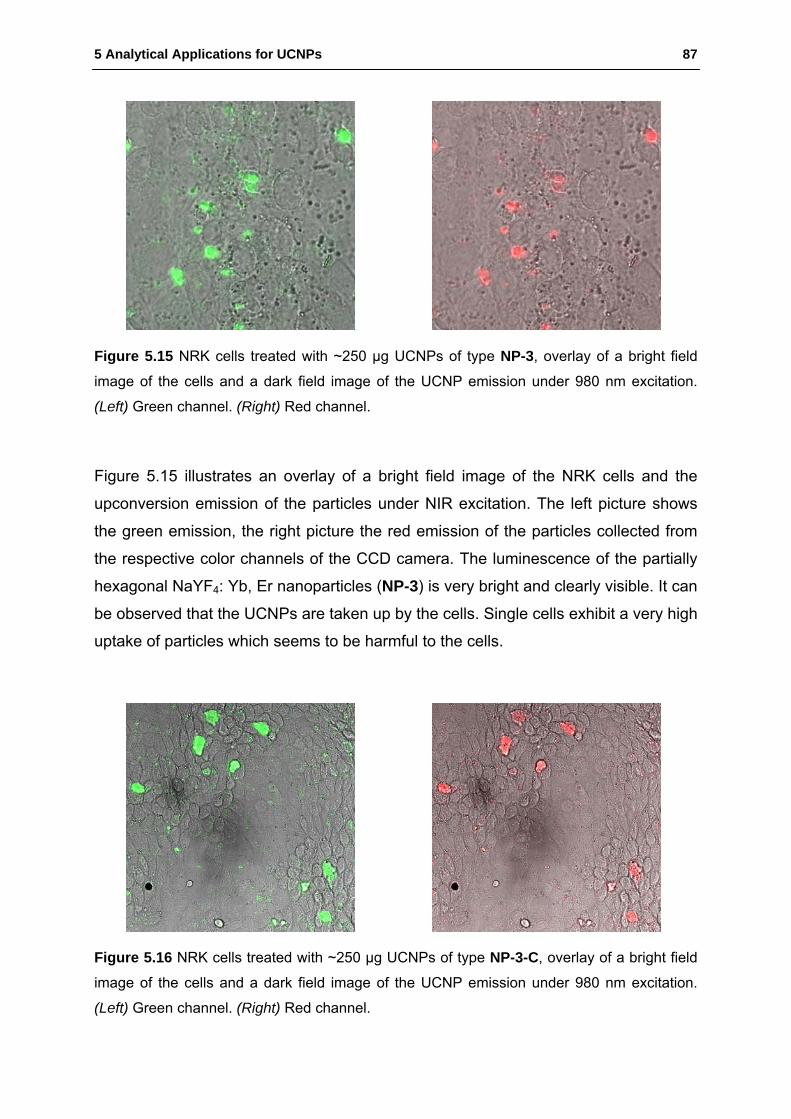
5 Analytical Applications for UCNPs 87
Figure 5.15 NRK cells treated with ~250 µg UCNPs of type NP-3, overlay of a bright field
image of the cells and a dark field image of the UCNP emission under 980 nm excitation.
(Left) Green channel. (Right) Red channel.
Figure 5.15 illustrates an overlay of a bright field image of the NRK cells and the
upconversion emission of the particles under NIR excitation. The left picture shows
the green emission, the right picture the red emission of the particles collected from
the respective color channels of the CCD camera. The luminescence of the partially
hexagonal NaYF4: Yb, Er nanoparticles (NP-3) is very bright and clearly visible. It can
be observed that the UCNPs are taken up by the cells. Single cells exhibit a very high
uptake of particles which seems to be harmful to the cells.
Figure 5.16 NRK cells treated with ~250 µg UCNPs of type NP-3-C, overlay of a bright field
image of the cells and a dark field image of the UCNP emission under 980 nm excitation.
(Left) Green channel. (Right) Red channel.
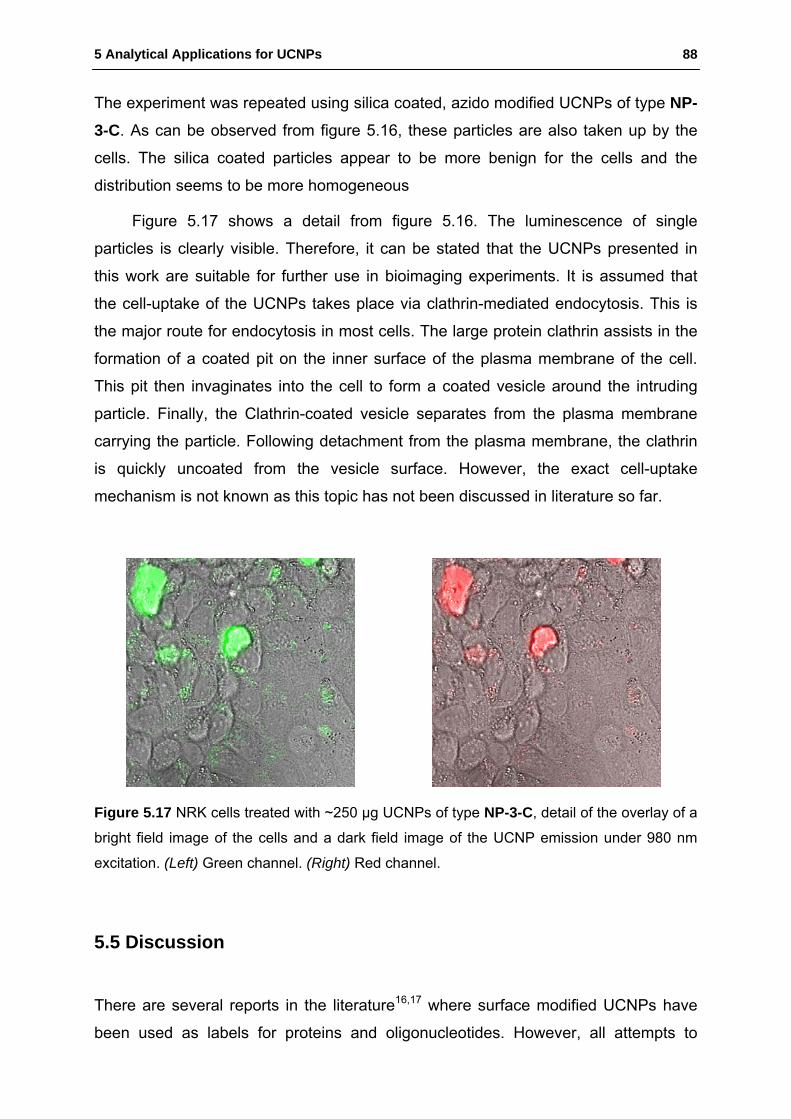
5 Analytical Applications for UCNPs 88
The experiment was repeated using silica coated, azido modified UCNPs of type NP-3-C. As can be observed from figure 5.16, these particles are also taken up by the
cells. The silica coated particles appear to be more benign for the cells and the
distribution seems to be more homogeneous
Figure 5.17 shows a detail from figure 5.16. The luminescence of single
particles is clearly visible. Therefore, it can be stated that the UCNPs presented in
this work are suitable for further use in bioimaging experiments. It is assumed that
the cell-uptake of the UCNPs takes place via clathrin-mediated endocytosis. This is
the major route for endocytosis in most cells. The large protein clathrin assists in the
formation of a coated pit on the inner surface of the plasma membrane of the cell.
This pit then invaginates into the cell to form a coated vesicle around the intruding
particle. Finally, the Clathrin-coated vesicle separates from the plasma membrane
carrying the particle. Following detachment from the plasma membrane, the clathrin
is quickly uncoated from the vesicle surface. However, the exact cell-uptake
mechanism is not known as this topic has not been discussed in literature so far.
Figure 5.17 NRK cells treated with ~250 µg UCNPs of type NP-3-C, detail of the overlay of a
bright field image of the cells and a dark field image of the UCNP emission under 980 nm
excitation. (Left) Green channel. (Right) Red channel.
5.5 Discussion
There are several reports in the literature16,17 where surface modified UCNPs have
been used as labels for proteins and oligonucleotides. However, all attempts to
5 Analytical Applications for UCNPs 89
develop a selective assay for proteins or thiolated oligonucleotides with the UCNPs
described in this work failed in that the selective recognition of the target molecules
could not be ensured. In case of the oligonucleotide assay, it could be proven that
the alkyne maleinimide (7) selectively binds to the thiolated oligonucleotides.
However, oligos bound to the particles could be detected. It is assumed that the
amount of both, the maleinimide bound to the particle surface and the concentration
of the oligos used, need to be controlled very carefully. Another possible reason for
the failure of this assay might be the insufficient brightness of the upconverting
particles used in these experiments. Substitution of the used particles of type NP-1
by the brighter particles of type NP-3 might substantially increase the sensitivity of
the assay and enable the detection of very low amounts of bound oligonucleotide.
This could not be tested as all MTP assay measurements were performed at the
Department of Biotechnology in Turku (Finland) during a 3 month visit and NP-3 was
not developed until after this stay. It is also conceivable that the linker used to attach
the maleinimide group to the particles surface is too short to enable a selective and
specific binding of the target protein or oligonucleotide. This might also be true for the
biotin moiety. The biotin-(strept)avidin interaction possibly is sterically hindered as the
biotin is located very close to the particle surface. Introduction of a longer spacer
between the biotin and the click site could solve this problem. The unselective
electrostatical binding of proteins to the silica surface of the particles proved to be
another problem. Avidin (pI 10) is a highly basic protein with an overall positive
charge at neutral pH this giving rise to nonspecific binding to the negatively charged
silica surface. By introduction of charge compensating groups to the silica surface
this kind of electrostatical binding is likely to be substantially reduced. The
competitive binding of HSA coated UCNPs to an immobilized anti-HSA antibody
could be shown. Nevertheless, the covalent attachment of the protein to the
maleinimido group on the particle surface could not be definitely proven.
Furthermore, the standard deviation of the intensity readings for this assay was very
high, again due to the use of the particles of type NP-1 with only moderate
brightness. Concluding it has to be stated that the objective to develop a click based
immuno or gene assay was not achieved.
On the other hand, it was shown that UCNPs have large potential for sensing
applications. Using different pH indicators with a pH dependent absorbance
overlapping with the green emission of the UCNPs of type NP-3 allows for the
5 Analytical Applications for UCNPs 90
development of upconversion based pH sensors covering a broad pH range.
Compared to the literature example1 with bromothymol blue as the pH probe the
systems presented here are advantageous as the red emission of the UCNPs is not
affected by the pH dependent color change of the indicators thereby allowing
ratiometric sensing.
Moreover, this effect can be exploited for the sensing of acidic and basic gases
by incorporating the UCNP indicator system into a proton impermeable polymer
matrix. Thus, the first ammonia sensor known in literature based on upconversion
luminescence was presented. The ratiometric readout using the red peak of the
UCNPs as reference peak renders the system independent of excitation intensity and
particle concentration. This allows for measurements in turbid or inhomogeneous
samples. The detection range attained for the sensor membrane of 40 to 800 ppm of
dissolved ammonia admittedly is too high for use as a trace ammonia detection
system. However, this robust and simple sensing scheme can be enhanced by
choosing a pH indicator with a lower pKa, e. g. methyl red. In comparison to ammonia
sensing systems based on the use of conventional organic fluorophores7,9 the NIR
excitation of this sensor system minimizes negative effects from background
luminescence.
In addition, initial experiments have shown that the upconverting nanoparticles
presented in this work are suitable for bioimaging applications. Cells of the NRK type
displayed a considerable uptake of the UCNPs. The silica coated particles in
particular appeared to be benign for the cells especially when applied in low
concentrations. Separate images of the green and the red particle emission were
acquired. This paves the way for ratiometric measurements within cells. This concept
has not been described in the literature so far. Consequently, the functionalization of
the UCNPs with clickable DNA,18,19 peptides20 or antibodies could lead to the
development of sensitive new tumor markers21 or release systems for siRNA.22
5 Analytical Applications for UCNPs 91
5.6 References
1 Sun L, Peng H, Stich MIJ, Achatz D, Wolfbeis OS (2009) pH Sensor Based on Upconverting Luminescent Lanthanide Nanorods, Chem. Comm. 5000-5002.
2 Berthois Y, Katzenellenbogen JA, Katzenellenbogen BS (1986) Phenol Red in Tissue Culture Media is a Weak Estrogen: Implications Concerning the Study of Estrogen-Responsive Cells in Culture, Proc. Natl. Acad. Sci. USA 83: 2496-2500.
3 Masserini RT, Fanning KA (2000) A Sensor Package for the Simultaneous Determination of Nanomolar Concentrations of Nitrite, Nitrate, and Ammonia in Seawater by Fluorescence Detection, Mar. Chem. 68: 323-333.
4 Timmer B, Olthuis W, van der Berg A (2005) Ammonia Sensors and Their Applications—a Review, Sens. Actuators B 107: 666-677.
5 Kar S, Arnold MA (1992) Fiber-optic Ammonia Sensor for Measuring Synaptic Glutamate and Extracellular Ammonia, Anal. Chem. 94: 2438-2443.
6 Elamari A, Gisin N, Munoz JL, Poitry S, Tsacopoulos M, Zbinden H (1997) Photon-counting Optical-fiber Sensor for the Detection of Ammonia in Neurochemical Applications, Sens. Actuators B, 38-39, 183-188.
7 Waich K, Borisov S, Mayr T, Klimant I (2009) Dual Lifetime Referenced Trace Ammonia Sensors, Sens. Actuators. B 139: 132-138.
8 Totschnig G, Lackner M, Shau R, Ortsiefer M, Rosskopf J, Amann MC, Winter F (2003) High-speed Vertical-cavity Surface-emitting Laser (VCSEL) Absorption Spectroscopy of Ammonia (NH3) near 1.54 µm, Appl. Phys. B 76: 603-608.
9 Mills A, Wild L, Chang Q (1995) Plastic Colorimetric Film Sensors for Gaseous Ammonia Microchim. Acta 121: 225-236.
10 Wolfbeis OS (2008) Fiber-Optic Chemical Sensors and Biosensors, Anal. Chem. 80: 4269-4283.
11 Rhines TD, Arnold MA (1988) Simplex Optimization of a Fiber-optic Ammonia Sensor Based on Multiple Indicators, Anal. Chem. 60: 76-81.
12 Lobnik A, Wolfbeis OS (1998) Sol-gel Based Optical Sensor for Dissolved Ammonia, Sens. Actuators B 51: 203-207.
13 Preininger C, Mohr GJ, Klimant I, Wolfbeis OS (1996) Ammonia Fluorosensors Based on Reversible Lactonisation of Polymer-entrapped Rhodamine Dyes and the Effects of Plasticizers, Anal. Chim. Acta. 334: 113-123.
14 Werner T, Klimant I, Wolfbeis OS (1995) Ammonia-sensitive Polymer Matrix Employing Immobilized Indicator Ion Pairs, Analyst 120: 1627-1631.
15 McDonagh C, Burke CS, MacCraith BD (2008) Optical Chemical Sensors, Chem. Rev. 108: 400-422.
16 Sivakumar S, Diamente PR, van Veggel FCJM (2006) Silica-Coated Ln3+-Doped LaF3 Nanoparticles as Robust Down- and Upconverting Biolabels, Chem. Eur. J 12: 5878-5884.
17 Zhang P, Rogelj S, Nguyen K, Wheeler D (2006) Design of a Highly Sensitive and Specific Nucleotide Sensor Based on Photon Upconverting Particles, J. Am. Chem. Soc. 128: 12410-12411.
18 Berndl S, Herzig N, Kele P, Lachmann D, Li X, Wolfbeis OS, Wagenknecht H-A (2009) Comparison of a Nucleosidic vs Non-Nucleosidic Postsynthetic “Click“ Modification of DNA with Base-Labile Fluorescent Probes, Bioconjugate Chem. 20: 558-564.
19 Gierlich J, Gutsmiedl K, Gramlich PME, Schmidt A, Burley GA, Carell T (2007) Synthesis of Highly Modified DNA by a Combination of PCR with Alkyne-Bearing Triphosphates and Click Chemistry, Chem. Eur. J. 13: 9486 – 9494.

5 Analytical Applications for UCNPs 92
20 Kele P, Mezö G, Achatz D, Wolfbeis OS (2009) Dual Labeling of Biomolecules by Using Click Chemisty: A Sequential Approach, Angew. Chem. Int. Ed. 48: 344-347, Angew. Chem. 121: 350-353.
21 Hu H, Xiong L, Zhou J, Li F, Cao T, Huang C (2009) Multimodal-Luminescence Core-Shell Nanocomposites for Targeted Imaging of Tumor Cells, Chem. Eur. J. 15: 3577-3584.
22 Jiang S, Zhang Y (2010) Upconversion Nanoparticles-Based FRET System for Study of siRNA in Live Cells, Langmuir published online DOI: 10.1021/la904011q
6 Experimental Section 93
6 Experimental Section
6.1 Particle Synthesis
6.1.1 Silica Nanoparticles
10 nm silica nanoparticles (referred to as SiNP) were obtained from Nanostructured
& Amorphous Materials, Inc. (www.nanoamor.com) and directly used for surface
modification.
6.1.2 Upconverting Microparticles (UCµPs)
Two types of commercially available UCµPs, referred to as µP-1 and µP-2 (see Table
1) were used. Microparticles of type µP-1 are composed of La2O2S and doped with
ytterbium and erbium ions, those of type µP-2 consist of Y2O2S and are doped with
ytterbium and thulium ions. Both were obtained from MolTech GmbH Berlin (www.mt-
berlin.com).
6.1.3 Upconverting Nanoparticles (UCNPs)
The UCNPs were synthesized using the established1,2 co-precipitation method. 0.2 M
lanthanide stock solutions were prepared by dissolving the respective lanthanide
trichlorides in water. The solutions were adjusted to pH 2 with 1 M hydrochloric acid
to avoid hydrolysis. Subsequently, a cocktail of the lanthanides was prepared by
mixing the appropriate volumes of the stock solutions according to the desired
composition of the NPs (see table 6.1). 20 mL of a 0.2 M ethylenediaminetetraacetic
acid (EDTA) solution were added to from Ln-EDTA complexes. Then, this complex
solution was injected into 60 mL of a 0.83 M sodium fluoride solution.
Instantaneously, the precipitation of nanoparticles can be observed. The reaction
mixture was stirred for 1h at room temperature. The colorless precipitate was
separated by centrifugation at 4000 rpm for 30 min, washed 3 times with water and
then once with ethanol. The precipitate was dried in a drying furnace and under
vacuum. Afterwards, the colorless powder was tempered at 400°C for 4.5 h under
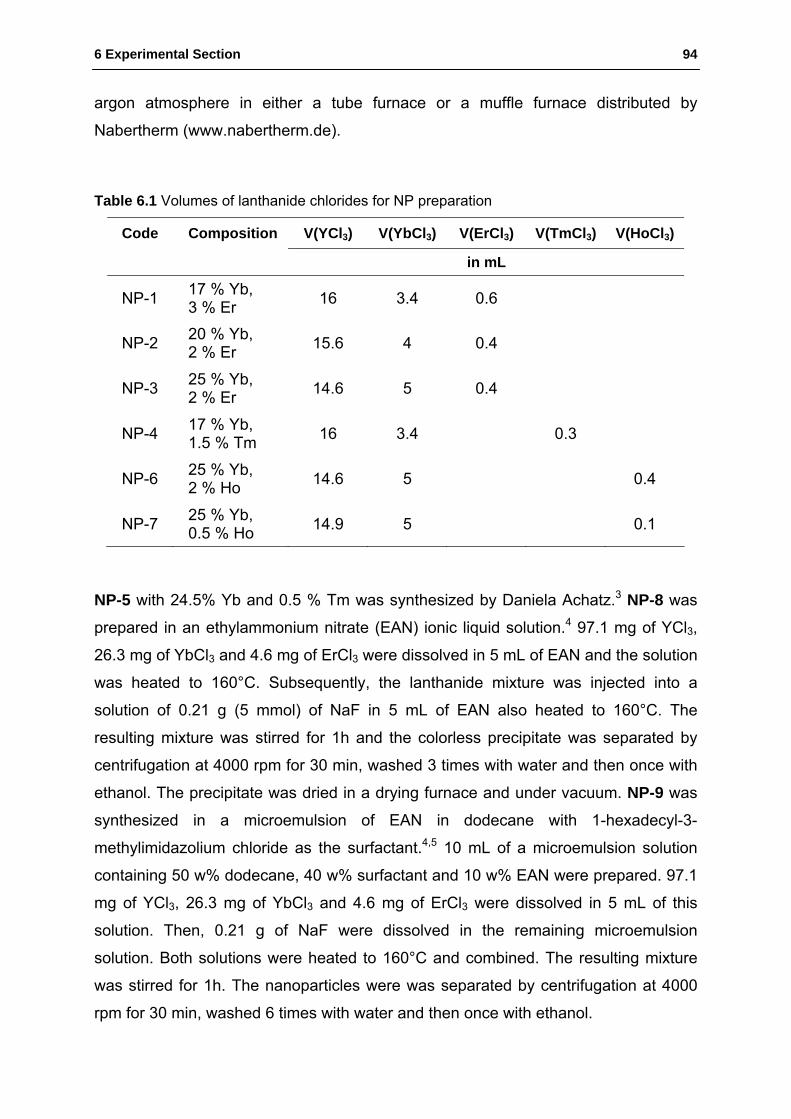
6 Experimental Section 94
argon atmosphere in either a tube furnace or a muffle furnace distributed by
Nabertherm (www.nabertherm.de).
Table 6.1 Volumes of lanthanide chlorides for NP preparation
Code Composition V(YCl3) V(YbCl3) V(ErCl3) V(TmCl3) V(HoCl3)
in mL
NP-1 17 % Yb, 3 % Er 16 3.4 0.6
NP-2 20 % Yb, 2 % Er 15.6 4 0.4
NP-3 25 % Yb, 2 % Er 14.6 5 0.4
NP-4 17 % Yb, 1.5 % Tm 16 3.4 0.3
NP-6 25 % Yb, 2 % Ho 14.6 5 0.4
NP-7 25 % Yb, 0.5 % Ho 14.9 5 0.1
NP-5 with 24.5% Yb and 0.5 % Tm was synthesized by Daniela Achatz.3 NP-8 was
prepared in an ethylammonium nitrate (EAN) ionic liquid solution.4 97.1 mg of YCl3,
26.3 mg of YbCl3 and 4.6 mg of ErCl3 were dissolved in 5 mL of EAN and the solution
was heated to 160°C. Subsequently, the lanthanide mixture was injected into a
solution of 0.21 g (5 mmol) of NaF in 5 mL of EAN also heated to 160°C. The
resulting mixture was stirred for 1h and the colorless precipitate was separated by
centrifugation at 4000 rpm for 30 min, washed 3 times with water and then once with
ethanol. The precipitate was dried in a drying furnace and under vacuum. NP-9 was
synthesized in a microemulsion of EAN in dodecane with 1-hexadecyl-3-
methylimidazolium chloride as the surfactant.4,5 10 mL of a microemulsion solution
containing 50 w% dodecane, 40 w% surfactant and 10 w% EAN were prepared. 97.1
mg of YCl3, 26.3 mg of YbCl3 and 4.6 mg of ErCl3 were dissolved in 5 mL of this
solution. Then, 0.21 g of NaF were dissolved in the remaining microemulsion
solution. Both solutions were heated to 160°C and combined. The resulting mixture
was stirred for 1h. The nanoparticles were was separated by centrifugation at 4000
rpm for 30 min, washed 6 times with water and then once with ethanol.
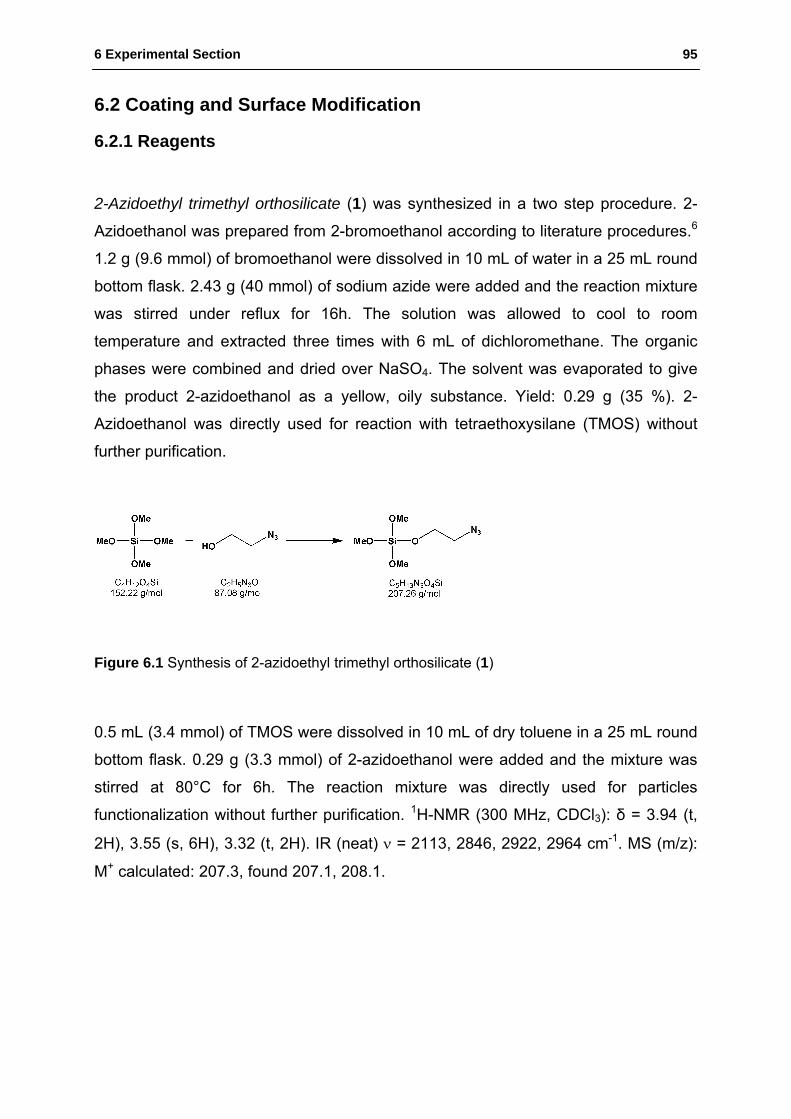
6 Experimental Section 95
6.2 Coating and Surface Modification
6.2.1 Reagents
2-Azidoethyl trimethyl orthosilicate (1) was synthesized in a two step procedure. 2-
Azidoethanol was prepared from 2-bromoethanol according to literature procedures.6
1.2 g (9.6 mmol) of bromoethanol were dissolved in 10 mL of water in a 25 mL round
bottom flask. 2.43 g (40 mmol) of sodium azide were added and the reaction mixture
was stirred under reflux for 16h. The solution was allowed to cool to room
temperature and extracted three times with 6 mL of dichloromethane. The organic
phases were combined and dried over NaSO4. The solvent was evaporated to give
the product 2-azidoethanol as a yellow, oily substance. Yield: 0.29 g (35 %). 2-
Azidoethanol was directly used for reaction with tetraethoxysilane (TMOS) without
further purification.
Figure 6.1 Synthesis of 2-azidoethyl trimethyl orthosilicate (1)
0.5 mL (3.4 mmol) of TMOS were dissolved in 10 mL of dry toluene in a 25 mL round
bottom flask. 0.29 g (3.3 mmol) of 2-azidoethanol were added and the mixture was
stirred at 80°C for 6h. The reaction mixture was directly used for particles
functionalization without further purification. 1H-NMR (300 MHz, CDCl3): δ = 3.94 (t,
2H), 3.55 (s, 6H), 3.32 (t, 2H). IR (neat) ν = 2113, 2846, 2922, 2964 cm-1. MS (m/z):
M+ calculated: 207.3, found 207.1, 208.1.
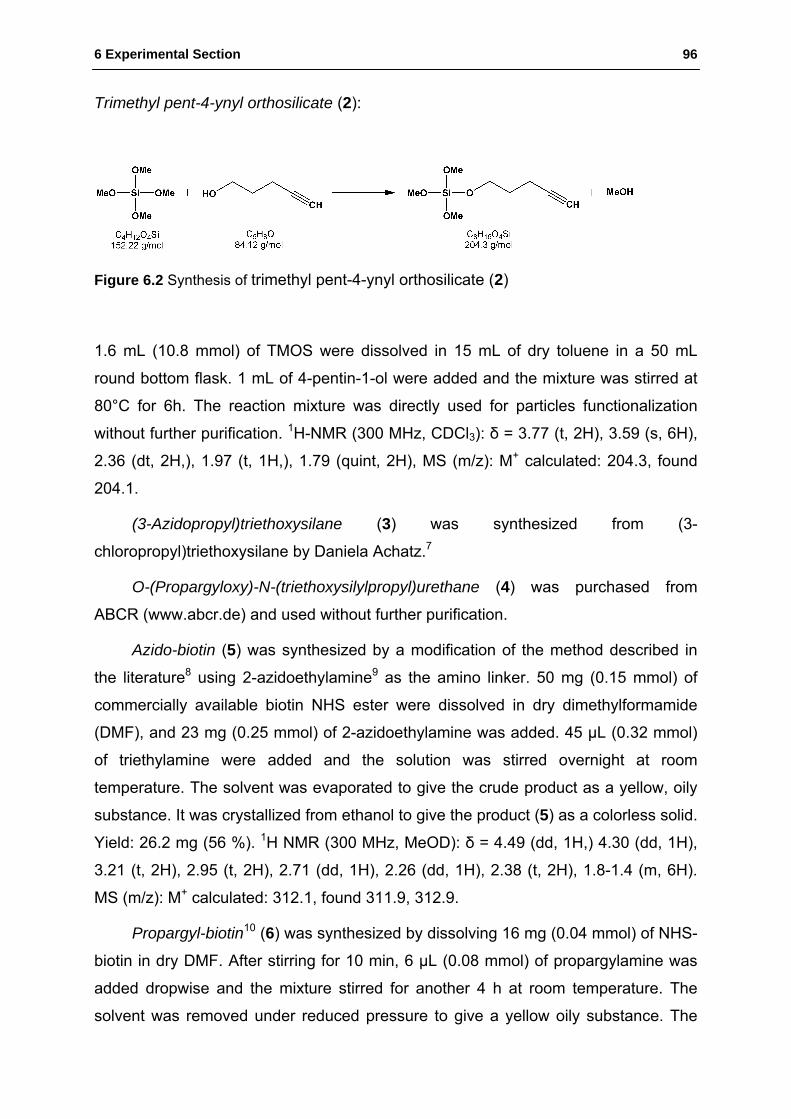
6 Experimental Section 96
Trimethyl pent-4-ynyl orthosilicate (2):
Figure 6.2 Synthesis of trimethyl pent-4-ynyl orthosilicate (2)
1.6 mL (10.8 mmol) of TMOS were dissolved in 15 mL of dry toluene in a 50 mL
round bottom flask. 1 mL of 4-pentin-1-ol were added and the mixture was stirred at
80°C for 6h. The reaction mixture was directly used for particles functionalization
without further purification. 1H-NMR (300 MHz, CDCl3): δ = 3.77 (t, 2H), 3.59 (s, 6H),
2.36 (dt, 2H,), 1.97 (t, 1H,), 1.79 (quint, 2H), MS (m/z): M+ calculated: 204.3, found
204.1.
(3-Azidopropyl)triethoxysilane (3) was synthesized from (3-
chloropropyl)triethoxysilane by Daniela Achatz.7
O-(Propargyloxy)-N-(triethoxysilylpropyl)urethane (4) was purchased from
ABCR (www.abcr.de) and used without further purification.
Azido-biotin (5) was synthesized by a modification of the method described in
the literature8 using 2-azidoethylamine9 as the amino linker. 50 mg (0.15 mmol) of
commercially available biotin NHS ester were dissolved in dry dimethylformamide
(DMF), and 23 mg (0.25 mmol) of 2-azidoethylamine was added. 45 µL (0.32 mmol)
of triethylamine were added and the solution was stirred overnight at room
temperature. The solvent was evaporated to give the crude product as a yellow, oily
substance. It was crystallized from ethanol to give the product (5) as a colorless solid.
Yield: 26.2 mg (56 %). 1H NMR (300 MHz, MeOD): δ = 4.49 (dd, 1H,) 4.30 (dd, 1H),
3.21 (t, 2H), 2.95 (t, 2H), 2.71 (dd, 1H), 2.26 (dd, 1H), 2.38 (t, 2H), 1.8-1.4 (m, 6H).
MS (m/z): M+ calculated: 312.1, found 311.9, 312.9.
Propargyl-biotin10 (6) was synthesized by dissolving 16 mg (0.04 mmol) of NHS-
biotin in dry DMF. After stirring for 10 min, 6 µL (0.08 mmol) of propargylamine was
added dropwise and the mixture stirred for another 4 h at room temperature. The
solvent was removed under reduced pressure to give a yellow oily substance. The
6 Experimental Section 97
crude product was then purified by column chromatography using a gradient of
methylene chloride and methanol as eluents to yield propargylbiotin (6) as a colorless
solid. Yield: 7 mg (62 %). 1H-NMR (300 MHz, D6-DMSO): δ = 8.22 (bs, 1H), 6.41 (s,
1H), 6.35 (s, 1H), 4.29 (t, 1H), 4.10 (m, 1H), 3.83 (dd, 2H), 3.08 (m, 2H), 2.81 (dd,
1H), 2.57 (d, 1H), 2.08 (t, 2H), 1.60-1.40 (m, 4H), 1.60-1.40 (m, 2H). MS (m/z): M+
calculated: 281.1, found 280.9.
Propargyl-maleimide (7) was synthesized from maleic acid anhydride and
propargylamine by Martin Link and Jana Kleim.11
6.2.2 Surface Modification of SiNPs
100 mg of SiNPs were suspended in 20 mL of dry toluene in a 100 mL Schlenk flask
and flushed with dry nitrogen. 150 µL of the respective silane (1 or 2) were added
and the mixture was stirred for 48 h at 90°C. The mixture was allowed to cool and the
particles were separated by centrifugation for 20 min at 4000 rpm. The particles were
washed several times with ethanol and acetone, and finally dried in a drying furnace
at 60 °C.
6.2.3 Surface Modification of UCµPs
200 mg of UCµPs of type µP-1 were rinsed 3 times with 2 mL of 0.1 M acetic acid
and washed several times with doubly distilled water. The particles were filtered
using a suction filter and then dried overnight in a drying furnace. The activated
UCµPs were then suspended in 20 mL of dry toluene in a 100 mL Schlenk flask and
flushed with dry nitrogen. 200 µL of the respective silane (3 or 4) were added and the
mixture stirred for 48 h at 90 °C. The mixture was allowed to cool and the particles
were separated by centrifugation for 15 min at 4000 rpm. After removal of the
supernatant, the particles were washed several times with ethanol and acetone, and
finally dried in a drying furnace at 60 °C.
6 Experimental Section 98
6.2.4 Coating and Surface Modification of UCNPs
The particles were coated with a silica shell via a modified Stöber process.12 Two
different procedures were used. In the first method, 75 mg of the UCNPs were
dispersed in 80 mL of ethanol by ultrasonication for 10 min. Subsequently, the
mixture was heated to 40 °C, and 500 µL of water and 500 µL of 25 w% ammonia
were added, followed by 400 µL of tetraethoxysilane (TEOS). The solution was
stirred for 30 min. The respective functionalized silane (3 or 4; 25 µL) was added and
the mixture stirred for another 2.5 h. After cooling to room temperature, the particles
were purified by size exclusion chromatography (on Sephadex LH-60) using ethanol
as the eluent to remove unreacted TEOS and ammonia. The proper fraction was
recognized by its slight turbidity and by illuminating it with a 980-nm laser which
results in visible luminescence. The resulting silica-coated UCNPs were stored in
ethanol solution to avoid aggregation. To transfer the particles into aqueous solution,
the reaction mixture from the Stöber coating process was diluted with water and
purified again by size exclusion chromatography using Sephadex G-75 (which is
better water-compatible than LH-60) with distilled water as the eluent. The resulting
suspensions in either ethanol or water are stable for several months.
In the second procedure, 30 mg of the UCNPs were dispersed in 80 mL of
ethanol via ultrasonication for 10 min. The mixture was heated to 40 °C, and 7.5 mL
of H2O, and 8.5 mL of 25 w% ammonia were added, followed by 100 µL of TEOS.
The solution was stirred for 2h. Subsequently, 25 µL of the respective silane (3 or 4)
were added and the mixture was stirred for another hour. The work up was
performed analog to the first method.
For the microemulsion process, 16 mg of the UCNPs were dispersed in 1160 µL
of distilled H2O via ultrasonication. The microemulsion was prepared from
cyclohexane (30 mL), Triton X-100 (1.77 mL), and n-hexanol (1.8 mL). The dispersed
UCNPs were added to 20 mL of the microemulsion together with 240 µL of ammonia
(33 w%) and the mixture was ultrasonicated for 10 min. 932 µL of H2O, 100 µL of
TEOS, and 60 µL of azidosilane 3 were added to the remaining microemulsion and
then, both mixtures were combined. The resulting reaction mixture was
ultrasonicated for 10 min and then vortexed for 2h. After 1h the mixture was
ultrasonicated again for 10 min. The microemulsion was broken by addition of 6 mL
6 Experimental Section 99
of acetone. The particles were separated via centrifugation at 2860 rpm for 5 min and
washed 2 times with ethanol and 2 times with water. The particles were stored in
aqueous dispersion.
6.3 Click Reaction
Click reactions were generally performed in water/ethanol mixtures (1:10 to 10:1; v/v)
by adding a mixture of copper(II) sulfate and ascorbic acid. Catalytic quantities of
triethylamine accelerate the cycloaddition. In a standard procedure, 0.5 – 1 mg of
one of the clickable reagents (5 - 15) is added to 2 mL of a 1 mg/mL dispersion of the
respective UCP or SiNP in a water/ethanol mixture. Thereafter, 10 µL of a 20 mM
aqueous solution of copper sulfate, 10 µL of a 0.1 M solution of sodium ascorbate,
and 10 µL of triethylamine were added. The mixture was stirred at room temperature
for 1 to 14 h. Experiments without the copper catalyst were performed in parallel at all
stages. In case of UCµPs and silica nanoparticles, the solutions were centrifuged and
washed several times with water and ethanol. In case of UCNPs, work up was
accomplished by size exclusion chromatography (Sephadex LH-60) to remove
unreacted dyes, any biomolecules, and catalyst.
6.4 UCNPs as Protein and Oligonucleotide Labels
6.4.1 Oligonucleotide Assay
All experiments regarding the oligonucleotide and the protein assay were carried out
at the Department of Biotechnology, University of Turku, Turku, Finland.
Sequence of the thiol-oligonucleotide (SH-oligos): 5'- cat tgc cga cag ga -3'.
Sequence of the biotinylated-oligonucleotide (bio-oligo): 5'- tcc tgt cgg caa tg -3'.
SH-oligos were labeled with UCNPs of type NP-1-C-7. 5 nmol of the SH-oligos were
dissolved in 400 µL of phosphate-buffered silane (PBS) buffer. 4 µL of a 15 mM tris
(2-carboxyethyl) phosphine (TCEP)-solution were added as reducing agent. After
stirring at 30 min at room temperature, the SH-oligos were added to 1.5 mg of NP-1-
6 Experimental Section 100
C-7 in 100 µL of PBS. The mixture was stirred overnight and the particles were
separated by centrifugation at 12000 rpm for 7 min and washed 3 times with PBS
buffer.
In the assay, three replicates of appropriate dilutions of the bio-oligos in 50 µL
assay buffer were first incubated in streptavidin wells (streptavidin MTPs, 8x12 wells
regular, obtained from Kaivogen Oy, www.kaivogen.com,) for 30 min at room
temperature with slow shaking. The wells were washed once with wash solution
(Delfia Platewash, Perkin Elmer Life and Analytical Sciences, www.perkinelmer.com),
and 75 µL of NP-1-C-7-Oligo (5 µg/mL) were added. Wells were incubated for 1.5 h
with slow shaking, washed four times and the luminescence of the UCNPs was
measured in a 3x3 raster per well.
6.4.2 Protein Assay
Special, white, low-fluorescence MaxiSorp microtitration wells (Nunc A/S Denmark,
www.nuncbrand.com) were coated with anti-human serum albumin (anti-HSA
produced in rabbit, obtained from Sigma Aldrich, www.sigma-aldrich.com) by physical
adsorption to prepare low-capacity, anti-HSA-coated microtitration wells. In the
coating, the wells were first incubated at 35 °C for 2 h with 375 ng of anti-HSA in 50
µL of 200 mM phosphate buffer (pH 7.8). The coated wells were washed twice and
saturated for 1h at room temperature with 150 µL of 50 mM Tris-HCl buffer, pH 7.2,
containing 0.1 % BSA, 0.1 % Germall II, and 3% trehalose. The wells were aspirated,
dried in a laminar hood overnight, and stored at 4 °C in a sealed package with
desiccant.
HSA coated UCNPs were prepared by dispersing 5 mg of NP-1-C-7 in 400 µL
of PBS via ultrasonication and addition of 100 µL of a 10 mg/mL solution of HSA in
PBS. The mixture was stirred overnight. The particles were collected via
centrifugation at 12000 rpm for 7 min and washed 3 times with PBS.
In the assay, three replicates of appropriate dilutions of free HSA in 25 µL assay
buffer were pipetted into the anti-HSA coated wells, followed by 75 µL of NP-1-C-7-HSA (7.5 µg/mL) in assay buffer. The solution was incubated for 1h at room
temperature with slow shaking. The wells were washed four times with wash solution.
6 Experimental Section 101
The luminescence of the UCNPs was measured in a 3x3 raster per well.
6.5 pH Sensing
All measurements were performed in 40 mM Britton-Robinson buffer. Silica coated
UCNPs of type NP-3-C (50 µg/mL) were dispersed in buffered solutions of the
respective pH-indicator. Concentrations of the indicators were 66.7 µM for
phenolphthalein, and 40 µM for both phenol red and methyl red.
6.6 Ammonia Sensor
In order to minimize leaching of the dye and improving its solubility in the
hydrophobic polymer, the sodium ion of the indicator phenol red was replaced by the
tetrabutyl ammonium ion.13 Phenol Red (10 mg) was dissolved in 30 mL of water and
extracted with 30 mL of chloroform containing 9 mg of tetrabutyl ammonium chloride.
The organic phase containing the tetrabutyl ammonium salt of phenol red (TBA-PR)
was collected and dried using a rotary evaporator. The probe TBA-PR (3 mg) was
then dissolved in 2 mL of a 10 % solution of polystyrene in chloroform. Then, 5 mg of
the NaYF4: Yb, Er were added and the mixture stirred for 5 h. The sensor “cocktail”
was spread onto the polyester support (Mylar™, obtained from Goodfellow,
www.goodfellow.com) using a home-made device. The resulting layer was dried at
air at room temperature. From the quantities of materials and solvents employed, the
thickness of the dried membrane was calculated to be 12 µm.
6.7 Instrumental Techniques Scanning electron microscopy (SEM) images were acquired on a Jeol
(www.jeolusa.com) instrument (JSM 800). Transmission electron microcopy (TEM)
images were acquired using a 120 kV Zeiss (www.smt.zeiss.com) instrument of type
Leo 912AB equipped with a Proscan CCD (www.proscan.de) camera (UCNPs) or a
6 Experimental Section 102
120 kV FEI instrument of type TEMCM12 (www-fei.com) equipped with a Gatan
CCD-camera (www.gatan.com) (SiNPs). 1H-NMR spectra were recorded on an
Avance 300 NMR-spectrometer from Bruker Bio Spin (www.bruker-biospin.com).
Tetramethylsilane (TMS) was used as the internal standard. Elemental analysis and
mass spectrometry was performed by the Central Analytics Department at the
University of Regensburg. DR-FTIR spectra were acquired on a FT/IR – 6100 IR
spectrometer distributed by Jasco (www.jascoinc.com). A diffuse reflectance
accessory (EasiDiff) provided by Pike Technologies (www.piketech.com) was used
for sample preparation. UV-spectra were recorded with a Cary 50 Bio UV-visible
Spectrophotometer from Varian (www.varian.com). Fluorescence microscopy images
were acquired on a Leica DMRE microscope (www.leica.de). A mercury lamp acted
as the light source, and the excitation band (515 to 560 nm) was adjusted by using a
bandpass filter. Fluorescence was collected after it had passed a longpass filter with
a cut-off wavelength of 590 nm. Luminescence spectra of particles and fluorescence
spectra of dyes were recorded on a Cary Eclipse fluorometer (from Varian;
www.varianinc.com). A 980-nm fiber-optic diode laser (5 mW cw; from Roithner
Lasertechnik; www.roithner-laser.com) was used as the light source for upconversion
photoexcitation. Spectra are not corrected. All microplate measurements were
acquired on a HIDEX Plate Chameleon Multilabel Detection Platform
(www.hidex.com) using a 980-nm laser diode as the excitation source and a 550 nm
or 660 nm bandpass filter for collecting the signal of the green and red peaks
respectively.14 Upconversion microscopy images were taken on a Leica SP5
Confocal Microscope (www.leica-microsystems.com) with Acousto-Optical Beam
Splitter and a resonant scanner using a 980 nm laser diode (1 W) as the excitation
source.
6.8 References
1 Yi G, Lu H, Zhao S, Ge Y, Yang W, Chen D, Guo L-H (2004) Synthesis, Characterization, and Biological Application of Size-Controlled Nanocrystalline NaYF4: Yb, Er Infrared-to-Visible Up-Conversion Phosphors, Nano Lett. 4: 2191-9196.
2 Mader HS, Link M, Achatz DE, Uhlmann K, Li X, Wolfbeis OS (2010) Surface-Modified Upconverting Microparticles and Nanoparticles for Use in Click Chemistries, Chem.-Eur. J., accepted.
6 Experimental Section 103
3 Achatz DE, Meier RJ, Fischer LH, Wolfbeis OS (2010) Oxygen Sensor based on NaYF4:Yb, Tm Upconverting Nanoparticles, submitted
4 Zech O (2010) Ionic Liquids in Microemulsions – a Concept to Extend the Conventional Thermal Stability Range of Microemulsions, Dissertation, University of Regensburg
5 Zech O, Thomaier S, Bauduin P, Rück T, Touraud D, Kunz W (2009) Microemulsions with an Ionic Liquid Surfactant and Room Temperature Ionic Liquids As Polar Pseudo-Phase, J. Phys. Chem. B 113: 465-473.
6 Demko ZP, Sharpless KB (2001) An Intramolecular [2+3] Cycloaddition Route to Fused 5-Heterosubstituted Tetrazoles, Org. Lett. 3, 4091-4094.
7 Achatz DE (2008) Fluorescent Silica Nanoparticles for Click Labeling of Proteins, Diplomarbeit, University of Regensburg,
8 Lin P-C, Ueng S-H, Zseng M-C, Ko J-L, Hunag K-T, Yu S-C, Adak AK, Chen Y-J, Lin C-C (2006) Site-Specific Protein Modification trough CuI-Catalyzed 1,2,3-Triazole Formation and its Implementation in Protein Microarray Fabrication. Angew. Chem. Int. Ed. 45: 4286-4290.
9 Mayer T, Maier ME (2007) Design and Synthesis of a Tag-Free Chemical Probe for Photoaffinity Labeling, Eur. J. Org. Chem. 4711-4720.
10 Meier JL, Mercer AC, Rivera H, Burkart MD (2006) Synthesis and Evaluation of Bioorthogonal Pantetheine Analogues for in Vivo Protein Modification, J. Am. Chem. Soc. 128: 12474-12184.
11 Link M, Li X, Kleim J, Wolfbeis OS, (2010) Novel Method for Introducing Maleinimido Groups into Thiol-Reactive Labels, Eur. J. Org. Chem. submitted.
12 Stöber W, Fink A (1968) Controlled Growth of Monodisperse Silica Spheres in the Micron Size Range, J. Colloid. Interf. Sci. 26: 62-69.
13 Mohr GJ, Werner T, Oehme I, Preininger C, Klimant I, Kovacs B, Wolfbeis OS (1997) Novel Optical Sensor Materials Based on Solubilization of Polar Dyes in Apolar Polymers, Adv. Mater. 9: 1108-1113.
14 Soukka T, Kuningas K, Rantanen T, Haaslahti V, Lövgren T (2005) Photochemical Characterization of Up-Converting Inorganic Lanthanide Phosphors as Potential Labels, J. Fluorescence 15: 513-528.
7 Summary 104
7 Summary
7.1 In English
Upconverting nanoparticles (UCNPs) of the NaYF4 type with narrow size distribution
from 60 to 90 nm, were prepared using the established co-precipitation method. The
particles were codoped using Yb3+ as the sensitizer ion, Er3+, Tm3+ or Ho3+,
respectively as the emitting activator ions. Erbium doped particles displayed the
brightest luminescence (green and red). A dopant ratio of 25% Yb3+ and 2% Er3+
proved to be the best composition to enable a partial phase transfer from the cubic α-
NaYF4 with moderate luminescence to the hexagonal β-NaYF4 with much higher
upconversion emission intensities. Effects of fluctuations of the oven temperature on
the resulting luminescence intensity during the annealing step of the particle
preparation could not be completely eliminated. The ionic liquid ethylammonium
nitrate (EAN) proved to be a suitable solvent for the preparation of small UCNPs with
diameters around 30 nm. However, the direct synthesis of hexagonal NaYF4 failed
and the annealing step could not be circumvented.
Commercially available silica nanoparticles (SiNPs) and upconverting
microparticles (UCµP) as well as the synthesized UCNPs were successfully
functionalized with azido and alkyne groups, respectively. Thereby the particle
surfaces become compatible with click chemistry which is highly versatile, particularly
with respect to bioconjugation as it is bioorthogonal and thus not troubled by
functional groups often present in biological samples. It was shown that SiNPs and
UCµPs can be directly functionalized using the appropriate silanes. The UCNPs were
coated with a layer of SiO2 (silica) and click functionalized in a one step Stöber
procedure. Purification of the coated UCNPs via size exclusion chromatography
minimized aggregation of the particles and guaranteed good dispersibility in aqueous
solutions.
Fluorescently labeled SiNPs covering emission wavelengths from green to red
were prepared by covalent attachment of click functionalized dyes. Color and
intensity of the particles are easily fine-tuned via strict control of dye load and
reaction times. UCµPs and UCNPs click labeled with fluorescent dyes have attractive
spectral features in giving dual emissions depending on the wavelength of excitation
7 Summary 105
which can be exploited for encoding applications. The photoexcitation of an organic
dye by the UCNPs emission was shown for the green emitting UCNPs of type NP-3
and a click derivative of rhodamine B. The energy transfer from the UCNP to the dye
did not occur in a non-radiative FRET mechanism but most likely by the actual
emission and reabsorption of photons, with the UCNPs acting as “nano-lamps”.
Bioreactive particles, functionalized with either maleinimide or biotin were also
prepared via the click reaction. Unfortunately, the reactivity of maleinimide
functionalized UCNPs to thiol groups and the affinity of UCNPs modified with the
biotin group to (strept)avidin could not successfully be exploited for the labeling of
proteins and oligonucleotides.
On the other hand, it was demonstrated that UCNPs have high potential in
sensing applications. Sensing schemes for the determination of pH were presented
based on the inner filter effect of selected pH indicators on the emission of the
UCNPs. This concept was extended to the development of an ammonia sensor
membrane doped with UCNPs of type NP-3 and the pH indicator phenol red. Using
this fully reversible sensor membrane, ammonia concentrations ranging from 1 to 20
mM (40 – 800 ppm) could be determined in a ratiometric setup. Moreover, it was
shown that unmodified as well as silica coated UCNPs are taken up by normal rat
kidney cells and therefore are suitable tools for bioimaging applications.
7.2 In German
Upconvertierende Nanopartikel (UCNPs) vom NaYF4 Typ mit einer engen
Größenverteilung von 60 bis 90 nm wurden mittels der etablierten Co-
Präzipitationsmethode hergestellt. Die Partikel wurden mit Yb3+ als Sensitizer Ion und
Er3+, Tm3+ beziehungsweise Ho3+ als emittierendes Aktivator Ion co-dotiert. Die
hellste Lumineszenz (grün und rot) wurde für Erbium dotierte Partikel gemessen. Ein
Dotierungsverhältnis von 25% Yb3+ und 2% Er3+ erwies sich als die beste
Zusammensetzung, um einen teilweisen Phasenübergang vom nur mäßig
lumineszenten kubischen α-NaYF4 zum hexagonalen β-NaYF4 zu erreichen. Dieses
weist wesentlich höhere Upconversions-Emissionsintensitäten auf. Ein Einfluss von
Schwankungen der Ofentemperatur während des Sinterns der Partikel auf die
7 Summary 106
resultierende Lumineszenzintensität konnte nicht völlig eliminiert werden. Die
ionische Flüssigkeit Ethylammoniumnitrat (EAN) erwies sich als geeignetes
Lösungsmittel für die Herstellung von kleinen UCNPs mit Durchmessern von
ungefähr 30 nm. Die direkte Synthese von hexagonalem NaYF4 scheiterte jedoch
und das Sintern der Partikel konnte nicht umgangen werden.
Kommerziell erhältliche Silicananopartikel (SiNPs) und upconvertierende
Mikropartikel (UCµPs) sowie die synthetisierten UCNPs wurden erfolgreich mit
Azido- beziehungsweise Alkingruppen funktionalisiert. Dadurch wurden die Partikel
zugänglich für die Click Chemie. Diese ist auf Grund ihrer Bioorthogonalität sehr
vielseitig, vor allem in Hinblick auf Biokonjugation, da sie durch in biologischen
Proben häufig vorkommende funktionelle Gruppen nicht beeinträchtigt wird. Es
wurde gezeigt, dass SiNPs und UCµPs mit geeigneten Silanen direkt funktionalisert
werden können. Die UCNPs wurden mittels eines Stöber Prozesses mit einer Schicht
SiO2 (Silica) überzogen und gleichzeitig click funktionalisiert. Die Aufreinigung der
gecoated UCNPs erfolge mittels Größenausschlusschromatographie wodurch die
Partikelaggregation minimiert und eine gute Dispersibilität der Partikel in wässrigen
Lösungen erreicht wurde.
Fluoreszenzmarkierte SiNPs mit Emissionswellenlängen von grün bis rot
wurden durch kovalente Bindung von click-funktionalisierten Farbstoffen hergestellt.
Durch strikte Kontrolle der Farbstoffmenge und der Reaktionszeiten lassen sich
Farbe und Fluoreszenzintensität der Partikel leicht abstimmen. Mittels Click Reaktion
fluoreszenzmarkierte UCµPs and UCNPs zeigen attraktive spektrale Eigenschaften,
da sie eine von der Anregungswellenlänge abhängige duale Emission aufweisen.
Dies kann für Encoding Anwendungen genutzt werden. Die Photoanregung eines
organischen Farbstoffes durch die UCNP Emission wurde für die grün emittierenden
UCNPs vom Typ NP-3 und ein click-Derivat von Rhodamin B gezeigt. Die
Energieübertragung vom UCNP zum Farbstoff fand nicht durch einen
strahlungslosen FRET Mechanismus statt, sondern vermutlich durch die tatsächliche
Emission und Reabsorption von Photonen, wobei die UCNPs als „Nano-Lampen“
agieren.
Des Weiteren wurden bioreaktive Partikel, die entweder mit Maleinimide oder
Biotin funktionalisiert sind, durch Click Reaktion hergestellt. Leider konnte die
Reaktivität von Maleinimide funktionalisierten UCNPs gegenüber Thiolgruppen und
7 Summary 107
die Affinität von UCNPs, die mit Biotin modifiziert sind, zu (Strept)avidin nicht
erfolgreich für die Markierung von Proteinen und Oligonukleotiden genutzt werden.
Allerdings wurde dargelegt, dass UCNPs hohes Potenzial für sensorische
Applikationen aufweisen. Sensorische Strategien für die Bestimmung des pH-Wertes,
die auf dem inneren Filter Effekt von ausgewählten pH-Indikatoren auf die Emission
der UCNPs basieren, wurden vorgestellt. Dieses Konzept wurde auf die Entwicklung
einer Ammoniaksensormembran, die mit UCNPs des Typs NP-3 und dem pH-
Indikator Phenolrot dotiert wurde, ausgeweitet. Mittels dieser vollständig reversiblen
Sensormembran konnte Ammoniak in einem Konzentrationsbereich von 1 bis 20 mM
(40 – 800 ppm) in einem ratiometrischen Aufbau bestimmt werden. Außerdem wurde
gezeigt, dass sowohl unmodifizierte als auch silica gecoatede UCNPs von „normal
rat kidney“ Zellen aufgenommen werden und daher fürs Bioimaging geeignet sind.

108
8 Curriculum Vitae Heike Sabine Mader
born on May 22, 1982 in Munich
Education 09/1988 – 06/2001 Primary and Secondary School in Bietigheim-Bissingen General qualification for university entrance 10/2001 – 11/2006 Chemistry Studies, Diploma, Regensburg University Diploma Thesis at the Institute of Analytical Chemistry,
Chemo- and Biosensors, Prof. Otto S. Wolfbeis: “Fluorescent Labels for Glycoproteins Based on Boronic Acids” 11/2006 Diploma degree in Chemistry (equivalent to M. Sc.) 12/2006 - present PhD Thesis at the Institute of Analytical Chemistry, Chemo-
and Biosensors, Prof. Otto S. Wolfbeis: “Surface Modification of Silica and Upconverting Particles based
on Click Chemistry” Work Experience 09/2000 – 08/2005 Regular Summer Jobs at Elbe Schleiftechnik, Bietigheim-Bissingen (Manufacturer of Grinding Tools) 10/2004 - present Regular Tasks as Student and Graduate Assistant: Supervision of laboratory courses for medical, dentistry and
chemistry students, tutorials in inorganic and organic chemistry for medical and dentistry students
10/2006 - present Private Lessons in Inorganic, Physical and Organic Chemistry
for Medical and Dentistry Students 06/2007 – 12/2007 Assistance in the Organization of the Conference „Methods
and Applications of Fluorescence - MAF10“, Salzburg 06/2009 – 08/2009 Visiting Scientist at the Institute of Biotechnology, Turku University, Finland
109
Language Skills German (native), English (fluent), Spanish (good, Unicert II), French (moderate), Swedish (basic), Finnish (basic) Publications H. S. Mader, O. S. Wolfbeis, Boronic Acid Based Probes for Microdetermination of Saccharides and Glycosylated Biomolecules, Microchim. Acta 2008, 162, 1-34.
H. Mader, X. Li, S. Saleh, M. Link, P. Kele, O. S. Wolfbeis, Fluorescent Silica Nanoparticles, Ann. N. Y. Acad. Sci. 2008, 1130, 213-223.
H. S. Mader, M. Link, D. E. Achatz, K. Uhlmann, X. Li, O. S. Wolfbeis, Surface-Modified Upconverting Microparticles and Nanoparticles for Use in Click Chemistries, Chem.-Eur. J. 2010, published online, doi: 10.1002/chem.201000117.
S. M. Saleh, R. Müller, H. S. Mader, A. Duerkop, O. S. Wolfbeis, Novel Multicolor Fluorescently Labeled Silica Nanoparticles for Interface Fluorescence Resonance Energy Transfer to and from Labeled Avidin, Anal. Bioanal. Chem. 2010, accepted.
H. S. Mader, O. S. Wolfbeis, Optical Ammonia Sensor based on Upconverting Luminescent Nanoparticles, submitted for publication.
H. S. Mader, P. Kele, S. M. Saleh, L. H. Fischer, O. S. Wolfbeis, Upconverting Nanoparticles for Bioconjugation, Curr. Opin. Chem. Biol. in preparation.
Posters Summerschool of the Graduate College “Sensory Photoreceptors in Natural and Artificial Systems” 2008, Kostenz, Germany. “Functionalization of Upconverting Microparticles Using Click Chemistry” Conference Methods and Applications of Fluorescence (MAF-11) 2009, Budapest: “Surface-Modified Upconverting Nanoparticles for Use in Click Chemistries”