Chapter 8 Erythrocyte sedimentation rate and 8.pdf · 2015. erythrocyte sedimentation rate,...
12
Transcript of Chapter 8 Erythrocyte sedimentation rate and 8.pdf · 2015. erythrocyte sedimentation rate,...
Chapter 8Erythrocyte sedimentation rate and
albumin as markers of inflammation are associated with measures of
sarcopenia: a cross-sectional studyVera A. van Atteveld
Jeanine M. Van AncumEsmee M. Reijnierse
Marijke C. TrappenburgCarel G. M. Meskers
Andrea B. Maier
BMC Geriatrics. 2019;19:233.

124
Chapter 8AbstractBackground: Chronic inflammation is considered to affect physical perfor-mance, muscle strength and muscle mass, i.e. measures of sarcopenia. We need to identify a marker of inflammation that is univocally associated with measures of sarcopenia. We aimed to associate three markers of inflammation, erythrocyte sedimentation rate, albumin and white blood cell count, with measures of sarco-penia in geriatric outpatients. Methods: Data from the Centre Of Geri-atrics Amsterdam cohort was used. Geri-atric outpatients at the VU University Medical Center in Amsterdam were re-cruited based on referral between Jan-uary 1st 2014 and the 31st of December 2015. erythrocyte sedimentation rate, al-bumin and white blood cell count were assessed from venous blood samples. Measures of sarcopenia included physi-cal performance by measuring gait speed with the four meter walk test, duration of the timed up and go test and of the chair stand test, muscle strength by assess-ing handgrip strength using handheld dynamometry and skeletal muscle mass by performing bioelectrical impedance analysis. Multivariable linear regression analyses were performed to assess the associations between erythrocyte sedi-mentation rate, albumin, white blood cell count and measures of sarcopenia.
Results: A total of 442 patients (mean age 80.8 years, SD 6.7, 58.1% female) were included. A higher erythrocyte sedimen-tation rate rate was significantly associ-ated with lower gait speed (β = -0.005; 95%CI = -0.007, -0.003), longer duration of timed up and go test (Ln β = 0.006; 95%CI = 0.003, 0.010), longer duration of chair stand test (Ln β = 0.005; 95%CI = 0.002, 0.008), lower handgrip strength
(β = -0.126; 95%CI = -0.189, -0.063) and lower relative skeletal muscle mass (β = -0.179; 95%CI = -0.274, -0.084). Lower al-bumin levels were significantly associated with lower gait speed (β = -0.020; 95%CI = -0.011, -0.028) and handgrip strength (β = -0.596; 95%CI = -0.311, -0.881). Associations remained significant after adjustment for age, sex and number of morbidities. No significant associations were found for white blood cell count and measures of sarcopenia.
Conclusion: In geriatric outpatients, erythrocyte sedimentation rate was asso-ciated with all three measures of sarco-penia, underpinning the potential role of inflammation in sarcopenia.
IntroductionSarcopenia, low physical performance, muscle strength and muscle mass, re-cently redefined by the European Work-ing Group on Sarcopenia in Older People (EWGSOP2)10, is a highly prevalent dis-ease ranging up to 15% in older persons of 60 to 70 years old, and between 40% to 50% in individuals of 80 years and older139,73. Sarcopenia is associated with impaired functional status332, which is re-lated to adverse health outcomes such as nursing home admission and mortal-ity333. Many factors have been identified that are involved in the pathophysiology of sarcopenia, such as malnutrition, hor-monal changes (lower levels of growth hormone and sex hormones), physical in-activity and chronic inflammation334.
Inflammation is thought to be an important risk factor for sarcopenia, as it induces a catabolic state in the mus-cles335. Inflammatory markers that have been investigated in relation to sarco-penia showed contradicting results, in-cluding C-reactive protein (CRP), eryth-rocyte sedimentation rate (ESR), albumin,
125
ESR and albumin associated with measures of sarcopenia
8
white blood cell (WBC) count, cytokines (e.g. Tumor Necrosis Factor-α (TNF-α), Interleukine-6 (IL-6)) and its soluble re-ceptors336-334. TNF-α, IL-6, CRP, albumin, WBC count and ESR were found to be as-sociated with low physical performance, muscle strength or muscle mass in old-er people336,337,341,342,344, but other studies failed to find this association338,339,341,345. To date, TNF-α, IL-6, albumin and CRP have shown a relation with the development of low muscle strength or muscle mass over time336,341-343, however, the current body of evidence fails to reveal a marker of chronic inflammation that is univocally associated with measures of sarcopenia in older people346,347.
The aim of the present paper is to associate ESR, albumin and WBC count as markers of inflammation, with measures of sarcopenia i.e. physical per-formance, muscle strength and muscle mass in a cohort of geriatric outpatients. The number of studies evaluating geriat-ric outpatients is limited.
MethodsStudy designThe Centre Of Geriatrics Amsterdam (COGA) cohort encompasses 572 pa-tients who were referred to the geriat-ric outpatient clinic of the VU University Medical Center in Amsterdam, the Neth-erlands, between January 1st 2014 and the 31st of December 2015. Study inclu-sion was based on referral by general practitioners due to either mobility, cog-nitive problems or functional decline. A comprehensive geriatric assessment was performed by a geriatric nurse, includ-ing measurements of physical and cog-nitive performance. The assessment was followed by a consultation of a geriatri-cian. Blood samples were collected in 505 patients, of which ESR, albumin or WBC count and at least one physical test were
available in 442 patients. No exclusion criteria were applied. The medical ethical committee of the VU University Medical Center approved the study (reference number 2017.582). As this cross-section-al study was based on regular care, the need for individual informed consent was waived.
Patient characteristicsRelevant characteristics such as age, sex, living status, education, alcohol use, smoking, medication use, medical histo-ry, cognitive status, weight, height and functional status were obtained in the abovementioned comprehensive geriat-ric assessment. Use of anti-inflammato-ry medication was defined as the use of prednisone, prednisolone, methotrexate, mesalazine, hydroxychloroquine, inflix-imab or non-steroid anti-inflammatory drugs (NSAID). Medical history that was counted as morbidities included angina, dementia, depression, diabetes type 1 or 2, heart failure, hypercholesterolemia, hypertension, hyperthyroidism, hypothy-roidism, malignancy, myocardial infarc-tion, renal insufficiency, osteoporosis, Parkinson’s disease, transient ischemic attack (TIA), cerebral infarction, arrhyth-mias, joint prosthesis, joint disease or obstructive pulmonary disease. Cognitive status was tested using the mini-mental state examination (MMSE)348. Functional status included independency in activi-ties of daily living (ADL) measured by the Katz index349 with a higher score indicat-ing more dependency, use of a walking aid, immobility for more than 1 week in the preceding 3 months, maximal walk-ing distance and experiencing a fall in the preceding year. Hemoglobin level in mmol/L was measured using non-he-molyzed EDTA-anticoagulated whole blood analyzed using the sodium lauryl sulphate (SLS) detection method. SLS
126
Chapter 8binds with heme, causing a color change that is measured photometrically (Sys-mex XN9000, Sysmex BV, Etten-Leur, the Netherlands).
Inflammatory markersESR in millimeter/hour (mm/hr) was mea-sured using non-hemolyzed EDTA-anti-coagulated whole blood that was ana-lyzed following the Westergren method (StaRRsed Auto Compact VERA109900, Mechatronics BV, Hoorn, the Nether-lands). The Westergren method is de reference method of the International Council for Standardization in Hematol-ogy (ICSH)350.
Albumin in g/L was measured in serum using a colorimetric test with bromcresol purple. Bromcresol purple binds selectively with albumin and the color change is measured photometrical-ly (Cobas 8000 modular analyzer series, Roche Netherlands BV, Woerden, the Netherlands).
WBC count in E9/L was measured using non-hemolyzed EDTA-anticoagu-lated whole blood with fluorescence flow cytometry (Sysmex XN9000, Sysmex BV, Etten-Leur, the Netherlands).
Measures of sarcopeniaGait speed was assessed by the 4 meter walk test at usual pace351, and expressed in meters/second (m/s). The timed up and go (TUG) test as a measure of functional mobility217, and the chair stand test (CST) as an indicator of lower limb strength352 were both expressed in seconds (s).
Handgrip strength (HGS) was measured by a hand dynamometer in a standing position with a stretched arm (angle of 180 degrees) (Jamar hand dy-namometer, Sammons Preston, Inc., Bolingbrook, IL) and expressed in kilo-grams (kg). Maximal handgrip strength out of six attempts (three left and three
right) was used101.Muscle mass was measured in a
standing position using direct segmental multi-frequency bioelectrical impedance analysis (DSM-BIA; InBody 720; Biospace Co.,Ltd, Seoul, Korea), which is a validat-ed tool to assess body composition136. Patients with a pacemaker or defibrillator were excluded from this measurement. Two parameters were extracted from the DSM-BIA measurements: relative skel-etal muscle mass (RMM) in percent cal-culated as [skeletal muscle mass in kg/weight*100] and appendicular lean mass (ALM) divided by height2 in kg/m2 calcu-lated as [ALM/height2]. DSM-BIA mea-surements were available in 68 patients as these measurements were added to the comprehensive geriatric assessment in a later stage of the inclusion period.
Statistical analysesFor normally distributed variables, mean values and standard deviations (SD) were presented, for skewed variables medi-ans and interquartile ranges (IQR), and for categorical variables the number and percentage. The associations between the independent variables (ESR, albu-min and WBC count) and the dependent variables (measures of sarcopenia) were analyzed using multivariable linear re-gression. Results were presented as β with 95% confidence intervals (95%-CI) and p values; significance level was set at α= 0,05. Skewed variables (TUG test and CST), were log-transformed using the natural logarithm. The log-trans-formed β can be interpreted as follows: [(eβ -1) . 100] equals the percentage of change in the dependent variable with every unit increase of the independent variable. Age, sex and number of mor-bidities were identified as possible con-founders. An additional sensitivity anal-ysis was performed, excluding patients

127
ESR and albumin associated with measures of sarcopenia
8
Table 1. Patient characteristics.Characteristics n Total (n = 442)GeneralAge, years 442 80.8 (6.7)Sex, female, n (%) 442 257 (58.1)Living independently, n (%) 421 367 (87.2)Education, years, median [IQR] 380 10 [9, 13]Use of alcohol, n (%) 408 255 (62.5)Current smoking, n (%) 410 43 (10.5)Polypharmacy, n (%)a 441 257 (58.3)Anti-inflammatory medication, n (%)b 440 36 (8.2)Number of morbidities, median [IQR] 441 3 [2, 4]MMSE score, median [IQR] 425 26 [22, 28]Weight, kg 413 70.2 (13.5)Height, cm 414 166.6 (9.7)BMI, kg/m2 408 25.3 (4.2)Hemoglobin, mmol/L 435 8.6 (0.9)Anemia, n (%) 435 83 (19.1)Functional statusKatz ADL score, median [IQR] 399 0 [0, 1]Use of walking aid, n (%) 408 169 (41.4)Immobile >1 week in last 3 months, n (%) 387 59 (15.2)Maximal walking distance, >1km, n (%) 391 140 (35.8)Fall in past year, n (%) 404 246 (60.9)Inflammatory marker ESR, mm/hr, median [IQR] 408 11 [6, 22]Albumin, g/L, median [IQR] 433 37.8 [35.7, 39.7]WBC count, E9/L, median [IQR] 442 7.2 [6.0, 8.7]Measures of sarcopeniaGait speed, m/s 419 0.8 (0.3)TUG test, s, median [IQR] 303 14.9 [11.5, 19.0]CST, s, median [IQR] 356 13.6 [11.4, 18.6]HGS, kg 423 22.2 (9.6)RMM, % 68 36.7 (5.4)ALM/height2, kg/m2 68 7.1 (1.2)All variables are presented as mean (standard deviation), unless otherwise specified. ADL: Activities of daily living. ALM: Appendicular lean mass. BMI: Body mass index. CST: Chair stand test. ESR: Erythrocyte sedimentation rate. HGS: Handgrip strength. IQR: Interquartile range. MMSE: Mini-mental state examination. RMM: Relative skeletal muscle mass. TUG: Timed up and go. VAS: Visual analogue scale. WBC: White blood cell. aPolypharmacy: use of >4 medica-tion. bAnti-inflammatory medication: use of prednisone, prednisolone, methotrexate, mesala-zine, hydroxychloroquine, infliximab or non-steroid anti-inflammatory drugs.
128
Chapter 8
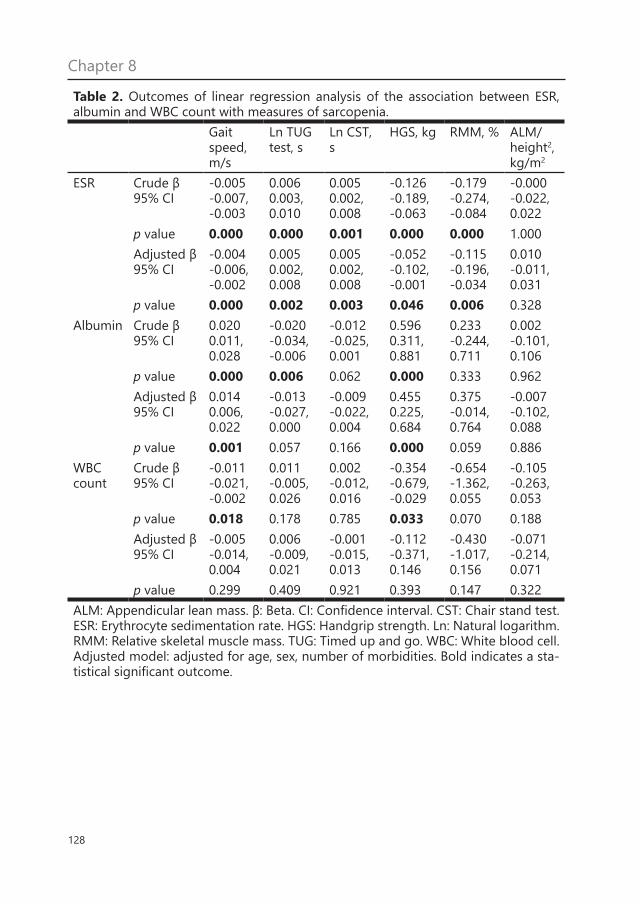
Table 2. Outcomes of linear regression analysis of the association between ESR, albumin and WBC count with measures of sarcopenia.
Gait speed, m/s
Ln TUG test, s
Ln CST, s
HGS, kg RMM, % ALM/height2, kg/m2
ESR Crude β 95% CI
-0.005-0.007, -0.003
0.006 0.003, 0.010
0.0050.002, 0.008
-0.126 -0.189, -0.063
-0.179-0.274, -0.084
-0.000-0.022, 0.022
p value 0.000 0.000 0.001 0.000 0.000 1.000Adjusted β 95% CI
-0.004 -0.006, -0.002
0.0050.002, 0.008
0.0050.002, 0.008
-0.052 -0.102, -0.001
-0.115 -0.196, -0.034
0.010-0.011, 0.031
p value 0.000 0.002 0.003 0.046 0.006 0.328Albumin Crude β
95% CI0.0200.011, 0.028
-0.020-0.034, -0.006
-0.012-0.025, 0.001
0.5960.311, 0.881
0.233-0.244, 0.711
0.002-0.101, 0.106
p value 0.000 0.006 0.062 0.000 0.333 0.962Adjusted β 95% CI
0.0140.006, 0.022
-0.013-0.027, 0.000
-0.009-0.022, 0.004
0.4550.225, 0.684
0.375-0.014, 0.764
-0.007-0.102, 0.088
p value 0.001 0.057 0.166 0.000 0.059 0.886WBC count
Crude β 95% CI
-0.011-0.021, -0.002
0.011-0.005, 0.026
0.002-0.012, 0.016
-0.354-0.679, -0.029
-0.654-1.362, 0.055
-0.105-0.263, 0.053
p value 0.018 0.178 0.785 0.033 0.070 0.188Adjusted β 95% CI
-0.005-0.014, 0.004
0.006-0.009, 0.021
-0.001-0.015, 0.013
-0.112-0.371, 0.146
-0.430-1.017, 0.156
-0.071-0.214, 0.071
p value 0.299 0.409 0.921 0.393 0.147 0.322ALM: Appendicular lean mass. β: Beta. CI: Confidence interval. CST: Chair stand test. ESR: Erythrocyte sedimentation rate. HGS: Handgrip strength. Ln: Natural logarithm. RMM: Relative skeletal muscle mass. TUG: Timed up and go. WBC: White blood cell. Adjusted model: adjusted for age, sex, number of morbidities. Bold indicates a sta-tistical significant outcome.
129
ESR and albumin associated with measures of sarcopenia
8
who used anti-inflammatory medication (n = 36). A second additional analysis was performed, comparing ESR, albumin levels and WBC count for patients with low or normal measures of sarcopenia based on the EWGSOP2 definition cut-off points, using logistic regression anal-yses adjusted for age, sex and number of comorbidities. For the statistical analysis, IBM SPSS statistics 25 for Windows was used. For visual presentation, ESR ter-tiles were calculated and bar charts were made using GraphPad Prism version 7.00 for Windows, GraphPad Software, La Jolla California USA.
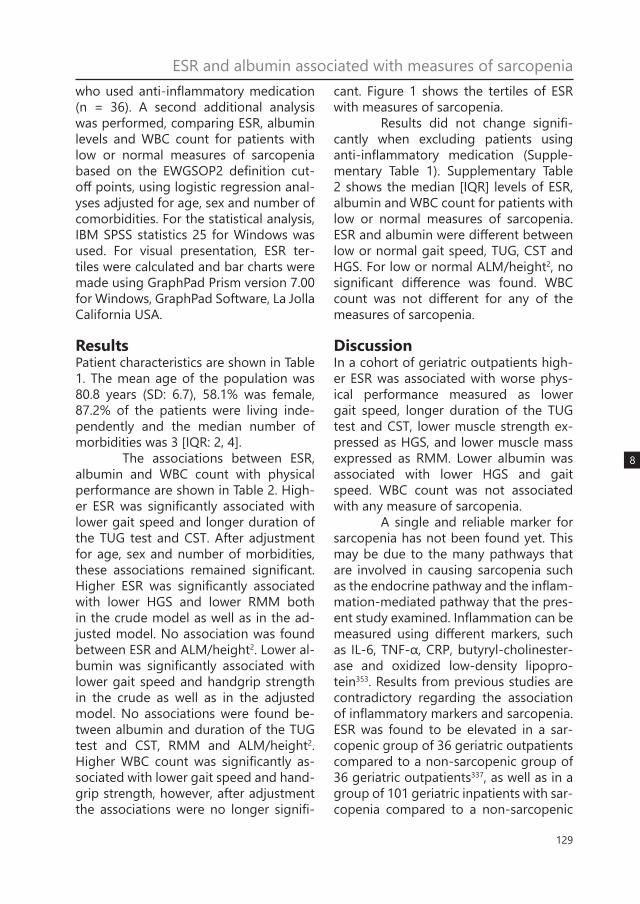
ResultsPatient characteristics are shown in Table 1. The mean age of the population was 80.8 years (SD: 6.7), 58.1% was female, 87.2% of the patients were living inde-pendently and the median number of morbidities was 3 [IQR: 2, 4].
The associations between ESR, albumin and WBC count with physical performance are shown in Table 2. High-er ESR was significantly associated with lower gait speed and longer duration of the TUG test and CST. After adjustment for age, sex and number of morbidities, these associations remained significant. Higher ESR was significantly associated with lower HGS and lower RMM both in the crude model as well as in the ad-justed model. No association was found between ESR and ALM/height2. Lower al-bumin was significantly associated with lower gait speed and handgrip strength in the crude as well as in the adjusted model. No associations were found be-tween albumin and duration of the TUG test and CST, RMM and ALM/height2. Higher WBC count was significantly as-sociated with lower gait speed and hand-grip strength, however, after adjustment the associations were no longer signifi-
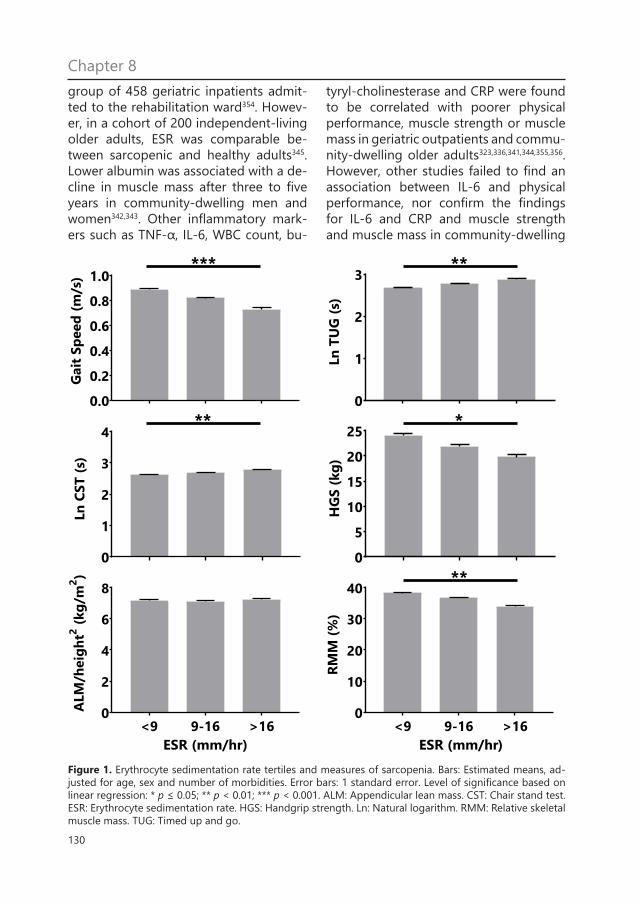
cant. Figure 1 shows the tertiles of ESR with measures of sarcopenia.
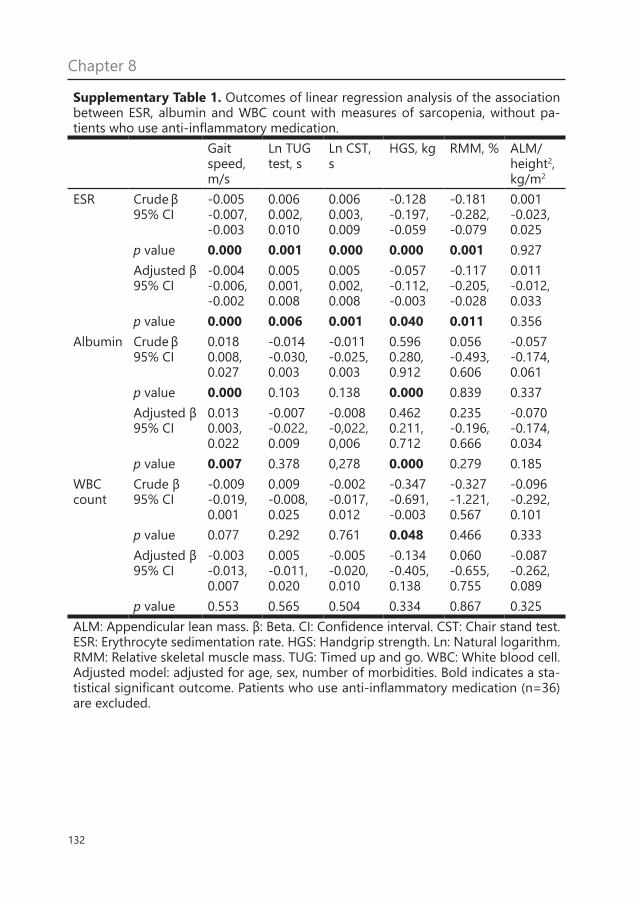
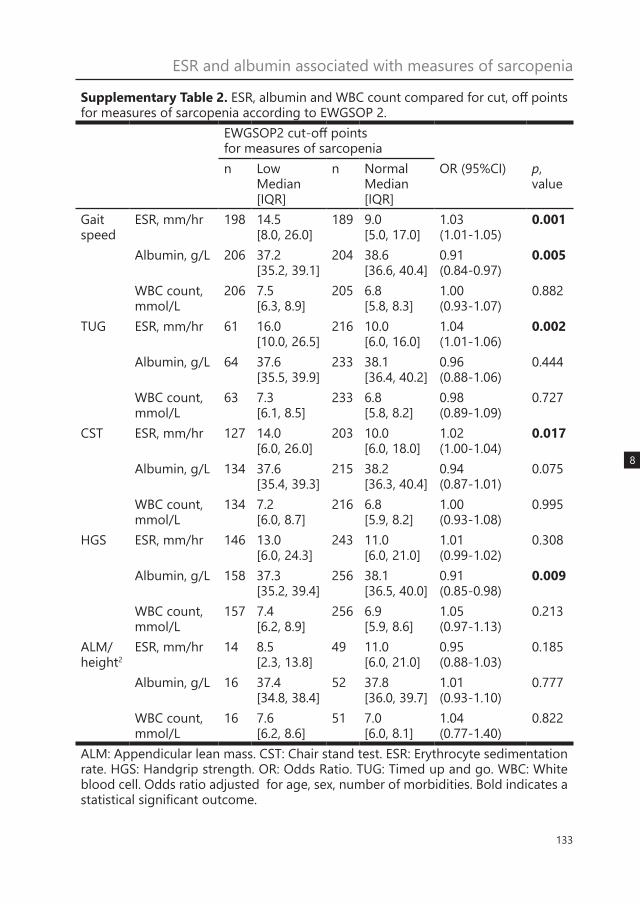
Results did not change signifi-cantly when excluding patients using anti-inflammatory medication (Supple-mentary Table 1). Supplementary Table 2 shows the median [IQR] levels of ESR, albumin and WBC count for patients with low or normal measures of sarcopenia. ESR and albumin were different between low or normal gait speed, TUG, CST and HGS. For low or normal ALM/height2, no significant difference was found. WBC count was not different for any of the measures of sarcopenia.
DiscussionIn a cohort of geriatric outpatients high-er ESR was associated with worse phys-ical performance measured as lower gait speed, longer duration of the TUG test and CST, lower muscle strength ex-pressed as HGS, and lower muscle mass expressed as RMM. Lower albumin was associated with lower HGS and gait speed. WBC count was not associated with any measure of sarcopenia.
A single and reliable marker for sarcopenia has not been found yet. This may be due to the many pathways that are involved in causing sarcopenia such as the endocrine pathway and the inflam-mation-mediated pathway that the pres-ent study examined. Inflammation can be measured using different markers, such as IL-6, TNF-α, CRP, butyryl-cholinester-ase and oxidized low-density lipopro-tein353. Results from previous studies are contradictory regarding the association of inflammatory markers and sarcopenia. ESR was found to be elevated in a sar-copenic group of 36 geriatric outpatients compared to a non-sarcopenic group of 36 geriatric outpatients337, as well as in a group of 101 geriatric inpatients with sar-copenia compared to a non-sarcopenic
130
Chapter 8group of 458 geriatric inpatients admit-ted to the rehabilitation ward354. Howev-er, in a cohort of 200 independent-living older adults, ESR was comparable be-tween sarcopenic and healthy adults345. Lower albumin was associated with a de-cline in muscle mass after three to five years in community-dwelling men and women342,343. Other inflammatory mark-ers such as TNF-α, IL-6, WBC count, bu-
tyryl-cholinesterase and CRP were found to be correlated with poorer physical performance, muscle strength or muscle mass in geriatric outpatients and commu-nity-dwelling older adults323,336,341,344,355,356. However, other studies failed to find an association between IL-6 and physical performance, nor confirm the findings for IL-6 and CRP and muscle strength and muscle mass in community-dwelling
0
1
2
3
Ln
TU
G(s
)
0
5
10
15
20
25
HG
S(k
g)
0.0
0.2
0.4
0.6
0.8
1.0
Gait
Sp
eed
(m/s
)
0
1
2
3
4
Ln
CS
T(s
)
<9 9-16 >160
10
20
30
40
RM
M(%
)
***
ESR (mm/hr) ESR (mm/hr)
**
** *
**
<9 9-16 >160
2
4
6
8
ALM
/heig
ht2
(kg
/m2)
Figure 1. Erythrocyte sedimentation rate tertiles and measures of sarcopenia. Bars: Estimated means, ad-justed for age, sex and number of morbidities. Error bars: 1 standard error. Level of significance based on linear regression: * p ≤ 0.05; ** p < 0.01; *** p < 0.001. ALM: Appendicular lean mass. CST: Chair stand test. ESR: Erythrocyte sedimentation rate. HGS: Handgrip strength. Ln: Natural logarithm. RMM: Relative skeletal muscle mass. TUG: Timed up and go.
131
ESR and albumin associated with measures of sarcopenia
8
older people338,339,341. The current study included a broad range of measures of sarcopenia, and found that ESR is asso-ciated with three measures of physical performance (gait speed, duration of the TUG test and the CST), as well as with muscle strength and muscle mass. Albu-min was found to be associated with two measures of sarcopenia: gait speed and handgrip strength.
The inverse associations be-tween inflammatory markers and mea-sures of sarcopenia may be explained by ageing. Ageing is associated with a state of chronic low-grade inflammation357, the main source of pro-inflammatory mole-cules being adipose tissue335. Increased levels of inflammatory markers can lead to skeletal muscle proteolysis activation, raised insulin resistance lowering the in-hibition of protein catabolism by insu-lin358, and eventually atrophy of skeletal muscle335. This may explain why no sig-nificant associations were found for WBC count. Higher WBC count is most typical-ly associated with acute infections rath-er than with chronic low grade inflam-mation359, and is less commonly studied in this perspective as opposed to other markers360.
In the current study, ESR was not significantly associated with ALM/height2. On the contrary, the association with RMM, a percentage of body mass, was significant in all statistical models. In previous studies, ALM/height2 and RMM are commonly used in diagnosis of sarcopenia, but there is no consensus on which measure defines low muscle mass best3. The significant association between ESR and RMM may reflect the tight interaction between fat mass and muscle mass in the sense that a higher fat mass leads to a chronic pro-inflam-matory state which is subsequently asso-ciated with sarcopenia361.
Strengths and limitationsStrengths of the present study were the large sample of patients in a relevant study population of geriatric outpatients, and the use of different outcome mea-sures encompassing measures of sar-copenia. There are a few limitations to this study to report. The study samples of outpatients with muscle mass mea-sures were small, as BIA measurements were added to the protocol in a later stage. The small sample size might have reduced the power of the associations with muscle mass. ESR, albumin and WBC count are not specific markers of chron-ic inflammation. ESR, albumin levels and WBC count can also change as a result of other (non-chronic) conditions. Other markers of inflammation such as CRP and butyryl-cholinestarase were not available in our database, therewith the analyses were limited to ESR, albumin and WBC count353,356. Furthermore, the cross-sec-tional study design cannot prove causal-ity, so our findings need to be confirmed in a longitudinal study.
ConclusionIn summary, in a cohort of geriatric outpatients, ESR, a marker of chron-ic inflammation, was associated with all three measures of sarcopenia: physical performance, muscle strength and mus-cle mass. Albumin was associated with handgrip strength and gait speed. No associations were found for WBC count. These results underpin a role of chronic inflammation in sarcopenia in geriatric outpatients, a population that has not been extensively studied to date.
AcknowledgementsThis study was supported by the Euro-pean Union’s Horizon 2020 research and innovation programme (No 689238 and No 675003). No conflicts of interest.
132
Chapter 8
Supplementary Table 1. Outcomes of linear regression analysis of the association between ESR, albumin and WBC count with measures of sarcopenia, without pa-tients who use anti-inflammatory medication.
Gait speed, m/s
Ln TUG test, s
Ln CST, s
HGS, kg RMM, % ALM/height2, kg/m2
ESR Crude β 95% CI
-0.005 -0.007, -0.003
0.006 0.002, 0.010
0.006 0.003, 0.009
-0.128 -0.197, -0.059
-0.181 -0.282, -0.079
0.001-0.023, 0.025
p value 0.000 0.001 0.000 0.000 0.001 0.927Adjusted β 95% CI
-0.004 -0.006, -0.002
0.005 0.001, 0.008
0.005 0.002, 0.008
-0.057 -0.112, -0.003
-0.117 -0.205, -0.028
0.011-0.012, 0.033
p value 0.000 0.006 0.001 0.040 0.011 0.356Albumin Crude β
95% CI0.0180.008, 0.027
-0.014-0.030, 0.003
-0.011-0.025, 0.003
0.5960.280, 0.912
0.056-0.493, 0.606
-0.057-0.174, 0.061
p value 0.000 0.103 0.138 0.000 0.839 0.337Adjusted β 95% CI
0.0130.003, 0.022
-0.007-0.022, 0.009
-0.008-0,022, 0,006
0.4620.211, 0.712
0.235-0.196, 0.666
-0.070-0.174, 0.034
p value 0.007 0.378 0,278 0.000 0.279 0.185WBC count
Crude β 95% CI
-0.009-0.019, 0.001
0.009-0.008, 0.025
-0.002-0.017, 0.012
-0.347-0.691, -0.003
-0.327-1.221, 0.567
-0.096-0.292, 0.101
p value 0.077 0.292 0.761 0.048 0.466 0.333Adjusted β 95% CI
-0.003-0.013, 0.007
0.005-0.011, 0.020
-0.005-0.020, 0.010
-0.134-0.405, 0.138
0.060-0.655, 0.755
-0.087-0.262, 0.089
p value 0.553 0.565 0.504 0.334 0.867 0.325ALM: Appendicular lean mass. β: Beta. CI: Confidence interval. CST: Chair stand test. ESR: Erythrocyte sedimentation rate. HGS: Handgrip strength. Ln: Natural logarithm. RMM: Relative skeletal muscle mass. TUG: Timed up and go. WBC: White blood cell. Adjusted model: adjusted for age, sex, number of morbidities. Bold indicates a sta-tistical significant outcome. Patients who use anti-inflammatory medication (n=36) are excluded.
133
ESR and albumin associated with measures of sarcopenia
8
Supplementary Table 2. ESR, albumin and WBC count compared for cut, off points for measures of sarcopenia according to EWGSOP 2.
EWGSOP2 cut-off points for measures of sarcopenian Low
Median [IQR]
n NormalMedian [IQR]
OR (95%CI) p, value
Gait speed
ESR, mm/hr 198 14.5 [8.0, 26.0]
189 9.0 [5.0, 17.0]
1.03 (1.01-1.05)
0.001
Albumin, g/L 206 37.2 [35.2, 39.1]
204 38.6 [36.6, 40.4]
0.91 (0.84-0.97)
0.005
WBC count, mmol/L
206 7.5 [6.3, 8.9]
205 6.8 [5.8, 8.3]
1.00 (0.93-1.07)
0.882
TUG ESR, mm/hr 61 16.0 [10.0, 26.5]
216 10.0 [6.0, 16.0]
1.04 (1.01-1.06)
0.002
Albumin, g/L 64 37.6 [35.5, 39.9]
233 38.1 [36.4, 40.2]
0.96 (0.88-1.06)
0.444
WBC count, mmol/L
63 7.3 [6.1, 8.5]
233 6.8 [5.8, 8.2]
0.98 (0.89-1.09)
0.727
CST ESR, mm/hr 127 14.0 [6.0, 26.0]
203 10.0 [6.0, 18.0]
1.02 (1.00-1.04)
0.017
Albumin, g/L 134 37.6 [35.4, 39.3]
215 38.2 [36.3, 40.4]
0.94 (0.87-1.01)
0.075
WBC count, mmol/L
134 7.2 [6.0, 8.7]
216 6.8 [5.9, 8.2]
1.00 (0.93-1.08)
0.995
HGS ESR, mm/hr 146 13.0 [6.0, 24.3]
243 11.0 [6.0, 21.0]
1.01 (0.99-1.02)
0.308
Albumin, g/L 158 37.3 [35.2, 39.4]
256 38.1 [36.5, 40.0]
0.91 (0.85-0.98)
0.009
WBC count, mmol/L
157 7.4 [6.2, 8.9]
256 6.9 [5.9, 8.6]
1.05 (0.97-1.13)
0.213
ALM/height2
ESR, mm/hr 14 8.5 [2.3, 13.8]
49 11.0 [6.0, 21.0]
0.95 (0.88-1.03)
0.185
Albumin, g/L 16 37.4 [34.8, 38.4]
52 37.8 [36.0, 39.7]
1.01 (0.93-1.10)
0.777
WBC count, mmol/L
16 7.6 [6.2, 8.6]
51 7.0 [6.0, 8.1]
1.04 (0.77-1.40)
0.822
ALM: Appendicular lean mass. CST: Chair stand test. ESR: Erythrocyte sedimentation rate. HGS: Handgrip strength. OR: Odds Ratio. TUG: Timed up and go. WBC: White blood cell. Odds ratio adjusted for age, sex, number of morbidities. Bold indicates a statistical significant outcome.