Choice architecture and incentives increase COVID-19 ...
30
Choice architecture and incentives increase COVID-19 vaccine intentions and test demand by Marta Serra-Garcia and Nora Szech No. 150 | APRIL 2021 WORKING PAPER SERIES IN ECONOMICS KIT – Die Forschungsuniversität in der Helmholtz-Gemeinschaft econpapers.wiwi.kit.edu
Transcript of Choice architecture and incentives increase COVID-19 ...
Choice architecture and incentives increase COVID-19 vaccine intentions and test demand
by Marta Serra-Garcia and Nora Szech
No. 150 | APRIL 2021
WORKING PAPER SERIES IN ECONOMICS
KIT – Die Forschungsuniversität in der Helmholtz-Gemeinschaft econpapers.wiwi.kit.edu

Impressum
Karlsruher Institut für Technologie (KIT)
Fakultät für Wirtschaftswissenschaften
Institut für Volkswirtschaftslehre (ECON)
Kaiserstraße 12
76131 Karlsruhe
KIT – Die Forschungsuniversität in der Helmholtz-Gemeinschaft
Working Paper Series in Economics
No. 150, April 2021
ISSN 2190-9806
econpapers.wiwi.kit.edu
1
Choice Architecture and Incentives Increase COVID-19 Vaccine Intentions
and Test Demand
Marta Serra-Garcia* and Nora Szech*
April 2021
Abstract
Willingness to vaccinate and test are critical in the COVID-19 pandemic. We study the effects of two measures to increase vaccination and testing: “choice architecture” and monetary compensations. Choice architecture has the goal of “nudging” people into a socially desired direction without affecting their choice options. Compensations reward vaccine takers and are already in use by some organizations. Yet there is the concern that compensations may decrease vaccination if compensations erode intrinsic motivation to vaccinate. We show that both approaches, compensations and choice architecture, significantly increase COVID-19 test and vaccine demand. Yet, for vaccines, low compensations can backfire.
JEL: D01, D04, I12 Keywords: choice architecture, incentives, COVID-19, vaccine hesitancy, test avoidance
*Co-corresponding authors. Marta Serra-Garcia, PhD, Rady School of Management, UC San Diego, 9500 Gilman Dr., #0553, 92093 San Diego, USA ([email protected]); Nora Szech, PhD, Karlsruhe Institute of Technology, Chair of Political Economy, ECON Institute, Fritz-Erler-Straße 1-3, 76133 Karlsruhe ([email protected]).
2
Introduction
Vaccination and testing play fundamental roles in overcoming the COVID-19 pandemic. Yet
both require peoples’ time investment and, in the case of testing, may come at a direct cost if
tests have to be paid for. We study the impact of “choice architecture” and of monetary
incentives on COVID-19 vaccination and test demand. Choice architecture is a central concept
from behavioral economics (1). The idea is to nudge decision-makers into a direction, e.g., the
socially desired direction, by making a behavior the default, without changing the options that
decision-makers have. Such a nudge could be a pre-scheduled vaccine appointment or an
assigned infection test that decision-makers could still choose not to take. Defaults have proved
effective for influenza immunization (2-4). Yet, COVID-19 vaccines are new and have raised
hesitancy among many, and the effect of interventions could be fundamentally different for new
vaccines. Encouragingly, our data show that choice architecture and incentives can significantly
increase COVID-19 vaccine and test demand.
So far in this pandemic, supply of vaccines is scarce, and most debate has focused on who should
get access first (5). Yet over time, herd immunity will become a goal. To achieve this goal,
economists have proposed compensating those taking the vaccine (6). Some employers have
already started offering compensations, with incentives ranging from $25 to $750 for those
employees who get vaccinated. Employers using compensations include hospitals,
telecommunications and train companies, restaurant and supermarket chains (e.g., 7). Yet an
analysis of the causal influence of compensations on vaccine intentions and test demand is still
missing. An important concern is that low monetary incentives may commodify goods and
behaviors of moral relevance (8), leading to a loss in intrinsic motivation that could lower
3
vaccination rates below those without compensation (9). Our data show that indeed, this can
occur for COVID-19 vaccines: we find that low monetary compensations of $20 reduce vaccine
demand. Yet compensations of $100 or more increase vaccine uptake. By contrast, COVID-19
test demand increases monotonically with compensations, even if compensations are small.
Design
We designed and conducted an online experiment in which participants decided about taking the
COVID-19 vaccine (N=1,040) or an at-home PCR saliva-based test (N=388). Participants were
randomly assigned to the “Opt-out” or “Opt-in” conditions. In the Opt-out conditions,
participants were asked either whether they would take the vaccine, if an appointment had been
scheduled for them to receive it; or participants decided whether they would keep a PCR test, if
they had been randomly assigned one. They could opt-out from their “default” option. In
contrast, in the Opt-in conditions, not taking the test or vaccine was the default, but participants
were asked whether they wanted to receive it.
Taking the vaccine either involved no compensation (N=615) or 8 different compensation
levels (from $0 to $500, N=929). Taking the test involved 8 different monetary levels. These
were compensations for taking the test, or cost reductions compared to the market price (ranging
from an additional $25 gift card for taking the test to forgoing a $119 gift card, the listed test
price). One testing decision was actually implemented for 1 of each 25 participants.
After preregistration (on aspredicted.org), data collection took place between December 2020
and February 2021 on Prolific Academic, targeting and achieving 34% Black participants in the
US. We first recruited 200 subjects per condition, which detects a 12 percentage-point (p.p.)
effect on a 70% baseline with 80% power. We added ca. 300 subjects per condition for
4
vaccination decisions, five weeks later, to detect a 6 p.p. effect with 80% power. Decisions were
stable over time (t-test, P=0.4927).
In a separate treatment, participants made an active choice without the possibility of sticking
with a default (N= 599). Additionally, we elicited demand for antibody tests under defaults and
active choice (N=591). We compared active decisions on tests to a quota-representative sample
of the US (N=1,984) and results prove robust.
Results
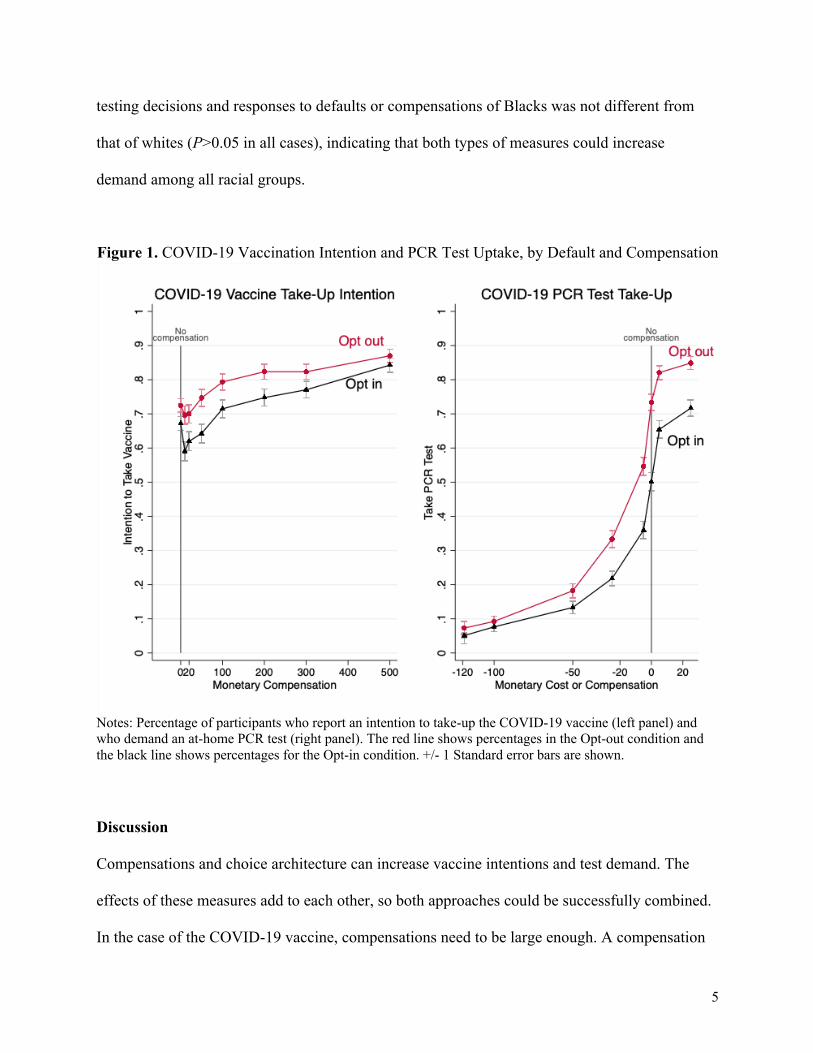
Without compensation, 70% wanted to receive the COVID-19 vaccine, averaging across the
default conditions (Figure 1). Vaccine intentions increased by 4.5 pp. with $100 compensation
and 13.6 pp. with $500 (P<0.001 in all cases). However, a $20 compensation decreased
intentions by 5 pp. relative to no compensation (95% CI, -6.7 – -3.0 p.p., P<0.001). Thus, small
compensations can erode an intrinsic, possibly moral motivation to vaccinate (8, 9). In contrast,
PCR testing monotonically increased with the monetary incentive.
The Opt-out condition increased vaccine intentions by 6.8 p.p. (95% CI, 1.2 – 12.4, P=0.022)
and PCR test uptake by 15 p.p. (95% CI, 9.6 – 20.3, P<0.001) relative to the Opt-in condition,
revealing that choice architecture could significantly increase testing and vaccination.
Racial inequality is an important concern, as studies have indicated that Blacks exhibit
unequal access to immunization and have lower intentions to take the COVID-19 vaccine (10).
The data confirm that Black participants take-up the vaccine 13.6 p.p. less than whites (95% CI, -
18.9 – -8.4 p.p., P<0.001). This difference is explained by trust in the vaccine: Blacks are 15.4
p.p. less likely to trust the vaccine completely (95% CI, -17.9 – -12.9), and adjusting for trust
eliminates the difference in vaccination intentions (3.1 p.p., 95% CI, -0.08– -2.0, P=0.231). The
5
testing decisions and responses to defaults or compensations of Blacks was not different from
that of whites (P>0.05 in all cases), indicating that both types of measures could increase
demand among all racial groups.
Figure 1. COVID-19 Vaccination Intention and PCR Test Uptake, by Default and Compensation
Notes: Percentage of participants who report an intention to take-up the COVID-19 vaccine (left panel) and who demand an at-home PCR test (right panel). The red line shows percentages in the Opt-out condition and the black line shows percentages for the Opt-in condition. +/- 1 Standard error bars are shown.
Discussion
Compensations and choice architecture can increase vaccine intentions and test demand. The
effects of these measures add to each other, so both approaches could be successfully combined.
In the case of the COVID-19 vaccine, compensations need to be large enough. A compensation
6
of $20 backfired and reduced vaccine intentions. Yet compensations of at least $100 increased
vaccine intentions compared to when no compensation was offered. Test demand, by contrast,
increased monotonically with monetary compensations.
A broader discussion of both, choice architecture and compensations in the present context, is
necessary. Both measures can be controversial from a cost and/or moral perspective. Pre-
scheduled appointments may be called off or more likely become postponed than when patients
schedule appointments themselves. Indirectly, this could create additional costs. The way in
which appointments and similar nudges are worded may matter as well, as has been documented
for flu shots (11). Compensations come with an obvious direct cost as compensations need to be
paid for, e.g., by employers, insurance companies, or states. Moreover, many people may profit
from a compensation or price-reduction even though they would test or vaccinate also without
them. Further, in the case of the vaccine, it is likely that the lowest possible compensation we
tested, $20 upon completion of the second dose, devalued the moral value of taking the vaccine
and thus eroded intrinsic motivation. The phenomenon of commodification and moral erosion
from market mechanisms has been discussed for centuries (12, 13). Yet also the beneficial
potential of market design in this pandemic has been pointed out (14). In our data, larger
compensations prove successful at increasing vaccine uptake. Compensations from $100 on
seem to offset and overpower the detrimental effects of commodification. A limitation of the
study is that, for vaccination, intentions were measured. For testing, we could measure real
decisions.
7
Materials and Methods This project was reviewed and approved by the University of California, San Diego institutional
review board. Informed consent was obtained from participants.
Participants in the study were recruited on the platform Prolific Academic (15). They were
required to be individuals born and residing in the United States, whose participation in previous
studies had been approved in more than 95% of the cases. Participants received a fixed fee of
$1.00 for a ca. 5-minute study. When making PCR testing decisions, they could additionally
receive an Amazon gift card and/or a PCR test. The PCR test was a saliva-based test, provided
by the company Vault. As it was a saliva-based test, no deep nasal swab was necessary for taking
this test. If participants wanted the test, they would get a personalized URL so that they could
order the test at Vault themselves. Participants knew that 1 in 25 of them would see one of their
eight decisions materialize. The value of the gift card went up to $119 (market price of the Vault
PCR test). The study platform allows to target studies to participants based on their demographic
and socioeconomic characteristics. We oversampled Black participants so that we could study
ethnic differences with sufficient statistical power. Previous research shows that Blacks are less
interested in taking the COVID-19 vaccine US (10) and our data document that this difference
can be explained by their distrust of the vaccine.
The instructions presented in the study are shown in the Appenidx and will be made available on
the Open Science Framework page
(https://osf.io/ahnvq/?view_only=de1336742a59478ab58300d5ba6a549a). The pre-registrations
will also be made available.
8
The samples were balanced in terms of gender, ethnicity and age across treatments. For PCR
testing decisions, between 48% and 54% of the participants were female, the average age of
participants was between 35 and 37 years old. Between 44% and 51% of participants were white,
while 34% to 36% were Black. For COVID-19 vaccine decisions, between 48% and 57% of
participants were female, of 33 to 34 years of age. Between 47% and 51% of participants were
white, while 35% to 36% were Black.
Effect sizes are computed using probit models, adjusted for age, gender, race and income, with
S.E. clustered at the individual level, and FWER corrected p-values.
References
1. R. Thaler, C. Sunstein, Nudge. Improving Decisions about health, wealth, and happiness. (Yale University Press, 2008).
2. G. B. Chapman, M. Li, H. Colby, H. Yoon, Opting in vs. opting out influenza vaccinations. JAMA; 304(1), 43-44 (2010).
3. K. L. Milkman, J. Beshears, J. J. Choi, D. Laibson, B. C. Madrian, Using implementation intentions prompts to enhance influenza vaccination rates. PNAS 108(26), 10415-10420 (2011).
4. M. Patel, Test behavioural nudges to boost COVID immunization. Nature 590(7845), 185 (2021).
5. J. R. Goldstein, T. Cassidy, K. W. Wachter, Vaccinating the oldest against COVID-19 saves both the most lives and most years of life. PNAS 118(11) (2021).
6. R. E. Litan, If necessary, the U.S. should pay people to get a COVID-19 vaccine. Brookings. https://www.brookings.edu/blog/fixgov/2020/12/17/if-necessary-the-u-s-should-pay-people-to-get-a-covid-19-vaccine/ Published December 17, 2020. Accessed December 22, 2020.
7. N. Dailey, Companies across the US are offering workers perks for getting the COVID-19 vaccine. Here’s the running list https://www.businessinsider.com/companies-paying-workers-get-coronavirus-vaccine-time-off-covid-19-2021-2?r=DE&IR=T Published February 10, 2021. Accessed March 12, 2021.
8. U. Gneezy, A. Rustichini, Pay enough or don’t pay at all. QJE 115(3), 791-810 (2000).
9
9. G. Loewenstein, C. Cryder, Why paying people to be vaccinated could backfire https://www.nytimes.com/2020/12/14/upshot/covid-vaccine-payment.html Published December 14, 2020. Accessed 03-15-2021.
10. C. Funk, A. Tyson. Intent to Get a COVID-19 Vaccine Rises to 60% as Confidence in Research and Development Process Increases. https://www.pewresearch.org/science/2020/12/03/intent-to-get-a-covid-19-vaccine-rises-to-60-as-confidence-in-research-and-development-process-increases/ December 3, 2020. Accessed 03-15-2021.
11. K. L. Milkman et al., A mega-study of text-based nudges encouraging patients to get vaccinated at an upcoming doctor’s appointment. PNAS 10.2139/ssrn.3780267 invited for revision and resubmission (2021).
12. G. Simmel, The philosophy of money. (Routledge, London and New York, 1990), ch. 5. 13. A. Falk, N. Szech, Morals and markets. Science 340(6133), 707-711 (2013). 14. P. Cramton, A. Ockenfels, A. E. Roth, R. B. Wilson, Borrow crisis tactics to get COVID-
19 supplies to where they are needed. Nature 582, 334-336 (2020). 15. S. Palan and C. Shitter. Prolific.ac – A subject pool for online experiments. Journal of
Behavioral and Experimental Finance 17, 22-28 (2018).
10
APPENDIX for
Choice Architecture and Incentives Increase COVID-19 Vaccine Intentions and
Test Demand
Marta Serra-Garcia Nora Szech Email: [email protected], [email protected]
A. Additional Results B. Experimental Instructions & Pre-registration C. Description of Additional Decisions Elicited
11
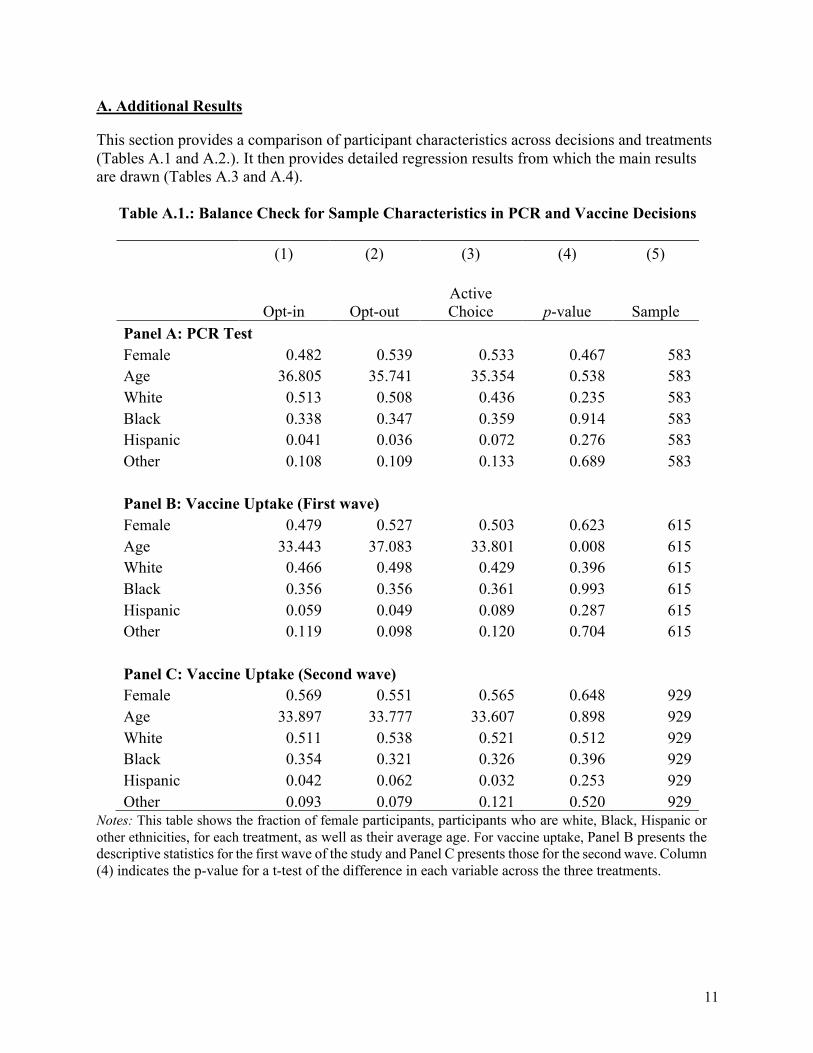
A. Additional Results
This section provides a comparison of participant characteristics across decisions and treatments (Tables A.1 and A.2.). It then provides detailed regression results from which the main results are drawn (Tables A.3 and A.4).
Table A.1.: Balance Check for Sample Characteristics in PCR and Vaccine Decisions
(1) (2) (3) (4) (5)
Opt-in Opt-out Active Choice p-value Sample
Panel A: PCR Test Female 0.482 0.539 0.533 0.467 583 Age 36.805 35.741 35.354 0.538 583 White 0.513 0.508 0.436 0.235 583 Black 0.338 0.347 0.359 0.914 583 Hispanic 0.041 0.036 0.072 0.276 583 Other 0.108 0.109 0.133 0.689 583
Panel B: Vaccine Uptake (First wave) Female 0.479 0.527 0.503 0.623 615 Age 33.443 37.083 33.801 0.008 615 White 0.466 0.498 0.429 0.396 615 Black 0.356 0.356 0.361 0.993 615 Hispanic 0.059 0.049 0.089 0.287 615 Other 0.119 0.098 0.120 0.704 615
Panel C: Vaccine Uptake (Second wave) Female 0.569 0.551 0.565 0.648 929 Age 33.897 33.777 33.607 0.898 929 White 0.511 0.538 0.521 0.512 929 Black 0.354 0.321 0.326 0.396 929 Hispanic 0.042 0.062 0.032 0.253 929 Other 0.093 0.079 0.121 0.520 929
Notes: This table shows the fraction of female participants, participants who are white, Black, Hispanic or other ethnicities, for each treatment, as well as their average age. For vaccine uptake, Panel B presents the descriptive statistics for the first wave of the study and Panel C presents those for the second wave. Column (4) indicates the p-value for a t-test of the difference in each variable across the three treatments.
12
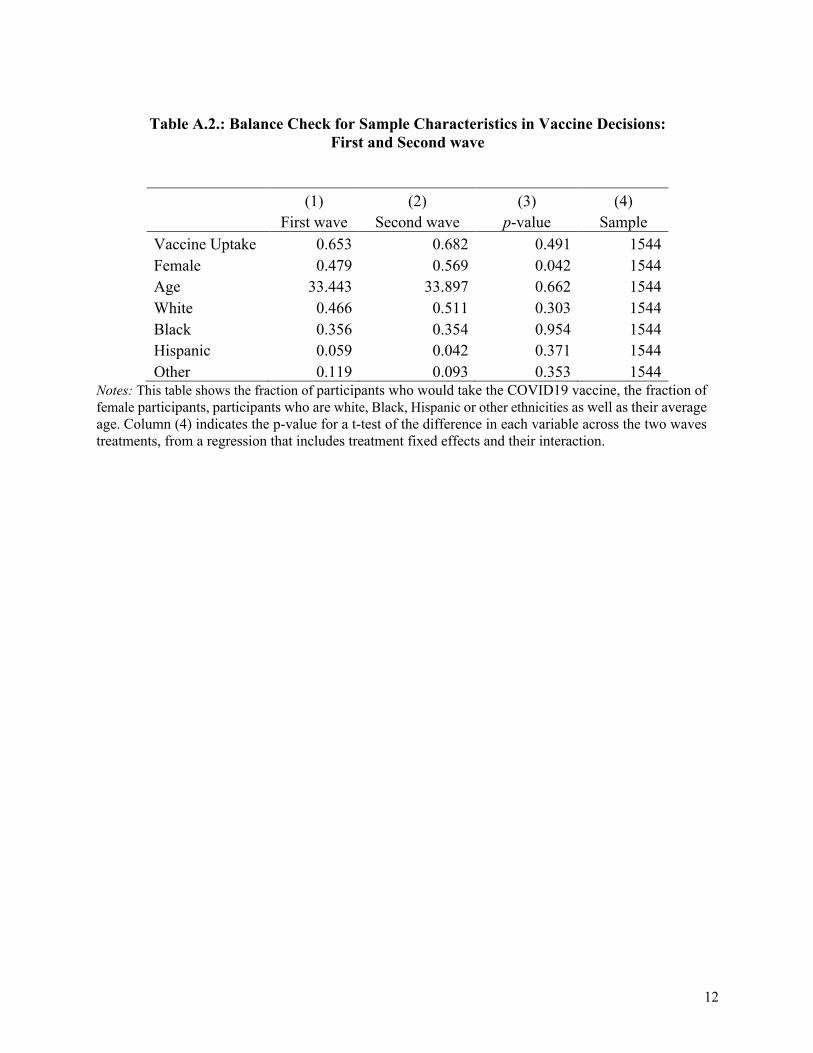
Table A.2.: Balance Check for Sample Characteristics in Vaccine Decisions:
First and Second wave
(1) (2) (3) (4) First wave Second wave p-value Sample Vaccine Uptake 0.653 0.682 0.491 1544 Female 0.479 0.569 0.042 1544 Age 33.443 33.897 0.662 1544 White 0.466 0.511 0.303 1544 Black 0.356 0.354 0.954 1544 Hispanic 0.059 0.042 0.371 1544 Other 0.119 0.093 0.353 1544
Notes: This table shows the fraction of participants who would take the COVID19 vaccine, the fraction of female participants, participants who are white, Black, Hispanic or other ethnicities as well as their average age. Column (4) indicates the p-value for a t-test of the difference in each variable across the two waves treatments, from a regression that includes treatment fixed effects and their interaction.
13
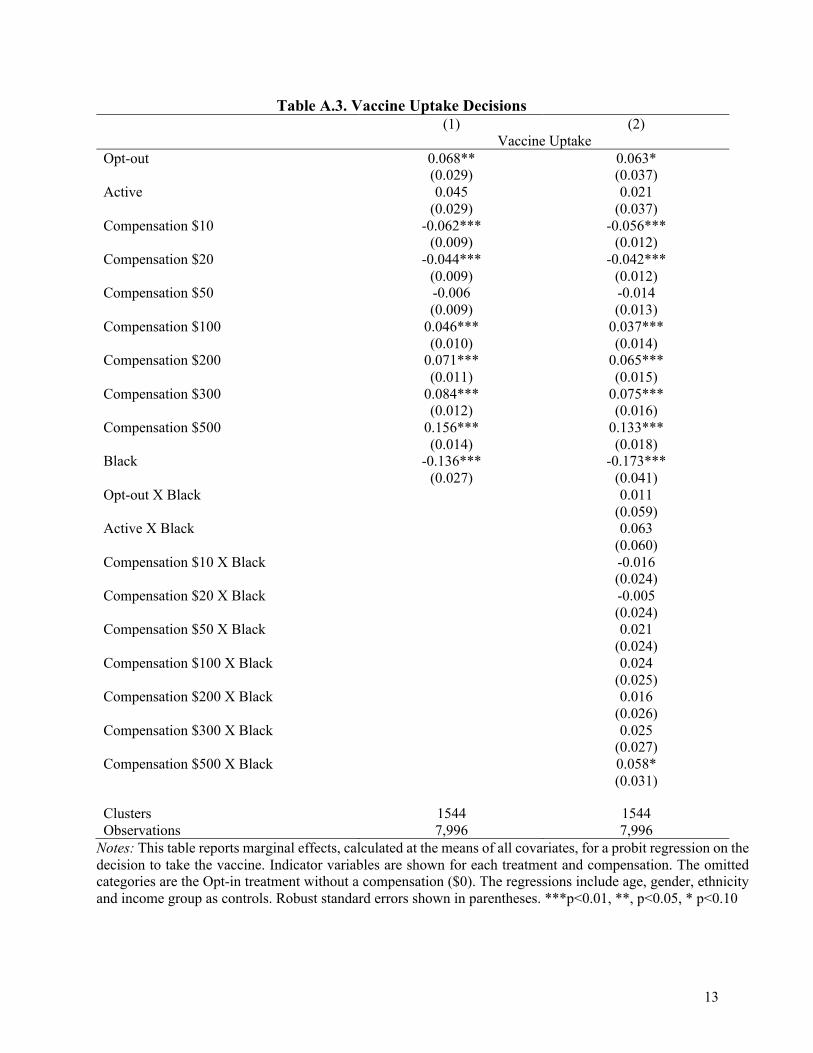
Table A.3. Vaccine Uptake Decisions (1) (2)
Vaccine Uptake Opt-out 0.068** 0.063*
(0.029) (0.037) Active 0.045 0.021
(0.029) (0.037) Compensation $10 -0.062*** -0.056***
(0.009) (0.012) Compensation $20 -0.044*** -0.042***
(0.009) (0.012) Compensation $50 -0.006 -0.014
(0.009) (0.013) Compensation $100 0.046*** 0.037***
(0.010) (0.014) Compensation $200 0.071*** 0.065***
(0.011) (0.015) Compensation $300 0.084*** 0.075***
(0.012) (0.016) Compensation $500 0.156*** 0.133***
(0.014) (0.018) Black -0.136*** -0.173***
(0.027) (0.041) Opt-out X Black 0.011
(0.059) Active X Black 0.063
(0.060) Compensation $10 X Black -0.016
(0.024) Compensation $20 X Black -0.005
(0.024) Compensation $50 X Black 0.021
(0.024) Compensation $100 X Black 0.024
(0.025) Compensation $200 X Black 0.016
(0.026) Compensation $300 X Black 0.025
(0.027) Compensation $500 X Black 0.058*
(0.031)
Clusters 1544 1544 Observations 7,996 7,996
Notes: This table reports marginal effects, calculated at the means of all covariates, for a probit regression on the decision to take the vaccine. Indicator variables are shown for each treatment and compensation. The omitted categories are the Opt-in treatment without a compensation ($0). The regressions include age, gender, ethnicity and income group as controls. Robust standard errors shown in parentheses. ***p<0.01, **, p<0.05, * p<0.10
14
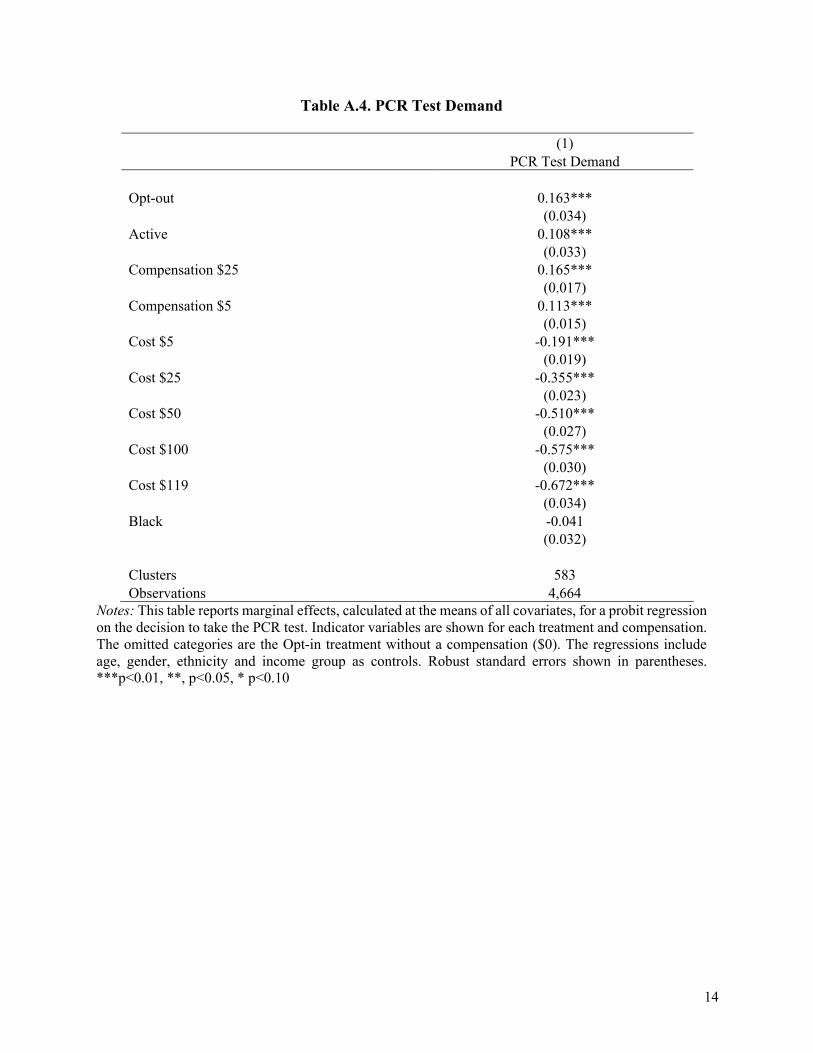
Table A.4. PCR Test Demand
(1) PCR Test Demand
Opt-out 0.163***
(0.034) Active 0.108***
(0.033) Compensation $25 0.165***
(0.017) Compensation $5 0.113***
(0.015) Cost $5 -0.191***
(0.019) Cost $25 -0.355***
(0.023) Cost $50 -0.510***
(0.027) Cost $100 -0.575***
(0.030) Cost $119 -0.672***
(0.034) Black -0.041
(0.032)
Clusters 583 Observations 4,664
Notes: This table reports marginal effects, calculated at the means of all covariates, for a probit regression on the decision to take the PCR test. Indicator variables are shown for each treatment and compensation. The omitted categories are the Opt-in treatment without a compensation ($0). The regressions include age, gender, ethnicity and income group as controls. Robust standard errors shown in parentheses. ***p<0.01, **, p<0.05, * p<0.10
15
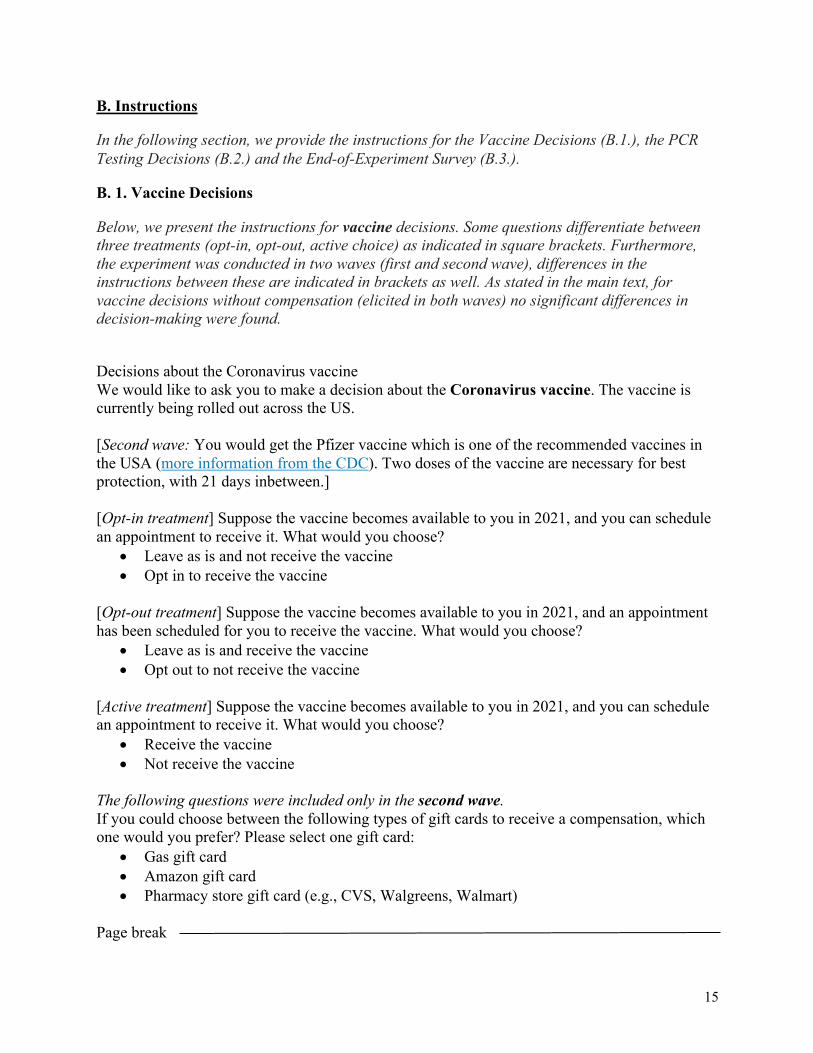
B. Instructions
In the following section, we provide the instructions for the Vaccine Decisions (B.1.), the PCR Testing Decisions (B.2.) and the End-of-Experiment Survey (B.3.).
B. 1. Vaccine Decisions
Below, we present the instructions for vaccine decisions. Some questions differentiate between three treatments (opt-in, opt-out, active choice) as indicated in square brackets. Furthermore, the experiment was conducted in two waves (first and second wave), differences in the instructions between these are indicated in brackets as well. As stated in the main text, for vaccine decisions without compensation (elicited in both waves) no significant differences in decision-making were found.
Decisions about the Coronavirus vaccine We would like to ask you to make a decision about the Coronavirus vaccine. The vaccine is currently being rolled out across the US. [Second wave: You would get the Pfizer vaccine which is one of the recommended vaccines in the USA (more information from the CDC). Two doses of the vaccine are necessary for best protection, with 21 days inbetween.] [Opt-in treatment] Suppose the vaccine becomes available to you in 2021, and you can schedule an appointment to receive it. What would you choose?
• Leave as is and not receive the vaccine • Opt in to receive the vaccine
[Opt-out treatment] Suppose the vaccine becomes available to you in 2021, and an appointment has been scheduled for you to receive the vaccine. What would you choose?
• Leave as is and receive the vaccine • Opt out to not receive the vaccine
[Active treatment] Suppose the vaccine becomes available to you in 2021, and you can schedule an appointment to receive it. What would you choose?
• Receive the vaccine • Not receive the vaccine
The following questions were included only in the second wave. If you could choose between the following types of gift cards to receive a compensation, which one would you prefer? Please select one gift card:
• Gas gift card • Amazon gift card • Pharmacy store gift card (e.g., CVS, Walgreens, Walmart)
Page break
16
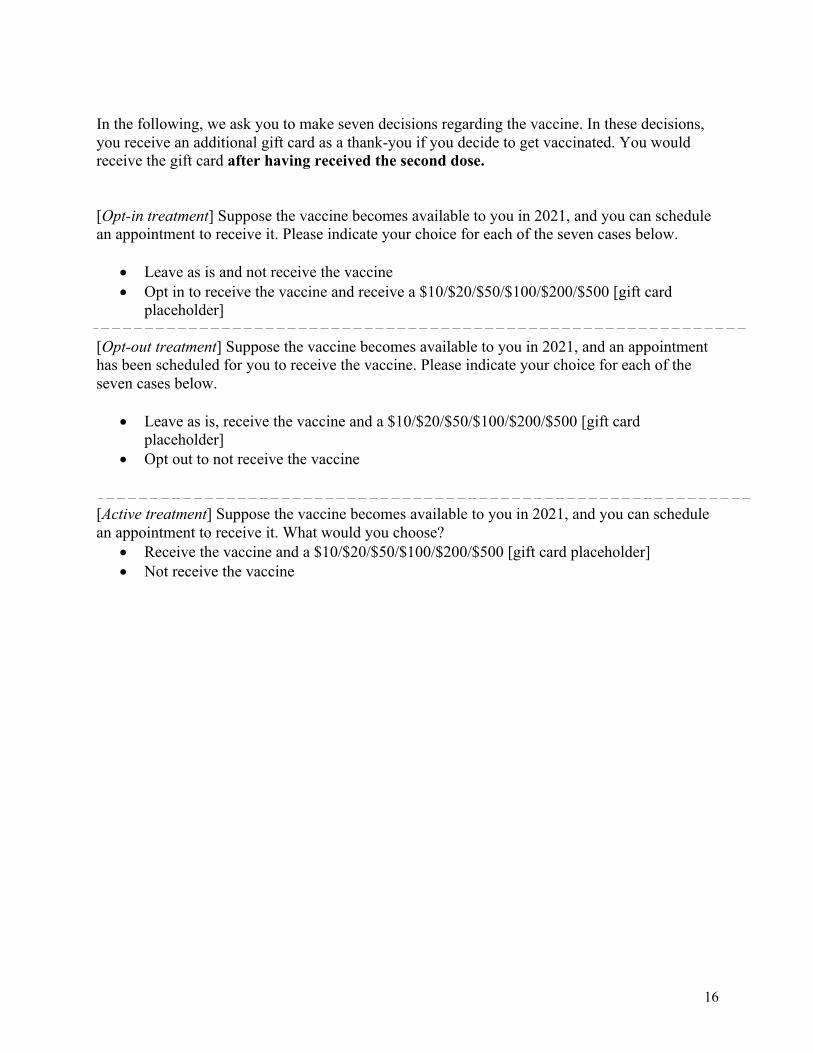
In the following, we ask you to make seven decisions regarding the vaccine. In these decisions, you receive an additional gift card as a thank-you if you decide to get vaccinated. You would receive the gift card after having received the second dose. [Opt-in treatment] Suppose the vaccine becomes available to you in 2021, and you can schedule an appointment to receive it. Please indicate your choice for each of the seven cases below.
• Leave as is and not receive the vaccine • Opt in to receive the vaccine and receive a $10/$20/$50/$100/$200/$500 [gift card
placeholder] [Opt-out treatment] Suppose the vaccine becomes available to you in 2021, and an appointment has been scheduled for you to receive the vaccine. Please indicate your choice for each of the seven cases below.
• Leave as is, receive the vaccine and a $10/$20/$50/$100/$200/$500 [gift card placeholder]
• Opt out to not receive the vaccine [Active treatment] Suppose the vaccine becomes available to you in 2021, and you can schedule an appointment to receive it. What would you choose?
• Receive the vaccine and a $10/$20/$50/$100/$200/$500 [gift card placeholder] • Not receive the vaccine
17
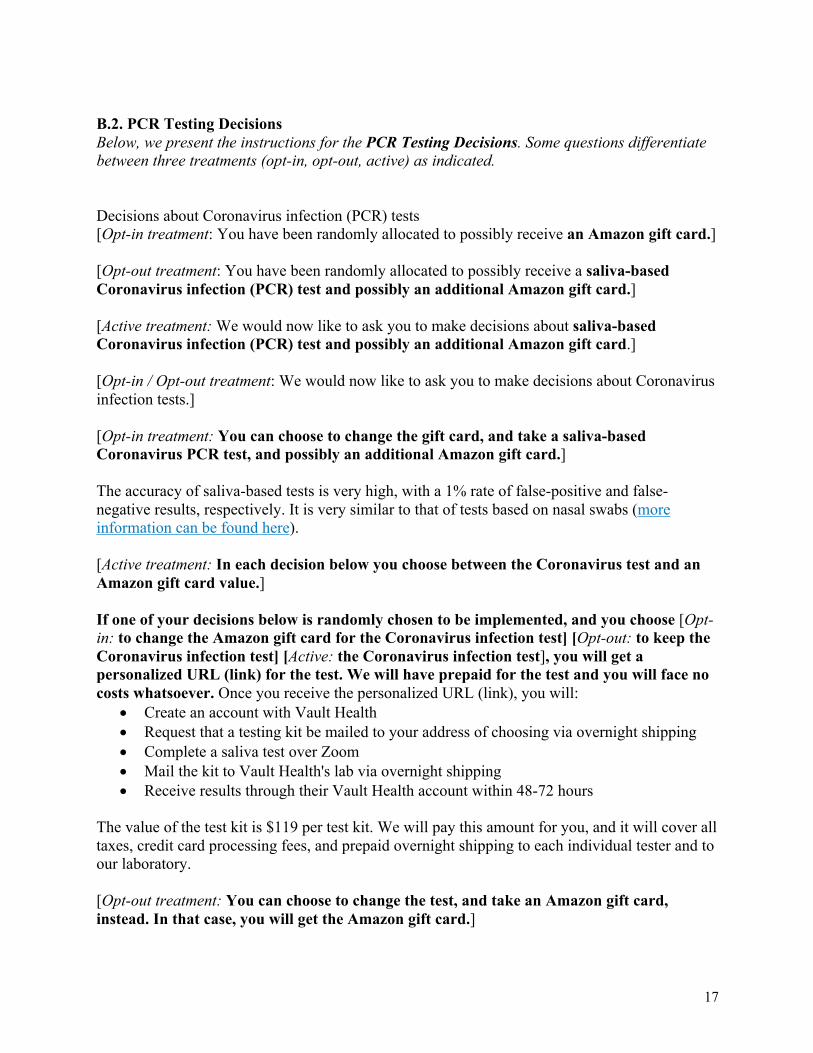
B.2. PCR Testing Decisions Below, we present the instructions for the PCR Testing Decisions. Some questions differentiate between three treatments (opt-in, opt-out, active) as indicated. Decisions about Coronavirus infection (PCR) tests [Opt-in treatment: You have been randomly allocated to possibly receive an Amazon gift card.] [Opt-out treatment: You have been randomly allocated to possibly receive a saliva-based Coronavirus infection (PCR) test and possibly an additional Amazon gift card.] [Active treatment: We would now like to ask you to make decisions about saliva-based Coronavirus infection (PCR) test and possibly an additional Amazon gift card.] [Opt-in / Opt-out treatment: We would now like to ask you to make decisions about Coronavirus infection tests.] [Opt-in treatment: You can choose to change the gift card, and take a saliva-based Coronavirus PCR test, and possibly an additional Amazon gift card.] The accuracy of saliva-based tests is very high, with a 1% rate of false-positive and false-negative results, respectively. It is very similar to that of tests based on nasal swabs (more information can be found here). [Active treatment: In each decision below you choose between the Coronavirus test and an Amazon gift card value.] If one of your decisions below is randomly chosen to be implemented, and you choose [Opt-in: to change the Amazon gift card for the Coronavirus infection test] [Opt-out: to keep the Coronavirus infection test] [Active: the Coronavirus infection test], you will get a personalized URL (link) for the test. We will have prepaid for the test and you will face no costs whatsoever. Once you receive the personalized URL (link), you will:
• Create an account with Vault Health • Request that a testing kit be mailed to your address of choosing via overnight shipping • Complete a saliva test over Zoom • Mail the kit to Vault Health's lab via overnight shipping • Receive results through their Vault Health account within 48-72 hours
The value of the test kit is $119 per test kit. We will pay this amount for you, and it will cover all taxes, credit card processing fees, and prepaid overnight shipping to each individual tester and to our laboratory. [Opt-out treatment: You can choose to change the test, and take an Amazon gift card, instead. In that case, you will get the Amazon gift card.]
18
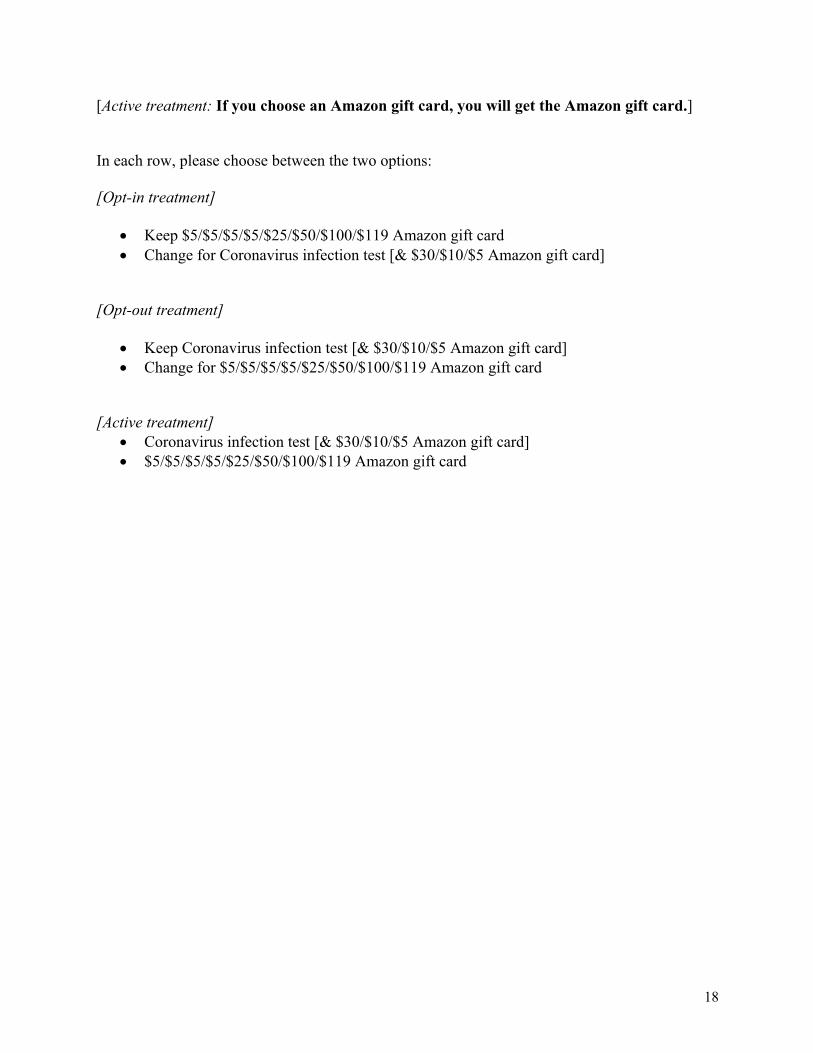
[Active treatment: If you choose an Amazon gift card, you will get the Amazon gift card.] In each row, please choose between the two options: [Opt-in treatment]
• Keep $5/$5/$5/$5/$25/$50/$100/$119 Amazon gift card • Change for Coronavirus infection test [& $30/$10/$5 Amazon gift card]
[Opt-out treatment]
• Keep Coronavirus infection test [& $30/$10/$5 Amazon gift card] • Change for $5/$5/$5/$5/$25/$50/$100/$119 Amazon gift card
[Active treatment]
• Coronavirus infection test [& $30/$10/$5 Amazon gift card] • $5/$5/$5/$5/$25/$50/$100/$119 Amazon gift card
19
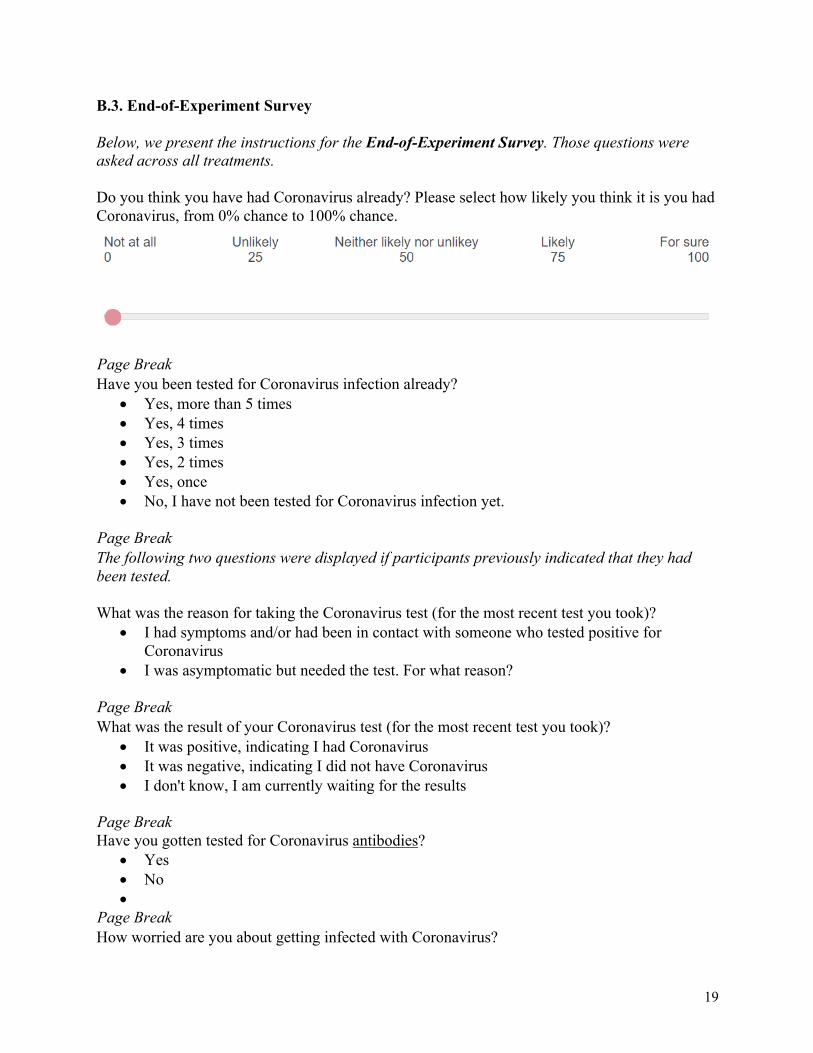
B.3. End-of-Experiment Survey Below, we present the instructions for the End-of-Experiment Survey. Those questions were asked across all treatments. Do you think you have had Coronavirus already? Please select how likely you think it is you had Coronavirus, from 0% chance to 100% chance.
Page Break Have you been tested for Coronavirus infection already?
• Yes, more than 5 times • Yes, 4 times • Yes, 3 times • Yes, 2 times • Yes, once • No, I have not been tested for Coronavirus infection yet.
Page Break The following two questions were displayed if participants previously indicated that they had been tested. What was the reason for taking the Coronavirus test (for the most recent test you took)?
• I had symptoms and/or had been in contact with someone who tested positive for Coronavirus
• I was asymptomatic but needed the test. For what reason? Page Break What was the result of your Coronavirus test (for the most recent test you took)?
• It was positive, indicating I had Coronavirus • It was negative, indicating I did not have Coronavirus • I don't know, I am currently waiting for the results
Page Break
Have you gotten tested for Coronavirus antibodies? • Yes • No •
Page Break How worried are you about getting infected with Coronavirus?
20
• A great deal • A lot • A moderate amount • A little • Not at all
Page Break How many people in your family, friends and acquaintances circle have died from Coronavirus, that you know of? Page Break What do you think is the chance, from 0% chance to 100% chance, that the Coronavirus pandemic will be over, and most economic and social activity return to normal, by...[Sliders for March 2021, June 2021, September 2021, December 2021, March 2022, June 2022] Page Break Suppose all high-risk individuals and health-care workers have received the vaccine. You can then choose in which order to receive the vaccine. Which place in line would you like to be? [Slider from 0 to 100, among the first…among the last] Why did you choose the place in line above? Please explain briefly. Page Break
What is the chance, from 0% chance to 100% chance, that you would take the Coronavirus vaccine, if 0%/ 20%/ 40%/ 60%/ 80%/100% of others in your community took it? Page Break If the vaccine would protect from infecting others, should people who received the vaccine be excluded from lock-downs and travel restrictions?
• Strongly agree • Somewhat agree • Neither agree nor disagree • Somewhat disagree • Strongly disagree •
Page Break How willing are you to give to good causes without expecting anything in return? Please again indicate your answer on the scale from 0 to 10, where 0 means you are “completely unwilling to do so” and a 10 means you are “very willing to do so”. Imagine the following situation: You receive unexpectedly $10,000 today. How much of that sum would you donate to a charitable cause? Page Break What is your gender?
21
• Male • Female • Other
What is your age? What is your ethnicity?
• Non-Hispanic White • Non-Hispanic Black • Hispanic • Asian • Other Race
What was your household income in 2019?
• Less than $25,000 • $25,000-$49,999 • $50,000-$74,999 • $75,000-$99,999 • $100,000-$149,999 • More than $150,000
What is your current employment situation?
• I am an essential worker and I am currently working outside of my home • I am not an essential worker and I am currently working outside of my home • I am currently working from home • I have been put on furlough or lost my job due to the Coronavirus pandemic • I am not currently working (e.g., retired, student, etc.) • Other. Please specify
How do you position yourself politically?
• Democrat • Republican • Independent
Page Break On a scale from 0 to 10, how would you rate President Trump's performance during the Coronavirus crisis? On a scale from 0 to 10, how would you rate Dr. Fauci's performance during the Coronavirus crisis? Page Break Do you have health insurance?
• Yes • No
22
• Prefer not to answer How much do you trust doctors?
• Do not trust at all • Do not trust very much • Trust somewhat • Trust completely
How much do you trust that the Coronavirus vaccine will be effective and safe to take?
• Do not trust at all • Do not trust very much • Trust somewhat • Trust completely
23
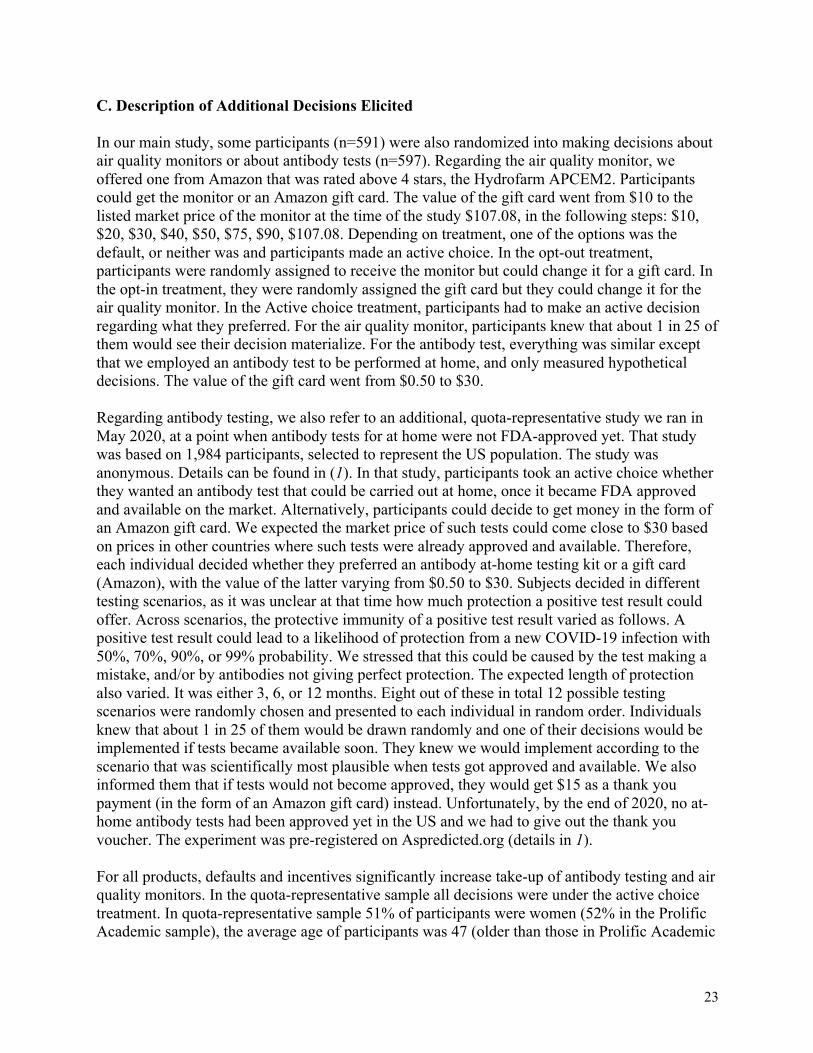
C. Description of Additional Decisions Elicited In our main study, some participants (n=591) were also randomized into making decisions about air quality monitors or about antibody tests (n=597). Regarding the air quality monitor, we offered one from Amazon that was rated above 4 stars, the Hydrofarm APCEM2. Participants could get the monitor or an Amazon gift card. The value of the gift card went from $10 to the listed market price of the monitor at the time of the study $107.08, in the following steps: $10, $20, $30, $40, $50, $75, $90, $107.08. Depending on treatment, one of the options was the default, or neither was and participants made an active choice. In the opt-out treatment, participants were randomly assigned to receive the monitor but could change it for a gift card. In the opt-in treatment, they were randomly assigned the gift card but they could change it for the air quality monitor. In the Active choice treatment, participants had to make an active decision regarding what they preferred. For the air quality monitor, participants knew that about 1 in 25 of them would see their decision materialize. For the antibody test, everything was similar except that we employed an antibody test to be performed at home, and only measured hypothetical decisions. The value of the gift card went from $0.50 to $30. Regarding antibody testing, we also refer to an additional, quota-representative study we ran in May 2020, at a point when antibody tests for at home were not FDA-approved yet. That study was based on 1,984 participants, selected to represent the US population. The study was anonymous. Details can be found in (1). In that study, participants took an active choice whether they wanted an antibody test that could be carried out at home, once it became FDA approved and available on the market. Alternatively, participants could decide to get money in the form of an Amazon gift card. We expected the market price of such tests could come close to $30 based on prices in other countries where such tests were already approved and available. Therefore, each individual decided whether they preferred an antibody at-home testing kit or a gift card (Amazon), with the value of the latter varying from $0.50 to $30. Subjects decided in different testing scenarios, as it was unclear at that time how much protection a positive test result could offer. Across scenarios, the protective immunity of a positive test result varied as follows. A positive test result could lead to a likelihood of protection from a new COVID-19 infection with 50%, 70%, 90%, or 99% probability. We stressed that this could be caused by the test making a mistake, and/or by antibodies not giving perfect protection. The expected length of protection also varied. It was either 3, 6, or 12 months. Eight out of these in total 12 possible testing scenarios were randomly chosen and presented to each individual in random order. Individuals knew that about 1 in 25 of them would be drawn randomly and one of their decisions would be implemented if tests became available soon. They knew we would implement according to the scenario that was scientifically most plausible when tests got approved and available. We also informed them that if tests would not become approved, they would get $15 as a thank you payment (in the form of an Amazon gift card) instead. Unfortunately, by the end of 2020, no at-home antibody tests had been approved yet in the US and we had to give out the thank you voucher. The experiment was pre-registered on Aspredicted.org (details in 1). For all products, defaults and incentives significantly increase take-up of antibody testing and air quality monitors. In the quota-representative sample all decisions were under the active choice treatment. In quota-representative sample 51% of participants were women (52% in the Prolific Academic sample), the average age of participants was 47 (older than those in Prolific Academic
24
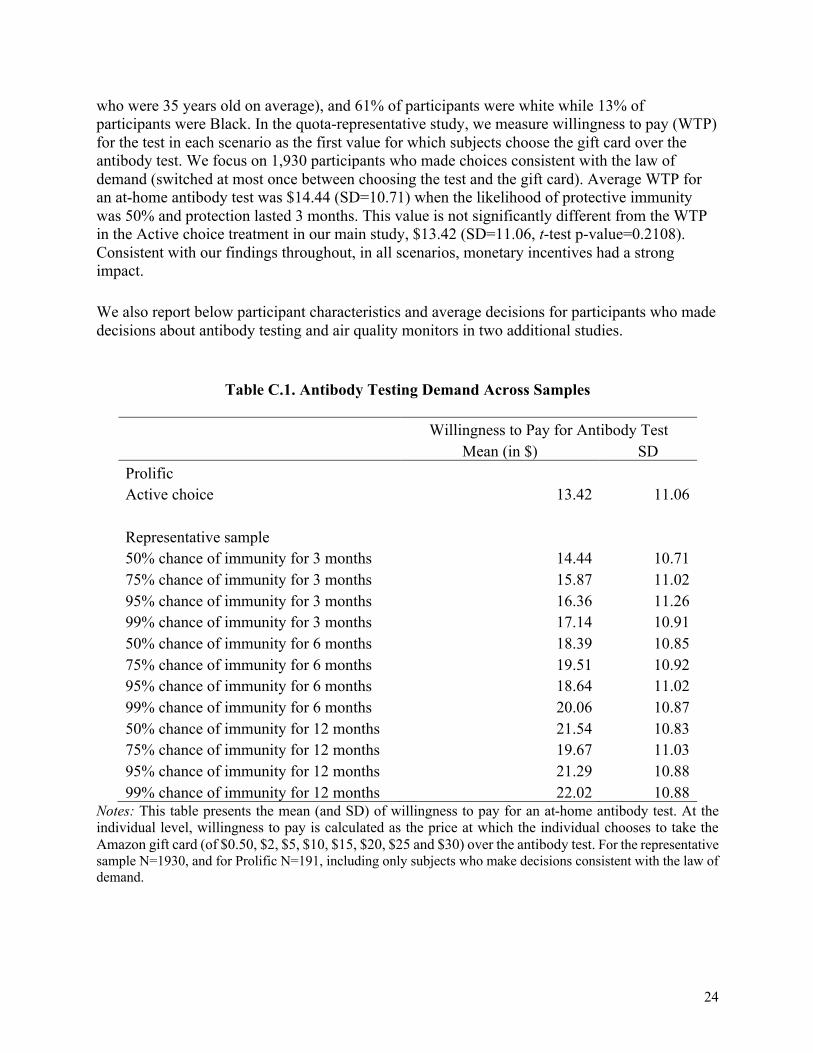
who were 35 years old on average), and 61% of participants were white while 13% of participants were Black. In the quota-representative study, we measure willingness to pay (WTP) for the test in each scenario as the first value for which subjects choose the gift card over the antibody test. We focus on 1,930 participants who made choices consistent with the law of demand (switched at most once between choosing the test and the gift card). Average WTP for an at-home antibody test was $14.44 (SD=10.71) when the likelihood of protective immunity was 50% and protection lasted 3 months. This value is not significantly different from the WTP in the Active choice treatment in our main study, $13.42 (SD=11.06, t-test p-value=0.2108). Consistent with our findings throughout, in all scenarios, monetary incentives had a strong impact. We also report below participant characteristics and average decisions for participants who made decisions about antibody testing and air quality monitors in two additional studies.
Table C.1. Antibody Testing Demand Across Samples
Willingness to Pay for Antibody Test Mean (in $) SD Prolific Active choice 13.42 11.06
Representative sample 50% chance of immunity for 3 months 14.44 10.71 75% chance of immunity for 3 months 15.87 11.02 95% chance of immunity for 3 months 16.36 11.26 99% chance of immunity for 3 months 17.14 10.91 50% chance of immunity for 6 months 18.39 10.85 75% chance of immunity for 6 months 19.51 10.92 95% chance of immunity for 6 months 18.64 11.02 99% chance of immunity for 6 months 20.06 10.87 50% chance of immunity for 12 months 21.54 10.83 75% chance of immunity for 12 months 19.67 11.03 95% chance of immunity for 12 months 21.29 10.88 99% chance of immunity for 12 months 22.02 10.88
Notes: This table presents the mean (and SD) of willingness to pay for an at-home antibody test. At the individual level, willingness to pay is calculated as the price at which the individual chooses to take the Amazon gift card (of $0.50, $2, $5, $10, $15, $20, $25 and $30) over the antibody test. For the representative sample N=1930, and for Prolific N=191, including only subjects who make decisions consistent with the law of demand.
25
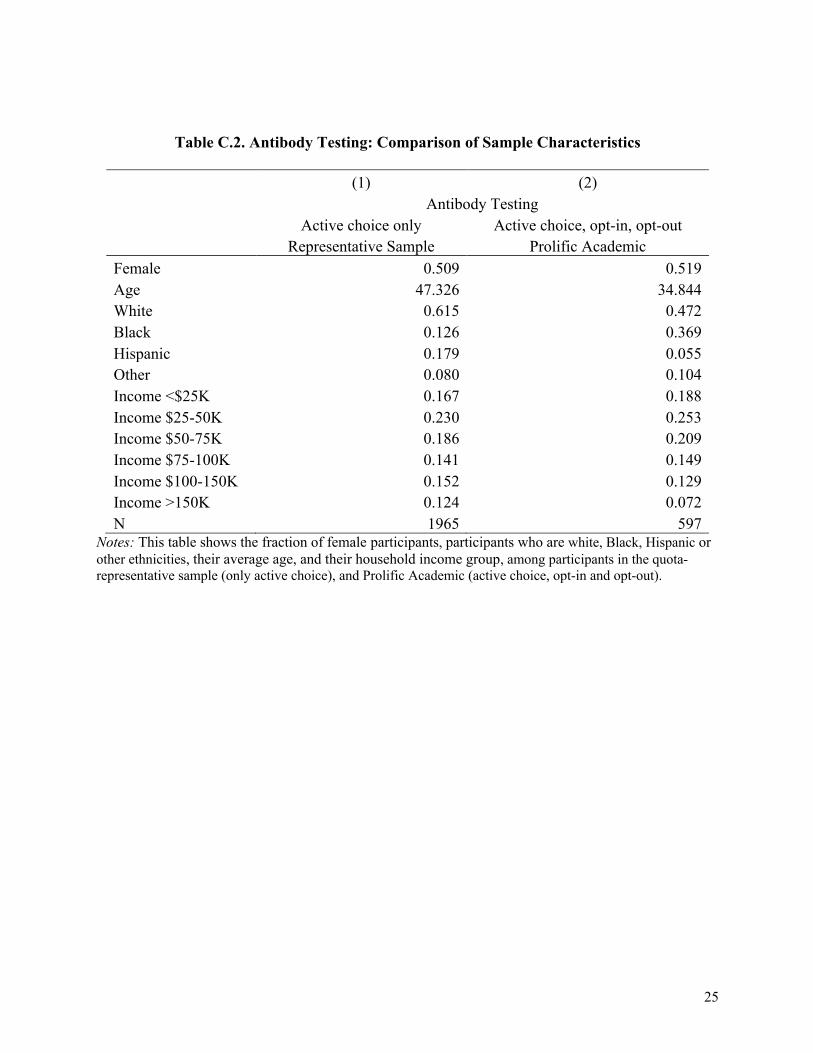
Table C.2. Antibody Testing: Comparison of Sample Characteristics
(1) (2) Antibody Testing Active choice only Active choice, opt-in, opt-out
Representative Sample Prolific Academic Female 0.509 0.519 Age 47.326 34.844 White 0.615 0.472 Black 0.126 0.369 Hispanic 0.179 0.055 Other 0.080 0.104 Income <$25K 0.167 0.188 Income $25-50K 0.230 0.253 Income $50-75K 0.186 0.209 Income $75-100K 0.141 0.149 Income $100-150K 0.152 0.129 Income >150K 0.124 0.072 N 1965 597
Notes: This table shows the fraction of female participants, participants who are white, Black, Hispanic or other ethnicities, their average age, and their household income group, among participants in the quota-representative sample (only active choice), and Prolific Academic (active choice, opt-in and opt-out).
26
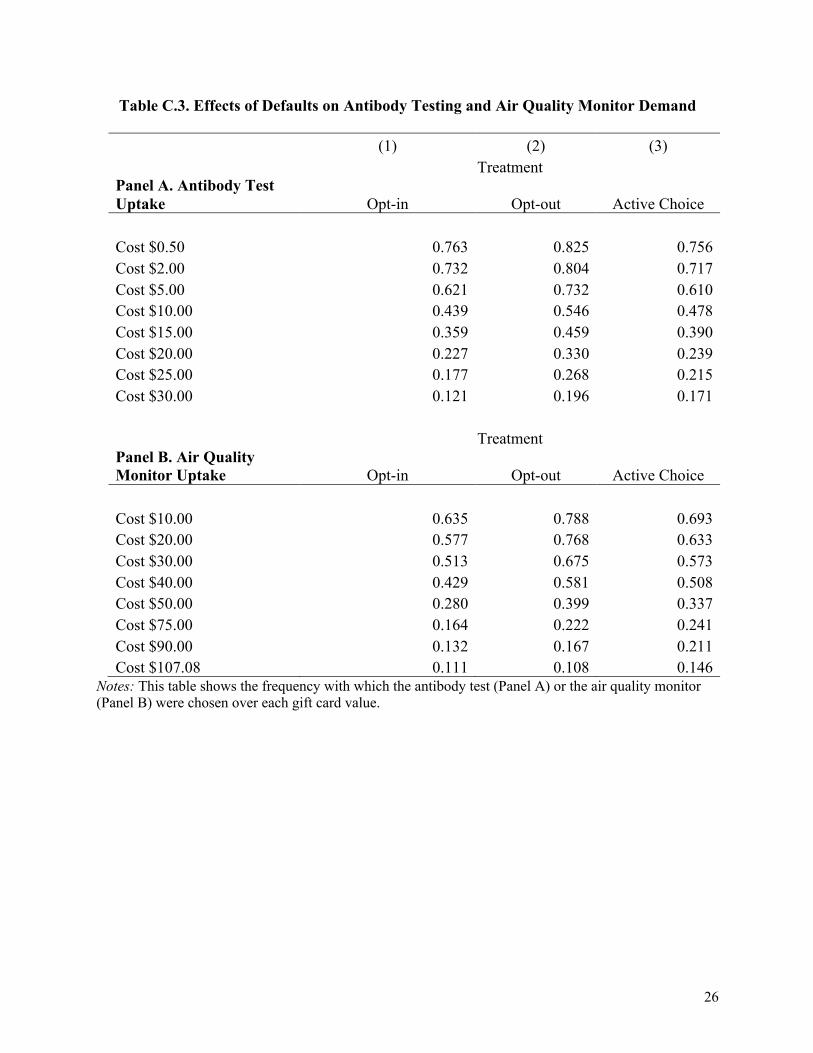
Table C.3. Effects of Defaults on Antibody Testing and Air Quality Monitor Demand
(1) (2) (3) Treatment
Panel A. Antibody Test Uptake Opt-in Opt-out Active Choice Cost $0.50 0.763 0.825 0.756 Cost $2.00 0.732 0.804 0.717 Cost $5.00 0.621 0.732 0.610 Cost $10.00 0.439 0.546 0.478 Cost $15.00 0.359 0.459 0.390 Cost $20.00 0.227 0.330 0.239 Cost $25.00 0.177 0.268 0.215 Cost $30.00 0.121 0.196 0.171
Treatment Panel B. Air Quality Monitor Uptake Opt-in Opt-out Active Choice Cost $10.00 0.635 0.788 0.693 Cost $20.00 0.577 0.768 0.633 Cost $30.00 0.513 0.675 0.573 Cost $40.00 0.429 0.581 0.508 Cost $50.00 0.280 0.399 0.337 Cost $75.00 0.164 0.222 0.241 Cost $90.00 0.132 0.167 0.211 Cost $107.08 0.111 0.108 0.146
Notes: This table shows the frequency with which the antibody test (Panel A) or the air quality monitor (Panel B) were chosen over each gift card value.
27
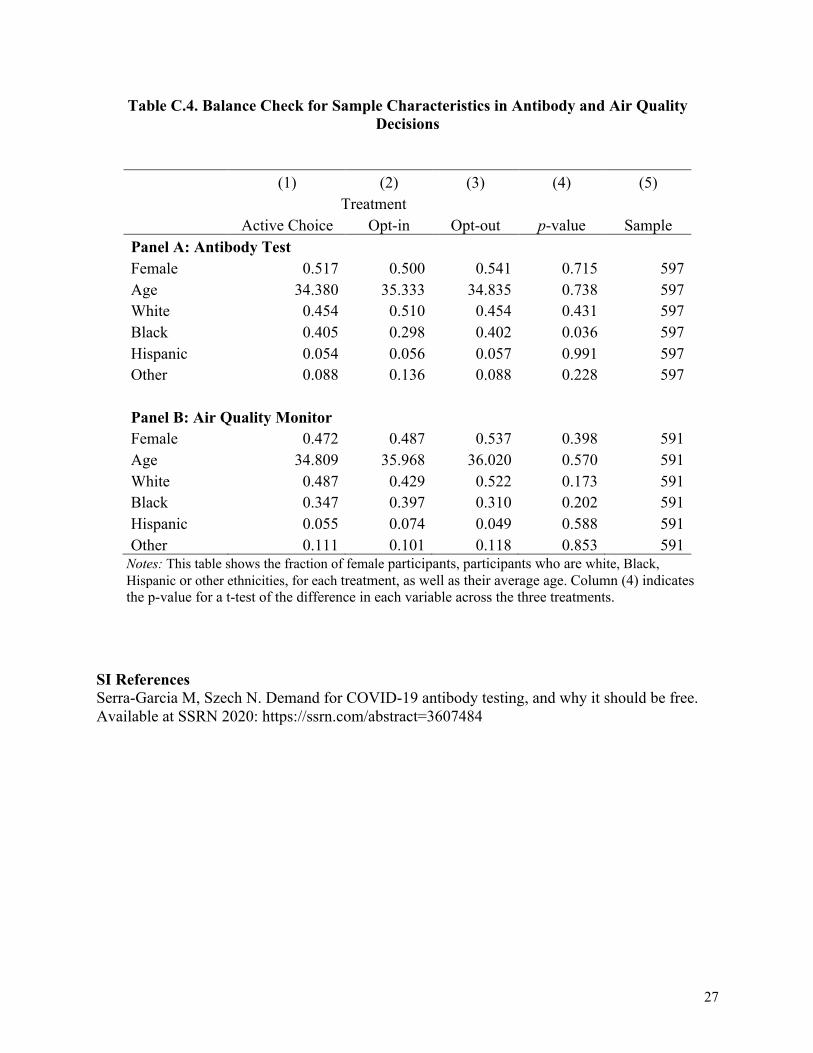
Table C.4. Balance Check for Sample Characteristics in Antibody and Air Quality Decisions
(1) (2) (3) (4) (5) Treatment
Active Choice Opt-in Opt-out p-value Sample Panel A: Antibody Test Female 0.517 0.500 0.541 0.715 597 Age 34.380 35.333 34.835 0.738 597 White 0.454 0.510 0.454 0.431 597 Black 0.405 0.298 0.402 0.036 597 Hispanic 0.054 0.056 0.057 0.991 597 Other 0.088 0.136 0.088 0.228 597
Panel B: Air Quality Monitor Female 0.472 0.487 0.537 0.398 591 Age 34.809 35.968 36.020 0.570 591 White 0.487 0.429 0.522 0.173 591 Black 0.347 0.397 0.310 0.202 591 Hispanic 0.055 0.074 0.049 0.588 591 Other 0.111 0.101 0.118 0.853 591
Notes: This table shows the fraction of female participants, participants who are white, Black, Hispanic or other ethnicities, for each treatment, as well as their average age. Column (4) indicates the p-value for a t-test of the difference in each variable across the three treatments.
SI References Serra-Garcia M, Szech N. Demand for COVID-19 antibody testing, and why it should be free. Available at SSRN 2020: https://ssrn.com/abstract=3607484
No. 150
No. 149
No. 148
No. 147
No. 146
No. 145
No. 144
No. 143
No. 142
No. 141
No. 140
Marta Serra-Garcia and Nora Szech: Choice architecture and incentives
increase COVID-19 vaccine intentions and test demand, April 2021
Daniel Hoang, Fabian Silbereis and Raphael Stengel: Do nonfinancial
firms hold risky financial assets? Evidence from Germany, March 2021
Francesco D‘Acunto, Daniel Hoang and Michael Weber: Managing
households‘ expectations with unconventional policies, March 2021
Francesco D‘Acunto, Daniel Hoang, Maritta Paloviita and Michael Weber:
Effective policy communication: Targets versus instruments, March 2021
Jörg Urban: Credit cycles revisited, November 2020
Dávid Burka, Clemens Puppe, László Szepesváry and Atilla Tasnádi: Vo-
ting: a machine learning approach, November 2020
Guanhao Li, Clemens Puppe and Arkadii Slinko: Towards a classification
of maximal peak-pit Condorcet domains, September 2020
Andranik S. Tangian: Using composite indicators in econometric decision
models with application to occupational health, September 2020
Ingrid Ott and Susanne Soretz: Institutional design and spatial (in)equali-
ty – the Janus face of economic integration, August 2020
Laura Reh, Fabian Krüger and Roman Liesenfeld: Predicting the global
minimum variance portfolio, July 2020
Marta Serra Garcia and Nora Szech: Understanding demand for CO-
VID-19 antibody testing, May 2020
recent issues
Working Paper Series in Economics
The responsibility for the contents of the working papers rests with the author, not the Institute. Since working papers
are of a preliminary nature, it may be useful to contact the author of a particular working paper about results or ca-
veats before referring to, or quoting, a paper. Any comments on working papers should be sent directly to the author.
Eective Policy Communica-tion: Targets versus Instru-ments