COVID-19 Mortality Risk Assessment among Various Age ...
26
COVID-19 Mortality Risk Assessment among Various Age Groups Using Phylogenetic Analysis Verma, Pawan 1 , Elkaffas, Rasha 2* , Shodunke, Oluwasefunmi C. 3 , Hrab, Pavlo 4 , Adebayo, Oluwatobiloba H. 5 , Alam, Humaira Marzia 6 , Gbedema, Wilson 7 , Agbonyin, Mosadoluwa A. 8 , Osman, Ahmed M. 9 , Igbokwe, Joseph O. 10 , Sudarsanam, Harinath 11 , Adepoju, Ayodeji 12 , Abass, Ohilebo A. 13 , Olorunfemi, Sola R. 14 , Oladejo, Sarah O. 15 , Semilogo, Sonaike 16 , Hurtado, Jairo 17 , Ferdousee, Shahida 18 , Peter, Josiah Aminu 19 , Oluwasanmi, Adetutu D. 20 , Agbaje, Sheriff T. 21 , Sheen, Alexandra 22 , Sharma, Mukul 23 , Ibitoye, Opeyemi 24 , El-Gammal, Ahmed 25 , Olutunde, Olaleye T. 26 , Krishna, Meera 27 , Ezechukwu, Tracy-allen M. 28 , Carl, Sarah H. 29 1. Centre for Computational Natural Sciences and Bioinformatics, International University of Information Technology, Hyderabad, India. [email protected] 2. Clinical and Chemical Pathology Department, Faculty of Medicine, Cairo University, Egypt. [email protected] 3. Department of Microbiology Obafemi Awolowo University, Ile-Ife, Osun, Nigeria. [email protected] 4. Ivan Franko National University of Lviv. [email protected] 5. Department of Physiology, University of Ilorin, Ilorin, Nigeria. [email protected] 6. School of Life Sciences, Independent University, Bangladesh, Dhaka, Bangladesh. [email protected] 7. Department of Biomedical Sciences, University of Cape Coast, Cape Coast, Ghana. [email protected] 8. Department of Physiology, Benjamin S Carson School of Medicine, Babcock University, Ogun State Nigeria. [email protected] 9. Researcher at virology & Immunology unite, cancer biology Dept, National cancer institute, Cairo University, Egypt. [email protected] 10. Department of Zoology, Obafemi Awolowo University, Ile-Ife, Nigeria. [email protected] 11. Department of Biotechnology, Rajalakshmi Engineering College, Anna University, Chennai, India. [email protected] 12. Department of Biochemistry, Adeleke University, Ede-Nigeria. [email protected] 13. Department of Biochemistry, Ambrose Alli University, Ekpoma, Nigeria. [email protected] 14. Department of Occupational Safety, Health and Environment, Manchester Metropolitan University, Student member at occupational safety and Health (IOSH). [email protected] 15. Department of Microbiology, Lagos State University, Nigeria. [email protected] 16. Department of Biochemistry, University of Ibadan, Ibadan, Nigeria. [email protected] 17. Center for Research and Advanced Studies of the National Polytechnic Institute (CINVESTAV-IPN), Mexico City, Mexico. [email protected] 18. Department of Biochemistry & Molecular Biology, Shahjalal University of Science & Technology, Sylhet, Bangladesh. [email protected] 19. Department of Biochemistry, Kaduna State University, Nigeria. [email protected] 20. Department of Microbiology, Lagos State University, Lagos, Nigeria. [email protected] 21. Virology Department, College of Medicine, University of Ibadan, Ibadan Nigeria. [email protected] 22. Universidad Nacional Mayor de San Marcos, Lima –Perú. [email protected] 23. Indian Institute of Technology Hyderabad, Kandi, India. [email protected] 24. Skolkovo Institute of Science and Technology, Moscow, Russia. [email protected] 25. Biotechnology, Faculty of Science, Cairo University, Egypt. [email protected] 26. Department of Anatomy, University of Ilorin, Ilorin, Nigeria. [email protected] 27. Animal Genetics and Breeding Division, ICAR- National Dairy Research Institute, Karnal, India. [email protected] 28. Department of Biochemistry, University of Ilorin, Kwara State, Nigeria. [email protected] 29. Scailyte AG, Industriestrasse 12, 6210 Sursee, Switzerland. [email protected] *Corresponding author: [email protected], https://orcid.org/0000-0001-9375-5100 Correspondance: Rasha Elkaffas. Clinical and Chemical Pathology Department, Faculty of Medicine, Cairo University, Egypt. [email protected] Preprints (www.preprints.org) | NOT PEER-REVIEWED | Posted: 21 September 2020 doi:10.20944/preprints202009.0487.v1 © 2020 by the author(s). Distributed under a Creative Commons CC BY license.
Transcript of COVID-19 Mortality Risk Assessment among Various Age ...
COVID-19 Mortality Risk Assessment among Various Age Groups Using Phylogenetic Analysis
Verma, Pawan1, Elkaffas, Rasha2*, Shodunke, Oluwasefunmi C.3, Hrab, Pavlo4, Adebayo, Oluwatobiloba H.5, Alam, Humaira Marzia6, Gbedema, Wilson7, Agbonyin, Mosadoluwa A.8, Osman, Ahmed M.9, Igbokwe, Joseph O.10, Sudarsanam, Harinath11, Adepoju, Ayodeji12, Abass, Ohilebo A.13, Olorunfemi, Sola R.14, Oladejo, Sarah O.15, Semilogo, Sonaike16, Hurtado, Jairo17, Ferdousee, Shahida18, Peter, Josiah Aminu19, Oluwasanmi, Adetutu D.20, Agbaje, Sheriff T.21, Sheen, Alexandra 22, Sharma, Mukul23, Ibitoye, Opeyemi24, El-Gammal, Ahmed25, Olutunde, Olaleye T.26, Krishna, Meera27, Ezechukwu, Tracy-allen M.28, Carl, Sarah H.29
1. Centre for Computational Natural Sciences and Bioinformatics, International University of Information Technology, Hyderabad, India. [email protected]
2. Clinical and Chemical Pathology Department, Faculty of Medicine, Cairo University, Egypt. [email protected]
3. Department of Microbiology Obafemi Awolowo University, Ile-Ife, Osun, Nigeria. [email protected]
4. Ivan Franko National University of Lviv. [email protected] 5. Department of Physiology, University of Ilorin, Ilorin, Nigeria. [email protected] 6. School of Life Sciences, Independent University, Bangladesh, Dhaka, Bangladesh. [email protected] 7. Department of Biomedical Sciences, University of Cape Coast, Cape Coast, Ghana.
[email protected] 8. Department of Physiology, Benjamin S Carson School of Medicine, Babcock University, Ogun State Nigeria.
[email protected] 9. Researcher at virology & Immunology unite, cancer biology Dept, National cancer institute, Cairo University,
Egypt. [email protected] 10. Department of Zoology, Obafemi Awolowo University, Ile-Ife, Nigeria. [email protected] 11. Department of Biotechnology, Rajalakshmi Engineering College, Anna University, Chennai, India.
[email protected] 12. Department of Biochemistry, Adeleke University, Ede-Nigeria. [email protected] 13. Department of Biochemistry, Ambrose Alli University, Ekpoma, Nigeria. [email protected] 14. Department of Occupational Safety, Health and Environment, Manchester Metropolitan University, Student
member at occupational safety and Health (IOSH). [email protected] 15. Department of Microbiology, Lagos State University, Nigeria. [email protected] 16. Department of Biochemistry, University of Ibadan, Ibadan, Nigeria. [email protected] 17. Center for Research and Advanced Studies of the National Polytechnic Institute (CINVESTAV-IPN), Mexico
City, Mexico. [email protected] 18. Department of Biochemistry & Molecular Biology, Shahjalal University of Science & Technology, Sylhet,
Bangladesh. [email protected] 19. Department of Biochemistry, Kaduna State University, Nigeria. [email protected] 20. Department of Microbiology, Lagos State University, Lagos, Nigeria. [email protected] 21. Virology Department, College of Medicine, University of Ibadan, Ibadan Nigeria. [email protected] 22. Universidad Nacional Mayor de San Marcos, Lima –Perú. [email protected] 23. Indian Institute of Technology Hyderabad, Kandi, India. [email protected] 24. Skolkovo Institute of Science and Technology, Moscow, Russia. [email protected] 25. Biotechnology, Faculty of Science, Cairo University, Egypt. [email protected] 26. Department of Anatomy, University of Ilorin, Ilorin, Nigeria. [email protected] 27. Animal Genetics and Breeding Division, ICAR- National Dairy Research Institute, Karnal, India.
[email protected] 28. Department of Biochemistry, University of Ilorin, Kwara State, Nigeria. [email protected] 29. Scailyte AG, Industriestrasse 12, 6210 Sursee, Switzerland. [email protected]
*Corresponding author: [email protected], https://orcid.org/0000-0001-9375-5100
Correspondance: Rasha Elkaffas. Clinical and Chemical Pathology Department, Faculty of Medicine, Cairo University, Egypt. [email protected]
Preprints (www.preprints.org) | NOT PEER-REVIEWED | Posted: 21 September 2020 doi:10.20944/preprints202009.0487.v1
© 2020 by the author(s). Distributed under a Creative Commons CC BY license.
ABSTRACT
The age-related mortality and morbidity risk of COVID-19 has been considered speculative without enough scientific evidence. This study aimed to collect more evidence on the association between patient age and risk of severe disease state and/or mortality from SARS-CoV-2 infection. Genomic dataset along with metadata (3608 samples) retrieved from GISAID from different geographical regions were grouped into 10 age groups (0-10, 11-20, 21-30, 31-40, 41-50, 51-60, 61-70, 71-80, 81-90, 91-100 years) as well as high-risk or low-risk according to patient clinical status. Genomic sequences were aligned and analyzed using MAFFT and FASTTREE to build a phylogenetic tree in order to identify age-risk associations based on phylogenetic clustering. Case fatality rates(CFR), as well as the Odds ratio (OR) for high-risk outcomes, were calculated for different age groups. Results revealed that individuals aged between 25-50 years have the best immune response to the infection. On the other hand, disease fatality was higher in patients aging above 50 years. We created an application to calculate the OR of being at high risk given a certain age threshold from GISAID datasets. OR values increased between ages 1-10 years (1.271) and 11-20 years (1.313) but reduced at age range 21-30 years (1.290) and increased again for 61-70 years (2.465). CFR calculated for each of the age groups had peak values at 90-100 years (26.8%) and the lowest at 0-10 years (0%). The CFR for ages above 50 years was about twice greater (11.6%-26.8%) than that for ages below (0-6.6%). The phylogenetic analysis revealed that the majority of samples obtained from India showed low-risk among different age groups and were defined as clade GH. Another cluster from Singapore visualization showed unfavorable patient outcome across several age groups and were classified under clade O. To conclude, this study analyses showed a variety of age-risk associations. As scientists from different countries upload more genomes to globally shared databases, more evidence will reinforce mortality risk associations in COVID-19 patients.
Keywords
SARS-CoV-2; COVID-19; Phylogenetics; mortality
Preprints (www.preprints.org) | NOT PEER-REVIEWED | Posted: 21 September 2020 doi:10.20944/preprints202009.0487.v1
1. BACKGROUND AND INTRODUCTION The current coronavirus pandemic that was caused by severe acute respiratory
syndrome coronavirus 2 (SARS-CoV-2) is not the first pandemic of the family
Coronaviridae [1]. In 2002 and 2012 respectively, severe acute respiratory syndrome
(SARS) and middle east respiratory syndrome (MERS) caused by severe acute
respiratory syndrome coronavirus (SARS-CoV) and middle east respiratory syndrome
coronavirus (MERS-CoV) outbreaks emerged [1][2][3][4][5]. Taxonomically, There are
seven coronaviruses namely: 229E (α), NL63 (α), OC43 (β), HKU1 (β), MERS-CoV,
SARS-CoV, SARS-CoV-2. They belong to the family Coronaviridae and SARS-CoV-2 is
a strain of the SARS related coronavirus (SARSr-CoV) that is genetically associated with
other coronavirus strains that infect bats in China [6][7]. From its period of emergence up
until the end of 2002, coronavirus was considered to be non-fatal [7]. Currently, SARS-
CoV-2; first isolated in Wuhan China; has led to more deaths than the earlier SARS
outbreak of 2002-2003. As of September 7, 2020, it has been responsible for nearly 27
million cases and 900,000 deaths worldwide [8]. Sequenced SARS-CoV-2 genomic data
from human hosts available at the Global Initiative on Sharing All Influenza Data
(GISAID), identified three major clades of SARS-CoV-2 viz; clade G (a variant of the
spike protein S-D614G), clade V (a variant of the ORF3a coding protein NS3-G251), and
clade S (variant ORF8-L84S) [9]. Phylogenetic data has grouped the variants into
clusters namely; A, B, and C. Both clusters A and C spread more outside of East Asia,
mostly in America and Europe. In contrast, type B is the most common variant infecting
East Asia, and the ancestor species appears to have never spread outside of East Asia
without first converting to the B species [10]. Until this moment, the SARS-CoV-2 has
been characterized by mutations, which help explain its origin, distribution, and tracing
viral pathogenesis in every continent [11]. For instance, there were 5775 distinct variants
out of 10022 SARS-CoV-2 genomes analyzed; of these, 2969 missense mutations, 1965
synonymous mutations, and 484 mutations in the non-coding regions were observed in
samples obtained from 68 countries [12]. SARS-CoV-2 belongs to the Betacoronavirus
genus, the most prevalent, which shares 82% nucleotide identity with SARS-CoV and
about 50 % with MERS-CoV [13]. Using specialized tools and techniques, researchers
have been able to conduct phylogenetic studies of the SARS-CoV-2 genome against
suspected zoonotic reservoirs [14][15]. Multiple Sequence Alignment (MSA) of SARS-
CoV-2 genome data has revealed tremendous amounts of information, including
Preprints (www.preprints.org) | NOT PEER-REVIEWED | Posted: 21 September 2020 doi:10.20944/preprints202009.0487.v1
evolutionary diversity, and similarity with other coronavirus strains. With the help of
Multiple Alignment using Fast Fourier Transform (MAFFT), research has revealed that
SARS-CoV and MERS-CoV both originated in bats [16]. In humans, as one age, the
potential of the immune system to fight against infections diminishes [17]. Previous
studies have suggested that older adults are highly susceptible to SARS-CoV-2 infection
and may suffer severe COVID-19 outcomes due to comorbidities [18]. It is still not clear
whether age (associated immune decline) has a direct influence on COVID-19 mortality.
It is therefore important that we identify whether patient age may affect disease severity
and/or mortality rates, and also identify any evolutionary pattern exhibited by the virus as
it is transmitted between different hosts across various geographical locations. In this
study, we have constructed a maximum likelihood phylogenetic tree of SARS-CoV-2
virus strains collected from different countries the virus has spread its tail. The
phylogenetic tree will give us an idea about the strain of the virus that got introduced in a
country and how that affects disease severity and/or mortality.
2. METHODS
2.1 Data Download and Filtration The clinical dataset of COVID-19 patients and the genomic sequence for each SARS-
CoV-2 infected patient was collected from the GISAID EpiCoV repository [9]. The
retrieved dataset contains a total of 4592 genomes. A Python (v.3.7.4) script (pandas
v.1.0.5 [19] and Biopython v.1.77 [20] packages) was used to filter the data, generate
FASTA and the clinical dataset files. For the data cleaning, samples corresponding to
non-human hosts were filtered out. Additionally, all samples corresponding to unknown
and those tagged as Not Available (NA) in the patient status and patient age column
were filtered out thereby reducing the dataset from 4592 samples to 3608 samples. The
Biopython package was specifically used to parse the FASTA file containing the
complete genomic data. All the filtered genomic and clinical data were written to a new
file using the python script.
2.2 Multiple Sequence Alignment and Phylogenetic tree reconstruction Using the filtered genomic data, multiple sequence alignment was performed using
MAFFT (Galaxy v.7.221). MAFFT performs progressive alignment and iterative
Preprints (www.preprints.org) | NOT PEER-REVIEWED | Posted: 21 September 2020 doi:10.20944/preprints202009.0487.v1
refinement for increased accuracy and aligns as many as 30,000 sequences [21]. To
generate the maximum likelihood phylogenetic tree, the FastTree program was used
(Galaxy v.2.1.10+galaxy). FastTree generates maximum likelihood phylogenetic trees to
find the local optimum or ‘best tree’ [22]. All the analysis concerning Phylogenetic tree
reconstruction was performed on the Galaxy web server [23]. Default parameters were
used to perform the analysis using the filtered genomic dataset. MAFFT generated an
alignment in FASTA format, which was used as an input to the FastTree program. iToL
was used To efficiently visualize the phylogenetic tree, One of the key features of this
software is that it allows large trees with large numbers of taxa to be easily visualized,
located on the internet, and edited. The public sharing allows the tree to be reused for
future analysis [24].
2.3 Odds Ratio calculations
To determine whether exposure is a risk factor for a particular risk outcome, a measure
of association, Odds ratio (OR), was used to compare the relative odds of the disease
outcome with a given exposure to a specific variable of interest (e.g.age) [25]. In this
study, the clinical dataset was used to calculate the OR, after being categorized into
"Low risk" and "High risk" using R (Supplementary Table 4). 12 patients with ages lesser
than 1 and greater than 100 were filtered out of the clinical dataset, and the filtered data
was sorted in order of increasing age. This was done using an R script and Microsoft
Excel.
The OR calculations were performed in R, using epiR (v. 1.0-15) and epitools (v 0.5-
10.1) packages. We used the epiR package for 2 by 2 OR calculation and epitools for
multiple OR calculation. The Age versus Outcome plot was built with the construction of
2 by 2 tables for every age cutoff and then plotting every odds ratio as a single value.
The OR values for Clade versus Outcome with comparison to the reference clade were
calculated with epitools package. The reference clade was artificially created with the
median value among all clades for the patient count and with the general outcome ratio
for data split. For age group OR representation, we computed mean OR values for given
age intervals. P-values are calculated from the chi-squared test.
Preprints (www.preprints.org) | NOT PEER-REVIEWED | Posted: 21 September 2020 doi:10.20944/preprints202009.0487.v1
2.4 CFR calculations The case fatality ratio (CFR) is used to measure the proportion of infected individuals
with fatal outcomes. It estimates the percentage of deaths among identified confirmed
cases. It is measured by the formula:
where, Ndp = number of deaths from disease, Np = number of confirmed cases
3 RESULTS 3.1 OR calculations The Odds Ratio (OR) for a particular age range illustrates the odds that patients older
than the specified age threshold are more likely to be at high risk.
After the cleaning step, the data contained 3608 individual patient records for
subsequent analysis. OR analysis for the patient age groups highlights a trend towards
being more exposed to the disease ( High risk) with higher age. In particular, the OR
increased between the age range of 1-10 (1.271) and 11-20 (1.313) but further
decreased at age range 21-30 (1.290) before a progressive increase, with a first leap at
the age range 61-70 (2.465) and a second leap at the age range of 81-90 (8.977),
representing the spiked value in the plot (Figure 2a). A decrease in the age range of 91-
100 (5.306) was then observed. (Figure 2a, Supplementary Table 2). The mentioned
tendency is also shown for an individual age cutoff. (Supplementary Figure 1 )
OR values were obtained for individual clades (as stated in GISAID dataset) to test
whether a risk is associated with the evolution of a virus. Descriptive analysis for known
clades shows no significant age difference between them, except for GH and GR clades
which showed significant (P<.05) difference (Supplementary Figure. 2). On the contrary,
the number of patients for each clade in a given country is now so consistent (Figure. 3).
For the 11 countries with some patients above or equal to 100 (Supplementary Figure
3), Columbia, France, India, Saudi Arabia, and the USA had the most samples for the
GH clade, China for the L clade. Moreover, Brazil, Russia, and Turkey for the GR clade,
Singapore for O, and Spain for G clades. The samples from L clade are almost
Preprints (www.preprints.org) | NOT PEER-REVIEWED | Posted: 21 September 2020 doi:10.20944/preprints202009.0487.v1
exclusively derived from China, whereas other patient counts per clade are distributed
among all countries.
With regard to the reference, OR analysis was illustrated (Figure 2b). Further analysis
between Individual pairwise Clade and OR analysis confirms the approach
(Supplementary Figure 4). The highest OR value, compared to the base level, was the L
clade with a 1.58 estimate. Results for G and O clades are quite similar to 1.38 and 1.40
OR values, respectively. The lower limit of the CI intervals (95%) for all of the above-
mentioned clades (L, G, and O) have OR values that are above 1, which indicates that
the odds of being at High risk for the patients with virus clades L, G and O are higher
than the base level. The pairwise OR calculation for G and S clades shows that their
values are quite similar (Supplementary Figure 4 ). However, usage of a reference
highlights a difference between them with an estimated 1.06 for G clade and 0.82 for S
clade. On the other hand, the patient outcome for this clade is insignificant (P>.05; 0.57
and 0.28 for G and S clades respectively, and CI (95%) covers above and below 1). The
clade, which is associated with the low-risk outcome for the patients is GR, which has
0.61 times low disease risk, with a 95% confidence interval and true odds which lies
between 0.48-0.76 (P<.05). V clade has the widest CI limits and a P-value of 0.7.
To increase research reproducibility and for easy analysis, result exploration, and
interpretation, an ORCaG (Odds Ratio Calculations for GISAID data) shiny application
was created, which is available online at https://biopavlohrab.shinyapps.io/ORCaG/, and
https://github.com/MountainMan12/GISAID_phylo/tree/master/ORCaG. The application
allows to dynamically change patient status category with the age cut-off for easy visual
inspection of data. Documentation for the app is available at the corresponding GitHub
page. 3.2 CFR calculations In this study, the CFR for each age group was measured. The CFR had its peak in the
age range of 90-100 (26.8%) and the least at age 0-10 (0%). The CFR for ages above 50
was about two times (or greater) more than that of ages below. This supports the fact
that patients above 50 years are at a higher risk when compared to patients below 50
Preprints (www.preprints.org) | NOT PEER-REVIEWED | Posted: 21 September 2020 doi:10.20944/preprints202009.0487.v1
years of age, though being at high risk doesn't confirm a death penalty. (Supplementary
Table 3, Figure 6).
3.3 Phylogenetic Analysis Phylogenetic analysis suggests the evolution of SARS-CoV-2. In the present study, more
than 3500 genomes from 69 countries were analyzed, where the highest number of
patients were observed corresponding to the GH clade for Indian samples (Figure 3).
Upon tree visualization, a group of closely related Indian samples was clustered, the
majority of which were classified as low-risk (Figure 4) corresponding to clade GH. In this
cluster, no certain age relationship with the disease risk nor the clade type could be
seen.
In another cluster of samples from Singapore, most of them showed high risk and
corresponded to clade O with no special correspondence to a certain age group. (Figure
5). Figure 3 shows the samples from Singapore have the highest frequency of clade O.
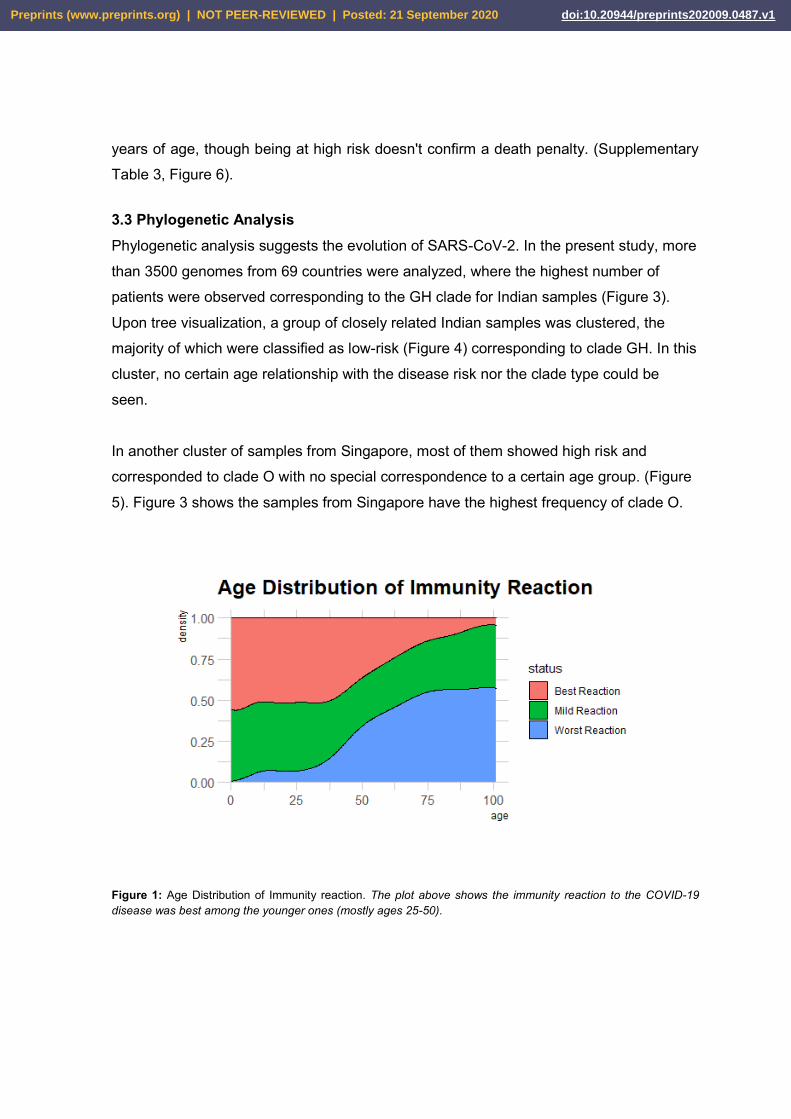
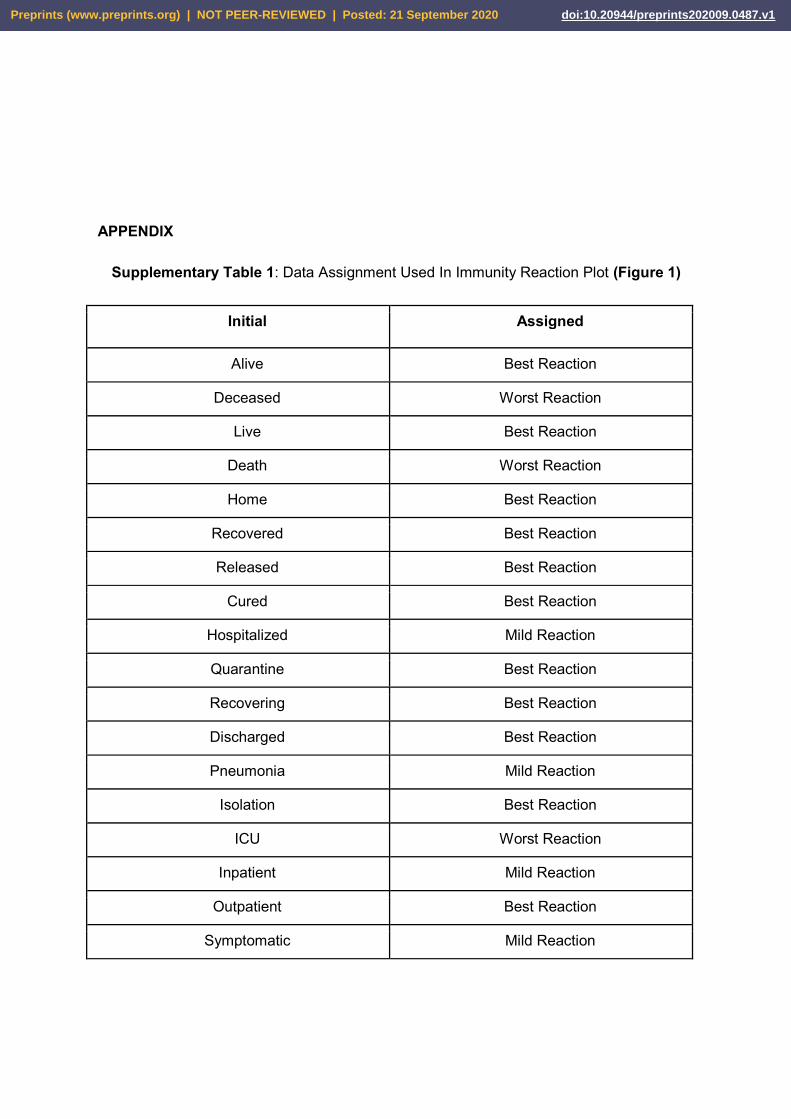
Figure 1: Age Distribution of Immunity reaction. The plot above shows the immunity reaction to the COVID-19 disease was best among the younger ones (mostly ages 25-50).
Preprints (www.preprints.org) | NOT PEER-REVIEWED | Posted: 21 September 2020 doi:10.20944/preprints202009.0487.v1
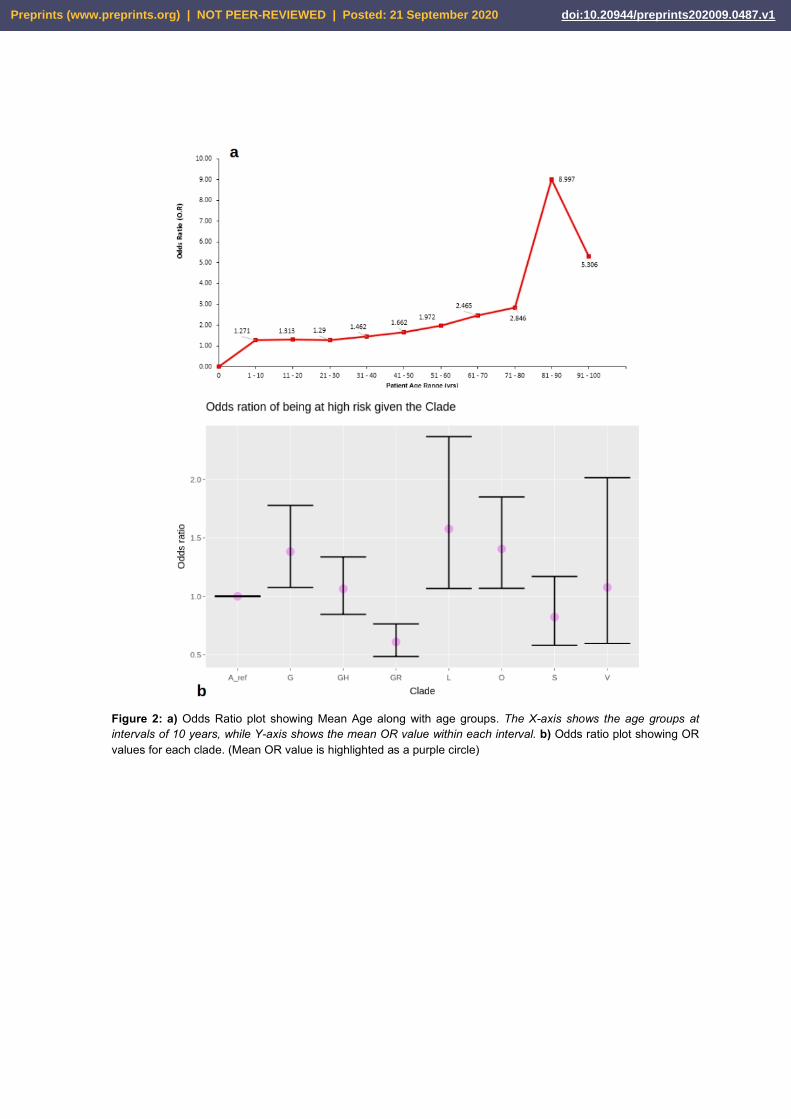
Figure 2: a) Odds Ratio plot showing Mean Age along with age groups. The X-axis shows the age groups at intervals of 10 years, while Y-axis shows the mean OR value within each interval. b) Odds ratio plot showing OR values for each clade. (Mean OR value is highlighted as a purple circle)
Preprints (www.preprints.org) | NOT PEER-REVIEWED | Posted: 21 September 2020 doi:10.20944/preprints202009.0487.v1
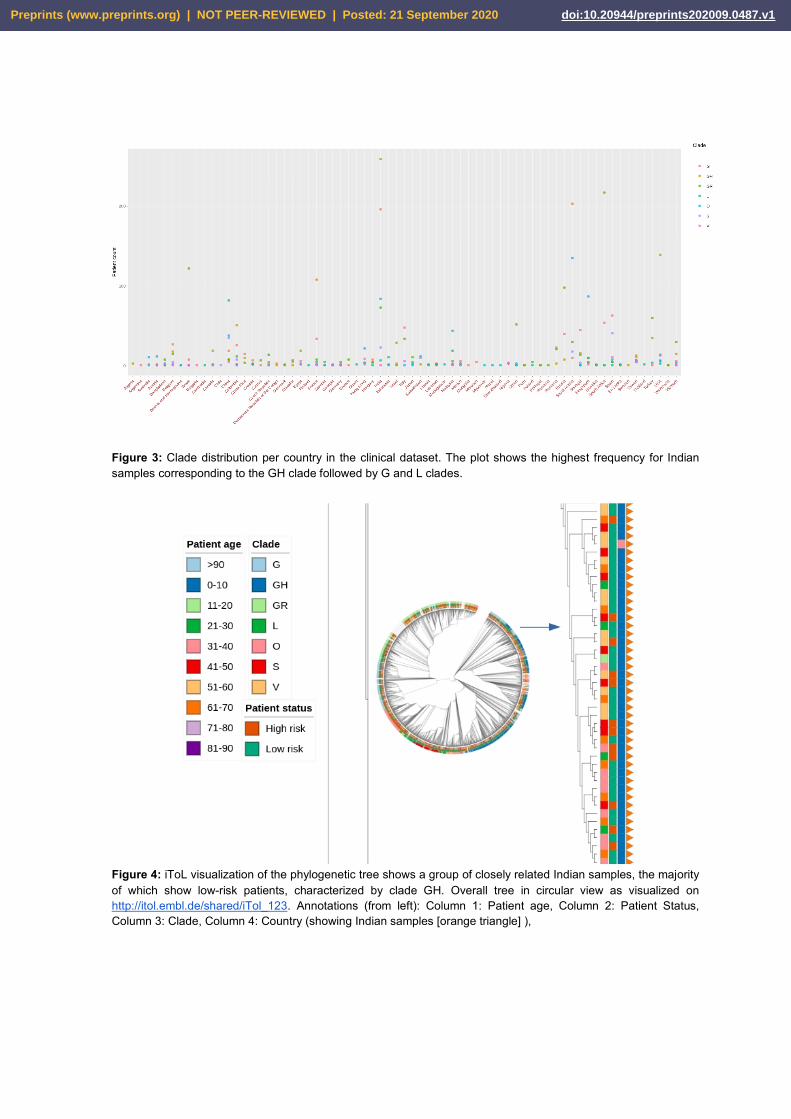
Figure 3: Clade distribution per country in the clinical dataset. The plot shows the highest frequency for Indian samples corresponding to the GH clade followed by G and L clades.
Figure 4: iToL visualization of the phylogenetic tree shows a group of closely related Indian samples, the majority of which show low-risk patients, characterized by clade GH. Overall tree in circular view as visualized on http://itol.embl.de/shared/iTol_123. Annotations (from left): Column 1: Patient age, Column 2: Patient Status, Column 3: Clade, Column 4: Country (showing Indian samples [orange triangle] ),
Preprints (www.preprints.org) | NOT PEER-REVIEWED | Posted: 21 September 2020 doi:10.20944/preprints202009.0487.v1
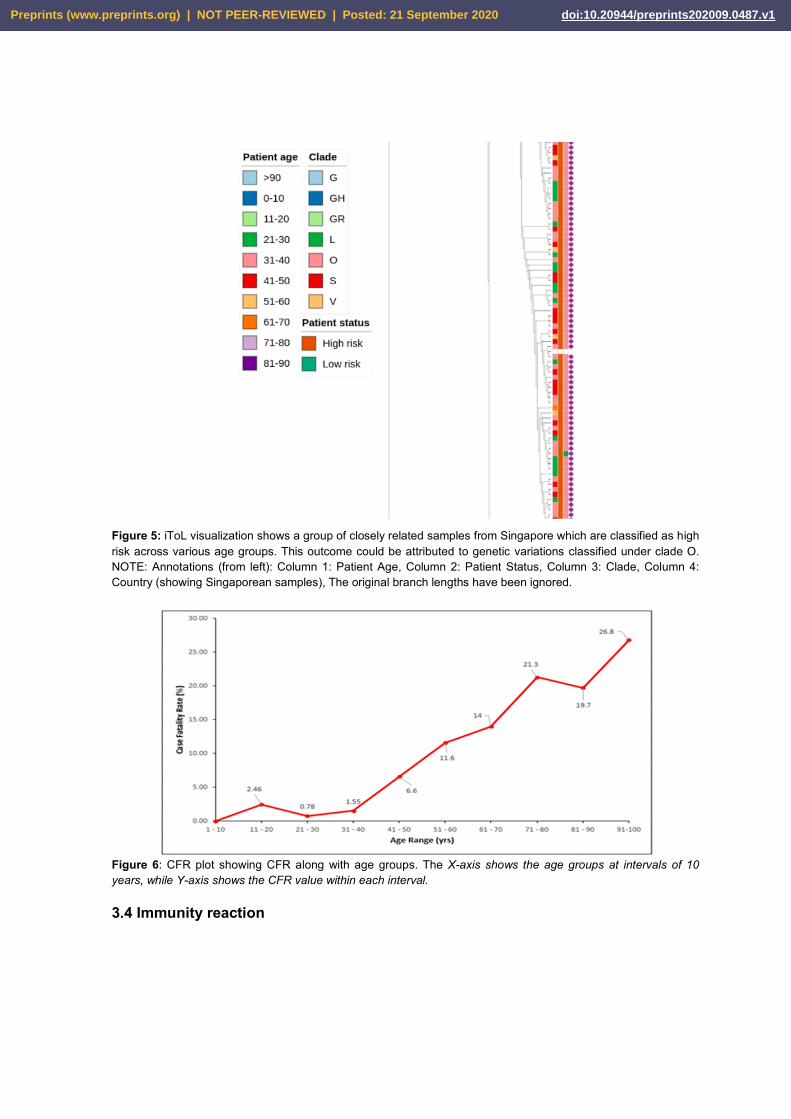
Figure 5: iToL visualization shows a group of closely related samples from Singapore which are classified as high risk across various age groups. This outcome could be attributed to genetic variations classified under clade O. NOTE: Annotations (from left): Column 1: Patient Age, Column 2: Patient Status, Column 3: Clade, Column 4: Country (showing Singaporean samples), The original branch lengths have been ignored.
Figure 6: CFR plot showing CFR along with age groups. The X-axis shows the age groups at intervals of 10 years, while Y-axis shows the CFR value within each interval. 3.4 Immunity reaction
Preprints (www.preprints.org) | NOT PEER-REVIEWED | Posted: 21 September 2020 doi:10.20944/preprints202009.0487.v1
Additionally, an immunity reaction distribution plot of COVID-19 across all ages given in
the dataset was generated (Figure 1) which shows that the immunity reaction to COVID-
19 was optimal among the younger individuals(mostly ages 25-50 years). The immunity
reaction dataset based on patient reaction is provided in Supplementary Table 1.
4. DISCUSSION
Since the beginning of the disease outbreak, age has been a significant forecasting
determinant of COVID-19 in patients [26]. In this study, immunity reaction to COVID-19
infection was analyzed across all ages of the study's dataset. It showed that the immunity
reaction to COVID-19 was optimal among the younger individuals(mostly ages 25-50
years), declined after the age of 50 years, and the least reaction was seen in the age
range from 75 to100 years. Our results support the fact that immunosenescence is
characterized by reduced B and T cell numbers as well as responses. Moreover, COVID-
19 infection is characterized in many cases with lymphopenia (decreased lymphocytes
numbers) which is much higher in the elderly than that of the young and middle-aged
patients [27], this may worsen the immune response in the elderly than younger age
groups. Taken together, age-associated immune remodeling, in company with other
predisposing factors such as malnutrition, decreased physical activity, and associated
chronic medical conditions among the elderly lead to the decreased immune response in
the older age groups, elevating their susceptibility to infectious diseases and responsible
for the severe clinical manifestations observed in older patients. In this line of thought,
the previously mentioned mechanisms suggest the underlying worse prognosis in older
patients with COVID-19 and to some extent explain our following results that might lead
to further research.
An important characteristic of a novel infectious disease as COVID-19 is its severity
and its ability to cause death. The World Health Organization (WHO) report in August
2020 on estimating mortality from COVID-19 recommended that “efforts should be made
to calculate risk-group-specific estimates of fatality risk to have a better insight on the
true patterns of fatality” [28]. In the present study, we measured the CFR for different age
groups, and results showed that the death rate increases as age increases which agrees
Preprints (www.preprints.org) | NOT PEER-REVIEWED | Posted: 21 September 2020 doi:10.20944/preprints202009.0487.v1
with the Center for Disease Control and Prevention (CDC) report comparing death rate
ratios of different age groups to the 18-29 years age group [29]. A slight difference in
CFR progression was seen at the ages range 11-20 and 81-90, this proves the theory
that CFR calculated during an ongoing pandemic is conditional because some active
cases may subsequently die after the time of the report leading to underestimation of the
CFR of the report [28,29].
So we measured another estimate for disease outcome, we calculated odds ratios
(OR) for disease severity with different age groups (Supplementary Table 2). Our results
are consistent with a study done on 17 million people in England, where more than 90%
of COVID-19 related deaths were recorded among people over 60 years of age.
Furthermore, those above 80 years had an about 40-fold increased risk compared with
those who are 51-60 years [30]. In the current study, the OR had its peak at age range
81-90 years which almost tripled that of patients within the age range of 71-80 years, this
also agrees with an initial study conducted in Italy that described the mortality rate and
risk factors for patients above 80 years [31]. This shows that patients above 80 years of
age are at higher risk [32], which could be due to their inherent reduced immune
capacities and resilience [31].
The phylogenetic analysis of the circulating clade in a country and its risk association
along with specific age groups is necessary to identify the specific groups with the
highest treatment-targeted priority. Our study identified seven clades with the most
abundant one was the GH clade accounting for low disease risk and the highest count in
Indian and Saudi-Arabian populations. Bartolini et al., [33] reported the clustering of V
and G clades from the European Union (EU) countries. However, in our present study,
there was an expanded clustering of clades across the 69 countries. Clades L and O with
the highest disease risk had the least pairwise OR when compared with the other 5
clades. GISAID genome sequence interspersed different non-G clades, located on the
gene with distribution in different clades indicating repeated occurrence with no
evolutionary advantage[34].
Interestingly and in contrast to our previous results, our phylogenetic tree
visualization showed a deviation from the regular observed pattern of the relationship
between advanced age (>50 years) and high-risk disease outcomes. Clusters from
Preprints (www.preprints.org) | NOT PEER-REVIEWED | Posted: 21 September 2020 doi:10.20944/preprints202009.0487.v1
Indian samples showed the prevalence of the low-risk clade GH across varying age
groups. Also, clusters from Singapore showed the prevalence of the high-risk clade O
across all age groups. Changes in age-group-specific infection were earlier observed in a
study, carried out in EU countries, showing changes in the age group of the most
affected population from ages >60 to ages 20 - 29 over several months. The median
infection age also was shown to have decreased from 54 years to 39 years in a space of
7 months [34]. The impact of several genetic variants can be suggested by the fact that
the virus does not show similar mortality rates across different countries. The viral
progression may vary in terms of the genetic makeup of an individual, and the outcomes
may also be due to several other factors that influence treatment and patient care. This
deviation suggests that further factors should be taken into account during performing a
risk-group-specific analysis of the disease, it will provide a more accurate understanding
of the mortality rates related to SARS-CoV-2.
5. CONCLUSIONS
We have successfully analyzed more than 3500 genomes of SARS-CoV-2 isolated from
COVID-19 patients from different geographical locations and identified a positive
association between patient age and COVID-19 disease severity.
This study has its limitations, and this includes working with small datasets. More
genomes could increase our confidence in OR analysis results. Variation in the
accessibility to treatment availability and facilities can also influence the patient outcome.
In the context of the proposed hypothesis, it is not clear as to whether age could have a
direct impact on mortality of the patients, but this could be better understood by looking
at other clinical factors.
DATA AVAILABILITY All datasets used are provided in the Zenodo repository: https://zenodo.org/record/4007666#.X1tmwnYzavM All scripts written for the analysis are provided in the GitHub repo: https://github.com/MountainMan12/GISAID_phylo
Preprints (www.preprints.org) | NOT PEER-REVIEWED | Posted: 21 September 2020 doi:10.20944/preprints202009.0487.v1
ACKNOWLEDGMENTS We thank all contributors in this research work for their expertise, collaborative effort, and
assistance throughout all aspects of the study. We thank HackBio for providing an
enabling environment and platform on which the research was successfully carried out.
We are grateful to our mentor Sarah Carl for her advice and constant guidance during
the research work.
We gratefully acknowledge the authors, originating and submitting laboratories of the
sequences from GISAID EpiCoV™ database on which the research was based. A table
of the contributors is available in Supplementary Table 5 (GISAID acknowledgment
table). We also thank the Galaxy Project which enabled us to carry out the analysis
efficiently.
CONFLICTS OF INTEREST The authors declare no conflict of interest
REFERENCES
1. Ayukekbong, J.A., Ntemgwa, M.L., Ayukekbong, S.A., Ashu, E.E., and Agbor, T.A. (2020). COVID-19 Compared to other Epidemic Coronavirus Diseases and the Flu. World Journal of Clinical Infectious Diseases. 10(1):1-13. DOI: 10.5495/wjcid.v10.i1.1
2. Čivljak, R., Markotić, A., and Kuzman, I. (2020). The Third Coronavirus Epidemic in the Third Millennium: What's Next?. Croatian Medical Journal. 61(1):1–4. DOI: 10.3325/cmj.2020.61.1
3. Peeri, N.C., Shrestha, N., Rahman, M.S., Zaki, R., Tan, Z., Bibi, S., Baghbanzadeh, M., Aghamohammadi, N., Zhang, W. and Haque, U. (2020). The SARS, MERS, and Novel Coronavirus (COVID-19) Epidemics, the Newest and Biggest Global Health Threats: What Lessons Have We Learned?. International Journal of Epidemiology. 49(3):717-726. DOI: 10.1093/ije/dyaa033
4. McIntosh, K., and Perlman, S. (2015). Coronaviruses, Including Severe Acute Respiratory Syndrome (SARS) and Middle East Respiratory Syndrome (MERS). Mandell, Douglas, and Bennett's Principles and Practice of Infectious Diseases. 1928-1936.e2. DOI: 10.1016/B978-1-4557-4801-3.00157-0
5. Petrosillo, N., Viceconte, G., Ergonul, O., Ippolito, G., and Petersen, E. (2020). COVID-19, SARS, and MERS: Are They Closely Related?. Clinical Microbiology and Infection. 26(6):729-734. DOI: 10.1016/j.cmi.2020.03.026
Preprints (www.preprints.org) | NOT PEER-REVIEWED | Posted: 21 September 2020 doi:10.20944/preprints202009.0487.v1
6. Zhu, N., Zhang, D., Wang, W., Li, X., Yang, B., Song, J., Zhao, X., Huang, B., Shi, W., Lu, R., Niu, P., Zhan, F., Ma, X., Wang, D., Xu, W., Wu, G., Gao, G.F., Tan, W. (2020). China Novel Coronavirus Investigating and Research Team. A Novel Coronavirus from Patients with Pneumonia in China, 2019. New England Journal of Medicine. 382:727-733. DOI: 10.1056/NEJMoa2001017.
7. Wu, F., Zhao, S., and Yu, B. (2020). A New Coronavirus Associated with Human Respiratory Disease in China. Nature. 579:265 269. DOI: 10.1038/s41586‐ -020-2008-3
8.World Health Organization (WHO) Coronavirus disease (COVID-19): weekly epidemiological update.Geneva (WHO); 07 September 2020. Available from https://www.google.com/url?q=https://www.who.int/docs/default source/coronaviruse/situation-reports/20200907-weekly-epi-update-4.pdf?sfvrsn%3Df5f607ee_2&sa=D&ust=1599538538578000&usg=AFQjCNEsaB84WSIVv5vpJ2qu2MpQ78LXsg. Accessed on 8th of September 2020.
9.Elbe, S., and Buckland-Merrett, G. (2017) Data, disease, and diplomacy: GISAID’s innovative contribution to global health. Global Challenges, 1:33-46. DOI:10.1002/gch2.1018 PMCID: 31565258
10. Siarhei, A.D., and Yury, K.K. (2020). SARS CoV 2: Structural diversity, phylogeny, ‐ ‐
and potential animal host identification of spike glycoprotein. Journal of Medical Virology. 92(9):1690-1694. DOI: 10.1002/jmv.25976.
11. Sheikh, J. A., Singh, J., Singh, H., Jamal, S., Khubaib, M., Kohli, S., Dobrindt, U., Rahman, S. A., Ehtesham, N. Z., & Hasnain, S. E. (2020). Emerging genetic diversity among clinical isolates of SARS-CoV-2: Lessons for today. Infection, genetics, and evolution: journal of molecular epidemiology and evolutionary genetics in infectious diseases, 84, 104330. https://doi.org/10.1016/j.meegid.2020.104330
12. Koyama, T., Platt, D., Parida, L. (2020) Variant analysis of SARS-CoV-2 genomes. Bulletin of the World Health Organization 2020;98:495-504. DOI: http://dx.doi.org/10.2471/BLT.20.253591
13. Zhu, N., Zhang, D., Wang, W., Li, X., Yang, B., Song, J., et al. (2020) A novel coronavirus from patients with pneumonia in China, 2019. New England Journal of Medicine. N Engl J Med 2020; 382:727-733. DOI: 10.1056/NEJMoa2001017
14. Ji, W., Wang, W., Zhao, X., Zai, J., Li, X. (2020) Cross-species transmission of newly identified coronavirus 2019-nCoV. J Med Virol. 2020; 92:433-440
15. Yamada, K. D., Tomii, k., and Katoh, K. (2016). Application of MAFFT sequence alignment program to large data-re-examination of the usefulness of chained guide trees. Bioinformatics (Oxford, English), 32(21), 3246-3251. https://doi.org/10.1093/bionformatics/btw412
Preprints (www.preprints.org) | NOT PEER-REVIEWED | Posted: 21 September 2020 doi:10.20944/preprints202009.0487.v1
16. Tan, G., Gil, M., Loytynoja, A. P., Goldman, N., and Dessimoz, C. (2015). Simple chained guide trees give poorer multiple sequence alignments than inferred trees in simulation and phylogenetic benchmarks. Proceedings of the National Academy of Sciences of the United States of America, 112(2), E99-E100. https://doi.org/10.1073/pnas.1417526112
17. Wei, M., Yuan, J., Liu, Y., Tao Fu, T., Yu, X., Zhang, Z. (2020) Novel Coronavirus Infection in Hospitalized Infants Under 1 Year of Age in China. JAMA. 2020;323(13):1313-1314. DOI:10.1001/jama.2020.2131
18. Wang, D., Hu, B., Hu, C., Zhu, F., Liu, X., Zhang, J., Wang, B., Xiang, H., Cheng, Z., Xiong, Y., Zhao, Y., Li, Y., Wang, X., Peng, Z. (2020). Clinical Characteristics of 138 Hospitalized Patients With 2019 Novel Coronavirus–Infected Pneumonia in Wuhan, China. JAMA. 2020;323(11):1061-1069. DOI:10.1001/jama.2020.1585
19. Wes McKinney. Data Structures for Statistical Computing in Python. Proceedings of the 9th Python in Science Conference, 51-56 (2010)
20. Cock PA, Antao T, Chang JT, Chapman BA, Cox CJ, Dalke A, Friedberg I, Hamelryck T, Kauff F, Wilczynski B, and de Hoon MJL (2009) Biopython: freely available Python tools for computational molecular biology and bioinformatics. Bioinformatics, 25, 1422-1423
21. Katoh, K., Misawa, K., Kuma, K., and Miyata, T. (2002) MAFFT: a novel method for rapid multiple sequence alignment based on fast Fourier transform. Nucleic Acid Res., 30:3059-3066
22. Price, Morgan N., and Dehal, Paramvir S. and Arkin, Adam P. (2010). FastTree 2 â Approximately Maximum-Likelihood Trees for Large Alignments. In PLoS ONE, 5 (3), pp. e9490. DOI:10.1371/journal.pone.0009490
23. Blankenberg, D., Coraor, N., Von Kuster, G., Taylor, J., Nekrutenko, A. and The Galaxy Team. (2011) Integrating diverse databases into a unified analysis framework: a Galaxy approach. Database (Oxford):bar011. DOI:10.1093/database/bar011.
24. Letunic, I., & Bork, P. (2019). Interactive Tree Of Life (iTOL) v4: recent updates and new developments. Nucleic acids research, 47(W1), W256-W259.
25. Szumilas M. (2010) Explaining Odds Ratios. J Can Acad Child Adolesc Psychiatry. 19(3): 227–229.
26. Bonanad, C., García-Blas, S., Tarazona-Santabalbina, F., Sanchis, J., Bertomeu-González, V., Fácila, L., Ariza, A., Núñez, J., & Cordero, A. (2020). The Effect of Age on Mortality in Patients With COVID-19: A Meta-Analysis With 611,583 Subjects. Journal of the American Medical Directors Association. 21(7), pages 915-918 DOI: https://doi.org/10.1016/j.jamda.2020.05.045
Preprints (www.preprints.org) | NOT PEER-REVIEWED | Posted: 21 September 2020 doi:10.20944/preprints202009.0487.v1
27. Liu, K, Chen, Y, Lin, R, Han, K. Clinical features of COVID-19 in elderly patients: A comparison with young and middle-aged patients. J Infect. 2020;80(6):e14-e18. DOI:10.1016/j.jinf.2020.03.005
28. World Health Organisation, WHO. (2020). Estimating mortality from COVID-19. Scientific brief. https://www.who.int/news-room/commentaries/detail/estimating-mortality-from-covid-19#
29. Center for Disease Control and Prevention (2020). Coronavirus Disease 2019 (COVID-19): COVID-19 Hospitalization and Death by Age.https://www.cdc.gov/coronavirus/2019-ncov/covid-data/investigations-discovery/hospitalization-death-by-age.html
30. Williamson, E. J., Walker, A. J., Bhaskaran, K., Bacon, S., Bates, C., Morton, C. E., Curtis, H. J., Mehrkar, A., Evans, D., Inglesby, P., Cockburn, J., McDonald, H. I., MacKenna, B., Tomlinson, L., Douglas, I. J., Rentsch, C. T., Mathur, R., Wong, A. Y. S., Grieve, R., … Goldacre, B. (2020). OpenSAFELY: factors associated with COVID-19 death in 17 million patients. Nature. 584, pages 430–436 DOI: https://doi.org/10.1038/s41586-020-2521-4
31. Porcheddu R., Serra C., Kelvin D., Kelvin, N., and Rubino, S. (2020) Similarity in case fatality rates (CFR) of COVID-19/SARS-COV-2 in Italy and China. Journal of Infection in Developing Countries. 14 (2), pages 125-128. DOI: https://doi.org/10.3855/jidc.12600
32. Worldometer (13th May 2020). Coronavirus Age, Sex, Demographics (COVID-19). Accessed 27th August 2020 from https://wwwworldometersinfo/coronavirus/coronavirus-age-sex-demographics
33. Bartolini, B., Rueca, M., Gruber, C., Messina, F., Carletti, F., Giombini, E., Inpatient Di Caro, A. (2020). SARS-CoV-2 Phylogenetic Analysis, Lazio Region, Italy, February–March 2020. Emerging Infectious Diseases, 26(8), 1842-1845. https://dx.doi.org/10.3201/eid2608.201525.
34. Coronavirus disease 2019 (COVID-19) in the EU/EEA and the UK –eleventh update, 10 August 2020.Stockholm: ECDC; 2020.
Preprints (www.preprints.org) | NOT PEER-REVIEWED | Posted: 21 September 2020 doi:10.20944/preprints202009.0487.v1
APPENDIX
Supplementary Table 1: Data Assignment Used In Immunity Reaction Plot (Figure 1)
Initial Assigned
Alive Best Reaction
Deceased Worst Reaction
Live Best Reaction
Death Worst Reaction
Home Best Reaction
Recovered Best Reaction
Released Best Reaction
Cured Best Reaction
Hospitalized Mild Reaction
Quarantine Best Reaction
Recovering Best Reaction
Discharged Best Reaction
Pneumonia Mild Reaction
Isolation Best Reaction
ICU Worst Reaction
Inpatient Mild Reaction
Outpatient Best Reaction
Symptomatic Mild Reaction
Preprints (www.preprints.org) | NOT PEER-REVIEWED | Posted: 21 September 2020 doi:10.20944/preprints202009.0487.v1
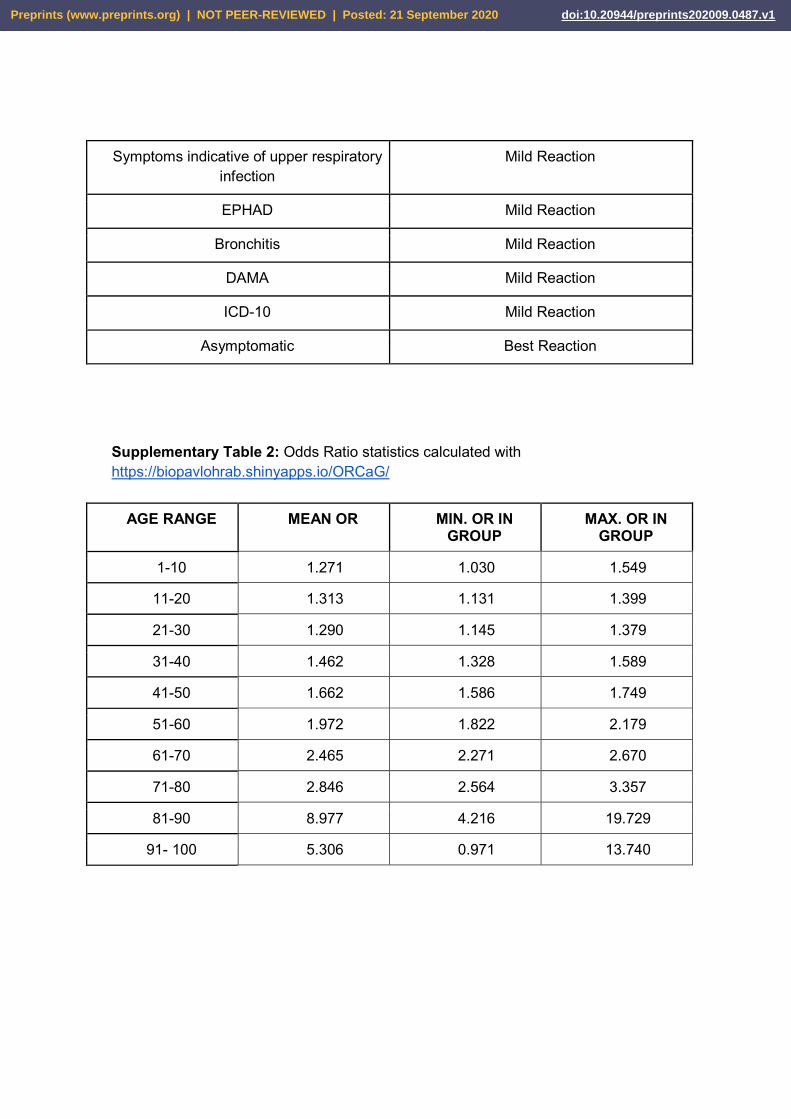
Symptoms indicative of upper respiratory infection
Mild Reaction
EPHAD Mild Reaction
Bronchitis Mild Reaction
DAMA Mild Reaction
ICD-10 Mild Reaction
Asymptomatic Best Reaction
Supplementary Table 2: Odds Ratio statistics calculated with https://biopavlohrab.shinyapps.io/ORCaG/
AGE RANGE MEAN OR MIN. OR IN GROUP
MAX. OR IN GROUP
1-10 1.271 1.030 1.549
11-20 1.313 1.131 1.399
21-30 1.290 1.145 1.379
31-40 1.462 1.328 1.589
41-50 1.662 1.586 1.749
51-60 1.972 1.822 2.179
61-70 2.465 2.271 2.670
71-80 2.846 2.564 3.357
81-90 8.977 4.216 19.729
91- 100 5.306 0.971 13.740
Preprints (www.preprints.org) | NOT PEER-REVIEWED | Posted: 21 September 2020 doi:10.20944/preprints202009.0487.v1
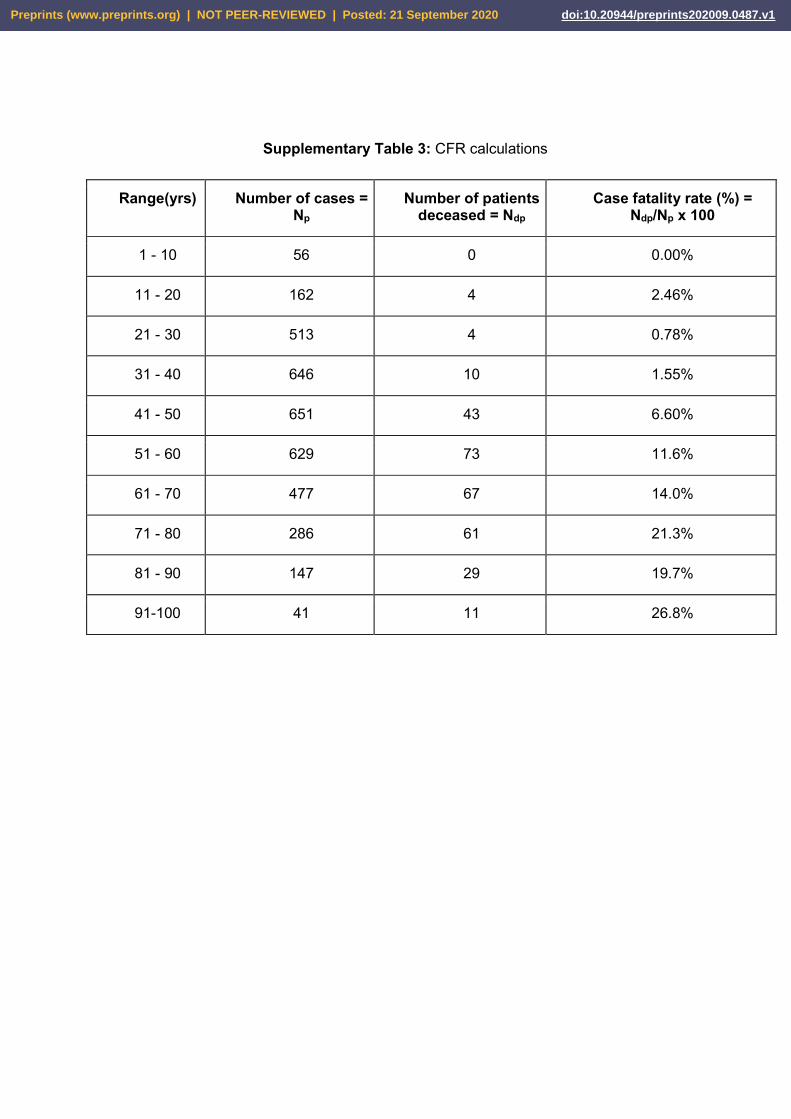
Supplementary Table 3: CFR calculations
Range(yrs) Number of cases = Np
Number of patients deceased = Ndp
Case fatality rate (%) = Ndp/Np x 100
1 - 10 56 0 0.00%
11 - 20 162 4 2.46%
21 - 30 513 4 0.78%
31 - 40 646 10 1.55%
41 - 50 651 43 6.60%
51 - 60 629 73 11.6%
61 - 70 477 67 14.0%
71 - 80 286 61 21.3%
81 - 90 147 29 19.7%
91-100 41 11 26.8%
Preprints (www.preprints.org) | NOT PEER-REVIEWED | Posted: 21 September 2020 doi:10.20944/preprints202009.0487.v1
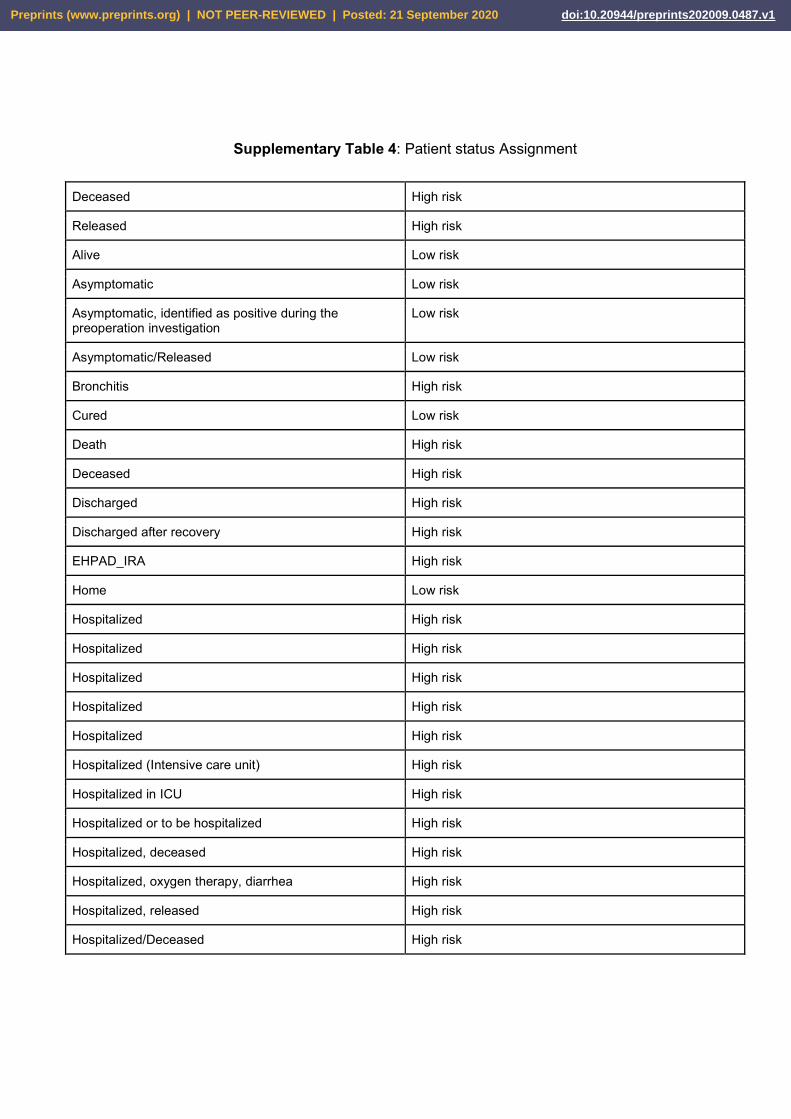
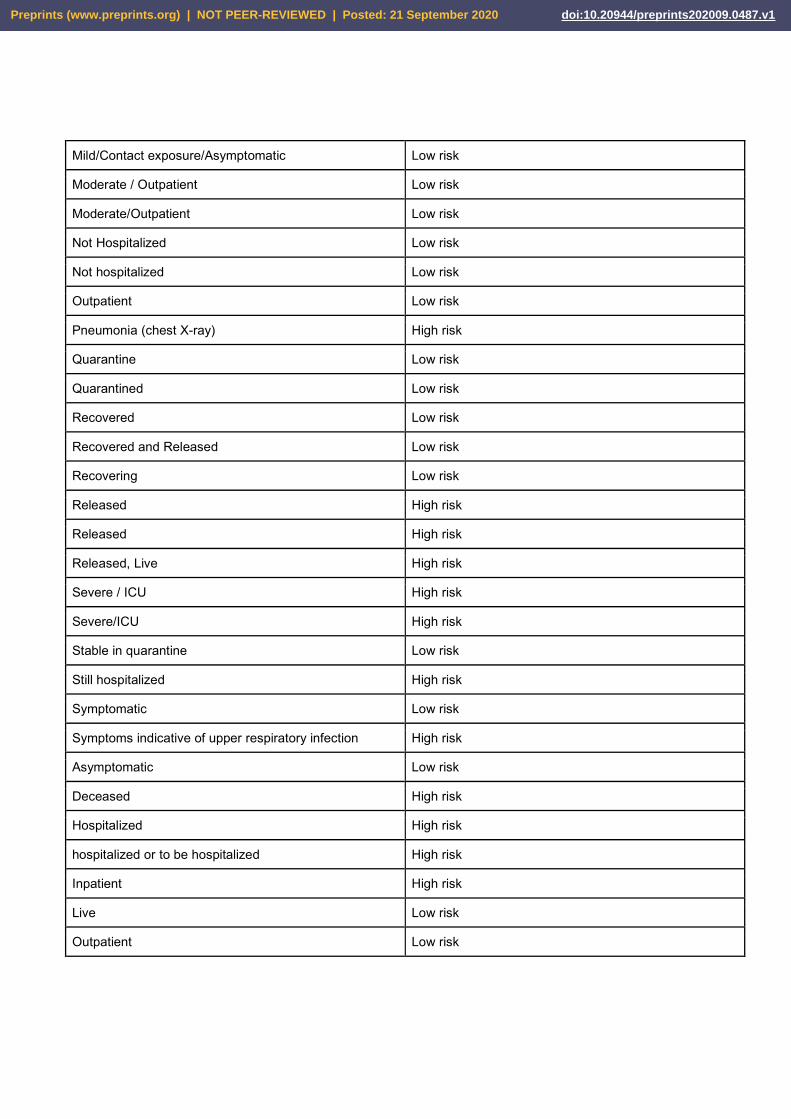
Supplementary Table 4: Patient status Assignment
Deceased High risk
Released High risk
Alive Low risk
Asymptomatic Low risk
Asymptomatic, identified as positive during the preoperation investigation
Low risk
Asymptomatic/Released Low risk
Bronchitis High risk
Cured Low risk
Death High risk
Deceased High risk
Discharged High risk
Discharged after recovery High risk
EHPAD_IRA High risk
Home Low risk
Hospitalized High risk
Hospitalized High risk
Hospitalized High risk
Hospitalized High risk
Hospitalized High risk
Hospitalized (Intensive care unit) High risk
Hospitalized in ICU High risk
Hospitalized or to be hospitalized High risk
Hospitalized, deceased High risk
Hospitalized, oxygen therapy, diarrhea High risk
Hospitalized, released High risk
Hospitalized/Deceased High risk
Preprints (www.preprints.org) | NOT PEER-REVIEWED | Posted: 21 September 2020 doi:10.20944/preprints202009.0487.v1
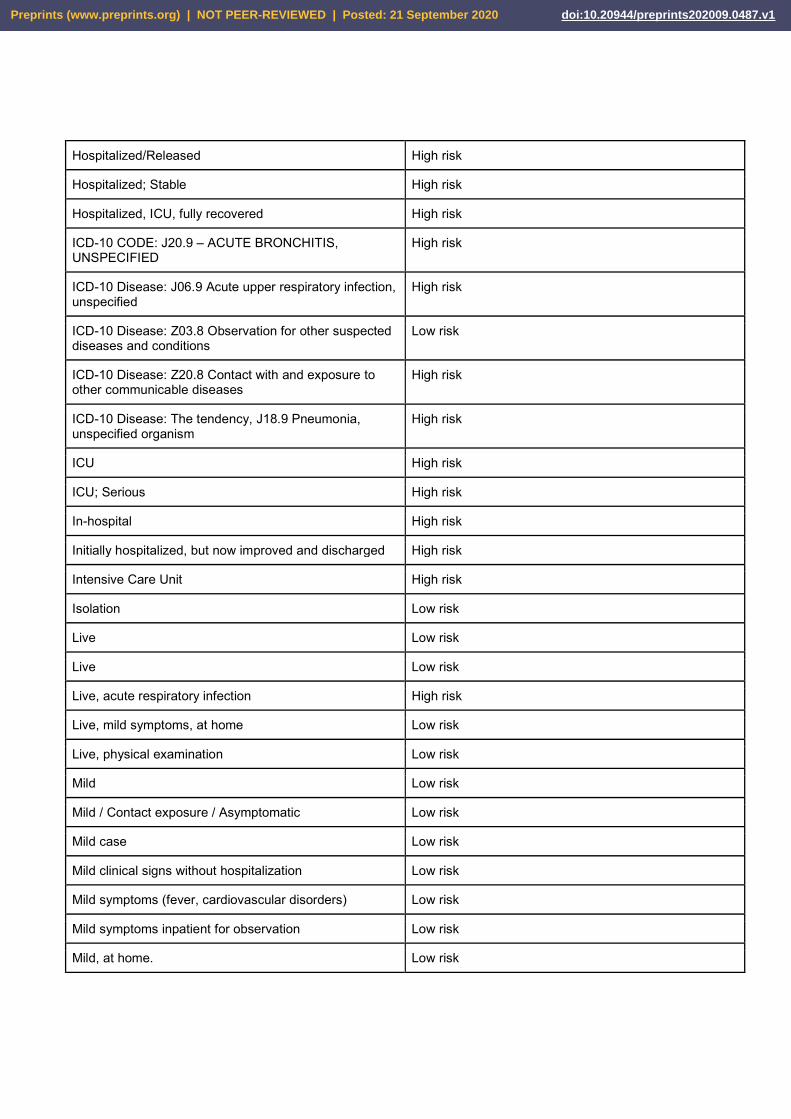
Hospitalized/Released High risk
Hospitalized; Stable High risk
Hospitalized, ICU, fully recovered High risk
ICD-10 CODE: J20.9 – ACUTE BRONCHITIS, UNSPECIFIED
High risk
ICD-10 Disease: J06.9 Acute upper respiratory infection, unspecified
High risk
ICD-10 Disease: Z03.8 Observation for other suspected diseases and conditions
Low risk
ICD-10 Disease: Z20.8 Contact with and exposure to other communicable diseases
High risk
ICD-10 Disease: The tendency, J18.9 Pneumonia, unspecified organism
High risk
ICU High risk
ICU; Serious High risk
In-hospital High risk
Initially hospitalized, but now improved and discharged High risk
Intensive Care Unit High risk
Isolation Low risk
Live Low risk
Live Low risk
Live, acute respiratory infection High risk
Live, mild symptoms, at home Low risk
Live, physical examination Low risk
Mild Low risk
Mild / Contact exposure / Asymptomatic Low risk
Mild case Low risk
Mild clinical signs without hospitalization Low risk
Mild symptoms (fever, cardiovascular disorders) Low risk
Mild symptoms inpatient for observation Low risk
Mild, at home. Low risk
Preprints (www.preprints.org) | NOT PEER-REVIEWED | Posted: 21 September 2020 doi:10.20944/preprints202009.0487.v1
Mild/Contact exposure/Asymptomatic Low risk
Moderate / Outpatient Low risk
Moderate/Outpatient Low risk
Not Hospitalized Low risk
Not hospitalized Low risk
Outpatient Low risk
Pneumonia (chest X-ray) High risk
Quarantine Low risk
Quarantined Low risk
Recovered Low risk
Recovered and Released Low risk
Recovering Low risk
Released High risk
Released High risk
Released, Live High risk
Severe / ICU High risk
Severe/ICU High risk
Stable in quarantine Low risk
Still hospitalized High risk
Symptomatic Low risk
Symptoms indicative of upper respiratory infection High risk
Asymptomatic Low risk
Deceased High risk
Hospitalized High risk
hospitalized or to be hospitalized High risk
Inpatient High risk
Live Low risk
Outpatient Low risk
Preprints (www.preprints.org) | NOT PEER-REVIEWED | Posted: 21 September 2020 doi:10.20944/preprints202009.0487.v1
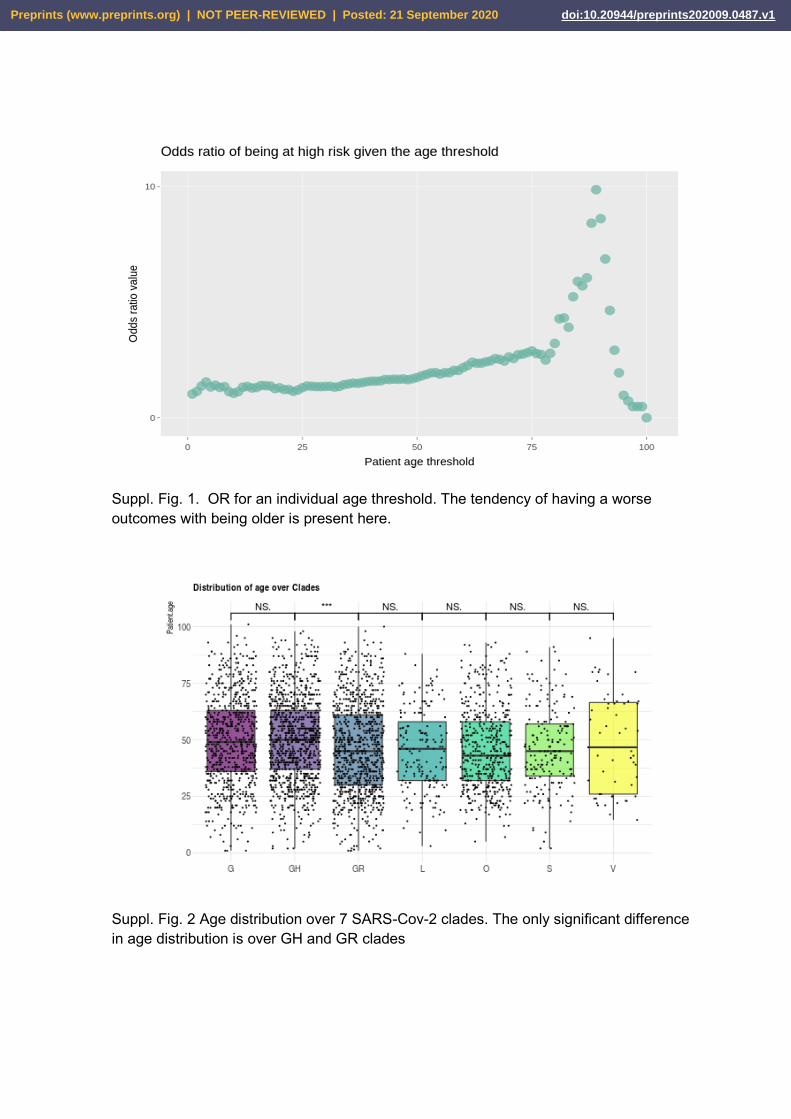
Suppl. Fig. 1. OR for an individual age threshold. The tendency of having a worse outcomes with being older is present here.
Suppl. Fig. 2 Age distribution over 7 SARS-Cov-2 clades. The only significant difference in age distribution is over GH and GR clades
Preprints (www.preprints.org) | NOT PEER-REVIEWED | Posted: 21 September 2020 doi:10.20944/preprints202009.0487.v1
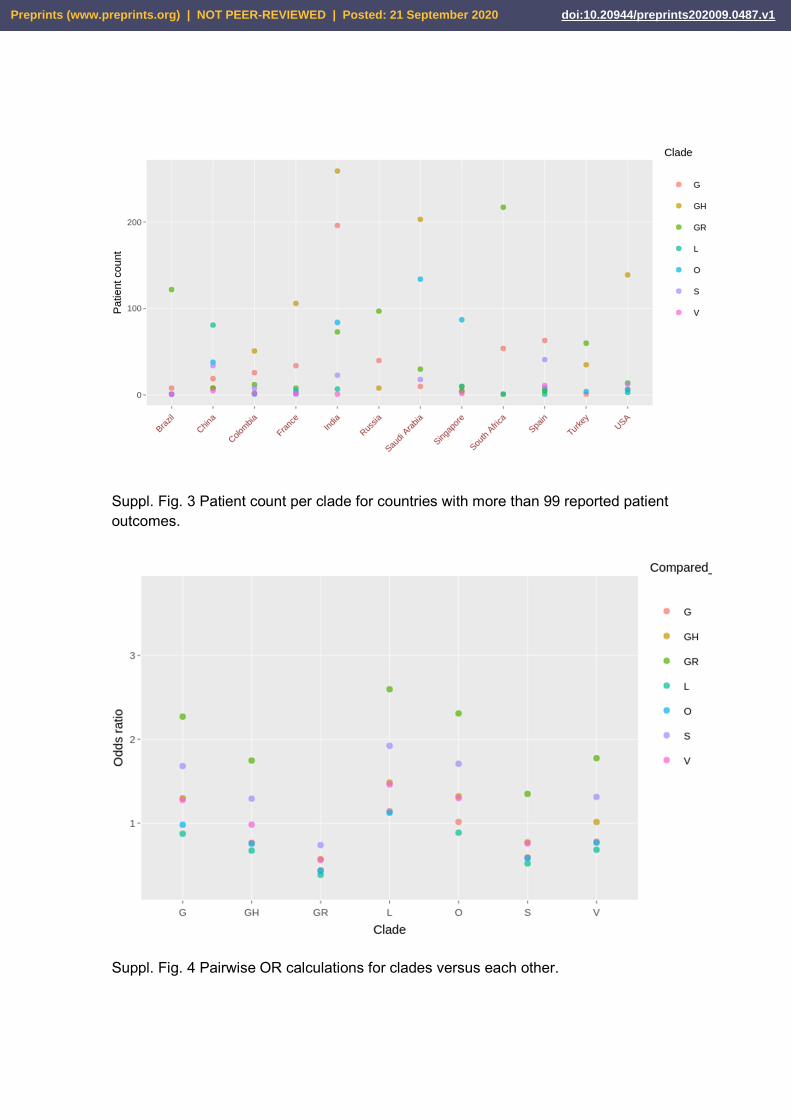
Suppl. Fig. 3 Patient count per clade for countries with more than 99 reported patient outcomes.
Suppl. Fig. 4 Pairwise OR calculations for clades versus each other.
Preprints (www.preprints.org) | NOT PEER-REVIEWED | Posted: 21 September 2020 doi:10.20944/preprints202009.0487.v1

![Journal für Reproduktionsmedizin und EndokrinologieThe prevalence of infertility among couples of reproduc-tive age is estimated at 15 % [1]. In approximately 25 %, various causes](https://static.fdokument.com/doc/165x107/600f3716e12e95082562ba4d/journal-fr-reproduktionsmedizin-und-endokrinologie-the-prevalence-of-infertility.jpg)