Antibiotic Resistance in Staphylococcus Species of Animal Origin
18 Nganou et al.
Int. J. Biosci. 2012
RESEARCH PAPER OPEN ACCESS
Determination of coffee origin by using 28S rDNA fingerprinting
of fungal communities by PCR-DGGE: Application to the
Cameroonian coffee
Nganou Donkeng N1, Durand N3, Tatsadjieu Ngoune L1*, Meile JC3, EL Sheikha AF2,
Montet D3, Mbufung CM1
1Department of Food Science and Nutrition, Food Microbiology laboratory, National School of Agro-
Industrial Sciences, University of Ngaoundere, P. O. Box. 455 Ngaoundere, Cameroon
2Minufiya University, Faculty of Agriculture, Department of Food Science and Technology, 32511
Shibin El Kom, Minufiya Government, Egypt
3UMR 95 Qualisud, CIRAD, TA B-95/16, 73, rue Jean-François Breton, 34398 Montpellier cedex 5
Received: 30 March 2012 Revised: 10 May 2012 Accepted: 12 May 2012
Key words: Coffee, PCR-DGGE, fungal community, traceability, Cameroon.
Abstract
The new European regulation 178/2002 imposes the determination of the geographical origin in the traceability
process of foodstuffs at the moment of commercial transactions. In practice, it is difficult to determine with accuracy
the geographical origin of foodstuffs. For this purpose, the total analysis of fungal communities in samples of coffee is
used. In the present study the molecular technique using 28S rDNA profiles generated by PCR-DGGE was used in
order to detect the variation in fungal community structures of coffee from five different locations in West and Coastal
plain in Cameroon and the effect of treatment and coffee species on these fungal profiles. When the 28S rDNA profiles
were analyzed by multivariate analysis, distinct microbial communities were detected. The band profiles obtained
from different samples of coffee and specific for each location and could be used as a bar code to certify the origin of
the coffee. This method is a new traceability tool which provides coffee products with a unique biological bar code and
makes it possible to trace back the coffee to their original location.
*Corresponding Author: Tatsadjieu Ngoune [email protected]
International Journal of Biosciences (IJB) ISSN: 2220-6655 (Print) 2222-5234 (Online)
Vol. 2, No. 5, p. 18-30, 2012 http://www.innspub.net
19 Nganou et al.
Int. J. Biosci. 2012
Introduction
International trade intensifies and extends to the entire
planet. Foodstuffs are often consumed far from their
zone of production. The consumer is more and more
demanding and sensitive to the quality and the origin
of the foodstuffs that they buy. Issues surrounding
food safety and security continue to be hot topics that
concern the whole the supply chain. Food crises such
as bovine spongiform encephalopathy and avian
influenza remain embedded in the memories of
European customers. Regulations across Europe
continue to be tightened in order to provide a greater
degree of assurance in quality and safety. Meanwhile,
the traceability and labeling of imported products in
European countries remains a compulsory issue (UE
Regulation No. 178/2002).
Coffee is produced by processing fruits of the genus
Coffea. Two species dominate the world market, Coffea
arabica (yielding coffee variety arabica) and Coffea
canephora (yielding coffee variety robusta). Coffee
production in Cameroon is shared between producers,
grouped into farmer cooperative societies (FCS) and
estates (E). FCS farmers practice extensive cultivation
of few acres of coffee trees with very few or no inputs.
Conversely, estates practice intensive coffee
cultivation, where coffee plants are kept in good
phytosanitary condition by regular applications of
fungicides and insecticides (FAO, 2006). Cameroonian
producers retain ownership of their coffee up to its sale
to exporters or roasters. The price paid for coffee
depends on its quality when it goes up for auction. As a
consequence, this calls for perfect traceability of coffee
from the production unit to the warehouses in which
the coffee entering the market is stored. Microflora of
coffee beans is composed of yeasts, bacteria and fungi,
which could have deep impacts on coffee quality (Sylva
et al., 2000). Undesirable micro-organisms present on
coffee beans before and/or during transformation can
irremediably cause detrimental, sensorial or chemical
defects. Fungi are responsible for coffee diseases
(mildew and black rot), mycotoxin production
(Cabanes et al., 2002; Battilani et al., 2003) or
sensorial defects in coffee such as musty or earthy
aromas (La Guerche et al., 2004). Knowledge of the
structure and diversity of the fungal community of
coffee beans would lead to a better understanding of
the emergence of defects in coffee in relation to fungi
presence on coffee beans.
For economic reasons and for profitability, several
batches of coffee of various origin or various cultivars
could be mixed. It is thus very difficult to check their
exact geographical origin. Traceability is only assured
by rigorous labeling and administrative documentation
however it is not under control. In case of doubt or
fraud, it is necessary to find a precise and rapid
analytical technique in order to determine the
geographical origin. The most popular analytical
methods that allow us to ensure the determination of
origin are bar coding, spec-troscopy, stable isotopes,
etc. (Peres et al., 2007). Stable isotopes are the only
methods that are referenced as an European regulation
for wine origin determination (Ghidini et al., 2006).
Thus, it seems difficult to use coffee genomic markers
to ensure the traceability. However, the skin of coffee is
not sterile and can carry microorganisms or their
fragments. The presence of various microorganisms
must depend on the external environment of the coffee
(soil ecology, spoilage, insects, diseases), but also
microorganisms brought by human activity (Sodeko et
al., 1987).
The idea was to create a ‘‘biological bar code’’ (Montet
et al., 2004), based on the analysis of the DNA of
microorganisms present on the products. This method
is based on the assumption that the microbial
communities of the coffee are specific for a
geographical area (Le Nguyen et al., 2008; Montet et
al., 2008).
The main objective of this study was to apply the PCR–
DGGE method to analyze in a unique step all the
moulds present on the coffee, in order to create an

20 Nganou et al.
Int. J. Biosci. 2012
analytical technique that will permit the linkage of
fungal communities to the geographical origin and
avoid the individual analysis of each moulds strain.
The acquired band patterns for the fungal communities
of different species of coffee and different harvesting
locations were compared and analyzed statistically to
determine the coffee geographical origin. To the best of
our knowledge, this paper describing a molecular
method, PCR–DGGE that will permit the certification
of the coffee origin, in particular by using 28S rDNA
fingerprinting of moulds.
Materials and methods
Coffee samples
Before sample collection investigations were made on
the field with farmers every three months for one year.
Fig. 1 recapitulates this field work with samples
collected at stages Ia, Ib and II of the process. Samples
of 500g of coffee (parchment, coffee cherries and
coffee beans) (stage Ia, Ib, II) were collected from five
different sites of the west regions and the coastal plain
in Cameroon, during the campaigns of 2009 and 2010.
The samples were then placed in sterile plastic bags
and sent for laboratory analysis.
Fungi analysis
Subsamples of parchment coffee, dry cherry or green
coffee were also plated directly onto Petri dishes (five
beans per plate) containing Dichloran 18% Glycerol
agar (DG18) (Hocking and Pitt, 1980; Guiraud, 1998)
and Potato dextrose Agar (PDA) without prior
superficial disinfection. Plates were incubated at 25°C
for 5 to 7 days; results were expressed as a rate of
contaminated coffee beans. Moulds were isolated, sub-
cultured and observed with an optical microscope for
preliminary identification. This was done by
morphotypic analysis of the colony, especially color
and appearance using the proposals of Pitt and
Hocking (1997). Only genera of Penicillium, Fusarium
and Aspergillus were further identified to species level.
Fungal DNA isolation and PCR amplification
Fungal spores were harvested from plates in aseptic
conditions using sterile distilled water with 0.1%
Tween 80. Extraction method which combined
mechanical/enzymatic/chemical was applied according
to El Sheikha et al. (2009).
Fig. 1. Coffee processing steps from fresh cherries to
coffee beans in Cameroon. Ia, Ib II: sampling steps.
DNA was quantified spectrophotometrically with a
NanoDrop ND-1000 (NanoDrop Technologies,
Wilmington, USA) and kept at – 20°C until used as
template for PCR amplification. Additionally, the
successful application of a eukaryotic universal primer
for PCR permitted to amplify and identify many fungi
species in a unique PCR step.
A fragment of the D1/D2 region of the 28S rDNA gene
was amplified using eukaryotic universal primers:
forward, U1f GC (5' - CGC CCG CCG CGC GCG GCG
GGC GGG GCG GGG GTG AAA TTG TTG AAA GGG
AA – 3'; Sigma); reverse, U2r (5' - GAC TCC TTG GTC
CGT GTT – 3'; Sigma), amplifying a 260 bp fragment

21 Nganou et al.
Int. J. Biosci. 2012
(Möhlenhoff et al., 2001; Khot et al., 2009; El Sheikha
and Montet, 2010; El Sheikha et al., 2010). A 30 bp
GC-clamp (Sigma) was added to the forward primer
PCR was performed in a final volume of 50 µL
containing 0.2 µM of each primer, all the
deoxyribonucleotide triphosphate (dNTPs) at 200 µM,
1.5 mM of MgCl2, 5 µL of MgCl2-free 10xTaq reaction
buffer (Promega), 1.25 Units of Taq DNA polymerase
(Promega) and 2 µL of extracted DNA (≈ 30 ng). The
amplification was carried out as follows: An initial
denaturation at 94°C for 3 min, 30 cycles of 94°C for
45 sec, 50°C for 50 sec, 72°C for 90 sec and a final
extension at 72°C for 5 min.
PCR products were verified by electrophoresis by
loading 5 µL on 2% TAE agarose gels with a 100 pb
molecular weight ladder. Gels were stained and
photographed as mentioned above.
DNA extraction from coffee moulds
8 grams of each coffee beans sample were taken
aseptically and filled into sterile 50 mL tubes
containing 10 mL of sterile peptone water. The tubes
were placed on a rotating wheel for 1 h. 2 mL of
supernatant were then collected into Eppendorf tubes
of 2 mL containing 0.3 g of glass beads. Extraction was
done following the protocol of El Sheikha et al. (2010).
DNA extraction samples were verified by
electrophoresis and loaded into 0.8% agarose gels in 1
× TAE buffer (40 mM Tris–HCl, pH 7.4, 20 mM
sodium acetate, 1.0 mM Na2–EDTA; Eppendorf,
Germany) with a molecular weight ladder (Supercoiled
DNA Ladder 16.21 kb; Invitrogen, USA). After running
at 100 V for 30 min, the gels were stained for 30 min in
an ethidium bromide solution (50 µg/mL; Promega),
rinsed for 20 min in distilled water, then observed and
photographed on a UV transilluminator, using a black
and white camera (Scion Co., USA) and Gel Smart 7.3
system software (Clara Vision, Les Ulys, France).
Denaturing Gradient Gel Electrophoresis (DGGE)
analysis
The PCR products were analyzed by DGGE, by
using a Bio-Rad Dcode universal mutation detection
system (Bio-Rad, USA), using the procedure first
described by Muyzer et al. (1993) and improved by
Leesing (2005). Samples containing approximately
equal amounts of PCR amplicons were loaded into 8%
w/v polyacrylamide gels (acrylamide: N,N’-methylene
bisacrylamide, 37.5 : 1; Promega) in 1 × TAE buffer
(40 mM Tris–HCl, pH 7.4, 20 mM sodium acetate, 1.0
mM Na2-EDTA).
All electrophoresis experiments were performed at
60°C, using a denaturing gradient in the 40–70%
range (100% corresponded to 7 M urea and 40% v/v of
formamide; Promega). The gels were electrophoresed
at 20 V for 10 min and then at 80 V for 16 h. After
electrophoresis, the gels were stained for 30 min with
ethidium bromide and rinsed for 20 min in distilled
water and then photographed on a UV transilluminator
with the Gel Smart 7.3 system (Clara Vision, Les Ulys,
France).
Identification of DGGE bands
Detected bands were cut from the DGGE gel with a
sterile scalpel. DNA of each band was then eluted in
100 μL TE buffer at 4°C overnight. 100μL of DNA
eluted from each band was purified and sent for
sequencing as described above (in section Fungal DNA
isolation and PCR amplification) but using U1 primer
with no GC clamp, and then sent for sequencing at
GATC Biotech (Germany).
Sequences were finally compared to those in the
GenBank database (http://www.ncbi.nlm.nih.gov/
BLAST/) and those of the Ribosomal Database Project
(http://rdp.cme.msu.edu/index.jsp) using the BLAST
program (Altschul et al., 1997). Sequences with a
percentage identity of 97% or greater were considered
to belong to the same species (Stackebrandt and
Goebel, 1994; Palys et al., 1997).

22 Nganou et al.
Int. J. Biosci. 2012
Image and statistical analysis
Individual lanes of the gel images were straightened
and aligned using Image Quant TL software v. 2003
(Amersham Biosciences, USA). Banding patterns were
standardized with three reference patterns included in
all gels, Wickerhamomyces anomalus DNA and
Komagataella pastoris DNA. This software permitted
identification of the bands relative positions compared
with standard patterns. In DGGE analysis, the
generated banding pattern is considered as an image of
all of the major yeast in the populations. An individual
discrete band refers to a unique ‘sequence type’ or
phylotype (Van Hannen et al., 1999; Muyzer et al.,
1995). This was confirmed by Kowalchuk et al. (1997),
who showed that co-migrating bands generally
corresponded to identical sequences. The DGGE
fingerprints were manually scored by the presence and
absence of co-migrating bands, independent of
intensity. Pairwise community similarities were
quantified using the Dice similarity coefficient (SD)
(Heyndrickx et al., 1996): SD = 2Nc/Na + Nb
Where Na represents the number of bands detected in
sample A, Nb the number of bands in sample B, and Nc
the number of bands common to both samples. The
similarity index was expressed within a range of 0
(completely dissimilar) to 100 (perfect similarity).
Dendograms were constructed using the stat graphic
plus version 5.1 software (sigma plus, France).
Similarities in community structure were determined
using the cluster analysis with Euclidian distance
measure.
Table 1. Comparison of dominant moulds species identified during technological treatments of coffee by classical
culturing techniques and by DGGE.
Samplea Species identified by culturing Species identified by DGGE
Wet process: stage Ia
3409 A. carbonarius; A. niger; P. roqueforti
A. nomius ; A. fumigatus ; P. citrinum ; Wallemia muriae ; W. sebi ; roqueforti; Mucor sp.
3709 A. niger ; P. roqueforti; Fusarium lacertarum
A. niger ; P. citrinum ; W. sebi
3410 A. carbonarius; A. niger; P. citrinum
A. carbonarius; A. niger; A.ochraceus; Acremonium murorum; P. roqueforti; W. muriae; P. citrinum; P. arenicola
4210 A. carbonarius; A. niger; F. lacertarum,
Mucor sp.; W. sebi; P. roqueforti; Acremonium murorum
Dry process: stage Ib
1209 A. carbonarius; Rhizopus nigricans ; P. roqueforti
A.niger; A.carbonarius; Acremonium murorum; W. muriae
0510 A. niger; R. nigricans ; P. roqueforti ; F. chlamidosporum
A.niger; A. carbonarius; A. ochraceus; W.sebi; P. citrinum ; P. arenicola, P. roqueforti
0610 A. niger; R. nigricans ; P. roqueforti ; F. chlamidosporum
//
1210 A. niger ; F. lacertarum
A.niger, A.carbonarius; P. citrinum ; P. arenicola, P. roqueforti
1710 A. carbonarius; A. niger; R. nigricans ; P. roqueforti
A.niger; A. nomius ; W. sebi ; Acremonium murorum; W. muriae

23 Nganou et al.
Int. J. Biosci. 2012
2510 A. carbonarius; A. niger; P. roqueforti ; A. tamarii
A. nomius ; w. sebi ; P. roqueforti; Mucor sp.
3810 A. niger; R. nigricans ; P. citrinum
//
1110 A. carbonarius; R. nigricans ; Mucor hiemalis
A. carbonarius; A. ochraceus; W. muriae; P. citrinum; P. arenicola
Dry and Wet process: stage II
0410 A. niger; R. nigricans ; M. hiemalis ; A. flavus
A. niger; A.carbonarius; W. sebi; P. citrinum; P. arenicola
2710 A. carbonarius; R. nigricans
A. nomius; P. roqueforti; W.sebi; Acremonium murorum; Mucor sp.
3910 A. niger; F. lacertarum ; mucor sp.
A.nomius; A.fumigatus; A. carbonarius; A. ochraceus; W. sebi; W. muriae; Mucor sp.
4010 A. carbonarius; A. niger; A. tamarii
A.nomius; W. sebi; P. citrinum; P. roqueforti; Acremonium murorum; Mucor sp.
aSample number assigned for laboratory control; Ia, Ib, II: stage of process
Table 2. Characteristics of samples coffee used for the comparison of fungal profiles obtained by PCR-DGGE
Reference
Ma
rk
er (
M)
3410 0610 1409 41/9 3109 2710 2510 0909 3110 4810 5110
Type P V P V V V C V C V C
Variety A R A R R R R R R R R
Treatment VH VS VH VS VS VS VS VS VS VS VS
VHD VSD VHB VS1B VSB VSS VS1S VSA VS1A VSM VS1M
locations DSH BFSS SAN BAF MEL
P : parchement ; V : Green coffee ; C :Dry cherries ; A : arabica ; R : robusta ; VH : wet process ; VS : Dry process ; DSH : Dscang ;
BFSS : Bafoussam ; SAN : Santchou ; BAF : Bafang ; MEL : Melong
Results
Extraction of fungal DNA and verification of PCR
amplification of the extracted DNA
DNA extraction of the fungal community was
performed on coffee, with and without husks.
Extraction efficiency was verified with a 0.8% w/v
agarose gel. The DNA extraction method showed high
efficiency and bands with a molecular weight >16 kb
corresponding to genomic fungi DNA were clearly
observed on the gel.
Fig. 2. Banding pattern of PCR reactions of isolated
filamentous fungi (M: marker 100pb; g: negative
reference; a – e: Moulds DNA).
Fungal DNA obtained after extraction was amplified by
classical PCR, adapted from Kurtzman and Robnett
(1998) and Cocolin et al. (2000). PCR amplicons were
analyzed by electrophoresis on 1% w/v low melting
agarose gel at 100 V for 30 min in TEA buffer, as
described above. All bands were clearly observed and
had a molecular weight of the expected size of the
amplicon (Fig. 2). The high intensity of the bands
representing the PCR amplicons indicated that PCR
amplification yielded high quantities of fungal DNA
allowing further analysis by DGGE (from coffee
samples) and direct sequencing (of pure strains
isolated from coffee) to be completed.

24 Nganou et al.
Int. J. Biosci. 2012
Mycological analysis and identification of fungal
isolates by sequencing
As part of this work, analysis of the fungal flora was
made on coffee samples taken at different stages of
coffee processing method as shown in Fig. 1. Of these
samples, the fungal flora was characterized by
traditional techniques and by sequencing bands
obtained by PCR-DGGE.
Fig. 3. DGGE profiles of PCR amplicons of the domain
D1 of 28S rDNA that represent the fungi biodiversity in
samples taken during treatment of coffee (M: marker;
a-g: samples of coffee (3709, 3409, 3910, 1209, 1710,
2710, and 2510). The position of bands is indicated by
numbers that correspond to species of fungi: 1: A.
niger; 2: A. carbonarius; 3: Wallemia muriae; 4:
Mucor sp.; 5: Wallemia sebi; 6: Acremonium
murorum; 7 A.nomius; 8: Penicillium roqueforti; 9: P.
citrinum; 10: A. fumigatus; 11: A. ochraceus.
Table 1 shows the comparison of dominant moulds
species identified during technological treatments of
coffee by the classical culturing techniques and by
DGGE. The use of direct plating of beans in Petri
dishes on DG18 agar and PDA for samples (Table 1)
was employed. A high level of infection by moulds was
observed on parchment and dry cherries in all
processes after drying. Eleven different species have
been identified by conventional techniques, they were:
Aspergillus niger, A. carbonarius, A. flavus, A.
tamarii, Fusarium chlamidosporum, F. lacertarum,
Mucor hiemalis, Mucor sp., Penicillium citrinum, P.
roqueforti, Rhizopus nigricans.
DGGE analysis of representative fungal flora from
coffee
Samples of fungal DNA extracted from coffee beans
produced DNA bands on DGGE gels that had sufficient
intensities to be analyzed by sequencing (Fig. 3 and 4).
Two reference DNA of A. carbonarius and A. niger
were used as markers and loaded on DGGE gels (bands
1 and 2) to facilitate identification. In Fig. 3 and 4, each
vertical line represents a coffee beans sample and each
band represents a mould species. The PCR-DGGE
patterns of duplicate coffee for each stage of processing
were similar and revealed the presence of three to
twelve bands for each coffee sample. In addition, the
comparative study of strains obtained from both
methods suggests a higher diversity in the fungal
population obtained by DGGE method than with
traditional microbial techniques for the same samples.
However, some species that appear in the profiles of
direct methods were absent in the DGGE profile (Table
1).
Fig. 4. DGGE profiles of PCR amplicons of the domain
D1 of 28S rDNA that represent the fungi biodiversity in
samples taken during treatment of coffee (M: marker;
h-n: samples of coffee (3410, 0510, 1210, 1110, 4210,
4010, and 0410). The position of bands is indicated by
numbers that correspond to species of fungi: 1: A.
25 Nganou et al.
Int. J. Biosci. 2012
niger; 2: A. carbonarius; 3: P. arenicola; 4: Mucor
sp.; 5: Wallemia sebi; 6: Acremonium murorum; 7: A.
ochraceus; 8: A. nomius; 9: P. citrinum, 10: P.
roqueforti, 11: Wallemia muriae.
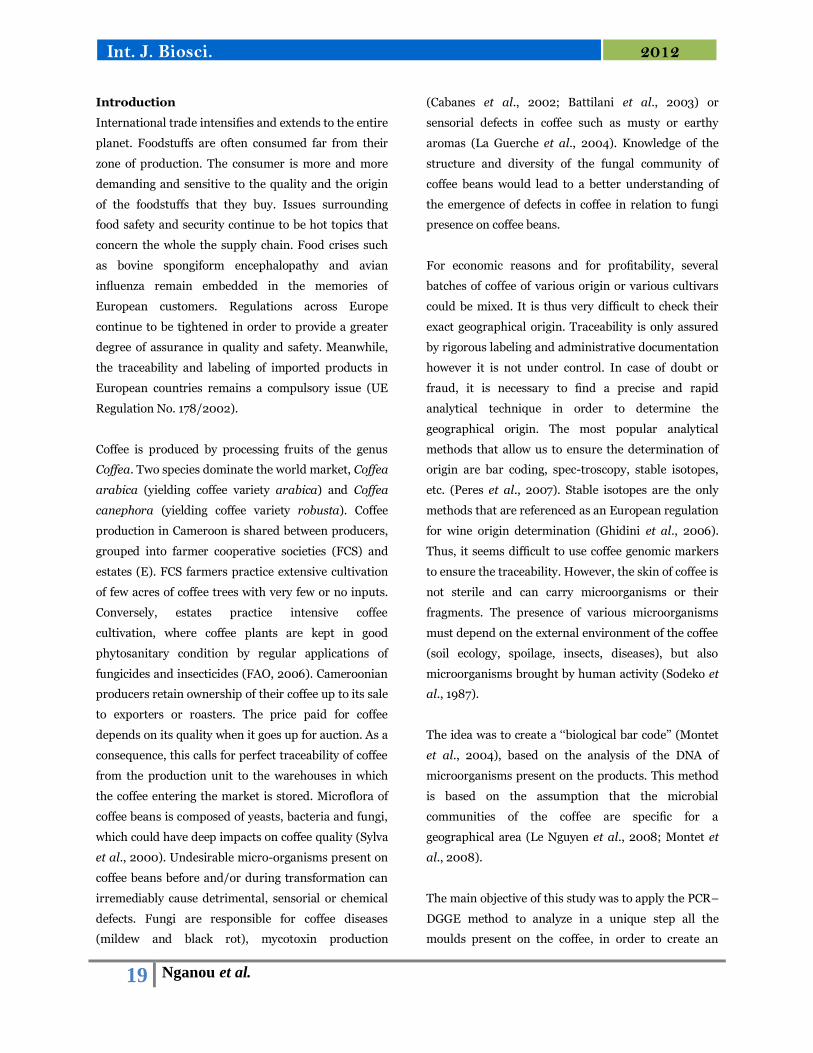
Fig. 5. PCR-DGGE 28S rDNA banding profiles of
coffee moulds from Dschang (DSH), Bafoussam
(BFSS), Santchou (SAN), Bafang (BAF) and Melong
(MEL), taken during two treatment (wet and dry
process). (M: marker).
DGGE pattern of moulds DNA from coffee among
different locations
On DGGE gel, the observed bands had sufficient
intensities to analyze samples of fungal DNA extracted
from coffee, from various geographical locations in
Cameroon (Fig. 5), so the total quantity of DNA
deposited in the wells of DGGE gel was sufficient to
consider that moulds DNA could be used as potential
markers to ensure the determination of coffee origin.
The reference DNA of A. cabonarius and A. niger
indicates that DGGE was working successfully. Each
vertical line represents a coffee and each spot
represents a moulds. The PCR–DGGE patterns of
duplicate sample of coffee for each location were
similar (Fig. 5).
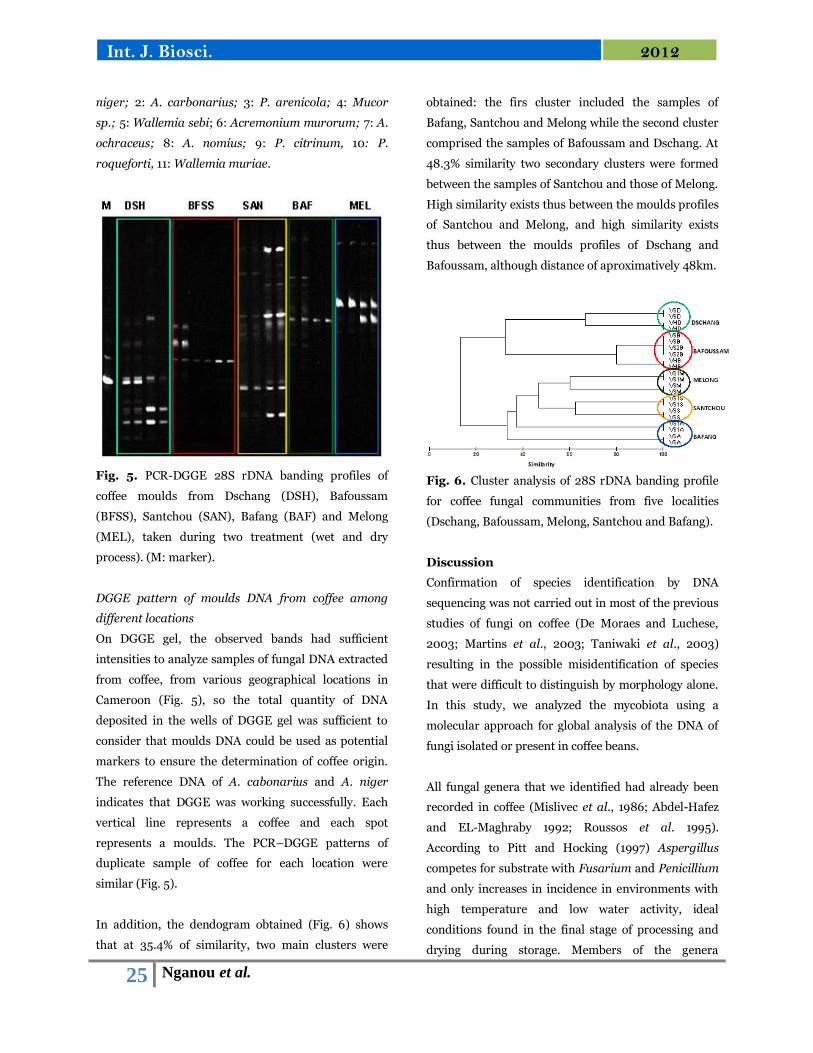
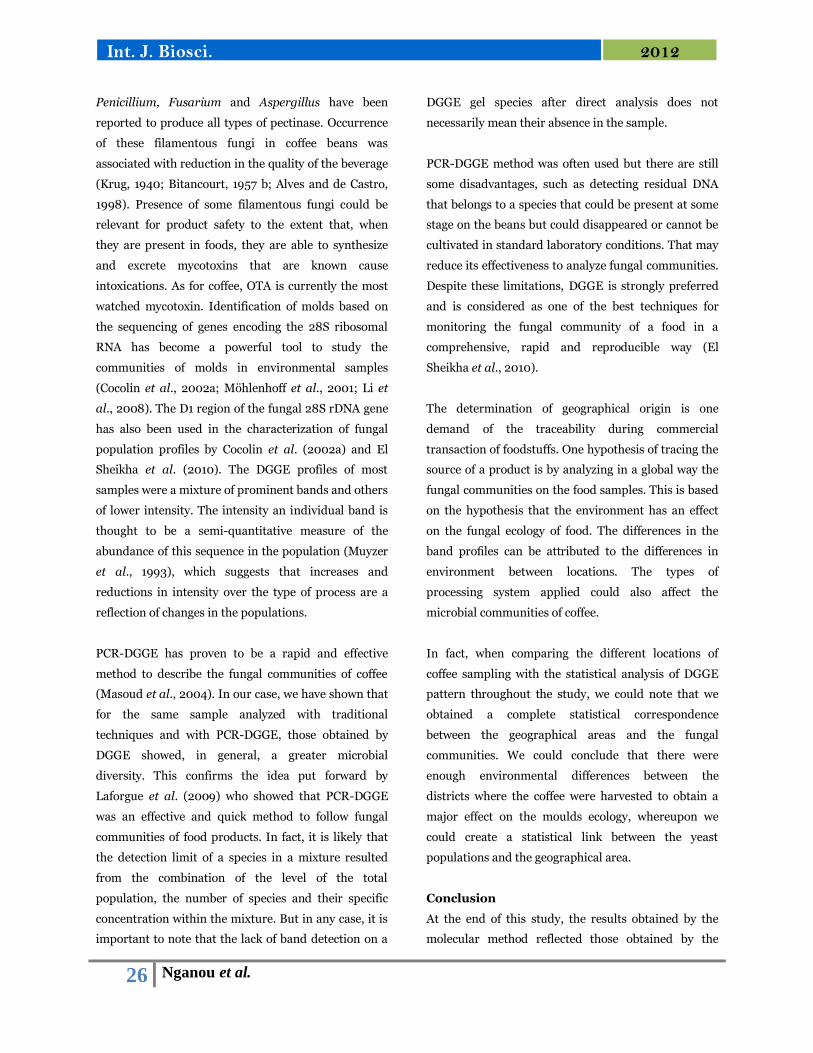
In addition, the dendogram obtained (Fig. 6) shows
that at 35.4% of similarity, two main clusters were
obtained: the firs cluster included the samples of
Bafang, Santchou and Melong while the second cluster
comprised the samples of Bafoussam and Dschang. At
48.3% similarity two secondary clusters were formed
between the samples of Santchou and those of Melong.
High similarity exists thus between the moulds profiles
of Santchou and Melong, and high similarity exists
thus between the moulds profiles of Dschang and
Bafoussam, although distance of aproximatively 48km.
Fig. 6. Cluster analysis of 28S rDNA banding profile
for coffee fungal communities from five localities
(Dschang, Bafoussam, Melong, Santchou and Bafang).
Discussion
Confirmation of species identification by DNA
sequencing was not carried out in most of the previous
studies of fungi on coffee (De Moraes and Luchese,
2003; Martins et al., 2003; Taniwaki et al., 2003)
resulting in the possible misidentification of species
that were difficult to distinguish by morphology alone.
In this study, we analyzed the mycobiota using a
molecular approach for global analysis of the DNA of
fungi isolated or present in coffee beans.
All fungal genera that we identified had already been
recorded in coffee (Mislivec et al., 1986; Abdel-Hafez
and EL-Maghraby 1992; Roussos et al. 1995).
According to Pitt and Hocking (1997) Aspergillus
competes for substrate with Fusarium and Penicillium
and only increases in incidence in environments with
high temperature and low water activity, ideal
conditions found in the final stage of processing and
drying during storage. Members of the genera
26 Nganou et al.
Int. J. Biosci. 2012
Penicillium, Fusarium and Aspergillus have been
reported to produce all types of pectinase. Occurrence
of these filamentous fungi in coffee beans was
associated with reduction in the quality of the beverage
(Krug, 1940; Bitancourt, 1957 b; Alves and de Castro,
1998). Presence of some filamentous fungi could be
relevant for product safety to the extent that, when
they are present in foods, they are able to synthesize
and excrete mycotoxins that are known cause
intoxications. As for coffee, OTA is currently the most
watched mycotoxin. Identification of molds based on
the sequencing of genes encoding the 28S ribosomal
RNA has become a powerful tool to study the
communities of molds in environmental samples
(Cocolin et al., 2002a; Möhlenhoff et al., 2001; Li et
al., 2008). The D1 region of the fungal 28S rDNA gene
has also been used in the characterization of fungal
population profiles by Cocolin et al. (2002a) and El
Sheikha et al. (2010). The DGGE profiles of most
samples were a mixture of prominent bands and others
of lower intensity. The intensity an individual band is
thought to be a semi-quantitative measure of the
abundance of this sequence in the population (Muyzer
et al., 1993), which suggests that increases and
reductions in intensity over the type of process are a
reflection of changes in the populations.
PCR-DGGE has proven to be a rapid and effective
method to describe the fungal communities of coffee
(Masoud et al., 2004). In our case, we have shown that
for the same sample analyzed with traditional
techniques and with PCR-DGGE, those obtained by
DGGE showed, in general, a greater microbial
diversity. This confirms the idea put forward by
Laforgue et al. (2009) who showed that PCR-DGGE
was an effective and quick method to follow fungal
communities of food products. In fact, it is likely that
the detection limit of a species in a mixture resulted
from the combination of the level of the total
population, the number of species and their specific
concentration within the mixture. But in any case, it is
important to note that the lack of band detection on a
DGGE gel species after direct analysis does not
necessarily mean their absence in the sample.
PCR-DGGE method was often used but there are still
some disadvantages, such as detecting residual DNA
that belongs to a species that could be present at some
stage on the beans but could disappeared or cannot be
cultivated in standard laboratory conditions. That may
reduce its effectiveness to analyze fungal communities.
Despite these limitations, DGGE is strongly preferred
and is considered as one of the best techniques for
monitoring the fungal community of a food in a
comprehensive, rapid and reproducible way (El
Sheikha et al., 2010).
The determination of geographical origin is one
demand of the traceability during commercial
transaction of foodstuffs. One hypothesis of tracing the
source of a product is by analyzing in a global way the
fungal communities on the food samples. This is based
on the hypothesis that the environment has an effect
on the fungal ecology of food. The differences in the
band profiles can be attributed to the differences in
environment between locations. The types of
processing system applied could also affect the
microbial communities of coffee.
In fact, when comparing the different locations of
coffee sampling with the statistical analysis of DGGE
pattern throughout the study, we could note that we
obtained a complete statistical correspondence
between the geographical areas and the fungal
communities. We could conclude that there were
enough environmental differences between the
districts where the coffee were harvested to obtain a
major effect on the moulds ecology, whereupon we
could create a statistical link between the yeast
populations and the geographical area.
Conclusion
At the end of this study, the results obtained by the
molecular method reflected those obtained by the

27 Nganou et al.
Int. J. Biosci. 2012
classical methods, but the molecular approach has the
advantage of rapidity (less than 24h) and specificity.
The presence of several fungal DGGE bands showed
around 97% homology that culture-independent
methods area useful complement to cultured methods
to fully characterize the coffee process. In addition, the
analysis of coffee fungal communities by PCR–DGGE
could be applied to differentiate geographical
locations. We showed that the biological markers for
the specific locations were sufficient statistically to
discriminate regions. This global technique is quicker
(<24 h) than all of the classical microbial techniques
and avoids the precise analysis of moulds by
biochemistry or molecular biology (sequencing). This
method can thus be proposed as a rapid analytical
traceability tool for coffee and could be considered as a
provider of a unique biological bar code.
Acknowledgement
Our gratitude goes to the French Ministry of Foreign
affairs SCAC (Service de Coopération et d’Action
Culturelle) which financed this work .We thank all the
personal of the laboratory of Food safety of the UMR
95 Qualisud of CIRAD Montpellier (France) who had
treated tactfully no effort for the realization of these
works.
References
Abdel-Hafez AII, EL-Maghraby OMO. 1992.
Fungal flora and aflatoxin associated with cocoa,
roasted coffee and tea powders in Egypt. Cryptogamie
Mycology 13, 31–45.
Altschul SF, Madden TL, Schäffer AA, Zhang J,
Zhang Z, Miller W, Lipman DJ. 1997. Gapped
BLAST and PSI-BLAST: a new generation of protein
databases search programs. Nucleic Acids Research
25, 3389–3402.
Alves E, De Castro HA. 1998. Fungos associados
ao café (Coffea arabica L.) nas fasespreepos-colheita
em lavouras da regiao de Lavras. Summary
Phytopathology 24, 4–7.
Battilani P, Pietri A, Bertuzzi T, Languasco L,
Giorni P, Kozakiewicz Z. 2003. Occurrence of
ochratoxin A producing fungi in grapes grown in Italy.
Jounal of Food Protect 66, 633–636.
Cabanes FJ, Accensi F, Bragulat MR, Abarca
ML, Castella G, Minguez S, Pons A. 2002. That is
the source of ochratoxin A in wine? International
Journal of Food Microbiology 79, 213–215.
Cocolin L, Bisson LF, Mills DA. 2000. Direct
profiling of the yeast dynamics in wine fermentations.
FEMS Microbiology Letters 189, 81–87.
Cocolin L, Aggio D, Manzano M, Cantoni C,
Comi G. 2002. An application of PCR-DGGE analysis
to profile the yeast populations in raw milk.
International Dairy Journal 12, 407–411.
De Moraes MHP, Luchese RH. 2003. Ochratoxin
A in coffee: influence of harvest and drying processing
procedures. Journal of Agricultural and Food
Chemistry 51, 5824–5828.
El Sheikha AF, Condur A, Métayer I, Le Nguyen
DD, Loiseau G, Montet D. 2009. Determination of
fruit origin by using 26S rDNA fingerprinting of yeast
communities by PCR-DGGE: preliminary application
to Physalis fruits from Egypt. Yeast 26, 567-573.
El Sheikha AF, Métayer I, Montet D. 2010. A
Biological bar-code for determining the geographical
origin of fruit by using 28S rDNA fingerprinting of
fungi communities by PCR-DGGE: an application to
Physalis fruits from Egypt. Food Biotechnology 25,
115-129.
El Sheikha AF, Montet D. 2010. Determination of
fruit origin by using 28S rDNA fingerprinting of fungal

28 Nganou et al.
Int. J. Biosci. 2012
communities by PCR-DGGE: An application to
Physalis fruits from Egypt, Uganda and Colombia.
Fruits 65 (4), 255-265.
Food and Agriculture Organization of United
Nations, FAO. 2006. Reducing Ochratoxin A in
Coffee. Available source: http://www.coffee-ota.org,
February 3, 2006.
Ghidini S, Ianieri A, Zanardi E. 2006. Stable
isotopes determination in food authentication: a
review. Annal Faculty of Medecine Veterinary
University of Parma XXVI, 193–204.
Guiraud JP. 1998. Microbiologie Alimentaire. pp
321–333. Paris Dunod Ed.
Heyndrickx M, Vauterin L, Vandamme P. 1996.
Applicability of combined amplified ribosomal DNA
restriction analysis (ARDRA) patterns in bacterial
phylogeny and taxonomy. Journal of Microbiology
Methods 26, 247–259.
Hocking AD, Pitt JI. 1980. Dichloran-glycerol
medium for enumeration of xerophilic fungi from low
moisture foods. Applied and Environmental
Microbiology 39, 488–492.
Khot PD, Ko D, Fredricks DN. 2009. Sequencing
and analysis of fungal rRNA operons for development
of broad-range fungal PCR assays. Applied and
Environmental Microbiology 75, 1559-1565.
Kowalchuk GA, Stephen JR, De Boer W. 1997.
Analysis of ammonia-oxidizing bacteria of the β-
subdivision of the class Proteobacteria in coastal sand
dunes by denaturing gradient gel electrophoresis and
sequencing of PCR amplified 16S ribosomal DNA
fragments. Applied and Environmental Microbiology
63, 1489–1497.
Krug HP. 1940. Cafés duros. Revista do Instituto de
café do estado de São Paulo 25, 636–638.
Kurtzman CP, Robnett CJ. 1998. Identification
and phylogeny of ascomycetous yeasts from analysis of
nuclear large subunit (26S) ribosomal DNA partial
sequences. Antonie Van Leeuwenhoek 73, 331–371.
La Guerche S, Garcia C, Darriet P, Dubourdieu
D, Labarère J. 2004. Characterization of
Penicillium species isolated from grape berries by their
internal transcribed spacer (ITS1) sequences and by
gas chromatography mass spectrometry analysis of
geosmin production. Current Microbiology 48, 405–
411.
Laforgue R, Guérin L, Pernelle JJ, Monnet C,
Dupont J, Bouix M. 2009. Evaluation of PCR-
DGGE methodology to monitor fungal communities on
grapes. Journal of Applied Microbiology 107, 1208-
1218.
Le Nguyen DD, Ha H, Dijoux D. 2008.
Determination of fish origin by using 16S rDNA
fingerprinting of bacterial communities by PCR–
DGGE: an application on Pangasius fish from Vietnam.
Food Control 19, 454–460.
Leesing R. 2005. Identification and validation of
specific markers for traceability of aquaculture fish for
import/export. Ph.D. Thesis, University of Montpellier
2, 118-142.
Li X, Zhang H, Wu M, Zhang Y, Zhang C. 2008.
Effect of methamidophos on soil fungi community in
microcosms by plate count, DGGE and clone library
analysis. Jounal of Environment Sciences 20, 619-
625.
Martins ML, Martins HM, Gimeno A. 2003.
Incidence of micro flora and of ochratoxin A in green
29 Nganou et al.
Int. J. Biosci. 2012
coffee beans (Coffea arabica). Food Additives and
Contaminants 20, 1127–1131.
Masoud W, Cesar LB, Jespersen L, Jakobsen
M. 2004. Yeast involved in the fermentation of Coffea
arabica in East Africa determined by genotyping and
by direct denaturing gradient gel electrophoresis. Yeast
21, 549-556.
Mislivec PB, Bruce VR, Gibson R. 1986.
Incidence of toxigenic and other molds in green coffee
beans. Journal of Food Protect 46 (11), 969–973.
Möhlenhoff P, Müller L, Gorbushina AA,
Petersen K. 2001. Molecular approach to the
characterization of fungal communities: methods for
DNA extraction, PCR amplification and DGGE analysis
of painted art objects. FEMS Microbiology Letters 195,
169-173.
Montet D, Le Nguyen DD, El Sheikha AF. 2008.
Application PCR–DGGE in determining food origin:
case studies of fish and fruits. Aspects of Applied
Biology 87, 11–22.
Montet D, Leesing R, Gemrot F, Loiseau G.
2004. Development of an efficient method for
bacterial diversity analysis: denaturing gradient gel
electrophoresis (DGGE). In Seminar on Food Safety
and International Trade, Bangkok, Thailand.
Muyzer G, De Waal EC, Uitterlinden AG. 1993.
Profiling of complex microbial populations by
denaturing gradient gel electrophoresis analysis of
polymerase chain reaction-amplified genes encoding
for 16S rRNA. Applied and Environmental
Microbiology 59, 695–700.
Muyzer G, Teske A, Wirsen CO, Jannasch HW.
1995. Phylogenetic relationships of Thiomicrospira
species and their identification in deep-sea
hydrothermal vent sample by denaturing gradient gel
electrophoresis of 16S rDNA fragment. Archives of
Microbiology 164, 165–172.
Palys T, Nakamura LK, Coha FM. 1997.
Discovery and classification of ecological diversity in
the bacterial world: the role of DNA sequence data.
International Journal of Systematic Bacteriology 47,
1145–1156.
Peres B, Barlet N, Loiseau G, Montet D. 2007.
Review of the current methods of analytical traceability
allowing determination of the origin of foodstuffs.
Food Control 18, 228–235.
Pitt JI, Hocking AD. 1997. Fungi and Food
Spoilage, pp 593. 2nd ed. London: Blackie Academic
and Professional
Roussos S, Angeles Aquiáhuatl M, Trejo-
Hernández MR, Gaime Perraud I. Favela E,
Ramakrishna M, Raimbault M, Viniegra-
gonzále G. 1995. Biotechnological management of
coffee pulp-isolation, screening, characterization,
selection of caffeine-degrading fungi and natural
microflora present in coffee pulp and husk. Applied
and Microbiology Biotechnology 42, 756–762.
Sodeko OO, Izuagbe YS, Ukhun ME. 1987. Effect
of different preservative treatment on the microbial
population of Nigerian orange juice. Microbios 51,
133–143.
Stackebrandt E, Goebel BM. 1994. Taxonomic
note: a place for DNA–DNA reassociation and 16S
rRNA sequence analysis in the present species
definition in bacteriology. International Journal of
Systematic Bacteriology 44, 846–849.
Silva CF, Schwan RF, Dias ES, Wheals AE.
2000. Microbial diversity during maturation and
natural processing of coffee cherries of Coffea arabica

30 Nganou et al.
Int. J. Biosci. 2012
in Brazil. International Journal of Food Microbiology
60, 251–260.
Taniwaki MH, Pitt JI, Teixeira AA, Iamanaka
BT. 2003. The source of ochratoxin A in Brazilian
coffee and its formation in relation to processing
methods. International Journal of Food Microbiology
82, 173–179.
Van Hannen EJ, Zwart G, Van Agterveld MP.
1999. Changes in bacterial and eukaryotic community
structure after mass lysis of filamentous cyanobacteria
associated with viruses. Applied and Environmental
Microbiology 65, 795–801.