Determination of the Cardiovascular Phenotype of Different ...
153
Determination of the Cardiovascular Phenotype of Different Transgenic Mouse Models Inaugural-Dissertation zur Erlangung des Grades eines Doktors der Humanbiologie des Fachbereichs Humanmedizin der Justus-Liebig-Universität Giessen Vorgelegt von Swen Wolfram aus Leipzig Giessen, 2002
Transcript of Determination of the Cardiovascular Phenotype of Different ...
Determination of the Cardiovascular Phenotypeof Different Transgenic Mouse Models
Inaugural-Dissertationzur Erlangung des Grades eines Doktors der Humanbiologiedes Fachbereichs Humanmedizinder Justus-Liebig-Universität Giessen
Vorgelegt von Swen Wolframaus Leipzig
Giessen, 2002

Aus dem Max-Planck-Institut
für Physiologische und Klinische ForschungKerckhoff-InstitutAbteilung Experimentelle KardiologieLeiter: Prof. Dr. Dr. h. c. W. SchaperIn Bad Nauheim
Gutachter: Prof. Dr. Dr. h. c. W. SchaperGutachter: Prof. Dr. K.-D. Schlüter
Tag der Disputation: 25. Oktober 2002

For my family and my girlfriend Silja.
Table of Content - I -
Table of ContentPage
Chapter
Table of Content I
Table of Figures IV
Table of Tables VI
Table of Abbreviations VII
1. Abstract 1
2. Introduction 2
3. Review of Literature 4
3.1. FGFs in the Cardiovascular System 4
3.1.1. Biochemistry of FGF–1 and FGF–2 4
3.1.2. Cardiovascular Background 7
3.1.3. FGFs in Therapeutic Angiogenesis 8
3.1.4. FGFs in Vascular Response Against Ischemia 10
3.1.5. FGFs in Arteriogenesis 11
3.1.6. FGFs in Myocardial Ischemic Preconditioning 12
3.2. MCP–1 in the Cardiovascular System 16
3.2.1. Biochemistry of MCP–1 16
3.2.2. MCP–1 and Atherosclerosis 18
3.2.3. MCP–1 and Congestive Heart Failure 21
3.2.4. MCP–1 and Myocarditis 22
3.3. Physical Activity - Angiogenesis and Arteriogenesis 24
3.3.1. Introduction 24
3.3.2. Physical Activity and Angiogenesis - Background 24
3.3.3 Vascular Endothelial Growth Factor 25
3.3.4. FGF–1 and FGF–2 27
Table of Content - II -
3.3.5. Other Growth Factors 30
3.3.6. Physical Activity and Arteriogenesis - Background 30
3.3.7. Development of Collateral Arteries 32
3.3.8. Exercise-Induced Arteriogenesis - The Rat Model 32
3.3.9. The Dog Model of Exercise-Induced Arteriogenesis 36
3.3.10. The Pig Model of Exercise-Induced Arteriogenesis 40
3.3.11. The Mouse Model of Exercise-Induced Arteriogenesis 42
3.3.12. Exercise and Arteriogenesis in Humans 43
3.3.13. Summary 44
4. Methods 47
4.1. Animals 47
4.1.1. FGF–1 Overexpressing Mice 47
4.1.2. FGF–2 Overexpressing Mice 48
4.1.3. MCP–1 Overexpressing Mice 49
4.1.4. Nontransgenic Mice 49
4.2. Simulated Ischemia 50
4.2.1. Isolation of Mouse Ventricular Cardiac Myocytes 50
4.2.2. Simulated Ischemia 52
4.3. Determination of a Flow-Pressure-Relationship 54
4.4. Femoral Artery Occlusion and Blood Flow Measurements 55
4.5. Training of Mice with Unilateral Femoral Artery Occlusion 58
4.6. Determination of Exercise Capacity 61
4.6.1. Time Course after Bilateral Femoral Artery Occlusion 61
4.6.2. Time Course after the Onset of Congestive Heart Failure 63
4.6.3. Trained Mice with Unilateral Femoral Artery Occlusion 64
4.7. Statistical Analysis 64
5. Results 65
5.1. Simulated Ischemia 65
5.2. Determination of a Flow-Pressure-Relationship 68
5.3. FGF–2 Transgenic Mice with Unilateral Femoral Artery Occlusion 71
Table of Content - III -
5.3.1. Progressive, Moderate Intensity Endurance Exercise Program 71
5.3.2. Collateral Dependent Blood Flow 71
5.3.3. Exercise Capacity 76
5.3.4. Gastrocnemius Weight-to-Body Weight Ratio 77
5.4. Determination of Exercise Capacity 82
5.4.1. Time Course after the Onset of Congestive Heart Failure 82
5.4.2. Time Course after Bilateral Femoral Artery Occlusion 84
6. Discussion 89
6.1. Simulated Ischemia 89
6.2. Determination of a Flow-Pressure-Relationship 92
6.3. FGF–2 Transgenic Mice with Unilateral Femoral Artery Occlusion 93
6.4. Determination of Exercise Capacity 99
6.4.1. Time Course after the Onset of Congestive Heart Failure 99
6.4.2. Time Course after Bilateral Femoral Artery Occlusion 101
7. References 105
8. Acknowledgements 138
9. Curriculum vitae 139
Table of Figures - IV -
Table of FiguresPage
Figure
1. Schematic structure of FGFR1. 6
2. Structure-function relationships for MCP–1. 17
3. Schematic drawing of the construct for FGF–1 transgenic mice. 48
4. Schematic drawing of the Langendorff-perfusion-apparatus. 51
5. Isolated ventricular cardiac myocytes of a FGF–1 mouse. 52
6. Setup for experiments of simulated ischemia. 53
7. Acute and chronic occlusion of the femoral artery. 56
8. Time course of Laser Doppler Imaging (LDI) measurements. 57
9. Typical exercise session of FGF–2 transgenic mice. 61
10. Experimental setup for determination of exercise capacity. 62
11. Exercise test of a Balb/C mouse. 63
12. CK release of cardiac myocytes during simulated ischemia. 66
13. LDH release of cardiac myocytes during simulated ischemia. 67
14. Coronary flow of mouse hearts at four different pressures. 69
15. Regression curves of coronary flow vs. pressure of FGF–1 mice. 70
16. Collateral dependent blood flow to the foot (LDI) of FGF–2 mice. 72
17. Collateral dependent blood flow to the gastrocnemius (MRI). 73
18. Magnetic Resonance Images (MRI) of FGF–2 mice. 74
19. Exercise capacity of FGF–2 transgenic and nontransgenic mice. 78
20. Gastrocnemius weight-to-body weight ratio of FGF–2 mice. 79
21. Representative angiographies of FGF–2 transgenic mice. 80
22. Exercise capacity of MCP–1 transgenic and nontransgenic mice. 82

Table of Figures - V -
23. Collateral dependent blood flow to the foot (LDI) of three strains. 85
24. Time course of exercise capacity of three different mouse strains. 86
25. Recovery of exercise capacity of three different mouse strains. 88
Table of Tables - VI -
Table of TablesPage
Table
1. CK release of cardiac myocytes during simulated ischemia. 65
2. LDH release of cardiac myocytes during simulated ischemia. 67
3. Coronary flow of mouse hearts at four different pressures. 69
4. Collateral dependent blood flow to the foot and gastrocnemius. 76
5. Exercise capacity of FGF–2 transgenic and nontransgenic mice. 77
6. Gastrocnemius weight-to-body weight ratio of FGF–2 mice. 78
7. Exercise capacity of MCP–1 transgenic and nontransgenic mice. 82
8. Collateral dependent blood flow to the foot (LDI) of three strains. 84
9. Time course of exercise capacity of three different mouse strains. 86
10. Recovery of exercise capacity of three different mouse strains. 87
Table of Abbreviations - VII -
Table of Abbreviations
3T3 = murine fibroblast cell line
ACE = angiotensin converting enzyme
AUG–codon = adenine-uracil-guanine codon for translation initiation
BSA = bovine serum albumin
CCR2 = chemokine receptor 2
cDNA = complementary deoxyribonucleic acid
CHF = congestive heart failure
CK = creatine kinase
CMV = cytomegalovirus
CT = C-terminal tail
CUG–codon = cytosine-uracil-guanine codon for translation initiation
DNA = deoxyribonucleic acid
EC = extracellular domain
EcoRI = restriction endonuclease
EGF = endothelial cell growth factor
ESAF = endothelial cell-stimulating factor
FCS = fetal calf serum
FGF–1 = fibroblast growth factor 1
FGF–2 = fibroblast growth factor 2
FGFR = fibroblast growth factor receptor
FGFR1 = fibroblast growth factor receptor 1
FGFR2 = fibroblast growth factor receptor 2
FGFR3 = fibroblast growth factor receptor 3
FGFR4 = fibroblast growth factor receptor 4
FGFs = fibroblast growth factors
g = gravitation constant
HIF–1 = hypoxia inducible factor 1
HIF–1α = hypoxia inducible factor 1α
HIF–1β = hypoxia inducible factor 1β
Table of Abbreviations - VIII -
i.p. = intra peritoneal
ICAM–1 = intercellular adhesion molecule 1
IG = immunoglobulin
IGF–1 = insulin-like growth factor 1
IL–1 = interleukin 1
IL–2 = interleukin 2
IL–6 = interleukin 6
IL–8 = interleukin 8
IU = international units
JE = murine homologue of MCP–1
JM = juxtamembrane domain
kb = kilo base
KD = kinase domain
kDa = kilo Dalton
LDH = lactate dehydrogenase
LDI = laser doppler imaging
LDL = low density lipoprotein
MAP kinase = mitogen-activated-protein kinase
MCP–1 = monocyte chemoattractant protein 1
MLC2v = ventricular isoform of the regulatory myosin light chain
MMPs = matrix metalloproteinases
MRI = magnetic resonance imaging
mRNA = messenger ribonucleic acid
NIH = National Institutes of Health
NO = nitric oxide
NOS = nitric oxide synthase
NTG = nontransgenic control mice
NYHA = New York Heart Association
PAOD = peripheral arterial obstructive disease
PC = phosphatidylcholine
PDGF = platelet derived growth factor
PKC = protein kinase C
Table of Abbreviations - IX -
PO2 = oxygen partial pressure
rpm = rotations per minute
SEM = standard error of the mean
SMCs = vascular smooth muscle cells
SV40 = Simian virus 40
T1 = longitudinal relaxation time
T2 = transversal relaxation time
TG = transgenic mice
TGF–β = transforming growth factor β
TGF–β1 = transforming growth factor β1
Tie-2 = tyrosine kinase with immunoglobulin and EGF–homologous regions
TIMP–1 = tissue inhibitor of metalloproteinase 1
TM = transmembrane domain
TNF–α = tumor necrosis factor α
VCAM–1 = vascular adhesion molecule 1
VEGF = vascular endothelial growth factor
1. Abstract - 1 -
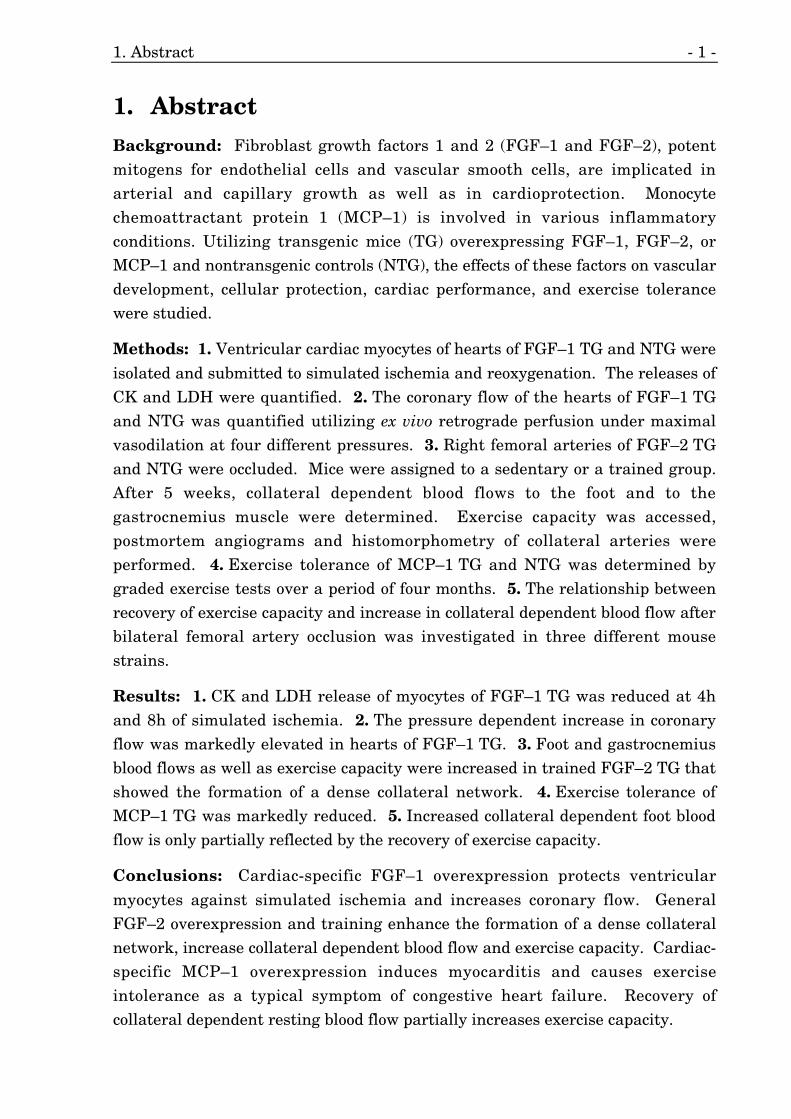
1. AbstractBackground: Fibroblast growth factors 1 and 2 (FGF–1 and FGF–2), potentmitogens for endothelial cells and vascular smooth cells, are implicated inarterial and capillary growth as well as in cardioprotection. Monocytechemoattractant protein 1 (MCP–1) is involved in various inflammatoryconditions. Utilizing transgenic mice (TG) overexpressing FGF–1, FGF–2, orMCP–1 and nontransgenic controls (NTG), the effects of these factors on vasculardevelopment, cellular protection, cardiac performance, and exercise tolerancewere studied.
Methods: 1. Ventricular cardiac myocytes of hearts of FGF–1 TG and NTG were
isolated and submitted to simulated ischemia and reoxygenation. The releases ofCK and LDH were quantified. 2. The coronary flow of the hearts of FGF–1 TGand NTG was quantified utilizing ex vivo retrograde perfusion under maximalvasodilation at four different pressures. 3. Right femoral arteries of FGF–2 TGand NTG were occluded. Mice were assigned to a sedentary or a trained group.After 5 weeks, collateral dependent blood flows to the foot and to thegastrocnemius muscle were determined. Exercise capacity was accessed,postmortem angiograms and histomorphometry of collateral arteries wereperformed. 4. Exercise tolerance of MCP–1 TG and NTG was determined bygraded exercise tests over a period of four months. 5. The relationship betweenrecovery of exercise capacity and increase in collateral dependent blood flow afterbilateral femoral artery occlusion was investigated in three different mousestrains.
Results: 1. CK and LDH release of myocytes of FGF–1 TG was reduced at 4hand 8h of simulated ischemia. 2. The pressure dependent increase in coronaryflow was markedly elevated in hearts of FGF–1 TG. 3. Foot and gastrocnemiusblood flows as well as exercise capacity were increased in trained FGF–2 TG thatshowed the formation of a dense collateral network. 4. Exercise tolerance ofMCP–1 TG was markedly reduced. 5. Increased collateral dependent foot bloodflow is only partially reflected by the recovery of exercise capacity.
Conclusions: Cardiac-specific FGF–1 overexpression protects ventricular
myocytes against simulated ischemia and increases coronary flow. GeneralFGF–2 overexpression and training enhance the formation of a dense collateralnetwork, increase collateral dependent blood flow and exercise capacity. Cardiac-specific MCP–1 overexpression induces myocarditis and causes exerciseintolerance as a typical symptom of congestive heart failure. Recovery ofcollateral dependent resting blood flow partially increases exercise capacity.
2. Introduction - 2 -
2. IntroductionAt the Max-Planck-Institute, Department of Experimental Cardiology, we areinvestigating possible ways to protect tissues like myocardium and skeletalmuscle, which are exposed to ischemia caused by occlusion of a major artery.Protection of ischemic tissues can be achieved by two different mechanisms.
The first mechanism concentrates on the short-term protection of ischemic
tissues and includes the phenomenon of ischemic preconditioning. It is wellknown that a series of brief periods of ischemia induces an intracellular signalingcascade involving protein kinase C and mitogen activated protein kinases. Thissignaling cascade causes transcriptional events, which finally increase thetolerance of the tissue towards a longer period of ischemia. The application ofdifferent growth factors including FGF–1 and FGF–2 before a longer period ofischemia mimics the phenomenon of ischemic preconditioning.
The second mechanism involves the growth of blood vessels that are capable ofconducting blood flow to the ischemic tissues. Arteriogenesis, the growth ofpreexisting collateral arterioles by mitotic cell division and after DNA replicationof endothelial and smooth muscle cells, is thought to be the only functionallyrelevant process to increase blood flow to the ischemic tissues. Arteriogenesis isinduced by occlusion of a major artery and serves as a rescue mechanism for thedistal tissues.
Tissue ischemia is tolerated only for a short period of time whereas
arteriogenesis requires at least one day to become functionally relevant.Therefore, we investigated whether the stimulation of short-term tissueprotection could bridge the gap between the time requirements from the onset ofischemia to the increase in collateral dependent blood flow.
Furthermore, we studied possible ways to increase the collateral blood flow to theischemic tissues. Therefore, it was necessary to explore the mechanisms of vesselgrowth in general and of preexistent collateral arterioles in particular.
The ideal approach would be to increase the short-term protection and at the
same time enforce and accelerate the long-term protection via stimulation ofvessel growth to the ischemic tissues possibly by the same growth factor or bycombined treatments. Increasing the tolerance towards ischemia and restoringblood flow as fast as possible could reduce or even prevent tissue necrosis andpotentially safe hearts, brains, limbs, and therefore, many lives in the Westernsociety.
2. Introduction - 3 -
The studies presented here relate to these two important topics and mainlyutilize transgenic mouse models. These studies contribute to other investigationsconsidering the action of various growth factors and chemokines by providinginformation about some important and unknown features.
Using our own system of cardiac-specific overexpression of FGF–1, we
investigated the cardioprotective effect of FGF–1 on isolated ventricular cardiacmyocytes subjected to different periods of simulated ischemia and subsequentreoxygenation.
We studied the effects of cardiac-specific overexpression of fibroblast growthfactor 1 (FGF–1) on the development of coronary arteries and arterioles.Therefore, we determined the coronary flow using ex vivo perfusion of thecoronary system under maximal vasodilation at four different pressures.
To explore the effects of general overexpression of FGF–2 on the development of
collateral arteries, we occluded the femoral arteries of FGF–2 transgenic andnontransgenic animals. In addition, a sub-population of each group wassubmitted to regular endurance training to determine if there is any treatmentinteraction between FGF–2 application and endurance training.
We accessed the effects of cardiac-specific overexpression of monocytechemoattractant protein 1 (MCP–1) on the development of congestive heartfailure (CHF) due to myocarditis. Exercise intolerance as a common symptom ofcongestive heart failure was determined by graded exercise tests over the periodof four months. We explored whether the exercise capacity could serve as anindicator for the decreased cardiac function in this animal model.
Furthermore, we investigated if exercise capacity serves as a physiological
marker of the functional capacity of hindlimbs with femoral artery occlusion. Forthis purpose we utilized three strains of mice with different dynamics in therecovery of collateral dependent blood flow and determined the recovery ofexercise capacity after femoral artery occlusion. Because arteriogenesis displaysdifferent dynamics in these mouse strains we anticipated changes in thefunctional capacity of the hindlimbs and thus, in exercise capacity.
3. Review of Literature - 4 -
3. Review of Literature
3.1. FGFs in the Cardiovascular System
3.1.1. Biochemistry of FGF–1 and FGF–2
As early as 1939, tissue extracts of brain were shown to be a rich source of factorsthat promoted fibroblast proliferation in vitro (for review see 1). In the followingyears, acid extracts of bovine pituitary were found to contain a potent polypeptidemitogen for the murine cell line 3T3 and for chondrocytes. The protein wasdistinct biochemically from other known hormones or growth factors andextraction conditions seemed to be important for the maintenance of thebiological activity.
In the 1970s, a basic polypeptide mitogen for 3T3 cells and mesoderm- and
neuroectoderm-derived cells was isolated from bovine pituitary and brain. Thispolypeptide was named fibroblast growth factor. However, due to technicaldifficulties its structure could not be analyzed. Later, these difficulties wereovercome and it turned out that acidic and basic fibroblast growth factors arerelated polypeptides and serve to establish the basis for a larger family ofpolypeptide growth factors. Both FGFs were also shown to be potent mitogensfor endothelial cells. Because more growth factors belonging to the FGF–familywere discovered the nomenclature FGF–1, FGF–2, etc. has been chosen. Acidicand basic fibroblast growth factors were assigned the names FGF–1 and FGF–2,respectively.
Before the structures of FGF–1 and FGF–2 were identified and the presentnomenclature was chosen other names have been ascribed to these FGFs.Among them are eye-derived growth factor 1 and –2, endothelial cell growthfactor, heparin–binding growth factor α and –β, anionic and basic brain–derivedgrowth factor, hypothalamus-derived growth factor, retinal–derived growthfactor, astoglial growth factor 1 and –2, cartilage–derived growth factor,myogenic growth factor, pituitary growth factor, bone–derived growth factor,anionic endothelial growth factor, prostatic growth factor, and prostatropin. Thevariety of names describing their source or target cells demonstrate the potentialbiological significance of FGF–1 and FGF–2.
In 1986, the primary structure of human FGF–1 derived from the cDNA clone
was identified 2. This study demonstrated that there is a single copy of the
3. Review of Literature - 5 -
FGF–1 gene and that it is located at chromosome 5 at bands 5q31.3 to 5q33.2.The gene encodes for a 4.8 kb mRNA. It was shown that the open reading frameof FGF–1 is flanked by translation stop codons and does not contain a signalpeptide or a hydrophobic domain for the secretion of FGF–1. Later, the same wasshown to be true for FGF–2. Sequence analysis of bovine and human FGF–1revealed an approximate 92% sequence identity, conservation of the positions oftwo of three cysteine residues, and the presence of a potential N–linkedglycosylation site. Structural analysis of FGF–1 and FGF–2 demonstrated a 55%homology between the two polypeptides 3. Even though the FGF–2 gene islocated at chromosome 4, the structural similarity together with similar organsources and biological activities suggest FGF–1 and FGF–2 may have originatedfrom a common ancestral gene.
Both genes are similar in their overall organization. They contain three exons
separated by two relatively large introns. The major difference that appearsafter analysis of the cDNAs is the precise location of the amino terminus of thetwo proteins. The termination codons flanking the open reading frame of theFGF–1 gene were not found in the FGF–2 gene.
FGF–2 was first identified as a 146 amino acid protein isolated from bovinepituitary 4. The isolated form possessed a strong potency to stimulate theproliferation of bovine aortic endothelial cells. This effect was markedlyinhibited by acidic purification procedures. Therefore, it was commonly referredto as “basic” FGF.
Cloning of FGF–2 cDNA lead to a predicted length of 155 amino acids. However,
only the 146 amino acid protein and higher molecular weight forms (196, 201,210 amino acids) were actually isolated from tissues. The shorter form is derivedfrom the 155 amino acid protein by proteolytic degradation 5. Longer forms aregenerated by initiation of translation at different CUG–codons located 5’ to theAUG–codon, which is used for translation of the 155 amino acid protein 6.
The three forms initiated at CUG-codons have molecular masses of 22, 22.5, and24 kDa and are predominantly located in the nucleus. The AUG-initiated formwith a molecular mass of 18 kDa is primarily localized in the cytoplasm.However, the occurrence of the different forms may depend upon the specific cellsexamined and the expression levels of FGF–2.
The 18 kDa form of FGF–2 contains 12 anti–parallel β–sheets organized into a
trigonal pyramidal structure. Amino acid residues 13–30 and 106–129 arebelieved to be involved in receptor binding 7. Serine 64 and threonine 112 are
3. Review of Literature - 6 -
potential phosphorylation sites, which can be phosphorylated by protein kinase Aand protein kinase C, respectively 8. Even though FGF–2 contains four cysteineresidues, there are no intramolecular disulfide bonds.
The high molecular weight forms of FGF–2 have an amino terminal extension as
a unique feature. The 24 kDa form contains nine glycin–arginine residues, ofwhich seven are methylated 9,10. However, neither the exact number nor thefunctional significance of the methylated arginines of the high molecular weightforms is known, but they might be involved in nuclear transport or retention.
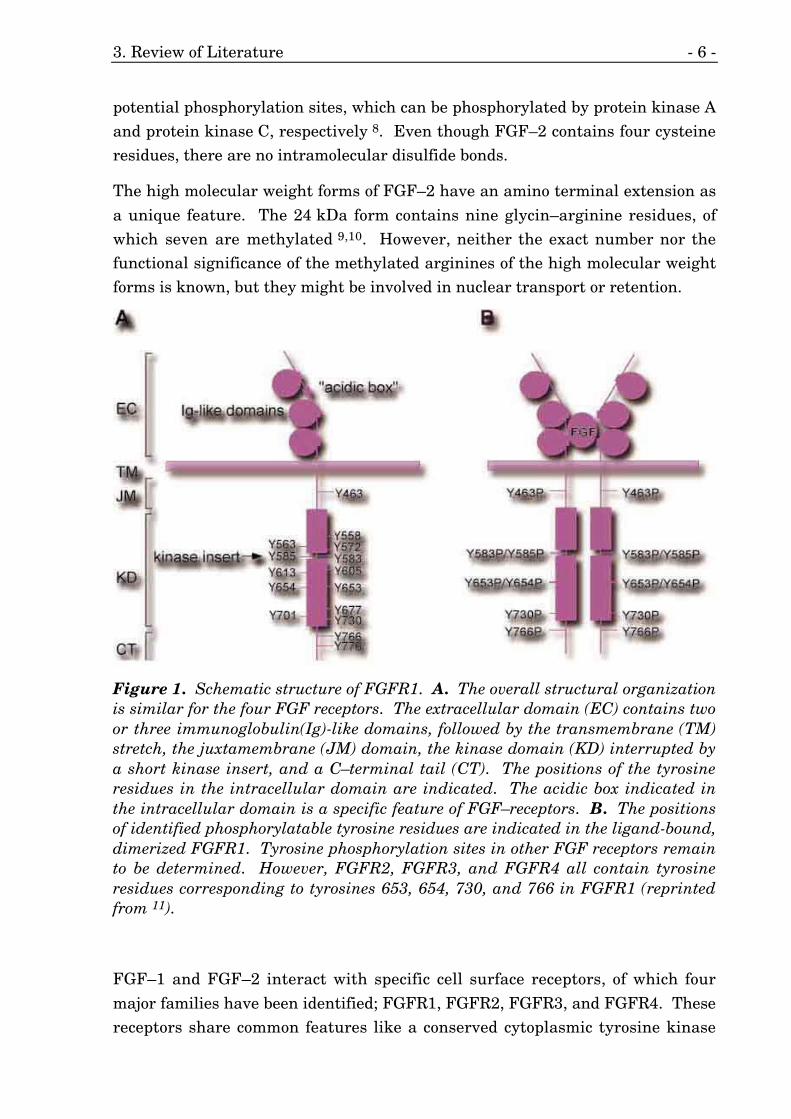
Figure 1. Schematic structure of FGFR1. A. The overall structural organizationis similar for the four FGF receptors. The extracellular domain (EC) contains twoor three immunoglobulin(Ig)-like domains, followed by the transmembrane (TM)stretch, the juxtamembrane (JM) domain, the kinase domain (KD) interrupted bya short kinase insert, and a C–terminal tail (CT). The positions of the tyrosineresidues in the intracellular domain are indicated. The acidic box indicated inthe intracellular domain is a specific feature of FGF–receptors. B. The positionsof identified phosphorylatable tyrosine residues are indicated in the ligand-bound,dimerized FGFR1. Tyrosine phosphorylation sites in other FGF receptors remainto be determined. However, FGFR2, FGFR3, and FGFR4 all contain tyrosineresidues corresponding to tyrosines 653, 654, 730, and 766 in FGFR1 (reprintedfrom 11).
FGF–1 and FGF–2 interact with specific cell surface receptors, of which four
major families have been identified; FGFR1, FGFR2, FGFR3, and FGFR4. Thesereceptors share common features like a conserved cytoplasmic tyrosine kinase
3. Review of Literature - 7 -
domain, a transmembrane domain, and an extracellular ligand-binding domain(Figure 1). The composition of the ligand-binding domain differs between thesplice–variants. They contain either two or three immunoglobulin(Ig)–like loops.The existences of additional splice variants with sequence modifications in theintracellular portions of the protein have been demonstrated (for review see 11).
FGF binding induces autophosphorylation of the receptor and receptor
association with putative substrates such as phospholipase C–γ. The long–termmechanism of FGF–1 and FGF–2 action involves growth factor translocation tothe nucleus. After at least 12 hours of stimulation with FGF–1, the maximalDNA synthesis of 3T3 cells was achieved 12. In stimulated cells, the FGFR1 wasphosphorylated and translocated perinuclearly. At the same time FGF–1accumulated in the nucleus. Therefore, it was concluded that signaling throughthe FGF receptor might occur at the plasma membrane and after receptortranslocation to an intracellular site.
However, receptor-independent mechanisms for FGF–1 stimulation ofproliferation have also been proposed 13. FGFR expression levels changemarkedly and during proliferation, differentiation, or malignant transformation.FGFR expression levels during differentiation for example differ depending onthe experimental conditions and cell types used and therefore, no generalconclusion about FGFR expression levels can be derived.
3.1.2. Cardiovascular Background
Ischemic heart disease caused by stenosis or occlusions of the coronary arteries
represents the major cause of mortality in western societies. Two distinctphysiological processes can help in maintaining the viability of ischemicmyocardium: the development of an effective vascular collateral system, and theeffect of myocardial preconditioning, the endogenous protection of cardiacmyocytes against ischemia.
During the last decade, extensive research has been dedicated to the basicmechanisms responsible for the formation and enlargement of blood vessels inischemic tissues. It was mainly focused on the role of growth factors asmodulators of vascular growth due to their capacity for directing the proliferationand differentiation of cells composing the vascular system. FGF–1, FGF–2,vascular endothelial growth factor (VEGF), insulin-like growth factor 1 (IGF–1),
3. Review of Literature - 8 -
platelet derived growth factor (PDGF), and angiopoietins have received specialattention.
FGF–1 and FGF–2 are potent angiogenic factors inducing capillary formation.
Their mitogenic capacity for endothelial cells is even stronger than that of theendothelial specific mitogen VEGF (for review see 14). Additionally, both FGF–2and VEGF have been demonstrated to act synergistically in vitro 15 and invivo 16. Unlike VEGF, FGF–1 and FGF–2 also induce vascular smooth musclecell (SMC) proliferation and migration in cell cultures 17, constituting exceptionalcandidates for the regulation of vascular development and growth after anepisode of ischemia.
FGFs are members of the heparin binding family of growth factors. Due to theirhigh affinity to heparin, FGF–1 and FGF–2 commonly accumulate in theextracellular matrix. They bind to heparin sulfate proteoglycans, which aid inthe protection against protein degradation. Indeed, with a half lifetime of about15 minutes, unbound FGF–1 is very rapidly degraded by proteases 18.
FGF–1 and FGF–2 proteins lack a signal peptide sequence for secretion from
cells 19. Their secretion in vivo is still not entirely clarified. In the normal heart,FGF mRNA has been shown to be expressed by cardiac myocytes, and the proteinlocated to both myocytes and extracellular matrix 20,21. In contrast, FGFreceptors are normally not expressed by cardiac myocytes and endothelialcells 22. However, FGF receptor and ligand have been demonstrated to beupregulated during ischemia in several animal models 23,24. These observationshave led to the hypothesis that a tight regulation of FGF receptors might be abasic mechanism for the control of vascular growth during ischemia. This type ofregulatory mechanism has been shown to be important for tumor angiogenesis 25.FGF protein bound to heparin sulfate proteoglycans and stored in theextracellular matrix might serve as a growth factor reservoir, ready to bind itsreceptor on endothelial cells and SMCs under ischemia-induced upregulation.
3.1.3. FGFs in Therapeutic Angiogenesis
There is accumulating evidence from studies, in which the induction ofangiogenesis for therapeutic purposes is investigated, demonstrating theimportance of FGF–1 and FGF–2 for the vascular response against ischemia. Inthese in vivo experiments, native, recombinant, or vectors coding for the FGFprotein are locally or systemically infused in animals subjected experimentally to
3. Review of Literature - 9 -
ischemia. Two main experimental designs have been used. The model of chronicmyocardial ischemia, in which one branch of the coronary arterial tree isgradually stenosed by ameroid constrictors, was mainly developed in dogs andpigs. The model of acute hindlimb ischemia, in which the femoral artery ischirurgically excised or occluded, was designed for rabbits.
The first study on the therapeutic potential of FGF in the ischemic heart was
conducted by Banai and collaborators utilizing the dog model 26. Locallydelivered FGF–1 via a soaked sponge induced SMC hyperplasia in arterioles andsmall arteries in the area of the subendocardial infarction. No effect on capillarygrowth was detected.
In a more recent study, López et al. used the porcine model of chronic leftcircumflex artery occlusion by Ameroid constrictors to test the effect of FGFapplication 27. In this study FGF–1 together with heparin were administeredperivascularly via sustained release from a polymer matrix. The matrix wasimplanted in the course of the occluded left circumflex coronary artery. Treatedanimals showed significantly improved myocardial blood flow in the compromisedterritory under resting coditions and during pacing as well as enhanced globaland regional left ventricular function. However, the study did not provideconclusive evidence on how FGF–1 released at the epicardium can inducecollateral vessel growth in the endocardium where it usually occures in the pig.
Other experiments with the model of chronic myocardial ischemia have also
demonstrated improved myocardial function and collateral flow, as well as newvessel formation after local or systemic administration of FGF–2 28-31.
Similar results have been obtained with the rabbit model of hindlimb ischemia.Administration of FGF–1 intramuscularly 32, or of cDNA coding for a secretedform of FGF–1 systemically 33 resulted in improved perfusion, increased numberof capillaries, and augmented angiographically visible collateral arteries (forother studies of therapeutic FGF application see chapter 3.3.8).
These studies provide evidence that FGF–1 and FGF–2 play important roles in
the response of hypoxic tissues to ischemia, increasing blood flow, and improvingmuscular function. However, the mechanisms implicated in these effects ofFGF–1 and FGF–2 are still unknown. Several distinct physiological processesmay increase blood flow, namely the angiogenic response of the capillary system,de-novo formation of arterioles, and the growth of collateral arteries.Improvement in ventricular function might be the consequence of increased blood
3. Review of Literature - 10 -
flow, but it could also result from a hypothetical cardioprotective potential ofFGF–1 and FGF–2.
3.1.4. FGFs in Vascular Response Against Ischemia
Angiogenesis is defined the growth of capillary tubes from pre-existing capillary
vessels or small venuoles 34. Single endothelial cells proliferate, disrupt thecontinuity of the vessel wall, invade the surrounding tissue, and form newtubular structures, which expand the pre-existing capillary bed.
FGF–1 and FGF–2 induce capillary tube formation in vitro and are able toincrease the capillary density of ischemic organs in vivo. However, it is currentlybelieved that capillaries are not able to conduct enough blood flow to ischemictissues of larger sizes, when the stenosis affects the perfusion of a large tissuemass.
Resistance vessels are the major determinants of blood flow, and therefore they
are good candidates for increasing the blood flow to an ischemic tissue. Verylittle is known about the growth of arteries in adult organs. De novo formation ofarteries takes place by elongation of the distal segment of terminal arterioles 35.The capillary to which an arteriole is connected must recruit new SMCs fromsurrounding pericytes or from SMCs in the distal end of the terminal arteriole,and differentiate into a histologically mature artery 35. This process requirespericyte and SMC proliferation, differentiation, and matrix deposition,resembling the embryonic or neonatal process of arterial differentiation.
The increased number of angiographically detectable vessels in the rabbit modelof hindlimb ischemia obtained after treatment with FGF–1 may represent thistype of growth 33. In this experimental model, the whole femoral artery isexcised, so that the only source of blood to the ischemic muscles are capillaries aswell as small arteries that can grow into the ischemic tissue from nearby arteriesnot affected by exision of the femoral artery.
Collateral arteries are vascular segments, which connect two feeding arteries.
The anatomical and hemodynamical characteristics of collateral arteries makethem a unique vascular resource against ischemia. Upon stenosis of a majorartery, the collateral arteries are the only vessels able to bridge the occludedsegment, providing an effective blood supply to the ischemic tissue. Likewise,collateral arteries are the only vascular structures that experience a change in
3. Review of Literature - 11 -
shear stress, caused by the pressure difference after an arterial occlusion. Thisincrease in shear stress has a known potential effect as a vascular growthpromoter. Moreover, after occlusion of an arterial segment, collateral arteriesbegin a process of growth, called arteriogenesis that culminates in a 20 foldincrease in their final diameter, improving their flow capacity by the factor of 10,and leading to a final compensation up to 30% of the normal maximum flow 24,36-
38. Currently, it is thought that only the growth of collateral arteries byarteriogenesis is able to provide enough of blood flow to the ischemic area.
With this knowledge we planned a study with mice generally overexpressing
FGF–2. We recently established a mouse model of collateral artery developmentafter occlusion of the femoral artery. We hypothesized that generaloverexpression of FGF–2 would facilitate arteriogenesis.
3.1.5. FGFs in Arteriogenesis
The process of arteriogenesis consists of complete reorganization of the collateralvessel wall, including the destruction of the old lamina media, and formation of anew one. The first morphological evidence of collateral growth is the activation ofendothelial cells, probably induced by shear stress. They express cell adhesionmolecules for the attachment and migration of monocytes 39. Once they hadmigrated into the arterial wall, the activated macrophages express cytokines andgrowth factors, including FGF–2 40. These substances are most probably theresponsible signals that trigger the whole process of arteriogenesis. Moreover,gene expression experiments performed in our laboratory with the rabbit modelof femoral artery occlusion have shown a significant up-regulation of the FGFR1mRNA during the first phase of collateral growth 41. The FGFR1 is thepredominant form of the four known FGFRs expressed by proliferating SMCs 42,suggesting that FGFR1 mediates signal transduction in proliferating SMCs, andpointing to a crucial role of FGFs in the initial phase of arteriogenesis.
During this initial phase of growth, the internal elastic lamina of collateral
arteries is degraded, and SMCs dedifferentiate, proliferate and migrate to thesubendothelial space, forming a thick neointima, which is required to build a newvessel 43,44. These SMCs show an undifferentiated or synthetic phenotype withabundant organelles, loss of basement membrane, reduced amount of α–smoothmuscle actin, vinculin, caldesmon, and calponin. The intermediate filaments ofthese cells change from desmin to vimentin during the period of migration and
3. Review of Literature - 12 -
growth. The extracellular matrix of growing collateral arteries shows a deeprearrangement, with increased collagen IV and fibronectin secretion. All thesecharacteristics indicate an extensive vascular remodeling process, probablyregulated by FGFs that resembles the embryonic development anddifferentiation of arteries.
The embryonic development of arteries is a complex developmental process, in
which multiple molecular signals are implicated. Numerous homebox genes andtranscription factors have been identified during the last years, but theirparticular functions still remain unknown. The system Tie–2/angiopoietin–1 hasbeen shown to participate in the regulation of the process 45, whereas PDGFprobably controls the secretion of extracellular matrix and the cellulardifferentiation (for review see 46). FGF is also implicated in the embryonicdevelopment of arteries 47, and it is probably necessary for the cellularproliferation and differentiation of SMCs.
Recently, a strain of transgenic mice that specifically overexpress FGF–1 in theheart was developed in our laboratory 48. The gross anatomy, histologicalstructure and ultrastructure of the hearts of these transgenic mice are normal.However, a significant 1.5 fold increase in the density of small arteries wasnoted, whereas the capillary density was unchanged. Moreover, the number ofbranches of the main coronary arteries was also significantly increased 1.5 fold.The arrangement and anatomical disposition of the coronary arterial tree wasnormal. These results suggest that FGF–1 is a master regulator of thedevelopment and growth of the arterial system. The cardiac–specificoverexpression offers an appropriate animal model for the study of potentialgenes involved in the development and growth of arteries in the heart duringembryogenesis and during ischemic heart disease.
The increase in the density of small arteries and in branching of the main
coronary arteries could have potential effects on myocardial flow. Therefore, wedetermined the coronary flow using ex vivo retrograde perfusion of the heartunder maximal vasodilation at four different pressures.
3.1.6. FGFs in Myocardial Ischemic Preconditioning
Ischemic preconditioning is defined as the cardioprotective effect againstischemia obtained after repetitive short-term coronary occlusions 49. After one ormore short cycles of ischemia, infarct development is delayed, but not prevented.
3. Review of Literature - 13 -
Thus, preconditioning can limit infarct size during a temporary occlusion, but notduring a permanent occlusion.
During the last years, enormous efforts have been made to identify the factors
responsible for cardioprotection. The aim of many of these studies was todiscover trigger factors, which could be released at the onset of ischemicpreconditioning, looking for new and efficient therapies against myocardialinfarction. Adenosine, acetylcholine, catecholamines, angiotensin, bradykinin,endothelin, and opioids are some of these triggers (for review see 50). Thereceptors of some of these factors are coupled to G–proteins. It has beenproposed that their activation may converge in a common pathway, resulting inprotein kinase C (PKC) activation, which would be responsible forcardioprotection 51. Indeed, ischemic preconditioning can be selectively blockedby PKC inhibitors 52,53.
Other studies have suggested that kinases other than PKC are implicated in themechanism of ischemic preconditioning 54,55. Previous studies in our laboratorydemonstrated up–regulation of tyrosine receptor kinase–ligands following briefcycles of coronary occlusion 56. FGF–1 was one of these ligands. In neural tissueand skeletal muscle models, FGF–1 demonstrated trophic and protectiveeffects 57,58. With this knowledge, we conducted a study on the effects of FGF–1and FGF–2 administration before an episode of ischemia.
FGF–1 or FGF–2 was directly infused into the myocardium of pigs just before
coronary occlusion 59. Both FGF–1 and FGF–2 infusion showed a protectiveeffect, which significantly reduced infarct size. In terms of ischemic tolerance,FGF infusion approximately doubled the time required for complete infarction.
The cardioprotection obtained after FGF infusion is probably not a general effectof activation of tyrosine kinases, because other tyrosine kinase receptor ligands,like VEGF, do not achieve protection 59. On the other hand, suramin, a growthfactor antagonist, prevented FGF-induced cardioprotection, indicating that thepreconditioning effect of FGF is receptor mediated. Moreover, when the tyrosinekinase inhibitor genistein was infused prior to FGF, cardioprotection vanished,indicating that receptor activation is required for the preconditioning effect ofFGF.
One possible explanation of this preconditioning effect relies on the already
known vasodilatory capacity of FGF–1 60, that might lead to improved perfusion.However, infusion of a truncated form of FGF–1, non-mitogenic but
3. Review of Literature - 14 -
hemodynamically active 60, did not result in cardioprotection, indicating that thepreconditioning effect is due to the mitogenic activity of FGFs.
In this set of experiments, FGF–1 showed a significantly stronger
preconditioning effect than FGF–2, in terms of protein concentration required toobtain a functional response. This result is surprising because both FGFs havebeen demonstrated to bind equally to FGFR-1 and FGFR-2 in vitro 61. However,some studies have stressed the fact that FGF–1 has a greater importance thanFGF–2, in terms of gene expression in normal hearts 62,63.
As already mentioned, we have recently developed a transgenic strain of micespecifically overexpressing FGF–1 in cardiac myocytes 48. Believing that thismay be an appropriate model to study the cardioprotective effect of FGF–1, wehave performed experiments in which the left coronary artery was chirurgicallyoccluded. The infarct and risk areas were quantified in tissue slices 15, 30, 45,60, and 75 minutes after coronary artery occlusion 64.
The hearts of transgenic mice showed a significantly delayed infarct
development. After 75-90 minutes of occlusion, however, the infarcts hadreached the same size in both transgenic and control mice. Most likely, thisexcludes the possibility that the increased arterial density of transgenic mice,already discussed in this chapter, could cause an improved blood flow that wouldhave markedly reduced the final infarct size.
These results demonstrate that overexpression of FGF–1 is cardioprotective inmice, strengthening the hypothesis of an important role for FGF–1 in ischemicmyocardial preconditioning. However, to undoubtedly prove that transgeniccardiac myocytes are protected against ischemia without any influence of thevasculature, we had to conduct a new set of experiments. The best solution forthis purpose seemed to be the isolation of ventricular cardiac myocytes andsubmitting them to simulated ischemia. The results of this study would thenprove if overexpression of FGF–1 in cardiac myocytes protects them againstischemia without influence of the vasculature.
The next question arising would concern the pathway by which FGF–1 exerts its
cardioprotective function?
FGF ligand binding induces receptor dimerization, autophosphorylation, andinitiation of a downstream signaling cascade leading to the activation of mitogen-activated protein kinases (MAP kinases). Interestingly, MAP kinases have beenshown to be upregulated by transient ischemia in rats 65. MAP kinases aremediators of signal transduction to the nucleus, and are involved in the response

3. Review of Literature - 15 -
to cellular stress such as hypoxia, activating the transcription of genes probablyimplicated in the cellular responses of the myocardium against ischemia.
Further studies with our FGF–1 transgenic mouse model are needed, in order to
explore the functions and pathways of FGF–1 leading to myocardial ischemicpreconditioning, as well as in coronary vascular growth during embryonicdevelopment, neonatal life, and episodes of ischemia.
3. Review of Literature - 16 -
3.2. MCP–1 in the Cardiovascular System
3.2.1. Biochemistry of MCP–1
The study of the influence of cardiac-specific overexpression of MCP–1 on
exercise tolerance over a period of four month is a relatively small part of thisthesis. Therefore, only a short outline about the role of MCP–1 in thecardiovascular system will be provided.
There is accumulating evidence that MCP–1 plays important roles inpathophysiological conditions like decompensated heart failure, myocarditis,atherosclerosis, and inflammation. MCP–1 is a potent chemokine attractingmonocytes to the location of its secretion. Most chemokines have a conserved setof four cysteine residues. Chemokines with the amino terminal pair of cysteineresidues adjacent to each other are called C–C chemokines. In the case of anamino acid residue between the two cysteines they are called C–X–C chemokines.MCP–1 is considered the most studied member of the former class, whereasinterleukin 8 (IL–8) is the best studied member of the latter.
Shortly after the discovery of the neutrophil-specific chemoattractant now called
IL–8, different independent groups purified MCP–1 on the basis of its ability toattract monocytes in vitro. Surprisingly, the amino acid sequence of MCP–1indicated that the gene encoding its murine homologue had already been cloned.It was discovered in mouse fibroblasts as a platelet-derived growth factor-inducible gene, called JE 66. This became a recurring theme during the followingyears as more chemokines were isolated and sequenced. Many cDNAs encodingchemokines had already been isolated by differentially screening activated cells.This was probably due to the fact that the genes of many chemokines areextremely inducible, with expression levels often increasing 30- to 50–fold afterstimulation.
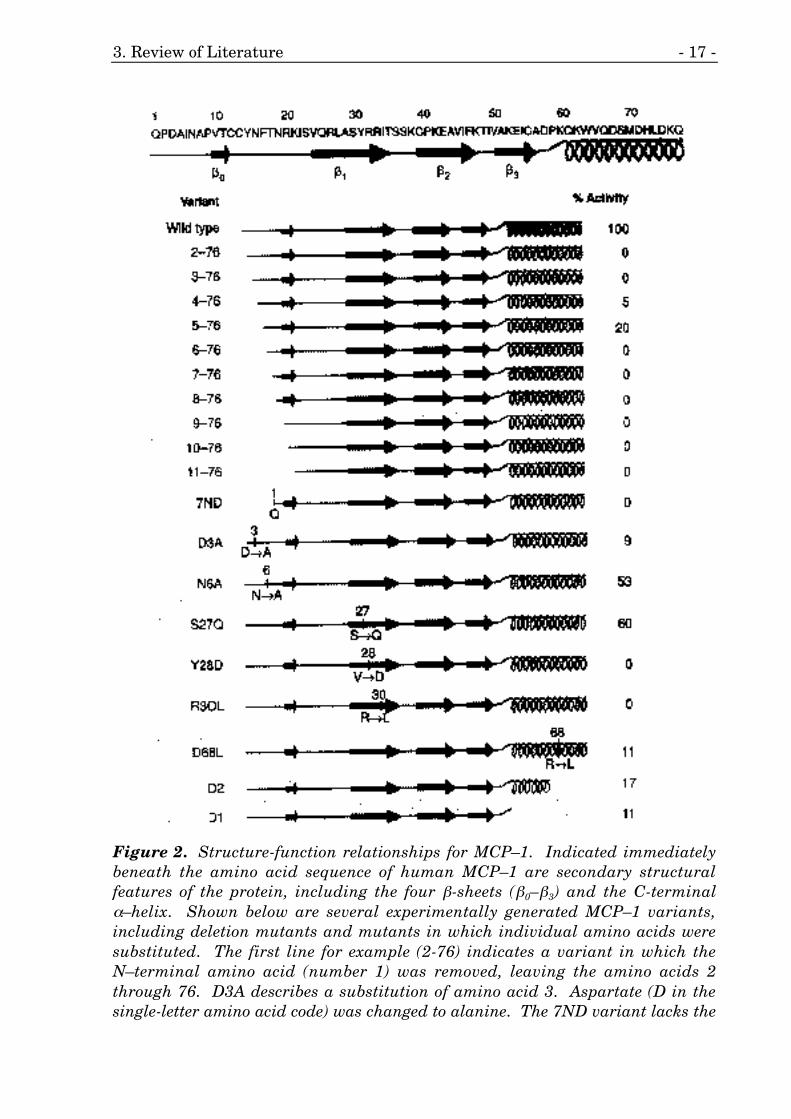
The genes encoding for C–C chemokines cluster at chromosome 17 (q11.2–12).The amino-terminal region of MCP–1 is characterized by a short β–sheet(Figure 2), designated β0. It is otherwise disorganized and floppy, neverthelessessential for the biological activity of MCP–1 and possibly for dimerization 67.The following β1–sheet including serine 27, tyrosine 28, and arginine 30 is alsoimportant for the activity of MCP–1. Thereafter, a C–terminal α–helix follows,which seems to interact with glycosaminoglycans. This interaction mightenhance dimerization and high-affinity receptor binding.
3. Review of Literature - 17 -
Figure 2. Structure-function relationships for MCP–1. Indicated immediatelybeneath the amino acid sequence of human MCP–1 are secondary structuralfeatures of the protein, including the four β-sheets (β0–β3) and the C-terminalα–helix. Shown below are several experimentally generated MCP–1 variants,including deletion mutants and mutants in which individual amino acids weresubstituted. The first line for example (2-76) indicates a variant in which theN–terminal amino acid (number 1) was removed, leaving the amino acids 2through 76. D3A describes a substitution of amino acid 3. Aspartate (D in thesingle-letter amino acid code) was changed to alanine. The 7ND variant lacks the
3. Review of Literature - 18 -
amino acids 2–8. Next to the name of each variant is a schematic of its structureand its relative biological activity (reprinted from 68)
However, the physiological role of MCP–1 dimers remains to be clarified. It hasbeen shown that MCP–1 is under physiological concentrations a monomer anddimerization might happen at concentrations that are irrelevant 69. However,this does not rule out the possibility that two independent monomers might bindsimultaneously to the receptor to generate a signal. It has also been shown thatMCP–1 as a dimer interacts with other chemokines even at physiologicalconcentrations 70.
MCP–1 mainly interacts with the chemokine receptor 2 (CCR2), a specific seven-
transmembrane-domain G protein coupled receptor on the surface of its targetcells.
3.2.2. MCP–1 and Atherosclerosis
The attraction of leukocytes to a specific area of the vasculature and themigration through the underlying tissue are central key-mechanisms in thegeneration of an inflammatory response, e.g. in wound healing, infections, etc..However, many diseases with an inflammatory component are the result of thisbeneficial recruitment process getting out of control. It is generally consideredthat atherosclerosis is among the group of chronic diseases, in which recruitmentof monocytes and to a lesser extent T–cells is the root of the pathology. Therecruitment of monocytes and T–cells requires the expression of various classesof adhesion molecules like selectins, intercellular adhesion molecule 1 (ICAM–1),and vascular adhesion molecule 1 (VCAM–1) as well as the presence of counterreceptor molecules on leukocytes and endothelial cells (for review see 71).Furthermore, a chemotactic gradient to guide monocytes and T–cells to thesource of the inflammatory signal is necessary. In atherosclerosis, theinflammatory signal originates in the vessel wall.
Oxidized low density lipoprotein (LDL) located in the sub-endothelial space plays
a role in increasing the adherence of monocytes and their migration into thevessel wall. Oxidized LDL upregulates adhesion molecules on endothelial cells 72
and the expression of MCP–1 in endothelial and vascular smooth muscle cells 73.During oxidation of LDL a large amount of the phosphatidylcholine (PC) isconverted to lysoPC through phospholipase A2 activity. LysoPC has also been
3. Review of Literature - 19 -
shown to induce the expression of adhesion molecules and MCP–1 on endothelialcells 74. A non-oxidized, enzymatically degraded form of LDL was found inatherosclerotic plaques. It was demonstrated to cause monocyte adhesion andmigration to the sub-endothelium and to induce MCP–1 expression and releasefrom macrophages 75.
Arterial bifurcations, branches and curvatures, which typically characterize
lesion prone areas, cause alterations in blood flow patterns in these areas.Interestingly, it has been shown that shear stress upregulates the expression ofICAM–1 76 and MCP–1 77.
In human atherosclerotic lesions, MCP–1 has been found to be expressed mainlyby macrophages, but also by smooth muscle cells 78. The MCP–1 protein has alsobeen detected on the luminal endothelium of early human atheroscleroticlesions 79. It was suggested that MCP–1 has an intimate involvement in thecontinued infiltration of monocytes into lesions and perhaps other downstreamchronic modulatory events.
In a recent in vitro study, the effect of MCP–1 and IL–8 on endothelial cell
monolayers expressing E-selectin under flow conditions was studied 80. It wasfound that MCP–1 and IL–8 could convert monocyte rolling to a firm adhesion,demonstrating its importance for atherosclerotic plaque development andprogression.
CCR2 mRNA is decreasing during monocyte differentiation into macrophages.Oxidized LDL reduces CCR2 mRNA of a monocyte cell line, which is probablydue to its ability to stimulate monocyte differentiation to macrophages 81.However, non-modified LDL possesses an opposite activity. LDL increased CCR2mRNA and protein levels of the monocyte cell line, resulting in increasedchemotactic response to MCP–1. The differential regulation of CCR2 suggeststhat its main function is the recruitment of monocytes from the bloodstream andthat perhaps other chemokines/receptors are more important for movement ofmacrophages within lesions. Downregulation of CCR2 receptors on monocytesupon entering the lesion could serve to maintain the cells in a specific area of theinflammation until other chemokine signals are transmitted.
Macrophages are present throughout all stages of atherosclerosis and are
considered to be the major inflammatory mediators during disease progression.After entering the atherosclerotic lesion environment, macrophages function asscavenger cells internalizing modified lipoprotein particles, becoming foamcells 82. Macrophages are the richest source of chemokines and growth factors in
3. Review of Literature - 20 -
atherosclerotic regions, indicating that macrophages (monocytes) and, thus,MCP–1 play a key role in atherosclerosis. Additionally, macrophages act asantigen-presenting cells to T–cells during the immune response, which occursduring the disease 83.
The presence of T–cells in atherosclerotic lesions indicates that adaptive
immunological events in conjunction with inflammatory ones are implicated inatherogenesis. T–cells along with macrophages occur in large numbers at thesites of plaque rupture. Because T–cells secret inflammatory cytokines, whichare capable of inducing metalloproteinase expression by macrophages, they arethought to be involved in the development of unstable plaques 83. Knowing thatMCP–1 is also a chemoattractant for T–cells and, therefore, implicated in thedevelopment of unstable plaques, things have come full circle 84.
Vascular smooth muscle cells are also a source of MCP–1 under certainconditions. Balloon injury provokes a transient upregulation of MCP–1 invascular smooth muscle cells. Cultured rat aortic vascular smooth muscle cellsstimulated by platelet-derived growth factor showed a similar increase in MCP–1expression 85.
Interestingly, the potent vasoconstrictor angiotensin II, playing such an
important role in many cardiovascular diseases, can directly upregulate MCP–1expression in rat vascular smooth muscle cells 86. Vascular smooth muscle cellsexpress mRNA for the MCP–1 receptor CCR2. However, no conclusive data areavailable about the role of MCP–1 as a positive or negative regulator ofproliferation.
CCR2 knockout mice crossed with ApoE knockout mice demonstrated uponfeeding with a Western type diet markedly decreased atherosclerotic lesionformation 87. Furthermore, MCP–1 knockout mice crossed with LDL receptorknockout mice showed a decreased lesion size and a reduction of macrophageswithin the lesion 88. The fact that there are still macrophages in the lesions,albeit fewer, suggests that other chemokines are also playing a role in thedisease. On the contrary, mice overexpressing MCP–1 crossed with ApoEknockout mice displayed accelerated atherosclerosis through an increasedmacrophage number in the lesion and lipid accumulation 89. These studiesprovide direct evidence for a direct role of MCP–1 and CCR2 in monocyterecruitment during atherosclerosis. However, these animal models show thatinterfering with a single chemokine or receptor can have profound effects ondisease progression without an effect on plasma lipids.
3. Review of Literature - 21 -
3.2.3. MCP–1 and Congestive Heart Failure
Serological investigations of patients with congestive heart failure (CHF) have
demonstrated elevated circulating levels of MCP–1 90. MCP–1 levels correlatedsignificantly inversely with left ventricular ejection fraction and wereparticularly raised in patients with coronary artery disease, connectingatherosclerosis with CHF. The serum of CHF patients enhanced the generationof superoxide anions of monocytes in vitro. This effect could be inhibited byneutralizing antibodies against MCP–1.
Heart failure and cardiac hypertrophy induced by pressure overload inhypertensive rats increased the expression of MCP–1 in the heart significantly 91.The MCP–1 protein was localized in endothelial cells and interstitialmacrophages. The number of interstitial macrophages was increased in theseanimals. These facts suggest that MCP–1 induced macrophage infiltration playsa role in the development of cardiac hypertrophy and failure.
In another study, CHF was induced by volume overload via an aortocaval
fistula 92. MCP–1 expression correlated with the severity of CHF. The proteinwas localized in cardiac myocytes, endothelial cells, vascular smooth muscle cells,macrophages, and interstitial fibroblasts, and the intensity increased with theseverity of CHF. Interestingly, MCP–1 binding sites to the membrane fraction ofthe myocardium decreased with the progression of heart failure.
Chronic nitric oxide (NO) inhibition in rats induced MCP–1 expression, vascularinflammatory changes, medial thickening and perivascular fibrosis as a sign ofatherosclerotic changes, and cardiac fibrosis 93. The expression of MCP–1 wasespecially increased in endothelial cells and monocytes in inflammatory lesions.One of the initial experiments of the study demonstrated the potency of MCP–1injection into the skin of control rats recruiting monocytes to these areas.Administration of MCP–1 antibodies resulted in an inhibition of monocyteinfiltration of rat dermis injected with MCP–1. The experiment furthermorerevealed that there is a dose dependent effect of the antibody treatment.Infiltration of polymorphonuclear cells into the dermis induced by IL–8 injectionwas not affected by the administration of MCP–1 antibodies. Antibody treatmentin rats with NO inhibition resulted in inhibition of the medial thickening of largeand small coronary arteries but was not able to prevent perivascular fibrosis andcardiac fibrosis. Furthermore, the increase in TGF–β1 (transforming growthfactor β1) and collagen I expression due to NO inhibition could not be inhibited byapplication of MCP–1 antibodies. This study demonstrates that even thoughatherosclerosis and CHF are closely linked by many pathophysiological and
3. Review of Literature - 22 -
anatomical features, a variety of distinct processes have to be considered. Amajor role of MCP–1 in these diseases is evident. However, more evidence has tobe collected to precisely understand its function and influence on the differentdisease processes.
3.2.4. MCP–1 and Myocarditis
In 1998, Kolattukudy et al. reported their findings about the cardiac-specific
overexpression of MCP–1 in mice 94. Transgenic mice showed leukocyteinfiltration into the interstitium between cardiac myocytes. The infiltrateconsisted mainly of macrophages but the presence of a significant amount ofT–cells was not observed. At an age of 100 days these mice did not display majorfibrosis or vascular alterations. Myocardial samples of transgenic mice analyzedfor the expression of IL–1, IL–2, IL–6, TNF–α (tumor necrosis factor α), andTGF–β (transforming growth factor β) mRNA did not show the production of anyof these proinflammatory or morphogenic chemokines. This indicates that therewas no local leukocyte or endothelial cell activation up to 100 days of age.Echocardiographic analysis of approximately one year old transgenic micerevealed a substantial cardiac hypertrophy and dilation when compared tonontransgenic control mice. Left ventricular mass and both systolic and diastolicleft ventricular internal diameters were increased and contractile function wasdecreased. Heart mass of transgenic mice was increased by approximately 65%.Histological analysis of the myocardium of these mice showed hypertrophy ofmyocytes, mild interstitial edema, moderate myocarditis and a limited amount offibrosis. These findings closely resemble the situation in humans withmyocarditis. Thus, targeted expression of MCP–1 in the adult heart muscleproduces a pathological condition that shares many features associated withmyocarditis/cardiomyopathy.
In another study, the contribution of monocytes/macrophages to compensatoryneovascularization was evaluated in the same transgenic mouse line withcardiac-specific overexpression of MCP–1. The investigators observed tunnels inthe myocardium of these mice that were free of endothelium and occasionallycontained blood-derived cells. Their data suggest that monocytes/macrophagesdrill tunnels by using the broad-spectrum mouse macrophage metalloelastase.Tunnels were characterized by neo-endothelial markers and proliferationmarkers suggesting an active angiogenic process. However, this study does not
3. Review of Literature - 23 -
show whether these tunnels eventually become capillaries connected to anexisting vessel and colonized by circulating endothelial cell progenitors.
Data available from the literature prove that MCP–1 is a potent chemokine
influencing inflammatory events, atherosclerosis, congestive heart failure, andmyocarditis. Cardiac-specific overexpression of MCP–1 results in a pathologicalcondition that closely resembles the situation in humans suffering frommyocarditis. Preliminary experiments performed in our laboratory demonstratedthe development of severe congestive heart failure in these transgenic mice.Exercise tolerance is used as a primary marker for the severity of CHF inhumans and the base of the New York Heart Association (NYHA) classificationsystem. In order to evaluate whether these mice demonstrate impaired exercisetolerance and to evaluate the progression of heart failure we conductedexperiments to access the exercise capacity of these mice every four weeksstarting at an age of 16 weeks.
3. Review of Literature - 24 -
3.3. Physical Activity - Angiogenesis and Arteriogenesis
3.3.1. Introduction
Physical activity-induced sprouting and formation of new capillaries
(angiogenesis) in the exercising muscle has been reported as early as 1934 95. Inthe 1960s, the increased number and/or size of collateral vessels in patients withperipheral arterial obstructive disease (PAOD) due to exercise had beenpostulated 96-98. The development of functionally relevant arteries frompreexistent collateral arterioles (arteriogenesis) was hypothesized and laterconfirmed 99.
The induction of angiogenesis and arteriogenesis are considered very importanttherapeutic goals in the treatment of PAOD. Ever since the initial findings ofvascular changes and adaptations to physical activity, great efforts have beenmade to determine the underlying mechanisms.
Therefore, this chapter is written to:
- Summarize the physiological adaptations of the vasculature to physicalactivity,
- Explore their underlying mechanisms,
- Suggest new methods for therapeutic use of physical activity in the treatment of PAOD.
3.3.2. Physical Activity and Angiogenesis - Background
Angiogenesis is mainly occurring in pre- and neonatal developmental stages and
usually finished at the onset of adulthood. However, numerous studies havedemonstrated that angiogenesis is a common adaptation of the adult skeletalmuscle in response to exercise (for reviews see 100,101).
The angiogenic response of the rabbit extensor digitorum longus muscle to low-frequency stimulation could be observed four days after the onset ofstimulation 102. Daily endurance treadmill running increased capillary-to-fiberratio of the rat gastrocnemius and soleus muscles within one week of training 103.
3. Review of Literature - 25 -
These studies indicate that angiogenesis is occurring during relatively shortstimulus duration. They also demonstrate the increase in capillary-to-fiber ratiofor the entire duration of the skeletal muscle stimulation. Nevertheless, uponcessation of the exercise regime, the angiogenic adaptation to increased physicalactivity is reversed under physiological conditions 104. It is unknown, whetherthe exercise-induced increase in capillarity is reversible or persistent underpathophysiological conditions like PAOD.
It is generally believed that angiogenesis is mediated by certain growth factors
that act on endothelial and vascular smooth muscle cells. Since the early 1990sit became apparent that these growth factors are released in response to physicalactivity.
3.3.3. Vascular Endothelial Growth Factor
Vascular endothelial growth factor (VEGF) is one of the growth factors thatreceived a lot of attention in this context. The homodimeric glycoprotein isknown to exist in at least five isoforms. Three different receptors that arerestricted to endothelial cells have been characterized 105-107. In 1995, Hang etal. 108 reported upregulation of VEGF gene expression in skeletal muscle of therat exposed to electrical stimulation. This observation was confirmed by Breenand coworkers 109, who found increased skeletal muscle VEGF mRNA in ratsafter a single exercise bout.
In 1999, two independent groups observed increased VEGF mRNA levels after
single exercise bouts in human skeletal muscle 110,111. VEGF expression isknown to be stimulated by hypoxia 112,113, which seems to be at least partiallymediated by hypoxia inducible factor 1 (HIF–1) 114. Gustafsson et al. 1 1 1
investigated the relationship of VEGF and HIF–1 mRNA in response to exercise.These investigators found that the exercise-induced increase in expression levelsof VEGF correlated with the increase in HIF–1α and HIF–1β mRNA.Furthermore, these changes correlated with the increase in femoral venouslactate concentration. However, when blood flow was restricted by 15-20%, nofurther increase in the expression levels of VEGF, HIF–1α and HIF–1β could beobserved. Similarly, in the study performed by Richardson and colleagues 110
skeletal muscle VEGF mRNA increased in response to a single exercise session.But no further increase in the expression of VEGF was found when inhalation ofa hypoxic gas during exercise caused an even greater reduction of intracellular
3. Review of Literature - 26 -
PO2. The results of these two independent studies suggest that the increase inVEGF mRNA is at least partially mediated by the increase in HIF–1 due to asingle bout of exercise. The moderate skeletal muscle hypoxia caused by a singleexercise bout seems to be sufficient to induce VEGF expression. It appeared thatnormoxic exercise achieves the postulated intracellular PO2 “threshold” for theVEGF response. A further decrease of the intracellular PO2 either by restrictionof blood flow or inhalation of hypoxic gas during exercise does not result in agreater elevation of VEGF expression compared to normoxic exercise.
Interestingly, chronic hypoxia (inspired O2 fraction of 0.12 for eight weeks) was
shown to attenuate resting as well as exercise-induced VEGF mRNA levels inrats 115. Furthermore, it was demonstrated that mRNA of two VEGF receptors(flt–1 and flk–1) decreased in response to chronic hypoxia under restingconditions and after exercise. These findings could provide an explanation forthe lack of increased capillarity due to chronic hypoxia.
In 2000, Richardson et al. 116 revealed that the VEGF response to exercise isattenuated in trained individuals, suggesting a negative feedback. In trainedindividuals capillary-to-fiber ratio increased as well as maximal skeletal muscleoxygen extraction and oxygen conductance. These findings are in accordance tothe current opinion: When structural and functional requirements of theexercising skeletal muscle are met, no further angiogenic response e.g. increasedVEGF expression is needed.
An endurance exercise regime of five days in rats was shown to cause an
attenuated VEGF response 117. After the first exercise bout VEGF expressionwas maximal. After exercise at the second day VEGF expression was stillsignificantly elevated when compared to resting levels but reduced whencompared to VEGF mRNA after the first exercise bout.
Recently, Gustafsson et al. 118 reported a twofold increase in VEGF at both themRNA and the protein levels in heart failure patients that underwent a trainingregime of eight weeks. The importance of these findings is demonstrated by thestudy of Duscha and coworkers 119 who showed that capillary density is markedlydecreased in heart failure patients. The decrease in skeletal muscle capillarityappears to be a contributing mechanism for the exercise intolerance observed inthis patient group. Based on the knowledge that the VEGF response to exerciseis intact in heart failure patients the role of physical activity for the maintenanceof skeletal muscle capillary density can be appreciated.
3. Review of Literature - 27 -
Nitric oxide (NO) is released during exercise, induces VEGF expression invitro 120, and is known to be implicated in the signaling pathway of VEGF-induced angiogenesis 121. Benoit et al. 1 2 2 investigated the potency of NOapplication for one hour to induce VEGF expression in vivo. They observed anincrease in VEGF mRNA upon application of NO and suggested that the releaseof the vasodilator NO could be involved in exercise-induced angiogenesis.However, the magnitude of the NO-induced VEGF expression does not achievethe exercise-induced VEGF mRNA level.
Inhibition of the nitric oxide synthase was demonstrated to attenuate the VEGF
response to a single exercise bout in rats 123. This is again suggesting thatexercise induced NO release plays an important role in the angiogenic adaptationof the skeletal muscle by either inducing VEGF transcription or increasing VEGFstability.
3.3.4 FGF–1 and FGF–2
The fibroblast growth factor (FGF) family and the mediating receptors haveextensively been studied (for reviews see 124-126). FGF–1 and FGF–2 were shownto induce angiogenesis in vitro and in vivo 127,128.
In contrast to VEGF expression, the response of FGF–1 and/or FGF–2 expression
to physical activity remains to be determined. It was found that chronicelectrical stimulation of rat skeletal muscle for five days leads to elevated mRNAlevels for FGF–1, FGF–2, FGF receptor 1 (FGFR1), and FGF receptor 4(FGFR4) 129. After longer stimulation FGF–1 and FGFR4 mRNAs decreased tonormal levels, whereas FGFR1 mRNA returned to normal levels after ten daysbut increased again after 20 days of stimulation. FGF–2 expression remainedelevated over the whole experimental period. When satellite cell cultures werestimulated FGF–1 and FGF–2 expressions also increased but to a lesser extendin comparison to intact skeletal muscle. FGF–1 and FGF–2 proteins increased inelectrically stimulated rabbit skeletal muscle. These changes were concomitantwith increased mitotic activity, fast to slow skeletal muscle fiber conversion andincreased capillarity 130.
A short-term exercise program of rats did not cause increased FGF–2expression 117 when compared to resting levels. A single bout of submaximalexercise also didn’t lead to a response of FGF–2 expression 123. There was noFGF–2 response to a single exercise bout in rats under normoxic conditions or
3. Review of Literature - 28 -
after a chronic hypoxia period of eight weeks 115. However, it was shown earlierby the same group that the same exercise stimulus leads to increased FGF–2expression in the rat 109. In humans, these investigators reported no measurableFGF–2 expression after a single endurance exercise bout 110. Similarly,Gustafson and coworkers did not observe increased FGF–2 mRNA after a singleexercise bout in the human 111.
A short-term exercise program in rats with bilateral femoral artery occlusion led
to increased capillarity in the gastrocnemius muscle when compared to sedentarycontrol rats 131. The increase in capillarity was caused by endothelial cellproliferation. However, FGF–2 content of the gastrocnemius muscle was notaltered by exercise, suggesting that other endothelial cell mitogens areresponsible for the observed changes.
Overload of a particular skeletal muscle by removal of the synergist has beenreported to cause increased capillary-to-fiber ratio 132. This change was notassociated by an increase in FGF–2 expression. No FGF–2 immunoreactivitywas observed in capillaries, whereas it was present in larger vessels and nerves.There was no difference in maximal muscle blood flow between overloadedmuscle and muscle of unoperated control rats, suggesting that neither FGF–2 norincreased blood flow are responsible for the increase in capillarity.
The role of FGFs in exercise induced angiogenesis remains to be clarified.
Electrical stimulation of rat skeletal muscle appears to induce expression ofFGF–1 and FGF–2 mRNAs and to increase their protein levels. However, mostof the endurance exercise studies in both rats and humans did not lead to asignificant response of FGF expression. It has to be mentioned that most of theseinvestigations concentrated on the expression levels while paying no attention tothe protein levels.
It has been questioned whether FGF–1 and FGF–2 are secreted via theendoplasmic reticulum since they lack the conventional leader sequences.Cellular damage and stretching as well as a contraction based mechanism havebeen suggested to cause the release of FGFs from cells in vivo 133-137. Thus, apossible influence of physical activity on the release of intracellular FGFs can notbe excluded and further investigations are needed.
Recently, Maciag and colleagues started to resolve the puzzle of FGF–1 release.
The release of FGF–1 may proceed through a novel release/export pathway.They found that FGF–1, but not FGF–2, is released as a latent homodimer by atranscription- and translation-dependent mechanism in response to a variety of
3. Review of Literature - 29 -
cellular stresses including heat shock 138, hypoxia 139, and serum starvation 140.The disruption of communication between the endoplasmic reticulum and Golgiapparatus by brefeldin A does not prevent the release of FGF–1 from 3T3cells 138, which confirms that FGF–1 release may occur through anonconventional pathway. FGF–1 is released in vitro complex sensitive toreducing agents and denaturants. The complex contains the p40 extravesiculardomain of the calcium-binding protein p65 synaptotagmin 1 141. The expressionof synaptotagmin 1 is essential for the release of FGF–1 in response to stress 142.Furthermore, it was demonstrated that FGF–1 isolated from tissues as a highmolecular weight aggregate exists as a component of a noncovalent heparin-binding complex with p40 synaptotagmin 1 and S100A13, a member of the S100gene family of calcium-binding proteins 143. The precursor form of interleukin 1αwas shown to block the release of FGF–1 suggesting that their release pathwaysmay be mechanistically linked 144. The anti-allergic drug amlexanox, whichbinds S100A13, is able to inhibit the release of FGF–1 and p40 synaptotagmin 1in response to temperature stress 145. Amlexanox also causes the reversibledisassembly of actin stress fibers indicating that the actin cytoskeleton also playsa role in the regulation of FGF–1 release. The expression of S100A13 facilitatesthe release of FGF–1 into the extracellular compartment in response totemperature stress in vitro 146. Interestingly, the expression of S100A13 wasdemonstrated to reverse the sensitivity of FGF–1 release to inhibitors oftranscription and translation 146. S100A13 may also induce the formation of anoncovalent FGF–1 homodimer, which is essential for FGF–1 release 146. Themost recent study of Maciag and colleagues showed that copper induces theformation of a multiprotein aggregate between S100A13, FGF–1, andp40 synaptotagmin 1 147. When copper was bound by a copper chelator, the heatshock-induced release of FGF–1 and S100A13 was repressed in a dose-dependentmanner. However, the mechanism by which the multiprotein complex is finallyreleased to the extracellular space remains to be determined. Maciag andcolleagues anticipate that phosphatidylserine flipping from the inner leaflet tothe outer leaflet of the plasma membrane might be involved in this mechanismsince S100A13, FGF–1, and p40 synaptotagmin 1 are phosphatidylserine-bindingproteins 146.
Since FGF receptors are not restricted to endothelial cells and biological effects of
FGFs on other cell types have been shown, skeletal muscle adaptations inresponse to physical activity beyond angiogenesis remain to be determined.
3. Review of Literature - 30 -
3.3.5. Other Growth Factors
The angiogenic effect of transforming growth factor–β1 (TGF–β1) is not directly
mediated (for review see 148). However, TGF–β1 is essential in the process ofvasculogenesis 149,150. A shear stress response element located in the TGF–β1
promoter region causes increased TGF–β1 expression of vascular endothelial cellsupon submission to increased shear stress in vitro and in vivo 151,152. A singleexercise bout as well as hypoxia at rest increased TGF–β1 expression in rats 109.However, exercise under hypoxic conditions did not further increase TGF–β1
mRNA. To precisely determine the role of TGF–β1 expression in response toexercise further studies on different species are needed. The long-term effects ofexercise on TGF–β1 expression also with regard to shear stress-inducedregulation remain to be determined.
Platelet derived growth factor (PDGF) expression is induced through shear stressvia two shear stress response elements in its promoter region 153-155. PDGF issimilar to TGF–β1 essential for vasculogenesis 156. However, no studies havebeen performed investigating the effect of exercise on PDGF expression eventhough increased mRNA levels could be expected via greater shear stress due toexercise.
Endothelial cell-stimulating angiogenic growth factor (ESAF) has been shown to
be implicated in angiogenesis possibly via regulation of enzymes involved in theangiogenic process like procollagenase, prostromelysin 1, progelatinase A, andtissue inhibitor of metalloproteinase 1 (TIMP–1) 157,158. Brown et al. 159 reportedthat chronic electrical stimulation of rat skeletal muscle leads to increasedactivity of ESAF. The same was demonstrated to occur in overloaded skeletalmuscle of the rat 132.
Even though a close relationship between angiopoietins and VEGF has beenobserved and their importance in the process of blood vessel formation has beendemonstrated 160,161 no studies have been published regarding the influence ofphysical activity on this new group of growth factors.
3.3.6. Physical Activity and Arteriogenesis - Background
One of the first studies that explored the role of exercise for the treatment of
PAOD was done by Foley in 1957 162. He reported faster healing of gangrenousfeet when patients were subjected to a walking program. The German clinician
3. Review of Literature - 31 -
Schoop focused mainly on the importance of the collateral circulation 163. Hehypothesized that the speed of blood flow, but not ischemia, causes an increase inthe collateral circulation and that exercise is the simplest, most effective methodfor augmenting the collateral circulation. He even suggested a precise intervaltraining program for the treatment of PAOD. Unfortunately, these studies weremainly based on clinical impressions and little data were presented to prove thehypothesis and the effect of exercise on PAOD in general and on the collateralcirculation in particular. In 1967, Skinner and Strandness 96 investigated theeffect of a walking exercise program on three different parameters in patientswith PAOD. Systolic pressure at the ankle after exercise, maximal walking time,and the time of the onset of claudication pain were significantly increased in allof the five study subjects. They concluded, without supplying further data, that asignificant increase in collateral circulation of long-term exercised patients isimproving the blood supply to the obstructed leg. In 1969, Alpert et al. 98
observed a significant correlation between the improvement in maximal walkingtime and the increase in calf blood flow during exercise after a six monthswalking regime. Based on their results, the authors concluded that functionalfactors (e.g. better coordination of the working muscles) as well as anatomicfactors (increase in the number and/or size of collateral vessels) are involved inthe improved performance of patients after regular physical activity.
In 1968, Sanne and Sivertsson 97 performed one of the first true experimental
studies with regard to exercise and PAOD. After unilateral ligation of thefemoral artery cats were trained for five weeks on a treadmill. The collateralresistance at maximal vasodilation was shown to be significantly reduced intrained cats, when compared to sedentary controls. They also reported that theflow resistance in the distal vascular bed was not changed after occlusion and notaffected by exercise. Even though not providing any histological evidence theysuggested that the “spontaneous” growth of the collateral vessels in the occludedlimb was very good. Five weeks after occlusion, the collateral resistance duringmaximal vasodilation decreased almost exactly threefold in the untrainedanimals. The authors hypothesized that the “normal” stimuli for collateraldevelopment, whatever their nature would be, are very efficient. They concludedthat physical exercise is a very potent additional stimulus, which furtherenhances the development of collateral vessels. This study, being very elegantfor its time, was pointing into a new direction. From there on, more attentionwas paid to collateral vessel development as a therapeutic mechanism for thetreatment of PAOD.
3. Review of Literature - 32 -
3.3.7. Development of Collateral Arteries
The terms “collateral circulation” and “collateral resistance” were used for
decades. Their changes due to different treatments, interventions andphysiological processes have been detected without precisely understanding theunderlying mechanisms. In 1971, Schaper et al. 99, who was mainly focusing oncoronary collaterals at the time, provided evidence that the fall in collateralresistance was caused by active growth of preformed arterioles. A new paradigmwas formed: Collateral arterioles grow by mitotic cell division after DNAreplication of endothelial and smooth muscle cells. Recently the term“arteriogenesis” has been ascribed to the process of collateral artery growth 164.Arteriogenesis is now considered the only relevant type of vascular growth thatpotentially saves limbs, hearts, and brains. Angiogenesis, the growth ofcapillaries, can never replace a major occluded artery. Therefore, enhancementof arteriogenesis is becoming the main target for researchers and physiciansinvolved in the treatment of PAOD. Arteriogenesis has been shown to take placein hindlimbs with femoral artery occlusion 40,165,166. This process is restricted tothe thigh, whereas angiogenesis is predominantly occurring in the calf muscleand is associated with hypoxia. The regulating mechanisms for arteriogenesisare not yet entirely clarified. However, the results of several studies suggest thatthe arterial diameter increases when wall shear stress is elevated 167-171. Thisprocess continues until wall shear stress has normalized. It has beendemonstrated that shear stress induces expression and release of FGF–2 fromvascular smooth muscle cells and endothelial cells 172,173. Increased shear stresswas also shown to induce expression of MCP–1 174 and the upregulation of celladhesion molecules in the proliferating arterioles 39. The adhesion of monocytesand their subsequent transformation to macrophages seems to be essential forarteriogenesis. Macrophages release a variety of growth factors and cytokinesknown to be important for arterial growth e.g. FGF–2, MCP–1, TNF-α, andMMPs (matrix metalloproteinases). (see also chapter 3.2.)
3.3.8. Exercise-Induced Arteriogenesis - The Rat Model
Numerous studies demonstrated the potential role of exercise in the induction ofarteriogenesis in many species. However, both positive and negative results havebeen reported.
3. Review of Literature - 33 -
The rat model of PAOD and exercise as a stimulus for arteriogenesis was mainlyestablished by Terjung and coworkers. In 1986, the results of their first studyabout the influence of exercise on rat hindlimbs with femoral artery occlusionwere reported 175. Their results indicate a clear beneficial effect of exercise onmaximal running duration and intensity. Functional performance of thegastrocnemius-plantaris-soleus muscles in trained occluded animals was similarto unoperated control rats but reduced in sedentary occluded animals. However,the blood flow determination of this muscle group by microspheres did not yetprovide conclusive results about the exercise-induced arteriogenesis withsubsequent increase in skeletal muscle perfusion during exercise.
Four years later this work was continued with slightly modified techniques 176.
After an endurance exercise program of six weeks no significant difference intotal hindlimb blood flow was observed between acutely occluded, sedentaryoccluded, and trained occluded animals. Total hindlimb blood flow reached only46-63% when compared to unoperated control rats. However, a significantdifference could be observed when blood flow distribution was analyzed. Acutelyoccluded animals had a markedly reduced blood flow to the gastrocnemius-plantaris-soleus muscle group when expressed relative to the proximal bloodflow. In sedentary occluded animals, distal blood flow partially recovered andfurther increased in trained occluded animals. The authors suggested that theincrease in blood flow to the distal hindlimb in trained animals could be due tobetter collateral vessel function. However, the total hindlimb perfusion could notbe recovered by treatment with an endurance exercise program for six weeks.
In the same year, Terjung and colleagues could detect a significant increase intotal hindlimb blood flow in rats with femoral artery occlusions trained for up toeight weeks 177. Again a significantly greater redistribution of blood flow to thegastrocnemius-plantaris-soleus muscles was observed in trained occluded ratswhen compared to sedentary occluded rats.
In 1993, the same group reported increased blood flow to the total hindlimb, to
proximal muscles, and to distal muscles, when the femoral artery was occludedafter pretreatment with an ACE inhibitor for up to seven days 178. The authorshypothesized that a larger diameter of the collateral vessels due to ACEinhibition could be responsible for the increased blood flow. In a follow-upstudy 179, it was observed that chronic administration of an ACE inhibitorcombined with physical activity for three weeks elevated total hindlimb bloodflow and exercise tolerance to a greater extent than physical activity or ACEinhibition alone.
3. Review of Literature - 34 -
The next pharmacological intervention applied to the same model was chronicheparin treatment 180. It was demonstrated that heparin treatment furtherenhanced blood flow to the total hindlimb, to proximal muscles, and to distalmuscles. Heparin treatment in combination with physical activity also increasedcontractile force of the gastrocnemius-plantaris-soleus muscle group as well asexercise capacity when compared to sedentary heparin treated animals. Thisstudy was particularly interesting because heparin is known to interact withangiogenic growth factors. Through its high-affinity binding, heparin aids in thestorage and possibly in the mobilization of growth factors in and from theextracellular matrix (for reviews see 181-183). It has been shown to interact withcell surface receptors and growth factors initiating the growth factor signaling.Therefore, it is not surprising that heparin enhances the process of collateralartery growth by possibly potentiating the effects of growth factors released dueto physical activity.
In 1996, these investigators determined the influence of FGF–2 on collateral
artery dependent blood flow 184. FGF–2 infusion via osmotic pumps for fourweeks markedly increased blood flow to the total hindlimb, to proximal muscles,and to distal muscles. Muscle performance of the gastrocnemius-plantaris-soleusmuscle group was enhanced and capillary-to-fiber ratio of FGF–2 infused ratswas increased in high-oxidative fiber sections but not in a predominantly low-oxidative section when compared to acutely ligated rats and to heparin infusedcontrol animals. Postmortem angiograms revealed more collateral arteries and abetter filling of the femoral artery distal to the point of occlusion. Thus, theauthors proved FGF–2 treatment to be very efficient in induction ofarteriogenesis upon femoral artery ligation.
When the stimulating effect of FGF–2 was combined with physical activity, amore pronounced increase in collateral artery dependent blood flow could beobserved 185. Hindlimb blood flow measurements compared to the sedentarycarrier group revealed an increase in the following order: trained carrier group,sedentary FGF–2 group, trained FGF–2 group. Interestingly, blood flow to theproximal hindlimb muscles was especially enhanced in the trained FGF–2 groupindicating a significant treatment interaction. However, when muscleperformance was analyzed the two sedentary groups could not maintain thetension as well as the trained carrier group. Again, the interaction of trainingand FGF–2 application led to the highest increase e.g. muscle performance.These data indicate that muscle performance is not just determined by blood flowto the working muscle. Therefore, other factors must have contributed to theenhanced muscle performance of the trained rats. Unfortunately, the
3. Review of Literature - 35 -
investigators did not determine blood flow and muscle performance inunoperated control animals. It would be very interesting to compare the potencyof the combined treatment with the physiological conditions. This could revealwhether blood flow to the occluded limb is partially or even totally restored andthus, the true importance of the combined treatment. Additionally, capillary-to-fiber ratio increased only in the low-oxidative gastrocnemius section of trainedrats opposing their findings of the previous FGF–2 infusion study 184.
In 2000, the efficacy and specificity of FGF–2 application on the increase in
collateral artery blood flow were determined 186. The investigators found similarincreases in the intra arterially infused group when compared to the intravenously infused group or the subcutaneously injected group as long as similaramounts were administered. There was no obvious difference in collateral arteryblood flow when FGF–2 application was short-term or prolonged and continuousor intermittent. Chronic FGF–2 treatment did not alter blood flow upon acutefemoral artery occlusion when compared to untreated or carrier treated controlrats. Therefore, the authors conclude that FGF–2-induced arteriogenesisrequires vascular occlusion and can be restricted to short-term applicationthough different routes to be effective.
In the same year, these investigators evaluated the influence of an enduranceexercise program before acute occlusion of the femoral artery on collateral arteryblood flow 187. Prior endurance exercise training increased blood flow to thehindlimb in the distal as well as in the proximal segment when compared tosedentary control rats. Blood flow to the gastrocnemius-plantaris-soleus muscleswas significantly increased but did not nearly reach the level of trained FGF–2infused rats that was shown earlier 185. These results indicate that prior exercisetraining is effective in increasing blood flow to the distal hindlimb muscles uponacute occlusion of the femoral artery. But since there is no need for an excessiveuse of the preexistent collateral arterioles during exercise with intact legs theincrease in shear stress is just enough to induce a moderate growth of thesevessels.
The most recently published study by Terjung and colleagues indicates that
nitric oxide (NO) is implicated in arteriogenesis induced by FGF–2 as well asVEGF 188. Nitric oxide synthase (NOS) inhibition abolished the effect of bothFGF–2 and VEGF on arteriogenesis. Both growth factors alone were capable ofincreasing blood flow to the total hindlimb, to proximal muscles, and to distalmuscles to a similar extent when compared to untreated control rats. However,NOS inhibition together with FGF–2 or VEGF treatment resulted in unchanged
3. Review of Literature - 36 -
blood flow when compared to untreated control rats. Thus, reduced NOproduction, availability, and/or responsiveness that are frequent phenomenon inpatients with PAOD and CHF 189-191, could inhibit the arteriogenic response toFGF–2 and VEGF treatments.
Summarizing the results of Terjung and colleagues, one could speculate that the
ideal treatment for rats with an arterial occlusion would begin even before theonset of occlusion with at least six weeks of treadmill running. After femoralartery occlusion FGF–2 application via different routes has proven to beextremely effective when combined with an endurance regime for at least fourweeks. In this model, exercise appears to multiply the effect of FGF–2 viafurther increase in shear stress and increased release of NO (for review see 192).It has also been shown that FGF–2 application to vascular smooth muscle cellsin vitro upregulates the expression of VEGF 193. A marked synergist effect onVEGF expression could be observed when hypoxia was combined with FGF–2application. This study suggests that FGF–2 and skeletal muscle hypoxia duringexercise could have promoted among other factors an amplified VEGF responsein trained FGF–2 rats.
However, Terjung and colleagues did not show that a treatment exists, whichfully restores the dilatory capacity of the normal vasculature in a hindlimb withfemoral artery occlusion. It would be very interesting to investigate the level ofblood flow recovery to the total hindlimb that can be achieved with the “optimal”therapy. Nevertheless, the optimum remains to be determined. There could besignificant additive effects of a combined VEGF and FGF–2 treatment, whichcould be used even during the initial training period.
3.3.9. The Dog Model of Exercise-Induced Arteriogenesis
In the late 1970s, researchers and clinicians paid much more attention to the
possible effect of exercise on the development of the collateral circulation uponocclusion of a major coronary artery. Arteriosclerosis had become the leadingcause of death some years ago and cardiovascular medicine was looking for waysto increase perfusion in areas distal to the site of occlusion. The dog model hadbeen shown to be useful for clinicians, surgeons, and researchers at the time forthree reasons:
- Surgical techniques used for humans could be applied with slightmodifications.
3. Review of Literature - 37 -
- Dogs develop impressive coronary collaterals that could be visualized byangiography.
- Last but not least dogs proved to be very good runners.
In 1978, Heaton et al. 194 reported that exercise enhanced blood flow only to theendocardium of the collateral dependent zone in dogs with occlusions of the leftcircumflex coronary artery and of the distal part of the left anterior descendingartery. The enhanced endocardial blood flow could only be observed duringexercise. The training program of six weeks was sufficient to induce a decreasein heart rate at a given workload. In sedentary control animals blood flow didnot change over the same period, which would indicate that no significantarteriogenic response occurred. However, the baseline measurements wereperformed two weeks after the initial operation, which is the period were themain arteriogenic adaptation occurs. Thus, these results are not indicative forthe entire process of arteriogenesis.
Neill and Oxendine 195 reported that trained dogs with occlusion of the left
circumflex coronary artery had a higher retrograde flow from the distal part ofthe occluded artery when compared to their sedentary controls. However, theretrograde flow method does not indicate the true tissue perfusion by collaterals.The greater pressure drop across the coronary collaterals observed in sedentarydogs is most likely due to increased scar formation in the collateral dependentzone of the myocardium. There was no apparent difference in the angiographicimages of trained and sedentary dogs. Furthermore, the microsphere techniquedemonstrated that there was no beneficial effect of physical activity on blood flowto the collateral dependent zone of the myocardium.
In 1981 196, it was reported that an exercise program initiated three months afterocclusion of the left circumflex coronary artery promotes collateral dependentblood flow. Again, the retrograde perfusion method used in this study does notallow conclusions about the tissue perfusion provided by collateral arteries.Daily low intensity exercise for six weeks did not alter collateral dependent bloodflow in control dogs with normal coronary arteries.
In 1982, our group at the Max-Planck-Institute in Bad Nauheim conducted a
study to precisely determine the role of exercise in the induction of collateralcoronary growth 197. Therefore, we used the rigidly standardized isolated heartmodel of testing regional blood flows with tracer microspheres during maximalvasodilation and under a wide range of perfusion pressures (40-140mmHg). Thedogs performed a vigorous exercise program (up to three month) before the left
3. Review of Literature - 38 -
circumflex and the right coronary arteries were slowly occluded with ameroidconstrictors (one-vessel occlusion was used in most of the aforementionedstudies). After a recovery period of two weeks the dogs continued the exerciseprogram for another 12 weeks. The workloads used in this study were thehighest reported so far. At the end of the training period the dogs achieved avery high level of physical fitness. They were able to run up an inclination of22% and a speed of eight miles per hour for one hour. However, there wasneither a difference in coronary nor in collateral blood flow in exercised dogswhen compared with the sedentary control animals. Collateral conductance intrained and sedentary dogs reached only about 40% of that of the replacedcoronary artery. Calculated total collateral resistance of trained dogs was notdifferent from sedentary animals. No significant change in mortality wasobserved. This study was mainly designed to precisely determine the influence ofphysical activity on coronary collateral arteries of the dog. The isolated heartpreparation allowed the use of fixed pressures under maximal vasodilation andthe determination of the corresponding blood flow via use of radiolabledmicrospheres. The study demonstrated that a very high level of physical activitydoes not produce an increase in coronary collateral blood flow in dogs and thus,did not provide a further stimulus for arteriogenesis. Because of the advancedtechniques used in our study the observations are at variance with other studiesthat reported beneficial effects of physical activity on collateral dependent bloodflow. Nevertheless, we can not exclude the possibility that treadmill running at acertain workload could have produced differences in collateral blood flow whencomparing the highly trained dogs and their sedentary controls. Note that thebeneficial effect of exercise on final infarct size that was previously reported byus 198 was not again assessed in this study.
A study that partially confirmed this assumption was conducted in the same
year 199. Dogs with a stenosed the left circumflex coronary artery were trainedfor 12 weeks on a treadmill using sprints and endurance running. Whencompared to sedentary controls trained dogs exhibited less evidence of leftventricular failure (higher cardiac output, lower left atrial pressure) upon totalocclusion of the left circumflex coronary artery during a single exercise session.Trained dogs showed improved collateral dependent blood flow at rest and duringexercise while there was virtually no improvement in the sedentary control dogs.The authors concluded that running exercise stimulates the development ofcollateral vessels in dogs with a stenosed coronary artery, and that the enhancedcollateral flow has salutary effects on myocardial function. However, with ourfindings of myocardial blood flow in mind, these results could also be interpreted
3. Review of Literature - 39 -
the other way around. Physical activity induced beneficial changes of myocardialfunction during exercise, leading to enhanced perfusion of the myocardium upontotal occlusion during a given level of exercise.
In 1985, Cohen and Steingart reported their findings on coronary collateral
development after occlusion of the left circumflex coronary artery in dogssubmitted to an endurance exercise program for six weeks 200. Usingthallium–201 scintigraphy during exercise, the investigators revealed asignificant improvement in scintigraphic measurements over the first four weeks.Microsphere measurements showed a good recovery of perfusion distal to the siteof occlusion. Serial angiographic studies demonstrated the development ofcollateral vessels and the increase in collateral circulation to the left circumflexcoronary artery. Cardiac output during exercise increased and the left atrialpressure decreased significantly during the study period. However, the lack of areal control group makes it difficult to ascribe these beneficial effects to theexercise regime used in this study. Nevertheless, this study demonstrated thatcollateral coronary artery development is a dynamic process and that exercisehemodynamic measurements improve with progression of arteriogenesis.
Two years later, the same model was used to investigate the effect of an exerciseprogram prior to occlusion of the left circumflex coronary artery on the degree ofinfarction and collateral dependent blood flow 201. They observed no significantchange in infarct size. The effect of exercise on collateral dependent blood flowdid not reach the level of significance. Evaluating the parameters used in thisstudy, no clear beneficial role of prior exercise in cardioprotection was observed.
Cohen and coworkers 202 investigated the role of exercise training in collateral
vessel development in dogs with normal coronary arteries. Ten to 12 weeks ofendurance exercise resulted in significant adaptations of the cardiovascularsystem and skeletal muscle. However, the increase in collateral dependent bloodflow was not significant, suggesting that exercise is not an appropriate stimulusfor significant arteriogenesis in dogs with normal coronary arteries.
In 1990, it was reported that endurance training does not induce changes incollateral development in dogs with normal coronary arteries 203. After anendurance exercise regime of 12 weeks collateral blood flow determined bymicrospheres was not different from sedentary animals. The author concludedthat exercise in dogs with normal coronary arteries does not alter thedevelopment of collateral vessels. This suggests that arteriogenesis is not anadaptation mechanism to an exercise program of 12 weeks in dogs with normalcoronary arteries.
3. Review of Literature - 40 -
Weiss et al. 204 investigated the effect of treadmill walking for over one year oncollateral dependent blood flow in dogs with unilateral occlusions of the femoralartery and its branches. At the end of the exercise period blood flow duringresting conditions as well as immediately after exercise was determined bymicrospheres. Interestingly, there was no difference in blood flow between thenormal control leg and the occluded leg under both conditions, suggesting thatwalking exercise induced an immense increase in collateral dependent blood flowto hindlimb muscles. However, due to the lack of a sedentary control group nodefinite conclusion can be drawn about the true role of physical activity in thisstudy.
In summary, dogs with occlusion of one or two coronary arteries develop large
and well visible collateral arteries. The collateral conductance reaches onlyabout 40% of that of the replaced coronary artery leaving room for therapeuticintervention. Exercise has failed to induce arteriogenesis. Increases in tissueperfusion in exercised dogs have mainly been observed during exercise but notunder pressure controlled ex vivo conditions. Cardiac output increases, heartrate and atrial filling pressure decrease at a given workload. Therefore, regularphysical activity could lead to either increased myocardial perfusion at a certainworkload due to the increased cardiac output and/or to a reduced myocardialoxygen demand at this workload due to enhanced oxidative metabolism. Thesequestions remain to be solved.
Furthermore, there are no studies that undoubtedly prove the acceleration ofarteriogenesis due to exercise in dogs with femoral artery occlusion. However,regular physical activity causes beneficial changes of hemodynamic parameters.Applying these results to the human should not result in questioning theimportance of physical activity. Even without paying attention to the anatomicaland physiological species differences it should be encouraging for us that traineddogs with coronary occlusions can develop an impressive physical fitness eventhough their collateral conductance has not changed when compared to sedentarycontrols.
3.3.10. The Pig Model of Exercise-Induced Arteriogenesis
Bloor and coworkers made major contributions considering the development of
coronary arteries due to exercise. In 1984, Bloor et al. 205 investigated the effectsof exercise on coronary collateral artery development in pigs with occlusion of the
3. Review of Literature - 41 -
left circumflex coronary artery. The investigators have chosen the pig as a studyspecies since it has sparse innate coronary collaterals like in humans. Twoweeks after placing an ameroid constrictor around the left circumflex coronaryartery the pigs were assigned to an endurance exercise regime for five months.Physical activity resulted in an increase of exercise capacity, a reduction ofinfarct size, and an increase in collateral blood flow to the noninfarctedjeopardized myocardium when compared to sedentary control animals.Therefore, with respect to the utilized exercise regime and the experimentalprotocol, it appears that collateral vessels developed primarily in or near theischemic zone of the myocardium and served in tissue salvage especially in theexercised pigs.
The influence of strenuous exercise on cardiac hypertrophy as well as capillary
and arteriolar density of pig myocardium was accessed in a later study 206. Areduction in capillary density and an increase in arteriolar density were reported.However, densities were accessed in number per mm2 and since myocyte crosssectional area was shown to be increased by 21% in the trained group these dataare not conclusive. Nevertheless, the increase in arteriolar density would then beeven more impressive when expressed as arteriole-to-fiber ratio. Blood flow wasnot significantly different at rest, during exercise, and during exercise undermaximal vasodilation. The only change in blood flow that could be detected intrained pigs was an increase in epicardial blood flow during exercise and exerciseunder maximal vasodilation.
In 1987, these investigators reported similar results considering capillary andarteriolar densities 207. Additional measurements revealed increased maximaloxygen consumption, and increased stroke volume and end-diastolic volumeduring exercise. The initial reduction in left ventricular end-diastolic diameterduring progressive exercise was abolished after the strenuous training regime.This study is again highlighting the importance of functional adaptations of themyocardium to exercise stimuli. Nevertheless, arteriolar growth has beendemonstrated to be induced by strenuous physical activity in pig myocardium.
Four years later, another study was carried out to determine the effect of exercise
on myocardial blood flow and function after occlusion of the left circumflexcoronary artery 208. An increase in systolic wall thickening during exercise couldbe observed after a running regime of 25 days. The effect of the training regimeon myocardial blood flow was best visible during severe exercise. Subepicardial,submyocardial, and subendocardial blood flow ratios increased significantly whencompared to the initial blood flow measurements prior training. Neither systolic
3. Review of Literature - 42 -
wall thickening or blood flow measurements during exercise changed insedentary control animals over the study period. The authors concluded that theutilized exercise regime improved myocardial function and blood flow to thecollateral dependent myocardium during severe exercise.
In summary, pigs with occlusion of the left circumflex coronary artery respond to
regular physical activity with improved myocardial performance. Blood flow tothe jeopardized myocardium is increased at a given workload suggesting thatarteriogenesis has taken place. Nevertheless, these results are in need ofconfirmation by other techniques. The isolated heart preparation could be usefulto detect if the increase in blood flow during exercise is induced by growth ofcollaterals or by enhanced myocardial performance. However, exercise has beendemonstrated to induce the growth of arterioles in hypertrophied myocardium ofpigs. This growth appears to be only one mechanism for blood flow maintenance.
There are no studies available investigating the effect of exercise onarteriogenesis after femoral artery occlusion in the pig.
3.3.11. The Mouse Model of Exercise-Induced Arteriogenesis
To the best of our knowledge, there are no studies considering the effect of
exercise on arteriogenesis in mice. In the last years it has been a major issue forour department to develop a mouse model of PAOD. This was especiallyimportant since the availability of different transgenic mice give us thepossibility to explore the factors increasing and decreasing arteriogenesis.Transgenic animals enable us to explore the underlying mechanisms ofarteriogenesis. The small size of the animal allows the use of very expensive andrare compounds. After investing a lot of time and effort, we were able to developa mouse model of PAOD together with the techniques to detect changes incollateral dependent blood flow via laser doppler imaging (LDI) 209 and magneticresonance imaging (MRI). We adopted our histological methods to the mousemodel to visualize arteriogenesis in the tissue. Angiography of the hindlimbsdepicts the growth pattern of the collateral vessels. Determination of exercisecapacity provides us with information about functional relevance of thearteriogenesis 210. We developed a progressive, moderate intensity exerciseprogram for mice with femoral artery ligation to determine the influence ofphysical activity on arteriogenesis in mice.
3. Review of Literature - 43 -
The first study conducted in our laboratory concentrated on the effects of generaloverexpression of FGF–2 in addition to endurance exercise on arteriogenesis.The results of this study are described and discussed in chapters 5.3. and 6.3.,respectively.
3.3.12. Exercise and Arteriogenesis in Humans
There are numerous studies that demonstrate the beneficial effect of exercise on
increases in both pain free walking distance and maximal walking distance inpatients with PAOD (for reviews see 211,212). However, results are conflictingconsidering increased blood flow due to regular physical activity in patients withPAOD. There are some studies that report increased blood flow 96,98,213-215, somestudies that demonstrate unaltered perfusion 216-221, and one study even reportsa decreased resting perfusion 222.
Two recently published studies could be taken as examples for the existingdiversity. Gardner et al. 223 reported that calf blood flow was increased in elderlypatients with PAOD after taking part in a six-month treadmill exercise program.Blood flow was slightly elevated under resting conditions and more pronouncedunder reactive hyperemic conditions. The increase in reactive hyperemic bloodflow correlated with the increase in pain free walking distance. On the otherhand, Tan et al. 224 reported that three month of exercise training did not resultin an increase in common femoral artery blood flow.
Explanations for the opposite findings might involve methodological differences
in accessing blood flow. There is no “gold standard” that has been establishedpreviously and is now used in all of the studies. Furthermore, blood flow isdetermined at various time points and under different conditions. The lengthand the intensity of the exercise regime differ markedly. There is no consensuswhether blood flow should be accessed under resting conditions, during orimmediately after exercise, or during reactive hyperemia. These studies wereconducted over a period of almost 40 years, which might explain the use ofdifferent methods. Nevertheless, establishing a widely accepted standard formeasuring blood pressure in the human could solve this problem for furtherstudies.
It has to be mentioned that exercise proved to exert beneficial effects onendothelial function of patients heart failure 225. Therefore, the beneficial effect
3. Review of Literature - 44 -
of exercise training on blood flow could also be ascribed to enhanced endothelialfunction in some of the experimental settings.
Furthermore, exercise influences a variety of other factors that are likely to
contribute to the increase in maximal walking distance. These factors includeskeletal muscle metabolism and morphology, blood rheology, regression ofatherosclerosis, walking economy, pain perception, and cardiac adaptations (forreview see 226).
Human studies on PAOD often lack histological evidence that exercise inducedarteriogenesis. While the induction of angiogenesis can be detected by usingmuscle biopsies only postmortem tissue preparations could provide thehistological evidence for arteriogenesis. Angiography is another tool to determinecollateral artery growth but was unfortunately very rarely utilized by most of thestudies.
Growth factors therapies for cardiovascular diseases are presently evaluated in
clinical studies mainly focusing on coronary collateral development. However,many problems and unresolved issues appear as these trials proceed (for reviewsee 227). A definite answer on which growth factor is effective in the induction ofarterial growth in different cardiovascular diseases can not undoubtedly begiven.
There is no study investigating the combined effect of regular physical activityand growth factor treatment in humans.
In conclusion, there is no definite evidence for induction of arteriogenesis in
patients with PAOD. However, exercise has been proven to be beneficial formaximal walking distance and quality of life of these patients. Further studiesare needed to investigate the role of exercise for arteriogenesis in humanssuffering from PAOD.
3.3.13. Summary
That exercise induces angiogenesis has been demonstrated for almost 70 years.The reason for this phenomenon has been discovered during the last years.Expression of various angiogenic growth factors in response to a single exercisebout or to electrical stimulation was demonstrated in different animal models aswell as in humans. Among these were VEGF, TGF–β, FGF–1 and FGF–2including their receptors, and ESAF. However, other potent growth factors like
3. Review of Literature - 45 -
PDGF and angiopoietins have not been investigated. Angiogenesis is animportant adaptive mechanism to increased physical activity. It can beappreciated that the more capillaries are surrounding a skeletal muscle fiber thebetter is its supply with oxygen, glucose, and free fatty acids. The removallactate and carbon dioxide is facilitated by this adaptation. Thus, there is nodoubt about the structural importance of angiogenesis for enhancing the functionof exercising skeletal muscle.
However, the importance of angiogenesis is reduced in magnitudes when the
blood supply of the skeletal muscle is limited by occlusion of a major artery. Herearteriogenesis is the dominant factor. Preexisting collateral arterioles grow bymitotic cell division and after DNA replication of endothelial and smooth musclecells. The developing arteries are capable of replacing a substantial amount ofblood flow and therefore provide the prerequisite for survival of the distal tissues.
Early studies in cats and in rats demonstrated the increase in blood flow throughthese collateral arteries in response to endurance exercise. The increase in shearstress and the release of growth factors due to endurance exercise probablymediate this response. Early studies in dogs suggested a beneficial effect ofexercise on growth of coronary collateral arteries. However, this could not beconfirmed by investigation of collateral dependent blood flow utilizing a rigidlystandardized isolated heart model. Exercise leads to cardiovascular adaptationsthat most likely caused these false positive results. Nevertheless, theimprovements in cardiac function are impressive and of importance for patientssuffering from myocardial infarction. Data obtained in pigs do not conclusivelyprove the enhanced development of collateral coronary arteries due to exercise.However, exercise was shown to induce arterial growth in normal myocardium ofpigs. There are only a few studies in dogs and pigs investigating the role ofexercise in PAOD.
More recent studies in rats demonstrated the potential of growth factor
application in addition to exercise. When comparing to single exercise or growthfactor treatment the combination of both is much more effective whenconsidering the increase in hindlimb blood flow and muscle performance.
Our latest study in a transgenic mouse model of PAOD indicates a significanttreatment interaction between FGF–2 and regular physical activity (see alsochapters 5.3. and 6.3.). We observed a different collateral growth pattern withformation of a dense vascular network. Although to a lesser extent, the samepattern was found in trained nontransgenic mice suggesting that physicalactivity induced branching and growth of the preexisting collateral arterioles.
3. Review of Literature - 46 -
This response appears to be more effective than just the enlargement of a fewcollateral arteries exhibiting the corkscrew growth pattern.
In conclusion, there is enormous evidence about the induction of angiogenesis by
regular physical activity. The expression of various growth factors is mediatingthis process. Enhanced arteriogenesis due to physical activity has beendemonstrated in some animal models but not in others. Although it is evidentthat patients with cardiovascular diseases benefit from endurance exercise,enhanced arteriogenesis has not yet proven to be one of the main reasons for thisbeneficial effect. Recent studies in rats and mice have demonstrated that growthfactor application causes a significant treatment interaction with enduranceexercise. It is of immense importance to extent these first encouraging studies toother animal models and finally to the human patient. This powerful approachcould potentially cure thousands of patients suffering from cardiovasculardiseases.

4. Methods - 47 -
4. Methods
4.1. Animals
The present studies were performed with permission of the State of Hessen,
Regierungspräsidium Darmstadt, according to section 8 of the German "Law forthe protection of animals." The investigations conformed with the NationalInstitutes of Health (NIH) Guide for the Care and Use of Laboratory Animals[DHHS Publication No. (NIH) 85–23, Revised 1985, Office of Science and HealthReports, Bethesda, MD 20892]. All mice were housed in standard cages,maintained on a 12 hour light and 12 hour dark cycle, and received water andchow ad libitum.
4.1.1. FGF–1 Overexpressing Mice
For experiments of simulated ischemia 18 mice with cardiac-specificoverexpression of FGF–1 (FGF–1 transgenic) were used.
A 2.2 kb EcoRI fragment of clone pHBGF1.3A, including the coding and the 3’
untranslated sequence of human FGF–1 but lacking any signal sequence, wasligated between the SV40 large intron and the 2.2 kb mouse MLC2v promoter. ACMV enhancer was positioned upstream from the MLC2v promoter, whichprovided the cardiac-specific expression (plasmid CMV/MLC2v/FGF) (Figure 3).The nontransgenic littermates (n=18) served as control mice. The mice weregenerated at the Max-Planck-Institute, Department of Experimental Cardiology.
The same strain of FGF–1 transgenic mice was used for determination of apressure-flow-relationship (eight FGF–1 transgenic mice and sevennontransgenic control mice). The mice were 12 weeks old at the onset of thestudies. (For detailed description of the generation of FGF–1 transgenic micesee 48.)
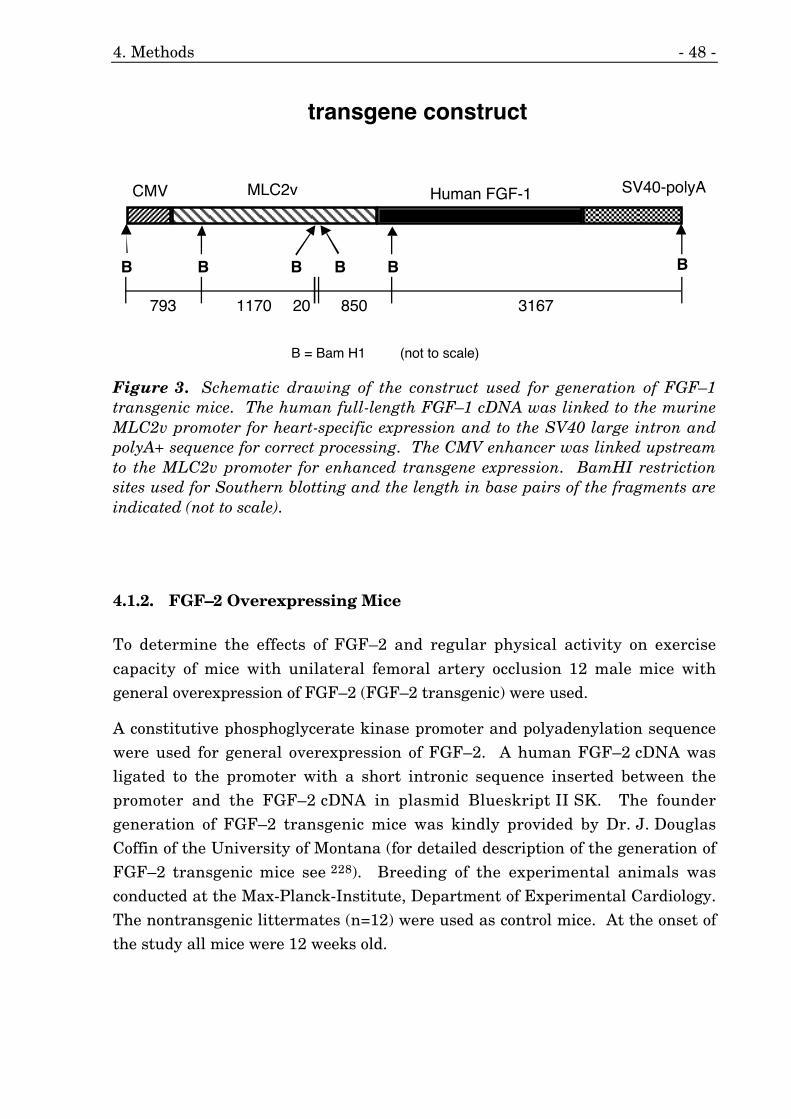
4. Methods - 48 -
B = Bam H1 (not to scale)
B BB B B B
transgene construct
793 1170 20 850 3167
CMV MLC2v Human FGF-1 SV40-polyA
Figure 3. Schematic drawing of the construct used for generation of FGF–1transgenic mice. The human full-length FGF–1 cDNA was linked to the murineMLC2v promoter for heart-specific expression and to the SV40 large intron andpolyA+ sequence for correct processing. The CMV enhancer was linked upstreamto the MLC2v promoter for enhanced transgene expression. BamHI restrictionsites used for Southern blotting and the length in base pairs of the fragments areindicated (not to scale).
4.1.2. FGF–2 Overexpressing Mice
To determine the effects of FGF–2 and regular physical activity on exercise
capacity of mice with unilateral femoral artery occlusion 12 male mice withgeneral overexpression of FGF–2 (FGF–2 transgenic) were used.
A constitutive phosphoglycerate kinase promoter and polyadenylation sequencewere used for general overexpression of FGF–2. A human FGF–2 cDNA wasligated to the promoter with a short intronic sequence inserted between thepromoter and the FGF–2 cDNA in plasmid Blueskript II SK. The foundergeneration of FGF–2 transgenic mice was kindly provided by Dr. J. DouglasCoffin of the University of Montana (for detailed description of the generation ofFGF–2 transgenic mice see 228). Breeding of the experimental animals wasconducted at the Max-Planck-Institute, Department of Experimental Cardiology.The nontransgenic littermates (n=12) were used as control mice. At the onset ofthe study all mice were 12 weeks old.
4. Methods - 49 -
4.1.3. MCP–1 Overexpressing Mice
To determine the changes in exercise capacity after the onset of chronic heart
failure due to myocarditis 10 male mice with cardiac-specific overexpression ofMCP–1 (MCP–1 transgenic) were used.
A 1.9 kb EcoRI fragment of mouse JE-MCP–1 gene cloned into pUC19 plasmidwas ligated to the Sa/I–KpnI–digested Myhca clone. The α–cardiac myosin heavychain gene (Myhca) promoter was responsible for the cardiac-specific expression(for detailed description of the generation of MCP–1 transgenic mice see 94). Thefounder generation of MCP–1 transgenic mice was kindly provided byDr. Pappachan E. Kolattukudy of the Ohio State University. Breeding of theexperimental animals was conducted at the Max-Planck-Institute, Department ofExperimental Cardiology. The nontransgenic littermates (n=5) were used ascontrol mice.
At the onset of the study all mice were 16 weeks old. Every four weeks, one
MCP–1 transgenic mouse with an exercise capacity representing the averageexercise capacity of the transgenic mice was used for histological analysis of theheart.
4.1.4. Nontransgenic Mice
For determination of the change in exercise capacity immediately after bilateralfemoral artery occlusion male Balb/C (n=12), sv129 (n=12), or C57Bl/6 (n=12)mice were used. The mice were obtained from Charles River Laboratories(Sulzfeld, Germany) at an age of 11 weeks and after an habitation period of oneweek immediately used for the studies. Six mice of each strain with unilateralfemoral artery occlusion performed at the same day were used for determinationof the recovery of collateral dependent blood flow by Laser Doppler Imaging.
4. Methods - 50 -
4.2. Simulated Ischemia
4.2.1. Isolation of Mouse Ventricular Cardiac Myocytes
Ventricular cardiac myocytes of FGF–1 transgenic and control mice were isolatedas previously described for rats 229 with a few adoptions.
In brief, the mice were anesthetized by intra peritoneal (i.p.) injection of a
mixture of ketamine (10 %, Medistar) and xylazine (Serum-Werk Bernburg AG).Five IU of heparin (Liquemin N 25000, Roche) were administered.
Under a binocular microscope (Leica) the thorax was opened, the heart quicklyexcised and placed in ice-cold perfusion buffer (110 mM NaCl, 2.6 mM KCl,1.2 mM KH2PO4, 1.2 mM MgSO4, 1 mM CaCl2, 10 mM HEPES, 11 mM glucose,pH 7.4). The ascending aorta was cannulated with a polyethylene catheter (innerand outer diameter 0.40 and 0.80 mm, respectively) (Portex), which wasconnected with a 26 gauge hypodermic-needle (Sterican) to a 1 ml single-usesyringe (Braun) filled with perfusion buffer and 5 IU heparin. The tip of thepolyethylene catheter was placed approximately 2 mm distal to the aortic valve.The catheter was fixed with a 5-0 surgical suture. Care had to be taken that thecatheter, needle, and syringe were free of air bubbles.
Next, the heart was retrogradely perfused with the content of the syringe. The
perfusion lasted approximately 1 min and was used to control the placement ofthe catheter tip, to confirm the absence of any leakage, to remove blood from thecoronary system, and to look for damage of the heart and air bubbles in thecoronary system.
Thereafter, the heart was connected to a Langendorff-perfusion-apparatus(Figure 4) and retrogradely perfused with perfusion buffer gassed with 95% O2
and 5% CO2. Four minutes later perfusion was switched to 0.03% collagenase(CLS 2, Worthington Biochemical Corp), 0.004% pronase (Boehringer),0.005% trypsin (Sigma), and 0.04 mM CaCl2 for 25 min.
Then the heart was disconnected from the Langendorff-perfusion-apparatus,
minced in the collagenase solution containing 1.2% BSA (Sigma), gently shakenat 37°C for 5 min, filtered through a nylon mesh and centrifuged at 15g for 5 min.The pellet was then carefully resuspended in perfusion buffer containing0.1 mM CaCl2 and centrifuged at 15g for 3 min. This step was repeated twicewith perfusion buffer first containing 0.5 mM CaCl2 and then containing1.0 mM CaCl2 and 4% BSA. The cells were resuspended in medium 199 (Sigma)
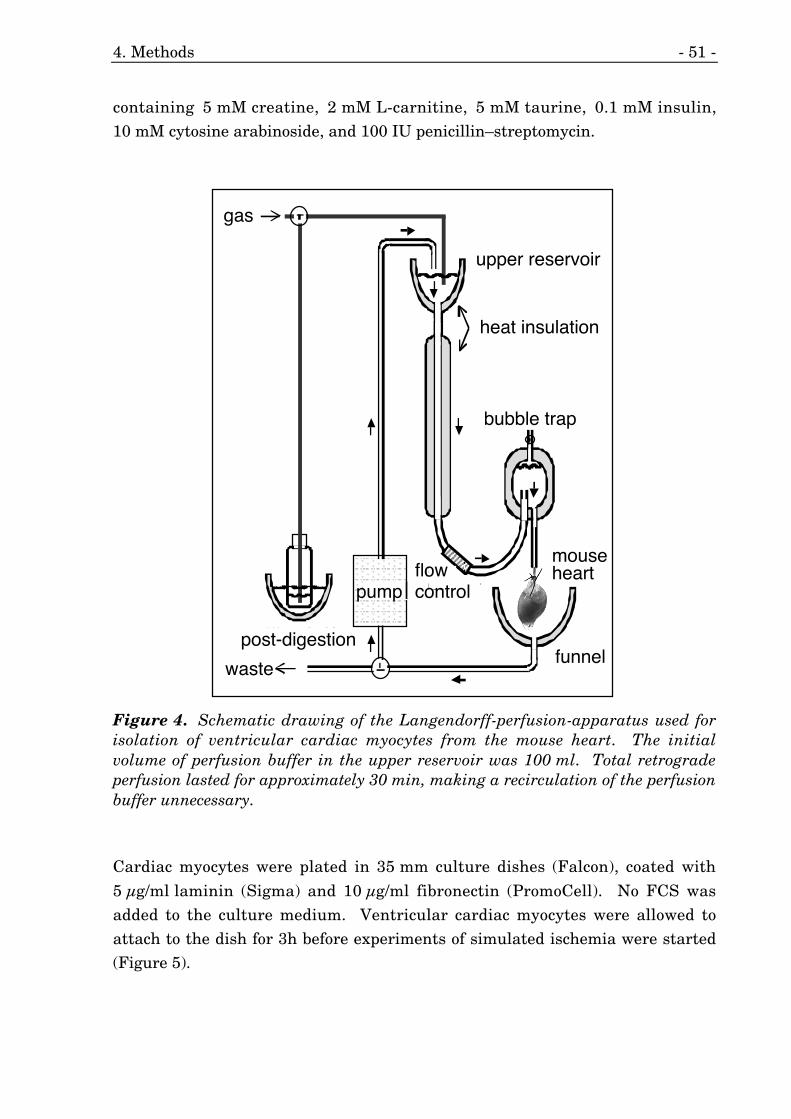
4. Methods - 51 -
containing 5 mM creatine, 2 mM L-carnitine, 5 mM taurine, 0.1 mM insulin,10 mM cytosine arabinoside, and 100 IU penicillin–streptomycin.
&
Abfall
Pumpe
Wasserbad fürNachverdau
Gas
Blasenfalle
Wärmemantel
oberesReservoir
Auffang-
trichter
Fluß-reduzierer
mouseheart
post-digestion
waste
pump
upper reservoir
heat insulation
bubble trap
funnel
gas
flowcontrol
Figure 4. Schematic drawing of the Langendorff-perfusion-apparatus used forisolation of ventricular cardiac myocytes from the mouse heart. The initialvolume of perfusion buffer in the upper reservoir was 100 ml. Total retrogradeperfusion lasted for approximately 30 min, making a recirculation of the perfusionbuffer unnecessary.
Cardiac myocytes were plated in 35 mm culture dishes (Falcon), coated with
5 µg/ml laminin (Sigma) and 10 µg/ml fibronectin (PromoCell). No FCS wasadded to the culture medium. Ventricular cardiac myocytes were allowed toattach to the dish for 3h before experiments of simulated ischemia were started(Figure 5).
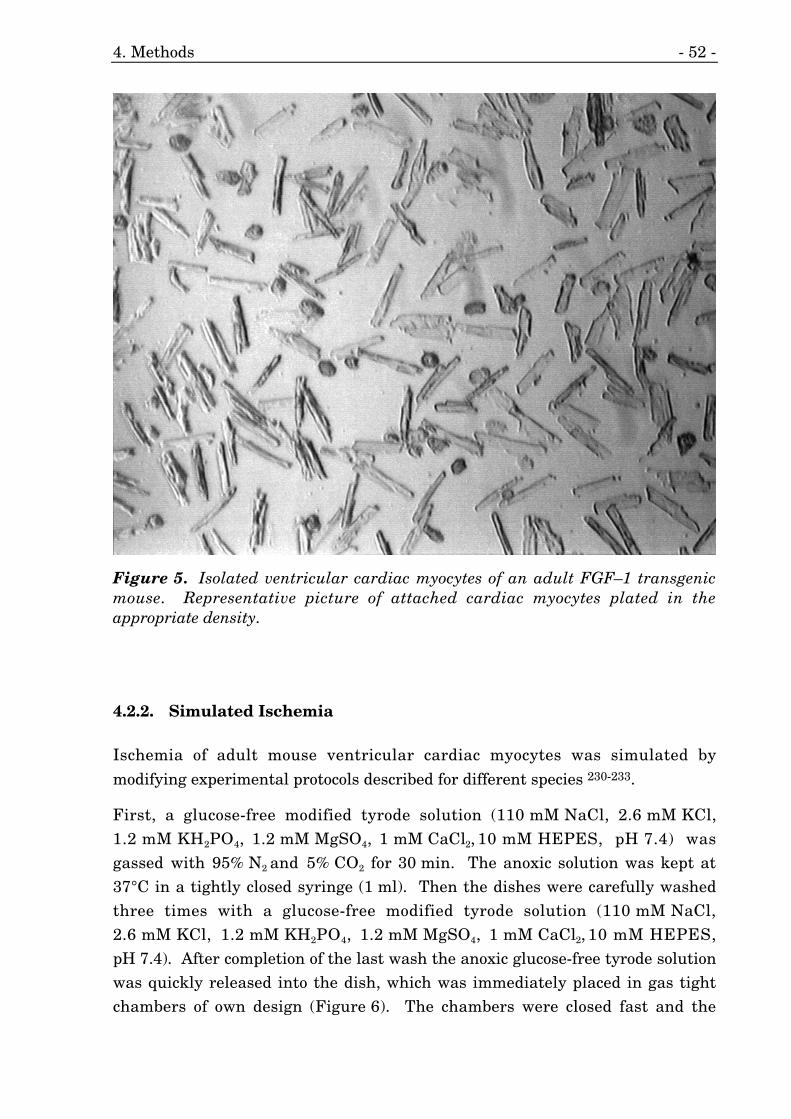
4. Methods - 52 -
Figure 5. Isolated ventricular cardiac myocytes of an adult FGF–1 transgenicmouse. Representative picture of attached cardiac myocytes plated in theappropriate density.
4.2.2. Simulated Ischemia
Ischemia of adult mouse ventricular cardiac myocytes was simulated by
modifying experimental protocols described for different species 230-233.
First, a glucose-free modified tyrode solution (110 mM NaCl, 2.6 mM KCl,1.2 mM KH2PO4, 1.2 mM MgSO4, 1 mM CaCl2, 10 mM HEPES, pH 7.4) wasgassed with 95% N2 and 5% CO2 for 30 min. The anoxic solution was kept at37°C in a tightly closed syringe (1 ml). Then the dishes were carefully washedthree times with a glucose-free modified tyrode solution (110 mM NaCl,2.6 mM KCl, 1.2 mM KH2PO4, 1.2 mM MgSO4, 1 mM CaCl2, 10 mM HEPES,pH 7.4). After completion of the last wash the anoxic glucose-free tyrode solutionwas quickly released into the dish, which was immediately placed in gas tightchambers of own design (Figure 6). The chambers were closed fast and the
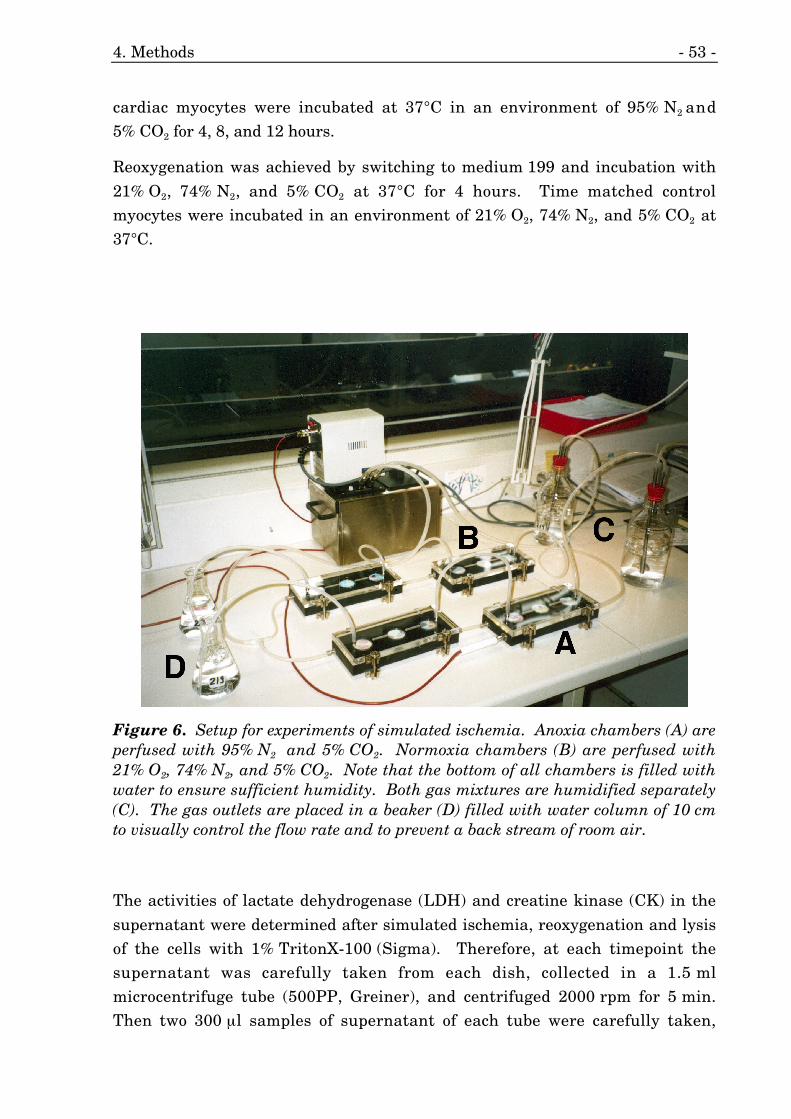
4. Methods - 53 -
cardiac myocytes were incubated at 37°C in an environment of 95% N2 and5% CO2 for 4, 8, and 12 hours.
Reoxygenation was achieved by switching to medium 199 and incubation with
21% O2, 74% N2, and 5% CO2 at 37°C for 4 hours. Time matched controlmyocytes were incubated in an environment of 21% O2, 74% N2, and 5% CO2 at37°C.
Figure 6. Setup for experiments of simulated ischemia. Anoxia chambers (A) areperfused with 95% N2 and 5% CO2. Normoxia chambers (B) are perfused with21% O2, 74% N2, and 5% CO2. Note that the bottom of all chambers is filled withwater to ensure sufficient humidity. Both gas mixtures are humidified separately(C). The gas outlets are placed in a beaker (D) filled with water column of 10 cmto visually control the flow rate and to prevent a back stream of room air.
The activities of lactate dehydrogenase (LDH) and creatine kinase (CK) in the
supernatant were determined after simulated ischemia, reoxygenation and lysisof the cells with 1% TritonX-100 (Sigma). Therefore, at each timepoint thesupernatant was carefully taken from each dish, collected in a 1.5 mlmicrocentrifuge tube (500PP, Greiner), and centrifuged 2000 rpm for 5 min.Then two 300 µl samples of supernatant of each tube were carefully taken,
4. Methods - 54 -
collected in 1.5 ml microcentrifuge tubes, immediately frozen in liquid nitrogen,and stored at –80°C until further analysis. The remaining volume of the initialsupernatant contained a few broken cardiac myocytes and cellular debris andwas discarded in order not to disturb the measurements. For lysis of the cellsmedium 199 with Triton-X (1% final concentration) was applied to the cells. Thedishes were then placed on a shaker (Schüttler MTS4, IKA) and gently moved at200 rpm for 30 min.
The release of enzymes was calculated as the percentage of activity after
ischemia / reoxygenation versus total activity (simulated ischemia +reoxygenation + TritonX-100 extracts). The activities of LDH and CK weredetermined by a Hitachi 917 Automatic Analyzer (Hitachi) according to methodsof the German Society for Clinical Chemistry 1970 234 and 1993 235, respectively.The hearts of six FGF–1 transgenic mice and six nontransgenic control mice wereused per timepoint of simulated ischemia.
4.3. Determination of a Flow-Pressure-Relationship
The hearts of eight FGF–1 transgenic mice and of seven nontransgeniclittermates used as control mice were quickly dissected, cannulated through theascending aorta and retrogradely perfused as described above (chapter 2.1).
Thereafter, the catheter was connected to a perfusion apparatus of own design,
which allowed a pressure and temperature controlled retrograde perfusion of themouse heart. Perfusion buffer was supplemented with 0.01% adenosine toachieve maximal vasodilation and kept at a temperature of 37°C. Four differentperfusion pressures were applied: 80 mmHg, followed by 100, 122, and142 mmHg for 10 minutes each.
The coronary perfusates were collected in 50 ml tubes (Falcon). Aftercentrifugation at 2000 rpm the volume of the coronary perfusate was determined.Finally, the hearts were weighed on a scientific scale (BP 211 D, Sartorius). Thecoronary flow was expressed in terms of milliliters of coronary perfusate per150 mg of heart weight.
Preliminary experiments showed that addition of BSA or any other protein to the
perfusion buffer was not necessary. The coronary flow at 80 mmHg was the samebefore and after the regular 40 min perfusion period indicating that no vascularleakage, possibly due to a lack of protein in the perfusion buffer, occurred.
4. Methods - 55 -
4.4. Femoral Artery Occlusion and Blood FlowMeasurements
Mice were anesthetized by injection (i.p.) of a mixture of ketamine (10 %,Medistar) and xylazine (Serum-Werk Bernburg AG). The right femoral arterywas ligated proximal to the orifices of the arteria poplitea but distal to thebranching-point of the arteria profunda femoris (Figure 7). Blood flowmeasurements were performed before, immediately after, three, seven, 21, and28 days after occlusion, using the same anesthesia protocol. At the end of thestudy the mice were euthanized and the descending thoracic aortas werecannulated for subsequent perfusion fixation of the hindlimbs.
A red Laser Doppler Imager (MLDI 5063, Moor Instruments Ltd.) was used to
detect blood cell motion in the foot to estimate relative blood flow. Relative scoreof vessels were compared after the background subtracting.
Preliminary experiments showed that blood flow results obtained by LDI aredependent on the ambient temperature. Therefore, in order to standardizemeasurements, anesthetized mice were kept for 5 min in a climatized chamber ofown design at 37°C before the measurements were performed. Special care wastaken that the measured paws were clean and dry.
Blood flow measurements by LDI were performed in sedentary FGF–2 transgenic
and nontransgenic control mice on following time points: before right femoralartery occlusion, immediately thereafter and on days 3, 7, 14, 21, 28, and 39 afterocclusion. Trained mice were only measured before, immediately after, and39 days after the initial surgery to avoid disturbance of the exercise protocol dueto the anesthesia. The last training session was completed at day 36 to ensure afull recovery of two days before the final measurements. LDI measurements ofthe whole feet were made at a pixel resolution of 256x256 and at a scan rate of4 ms/pixel for a 1.7 by 3 cm area. Dead mice were used to determine thebackground level separately for each strain for subsequent subtraction. Theright-to-left, i.e. occluded-to-nonoccluded side, perfusion ratios were calculatedfor each timepoint and mouse (Figure 8).
To determine gastrocnemius blood flow by MRI a flow phantom consisting of fourtubes connected in series with inner diameters of 0.40 mm, 0.58 mm, and two of1.46 mm was evaluated in an eight-leg 2.8 cm diameter by 3.2 cm length lowpassbirdcage coil. Sufficiently long tubing between the flow tubes allowed forequilibration of exited spins before entering the detection and excitation plane.
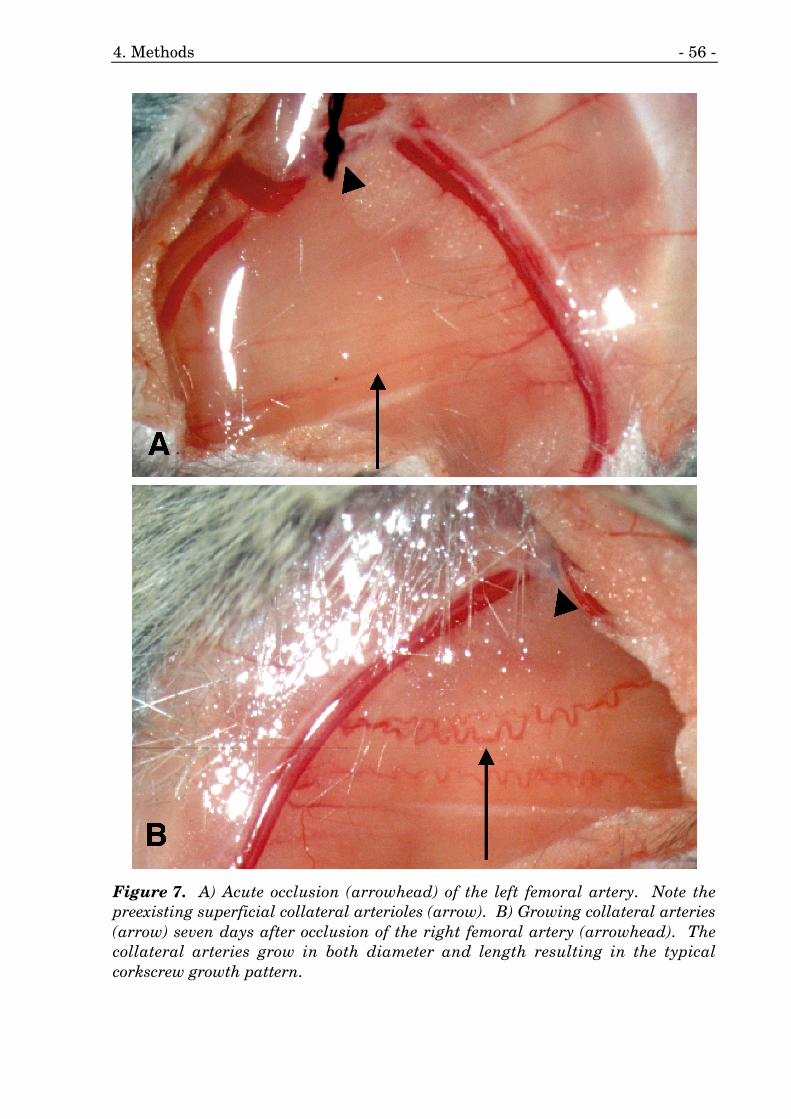
4. Methods - 56 -
Figure 7. A) Acute occlusion (arrowhead) of the left femoral artery. Note thepreexisting superficial collateral arterioles (arrow). B) Growing collateral arteries(arrow) seven days after occlusion of the right femoral artery (arrowhead). Thecollateral arteries grow in both diameter and length resulting in the typicalcorkscrew growth pattern.
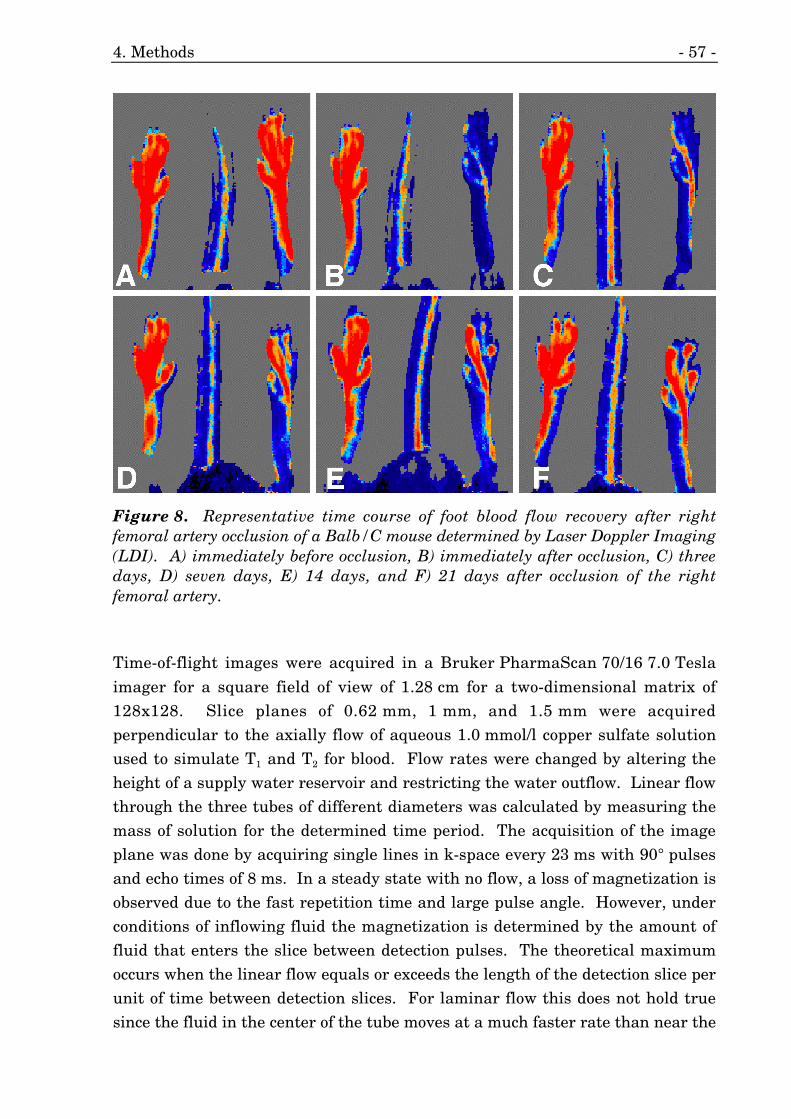
4. Methods - 57 -
Figure 8. Representative time course of foot blood flow recovery after rightfemoral artery occlusion of a Balb/C mouse determined by Laser Doppler Imaging(LDI). A) immediately before occlusion, B) immediately after occlusion, C) threedays, D) seven days, E) 14 days, and F) 21 days after occlusion of the rightfemoral artery.
Time-of-flight images were acquired in a Bruker PharmaScan 70/16 7.0 Tesla
imager for a square field of view of 1.28 cm for a two-dimensional matrix of128x128. Slice planes of 0.62 mm, 1 mm, and 1.5 mm were acquiredperpendicular to the axially flow of aqueous 1.0 mmol/l copper sulfate solutionused to simulate T1 and T2 for blood. Flow rates were changed by altering theheight of a supply water reservoir and restricting the water outflow. Linear flowthrough the three tubes of different diameters was calculated by measuring themass of solution for the determined time period. The acquisition of the imageplane was done by acquiring single lines in k-space every 23 ms with 90° pulsesand echo times of 8 ms. In a steady state with no flow, a loss of magnetization isobserved due to the fast repetition time and large pulse angle. However, underconditions of inflowing fluid the magnetization is determined by the amount offluid that enters the slice between detection pulses. The theoretical maximumoccurs when the linear flow equals or exceeds the length of the detection slice perunit of time between detection slices. For laminar flow this does not hold truesince the fluid in the center of the tube moves at a much faster rate than near the
4. Methods - 58 -
walls. This can be observed in images with slow flow rates. The intensity in thecenter volume is higher than the edges. In nonlinear tortuous vessels streaminghas also been characterized and observed. The smaller tubes of the flow phantomshowed similar effects. Streaming occurred preferential at the edges of the tubes.Increasing slice thickness results in phase artifacts from greater fieldinhomogenities, manifested as concentric rings in the cross-section. Theseartifacts, however, did not significantly affect the results at the slow flow rates.Gastrocnemius blood flow was determined at day 39 after femoral arteryocclusion.
At the end of the study all mice were euthanized. The thorax was opened and the
descending aorta was cannulated as described for the ascending aorta (seechapter 4.1). Then the catheter was connected to a perfusion apparatus of owndesign, which allowed a pressure and temperature controlled perfusion of thedistal vessels. The perfusion buffer was supplemented with 0.01% adenosine toachieve vasodilation. The distal vessels were perfused with perfusion buffer at atemperature of 37°C and a pressure of 100 mmHg until they were free of blood.Afterwards, both hindlimbs were perfusion-fixed with 2% paraformaldehyde inperfusion buffer for 10 minutes at a pressure of 100 mmHg.
Following perfusion fixation a contrast medium (bismuth chloride in 5% gelatin)was infused and the hindlimbs were immersed in ice. Angiographies wereacquired using a Machlett-Balteau X-ray source (set at 20 kV /8 mA). Superficialcollateral arteries visible under the operating microscope were photographed andsampled for ultrastructural studies and histological analysis. Furthermore,skeletal muscle samples containing the deep collateral arteries and thegastrocnemius muscles were sampled for histological analysis. The postmortemangiographies were individually evaluated by two independent observersunaware of the sample identities.
4.5. Training of Mice with Unilateral Femoral ArteryOcclusion
Two days after unilateral occlusion of the femoral artery 12 FGF–2 transgenicanimals and their 12 nontransgenic littermates that were used as control micewere randomly separated into six sedentary mice and six mice that were trainedfor five weeks. The mice were trained using a progressive, moderate intensityendurance running regime on the mouse treadmill as follows:

4. Methods - 59 -
Day 0: Occlusion of the right femoral artery.
Day 1: Rest.
Day 2: Rest.
Day 3: Running at an inclination of 9° and a speed of 10 m/min for 30 min.
Day 4: Running at an inclination of 9° and a speed of 11 m/min for 35 min.
Day 5: Running at an inclination of 9° and a speed of 12 m/min for 40 min.
Day 6: Rest.
Day 7: Running at an inclination of 9° and a speed of 13 m/min for 45 min.
Day 8: Running at an inclination of 9° and a speed of 14 m/min for 50 min.
Day 9: Running at an inclination of 9° and a speed of 15 m/min for 55 min.
Day 10: Running at an inclination of 9° and a speed of 16 m/min for 55 min.
Day 11: Running at an inclination of 9° and a speed of 17 m/min for 60 min.
Day 12: Running at an inclination of 9° and a speed of 18 m/min for 60 min.
Day 13: Rest.
Day 14: Running at an inclination of 9° and a speed of 19 m/min for 60 min.
Day 15: Running at an inclination of 9° and a speed of 20 m/min for 60 min.
Day 16: Running at an inclination of 9° and a speed of 21 m/min for 60 min.
Day 17: Running at an inclination of 9° and a speed of 22 m/min for 60 min.
Day 18: Running at an inclination of 9° and a speed of 23 m/min for 60 min.
Day 19: Running at an inclination of 9° and a speed of 24 m/min for 60 min.
Day 20: Rest.
Day 21: Running at an inclination of 9° and a speed of 25 m/min for 60 min.
Day 22: Running at an inclination of 9° and a speed of 25 m/min for 60 min.
Day 23: Running at an inclination of 9° and a speed of 25 m/min for 60 min.
Day 25: Running at an inclination of 9° and a speed of 25 m/min for 60 min.
Day 26: Running at an inclination of 9° and a speed of 25 m/min for 60 min.

4. Methods - 60 -
Day 27: Running at an inclination of 9° and a speed of 30 m/min for 60 min.
Day 28: Rest.
Day 29: Running at an inclination of 9° and a speed of 25 m/min for 60 min.
Day 30: Running at an inclination of 9° and a speed of 25 m/min for 60 min.
Day 31: Running at an inclination of 9° and a speed of 25 m/min for 60 min.
Day 32: Running at an inclination of 9° and a speed of 25 m/min for 60 min.
Day 33: Running at an inclination of 9° and a speed of 25 m/min for 60 min.
Day 34: Running at an inclination of 9° and a speed of 30 m/min for 60 min.
Day 35: Rest.
Day 36: Determination of exercise capacity.
Day 37: Rest.
Day 38: Rest.
Day 39: Final measurements and tissue harvesting.
The first exercise session was initiated at day 3 post ligation. The inclinationwas set to 9° and a speed of 10 m/min was chosen. The first exercise sessionlasted for 30 min. Thereafter, the speed and the duration were increased by1 m/min and 5 min, respectively, until the mice were able to run up a9° inclination at a speed of 25 m/min for 60 min (Figure 9). This level wasachieved at day 21 of the study. During the first week, the mice were submittedto three consecutive exercise sessions followed by one day of rest. From there on,mice were trained six times per week followed by one day of rest. After the micewere capable to run at the final workload, the day before the day of rest was usedfor a more strenuous exercise session at a speed of 30 m/min. If a mouseexhibited signs of fatigue the exercise session was terminated. The final exercisecapacity was determined at day 36 of the study after one day of rest. Thereafter,the animals were allowed to recover for two days before the final measurementsof blood flow by LDI and MRI, angiography, and tissue harvesting.
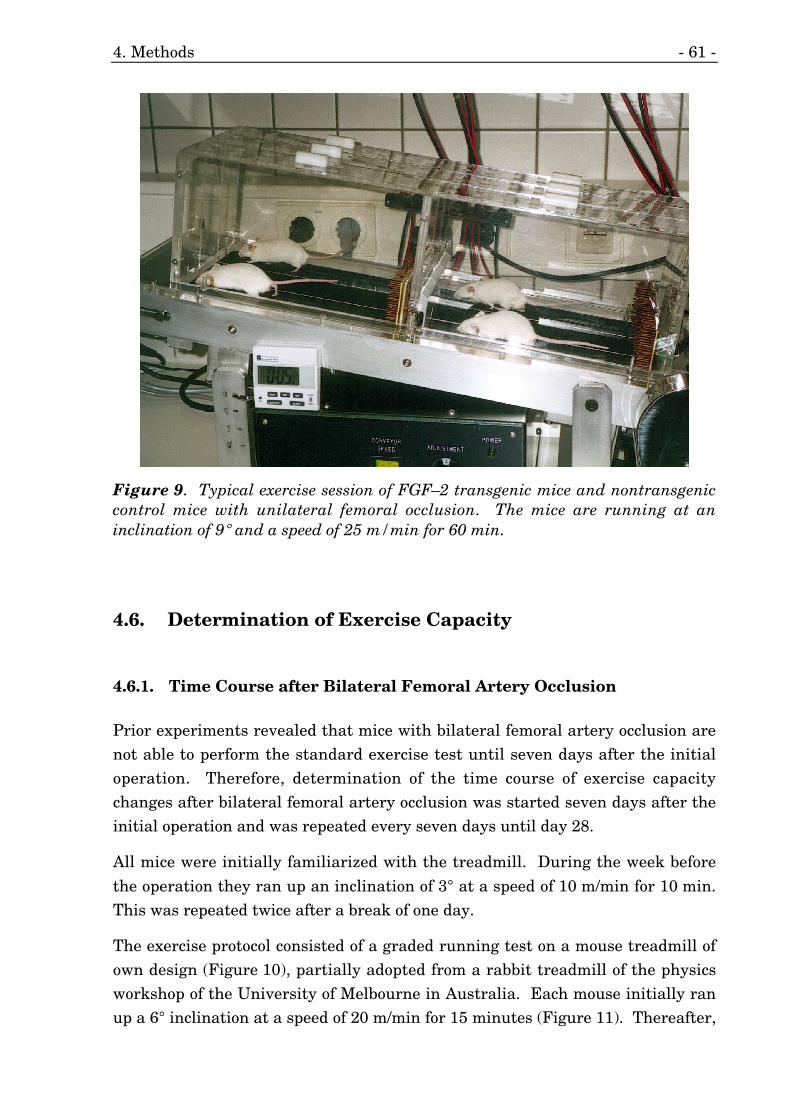
4. Methods - 61 -
Figure 9. Typical exercise session of FGF–2 transgenic mice and nontransgeniccontrol mice with unilateral femoral occlusion. The mice are running at aninclination of 9° and a speed of 25 m/min for 60 min.
4.6. Determination of Exercise Capacity
4.6.1. Time Course after Bilateral Femoral Artery Occlusion
Prior experiments revealed that mice with bilateral femoral artery occlusion arenot able to perform the standard exercise test until seven days after the initialoperation. Therefore, determination of the time course of exercise capacitychanges after bilateral femoral artery occlusion was started seven days after theinitial operation and was repeated every seven days until day 28.
All mice were initially familiarized with the treadmill. During the week before
the operation they ran up an inclination of 3° at a speed of 10 m/min for 10 min.This was repeated twice after a break of one day.
The exercise protocol consisted of a graded running test on a mouse treadmill ofown design (Figure 10), partially adopted from a rabbit treadmill of the physicsworkshop of the University of Melbourne in Australia. Each mouse initially ranup a 6° inclination at a speed of 20 m/min for 15 minutes (Figure 11). Thereafter,
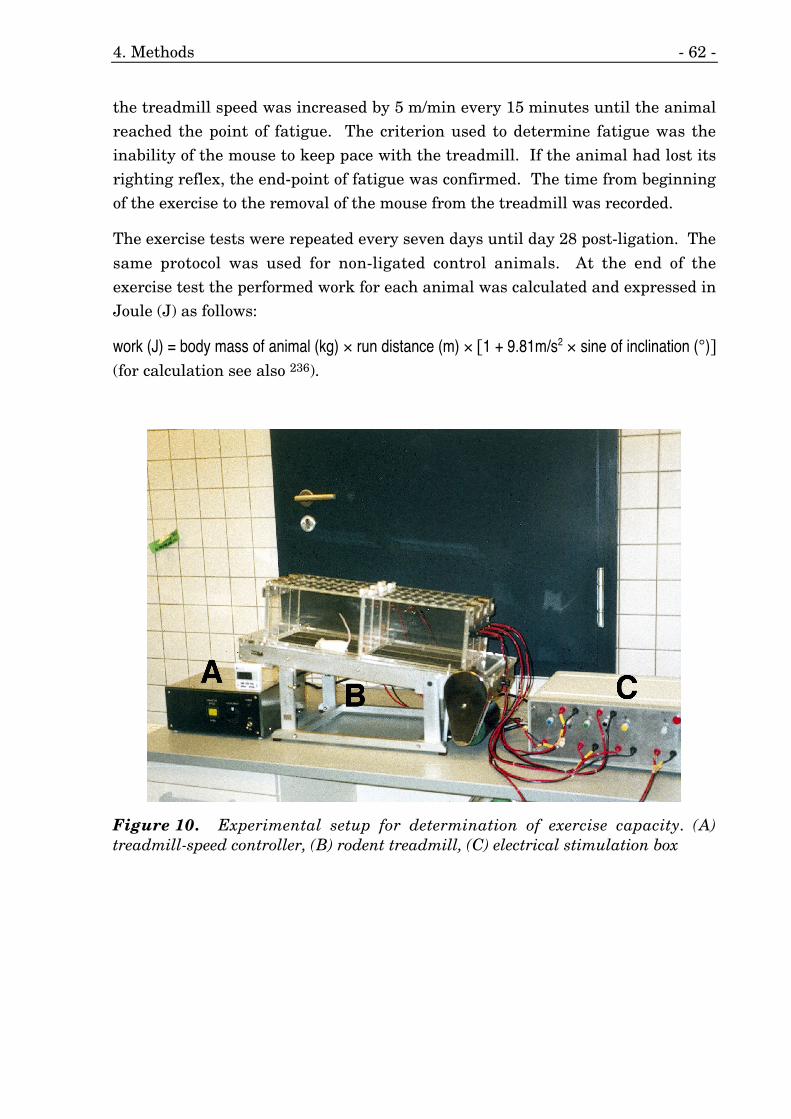
4. Methods - 62 -
the treadmill speed was increased by 5 m/min every 15 minutes until the animalreached the point of fatigue. The criterion used to determine fatigue was theinability of the mouse to keep pace with the treadmill. If the animal had lost itsrighting reflex, the end-point of fatigue was confirmed. The time from beginningof the exercise to the removal of the mouse from the treadmill was recorded.
The exercise tests were repeated every seven days until day 28 post-ligation. The
same protocol was used for non-ligated control animals. At the end of theexercise test the performed work for each animal was calculated and expressed inJoule (J) as follows:
work (J) = body mass of animal (kg) × run distance (m) × [1 + 9.81m/s2 × sine of inclination (°)](for calculation see also 236).
Figure 10. Experimental setup for determination of exercise capacity. (A)treadmill-speed controller, (B) rodent treadmill, (C) electrical stimulation box
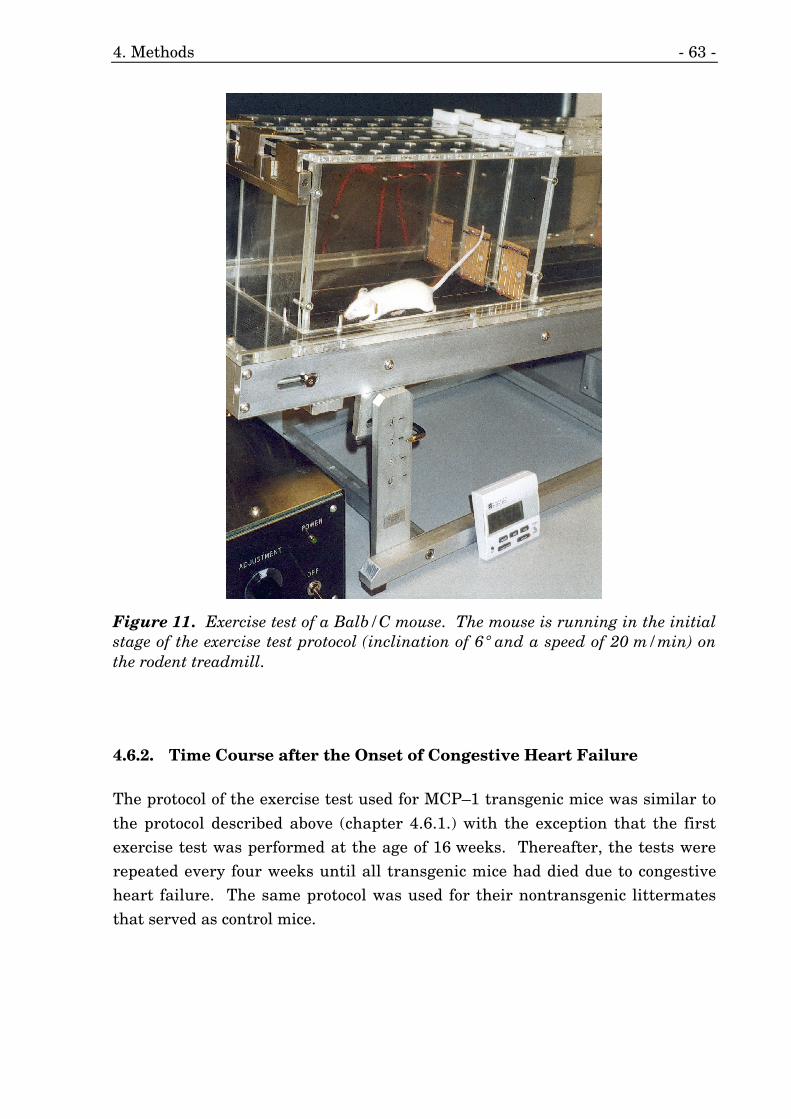
4. Methods - 63 -
Figure 11. Exercise test of a Balb/C mouse. The mouse is running in the initialstage of the exercise test protocol (inclination of 6° and a speed of 20 m/min) onthe rodent treadmill.
4.6.2. Time Course after the Onset of Congestive Heart Failure
The protocol of the exercise test used for MCP–1 transgenic mice was similar to
the protocol described above (chapter 4.6.1.) with the exception that the firstexercise test was performed at the age of 16 weeks. Thereafter, the tests wererepeated every four weeks until all transgenic mice had died due to congestiveheart failure. The same protocol was used for their nontransgenic littermatesthat served as control mice.

4. Methods - 64 -
4.6.3. Trained Mice with Unilateral Femoral Artery Occlusion
FGF–2 transgenic animals and their nontransgenic littermates that used as
control mice were randomly separated into sedentary mice and mice that weretrained for five weeks. The exercise test was performed at day 36 after the initialoperation. The protocol of the exercise test used for these mice was similar to theprotocol described above (chapter 4.6.1.) with the exception that the inclination ofthe treadmill was 9°.
4.7. Statistical Analysis
After all data were analyzed for normal distribution and variance homogeneity aone–way analysis of variance (ANOVA) or a Student-Newman-Kuels post-hocanalysis revealed the significance of the groups differences. Differences at thep<0.05 level were considered significant.
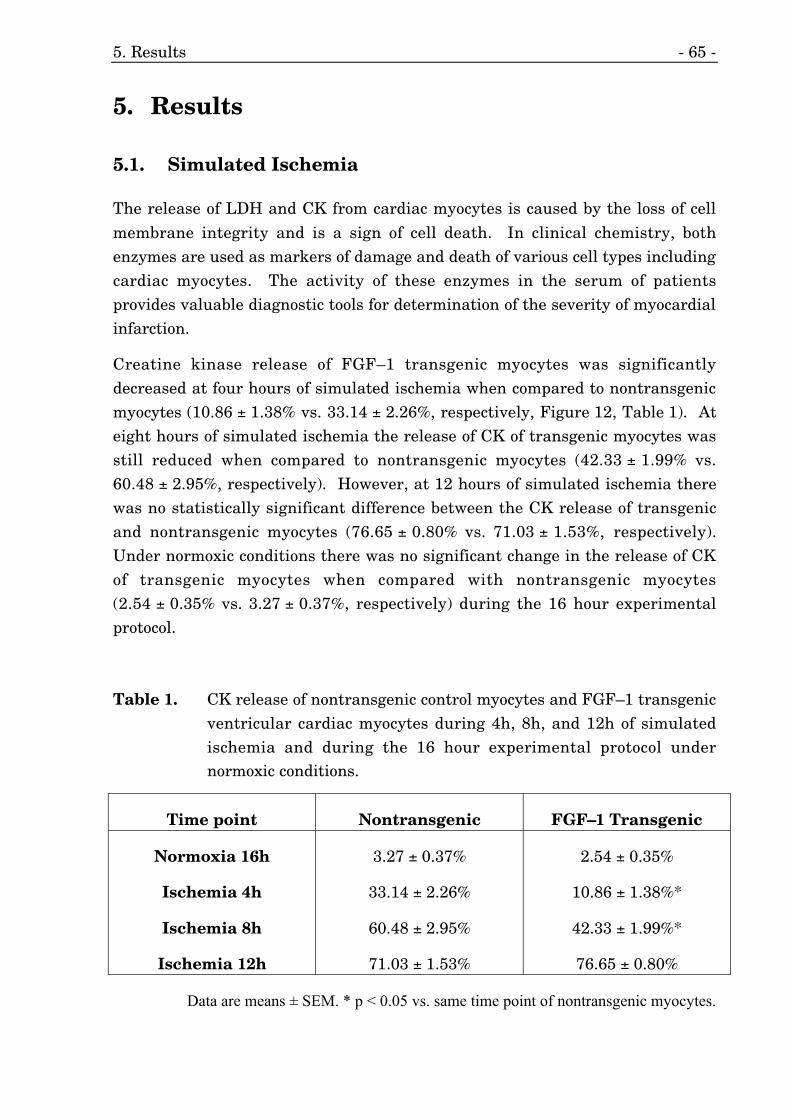
5. Results - 65 -
5. Results
5.1. Simulated Ischemia
The release of LDH and CK from cardiac myocytes is caused by the loss of cell
membrane integrity and is a sign of cell death. In clinical chemistry, bothenzymes are used as markers of damage and death of various cell types includingcardiac myocytes. The activity of these enzymes in the serum of patientsprovides valuable diagnostic tools for determination of the severity of myocardialinfarction.
Creatine kinase release of FGF–1 transgenic myocytes was significantlydecreased at four hours of simulated ischemia when compared to nontransgenicmyocytes (10.86 ± 1.38% vs. 33.14 ± 2.26%, respectively, Figure 12, Table 1). Ateight hours of simulated ischemia the release of CK of transgenic myocytes wasstill reduced when compared to nontransgenic myocytes (42.33 ± 1.99% vs.60.48 ± 2.95%, respectively). However, at 12 hours of simulated ischemia therewas no statistically significant difference between the CK release of transgenicand nontransgenic myocytes (76.65 ± 0.80% vs. 71.03 ± 1.53%, respectively).Under normoxic conditions there was no significant change in the release of CKof transgenic myocytes when compared with nontransgenic myocytes(2.54 ± 0.35% vs. 3.27 ± 0.37%, respectively) during the 16 hour experimentalprotocol.
Table 1. CK release of nontransgenic control myocytes and FGF–1 transgenicventricular cardiac myocytes during 4h, 8h, and 12h of simulatedischemia and during the 16 hour experimental protocol undernormoxic conditions.
Time point Nontransgenic FGF–1 Transgenic
Normoxia 16h
Ischemia 4h
Ischemia 8h
Ischemia 12h
3.27 ± 0.37%
33.14 ± 2.26%
60.48 ± 2.95%
71.03 ± 1.53%
2.54 ± 0.35%
10.86 ± 1.38%*
42.33 ± 1.99%*
76.65 ± 0.80%
Data are means ± SEM. * p < 0.05 vs. same time point of nontransgenic myocytes.
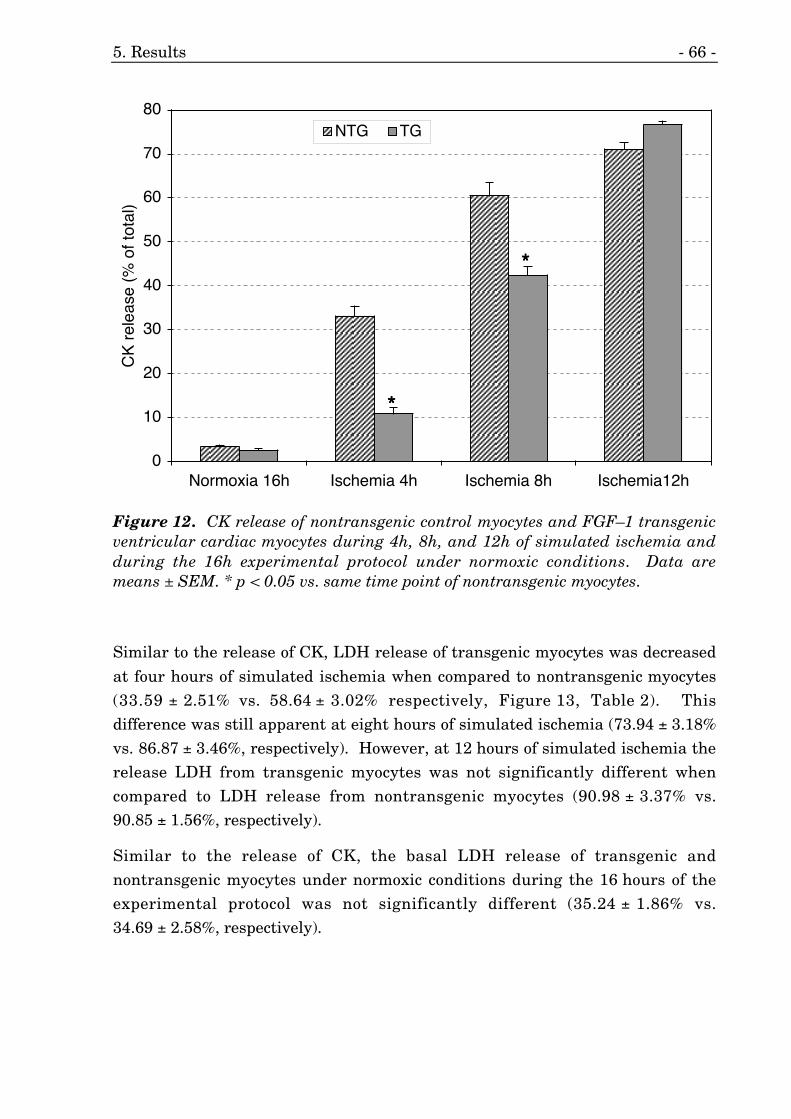
5. Results - 66 -
0
10
20
30
40
50
60
70
80
Normoxia 16h Ischemia 4h Ischemia 8h Ischemia12h
CK
rel
ease
(%
of t
otal
)NTG TG
****
****
Figure 12. CK release of nontransgenic control myocytes and FGF–1 transgenicventricular cardiac myocytes during 4h, 8h, and 12h of simulated ischemia andduring the 16h experimental protocol under normoxic conditions. Data aremeans ± SEM. * p < 0.05 vs. same time point of nontransgenic myocytes.
Similar to the release of CK, LDH release of transgenic myocytes was decreased
at four hours of simulated ischemia when compared to nontransgenic myocytes(33.59 ± 2.51% vs. 58.64 ± 3.02% respectively, Figure 13, Table 2). Thisdifference was still apparent at eight hours of simulated ischemia (73.94 ± 3.18%vs. 86.87 ± 3.46%, respectively). However, at 12 hours of simulated ischemia therelease LDH from transgenic myocytes was not significantly different whencompared to LDH release from nontransgenic myocytes (90.98 ± 3.37% vs.90.85 ± 1.56%, respectively).
Similar to the release of CK, the basal LDH release of transgenic andnontransgenic myocytes under normoxic conditions during the 16 hours of theexperimental protocol was not significantly different (35.24 ± 1.86% vs.34.69 ± 2.58%, respectively).
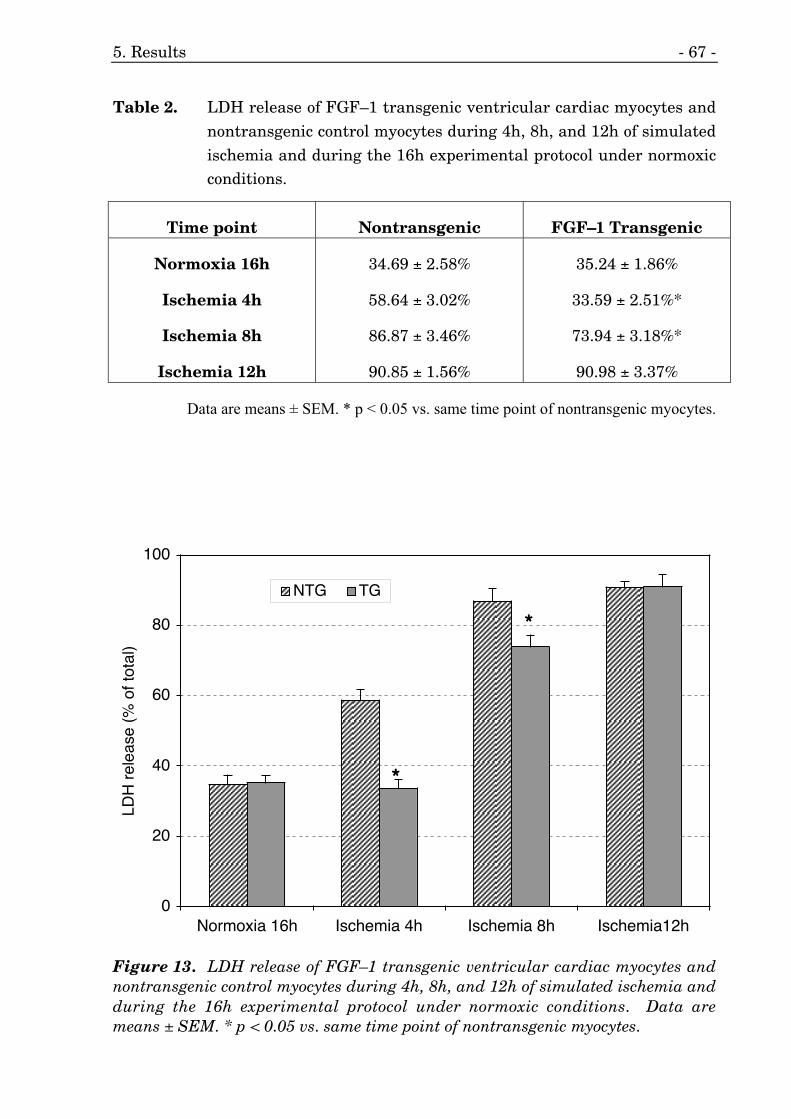
5. Results - 67 -
Table 2. LDH release of FGF–1 transgenic ventricular cardiac myocytes andnontransgenic control myocytes during 4h, 8h, and 12h of simulatedischemia and during the 16h experimental protocol under normoxicconditions.
Time point Nontransgenic FGF–1 Transgenic
Normoxia 16h
Ischemia 4h
Ischemia 8h
Ischemia 12h
34.69 ± 2.58%
58.64 ± 3.02%
86.87 ± 3.46%
90.85 ± 1.56%
35.24 ± 1.86%
33.59 ± 2.51%*
73.94 ± 3.18%*
90.98 ± 3.37%
Data are means ± SEM. * p < 0.05 vs. same time point of nontransgenic myocytes.
0
20
40
60
80
100
Normoxia 16h Ischemia 4h Ischemia 8h Ischemia12h
LDH
rel
ease
(%
of t
otal
)
NTG TG
****
****
Figure 13. LDH release of FGF–1 transgenic ventricular cardiac myocytes andnontransgenic control myocytes during 4h, 8h, and 12h of simulated ischemia andduring the 16h experimental protocol under normoxic conditions. Data aremeans ± SEM. * p < 0.05 vs. same time point of nontransgenic myocytes.
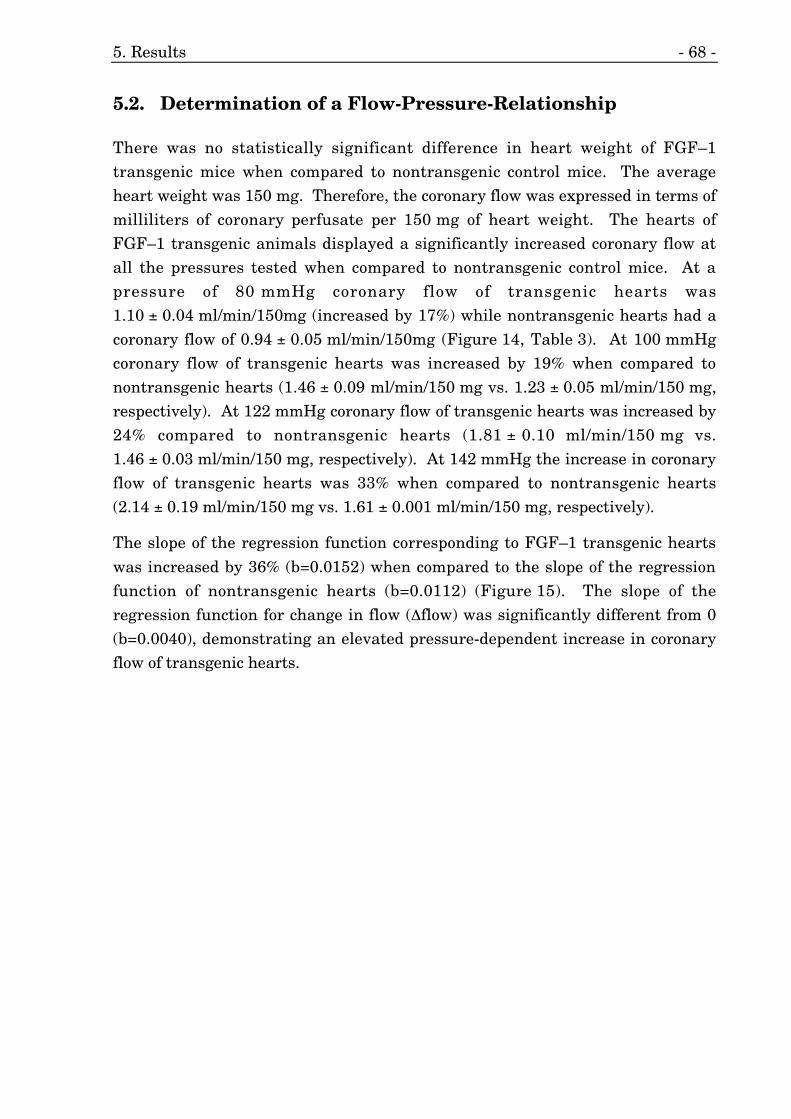
5. Results - 68 -
5.2. Determination of a Flow-Pressure-Relationship
There was no statistically significant difference in heart weight of FGF–1transgenic mice when compared to nontransgenic control mice. The averageheart weight was 150 mg. Therefore, the coronary flow was expressed in terms ofmilliliters of coronary perfusate per 150 mg of heart weight. The hearts ofFGF–1 transgenic animals displayed a significantly increased coronary flow atall the pressures tested when compared to nontransgenic control mice. At apressure of 80 mmHg coronary flow of transgenic hearts was1.10 ± 0.04 ml/min/150mg (increased by 17%) while nontransgenic hearts had acoronary flow of 0.94 ± 0.05 ml/min/150mg (Figure 14, Table 3). At 100 mmHgcoronary flow of transgenic hearts was increased by 19% when compared tonontransgenic hearts (1.46 ± 0.09 ml/min/150 mg vs. 1.23 ± 0.05 ml/min/150 mg,respectively). At 122 mmHg coronary flow of transgenic hearts was increased by24% compared to nontransgenic hearts (1.81 ± 0.10 ml/min/150 mg vs.1.46 ± 0.03 ml/min/150 mg, respectively). At 142 mmHg the increase in coronaryflow of transgenic hearts was 33% when compared to nontransgenic hearts(2.14 ± 0.19 ml/min/150 mg vs. 1.61 ± 0.001 ml/min/150 mg, respectively).
The slope of the regression function corresponding to FGF–1 transgenic hearts
was increased by 36% (b=0.0152) when compared to the slope of the regressionfunction of nontransgenic hearts (b=0.0112) (Figure 15). The slope of theregression function for change in flow (∆flow) was significantly different from 0(b=0.0040), demonstrating an elevated pressure-dependent increase in coronaryflow of transgenic hearts.
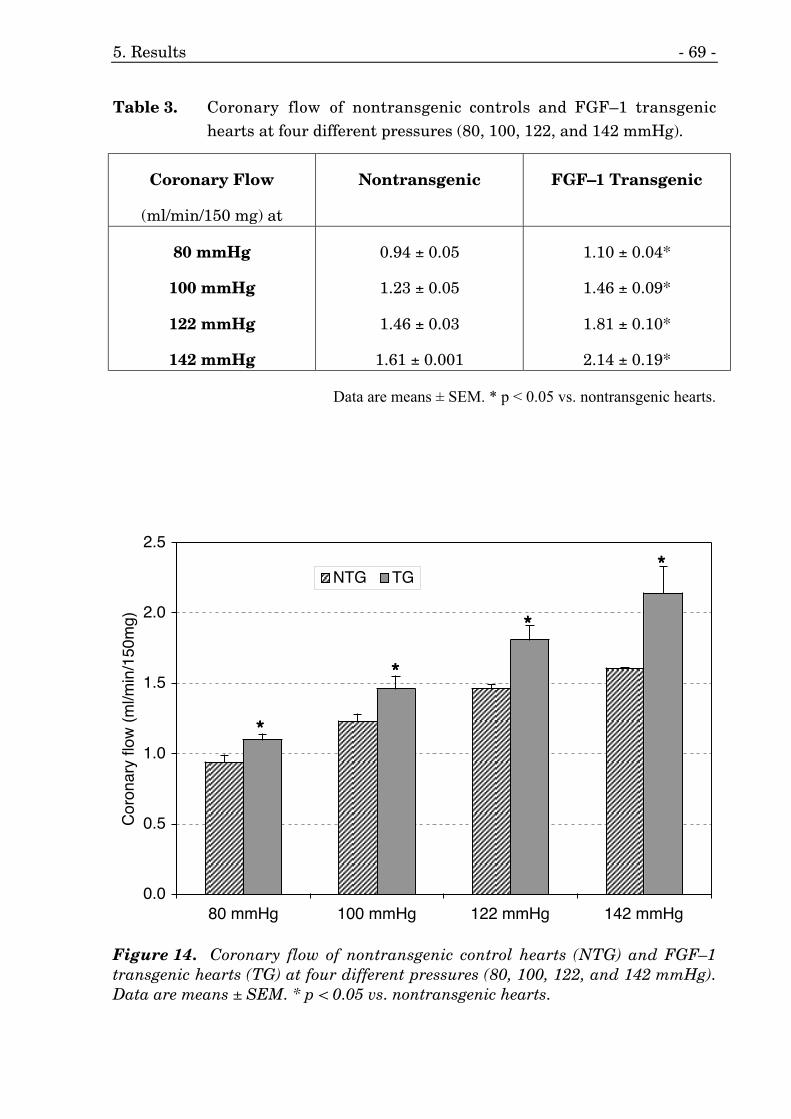
5. Results - 69 -
Table 3. Coronary flow of nontransgenic controls and FGF–1 transgenichearts at four different pressures (80, 100, 122, and 142 mmHg).
Coronary Flow
(ml/min/150 mg) at
Nontransgenic FGF–1 Transgenic
80 mmHg
100 mmHg
122 mmHg
142 mmHg
0.94 ± 0.05
1.23 ± 0.05
1.46 ± 0.03
1.61 ± 0.001
1.10 ± 0.04*
1.46 ± 0.09*
1.81 ± 0.10*
2.14 ± 0.19*
Data are means ± SEM. * p < 0.05 vs. nontransgenic hearts.
0.0
0.5
1.0
1.5
2.0
2.5
80 mmHg 100 mmHg 122 mmHg 142 mmHg
Cor
onar
y flo
w (
ml/m
in/1
50m
g)
NTG TG
****
****
****
****
Figure 14. Coronary flow of nontransgenic control hearts (NTG) and FGF–1transgenic hearts (TG) at four different pressures (80, 100, 122, and 142 mmHg).Data are means ± SEM. * p < 0.05 vs. nontransgenic hearts.
5. Results - 70 -
0.0
0.5
1.0
1.5
2.0
2.5
70 90 110 130 150
flow
[ml/m
in/1
50m
g]
pressure [mmHg]
L1: a = -0.143 b = 0.0152 r = 0.999
wt: a = 0.0111 b = 0.0112 r = 0.999
∆∆∆∆ flow: a = -0.1537 b = 0.004 r = 0.998
Figure 15. Regression curves of coronary flow vs. pressure of nontransgeniccontrol hearts (wt) and FGF–1 transgenic hearts (L1) at four different pressures(80, 100, 122, and 142 mmHg). (∆ flow = change in coronary flow betweentransgenic and nontransgenic hearts)
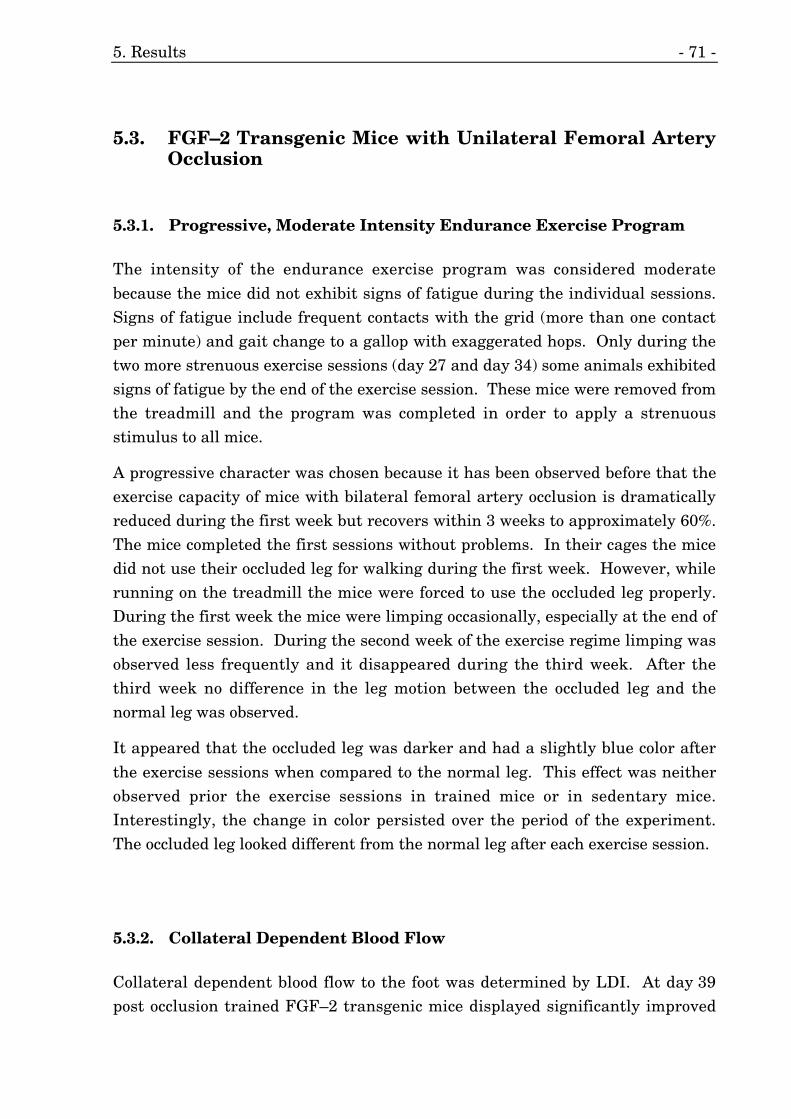
5. Results - 71 -
5.3. FGF–2 Transgenic Mice with Unilateral Femoral ArteryOcclusion
5.3.1. Progressive, Moderate Intensity Endurance Exercise Program
The intensity of the endurance exercise program was considered moderate
because the mice did not exhibit signs of fatigue during the individual sessions.Signs of fatigue include frequent contacts with the grid (more than one contactper minute) and gait change to a gallop with exaggerated hops. Only during thetwo more strenuous exercise sessions (day 27 and day 34) some animals exhibitedsigns of fatigue by the end of the exercise session. These mice were removed fromthe treadmill and the program was completed in order to apply a strenuousstimulus to all mice.
A progressive character was chosen because it has been observed before that theexercise capacity of mice with bilateral femoral artery occlusion is dramaticallyreduced during the first week but recovers within 3 weeks to approximately 60%.The mice completed the first sessions without problems. In their cages the micedid not use their occluded leg for walking during the first week. However, whilerunning on the treadmill the mice were forced to use the occluded leg properly.During the first week the mice were limping occasionally, especially at the end ofthe exercise session. During the second week of the exercise regime limping wasobserved less frequently and it disappeared during the third week. After thethird week no difference in the leg motion between the occluded leg and thenormal leg was observed.
It appeared that the occluded leg was darker and had a slightly blue color after
the exercise sessions when compared to the normal leg. This effect was neitherobserved prior the exercise sessions in trained mice or in sedentary mice.Interestingly, the change in color persisted over the period of the experiment.The occluded leg looked different from the normal leg after each exercise session.
5.3.2. Collateral Dependent Blood Flow
Collateral dependent blood flow to the foot was determined by LDI. At day 39post occlusion trained FGF–2 transgenic mice displayed significantly improved
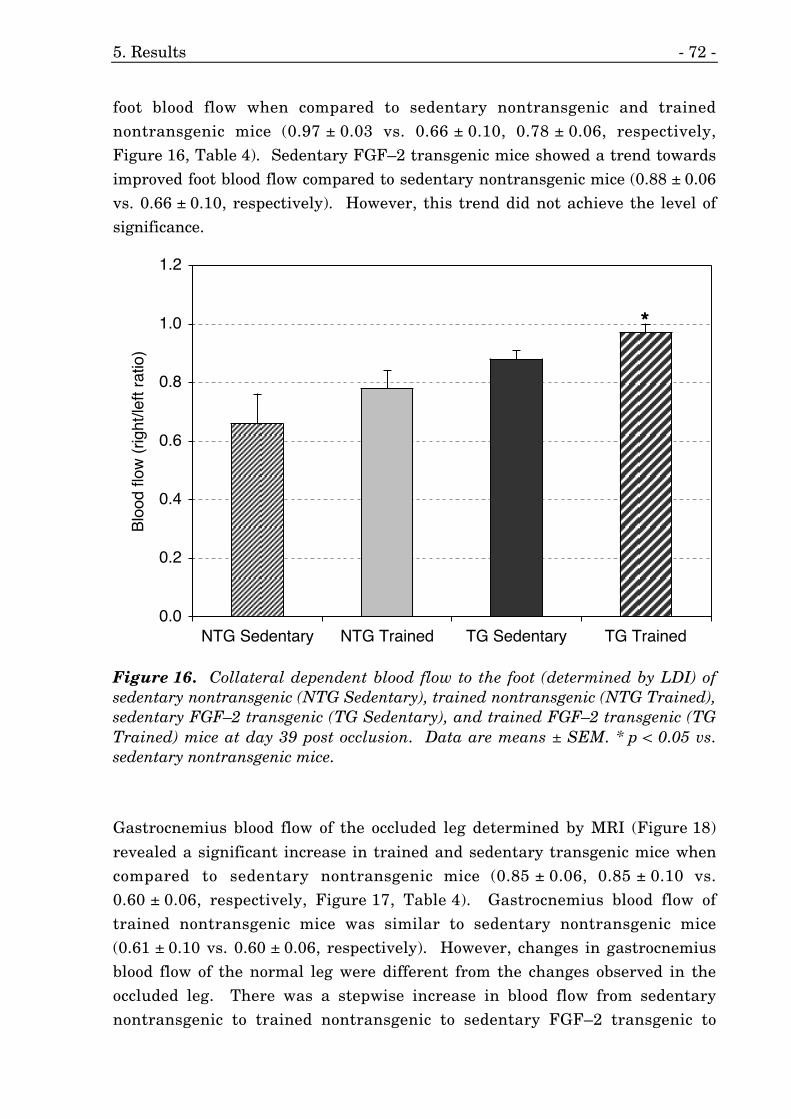
5. Results - 72 -
foot blood flow when compared to sedentary nontransgenic and trainednontransgenic mice (0.97 ± 0.03 vs. 0.66 ± 0.10, 0.78 ± 0.06, respectively,Figure 16, Table 4). Sedentary FGF–2 transgenic mice showed a trend towardsimproved foot blood flow compared to sedentary nontransgenic mice (0.88 ± 0.06vs. 0.66 ± 0.10, respectively). However, this trend did not achieve the level ofsignificance.
0.0
0.2
0.4
0.6
0.8
1.0
1.2
NTG Sedentary NTG Trained TG Sedentary TG Trained
Blo
od fl
ow (
right
/left
ratio
)
****
Figure 16. Collateral dependent blood flow to the foot (determined by LDI) ofsedentary nontransgenic (NTG Sedentary), trained nontransgenic (NTG Trained),sedentary FGF–2 transgenic (TG Sedentary), and trained FGF–2 transgenic (TGTrained) mice at day 39 post occlusion. Data are means ± SEM. * p < 0.05 vs.sedentary nontransgenic mice.
Gastrocnemius blood flow of the occluded leg determined by MRI (Figure 18)
revealed a significant increase in trained and sedentary transgenic mice whencompared to sedentary nontransgenic mice (0.85 ± 0.06, 0.85 ± 0.10 vs.0.60 ± 0.06, respectively, Figure 17, Table 4). Gastrocnemius blood flow oftrained nontransgenic mice was similar to sedentary nontransgenic mice(0.61 ± 0.10 vs. 0.60 ± 0.06, respectively). However, changes in gastrocnemiusblood flow of the normal leg were different from the changes observed in theoccluded leg. There was a stepwise increase in blood flow from sedentarynontransgenic to trained nontransgenic to sedentary FGF–2 transgenic to
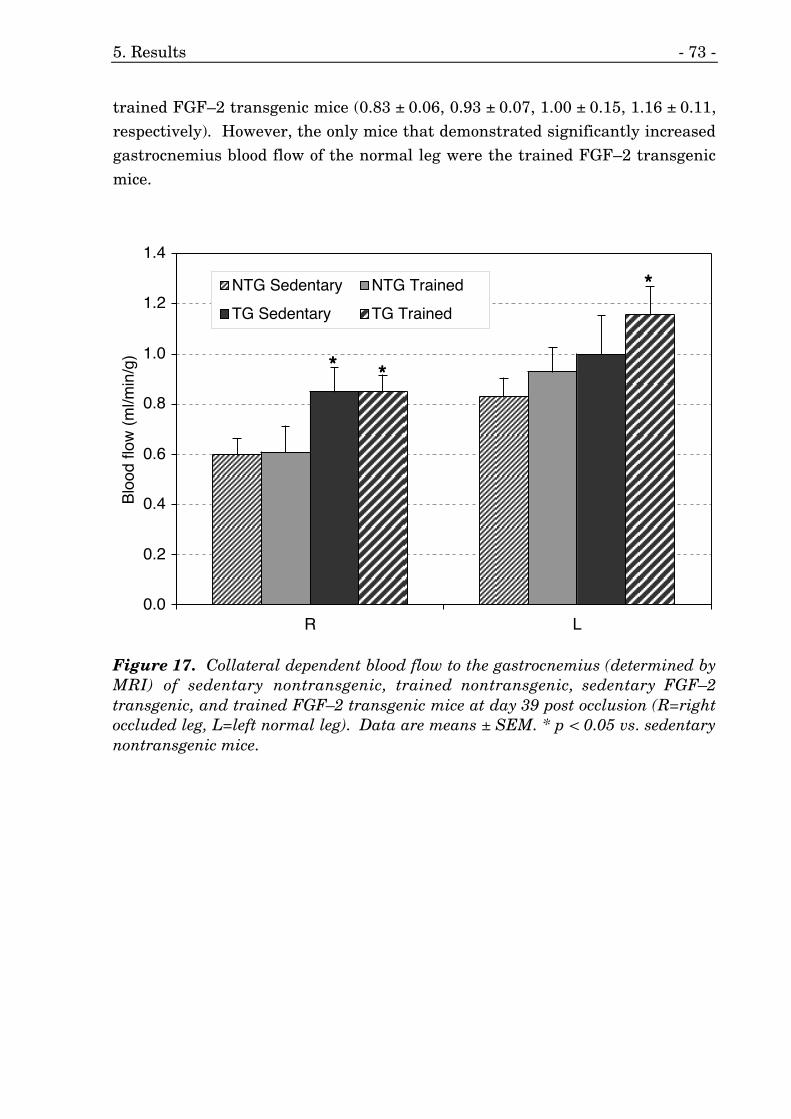
5. Results - 73 -
trained FGF–2 transgenic mice (0.83 ± 0.06, 0.93 ± 0.07, 1.00 ± 0.15, 1.16 ± 0.11,respectively). However, the only mice that demonstrated significantly increasedgastrocnemius blood flow of the normal leg were the trained FGF–2 transgenicmice.
0.0
0.2
0.4
0.6
0.8
1.0
1.2
1.4
R L
Blo
od fl
ow (
ml/m
in/g
)
NTG Sedentary NTG Trained
TG Sedentary TG Trained
**** ****
****
Figure 17. Collateral dependent blood flow to the gastrocnemius (determined byMRI) of sedentary nontransgenic, trained nontransgenic, sedentary FGF–2transgenic, and trained FGF–2 transgenic mice at day 39 post occlusion (R=rightoccluded leg, L=left normal leg). Data are means ± SEM. * p < 0.05 vs. sedentarynontransgenic mice.
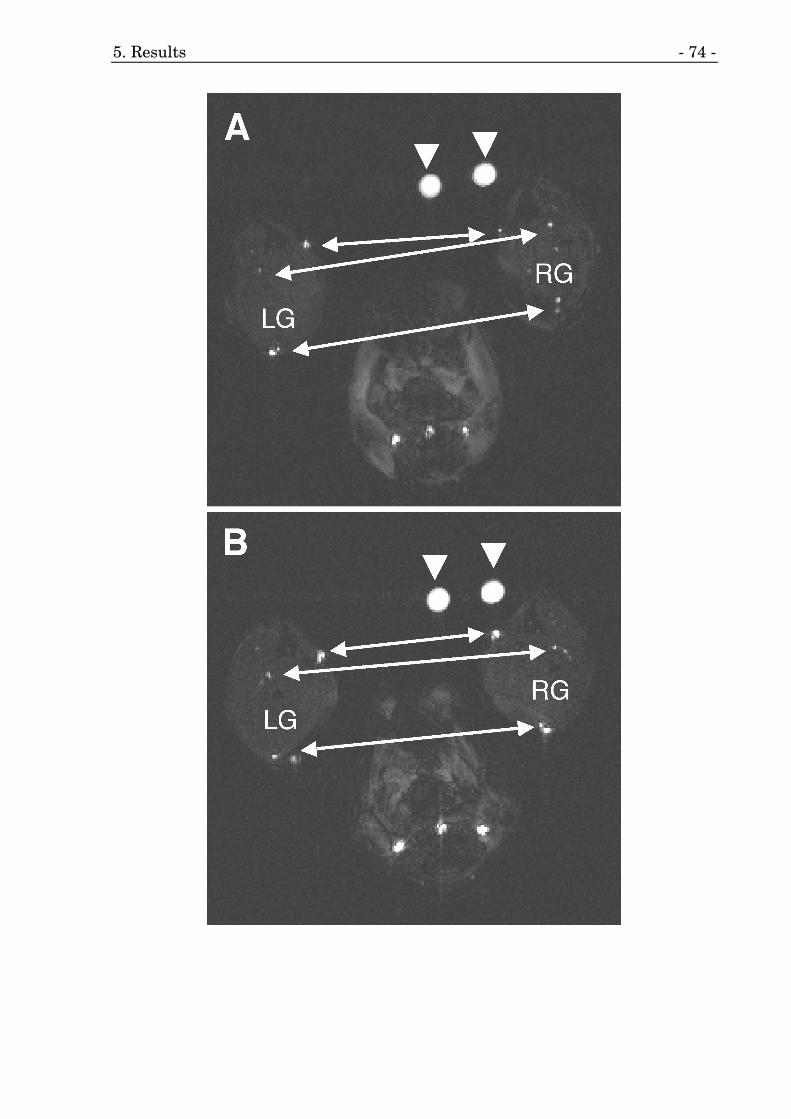
5. Results - 74 -
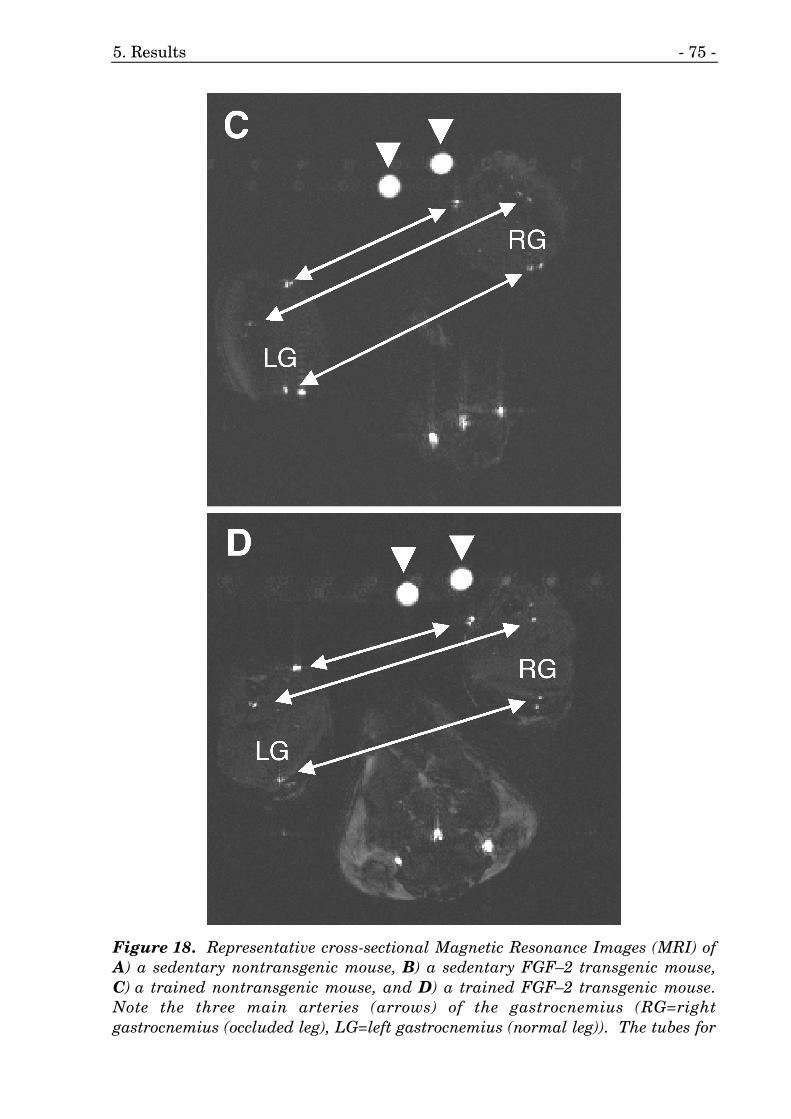
5. Results - 75 -
Figure 18. Representative cross-sectional Magnetic Resonance Images (MRI) ofA) a sedentary nontransgenic mouse, B) a sedentary FGF–2 transgenic mouse,C) a trained nontransgenic mouse, and D) a trained FGF–2 transgenic mouse.Note the three main arteries (arrows) of the gastrocnemius (RG=rightgastrocnemius (occluded leg), LG=left gastrocnemius (normal leg)). The tubes for
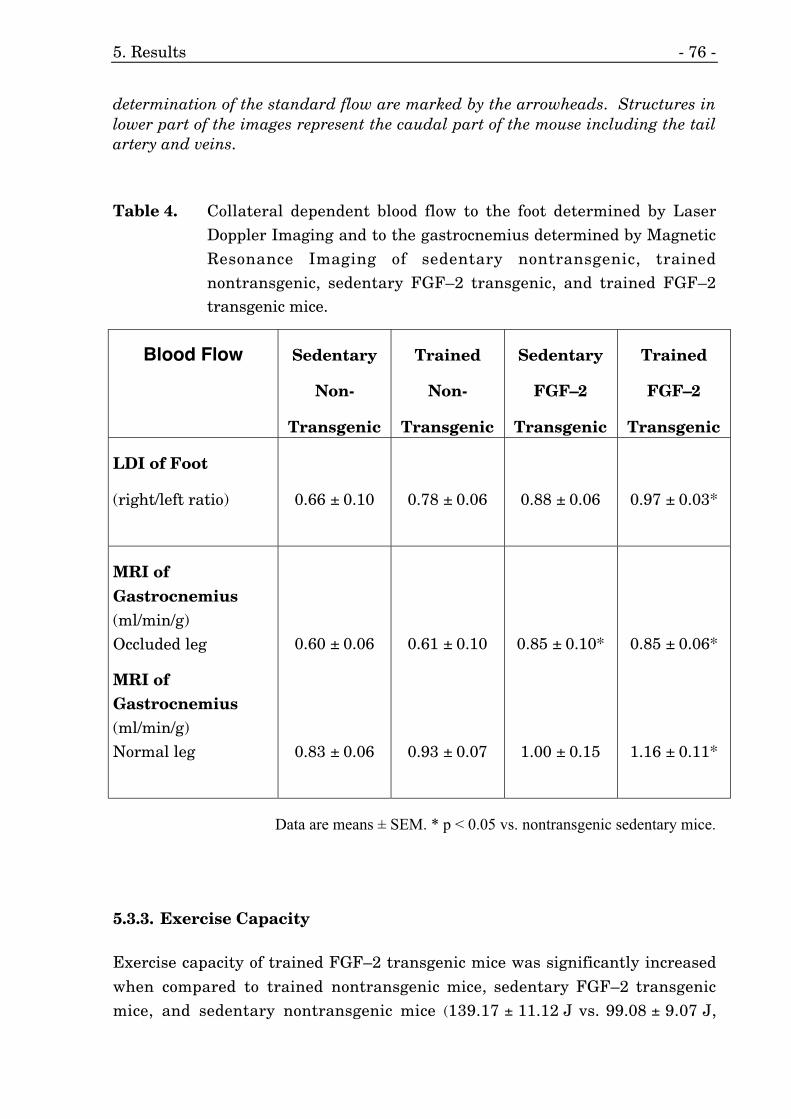
5. Results - 76 -
determination of the standard flow are marked by the arrowheads. Structures inlower part of the images represent the caudal part of the mouse including the tailartery and veins.
Table 4. Collateral dependent blood flow to the foot determined by LaserDoppler Imaging and to the gastrocnemius determined by MagneticResonance Imaging of sedentary nontransgenic, trainednontransgenic, sedentary FGF–2 transgenic, and trained FGF–2transgenic mice.
Blood Flow Sedentary
Non-
Transgenic
Trained
Non-
Transgenic
Sedentary
FGF–2
Transgenic
Trained
FGF–2
Transgenic
LDI of Foot
(right/left ratio) 0.66 ± 0.10 0.78 ± 0.06 0.88 ± 0.06 0.97 ± 0.03*
MRI ofGastrocnemius(ml/min/g)Occluded leg
MRI ofGastrocnemius(ml/min/g)Normal leg
0.60 ± 0.06
0.83 ± 0.06
0.61 ± 0.10
0.93 ± 0.07
0.85 ± 0.10*
1.00 ± 0.15
0.85 ± 0.06*
1.16 ± 0.11*
Data are means ± SEM. * p < 0.05 vs. nontransgenic sedentary mice.
5.3.3. Exercise Capacity
Exercise capacity of trained FGF–2 transgenic mice was significantly increased
when compared to trained nontransgenic mice, sedentary FGF–2 transgenicmice, and sedentary nontransgenic mice (139.17 ± 11.12 J vs. 99.08 ± 9.07 J,
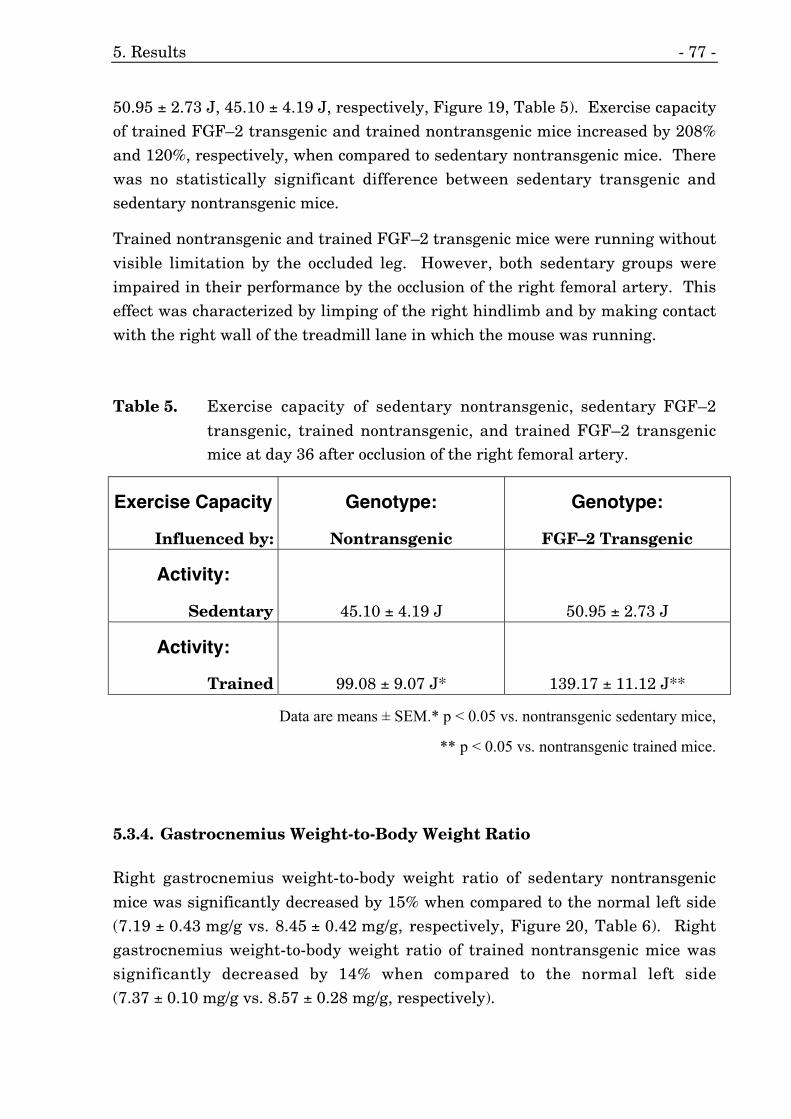
5. Results - 77 -
50.95 ± 2.73 J, 45.10 ± 4.19 J, respectively, Figure 19, Table 5). Exercise capacityof trained FGF–2 transgenic and trained nontransgenic mice increased by 208%and 120%, respectively, when compared to sedentary nontransgenic mice. Therewas no statistically significant difference between sedentary transgenic andsedentary nontransgenic mice.
Trained nontransgenic and trained FGF–2 transgenic mice were running without
visible limitation by the occluded leg. However, both sedentary groups wereimpaired in their performance by the occlusion of the right femoral artery. Thiseffect was characterized by limping of the right hindlimb and by making contactwith the right wall of the treadmill lane in which the mouse was running.
Table 5. Exercise capacity of sedentary nontransgenic, sedentary FGF–2
transgenic, trained nontransgenic, and trained FGF–2 transgenicmice at day 36 after occlusion of the right femoral artery.
Exercise Capacity
Influenced by:
Genotype:
Nontransgenic
Genotype:
FGF–2 Transgenic
Activity:
Sedentary 45.10 ± 4.19 J 50.95 ± 2.73 J
Activity:
Trained 99.08 ± 9.07 J* 139.17 ± 11.12 J**
Data are means ± SEM.* p < 0.05 vs. nontransgenic sedentary mice,
** p < 0.05 vs. nontransgenic trained mice.
5.3.4. Gastrocnemius Weight-to-Body Weight Ratio
Right gastrocnemius weight-to-body weight ratio of sedentary nontransgenic
mice was significantly decreased by 15% when compared to the normal left side(7.19 ± 0.43 mg/g vs. 8.45 ± 0.42 mg/g, respectively, Figure 20, Table 6). Rightgastrocnemius weight-to-body weight ratio of trained nontransgenic mice wassignificantly decreased by 14% when compared to the normal left side(7.37 ± 0.10 mg/g vs. 8.57 ± 0.28 mg/g, respectively).
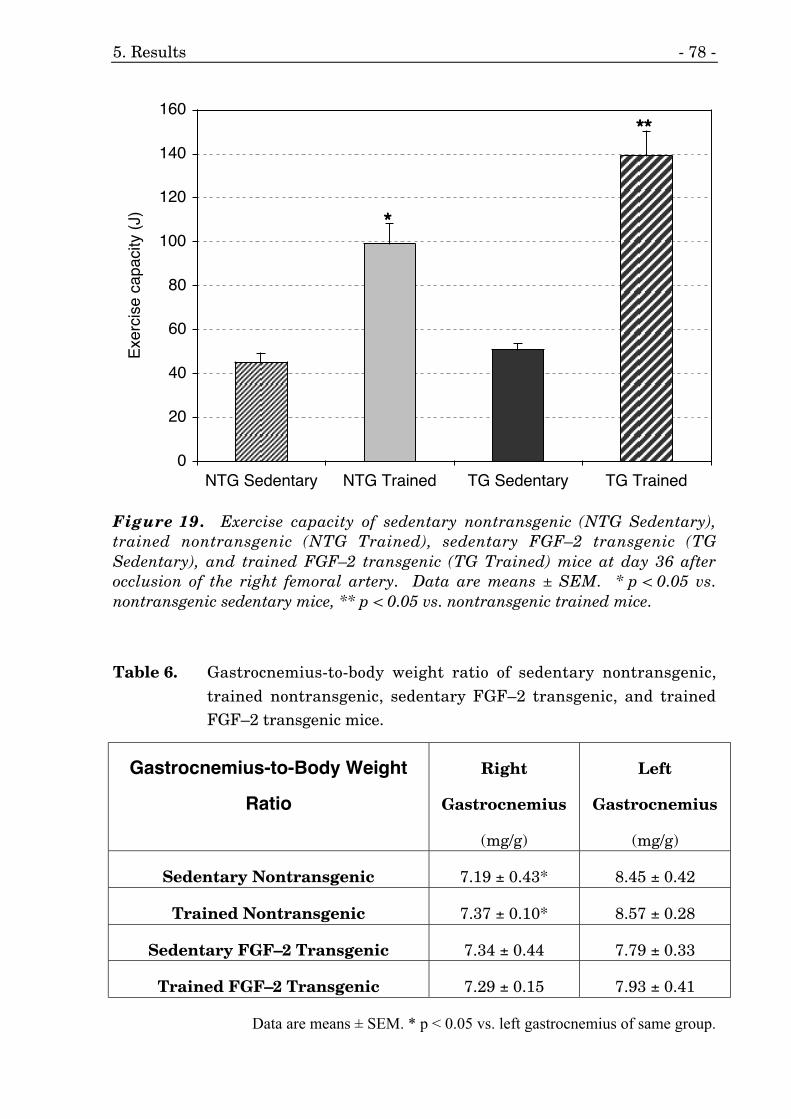
5. Results - 78 -
0
20
40
60
80
100
120
140
160
NTG Sedentary NTG Trained TG Sedentary TG Trained
Exe
rcis
e ca
paci
ty (
J)********
****
Figure 19. Exercise capacity of sedentary nontransgenic (NTG Sedentary),trained nontransgenic (NTG Trained), sedentary FGF–2 transgenic (TGSedentary), and trained FGF–2 transgenic (TG Trained) mice at day 36 afterocclusion of the right femoral artery. Data are means ± SEM. * p < 0.05 vs.nontransgenic sedentary mice, ** p < 0.05 vs. nontransgenic trained mice.
Table 6. Gastrocnemius-to-body weight ratio of sedentary nontransgenic,trained nontransgenic, sedentary FGF–2 transgenic, and trainedFGF–2 transgenic mice.
Gastrocnemius-to-Body Weight
Ratio
Right
Gastrocnemius
(mg/g)
Left
Gastrocnemius
(mg/g)
Sedentary Nontransgenic 7.19 ± 0.43* 8.45 ± 0.42
Trained Nontransgenic 7.37 ± 0.10* 8.57 ± 0.28
Sedentary FGF–2 Transgenic 7.34 ± 0.44 7.79 ± 0.33
Trained FGF–2 Transgenic 7.29 ± 0.15 7.93 ± 0.41
Data are means ± SEM. * p < 0.05 vs. left gastrocnemius of same group.
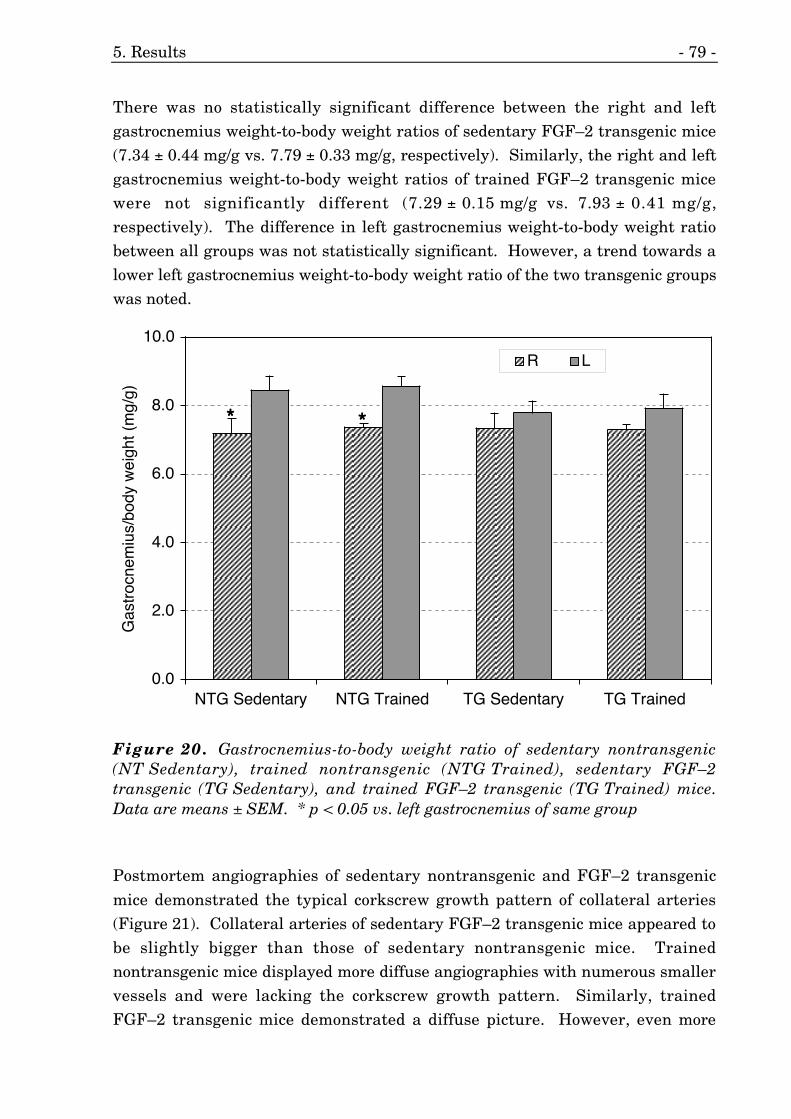
5. Results - 79 -
There was no statistically significant difference between the right and leftgastrocnemius weight-to-body weight ratios of sedentary FGF–2 transgenic mice(7.34 ± 0.44 mg/g vs. 7.79 ± 0.33 mg/g, respectively). Similarly, the right and leftgastrocnemius weight-to-body weight ratios of trained FGF–2 transgenic micewere not significantly different (7.29 ± 0.15 mg/g vs. 7.93 ± 0.41 mg/g,respectively). The difference in left gastrocnemius weight-to-body weight ratiobetween all groups was not statistically significant. However, a trend towards alower left gastrocnemius weight-to-body weight ratio of the two transgenic groupswas noted.
0.0
2.0
4.0
6.0
8.0
10.0
NTG Sedentary NTG Trained TG Sedentary TG Trained
Gas
troc
nem
ius/
body
wei
ght (
mg/
g)
R L
**** ****
Figure 20. Gastrocnemius-to-body weight ratio of sedentary nontransgenic(NT Sedentary), trained nontransgenic (NTG Trained), sedentary FGF–2transgenic (TG Sedentary), and trained FGF–2 transgenic (TG Trained) mice.Data are means ± SEM. * p < 0.05 vs. left gastrocnemius of same group
Postmortem angiographies of sedentary nontransgenic and FGF–2 transgenic
mice demonstrated the typical corkscrew growth pattern of collateral arteries(Figure 21). Collateral arteries of sedentary FGF–2 transgenic mice appeared tobe slightly bigger than those of sedentary nontransgenic mice. Trainednontransgenic mice displayed more diffuse angiographies with numerous smallervessels and were lacking the corkscrew growth pattern. Similarly, trainedFGF–2 transgenic mice demonstrated a diffuse picture. However, even more
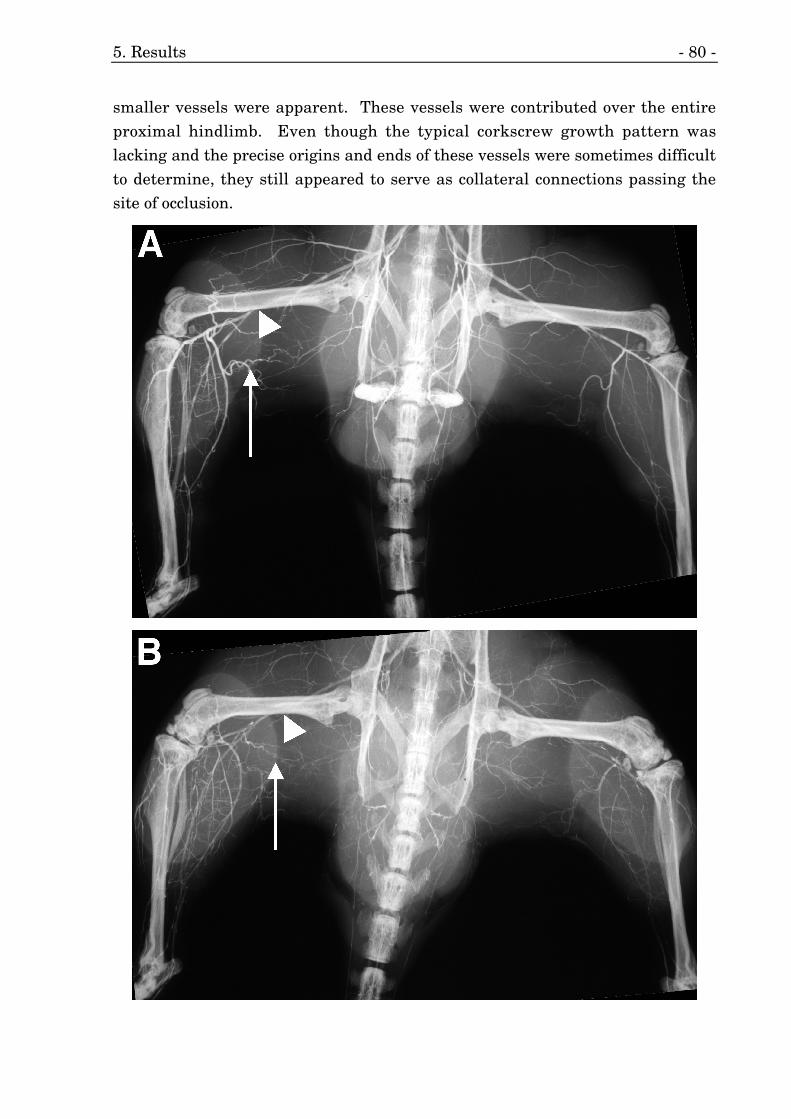
5. Results - 80 -
smaller vessels were apparent. These vessels were contributed over the entireproximal hindlimb. Even though the typical corkscrew growth pattern waslacking and the precise origins and ends of these vessels were sometimes difficultto determine, they still appeared to serve as collateral connections passing thesite of occlusion.
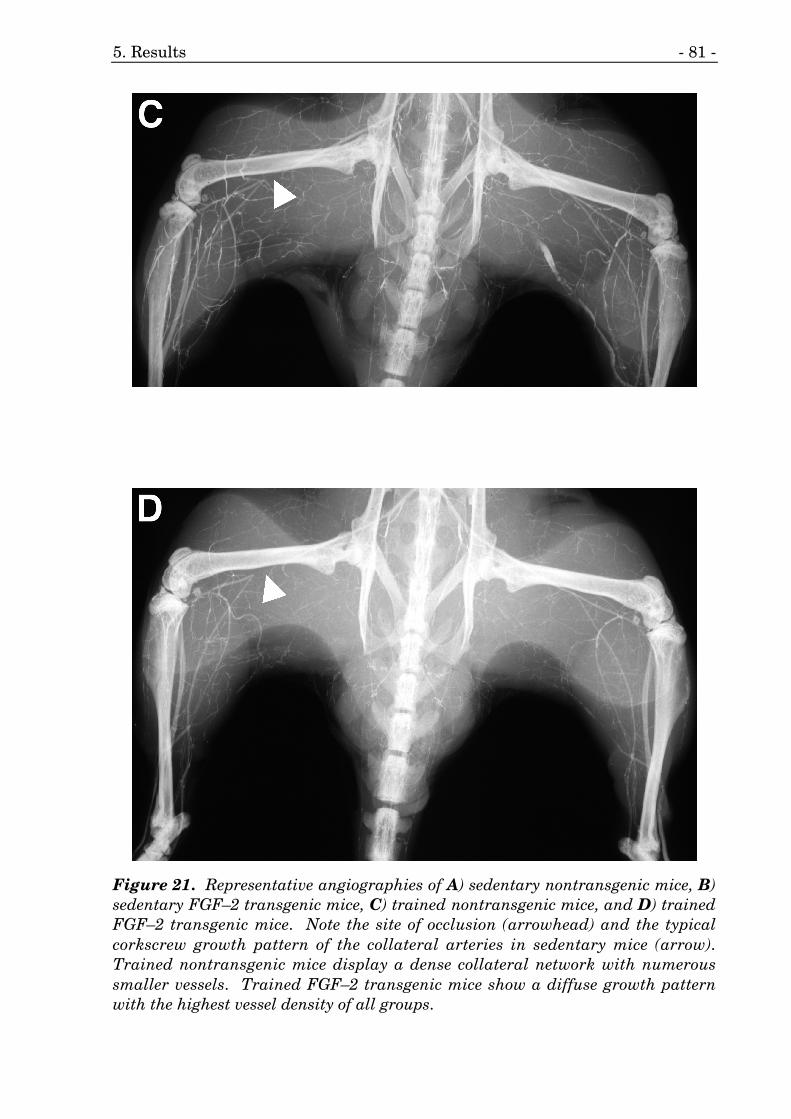
5. Results - 81 -
Figure 21. Representative angiographies of A) sedentary nontransgenic mice, B)sedentary FGF–2 transgenic mice, C) trained nontransgenic mice, and D) trainedFGF–2 transgenic mice. Note the site of occlusion (arrowhead) and the typicalcorkscrew growth pattern of the collateral arteries in sedentary mice (arrow).Trained nontransgenic mice display a dense collateral network with numeroussmaller vessels. Trained FGF–2 transgenic mice show a diffuse growth patternwith the highest vessel density of all groups.
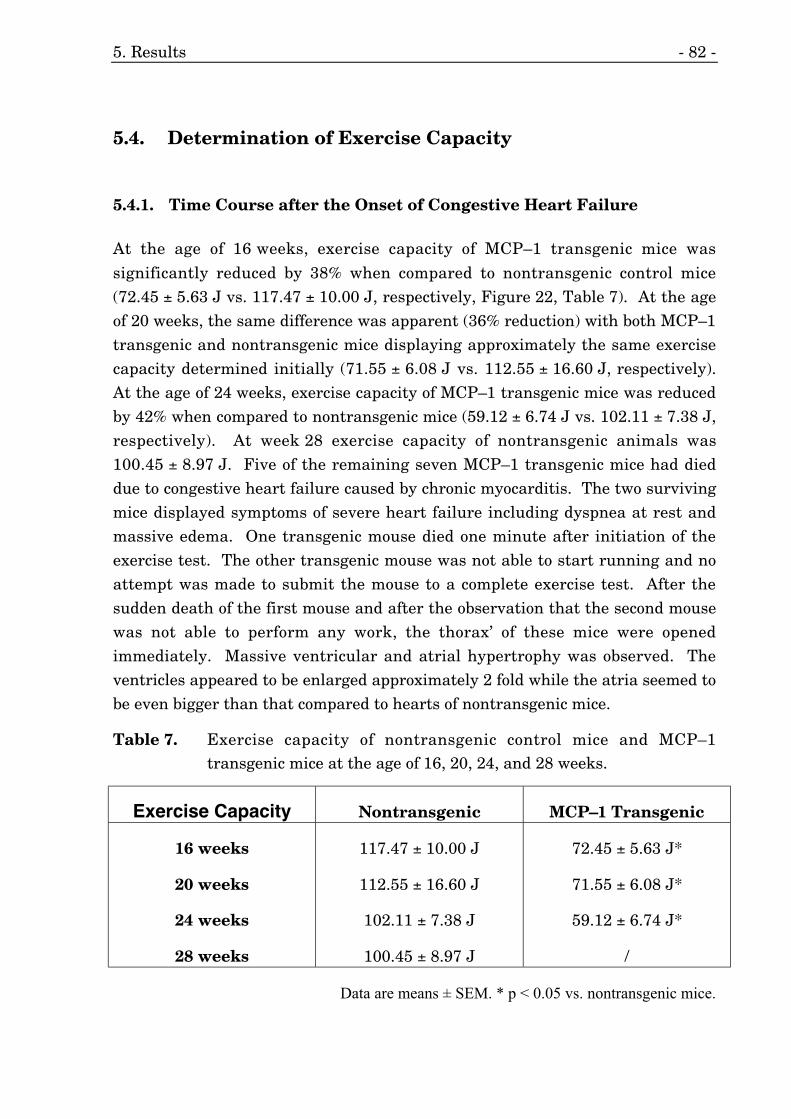
5. Results - 82 -
5.4. Determination of Exercise Capacity
5.4.1. Time Course after the Onset of Congestive Heart Failure
At the age of 16 weeks, exercise capacity of MCP–1 transgenic mice was
significantly reduced by 38% when compared to nontransgenic control mice(72.45 ± 5.63 J vs. 117.47 ± 10.00 J, respectively, Figure 22, Table 7). At the ageof 20 weeks, the same difference was apparent (36% reduction) with both MCP–1transgenic and nontransgenic mice displaying approximately the same exercisecapacity determined initially (71.55 ± 6.08 J vs. 112.55 ± 16.60 J, respectively).At the age of 24 weeks, exercise capacity of MCP–1 transgenic mice was reducedby 42% when compared to nontransgenic mice (59.12 ± 6.74 J vs. 102.11 ± 7.38 J,respectively). At week 28 exercise capacity of nontransgenic animals was100.45 ± 8.97 J. Five of the remaining seven MCP–1 transgenic mice had dieddue to congestive heart failure caused by chronic myocarditis. The two survivingmice displayed symptoms of severe heart failure including dyspnea at rest andmassive edema. One transgenic mouse died one minute after initiation of theexercise test. The other transgenic mouse was not able to start running and noattempt was made to submit the mouse to a complete exercise test. After thesudden death of the first mouse and after the observation that the second mousewas not able to perform any work, the thorax’ of these mice were openedimmediately. Massive ventricular and atrial hypertrophy was observed. Theventricles appeared to be enlarged approximately 2 fold while the atria seemed tobe even bigger than that compared to hearts of nontransgenic mice.
Table 7. Exercise capacity of nontransgenic control mice and MCP–1transgenic mice at the age of 16, 20, 24, and 28 weeks.
Exercise Capacity Nontransgenic MCP–1 Transgenic
16 weeks
20 weeks
24 weeks
28 weeks
117.47 ± 10.00 J
112.55 ± 16.60 J
102.11 ± 7.38 J
100.45 ± 8.97 J
72.45 ± 5.63 J*
71.55 ± 6.08 J*
59.12 ± 6.74 J*
/
Data are means ± SEM. * p < 0.05 vs. nontransgenic mice.
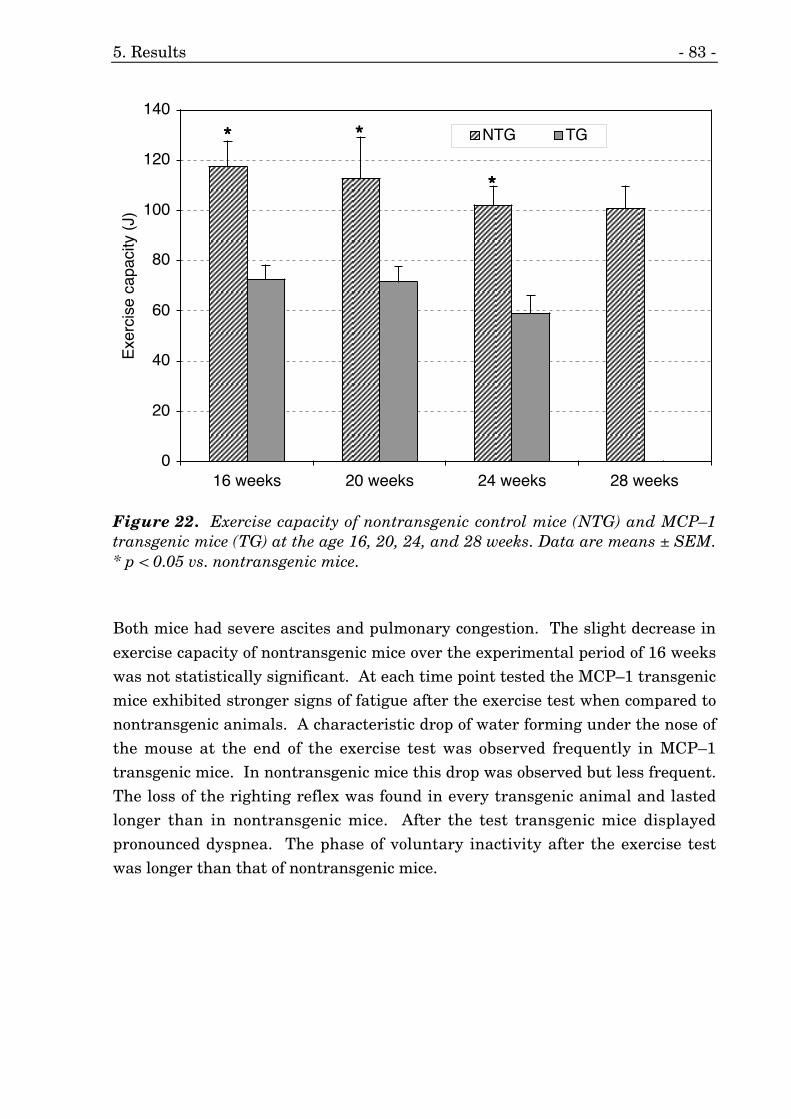
5. Results - 83 -
0
20
40
60
80
100
120
140
16 weeks 20 weeks 24 weeks 28 weeks
Exe
rcis
e ca
paci
ty (
J)NTG TG**** ****
****
Figure 22. Exercise capacity of nontransgenic control mice (NTG) and MCP–1transgenic mice (TG) at the age 16, 20, 24, and 28 weeks. Data are means ± SEM.* p < 0.05 vs. nontransgenic mice.
Both mice had severe ascites and pulmonary congestion. The slight decrease in
exercise capacity of nontransgenic mice over the experimental period of 16 weekswas not statistically significant. At each time point tested the MCP–1 transgenicmice exhibited stronger signs of fatigue after the exercise test when compared tonontransgenic animals. A characteristic drop of water forming under the nose ofthe mouse at the end of the exercise test was observed frequently in MCP–1transgenic mice. In nontransgenic mice this drop was observed but less frequent.The loss of the righting reflex was found in every transgenic animal and lastedlonger than in nontransgenic mice. After the test transgenic mice displayedpronounced dyspnea. The phase of voluntary inactivity after the exercise testwas longer than that of nontransgenic mice.
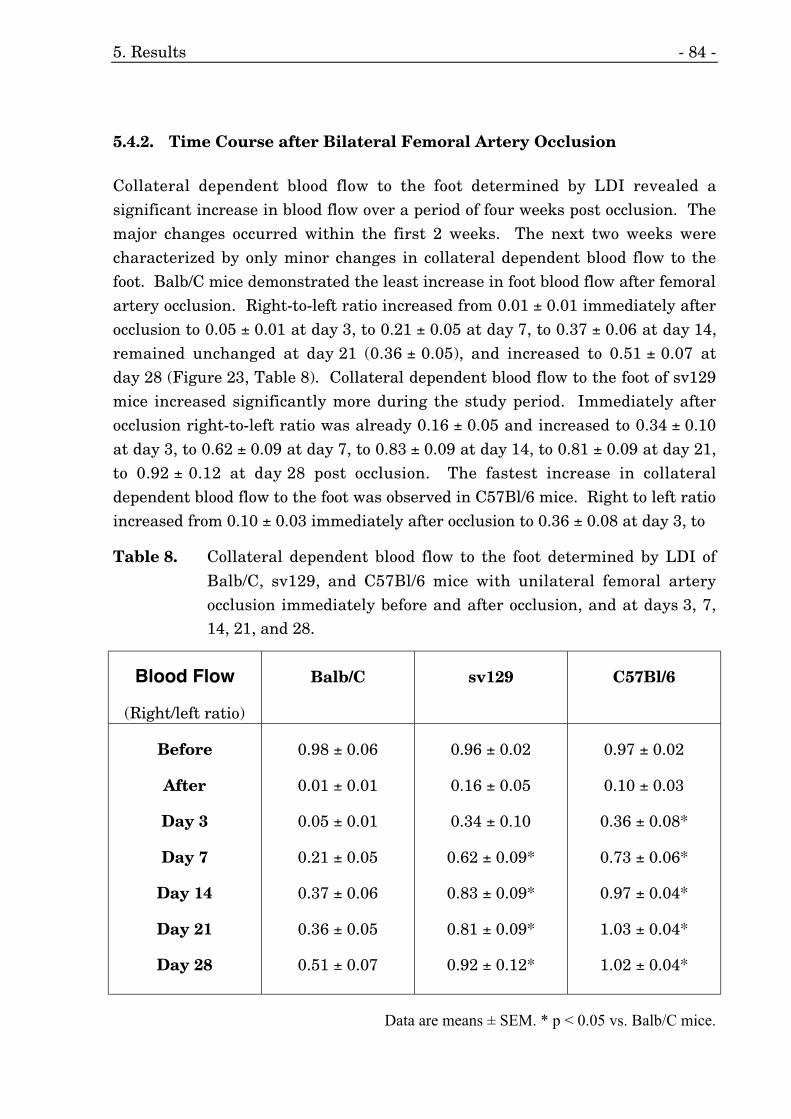
5. Results - 84 -
5.4.2. Time Course after Bilateral Femoral Artery Occlusion
Collateral dependent blood flow to the foot determined by LDI revealed asignificant increase in blood flow over a period of four weeks post occlusion. Themajor changes occurred within the first 2 weeks. The next two weeks werecharacterized by only minor changes in collateral dependent blood flow to thefoot. Balb/C mice demonstrated the least increase in foot blood flow after femoralartery occlusion. Right-to-left ratio increased from 0.01 ± 0.01 immediately afterocclusion to 0.05 ± 0.01 at day 3, to 0.21 ± 0.05 at day 7, to 0.37 ± 0.06 at day 14,remained unchanged at day 21 (0.36 ± 0.05), and increased to 0.51 ± 0.07 atday 28 (Figure 23, Table 8). Collateral dependent blood flow to the foot of sv129mice increased significantly more during the study period. Immediately afterocclusion right-to-left ratio was already 0.16 ± 0.05 and increased to 0.34 ± 0.10at day 3, to 0.62 ± 0.09 at day 7, to 0.83 ± 0.09 at day 14, to 0.81 ± 0.09 at day 21,to 0.92 ± 0.12 at day 28 post occlusion. The fastest increase in collateraldependent blood flow to the foot was observed in C57Bl/6 mice. Right to left ratioincreased from 0.10 ± 0.03 immediately after occlusion to 0.36 ± 0.08 at day 3, to
Table 8. Collateral dependent blood flow to the foot determined by LDI of
Balb/C, sv129, and C57Bl/6 mice with unilateral femoral arteryocclusion immediately before and after occlusion, and at days 3, 7,14, 21, and 28.
Blood Flow
(Right/left ratio)
Balb/C sv129 C57Bl/6
Before
After
Day 3
Day 7
Day 14
Day 21
Day 28
0.98 ± 0.06
0.01 ± 0.01
0.05 ± 0.01
0.21 ± 0.05
0.37 ± 0.06
0.36 ± 0.05
0.51 ± 0.07
0.96 ± 0.02
0.16 ± 0.05
0.34 ± 0.10
0.62 ± 0.09*
0.83 ± 0.09*
0.81 ± 0.09*
0.92 ± 0.12*
0.97 ± 0.02
0.10 ± 0.03
0.36 ± 0.08*
0.73 ± 0.06*
0.97 ± 0.04*
1.03 ± 0.04*
1.02 ± 0.04*
Data are means ± SEM. * p < 0.05 vs. Balb/C mice.
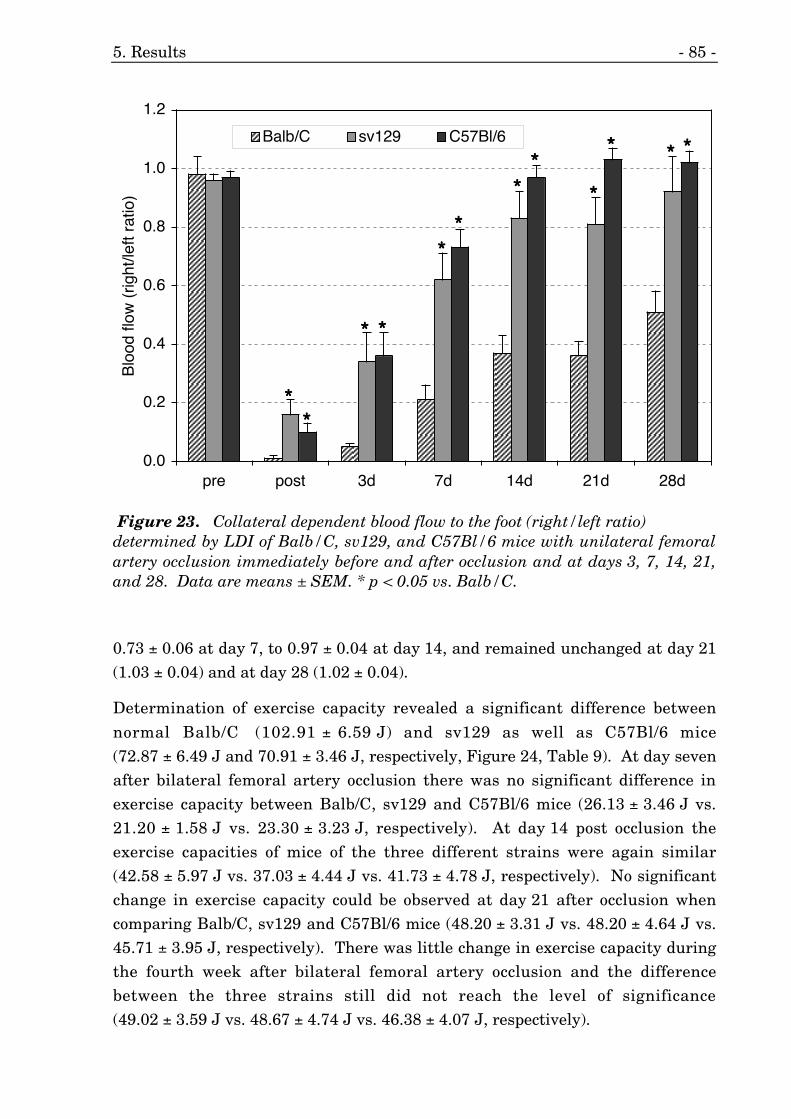
5. Results - 85 -
0.0
0.2
0.4
0.6
0.8
1.0
1.2
pre post 3d 7d 14d 21d 28d
Blo
od fl
ow (
right
/left
ratio
)Balb/C sv129 C57Bl/6
****
********
****
********
****
****
**** **** ****
****
Figure 23. Collateral dependent blood flow to the foot (right/left ratio)determined by LDI of Balb/C, sv129, and C57Bl/6 mice with unilateral femoralartery occlusion immediately before and after occlusion and at days 3, 7, 14, 21,and 28. Data are means ± SEM. * p < 0.05 vs. Balb/C.
0.73 ± 0.06 at day 7, to 0.97 ± 0.04 at day 14, and remained unchanged at day 21(1.03 ± 0.04) and at day 28 (1.02 ± 0.04).
Determination of exercise capacity revealed a significant difference between
normal Balb/C (102.91 ± 6.59 J) and sv129 as well as C57Bl/6 mice(72.87 ± 6.49 J and 70.91 ± 3.46 J, respectively, Figure 24, Table 9). At day sevenafter bilateral femoral artery occlusion there was no significant difference inexercise capacity between Balb/C, sv129 and C57Bl/6 mice (26.13 ± 3.46 J vs.21.20 ± 1.58 J vs. 23.30 ± 3.23 J, respectively). At day 14 post occlusion theexercise capacities of mice of the three different strains were again similar(42.58 ± 5.97 J vs. 37.03 ± 4.44 J vs. 41.73 ± 4.78 J, respectively). No significantchange in exercise capacity could be observed at day 21 after occlusion whencomparing Balb/C, sv129 and C57Bl/6 mice (48.20 ± 3.31 J vs. 48.20 ± 4.64 J vs.45.71 ± 3.95 J, respectively). There was little change in exercise capacity duringthe fourth week after bilateral femoral artery occlusion and the differencebetween the three strains still did not reach the level of significance(49.02 ± 3.59 J vs. 48.67 ± 4.74 J vs. 46.38 ± 4.07 J, respectively).
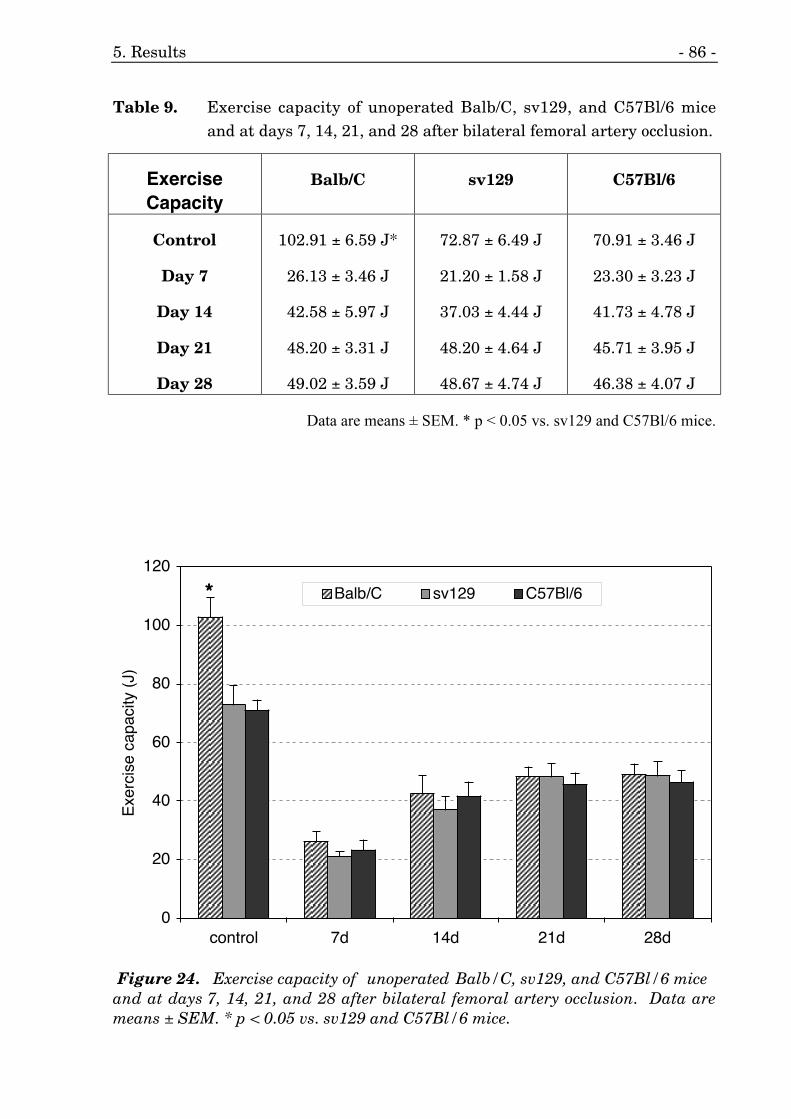
5. Results - 86 -
Table 9. Exercise capacity of unoperated Balb/C, sv129, and C57Bl/6 miceand at days 7, 14, 21, and 28 after bilateral femoral artery occlusion.
ExerciseCapacity
Balb/C sv129 C57Bl/6
Control
Day 7
Day 14
Day 21
Day 28
102.91 ± 6.59 J*
26.13 ± 3.46 J
42.58 ± 5.97 J
48.20 ± 3.31 J
49.02 ± 3.59 J
72.87 ± 6.49 J
21.20 ± 1.58 J
37.03 ± 4.44 J
48.20 ± 4.64 J
48.67 ± 4.74 J
70.91 ± 3.46 J
23.30 ± 3.23 J
41.73 ± 4.78 J
45.71 ± 3.95 J
46.38 ± 4.07 J
Data are means ± SEM. * p < 0.05 vs. sv129 and C57Bl/6 mice.
0
20
40
60
80
100
120
control 7d 14d 21d 28d
Exe
rcis
e ca
paci
ty (
J)
Balb/C sv129 C57Bl/6****
Figure 24. Exercise capacity of unoperated Balb/C, sv129, and C57Bl/6 miceand at days 7, 14, 21, and 28 after bilateral femoral artery occlusion. Data aremeans ± SEM. * p < 0.05 vs. sv129 and C57Bl/6 mice.
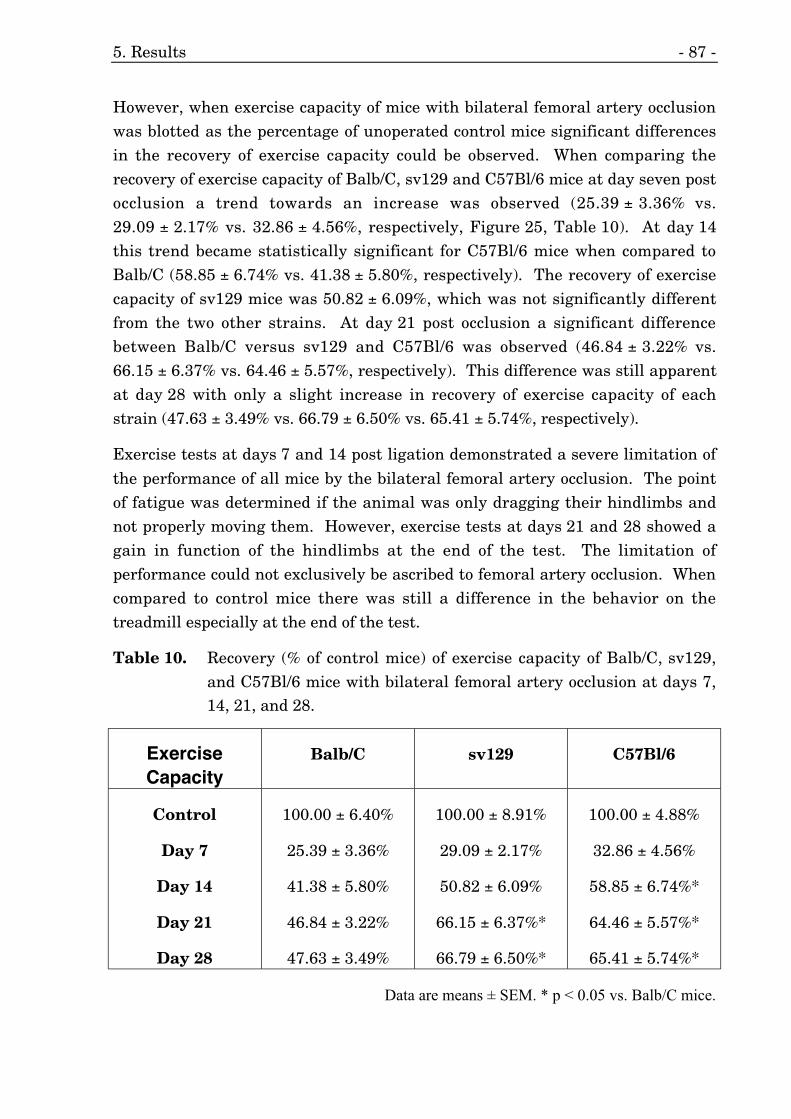
5. Results - 87 -
However, when exercise capacity of mice with bilateral femoral artery occlusionwas blotted as the percentage of unoperated control mice significant differencesin the recovery of exercise capacity could be observed. When comparing therecovery of exercise capacity of Balb/C, sv129 and C57Bl/6 mice at day seven postocclusion a trend towards an increase was observed (25.39 ± 3.36% vs.29.09 ± 2.17% vs. 32.86 ± 4.56%, respectively, Figure 25, Table 10). At day 14this trend became statistically significant for C57Bl/6 mice when compared toBalb/C (58.85 ± 6.74% vs. 41.38 ± 5.80%, respectively). The recovery of exercisecapacity of sv129 mice was 50.82 ± 6.09%, which was not significantly differentfrom the two other strains. At day 21 post occlusion a significant differencebetween Balb/C versus sv129 and C57Bl/6 was observed (46.84 ± 3.22% vs.66.15 ± 6.37% vs. 64.46 ± 5.57%, respectively). This difference was still apparentat day 28 with only a slight increase in recovery of exercise capacity of eachstrain (47.63 ± 3.49% vs. 66.79 ± 6.50% vs. 65.41 ± 5.74%, respectively).
Exercise tests at days 7 and 14 post ligation demonstrated a severe limitation of
the performance of all mice by the bilateral femoral artery occlusion. The pointof fatigue was determined if the animal was only dragging their hindlimbs andnot properly moving them. However, exercise tests at days 21 and 28 showed again in function of the hindlimbs at the end of the test. The limitation ofperformance could not exclusively be ascribed to femoral artery occlusion. Whencompared to control mice there was still a difference in the behavior on thetreadmill especially at the end of the test.
Table 10. Recovery (% of control mice) of exercise capacity of Balb/C, sv129,and C57Bl/6 mice with bilateral femoral artery occlusion at days 7,14, 21, and 28.
ExerciseCapacity
Balb/C sv129 C57Bl/6
Control
Day 7
Day 14
Day 21
Day 28
100.00 ± 6.40%
25.39 ± 3.36%
41.38 ± 5.80%
46.84 ± 3.22%
47.63 ± 3.49%
100.00 ± 8.91%
29.09 ± 2.17%
50.82 ± 6.09%
66.15 ± 6.37%*
66.79 ± 6.50%*
100.00 ± 4.88%
32.86 ± 4.56%
58.85 ± 6.74%*
64.46 ± 5.57%*
65.41 ± 5.74%*
Data are means ± SEM. * p < 0.05 vs. Balb/C mice.
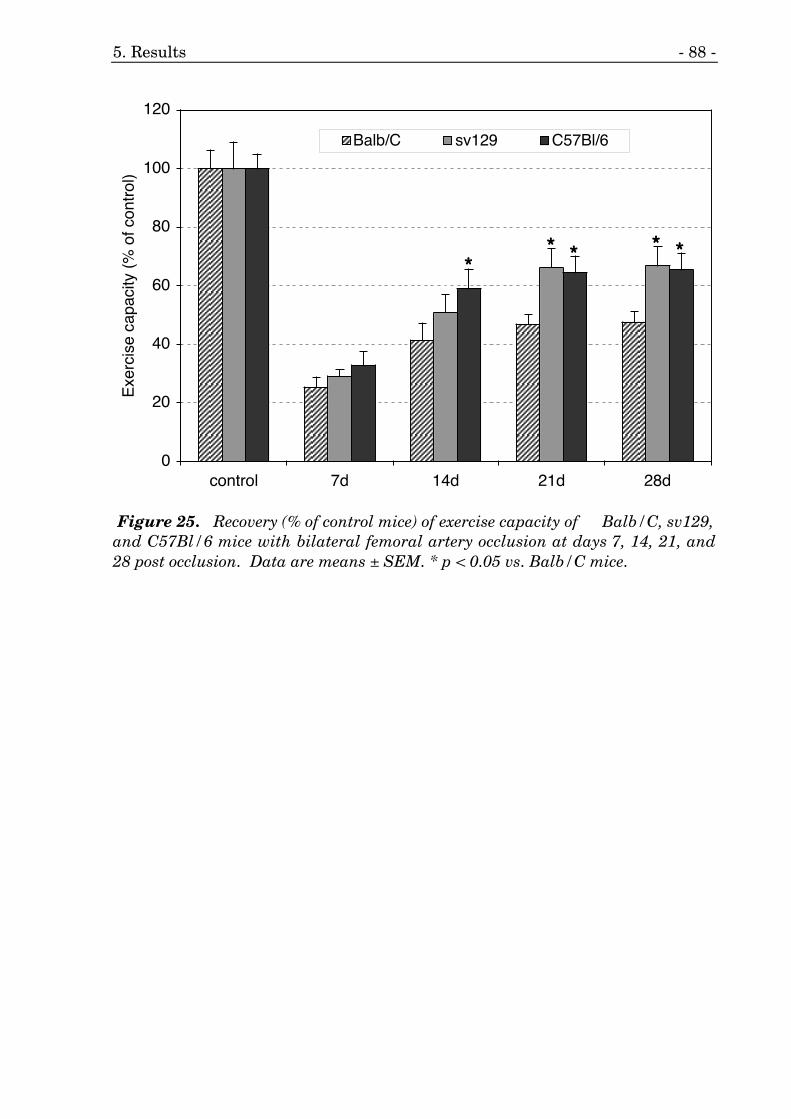
5. Results - 88 -
0
20
40
60
80
100
120
control 7d 14d 21d 28d
Exe
rcis
e ca
paci
ty (
% o
f con
trol
)Balb/C sv129 C57Bl/6
******** **** **** ****
Figure 25. Recovery (% of control mice) of exercise capacity of Balb/C, sv129,and C57Bl/6 mice with bilateral femoral artery occlusion at days 7, 14, 21, and28 post occlusion. Data are means ± SEM. * p < 0.05 vs. Balb/C mice.
6. Discussion - 89 -
6. Discussion
6.1. Simulated Ischemia
A study conducted in our laboratory 64 demonstrated that mice with cardiac-
specific overexpression of FGF–1 display a marked cardioprotection whensubmitted to myocardial infarction induced by ligation of the left coronary artery(see also chapter 3.1.5.). However, infarct development was only delayed and notprevented by overexpression of FGF–1. This suggested that a direct protectiveeffect of FGF–1 on cardiac myocytes was responsible for these findings ratherthan the increase in the density of small arterioles demonstrated in anotherstudy 48. There exists a direct relation between the amount of permanentlysalvaged myocardium and collateral flow. Since permanent salvage was notachieved we concluded that collateral vessels did not contribute to the increasedarteriolar density. However, to undoubtedly prove that FGF–1 overexpressionincreased the tolerance of cardiac myocytes towards ischemia we conducted theexperiments of simulated ischemia.
When isolated cardiac myocytes were submitted to simulated ischemia, cellviability of transgenic cardiac myocytes was increased at the first two of threetime points. CK and LDH are two commonly used enzymes and their releasefrom cells is indicative of cell death. Similar to our in vivo study, thecardioprotective effect of FGF–1 occured during the early time points. At 4 hoursof simulated ischemia CK release from nontransgenic control myocytes wasincreased approximately 10 fold when compared to the CK release undernormoxic conditions during the 16 hours of the experimental protocol.Transgenic myocytes on the other hand increased the CK release only 4 fold,indicating a markedly enhanced viability of transgenic myocytes. This effect wasstill apparent at 8 hours of simulated ischemia. However, the protective effect ofFGF–1 overexpression on cardiac myocyte viability was abolished at 12 hours ofsimulated ischemia. The release of CK of nontransgenic and transgenic cardiacmyocytes was similar at 12 hours of simulated ischemia.
When LDH was used as a marker of cell death, similar results were obtained.
Interestingly, transgenic cardiac myocytes did not release more LDH at 4 hoursof simulated ischemia when compared to the basal release under normoxicconditions during the 16 hours of the experimental period. This suggests that4 hours of simulated ischemia caused very little damage. However, the increasedCK release at 4 hours compared to the basal release demonstrates that it wouldbe an underestimation to state that 4 hours of simulated ischemia did not cause
6. Discussion - 90 -
any cell damage. Nontransgenic control myocytes increased the LDH release atthe same time point by approximately 60%, showing a clear increase in celldeath. At 8 hours of simulated ischemia nontransgenic control myocytesdisplayed significantly increased LDH release when compared to transgenicmyocytes. The difference between the LDH release of nontransgenic andtransgenic myocytes was smaller but still statistically significant. Again, at12 hours of simulated ischemia, no difference in LDH release betweennontransgenic and transgenic cardiac myocytes was observed, indicating a loss ofthe cardioprotective effect at later time points.
Both markers of cell death revealed a strong cardioprotective effect of FGF–1
overexpression on isolated ventricular cardiac myocytes. The effect was mostpronounced at the earliest time point of simulated ischemia. The protectiveeffect decreased at 8 hours of simulated ischemia but was still prominent andstatistically significant. However, FGF–1 overexpression could only delay butnot abolish the damaging effects of simulated ischemia as indicated by similarrelease of cell death markers at 12 hours.
These in vitro findings closely resemble the situation found in vivo. Therefore,we conclude that cardiac-specific overexpression of FGF–1 delays infarctdevelopment in vivo and increases the tolerance of isolated cardiac myocytestowards simulated ischemia. The results of the in vitro experiments demonstratethat the delayed infarct development was caused by cardiac myocytes, whichdisplay enhanced viability under ischemic conditions. We could show with theseexperiments that the increased density of small arteries and arterioles did notprovide any protective effect and thus, was not the reason for the observed delayin infarct development.
Our findings are in accordance with a recently published study that investigated
the cardioprotective effect of FGF–2 on hearts of mice overexpressing FGF–2 237.Similar to our model of cardiac-specific overexpression of FGF–1 no significanteffect on heart weight-to-body weight ratio was noted. FGF–2 overexpressionresulted in a 20% increase in capillary density. Thus, FGF–1 and FGF–2 exertdifferent effects considering the growth of capillaries and of arterioles and smallarteries. The investigators utilized an isolated mouse heart model of ischemia-reperfusion to access the cardioprotective effect of FGF–2 overexpression. TheLDH release of transgenic and nontransgenic mouse hearts was determined inthe perfusate. A significantly decreased release from transgenic hearts wasfound during the reperfusion period, indicating a strong cardioprotective effect ofFGF–2. However, this study accessed only the cardioprotective effect of FGF–2
6. Discussion - 91 -
during 30 minutes of ischemia followed by 60 minutes of reperfusion.Investigating more time points and evaluating the total release of LDH duringthe reperfusion period could have revealed more information. Nevertheless, it isevident that cardiac-specific overexpression of FGF–1 as well as FGF–2 exertstrong cardioprotective effects.
The aforementioned results proved our initial hypothesis and were therefore very
valuable. However, this study revealed other interesting details that werepreviously not described in the literature. The basal release of LDH for example,was higher when compared to the basal release of CK. If taken as the onlymarker, one would think that, in the case of CK, only approximately 3% of thecells die under normoxic conditions during the 16 hours of the experimentalprotocol. However, under the same conditions the basal release of LDH wasmuch higher when compared to the release of CK. The LDH release ofapproximately 35% under normoxic condition during the 16 hours of theexperimental protocol suggests that about one third of all cardiac myocytes dieduring the control period.
Frequent microscopic evaluation of the dishes revealed that the basal LDHrelease most likely reflects the actual number of dead cells. After 12 hours ofanoxia, only a fairly small percentage of myocytes was still rod-shaped and hadintact cell membranes. Again, LDH release appeared to reflect the situationbetter than CK release.
The fact that approximately one third of all myocytes dies under normoxic
conditions during the 16 hours of the experimental period is easy to explain andno surprise. Adult ventricular cardiac myocytes are extremely fragile andsensitive cells that have very stringent requirements on culture media,temperature, oxygen tension, etc.. Since the used medium lacks any growthfactors and no FCS was added, the cardiac myocytes were not kept under optimalconditions. Therefore, it is not surprising that approximately one third of allmyocytes died within the control period.
The observation that the release of CK and LDH from isolated ventricularcardiac myocytes submitted to the same experimental condition differs, has notbeen described before. This suggests that the release of CK displays a differentkinetic. The cause of this difference has to be clarified. Differences in molecularweight and different structural features might be of importance but this remainsa matter of speculation until further studies are conducted. However, theseobservations are of importance for following studies and for comparisons ofdifferent studies using these two markers of cell damage and death.
6. Discussion - 92 -
In conclusion, the experiments of simulated ischemia demonstrated thatventricular cardiac myocytes isolated from adult mice with cardiac specific-overexpression of FGF–1 show a marked delay in cell death when compared tonontransgenic control myocytes. This suggests that overexpression of FGF–1exerts a cardioprotective effect. However, the cardioprotection delays but doesnot abolish cell death due to simulated ischemia. These experiments provided anexplanation for the in vivo finding of a delayed infarct development in transgenicmice. The marker that most accurately reflected the microscopic evaluation ofthe dishes was the release of LDH. The difference between the release of LDHand CK is pronounced and requires careful interpretation of studies using eitherone of these markers.
6.2. Determination of a Flow-Pressure-Relationship
Investigating the effects of cardiac-specific FGF–1 overexpression on capillary
and arterial growth in the heart 48, we found an increase in the number ofarterioles and small arteries. Furthermore, the number of branches of the maincoronary arteries was significantly increased in transgenic animals. There wasno change in the number of capillaries. We hypothesized that the increasednumber of arterioles would lead to an increase in coronary flow of intacttransgenic mouse hearts. Therefore, we accessed the coronary flow by ex vivoretrograde perfusion of the heart under maximal vasodilatory conditions at fourdifferent pressures.
The established flow-pressure-relationship demonstrated that the increase inarteriolar density is reflected by an enhanced myocardial perfusion.Furthermore, the difference in coronary flow between transgenic andnontransgenic mice increased with the perfusion pressure, resulting in asignificant pressure-dependent increase in coronary flow of transgenic mice. Thissuggests that the increase in the arteriolar density could have importantphysiological consequences. However, the significance of an enhanced coronaryflow, especially at higher pressures, in the in vivo situation remains to bedetermined.
The determination of the flow-pressure-relationship of mice overexpressing
FGF–1 revealed that increased branching of the main coronary arteries and anincrease in the number of arterioles and small arteries is capable of changing themyocardial perfusion.
6. Discussion - 93 -
The isolated heart preparation for determination of the coronary flow in order toreflect vascular growth was recently used by another group of investigators 238.The pressure-flow relationship was established in a slightly different mannerthan in our experiments. Instead of using different perfusion pressures andmonitoring the amount of coronary effluent, these investigators controlled thecoronary inflow rate and monitored the required pressure to achieve a certaincoronary flow. The angiogenic effect of PR39, a 39 amino acid peptide secreted bymacrophages, was reflected by a shift to the left of the pressure-flow curve. Thefindings that an increase in the number of vessels increases the coronary flow aresimilar to our results even tough they were obtained with slightly differentmethods.
However, the linear relationship between the applied pressure and the resulting
coronary flow was not accessed in the aforementioned study. Our study revealedthat the increase in the number of resistance vessels in the hearts of transgenicmice was reflected by a steeper inclination of the pressure-flow curve. Therefore,we observed at higher pressures a greater difference in coronary flow betweentransgenic and nontransgenic mouse hearts.
It appears that our model of investigating the coronary flow via establishing apressure-flow relationship is accurate and suitable for determination of thefunctional relevance of an increase in the number of small arteries and arteriolesin hearts overexpressing FGF–1. The pressure-flow curves reveal importantdetails about the dynamic change of the coronary flow in response to increasedperfusion pressures. Therefore, the established protocol is valuable for futurestudies investigating changes of the coronary vasculature.
6.3. FGF–2 Transgenic Mice with Unilateral Femoral ArteryOcclusion
The progressive, moderate intensity endurance exercise program was welltolerated by all mice and induced significant morphological, hemodynamic, andfunctional changes in trained mice. These changes were more pronounced inmice with a general overexpression of FGF–2. This study revealed interestingdetails about the functional significance of the exercise program on one hand andof FGF–2 overexpression on the other hand.
Sedentary mice overexpressing FGF–2 increased the hindlimb perfusion of the
occluded leg determined by MRI compared to nontransgenic sedentary control
6. Discussion - 94 -
mice. The normal leg displayed slightly (not statistically significant) elevatedblood flow. The increase in right-to-left ratio determined by LDI did not achievethe level of significance. Thus, the increase in hindlimb blood flow due to FGF–2overexpression in sedentary mice was at the level of borderline significance.
These findings were reflected by the exercise capacity. Sedentary FGF–2
transgenic mice displayed a small increase in exercise capacity that did notachieve the level of significance when compared to sedentary nontransgenic mice.It would be interesting to see whether the difference in exercise capacity betweentransgenic and nontransgenic mice would be more pronounced if determined inmice with bilateral femoral artery occlusion. Possibly, the limiting effect ofbilateral femoral artery occlusion would be so severe that the small increase inblood flow in transgenic mice would lead to a significant increase in exercisecapacity. However, this remains a matter of speculation until clarifyingexperiments are carried out.
Surprisingly, nontransgenic mice with unilateral femoral artery occlusion thatwere submitted to the progressive, moderate intensity endurance exerciseprogram increased their exercise capacity by approximately 120% compared totheir sedentary counterparts. Hindlimb perfusion of trained nontransgenic micedetermined by two different methods was insignificantly less when compared tosedentary transgenic mice. However, since the difference in exercise capacitybetween the two sedentary groups was small, trained nontransgenic animalsincreased their exercise capacity also by about 100% when compared to sedentarytransgenic mice.
Thus, a fairly small increase in hindlimb perfusion of sedentary FGF–2
transgenic mice lead to a similar, insignificant increase in exercise capacity.However, blood flow levels between that of sedentary nontransgenic andtransgenic mice were not reflected by exercise capacity in trained nontransgenicmice. The training program was causing a significant increase in exercisecapacity without exerting a major effect on resting hindlimb blood flow.
There was a significant increase in hindlimb blood flow determined by LDIbetween trained nontransgenic and transgenic mice. However, determination ofblood flow by MRI did not reveal significant differences. Therefore, weconsidered the blood flow difference between the two trained groups to be at thelevel of borderline significance. However, determination of exercise capacityuncovered the significance of increase in blood flow due to overexpression ofFGF–2. Trained transgenic mice displayed a significant 40% increase in exercisecapacity when compared to trained nontransgenic mice. When compared to
6. Discussion - 95 -
sedentary nontransgenic mice, trained FGF–2 transgenic mice increased exercisecapacity by approximately 200%.
One could speculate that the significant difference in exercise capacity between
the two trained groups arises from adaptations due to the endurance exerciseprogram. The increased exercise capacity compared to the sedentary groups canin part be explained by the full range of metabolic alterations due to training (forreview see 100). With the advanced skeletal muscle metabolism during exercisethe enhanced blood supply becomes a limiting factor. Then, trained transgenicmice have the advantage of a better blood flow, which is now responsible for asignificant difference in exercise capacity.
Another contributing factor to the increased exercise capacity could be an alteredpattern of vascular growth. Angiographic observations showed that trained miceform a dense collateral network. The typical corkscrew collateral arteriesdeveloped only in sedentary mice. It is possible that trained mice have developeda skeletal muscle vasculature that efficiently supplies blood to the wholehindlimb especially during exercise. It seems that the corkscrew growth patternis capable of increasing calf blood flow and foot blood flow during restingconditions to a certain extent so that no ischemia is present. However, thiscorkscrew growth pattern might not be sufficient to meet the blood flow needsduring exercise, especially of the muscles of the thigh.
Currently, we perform histological studies to precisely determine the vascular
growth pattern. We investigate skeletal muscle tissue from the proximalhindlimb where collateral arteries developed (arteriogenesis) and from the distalhindlimb where possibly angiogenesis occurred. Analysis of these skeletalmuscle samples will provide us with information whether the increased vesseldensity observed in the angiograms is due to growth of the preexistent collateralvessels in diameter or due to increased arteriolar development and growth. Wewill determine the extent of angiogenesis in the gastrocnemius and we willinvestigate the roles of overexpression of FGF–2 and of the endurance exerciseprogram with possible treatment interactions.
It would be of great interest to determine hindlimb blood flow during exercise.Unfortunately, until now we did not succeed to develop a precise system fordetermination of exercise blood flow. However, similar studies of Terjung andcolleagues provide valuable information.
In 1998, they conducted a study in rats investigating the effect of intra arterial
FGF–2 infusion via osmotic minipumps 185. Subgroups of the FGF–2 group and
6. Discussion - 96 -
the carrier group were trained for four weeks twice daily until the point of fatiguewas reached. They determined the hindlimb blood flow at the end of contractilitytests. Therefore, blood flow measurements can be considered to reflect exerciseblood flow. Similar to our study, a stepwise increase in total hindlimb blood flowfrom the sedentary carrier group to the trained carrier group to the sedentaryFGF–2 group and to the trained FGF–2 group was found. The total hindlimbblood flow of the trained FGF–2 group was significantly greater than all othergroups. Proximal hindlimb blood flow showed similar results. Distal blood flowof the trained carrier group, sedentary FGF–2 group, and trained FGF–2 groupwere significantly increased compared to the sedentary carrier group. Tensiondevelopment of the calf muscles showed similar results compared to our exercisecapacity results. Even though blood flow of the trained carrier group was(insignificantly) lower than blood flow of the sedentary FGF–2 group the oppositewas true for the developed tension. Similar to our results, muscle performance ofthe trained FGF–2 group was by far the greatest. Therefore, one could speculatethat blood flow levels during exercise in our model would be similar to the restingblood flow levels possibly with increased absolute values and greater differencesbetween the groups. The order, however, would probably stay the same.
Our study demonstrated that trained mice generally overexpressing FGF–2
display an increased exercise capacity when compared to all other groups. Thisfinding opposes the results reported in the aforementioned study 185. In thisstudy no significant difference in total running time was observed. However, fordetermination of exercise capacity we did not just record total running time oftraining sessions but performed a precise and reproducible exercise test.Furthermore, contractile performance of trained rats with FGF–2 infusion wassignificantly better when compared to all other groups. It’s hard to imagine thatthe improved contractile performance together with the increased blood flowwould not lead to increased exercise capacity under controlled conditions as usedin our study.
That trained animals display a significantly increased skeletal muscle blood flowduring exercise is shown by another recent study 187. Rats with prior training tobilateral femoral artery occlusion show a markedly increased skeletal muscleblood flow during exercise when compared to sedentary control rats. A previousstudy of the same investigators 177 indicates that rats with bilateral femoralartery occlusion, which were then trained for up to eight weeks, increasehindlimb blood flow during exercise significantly when compared to sedentarycontrol animals. Unfortunately, these studies did not determine resting bloodflow levels because the investigators did probably not expect any difference.
6. Discussion - 97 -
The current understanding is that exercise uncovers latent ischemia in the heartas well as in limbs. Nevertheless, our resting blood flow measurementsdetermined by MRI and LDI do show differences. However, only the trainedFGF–2 transgenic mice demonstrated a significant increase in blood flowdetermined by both methods. The magnitude of the differences between theother groups is smaller. Statistically significant results are only observed by oneof the methods or not at all. Therefore, we can only speculate that resting bloodflow measurements reflect to some extent the predicted exercise blood flowmeasurements. Furthermore, blood flow levels during exercise would probablygive rise to a greater difference between the groups.
As described in chapter 5.3.3., the occluded leg of trained mice did not display
any functional limitation during the test. This indicated that the blood supply ofthe occluded hindlimb during exercise was fairly normal and/or that metabolicadaptations developed leading to proper function despite a limited blood supply.Interestingly, FGF–2 overexpression abolished gastrocnemius atrophy due toocclusion of the femoral artery. A significant difference between left and rightgastrocnemius weight-to-body weight ratio was only observed in nontransgenicmice. Endurance exercise did not influence the gastrocnemius weight-to-bodyweight ratios. The atrophy of the right gastrocnemius could have been a limitingfactor for exercise capacity of trained nontransgenic animals, leading to asignificant decrease when compared to the exercise capacity of trained FGF–2transgenic mice.
These findings confirm one of the earliest studies investigating the effect ofendurance exercise on development of the collateral circulation 97. Among otherresults (see also chapter 3.3.) the study demonstrated that femoral arteryocclusion causes atrophy of the distal muscles, which is not influenced by anendurance exercise program alone. Many years later, we could now show thatoverexpression of FGF–2 abolishes distal skeletal muscle atrophy due to femoralartery occlusion. The protective effect of FGF–2 on cells submitted toischemia 237 could be one of the reasons for this effect. Other explanationsinvolve the angiogenic effect of FGF–2. Better capillary supply of the individualskeletal muscle fibers of the distal hindlimb in FGF–2 transgenic mice could leadto less ischemia and thus, less atrophy.
The slightly decreased gastrocnemius weight-to-body weight ratio of the normal
leg of transgenic mice is most likely due to the reduction in bone length caused byoverexpression of FGF–2 228.
6. Discussion - 98 -
Preliminary experiments performed in our laboratory could aid in understandingthe mechanism by which trained transgenic animals were able to increaseskeletal muscle blood flow as well as exercise capacity significantly. Our initialhypothesis was that training of FGF–2 transgenic mice would lead to a promoter-dependent increase in expression of the transgene. The promoter ofphosphoglycerate kinase was used for construction of the transgene. Since thisenzyme is a part of glycolysis, we hypothesized that acceleration of glycolysis dueto exercise would in turn increase the expression of FGF–2. Furthermore, thephosphoglycerate kinase gene contains a binding element for HIF–1 in itspromoter region 239 and HIF–1 expression has been shown to increase inresponse to exercise 111.
However, preliminary results obtained by Northern blots of phosphoglycerate
kinase 1 do not support our initial hypothesis. We did not observe a clearincrease in phosphoglycerate kinase 1 expression due to exercise. Nevertheless,we could see increased levels of phosphoglycerate kinase in transgenic animals.The expression patterns between nontransgenic and FGF–2 transgenic mice werealso different. The significance of these findings remains to be determined. Wecurrently perform Northern blots of FGF–2 to investigate whether the expressionlevels of phosphoglycerate kinase and FGF–2 correlate. Furthermore, we willstudy FGF–2 at the protein level by Western blot analysis. The enhanced releaseof intracellular FGF–2 in response to stress (exercise) could have increased theamount of FGF–2 in the extracellular space. Therefore, it is possible that trainedFGF–2 transgenic mice display enhanced vascular growth due to the increasedavailability of FGF–2 in the extracellular space.
However, other mechanisms could have also contributed to the observed increasein blood flow and exercise in trained FGF–2 transgenic mice. Exercise forexample could have increased shear stress in the collateral circulation, simplyproviding an additional stimulus for arteriogenesis in the FGF–2 transgenicmice. Another possible explanation could be that overexpression of FGF–2 couldhave multiplied the growth factor response to exercise (see also chapters 3.1. and3.3.).
In conclusion, our study demonstrates that trained mice with unilateral femoral
artery occlusion overexpressing FGF–2 display increased hindlimb blood flow andexercise capacity. FGF–2 abolished the gastrocnemius atrophy due to femoralartery occlusion. Training did not influence gastrocnemius atrophy.Angiographic observations show the formation of a dense vascular network intrained FGF–2 transgenic mice. Future studies will uncover the mechanism of
6. Discussion - 99 -
this treatment interaction and reveal histological details about the changedvascular growth pattern in trained FGF–2 transgenic mice.
6.4. Determination of Exercise Capacity
6.4.1. Time Course After the Onset of Congestive Heart Failure
Mice with cardiac specific overexpression of MCP–1 displayed already at an ageof 16 weeks moderate exercise intolerance as one of the main symptoms of heartfailure patients. At an age of 20 weeks exercise capacity remained reduced bythe same magnitude when compared to nontransgenic mice. At 24 weeks of ageexercise capacity of MCP–1 transgenic mice was decreased by 42%, which was anadditional reduction of 6% compared to the month before.
However, during this period of time no major change in exercise capacity
occurred. Unexpectedly, signs of exercise intolerance were already found at anage of 16 weeks. The presence of this major symptom of heart failure indicatesthat deleterious cardiac changes had already occurred. The lack of othersymptoms like visible congestion and resting dyspnea suggests that heart failurewas at a compensated stage.
During the next eight weeks no major changes in exercise capacity were notedindicating that progression of heart failure was slowly. However, betweenweeks 24 and 28 of age, five of the seven remaining mice died due to heartfailure. Symptoms then included severe congestion and dyspnea at rest. Thesefindings demonstrate progression of heart failure from the compensated to thedecompensated stage. The two remaining mice were severely impaired in theirability to perform work. They also displayed severe congestion and restingdyspnea as signs of end-stage congestive heart failure. The facts that one mousedied during the test and that the other remaining mouse could not even start thetest illustrate the severity and the progression of heart failure between weeks 24and 28.
The observed ventricular and atrial hypertrophy was massive and developed
mainly during the last weeks of the study period. Hearts taken at the beginningof the study and at an age of 20 weeks did not show signs of hypertrophy, whilethe heart taken at 24 weeks of age was already moderately hypertrophied.
6. Discussion - 100 -
These observations demonstrate that cardiac-specific overexpression of MCP–1leads to chronic myocarditis 94 resulting in the development of congestive heartfailure. At an age of 16 weeks, exercise intolerance was present as the first signof heart failure. Thereafter, a slow progression of heart failure was notedwithout severe worsening of exercise intolerance. Between 24 and 28 weeks ofage, cardiac-specific overexpression of MCP–1 led to a sudden and homogeneousswitch from the compensated to the decompensated heart failure stage. Thisresulted first in visible congestion, resting dyspnea, and severe exerciseintolerance and later in death of the animals. Mice with decompensated heartfailure showed ascites, pulmonary congestion, and massive ventricular and atrialhypertrophy.
Histological examination of the hearts taken at each time point of the study is
currently performed in our laboratory and will reveal the degrees of myocarditis,monocyte infiltration, fibrosis, and hypertrophy of ventricular and atrial cardiacmyocytes.
Another interesting experiment to perform in the future would be to study theeffect of different endurance exercise programs on the development of CHF. Low,moderate, and high intensity endurance exercise programs exert different kindsof stress on the heart. The model of cardiac-specific overexpression of MCP–1mimics closely the human form of CHF due to chronic myocarditis. Therefore,this study could reveal important information for human patients considering theeffect of exercise on progression or regression of CHF. A low intensity enduranceexercise program could hypothetically exert a beneficial influence on myocarditis,leading to regression of CHF. A high intensity endurance exercise program couldpossibly worsen myocarditis and CHF. Since very few studies exist that areproviding conclusive information about this topic these hypotheses are veryspeculative and in need of experimental prove. Treating subgroups of mice withMCP–1 antibodies and/or CCR2 blockers would provide even more information.
In conclusion, cardiac-specific overexpression of MCP–1 induces myocarditis
causing the homogenous development of CHF. The determination of exercisecapacity has proven to be a precise marker for the limitation of cardiac functionin CHF. We could demonstrate that, without the presence of other symptomslike visible congestion and resting dyspnea, moderate exercise intolerance waspresent at an age of 16 weeks, indicative of a compensated stage of CHF. Theswitch from the compensated to the decompensated CHF stage occurs between 24and 28 weeks of age of MCP–1 transgenic mice. Visible congestion and restingdyspnea are additional symptoms, which become apparent during this period.
6. Discussion - 101 -
Exercise capacity was then severely impaired, resulting either in death of themouse during the exercise test or inability to run at the initial level of the test.Massive cardiac and atrial hypertrophy in combination with severe ascites andpulmonary congestion illustrate the development of decompensated CHF.
6.4.2. Time Course after Bilateral Femoral Artery Occlusion
Measurements of collateral dependent foot blood flow by LDI give rise to relative
numbers, which indicate that foot blood flow of the occluded leg is at the level of acertain percentage of foot blood flow of the normal leg. LDI measurementsrevealed that Balb/C mice increased collateral dependent foot blood flow only to51% during four weeks after femoral artery occlusion. Collateral dependent footblood flow of sv129 mice increased significantly during the same period whencompared to Balb/C mice. After four weeks foot blood flow of the occluded legincreased to 92% of the normal leg. C57Bl/6 mice displayed an even faster andstronger recovery in collateral dependent foot blood flow. These mice had a footperfusion of 97% after two weeks.
We hypothesized that these remarkable differences in the recovery of foot bloodflow would lead to similar differences in the recovery of exercise capacity. Inorder to establish the recovery of exercise capacity as a marker of the increase incollateral dependent foot blood flow, we had to make sure that femoral arteryocclusion severely influences exercise capacity. Therefore, we bilaterallyoccluded the femoral artery of six mice of each strain. Results obtained sevendays after occlusion indicate that a severe limitation of exercise capacity wasexerted by bilateral femoral artery occlusion.
However, to compare the relative blood flow data with the results from the
exercise tests, we had to express these data in relative units as well. For thispurpose, we determined the exercise capacity of six control mice of each strainwithout femoral artery occlusion and set this number to 100%. Exercise capacityof each time point was then expressed as the percentage of exercise capacity ofcontrol mice without femoral artery occlusion.
While Balb/C mice with bilateral femoral artery occlusion were able to increasetheir exercise capacity during four weeks only to 48%, sv129 and C57/Bl6 miceshowed a recovery of 69% and 65%, respectively. Similar to the faster increase infoot blood flow, C57Bl/6 mice increased exercise capacity to 59% after two weeks.However, the recovery of exercise capacity did not even reach 70% in any of the
6. Discussion - 102 -
strains. Even though sv129 and C57Bl/6 mice recovered foot blood flow toapproximately 100%, the recovery of exercise capacity was markedly less.
Therefore, the results of the present study indicate that the recovery of collateral
dependent resting foot blood flow is only partially reflected by the recovery ofexercise capacity. Mice with the greatest recovery in blood flow (sv129 andC57Bl/6) demonstrate the greatest improvement in exercise capacity. However,their recovery in exercise capacity levels off at 68% to 65%, respectively, eventhough they entirely recover foot blood flow. Accordingly, mice with the smallestrecovery in foot blood flow (Balb/C) show the smallest recovery in exercisecapacity.
These observations give rise to several possible explanations. One explanationinvolves the significance of the resting foot blood flow measurements by LDI forskeletal muscle blood flow during exercise. Even though we observed in C57Bl/6a total recovery of collateral dependent foot blood flow, this does not necessarilymean that skeletal muscle blood flow during exercise had increased to the sameextend. Moreover, it is possible that skeletal muscle blood flow during exerciseremained decreased when compared to control animals without femoral arteryocclusion.
A study in rats performed by Yang et al. 177 points into this direction (see also
chapter 6.3.). In their study not even rats with femoral artery occlusion trainedfor up to eight weeks were able to recover skeletal muscle blood flow to a levelsimilar to control rats without occlusion of the femoral artery. The differencebecame especially apparent when the rats were running at high treadmill speeds.Trained rats with occlusion of the femoral artery showed only approximately 50%skeletal muscle blood flow during high-intensity exercise when compared tocontrol rats. The difference was less during low-intensity exercise. Thus, it ispossible that mice are capable to increase resting foot perfusion to 100% whileskeletal muscle blood flow during high-intensity exercise is significantlydecreased.
Therefore, future studies considering the relationship between the recovery ofblood flow and the recovery of exercise capacity are in need of the determinationof skeletal muscle blood flow during exercise. However, adaptation of themethods currently used for evaluation of blood flow will take some time andcertain technical difficulties will have to be overcome. It is, nevertheless, worthyto do so because this technique can be used for other studies (see also chapter6.3.).
6. Discussion - 103 -
Skeletal muscle blood flow measurements during exercise could provideinformation about a possible correlation of exercise capacity with skeletal muscleblood flow. It would be interesting to see if skeletal muscle blood flow duringexercise is in better agreement with exercise capacity than resting foot blood flowdetermined by LDI. An endurance exercise program is able to increase skeletalmuscle blood flow during exercise 177 and increases exercise capacity as well. If acorrelation could be established, the real importance of skeletal muscle blood flowfor exercise capacity could be uncovered.
One of the first observations of this study was the difference in the initial
exercise capacity between the three strains expressed in absolute numbers (workin Joule). Normal Balb/C mice display the highest absolute exercise capacityfollowed by sv129 mice. C57Bl/6 mice displayed an absolute exercise capacitythat was only slightly less than that of sv129 mice. This strain dependentdifference of absolute exercise capacity could not be explained by any of the abovementioned observations. These findings provide material for future studiesregarding anatomical and metabolic changes of mice of different strains leadingto increased absolute exercise capacity.
Similarly, the reason for the difference in the recovery of collateral dependentblood flow is not presently known. Postmortem angiographies performed in ourlaboratory have recently shown that Balb/C mice display the typical corkscrewgrowth pattern of collateral arteries. Angiographies from sv129 and C57Bl/6mice show a more diffuse picture of the developing collateral circulation. Theangiographic findings suggest that Balb/C mice have a limited ability to grow andrecruit more arteries for the blood supply of the hindlimb. It appears that theyhave to rely on the preexistent collateral arterioles and only the increase indiameter of these vessels provides the blood supply for the distal hindlimb. Thus,growth of a few collateral connections in size leads to angiographies with wellvisible collateral arteries in the typical corkscrew pattern. Especially C57Bl/6mice that have the capacity to grow numerous arteriolar connections displayrather diffuse angiographies without well visible collateral arteries in the typicalcorkscrew pattern.
These assumptions are in accordance with the recent angiographic findings of our
study investigating the effect of general overexpression FGF–2 and enduranceexercise (see also chapter 6.3.). Trained FGF–2 transgenic mice demonstratedthe best gastrocnemius and foot blood flow and displayed diffuse angiographies.Sedentary nontransgenic mice with the worst perfusion had well visible collateralarteries in the typical corkscrew growth pattern.
6. Discussion - 104 -
However, the significance of these observations remains unclear. Therefore,histological analysis of the hindlimb tissue has to reveal the precise differences incollateral growth pattern. Differential gene expression arrays could indicate keygenes responsible for the different recovery in collateral dependent blood flow.
In conclusion, our study provides evidence that different strains of mice with
femoral artery occlusion display a different recovery of collateral dependent footblood flow under resting conditions. This observation is reflected by a similarpattern of the recovery of exercise capacity, which does not reach the extent ofthe recovery in foot blood flow. C57Bl/6 mice demonstrate the best recovery offoot blood flow and exercise capacity. Compared to the other strains theyincrease foot blood flow and exercise capacity very rapidly. However, whileresting foot blood flow increases to 100%, exercise capacity remains below 70% ofcontrol mice without occlusion of the femoral artery. Foot blood flow of sv129mice was slightly less after four weeks when compared to C57Bl/6 mice. Exercisecapacity was very similar after four weeks. Again, resting foot blood flowrecovered to almost 100% but exercise capacity remained below 70%. Finally,Balb/C mice showed the worst recovery in foot blood flow (51%) as well as inexercise capacity (48%).
7. References - 105 -
7. References
1. Burgess WH, Maciag T. The heparin-binding (fibroblast) growth factor
family of proteins. Annual Review of Biochemistry. 1989;58:575-606.
2. Jaye M, Howk R, Burgess W, Ricca GA, Chiu IM, Ravera MW, O'Brien SJ,
Modi WS, Maciag T, Drohan WN. Human endothelial cell growth factor:
cloning, nucleotide sequence, and chromosome localization. Science.
1986;233:541-5.
3. Thomas KA. Fibroblast growth factors. FASEB Journal. 1987;1:434-40.
4. Bohlen P, Baird A, Esch F, Ling N, Gospodarowicz D. Isolation and partial
molecular characterization of pituitary fibroblast growth factor. Proceedings
of the National Academy of Sciences of the United States of America.
1984;81:5364-8.
5. Klagsbrun M, Smith S, Sullivan R, Shing Y, Davidson S, Smith JA, Sasse J.
Multiple forms of basic fibroblast growth factor: amino-terminal cleavages
by tumor cell- and brain cell-derived acid proteinases. Proceedings of the
National Academy of Sciences of the United States of America.
1987;84:1839–43.
6. Florkiewicz RZ, Sommer A. Human basic fibroblast growth factor gene
encodes four polypeptides: three initiate translation from non-AUG codons.
Proceedings of the National Academy of Sciences of the United States of
America. 1989;86:3978-81.
7. Eriksson AE, Cousens LS, Weaver LH, Matthews BW. Three-dimensional
structure of human basic fibroblast growth factor. Proceedings of the
National Academy of Sciences of the United States of America.
1991;88:3441–5.
7. References - 106 -
8. Feige JJ, Baird A. Basic fibroblast growth factor is a substrate for protein
phosphorylation and is phosphorylated by capillary endothelial cells in
culture. Proceedings of the National Academy of Sciences of the United
States of America. 1989;86:3174-8.
9. Quarto N, Finger FP, Rifkin DB. The NH2-terminal extension of high
molecular weight bFGF is a nuclear targeting signal. Journal of Cellular
Physiology. 1991;147:311-8.
10. Burgess WH, Bizik J, Mehlman T, Quarto N, Rifkin DB. Direct evidence for
methylation of arginine residues in high molecular weight forms of basic
fibroblast growth factor. Cell Regulation. 1991;2:87-93.
11. Klint P, Claesson-Welsh L. Signal transduction by fibroblast growth factor
receptors. Frontiers in Bioscience. 1999;4:D165-77.
12. Zhan X, Hu X, Friesel R, Maciag T. Long term growth factor exposure and
differential tyrosine phosphorylation are required for DNA synthesis in
BALB/c 3T3 cells. Journal of Biological Chemistry. 1993;268:9611-20.
13. Wiedlocha A, Falnes PO, Madshus IH, Sandvig K, Olsnes S. Dual mode of
signal transduction by externally added acidic fibroblast growth factor. Cell.
1994;76:1039-51.
14. Klagsbrun M, D'Amore PA. Regulators of angiogenesis. Annual Review of
Physiology. 1991;53:217-39.
15. Goto F, Goto K, Weindel K, Folkman J. Synergistic effects of vascular
endothelial growth factor and basic fibroblast growth factor on the
proliferation and cord formation of bovine capillary endothelial cells within
collagen gels. Laboratory Investigation. 1993;69:508-17.
7. References - 107 -
16. Asahara T, Bauters C, Zheng LP, Takeshita S, Bunting S, Ferrara N, Symes
JF, Isner JM. Synergistic effect of vascular endothelial growth factor and
basic fibroblast growth factor on angiogenesis in vivo. Circulation.
1995;92:II365-71.
17. Baird A, Esch F, Mormede P, Ueno N, Ling N, Bohlen P, Ying SY,
Wehrenberg WB, Guillemin R. Molecular characterization of fibroblast
growth factor: distribution and biological activities in various tissues. Recent
Progress in Hormone Research. 1986;42:143-205.
18. Ortega S, Schaeffer MT, Soderman D, DiSalvo J, Linemeyer DL, Gimenez-
Gallego G, Thomas KA. Conversion of cysteine to serine residues alters the
activity, stability, and heparin dependence of acidic fibroblast growth factor.
Journal of Biological Chemistry. 1991;266:5842-6.
19. Abraham JA, Mergia A, Whang JL, Tumolo A, Friedman J, Hjerrild KA,
Gospodarowicz D, Fiddes JC. Nucleotide sequence of a bovine clone encoding
the angiogenic protein, basic fibroblast growth factor. Science .
1986;233:545–8.
20. Sasaki H, Hoshi H, Hong YM, Suzuki T, Kato T, Saito M, Youki H, Karube
K, Konno S. Purification of acidic fibroblast growth factor from bovine heart
and its localization in the cardiac myocytes. Journal of Biological Chemistry.
1989;264:17606-12.
21. Spirito P, Fu YM, Yu ZX, Epstein SE, Casscells W. Immunohistochemical
localization of basic and acidic fibroblast growth factors in the developing
rat heart. Circulation. 1991;84:322-32.
22. Mima T, Ueno H, Fischman DA, Williams LT, Mikawa T. Fibroblast growth
factor receptor is required for in vivo cardiac myocyte proliferation at early
embryonic stages of heart development. Proceedings of the National
Academy of Sciences of the United States of America. 1995;92:467-71.
7. References - 108 -
23. Bernotat-Danielowski S, Sharma HS, Schott RJ, Schaper W. Generation
and localisation of monoclonal antibodies against fibroblast growth factors
in ischaemic collateralised porcine myocardium. Cardiovascular Research.
1993;27:1220-8.
24. Schaper W, Ito W. Molecular mechanisms of coronary collateral vessel
growth. Circ Res. 1996;79:911-919.
25. Warren RS, Yuan H, Matli MR, Gillett NA, Ferrara N. Regulation by
vascular endothelial growth factor of human colon cancer tumorigenesis in a
mouse model of experimental liver metastasis. Journal of Clinical
Investigation. 1995;95:1789-97.
26. Banai S, Jaklitsch MT, Casscells W, Shou M, Shrivastav S, Correa R,
Epstein SE, Unger EF. Effects of acidic fibroblast growth factor on normal
and ischemic myocardium. Circulation Research. 1991;69:76-85.
27. Lopez JJ, Edelman ER, Stamler A, Hibberd MG, Prasad P, Thomas KA,
DiSalvo J, Caputo RP, Carrozza JP, Douglas PS, Sellke FW, Simons M.
Angiogenic potential of perivascularly delivered aFGF in a porcine model of
chronic myocardial ischemia. American Journal of Physiology.
1998;274:H930-6.
28. Battler A, Scheinowitz M, Bor A, Hasdai D, Vered Z, Di Segni E, Varda-
Bloom N, Nass D, Engelberg S, Eldar M. Intracoronary injection of basic
fibroblast growth factor enhances angiogenesis in infarcted swine
myocardium. Journal of the American College of Cardiology. 1993;22:2001-6.
29. Harada K, Grossman W, Friedman M, Edelman ER, Prasad PV, Keighley
CS, Manning WJ, Sellke FW, Simons M. Basic fibroblast growth factor
improves myocardial function in chronically ischemic porcine hearts.
Journal of Clinical Investigation. 1994;94:623-30.
7. References - 109 -
30. Unger EF, Banai S, Shou M, Lazarous DF, Jaklitsch MT, Scheinowitz M,
Correa R, Klingbeil C, Epstein SE. Basic fibroblast growth factor enhances
myocardial collateral flow in a canine model. American Journal of
Physiology. 1994;266:H1588-95.
31. Lazarous DF, Scheinowitz M, Shou M, Hodge E, Rajanayagam S,
Hunsberger S, Robison WG, Jr., Stiber JA, Correa R, Epstein SE. Effects of
chronic systemic administration of basic fibroblast growth factor on
collateral development in the canine heart. Circulation. 1995;91:145-53.
32. Pu LQ, Sniderman AD, Brassard R, Lachapelle KJ, Graham AM, Lisbona R,
Symes JF. Enhanced revascularization of the ischemic limb by angiogenic
therapy. Circulation. 1993;88:208-15.
33. Tabata H, Silver M, Isner JM. Arterial gene transfer of acidic fibroblast
growth factor for therapeutic angiogenesis in vivo: critical role of secretion
signal in use of naked DNA. Cardiovascular Research. 1997;35:470-9.
34. Folkman J. Angiogenesis in cancer, vascular, rheumatoid and other disease.
Nature Medicine. 1995;1:27-31.
35. Price RJ, Skalak TC. Arteriolar remodeling in skeletal muscle of rats
exposed to chronic hypoxia. Journal of Vascular Research. 1998;35:238-44.
36. Schaper W, Flameng W, Wüsten B, Palmowski J. The distribution of
coronary and of coronary collateral flow in normal hearts and after chronic
coronary occlusion. In: Bloor CM, Olsson RA, eds. Current Topics in
Coronary Research. New York, London: Plenum Publishing Corporation;
1973: 151-160.
7. References - 110 -
37. Schaper W, Flameng W, Winkler B, Wuesten B, Türschmann W,
Neugebauer G, Carl M, Pasyk S. Quantification of collateral resistance in
acute and chronic experimental coronary occlusion in the dog. Circ Res.
1976;39:371-377.
38. Schaper W. Collateral circulation. V. Mechanisms of collateral enlargement.
In: Schaper W, eds. The Pathophysiology of Myocardial Perfusion.
Amsterdam, New York, Oxford: Elsevier/North-Holland Biomedical Press;
1979: 458-470.
39. Scholz D, Ito W, Fleming I, Deindl E, Sauer A, Wiesnet M, Busse R, Schaper
J, Schaper W. Ultrastructure and molecular histology of rabbit hind-limb
collateral artery growth (arteriogenesis). Virchows Arch. 2000;436:257-270.
40. Arras M, Ito WD, Scholz D, Winkler B, Schaper J, Schaper W. Monocyte
activation in angiogenesis and collateral growth in the rabbit hindlimb. J
Clin Invest. 1998;101:41-50.
41. Deindl E, Ito W, Zimmermann R, Schaper W In J Mol Med; 1997;pp 13
(abstr).
42. Xin X, Johnson AD, Scott-Burden T, Engler D, Casscells W. The
predominant form of fibroblast growth factor receptor expressed by
proliferating human arterial smooth muscle cells in culture is type I.
Biochemical & Biophysical Research Communications. 1994;204:557-64.
43. Schaper W, Bernotat-Danielowski S, Nienaber C, Schaper J. Collateral
circulation. In: Fozzard H, Haber E, Jennings R, Katz A, Morgan H, eds.
The Heart and Cardiovascular System. New York: Raven Press; 1992:
1427–1464.
7. References - 111 -
44. Wolf C, Cai WJ, Vosschulte R, Koltai S, Mousavipour D, Scholz D, Afsah-
Hedjri A, Schaper W, Schaper J. Vascular remodeling and altered protein
expression during growth of coronary collateral arteries. J Mol Cell Cardiol.
1998;30:2291-2305.
45. Patan S. TIE1 and TIE2 receptor tyrosine kinases inversely regulate
embryonic angiogenesis by the mechanism of intussusceptive microvascular
growth. Microvascular Research. 1998;56:1-21.
46. Betsholtz C, Raines EW. Platelet-derived growth factor: a key regulator of
connective tissue cells in embryogenesis and pathogenesis. Kidney
International. 1997;51:1361-9.
47. Tomanek RJ, Haung L, Suvarna PR, O'Brien LC, Ratajska A, Sandra A.
Coronary vascularization during development in the rat and its relationship
to basic fibroblast growth factor. Cardiovascular Research. 1996;31:E116-26.
48. Fernandez B, Buehler A, Wolfram S, Kostin S, Espanion G, Frank WM,
Niemann H, Doevendans PA, Schaper W, Zimmermann R. Transgenic
myocardial overexpression of fibroblast growth factor-1 increases coronary
artery density and branching. Circ Res. 2000;87:207-213.
49. Murry CE, Jennings RB, Reimer KA. Preconditioning with ischemia: a delay
of lethal cell injury in ischemic myocardium. Circulation. 1986;74:1124-36.
50. Yellon DM, Baxter GF, Garcia-Dorado D, Heusch G, Sumeray MS.
Ischaemic preconditioning: present position and future directions.
Cardiovascular Research. 1998;37:21-33.
51. Downey JM, Cohen MV. Signal transduction in ischemic preconditioning.
Zeitschrift fur Kardiologie. 1995;84:77-86.
7. References - 112 -
52. Ytrehus K, Liu Y, Downey JM. Preconditioning protects ischemic rabbit
heart by protein kinase C activation. American Journal of Physiology.
1994;266:H1145-52.
53. Kitakaze M, Node K, Minamino T, Komamura K, Funaya H, Shinozaki Y,
Chujo M, Mori H, Inoue M, Hori M, Kamada T. Role of activation of protein
kinase C in the infarct size-limiting effect of ischemic preconditioning
through activation of ecto-5'-nucleotidase. Circulation. 1996;93:781-91.
54. Baines CP, Wang L, Cohen MV, Downey JM. Protein tyrosine kinase is
downstream of protein kinase C for ischemic preconditioning's anti-infarct
effect in the rabbit heart. Journal of Molecular & Cellular Cardiology.
1998;30:383-92.
55. Sellke FW, Wang SY, Stamler A, Lopez JJ, Li J, Simons M. Enhanced
microvascular relaxations to VEGF and bFGF in chronically ischemic
porcine myocardium. American Journal of Physiology. 1996;271:H713-20.
56. Schaper W, Zimmermann R, Kluge A, Andres J, Sharma HS, Frass O, Knöll
R, Winkler B, Verdouw P. Patterns of myocardial gene expression after
cycles of brief coronary occlusion and reperfusion. Ann NY Acad Sci.
1994;723:284-291.
57. Cuevas P, Carceller F, Gimenez-Gallego G. Acidic fibroblast growth factor
prevents post-axotomy neuronal death of the newborn rat facial nerve.
Neuroscience Letters. 1995;197:183-6.
58. Fu X, Cuevas P, Gimenez-Gallego G, Sheng Z, Tian H. Acidic fibroblast
growth factor reduces rat skeletal muscle damage caused by ischemia and
reperfusion. Chinese Medical Journal. 1995;108:209-14.
7. References - 113 -
59. Htun P, Ito WD, Hoefer IE, Schaper J, Schaper W. Intramyocardial infusion
of FGF-1 mimics ischemic preconditioning in pig myocardium. J Mol Cell
Cardiol. 1998;30:867-877.
60. Cuevas P, Carceller F, Ortega S, Zazo M, Nieto I, Gimenez-Gallego G.
Hypotensive activity of fibroblast growth factor. Science. 1991;254:1208-10.
61. Bellot F, Crumley G, Kaplow JM, Schlessinger J, Jaye M, Dionne CA.
Ligand-induced transphosphorylation between different FGF receptors.
EMBO Journal. 1991;10:2849-54.
62. Quinkler W, Maasberg M, Bernotat-Danielowski S, Luthe N, Sharma HS,
Schaper W. Isolation of heparin-binding growth factors from bovine, porcine
and canine hearts. European Journal of Biochemistry. 1989;181:67-73.
63. Casscells W, Speir E, Sasse J, Klagsbrun M, Allen P, Lee M, Calvo B, Chiba
M, Haggroth L, Folkman J. Isolation, characterization, and localization of
heparin-binding growth factors in the heart. Journal of Clinical
Investigation. 1990;85:433-41.
64. Bühler A, Fernandez B, Bronsaer RJP, Doevendans PA, Schaper W,
Zimmermann R In J Mol Cell Cardiol; 1999;pp Th12 (abstr).
65. Maulik N, Watanabe M, Zu YL, Huang CK, Cordis GA, Schley JA, Das DK.
Ischemic preconditioning triggers the activation of MAP kinases and
MAPKAP kinase 2 in rat hearts. FEBS Letters. 1996;396:233-7.
66. Rollins BJ, Morrison ED, Stiles CD. Cloning and expression of JE, a gene
inducible by platelet-derived growth factor and whose product has cytokine-
like properties. Proceedings of the National Academy of Sciences of the
United States of America. 1988;85:3738-42.
7. References - 114 -
67. Zhang YJ, Rutledge BJ, Rollins BJ. Structure/activity analysis of human
monocyte chemoattractant protein-1 (MCP-1) by mutagenesis. Identification
of a mutated protein that inhibits MCP-1-mediated monocyte chemotaxis.
Journal of Biological Chemistry. 1994;269:15918-24.
68. Rollins BJ. Monocyte chemoattractant protein 1: a potential regulator of
monocyte recruitment in inflammatory disease. Molecular Medicine Today.
1996;2:198-204.
69. Paolini JF, Willard D, Consler T, Luther M, Krangel MS. The chemokines
IL-8, monocyte chemoattractant protein-1, and I-309 are monomers at
physiologically relevant concentrations. Journal of Immunology.
1994;153:2704-17.
70. Zhang Y, Rollins BJ. A dominant negative inhibitor indicates that monocyte
chemoattractant protein 1 functions as a dimer. Molecular & Cellular
Biology. 1995;15:4851-5.
71. Reape TJ, Groot PH. Chemokines and atherosclerosis. Atherosclerosis.
1999;147:213-25.
72. Erl W, Weber PC, Weber C. Monocytic cell adhesion to endothelial cells
stimulated by oxidized low density lipoprotein is mediated by distinct
endothelial ligands. Atherosclerosis. 1998;136:297-303.
73. Cushing SD, Berliner JA, Valente AJ, Territo MC, Navab M, Parhami F,
Gerrity R, Schwartz CJ, Fogelman AM. Minimally modified low density
lipoprotein induces monocyte chemotactic protein 1 in human endothelial
cells and smooth muscle cells. Proceedings of the National Academy of
Sciences of the United States of America. 1990;87:5134-8.
7. References - 115 -
74. Takahara N, Kashiwagi A, Maegawa H, Shigeta Y. Lysophosphatidylcholine
stimulates the expression and production of MCP-1 by human vascular
endothelial cells. Metabolism: Clinical & Experimental. 1996;45:559-64.
75. Klouche M, May AE, Hemmes M, Messner M, Kanse SM, Preissner KT,
Bhakdi S. Enzymatically modified, nonoxidized LDL induces selective
adhesion and transmigration of monocytes and T-lymphocytes through
human endothelial cell monolayers. Arteriosclerosis, Thrombosis & Vascular
Biology. 1999;19:784-93.
76. Nagel T, Resnick N, Atkinson WJ, Dewey CF, Jr., Gimbrone MA, Jr. Shear
stress selectively upregulates intercellular adhesion molecule-1 expression
in cultured human vascular endothelial cells. Journal of Clinical
Investigation. 1994;94:885-91.
77. Shyy YJ, Hsieh HJ, Usami S, Chien S. Fluid shear stress induces a biphasic
response of human monocyte chemotactic protein 1 gene expression in
vascular endothelium. Proceedings of the National Academy of Sciences of
the United States of America. 1994;91:4678-82.
78. Nelken NA, Coughlin SR, Gordon D, Wilcox JN. Monocyte chemoattractant
protein-1 in human atheromatous plaques. Journal of Clinical Investigation.
1991;88:1121-7.
79. Takeya M, Yoshimura T, Leonard EJ, Takahashi K. Detection of monocyte
chemoattractant protein-1 in human atherosclerotic lesions by an anti-
monocyte chemoattractant protein-1 monoclonal antibody. Human
Pathology. 1993;24:534-9.
80. Gerszten RE, Garcia-Zepeda EA, Lim YC, Yoshida M, Ding HA, Gimbrone
MA, Jr., Luster AD, Luscinskas FW, Rosenzweig A. MCP-1 and IL-8 trigger
firm adhesion of monocytes to vascular endothelium under flow conditions.
Nature. 1999;398:718-23.
7. References - 116 -
81. Han KH, Tangirala RK, Green SR, Quehenberger O. Chemokine receptor
CCR2 expression and monocyte chemoattractant protein-1-mediated
chemotaxis in human monocytes. A regulatory role for plasma LDL.
Arteriosclerosis, Thrombosis & Vascular Biology. 1998;18:1983-91.
82. Ross R. The pathogenesis of atherosclerosis: a perspective for the 1990s.
Nature. 1993;362:801-9.
83. Hansson GK. Cell-mediated immunity in atherosclerosis. Current Opinion
in Lipidology. 1997;8:301-11.
84. Taub DD, Proost P, Murphy WJ, Anver M, Longo DL, van Damme J,
Oppenheim JJ. Monocyte chemotactic protein-1 (MCP-1), -2, and -3 are
chemotactic for human T lymphocytes. Journal of Clinical Investigation.
1995;95:1370-6.
85. Taubman MB, Rollins BJ, Poon M, Marmur J, Green RS, Berk BC, Nadal-
Ginard B. JE mRNA accumulates rapidly in aortic injury and in platelet-
derived growth factor-stimulated vascular smooth muscle cells. Circulation
Research. 1992;70:314-25.
86. Chen XL, Tummala PE, Olbrych MT, Alexander RW, Medford RM.
Angiotensin II induces monocyte chemoattractant protein-1 gene expression
in rat vascular smooth muscle cells. Circulation Research. 1998;83:952-9.
87. Boring L, Gosling J, Cleary M, Charo IF. Decreased lesion formation in
CCR2-/- mice reveals a role for chemokines in the initiation of
atherosclerosis. Nature. 1998;394:894-7.
88. Gu L, Okada Y, Clinton SK, Gerard C, Sukhova GK, Libby P, Rollins BJ.
Absence of monocyte chemoattractant protein-1 reduces atherosclerosis in
low density lipoprotein receptor-deficient mice. Molecular Cell.
1998;2:275–81.
7. References - 117 -
89. Aiello RJ, Bourassa PA, Lindsey S, Weng W, Natoli E, Rollins BJ, Milos PM.
Monocyte chemoattractant protein-1 accelerates atherosclerosis in
apolipoprotein E-deficient mice. Arteriosclerosis, Thrombosis & Vascular
Biology. 1999;19:1518-25.
90. Aukrust P, Ueland T, Muller F, Andreassen AK, Nordoy I, Aas H, Kjekshus
J, Simonsen S, Froland SS, Gullestad L. Elevated circulating levels of C-C
chemokines in patients with congestive heart failure. Circulation.
1998;97:1136-43.
91. Shioi T, Matsumori A, Kihara Y, Inoko M, Ono K, Iwanaga Y, Yamada T,
Iwasaki A, Matsushima K, Sasayama S. Increased expression of
interleukin-1 beta and monocyte chemotactic and activating factor/monocyte
chemoattractant protein-1 in the hypertrophied and failing heart with
pressure overload. Circulation Research. 1997;81:664-71.
92. Behr TM, Wang X, Aiyar N, Coatney RW, Li X, Koster P, Angermann CE,
Ohlstein E, Feuerstein GZ, Winaver J. Monocyte chemoattractant protein-1
is upregulated in rats with volume-overload congestive heart failure.
Circulation. 2000;102:1315-22.
93. Koyanagi M, Egashira K, Kitamoto S, Ni W, Shimokawa H, Takeya M,
Yoshimura T, Takeshita A. Role of monocyte chemoattractant protein-1 in
cardiovascular remodeling induced by chronic blockade of nitric oxide
synthesis. Circulation. 2000;102:2243-8.
94. Kolattukudy PE, Quach T, Bergese S, Breckenridge S, Hensley J, Altschuld
R, Gordillo G, Klenotic S, Orosz C, Parker-Thornburg J. Myocarditis
induced by targeted expression of the MCP-1 gene in murine cardiac muscle.
American Journal of Pathology. 1998;152:101-11.
7. References - 118 -
95. Vanotti A, Magiday M. Untersuchungen zum Studium des Trainiertsein V.
Über die Capillarisierung der trainierten Muskulaturen. Arbeitsphysiologie.
1934;7:615-622.
96. Skinner JS, Strandness DE. Exercise and intermittent claudication.II.
Effect of physical training. Circulation. 1967;36:23-9.
97. Sanne H, Sivertsson R. The effect of exercise on the development of
collateral circulation after experimental occlusion of the femoral artery in
the cat. Acta Physiologica Scandinavica. 1968;73:257-63.
98. Alpert JS, Larsen OA, Lassen NA. Exercise and intermittent claudication.
Blood flow in the calf muscle during walking studied by the xenon-133
clearance method. Circulation. 1969;39:353-9.
99. Schaper W, DeBrabander M, Lewi P. DNA-synthesis and mitoses in
coronary collateral vessels of the dog. Circ Res. 1971;28:671-679.
100. Booth FW, Thomason DB. Molecular and cellular adaptation of muscle in
response to exercise: perspectives of various models. Physiological Reviews.
1991;71:541-85.
101. Hudlicka O, Brown M, Egginton S. Angiogenesis in skeletal and cardiac
muscle. Physiological Reviews. 1992;72:369-417.
102. Brown MD, Cotter MA, Hudlicka O, Vrbova G. The effects of different
patterns of muscle activity on capillary density, mechanical properties and
structure of slow and fast rabbit muscles. Pflugers Archiv - European
Journal of Physiology. 1976;361:241-50.
103. Suzuki J, Kobayashi T, Uruma T, Koyama T. Time-course changes in
arteriolar and venular portions of capillary in young treadmill-trained rats.
Acta Physiologica Scandinavica. 2001;171:77-86.
7. References - 119 -
104. Serrano AL, Quiroz-Rothe E, Rivero JL. Early and long-term changes of
equine skeletal muscle in response to endurance training and detraining.
Pflugers Archiv - European Journal of Physiology. 2000;441:263-74.
105. Mustonen T, Alitalo K. ENDOTHELIAL RECEPTOR TYROSINE KINASES
INVOLVED IN ANGIOGENESIS [Review]. Journal of Cell Biology.
1995;129:895-898.
106. Hanahan D. Signaling vascular morphogenesis and maintenance. Science.
1997;277:48-50.
107. Neufeld G, Cohen T, Gengrinovitch S, Poltorak Z. Vascular endothelial
growth factor (VEGF) and its receptors. FASEB Journal. 1999;13:9-22.
108. Hang J, Kong L, Gu JW, Adair TH. Vegf Gene Expression Is Upregulated in
Electrically Stimulated Rat Skeletal Muscle. American Journal of
Physiology - Heart & Circulatory Physiology. 1995;38:H1827-H1831.
109. Breen EC, Johnson EC, Wagner H, Tseng HM, Sung LA, Wagner PD.
Angiogenic Growth Factor mRNA Responses in Muscle to a Single Bout of
Exercise. Journal of Applied Physiology. 1996;81:355-361.
110. Richardson RS, Wagner H, Mudaliar SRD, Henry R, Noyszewski EA,
Wagner PD. Human VEGF gene expression in skeletal muscle: effect of
acute normoxic and hypoxic exercise. American Journal of Physiology Heart
& Circulatory Physiology. 1999;277:H2247-H2252.
111. Gustafsson T, Puntschart A, Kaijser L, Jansson E, Sundberg CJ. Exercise-
induced expression of angiogenesis-related transcription and growth factors
in human skeletal muscle. American Journal of Physiology - Heart &
Circulatory Physiology. 1999;45:H679-H685.
7. References - 120 -
112. Minchenko A, Salceda S, Bauer T, Caro J. Hypoxia regulatory elements of
the human vascular endothelial growth factor gene. Cellular & Molecular
Biology Research. 1994;40:35-9.
113. Minchenko A, Bauer T, Salceda S, Caro J. Hypoxic stimulation of vascular
endothelial growth factor expression in vitro and in vivo. Laboratory
Investigation. 1994;71:374-9.
114. Forsythe JA, Jiang BH, Iyer NV, Agani F, Leung SW, Koos RD, Semenza
GL. Activation of vascular endothelial growth factor gene transcription by
hypoxia-inducible factor 1. Mol Cell Biol. 1996;16:4604-13.
115. Olfert IM, Breen EC, Mathieu-Costello O, Wagner PD. Chronic hypoxia
attenuates resting and exercise-induced VEGF, fit-1, and flk-1 mRNA levels
in skeletal muscle. Journal of Applied Physiology. 2001;90:1532-1538.
116. Richardson RS, Wagner H, Mudaliar SRD, Saucedo E, Henry R, Wagner
PD. Exercise adaptation attenuates VEGF gene expression in human
skeletal muscle. American Journal of Physiology Heart & Circulatory
Physiology. 2000;279:H772-H778.
117. Gavin TP, Wagner PD. Effect of short-term exercise training on angiogenic
growth factor gene responses in rats. Journal of Applied Physiology.
2001;90:1219-1226.
118. Gustafsson T, Bodin K, Sylven C, Gordon A, Tyni-Lenne R, Jansson E.
Increased expression of VEGF following exercise training in patients with
heart failure. European Journal of Clinical Investigation. 2001;31:362-366.
7. References - 121 -
119. Duscha BD, Kraus WE, Keteyian SJ, Sullivan MJ, Green HJ, Schachat FH,
Pippen AM, Brawner CA, Blank JM, Annex BH. Capillary density of
skeletal muscle - A contributing mechanism for exercise intolerance in class
II-III chronic heart failure independent of other peripheral alterations.
Journal of the American College of Cardiology. 1999;33:1956-1963.
120. Chin K, Kurashima Y, Ogura T, Tajiri H, Yoshida S, Esumi H. Induction of
Vascular Endothelial Growth Factor By Nitric Oxide in Human
Glioblastoma and Hepatocellular Carcinoma Cells. O n c o g e n e .
1997;15:437–442.
121. Ziche M, Morbidelli L, Choudhuri R, Zhang HT, Donnini S, Granger HJ,
Bicknell R. Nitric oxide synthase lies downstream from vascular endothelial
growth factor-induced but not basic fibroblast growth factor-induced
angiogenesis. Journal of Clinical Investigation. 1997;99:2625-34.
122. Benoit H, Jordan M, Wagner H, Wagner PD. Effect of NO, vasodilator
prostaglandins, and adenosine on skeletal muscle angiogenic growth factor
gene expression. Journal of Applied Physiology. 1999;86:1513-1518.
123. Gavin TP, Spector DA, Wagner H, Breen EC, Wagner PD. Nitric oxide
synthase inhibition attenuates the skeletal muscle VEGF mRNA response
to exercise. Journal of Applied Physiology. 2000;88:1192-8.
124. Powers CJ, McLeskey SW, Wellstein A. Fibroblast growth factors, their
receptors and signaling. Endocrine-Related Cancer. 2000;7:165-97.
125. Szebenyi G, Fallon JF. Fibroblast growth factors as multifunctional
signaling factors. International Review of Cytology. 1999;185:45-106.
126. Galzie Z, Kinsella AR, Smith JA. Fibroblast growth factors and their
receptors. Biochemistry & Cell Biology. 1997;75:669-85.
7. References - 122 -
127. Safi J, Jr., DiPaula AF, Jr., Riccioni T, Kajstura J, Ambrosio G, Becker LC,
Anversa P, Capogrossi MC. Adenovirus-mediated acidic fibroblast growth
factor gene transfer induces angiogenesis in the nonischemic rabbit heart.
Microvascular Research. 1999;58:238-49.
128. Klein S, Roghani M, Rifkin DB. Fibroblast growth factors as angiogenesis
factors: new insights into their mechanism of action. Exs. 1997;79:159-92.
129. Dusterhoft S, Putman CT, Pette D. Changes in FGF and FGF receptor
expression in low-frequency-stimulated rat muscles and rat satellite cell
cultures. Differentiation. 1999;65:203-208.
130. Morrow NG, Kraus WE, Moore JW, Williams RS, Swain JL. Increased
expression of fibroblast growth factors in a rabbit skeletal muscle model of
exercise conditioning. Journal of Clinical Investigation. 1990;85:1816-20.
131. Deschenes MR, Ogilvie RW. Exercise stimulates neovascularization in
occluded muscle without affecting bFGF content. Medicine & Science in
Sports & Exercise. 1999;31:1599-604.
132. Egginton S, Hudlicka O, Brown MD, Walter H, Weiss JB, Bate A. Capillary
growth in relation to blood flow and performance in overloaded rat skeletal
muscle. Journal of Applied Physiology. 1998;85:2025-2032.
133. Clarke MS, Caldwell RW, Chiao H, Miyake K, McNeil PL. Contraction-
induced cell wounding and release of fibroblast growth factor in heart.
Circulation Research. 1995;76:927-34.
134. Clarke MS, Feeback DL. Mechanical load induces sarcoplasmic wounding
and FGF release in differentiated human skeletal muscle cultures. FASEB
Journal. 1996;10:502-9.
135. Friesel RE, Maciag T. Molecular mechanisms of angiogenesis: fibroblast
growth factor signal transduction. FASEB Journal. 1995;9:919-25.
7. References - 123 -
136. Kaye D, Pimental D, Prasad S, Maki T, Berger HJ, McNeil PL, Smith TW,
Kelly RA. Role of transiently altered sarcolemmal membrane permeability
and basic fibroblast growth factor release in the hypertrophic response of
adult rat ventricular myocytes to increased mechanical activity in vitro.
Journal of Clinical Investigation. 1996;97:281-91.
137. McNeil PL, Muthukrishnan WE, D'Amore PA. Growth factors are released
by mechanically wounded endothelial cells. J Cell Biol. 1989;109:811-821.
138. Jackson A, Tarantini F, Gamble S, Friedman S, Maciag T. The Release of
Fibroblast Growth Factor-1 From Nih 3t3 Cells in Response to Temperature
Involves the Function of Cysteine Residues. Journal of Biological
Chemistry. 1995;270:33-36.
139. Carreira CM, Landriscina M, Bellum S, Prudovsky I, Maciag T. The
comparative release of FGF1 by hypoxia and temperature stress. Growth
Factors. 2001;18:277-285.
140. Shin JT, Opalenik SR, Wehby JN, Mahesh VK, Jackson A, Tarantini F,
Maciag T, Thompson JA. Serum-Starvation Induces the Extracellular
Appearance of Fgf-1. Biochimica et Biophysica Acta - Molecular Cell
Research. 1996;1312:27-38.
141. Tarantini F, Lavallee T, Jackson A, Gamble S, Carreira CM, Garfinkel S,
Burgess WH, Maciag T. The Extravesicular Domain of Synaptotagmin-1 Is
Released With the Latent Fibroblast Growth Factor-1 Homodimer in
Response to Neat Shock. Journal of Biological Chemistry.
1998;273:22209–22216.
142. Lavallee TM, Tarantini F, Gamble S, Carreira CM, Jackson A, Maciag T.
Synaptotagmin-1 Is Required For Fibroblast Growth Factor-1 Release.
Journal of Biological Chemistry. 1998;273:22217-22223.
7. References - 124 -
143. Carreira CM, Lavallee TM, Tarantini F, Jackson A, Lathrop JT, Hampton
B, Burgess WH, Maciag T. S100a13 Is Involved in the Regulation of
Fibroblast Growth Factor-1 and P40 Synaptotagmin-1 Release in Vitro.
Journal of Biological Chemistry. 1998;273:22224-22231.
144. Tarantini F, Micucci I, Bellum S, Landriscina M, Garfinkel S, Prudovsky I,
Maciag T. The precursor but not the mature form of IL1 alpha blocks the
release of FGF1 in response to heat shock. Journal of Biological Chemistry.
2001;276:5147-5151.
145. Landriscina M, Prudovsky I, Carreira CM, Soldi R, Tarantini F, Maciag T.
Amlexanox reversibly inhibits cell migration and proliferation and induces
the Src-dependent disassembly of actin stress fibers in vitro. Journal of
Biological Chemistry. 2000;275:32753-32762.
146. Landriscina M, Soldi R, Bagala C, Micucci I, Bellum S, Tarantini F,
Prudovsky I, Maciag T. S100A13 participates in the release of fibroblast
growth factor 1 in response to heat shock in vitro. Journal of Biological
Chemistry. 2001;276:22544-22552.
147. Landriscina M, Bagala C, Mandinova A, Soldi R, Micucci I, Bellum S,
Prudovsky I, Maciag T. Copper induces the assembly of a multiprotein
aggregate implicated in the release of fibroblast growth factor 1 in response
to stress. Journal of Biological Chemistry. 2001;276:25549-25557.
148. Risau W. Mechanisms of angiogenesis. Nature. 1997;386:671-4.
149. Dickson MC, Martin JS, Cousins FM, Kulkarni AB, Karlsson S, Akhurst RJ.
Defective haematopoiesis and vasculogenesis in transforming growth factor-
beta 1 knock out mice. Development. 1995;121:1845-54.
7. References - 125 -
150. Martin JS, Dickson MC, Cousins FM, Kulkarni AB, Karlsson S, Akhurst RJ.
Analysis of homozygous TGF beta 1 null mouse embryos demonstrates
defects in yolk sac vasculogenesis and hematopoiesis. Annals of the New
York Academy of Sciences. 1995;752:300-8.
151. Lum RM, Wiley LM, Barakat AI. Influence of different forms of fluid shear
stress on vascular endothelial TGF-beta1 mRNA expression. International
Journal of Molecular Medicine. 2000;5:635-41.
152. Song RH, Kocharyan HK, Fortunato JE, Glagov S, Bassiouny HS. Increased
flow and shear stress enhance in vivo transforming growth factor-beta1
after experimental arterial injury. Arteriosclerosis, Thrombosis & Vascular
Biology. 2000;20:923-30.
153. Khachigian LM, Anderson KR, Halnon NJ, Gimbrone MA, Jr., Resnick N,
Collins T. Egr-1 is activated in endothelial cells exposed to fluid shear stress
and interacts with a novel shear-stress-response element in the PDGF A-
chain promoter. Arteriosclerosis, Thrombosis & Vascular Biology.
1997;17:2280-6.
154. Khachigian LM, Resnick N, Gimbrone MA, Jr., Collins T. Nuclear factor-
kappa B interacts functionally with the platelet-derived growth factor B-
chain shear-stress response element in vascular endothelial cells exposed to
fluid shear stress. Journal of Clinical Investigation. 1995;96:1169-75.
155. Resnick N, Collins T, Atkinson W, Bonthron DT, Dewey CF, Jr., Gimbron
MA, Jr. Platelet-derived growth factor B chain promoter contains a cis-
acting fluid shear-stress-responsive element. Proceedings of the National
Academy of Sciences of the United States of America. 1993;90:7908.
156. Leveen P, Pekny M, Gebre-Medhin S, Swolin B, Larsson E, Betsholtz C.
Mice deficient for PDGF B show renal, cardiovascular, and hematological
abnormalities. Genes & Development. 1994;8:1875-87.
7. References - 126 -
157. McLaughlin B, Weiss JB. Endothelial-Cell-Stimulating Angiogenesis Factor
(Esaf) Activates Progelatinase a (72 Kda Type Iv Collagenase),
Prostromelysin 1 and Procollagenase and Reactivates Their Complexes With
Tissue Inhibitors of Metalloproteinases - a Role For Esaf in Non-
Inflammatory Angiogenesis. Biochemical Journal. 1996;317:739-745.
158. Weiss JB, McLaughlin B. Endothelial Cell Stimulating Angiogenesis Factor.
International Journal of Biochemistry & Cell Biology. 1998;30:423-427.
159. Brown MD, Hudlicka O, Makki RF, Weiss JB. Low-Molecular-Mass
Endothelial Cell-Stimulating Angiogenic Factor in Relation to Capillary
Growth Induced in Rat Skeletal Muscle By Low-Frequency Electrical
Stimulation. International Journal of Microcirculation: Clinical &
Experimental. 1995;15:111-116.
160. Dumont DJ, Fong GH, Puri MC, Gradwohl G, Alitalo K, Breitman ML.
Vascularization of the mouse embryo: a study of flk-1, tek, tie, and vascular
endothelial growth factor expression during development. Develop Dynam.
1995;203:80-92.
161. Sato TN, Tozawa Y, Deutsch U, Wolburg-Buchholz K, Fujiwara Y, Gendron-
Maguire M, Gridley T, Wolburg H, Risau W, Qin Y. Distinct roles of the
receptor tyrosine kinases Tie-1 and Tie-2 in blood vessel formation. Nature.
1995;376:70-74.
162. Foley W. Treatment of gangrene of the feet and legs by walking. Circulation.
1957;15:689-700.
163. Schoop W. Bewegungstherapie bei peripheren Durchblutungsstörungen.
Med Welt Part 1. 1964;502-506.
7. References - 127 -
164. Schaper W, Piek JJ, Munoz-Chapuli R, Wolf C, Ito W. Collateral circulation
of the heart. In: Ware JA, Simons M, eds. Angiogenesis and Cardiovascular
Disease. New York, NY, Oxford: Oxford University Press; 1999: 159-198.
165. Ito WD, Arras M, Winkler B, Scholz D, Schaper J, Schaper W. Monocyte
chemotactic protein-1 increases collateral and peripheral conductance after
femoral artery occlusion. Circ Res. 1997;80:829-837.
166. Ito WD, Arras M, Winkler B, Scholz D, Htun P, Schaper W. Angiogenesis
but not collateral growth is associated with ischemia after femoral artery
occlusion. Am J Physiol. 1997;273:H1255-H1265.
167. Zhuang YJ, Singh TM, Zarins CK, Masuda H. Sequential increases and
decreases in blood flow stimulates progressive intimal thickening. European
Journal of Vascular & Endovascular Surgery. 1998;16:301-10.
168. Singh TM, Abe KY, Sasaki T, Zhuang YJ, Masuda H, Zarins CK. Basic
fibroblast growth factor expression precedes flow-induced arterial
enlargement. Journal of Surgical Research. 1998;77:165-73.
169. Kamiya A, Togawa T. Adaptive regulation of wall shear stress to flow
change in the canine carotid artery. American Journal of Physiology.
1980;239:H14-21.
170. Zarins CK, Zatina MA, Giddens DP, Ku DN, Glagov S. Shear stress
regulation of artery lumen diameter in experimental atherogenesis. Journal
of Vascular Surgery. 1987;5:413-20.
171. Glagov S, Weisenberg E, Zarins C, Stankunavicius R, Kolettis G.
Compensatory enlargement of human atherosclerotic coronary arteries. N
Engl J Med. 1987;316:1371-5.
7. References - 128 -
172. Rhoads DN, Eskin SG, McIntire LV. Fluid flow releases fibroblast growth
factor-2 from human aortic smooth muscle cells. Arteriosclerosis,
Thrombosis & Vascular Biology. 2000;20:416-21.
173. Malek AM, Gibbons GH, Dzau VJ, Izumo S. Fluid shear stress differentially
modulates expression of genes encoding basic fibroblast growth factor and
platelet-derived growth factor B chain in vascular endothelium. Journal of
Clinical Investigation. 1993;92:2013-21.
174. Shyy Y-J, Hsieh H-J, Usami S, Chien S. Fluid shear stress induces a
biphasic responce of human monocyte chemotactic protein 1 gene expression
in vascular endothelium. Proc. Natl. Acad. Sci. USA. 1994;91:4678-4682.
175. Mathien GM, Terjung RL. Influence of training following bilateral stenosis
of the femoral artery in rats. American Journal of Physiology.
1986;250:H1050-9.
176. Mathien GM, Terjung RL. Muscle blood flow in trained rats with peripheral
arterial insufficiency. American Journal of Physiology. 1990;258:H759-65.
177. Yang HT, Dinn RF, Terjung RL. Training increases muscle blood flow in
rats with peripheral arterial insufficiency. Journal of Applied Physiology.
1990;69:1353-9.
178. Yang HT, Terjung RL. Angiotensin-converting enzyme inhibition increases
collateral-dependent muscle blood flow. Journal of Applied Physiology.
1993;75:452-7.
179. Yang HT, Terjung RL. Angiotensin-converting enzyme inhibition increases
exercise tolerance and muscle blood flow in rats with peripheral arterial
insufficiency. Journal of Clinical Pharmacology. 1994;34:345-55.
7. References - 129 -
180. Yang HT, Ogilvie RW, Terjung RL. Heparin increases exercise-induced
collateral blood flow in rats with femoral artery ligation. Circulation
Research. 1995;76:448-56.
181. Castellot JJ, Jr., Wright TC, Karnovsky MJ. Regulation of vascular smooth
muscle cell growth by heparin and heparan sulfates. Seminars in
Thrombosis & Hemostasis. 1987;13:489-503.
182. Ornitz DM. FGFs, heparan sulfate and FGFRs: complex interactions
essential for development. Bioessays. 2000;22:108-12.
183. Faham S, Linhardt RJ, Rees DC. Diversity does make a difference:
fibroblast growth factor-heparin interactions. Current Opinion in Structural
Biology. 1998;8:578-86.
184. Yang HT, Deschenes MR, Ogilvie RW, Terjung RL. Basic fibroblast growth
factor increases collateral blood flow in rats with femoral arterial ligation.
Circulation Research. 1996;79:62-9.
185. Yang HT, Ogilvie RW, Terjung RL. Exercise Training Enhances Basic
Fibroblast Growth Factor-Induced Collateral Blood Flow. American Journal
of Physiology - Heart & Circulatory Physiology. 1998;43:H2053-H2061.
186. Yang HT, Feng Y, Allen LA, Protter A, Terjung RL. Efficacy and specificity
of bFGF increased collateral flow in experimental peripheral arterial
insufficiency. American Journal of Physiology - Heart & Circulatory
Physiology. 2000;278:H1966-73.
187. Yang HT, Laughlin MH, Terjung RL. Prior exercise training increases
collateral-dependent blood flow in rats after acute femoral artery occlusion.
American Journal of Physiology - Heart & Circulatory Physiology.
2000;279:H1890-7.
7. References - 130 -
188. Yang HT, Yan Z, Abraham JA, Terjung RL. VEGF(121)- and bFGF-induced
increase in collateral blood flow requires normal nitric oxide production.
American Journal of Physiology - Heart & Circulatory Physiology.
2001;280:H1097-104.
189. Katz SD, Khan T, Zeballos GA, Mathew L, Potharlanka P, Knecht M,
Whelan J. Decreased activity of the L-arginine-nitric oxide metabolic
pathway in patients with congestive heart failure. Circulation.
1999;99:2113-7.
190. Arimura K, Egashira K, Nakamura R, Ide T, Tsutsui H, Shimokawa H,
Takeshita A. Increased inactivation of nitric oxide is involved in coronary
endothelial dysfunction in heart failure. American Journal of Physiology -
Heart & Circulatory Physiology. 2001;280:H68-75.
191. Mombouli JV, Vanhoutte PM. Endothelial dysfunction: from physiology to
therapy. Journal of Molecular & Cellular Cardiology. 1999;31:61-74.
192. Radegran G, Hellsten Y. Adenosine and nitric oxide in exercise-induced
human skeletal muscle vasodilatation. Acta Physiologica Scandinavica.
2000;168:575-91.
193. Stavri GT, Zachary IC, Baskerville PA, Martin JF, Erusalimsky JD. Basic
fibroblast growth factor upregulates the expression of vascular endothelial
growth factor in vascular smooth muscle cells. Synergistic interaction with
hypoxia. Circulation. 1995;92:11-4.
194. Heaton WH, Marr KC, Capurro NL, Goldstein RE, Epstein SE. Beneficial
effect of physical training on blood flow to myocardium perfused by chronic
collaterals in the exercising dog. Circulation. 1978;57:575-81.
7. References - 131 -
195. Neill WA, Oxendine JM. Exercise can promote coronary collateral
development without improving perfusion of ischemic myocardium.
Circulation. 1979;60:1513-1519.
196. Scheel KW, Ingram LA, Wilson JL. Effects of exercise on the coronary and
collateral vasculature of beagles with and without coronary occlusion.
Circulation Research. 1981;48:523-30.
197. Schaper W. Influence of physical exercise on coronary collateral blood flow
in chronic experimental two-vessel occlusion. Circulation. 1982;65:905-912.
198. Schaper W, Flameng W, Snoeckx L, Jageneau A. Der Einfluß körperlichen
Trainings auf den Kollateralkreislauf des Herzens. Verh Dt Ges
Kreislaufforschg. 1971;37:112-121.
199. Cohen MV, Yipintsoi T, Scheuer J. Coronary collateral stimulation by
exercise in dogs with stenotic coronary arteries. Journal of Applied
Physiology: Respiratory, Environmental & Exercise Physiology. 1982;52:664-
71.
200. Cohen MV, Steingart RM. Exercise thallium-201 scintigraphy in dogs:
effects of long-term coronary occlusion and collateral development on early
and late scintigraphic images. Circulation. 1985;72:881-91.
201. Cohen MV, Steingart RM. Lack of effect of prior training on subsequent
ischaemic and infarcting myocardium and collateral development in dogs
with normal hearts. Cardiovascular Research. 1987;21:269-78.
202. Cohen MV, Yipintsoi T, Malhotra A, Penpargkul S, Scheuer J. Effect of
exercise on collateral development in dogs with normal coronary arteries.
Journal of Applied Physiology: Respiratory, Environmental & Exercise
Physiology. 1978;45:797-805.
7. References - 132 -
203. Cohen MV. Training in dogs with normal coronary arteries: lack of effect on
collateral development. Cardiovascular Research. 1990;24:121-8.
204. Weiss T, Fujita Y, Kreimeier U, Messmer K. Effect of intensive walking
exercise on skeletal muscle blood flow in intermittent claudication.
Angiology. 1992;43:63-71.
205. Bloor CM, White FC, Sanders TM. Effects of exercise on collateral
development in myocardial ischemia in pigs. Journal of Applied Physiology:
Respiratory, Environmental & Exercise Physiology. 1984;56:656-65.
206. Breisch EA, White FC, Nimmo LE, McKirnan MD, Bloor CM. Exercise-
induced cardiac hypertrophy: a correlation of blood flow and
microvasculature. Journal of Applied Physiology. 1986;60:1259-67.
207. White FC, McKirnan MD, Breisch EA, Guth BD, Liu YM, Bloor CM.
Adaptation of the left ventricle to exercise-induced hypertrophy. Journal of
Applied Physiology. 1987;62:1097-110.
208. Roth DM, White FC, Nichols ML, Dobbs SL, Longhurst JC, Bloor CM. Effect
of long-term exercise on regional myocardial function and coronary
collateral development after gradual coronary artery occlusion in pigs.
Circulation. 1990;82:1778-89.
209. Scholz D, Ziegelhoeffer T, Helisch A, Wagner S, Friedrich C, Elsaesser H,
Wolfram S, Schaper W In J Mol Cell Cardiol; 2001;pp A107 (abstr).
210. Wolfram S, Ziegelhoeffer T, Scholz D, Fernandez B, Schaper W In Journal
of the American College of Cardiology; 2001;pp A107 (abstr).
211. Gardner AW, Poehlman ET. EXERCISE REHABILITATION PROGRAMS
FOR THE TREATMENT OF CLAUDICATION PAIN - A META-ANALYSIS
[Review]. Jama: Journal of the American Medical Association.
1995;274:975-980.
7. References - 133 -
212. Girolami B, Bernardi E, Prins MH, ten Cate JW, Hettiarachchi R, Prandoni
P, Girolami A, Buller HR. Treatment of intermittent claudication with
physical training, smoking cessation, pentoxifylline, or nafronyl - A meta-
analysis [Review]. Archives of Internal Medicine. 1999;159:337-345.
213. Jonason T, Ringqvist I. Effect of training on the post-exercise ankle blood
pressure reaction in patients with intermittent claudication. Clinical
Physiology. 1987;7:63-9.
214. Hiatt WR, Regensteiner JG, Hargarten ME, Wolfel EE, Brass EP. Benefit of
exercise conditioning for patients with peripheral arterial disease.
Circulation. 1990;81:602-9.
215. Feinberg RL, Gregory RT, Wheeler JR, Snyder SO, Jr., Gayle RG, Parent
FN, 3rd, Patterson RB. The ischemic window: a method for the objective
quantitation of the training effect in exercise therapy for intermittent
claudication. Journal of Vascular Surgery. 1992;16:244-50.
216. Larsen OA, Lassen NA. Effect of daily muscular exercise in patients with
intermittent claudication. Lancet. 1966;2:1093-6.
217. Zetterquist S. The effect of active training on the nutritive blood flow in
exercising ischemic legs. Scandinavian Journal of Clinical & Laboratory
Investigation. 1970;25:101-11.
218. Dahllof AG, Bjorntorp P, Holm J, Schersten T. Metabolic activity of skeletal
muscle in patients with peripheral arterial insufficiency. European Journal
of Clinical Investigation. 1974;4:9-15.
219. Sorlie D, Myhre K. Effects of physical training in intermittent claudication.
Scandinavian Journal of Clinical & Laboratory Investigation.
1978;38:217–22.
7. References - 134 -
220. Ruell PA, Imperial ES, Bonar FJ, Thursby PF, Gass GC. Intermittent
claudication. The effect of physical training on walking tolerance and venous
lactate concentration. European Journal of Applied Physiology &
Occupational Physiology. 1984;52:420-5.
221. Carter SA, Hamel ER, Paterson JM, Snow CJ, Mymin D. Walking ability
and ankle systolic pressures: observations in patients with intermittent
claudication in a short-term walking exercise program. Journal of Vascular
Surgery. 1989;10:642-9.
222. Pancera P, Prior M, Zannoni M, Lucchese L, De Marchi S, Arosio E. Micro-
and macrocirculatory, and biohumoral changes after a month of physical
exercise in patients with intermittent claudication. Scandinavian Journal of
Rehabilitation Medicine. 1995;27:73-6.
223. Gardner AW, Katzel LI, Sorkin JD, Killewich LA, Ryan A, Flinn WR,
Goldberg AP. Improved functional outcomes following exercise
rehabilitation in patients with intermittent claudication. Journals of
Gerontology Series A Biological Sciences & Medical Sciences.
2000;55:M570–M577.
224. Tan KH, Cotterrell D, Sykes K, Sissons GRJ, de Cossart L, Edwards PR.
Exercise training for claudicants: Changes in blood flow, cardiorespiratory
status, metabolic functions, blood rheology and lipid profile. European
Journal of Vascular & Endovascular Surgery. 2000;20:72-78.
225. Linke A, Schoene N, Gielen S, Hofer J, Erbs S, Schuler G, Hambrecht R.
Endothelial dysfunction in patients with chronic heart failure: Systemic
effects of lower-limb exercise training. Journal of the American College of
Cardiology. 2001;37:392-397.
7. References - 135 -
226. Remijnse-Tamerius HCM, Duprez D, De Buyzere M, Oeseburg B, Clement
DL. Why is training effective in the treatment of patients with intermittent
claudication? [Review]. International Angiology. 1999;18:103-112.
227. Simons M, Bonow RO, Chronos NA, Cohen DJ, Giordano FJ, Hammond HK,
Laham RJ, Li W, Pike M, Sellke FW, Stegmann TJ, Udelson JE, Rosengart
TK. Clinical trials in coronary angiogenesis: issues, problems, consensus: An
expert panel summary. Circulation. 2000;102:E73-86.
228. Coffin JD, Florkiewicz RZ, Neumann J, Mort-Hopkins T, Dorn GW, 2nd,
Lightfoot P, German R, Howles PN, Kier A, O'Toole BA. Abnormal bone
growth and selective translational regulation in basic fibroblast growth
factor (FGF-2) transgenic mice. Molecular Biology of the Cell.
1995;6:1861–73.
229. Kostin S, Hein S, Bauer EP, Schaper J. Spatiotemporal development and
distribution of intercellular junctions in adult rat cardiomyocytes in culture.
Circulation Research. 1999;85:154-67.
230. Gray MO, Karliner JS, Mochly-Rosen D. A selective epsilon-protein kinase
C antagonist inhibits protection of cardiac myocytes from hypoxia-induced
cell death. Journal of Biological Chemistry. 1997;272:30945-51.
231. Arstall MA, Zhao YZ, Hornberger L, Kennedy SP, Buchholz RA,
Osathanondh R, Kelly RA. Human ventricular myocytes in vitro exhibit
both early and delayed preconditioning responses to simulated ischemia.
Journal of Molecular & Cellular Cardiology. 1998;30:1019-25.
232. Taimor G, Lorenz H, Hofstaetter B, Schluter KD, Piper HM. Induction of
necrosis but not apoptosis after anoxia and reoxygenation in isolated adult
cardiomyocytes of rat. Cardiovascular Research. 1999;41:147-56.
7. References - 136 -
233. Ping P, Zhang J, Cao X, Li RC, Kong D, Tang XL, Qiu Y, Manchikalapudi S,
Auchampach JA, Black RG, Bolli R. PKC-dependent activation of p44/p42
MAPKs during myocardial ischemia-reperfusion in conscious rabbits.
American Journal of Physiology. 1999;276:H1468-81.
234. German Society for Clinical Chemistry. [Recommendations of the German
Society for Clinical Chemistry. Standardization of methods for the
determination of enzyme activities in biological fluids]. Zeitschrift fur
Klinische Chemie und Klinische Biochemie. 1970;8:658-60.
235. Klauke R, Schmidt E, Lorentz K. Recommendations for carrying out
standard ECCLS procedures (1988) for the catalytic concentrations of
creatine kinase, aspartate aminotransferase, alanine aminotransferase and
gamma-glutamyltransferase at 37 degrees C. Standardization Committee of
the German Society for Clinical Chemistry, Enzyme Working Group of the
German Society for Clinical Chemistry. European Journal of Clinical
Chemistry & Clinical Biochemistry. 1993;31:901-9.
236. Heglund NC, Cavagna GA, Taylor CR. Energetics and mechanics of
terrestrial locomotion. III. Energy changes of the centre of mass as a
function of speed and body size in birds and mammals. Journal of
Experimental Biology. 1982;97:41-56.
237. Sheikh F, Sontag DP, Fandrich RR, Kardami E, Cattini PA. Overexpression
of FGF-2 increases cardiac myocyte viability after injury in isolated mouse
hearts. American Journal of Physiology - Heart & Circulatory Physiology.
2001;280:H1039-50.
238. Li J, Post M, Volk R, Gao Y, Li M, Metais C, Sato K, Tsai J, Aird W,
Rosenberg RD, Hampton TG, Li JY, Sellke F, Carmeliet P, Simons M. PR39,
a peptide regulator of angiogenesis. Nature Medicine. 2000;6:49-55.

7. References - 137 -
239. Semenza GL, Roth PH, Fang HM, Wang GL. Transcriptional regulation of
genes encoding glycolytic enzymes by hypoxia-inducible factor 1. Journal of
Biological Chemistry. 1994;269:23757-63.

8. Acknowledgements - 138 -
8. AcknowledgementsI thank Professor Wolfgang Schaper for the assignment of this interesting topic.He constantly supported of my work in the laboratory and provided helpfuladvice. I gratefully acknowledge his guidance during the preparation of thismanuscript.
I thank Dr. Borja Fernandez for countless discussions evaluating the results of
my work in the laboratory. He provided valuable advise and help during theexperiments. I acknowledge his constant supply with ideas, hypothesies,questions, and observations.
I thank Dr. Sawa Kostin and Dr. Veronika Person for help during theestablishment of a protocol for the isolation of adult mouse ventricular cardiacmyocytes.
I acknowledge Nico Landes for his help during the MCP–1 study and for valuable
comments during the preparation of this manuscript.
I thank Tibor Ziegelhöffer, Dr. Armin Helisch, and Dr. Shawn Wagner for theirhelp with the FGF–2 and strain studies. They provided the methodological andtechnical background as well as valuable comments and suggestions.
I thank Dr. René Zimmermann and Claudia Uhlmann for genotyping of all mice
used in these studies.
I gratefully acknowledge Gerd Stämmlers help during the preparation of thismanuscript and for statistical analysis of the results.
I especially thank Siegfried Langsdorf and Christof Bingel for their consistent
technical support and for construction of the anoxia chambers and the mousetreadmill.
I thank all members of the Department of Experimental Cardiology of the Max-Planck-Institute in Bad Nauheim. They made my studies a pleasant experience.
I thank all my friends for their friendship. They supported of my work at the
Max-Planck-Institute and at the University in Giessen.
I wish to gratefully acknowledge my family for their constant financial and moralsupport of during the last years. They made my stay at the University inGiessen, at the Kansas State University, and at the Max-Planck-Institute in BadNauheim possible.
I thank my girlfriend Dr. Silja Lorenz-Meyer for her love and support.
9. Curriculum vitae - 139 -
9. Curriculum vitae
Name: Swen Wolfram
Date of Birth: 10.06.1975
Place of Birth: Leipzig
Nationality: German
Marital status: Single
Education
1982-1983 157.Oberschule in Leipzig
1983-1990 94.Oberschule in Leipzig
1990-1994 Max-Klinger-Gymnasium in Leipzig
06/1994 Abitur with final grade point average 1.1
Social Service
1994-1995 Johanniter-Unfall-Hilfe e.V. in Leipzig, Certified AmbulanceFirst-Aid Attendant
University
1995-1997 Nutritional Sciences at the Justus-Liebig-University,Giessen/Germany
1998 Nutritional and Exercise Sciences Including a ResearchInternship at the Kansas State University, Manhattan/USA,Laboratory of Prof. Timothy I. Musch, Diploma-Thesis:“Reduced Concentration of Skeletal Muscle Na,K-ATPaseConcomitant with Exercise Intolerance in Rats with SevereCongestive Heart Failure”, GPA: 3.786
1999-2001 Nutritional Sciences at the Justus-Liebig-University,Giessen/Germany
04/2001 Certified Diplom-Oecotrophologe with final grade pointaverage 1.5
Doctorate
1999-2002 Max-Planck-Institute for Experimental and Clinical Researchin Bad Nauheim/Germany at the Department of ExperimentalCardiology, Director: Prof. Dr. Dr. hc. Wolfgang Schaper,Ph.D.–Thesis: “Determination of the CardiovascularPhenotype of Different Transgenic Mouse Models”
9. Curriculum vitae - 140 -
Postdoctorate
2002-present Roche Vitamins AG, Department of Human Nutrition andHealth in Basel/Switzerland,
Internship
November 1997 Office of Public Health in Leipzig
Special Interests
Sports Fitness-Training, Soccer, Running
1996-1997 Personal-Trainer in Giessen
Traveling abroad 1998 Studies and Research at the Kansas State University,
Traveling around the U.S.A., English Movies and Books
9. Curriculum vitae - 141 -
Abstracts & Publications
Wolfram S, Fach C, Tomars M, Hein S, Kubin T. Adult and neonatal rat cardiacmyocytes respond differently to endothelial trophic factors. Journal of Molecularand Cellular Cardiology. 1999;31(6):Th102 (abstract)
Fernandez B, Bühler A, Wolfram S, Franz WM, Niemann H, Schaper J,Schaper W, Zimmermann R. Fibroblast growth factor-1 overexpression causescoronary artery overgrowth in transgenic mice. FASEB Journal. 2000;14:192.2(abstract)
Fernandez B, Buehler A, Wolfram S, Kostin S, Espanion G, Franz WM,Niemann H, Doevendans PA, Schaper W, Zimmermann R. Transgenicmyocardial overexpression of fibroblast growth factor-1 increases coronary arterydensity and branching. Circulation Research. 2000;87:207-213
Scholz D, Ziegelhoeffer T, Helisch A, Wagner S, Friedrich C, Elsaesser H,Wolfram S, Schaper W. Augmentation of collateral vessel growth preventsangiogenesis. Journal of Molecular and Cellular Cardiology. 2001;33:A107(abstract)
Wolfram S, Ziegelhoeffer T, Scholz D, Fernandez B, Schaper W. Exercise capacityprecisely reflects arteriogenic adaptation to femoral artery occlusion in mice.Journal of the American College of Cardiology. 2001;37(2)A180 (abstract)
Zimmermann R, Fernandez B, Buehler A, Martire A, Strohm C, Wolfram S,Schaper W. The role of FGF–1 in the heart: studies in the FGF–1 transgenicmouse. Israel Heart Society - Molecular Cardiology Newsletter. 2001;3(3117):6-7
Wolfram S, Ziegelhoeffer T, Fernandez B, Coffin JD, Wagner S, Helisch A,Zimmermann R, Schaper W. Arteriogenesis on demand in exercising miceexpressing FGF-2 under the control of the phosphoglycerate kinase promoter.Journal of the American College of Cardiology. 2002;39(1)A204 (abstract)
Musch TI, Wolfram S, Hageman KS, Pickar JG. Skeletal Muscle OuabainBinding Sites are Reduced in Rats with Chronic Heart Failure. Journal ofApplied Physiology. 2002;92(6):2334-2334
Buehler A, Martire A, Strohm C, Wolfram S, Fernandez B, Palmen M, WehrensXHT, Doevendans PA, Franz WM, Schaper W, Zimmermann R. Angiogenesis-independent cardioprotection in FGF-1 transgenic mice. CardiovascularResearch. 2002;55(4):768-777