Die Euro-Übernahme in den neuen Mitgliedsländern aus der...
33
Die Euro-Übernahme in den neuen Mitgliedsländern aus der Sicht der OCA-Theorie Ringvorlesung der Universität Wien 19. Mai 2008 Jarko Fidrmuc Ludwig-Maximilians-Universität München, CESifo, und Comenius University Bratislava http://www.vwl.uni-muenchen.de/fidrmuc/index.html [email protected] Department of Economics University of Munich Comenius University Bratislava Faculty of Mathematics and Physics Department of Applied Mathematics
Transcript of Die Euro-Übernahme in den neuen Mitgliedsländern aus der...

Die Euro-Übernahme in den neuen Mitgliedsländern aus der Sicht der
OCA-TheorieRingvorlesung der Universität Wien
19. Mai 2008
Jarko FidrmucLudwig-Maximilians-Universität München, CESifo, und Comenius University Bratislava
http://www.vwl.uni-muenchen.de/fidrmuc/[email protected]
Department of EconomicsUniversity of Munich
Comenius University BratislavaFaculty of Mathematics and Physics Department of Applied Mathematics

• After a relatively smooth enlargement of the European Union in only two waves (2004 and 2007), we expected a similarly fast progress with regard to the euro introduction in CEECs.
• Now we can see that the process will be more difficult and slower than expected.
• Furthermore, the core countries of the NMS (Czech Republic, Hungary, and Poland) are currently missing in the euro area enlargement.
• Can we explain this feature of the European integration process?
• The Maastricht criteria and the reform of the ECB will be not analyzed in this lecture.
Motivation
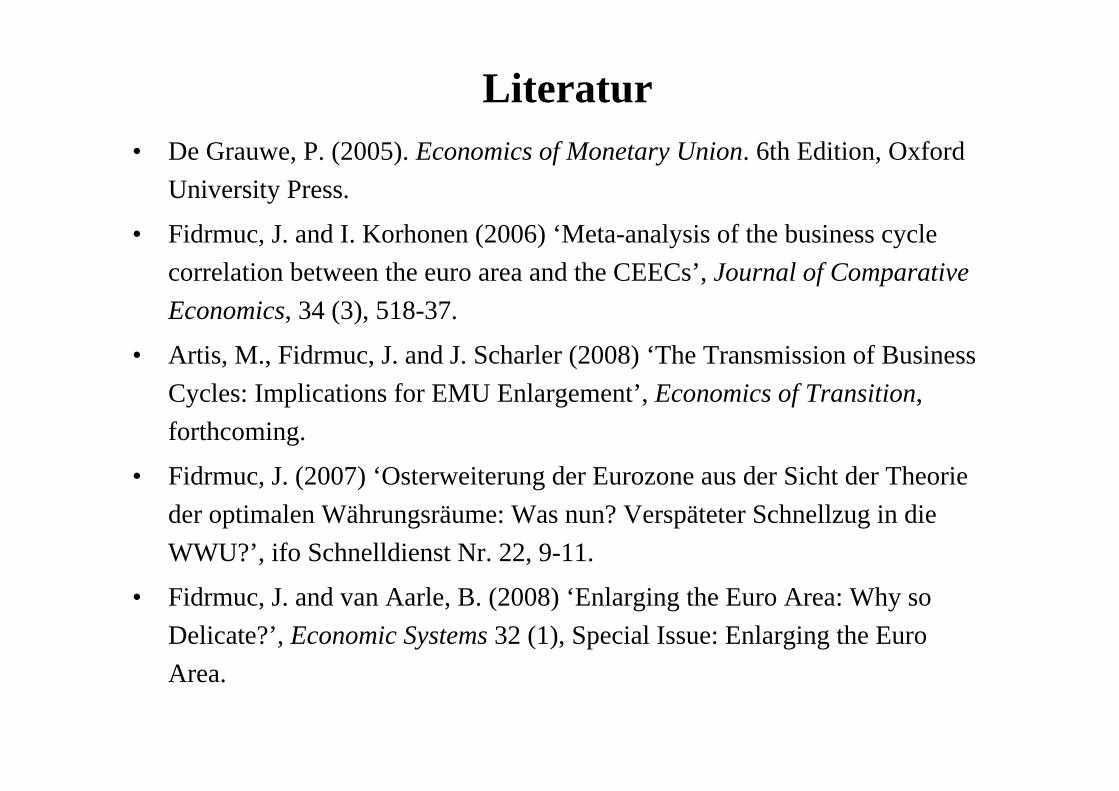
• De Grauwe, P. (2005). Economics of Monetary Union. 6th Edition, Oxford University Press.
• Fidrmuc, J. and I. Korhonen (2006) ‘Meta-analysis of the business cycle correlation between the euro area and the CEECs’, Journal of Comparative Economics, 34 (3), 518-37.
• Artis, M., Fidrmuc, J. and J. Scharler (2008) ‘The Transmission of Business Cycles: Implications for EMU Enlargement’, Economics of Transition, forthcoming.
• Fidrmuc, J. (2007) ‘Osterweiterung der Eurozone aus der Sicht der Theorie der optimalen Währungsräume: Was nun? Verspäteter Schnellzug in die WWU?’, ifo Schnelldienst Nr. 22, 9-11.
• Fidrmuc, J. and van Aarle, B. (2008) ‘Enlarging the Euro Area: Why so Delicate?’, Economic Systems 32 (1), Special Issue: Enlarging the Euro Area.
Literatur

I. The Theory of Optimum Currency Area.
II. Demand and Supply Shocks.
III. Static OCA Theory and the EMU Enlargement.
IV. Dynamic Aspects and the Endogeneity of the
OCA Criteria.
V. Conclusions
EMU Enlargement and the OCA Theory
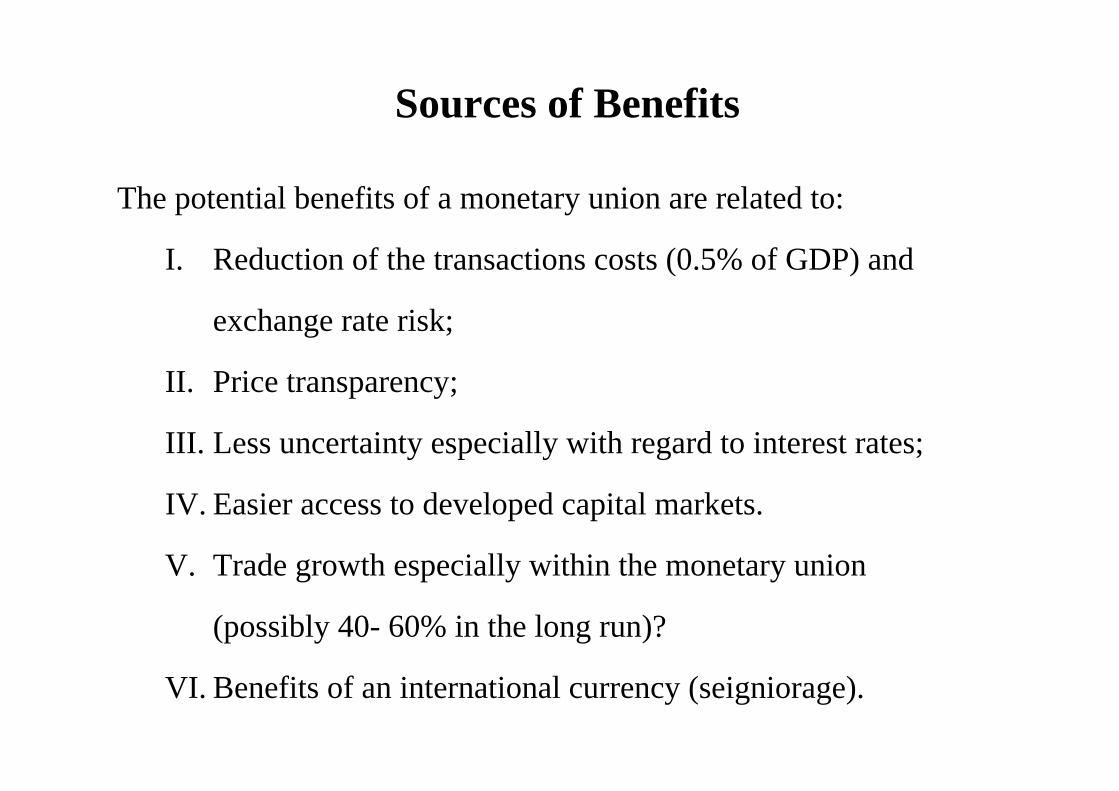
The potential benefits of a monetary union are related to:
I. Reduction of the transactions costs (0.5% of GDP) and
exchange rate risk;
II. Price transparency;
III. Less uncertainty especially with regard to interest rates;
IV. Easier access to developed capital markets.
V. Trade growth especially within the monetary union
(possibly 40- 60% in the long run)?
VI. Benefits of an international currency (seigniorage).
Sources of Benefits

• Mundell (1961) defines an optimum currency area as a region with similar business cycles (similar development of aggregate demand). He received the Nobel Prize in Economics in 1999.
• The economic policy may need adjustment mechanisms if business cycles are different (exchange rate vis-à-vis labor mobility).
• McKinnon (1963) and Kenen (1969) and other discuss additional OCA criteria: fiscal policy, openness, diversification, labor market flexibility, etc.
• Furthermore, countries may import credibility of monetary policyfrom their target countries.
Theory of OCA

OCA Criteria
• On the one hand, there are potential welfare gains resulting
from the introduction of euro.
• On the other hand, there are possible costs due to the loss of
own monetary policy.
• Countries may use different adjustment channels to react to
adverse shocks.
• Exchange rate may be inefficient or inappropriate policy tool.
• These tradeoffs are referred to as the optimum currency area
criteria.
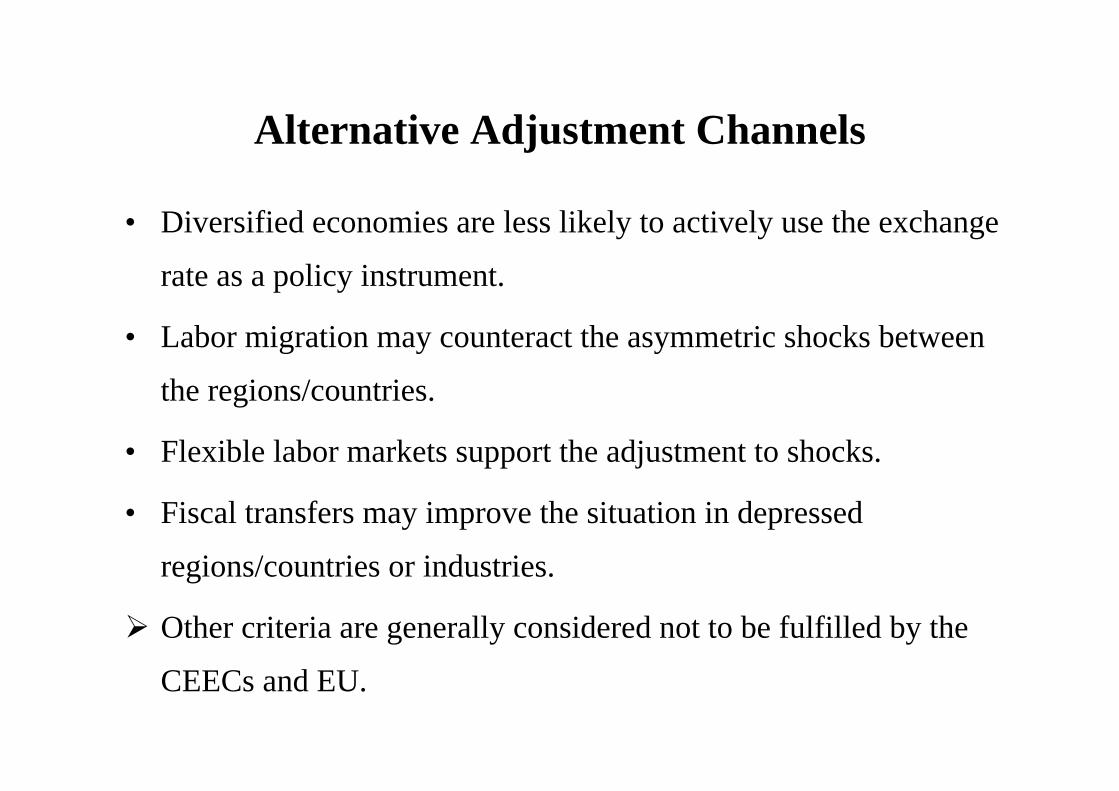
Alternative Adjustment Channels
• Diversified economies are less likely to actively use the exchange
rate as a policy instrument.
• Labor migration may counteract the asymmetric shocks between
the regions/countries.
• Flexible labor markets support the adjustment to shocks.
• Fiscal transfers may improve the situation in depressed
regions/countries or industries.
Other criteria are generally considered not to be fulfilled by the
CEECs and EU.

Potential Costs of an OCA
• There are possible costs due to the loss of monetary independence.
• The loss of the nominal exchange rate instrument is important if
business cycles are not sufficiently synchronized.
• The ECB policy is more difficult for countries with different
business cycles, which cause a necessity of ECB reform.
• However, exchange rate may act as a source of monetary shocks,
and not an absorber of demand and supply shocks.
High correlation of business cycles indicates low costs of common
monetary policy.

Business Cycles in Selected CountriesAustria
-.04
-.03
-.02
-.01
.00
.01
.02
.03
1970 1975 1980 1985 1990 1995 2000 2005
Belgium
-.03
-.02
-.01
.00
.01
.02
.03
1970 1975 1980 1985 1990 1995 2000 2005
Denmark
-.03
-.02
-.01
.00
.01
.02
.03
1970 1975 1980 1985 1990 1995 2000 2005
Germany
-.03
-.02
-.01
.00
.01
.02
.03
1970 1975 1980 1985 1990 1995 2000 2005
Finland
-.04
-.03
-.02
-.01
.00
.01
.02
.03
.04
.05
1970 1975 1980 1985 1990 1995 2000 2005
France
-.03
-.02
-.01
.00
.01
.02
1970 1975 1980 1985 1990 1995 2000 2005
UK
-.03
-.02
-.01
.00
.01
.02
.03
.04
1970 1975 1980 1985 1990 1995 2000 2005
Ireland
-.02
-.01
.00
.01
.02
.03
1970 1975 1980 1985 1990 1995 2000 2005
Italy
-.03
-.02
-.01
.00
.01
.02
.03
.04
1970 1975 1980 1985 1990 1995 2000 2005
Netherlands
-.03
-.02
-.01
.00
.01
.02
1970 1975 1980 1985 1990 1995 2000 2005
Portugal
-.03
-.02
-.01
.00
.01
.02
1970 1975 1980 1985 1990 1995 2000 2005
Spain
-.02
-.01
.00
.01
.02
.03
1970 1975 1980 1985 1990 1995 2000 2005
Sweden
-.03
-.02
-.01
.00
.01
.02
1970 1975 1980 1985 1990 1995 2000 2005
Switzerland
-.06
-.04
-.02
.00
.02
.04
.06
1970 1975 1980 1985 1990 1995 2000 2005
Norway
-.06
-.04
-.02
.00
.02
.04
.06
1970 1975 1980 1985 1990 1995 2000 2005
USA
-.04
-.03
-.02
-.01
.00
.01
.02
.03
.04
1970 1975 1980 1985 1990 1995 2000 2005
Canada
-.04
-.03
-.02
-.01
.00
.01
.02
.03
1970 1975 1980 1985 1990 1995 2000 2005
Japan
-.03
-.02
-.01
.00
.01
.02
.03
.04
.05
1970 1975 1980 1985 1990 1995 2000 2005
Czech R.
-.02
-.01
.00
.01
.02
.03
1970 1975 1980 1985 1990 1995 2000 2005
Estonia
-.04
-.03
-.02
-.01
.00
.01
.02
.03
.04
.05
1970 1975 1980 1985 1990 1995 2000 2005
Hungary
-.02
-.01
.00
.01
.02
.03
1970 1975 1980 1985 1990 1995 2000 2005
Poland
-.020
-.015
-.010
-.005
.000
.005
.010
.015
1970 1975 1980 1985 1990 1995 2000 2005
Slovakia
-.015
-.010
-.005
.000
.005
.010
.015
.020
1970 1975 1980 1985 1990 1995 2000 2005
Slovenia
-.012
-.008
-.004
.000
.004
.008
.012
.016
1970 1975 1980 1985 1990 1995 2000 2005
Source: Artis et al. (2008).

I. The Theory of Optimum Currency Area.
II. Demand and Supply Shocks.
III. Static OCA Theory and the EMU Enlargement.
IV. Dynamic Aspects and the Endogeneity of the
OCA Criteria.
V. Conclusions
EMU Enlargement and the OCA Theory

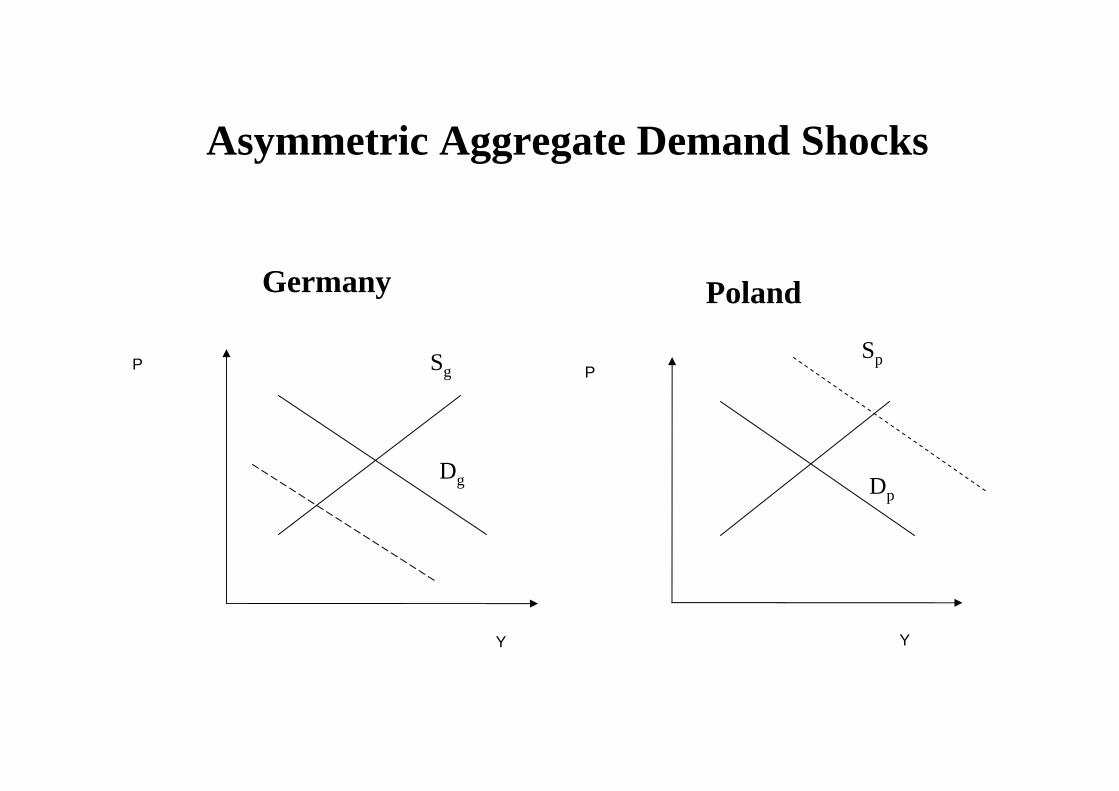
• Two countries: Germany and Poland.
• Consumers shift their preferences away from German to Polish
products.
⇒There is a positive demand shock in Poland and negative demand
shock in Germany.
• The supply in both countries is unchanged in the short run.
• Adjustment problem:
a) output decline and unemployment in Germany;
b) boom and inflation hikes in Poland.
OCA: The Story
Germany
Y
P
Poland
P
Y
Sg
Dg Dp
Sp
Asymmetric Aggregate Demand Shocks

There are possibly two mechanisms which may automatically bring back the equilibrium in both countries: • Wage flexibility: Unemployment results in lower wages in
Germany and the labor shortage increases wages in Poland. => Wage changes (second order effects) shifts the supply curve
downwards in Germany and upwards in Poland.=> The long-run level of output is not influenced by
the demand shocks, but the price level increases.
• Labor Mobility: Excluding other factors, labor could migrate from depressed (Germany) to booming (Poland) regions. => Labor flows shift the supply curve left in Germany
and to the right in Poland, which can cause political tensions.
Possible Automatic Adjustment Processes

Germany
Y
P
Poland
P
Y
Sg
Dg Dp
Sp
Automatic Adjustments(Wage Flexibility)

• The automatic adjustment channels may last long and be
extremely costly (deflation, unemployment) in the welfare terms
(politically undesired inflation or migration).
• The empirical analysis indicate a low degree of labor market
flexibility or migration response to income shocks.
• The costs of adjustment will be likely concentrated on one country
(via the inflation channel).
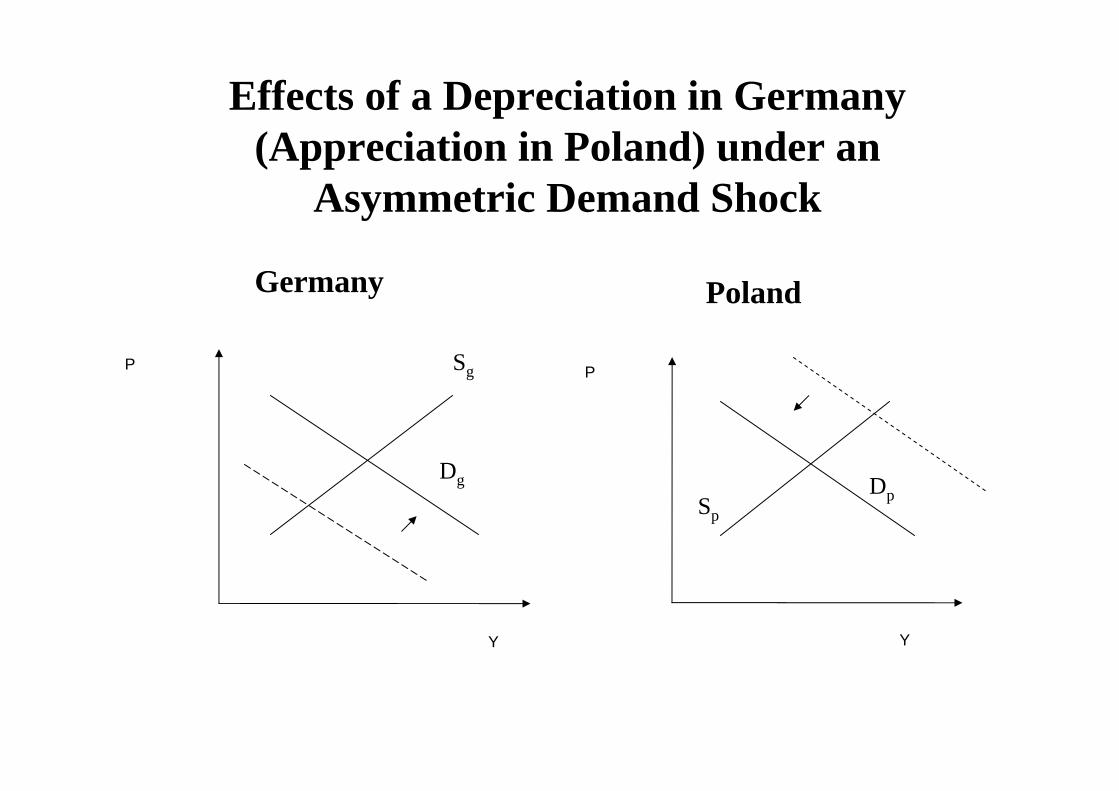
• By contrast, the initial macroeconomic equilibrium can be easily
restored by a depreciation of the Polish Zloty, which shifts the
demand curve upwards in Germany and downwards in Poland.
The Role of Exchange Rate Policy
Germany
Y
P
Poland
P
Y
Sg
Dg DpSp
Effects of a Depreciation in Germany (Appreciation in Poland) under an
Asymmetric Demand Shock

• If both countries face a symmetric (negative) demand shock, the monetary policy of a monetary union can react by the reduction of the interest rates.
• A devaluation is attractive only in the short run, because exchange rate change in one country worsens the economic problems in its trading partners.
• This is likely to cause a spiral of devaluations and counter-devaluations.
• As a result, the countries gain from the coordination of monetary policies.
Monetary Policy under Symmetric Demand Shocks

Germany
Y
P Sg
Dg Dp
Sp
Effects of a Depreciation in Germany under a Symmetric Demand Shocks
Poland
Y
P

• Supply shocks have permanent effect on the potential output.
• Furthermore, supply shocks lower price level of the country
(exchange rate appreciates permanently).
• There is less need for a monetary authority to react to supply
shocks.
• There are no automatic adjustment channels to supply shocks
(except to technology transfers and spillovers).
• Still, a monetary unions has to be characterized by similar demand
and supply shocks.
Supply Shocks vis-à-vis Demand Shocks

Supply and Demand Shocks
Note: This figure displays the correlation of supply (x-axis) and demand shocks (y-axis) in the selected countries and in the euro area. Source: Fidrmuc, Jarko and Iikka Korhonen (2003) ‘Similarity of Supply and Demand Shocks between the Euro Area and the CEECs.’ Economic Systems 27(3), 313-334.
HR
GR
IE
ROBGNZ
NO
ES
CH
AU
CA
JP
US
IT
TR
SE ATFI
PL FR
UK
CZSI
LVLT
SK
HUDK EE
PTNL BE
DE
-0.6
-0.4
-0.2
0.0
0.2
0.4
0.6
0.8
-0.2 0.0 0.2 0.4 0.6 0.8
Supply shocks
Dem
and
shoc
ks
I. The Theory of Optimum Currency Area.
II. Demand and Supply Shocks.
III. Static OCA Theory and the EMU Enlargement.
IV. Dynamic Aspects and the Endogeneity of the
OCA Criteria.
V. Conclusions
EMU Enlargement and the OCA Theory

• The previous findings are generally confirmed in the literature.
• By contrast, the integration steps consider different criteria.
• Especially Hungary, Poland, and the Czech Republic fail to fulfill the Maastricht fiscal criteria, which may reflect less interest of these countries in euro area membership.
• Furthermore, high inflation is observed especially in the BalticStates.
• Nevertheless, it seems that the revised plans for the euro adoption are more compatible with the OCA results than the early statements.
Do we Care about OCA Theory?
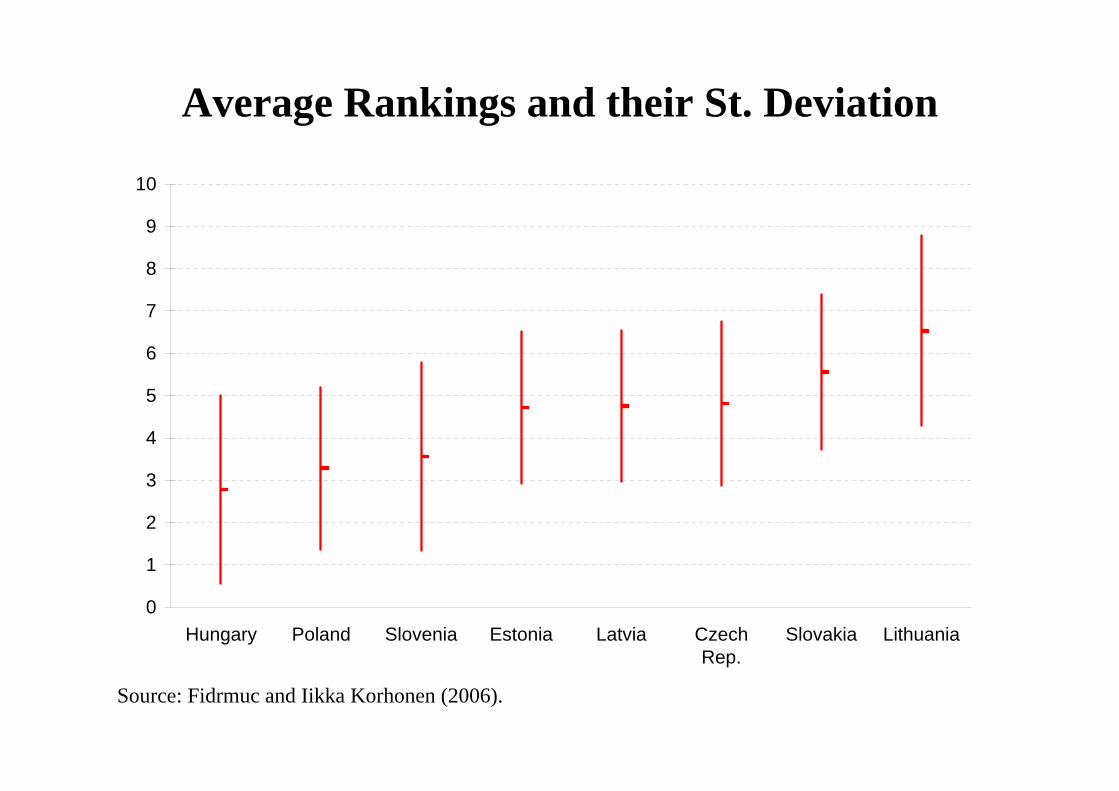
Average Rankings and their St. Deviation
0
1
2
3
4
5
6
7
8
9
10
Hungary Poland Slovenia Estonia Latvia CzechRep.
Slovakia Lithuania
Source: Fidrmuc and Iikka Korhonen (2006).
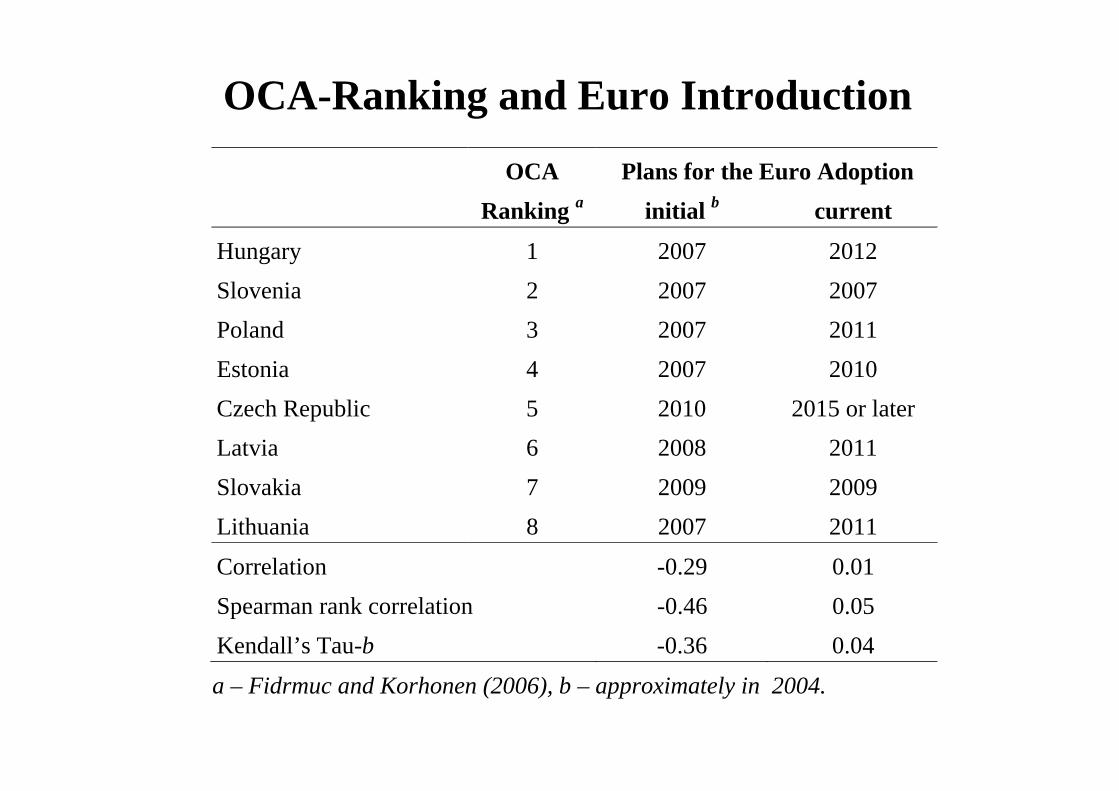
OCA-Ranking and Euro Introduction
OCA Plans for the Euro Adoption Ranking a initial b current
Hungary 1 2007 2012 Slovenia 2 2007 2007 Poland 3 2007 2011 Estonia 4 2007 2010 Czech Republic 5 2010 2015 or later Latvia 6 2008 2011 Slovakia 7 2009 2009 Lithuania 8 2007 2011
Correlation -0.29 0.01 Spearman rank correlation -0.46 0.05 Kendall’s Tau-b -0.36 0.04
a – Fidrmuc and Korhonen (2006), b – approximately in 2004.
I. The Theory of Optimum Currency Area.
II. Demand and Supply Shocks.
III. Static OCA Theory and the EMU Enlargement.
IV. Dynamic Aspects and the Endogeneity of the
OCA Criteria.
V. Conclusions
EMU Enlargement and the OCA Theory

• Frankel and Rose (1997, 1998) show the possibility that the OCA criteria may be endogenous.
• Trade integration, FDI flows and restructuring of EU’s trade with the CEECs (intraindustry trade) is already relatively progressed;
• The synchronization of business cycles is likely to increase with EU accession as a result of increased trade intensity and structural improvements.
• Different and inflexible labor markets and country-specific fiscal policies may cause different transmission mechanisms of more or less symmetric shocks.
OCA-Endogeneity
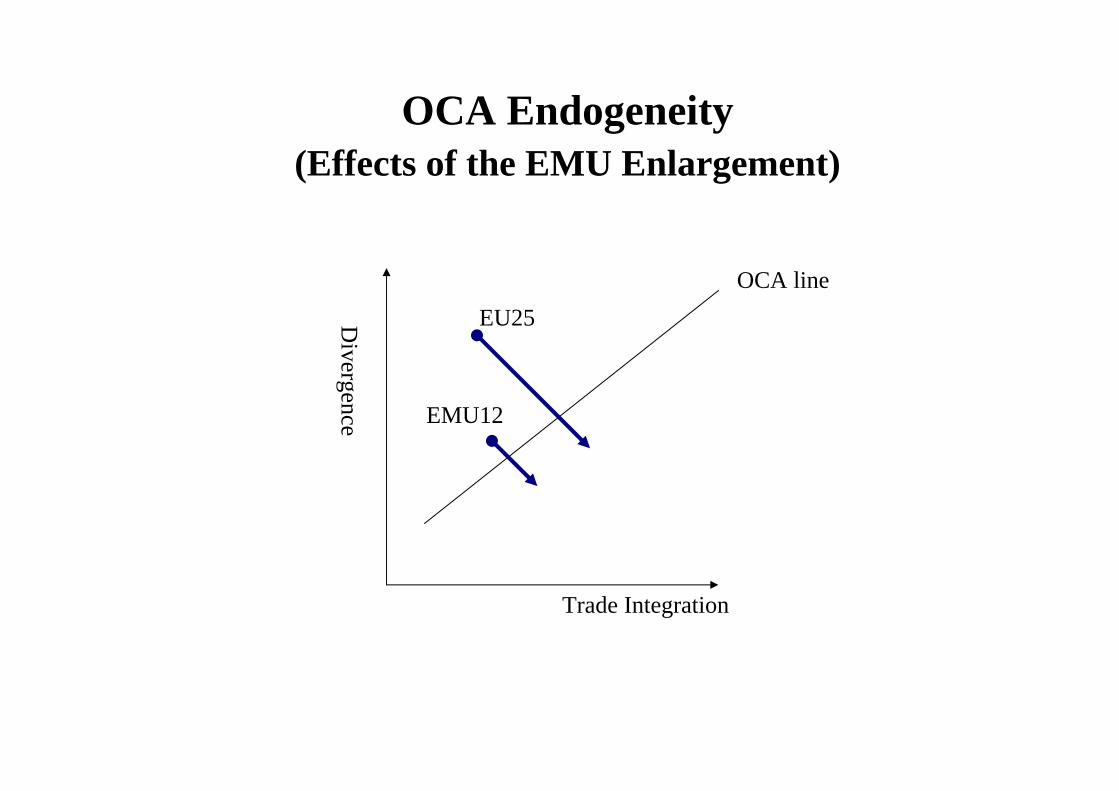
OCA Endogeneity(Effects of the EMU Enlargement)
Divergence
Trade Integration
OCA line
EMU12
EU25

Regional Structure of Exports (%) in 2001 / II
0
10
20
30
40
50
60
70
80
90
100Po
rtuga
l
Nor
way
Bel
gium
Hun
gary
Net
herl.
Spai
n
Pola
nd
Cze
ch R
.
Rom
ania
Latv
ia
Slov
enia
Aus
tria
Irel
and
Fran
ce
Den
mar
k
Switz
erl.
Slov
akia
Esto
nia
UK
Swed
en
Italy
Ger
man
y
Finl
and
Bul
garia
Lith
uani
a
Gre
ece
US
Japa
n
New
Zea
l.
Aus
tralia
Can
ada
Euro Area Pre-Ins CE5 Baltic States

Labor Market Restrictions
0.0
0.5
1.0
1.5
2.0
2.5
3.0
3.5
4.0Po
rtuga
l
Slov
enia
Italy
Spai
n
Fran
ce
Swed
en
Nor
way
Ger
man
y
Esto
nia
Bel
gium
Slov
akia
Japa
n
Aus
tria
Net
herla
nds
Finl
and
Cze
ch R
epub
lic
Pola
nd
Hun
gary
Switz
erl.
Den
mar
k
Aus
tralia
Irel
and
Can
ada
UK
New
Zea
land
USA
EU15 New Member States Non-EU Countries
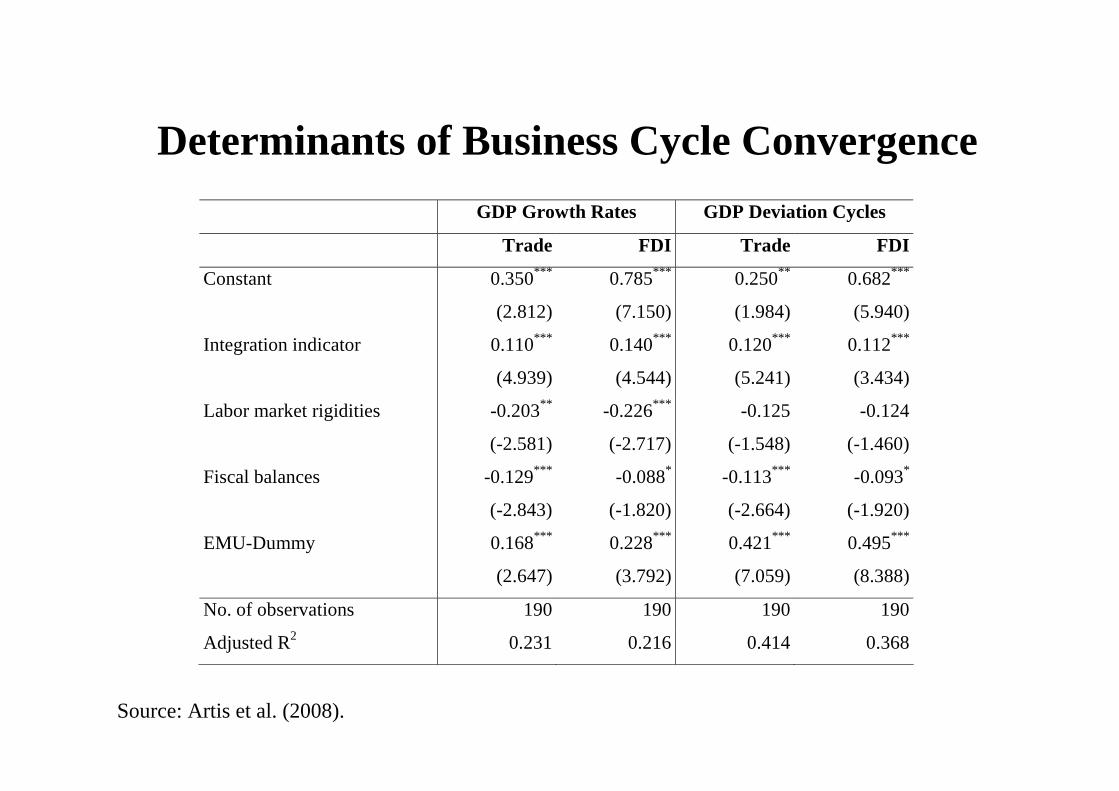
Determinants of Business Cycle Convergence GDP Growth Rates GDP Deviation Cycles
Trade FDI Trade FDI
Constant 0.350*** 0.785*** 0.250** 0.682***
(2.812) (7.150) (1.984) (5.940)
Integration indicator 0.110*** 0.140*** 0.120*** 0.112***
(4.939) (4.544) (5.241) (3.434)
Labor market rigidities -0.203** -0.226*** -0.125 -0.124
(-2.581) (-2.717) (-1.548) (-1.460)
Fiscal balances -0.129*** -0.088* -0.113*** -0.093*
(-2.843) (-1.820) (-2.664) (-1.920)
EMU-Dummy 0.168*** 0.228*** 0.421*** 0.495***
(2.647) (3.792) (7.059) (8.388)
No. of observations 190 190 190 190
Adjusted R2 0.231 0.216 0.414 0.368
Source: Artis et al. (2008).

Implications for EMU Enlargement: Decomposition of Business Cycle Correlation
-0.4
-0.3
-0.2
-0.1
0.0
0.1
0.2
0.3
0.4
0.5
0.6
Czech Republic Hungary Poland Slovakia Slovenia Estonia
Actual CorrelationImplied ValuesEMU Benchmark (Actual)
Source: Artis et al. (2008).

• There are potentially significant gains but also possibly high
costs of the euro introduction.
• A fairly clear ranking of new EU member countries seems
to emerge: Mainly business cycles of Slovenia, and Poland
are already correlated with the EMU’s business cycle.
• This pattern is rather different from the proposals of euro
introduction in the new member states.
• The underlying integration process should speed up the
convergence of business cycles within the enlarged EU.
Conclusions


![Ergotherapie - Thieme€¦ · eignen sich das Functional Independence Measure (FIM) und der Barthel-Index [3]. Für den Bereich der Körperfunktionen wenden wir in unserer Einrichtung](https://static.fdokument.com/doc/165x107/6062a4ff7cebd072da6be847/ergotherapie-thieme-eignen-sich-das-functional-independence-measure-fim-und.jpg)