Die kleine Berlin–Statistik 2015 · Die kleine Berlin–Statistik 2015 tistics Asylum seekers ⌜...
64
Die kleine Berlin–Statistik 2015 statistics Berlin Brandenburg Editor: Amt für Statistik Berlin-Brandenburg English edition 89,169 ha City area ⌜ 3.5 million Inhabitants ⌜ 1.8 million economically active population 2.0 million Privat households ⌜ 166 Museums ⌜ 171,263 Students ⌜ 80 Hospitals 24,607 Asylum seekers ⌜ 94.0 ever 100 of children in age from 3 until under 6 years in Day care centres 33,854 places in nursing homes ⌜ 33.1 million EUR Investment in environmental protection ⌜ 27.9 million air passengers 117.3 billion EUR Gross domestic product ⌜ 44,924 Business registrations ⌜ 38,528 EUR Compensation of employees per employee 318 thousend Residential buildings ⌜ 24.1 billion EUR Turnover in manufacturing ⌜ 11.9 million Guests of Berlin 13.3 billion EUR Exports ⌜ 107.8 Index of consumer prices based on 2010 60.6 billion EUR Dept level ⌜ 237 Convicts because of offences dangerous to the public 60.2 percent Turnout of the election to the House of Representatives of Berlin on 18.09.2011
Transcript of Die kleine Berlin–Statistik 2015 · Die kleine Berlin–Statistik 2015 tistics Asylum seekers ⌜...

Die kleine
Berlin–Statistik2015
statistics Berlin Brandenburg
Editor: Amt für Statistik Berlin-Brandenburg
English edition
89,169 ha City area ⌜3.5 m
illion Inhabitants ⌜1.8 m
illion economically active population
2.0 million Privat households ⌜
166 Museum
s ⌜171,263 Students ⌜
80 Hospitals 24,607 Asylum
seekers ⌜94.0 ever 100 of children in age from
3 until under 6 years in Day care centres 33,854 places in nursing hom
es ⌜33.1 m
illion EUR Investment in environm
ental protection ⌜27.9 m
illion air passengers 117.3 billion EUR Gross dom
estic product ⌜44,924 Business registrations ⌜
38,528 EUR Compensation of em
ployees per employee
318 thousend Residential buildings ⌜
24.1 billion EUR Turnover in manufacturing ⌜
11.9 million Guests of Berlin
13.3 billion EUR Exports ⌜107.8 Index of consum
er prices based on 2010 60.6 billion EUR Dept level ⌜
237 Convicts because of offences dangerous to the public 60.2
percent Turnout of the election to the House of Representatives of Berlin on 18.09.2011
Photograph credits
»The Berlin Bear« (heraldic beast) The photo was created with the kind support of Mrs. Kutzner (District Office Berlin-Mitte) in October 2011. © AfS Berlin-Brandenburg
Information management
Amt für Statistik Berlin-BrandenburgBehlertstraße 3 a14467 PotsdamTelephone: +49 331 8173-1777Telefax: +49 30 9028-4091 E-Mail: [email protected]
www.statistik-berlin-brandenburg.de
Imprint
Published in December 2015 Design and LayoutAmt für Statistik Berlin-BrandenburgPrinted by Brandenburgische Universitätsdruckerei und Verlagsgesellschaft Potsdam mbH
© Amt für Statistik Berlin-BrandenburgPotsdam, 2015Reproduction and distribution, also of parts, are permitted provided that the source is mentioned.
Explanation of symbols– no figures… data will be available later• numerical value unknown or not to be disclosedx cell blocked for logical reasons( ) limited informational value because numerical value is of limited statistical reliability/ no data because the numerical value is not sufficiently reliable
Abbreviation of unitsbn billionEUR euroha hectarehrs hourskm kilometrekm² square kilometrel litrem² square metrem³ cubic metre MJ mega joule mm millimetremn milliont ton

Contents D
ie kleine Berlin-Statistik
16 Employment and compensation of employees, Labour Market | 32
17 Construction, Housing | 34
18 Industry | 35
19 Retail Trade, Hotel and Restaurant Industry, Tourism | 38
20 Foreign Trade | 41
21 Consumer Prices | 42
22 Construction Prices | 43
23 Earnings | 44
24 Public Finances | 46
25 Judicature | 48
26 Political Parties | 49
27 Elections | 50
28 The Boroughs of Berlin 2014 | 56
29 Berlin 1871 to 2014 | 58
30 The Region Berlin/Brandenburg 2014 | 60
1 City Area | 6
2 Population | 8
3 Livelihood | 13
4 Households and Families | 14
5 Culture | 15
6 Education | 16
7 Sports, Leisure | 19
8 Public health system | 20
9 Public social benefits | 22
10 Facilities for child care, youth welfare | 23
11 Care | 25
12 Environment | 26
13 Transport | 28
14 National Accounts | 30
15 Business notification, Insolvencies | 31

Introduction
»DIE kleine BERLIN-STATISTIK 2015« (statistics for the City of Berlin 2015, key facts and figures) offers infor- mation on the development of the German capital, based on the most important statistical results.
Benchmarks to demographic, economic, social, cultural and political structures of Berlin are presented in Chapter 1 to 27. The results are compared to previous years. The brochure also contains information on the city’s boroughs (Chapter 28), data on Berlin‘s development since 1871 (Chapter 29) and figures for the region of Berlin/Brandenburg (Chapter 30).
On December 31, 2014 the area of Berlin covered 892 km². More than 41 percent of it were buildings and associated open spaces and nearly 15 percent traffic areas. Recreation area covered 12 and production area 0.6 percent.
In 2014, Berlin had more than 37 thousand live births. The number of deaths was more than 32 thousand, which leads to a sur- plus of births of 5 thousand people. Berlin registered in 2014 a migration surplus of approximately 40 thousand people. At the end of 2014 Berlin had nearly 3.5 million inhabitants, 48 thousand persons more compared to the beginning of the year. About 497 thousand foreigners lived in Berlin at the end of 2014.
Nearly 2.0 million households were coun-ted 2014 in Berlin. 54 percent of them were single-person households. More than 337 thousand families with children under the age of 18 lived in Berlin.
In the school year 2014/15 approximately 330 thousand pupils visited general education schools, including 10 percent private schools.
In the winter semester 2014/15 there were about 171 thousand students in Ber-lin, including 49 percent women. 66 per-cent of students were enrolled at universi-ties. 27 percent were students in the fields of law, economics and social sciences, and 21 percent of engineering.
Die kleine Berlin-Statistik
2014, practiced nearly 20 thousand physi-cians and 4 thousand dentists in Berlin.
The 80 hospitals in Berlin possessed more than 20 thousand beds in. The average length of stay was 7.5 days.
In 2014, there were approximately 22 thousand recipients of continual subsis- tence payment, 74 thousand recipients of basic security in old age and disability and 60 thousand benefits under the 5th to 9th Chapter of SGB XII.
For the past twelve years in a row Berlin reports increasing numbers of visitors and overnight stays. With 28.7 million over-night stays, the result of 2013 was excee- ded by more than 6 percent. The number of visitors increased in 2014 to 11.9 mil-lion, or by nearly 5 percent. The average length of stay of tourists in Berlin in 2014 was 2.4 days.
Nearly 9 thousand dwellings were built in Berlin in 2014, almost one third more than in the previous year. Most dwellings were built in in the boroughs of Pankow, Mitte and Treptow-Köpenick.
Nearly 45 thousand business registrations were registered in 2014 for Berlin. This was 2.8 percent less than in previous year. With approximately 35 thousand business deregistrations were at previous year‘s level.
Berlin’s economy grew by 2.2 percent in 2014. The year before the economic output increased by 0.2 percent.
In 2014, the European Parliament elections took place. The SPD with 24.0 percent of the votes is the strongest party in Berlin, followed by the CDU with 20.0 percent and the Greens with 19.1 percent.
»DIE kleine BERLIN-STATISTIK 2015« gives an initial overview of the data provided by official statistics. A similar brochure has been published for the fede- ral state of Brandenburg (»DIE kleine BRANDENBURG-STATISTIK 2015«). Both booklets are also published in German. Comparative figures for the federal states interested can be found in the common statistics portal of the statistical offices of Germany and the federal states
www.statistikportal.de.

�������������
�������
������
����� ��������� ��������
�����������
����������������
����������
��������
�����������������
����������
������������������������
����� ������
������������
����������������������� ������������������
��������������������
���� ���������
�������������� �������
�����������
����������
������
���������������
���������
�������
������
����������
����������
���������
������
������� ��
����������������������
6 |
01.1 City Area
Geographical locationCity centre - Berlin Town Hall -52° 31‘ 12“ north latitude13° 24‘ 36“ east longitude
Local time6 minutes 22 seconds behind Central European Time12 o‘clock CET = 11:53:38Berlin local time
Length of border234 km
Largest expansion45 km, east-west38 km, north-south

�������������
�������
������
����� ��������� ��������
�����������
����������������
����������
��������
�����������������
����������
������������������������
����� ������
������������
����������������������� ������������������
��������������������
���� ���������
�������������� �������
�����������
����������
������
���������������
���������
�������
������
����������
����������
���������
������
������� ��
����������������������
| 7
01.2 City Area
City area (ha) 89,169
Land use % Bigger lakes haBuildings and associated open spaces ............ 41.5 Großer Müggelsee .......................... 743.3Industrial ................................. 0.6 Tegeler See ..................................... 384.3Recreational ............................. 12.0 Langer See ..................................... 290.3Traffic area ............................... 14.9 Großer Wannsee ............................. 276.4Agricultural .............................. 4.3 Seddinsee ...................................... 258.0Forest land ............................... 18.4 Zeuthener See ................................ 228.4Lakes and waterways ............... 6.7 including in Köpenick .................. 131.0Other uses ................................ 1.6 Jungfernsee ................................... 124.2
metre including in Zehlendorf ............... 31.4Elevations abovesea level Dämeritzsee .................................. 93.5Müggelberge ........................... 115 including in Köpenick ................. 46.3Teufelsberg .............................. 115 Niederneuendorfer See .................. 76.6Ahrensfelder Berge .................. 112 including in Reinickendorf .......... 55.5Schäferberg .............................. 103Kienberg .................................. 102 Rivers (within Berlin) Length in kmHavelberg ................................. 97 Spree .............................................. 45.1Stolper Berge ........................... 97 Havel .............................................. 27.1Mülldeponie Wannsee .............. 92 Panke ............................................. 17.6Prenzlauer Berg ........................ 91 Dahme ............................................ 16.4Hahneberg ............................... 88 Wuhle ............................................ 15.7Humboldthöhe ......................... 85Lübarser Höhe .......................... 85 Canals (within Berlin) Dörferblick ............................... 84 Teltowkanal ................................... 29.1 Biesdorfer Höhe ....................... 82 Landwehrkanal with Flutgraben .... 11.8Finkenberg ............................... 81 Berlin-Spandauer Schifffahrtskanal Karlsberg ................................. 79 (Hohenzollernkanal) ...................... 7.9 Großer Bunkerberg .................. 78 Neuköllner Schifffahrtskanal .......... 4.0 Freizeitpark Marienfelde .......... 77

Foreigners as of 31 December 2014 by age groups
8 |
02.1 Population
The censuses taking place in several years' distance, provide the basis of data on the popula-tion as well as for regional and demographic structure of the population. Their results serve as basis for the updating the official total population, which is shown here (as of 31 December).
Unit 2006 2010 2014 ¹
Inhabitants ......... 1000 3,404 3,461 3,470including female % 51.1 51.0 51.1
Foreigners ........... 1000 473 472 497including female % 47.4 48.6 49.4
Age in years 0 to 5 ........... % 4.9 5.4 5.9 6 to 17 ........... % 9.7 9.1 9.718 to 24 ........... % 8.8 8.5 7.325 to 34 ........... % 14.6 15.7 17.035 to 44 ........... % 17.5 14.8 13.445 to 54 ........... % 14.4 15.8 15.655 to 64 ........... % 12.1 11.6 11.965 and over ....... % 17.9 19.1 19.2
Marital statusMen ..................... 1000 1,665.8 1,695.4 1,696.2single ................... % 53.0 55.4 54.2married² .............. % 35.3 32.8 35.3widowed² ............ % 2.3 2.4 2.3divorced² .............. % 9.3 9.4 8.2Women ................ 1000 1,738.3 1,765.3 1,773.6single ................... % 44.8 47.3 46.1married² .............. % 34.0 32.1 33.8widowed² ............ % 10.0 9.3 9.0divorced² .............. % 11.2 11.3 11.2
1 data, population projections based on the census 2011
2 2014: including cohabiting couple
20 to 39
0 to 19
40 to 59
60 and over

02.2 Population
Updated age pyramid on 31 December 2014 by age and marital status
widowed²
40 35 30 25 20 15 10 5 0thousand
0
5
10
15
20
25
30
35
40
45
50
55
60
65
70
75
80
85
90
95
100
5 10 15 20 25 30 35 400thousand
5
10
15
20
25
30
35
40
45
50
55
60
65
70
75
80
85
90
95
100Age in yearsiiiiiii
0
divorced²
married²single
Surplus of womenSurplus of man
Male Female
| 9

10203040
02006 2007 2008 2009 2010 2011 2012 2013 2014
MarriagesDivorces
thousand
2006 2007 2008 2009 2010 2011 2012 2013 2014
Live birthsDeaths
10 |
02.3 Population
Unit 2006 2010 2014MarriageMarriages ........................... number 11,634 12,394 13,373Divorces .............................. number 8,315 8,384 6,405
BirthLive births .......................... number 29,627 33,393 37,368
rate¹ 40.4 47.4 54.4viz. outside marriage ..... number 13,761 16,545 18,865
% 46.4 49.5 50.5foreigners² .............. number 4,621 4,246 5,752
% 15.6 12.7 15.4
DeathDeaths ................................ number 31,523 32,234 32,314
rate³ 9.3 9.4 9.4incl. deaths under 1 year number 108 101 103
rate⁴ 3.6 3.0 2.8Excess of births or deaths . number -1,896 1,159 5,054
rate³ -0.6 0.3 1.5
1 Per 1000 women at the age from 15 to under 45 years, 2006 and 2010 calculated based on 1987/1990, 2014 calculated on the basis of the 2011 census
2 Both parents foreigners or the mother only when unmarried
3 Per 1000 inhabitants, 2014: based on the average population, calculated on the basis of the 2011 census
4 Per 1000 live births

Migration across the border of Berlin
-80-70-60-50-40-30-20-10
102030405060708090
100 thousand
0
2006 2007 2008 2009 2010 2011 2012 2013 2014
ImmigrantsEmigrants
�
�
Balance
GermansForeigners
| 11
02.4 Population
Migration across the border of Berlin
Unit 2006 2010 2014
Arrivals .................................... number 118,893 147,769 174,572including foreigners ............... number 45,214 61,462 97,287
Departures .............................. number 108,214 130,951 137,459including foreigners ............... number 31,908 59,091 61,463
Balance ................................... number 10,679 16,818 37,113
Internal migration ................. number 354,497 319,251 •
Members of religious denominationsProtestant ................................ 1000 733 648 612Catholic .................................... 1000 321 318 331Jewish ...................................... 1000 12 12 11¹Islamic ..................................... 1000 214 249² 249²
1 Data of 20112 Data of 2009Sources: Consistory of the Protestant Church Berlin- Brandenburg-schlesische Oberlausitz (Konsistorium der Evangelischen Kirche Berlin- Brandenburg-schlesische Oberlausitz) and Ordinariate archbishopric Berlin
12 |
02.5 Population
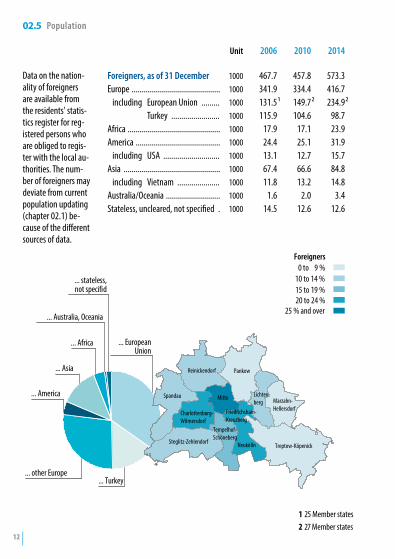
Data on the nation-ality of foreigners are available from the residents' statis-tics register for reg-istered persons who are obliged to regis-ter with the local au-thorities. The num-ber of foreigners may deviate from current population updating (chapter 02.1) be-cause of the different sources of data.
Unit 2006 2010 2014
Foreigners, as of 31 December 1000 467.7 457.8 573.3Europe ............................................ 1000 341.9 334.4 416.7
including European Union ......... 1000 131.5¹ 149.7² 234.9²Turkey ........................ 1000 115.9 104.6 98.7
Africa .............................................. 1000 17.9 17.1 23.9America .......................................... 1000 24.4 25.1 31.9
including USA ............................ 1000 13.1 12.7 15.7Asia ................................................ 1000 67.4 66.6 84.8
including Vietnam ..................... 1000 11.8 13.2 14.8Australia/Oceania ........................... 1000 1.6 2.0 3.4Stateless, uncleared, not specified . 1000 14.5 12.6 12.6
1 25 Member states2 27 Member states
0 to 9 %10 to 14 %15 to 19 %20 to 24 %
25 % and over
Foreigners
Mitte
Pankow
Charlottenburg-Wilmersdorf
Spandau
Steglitz-Zehlendorf
Tempelhof-Schöneberg
Neukölln Treptow-Köpenick
Marzahn-Hellersdorf
Lichten-berg
Reinickendorf
... Africa
... Asia
... other Europe
... America
... Turkey
... EuropeanUnion
... stateless,not specifid
... Australia, Oceania
Friedrichshain-Kreuzberg

Private households by monthly net income 2014
50 100 150 200 250 3000 thousand
0 to 500500 to 900
900 to 1,3001,300 to 1,5001,500 to 2,0002,000 to 2,6002,600 to 3,2003,200 to 4,0004,000 and over
Single-personhouseholdsMulti-personhouseholds
EUR
| 13
03 Livelihood
Unit 2006 2010 2014
The microcensus is a household survey conducted annually, comprising 1 percent of households. It pro-vides information on the economic and social situation of the population.
Population .................................... 1000 3,398.9 3,444.8 3,443.1… by labour force participation Economically active population ...... 1000 1,792.6 1,805.8 1,823.4
Employed persons ....................... 1000 1,458.0 1,568.8 1,644.4Unemployed persons .................. 1000 334.6 237.0 179.1
Inactive population ........................ 1000 1,606.3 1,639.0 1,619.6
… by main subsistence Employment .................................. 1000 1,352.1 1,462.3 1,501.7Unemployment benefit/relief – ALG I/II ¹ ...................................... 1000 413.5 35.3 35.1Benefits according Hartz IV (ALG II, social benefit) .................... 1000 – 346.1 349.9Pension .......................................... 1000 765.5 805.5 735.9Assistance by affiliated ................... 1000 694.1 668.7 667.8Own fortune, letting etc. ............... 1000 19.1 25.3 25.6Social welfare assistance/ current assistance to living costs .... 1000 79.7 30.2 44.0Parental benefit, child-raising benefit² ..................... 1000 – 15.6 16.7Other support ................................. 1000 75.0 55.9 66.4
1 With implementation of SGB II omission of the unemployment relief and intro- duction of new achievement forms
2 Since 2009 only parental benefit
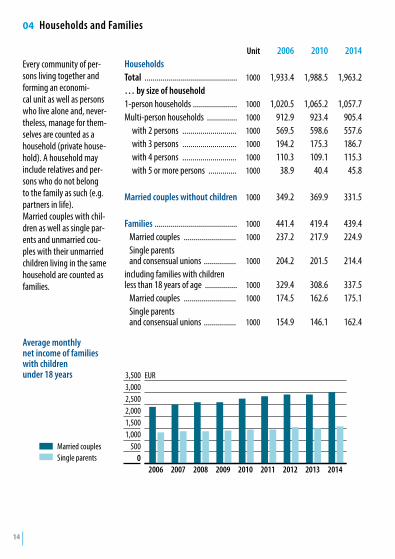
Average monthly net income of families with children under 18 years
5001,0001,5002,0002,5003,0003,500
02006 2007 2008 2009 2010 2011 2012 2013 2014
Married couplesSingle parents
EUR
14 |
04 Households and Families
Every community of per-sons living together and forming an economi-cal unit as well as persons who live alone and, never-theless, manage for them-selves are counted as a household (private house-hold). A household may include relatives and per-sons who do not belong to the family as such (e.g. partners in life). Married couples with chil-dren as well as single par-ents and unmarried cou-ples with their unmarried children living in the same household are counted as families.
Unit 2006 2010 2014HouseholdsTotal .............................................. 1000 1,933.4 1,988.5 1,963.2… by size of household1-person households ...................... 1000 1,020.5 1,065.2 1,057.7Multi-person households ............... 1000 912.9 923.4 905.4
with 2 persons ........................... 1000 569.5 598.6 557.6with 3 persons ........................... 1000 194.2 175.3 186.7with 4 persons ........................... 1000 110.3 109.1 115.3with 5 or more persons .............. 1000 38.9 40.4 45.8
Married couples without children 1000 349.2 369.9 331.5
Families ......................................... 1000 441.4 419.4 439.4Married couples .......................... 1000 237.2 217.9 224.9Single parents and consensual unions ................ 1000 204.2 201.5 214.4
including families with children less than 18 years of age ................ 1000 329.4 308.6 337.5
Married couples .......................... 1000 174.5 162.6 175.1Single parents and consensual unions ................ 1000 154.9 146.1 162.4
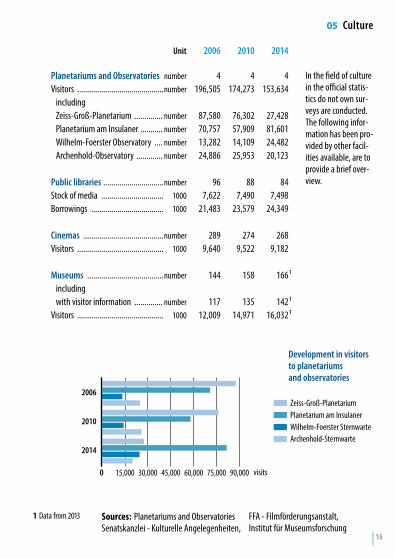
Development in visitors to planetariums and observatories
15,000 30,000 45,000 60,000 75,000 90,0000 visits
2006
2010
2014
Zeiss-Groß-PlanetariumPlanetarium am InsulanerWilhelm-Foerster SternwarteArchenhold-Sternwarte
| 15
05 Culture
Unit 2006 2010 2014
In the field of culture in the official statis-tics do not own sur-veys are conducted. The following infor-mation has been pro-vided by other facil-ities available, are to provide a brief over-view.
Planetariums and Observatories number 4 4 4Visitors ...........................................number 196,505 174,273 153,634
includingZeiss-Groß-Planetarium .............. number 87,580 76,302 27,428Planetarium am Insulaner ........... number 70,757 57,909 81,601Wilhelm-Foerster Observatory .... number 13,282 14,109 24,482Archenhold-Observatory ............. number 24,886 25,953 20,123
Public libraries ..............................number 96 88 84Stock of media ............................... 1000 7,622 7,490 7,498Borrowings .................................... 1000 21,483 23,579 24,349
Cinemas ........................................number 289 274 268Visitors ........................................... 1000 9,640 9,522 9,182
Museums ......................................number 144 158 166¹includingwith visitor information .............. number 117 135 142¹
Visitors ........................................... 1000 12,009 14,971 16,032¹
1 Data from 2013 Sources: Planetariums and Observatories Senatskanzlei - Kulturelle Angelegenheiten,
FFA - Filmförderungsanstalt, Institut für Museumsforschung

16 |
6.1 Education
Unit 2006 2010 2014Pupils in Primary schools ................................... number 158,464 152,694 156,999Integrated secondary schools .............. number x 17530 84,494Secondary general schools .................. number 12,894 8,110 xNDH-classes¹ ....................................... number 535 x xIntermediate schools ........................... number 22,482 15,363 xGrammar schools ................................ number 81,046 78,058 75,529Comprehensive schools ....................... number 46,450 36,845 4,217Special schools .................................... number 13,008 11,458 8,993Vocational schools (dual system) ........ number 62,927 57,517 48,510Full-time vocational schools ................ number 17,852 17,365 16,919Specialised upper secondary schools² . number 7,709 6,143 4,655Two-year full-time vocational schools² number 1,130 1,400 1,093Vocational grammar schools ............... number 2,762 2,603 4,400Trade and technical schools ................. number 6,232 7,857 11,349Schools of nurses, midwives etc .......... number 5,763 5,917 5,851
School leavers³ .................................. number 32,722 26,638 24,853Without final certificate ...................... number 3,220 2,730 2,430
including female ............................... % 39.3 41.0 42.5With secondary general school certificate ................................. number 2,250 1,963 1,842
including female ............................... % 40.8 41.7 41.4With extended secondary general school certificate ................................. number 5,212 3,792 2,261
including female ............................... % 44.9 45.4 45.3With certificate obtained after grade 10 ..................................... number 9,794 6,517 6,608
including female ............................... % 47.6 46.4 46.4With general higher education entrance qualification ......................... number 12,246 11,636 11,712
including female ............................... % 56.5 55.0 54.6
Teaching staff⁴… Schools of general education .............. number 25,527 25,083 27,174Vocational schools² ............................. number 4,689 4,552 4,752Schools for nurses, midwives etc ......... number 410 468 487
1 Special classes for pupils of non-German origin language
2 Incl. courses of the second-chance education qualifying for higher education
3 Schools of general education
4 Full- and part-time teaching staff
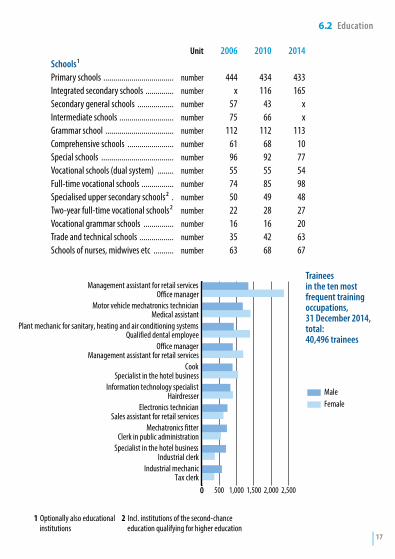
Trainees in the ten most frequent training occupations, 31 December 2014, total: 40,496 trainees
| 17
1 Optionally also educational institutions
6.2 Education
Unit 2006 2010 2014Schools ¹ Primary schools ................................... number 444 434 433Integrated secondary schools .............. number x 116 165Secondary general schools .................. number 57 43 xIntermediate schools ........................... number 75 66 xGrammar school .................................. number 112 112 113Comprehensive schools ....................... number 61 68 10Special schools .................................... number 96 92 77Vocational schools (dual system) ........ number 55 55 54Full-time vocational schools ................ number 74 85 98Specialised upper secondary schools² . number 50 49 48Two-year full-time vocational schools² number 22 28 27Vocational grammar schools ............... number 16 16 20Trade and technical schools ................. number 35 42 63Schools of nurses, midwives etc .......... number 63 68 67
2 Incl. institutions of the second-chance education qualifying for higher education
500 1,000 1,500 2,000 2,5000
Management assistant for retail services
Motor vehicle mechatronics technician
Plant mechanic for sanitary, heating and air conditioning systems
Office manager
Cook
Information technology specialist
Electronics technician
Mechatronics fitter
Specialist in the hotel business
Industrial mechanic
Office manager
Medical assistant
Qualified dental employee
Management assistant for retail services
Specialist in the hotel business
Hairdresser
Sales assistant for retail services
Clerk in public administration
Industrial clerk
Tax clerk
MaleFemale

Students in winter semester 2014/15 by area of study
Legal, economic and social sciences
Languages and arts
Mathematics, natural sciences
Engineering
Other subject
18 |
6.3 Education
All universities, art schools and colleges which are recognized under national law, submit their infor-mation based on the Higher Education Statistics Act.
Unit 2006 2010 2014
Students ¹ ........................................... number 132,822 147,030 171,263incl. female ....................................... % 49.7 49.3 49.5
At universities ................................... number 97,612 102,066 113,615incl. female ....................................... % 51.7 50.3 50.0
At collegesof art and music .............. number 4,899 4,995 5,383incl. female ....................................... % 57.8 57.4 59.7
At specialised colleges of higher education (Fachhochschulen) .......... number 28,221 39,542 51,789
incl. female ....................................... % 40.6 45.3 47.0At colleges of public administration number 2,090 427 476
incl. female ....................................... % 60.4 63.7 70.8
New entrants² viz. in the first semester in higher education ............................... number 20,318 28,850 32,670in the first subject-related semester .. number 28,122 44,836 55,583
Academic and creative arts staff³ (without student auxiliary workers) .... number 19,725 23,294 24,543as primary occupation ......................... number 12,035 14,539 14,993as secondary occupation ..................... number 7,690 8,755 9,550
1 Winter semester 2 Academic year (summer semester and the following winter semester)
3 At 1 December

The ten most popular kinds of sports, by members of sports associations 2014
10 20 30 40 50 60 70 80 90 100 110 120 130 140 thousand0
Football / SoccerGymnastics
TennisSwimming
MountaineeringSailing
GolfHandball
VolleyballAthletics
| 19
07 Sports, Leisure
Unit 2006 2010 2014
The statistics of the sports associations will be created in collaboration with the State Sports Association. Further information provided by the competent bodies.
Sports clubs ............................... number 1,850 1,931 2,012Members ..................................... 1000 439 479 531
Sports facilities ..........................Sports halls ................................. number 1,147 1,086 1,638Playing fields .............................. number 1,096 1,099 1,093400m-round-courses .................. number 98 88 94Public indoor pools, open-air swimming pools and baths¹ ........ number 92 92 95
Children's playgrounds ............. number 1,824 1,842 1.847Area ............................................ ha 199 192 217
AllotmentLots ............................................. number 76,165 74,094 73,057Area ............................................ ha 3,137 3,046 2,992
Visits to zoological gardensZoologischer Garten .................... 1000 1,577 1,971 2,282Aquarium .................................... 1000 824 914 975Tierpark ....................................... 1000 866 967 1,160
1 Incl. pools for specific purposes

Diseases of the respiratory system
20 |
08.1 Public health system
The statistics of the public health system are based on reports by the public health authorities and the hospitals.
Unit 2006 2010 2014Selected causes of death Diseases of the circulatory system number 12,155 11,936 9,972Neoplasms .................................. number 8,291 8,855 8,693Injury and poisoning ................... number 1,166 1,185 1,233AIDS/HIV diseases ....................... number 80 66 30Diseases of the respiratory system ....................... number 2,293 2,369 2,549
Died infants ............................... number 108 101 103rate¹ 3.6 3.0 2.8
Physicians ................................. number 17,089 18,184 19,737
Dentists ...................................... number 3,751 3,791 4,002
500
1,000
1,500
2,000
2,500
3,000
0
2006 2007 2008 2009 2010 2011 2012 2013 2014
1 Per 1000 live births

Average length of stay
2
4
6
8
10 days
0
2006 2007 2008 2009 2010 2011 2012 2013 2014
| 21
08.2 Public health system
Unit 2006 2010 2014
Hospitals ............................................ number 72 79 80Beds provided ..................................... number 19,859 19,782 20,021Admissions .......................................... number 694,234 755,309 813,375Dismissals ........................................... number 678,048 737,868 797,402Inpatient treatments² ......................... number 694,518 755,185 813,799Death cases ......................................... number 16,754 17,193 16,821Average length of stay ........................ days 8.4 7.8 7.5Full-time physicians ............................ number 7,246 7,765 8,681Nursing staff ....................................... number 15,168 15,651 16,394Medical laboratory staff ...................... number 7,717 7,581 7,663Functional staff ................................... number 5,059 5,393 5,896Other non-medical staff ...................... number 981 778 276
Selected causes for treatment (main diagnoses)³Diseases of the circulatory system ....... number 110,185 114,925 118,774Neoplasms .......................................... number 87,977 92,851 97,928Injury and poisoning ............................ number 65,507 74,073 80,805Diseases of the digestive system ......... number 72,064 77,810 84,492
2 Incl. same-day cases3 Incl. deaths and hourly cases

Recipients of basic security in old age and disability
10,00020,00030,00040,00050,00060,00070,00080,000
02006 2007 2008 2009 2010 2011 2012 2013 2014
22 |
09 Public social benefits
Information about social benefits is taken from different official statistics (e.g. social assistance, housing allowance and severely disabled person statistics).
Public assistance Unit 2006 2010 2014Recipients of continual subsistence payment .................. number 22,980 18,523 22,381Recipients of basic security in old age and disability .............. number 51,922 59,611 73,983Recipients of benefits under the 5th to 9th Chapter of SGB XII ....... number 49,404 56,067 59,912Gross expenditures ...................... EUR mn 1,222.0 1,464.9 1,732.4
Asylum seekers Recipients, end of year ................ number 13,168 11,429 24,607Gross expenditures ...................... EUR mn 87.0 75.7 185.3
Housing allowance Recipients (households) .............. number 32,365 38,414 21,826
Severely handicapped persons ¹ number 308,765 342,968 346,826rate² 91 100 101
1 Data from the previous year2 Per 1000 inhabitants

| 23
10.1 Facilities for child care
Unit 2006 2010 2014
Child day care centres ............... number 1,712 1,920 2,251Places .......................................... number 124,136 134,995 154,609Cared children ............................. number 105,583 121,036 141,347Staff ............................................ number 18,753 21,801 29,251Public institutions ..................... number 348 280 294Places .......................................... number 41,527 36,220 37,885Cared children ............................. number 35,221 31,813 34,848Staff ............................................ number 5,906 5,043 6,104Independent institutions ......... number 1,364 1,640 1,957Places .......................................... number 82,609 98,775 116,724Cared children ............................. number 70,362 89,223 106,499Staff ............................................ number 12,847 16,758 23,147
Attendance rates of children under 3 years ............. rate¹ 34.4 38.4 41.9of children 3 to under 6 years ...... rate¹ 87.1 92.6 94.0
Children in day care by child minders ........................ number 4,281 4,897 6,066
incl. under 3 years ..................... number 3,008 3,545 4,382Daily care staff ............................. number 1,342 1,433 1,703
Attendance ratesof children under 3 years ............. rate¹ 3.5 3.7 4.3of children 3 to under 6 years ...... rate¹ 1.3 1.3 1.4
1 Number of children in day care ever 100 of children in the same age group

24 |
10.2 Youth welfare
Closed cases, in the course of the year
Unit 2006 2010 ¹ 2014 ¹
Adoptions ................................... number 133 76 95Take of children in care ................ number 1,342 1,241 2,666Procedure to assess the child's welfare ..................... number • • 11,772acute child welfare risk ............... number • • 2,369latent child welfare risk ............... number • • 3,660no child welfare risk, but needs help ............................ number • • 3,286no child welfare risk and no need for assistance .......... number • • 2,457
Cases, as of end of year Assistance/counselling for young people Help for education ....................... number • 900 1,266Parenting advice ......................... number • 7,337 6,821Social group work ....................... number 639 511 548Individual assistance ................... number 717 856 1,306Day group education ................... number 482 452 466Full-time care .............................. number 1,677 1,376 1,502Care in residential homes; other forms of supported housing number 4,696 3,726 4,108Individual intensive socio-educational assistance ....... number 170 79 86Adaption support for mentally disordered young people ............. number • 1,536 2,751Family-oriented assistance/counselling help for education ....................... number • 78 162Socio-educational family assistance ......................... number 2,077 2,711 3,228
1 Methodical changes since 2007

Recipients of care² per 1000 of the population
5101520253035
0
2001 2003 2005 2007 2009 2011 2013
| 25
11 Care
Benefits from nursing care insurances ¹
Unit 2005 2009 2013
This data is provided by the institutions of outpatient and in-patient care facilities and the care funds.
Recipients of care² .................... number 94,996 101,351 112,509with inpatient care .................... number 25,676 26,013 27,528with ambulatory care ................ number 22,895 26,263 27,769cared for exclusively by family members at home ..... number 46,425 49,075 57,212
Nursing homes .......................... number 350 378 378private ....................................... number 148 181 191non-profit ................................. number 182 188 171public ........................................ number 20 9 16
Nursing home places ................ number 30,599 33,665 33,854
Ambulatory care services ......... number 422 505 567private ....................................... number 305 378 442non-profit ................................. number 117 123 121public ........................................ number – 4 4
Staff ............................................ number 31,752 39,082 42,040Nursing homes .......................... number 17,178 19,674 20,632Ambulatory care services .......... number 14,574 19,408 21,408
1 As of 15 December2 without outpatient care
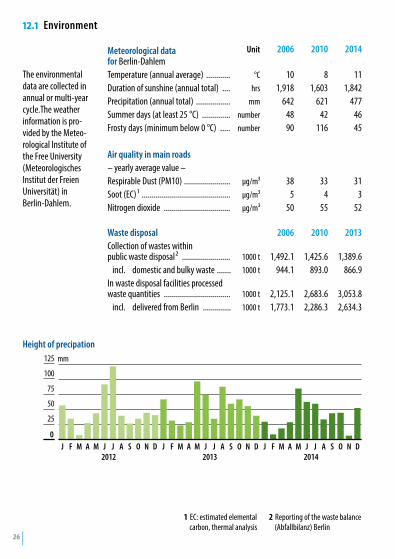
Height of precipation
25
50
75
100
125
J F M A M J J A S O N D J F M A M J J A S O N D J F M A M J J A S O N D2012 2013 2014
mm
0
26 |
12.1 Environment
The environmental data are collected in annual or multi-year cycle.The weather information is pro-vided by the Meteo- rological Institute of the Free University (Meteorologisches Institut der Freien Universität) in Berlin-Dahlem.
Meteorological data for Berlin-Dahlem
Unit 2006 2010 2014
Temperature (annual average) ............ °C 10 8 11Duration of sunshine (annual total) .... hrs 1,918 1,603 1,842Precipitation (annual total) ................. mm 642 621 477Summer days (at least 25 °C) .............. number 48 42 46Frosty days (minimum below 0 °C) ..... number 90 116 45
Air quality in main roads– yearly average value –Respirable Dust (PM10) ....................... µg/m³ 38 33 31Soot (EC)¹ ............................................ µg/m³ 5 4 3Nitrogen dioxide ................................. µg/m³ 50 55 52
Waste disposal 2006 2010 2013Collection of wastes within public waste disposal² ........................ 1000 t 1,492.1 1,425.6 1,389.6
incl. domestic and bulky waste ....... 1000 t 944.1 893.0 866.9In waste disposal facilities processed waste quantities ................................. 1000 t 2,125.1 2,683.6 3,053.8
incl. delivered from Berlin .............. 1000 t 1,773.1 2,286.3 2,634.3
1 EC: estimated elemental carbon, thermal analysis
2 Reporting of the waste balance (Abfallbilanz) Berlin

Investments for environmental protection of the enterprises of the mining industry and manufacturing
10 20 30 40 50 60 70 80 90 100
2006
2010
2013
%0waste managementPrevention of water pollutionNoise controlAir pollution controlNature protection andlandscape conservationGround redevelopmentClimate protection
| 27
12.2 Environment
Unit 2007 2010 2013Public water supplyWithdrawal of water ............................................ m³ mn 202.3 207.1 206.9Provison of water to final consumers in Berlin ..... m³ mn 189.4 193.3 189.1
incl. households and small businesses ............... m³ mn 138.4 141.7 140.7Connection rate to public water supply ................ % 99.8 99.8 99.8Water consumption per inhabitant and day ......... litre 111.6 112.9 113.8
Public sewage disposalIn facilities in Berlin treated sewage, total ........... m³ mn 81.7 82.4 84.6
viz. waste water ............................................... m³ mn 68.4 71.5 74.1treated in biological facilities ..................... m³ mn 81.7 82.4 84.6
Connection rate to public sewage treatment facilities .................................. % 99.0 99.6 99.6
Investment in environmental protection 2006 2010 2013Enterprises³ with investments ............................. number 656 601 596
incl. enterprises with investments in environmental protection ...................... number 69 75 100
Investments ......................................................... EUR mn 971.3 747.6 798.0incl. investment in environmental protection .... EUR mn 11.6 23.7 33.1
Share of the investments ........................... % 1.2 3.2 4.1
3 Companies of the Mining and Quarrying and the manufacturing

Passenger car
200 400 600 800 1,000 1,200 1,4000 thousand
2006
2010
2014
not reduced pollutant
pollutant-reduced withpetrol engine 6
pollutant-reducedwith diesel engine
28 |
13.1 Transport
The information on the traffic that come from official statis-tics.Additional infor-mation provided by other bodies.
Unit 2006 2010 2014Traffic routesPublic roads ............................................ km 5,343 5,413 5,437
incl. Autobahn system (motorways) ... km 73 77 77Bridges¹ ................................................. number 917 963 984Tram route length .................................. km 189.4² 296.7 295.7Underground line length ........................ km 144.2² 146.3 146.3S-Bahn (city railway) route length ......... km 331.0² 330.0 327.4Bus line length ....................................... km 1,656.0² 1,675.0 1,725.0
PassengersTram incl. Underground .......................... mn 628.2 675.6 698.4Bus ......................................................... mn 408.0 382.6 405.5Railroad incl. city railway (S-Bahn) ........ mn 318.2 391.9 433.3
Air traffic³Aircraft fligths⁴ ...................................... 1000 222.8 218.2 238.3Passengers ............................................. mn 18.4 22.2 27.9
Motor vehicles⁵(As of 1 January) .................................... 1000 1,416.4 1,287.2 1,352.6
incl. passenger/estate cars ................. 1000 1,226.0 1,105.7 1,154.1Lorries ......................................... 1000 80.8 73.7 82.8motorcycles ................................. 1000 94.3 93.5 100.3buses and coaches ....................... 1000 2.4 2.3 2.1
1 public easement in the federal government and the state of Berlin, since 2007 change of definition
2 route length
3 At Tegel, Tempelhof (up to Oktober 2008) and Schönefeld airports
4 Passenger, freight and training flights
5 Since 2008 according to the new regulaion for vehicle registration without tempo-rary de-registered vehicals
6 including vehicles that can not be assigned to any group of pollutants
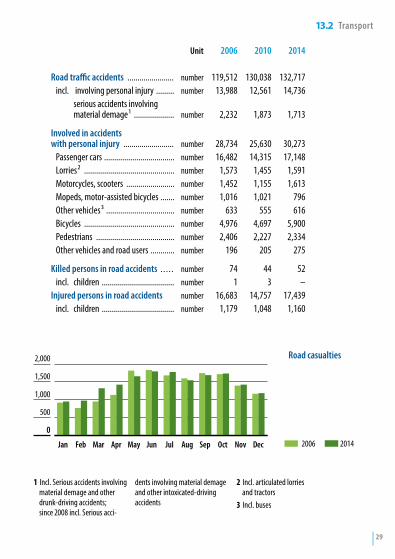
Road casualties
500
1,000
1,500
2,000
0
Jan Feb Mar Apr May Jun Jul Aug Sep Oct Nov Dec 20142006
| 29
1 Incl. Serious accidents involving material demage and other drunk-driving accidents; since 2008 incl. Serious acci-
dents involving material demage and other intoxicated-driving accidents
2 Incl. articulated lorries and tractors
3 Incl. buses
13.2 Transport
Unit 2006 2010 2014
Road traffic accidents ....................... number 119,512 130,038 132,717incl. involving personal injury ......... number 13,988 12,561 14,736
serious accidents involving material demage¹ .................... number 2,232 1,873 1,713
Involved in accidents with personal injury ......................... number 28,734 25,630 30,273
Passenger cars ................................... number 16,482 14,315 17,148Lorries² ............................................. number 1,573 1,455 1,591Motorcycles, scooters ........................ number 1,452 1,155 1,613Mopeds, motor-assisted bicycles ....... number 1,016 1,021 796Other vehicles³ .................................. number 633 555 616Bicycles ............................................. number 4,976 4,697 5,900Pedestrians ....................................... number 2,406 2,227 2,334Other vehicles and road users ............ number 196 205 275
Killed persons in road accidents . . . . . number 74 44 52incl. children .................................... number 1 3 –
Injured persons in road accidents number 16,683 14,757 17,439incl. children .................................... number 1,179 1,048 1,160

Gross domestic product² in current prices rate of change in percent
%
-2-1012345
0
2006 2007 2008 2009 2010 2011 2012 2013 2014
1 Provisional data 2 2011 - 2014: provisional data
30 |
14 National Accounts
National accounts (VGR) are a statistical system for presenting a comprehen-sive, overall view of the economic activities of all business entities in Berlin. They are based on the European System of na-tional accounts (ESA 2010) and the Classification of Industries (WZ 2008). At the centre of national accounts is the origin of the gross domestic pro- duct (GDP) as a measure of performance in Berlin.
Unit 2006 2010 2014 ¹Gross domestic productin current prices .................. EUR bn 90.1 103.1 117.3
Gross value added ............. EUR bn 81.5 92.7 105.5all sectorsAgriculture, forestry and fishing ................................. EUR bn 0.0 0.0 0.0Industry, excluding construction ........ EUR bn 11.3 13.1 13.1Construction ........................ EUR bn 2.4 3.1 4.2Trade, transport, accommodation and food services, Information and communication ................... EUR bn 18.1 18.5 22.5Financial, insurance and Business services, Real estate activities ........... EUR bn 25.5 30.0 32.9Public and other services, education, health ................ EUR bn 24.1 27.9 32.7

Insolvency proceedings by type of debtor
500 1,000 1,500 2,000 2,500 3,000 3,500 4,000 4,500 5,000 5,5000
Enterprises
Consumer
former self-employed person
other debtors
20062014
| 31
15 Business notifications, Insolvencies
Unit 2006 2010 2014The reports of traders are delivered monthly from the trading super- vision departments. Information about insol-vency of companies, consumers and other groups of borrowers pro-vide the district courts.
Business notificationsBusiness registrations ......... number 45,762 47,300 44,924
includingnew establishments¹ ....... number 41,098 42,722 41,418
Business deregistrations ..... number 32,773 31,626 35,251includingclosing downs² ................. number 28,136 27,441 31,615
Insolvencies ....................... number 8,460 7,910 6,147Enterprises .......................... number 1,381 1,568 1,305Other debtors ...................... number 7,079 6,342 4,842
includingconsumer insolvencies ..... number 5,100 4,706 3,643
1 Establishment of businesses, without movings
2 Without relocations; incl. closure of a branch office or dependent
branch (ie including “partial task of continuing operations”)

32 |
16.1 Employment and Compensation of Employees
The number of employed persons along with their wages and salaries are determined within the scope of national account. The figures on the number of employed persons cor-respond to the workplace concept; that is, all em-ployed persons who have their job in Berlin are taken into consideration. In the result for income creation the figure for em-ployee earnings reflects all of the cash and non-cash benefits accrued to em-ployees working in Berlin from work or other em-ployment relationships.
Unit 2006 2010 2014 ¹
Persons engaged in economic activity ......................... 1000 1,582.5 1,689.0 1,810.3Self-employed and family workers 1000 216.3 229.2 228.2Employees ...................................... 1000 1,366.2 1,459.8 1,582.1
Employees by economic sectors Agriculture, forestry and fishing ..... 1000 1.0 0.6 0.5Industry, including energy ............. 1000 136.4 135.4 139.3Construction ................................... 1000 73.6 75.6 81.3Trade, transport, accommodation and food services, Information and communication ....................... 1000 404.0 426.3 479.3Finan.cial, insurance and Business services, Real estate activities ........ 1000 335.0 369.8 392.2Public and other services, education, health ........................... 1000 632.4 681.3 717.7
Compensation of employees per employee ............................... EUR 33,584 35,422 38,528Agriculture, forestry and fishing ..... EUR 19,060 20,907 21,805Industry, including energy ............. EUR 48,935 51,598 55,648Construction ................................... EUR 34,444 37,650 36,196Trade, transport, accommodation and food services, Information and communication ........................ EUR 29,509 31,196 34,561Finan.cial, insurance and Business services, Real estate activities ........ EUR 32,822 33,184 35,544Public and other services, education, health ........................... EUR 32,848 35,499 39,457
1 provisional data

Unemployment rate
8
10
12
14
J F M A M J J A S O N D J F M A M J J A S O N D J F M A M J J A S O N D2012 2013 2014
%
| 33
16.2 Labour Market
Unit 2006 2010 2014
The Federal Employment Agency (Bundesagentur für Arbeit) calculates the labour market data (here annual averages).
Unemployed persons ........ number 293,476 231,221 202,927viz.female .............................. number 127,422 99,632 89,151foreign ............................. number 57,941 48,304 48,757
at the age of …15 to 19 years ...................... number 7,099 4,269 3,55920 to 24 years ...................... number 26,115 18,563 13,246
Announced positions ¹ ....... number 10,869 9,858 20,279Short-time workers ........... number 1,760 7,558 1,260
Unemployment rate² ........ % 17.5 13.6 11.1
1 Retroactive corrections due to conversion of the statistics of announced positions with the Federal Employment Agency
2 Unemployed persons as % of all civilian employees (employees subject to social insurance and employees at a
low level, officials and unemployed persons additionally self-employed persons and family workers), as of 30 June on previous year
2,000
4,000
6,000
8,000
10,000
02006 2007 2008 2009 2010 2011 2012 2013 2014
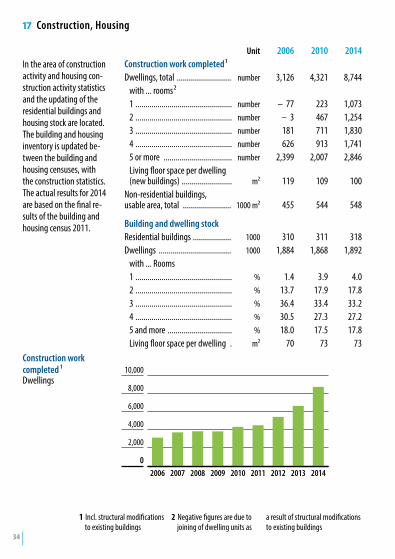
Construction work completed ¹ Dwellings
34 |
17 Construction, Housing
In the area of construction activity and housing con-struction activity statistics and the updating of the residential buildings and housing stock are located. The building and housing inventory is updated be-tween the building and housing censuses, with the construction statistics. The actual results for 2014 are based on the final re-sults of the building and housing census 2011.
Unit 2006 2010 2014Construction work completed ¹Dwellings, total ........................... number 3,126 4,321 8,744
with ... rooms²1 ................................................ number – 77 223 1,0732 ................................................ number – 3 467 1,2543 ................................................ number 181 711 1,8304 ................................................ number 626 913 1,7415 or more .................................. number 2,399 2,007 2,846Living floor space per dwelling (new buildings) ......................... m² 119 109 100
Non-residential buildings, usable area, total ........................ 1000 m² 455 544 548
Building and dwelling stockResidential buildings ................... 1000 310 311 318Dwellings .................................... 1000 1,884 1,868 1,892
with ... Rooms1 ................................................ % 1.4 3.9 4.02 ................................................ % 13.7 17.9 17.83 ................................................ % 36.4 33.4 33.24 ................................................ % 30.5 27.3 27.25 and more ................................ % 18.0 17.5 17.8Living floor space per dwelling . m² 70 73 73
1 Incl. structural modifications to existing buildings
2 Negative figures are due to joining of dwelling units as
a result of structural modifications to existing buildings

48
121620242832
02006 2007 2008 2009 2010 2011 2012 2013 2014
EUR mn
Foreign turnoverDomestic turnover
Turnover of the manufacturing
| 35
18.1 Industry
Manufacturing, mining and quarrying
Unit 2010 2012 2014
Industry includes the sup-ply of water and energy, mining and quarrying, and manufacturing and construction. Unless other- wise indicated, data is based on the data pro-vided by companies with generally 20 or more em-ployees in accordance with the classification of Eco-nomic branches, valid since 2008 (Klassifikation der Wirtschaftszweige). Crafts businesses are also in-cluded.
Establishments¹ .......................... number 728 736 730Employees¹ ................................. number 89,957 92,836 93,532Gross earnings ............................. EUR mn 3,901 4,262 4,468Turnover ...................................... EUR mn 23,811 23,327 24,150
incl. with foreign countries ........ EUR mn 10,971 12,306 12,949
Turnover of selected Economic branchesManufacture of food products ..... EUR mn 2,320 2,331 2,202Manufacture of basic pharmaceutical products and pharmaceutical preparations ...... EUR mn 5,648 6,033 6,468Manufacture of basic metals ....... EUR mn 1,047 1,174 1,126Manufacture of computer, electronic and optical products ... EUR mn 2,267 2,198 2,455Manufacture of electrical equipment .................................. EUR mn 1,588 2,113 1,714Manufacture of machinery and equipment n.e.c. ......................... EUR mn 1,834 2,342 2,200
1 September

36 |
18.2 Industry
Unit 2010 2012 2014Production of selected goods Sweets (excluding Biscuits) ................. 1000 t 275 330 305Coffee and tea and coffee substitutes .. 1000 t 246 251 244Pharmaceutical specialties and other pharmaceutical products ........... EUR mn 3,312 3,493 3,354Plates, sheets, tubes and profiles made of plastics .................................. 1000 t 104 71 73Fresh concrete (ready-mixed concrete) 1 000 m³ 859 1,009 1,068Aluminum and semi-finished products therefrom ............................................ 1000 t 143 139 105Equipment and facilities of telecommunications technology ......... EUR mn 509 436 406Electric motors, generators, transformers and parts ........................ EUR mn 193 409 377Electric lighting ................................... EUR mn 298 295 •Combustion engines and turbines (except engines for aircraft and road vehicles) ...................................... EUR mn 910 1,119 1,037Cars and car parts ................................ EUR mn 281 228 268Medical and dental instruments and supplies ........................................ EUR mn 249 347 420
2006 2010 2013Energy consumption ......................... MJ mn 15,988 17,264 16,591Gas ...................................................... MJ mn 4,663 4,782 5,100Electricity ............................................ MJ mn 7,613 7,136 6,289
Public energy supplyGross generation of electricity ............. MJ mn 32,746 31,882 29,052Electricity consumption¹ ..................... MJ mn 47,095 42,721 41,206Gas consumption ................................ MJ mn 104,051 100,408 125,615
1 Excl. own consumption and losses

200 400 600 800 1,000 1,2000
House buildingCommercial and industrial building construction
Public buildingCommercial and industrial civil engineering
Road constructionOther civil engineering
EUR mn
Turnover in construction work within the construction industry by type of construction 2014
| 37
18.3 Industry
Site preparation, civil engineering
Unit 2006 2010 2014
Establishments¹ .......................... number 3,578 2,727 2,534Employees² ................................. number 18,156 19,092 20,667Hours worked² ............................ mn 17.9 20.2 23.9
incl. in house building² ............. mn 6.0 8.2 10.6Turnover in construction work² ... EUR mn 2,124.1 2,384.5 2,889.2
Building installation³Establishments¹ .......................... number 649 677 696Employees ................................... number 15,115 17,737 19,356Turnover in construction work for previous year ......................... EUR mn 1,295.1 1,791.6 2,056.9
1 Results of the annual supplementary survey (Site preparation, civil engineering) or annual survey (Building installation) - as of end of June
2 Projected results on the basis of the supplementary survey
3 Establishments with generally 10 and more employees

Guests from GermanyGuests from other countries
38 |
19.1 Retail Trade, Hotel and Restaurant Industry, Tourism
The index for the retail trade and the hotel and restaurant industry are calculated on the basis 2010 ≙ 100. The data on tourism come from the statistics on accommoda-tions. Only accommoda-tion establishments with more than nine beds (from 2012, before more than eight beds) and camping sites are surveyed.
Unit 2006 2010 2014 ¹Retail saleTurnover .............................. index 89.2 100 121.6Employees ........................... index 90.5 100 115.4
Accommodation and food service activitiesTurnover .............................. index 87.7 100 111.7Employees ........................... index 113.3 100 107.8
TourismAccommodation establishments² .................. number 583 750 809Bed places³ ......................... number 85,848 111,178 135,246Guests, total ........................ 1000 7,077 9,051 11,871Guests from Germany .......... 1000 4,755 5,777 7,352Guests from other countries 1000 2,322 3,274 4,520
incl. United Kingdom ...... 1000 301 330 481Italy ......................... 1000 182 279 299Netherlands ............ 1000 193 245 295USA ......................... 1000 215 261 345Spain ....................... 1000 136 213 218
Overnight stays ................... 1000 15,910 20,796 28,689
1 provisional data2 As of July3 As of July, excl. camping sites

Mitte
July 2006July 2010July 2014
Friedrichshain-Kreuzberg
Pankow
Charlottenburg-Wilmersdorf
Spandau
Steglitz-Zehlendorf NeuköllnTreptow-Köpenick
Marzahn-Hellersdorf
Lichten-berg
Reinickendorf
Tempelhof-Schöneberg
40002000
6000
0
Bed capicity
| 39
19.2 Retail Trade, Hotel and Restaurant Industry, Tourism
Bed capacity in accomodation establishments

Overnights by guest origin
1,500
3,000
4,500
6,000
7,500
9,000
10,500
12,000
13,500
15,000
16,500
02006 2007 2008 2009 2010 2011 2012 2013 2014
GermanyOther countries
thousand
40 |
19.3 Retail Trade, Hotel and Restaurant Industry, Tourism
Unit 2006 2010 2014
Overnight stays ............................ 1000 15,910 20,796 28,689… by type of establishmentsHotels, Inns, Guest-houses .......... 1000 13,560 17,256 24,109Hotel .............................................. 1000 8,818 11,016 15,326Hotel garni (hotel, breakfast only) . 1000 4,501 5,855 8,245Gasthof (Inns) ................................ 1000 21 22 30Guest-houses ................................. 1000 219 363 507Other accommodation ................. 1000 2,351 3,539 4,580Camping sites ................................. 1000 83 89 114

| 41
20 Foreign Trade
Unit 2006 2010 2014 ¹
The foreign trade statistics provide figures with re-gard to the movement of goods across the frontiers (export and import) be-tween Berlin and foreign countries. The basis for the results is provided by the customs documents of importers and exporters in the trading industry with countries outside of the European Union (extra trade) as well as the sta-tistical registrations of acquisitions and delive- ries within the community within the meaning of the Value-Added Tax Law (intra trade).
Exports ............................... EUR mn 11,484 12,041 13,299Food industry ...................... EUR mn 911 1,476 1,808
incl. food ........................ EUR mn 516 706 725luxury food (Genussmittel) ........ EUR mn 394 766 1,083
Trade and industry .............. EUR mn 10,397 10,435 11,211raw materials .......... EUR mn 10 40 20semi-finished products .................. EUR mn 105 256 589finished products .... EUR mn 10,282 10,138 10,603
Important exporting countriesUSA ..................................... EUR mn 1,286 1,151 1,539Russian Federation .............. EUR mn 627 689 529France ................................. EUR mn 813 768 796
Imports .............................. EUR mn 7,898 9,505 9,821Food industry ...................... EUR mn 1,122 1,313 1,356
incl. food ........................ EUR mn 944 942 1,070luxury food (Genussmittel) ........ EUR mn 177 368 284
Trade and industry .............. EUR mn 6,491 7,677 7,683raw materials .......... EUR mn 98 179 174semi-finished products .................. EUR mn 233 291 291finished products .... EUR mn 6,160 7,207 7,218
Important importing countriesUSA ..................................... EUR mn 1,096 1,464 789Italy ..................................... EUR mn 555 567 996Poland ................................. EUR mn 545 812 959
1 provisional data

Index of consumer prices change on same month of previous year
0,51,01,52,02,53,0
0J F M A M J J A S O N D J F M A M J J A S O N D
2013 2014
%
42 |
21 Consumer Prices
The consumer price index, shows the price development of all goods and ser-vices purchased by private households for consumption pur-poses, relative to a base year (here: 2010). The change in the consumer price index compared to the same month last year is also known as "inflation".
Consumer price index for Berlin Unit 2006 2010 2014
Total cost of living ............................. index 94.5 100 107.8Food and non-alcoholic beverages ...... index 90.2 100 112.2Alcoholic beverages and tobacco ......... index 91.1 100 110.8Clothing and footwear ........................ index 95.1 100 102.4Housing, water, electricity, gas and other fuels .................................... index 93.4 100 111.0Furniture, household equipment and routine maintenance of the house index 98.1 100 103.1Health ................................................. index 97.2 100 101.5Transport ............................................. index 92.4 100 107.4Communication ................................... index 109.5 100 92.2Recreation, entertainment and culture index 98.8 100 105.0Education ............................................ index 107.1 100 96.0Accomodation and restaurant services index 95.9 100 107.8Miscellaneous goods and services ....... index 93.0 100 109.2
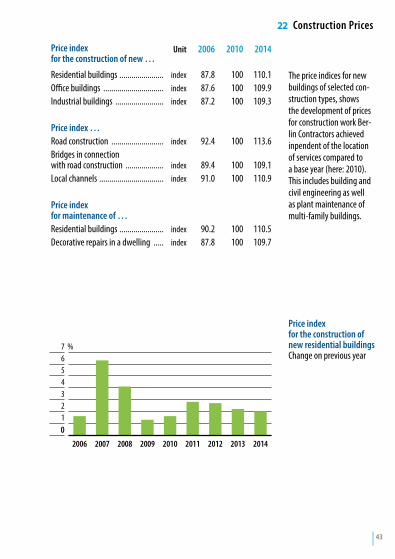
Price index for the construction of new residential buildings Change on previous year
1234567
0
2006 2007 2008 2009 2010 2011 2012 2013 2014
%
| 43
22 Construction Prices
Price index for the construction of new …
Unit 2006 2010 2014
The price indices for new buildings of selected con-struction types, shows the development of prices for construction work Ber-lin Contractors achieved inpendent of the location of services compared to a base year (here: 2010). This includes building and civil engineering as well as plant maintenance of multi-family buildings.
Residential buildings ...................... index 87.8 100 110.1Office buildings .............................. index 87.6 100 109.9Industrial buildings ........................ index 87.2 100 109.3
Price index …Road construction .......................... index 92.4 100 113.6Bridges in connection with road construction ................... index 89.4 100 109.1Local channels ................................ index 91.0 100 110.9
Price index for maintenance of …Residential buildings ...................... index 90.2 100 110.5Decorative repairs in a dwelling ..... index 87.8 100 109.7
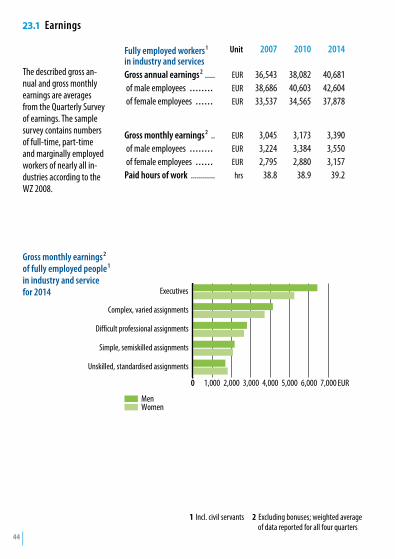
Gross monthly earnings² of fully employed people ¹ in industry and service for 2014
1,000 2,000 3,000 4,000 5,000 6,000 7,0000
Executives
Complex, varied assignments
Difficult professional assignments
Simple, semiskilled assignments
Unskilled, standardised assignments
MenWomen
EUR
44 |
23.1 Earnings
The described gross an-nual and gross monthly earnings are averages from the Quarterly Survey of earnings. The sample survey contains numbers of full-time, part-time and marginally employed workers of nearly all in-dustries according to the WZ 2008.
Fully employed workers ¹ in industry and services
Unit 2007 2010 2014
Gross annual earnings² ..... EUR 36,543 38,082 40,681 of male employees . . . . . . . . EUR 38,686 40,603 42,604 of female employees . . . . . . EUR 33,537 34,565 37,878
Gross monthly earnings² .. EUR 3,045 3,173 3,390 of male employees . . . . . . . . EUR 3,224 3,384 3,550 of female employees . . . . . . EUR 2,795 2,880 3,157Paid hours of work ............ hrs 38.8 38.9 39.2
1 Incl. civil servants 2 Excluding bonuses; weighted average of data reported for all four quarters

| 45
23.2 Earnings
Gross annual earnings² of the full-time employees ¹ in selected economic sectors
Unit 2007 2010 2014
Manufacturing .................................... EUR 38,380 41,097 46,047Electricity, gas, steam and air conditioning supply ....................... EUR • • 59,587Water supply³ ..................................... EUR 37,662 40,467 42,042Construction ........................................ EUR 32,122 32,941 32,509Retail Trade⁴ ....................................... EUR 32,328 33,431 36,864Transport ............................................. EUR 31,734 34,321 34,838Hotels and restaurants ........................ EUR 22,261 23,247 25,656Communication ................................... EUR 48,909 49,780 50,814Provision of finance and insurance services ............................... EUR 46,637 51,021 51,307Real estate and housing ...................... EUR 36,533 38,557 43,172Provision of freelance, scientific and technical services ................................ EUR 43,533 46,657 47,387Provision of other economic services .. EUR 24,041 25,532 25,306Upbringing and education .................. EUR 42,075 42,949 47,427Health and social services ................... EUR 40,056 35,713 38,601Art, entertainment and recreation ..... EUR 39,394 / 37,959Provision of other services ................... EUR 35,575 (39,450) 46,317
3 Incl. sewage and waste manage-ment and remidiation activities
4 Incl. Repair of motor vehicles and motorcycles
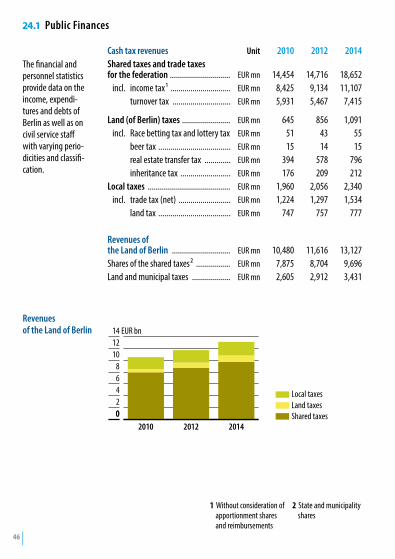
Revenues of the Land of Berlin
02468
101214
02010 2012 2014
Shared taxesLand taxesLocal taxes
EUR bn
46 |
24.1 Public Finances
The financial and personnel statistics provide data on the income, expendi-tures and debts of Berlin as well as on civil service staff with varying perio-dicities and classifi-cation.
Cash tax revenues Unit 2010 2012 2014Shared taxes and trade taxes for the federation .............................. EUR mn 14,454 14,716 18,652
incl. income tax¹ .............................. EUR mn 8,425 9,134 11,107turnover tax ............................. EUR mn 5,931 5,467 7,415
Land (of Berlin) taxes ........................ EUR mn 645 856 1,091incl. Race betting tax and lottery tax EUR mn 51 43 55
beer tax .................................... EUR mn 15 14 15real estate transfer tax ............. EUR mn 394 578 796inheritance tax ......................... EUR mn 176 209 212
Local taxes ......................................... EUR mn 1,960 2,056 2,340incl. trade tax (net) .......................... EUR mn 1,224 1,297 1,534
land tax .................................... EUR mn 747 757 777
Revenues of the Land of Berlin ............................. EUR mn 10,480 11,616 13,127Shares of the shared taxes² ................. EUR mn 7,875 8,704 9,696Land and municipal taxes ................... EUR mn 2,605 2,912 3,431
1 Without consideration of apportionment shares and reimbursements
2 State and municipality shares

| 47
24.2 Public Finances
Unit 2010 2012 2014Depts of core budget of Berlin on 31.12.Cash credits .......................................................... EUR mn – 243 6Debt securities ..................................................... EUR mn 36,175 38,202 38,683
Money market securities ..................... EUR mn – – –Long-term securities ........................... EUR mn 36,175 38,202 38,683
Loans ................................................................... EUR mn 25,165 23,681 21,879incl. at credit institutions ............................ EUR mn 14,384 13,409 12,053
at other domestic range ...................... EUR mn 9,684 9,248 8,890at other foreign range ......................... EUR mn 0 5 7
Depts, total ......................................................... EUR mn 61,340 62,126 60,568
Public service Employees³ 2006 2010 2014of the Land of Berlin .......................................... number 195,760 186,660 191,655
of which female ................................................. number 108,025 102,485 104,295male .................................................... number 87,735 84,175 87,360
of which public official ...................................... number 80,075 74,470 69,670employee ............................................ number 115,690 112,190 121,985
of which full-time .............................................. number 149,480 139,830 144,805part-time ............................................ number 46,280 46,835 46,850
of which administrative center - core budget .... number 99,655 95,405 94,315district Administrative - core budget ... number 27,395 24,165 22,855off-budget special accounts, hospitals number 8,365 8,245 8,725Universities and university hospitals ... number 33,450 36,275 36,825Facilities in the form of public law . . number 23,065 22,415 28,770Social insurance . . . . . . . . . . . . . . . . . . . . . . . . number 3,830 160 165
3 The data of personal statistics data pro-tection. As confidentiality procedures, the 5 Series was rounding applied.

48 |
25 Judicature
The data on courts, convict and the enforcement of sentences are taken from the statistics on Judicature which are maintained at the national level as the business statistics of the administration of justice.
Unit 2006 2010 2014
Courts ................................................. number 21 18 18Judges¹ ............................................... number 1,270 1,326 1,320Public prosecutors ............................... number 462 458 423Lawyers ............................................... number 11,148 12,759 13,672Notaries .............................................. number 999 907 772
First-instance proceedings (New acquisitions) Local Court (Amtsgericht) ................... number 195,054 196,723 175,466Regional Court (Landgericht) .............. number 24,573 22,555 20,038Social Court ......................................... number 25,708 43,957 38,439Labour Court ....................................... number 26,426 20,073 19,551Administrative Court ........................... number 15,318 16,347 13,401
Convict ............................................... number 46,491 44,194 41,970of which because of offences … against public order and offences in office ................................. number 1,950 1,573 1,253against sexual self-determination ....... number 343 337 226other offences against the person, except in road traffic ............... number 8,049 7,213 6,855theft and misappropriation ................. number 10,157 9,301 9,348robbery and extortion ......................... number 982 726 608other offenses against property and forgery of documents .......................... number 12,731 13,492 14,506offences dangerous to the public ........ number 496 345 237road traffic offences ............................ number 7,185 6,723 5,565according to other federal or state laws number 4,598 4,484 3,372
Prisoners² .......................................... Unit 4,434 4,422 3,564viz. men ......................................... Unit 4,248 4,224 3,406
women ..................................... Unit 186 198 158juveniles and adolescents ........ Unit 255 241 146
1 Excl. judges at labour courts, Higher Social Court of Berlin-Brandenburg
(from 2005) and the Finance Court of Berlin-Brandenburg (from 2007)
2 As on 31 March excl. imprisonment on remand

| 49
26 Political Parties
Members of selected political parties ¹
Boroughs CDU SPDDIE
LINKE GRÜNE FDP PIRATEN AfD
Mitte ................................... 1,360 2,322 990 809 416 405 86Friedrichshain-Kreuzberg .... 440 1,591 760 911 132 429 39Pankow ............................... 900 1,642 1,156 776 235 366 93Charlottenburg-Wilmersdorf 2,030 2,277 194 567 613 220 144Spandau .............................. 990 943 116 119 87 94 50Steglitz-Zehlendorf ............. 2,290 2,083 110 463 364 174 178Tempelhof-Schöneberg ....... 1,160 2,095 221 630 358 263 106Neukölln ............................. 690 1,325 346 425 70 247 42Treptow-Köpenick ............... 510 621 1,227 127 73 153 53Marzahn-Hellersdorf ........... 460 326 916 75 40 96 39Lichtenberg ......................... 270 480 1,332 123 57 136 48Reinickendorf ...................... 1,190 1,149 112 159 162 93 81Berlin-International ............ – 184² – – – 99² –
Berlin ................................. 12,290 17,038 7,480 5,184 2,607 2,775 959
1 According to data from the parties; as at the end of 2014
2 Berlin members who are in foreign countries for professional reasons

50 |
27.1 Elections
Results of the election to the House of Representatives of Berlin (Abgeordnetenhaus) on 18 September 2011– second vote in percent –
Constituencies federation (Boroughs) Turnout SPD CDU GRÜNE
DIE LINKE FDP
PIRA TEN
- Others
Mitte .................. 55.9 28.7 17.9 22.5 11.0 1.7 10.5 7.9Friedrichshain- Kreuzberg ........... 62.2 23.9 8.4 30.3 13.0 1.0 14.7 8.8Pankow .............. 60.8 29.1 13.8 19.1 17.9 1.3 10.5 8.3Charlottenburg- Wilmersdorf ....... 65.1 31.2 28.2 21.7 3.6 3.0 7.0 5.2Spandau ............. 58.0 31.7 34.2 12.5 3.7 2.1 7.3 8.5Steglitz- Zehlendorf ......... 70.0 25.1 36.2 21.1 3.0 3.0 6.4 5.2Tempelhof- Schöneberg ........ 64.1 27.1 28.9 23.0 4.0 2.0 7.8 7.2Neukölln ............ 57.2 27.4 26.7 17.9 5.6 1.8 9.6 11.0Treptow- Köpenick ............ 60.9 28.9 15.9 10.7 23.0 1.2 9.3 11.0Marzahn- Hellersdorf ......... 51.0 28.2 17.5 5.6 27.4 1.3 8.8 11.3Lichtenberg ........ 53.5 30.9 12.3 7.6 29.0 0.9 9.3 10.0Reinickendorf ..... 62.1 28.1 38.4 13.6 3.3 2.3 6.7 7.6
Berlin ................ 60.2 28.3 23.3 17.6 11.7 1.8 8.9 8.3
In voting for the House of Representatives of Berlin (Abgeordnetenhaus), the first vote was cast for direct elec-tion of a candidate to one of
the 78 constituencies and the second vote was to be used to vote for the state and borough lists of the parties.

| 51
27.2 Elections
Elected representatives to the House of Representatives of Berlin (Abgeordnetenhaus) since 1990
Seats … 1990 1995 1999 2001 2006 2011won in constituenciesSPD .................................. 37 3 – 26 40 33CDU .................................. 71 51 46 19 19 25DIE LINKE¹ ........................ 12 34 30 32 14 9GRÜNE .............................. – 2 2 1 5 11FDP .................................. – – – – – –PIRATEN ........................... x x x x x –
won by party listSPD .................................. 39 52 42 18 13 14CDU .................................. 30 36 30 16 18 14DIE LINKE¹ ........................ 11 – 3 1 9 10GRÜNE .............................. 23 28 16 13 18 18FDP .................................. 18 – – 15 13 –PIRATEN ........................... x x x x x 15
Seats, totalSPD .................................. 76 55 42 44 53 47CDU .................................. 101 87 76 35 37 39DIE LINKE¹ ........................ 23 34 33 33 23 19GRÜNE .............................. 23 30 18 14 23 29FDP .................................. 18 – – 15 13 –PIRATEN ........................... x x x x x 15
The parties received par-liamentary seats in ac-cordance with their share of the valid second votes. A party which won more direct parliamentary seats than it was entitled to in accordance with its share of the second votes in the entire polling area was authorised to retain such seats won in addition to the number gained through proportional representation. The other parties received as many compensatory seats as were required for alloca-tion of the parliamentary seats in accordance with the proportion of the second votes.
1 until 2004 PDS

27.3 Elections
Results of the elections to the House of Representatives of Berlin (Abgeordnetenhaus) since 1990second vote in percent
Results of the direct election of a candidate to one of the 78 constituencies to the House of Representatives of Berlin, on 18 September 2011
5
10
15
20
25
30
35
40
45
0
%1990 1995 1999 2001 2006 2011
SPDCDU
GRÜNE
PIRATENDIE LINKE
FDP
SPDCDUGRÜNEDIE LINKE
52 |

| 53
27.4 Elections
Distribution of seats in the Borough Assemblies (Bezirksverordnetenversammlungen) according to the election on 18 September 2011
Boroughs Total SPD CDU GRÜNEDIE
LINKE NPDPIRA TEN
-
Mitte .................... 55 18 10 15 6 – 6Friedrichshain- Kreuzberg ............. 54 13 4 22 7 – 8¹Pankow ................ 55 17 8 13 11 – 6Charlottenburg- Wilmersdorf ......... 55 17 18 14 2 – 4Spandau ............... 54 21 23 6 1 – 3¹Steglitz- Zehlendorf ........... 55 15 24 13 – – 3Tempelhof- Schöneberg .......... 55 16 18 15 2 – 4Neukölln .............. 55 27 13 8 3 – 4Treptow- Köpenick .............. 54 18 9 6 15 2 4¹Marzahn- Hellersdorf ........... 55 16 10 3 19 2 5Lichtenberg .......... 55 17 7 4 20 2 5Reinickendorf ....... 55 17 26 8 – – 4
Berlin .................. 657 212 170 127 86 6 56
1 The seats allocated the PIRATEN could not be filled completely, because the district candidate list was exhausted.
SPD - Social Democratic Party of GermanyCDU - Christian Democratic Union of GermanyDIE LINKE - The LeftFDP - Free Democratic PartyGRÜNE - Alliance 90/The GreensNPD - National Democratic Party of GermanyPIRATEN - Pirate Party Germany
A total of 55 representatives were selected in the elections for the Borough Assemblies.

54 |
27.5 Elections
Results of the election to the German Parliament (Deutscher Bundestag) on 22 September 2013 in Berlin– second vote in percent –
Constituency Turnout CDUDIE
LINKE SPD GRÜNE FDPPIRA TEN
- Others
75 ......................... 69.4 22.6 18.7 26.1 16.7 3.7 4.7 7.476 ......................... 74.4 23.5 25.2 22.0 14.1 2.5 3.9 8.877 ......................... 73.0 40.1 7.9 26.4 8.7 4.4 2.6 9.978 ......................... 69.6 36.6 9.5 28.9 8.2 3.8 3.1 9.979 ......................... 79.8 37.2 7.2 25.6 13.5 6.4 2.5 7.680 ......................... 77.6 32.5 8.9 27.1 15.4 6.8 2.6 6.881 ......................... 75.3 31.7 10.3 27.4 15.4 4.1 3.2 7.982 ......................... 68.5 29.0 14.3 26.2 13.9 3.0 4.1 9.583 ......................... 74.3 15.4 25.1 24.0 20.8 2.2 5.8 6.784 ......................... 73.6 25.4 29.5 21.3 7.4 2.0 3.5 10.985 ......................... 65.1 26.0 32.9 19.2 3.9 1.7 3.1 13.286 ......................... 67.4 23.1 34.6 20.4 5.8 1.6 3.7 10.8Berlin .................. 72.5 28.5 18.5 24.6 12.3 3.6 3.6 9.0
Seats (27) ............ x 9 6 8 4 – – –Direct seats (12) ... x 5 4 2 1 – – –List seats (15) ....... x 4 2 6 3 – – –
Constituencies:75 Mitte76 Pankow77 Reinickendorf78 Spandau–Charlottenburg Nord79 Steglitz-Zehlendorf80 Charlottenburg-Wilmersdorf
81 Tempelhof-Schöneberg82 Neukölln83 Friedrichshain-Kreuzberg–Prenzlauer Berg Ost84 Treptow-Köpenick85 Marzahn-Hellersdorf86 Lichtenberg
On 22 September 2013 new election to the German Parliament (Deutscher Bundestag) took place.
In Berlin aproximately 2,5 million citizens entitled to vote from a total 62 million were able to cast their votes in 12 of 299 constituencies in Germany.

| 55
27.6 Elections
Results of the elections to the European Parliament (Europäisches Parlament) on 25 May 2014 in Berlin– valid votes in percent –
Boroughs Turnout CDU GRÜNE SPDDIE
LINKE FDPPIRA TEN
- AfD Others
Mitte ....................... 46.0 15.2 24.7 23.1 17.0 3.1 4.3 5.9 6.7Friedrichshain- Kreuzberg ................ 54.5 7.7 33.9 18.4 22.0 1.6 5.1 3.4 7.8Pankow ................... 47.2 13.4 22.4 22.1 22.7 2.2 3.7 6.7 6.8Charlottenburg- Wilmersdorf ............ 53.6 23.6 20.7 27.8 8.2 4.7 2.4 7.8 4.8Spandau .................. 40.1 29.7 11.3 30.2 7.0 2.9 2.5 10.0 6.5Steglitz- Zehlendorf .............. 57.1 28.6 19.1 26.2 6.0 4.8 2.2 8.5 4.6Tempelhof- Schöneberg ............. 53.6 23.5 22.2 25.8 9.3 2.9 3.1 7.1 6.1Neukölln ................. 46.5 20.8 20.9 23.4 13.8 1.8 3.7 7.5 8.2Treptow- Köpenick ................. 44.0 15.7 11.8 22.0 27.0 1.4 3.5 10.1 8.5Marzahn- Hellersdorf .............. 33.4 17.0 6.5 20.5 31.3 1.3 2.7 11.7 9.0Lichtenberg ............. 37.2 13.9 10.2 20.4 33.3 1.2 3.4 9.3 8.3Reinickendorf .......... 44.5 31.7 12.9 27.8 6.1 3.5 2.0 10.0 5.9
Berlin ..................... 46.7 20.0 19.1 24.0 16.2 2.8 3.2 7.9 6.7
81 Tempelhof-Schöneberg82 Neukölln83 Friedrichshain-Kreuzberg–Prenzlauer Berg Ost84 Treptow-Köpenick85 Marzahn-Hellersdorf86 Lichtenberg
On 25 May 2014 the citizens of Berlin were able to directly participate in an election for the European Parliament (Europäisches Parlament) for the fifth time.
In the case of the European elections which took place prior to German Reunification the Berlin representatives in the European Parliament were determined by the House of
Representatives (Abgeordneten-haus von Berlin) in accordance with the size of the respective parliamentary groups repre-sented there.

56 |
28 The Boroughs of Berlin 2014
Unit Mitte
Friedrichs hain
Kreuzberg
- –
Pankow
Charlotten burg
Wilmers dorf
- – - Spandau
Steglitz Zehlendorf
– Tempelhof
Schöne berg
– -
NeuköllnTreptow
Köpenick–
Marzahn Hellers
dorf
– - Lichten
berg- Reinicken
dorf-
Berlin
Area .............................................. km² 39 20 103 65 92 103 53 45 168 62 52 89 892
Population ................................... 1000 347.0 266.4 378.5 305.7 225.9 285.5 328.3 316.0 247.4 253.1 266.6 249.3 3,469.8Inhabitants/ha¹ ............................. rate 88 131 37 47 25 28 62 70 15 41 51 28 38.9incl. female¹ .................................. % 49 49 51 53 52 54 52 50 52 51 51 51 51.1incl. foreigners¹ ............................. % 28 21 9 17 13 9 15 22 4 5 10 13 14.3Age in years 0 to 5¹ .................. % 6 7 7 5 6 5 5 6 6 6 6 6 5.9
6 to 14¹ ................ % 7 7 8 7 8 8 7 8 7 8 7 8 7.315 to 64¹ ................ % 73 77 70 65 64 61 67 69 64 68 67 62 67.665 and over¹ .......... % 13 10 15 23 22 26 21 18 24 18 20 24 19.2
Live births¹ .................................... rate² 13 13 13 9 10 8 10 12 10 10 11 9 10.8Deaths¹ ......................................... rate² 7 6 8 10 11 12 10 9 11 9 10 11 9.4Arrival¹ ³ ....................................... rate² 86 70 51 60 51 41 42 49 34 30 47 34 50.7Departure¹ ³ .................................. rate² 55 54 41 44 37 38 31 38 32 32 40 33 39.9
Pupils⁴ ......................................... number 30,212 23,819 33,839 29,683 22,757 34,630 29,080 28,975 22,201 22,149 23,624 29,263 330,232incl. foreigners .............................. % 24.6 15.4 5.0 16.3 11.7 10.8 12.9 21.1 3.7 5.9 10.9 12.9 12.8
Dwelling units⁵ ........................... 1000 190.8 147.5 210.0 182.6 118.0 155.0 180.5 162.3 134.0 133.4 148.0 129.8 1,891.8
Day care centres .......................... number 264 266 316 230 116 181 218 186 138 91 113 132 2,251Places ............................................ number 17,840 14,419 20,665 10,993 9,459 11,688 13,303 13,063 10,678 10,980 12,192 9,329 154,609Cared children ............................... number 16,144 12,992 19,428 9,922 8,353 10,472 12,219 11,569 10,182 10,414 11,160 8,492 141,347Staff .............................................. number 3,304 2,835 3,992 2,197 1,660 2,180 2,563 2,455 2,094 2,017 2,213 1,741 29,251
Monthly mean net household income⁶ ....................................... EUR 1,600 1,675 1,850 1,800 1,600 2,100 1,925 1,550 1,825 1,700 1,600 1,850 1,750
Manufacturing ⁷⁸Establishments⁹ ............................ number 52 22 50 41 58 45 121 80 74 44 42 101 730Employees⁹ ................................... number 12,834 4,491 4,157 2,873 13,303 4,310 13,112 12,207 7,880 4,013 3,180 11,172 93,532
Public service employees by borough administration ¹⁰ ..... number 2,615 1,915 2,375 1,995 1,585 1,895 1,800 1,755 1,775 1,725 1,910 1,510 22,855
1 For Boroughs results of estimation 2 per 1000 inhabitants, based on the average population, calculated on the basis of the 2011 census
3 Across the respective boundaries4 At general education schools
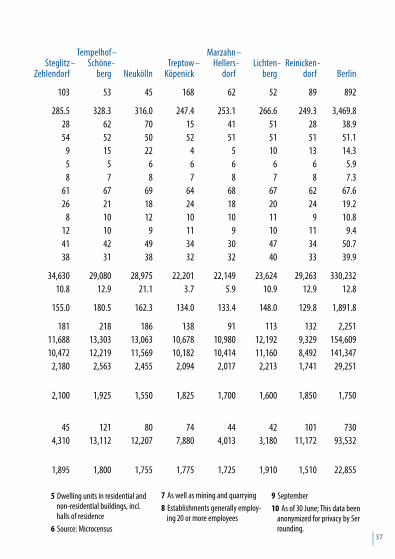
| 57
28 The Boroughs of Berlin 2014
Unit Mitte
Friedrichs hain
Kreuzberg
- –
Pankow
Charlotten burg
Wilmers dorf
- – - Spandau
Steglitz Zehlendorf
– Tempelhof
Schöne berg
– -
NeuköllnTreptow
Köpenick–
Marzahn Hellers
dorf
– - Lichten
berg- Reinicken
dorf-
Berlin
Area .............................................. km² 39 20 103 65 92 103 53 45 168 62 52 89 892
Population ................................... 1000 347.0 266.4 378.5 305.7 225.9 285.5 328.3 316.0 247.4 253.1 266.6 249.3 3,469.8Inhabitants/ha¹ ............................. rate 88 131 37 47 25 28 62 70 15 41 51 28 38.9incl. female¹ .................................. % 49 49 51 53 52 54 52 50 52 51 51 51 51.1incl. foreigners¹ ............................. % 28 21 9 17 13 9 15 22 4 5 10 13 14.3Age in years 0 to 5¹ .................. % 6 7 7 5 6 5 5 6 6 6 6 6 5.9
6 to 14¹ ................ % 7 7 8 7 8 8 7 8 7 8 7 8 7.315 to 64¹ ................ % 73 77 70 65 64 61 67 69 64 68 67 62 67.665 and over¹ .......... % 13 10 15 23 22 26 21 18 24 18 20 24 19.2
Live births¹ .................................... rate² 13 13 13 9 10 8 10 12 10 10 11 9 10.8Deaths¹ ......................................... rate² 7 6 8 10 11 12 10 9 11 9 10 11 9.4Arrival¹ ³ ....................................... rate² 86 70 51 60 51 41 42 49 34 30 47 34 50.7Departure¹ ³ .................................. rate² 55 54 41 44 37 38 31 38 32 32 40 33 39.9
Pupils⁴ ......................................... number 30,212 23,819 33,839 29,683 22,757 34,630 29,080 28,975 22,201 22,149 23,624 29,263 330,232incl. foreigners .............................. % 24.6 15.4 5.0 16.3 11.7 10.8 12.9 21.1 3.7 5.9 10.9 12.9 12.8
Dwelling units⁵ ........................... 1000 190.8 147.5 210.0 182.6 118.0 155.0 180.5 162.3 134.0 133.4 148.0 129.8 1,891.8
Day care centres .......................... number 264 266 316 230 116 181 218 186 138 91 113 132 2,251Places ............................................ number 17,840 14,419 20,665 10,993 9,459 11,688 13,303 13,063 10,678 10,980 12,192 9,329 154,609Cared children ............................... number 16,144 12,992 19,428 9,922 8,353 10,472 12,219 11,569 10,182 10,414 11,160 8,492 141,347Staff .............................................. number 3,304 2,835 3,992 2,197 1,660 2,180 2,563 2,455 2,094 2,017 2,213 1,741 29,251
Monthly mean net household income⁶ ....................................... EUR 1,600 1,675 1,850 1,800 1,600 2,100 1,925 1,550 1,825 1,700 1,600 1,850 1,750
Manufacturing ⁷⁸Establishments⁹ ............................ number 52 22 50 41 58 45 121 80 74 44 42 101 730Employees⁹ ................................... number 12,834 4,491 4,157 2,873 13,303 4,310 13,112 12,207 7,880 4,013 3,180 11,172 93,532
Public service employees by borough administration ¹⁰ ..... number 2,615 1,915 2,375 1,995 1,585 1,895 1,800 1,755 1,775 1,725 1,910 1,510 22,855
5 Dwelling units in residential and non-residential buildings, incl. halls of residence
6 Source: Microcensus
7 As well as mining and quarrying8 Establishments generally employ-
ing 20 or more employees
9 September10 As of 30 June; This data been
anonymized for privacy by 5er rounding.

58 |
29 Berlin 1871 to 2014Old
BerlinOld
BerlinOld
BerlinGreater
Berlin Greater
Berlin West
BerlinWest
BerlinEast
Berlin Berlin Berlin BerlinUnit 1871 1895 1910 1925 1939 1950 1970 1970 1990 2000 2014
Area ............................................... km² 59 63 63 878 884 481 480 403 889 892 892
Population ¹ ................................... 1000 878.2 1,627.2 2,050.4 4,032.0 4,332.7 2,138.8 2,122.3 1,083.7 3,420.2 3,382.2 3,469.8Live births ...................................... rate² 40.2 30.5 21.5 11.7 15.7 10.1 9.5 13.4 11.0 8.8 10.8Deaths ............................................ rate² 32.7 20.5 14.6 11.3 14.3 12.3 19.1 16.2 12.9 9.8 9.4Balance .......................................... rate² 7.5 10.0 6.9 0.4 1.4 – 2.2 – 9.6 – 2.8 – 1.9 -1.1 1.5Arrival ............................................ rate² 152.1 115.5 127.9 84.3 77.4 49.8 53.4 12.8 41.4 36.3 50.7Departure ....................................... rate² 115.7 113.2 127.8 60.8 73.4 31.9 49.2 5.7 33.8 36.5 39.9Balance .......................................... rate² 36.3 2.3 0.1 23.5 4.0 17.9 4.2 7.1 7.7 -0.3 10.8Population increase or decrease ..... rate² 43.8 12.3 7.0 23.9 5.4 15.7 – 5.4 2.3 5.1 -1.3 13.9
Marriages ...................................... rate² 13.5 10.5 10.6 8.7 14.1 9.1 7.9 8.2 6.4 4.2 3.9
Divorces ......................................... rate² 0.5 0.7 1.0 1.9 2.9 4.4 3.0 3.1 2.3 2.8 1.9
Employed persons (workplace)³ . 1000 380.2 589.0 854.4 2,184.0 2,302.6 744.9 944.2 645.5 1,703.2 1,615.0 1,810.3⁴Agriculture, forestry and fishing ..... % 0.7 0.6 0.2 0.9 0.8 2.3 0.4 0.9 0.1 0.1 0.0Industry ......................................... % 59.5 58.7 60.8 51.2 48.4 44.4 43.2 36.6 26.6 17.8 12.2Service industries ........................... % 39.8 40.6 39.0 47.9 50.8 53.3 56.4 62.5 73.3 82.1 87.8
Dwellings ...................................... 1000 178.6 408.6 555.4 1,171.5 1,462.9 704.4 1,005.7 463.7 1,712.8 1,862.8 1,891.8⁵rate² 203 251 271 291 338 329 474 428 501 551 545⁵
Pupils⁶ ........................................... 1000 93.2 231.4 253.5 362.6 322.6 293.2 216.9 154.1 360.2 377.4 330.2Students (winter semester) .......... 1000 2.1 8.5 13.5 18.2 18.4 11.3 30.2 22.0 139.2 132.4 171.3
1 Annual averages: The data for population in the column 1871 are averages of the years 1871 to 1875, in the column 1895 average values of the years 1891 to 1895, and for West Berlin 1970 the result of the census.

| 59
29 Berlin 1871 to 2014Old
BerlinOld
BerlinOld
BerlinGreater
Berlin Greater
Berlin West
BerlinWest
BerlinEast
Berlin Berlin Berlin BerlinUnit 1871 1895 1910 1925 1939 1950 1970 1970 1990 2000 2014
Area ............................................... km² 59 63 63 878 884 481 480 403 889 892 892
Population ¹ ................................... 1000 878.2 1,627.2 2,050.4 4,032.0 4,332.7 2,138.8 2,122.3 1,083.7 3,420.2 3,382.2 3,469.8Live births ...................................... rate² 40.2 30.5 21.5 11.7 15.7 10.1 9.5 13.4 11.0 8.8 10.8Deaths ............................................ rate² 32.7 20.5 14.6 11.3 14.3 12.3 19.1 16.2 12.9 9.8 9.4Balance .......................................... rate² 7.5 10.0 6.9 0.4 1.4 – 2.2 – 9.6 – 2.8 – 1.9 -1.1 1.5Arrival ............................................ rate² 152.1 115.5 127.9 84.3 77.4 49.8 53.4 12.8 41.4 36.3 50.7Departure ....................................... rate² 115.7 113.2 127.8 60.8 73.4 31.9 49.2 5.7 33.8 36.5 39.9Balance .......................................... rate² 36.3 2.3 0.1 23.5 4.0 17.9 4.2 7.1 7.7 -0.3 10.8Population increase or decrease ..... rate² 43.8 12.3 7.0 23.9 5.4 15.7 – 5.4 2.3 5.1 -1.3 13.9
Marriages ...................................... rate² 13.5 10.5 10.6 8.7 14.1 9.1 7.9 8.2 6.4 4.2 3.9
Divorces ......................................... rate² 0.5 0.7 1.0 1.9 2.9 4.4 3.0 3.1 2.3 2.8 1.9
Employed persons (workplace)³ . 1000 380.2 589.0 854.4 2,184.0 2,302.6 744.9 944.2 645.5 1,703.2 1,615.0 1,810.3⁴Agriculture, forestry and fishing ..... % 0.7 0.6 0.2 0.9 0.8 2.3 0.4 0.9 0.1 0.1 0.0Industry ......................................... % 59.5 58.7 60.8 51.2 48.4 44.4 43.2 36.6 26.6 17.8 12.2Service industries ........................... % 39.8 40.6 39.0 47.9 50.8 53.3 56.4 62.5 73.3 82.1 87.8
Dwellings ...................................... 1000 178.6 408.6 555.4 1,171.5 1,462.9 704.4 1,005.7 463.7 1,712.8 1,862.8 1,891.8⁵rate² 203 251 271 291 338 329 474 428 501 551 545⁵
Pupils⁶ ........................................... 1000 93.2 231.4 253.5 362.6 322.6 293.2 216.9 154.1 360.2 377.4 330.2Students (winter semester) .......... 1000 2.1 8.5 13.5 18.2 18.4 11.3 30.2 22.0 139.2 132.4 171.3
2 per 1000 inhabitants3 Data for 1990 are from 19914 provisional data
5 intercensal updates based on the final results of building and housing census (Census 2011)
6 at schools of general education

60 |
30 The Region Berlin/Brandenburg 2014
Selected structural data on the Lands Berlin and Branden-burg.
Unit BerlinBranden
burg-
Berlin Branden
burg
/ -
Area ............................................ km² 892 29,654 30,546
Population ................................. 1000 3,469.8 2,457.9 5,927.7incl. female ............................... % 51.1 50.8 51.0
Foreigners ................................... 1000 496.5 64.2 560.7incl. female ............................... % 49.4 47.1 49.1
Population density ...................... per km² 3,891.3 82.9 194.1Age in years 0 to 5 .......... % 5.9 4.9 5.5
6 to 14 .......... % 7.3 7.4 7.415 to 64 .......... % 67.6 64.6 66.365 and over .... % 19.2 23.1 20.8
Share among 18-year-old in the population ........................ % 15.5 14.7 15.2Share of foreigners in the population ........................ % 14.3 2.6 9.5
MarriageMarriages .................................... rate¹ 3.9 5.2 4.4Divorces ...................................... rate¹ 1.9 2.0 1.9
Natural population changesLive Births ................................... rate¹ 10.8 7.9 9.6Deaths ......................................... rate¹ 9.4 11.8 10.4
Migrations²Arrival ......................................... number 174,572 75,806 199,763Departure .................................... number 137,459 57,792 144,636Balance ....................................... number 37,113 18,014 55,127
1 per 1000 inhabitants 2 Across the boundary of the region Berlin/Brandenburg, excl. migrations between Berlin and Brandenburg

| 61
30 The Region Berlin/Brandenburg 2014
Unit BerlinBranden
burg-
Berlin Branden
burg
/ -
Population³ ............................................. 1000 3,443.1 2,448.9 5,892.0… by labour force participationLabour force ............................................. 1000 1,823.4 1,281.8 3,105.2
Persons in employment ........................... % 47.8 48.8 48.2Unemployed persons .............................. % 5.2 3.5 4.5
Non-labour force ..................................... 1000 1,619.6 1,167.1 2,786.7
Households, by size³Households .............................................. 1000 1,963.2 1,234.7 3,197.8Single-person households ......................... 1000 1,057.7 462.2 1,520.0Multi-person households .......................... 1000 905.4 772.4 1,677.9
with 2 persons ........................................ % 28.4 39.7 32.7with 3 persons ........................................ % 9.5 13.7 11.1with 4 persons ........................................ % 5.9 7.3 6.4with 5 and more persons ......................... % 2.3 1.9 2.2
Dwelling units rate¹ 545 526 537Living floor space per dwelling ............... m² 73 85 78
per inhabitant ............. m² 40 44 42
EducationPupils, 2014/2015 school year⁴ ................. number 417,158 271,235 688,393Students, winter semester2014/2015 ....... number 171,263 49,762 221,025
Labour market⁵ Unemployment rate⁶ ................................ % 11.1 9.4 10.4Unemployed persons ................................ number 202,927 124,628 327,555
viz. female .............................................. % 43.9 45.0 44.3foreign ............................................. % 24.0 3.8 16.3age from 15 to 24 years .................... % 8.3 7.0 7.8age from 55 to 64 years .................... % 15.4 24.6 18.9
3 Source: microcensus4 At schools of general education
and occupational schools (without schools of nurses, midwives etc)
5 Source: The Federal Employment Agency/yearly average
6 Unemployed persons as % of the dependent labour force in civilian employ-ment (national insurance
contributors and marginally employed, civil servants and unemployed) as of 30 June on previous year.
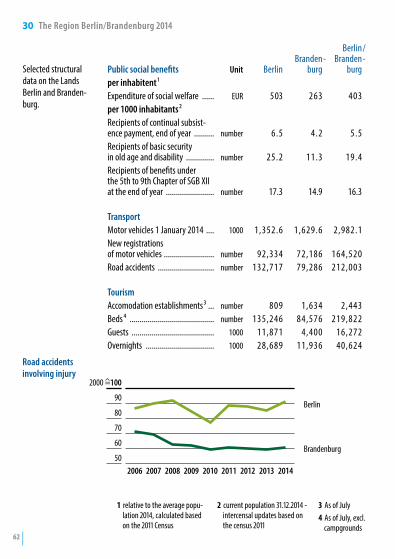
Road accidents involving injury
50
60
70
80
90
100
2006 2007 2008 2009 2010 2011 2012 2013 2014
Berlin
Brandenburg
2000 =
62 |
30 The Region Berlin/Brandenburg 2014
Selected structural data on the Lands Berlin and Branden-burg.
Public social benefits Unit BerlinBranden
burg-
Berlin Branden
burg
/ -
per inhabitent ¹Expenditure of social welfare ...... EUR 503 263 403per 1000 inhabitants²Recipients of continual subsist-ence payment, end of year .......... number 6.5 4.2 5.5Recipients of basic security in old age and disability .............. number 25.2 11.3 19.4Recipients of benefits under the 5th to 9th Chapter of SGB XII at the end of year ........................ number 17.3 14.9 16.3
Transport Motor vehicles 1 January 2014 .... 1000 1,352.6 1,629.6 2,982.1New registrations of motor vehicles ......................... number 92,334 72,186 164,520Road accidents ............................ number 132,717 79,286 212,003
Tourism Accomodation establishments³ ... number 809 1,634 2,443Beds⁴ .......................................... number 135,246 84,576 219,822Guests ......................................... 1000 11,871 4,400 16,272Overnights .................................. 1000 28,689 11,936 40,624
1 relative to the average popu-lation 2014, calculated based on the 2011 Census
2 current population 31.12.2014 - intercensal updates based on the census 2011
3 As of July4 As of July, excl.
campgrounds

| 63
30 The Region Berlin/Brandenburg 2014
Unit BerlinBranden
burg-
Berlin Branden
burg
/ -
Manufacturing⁵ ⁶Establishments⁷ ........................................... number 730 1,200 1,930Employees⁷ .................................................. number 93,532 99,432 192,964Turnover ....................................................... EUR mn 24,150 26,031 50,181
incl. with foreign countries ........................ EUR mn 12,949 7,296 20,245
Construction⁶ ⁸Establishments ............................................. number 196 337 533Employees .................................................... number 11,661 16,339 28,000
Foreign tradeExports ......................................................... EUR mn 13,299 13,231 26,531Change on previous year .............................. % 2.9 2.3 2.6Imports ........................................................ EUR mn 9,821 18,254 28,075Change on previous year .............................. % 0.9 -2.2 -1.1
Gross domestic product price-adjustedChange on previous year .............................. % 2.2 0.9 1.8
Consumer price index(2010 ≙ 100)⁸ .............................................. Index 107.8 106.2 x
Price index for all residential buildings(2010 ≙ 100)⁸ .............................................. Index 110.1 112.8 x
5 As well as mining and quarrying
6 Establishments generally employing 20 and more employees
7 September8 Annual average
English edition
The longest, shortest, highest, smallest, largest,
hottest and coldest
Berlin- StatistikThe longest underground route32 km, 57 min. running timeU7, Rathaus Spandau – RudowThe shortest underground route1.8 km, 3 min. running timeU55, Brandenburger Tor – HauptbahnhofThe longest S-Bahn (city railway) line58.4 km, 90/91 min. running timeS5, Spandau - Strausberg NordThe shortest S-Bahn (city railway) line10.2 km, 16 min. running timeS47, Spindlersfeld - HermannstraßeThe highest building368 m – television tower, AlexanderplatzThe smallest built-on area48 m² – Oranienstraße 46, in the borough of Friedrichshain-KreuzbergThe largest lake743.3 ha – Großer MüggelseeThe hottest day in 201420 July: 34.3 °CThe coldest day in 201425 January: - 13.6 °C