Die Rolle von Wassersstoff im Erneuerbaren Energiesystem · © Fraunhofer Die Rolle von...
50
© Fraunhofer Die Rolle von Wassersstoff im Erneuerbaren Energiesystem Hochschule Karlsruhe Technik und Wirtschaft Seminar Erneuerbare Energien, 22. März 2017 Dr. Christopher Hebling Bereichsleiter Wasserstofftechnologien H2T Fraunhofer-Institut für Solare Energiesysteme ISE, Freiburg [email protected]
Transcript of Die Rolle von Wassersstoff im Erneuerbaren Energiesystem · © Fraunhofer Die Rolle von...

© Fraunhofer
Die Rolle von Wassersstoff im Erneuerbaren Energiesystem Hochschule Karlsruhe Technik und Wirtschaft Seminar Erneuerbare Energien, 22. März 2017
Dr. Christopher Hebling Bereichsleiter Wasserstofftechnologien H2T Fraunhofer-Institut für Solare Energiesysteme ISE, Freiburg [email protected]

© Fraunhofer
FhG-SK: INTERNAL
Fraunhofer Institute for Solar Energy Systems ISE Research for the Energy Transformation
1160 scientists, engineers, students, administrators
€ 81.1 M€ budget in 2016
12 % basic financing, 88 % contract research
Largest European Solar Energy Research Institute
Business Areas Photovoltaics
Solar Thermal Technology
Energy Efficient Buildings
Energy System Technology
Hydrogen Technologies

© Fraunhofer
FhG-SK: INTERNAL
Invention of voltaic pile (1799) enabled investigations of electrolytic approaches
Main principle demonstrated around 1800 by J. W. Ritter, William Nicholson and Anthony Carlise
Today 3 technologies available:
Alkaline electrolysis (AEL)
Electrolysis in acid environment (PEM electrolysis - PEMEL)
Steam electrolysis (High temperature HTEL or SOEL)
Hydrogen Production by Electrolytical Water Splitting Known for more than 200 years.
Johann Wilhelm Ritter (1776-1810)
First quantitative water electrolsis by Ritter in 1800
Picture credits: all www.wikipedia.org
© Fraunhofer
FhG-SK: INTERNAL
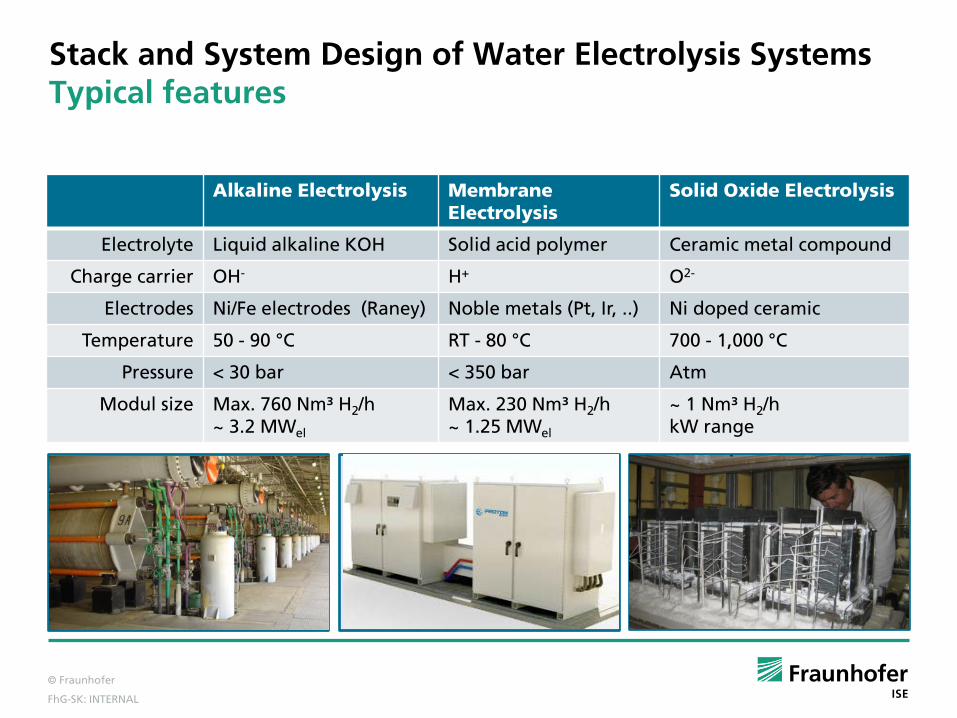
Stack and System Design of Water Electrolysis Systems Typical features
Alkaline Electrolysis Membrane Electrolysis
Solid Oxide Electrolysis
Electrolyte Liquid alkaline KOH Solid acid polymer Ceramic metal compound
Charge carrier OH- H+ O2-
Electrodes Ni/Fe electrodes (Raney) Noble metals (Pt, Ir, ..) Ni doped ceramic
Temperature 50 - 90 °C RT - 80 °C 700 - 1,000 °C
Pressure < 30 bar < 350 bar Atm
Modul size Max. 760 Nm³ H2/h ~ 3.2 MWel
Max. 230 Nm³ H2/h ~ 1.25 MWel
~ 1 Nm³ H2/h kW range
O2-
½ O2H2
H2/H2O
H2O - +
HT
Cathode
Anode
AEL
PEMEL HTEL

© Fraunhofer
FhG-SK: INTERNAL
Source and picture credits: en.wikipedia.org/wiki/Poul_la_Cou http://www.poullacour.dk/engelsk/menu.htm
Poul la Cour (1846 - 1908)
Danish inventor and teacher at Askov folk high school
First wind mill in 1891 for rural electrification
Hydrogen storage system
Alkaline tubular electrolysis cells
H2 / O2 tanks
Gas lamps for school building (1895 - 1902)
(Autogenous gas welding)
Hydrogen Production by Electrolytical Water Splitting 1890s: Hydrogen production by wind power

© Fraunhofer
FhG-SK: INTERNAL
Alkaline Water Electrolysis Plants Since 1920s
Picture credits: Fell – StatoilHydro,2008, NOW-Workshop

© Fraunhofer
FhG-SK: INTERNAL
Hydrogen Storage Systems High pressure and low temperature are prefered
Capacity
CGH2 (70 MPa) LH2 (20.4 K)
stati
on
ary
CGH2 (20 MPa) CGH2 (45 MPa) LH2 (20.4 K) CGH2 (< 20 MPa) CGH2 (35 MPa) CGH2 (< 3 MPa)
Das Bild kann zurzeit nicht angezeigt werden.
CGH2 (35 MPa) LH2 (20.4 K) LH2 (20.4 K)
Picture Credits: Top: Dynetek, Quantum, Linde, Magna Steyr, NASA Bottom: Westfalen Gas, Wystrach, Dynetek, Hyfleet, NASA, KBB UT
mo
bil
e

© Fraunhofer
FhG-SK: INTERNAL
Hydrogen Storage Systems Underground storage in salt caverns
© EWE AG
Up to 1.000.000 m³
Echometric cavern survey
© KBB UT
In the past: Storage of town gas in Germany
Today: Natural gas reserve in Germany
Hydrogen salt caverns in UK and US
© …

© Fraunhofer
FhG-SK: INTERNAL
Hydrogen Storage Systems Hydrogen salt caverns in UK and US
Well head of a salt cavern
Teeside (GB): Sabic Petrochemicals
V = 3x 70,000 m3
p = 4.5 MPa (const)
W = 25.4 GWh (761 t H2)
depth ~ 370 m
operation > 30 years
Clemens Dome, Lake Jackson, Texas (USA)
ConocoPhillips
V = 1x 580,000 m³
p = 7 - 13.5 MPa
W = 83.3 GWh (~2,500 t H2)
depth ~ 850 - 1150 m
Since 1986
Landinger, Crotogino: The role of large-scale hydrogen storage for future renewable energy utilisation, IRES II conference, 2007
Schematic comparison of the 2 caverns

© Fraunhofer
FhG-SK: INTERNAL
Hydrogen as Future Energy Carrier Today's industrial hydrogen production.
Picture credits: http://www.making-hydrogen.com/steam-reforming-hydrogen.html (last access 2016-11-08) https://www.engineering-airliquide.com/project-delivery-services-references/steam-methane-reforming-plant-germany
Global hydrogen production: 600 bn. Nm³/yr
Mostly steam methane reforming
H2O (g) + CH4 (g) 3 H2 (g) + CO (g)
Required in the petrochemical industry, cracking-reforming process of crude oil

© Fraunhofer
FhG-SK: INTERNAL
Which are Today‘s Drivers for Hydrogen Technologies ? International Partnership for Hydrogen Energy IPHE
Energy security- Independency from fossil fuels
Zero emission mobility
CO2 Reduction - Decarbonization of the Energy System
Securing the economy - new markets and new jobs through innovations
Integration of intermittant renewable energy into the energy system
Power-to-X

© Fraunhofer
FhG-SK: INTERNAL
Global Fossil Fuel CO2 Emissions 2010 data
Source: http://hpcg.purdue.edu/FFDAS/index.phpl

© Fraunhofer
FhG-SK: INTERNAL
Current CO2 Emissions in Millions of Metric Tons Fourteen nations and Europe account for about 80 percent of world greenhouse gas emissions
Source: http://environment.nationalgeographic.com/environment/energy/great-energy-challenge/global-footprints/

© Fraunhofer
FhG-SK: INTERNAL
Current CO2 Emissions in Millions of Metric Tons per Millions of Dollars of GDP
Source: http://environment.nationalgeographic.com/environment/energy/great-energy-challenge/global-footprints/

© Fraunhofer
FhG-SK: INTERNAL
Cumulative CO2 Emissions in Metric Tons Since 1850
Source: http://environment.nationalgeographic.com/environment/energy/great-energy-challenge/global-footprints/

© Fraunhofer
FhG-SK: INTERNAL
Energy Concept of the German Government Decarbonization of Germany’s future energy system
Ambitious goals by the German government:
Green house gas reduction by
- 40% in 2020
- 80/95% in 2050
Reduction of primary energy consumption
- 50% in 2050
Transition towards decarbonization of the energy system
Development of German GHG emissions 1990 - 2013 and target values until 2050 (The Energy Concept of Germany)

© Fraunhofer
FhG-SK: INTERNAL
Year 2016 Total 32,3% El.-gen Installed Capacity PV 41,2 GW Bio 4.1 GW Wind 45,1 GW Hydro 5.6 GW
Electricity Generation from Renewable Energy Sources 191,4 TWh electricity were produced from renewable energy sources in 2016

© Fraunhofer
FhG-SK: INTERNAL
Regional Distribution of Power Capacities in Germany
© Fraunhofer
FhG-SK: INTERNAL
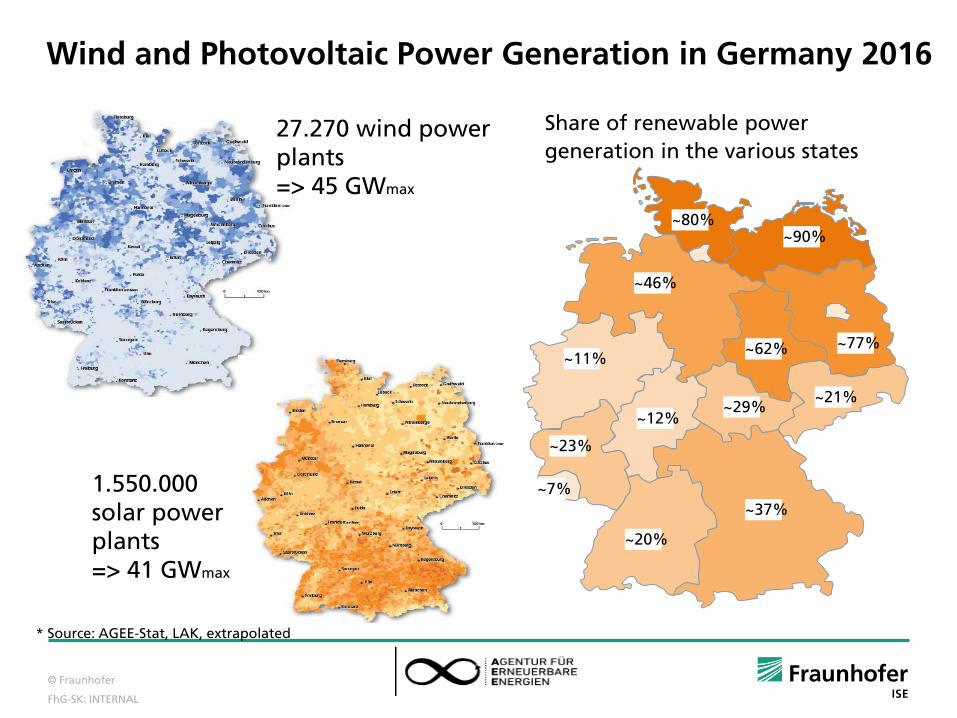
Wind and Photovoltaic Power Generation in Germany 2016
~90% ~80%
~46%
~77% ~62%
~21% ~29%
~37%
~20%
~23%
~11%
~12%
~7%
Share of renewable power generation in the various states
* Source: AGEE-Stat, LAK, extrapolated
27.270 wind power plants => 45 GWmax
1.550.000 solar power plants => 41 GWmax

© Fraunhofer
FhG-SK: INTERNAL
Power Generation by Solar and Wind in June 2016

© Fraunhofer
FhG-SK: INTERNAL
Power Generation by Solar and Wind in December 2016

© Fraunhofer
FhG-SK: INTERNAL
Power Generation in December 2016 from both Renewables and Fossile Energy Carriers

© Fraunhofer
FhG-SK: INTERNAL
Electricity Production and Spot Prices in December 2016
7.5 TWh were exported in Dec. 2016
© Fraunhofer
FhG-SK: INTERNAL
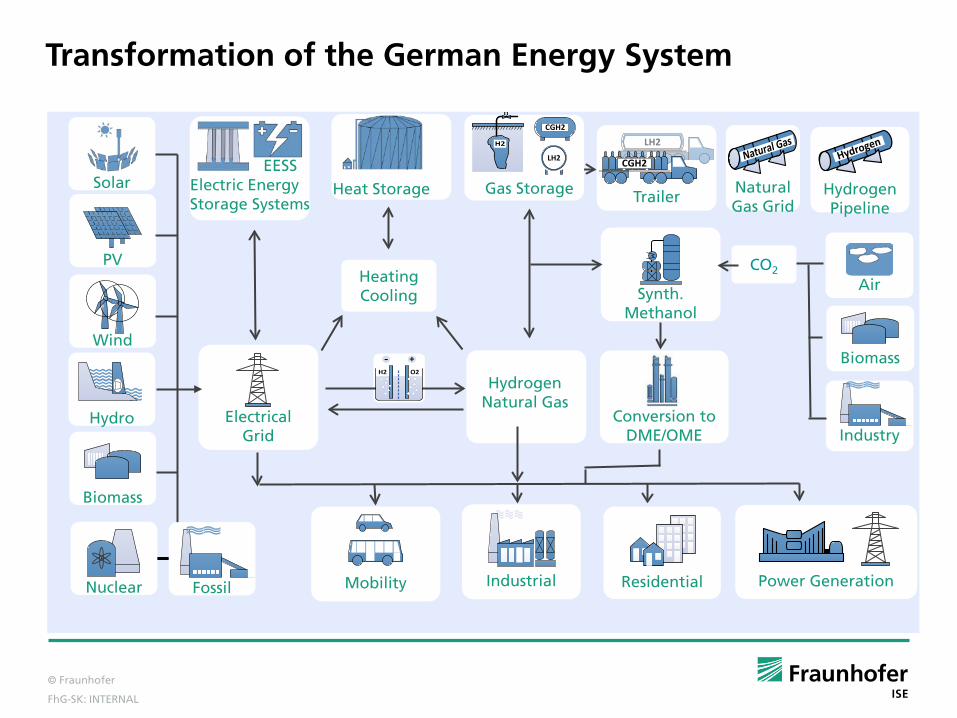
Transformation of the German Energy System
Electrical Grid
Heating Cooling
Conversion to DME/OME
Industrial
Mobility
Residential
Power Generation
Trailer
Natural Gas Grid
Natural GasLH2
CGH2
Hydrogen Pipeline
Hydrogen
Biomass
Industry
CO2
Air
Wind
PV
Hydro
Solar
Biomass
Natural Gas
H2 O2
+-
Heat Storage
H2
CGH2
LH2
Gas Storage
Electric Energy
Storage Systems
EESS
Nuclear
Fossil
Hydrogen Natural Gas
Synth. Methanol

© Fraunhofer
FhG-SK: INTERNAL
The Power to Liquid Concept Hydrogenation of CO2 to MeOH/DME/OME Motivation: Promising perspective
for MeOH
Important bulk chemical/ fuel (additive)
Increasing demand
Existing infrastructure
Liquid: easy storage/high energy density 19.5 MJ/kg
Easy conversion to DME, etc.
Source: D. Johnson (2012) Global Methanol Market Review
MeOH: Methanol - CH3OH DME : Dimethylether = CH3OCH3 = Methoxymethane OME: Oxymethylenether (in German)

© Fraunhofer
FhG-SK: INTERNAL
The Power to Liquid Concept What are poly(oxymethylene) dimethyl ethers, OMEs
DME n = 0
Methylal, DMM, OME1 n = 1
OME2 n = 2
. . .
Ethers of the formula H3CO-(CH2O)n-CH3, n = 0, 1, 2, 3,…
OMEs do not contain C-C-bonds and are excellent solvents
MeOH: Methanol - CH3OH DME : Dimethylether = CH3OCH3 = Methoxymethane OME: Chemicals with methoxy group

© Fraunhofer
FhG-SK: INTERNAL
German GHG Emissions Since 1990 and Target Values 2050 The Energy Concept of Germany
- 40 %
- 55 %
- 70 %
- 80 %
- 95 % Gre
enh
ou
seg
as E
mis
sio
ns,
Mio
t C
O2,
Eq
u.
Others Agriculture Mobility Industry CC Gas Turbines Households Energy Economy
Sectors

© Fraunhofer
FhG-SK: INTERNAL
(c) Ludwig-Bölkow-Systemtechnik GmbH
The Course of CO2-Reductions in the Various Sectors
Graphs: G. Rosenkranz, Agora Energiewende, 20.09.2016
Energy (Target: -92,5%) Industry (Target: -81%) Homes (Target: -92,5%)
Transport (Target: -92,5%) Agriculture (Target: -60%)

© Fraunhofer
FhG-SK: INTERNAL
Energy System Modelling at Fraunhofer ISE What will the Energy Transformation Cost ?
What is the cost-optimized transformation pathway including all end-use sectors?
The goals of reducing green house
gas emissions are fulfilled each year
Further boundary conditions
Fade-out of nuclear energy until 2022
No implementation of CCS technology

© Fraunhofer
FhG-SK: INTERNAL
Optimization of Germany’s Future Energy System
Electricity generation, storage and end-use
Fuels (including biomass and synthetic
fuels from RE)
Mobility (battery-electric,
hydrogen, conv. fuel mix)
Processes in industry and
tertiary sector
Heat (buildings,
incl. storage and heating networks)
Mimimize total annual cost (operation, invest, maintenance, …)

© Fraunhofer
FhG-SK: INTERNAL
Fluctuating Renewable Energies: Solar and Wind
Installed capacity in 2050
Offshore wind 33 GW
Onshore wind 168 GW (∼4*today)
Solar PV 166 GW (∼4.5*today)
© Fraunhofer
FhG-SK: INTERNAL
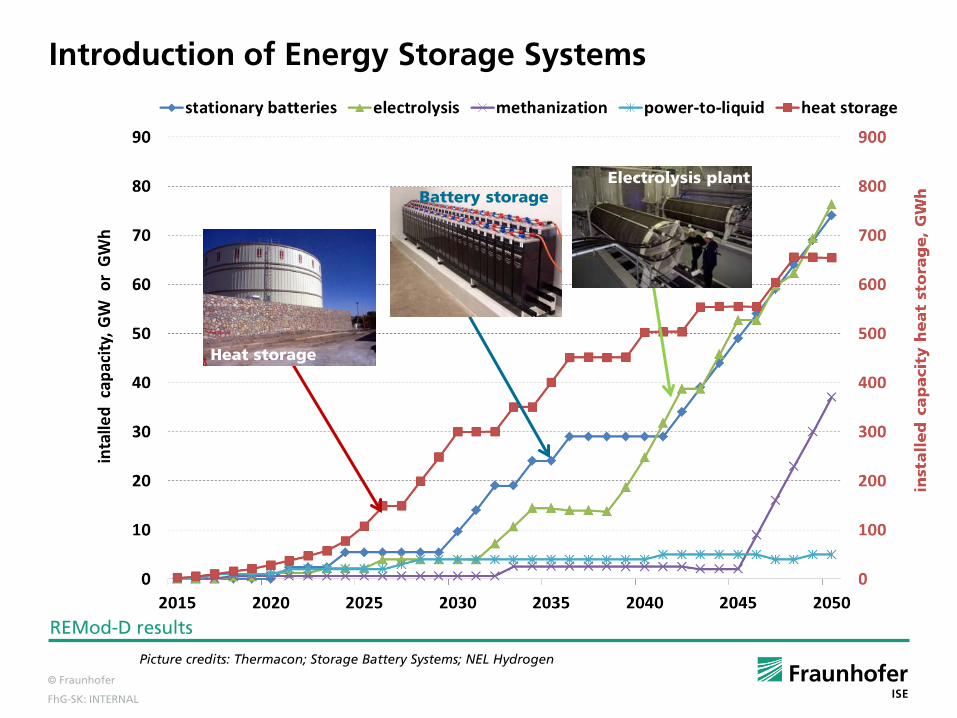
Introduction of Energy Storage Systems
Picture credits: Thermacon; Storage Battery Systems; NEL Hydrogen
Battery storage Electrolysis plant
Heat storage
REMod-D results

© Fraunhofer
FhG-SK: INTERNAL
Power to Gas Installations in Germany in 2016 Overview
Several PtG installations in Germany since 2011 for different applications
Direct H2 injection in NG pipeline
Methanisation and SNG injection
Secondary control reserve
Power balancing
Hybrid power plant
Hydrogen for FCEV mobility (on-site hydrogen refuelling stations and trailer distribution)
Industrial use and PtX
Demonstration stage with public support by funded projects
Source: DENA Potenzialatlas Power-to-Gas (2016-06)

© Fraunhofer
FhG-SK: INTERNAL
Power to Gas Installations in Germany Hybrid power plant ENERTRAG Prenzlau
Technical features
1x alkaline 600 kW NDE electrolyzer from Enertrag HyTec/McPhy
H2 production rate: 120 Nm³/h @ atmospheric
Mech. compression units
Commissioning: 10/2011
Application
Re-electrification via CHP
H2 for Hydrogen Refueling Stations
Partners
Enertrag
Vattenfall Europe
Total & DB
Source: https://www.enertrag.com/90_hybridkraftwerk.html
© Fraunhofer
FhG-SK: INTERNAL
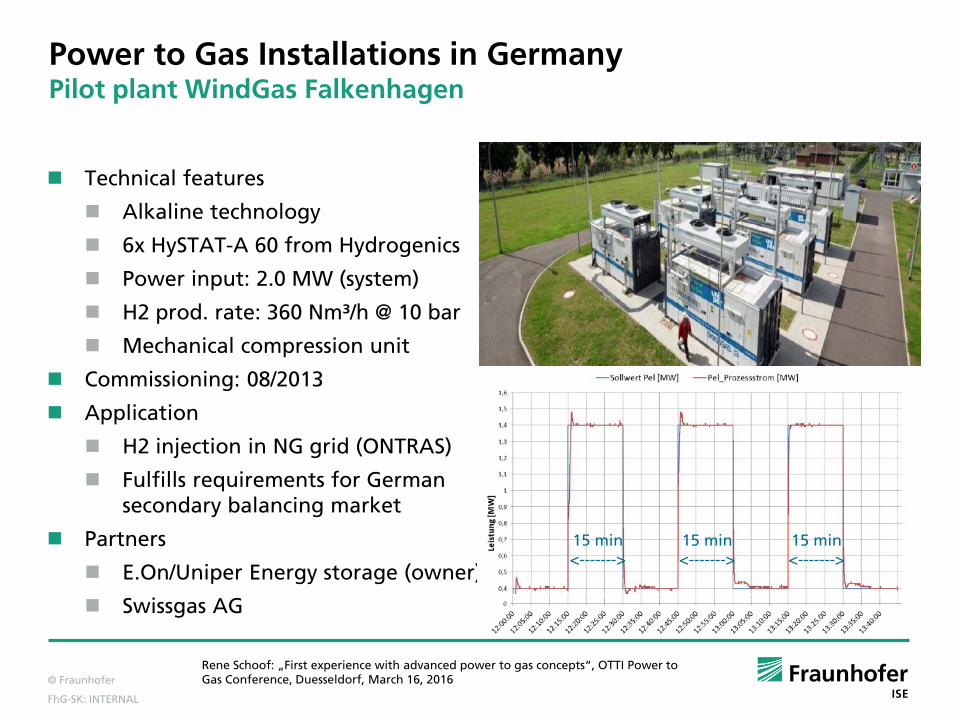
Power to Gas Installations in Germany Pilot plant WindGas Falkenhagen
Technical features
Alkaline technology
6x HySTAT-A 60 from Hydrogenics
Power input: 2.0 MW (system)
H2 prod. rate: 360 Nm³/h @ 10 bar
Mechanical compression unit
Commissioning: 08/2013
Application
H2 injection in NG grid (ONTRAS)
Fulfills requirements for German secondary balancing market
Partners
E.On/Uniper Energy storage (owner)
Swissgas AG
15 min <------->
15 min <------->
15 min <------->
Rene Schoof: „First experience with advanced power to gas concepts“, OTTI Power to Gas Conference, Duesseldorf, March 16, 2016

© Fraunhofer
FhG-SK: INTERNAL
Power to Gas Installations in Germany Project Windgas Hamburg Reitbrook
Technical features
1x 1500E from Hydrogenics
Ultra compact PEM stack: L900 x W500 x H700 mm
Power input: 1.5 MW (stack)
H2 prod. rate: 290 Nm³/h @ 25 bar
No compression stage
Application
H2 fed into local NG grid (HanseW.)
Commissioning: 10/2015
Partners:
Uniper Energy Storage, HanseWerk
Hydrogenics, Greenerity
DLR, Fraunhofer ISE
Rene Schoof: „First experience with advanced power to gas concepts“, OTTI Power to Gas Conference, Duesseldorf, March 16, 2016

© Fraunhofer
FhG-SK: INTERNAL
Power-to-Gas Installations in Germany Energiepark Mainz
Technical features
PEM techn. SILYZER 200 / Siemens
3x stacks à 1.25 MW / 2.0 MW
H2 prod rate@35 barg ~ 700 Nm³/h
1000 kg H2 storage (8 MPa)
Commissioning: 07/2015
Application
Injection in local gas grid
Multi-use trailer-filling (22.5 MPa)
Grid service (balancing power, SCR)
Partners
Stadtwerke Mainz
Linde & Siemens
RheinMain University
Katharina Beumelburg: „Status report “Energiepark Mainz” – efficient electrolyzes for green hydrogen“, Energy Storage Europe 2016, Duesseldorf, March 17, 2016

© Fraunhofer
FhG-SK: INTERNAL
Power to Gas Installations in Germany e-gas plant Werlte/Emsland
Technical features:
Alkaline technology from Enertrag
3x stacks à 2.1 MW, NDE series
H2 prod. rate @ atmospheric: 1.300 Nm³/h at rated power
Fixed bed methanisation with CO2 from on-site biogas plant: 300 Nm³/h
Opening 06/2013
Applications
SNG injection in local gas grid
Grid service (SCR)
Partners
EWE & ETOGAS
ZSW & Fraunhofer IWES
Audi
Stephan Rieke: „Power-To-Gas-Anlage: Bau und Betrieb einer 6-MW-Anlage in Werlte“,, München, March 17, 2016
Fixed bed methanisation Alkaline electrolysis units

© Fraunhofer
FhG-SK: INTERNAL
The Power to Liquid Concept Demonstration project in Lünen ‘MefCO2‘
MeOH Production capacity: 1t /day
CO2 capture capacity per ton of MeOH: 1.5 t/d
Exhaust gas from coal fired power plant
1 MW alkaline electrolyser
Flexible load operation for MeOH reactor
Scale up by factor 200 possible?
Partners
Hydrogenics & Mitsubishi Hitachi Power Systems (MSHP)
Carbon Recycling International
© obs/Mitsubishi Hitachi Power Systems Europe GmbH/MHPSE
Source: http://www.presseportal.de/pm/81168/2930631

© Fraunhofer
FhG-SK: INTERNAL
Local Storage of Natural Gas in Switzerland (Volketswil)
22 tubes
L = 250 m length
Ø = 1.5m
V = 10,000 m3
p = 70 bar
~ 710.000 Nm3 NG
Storage capacity ~ 2 GWh if filled with hydrogen
Picture credits: http://www.gaznat.ch/en/natural-gas/storage/
Construction of the pipe storage facility in Volketswil (2003)

© Fraunhofer
FhG-SK: INTERNAL
Local Storage of Natural Gas in Switzerland (Volketswil) 22 tubes of 250m length (1.5m), 10.000 m3 vol., 70 bar pressure, 714.000 Nm3 If filled with hydrogen under 70 bar: 1.5 – 2 GWh Storage Capacity (Hydrogen)

© Fraunhofer
FhG-SK: INTERNAL
Local Storage of Natural Gas in Switzerland (Volketswil)

© Fraunhofer
FhG-SK: INTERNAL
Gas Tube Storage of Natural Gas in Switzerland (Volketswil)
© Fraunhofer
FhG-SK: INTERNAL
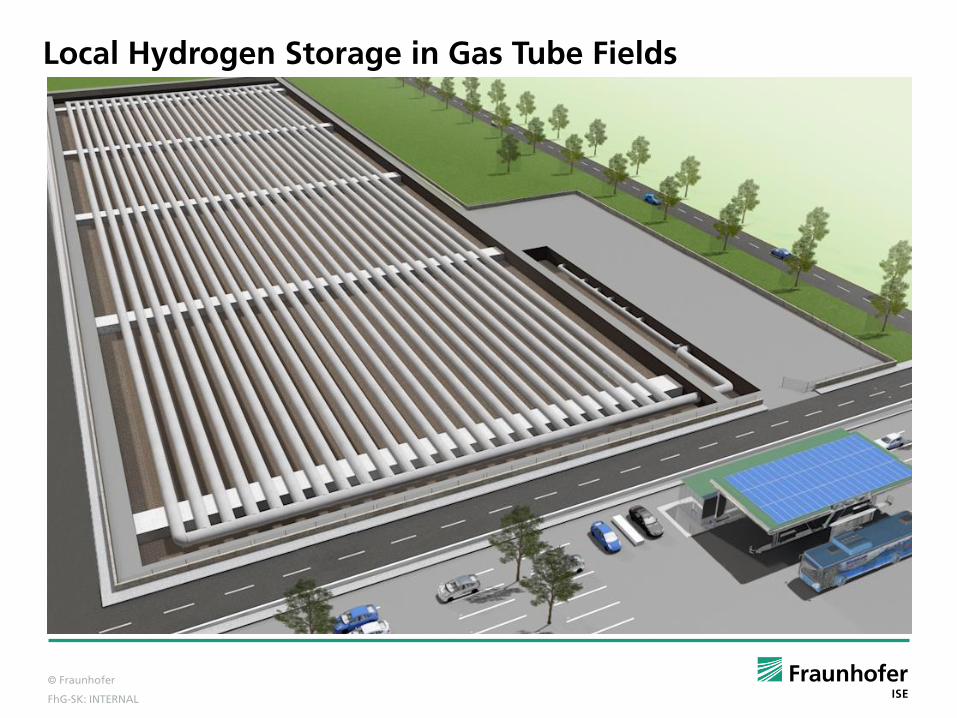
Local Hydrogen Storage in Gas Tube Fields

© Fraunhofer
FhG-SK: INTERNAL
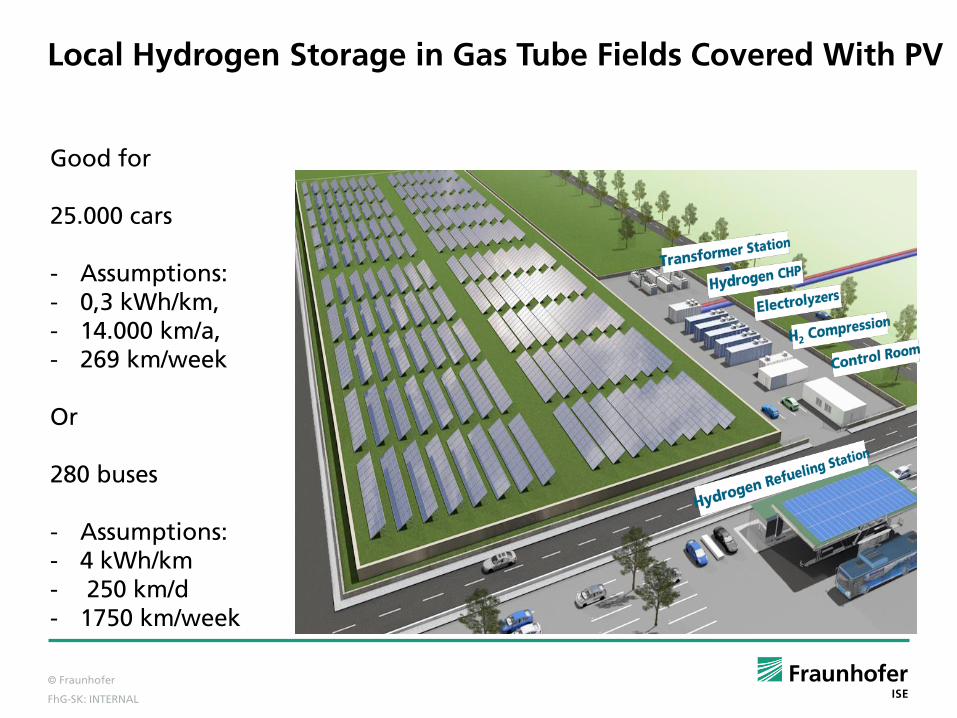
Local Hydrogen Storage in Gas Tube Fields Covered With PV
© Fraunhofer
FhG-SK: INTERNAL
Local Hydrogen Storage in Gas Tube Fields Covered With PV
Good for 25.000 cars - Assumptions: - 0,3 kWh/km, - 14.000 km/a, - 269 km/week
Or 280 buses - Assumptions: - 4 kWh/km - 250 km/d - 1750 km/week

© Fraunhofer
FhG-SK: INTERNAL
Our Modern Fairytale: From Photon to Traction

© Fraunhofer
FhG-SK: INTERNAL
Conclusions
Hydrogen (and fuel cell) technologies will play an important role in a renewable energy system as an energy storage media, as a fuel for mobility and as a chemical feedstock for synthetic liquid fuels and chemicals
A stable policy and regulatory framework (carbon pricing, feed-in-tarifs, fuel economy standards, zero-emission vehicle mandates) is required for market certainty for investors and create a self-sustaining market
The global energy transformation from fossil and nuclear energy carriers towards renewable energy is the challenge of our generation to overcome poverty and to reduce the climate change.
© Fraunhofer
FhG-SK: INTERNAL
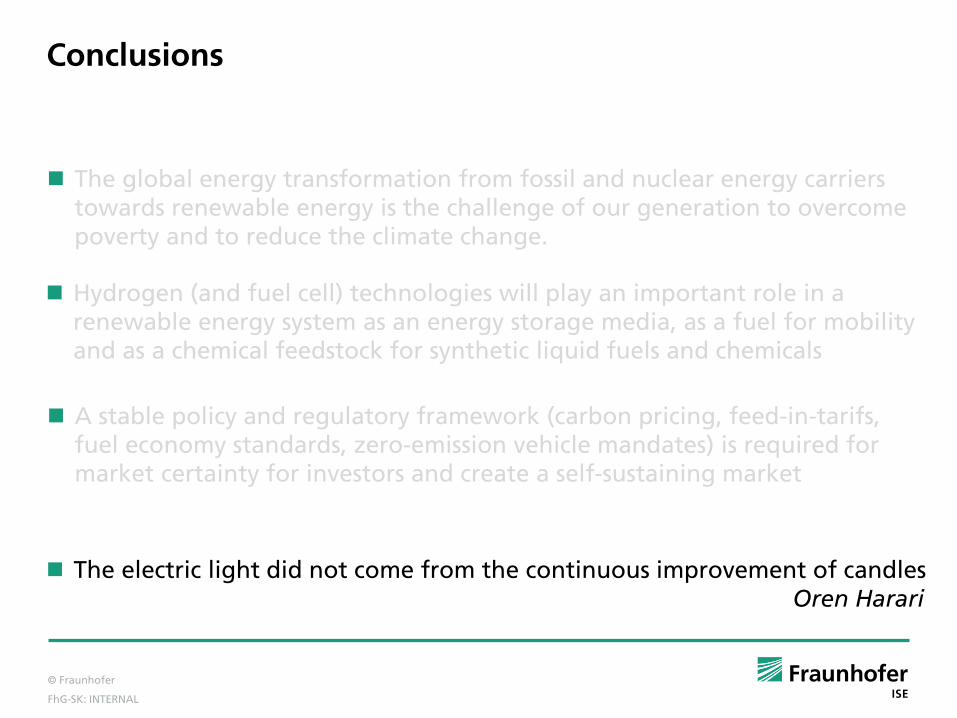
Conclusions
Hydrogen (and fuel cell) technologies will play an important role in a renewable energy system as an energy storage media, as a fuel for mobility and as a chemical feedstock for synthetic liquid fuels and chemicals
The electric light did not come from the continuous improvement of candles Oren Harari
A stable policy and regulatory framework (carbon pricing, feed-in-tarifs, fuel economy standards, zero-emission vehicle mandates) is required for market certainty for investors and create a self-sustaining market
The global energy transformation from fossil and nuclear energy carriers towards renewable energy is the challenge of our generation to overcome poverty and to reduce the climate change.

© Fraunhofer
FhG-SK: INTERNAL
Thank you
Christopher Hebling, Director Division Hydrogen Technologies www.ise.fraunhofer.de Email: [email protected] Cell: +49 175 2966752
Fraunhofer Institute for Solar Energy Systems ISE