![DFG-Schwerpunktprogramm 1324 · 1.2 Layout of the Paper The paper is organized as follows: in Section 2 we recall the in nite dimensional setting of [20, 17]. A general strategy is](https://static.fdokument.com/doc/165x107/600ea1aae3c14743656ee44d/dfg-schwerpunktprogramm-12-layout-of-the-paper-the-paper-is-organized-as-follows.jpg)
Discussion Paper No. 7639 - CORE This paper aims to provide the recent developments on the...
62
econstor www.econstor.eu Der Open-Access-Publikationsserver der ZBW – Leibniz-Informationszentrum Wirtschaft The Open Access Publication Server of the ZBW – Leibniz Information Centre for Economics Standard-Nutzungsbedingungen: Die Dokumente auf EconStor dürfen zu eigenen wissenschaftlichen Zwecken und zum Privatgebrauch gespeichert und kopiert werden. Sie dürfen die Dokumente nicht für öffentliche oder kommerzielle Zwecke vervielfältigen, öffentlich ausstellen, öffentlich zugänglich machen, vertreiben oder anderweitig nutzen. Sofern die Verfasser die Dokumente unter Open-Content-Lizenzen (insbesondere CC-Lizenzen) zur Verfügung gestellt haben sollten, gelten abweichend von diesen Nutzungsbedingungen die in der dort genannten Lizenz gewährten Nutzungsrechte. Terms of use: Documents in EconStor may be saved and copied for your personal and scholarly purposes. You are not to copy documents for public or commercial purposes, to exhibit the documents publicly, to make them publicly available on the internet, or to distribute or otherwise use the documents in public. If the documents have been made available under an Open Content Licence (especially Creative Commons Licences), you may exercise further usage rights as specified in the indicated licence. zbw Leibniz-Informationszentrum Wirtschaft Leibniz Information Centre for Economics Tansel, Aysit Working Paper Supplementary Education in Turkey: Recent Developments and Future Prospects IZA Discussion Paper, No. 7639 Provided in Cooperation with: Institute for the Study of Labor (IZA) Suggested Citation: Tansel, Aysit (2013) : Supplementary Education in Turkey: Recent Developments and Future Prospects, IZA Discussion Paper, No. 7639 This Version is available at: http://hdl.handle.net/10419/89981
Transcript of Discussion Paper No. 7639 - CORE This paper aims to provide the recent developments on the...
econstor www.econstor.eu
Der Open-Access-Publikationsserver der ZBW – Leibniz-Informationszentrum WirtschaftThe Open Access Publication Server of the ZBW – Leibniz Information Centre for Economics
Standard-Nutzungsbedingungen:
Die Dokumente auf EconStor dürfen zu eigenen wissenschaftlichenZwecken und zum Privatgebrauch gespeichert und kopiert werden.
Sie dürfen die Dokumente nicht für öffentliche oder kommerzielleZwecke vervielfältigen, öffentlich ausstellen, öffentlich zugänglichmachen, vertreiben oder anderweitig nutzen.
Sofern die Verfasser die Dokumente unter Open-Content-Lizenzen(insbesondere CC-Lizenzen) zur Verfügung gestellt haben sollten,gelten abweichend von diesen Nutzungsbedingungen die in der dortgenannten Lizenz gewährten Nutzungsrechte.
Terms of use:
Documents in EconStor may be saved and copied for yourpersonal and scholarly purposes.
You are not to copy documents for public or commercialpurposes, to exhibit the documents publicly, to make thempublicly available on the internet, or to distribute or otherwiseuse the documents in public.
If the documents have been made available under an OpenContent Licence (especially Creative Commons Licences), youmay exercise further usage rights as specified in the indicatedlicence.
zbw Leibniz-Informationszentrum WirtschaftLeibniz Information Centre for Economics
Tansel, Aysit
Working Paper
Supplementary Education in Turkey: RecentDevelopments and Future Prospects
IZA Discussion Paper, No. 7639
Provided in Cooperation with:Institute for the Study of Labor (IZA)
Suggested Citation: Tansel, Aysit (2013) : Supplementary Education in Turkey: RecentDevelopments and Future Prospects, IZA Discussion Paper, No. 7639
This Version is available at:http://hdl.handle.net/10419/89981
DI
SC
US
SI
ON
P
AP
ER
S
ER
IE
S
Forschungsinstitut zur Zukunft der ArbeitInstitute for the Study of Labor
Supplementary Education in Turkey:Recent Developments and Future Prospects
IZA DP No. 7639
September 2013
Aysit Tansel
Supplementary Education in Turkey:
Recent Developments and Future Prospects
Aysit Tansel Middle East Technical University,
IZA and ERF
Discussion Paper No. 7639 September 2013
IZA
P.O. Box 7240 53072 Bonn
Germany
Phone: +49-228-3894-0 Fax: +49-228-3894-180
E-mail: [email protected]
Any opinions expressed here are those of the author(s) and not those of IZA. Research published in this series may include views on policy, but the institute itself takes no institutional policy positions. The IZA research network is committed to the IZA Guiding Principles of Research Integrity. The Institute for the Study of Labor (IZA) in Bonn is a local and virtual international research center and a place of communication between science, politics and business. IZA is an independent nonprofit organization supported by Deutsche Post Foundation. The center is associated with the University of Bonn and offers a stimulating research environment through its international network, workshops and conferences, data service, project support, research visits and doctoral program. IZA engages in (i) original and internationally competitive research in all fields of labor economics, (ii) development of policy concepts, and (iii) dissemination of research results and concepts to the interested public. IZA Discussion Papers often represent preliminary work and are circulated to encourage discussion. Citation of such a paper should account for its provisional character. A revised version may be available directly from the author.
IZA Discussion Paper No. 7639 September 2013
ABSTRACT
Supplementary Education in Turkey: Recent Developments and Future Prospects*
Purpose: This paper aims to provide the recent developments on the supplementary education system in Turkey. The national examinations for advancing to higher levels of schooling are believed to fuel the demand for Supplementary Education Centers (SEC). Further, we aim to understand the distribution of the SECs and of the secondary schools across the provinces of Turkey in order to evaluate the spacial equity considerations. Design/Methodology/Approach: The evolution of the SECs and of the secondary schools over time are described and compared. The provincial distribution of the SECs, secondary schools and the high school age population are compared. The characteristics of these distributions are evaluated to inform the about spatial equity issues. The distribution of high school age population that attend secondary schools and the distribution of the secondary school students that attend SECs across the provinces are compared. Findings: The evidence points out to significant provincial variations in various characteristics of SECs and the secondary schools. The distribution of the SECs is more unequal than that of the secondary schools. The provinces located mostly in the east and south east of the country have lower quality SECs and secondary schools. Further, the SEC participation among the secondary school students and the secondary school participation among the relevant age group are lower in some of the provinces indicating major disadvantages. Originality/Value: The review of the most recent developments about the SECs, examination and comparison of provincial distributions of the SECs and of the secondary schools are novelties in this paper. JEL Classification: I20, I21, I22 Keywords: supplementary education, demand for education, Turkey Corresponding author: Aysit Tansel Department of Economics Middle East Technical University 06800 Ankara Turkey E-mail: [email protected]
* This paper is prepared at the kind request of Janice Aurini, Scott Davies and Julian Dierkes. I am grateful to them for their encouragement and comments. I would also like to thank Hakan Berument and Ali Akarca for providing thoughtful comments on the manuscript and Özgen Öztürk for his help in data preparation. Any errors are my own.
2
Supplementary Education in Turkey: Recent Developments and Future
Prospects
Table of Contents
1. Introduction
2. Education System in Turkey
2.1 The National Examination Systems in Turkey
2.2 The High Demand for University Education in Turkey
3. The Supplementary Education Centers in Turkey
3.1 Recent Trends in Supplementary Education Centers
3.2. Disruption of Mainstream Classes
3.3 Determinants of Receiving Supplementary Education
3.4 Effectiveness of Supplementary Education Centers
3.5 Cost of the Supplementary Education Centers
3.6 A Discussion of the TED Survey
4. Provincial Distribution of Supplementary Education Centers and Secondary
Schools
4.1 Intensity of SECs and secondary Schools by Provinces
4.2 Main Characteristics of SECs and Secondary Schools by Provinces
5. Future Prospects
6. Conclusions
References
3
List of Acronyms and Abbreviations
SEC : Supplementary Education Center (Dersane).
YÖK: Higher Education Board of Turkey (Yüksek Öğretim Kurumu)
SBS : Level Determining Examination (Seviye Belirleme Sınavı) for advancing to
secondary education.
YGS: Examination for Transition to the Higher Education (Yüksek Öğretime Geçiş
Sınavı).
LYS: Placement Examination for Undergraduate Programs (Lisans Yerleştirme
Sınavı).
ÖSYM: Student Selection and Placement Center (Öğrenci Seçme ve Yerleştirme
Merkezi).
ÖZ-DE-BİR: Association of Supplementary Education Centers (Özel Dersaneler
Birliği).
GÜVEN-DER: Association of The Owners of Güven Supplementary Education
Centers (Güven Dersane Sahipleri Derneği).
TÖDER: Association of the all Private Educational Establishments (Tüm Özel
Öğretim Kurumları Derneği).
TED: Turkish Educational Association (Türk Eğitim Derneği).
ERG: Educational Reform Initiative (Eğitim Reformu Girişimi).
TURKSTAT: Turkish Statistical Institute.
4
1. Introduction
Private supplementary education is a wide-spread phenomenon all over the
world but especially in the East Asian countries. During the recent decades it has
spread substantially to the other regions of the world including Western developed
countries and more recently to the East European countries. There is a global trend
that parents and students around the world resort to supplementary education in
response to the competitive pressures in their educational systems.
Parallel to the recent expansion of the supplementary education there is an
upsurge of studies on supplementary education recently. Stevenson and Baker
(1992) was one of the first to investigate this topic in Japan. They were followed
more recently by Bray (1999) who draws attention of the international community
on supplementary education with works such as Bray (2003), Bray and Kwok
(2003), Silova, Budiene and Bray (2006), Bray (2009, 2010, 2011) and Mori and
Baker (2010). Some researchers used the term “hidden market place” and some
researchers used the term “shadow education” all to refer to the supplementary
education. Burch (2009) used the term “hidden markets” and Bray (1999) coined
the word “shadow education” for the supplementary education since it develops
parallel to the mainstream education but with different characteristics. Heyneman
(2011) summarizes the points in favor of and against supplementary education and
states that it may be contrary to the United Nations Declaration of Human Rights. In
the context of SECs the issue of equity and social justice arises because wealthy
5
families can buy supplementary education in greater intensity and better quality.
Safarzynska (2013) examine the gender gap and the production of socio-economic
inequalities by supplementary education. Lee, Park and Lee (2009) also suggested
that SECs could further the socio-economic inequalities. Bray, Mazawi and Sultana
(2013) discuss extensively the issues of SECs and social equity in a number of
Mediterranean countries.
Bray (1999) review the research on the effectiveness of supplementary education
and finds mixed results. Tansel and Bircan (2005) and Zhang (2013) are some of the
limited research in this area. The factors that contribute to the growth of
supplementary education all over the world are different and its extent varies widely
among the countries. Ireson (2004) examine this topic in Ireland and Bray and Kwok
(2003) examine the system in Hong Kong. Bray (2011) considers the supplementary
education in the European Union which is a region studied less often. Bray and Suso
(2008) study the patterns in Africa and Bray and Lykins (2012) examine the same in
Asia. Silova (2009) consider the developments in supplementary education in
Central Asia, Silova (2010) in Eastern Europe and Central Asia and Silova, Budiene
and Bray (2006) in Eastern European countries.
Supplementary education is especially wide-spread in the countries where
there are national examinations in selecting students in their transitions to upper
levels of schools. There are national, central examinations for transitions to higher
levels of schooling in many countries such as South Korea, Hong Kong, Greece,
Japan and Taiwan. The system of SECs is most prevalent in these countries. The
system of supplementary education in Turkey is believed to have developed as a
6
result of such national, central examinations. In 2012 there were close to four
thousand registered Supplementary Education Centers (SEC) with 1.3 million
students and about fifty-two thousand teachers in Turkey. The interest by the
researchers and the academicians on this topic in Turkey is rather recent. Tansel
(2013) investigate the equity issues in relation to supplementary education. Tansel
and Bircan (2005; 2006 and 2007) study the effectiveness, the determinants and
other aspects of the supplementary education. Berberoglu and Tansel (2013) also
investigate the effectiveness considerations of the supplementary education. These
studies devoted to various aspects of supplementary education in Turkey use mostly
survey data and quantitative methods. Altınyelken (2013), Nartgün, et al. (2012),
Baştürk and Doğan (2010), Gök (2006; 2010), Akgün (2005), Güvercin (2005),
Okur and Dikici (2004), Morgil, Yılmaz and Geban (2001) and Morgil, Yılmaz,
Seçken and Erökten.(2000) are the other studies that indicate the extent of the
growing interest on the topic of supplementary education by the Turkish
academicians. There are also several reports prepared by governmental and non-
governmental organizations on the university entrance examination system and the
SECs in Turkey. For example, the Turkish Educational Association (TED) prepared
a report based on an extensive survey of students, parents, teachers and school
administrators (TED, 2005). The results of this report are covered in Section 3.6 of
this paper. Higher Education Board (YÖK) which is an independent organization
published a report on the universities in Turkey (YÖK, 2007). The Trade Union of
Educators (Eğitim-Sen) publishes their views on the public and the private schools
as well as SECs in Turkey (Eğitim-Sen, 2013).
7
This study will provide information on various aspects of private
supplementary education in Turkey. In particular the provincial distribution of the
SECs and of secondary schools will be addressed. Organization of the paper is as
follows. Section 2 will review the educational system in Turkey and the two national
examinations considered responsible for the development of the SEC system. The
transition from middle school to high schools generates a demand for the services of
SECs. Similarly, the transition from high schools to universities creates a second
wave of demand for the services of SECs. The reasons for the high demand for
university education in Turkey and therefore the derived demand for services of the
SECs are discussed in Section 2.2. Section 3 reviews the recent trends and the
developments in the in the SECs and the secondary schools. The disruption of
mainstream classes close to the national examination times, effectiveness of SECs,
determinants of attending SECs and the cost of the SECs are also addressed in this
section. Provincial distribution of supplementary education centers, general high
schools and the high school age population are considered in Section 4 along with
discussions of the various characteristics of the provincial distributions of the SECs
and of the secondary schools including their provincial intensity and quality by
various measures. This section is expected to shed light on the spatial equity issues
in the distribution of SECs and secondary schools among the provinces of Turkey.
Section 5 is a discourse on future prospects of the SECs. Finally, concluding
remarks are given in Section 6.
2. Education System in Turkey
Education system in Turkey consists of basic education, secondary education
and tertiary education. Primary schooling of five years was the only compulsory

8
level of schooling until educational reform of 1997. In 1997 primary schooling and
the three years of middle schooling was combined into one unit and called basic
education. The basic education which took 8 years became compulsory in 1997.
Basic education is followed by three years and since 2005-2006 four years of
secondary education. The secondary education could take place at the general high
schools or vocational high schools. In the 2012-2013 academic year an educational
system referred to as 4+4+4 was instituted and 12 years of education covering high
school became compulsory. One of the main novelties of this system is introduction
of streamlining after grade four. The second four year stage is called middle school.
Under this system children start schooling at 66 months of age. There was not a
public consensus about this system. This system is criticized extensively by many
educators. Both the reduction of school starting age and the early streamlining were
the main objects of criticism by the public and the educators. Many parents resorted
to taking medical reports for their children in order to delay for another year their
children’s start of school at 66 months. Reports by the Educational Reform
Initiative such as ERG (2012) and reports by the deans of various schools of
education at the universities contributed to the criticisms of the 4+4+4 system.
The tertiary education in Turkey takes place at the universities. Universities
take two-four years (medical schools six years) depending on the program of study.
Four years lead to a Bachelor’s degree. The two-year programs lead to the so called
Associate Degree. There are also masters and Ph.D. degree programs. In view of the
excess demand for tertiary level education, the number of both the public and the
private universities has increased substantially during the past two decades. In
1992, 25 additional public universities were established. In 2006, 15 new
9
universities are established. A recent law of April 2007 stipulated the establishment
of 17 additional new universities. Currently there are 166 universities all over the
country while previously there were only a handful of universities only in the major
cities. Of the 166 universities 62 are private universities (YÖK, 2013). Private
universities in Turkey are non-profit organizations owned by foundations. Operation
of for-profit universities is banned by the constitution. There is also an Open
University which is a distance university. The distance university is one of the
largest distance universities in the world in terms of its number of students.
Although state is the major provider, there are a number of private providers
at all of the three levels of education. For example, in the academic year of 2012-
2013, of the total of 29 169 primary schools, 3 percent were private primary schools.
Of the total of 16 987 middle schools 5 percent were private middle schools. Of the
total of 4 214 high schools 21 percent were private high schools (Ministry of
National Education, 2013). Therefore, there were more private schools at the high
school level than at the other school levels.
2.1 The National Examination Systems in Turkey
There are two national examinations in Turkey which determine who will
advance to the upper levels of schooling. The first examination is called Level
Determining Examination, SBS in short. This examination is taken by the students
of middle school in their senior year and determines who will go to the elite
“special” high schools which are much in demand. Others can attend general high
schools or vocational high schools for which there is no entrance examination. In
10
2013, 1.1 million students took the SBS examination to compete for entry into elite
“special” high schools. .
The elite “special” high schools are believed to provide better quality
education and their graduates are believed to have higher chance of success at the
university entrance examination. These schools include Anatolian high schools,
Science high schools, Social Sciences high schools and private high schools.
Recently, the number of Anatolian high schools is increased substantially (by
converting regular high schools to Anatolian high schools) in response to the high
demand for such schools. Anatolian high schools are public schools and give full
day instruction unlike regular high schools and have class sizes less than 30 students.
Most of the Anatolian high schools teach in English but some teach in French or
German. As of 2012-2013 academic year there were 1627 Anatolian high schools,
144 science high schools, 907 private high schools and 1111 regular high schools.
These constituted the 39 percent, 3.4 percent, 22 percent and 26 percent of the total
high schools, respectively (Ministry of National Education, 2013). In the same year
there are a total of 4 213 various types of general high schools 79% of which were
public and 22% which were private high schools. Further, in 2012-2013 there are a
total of 10 418 secondary schools 40% of which were various types of general high
schools and 60% of which were vocational and technical high schools (Ministry of
National Education, 2013).
There have been several changes in this examination system during the past
decade. The SBS examination system was first called LGS, then OKS afterwards
SBS and they are all administered by the Ministry of National Education. In an
11
attempt to reduce the role of supplementary education centers, Ministry of National
Education announced in March 2007 that SBS will be held every year during the last
three years of the basic school (6th
, 7th
, and 8th
grade) (Ministry of National
Education, 2007). For a discussion of this system see Tansel and Bircan (2007).
Currently, since 2011-2012 academic year, SBS is being administered only in the
senior year of middle school (8th
grade). In 2013, 1.1 million students took the SBS.
On July 3, 2013, the Minister of National Education announced that SBS will be
eliminated and SECs will be closed down. This created havoc in the public. For
further discussion of this issue see Section 5 of this chapter.
The second national examination determines the advancement to
Universities. It is administered by an independent organization called ÖSYM
(Student Selection and Placement Center). Unlike SBS which is relevant only for
admission to “special” high schools, University entrance examination must be taken
by all students who want to be placed at a public or private university program. Not
all of the 166 universities scattered around the country are considered of the same
quality in terms of the job market prospects of their graduates and the salaries they
command. In some of the public universities some programs of study are conducted
in English Most of private universities provide instruction in English. Competition
for placement at a “prestigious” public or private university- most of which use
English as the medium of instruction- is fierce.
The high demand for learning English is the reason as to why some high
schools and some universities use English as the medium of instruction. Indeed,
there are high monetary returns to knowledge of English language in the Turkish
12
labor market (Di Paolo and Tansel, 2013). However the SECs do not use English or
any other foreign language in their instruction system possibly because SBS and the
university entrance examinations (YGS and LYS) are all conducted in Turkish
except the foreign language examinations of LYS.
In 2012, 1 895 478 applicants took the university entrance examination. Of
those applicants 42 percent were senior high school students and 30 percent were
high school graduates 9 percent were registered at a university program and 3
percent were already graduates of a university. Overall only 19 percent of the total
applicants was placed at a four–year university program and 15 percent was placed
at a two-year university program. Further, 12 percent of the total applicants was
placed at the Open University (Ministry of National Education, 2013, Student
Selection and Placement Center, 2013). As remarked earlier the open university in
Turkey is one of the largest in the world with close to 800 thousand students in
2012-2013. This implies that about 15 percent of the total university students are
attending the open university of Turkey.
As indicated above, 42 percent of the university entrance examination
applicants were high school seniors in 2012 which implies that most of the
remaining 58 percent were repeat-takers. The rather high percent of repeat-takers
imply that most high school graduates spend a year or more in preparation for the
university entrance examination often by attending a SEC.
The wide differences in the quality of secondary schools can be observed by
the percentage of the applicants from these schools that are placed in a four-year or

13
two-year university program. Following success rates which give the percentage of
the applicants that got placed in a university program give an idea about the quality
of the various secondary schools. These statistics pertain to the university entrance
examinations in 2011-2012. Among the applicants from various high schools the
success rate was 24 percent at a four-year university program and 10 percent at a
two-year university program. Conversely among the applicants from a vocational
and technical high schools the success rate was 7 percent at a four-year university
program and 26 percent at a two-year university program. These statistics give an
idea about the differences between high schools and vocational and technical high
schools in terms of their orientation and functions.
Besides these general rates for the high schools and vocational and technical
high schools, we can also consider the success rates for the various high schools.
Among the applicants from Anatolian high schools the success rate at the four-year
university programs was 54 percent (two percent at the two-year university
programs). The success rate among the applicants from the foreign language private
high schools was 55 percent ( three percent at the two-year programs). The success
rate among the applicants from science high schools at a four-year program was 60
percent (less than half a percent at the two-year programs) and that of the private
science high schools was 65 percent (about half a percent at the two-year programs).
The success rate of the applicants among the social science high schools was 75
percent at the four-year programs (none at the two-year programs). Finally, the
success rate of the applicants from the regular public high schools was 20 percent at
a four-year university program (11 percent at a two-year program). The success rate
of the religious vocation high schools (excluding those from the Anatolian religious
14
vocation high school which have higher rates) was 13 percent at a four-year
university program (six percent at a two-year university program) (Ministry of
National Education, 2013). These statistics indicate especially low success rates
among the applicants from regular public high schools and higher rates among the
science high schools and Anatolian high schools. These point to the substantial
quality differences among the various high schools. Berberoğlu and Kalender
(2005) find that differences between high school types in terms of the success of
their students in the university entrance examinations and some international tests
are larger than the regional differences. Dinçer and Uysal (2010) emphasize the
importance of family background in student attainments.
It is also noteworthy that most of the students who attend the science high
schools and Anatolian high schools which are good quality public high schools, free
of charge, are from wealthy families. According to the World Bank (2011) two-
thirds of the science high school students and one half of the Anatolian high school
students come from the richest 20 percent of the household. This point has serious
equity and social justice implications.
2.2. The High Demand for University Education in Turkey
There is a very high demand for university education in Turkey which may
be due to several factors. The foremost factor is the very high private monetary
returns to university education in Turkey. Tansel (1994, 2001, 2005 and 2010) show
that over the years the highest monetary returns are attained at the university level
of education which are higher than to other levels of education by a large margin.
15
Therefore, the possibility of high earnings is a main reason behind the high demand
for university education. The second main reason is the increased job finding ability
with a university degree. Tansel and Taşçı (2010) note the higher probability of
finding a job out of unemployment for the university graduates compared to the
unemployed at other levels of education. Further, university graduate men can serve
his military service as an officer rather than as a private soldier. Finally, an
university graduate enjoys a prestigious position in Turkish society as it is in other
countries
The above discussed advantages render university education very desirable
for the young and their parents. As remarked in the previous section, parents first
spend on supplementary education in order to place their children into elite “special”
high schools which are believed to increase their chances of placement at a
university program. Next, parents spend one more time on supplementary education
in order to place their children at a “prestigious” university program. The graduates
of such universities command higher earnings in the Turkish labor market and
prestigious positions in the society. For this reason parents invest into supplementary
education of their children with great sacrifices. At this point a related issue is that
parents who spend large sums on sending their children to private high schools and
SECs, pay no tuition once their children are placed at a “prestigious” public
university.
3. The Supplementary Education Centers in Turkey
16
Supplementary education can take in three different forms in Turkey as it is
in other countries. One kind is one-to-one individualized teaching by the tutor. The
second form is teaching by mainstream teachers for a nominal fee outside of the
formal class hours at the premises of the mainstream schools. The third type is
provided by the supplementary education centers (SEC) which are school-like
organizations operating for profit. SECs are called “dersane” in Turkish. See Section
3.2 for the licensing requirement of the SECs. Tansel and Bircan (2006 and 2007)
present a detailed discussion of the forms of Supplementary education in Turkey.
SECs offer examination oriented courses for entry to the elite “special” high schools
(SBS examination) and for entry to the universities (YGS and LYS examinations).
They also teach techniques on how to prepare for these examinations as well as
provide counseling and guidance services on the choice of universities, on the choice
of study fields at the universities and future career selection as well as personal
development and dealing with examination stress.
During the 2011-2012 academic year there was a total of 1.3 million SEC
students at approximately four thousand SECs with about 52 thousand teachers as
can be observed in Table 1. Table 3 shows that over the years more boys attended
SECs than girls. The gender gap somewhat closed during the recent years. In any
case the gender gap -however slight- may be related to differences in the male and
female students’ preference for various university programs. It is possible that
female students disproportionately choose social sciences and language studies
rather than technical fields. If this is true then they will need less supplementary
education.
17
The organization of SECs go back to early 1960’s They were legally
recognized in 1965 and a law passed governing their operation. Throughout the
1970s there were public discussions about the equity implications of the university
entrance examinations and the SECs which led to their banning 1980. But, the ban
was lifted a year later before it is implemented. Currently SECs operate with a
license from the Ministry of National Education and under its surveillance. They are
legally established, tax paying businesses. The licensing is a registration process as
well as an accreditation process. Tansel and Bircan (2006 and 2007) provide detailed
discussion of the history and organization of the SECs.
ÖZ-DE-BİR, GÜVEN-DER and TÖDER are the associations of SECs
with membership on a voluntary basis. ÖZ-DE-BİR is the largest and the oldest of
these associations. Further information about the associations of SECs are provided
in ÖZ-DE-BİR (2013), GÜVEN-DER (2013) TÖDER (2013) and Tansel and Bircan
(2006 and 2007) ÖZ-DE-BİR officials claimed that there are at least an additional
two thousand SECs operating unofficially without a license as part of the
underground economy of Turkey. They not only avoid paying taxes but also avoid
inspection by the Ministry of National Education and cause unfair competition for
the legal SECs. The three associations administer jointly a national a mock
university entrance examination. Morgil, Yılmaz, Seçken and Erökten (2000) found
close correlation between the results of the mock and the real entrance examinations.
SECs are required to register five percent of their students from low income families
free of charge. ÖZ-DE-BİR officials state that in practice this often exceeds the
officially required five percent for their members. Most SECs give an initial
placement test for their applicants. Students who do best on these tests are registered
18
free of charge or at a reduced rate for advertisement purposes. Further details of this
process are provided in Tansel and Bircan (2007).
3.1. Recent Trends in Supplementary Education Centers
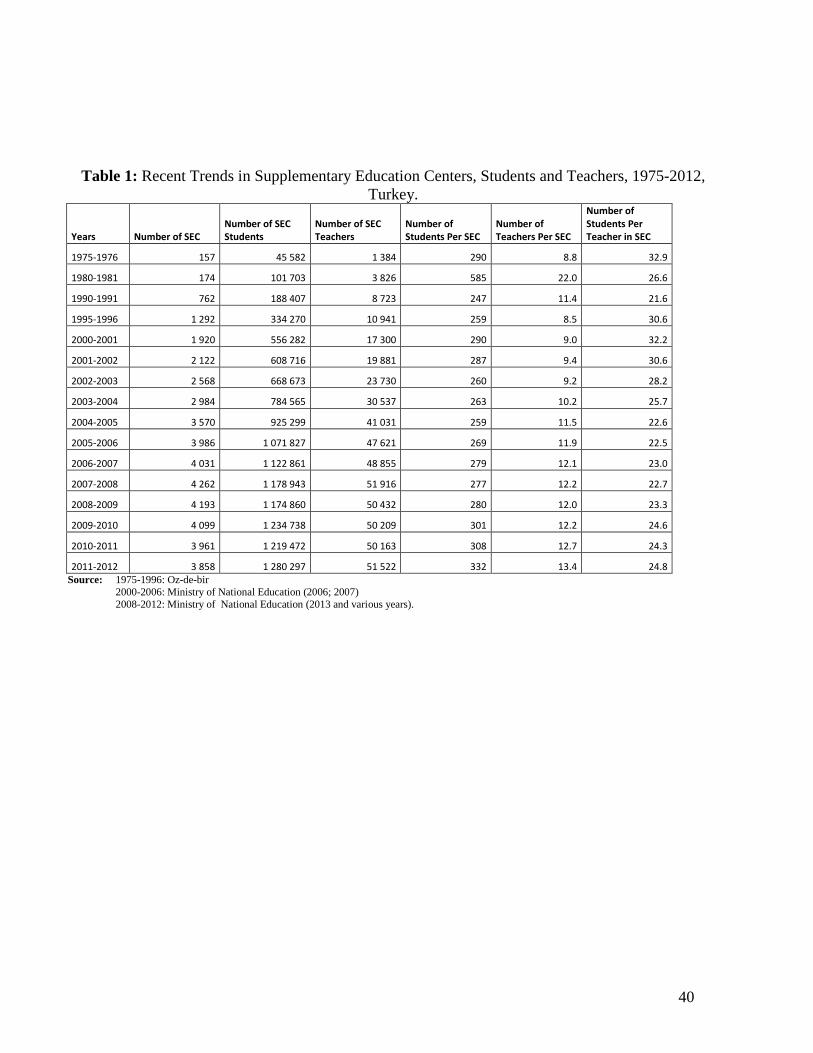
Table 1 gives the recent trend in the numbers, students and teachers of SEC’s
and related statistics. During the 1975-76 academic year there were only 157 SEC’s
throughout the country which increased to about four thousand in 2011-2012
academic year. The number of SEC students increased from about 46 thousand to
1.3 million in 2011-2012. The number of teachers employed at the SEC’s reached 52
thousand in 2011-12. Thus, the SEC’s are a significant outlet in employing people
with “teacher” training. The number of teachers employed per SEC was about 13
teachers in 2011-2012. The average number of students per SEC reached 332 in
2012-2013. The SEC’s in Turkey are thus of medium size. They are not very large
enterprises by the standards of the SECs in Hong-Kong. (Bray and Kwok, 2003).
The number of students per teacher in SEC’s ranged between 22-33. Table 1 also
shows that the number of SECs reached a peak in 2007-2008 with 4.3 thousand. It
has declined since after that date while the number of students and teachers are
increasing. However, one must consider that the number of students per SEC and the
number of teachers per SEC both increased while the number of students per teacher
did not change substantially. This implies that while the number of SECs declined
and the number of students increased the quality of the SECs did not get affected.
Take in Table 1
Table 2 gives the recent developments in the various characteristics of the
secondary schools in Turkey. The secondary schools include both the high schools
19
and the vocational and technical high schools. According to this table, the numbers
of secondary schools, the number of their graduates, students and teachers have all
increased substantially over time. The number of students per secondary school has
increased over time and in 2012-2013 it is about 500 students per establishment.
The number of teachers per secondary school varied over time and it was 25 teachers
per establishment in 2012-2013. The number of students per teacher indicating the
quality of the secondary schools has varied over time but was about 20 students per
teacher in both of the 2011-2012 and 2012-2013 academic years.
Take in Table 2
The rules about allowing vocational and technical high school students to sit in
the university entrance examinations have changed several times during the past
decade. A discussion of this is available in Tansel and Bircan (2007). Currently
they are allowed to sit in the university entrance examinations and there was an
influx of them to the SECs when they were fist allowed to take the university
entrance examination (Tansel, 2013).
In conclusion, judging by the number of students per establishment the SECs are
smaller establishments than the secondary schools: 332 students in SECs versus 492
students in secondary schools in 2011-2012. In contrast, the number of students per
teacher at the SECs is higher than at the secondary schools: 25 students versus 20
students, respectively in 2011-2012 (see Tables 1 and 2).
In spite of the fact that returns to women’s education is higher or at least as
large as those to men in Turkey (Tansel, 1994, 2001, 2005 and 2010), parents invest
more into educating their sons than into their daughters (Tansel, 2002a) especially
20
when household resources are limited Tansel (2002a). Same may be true in case of
supplementary education also. Assaad and El-Badawy (2004) in Egypt consider the
gender issues in supplementary education. Tansel and Bircan (2005) found that the
probability of receiving supplementary education is lower among females in Turkey.
Table 3 shows the numbers and the proportions of the male and female students at
the SECs versus among the secondary school graduates during the period of 2000-
2001 to 2011-2012. The proportion of the male students is higher than that of the
female students both among the SECs and the secondary school graduates in the
early 2000s. That is the gender gap was somewhat large at both the SECs and among
the secondary school graduates. About ten years later the gender gap has almost
disappeared in both the SECs and among the secondary school graduates and even
reversed slightly among the secondary school graduates.
Take in Table 3
3.2. Disruption of Mainstream Classes
It is a well-known observation that attending SECs and the process of preparation
for the two national examinations disrupt the formal schooling attendance during the
second semester of the senior students who are preparing for the SBS and the YGS
(takes place in April) and LYS (takes place in the second half of June). During this
period the students concentrate on attending the SECs and on their own preparations
at home rather than attending mainstream classes. The Ministry of National
Education allows the senior students in their last semester to be absent from
mainstream classes for 45 days. The students who need more time than this resort to
false medical reports of sickness in order to be absent from their mainstream classes.
Acquiring such a report is widely accepted and an expensive process. Recently, the
21
president of the Independent Educators Union (2007) gave a statement that false
medical reports of sickness undermine the “psychological and ethical development”
of the children teaching them how to cheat the establishment. This is an aspect that
has been totally ignored in the public discussions. Further discussions of this issue in
relation to SBS and the university entrance examinations are provided in Tansel and
Bircan (2007).
3.3. Determinants of Receiving Supplementary education
Tansel and Bircan (2006) examined the determinants of the household
expenditures on supplementary education in Turkey. Their findings emphasize the
importance of household income and parental education levels as the most important
determinants. They also found a larger effect of the mother’s education than that of
the father’s education. Tansel (2002a) also found that the parental education level is
the most important factor determining the educational attainment of children in
Turkey after household income. Tansel and Bircan (2005) examined the factors that
contributed to the probability of receiving supplementary education. The high school
graduation ranking of the student was found to be the most important factor pointing
out to the importance of motivation and the ability of the students. Zhang (2013)
find that students with high achievement benefit more from supplementary
education. In conclusion, the students with high academic ability, high household
income and highly educated parents receive more supplementary education. Further
discussion of this topic can be found in Tansel and Bircan (2007).
22
3.4. Effectiveness of Supplementary Education Centers
There are a few studies examining the effect of supplementary education on
academic achievement. Dang and Rogers (2008) consider this issue among others.
Bray (1999 and 2006) review the research on the effectiveness of the SECs and find
mixed results. Some studies found positive influence of supplementary education on
academic achievement performance while some studies found no correlation
between supplementary education and academic achievement. Tansel and Bircan
(2005) find that attending SECs during the senior year in high school increased
significantly the probability of getting placed in a university program. Further,
attending SECs increased the test scores significantly in most of the subjects in the
university entrance examination among the applicants to the university entrance
examination in 2002. Morgil, Yılmaz, Seçkem and Erökten (2000), Okur and Dikici
(2004) also reported that those who receive supplementary education exhibit better
examination performance. Ekici (2005) find that students who attend SECs have a
positive attitude towards university entrance examinations as compared to those who
do not attend the SECs. Further discussions can be found in Tansel and Bircan (2005
and 2007).
3.5 Cost of the Supplementary Education Centers
Köprülü (2012) who is the president of ÖZ-DE-BİR reported an estimate of
1.5 to 2 billion USD as gross income of SECs. This amounts to 0.19 to 2.6 percent
of Turkey’s Gross Dometic Product (GDP) in 2012. In contrast, the national
government expenditures on education were 3.0 percent of the GNP of Turkey in
2006. The per capita GDP of Turkey in 2011 was 10 444 USD. Kim (2008) notes
that in South Korea parents invest 20 billion USD in supplementary education.

23
According to the information provided by Köprülü (2012) the average
annual fee of the SECs’ range between 300- 2 250 USD for the preparation to SBS
depending on location. It ranges between 1 100-3 300 USD for the students in the
first three years of the high schools and it ranges between 1700-5 600 USD during
the senior year of the high school again depending on location. In contrast, the
annual minimum wage for adults was about 5 000 USD in 2012 (Tansel, 2013).
There are also the so called “boutique” SECs in cities like Istanbul, which cater to
wealthy. Their class sizes are a maximum of 6-8 students and their annual average
cost is within the range of 8 000- 12 000 USD.
3.6 A Discussion of the TED Survey
Appendix Table provides the selective results of a survey by TED among high
school seniors, high school graduates and university students. An extended version
of this table which includes the responses of the parents, teachers and the school
administrators is given in Tansel and Bircan (2007) together with a detailed
discussion of the results of this survey. Here, only a brief summary will be provided.
According to the results in the Appendix Table, more than half of the high school
seniors feel that there is nothing in their life now more important than the university
entrance examination. Further, at the time of the survey between 70-83 percent of
the respondents were attending SECs. More than half of the respondents believed
that school education is not adequate for success in university entrance examination.
Close to half of the respondents stated that their teachers and school administrators
absolutely want them to attend the SECs.
24
When asked to compare the quality of education at the SECs and at the
mainstream schools, 34-65 percent of the respondents indicate that the quality of
education is better at the SECs than at the mainstream schools. Further, among each
of these groups a substantial percent stated that SECs teach only examination
techniques.
Close to 70 percent of the respondents agree that quality of high school is an
important determinant of success at university entrance examination. This makes it
clear as to why students strive to enter a better high school at SBS and most parents
consider the past performance of the high schools at the university entrance
examination while making choice of high schools for their children. The SECs and
the secondary schools both provide counseling and guidance services in selecting
universities, study fields and future careers as well as in the issues of personal
development, dealing with examination stress and developing efficient work habits.
A high proportion of the respondents believe that these services are better at the
SECs or are similar in both places. Some educators claimed that SECs are
substituting for the high schools in both teaching and as a place where students
socialize. When asked whether the SECs or the schools they like better, same
proportion of the students liked SECs or the schools however, majority of them like
both places.
The Appendix Table also provides the hours of education per week received
at the SECs by various groups. This information indicates that 51 percent of the high
school seniors attend SECs for 10-20 hours per week while 84 percent of the high
school graduates attend SECs for 15-20 or more hours per week. The high school
25
graduates attend SECs for more hours per week than the other groups. This group is
possibly repeat-takers of the university examination with full time preparations.
Over half of the respondents said that they will receive a false medical report
of sickness for their non-attendance to the mainstream school while a quarter of the
respondents said that they will use the legally allowed non-attendance days while
about 19-34 percent of the respondents stated that they will continue mainstream
schools as usual. Is it possible to succeed at the university entrance examination
without attending SECs? A larger percentage of the respondents believe that it is
difficult or not possible. Further, over half of the respondents believe that SECs will
contribute a lot to their success at the university entrance examinations. Finally,
over half of the respondents were satisfied with the SECs they are attending.
4. Provincial Distribution of Supplementary Education Centers and
Secondary Schools
4.1 Intensity of SECs and Secondary Schools by Provinces
This section considers the provincial distribution of the SECs and secondary
schools in Turkey. In this section we consider the total of secondary schools which
include general high schools and vocational and technical high schools. For the
purposes of comparison we do not use just high schools because we believe that the
total of the high schools give a better indication of the secondary school educational
opportunities for the secondary school age children. Further, currently the vocational
and technical school students are allowed to sit in the university entrance
examinations just like the general high school students giving them the same

26
opportunity for further education albeit with a lower chance to succeed in that
examination (Tansel, 2002b). Table 4 provides the numbers of SECs and secondary
schools across the 81 provinces of Turkey during the academic year 2011-2012.
The provinces are listed from the highest number of SECs to the lowest. Istanbul has
the highest number of SECs with 710 and also the highest number of secondary
school with 1179. Ankara has the second highest number of SECs with 384 and the
secondary schools with 590. At the other extreme Ardahan and Bayburt each has
only two SECs and 25 and 17 secondary schools respectively. The last column in
this table gives the number of SECs per 100 secondary schools which is defined as
the intensity of SECs. The highest concentrations of SECs are in Ankara and
Istanbul with over 60 SECs per 100 secondary schools. Izmir, Bursa, Antalya,
Mersin, Adana, Kocaeli, Denizli, Aydın, Tekirdağ, Osmaniye, Mardin are the other
provinces with high concentration of SECs. They are mostly located in the west of
the country except Osmaniye and Mardin. The provinces with low concentration of
SECs are Ardahan, Gümüşhane, Bayburt, Kilis, Çankırı, Sinop and Bingöl where
the number of SECs is substantially less than that of the secondary schools. These
provinces are located mostly in the east and southeast of the country except Çankırı
and Sinop.
Take in Table 4
Table 5 shows the distribution of the SECs, secondary schools and the
secondary school age (14-17) children of Turkey among the provinces. This table
gives idea about the SEC and secondary school opportunities available to the
secondary school age children in the provinces. The provinces are listed according to
their share of SECs in Turkey’s total from the highest to the lowest. For example,
Istanbul has by far the highest share of SECs among all of the provinces of Turkey.
27
Istanbul houses about 18 percent of the total SECs in Turkey and 12 percent of the
secondary schools of Turkey while about 17 percent of secondary school age
children of Turkey lives in Istanbul. Thus, we can say that the share of the secondary
schools in Istanbul is lower compared to the share of the secondary school age
children. Ankara houses about 10 percent of the SECs and about 6 percent of the
secondary schools of Turkey while about 6 percent of the secondary school age
children of Turkey. The share of secondary schools in Ankara seems commensurate
with its share of secondary school age children. However, Ankara is singled out as
the province with 15 percent of the total SECs serving only 6 percent of the total
secondary school age children.
At the other extreme, Şanlıurfa, Diyarbakır, Gaziantep, Van, Adıyaman and
Batman have smaller shares of the SECs and secondary schools than their shares of
the secondary school age children. These provinces have relatively high shares of
the Turkey’s secondary school age children in the order of 2-3 percent of the total.
Therefore it would seem sensible to increase the number of secondary schools and
possibly SECs in these provinces. The last ten provinces in this table seem to have
the shares of secondary schools commensurate with their shares of secondary school
age children but their shares of SECs are lower than their shares of children. Thus
SECs could possibly be increased in these provinces. However, opening up SECs
may not be a profitable business in these provinces. These provinces are mostly
located in the east and south east of the country except Çankırı, Bartın and Sinop.
Take in Table 5
We could also note that some of the provinces located in the east and southeast of
Turkey such as Hakkari, Şırnak, Bitlis, Siirt, Ağrı, Muş all have somewhat large
28
share of the secondary school age children which are slightly higher than their shares
of secondary schools and/or shares of SECs. The median number of the SECs is 24
per province and the median number of the secondary schools is 80 per province. In
general we observe a more unequal provincial distribution of the SECs (with mean
48 and standard deviation 150) compared to that of the secondary schools (with
mean 120 and standard deviation 91). This implies that the distribution of the SECs
is more unequal than that of the secondary schools across the provinces of Turkey.
Naturally, this has spacial equity implications in their provision across the provinces.
4.2 Main Characteristics of SECs and Secondary Schools by Provinces
Table 6 gives the distribution of the number of students and teachers of the SECs
across the provinces as well as the number of students per SEC, number of students
per teacher in SEC and finally in the last column the number of SEC students per
secondary school students. Considering column three we see that there is no obvious
pattern to the number of students per SEC. For Turkey general the average number
of students per SEC is 332. Those provinces with students larger than this can be
considered large and less than 332 can be considered small. With this in mind,
there are 48 provinces with SECs larger than Turkey’s average and 33 provinces
with SECs smaller than Turkey’s average. The SECs with 500 or more students per
SEC are in Batman, Bayburt, Düzce, Karaman, Kilis and Niğde.Among these
provinces three of which, Düzce, Karaman and Niğde are located in the western part
of the country. Considering the number of studenst per teacher in the SECs in the
fourth column of Table 6, we observe that in some provinces there are more than 30
students per teacher. They are Artvin, Batman, Bayburt, Bingöl, Bitlis, Çankırı,
29
Karabük, Karaman, Kilis, Mardin, Mersin, Muş, Sakarya, Şırnak, Van and
Yozgat.Some of these provinces are located in the east and some of them are
located in the west. Among these provinces Batman, Bayburt, Bingöl, Düzce,
Karaman, Kilis, Niğde and Van are the provinces with both over- crowded SECs and
more studenst per teacher. These considerations imply that the quality of the SECs in
these provinces may not be very good due to overcrowding of the SECs and the
large class sizes.
Next we address the following question: What is the percentage of secondary
school students attending SECs in each province? This is given in the last column of
Table 6. In Turkey on average 27 percent of the secondary school students attend
SECs. Ardahan and Hakkari are the provinces with the smallest percentage which
are 9 and 8 percents respectively. It is remarkable that Van is the province with
highest (55 percent) of its secondary school students attending an SEC. This is
cruious and one wonders if this is related in any way to the earthquake experience in
Van two years ago and the ensuing campaign of relief to Van. Van is followed by
Balıkesir (38 percent) Çanakkale (39 percent), Denizli (38 percent), Eskişehir (39
percent), Kırklareli (38 percent) and Mersin (40 percent).
Take in Table 6
Following are the provinces that send 20 percent less of their secondary school
students to SECs: Adıyaman, Ağrı, Aksaray, Ardahan, Bingöl, Bitlis, Çankırı,
Diyarbakır, Gaziantep, Hakkari, Kars, Muş, Siirt, Sivas, Şanlıurfa and Şırnak.
Among these provinces following have more than 30 students per teacher: Artvin,
Batman, Bayburt, Bingöl, Bitlis, Çankırı, Düzce, Muş and Şırnak. That is, in those
provinces with 20 percent or less secondary school students attending SECs, the
30
SEC classes are overcrowded . That is, they have more than 30 students per teacher.
Ministry of National Education officers and inspectors must pay attention to the
SECs in particular in these provinces.
Table 7 gives the distribution of the number of students and teachers of the
secondary schools across the provinces as well as the number of students per
secondary school, number of students per teacher in secondary schools, number of
children scondary school age of 14-17 and finally in the last column the number of
secondary school students per secondary school age children. Considering first the
number of students per secondary school, the average for Turkey is 492. Following
provinces have 600 or more students per school: Adana, Adıyaman, Batman,
Diyarbakır, Gaziantep, Hatay, Istanbul, Mardin, Şanlıurfa and Şırnak. There is no
information about the physical capasity or the infrastructure of these secondary
schools but, these seem to be rather large schools. The following provinces have
500-599 students per seconday school: Ankara, Antalya, Bingöl, Elazığ, Hakkari,
Izmir, Kocaeli, Mersin and Van. Next we look at the number of students per teacher
at the secondary schools. The average for Turkey is 20 students per teacher. Batman,
Hakkari, Mardin, Şanlıurfa and Şırnak are the provinces with number of students
per teacher 30 or more. Following are the provinces with number of students per
teacher is 25-29: Ağrı, Diyarbakır, Gaziantep, Istanbul and Siirt. The provinces with
the lowest number of students per teacher are Tunceli (12 students), Burdur (13
students), Isparta (13 students), Karabük (13 students), Çanakkale (14 students)
Edirne (14 students) and Sinop (14 students). Those provinces with over 25
students per teacher should be given attention by the Ministry of National Education.
Take in Table 7
31
Finally, in the last column we examine the number of secondary school students per
population of secondary school age children. This gives a measure of enrollment
rate in each province for the age group 14-17. There are about 30 provinces with
enrollment rate over 100. However there are also several provinces where
substantially small percent of the secondary school age group are not enrolled in
secondary schools. Ağrı (48 percent) and Van (46 percent) are the two provinces
with less than 50 percent of the age group are enrolled in secondary school. The
provinces with 50-75 percent enrollmet rate are Aksaray (75 percent), Bitlis (62
percent), Diyarbakır (75 percent), Iğdır (73 percent), Kars (65 percent), Mardin (73
percent), Muş (53 percent), Siirt (70 percent), Şanlıurfa (56 percent) and Şırnak
(65 percent. Raising the rate of secondary school enrollment of 14-17 year groups in
these provinces will probably lead to a reduction in their involvement in terror
organizations.
As remarked in Section 2, during the academic year of 2012-2013 the compulsory
level of schooling is increased to 12 years covering the secondary schools and the
data in this section pertains to the academic year of 2011-2012. However, it is
doubtful if in some provinces the physical capasity will allow enrolments of all of
this age group. Therefore, the Ministry of National Education should pay special
attention to those provinces where infrastructure and teachers may be lacking.
In conclusion we can say that the provinves where the quality of of secondary
school is low ( 30 or more students per teacher) are Batman, Hakkari, Mardin,
Şanlıurfa and Şırnak.(Others are Ağrı, Diyarbakır, Gaziantep, Istanbul and Siirt).
The five provinces have the worst secondary school quality. Therefore we will

32
examine them in more detail below. They are also the provinces where the schools
are overcrowded ( Batman (929), Hakkari (575), Mardin (718), Şanlıurfa (637) and
Şırnak (644) among several other provinces. When we consider these five provinces
in terms of their equipment with SECs we observe the following. First of all, these
provinces have relatively low number of SECs per secondary school within the
range of 31-43 percent, although they are not the ones with lowest percentages
ofSECs per secondary school. The lowest percentages are for Ardahan (8), Bayburt
(12), and Kilis (14). Second, these five provinces have relatively high share of the
Turkey’s secondary school age children (14-17) but lesser percentage of the
Turkey’s secondary schools and SECs. Third, these five provinces have relatively
low (but not necessarily the lowest) percentages of the secondary school students
who are attending SECs. These percetages are as follows: Batman (22), Hakkari
(8), Mardin (24), Şanlıurfa (18), Şırnak (20). Further, these five provinces are further
disadvantaged in terms of the enrollment rate in a secondary school of the relevant
age group of 14-17 years. The percentages of the age group who are enrolled are as
follows: Batman (83), Hakkari (86), Mardin (73), Şanlıurfa (56), Şırnak (65). In
these five provinces the number of secondary schools and teachers should be
increased improving the quality of the schools as well as building more schools to
reduce the overcrowding in the schools. In order to increase the quality of the
schools the number of students per teacher should be reduced by incerasing the
number of teachers. Further, SECs could be encouraged to open up more businesses
to increase the proportion of the secondary school students attending SECs. Also
students in those provinces could be given scholarships to attend SECs.
5. Future Prospects
33
In March 2012 the prime Minister announced that the university entrance
examinations will be eliminated and that the SECs will be closed down (Haber-Türk
Newspaper, 2012; Hürriyet Newspaper, 2012 and Milliyet Newspaper, 2012). This
has created a series of discussions in the print media and the TVs. As remarked in
Section 2, on July 3, 2013, the Minister of National Education announced that
starting in 2014 the SBS will be eliminated and the SECs will be closed. Further 5
percent of the SECs which have a suitable infrastructure will be converted to private
high schools. All of this was very confusing for the parents who had already
registered their children to the SECs and for the SECs which had signed contracts
with their teachers. Again there were many discussions at prime times on the
national TVs and the national print media all over the country. The educators from
the universities and the president of ÖZ-DE-BİR and representatives from the NGOs
such as from ERG participated in these debates. The president of ÖZ-DE-BİR, in
one of his talks remarked that currently the private high schools are operating with
50 percent of their student capacity and if some of the SECs are converted to private
high schools there may not be enough demand for them.
It is also pointed out in the debates that the closure of the SECs will cause at least
80 thousand people (52 thousand teachers and 30 thousand other personnel) become
unemployed as well as the loss of the businesses and the income generated and the
tax revenue lost. This will harm the national economy. Further if SECs are closed
they will reappear under different names and forms. They may even have to go
underground and continue to function unregistered, pay no taxes and not be subject
to monitoring by the inspectors of the Ministry of National education.
34
Currently, there are wide differences in the quality of secondary schools in the
country as discussed in detail in Section 2.1. As a result there is a high demand for
the high quality, elite “special” high schools because their graduates perform better
at the university entrance examinations and get placed at the high quality
“prestigious” universities which are in high demand. The graduates of these
universities go on to be successful in the labor market, at the governmental positions
and the society. Therefore it is the opinion of the present writer that as long as there
are quality differences among the secondary schools and among the universities
there will be selection examinations determining the transitions at both levels and
demand for the SECs which will help students to prepare for the selection
examinations. SBS could be eliminated as announced but inevitably there will be
other examinations as long as there are school quality differences.
The president of ÖZ-DE-BİR stated that not all attendees of the SECs are preparing
for the national examinations. There are many students who are attending SECs for
the purposes of getting support for their school classes. Therefore even if the
examinations are eliminated there will still be demand for the services of SECs. The
president further argued the functions of the SECs and the schools are different. The
SECs are not substitutes for school classes but they complement the school classes.
It was also made clear in the TV debates that that the counseling and guidance
services provided at the SECs are much better than those at schools. Such services
cover dealing with examination stress, personal development, developing efficient
work habits, selection of the study fields, and selection of the universities together
with emphasis on the importance of selecting an occupation.
35
It is true that SECs concentrate on preparing the students for the national
examinations and teach multiple choice question answering techniques in the
shortest possible time. For this reason development of students in the subjects that
are not covered in examinations such as sports, arts, music and foreign languages are
hindered during the valuable high school years except for the students who major in
foreign languages in the high schools. The lack of foreign language skills is
especially noticeable among high school graduates. The anecdotal evidence shows
the inefficiency in foreign language teaching at secondary schools as students and
teachers overlook the language classes since foreign languages are not covered in the
university entrance examinations except for those who will continue to major in
languages. . Even the students from elite “special” high schools (most of which
teach in a foreign language, mostly in English) spend a year of intensive instruction
in English if they are admitted to a university with English medium of instruction.
Anecdotal evidence also shows that such students prefer to take a year of “rest” by
attending English preparatory school after years of fierce race of preparing for the
university entrance examination. This is indeed a waste and misuse of scarce public
funds both at the high school level and at the universities. Both the Ministry of
National education and the YÖK must devise ways to deal with this problem.
The Ministry of National Education sees the future of SECs in their conversion to
private high schools in the long-run. The president of ÖZ-DE-BİR- sees the future of
SECs in providing services for life-long education in the long-run (ÖZ-DE-BİR,
2013).
6. Conclusions
36
This study provides a discussion of the various aspects of supplementary education
in Turkey including a consideration of the various implications of provincial
distribution of SECs, of the secondary schools and of the secondary school age (14-
17) children. We investigate and compare their main characteristics of these
distributions. These comparisons give an idea about the spatial equity in the
respective distributions of SECs and of the secondary schools across the provinces.
The median number of SECs is 24 and that of the secondary schools is 119 per
province. However standard deviation of the distribution of SECs is much larger
than that of the secondary schools. Thus, there is more inequality in provincial
distribution of the SECs than that of the secondary schools as indicated by their
respective standard deviations.
The number of students per teacher in the secondary schools is an important
indicator of the quality of these schools. Wide variation in this indicator is an aspect
that can be addressed by the Ministry of National Education. The high number of
students per teacher in Batman, Hakkari, Mardin, Şanlıurfa and Şırnak indicate that
they are the five provinces with worst secondary school quality.The other provinces
are Ağrı, Diyarbakır, Gaziantep, Istanbul and Siirt. We further considered the other
characteristics of these five provinces. First of all, these five provinces have
relatively low (but not necessarily the lowest) number of SECs per secondary
school. Second, these five provinces have relatively high share of Turkey’s
secondary school age children but smaller percentage of the Turkey’s secondary
schools and SECs. Third, these five provinces have relatively low (but not
necessarily the lowest) percentages of the secondary school students who are
attending SECs. Further, these five provinces are disadvantaged (not necessarily the
37
worst) in terms of the enrollment rate in a secondary school of the relevant age
group in particular, Şanlıurfa and Şırnak. Raising the rate of secondary school
enrollment of 14-17 year old groups in these five provinces will reduce the
likelihood of their involvement in terror organizations. In these five provinces the
number of secondary school teachers should be increased improving the quality of
the schools as well as building more schools to reduce the overcrowding in the
schools. Further SECs could be encouraged to open up more businesses to make
their numbers more commensurate with these five provinces’ share of Turkey’s
seconday school age children. Also students in these five provinces could be given
scholarships to attend SECs. These provinces are located in the southeast of
Turkey, However there are several provinces located in the middle or westen part of
the country that may have unfavorable indicators also. The number of students per
teacher in the SECs is larger than in the secondary schools. That is most of the SEC
classes, located in southeast and east and also in the west and middle are
overcrowded with more than 30 students per teacher. Ministry of National
Education officers and inspectors must pay attention to the SECs in particular, in
these provinces.
The high demand for supplementary education has its roots at the national
selection examinations for transitions to the secondary schools and the universities
Those who receive supplementary education will be able to go to better secondary
schools and prestigious universities and finally succeed in the labor market with high
paying jobs and may reach influential positions in the government and in the society.
38
Students attending SECs learn techniques of answering multiple-choice
questions in a short period of time rather than develop abilities and skills to analyze
and interpret. The lack of foreign language skills is especially noticeable for high
school graduates. The authorities of the Ministry of National Education must pay
attention to the lack of foreign language skills of the high school graduates. YÖK
must devise ways to prevent misuse of English preparatory schools at the
universities leading to waste of public funds.
In order to improve the quality of the high schools and reduce the differences
between them voucher system could be implemented. It is believed to increase the
competition among the high schools and improve quality and cost efficiency
although there are opponents of the voucher system for philosophical and other
reasons. School vouchers are subsidies given to parents for to use at any school. In
the voucher system government gives the parents a voucher which can be redeemed
at a school of their choice. The system can be restricted to public schools or can
include private schools as well. The voucher covers children's tuition (that is, the
expenditure incurred by the government), either fully or partially. This system
encourages competition among schools and gives them incentive to do better. Only
schools which can attract more vouchers (thus students) get the means to expand and
hire better teachers. Those which fail to attract parents (thus the students) shrink or
even be forced to close. Vouchers are like food stamps in the USA but they can be
39
used only for formal education instead of food items1.
The voucher system is being implemented in the various cities in the USA,
Europe, Pakistan, Chile, Ireland, Sweden and the Netherlands among other
countries. There is a large literature on the implementation and effectiveness of the
voucher system. These must be carefully studied and investigated by the Ministry of
National Education for possible implementation in Turkey.
It has been suggested that supplementary education contributes to social
stratification and inequalities in the society since attending SECs depends closely on
household income and parental education. However, ÖZ-DE-BİR officials argued
that SECs provide services for the middle and low income families at affordable
prices in contrast to the wealthy who could afford one-to-one private instruction for
their children. In order to have a better understanding of this issue, for future
research, the socio-economic backgrounds of the SEC participants must be carefully
studied. It is the opinion of the present author that the Ministry of National
Education must expend resources to improve the quality of education at the
secondary schools all over the country but, especially in the east and the southeast.
Further, annual examinations could be introduced at the schools while redesigning
the national examination systems to increase their dependence on the school
curriculums. These will contribute towards better (but not complete) provision of
equitable opportunities than the current systems.
1 The educational voucher system is also like the payment of medicine expenses by the Social
Security Organization (SGK). A person with a doctor’s prescription can go to any pharmacy of
his/her choice and get the medicine after paying a contribution. The SGK guarantees the pharmacy
for the payment of the prescription. Of course this is a simplified example and the educational
voucher system is more complicated. For this reason its implementation requires substantial
preliminary studies. Precisely for this ground even in the USA its implementation took a long time
and although the coverage is increasing, so far it is observed only in a few cities and states.
40
Table 1: Recent Trends in Supplementary Education Centers, Students and Teachers, 1975-2012,
Turkey.
Years Number of SEC Number of SEC Students
Number of SEC Teachers
Number of Students Per SEC
Number of Teachers Per SEC
Number of Students Per Teacher in SEC
1975-1976 157 45 582 1 384 290 8.8 32.9
1980-1981 174 101 703 3 826 585 22.0 26.6
1990-1991 762 188 407 8 723 247 11.4 21.6
1995-1996 1 292 334 270 10 941 259 8.5 30.6
2000-2001 1 920 556 282 17 300 290 9.0 32.2
2001-2002 2 122 608 716 19 881 287 9.4 30.6
2002-2003 2 568 668 673 23 730 260 9.2 28.2
2003-2004 2 984 784 565 30 537 263 10.2 25.7
2004-2005 3 570 925 299 41 031 259 11.5 22.6
2005-2006 3 986 1 071 827 47 621 269 11.9 22.5
2006-2007 4 031 1 122 861 48 855 279 12.1 23.0
2007-2008 4 262 1 178 943 51 916 277 12.2 22.7
2008-2009 4 193 1 174 860 50 432 280 12.0 23.3
2009-2010 4 099 1 234 738 50 209 301 12.2 24.6
2010-2011 3 961 1 219 472 50 163 308 12.7 24.3
2011-2012 3 858 1 280 297 51 522 332 13.4 24.8 Source: 1975-1996: Oz-de-bir
2000-2006: Ministry of National Education (2006; 2007)
2008-2012: Ministry of National Education (2013 and various years).
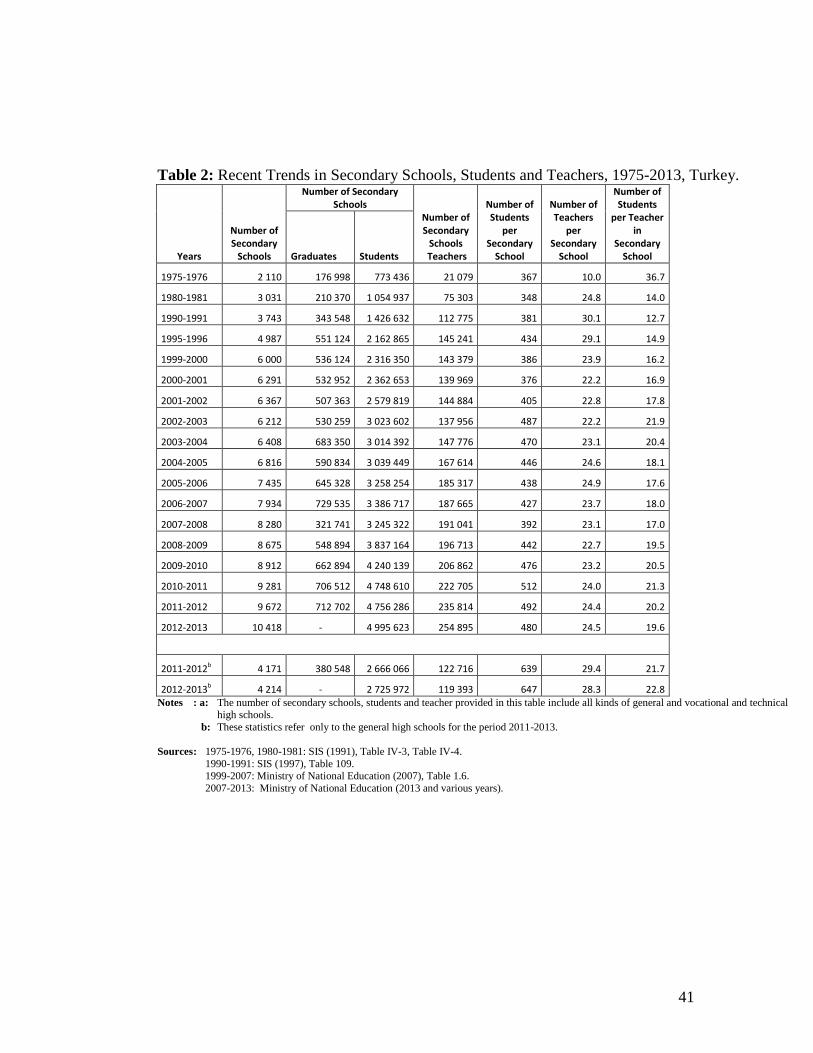
41
Table 2: Recent Trends in Secondary Schools, Students and Teachers, 1975-2013, Turkey.
Years
Number of Secondary
Schools
Number of Secondary Schools
Number of Secondary
Schools Teachers
Number of Students
per Secondary
School
Number of Teachers
per Secondary
School
Number of Students
per Teacher in
Secondary School Graduates Students
1975-1976 2 110 176 998 773 436 21 079 367 10.0 36.7
1980-1981 3 031 210 370 1 054 937 75 303 348 24.8 14.0
1990-1991 3 743 343 548 1 426 632 112 775 381 30.1 12.7
1995-1996 4 987 551 124 2 162 865 145 241 434 29.1 14.9
1999-2000 6 000 536 124 2 316 350 143 379 386 23.9 16.2
2000-2001 6 291 532 952 2 362 653 139 969 376 22.2 16.9
2001-2002 6 367 507 363 2 579 819 144 884 405 22.8 17.8
2002-2003 6 212 530 259 3 023 602 137 956 487 22.2 21.9
2003-2004 6 408 683 350 3 014 392 147 776 470 23.1 20.4
2004-2005 6 816 590 834 3 039 449 167 614 446 24.6 18.1
2005-2006 7 435 645 328 3 258 254 185 317 438 24.9 17.6
2006-2007 7 934 729 535 3 386 717 187 665 427 23.7 18.0
2007-2008 8 280 321 741 3 245 322 191 041 392 23.1 17.0
2008-2009 8 675 548 894 3 837 164 196 713 442 22.7 19.5
2009-2010 8 912 662 894 4 240 139 206 862 476 23.2 20.5
2010-2011 9 281 706 512 4 748 610 222 705 512 24.0 21.3
2011-2012 9 672 712 702 4 756 286 235 814 492 24.4 20.2
2012-2013 10 418 - 4 995 623 254 895 480 24.5 19.6
2011-2012b 4 171 380 548 2 666 066 122 716 639 29.4 21.7
2012-2013b 4 214 - 2 725 972 119 393 647 28.3 22.8 Notes : a: The number of secondary schools, students and teacher provided in this table include all kinds of general and vocational and technical high schools.
b: These statistics refer only to the general high schools for the period 2011-2013.
Sources : 1975-1976, 1980-1981: SIS (1991), Table IV-3, Table IV-4.
1990-1991: SIS (1997), Table 109. 1999-2007: Ministry of National Education (2007), Table 1.6.
2007-2013: Ministry of National Education (2013 and various years).
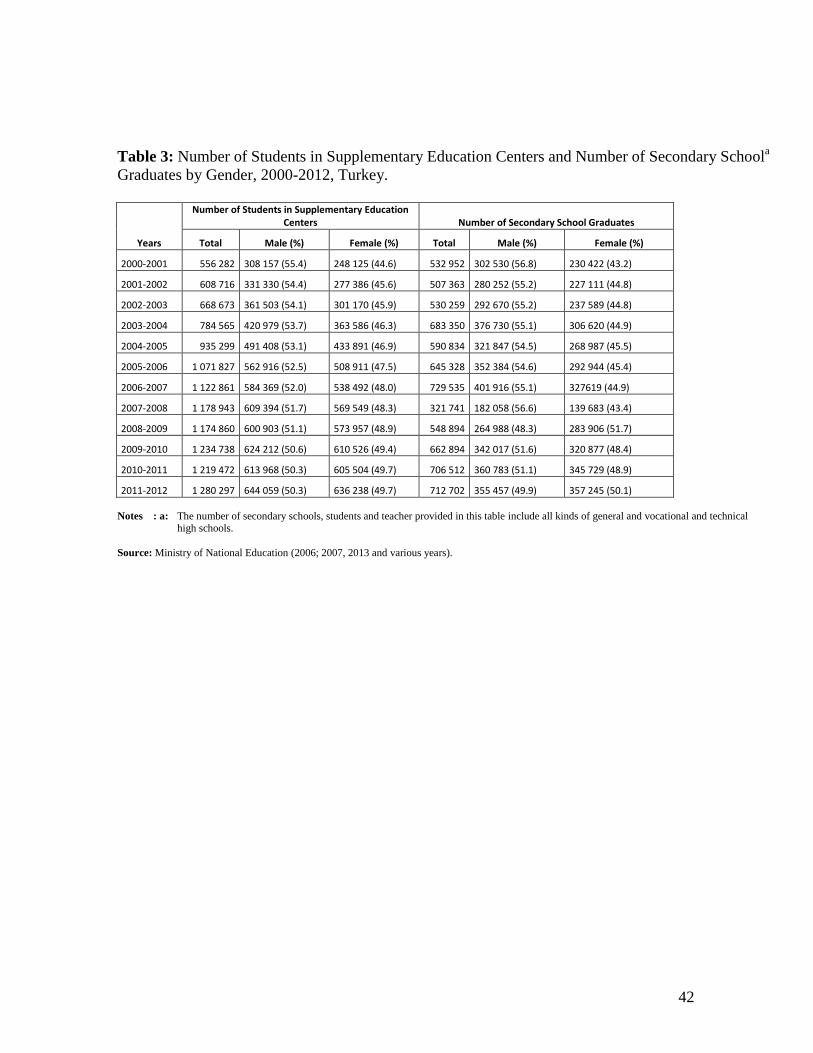
42
Table 3: Number of Students in Supplementary Education Centers and Number of Secondary Schoola
Graduates by Gender, 2000-2012, Turkey.
Years
Number of Students in Supplementary Education Centers Number of Secondary School Graduates
Total Male (%) Female (%) Total Male (%) Female (%)
2000-2001 556 282 308 157 (55.4) 248 125 (44.6) 532 952 302 530 (56.8) 230 422 (43.2)
2001-2002 608 716 331 330 (54.4) 277 386 (45.6) 507 363 280 252 (55.2) 227 111 (44.8)
2002-2003 668 673 361 503 (54.1) 301 170 (45.9) 530 259 292 670 (55.2) 237 589 (44.8)
2003-2004 784 565 420 979 (53.7) 363 586 (46.3) 683 350 376 730 (55.1) 306 620 (44.9)
2004-2005 935 299 491 408 (53.1) 433 891 (46.9) 590 834 321 847 (54.5) 268 987 (45.5)
2005-2006 1 071 827 562 916 (52.5) 508 911 (47.5) 645 328 352 384 (54.6) 292 944 (45.4)
2006-2007 1 122 861 584 369 (52.0) 538 492 (48.0) 729 535 401 916 (55.1) 327619 (44.9)
2007-2008 1 178 943 609 394 (51.7) 569 549 (48.3) 321 741 182 058 (56.6) 139 683 (43.4)
2008-2009 1 174 860 600 903 (51.1) 573 957 (48.9) 548 894 264 988 (48.3) 283 906 (51.7)
2009-2010 1 234 738 624 212 (50.6) 610 526 (49.4) 662 894 342 017 (51.6) 320 877 (48.4)
2010-2011 1 219 472 613 968 (50.3) 605 504 (49.7) 706 512 360 783 (51.1) 345 729 (48.9)
2011-2012 1 280 297 644 059 (50.3) 636 238 (49.7) 712 702 355 457 (49.9) 357 245 (50.1)
Notes : a: The number of secondary schools, students and teacher provided in this table include all kinds of general and vocational and technical high schools.
Source: Ministry of National Education (2006; 2007, 2013 and various years).
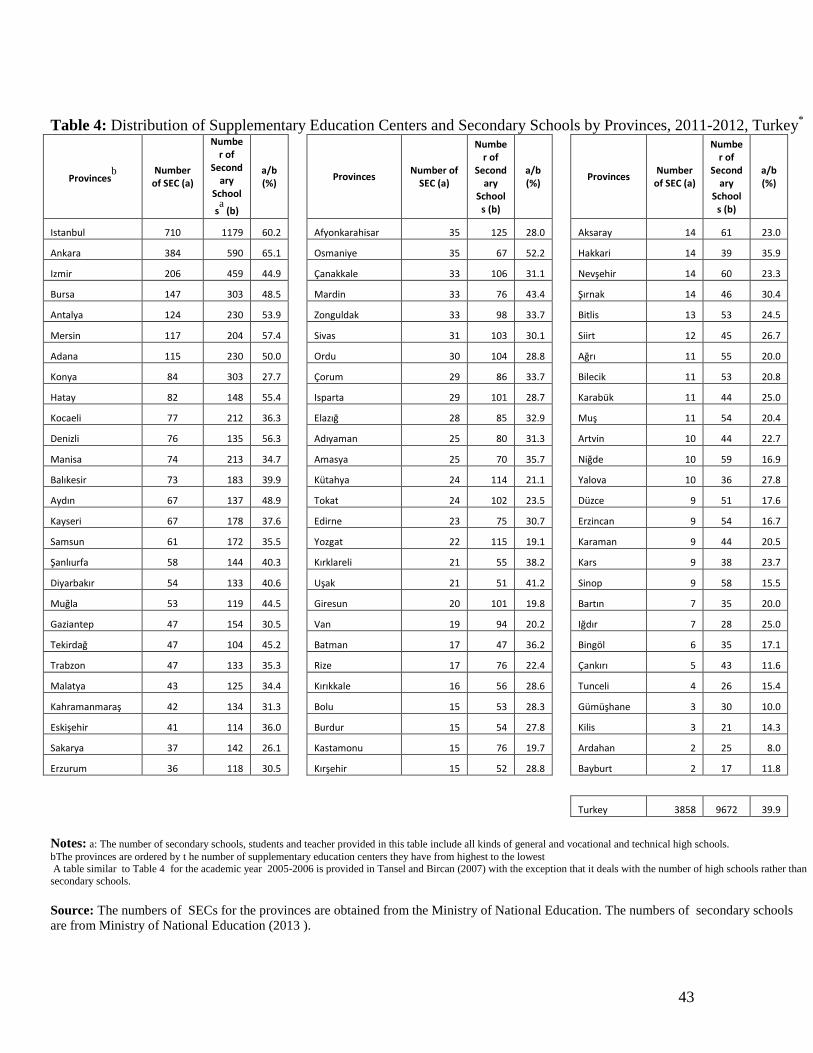
43
Table 4: Distribution of Supplementary Education Centers and Secondary Schools by Provinces, 2011-2012, Turkey*
Provincesb
Number
of SEC (a)
Number of
Secondary
School
sa (b)
a/b (%)
Provinces Number of
SEC (a)
Number of
Secondary
Schools (b)
a/b (%)
Provinces Number
of SEC (a)
Number of
Secondary
Schools (b)
a/b (%)
Istanbul 710 1179 60.2
Afyonkarahisar 35 125 28.0
Aksaray 14 61 23.0
Ankara 384 590 65.1
Osmaniye 35 67 52.2
Hakkari 14 39 35.9
Izmir 206 459 44.9
Çanakkale 33 106 31.1
Nevşehir 14 60 23.3
Bursa 147 303 48.5
Mardin 33 76 43.4
Şırnak 14 46 30.4
Antalya 124 230 53.9
Zonguldak 33 98 33.7
Bitlis 13 53 24.5
Mersin 117 204 57.4
Sivas 31 103 30.1
Siirt 12 45 26.7
Adana 115 230 50.0
Ordu 30 104 28.8
Ağrı 11 55 20.0
Konya 84 303 27.7
Çorum 29 86 33.7
Bilecik 11 53 20.8
Hatay 82 148 55.4
Isparta 29 101 28.7
Karabük 11 44 25.0
Kocaeli 77 212 36.3
Elazığ 28 85 32.9
Muş 11 54 20.4
Denizli 76 135 56.3
Adıyaman 25 80 31.3
Artvin 10 44 22.7
Manisa 74 213 34.7
Amasya 25 70 35.7
Niğde 10 59 16.9
Balıkesir 73 183 39.9
Kütahya 24 114 21.1
Yalova 10 36 27.8
Aydın 67 137 48.9
Tokat 24 102 23.5
Düzce 9 51 17.6
Kayseri 67 178 37.6
Edirne 23 75 30.7
Erzincan 9 54 16.7
Samsun 61 172 35.5
Yozgat 22 115 19.1
Karaman 9 44 20.5
Şanlıurfa 58 144 40.3
Kırklareli 21 55 38.2
Kars 9 38 23.7
Diyarbakır 54 133 40.6
Uşak 21 51 41.2
Sinop 9 58 15.5
Muğla 53 119 44.5
Giresun 20 101 19.8
Bartın 7 35 20.0
Gaziantep 47 154 30.5
Van 19 94 20.2
Iğdır 7 28 25.0
Tekirdağ 47 104 45.2
Batman 17 47 36.2
Bingöl 6 35 17.1
Trabzon 47 133 35.3
Rize 17 76 22.4
Çankırı 5 43 11.6
Malatya 43 125 34.4
Kırıkkale 16 56 28.6
Tunceli 4 26 15.4
Kahramanmaraş 42 134 31.3
Bolu 15 53 28.3
Gümüşhane 3 30 10.0
Eskişehir 41 114 36.0
Burdur 15 54 27.8
Kilis 3 21 14.3
Sakarya 37 142 26.1
Kastamonu 15 76 19.7
Ardahan 2 25 8.0
Erzurum 36 118 30.5
Kırşehir 15 52 28.8
Bayburt 2 17 11.8
Turkey 3858 9672 39.9
Notes: a: The number of secondary schools, students and teacher provided in this table include all kinds of general and vocational and technical high schools.
bThe provinces are ordered by t he number of supplementary education centers they have from highest to the lowest A table similar to Table 4 for the academic year 2005-2006 is provided in Tansel and Bircan (2007) with the exception that it deals with the number of high schools rather than
secondary schools.
Source: The numbers of SECs for the provinces are obtained from the Ministry of National Education. The numbers of secondary schools
are from Ministry of National Education (2013 ).
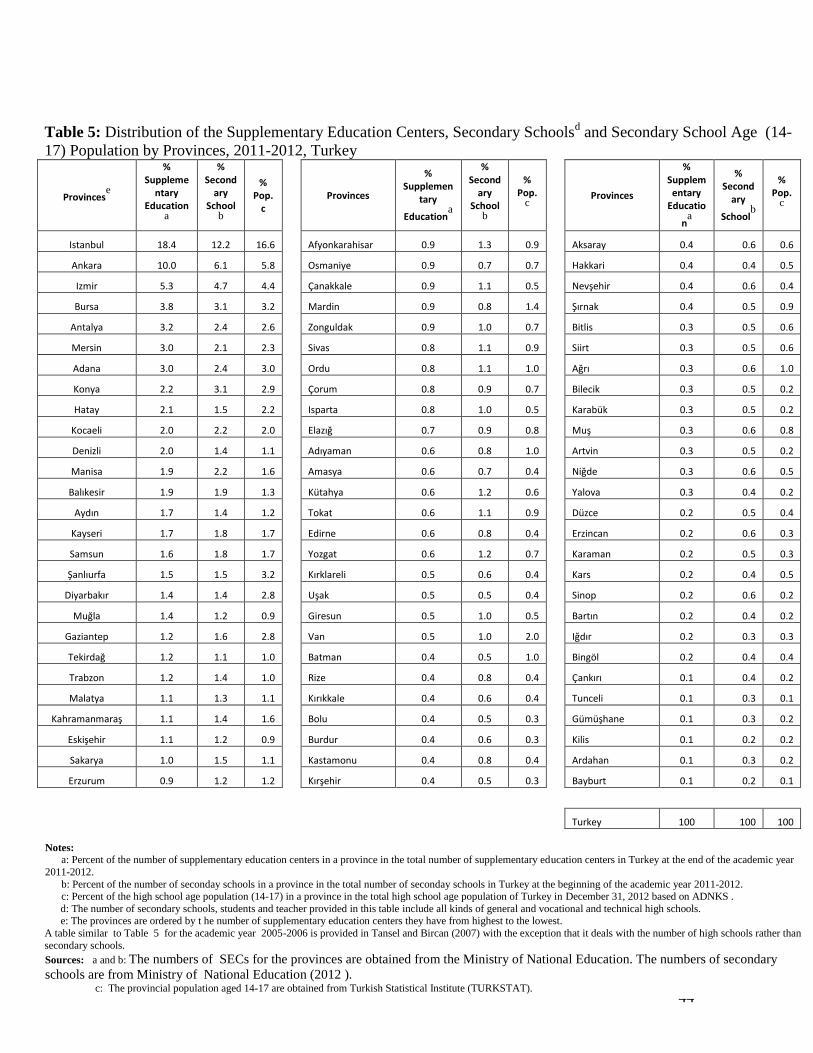
44
Table 5: Distribution of the Supplementary Education Centers, Secondary Schoolsd and Secondary School Age (14-
17) Population by Provinces, 2011-2012, Turkey
Provincese
% Suppleme
ntary Education
a
% Second
ary School
b
% Pop.
c
Provinces
% Supplemen
tary
Educationa
% Second
ary School
b
% Pop.
c
Provinces
% Supplementary
Educatio
na
% Second
ary
Schoolb
% Pop.
c
Istanbul 18.4 12.2 16.6
Afyonkarahisar 0.9 1.3 0.9
Aksaray 0.4 0.6 0.6
Ankara 10.0 6.1 5.8
Osmaniye 0.9 0.7 0.7
Hakkari 0.4 0.4 0.5
Izmir 5.3 4.7 4.4
Çanakkale 0.9 1.1 0.5
Nevşehir 0.4 0.6 0.4
Bursa 3.8 3.1 3.2
Mardin 0.9 0.8 1.4
Şırnak 0.4 0.5 0.9
Antalya 3.2 2.4 2.6
Zonguldak 0.9 1.0 0.7
Bitlis 0.3 0.5 0.6
Mersin 3.0 2.1 2.3
Sivas 0.8 1.1 0.9
Siirt 0.3 0.5 0.6
Adana 3.0 2.4 3.0
Ordu 0.8 1.1 1.0
Ağrı 0.3 0.6 1.0
Konya 2.2 3.1 2.9
Çorum 0.8 0.9 0.7
Bilecik 0.3 0.5 0.2
Hatay 2.1 1.5 2.2
Isparta 0.8 1.0 0.5
Karabük 0.3 0.5 0.2
Kocaeli 2.0 2.2 2.0
Elazığ 0.7 0.9 0.8
Muş 0.3 0.6 0.8
Denizli 2.0 1.4 1.1
Adıyaman 0.6 0.8 1.0
Artvin 0.3 0.5 0.2
Manisa 1.9 2.2 1.6
Amasya 0.6 0.7 0.4
Niğde 0.3 0.6 0.5
Balıkesir 1.9 1.9 1.3
Kütahya 0.6 1.2 0.6
Yalova 0.3 0.4 0.2
Aydın 1.7 1.4 1.2
Tokat 0.6 1.1 0.9
Düzce 0.2 0.5 0.4
Kayseri 1.7 1.8 1.7
Edirne 0.6 0.8 0.4
Erzincan 0.2 0.6 0.3
Samsun 1.6 1.8 1.7
Yozgat 0.6 1.2 0.7
Karaman 0.2 0.5 0.3
Şanlıurfa 1.5 1.5 3.2
Kırklareli 0.5 0.6 0.4
Kars 0.2 0.4 0.5
Diyarbakır 1.4 1.4 2.8
Uşak 0.5 0.5 0.4
Sinop 0.2 0.6 0.2
Muğla 1.4 1.2 0.9
Giresun 0.5 1.0 0.5
Bartın 0.2 0.4 0.2
Gaziantep 1.2 1.6 2.8
Van 0.5 1.0 2.0
Iğdır 0.2 0.3 0.3
Tekirdağ 1.2 1.1 1.0
Batman 0.4 0.5 1.0
Bingöl 0.2 0.4 0.4
Trabzon 1.2 1.4 1.0
Rize 0.4 0.8 0.4
Çankırı 0.1 0.4 0.2
Malatya 1.1 1.3 1.1
Kırıkkale 0.4 0.6 0.4
Tunceli 0.1 0.3 0.1
Kahramanmaraş 1.1 1.4 1.6
Bolu 0.4 0.5 0.3
Gümüşhane 0.1 0.3 0.2
Eskişehir 1.1 1.2 0.9
Burdur 0.4 0.6 0.3
Kilis 0.1 0.2 0.2
Sakarya 1.0 1.5 1.1
Kastamonu 0.4 0.8 0.4
Ardahan 0.1 0.3 0.2
Erzurum 0.9 1.2 1.2
Kırşehir 0.4 0.5 0.3
Bayburt 0.1 0.2 0.1
Turkey 100 100 100
Notes:
a: Percent of the number of supplementary education centers in a province in the total number of supplementary education centers in Turkey at the end of the academic year
2011-2012.
b: Percent of the number of seconday schools in a province in the total number of seconday schools in Turkey at the beginning of the academic year 2011-2012. c: Percent of the high school age population (14-17) in a province in the total high school age population of Turkey in December 31, 2012 based on ADNKS .
d: The number of secondary schools, students and teacher provided in this table include all kinds of general and vocational and technical high schools. e: The provinces are ordered by t he number of supplementary education centers they have from highest to the lowest.
A table similar to Table 5 for the academic year 2005-2006 is provided in Tansel and Bircan (2007) with the exception that it deals with the number of high schools rather than
secondary schools.
Sources: a and b: The numbers of SECs for the provinces are obtained from the Ministry of National Education. The numbers of secondary
schools are from Ministry of National Education (2012 ). c: The provincial population aged 14-17 are obtained from Turkish Statistical Institute (TURKSTAT).
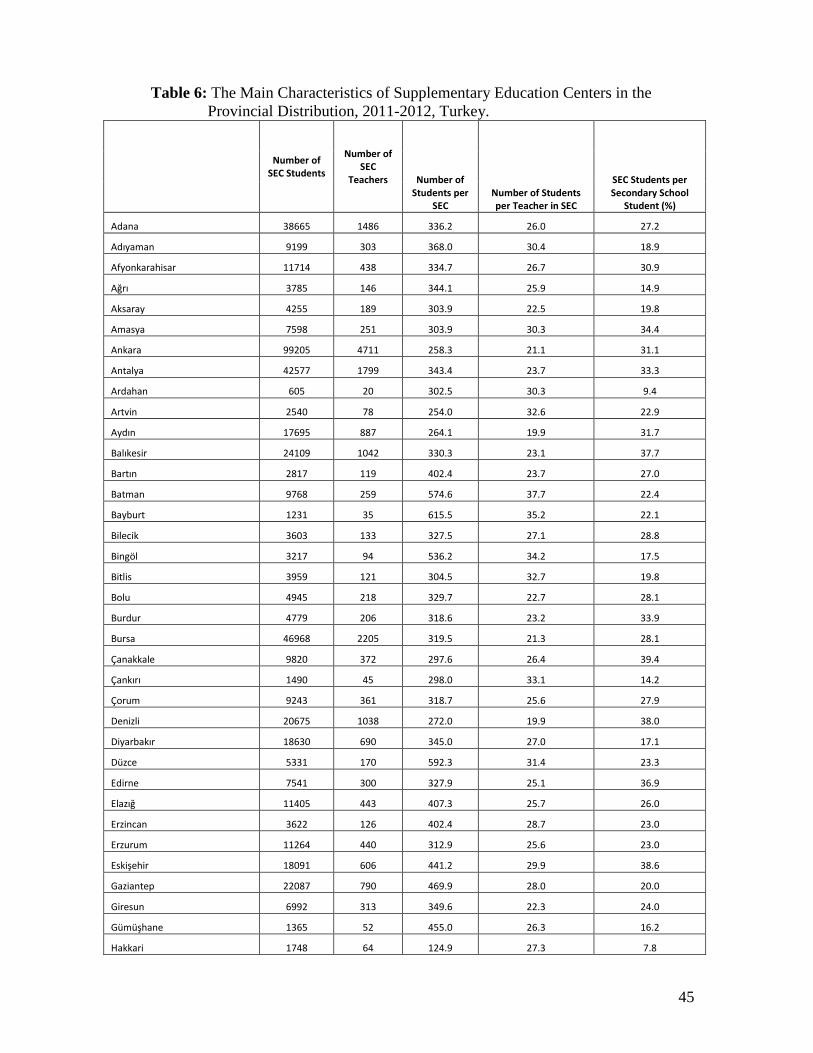
45
Table 6: The Main Characteristics of Supplementary Education Centers in the
Provincial Distribution, 2011-2012, Turkey.
Number of SEC Students
Number of SEC
Teachers Number of Students per
SEC Number of Students per Teacher in SEC
SEC Students per Secondary School
Student (%)
Adana 38665 1486 336.2 26.0 27.2
Adıyaman 9199 303 368.0 30.4 18.9
Afyonkarahisar 11714 438 334.7 26.7 30.9
Ağrı 3785 146 344.1 25.9 14.9
Aksaray 4255 189 303.9 22.5 19.8
Amasya 7598 251 303.9 30.3 34.4
Ankara 99205 4711 258.3 21.1 31.1
Antalya 42577 1799 343.4 23.7 33.3
Ardahan 605 20 302.5 30.3 9.4
Artvin 2540 78 254.0 32.6 22.9
Aydın 17695 887 264.1 19.9 31.7
Balıkesir 24109 1042 330.3 23.1 37.7
Bartın 2817 119 402.4 23.7 27.0
Batman 9768 259 574.6 37.7 22.4
Bayburt 1231 35 615.5 35.2 22.1
Bilecik 3603 133 327.5 27.1 28.8
Bingöl 3217 94 536.2 34.2 17.5
Bitlis 3959 121 304.5 32.7 19.8
Bolu 4945 218 329.7 22.7 28.1
Burdur 4779 206 318.6 23.2 33.9
Bursa 46968 2205 319.5 21.3 28.1
Çanakkale 9820 372 297.6 26.4 39.4
Çankırı 1490 45 298.0 33.1 14.2
Çorum 9243 361 318.7 25.6 27.9
Denizli 20675 1038 272.0 19.9 38.0
Diyarbakır 18630 690 345.0 27.0 17.1
Düzce 5331 170 592.3 31.4 23.3
Edirne 7541 300 327.9 25.1 36.9
Elazığ 11405 443 407.3 25.7 26.0
Erzincan 3622 126 402.4 28.7 23.0
Erzurum 11264 440 312.9 25.6 23.0
Eskişehir 18091 606 441.2 29.9 38.6
Gaziantep 22087 790 469.9 28.0 20.0
Giresun 6992 313 349.6 22.3 24.0
Gümüşhane 1365 52 455.0 26.3 16.2
Hakkari 1748 64 124.9 27.3 7.8
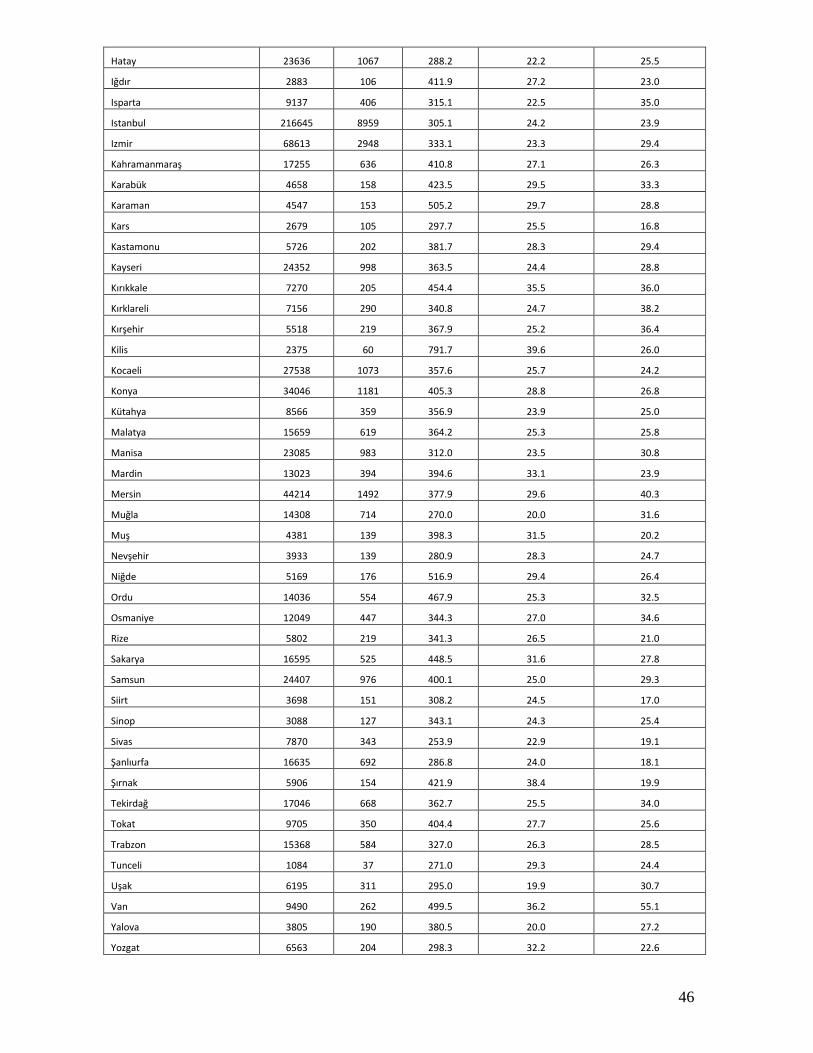
46
Hatay 23636 1067 288.2 22.2 25.5
Iğdır 2883 106 411.9 27.2 23.0
Isparta 9137 406 315.1 22.5 35.0
Istanbul 216645 8959 305.1 24.2 23.9
Izmir 68613 2948 333.1 23.3 29.4
Kahramanmaraş 17255 636 410.8 27.1 26.3
Karabük 4658 158 423.5 29.5 33.3
Karaman 4547 153 505.2 29.7 28.8
Kars 2679 105 297.7 25.5 16.8
Kastamonu 5726 202 381.7 28.3 29.4
Kayseri 24352 998 363.5 24.4 28.8
Kırıkkale 7270 205 454.4 35.5 36.0
Kırklareli 7156 290 340.8 24.7 38.2
Kırşehir 5518 219 367.9 25.2 36.4
Kilis 2375 60 791.7 39.6 26.0
Kocaeli 27538 1073 357.6 25.7 24.2
Konya 34046 1181 405.3 28.8 26.8
Kütahya 8566 359 356.9 23.9 25.0
Malatya 15659 619 364.2 25.3 25.8
Manisa 23085 983 312.0 23.5 30.8
Mardin 13023 394 394.6 33.1 23.9
Mersin 44214 1492 377.9 29.6 40.3
Muğla 14308 714 270.0 20.0 31.6
Muş 4381 139 398.3 31.5 20.2
Nevşehir 3933 139 280.9 28.3 24.7
Niğde 5169 176 516.9 29.4 26.4
Ordu 14036 554 467.9 25.3 32.5
Osmaniye 12049 447 344.3 27.0 34.6
Rize 5802 219 341.3 26.5 21.0
Sakarya 16595 525 448.5 31.6 27.8
Samsun 24407 976 400.1 25.0 29.3
Siirt 3698 151 308.2 24.5 17.0
Sinop 3088 127 343.1 24.3 25.4
Sivas 7870 343 253.9 22.9 19.1
Şanlıurfa 16635 692 286.8 24.0 18.1
Şırnak 5906 154 421.9 38.4 19.9
Tekirdağ 17046 668 362.7 25.5 34.0
Tokat 9705 350 404.4 27.7 25.6
Trabzon 15368 584 327.0 26.3 28.5
Tunceli 1084 37 271.0 29.3 24.4
Uşak 6195 311 295.0 19.9 30.7
Van 9490 262 499.5 36.2 55.1
Yalova 3805 190 380.5 20.0 27.2
Yozgat 6563 204 298.3 32.2 22.6

47
Zonguldak 12045 397 365.0 30.3 33.8
Turkey 1280297 51522 331.9 24.8 27.1
Notes: The number of secondary schools, students and teacher provided in this table include all
kinds of general and vocational and technical high schools.
Source: The numbers of SEC students and teachers for the provinces are obtained from the Ministry
of National Education.
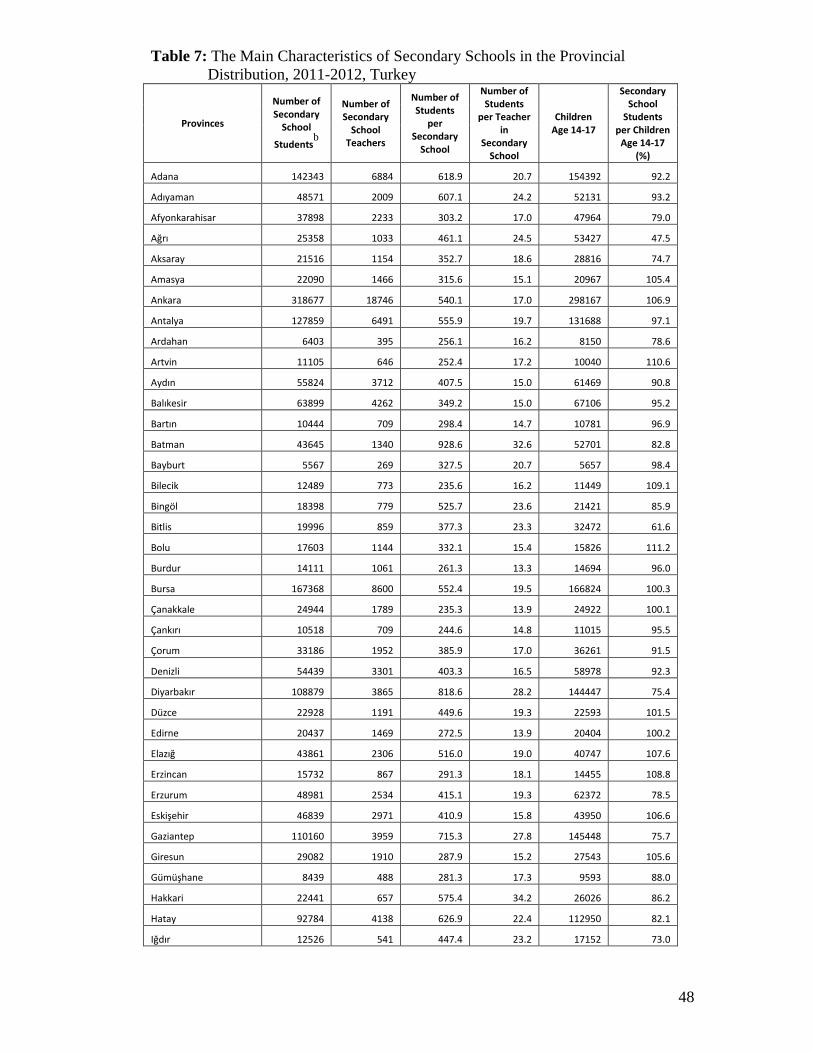
48
Table 7: The Main Characteristics of Secondary Schools in the Provincial
Distribution, 2011-2012, Turkey
Provinces
Number of Secondary
School
Studentsb
Number of Secondary
School Teachers
Number of Students
per Secondary
School
Number of Students
per Teacher in
Secondary School
Children Age 14-17
Secondary School
Students per Children
Age 14-17 (%)
Adana 142343 6884 618.9 20.7 154392 92.2
Adıyaman 48571 2009 607.1 24.2 52131 93.2
Afyonkarahisar 37898 2233 303.2 17.0 47964 79.0
Ağrı 25358 1033 461.1 24.5 53427 47.5
Aksaray 21516 1154 352.7 18.6 28816 74.7
Amasya 22090 1466 315.6 15.1 20967 105.4
Ankara 318677 18746 540.1 17.0 298167 106.9
Antalya 127859 6491 555.9 19.7 131688 97.1
Ardahan 6403 395 256.1 16.2 8150 78.6
Artvin 11105 646 252.4 17.2 10040 110.6
Aydın 55824 3712 407.5 15.0 61469 90.8
Balıkesir 63899 4262 349.2 15.0 67106 95.2
Bartın 10444 709 298.4 14.7 10781 96.9
Batman 43645 1340 928.6 32.6 52701 82.8
Bayburt 5567 269 327.5 20.7 5657 98.4
Bilecik 12489 773 235.6 16.2 11449 109.1
Bingöl 18398 779 525.7 23.6 21421 85.9
Bitlis 19996 859 377.3 23.3 32472 61.6
Bolu 17603 1144 332.1 15.4 15826 111.2
Burdur 14111 1061 261.3 13.3 14694 96.0
Bursa 167368 8600 552.4 19.5 166824 100.3
Çanakkale 24944 1789 235.3 13.9 24922 100.1
Çankırı 10518 709 244.6 14.8 11015 95.5
Çorum 33186 1952 385.9 17.0 36261 91.5
Denizli 54439 3301 403.3 16.5 58978 92.3
Diyarbakır 108879 3865 818.6 28.2 144447 75.4
Düzce 22928 1191 449.6 19.3 22593 101.5
Edirne 20437 1469 272.5 13.9 20404 100.2
Elazığ 43861 2306 516.0 19.0 40747 107.6
Erzincan 15732 867 291.3 18.1 14455 108.8
Erzurum 48981 2534 415.1 19.3 62372 78.5
Eskişehir 46839 2971 410.9 15.8 43950 106.6
Gaziantep 110160 3959 715.3 27.8 145448 75.7
Giresun 29082 1910 287.9 15.2 27543 105.6
Gümüşhane 8439 488 281.3 17.3 9593 88.0
Hakkari 22441 657 575.4 34.2 26026 86.2
Hatay 92784 4138 626.9 22.4 112950 82.1
Iğdır 12526 541 447.4 23.2 17152 73.0
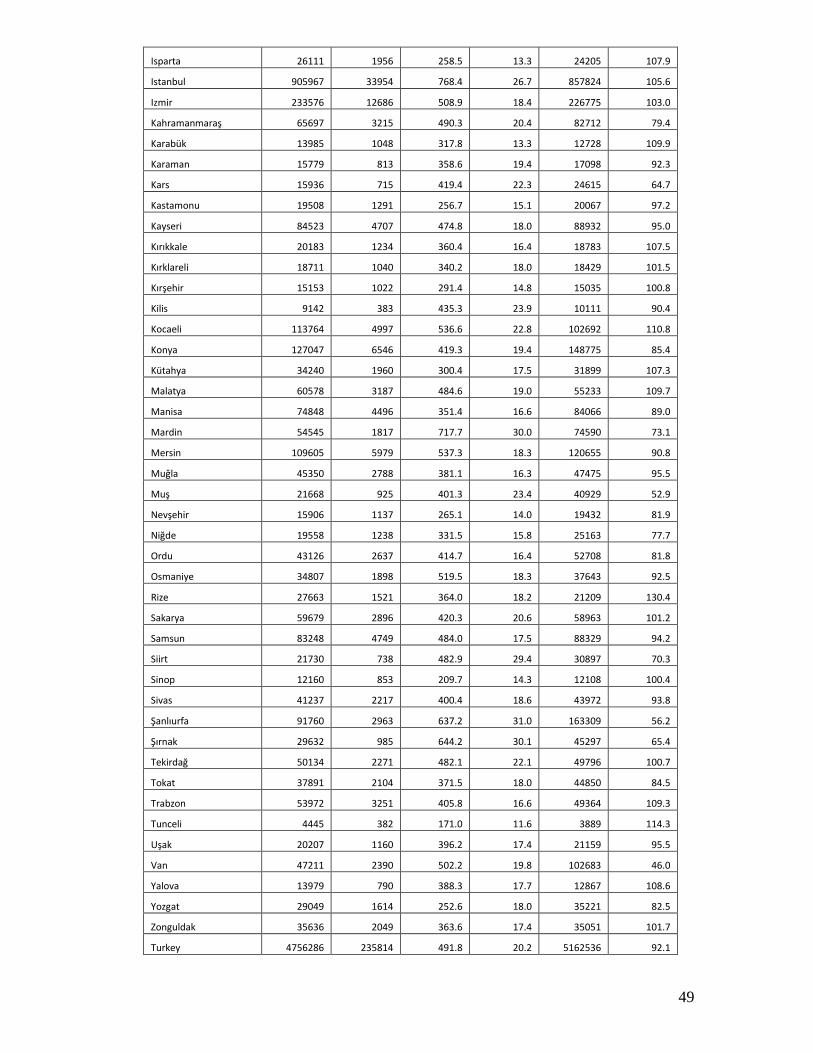
49
Isparta 26111 1956 258.5 13.3 24205 107.9
Istanbul 905967 33954 768.4 26.7 857824 105.6
Izmir 233576 12686 508.9 18.4 226775 103.0
Kahramanmaraş 65697 3215 490.3 20.4 82712 79.4
Karabük 13985 1048 317.8 13.3 12728 109.9
Karaman 15779 813 358.6 19.4 17098 92.3
Kars 15936 715 419.4 22.3 24615 64.7
Kastamonu 19508 1291 256.7 15.1 20067 97.2
Kayseri 84523 4707 474.8 18.0 88932 95.0
Kırıkkale 20183 1234 360.4 16.4 18783 107.5
Kırklareli 18711 1040 340.2 18.0 18429 101.5
Kırşehir 15153 1022 291.4 14.8 15035 100.8
Kilis 9142 383 435.3 23.9 10111 90.4
Kocaeli 113764 4997 536.6 22.8 102692 110.8
Konya 127047 6546 419.3 19.4 148775 85.4
Kütahya 34240 1960 300.4 17.5 31899 107.3
Malatya 60578 3187 484.6 19.0 55233 109.7
Manisa 74848 4496 351.4 16.6 84066 89.0
Mardin 54545 1817 717.7 30.0 74590 73.1
Mersin 109605 5979 537.3 18.3 120655 90.8
Muğla 45350 2788 381.1 16.3 47475 95.5
Muş 21668 925 401.3 23.4 40929 52.9
Nevşehir 15906 1137 265.1 14.0 19432 81.9
Niğde 19558 1238 331.5 15.8 25163 77.7
Ordu 43126 2637 414.7 16.4 52708 81.8
Osmaniye 34807 1898 519.5 18.3 37643 92.5
Rize 27663 1521 364.0 18.2 21209 130.4
Sakarya 59679 2896 420.3 20.6 58963 101.2
Samsun 83248 4749 484.0 17.5 88329 94.2
Siirt 21730 738 482.9 29.4 30897 70.3
Sinop 12160 853 209.7 14.3 12108 100.4
Sivas 41237 2217 400.4 18.6 43972 93.8
Şanlıurfa 91760 2963 637.2 31.0 163309 56.2
Şırnak 29632 985 644.2 30.1 45297 65.4
Tekirdağ 50134 2271 482.1 22.1 49796 100.7
Tokat 37891 2104 371.5 18.0 44850 84.5
Trabzon 53972 3251 405.8 16.6 49364 109.3
Tunceli 4445 382 171.0 11.6 3889 114.3
Uşak 20207 1160 396.2 17.4 21159 95.5
Van 47211 2390 502.2 19.8 102683 46.0
Yalova 13979 790 388.3 17.7 12867 108.6
Yozgat 29049 1614 252.6 18.0 35221 82.5
Zonguldak 35636 2049 363.6 17.4 35051 101.7
Turkey 4756286 235814 491.8 20.2 5162536 92.1
50
Notes: a: This column gives the number of secondary school students per children of 14-17 years of
age which is considered to be the secondary school age.
b: The number of secondary schools, students and teacher provided in this table include all
kinds of general and vocational and technical high schools.
Source: The number of secondary school teachers and students are from Ministry of National
Education (2013).
The population of age 14-17 is obtained from TURKSTAT (2013).
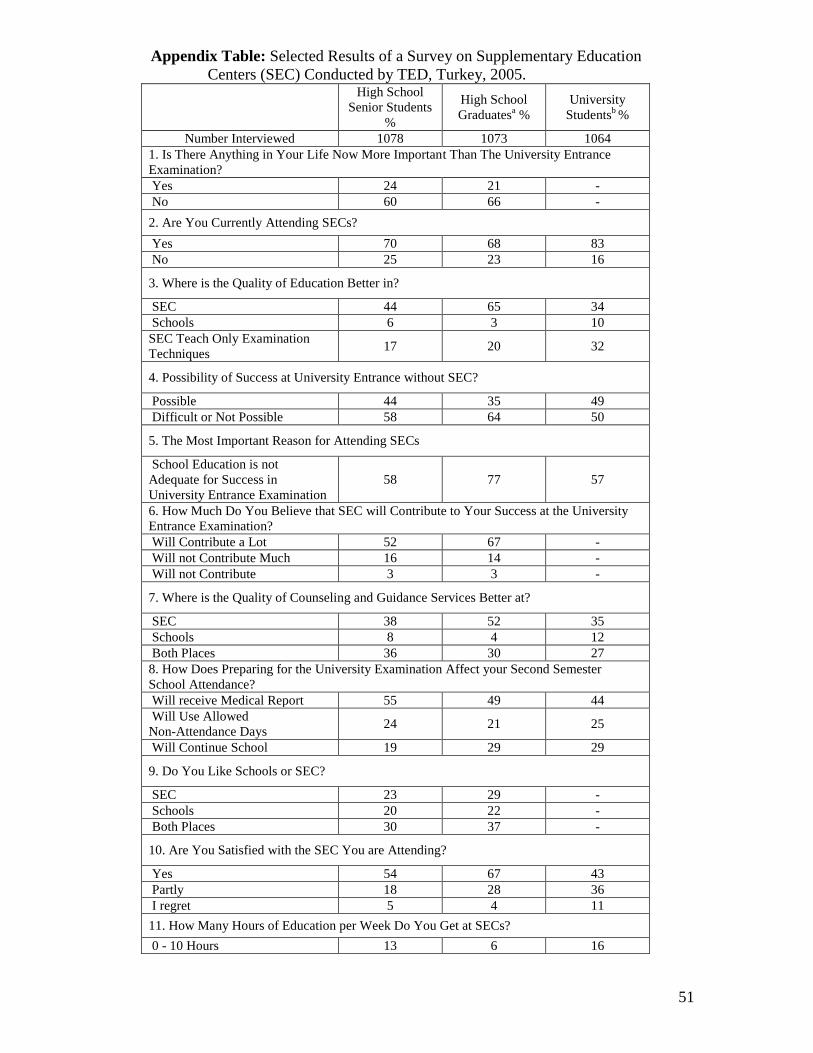
51
Appendix Table: Selected Results of a Survey on Supplementary Education
Centers (SEC) Conducted by TED, Turkey, 2005.
High School
Senior Students
%
High School
Graduatesa %
University
Studentsb %
Number Interviewed 1078 1073 1064
1. Is There Anything in Your Life Now More Important Than The University Entrance
Examination?
Yes 24 21 -
No 60 66 -
2. Are You Currently Attending SECs?
Yes 70 68 83
No 25 23 16
3. Where is the Quality of Education Better in?
SEC 44 65 34
Schools 6 3 10
SEC Teach Only Examination
Techniques 17 20 32
4. Possibility of Success at University Entrance without SEC?
Possible 44 35 49
Difficult or Not Possible 58 64 50
5. The Most Important Reason for Attending SECs
School Education is not
Adequate for Success in
University Entrance Examination
58 77 57
6. How Much Do You Believe that SEC will Contribute to Your Success at the University
Entrance Examination?
Will Contribute a Lot 52 67 -
Will not Contribute Much 16 14 -
Will not Contribute 3 3 -
7. Where is the Quality of Counseling and Guidance Services Better at?
SEC 38 52 35
Schools 8 4 12
Both Places 36 30 27
8. How Does Preparing for the University Examination Affect your Second Semester
School Attendance?
Will receive Medical Report 55 49 44
Will Use Allowed
Non-Attendance Days 24 21 25
Will Continue School 19 29 29
9. Do You Like Schools or SEC?
SEC 23 29 -
Schools 20 22 -
Both Places 30 37 -
10. Are You Satisfied with the SEC You are Attending?
Yes 54 67 43
Partly 18 28 36
I regret 5 4 11
11. How Many Hours of Education per Week Do You Get at SECs?
0 - 10 Hours 13 6 16
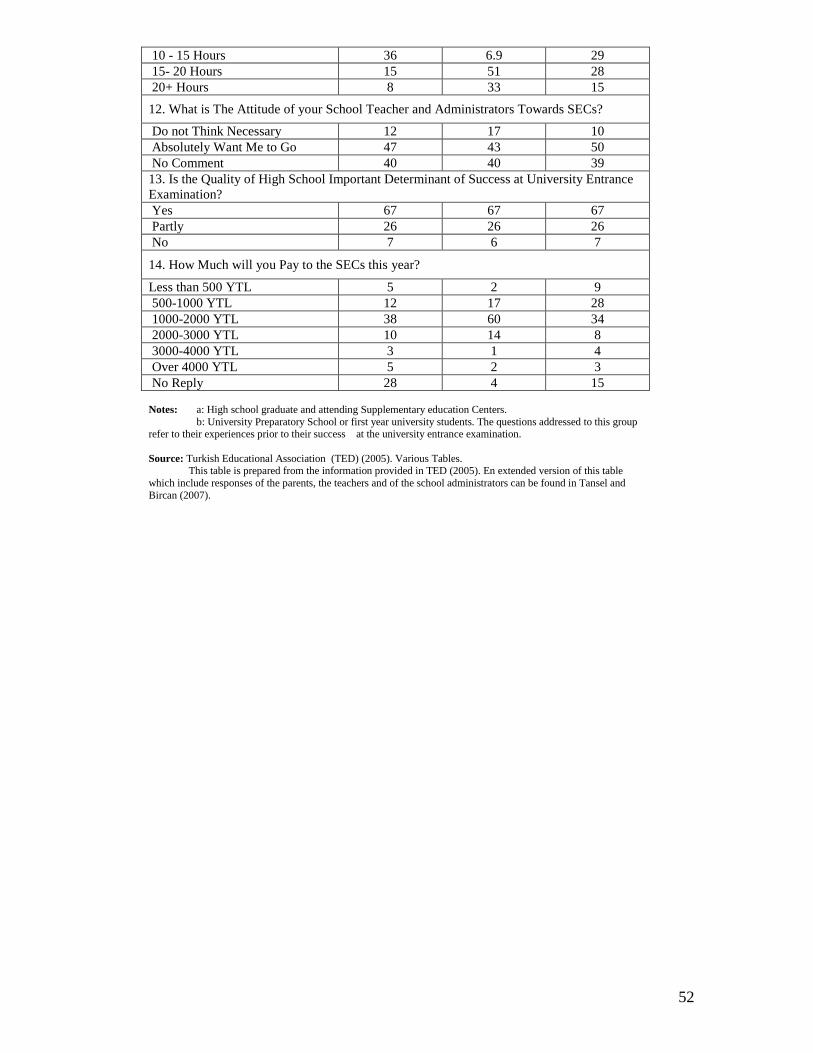
52
10 - 15 Hours 36 6.9 29
15- 20 Hours 15 51 28
20+ Hours 8 33 15
12. What is The Attitude of your School Teacher and Administrators Towards SECs?
Do not Think Necessary 12 17 10
Absolutely Want Me to Go 47 43 50
No Comment 40 40 39
13. Is the Quality of High School Important Determinant of Success at University Entrance
Examination?
Yes 67 67 67
Partly 26 26 26
No 7 6 7
14. How Much will you Pay to the SECs this year?
Less than 500 YTL 5 2 9
500-1000 YTL 12 17 28
1000-2000 YTL 38 60 34
2000-3000 YTL 10 14 8
3000-4000 YTL 3 1 4
Over 4000 YTL 5 2 3
No Reply 28 4 15
Notes: a: High school graduate and attending Supplementary education Centers.
b: University Preparatory School or first year university students. The questions addressed to this group refer to their experiences prior to their success at the university entrance examination.
Source: Turkish Educational Association (TED) (2005). Various Tables. This table is prepared from the information provided in TED (2005). En extended version of this table
which include responses of the parents, the teachers and of the school administrators can be found in Tansel and
Bircan (2007).
53
References
Akgün, M. (2005). Özel dersanelere ayrılan ekonomik kaynakların incelenmesi (An
investigation of the economic resources devoted to supplementary education
centers). Paper presented at the Educational Sciences Congress, 28-30
September, 2005, Pamukkale University, Denizli, Turkey.
Altınyelken, H. K. (2013) The Demand for Private Tutoring in Turkey. In Bray, M.,
Mazawi, A. E. & Sultana, R. G. (2013). Private Tutoring Across the
Mediterranean, Rotterdam, The Netherlands: Sense Publishers. Euro-
Mediterranean Centre for Educational Research.
Assaad, R. & El-Badawy, A. (2004). Private and group tutoring in Egypt: Where is
the gender inequality? Paper presented at the workshop on Gender Work and
Family in the Middle East and North Africa, University of Minnesota.
Baştürk, S. & Doğan, S. (2010) Lise öğretmenlerinin özel dersaneler hakkındaki
görüşlerinin incelenmesi ( Investigating high school teachers’ views on cram
schools) Uluslarasi Insan Bilimleri Dergisi (International Journal of Human
Sciences), 7(2), 135-157.
Berberoğlu, G. & Kalender, I. (2005) Öğrenci başarısının yıllara, okul türlerine,
bölgelere göre incelenmesi: ÖSS ve PISA analizi (Analysis of student
achievement by year, school type and regions: ÖSS and PISA analysis),
Eğitim Bilimleri ve Uygulama (Educational Sciences and Practice), 4(7), 21-
35.
Berberoğlu, G. & Tansel, A. (2013) Private tutoring and academic performance:
evidence from Turkey, International Review of Education, forthcoming.
Bray, M. (1999). The shadow education system: private tutoring and its implications
for planners. Fundamentals of educational planning No. 61. Paris: UNESCO
International Institute for Educational Planning (IIEP).
Bray, M. (2003). Adverse effects of private supplementary tutoring: Dimensions,
implications, and government responses. Paris: UNESCO International
Institute for Educational Planning (IIEP).
Bray, M. (2006). Private supplementary tutoring: comparative perspectives on
patterns and implications, Compare: A Journal of Comparative Education,
36 (4), 515 – 530.
Bray, M. (2009). Confronting the shadow education system: what government
policies for what private tutoring. Paris: UNESCO International Institute for
Educational Planning (IIEP).

54
Bray, M. (2010). Researching shadow education: Methodological challenges and
directions, Asia Pacific Education Review, 11 (1), 3-13.
Bray, M. (2011). The challenge of shadow education: Private tutoring and its
implications for policy makers in the European Union. Brussels, Belgium:
European Commission.
Bray, M. & Kwok, P. (2003). Demand for private supplementary tutoring:
Conceptual considerations, and socio-economic patterns in Hong Kong,
Economics of Education Review, 22 (6), 611–620.
Bray, M. & Lykins, C. (2012) Shadow education: Private supplementary tutoring
and its implications for policy makers in Asia. Hong Kong: Comparative
Education Research Center, The University of Hong Kong.
Bray, M. & Suso, E. (2008). The challenges of private supplementary tutoring:
Global patterns and their implications for Africa. Maputo, Mozambique:
Presented at the Biennale of the Association for the Development of
Education in Africa.
Bray, M., Mazawi, A. E. & Sultana, R. G. (2013). Private tutoring across the
Mediterranean, Rotterdam, The Netherlands: Sense Publishers. Euro-
Mediterranean Centre for Educational Research.
Burch, P. (2009). Hidden markets: The new education privatization, London, UK:
Routledge publishers.
Dang, H.A. & Rogers, H. (2008). The growing phenomenon of private tutoring:
Does it deepen human capital, widen inequalities, or waste resources? The
World Bank Research Observer, 23(2) 161-200.
Di Paolo, A. & Tansel, A. (2013). Returns to foreign language skills in a developing
country: The case of Turkey. Department of Economics, Barcelona
University, Barcelona, Spain and Middle East Technical University, Ankara
Turkey.
Dinçer, M. A. & Uysal G. (2010). Determinats of student achievement in Turkey.
Istanbul, Turkey: Bahçeşehir University Center for Economic and Social
Research (BETAM) Working Paper.
Ekici, G. (2005). Öğrencilerin ÖSYM sınavına karsı tutumlarının bir çok değişkenle
incelenmesi. (An investigation of the attitudes of students’ toward the student
selection examination through a number of variables). Educational
Administration, 28, 82-90.
Gök, F. (2006). Üniversiteye girişte umut pazarı: Özel dershaneler (Hope market in
the entrance to universities: Supplementary education centers), Eğitim, Bilim,
Society, 8: 102-109.
55
Gök, F. (2010) Marketing hope: Private institutions preparing students for the
university entrance examination in Turkey, In S. Karin Amos (ed.)
International Educational Governance, International Perspectives on
Education and Society, 12, 123-134.
Güven-Der (Güven Dershane Sahipleri Derneği) (Association of the Owners of
Güven Supplementary education Centers), (July, 2013). Retrieved from
http://www.guvender.org.tr/
Güvercin, G. (2005) Özel dersanelerde ve MEB’e bağlı okullarda öğretmenlik yapan
öğretmenlerin, öğretmenlik mesleği ile ilgili tutumlarının karşılaştırılması,
Özel dersanelerde öğrenim gören lise-3 öğrencilerinin dersaneye ilişkin
görüşleri (A comparison of the views of supplementary education center
teachers and Ministry of National Education teachers on teaching
profession, Views of high school senior students who are attending
supplementary education centers on private tutoring centers) Paper
presented at the Educational Sciences Congress, 28-30 September, 2005,
Pamukkale University, Denizli, Turkey.
Haber-Türk Newspaper (2012). Üniversite sınavları kaldırılacak ve dersaneler
kapanacak (The university entrance exam is going to be abolished and
private tutoring centers will be closed down) 25 March, 2012.
Heyneman, S. P. (2011). Private tutoring and social cohesion. Peabody Journal of
Education , 86, 183-188.
Higher Education Board of Turkey (Yüksek Öğretim Kurumu) (YÖK). (July, 2013).
Retrieved from http://www.yok.gov.tr/
Higher Education Board of Turkey (Yüksek Öğretim Kurumu) (YÖK). (2007).
Türkiye’nin Yüksek Öğretim Stratejisi (Higher Education Strategy for
Turkey), Yüksek Öğretim Kurumu, Ankara.
Hürriyet Newspaper (2012) YGS ve dersaneler kalkıyor (University entrance
examination and private tutoring centers will be eliminated), Hüriyet
Newspaper, 25 March, 2012.
Independent Educators Union (Bağımsız Eğitimciler sendikası) (2007)
Çocuklarımızı sahtekarlığa alıştırıyoruz. (We allow our children to cheat).
Press Release, May 24, 2007 Ankara, Turkey.
Ireson, J. (2004). Private Tutoring: How Prevalent and Effective is it? London
Review of Education, 2(2), 109-122.
Kim, H. (2008). After-school programs in Korea: A policy for reducing the heavier
reliance on private education. Seoul, Korea: Korean Education Development
Institute.
56
Köprülü, F. (2012). Ekonomist dergisinin sorularına iliskin açıklamalarımız
(Explanations for the questions by the Economist journal).Mimeo provided
by ÖZ-DE-BİR.
Lee, C. J:, H. J. Park and H. Lee (2009) Shadow education system. In G. Sykes, B.
Schneider and D: N: Plank (Eds.) Handbook of education policy research.
New York, USA: Routledge publishers for the American Educational
Research Association.
Milliyet Newspaper, (2012). Dersanelerin kapanacağı ve sınavların kalkacağı
söyleniyor (They say supplementary tutoring centers will be closed down and
the examinations will be abolished). 27 March, 2012
Ministry of National Education. (2006, 2007, 2012, 2013). National education
statistics, formal education, 2012-2013, Ankara, Turkey: The Ministry of
NationalEducation, the Presidency of Strategy Development.
Morgil, I. Yılmaz, A. Seçken, N. & Erökten, S. 2000. An assessment of the
contribution of trial OSS examinations organized by private tutoring centers
and ÖZ-DE-BİR on student success at university entrance examination
Hacettepe Üniversitesi Eğitim Fakültesi Dergisi (Journal of the Hacettepe
University School of Education), 19 , 96-103.
Morgil, I., A. Yılmaz & Geban, O. (2001) Özel dersanelerin üniversiteye girişte
öğrenci başarısına etkileri (The effect of private tutoring centers on the
success of students in the university entrance examinations), Hacettepe
Üniversitesi Eğitim Fakültesi Dergisi ( Journal of the Hacettepe University
School of Education), Vol. 21, pp. 89-96.
Mori, I. & Baker, D. (2010) The origin of universal shadow education: What the
supplemental education phenomenon tells us about the postmodern
institutions of education. Asia Pacific Education Review, 11(1), 36-48.
Nartgün, Ş. S., Altındağ, Ü. & Özen, R. (2012). Dersanelerin Öğrencilerin sosyal ve
ekonomik yaşamları üzerine etkisi (The impact of Private tutoring on social
and economic lives of students), Journal of Educational and Instructional
Studies in the World, 2(1), 54-61.
ÖZ-DE-BİR (Özel Dershaneler Birliği) (Association of supplementary education
centers). (July, 2013). Retrieved from http://www.ozdebir.org.tr/
Okur, M. & Dikici, R. (2004). A comparative analysis of supplementary education
centers and public schools. Kastomonu Eğitim Dergisi ( Kastomonu Journal
of Education), 12 (2), 417-426.
57
Safarzynska, K. (2013). Socio-economic determinants of demand for private
tutoring. European Sociological Review, 29(2): 139-154.
Silova, I. (2009). Private supplementary tutoring in central Asia: New opportunities
and burdens, Paris: UNESCO International Institute for Educational Planning
(IIEP).
Silova, I. (2010). Private tutoring in Eastern Europe and Central Asia: Policy
choices and implications, Compare: A Journal of Comparative and
International Education, 40(3), 327-344.
Silova, I., Budiene, V. & Bray, M. (eds.) (2006) Education in the hidden market
place: Monitoring of supplementary education. New York, USA: Open
Society Institute.
Stevenson, D. L. & Baker, D. P. (1992). Shadow education and allocation in formal
schooling: Transition to university in Japan, American Journal of Sociology,
97 (6), 1639–1657.
Student Selection and Placement Center (Öğrenci Seçme ve Yerleştirme Merkezi)
(ÖSYM), (July, 2013) Retrieved from http://www.osym.gov.tr
Tansel, A. (1994). Wage employment, earnings and returns to schooling for men and
women in Turkey. Economics of Education Review, 13 (4), 305–320.
Tansel, A. (2001). Self-employment, wage employment and returns to schooling by
gender in Turkey. In Labor and Human Capital in the Middle East: Studies
of markets and household behavior (pp. 337–367), Djavad Salehi-Isfahani
(Ed.). Reading, USA: Ithaca Press. Another version appeared as “Self
Employment, Wage Employment and Returns to Education for Urban Men
and Women in Turkey” in Education and the Labor Market in Turkey,
Tuncer Bulutay (Ed.). Ankara, Turkey: SIS Publication, pp.175-208.
Tansel, A. (2002a). Determinants of schooling attainment for boys and girls in
Turkey: Individual, household and community factors. Economics of
Education Review, 21, 455–470.
Tansel, A. (2002b). “General versus vocational high schools and labor market
outcomes in Turkey”, in Human Capital: Population Economics in the
Middle East, İsmail Sırageldin (Ed.), Cairo, Egypt: Economic Research
Forum and American University of Cairo Press.
Tansel, A. (2005). Public–private employment choice, wage differentials and gender
in Turkey. Economic Development and Cultural Change, 53 (1), 453–477.

58
Tansel, A. (2010) “Changing returns to education for men and women in a
developing country: Turkey, 1994-2005,” paper presented at the ESPE
Conference, London, UK and at the MEEA conference, March 2009 in Nice,
France.
Tansel, A. (2013) Private tutoring and equitable opportunities in Turkey: Challenges
and policy implications, Mediterranean Journal of Educational Studies,
2013, forthcoming. Also published in Bray, M., A. E. Mazawi and R .G.
Sultana (Eds.) (2013) Private Tutoring Across the Mediterranean,
Rotterdam, The Netherlands: Sense Publishers, (177-186).
Tansel A. & Bircan, F. (2005). Effect of supplementary education on university
entrance examination performance in Turkey, Economic Research Forum
WP No. 0407, Cairo, Egypt and IZA Discussion Paper No. 1609, Bonn,
Germany.
Tansel, A. & Bircan, F. (2006). Demand for education in Turkey: a Tobit analysis of
supplementary education expenditures, Economics of Education Review, 25
(4), 303–313.
Tansel, A. & Bircan, F. (2007) Supplementary education in Turkey: recent evidence
on its various aspects, Paper presented at the UNESCO, IIEP Policy Forum
on Confronting the Shadow Education System, Paris, 5-6 July 2007 and IZA
Discussion Paper no: 3471, May 2008.
Tansel, A. & Taşçı, H. M. (2010). Hazard analysis of unemployment duration by
gender in a developing country: The case of Turkey. Labour: Review of
Labor Economics and Industrial Relations, 2010, 24(4): 501-530.
TÖDER (Tüm Özel Öğretim Kurumları Derneği) (Association of All Private
Educational Establishments). (July, 2013). Retrieved from
http://www.toder.org/
Trade Union of Educators (Eğitim-Sen) (Eğitimciler Sendikası) (July, 2013).
Retrieved from http://www.egitimsen.org.tr/
Turkish Educational Association (Türk Eğitim Derneği) (TED). (2005). Türkiye’de
üniversiteye giriş sistemi araştırması ve çözüm önerileri (Study on the
university placement system in Turkey and suggestions for solution),
Ankara, Turkey:Türk Eğitim Derneği.
Turkish Satistical Institute (TURKSTAT) (2013) Retrieved from
http://www.tuik.org.tr/
World Bank (2011) Improving the quality and equity of basic education in Turkey:
59
Challenges and options, Washington DC, USA: The World Bank Human
Development Department, Europe and Central Asia Region. Report No:
54131-TR.
Zhang, Y. (2013). Does private tutoring improve students’ National College
Entrance Exam performance?—A case study from Jinan, China. Economics
of Education Review, 32, 1-28.