
Dissertation full text - Universit¤t St.Gallen
245
I The Competitiveness of Ghana’s Industry D I S S E R T A T I O N der Universität St.Gallen, Hochschule für Wirtschafts-, Rechts- und Sozialwissenschaften (HSG) zur Erlangung der Würde eines Doktors der Staatswissenschaften vorgelegt von Anton Fidelis Hoefter von Wollerau (Schwyz) Genehmigt auf Antrag der Herren Prof. Dr. Jean-Max Baumer und Prof. Dr. Hans Georg Graf Dissertation Nr. 2494 Difo-Druck GmbH, Bamberg
Transcript of Dissertation full text - Universit¤t St.Gallen

I
The Competitiveness of Ghana’s Industry
D I S S E R T A T I O N der Universität St.Gallen,
Hochschule für Wirtschafts-, Rechts- und Sozialwissenschaften (HSG)
zur Erlangung der Würde eines Doktors der Staatswissenschaften
vorgelegt von
Anton Fidelis Hoefter
von
Wollerau (Schwyz)
Genehmigt auf Antrag der Herren
Prof. Dr. Jean-Max Baumer
und
Prof. Dr. Hans Georg Graf
Dissertation Nr. 2494
Difo-Druck GmbH, Bamberg
II
Die Universität St.Gallen, Hochschule für Wirtschafts-, Rechts- und Sozial-wissenschaften (HSG), gestattet hiermit den Druck der vorliegenden Dissertation, ohne damit zu den darin ausgesprochenen Anschauungen Stellung zu nehmen.
St. Gallen, den 23. Januar 2001
Der Rektor:
Prof. Dr. Peter Gomez

III
Meiner Familie mit Dank für die Geduld und Unterstützung

IV
Preface
The motivation to write a thesis on Ghana was born out of a friendship with late Father Joseph Apuri from Navrongo, Ghana. A good friend of my father from University, I had gotten to know him already as a child, and continued to be fascinated by his home country and the challenges of his people. Although I have not contributed a lot, I hope that a part of this work could provide some explanation and help on how to improve the economic conditions of Ghana.
Many people have helped me to complete this thesis. In Ghana, I had the opportunity to talk to a large number of people, and I would like to thank all my interview partners for their time and interest in my work, and the hospitality that many of them offered.
Without the advice and support of Prof. Jean-Max Baumer, this thesis would not have been possible. I would like to thank him for his help, encouragement and patience during this time. I would also like to thank Prof. Dr. Hans Georg Graf for his valuable input and advice.
McKinsey & Company has given me the opportunity to work part-time for some months to get this thesis off the ground, and many of my there friends have helped and encouraged me during these years.
I am particularly grateful to my friends from St.Gallen. Hans-Gereon Früh, Andreas Steininger, Jürgen Krotzinger, Benedikt Braumann, Katharina Fehr, Pascal Guillet and Thomas Petermann (in no particular order) were always there for long discussions, and helped with their input and support.
Special thanks goes to my family. My parents who have always encouraged and supported me. And particularly my wife and friend Myriam, for giving her loving patience to a husband who had to combine a normal working day with an academic project. Our son Richard accompanied us during the last months of this thesis and motivated me to complete this work.
Zürich, January 30 Anton Hoefter

V
Overview of content Overview of content V Table of content VII Table of figures XIII Table of tables XIV Abbreviations XV
I INTRODUCTION 1
1 Motivation 1
2 Research approach 3
II OVERVIEW OF GHANA’S ECONOMY 7
3 The political background of Ghana’s economic development 7
4 The structure of Ghana’s economy 21
5 The role of foreign trade in Ghana’s economy 30
6 Other research on Ghana’s competitiveness 34
III THEORETICAL AND METHODOLOGICAL CONCEPTS 41
7 Competitiveness – a definition 41
8 Theoretical approach 45
9 Methodology to measure competitive advantage 61
10 Methodology to explain impact of determinants of competitive advantage 68
IV ANALYSIS OF COMPETITIVENESS OF GHANA’S INDUSTRIES 71
11 Ghana’s competitive and uncompetitive industries 71
12 The competitive advantage of the Aluminum industry 78
13 The competitive advantage of the Cocoa industry 94

VI
14 The competitive advantage of the Food industry 111
15 The competitive advantage of the Gold industry 125
16 The competitive advantage of the Timber and Furniture Industry 138
17 The competitive disadvantage of the Textile and Garment industry 151
V CONCLUSIONS ON DETERMINANTS OF COMPETITIVE ADVANTAGE 163
18 Factor conditions 163
19 Demand conditions 177
20 Related and supporting industries 181
21 Strategy, structure, and rivalry 184
22 Government 192
23 Summary - the challenges of Ghana’s Diamond of National Advantage 208 Sources 214
VII
Table of content Overview of content V Table of content VII Table of figures XIII Table of tables XIV Abbreviations XV
I INTRODUCTION 1
1 Motivation 1
2 Research approach 3 2.1 Main question and contribution 3 2.2 Framework for analysis 3 2.3 Working hypothesis 4 2.4 Data availability 5 2.5 Structure and research design 5
II OVERVIEW OF GHANA’S ECONOMY 7
3 The political background of Ghana’s economic development 7 3.1 The political economy of Ghana until 1983 7
3.1.1 Trade in gold and slaves main source of profit before colonialism 7 3.1.2 Specialization on cocoa during colonial rule 8 3.1.3 The history of decline: 1957 to 1983 9 3.1.4 The basis for decline: Nkrumah’s industrialization program 11 3.1.5 “Killing the golden geese”, the consequences of failed policies 15
3.2 Economic reforms after 1983 16 3.2.1 Main elements of Ghana’s Economic Reform Program 17 3.2.2 Political structure since 1992 19
4 The structure of Ghana’s economy 21 4.1 Ghana’s macroeconomic development after the ERP 21 4.2 Sectoral structure of Ghana’s economy 23
4.2.1 Agricultural sector 24 4.2.2 Mining and manufacturing sector 26 4.2.3 Service sector 28

VIII
5 The role of foreign trade in Ghana’s economy 30 5.1 Overview of Ghana’s export structure 30 5.2 Overview of Ghana’s import structure 33
6 Other research on Ghana’s competitiveness 34 6.1 Ghana’s competitiveness based on real exchange rate movements 34 6.2 Other research on Ghana’s competitiveness 35
6.2.1 Competitiveness reports 35 6.2.2 Degree of economic freedom reports 37 6.2.3 Evaluation of research on competitiveness 39
III THEORETICAL AND METHODOLOGICAL CONCEPTS 41
7 Competitiveness – a definition 41
8 Theoretical approach 45 8.1 “Diamond of National advantage” 45 8.2 Innovation as driver of competitive advantage 47 8.3 Review of work leading to “Competitive Advantage of Nations” 49
8.3.1 Industry structure determining competitive strategy 49 8.3.2 Management of firm’s value chain to gain competitive advantage 50 8.3.3 National attributes as determinant of national competitive advantage 51
8.4 Comparison of Porter with neoclassical approaches 53 8.5 A short critique of Porter’s Competitive Advantage of Nations 57 8.6 Adaptation of Porter approach to specific situation of Ghana 59
9 Methodology to measure competitive advantage 61 9.1 World market share of exports as indicator for competitive advantage 61 9.2 Measuring the World market export share of Ghana’s industry 64
9.2.1 Poor quality of Ghana export data 64 9.2.2 Most exports from gold and cocoa 65
9.3 Revised methodology to measure the competitiveness of Ghana’s industry 66
10 Methodology to explain impact of determinants of competitive advantage 68

IX
IV ANALYSIS OF COMPETITIVENESS OF GHANA’S INDUSTRIES 71
11 Ghana’s competitive and uncompetitive industries 71 11.1 Ghana’s competitive industries 71 11.2 Ghana’s uncompetitive products 74 11.3 Selection criteria for industry analysis 77
12 The competitive advantage of the Aluminum industry 78 12.1 Structure of Ghana’s Aluminum industry 78
12.1.1 Buyers 80 12.1.2 Competition 81 12.1.3 Substitutes 83
12.2 History of Ghana’s Aluminum industry 83 12.3 Aluminum’s Diamond of National Advantage 85
12.3.1 Factor conditions 86 12.3.2 Domestic demand conditions 88 12.3.3 Relating and supporting industries 89 12.3.4 Firm structure, strategy and rivalry 90 12.3.5 Influence of Government Policy 91
12.4 Summary and conclusion on Ghana’s Aluminum industry 92
13 The competitive advantage of the Cocoa industry 94 13.1 Structure of Ghana’s Cocoa industry 94
13.1.1 Buyers 96 13.1.2 Competition 97 13.1.3 Substitutes 99
13.2 History of Ghana’s Cocoa industry 100 13.3 Cocoa’s Diamond of National Advantage 103
13.3.1 Factor conditions 103 13.3.2 Domestic demand conditions 106 13.3.3 Related and supporting industries 106 13.3.4 Firm structure, strategy and rivalry 106 13.3.5 Influence of Government Policy 107
13.4 Summary and conclusion on Ghana’s Cocoa industry 108
14 The competitive advantage of the Food industry 111 14.1 Structure of the Ghana’s Food industry 111
14.1.1 Buyers 113

X
14.1.2 Competition 114 14.2 History of Ghana’s Food industry 115 14.3 The Food industry’s Diamond of National Advantage 118
14.3.1 Factor conditions 118 14.3.2 Domestic demand conditions 121 14.3.3 Related and supporting industries 121 14.3.4 Firm structure, strategy and rivalry 121 14.3.5 Influence of Government Policy 123
14.4 Summary and conclusion on Ghana’s Food industry 123
15 The competitive advantage of the Gold industry 125 15.1 Structure of Ghana’s Gold mining industry 125
15.1.1 Buyers 126 15.1.2 Competition 126 15.1.3 Substitutes 127
15.2 History of Ghana’s Gold mining industry 127 15.3 Gold mining’s Diamond of National Advantage 130
15.3.1 Factor conditions 130 15.3.2 Domestic demand conditions 133 15.3.3 Related and supporting industries 133 15.3.4 Firm structure, strategy and rivalry 134 15.3.5 Influence of Government Policy 135
15.4 Summary and conclusion on Ghana’s Gold mining industry 136
16 The competitive advantage of the Timber and Furniture Industry 138 16.1 Structure of Ghana’s Timber and Furniture industry 138
16.1.1 Buyers 139 16.1.2 Competitors 141 16.1.3 Substitutes 142
16.2 History of Ghana’s Timber and Furniture industry 142 16.3 Timber and Furniture’s Diamond of National Advantage 144
16.3.1 Factor conditions 145 16.3.2 Domestic demand conditions 147 16.3.3 Related and supporting industries 147 16.3.4 Firm structure, strategy and rivalry 147 16.3.5 Influence of Government Policy 149
16.4 Summary and conclusion on Ghana’s Timber and Furniture industry 149
XI
17 The competitive disadvantage of the Textile and Garment industry 151 17.1 Structure of Ghana’s Textile and Garment industry 151
17.1.1 Buyers 152 17.1.2 Competition 153 17.1.3 Substitutes 154
17.2 History of Ghana’s Textile and Garment industry 154 17.3 Textile and Garment’s Diamond of National Advantage 156
17.3.1 Factor conditions 157 17.3.2 Domestic demand conditions 158 17.3.3 Related and supporting industries 159 17.3.4 Firm structure, strategy and rivalry 159 17.3.5 Influence of Government Policy 160
17.4 Summary and conclusion on Ghana’s Textile and Garment industry 161
V CONCLUSIONS ON DETERMINANTS OF COMPETITIVE ADVANTAGE 163
18 Factor conditions 163 18.1 Raw Material 164 18.2 Human resources 164
18.2.1 Basic education level 165 18.2.2 Secondary and tertiary education 166 18.2.3 Internal training 167
18.3 Specialized factors 168 18.3.1 Research and development 168 18.3.2 Management and entrepreneurship 168
18.4 Capital availability 169 18.5 Physical infrastructure 171 18.6 Information infrastructure 173 18.7 Administrative infrastructure 174 18.8 Conclusions on Ghana’s factor conditions 175
19 Demand conditions 177 19.1 Size of Ghana’s home market 178 19.2 Quality of Ghana’s home market demand 178 19.3 Conclusions on Ghana’s home demand 179

XII
20 Related and supporting industries 181 20.1 Presence of supporting industries 181 20.2 Presence of related industries 182 20.3 Conclusions on Ghana’s related and supporting industry 182
21 Strategy, structure, and rivalry 184 21.1 Structure and rivalry 184 21.2 Climate for investments 185
21.2.1 Investment and trade laws, taxes 186 21.2.2 Labor market policies 187 21.2.3 Political and economic uncertainty 187
21.3 Strategy 188 21.3.1 Strategic focus 188 21.3.2 Value chain presence 189 21.3.3 Management practices and goals of individuals 189
21.4 Conclusion on strategy and structure of Ghana’s industry 191
22 Government 192 22.1 The role of government in promoting competitive advantage 192
22.1.1 Ensure macroeconomic stability 192 22.1.2 Provide enabling microeconomic environment 193
22.2 Ghana’s macroeconomic and microeconomic track record 193 22.3 Ghana’s macroeconomic environment 195 22.4 Ghana’s microeconomic environment 197
22.4.1 Government influence on factor conditions 197 22.4.2 Government influence on demand conditions 203 22.4.3 Government influence on related and supporting industries 203 22.4.4 Government influence on firm strategy, structure, and rivalry 204
22.5 Conclusions on Ghana’s government 206
23 Summary - the challenges of Ghana’s Diamond of National Advantage 208 23.1 Nature of competitive advantage 208 23.2 Capacity to innovate 211 23.3 Conclusion 212 Sources 214
Literature 214 Interviews 227

XIII
Table of figures FIGURE 1: GOVERNMENT REVENUES FROM COCOA, 1956 - 1985 (PERCENT OF TOTAL) 12 FIGURE 2: COCOA PRODUCTION AND PRODUCER PRICES, 1950 - 1989 13 FIGURE 3: KEY ECONOMIC INDICATORS, 1965 - 1983 15 FIGURE 4: REAL EXCHANGE RATE CEDI/USD 1951 - 1985 16 FIGURE 5: DEVELOPMENT OF REAL GDP PER CAPITA, 1975 - 1998 22 FIGURE 6: FOREIGN DIRECT INVESTMENT INFLOW 1987 - 1998 23 FIGURE 7: GHANA’S GDP STRUCTURE, 1972-1996 24 FIGURE 8: AVERAGE PRODUCTIVITY RELATIVE TO BEST PRACTICE IN GHANA 25 FIGURE 9: EXPORT SHARE IN GDP BY EXPENDITURE CATEGORY, 1993 - 1997 31 FIGURE 10: EXPORT VALUES OF MAJOR PRODUCTS, 1983 – 1997 31 FIGURE 11: GHANA'S TOP TEN EXPORT DESTINATIONS, 1996 32 FIGURE 12: AFRICA'S COMPETITIVENESS INDEX, 2000 36 FIGURE 13: THE DIAMOND OF NATIONAL ADVANTAGE 45 FIGURE 14: FIVE FORCES DETERMINING INDUSTRY PROFITABILITY 49 FIGURE 15: FOUR GENERIC STRATEGIES 51 FIGURE 16: CLUSTER CHART TO HIGHLIGHT COMPETITIVE PATTERNS 63 FIGURE 17: GHANA'S ALUMINUM INDUSTRY, 1997 79 FIGURE 18: STRUCTURE OF GHANA'S COCOA INDUSTRY, 1997 95 FIGURE 19: EXPORTS OF RAW AND PROCESSED COCOA FOR MAJOR EXPORTERS, 1990 97 FIGURE 20: STRUCTURE OF GHANA'S FOOD INDUSTRY, 1997 113 FIGURE 21: GOLD PRODUCTION 1901 - 1995 129 FIGURE 22: STRUCTURE OF GHANA'S TIMBER AND FURNITURE INDUSTRY, 1997 139 FIGURE 23: STRUCTURE OF GHANA'S TEXTILE AND GARMENT INDUSTRY, 1997 152 FIGURE 24: INFLATION, EXCHANGE RATE AND INTEREST RATES IN GHANA, 1992 - 1997 196 FIGURE 25: TERMS OF TRADE AND PRICE DEVELOPMENT OF COCOA, GOLD, ALUMINUM 209

XIV
Table of tables TABLE 1: STRUCTURE AND RESEARCH DESIGN 5 TABLE 2: CHRONOLOGY OF MAJOR EVENTS, 1957 - 1996 10 TABLE 3: RELATIVE PRODUCTION VOLUME OF FOOD CROPS, 1962 – 1988 14 TABLE 4: DEVELOPMENT OF GHANA'S MANUFACTURING STRUCTURE, 1987 – 1993 28 TABLE 5: MAIN TRADE INDICATORS, 1989-1997 30 TABLE 6: CONSTRAINTS ON ECONOMIC FREEDOM IN GHANA, 1997 39 TABLE 7: OVERVIEW OF ELEMENTS OF COMPETITIVE ADVANTAGE REVIEWED 69 TABLE 8: CLUSTER CHART FOR COMPETITIVE UPSTREAM INDUSTRIES 72 TABLE 9: CLUSTER CHART FOR COMPETITIVE FINAL CONSUMPTION GOODS 73 TABLE 10: CLUSTER CHART FOR UNCOMPETITIVE UPSTREAM INDUSTRIES 75 TABLE 11: CLUSTER CHART FOR UNCOMPETITIVE FINAL CONSUMPTION GOODS 76 TABLE 12: DETERMINANTS OF ALUMINUM'S COMPETITIVE ADVANTAGE 85 TABLE 13: MARKET LEADERSHIP IN WORLD COCOA INDUSTRY 96 TABLE 14: OVERVIEW OF COCOA PRODUCER COUNTRY CHARACTERISTICS 98 TABLE 15: PERCENTAGE SHARE IN COCOA EXPORT REVENUES, 1995 99 TABLE 16: DETERMINANTS OF COCOA'S COMPETITIVE ADVANTAGE 103 TABLE 17: WHOLESALE PRICES FOR PINEAPPLES, 1997 114 TABLE 18: DETERMINANTS OF FOOD'S COMPETITIVE ADVANTAGE 118 TABLE 19: DETERMINANTS OF GOLD MINING’S COMPETITIVE ADVANTAGE 130 TABLE 20: EXPORTS OF GHANESE TIMBER PRODUCTS BY DESTINATION, USD '000, 1996 140 TABLE 21: DETERMINANTS OF TIMBER’S COMPETITIVE ADVANTAGE 144 TABLE 22: COST AND PRODUCTIVITY COMPARISONS FOR SHIRT PRODUCTION, 1994 154 TABLE 23: DETERMINANTS OF TEXTILE AND GARMENT'S COMPETITIVE ADVANTAGE 156 TABLE 24: SUMMARY OF FACTOR CONDITIONS 164 TABLE 25: ACCESS TO EDUCATION IN GHANA AND SUB-SAHARAN AFRICA 166 TABLE 26: TERTIARY STUDENTS IN TECHNICAL FIELDS (PERCENT OF POPULATION) 166 TABLE 27: RATES OF RETURN (PERCENT) TO HUMAN CAPITAL IN GHANA 168 TABLE 28: FINANCIAL MARKET RATES, 1991-1997 170 TABLE 29: GHANA'S PHYSICAL INFRASTRUCTURE COMPARED TO SELECTED COUNTRIES 171 TABLE 30: SUMMARY OF DEMAND CONDITIONS 177 TABLE 31: SUMMARY OF RELATED AND SUPPORTING INDUSTRIES 181 TABLE 32: SUMMARY OF FIRM STRUCTURE, STRATEGY, AND RIVALRY 184 TABLE 33: SUMMARY OF GOVERNMENT DETERMINANTS 193 TABLE 34: WORLD BANK EVALUATION OF GHANA’S ECONOMIC REFORMS - OVERVIEW 194 TABLE 35: GOVERNMENT SPENDING ON EDUCATION AND ECONOMIC SERVICES 198 TABLE 36: PUPIL/TEACHER RATIOS AND PERCENTAGE OF TRAINED TEACHERS 199 TABLE 37: PUBLIC EXPENDITURE ON EDUCATION, SELECTED COUNTRIES 200 TABLE 38: SAVING AND INVESTMENT (PERCENT OF GDP) 201 TABLE 39: OVERVIEW OF BUSINESS REGULATION CHANGES 205

XV
Abbreviations CAGR Compound annual growth rate
CMB / Cocobod Cocoa Marketing Board
ECOWAS Economic Community of West African States
e.g. For example
ERP Economic Reform Program
EU European Union
FAO Food and Agricultural Organization
FDI Foreign direct investment
FOB Free-on-board
GATT General Agreement on Tariffs and Trade
GDP Gross domestic product
GNP Gross national product
ha Hectares
HS Harmonized System (trade classification system)
i.e. that is to say
IMD IMD School, Lausanne
IMF International Monetary Fund
kg Kilogram
km Kilometer
MWh / gWh Mega Watt hours / Giga Watt hours
N/A Not available
OECD Organization for economic cooperation and development
p.a. Per annum
R&D Research and Development
SITC Standard International Trade Classification
SOE State-owned enterprise
UKP British pound
UN United Nations
US United States
USD US Dollar


1
I INTRODUCTION
Chapter 1 of the introduction describes the importance of analyzing the competitiveness of Ghana’s industries. The second chapter outlines the research approach with the main questions, the framework for analysis and the research design.
1 Motivation
Over the last 15 years, Ghana has become a showcase of successful macroeconomic reforms and stabilization programs.1 Starting with its economic reform program in 1983, Ghana’s government has managed to achieve a broad budget balance, to implement a system of flexible exchange rates, and to liberalize the country’s trade regime. Also, it started to install an investor-friendly regulatory environment, initiated the privatization of 230 state owned enterprises, and began to significantly reduce the export tax on cocoa, the country’s second most important export product after gold. However, the currently low GDP growth rates indicate that this has not been sufficient. Even though the structural adjustment program provided the basis for sustainable economic development, Ghana’s economic performance has been relatively disappointing. Between 1985 and 1995, Ghana’s total GNP grew by 4.2 % p.a., and real GDP per capita had an average annual growth of 1.3 percent. Exports, though they had been growing at a rate of 7.5 percent annually between 1990 and 1997, made up only 13 percent of GDP between 1990 and 1995.
Ultimately, a nation’s productivity, the prerequisite for prosperity, is the sum of the productivity of its companies. Their productivity is driven by three variables: (1) stable political and legal institutions coupled with macroeconomic stability; (2) an enabling microeconomic business environment, such as infrastructure and education standards; (3) the strategies and operational structures of the private sector, which determine the sophistication with which companies produce and compete.2 The objective of Ghana’s current government is to make Ghana a middle-income country within one generation. To achieve this, it plans to double Ghana’s annual economic growth rate from the
1 Reflected in articles and comments like NZZ December 19, 1994, p. 11 “Ghana weiterhin Westafrikas Hoffnungsträger”; and World Bank (1994) p. 69: “Ghana as most advanced trade policy reformer in Sub-Saharan Africa after Mauritius”
2 See Porter (1998a) p. 41

2
current 4 percent to about 8 percent for the next 30 years, with agriculture’s share dropping to 20 percent of GDP, and industry’s share rising to 37 percent by the year 2020.3 To realize this ambitious growth target for industrial development, Ghana needs much more vigorous private sector participation and investments from home and abroad. However, “while much progress has been made in understanding the macroeconomic side of development, there has been an increasing recognition that macroeconomic reform is necessary but not sufficient. As, or more, important are the microeconomic foundations of development, rooted in the nature of firm strategies and in the institutions, resources, and policies that constitute the environment in which firms compete.”4 Ghana has worked intensively on implementing structural reforms and providing a stable macroeconomic environment, but the effect has not met its expectations. This could be either because the macroeconomic reforms did not go far enough, or because other conditions needed for the successful development of industries5 have been lacking. To guide the actions of Ghana’s government, an analysis is needed on the conditions of the variables that are responsible for the success or failure of industries, and how these conditions should be improved.
3 Presidential Report to Parliament (1995) p. vii; for the industrial sector this translates into 12% annual growth, ibid. p. 36
4 Porter (1997) p. x 5 In the context of this work, ‘industry’ is used to describe a sector of the nation’s economy, equal
to the German connotation ‘Industriezweig’ or ‘Branche’. Unlike many research papers on Africa’s and Ghana’s industrial development (see for instance Teal (1998a&b); Elbadawi (1999); Biggs et al. (1996); Lall, Navaretti, Teitel, Wignaraja (1994)) the focus here is not exclusively on the performance of the manufacturing sector, but includes all sectors of the economy.

3
2 Research approach
2.1 Main question and contribution
The objective of this thesis is to understand the specific conditions that enabled individual industries in Ghana to become internationally competitive. The main questions of my thesis are:
¶ Which industries in Ghana are globally competitive?6
¶ What are the success conditions that have led to a competitive advantage of certain industries in Ghana?
The contribution of this research has two elements. The first is the application of Porter’s framework developed in “Competitive Advantage of Nations” to Ghana, to analyze and explain the competitiveness of Ghana’s industry. The second element is the conclusions from the analysis of Ghana’s industry. These conclusions could be the basis for policy actions to improve the current conditions for competitiveness.
2.2 Framework for analysis
To analyze the industry of Ghana and to determine the conditions that make certain industries successful, a framework is required that allows structuring all the factors influencing an industry’s competitiveness in a consistent and convincing way.
The framework used in this thesis is based on Michael Porter’s ‘Diamond of National Advantage’; a framework developed to answer the question why a nation is home base for a globally competitive industry.7 There are two major reasons for using this framework to analyze the competitiveness of the Ghanaian industry. First, it is internally consistent, with an empirically tested methodology, based on extensive empirical research on several industries in ten countries.8 Second, it goes down to the level of the individual industries, and produces very specific recommendations on what to change to make a particular industry more successful.
6 For the definitions of “industry” and “competitiveness” see Chapter 7 7 Developed in Porter (1990a &b)

4
The ‘Diamond of National Advantage’ as a framework encompasses the influencing factors on a company’s productivity: the macroeconomic conditions, the microeconomic business environment, and a company’s strategy and organization.
The framework will be adapted to the specific conditions of Ghana and changed to incorporate aspects that are different from Porter’s original question.9 In this adapted form, the framework allows to structure the answer to the two main questions of this thesis: Which industries located in Ghana are internationally competitive, and what are the conditions that enabled them to be internationally successful. The answer is then the basis for a discussion on how Ghana’s ‘Diamond of National Advantage’ could be upgraded and improved.
2.3 Working hypothesis
In Ghana, there are companies and industries that are able to successfully compete on the World market. They are internationally competitive because of certain conditions in Ghana, and because the economic reform program has improved some conditions for doing business in Ghana. Other industries, however, in which both the government and the private sector have invested significantly, have not managed to compete successfully on the World market, or against imports.
Two main hypotheses will be analyzed:
1. The continuing dependence on natural resources did not create advanced factors such as specially skilled labor or innovative processes
2. Ghana’s structural adjustment program has not gone far enough, and regulatory uncertainty, unpredictable macroeconomic policy and bureaucratic inefficiency did not create a microeconomic environment conducive to business
The analysis of competitive industries in Ghana should allow us to verify whether these hypotheses are correct, or whether other reasons are responsible for the competitiveness of Ghana’s industries.
8 Porter (1990b) p. 76 9 One of the most important adaptations is the focus on all companies within Ghana. Porter only
analyzed the companies that had their home base in the nation researched. This thesis will also look at foreign direct investment in Ghana to understand the overall attractiveness of a country’s economic environment.

5
2.4 Data availability
The main challenge to overcome in this thesis was to work with partially incomplete and inconsistent information. As in many other developing countries, Ghana’s statistical data is often incomplete, or inconsistent if compared across different sources. This concerns in particular data on Ghana’s trade activities, information on foreign investment activities, and information on the structure of industries or individual companies. To alleviate the problem of unreliable information, all important information was reviewed with personal interviews and crosschecked with information from other sources as far as possible.
2.5 Structure and research design
The thesis has five major parts. After the introduction, the second part provides a brief overview on the structure of Ghana’s economy. The third part is a critical review of the Porter theory and methodology, with adaptations to the methodology to apply it to Ghana. The fourth part is the application of the methodology to analyze the competitiveness of Ghana’s industry. The fifth part summarizes the findings from the analysis of Ghana’s competitive industries to describe Ghana’s determinants of competitive advantage (Table 1).
Table 1: Structure and research design I. Introduction
II. Overview of Ghana’s Economy III. Theoretical and methodological concepts
Theoretical approach Methodology IV. Analysis of competitiveness of Ghana’s industries
V. Conclusions on determinants of competitive advantage Factor
conditions Demand
conditions Related & Supporting industries
Strategy, Structure, & Rivalry
Influence of Government
Policy

6
7
II OVERVIEW OF GHANA’S ECONOMY
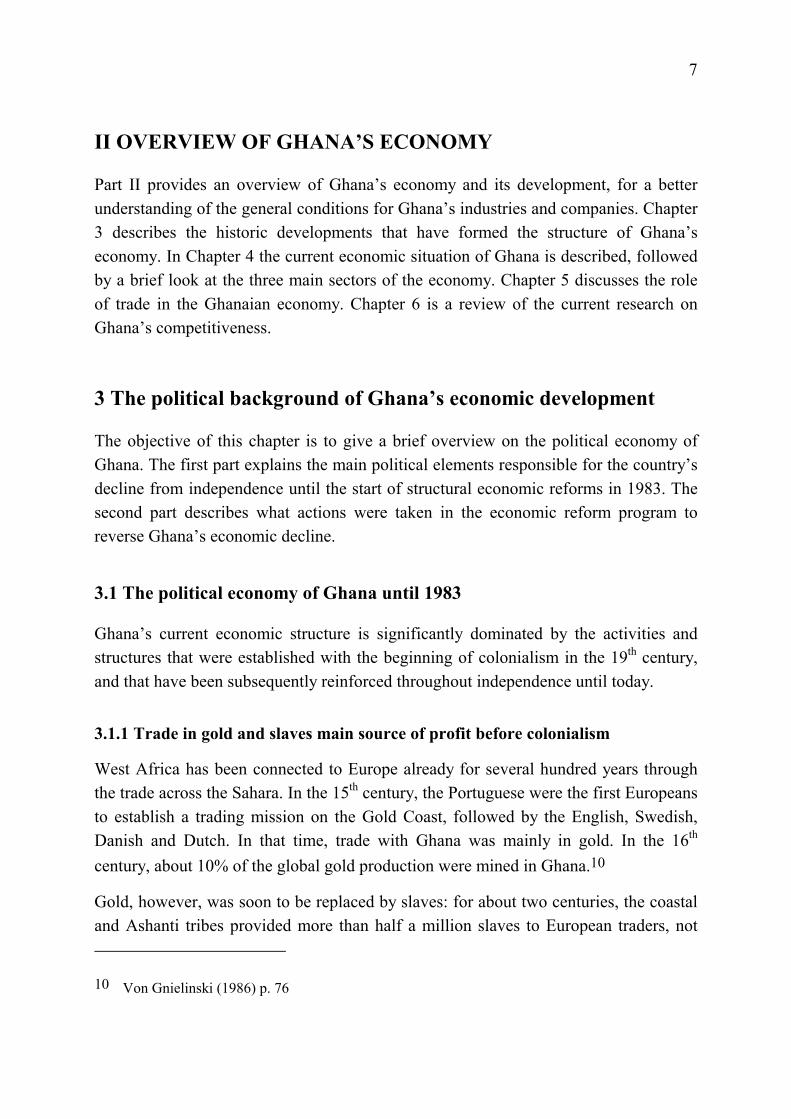
Part II provides an overview of Ghana’s economy and its development, for a better understanding of the general conditions for Ghana’s industries and companies. Chapter 3 describes the historic developments that have formed the structure of Ghana’s economy. In Chapter 4 the current economic situation of Ghana is described, followed by a brief look at the three main sectors of the economy. Chapter 5 discusses the role of trade in the Ghanaian economy. Chapter 6 is a review of the current research on Ghana’s competitiveness.
3 The political background of Ghana’s economic development
The objective of this chapter is to give a brief overview on the political economy of Ghana. The first part explains the main political elements responsible for the country’s decline from independence until the start of structural economic reforms in 1983. The second part describes what actions were taken in the economic reform program to reverse Ghana’s economic decline.
3.1 The political economy of Ghana until 1983
Ghana’s current economic structure is significantly dominated by the activities and structures that were established with the beginning of colonialism in the 19th century, and that have been subsequently reinforced throughout independence until today.
3.1.1 Trade in gold and slaves main source of profit before colonialism
West Africa has been connected to Europe already for several hundred years through the trade across the Sahara. In the 15th century, the Portuguese were the first Europeans to establish a trading mission on the Gold Coast, followed by the English, Swedish, Danish and Dutch. In that time, trade with Ghana was mainly in gold. In the 16th century, about 10% of the global gold production were mined in Ghana.10
Gold, however, was soon to be replaced by slaves: for about two centuries, the coastal and Ashanti tribes provided more than half a million slaves to European traders, not
10 Von Gnielinski (1986) p. 76
8
counting those that had died while being captured, or during the transportation to the coast.11 The effects of the slave trade were clearly detrimental to the development of the Gold Coast. The continuous raids on villages disrupted all economic activities in the country, and mostly the young and vigorous were captured as slaves. Mining was abandoned because mining workers from Benin were pulled away by the slave trade,12 and early cottage manufacturing activities were eroded by cheaper imports from Europe as payments for slaves.
3.1.2 Specialization on cocoa during colonial rule
The end of the slave trade in the 19th century marked the beginning of the British Gold Coast colony. Several wars were started between the Ashanti and the coastal tribes, whose living had depended upon slave trade. As these wars started to touch the interests of British merchants, the British government decided to intervene, won the war against all parties involved, and proclaimed the Gold Coast formally as a colony.
West Africa was not chosen to be a settler’s colony, and the British governed their West African colonies indirectly, by establishing close relationships with the local rulers. The West African colonies were an excellent location to produce cash crops like cocoa, coffee, cotton, and rubber, in exchange for manufactured items from Europe.13 The Gold Coast became the most important producer for cocoa and gold, and by 1911 the country was the world’s largest cocoa exporter, producing about 40% of the total World supply between 1920 and 1940.14 The cocoa production itself remained almost entirely in African hands, and is still today dominated by smallholder farming. However, cocoa trade was firmly controlled by European trading houses and the colonial government. As a result of improved transportation and communication, companies like Cadbury’s were able to establish their own agencies, displacing most African trading firms.15 These trading oligopolies also had sole import and distribution rights for certain British goods, and pushed small newcomers out of the market through destructive price-cutting.
11 La Verle (1995) p. 133 12 Agbodeka (1992) p. 34; see also Petchenkine (1993) pp. 147 13 Agbodeka (1992) p. 71 14 Rimmer (1992) p. 20 15 In the mid 1930s, less than 1% of the cocoa shipped abroad came from indigenous traders, while
the top four Gold Coast trading firms controlled 70% of the exports. Kennedy (1988) p. 36 and 39

9
The British rule provided a relatively stable legal and political structure, and led to a remarkable increase in agricultural output, and investments in infrastructure and education.16 However, while the British initiated the building of infrastructure to transport the cash crops to the coast, they prevented the development of indigenous industries in order to keep the colonies as a protected market for their own manufactured exports.17 In several industries, trading licenses had to be acquired from the government, making most kinds of business more or less illegal for Africans. By forbidding or licensing the import of machinery, and with export bans on items such as locally woven cloth, the government consciously clamped down all major industrialization efforts.18 Ghanaians had limited access to financing because of the difficulty of getting a collateral to secure bank loans, as most of the land was still owned communally.19 As a result, African entrepreneurs and traders were confined to traditional activities in which the European firms had no commercial interests. This was mostly internal trade in foodstuffs between the forest and Savannah areas of West Africa, or small-scale commercial ventures at the bottom of the European trading hierarchy. When the British left the Gold Coast, the colony was focused on the extraction of minerals and the production of cash crops. While the Africans had solid trading experience, there was no industrial base, and limited entrepreneurial experience to manage large industrial corporations.
3.1.3 The history of decline: 1957 to 1983
Ghana started independence with over UKP 500 Million in foreign exchange reserves, and a GDP per capita of about USD 300, making it a middle-income country with a per capita income equal to South Korea at that time.20 Even though a solid industrial base was lacking, the country had inherited from the British a sound economy that had experienced sustained growth over the past decades.21 In fact, the economy appeared
16 Kennedy (1988) p. 12 17 See also Frimpong-Ansah (1991) p. 47 on the theory of that a colonial predatory state survives
primarily because of superior military technology, and has no real interest in the development of a colony if this conflicts with the economic goal of the ruling country.
18 Agbodeka (1992) p. 135 19 Kennedy (1988) p. 40 20 Leith, Lofchie (1993) p. 226 21 Alpine, Pickett (1993) p. 91

10
stable and prosperous, with the country being the worlds leading cocoa producer, boasting a well-developed infrastructure and relatively advanced education system.22
By 1983, after 36 years of independence (Table 2), Ghana had a GDP per capita of USD 300, not higher than at the beginning of independence. Production of cocoa, the main export product over all these years, had dropped from a peak of 572,000 tons in 1964 to 180,000 tons in 1983. Between 1960 and 1982, the productivity of labor had declined by 3.6 percent p.a., and the productivity of capital declined 2.0 percent p.a., with total factor productivity for all sectors of the economy decreasing by 2.3 percent p.a.
Table 2: Chronology of major events, 1957 - 1996 Year Events
1957 Independence, Nkrumah as prime minister
1964 Single party (CPP) government
1965 1st serious drop in World market price of cocoa (from USD 467/t to USD 91/t)
1966 Military coup against Nkrumah and establishment of National Liberation Council (NLC)
1967 Devaluation of cedi from 0.71 cedi/USD to 1.02 cedi/USD
1969 Election of K. Busia
1971 2nd serious drop in World market price of cocoa (from USD 517/t to USD 289/t), devaluation of cedi from 1.02/USD to 1.82/USD, followed by urban unrest
1972 Military coup overthrows Busia, and establishment of National Redemption Council under Acheampong, revaluation of cedi to 1.15/USD, import and exchange controls tightened
1975 Acheampong replaces NRC by Supreme Military Council.
Investment Policy Decree to establish minimum 55 percent Ghanaian ownership of all manufacturing enterprises
1978 Acheampong replaced by General Akuffo, cedi devalued to 2.75/USD, triggering urban strikes and unrest
1979 Military coup by J.J. Rawlings, SMC replaced by lower ranks with Armed Forces Revolutionary Council, elections won by Limann
1981 New coup by Rawlings to establish Provisional National Defense Council
1982/83 Series of disastrous events: drought and fires, murder of judges, expulsion of 1 million Ghanaians from Nigeria, failed coup attempt, 3rd serious drop in World market price of cocoa (from USD 2935/t to USD 980/t)
1983 Economic Recovery Program launched, cedi devalued to 30/USD
1986 Auction system for foreign exchange introduced, import licensing abandoned, new mining code established
22 La Verle (1995) p. 134

11
1988 Foreign exchange bureaus established
1989 Initialization of privatization of State-owned enterprises (SOEs)
1992 New constitution introduced, with multiparty elections. Retired flight-lieutenant J.J. Rawlings elected as president
1994 Implementation of fully liberalized investment code
1996 J.J. Rawlings reelected to president for second term, leading National Democratic Congress has 132 (of 200) seats in parliament
Source: Leith, Lofchie (1993) Table 6.1, p. 231; EIU (1997a) pp. 7; Dordunoo, Nyanteng (1997) pp. 18
As will be shown further on, the origin of Ghana’s economic decline was the transfer of resources from the highly profitable cocoa sector to finance state-owned industries, coupled with a regime of import substitution that protected indigenous companies from efficient foreign competition. Rampant corruption and private rent seeking aggravated the detrimental effects of this policy, which was nourished by a system of import licenses and foreign exchange quotas. The consequence of this policy was a steady decline of cocoa exports, leading to serious balance of payment deficits, high inflation, and finally to the collapse of the economy in 1983.
3.1.4 The basis for decline: Nkrumah’s industrialization program
When Nkrumah took over as the first president of Ghana, he believed that growth and development in Ghana would only come from massive investment into the mechanization of agriculture and industrial development. His economic goal was to diversify Ghana’s economic base through industrialization, thereby reducing the country’s exposure to World commodity price fluctuations.
Industrialization was to be achieved with two instruments: a protectionist trade regime, and state-owned enterprises. Ghana’s entrepreneurial class was judged too small to take over a leading role in such a massive industrialization effort, and a strong local entrepreneurial class also represented a political threat.23 In line with Nkrumah’s socialist background, it was the government that had to assume responsibility for both the selection of appropriate sectors, and the management of the state-owned enterprises. The main source of revenues for this massive industrialization program was the export earnings from agricultural commodities, primarily cocoa (Figure 1).
23 Aryeetey, Baah-Nuakoh, Duggleby, Hettige, Steel (1994), p. 4

12
Figure 1: Government revenues from cocoa, 1956 - 1985 (percent of total)
0%
5%
10%
15%
20%
25%
30%
35%
40%
1956-60 1961-65 1966-70 1971-75 1976-80 1981-85
Source: Jakobeit (1991) Table 12.2
Since 1939, colonial statutory marketing boards controlled the export of cocoa and other cash crops. Originally, the purpose of these produce-buying boards was to cut the link between fluctuating World prices and local prices. The Cocoa Marketing Board (CMB) would buy the goods at from the producer at a fixed price, and sell them at the World price. Depending on the direction of change, it might either make a loss or a surplus. The surplus would be kept as a stabilization reserve to finance deficits of other seasons. In reality, however, the statutory monopoly boards had already in colonial times produced a high rate of enforced and collectivized savings,24 and functioned almost never to design. The marketing boards acted as monopsonies, paying fixed prices to African farmers well below World market export prices. The accumulated funds were either invested in British government securities – leading to large outflows of capital to finance the British wars – or were used for investments in infrastructure building.25 After independence, the CMB became the funding agency for government development plans, as well as a source of public employment and political patronage. 26 Between 1949 and 1985, payments to farmers exceeded the CMB’s FOB sales only once, and in only 14 years did the farmers receive more than 50% of the gross value of their crops (Figure 2).
24 Rimmer (1992) p. 42 25 Kennedy (1988) p. 15, Schmidt-Kallert (1994) p. 41. Compare Rimmer (1992) pp. 41 for a
detailed account on the differences between original objectives and reality. 26 By the end of 1982, the Cocoa Marketing Board had more than 100’000 people on its payroll.
Rimmer (1992) pp. 201

13
Figure 2: Cocoa production and producer prices, 1950 - 1989
0
100
200
300
400
500
600
700
1955
/56
1957
/58
1959
/60
1961
/62
1963
/64
1965
/66
1967
/68
1969
/70
1971
/72
1973
/74
1975
/76
1977
/78
1979
/80
1981
/82
1983
/84
1985
/86
1987
/88
Crop year
CMBpurchases('000 tons)
Real producerprice per ton,indexed (1963= 500)
Source: Jakobeit (1991) Table 12.2; Leith, Lofchie (1993) Table 6.2, p. 232
The CMB was a central instrument to shift resources from the rural population to the urban dwellers. To promote industrial development, the government was willing to sacrifice the interests of the farmers, since its political survival depended primarily on the happiness of urban workers,27 and because only little opposition was expected from the rural population.28
To limit the impact of reduced prices for export crops, a large number of farmers switched to alternative products that were not under the control of the government, but could be sold freely in the market. As a result, food production fell continuously, with
27 The push towards independence had been initialized by urban riots in 1948. Unemployment among ex-servicemen and primary school leavers, a shortage of housing and sharp rises in the cost of imported consumer goods were the main reasons for the urban discontent. The urban social groupings were the main constituents of Nkrumah's Convention People’s Party, the main political force in the Gold Coast and Ghana until 1966. The political power of urban workers was revealed again in 1972, when the Busia government was overthrown in a military coup after it had tried to devalue the cedi. This devaluation prompted again urban unrest since prices of imported consumer goods had gone up. Bates (1981) p. 33; Leith, Lofchie (1993) p. 228
28 The cost of organized opposition is significantly higher for the rural population than for the urban population. Their attachment to their land limits their possibilities to participate in national politics, and being disunited, there was no effective way to protect their interests. As a result, farmers used the market as a less costly alternative, and shifted production to other products. See Bates (1981) p. 82

14
the food self-sufficiency ratio dropping from 83 percent in 1961-66 to 71 percent in 1978-80 (Table 3).29
Table 3: Relative production volume of food crops, 1962 – 1988
1962 1982 1988
Cocoa 100 56 48
Rice 100 116 270
Maize 100 157 341
Millet 100 117 295
Sorghum 100 81 170 Source: Alpine, Pickett (1993) Table 25
Ghana’s method of implementing its import substituting industrialization policy led to dismal results from the beginning. The number and range of industries chosen for protection were vast, and no economic criterion for their selection could be identified.30 A chaotic mix of subsidized credits, tariffs, import quotas, exchange controls and outright import bans granted protection from cheaper imports.31 The state-owned enterprises (SOEs) had virtually unlimited borrowing rights from the banking system, and made substantial losses early on.32
To add to the inefficiency of Ghana’s SOEs33 and the poor performance of the agricultural sector, personal rent seeking consumed even more of the country’s economic resources. The public service organization was not very well developed and driven beyond its capabilities.34 The weakness of the administration combined with the political elements of import licensing and state-owned industries provided ample
29 La Verle (1995) p. 159 30 Well illustrated by the fact that at the end of the 1970s, Ghana had 36 car assembly plants and 40
pharmaceutical manufacturers. Asamoa (1996) p. 80 31 See also Pickett, Shaeldin (1990) pp. 25 32 Leith, Lofchie (1993) p. 237. For background on the ideological foundations of Ghana’s
industrialization policy see ibid. pp. 240 33 See Rimmer (1992) p. 91. In 1967, out of a sample of 40 firms, broadly representative for large-
scale manufacturing, only six were efficient in the sense that they were transforming domestic resources into foreign exchange at a rate equal or less than the official value. A further four companies were efficient if the shadow exchange rate was considered. In the large mechanized farms, the production of rice fell from 1.11 tons/ha in 1962 to 0.59 tons/ha in 1982. Alpine, Pickett (1993) Table 14
34 Frimpong-Ansah (1991) p. 44

15
opportunity for personal enrichment in public office.35 Incidents involving massive corruption became known early on, but were popularly tolerated.36 Personal rent seeking, coupled with strong interest groups, also explains why the policies that had shown to be ineffective already in the mid 1960s, were pursued for almost twenty more years.37
3.1.5 “Killing the golden geese”, the consequences of failed policies
Ghana’s desolate economy in the early 1980s was marked by chronic inflation, fueled by fiscal deficits (Figure 3).38
Figure 3: Government surplus and inflation, 1965 - 1983
-60
-40
-20
0
20
40
60
1965 1970 1975 1976 1977 1978 1979 1980 1981 1982 1983
0
20
40
60
80
100
120
140Governmentsurplus (cedis100 million),left axis
Rate ofinflation(percent), rightaxis
Source: Leith, Lofchie (1993) Table 6.2, p. 232
Between 1965 and 1980, agricultural output increased at an average annual rate of 1.6 percent, while manufacturing grew by 2.5 percent per year.39 The implicit taxation of
35 Import licenses and tariffs were based on 6-digit code, allowing a very precise definition of the relevant products. This indicates that they were geared towards the protection of individual firms. Furthermore, import licenses were issued for a commission, payable to the responsible minister in person. Bates (1981) p. 67 & p. 101
36 In Ashanti, using political authority to accumulate, display and enjoy wealth is part of an indigenous historical tradition, and patronage is even socially obligatory. Rimmer (1992) p. 46
37 Leith, Lofchie (1993) p. 245 38 Alpine, Pickett (1993) p. 91 39 Pickett, Shaeldin (1990) p. 22
16
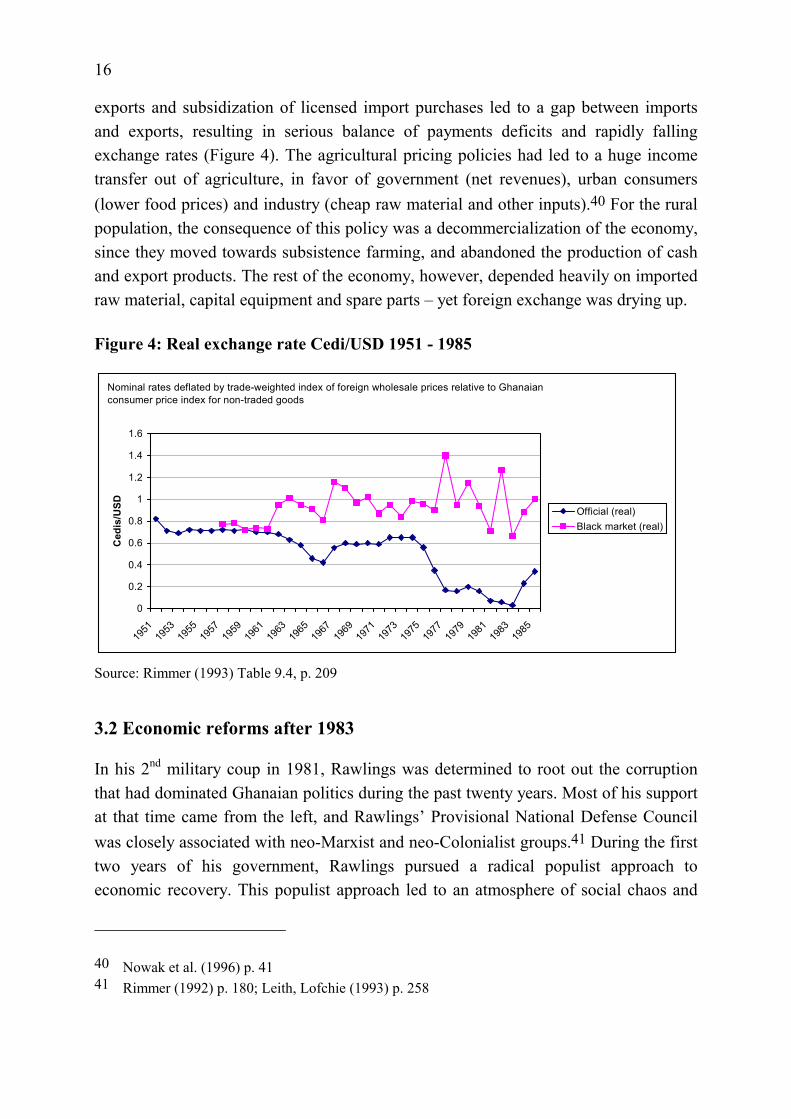
exports and subsidization of licensed import purchases led to a gap between imports and exports, resulting in serious balance of payments deficits and rapidly falling exchange rates (Figure 4). The agricultural pricing policies had led to a huge income transfer out of agriculture, in favor of government (net revenues), urban consumers (lower food prices) and industry (cheap raw material and other inputs).40 For the rural population, the consequence of this policy was a decommercialization of the economy, since they moved towards subsistence farming, and abandoned the production of cash and export products. The rest of the economy, however, depended heavily on imported raw material, capital equipment and spare parts – yet foreign exchange was drying up.
Figure 4: Real exchange rate Cedi/USD 1951 - 1985
Nominal rates deflated by trade-weighted index of foreign wholesale prices relative to Ghanaian consumer price index for non-traded goods
0
0.2
0.4
0.6
0.8
1
1.2
1.4
1.6
1951
1953
1955
1957
1959
1961
1963
1965
1967
1969
1971
1973
1975
1977
1979
1981
1983
1985
Ced
is/U
SD Official (real)Black market (real)
Source: Rimmer (1993) Table 9.4, p. 209
3.2 Economic reforms after 1983
In his 2nd military coup in 1981, Rawlings was determined to root out the corruption that had dominated Ghanaian politics during the past twenty years. Most of his support at that time came from the left, and Rawlings’ Provisional National Defense Council was closely associated with neo-Marxist and neo-Colonialist groups.41 During the first two years of his government, Rawlings pursued a radical populist approach to economic recovery. This populist approach led to an atmosphere of social chaos and
40 Nowak et al. (1996) p. 41 41 Rimmer (1992) p. 180; Leith, Lofchie (1993) p. 258

17
further decline, and Ghana was unsuccessful in getting assistance from the “true friends of Africa”, the Soviet Union, Eastern Europe, Cuba or Libya.42 By 1983, the lack of external support and a series of other events such as the drop in cocoa prices and the expulsion of a large number of Ghanaians from Nigeria had brought Ghana close to economic collapse. When Rawlings turned to the IMF and the World Bank as lenders of last resort, neither would provide financial aid without major economic reforms.43
The virtual breakdown of the country’s economy enabled Rawlings to break with the politics of the past. Even though the detrimental effects of the policies of the 1970s had been transparent before, they were kept alive because they generated rents for the supporters of these regimes. In the beginning of the 1980s, however, the real exchange rate had dropped to 10 percent of the rate at independence. Export earnings had been eroded, credits from donors and commercial sources dried up, and there was no more foreign exchange available for distribution of rent-generating import licenses. The glue that held the former regimes together had vanished. The reforms were widely supported, as there was no additional hardship from the structural adjustment measures. The educational system and health care had ceased to deliver services to the majority of the population.44 And finally, the real purchasing power had already fallen as the official prices, salaries and exchange rates had no economic function anymore.
3.2.1 Main elements of Ghana’s Economic Reform Program
Ghana’s Economic Recovery Program (ERP) had five key objectives:45 (1) The realignment of relative prices to encourage production and exports; (2) a progressive shift from direct intervention towards the reliance on market forces; (3) the restoration of fiscal and monetary discipline; (4) the rehabilitation of social and economic infrastructure; and (5) structural and institutional reforms to enhance the efficiency of the economy and to encourage the expansion of savings and investments.
42 Rimmer (1992) p. 180 See also Ahiakpor (1985) for an account about Rawlings’ transformation. This brief period of radicalism has not yet been forgotten by many Ghanaian business people, who still do not sincerely trust in Rawlings’ economic policy, and are skeptical about his attitude towards private business.
John Kufuor defeated presidential candidate of the opposition NPP in 1996, has been cited with the words in the Financial Times, June 22, 1998 (Database download): “Fidel Castro remains his idol. His closest advisers have been card-carrying communists.”
43 Leith, Lofchie (1993) p. 266 44 Compare Leith, Lofchie (1993) p. 263, and p. 259 45 See Kapur et al. (1991) for a detailed description

18
The devaluation of the cedi and the liberalization of the exchange rate were the first reform steps undertaken. As a start in 1983, the Rawlings government introduced export bonuses and import surcharges, two measures that had the same effect as devaluation but needed not to be communicated as such.46 After half a year, the taboo of devaluation had been broken, and the government devalued the cedi continuously until 1986, when it introduced an auction system to depoliticize the exchange rate policy and to remove the burden of acting from the government. As a final step, the government absorbed the remaining parallel market in 1988 by establishing foreign exchange bureaus.47 In the view of many Ghanaians, the creation of these exchange bureaus had made market-determined foreign exchange a permanent fixture, the basis for the belief in the sustainability of the economic reforms.48 In parallel to the liberalization of the exchange rate reform, the country’s trade and investment policies were reformed. The government eliminated the highly complex import licensing system that had been the basis for political favourism and corruption. For almost all imports a uniform tariff was established.
While trade reforms were implemented very rapidly, the complex legal and regulatory framework for investments and corporate taxes was dismantled only slowly. In 1991, the government called in an advisory group to identify constraints on the private sector and to pave the way to revisions in the regulatory framework.49 However, a fully liberalized investment code was only established in 1994, incorporating a broad range of investment incentives. The privatization of Ghana’s SOEs was initiated in 1987, but started only in 1992. During the first phase of the ERP, Ghana’s reform strategy was not to reduce the SOE sector, but to expose it to competition as a forcing device. Only after 1992 did the divestiture program really start. By the end of 1998, 212 of the more than 300 SOEs had been either sold or liquidated. However, sectors such as transportation (airlines, ports) and utility (electricity, oil) are still government monopolies dominated by SOEs.50
46 Rawlings exchange rate policy was not in line with the ‘cold turkey’ policy recommended by the IMF, as he considered this equal to political suicide. Urban unrest and political turmoil had always followed devaluation of the cedi in previous regimes, with the consequence that all Ghanaian governments used every trick to disguise devaluation. See Herbst (1993) p. 53
47 Kapur (1991) pp. 17 - 21 48 Leith, Lofchie (1993) p. 271 49 Nowak et al. (1996) p. 38 50 Divestiture Implementation Committee, Web page (April 1998)

19
Together with the institutional reforms, Ghana also made strong efforts to adjust its fiscal and monetary policy. To establish a solid fiscal basis, Ghana simplified and rationalized its tax system to improve both its efficiency and equity.51 On the income side, tax exemptions and tax brackets were reformed to reduce the progressivity of personal income tax, corporate taxes were reduced and sectoral differences were removed. Expenditures were cut and restructured to favor development and rehabilitation activities. The main measures were a reduction of subsidies for agricultural inputs coupled with the removal of price controls, the introduction of cost recovery programs in health care and education,52 and a significant reduction of the civil service.53 In order to keep a stable monetary environment and to enable credits to the private sector, restrictive monetary and credit policies were implemented to reduce government borrowing from the banking system. Monetary control was to rely on market-based instruments, and credit controls and administrative interest rates were dismantled. To rebuild the country’s decrepit infrastructure and to start industrial production, a USD 4.2 billion program was prepared by the IMF and the World Bank for infrastructure repair, energy imports, and the import of key inputs for the export industries.54
3.2.2 Political structure since 1992
Since 1992, Ghana is a constitutional democracy based on the US system, with executive power in the president, who is elected by universal suffrage every four years, with tenure limited to two four-year terms. The cabinet is appointed by the president and approved by a single-chamber parliament.
Ghana’s last elections in 1996 resulted in a second term of Rawlings and his party, the National Democratic Congress. Support for the NDC comes mainly from rural areas, where people have benefited most from the economic reforms. Ghana has two major opposition parties: one is the People’s Convention Party, which consists largely of left leaning groups and Nkrumahists. The other opposition force is the New Patriotic Party,
51 Roe, Schneider (1992) p. 75 52 The impact of these measures was not so adverse because formal charging combined with
improved availability of items such as textbooks and drugs partly replaced the informal costs of delays and bribes associated with a system characterized by chronic shortages and very low quality of service. Roe, Schneider (1992) p. 75
53 Relative to the size of the population, Ghana in 1992 still had one of the largest civil services in Africa. Leechor (1994) p. 167
54 La Verle (1995) p. 145

20
which is dominated by lawyers, academics and business people, and is largely identified with the Ashanti region.55
55 EIU (1998b) p. 8

21
4 The structure of Ghana’s economy
The objective of this chapter is to first describe the impact of the ERP on Ghana’s economy, and then to briefly introduce the characteristics of Ghana’s agricultural, industrial, and service sector.
4.1 Ghana’s macroeconomic development after the ERP
Ghana’s reform program was implemented in three phases: In the first phase between 1983 and 1986, the focus was on getting prices right, and on reducing the government’s budget deficit by increasing revenues. Between 1987 and 1990, efforts were concentrated on the initiation of structural changes, such as the liberalization of the exchange rate and the trade system, the start of the SOE divestiture program, and civil service reforms. In the third phase, after 1990, the government started to look at the more demanding structural and institutional reforms.56
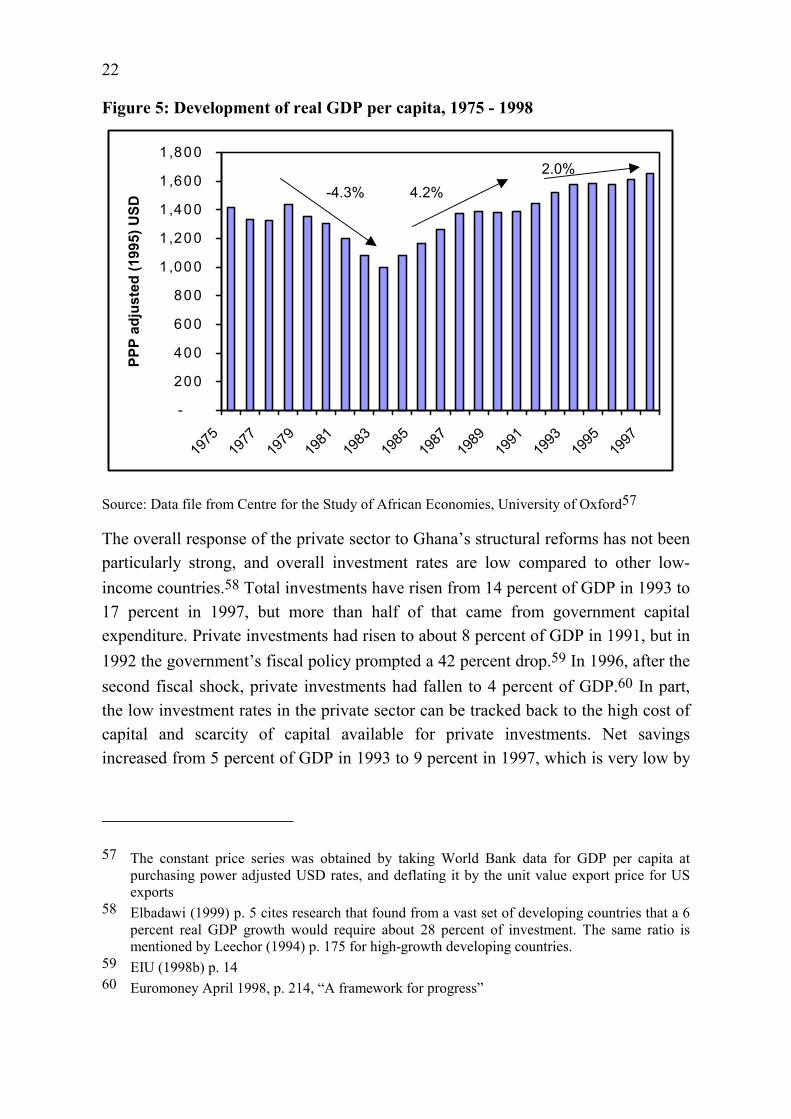
The implementation of these policies resulted in a major turnaround between 1983 and 1991. Inflation declined, the overall balance of payment position stabilized, and GDP growth recovered from negative numbers to about 5.5 percent p.a., and the real GDP per capita grew by 4.2 percent p.a. After 1991, Ghana’s macroeconomic performance suffered a marked downturn. In 1992, as part of its election campaign, the government granted large increases in wages and benefits for public sector employees. This fiscal shock helped to fuel inflation, and led to an increase in government debt. In the election year 1996, the government repeated the same mistakes as in 1992, when spending levels were massively increased and the government deficit rose from 6 percent to 10 percent of the GDP. Between 1992 and 1998, GDP growth averaged 4.2 percent, and real GDP per capita 2.0 percent p.a. (Figure 5).
56 Kapur et al. (1991) p. 57
22
Figure 5: Development of real GDP per capita, 1975 - 1998
-
200
400
600
800
1,000
1,200
1,400
1,600
1,800
1975
1977
1979
1981
1983
1985
1987
1989
1991
PPP
adju
sted
(199
5) U
SD
Source: Data file from Centre for the Study of African Economies, Unive
The overall response of the private sector to Ghana’s structuraparticularly strong, and overall investment rates are low coincome countries.58 Total investments have risen from 14 perc17 percent in 1997, but more than half of that came fromexpenditure. Private investments had risen to about 8 percent o1992 the government’s fiscal policy prompted a 42 percent drosecond fiscal shock, private investments had fallen to 4 percethe low investment rates in the private sector can be tracked bcapital and scarcity of capital available for private inveincreased from 5 percent of GDP in 1993 to 9 percent in 1997
57 The constant price series was obtained by taking World Bank dapurchasing power adjusted USD rates, and deflating it by the unit exports
58 Elbadawi (1999) p. 5 cites research that found from a vast set of depercent real GDP growth would require about 28 percent of invementioned by Leechor (1994) p. 175 for high-growth developing cou
59 EIU (1998b) p. 14 60 Euromoney April 1998, p. 214, “A framework for progress”
% %
2.0
4.2% -4.31993
1995
1997
rsity of Oxford57
l reforms has not been mpared to other low-ent of GDP in 1993 to government capital
f GDP in 1991, but in p.59 In 1996, after the nt of GDP.60 In part,
ack to the high cost of stments. Net savings , which is very low by
ta for GDP per capita at value export price for US
veloping countries that a 6 stment. The same ratio is ntries.

23
international and also by Sub-Saharan African standards.61 In addition, uncertainty about the government’s long-term attitude towards private enterprises probably increased the cost of capital and further reduced the incentives for capital investments.
Foreign aid, debt, and direct investments have financed most of Ghana’s increase in investments. In 1997, per capita aid averaged about USD 50, more than double the Sub-Saharan average, and contributed about 55 percent to the total investment level.62 Foreign direct investments (see Figure 6) were substantial between 1993 and 1996 when the gold mining industry was privatized, but have declined since then.
Figure 6: Foreign direct investment inflow 1987 - 1998
050
100150200250
1987-1992(avg)
1993 1994 1995 1996 1997 1998
USD
mill
ion
Source: UNCTAD (1999), Annex table B.1, p. 478
4.2 Sectoral structure of Ghana’s economy
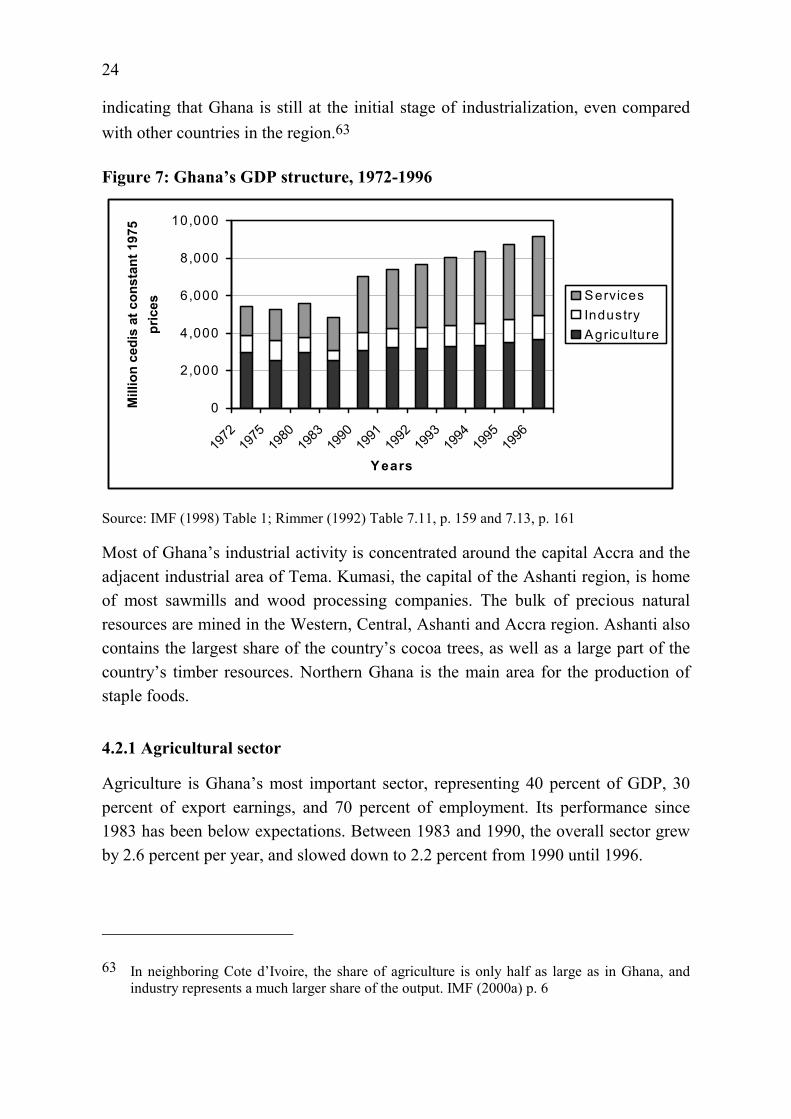
Ghana’s economy continues to be dominated by the agricultural sector. Although its importance has diminished since 1972, it is still responsible for 40 percent of the GDP. The second largest sector after agriculture is the service sector, in particular trading. Industry only commands about 15 percent of the GDP (see Figure 7),
61 Saving rates from CEPA (1998) p. 17. The Sub-Saharan average is about 13 percent; the Asian average is about 28 percent of GDP. Leechor (1994) p. 174
62 IMF (2000a) p. 16. According to CEPA (1998) p. 25, foreign aid made up 70 percent of total government development capital expenditure.
24
indicating that Ghana is still at the initial stage of industrialization, even compared with other countries in the region.63
Figure 7: Ghana’s GDP structure, 1972-1996
0
2,000
4,000
6,000
8,000
10,000
1972
1975
1980
1983
1990
1991
1992
1993
1994
1995
1996
Y ears
Mill
ion
cedi
s at
con
stan
t 197
5 pr
ices
ServicesIndustryAgriculture
Source: IMF (1998) Table 1; Rimmer (1992) Table 7.11, p. 159 and 7.13, p. 161
Most of Ghana’s industrial activity is concentrated around the capital Accra and the adjacent industrial area of Tema. Kumasi, the capital of the Ashanti region, is home of most sawmills and wood processing companies. The bulk of precious natural resources are mined in the Western, Central, Ashanti and Accra region. Ashanti also contains the largest share of the country’s cocoa trees, as well as a large part of the country’s timber resources. Northern Ghana is the main area for the production of staple foods.
4.2.1 Agricultural sector
Agriculture is Ghana’s most important sector, representing 40 percent of GDP, 30 percent of export earnings, and 70 percent of employment. Its performance since 1983 has been below expectations. Between 1983 and 1990, the overall sector grew by 2.6 percent per year, and slowed down to 2.2 percent from 1990 until 1996.
63 In neighboring Cote d’Ivoire, the share of agriculture is only half as large as in Ghana, and industry represents a much larger share of the output. IMF (2000a) p. 6
25
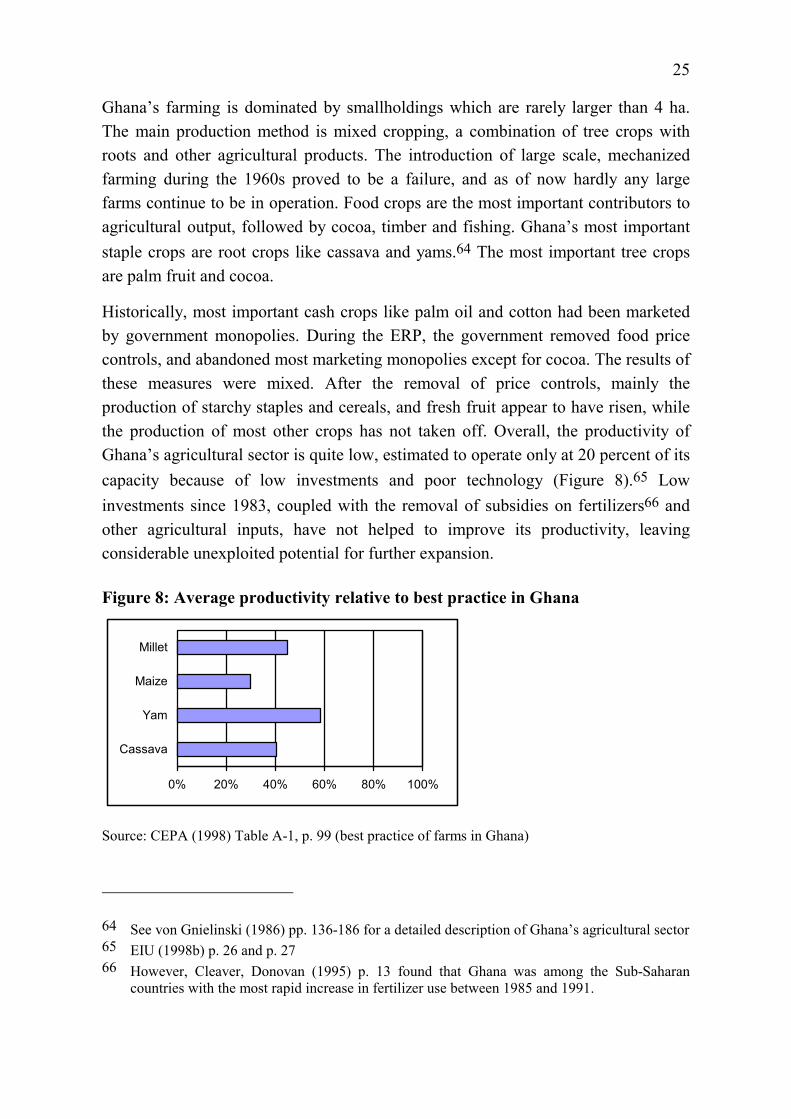
Ghana’s farming is dominated by smallholdings which are rarely larger than 4 ha. The main production method is mixed cropping, a combination of tree crops with roots and other agricultural products. The introduction of large scale, mechanized farming during the 1960s proved to be a failure, and as of now hardly any large farms continue to be in operation. Food crops are the most important contributors to agricultural output, followed by cocoa, timber and fishing. Ghana’s most important staple crops are root crops like cassava and yams.64 The most important tree crops are palm fruit and cocoa.
Historically, most important cash crops like palm oil and cotton had been marketed by government monopolies. During the ERP, the government removed food price controls, and abandoned most marketing monopolies except for cocoa. The results of these measures were mixed. After the removal of price controls, mainly the production of starchy staples and cereals, and fresh fruit appear to have risen, while the production of most other crops has not taken off. Overall, the productivity of Ghana’s agricultural sector is quite low, estimated to operate only at 20 percent of its capacity because of low investments and poor technology (Figure 8).65 Low investments since 1983, coupled with the removal of subsidies on fertilizers66 and other agricultural inputs, have not helped to improve its productivity, leaving considerable unexploited potential for further expansion.
Figure 8: Average productivity relative to best practice in Ghana
0% 20% 40% 60% 80% 100%
Cassava
Yam
Maize
Millet
Source: CEPA (1998) Table A-1, p. 99 (best practice of farms in Ghana)
64 See von Gnielinski (1986) pp. 136-186 for a detailed description of Ghana’s agricultural sector 65 EIU (1998b) p. 26 and p. 27 66 However, Cleaver, Donovan (1995) p. 13 found that Ghana was among the Sub-Saharan
countries with the most rapid increase in fertilizer use between 1985 and 1991.

26
Given the current level of technology, farming labor is already scarce.67 No “Green Revolution” as in Asia is likely to take place as long as slow technological innovation and poor infrastructure blunt farmer’s incentives to switch from extensive subsistence farming to market-focused, intensive production. No agricultural machinery is used, irrigation is absent, and a large part of the land is still under shifting cultivation.68 Outputs remain very vulnerable to weather conditions,69 which has a large effect on the country’s export earnings as well as domestic inflation. A large amount of the output is wasted along the value chain – mainly because of the absence of adequate storage facilities, very poor rural roads and the dominance of human portage.70
The growth experience from Asia points towards agriculture as initial impetus for rapid development. Profits from agriculture would create export surpluses, which can then be used to finance growth in manufacturing and manufactured exports. Ghana, however, has not been able to achieve a similar agriculture-led growth path. The key shortcomings of its reforms were, as critiques point out, a too slow upgrading of the agricultural infrastructure, such as extension services, feeder roads, and urban markets. At the same time, the slow removal of marketing and distribution monopolies gave farmers not enough incentives to push up their production.71
4.2.2 Mining and manufacturing sector
Between 1990 and 1996, the total sector has grown at 4.2 percent, with most of the growth coming from the mining and construction-related sector. Ghana’s mining sector is dominated by gold mining. With the introduction of a new mineral law in 1986 and the privatization of the country’s largest gold mines, the mining industry has been thriving, and gold output has increased more then five-fold between 1987 and 1996 (see Figure 21: Gold production 1901 - 1995, p. 129). Ghana is one of the
67 World Bank (1993) p. 33 68 Cleaver, Donovan (1995) p. 24 69 Only about 1.1 percent of West Africa’s arable land is irrigated. See Aspesi, Lloyd, Crenshaw,
D’Oyen, Yeboah-Amankwah, Abiola (1998) 70 Aspesi, Lloyd, Crenshaw, D’Oyen, Yeboah-Amankwah, Abiola (1998) estimate that every
year in Ghana about USD 110 million of maize are being lost between the field and end consumer, mainly because of the inability to draw on a sufficiently large labor pool during the harvest, old storage facilities, and bad transportation.
71 See Nowak et al. (1994) p. 42

27
world’s largest exporters of manganese, and mines some bauxite and diamonds. The diamond, manganese and bauxite sectors have also recovered after considerable contraction during the decline in the 1970s, increasing its output by almost 50 percent between 1990 and 1996.72
The impact of the ERP on the manufacturing sector has been mixed. Ghana has a broad industrial base across almost all sectors. Most of today’s larger manufacturing companies were established as state-owned enterprises in the 1960s. Between 1983 and 1990, the manufacturing sector grew by 8.1 percent per year, benefiting from the availability of imported inputs, which enabled them to use their existing excess capacity. From 1990 onwards, growth slowed to 2.2 percent, mainly because of the exposure to import competition; and the abandonment of subsidies forced companies to rationalize and improve their performance. Employment in manufacturing fell from 78’000 in 1987 to 28’000 in 1993,73 and the number of companies between 1987 and 1993 declined by 21 percent, from 634 companies to 500 companies (Table 4).
The largest sector in manufacturing – based on gross output – are the non-ferrous metal industry, the wood industry, food manufacturing, chemical products and tobacco manufacturing, which accounted for 54 percent of the gross output in 1993.74 Most seriously hit by import competition were the food, textile, furniture and chemical industry, where a significant number of companies were forced to close down. While both the food and chemical industry managed to recover in terms of output, the textile industry continues to do badly.
72 IMF (2000a) p. 10 73 African Development Bank, cited in Lall (1995) p. 2025, not fully consistent with Ghana’s
Manufacturing Survey cited below. 74 Based on Ghana Manufacturing Survey 1993. Another survey had been planned for 1998, but
was not executed because of lack of financing.

28
Table 4: Development of Ghana's manufacturing structure, 1987 – 199375 USD million (at average rate)Industry 1987 1993 1987 1993 1987 1993 1987 1993Food manufacturing 88 43 11'628 7'418 135 146 42 51Beverage industry 27 27 5'057 3'418 84 97 68 56Tobacco manufacturers 4 3 1'856 1'060 66 124 59 110Textile, wearing apparel and leather 117 43 14'018 10'654 72 98 35 31Wood and cork products excl. furniture 97 81 18'328 21'987 83 163 43 93Furniture and fixture excl. metal 67 29 3'886 2'855 10 10 5 5Manufacture of paper products 5 13 761 1'461 6 25 3 11Printing, publishing and allied industries 40 48 4'518 4'391 13 24 8 8Manufacture of industrial chemicals 13 7 747 512 10 24 4 5Manufacture of other chemical products 37 42 3'729 4'455 59 142 21 54Petroleum refineries 2 2 678 399 165 95 37 50Manufacture of rubber products 5 6 1'140 2'741 5 6 3 3Manufacture of other plastic products 5 31 319 2'963 3 43 2 16Manufacture of non metallic minerals 30 30 3'133 3'305 34 88 16 27Iron and steel basic industries 3 3 571 1'362 5 16 2 4Non-ferrous metal basic industries 6 5 2'276 2'483 207 171 83 50Metal products 31 41 2'978 3'553 26 51 12 21Manufacture of machinery 12 11 946 646 2 5 1 2Electrical machinery, appliances 13 18 935 1'166 8 23 4 9Other 32 17 1'767 1'827 8 17 3 4Total Manufacturing Sector 634 500 79'271 78'656 1'001 1'372 452 610
Companies Persons engaged Gross output Value added
Source: Ministry of Trade and Industry (Ghana Manufacturing Survey, 1987); Addo, Julemun, Sonntagbauer (1995)
In general, firms operating in export-oriented sectors, and established multinationals have fared better than small and medium-scale industries, because these companies had better access to credit and better marketing opportunities for their products,76 and they were better able to circumvent the problems resulting from poor infrastructure. Most hard hit were large, inefficient SOEs, which suffered not only from huge inefficiencies and management faults, but also from high wages and non-wage liabilities.
4.2.3 Service sector
Ghana’s service sector has been the fastest growing sector of the economy, with a growth rate of 5.9 percent between 1990 and 1996. The bulk of service activities are in trading and public services. Trading in particular is one of the activities that benefited from the contraction of the manufacturing services and absorbed part of
75 Includes companies with more than 20 employees 76 Teal (1995) p. 4; Financial Times, July 9, 1996: “Ghana 1996: Hard times for manufactures”

29
their unemployed workers.77 Transportation services have grown only slowly because of substantial structural problems, such as a poor road and railway system.
One of Ghana’s promising service sectors is tourism, which has become the country’s third largest foreign exchange earner.78 The country’s main attractions are the beaches and the former slave castles along the Atlantic coast, and the cities Accra and Kumasi.
After the initiation of the ERP, Ghana’s financial sector incurred serious difficulties. The devaluation of the cedi had raised the external liabilities of the banks, and at the same time weakened many of their customers who depended on imported material. The financial sector reform program was initiated in 1988. Its main elements were the introduction of a new regulatory base with new capital adequacy rules, a clean-up of the banks’ balance sheets through a swap of all nonperforming loans against government loans, and individual restructuring for some distressed banks.79 The largest commercial banks have been privatized, and in 1990 a stock exchange was established. Today, there are six commercial banks with about 280 branches across the country, the three largest banks, Ghana Commercial Bank, Standard Chartered, and Barclays, share 70 percent of the deposit volume. Three development banks focus on the manufacturing, agricultural, and construction sector. Five merchant banks are specialized on corporate finance activities. About 120 rural banks, owned and managed by local residents, provide financing for small-scale agricultural activities and cottage industries. In addition, there are about 16 insurance companies active in Ghana, as well as several security brokerages, export financing and leasing companies, and venture capital funds. The Ghana stock exchange, currently the fifth largest in Africa, has 21 companies listed. At 4 percent turnover and with very high bid/ask spreads, the country’s stock market remains one of the world’s least liquid exchanges.80 Ashanti Goldfields accounts for 64 percent of the USD 1.4 billion market capitalization.81 Besides Ashanti, the manufacturing and brewing sector dominate the exchange, followed by the banking sector. Many of the listed companies are local subsidiaries of foreign multinationals.
77 See also Canagarajah, Mazumdar (1997) p. 50 78 US Department of Commerce (2000) Chapter 1 79 Kapur (1991) p. 60 80 EIU (1999) p. 21 81 Year end 1998

30
5 The role of foreign trade in Ghana’s economy
Ghana’s total volume of foreign trade, both imports and exports after exclusion of aid-funded imports, is about 35 percent of GDP – considerably lower than the trade level for other high-growth countries, which are often above 100 percent of GDP.82
Ghana’s exports continue to be dominated by primary commodities, namely gold and cocoa. The country’s terms of trade have been declining rapidly between 1989 and 1993 as a result of falling gold and cocoa prices.83 Capital goods, intermediate goods, and fuel and energy dominate Ghana’s import bill.84 Increasing energy shortages requiring additional fuel imports, and a decline in gold prices have led to a worsening of Ghana’s trade balance particularly in 1997 (Table 5).
Table 5: Main trade indicators, 1989-1997
USD million 1989 1990 1992 1993 1994 1995 1996 1997 1998
Total exports 808 897 988 1,064 1,227 1,431 1,810 1,810 2,091
Total imports 1,006 1,205 1,457 1,728 1,580 1,687 2,296 3,041 2,897
Trade balance -198 -308 -468 -664 -353 -256 -485 -1,231 -806
Terms of Trade (1985=100) 76.7 71 65 58 60 64 62 62 78 Source: IMF (1999a) Table 51&52, pp. 133-134; IMF (2000) Table 33 & 34, pp. 43-44
5.1 Overview of Ghana’s export structure
Between 1990 and 1997, Ghana’s total exports have grown 7.5 percent per year, from USD 897 million to USD 1.5 billion. While in 1990, exports made up 16 percent of GDP, by 1997 its share had grown to 25 percent of GDP (Figure 9).
82 Leechor (1994) p. 175 83 The terms of trade express the purchasing power of a country’s exports in terms of the imports
they will buy. A price decrease of export products or a price increase in import products can both lead to declining terms of trade.
84 Detailed data on import figures were only available for 1990.

31
Figure 9: Export share in GDP by expenditure category, 1993 - 1997
-
1,000
2,000
3,000
4,000
5,000
1993 1994 1995 1996 1997Mill
ion
cedi
s at
con
stan
t 199
3 pr
ices
Non-traditional ExportsTraditional ExportsOther Expenditure
Source: IMF (1999a) Table 19, p. 98; Ghana Export Promotion Council85
Ghana’s most important traditional export products, gold, cocoa, and timber, accounted for 82 percent of Ghana’s export in 1997. Most of the growth in Ghana’s export comes from an increase in gold production from 526’000 ounces in 1990 to 1.75 million ounces in 1997, leading to an average annual export growth of 20 percent in value per year. The recovery of cocoa, Ghana’s second most important export product, has been sluggish, with exports growing from 267’000 tons in 1990 to 314’000 tons in 1997, equal to a two percent increase in value. Over the same period, timber exports have grown from 370’00 cubic meters to 442’000 cubic meters, with a value increase of 12 percent per year.
Figure 10: Export values of major products, 1983 – 1997
0200400600800
1,0001,2001,4001,6001,800
1983
1985
1987
1989
1990
1991
1992
1993
1994
1995
1996
1997
USD
mill
ion Gold
Other mineral exportsTimberOther agricultural exportsCocoa and productsOther exports
Source: IMF (1999a) Table 53, p. 135; Rimmer (1992) Table 8.2 p. 186 for 1983 - 1989
85 The 1995 non-traditional export numbers are a linear interpolation of the 1994 and 1996 data
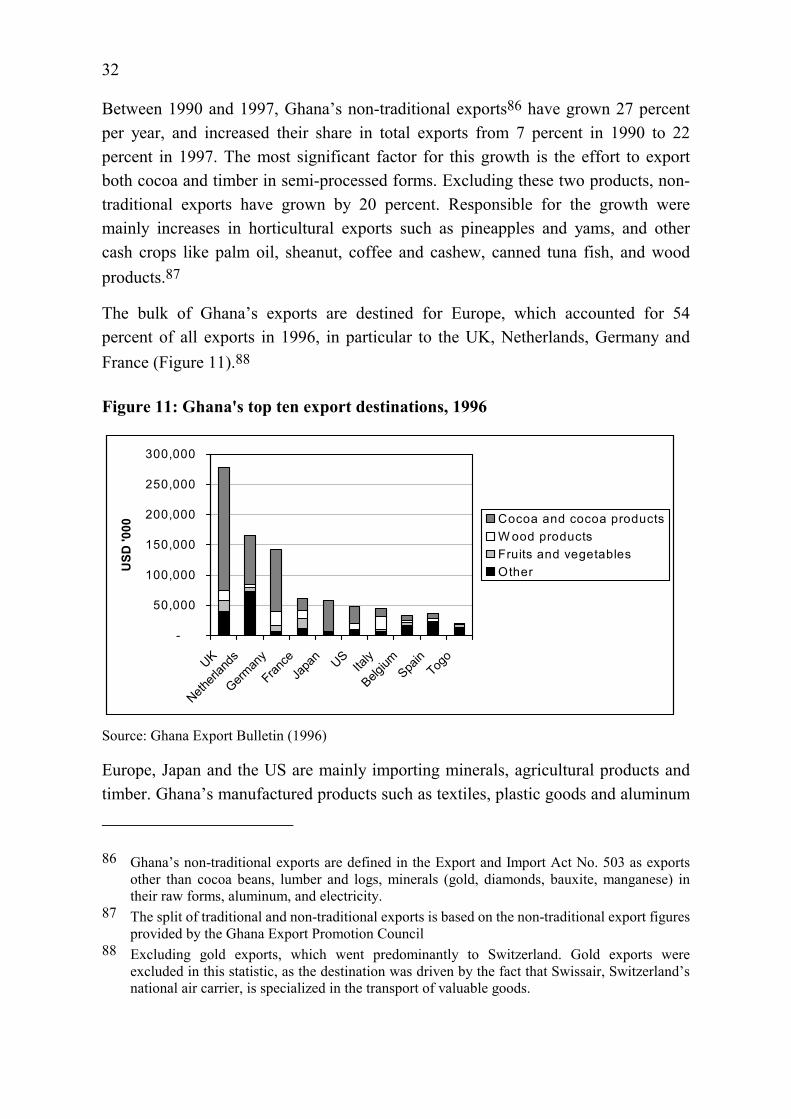
32
Between 1990 and 1997, Ghana’s non-traditional exports86 have grown 27 percent per year, and increased their share in total exports from 7 percent in 1990 to 22 percent in 1997. The most significant factor for this growth is the effort to export both cocoa and timber in semi-processed forms. Excluding these two products, non-traditional exports have grown by 20 percent. Responsible for the growth were mainly increases in horticultural exports such as pineapples and yams, and other cash crops like palm oil, sheanut, coffee and cashew, canned tuna fish, and wood products.87
The bulk of Ghana’s exports are destined for Europe, which accounted for 54 percent of all exports in 1996, in particular to the UK, Netherlands, Germany and France (Figure 11).88
Figure 11: Ghana's top ten export destinations, 1996
-
50,000
100,000
150,000
200,000
250,000
300,000
UK
Netherl
ands
German
y
France
Japa
n USIta
ly
Belgium
Spain
Togo
USD
'000
Cocoa and cocoa productsW ood productsFruits and vegetablesOther
Source: Ghana Export Bulletin (1996)
Europe, Japan and the US are mainly importing minerals, agricultural products and timber. Ghana’s manufactured products such as textiles, plastic goods and aluminum
86 Ghana’s non-traditional exports are defined in the Export and Import Act No. 503 as exports other than cocoa beans, lumber and logs, minerals (gold, diamonds, bauxite, manganese) in their raw forms, aluminum, and electricity.
87 The split of traditional and non-traditional exports is based on the non-traditional export figures provided by the Ghana Export Promotion Council
88 Excluding gold exports, which went predominantly to Switzerland. Gold exports were excluded in this statistic, as the destination was driven by the fact that Swissair, Switzerland’s national air carrier, is specialized in the transport of valuable goods.
33
household ware are mostly destined for neighboring ECOWAS (Economic Community of West African States) countries. Compared to the overall volume of trade, Ghana participates very little in interregional trade. In 1996, only 2.5 percent of the total export value went to neighboring countries and ECOWAS members.89
5.2 Overview of Ghana’s import structure
Since 1990, Ghana’s imports have risen by 8.5 percent, more rapidly then exports. In 1990, capital goods and intermediate goods dominated the country’s import bill. The energy shortages in 1997 and 1998 however have led to an increased share of fuel and energy inputs. The major sources for Ghana’s imports are the UK, Nigeria, the US, and Germany.
Several critiques point out that the rapid opening for imports made it difficult for some previously protected industries to adjust. This concerns mainly the processed food and beverage industry, and the textile, garment, and leather industry.90 However, looking at the import mix in 1990, the liberalized trade regime enabled manufacturers to import raw material and machinery, and a 25 percent tariff on consumer goods still provides a significant degree of protection.
89 Ghana Export Bulletin (1996) 90 Nowak et al. (1996) p. 43

34
6 Other research on Ghana’s competitiveness
This chapter provides an overview of other research approaches to measure Ghana’s competitiveness. The IMF91 analyzed Ghana’s competitiveness based on the relative prices of import and export goods, reflected in the movements of the real exchange rate. The World Competitiveness Reports92 and Index of Economic Freedom93 capture the general economic and institutional environment of Ghana in comparison to other countries.
6.1 Ghana’s competitiveness based on real exchange rate movements
The work of the IMF analyses Ghana’s competitiveness based on real exchange rate appreciation and depreciation. Underlying this study is the belief that a country is competitive if it can export more than it imports, which is equal to having a positive balance of trade. The indicator for competitiveness is the real exchange rate. A depreciation of the real exchange rate means that export goods are becoming comparatively cheaper and more competitive because domestic prices increase slower than foreign prices.94
In this analysis, the IMF’s main question was if the country’s exchange rate was consistent with its desired balance of trade (equal to an increase of exports relative to imports). Depending on the availability and accuracy of data, there are several ways to calculate a country’s real exchange rate. Using a set of price and labor cost indicators to deflate Ghana’s nominal exchange rate, the study concluded that Ghana’s competitiveness had increased steadily between 1983 and 1994, since in all measured cases the real exchange rate depreciated over that time. The evidence for the three years 1995 to 1997 is mixed. Accounting for the strengths and weaknesses of all indicators used,95 Ghana had a decrease in competitiveness between 1995 and
91 IMF (1999a) pp. 47-62 92 World Economic Forum (1998) 93 Gwartney, Lawson (197); Heritage Foundation (1997) 94 The theoretical framework for the study was provided by Marsh, Tokarick (1994) p. 2 95 And considering that in general, none of the three indicators works well across all countries,
probably because movements in real exchange rates may be dominated by the volatility in the nominal rate. Marsh, Tokarick (1994) p. 40

35
1997, primarily because of a surge in inflation in 1995 and a drop in the prices of the main export goods gold and cocoa.
6.2 Other research on Ghana’s competitiveness
6.2.1 Competitiveness reports
Probably the best-known reports on the competitiveness of nations are published yearly by both the IMD and the World Economic Forum.96 The reports are an attempt to capture in a single index the nation’s business environment, which reflects its’ capability to promote economic growth. In these reports, a nation’s competitiveness is defined as the ability to sustain the creation of value added, which is the basis for the competitiveness of its companies.97 Both reports are compiled annually, and allow to make comparisons between countries, and to track the development of a specific country over time.
In the IMD model, four forces are driving this capability: a country’s integration in the global economy (proximity versus globality), its attractiveness for foreign investments and its aggressiveness in international markets (attractiveness and aggressiveness), its factor endowments such as natural resources, infrastructure and education (assets and processes), and its social structure and risk taking culture (individual risk taking and social cohesiveness).98 In the model currently used by the World Economic Forum, the competitiveness of a country is evaluated based on eight factors of competitiveness, which are very similar to the ones used in the IMD model. The main difference between the two models is the use of the “Forces of Competitiveness” in the IMD model, which stem from a slightly different aggregation of the competitiveness indicators. Each nation represented in the reports is analyzed based on both hard statistical indicators and soft survey data from questionnaires sent out to executives. The indicators are then grouped into eight
96 Until 1996, the World Competitiveness Report was published jointly by the two institutions. Since 1997, the IMD and the World Economic Forum publish a separate report. While the country’s individual rankings are now slightly different, the reports use a similar model and apply in principle the same methodology to measure a country’s competitiveness.
97 IMD (1997) p. 14 98 IMD (1997) p. 15-16

36
factors and summed up to one indicator that reflects the relative competitiveness of a nation compared to all other nations in the sample.99
Using a similar methodology, a report on the competitiveness of Africa was compiled by the World Economic Forum under the leadership of Jeffrey Sachs in 1998 and 2000.100 The competitiveness of 24 African countries is calculated based on an average of six indices: openness, government, finance, labor, infrastructure, and institutions. On a scale ranging from +1 to –1, Ghana’s competitiveness is indexed at 0.1, and ranked as number nine (Figure 12), unchanged from its position in 1998.
Figure 12: Africa's competitiveness index, 2000 TunisiaMauritiusBotswanaNamibiaMoroccoEgyptSouth AfricaSenegalGhanaSwazilandEthiopiaZambiaLesothoTanzaniaCote D'IvoireCameroonUgandaMozambiqueMalawiNigeriaBurkina FasoKenyaZimbabweMadagascar
1.00.8
0.70.40.40.4
0.30.2
0.1-0.1-0.1-0.1
-0.2-0.2-0.2
-0.3-0.3-0.3-0.3
-0.4-0.4-0.4-0.4
-0.6
Source: World Economic Forum, Web page information (July 2000)
Unique to the Africa Competitiveness Report are an ‘improvement’ and an ‘optimism’ index, which measure the impressions of the local business communities
99 IMD (1997) pp. 40 In the World Economic Forum version, the eight factors are the aggregate of 56 indices and the qualitative results from 3’000 surveys. World Economic Forum (1998) p. 79 & 318
100 Sachs, Sievers (1998), World Economic Forum Website (September 1998)

37
regarding past improvements in the business climate, and the expected direction of future changes. Ghana is ranked as 13th country on the improvement index (with a weight of 0), down from number 5 in 1998, indicating no improvements since. On the optimism index, Ghana is ranked fifth, reflecting the overall positive attitude coupled with some skepticism regarding expected changes in the two coming years.
In Africa, the best performing countries are those that were able to avoid extreme economic and political turmoil in the 1970s and 1980s, and have managed to become dynamic, stable economies with a solid export performance. The middle performers are in general countries that have implemented reforms but are still recovering from a long period of poor performance, such as Ghana. On the lower part of the rankings are countries that continue to struggle with political uncertainty and are hit by civil wars. On an overall level, the survey results suggest which specific reforms are most important for African countries: political and policy stability, openness to trade, transparency between business and government, the absence of corruption, and improved infrastructure.
6.2.2 Degree of economic freedom reports
The Economic Freedom Index and the Heritage Foundation index have measured Ghana’s degree of economic freedom. Both indices are an attempt to describe and compare the institutional environments for business in most countries of the World.
The Economic Freedom Index tries to measure to which extent “individuals in a nation are free to choose for themselves and engage in voluntary transactions with others, and have their rightly acquired property protected from invasions by others.”101 The index consists of 17 components, which are weighted and divided into the four areas of money and inflation, government operations and economic structure, taxes and subsidies, and international trade. On a scale from 10 (country among the freest of the World) to 0 (least free), Ghana’s weighted overall rate for 1995 is 4.4, which ranks it 78th among the 115 countries of the study, and 11th among the 31 African countries. The rate of 4.4 is a modest improvement over the rates of 1985 (2.7) and 1990 (3.3), with the higher rate resulting primarily from lower tax rates and tariff reductions since 1985. The main problem areas of Ghana according to the report are its high and variable inflation rate, its approval requirements for foreign investors, price controls on several products, and the great
101 Gwarner, Lawson (1997) p. 2

38
deal of discretionary authority of political officials, which allows them to intrude and limit business activities.102
A similar index of economic freedom for more than 100 countries is provided by the Heritage foundation.103 The index uses ten factors to assess the overall economic freedom of a nation: trade policy, taxation policy, government intervention, monetary policy, capital flows and foreign investments, banking policy, wage and price controls, property rights, regulation policy, and black markets. Each factor is the average aggregate of several indicators and qualitative criteria. On a scale ranging from 1 (very free) to 5 (repressed), Ghana’s average rank is 3.1, “mostly not free”, but with slight improvements from its 1995 and 1996 rankings of 3.2.104 The main factors determining this ranking for Ghana were relatively high average tariff rates, a high level of inflation and a high level of business regulation (Table 6).105
102 Gwarner, Lawson (1997) p. 101 103 For a comparison of the Heritage Foundation index and the Economic Freedom of the World
Index see Gwarner, Lawson (1997) pp. 9. Their main critique is that the Heritage foundation index does not properly define what economic freedom is, and that some components of the index are highly subjective.
104 The Heritage Foundation (1997) p. xxxi 105 The Heritage Foundation (1997) p. 200

39
Table 6: Constraints on economic freedom in Ghana, 1997 Factor Score Reason Trade policy 4 High average rate of tariffs of 12.5%; handling and customs
delays are frequent Taxation 3 Low income tax rates and moderate corporate taxes Government intervention 3 Government consumes 12% of GDP and SOEs still dominate
many sectors of the economy; large public sector; organized labor generally opposes governments privatization program
Monetary policy 4 High level of inflation Capital flows and FDI 3 Moderate barriers based on new investment code, with some
investment incentives. Minimum investments of USD 50’000, coupled with an inefficient and corrupt bureaucracy create considerable barriers
Banking 3 Central bank heavily influenced by government, and public-sector borrowing crowds out private sector
Wage and price controls 2 Minimum wage and some food subsidies Property rights 3 Investment code guarantees private property rights against
expropriation. Domestic owned property is less protected than foreign-owned property, and there have been cases of arbitrary seizure of domestic commercial property. No central land registry
Regulation 4 High level of regulation due to burdensome business licensing and requirements for foreign firms to hire local employees. Bureaucratic approval required for land acquisitions; bureaucratic inertia and politically inspired administrative judgments reduce competition among domestic firms.
Black market 2 Dismantling of price controls has reduced black market activities. High tax on used clothes has encouraged smuggling
Index: 1 – Very low 2 - Low 3 - Moderate 4 - High 5 – Very high Source: Heritage Foundation (1997) pp. 200-202
Overall, Ghana’s worldwide position in 1997 was number 78. In 1996, only Mauritius and Botswana ranked in the top 50 nations, with African nations occupying half of the lowest 20 positions.106
6.2.3 Evaluation of research on competitiveness
The objective of all these reports is to provide an indicator that explains a nation’s ability to sustain the creation of high value added products, and therefore the
106 Becker (1997) p. 7

40
competitiveness of its companies.107 For each nation, the reports aim to provide a comparable description of the general state of its economy, of its business environment and its institutional settings. The comparability across nations allows potential investors to scan target countries and identify which country provides the best environment for production. From a country perspective, these reports allow national governments to assess their standing vis à vis other countries overall and in particular areas, and to determine in which area further reforms seem to be most necessary.
All indices are a mix of macroeconomic and microeconomic conditions, in the case of the competitiveness indicators even supplemented with assessment of firm behavior. The economic freedom indices limit themselves to measure the institutional environment, and see the degree of freedom as possible indicator for a country’s ability to generate welfare. The main weakness of competitiveness indicators is the lack of a consistent theoretical model behind it. As a consequence, they have no clear separation between indicators for competitiveness (e.g., real GDP per capita growth), and the determinants of competitiveness (e.g., economic literacy, alcohol and drug abuse as used in the IMD report). If we build on the premise that competitive advantage is created at the level of industries, the reports suffer from the same deficiency as most macroeconomic approaches. These approaches can neither provide an explanation for success or failure of a particular industry even though on the surface all seemingly relevant conditions are there. Also, they give no directly applicable and actionable advice on what to change to improve the competitiveness for a nation’s industries. However, all analyses find that Ghana’s macro- and microeconomic environment is not providing optimal conditions for the growth of successful companies. The main barriers to economic development are related to the volatile macroeconomic environment, and political and regulatory uncertainty.
107 Sachs, Sievers (1998) p. 19; World Economic Forum (1998) p. 28; Heritage Foundation (1997) p. 7

41
III THEORETICAL AND METHODOLOGICAL CONCEPTS
Chapter 7 in this part defines the terms ‘competitiveness’ and ‘competitive advantage’ in the context of this thesis, and explains why the focus is on the competitiveness of a nation’s industries. Chapter 8 reviews the theoretical approach used to explain why certain industries in a nation achieve a competitive advantage. It describes first the Porter approach that will be used to analyze the competitive industries of Ghana, then briefly reviews Porter’s previous work leading him to the currently used approach, and finally discusses Porter in the context of other economic theories. Chapter 9 reviews the methodology to identify competitive industries as used by Porter, and describes how this methodology is adapted to be used with the quality of data available on Ghana. Chapter 8 describes the method to quantify the impact and importance of Porter’s ‘Determinants of competitive advantage’ for the competitiveness of Ghana’s industries.
7 Competitiveness – a definition
The term “competitiveness” is one of the magic expressions used by economists, politicians, and business people in different contexts. Competitiveness can be defined at the level of nations, industries or individual companies. However, different definitions about competitiveness particularly at the level of nations exist, and a clear concept of what will be measured and explained is needed.108
At the level of individual firms, competitiveness is the ability of a firm to survive and prosper, given the competition of other firms for the same profits. The competitiveness of a firm is the result of a competitive advantage relative to other firms. Porter defines competitive advantage as the ability of a company to make products that provide more value to the customer than rival products, leading to higher sales and higher profits for that company.109 However, the ability to create higher value and to extract more profit at one point in time is not sufficient for a
108 For discussions of the meanings and uses of competitiveness see Blattner, Maurer, Weber (1987) pp. 42-55. For a discussion on the dimensions of competitiveness, see for instance Neuner (1993) pp. 6-10
109 Porter (1985) p. 2 See also Porter (1996) p. 62

42
company to have a competitive advantage. Rivals will be quick to imitate either the products or the production processes of a firm, and compete for its profits. Competitive advantage is only achieved if a company manages to sustain its edge over its rivals over time.110
In this thesis, an industry is defined as a group of companies located in a nation – regardless of ownership111 - that produce products that are viewed as close substitutes by consumers. A nation’s industry consists of a group of companies competing not only amongst themselves, but also as an aggregate against the same industries in other countries. Firms position themselves within an industry through different strategies. In most cases, however, firms in a nation’s industry pursue similar strategies that make the industry’s strategy clearly different from the strategy of the same industry in another nation. Important at the industry level is also the effect of clustering, where vertical and horizontal relationships between suppliers and buyers can lead to a mutually reinforcing process of increasing competitiveness through external economies of scale (see Chapter 8.3.3 for more details). A nation’s industry is competitive relative to other nations’ industries if the industry as an aggregate has a competitive advantage that allows it to consistently create higher value and higher profits than rival industries in other nations.
On the level of an entire nation, the term competitiveness has a more vague connotation. A nation is not the same as a corporation or an industry; nations do not compete against each other. When talking about national competitiveness, the term is typically used to describe either a nation’s ability to sustain high productivity, leading to higher standards of living for its citizens,112 or the quality of a nation’s
110 Porter (1996) p. 62. Foss (1996) p. 1 defines firm strategy to be about how to position and manage a firm in order to create, protect and increase efficiency rents. A rent is the part of return accruing to a resource that is not strictly necessary for keeping it in its current use. The source of this rent must be some unique and hard-to-copy resource that prevents rapid imitation by competing firms, eliminating the rent-yielding potential. In line with above, competitive advantage is then the ability of a firm or an entire industry to build up such a rent and to defend it against competing rivals (Italics added).
111 This is equal to applying the domestic principle, which includes all companies of an industry that are located in a country, regardless of ownership. In contrast, the national principle looks at all companies whose home base/headquarters are in that particular country and excludes activities of subsidiaries from foreign companies. Compare Neuner (1993) p. 7
112 As for instance defined by the OECD and the US Competitiveness Council (see OECD (1996b) p. 13)

43
business environment,113 i.e. its attractiveness as a location for production. However, it is difficult to find a clear definition of a nation’s competitiveness, or to determine an indicator to measure the competitiveness of a country since nations don’t have a clearly defined bottom-line such as overall profitability or total market share.114 Neither trade balance nor exchange rates are conclusive indicators for gaining or loosing competitiveness relative to other countries.115 For Krugman,116 discussions about competitiveness at the level of nations can even be dangerous because resulting policy actions may be based on a wrong understanding of the actual problem.
What distinguishes the concept of competitive advantage from the economic concept of comparative advantage? The main difference between the concept of competitive advantage and comparative advantage is the notion of a one-time advantage versus sustainable advantage in dynamic competition. A country’s industry has a comparative advantage in a certain product if it exhibits a lower relative autarky price for that good than a foreign country.117 This advantage exists at one point of time, and strategic actions by rivals can compete away this one-time cost advantage. A country’s industry develops a competitive advantage if it is able to utilize its resources to create more value than its rivals, and if it can maintain this better performance over time. While the concept of comparative advantage rests largely on “historic” factor advantages, the concept of competitive advantage stresses the importance of continuous efforts, learning and innovation in an ever-changing environment where one-time factor advantages can easily be competed away.
In the end, the wealth of a nation is determined by the productivity of its companies and industries. Higher living standards result from increasing salaries and capital returns, the factor prices of both labor and capital. These prices are a direct function of their productivity. 118 The living standard of a nation depends therefore on the
113 See Gassmann (1996) p. 39; 2nd definition used for instance in IMD/World Economic Forum World Competitiveness Report (see below)
114 See Krugman (1994) p. 31 115 See for instance Krugman (1994) p. 31 for critique of balance of trade as useless indicator.
Others, such as Ul Haque (1994) see a nation’s competitiveness very much related to its ability to maintain a stable balance of payments.
116 Krugman (1994) 117 Caves, Frankel, Jones (1990) p. 38 118 Productivity is the ratio of the output of goods and services – measured by their market value -
to the input of resources to produce them (McKinsey Global Institute (1994) Chapter 1, p. 2) or

44
capacity of its companies to achieve high levels of productivity, and to increase their productivity over time.119 Competitive companies have a competitive advantage because they use available resources more productively, either through creating higher value products, or using more cost-effective production processes. The ability of firms to achieve a competitive advantage is a function of the sophistication of their strategy, of the quality of their microeconomic environment, and of the stability of the macroeconomic environment. This research tries to identify why certain industries in Ghana have achieved a competitive advantage and are competitive relative to their rivals on the World market. An industry is defined as internationally competitive if it has a competitive advantage relative to the best worldwide competitors.120
The interest for industries, rather than individual companies, is based on the findings from other countries that certain national conditions favor the competitiveness not only of one company, but also of an entire industry. The objective of this thesis is to identify these conditions and to explain how they support or prevent the competitiveness of an industry. Because the needs of each industry are different, meaningful explanations and directly applicable recommendations on how to improve competitiveness can only be given at the level of industries or companies.
No nation can be competitive in all industries. However, “exports by above average productivity industries raise the production volume in these industries, and thus raise a nation’s average level of productivity. Exports also generate the needed income to finance imports of those goods whose domestic production would occupy capital and labor that could be employed more productively elsewhere.”121 Foreign direct investment raises national productivity if it shifts the production of below average productivity industries abroad, and allows the investment of repatriated profits in high productivity industries.
equal, the value created per day of work, dollar of capital invested, and unit of the nation’s physical resources employed. Porter (1997) p. ix, Porter (1990b) p. 84
119 See also Porter (1990b) p. 84: “The principal goal of a nation is to produce a high and rising standard of living for its citizens. The ability to do so depends on the productivity with which a nation’s labor and capital are employed.”
120 Porter (1990a) p. 25 121 Van der Linde (1991) p. 4
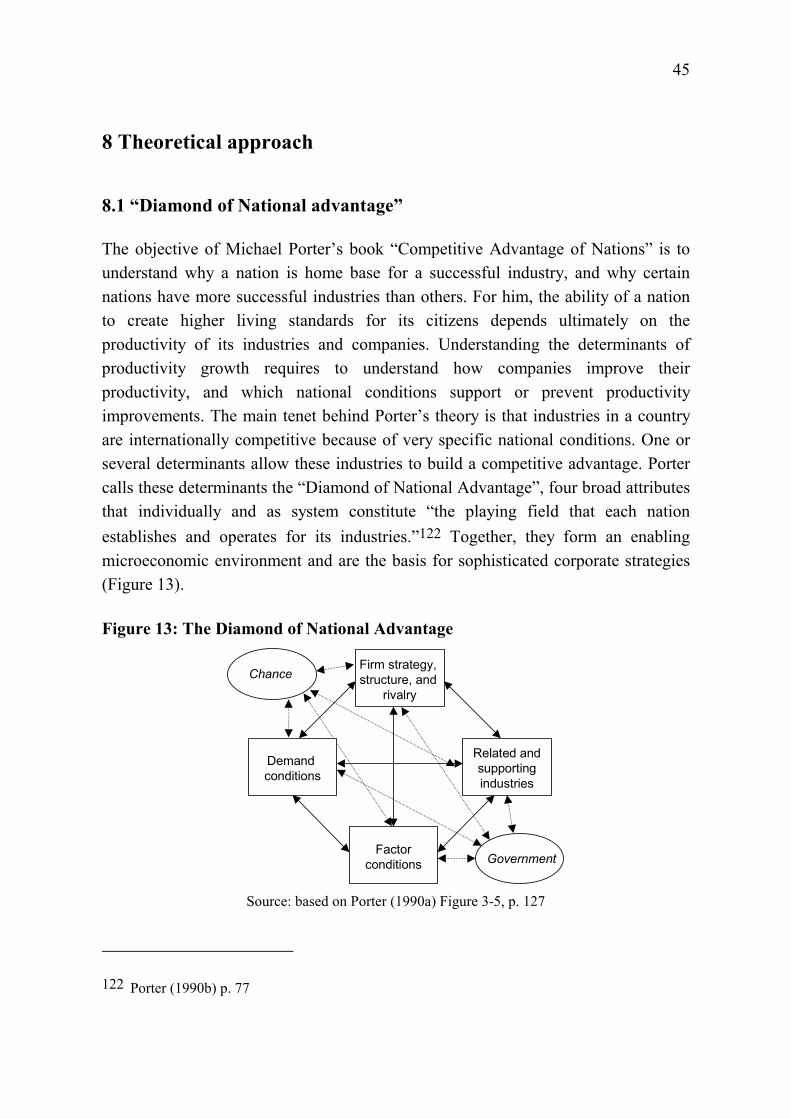
45
8 Theoretical approach
8.1 “Diamond of National advantage”
The objective of Michael Porter’s book “Competitive Advantage of Nations” is to understand why a nation is home base for a successful industry, and why certain nations have more successful industries than others. For him, the ability of a nation to create higher living standards for its citizens depends ultimately on the productivity of its industries and companies. Understanding the determinants of productivity growth requires to understand how companies improve their productivity, and which national conditions support or prevent productivity improvements. The main tenet behind Porter’s theory is that industries in a country are internationally competitive because of very specific national conditions. One or several determinants allow these industries to build a competitive advantage. Porter calls these determinants the “Diamond of National Advantage”, four broad attributes that individually and as system constitute “the playing field that each nation establishes and operates for its industries.”122 Together, they form an enabling microeconomic environment and are the basis for sophisticated corporate strategies (Figure 13).
Figure 13: The Diamond of National Advantage
Firm strategy, structure, and
rivalry
Demand conditions
Related andsupportingindustries
Factorconditions Government
Chance
Source: based on Porter (1990a) Figure 3-5, p. 127
122 Porter (1990b) p. 77
46
In short, these four attributes are (1) factor conditions, such as skilled labor or infrastructure, (2) demand conditions, (3) related and supporting industries, i.e. suppliers and related industries, and (4) firm strategy, structure and rivalry, the conditions that govern how companies are created, organized, and managed, and how they compete with each other. Depending on their characteristics and the relationship amongst them, they will allow certain industries to become internationally competitive.123
The general role of the government is to influence the four determinants; it can upgrade the national attributes that will create an environment in which companies can become successful. What it cannot do is create sustainable competitive advantage: A government is not directly involved in the process in making a nation’s industry competitive. A similar role is played by chance, such as inventions, political decisions by foreign governments or wars.124 By itself, this determinant cannot bring about competitive advantage, but it can strengthen and reinforce the conditions leading to competitive advantage.
The four determinants of national advantage, influenced by government and chance, shape the environment for competition, upgrading, and gaining and loosing competitive advantage of industries in a nation. A favorable diamond of national advantage tends to create an environment that promotes the development of clusters of competitive industries – geographic concentrations of interconnected companies and institutions, with vertical and horizontal linkages between suppliers, producers and customers. These clusters ideally become a mutually supporting system as firms have access to the best suppliers and most demanding customers, and benefit from a shared pool of knowledge coming from dedicated research institutions or experienced workers.
Porter’s theory of national competitive advantage rests on four premises.125 (1) The nature of competition and sources of competitive advantage differ widely among industries and industry segments. (2) Global competitors often perform some activities in the value chain outside their home country. (3) Firms gain and sustain competitive advantage in international competition through improvement, innovation and upgrading, by being able to sustain operational effectiveness and by
123 Porter (1990b) p. 86 124 Borner, Porter, Weder, Enright (1991) p. 204 also include entrepreneurship as one determinant
of competitive advantage, along with chance and government.
47
having a strategy that enables them to retain an edge over their rivals. (4) Firms that gain competitive advantage in an industry are often those that not only perceive a new market need or the potential of a new technology, but also move early and most aggressively to exploit it. The objective of Porter was to provide a framework that allows him to explain the conditions in a nation that make an industry successful. Central to his theory is the focus on industries. Ultimately, the creation of meaningful and commercially valuable skills and technology can only be understood at the level of particular industries.126 These conditions for success, or competitive advantage, are created and sustained through a highly local process. It is the differences in national economic structures, values, and cultures, institutions and histories that make certain industries in a country successful, and that prevent the success of other industries.127 And with fewer impediments to trade to shelter uncompetitive firms, the conditions of a nation become more significant because they are the source of skills and technology that underpin competitive advantage.
The end product of an analysis of the competitive advantages of a nation is a set of actionable, directly applicable recommendations that are meaningful for both companies and governments. Meaningful for a company means that the recommendation can be used to change the company’s strategy and organization. For governments, these recommendations should indicate where they should apply their scarce resources most productively to support the development of successful industries.
8.2 Innovation as driver of competitive advantage
In line with the definition in Chapter 7, competitive advantage is the ability of a company to make products which are cheaper or better than competing products: ”Competitive advantage grows fundamentally out of the value a firm is able to create for its buyers that exceeds the firm’s cost of creating it. Value is what buyers are willing to pay, and superior value stems from offering lower prices than competitors for equivalent benefits or providing unique benefits that more than
125 Porter (1990a) pp. 69 126 An industry is defined as a group of competitors producing products or services that compete
directly with each other. Drawing boundaries between industries will be based on the Standard Industry and Trade Classification (SITC). See Porter (1990a) p. 33
127 Porter (1990a) p. 19

48
offset a higher price.”128 To do so, it must either increase the efficiency and effectiveness of the production process – leading to lower costs of a product, or improve the quality and features of a product – leading to a higher market value of the product.
Creating and sustaining competitive advantage requires that a company always stay ahead of its competition. “A company can outperform rivals only if it can establish a difference that it can preserve.”129 The challenge for a company is to sustain its competitive advantage through continuous improvements of its production process or its products. The argument of the need for continuous improvement and innovation is central for Porter. Innovation is the result of competitive pressure: Companies innovate if their current advantages over their competitors are narrowing, and their profitability is being eroded. In a global economy with free trade, almost any advantage of a company can eventually be imitated.130 Competitors elsewhere will inevitably overtake companies that stop to innovate, and the only way to sustain a competitive advantage is to upgrade this advantage, to move to more sophisticated products and processes. Competitive advantage is the result of a dynamic and challenging home market. Firms gain competitive advantage when (1) their home base allows and supports the most rapid accumulation of specialized assets and skills, (2) their home base provides better information and insights into product and process needs, and (3) when the goals of owners, managers and employees support intense commitment and sustained investment.131 Therefore, on a global basis industries are most successful if their home environment stimulates and prods firms to upgrade and widen their advantages over time. International trade and mobile factors such as capital and technology force a country to continuously compete against the “best of the World.”132 This is the reason why Porter ranks the importance of attractiveness of an industry on its ability to improve and upgrade, to achieve higher productivity. With mobile production factors, it is difficult for a nation to sustain a comparative advantage stemming mainly from factor endowments. Factor advantages allow a nation only to compete on price, always
128 Porter (1985) p. 2 See also Porter (1996) p. 62 129 Porter (1996) p. 62 130 Porter (1990b) p. 75 131 Porter (1990a) p. 71 132 See Caves, Frankel, Jones (1990) p. 185 for the argument that if some productive inputs for an
industry are “footloose”, production and trade patterns are determined by both absolute and comparative advantages
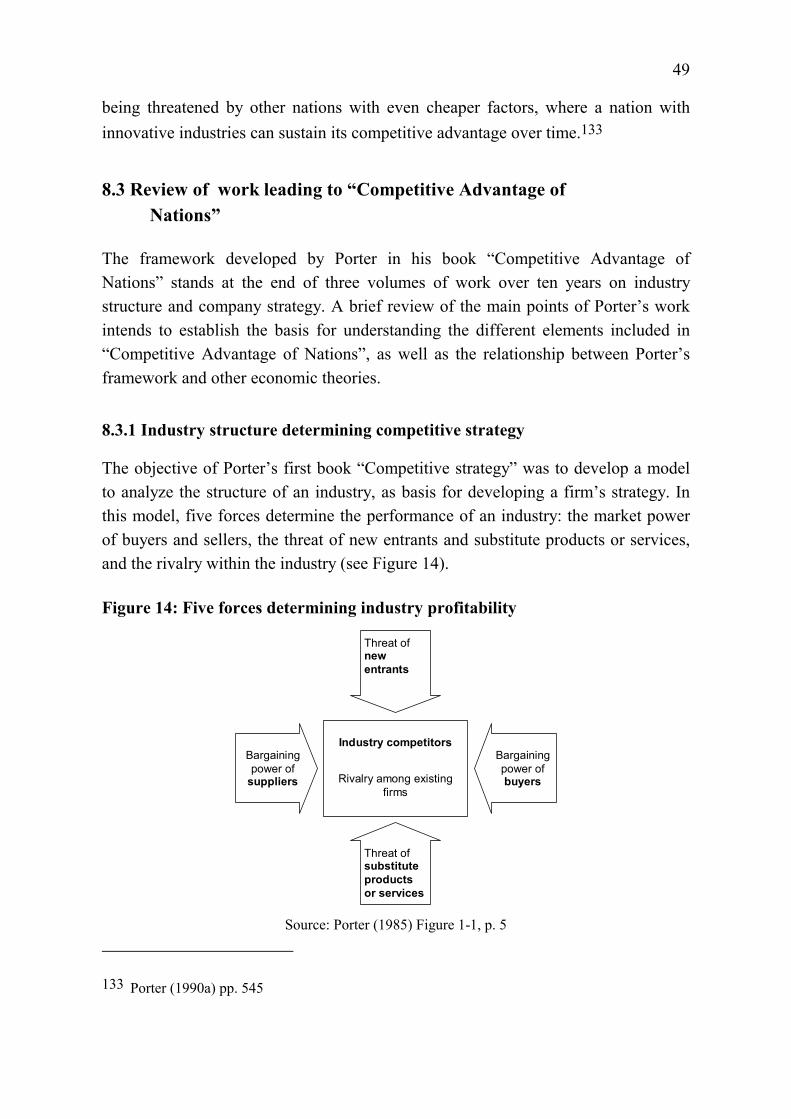
49
being threatened by other nations with even cheaper factors, where a nation with innovative industries can sustain its competitive advantage over time.133
8.3 Review of work leading to “Competitive Advantage of Nations”
The framework developed by Porter in his book “Competitive Advantage of Nations” stands at the end of three volumes of work over ten years on industry structure and company strategy. A brief review of the main points of Porter’s work intends to establish the basis for understanding the different elements included in “Competitive Advantage of Nations”, as well as the relationship between Porter’s framework and other economic theories.
8.3.1 Industry structure determining competitive strategy
The objective of Porter’s first book “Competitive strategy” was to develop a model to analyze the structure of an industry, as basis for developing a firm’s strategy. In this model, five forces determine the performance of an industry: the market power of buyers and sellers, the threat of new entrants and substitute products or services, and the rivalry within the industry (see Figure 14).
Figure 14: Five forces determining industry profitability
Threat ofnewentrants
Bargainingpower of
suppliers
Industry competitors
Rivalry among existingfirms
Bargainingpower ofbuyers
Threat ofsubstituteproductsor services
Source: Porter (1985) Figure 1-1, p. 5
133 Porter (1990a) pp. 545

50
A firm’s strategy has to build on the understanding of the rules of competition that determine the attractiveness of its industry, as the industry structure determines who will keep what part of the value created for buyers. To achieve competitive advantage, a company has to cope with these rules, and should ideally change existing rules in the firm’s favor134, e.g., building up entry or exit barriers to change the intensity of competition.
The focus of Porter is not on the strategy of individual companies, but mainly on the structure of an industry, and the impact of this structure on the performance of the entire industry. The model developed in “Competitive strategy” builds strongly on the theory of Industrial Organization135, especially on the Structure – Conduct – Performance approach.136 In this approach, the rules of competition are embodied in the industry structure, which determines the profitability of the industry because it influences the prices, costs, and required investments of the firms in the industry.137 Competition is a static process, and successful firms are able to build up barriers of entry to protect their profitability.
8.3.2 Management of firm’s value chain to gain competitive advantage
In his second book “Competitive Advantage” Porter focused on the activities of a firm that are required to achieve a sustainable competitive advantage. A company can have two basic types of competitive advantage: low costs or differentiation. Combined with the competitive scope of either focus or broad target, a company has the choice between four generic strategies for achieving above average performance in its industry (see Figure 15).138
134 Porter (1985) p. 4 135 The theory of Industrial Organization deals with the environmental setting within which
enterprises operate and how they behave in these settings as producers, sellers and buyers. 136 This approach focuses on the relationship between market performance and market structure.
Carlton, Perfloff (1994) p. 331. Econometric studies find weak evidence of a link between market concentration and market performance on the level of individual industries. Ibid. p. 357
137 Porter (1985) p. 4. The five forces model has become the traditional strategy framework since. See Coyne, Subramaniam (1996) p. 16 for a criticism and further developments.
138 Porter (1985) p. 11

51
Figure 15: Four generic strategies
Broa
d ta
rget
Com
petit
ive
scop
e
DifferentiationCompetitive advantage
Lower cost
Nar
row
tar
get
Differen-tiation
Costleadership
Costfocus
Differen-tiation focus
Source: Porter (1985) Figure 1-3, p. 12139
To understand how internal activities should be aligned in order to contribute to a firm’s cost position or basis for differentiation, Porter introduced the value chain as a tool. “The value chain disaggregates a firm into its strategically relevant activities (such as R&D, production, marketing) in order to understand the behavior of costs and the existing and potential sources of differentiation.”140 Competitive advantage is then the result of aligning the management of the internal activities with the strategy the company has chosen to follow. The main determinant of company success is no longer just the barriers to entry, but the management of internal activities and the building-up of know-how and experience.
8.3.3 National attributes as determinant of national competitive advantage
In “Competitive advantage of nations”, Porter completes his move from static competition to dynamic competition, with clear references to the work of
139 An improved version of this framework is provided by Porter (1996), where he identifies three ways of strategic positioning: variety-based positioning (producing only one product at very low cost), need-based positioning (providing a complete set of activities to serve a specific group of customers), and access-based positioning (segmenting by access).
140 Porter (1985) p. 33 Porter introduced the value chain as a tool to represent all activities of a firm, splitting them up into primary activities (e.g., operations, marketing & sales) and supporting activities (e.g., R&D, human resource management).

52
Schumpeter141 and evolutionary economics.142 Sustained competitive advantage of an industry is the result of its capacity to continuously innovate and upgrade. This capacity for innovation is a function of the ‘Diamond of National Advantage’. “Each point on the diamond – and the diamond as a system – affects essential ingredients for achieving international competitive success: the availability of resources and skills necessary for competitive advantage in an industry, the information that shapes the opportunities that companies perceive and the directions in which they deploy their resources and skills; the goals of the owners, managers, and individuals in companies; and most important, the pressures on companies to invest and innovate.”143
The common element of ‘Competitive Strategy’ and ‘Competitive Advantage of Nations’ is the importance of the external environment for a firm’s performance. In both books, the industry is the main unit of analysis, and the success of individual companies depends to a significant extent on their ability to work within the structure of their industry. A connection between static position and dynamic change is established by ‘Competitive Advantage’, where Porter describes how a firm creates competitive advantage by building up skills and know-how in managing its value chain – an understanding which provided the basis for innovation-driven competitive advantage in his 1990 book.144 For Porter, a firm’s strategy is responsible for the creation of competitive advantage, but this firm’s strategy must be seen within the structure of the industry in which it operates. Understanding the ‘rules’ and influencing factors of an industry are therefore the basis for strategic
141 Porter (1990a) p. 20, and “My fundamental perspective is more Schumpetarian than neoclassical. Entrepreneurship and innovation prove central to national advantage.” Ibid. p. 778 N46 referring to Schumpeter (1993) pp. 100
142 Such as Nelson, Winter (1982), referred to in Porter (1990a) p. 731, who developed a theory on the evolution of capabilities of firms.
143 Porter (1990b) p. 77 144 With this view of competitive advantage, Porter works along similar lines as Alfred Chandler.
The management of internal activities is the main driver of competitive advantage for Chandler (1992), who argues that the success of companies is the result of organizational and managerial capabilities. Similar to Porter, Chandler’s learned capabilities result from solving problems with the production process, acquiring knowledge of customers’ needs, and in becoming knowledgeable about recruiting and training workers and managers. Only a dynamic view of a firm’s development provides an understanding how new firms have become successful. While Chandler focused on the evolution of the multinational firm, Porter stresses the environment around the firms.
53
actions on the level of the firm, and influences its skills, organizational arrangements, and success in particular fields. 145
Porter analyzes competitive advantages not only at the industry level, but also at the industry cluster level. A cluster is a group of industries linked together through either vertical or horizontal relationship, and Porter finds that successful clusters tend to be geographically concentrated. The vertical and horizontal relationships allow sharing specialized factors. They create highly sophisticated demand for upstream machinery or inputs, and they lead to intensive competition as basis for innovation.146 Porter’s ‘Competitive Advantage of Nations’ is a book that contains elements of Industrial Organization theory (e.g., industry structure and competition). However, the development of competitive industries is the result of innovation and building of internal capabilities, a view supported by both evolutionary and resource-based economists.147
8.4 Comparison of Porter with neoclassical approaches
Porter developed a new theory because in his view, ‘orthodox’ economic approaches were unable to explain which decisive characteristics of a nation allow its firms to create and sustain competitive advantage in particular fields.
Explicitly, he criticizes the theory of international trade in the Heckscher-Ohlin version, which is based on the idea that nations have a comparative advantage
145 In his 1996 article, Porter uses his 1990 work to recommend how a company should think about its strategy. In the ‘Model of the Past Decade’, strategy was about finding and ideal competitive position in the industry, whereas today, sustainable competitive advantage rests on the ability to continuously maintain a competitive edge through innovation and change
146 The phenomenon of this concentration of industries has also been modeled by Krugman, where the origins of concentration lie in the cost of transaction across space and economies of scale, and where the concentration of industries, once established, tends to be self-sustaining. Krugman’s model is based on the interaction of increasing returns, transportation costs, and demand. For him, other important reasons for industry clusters are pooled labor markets, intermediate products, and technological spillovers. Krugman (1991) p. 99. See also Meckl, Rosenberg (1995) for a comparison and synthesis of Porter and Krugman. In their opinion, the idea of the industry cluster should be considered as a common ground of economics (unit of analysis: nation) and management science (unit of analysis: firm)
147 See de Man (1993) on Porter’s work and his shift from Industrial Organization to “Austrian/resource-based” perspective. In the resource-based theory, firms create competitive advantage because of some unique assets that they develop over time. ” Foss (1996) also argues that Porter’s 1980 book was firmly anchored in Industrial Organization, and that in 1990 Porter is clearly inspired by evolutionary economics.
54
because of different factor endowments. Porter supports the normative theory of trade. This theory argues that in the absence of trade, there will be some goods whose opportunity costs on World markets will be lower than those from obtaining them at home, and that the country should therefore import such goods – and export those goods in which it has a comparative advantage.148 However, for Porter the Heckscher-Ohlin version of comparative advantage is insufficient (1) because the theory is not able to explain current trade patterns and national developments149; (2) because the underlying assumptions of no economies of scale, identical technology, undifferentiated products and fixed pool of factors are unrealistic, and (3) because the theory assumes away the role of firm strategy and leaves no recommendations for managerial actions.150 While trade based on factor advantages is still important in natural-resource intensive industries (with unskilled labor and identical technology), factor advantages are an incomplete explanation for trade in goods involving sophisticated technology and highly skilled employees. The insufficient explanatory power of factor-based advantages leads to the conclusion that government actions are useless if they attempt to restore the competitiveness of a nation mainly through changes in factor costs.151
Although Porter openly criticizes only the neoclassical theory of trade, his work is an implicit criticism of the general neoclassical approaches and its unsatisfactory explanation of the nature and cause of the wealth of nations.152 In particular, the theory of economic growth has not been able yet to provide a theoretically and empirically robust model that explains national differences in economic growth
148 Stern (1989) p. 629. For Porter, Ricardo’s explanation of comparative advantage based on productivity differences pointed into the right direction, but stopped short when it came to explain why productivity differences existed and changed over time. Porter (1990a) p. 17 “My perspective is Ricardian, in that I view trade (and foreign investment) as determined most importantly by productivity differences, here broadened from Ricardo’s theory to include differences in technology, factor quality, and methods of competing.” Porter (1990a) p. 173
149 Trade patterns are difficult to explain in a world where most developed countries have similar factor endowments, where a large portion of traded goods have similar factor proportions, and where companies are able to source and produce worldwide, taking advantage of low cost factors. Porter (1990a) p. 14. Successful development can happen without natural resources, like for instance capital-poor Korea becoming a leader in steel production, and the skill-rich US having eroding export shares in machine tools and sophisticated electronic products. Porter (1990a) p. 12
150 Porter (1990a) pp. 11 151 Such as devaluation of the exchange rate, wage reductions, and industry subsidies. See also van
der Linde (1991) p. 17 152 See Auerbach, Skott (1995) p. 142

55
rates. The objective of both the neoclassical and new growth theories is to explain what factors determine the growth rate of output over long periods, and how lower-income countries will develop in relation to higher-income countries. Neoclassical growth theories153 predict convergence of income levels of poor and rich countries because of diminishing returns to capital, under the condition that they have the same population growth rate, the same saving rate and access to the same production function. The diminishing returns of capital, however, prevented the model to explain the wide variation in growth rates across countries and the absence of convergence between rich and poor countries. 154 To relax the assumption of diminishing returns to capital, two broad approaches have been followed in the new growth literature.155 The first approach views all production inputs as some form of capital, including human capital. The second approach models externalities in the form of spillover of technical knowledge available to all firms. A further stream of research incorporated R&D and imperfect competition into the growth framework.156 As a result, the theories predict that there could be persistent differences in growth rates among countries with different investment rates.
The main criticism from Porter (and others157) concerns the lack of a micro-foundation of both the neoclassical approach and the new growth theory, in particular the assumption that all producers are operating at their cost frontier, and that the market will weed out inefficient producers. “Some economists think that if the proper macroeconomic conditions can be put in place, the rest will take care of itself… However, the gap between macroeconomic policies and company competitiveness is a wide one. A myriad of intervening circumstances at the
153 The theory is called “neoclassical” because the neoclassical form of the production function is the key aspect of the Solow-Swan model, as such the most prominent model in that theory. The neoclassical production function assumes constant returns to scale, diminishing returns to each input, and positive and smooth elasticity of substitution between inputs. In the Solow-Swan model, this production function is combined with a constant saving rate rule to generate a simple general-equilibrium model of the economy. Barro, Sala-I-Martin (1995) p. 10
154 Dornbusch, Fischer (1994) p. 276; Agénor, Montiel (1996) p. 513. This was patched up by assuming that technological progress, the unexplained part of the empirical equation, occurred exogenously. Barro, Sala-I-Martin (1996) p. 11
155 The new growth theory is also called endogenous growth theory because it attempts to determine growth within the model, rather than by some exogenously growing variable such as unexplained technical progress. Barro, Sala-I-Martin (1996) p. 38
156 Agénor, Montiel (1996) p. 519; Auerbach, Skott (1995) p. 144). Stern (1991) provides a good survey.
157 Compare Stern (1991) for development economics, and also Auerbach, Skott (1995) and Ayres (1997)

56
microeconomic level must be understood and addressed by the private sector and through government policies if a nation’s prosperity is to improve.”158 None of the neoclassical or new growth theory models mention factors such as management and organization, infrastructure, and institutional arrangements of different sectors.159 In the same line of argument, the assumption of free floating capital and public knowledge160 is inconsistent with the empirical finding that know-how is not easily transferable across countries, and that competitive advantage of companies stem exactly from their ability to innovate and invent faster than their rivals, and from their ability to create customer value through differentiated products. “Most theories [of trade and growth] look solely at cost, treating quality and differentiated products in a footnote.”161
The new growth theories stress the importance of invention, human capital accumulation, development of new technologies, and financial intermediation as important determinants of economic growth.162 However, their results cannot be used to produce specific recommendations for firms and governments in different countries on where to best utilize their scarce resources in order to develop sustainable competitive advantage. For Porter, the phenomenon of economic growth can only be fully understood at the microeconomic level, at the level of firms and industries. In his theory Porter tries to show how the environment of a nation leads to the success (and failure) of certain industries. Industries remain internationally competitive if they continuously innovate and improve their products and production processes, and the speed of innovation is a function of the home environment. In contrast to neo-classical economists, for Porter it is not just the market that determines the success of a company, 163 and competitive advantage of a company
158 Porter (1998a) p. 38 159 “The problem is that although productive efficiency may be a first approximation, the
approximation may be poor and differences in growth and other performance characteristics may be related precisely to differences in the goodness of fit. Countries may perform well economically because their industries operate with less inefficiency than in other countries.” (Italic by author) Auerbach, Skott (1995) p. 147; “Deficiencies of infrastructure together with the weakness of management and economic organization are likely to account for a substantial part of low factor productivity in developing countries.” Stern (1991) p. 128
160 Although newer contributions to the theory attempt to model explicitly some monopoly power as a result of purposive R&D activity. See Barra, Sala-I-Martin (1996) p. 12
161 Porter (1990a) p. 20 162 Agénor, Montiel (1996) p. 531 163 Stern (1991) refers to Porter as “management analyst” because of his emphasis on competition
as driver of economic growth (p. 130).

57
is the result of a dynamic process.164 Porter’s end product is a consistent and coherent theory165 that can incorporate phenomena such as segmented markets, differentiated products, technology differences, and economies of scale to explain the success of individual industries.
8.5 A short critique of Porter’s Competitive Advantage of Nations
As any economic theory, also Porter’s has some shortcomings. The Porter model allows to integrate very different national circumstances and industry structures, to explain the success of very different industries in different countries. Porter does not expose his model to formal econometric testing. Instead, his work is based on stories and anecdotes, which makes it difficult to exactly pinpoint the effects of the “National Diamond” on industry competitiveness.166 There are cases where Porter, after a very conclusive explanation for the success of an industry, could have found an example pointing to the opposite of the conclusions he draws.167 This makes it also difficult to establish a direct cause-effect relationship with his model, because the reasons for success for every industry are very specific. What Porter provides is a theory that can convincingly describe and explain the success of very different industries, and to provide recommendations on how to improve certain key factors of success. However, it is difficult to use the Porter model to look at a country’s economic structure and to conclude from that which industries will be most successful in the future. For instance, in 1991 Borner, Porter, Weder, Enright identified the forwarding industry as one of the strongest Swiss industries, and at the same time classified the Swiss insurance industry as an industry which had lost competitiveness and was under significant pressure. Eight years later, the Swiss
164 Auerbach, Skott (1995) p. 158; de Man (1993) p. 10 165 According to Kromrey (1990) p. 21, the criteria for a theory are: a system of logically
consistent hypotheses which are empirically testable and which allow a clear formulation of relationships and implications.
166 Although the detailed country studies, e.g. van der Linde (1991) for Germany provide a more detailed and complete picture of a nation’s competitive industries and the “National Diamond”.
167 Dunning (1991)

58
forwarding industry still has not recovered from the EU 1992 shock, and the Swiss insurance industry continues to be one of the leading ones in the World.168
Porter’s model is not founded completely on one dominant economic theory. Foss (1995) criticizes what he calls “increasing eclecticism”, the fact that Porter moved away from the theory of Industrial Organization to a more eclectic view. To him, this is much more “a matter of quickly reacting to the need to address some new phenomena than it has been a matter of applying outgrowths of fundamental theory. That is, the evolution of his thinking has been much more practically driven than theoretically driven,”169 which makes in his view Porter’s theory much less coherent. On the other hand, Porter attempted to provide a theory that could be used to explain the phenomenon of very different industrial settings, something to which no economic theory has been able to provide an answer yet.
In my opinion Porter’s “Competitive Advantage of Nations” has two contributions. The first is a consistent model that can explain why, for example, the environment in Italy supported a successful fashion industry, and how a completely different national setting like Germany provided the basis for successful car and machine manufacturers. The second is that based on results of his analysis, Porter can give directly applicable recommendations on what to change to improve the competitiveness of an industry, and what to do to improve the attributes of a nation.
168 Borner, Porter, Weder, Enright (1991) provide an extended version of Porter (1990a) on Switzerland. For Borner, Porter, Weder, Enright the core skill of the Swiss Forwarding industry was the order processing and organization. With the fall of customs in Europe, this service was no longer needed. Most forwarding companies lost significant market share to small trucking companies that competed solely on price. Swiss forwarding companies such as Danzas and Panalpina have been slow in offering innovative services such as integrated supply chain management and are loosing out against fast moving US integrators like FedEx and UPS. In Europe, the top ten industry leaders have less then 20 percent market share, and industry consolidation has only started in 1997.
The insurance industry on the other side was able to consolidate and to assume World-wide leadership in new profitable fields such as asset management (Zurich Financial Services) and innovative alternative risk transfer products (Swiss Re New Markets).
169 Foss (1995) p. 17
59
8.6 Adaptation of Porter approach to specific situation of Ghana
“Competitive Advantage of Nations” is a theory about the success of industries in ten leading nations.170 The main focus of Porter was on the ability of a nation to innovate and remain competitive in the most advanced and profitable industries. The question for Porter is: why are certain nations the home base for an internationally successful industry, what national attributes enabled an industry to build up international leadership both through export activities and foreign direct investment.
Ghana, as most African countries, is in a different situation. Its goal is to move from a natural resource-based economy to an innovation-based economy. On its national agenda are different tasks: How to raise the productivity in the current industries as prerequisite for competitive advantage, and how to attract domestic and foreign investors to provide capital, technology and management skills for further economic growth. For Ghana, it is more important to understand how to develop any industry, be it domestically controlled or be it a subsidiary of a foreign multinational. The interesting question is: What are the conditions that make Ghana a home for internationally successful industries? This means that the focus of research will be shift from a national perspective to a domestic perspective: Which industries are successful in Ghana, and what are the specific attributes of the country that make industries there successful, regardless of the owner’s nationality.
While innovation and upgrading will be important to sustain competitive advantage later on, the first task of Ghana’s industries is to use the currently available resources and equipment efficiently, and to acquire a basic understanding of imported technology as basis for own innovation and upgrading. The challenge for Ghana is to build up competitive industries in an environment where most exports are natural resource based, where companies have difficulties understanding the need of their foreign customers, where there is no specialized related and supporting industry in place, where domestic competition is limited and management talent is scarce, and where government activities are at times rather harmful to development.
Even though Porter’s model with the ‘National diamond’ is geared towards industrialized nations, it can very well be applied to explain Ghana’s national attributes. What will be treated different is the importance of the national attributes.
170 Fairbanks, Lindsay (1997) applied the Porter model to provide recommendations on how to improve the competitiveness of the Andean region.

60
For instance, sophisticated domestic demand that drives innovation will be less important than the status of the factor conditions, as these provide primarily the basis for efficient production. Innovation in the context of Ghana will not just include the development of more sophisticated products and processes, but also the capability to use available technology in an effective way. Applying the Porter model to Ghana means that the industry will be analyzed and explained based on the model, but the recommendations with regards to the general role of the different actors and the importance of the national attributes will be different.171
171 Porter (1990a) pp. 675-682 acknowledges that his focus has been on advanced nations, but that the principles can be applied to developing nations as well.

61
9 Methodology to measure competitive advantage
In order to identify the industries that are internationally successful, a method to measure the competitiveness of Ghana’s industries has to be defined.
9.1 World market share of exports as indicator for competitive advantage
A company, and in its aggregated version an industry, is competitive if it is able to design, produce, and/or market products that are superior to those offered by competitors. Products or services are superior if they provide a higher value to customers, either in the form of lower prices for equivalent benefits, or by providing unique benefits that more than offset a higher price. 172
In order to determine which industries of a nation have a competitive advantage, we need to define clear indicators that can be measured consistently across nations. Producing products that add more value to the customer than competitors’ products should have two effects for a company: it will lead to higher sales and increasing market share because more customers demand the products; and it will result in improved profitability because of higher sales. Hence, indicators to measure the competitiveness of a company or an industry could be the development of the global sales volume, relative to competitors (market share), or the industry’s profitability relative to competing industries. Even though industry profitability would initially be the best indicator to measure its competitiveness, it is difficult to operationalize. Industry profitability figures are difficult to compare across countries or other industries because of distortions stemming from domestic protection, ownership structure, financial structure and differences in national accounting standards.173
To measure an industry’s World market share, one has to find a robust indicator that includes both exports and sales generated by foreign direct investments, and that takes into account the change of the total World market volume for a particular product. Using an industry’s share in a country’s total exports reflects the industry’s importance within this country external sector, but leaves out the sales from foreign
172 Porter (1985) p. 3 173 van der Linde (1991) p.26; Porter (1990a) p. 25
62
direct investments and the changes of the World market in which these products compete. The same holds true for the “revealed comparative advantage”174 indicator, which does not take into account the total World market volume and also leaves out the sales from foreign direct investments.175
In ‘Competitive Advantage of Nations’, competitiveness was defined as the presence of substantial and sustained exports to a wide array of other nations, and/or significant outbound direct foreign investments based on skills and assets created in the home country.176 Substantial and sustained exports or foreign direct investments proved that an industry was able to successfully compete on World markets. To identify the competitive industries, the indicator selected measures the development of the World market share of a nation’s industry, based on its exports and foreign direct investments. This World market share of an industry is then compared with the nation’s market share in total World exports.177 Industries whose relative share of World exports in that particular industry equal or exceed the nation’s total share of World trade in a certain year revealed a comparative advantage.178 For each nation covered, after adjustments for large import shares and for foreign direct investments179 a profile of all industries was created for three points in time, 1971, 1978, and 1985. Industries with a competitive advantage were those that continued to have a comparative advantage over these 15 years.
174 A company reveals a comparative advantage if over time its ratio of exports to imports is bigger than the national ratio of exports to imports, i.e. if its own ‘balance of trade’ increases faster then the country’s balance of trade. See also Borner, Porter, Weber, Enright (1991) p. 42
175 For a review on industry competitiveness analysis based on other indicators such as factor productivity and institutional conditions see Borner, Porter, Weber, Enright (1991) p. 42; van der Linde (1991) pp. 17 - 19
176 Porter (1990a) p. 25. A firm was considered to have its home base in a specific nation if it was either locally owned, or managed autonomously.
177 Porter (1990a) p. 24. The unit of research, an industry, was defined along the Standard International Trade Classification (SITC), at the least aggregated five-digit level.
178 Porter (1990a) p. 739: “The use of this cutoff is equivalent to selecting those industries in which the nation has a revealed comparative advantage, in the parlance of the literature on international trade.”
179 From the initial list, industries were removed which had a negative balance of trade – unless their export share was two times higher than average, as well as industries that were considered to be dominated by foreign companies producing in a nation as part of a global strategy. Industries where trade was exclusively with neighboring countries (e.g., US-Canadian automotive trade) were excluded as well, as this trade only reflected geographic proximity. Added to that list were industries where data indicated that a nation’s firms had made substantial foreign direct investments in addition to exports (foreign investment data was not always available in a systematic form). Porter (1990a) p. 740
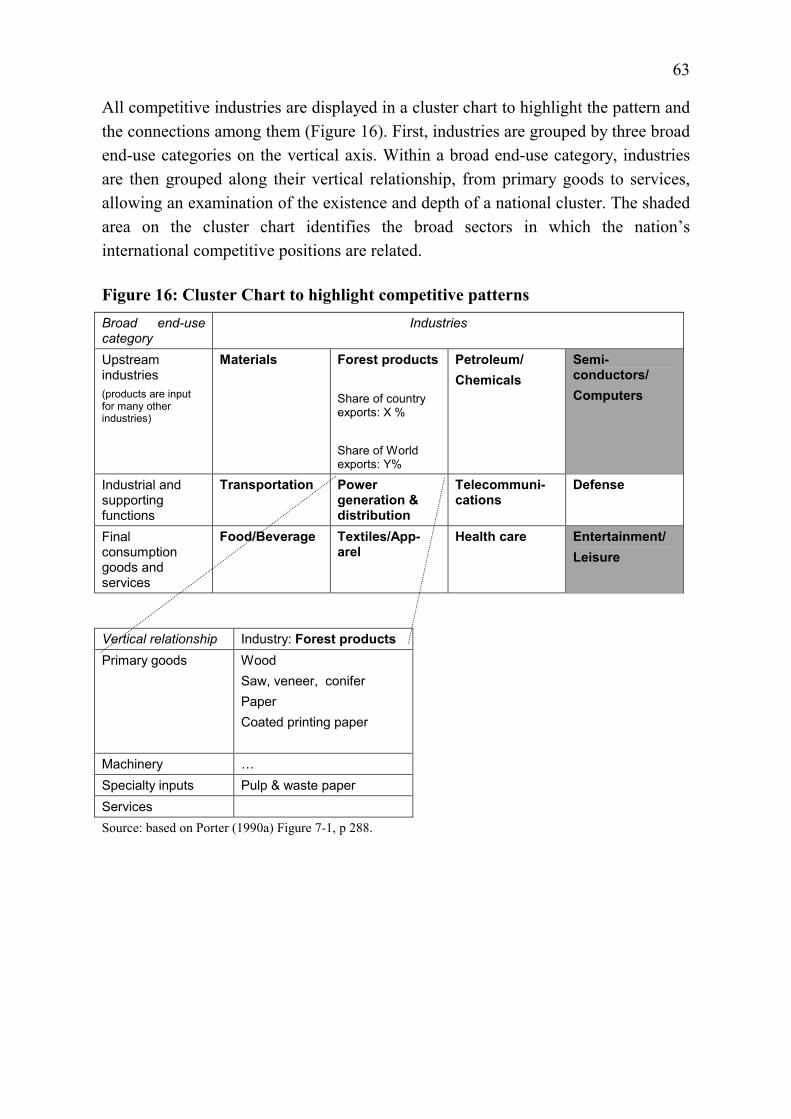
63
All competitive industries are displayed in a cluster chart to highlight the pattern and the connections among them (Figure 16). First, industries are grouped by three broad end-use categories on the vertical axis. Within a broad end-use category, industries are then grouped along their vertical relationship, from primary goods to services, allowing an examination of the existence and depth of a national cluster. The shaded area on the cluster chart identifies the broad sectors in which the nation’s international competitive positions are related.
Figure 16: Cluster Chart to highlight competitive patterns Broad end-use category
Industries
Upstream industries (products are input for many other industries)
Materials
Forest products Share of country exports: X % Share of World exports: Y%
Petroleum/ Chemicals
Semi-conductors/ Computers
Industrial and supporting functions
Transportation Power generation & distribution
Telecommuni-cations
Defense
Final consumption goods and services
Food/Beverage Textiles/App-arel
Health care Entertainment/ Leisure
Vertical relationship Industry: Forest products Primary goods Wood
Saw, veneer, conifer Paper Coated printing paper
Machinery … Specialty inputs Pulp & waste paper Services Source: based on Porter (1990a) Figure 7-1, p 288.

64
9.2 Measuring the World market export share of Ghana’s industry
Porter’s approach to measure the competitive advantage of an industry is primarily based on its World export share.180 Information on a country’s exports is available in a consistent and comparable form. Two major factors make it difficult to apply the same approach to Ghana: The availability of reliable data, and the dominant shares of cocoa, and gold, which account for 70 percent of Ghana’s exports.
9.2.1 Poor quality of Ghana export data
In the Porter approach, UN trade statistics were used to measure the World share of exports of a certain industry in a nation. These statistics are the only available source of internationally comparable and reliable trade data that allow intra and cross-country analysis of narrowly defined industries over an extended period of time.181 However, the last time that Ghana reported both imports and exports to the UN was in 1984. Since then, the statistics for Ghana are compiled based on the information given by all other reporting nations (i.e. exports of Ghana are reported as imports in another country), but not published in the UN trade statistics yearbook.182 It is hence not possible to directly calculate Ghana’s World share of exports based on UN data.
For Ghana, two institutions publish statistics on the country’s export: (1) The Ministry of Trade and Industry, which provides export statistics based on the Harmonized System (HS); and (2) the Ghana Export Promotion Council, which provides export statistics for the so-called non-traditional products (all exports excluding cocoa, minerals, and timber in their raw forms). The two institutions use slightly different data from the Ghana Customs, Excise and Preventive Service and
180 For a complete picture on an industry’s competitiveness, Porter used also information on its foreign direct investments. However, using foreign direct investment activities as an indicator of competitive advantage is a bit more difficult, as foreign investments could have been driven by import restrictions. Data on foreign direct investments is difficult to get in a disaggregated form, and hard to compare across countries. In the case of Ghana, this problem is not relevant because there are limited outward foreign direct investment activities, largely confined to one company in the gold mining industry.
181 van der Linde (1991) p. 26 182 According to UN statistics personnel, the number of countries reporting trade with Ghana has
varied between 80 and 95 in the last 4 years, which makes the UN trade statistics not a reliable source to measure Ghana’s export performance (Telephone Interview).

65
compile this information in different, not comparable statistics that contain significant deviations in some areas.
For the years prior to 1996, the information on exports provided by the Ministry of Trade and Industry is only given at the 2-digit HS level, and cannot be compared with UN trade data. In 1995, an export data information system was installed which allows to capture all exports of Ghana in a consistent form, and first results are available for 1996 exports.183 The Ghana Export Promotion Council provides information going back as far as 1986, but only for non-traditional exports. Therefore, adjustments have to be made to measure the development of comparative advantage – which is equal to the presence of competitive advantage – over time.
To achieve an understanding of the competitiveness of Ghana’s industry with comparable data available for one year, both statistics have to be used in conjunction. Significant deviations are mentioned in the text, and the analysis is based on the most reasonable number.184
9.2.2 Most exports from gold and cocoa
In 1997, 70% of Ghana’s total export value came from cocoa products and gold. If in any year Porter’s cut-off rate would be applied (all industries whose share of World exports was larger than Ghana’s average share of exports), hardly any industry except gold and cocoa would reveal a competitive advantage.185 In the past years, other exports mainly from the non-traditional sector have been growing significantly, but compared to gold and cocoa their share of Ghana’s total exports is negligible. To evaluate the development of their competitiveness, their export share is compared against Ghana’s total export share excluding cocoa and gold exports.186
183 Used for the Ghana Export Bulletin, Annual Report 1996 & 1997 184 Information from interview results, other sources, and the consistency with other years was
used to determine the reasonability of a number. 185 If the country’s World market share including gold and cocoa had been used, the following
products had not revealed a comparative advantage in 1996: fish salted, preserved fruit, fresh vegetables, tobacco, wood charcoal, diamonds, and furniture. The cluster chart for uncompetitive industries was built from the remaining export goods. Export categories where total exports were below USD 100’000 in that year were not included.
186 To adjust for the large share of natural resource products, one could also have analyzed the country’s exports of non-traditional products only. However, the reconciliation of both data sources into traditional and non-traditional products was not possible because the definition of non-traditional products is not based on the same categories as provided by the HS.

66
9.3 Revised methodology to measure the competitiveness of Ghana’s industry
To achieve similar results as used in ‘Competitive Advantage of Nations’ and accounting for the specific situation of Ghana, two adjustments to the methodology described above were made:
¶ Ghana’s total World market share in exports is measured based on all exports excluding cocoa and gold. The World market share of an industry’s export is determined based on 1996 data for UN total export figures and Ghana’s official export statistics.
¶ A Ghanaian industry is determined to have a competitive advantage if it has revealed a comparative advantage in 1996, and if its export growth between 1990 and 1996 has been higher than the World export growth of that industry. Industries that had a comparative advantage in 1996 but had slower growing exports than their respective World market exports are loosing comparative advantage. Industries that had no comparative advantage in 1996 but faster growing exports than World market exports are building competitive advantage.
To measure the world export share of Ghana’s industry in 1996, all Ghanaian exports were compared against the total World exports. The source for Ghanaian exports was the Ghana Export Promotion Bulletin 1996, published by the Ministry of Trade and Industry. The source for World exports was the 1996 International Trade Statistics Yearbook published by the UN. The exports from Ghana and World exports were compared on the 3-digit SITC level, the lowest level available in the International Trade Statistics Yearbook. SITC product descriptions were used to identify comparable products under the HS code. On the cluster charts for competitive industries, products are shown on the 4-digit HS level to better illustrate the individual products. The cluster chart for uncompetitive industries is based on the 2-digit HS code level.
Complete information on Ghana’s exports at the 5-digit HS level has only been published starting 1996, after a new data collection system had been implemented across the country. The Ghana Export Promotion Council collected data on non-traditional exports going back to 1986, based on the individual exports of companies as reported by Ghana Customs. As no consistent and comparable data on the total level of Ghana’s exports is available, competitive advantage is measured based on
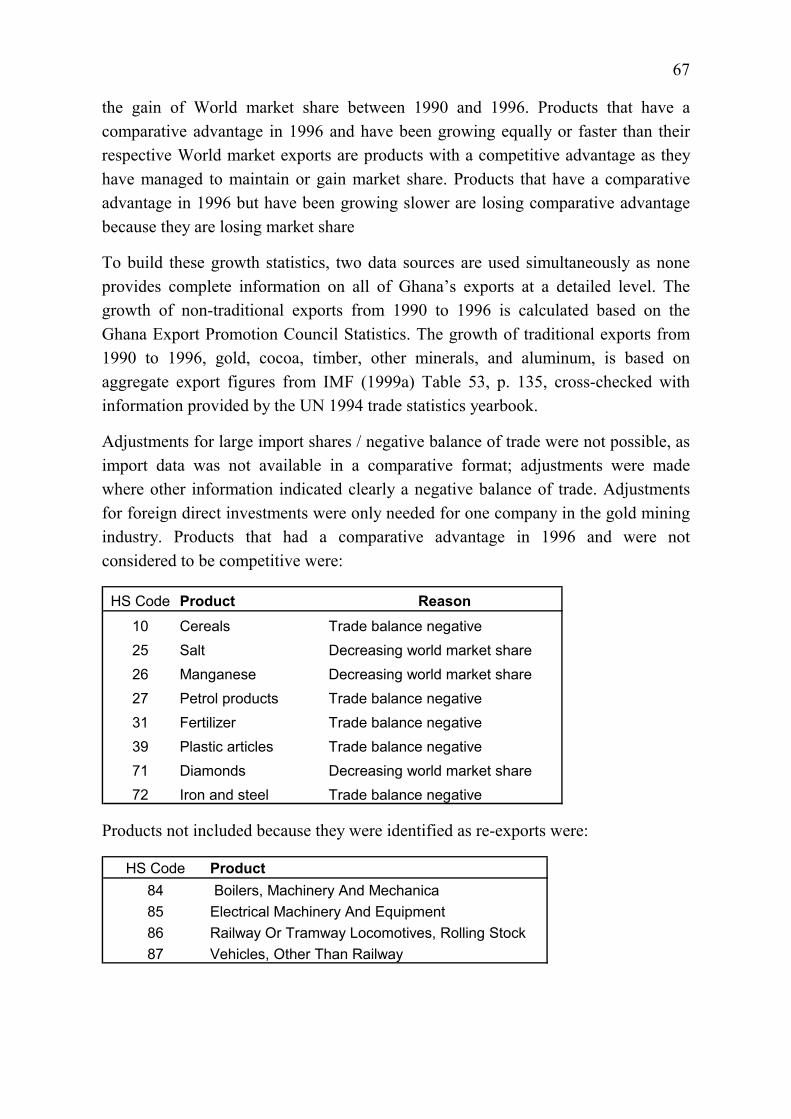
67
the gain of World market share between 1990 and 1996. Products that have a comparative advantage in 1996 and have been growing equally or faster than their respective World market exports are products with a competitive advantage as they have managed to maintain or gain market share. Products that have a comparative advantage in 1996 but have been growing slower are losing comparative advantage because they are losing market share
To build these growth statistics, two data sources are used simultaneously as none provides complete information on all of Ghana’s exports at a detailed level. The growth of non-traditional exports from 1990 to 1996 is calculated based on the Ghana Export Promotion Council Statistics. The growth of traditional exports from 1990 to 1996, gold, cocoa, timber, other minerals, and aluminum, is based on aggregate export figures from IMF (1999a) Table 53, p. 135, cross-checked with information provided by the UN 1994 trade statistics yearbook.
Adjustments for large import shares / negative balance of trade were not possible, as import data was not available in a comparative format; adjustments were made where other information indicated clearly a negative balance of trade. Adjustments for foreign direct investments were only needed for one company in the gold mining industry. Products that had a comparative advantage in 1996 and were not considered to be competitive were:
HS Code Product Reason10 Cereals Trade balance negative25 Salt Decreasing world market share26 Manganese Decreasing world market share27 Petrol products Trade balance negative31 Fertilizer Trade balance negative39 Plastic articles Trade balance negative71 Diamonds Decreasing world market share72 Iron and steel Trade balance negative
Products not included because they were identified as re-exports were:
HS Code Product84 Boilers, Machinery And Mechanica85 Electrical Machinery And Equipment86 Railway Or Tramway Locomotives, Rolling Stock87 Vehicles, Other Than Railway

68
10 Methodology to explain impact of determinants of competitive advantage
The ‘Diamond of national advantage’ framework is used with the objective to explain how each of the different elements of the diamond – the determinants of competitive advantage – individually and as a system have influenced the development of competitive advantage of an industry. From the analysis of a nation’s most important competitive industries we should then be able to synthesize a picture of the overall ‘Diamond’.
In this study, the case study approach was chosen to explore how the elements of the ‘Diamond’ determine the competitive advantage of an industry.187 The case studies examine in detail the history of each industry group selected to understand which determinants were responsible for the development of competitive advantage. In each case study, the industry group is systematically analyzed in the context of the global industry, to understand what enabled these industries to gain a competitive advantage over the best competitors.
In his 1990 book, Porter did not use quantitatively measured criteria to evaluate the impact of the determinants on the competitiveness of a nation. However, in 1998, Porter constructed a Microeconomic Competitiveness Index (MICI), which measures the relationship between the microeconomic foundations of development and the prosperity of a nation.188 A similar approach to evaluate the impact of each determinant was chosen for this research. The individual elements of each determinant of competitive advantage are based on a similar structure as used by Porter (1998a), but are adapted to fit the structure of the ‘National Diamond’, and to include elements that were not part of the MICI.
187 The approach of case studies was chosen as an approach because it allows to analyze in detail the description and analysis of the research subject – the competitive industries of Ghana. Based on these case studies, it was then possible to determine what factors are driving the competitive advantages and disadvantages of Ghana’s industries. See also Kromrey (1990) p. 320
188 Survey data from questionnaires to senior business leaders and government officials in 52 nations were used to estimate the correlation between the microeconomic environment and the GDP per capita of a nation. The questionnaires were sent out and evaluated together with the questionnaires prepared for the World Economic Forum (1998) Global competitiveness report

69
Table 7: Overview of elements of competitive advantage reviewed Determinant Elements Variables reviewed
Raw material Availability, and quality of raw material
Human resources Quality of primary, secondary and tertiary education (particularly scientists and engineers); quality of on-the-job training and learning
Specialized factors Presence of public and private research and development activities
Capital availability Quality of capital markets, access to credit and stock market
Physical infrastructure Quality of basic infrastructure (roads, ports, power) and advanced infrastructure (telecommunications, storage, logistics)
Information infrastructure
Availability of business and market information
Factor conditions
Administrative infrastructure
Quality and cost of administrative and regulatory environment
Size of home market Demand conditions
Quality of demand Degree of buyer sophistication, quality of regulatory standards, openness of public sector contracts
Supporting industries Quality and quantity of supporting industries Related and supporting industries Related industries Quality and quantity of related industries
Structure and rivalry Competitive intensity; presence of barriers to entry
Climate for investments
Influence of Industry, trade, and labor policy; economic and political uncertainty
Firm strategy, structure and rivalry
Strategy Strategic focus; value chain presence; management practices and goals of individuals
Macroeconomic stability
Interest rate level, volatility of exchange rate, inflation
Government
Microeconomic environment
Influence on factor conditions; demand conditions; related and supporting industries; firm structure and rivalry; strategy
Development of competitive advantage
Nature of current advantage; development of advantage
Summary
Capacity for innovation Possibilities for innovation
Source: Based on Porter (1998b) Table 2, p. 60 with adaptations

70
In every industry, each element is ranked on an ordinal scale from 2 (very important for competitive advantage) to – 2 (major obstacle to competitive advantage), with 0 defined as ‘not important for competitive advantage’. For the summary evaluation of the development of competitive advantage and the capacity for innovation, an ordinal ranking from 2 (high) to 0 (low) is used. The ranking of each element per industry is based on a subjective evaluation of the element. The summary weights for all factors are an unweighted average for all selected industries.
Six industry groups were analyzed in these case studies: five industries that have a competitive advantage, and one industry with a competitive disadvantage. Selected were those competitive industry groups that represented the most important clusters in Ghana. The textile and garment industry group was chosen to understand the determinants of its uncompetitiveness, as a basis to reinforce the understanding of the status of Ghana’s ‘National Diamond’.
Most of the information for these case studies has been gained from structured interviews with individual companies of each industry analyzed. Supporting information comes from industry journals, and other literature sources. Interviews were held in Ghana in two rounds, in the summer of 1995, and in the winter of 1999. In total, 15 interviews were held with company representatives, and 19 interviews were held with representatives from banks, industry associations, supporting institutions, and government officials. At the time of this study, there was no reliable primary data (e.g., company addresses, type of industry) available to extract information with the help of a structured questionnaire.
Each case study starts with a description of the current industry structure in the context of the international market place, with an analysis of global buyers, global competitors and substitutes. The second part is an overview of the industry’s history, its founding, its development over time, and the factors that have influenced the current structure. On the basis of the industry’s structure and historic development, the impact of each determinant of competitive advantage is analyzed along the elements of Table 11. The results are then summarized to describe the determinants of competitive advantage for Ghana’s industries. This allows assessing the overall importance of each element – and on a more aggregate level the importance of each determinant – on the competitive advantage of Ghana’s industries. The summary evaluation of Ghana’s ‘National Diamond’ is then used to verify the working hypotheses from Chapter 2.3.
71
IV ANALYSIS OF COMPETITIVENESS OF GHANA’S INDUSTRIES
The objective of this part is to provide an analysis of Ghana’s competitive industries. The first chapter provides an overview of all competitive industries based on the methodology described in Chapter 9. The following chapters contain detailed analyses of Ghana’s competitive industries and their nature of competitive advantage. The last chapter reviews one uncompetitive industry and tries to determine the reason for its competitive disadvantage.
11 Ghana’s competitive and uncompetitive industries
The overview of Ghana’s competitive and uncompetitive industries forms the basis for the analysis of the determinants of competitive advantage of Ghana’s competitive industries. In form of cluster charts, the structures of the competitive and uncompetitive industries are shown. The degree of competitiveness is reflected in the relative export share of each cluster: Very competitive industries have export shares that are much higher than the nation’s export share. Less competitive industries have export shares slightly above the nation’s export share. The different levels of export shares – or degrees of competitiveness – are shown by different typefaces. Grey shades indicate that industries are related.
11.1 Ghana’s competitive industries
The bulk of Ghana’s competitive industries are in natural resource extraction, and in agriculture. Consequently, the country’s largest competitive cluster is in materials, dominated by the gold mining, and the aluminum processing industries. The second largest cluster is in foods, in particular in cocoa. The third largest cluster is the forest cluster. The housing and personal sectors are quite small. There are no export industries in the “industrial and supporting functions” clusters – neither in the competitive, nor in the uncompetitive sector. Relative to its World market share, the fastest growing cluster has been cocoa, followed by gold, aluminum, preserved fish, oil, and fruits.
The relationships between the different clusters are only weakly developed. There are some ties between the materials cluster (aluminum) and the housing cluster

72
(aluminum household goods); and the forest cluster and the housing cluster are also related (furniture, special inputs). All other competitive clusters, however, have only weak or no links at all to other competitive clusters. Even within clusters there are only weak vertical links. There is a link between the food-special input (cocoa) and primary food (chocolate), as well as within the primary food sector such as pineapples and papayas, or fresh/frozen fish and canned fish. Yet, these links are not strong, and the success in the fish canning industry has not spread to other sectors.
Table 8: Cluster chart for competitive upstream industries189
Primary 2606 Aluminium ores 4407 Wood sawn or chipped lengthwise sliced or peeled > 6mm thick
4001 Natural rubber and similar gums in primary form
4408 Veeer sheets and sheets for plywood (not exceeding 6mm)
7108 Gold 4412 Plywood, venered panels and other similar laminated wood
7601 Aluminium, unwrought7606 Aluminium, plates, sheets and
strips of thickness > 0.2mm
MachinerySpecial inputsLegend Between 0 and 0.01% above Ghana's total export share (excl. cocoa and gold)
Between 0.01 and 0.1% above Ghana's total export share (excl. cocoa and gold)Above 0.1% of Ghana's total export share (excl. cocoa and gold)Cocoa and goldRelated industries (clusters)
Upstream industries (HS-code, description)Materials Forest
Note: Numbers indicate 4-digit HS code for product class; related clusters (also between upstream and final consumption industries) are shaded in gray
189 To illustrate how the competitiveness of an industry was determined, I use the example of the aluminum industry: In 1996, Ghana´s total export value made up 0.03 percent of total World export value, based on the Ghana Export Bulletin (1996) and the UN trade statistics yearbook (1997). In the same year, Ghana´s aluminum export value made up 0.6 percent of total World aluminum export value, indicating that in 1996 aluminum had a comparative advantage in Ghana (also based on the Ghana Export Bulletin and the UN trade statistics yearbook). For 1990, no complete export statistics for Ghana have been published. The information for 1990 is based on the Ghana Export Promotion Council statistics for non-traditional products, and IMF export statistics for traditional exports (minerals, cocoa, aluminum). In 1990, Ghana´s aluminum export value made up 0.03 percent of total World aluminum export value. The fact that over six years Ghana´s aluminum exports have been growing gained market share in World market exports and have therefore grown faster than total World aluminum exports indicates that between 1990 and 1996, Ghana´s aluminum industry has developed a competitive advantage.
This approach was applied systematically to all Ghanaian exports on the 4-digit HS level (to identify also low volume competitive products). Uncompetitive industries were also analyzed at the 4-digit level, and then summarized to the 2-digit HS level in the cluster charts.

73
Table 9: Cluster chart for competitive final consumption goods
TextilesPrimary 7615 Houshold
articles of aluminium
2401 Unmanufactured tobacco
304 Fish fillets and other fish meat
9403 Furniture and parts
305 Fish, dried, salted, smoked
306 Shellfish714 Roots and Tubers
with high starch content,egl. Yams, cocoyams etc.
803 Bananas - Plaintain
804 Pineaples, Mangoes,Avocados, Guavas, Figs, Dates
807 Melons including watermelons and papayas
901 Coffee904 Pepper910 Ginger, saffron,
turmeric, thyme, bay leaves, curry
1207 Other oil seeds and oleaginous fruits
1511 Palm oil and its fractions
1604 Prepared or preserved fish
1806 Chocolate and other food preparations containing cocoa
2009 Fruit juices (incl. Grpe must) and vegetable juices
MachinerySpecial inputs
1209 Seeds for sowing 4409 Parquet flooring
1211 Parts of plants 4418 Builder's joinery and carpentry
1801 Cocoa beans1802 Cocoa shells1803 Cocoa paste1804 Coco Butter
Legend Between 0 and 0.01% above Ghana's total export share (excl. cocoa and gold)Between 0.01 and 0.1% above Ghana's total export share (excl. cocoa and gold)Above 0.1% of Ghana's total export share (excl. cocoa and gold)Cocoa and gold
Basic foods
Edible oils
Processed foods
Final consumption goods and services (HS-code, description)Food & beverage Housing Personal

74
11.2 Ghana’s uncompetitive products
The list of Ghana’s uncompetitive industries is far longer than competitive industries. On a very broad level, there is a distinction between processed goods mainly for domestic consumption, industries dominated by state-owned enterprises, and machinery and special inputs for competitive industries.
In the final consumption segment with the food, textile, housing, personal, entertainment and health clusters, most products are made primarily for the domestic market by foreign multinationals (e.g. milk products, soap, pharmaceuticals) and domestic producers. Within these clusters there are some weak vertical relationships relating to machinery and special inputs; the special inputs and machinery cluster builds on imported components, and the export figures also probably contain a significant part of re-exports of used equipment.
State-owned mining companies control the manganese and diamond industries, and Ghana has lost significant market share in the past years. Other upstream industries such as the paper, petroleum and chemical industries are mainly former SOEs, whose performance has improved significantly in the past 15 years, but which are still not internationally competitive as their processing of imported raw material adds little value.
Related to competitive upstream industries are the uncompetitive primary forest clusters, and the materials machinery cluster. The products in the forest sector have lost competitive advantage as they were replaced with higher value added goods. The machinery sector in the materials industry reflects mostly re-exports of mining machinery. In the special inputs for materials is one industry that provides special input to the competitive gold industry.
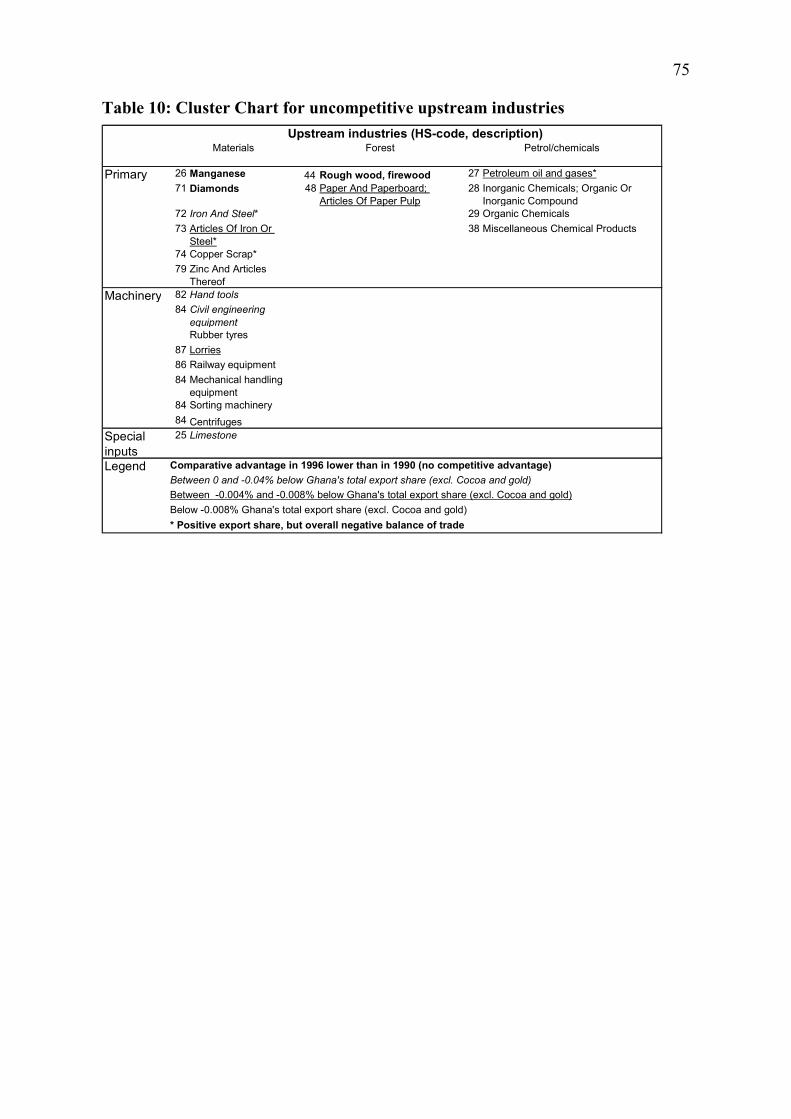
75
Table 10: Cluster Chart for uncompetitive upstream industries
Primary 26 Manganese 44 Rough wood, firewood 27 Petroleum oil and gases*71 Diamonds 48 Paper And Paperboard;
Articles Of Paper Pulp28 Inorganic Chemicals; Organic Or
Inorganic Compound72 Iron And Steel* 29 Organic Chemicals73 Articles Of Iron Or
Steel*38 Miscellaneous Chemical Products
74 Copper Scrap*79 Zinc And Articles
ThereofMachinery 82 Hand tools
84 Civil engineering equipmentRubber tyres
87 Lorries86 Railway equipment84 Mechanical handling
equipment84 Sorting machinery84 Centrifuges
Special inputs
25 Limestone
Legend Comparative advantage in 1996 lower than in 1990 (no competitive advantage)Between 0 and -0.04% below Ghana's total export share (excl. Cocoa and gold)Between -0.004% and -0.008% below Ghana's total export share (excl. Cocoa and gold)Below -0.008% Ghana's total export share (excl. Cocoa and gold)* Positive export share, but overall negative balance of trade
Upstream industries (HS-code, description)Materials Forest Petrol/chemicals

76
Table 11: Cluster chart for uncompetitive final consumption goods
Textiles & Footwear
Primary 33 Essential Oils And Resinoids; Perfumery, Cosmetic
49 Printed Books, Newspapers
30 Pharmaceutical Products
4 Milk products 42 Articles Of Leather
39 Plastics articles (table/ kitchenware)*
34 Soap; Lubricating Products; Waxes
92 Musical Instruments
10 Cereals* 61 Apparel And Clothing Accessories, Knitted
46 Manufactures of straw
24 Cigarettes
62 Apparel And Clothing Accessories, Not knitted
70 Glass And Glassware
17 Sugars And Confectionary
63 Made-Up Textile Articles
97 Works Of Art
19 Preparations Of Cereals
64 Footwear
21 Miscellaneous Food Preparations
68 Articles Of Stone, Plaster, Cement
22 Beer made from malt
Machinery 84 Textile machines 84 Printing machines
Special inputs
32 Tanning Or Dyeing Extracts; Tannins And Derivative
31 Fertilizers* 52 Cotton, Including Yarns And Woven Fabrics
38 Insecticides (Misc. chem. Products)
56 Wadding, Felt And Nonwovens; Special Yarns
11 Milling Industry Products; Malt; Starches
27 SaltLegend Comparative advantage in 1996 lower than in 1990 (no competitive advantage)
Between 0 and -0.04% below Ghana's total export share (excl. Cocoa and gold)Between -0.004% and -0.008% below Ghana's total export share (excl. Cocoa and gold)Below -0.008% Ghana's total export share (excl. Cocoa and gold)* Positive export share; but overall negative balance of trade
Food processing
Building material
Basic foods Houseware
Agricultural
Processed food
Apparel
Beverages
Health careFinal consumption goods and services (HS-code, description)
Food & beverage Housing Personal Entertainment

77
11.3 Selection criteria for industry analysis
As mentioned in chapter 9, the main selection criterion for competitive industry groups was their importance for Ghana’s economy. The five competitive industry groups selected are the aluminum, cocoa, gold, food, and timber industry. The selection of industry groups rather than individual industries allows to see the vertical relationship between industries, and provides also a more robust research object as some industries are dominated by one company only. Together, these five groups account for roughly 80 percent of all exports. The textile and garment industry was chosen as an example of an industry that had been quite large in the 1970s, but is not competitive today.

78
12 The competitive advantage of the Aluminum industry
In 1997 bauxite and aluminum products worth USD 146 million accounted for 9 percent of Ghana’s exports. The main products were aluminum ingots (USD 130 million) and bauxite (USD 11 million) followed by aluminum products, mainly household articles and aluminum sheets (USD 6 million). While Ghana’s aluminum ingot exports have been stable over the past years, exports of aluminum goods have grown 64 percent between 1996 and 1997, and bauxite exports have grown 43 percent. The main destination for Ghana’s aluminum ingots is the Netherlands. The aluminum products are mainly going to neighboring West African countries, Cote d’Ivoire, Togo, and Nigeria. Ghana’s bauxite is exported to Scotland and Canada.
12.1 Structure of Ghana’s Aluminum industry
Aluminum has one of the most complex processing chains of all metals, with four major production steps leading from the raw material bauxite to raw aluminum sheets and profiles. The major steps in aluminum processing are (1) bauxite mining, (2) refining of bauxite into alumina, (3) smelting of alumina into raw aluminum ingots, and (4) processing of aluminum ingots into sheets, coils, and profiles. The processed aluminum is the input for aluminum goods ranging from packaging material, automotive parts and construction elements to household goods. Worldwide, 10 vertically integrated global companies dominate about 70 percent of the global production capacity.190 The key success factor in the aluminum industry is low cost production, which requires access to different sources of input material, mainly bauxite and electricity across the globe. The complexity of the production process and the importance of having access to the right resources are the main reasons for persistent vertical integration across the industry.
As a country, Ghana is home of almost all major production steps in aluminum processing, but not in an integrated form. While bauxite is exported to smelters in Scotland and Canada, alumina is imported from Jamaica and the US for the local smelter.
190 McKinsey (1997)
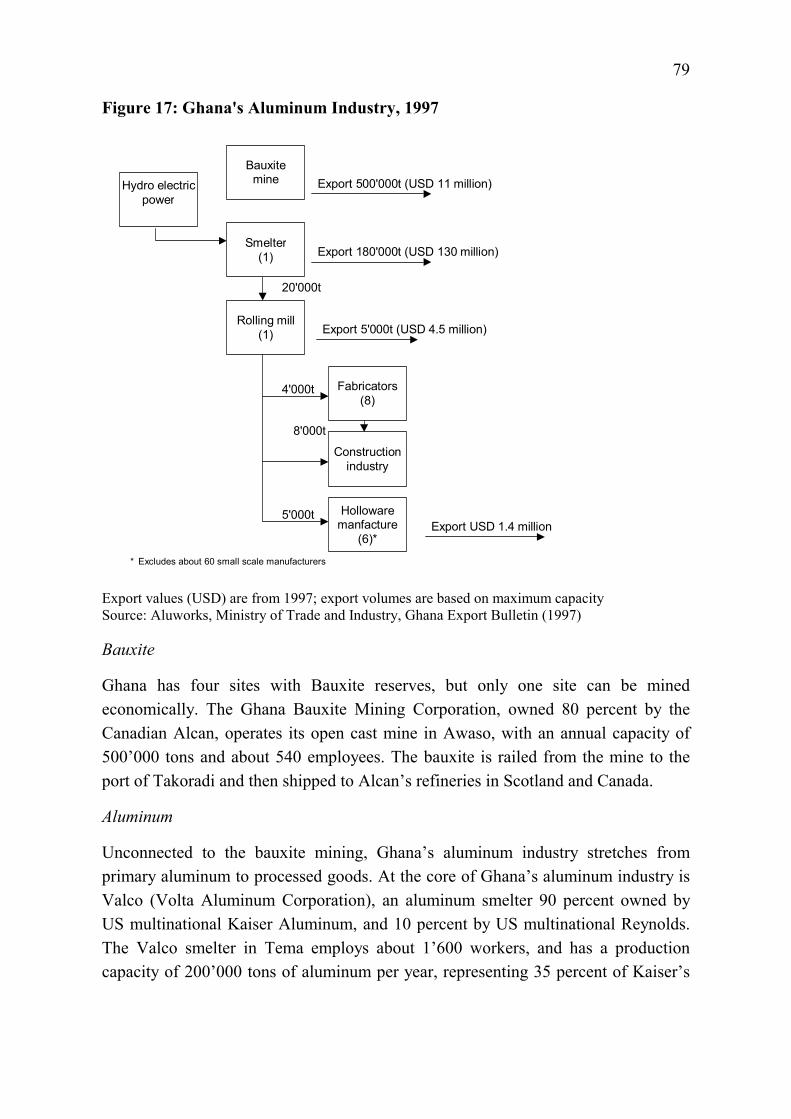
79
Figure 17: Ghana's Aluminum Industry, 1997
Rolling mill(1)
Fabricators(8)
Export 5'000t (USD 4.5 million)
Export USD 1.4 million
Smelter(1)
Hydro electricpower
Bauxitemine Export 500'000t (USD 11 million)
Export 180'000t (USD 130 million)
Constructionindustry
Hollowaremanfacture
(6)*
20'000t
5'000t
4'000t
8'000t
* Excludes about 60 small scale manufacturers
Export values (USD) are from 1997; export volumes are based on maximum capacity Source: Aluworks, Ministry of Trade and Industry, Ghana Export Bulletin (1997)
Bauxite
Ghana has four sites with Bauxite reserves, but only one site can be mined economically. The Ghana Bauxite Mining Corporation, owned 80 percent by the Canadian Alcan, operates its open cast mine in Awaso, with an annual capacity of 500’000 tons and about 540 employees. The bauxite is railed from the mine to the port of Takoradi and then shipped to Alcan’s refineries in Scotland and Canada.
Aluminum
Unconnected to the bauxite mining, Ghana’s aluminum industry stretches from primary aluminum to processed goods. At the core of Ghana’s aluminum industry is Valco (Volta Aluminum Corporation), an aluminum smelter 90 percent owned by US multinational Kaiser Aluminum, and 10 percent by US multinational Reynolds. The Valco smelter in Tema employs about 1’600 workers, and has a production capacity of 200’000 tons of aluminum per year, representing 35 percent of Kaiser’s

80
smelting capacity.191 Valco is Africa’s largest smelter, and Ghana’s second largest company with a turnover of USD 169 million in 1997. The smelter processes imported alumina into aluminum ingots, using around 270 MWh of electricity, 45 percent of the power produced by Volta River Authority’s Akosombo dam.192 The bulk of the production, 180’000 tons, is exported, and 20’000 tons are sold to Ghana’s local industry.
The raw aluminum produced by Valco is processed by Ghana’s rolling mill, Aluworks, into coils, circles and flat sheets. The company has 430 employees, and had a turnover of USD 39 million turnover in 1997. The processed aluminum is sold both to the construction industry, and to hollowware manufacturers. Twenty percent of the production is exported, mainly to regional markets.
In the local construction industry, aluminum is used for roofing sheets, window frames, and panels. The hollowware manufacturing industry, about six medium sized companies and numerous small-scale producers, processes aluminum circles into cooking pots, washbasins and other household articles. The most important companies in the hollowware industry are Domod, with 200 employees and a turnover of USD 4.1 million in 1997, and Pioneer Aluminum with 170 employees and a turnover of USD 4.6 million.193 Roughly 30 percent of their production is exported through both formal and informal routes mainly to neighboring countries.194 About 500 tons of processed aluminum per year goes into Ghana’s informal (small-scale) sector, which manufactures casted and welded products for the construction, fishing, agro-processing and livestock industry.
12.1.1 Buyers
Between 1984 and 1994, World consumption of aluminum has grown by 34 percent chiefly because of the development of new aluminum application in the transport sector, packaging and construction industry. For the next decade, worldwide demand for primary aluminum is expected to follow GDP growth of about 2.5 percent per year.195
191 McKinsey (1998) p. 82 192 IMF (1999a) Table 30, p. 109 193 Ghana Club 100 (1998) 194 Aluworks Interview 195 McKinsey (1997) p. 7

81
Bauxite
Bauxite is a generally available commodity input, but alumina refineries are usually specified to handle only particular grades of bauxite from one or two sources. Ghana produces chemical grade bauxite, which is used by Alcan for blending with bauxite from other sources to achieve a specific grade for its refineries. Alcan currently lacks access to quality bauxite reserves, and is keen on sourcing more bauxite from Ghana.196
Primary aluminum
Primary aluminum is a pure commodity product, and secondary markets are developing rapidly to replace integrated players. Valco produces aluminum based on a tolling contract, where it charges a fee for the processing of alumina provided by its customers.
Aluminum products
The buyers of aluminum products are the construction industry and private households. In the construction industry, price is the main purchasing criteria for a standard good like aluminum roofing sheets. For household goods, the main purchasing criteria are price and quality, such as design, finish and non-stick surfaces of cooking pans.
12.1.2 Competition
Compared to the total World market volume, Ghana plays no significant role in the global aluminum industry.
Bauxite
Bauxite mining is highly concentrated, with five countries providing about 75 percent of the Western World consumption.197 A large part of bauxite is directly processed into alumina at the mine, 198 leading to a weight reduction of about 50
196 McKinsey (1998) p. 22 197 Australia, Jamaica, Guinea, Brazil, Guyana. McKinsey (1997)p. 54 198 Out of the worldwide 18 lowest cost alumina refineries, 16 are geographically integrated with a
bauxite mine. McKinsey (1997) p. 61
82
percent.199 In 1996, worldwide bauxite exports amounted to USD 790 million, and alumina exports to USD 5 billion.200 With exports of USD 11 million, Ghana’s World market position in bauxite is close to invisible. Ghana’s mining operations are currently not profitable, and will only become economical once more reliable and cost-efficient transportation structures are in place.
Aluminum smelting
In the smelting process, alumina, the alumina oxide refined from bauxite, is reduced to aluminum through electrolysis. Smelting is very energy intensive, with electricity costs accounting for roughly 20 percent of the total costs of the final aluminum.201 The key factors of success for a smelter are access to cheap and reliable sources of energy and low labor costs. Energy prices are the main determinant for the location of electrolysis plants.202 The bulk of the world’s 22 million ton aluminum smelting capacity is located in the US (4.1 million tons), Russia (3.8 million tons), Canada (2.3 million tons) and Brazil (2.2 million tons), where energy prices range between US cents 0.1/kWh (Russia) to US cents 2.4/kWh (US).203 To export cheap energy, additional capacity for aluminum smelting is planned in the Middle East, Brazil, Canada and Nigeria. With a capacity of 200’000 tons, Ghana does not have an important World market position, and its current energy prices of US cents 3.9/kWh204 make it one of the most expensive countries.
Aluminum products
The main competitors for Ghana’s aluminum products are East Asian manufacturers. In general, the types of household goods manufactured in Ghana are not produced in developed countries. In the domestic market, closeness to the input material and low transportation costs result in a very cost-competitive position for the local industry.
199 The minimum economic scale for a bauxite refinery is 1 million tons, which makes it unfeasible for Ghana’s current production capacity. McKinsey (1997) p. 58
200 United Nations (1997), Table 3.1.1, p. 145 201 McKinsey (1997) p. 37 202 Across the globe, differences in transport costs lead to changes of maximum USD 60 per ton,
while differences in energy prices can lead to cost differences of up to USD 650 per ton, and differences in labor costs can change costs by up to USD 380 per ton. McKinsey (1997) p. 70, p. 77
203 McKinsey (1997) p. 70 204 Published industrial rate for 1998. The rates negotiated with Valco are not published.
83
Exports to neighboring countries however are in strong competition with goods from East Asia and other African countries.
12.1.3 Substitutes
The main applications for aluminum are in transport (25%), building and construction (22%), and packaging (20%). Aluminum is attractive because it is low weight, good reusable, easy to reshape, highly corrosion- and weatherproof and has no taste or smell. Due to the wide range of applications, it is not seriously threatened by substitutes. In passenger cars and beverage cans, the main substitution threats come from innovative steel solutions. In the packaging industry, plastic foils and containers, and glass bottles are the main substitute for aluminum. In the construction industry, aluminum can be substituted by timber for paneling applications. For more expensive rooftops, aluminum-roofing sheets are often replaced with tiles. In the household industry, stainless steel cooking pans are competing in the more expensive segment of the market, while plastic products compete in the low price container segments.
12.2 History of Ghana’s Aluminum industry
The first bauxite deposits in Ghana were discovered in 1920. Bauxite mining was started in 1941 by British Aluminum in two mines, Ejuanema and Awaso, to supply the Allied forces with aluminum for the aircraft industry. The Ejuanema mine was closed after the war, while operations at the Awaso mine were continued. Initially, the mine produced about 150’000 tons per year, increased to about 300’000 tons until 1976, when the government nationalized all operations. From then on, production declined rapidly until 1984, when annual output was at 50’000 tons. In 1986 the mine began to increase its production again, and has now reached a capacity of 500’000 tons per year. In 1995, Alcan Aluminum bought 40 percent of the mine, and increased its share to 80 percent in 1998, with plans to expand production to 1 million tons per year, and to rehabilitate the railway track between the mine and Takoradi harbor.205
The building of an aluminum smelter in Tema was a major part of Nkrumah’s post-independence industrialization strategy. Nkrumah wanted an integrated industry that
205 IAC Newsletter Database, March 23, 1998 “News in Brief: Alcan takes Control of Ghana Bauxite”

84
would make use of Ghana’s bauxite reserves and the hydroelectric power from an artificial lake. In his view, this industry was to be the seedling for a whole range of related industries, such as aluminum-related manufacturing industries, irrigation for agriculture, lake transport, inland fisheries, and tourist facilities, leading to a rapid industrialization of Ghana.
The earliest feasibility studies on the production of hydroelectric power at the Volta River had been initiated already in 1915, and were continued until independence. After independence, Ghana constructed the Akosombo dam and a deep-sea harbor at Tema between 1961 and 1965, with the financial help of the World Bank, the US and the UK government. At the same time, the US-companies Kaiser and Reynolds undertook the construction of the smelter.206 The smelter had an initial capacity of 145’000 tons/year, and was extended to today’s capacity of 200’000 tons in 1970 and in 1975.207 From 1965 until 1980, Valco supposedly enjoyed the cheapest electricity rates in the World.208 The construction of a refinery in Ghana was never undertaken, mainly because of the high investment costs, but also because investors feared that an integrated industry would be immediately nationalized.209 Until the opening of a rolling mill, the VALCO smelter remained largely an isolated part of what should have been a completely integrated industry, and was basically used to export Ghana’s electricity in form of aluminum. In 1982, the Ghanaian government initiated the construction of the Aluworks cold rolling mill next to the smelter, to provide the raw material for a local household good and construction material industry. The company went public in 1996, and the government sold its share in 1997. Between 1989 and 1994, Valco underwent a massive renewal and restructuring program,210 and is considered to be Kaiser’s lowest cost smelter at the moment.211
Ghana’s first small-scale industries have been started in the 1960s and 1970s, often as joint ventures with foreign owners who then left the country. Today’s largest hollowware companies, DOMOD and Pioneer Aluminum, were founded in the late 1980s, when rolled aluminum had become directly available as input. The
206 Agbodeka (1992) pp. 143 207 North (1997) p. 124 208 See Diaw, Schmidt-Kallert (1994) p. 305 who point to several sources. 209 Agbodeka (1992) p.144. The building of an alumina processing plan has been a wish of
successive governments ever since. Tsikata (1997) p. 13 210 North (1997) p. 126-136

85
establishment of an aluminum rolling plant and larger processors was accompanied by the start-up of many small-scale hollowware producers during the late 1980s and early 1990s.
12.3 Aluminum’s Diamond of National Advantage
Table 12: Determinants of aluminum's competitive advantage Determinant Elements Bauxite Primary Processed
Raw material 2 2 1
Human resources 0 1 2
Specialized factors 0 1 2
Capital availability 0 0 2
Physical infrastructure -2 -1 0
Information infrastructure 0 0 0
Factor conditions
Administrative infrastructure
0 0 -1
Size of home market 0 0 1 Demand conditions
Quality of demand 0 0 2
Supporting industries 0 0 2 Related and supporting industries Related industries 0 0 2
Structure and rivalry 0 0 2
Climate for investments 1 -1 2
Firm strategy, structure and rivalry
Strategy 0 1 2
Macroeconomic stability 0 0 1 Government
Microeconomic environment
-1 -1 0
Development of competitive advantage
-1 -1 1 Summary
Capacity for innovation 0 0 1
2 = very important
1 = important 0 = not relevant -1 = negative -2= very negative
211 McKinsey (1998) p.83

86
12.3.1 Factor conditions
The factor conditions describe the mix of production factors – the inputs necessary to compete – which a country has available. Two types of factors are considered in the analysis of each industry: basic factor advantages, such as raw material and low-cost labor, and advanced factor advantages, mainly special skills and know-how that are particular to this specific industry. The four broad categories considered here are raw material, human resources, knowledge resources, capital resources, and the country’s infrastructure.
Raw material:
Basic factor advantages in the form of high-grade bauxite and cheap electricity were the main reason for the establishment of bauxite mining and primary aluminum industry in Ghana. As such, they continue to be the main drivers of competitiveness of Ghana’s bauxite and primary aluminum industry. However, while the quality of the bauxite is still a competitive advantage, the advantage of cheap electricity is vanishing. Primary aluminum is a commodity product where low costs determine economic success. Electricity and labor, accounting for half of the total costs mainly drive production costs.212 Between 1960 and 1980 Ghana’s electricity prices were the lowest in the World, with the result that Valco was considered to be the lowest-cost smelter within its group. In 1998, industrial rates for power were raised from US cents 2.2 to 3.9 in 1998213, leading to a cost increase of at least USD 140/ton of aluminum produced.214 Operational improvements at the smelter resulted in short-term profit improvements. However, in the long run Ghana will not be able to provide competitive energy prices to Valco.215 Worse, the unreliability of supply is threatening the long-term viability of Ghana’s smelter even more. Severe droughts have led to falling water levels in the Volta Lake, and electricity production was
212 McKinsey (1997) 213 EIU (1998a) p. 21 214 A cost increase of US cent 1/kWh leads to an increase of approximately USD 140/ton of
aluminum. McKinsey (1997). Although Valco’s electricity rates are not published, it is likely that in the course of rising energy prices, their rates have increased by at least US cent 1 as well.
215 The current operating costs of the Akosombo power plant are estimated to be around US cents 4.4/kWh, compared to the US cents 0.1/kWh for Russian power or the US cents 2.4/kWh for US power. The new Aboadse thermal power plant is estimated to produce at about US cents 5.5/kWh. EIU (1998a) p. 21; McKinsey (1997) p. 70. Significant efforts are made to tap alternative sources of energy, such as natural gas from Nigeria and electricity imports from Cote d’Ivoire, but mainly for the benefit of the gold mining industry.

87
curtailed to 6’400 gWh in the best years.216 In 1998, Valco was operating only one out of its five potlines, and aluminum for domestic consumption had to be imported.
For the aluminum processing industry, the availability of domestic aluminum constitutes a modest advantage. The processing industry was founded because of domestically produced aluminum, but there are hardly any price or quality differences from imported aluminum.
Human resources, specialized factors
In the bauxite mining, human resources and specialized factors play no major role. In the primary aluminum industry however, competitive advantage has been gained through investments in staff training. Since the start of its operations in the late 1960s, Valco has been active in skill transfer and workers training, building up the required skills and specialized know-how internally. In the beginning, about 60 expatriates worked at the smelter. Through continuous skill transfer that number has been reduced to 13 expatriates. The availability of engineers and specialized workers has significant benefits particularly for the processed aluminum industry. All major companies are doing development work, and often benefit from the metallurgical research work done at Valco. Companies like Aluworks also provide direct support and advice mainly to their smaller customers, while workers from the larger aluminum processors often move on to open their own small operation.
Both the bauxite mining and primary aluminum companies are managed by multinationals, and have a significant share of foreign managers. In contrast, the aluminum processing industry has been built-up by Ghanaians, and is also controlled now by Ghanaian management.
Capital availability
Availability of capital has not been an issue for Ghana’s bauxite mining and primary aluminum industry, which were both financed by their foreign parent companies. Some aluminum processing companies were able to initially draw on government investments (Aluworks); most have capitalized themselves either on Ghana’s stock market or through private investors.
216 EIU (1998b) p. 19, IMF (1999a) Table 30, p. 109

88
Physical infrastructure
The poor state of Ghana’s infrastructure, in particular its decrepit power plant, are a major problem for the country’s primary aluminum processor (see p. 86). For the bauxite mining, the poor condition of the country’s railway system is the main factor for its inability to grow its capacity and to return a profit. The bauxite is transported over 240 km on a single-track railway, which is also used for manganese, timber, and cocoa loads.217 As transport costs make up 45 percent of the total FOB price, Ghana’s bauxite is currently not competitive on World markets.
Most of Ghana’s aluminum processing industry is located around Accra and Tema, and except for utility problems does not suffer from the country’s poor physical infrastructure.
Information infrastructure
Although the aluminum industry as a whole is a very important industry for Ghana, there are no government or industry-sponsored research or training institutions providing specific support for the industry.
Administrative infrastructure
Overall, the administrative infrastructure of Ghana does not support nor hinder the development of competitive advantage of Ghana’s aluminum industry.218
12.3.2 Domestic demand conditions
Domestic demand conditions are important for the competitive advantage of an industry because they shape how firms perceive, interpret and respond to buyers needs. Firms focus on the demands of their home customers because they are much closer, both geographically and culturally, and their needs can be felt much more acutely. Domestic demand has two elements, the total market size, and the quality of home demand. A large market allows firms to leverage economies of scale, while small markets force companies to focus on exports early on. Sophisticated demand
217 With the tracks being in poor condition, derailments occur up to twice a month, blocking shipments from the mine to the harbor for several days.
218 The processed aluminum industry complains about administrative hurdles for exports to neighboring ECOWAS countries, on which Ghana’s government has only limited direct impact.

89
and high quality standards force an industry to upgrade their products, and offer insights into customer needs that are hard to gain in foreign markets.
Bauxite and primary aluminum are commodity products, and the quality and quantity of home demand play basically no role for its cost-efficient production. For household aluminum products, however, Ghana’s domestic demand has been quite important. On the quality side, the country’s growing middle class has been demanding reasonable-quality cooking pots and household goods. Domestic customers are no longer happy with simple pots, but also demand special features such as non-stick surfaces and special designs. The experience gained in their home market allows Ghana’s hollowware manufacturers now to export successfully to neighboring countries with similar demand patterns. In the hollowware industry, the small size of Ghana’s home market and the low quantity of demand has been favorable, as firms are forced to export if they want to grow.
The Standards Board checks most processed aluminum products. However, it does not provide any technical advice, and it does not seem to be informed about international standards.219
12.3.3 Related and supporting industries
A strong related and supporting industries gives companies access to sophisticated input and partners. Ideally, the close relationship between sophisticated industries leads to reinforcing advancements through innovation and productivity improvements, allowing both partners to benefit from the success of the other.
Ghana’s open pit bauxite mine requires heavy equipment, which is all imported. The company benefits from the contact to other mining companies through the Ghana Chamber of Mines. Also in the primary aluminum industry all machinery and inputs are imported. In the aluminum processing industry, all machinery and materials such as master alloys and pot handles are imported. Nonetheless, the industry benefits from the clustering of all aluminum processors around Accra and Tema. This enables the rolling mill to draw on the expertise of its main supplier Valco. It allows also small customers to ask for support from the rolling mill, starting with the selection of the appropriate machinery to the preparation of the right material for the production, and the resolution of technical problems. Furthermore, special expertise
219 Lall, Navaretti, Teitel, Wignaraja (1994) p. 238

90
and know-how on the technical level is easily transferred between firms through skilled workers changing their employer.
12.3.4 Firm structure, strategy and rivalry
The rivalry within an industry determines how intensive companies compete, and how strong the pressure is to innovate and upgrade their products. The competitive environment is determined both by the structure of the industry and the climate for investment, and the strategic choices taken by firms.
Structure and rivalry
In the bauxite, primary and aluminum rolling industry, there is only one player in each segment. In the aluminum processing industry, the structure is more diverse and rivalry is intensive. The easy access to raw material and machinery, and the possibility to start at small scale results in very low entry barriers for the aluminum hollowware and household industry. There is intense rivalry within the hollowware industry, and many former employees of one of the big manufacturers have started most small-scale companies. The high degree of rivalry has forced the industry to compete not only on costs, but to upgrade in order to compete on quality, such as non-stick surfaces and high-quality design.220
Climate for investments
Similar to other mining extraction industries, the bauxite industry benefits from the country’s favorable regulatory environment, which supports the establishment of new mines in Ghana. Also the processed aluminum industry has taken advantage of more favorable investment conditions. Yet, the investment climate for Valco has not always been friendly. The sheer size of the company, the history of its foundation and its importance for the country made its dealing with the country’s government sometimes difficult. This concerns in particular the current energy prices, which were at a very low level when the company started out in 1960, and expanded during
220 For an analysis of Ghana’s small-scale aluminum industry see Yankson (1996). According to the author, there are hardly any links between the small-scale and large-scale firms. The small-scale industry processes largely scrap aluminum, with only 4 percent of the material being purchased from the formal primary aluminum sector. Only 2 percent of the operators had been employed previously in larger aluminum processing firms. Interview results however indicate that the skill-transfer from large-scale to small-scale companies is significant, and that competition particularly in the low price segment is fierce.
91
the 1970s. Subsequent contract renegotiations have led to rising prices up to a level where the profitability of the company is now seriously threatened.221
Strategy
The competitive success of Ghana’s bauxite mining industry does not rest on a particular strategy, as the mine is mainly a producer of bauxite for export to its foreign parent.
The success of Valco in Ghana depended to a significant extent on the two main elements of its strategy: to maintain good relationships with Ghana’s government; and to improve production efficiency in order to reach World class productivity and cost competitiveness in the face of rising energy prices. Aside from that, however, the company also operates mainly as a production outlet for its multinational parent.
The dominant strategy of small-scale players in the hollowware industry is to focus on costs, and to sell in local markets. The larger companies however focus on producing high quality, innovative products to beat their competitors. Their success hinges not only on good production skills, but also on the presence of other parts of the value chain such as research and development, and sales and marketing activities.
12.3.5 Influence of Government Policy
The influence of the government on industry is extensive. Indirectly, the government shapes an industry’s factor conditions through training and infrastructure, it influences the sophistication of home demand through regulatory standards, and its policies are usually reflected in a firm’s strategy. Directly, the government influences the competitiveness of an industry through direct intervention and regulation.
Except for the aluminum processing companies, Ghana’s government still influences every part of Ghana’s aluminum industry. In the past, the nationalization of Ghana’s bauxite industry resulted in a rapid deterioration of the mine, and only new foreign investments made a return to profitability possible. Today, there is no direct government influence on the bauxite mining industry, but the government still owns a minority share of the mine and is responsible for the (lack of) investments in the
221 Although one could probably argue that prices had been initially low, and currently reflect the true operating costs of Ghana’s power plants.

92
required transport infrastructure. Ghana’s primary aluminum industry is arguably the only successful industry resulting from Nkrumah’s national economic policy of the 1960s. The industry buys its most important input factor, electricity, from a state-monopoly, the Volta River Authority. Both the current political atmosphere as well as the operating efficiency of the monopoly influences the rates negotiated with the Valco smelter. As a result, the economic viability of Ghana’s primary aluminum industry is determined largely by the (in)efficiency of Ghana’s SOEs, and by negotiations with the government. Similar to the foundation of the primary industry, the forward integration into aluminum rolling is a result of a successful government initiative, and the country’s economic recovery. Since then, however, the processed aluminum industry has been growing largely independent of specific government policies or regulations.
12.4 Summary and conclusion on Ghana’s Aluminum industry
Nature and development of competitive advantage
The foundation of a competitive primary aluminum and processed aluminum industry has been the result of targeted government intervention. The construction of the hydroelectric dam, a deep-sea harbor and later a rolling mill has eventually led to the foundation of a competitive aluminum industry cluster. The main reasons for foreign direct investments were basic factor advantages in the form of cheap electricity. Today, however, this basic factor advantage is about to disappear, and makes the long-term future of a primary aluminum industry in Ghana uncertain. 222 As the cost of electricity is to a significant extent driven by political negotiations, the long-term competitiveness of Ghana’s aluminum smelter depends on the ability of Ghana’s government to improve the efficiency of its monopoly and on the will to grant competitive (subsidized) rates to the aluminum industry.
Two elements are responsible for the success of Ghana’s processed aluminum industry. One is the closeness of the Valco smelter, which not only delivers raw material, but also provides specialist workers and targeted research. The second element is the low entry barrier to the industry, resulting in intense rivalry between large and small players. Competition forces companies to look for different ways to compete than price, and to search for new markets outside Ghana. Even without a
222 EIU (1998c) p. 18

93
smelter close by, Ghana’s aluminum processing industry can remain competitive if the domestic rivalry continues to force all players to upgrade and innovate. Primary aluminum is available on the World market, and the aluminum processing industry will not be severely affected if Ghana would loose its current smelter.
Capacity for innovation
Overall, the capacity for innovation in Ghana’s aluminum industry is limited. In the bauxite mining and primary aluminum industry, there are very few opportunities to improve productivity, to launch new products, or to extend into other services. The main improvement potential in the bauxite mining is the establishment of a better transport infrastructure, and possibly of additional processing facilities (i.e. alumina plants). In the primary aluminum industry, innovation comes mainly from the implementation of new production processes leading to lower costs because of lower energy requirements or increased machine efficiency. Although there is significant cost reduction pressure on Ghana’s smelter, this type of innovations is unlikely to be devised in Ghana, but rather “imported” from other facilities abroad.
In the aluminum processing industry, there remains some capacity for innovation, such as new product development and product improvements. As domestic demand and pressure for innovative aluminum solutions is limited, further innovations could be achieved by exporting to other West African markets.

94
13 The competitive advantage of the Cocoa industry
In 1997, cocoa product exports from Ghana amounted to USD 470 million, down from USD 559 million in 1996. While exports of cocoa butter and cocoa liquor had increased from USD 62.5 million in 1996 to USD 89.5 million in 1997, exports of raw cocoa beans had fallen from USD 495 million to USD 378 million in 1997 due to less favorable weather conditions223. Chocolate exports in 1997 amounted to USD 700’000, going primarily to neighboring Togo.224
13.1 Structure of Ghana’s Cocoa industry
Ghana is the world’s second largest exporter of cocoa with a World market share of 13.7 percent,225 behind Cote d’Ivoire (45.1 percent), and ahead of Malaysia/Singapore (9.2 percent) and Indonesia (9.1 percent). Ghana’s entire cocoa production is exported through the Cocoa Marketing Board (Cocobod), the government marketing monopoly. The original objective of the Cocobod had been to provide farmers with a buffer against fluctuating World market prices, but today it operates primarily as a marketing, quality control, and tax collection institution.
In Ghana, around 1.6 million smallholder farmers grow cocoa, each cultivating no more than 3 hectares in mixed culture, together with oil palms, yams and bananas.226 Cocoa is grown on cocoa trees, which start to produce pods after three to five years, and achieve their highest yields during their 10th and 20th year. Farmers ferment and dry the cocoa beans, and sell them to the Cocobod, or to one of its 17 licensed buyers. In general, high quality cocoa beans are exported directly, as the country can fetch a price premium for them. Substandard beans are processed and exported as intermediate products.
223 The 1995/96 crop was a bumper harvest, the best since the 1960s. The 1996/97 harvest was more representative of an average harvest. EIU (1997b) p. 27
224 Based on Ghana Export Promotion Council Statistics. The Ghana Export Bulletin shows chocolate exports of USD 9.5 million in 1996 – probably a data entry or classification error when compared against USD 880’000 exports in 1996 from other sources.
225 Based on 1996 world exports, UN Trade Statistics Yearbook (1996) 226 La Verle (1995) p. 160 indicates that while production is scattered, the trade of cocoa seems
to be in the hands of a small number of farmers, with 25 percent of all farmers receiving 50 percent of the total cocoa income.

95
In the grinding process, cocoa is ground to produce cocoa liquor. In hydraulic presses, cocoa liquor is split into cocoa butter and cocoa powder. For the manufacturing of chocolate, cocoa liquor and cocoa butter are mixed, kneaded, and then conched227; cocoa powder is used in cocoa-flavored products. Two major cocoa mills operate in Ghana to process those beans that cannot fetch a price premium. The West African Mills in Takoradi is majority-owned by the German Schröder/Hosta group, has 450 employees and a processing capacity of 60’000 tons,228 and produces mainly cocoa butter and cocoa cake. The state-owned Cocoa Processing Company has one mill in Takoradi, and one in Tema with an annual capacity of 25’000 tons, manufacturing cocoa liquor, cocoa butter, and cocoa powder. It also produces chocolate in its confectionery subsidiary in Tema. Nestle and Cadbury, two of the world’s largest chocolate confectionery producers, have smaller operations in Ghana, producing cocoa products primarily for domestic consumption
Figure 18: Structure of Ghana's cocoa industry, 1997
Cocoa Buyer(17+1)
Cocoa processing
(2)
Chocolatemanufacture
(1)
Export USD 378.4 million
Export USD 89.5 million
Export USD 0.7 million
Cocoa farming
(1.6 million)
Source: Ghana Export Bulletin (1997), own research
227 In the conching process, the chocolate mass is constantly agitated under the application of heat
228 EIU (1998c), p. 19

96
13.1.1 Buyers
The buyers of cocoa beans are cocoa grinders and chocolate manufacturers. The cocoa and chocolate industry is heavily concentrated, with five to six players dominating around 75 percent of the World market in each production step. Five trading companies dominate the main futures markets for cocoa in New York and London. The World’s largest cocoa processors are in the US, the Netherlands, Germany and the UK (Table 13).
Table 13: Market leadership in World cocoa industry
Activity Number of leading countries/ companies
World market share (estimate)
Production 4 77%
Trade 5 80%
Processing 4 70%
Chocolate 6 80%
Source: Rabobank (1995) Table 9.1, p. 59, own calculations
In general, there is very little vertical integration between the cocoa bean production, cocoa processing, and chocolate manufacturing. Large scale cocoa processing requires significant investments and is a highly specialized business. The combined marketing of cocoa butter and cocoa powder is tricky, as the chocolate industry requires more butter than powder, resulting in a surplus of powder. From a processor perspective, more or less efficient market conditions make backward integration from the processor to the production level not really necessary. Seventy percent of cocoa processing is still concentrated in the consuming countries, as it enables manufacturers to mix suppliers from different countries, and the ease of raw material storage in temperate climate allows for efficient year-round production.229 Apparently, cocoa processing in producing countries is only profitable if beans are of lower-than-average quality, and could only be sold at a discount.230 However, several leading cocoa growing countries have moved towards cocoa processing, as this step provides additional value-added from a pure agricultural commodity product (Figure 19).
229 Rabobank (1995) p. 41 230 Rabobank (1995) p. 41
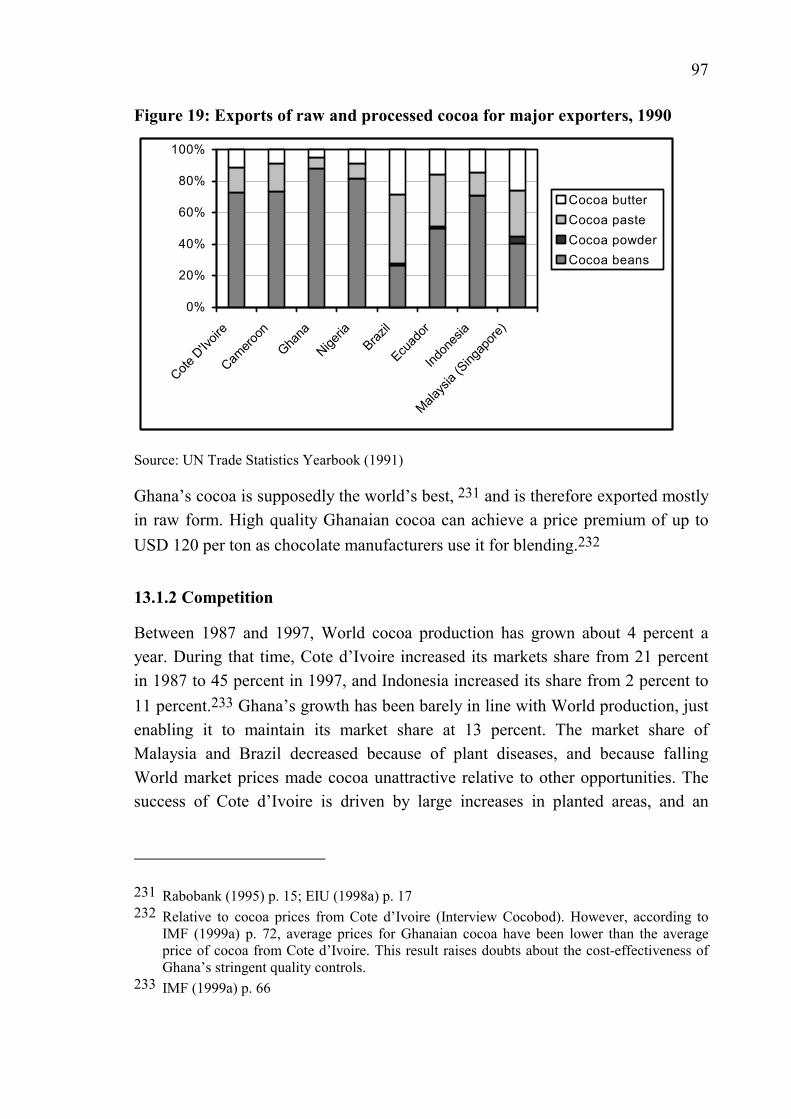
97
Figure 19: Exports of raw and processed cocoa for major exporters, 1990
0%
20%
40%
60%
80%
100%
Cote D
'Ivoir
e
Camero
on
Ghana
Nigeria
Brazil
Ecuad
or
Indon
esia
Malays
ia (S
ingap
ore)
Cocoa butterCocoa pasteCocoa powderCocoa beans
Source: UN Trade Statistics Yearbook (1991)
Ghana’s cocoa is supposedly the world’s best, 231 and is therefore exported mostly in raw form. High quality Ghanaian cocoa can achieve a price premium of up to USD 120 per ton as chocolate manufacturers use it for blending.232
13.1.2 Competition
Between 1987 and 1997, World cocoa production has grown about 4 percent a year. During that time, Cote d’Ivoire increased its markets share from 21 percent in 1987 to 45 percent in 1997, and Indonesia increased its share from 2 percent to 11 percent.233 Ghana’s growth has been barely in line with World production, just enabling it to maintain its market share at 13 percent. The market share of Malaysia and Brazil decreased because of plant diseases, and because falling World market prices made cocoa unattractive relative to other opportunities. The success of Cote d’Ivoire is driven by large increases in planted areas, and an
231 Rabobank (1995) p. 15; EIU (1998a) p. 17 232 Relative to cocoa prices from Cote d’Ivoire (Interview Cocobod). However, according to
IMF (1999a) p. 72, average prices for Ghanaian cocoa have been lower than the average price of cocoa from Cote d’Ivoire. This result raises doubts about the cost-effectiveness of Ghana’s stringent quality controls.
233 IMF (1999a) p. 66

98
increase in the share of hybrid cocoa trees,234 while Indonesia is able to maintain relatively low production costs (Table 14).
Table 14: Overview of cocoa producer country characteristics Africa Latin America Asia
Cote d’Ivoire
Cameroon Ghana Nigeria Brazil Ecuador Indonesia Malaysia/ Singapore
World export share, 1996
45.1% 4.5% 13.7% 5.2% 4.3% 3.9% 9.1% 9.2%
Production structure
Mainly small holdings in combination with food crops
Mainly large, monoculture plantations
Yield (kg/ha) 1997
550 352 453 322 404 244 1074 609
Percent of trees older than 30 years
20% 46% 39% 59% 50% N/A 1% 3%
Production costs (USD/kg)
0.40 0.45 N/A235 0.45 > 1.00 N/A 0.30 – 0.80
0.70 – 1.30
Source: Rabobank (1995) pp. 14 – 21, p. 40; UN International Trade Statistics Yearbook (1996); FAO FAOSTAT (Database download)
In Africa, cocoa is grown predominantly in smallholdings in conjunction with food crops. In Latin America and South East Asia, cocoa is grown mainly on large plantations. In general, small holders achieve significantly lower yields than large-scale plantations, as these are able to use professional management, and leverage the latest development in cultivation and planting material. On the other hand, production costs on small holding farms are significantly lower than on plantations, and during low price cycles farmers can shift their resources to other food crops.
Compared to Cote d’Ivoire and Malaysia, Ghana’s cocoa yields are relatively low,236 as it had only 12 percent hybrid trees, while in Cote d’Ivoire one-third the tree stock consisted of hybrids.237
234 Rabobank (1995) p. 14 235 Ghana’s production costs are most likely slightly higher than Cote d’Ivoire’s production
costs because of higher quality standards 236 Ghana’s low official productivity is partially distorted by smuggling of cocoa to Togo and
Cote d’Ivoire.
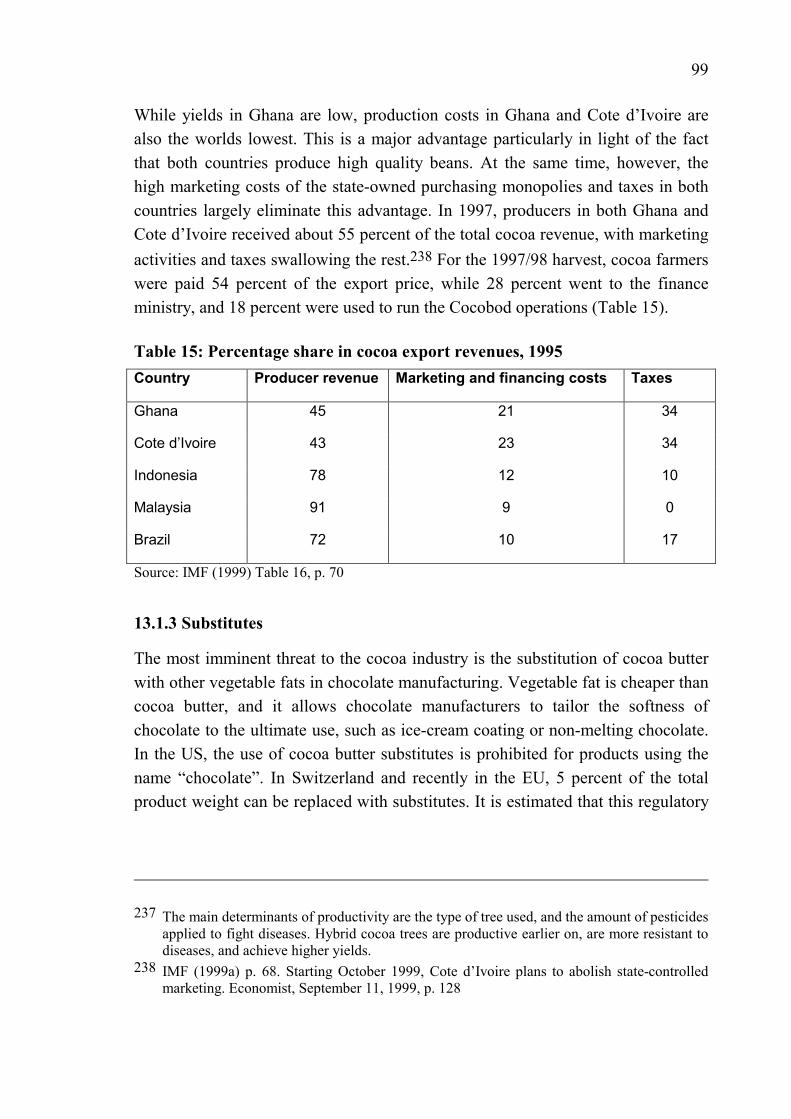
99
While yields in Ghana are low, production costs in Ghana and Cote d’Ivoire are also the worlds lowest. This is a major advantage particularly in light of the fact that both countries produce high quality beans. At the same time, however, the high marketing costs of the state-owned purchasing monopolies and taxes in both countries largely eliminate this advantage. In 1997, producers in both Ghana and Cote d’Ivoire received about 55 percent of the total cocoa revenue, with marketing activities and taxes swallowing the rest.238 For the 1997/98 harvest, cocoa farmers were paid 54 percent of the export price, while 28 percent went to the finance ministry, and 18 percent were used to run the Cocobod operations (Table 15).
Table 15: Percentage share in cocoa export revenues, 1995 Country Producer revenue Marketing and financing costs Taxes
Ghana 45 21 34
Cote d’Ivoire 43 23 34
Indonesia 78 12 10
Malaysia 91 9 0
Brazil 72 10 17
Source: IMF (1999) Table 16, p. 70
13.1.3 Substitutes
The most imminent threat to the cocoa industry is the substitution of cocoa butter with other vegetable fats in chocolate manufacturing. Vegetable fat is cheaper than cocoa butter, and it allows chocolate manufacturers to tailor the softness of chocolate to the ultimate use, such as ice-cream coating or non-melting chocolate. In the US, the use of cocoa butter substitutes is prohibited for products using the name “chocolate”. In Switzerland and recently in the EU, 5 percent of the total product weight can be replaced with substitutes. It is estimated that this regulatory
237 The main determinants of productivity are the type of tree used, and the amount of pesticides applied to fight diseases. Hybrid cocoa trees are productive earlier on, are more resistant to diseases, and achieve higher yields.
238 IMF (1999a) p. 68. Starting October 1999, Cote d’Ivoire plans to abolish state-controlled marketing. Economist, September 11, 1999, p. 128
100
change of the EU could reduce worldwide cocoa demand by about 120’000 to 300’000 tons per year (around 12 percent of total World production).239
13.2 History of Ghana’s Cocoa industry
Cocoa was first brought to the Gold Coast by the Dutch in 1815, and the Basle Missionaries in the mid 19th century. The colonial government supported cocoa research in its Aburi Botanical Gardens, and started to distribute imported seedlings to farmers. With the end of slave trade during that time, a great number of resources were released for agriculture, and cocoa cultivation started booming in Ghana.240 In 1903, a railway line was constructed between Kumasi and the port of Takoradi, allowing to ship large volumes of cocoa from the Ashanti forest region to the coast.
The cultivation of cocoa in Ghana was always in the hands of small-scale farmers, and European planters never established themselves in the country. Large companies like Cadburys and United Africa brothers bought cocoa from farmers, and supplied them with imported manufactured goods in return.241 By 1925, Ghana was exporting about 250’000 tons of cocoa, and commanded a World market share of about 44 percent242. Soon after, the global recession, World War II and the spread of swollen shoot disease reduced annual production to about 200’000 tons until 1950.243 From then onwards, production continued to raise a record harvest of 575’000 tons in 1964. After this peak, harvests declined rapidly, Ghana lost its market leadership to Cote d’Ivoire in 1977 and reached its lowest point in 1983 with an annual harvest of 158’000 tons.
The rise and fall of Ghana’s cocoa has been closely linked to the economic infrastructure and development programs of the post-colonial government. Taxes on cocoa financed Ghana’s industrialization strategy, resulting in a resource transfer from the highly profitable agricultural sector to the poorly performing industrial sector. The Cocoa Marketing Board was badly run and abused for
239 Rabobank (1995) p. 50 (lower limit); Interview Cocobod (upper limit) 240 Agbodeka (1992) p. 57 241 The involvement of private companies in cocoa purchasing ended in 1947, with the
establishment of the Cocoa Marketing Board. 242 Agbodeka (1992) p. 58 243 von Gnielinski (1986) p. 162

101
political cronyism.244 Adding to the poor internal management, rapidly declining prices for cocoa lead to a further reduction of cocoa revenues. While farmers had received 50 percent of the export revenues in the early 1960s and only 40 percent in the 1970s, the decline in real international prices resulted in even lower revenues in the 1980s, when they received 60 percent of the export revenues.245 As a consequence, in the short run farmers shifted towards other food crops that had suffered much smaller real price deterioration. The long run consequence was a decline in new tree planting, resulting in overaged trees after about 10 years. In 1983, most cocoa trees were aged fifty years and older, way beyond their prime time, 246 and about 30 percent of the production was smuggled to Cote d’Ivoire and Togo.247
After 1983, the new government undertook several measures to rehabilitate one of the country’s most important sectors. These measures included an increase of producer prices from as low as 25 percent in 1986 to 56 percent in 1997,248 and a cost-cutting program and slimming of Cocobod from 140’000 employees in 1980 to 10’500 employees in 1998.249 The main cost-cutting measure was the liberalization of the internal marketing system in 1992, allowing licensed traders to purchase cocoa from the producers. Additional measures included the construction of additional feeder roads to ease transportation bottlenecks, and the elimination of subsidies for agrochemicals and equipment, leading to improved availability. Since 1987, Ghana’s cocoa production has been growing slowly from about 280’000 tons to roughly 390’000 tons in 1997, and yields have been rising from about 200kg/ha to 450kg/ha.250 In April 2000, the state-owned buying monopoly was privatized under the name of Produce Buying Company.251
244 In 1980, when Ghana produced 200’000 tons of cocoa, the Cocobod employed 105’000 employees, or 0.5 workers per ton.
245 Bulír (1998) p. 9 246 von Gnielinski (1986) p. 162 247 Bulír (1998) 248 IMF (1999a) p. 75 249 Financial Times, June 22, 1998 (Database download) “Survey – Ghana 1998: Cocobod
monopoly under pressure” 250 IMF (1999a) Figure 16, p. 71; Figure 13, p. 65. Part of the yield increase can be attributed to
the reduced smuggling of cocoa. 251 EIU ViewsWire, June 28, 2000 (Database download): “Africa industry: Agribusiness sector
update

102
Foundation of important companies
The international commodity merchant Gill & Duffus founded Ghana’s largest cocoa processors West African Mills in 1947. The company was nationalized during the 1970s, and privatized again in 1992. Today, 60 percent of the company is owned by the German Hosta group, one of the world’s largest cocoa processors, which invested DM 30 million to “salvage it from immediate collapse”252, increasing its annual cocoa processing from 10,000 tons to over 50’000 tons. The second largest cocoa processor in Tema was built by the German Drevici Group in 1965, and taken over by the government in 1972. Attempts to privatize it have been unsuccessful, but there are plans to double its processing capacity to 50’000 tons per year in 1999.253
252 Divestiture Implementation Committee, Web page (April 1999) 253 EIU (1998c) p. 19

103
13.3 Cocoa’s Diamond of National Advantage
Table 16: Determinants of cocoa's competitive advantage Determinant Elements Primary Processed
Raw material 2 1 Human resources -1 0 Specialized factors -1 1 Capital availability -1 1 Physical infrastructure 0 0 Information infrastructure
0 1
Factor conditions
Administrative infrastructure
-2 0
Size of home market 0 0 Demand conditions Quality of demand 0 0 Supporting industries -1 0 Related and supporting
industries Related industries -1 0 Structure and rivalry 0 0 Climate for investments 1 1
Firm strategy, structure and rivalry
Strategy 1 0 Macroeconomic stability
0 0 Government
Microeconomic environment
-1 0
Development of competitive advantage
1 0 Summary
Capacity for innovation 2 0
13.3.1 Factor conditions
Raw material
The quality of the raw material is one of the major determinants of Ghana’s competitive advantage in cocoa. Ghana is renowned for producing the best quality

104
cocoa in the World,254 and its entire marketing system, starting from stringent quality controls to an export monopoly, is geared towards maintaining this quality. However, compared to all competing countries, Ghana’s productivity is very low. To increase Ghana’s current production level and to grow its yield over the next years, Ghana’s farmers would need to invest aggressively in new hybrid trees. This is particularly critical as only 13 percent of all trees are within their peak producing range of 16 to 23 years, and more than a quarter is over 30 years old.255 Today, they can barely afford more fertilizer and insecticides to increase production.
Human resources and specialized factors
Cocoa is grown by smallholders who have typically no special skills or know-how. Although simple cocoa processing is not very technology intensive, the low skill levels make it difficult for farmers to capture the benefits from new tree varieties and improved production methods. The highest skill level is required for cocoa marketing, where Ghana has built up expertise starting in the 1920s. Although the Cocobod was abused for political favourism during the 1960s and 1970s, it developed into a reasonably efficient administration since 1983. Today, it continues to sell Ghana’s entire cocoa harvest, and a large part of its processed products. The Cocobod claims to have a lot of experience about foreign markets, which it attempts to use in evaluating the profitability-tradeoff between high quality beans and intermediary products.
Capital availability
The lack of capital is probably the most important factor for the low productivity of Ghana’s cocoa farmer. As the rural credit system is only poorly developed, it is very difficult for farmers to finance the purchasing of fertilizer and herbicides for current production, or to invest in new, higher-yielding trees. To increase yields and production volumes, Ghana’s Cocobod has initiated several efforts for both knowledge dissemination as well as producer credits. At the moment, private cocoa buyers grant producer credits, and there are attempts to build up funds to provide capital for investments into high-yield varieties, and agrochemicals financed by a share of export revenues.
254 EIU (1998a) p. 17 255 EIU (1999) p. 19
105
Physical infrastructure
Ghana’s cocoa sector suffers from poor transport infrastructure, mainly the lack of feeder roads. While this increases the cost of cocoa transport and marketing, it does not lead to serious quality deterioration since cocoa is not highly perishable.
Information infrastructure
Ghana’s Cocobod has a good understanding of the World markets for cocoa, in particular about price movements, qualities, and products. This knowledge however is not widely spread among farmers, but rather utilized to improve the operations of the Cocobod’s marketing monopoly.
The impact of Ghana’s research infrastructure on the competitiveness of cocoa is difficult to judge. Ghana is home of the West African Cocoa Research Institute at Tafo, and has additional research institutes at the University of Science and Technology in Kumasi, and at the University of Ghana in Legon.256 The work of these institutions is focused on issues around pest control and yield improvements through the use of fertilizers and new hybrid varieties. The result of this research is transferred to the cocoa farmers through the Cocoa service division, an extension service operated mainly by the West African Research Institute, and through the Ministry of Agriculture. While the research institutes are participating at the forefront of scientific research on cocoa, it is unclear how the results of this work are actually put to work in cocoa farming as farmers in Ghana continue to use very little agrochemicals, and grow a very low share of high-yield hybrids. Over the last years the Cocoa Service Division has suffered from cost cuts, and farmers complain that it has made little contribution to cocoa production.257 There are plans to merge the extension services of the Cocoa Research Institute and the Ministry of Agriculture, which should lead to lower service costs and improved efficiency.
Administrative infrastructure
For primary cocoa, Ghana’s export monopoly and the restrictive buying licenses impose a heavy burden on its competitiveness. The benefits of the Cocobod mainly rest in its knowledge about World cocoa markets, its international reputation for good quality and reliability, and its financing power. The costs
256 von Gnielinski (1986) p. 161
106
however are high: to provide this service, the Cocobod consumes roughly one fifth of all cocoa export revenues, at least double the marketing costs of other leading producer countries (see Table 15: Percentage share in cocoa export revenues, 1995).
13.3.2 Domestic demand conditions
Cocoa is a pure export crop, and there is hardly any domestic demand for cocoa.
13.3.3 Related and supporting industries
Despite the size and importance of the cocoa sector, hardly any related or supporting industries have developed around it. All agrochemicals are imported or assembled from imported material.
13.3.4 Firm structure, strategy and rivalry
Structure
Small-scale farmers dominate Ghana’s cocoa sector, particularly because land ownership rights make it difficult to start large plantations, and because the country lacks skilled plantation managers. However, according to the Cocobod, the profitability of small-scale farming is higher than in large plantations, as production costs are lower, and the average quality produced is higher. Rivalry among farmers is not intense, as every quantity produced is cleared by the buying monopoly. The Cocobod plans to increase the area under cultivation from 850’000 ha to 1 million by relying on small-scale farmers who will get more technical support and access to planting credits.
Climate for investments
In both the primary and processed cocoa industry, the climate for investments is improving. Ghana’s government has recognized the importance of cocoa growing for wealth creation amongst the rural population. Efforts are made to reduce the operating costs of the Cocobod and to liberalize internal marketing, and more emphasis is now being put on financing farmers’ investments in agrochemicals
257 EIU (1998a) p. 19

107
and high-yield trees. Yet, there are no plans to abolish the marketing monopoly of the Cocobod.
Strategy
The Cocobod’s strategy is to export high quality beans for a premium price, and to process sub-standard beans within the country. The reasoning behind this strategy is the fact that the premium on high quality beans should lead to higher profits for cocoa farmers. The quality of cocoa is a result of the fermentation and drying process at the farm, and of stringent quality controls by the Cocobod. While premium beans are supposed to achieve a price premium, substandard beans are sold to processors below World market prices.258 The country’s largest mill, West African Mills, is owned by one of the world’s largest operators and has therefore full access to global marketing channels. The state-owned mills however are probably producing at above World-market costs if profits are calculated based on World market costs of beans.259
On a limited scale, Ghana’s state-owned cocoa processor is attempting to enter foreign markets with Ghana-made chocolate, focusing in parts on the “ethnic” consumer markets in the US and Scandinavia.
13.3.5 Influence of Government Policy
Government involvement and government regulations have been the main responsible for the fall and low level of Ghana’s cocoa sector. The instrument of government intervention is the Ghana Cocobod, in its double function as marketing monopoly and tax authority. Cocoa is the country’s most important source of revenue, accounting for roughly 10 percent of all revenues in 1997. Because of high taxes and the Cocobod’s high operating costs, the revenues of Ghana’s farmers were the lowest worldwide until 1995. Although the government has privatized the loss-making Produce Buying Company, it remains reluctant to fully liberalize external marketing, arguing that it is the only way to maintain high
258 With the argument that this way the cost-savings from reduced marketing costs for these beans are transferred to the processors.
259 Profitability figures were not obtainable on a comparable basis. Profitability of the state-owned cocoa processor is only measured in form of value-added above cocoa bean price, which does not allow to calculate the opportunity costs of local processing.

108
quality standards.260 The benefits of these structures are hard to see: Although both the government and the Cocobod seem to provide intensive know-how to farmers, productivity levels remain low. There are little incentives to increase production when taxes eat up a significant part of the profits. Reforms and further liberalization of internal and external marketing have been started, but are moving slowly. At the moment, private buyers have a market share of 40 percent in internal marketing, and there are plans to allow them to export up to 30 percent of their domestic purchases starting in 2001. For the year 2000, the Cocobod plans to increase producer prices to 70 percent, at the expense of government revenues, which will drop from 25 to 15 percent.261 Further reductions in taxation are not planned, as they would have a significant impact on the country’s budget balance.
13.4 Summary and conclusion on Ghana’s Cocoa industry
Nature and development of competitive advantage
The advantage of Ghana’s cocoa is based on one basic factor advantage, the country’s favorable climate. While Ghana was the world’s leading cocoa producer up until the 1950s, countries with similar climate but less greedy governments have eroded this comparative advantage during the 1960s and 1970s. Since the inception of the ERC, the cocoa industry has started to recover – but production levels have not yet reached the levels of the 1960s. Between 1987 and 1997, Ghana has just about managed to keep its World market share of roughly 13 percent, while countries like Cote d’Ivoire and Indonesia were able to significantly increase their production. Unlike Ghana, these countries were able to grow their productivity with the use of new hybrid trees, through better extension service, and most of all because of high economic incentives, i.e. low production costs and high producer revenues. The main problems for Ghana’s cocoa industry are the low prices paid to farmers. As a result, they have neither the incentive nor the money to invest into new, high yield trees to increase their low productivity. This means that the tax transfers to the government continue to deteriorate the competitiveness of Ghana’s cocoa industry. Also, Ghana’s strategy of producing
260 Financial Times, July 9, 1996 (Database download) “Survey – Ghana 1996: Bumper bean crop expected” As examples it cites the cases of Nigeria and Togo, where privatization has led to low quality and a loss of reputation in world markets.

109
only high quality cocoa beans is becoming increasingly questionable. The Cocobod claims to be able to achieve a price premium for high quality cocoa that more than justifies higher producer and marketing costs resulting from stringent quality controls. However, the results of the last ten years do not support this, and by no means justify the high operating costs of the Cocobod. Today, most large buyers do no longer rely on certificates, but do their own testing. In addition, the average price obtained by Cote d’Ivoire has often been higher than that of Ghana in the last decade.262 Better prices, which are possibly the result of better timing and higher purchasing power, mean that farmers’ profits per ton are higher in Cote d’Ivoire than in Ghana. But more important, high quality cocoa is losing importance for chocolate producers, as they have found ways to better use low-quality cocoa.263
Capacity for innovation
Ghana’s primary cocoa industry still has significant capacity for innovation, in particular by increasing productivity. In farming, the introduction of high-yield hybrid trees, improvements in husbandry, and increased use of agrochemicals could lead to significant productivity increases. To do this successfully, improvements in Ghana’s cocoa extension service are required to build up the farmers’ know-how, supported by additional credit facilities to finance the planting of new trees and the use of agrochemicals. A first step for all programs is an increase in producer prices as basis for further investments. On the marketing side, further privatization of the internal marketing would result in reduced marketing costs and higher producer revenues. On top of all, marketing costs could be significantly reduced if Ghana would privatize its external marketing. To do this successfully, however, the entire sector must be prepared for further reforms, such as the foundation of professional associations dealing with cocoa trade, and institutionalized knowledge dissemination about World cocoa markets and best practice cocoa farming.
An unresolved question is the potential value-added from cocoa processing. Ghana’s cocoa processing industry seems to have less capacity for innovation other than general productivity enhancement programs. The privatized Takoradi
261 Interview Cocobod 262 See IMF (1999a) p. 73 263 IMF (1999a) p. 81

110
mill is part of one of the large cocoa multinationals, and well integrated into their production network. While processing in Ghana is probably not ideal for the cocoa processors, it would allow Ghana to extract additional revenues from its commodity products.264
264 Although this would only be the case if bean prices to cocoa processors reflect the opportunity costs of direct exports.

111
14 The competitive advantage of the Food industry
Roughly one third of Ghana’s non-traditional exports265 stem from the sale of fresh and processed food. In 1997, Ghana exported USD 19.2 million of fresh fruits and vegetables, and USD 66.7 million of prepared foods. The most important export items were pineapples (USD 9.6 million), bananas (USD 1.9 million), yams (USD 4.5 million), and canned tuna fish (USD 64.8 million).266
14.1 Structure of the Ghana’s Food industry
With a combined share of 30 percent in 1997’s GDP, agriculture and fishing are Ghana’s most important sectors, employing roughly 80 percent of the country’s population. However, the export-oriented fresh produce and processed food industry is almost completely separated from the rest of the country’s agricultural sector. Almost all companies producing for exports are focusing entirely on export markets and do not supply local markets, nor is there significant sourcing from small-scale farmers.
Ghana’s most prominent fresh food export products are pineapples. Pineapples are farmed on small and medium-sized plantations around Accra, and are shipped to Europe by air and sea. With proper irrigation and fertilization, pineapples can be grown all year round, and on professionally managed farms their ripening point can be timed to be in line with the peak demand seasons in Europe. About six large farms, and around 40 smaller farms and exporters dominate the pineapple export industry. Between 1994 and 1997, the largest six farms have increased their exports from USD 2.3 million to USD 5.2 million, and accounted together for 54 percent of all pineapple exports in 1997. The country’s largest pineapple farm, Jei River Farms, is majority-owned by Ashanti Goldfields, and had roughly a 25 percent export share in 1997.267 The country’s main banana exporter is Volta
265 Excluding cocoa products and sawn wood 266 Export figures for bananas, pineapples and yam are based on Ghana Export Promotion
Council Statistics, all others on Ghana Export Bulletin (1996 & 1997) 267 Ghana Export Promotion Council data. The company grows pineapple and papaya on 1,500
ha, and employs 26 workers. Conafric (1996) pp. 132

112
River Estates, a Dutch-owned banana plantation.268 Yam production for exports is small scale, with the largest farm, Baafour, accounting for roughly 10 percent of all exports.
Ghana has one of the highest per capita fish consumption in Africa, and its fishery ranks 35th in world’s fish catches.269 Total landings are estimated at around 250’000 to 330’000 tons.270 Exports of fresh and frozen fish were USD 30.7 million in 1997, and the industry delivers more than 50’000 tons of tuna fish to the food canning industry. The fishing industry is very small-scale, more than 80 percent of the landings come from the artisanal fishing sector.271 Pioneer Food Cannery (PFC), Ghana’s 11th largest company, owned by US food company Heinz, dominates the food processing industry of Ghana. In 1997, PFC employed 1’500 workers, and exported tuna worth USD 42.2 million, making it one of the largest tuna fish canneries within Heinz’s seven worldwide canneries. The second largest food processor is Ghana Agro Food Processing Company (GAFCO) with exports of USD 7.0 million of canned Tuna.272 Numerous smaller food processors like Astek and Nkulenu export niche market products such as pineapple juice, canned palm soup and spices.
268 The farm produces about 6000 tons of bananas on 350 ha irrigated farmland, and employs 513 workers. Conafric (1996) p. 127
269 Ames, Bennet (1995) p. 375 270 World Bank (1993b) p. 41 271 The artisan fishing sector is estimated to be around 8’000 canoes, only half of them with
outboard motors. The rest of the landings come from about 80 commercial fishing vessels. World Bank (1993b) p. 41
272 GAFCO, is owned by Swiss Industrie Bau Nord AG, employs 1’600 people, and produces canned fish, baking flour, and cooking oil. Divestiture Implementation Committee, Web page (April 1999)

113
Figure 20: Structure of Ghana's food industry, 1997
Fresh produce Export USD 19.2 millionExport USD 30.7 million
Prepared food*(5)
Fresh/frozen fish(30)*
Containers(7)**
Packaging material
(4)**
* Exporters only, excluding small scale fishers and food processors** Based on own research of medium and large companies in Accra and Tema
Export USD 66.7 million
Source: Ghana Export Bulletin (1997), own research Grey shades indicate that industries are related.
14.1.1 Buyers
The main markets for Ghanaian tropical fruit are the European Union and Switzerland. Overall market trends indicate increasing demand for fresh tropical fruit, partially at the expense of temperate domestic fruit. Imports of fresh fruit into the EU increased from 14’449 tons in 1993 to 16’332 tons in 1995. At the same time, fresh fruit production in the EU declined from 30’800t in 1993 to 29’300t in 1995.273
The buyers of Ghana’s fresh and processed food are wholesalers and supermarket chains, as well as the distribution arms of large multinationals. The buyers of Ghana’s niche products from smaller food processors, such as yam and palm soup, are mostly ethnic food stores in the UK and the US.
273 COLECAB, CBI, Protrade (1997) pp. 16-18
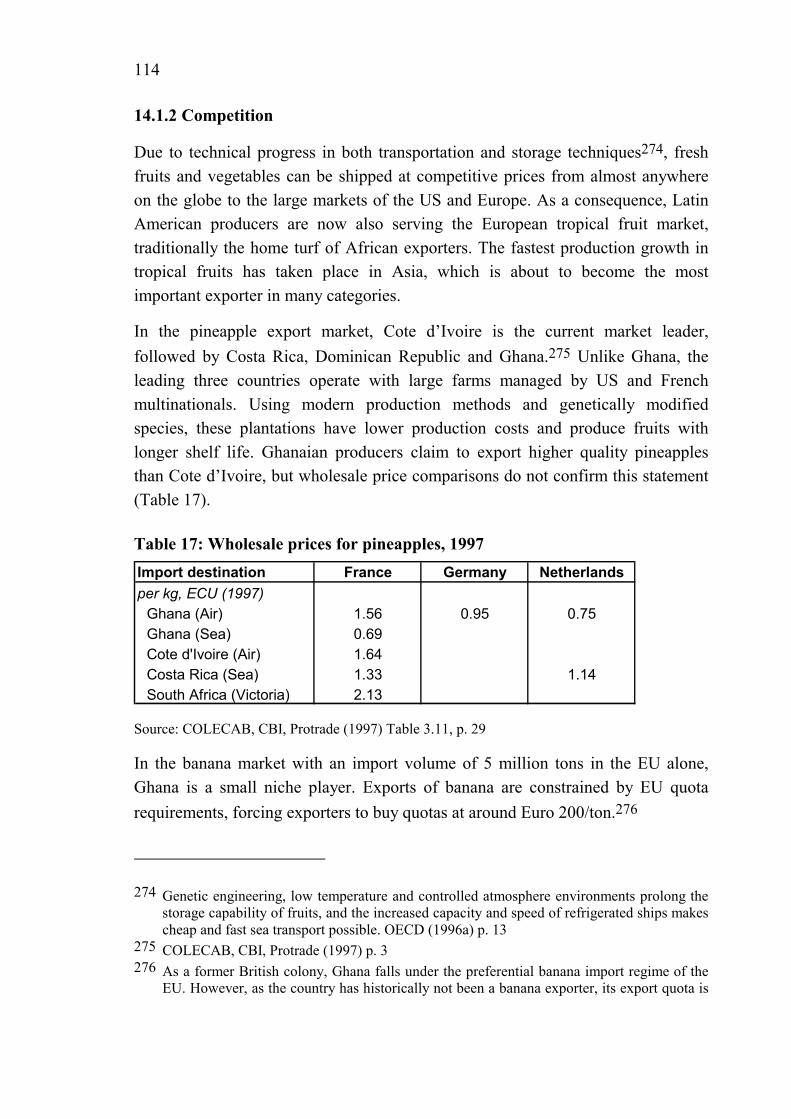
114
14.1.2 Competition
Due to technical progress in both transportation and storage techniques274, fresh fruits and vegetables can be shipped at competitive prices from almost anywhere on the globe to the large markets of the US and Europe. As a consequence, Latin American producers are now also serving the European tropical fruit market, traditionally the home turf of African exporters. The fastest production growth in tropical fruits has taken place in Asia, which is about to become the most important exporter in many categories.
In the pineapple export market, Cote d’Ivoire is the current market leader, followed by Costa Rica, Dominican Republic and Ghana.275 Unlike Ghana, the leading three countries operate with large farms managed by US and French multinationals. Using modern production methods and genetically modified species, these plantations have lower production costs and produce fruits with longer shelf life. Ghanaian producers claim to export higher quality pineapples than Cote d’Ivoire, but wholesale price comparisons do not confirm this statement (Table 17).
Table 17: Wholesale prices for pineapples, 1997 Import destination France Germany Netherlandsper kg, ECU (1997)
Ghana (Air) 1.56 0.95 0.75Ghana (Sea) 0.69Cote d'Ivoire (Air) 1.64Costa Rica (Sea) 1.33 1.14South Africa (Victoria) 2.13
Source: COLECAB, CBI, Protrade (1997) Table 3.11, p. 29
In the banana market with an import volume of 5 million tons in the EU alone, Ghana is a small niche player. Exports of banana are constrained by EU quota requirements, forcing exporters to buy quotas at around Euro 200/ton.276
274 Genetic engineering, low temperature and controlled atmosphere environments prolong the storage capability of fruits, and the increased capacity and speed of refrigerated ships makes cheap and fast sea transport possible. OECD (1996a) p. 13
275 COLECAB, CBI, Protrade (1997) p. 3 276 As a former British colony, Ghana falls under the preferential banana import regime of the
EU. However, as the country has historically not been a banana exporter, its export quota is
115
With USD 65 million of exports, Ghana is Africa’s leading producer for canned tuna fish and the second largest source of tuna in the UK. However, measured on World market volumes Ghana is a still a small player when compared with Thailand’s exports of USD 1.6 billion of processed fish in 1996, followed by China with USD 1.1 billion.
14.2 History of Ghana’s Food industry
Ghana’s agricultural tradition is largely based on small-scale farming and fishing. The Gold Coast was never chosen to be a settler colony with large-scale plantation farming as Cote d’Ivoire, and up until independence only few commercial plantations were established. The first major agricultural activity after the end of slavery was the production of oil palm products, to satisfy the growing demands of the soap and margarine industry in Great Britain. In 1884, the Gold Coast exported about 20’000 tons of palm oil, and 40’000 tons of palm kernels. Only very few palm trees were cultivated in plantations, most fruits were picked from wild groves. After World War I, Ghanaian oil palm exports were replaced with products from Malaysia, where large plantations had evolved.277 The first rubber plantations in the Gold Coast were established at the end of the 19th century, and by 1892 the colony had become the world’s third largest rubber exporter.278 However, wide price fluctuations on the English rubber market brought the rubber industry in Ghana to a halt. The Basle missionaries in the middle of the 19th century had introduced coffee, but unlike in Cote d’Ivoire, it never really took off in Ghana.
After independence, the new government founded state-owned farms to grow cotton, rice, palm oil and rubber, with the goal to establish modern large-scale mechanized farming in the country. By 1966, Ghana counted 105 State Farms cultivating about 14’000 ha of oil palm, coconut, kola and rubber, and about 8’600 ha of food crops, employing 20’000 people.279 However, the idea of capital-intensive development of agricultural complexes proved to be a failure. After 1983, most farms were abandoned.
very small. For planned changes see also Neue Zürcher Zeitung, November 11, 1999 p. 21 “Vorschlag für eine neue Bananen-Ordnung der EU”
277 Agbodeka (1992) p. 41 278 Agbodeka (1992) p. 44 279 Asamoa (1996) p. 82

116
Modern fishing started in 1961, with the founding of the State Fisheries Corporation. The company was equipped with a fleet of deep-sea vessels,280 making Ghana the owner of the largest and most modern fishing fleet of Africa.281 Twenty-seven fish markets with cold storage facilities were constructed across the country, as well as deep freezing facilities in major harbors. Fishing yields doubled from 1967 until 1971, from 105’100 tons of marine fish to 230’100 tons.282 As most industries in Ghana, the fishing industry started suffering from fuel shortages and inadequate storage facilities, and production sled to 199’100 tons of marine fish in 1982. With the arrival of the ERP and support from external donors, fishing output rose to 302’900 tons in 1989.283 Between 1990 and 1997, total exports of fish products rose from about USD 41 million to USD 84 million.
Foundation of important companies
The large-scale production of fresh produce for export is of much newer date. In 1986, Ghana’s pineapple exports were worth less than USD 500’000. With the establishment of larger farms, the export of pineapples grew tenfold to USD 5.1 million in 1991, and doubled to about USD 10 million in 1997. The first large-scale plantations were established in the early 1990s, and continue to expand their area under cultivation. Ghana’s banana farm, Volta River, had already been planned in 1957,284 but was only established in 1988. The pineapple farm Jei River was founded by Ashanti Goldfields in 1992.
Parallel to the establishment of a fishing industry in 1960 was the foundation of the Tema Food Complex Corporation and Pioneer Food Cannery. The Tema Food Corporation was integrated with a mill and a fishmeal plant, and produced frozen fish, canned sardines and tuna fish integrated fish canning of sardines and tuna, smoking and freezing. The company was sold to the Swiss company Industrie Bau
280 Ames, Bennet (1995) p. 387 281 The success of the State Fisheries Corporation was limited. Agbodeka (1992) p. 95 mentions
however that none of the vessels proved seaworthy and were abandoned, and that in 1970 the company was producing at 20 percent of capacity.
282 La Verle (1995) p. 167 283 La Verle (1995) p. 167 284 Asamoa (1996) p. 55

117
Nord in 1996. Since then, it has doubled its tuna production, and tripled its workforce to 1’600 employees.285
In 1977, Pioneer Food Cannery entered into a joint venture with US-based Star-Kist to produce frozen tuna loins for canning in the UK. During the 1980s, Star-Kist withdrew from Ghana and returned only in 1990 to restart production. Soon after, Star-Kist was taken over by US-based Heinz, which decided to turn Pioneer Food Cannery into one of its five worldwide sites for tuna fish canning. After significant investments into canning equipment, Pioneer Food Cannery increased its production five fold between 1993 and 1995.
285 IMF (2000a) p. 33
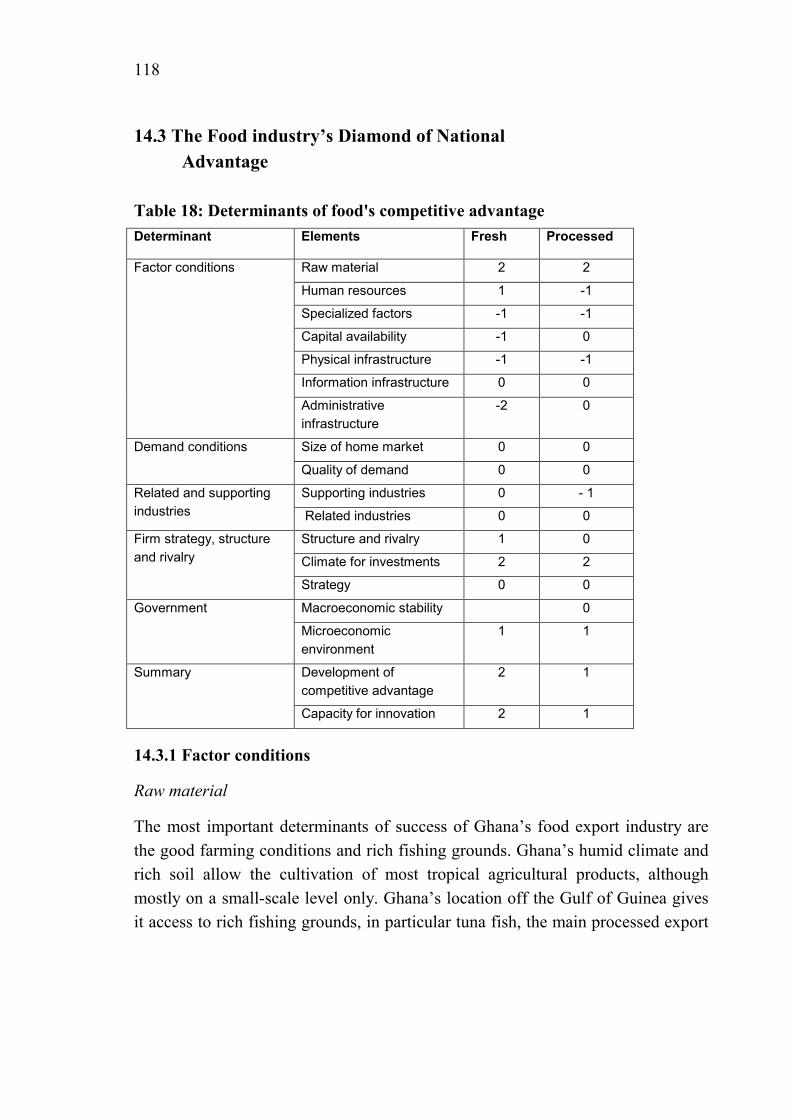
118
14.3 The Food industry’s Diamond of National Advantage
Table 18: Determinants of food's competitive advantage Determinant Elements Fresh Processed
Raw material 2 2
Human resources 1 -1
Specialized factors -1 -1
Capital availability -1 0
Physical infrastructure -1 -1
Information infrastructure 0 0
Factor conditions
Administrative infrastructure
-2 0
Size of home market 0 0 Demand conditions
Quality of demand 0 0
Supporting industries 0 - 1 Related and supporting industries Related industries 0 0
Structure and rivalry 1 0
Climate for investments 2 2
Firm strategy, structure and rivalry
Strategy 0 0
Macroeconomic stability 0 Government
Microeconomic environment
1 1
Development of competitive advantage
2 1 Summary
Capacity for innovation 2 1
14.3.1 Factor conditions
Raw material
The most important determinants of success of Ghana’s food export industry are the good farming conditions and rich fishing grounds. Ghana’s humid climate and rich soil allow the cultivation of most tropical agricultural products, although mostly on a small-scale level only. Ghana’s location off the Gulf of Guinea gives it access to rich fishing grounds, in particular tuna fish, the main processed export

119
product. While there are no indications that the farming conditions will worsen, overfishing is threatening Ghana’s fishing resources.286
Human resources and specialized factors
Overall, the availability of know-how and special skills for the food industry is limited. There is hardly any know-how or management skill for large plantations available. Even University-educated farm managers have difficulties to organize the day-to-day operations of a larger pineapple plantation. As a consequence, expatriates from Europe and neighboring countries manage most large plantations. In the food processing industry, the human resource situation is comparable. Ghanaian students get no real training in the technical aspects of food production and lack exposure to practical work like new product development or processing machines. In general, small and medium sized food processors employ mostly unskilled workers, and only a few of them have personnel with overseas education.287 In the large-scale food processing industry, sophisticated production know-how has to be transferred by the parent company.
Capital availability
In the fresh fruit and medium-scale processed food industry, capital comes primarily as equity capital. All larger food processors are subsidiaries of multinationals, and most larger farms have foreign participation with adequate access to capital. For smaller, domestic food producers – in particular farmers, the current costs of capital, the poorly developed rural banking network, the lending policies of banks (limited credits to agricultural sector), and the inability to use land as a collateral (see below) make it almost impossible to take up credits. The major source of capital is equity capital and reinvested profits. As there is no capital available for large farms or investments into irrigation, the growth of successful ventures is often hampered, and food processors cannot backward integrate into farming to solve their chronic bottlenecks of agricultural supplies.
Physical infrastructure
Success in fresh fruit export depends on the speed and reliability of a country’s transportation infrastructure. To avoid transport problems, Ghana’s fresh fruit and
286 As a consequence, the government banned the catching of specified shellfish, and all fishing vessels were required to obtain licenses. La Verle (1995) p. 167
287 See also Boeh-Ocansey (1996) p. 224

120
also the processed food industry are forced to cluster around Accra, close to the airport and harbor. In the north of the country, poor roads prevent the establishment of large food plantations in an otherwise fertile environment.
During the 1960s, the government established refrigerated warehouses along the coast, from which the country’s fishing industry benefits still today. For the fresh fruit industry, however, there are no refrigerated storage facilities at the airport or harbor available.
Information infrastructure
The Ghana Export Promotion Council, a government sponsored institution, provides extensive support to the food exporting industry through export seminars, export promotion events, and its internal library with market research data. In some cases, the Export Promotion Council has also assumed an active role in finding investors for industries that it identified to have significant market potential. Other than that, Ghana’s agricultural education and research infrastructure does not provide meaningful support to the fresh fruit and food processing industry.
Administrative infrastructure
The most important factor limiting the growth of professional plantations is the difficulty to acquire land. Most of the country’s land is under traditional ownership structure, which does not allow outright land ownership, but only provides usurpatory rights. Ghana does not have a central land registry, and it can take several months to years to identify the rightful owner of a plot of land, and to negotiate a sale with him.288 In traditional farming, the lack of full land ownership reduces the willingness of farmers to make long-term investments in plantations, and prevents the establishment of large commercial farms.289 Other than land acquisition, there are no particular administrative hurdles. In general, exporting procedures for food products are simple, and export-oriented food processors can take advantage of Ghana’s Export Processing Zone.
288 In the case of Volta River Farms, disputes over land ownership delayed its establishment by one year, leading to exhausting the loan facilities and the subsequent abandonment of the farm for 2 years. Conafric (1996) p. 125
289 See Besley (1995) p. 936

121
14.3.2 Domestic demand conditions
The quality and quantity of Ghana’s domestic demand has no positive impact on the competitiveness of the food industry, since the export oriented food industry is almost completely disconnected from domestic demand. Smaller farmers and food processors, and imported food satisfy domestic demand for fresh fruit and processed food. Because of limited domestic demand and long payment delays from local merchants, even smaller food processors tend to focus more on export markets and neglect domestic demand.
Ghana’s food industry is controlled by Ghana’s Standards Board, which ensures the adherence to basic quality standards. Relevant for exporters, however, are the production standards of the importing countries. Export goods from Ghana are produced to the requirements of the buyer with respect to quality, health, and environmental standards. In the fresh produce segment, exporters have to provide phytosanitary documentation regarding the chemical treatment and storage of their products. Supermarket chains in the UK send their own inspectors to Pioneer Food Cannery, and the company has to document that it produces according to the hygienic and environmental regulations of the EU.
14.3.3 Related and supporting industries
Ghana’s food industry benefits from the presence of local packaging industries. Packaging material and cans are produced domestically by about 10 firms in Accra, Tema and Takoradi. However, these firms provide only basic material. Rugged cartons for sea-transport of fresh pineapples must be imported; and some non-standard packaging material is not available, forcing for instance small-scale food processors to compromise on product quality because they cannot get glass jars for their products. Agrochemicals such as fertilizers and pesticides are all imported or assembled from imported inputs.
14.3.4 Firm structure, strategy and rivalry
Firm structure and rivalry
The barriers of entry in Ghana’s fresh food exporters are set by the requirements of export markets. To survive in export markets, exporters must have a continuous market presence and should be able to deliver large quantities at short notice. To do so, exporters must either have medium to large plantations or they must be able

122
to draw on a large number of small-scale growers. Rivalry between large plantations is limited, as there still seems to be excess demand for Ghanaian pineapple; interactions are more cooperative and focused on overcoming common difficulties, such as competing against the highly productive plantations of Cote d’Ivoire and Central America. In the medium-scale food processing industry, the founding families own most companies. Rivalry is not very intense, and domestic competition comes mostly from import products or small market stands with freshly cooked food. The large-scale food processing industry is dominated by multinationals, which use Ghana only as production location.
Climate for investments
Ghana’s food industry benefits heavily from the government’s ambition to shift the economy towards the production of non-traditional export products, coupled with the desire to leverage knowledge gained in export production to increase the productivity of the entire agriculture sector.
Strategy
The successful strategy in Ghana’s fresh produce and processed food industry is a focus on export markets, and to backward integrate to reduce frictions with their supplier industry. The dominant strategy in pineapple farming is to grow on own plantations. In the past years, most exporters have moved away from small-scale sourcing, as their production tends to be relatively unreliable in terms of quantity and quality. In the agro food processing industry, the lack of capital forces most companies to focus on production only, although most suffer from continuous bottlenecks in supply. Large multinational companies with sufficient capital are often vertically integrated, rather than building on a weak supplier industry.290
The largest value added to the product – shipping, distribution and marketing of the product in the importing country – is managed directly by the buyer. In the fresh food segment, orders are placed directly with the farmers, who have to ship the goods within 2 days to one week to the airport or harbor from where the wholesaler takes over the freight. In the processed food segment, manufacturers produce either directly for their parent company, or on order of wholesalers. As a consequence, the value-added from food exports remains small: in general, less
290 Pioneer Food Cannery produces 50 percent of its tuna input with its own fleet

123
than 10 percent of the retail sales revenues can be captured by the Ghanaian producer.291
14.3.5 Influence of Government Policy
Only few companies of today’s fresh food and processed food industry in Ghana were established during the industrialization program of the 1960s, and almost all of them have been privatized or closed down. Most companies were founded after 1990, benefiting from the liberalized trade and investment environment. Government support has played an important role particularly through the Ghana Export Promotion Council, which is focused on the promotion of non-traditional products, in particular food.
14.4 Summary and conclusion on Ghana’s Food industry
Nature and development of competitive advantage
The competitive advantage of Ghana’s food industry is mostly driven by basic factor advantages – an optimal climate for agricultural products and fishing grounds. In the past, these advantages were only leveraged in the cocoa industry, and only after the ERC program were they transferred to other products. A condition for export success, in particular in fresh products, is a minimum size. Until today, only few companies have been able to achieve this size and to compete successfully in foreign markets, mainly for two reasons: lack of capital for investments in agriculture, but more important the lack of management capacity to operate large scale plantations and food processing industries. The absence of large professional plantations results in inadequate supply of agricultural produce for small- and medium-scale food processors. Raw material, such as palm hearts, has to be bought from small-scale farmers across the country, who do not produce at regular intervals or at large scale. On the other hand, the Ghanaian food industry has not managed to capture additional parts of the value chain, with the result that only a very small part of the total value-added of a product is captured in Ghana.
Capacity for innovation
291 For illustration, a pineapple sold for USD 0.34 FOB in Ghana is retailed at CHF 7.50 in Switzerland

124
Ghana’s primary food industry still has a significant capacity for innovation. Today’s production structures are predominantly traditional, i.e. no modern production methods or high-tech varieties are used, and most farms operate on a small-scale level, leaving significant potential for increased productivity. In the processed food industry, capacity for innovation is limited. The most significant increase in value added in Ghana’s food processing was the shift from producing frozen tuna loins to canning them directly in Ghana. Given the nature of the product, further steps in value-added will be difficult to achieve within production. A great potential for improvements in Ghana’s food industry is to capture additional parts of the value chain, and to create a distinctive position relative to other countries. A distinctive position could be created for instance through the certification of organic fruit. Additional parts of the value changing could be captured with measures such as joint marketing organizations abroad, direct links to supermarket chains to cut out middlemen, and the preprocessing of food for higher convenience.

125
15 The competitive advantage of the Gold industry
In 1997, Gold accounted for 34 percent of Ghana’s exports, worth USD 543 million. Although the volume of gold exports had risen by 9 percent from 52 tons to 57 tons, the drop in gold prices from USD 442/ounce in 1996 to USD 331/ounce in 1997 caused a 7 percent reduction in export value.292
15.1 Structure of Ghana’s Gold mining industry
Ghana is Africa’s second largest gold producer behind South Africa, and accounted for 2.3 percent of the World gold mining output in 1997.293 In 1997, 12 major gold mining corporations were operating in Ghana, providing employment for about 17’000 workers.294 The country’s largest gold mining company (and the country’s largest company) is Ashanti Goldfields. Outside Ghana, Ashanti has operations in 12 other African countries, with major mines in Zimbabwe, Guinea and Tanzania. Except for Ghana Consolidated Diamonds295, all other major gold mines in Ghana are owned by US, South African, Canadian and Australian gold mining corporations
Success in gold mining is determined by the ability to find rich ores in the exploration process, and the ability to extract these ores with low cost processes.296 Today, most exploration work is done by smaller “junior” ventures, which raise risk capital for explorations, and then try to sell their most prospective projects to larger gold mining corporations. By the end of 1996, 126 local and 77 foreign companies had been granted gold reconnaissance and prospecting
292 Ghana Export Bulletin (1996 & 1997) 293 Based on total volume as reported in Neue Zürcher Zeitung, April 22, 1999, p. 33 294 Ghana Chamber of Mines (1996) p. 33 and 35 295 Ghana Consolidated Diamonds – still State-owned – produces gold as a byproduct of its
diamond mining 296 In the past years, creative financing has become a key factor of success in gold mining.
Sophisticated financial instruments are used by mining companies to gain access to promising projects and to share both the risks and potential rewards with investors. Modern hedging tools allow companies to survive through periods of low gold prices as in 1997 and 1998, when World gold prices were close to the costs of Ghana’s gold mines. However, mistakes in its risk management brought Ashanti near bankruptcy in September 1999, when gold prices rose faster than the company had expected.
126
licenses.297 However, most of Ghana’s currently exploited gold mines were already discovered at the turn of the century. Ghana has both surface and underground mining.298 Surface mining is done with large machines and vehicles, while underground mining is more labor intensive. Gold extraction requires sophisticated chemical treatment plants.
15.1.1 Buyers
Gold is standardized commodity, making price the only determinant of buyers. Traditionally, gold has been used for jewelry production and as a savings instrument. The main buyer of gold is the jewelry industry, in particular in Italy, Hong Kong, India, and Japan. Government bonds have increasingly replaced gold as safe haven, in particular in Europe and North America.299
15.1.2 Competition
Competition for Ghana’s gold mining industry comes from the attractiveness of other mines. In Africa, several countries with rich ores have adapted and improved the Ghanaian mining code, and are trying to capture new investors by providing a stable political environment coupled with regulatory incentives. However, with the low gold price levels, few mining corporations are starting new mining engagements.
297 The Mining Journal, January 30, 1998, p. 67 “Investing in Africa” 298 Ghana’s gold comes either as lode ore in quartz reefs (Birrimian) or banket reefs (Tarkwain).
The richer quartz reefs are mainly at Obuasi, and the banket is concentrated at Tarkwa. A third source of gold is alluvial deposits. Agbodeka (1992) p. 10. Quartz and banket reef deposits are exploited with surface and underground mining. Surface mining produces both sulfide and oxide ores, while underground mining produces mainly sulfide ores and some quartz ores. Sulfide ores are crushed and ground, and then subjected to froth flotation to concentrate the sulfide mineral that contains the gold. Oxide ores are typically of lower grade. High-grade oxide ores are treated in oxide plants, while low-grade oxide ores (heap leach) are merely shattered by explosives, and piled into huge heaps for extraction by cyanidation.
299 Neue Zürcher Zeitung, April 22, 1999, p. 33 “Wenig glänzende Aussichten für das Gold”
127
15.1.3 Substitutes
Substitutes to gold mining are non-mining suppliers of gold, in particular central banks liquidating their gold holdings.300 As a result, the World gold price has been falling during the last 2 years to a level of USD 260/ounce, the lowest level of the past 20 years. The consequences are lower mining profits, leading to reduced exploration activities and more mergers and acquisitions to realize cost synergies.
15.2 History of Ghana’s Gold mining industry
The first records of gold trade in Ghana date back to the 13th and 14th century, when open pit gold mining and gold smithery were one of the core activities in the Ashante kingdom. Between the 15th and the 17th century, the Gold Coast was the world’s most important gold producer, hence the name “guinea” for British gold coins.301 During peak production in 1700, some 40’000 workers were operating in the Ashanti mines.302 Travel reports from the 18th and 19th century point to the enormous riches of the Ashante kings, and the versatility of their gold smiths. With the beginning of the slave trade, the traditional pool of workers from Benin dried up, and gold mining activities in Ghana were stopped.
Modern mining started with the rediscovery of gold at Tarkwa in 1878, and later at Obuasi (with the foundation of Ashanti Goldfields in 1897), Prestea and Dunkwa. At that time, mining was completely in the hands of Europeans.303 At the beginning of the century 450 mining corporations were founded, 3’500 exploration licenses were issued, and a railway line was constructed between Obuasi and Takoradi harbor.304 The boom did not last very long. A large number of companies were forced to close down or to merge, and gold production
300 The central banks of Argentina, Australia, Belgium, the Netherlands, and Canada have reduced their gold holdings, while the IMF, Switzerland and the UK have recently announced gold liquidations for the coming years. Neue Zürcher Zeitung, June 15, 1999 p. 33 “Der Goldpreis unter anhaltendem Druck”
301 von Gnielinski (1986) p. 202 302 Asamoa (1996) p. 5 303 Ghanaians were excluded from the mining sector through the colonial Mercury Ordinance
Act, which prohibited the import of mercury needed for mining without license. Such licenses were rarely if ever granted to the natives of the Gold Coast, and possession of gold was illegal. Anyemedu (1991) p. 214; La Verle (1995) p. 169

128
remained at around 200’000 ounces until 1930. Only when the sterling value of gold was increased in 1931, dormant mines were reopened, and gold production soared to 818’000 ounces in 1940.305 Until independence in 1957, the mines relied on cheap migrant labor from the North and saw no need for increasing labor productivity through education and training. In 1952 the Technical Training Institute at Tarkwa was established for apprenticeship training. In 1961, after independence, the Institute was changed into the School of Mines, offering a three-year diploma course in Mining Engineering. Specific mining apprenticeship courses for mine mechanics were introduced in 1962. In 1976 School of Mines became part of the University of Science and Technology, offering degree courses in mining engineering.306
In 1965, the government founded the State Gold Mining Corporation. The company took over five mines that had been left behind by foreign mining corporations. The mines had hit poorer gold reefs, and the owners were not willing to invest in the production in new reefs.307 From then onwards, a combination of poor management, low productivity, lack of qualified and experienced staff, and rising production costs resulted in a continuous decline of gold output. In 1972, the government took ownership in all natural resource-based industries in the country, in particular a 55 percent share in the country’s largest gold mine, Ashanti Goldfields.308 Technical management was left to the minority owner, UK-based Lonrho. Nevertheless, the inability to get foreign exchange for equipment and supply purchases led to a decline of gold production from 533’000 ounces in 1972 to 232’000 ounces in 1982.309
One of the main measures in Ghana’s economic reform program was the rehabilitation of the important mining sector. In 1986, the government of Ghana
304 von Gnielinski (1986) p. 202 305 Agbodeka (1992) points out that very little of the revenues generated by gold mining
actually remained in the country. In 1949, total gold sales amounted to UKP 7.4 million, of which only UKP 2.6 million (35 percent) remained in the country in form of salaries and royalties.
306 Agbodeka (1992) p. 110 307 Schmidt-Kallert (1994) p. 153; La Verle (1995) p. 169 308 von Gnielinski (1986) p. 203. The London-based ACG was transformed into a Ghanaian
company, after which the government increased its initial share of 20 percent (acquired in 1969) to 55 percent. Tsikata (1997) p. 11
309 Arthur, Doverspike, Kuthy (1996) p. 177

129
passed a new Minerals and Mining with the purpose of restoring current mines and to attract foreign investors. Specific actions included the provision of foreign exchange for the purchase of machinery and equipment, a new fiscal regime, and the foundation of the Minerals Commission. The World Bank provided finance and consulting assistance for the rehabilitation of the State Mining Corporation, and for the upgrading and expansion of Ashanti Goldfields.310 The first foreign entrant, Southern Cross, came in 1988, followed by Teberebie and Bogosu in 1991, Gold Field Ghana in 1993,311 and Barnex and Dunkwa in 1995.312 Since then, gold production has soared (Figure 21).
Figure 21: Gold production 1901 - 1995
-
500,000
1,000,000
1,500,000
2,000,000
1901
1910
1920
1930
1940
1950
1960
1970
1980
1985
1990
1995
Oun
ces
Source: Ghana Chamber of Mines (1996), App. 2A, p. 17
By the end of 1995, all subsidiaries of the State Gold Mining Corporation had been divested. In 1994 the government reduced its share in Ashanti Goldfields from 55 percent to 20 percent, and the company was subsequently listed on the London and Accra stock exchange, and later on in New York and Toronto.
310 Ashanti alone received an USD 105 million loan from the IFC. Anyemedu (1991) p. 217 311 Anyemedu (1991) p. 216 312 Ghana Chambers of Mine (1996) p. 6

130
15.3 Gold mining’s Diamond of National Advantage
Table 19: Determinants of gold mining’s competitive advantage Determinant Elements Gold
Raw material 2 Human resources 1 Specialized factors 2 Capital availability 1 Physical infrastructure 0 Information infrastructure
0
Factor conditions
Administrative infrastructure
2
Size of home market 0 Demand conditions Quality of demand 0 Supporting industries 0 Related and supporting
industries Related industries 0 Structure and rivalry 1 Climate for investments 2
Firm strategy, structure and rivalry
Strategy 2 Macroeconomic stability
0 Government
Microeconomic environment
1
Development of competitive advantage
2 Summary
Capacity for innovation 1
15.3.1 Factor conditions
Raw material
One of the major determinants of success of Ghana’s gold mining industry is the basic factor advantage of high-grade ore. Historically, the Ashanti mine at Obuasi

131
had the world’s highest-grade ore, and today it puts Ashanti among the one-third lowest cost mines of the World.313
A major factor disadvantage is the unreliable and expensive electricity supplies. In 1997 and 1998, Ghana’s gold mine performance has been hampered severely by the country’s energy crises. Even though the mines had priority access to electricity, increased energy prices led to a cost hike from USD 228/ounce to 260/ounce.314 Specific investments planned for the energy sector promise to remove this obstacle,315 but energy problems almost nullify the natural cost competitiveness of Ghana’s gold mining sector.
Human resources and specialized factors
Ghana has a long-standing mining tradition, grown in a World class mine (Obuasi) over more than 100 years. Mining companies in Ghana can draw from a large body of skilled mining engineers, many of them well traveled and with overseas work experience. Most of the miners have been educated at the Tarkwa School of Mines, which is part of the University of Science and Technology in Kumasi. In addition to formal education, all mines provide extensive in-house training to their workers and managers, including specific mining apprenticeship programs.
Graduates from the School of Mine have a good basic mining education, but significant internal training is needed to familiarize them with modern gold mining equipment and state-of-the-art processes. Modern mining techniques and cutting-edge know-how do not originate from Ghanaian operations, but have to be imported.316 No gold mine in Ghana comes by without expatriate support at different levels. The operational management of all Gold mines in Ghana is handled by expatriates317, who do not only provide know-how on new technology, but are also responsible for the productivity increases since 1986.
313 Financial Times, July 8, 1996 (Database download) “Survey – Ghana 1996: Predator may be stalking Ashanti”. The EIU (1998a) p. 19 even claims Ashanti to be the world’s lowest-cost producer.
314 Internet press reports, based on Ashanti Goldfields information 315 Ashanti Goldfields has commissioned a private power provider to build a 220-mw plant,
with half of the output guaranteed for ACG. EIU (1998d) p. 21 316 The exception is Ashanti gold mines, which is able to develop cutting-edge technology in its
large Ghanaian mining operations. 317 In 1996, more than 200 expatriates worked in Ghana’s gold mines. Chamber of Mines
(1996)

132
Today, some mines still comment on the poor attitude of their workers, which they attribute to the management style of the former state-owned mining company. Many foreign entrants did not bring in a lot of capital, but only removed some bottlenecks and made the required ‘uncomfortable, sometimes tough decisions’ to install discipline and high operating standards.318
Capital availability
Today’s mining companies in Ghana are all predominantly financed by foreign funds, in particular from the US, Canada, and the UK. Starting in 1986, the World Bank injected capital of USD 85 million and provided extensive consulting services to the decrepit mining industry, in particular the State Gold Mining Corporation.319 However, the country’s gold output stagnated around 400’000 ounces until 1991, when multinational mining companies took over.
Physical infrastructure
The mining corporations have mainly circumvented the absence of a well functioning transport and communication infrastructure. Due to the large scale of their operations, most mining companies have established their own infrastructure, such as regular airlinks to Accra, fixed and mobile telephone systems, roads, schools, hospitals, even farms and entertainment facilities for their workers.
Information infrastructure
Ghana’s mining industry does not benefit from the research of Ghana’s Universities. Although companies cooperate with the School of Mines on the students’ curriculum, there is no research done by the school that can be leveraged in the mining operations. All modern processes and technologies are either imported or developed in-house. The gold mines benefit to some extent from the presence and experience of related mining ventures in bauxite, diamond and manganese through the Ghana Chamber of Mines, which serves as a representative for the country’s mining industry.
Administrative infrastructure
Gold mining requires long-term investments, and a stable judicial system. One of the major determinants of success for Ghana’s gold mining industry was the
318 Interview results

133
introduction of a new mining code in 1986.320 The code provides protection by regulating taxation, royalty payments, and ownership structures. The major elements are reduced tax rates, generous capital and depreciation allowances, exemption from duties on plant machinery, equipment and accessories, free personal remittances for expatriates, retention of foreign exchange, and the pegging of royalties on minerals between 3 and 12 percent of total value.321 The government is entitled to a 10 percent free interest in all mineral operations; in return shareholders in mining corporations are exempted from a dividend withholding tax.322 Coupled to the introduction of the mining code was the establishment of Ghana’s Minerals commission, whose objective is to attract foreign investments by minimizing initial capital costs and by reducing the hassles to set up a mining project. The commission consists of experienced miners who understand the needs of the mining industry, and it has the direct backing of the president. The task of the commission is to act as a facilitator and “one-stop-shop” for the gold mining industry, mainly to prevent prospective investors from getting tied up in bureaucratic tangles. The Minerals Commission evaluates the investment needs, and settles everything else around it, such as visa needs, money transfers, land acquisition, work permits and imports of mining equipment.
15.3.2 Domestic demand conditions
Domestic demand conditions play no role for the country’s gold industry. Ashanti jewelry made for the royal court used to be famous, but the tradition of gold smiting has largely vanished, and the income levels of the population do not allow large jewelry investments.
15.3.3 Related and supporting industries
Even though there are nine large mines exploited in Ghana, the industry does not benefit from a significant supporting industry. Most of the equipment and material has to be imported, and foreign companies provide most of the services at the mine (e.g., oil and lubricants, machine maintenance). Surface mining is highly capital intensive, and the machinery for its operations is all imported.
319 Interview results 320 A similar code has been recently adopted by Tanzania 321 Anyemedu (1991) p. 213

134
Underground mining is labor intensive, yet even there most of the tools (shovels, gloves, hardhats) and equipment are imported in large quantities. Equipment for the further processing of gold, such as oxidation plants, agents and chemicals are imported as well.
Because of the large quantities of limestone and explosives needed, Ashanti Goldfields has established its own explosive and limestone producers to serve the mining and quarrying industries in Ghana and in West Africa. Currently, the limestone company supplies 12 other customers, among them other gold mines, water treatment plants, and other manufactures and had exports of USD 1.1 million in 1997.323 There are plans by a Ghanaian investor to establish a second limestone company to exploit domestic resources.
15.3.4 Firm structure, strategy and rivalry
Structure and rivalry
Success in gold mining is determined by two factors: high-grade ore, and low production costs. In the past, gold mining companies competed fiercely for the best high-grade ore sites, but would then share production know-how amongst each other. Today, with cost control becoming a strong determinant of success, companies have stopped to share information. Competition for skilled workers is not very fierce, as most mines are quite far apart from each other.
Climate for investments
With the introduction of the new Mining Code in 1985, the explicit goal of Ghana’s government was to attract foreign capital and expertise into the country’s mining industry. As a result, the gold mining industry has grown into the country’s most successful industry. This success, however, has also resulted in increasing demands from several stakeholders, amongst them the government and workers. In 1999, several strikes hampered the production at some of the country’s largest mines. More worrying than the strikes themselves was the lack of support from the
322 Tsikata (1997) p. 12 323 Ghana 40th Anniversary (1996) p. 84
135
government, which even started to openly attack the management of some mines.324
Strategy
Gold mining is a global business, with Ghana being just one favorable location for most foreign Gold mining corporations. Except for Ashanti, all mines are majority owned by foreign companies, whose strategy is to find high-grade ore sites and to keep operating costs as low as possible. The success of Ashanti Goldfields is linked to its commitment to Ghana as the core of its operations, and by its focus on being Africa’s prime mining company. In 1991, Ashanti moved its headquarters from London to Ghana, and elected a Ghanaian national as CEO. Through its focus on Africa, the company has built a network of relationships with various heads of states and policy makers, and has a better understanding of the local culture and environment. Its expansion strategy is to buy companies with high quality reserves but weak management teams the across the African continent,325 and to use sophisticated financial engineering to pay for the acquisitions.326
15.3.5 Influence of Government Policy
Ghana’s government has had an enormous influence on the rise and fall of the country’s gold mining industry. The productivity of the gold mining industry dropped after the government had taken control of the industry in the 1960s, and only started to recover when the mines were privatized again in the late 1980s, coupled with the establishment of an advantageous mining code.
324 In June 1999, 9’000 miners at Ashanti went on strike for higher pay, despite falling gold prices. EIU ViewsWire, June 11, 1999 (Database download) “Labor strife hits Ashanti Goldfields”
325 When Ashanti acquired Australian Cluff, Canadian International Gold Resources and Australian Golden Shamrock mines in 1996, the company only kept the African interests of the acquired companies and sold off all other interests.
326 However, in September 1999, when World gold prices rose rapidly within a week, Ashanti’s hedging problem led to heavy losses. Economist, November 13, 1999 p. 87 “The great black hope”

136
15.4 Summary and conclusion on Ghana’s Gold mining industry
Nature and development of competitive advantage
Success in gold mining is determined primarily by access to high-grade ore, and by low cost mining processes. Ghana’s main determinants of competitive advantage in gold mining are its high grade ore reserves, the availability of highly skilled miners, and a stable and favorable regulatory environment that allows mining companies to make large investments into state-of-the-art equipment and processing plants, and to operate their mines profitable even during low gold prices. Due to their size, mining corporations were able to circumvent the problem of poor transport and communication infrastructure by building their own enclaves around the mines, with own schools, airports, roads, and even power plants. As a consequence, the mining industry does not have much linkage to the other sectors of the economy.327
The main threats to Ghana’s competitive advantage in gold mining are volatile gold prices, and changes in the country’s favorable regulatory environment. In 1998, gold prices averaged USD 294/ounce, and worldwide only 2 percent of all mining companies were able to produce gold below this price. For the next years, gold prices are expected to move between USD 265 and USD 305/ounce,328 threatening the profitability of current mines, and preventing further exploration activities in the country. When introduced in 1986, Ghana’s mining code was the most advanced mining code of the World. Its guarantees and benefits were the main reason for foreign mining companies to undertake exploration activities in the country. Since then, countries such as Guinea and Tanzania have established new mining codes based on Ghana’s example, and are attracting an increasing share of investments. Even more, Ghana’s favorable conditions are threatened by government actions. Tempted by easy money, the government is reconsidering to revise its incentive program, and to increase its participation in the gold mine’s revenues.
327 Tsikata (1997) p. 13 328 Neue Zürcher Zeitung, April 22, 1999, p. 33 “Wenig glänzende Aussichten für das Gold”

137
Capacity for innovation
The capacity for innovation in Ghana’s gold mining industry lies chiefly in productivity improvements in the current mines. The success of the industry in the past years had been possible with the infusion of foreign production management, with further improvement possibilities ahead. Other fields of improvement are spillover effects into other parts of the Ghanaian economy. So far, they have been limited to limestone and explosives, and the industry remains as an isolated enclave with little skill transfer.329
329 In the US however, the mining industry had been one of the drivers for the rise of companies like Caterpillar

138
16 The competitive advantage of the Timber and Furniture Industry
In 1997, Ghana exported USD 170.8 million worth of timber and furniture, an increase of 17 percent over the USD 145.6 million exports in 1996. The largest export category in 1997 was sawn wood, followed by veneer sheets and plywood. Furniture and bedding exports, worth USD 8.2 million, accounted for 4.8 percent of the total timber exports.330
16.1 Structure of Ghana’s Timber and Furniture industry
In Ghana’s timber and furniture industry, there are three major production steps. Timber is cut in timber concessions, and then processed into sawn wood and veneer, from which other products such as plywood and furniture are made.331 The country’s industry employs about 75’000 people and provides indirect employment to close to 2 million people.
In 1997, Ghana’s Timber Export Development Board registered some 200 logging firms, about 130 saw milling, veneering and plymilling companies, and more than 200 large and medium-scale furniture and wood-working enterprises.332 The four largest exporters have annual revenues of around USD 5 to 6 million, and account for roughly 40 percent of all processed wood exports. Aside from the government, several families control a large part of the country’s timber industry.333
330 Ghana Export Bulletin (1996 & 1997) 331 Solid wood furniture is assembled from solid wooden parts, while veneered furniture is made
from plywood or veneer sheets. 332 Conafric (1996) p. 146 333 Friends of the Earth (1992) p. 15
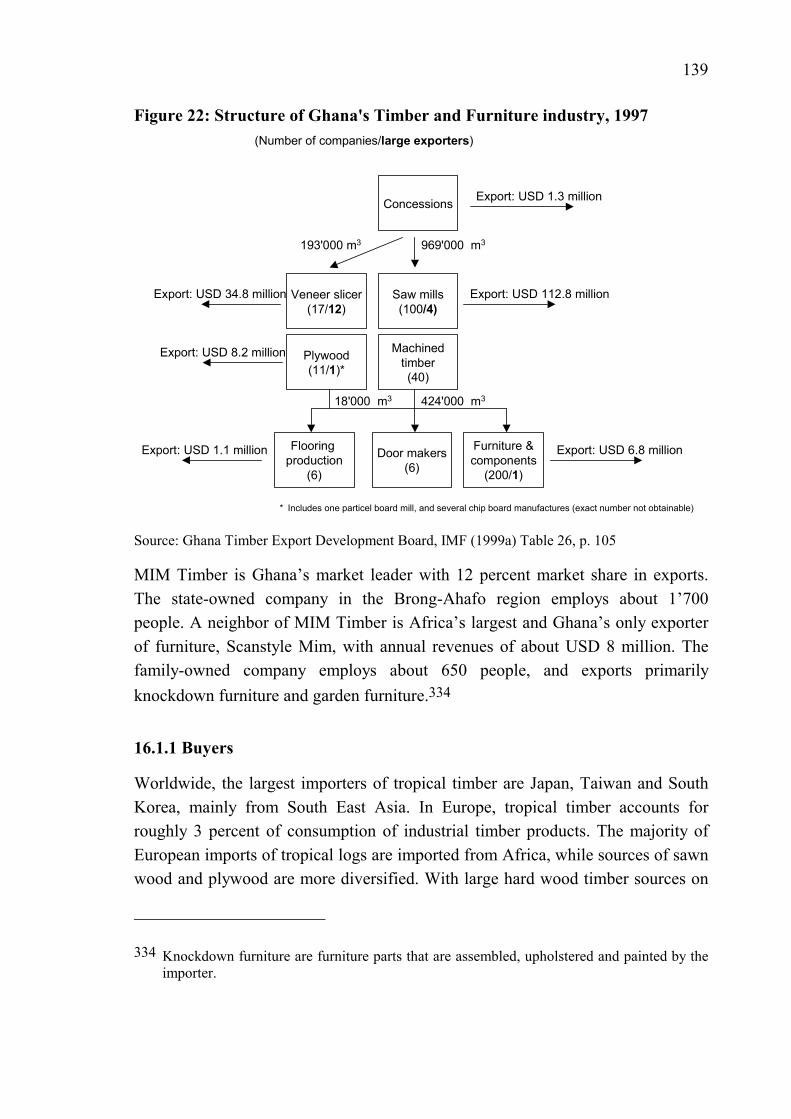
139
Figure 22: Structure of Ghana's Timber and Furniture industry, 1997 (Number of companies/large exporters)
* Includes one particel board mill, and several chip board manufactures (exact number not obtainable)
Concessions
Saw mills(100/4)
Machinedtimber(40)
Veneer slicer(17/12)
Plywood(11/1)*
Furniture &components
(200/1)
Door makers(6)
Flooring production
(6)
969'000 m3
Export: USD 1.3 million
193'000 m3
Export: USD 112.8 millionExport: USD 34.8 million
Export: USD 8.2 million
424'000 m318'000 m3
Export: USD 1.1 million Export: USD 6.8 million
Source: Ghana Timber Export Development Board, IMF (1999a) Table 26, p. 105
MIM Timber is Ghana’s market leader with 12 percent market share in exports. The state-owned company in the Brong-Ahafo region employs about 1’700 people. A neighbor of MIM Timber is Africa’s largest and Ghana’s only exporter of furniture, Scanstyle Mim, with annual revenues of about USD 8 million. The family-owned company employs about 650 people, and exports primarily knockdown furniture and garden furniture.334
16.1.1 Buyers
Worldwide, the largest importers of tropical timber are Japan, Taiwan and South Korea, mainly from South East Asia. In Europe, tropical timber accounts for roughly 3 percent of consumption of industrial timber products. The majority of European imports of tropical logs are imported from Africa, while sources of sawn wood and plywood are more diversified. With large hard wood timber sources on
334 Knockdown furniture are furniture parts that are assembled, upholstered and painted by the importer.
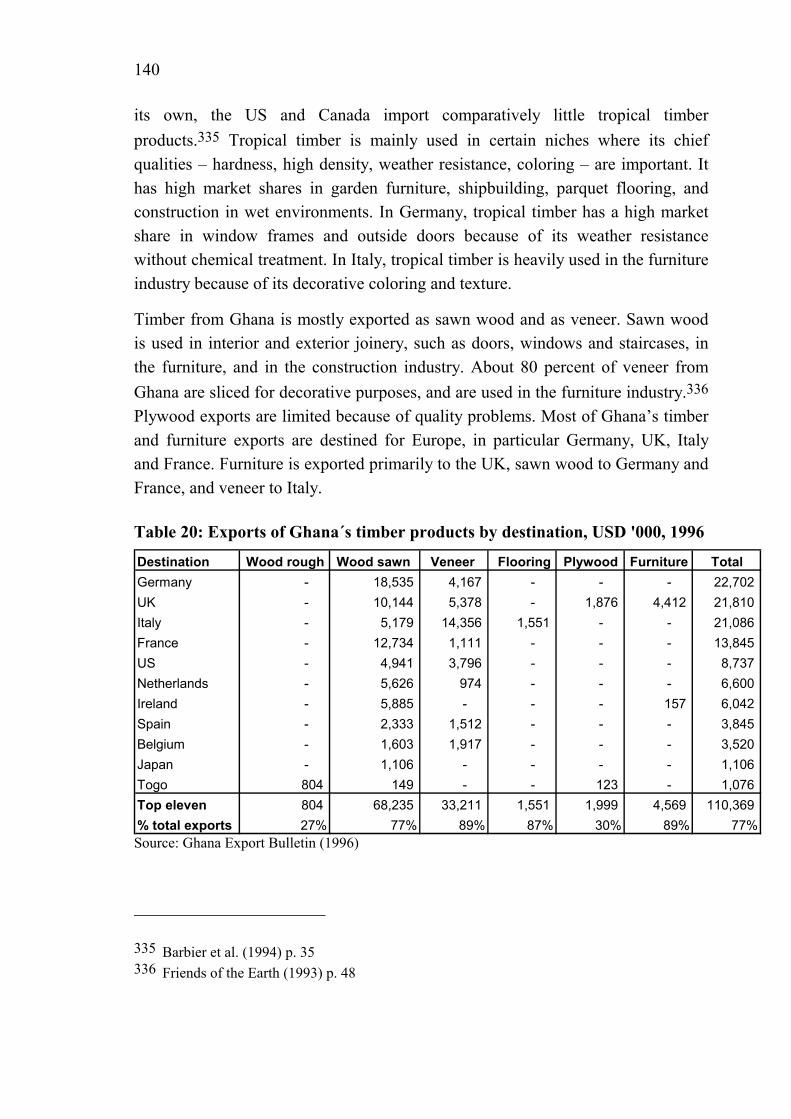
140
its own, the US and Canada import comparatively little tropical timber products.335 Tropical timber is mainly used in certain niches where its chief qualities – hardness, high density, weather resistance, coloring – are important. It has high market shares in garden furniture, shipbuilding, parquet flooring, and construction in wet environments. In Germany, tropical timber has a high market share in window frames and outside doors because of its weather resistance without chemical treatment. In Italy, tropical timber is heavily used in the furniture industry because of its decorative coloring and texture.
Timber from Ghana is mostly exported as sawn wood and as veneer. Sawn wood is used in interior and exterior joinery, such as doors, windows and staircases, in the furniture, and in the construction industry. About 80 percent of veneer from Ghana are sliced for decorative purposes, and are used in the furniture industry.336 Plywood exports are limited because of quality problems. Most of Ghana’s timber and furniture exports are destined for Europe, in particular Germany, UK, Italy and France. Furniture is exported primarily to the UK, sawn wood to Germany and France, and veneer to Italy.
Table 20: Exports of Ghana´s timber products by destination, USD '000, 1996
Destination Wood rough Wood sawn Veneer Flooring Plywood Furniture TotalGermany - 18,535 4,167 - - - 22,702 UK - 10,144 5,378 - 1,876 4,412 21,810 Italy - 5,179 14,356 1,551 - - 21,086 France - 12,734 1,111 - - - 13,845 US - 4,941 3,796 - - - 8,737 Netherlands - 5,626 974 - - - 6,600 Ireland - 5,885 - - - 157 6,042 Spain - 2,333 1,512 - - - 3,845 Belgium - 1,603 1,917 - - - 3,520 Japan - 1,106 - - - - 1,106 Togo 804 149 - - 123 - 1,076 Top eleven 804 68,235 33,211 1,551 1,999 4,569 110,369 % total exports 27% 77% 89% 87% 30% 89% 77%Source: Ghana Export Bulletin (1996)
335 Barbier et al. (1994) p. 35 336 Friends of the Earth (1993) p. 48

141
Demand for tropical timber in the developed World is stable to decreasing, but not expected to grow in the long term. Prices for tropical hardwood have been falling by 35 percent between 1993 and 1996.337 Recent trends in Europe go towards a reduction of log imports and a relative increase in processed timber products, with an overall decline in total tropical timber consumption. These trends are expected to continue, leading to a loss of market share and absolute reductions in quantities of tropical timber products consumed.338 Yet, even though demand for timber is growing rapidly in developing countries, developed countries will remain the largest markets for high-priced tropical timber in the near future.
16.1.2 Competitors
Tropical timber plays only a minor role in World timber trade and processing, accounting for about 5 percent of all exports in terms of volume, and 12 percent in terms of value.339 The world’s largest tropical timber exporters are Indonesia with USD 5.1 billion in 1996, Malaysia (USD 4.8 billion), and Brazil (USD 1.0 billion). Both Malaysia and Indonesia export primarily processed timber in form of veneer and plywood, with Malaysia responsible for 44 percent of exports to the EU. The largest timber exporters in Africa ahead of Ghana are Gabon (USD 399 million), Cote d’Ivoire (USD 389 million) and Cameroon (USD 272 million).340 African countries still export large shares of their timber in form of logs, capturing 99 percent of the EU tropical log market.341
The furniture market can be segmented into solid wood furniture and plywood/veneered furniture. The veneered furniture segment is very technology intensive, requiring sophisticated machinery and highly skilled operators. For export, Ghana is only producing solid wood furniture, which require less technology. Competition for solid wood furniture is intensive, mainly from low- price manufacturers from Eastern Europe and the Far East.
337 Prices for Malaysian Hardwood Logs; IMF (1997) p. 163 338 Barbier et al. (1994) p. 37 339 The high relative value stems from the fact that tropical timber is used for specific
applications. Barbier et al. (1994) Table 2.3a and 2.3b, p. 10 340 Based on SITC 247, 248, 634, 635; UN International Trade Statistics Yearbook (1997) 341 Friends of the Earth (1993) p. 31
142
16.1.3 Substitutes
Almost all applications of tropical timber are threatened by substitutes, both by cheaper temperate timber from Russia and New Zealand, and by other materials such as plastic or aluminum. Limited anecdotal evidence suggests that substitution of tropical timber with non-wood products is significant. Mainly in the building industry, aluminum for window frames and outer wall panels is replacing tropical timber, while chemically treated temperate timber is increasingly used for other outdoor applications. In railway construction, wooden sleepers have been completely substituted by concrete and steel.342
16.2 History of Ghana’s Timber and Furniture industry
The development of Ghana’s timber industry started in the 19th century with the export of mahogany to the US. Significant timber exports to Europe started to take-off in 1903 with the establishment of a railway line between Kumasi and Takoradi.343 The establishment of a wood working industry at the village level started during World War II, when carpenters across the country produced furniture and wooden articles for the British Army and Air Force.344 After the World War II, Ghana’s timber exports rose rapidly to about 236’000 cubic meters of logs and about 60’000 cubic meters of sawn timber in 1950. In 1959, Ghana’s industrial census counted already 89 timber processing companies, and 20 small-scale furniture workshops,345 and between 1963 and 1970, annual exports were around 600’000 cubic meters per year.346 In 1970, Ghana’s government implemented the first measures to get the exploitation of the country’s forest resources under control. This included the banning of exports of trees that took longer than 25 years to grow,347 the establishment of the Timber Marketing Company as a buying monopoly, and limitation of the number of concessions. In 1974, the government also started to take controlling stakes in several sawmills
342 Brockmann, Hemmelskamp, Hohmeyer (1996) p. 53 343 Agbodeka (1992) p. 120 344 Agbodeka (1992) p. 136. Between 1941 and 1946, the Gold Coast was a staging posts for
British and American troops on their way to the Far East. Frimpong-Ansah (1991) p. 29 345 Asamoa (1996) p. 27 346 Based on Asamoa (1996) Appendix 7, p. 213 347 Brockmann, Hemmelskamp, Hohmeyer (1996) p. 70

143
and foreign controlled forest concessions. Soon after, managerial inefficiency and lack of foreign exchange to buy new equipment led to a severe decline of Ghana’s timber industry. In the mid 1980s, as part of Ghana’s economic reforms, the World Bank and UK development agencies invested USD 53 million into timber industry, primarily for purchasing of new equipment for logging and processing companies.348 Aside from a financial revival, there were also organizational changes, such as the replacement of Ghana’s highly inefficient Timber Marketing Board with the Timber Export Development Board, responsible for marketing and pricing, and the Forest Products’ Inspection Bureau, which monitors contracts, maintains quality standards, and grades products.
Severe problems remained, such as failure to pay royalties, illegal trading, and wild felling leading to accelerated deforestation.349 In 1990, international prices for timber rose markedly, leading to a rapid export increase.350 In 1994, the Ghana’s government started to take active measures to protect the country’s forest resources by banning certain species for export.351 In late 1995, it suspended the export of unprocessed logs altogether, with the objective to curtail felling and to emphasize value added processing. As a result, the harvesting of logs decreased by 487’000 cubic meters in 1995, roughly equal to the amount of log exports in 1994.
Foundation of important companies
The country’s largest timber processing company, MIM Timber, was established in 1947 by Hungarian investors and remained a family-owned business until 1977, when the company was completely nationalized. Like most large timber processors, the company has built its own infrastructure complete with power supply, educational facilities for the children of its workers, and roads. The foundation of the country’s main furniture exporter, Scanstyle Mim, dates back to 1968, when it was founded as a joint venture between MIM Timber and a Norwegian businessman. Originally, the company produced parquet flooring and furniture parts using cut-offs from the MIM sawmill, and moved then rapidly towards the production of finished furniture. With the nationalization of MIM
348 Friends of the Earth (1992) p. 9; La Verle (1995) mentions USD 120 million of aid and commercial credits being invested in the forestry sector between 1983 and 1993.
349 See Conafric (1996) and Friends of the Earth (1992) 350 IMF (2000a) p. 16 351 La Verle (1995) p. 166

144
timber in 1977, the government took over a large share in Scanstyle. In 1982, a Ghanaian businessman started a massive investment and rehabilitation program.
16.3 Timber and Furniture’s Diamond of National Advantage
Table 21: Determinants of timber’s competitive advantage Determinant Elements Timber Furniture
Raw material 2 2 Human resources 0 0 Specialized factors 1 1 Capital availability 1 1 Physical infrastructure -1 -1 Information infrastructure
1 2
Factor conditions
Administrative infrastructure
-1 -1
Size of home market -1 -1 Demand conditions Quality of demand -1 -2 Supporting industries 0 -1 Related and supporting
industries Related industries 0 0 Structure and rivalry 0 0 Climate for investments 1 1
Firm strategy, structure and rivalry
Strategy 0 2 Macroeconomic stability
0 0 Government
Microeconomic environment
0 0
Development of competitive advantage
1 1 Summary
Capacity for innovation 0 1

145
16.3.1 Factor conditions
Raw material
The main factor driving the competitiveness of Ghana’s timber and furniture industry is access to cheap raw material. However, the availability of timber is threatened by excessive resource utilization. In 1946, Ghana had between 26’000 and 31’000 square kilometers of Tropical High Forest.352 Since then, more than 90 percent of Ghana’s forest reserves have been logged.353 Today, the country has 266 forest reserves of 1.2 million ha for timber production, on which it grows about 680 different wood species. If these resources should be sustained, timber production should not exceed 1 million cubic meters a year, a volume that is slightly below of what has been officially produced in the last years.354
Human resources and specialized factors
Although the timber industry is one of the leading industries in the country, there is a gap between the excellent artisan capabilities, and the skills required for modern industrial production. Today, there are very few highly skilled indigenous workers who can program and operate modern machinery. Expertise lacks both at the technological and managerial levels.355 As a result, Ghana’s timber industry employs a significant number of European and US expatriates to manage their companies and to ensure proper utilization of imported machinery and equipment.
Capital availability
For most parts, Ghana’s timber and furniture industry has no particular problems getting access to capital. Aside from the large capital injection of USD 53 million in World Bank loans, most of the industry’s capital is equity capital raised by the owners. Most of Ghana’s timber companies are owned by the government, or by wealthy Ghanaian and Lebanese families. Because of its export orientation and its
352 Agbodeka (1992) p. 96 353 Friends of the Earth (1992) p. 4 354 Conafric (1996) p. 146. A UK consultancy advises that the annual exploitation of timber be
pegged at 300,000 cubic meters only, otherwise Ghana would be a net importer by the year 2010. African Business Issue 211, June 1996, p. 35
355 La Verle (1995) p. 167
146
well-connected owners, the industry has also access to letters of credit for working capital, foreign loans, and equity participations.
Physical infrastructure
Poor transport infrastructure and inadequate utilities have been hampering the performance of the industry. Roads are in bad conditions, the railway system is unreliable, and most companies have to maintain their own road network in their area. Until very recently, remote saw mills and factories were not connected to the national grid and were required to operate their own generators. One company relying on public power supply had to abandon the export business because power cuts made it impossible to operate modern computer-controlled machinery, leading to frequent shipment delays and loss of customers.
Information infrastructure
Even though the timber industry accounts for an enormous share of Ghana’s economy, there is little direct support from public or private research institutions. Interviewers mention the lack of success in research projects that were conducted by local universities and the absence of help by other government institutions. The Ghana Timber Export Development Board operates export promotion offices in Ghana and London, but the success or importance of this support is not visible.
Administrative infrastructure
Ghana’s bureaucracy seem still to present a major obstacle – although its performance has improved over the last years. In 1995, the export of one container required 172 forms to be filled out, and due to restricted office hours containers could only be shipped Tuesday through Thursday. Exporting companies have to spend roughly USD 1’000 on annual registration fees for the Timber Board, Forest Bureau and other industry organizations. Companies cited bureaucratic difficulties as the main reason to stop exporting,356 as delays had the consequence that contractual obligations could not be met.
356 However, one company mentioned that it was thinking to focus on exports only in order to liberate itself from the need to compete for corrupt government orders where 10 percent of the order sum was typically required as pay-back.
147
16.3.2 Domestic demand conditions
Ghana’s home market for timber products is relatively large. In 1997, roughly 40 percent of Ghana’s officially cut timber was consumed on the domestic market.357 Unsatisfied demand particularly in the furniture industry poses a disincentive for furniture manufacturers and large carpenters to export. As for most articles, the quality standards of Ghanaian customers are well below the requirements of European importers. Ghanaian customers tend to accept poor work and late delivery, simply because otherwise they would not get any products at all. Ghanaian exporters cannot use their home markets as a learning basis for successful exports. Adding to poor quality is the absence of furniture or building material standards. Almost every piece of furniture, every door and every window is custom made, preventing companies from running large batches of the same product. In several cases, relatively minor faults that are nonetheless unacceptable to foreign consumers have prevented companies from becoming successful exporters. A driving factor for exports however is the frequent corruption in the public purchasing process, which has forced companies to abandon the domestic market in favor of export markets.
16.3.3 Related and supporting industries
The timber industry does not benefit from the presence of specialized suppliers or other related industries. Basically all machinery and parts are imported, along with supplies such as glue, paint, and material. While some companies are able to maintain their complex computer-controlled machinery themselves with the help of well-trained specialists and expatriates, others need to fly in specialists for repairs and upgrades.
16.3.4 Firm structure, strategy and rivalry
Structure and rivalry
Even though Ghana counts a large number of timber and furniture producers, rivalry and competition are not very intense because of excess demand and easy export facilities. In the domestic market, demand outstrips supply, and exporting firms are not competing for market share. In principle, barriers to entry are low.

148
However, only few companies manage to build up the required network of relationships to operate their companies successfully.
Climate for investments
The climate for investments in the timber and furniture industry is good. In general, the government supports value-added processing of the country’s raw material. Also, there are no indications about labor unrests or strikes.
Strategy
The dominant strategy in the timber industry is to focus on exports only, neglecting domestic markets. Exporting firms are able to specialize on certain products and run large production batches. Their exports give them access to foreign exchange for further machinery investments. Also, they are able to achieve better prices in export markets in general, and there are fewer incidents of payment problems or even corruption.358 However, except for Scanstyle, no firm has started to upgrade and to move towards more innovative, higher value added products. Scanstyle’s success is a good illustration of how a consistent strategy can lead to success. Since its founding, the company has focused on producing furniture parts and knockdown furniture. Most of the company’s production is sold through its marketing agents in Europe, who form the link between the final European customer and Scanstyle. The agent’s role is to transfer specific customer requirements, complaints, and suggestions. The company produces only on orders, and only to the design requirements of its customers. In its production, the company focuses on two elements: high product quality, and reliable delivery dates. When Scanstyle encountered supply problems, it started to backward integrate and has now the complete value chain under its own control. To ensure European quality standards, the company operates modern computer-controlled equipment, which is supported by expatriates responsible for production planning and quality control. With this strategy, Scanstyle has been able to circumvent various disadvantages: Backward integration and own power supply make the company independent from unreliable infrastructure and suppliers. The focus on demand-driven production and design saves the company design costs and eliminates the risk of not understanding European design requirements.
357 Based on IMF (1999a) Table 26, p. 105 358 See Bigsten et al. (1998b) p. 8

149
Competitors who have adopted individual elements of Scanstyle’s strategy have mostly failed. Another company that had invested into computer controlled machinery was forced to abandon exports because unreliable and fluctuating power supply made regular production impossible, because it was unable to secure a reliable source for raw material, and because its own designs were not in line with the taste of their European customers.
16.3.5 Influence of Government Policy
The main influence of government policy on Ghana’s timber industry are its felling and export regulations to ensure the sustainability of its forest reserves, and to enforce the export of higher value-added goods. These regulations forced the industry to upgrade and move towards processed products such as veneer and sawn wood. As a result, the total value of timber products exported rose by 17 percent between 1996 and 1997, with the official log production remaining constant.359
16.4 Summary and conclusion on Ghana’s Timber and Furniture industry
Nature and development of competitive advantage
Although it has been in operation since World War II, the focus on raw material exports have prevented the build-up of a strong diamond of national advantages for the timber industry. Still today, the competitiveness of Ghana’s timber industry is mostly limited to basic factor advantages, the access to cheap timber resources. The basic advantages have not been translated into other, more advanced advantages. The government’s efforts to force the industry towards higher value-added products have been hampered by the absence of other key determinants required for sustainable success, such as a functioning transport and utility
359 Based on Ghana Export Statistics Exports, and IMF (1999a) Table 26, p. 105. However, evidence from Malaysia suggests that timber processing inside the country itself was less efficient than in importing countries both from a resource utilization (raw logs) and cost perspective.

150
infrastructure, technical know-how or export legislation.360 Overall, the competitive advantage of Ghana’s timber industry is falling. Demand for tropical timber has been falling over the past years, and deforestation erodes the country’s basic factor advantages.
Capacity for innovation
Most timber companies are still successfully exporting semi-processed timber products, but with Worldwide demand for tropical wood falling, they are about to lose their competitive advantage. The main improvement potential lies in increased productivity, and in moving towards higher value-added products. One company, Scanstyle, has proven that Ghana’s basic factor advantage can be leveraged, as basis to upgrade and move towards other activities along the value chain of timber products. The company’s strategy was to build up the most critical elements of infrastructure by itself, to integrate backwards, and to produce only according to customer requirements. This strategy allowed it to circumvent the country’s factor disadvantages, to avoid unreliable suppliers, and to make up for its lack of design and marketing know-how.
360 The maximum yield of Ghanaian sawmills is between 40 to 55 percent of unprocessed timber, and the rest is wasted in sawdust. Productivity improvements in this area could lead to reduce the pressure from tighter felling limits. IMF (2000a) p. 35

151
17 The competitive disadvantage of the Textile and Garment industry
Ghana’s textile and garment industry is an example of an industry that should be quite successful in theory, but has performed poorly ever since the beginning of the economic reform program. In 1997, Ghana’s textile and garment exports were insignificant at USD 2.5 million, up from USD 1.9 million in 1996.361
17.1 Structure of Ghana’s Textile and Garment industry
Textile production and garment production are two different industries. The textile industry is highly capital intensive, producing cloth and yarns for the garment industry, which then knits or assembles clothing for final consumption. The garment industry is typically highly labor intensive, with low capital and skill requirements.
In 1999, five textile mills were in operation in Ghana. Their main products are batik-type wax cloth, fancy printed cloth, and kente, a traditional woven cloth. The major part of their output is used in small seamstress shops, which specialize on tailor-made traditional clothing for the local market. Ghana’s garment products can be separated into two distinct categories, “Afrocentric” and “standard”. Afrocentric clothing is made to local design and fashion, and is produced in several smaller companies, as well as in numerous seamstress-shops. These shops process mainly local cloth, or similar-looking imported cloth. Companies operating in the “standard” category assemble large volumes of one article, such as shirts or pants, for export. The cloth used for these standard items is usually imported. Three larger companies producing standard clothing for export in 1998.362
The raw material for the textile industry, cotton, is grown by about 7’500 farmers363 in Ghana’s Northern Region, and annual production is estimated to be
361 Ghana Export Bulletin 1996 and 1997 362 No reliable information could be obtained on the exact number of companies operating in
this segment. The largest company was closed down at the time of writing because of labor relation problems, and it was not clear if it would open again.
363 Conafric (1996) p. 143

152
around 35’000 tons.364 In three ginneries, the cotton fibers are separated from the seeds, and then shipped to the textile mills for yarn spinning and fabric weaving.
Figure 23: Structure of Ghana's Textile and Garment industry, 1997
Cotton ginnery
(3)
Textile mill(5)
Export USD 912'000
Cottonfarming*
Garmentmanufacture
(10)**Export USD 741'000
* 2 large plantations and numerous small-scale producers** Excludes 179 small-scale exporters
Note: Number of textile mills and garment manufactures based on export information
Source: Ghana Export Bulletin (1997), Ghana Export Promotion Council
17.1.1 Buyers
The retail market for textile and clothing products in the US and Europe is characterized by fierce competition and low margins. Competition is particularly intensive in the market for standardized garments, where large international buyers are constantly skimming the globe for optimal production conditions. Buyers of standardized clothing compete in their home market predominantly on costs, with fashion and design being less important.365 Consequently, mainly costs, product quality, and supplier reliability drive their buying decisions. Product requirements in the standard clothing category are very strict, with clearly defined size, quality, packaging standards, and tight delivery schedules.
364 EIU (1998c) p. 19 365 See also Singleton (1997) p. 69

153
Afrocentric articles are sold in niche markets, in particular to African Americans in the US, and in the “ethnic” market in Europe.366 In the US, African Americans tend to spend more money on apparel than the general population, leading to targeted efforts of department stores and specialty boutiques to serve them with imported African products.367 In Europe, the ethnic clothing markets is relatively small.368 Buyers for the afrocentric and ethnic markets are mostly working for trading companies or department stores. Often, they are specialized in working with small-scale, artisan producers in developing countries, but still they operate with clear standards concerning product quality, size, delivery schedules and payment methods.
17.1.2 Competition
On the World market, Ghana is competing with three major products: afrocentric textiles, afrocentric garments, and standard garments. In the textile segment, the main competitor is Nigeria, whose imported wax cloth in 1999 was 27 percent cheaper than domestic wax cloth, and Pakistan, whose fancy prints were 44 percent cheaper than domestic prints. In the afrocentric garment sector, competition is less intense, with countries like Zimbabwe, Uganda, Tanzania and Kenya producing comparable products.
In standardized garment production, fabric – although the single largest input - can be transported over long distances, without significant impact on unit costs, and manufacturers can produce anywhere irrespective of whether there is local supply of fabric. Hence, competition is driven by labor costs. The main competitors are in East and South East Asia, as well as Africa. For a men’s shirt, Ghana’s total production costs are lower than those of the world’s leading garment producers China and India, but mainly because Ghana is able to provide quota-free access to the US and European markets (Table 22).369
366 “Ethnic” goods can be described as products made in developing countries using traditional methods and design
367 Biggs et al. (1994) p. 12 368 Biggs et al. (1996) p. 14 369 Garments manufactured outside Europe and the US have been subject to quota agreements
under the GATT’s Multi-Fibre Agreement. However, apart from Lesotho and Mauritius, no African country is subject to quota agreements under the Multi-Fibre-Agreement. Biggs et

154
Table 22: Cost and productivity comparisons for shirt production, 1994
Cost comparison for standard Men's Casual Long-Sleeved ShirtCost items (USD) Ghana Kenya India ChinaFabric 3.18 3.00 2.90 2.78Misc. Material 0.52 0.65 0.65 0.65Washing 0.11 0.14 0.12 0.16Labels, Packaging 0.36 0.47 0.40 0.25Dir./indir. Labor 1.22 1.68 1.22 1.83Transport to Port 0.05 0.16 0.15 0.05Subtotal 5.44 6.10 5.44 5.72Tax and duty 0.67 0.75 0.58 0.61Quota cost 0.00 0.00 1.00 2.00Total costs 6.11 6.85 7.02 8.33Source: based on Biggs et al. (1996) Table 5.5, p. 80
Manufacturing efficiencyNumber of shirts produced per operator/ 8 hour day
Ghana Zimbabwe Kenya ChinaMen's casual shirt 12 12.5 18 20-24Source: based on Biggs et al. (1994) Table 4.5, p. 42
17.1.3 Substitutes
The main substitute for manufactured clothing in Ghana is used clothing imported from the US and Europe. The used-clothing segment has taken a significant share of Ghana’s textile market, to an extent that re-exports of used clothing were already two to three times larger than exports of new clothing in 1996 and 1997.
17.2 History of Ghana’s Textile and Garment industry
Cotton in Ghana was already cultivated before the arrival of the Europeans in the 13th century. In the Ashanti kingdom, the art of cotton weaving was brought to perfection with Kente products, colorful woven strips that are put together to one piece of cloth. During the 19th century, Ghana was growing cotton under the
al. (1994) pp. 40-42. Chinese and Indian manufacturers however have to buy quotas on the secondary market, ranging from USD 1 to 2 per shirt.
155
directions of the British Cotton Growing Association, and Mission Stations and individual Europeans had also established a few cotton plantations. However, insect pests and other plant diseases prevented a full take-off of cotton farming, and most investments were soon abandoned.370 A second effort to start a cottage-type textile industry in Ghana was made in 1942, when the Achimota College Textile Unit began to train apprentices in cloth weaving, and several looms and spinning wheels were installed.371 During World War II, the industry exported textiles to the UK and continued to grow until independence.372 The big push for Ghana’s textile industry came after independence, when Nkrumah chose to build up a textile industry as part of his overall industrialization strategy. In 1964, the government established a state-owned farm in the north to grow about 660 ha of cotton and built the country’s largest textile mill next to the Akosombo dam.
The textile industry was at its peak in the mid seventies. In 1974, Ghana had 8 major textile mills, with 25’000 employees, producing 121.3 million meters of cloth. The decline started as soon as the supply of foreign exchange for machine spare parts, dyes and chemicals dried up. In 1981, textile production had declined to 30.5 million meters,373 and textile mills were operating at 10 percent of their capacity.374 The most serious challenge however was the abolishment of trade barriers in 1986, which exposed the already fledgling industry to full import competition. Between 1987 and 1983, the number of large and medium size textile and garment manufacturers declined from 117 to 43, and in 1995, only five mills were operating in the country, employing 7’000 people, less than a third of the 1974 employment. The downturn in raw material production was similar: the production of raw cotton had peaked at 24’000 tons in 1977, but fallen to 8’000 tons in 1989.375 The country’s largest textile mill, Akosombo textiles, was taken over by the Swiss Cha group, which revamped its machinery and started Volta Garments, a garment assembly factory for export-destined standard shirts. Because
370 Agbodeka (1992) p. 38 371 Agbodeka (1992) p. 138 372 Except for wartime needs, the development of a textile industry was not supported by the
Colonial Government. In 1946, the British banned exports of locally woven cloth from Nigeria, indicating “that it was a West African policy to clamp down on manufacturing industries that could compete effectively with British manufactures.” Agbodeka (1992) p. 143
373 Agbodeka (1992) p. 153 374 Asamoa (1996) Table 6.3, p. 106

156
of low labor productivity and strikes, Volta garments has discontinued production in 1998.
17.3 Textile and Garment’s Diamond of National Advantage
Table 23: Determinants of textile and garment's competitive advantage Determinant Elements Textile Garment
Raw material -2 0 Human resources 0 1 Specialized factors 0 0 Capital availability -1 1 Physical infrastructure -1 0 Information infrastructure
0 1
Factor conditions
Administrative infrastructure
-1 1
Size of home market 0 0 Demand conditions Quality of demand 0 -1 Supporting industries -2 0 Related and supporting
industries Related industries 0 0 Structure and rivalry 0 -2 Climate for investments 0 1
Firm strategy, structure and rivalry
Strategy -1 0 Macroeconomic stability
0 0 Government
Microeconomic environment
-1 0
Development of competitive advantage
-1 1 Summary
Capacity for innovation 0 2
375 La Verle (1995) p. 162
157
17.3.1 Factor conditions
Raw material
Ghana’s textile and garment industry has no basic factor advantages. The main cost element of a textile product is raw material, mostly cotton, making up between 40 to 80 percent of the total costs. One major disadvantage for Ghana’s textile industry is the high price of domestic cotton. Ghanaian textile mills are required to process all local cotton before being allowed to import cotton.376 Yet, as a result of low yields (775kg/ha, compared to the 1’200 kg/ha regional average377) and high transportation costs, Ghanaian cotton prices are 40 percent above World market prices.378 The textile for Ghana’s standardized garment industry is all imported.
Human resources and specialized factors
Ghana’s textile sector operates with older, less automated equipment, where a high level of worker and supervisory skills are needed to achieve World market standards. Although wages are low, the low skill level makes Ghana an inefficient textile producer: Labor productivity is only between 10 to 20 percent of that of developed countries. The quality of textile output is very low, constituting a major handicap for local downstream users like garment makers, and the production cost of garment is almost twice as high as in East Asia.379 Ghana has quite a large pool of local seamstresses and textile graduates from polytechnics that possess the required skills for textile and garment manufacturing, with generally low wages. However, labor productivity in the textile and garment sector is the lowest of all sectors in Ghana; and the productivity declines with firm size in garment and textile sector. Ghana’s garment sector uses by far the most labor-intensive technology of any African country, as the capital per employee being one third of that of Mauritius.380 The low level of productivity is mainly attributed to lack of
376 Interview results 377 EIU (1998c) p. 20 378 Interview results. There are plans to boost cotton output from today’s 20’000 tons to 50’000
tons with help of French development grant. EIU (1999) p. 19. FAO reports 46’000 tons of seed cotton for 1998
379 Lall, Navaretti, Teitel, Wignaraja (1994) p. 202 380 This is mainly because small firms cannot realize any economies of scale. See Mengistae,
Teal (1998) p. 27

158
management skills for larger firms.381 Chinese, Indian, and European expatriates manage all the larger textile and garment companies.
Capital availability
For the export-oriented part of the industry, working capital is not a major problem, because standard orders also include a letter of credit. Typically, a buyer places an order backed up with a letter of credit, which can be used by the manufacturer as collateral for working loans from local banks. Only for small companies with poor banking relationships, it is difficult to realize the benefits of a letter of credit. Foreign investors make new investments into machinery and equipment for textile industry; credits for domestic investors are hard to get.
Physical infrastructure
Ghana’s export focused textile and garment industry is located around Accra and Tema, where transport and power infrastructure problems can be avoided. Two garment manufacturers are located in Ghana’s Export Processing Zone, where they benefit from reduced taxes and tariffs. Disregarding the occasional power cuts and usual communication problems, the textile and garment industry is not particularly affected by the country’s poor infrastructure.
Information infrastructure
The textile and garment industry does not benefit from research institutes in the areas of marketing, design or product development.
Administrative infrastructure
Overall, administrative issues do not affect the competitiveness of the textile and garment industry. Most garment manufacturers operate in the Export Processing Zone, where import/export procedures are very simple.
17.3.2 Domestic demand conditions
The taste and design of traditional Ghanaian clothing have been the foundation of the country’s afrocentric clothing industry. Traditional “tribal” clothing is usually hand-woven and of highest quality. Ghanaian designers have transferred this into export clothing and have achieved international success.
381 Mengistae, Teal (1998) p. 38, Teal (1998b) p. iii
159
One disadvantage for the garment manufacturing industry is the tradition of demanding tailor-made clothing. With the absence of large production runs, there have never been standardized sizes in Ghana. In particular in the afrocentric segment, manufacturers struggle with the tight quality and size requirements of overseas customers. However, foreign department stores and mail order companies require precise sizes for all their orders, as their entire collection from different sources must be comparable across one given size, allowing customers to easily switch between products.
17.3.3 Related and supporting industries
The textile and garment industry does not benefit from related or supporting industry. All machinery, spare parts and chemicals are imported. Even within the industry, there are no relations: domestic textile is only rarely used for garment production in Ghana.
17.3.4 Firm structure, strategy and rivalry
Structure and rivalry
The basic structure of today’s textile industry has been shaped by the industrialization efforts in the 1960s and 70s. While some mills have been closed since then, the mills still open have all been established by the government, with no investments into new mills. In 1995 capacity utilization was 35 percent,382 indicating that the restructuring phase is not over yet. In the garment sector, however, all current players are new entrants that were established after the opening and stabilization of Ghana’s economy. In the garment industry there are hardly any barriers to entry as the initial investment level is low, and workers can be trained relatively easily. Rivalry in Ghana’s textile and garment market is fierce, with competitive pressure coming from imported cloth and used clothing.
Climate for investments
One of the major challenges for Ghana’s textile industry is low labor productivity and poor working morale. The textile and garment industry is the country’s only industry with two labor unions competing for members. Interview partners attributed the low productivity in the garment sector to the poor relationships
382 Ministry of Trade and Industry, Web page (January 2000)

160
between unionized employees and employers, and to the fact that hard workers are ostracized by their working community. Volta garments for instance, a large manufacturer of shirts, closed own after having failed to raise its workers productivity from 5 shirts/day to the targeted 12 shirts/day.383
Strategy
Currently, three basic strategies are followed. Textile manufacturers try to satisfy domestic demand by production for local tastes, and rather than improving quality or reducing costs, they try to bully the government to introduce protective duties. Smaller design boutiques focus on domestic customers as well, but try to produce for small-scale exports. Typically they operate as family-owned businesses, and lack management capacity for expansion or running large orders. Standard garment producers focus on large volumes for exports, neglecting the demand structure of the domestic market.
17.3.5 Influence of Government Policy
The most significant influence of government policy was the foundation of state-owned enterprises in the cotton and textile sectors. With import protection and government subsidies, the textile sector thrived during the 1970s. Since then, the textile industry has not benefited from any particular government policy or public investments. The textile industry has probably been hit hardest by the economic reform and rapid liberalization.384 Others blame the current government for lack of support during strikes and argue that the country’s strict labor regulations and minimum wages make it impossible to achieve World-class productivity standards.
383 The problem of low productivity is confirmed by Teal (1999) who compared the productivity of garment manufacturers in Ghana and Mauritius. He finds that in companies with more than 100 employees (which he identified as the minimum size to enter export markets), salaries in Mauritius are three times higher than in Ghana, but productivity is seven times higher. This makes Mauritian firms 4 times more efficient than Ghanaian companies.
384 See Armstrong (1996)

161
17.4 Summary and conclusion on Ghana’s Textile and Garment industry
Nature and development of competitive advantage
Ghana’s textile and garment industry does not benefit from basic factor advantages. The capital-intensive textile industry has no other natural advantages, and it has not been able to innovate and build up other determinants of advantage while it still benefited from heavy government support. The garment industry benefits from comparatively low production costs,385 but has not been able to transform this into a competitive advantage. With an average size of 17 workers,386 companies are not able to build up economies of scale and produce the large quantities as required for exportation.387 What is lacking is management know-how to run large firms, and to increase the productivity of workers to international levels.388 In sum, neither the textile nor the garment industry has been able to overcome the disadvantages of its environment as a basis to upgrade their weak comparative advantage, and to build a sustainable competitive advantage.
385 Relative to other countries, Ghana’s labor costs are low, and African countries have benefited to some extent from the absence of export quotas imposed by the multifibre agreement. With the establishment of the World Trade Organization (WTO), this advantage will be eliminated over the next few years. See Hughes (1993) p. 1006
386 In Mauritius, the most successful African exporter, average firm size is 181. Teal (1998b) p. 25
387 According to Mengistae, Teal (1998) p. vi, only 3 percent of all Ghanaian textile and garment firms are exporting their products
388 Confirmed by Lall (1995) p. 2026

162
Capacity for innovation
In Ghana, capacity for innovation in the textile and clothing industry lies primarily in increasing the productivity of its firms. Productivity improvements could be realized by building up the management capabilities to run larger firms, and by providing appropriate training and incentives to its workers.

163
V CONCLUSIONS ON DETERMINANTS OF COMPETITIVE ADVANTAGE
Based on the findings from the case studies above, this part describes the overall determinants of competitive advantage along factor conditions, demand conditions, related and supporting industries, strategy, structure and rivalry, and government. The last chapter summarizes and concludes the challenges of Ghana’s ‘Diamond of National Advantage’.
18 Factor conditions
Factor conditions can be split into two broad categories, basic factor advantages and advanced factor advantages. Basic factor advantages such as natural resources, favorable climate conditions and cheap labor, are inherited by a nation. In most cases, they are very general and support more rudimentary types of advantages. To sustain the competitive advantage of a nation, basic factor advantages are not sufficient, since they can be easily copied and outcompeted by other nations. However, they should form the basis upon which more advanced factors are created. Advanced factor advantages like specialized labor and know-how are more focused on a particular industry, and are required to develop a sustainable competitive advantage.389 This chapter describes Ghana’s factor conditions along the structure defined in the table below. Every chapter on Ghana’s determinants of competitive advantage is supported by a table with the average rankings from all competitive industries (i.e., textile and garment industry excluded).
389 See also Porter (1990a) p. 74
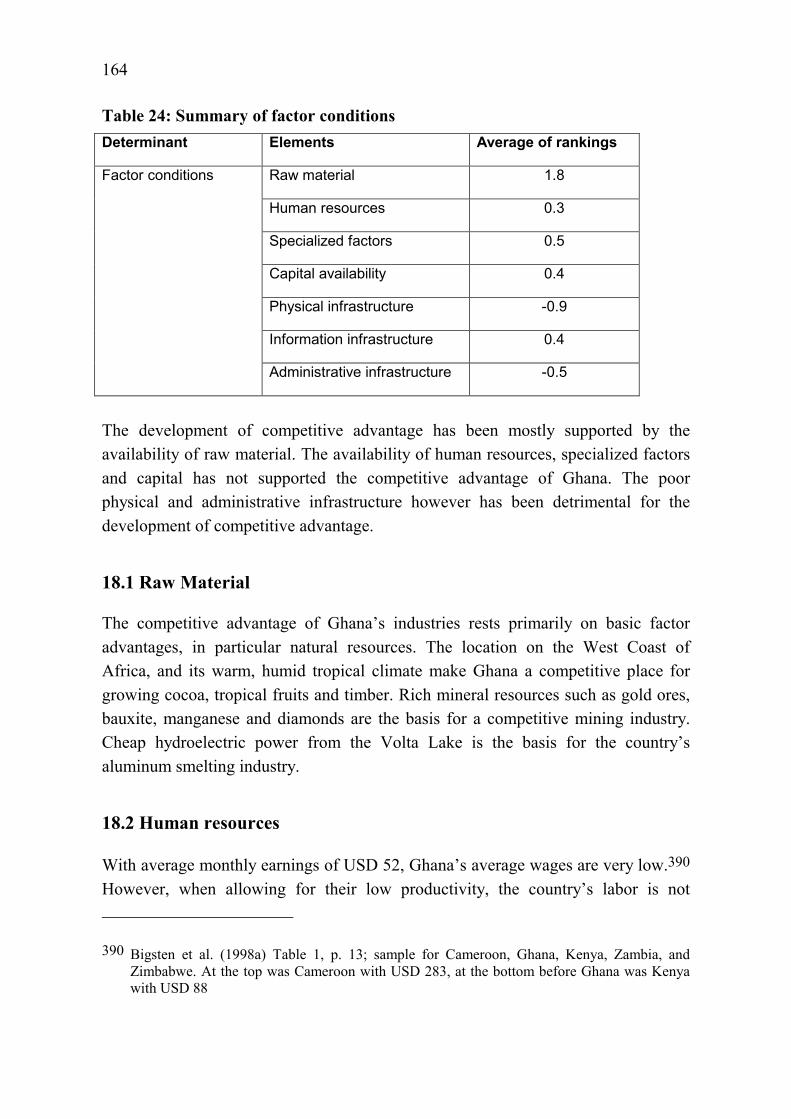
164
Table 24: Summary of factor conditions Determinant Elements Average of rankings
Raw material 1.8
Human resources 0.3
Specialized factors 0.5
Capital availability 0.4
Physical infrastructure -0.9
Information infrastructure 0.4
Factor conditions
Administrative infrastructure -0.5
The development of competitive advantage has been mostly supported by the availability of raw material. The availability of human resources, specialized factors and capital has not supported the competitive advantage of Ghana. The poor physical and administrative infrastructure however has been detrimental for the development of competitive advantage.
18.1 Raw Material
The competitive advantage of Ghana’s industries rests primarily on basic factor advantages, in particular natural resources. The location on the West Coast of Africa, and its warm, humid tropical climate make Ghana a competitive place for growing cocoa, tropical fruits and timber. Rich mineral resources such as gold ores, bauxite, manganese and diamonds are the basis for a competitive mining industry. Cheap hydroelectric power from the Volta Lake is the basis for the country’s aluminum smelting industry.
18.2 Human resources
With average monthly earnings of USD 52, Ghana’s average wages are very low.390 However, when allowing for their low productivity, the country’s labor is not
390 Bigsten et al. (1998a) Table 1, p. 13; sample for Cameroon, Ghana, Kenya, Zambia, and Zimbabwe. At the top was Cameroon with USD 283, at the bottom before Ghana was Kenya with USD 88
165
cheap.391 For most industries, Ghana’s labor is four times less efficient than Mauritius’ when productivity and wages are compared.392 One of the main drivers of low productivity is the lack of well-educated employees: Only a small percentage of Ghana’s workers have completed secondary or tertiary education. Poor primary education and a high degree of illiteracy leads to a lack of skilled workers that would have the know-how to operate complex machinery or upgrade production processes and products, and it prevents farmers from learning new methods or growing advanced type of products.393 As a result, “there seem to be serious deficiencies in skill availability at practically all levels of industry, from the shop floor and supervisory levels to the highest levels of technological and managerial manpower.”394
18.2.1 Basic education level
In comparison to fast growing nations in Asia and Africa, Ghana’s basic education level is low. School enrollment levels are the third highest in Sub-Saharan Africa395(Table 25), but overall educational outcomes are poor. Functional illiteracy is estimated to be around sixty percent.396 Basic tests scores show that only a small percentage of the nation’s schools were able to provide their students with acceptable education.397 In contrast, all the fast growing nations of Asia, including Thailand and Malaysia, had achieved universal literacy when they began their industrialization.398
391 Centre for the Studies of African Economies (1997) p. 44 392 “What exporting occurs within Ghana, there are virtually no labour intensive manufactures.”
“For those firms able to export wages are too high to enable the firms to compete given the efficiency at which the firms operate.” Teal (1999) p. 9 & 11
393 See also The Wall Street Journal, Jan 26, 1994, p. 1, which attributes the lack of export oriented manufacturing mostly to the country’s poor educational standards.
394 Lall, Navaretti, Teitel, Wignaraja (1994), p. 191 395 Lall, Navaretti, Teitel, Wignaraja (1994) p. 37 396 Chhibber, Leechor (1994) p. 88 397 In 1993, a National Criterion Test was conducted in a sample of public schools across the
nation. Only 5.5 percent of the students reached the literacy criterion score of 60 percent, and only 1.8 percent of the students reached the numeracy criterion of 55 percent. UNDP (1997) pp. 38
398 World Bank (1993a) p. 17
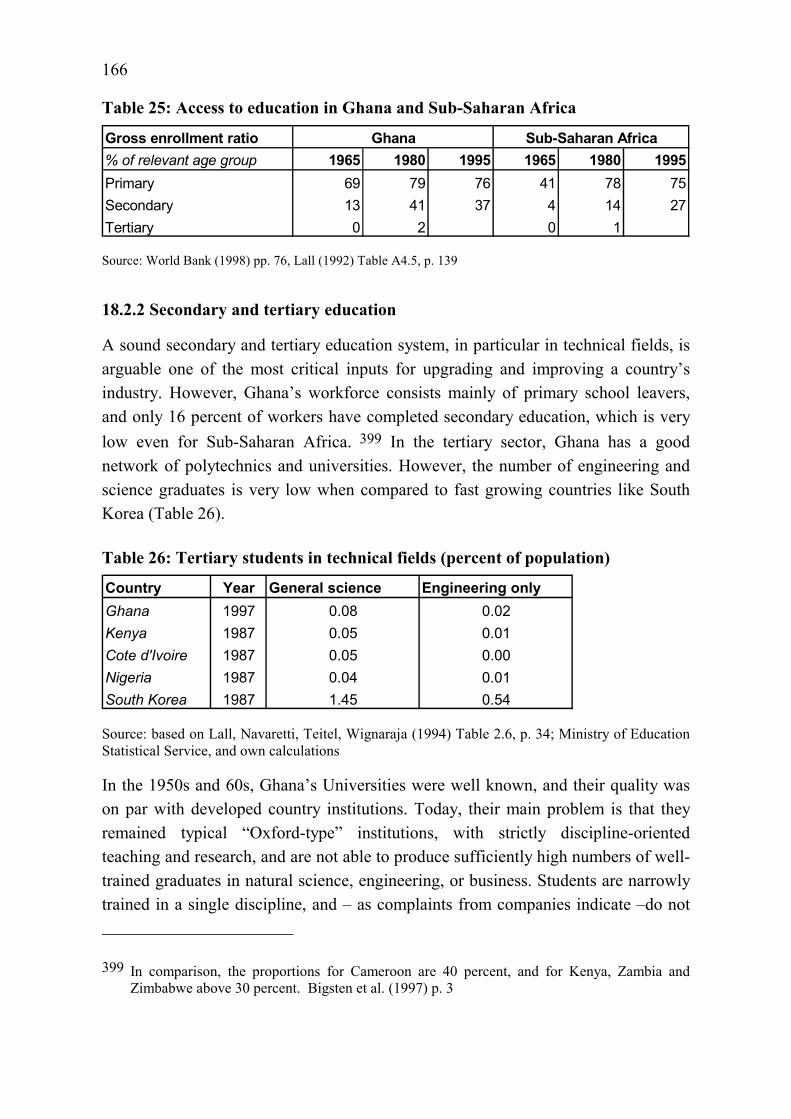
166
Table 25: Access to education in Ghana and Sub-Saharan Africa
Gross enrollment ratio% of relevant age group 1965 1980 1995 1965 1980 1995Primary 69 79 76 41 78 75Secondary 13 41 37 4 14 27Tertiary 0 2 0 1
Ghana Sub-Saharan Africa
Source: World Bank (1998) pp. 76, Lall (1992) Table A4.5, p. 139
18.2.2 Secondary and tertiary education
A sound secondary and tertiary education system, in particular in technical fields, is arguable one of the most critical inputs for upgrading and improving a country’s industry. However, Ghana’s workforce consists mainly of primary school leavers, and only 16 percent of workers have completed secondary education, which is very low even for Sub-Saharan Africa. 399 In the tertiary sector, Ghana has a good network of polytechnics and universities. However, the number of engineering and science graduates is very low when compared to fast growing countries like South Korea (Table 26).
Table 26: Tertiary students in technical fields (percent of population)
Country Year General science Engineering onlyGhana 1997 0.08 0.02Kenya 1987 0.05 0.01Cote d'Ivoire 1987 0.05 0.00Nigeria 1987 0.04 0.01South Korea 1987 1.45 0.54
Source: based on Lall, Navaretti, Teitel, Wignaraja (1994) Table 2.6, p. 34; Ministry of Education Statistical Service, and own calculations
In the 1950s and 60s, Ghana’s Universities were well known, and their quality was on par with developed country institutions. Today, their main problem is that they remained typical “Oxford-type” institutions, with strictly discipline-oriented teaching and research, and are not able to produce sufficiently high numbers of well-trained graduates in natural science, engineering, or business. Students are narrowly trained in a single discipline, and – as complaints from companies indicate –do not
399 In comparison, the proportions for Cameroon are 40 percent, and for Kenya, Zambia and Zimbabwe above 30 percent. Bigsten et al. (1997) p. 3

167
have the multidisciplinary breadth needed to tackle complex “real world” problems. Upon graduation they have no practically applicable skills, and lack exposure to the technology used in current production systems in Ghana.400 As a consequence, they need a significant amount of training before they can be used in a factory.401
18.2.3 Internal training
Because of poor educational standards, firms have to invest significantly in internal training to cover the skill gaps of their workers. Most large corporations like Ashanti Goldfields and Valco have established extensive internal training facilities, where they teach both basic and advanced skills to their workers. The need for intensive internal training puts mainly smaller companies at a disadvantage. Not only are they less capable of providing the same degree of training as large multinationals. Also, they have less incentive to invest in their workers when they can leave anytime to work for competitors – a threat that is less important for large companies that practically dominate the labor market in particular areas.
The impact of internal training on productivity is significant, as it is more applied and focused on the exact needs of the firm.402 In particular secondary school graduates achieve a high return on experience, indicating that they are particularly suitable and hence very important for the development of competitive industries (Table 27). 403
400 This is also confirmed by Lall, Navaretti, Teitel, Wignaraja (1994) p. 191: “Some of the larger and better-informed firms indicated that the content of the technical education curricula is unsuited to modern industrial needs, and there is insufficient emphasis on practical, hands-on experience.”
401 Interview results, Saint (1992) p. 89 402 Biggs, Srivastava (1996) p. 22, showed for a sample of firms from Zimbabwe, Kenya, and
Ghana that an increase of 1 percent of workers trained could increase the value added of the firms by 60 percent.
403 Finding that returns to education increase at more advanced level in Ghana are confirmed by Schultz (1994) p. 19

168
Table 27: Rates of Return (percent) to Human Capital in Ghana
Completed Return on education Return on work experiencePrimary 3% 5%Secondary 15% 8%University 29% n/a
Source: Bigsten et al. (1998a) Table 5, p. 17; based on a panel of firms within manufacturing sectors of Cameroon, Ghana, Kenya, Zambia and Zimbabwe.
18.3 Specialized factors
18.3.1 Research and development
Most of the technology applied in Ghana is simple, based on imported machinery and standard processes. The knowledge required to set-up production processes and operate machinery is transferred mainly by expatriates or multinationals. Formal R&D spendings have declined over the last ten years during the adjustment program, and are miniscule, estimated to be around 0.3 percent to 0.5 percent of GDP.404 The little research that is done in the country is practically all conducted by public institutions rather than by private companies. The link between these research institutes and competitive industries is very weak. None of the companies interviewed had ever successfully utilized the services of the country’s Universities and other research institutes (see also Chapter 18.6).
18.3.2 Management and entrepreneurship
The findings from the case studies clearly indicate that Ghana lacks management talent particularly for small and medium sized enterprises.405 Historically, managers of SOEs were not selected for their management capabilities, but for political reasons, and limited management capabilities have been built up since. Those Ghanaians that have returned from Europe and the US choose to work in more
404 Presidential Report to Parliament (1995) p. 17. According to World Bank data, only 42 patents were filed in 1995, all of them by non-residents (World Bank (1999) Table 19, p. 226). R&D expenditures in 1987 were 0.3 percent of GDP. Lall, Navaretti, Teitel, Wignaraja (1994) Table 2.9, p. 42
405 Gugerty, Steel (1996) also find that in Ghana the lack of qualified skilled labor and middle management is a major constraint for non-traditional exports.

169
attractive positions in banking and professional services. Today, most of Ghana’s competitive industries are managed by foreign multinationals,406 or by foreign managers.
18.4 Capital availability
Lack of credit, or the difficult access to capital, is the most frequently cited problem of Ghanaian companies across surveys and interviews.407 Three factors are responsible for this problem: High cost of capital, a poorly developed financial sector with restrictive credit policies, a lack of internal management capabilities leading to the rejection of loans.408 The most important factor determining the cost of capital is the high risk and uncertainty for investments. Several studies have found that even though profits across industries are high, very little investments are made, and they conclude that the reason for slow investment is high capital cost, not the availability of finance to firms.409 However, a macroeconomic policy environment with high rates of inflation, volatile exchange rates and high budget deficits has led to very high interest rate levels, and a crowding out of private credit by government lending. With riskless Treasury bills yielding more than risky loans until 1997 (Table 28), banks had limited appetite to lend to small and medium-sized
406 Among the top 20 companies in Ghana, there is only one private indigenous company. Ghana Club 100 (1998) p. 12
407 In the survey of Biggs, Srivastava (1997) p. 37, lack of credit was the most important obstacle to firm expansion in Ghana. Aryeetey, Baah-Nuakoh, Duggleby, Hettige, Steel (1994) p. 11 found that 22 percent of small and medium enterprises found that lack of credit for working capital and capital investment was the greatest obstacle to firm expansion, and 40 percent included it among their top four constraints.
408 Lack of access to capital has been cited as a major problem of African enterprises already in the 1950s and 1960s. At that time, several studies showed that capital was actually available, but either proper investment opportunities were missing, or companies did not fulfill the loan requirements (i.e. systematic management approach, reasonably documented accounts). See Kennedy (1988) p. 152
409 Bigsten et al. (1998b) p. 19: “The most important factor adversely affecting investment is the high capital costs facing the firms, which are reflected in their high profit rates. High capital costs, associated with uncertainty and high risk, constrain investment, not the availability of finance to the firms.” The propensity to invest (effect on investment of a USD 1 increase in profit) is about one third of that of Europe and India (See Bigsten et al. (1998a) Table 8, p. 17). Also Teal (1998b) p. iii, and Bigsten et al. (1997) p. 10 & 16 for four African countries. “Rates of return on capital are significantly higher than return on human capital, at very low investment level… High returns at low investment level must imply high capital costs facing the firms. This finding suggests that the failure of Africa to develop a successful manufacturing
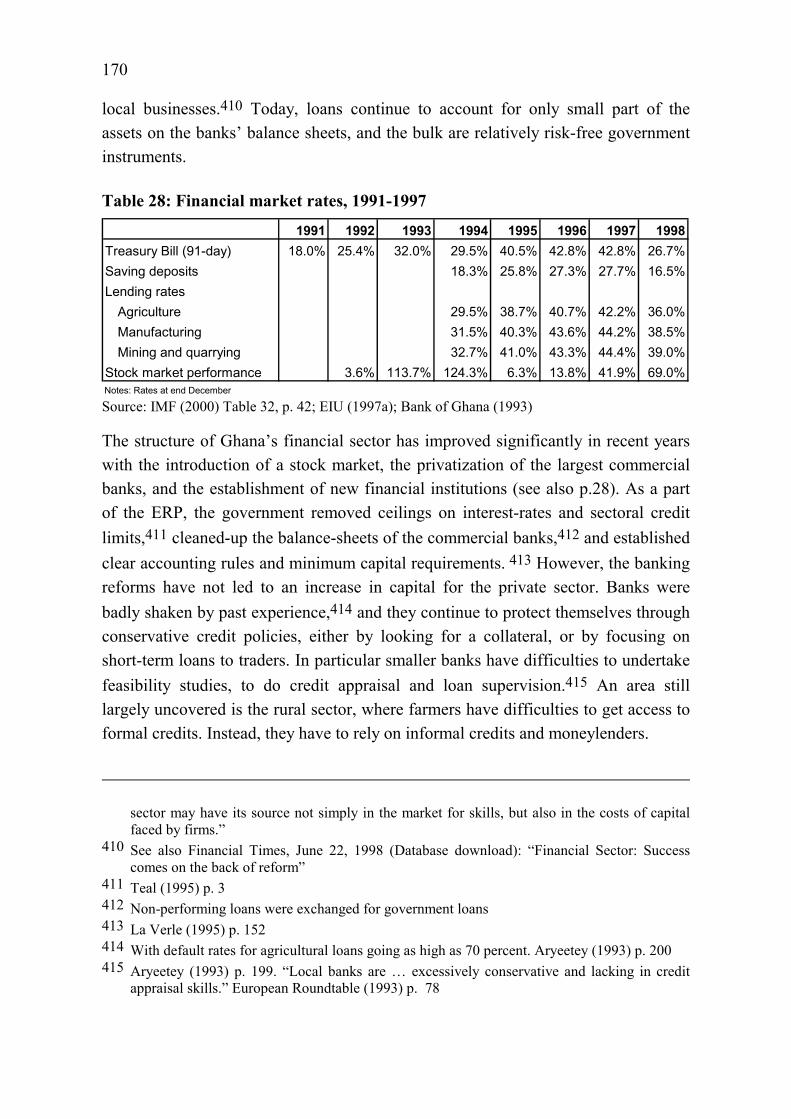
170
local businesses.410 Today, loans continue to account for only small part of the assets on the banks’ balance sheets, and the bulk are relatively risk-free government instruments.
Table 28: Financial market rates, 1991-1997
1991 1992 1993 1994 1995 1996 1997 1998Treasury Bill (91-day) 18.0% 25.4% 32.0% 29.5% 40.5% 42.8% 42.8% 26.7%Saving deposits 18.3% 25.8% 27.3% 27.7% 16.5%Lending rates
Agriculture 29.5% 38.7% 40.7% 42.2% 36.0%Manufacturing 31.5% 40.3% 43.6% 44.2% 38.5%Mining and quarrying 32.7% 41.0% 43.3% 44.4% 39.0%
Stock market performance 3.6% 113.7% 124.3% 6.3% 13.8% 41.9% 69.0%Notes: Rates at end December Source: IMF (2000) Table 32, p. 42; EIU (1997a); Bank of Ghana (1993)
The structure of Ghana’s financial sector has improved significantly in recent years with the introduction of a stock market, the privatization of the largest commercial banks, and the establishment of new financial institutions (see also p.28). As a part of the ERP, the government removed ceilings on interest-rates and sectoral credit limits,411 cleaned-up the balance-sheets of the commercial banks,412 and established clear accounting rules and minimum capital requirements. 413 However, the banking reforms have not led to an increase in capital for the private sector. Banks were badly shaken by past experience,414 and they continue to protect themselves through conservative credit policies, either by looking for a collateral, or by focusing on short-term loans to traders. In particular smaller banks have difficulties to undertake feasibility studies, to do credit appraisal and loan supervision.415 An area still largely uncovered is the rural sector, where farmers have difficulties to get access to formal credits. Instead, they have to rely on informal credits and moneylenders.
sector may have its source not simply in the market for skills, but also in the costs of capital faced by firms.”
410 See also Financial Times, June 22, 1998 (Database download): “Financial Sector: Success comes on the back of reform”
411 Teal (1995) p. 3 412 Non-performing loans were exchanged for government loans 413 La Verle (1995) p. 152 414 With default rates for agricultural loans going as high as 70 percent. Aryeetey (1993) p. 200 415 Aryeetey (1993) p. 199. “Local banks are … excessively conservative and lacking in credit
appraisal skills.” European Roundtable (1993) p. 78

171
At the same time, however, most banks stress that a large part of loan rejections is based on a pessimistic assessment of the applicants’ management capabilities. Smaller businesses often depend fully on the management-owner, and it is unclear how the business would continue after his exit. Banks are reluctant to lend to companies because they don’t see the right management approach in there: no systematic accounting system that gives updated information on business performance; a reluctance of the management/owner to open the business to outsiders, a lack of systematic business plans, and substantial underutilization of their machinery. “The lack of credit may be overstated as a constraint because entrepreneurs tend not to see their internal management constraints.”416
18.5 Physical infrastructure
One of Ghana’s weakest factors is its physical infrastructure, in particular poor transportation and communication networks. Compared to other African countries, Ghana has a poor road network, a poor telephone network, and a very thin availability of computers (Table 29).
Table 29: Ghana's physical infrastructure compared to selected countries Electricity consumption per capita, kWh (1995)
Paved roads, 1996 (% of total)
Telephones per 1'000 people (1996)
Personal computers per 1'000 people (1996)
Internet hosts per 10'000 people (1997)
Ghana 318 24% 4 1.2 0.15
Cote d'Ivoire 159 10% 9 1.4 0.17
Mauritius 93% 162 31.9 1.84
Zimbabwe 738 47% 15 6.7 0.24
Sub-Saharan Africa 437 42% 14 na 2.03Source: World Bank (1999) Table 18 & 19, pp. 224-227
While the basic infrastructure around Accra is reasonably well developed, the connection to the hinterland is in poor shape. Road transport accounts for around 98 percent of the freight moved, on a network of 35’000 km, of which only 6’000 km is
416 Aryeetey, Baah-Nuakoh, Duggleby, Hettige, Steel (1994) p. 1, also on p. 3: “We conclude that survey data may exaggerate credit as a binding constraint in that many SMEs reveal high growth rates – financed internally and through trade credits – despite lack of access to bank finance, while stagnant ones with poor cash flows would make poor credit risks because other constraints (particularly demand) are binding.”

172
paved.417 In the rainy season, a large number of the feeder roads become impassable. The choked transport infrastructure and the poor quality of Ghana’s roads slows down the delivery of goods and puts great wear and tear on the transport equipment.418 A 1300 km long railway system links the main cities Accra, Kumasi and Takoradi. Currently, the notoriously unreliable railway is mainly used for the transportation of manganese, bauxite, cocoa and timber. Ghana has two major ports with capability to handle large freight ships and tank ships. Takoradi is the export port for natural resource products like timber, bauxite, and manganese. Tema is Ghana’s main import port, and typically handles higher value added exports. Following rehabilitation work in the late 1980s, turnaround time has been reduced from 10 days to 2 – 3 days,419 making the ports now the quickest in West Africa.420 The Accra airport is served by major international airlines, and provides regular connections to all major cities in Europe, US, and neighboring countries. The bulk of the country’s electricity is hydroelectric power from the Volta Lake. Total installed capacity is about 1’100 MW, yet in the past few years droughts have made it unreliable, leading to frequent power cuts across the entire country. Currently, there are plans to provide power from imported gas, adding between 300 to 600 MW of capacity. In 1995, Ghana’s telephone capacity was 98’000 lines, putting availability to around four telephones per 1000 households.421 The waiting time for a new line can take up to 2.5 years. There are three independent cell phone networks installed, and five Internet access providers offer their service in the main cities, Accra (including Tema), Kumasi, and Sekondi-Takoradi.422
The country’s poor transport and communication infrastructure adds significant cost of doing business in Ghana. The poor road network cuts off large parts of the country from the industrialized part of Accra, and food-processing companies for instance have difficulties to source raw material from far away. The road network around Accra and Tema is well developed, but suffers already from congestion. To compete in this environment, most industries are forced to build up their own
417 EIU (1998b) p. 18 418 Financial Times, June 22, 1998 (Database download) 419 Conafric (1996) p. 83 420 EIU (1998b) p. 18; European Roundtable of Industrialists (1993) p. 74 421 EIU (1998b) p. 19. In 1996, Ghana Telecom was partially privatized and sold to two
competitors, who are required to install 225’000 new lines by the year 2002. 422 EIU (1998b) p. 19

173
infrastructure such as road networks, telephone lines, power generation plants, and even airstrips.
18.6 Information infrastructure
To disseminate knowledge and information about new production processes, or consumer demands at home and abroad, a country needs a well-working information infrastructure. This includes information from research institutes, from government agencies, as well as from private providers.
In Ghana, the Universities and government-owned institutes have several research programs, but none of the companies interviewed were able to utilize the results of their work. Universities have the reputation of performing only basic research that is not geared towards the needs of Ghana’s industries.423 The state research institutes (supervised by the Council for Scientific and Industrial Research, which includes members from the private sector) have limited means, and tend to focus on issues that are typically relevant only for micro enterprises and small holding farmers.424 Better developed than the research institutions are Ghana’s marketing information institutions, in particular the Ghana Export Promotion Council. The goal of the Council is to create awareness for export opportunities among the Ghanaian business community, and to promote Ghanaian products abroad. The council has been successful mainly in promoting food exports from smaller producers, such as pineapple, vegetables, and nuts. It regularly organizes export seminars and trade fairs, and links producers with technical assistance from international organizations.425
A problem particularly for small companies is the absence of information on the credit worthiness and reliability of business partners.426 With slow and expensive enforcement mechanisms, firms face high risks of contract default. As a consequence, they have to incur significant information costs before entering into a
423 In company-sponsored projects, they tend to be unresponsive to the needs of the sponsor, and prefer open-ended research to targeted problem-solving. Interview results
424 For instance, the significant achievements of the Institute for Industrial Research included the development of circular saws and band saws (which are already easily available on the market), cooking stoves, hand-operated rice seeders to facilitate sowing of rice, or a portable cassava slicer. See Web page (January 1998)
425 Anyemedu (1991) p. 212; Interview results 426 See Fafchamps (1996)

174
relationship with unknown suppliers, and hence limit their interactions with other firms.
18.7 Administrative infrastructure
A poorly functioning administrative infrastructure can lead to significant increases in the costs of doing business. These costs include the time spent on paper work or waiting for official approvals, money spent for bribes, and the costs of uncertainty when legal protection of property rights is slow and expensive. In Ghana, efforts were made to improve and overhaul the country’s administrative infrastructure to facilitate the establishment and operation of private ventures. However, an inefficient and corrupt bureaucracy still creates formal barriers to potential foreign investment, and reduces competition among domestic firms.427 Interview partners confirm difficulties with export formalities, incidents of corruption, and slow processing of administrative requests. “Residual effects of a drastically overregulated economy and the lack of transparency in government operations create an element of risk for potential investors. Bureaucratic inertia is sometimes a problem in government ministries, and administrative approvals often take longer than they should.”428 Reports of corruption exist even at the level of ministers, who are occasionally linked to favoritism of their clientele, and sometimes even drug-related transactions. The police have an image as an unaccountable and corrupt institution. Official inquiries found that they are ill equipped, ill trained, with low morale and motivation.429
A major cost factor in doing business in Ghana is the uncertainty of property rights. First, the police have no right to impound assets in case of payment defaults from debtors.430 The current court system is perceived as being largely inaccessible and expensive, frustratingly slow and possibly corrupt, favoring the rich and powerful. Second, land acquisition is very difficult: “Property rights in Ghana, particularly relating to landownership, are still governed by arcane regulations.”431 A central
427 Heritage Foundation (1997) p. 201 428 US Department of Commerce, Web page (June 2000) 429 UNDP (1997) p. 50 430 Fafchamps (1996) p. 446. According to Collier, Gunning (1999), 90 percent of all credit
defaulters are eventually forgiven. 431 Nowak et al. (1996) p. 38. Traditionally, land is either held by the “stool” (corresponding to the
clan or large family), or in public hand. Stool-land cannot be sold.

175
land registry does not exist, and land acquisitions can take up to one year, as it is difficult to identify the legal owner or to negotiate rights over clan and stool land.
18.8 Conclusions on Ghana’s factor conditions
Ghana’s main factor advantage is the availability of natural resources. All other areas, particularly more advanced factors, are in relatively poor shape. For companies, this means high transaction costs and consequently low profitability. Firms relating on slightly more complex production processes have to invest first in workers education and training. Meaningful public research and development activities are absent, and firm-internal knowledge building is limited. Most managers are foreign expatriates or work for foreign corporations. The country’s high cost of capital makes investment expensive and leads to the use of less efficient technology.432 The bad road network and the lack of storage facilities limit fresh fruit and vegetable growing to areas around Accra. A poor railway line makes bauxite mining prohibitively expensive. The lack of rural credits, the difficulties to acquire large areas of land, and unavailability of management talent prevent the foundation of larger plantations that could provide the raw material for the food processing industry. The poor education of farmers prevents them from introducing modern varieties for cocoa growing and other crops, and the targeted usage of fertilizer, pest control, and small-scale irrigation. The current legal system does not provide for the easy enforcement of contracts, and as a consequence it prevents banks from lending to industries with an unfavorable past. And last but not least, the current bureaucracy imposes additional costs of doing business rather than supporting the establishment of profitable firms
Ghana’s successful firms are those that are able to leverage the country’s basic factor advantages, and to work around its factor disadvantages by substituting the poor public infrastructure through private infrastructure investments. Small firms that cannot afford to invest in power generators and that cannot train their workers efficiently are significantly disadvantaged. Overall, the capital tied up in private
432 Technology in Ghana for instance is 30 percent less efficient then in Cameroon, Kenya and Zimbabwe for the same type of company. Virtually all of it could be explained by differences in physical capital endowment. Bigsten et al. (1998a) P. 9

176
infrastructure and large stocks cannot be used for investments in innovation and upgrading of factor conditions, and hence reduces the country’s capital productivity.

177
19 Demand conditions
In most nations – particularly in highly sophisticated industries – demand conditions are the most important determinant of competitive advantage because they shape how firms perceive, interpret and respond to buyers needs. “Firms are in a better position to monitor and interpret the needs of customers in their home region then they are of the requirements of purchasers in distant places.”433 The home market of a nation has a disproportionate impact on a firm’s ability to perceive and interpret buyer needs because their attention is better, the understanding and communication is less costly, and pressures from buyers is felt more acutely. Sophisticated customers at home press firms to upgrade, and they reveal insights into what future customer needs abroad could be.434
Two elements in a nation’s home demand structure are important: Size, and quality. Size is important because the large home market segments receive much more attention than the smaller segments. Quality is important because nations have an advantage where home demand gives local firms a better or clearer picture of buyer needs. The chapter first discusses the impact of the size of Ghana’s home market, and then the impact of the quality of demand.
Table 30: Summary of demand conditions Determinant Elements Average of rankings
Size of home market -0.1 Demand conditions
Quality of demand -0.1
Based on the findings from the case studies, Ghana’s demand conditions have not promoted the development of competitive advantage, and have even been detrimentous in some industries.
433 Singleton (1997) p. 53 434 Porter (1998a) p. 45
178
19.1 Size of Ghana’s home market
Ghana’s home market for all industries is quite small. With a population of 14 million people and a per capita GDP of USD 350, the nation’s purchasing power is limited. About 70 percent of the population live in rural areas and have no access to consumer goods. The largest part of the nation’s income is concentrated in Ghana’s major cities Accra and Kumasi. These cities are the home of a relatively well to do middle class with a high consumption of consumer goods and entertainment services. However, the size of this segment is too small to drive a sustainable industry with significant export activities. Except for the processed aluminum industry and to a limited extent the processed food industry, no competitive industry is selling significant volumes in the domestic market.
19.2 Quality of Ghana’s home market demand
Until 1983, Ghana’s consumers had basically no access to foreign goods. With the downturn of the general economy the production of domestic firms started to be reduced, and in the early 1980s almost no goods were available on the market. Low incomes, little information and limited selection forced buyers to accept inferior products at almost any quality. Only with the opening of Ghana’s trade system and the economic reforms in the mid-1980s was the country again exposed to domestic and foreign goods. Today, however, Ghana’s home market continues to be quite unsophisticated, both because consumer’s purchasing power is limited, and because certain products are still hard to get – forcing consumers to accept almost any quality and long delivery delays. More sophisticated demand comes from multinational companies producing in Ghana. Yet, only few multinationals are sourcing critical inputs for their products directly in Ghana.435 Most multinationals continue to import a very large part of their inputs, and buy only non-critical inputs on the local market. The lack of high-quality products is also a result of Ghana’s small-scale industry structure, where most goods are custom-made. Smaller companies are not used to produce standard products with very tight quality requirements. In the textile industry, foreign customers complain about the lack of size standards – which are a key requirement for standardized clothing. Furniture manufactures cannot grasp the need for completely identical pieces, since Ghanaian
435 Awuah (1994) p. 104 describes how the cooperation between Unilever, a Dutch multinational, and a Ghanaian supplier of palm kernel oil led to significant quality improvements of the input material.

179
customers are typically happy with their custom-made work. The Ghana Standards Board, the country’s official testing authority, subscribes to accepted international practices for testing of imports and locally produced goods. For large exporters, however, these standards are largely irrelevant, as buyers of Ghanaian products require adherence to their own standards. The Ghana Standards Board does provide some technical assistance in areas like quality management and export packaging, but has not yet been able to move to the establishment of quality labels or to establish standards in other areas such as the country’s textile and furniture industry.
19.3 Conclusions on Ghana’s home demand
The small size and limited sophistication of Ghana’s home market demand has not been a determinant for Ghana’s competitiveness. The quality of demand revealed by Ghanaian customers is less sophisticated than the demand structure of Ghana’s export markets, leading to a fundamental disconnect between home market demand and foreign demand. Most companies are unaware of how far they lag behind mature markets in terms of product quality, engineering, manufacturing productivity, and quality control.436 Successful export companies completely neglect their home market and focus on their export market. Their success depended to a large extent on finding ways to quickly understand the needs of their far-away customers through marketing agencies, trade-fairs, and wholesalers. In general, their production systems are geared towards meeting all foreign market standards, respecting quality requirements, delivery deadlines, and health and safety standards as for instance required by the EU. To sustain a competitive advantage, selected companies have moved towards new, and sometimes even more sophisticated products, building up more advanced factor advantages. Those companies that took the learning from their home market to foreign markets were often disappointed. The limited availability of high quality products in the home market prevented them from learning what kinds of standards were required for international markets. Particularly in the textile and furniture industry, exporting companies had big difficulties understanding why their goods were rejected by importers, when the quality was reasonable from their point of view, and shipments had only been
436 Gugerty, Stern (1996) p. 24

180
delayed by a couple of weeks.437 Overall, the quality of Ghana’s home demand has been a major inhibitor for gaining competitive advantage and moving to more sophisticated products. Many companies abandoned exports in frustration and continue to focus on unmet home market demand; others are asking for protection against cheaper and better imports.
437 Asante, Baah-Nuakoh, Jebuni, Oduro (1996) p. 69 report that roughly 60 percent of the exporters in their sample were forced to improve upon product quality based on buyer information – their home market had not provided them this information.

181
20 Related and supporting industries
Related and supporting industries play an important role in the development of competitiveness of an industry. The presence of a successful supplier industry allows efficient, rapid and sometimes preferential access to the most cost-effective inputs, enabling a close link between the different value chains. The presence of other related industries lead to a faster development of the country’s “skills” and know-how, it improves the availability of specialized infrastructure, and it enforces the development of a competitive supplier industry. In the ideal case, related and supporting industries form the basis for industry clusters, groups or networks of industries with similar activities. They are able to draw on the strengths of all other partners by sharing information and specialized factors such as highly skilled employees or special research and training institutions. This chapter describes the impact of Ghana’s supporting and related industries on the development of competitive advantage.
Table 31: Summary of related and supporting industries Determinant Elements Average of rankings
Supporting industries -0.1 Related and supporting industries
Related industries 0.1
Overall, Ghana’s related and supporting industry has not promoted the development of competitive advantage.
20.1 Presence of supporting industries
Most of Ghana’s competitive industries do not rely on specialized domestic suppliers for key inputs, either because they are not available in Ghana, or because the price and quality of domestically manufactured inputs are not competitive. Two factors are most likely responsible for this phenomenon: (1) the dominance of inefficient state-owned enterprises in most supplier industries until recently, forcing companies to import inputs even though they could have sourced them directly in Ghana. (2) The difficulties in establishing solid supplier-customer relationships with reliable deliveries and enforceable contracts, forcing companies to integrate backwards. In the food industry, suppliers for basic packaging material are there, but

182
slightly more advanced materials such as packaging cartons for food containers must be imported. Unreliable supplies from a next-door sawmill forced the country’s leading furniture manufacturer into backward integration. In the mining industry, all equipment is imported, starting from gloves and hardhats to expensive machinery; maintenance services are provided by subsidiaries of other multinationals. Over the last five years, a specialist supplier industry for the mining industry has started to produce inputs like limestone and explosives, but most mines continue to import even high volume inputs such as cement.438
20.2 Presence of related industries
Overall, there are very few industries related to Ghana’s competitive industries, and in none of the case studies was the competitiveness of an industry improved by the presence of other, related industries. In Ghana, networks among firms across different industries are generally poor, and the exchange of productive information is limited. This holds also true for international relationships: in general, Ghanaians have less linkage than non-Ghanaians with business people in other countries and the non-Ghanaian business community in Ghana.439 As a consequence, multinational or foreign-dominated companies benefit more from relationships with other countries rather than from companies within the country.
20.3 Conclusions on Ghana’s related and supporting industry
Ghana’s competitive industries draw their competitive advantage primarily from basic factor advantages, without relying or building on a cluster of related and supporting industries.440 Ghana’s related and supporting industries are scarce, and often uncompetitive. Most firms in Ghana, with the exception of multinationals and a few large firms, are technologically isolated from the World, and have no access to the modern technology that is required to supply internationally competitive
438 According to interviews, it is cheaper to import large amounts of cement than to source them locally from the state-owned monopoly.
439 Barr (1995) p. 10 440 Barr (1995) has estimated the impact of a network of relationships on the productivity of
Ghanaian firms. His results indicate that an increase of a company’s relationships with companies in other industries from 5 to 6 would lead to an average productivity improvement of 12.5 percent.

183
industries.441 Therefore, most competitive firms are vertically integrated or rely on imported inputs. For the industry as a whole, vertical integration leads to a waste of resources relative to specialized supplier industries because of lower efficiency and the lack of capital that could be invested in the core part of the company.
441 Biggs, Srivastava (1997) p. 23

184
21 Strategy, structure, and rivalry
The structure of an industry, the firms´ strategy and rivalry are the context in which firms are created, organized and managed, and that determines how they compete with each other. Upgrading and moving towards higher levels of competitive advantage is driven by the need to compete against successful rivals, and competitive intensity is a major determinant of competitive advantage. Even though there might be a duplication of efforts and a certain waste of resources in the course of competition, the balance will be positive in the end. Rivalry weeds out weak and unproductive firms. It keeps firms away from relying on basic and generalized factor advantages. Instead, they must seek more specialized advantages, and are forced to review all activities in their value chain. Strong competition at home also forces firms to export and to sell abroad if they want to expand, exposing them to new customer demands and different, often more advanced competitors.442 The chapter starts with a description of the current industry structure and the climate for investments, and describes then the overall strategies of Ghana’s firms.
Table 32: Summary of firm structure, strategy, and rivalry Determinant Elements Average of rankings
Structure and rivalry 0.4
Climate for investments 1.2
Firm structure, strategy, and rivalry
Strategy 0.8
Overall, the structure and rivalry of Ghana’s firms has had no significant impact on the development of competitive advantage. More important was the (improvement) in Ghana’s climate for investments, and the strategies of Ghana’s firms.
21.1 Structure and rivalry
As a small economy, Ghana does not have a very well developed firm structure, and rivalry among firms is limited. A few large corporations dominate competitive industries like aluminum smelting, gold mining, food processing and furniture
442 Van der Linde (1991) p. 12; Porter (1990a) p.108
185
manufacturing. Many of these firms are focused on export only, and their relevant competitors are other globally operating companies. Domestic rivalry is limited, and competition comes primarily from imports. In the primary aluminum industry, there is only one mining company and one smelter. Only in the aluminum hollowware industry there is intensive domestic rivalry, where major companies are fighting for market leadership and force each other to upgrade their products and production processes. The gold mining industry is clearly a global industry, dominated by one large company that competes with other global players. Rivalry for good sources across the entire African continent is intense, but within Ghana there is little direct competition. In the cocoa sector, the state monopoly Cocobod dominates the industry, and domestic competition is virtually eliminated. The timber industry has a large number of players, but competition is not very intense as most firms focus on export markets, leaving the home market to small-scale mills and carpenters. The situation is similar in the processed food industry, where the large players focus almost completely on exports and domestic rivalry is only relevant at the small and medium scale level. In the fresh fruit industry, the main rivals are in neighboring countries, and there is also no rivalry in the home market. In the textile industry, most firms consider their main rivals to be imported fabric, and direct competition amongst them is limited.
Competition rules and barriers to entry
There are no legally established competition rules or barriers to entry. De facto, however, the government continues to dominate large sectors of the economy. In many industries, current or former SOEs are still the only major player, and the government has decided to retain control over key sectors of the country’s economy, in particular cocoa, energy provision, insurance and pension fund management.443 In the timber industry, most of the larger sawmills were taken away from their owners in the late 1970s, and are still state-owned.
21.2 Climate for investments
In the recent past, Ghana’s government has undertaken a large number of steps to regain the confidence of both domestic and foreign investors. In particular the
443 The State Insurance Company currently captures around 80 percent of the total premium volume. A mandatory contribution of 17 percent of all wage bills goes to the state-owned Social Security and National Investment Trust, the only pension fund in the country. Leechor (1994) p. 182

186
encouragement of non-traditional exports, and the introduction of innovative solutions to circumvent the country’s bureaucracy have promoted the development of new and the growth of existing industries. However, both the regulatory reforms and special incentives have not led to a significant surge of investments. There is still a relatively high degree of uncertainty around the political and economic future of the country.444 Many industries, in particular mining and aluminum, continue to depend on good political relationships for their smooth operations. Government contracts are often subject to the payment of bribes. Worse, however, are the continuing direct political interventions in company affairs, such as in the case of labor strikes or takeover threats.445
21.2.1 Investment and trade laws, taxes
Ghana’s investment code incorporates a broad range of incentives, ranging from reduced tax rates446 to the full transferability of funds.447 Remaining legal restrictions include a minimum investment requirement of USD 50’000 for a wholly owned foreign subsidiary, and a government stake in all mining companies. The impact of the new investment code on the investment behavior of both domestic and foreign firms has been below expectations. The preferential taxes granted to foreign investors do not necessarily attract investments, as they are only a way to make up for the poor infrastructure of the country.448 From a regulatory perspective more important are other barriers, such as the difficulty to acquire land (see also p. 174), and cumbersome labor regulations.
444 On an analysis on the relationship between high uncertainty and reduced investments in Ghana see also Pattillo (1997) p. 27
445 Examples are the direct intervention of the President on behalf of striking miners at Ashanti Goldfields, and the involvement of vice ministers in strikes in the textile industry.
446 Reduced corporate taxes on non-traditional exports (8%) and hotels (25%), tax holidays ranging from 3 to 10 years in real estate, rural banking, and agricultural processing sector.
447 All investments require the approval of Ghana Investment Promotion Centre, although essentially for statistical purposes. Investment incentives are awarded automatically. US Department of Commerce, Web page (June 2000)
448 “Evidence suggests that fiscal incentives do not have a positive effect on FDI inflows. There is a negative significant relationship which is the result of an ‘illusory compensating effect’ that comes into play when host countries try to use incentives to make up for the lack of resources and economic development”. McMillan (1995) p. 154

187
21.2.2 Labor market policies
Ghana’s labor is not cheap relative to its productivity, and the relationship between companies and their employees are not always trouble-free. The Public sector still accounts for a very large share of formal employment, and high public wages exert pressure on the overall wage level.449 Collective bargaining in the public sector in the past yielded more generous provisions for retirement, redundancy and non-wage benefits than in the private sector; and the levels of wage increases typically exceeded the average productivity growth. Labor unions have a very powerful presence in the formal and public sector, and enjoy government support in many cases.450 In 1999, two companies well known for their “excellent” labor relations were surprised by strikes, with support for the striking workers coming as high as from the President. These factors restrict labor mobility, and limit flexibility to adjust wages to reflect changing market conditions.
21.2.3 Political and economic uncertainty
Many Ghanaian and foreign investors are still hesitant to invest in Ghana because of political and economic uncertainty. While the new investment regulations have granted protection mainly for foreign investors, Ghanaian investors are to a significant extent still at the mercy of the government.451 “… the private sector in Ghana received mixed signals during the ERP (1983-1992) as liberalization policies were not fully complemented by an institutional framework conducive to promote free competition.”452 In the 1990s, the mingling of the country’s top leaders in business affairs, the incomplete divestiture of SOEs, and the continuing presence of corruption in the civil service indicate the ambivalent attitude of the government towards a free market economy and private entrepreneurs.453 ‘Greedy’ private
449 Nowak et al. (1996) p. 44 450 On average unionized firms pay 32-34 percent more than non-unionized firms. Teal (1998b) p.
ii 451 “Today, Ghanaians still believe that doing business entails major political risks.” “…
convincing sings of a new approach and a new partnership with private businesses have not been forthcoming from the government. The divestiture of government commercial undertakings has been slow and faltering.” Leechor (1994) p. 153 & 178
452 Nowak et al. (1996) p. 38 453 Leith, Lofchie (1993) p. 280. “Ghanaian investors have gone through experiences in the last 13
years that make them uncertain about government’s long-term philosophy and ideology in relation to the ownership of capital and its employment. They saw some investors lose all their

188
investors continue to be considered as necessary evil rather than a benefit for the country’s development. With secondary markets for capital goods not well developed, large investments are de facto irreversible, and companies hesitate to invest unless they are certain that their economic and political environment will remain stable. As a consequence, most Ghanaian business people focus their energy on business with low investment costs and short turnover periods such as trading, rather than being stuck with large investments that would be ‘sunk’ should the economic framework be reversed.454
21.3 Strategy
21.3.1 Strategic focus
Competitive advantage in any industry is the result of its ability to deliver greater value to customer, or to create comparable value at a lower cost, or do both. To sustain this ability, companies cannot just rely on operational effectiveness. In the long run, companies need to have a solid strategy. Strategy is about creating a sustainable difference by deliberately choosing a different set of activities to deliver a unique mix of value. In dynamic markets with rapidly changing technologies, rivals can quickly copy any operational improvements, and competitive advantage based on operational superiority is, at best, temporary. Following Porter, choosing a strategy requires to make decisions on two generic variables: on narrow, clearly defined customer segments or on a broad range of customers (‘competitive scope’), and on the focus purely on lower costs or on differentiated products and services (‘competitive advantage’). Based on these decisions, a company has then to find its strategic position, defining if it will either perform activities different activities from rivals’ or perform similar activities in different ways.455 The preferred strategic position of the majority of Ghana’s competitive industries is a narrow focus on low cost, natural resource-based commodity products. For roughly 25 years, Ghana’s primary aluminum industry had thrived on the world’s lowest electricity costs. Ghana’s gold mines benefited from high-grade ore, which allowed them to produce gold at low costs. Ghana’s food industry lives on cheap inputs, both fish and
investments to government in 1979, and also in 1982, following arbitrary decisions by the government.” Aryeetey (1994) p. 1219
454 Aryeetey (1994) p. 1218 455 Porter (1996) p. 62

189
agricultural produce. Only few companies, such as Ghana’s only major furniture exporter, have a competitive advantage combining cheap resources as well as cost-efficient production.
21.3.2 Value chain presence
Picking the right strategy is in most cases a decision on making the right trade-off about which activities are core to a company’s success. Ghana’s competitive industries are characterized by a very narrow focus on a limited set of activities within an industry’s value chain. In almost all cases, companies focus on the parts of the value chain that can be handled easily in Ghana: the transformation of raw material (natural resources) into basic products in relatively simple production processes. Activities such as research and development, marketing, and trade are either handled by the parent of a multinational subsidiary, or by agents and buyers outside Ghana. There are two main reasons for this focus. (1) The management capacity of Ghana’s companies is fully absorbed with its work due to backward integration, poor infrastructure, and availability of low-skill labor only. (2) Companies have no foothold in developed markets, and are too far away from their customers to manage higher value-added activities.
21.3.3 Management practices and goals of individuals
The management style and organizational structures in most of Ghana’s companies reflect to a large extent Ghana’s social structure.456 Ghana’s companies are typically managed with an authoritarian leadership style, and workers often show a surprising degree of disinterest in the well-being of their company. Many African entrepreneurs are almost as unwilling to delegate authority to supervisors and
456 In Ghana, the extended family is the primary social unit. In this kind of structure, all purposes, actions, gains and ideals of individual members are evaluated by their contribution to the well-being of the family. All major decisions in the live of an individual are collectively discussed and agreed upon. Children are not encouraged to take individual initiatives over and above those required for doing daily routine tasks, as the family is the overall responsible unit. The importance of the family influences the Ghanaian organizational life with two important elements: First, by establishing strict rules of command in an organization. Seniors, either in age or position and status, are generally expected to give direction and guidance to their juniors, who in turn are expected to respect the wisdom underlying such guidance and to follow instructions given to them dutifully. Second, Ghanaians have to accept a moral obligation to help less advantaged family members, be it through job fixing, advancing their careers within a company, or intra-family redistribution of resources. See also Kuada (1994) p. 73

190
managers as they are to share ownership.457 These sole proprietors see the company as their personal asset, and manage it as a “one man show”. To establish professional management teams is difficult, because management skills at lower levels are not being developed and authority is never delegated.458 Since the structure to manage larger firms is not in place, most companies have difficulties in growing. In this context, the development of longer-term strategies and the recognition of market needs are not possible. Often, the behavior of management and workers reinforce each other in a vicious circle. Because of the dominant role of the family in securing people’s livelihood, most workers develop an instrumental relationship to their work, which means that their personal goals have priority over organizational goals.459 The absence of sense of ownership leads to lethargy and a lack of commitment to a common goal, up to the abuse of office for personal gains.460 Good leadership is equated with toughness, and effectiveness requires that a leader sets rigid work standards, organizes tasks down to the last detail, prescribes work methods to be followed and closely supervises subordinates’ work. Subordinates are likely to avoid the risks associated with personal initiatives by referring all essential matter to their superiors. Subordinates tend to believe that their superiors are likely to value personal loyalty and goodwill over and above competence. 461
While strong family cultures played a positive role in East Asian development, Africa’s family structures have been more a drag than a benefit. Owners of companies are under enormous social pressure to hire family members. However, once employed, the family members are then not interested in the well-being of the organization, but rather take their jobs for secure and granted. This “suggests that the collectivism of African family life is hardly translated into collective responsibility to work diligently under the leadership of a family member in order to build a viable enterprise. Family business is seen more as a source of refuge for family members than a source of collective growth and prosperity.”462 Family members, it is said, are unwilling to respond to the same discipline as other employees. They tend to demand special treatment and this provokes discontent among the work force.
457 Kennedy (1988) p. 167 458 Interviews with banks and consultants 459 Kuada (1994) p. 76 460 Woode (1997) pp. 33 461 See also Kuada (1994) p. 131 462 Kuada (1994) p. 171

191
Jealous of the owner’s success and resentful of his authority, they are also prone to dishonest and unreliable behavior. Kinship obligations are not only difficult for the establishment of a work organization, but they also prevent the accumulation of wealth as a basis for further investments. Whatever profit has been accumulated is expected to be distributed among family members, or invested in status symbols like cars and houses. 463
21.4 Conclusion on strategy and structure of Ghana’s industry
The structure and strategies of Ghana’s competitive companies are well adapted to the uncertainties of their environment, and the poor factor conditions of the country. The perception of a continuing economic and political uncertainty is responsible for the continuously low investment inflows in the country, and the limited appetite of entrepreneurs to invest in fix-cost intensive ventures. The focus on cost-based production in a small part of the value chain is the result of the country’s poor factor conditions that make innovations and product upgrades difficult, and that require full management attention to work around the shortcomings of the Ghana’s infrastructure.
Although this strategy works well in the context of Ghana’s current environment, it leads to a vicious cycle of decreasing competitiveness. A competitive advantage based on low costs and on focusing on a small part of the industry value chain leads to low profitability. That means that little money is available for investments in innovation and product upgrading to enhance again the industry’s competitiveness through more advanced products.
463 Kennedy (1988) p. 169

192
22 Government
A nation’s welfare, the prosperity of a its citizens, is at heart a function of its political and macroeconomic context, of its microeconomic environment, and of the strategy and operations of its companies.464 The role of the government is to promote the well being of its citizens, by establishing a stable macroeconomic environment through sound fiscal and monetary policy, and by ensuring a favorable microeconomic environment. Every government can significantly influence a country’s microeconomic environment through its regulatory framework and through direct activities and intervention. What a government cannot do is to create competitive advantage itself. Only in partnership with a nation’s companies can competitive advantage be created and strengthened. Working together with them, a government can hasten the gaining of competitive advantage of industries by influencing a nation’s factor conditions, demand conditions, its industrial structure, and companies’ strategy. The next sub-chapter briefly outlines the elements of sound macroeconomic policies and an enabling microeconomic environment. After that follows an analysis of Ghana’s track record in establishing macroeconomic stability and an enabling microeconomic environment.
22.1 The role of government in promoting competitive advantage
22.1.1 Ensure macroeconomic stability
The role of sound macroeconomic policies is to provide a stable, predictable environment for firms to operate, in particular undistorted prices and exchange rates. To operate profitably in a free market environment, companies need access to capital at reasonable costs, exchange rates that allow them to compete on World markets, and stable prices to minimize the uncertainty of their long-term planning. In terms of policy variables this translates into low rates of inflation, stable and appropriate exchange rates, and positive real interest rates that are not too high.465 This requires a mutually consistent and reinforcing fiscal, monetary, and exchange rate policy.
464 See Porter (1998a) p. 41 465 See Aryeetey (1994) p. 1212, CEPA (1998) p. 1

193
The monetary policy should limit the growth of money supply to a rate in accordance with growth of real output, the fiscal policy must constrain spending to a level close to revenues to keep a sustainable balance of payment position,466 and the exchange rate regime should provide undistorted import and export prices.
22.1.2 Provide enabling microeconomic environment
Aside from stable macroeconomics and institutions, companies need an enabling microeconomic environment in which to operate and thrive. For the government of Ghana, an enabling microeconomic environment entails:467 (1) The possibility for free enterprise foundation and free competition, (2) an attractive venue for domestic and foreign investments, (3) a legal and administrative systems that promotes private investment and initiative, and is equitable to all participants, (4) an efficient, reliable, and cost-effective economic infrastructure, and (5) a “Science & Technology” culture at all levels of society and in all types of production to accelerate economic growth and to improve quality of life in the population. These five elements are a recognition that growth will be driven by private investments. The role of the government is to provide favorable conditions for private sector initiative, and to ensure that the public sector promotes and/or does not hinder private sector operations.
22.2 Ghana’s macroeconomic and microeconomic track record
The following sections of this chapter describe the macro and microeconomic environment of Ghana.
Table 33: Summary of government determinants Determinant Elements Average of rankings
Macroeconomic stability
0.1 Government
Microeconomic environment
0.0
466 In successful nations in East Asia, the public sector has been a net saver, rarely crowding out the private sector. Chhibber, Leechor (1994) p. 90
467 See the Presidential Report to Parliament (1995) p. 34

194
Even though Ghana’s government has undertaken significant efforts to stabilize its macroeconomy and to establish an investor-friendly legal framework (see also Chapter 3.2.1) the country’s macroeconomic and microeconomic environment have enabled but not really supported the development of competitive advantage.
The key action of the government was to shift from direct intervention to the reliance on market forces, to restore fiscal and monetary discipline, to rehabilitate the country’s social and economic infrastructure, and to implement structural and institutional reforms, aimed at improving the efficiency of the economy. In this phase, the government was able to rapidly correct the largest distortions such as rampant inflation and fixed exchange rates. The country’s regulatory environment was adjusted quickly in the areas of trade policy, but investment policies were adjusted only after 1990. Public sector reforms like the privatization of SOEs and civil service reforms have not been completed yet (see Table 34).
Table 34: World Bank evaluation of Ghana’s economic reforms - overview Reform measures Performance Description Macroeconomic Exchange rates Excellent Fully liberalized, no black market
Fiscal discipline Fair Recurrent slippage in meeting fiscal targets
Financial liberalization
Fair Interest rates liberalized, but high spreads and low service level remaining due to bank oligopoly
Tax reform Good Broadened tax base, reduced marginal tax, and rationalization of indirect tax regime
Regulatory environment
Trade liberalization Mixed Abolishment of import licensing system and rapid rationalization of tariffs (between 0 to 25 percent), resulting in widespread bankruptcies in private sector (not enough time to adjust)
Deregulation Fair-Good New investment act with automatic approval of all investments, anecdotal reports of “informal” regulation and rent-seeking behavior
Foreign direct investment
Fair Barriers to investment largely abolished, but inflows so far limited

195
Public Sector Reforms
Public expenditure priorities
Fair Inefficient subsidies reduced, and expenditures directed towards primary education and infrastructure rehabilitation; but huge government sector not yet reduced
Privatization Slow Slow divestiture of state-owned enterprises because of insufficient political support
Civil service reform Very slow Demotivated, oversized, and underproductive bureaucracy, with rent-seeking prevalent
Source: Armstrong (1996) pp. 96-101
22.3 Ghana’s macroeconomic environment
Ghana’s macroeconomic reforms during the ERP were focused on stabilizing the country’s inflation, and implementing sound fiscal policies. In the first years, the government was quite successful in its exchange rate liberalization and fiscal policies, establishing the basis for rapid economic growth. However, since 1992, the country’s macroeconomic environment has not been conducive to sustainable economic growth. On the fiscal side, strong socio-political pressures468 led to increasingly large budget deficits and the resulting upward pressure on interest rates led to a crowding out of private sector investments. The country took on a significant amount of debt to make up for the lack of domestic savings, with the consequence that current interest payments are higher than the public wage bill.469
Since 1993, the country’s inflation has remained high and volatile by international standards (see Figure 24).470 The steady issuing of high yielding treasury bills to finance government expenditures and government-owned enterprises has led to a crowding out of private investments. For the country’s commodity exports, the
468 Public sector salary increases of 80 percent before the elections in 1992, high levels of infrastructure investments and social service costs such as education and health. CEPA (1998) p. 22
469 With accumulated external public debts of USD 6.3 billion (end 1997), Ghana is classified as a highly indebted country. CEPA (1998) p. 21
470 The main challenge in controlling the Ghana’s inflation is to manage the two main drivers, a very small monetary base and volatile food prices. In 1996 for instance, the money supply grew by 30 percent as a result of the unplanned expansion of credit to the public sector and an unexpected drop in fiscal revenue after a poor cocoa harvest. Euromoney, April 1998, p. 214

196
situation was worsened further by a real exchange rate appreciation of 2 percent since 1995, resulting from increased trade and current account deficits.471
Figure 24: Inflation, exchange rate and interest rates in Ghana, 1992 - 1997
0
500
1,000
1,500
2,000
2,500
1992 1993 1994 1995 1996 1997
Exch
ange
rate
(ced
i/USD
)
0%
10%
20%
30%
40%
50%
60%
70%
Infla
tion
and
inte
rest
rate
Exchange RateAverage InflationT-Bill interest rate
Source: IMF (1999a) Table 50, p. 132; CEPA (1998) Table 5.1, p. 56
Ghana’s macroeconomic policy in the past years has been criticized as being focused on short-term measures only. Particularly on the fiscal side, policy actions have been inconsistent with the overall reform goal,472 and required frequent countermeasures because the economy did not react in the expected way.473 For instance, corporate taxes were revised downwards to attract foreign investments, but no countermeasures were taken to correct for the reduced revenue. Only in 1999, serious measures were undertaken to improve the government’s revenues with the introduction of new value-added taxes.474 With 70 percent of the government’s
471 A large part of economists consider depreciating exchange rates to have a positive impact on the exports of a country. However, others (Porter 1990) strongly favor stable or appreciating exchange rates. Porter argues that devaluation discounts a nation’s products in foreign markets and leads firms towards a dependency on price competition. In such a situation they have little incentive to upgrade their competitive advantage from competing primarily on costs.
472 In particular the wage increases for public sector employees in 1992 and 1996 473 CEPA, an independent economic think tank, even accuses the government of having cheated
on the country’s inflation figures at one point in time. 474 The first attempt to introduce VAT had been made in 1995, but the scheme was withdrawn
after an upheaval of the population. The main reasons for its failure were (1) at an inception rate of 17.5% it had fuelled inflation, (2) inter-agency rivalries, particularly from other revenue institutions, and (3) insufficient education of the affected buyers and sellers about provisions and implementation. See Tskikata (1997) p. 34
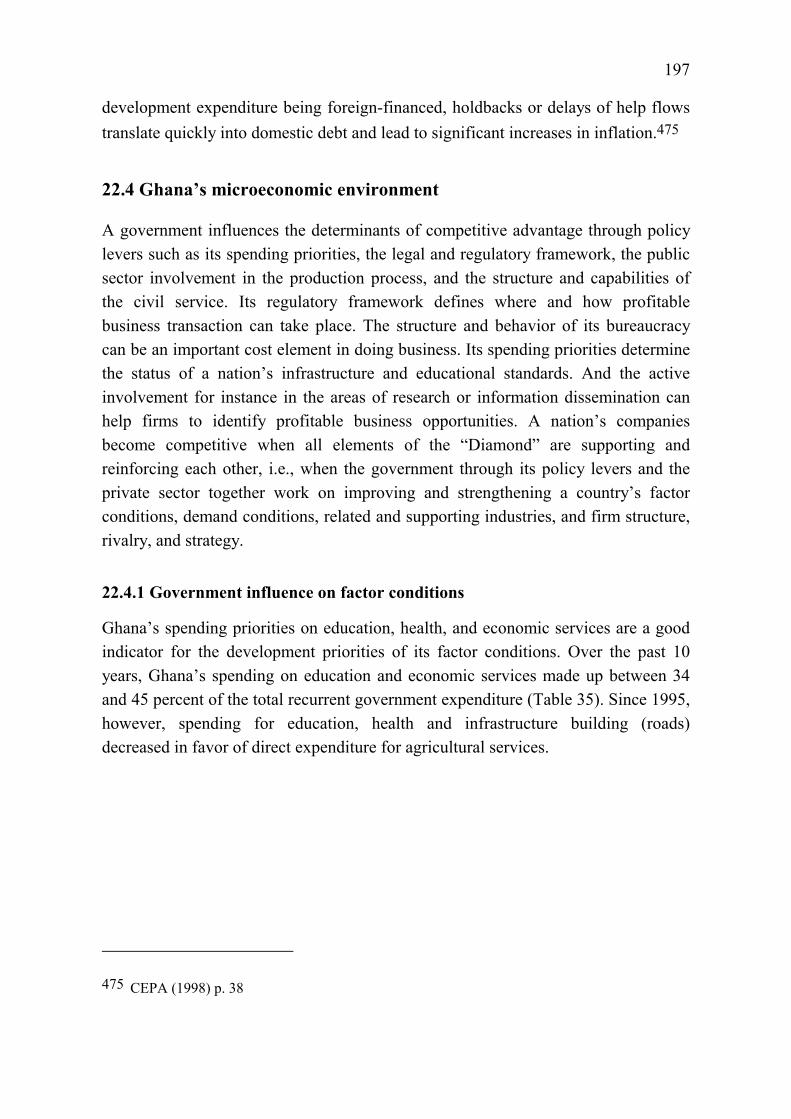
197
development expenditure being foreign-financed, holdbacks or delays of help flows translate quickly into domestic debt and lead to significant increases in inflation.475
22.4 Ghana’s microeconomic environment
A government influences the determinants of competitive advantage through policy levers such as its spending priorities, the legal and regulatory framework, the public sector involvement in the production process, and the structure and capabilities of the civil service. Its regulatory framework defines where and how profitable business transaction can take place. The structure and behavior of its bureaucracy can be an important cost element in doing business. Its spending priorities determine the status of a nation’s infrastructure and educational standards. And the active involvement for instance in the areas of research or information dissemination can help firms to identify profitable business opportunities. A nation’s companies become competitive when all elements of the “Diamond” are supporting and reinforcing each other, i.e., when the government through its policy levers and the private sector together work on improving and strengthening a country’s factor conditions, demand conditions, related and supporting industries, and firm structure, rivalry, and strategy.
22.4.1 Government influence on factor conditions
Ghana’s spending priorities on education, health, and economic services are a good indicator for the development priorities of its factor conditions. Over the past 10 years, Ghana’s spending on education and economic services made up between 34 and 45 percent of the total recurrent government expenditure (Table 35). Since 1995, however, spending for education, health and infrastructure building (roads) decreased in favor of direct expenditure for agricultural services.
475 CEPA (1998) p. 38

198
Table 35: Government spending on education and economic services
Recurrent expenditure, % of total 1991 1993 1994 1995 1996 1997 1998Education 23.2% 22.0% 18.0% 20.1% 19.9% 18.0% 18.2%Health 8.4% 7.0% 5.1% 5.7% 5.5% 4.6% 3.9%Economic services
Agriculture 3.6% 3.5% 2.3% 1.4% 1.8% 3.4% 3.3%Mining & manufacturing 0.9% 1.4% 1.6% 1.9% 1.6% 1.7% 1.6%Electricity, gas, water 0.3% 0.9% 1.1% 1.7% 1.4% 1.5% 1.5%Roads 8.3% 8.9% 6.5% 9.1% 6.4% 6.0% 5.4%
Total 44.8% 43.6% 34.6% 40.0% 36.7% 35.2% 33.9%% of GDP 6.3% 9.6% 8.0% 6.6% 6.5% 7.2% 6.6%Source: IMF (2000b) p. 29, Table 22, own calculations
Education
To improve Ghana’s poor educational standards, an education reform was started in 1987 to enhance the country’s primary and secondary education. Ghana’s old education system was modeled according to the British system, with an elitist focus on academic careers.476 A large part of the financial resources was directed towards Universities and secondary schools, leading to a highly educated but underemployed workforce. During the economic decline until 1983, the quality of Ghana’s education system declined rapidly as well. In 1983, nearly 50 percent of all primary school teachers were unqualified, as were about 30 percent of middle school teachers (see Table 36). All available money was spent on salaries, yet teachers were significantly underpaid, and the maintenance of school buildings and teaching material was completely neglected.477 In 1987, major educational reforms were introduced with the aim to increase school enrollment, and to raise the quality of the general education. The reforms shortened pre-university education from 17 years478 to 12 years. Financial resources were focused on strengthening primary education, in particular practical education with a lesser focus on subsequent University education. However, the outcome of these reforms has not been as high as expected. Enrollment in primary school rose from 1.5 million in 1985 to 2 million in 1995,
476 Schmidt-Kallert (1994) p. 176 477 Cobbe (1991) p. 105; Armstrong (1996) p. 85 478 Pre-university education in Ghana, consisting of primary school, middle school, junior
secondary and senior secondary school, took four years longer than the equivalent degree in Britain. However, private junior secondary schools prepared their students to bypass the four years of middle school entirely. Cobbe (1991) p. 104
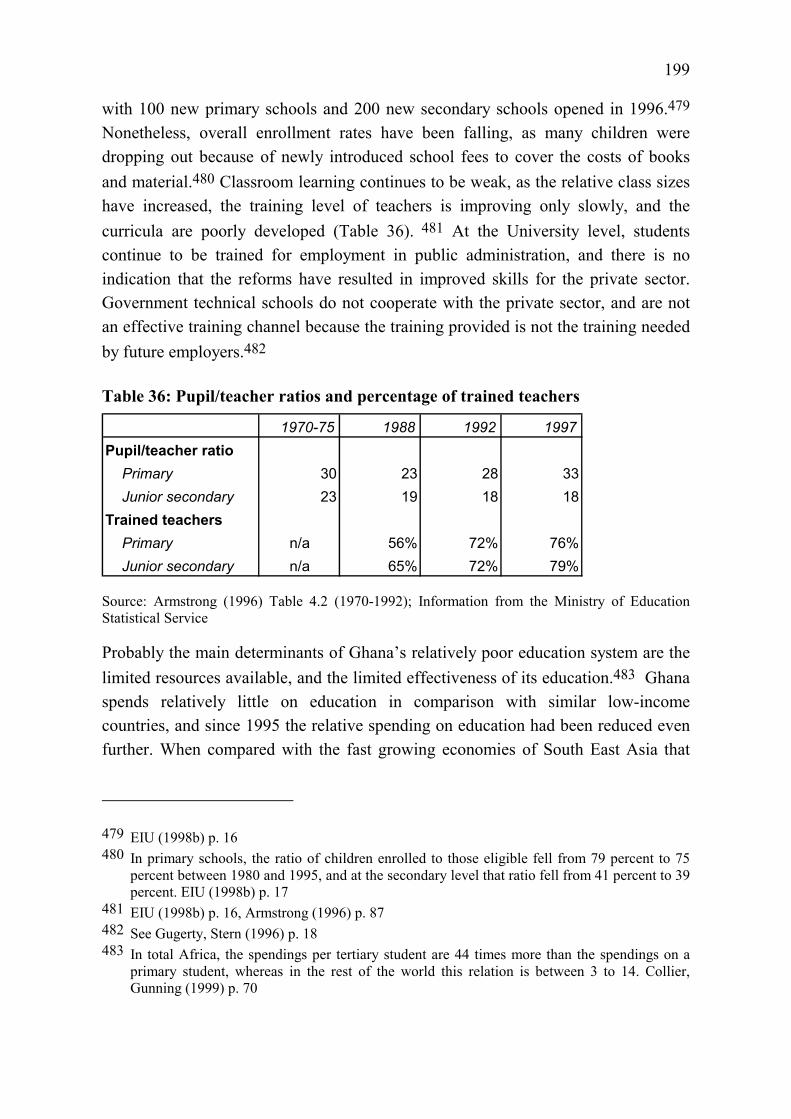
199
with 100 new primary schools and 200 new secondary schools opened in 1996.479 Nonetheless, overall enrollment rates have been falling, as many children were dropping out because of newly introduced school fees to cover the costs of books and material.480 Classroom learning continues to be weak, as the relative class sizes have increased, the training level of teachers is improving only slowly, and the curricula are poorly developed (Table 36). 481 At the University level, students continue to be trained for employment in public administration, and there is no indication that the reforms have resulted in improved skills for the private sector. Government technical schools do not cooperate with the private sector, and are not an effective training channel because the training provided is not the training needed by future employers.482
Table 36: Pupil/teacher ratios and percentage of trained teachers
1970-75 1988 1992 1997Pupil/teacher ratio
Primary 30 23 28 33Junior secondary 23 19 18 18
Trained teachersPrimary n/a 56% 72% 76%Junior secondary n/a 65% 72% 79%
Source: Armstrong (1996) Table 4.2 (1970-1992); Information from the Ministry of Education Statistical Service
Probably the main determinants of Ghana’s relatively poor education system are the limited resources available, and the limited effectiveness of its education.483 Ghana spends relatively little on education in comparison with similar low-income countries, and since 1995 the relative spending on education had been reduced even further. When compared with the fast growing economies of South East Asia that
479 EIU (1998b) p. 16 480 In primary schools, the ratio of children enrolled to those eligible fell from 79 percent to 75
percent between 1980 and 1995, and at the secondary level that ratio fell from 41 percent to 39 percent. EIU (1998b) p. 17
481 EIU (1998b) p. 16, Armstrong (1996) p. 87 482 See Gugerty, Stern (1996) p. 18 483 In total Africa, the spendings per tertiary student are 44 times more than the spendings on a
primary student, whereas in the rest of the world this relation is between 3 to 14. Collier, Gunning (1999) p. 70

200
had all achieved nearly universal literacy already in the 1970s, Ghana’s public expenditure on education is relatively low (Table 37).
Table 37: Public expenditure on education, selected countries
Percent of GNP 1980 1995Ghana 3.1% 3.3%Cote d'Ivoire 7.2%Mauritius 5.3% 4.3%Sub-Saharan Africa 4.1% 5.3%Thailand 3.4% 4.2%Malaysia 6.0% 5.3%Middle income countries 4.1% 4.5%
Source: World Bank (1999) Table 6, p. 200
Research and development
Although the development of a “Science and Technology” culture is one of the key elements on Ghana’s development agenda,484 it has had up until now limited impact on the competitiveness of Ghana’s industries. The main problem preventing effective research is the absence of cooperation between the public and private sector in research and development efforts, making it not focused on promoting the competitiveness of its industries.485 Ghana’s publicly funded research is taking place at the Universities and in government research institutes. Officially, there should be close involvement of the private sector in determining the public research agenda,486 but this has had no effect on the research needed by Ghana’s competitive industries. The priorities of state research institutes are still defined by the government, which wants them to focus primarily on basic research to support the country’s agricultural and simple industrial development. No research is done that benefits the country’s competitive industries directly. As a result, Ghana’s research is more backward oriented than forward looking, and not focused on the development of competitiveness in key industries. At the University level, students
484 See the Presidential Report to Parliament (1995) p. 17 485 In addition, the different public research activities are also poorly coordinated. For instance,
both the Ministry of Agriculture and the Cocoa Board maintain extension services for the cocoa sector.
486 By law, 40% of the members of the Ghana’s Council for Scientific and Industrial Research must be drawn from the private sector
201
are missing the opportunity of being involved early on in applied science, and as a consequence they are poorly prepared for their work in the private sector.
Capital availability
The availability of capital for Ghana’s private sector is constrained for several reasons. First and foremost, the country’s fiscal policy has caused a crowding out of private investments (Table 38, also Chapter 4.1).487
Table 38: Saving and Investment (percent of GDP)
1996 1997Government investment 12.0% 12.5%Government saving 5.7% 5.9%Net government saving -6.3% -6.6%Private investment 5.0% 6.0%Private saving 7.4% 9.4%Net private saving 2.4% 3.4%National investment 17.0% 18.5%National saving 13.1% 15.3%Net foreign saving 3.9% 3.2%
Source: CEPA (1998) Table 2.4, p. 17
There are no systems in place to encourage private saving rates, and Ghana’s net private savings ratio is well below the Sub-Saharan (13 percent) and Asian average (28 percent).488 The country relies on significant foreign capital inflows to cover its saving balance. Although the government has reformed the country’s financial sector (see p.169), three large banks, the insurance and the pension industry are still state-owned.
Physical infrastructure
The development of an appropriate physical infrastructure has been high on the government’s agenda early on. The main focus has been the construction of roads to connect the countryside to the larger cities, and the development of a national electricity grid. Ghana’s telecommunication sector has been partially privatized (see Chapter 18.5).
487 Informal and non-financial savings are not included in this analysis – but are not available for the productive investments
488 Leechor (1994) p. 174

202
The main issues regarding the involvement of Ghana’s government in infrastructure development is the right focus, and the degree of privatization of public utilities. In the past few years, the relative spending on infrastructure have been decreased (see Table 35), particularly road construction activities have slowed down since 1997
489. Also, Ghana’s government has not invested in specialized infrastructure (e.g., refrigerated warehouses for fresh produce) that would be beneficial for the country’s competitive industries. On the other hand, the government plans to extend its electricity grid to remote villages, and hesitates to divest poorly managed public utilities such as the Ghana Oil Company and the Volta River Authority (Electricity company), where mismanagement have caused severe energy shortages and power cuts.
Information infrastructure
One strong achievement regarding the provision of information on markets, technology and competition for Ghana’s companies has been the foundation of the Ghana Export Promotion Council. The Export Promotion Council organizes trade-fairs, customer visits and export seminars for Ghanaian companies, and its library contains all major trade journals and handbooks.490 Other data however is hard to get. Ghana is slow to publish key government statistics and decrees. Export statistics for instance are up to one year late, and basic statistical information such as employment data, and salary surveys are no longer published.
Administrative infrastructure
Ghana’s public service consumes roughly 5.8 percent of the nation’s GDP, and as a percentage of total population is Africa’s 2nd largest.491 Between 1987 and 1994, public service reform initiatives were started, reducing the number of (central) civil servants from about 140’000 in 1987 to 90’000 in 1994. However, the reforms were “introduced and implemented in an ad hoc manner, and have fallen short to intended outcomes.”492 Ghana’s bureaucracy is still highly inefficient, and suffers from incidents of corruption. One major reason for the poor performance of Ghana’s bureaucracy is the wage differential between the public and the private sector, which
489 CEPA (1998) p. 35 490 However, only few companies seem to know or use this source of information 491 IMF (1999a) Table 2, p. 11 492 IMF (1999a) p. 9

203
suggests that the government has difficulties in recruiting and keeping competent individuals.493
The difficulties in getting along with Ghana’s bureaucracy have been partially removed by the creation of one-stop approval processes for foreign investors. Investors in the mining industry and in the free-zone area can draw on the support of dedicated centers that take care of all administrative work. Foreign investors that do not operate in these areas are typically getting some support from the Ghana Investment Centers. However, domestic investors continue to complain about the difficulties in getting around a still corrupt bureaucracy.
22.4.2 Government influence on demand conditions
Ghana’s government has had little influence on improving the quality and quantity of demand of Ghana’s customers. Regarding the quality of demand, the standards required for export products are determined by the importers since Ghanaian standards are either absent (e.g., no building codes) or too weak. Government procurement is not relevant for competitive industries in terms of volume; however, the lengthy bidding process, events of corruption, and slow payments have deterred companies from becoming government contractors.
22.4.3 Government influence on related and supporting industries
Ghana’s largest industrialized areas are the cities of Accra and Tema, where most industrial activities are taking place, and where suppliers and related industries are naturally clustered. To the limited extent possible, this geographic proximity allows firms to draw on a relatively large group of qualified employees.
To spread the industrialization to Ghana’s rural areas in the rainforest and savanna zones, Ghana’s government is offering significant tax discounts to firms that are willing to move. While understandable from a rural development perspective, this effort would reduce the cluster of industries around Accra and Tema.
493 Harrold, Jayawickrama, Bhattasali (1996) p. 58. Median pay levels in the civil service range from 28 percent to 41 percent of the private sector levels (for comparison: Korea: 57 to 69 percent, Taiwan 60 to 66 percent).
204
22.4.4 Government influence on firm strategy, structure, and rivalry
Industry structure and rivalry
The involvement of Ghana’s public sector in the economy continues to be high, and the government continues to exert a significant influence on the country’s industry structure in particular through its SOEs and the export monopoly on Cocoa.494 The divestiture of SOEs was started in 1992, and has advanced only slowly. Between 1992 and 1995, a deterioration in the country’s fiscal position forced the government to float the shares of some of its most profitable businesses on the stock exchange. After 1997, however, the pace of divestitures has slowed down.495 By the end of 1998, 212 of the more than 300 SOEs had been divested.496 However, the emphasis has been on the sale or liquidation of small and medium-sized enterprises; many large enterprises like Ghana Airways, the Tema Oil Refinery, Ghana Commercial Bank, and the Electricity Company continue to be state owned.497 Most SOEs however continue to perform poorly and constitute a serious strain on government resources.498
494 Export taxes on cocoa accounted for 11 percent of the government revenues in 1998. IMF (2000b) Table 7, p. 13, and Table 20, p. 27
495 IMF (2000a) p. 90 496 Divestiture Implementation Committee, Web page (April 1998) 497 Several factors have prevented Ghana’s government from privatizing its SOEs more rapidly.
On the political side, there was widespread fear among the population that the government was selling off “our nation’s heritage” to favored cronies in secretive transactions, and that exploitative rich businessmen would take over and kick helpless workers into the street to face unemployment. See also Gyimah-Boadi (1991) p. 202. He argues that the popular fear of neo-colonialism through foreign multinationals was responsible for the fact that the government provides incentives for foreign companies to take on joint-venture partners in order to have an “African face” at the front. This “fear” and interference by officials led to the unwillingness to divest certain enterprises for political and “strategic” reasons. The absence of a strong capital market (Ghana’s stock exchange has only come to live in the past three years) made it difficult to find the capital required for the complete privatization of the existing SOEs (see p. 28). Inadequate transparency, a cumbersome legal and regulatory environment, and the need for approval by the President’s Office also deterred potential investors (IMF (2000a) p. 95). Finally, several SOEs are almost impossible to sell, because in many cases underfunded liabilities for retirement benefits exceed the total value of the company, or provisions in collective bargaining agreements are not sustainable (Nowak et al. (1996) p. 44).
498 In 1995, average capacity utilization of SOEs was between 25 percent to 40 percent, according to the Ministry of Industry & Trade, Web page

205
Investment trade laws and taxes
In the past 15 years, Ghana’s government has worked on several regulatory initiatives to improve the economic environment of the private sector. The most important starter was the liberalization of the country’s trade regime,499 followed by the establishment of a new mining code. A full commitment to private enterprise came relatively late, with the full start of the SOE divestiture program and the establishment of a liberalized investment code in 1992 and 1994 respectively (see Table 39).
Table 39: Overview of business regulation changes Regulation Established Main features
Mining Code 1986 Establishment of Minerals Commission, royalty rates (max. 12% of revenues), income taxes and depreciation allowances, duty free import of equipment, free capital transfers
Liberalization of exchange rate
1988 No capital import restrictions, no profit repatriation restrictions, no capital transfer restrictions for registered companies (as of 1994)
Establishment of Divestiture Implementation Committee
1988 (1992) Tasks: search of potential investors for SOEs
Restructuring of commercial banking system
1990 Removal of nonperforming loans and recapitalization of banks; new banking supervision law
Forest and wildlife policy 1994 Export of raw logs prohibited to ensure sustainable exploitation of forest resources and encourage value-added production
Liberalized investment code 1994 Investment guarantees, tax incentives, duty exemptions for machinery & equipment, minimum capital requirements
Implementation of the Ghana Investment Promotion Center as one-stop shop for economic, commercial and investment information
499 Ghana is a member of the World Trade Organization (WTO); the Lome convention, a trade and aid agreement between the European Union and 46 of Europe's former colonies (guarantees duty free imports into EU for a number of products); and the Economic Community of West African States (ECOWAS).

206
Establishment of Export processing zones
1996 Duty-free export processing in dedicated zones; tax holidays, contractual freedom, “one-stop” approval service for completion of all formalities
Utility Regulatory Commission
1999 Independent commission to determine appropriate (i.e. cost recovering) tariff levels, mainly for water and electricity
Introduction of VAT (Value-added tax)
1998 10% VAT, to replace 15% sales tax
Source: European Roundtable of Industrialists (1993); Ghana Investment Promotion Center, Ghana Free Zones Board
Government and private sector cooperation
One major concern of Ghanaian and foreign investors is the government’s attitude towards private enterprise and protection of private ownership. In the view of private investors, the Ghanaian government has not shown clear support for the country’s industry, and continues to fall back into the habit of accusing large companies and individual managers to be rent-seekers and profiteers. Examples include labor unrests where the government took immediately the side of the striking workers, or the seizing of private property by city or county authorities. Overall, the communication between the government and private sector is not very well established, and a culture of mutual blame and distrust is prevalent.500 In part, this ineffective communication is driven by misperceptions about the relative position of Ghana’s industries in World markets, and by assumptions about which industries should be enhanced and supported.
22.5 Conclusions on Ghana’s government
Compared to other Sub-Saharan countries, Ghana’s government has been relatively successful in achieving macroeconomic stability, and in providing the microeconomic foundations for the development of competitive industries. However, several elements have prevented the country to grow as fast as had been hoped for. Frequent compromises like election promises have prevented the full stabilization of the country’s macroeconomic environment. At the microeconomic level, the government’s actions were guided more by overall development targets,
500 See also Chhibber, Leechor (1994) p. 85

207
rather than by the needs of its competitive industries for a cost-efficient and reliable infrastructure.501 In general, the government’s attitude towards the private sector is still ambiguous, and inconsistent messages and behavior have created a source for uncertainty. Free competition is not fully established. The government has been slow and reluctant in privatizing its SOEs, and was initially driven by the need to improve government finances. A liberalized investment code has been introduced relatively late. In several instances, the government continues to overstep its limits, getting directly involved in company affairs. The legal and administrative system is not fully equitable and fair. There are again accusations of corruption at the highest level, which are replicated at all levels below.502 Until very recently, there was little involvement of the private sector in policy formulation, which indicates a paternalistic attitude of the government (we know what is good), and mistrust from the private sector.503 Overall, Ghana’s reforms were not radical enough to allow the country’s industry to compete successfully in international markets, and to build a sustainable competitive advantage through upgrading and innovation.
501 This includes for instance the electrification of the entire country, rather than focusing on providing a stable electricity supply to the country’s most important industries.
502 In March 2000, the World Bank and Britain’s Department for International Development withdrew USD 100 million respectively USD 30 million of loan facilities for dubiously awarded water projects. EIU ViewsWire, May 18, 2000 (Database download) “Ghana finance: A scandal cools relationships with donors”
503 “The sentiment is often expressed among Ghanaians that various macroeconomic reforms are pursued only to satisfy donor conditions for assistance. Hence, in the absence of such assistance, the government would reverse policies on liberalization. In reaction to this, the private sector chooses to put their capital in short-term assets and dabble in sectors of the economy with quick and relatively high turnover, such as trading.” Aryeetey (1994) p. 1219
208
23 Summary - the challenges of Ghana’s Diamond of National Advantage
This chapter contains the summary and conclusions on the nature of competitive advantage, and the capacity for innovation of Ghana’s industries.
23.1 Nature of competitive advantage
The main factor driving the competitiveness of Ghana’s industries are natural resources. Only industries building on the basic factor advantages, i.e. natural resources have been able to build up a competitive advantage. The aluminum industry benefits from the availability of cheap power and good bauxite resources. The cocoa industry benefits from Ghana’s climate and soil. The food industry depends on the availability of rich fishing resources as well as a good climate. The success of the gold mining industry comes from the availability of rich ores. Finally, the timber and furniture industry benefits from Ghana’s tropical forests. Only few industries have been able to build up a competitive advantage based on more advanced factors, namely the furniture and fresh fruit industry. In the six industries reviewed above, four elements were in place at all successful companies to overcome the shortcomings and disadvantages of Ghana’s environment. First, they had overcome the absence of a good supplier network by internalizing their supplier markets through backward integration whenever possible. Second, they invested significantly in building up their own infrastructure where the public infrastructure was insufficient. Third, they made-up the country’s lack of skilled management by working with foreign management, and they invested significantly into the training of their labor force. And fourth, they relied on simple products, either on commodity products where the tastes of the final customers did not really matter, or on products where the tastes and demands of their final customers could be transferred through agents. In sum, the industries that achieved a competitive advantage were those that fully leveraged Ghana’s basic factor advantages, and found ways to work around the country’s disadvantages.
The competitiveness of Ghana’s industries has improved in the past 17 years since the beginning of the ERP. Many successful companies have been started in the last 10 years, benefiting from an improved climate for investment. However, the reliance on basic factor advantages has not produced a rapid growth of the nation’s wealth.
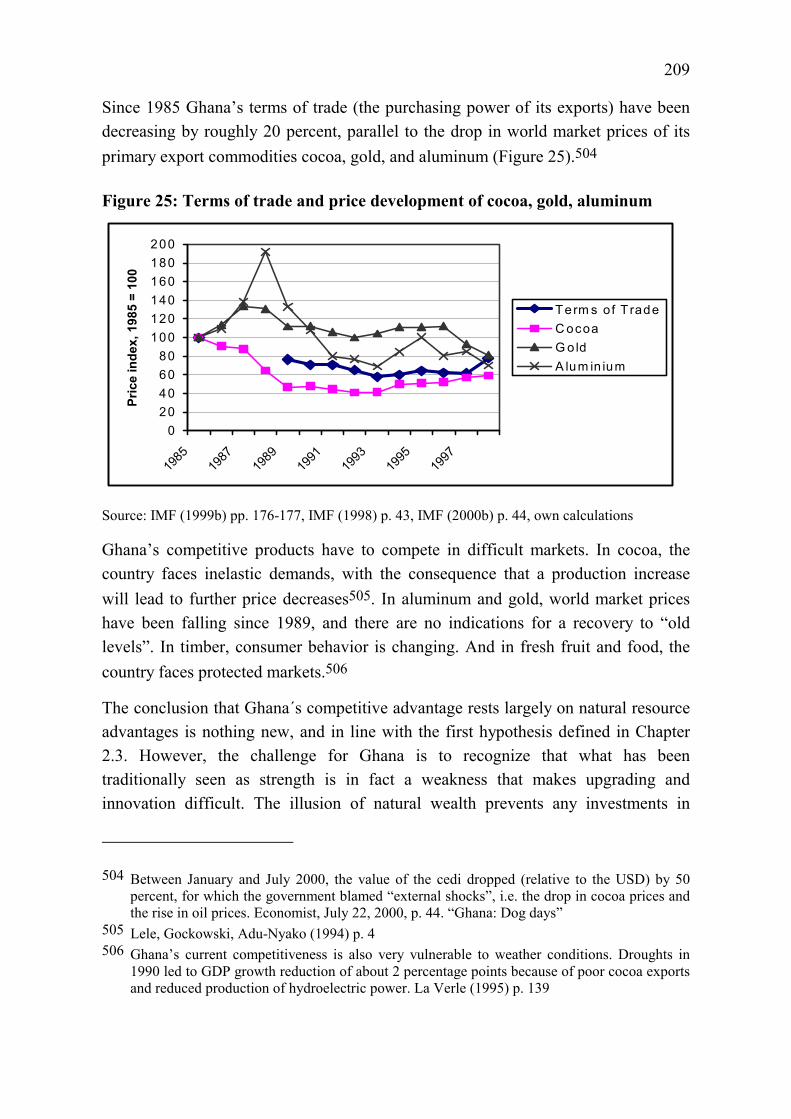
209
Since 1985 Ghana’s terms of trade (the purchasing power of its exports) have been decreasing by roughly 20 percent, parallel to the drop in world market prices of its primary export commodities cocoa, gold, and aluminum (Figure 25).504
Figure 25: Terms of trade and price development of cocoa, gold, aluminum
020406080
100120140160180200
1985
1987
1989
1991
1993
1995
1997
Pric
e in
dex,
198
5 =
100
Term s of T radeC ocoaG o ldA lum in ium
Source: IMF (1999b) pp. 176-177, IMF (1998) p. 43, IMF (2000b) p. 44, own calculations
Ghana’s competitive products have to compete in difficult markets. In cocoa, the country faces inelastic demands, with the consequence that a production increase will lead to further price decreases505. In aluminum and gold, world market prices have been falling since 1989, and there are no indications for a recovery to “old levels”. In timber, consumer behavior is changing. And in fresh fruit and food, the country faces protected markets.506
The conclusion that Ghana´s competitive advantage rests largely on natural resource advantages is nothing new, and in line with the first hypothesis defined in Chapter 2.3. However, the challenge for Ghana is to recognize that what has been traditionally seen as strength is in fact a weakness that makes upgrading and innovation difficult. The illusion of natural wealth prevents any investments in
504 Between January and July 2000, the value of the cedi dropped (relative to the USD) by 50 percent, for which the government blamed “external shocks”, i.e. the drop in cocoa prices and the rise in oil prices. Economist, July 22, 2000, p. 44. “Ghana: Dog days”
505 Lele, Gockowski, Adu-Nyako (1994) p. 4 506 Ghana’s current competitiveness is also very vulnerable to weather conditions. Droughts in
1990 led to GDP growth reduction of about 2 percentage points because of poor cocoa exports and reduced production of hydroelectric power. La Verle (1995) p. 139
210
innovative industries. High resource abundance leads to increased demand for labor that shifts workers away from high learning-by-doing sectors and thus depresses growth in labor productivity.507 In manufacturing for instance, there has been no technical progress, and the skill level of Ghana’s workers has not improved.508 Also, the illusion of wealth makes people greedy and shifts their focus on getting as much of the current pie as possible, rather than thinking about how to enlarge the pie for everybody.509
With this industry structure, it is very difficult to build up advanced competitive advantages based on innovation and upgraded factor advantages. Since successful industries were forced to build their own “enclave economies” that rely on imported technology and vertical integration, there are little spillovers of innovative know-how to other industries.510 As a result, there are basically no related or supporting industries to reinforce innovation and upgrading. The focus on resource-intensive, simple products makes active research unnecessary, and hence does not contribute to innovation either. And last, the high investments required to build up an own infrastructure puts significant strains on the profitability of companies, and leaves little resources available to be invested into research and development.
For the future, the situation seems to be worsening: a number of Ghana’s basic factor advantages are not sustainable and will be competed away eventually. The end of cheap electricity means that the competitive advantages of Ghana’s aluminum smelter are melting away rapidly. In the cocoa industry, limited investments into new trees could lead to a significant production decrease. In gold mining, there are other African countries that have adapted their mining regulations in order to draw away foreign investments from Ghana. In timber, new competitors like Russia are entering the world timber market, while Ghana has to reduce it’s felling to protect its endangered tropical forests.
507 Findings from Sachs, Warner (1995) p. 21 508 “In none of the equations was there any evidence for a rise in underlying productivity over
time. It was shown that nearly all of the differences across firms in labour productivity, which were very large, were explained by differences in physical, not human capital endowments.” Teal (1997) p. 9 Worse, there are indications for technical regress shown by Teal (1997) with the fact that the demand for unskilled workers relative to skilled workers has risen – they can only be substituted when there is technical regress. Also, the current investment rates are too low to even replace old equipment.
509 Sachs, Warner (1995) p. 4 find that resource-rich economies in general are subject to more extreme rent-seeking behavior.
510 See also Osotimehin, Tiffin, Saunders (1991) pp. 54

211
The findings from this thesis are that Ghana’s government has not been able to provide an environment that would have allowed the development of competitive industries that were not dependent on natural resource advantages only. This confirms the second hypothesis of Chapter 2.3 that Ghana´s structural adjustment program has not gone far enough, and regulatory uncertainty, unpredictable macroeconomic policy and bureaucratic inefficiency did not create a microeconomic environment conducive to business. In the words of Collier and Gunning511, Ghana´s government continues to commit both “sins of commission” as well as “sins of omission”. The sins of commission include elements such as the high taxes on cocoa, and the continuous involvement in business affairs. The sin of omission is basically the failure to have done everything possible to provide an optimal environment for private business. All firms continue to face high transaction costs from the lack of a working infrastructure and public social capital, and from specific barriers to business, such as information costs, negotiation costs, and enforcement costs. These high transaction costs lead to a waste of resources and energy through inefficiencies, and reduce the number of profitable business transactions.512 The results are limited new investment, limited technical improvements, and the absorption of valuable management capabilities. Those firms that want to compete with advanced products are fully exposed to global competition, where everything has to work perfectly. If only one small element is missing, and an order is delayed or of poor quality, it could become worthless for the customer. However, an improvement in this direction is difficult to accomplish in the current competitive environment of Ghana.
23.2 Capacity to innovate
Given its current position, Ghana has significant room to improve its competitive advantage through innovation and increased efficiency. While innovation should lead to more advanced competitive advantage, improved efficiency allows capturing higher returns from current activities as a basis for investment into innovation and
511 Collier, Gunning (1999) p. 66 512 This is the case not only for Ghana, but also for most African countries. Elbadawi (1999)
compared the performance of manufactured exports of a sample of African and Asian countries. He found that transaction costs (measured by corruption, miles of paved road, and telecommunication quality) were the most important factor that prevented the export of manufactures from Africa.

212
growth. If Ghana can realize this innovation potential, it would form a basis for sustainable growth and development of the country’s industry.
The first step towards innovation could be to raise operational standards to world standards. Most industries would be able to improve their effectiveness and their efficiency with the help of modern machinery, new production processes, the rationalization of small facilities, and upgraded management methods. In the cocoa industry, yields could be increased considerably by planting new hybrid varieties and by using modern agrochemicals. In the fresh fruit industry, modern production structures based on larger farms would lead to significant productivity increases. And with new farming structures in place, the food processing industry could tap on processing agricultural products in other areas of the country. A second step towards increasing innovation could be to widen the range of activities along the value chain. In the fresh fruit industry, more value could be captured in other steps such as marketing, and logistics. In the timber industry, significantly more value could be added with the production of furniture or pre-fabricated elements. The third step in innovation would be to move from short-term opportunities towards long-term strategies. A significant share of skilled labor is currently absorbed in activities such as trading and other services, mostly because few entrepreneurs are ready to invest significantly in long-term projects. A fourth step would be to create distinctive, long-term competitive positions, e.g., through brand reputation, and labeling. Firms would have to make explicit choice about where to compete, and where not to compete. This implies for instance the choice between focusing on costs or on quality, like in the cocoa industry, where Ghana has chosen to compete in the quality segment. A fifth step to improve innovation would be to gain direct contact with foreign customers, and to take control of international distribution channels. Communication with customers helps to understand their needs better, like the success in the furniture industry has proven. Control over distribution channels would allow keeping the share of profit that goes to middlemen. A sixth step would be to expand trade with neighboring countries where demand is less sophisticated. In these markets, processed aluminum products could be sold, which cannot be sold on advanced markets, but provide an opportunity to start simple upgrading and innovation.
23.3 Conclusion
Although the determinants of competitive advantage of Ghana have improved in the past two decades, significant barriers prevent firms from fully realizing their

213
potential. The objective of the last part was to summarize these barriers on a country level, to support the individual findings at the industry level. Even though the determinants of competitive advantage are very specific for each industry, there are barriers to competitiveness (such as uncertainty on the future of economic reforms or low-skilled labor) that affect all industries. As such, Ghana’s industries have significant capacity for innovation that could be released once these barriers have been removed.
To remove these barriers, Ghana´s government has to undertake bold steps to stabilize the country’s macroeconomic environment, and to ensure an enabling microeconomic environment. What Ghana´s government should not do is to manage firms, and to define in which industries the country should be competitive. Rather, Ghana´s government should only be active in areas where firms are unable to act (e.g., trade policy, exchange rate stabilization), where there are opportunities for valuable clustering and external economies of scale, or where externalities cause firms to underinvest, like general education and infrastructure. When cooperating with companies, Ghana´s government must ensure that it does not protect them and remove the pressure of foreign competitors. Otherwise, these companies will not be forced to innovate and upgrade their advantages, but will be happy with the current static comparative advantages that can be easily competed away. The process of creating competitive advantage might be uncomfortable for firms and their employees. Many firms prefer an environment where prosperity is guaranteed. The challenge is to bear the cost of bankruptcies of uncompetitive industries while the country is focusing on its competitive industries. However, Ghana´s government alone cannot manage the establishment of an enabling environment. The impact of its work depends much on corporate attitudes, on how much responsibility is transferred to and taken over by firms and other institutions, and how effective firms can actually implement sophisticated strategies and efficient operations. Things like joint public-private training and research institutions, close links with Universities, and the involvement of trade associations in policy formulation are the steps that ensure the effectiveness of government activities to foster Ghana’s competitiveness.
214
Sources Literature Addo, F.; Juleemun, D.; Sonntagbauer, P. (1995): Report on the Survey of Medium and Large Scale Manufacturing; Ministry of Trade and Industry, Accra
Agbodeka, Francis (1992): An economic history of Ghana from the earliest times; Ghana Universities Press, Accra
Agénor, Pierre Richard; Montiel, Peter J. (1996): Development Macroeconomics; Princeton University Press, Princeton NJ
Ahiakpor, James A. (1985): The success and failure of dependency theory: the experience of Ghana; in International Organization, 39, 3, Summer 1985, S. 535-552
Alpine, Robin W.L.; Pickett, James (1993): Agriculture, liberalization and economic growth in Ghana and Côte d’ Ivoire: 1960-1990; OECD, Paris
Ames, Geoffrey; Bennnet, C. (1995): Fish mammies and Tuna Conglomerates: Private Sector Fish Processing and Marketing in Ghana; in Jaffee, Steven; Morton, John (ed.): Marketing Africa’s High-Value Foods: Comparative Experience of an Emergent Private Sector; Kendhall/Hunt, Dubuque Illinois
Anyemedu, Kwasi (1991): Export Diversification Under the Economic Recovery Program; in Rothchild, Daniel (ed.): Ghana: The Political Economy of Recovery; Lynne Rienner, Boulder & London
Armah, Bartholomew (1993): Trade structures and Employment Growth in Ghana: A Historical Comparative Analysis; in African Economic History, 21, 1993, pp. 21-36
Armstrong, Robert P. (1996): Ghana Country Assistance Review: a Study in Development Effectiveness; World Bank, Washington D.C.
Arthur, Winfred; Doverspike, Dennis; Kuthy, James (1996): Striking gold through a deep-level organizational intervention in Ghana's mining industry; in International Journal of Organizational Analysis, Vol. 4, Iss. 2, April 1996, pp. 175-186
Aryeetey, Ernest (1993): Sectoral credit allocation policy and credit flow to small enterprises in Ghana; in Helmsing, A.H.J.; Kolstee, Th. (ed.): Small Enterprises and Changing Policies: Structural adjustment, financial policy and assistance programmes in Africa; IT Publications, London
Aryeetey, Ernest (1994): Private Investment Under Uncertainty in Ghana; in World Development, Vol. 22, No. 8, pp. 1211-1221
Aryeetey, Ernest; Baah-Nuakoh, Amoah; Duggleby, Tamara; Hettige, Hemamala; Steel, William (1994): Supply and Demand for Finance of Small Enterprises in Ghana; World Bank Discussion Paper 251, Washington D.C.

215
Asamoa, Ansa (1996): Socio-economic development strategies of independent African countries: the Ghanaian Experience; Ghana Universities Press, Accra
Asante, Yaw; Baah-Nuakoh, Amoah; Jebuni, Charles; Oduro, Abena (1996): Exporting manufactures from Ghana – Is Adjustment enough?; Overseas Development Institute, London
Aspesi, Claudio et al. (1998): Food for West Africa; in McKinsey Quarterly 1998, Number 1; pp. 104 – 115
Auberbach, Peter; Skott, Peter (1995): Michael Porter’s Inquiry into the Nature and Causes of the Wealth of Nations – A Challenge to Neoclassical Economics; in Groenewegen, John; Pitelis, Christos; Sjöstrand, Sven-Erik (ed.): On economic institutions: theory and applications; Edward Elgar, Brookfield and Hants
Awuah, Gabriel Baffour (1994): The presence of multinational companies in Ghana: a study of the impact of the interaction between an MNC and three indigenous companies; Department of Business Studies, Uppsala University
Ayres, Robert U. (1997): Theories of Economic Growth; INSEAD Working Paper Series, 97/13/EPS
Bank of Ghana (1993): Annual report; Bank of Ghana, Accra
Barbier, Edward et al. (1994): The Economics of the Tropical Timber Trade; Earthscan Publications, London
Barr, Abigail (1995): The Missing Factor: Entrepreneurial Networks, Enterprises and Economic Growth in Ghana; Working Paper Series 95-11, Center for the Study of African Economies, Oxford
Barro, Robert; Xavier, Sala-I-Martin (1995): Economic growth; McGraw Hill, New York
Bates, Robert H. (198(1): Markets and States in Tropical Africa: The Political Basis of Agricultural Policies; University of California Press, Berkeley, Los Angeles, London
Becker, Gary (1996): The numbers tell the story: economic freedom spurs growth; in Business Week, May 6, 1996, p. 7
Besley, Timothy (1995): Property rights and investment incentives: theory and evidence from Ghana; in Journal of Political Economy; 103, October 1995, pp. 903-937
Biggs, Taylor; Srivastava, Pradeep (1997): Structural Aspects of Manufacturing in Sub-Saharan Africa: Findings from a Seven Country Enterprise Survey; World Bank Discussion Paper No. 346; Washington D.C.

216
Biggs, Taylor et al. (1994): Africa Can Compete! Export Opportunities and Challenges for Garments and Home Market Products in the U.S. Market; World Bank Discussion Paper 242, Washington D.C.
Biggs, Taylor et al. (1996): Africa Can Compete! Export Opportunities and Challenges for Garments and Home Products in the European Market; World Bank Discussion Paper 300, Washington D.C.
Bigsten, Arne et al. (1997): Investment in Africa’s Manufacturing Sector: a Four Country Panel Data Analysis; Working Paper Series 97-11, Center for the Study of African Economies, Oxford
Bigsten, Arne et al. (1998a): Rates of Return on Physical and Human Capital in Africa’s Manufacturing Sector; Working Paper Series 98-12, Center for the Study of African Economies, Oxford
Bigsten, Arne et al. (1998b): Contract flexibility and conflict resolution: evidence from African manufacturing; Working Paper Series 98-21, Center for the Study of African Economies, Oxford
Bigsten, Arne et al. (1999): Exports of African manufactures: macro policy and firm behaviour; in The Journal of International Trade & Economic Development 8:1, 1999, p. 53-71
Blattner, Niklaus; Maurer, Martin; Weber, Markus (1987): Voraussetzungen der schweizerischen Wettbewerbsfähigkeit; Verlag Paul Haupt, Bern und Stuttgart
Boeh-Ocansey, Osei (1996): Product Quality and Human Resources: Small Food Processing Enterprises in Ghana; in McCormick, Dorothy; Pederson, Poul Ove (ed.): Small Enterprises: Flexibility and Networking in an African Context; Longhorn, Kenya
Borner, Silvio; Weder, Rolf (1990): Entwicklungstheorien versus moderne Mainstream-Ökonomie: Übersicht und kritische Gegenüberstellung; in WiSt Heft 4, April 1990, pp. 158 – 164
Brockmann, Karl Ludwig; Hemmelskamp, Jens; Hohmeyer, Olav (1996): Zertifiziertes Tropenholz und Verbraucherverhalten; Physica Verlag, Heidelberg
Bulir, Ales (1998): The Price Incentive to Smuggle and the Cocoa Supply in Ghana, 1950-96; IMF Working Paper 98/88, Washington D.C.
Canagarajah, Sudharshan; Mazumdar, Dipak (1997): Employment, labor markets and poverty in Ghana: A study of changes during economic decline and recovery; World Bank PRWP 1845, Washington D.C.
Carlton, Dennis W.; Perloff, Jeffrey M. (1994): Modern Industrial Organization; 2nd ed., Harper Collins, New York

217
Caves, Richard; Frankel, Jeffrey; Jones, Ronald (1990): World Trade and Payments; 5th ed., Scott, Forseman, Little, Brown; Glenview and London
Centre for the Studies of African Economies (1997): Research Summary; Centre for the Studies of African Economies, Oxford
CEPA (1998): Ghana Macroeconomic Review and Programme; Centre for Policy Analysis, Accra
Chandler, Alfred (1992): Organizational Capabilities and the Economic History of the Industrial Enterprise; in Journal of Economic Perspective, Volume 6, Number 3, Summer 1992, pp. 79–100
Chhibber, Ajay; Leechor, Chad (1994): From Adjustment to Growth in Sub-Saharan Africa: the Lessons of East Asian Experience Applied to Ghana; in Journal of African Economies, Volume4, Number 1, pp. 83-114
Cleaver, Kevin; Donovan, Graeme (1995): Agriculture, Poverty, and Policy Reform in Sub-Saharan Africa; World Bank Discussion Paper 280, Washington D.C.
Cobbe, James (1991): The Political Economy of Education Reform in Ghana; in Rothchild, Donald (ed.): Ghana: The Political Economy of Recovery; Lynnne Rienner, Boulder & London
COLECAB, CBI, Protrade (1997): Exporting Fresh Fruit and Vegetables: A Survey and Marketing Guide on the Major Markets in the European Union; COLECAB, CBI, Protrade, no location
Collier, Paul; Gunning, Jan Willem(1999): Explaining African Economic Performance; In Journal of Economic Literature, Vol. XXVII (March 1999), pp. 64-111
Conafric (1996): Ghana: We mean Business; Conafric, Tema
Coyne, Kevin P.; Subramaniam, Somu (1996): Bringing discipline to strategy; in McKinsey Quarterly, Number 4, 1996, pp. 14-25
de Man, Ard Pieter (1993): 1980, 1985, 1990: A Porter Exegesis; Management Report Series No. 166, Rotterdam School of Management
Diaw, Kofi; Schmidt-Kallert, Einhard (1994): The Volta Lake Project in Ghana – A Critical Analysis of a Giant Energy Project; in Bass Hans et al. (ed.): Energy and Sustainable Development, African Development Perspectives Yearbook 1992/93; Hamburg

218
Dordunoo, C.K., Nyanteng, V.K. (1997): Overview of Ghanaian Economic Development; in V.K. Nyanteng (ed.): Policies and Options for Ghanaian Economic Development; Institute of Statistical, Social, and Economic Research, University of Ghana, Legon
Dornbusch, Rüdiger; Fischer, Stanley (1994): Macroeconomics; 6th edition, McGraw Hill, New York and others
Dunning, John H. (199(1): The Competitive Advantage of Countries and TNC Activity: A Review Article; Discussion Paper in International Investment and Business Studies, University of Reading
EIU (1997a): Country profile Ghana; Economist Intelligence Unit, London
EIU (1997b): Country report Ghana, 3rd quarter 1997; Economist Intelligence Unit, London
EIU (1998a): Country report Ghana, 2nd quarter 1998; Economist Intelligence Unit, London
EIU (1998b): Country profile Ghana; Economist Intelligence Unit, London
EIU (1998c): Country report Ghana, 3rd quarter 1997; Economist Intelligence Unit, London
EIU (1998d): Country report Ghana, 4th quarter 1998; Economist Intelligence Unit, London
EIU (1999): Country report Ghana, 1st quarter 1999; Economist Intelligence Unit, London
Elbadawi, Ibrahim (1999): Can Africa Export Manufactures? The Role of Endowments, Exchange Rates and Transaction Costs; Working Paper, World Bank, Washington D.C.
European Roundtable of Industrialists (1993): Survey on the improvements of conditions for investment in the developing world; European Roundtable of Industrialists, Brussels
Fafchamps, Marcel (1996): The enforcement of commercial contracts in Ghana; in World Development 24: pp. 427-28, March 1996
Fairbanks, Michael; Lindsay, Steve (1997): Plowing the sea: nurturing the hidden sources of growth in the developing world; Harvard Business School Press, Boston MA
Foss, Nicolai (1996): Research in Strategy, Economics, and Michael Porter; in Journal of Management Studies 33:1 January 1996, pp. 1-24

219
Friends of the Earth (1992): Plunder in Ghana’s Rainforest for illegal Profit: An expose of corruption, fraud and other malpractice in the international timber trade; Friends of the Earth, London
Friends of the Earth (1993): Forests Foregone: The European Community’s Trade in Tropical Timbers and the Destruction of the Rainforests; Friends of the Earth, London
Frimpong-Ansah, Jonathan H. (1991): The Vampire State in Africa: The Political Economy of Decline in Ghana; James Currey, London
Garelli, Stéphane (1997): The Four Fundamental Forces of Competitiveness; in The World Competitiveness Yearbook 1997; IMD, Lausanne
Gassmann, Hanspeter (1995): Globalization and Industrial Competitiveness; The OECD Observer, No. 197 December 1995/January 1996, pp 38 - 42
Ghana 40th Anniversary (1996): Ghana 40th Anniversary; Maxhill Group, London
Ghana Chamber of Mines (1996): Annual report; Ghana Chamber of Mines, Accra
Ghana Club 100 (1998): Ghana's Top 100 Companies, 1998; Ghana Investment Promotion Centre, Accra
Ghana Export Bulletin (1996): Annual report 1996; Ghana Ministry of Trade and Industry; Ghana Customs, Excise and Preventive Service; Accra
Ghana Export Bulletin (1997): Annual report 1997; Ghana Ministry of Trade and Industry; Ghana Customs, Excise and Preventive Service; Accra
Gugerty, Mary Kay; Stern, Joseph (1996): Structural Barriers to Trade in Africa; Harvard Working Paper, Harvard Institute of International Development, Cambridge
Gwartney, James; Lawson, Robert (1997): Economic Freedom of the World: 1997 Annual Report; Fraser Institute, Vancouver B.C.
Gyimah-Boadi, E. (1991): State Enterprise Divestiture: Recent Ghanaian Experience; in Rothchild, Daniel (ed.): Ghana: The Political Economy of Recovery; Lynne Rienner, Boulder & London
Harrold, Peter; Jayawickrama, Malathi; Bhattasali, Deepak (1996): Practical Lessons for Africa from East Asia in Industrial and Trade Policies; World Bank Discussion Paper 310, Washington, D.C.
Herbst, Jeffrey (1993): The politics of reform in Ghana, 1982 - 1991; University of California Press, Berkley, Los Angeles, Oxford
Heritage Foundation (1997): Index of economic freedom; The Heritage Foundation, Washington D.C.
IMD (1997): The World Competitiveness Yearbook 1997; IMD, Lausanne

220
IMF (1997): International Financial Statistics Yearbook 1997; IMF, Washington D.C.
IMF (1998): Ghana: Statistical Annex; IMF Staff Country Report No 98/2, Washington, D.C.
IMF (1999a): International Financial Statistics Yearbook 1999; IMF, Washington D.C.
IMF (1999b): Ghana: Selected Issues; IMF Staff Country Report No. 99/3, Washington, D.C.
IMF (2000a): Ghana: Selected Issues; IMF Staff Country Report No. 2000/2, Washington, D.C.
IMF (2000b): Ghana: Statistical Annex; IMF Staff Country Report No 2000/1, Washington, D.C.
Jacobeit, Cord (1991): Reviving Cocoa: Policies and Perspectives on Structural Adjustment in Ghana’s Key Agricultural Sector; in Rothchild, Daniel (ed.): Ghana: The Political Economy of Recovery; Lynne Rienner, Boulder & London
Kapur, Ishan et al. (1991): Ghana: Adjustment and Growth, 1989-91; International Monetary Fund (Occasional Paper 86), Washington D.C.
Kennedy, Paul (1988): African Capitalism, the Struggle for Ascendancy; Cambridge University Press, Cambridge
Kromrey, Helmut (1990): Empirische Sozialforschung; 4th ed., Leske Verlag & Budrich GmbH, Opladen
Krugman, Paul (1991): Geography and Trade; Leuven University Press, Leuven; MIT Press, Cambridge MA
Krugman, Paul (1994): Competitiveness: A Dangerous Obsession; in Foreign Affairs, March/April 1994, pp. 28-44
Kuada, John E. (1994): Managerial Behaviour in Ghana and Kenya – A Cultural Perspective; Aalborg University Press, Aalborg
La Verle, Berry (ed.) (1995): Ghana: a country study; Federal Research Division, Washington D.C.
Lall, Sanjaya (1995): Structural Adjustment and African Industry; in World Development, Vol. 23 No. 12, pp. 2019-2031, 1995
Lall, Sanjaya (1992): Structural Problems of African Industry; in Lall, Sanjaya; Stuart, Frances; Wangwe, Samuel (ed.): Alternative Development Strategies in Subsaharan Africa; St. Martin’s Press, New York
221
Lall, Sanjaya; Navaretti, Giorgio; Teitel, Simón; Wignaraja, Geneshan (1994): Technology and Enterprise Development: Ghana under Structural Adjustment; St.Martin’s Press, New York
Lall, Sanjaya; Wignaraja, Ganeshan (1997): Skills and capabilities: Ghana’s industrial competitiveness; in Godfrey, Martin (ed.): Skill Development for International Competitiveness; Edward Elgar, Cheltenham, Brookfield
Leechor, Chad (1994): Ghana: frontrunner in adjustment; in Husain, Ishrat; Faruqee, Rashid (ed): Adjustment in Africa: Lessons from Country Case Studies; The World Bank, Washington D.C.
Leith, J. Clark; Lofchie, Michael (1993): The Political Economy of Structural Adjustment in Ghana; in Bates, Robert; Krueger, Anne O.: Political and Economic Interactions in Economic Policy Reform: Evidence from Eight Countries; Blackwell, Oxford and Cambridge MA
Lele, Uma; Gockowksi, James; Adu-Nyako, Kofi (1994): Economics, Politics, and Ethics of Primary Commodity Development: How Can Poor Countries in Africa Benefit the Most?; IMF Working Paper 94/23, Washington D.C.
Marsh, Ian; Tokarick, Stephen (1994): Competitiveness Indicators: A Theoretical and Empirical Assessment; IMF Working Paper 94/29, Washington D.C.
McKinsey (1997): Factpack: Aluminum; Internal Practice Document, McKinsey, Berlin
McKinsey (1998): Global Competitors in the Alumina and Primary Aluminum Industry; Internal Practice Document, McKinsey, Johannesburg
McKinsey Global Institute (1994): Latin American Productivity; McKinsey & Co, Washington, D.C
McMillan, Susan (1995): Foreign Direct Investment in Ghana and Côte d’Ivoire; in Chan Steve (ed.): Foreign direct investment in a changing global political economy; St.Martin’s Press, New York
Meckl, Reinhard; Rosenberg, Christoph (1995): Neue Ansätze zur Erklärung internationaler Wettbewerbsfähigkeit: Versuch einer Synthese zwischen volks- und betriebswissenschaftlicher Sichtweise; in Zeitschrift für Wirtschafts- und Sozialwissenschaften (ZWS) 115 (1995) S. 211-230
Mengistae, Taye; Teal, Francis (1998): Trade liberalization, Regional integration and Firm performance in Africa's Manufacturing Sector; Report to the European Commission, REP 98-1, Center for the Study of African Economies, Oxford
Nelson, Richard; Winter, Sidney (1982): An Evolutionary Theory of Economic Change; Harvard University Press, Cambridge and London

222
Neuner, Andreas (1993): Die Wettbewerbsfähigkeit der amerikanischen Automobilindustrie am Ende der 80er Jahre; Peter Lang, Frankfurt am Main und andere
North, Klaus (1997): Localizing global production: Know-how transfer in international manufacturing; ILO Management Development Series No. 33, Geneva
Nowak, Michael; Basanti, Rifaat; Horvath, Balazs; Kochhar, Kalpana; Prem, Roohi (1996): Ghana, 1983-91; in Hadjimichael, Michael; Nowak, Michael; Sharer, Robert; Tahari, Amor: Adjustment for Growth, the African Experience; IMF, Washington D.C.
OECD (1996a): Export Fruit Boom from the South: A Threat for the North?; OECD, Paris
OECD (1996b): Industrial Competitiveness; OECD, Paris
Osotimehin, Fola; Tiffin, Scott; Saunders, Richard (199(1): New Technologies and Enterprise Development in Africa; Development Center Studies, OECD, Paris
Pattillo, Catherine (1997): Investment, Uncertainty, and Irreversibility in Ghana; IMF Working Paper 97/169; Washington D.C.
Petchenkine, Youry (1993): Ghana: In Search of Stability 1957 - 1992; Praeger, Westport & London
Pickett, James; Shaeldin, P. (1990): Comparative advantage in agriculture in Ghana; OECD Technical Paper No. 31, Paris
Porter, Michael E. (1980): Competitive Strategy: Techniques for Analyzing Industries and Competitors; The Free Press, New York and others
Porter, Michael E. (1985): Competitive advantage: Creating and sustaining superior performance; The Free Press, New York and others
Porter, Michael E. (1990a): The Competitive Advantage of Nations; Macmillan Press, London and Basingstoke
Porter, Michael E. (1990b): The Competitive Advantage of Nations; Harvard Business Review, March-April 1990, pp 73-93
Porter, Michael E. (1996): What Is Strategy?; in Harvard Business Review, November-December 1996, pp. 61-78
Porter, Michael E. (1997): Foreword; in Fairbanks, Michael; Lindsay, Steve: Plowing the sea: nurturing the hidden sources of growth in the developing world; Harvard Business School Press, Boston MA
Porter, Michael E. (1998a): The microeconomic foundations of economic development; in World Economic Forum (1998): The Global Competitiveness Report; World Economic Forum, Geneva

223
Porter, Michael E. (1998b): Measuring the microeconomic foundations of economic development; in World Economic Forum (1998): The Global Competitiveness Report; World Economic Forum, Geneva
Porter, Michael E. (1999): Microeconomic competitiveness: Findings from the 1999 Executive Survey; in World Economic Forum (1999): The Global Competitiveness Report; World Economic Forum, Geneva
Presidential Report to Parliament (1995): Ghana – Vision 2020 (the First step: 1996-2000); Government of Ghana, Accra
Rabobank (1995): The cocoa and chocolate market; Food and Agribusiness Research, Rabobank, Utrecht
Rimmer, Douglas (1992): Staying poor: Ghana's political economy 1950 - 1990; Pergamon Press, Oxford etc.
Roe, Alan; Schneider, Hartmut (1992): Adjustment and Equity in Ghana; OECD, Paris
Roemer, Michael (1996): Could Asian Policies Propel African Growth?; Harvard Working Paper, Harvard Institute of International Development, Cambridge
Sachs, Jeffrey; Sievers, Sara E. (1998): The Africa Competitiveness Report 1998, Executive Summary; World Economic Forum, Davos (Internet download)
Sachs, Jeffrey; Warner, Andrew (1995): Natural Resource Abundance and Economic Growth; NBER Working Paper 5398, Cambridge, MA
Saint, William (1992): Universities in Africa: Strategies for Stabilization and Revitalization; World Bank Technical Paper No. 194, Washington D.C.
Schmidt-Kallert, Einhard (1994): Ghana; Perthes Verlag, Gotha
Schultz, Paul (1994): Human capital and economic development; Discussion Paper, Yale University, Economic Growth Center, No. 711
Schumpeter, Joseph (1993): Theorie der wirtschaftlichen Entwicklung; 9th ed., Duncker & Humblot, Berlin
Singh, Ajit (1994): State Intervention and the ‘Market-Friendly’ Approach to Development: A Critical Analysis of the World Bank Theses; in Dutt, Amitava; Kim, Kwan (ed.): The State, Markets and Development: Beyond the Neoclassical Dichotomy; Edward Elgar, Brookfield
Singleton, John (1997): The World Textile Industry; Routledge, London and New York
Statistisches Bundesamt (1994): Länderbericht Ghana, 1992; Wiesbaden
224
Stern, Nicholas (1989): The Economics of Development: A Survey; in The Economic Journal, September 1989, pp. 597 – 685
Stern, Nicholas (1991): The determinants of growth; in The Economic Journal, 101 (January 1991), 122-133
Teal, Francis (1995): Does ‘Getting Prices Right’ Work? Micro Evidence from Ghana; Working Paper Series 95/19, Center for the Study of African Economies, Oxford
Teal, Francis (1995): Real Wages and the Demand for Labour in Ghana’s Manufacturing Sector; Working Paper Series 95-7, Center for the Study of African Economies, Oxford
Teal, Francis (1997): Real Wages and the Demand for Labour in Ghana’s Manufacturing Sector: 1991-1995; Working Paper Series 97-10, Center for the Study of African Economies, Oxford
Teal, Francis (1998a): The Ghanaian Manufacturing Sector 1991-1995: Firm Growth, Productivity and Convergence; Working Paper Series 98-17, Center for the Study of African Economies, Oxford
Teal, Francis (1998b): The Ghanaian Manufacturing Sector: Firm Growth, Productivity, Exports and Investment; REP 98-2, Center for the Study of African Economies, Oxford
Teal, Francis (1999): Why can Mauritius export manufactures and Ghana not?; Working Paper Series 99-10, Center for the Study of African Economies, Oxford
Tsikata, Fui (1997): The vicissitudes of mineral policy in Ghana; in Resources Policy, Vol. 23 No 1/2, pp. 9-14, 1997
Ul Haque, Irfan (1994): International Competitiveness: The State and the Market; in Dutt, Amitava; Kim, Kwan (ed.): The State, Markets and Development: Beyond the Neoclassical Dichotomy; Edward Elgar, Brookfield
UNCTAD (1999): World Investment Report 1999; UNCTAD, Washington D.C.
UN Trade Statistics Yearbook (1997): 1996 International Trade Statistics Yearbook, Volume II; United Nations, New York
UNDP (1997): Ghana Human Development Report; United Nations Development Programme, Accra
United Nations (1997): Handbook of world mineral trade statistics; 1991-1996; United Nations, New York
US Department of Commerce (2000): Country Commercial Guide, Ghana 2000; Embassy of the United States, Accra

225
Van der Linde, Claas Matthias (1991): The Competitive Advantage of Germany: A Microeconomic Approach; Dissertation Hochschule St.Gallen, H. Tschudy & Co., St.Gallen
Von Gnielinski, Stefan (1986): Ghana: Tropisches Entwicklungsland an der Oberguineaküste; Wissenschaftliche Buchgesellschaft, Darmstadt
Woode, Samuel (1997): Values, Standards and Practices in Ghanaian Organisational Life; Asempa Publishers, Accra
World Bank (1993a): Ghana 2000 and Beyond: Setting the Stage for Accelerated Growth and Poverty Reduction; Africa Regional Office, Western Africa Department, Washington D.C.
World Bank (1993b): The East Asian Miracle: Economic Growth and Public Policy; Oxford University Press, Oxford etc.
World Bank (1994): Adjustment in Africa: Reforms, Results and the Road ahead; Oxford University Press, Oxford etc
World Bank (1995): Global Economic Prospects and the Developing Countries; World Bank, Washington D.C.
World Bank (1999): Knowledge for Development; Oxford University Press, Oxford etc.
World Economic Forum (1998): The Global Competitiveness Report 1998; World Economic Forum, Geneva
Yankson, Paul (1996): Small-Scale Aluminum Industry in Ghana: Employment, Profitability, and Development Strategies; in McCormick, Dorothy; Pederson, Poul Ove (ed.): Small Enterprises: Flexibility and Networking in an African Context; Longhorn, Kenya

226
Several institutions have provided statistics and brochures, or have Websites from which information and data were downloaded:
Aluworks, Tema
Centre for the Study of African Economies, Oxford (www.economics.ox.ac.uk/CSAE)
Divestiture Implementation Committee, Accra (www.webstar.com.gh/)
EIU ViewsWire, London (www.viewswire.com)
FAO, Rome (www.fao.org)
Ghana Export Promotion Council, Accra
Ghana Free Zones Board, Accra
Ghana Investment Promotion Centre, Accra (www.gipc.org.gh)
Ghana Timber Export Development Board, Accra
Ministry of Education Statistical Service, Accra
Ministry of Trade and Industry, Accra (www.ghana-embassy.org)
Tradeport, Washington (www.tradeport.org)
US Department of Commerce, Washington (www.bea.doc.gov)
World Economic Forum, Geneva (www.weforum.org; www.worldeconomicforum.org)
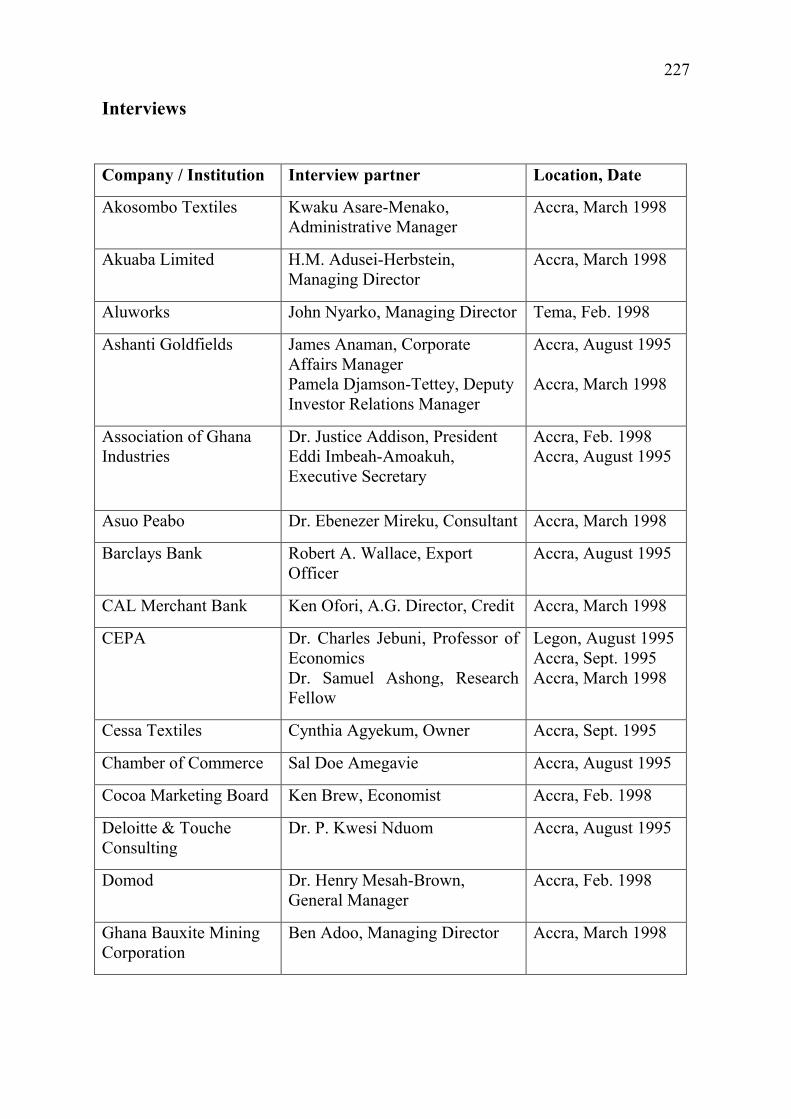
227
Interviews
Company / Institution Interview partner Location, Date
Akosombo Textiles Kwaku Asare-Menako, Administrative Manager
Accra, March 1998
Akuaba Limited H.M. Adusei-Herbstein, Managing Director
Accra, March 1998
Aluworks John Nyarko, Managing Director Tema, Feb. 1998
Ashanti Goldfields James Anaman, Corporate Affairs Manager Pamela Djamson-Tettey, Deputy Investor Relations Manager
Accra, August 1995 Accra, March 1998
Association of Ghana Industries
Dr. Justice Addison, President Eddi Imbeah-Amoakuh, Executive Secretary
Accra, Feb. 1998 Accra, August 1995
Asuo Peabo Dr. Ebenezer Mireku, Consultant Accra, March 1998
Barclays Bank Robert A. Wallace, Export Officer
Accra, August 1995
CAL Merchant Bank Ken Ofori, A.G. Director, Credit Accra, March 1998
CEPA Dr. Charles Jebuni, Professor of Economics Dr. Samuel Ashong, Research Fellow
Legon, August 1995 Accra, Sept. 1995 Accra, March 1998
Cessa Textiles Cynthia Agyekum, Owner Accra, Sept. 1995
Chamber of Commerce Sal Doe Amegavie Accra, August 1995
Cocoa Marketing Board Ken Brew, Economist Accra, Feb. 1998
Deloitte & Touche Consulting
Dr. P. Kwesi Nduom Accra, August 1995
Domod Dr. Henry Mesah-Brown, General Manager
Accra, Feb. 1998
Ghana Bauxite Mining Corporation
Ben Adoo, Managing Director Accra, March 1998

228
Company / Institution Interview partner Location, Date
Ghana Export Promotion Council
Tawia Akyea, Executive Secretary Constance N. Luacoe, Director General
Accra, Feb. 1998 Accra, August 1995
Ghana Investment Promotion Centre
Stephen Osei Yeboah Accra, August 1995
Goldfields Ghana Helgo Kahle, Managing Director Accra, March 1998
Mahagony Wood Processing
Fritz Soltermann, Managing Director
Accra, March 1998
Milani Pineapple Bijean Milani, Owner and CEO Accra, March 1998
Ministry of Trade and Industry
Abraham Laryen-Odai Accra, March 1998
Merki Woodworks Kurt Merki, Owner Tema, March 1998
Nkulenu Industries
Dr. Esther Okloo, Founder and CEO
Legon, March 1998
Pioneer Food Company Dr. Osei Boeh-Ocansey, Managing Director
Tema, Febr. 1998
Scanstyle MIM Michael Pepera, Managing Director Kwasi Amponsah, Operations Manager
Accra, March 1998 Accra, Sept. 1995
Standard Chartered Bank Ghana
E. A. Boate, Head Credit Operations
Accra, Febr. 1998
State Enterprise Comission
W.A. Adda Accra, August 1995
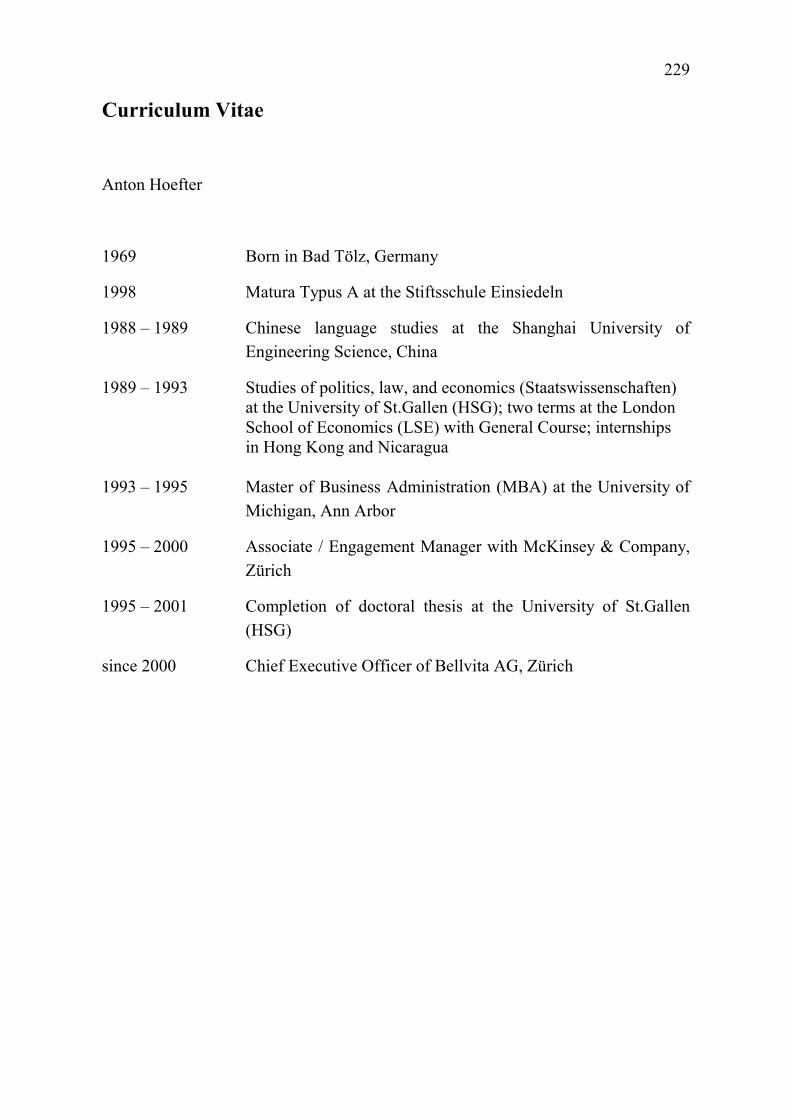
229
Curriculum Vitae
Anton Hoefter
1969 Born in Bad Tölz, Germany
1998 Matura Typus A at the Stiftsschule Einsiedeln
1988 – 1989 Chinese language studies at the Shanghai University of Engineering Science, China
1989 – 1993 Studies of politics, law, and economics (Staatswissenschaften) at the University of St.Gallen (HSG); two terms at the London School of Economics (LSE) with General Course; internships in Hong Kong and Nicaragua
1993 – 1995 Master of Business Administration (MBA) at the University of
Michigan, Ann Arbor
1995 – 2000 Associate / Engagement Manager with McKinsey & Company, Zürich
1995 – 2001 Completion of doctoral thesis at the University of St.Gallen (HSG)
since 2000 Chief Executive Officer of Bellvita AG, Zürich