
Electrochemical Chlorine Evolution at Sol-Gel Derived ...
187
Electrochemical Chlorine Evolution at Sol-Gel Derived Mixed Oxide Electrocatalyst Coatings Dissertation Zur Erlangung des Grades des Doktors der Naturwissenschaften der Naturwissenschaftlich-Technischen Fakultä t III der Universitä t des Saarlandes von Ruiyong Chen Saarbrücken 2010
Transcript of Electrochemical Chlorine Evolution at Sol-Gel Derived ...

Electrochemical Chlorine Evolution at Sol-Gel Derived
Mixed Oxide Electrocatalyst Coatings
Dissertation
Zur Erlangung des Grades des Doktors der Naturwissenschaften
der Naturwissenschaftlich-Technischen Fakultaumlt III
der Universitaumlt des Saarlandes
von
Ruiyong Chen
Saarbruumlcken
2010
Tag des Kolloquiums 04 February 2011
Dekan Prof Dr-Ing Stefan Diebels
Berichterstatter Prof Dr Rolf Hempelmann
Prof Dr Wilhelm F Maier
Prof Dr Herbert Over
Pruumlfungsvorsitzender Prof Dr Kaspar Hegetschweiler
Akademischer Beirat Dr Harald Natter
I
Abstract
Performance improvement in electrode coatings plays a critical role in reducing energy
consumption (ie overpotential) in the electrolytic chlorine production The performance
dependence on the chemical composition surface morphology and phase structure of the
oxide coatings has been investigated systematically The multi-component RuTiMOx
system prepared by the sol-gel route improved effectively the catalytic performance with
M = Ir Sn V The impermeable crack-free coatings obtained by controlling the
coatingdrying process are expected to protect the Ti-substrate against passivation Nano-
pores created by lanthanum leaching from the La-containing oxide matrix provided highly
accessible surface A novel in-situ supported rutile RuTiO2anatase TiO2 structure with
enhanced catalytic activity was achieved by the solvothermal crystallization of the Ru-O-
Ti xerogel Cl2 bubble evolution behaviour at the RuTiMOxTi electrodes has been studied
in a first approach by analyzing the bubble-induced potential noise using wavelet transform
II
III
Zusammenfassung
Die Effizienzverbesserung der Elektrodenbeschichtungen spielt eine kritische Rolle bei der
Reduzierung des Energieverbrauchs (zB der Uumlberspannung) fuumlr die elektrolytische
Chlorentwicklung Die Effizienzabhaumlngigkeit der Oxidbeschichtung wurde systematisch in
Abhaumlngigkeit von der chemischen Zusammensetzung der Oberflaumlchenbeschaffenheit und
der Phasenstruktur untersucht Die Multikomponent-Beschichtung RuTiMOx wurde im
Sol-Gel Verfahren hergestellt wobei der Anteil von M=Ir Sn V die katalytische Effizienz
erheblich verbesserte Die undurchlaumlssigen und rissfreien Beschichtungen die durch ein
kontrolliertes BeschichtenTrocknen-Verfahren erhalten wurden sollen die Passivierung
des Ti-Substrats verhindern Es wurden Nano-Poren infolge eines Leaching-Verfahrens
aus einer Lantan-haltigen Oxidmatrix erhalten die eine houmlchst zugaumlngliche Oberflaumlche
bieten Mittels einer solvothermalen Kristallisierung des Ru-O-Ti-Xerogels wurde eine
neue in-situ-verstaumlrkte Rutil-RuxTi1-xO2Anatas-TiO2 Struktur erhalten die eine erhoumlhte
katalytische Aktivitaumlt aufweist Die Entwicklung der Cl2-Gasblasen auf RuTiMOxTi-
Elektroden wurde in einem ersten Ansatz durch die Analyse des blaseninduzierten
Potentialrauschens mit Hilfe der Wavelet-Transformation untersucht
IV
V
Table of Contents
Abstract I
Zusammenfassung III
1 Introduction 1
2 Theory and background 3
21 The history of industrial chlorine production 3
22 The anodic process 7
221 Anodic chlorine evolving reaction and classical equations 7
222 The reaction mechanisms and kinetics of anodic chlorine evolution 11
223 Anode electrocatalyst coatings 13
2231 Electrode Materials 13
2232 Preparation route of RuO2-based materials 16
2233 Deactivation mechanism of electrode 17
224 Gas evolution and electrochemical noise 19
23 Sol-gel synthesis 21
231 The hydrolysis and condensation reactions 21
232 The formation of sol-gel coatings 26
233 The drying and post-sintering 26
24 Experimental methods 29
241 Structural characterization 29
2411 X-ray diffraction 29
2412 Scanning electron microscopy (SEM) 30
2413 Energy dispersive X-ray spectroscopy (EDX or EDS) 31
2414 Transmission electron microscopy (TEM) 31
2415 Selected area electron diffraction (SAED) 31
2416 Raman spectroscopy 32
242 Electrochemical characterization 32
2421 Cyclic voltammetry (CV) 32
2422 Chronopotentiometry (CP) 34
2423 Galvanostatic polarization 35
2424 Electrochemical impedance spectroscopy (EIS) 36
3 Experimental 37
31 Preparation of electrocatalyst coatings 37
311 Pre-treatment of Ti-substrates 37
312 Sol-gel synthesis of mixed oxide coatings 37
3121 RuTiO2 sol solutions prepared by acetic acid-isopropanol route 37
3122 RuTiMOx sol solutions prepared by propionic acid-isopropanol route 38
VI
3123 Preparation of Ti substrates supported oxide coatings 39
313 Preparation of crack-free coatings 39
314 Preparation of porous coatings 40
315 Combined sol-gel and solvothermal synthesis 41
32 Structural characterization of electrocatalysts 42
321 X-ray diffraction (XRD) 42
322 Raman spectroscopy 42
323 Scanning electron microscopy and energy dispersive analysis (SEM-EDS) 42
324 Transmission electron microscopy and electron diffraction (TEM-ED) 43
33 Electrochemical characterization 43
4 Results and discussion 45
41 Chemical compositions of the electrocatalysts 45
411 Influence of preparation parameters 45
4111 Oxide loading amount and coating thickness 46 4112 Influence of sintering conditions on the crystallization phase transition of powders
47 4113 Influence of sintering conditions on the phase transition surface morphology and
electrochemical properties of coatings 51
412 Chemical composition of electrocatalysts 54
4121 Doping effect of mixed oxides 55
4122 Microhomogeneous mixed oxide prepared by propionic acid-isopropanol route 61
413 Conclusion 70
42 Morphology-controlled preparation 71
421 Crack-free coatings 72
422 Porous oxide film coated electrodes 75
4221 Porous electrode coating Ru03Sn07O2 76
4222 Impedance behaviour of porous electrode coatings 79
4223 Charging behaviour of porous electrode coatings 83
423 Conclusion 88
43 Solvothermal-assisted synthesis 89
431 Phase structure of Ru-Ti-O system 89
432 Solvothermal crystallization of Ru-O-Ti xerogel coatings 91
433 Solvothermal processing parameters 97
434 Structure-property correlation of sol-gelsolvothermal prepared Ru04Ti06O2
coatings 101
435 Conclusion 109
44 Electrochemical noise analysis of gas-evolving electrodes 111
441 Data acquisition of potential fluctuations 112
442 Statistical analysis of potential fluctuations 115
443 Fourier analysis of potential fluctuations 118
444 Wavelet analysis of potential fluctuations 120
445 Influence of electrolysis temperature on the bubble evolution behaviour 125
446 Case analysis Bubble evolution behaviour for the commercial electrode and
sol-gel Ru03Sn07O2 electrode coatings 130
447 Conclusion 136
VII
5 Summary and conclusions 139
Appendix 141
A1 Chemicals 141
A2 Software 142
A3 List of abbreviations Nomenclature 143
A4 The calculation of energy consumption for chlorine production 144
A5 Peng-Robinson and van der Waals equations of state 145
A6 JCPDS standard data of RuO2 TiO2 146
A7 Phase diagram of binary RuO2-TiO2 system 149
A8 Mathematic basics of noise analysis 150
A81 Standard deviation 150
A82 Autocorrelation function 150
A83 Fourier transform 151
A84 Wavelet transform 153
A9 MATLAB source code 154
A10 Publications 161
A101 Journal article 161
A102 Patents 161
A103 Conference proceedingshelliphelliphelliphelliphelliphelliphelliphelliphelliphelliphelliphelliphelliphelliphelliphelliphelliphelliphelliphelliphelliphellip161
A11 Acknowledgements 162
A12 References 163
VIII
1 Introduction
1
1 Introduction
The industrial sector accounts for about a third of the both global primary energy
consumption and energy-related CO2 emissions Industrial energy efficiency has a
significant impact on the mitigation of the climate change security of energy supply and
sustainability Energy-efficient technological innovations particularly in the energy-
intensive industrial manufacturing processes become the core factors considered as
sustainable industrial strategy in the future
Chlorine and its co-product caustic soda (sodium hydroxide) are important building blocks
for the whole chemical and pharmaceutical industry which are produced industrially by
the electrolysis of brine Electricity is essential to produce chlorine in the chlor-alkali
industry which accounts for about half of the total production cost Energy savings arise
primarily through using more efficient technologies such as the replacement of the less
energy-efficient mercury and diaphragm processes by the most energy-efficient membrane
technology and the substitution of the hydrogen evolving cathode by the oxygen
depolarized cathode
In terms of electrocatalysis the chemical reaction proceeds electrochemically ie it is
driven by the electrode potential Overpotential related to the electron transfer reactions at
the electrode could be reduced by proper selection of electrode materials Thus it is a task
for chemists to develop and evaluate new catalytic materials and accordingly new
preparation routes to meet the continuous expansion of industrial requirements This is one
of the motivations of the present research project to optimize the electrocatalysts and to
innovate in the preparation strategy of electrocatalysts
Furthermore the design in electrode coating morphology (surface and cross-section) was
studied regarding the issue of electrode deactivation caused by the substrate passivation A
protective and impermeable crack-free oxide layer deposited onto the titanium substrate
has been fabricated by controlling the dippingdryingsintering processes Nanoporous
1 Introduction
2
electrode coatings were obtained by the lanthanum leaching route in order to increase the
electrocatalytically accessible active surface area which could improve the electrocatalytic
performance as a geometrical factor
The crystallization process of the mixed oxide coatings was modified by using
solvothermal curing of the xerogel coatings followed by post-sintering treatment The
resulting phase structure and the electrochemical properties of the electrode coatings as a
function of the solvothermal processing parameters have been investigated Detailed
structural characterization of the solvothermally prepared electrode coatings has been
carried out in order to elucidate the achieved significant improvement in the
electrocatalytic activity for chlorine evolution
Chlorine gas bubbles generated at the electrode surface result in additional ohmic drop due
to the shielding and blocking effects The preliminary identification of the bubble
evolution behaviour at the electrode surface was performed by analyzing the bubble-
induced electrochemical noise Various mathematical analysis methods such as the
statistical standard deviation autocorrelation function and Fourier power spectral density
were performed to analyze the time series of potential noise Wavelet transform which is
used widely in the field of signal processing as an alternative to the conventional Fourier
transform was used to extract the characteristic bubble evolution information such as
detachment frequency and also the possible in-situ wettability analysis of electrode
coatings The proposed analytical strategy is able to be extended to the further evaluation
of the electrode material morphology and structure dependent gas evolution behaviour
2 Theory and background
3
2 Theory and background
21 The history of industrial chlorine production
Equation Chapter 2 Section 1
Chlorine is essential to the global chemical industry and to our daily life Approximately
50 of the products marketed by the chemical industry and 85 of the pharmaceuticals
are derivatives of chlorine chemistry [1] The production of chlorine is being esteemed as
lsquolsquoEnginersquorsquo of the chemical industry in a country The industrial chlorine production dates
back to the last half of the 19th century [2] At that time chlorine was produced from
hydrochloric acid by the so-called Weldon and Deacon processes (chemical oxidation
route) The Weldon process uses the manganese dioxide (MnO2) as reactant
o100 110 C
2 2 2 2MnO 4HCl MnCl Cl 2H O (21)
The manganese is recycled by treating the MnCl2 with lime (CaO which is mixed with
H2O to obtain calcium hydroxide) and oxygen to improve the process economics
2 2 2 2 2 2
2MnCl 3Ca(OH) O 2MnO CaO 2CaCl 3H O (22)
The Deacon process generates chlorine by direct catalytic oxidation of the hydrochloric
acid gas with air according to
oca300 C
Catalyst2 2 24HCl O (air) 2Cl 2H O (23)
The reaction (21) and (23) are the secondary process of the manufacture of sodium
carbonate (Na2CO3) by the Leblanc process
32 4 CaCOH SO C
2 4 2 2 3
2
NaCl Na SO Na S Na CO
+ HCl + CO + CaS (24)
In the late 19th century the Solvay process for carbonates began to replace the Leblanc
process and the shortage of HCl made it necessary to find new route to produce chlorine
Most chlorine today is produced by using the electrolytic processes (electrolytic oxidation
2 Theory and background
4
route) where solutions of sodium chloride are electrolyzed to convert chloride ions (Cl-)
into molecular chlorine (Cl2) at the anode Simultaneously sodium hydroxide (NaOH)
solution and hydrogen (H2) are produced at the cathode side according to the following
equations
Anode 2
2Cl Cl 2e (25)
Cathode 2 2
2H O 2e H 2OH (26)
Overall 2 2 2
2NaCl 2H O 2NaOH Cl H (27)
Only a tiny part of chlorine is produced worldwide by other processes such as the chlorine
recovery by the electrolysis of hydrochloric acid (HCl) solutions Hydrogen chloride gas is
a by-product in the processes used to manufacture polyurethanes fluorocarbons hydro-
fluorocarbons and white pigments in which chlorine used is reduced to hydrogen chloride
The Deacon catalytical oxidation process [3] which is a thermochemical process opposite
to the electrochemical process is beyond the scope of the present work
Among the amalgam process diaphragm process and membrane process in which
different anode products separations are involved the mercury process is the most energy
intensive process whereas the membrane process is the most energy-efficient process (ca
2500 kWh of electrical energy consumption is required to produce one ton of chlorine) All
new plants in the world are based on the membrane cell process nowadays Worldwide the
annual production of chlorine amounts to approximately 55 million metric tons in the year
2005 [4] Accordingly the overall energy consumption amounts to more than 15times1011
kWha [5] Therefore a significant reduction of the energy consumption in the chlor-alkali
industry is highly desirable
The total consumption of electric power is proportional to the voltage applied to the cell
for a given current density (the rate of electrode reaction) (See Appendix A4) The cell
voltage consists of several components [6]
2 Theory and background
5
e adV E IR V (28)
where E is the thermodynamic potential difference for a given anodecathode reaction
is the sum of the overpotentials for the anodic and cathodic reactions (which are
dependent on the electrocatalysts) eIR is the ohmic drop of the electrolyte and adV is the
additional ohmic drop from the membrane gas bubble effect etc Industrial demands for
the energy-efficient chlorine production in order to reduce the electrical power
consumption in the chlor-alkali electrolysis processes drive increasingly the scientific and
technical innovations since the electrical power consumption occupies almost 50 of the
cost of chlorine manufacturing
Figure 21 Electrode potential in chlor-alkali electrolysis from NaCl aqueous solution as a function
of current density The curves deviate away from the dotted lines (The equilibrium potentials
which vary with the operation parameters such as temperature and concentration For simplicity
standard equilibrium potentials were given in this figure) with the increase of current density
indicating the overpotential required to drive the electrochemical reactions The unit of the current
density mA cm-2
was used throughout the present work to present the obtained experimental data
whereas the kA m-2
is more often used in the industrial technical data 100 mA cm-2
= 1 kA m-2
The electric energy needed for driving the electrode reaction depends on the reaction type
of the electrolytic cell The hydrogen evolving cathode (HEC) (see Eq (26)) can be
replaced by the oxygen depolarized cathode (ODC)
2 Theory and background
6
2 2
O 2H O 4e 4OH (29)
Accordingly the overall reaction turns to
2 2 2
4NaCl 2H O O 4NaOH 2Cl (210)
A comparison of the HEC and ODC process is illustrated in Figure 21 The
thermodynamic potential difference for the classical electrolysis with HEC is about 22 V
(in practice the overall cell voltage is approximately 31 V including the anode and
cathode overpotential ohmic resistance in membrane electrolyte and electrode materials
electrode gap) The ODC cell reduces the overall cell voltage by around 1 V compared to
the conventional process [7]
A technological breakthrough in the history of electrolytic chlorine production is the
presence of Dimensional Stable Anodes (DSA
) which were invented by HB Beer in
1965 [ 8 9 ] and were then developed and industrialized by De Nora [ 10 ] The
commercially available DSA consists of RuO2 as active component inert oxide such as
TiO2 as stabilizer and coated onto titanium substrate [11] The DSA using a conductive
titanium substrate as a substitution for conventional graphite anodes benefits from the fact
that fixed inter-electrode gap can be remained during the long-term operation of
electrolytic cell RuO2 exhibits excellent corrosion resistance and low potential for anodic
chlorine evolution reaction which can be diluted and stabilized by TiO2 by obtaining a
rutile structure of mixed oxide solid solution A thermal decomposition method is
generally used to prepare this kind of electrode coatings
2 Theory and background
7
22 The anodic process
221 Anodic chlorine evolving reaction and classical equations
The electrolysis process consists of the electron transfer at the electrode surface ions pass
through the electrolyte between the anode and cathode and electrons transfer through the
wires externally interconnecting the two electrodes The current through the external
circuit is a convenient measure of the rate of the cell reaction The charge (Q) required to
convert the starting materials to products in an electrode reaction is calculated using
Faradayrsquos law Q = nFmM where m is the mass of the substance produced from the
electrochemical reaction M is the molar mass of the substance F is the Faraday constant
and n is the number of equivalents per molar of reactant
Figure 22 Pictorial drawing of chlorine evolution reactions at the anode side which involves a
series of steps The reactant Cl- moves to the interface (mass transport) electron transfer occurs
close to the interface (electron transfer reaction) the product Cl2 moves away from the anode to
allow the fresh reactants to the anode surface
In the anode reaction the oxidation of Cl- species occurs by the loss of electrons to the
anode as shown in Figure 22 The electrode reaction is a sequence of several basic steps
To maintain a current it is essential to supply reactants to the electrode surface and also
remove the products (ie the mass-transfer processes such as diffusion and convection of
2 Theory and background
8
the reacting species between the electrode surface and bulk of the solution) as well as for
the electron transfer reactions at the electrode surface
For a simple reversible electrode reaction (electrochemical oxidation process)
f
b
k
kR O ne (211)
If the current if and ib are assigned to the forward and backward reactions respectively the
electrochemical reaction rate can be expressed usually by the net Faradaic current
f bi i i (212)
where if gt 0 and ib lt 0 At equilibrium conditions which means that the forward and
reverse reactions proceed at the same rates the positive current contributed by the forward
reaction is balanced by the negative current contributed by the backward current if = -ib =
i0 (where j0= i0A is the exchange current density A is the electrode surface area) and the
net Faradaic current is equal to zero i = 0
The process of reduction of O and oxidation of R is a dynamic equilibrium at the surface of
the working electrode The equilibrium potential (Ee) of the working electrode is given by
the Nernst equation
0 lns
Oe e s
R
CRTE E
nF C (213)
where Ee0
is the standard equilibrium potential of the couple RO CRs and CO
s are
the
surface concentration of R and O species at the working electrode respectively R T and F
are universal gas constant 8314 J mol-1
K-1
absolute temperature in degrees Kelvin and
Faradayrsquos constant (the number of coulombs per mole of electrons F = 96485 C mol-1
)
respectively and n is the number of electrons transferred in the anode reaction For the
chlorine evolution (Eq (25)) the equilibrium potential is represented by
2 Theory and background
9
2
2
0
2ln
2
Cl
e cl Cl
Cl
pRTE E
F
(214)
where 2
0
cl ClE is the standard potential (136 V vs NHE)
2Clp is the partial pressure of
chlorine in the gas phase and Cl
is the activity of the chloride ion
If the potential of the working electrode is imposed more positive than the equilibrium
potential (E gt Ee) this will require current to flow through the electrodesolution interface
In fact the decrease in the ratio CRs CO
s is necessary and this can be brought about by the
conversion of R to O by the passage of an anodic current to the counter electrode The
overpotential is defined as the deviation of the potential from the equilibrium value ie
eE E (215)
Overpotential is the driving force for the electrode reaction to proceed in a given direction
Overpotential arises from the kinetic limitations of the electrode reaction for a given
electrode material
For a given electron transfer reaction (Eq (211)) without the mass-transfer limitation the
empirical relation between the current density and overpotential is given commonly by the
Butler-Volmer equation
0
1exp exp
nF nFj j
RT RT
(216)
where j is current density j0 is the exchange current density η is the overpotential and α is
the dimensionless electronic transfer coefficient with a value between 0 and 1 R T and F
have its usual meanings and n is the number of electrons involved in the electrode reaction
It is worth noting that the Bulter-Volmer equation is valid when the electrode reaction is
controlled by electrical charge transfer at the electrode and not by the mass transfer
The Butler-Volmer equation is valid over the full potential range At high positive
overpotential ifgtgtib the second term in Eq (216) may be ignored ie the reverse
2 Theory and background
10
rate is negligible compared to the forward reaction rate Hence a simple exponential
relationship between the anodic current density and overpotential is then given by
0
1log log
2303
nFj j
RT
(217)
which is known as the Tafel equation loga b j It describes the relation between the
rate (ie current) of an electrode reaction and the overpotential The slope of a Tafel plot
(2303
1
RTb
nF) reveals the value of the electronic transfer coefficient (α) for the anode
reaction which can be measured experimentally
At low overpotential region of the Butler-Volmer equation the exponential terms in Eq
(216) may be linearized in a Taylor series expansion and thus a linear dependence of j-η
is usually obtained ie 0
nFj j
RT From the slope of the linear dependence of j-η the
exchange current density j0 can be determined ie
00
limdj nF
jd RT
(218)
The charge transfer resistance Rct (ohm cm2) is defined as the slope of the overpotential
versus current density at the equilibrium potential (ie at zero net current when the
overpotential is very small and the electrochemical system is at equilibrium)
0
1 1
(1 ) exp (1 ) exp
ct
d RTR
nF nFdj dj d nFj
RT RT
(219)
which describes the dynamic behaviour of the redox reaction Note that the value of Rct
changes with the overpotential and0
ct
RTR
nFj for η = 0
2 Theory and background
11
222 The reaction mechanisms and kinetics of anodic chlorine evolution
The reaction paths for the chlorine evolution reactions (Eq (25)) at the anode materials
have been described by the following mechanism (i) or mechanism (ii) [12]
(i) Volmer-Tafel mechanism [13]
adsCl Cl e (Volmer reaction the primary electron transfer step with the
formation of adsorbed species (Clads) by the discharge of its counter
species at the anode surface)
ads 22Cl Cl (Tafel reaction with the formation of molecular product (Cl2) by
recombination of two neighbouring surface chlorine atoms)
(ii) Volmer-Heyrovsky mechanism [14]
adsCl Cl e (Volmer reaction)
ads 2Cl Cl Cl e (Heyrovsky reaction with the formation of molecular product
(Cl2) by the electrochemical desorption of adsorbed species
(Clads) and a simultaneous oxidation of Cl-)
The initial Volmer step is the electron transfer resulting in the formation of the adsorbed
intermediate Clads The molecular Cl2 is formed by either chemical desorption (Tafel step)
or electrochemical desorption (Heyrovsky step) of the adsorbed species
The value of the Tafel slope depends on the rate-determining step of the Faradaic reaction
The Tafel slope and exchange current density for a given electrode reaction at a given
electrocatalyst are essential for understanding the reaction mechanism It is desirable to
have high exchange current density and low Tafel slope for the electrode reactions which
permits the operation at high current densities without significant voltage supply
Different reaction mechanisms for the chlorine evolution at oxide electrodes have been
proposed [ 15 ] The obtained Tafel slope depends on the concentration of NaCl the
operation temperature pH value Various electrode materials have been investigated for
the chlorine evolution reaction (Table 21) and the kinetic parameters dependence on the
electrode material are summarized
2 Theory and background
12
Table 21 Kinetic parameters for the chlorine evolution reactions from 5 M NaCl at 25oC [16]
Electrode material j0 mA cm-2
Tafel slope mV Mechanism
Pt 85 72 ii
Ir 64 76 ii
Rh 59 90 ii
Pt07Ir03 (smooth) 085 86 ii
Pt07Ir03 (thermally formed) 375 36 ii
Ru 02 38-40 ii
RuO2-TiO2Ti 125 40 ii
Vitreous carbon 03 120 i
Graphite 12 40-120 ii
Fe3O4 55times10-5
85 -
TiO2 40times10-2
30-120 i
IrO2 117 40 ii
(RuO2)03(Co3O4)01(TiO2)06 01 40 -
Ru03Pt03Ce04O2 30 32 other
Ru03Pt07O2 10 31 other
Co3O4 (thermally formed) 85times10-3
40 other
The activation energy of the reaction steps (catalytic effect) is related to the adsorption
strength of the intermediates bonded to the electrocatalyst surface (active sites) RuO2 is
the most widely studied anode materials for chlorine evolution The investigation of the
atomic scale surface catalytic reactivity of RuO2 reveals that the presence of the
coordinatively unsaturated surface sites (cus) of cus-Ru atoms and bridge-bonded Obr
atoms are the active sites [17] Density functional theory calculations indicate that at the
RuO2 (110) surface the adsorption energies of intermediates determine the reaction paths
and the selectivity of electrode reaction [12]
Electrode reactions can be charge-transfer controlled andor mass-transfer controlled For
the charge-transfer controlled process the rate equation is expressed by the Butler-Volmer
equation (Eq (216)) Mass-transfer controlled process can be observed from the
polarization curve either at highly applied current density under galvanostatic mode or at
high polarization potential under potentiostatic mode
2 Theory and background
13
223 Anode electrocatalyst coatings
The electrocatalyst could accelerate the electron transfer at the electrodeelectrolyte
interface (Figure 22) Industrially electrocatalyst is desired to bring about high current
density at lower applied potential ie to obtain high product yield per unit of energy
consumption Electrocatalysts are utilized in the coating form generally in order to
maximize the utilization of catalyst materials A three-phase interface of gas product solid
electrode and aqueous electrolyte exists in the chlorine evolution process Cl- ions are
oxidized to Cl2 by the loss the electrons to the anode The crucial factors for the practical
application of the electrocatalysts are the activity (to reduce the overpotential) (chemical
electrochemical and mechanical) stability selectivity and the cost of catalyst material and
manufacturing
2231 Electrode Materials
The expansion in the range of electrode materials is striking during the past 50 years of
electrocatalysis [ 18 ] However the practical applications of electrocatalysts are a
compromise between the technical economic and environmental targets Besides the
historical fluctuations in the materials cost dominate significantly the selection in
electrocatalytic materials In this regard noble metals andor their oxides play a critical
role in the past several decades [1920] and could even remain so for the foreseeable future
Platinum and graphite were employed as anode materials in the electrolytic chlorine
production The former is expensive and the latter is instable mechanically and
electrochemically The development of the dimensionally stable anodes (DSA) is a
revolution in the chlor-alkali industry compared to the prior graphite anode [82122] It
consists of commonly electrocatalytic coating containing platinum group metals or oxides
of platinum group metal and valve metal oxides coated onto an electrically conductive
valve metal base or alloy containing valve metal such as titanium tantalum nickel and
zirconium Ruthenium dioxide has been recognized as one of the best electrode materials
for chlorine evolution reaction The loss of the electrocatalytic activity of the ruthenium
2 Theory and background
14
dioxide caused by the electrochemical dissolution of active ruthenium species depresses
the long-term stability of the electrode [23] In chlor-alkali industry mixed RuO2-TiO2
with TiO2 as stability promoter is commonly used to inhibit the loss of active component
and reduce the material cost of the anode coatings Due to the same crystal symmetry
between RuO2 and TiO2 the formation of solid solution is possibly responsible for their
durability [24] The decrease of the ruthenium content below 10 mol is restricted due to
the poor electrical conductivity of the coatings which contributes to the voltage drop
significantly [25]
The electrocatalytic activity of the anode coatings depends on two major factors the
electronic and geometric factors The former is related to the chemical composition and
structure while the latter to the surface and layer morphology They are also more often
mentioned in another way in the literatures as the true electrocatalytic activity and apparent
electrocytalytic activity Metal or their oxide of platinum group elements such as platinum
iridium palladium and rhodium has been used as active additives into RuO2-TiO2 system
to improve the electrocatalytic activity of anode coatings for chlorine evolution Due to the
conflict of technical and economic problems industrial electrocatalysts prefer the activer
and cheaper materials In contrast to the improvement of the electrocatalytic activity
originated from the electronic effect due to the addition of precious metal promoters less
expensive transition metal as additives will contribute to the electrocatalytic activity by
geometric factors The most widely investigated RuO2-based oxide electrode materials are
listed in Table 22 S Trasatti summarized and classified the electrode oxides for chlorine
and oxygen evolution reactions into the rutile (RuO2-based) spinel (Co3O4-based)
perovskite (NiM2O4-based) etc types [26] Transition metals have also the potential to
show proper individual catalytic activity The doped multicomponent electrocatalysts are
expected to exhibit synergetic effect to improve the activity stability and selectivity
Numerous electrode materials exhibit high catalytic activity both for the chlorine evolution
and for the oxygen evolution Note that the oxygen evolution reaction (the anode side
reaction for the chlorine evolution 2 22H O O 4H 4e ) exhibits a lower standard
reversible potential (123 V vs NHE) than the one for chlorine evolution reaction (136 V
vs NHE) The former is thermodynamically favoured However the exchange current
densities of the chlorine evolution reactions are usually substantially greater than those of
2 Theory and background
15
oxygen evolution reactions ie the overpotential for chlorine evolution reactions at the
anode is lower than that for oxygen evolution reactions Therefore chlorine evolution is
the dominant reaction during the electrolysis of saturated aqueous NaCl solution in the low
pH range of 2~3 The selectivity of anode coatings is evaluated by the electrode potential
difference (2OE -
2ClE ) for the O2Cl2 evolution reactions Further purification of the desired
products is necessary in the industrial process
Table 22 Overview of the most investigated RuO2-based electrode materials for chlorine evolution
reaction
Material mol Preparation route Ref
RuO2+IrO2 100 TD [27]
RuO2+TiO2 5~30 TD [28]
5~50 TD [25]
20 SG [29]
40 SG [30]
30sect TD [11]
RuO2+TiO2+CeO2 30 TD [31]
RuO2+TiO2+SnO2 19~33 TD [32]
25 TD [33]
RuO2+TiO2+ CeO2+Nb2O5 30 TD [3435]
RuO2+CeO2 25~100 SG [36]
RuO2+TiO2+PtOx 30~100 TD [37]
RuO2+TiO2+CrNbO4 10~20 TD [28]
RuO2+TiO2+Cr2WO6 5~76 TD [27]
RuO2+TiO2+Cr2WO6+CoWO4 1~10 TD [27]
RuO2+MnO2 85 Solid state reaction [38]
RuO2boron-doped diamond - SG [3940]
RuO2areogel-SiO2 - Cryogenic decomposition of RuO4 [41]
Molar percent of noble metal elements
TD = thermal decomposition method SG = sol-gel method
sect Commercial DSA electrode
2 Theory and background
16
2232 Preparation route of RuO2-based materials
RuO2 can be prepared at relatively low temperature (350~550 oC) by the thermal
decomposition of RuCl3 dissolved in water or alcohols onto an inert metallic substrate such
as titanium tantalum Mixed oxide can be obtained by adding the additional precursor salts
into the coating solutions This technique is adopted routinely in the chlor-alkali industry
It is known that the oxide layers are not homogeneous in the structure and composition It
contains the non-stoichiometric Ru3+
and chloride impurities with the mixed amorphous
and crystalline structure The thermal decomposition process of RuCl3 to form RuO2 has
been analyzed by the EXAFS (extended X-ray absorption fine structure) combined with X-
ray diffraction [42] The simultaneous formation of the Ru-O bonds and the break of Ru-Cl
bonds occur at the sintering temperature from 300~400oC The change in the coordination
number with the calcination temperature was accompanied by the change in the lattice
constants The formation of solid solution has been confirmed for the binary RuO2-IrO2
system starting from the thermal decomposition of RuCl3 and IrCl3 inorganic salts
Sol-gel technique has the potential to replace the traditional thermal decomposition route
due to some intrinsic advantages More intimate mixing of multi-component at molecular
scale can be achieved by the hydrolysis and condensation reactions Different sol-gel
preparation routes have been demonstrated as summarized in Table 23
Single crystal RuO2 has been prepared by the vapour deposition technique operated at high
temperature to investigate the crystal plane dependent electrochemical properties [4344]
For the rutile structure RuO2 the metal cations locate at the corners and center of the
tetragonal unit cell and each cation is surrounded by six oxygen ions to form an octahedral
array RuO2 with the (100) or (101) orientation has only Ru atoms at the top plane whereas
at the (110) orientation plane both Ru and O atoms present Besides the atomic densities
of Ru and O and the number of active sites are different for different crystal planes The
kinetics investigation of the chlorine evolution on the RuO2 (110) and (230) showed that
the (230) plane is more active than the (110) plane [45]
2 Theory and background
17
Table 23 Summary of the sol-gel preparation route to obtain the coating solutions
Electrode Precursor(s) Preparation details Ref
Ru04Ti06O2Ti RuCl3 TiCl3 forced hydrolysis of RuCl3 and TiCl3 in HCl solutions
separately for different time then mixing
[30]
RuIrTiO2Ti RuCl3 TiCl3
H3IrCl6
forced hydrolysis of precursors separately then mixing [46]
RuO2Ti RuCl3xH2O refluxing the mixture of RuCl3 + ethanol + sodium
ethoxide washing the RuOxHy precipitate redispersing
the oxide into ethanol
[47]
RuO2Ti RuCl3xH2O RuCl3+citric acid + ethylene glycol Pechini route [48]
CexRu1-xO2Ti RuCl33H2O
Ce(NO3)6H2O
precursors + alcohol + glycol + citric acid
Pechini route
[36]
Ru02Ti08O2Ti RuCl33H2O
Ti(OC4H9)4
RuCl3 + n-C4H9OH acetylacetone Ti(OC4H9)4 with
controlled adding sequence then HNO3 or NH4OH was
added to catalyze the hydrolysis and condensation
reactions
[29]
2233 Deactivation mechanism of electrode
Figure 23 Sketch of the morphology of oxide coated electrodes [49] (a) electrolyte (b) oxide
layer (c) substrate (1) grain boundaries (2) island containing oxide crystallite (3) pore (4)
electrolytecoating interface (5) coatingsubstrate interface
The sketch of the cross-section morphology of the oxide layers supported onto the
underlying substrate is shown in Figure 23 Deactivation mechanism analysis of oxide
film coated titanium anodes implies that the dissolution of active component(s) (ruthenium
2 Theory and background
18
species) and the growth of insulating TiOx interlayer between Ti-substrate and oxide layer
(shown in Figure 24) are responsible for the loss of electrochemical activities [5051]
2 TiOx interlayer
1 active oxide layer
dissolution
Ti-substrate
2 TiOx interlayer
1 active oxide layer
dissolution
Ti-substrate Figure 24 Sketch of the DSAreg structure with compact catalytic layer or cracky catalytic layer
onto the Ti-substrate [51]
Although highly crackyporous films are favourable in terms of electrocatalytic properties
with respect to the electrode durability a compact and impermeable layer could provide
good protection of Ti-substrate from passivation Various strategies have been developed
to prevent the passivation of the substrates caused by the contact with electrolyte in the
electrolysis of aqueous solution of sodium chloride or hydrochloric acid As described in
EP 0046449 A1 multiple coatingsintering cycles are commonly applied in order to
increase the coating thickness and to prolong the service life The cracks and pores within
the first layer are filled by the next applied coating solutions The amount of inner defects
is gradually reduced after each stage of the cycle
To avoid the formation of the TiOx interlayers using titanium as substrate alternative
substrates or modified substrates are used In WO 2008046784 A1 an electrically
conductive titanium alloy substrate is used without the deterioration of the electrocatalytic
activity V Panić et al describe a Ti3SiC2 as anode coating substrate possessing higher
corrosion stability than titanium [52] EP 0 538 955 A1 describes an anode with semi-
conducting oxide interlayer such as titanium suboxide or higher valent metal ions doped
titanium oxide F Gestermann et al describe an electrode coating with titanium carbide
andor titanium boride interlayer [53]
2 Theory and background
19
224 Gas evolution and electrochemical noise
Cl- is oxidized to molecular chlorine by the anodic reactions As the reactions proceed
bubbles appear in the vicinity of electrode surface with the continuous local release of the
supersaturation of dissolved Cl2 gas in the electrolyte when the convection and diffusion
fail to do it [54] The supersaturated electrolyte recovers the stable thermodynamic state by
transferring the excess of dissolved gas molecules into vapour phase [55]
Gas bubble evolution includes a series of events such as bubble nucleation growth
coalescence detachment and lingering in the vicinity of electrode surface which causes
the chaos and turbulence of the electrochemical system Bubble nucleation may occur
within the liquid bulk in a manner of homogeneous nucleation or on a rough surface in a
way of heterogeneous nucleation The latter is the case of gas evolving on the electrode
surface Once a tiny bubble is formed at the nucleation sites at the surface of electrode a
gasliquid meniscus interface is created The concentration gradient of dissolved Cl2
between the liquid bulk and the bubble surface is the driving force responsible for the gas
molecules diffuse through the meniscus interface which results in the growth of bubble
The bubble is anchored to its nucleation sites and keeps growing When the buoyancy
force overcomes the capillary force anchoring the bubble to the nucleation sites the bubble
detaches and ascends upward [56]
Under the supersaturated conditions Ostwald ripening occurs when the disperse phase of
gas bubbles is slightly soluble in the continuous phase of electrolyte wherein the driving
force is Laplace pressure (for a spherical bubble PL = 2γ r where γ is the interfacial
tension and r is the bubble radius) [57] Consequently smaller bubbles decrease in size
while larger bubbles get larger as the gas diffuses from smaller to larger bubbles This
phenomenon is known as the Kelvin effect for gas in liquid The large bubbles grow at the
expense of the small ones The bubble size distribution becomes broader On the other
hand the bubble coalescence occurs when the film between the bubbles ruptures
Subsequently the Laplace pressure drives the bubbles to form a larger single bubble Thus
the coalescence results in the disappearance of the dispersion The coalescence by film
rupture can be caused by thermal fluctuations (~kBT) or mechanical agitation
2 Theory and background
20
The bubble evolution is a remarkably practical problem in terms of the loss of energy in
the chlor-alkali industry Usually the potential drop across the electrolyte is calculated
using Ohmrsquos law if the medium is homogenous However if the gas bubbles are generated
at the electrode interface the current lines go around the insulating gas bubbles the
specific conductivity of the medium decreases and accordingly the increase in ohmic drops
The technical data from the De Nora mercury cells show that the gas bubble effects
contribute ca 4 of the total cell voltage [6] The ohmic resistance dependence on the
electrode configurations (vertical horizontal upwards or downwards) current densities and
bubble froth layer thickness has been investigated by Kiuchi et al [58] Numerous efforts
of theoretical analysis and experimental observation have been made upon the
electrochemical gas evolving electrodes [59] As a matter of fact it is very delicate to get a
comprehensive understanding for the complex electrode process To simplify tractable
model and experimental setup are designed purposefully to isolate the individual effect
concerned to the electrode process The characteristic parameters of bubbles such as the
residence time the size and size distribution of detached bubbles have been determined by
using see-through cells with the help of video camera and laser Doppler velocimetry [60
61] The electrochemical events of gas bubble evolution occurred on the electrode surface
(and vicinity of electrode surface if froth layer is taken into consideration) cause the chaos
of the electrochemical system As an alternative of the optical technique the analysis of the
electrochemical signal fluctuation (fluctuation of potential or current signal) is a powerful
tool in the monitoring of electrochemical events occurred on the electrode surface
Considerable attention has been paid to the electrochemical noise signals analysis in the
fields of corrosion studies [62] electrode process in lithium batteries [63] estimating the
electrode surface morphologies using electrochemical noise data [64] Electrochemical
noise analysis is also being used to extract information of gas evolving behaviour on the
electrodeelectrolyte interface The characteristic parameters such as bubble size
detachment rate can be deduced from the noise data by using suitable noise analysis
techniques [54] The amplitude and shape of the signal fluctuations can be correlated with
the electrochemical events occurred The signal analysis is mainly based on the
mathematic algorithms and computerized data processing Different approaches have been
proposed for the noise data analysis statistical spectral and chaos theory-based methods
[65]
2 Theory and background
21
23 Sol-gel synthesis
The sol-gel process is a versatile solution-chemical process widely used in the fields of
materials science and ceramic engineering The sol-gel methods are used primarily for the
preparation of metal oxides starting from a chemical solution which acts as the precursor
for the build-up of metal oxide networks The starting materials used typically in the
preparation of the sol are usually inorganic metal salts or metal organic compounds such as
metal alkoxides which undergo various forms of hydrolysis and polycondensation
reactions The formation of a metal oxide involves the connection of metal ion centers with
oxo (-O-) or hydroxo (-OH-) bridges Thus the metal-oxo or metal-hydroxo bonds are
generated in the colloid solution (sol) The transition of the liquid sol into a solid phase
(gel) by removing the liquid solvent requires a drying process in which the significant
shrinkage and densification of the network occur Afterwards a post-sintering process is
often necessary in order to favour the further polycondensation and enhance the
mechanical properties and structural stability for the final practical applications
Applying the sol-gel process it is possible to fabricate ceramic materials in a wide variety
of forms ultra-fine powders thin film coatings ceramic fibers microporous inorganic
membranes or extremely porous aerogel materials One of the distinct features of the sol-
gel technique compared to the conversional solid state reactions or thermal decomposition
routes is the molecular-scale structural homogeneity especially for the preparation of
mixed oxide materials Moreover the structural densification is often achieved at a relative
low sintering temperature
231 The hydrolysis and condensation reactions
The preparation of SiO2 by sol-gel technique is the most thoroughly investigated process
which can be traced back to 1880s since the first observation of the hydrolysis reaction of
2 Theory and background
22
tetraethyl orthosilicate (Si(OC2H5)4 or Si(OR)4 where R = C2H5 abbreviated as TEOS)
under acidic conditions
The Si(OR)4 forms a stable solution in the absence of water The introduction of water into
the system initiates the hydrolysis reactions by the nucleophilic attacks The first step
hydrolysis reaction occurs by replace one OR group with one OH group as follow
Depending on the amount of water and catalyst present hydrolysis reactions may proceed
to completion (the leftmost path in Figure 25) so that all of the OR groups are replaced by
OH groups as follows
A series of intermediate species Si(OR)n(OH)4-n would be produced as the result of partial
hydrolysis Variation in the number of n has profound consequences for the morphology
and structure of the resulting Si-O-Si networks
The first step condensation occurs after the first step hydrolysis reaction by linking two
Si(OR)3(OH) molecules (nucleophilic substitution) and releasing one molar H2O to form
the first Si-O-Si bond in the colloid solution Afterwards the successive and overlapped
hydrolysis and condensation reactions proceed to form the three-dimensional Si-O-Si
macromolecule networks The competitive hydrolysis and condensation reactions would
dominate the final network towards linear (the rightmost path in Figure 25 low water
concentration or slow hydrolysis rate) or branched structure (the middle paths in Figure
25) which is one of the most critical aspects of sol-gel process
2 Theory and background
23
Figure 25 The formation of O-Si-O networks from the precursor Si(OR)4 by the successive and
overlapped hydrolysis (h) and polycondensation (c) reactions
The oxidation state (z = 4) and coordination number (N = 4) of silicon are equal However
in this case of z lt N such as the sol-gel process of vanadium pentoxide (V2O5) started from
the sodium metavanadate aqueous solution (NaVO3) the coordination expansion occurs
owing to the attack of nucleophilic reagents [66] After acidification performed through ion
exchange the colorless solution turns into yellow solution of vanadic acid The H3VO4 (or
VO(OH)3) is obtained by further aging and the coordination expansion of VO(OH)3
occurs via the nucleophilic addition of two molar H2O giving the hexa-coordinated
Si
2 Theory and background
24
VO(OH)3(OH2)2 in which one molar H2O attached to V ion center along the z axis
opposite to the VO double bond the second one is in the direction of y axis opposite to an
OH group
A distinct feature of the condensation reaction is that it cannot proceed along the z axis
Fast olation reactions (a condensation process in which a hydroxyl bridge is formed
between two metal centers M-OH-Mrsquo) along the y axis give rise to corner sharing chain
nevertheless the oxolation reactions (a condensation process in which an oxo bridge is
formed between two metal centers M-O-Mrsquo) along the x axis result in the edge sharing
double chains The difference in the linkage manner of the basic building-block based on
the controllable hydrolysis and condensation reaction rate is a prominent nature of the sol-
gel process which is particularly important for the preparation of desired structure of metal
oxide with respect to the oxide with various polymorphs
A similar effect has been demonstrated for the titanium (IV) isopropoxide (Ti(OiPr)4) TiO2
is another class of material particularly important in the sol-gel chemistry Titanium
dioxide (TiO2) exists in nature as rutile anatase and brookite The crystalline form size
and morphology of titania are critically important with reference to its performance for
most of the applications The microstructure and the related properties could be well
modulated by various parameters in the sol-gel chemistry such as solution pH chelating
reagent the nature of the precursor
The lower the electronegativities of the transition metals the more susceptible are their
alkoxides against the hydrolysis Complexing ligands such as bidentate acetylacetonate
2 Theory and background
25
(acac) can be used to slow down the fast hydrolysis and condensation reactions For the
preparation of mixed oxide the complexing ligands could control the competitive
hydrolysis and condensation reaction rates of the different precursors
Figure 26 Partial substituation of Ti(OiPr)4 (a) by acac One or two O
iPr
- ligands is substituted by
acac to form Ti(OiPr)3(acac) (b) and Ti(O
iPr)2(acac)2 (c) [ 67]
The analogous ligand displacement can also be obtained by using organic acids such as
formic acid acetic acid propionic acid and butyric acid [68] The alkyl-peroxo complexes
Ti(OOR)n(OiPr)4-n (R = Me Et Pr Bu etc) are produced in this case and the organic acid
acts as solvent for the precursors simultaneously
The basic building-block of the various TiO2 polymorphs is octahedral TiO6 The rutile
phase is characterized by linear chains of TiO6 octahedra that share a pair of opposite
edges while in anatase a TiO6 octahedron shares four edges with its neighbors to form the
zigzag ribbon structure In the brookite phase three edges of TiO6 octahedron are shared
by other octahedra
2 Theory and background
26
232 The formation of sol-gel coatings
The formation of films is one of the most important aspects of the sol-gel process Various
techniques such as dip coating spin coating brush coating spray coating have been
applied to obtain the desired film structures and properties The simple coating technique
facilitates the up-scaling operation for large scale application in industrial process The
substrate with various complex geometric shapes such as mesh rod and foam can be
deposited with the particulate precursors by liquid-based coating techniques
The preparation of the coating solution the selection of the coating technique and the
control of the post treatment conditions are critical factors in tailoring the resulting coating
structure and performance Composite oxides can be obtained by doping and mixing the
corresponding precursor salts into the coating solutions The stable coating solution which
can be exposed to air and moisture without the formation of sediments is very important
for the practical application The coating thickness microstructure and morphology can be
well controlled by using suitable coating technique The crystallization route of the initial
amorphous materials could determine the final phase structure phase composition
Therefore the electrocatalytic properties of sol-gel oxide coatings can be governed
effectively by controlling the preparation parameters and details
233 The drying and post-sintering
After applying the wet coating solution onto the substrates the subsequent thermal
treatment steps (drying sintering) are followed to densify the films and finish the
crystallization transformation of the initial amorphous structure As liquids evaporate from
the wet gel films during the drying process the M-O-M networks begin to shrink by
expelling the liquids towards the exterior in order to balance the capillary tension (see
Figure 27) For sol-gel films deposited onto a substrate the networks shrink more on the
drying side and warping occurs as observed in Figure 28 The difference in shrinkage rate
between the inside and outside of the gel body and the mismatching of the thermal
2 Theory and background
27
expansion coefficient between the substrate and the film are the cause of tensile stress (see
Figure 28)
rrr
Figure 27 Schematic illustration of the shrinkage of gel networks during the drying process [69]
The initial networks (left) lose liquid and accordingly the capillary tension develops in the liquid
(right r is the radius of the meniscus which is related to the radius of pore a and the contact angle
θ) and draws back the network into the liquid until the network stiffens
Figure 28 Tensile stress evolution and crack formation in gel films under heat-treatment (such as
drying and sintering) [70]
For the filmsubstrate assembly structure (Figure 28) with given substrate (material and
thickness) the tensile stress (σ) in coatings is associated with the thickness of oxide
coatings (hf) according to Stoneyrsquos equation
2
2 1
1 1( )
6(1 )
s s
s f
E h
h R R (220)
where Es and νs are elastic constant and Poissonrsquos ratio of substrate respectively hs and hf
are thickness of substrate and coating respectively R1 R2 are the radii of curvature of the
substrate before and after deposition Note that thinner coating and lower tensile stress will
reduce the difference between R1 and R2 and depress the possibility of crack formation
2 Theory and background
28
Kozuka et al [7071] have demonstrated that crack-free thick films (gt 1microm) can be
obtained by the single-step dip-coating method by using poly(vinylpyrrolidone) (PVP) as
stress-relaxation agent The idea behind is to retard the condensation reactions (which
results in the gel pore collapse under heat-treatment) and simultaneously to promote the
structural relaxation through strong hydrogen bonding interaction between the C=O groups
of the PVP and the OH groups of the gel bodies Stepwise heat treatment was executed and
a sintering temperature up to 700 oC was used to decompose the PVP However the
preparation of crack-free coatings using PVP-containing sol solution is not suitable in this
work because the complete decomposition of PVP is difficult especially when the single
layer is thick (gt 1microm) Note that for the preparation of titanium supported oxide electrode
coatings high sintering temperature (gt500 oC) has to be avoided due to the possible
formation of the insulating TiOx interlayer Besides the existence of the residual PVP in
the oxide matrix as contaminants could cause negative effects such as the influence in
oxide layer conductivity electrochemical stability
2 Theory and background
29
24 Experimental methods
241 Structural characterization
For the substrate supported electrocatalyst the most commonly used technique to disclose
the structure and surface information are the diffraction techniques (X-ray diffraction
electron diffraction neutron diffraction) electron microscopic techniques (SEM TEM)
and vibrational spectroscopic techniques (IR Raman)
2411 X-ray diffraction
In 1895 WC Roumlntgen (a German physicist) discovered the X-rays In 1921 M v Laue (a
German physicist) discovered that X-rays can be diffracted or scattered by the orderly
arrays of atoms in a crystal The three-dimensional atomic arrangement in a crystal is
deduced from the directions and intensities of the diffracted X-ray beams Crystalline
material can be considered as an infinite recurrence of parallel atomic planes with an
interplanar distance d When a beam of monochromatic X-rays is incident on the atoms in
a crystal the wavelets scattered by the atoms in each plane combine to form a reflected
wave The interference patterns of the scattered radiation are recorded by a detector The
interference is constructive when the Bragg condition for diffraction is fulfilled
ie 2 sinn d where n is diffraction order λ is X-ray wavelength θ is Bragg angle or
incident angle
The X-ray diffraction patterns allow the qualitative and quantitative crystal structure
characterization concerning the crystallite size and distribution phase composition and
percentage lattice parameters from the position intensity (which depends on the type of
atoms in the elementary cell and their positions site occupancy scattering factor etc) and
shape of the diffraction peaks The volume-weighted crystallite size (D the mean size of
the ordered domains or the mean dimension of the coherently diffracting domains) can be
estimated from the main diffraction peak by using Scherrerrsquos equation
2 Theory and background
30
09
cosD (221)
where λ is the X-ray wavelength β is the full width at the half-maximum intensity (FWHM)
in radians and θ is the Bragg angle
Various factors can result in the peak broadening such as the crystallite size (which is
caused by the finite size of domains diffracting essentially incoherently with respect to one
another) instrumental distortion lattice microstrain (which is caused by the displacements
of the atoms with respect to their reference-lattice position) [72 73] In contrast the
Warren and Averbachrsquos method which is based on the Fourier deconvolution of the
measured peaks and the instrument broadening since the measured peak profile is actually
the convolution of a function for the pure peak profile and a function of the instrumental
broadening is capable of providing the information of area-weighted crystallite size
crystallite size distribution and lattice microstrain Rietveld refinement analysis [74] which
uses a least-squares fit approach to refine a theoretical line profile until it matches the
measured diffraction profile is a powerful tool for quantitative phase analysis More
reliable structure parameters crystalline components can be obtained
2412 Scanning electron microscopy (SEM)
For particles with sizes down to nanometer~submicrometer it is essential to use electron
microscopy rather than optical microscopy to examine them The sample surface
topography can be visualized by scanning it with a high-energy beam of electrons (typical
energy range 5~20 keV) in a raster scan pattern Secondary electrons (generated by
inelastic scattering during the energy exchange between the electron beam and the sample)
are the common type to produce the SEM signals by the interactions between the electron
beam and the atoms at or near the sample surface The size of the interaction volume
depends on the electron energy the atomic number of the specimen and the density of the
specimen
2 Theory and background
31
2413 Energy dispersive X-ray spectroscopy (EDX or EDS)
EDX coupled with SEM analysis is used to obtain the qualitative element analysis from the
emission of characteristic X-rays from a specimen when a material is bombarded with
electrons in an electron beam instrument When the sample is bombarded by the electron
beam of the SEM electrons are ejected from the atoms comprising the sample surface A
resulting electron vacancy is then filled by an electron from the higher shell and an X-ray
is emitted to balance the energy difference between the two electrons The EDX X-ray
detector counts the emitted X-rays and measures their energy
2414 Transmission electron microscopy (TEM)
TEM is an imaging technique with a significantly higher resolution than light microscopes
owning to the small de Broglie wavelength of electrons A beam of electrons (typical
energy range 100~400 keV) is transmitted through an ultra thin solid sample interacting
with the specimen The transmitted beam containing information about the electron density
phase and periodicity is used to form an image
2415 Selected area electron diffraction (SAED)
SAED is a crystallographic technique coupled with TEM to obtain the information of
spots of interest from the TEM images In this case high-energy electrons pass through the
specimen electrons with a wavelength of a fraction of a nanometer and the spacing
between atoms in a solid is slight larger than the electron wavelength Thus the atoms act
as a diffraction grating to the electrons Part of the electrons will be scattered determined
by the crystal structure of the sample while others pass through without deflection As a
diffraction technique the SAED can be used to identify the crystal structures and study the
crystal defects in an area as small as several hundred nm The crystal structure lattice
parameters of the unit cell can be deduced from the reciprocal lattice of the sample crystal
2 Theory and background
32
2416 Raman spectroscopy
In the Raman technique the sample is illuminated with monochromatic light usually
generated by a laser Two types of scattered light are produced Rayleigh scattering
emerges with exactly the same energy and wavelength as the incident light Raman
scattering which is usually much less intensive then Rayleigh scatter emerges at either
longer or shorter wavelength than the incident light As a consequence the vibrational
transition of frequency was reflected from the Raman lines Each peak in a Raman
spectrum corresponds to a particular vibrational transition For inorganic solids the lattice
vibrations give rise to peaks in the region about 100~700 cm-1
Raman spectroscopy is
sensitive to the small lattice vibrations in inorganic solid even with very low phase
fractions In contrast X-ray diffraction patterns could provide information about the long-
range order Raman spectroscopy gives more reliable information than X-ray diffraction
when applied to local structural analysis of inorganic materials Due to the difference in
principal selection rules the active modes in Raman spectra and IR are different They
produce complementary information The vibrational mode to be Raman active is that the
vibrations involved must produce a change in polarizability [75]
242 Electrochemical characterization
2421 Cyclic voltammetry (CV)
Cyclic voltammetry is used for obtaining qualitative information about the electrochemical
reactions of an electrode surface such as the redox processes heterogeneous electron-
transfer reactions or adsorption processes It offers a rapid location of redox potential of
the electroactive species or a current response at the working electrode as a function of the
applied potential The current response is monitored during the potential sweep (Figure
29) The potential sweep range (Emin~Emax) and the sweep rate can be controlled
experimentally Additionally CV can provide information about the reversibility of the
chargingdischarging process
2 Theory and background
33
Cyclic voltammetry can produce informative characterization of oxide coatings if taken in
conditions where no Faradaic process occurs and the solvent is not electrochemically
decomposed A non-faradaic process involves the accumulation of charges at the
metalsolution interface which is called the electrical double layer However Faradaic
processes are associated with electron transfer across the interface result in redox of
species The shape of the voltammograms provides evidence of intermediate species
surface redox transitions or phase formations
Figure 29 (left) The triangular potential sweep waveform (one cycle is shown) used for the CV
measurement (right) The typical cyclic voltammogram recorded corresponding to the potential
sweep
To investigate the capacitor-like behaviour of oxide electrodes the voltammetric charge
density (qa) can be obtained by graphical integration of the voltammograms in the potential
range without the Faradaic reaction and calculated by using the equation
a
Sq (222)
where S (mA V cm-2
) is the integrated area of the anodic branch and υ (mV s-1) is the
potential sweep rate It provides some diagnostic criteria to assess the morphology and
evaluate the relative electroactive surface area of oxide electrodes assuming that the
voltammetric charge density is proportional to the surface concentration of active sites
The dependence of the voltammetric charge density on the sweep rate could provide
information about the oxide coating morphology
2 Theory and background
34
2422 Chronopotentiometry (CP)
The electrocatalytic activity of the electrode coatings can be evaluated in a relative way by
comparing the electrode potential for a given constant current density (termed as
chronopotentiometry) The CP measurement is performed generally by stepping from an
initial current typically zero to some finite value (left in Figure 210) and monitoring the
potential vs time (right in Figure 210) The overall redox reaction rate (current density) is
fixed and the potential of the working electrode is then monitored as a function of time
Generally the CP curves contain plateaus that correspond to the steady-state redox
potential of electroactive species The analysis of the noise in the recorded potential signal
can help the identification of the physico-chemical process associated with the noise source
at the electrode surface
Figure 210 (left) Current excitation signal for a chronopotentiometry measurement with an
interrupt from t1 to t2 (right) Potential-time profile for the CP measurement corresponding to the
current signal
For the CP measurement with a current interrupt the potential response vs time is shown
in the right panel in Figure 210 The current is interrupted at time t1 the potential drops
from the steady state A to B instantaneously with a potential difference of iR and then
decays with time The potential decay curve is also called as potential relaxation curve
After sufficiently long time the potential will decrease to the open circuit potential At
time t2 the current is applied once again the potential jumps immediately and then
increases non-linearly until reaches again the steady-state value The potential build-up
2 Theory and background
35
curve is also called as pseudocapacitor charging curve or potential transient curve The
decay process and charging process are non-steady-state processes Note that both the
chargingdischarging of the double layer and the Faradaic process contribute to the non-
steady-state process The characterization of the rough or porous electrode surface can be
carried out by analysing the chargingdischarging behaviour at the electrodeelectrolyte
interface Note that the double-layer capacitance arises from the electrostatic charging of
the electrode surface whereas the pseudocapacitance involves the electrochemical
adsorptiondesorption of reactive species along with the electron transfer [76]
2423 Galvanostatic polarization
The E-I polarization curves of a given electrode can be measured either galvanostatically
or potentiostatically The former measures the potential under steady-state conditions by
applying a constant current The latter records the steady-state current by imposing a
constant potential Prior to the polarization measurement the electrode should be activated
firstly For the galvanostatic polarization measurement current is applied stepwise with or
without intermediate current interrupt (Figure 211) The parameters for the experiments
are the current value and the length of the current steps (current interrupt is optional) This
Tafel slope can be determined from the polarization curves (potential vs log-current
curves) after the iR-correction
Figure 211 Current steps profile for the galvanostatic polarization measurements Electrodes were
activated at current density j0 for a certain time before starting the current steps (j1 j2hellip)
2 Theory and background
36
2424 Electrochemical impedance spectroscopy (EIS)
Impedance spectroscopy (IS) is a powerful tool for the investigation of frequency-
dependent electrical properties of materials and their interfaces The Electrochemical
impedance spectroscopy (EIS) measurements are performed by applying a stimulus current
(or potential) to the electrode and observing the potential (or current) response at different
frequency In a galvanostatic impedance measurement the monochromatic excitation
current expressed as a function of time has the form 0 sin( )tI I t where It is the current
at time t I0 is the amplitude of the excitation signal and ω = 2πf is the angular frequency
For a linear electrochemical system the resulting potential response 0 sin( )tE E t is
shifted in phase The complex impedance Z(ω) is obtained from the complex potential
and current ( ) tre im
t
EZ Z iZ
I where 1i The impedance is therefore expressed in
terms of a magnitude Z and a phase shift The most common representation of
impedance data is the Nyquist-plot (-Zim is plotted versus Zre) or Bode-plot ( Z and are
plotted as a function of log frequency)
For an electrode-solution interface with the occurrence of a Faradaic charge-transfer
reaction which is controlled by the charge-transfer step an equivalent circuit Re(RctCdl) is
normally used to represent the interface where Re is the solution resistance Rct is the
charge-transfer resistance and Cdl is the double layer capacitance More than one semi-
circle could present from the Nyquist plot for a complex system For the porous or rough
electrode surface a suppressed semicircle in the Nyquist plot originating from the
frequency dispersion of the interfacial impedance can be observed A constant phase
element (CPE) is often used to replace the capacitance element When the electrode
reaction is controlled by the mass-transfer step the Warburg element (W) can be involved
in the equivalent circuit Accordingly the Warburg straight line can be observed in the low
frequency region of the Nyquist plot
3 Experimental
37
3 Experimental
This section contains the experimental details regarding the electrocatalyst preparation by
sol-gel based routes followed by the structural characterization and electrochemical
performance analysis of electrocatalysts for chlorine evolution reactions
31 Preparation of electrocatalyst coatings
311 Pre-treatment of Ti-substrates
Equation Chapter 3 Section 1
Titanium plates with a diameter of 15 mm and a thickness of 2 mm (Goodfellow purity
996) were sandblasted (one side) and etched in 10 oxalic acid at 80 oC for 2 h to clean
and roughen the surface and then rinsed with isopropanol and dried in a nitrogen flow
Afterwards the titanium substrates were freshly coated with sol solutions For up-scaling
expanded titanium metal (100times100 mm2) used as substrates were pre-treated by following
the same procedure
312 Sol-gel synthesis of mixed oxide coatings
All chemicals used were listed in Appendix A1 and applied without further purification
Two different routes of acetic acid and propionic acid catalyzed sol-gel procedures were
applied to prepare the sol solutions
3121 RuTiO2 sol solutions prepared by acetic acid-isopropanol route
The general sol-gel recipe used to prepare 01125 M RuTiO2 binary oxides is as follows
The molar ratio of precursors chelating agent acetic acid and water is
Ru Ti DAA CH3COOH H2O = n (1-n) 3 640 1
3 Experimental
38
where DAA is 4-hydroxy-4-methyl-2-pentanone synonym diacetone alcohol n is the molar
content of ruthenium in RuTiO2 binary oxide
Addition sequence
isopropanol gtgt DAA gtgt Ti(i-OPr)4
gtgt H2O gtgt CH3COOH
RuCl3middotxH2O in isopropanol
Embodiment of the preparation procedure The preparation of 01125 M Ru04Ti06O2 sol
solutions for example were obtained by dissolving 1685 mg RuCl3middotxH2O (36 Ru)
(06 mmol Ru) into 6 mL isopropanol and stirred overnight (Solution A) 2665 microL Ti(i-
OPr)4 (09 mmol Ti) was added into the premixed solution of 5615 microL (45 mmol) 4-
hydroxy-4-methyl-2-pentanone in 647 mL isopropanol (Solution B) and keep stirring for
30 min Solution A and Solution B were ultrasonically mixed to acquire a clear solution
Afterwards 27microL deionized water (15 mmol) and 129 microL acetic acid (0225 mmol) were
added into the above solution The as-prepared solution was covered and kept stirring
overnight at room temperature
3122 RuTiMOx sol solutions prepared by propionic acid-isopropanol route
The general sol-gel recipe used to prepare RuTiMOx multicomponent oxides is carried out
by using hot isopropanol and propionic acid mixture (1 1 in volume) as co-solvents to
dissolve the precursor salts for the preparation of RuTiMOx where M is doping element
such as Ir V Sn Mo Zr etc
Embodiment of the preparation procedure The preparation of 01125 M
Ru01Ir01V005Sn04Ti035Ox sol solutions for example were obtained by adding 498 mg
Ru(acac)3 (0125 mmol) 612 mg Ir(acac)3 (0125 mmol) 166 mg VO(acac)2
(00625 mmol) 2076 mg Sn(i-OPr)4middotC3H7OH (05 mmol) and 1295 microL Ti(i-OPr)4
(04375 mmol) into 111 mL isopropanol and 111 mL propionic acid mixture respectively
The above solutions were refluxed at 150 oC for 30 min with vigorous stirring and then
3 Experimental
39
mixed after cooling down to room temperature The mixed solutions were homogeneous
and transparent with wine-red colour
3123 Preparation of Ti substrates supported oxide coatings
Titanium plates were drop-coated with 50 microL coating solutions (01125 M) using a
micropipetter The wet coatings were air-dried and sintered at 250 oC for 10 min and then
450 oC for 10 min in static air conditions The droppingdryingsintering cycle was repeated
8 times corresponding to a total metal loading amount of 45 μmol per Ti-plate (177 cm2
geometric surface area) After deposition of the final coating (the 8th
coating) the coated
titanium plates were sintered at 450 oC for another 1 h to finish the preparation process
313 Preparation of crack-free coatings
The crack-free and impermeable coatings were obtained by repetitious soaking-
withdrawing technique after obtaining the sol solutions The photograph of home-made
dip-coater is shown in Figure 31
Figure 31 Image of the home-made sol-gel dip-coater device The lifting arm movement speed
can be changed by each 1 mm min-1
and with a maximum of 200 mm min-1
The titanium substrates were immersed in the coating solutions for 20 s and then
withdrawn upwards vertically from the coating solutions with a controlled withdrawal
3 Experimental
40
speed The wet coatings were air-dried and sintered at 250 oC for 10 min or 90
oC for
30 min and then 450 oC for 5 min in static air conditions The soaking-withdrawing-
drying-sintering cycles were repeated many times in order to obtain thicker crack-free
coatings The single layer thickness of oxide coatings can be changed by the withdrawing
speed and the concentration of sol solutions
314 Preparation of porous coatings
The coating solutions were obtained by adding a certain amount of La(NO3)3 middot 6H2O or
polyvinylpyrrolidone (PVP) into the sol solutions prepared as described above The coating
processes were same as described before Pores were created by chemical leaching
(soaking the coated titanium plates into the 5 HCl aqueous solution at a temperature of
60 oC for 15 min with slight stirring) for the coatings prepared from La-containing sol
solutions or by organics burning for the coatings prepared from the PVP-containing sol
solutions
Embodiment of the preparation procedure To prepare Ru03Sn07O2 porous coatings for
example the coating solutions were obtained by dissolving 379 mg RuCl3 middot xH2O (36 Ru)
(0135 mmol) into 133 mL isopropanol and keep stirring overnight (Solution A) 1308
mg Sn(i-OPr)4middotC3H7OH (0315 mmol) was added into the mixture of 134 mL isopropanol
and 133 ml propionic acid and then refluxed at 150 oC for 30 min with vigorous stirring
(Solution B) Afterwards 39 mg La(NO3)3 middot 6H2O (009 mmol) was added into the hot
Solution B and kept stirring for another 20min until the solutions cool down to room
temperature Finally Solution A was added dropwise into the above solutions with
vigorous stirring The titanium plates were drop-coated with 50 microL coating solution using
a micropipetter The wet coatings were air-dried and sintered at 250 oC for 10 min and
then 450 oC for 10 min in static air conditions The coated titanium plates were soaked in
the 5 HCl aqueous solution at a temperature of 60 oC for 15 min with slight stirring to
leach away the lanthanum oxide The coating-sintering-leaching cycle was repeated for 8
times corresponding to a total ruthenium loading amount of 135 μmol per Ti-plate (1766 cm2
geometric surface area) followed by a final sintering at 450 oC for 1 h to finish the
preparation process
3 Experimental
41
315 Combined sol-gel and solvothermal synthesis
RuTiO2 sol solutions were prepared by the acetic acid-isopropanol route as described
above Titanium substrates were drop-coated with 50 microL coating solutions (01125 M) per
single layer using a micropipetter the process was repeated for 8 times with intermediate
air-drying and thermal stabilization at 200 oC (or 100
oC 250
oC) for 10 min each time
Figure 32 Images of autoclave pressure vessel and heating oven (left) Teflon liner (middle) and
the schematic diagram (right) for solvothermal processing of electrode coatings
A 250 mL teflon sealed stainless-steel autoclave (Figure 32 left middle) was used for
solvothermal processing of the above obtained amorphous coatings The coated Ti-plates
were put into a glass vial and located into the 30 mL diluted sol solutions (or 30 mL
isopropanol) filled autoclave (Figure 32 right) The Ti-plate was isolated with the filled sol
solutions by the glass vial The autoclave was heated to 150 oC with a heating rate of
10 oCmin and held at 150
oC for 24 h then furnace cooled down to room temperature
The solvothermally processed coating was taken out and post-sintered at 450 oC for 1h
under static air conditions
3 Experimental
42
32 Structural characterization of electrocatalysts
321 X-ray diffraction (XRD)
The phase structure of the prepared coatings was identified using a Siemens D500
diffractometer (Cu Kα12 radiation λKα1 = 15406 Aring λKα2 = 15444 Aring) operated at 35 kV
and 26 mA over a 2θ range of 20-60 o with a scanning step of 002
o 4s The crystal
structures of the solvothermally processed coatings were refined using the analytical
software TOPAS 21 based on the Rietveld methods to obtain the corresponding phase
weight percentage lattice parameters (a c) and crystallite size with the kind help of Prof
Dr Klaus Stoumlwe (Technical Chemistry Universitaumlt des Saarlandes) Degussa P-25 TiO2
powder was used as standard for the instrumental calibration [77]
High temperature X-ray diffraction (HT-XRD) was conducted on a Siemens D-5000
diffractometer with Cu Kα radiation operated at 40 kV and 30 mA to characterize the phase
evolution with temperature of the gel powders from room temperature to 600 oC with a
20 oC interval and a 30
oC min
-1 heating rate at a 2θ range of 22~44
o
322 Raman spectroscopy
The purpose for the measurements of the Raman spectrum is to obtain the lattice vibration
information of a crystal [ 78 ] A HORIBA-Jobin-Yvon LabRAM ARAMIS Raman
spectrometer using a 6328 nm excitation (He-Ne laser 10 mW) was employed to record
the Raman spectra and a silicon single-crystal was used for instrument calibration The
laser light was focused onto the sample using a 100times objective lens
323 Scanning electron microscopy and energy dispersive analysis (SEM-EDS)
The microstructure and elemental distribution were analyzed by scanning electron
microscopy (SEM) and energy dispersive spectrometer (EDS) using JOEL JSM-7000F
operated with an accelerating voltage 20 kV
3 Experimental
43
324 Transmission electron microscopy and electron diffraction (TEM-ED)
The transmission electron microscopy (TEM) and selected area electron diffraction (SAED)
were carried out using a JEOL JEM-2010 microscope operated at 200 kV
33 Electrochemical characterization
The electrochemical measurements of electrode coatings were carried out using a home-
made medium-throughput multi-cell The schematic diagram of the three-electrode
configuration of a single cell is shown in Figure 33 The photographs of the
electrochemical test cell are shown in Figure 34 The raw data were acquired by EC-Labreg
software for further analysis
Figure 33 Schematic diagram of the three-electrode configuration cell for the electrochemical
performance measurements of electrocatalyst coatings Ti plates (15 mm in diameter) supported
sol-gel coatings were used as working electrode with an exposed geometrical area of 1 cm-2
RuO2
coated titanium mesh (prepared by using sol-gel coating solutions) as counter electrode and
AgAgClKCl(saturated) as reference electrode The reference electrode was carefully positioned
close to the working electrode by using a Luggin capillary to minimize the uncompensated
electrolyte resistance
3 Experimental
44
The working electrode and the counter electrode are connected to a DC power supplier
through an ampemeter The potential of the working electrode is measured with respect to
a reference electrode The potential difference between the working electrode and the
reference electrode consists of the potential of the working electrode and ohmic drop (iR)
from the electrolyte between the reference and working electrode The iR-correction can be
done by using electrochemical impedance spectroscopy measurement or using current
interruption technique
Figure 34 Electrochemical test cells (a) single cell (b) 16-cell array (c) 8-cell array with forced
convection of electrolyte and (d) Electrochemical impedance instrument
Electrochemical performance measurements (CV CP galvanostatic polarization and EIS)
were performed in 35 M NaCl pH 3 at room temperature unless otherwise noted EIS
measurement of rotating disk electrode facing downwards (2000 rpm exposed area
177 cm2) was carried out using in a galvanostatic mode (i = 100 mA) The frequency
range was from 1 kHz to 1 Hz The raw data acquired by EC-Labreg
was exported into
ZSimpWin for impedance data analysis Then the data were fitted using appropriate
equivalent circuit by ZSimpWin analysis software
4 Results and discussion
45
4 Results and discussion
The results obtained in this work are presented in this chapter Four sections are included
the optimization in chemical composition of mixed RuTiMOx oxide electrocatalysts
prepared by sol-gel route in Section 41 the preparation of the oxide coatings with
controlled morphologies such as the crack-free coatings porous coatings and the
electrochemical property characterization in Section 42 the modification in the phase
structure of the mixed RuO2-TiO2 oxide coatings by solvothermal processing of the
xerogel coatings in Section 43 and the analysis of gas bubble behaviour of electrolytic
chlorine evolution at the gas-evolving electrodes in Section 44
41 Chemical compositions of the electrocatalysts
411 Influence of preparation parameters
Equation Chapter 4 Section 1
Prior to the deposition of oxide coatings onto the titanium substrates the substrates were
pre-treated by sand blasting and chemical etching to clean and roughen the surface The
surface topography of the Ti-substrates (15 mm in diameter) after the pre-treatment (sand
blasting and chemical etching) was studied by Atomic Force Microscopy (AFM) (Surface
Imaging Systems SIS GmbH) as shown in Figure 41 The clean and rough surface (mean
roughness 137 μm) is desirable for good adhesion between the substrate and oxide
coating
4 Results and discussion
46
Figure 41 Surface topography analysis of titanium metal substrate after pre-treatment by sand
blasting and chemical etching Top AFM image Bottom cross section analysis Statistical data of
the region of interest Maximal height difference 3232 μm Mean roughness 1373 μm Root
mean square 06371 μm
4111 Oxide loading amount and coating thickness
Oxide loading amount is one of the important parameters related to the coating service life
As shown in Figure 42 the electrode potential of the Ru025Ti075O2 coatings exhibits a
linear decrease with the oxide loading amounts at the range of 35~125 g m-2
due to the
effective utilization of the active sites depends on the penetration depth of the electrolytes
into the inner parts of the mud-crack oxide coatings It has been reported that the active
surface area (corresponding to the voltammetric charges measured by cyclic voltammetry
method) increases with coating thickness until it reaches to a plateau value [79] The
further increase in the thickness of the oxide coating can only prolong its service life
Another important factor concerning the available active surface area is the coating surface
morphologies (mud-crack layer porous layer crack-free compact layer etc) which will
be discussed in Section 42
The commercially available anodes for chlorine evolution reactions consist of the standard
composition of Ru03Ti07O2 deposited onto titanium substrates [1128] and with an oxide
loading amount about 20~30 g m-2
[29] For comparison purposes in this work the oxide
coatings were prepared by sol-gel method with the constant metal molar amounts of
45times10-5
mol per Ti-substrate plate (diameter 15 mm) and a fixed number of oxide layers
(8-layer films) Accordingly the mass of the oxide coatings could vary with the chemical
composition and the molar ratio of the components (For instance for a coating with
Ru03Ti07O2 the oxide loading amount is 244 g m-2
) Therefore the decrease in noble
4 Results and discussion
47
metal percentage means a decrease in the absolute quantity of the noble metal in the
resulting coatings
2 4 6 8 10 12 14
130
132
134
136
138
140
142
144
146
4-layer
3-layer2-layer
E
V v
s
AgA
gC
l
Oxide loading amount g m-2
1-layer
Figure 42 Dependence of performance on the oxide loading amounts of Ru025Ti075O2 coatings
Electrode potential measured under galvanostatic mode at a current density of 100 mA cm-2
in
35M NaCl pH 3 room temperature The number of the oxide layers is marked out corresponding
to the oxide loading amount Square dot indicates crack-free coating prepared by dipping-
withdrawing method (see Section 313)
4112 Influence of sintering conditions on the crystallization phase transition of powders
Thermal sintering is a necessary preparation step to obtain the mechanical and
electrochemical stability of the ceramic oxide coatings The crystallinity degree crystallite
size voltammetric charge etc depend on the sintering conditions such as the sintering
temperature and sintering time [3380] Increase in the sintering temperature could increase
the degree of crystallinity enhance the coating stability and on the other hand promote the
crystal growth reduce the active surface area induce the growth of insulating TiOx
interlayer due to the oxidization of underlying substrate under higher temperatures
(gt 500 oC) and O2-containing ambience
Although the powders behave differently from the coatings in the phase transition
behaviour and their properties [ 81 ] some helpful information for optimizing the
4 Results and discussion
48
preparation parameters for coatings can be obtained by using powders as research objects
Thermogravimetry and differential scanning calorimetry (TG-DSC) (Figure 43a) and high
temperature X-ray diffraction (HT-XRD) (Figure 44) were performed to investigate the
decomposition of residual organics and the amorphous-to-crystalline transition process of
xerogel powders during sintering
Figure 43 (a) TG-DSC data for air-dried Ru025Ti075O2 xerogel powders (prepared by using acetic
acid as catalyst for the hydrolysis and condensation reactions) recorded by elevating the
temperature from 35 oC to 1000
oC with a ramping rate of 10
oC min
-1 under mixed N2 (5 ml min
-1)
+ air (15 ml min-1
) flow (b) The coupled FTIR spectra are recorded continuously as a function of
temperature (Time index was shown in place of temperature) for the evolved products analysis (c)
Metastable rutile solid solution Ru025Ti075O2 powders decomposed into two separate RuO2 and
TiO2 phases after TG-DSC measurements
4 Results and discussion
49
The TG curve exhibits mass loss characteristics of the gel powders (Figure 43a) A weight
loss of 43 from room temperature to 450 oC and a slight weight loss of 07 from 450
oC
to 1000 oC were observed The wide endothermic peak around 115
oC associated with the
first weight loss between 90~180 oC can be assigned to the elimination of adsorbed
moisture and residual organic solvent which can be confirmed from the absorption band of
hydroxyl stretch vibration vOH at 3500~4000 cm-1
and ndashCH3 at 1500 cm-1
(Figure 43b)
The decomposition of carbonaceous compounds in the gel powders was confirmed by the
appearance of CO2 and CO as the decomposition products detected in the range
200~450 oC (Figure 43b) The two exothermal peaks are therefore evident from the
residual organic combustion along with the amorphous-to-crystalline transformation since
crystallization starts at 260 oC from HT-XRD results (Figure 44) The wide exothermal
peak from 320~470 oC implies that the decomposition of organics may occur progressively
Figure 44 HT-XRD patterns of air-dried Ru025Ti075O2 xerogel powders recorded on a Siemens D-
5000 diffractometer from 240 oC to 600
oC with a 20
oC interval (diffraction patterns of powders
with temperatures lower than 240 oC were amorphous and not shown here) and 30
oC min
-1 heating
rate at a 2θ range of 24~44o
As shown from HT-XRD (Figure 44) the crystallization of xerogel powders starts at
260 oC with the formation of rutile solid solution From 260
oC to 600
oC the single rutile
solid solution phase was transferred into a mixed RuO2 and rutile solid solution phases and
4 Results and discussion
50
accompanied by the position shift of the (110) diffraction peaks of the solid solution phases
toward the TiO2 side Furthermore the rutile RuO2-TiO2 solid solution decomposed
completely into separate RuO2 and rutile TiO2 phases for the powders after TG-DSC
measurements (Figure 43c)
Table 41 Dependence of the properties of Ru025Ti075O2 powders prepared by acetic acid-
isopropanol route on the sintering temperature
Sintering
temperature oC
SBET m2 g
-1 Median pore
radius nm
Crystallite size
nm
250 2225 274 amorphous
450 552 324 23
600 126 797 gt 25
Calculated from the X-ray diffraction peaks using Scherrerrsquos equation
Table 41 summarizes the surface area median pore radius measured by the BET gas
adsorption technique and the crystallite size as a function of the sintering temperature for
the Ru025Ti075O2 powders The BET specific surface area decreases with increasing
sintering temperature due to the grain coarsening as usual In contrast the pore size
showed a slight increasing trend with the sintering temperature The increase in the pore
size from 250 oC to 450
oC is possibly due to the continuous combustion of organic
impurities Further increase in the pore size from 450 oC to 600
oC is likely due to the
decomposition of the metastable rutile solid solution phase into separated phases which
results in the interpenetration of neighbouring pores
Note that the specific surface area of powder samples obtained from BET results is the
geometric surface area For the electrocatalysts used as coating form in the electrolyte
environment only the electroactive surface area should be taken into account It has been
observed that there is no simple linear relationship between the voltammetric charge
density for coatings against the BET surface area for powders [8283]
4 Results and discussion
51
4113 Influence of sintering conditions on the phase transition surface morphology and
electrochemical properties of coatings
25 30 35 40 45 50 55 60
RuO2 40-1290
TiO2 21-1276
Ti 44-1294
450oC-450
oC
250oC-450
oC
90oC-450
oC
Inte
nsity
au
2 o
Figure 45 XRD patterns of Ru04Ti06O2 coatings prepared by two-step sintering (1st at 90 250 and
450 oC for 10 min then 2
nd at 450
oC for 10 min) of air-dried coatings
For the preparation of oxide coatings repetitious coatingsintering were employed in order
to obtain the desired oxide loading amount and a two-step sintering process was generally
used to remove the solvent at the 1st step under relative lower temperature and then
stabilize and crystallize the oxide coating at the 2nd
step under higher temperature The
influence of the sintering temperature in the 1st and 2
nd steps on the XRD patterns of
Ru04Ti06O2 coatings is shown in Figure 45 and Figure 46 Although there are no obvious
differences of the final phase structures in Figure 45 the relatively mild sintering
conditions (250 oC 10 min) were used as the 1
st sintering treatment in the following
sections except where otherwise noted By keeping the same conditions in the 1st sintering
steps the amorphous-like structure was observed when the temperature of the 2nd
sintering
was lower than 250 oC whereas the decomposition of the metastable rutile RuO2-TiO2
solid solution was confirmed by the presence of RuO2 (110) shoulder when the 2nd
sintering temperature is 550 oC (Figure 46)
4 Results and discussion
52
Figure 46 XRD patterns of Ru04Ti06O2 coatings prepared by two-step sintering (1st at 250
oC for
10 min then 2nd
at 250 350 400 450 500 550 oC for 10 min) of air-dried coatings Inset Local
enlarged rutile (110) peaks of Ru04Ti06O2 coatings corresponding to coatings with the 2nd
sintering
temperatures of 350 450 550 oC
Sintering treatment of the titanium substrate supported oxide coating leads to a build-up of
the in-plane tensile stress in the oxide layer The mud-crack structure is formed to release
the thermal mismatch stress between the substrate and the oxide layer when the magnitude
of this tension is high enough [84] The cracks also promote the subsequent sintering
Figure 47 shows the typical mud-crack surface morphologies of sol-gel coatings sintered
at different temperatures There is no obvious difference in the size of the cleavage block
(island) with the increase in sintering temperature but the islands turn up at higher
temperatures due to the further shrinkage and densification The formed gaps between the
islands are favourable for the free access of electrolytes into the inner catalytic active sites
Meanwhile this encourages the passivation of the underlying substrate during the long-
term employment due to the direct chemical and electrochemical attack on the substrate by
electrolyte The design and control in coating morphologies in order to protect the
underlying substrate will be discussed in Section 42
4 Results and discussion
53
Figure 47 SEM images of surface morphologies of Ru04Ti06O2 coatings sintered at different
temperature (1st step sintering at 250
oC for 10 min) Scale bar 10 microm
The sintering conditions have significant influence on the final electrochemical
performance of oxide coatings As shown in Figure 48 with the increase of sintering
temperatures from 350 oC to 500
oC the voltammetric charges (ie the electrochemically
active surface area of oxide electrode) evaluated by integrating the anodic branches of the
cyclic voltammograms decrease from 47 mC cm-2
to 12 mC cm-2
Accordingly the
electrode potential for the chlorine evolution reactions increases by about 120 mV with the
increase of the sintering temperature from 350 oC to 500
oC (Figure 48)
RuO2-based electrode coatings contain the partial hydrated RuOx(OH)y which accounts for
the pseudo-capacitive properties For the CV curves recorded in the potential sweep
window without Faradaic chlorine evolution reactions the solid-state surface redox
transition of active species is represented by the pseudo-capacitive
protonationdeprotonation [8586]
4 Results and discussion
54
RuO (OH) H e RuO (OH)x y x y 0 2 (41)
The continuous change of δ during the proton exchange process occurs over a window of
about 12 V [87] Indeed the amorphous-like RuO2 nH2O is the target structure employed
as electrochemical supercapacitors [8889] The capability of the proton exchange of the
RuO2-based electrode coatings with the solution could be alleviated by thermal sintering
which dehydrates the hydrated ruthenium species and is responsible for the decrease in the
voltammetric charge density with the increase of sintering temperature
350 400 450 500
116
118
120
122
124
126
128
130
Sintering temperature oC
E
V v
s
Ag
Ag
Cl
10
15
20
25
30
35
40
45
50
Vo
ltam
me
tric c
harg
e m
C c
m-2
Figure 48 Dependence of voltammetric charges density () and electrode potential () (measured
at a current density of 100 mA cm-2
in 35M NaCl pH3 room temperature) on the sintering
temperature of Ru04Ti06O2 coating corresponding to Figure 46
412 Chemical composition of electrocatalysts
Mixed oxides using the electrocatalytically active component RuO2 (Table 22) andor IrO2
combined with inert oxide(s) TiO2 SnO2 V2O5 ZrO2 CeO2 etc represent the most
widely studied electrocatalyst materials in the attempt to enhance the catalytic activity to
modify the microstructure to reduce the material costs [90919293] The noble metal
oxides provide the active sites and conductive paths whereas inert oxides are used to dilute
and stabilize the active component
4 Results and discussion
55
Thin coatings of RuO2-based oxide can be deposited onto heat resistant substrates by the
thermal decomposition of corresponding metal salts The metal salts are usually dissolved
into suitable solvents and the substrates are wetted with the coating solutions by various
techniques such as brushing spraying After drying the substrate supported wet coatings
are sintered in air at high temperature to decompose the salts and to burn the carbonaceous
residues to get the final oxide or mixed oxide This process can be only applicable for the
metal substrate which does not oxidize at the required temperature Since the beginning
temperature for the titanium oxidation is about 500 oC the incomplete decomposition of
ruthenium precursor salts is one of the main problems encountered in the preparation
process Heterogeneity in microstructure is another intrinsic drawback of the oxide
coatings prepared by the conventional thermal decomposition technique [33] and it could
limit the ability to develop new electrocatalysts by optimized combination of
multicomponent composite oxides The inhomogenous elemental distribution could be due
to (i) the different solubilities of the precursor salts during the drying process (ii) some
nuclei of single oxide are formed before the firing step (iii) the differences of the salts
oxidation rate [94] Thus multi phase components with local enrichment of one phase is the
main feature of thermal decomposition derived oxide coatings
In the aspect of the microstructural homogeneity of composite oxides the low-temperature
sol-gel route prefers the formation of homogenously distributed oxo bridges between metal
centres (M-O-Mrsquo) by the hydrolysis and condensation reactions of molecular precursors
High crystallinity of oxides at lower sintering temperatures with less phase impurities of
the sol-gel derived materials have demonstrated higher activity and stability in comparison
with those prepared by thermal decomposition route [294895] However few studies
have been devoted to evaluate the multi-doping effects of sol-gel derived composite oxide
electrocatalysts so far with respect to nanoscale structural homogeneity (Table 23)
4121 Doping effect of mixed oxides
Although IrO2 is less active than RuO2 for chlorine evolution reaction (Figure 413) the
partial replacement of RuO2 by IrO2 was done in order to reduce the material cost
(considering the fluctuations in the market price) In addition iridium has the ability to
4 Results and discussion
56
enhance the durability of the RuO2-TiO2 oxide coatings [4696] IrO2 has the same rutile
tetragonal structure as RuO2 and TiO2 XRD patterns show that the diffraction peaks
become broader with the increase in Ir content in the Ru04-xIrxTi06O2 mixed oxide (Figure
49) indicating the decrease in crystallite size (Figure 412) As a consequence the
voltammetric charge density increases with the doping of Ir into binary RuTiO2 system
(Figure 412)
25 30 35 40 45 50 55 60
+ Ti-Substrate
rutile solid solution
+
+
++
e
dcb
Inte
nsity a
u
2 o
a
Figure 49 XRD patterns of Ru04-xIrxTi06O2 coatings prepared by acetic acid-isopropanol route
(IrCl3 was used as precursor salt and with the addition of HNO3 to dissolve the IrCl3 other
preparation details are described in the experimental section) (a) x = 0 (b) x = 01 (c) x = 02 (d) x
= 03 (e) x = 04
Table 42 Structural data for some metal oxides with rutile structure [97]
TiO2 RuO2 IrO2 SnO2 CrO2 NbO2 VO2
Metal ionic radii nm 0068 0067 0068 0071 0062 0074 0063
Lattice parameters ca 06441 06905 07011 06726 06596 06255 06260
Cell volume Aring3 6243 6278 6413 7151 5703 7120 5915
Compared to the reported XRD phase analysis results for the industrial IrO2-RuO2-TiO2Ti
electrode with a molar ratio of IrRu = 11 [96] the relative intensity of the rutile (110)
diffraction peaks at 2θ = 2762o is weaker for the present electrode using the diffraction
4 Results and discussion
57
peaks from Ti-substrate as reference The stronger and narrower X-ray diffraction peaks
from the industrial electrode could arise from the larger crystallite size rather than the
thicker oxide layer
SnO2 has been used as dopants added into RuTiO2 system to replace TiO2 The substitution
of Ti by Sn in the Ru04SnxTi06-xO2 mixed oxide results in the obvious shift of the rutile
diffraction peaks towards the SnO2 side and the broadening of diffraction peaks (Figure
410) The rutile structure has edge-sharing octahedrally coordinated metal ions which
form chains along the [001] direction [97] The M-O bond distances are not equal for the
MO6 octahedra with different metal ion centers Thus with the existence of the dopant ions
in the host lattice the lattice structural distortion could be caused by the difference in the
metal ionic radii (Table 42) M-O bond distances In contrast for the RuIrTiO2 system
due to the similarity in the metal ions radii and unit cell volume of the dioxide there is no
position shift observed in the diffraction peaks (Figure 49)
25 30 35 40 45 50 55 60
a
d
c
b
2 o
Inte
nsity a
u
Figure 410 XRD patterns of Ru04SnxTi06-xO2 coatings prepared by acetic acid-isopropanol route
(a) x = 0 (b) x = 02 (c) x = 04 (d) x = 06 The position of the diffraction peaks from the JCPDS
database of Ti-substrate (44-1294) RuO2 (40-1290) TiO2 (21-1276) SnO2 (41-1445)
4 Results and discussion
58
A single phase of rutile structure was formed for the Ru04Sn04Ti02O2 ternary oxide with a
crystallite size of about 5 nm (Figure 412) The growth of crystal has been inhibited in the
multicomponent system The voltammetric charge density increases four times compared
to the one of the binary Ru04Ti06O2 oxide Since the voltammetric charge density
represents the amount of protons exchanged between the oxide coating and the aqueous
electrolyte and the SnO2 does not show any notable redox behaviour in the CV potential
sweep range [98] therefore the surface redox equilibria (Eq (41)) are dominated by the
ruthenium species both for the binary Ru04Ti06O2 coatings and ternary Ru04Sn04Ti02O2
coatings The electrode potential for chlorine evolution reduces to about 116 V for the
Ru04Sn04Ti02O2 coatings ie a reduction of 90 mV compared to the Ru04Ti06O2 coatings
(Figure 413) The improvement in the electrocatalytic activity for oxygen evolution
reactions by the substitution of Ti by Sn in the Ru03SnxTi07-xO2 has also been reported [99]
25 30 35 40 45 50 55 60
(220)(211)
(101)
(110)
Ti 44-1294
RuO2 40-1290
TiO2 21-1276
a
b
c
d
X-ray diffraction of Ru04
Ti06-x
LaxO
2
Inte
nsity
au
2 o
Figure 411 XRD patterns of Ru04Ti06-xLaxO2 coatings prepared by acetic acid-isopropanol route
(a) x = 0 (b) x = 005 (c) x = 010 (d) x = 015
The doping of lanthanum into RuTiO2 system is different from the homogeneous doping of
Ir Sn The La2O3 has hexagonal crystal structure and the ionic radius of La3+
is 01016 nm
[100] which is very large in comparison with Ti4+
and Ru4+
(Table 42) Due to the
heterogeneous doping the substitution of La3+
for Ti4+
could affect the lattice symmetry
significantly
4 Results and discussion
59
0 10 20 30 40 50 60
0
4
8
12
16
20
24
28
M = La
M = Ir
Cry
sta
llite
siz
e
nm
M mol
M = Sn
(a)
0 10 20 30 40 50 60
0
10
20
30
40
Vo
lta
mm
etr
ic c
ha
rge
(m
Cc
m-2)
M mol
M = La
M = Ir
M = Sn
(b)
Figure 412 (a) Dependence of the crystallite size (calculated by using Scherrerrsquos equation) on the
coating composition Ru04SnxTi06-xO2 Ru04LaxTi06-xO2 Ru04-xIrxTi06O2 (b) Dependence of the
voltammetric charge density on the coating composition Ru04SnxTi06-xO2 Ru04LaxTi06-xO2 Ru04-
xIrxTi06O2 Potential sweep rate 50 mV s-1
With the doping of lanthanum the (110) (101) (220) diffraction peaks shift towards RuO2
side (Figure 411) No separate phase was observed for the coatings containing different
amount of lanthanum dopants The lanthanum dopant does not have a significant influence
on the crystallite size (Figure 412) Interestingly the voltammetric charge density
increases evidently for the lanthanum-containing coatings although the crystallite size is
larger than in the iridium- or tin-containing coatings (Figure 412) This is due to the
leaching characters of lanthanum oxide in the acidified solution which creates accessible
pores in the oxide matrix and accordingly provides higher active surface area The apparent
electrocatalytic activity was enhanced by the geometric effect (Figure 413)
4 Results and discussion
60
commercial Ru03Ti07O2 coating
Ru04Ti06O2
Ru01Ir03Ti06O2
Ru02Ir02Ti06O2
Ru03Ir01Ti06O2
Ru04Sn06O2
Ru04Sn04Ti02O2
Ru04Sn02Ti04O2
Ru04Ti055La005Ox
Ru04Ti05La01Ox
Ru04Ti045La015Ox
110
115
120
125
130
135
140
E V
vs A
gA
gC
l
Coating composition
Reference line
Figure 413 Electrode potential measured by chronopotentiometry in 35 M NaCl pH 3 at j = 100
mA cm-2
at room temperature for different coatings The measurement error of potential is about
20 mV The red reference line is the electrode potential value of the commercial Ru03Ti07O2Ti
electrode measured under the same conditions
Although the RuTiMOx coatings with M = Sn La shows improved electrocatalytic
performance (Figure 413) the high content of ruthenium in the mixed oxide could reduce
the oxygenchlorine electrode potential difference [21] since the selectivity for the
oxygenchlorine evolution reactions depends on the chemical composition of oxide
coatings [101] Therefore the addition of suitable dopants into the RuTiO2 system to
reduce the ruthenium molar content is not only technically necessary but also economically
important
Figure 414 compares the electrocatalytic performance of some ternary oxide RuTiMOx
coatings with M = V Zr Cr Mo prepared by the propionic acid-isopropanol route The
molar percentage of ruthenium is 25 or 15 which is below that of the commercial
electrode (30) Ru025Ti07V005Ox coatings show the best performance with an electrode
potential of about 117 V Unlike the oxides of Sn Zr Cr Mo the vanadium oxides such
as V2O5 VO2 exhibit electrochemical activity which has been widely investigated as
electrochemical supercapacitors [88102103] The mechanisms for the enhancement of
the electrochemical properties for chlorine evolution reactions with vanadium-containing
mixed oxide coatings are worth to be investigated further
4 Results and discussion
61
Ru025Ti065V01Ox
Ru025Ti065Zr01Ox
Ru025Ti065Cr01Ox
Ru025Ti065Mo01Ox
Ru025Ti07V005Ox
Ru025Ti07Zr005Ox
Ru025Ti07Cr005Ox
Ru025Ti07Mo005Ox
Ru015Ti075V01Ox
Ru015Ti075Zr01Ox
Ru015Ti075Cr01Ox
Ru015Ti075Mo01Ox
Ru015Ti08V005Ox
Ru015Ti08Zr005Ox
Ru015Ti08Cr005Ox
Ru015Ti08Mo005Ox
110
115
120
125
130
135
140
E V
vs A
gA
gC
l
Coating composition
Reference line
Figure 414 Electrode potential measured by chronopotentiometry in 35 M NaCl pH 3 at j = 100
mA cm-2
at room temperature for different coatings The measurement error of the potential is
about 20 mV The red reference line is the electrode potential value of the commercial
Ru03Ti07O2Ti electrode measured under the same conditions
4122 Microhomogeneous mixed oxide prepared by propionic acid-isopropanol route
On the basis of the above obtained results that the ternary RuTiMOx electrocatalysts with
M = Sn V exhibit improved electrocatalytic activity compared to the binary RuO2-TiO2
oxide further optimization of the electrocatalytic properties by using pentanary composite
oxides Ru01Ir01V005Sn04Ti035Ox with reduced noble metal content were investigated
herein
It is difficult experimentally to obtain stable sol solutions using the previous acetic acid-
isopropanol route for the preparation of the pentanary oxide Indeed mixed phases with
enrichment of individual component have been observed by other researchers by using the
sol-gel route to prepare the mixed oxide RuIrTiO2 [46] RuTiO2 [104] due to the unsuitable
recipe The presence of amorphous structure due to the incomplete crystallization metallic
ruthenium due to the incomplete hydrolysis reactions and single anatase TiO2 due to the
competitive hydrolysis reactions are undesirable for application as electrocatalysts [104]
No special advantages could be achieved from the sol-gel route in comparison with the
4 Results and discussion
62
conventional thermal decomposition route if the problems mentioned above can not be
resolved effectively
To obtain stable and homogenous initial sol solutions carboxylic acid acting as solvent
acid catalysts and also chelating reagents have been reported to overcome some common
difficulties encountered in the sol-gel synthesis of composite oxides due to the difference
in hydrolysis reactivity and dissolvability among various precursors [105106107108]
Once the metal alkoxides or acetylacetonates dissolve separately in the hot mixed
propionic acid and isopropanol solvents the ligand exchange reaction occurs [ 109 ]
Various metal cations are chelated due to the carboxylation and the formation of metal
propionates The propionate end groups act as steric hindrance to keep the dispersion of the
metal ions Thus the differences in reactivity against hydrolysis of the various precursors
could be harmonized After various metal precursors were dissolved and stabilized into
propionic acid and isopropanol mixture they were mixed to allow the further hydrolysis
and condensation reactions to build up the M-O-Mrsquo network
The pentanary oxide was prepared herein by propionic acid-isopropanol route to
investigate the microstructural homogeneity of the composite oxide materials For
comparison Ru04Ti06O2 and Ru025Ti07V005Ox coatings were prepared in the same way
and characterized under identical conditions
Figure 415 shows the phase structures of the composite oxide coatings deposited onto
titanium substrates for the binary Ru04Ti06O2 and pentanary Ru01Ir01V005Sn04Ti035Ox
Single phase rutile-type solid solutions were formed in both cases The inhibition effect of
crystal growth is more distinct in the pentanary oxide compared to the binary oxide
observed from the weaker and broader diffraction peaks of rutile configuration The
crystallite size was estimated from the rutile (110) peaks by using Scherrerrsquos equation The
calculated results were 4 nm and 16 nm for the pentanary composite and binary composite
respectively Due to the multi-doping in the composite oxides different metal ions
coordination and high structural distortion effects could be responsible for the inhibition of
crystal growth against the thermal sintering The decrease in the crystal dimension down to
a few nanometres could increase the coordinatively unsaturated sites of active component
and therefore the catalytic reactivity [110]
4 Results and discussion
63
25 30 35 40 45 50 55 60
Inte
nsity
au
2 o
b
rutile
+ substrate
+
++
+
a
Figure 415 X-ray diffraction patterns of the electrode coatings prepared by the propionic acid sol-
gel route (a) Ru04Ti06O2 (b) Ru01Ir01V005Sn04Ti035Ox
The microstructural homogeneity of the Ru01Ir01V005Sn04Ti035Ox coatings was
investigated by SEM-EDS The EDS elemental mapping results for the pentanary oxide are
shown in Figure 416 Due to the long acquisition time (20 min) the inevitable specimen
drift is monitored by comparing the SEM images before and after the acquisition as shown
in Figure 416a-b Several agglomerates observed from the SEM images on the coating
surface were selected as reference points Irrespective of the drift of the specimen towards
left-down during the acquisition there is no indication of individual element enrichment
observed from the EDS mapping images at the positions corresponding to the several
agglomerates attached on the coating surface Uniform elemental distributions in the whole
ranges were observed from the EDS maps thus one may suspect that there are no
discrepancies in the chemical composition between the agglomerates and the flat coating
surfaces and the multi-components of Ru Ir V and Sn are micro-homogenously dispersed
throughout the oxide matrix
4 Results and discussion
64
Figure 416 SEM images before (a) and after (b) EDS mapping showing the slight specimen drift
during the 20min acquisition time and the corresponding EDS elemental mapping images of
Ru01Ir01V005Sn04Ti035Ox oxide coatings Magnification times85000
The quantitative elemental composition analysis of the pentanary oxide obtained from the
SEM-EDS (Figure 417) shows the molar ratio of Ru Ir V Sn which is close to the
nominal composition The content of Ti identified is higher than the nominal value owing
to the electronsrsquo penetration through the oxide layers for the EDS analysis The electron-
4 Results and discussion
65
specimen interaction volume contains then parts from the underlying titanium substrate
with the applied acceleration voltage
0 1 2 3 4 5 6 7 8 9 10 11 12
Ir LIr LV K
V K
Ti K
Sn L
Sn L
Sn L
Ru LRu L
Ir M
keV
O K
Figure 417 Energy dispersive X-ray spectroscopy (EDS the X-ray intensity vs X-ray energy) of
the Ru01Ir01V005Sn04Ti035Ox coating The sample areas for EDS analysis corresponds to the SEM
image Figure 416a The elemental compositions identified quantitatively were (at ) 229 Ru
206 Ir 124 V 1127 Sn 1300 Ti 7014 O
Electrochemical cyclic voltammetry analysis for the obtained pentanary oxide is shown in
Figure 418 The voltammetric charge density calculated by the integration of the anodic
branch was 155 mC cm-2
for the Ru01Ir01V005Sn04Ti035Ox coatings which is about
fourfold larger than the one for Ru04Ti06O2 coatings It is well known that the
voltammetric charge density is a measure of the amount of the accessible electroactive
sites of the electrode surface The dopants of Ir Sn contribute to the decrease in the
crystallite size as confirmed in the previous section The addition of V is in order to
increase the electrocatalytic activity for chlorine evolution The Ru is partially substituted
by Ir with the intent of reducing the material costs and enhancing the stability of the
electrocatalysts [46]
4 Results and discussion
66
02 04 06 08 10-08
-06
-04
-02
00
02
04
06
08
j
mA
cm
-2
E V vs AgAgCl
Ru04
Ti06
O2
Ru01
Ir01
V005
Sn04
Ti035
Ox
Figure 418 Cyclic voltammograms of the Ru04Ti06O2 coating and the Ru01Ir01V005Sn04Ti035Ox
coating The cyclic voltammetry was measured in 35 M NaCl pH 3 room temperature AgAgCl
as reference electrode The potential was scanned from 02 to 10 V with a potential sweep rate υ
= 20 mV s-1
Exposed electrode surface areas 1 cm2
The galvanostatic polarization measurements for the Ru01Ir01V005Sn04Ti035Ox coatings
and Ru04Ti06O2 coatings are shown in Figure 419 For the current density steps from 05
to 100 mA cm-2
ie from the slight to the intensive chlorine evolution region the
electrode potential response was recorded Lower electrode potentials for chlorine
evolution were observed for the Ru01Ir01V005Sn04Ti035Ox coatings than for the
Ru04Ti06O2 coatings and the difference is larger at higher current densities The electrode
potential difference is about 80 mV at the current density of 100 mA cm-2
Compared to
the commercial Ru03Ti07O2 coatings (Figure 413) a decrease of electrode potential of
about 30mV is achieved for the Ru01Ir01V005Sn04Ti035Ox coatings measured under the
same conditions However the Ru04Ti06O2 coatings show worse performance than the
commercial Ru03Ti07O2 coatings The geometric effect could contribute to the higher
activity for the commercial coatings in this case due to the possible porous structure of the
inner oxide layer [1196]
The electrode potential value is stable at lower current densities but increases continuously
at higher current densities during the chlorine evolution reaction The reasons for the linear
drift of the electrode potential are not known The polarization curves plotted by taking the
middle value for the drift potential signal versus log j (Figure 420) are characterized by
4 Results and discussion
67
two Tafel slopes for both electrodes indicating the kinetic and mass transfer controlled
reaction mechanisms
Figure 419 Galvanostatic polarization profiles of Ru04Ti06O2 and Ru01Ir01V005Sn04Ti035Ox
coatings measured in 35 M NaCl pH 3 50 oC AgAgCl as reference electrode The applied
current densities were j (mA cm-2
) = 05 1 2 4 10 20 30 50 70 100 Exposed electrode
surface areas 1 cm2
10-1
100
101
102
110
115
120
125
130 Ru
04Ti
06O
2
Ru01
Ir01
V005
Sn04
Ti035
Ox
E
V v
s
AgA
gC
l
j mA cm-2
Figure 420 The E-log j curves obtained from Figure 419 without the iR-correction
The electrochemical impedance analysis allows separating various factors such as ohmic
resistance of electrolyte oxide film and interface response of the electrocatalytic coating
exposed to the electrolyte Figure 421 shows the impedance spectra of the composite
oxide coatings The semicircles corresponding to charge transfer for chlorine evolution
reactions were observed in the Nyquist plots (Figure 421a) The double logarithmic plots
4 Results and discussion
68
of ndashZ΄΄ vs f (Figure 421b) show clearly that one relaxation time exists [111] Using a
proposed equivalent circuit Re(QdlRct)(QfRf) [ 112 ] where Re is the electrolyte ohmic
resistance Rct and Rf are the charge transfer resistance and oxide film resistance
respectively while Qdl and Qf are constant phase elements related to the capacitance of the
charge transfer process and oxide film respectively The fitted parameters are summarized
in Table 43
00 01 02 03 04 05 06 07 0800
01
02
03
04
Commercial Ru03
Ti07
O2 coating
Ru025
Ti07
V005
O2
Ru01
Ir01
V005
Sn04
Ti035
O2
Ru04
Ti06
O2
-Z
Zcorr
(a)
100
101
102
103
10-2
10-1
100
-Z
f Hz
(b)
Figure 421 Impedance diagram for the sol-gel-derived Ru04Ti06O2 Ru025Ti07V005Ox
Ru01Ir01V005Sn04Ti035Ox coatings and commercial coating with the nominal composition
Ru03Ti07O2 measured in 35 M NaCl pH 3 at room temperature using in a galvanostatic mode
(applied current i = 100 mA) Exposed surface area 177 cm-2
(a) Nyquist plots for better clarity
the real parts were corrected by removing the electrolyte ohmic resistance (b) The double
logarithmic plots of ndashZPrime vs f Solid lines represent the fitted results using equivalent circuit
Re(QdlRct)(QfRf)
It was found that the oxide film resistance of the composite oxide ceramic coatings was so
small (~ 0075 Ω) even for the coating containing 10 Ru and 10 Ir which are different
from the reported critical concentration of 25~30 Ru or Ir to keep metallic conductivity
of oxide matrix [113] This behaviour can be well explained by the microstructural
homogeneity of the composite oxides Unlike the thermal decomposition prepared
materials in which poorly doped composite oxides consist of individual domains of
conductive noble metal oxide and inert and insulating valve metal oxide the highly
dispersed Ru andor Ir in the composite oxides prepared by the propionic acid-isopropanol
route assure the continuous conduction path
4 Results and discussion
69
Table 43 Parameters of the equivalent circuit (Re(QdlRct)(QfRf)) used to describe the impedance
behaviour of the composite oxide coatings
Re (Ω)
Qdl Rct (Ω)
Qf Rf (Ω)
Y0 (Ω-1
sn) n
Y0 (Ω
-1s
n) n
Ru04Ti06O2 06624 001133 084 06677 211 099 003158
Ru025Ti07V005Ox 02746 003087 093 01994 08138 079 007984
Ru01Ir01V005Sn04Ti035Ox 02359 006159 088 02174 5712 060 007528
Commercial coating 02196 005100 090 02484 5307 098 002885
A constant phase element (Q) instead of capacitance (C) is used to describe a practical electrode with
different degrees of surface roughness or a nonuniform distribution of surface active sites n is a
number between 0 and 1 (n = 1 for a pure capacitance) It means that the capacitor element has
characteristics intermediate between a capacitor and a resistor
The reciprocal of the charge transfer resistance 1Rct reflects the electrocatalytic activity
of the oxide coatings for the chlorine evolution reactions [112] Based on the fitted
parameters the activity of the coatings follows the sequence Ru025Ti07V005Ox gt
Ru01Ir01V005Sn04Ti035Ox gt commercial coating gt Ru04Ti06O2 (Table 43) This order is
consistent with the electrode potential measured by chronopotentiometry
Owing to the decrease in crystallite size the pseudocapacitance of the pentanary oxide was
twice that of the ternary oxide which means the active surface areas increase twice
although the pentanary oxide contains less content of noble metal The commercial
Ru03Ti07O2 coating has larger pseudocapacitance than the Ru04Ti06O2 coating which
confirms the assumption that the porous inner oxide layer of the commercial coating
contributes to the apparent electrocatalytic activity as geometric factor by increasing the
accessible surface area
4 Results and discussion
70
413 Conclusion
In this section the mixed oxide electrocatalyst RuTiMOx coatings were prepared by two
different sol-gel routes to investigate the influence of chemical composition on the
electrocatalytic activity for chlorine evolution reactions of the oxide coatings and their
structure-property correlation
An initial study of the influence of the coating preparation parameters on the coating
performance has been carried out to establish experimentally the suitable oxide loading
amount sintering conditions The acetic acid-isopropanol route is suitable for the
preparation of binary RuTiO2 system whereas the propionic acid-isopropanol route
possesses the advantage for the synthesis of mixed multicomponent RuTiMOx system
such as the ternary and pentanary oxide
The substitution of Sn V Cr La for the Ti in the RuTiMOx system increases the
electrocatalytic activity effectively The decrease in crystallite size and the corresponding
increase in the voltammetric charge density can be realized by the doping of Ir Sn into the
RuTiO2 system Compared to the commercial Ru03Ti07O2 coating the simultaneous
enhancement in the electrocatalytic activity and the reduction of noble metal content have
been achieved by using the Ru025Ti07V005Ox or Ru01Ir01V005Sn04Ti035Ox coating
The geometric factor could also play a critical role for the improvement of the apparent
electrocatalytic activity Porous structure of oxide layer is favourable for the practical
applications This has been deduced from the electrochemical properties of RuTiLaOx
coating and commercial coating The fabrication of pores with the intent of enhancing the
apparent catalytic activity will be discussed in the next section
4 Results and discussion
71
42 Morphology-controlled preparation
This section presents two different ways to control the coating morphology including the
fabrication of crack-free coating as inner layer to protect the substrate against passivation
and the preparation of porous coating as outer layer to increase the electrode specific
surface area
Traditionally the electrode coatings prepared by thermal decomposition of the
corresponding inorganic salts exhibit a mud-crack surface morphology Similarly the
typical surface morphologies of the sol-gel-derived oxide coatings are shown in Figure
422 The surface consists of islands with the size ca 4 μm in length boundary gaps ca
1~3 μm in width close-stacked particles with a diameter ca 30 nm inter-grain regions and
pores These flaws (such as cracks cavities and gaps) facilitate the penetration of
electrolytes and provide high accessible inner active surface areas which are responsible
for the electrocatalytic properties as a geometrical factor in contrast to the intrinsic
electrocatalytic activity related to the electrocatalyst materials (Section 41)
Figure 422 Representative SEM images of Ru04Ti06O2 coating show the typical mud-crack
characteristics of the sol-gel drop-coating prepared coatings Scale bar Left 10 μm Inset in Left
1 μm Right (enlarged image of the island) 100 nm
4 Results and discussion
72
421 Crack-free coatings
Controlled-preparation in surface morphologies such as the number of pores pore size
particle size cracks are critical to the enhancement in the electrocatalytic performance On
the other hand the penetration of electrolytes onto the underlying substrates through the
cracks could accelerate the deactivation of electrode due to the growth of an insulating
TiOx interlayer between the substrate and the oxide layer as described above A protective
and crack-free inner layer has been taken into account in this section
Figure 423 SEM images of crack-free Ru025Ti075O2 coatings prepared by dip-coating method by
(a b) propionic acid-isopropanol route (c d) acetic acid-isopropanol route 25 layers with oxide
loading of 42 g m-2 from 01125 M precursor solution and (e) acetic acid-isopropanol route 6
layers with oxide loading of 37 g m-2 from 045 M precursor solution Scale bar (a c e) 10 microm
(b d) 100 nm
4 Results and discussion
73
Herein a repetitive sol-gel dipping-withdrawing technique was performed to prepare crack-
free coatings (see Section 313) In this case the tensile stress was relaxed right away
through plastic deformation for each single thin layer after the heat-treatment without the
formation of cracks It is critical to control the single layer thickness (should be below a
critical thickness ie the maximal thickness without the formation of cracks) and thicker
crack-free coatings have been obtained by increasing the repetitive times of
dippingdryingsintering Acetic acid-isopropanol route and propionic acid-isopropanol
route were used to prepare the sol solutions As shown in Figure 423 in order to obtain the
crack-free coatings with comparable oxide loading amount or thickness more dipping-
withdrawingdryingsintering cycles are required if the concentration of coating solutions is
lower The coating solution and its concentration and the substrate withdrawing rate are
important factors to obtain crack-free coatings
Figure 424 SEM images of surface morphologies of Ru025Ti075O2 coatings (a) crack-mud coating
prepared by drop-coating (b) crack-free coating prepared by dipping-withdrawing method Scale
bar (a) 10 microm (b) 100 nm
Except for the direct observation of the mud-crack or crack-free surface morphologies by
SEM (Figure 424) electrochemical cyclic voltammetry provides in-situ characterization
of the electrolyte penetration into the inner cracks and the electrochemical response of the
surface (outer surface islands inner cracks gaps) to the applied potential sweep (Figure
425) One of the prominent characteristics of the crack-free coating is the impermeability
for electrolytes and accordingly the protective properties for the underlying titanium
substrates
(a) (b)
4 Results and discussion
74
02 04 06 08 10-020
-015
-010
-005
000
005
010
015
020
j
mA
cm
-2
E V (vs AgAgCl)
mud-crack coating crack-free coating
(a)
0 50 100 150 2000
2
4
6
8
10
12
14
qa
mC
cm
-2
mV s-1
crack-free coating mud-crack coating
(b)
Figure 425 (a) CV curves of Ru025Ti075O2 coating with different surface morphologies
corresponding to Figure 424 recorded in 35M NaCl pH 3 at room temperature with a scan rate
of 50mV s-1
(b) Dependence of voltammetric charges (qa) on the potential sweep rates (υ) for the
coating with crack-free or typical mud-crack surface morphology
The penetration behaviour of electrolyte through the oxide coatings (or the wetting of
oxide coating by electrolytes) as a function of potential sweep rate was evaluated by
plotting the voltammetric charges (qa) against the potential sweep rates (υ) as shown in
Figure 425 The voltammetric charges for the mud-crack coating show an initial sharp
decrease with the potential sweep rate from 5~50mV s-1
and then keep constant when the
potential sweep rate exceeds 50 mV s-1
In contrast the voltammetric charges for the crack-
free coating are independent of the potential sweep rate
This phenomenon can be explained from the relationship between the qa with the
electrochemically accessible surface of the oxide coated electrodes At very high potential
sweep rate only the outermost oxide layer gives response to the fast potential sweep
whereas for the slower potential sweep the electrochemical response from the much
deeper inside layer contributes to the total voltammetric charges by the progressively
penetration of electrolyte through the flaws The crack-free coatings prepared in this work
show the unique impermeable characteristics for the electrolyte of aqueous solution
sodium chloride This provides the possibility to protect the underlying titanium substrate
from passivation due to the direct contact with electrolyte under the harsh chlorine
evolution environment Further investigation to evaluate the long-term service life of the
oxide layer with the protective inner crack-free layer is necessary
4 Results and discussion
75
422 Porous oxide film coated electrodes
Porous electrodes are widely used in many technological applications such as energy
storage capacitive deionization water desalination and fuel cell materials [114] Porous
structures are usually employed to facilitate the electrolyte penetration through the pore
gaps and increase the material usage by creating highly available surface areas Porous
electrodes are expected to maximize the coating capacitance Pore size and distribution are
the critical factors related to the increase of the pseudo-capacitance of materials A
confinement of solvation ion in nano-channel has also been reported by Ohkubo et al[115]
In the case if the pore size is smaller than the corresponding ion size then there is no room
to accommodate one ion per pore The charge-storage mechanism in nanoporous materials
has been developed [116] Traditional double-layer model was used to describe the outer
surface charging and the double-cylinder model was applied to the inner pores Other
researchers proposed that the pore space within the electrode is filled with electrolyte
exchanging ions with a thin double-layer lsquolsquoskinrsquorsquo on the electron-conducting electrode
matrix [114]
Nano-pores have been created by chemical leaching routes by mixing leachable elements
(lanthanum for instance) into the oxide matrix (RuTiLaOx) The electrode coating
RuTiLaOx was prepared by multiple dropping-drying-sintering cycles The increase in the
number of pores by the subsequent leaching of lanthanum oxide will increase the
electrochemically accessible surface areas The in-situ electrochemical cyclic voltammetry
was used to monitor the change of electrode surface area by the cyclic potential sweep in
05 M hydrochloric acid Figure 426 shows the voltammetric charge density (qa obtained
by means of the EC-Lab software by integrating the anodic branches of the
cyclovoltammograms) of electrodes as a function of the voltammetric cycling times for
Ru04Ti045La015Ox (dotted line) and Ru04Ti06O2 (solid line) The qa of the Ru04Ti06O2
coating is independent of the voltammetric cycling times indicating that there are no
changes in the characteristics of the oxide electrode However a continuous increase in the
qa for the Ru04Ti045La015Ox coating was observed from the 2nd
potential cycle to the 79th
potential cycle This is caused by the continuous leaching of lanthanum oxide away from
4 Results and discussion
76
the oxide matrix during the voltammetric cycling and the simultaneous increase of the
coating porosity Open pores rather than closed pores are created by the chemical leaching
route which can be utilized fully in the aqueous solution system
0 10 20 30 40 50 60 70 80 9010
20
30
40
50
60
70
80
90
100
qa
mC
cm
-2
Cycling times
Ru04
Ti06
O2
Ru04
Ti045
La015
Ox
Figure 426 The voltammetric charge density (qa) of electrodes as a function of the voltammetric
cycling times for the Ru04Ti06O2 coating (solid line) and Ru04Ti045La015Ox (dotted line) The cyclic
voltammetry was measured in 05 M HCl room temperature AgAgCl as reference electrode The
potential was scanned from 02 to 10 V with a potential sweep rate υ = 50 mV s-1
The exposed
electrode areas is 1 cm2
4221 Porous electrode coating Ru03Sn07O2
In order to investigate systematically the electrochemical properties of porous electrode
coatings Ru03Sn07O2middot x La2O3 coatings (x = 0 005 01 02) were deposited onto
titanium substrates by propionic acid based sol-gel route Porosity is obtained by chemical
leaching of La2O3 with 163 M HCl (135 mL 37 wt HCl were diluted to 100 mL with
water) at 60 oC for 10 min with slight stirring after the deposition of each single layer
Coatings were obtained by 8 dropping-drying-sintering-leaching cycles and a final
sintering at 450 oC for 1h
4 Results and discussion
77
Figure 427 SEM images of (a b) Ru03Sn07O2 and (c d) Ru03Sn07O2 middot 020 La2O3 after lanthanum
oxide leaching prepared by propionic acid sol-gel method Scale bar (a) 1 microm (b c d) 100 nm
Figure 428 Energy-dispersive X-ray spectroscopy (EDS) of (a) Ru03Sn07O2 Ti and (b)
Ru03Sn07O2 middot 020 La2O3 Ti after lanthanum oxide leaching The absence of lanthanum species
(La Lα1 4651 keV La Lβ1 5042 keV) inside the oxide layer was confirmed
a b
c d
4 Results and discussion
78
A comparative observation of the surface morphologies of the Ru03Sn07O2 middot x La2O3
coatings (x = 0 020) is shown in Figure 427 The film electrodes prepared by the
dropping-sintering-leaching cycles possess typical mud-crack structures The cracks
provide a facilitated penetration path for the electrolyte for the electrode reactions
Meanwhile the split islands compose the entity of the electrocatalyst materials Nanopores
with a diameter around 15 nm (mesopores) were observed from the
Ru03Sn07O2 middot 020 La2O3 coating after lanthanum oxide leaching Energy-dispersive X-ray
spectroscopy (EDS) in Figure 428 shows that there is no residual lanthanum left in the
final oxide matrix
0 50 100 150 2008
12
16
20
24
28
32
qa
mC
cm
-2
v mV s-1
x = 0
x = 005
x = 015
x = 020
(a)
0 50 100 150 20006
07
08
09
10
No
rma
lize
d q
a
mV s-1
x = 0
x = 005
x = 015
x = 020
(b)
Figure 429 (a) Anodic charges as a function of potential scan rate as obtained by integration of the
cyclic voltammograms for Ru03Sn07O2 ∙ xLa2O3 film electrodes in 35 M NaCl pH 3 at room
temperature (b) Normalized voltammetric charges as a function of potential scan rate obtained by
dividing the voltammetric charges by the voltammetric charges measured at 5 mV s-1
The pores created by lanthanum oxide leaching increase the electrochemically accessible
sites effectively as confirmed by the increase in voltammetric charge densities (qa) in
4 Results and discussion
79
Figure 429a Accordingly the inner active sites contribute more to the electrochemical
response than the outer active sites for the porous electrodes observed from the normalized
voltammetric charges (Figure 429b)
A possible explanation for this phenomenon is that the embedded lanthanum clusters
within the split islands were leached away after the leaching of the outwards exposed
lanthanum clusters attached on the cracks and cavities which results in the formation of
three dimensional interpenetrating networks of inner pores within the islands Ultimately
the porous islands represent electrodes with higher inner geometric surface area These
pores in-situ created by hydrochloric acid liquid-phase-diffusion will be
electrocatalytically accessible to the NaCl electrolyte
4222 Impedance behaviour of porous electrode coatings
The substrateoxide coatingelectrolyte interfaces can be well investigated by using the
electrochemical impedance spectroscopy (EIS) The electrode interface response to the
applied small-signal stimulus in the frequency domain represents the information of
adsorption diffusion electron transfer at the electrodeelectrolyte interface The
electrochemical system can be described by using the serial andor parallel combinations of
various circuit elements such as resistor inductor and capacitor
Typically the impedance data are analyzed by fitting the data to an equivalent circuit The
most often used equivalent circuit for mixed metal oxide electrode coatings is shown in
Figure 430a which contains a ohmic resistance element (Re) a double layer capacitance
(Cdl) in parallel with a charge transfer resistance for chlorine evolution reaction (Rct) a film
capacitance (Cf) in parallel with a film resistance (Rf) All capacitors can be replaced by
constant phase elements (Q) to account for the inhomogeneities in the electrode system
The impedance of this equivalent circuit Re(CdlRct)(CfRf) has the expression
1 1
1 1e
dl f
ct f
Z R
j C j CR R
(42)
For the porous electrode coatings the porosity or roughness of the oxide matrix could be
expected to lead to a frequency dispersion of the interfacial impedance A transmission line
4 Results and discussion
80
model is generally used to describe the electrode system considering that the
electrochemical reaction could take place down the depth of the pore [117] Figure 430b
shows the physical model of electrode coatings with cylindrical pores Accordingly the
impedance of this equivalent circuit Re(CdloutRctout)( CdlinRctin)(CfRf) has the more complex
expression
1 1 1
1 1 1e
dl out dl in f
ct out ct in f
Z R
j C j C j CR R R
(43)
Figure 430 Physical model and equivalent circuit used to simulate the electrode response and to fit
the impedance data for the present electrodes with Ru03Sn07O2 middot x La2O3 coatings (a) The
conventional mixed metal oxide electrode (b) porous electrode with a cylindrical pore accessible to
the electrolyte [118119] Re describes the ohmic resistance of the electrolyte (RfCf) describes the
coatingsubstrate interface (RctCdl) describes the active coatingsolution interface Rct describes the
charge transfer resistance and Cdl describes the double layer capacitance
4 Results and discussion
81
017 019 021 023 025 027000
001
002
003
004
-Z
o
hm
Z ohm
Figure 431 Nyquist plot (dotted points) for the film electrodes Ru03Sn07O2 measured with a
rotating disk electrode (2000 rmp) at an applied current density of 566 mA cm-2
in 35 M NaCl pH
3 at room temperature Solid curves show the fitting results by using equivalent circuit R(CR)(CR)
030 032 034 036 038 040000
001
002
003
004
-Z
o
hm
Z ohm
Figure 432 Nyquist plot (dotted points) for the film electrodes Ru03Sn07O2 ∙ 015 La2O3 measured
with a rotating disk electrode (2000 rmp) at an applied current density of 566 mA cm-2
in 35 M
NaCl pH 3 at room temperature Solid curves show the fitting results by using equivalent circuit
R(CR)(CR)(CR)
The electrochemical impedance spectroscopy was recorded in 35 M NaCl pH 3 at room
temperature using a rotating disk electrode (2000 rmp exposed surface areas 177 cm2) at
applied current density 566 mA cm-2
(Figure 431 Figure 432) where the electric double-
layer responds jointly with the Faradaic redox processes The strongly scattered data points
arising from the gas bubble-induced fluctuations in recording the electroanalytical signals
have been rejected for further data fitting analysis The impedance data in the low
frequency region reflects the chlorine evolution reactions at the interface between the oxide
coating and the electrolyte solution whereas the impedance data at the high frequency
4 Results and discussion
82
region is related to the oxide coating properties A very good fit (χ2
lt 1times10-4
) for the
impedance data has been achieved by using the equivalent circuit described in Figure 430
Two characteristic time constants (1 1
2c RC
f
) corresponding to the two
semicircles (Figure 431) were obtained for the Ru03Sn07O2 coatings whereas three
characteristic time constants corresponding to the pore-containing coatings were observed
Table 44 Parameters of the equivalent circuit used to describe the impedance behaviour of the
Ru03Sn07O2 middot x La2O3 coatings in 35 M NaCl pH 3 at room temperature measured under
galvanostatic impedance mode with a current density of 566 mA cm-2
Physical units Resistance
Ω pseudocapacitance mF
x 0 005 015 020
Equivalent circuit R(CR)(CR) R(CR)(CR)(CR) R(CR)(CR)(CR) R(CR)(CR)(CR)
Re 01775 02357 03096 0737
Cout
1901 1039 1649 2188
Rout
005559 004595 004678 005381
Cin - 1175 2214 5370
Rin - 002349 001973 001176
Cf 04153 01835 05598 1061
Rf 002541 00124 001089 001399
χ2 7476E-5 8827E-5 1890E-5 6652E-6
Conventional electrochemical techniques such as cyclic voltammetry encounter the
problem when high current density is applied that the bulk electrolyte ohmic drop will
distort the measured electrode capacity behaviour For impedance measurements the bulk
electrolyte ohmic drop (Re) can be isolated from other electrochemical parameters (Table
44) The electrolyte ohmic drop depends on the distance between the working electrode
and the reference electrode The oxide film resistance Rf is about 001 Ω (Table 44) for the
Ru03Sn07O2 middot x La2O3 coatings corresponding to the small semicircle at high frequency
4 Results and discussion
83
domain in the Nyquist plots (Figure 432) The film resistance originates from the mixed
metal oxide coating and the interface between the oxide coating and titanium substrate
The small value in Rf indicates that the oxide coating is metallically conductive Note that
the Rf can be used for the investigation in electrode deactivation due to the passivation of
titanium substrate The parameter of Cdl reflects the number of electrocatalytically active
sites similarly to the voltammetric charge density (qa) obtained in cyclic voltammetry
measurements
For the porous coatings Ru03Sn07O2 xLa2O3 (x = 005 015 02) the outer surface
response behaviour (Cout Rout) is similar to the Ru03Sn07O2 coatings whereas the inner
surface exhibits the distinct capacitive behaviour (Cin) due to the existence of numerous
accessible nanopores The effect of the electrode pore geometry such as the pore radius
and depth is complicated and not well understood so far especially for the gas-evolving
electrodes On the one hand the electrodes should be designed by using nanoporous
structures to maximize the specific electrode surface areas on the other hand the pores
should be designed so that the movement and migration of reactant ions and product
molecules are not inhibited Some theoretical models have been developed to consider the
pore geometry [120] The dependence of the gradient of the potential distribution along the
center of the pore and ion concentration on the pore radius and depth has been modelled
using a planar electrode containing cylindrical pores The charging time of the Stern layer
(where the electrochemical reactions occur such as the ion dissociation and redox couples)
and the diffuse layer the percentage distribution of the total charge within the Stern layer
and the diffuse layer are governed by the surface potential ion concentration pore depth
and radius For low surface potential the diffuse layer accounts for a larger percentage of
the total charge than the Stern layer The charging behaviour of porous Ru03Sn07O2
electrode coatings will be discussed in the next section
4223 Charging behaviour of porous electrode coatings
The analytical technique to characterize the interfacial response of the electrode in the
electrolyte are impedance charging transient and open circuit potential relaxation after
interrupting the polarization current [121122123] The electrochemically accessible
4 Results and discussion
84
surface area of a rough and porous electrode was characterized herein based on the
electrochemical charging behaviour of porous electrode coating under slightly
galvanostatic polarization
0 100 200 300 400 500 600
06
07
08
09
10
11
Time s
x = 0 x = 005 x = 010 x = 015 x = 020
E
V v
s
Ag
Ag
Cl
(a)
1 10 1000
2
4
6
8
10
12
14
16
x = 015
x = 020
x = 010
x = 0 x = 005
dE
d
t m
V s
-1
Time s
(b)
Figure 433 (a) Representative potential response of Ru03Sn07O2 middot x La2O3 electrode coatings with
different porosity to the suddenly applied current density step at j = 05 mA cm-2
Conditions
forced electrolyte convection cell 35 M NaCl pH 3 at 50 oC Time record length 10 min The
data points were recorded with a time interval of 5 s (b) The slope of the potential response versus
log(t) corresponding to the recorded data in (a)
Galvanostatic charging behaviour of the porous electrodes was characterized at low
polarization current density conditions (j = 05 mA cm-2
) in order to get a comprehension
of the electrode potential E(t) dependence on the porosity as shown in Figure 433a At
low polarization current density conditions the chlorine evolution reactions proceed mildly
through molecular diffusion into bulk electrolyte rather than the formation of bubbles (see
4 Results and discussion
85
wavelet analysis of bubble-induced potential noise in Section 444) After the current
supply the initial potential increases instantaneously to about 06 V The potential plateau
was observed after 3 min for Ru03Sn07O2 electrode coating whereas the potential
equilibration time or the response time of the system to a step current exceeds 10 min for
the pore-containing electrode coatings which indicates a progressively deeper penetration
of the electrolyte into the inner spaces for the pore-containing electrode coatings
The rate of the potential response (the charging dynamics) slows down linearly with the
logarithm of time log(t) (Figure 433b) with a turning point at around 10s Before this
turning point the rates of potential response are close to each other for different coatings
indicating that the similar charging behaviour of the outer exposed surface and wider
cracks which is independent of the inner structure and morphologies The decrease in the
charging rate especially for the pore-containing oxide coatings after the turning point
implies that the slow inner pore charging process prevails For the anodic charging
behaviour of RuO2 film electrodes in HClO4 it has been reported [124] similarly that the
potential response takes several to about 20 min to reach a final steady-state potential
plateau Galvanostatic anodic charging curves for the porous PbO2Ti electrodes in Na2SO4
solution show the same charging profiles [125]
Note that the time-dependent potential in response to a current step is the potential
difference between the electrode and a point (where the tip of the Luggin capillary
reference electrode is positioned) in the bulk solution It consists of the potential difference
across the Stern layer and the potential difference across the part of the diffuse layer
according to the Gouy-Chapman-Stern model for the dilute solution [114] For the
concentrated solution (35 M NaCl as supporting electrolyte for instance) the time
evolution of the double layer concretely the expansion of the double layer due to the ion
crowding into the nano-channels occurs until an equilibrium is reached
The electrodeelectrolyte interface behaves as a capacitor In the absence of a redox couple
at the electrode surface the charge on the capacitor is proportional to the voltage drop
across the capacitor For the oxide film electrode the capacitance is a function of the
dielectric properties of the oxide material electrode area and the space between the
electrode and the electrostatically bound ions (usually on the order of the Debye screening
4 Results and discussion
86
length [126]) The charge-storage mechanism for the electric double-layer capacitor is that
the energy is stored non-Faradaically by charging the electrochemical double-layer at the
interface between the porous electrode and the electrolyte
When the Faradaic reaction is involved at the electrodeelectrolyte interface the
pseudocapacitance behaviour of the oxide film electrode originates from the ion diffusion
and the parallel redox processes of the active species (Eq (41)) For the redox
pseudocapacitor the total applied current (i0 = j0 middot A = 05 mA) at the porous electrode
consists of the current for charging the double layer (non-Faradaic current or capacitive
current dQdldt) and the current corresponding to the Faradaic charge transfer reaction
(Faradaic current iF) at the electrodeelectrolyte interface [127] ie
dl0 F
dlF dl
dQi i
dt
dCdEi C E
dt dt
(44)
The Faradaic current (iF) depends on the electron transfer kinetics and the diffusion rate of
the redox species to the electrode surface For the mass transfer controlled process the
current is related to the diffusion rate of the redox species (i = nFAJ where n is the number
of electrons F is Faradayrsquos constant A is electrode area and J is the flux of the redox
species to the surface governed by the Fickrsquos law) At the slight polarization conditions the
electrode reaction is under kinetic control
The charge of the double layer (Qdl) is a function of the double layer capacitance (Cdl) and
electrode potential (E) ie Qdl = f(Cdl E) The Cdl is dependent on the surface coverage
percentage of the electrode by gas bubbles at intensive gas evolution conditions For
simplicity at low applied current density conditions the surface coverage of the electrode
by gas bubbles is negligible and then the electric double layer capacitance (Cdl) is assumed
as constant at steady state Before reaching the steady state the electric double-layer
capacitance increases due to the increasing utilization of the inner surface In the case that
the Faradaic current is substantially greater than the double layer charging current the
analysis of the capacitive behaviour of the porous electrodes based on the galvanostatic
charging profiles becomes meaningless For the non-ideally polarizable electrode (ie the
Faradaic reaction is inevitable) when electrochemical Faradaic reactions are not
4 Results and discussion
87
significant after applying a current step the chemical ions adsorption and desorption occur
at the interface of outer plane surface and inner pores
The charging processes investigated in this work for the porous RuO2-based electrode
coatings are more complicated than the characterization of the supercapacitance behaviour
of electrode materials The process involves the electric double-layer charging the
pseudocapacitive charging of the Faradaic protonationdeprotonation process
RuO (OH) H e RuO (OH)x y x y (Eq (41)) and the interference of the chlorine
evolution reactions (Eq (25)) The quantitative separation of various factors is difficult
4 Results and discussion
88
423 Conclusion
In this section the oxide coatings with the designed morphology have been achieved
experimentally With the intention to protect the underlying titanium substrate against
passivation the crack-free and impermeable inner oxide layer has been prepared In order
to increase the electrocatalytically accessible active surface area a nanopore-containing
oxide layer has been prepared which can be used potentially as top layer onto the above
mentioned crack-free inner layer
The electrode coatings used for the chlorine evolution reactions possess the typical mud-
crack surface feature which is favourable to increase the utilization of the electrocatalyst
materials due to the penetration of electrolyte into the gaps (with the size of about 1 μm)
Unfortunately the cracks facilitate simultaneously the direct contact of the electrolyte with
the underlying substrate under the caustic conditions Electrode deactivation occurs prior
to the complete dissolution of the active ruthenium component as has been confirmed by
other researchers Therefore crack-free oxide coatings were fabricated as protective inner
layer No cracks were observed at the surface of coatings from the SEM images from the
scale bar 10 μm to 100 nm by controlling the reduplicate dippingdryingsintering process
CV as an in-situ analysis technique confirms the impermeable character of the obtained
crack-free coatings
Nanopore-containing oxide coatings were prepared by the chemical leaching method The
increase in the electrocatalytic accessible surface area was investigated by CV and EIS
The existence of the inner pores within the oxide matrix exhibits the unique
electrochemical response behaviour The charging behaviour of the porous electrode
coatings was studied by monitoring the time-dependent potential response under the slight
galvanostatic polarization conditions Further investigations of the pore size and shape and
its possible influence on the bubble release have to be performed to obtain the optimal pore
geometry
4 Results and discussion
89
43 Solvothermal-assisted synthesis
431 Phase structure of Ru-Ti-O system
The oxide materials prepared by sol-gel method are more often amorphous in the xerogel
stage post-sintering is necessary to crystallize the xerogel to remove the residual organics
to reinforce the thermal and mechanical stability and to increase the wear resistance and
durability The final phase structure of the mixed oxide in the Ru-Ti-O system depends on
the thermodynamic conditions Rutile-type Ru-Ti-O solid solution is the most common
structure used as active phase for chlorine evolution reactions Depending on the
preparation conditions such as sintering temperature [128] sintering atmosphere [129]
Ru Ti ratio [130] the product form (such as powders thin films) and the underlying
substrates [ 131 ] anatase structure of single TiO2 or anatase Ru-Ti-O solid solution
presents a secondary phase or a major phase [104] coexisting with rutile structure
In view of the Ru-Ti-O employed as electrocatalyst coatings for the chlorine evolution
reactions two necessary conditions have to be satisfied i) the electronic conductivity of
the oxide coating ruthenium species as conductive components should ensure the
continuous conductive path in the oxide coating matrix ii) coating stability which is
obtained by thermal sintering of the gel body Thus the feasibility to modify the Ru-Ti-O
coating phase structure under the restricted conditions of RuTi ratio (15~40 Ru mol) and
thermal sintering temperature (450 oC) becomes a remarkable issue
At ambient pressure TiO2 exists in three different polymorphs anatase rutile brookite
The structure parameters are listed in Table 45 The phase transition from the metastable
anatase to the thermodynamically stable rutile can be induced by various factors such as
ion impurities thermal sintering etc as shown in Figure 434 Further details concerning
the effects of pressure-temperature on the TiO2 polymorphs anatase brookite rutile and
TiO2-II (orthorhombic Pbcn) TiO2-B (monoclinic P21 c) please refer to [132133]
4 Results and discussion
90
Table 45 Data for some TiO2 polymorphs [134]
Structure Space group Density g cm-3
Unit-cell parameters Aring
Rutile tetragonal P42 mnm 413 a = 45933 c = 29592
Anatase tetragonal I41 amd 379 a = 37852 c = 95139
Brookite orthorhombic Pbca 399 a = 917 b = 546 c = 514
Anatase Rutile
Promoter
Ru4+
thermally sintering
Inhibitor
V5+ Nb5+
hydrothermal
TiO6 octahedron
Anatase Rutile
Promoter
Ru4+
thermally sintering
Inhibitor
V5+ Nb5+
hydrothermal
TiO6 octahedron
Figure 434 (top) The TiO6 octahedron building block for various TiO2 polymorphs The linkage
manners of the TiO6 building block are different for the various TiO2 polymorphs (bottom) The
linkage manners TiO6 octahedra for anatase and rutile configuration and the anatase-to-rutile
transition induced by various factors among which the hydrothermal processing could inhibit the
anatase-to-rutile phase transition
For particular applications such as photocatalysts the anatase phase is desirable In such
cases the inhibition of the phase transition has been put into practice The Gibbs free
energies of the different polymorphs are temperature and pressure dependent
( G U P V T S ) The high pressure-induced phase transition prefers the more
dense structure with increased atoms or ions coordination number On the contrary the
high temperature-induced transition favours the more open structure with lower atoms or
ions coordination number [135] Therefore high pressure and high temperature cause
opposite effects in the crystallization process Based on this fact a pressure-induced
crystallization route was adopted in the following sections to modify the phase structure of
the Ru-Ti-O coating system
4 Results and discussion
91
432 Solvothermal crystallization of Ru-O-Ti xerogel coatings
Solvothermal processing routes (or termed as hydrothermal when H2O used as filling
solvent) are widely used to convert amorphous materials to crystalline ones and increase
their crystallinity The solvothermal crystallization is a particular route operated under
auto-generated pressure (the driving force for the phase transition) within a sealed
autoclave at a temperature above the boiling point of the filling solvents (H2O or organic
solvents) The high pressure conditions are more often used to produce the metastable-
phase materials
Prior to the solvothermal processing the amorphous Ru-O-Ti coatings were obtained by
repeating the drop-coating air-drying thermal stabilization (at 200 oC for 10 min)
processes The thermal stabilizing step is necessary to facilitate the wetting of the next
drop of sol solution onto the existing layer and thus to obtain a thick layer 2-propanol
(physical properties see Table 46) used as solvent with a filling fraction of 12 was added
into a Teflon sealed autoclave The amorphous Ru-O-Ti xerogel coatings supported onto
titanium plates (see Experimental section) were located into the Teflon holder and then the
autoclave was heated with a ramping rate 10 oC min
-1 to 150
oC (lower than the critical
temperature 2352 oC of 2-propanol subcritical domain) and kept for different time
The auto-generated pressure in the sealed autoclave can be estimated by using the Peng-
Robinson equation of state proposed in the review by Rajamathi [136] (A comparison of
the Peng-Robinson equation of state with the van der Waals equation of state please refer
to Appendix A5)
2 22
m m m
RT ap
V b V bV b (45)
where R = 8314 J mol-1
K-1
is the gas constant p and T are the pressure and temperature
respectively Vm is the molar volume of the liquid in the autoclave the parameters a b are
given by
4 Results and discussion
92
12
22 2045724 1 1
c r
c
R T f Ta
p (46)
007780
c
c
RTb
p (47)
where Tc pc are the critical temperature and critical pressure of the solvent 2-propanol
Tr = T Tc is the reduced temperature fω = 037464 + 154226ω - 026992ω2 ω is acentric
factor Thus the estimated pressure in the autoclave of the present system is around
2times106 Pa
Table 46 Physical properties of pure 2-propanol [137]
Molecular weight
g mol-1
Boiling point
K at 1atm
Critical
temperature K
Critical
pressure Pa Acentric factor
60097 35548 50831 47343 times106 066615
Figure 435 TEM image of powders scratched from the coating surface of as thermally stabilized
(at 200 oC for 10min) Ru025Ti075O2 coating
Ru025Ti075O2 coatings after thermal stabilizing treatment (200 oC) were amorphous-like
(Figure 438) TEM image (Figure 435) of the powders scratched from the Ti-plate
supported coatings shows the amorphous features The amorphous coatings were
crystallized under the subcritical curing conditions (gas-liquid co-existence state of 2-
propanol) It is worth noting that the solvothermal processing of the xerogel coatings
4 Results and discussion
93
(isolated from the filled solvent by a glass bottle) performed herein is different from the
impregnating process of solvothermal reactions [138139]
4000 3500 3000 2500 2000 1500 1000 50030
40
50
60
70
80
90
100
672
1116
460
8121
436
1521
1616
3393
(a)
Tra
nsm
itta
nce
Wave number cm-1
(b)
Figure 436 FTIR of Ru025Ti075O2 xreogel powders measured using the KBr pellet method (a) air-
dried xerogel after solvothermal processing at 150 oC for 3 h (b) air-dried xerogel Xerogel
powders were obtained by removing the solvents of the sol solution in uncovered glass bottle at
room temperature For solvothermal processing powders were put into a glass bottle and then
located in the Teflon holder
The solvothermal effect in the decomposition of organics was investigated by powder
FTIR spectroscopy (Figure 436) Xerogel powders were prepared by removing the
solvents of the sol solution in uncovered glass bottle at room temperature for several days
For solvothermal processing powders were put into a glass bottle and then located in the
Teflon holder The broad absorption band centered at 3393 cm-1
and weak absorption band
at 1616 cm-1
in Figure 436 are associated with the physisorbed water [140] Residual
organic compounds were partially eliminated after solvothermal processing at 150 oC for
3 h which can be confirmed by the decrease in absorption intensity at 1521cm-1
and
1436cm-1
(vCOO- vibrations) [141] The vibration band at 812cm
-1 in Figure 436b can be
assigned to the O-O stretching mode of the Ti-OO-Ti or Ti-OOH groups [142] The bands
centered at 460cm-1
observed in the FTIR spectra are due to the Ru-O-Ti stretching
vibrations [143] The disappearance of the vibration band at 812 cm-1
after solvothermal
4 Results and discussion
94
processing implies that the solvothermal processing promotes the further polycondensation
reactions (oxolation reactions) The analysis of xerogel powders provides auxiliary
information for the understanding of the structure evolution of xerogel coatings under the
solvothermal curing conditions
The surface morphologies of the solvothermally processed coatings were observed with
SEM as shown in Figure 437 (top middle) The typical mud-crack structures were
observed for the solvothermally processed coatings both before and after post-sintering
treatment The initial cracks might have formed during the thermal stabilizing of the
xerogel coatings at 200 oC (ie before the solvothermal processing) These cracks will help
expose the inner layers of the coating matrix to the solvothermal curing atmosphere After
post-sintering more cracks were formed due to the further release of the stress The
particle size of the Ru025Ti075O2 after solvothermal curing and post-sintering was ca
15 nm observed from the TEM image (Figure 437 bottom)
Phase evolution as a function of post-sintering temperature of Ru025Ti075O2 coatings
without (Figure 438) and with (Figure 439) solvothermal processing was investigated by
XRD For the coatings prepared without solvothermal processing the amorphous structure
was observed below 300 oC Above 350
oC single rutile solid solution phase was formed
With the increase of sintering temperature until to 450 oC the crystallinity was increased
gradually In contrast for the coatings prepared with solvothermal processing the distinct
phase evolution behaviour was observed The coating phase transition from amorphous to
single anatase was observed after sintering at 300 oC Therefore we can deduce that the
solvothermal processing is effective to help modify the coating phase structure Post-
sintering at higher temperatures (350~450 oC) results in the crystallization of the rutile
phase Thus the final structure was mixed anatase-rutile phase
4 Results and discussion
95
Figure 437 SEM images of surface morphologies for the solvothermally processed Ru025Ti075O2
coatings (thermally stabilized at 200 oC for 10min) (top) and then post-sintered at 450
oC for 10min
(middle) TEM images of powders scratched from the coating surface of Ru025Ti075O2 coating after
solvothermal processing and post-sintering at 450 oC for 10min (bottom)
4 Results and discussion
96
20 25 30 35 40 45 50 55 60
rutile
Ti
d)
c)
b)
a)
Inte
nsity
au
2 o
300oC
350oC
400oC
450oC
20 25 30 35 40 45 50 55 60
Ti-substrate
RuO2
rutile TiO2
2
Figure 438 XRD patterns of Ru025Ti075O2 coatings prepared by thermal stabilization at 200
oC for
10min each xerogel layer and then annealed at different temperatures for 10min
20 25 30 35 40 45 50 55 60
anatase
rutile
Inte
nsity a
u
Ti
d)
c)
b)
a)
2 o
300oC
350oC
400oC
450oC
20 25 30 35 40 45 50 55 60
Ti-substrate
anatase TiO2
RuO2
rutile TiO2
2
Figure 439 XRD patterns of Ru025Ti075O2 coatings prepared by thermal stabilization at 200
oC for
10min each xerogel layer and then solvothermally processed at 150oC for 3 h and finally annealed
at different temperatures for 10 min
4 Results and discussion
97
433 Solvothermal processing parameters
To obtain the amorphous coatings for the subsequent solvothermal processing the initial
thermal stabilizing temperature is an important parameter which can impose influence on
the subsequent coating phase evolution and accordingly the electrochemical properties of
Ru025Ti075O2 coatings Lower thermal stabilizing temperature provides more flexibility to
modify the coating phase structure for the subsequent solvothermal curing As shown in
Figure 440 higher percentage of anatase phase was obtained in the final mixed anatase-
rutile phase when the coatings were prepared with the initial thermal stabilizing
temperature of 100 oC However for the coatings prepared with the initial thermal
stabilization temperature of 250 oC as shown in Figure 441 only tiny anatase grains
contained in the final anatase-rutile structure are observed Compared with the exclusively
thermal sintering prepared coatings a common interest for the coatings prepared with
solvothermal processing is that the anatase percentage in the final phase structure increases
25 30 35 40 45 50 55 60
Inte
nsity
au
2
a)
b)
Figure 440 XRD patterns of Ru025Ti075O2 coatings prepared by thermal stabilization at 100
oC for
10min each xerogel layer and then (a) thermally sintered at 450 oC for 1 h (b) solvothermally
processed at 150 oC for 24h and finally sintered at 450
oC for 1 h
4 Results and discussion
98
25 30 35 40 45 50 55 60
Inte
nsity a
u
2 o
a)
b)
Figure 441 XRD patterns of Ru025Ti075O2 coatings prepared by thermal stabilization at 250
oC for
10min each xerogel layer and then (a) thermally sintered at 450 oC for 1 h (b) solvothermally
processed at 150 oC for 24h and finally sintered at 450
oC for 1 h
The electrocatalytic activity of the solvothermally prepared coatings was evaluated by
chronopotentiometry as shown in Figure 442 The comparative investigation shows that
the coatings prepared by exclusively thermal sintering possess higher electrode potential
(ca 142 V vs AgAgCl) for the chlorine evolution reactions whereas a decrease in
electrode potential was observed for the coatings prepared by solvothermal curing In
particular for the coatings prepared with lower initial thermal stabilization temperature
(100 oC) a decrease of electrode potential by ca 170 mV has been achieved This is
extremely important as a demonstration for the reduction of energy-loss in the industrial
chlor-alkali process The explanation for the enhanced activity of the solvothermally
processed coatings will be discussed in the following section
4 Results and discussion
99
500 1000 1500 2000 2500 300010
11
12
13
14
15
E V
vs A
gA
gC
l
Time s
a)
b)
500 1000 1500 2000 2500 300010
11
12
13
14
15
E V
vs A
gA
gC
l
Time s
a)
b)
Figure 442 Chronopotentiometric curves of Ru025Ti075O2 coatings recorded at a constant current
density j = 100 mA cm-2
in 35 M NaCl pH3 at room temperature Left corresponding to Figure
440 and Right corresponding to Figure 441
The molar content of ruthenium in the RuxTi1-xO2 binary oxide coatings is another
important parameter to determine the electrocatalytic activity The XRD patterns of
coatings containing different ruthenium content are shown in Figure 443 In all three cases
of x = 04 025 and 015 the (110) peaks (after the peak position correction using the Ti-
substrate (101) peak as reference JCPDS 44-1294) were located in between the pure rutile
TiO2 (27447o) and pure RuO2 (2801
o) which indicates that the rutile solid solutions were
formed The (110) diffraction peak corresponding to rutile structure displays a shift toward
higher angles with the increase of ruthenium content which is related to the change in
lattice parameters The lattice parameters for the rutile RuO2 and anatase rutile TiO2 are
listed in Appendix A6 Except the Ru015Ti085O2 coating weak and broad anatase (101)
peaks are present along with the rutile solid solution phase for the Ru025Ti075O2 and
Ru040Ti060O2 coatings Ru040Ti060O2 coatings exhibit better apparent electrocatalytic
activity for the chlorine evolution reactions than other coatings containing less ruthenium
as shown in Figure 444
4 Results and discussion
100
23 24 25 26 27 28 29 30
Inte
nsity a
u
2 o
RuO2 (110)
TiO2 rutile (110)
b)
a)
c)
TiO2 anatase (101)
Figure 443 X-ray diffraction patterns of RuxTi1-xO2 coatings (a) x = 04 (b) x = 025 (c) x = 015
Coatings were prepared by thermal stabilization at 200 oC for 10min each xerogel layer and then
solvothermally processed at 150 oC for 3 h and final post-calcination at 450
oC for 1 h
0 500 1000 1500 2000 2500 3000 3500100
105
110
115
120
125
130
E
V v
s
AgA
gC
l
Time s
a)
b)
c)
Figure 444 Chronopotentiometric curves of RuxTi1-xO2 coatings corresponding to Figure 443
recorded at a constant current density j = 100 mA cm-2
in 35 M NaCl pH 3 at room temperature
It is worth noting that the single anatase TiO2 is an insulating phase and pure TiO2 is inert
for chlorine evolution reactions One of the motivations of using mixed RuO2-TiO2 binary
oxides as electrocatalytic coating is that ruthenium (active component) and titanium have
similar ionic radius and their oxides possess the same tetragonal rutile structure which
facilitates the formation of rutile solid solution structure (the active phase for chlorine
evolution reactions)
4 Results and discussion
101
It has been proven that the formation of anatase solid solution is possible for the TiSnO2
[144] and TiRuO2 systems [128] however it is limited to lower Sn or Ru contents
(lt 10 mol) and lower sintering temperatures (lt 400 oC) In this case the materials are
worthless to be used as electrocatalysts for chlorine evolution reactions It is a
contradiction to obtain electrocatalysts with high activity (which requires the higher
ruthenium content) and simultaneously with anatase solid solution structure
434 Structure-property correlation of sol-gelsolvothermal prepared Ru04Ti06O2
coatings
Figure 445 Schematic illustration of the coating structure formation of in-situ supported rutile
nanocrystals Ru072Ti028O2 onto anatase TiO2 (a) Ru-O-Ti xerogel coating with rutile-type local
order structure (b) coating containing anatase TiO2 pre-crystallized by solvothermal processing
(step A 150 oC for 24 h) of (a) (c) coating with supported structure of Ru072Ti028O2TiO2 after
post-sintering treatment (step B 450 oC for 1 h) of (b) (d) coating with single rutile structure
obtained by post-sintering treatment (step B) of (a)
To explain the experimental data for the observed enhancement of electrocatalytic activity
of the mixed anatase-rutile RuTiO2 coatings prepared by solvothermal curing a systematic
investigation of the structure-property correlation was carried out by using Ru04Ti06O2
coating as an example The detailed procedure to obtain the coating is illustrated in Figure
445 Starting from the Ru-O-Ti xerogel coating (Figure 445a) two different routes were
4 Results and discussion
102
adopted to obtain the resulting coating i) exclusive post-sintering treatment a) rarr d) ii)
solvothermal curing with subsequent post-sintering a) rarr b) rarr c)
25 30 35 40 45 50 55 60
2 o
Inte
nsity a
u
anatase
rutile
substrate
d)
c)
b)
a)
25 30 35 40 45 50 55 60
2 o
anatase TiO2
rutile TiO2
RuO2
Ti -substrate
Figure 446 XRD patterns of electrodes with coatings (a) (b) (c) and (d) corresponding to (a) (b)
(c) and (d) in Figure 445
The phase development of the deposited Ru-O-Ti xerogel coatings on titanium substrates
both with and without solvothermal processing was studied by XRD (Figure 446) and
Raman spectroscopy (Figure 448) As shown in Figure 446a the amorphous structure of
the thermally stabilized Ru-O-Ti xerogel coatings was confirmed and only the presence of
diffraction peaks from the titanium substrate (JCPDS 44-1294) Raman spectra applied as
a sensitive local probe (Figure 448a) show the vibration bands at 610 114 cm-1
assigned
to the A1g and B1u mode of rutile lattice [145146] suggesting the formation of rutile
particles within the xerogel coatings Post-sintering treatments of the xerogel coatings
result in the densification and crystallization of the gel networks Similarly to what has
been reported by exclusively direct thermal sintering of Ru-O-Ti xerogel coatings at
450 oC for 1 h (Figure 446d) a single rutile solid solution phase with a rutile crystallite
size of 17 nm was formed (Table 47)
4 Results and discussion
103
Figure 447 (a b) Rietveld structure refinement of X-ray diffraction patterns corresponding to the
diffraction profiles in Figure 446c d respectively Red curve is the fitting result Phase
composition (Ti substrate anatase TiO2 rutile RuxTi1-xO2) and its weight percent lattice parameters
were obtained and summarized in Table 47 Commercial TiO2 P25 was used for the diffractometer
instrument calibration
In contrast starting from the amorphous Ru-O-Ti xerogel coating the crystallization
induced by solvothermal processing (150 oC for 24 h) results in the formation of a single
anatase phase (Figure 446b) Consistent with the XRD results a new sharp Raman band
(Figure 448b) at 153 cm-1
along with weak bands at 204 399 cm-1
can be assigned to the
anatase characteristic bands of Eg(1) Eg(2) B1g respectively [144147] A rutile phase with a
weak and broad (110) peak appears after the post-sintering treatment (Figure 446c) The
crystal growth of the rutile structure in the coating is retarded significantly based on the
Rietveld refinement analysis results (ca 3 nm) (Table 47) Recalling that the rutile
nanoparticles have been detected by Raman spectroscopy within the xerogel coating thus
it can be deduced that the nanocrystals with the size of 3 nm originate from the growth of
these initial rutile nanoparticles on the local scale surrounding the anatase phase (ca 20nm)
(Table 47)
RU40-CRAW
2Th [deg]58565452504846444240383634323028262422201816
Co
un
ts [
cp
s]
300
250
200
150
100
50
0
-50
RU40-CRAW Ti 3693
Anatase 005
Rutile 6302
RU40-S-CRAW
2Th [deg]58565452504846444240383634323028262422201816
Co
un
ts [
cp
s]
300
250
200
150
100
50
0
-50
RU40-S-CRAW Ti 3312
Anatase 2253
Rutile 4435
(a)
(b)
[o]
4 Results and discussion
104
For the coating prepared by the a) rarr b) rarr c) route (Figure 445) the lattice parameters
obtained by Rietveld structure refinement (Table 47) confirmed the formation of rutile-
type RuxTi1-xO2 solid solution where x = 072 was calculated using the Vegardrsquos law [148]
1- 2 2 2Ru Ti O TiO RuO = (1- ) +
x xc a c a x c a x (48)
ie 06775 = 06442 times (1-x) + 06906 x
Table 47 Results of Rietveld refinement of XRD data corresponding to Figure 445 c d
Coating Phase Phase wt a Aring c Aring Crystallite size nm
Figure 445c rutile 663 4526(4) 3066(5) 34(2)
anatase 337 3788(1) 9497(4) 203(7)
Figure 445d rutile 100 4575(1) 2997(1) 172(4)
700 600 500 400 300 200 100
Inte
nsity
au
d)
c)
b)
Raman shift cm-1
a)610
514
114
496
617
399 204
153
Figure 448 Raman spectra of coatings (a) (b) (c) and (d) corresponding to (a) (b) (c) and (d) in
Figure 445 A HORIBA-Jobin-Yvon LabRAM ARAMIS Raman spectrometer using a 6328 nm
excitation (He-Ne laser 10 mW) was employed to record the Raman spectra and a silicon single-
crystal was used to instrument calibration The laser light was focused onto the sample using a
100times objective lens
4 Results and discussion
105
The Raman bands at 496 cm-1
(Figure 448c) show the evident shift from the Eg mode
positions of rutile TiO2 nanocrystals (447 cm-1
) [ 149 ] and rutile RuO2 nanocrystals
(511 cm-1
) [150] which is caused by the lattice distortion arising from the incorporation of
Ti into the RuO2 There is no evidence for Ru incorporation into the anatase TiO2 lattice
These results reveal that the coating consists of rutile-type Ru072Ti028O2 solid solution and
undoped anatase TiO2 Along with the quantitative Rietveld phase analysis (Table 47) the
calculated RuTi molar ratio in the coating is 4159 which agrees well with the nominal
composition (4060)
For the coating prepared by the a) rarr d) route (Figure 445) the existence of a ruthenium-
containing amorphous structure in the oxide matrix was confirmed by the Raman band at
514 cm-1
(Figure 448) attributed to RuO2 Eg mode [150] since no separated RuO2 phase
has been detected in the XRD Prior studies showed the complete crystallization of the Ru-
O-Ti xerogel at higher temperatures (gt 500 oC) [ 151 ] It can be concluded that the
solvothermal processing effectively assists the crystallization of oxide coating
Figure 449 (a) The bright-field and (b) high-resolution TEM images (scale bar 2 nm) of powder
samples scratched from the coating prepared by a) rarr b) rarr c) route (Figure 445) The inset of
electron diffraction pattern in (a) showing the diffraction rings of anatase TiO2 phase Powders
were obtained by a mechanical scratching of the Ti-substrate supported coating and subsequently
dispersed ultrasonically into ethanol A drop of the particles dispersion was deposited on the TEM
copper grid and allowed to evaporate under ambient conditions
4 Results and discussion
106
Unlike the O2-rich thermal sintering the solvothermal processing creates a particular
crystallization environment wherein atomic short-range diffusion organics removal and
restricted grains growth occur within the xerogel networks at mild temperature under
elevated pressure conditions [152] The undoped spherical anatase TiO2 was formed by the
local enrichment of titanium species oriented along the (101) direction as visualized from
the transmission electron microscopy images (Figure 449) Nanoclusters of a few
nanometers in size were observed on the surface of anatase TiO2 which are supposed to be
rutile Ru072Ti028O2 nanocrystals The phase stabilization of the nanostructural TiO2
exhibits a strong dependence on particle size and surface chemistry [153] The as-obtained
anatase TiO2 particles are thermally stable during the post-sintering treatment and thus act
as an ideal support for the subsequent dispersion of the active rutile phase [154] Owing to
the steric barrier effects of support and the restrained thermal motion of rutile particles the
detrimental rutile particle growth during the post-sintering is inhibited which is beneficial
for the practical applications Although the undoped anatase TiO2 is insulating the
electronic conduction path could be assured by interconnected particles of rutile
Ru072Ti028O2 or rutile particles separated with very small gaps (tunneling effect) [41]
The capacitive behaviour was examined by monitoring current densities of the oxide
coatings in the acidified NaCl electrolyte (Figure 450) The number of electrochemically
active sites of the coatings estimated in terms of the integrated area of the anodic branches
in the cyclovoltammograms shows a 4-fold increase in the solvothermalpost-sintering
prepared coating (Figure 450a) to that in the direct thermal sintering prepared coating
(Figure 450b) This is roughly close to the increase in geometric surface area calculated by
decreasing the crystal size from 17 nm to 3 nm assuming spherical particle morphology
This suggests that active rutile nanocrystals in the solvothermalpost-sintering prepared
coating are highly dispersed and electrochemically accessible More importantly the onset
of the chlorine evolution reactions at much lower positive potential (ca 085 V
vs AgAgCl) was observed for the electrode with the solvothermalpost-sintering prepared
coating (Figure 450a) indicating a significant activity enhancement Considering that only
surface exposed species are responsible for the surface redox process the significant
increase in the coordinatively unsaturated surface sites due to the nanoscale effect can
account for the enhancement in electrocatalytic activity of the in-situ supported rutile
nanocrystals [110]
4 Results and discussion
107
01 02 03 04 05 06 07 08 09 10 11-06
-04
-02
00
02
04
06
08
10
j
mA
cm
-2
E V vs AgAgCl
(b)
(a)
Figure 450 Cyclovoltammograms recorded for the electrodes with coatings (a) prepared by a) rarr b)
rarr c) route and (b) prepared by a) rarr d) route (Figure 445) with a scan rate of 20 mV s-1
in 35 M
NaCl aqueous solution pH 3 controlled by HCl additions at room temperature using RuO2 coated
titanium wire as counter electrode and AgAgCl as reference electrode The reference electrode was
carefully positioned close to the working electrode by using a Luggin capillary to minimize the
uncompensated electrolyte resistance The working electrodes were used with an exposed area of
1 cm2
100
101
102
105
110
115
120
125
130
(b)
E
V v
s
AgA
gC
l
j mA cm-2
(a)
Figure 451 Galvanostatic polarization curves for the electrodes with coatings (a) prepared by a) rarr
b) rarr c) route and (b) prepared by a) rarr d) route (Figure 445) recorded in 35 M NaCl pH 3 at
50 oC
The polarization behaviour of the electrodes between the solvothermalpost-sintering
prepared coating (Figure 451a) and the direct thermal sintering prepared coating (Figure
4 Results and discussion
108
451b) is compared The former is clearly more active than the later only a slight
overpotential is necessary to keep an intensive chlorine evolution reaction for the
solvothermalpost-sintering prepared coating The difference in Tafel slope implies that a
different reaction mechanism is involved Two basic reaction paths of the chlorine
evolution reactions on electrode surfaces have been proposed Cl- discharge (in which the
adsorption species of Clad on the active sites are formed) followed by either chemical
desorption (CD) or electrochemical desorption (ED) [35] Two Tafel slopes of 61 mV dec
-
1 (ED determining) and 148 mV dec
-1 (mass transfer determining) were observed for the
direct thermal sintering prepared coating at the lower and higher current density regions
respectively In contrast one Tafel slope of 25 mV dec-1
(CD determining) was observed
for the solvothermalpost-sintering prepared coating The ED occurs on the active sites
with the participation of electron transfer but the CD may proceed on the inert anatase
TiO2 support Anatase TiO2 may play a role analogously to boron-doped diamond (BDD)
support in RuO2BDD [40] the desorption rate of the intermediate species could be
accelerated by their surface diffusion from the active sites to the neighbouring inert support
due to the weakened binding interaction
Based on the elaborate investigation of the structure-property correlations of solvothermal-
assisted preparation of Ru04Ti06O2 coatings it can be concluded that the solvothermal
curing of amorphous Ru-O-Ti xerogel coatings helps the formation of anatase TiO2 nano-
particles within the oxide coating matrix which act subsequently as support particles for
the growth of active rutile RuxTi1-xO2 solid solution phase Due to the steric isolation
effects of anatase TiO2 particles the crystal growth of active rutile structure is inhibited
which has been observed for the coatings with various ruthenium content and solvothermal
processing conditions from the broad rutile (110) X-ray diffraction peaks by comparing
with those prepared by direct thermal sintering The novel structure of electrocatalytic
coating with in-situ supported nanocrystals RuxTi1-xO2TiO2 exhibits a significant
enhancement in electrocatalytic activity for chlorine evolution reactions This structural
and crystal size controlled preparation strategy of mixed oxide catalyst coatings will assist
the design of advanced heterocatalysts the understanding of the electrocatalytic effects at
nanoscale and help to improve the energy efficiency of industrial electrolysis
4 Results and discussion
109
435 Conclusion
In this section the crystallization of the Ru-O-Ti xerogel coatings has been tailored by
using the solvothermal processing route under elevated pressure conditions in order to
modify the phase structure of mixed oxide and to study the phase structure-property
correlation of the binary RuxTi1-xO2 oxide coatings
A single rutile solid solution structure of the RuxTi1-xO2 coatings is the usual phase
structure obtained by the sol-gel route Thermal sintering treatment of the xerogel coatings
assists the combustion of organic residues and the amorphous-to-crystalline transformation
In contrast solvothermal curing (150 oC 2 MPa 3~24 h) of the thermally stabilized (at
100~250oC) xerogel coatings with the subsequent post-sintering (450
oC 1h) promotes the
formation of mixed anatase-rutile phase with improved electrocatalytic activity for the
chlorine evolution reactions
The phase and structure transition of the Ru-O-Ti xerogel coatings (nominal composition
Ru04Ti06O2) with and without solvothermal processing has been traced by using XRD
Raman spectroscopy Phase identified in the final oxide coatings consists of a single
anatase TiO2 and rutile type RuxTi1-xO2 solid solution Nanoscaled RuxTi1-xO2 solid solution
particles (3 nm) were supported surrounding the larger anatase TiO2 particles (20 nm)
Attributed to the high dispersion of the active components (rutile solid solution particle)
and the increase in the coordinatively unsaturated surface sites a significant enhancement
in the electrocatalytic activity has been achieved
This work demonstrates a novel way to obtain the highly active oxide electrocatalyst
coatings The preparation of the alternative binary oxide system such as RuSnO2 RuVOx
using the proposed route could possibly exhibit the combined advantages such as the high
activity and low ruthenium content based on the results obtained in Section 41
4 Results and discussion
110
4 Results and discussion
111
44 Electrochemical noise analysis of gas-evolving electrodes
The electrochemical generation of gas molecules of chlorine at the electrode surface is a
discharging process The discharge current densities which determine the production rate
of chlorine are related to the electrode overpotential exchange current density of the
electrode reactions supersaturation of the electrolyte with gas molecules and the charge
transfer coefficients etc [155] The generation and removal of gas bubbles at the electrode
surface cause additional ohmic drop due to the coverage and shielding effect of bubbles on
the surface and vicinity of the electrode As shown in Figure 452 individual gas bubble
evolution is present at very low applied current densities and the nucleation-growth-
detachment is the whole life course of bubble evolution in this case Coalescence of
adjacent bubbles could occur more frequently for the electrodes with poor wettability with
electrolyte Intensive bubble evolution at higher applied current densities results in the
formation of a froth layer adjacent to the electrode
Figure 452 The sketch of gas bubble evolution events as a function of applied current densities
Theoretically bubbles form starting at a low value of critical current density below which the
chlorine molecules diffuse into the bulk solution rather than form bubbles The nucleation growth
and detachment events overlap at higher applied current densities
4 Results and discussion
112
Bubble behaviour on the gas-evolving electrodes has attracted considerable interest in the
electrolytic gas generation processes such as H2 O2 Cl2 [156157158159] Bubble-
induced effects such as blocking the electrode active surface adding extra ohmic drop
causing chaos in mass transfer and current distributions [59160] are associated with
energy losses in industrial electrolysis Identifying the bubble behaviour is essential to get
insight into the electrode materials and structure dependent properties in order to guide the
optimization in electrode preparation The quasi-periodic bubble events occurring at the
electrode surface could result in periodic fluctuations of the electroanalytical signals such
as potential current or resistance etc This provides the possibility to identify the bubble
evolution behaviour by analyzing the bubble-induced electrochemical noise
441 Data acquisition of potential fluctuations
Ru025Ti065V01Ox ternary oxide coated titanium plates were used as working electrodes
facing upwards with an exposed area of 1 cm2 The electrode potential fluctuations ΔV(t)
were recorded galvanostatically between 05 and 100 mA cm-2
in 35 M NaCl pH 3
electrolytes at 50 oC (Figure 453) The time series of potential fluctuations data were
acquired with a sampling interval (∆t) of 5 ms using EC-Lab software (Bio-Logic SAS)
The reciprocal of the sampling interval is the sampling frequency (fs = 1∆t) which is 200
Hz in this case According to the Nyquist sampling theorem the highest frequency (fmax) in
the original signal should be below 100 Hz ( smax
1
2 2
ff
t) as prerequisite for perfect
signal reconstruction The time series segments chosen out of the chronopotentiograms
with a recording duration of T = 300 s were used for further signal analysis
4 Results and discussion
113
Figure 453 Top Protocol for the measurement of electrode potential under galvanostatic
polarization mode with an initial activation of the electrode at a current density of 100 mA cm-2
for
20 min followed by the applied current density steps of j = 05 1 2 4 10 20 30 50 70
100 mA cm-2
Bottom A representation of the electrochemical potential fluctuation signals
observed in the measurement of electrode potential under galvanostatic polarization in 35 M NaCl
pH 3 at 50 oC in a forced convection cell for the Ru025Ti065V01Ox coating The time series of
potential fluctuations data were acquired with a sampling interval of 5 ms (ie sampling frequency
200 Hz) using the EC-Lab software
The current noise from instrument output was also monitored (top in Figure 453) and its
conversion to potential response was quite small compared to bubble induced potential
fluctuations However the distortion in instrument current output could cause sharp jumps
in the potential response Therefore the analytical segments must be chosen carefully to
exclude an abnormal noise record
4 Results and discussion
114
Figure 454 (a) The zero-averaged time series of current noise from the computer-controlled
galvanostat with the set output of 100 mA the current segment was chosen out of Figure 453 (b)
the corresponding sample autocorrelation function (ACF) of the current noise and (c) the
corresponding Fourier power spectral density (PSD) of the current noise
The time series segment of current noise from the instrument output and its autocorrelation
function (ACF) Fourier power spectral density (PSD) were shown in Figure 454 The
applied current was 100 mA with a variance of around 15 microA during the experiment
(Figure 454a) The autocorrelation function of the random current noise shows a
maximum value of one (ACFmax = 1) at zero time lag and approaches to zero elsewhere
(Figure 454b) The Fourier PSD shows the flat profile at all frequencies and larger
4 Results and discussion
115
fluctuations in the high frequency region (Figure 454c) These results indicate that the
current noise from the galvanostat output is a random discrete white noise We must keep
in mind that the chaotic potential fluctuations ΔE(t) as a consequence of the accumulated
events occurring between the working electrode and reference electrode [160] consist of
periodic potential response induced by quasi-periodic bubble formation and their
detachment along with superimposed random background noise which is partially from
the instrument current output noise
442 Statistical analysis of potential fluctuations
One of the most common phenomena observed on the gas evolving electrodes is the
electrochemical fluctuations of potential or current signals as shown in Figure 453
Violent fluctuations in the measured potential value were observed at higher applied
current densities which are correlated to the intensive bubble evolution at the higher
applied current density regions A representative time series segment of potential
fluctuations with a time length of 300 s chosen out of the chronopotentiometric curves
recorded in Figure 453 was shown in Figure 455
The sample standard deviation (σ) of a statistical data set is used commonly as a measure
of the variability or dispersion Larger standard deviation indicates that the data points are
dispersed over a larger range of values The large fluctuations in potential value are
associated with the intensive bubble evolution process whereas the slight fluctuations
indicate a slow and mild bubble evolution process As shown in Figure 456 a linear
relationship exists between the standard deviation of potential fluctuations and the applied
current density at the range of 05~70 mA cm-2
However for the standard deviation value
calculated from the potential value measured at the current density of 100 mA cm-2
the
deviation of the data points away from the linear part is due to the drift of the measured
potential signal The uncertainty in the drift term of the electroanalytical signal makes it
difficult to analyze and explain the experimental data By extrapolating the linear part (blue
line in Figure 456) to zero current density the obtained intercept in y-axis is around 013
mV indicating the existence of background noise even without chlorine bubbles present at
the electrode surface
4 Results and discussion
116
Figure 455 Potential fluctuation segment with a record length of 300 s chosen out of the
chronopotentiometric curves recorded in Figure 453 at the current density of 70 mA cm-2
The
mean of the discrete time series is ltEgt = 118849 V (red dashed line) and the standard deviation (σ)
of potential noise data is 039941 mV (blue dashed lines)
0 20 40 60 80 10000
02
04
06
08
10
12
14
m
V
j mA cm-2
Figure 456 Plot of the standard deviation (σ) of potential fluctuation segments as a function of
applied current density (j) in Figure 453 The data point (marked with red square) of standard
deviation corresponding to the current density of 100 mA cm-2
deviates away from the linear part
(solid line) due to the signal drift of recorded potential during the experiment
For better clarity the potential fluctuations ΔE(t) as a response to the applied current
density (j) were normalized by (E(t)-micro)σ where micro is mean value and σ is standard
deviation This allows us to observe clearly the local patterns and temporal structures (such
4 Results and discussion
117
as time dependence trend and periodicity) of the time series as shown in Figure 457 in
the time domain The normalized time series with the amplitudes in the same range (-5~5)
indicates that a linear correlation exists between j and σ of the potential fluctuations [161]
The drift in potential record (Figure 457d) reduces its amplitude due to the increase in σ
The variability of potential signal is strongly dependent on j Long lasting random noise is
the main feature at low j implying the slow bubble evolution whereas transient impulse
variance prevails at high j as the consequences of the intensive chlorine evolution events
Figure 457 The normalized time series segments of potential noise with a record length of 300 s
(the number of the discrete data points is 60 000) for chlorine evolution under galvanostatic
polarization in 35 M NaCl pH 3 at 50 oC at a current density of (a) 4 mA cm
-2 (b) 30 mA cm
-2 (c)
70 mA cm-2
(d) 100 mA cm-2
Note that the above statistical analysis results could not provide any information about the
periodicity of gas bubble evolution although the periodic information is contained within
the noise data It is necessary to use more advanced and effective mathematical method
and signal processing technique to extract the characteristic bubble evolution information
4 Results and discussion
118
The following sections demonstrate two widely used signal analysis methods Fourier
transform and wavelet transform
443 Fourier analysis of potential fluctuations
Fourier transform (FT) is an operation that transforms the signal from the time domain into
the frequency domain The time series of potential signal can be represented in the
frequency domain by a Fourier power spectral density function (PSD) The PSD describes
how the power per unit of frequency (spectral) of a time series is distributed with the
frequency The typical PSD units for the potential noise signals are mV2 Hz
-1 The value
[Hz-1
] refers to a bandwidth rather than to the frequency in Hz along the x-axis The
integral of the PSD over a given frequency band calculates the average power in the signal
over that frequency band Note that the peaks in the Fourier PSD spectra do not reflect the
power at a given frequency The popular way to estimate the PSD is based on the
computation of the squared modulus of the Fourier transform of the time series through
fast Fourier transform (FFT) which requires the zero-padding of the time series to a length
of an integer power of 2
The characteristic parameters of bubble evolution such as the detachment diameter
frequency and population density have been derived from the theoretical models based on
the Fourier power spectra of the electrochemical noise data [157162163] The plateau-f -α
roll-off profiles of PSD where α is power-law slope can be used to separate various
factors associated with the fluctuation in electrochemical signals and to estimate
quantitatively the characteristic parameters of bubble evolution by fitting the profiles to
theoretical equations However in the cases of overlapped PSD curves or the absence of
frequency-localized plateau and peaks in PSD curves [164165] the Fourier PSD is
incapable of providing further information
4 Results and discussion
119
Figure 458 Fourier power spectral densities (PSD) of potential noise data corresponding to Figure
457 at the current density of (a) 4 mA cm-2
(b) 30 mA cm-2
(c) 70 mA cm-2
(d) 100 mA cm-2
Fourier PSD plots of potential noise recorded at different current densities are shown in
Figure 458 Although there are obvious differences in noise time series profiles (Figure
457) it is impossible to distinguish the noise series by the PSD curves due to the extreme
similarity of Figure 458 a-d since the PSD analysis is based on the perfectly
distinguishable PSD profiles among different noise data The PSD analysis obscures the
important underlying information of bubble evolution in this case In addition some
restrictions of PSD in the analysis of noise data have also been emphasized in cases of
impulse or drift signals [65] As a matter of fact non-stationary signals which dissatisfy
the fundamental assumptions of Fourier analysis [166] could appear in bubble evolution
process for practical electrolysis
4 Results and discussion
120
444 Wavelet analysis of potential fluctuations
Accurate feature extraction of the periodicity from the chaotic time series can provide
characteristic correspondence of bubble behaviour As a powerful alternative to Fourier
transform wavelet transform (WT) has been utilized widely in the field of analytical
chemistry such as spectroscopy chromatography and electroanalytical signals [167] By
the convolution operation of the input data sequence with a scaled wavelet function WT
possesses the capability to visualize the frequency contents localized in time of a signal In
this section a straightforward analysis strategy based on wavelet analysis of potential noise
data has been presented to identify the characteristic Cl2 bubble evolution behaviour when
Fourier analysis is proven to be helpless
The normalized complex Morlet wavelet function (a product of a complex exponential
wave and a Gaussian envelope 1 4 is a normalization factor) [168] is given by
1 4 2
0 0( ) exp( )exp( 2)t i t t (49)
where 0 is the wavelet value at the non-dimensional time t (Figure 459) and ω0 = 6 is a
non-dimensional parameter was used to calculate the local wavelet power spectra using
algorithm proposed by Torrence and Compo [169]
Figure 459 Complex Morlet wavelet base function (Eq (49)) in the time domain with the wave-
like oscillation Real part (black curve) and imaginary part (red curve)
4 Results and discussion
121
The relation between the equivalent Fourier periods (p) and wavelet scales (s) for Morlet
wavelet is given by
2
0 0
41033
2
sp s (410)
Significance test against red noise background spectra under null hypothesis for the
wavelet power spectra was conducted to identify the physically meaningful components of
the potential fluctuations [169] The global wavelet power spectra were calculated by the
statistical average of the wavelet power spectrum over time [170] excluding the data
points within the cone-of-influence due to the edge-effects for a time series with truncated
boundaries It should be stressed that the global wavelet spectrum is the biased estimator of
the true signal power P(f) rather than the original signal amplitude |ΔV(t)| To correlate
approximately the potential amplitude with the dominant periodic events the power peaks
in the global wavelet power spectra were modulated by ( )P f f where Δf = 1s 2 is the
frequency bandwidth [168171172]
The one-dimensional time series were depicted into two-dimensional time-period local
wavelet power spectra (left column in Figure 460) by performing WT which visualizes
the periodic contents of bubble evolution and simultaneously how the periodic contents
evolve over time The extracted features were highlighted from wavelet power contours by
computing the local maxima of squared modulus of the wavelet coefficients The cross-
hatched regions mark out the cone-of-influence caused by edge effects The right column
in Figure 460 shows the global wavelet power spectrum (black curves) along with the 5
significance levels (red dashed curves)
Note that for the present time series and the type of wavelet used the maximal reliable
period (pmax) to satisfy the wavelet detection criterion is 73 s given by [173]
max
1033
3 2
Tp (411)
where T = N Δt = 300 s is the total sampling time of the time series segment N = 60 000
is the number of the sampled data points in the time series segment Δt = 5 ms is sampling
interval Therefore some peaks exceeding the 73 s limit have to be rejected before
4 Results and discussion
122
considering the bubble behaviour Experimentally the artefacts of long-period contents
could be attributed to the assembly and detachment of bubbles at the electrode border [157]
Figure 460 (left column) Local wavelet power spectra (the noise power increases from dark blue
contours to red contours) corresponding to time series in Figure 457 at the current density of (a)
4 mA cm-2
(b) 30 mA cm-2
(c) 70 mA cm-2
(d) 100 mA cm-2
Cross-hatched regions define the
cone-of-influence (right column) The corresponding global wavelet power spectra (black solid
curves) along with 5 significance levels (red dashed curves) and modulated global wavelet
power amplitude spectra (blue solid curves shown on relative scales)
4 Results and discussion
123
As observed from the peaks in the global wavelet power spectra (black curves right
column in Figure 460) several time patterns were well resolved corresponding to each
applied current density indicating that bubble evolution is characterized by multi-period
events This reflects the electrocatalytical and morphological heterogeneities of the discrete
nucleation sites and electrode surface In contrast simulations from the PSD profiles
usually return a single value of bubble release frequency for a given current density [174]
which should be applied restrictively to the cases of perfectly uniform electrodes WT is
superior to Fourier analysis to reflect the reality in this respect At smaller wavelet scales
the events with periods less than 1 s were captured from the potential fluctuations and the
resulting wavelet power peaks were below the 5 significance level At higher j the peaks
attributed to short-period events of 2~4 s become distinct implying the increased release
frequency of bubbles
The WT yields a wide frequency bandwidth ( 1 2 1033 2f s p ) in the higher
frequency regions and accordingly the wavelet power peaks get smoothed out By
modulating the true potential fluctuations power by ( )P f f the relative amplitudes of
the high-frequency (short-period) components of bubble evolution were amplified (blue
curves right column in Figure 460) Approximately the modulated peak amplitudes
represent the contribution of different periodic events to the total σ of potential fluctuations
[172] Thus the dominant characteristic periodic components causing the actual potential
fluctuations |ΔV(t)| at gas-evolving electrodes can be well resolved A linear relationship of
dominant bubble characteristic frequency fc = 1p with applied j was obtained (Figure 461)
Considering the frequency localization is more precise at large scale of wavelet analysis
the value of data points at low j is more accurate in Figure 461
Theoretically a limiting current density (jlim) corresponding to the initial bubble nucleation
can be obtained from the intercept on horizontal axis (Figure 461) which is related to the
electrode properties controlling the gas-evolving behaviour A value of jlim = 104 mA cm-2
for the present electrode was obtained roughly using wavelet analysis of the noise data
mathematically Similar values were found for H2 and O2 evolution [175176] Below this
threshold the removal of product molecules proceeds through diffusion into bulk solution
rather than through gas evolution Wavelet analysis of potential fluctuations time series for
j = 1 mA cm-2
proves that periodic events are absent and wavelet power peaks are below
4 Results and discussion
124
the 5 significance level indicating a purely random process and confirming the bubble-
free presumption when j lt jlim The jlim is an important identifier of gas-evolving electrodes
and often difficult to be determined by traditional analysis [175]
0 10 20 30 40 50 60 70 80 90 100000
005
010
015
020
025
030
035
040f c
H
z
j mA cm-2
y = 000356x - 000369
R2 = 098
Figure 461 Dominant characteristic frequency (fc) of bubble evolution resolved from the
modulated global wavelet power amplitude spectra as a function of applied current density
Fourier transform contains no information about the time evolution of the spectra In
contrast local wavelet power spectra reveal not only the frequency contents but also their
time localization The transitions of bubble evolution events can be observed from the time
history of wavelet power The discontinuity of certain frequency contents over the whole
time record implies that the time series of potential fluctuations are not strictly wide-sense
stationary signals [166] The time spans of the dominant events along time axis (local
wavelet power spectra in Figure 460) shortened with the increase of j At low j the broad
time spans were observed as evidence of anchored bubble growth and coalescence events
for a longer time until substantial buoyancy force raises the bubbles up Compared to
bubble departure although bubble coalescence imposes weaker influence on the electrode
surface shadowing [162] it exerts a pronounced effect on micro-convection and current
distribution For an electrode easily wetted by electrolyte the formed bubbles are prone to
detach rather than coalescence This provides a feasible way for in-situ evaluation of the
wettability of different electrodes by comparing the bubble coalescence behaviour Much
4 Results and discussion
125
finer separation of contours in the local wavelet power spectra at j = 100 mA cm-2
implies
that short-time and numerous bubbles release is the dominant characters and the bubble
coalescence effects fade away
This section demonstrates and validates the methodology for the identification of bubble
evolution behaviour using wavelet analysis of potential fluctuations data The obtained
results confirm that the abundant and valuable information hidden in the noise data can be
easily extracted using wavelet transform which is independent of theoretical models or
visual observations The local detailed behaviour and global behaviour of bubble evolution
can be visualized from the time-frequency localization A more realistic evaluation of
bubble behaviour on any arbitrary electrode geometry can be actualized using the proposed
analytical method The analytical resolution and sensitivity of potential signals can be
further improved by optimal selection of wavelet basis function and algorithm Further
investigation to compare the electrode morphology and structure dependent gas bubble
evolution behaviour is necessary to guide the controlled coating preparation technique
445 Influence of electrolysis temperature on the bubble evolution behaviour
Electrolysis temperature is one of the most critical parameters to maximize the electrolysis
efficiency for the electrolytic chlorine production processes For the anodic
reaction2
2Cl Cl 2e the theoretical electrochemical equilibrium potential Ee
(
2
2
0
2ln
2
Cl
e cl Cl
Cl
pRTE E
F
) decreases with the increase of electrolysis temperature T
(The argument of the logarithm is negative in the equation) Meanwhile the electrolysis
temperature imposes an influence on the bubble-induced potential fluctuations as shown in
Figure 462 Lower amplitudes of potential noise were observed at higher electrolysis
temperatures Above 50 oC the influence of electrolysis temperature on the amplitude of
the potential fluctuations was negligible (Figure 462) The influence of electrolysis
4 Results and discussion
126
temperature on the potential fluctuations is evident at higher applied current densities in
which region the bubble evolution is intensive
H Vogt qualitatively summarized the influence of electrolysis temperature on the anode
effects [163] Increasing electrolysis temperature can increase the diffusion coefficient of
dissolved gas enhance the mass transfer lower the bubble population density and change
the wettability of electrode coatings Bubbles easily detach away from the electrode
surface and with larger bubble diameter at higher electrolysis temperatures The rate of
heterogeneous bubble nucleation is a function of electrolysis temperature and contact angle
[177] Note that the dependence of bubble behaviour on the electrolytic conditions for H2
O2 Cl2 is different A direct comparison of bubble behaviour with reported results for
different gases in the electrolytic system does not make sense
10 10000
05
10
15
20
25
30
705030
m
V
j mA cm-2
25 oC
50 oC
80 oC
20
Figure 462 Standard deviation of potential fluctuations (σE) as a function of the applied current
density on a logarithmic scale and as a function of the electrolysis temperature () 25 oC ()
50 oC () 80
oC Steady-state current-potential curves for chlorine evolution reactions measured
galvanostatically in 35 M NaCl pH 3 with forced convection of electrolyte (volumetric flow rate
of electrolyte 100 mL min-1
) for the electrode coating Ru025Ti065V01Ox (see Section 441)
4 Results and discussion
127
(a)
(b)
(c)
Figure 463 Local wavelet power spectra show the influence of electrolysis temperature on the
bubble detachment period for the electrode coating Ru025Ti065V01Ox (see Section 441) The
potential noise data points were recorded in 35 M NaCl pH 3 at a current density of 05 kA m-2
at
the electrolysis temperature of (a) 25 oC (b) 50
oC and (c) 80
oC
The dependence of bubble evolution behaviour on the electrolysis temperature was
investigated by performing wavelet transform of the recorded potential fluctuation signals
The local wavelet power spectra (ie the three-dimensional time-period-wavelet power
plots) and the modulated global wavelet power spectra (which reflects the real contribution
of the frequency components to the total fluctuations of the potential noise signal) for the
potential noise were shown in Figure 463 and Figure 464 respectively
4 Results and discussion
128
05 1 2 4 8 16 32 6400
05
10
15
20
25
30
22
12
78
48
63
146329
25
18
22
6733
(P(f
)f)
0510
3
Period s
25 oC
50 oC
80 oC
11
Figure 464 Modulated global wavelet power spectra corresponding to the local wavelet power
spectra in Figure 463 The potential noise data points were recorded in 35 M NaCl pH 3 at a
current density of 05 kA m-2
at the electrolysis temperature of (Δ) 25 oC () 50
oC and () 80
oC
The time-period localized wavelet power ridges (ie the local maximum of the wavelet
power) observed in the local wavelet power spectra (Figure 463) show the frequency
components (ie frequency- or period-localized characteristic of wavelet transform) of
bubble evolution events and meanwhile when they occur (ie time-localized characteristic
of wavelet transform) Short-period bubble evolution events become dominant at higher
electrolysis temperatures (Figure 463 Figure 464) The 33- and 67-second periodic
events observed at the electrolysis temperature of 80 oC (Figure 463c) frequently occur at
certain intervals over the 300-second time-record The 25-second periodic events happen
only once during the 300-second time-record (Figure 463c) The analysis of the amplitude
of the peaks in the modulated global wavelet power spectra (Figure 464) must be done
carefully in the presence of the fortuitous events (such as the 25-second periodic events in
Figure 463c) The relative amplitude of the period-peaks in the modulated global wavelet
power spectra (Figure 464) approximately represents the relative contribution of the
period-components to the total amplitude of the potential fluctuations Thus the highest
period-peak in the modulated global wavelet power spectra corresponds to dominant
bubble evolution events causing the potential fluctuations
4 Results and discussion
129
0 20 40 60 80 10000
01
02
03
04
05
06
f c
Hz
j mA cm-2
80 oC
50 oC
25 oC
Figure 465 Dominant characteristic frequency (fc) of bubble evolution resolved from the
modulated global wavelet power amplitude spectra as a function of applied current density and
electrolysis temperature () 25 oC () 50
oC and () 80
oC
The resolved dominant characteristic bubble evolution frequency (fc) as a function of
current density and electrolysis temperature was shown in Figure 465 A linear
dependence of the fc on the current density was observed at each electrolysis temperature
The difference in the slope of the fitting lines implies the different bubble detachment rates
under various electrolysis temperature conditions High temperature electrolysis
accelerates the detachment of the chlorine bubble The limiting current densities (jlim)
corresponding to the initial bubble nucleation at different electrolysis temperatures
obtained from the intercept of the fitting line on horizontal axis in Figure 465 are roughly
equal
4 Results and discussion
130
446 Case analysis Bubble evolution behaviour for the commercial electrode and
sol-gel Ru03Sn07O2 electrode coatings
In this section the bubble evolution behaviour for a very active Ru03Sn07O2 electrocatalyst
coating prepared by the sol-gel route (see Section 314 ruthenium metal loading amount
was 77 g m-2
) was analyzed based on the potential noise data A commercial
Ru03Ti07O2Ti electrode with a ruthenium metal loading amount of 121 g m-2
prepared by
thermal decomposition technique was used for a comparative investigation The titanium
supported Ru03Ti07O2 and sol-gel derived Ru03Sn07O2 electrocatalyst coatings were
prepared by using the similar procedure of coatingdryingsintering cycles Accordingly
the typical mud-crack surface structures were observed for both electrode coatings and the
crack gaps in the commercial coating were broader than that in the sol-gel Ru03Sn07O2
coating (Figure 466)
Figure 466 SEM images of commercial Ru03Ti07O2 and sol-gel Ru03Sn07O2 coatings show the
typical mud-crack surface morphologies
The electrocatalytic activity toward the chlorine evolution reactions of the as-obtained sol-
gel Ru03Sn07O2 coating and the commercial Ru03Ti07O2 electrode coating were evaluated
by steady state chronopotentiometric measurements in 35 M NaCl pH 3 at 80 oC with the
applied current density stepping from 004 to 4 kA m-2
The potential fluctuation data
4 Results and discussion
131
points were recorded using the same way as described in Section 441 The electrocatalytic
activity of the commercial Ru03Ti07O2 electrode coating and sol-gel Ru03Sn07O2 coating
for chlorine evolution reactions was compared in Figure 467 At the applied current
density of 4 kA m-2
the sol-gel Ru03Sn07O2 coating shifts down the electrode potential
around 60 mV compared to the commercial Ru03Ti07O2 electrode coating although the
sol-gel Ru03Sn07O2 coating contains less ruthenium loading amount (77 g Ru m-2
) than
the commercial coating (121 g Ru m-2
) As shown in the inset in Figure 467 the standard
deviation of the potential noise (σE) linearly increases with logj for the sol-gel Ru03Sn07O2
coating whereas for the commercial electrode the σE increases slowly form 004 to
1 kA m-2
and then increases sharply from 1 to 4 kA m-2
10-2
10-1
100
101
110
112
114
116
118
120
122
124
10-2
10-1
100
1010
1
2
3
4
E
mV
j kA m-2
E
- iR
V
vs A
gA
gC
l
j kA m-2
Figure 467 Steady-state current-potential curves for chlorine evolution reactions measured
galvanostatically in 35 M NaCl pH 3 at 80 oC with forced convection of electrolyte for ()
commercial Ru03Ti07O2 electrode coating (Δ) sol-gel Ru03Sn07O2 electrode coating Mean
potential values were corrected for the electrolyte ohmic resistance (E-iR) Inset shows the standard
deviation of potential fluctuations (σE) as a function of current density
Oscillating gas bubbles impose significant influence on the mixing hydrodynamics and
mass transfer in the electrolysis system Except for the factor of bubble detachment rate
4 Results and discussion
132
increase either in bubble size or in bubble population density can result in large
fluctuations in the electrode potential signals Quantitative study of various factors
contributed to the chaos of electrolysis system is necessary to improve design of electrode
coatings
Figure 468 Chronopotentiometric response of electrodes (the mean values μE were removed) (a)
commercial electrode (b) sol-gel Ru03Sn07O2 electrode coating in 35 M NaCl (pH 3) at 80 oC and
polarized at 4 kA m-2
A time series segment of 300 s was chosen from the chronopotentiometry
measurements (sampling frequency 200 Hz) for the statistical analysis Right column shows the
corresponding histograms of potential noise data fitted with a normal distribution (red curves)
The representative potential fluctuation noise recorded galvanostatically at 4 kA m-2
for the
commercial coating and sol-gel derived coating was shown in Figure 468 The noise
amplitude is about four times larger for the commercial coating than that for the sol-gel
coating suggesting a more chaotic bubble evolution process at the electrodeelectrolyte
interface for the former The potential noise obeys a normal distribution law for both
coatings It has been proposed that the amplitude of the potential noise is associated with
the bubble diameter [162] Thus larger bubbles could be generated at the commercial
coating than that at the sol-gel coating The bubble evolution behaviour could be governed
by the local activity the distribution and spacing of the active sites at the electrode surface
The characteristics of bubble evolution events at the electrode surface were identified by
the electrochemical noise analysis technique as shown in Figure 469 and Figure 470
4 Results and discussion
133
(a) (d)
(b) (e)
(c) (f)
Figure 469 Local wavelet power spectra (three-dimensional time-period-wavelet power plots) of
potential noise for the (abc) commercial electrode and (def) sol-gel Ru03Sn07O2 electrode
coating The potential noise data were recorded in 35 M NaCl pH 3 at 80 oC at a current density
of (ad) 4 (be) 05 (cf) 004 kA m-2
The short-periodic bubble evolution events become evident at higher applied current
densities For the commercial electrode galvanostatically polarized at 4 kA m-2
the bubble
evolution induced larger potential fluctuations (Figure 468a) The potential fluctuations in
Figure 468a were caused by four resolved periodic-components (or frequency-
components) 26 7 14 and 31 s (Figure 470) The amplitudes of the wavelet power ridges
for the short-periodic events (2~16 s) were comparable to those for the long-periodic
events (16~64 s) as observed from Figure 469a This indicates that the short-periodic
events contribute more to the total amplitude of the potential fluctuations than the long-
4 Results and discussion
134
periodic events The quantitative analysis was shown in the modulated wavelet power
spectra (ie the (P(f)Δf)05
vs period plots top in Figure 470) since the standard
deviations of the potential fluctuations (σE) were approximately proportional to the
P(f)Δf)05
[172] Therefore the 26- and 7-s periodic events contribute around two times
larger to the amplitudes of the potential fluctuations (Figure 468a) than the 14- and 31-s
periodic events In comparison with the sol-gel Ru03Sn07O2 coating the 4 8 16 and 26 s
periodic events (red lines top in Figure 470) contribute equally to the amplitudes of the
potential fluctuations (Figure 468b)
05 1 2 4 8 16 32 6400
03
06
09
12
5030
17
10
4526
8
Period s
j = 004 kA m-2
00
04
08
12
16
20
(P
(f)
f)0
51
03
58
32
12
46
26
4622
15
j = 05 kA m-2
64
0
4
8
12
16
20
51
261684
31
14
726
j = 4 kA m-2
Figure 470 Modulated global wavelet power spectra for the () commercial electrode and (Δ) sol-
gel Ru03Sn07O2 electrode coating
4 Results and discussion
135
Interestingly the relative contribution of the periodic events to the amplitudes of potential
fluctuations changes with the applied current density as shown in Figure 470 For the
commercial electrode the dominant periodic events causing the potential fluctuations
change from 45-s at 004 kA m-2
to 15-s at 05 kA m-2
and then to 26-s at 4 kA m-2
(black
curves in Figure 470) For the sol-gel Ru03Sn07O2 coating the similar phenomena were
only observed at current density from 004 to 05 kA m-2
The wettability of the oxide
coatings could change with the electrolysis conditions (such as temperature and current
density) which depends on the coating materials This could be a reason for the different
bubble evolution behaviour observed for the commercial and sol-gel coatings
For the gas-evolving electrode molecular chlorine is partially dissolved and diffuses into
the bulk electrolyte the rest exists as adhering bubbles at the electrodeelectrolyte interface
The efficiency of gas evolution is defined as the ratio of gas bubble evolved at the
electrode to the total amount of molecular chlorine generated According to the Faradayrsquos
law equivalent amount of chlorine was produced per unit time at both electrodes polarized
at the same current density Assuming that all of the chlorine produced exists as bubbles
close to the electrode surface at the extraordinary high current density of j = 4 kA m-2
(ie
the gas evolution efficiency is 100) the total volume flux density of chlorine produced is
g
g
1j j
V jRTn v
At zFp At (412)
where A is the electrode surface area t is the sampling duration of bubble events R is gas
constant T is absolute electrolysis temperature z = 2 is the number of electrons transferred
for the electrode reaction F is Faradayrsquos constant p is the gas pressure in the bubbles nj is
the number of adhering bubbles with the volume of vgj The total volume flux density of
chlorine produced is 006 cm3cm
-2s
-1 at j = 4 kA m
-2 80
oC p asymp1 bar and assuming the gas
evolution efficiency and the current efficiency are 100 The bubble population density
buble volume bubble coverage fraction etc are important parameters for the systematic
evaluation of the gas-evolving electrodes The development of a mathematical model and
the experimental observation of bubble evolution processes using video camera could be
helpful to deduce the various parameters
4 Results and discussion
136
447 Conclusion
In this section chlorine bubble evolution behaviour at the electrode surface was identified
by analyzing the bubble-induced electrochemical noise (electrode potential noise) using the
mathematic analysis methods such as standard deviation autocorrelation function Fourier
power spectral density and wavelet transform
Bubble effects at the gas-evolving electrode cause additional ohmic drop due to the
blocking and shielding effect of the electrode surface by the formed or anchored bubbles
which could depend on the surface morphology of the electrode coatings and the electrode
materials Identification of the bubble behaviour is necessary to assist the design of
electrode structure and the selection of suitable electrode materials
A statistical quantity such as the standard deviation of the electrochemical noise is able to
establish the correlation between the noise intensity and the cell operation parameters
electrode materials etc However for the electroanalytical signals with undesirable drift
the statistical analysis encounters the difficulty to provide reliable results
The transformation of the signals from the time domain to the frequency domain using
Fourier transform methods is expected to provide the frequency information of bubble
evolution contained within the noisy signals However the Fourier transform is not able to
distinguish the signals with similar features As an alternative the wavelet transform is
capable of providing accurate time-frequency localization which is used in this work to
extract the characteristic frequency information of bubble evolution
The dependence of the bubble evolution behaviour on the applied current density and
electrolysis temperature was investigated A linear relationship between the dominant
characteristic frequency of bubble evolution and the current density was observed High
temperature electrolysis accelerates the detachment of the chlorine bubble A systematic
and comparative analysis of the electrode activity bubble induced noise and bubble
evolution behaviour for the commercial Ru03Ti07O2 coating and sol-gel derived
4 Results and discussion
137
Ru03Sn07O2 coating was carried out The periodic bubble evolution events causing the
potential fluctuations were resolved from the wavelet analysis of potential noise data The
dominant periodic events contributing to the total amplitude of the potential noise (or the
total standard deviation of the potential noise) have been analyzed by the modulated
wavelet power spectra Future work to develop a mathematical model is essential to deduce
more valuable bubble parameters such as the bubble population density bubble size
bubble coverage fraction and gas evolution efficiency etc
4 Results and discussion
138
5 Summary and conclusions
139
5 Summary and conclusions
A multi-perspective investigation including (i) the selection of electrocatalyst materials (ii)
the design of coating morphology (iii) the modification of the phase structure and (iv) the
identification of the bubble evolution behaviour has been carried out in this work The
electrocatalytic performance of sol-gel derived oxide coatings has been optimized by
choosing the chemical composition and by controlling the surface morphology In order to
avoid the underlying substrate passivation a crack-free inner protective layer was
fabricated purposely A wavelet-based analytical strategy has been developed to identify
the bubble effects for the electrochemical chlorine evolution reactions The structural and
electrochemical characterization was performed to disclose the material-structure-property
correlations
Based on the typical binary RuxTi1-xO2 oxide system the multi-component system
RuTiMOx have been prepared by using acetic acid and propionic acid catalyzed sol-gel
routes to optimize the chemical composition-dependent electrocatalytic activity and to
reduce the ruthenium content It has been proven that the doping of vanadium andor tin
element(s) into the RuTiO2 system is able to enhance significantly the electrocatalytic
activity of oxide coatings compared to the binary RuTiO2 system Compared to the
commercial electrode coating Ru03Ti07O2 a reduction in the electrode potential (measured
in 35 M NaCl pH 3 with an applied current density of 100 mA cm-2
ie 1 kA m
-2) by
about 80 mV has been achieved for the sol-gel-derived oxide coatings with 15~30 mol
ruthenium This indicates the possibility of a considerable reduction of the total electric
energy consumption for the present industrial membrane process (cell voltage 31 V) of the
electrolysis of NaCl aqueous solution or for the membrane process using an oxygen
depolarized cathode
It has been confirmed by other researchers that the electrode deactivation occurs before the
complete dissolution of the active ruthenium components due to the formation of TiOx
interlayers between the substrate and the electrocatalyst layer by the penetration of
5 Summary and conclusions
140
electrolyte through the cracky gaps of the oxide coatings The crack-free oxide coatings
(no visible cracks gaps can be seen from SEM images) were prepared purposely by
reduplicate dipping-withdrawing-drying-sintering steps with the intention to protect the
underlying titanium substrates against passivation The electrochemical cyclic voltammetry
analysis shows that the obtained crack-free coatings have the impermeable characters for
electrolyte Thus the attack of the electrolyte on the titanium substrates can be avoided
Nanopore-containing oxide coatings were prepared by using the lanthanum leaching
technique in order to increase the active surface area of the oxide coatings The utilization
of the nanopores was investigated by electrochemical cyclic voltammetry and impedance
spectroscopy The charging behaviour of the nanopore-containing oxide coatings was
studied by analyzing the charging curves recorded galvanostatically under slight
polarization conditions Further work to evaluate the dependence of the performance on the
pore size geometry and its gradient distribution is recommended
Solvothermal processing of the xerogel oxide coatings has been demonstrated with the
purpose to modify the phase structure of mixed RuTiO2 oxide coatings The solvothermal
processing of the amorphous Ru-O-Ti xerogel coatings with subsequent thermal sintering
treatment results in the formation of a mixed anataserutile structure with improved
electrocatalytic activity for the chlorine evolution reactions The structural and phase
development of the xerogel coatings processed solvothermally were traced by using X-ray
diffraction and Raman spectroscopy It has been deduced that the unique structure
nanoparticles of rutile structure RuxTi1-xO2 (3 nm) decorating larger anatase TiO2 particles
(20 nm) is responsible for the enhanced electrocatalytic activity
Bubble effects at the gas-evolving electrodes have been analyzed preliminaryly by
performing wavelet transforms of the bubble-induced potential fluctuation signals The Cl2
gas bubble evolution at the electrode surface is characterized by multi-period events The
dominant characteristic frequency of bubble evolution as a function of the applied current
density has been extracted out of the noisy signals Further work is necessary to understand
the interrelationship between materials structure and morphology on the one hand and the
bubble evolution behaviour on the other hand
Appendix 141
Appendix
A1 Chemicals
Description CAS No Molecular Formula Molecular
Weight
g mol-1
Density
g mL-1
Supplier
4-Hydroxy-4-methyl-2-pentanone 99 123-42-2 (CH3)2C(OH)CH2COCH3 11616 0931 Sigma-Aldrich
Acetic acid 64-19-7 C2H4O2 6005 104 UdS
Hydrochloric acid 37 7647-01-0 HCl 3646 119 ABCR
Iridium (III) 24-pentanedionate 999 15635-87-7 C15H21IrO6 4895 - ABCR
Isopropanol 67-63-0 C3H8O 6010 0785 UdS
Lanthanum(III) nitrate hexahydrate 99 10277-43-7 La(NO3)3∙6H2O 43301 - ABCR
Oxalic acid dihydrate 98 6153-56-6 C2H2O4 12607 165 ABCR
Polyvinylpyrrolidone average MW 58000 9003-39-8 (C6H9NO)n - - Alfa Aesar
Propionic acid 99+ 79-09-4 CH3CH2CO2H 7408 0992 Alfa Aesar
Ruthenium (III) 24-pentanedionate 14284-93-6 Ru(C5H7O2)3 39840 - Alfa Aesar
Ruthenium (III) chloride hydrate (36Ru) 999 14898-67-0 RuCl3 20743 - ABCR
Tin(IV) isopropoxide isopropanol adduct 98 (metals
basis)
132951-93-0 Sn[OCH(CH3)2]4C3H7OH 41515 - Alfa Aesar
Titanium (IV) isoproxide 97 546-68-9 Ti[OCH(CH3)2]4 28422 096 Sigma-Aldrich
Vanadium (IV) oxide bis (24-pentanedionate) 3153-26-2 C10H14O5V 26516 - ABCR
Zirconium (IV) n-propoxide 70ww in n-propanol 23519-77-9 Zr[O(CH2)2CH3]4 32756 1044 Alfa Aesar
Moisture sensitive Zentrales Chemikalienlager der UdS
Appendix
142
A2 Software
Programme Version Manufacturer
CorelDRAW 10 Corel Corporation (Ottawa Canada)
EC-Lab V995 Bio-Logic SAS (Claix France)
MATLAB 70 The MathWorks Inc (Massachusetts USA)
OriginPro 81 OriginLab Corporation (Northampton USA)
ZSimpWin 310 EChem Software (Michigan USA)
Appendix 143
A3 List of abbreviations Nomenclature
Abbreviation Description
ACF Autocorrelation function
AFM Atomic force microscopy
BDD Boron-doped diamond
CD Chemical desorption
CP Chronopotentiometry
cus Coordinatively unsaturated surface sites
CV Cyclic voltammetry
DSA Dimensionally stable anode
DSC Differential scanning calorimetry
ED Electrochemical desorption
EDS Energy dispersive X-ray spectroscopy
EIS Electrochemical impedance spectroscopy
FT Fourier transform
FTIR Fourier transform infrared spectroscopy
HEC Hydrogen evolving cathode
HT-XRD High temperature X-ray diffraction
IS Impedance spectroscopy
ODC Oxygen depolarized cathode
PSD Power spectral density
PVP Poly(vinylpyrrolidone)
SEM Scanning electron microscope
StDev Standard deviation
TEM Transmission electron microscope
TG Thermogravimetry
WT Wavelet transform
XRD X-ray diffraction
Appendix
144
A4 The calculation of energy consumption for chlorine production
For the industrial electrolytic chlorine (Cl2 71 g mol-1
) production from NaCl aqueous
solution Cl- is oxidized by the loss of electron to the anode 2
1
2Cl Cl e The
driving force for the electrode reaction is provided by applying a cell voltage for instance
31 V Assume the chlorine current efficiency is 98 Then for the production of 1 ton Cl2
the energy consumption is calculated as follows
The molar number of the electron transfer is
- -1000 kg098 1000 g 1 mol e 2878443 mol
M =1ton 1kg 3545 g ton of chlorinee
e
The amount of charge transfer is calculated according to the Faradayrsquos law
-23 1 19
--1
9
M Avogadro number charge of an electron
2878443 mol = 6022137 10 mol 1602177 10 C
ton of chlorine
2878443 mol = 9648531 C mol
ton of chlorine
277727 10 C=
ton of chlorine
e
e
e
The energy consumption (kWh) for the production of 1 ton Cl2 is
9 9 3277727 10 C 860954 10 J 2392 10 kWh31 V = =
ton of chlorine ton of chlorine ton of chlorine
(The energy per unit charge is the potential difference 1V = 1J C-1
1 kWh = 1000A times 1V times3600s = 1000 C s-1
times 1V times3600s = 36times106 CV = 36times10
6 J)
Appendix 145
A5 Peng-Robinson and van der Waals equations of state
The equation of state is a thermodynamic equation describing the state of matter under a
given set of physical conditions (such as temperature pressure volume) Cubic equations
of state are widely used in chemical engineering practice for the calculation and prediction
of the properties of fluids or their mixtures The van der Waals equation of state
(2
m m
RT ap
V b V
2
27
64
c
c
RTa
p and
8
c
c
RTb
p 1873) is developed based on the
modification of the ideal gas law (PVm = RT) However it has limited accuracy for the
prediction of properties of compressed fluids Other equations of state have been
developed on the basis of the van der Waals equation of state such as Redlich-Kwong
equation of state ( 1 2
m m m
RT ap
V b T V V b
2 25042748 c
c
R Ta
p and
008662 c
c
RTb
p
1949) and Peng-Robinson equation of state (2 22
m m m
RT ap
V b V bV b 1976)
(Ref TY Kwak GA Mansoori Chem Eng Sci 1986 41 1303)
The Peng-Robinson equation of state is applicable to the prediction of the properties of
subcritical and supercritical fluids
Appendix
146
A6 JCPDS standard data of RuO2 TiO2
Pattern Lattice 2θ o d Aring hkl IImax
RuO2 40-1290 tetragonal
P42mnm (136)
a = 449940
c = 310710
Vcell = 6290
28010
35051
40022
40548
44997
54247
57931
59439
65542
65912
66991
69542
74126
77572
83395
86435
87750
93163
94487
96886
99494
99926
113537
115443
318300
255800
225100
222300
201300
168960
159060
155380
142310
141600
139580
135070
127810
122970
115800
112490
111140
106050
104910
102940
100930
100610
092090
091110
110
101
200
111
210
211
220
002
310
221
112
301
202
212
321
400
222
330
312
411
103
420
213
402
100
77
12
6
1
39
9
6
5
3
8
7
4
1
5
1
4
2
4
3
3
2
4
1
Pattern Lattice 2θ o d Aring hkl IImax
TiO2 21-1276 rutile
tetragonal
P42mnm (136)
a = 459330
c = 295920
Vcell = 6243
27447
36086
39188
41226
44052
54323
56642
62742
64040
65480
69010
69790
72410
74411
76510
79822
82335
84260
87464
89557
90708
95275
96017
324700
248700
229700
218800
205400
168740
162370
147970
145280
142430
135980
134650
130410
127390
124410
120060
117020
114830
111430
109360
108270
104250
103640
110
101
200
111
210
211
220
002
310
221
301
112
311
320
202
212
321
400
410
222
330
411
312
100
50
8
25
10
60
20
10
10
2
20
12
2
1
4
2
6
4
2
8
4
6
6
Appendix 147
97176
98514
105099
106019
109406
116227
117527
120059
122788
123660
131847
136549
140052
143116
155869
102710
101670
097030
096440
094380
090720
090090
088920
087740
087380
084370
082920
081960
081200
078770
420
331
421
103
113
402
510
213
431
332
422
303
521
440
530
4
1
2
2
2
4
4
8
8
8
6
8
12
2
2
Pattern Lattice 2θ o d Aring hkl IImax
TiO2 21-1272 anatase
body-centered
tegragonal
I41amd (141)
a = 378520
c = 951390
Vcell = 13631
25281
36947
37801
38576
48050
53891
55062
62121
62690
68762
70311
74031
75032
76020
80727
82139
82662
83149
93220
94181
95143
98318
99804
101221
107448
108963
112840
113861
114909
118439
120104
121725
122336
131035
135998
137391
143887
352000
243100
237800
233200
189200
169990
166650
149300
148080
136410
133780
127950
126490
125090
118940
117250
116640
116080
106000
105170
104360
101820
100700
099670
095550
094640
092460
091920
091380
089660
088900
088190
087930
084640
083080
082680
081020
101
103
004
112
200
105
211
213
204
116
220
107
215
301
008
303
224
312
217
305
321
109
208
323
316
400
307
325
411
219
228
413
404
420
327
415
309
100
10
20
10
35
20
20
4
14
6
6
2
10
4
2
2
6
4
2
4
4
2
2
2
4
4
2
2
2
4
2
2
2
2
2
4
2
Appendix
148
150039
152633
079740
079280
424
0012
4
2
Pattern Lattice 2θ o d Aring hkl IImax
TiO2 29-1360 brookite
orthorhombisch
Pcab (61)
a = 54558
b = 91819
c = 51429
Vcell = 25763
25340
25689
30808
32791
36252
37297
37934
38371
38576
39205
39967
40153
42340
46072
48012
49173
49694
52012
54205
55234
55711
57176
57685
59991
62065
63065
63416
63643
64104
64603
65003
65876
68768
70432
71490
71931
73648
76949
79025
79283
83643
84288
84724
86743
95590
95993
97609
102559
103201
351200
346500
290000
272900
247600
240900
237000
234400
233200
229600
225400
224400
213300
196850
189340
185140
183320
175680
169080
166170
164860
160980
159680
154080
149420
147290
146560
146090
145150
144150
143360
141670
136400
133580
131860
131160
128520
123810
121070
120740
115520
114800
114320
112170
103990
103660
102370
098730
098290
120
111
121
200
012
201
131
220
211
040
112
022
221
032
231
132
212
240
320
241
151
113
232
123
052
160
312
251
203
133
213
161
400
332
401
233
004
024
431
124
333
080
441
044
521
281
324
125
372
100
80
90
4
25
18
6
4
4
5
8
18
16
16
30
18
3
3
20
30
5
13
2
7
10
4
9
12
12
6
10
9
5
8
3
2
2
10
2
1
4
2
2
4
3
2
4
2
4
Appendix 149
A7 Phase diagram of binary RuO2-TiO2 system
Figure A1 Phase diagram of RuO2-TiO2 system Top ss1 solid solution of RuO2 in TiO2 ss2
solid solution of TiO2 in RuO2 Below phase composition of the TiO2-RuO2-Cl system A region
with dominating anatase solid solution R region with dominating rutile solid solution (Ref YuE
Roginskaya ID Belova BSh Galyamov FKh Chibirova RR Shifrina Mater Chem Phys
1989 22 203)
Appendix
150
A8 Mathematic basics of noise analysis
A81 Standard deviation
For the statistical method considering a discrete time-series x(t) measured by sampling
the signal at constant intervals t taking N points in the time record the acquisition time
of the record is T = N ∙t Accordingly the sampling frequency is indicated as 1t in Hz
The easier way to characterize a time series of random signal (x0 x1hellip xN-1) is to calculate
its arithmetic mean value (the mean intensity over all values of times) x and sample
standard deviation s defined as
1
0 1 1
0
1
NN
i
i
x x xx x
N N (A1)
1 2
0
1
1
N
i
i
s x xN
(A2)
The noise signal intensity and the fluctuation amplitude of current density (or potential)
can be obtained from the above calculation and the measurement results allow different
electrocatalysts to be compared as a function of applied potential (or current density) For
the electrode surface with larger anchored bubbles larger amplitudes of signal fluctuation
(ie larger standard deviation) are expected
A82 Autocorrelation function
For the analysis of time domain signals autocorrelation is often used to judge the presence
of a periodic signal which has been buried in the noise The autocorrelation function (ACF)
of a periodic signal is also periodic and more important with the same signal period and
frequency The autocorrelation is defined as the expected value of the product of a random
variable or signal x(t) with a time-shifted version of itself x(t+ τ) where τ is an integer
multiple of the time interval t This illustrates how the signal resembles a delayed version
of itself The estimation of the mean normalized (biased) autocorrelation of a discrete time
series (x0 x1hellip xN-1) is obtained by using
Appendix 151
1
0
1 2
0
1
( )1
N k
i i k
ixx N
i
i
x x x xN
R k
x xN
(A3)
where xi (i = 0 1 hellip N-1) is the amplitude of the time series k = 0 1 hellip N-1 is the time
lags Various formulas can be found from the literature for the estimation of
autocorrelation functions The autocorrelation attenuates from Rxx(0) = 1 to the zero base
line of the correlation function in the present formula which makes it easy to analyze the
data
The correlation is calculated using a fast algorithm based on the correlation theorem (the
Fourier transform of an autocorrelation function is equal to the product of the Fourier
transform of the function and the complex conjugate of the Fourier transform of the
function)
F Rxx(τ) = X(f) X(f) = |X(f)|
2 (A4)
where x(t) is the input signal X(f) is the Fourier transform of x(t) and X(f) the complex
conjugate of X(f) F is the Fourier transform Rxx(τ) is the autocorrelation of x(t) then we
have
Rxx(τ) = F -1X(f) X
(f) (A5)
where F -1 is the inverse Fourier transform The Fourier transform x(t)
FX(f) is
defined as X(f) =
x (t) e-2πjtf
dt
A83 Fourier transform
Regarding the spectral methods the signals are studied in frequency domain In the time
domain signals are represented as amplitude versus time whereas in the frequency domain
signals are expressed as amplitude versus frequency It is more intuitional to see the period
and amplitude of individual event contained in the overlapped transients The transform of
Appendix
152
time-domain data to frequency-domain data is executed by Fourier transformation For a
discrete sequence xi of length N its discrete Fourier transform (DFT) is given by
1 2
0
( )
ikN jN
DFT i
i
f k x e
(A6)
where k = 01hellipN-1 j is the imaginary unit The difference of frequency responses of two
random signals can be distinguished from the Fourier transform even if they possess a
common mean value and similar overall randomness
Power spectral density (PSD) of a random signal is the distribution of the signal power
over frequency domain which is computed based on the fast Fourier transform (FFT)
algorithm To determine the PSD the signal has to be stationary which means there should
be no signal drift as a function of time By definition the power spectral density of a
random time series x(t) is the average of the Fourier transform magnitude squared over a
time interval If the signal is a wide-sense stationary process (the signalrsquos mean and
variance do not change over time or position de-trending is necessary for a non-stationary
signal) then the PSD is the Fourier transform of the autocorrelation function
2( ) ( )
j f
x xxS f R e d (A7)
The power of a random signal x(t) over a given band of frequencies (in the range f1~f2)
can be calculated as follows
2
112 ( )
f
xf
P S f df (A8)
The slope of the PSD plot on a log-log scale has been proposed as a characterization of
bubble evolution mechanisms such as diffusion-controlled bubble growth bubble
coalescence and gas oscillatory behaviour caused by the synchronized gas production and
gas release Besides the PSD plots contain the information of magnitude and
characteristic frequency and frequency distribution of the signal
In the Fourier analysis the linear time-invariant signals are correlated with sine waves by
linear time-invariant operators For the non-stationary or transient signals the Fourier
Appendix 153
analysis becomes invalid In addition the Fourier transform gives frequency components
presented in the signals but loses the time localized information
A84 Wavelet transform
Wavelet analysis represents a more accurate and efficient method of time-frequency
localization in the analysis of electrochemical noise signals and has been used to overcome
the limitations of the Fourier transform The information of both the amplitude of any
periodic signals within the series and how the amplitude varies with time can be resolved
Wavelet transform of a function x(t) is defined as
1( ) ( )
t bW b a x t dt
aa (A9)
where b a are time index and wavelet scale respectively Function ( )t is called as the
mother wavelet the asterisk () denotes the complex conjugate The mother wavelet ( )t
is scaled by a factor of a and shifted by a factor of b to obtain the wavelet
basis1
t b
aa
The plots of wavelet power spectrum give the high time and frequency resolutions of
dominant events of a time (or spatial) series The wavelet analysis results are very sensitive
to the selection of mother wavelet function and the related parameters and even
contradictory results could be yielded among different analysis [169] This fact should be
kept in mind in the practical applications
Wavelet analysis has been widely used in signal and image processing and has been proved
to be universal in various applications and fields In chemistry wavelet transform has been
utilized for signal processing in the analytical chemistry including infrared spectroscopy
UV-Vis spectroscopy mass spectrometry chromatography X-ray diffraction and various
electroanalytical signals (Ref X-G Shao A K-M Leung F-T Chau Acc Chem Res
2003 36 276)
Appendix
154
A9 MATLAB source code
The present MATLAB code is written for the purpose of demonstration The details of the
wavelet algorithms are explained somewhere else (See C Torrence G P Compo A
practical guide to wavelet analysis Bull Am Meteor Soc 1998 79 61) The following
MATLAB code is adapted from the Torrencersquos code for the Morlet wavelet transform The
Torrencersquos subprograms chisquare_solvem and chisquare_invm were directly called
herein by the main program wavelet_fourier(xfsdjsminfname) A 30-day trial version
of MATLAB R2009b was kindly offered by The MathWorks Inc (Massachusetts USA)
The further data analysis using a licensed MATLAB version 70 was carried out in the
group of our project partner Prof Dr WF Maier Technical Chemistry Saarland
University
----------------------------------------------------------------------------
Fourier transform amp Wavelet transform (Modified TC98 source code)
Edited on 29 Jan 2010 by Ruiyong Chen
Reference
CTorrence GCompohttppaoscoloradoeduresearchwavelets
Global wavelet spectrum excludes points within the coi herein
Note that for TC98rsquos code global_ws=variance(sum(power)length(x))
INPUTS
x = raw time series of potential fluctuations acquired by EC-Lab software
fs = sampling frequency 200 Hz
dj = wavelet scale resolution
smin = determine the smallest scale
fname = figure name
OUTPUTS
a) Potential fluctuations under galvanostatic polarization mode
b) Frequency spectrum
Appendix 155
c) FFT periodogram
d) Local wavelet power spectrum
e) Global wavelet spectrum
whos
Command Window INPUTS
load x20sc_seg11_100mA_51878dat
x=x20sc_seg11_100mA_51878
fname=20sc_seg11_100mA_51878
wavelet_fourier(x20002550fname)
----------------------------------------------------------------------------
function wavelet_fourier(xfsdjsminfname)
x_zeromean=x-mean(x)
variance=std(x)^2 the square of the standard deviation delta^2
x=(x-mean(x))sqrt(variance) normalized by std with variance = 1
fs=200 sampling frequency
time=(0length(x)-1)(1fs) construct time array
FFT
p=nextpow2(x) returns the smallest power of two that
satisfies 2^p gt= abs(x)
n1=2^nextpow2(length(x))
f1=(0length(x)-1)(fsn1) frequency range
y=fft(xn1) DFT zero padding
mag=abs(y) Amplitude of the DFT Frequency spectrum
power1= yconj(y)n1 power of the DFT
wavelet transform Morlet omega_0=6
mother=Morlet
k0=6
dt=1fs
dj=025
smin=50
s0= smin dt
j1=fix(log2(length(x)smin))
Appendix
156
j1=j1dj
scale=s02^((0j1)dj) construct scale array 1-by-(j1+1)
fourier_factor=(4pi)(k0 + sqrt(2 + k0^2)) fourier_factor=1033044
period=scalefourier_factor compute Fourier period
cone of influence
coi = fourier_factorsqrt(2)dt
[1E-51((length(x)+1)2-1)fliplr((1(length(x)2-1)))1E-5]
zero padding construct Fourier angular frequency array omega_k
z(1length(x))=x-mean(x) x is the normalized time series see above
base2=fix(log(length(x))log(2)+04999)
z=[zzeros(12^(base2+1)- length(x))] new time series z
n=length(z) Attention n is not equal to n1
k=[1fix((n2))]
k=k((2pi)(ndt))
omegak=[0k-k(fix((n-1)2)-11)] 1-by-n
wavelet transform
f=fft(z) 1-by-n complex
wave=zeros(j1+1n) construct empty wave array(j1+1)-by-n matrix of zeros
wave=wave+1iwave make it complex
nomegak=length(omegak)
for a1 = 1j1+1
expnt = -(scale(a1)omegak - k0)^22(omegak gt 0)
norm = sqrt(scale(a1) omegak (2))(pi^(-025))sqrt(nomegak)
sqrt(scale omegak (2)) sqrt(nomegak) = sqrt(scale2pidt)
daughter = normexp(expnt)
daughter = daughter(omegak gt 0)
wave(a1) = ifft(fdaughter)
end
wavelet transform coefficients(j1+1)-by-length(x)
coefs=wave(1length(x))
power=(abs(coefs))^2
transpose=power length(x)-by-(j1+1)
global wavelet power spectrum includes points within coi
Appendix 157
break terminates the execution of a for or while loop
In nested loops break exits only from the loop in which it occurs
returns the index of the maximal period (id_period) outside the coi
for id_period=1j1+1
if (period(id_period)gt=max(coi))id_period=id_period-1 break end
end
global wavelet power spectrum excludes points within coi
for b1=id_period-1 1
if mod(length(x)2) == 0 length(x) is even
valid=fix((max(coi)-period(b1))(max(coi)-period(1))
fix((length(x)+1)2-1))
middle= ceil((length(x)+1)2-1)
low=middle-valid
high=middle+1+valid
global_ws_excoi(b1)=sum(transpose(lowhighb1))(2(valid+1))
else length(x) is odd
valid=fix((max(coi)-period(b1))(max(coi)-period(1))
fix((length(x)+1)2-1))
middle= ceil((length(x)+1)2-1)+1
low=middle-valid
high=middle+valid
global_ws_excoi(b1)=sum(transpose(lowhighb1))(2valid+1)
end
global_ws_excoi(b1)=variance global_ws_excoi(b1)
end
significance test
lag1=072
gamma_factor=232
freq=dtperiod
pk = (1-lag1^2)(1-2lag1cos(freq2pi)+lag1^2)
fft_theor = variancepk include time-series variance
dof=length(x) -scale
dof = 2sqrt(1 + (dofdtgamma_factor scale)^2 )
Appendix
158
Default confidence level 095
chisquare_inv(0952)=59915
signif = fft_theorchisquare_inv(0952)2 signif(1-by(j1+1))
ones(1length(x))returns a 1-by-length(x) matrix of ones
sig95 = (signif)(ones(1length(x)))
sig95 = powersig95 when ratio gt 1 power is significant
significance level for global wavelet spectrum
for a1 = 1j1+1
chisquare = chisquare_inv(095dof(a1))dof(a1)
global_signif(a1)= fft_theor(a1)chisquare 1-by-(j1+1)
end
OUTPUTS
a) Normalized potential fluctuations
b) Frequency spectrum
c) FFT Periodogram
d) Local wavelet power spectrum
e) Global wavelet spectrum
whos
subplot(position[01 080 055 010])
plot(timexk) plot normalized time series
hold on
plot([1 max(time)][0 0]w--) magenta color
hold off
xlabel(Time s)
ylabel(Amplitude)
set(gcaFontSize8)
set(gcaXLim[min(time) max(time)])
text(-01513(a)scFontSize8) marking on the figure
text(xytextsc) adds the text in the quotes text to
location (xy)on the current axes
sc assuming lower left corner is (00) and upper right corner is (11)
set(gcfcolorwhite)
subplot(position[01 060 055 010])
Appendix 159
plot(f1(1n12)mag(1n12)2n1k) plot FFT amplitude vs frequency
The first half of the frequency range (0~Nyquist frequency fs2) is
sufficient to identify the component frequencies in the data
xlabel(Frequency Hz)
ylabel(Amplitude)
set(gcaFontSize8)
set(gcaXLim[f1(1) 2]) set maximal x-axes 2 Hz
text(-01513(b)scFontSize8)
set(gcfcolorwhite)
plot FFT periodogram (plot of power versus frequency)
loglog(xy) logarithmic scale
subplot(position[01 035 055 015])
loglog(f1(1n12)power1(1n12)k)
xlabel(Frequency Hz)
ylabel(FFT PSD)
set(gcaFontSize8)
set(gcaYLim[1E-10 1E5]
YTick[1E-10 1E-5 1E0 1E5])
text(-01512(c)scFontSize8)
set(gcfcolorwhite)
grid on
Contour plot wavelet power spectrum
subplot(position[01 01 055 015])
levels = [00625012502505124816] 1-by-9
Yticks = 2^(fix(log2(min(period)))fix(log2(max(period))))
contour(timelog2(period)log2(power)log2(levels))
xlabel(Time s)
ylabel(Period s)
set(gcaYLimlog2([min(period)max(period)])
YDirreverse
YTicklog2(Yticks())
YTickLabelYticks)
set(gcaFontSize8)
Appendix
160
text(-01512(d)scFontSize8)
set(gcfcolorwhite)
hold on
level at -99 (fake) and 1(5 significance level)
contour(timelog2(period)sig95[-991]k)
hold on
plot(timelog2(coi)k) cone-of-influence
hold off
plot global wavelet spectrum excludes points within the coi
plot([min(global_ws) max(global_ws)][log2(max(coi))
log2(max(coi))]r--)
subplot(position[072 01 015 015])
plot(global_ws_excoilog2(period(1id_period))k)
xlabel(Power)
set(gcaYLimlog2([min(period)max(period)])
YDirreverse
YTicklog2(Yticks())
YTickLabelYticks)
set(gcaXLim[-002max(global_ws_excoi) 12max(global_ws_excoi)])
set(gcaYgridon)
set(gcaFontSize8)
text(-0312(e)scFontSize8)
set(gcfcolorwhite)
hold on
plot significance level
plot(global_signif(1id_period)log2(period(1id_period))r--)
plot(global_signiflog2(period)r--)
hold off
save figure as fig tif
saveas(gcffnamefig)
saveas(gcffnametif)
whos
end of code
Appendix 161
A10 Publications
A101 Journal article
1 R Chen V Trieu H Natter K Stoumlwe WF Maier R Hempelmann A Bulan J
Kintrup R Weber
In-situ supported nanoscale RuxTi1-xO2 on anatase TiO2 with improved electroactivity
Chem Mater 2010 22 6215-6217
A102 Patents
2 R Chen V Trieu H Natter R Hempelmann A Bulan J Kintrup R Weber
Verfahren zur Herstellung von Anodenbeschichtungen fuumlr die Elektrolytische
Chlorherstellung
Deutsches Patent Anmeldetag 28102010
3 R Chen V Trieu H Natter R Hempelmann A Bulan J Kintrup R Weber
Anoden mit erhoumlhtem Anatas-Gehalt fuumlr die elektrolytische Chlorgewinnung
Deutsches Patent Aktenzeichen 10 2010 030 2937 Anmeldetag 21062010
A103 Conference proceedings
4 V Trieu R Chen H Natter R Hempelmann
Ru-based Mixed Oxide Electrodes Prepared by Electrochemical Deposition
Poster Electrochemistry 2010 From Microscopic Understanding to Global Impact
Bochum 13-15092010
5 R Chen V Trieu H Natter R Hempelmann K Stoumlwe W F Maier
Oxide Catalysts for Electrochemical Chlorine Evolution Prepared by Sol-gel Route
Talk Minisymposium From molecules to Materials Saarbruumlcken 10-11092009
Appendix
162
A11 Acknowledgements
The present work was carried out at the Institute of Physical Chemistry at Saarland
University in the period from Sep 2006 to Sep 2010 under the supervision of Prof Dr
Rolf Hempelmann I gratefully acknowledge and thank Prof Hempelmann for providing
me the great opportunity and for showing his enthusiastic support for my Ph D research
work Thanks to Dr Harald Natter for many fruitful discussions Thanks to Mrs Sylvia
Kuhn for showing endless patience for the SEM TEM measurements Thanks to Josef
Wilhelm and Dieter Muumlnch for the help in technical problems
Special thanks to my partner Mr Vinh Trieu who measured electrochemically all of my
Sol-Gel coatings with great passions and burdened me with several GB of the very
precious raw data I am very grateful for his help to screen out the well-pleasing coatings
I would also like to acknowledge Prof Dr Wilhelm F Maier Prof Dr Klaus Stoumlwe and
their research group at the Institute of Technical Chemistry at Saarland University for the
practical help in the sol-gel preparation Thanks to Prof Dr Wilhelm F Maier for kindly
providing the MATLAB software program Thanks to Prof Dr Klaus Stoumlwe for XRD
Rietveld refinement analysis
The Bayer MaterialScience AG (Project lsquolsquoIdentifizierung und Charakterisierung von
Elektrokatalysatoren fuumlr die Chlorherstellungrsquorsquo) and BMBF (Joint project
lsquolsquoEffizienzsteigerung bei der Chlor-Herstellungrsquorsquo FKZ 033R018G) are acknowledged for
financial support for the research projects I would like to acknowledge our industrial
project partners Mr Andreas Bulan Dr Juumlrgen Kintrup Dr Rainer Weber for organizing
the projects and their valuable advice
Finally I would like to gratefully thank my family for their love and support and
especially my wife Shuhua for all her love and patience
Ruiyong Chen
Saarbruumlcken 2010
Appendix 163
A12 References
[1] J Fauvarque The chlorine industry Pure amp Appl Chem 1996 68 1713
[2] TF OBrien TV Bommaraju F Hine Handbook of Chlor-Alkali Technology
Vol 1 Fundamentals Springer New York 2005 p17
[3] H Deacon Improvements in manufacture of chlorine US Patent 165 802 1875
[4] httpworldchlorinecomproductsindexhtml
[5] I Moussallem J Joumlrissen U Kunz S Pinnow T Turek Chlor-alkali electrolysis
with oxygen depolarized cathodes history present status and future prospects J
Appl Electrochem 2008 38 1177
[6] S Trasatti Electrolysis understanding the success of DSA
Electrochim Acta
2000 45 2377
[7] J Kintrup R Weber A Bulan M Weis Energy-efficient chlorine production with
gas diffusion electrodes (ODC) Electrochemistry-Crossing boundaries Oct 2008
Gieszligen Germany
[8] HB Beer Improvements in or relating to electrodes for electrolysis British Patent
1 147 442 1965
[9] HB Beer The invention and industrial development of metal anodes J
Electrochem Soc 1980 127 303C
[10] O De Nora Anwendung maszligbestaumlndiger aktivierter Titan-Anoden bei der
Chloralkali-Elektrolyse (Use of dimensionally stable activated titanium anodes in
alkali-metal chloride electrolysis) Chemie Ingenieur Technik (Chem Eng Technol)
1970 42 222
[11] GRP Malpass RS Neves AJ Motheo A comparative study of commercial and
laboratory-made TiRu03Ti07O2 DSA
electrodes lsquolsquoIn-sitursquorsquo and lsquolsquoex-sitursquorsquo surface
characterization and organic oxidation activity Electrochim Acta 2006 52 936
[12] HA Hansen IC Man F Studt F Abild-Pedersen T Bligaard J Rossmeisl
Electrochemical chlorine evolution at rutile oxide (110) surfaces Phys Chem
Chem Phys 2010 12 283
Appendix
164
[13] S Trasatti WEOrsquoGrady in Advances in Electrochemistry and Electrochemical
Engineering Vol 12 H Gerischer and CW Tobias Editors Wiley New York
1981 p 117
[14] S Trasatti G Lodi Electrodes of conductive metallic oxides Elsevier 1980 pp
301-358
[15] S Trasatti Progress in the understanding of the mechanism of chlorine evolution at
oxide electrodes Electrochim Acta 1987 32 369
[16] TF OBrien TV Bommaraju F Hine Handbook of Chlor-Alkali Technology
Vol 1 Chemistry and Electrochemistry of the Chlor-Alkali Process Springer New
York 2005 p 111
[17] H Over Ruthenium dioxide a fascinating material for atomic scale surface
chemistry Appl Phys A 2002 75 37
[18] V De Nora TT Nguyen Non-carbon anodes with active coatings WO
2005090641 A2 2005
[19] HB Beer Composite catalytic material particularly for electrolysis electrodes and
method of manufacture US Patent 4 585 540 1986
[20] DF Difranco KL Hardee Pd-containing coating for low chlorine overpotential
WO 2006028443 A1 2006
[21] PCS Hayfield Development of the noble metaloxide coated titanium electrode
Part II The move from platinumiridium to ruthenium oxide electrocatalysts
Platinum Metals Rev 1998 42 46
[22] F Herlitz Titanium in the electrochemical industry use and protection Stainless
Steel World 2004 wwwstain-steel-worldnet
[23] T Loučka The reason for the loss of activity of titanium anodes coated with a layer
of RuO2 and TiO2 J Appl Electrochem 1977 7 211
[24] HB Beer Electrode and coating therefore US Patent 3 632 498 1972
[25] J Aromaa O Forseacuten Evaluation of the electrochemical activity of a Ti-RuO2-TiO2
permanent anode Electrochim Acta 2006 51 6104
[26] S Trasatti Electrocatalysis in the anodic evolution of oxygen and chlorine
Electrochim Acta 1984 29 1503
Appendix 165
[27] C Angelinetta S Trasatti LjD Atanasoska ZS Minevski RT Atanasoski
Effect of preparation on the surface and electrocatalytic properties of RuO2+IrO2
mixed oxide electrodes Mater Chem Phys 1989 22 231
[28] SV Evdokimov Electrochemical and corrosion behavior of electrode materials
based on compositions of ruthenium dioxide and based-metal oxides Russ J
Electrochem 2002 38 583
[29] M Aparicio LC Klein Thin and thick RuO2-TiO2 coatings on titanium substrates
by the sol-gel process J Sol-Gel Sci Technol 2004 29 81
[30] V Panić A Dekanski S Milonjić R Atanasoki B Nikolić Influence of the
aging time of RuO2 and TiO2 sols on the electrochemical properties and behavior
for the chlorine evolution reaction of activated titanium anodes obtained by the sol-
gel procedure Electrochim Acta 2000 46 415
[31] LA De Faria JFC Boodts S Trasatti Physico-chemical and electrochemical
characterization of Ru-based ternary oxides containing Ti and Ce Electrochim
Acta 1992 37 2511
[32] KJ OrsquoLeary US Patent 3 776 834 1973
[33] YuE Roginskaya OV Morozova The role of hydrated oxides in formation and
structure of DSA-type oxide electrocatalysts Electrochim Acta 1995 40 817
[34] MHP Santana LM Da Silva LA De Faria Investigation of surface properties
of Ru-based oxide electrodes containing Ti Ce and Nb Electrochim Acta 2003 48
1885
[35] MHP Santana LA De Faria Oxygen and chlorine evolution on
RuO2+TiO2+CeO2+Nb2O5 mixed oxide electrodes Electrochim Acta 2006 51
3578
[36] T Zhang D Tang Y Shao X Ke S You Synthesis and characterization of
nanoscale Ce(x)Ru(1-x)O2 coatings with electrochemical activity J Am Ceram Soc
2007 90 989
[37] TAF Lassali JfC Boodts S Trasatti Electrocatalytic activity of the ternary
oxide Ru03PtxTi(07-x)O2 for chlorine evolution Electrochim Acta 1994 39 1545
[38] CR Davidson JM Sedlak Halogen evolution with improved anode catalyst
WO1981003186 1981
Appendix
166
[39] A De Battisti S Ferro M Dal Colle Electrocatalysis at conductive diamond
modified by noble-metal oxides J Phys Chem B 2001 105 1679
[40] S Ferro A De Battisti Electrocatalysis and chlorine evolution reaction at
ruthenium dioxide deposited on conductive diamond J Phys Chem B 2002 106
2249
[41] JV Ryan AD Berry ML Anderson JW Long RM Stroud VM Cepak VM
Browning DR Rolison CI Merzbacher Electronic connection to the interior of a
mesoporous insulator with nanowires of crystalline RuO2 Nature 2000 406 169
[42] T Arikawa Y Takasu Y Murakami K Asakura Y Iwasawa Characterization of
the structure of RuO2-IrO2Ti electrodes by EXAFS J Phys Chem B 1998 102
3736
[43] LM Doubova S Daolio A De Battisti Examination of RuO2 single-crystal
surfaces charge storage mechanism in H2SO4 aqueous solution J Electroanal
Chem 2002 532 25
[44] WE OrsquoGrady AK Goel FH Pollak HL Park YS Huang Cyclic
voltammetry on RuO2 (100) (101) (001) and (110) lsquolsquoas-grownrsquorsquo single-crystal
surfaces J Electroanal Chem 1983 151 295
[45] E Guerrini V Consonni S Trasatti Surface and electrocatalytic properties of
well-defined and vicinal RuO2 single crystal faces J Solid State Electrochem 2005
9 320
[46] Z Yi C Kangning W Wei J Wang S Lee Effect of IrO2 loading on RuO2-IrO2-
TiO2 anodes A study of microstructure and working life for the chlorine evolution
reaction Ceram Int 2007 33 1087
[47] V Panić A Dekanski S Milonjić VB Mišković-Stanković B Nikolić Activity
and stability of RuO2-coated titanium anodes prepared via the alkoxide route J
Serb Chem Soc 2006 71 1173
[48] AJ Terezo EC Pereira Preparation and characterization of TiRuO2 anodes
obtained by sol-gel and conventional routes Mater Lett 2002 53 339
[49] S Trasatti Physical electrochemistry of ceramic oxides Electrochim Acta 1991
36 225
Appendix 167
[50] SM Hoseinieh F Ashrafizadeh MH Maddahi A comparative investigation of
the corrosion bahavior of RuO2-IrO2-TiO2 coated titanium anodes in chloride
solutions J Electrochem Soc 2010 157 E50
[51] LM Da Silva KC Fernandes LA De Faria JFC Boodts Electrochemical
impedance spectroscopy study during accelerated life test of conductive oxides
Ti(Ru+Ti+Ce)O2-system Electrochim Acta 2004 49 4893
[52] V Panić A Dekanski V Jovanović VD Jović MW Barsoum Ruthenium
oxide based coatings formed on Ti3SiC2 support 57th
Annual Meeting of the
International Society of Electrochemistry Book of Abstracts II Edinburgh UK
2006 p S4-P-19
[53] F Gestermann H-D Pinter G Speer P Fabian R Scannel Electrode for
electrolysis in acid media US Patent 7 211 177 B2 2007
[54] C Gabrielli F Huet R P Nogueira Electrochemical noise measurements of
coalescence and gas-oscillator phenomena on gas-evolving electrodes J
Electrochem Soc 2002 149 E71
[55] F Lugli F Zerbetto An introduction to bubble dynamics Phys Chem Chem
Phys 2007 9 2447
[56] G Liger-Belair M Vignes-Adler C Voisin B Robillard P Jeandet Langmuir
2002 18 1294-1301
[57] R Ettelaie E Dickinson Z Du BS Murray Disproportionation of clustered
protein-stabilized bubbles at planar air-water interfaces J Colloid Interface Sci
2003 263 47
[58] D Kiuchi H Matsushima Y Fukunaka K Kuribayashi Ohmic resistance
measurement of bubble froth layer in water electrolysis under microgravity J
Electrochem Soc 2006 153 E138
[59] J Dukovic CW Tobias Influence of attached bubbles on potential drop and
current distribution at gas-evolving electrodes J Electrochem Soc 1987 134 331
[60] L Cassayre TA Utigard S Bouvet Visualizing gas evolution on graphite and
oxygen-evolving anodes JOM 2002 54 41
[61] P Boissonneau P Byrne Experimental investigation of bubble-induced free
convection in a small electrochemical cell J Appl Electrochem 2000 30 767
Appendix
168
[62] A Legat V Doleček Chaotic analysis of electrochemical noise measured on
stainless steel J Electrochem Soc 1995 142 1851
[63] BM Grafov LS Kanevskii MG Astafiev Noise characterization of surface
processes of the Liorganic electrolyte interface J Appl Electrochem 2005 35
1271
[64] L Kwiatkowski Phosphate coatings porosity Review of new approaches Surface
Engineering 2004 20 292
[65] A Aballe M Bethencourt F J Botana M Marcos Using wavelets transform in
the analysis of electrochemical noise data Electrochim Acta 1999 44 4805
[66] J Livage F Beteille C Roux M Chatry P Davidson Sol-gel synthesis of oxide
materials Acta Mater 1998 46 743
[67] BL Cushing VL Kolesnichenko CJO Connor Recent advances in the liquid-
phase synthesis of inorganic nanoparticles Chem Rev 2004 104 3893
[68] DE Babushkin EP Talsi Formation solution structure and reactivity of
alkylperoxo complexes of titanium J Mol Catal A Chem 2003 200 165
[69] CJ Brinker GW Scherer Sol-Gel science The physics and chemistry of sol-gel
processing Academic Press Inc 1990 p 459
[70] H Kozuka M Kajimura T Hirano K Katayama Crack-free thick ceramic
coating films via non-repetitive dip-coating using polyvinylpyrrolidones as stress-
relaxing agent J Sol-Gel Sci Technol 2000 19 205
[71] H Kozuka M Kajimura Single-step dip coating of crack-free BaTiO3 films gt 1μm
thick effect of poly(vinylpyrrolidone) on critical thickness J Am Ceram Soc
2000 83 1056
[72] JGM van Berkum AC Vermeulen R Delhez TH De Keijser EJ Mittemeijer
Applicabilities of the Warren-Averbach analysis and an alternative analysis for
separation of size and strain broadening J Appl Cryst 1994 27 345
[73] H Savaloni M Gholipour-Shahraki MA Player A comparison of different
methods for X-ray diffraction line broadening analysis of Ti and Ag UHV
deposited thin films nanostructural dependence on substrate temperature and film
thickness J Phys D Appl Phys 2006 39 2231
[74] HR Rietveld Line profiles of neutron powder-diffraction peaks for structure
refinement Acta Cryst 1967 2 151
Appendix 169
[75] AR West Solid state chemistry and its applications John Wiley amp Sons 1984 pp
71-75
[76] E Rasten Electrocatalysis in water electrolysis with solid polymer electrolyte
PhD Dissertation Norwegian University of Science and Technology 2001 p 13
[77] T Ohno K Sarukawa K Tokieda M Matsumura Morphology of a TiO2
photocatalyst (Degussa P-25) consisting of Anatase and rutile crystalline phases J
Catal 2001 203 82
[78] R Loudon The Raman effect in crystals Adv Phys 1964 13 423
[79] OR Camara S Trasatti Surface electrochemical properties of Ti(RuO2+ZrO2)
electrodes Electrochim Acta 1996 41 419
[80] S Ardizzone A Carugati G Lodi S Trasatti Surface structure of ruthenium
dioxide electrodes and kinetics of chlorine evolution J Electrochem Soc 1982
129 1689
[81] F Hine M Yasuda T Yoshida Studies on the oxide-coated metal anodes for
chlor-alkali cells J Electrochem Soc 1977 124 500
[82] LD Burke OJ Murphy JF OrsquoNeill S Venkatesan The oxygen electrode Part
8-Oxygen evolution at ruthenium dioxide anodes J Chem Soc Faraday Trans 1
1977 73 1659
[83] LD Burke OJ Murphy Surface area-voltammetric charge correlation for
RuO2TiO2-based anodes J Electroanal Chem 1980 112 39
[84] RG Hutchinson NA Fleck ACF Cocks A sintering model for thermal barrier
coatings Acta Mater 2006 54 1297
[85] V Panić A Dekanski VB Mišković-Stanković S Milonjić B Nikolić On the
deactivation mechanism of RuO2-TiO2Ti anodes prepared by the sol-gel procedure
J Electroanal Chem 2005 579 67
[86] S Trasatti Oxideaqueous solution interfaces interplay of surface chemistry and
electrocatalysis Mater Chem Phys 1987 16 157
[87] P Simon Y Gogotsi Materials for electrochemical capacitors Nat Mater 2008 7
845
[88] W Sugimoto T Shibutani Y Murakami Y Tkasu Charge storage capabilities of
rutile-type RuO2-VO2 solid solution for electrochemical supercapacitors
Electrochem Solid-State Lett 2002 5 A170
Appendix
170
[89] C-C Hu K-H Chang M-C Lin Y-T Wu Design and tailoring of the
nanotubular arrayed architecture of hydrous RuO2 for next generation
supercapacitors Nano Lett 2006 6 2690
[90] Y-Y Chen T Zhang X Wang Y-Q Shao D Tang Phase structure and
microstructure of a nanoscale TiO2-RuO2-IrO2-Ta2O5 anode coating on titanium J
Am Ceram Soc 2008 91 4154
[91] A Marshall B Boslashrresen G Hagen M Tsypkin R Tunold Preparation and
characterization of nanocrystalline IrxSn1-xO2 electrocatalytic powders Mater
Chem Phys 2005 94 226
[92] S Ardizzone CL Bianchi G Cappelletti M Ionita A Minguzzi S Ronfinini A
Vertova Composite ternary SnO2-IrO2-Ta2O5 oxide electrocatalysts J Electroanal
Chem 2006 589 160
[93] K Macounovaacute M Makarova J Franc J Jirkovskyacute P Krtil Influence of oxygen
on reactivity of Ru1-xFexO2-y-doped materials Electrochem Solid-State Lett 2008
11 F27
[94] C Angelinetta S Trasatti LjD Atanososka RT Atanasoski Surface properties
of RuO2+IrO2 mixed oxide electrodes J Electroanal Chem 1986 214 535
[95] VV Panić A Dekanski SK Milonjić RT Atanasoski BŽ Nikolić RuO2-TiO2
coated titanium anodes obtained by the sol-gel procedure and their electrochemical
behaviour in the chlorine evolution reaction Colloids Surf A 1999 157 269
[96] Y Takasu W Sugimoto Y Nishiki S Nakamatsu Structural analyses of RuO2-
TiO2Ti and IrO2-RuO2-TiO2Ti anodes used in industrial chlor-alkali membrane
processes J Appl Electrochem 2010 DOI 101007s10800-010-0137-3
[97] AA Bolzan C Fong BJ Kennedy CJ Howard Structural studies of rutile-type
metal dioxides Acta Cryst 1997 B53 373
[98] J Gaudet AC Tavares S Trasatti D Guay Physicochemical characterization of
mixed RuO2-SnO2 solid solutions Chem Mater 2005 17 1570
[99] AI Onuchukwu S Trasatti Effect of substitution of SnO2 for TiO2 on the surface
and electrocatalytic properties of RuO2+TiO2 electrodes J Appl Electrochem
1991 21 858
Appendix 171
[100] S Yuan Q Sheng J Zhang H Yamashita D He Synthesis of thermally stable
mesoporous TiO2 and investigation of its photocatalytic activity Micropor
Mesopor Mat 2008 110 501
[101] K Macounovaacute M Makarova J Jirkovskỳ J Franc P Krtil Parallel oxygen and
chlorine evolution on Ru1-xNixO2-y nanostructured electrodes Electrochem Acta
2008 53 6126
[102] Y Takasu S Mizutani M Kumagai S Sawaguchi Y Murakami Ti-V-W-OTi
oxide electrodes as candidates for electrochemical capacitors Electrochem Solid-
State Lett 1999 2 1
[103] K Takahashi Y Wang K Lee G Cao Fabrication and Li+-intercalation
properties of V2O5-TiO2 composite nanorod arrays Appl Phy A 2006 82 27
[104] JR Osman JA Crayston A Pratt DT Richens RuO2-TiO2 mixed oxides
prepared from the hydrolysis of the metal alkoxides Mater Chem Phys 2008 110
256
[105] M Kraumlmer T Schmidt K Stoumlwe WF Maier Structural and catalytic aspects of
sol-gel derived copper manganese oxides as low-temperature CO oxidation catalyst
Appl Catal A 2006 302 257
[106] L Hernaacuten J Morales L Saacutenchez J Santos Use of Li-M-Mn-O [M = Co Cr Ti]
spinels prepared by a sol-gel method as cathodes in high-voltage lithium batteries
Solid State Ionics 1999 118 179
[107] LJQ Maia VR Mastelaro S Pairis AC Hernandes A Ibanez A sol-gel route
for the development of rare-earth aluminium borate nanopowders and transparent
thin films J Solid State Chem 2007 180 611
[108] JM Miller LJ Lakshmi Spectroscopic characterization of sol-gel-derived mixed
oxides J Phys Chem B 1998 102 6465
[109] FR Kogler M Jupa M Puchberger U Schubert Control of the ratio of
functional and non-functional ligands in clusters of the type
Zr6O4(OH)4(carboxylate)12 for their use as building blocks for inorganic-organic
hybrid polymers J Mater Chem 2004 14 3133
[110] H Over YD Kim AP Seitsonen S Wendt E Lundgren M Schmid P Varga
A Morgante G Ertl Atomic-scale structure and catalytic reactivity of the
RuO2(110) surface Science 2000 287 1474
Appendix
172
[111] E Haumlrk K Lust A Jaumlnes E Lust Electrochemical impedance study of hydrogen
evolution on Bi(001) electrode in the HClO4 aqueous solutions J Solid State
Electrochem 2009 13 745
[112] LK Xu JD Scantlebury Microstructure and electrochemical properties of IrO2-
Ta2O5 coated titanium anodes J Electrochem Soc 2003 150 B254
[113] R Lin PL Taberna J Chmiola D Guay Y Gogotsi P Simon Microelectrode
study of pore size ion size and solvent effects on the chargedischarge behaviour
of microporous carbons for electrical double-layer capacitors J Electrochem Soc
2009 156 A7
[114] PM Biesheuvel MZ Bazant Nonlinear dynamics of capacitive charging and
desalination by porous electrodes Phys Rev E 2010 81 031502
[115] T Ohkubo T Konishi Y Hattori H Kanoh T Fujikawa K Kaneko Restricted
hydration structures of Rb and Br ions confined in slit-shaped carbon nanospace J
Am Chem Soc 2002 124 11860
[116] J Huang BG Sumpter V Meunier Theoretical model for nanoporous carbon
supercapacitors Angew Chem Int Ed 2008 47 520
[117] E Barsoukov JR Macdonald Impedance spectroscopy Theory experiment and
applications (second Edition) John Wiley amp Sons Inc 2005 p 75
[118] J Bisquert M Graumltzel Q Wang F Fabregat-Santiago Three-channel
transmission line impedance model for mesoscopic oxide electrodes functionalized
with a conductive coating J Phys Chem B 2006 110 11284
[119] F Fabregat-Santiago EM Barea J Bisquert GK Mor K Shankar CA Grimes
High carrier density and capacitance in TiO2 nanotube arrays induced by
electrochemical doping J Am Chem Soc 2008 130 11312
[120] J Lim JD Whitcomb JG Boyd J Varghese Effect of electrode pore geometry
modelled using Nerst-Planck-Poisson-modified stern layer model Comput Mech
2009 43 461
[121] L Bai L Gao BE Conway Problem of in situ real-area determination in
evaluation of performance of rough or porous gas-evolving electrocatalysts Part
1-Basis for distinction between capacitance of the double layer and the
pseudocapacitance due to adsorbed H in the H2 evolution reaction at Pt J Chem
Soc Faraday Trans 1993 89 235
Appendix 173
[122] JC Myland KB Oldham Which of three voltammetric methods when applied to
a reversible electrode reaction can best cope with double-layer capacitance and
severe uncompensated resistance Anal Chem 2000 72 3210
[123] V Lazarov D Stoychev Method for determination of the kinetic parameters in
electrolytes containing surface-active substances accounting for the influence of
electrode potential on the changes of the free electrode surface Electroanalysis
2004 16 211
[124] D Galizzioli F Tantardini S Trasatti Ruthenium dioxide a new electrode
material I Behaviour in acid solutions of inert electrolytes J Appl Electrochem
1974 4 57
[125] N Munichandraiah S Sathyanayana Insoluble anode of porous lead dioxide for
electrosynthesis preparation and characterization J Appl Electrochem 1987 17
22
[126] M van Soestbergen PM Biesheuvel MZ Bazant Diffuse-charge effects on the
transient response of electrochemical cells Phys Rev E 2010 81 021503
[127] R Liu J Duay T Lane SB Lee Synthesis and characterization of
RuO2poly(34-ethylenedioxythiophene) composite nanotubes for supercapacitors
Phys Chem Chem Phys 2010 12 4309
[128] MT Colomer MJ Velasco JR Jurado Synthesis and thermal evolution of TiO2-
RuO2 xerogels J Sol-Gel Sci Technol 2006 39 211
[129] J Maacutelek A Watanabe T Mitsuhashi Sol-gel preparation of rutile type solid
solution in TiO2-RuO2 system J Therm Anal Cal 2000 60 699
[130] PH Duvigneaud A Coussement Effect of chlorine on solid solution formation in
ruthenium titanium dioxide coatings J Solid State Chem 1984 52 22
[131] F Hine M Yasuda T Yoshida Studies on the oxide-coated metal anodes for
chlorine-alkali cells J Electrochem Soc 1977 124 500
[132] J Muscat V Swamy NM Harrison First-principles calculations of the phase
stability of TiO2 Phys Rev B 2002 65 224112
[133] F Dachille PY Simons R Roy Pressure-temperature studies of anatase brookite
rutile and TiO2-II American Mineralogist 1968 53 1929
Appendix
174
[134] JF Banfield DR Veblen Conversion of perovskite to anatase and TiO2 (B) a
TEM study and the use of fundamental building blocks for understanding
relationships among the TiO2 minerals American Mineralogist 1992 77 545
[135] AR West Solid state chemistry and its applications John Wiley amp Sons 1984 p
445
[136] M Rajamathi R Seshadri Oxide and chalcogenide nanoparticles from
hydrothermalsolvothermal reactions Curr Opin Solid State Mater 2002 6 337
[137] J Cho J-K Jeon Optimization study on the azeotropic distillation process for
isopropyl alcohol dehydration Korean J Chem Eng 2006 23 1
[138] M Wu G Lin D Chen G Wang D He S Feng R Xu Sol-hydrothermal
synthesis and hydrothermally structural evolution of nanocrystal titanium dioxide
Chem Mater 2002 14 1974
[139] G Demazeau Solvothermal reactions an original route for the synthesis of novel
materials J Mater Sci 2008 43 2104
[140] G Li L Li J Boerio-Goates BF Woodfield High purity anatase TiO2
nanocrystals Near room-temperature synthesis grain growth kinetics and surface
hydration chemistry J Am Chem Soc 2005 127 8659
[141] LM Bronstein X Huang J Retrum A Schmucker M Pink BD Stein B
Dragnea Influence of iron oleate complex structure on iron oxide nanoparticle
formation Chem Mater 2007 19 3624
[142] httpwwwelectrochemorgdlma206pdfs1540pdf
[143] I Shaltout Crystallization kinetics and structure of (TeO2-TiO2-Fe2O3) glasses J
Mater Sci 2000 35 323
[144] MM Oliveira DC Schnitzler AJG Zarbin (TiSn)O2 mixed oxides
nanoparticles obtained by the sol-gel route Chem Mater 2003 15 1903
[145] V Swamy Size-dependent modifications of the first-order Raman spectra of
nanostructured rutile TiO2 Phys Rev B 2008 77 195414
[146] M Ocantildea V Forneacutes JV Garciacutea Ramos CJ Serna Factors affecting the infrared
and Raman spectra of rutile powders J Solid State Chem 1988 75 364
[147] H Liu W Yang Y Ma Y Cao J Yao J Zhang T Hu Synthesis and
characterization of titania prepared by using a photoassisted sol-gel method
Langmuir 2003 19 3001
Appendix 175
[148] L Vegard Die Konstitution der Mischkristalle und die Raumfuumlllung der Atome Z
Phys 1921 5 17
[149] H Nakano N Hasuike K Kisoda K Nishio T Isshiki H Harima Synthesis of
TiO2 nanocrystals controlled by means of the size of magnetic elements and the
level of doping with them J Phys Condens Matter 2009 21 064214
[150] AV Korotcov Y-S Huang K-K Tiong D-S Tsai Raman scattering
characterization of well-aligned RuO2 and IrO2 nanocrystals Raman Spectrosc
2007 38 737
[151] MT Colomer MJ Velasco Rutile-type dense ceramics fabricated by pressureless
sitering of Ti1-xRuxO2 powders prepared by sol-gel J Eur Ceram Soc 2007 27
2369
[152] BL Cushing VL Kolesnichenko CJ OrsquoConnor Recent advances in the liquid-
phase synthesis of inorganic nanoparticles Chem Rev 2004 104 3893
[153] AS Barnard L A Curtiss Prediction of TiO2 nanoparticle phase and shape
transitions controlled by surface chemistry Nano Lett 2005 5 1261
[154] SC Pillai P Periyat R George DE McCormack MK Seery H Hayden J
Colreavy D Corr SJ Hinder Synthesis of high-temperature stable anatase TiO2
photocatalyst J Phys Chem C 2007 111 1605
[155] YuG Chirkov VI Rostokin Gas-generating porous electrodes Effect of the
porous space structure on polarization curves Russ J Electrochem 2001 37 353
[156] D Kiuchi H Matsushima Y Fukunaka K Kuribayashi Ohmic resistance
measurements of bubble froth layer in water electrolysis under microgravity J
Electrochem Soc 2006 153 E138
[157] C Gabrielli F Huet RP Nogueira Electrochemical noise measurements of
coalescence and gas-oscillator phenomena on gas-evolving electrodes J
Electrochem Soc 2002 149 E71
[158] L Zhang Y Zhang X Zhang Z Li G Shen M Ye C Fan H Fang J Hu
Electrochemically controlled formation and growth of hydrogen nanobubbles
Langmuir 2006 22 8109
[159] M Boinet D Marlot JC Lenain S Maximovitch F Dalard RP Nogueira First
results from coupled acousto-ultrasonics and electrochemical noise technique
applied to gas evolving electrodes Electrochem Commun 2007 9 2174
Appendix
176
[160] C Gabrielli F Huet M Keddam Real-time measurement of electrolyte resistance
fluctuations J Electrochem Soc 1991 138 L82
[161] DR Hodgson Application of electrochemical noise and in situ microscopy to the
study of bubble evolution on chlorine evolving anodes Electrochim Acta 1996 41
605
[162] C Gabrielli F Huet M Keddam A Sahar Investigation of water electrolysis by
spectral analysis I Influence of the current density J Appl Electrochem 1989 19
683
[163] H Vogt Contribution to the interpretation of the anode effect Electrochim Acta
1997 42 2695
[164] F Huet M Musiani RP Nogueira Electrochemical noise analysis of O2 evolution
on PbO2 and PbO2-matrix composites containing Co or Ru oxides Electrochim
Acta 2003 48 3981
[165] F Huet M Musiani RP Nogueira Oxygen evolution on electrodes of different
roughness An electrochemical noise study J Solid State Electrochem 2004 8
786
[166] A Maksumov R Vidu A Palazoglu P Stroeve Enhanced feature analysis using
wavelets for scanning probe microscopy images of surfaces J Colloid Interface
Sci 2004 272 365
[167] X-G Shao AK-M Leung F-T Chau Wavelet A new trend in chemistry Acc
Chem Res 2003 36 276
[168] I Simonovski M Boltežar The norms and variances of the Gabor Morlet and
general harmonic wavelet functions J Sound Vib 2003 264 545
[169] C Torrence GP Compo A practical guide to wavelet analysis Bull Am
Meteorol Soc 1998 79 61
[170] B Cazelles M Chavez GC De Magny J-F Gueacutegan S Hales Time-depedent
spectral analysis of epidemiological time-series with wavelets J R Soc Interface
2007 4 625
[171] R Buumlssow An algorithm for the continous Morlet wavelet transform Mech Syst
Signal Pr 2007 21 2970
[172] P Lachowicz Wavelet analysis a new significance test for signals dominated by
intrinsic red-noise variability arXiv09064176v1 [astro-phHE]
Appendix 177
[173] DS Bloomfield RTJ McAteer M Mathioudakis DR Williams FP Keenan
Propagating waves and magnetohydrodynamic mode coupling in the quiet-sun
network Astrophys J 2004 604 936
[174] JM Silva RP Nogueira L De Miranda F Huet Hydrogen absorption estimation
on Pd electrodes from electrochemical noise measurements in single-compartment
cells J Electrochem Soc 2001 148 E241
[175] D Schoumlnfuss L Muumlller On the current-potential curve of a very fast hydrogen
evolution process up to high current densities Electrochim Acta 1994 39 2097
[176] H Vogt Ouml Aras RJ Balzer The limits of the analogy between boiling and gas
evolution at electrodes Int J Heat Mass Transfer 2004 47 787
[177] SD Lubetkin The fundamentals of bubble evolution Chem Soc Rev 1995 24
243
V
Table of Contents
Abstract I
Zusammenfassung III
1 Introduction 1
2 Theory and background 3
21 The history of industrial chlorine production 3
22 The anodic process 7
221 Anodic chlorine evolving reaction and classical equations 7
222 The reaction mechanisms and kinetics of anodic chlorine evolution 11
223 Anode electrocatalyst coatings 13
2231 Electrode Materials 13
2232 Preparation route of RuO2-based materials 16
2233 Deactivation mechanism of electrode 17
224 Gas evolution and electrochemical noise 19
23 Sol-gel synthesis 21
231 The hydrolysis and condensation reactions 21
232 The formation of sol-gel coatings 26
233 The drying and post-sintering 26
24 Experimental methods 29
241 Structural characterization 29
2411 X-ray diffraction 29
2412 Scanning electron microscopy (SEM) 30
2413 Energy dispersive X-ray spectroscopy (EDX or EDS) 31
2414 Transmission electron microscopy (TEM) 31
2415 Selected area electron diffraction (SAED) 31
2416 Raman spectroscopy 32
242 Electrochemical characterization 32
2421 Cyclic voltammetry (CV) 32
2422 Chronopotentiometry (CP) 34
2423 Galvanostatic polarization 35
2424 Electrochemical impedance spectroscopy (EIS) 36
3 Experimental 37
31 Preparation of electrocatalyst coatings 37
311 Pre-treatment of Ti-substrates 37
312 Sol-gel synthesis of mixed oxide coatings 37
3121 RuTiO2 sol solutions prepared by acetic acid-isopropanol route 37
3122 RuTiMOx sol solutions prepared by propionic acid-isopropanol route 38
VI
3123 Preparation of Ti substrates supported oxide coatings 39
313 Preparation of crack-free coatings 39
314 Preparation of porous coatings 40
315 Combined sol-gel and solvothermal synthesis 41
32 Structural characterization of electrocatalysts 42
321 X-ray diffraction (XRD) 42
322 Raman spectroscopy 42
323 Scanning electron microscopy and energy dispersive analysis (SEM-EDS) 42
324 Transmission electron microscopy and electron diffraction (TEM-ED) 43
33 Electrochemical characterization 43
4 Results and discussion 45
41 Chemical compositions of the electrocatalysts 45
411 Influence of preparation parameters 45
4111 Oxide loading amount and coating thickness 46 4112 Influence of sintering conditions on the crystallization phase transition of powders
47 4113 Influence of sintering conditions on the phase transition surface morphology and
electrochemical properties of coatings 51
412 Chemical composition of electrocatalysts 54
4121 Doping effect of mixed oxides 55
4122 Microhomogeneous mixed oxide prepared by propionic acid-isopropanol route 61
413 Conclusion 70
42 Morphology-controlled preparation 71
421 Crack-free coatings 72
422 Porous oxide film coated electrodes 75
4221 Porous electrode coating Ru03Sn07O2 76
4222 Impedance behaviour of porous electrode coatings 79
4223 Charging behaviour of porous electrode coatings 83
423 Conclusion 88
43 Solvothermal-assisted synthesis 89
431 Phase structure of Ru-Ti-O system 89
432 Solvothermal crystallization of Ru-O-Ti xerogel coatings 91
433 Solvothermal processing parameters 97
434 Structure-property correlation of sol-gelsolvothermal prepared Ru04Ti06O2
coatings 101
435 Conclusion 109
44 Electrochemical noise analysis of gas-evolving electrodes 111
441 Data acquisition of potential fluctuations 112
442 Statistical analysis of potential fluctuations 115
443 Fourier analysis of potential fluctuations 118
444 Wavelet analysis of potential fluctuations 120
445 Influence of electrolysis temperature on the bubble evolution behaviour 125
446 Case analysis Bubble evolution behaviour for the commercial electrode and
sol-gel Ru03Sn07O2 electrode coatings 130
447 Conclusion 136
VII
5 Summary and conclusions 139
Appendix 141
A1 Chemicals 141
A2 Software 142
A3 List of abbreviations Nomenclature 143
A4 The calculation of energy consumption for chlorine production 144
A5 Peng-Robinson and van der Waals equations of state 145
A6 JCPDS standard data of RuO2 TiO2 146
A7 Phase diagram of binary RuO2-TiO2 system 149
A8 Mathematic basics of noise analysis 150
A81 Standard deviation 150
A82 Autocorrelation function 150
A83 Fourier transform 151
A84 Wavelet transform 153
A9 MATLAB source code 154
A10 Publications 161
A101 Journal article 161
A102 Patents 161
A103 Conference proceedingshelliphelliphelliphelliphelliphelliphelliphelliphelliphelliphelliphelliphelliphelliphelliphelliphelliphelliphelliphelliphelliphellip161
A11 Acknowledgements 162
A12 References 163
VIII
1 Introduction
1
1 Introduction
The industrial sector accounts for about a third of the both global primary energy
consumption and energy-related CO2 emissions Industrial energy efficiency has a
significant impact on the mitigation of the climate change security of energy supply and
sustainability Energy-efficient technological innovations particularly in the energy-
intensive industrial manufacturing processes become the core factors considered as
sustainable industrial strategy in the future
Chlorine and its co-product caustic soda (sodium hydroxide) are important building blocks
for the whole chemical and pharmaceutical industry which are produced industrially by
the electrolysis of brine Electricity is essential to produce chlorine in the chlor-alkali
industry which accounts for about half of the total production cost Energy savings arise
primarily through using more efficient technologies such as the replacement of the less
energy-efficient mercury and diaphragm processes by the most energy-efficient membrane
technology and the substitution of the hydrogen evolving cathode by the oxygen
depolarized cathode
In terms of electrocatalysis the chemical reaction proceeds electrochemically ie it is
driven by the electrode potential Overpotential related to the electron transfer reactions at
the electrode could be reduced by proper selection of electrode materials Thus it is a task
for chemists to develop and evaluate new catalytic materials and accordingly new
preparation routes to meet the continuous expansion of industrial requirements This is one
of the motivations of the present research project to optimize the electrocatalysts and to
innovate in the preparation strategy of electrocatalysts
Furthermore the design in electrode coating morphology (surface and cross-section) was
studied regarding the issue of electrode deactivation caused by the substrate passivation A
protective and impermeable crack-free oxide layer deposited onto the titanium substrate
has been fabricated by controlling the dippingdryingsintering processes Nanoporous
1 Introduction
2
electrode coatings were obtained by the lanthanum leaching route in order to increase the
electrocatalytically accessible active surface area which could improve the electrocatalytic
performance as a geometrical factor
The crystallization process of the mixed oxide coatings was modified by using
solvothermal curing of the xerogel coatings followed by post-sintering treatment The
resulting phase structure and the electrochemical properties of the electrode coatings as a
function of the solvothermal processing parameters have been investigated Detailed
structural characterization of the solvothermally prepared electrode coatings has been
carried out in order to elucidate the achieved significant improvement in the
electrocatalytic activity for chlorine evolution
Chlorine gas bubbles generated at the electrode surface result in additional ohmic drop due
to the shielding and blocking effects The preliminary identification of the bubble
evolution behaviour at the electrode surface was performed by analyzing the bubble-
induced electrochemical noise Various mathematical analysis methods such as the
statistical standard deviation autocorrelation function and Fourier power spectral density
were performed to analyze the time series of potential noise Wavelet transform which is
used widely in the field of signal processing as an alternative to the conventional Fourier
transform was used to extract the characteristic bubble evolution information such as
detachment frequency and also the possible in-situ wettability analysis of electrode
coatings The proposed analytical strategy is able to be extended to the further evaluation
of the electrode material morphology and structure dependent gas evolution behaviour
2 Theory and background
3
2 Theory and background
21 The history of industrial chlorine production
Equation Chapter 2 Section 1
Chlorine is essential to the global chemical industry and to our daily life Approximately
50 of the products marketed by the chemical industry and 85 of the pharmaceuticals
are derivatives of chlorine chemistry [1] The production of chlorine is being esteemed as
lsquolsquoEnginersquorsquo of the chemical industry in a country The industrial chlorine production dates
back to the last half of the 19th century [2] At that time chlorine was produced from
hydrochloric acid by the so-called Weldon and Deacon processes (chemical oxidation
route) The Weldon process uses the manganese dioxide (MnO2) as reactant
o100 110 C
2 2 2 2MnO 4HCl MnCl Cl 2H O (21)
The manganese is recycled by treating the MnCl2 with lime (CaO which is mixed with
H2O to obtain calcium hydroxide) and oxygen to improve the process economics
2 2 2 2 2 2
2MnCl 3Ca(OH) O 2MnO CaO 2CaCl 3H O (22)
The Deacon process generates chlorine by direct catalytic oxidation of the hydrochloric
acid gas with air according to
oca300 C
Catalyst2 2 24HCl O (air) 2Cl 2H O (23)
The reaction (21) and (23) are the secondary process of the manufacture of sodium
carbonate (Na2CO3) by the Leblanc process
32 4 CaCOH SO C
2 4 2 2 3
2
NaCl Na SO Na S Na CO
+ HCl + CO + CaS (24)
In the late 19th century the Solvay process for carbonates began to replace the Leblanc
process and the shortage of HCl made it necessary to find new route to produce chlorine
Most chlorine today is produced by using the electrolytic processes (electrolytic oxidation
2 Theory and background
4
route) where solutions of sodium chloride are electrolyzed to convert chloride ions (Cl-)
into molecular chlorine (Cl2) at the anode Simultaneously sodium hydroxide (NaOH)
solution and hydrogen (H2) are produced at the cathode side according to the following
equations
Anode 2
2Cl Cl 2e (25)
Cathode 2 2
2H O 2e H 2OH (26)
Overall 2 2 2
2NaCl 2H O 2NaOH Cl H (27)
Only a tiny part of chlorine is produced worldwide by other processes such as the chlorine
recovery by the electrolysis of hydrochloric acid (HCl) solutions Hydrogen chloride gas is
a by-product in the processes used to manufacture polyurethanes fluorocarbons hydro-
fluorocarbons and white pigments in which chlorine used is reduced to hydrogen chloride
The Deacon catalytical oxidation process [3] which is a thermochemical process opposite
to the electrochemical process is beyond the scope of the present work
Among the amalgam process diaphragm process and membrane process in which
different anode products separations are involved the mercury process is the most energy
intensive process whereas the membrane process is the most energy-efficient process (ca
2500 kWh of electrical energy consumption is required to produce one ton of chlorine) All
new plants in the world are based on the membrane cell process nowadays Worldwide the
annual production of chlorine amounts to approximately 55 million metric tons in the year
2005 [4] Accordingly the overall energy consumption amounts to more than 15times1011
kWha [5] Therefore a significant reduction of the energy consumption in the chlor-alkali
industry is highly desirable
The total consumption of electric power is proportional to the voltage applied to the cell
for a given current density (the rate of electrode reaction) (See Appendix A4) The cell
voltage consists of several components [6]
2 Theory and background
5
e adV E IR V (28)
where E is the thermodynamic potential difference for a given anodecathode reaction
is the sum of the overpotentials for the anodic and cathodic reactions (which are
dependent on the electrocatalysts) eIR is the ohmic drop of the electrolyte and adV is the
additional ohmic drop from the membrane gas bubble effect etc Industrial demands for
the energy-efficient chlorine production in order to reduce the electrical power
consumption in the chlor-alkali electrolysis processes drive increasingly the scientific and
technical innovations since the electrical power consumption occupies almost 50 of the
cost of chlorine manufacturing
Figure 21 Electrode potential in chlor-alkali electrolysis from NaCl aqueous solution as a function
of current density The curves deviate away from the dotted lines (The equilibrium potentials
which vary with the operation parameters such as temperature and concentration For simplicity
standard equilibrium potentials were given in this figure) with the increase of current density
indicating the overpotential required to drive the electrochemical reactions The unit of the current
density mA cm-2
was used throughout the present work to present the obtained experimental data
whereas the kA m-2
is more often used in the industrial technical data 100 mA cm-2
= 1 kA m-2
The electric energy needed for driving the electrode reaction depends on the reaction type
of the electrolytic cell The hydrogen evolving cathode (HEC) (see Eq (26)) can be
replaced by the oxygen depolarized cathode (ODC)
2 Theory and background
6
2 2
O 2H O 4e 4OH (29)
Accordingly the overall reaction turns to
2 2 2
4NaCl 2H O O 4NaOH 2Cl (210)
A comparison of the HEC and ODC process is illustrated in Figure 21 The
thermodynamic potential difference for the classical electrolysis with HEC is about 22 V
(in practice the overall cell voltage is approximately 31 V including the anode and
cathode overpotential ohmic resistance in membrane electrolyte and electrode materials
electrode gap) The ODC cell reduces the overall cell voltage by around 1 V compared to
the conventional process [7]
A technological breakthrough in the history of electrolytic chlorine production is the
presence of Dimensional Stable Anodes (DSA
) which were invented by HB Beer in
1965 [ 8 9 ] and were then developed and industrialized by De Nora [ 10 ] The
commercially available DSA consists of RuO2 as active component inert oxide such as
TiO2 as stabilizer and coated onto titanium substrate [11] The DSA using a conductive
titanium substrate as a substitution for conventional graphite anodes benefits from the fact
that fixed inter-electrode gap can be remained during the long-term operation of
electrolytic cell RuO2 exhibits excellent corrosion resistance and low potential for anodic
chlorine evolution reaction which can be diluted and stabilized by TiO2 by obtaining a
rutile structure of mixed oxide solid solution A thermal decomposition method is
generally used to prepare this kind of electrode coatings
2 Theory and background
7
22 The anodic process
221 Anodic chlorine evolving reaction and classical equations
The electrolysis process consists of the electron transfer at the electrode surface ions pass
through the electrolyte between the anode and cathode and electrons transfer through the
wires externally interconnecting the two electrodes The current through the external
circuit is a convenient measure of the rate of the cell reaction The charge (Q) required to
convert the starting materials to products in an electrode reaction is calculated using
Faradayrsquos law Q = nFmM where m is the mass of the substance produced from the
electrochemical reaction M is the molar mass of the substance F is the Faraday constant
and n is the number of equivalents per molar of reactant
Figure 22 Pictorial drawing of chlorine evolution reactions at the anode side which involves a
series of steps The reactant Cl- moves to the interface (mass transport) electron transfer occurs
close to the interface (electron transfer reaction) the product Cl2 moves away from the anode to
allow the fresh reactants to the anode surface
In the anode reaction the oxidation of Cl- species occurs by the loss of electrons to the
anode as shown in Figure 22 The electrode reaction is a sequence of several basic steps
To maintain a current it is essential to supply reactants to the electrode surface and also
remove the products (ie the mass-transfer processes such as diffusion and convection of
2 Theory and background
8
the reacting species between the electrode surface and bulk of the solution) as well as for
the electron transfer reactions at the electrode surface
For a simple reversible electrode reaction (electrochemical oxidation process)
f
b
k
kR O ne (211)
If the current if and ib are assigned to the forward and backward reactions respectively the
electrochemical reaction rate can be expressed usually by the net Faradaic current
f bi i i (212)
where if gt 0 and ib lt 0 At equilibrium conditions which means that the forward and
reverse reactions proceed at the same rates the positive current contributed by the forward
reaction is balanced by the negative current contributed by the backward current if = -ib =
i0 (where j0= i0A is the exchange current density A is the electrode surface area) and the
net Faradaic current is equal to zero i = 0
The process of reduction of O and oxidation of R is a dynamic equilibrium at the surface of
the working electrode The equilibrium potential (Ee) of the working electrode is given by
the Nernst equation
0 lns
Oe e s
R
CRTE E
nF C (213)
where Ee0
is the standard equilibrium potential of the couple RO CRs and CO
s are
the
surface concentration of R and O species at the working electrode respectively R T and F
are universal gas constant 8314 J mol-1
K-1
absolute temperature in degrees Kelvin and
Faradayrsquos constant (the number of coulombs per mole of electrons F = 96485 C mol-1
)
respectively and n is the number of electrons transferred in the anode reaction For the
chlorine evolution (Eq (25)) the equilibrium potential is represented by
2 Theory and background
9
2
2
0
2ln
2
Cl
e cl Cl
Cl
pRTE E
F
(214)
where 2
0
cl ClE is the standard potential (136 V vs NHE)
2Clp is the partial pressure of
chlorine in the gas phase and Cl
is the activity of the chloride ion
If the potential of the working electrode is imposed more positive than the equilibrium
potential (E gt Ee) this will require current to flow through the electrodesolution interface
In fact the decrease in the ratio CRs CO
s is necessary and this can be brought about by the
conversion of R to O by the passage of an anodic current to the counter electrode The
overpotential is defined as the deviation of the potential from the equilibrium value ie
eE E (215)
Overpotential is the driving force for the electrode reaction to proceed in a given direction
Overpotential arises from the kinetic limitations of the electrode reaction for a given
electrode material
For a given electron transfer reaction (Eq (211)) without the mass-transfer limitation the
empirical relation between the current density and overpotential is given commonly by the
Butler-Volmer equation
0
1exp exp
nF nFj j
RT RT
(216)
where j is current density j0 is the exchange current density η is the overpotential and α is
the dimensionless electronic transfer coefficient with a value between 0 and 1 R T and F
have its usual meanings and n is the number of electrons involved in the electrode reaction
It is worth noting that the Bulter-Volmer equation is valid when the electrode reaction is
controlled by electrical charge transfer at the electrode and not by the mass transfer
The Butler-Volmer equation is valid over the full potential range At high positive
overpotential ifgtgtib the second term in Eq (216) may be ignored ie the reverse
2 Theory and background
10
rate is negligible compared to the forward reaction rate Hence a simple exponential
relationship between the anodic current density and overpotential is then given by
0
1log log
2303
nFj j
RT
(217)
which is known as the Tafel equation loga b j It describes the relation between the
rate (ie current) of an electrode reaction and the overpotential The slope of a Tafel plot
(2303
1
RTb
nF) reveals the value of the electronic transfer coefficient (α) for the anode
reaction which can be measured experimentally
At low overpotential region of the Butler-Volmer equation the exponential terms in Eq
(216) may be linearized in a Taylor series expansion and thus a linear dependence of j-η
is usually obtained ie 0
nFj j
RT From the slope of the linear dependence of j-η the
exchange current density j0 can be determined ie
00
limdj nF
jd RT
(218)
The charge transfer resistance Rct (ohm cm2) is defined as the slope of the overpotential
versus current density at the equilibrium potential (ie at zero net current when the
overpotential is very small and the electrochemical system is at equilibrium)
0
1 1
(1 ) exp (1 ) exp
ct
d RTR
nF nFdj dj d nFj
RT RT
(219)
which describes the dynamic behaviour of the redox reaction Note that the value of Rct
changes with the overpotential and0
ct
RTR
nFj for η = 0
2 Theory and background
11
222 The reaction mechanisms and kinetics of anodic chlorine evolution
The reaction paths for the chlorine evolution reactions (Eq (25)) at the anode materials
have been described by the following mechanism (i) or mechanism (ii) [12]
(i) Volmer-Tafel mechanism [13]
adsCl Cl e (Volmer reaction the primary electron transfer step with the
formation of adsorbed species (Clads) by the discharge of its counter
species at the anode surface)
ads 22Cl Cl (Tafel reaction with the formation of molecular product (Cl2) by
recombination of two neighbouring surface chlorine atoms)
(ii) Volmer-Heyrovsky mechanism [14]
adsCl Cl e (Volmer reaction)
ads 2Cl Cl Cl e (Heyrovsky reaction with the formation of molecular product
(Cl2) by the electrochemical desorption of adsorbed species
(Clads) and a simultaneous oxidation of Cl-)
The initial Volmer step is the electron transfer resulting in the formation of the adsorbed
intermediate Clads The molecular Cl2 is formed by either chemical desorption (Tafel step)
or electrochemical desorption (Heyrovsky step) of the adsorbed species
The value of the Tafel slope depends on the rate-determining step of the Faradaic reaction
The Tafel slope and exchange current density for a given electrode reaction at a given
electrocatalyst are essential for understanding the reaction mechanism It is desirable to
have high exchange current density and low Tafel slope for the electrode reactions which
permits the operation at high current densities without significant voltage supply
Different reaction mechanisms for the chlorine evolution at oxide electrodes have been
proposed [ 15 ] The obtained Tafel slope depends on the concentration of NaCl the
operation temperature pH value Various electrode materials have been investigated for
the chlorine evolution reaction (Table 21) and the kinetic parameters dependence on the
electrode material are summarized
2 Theory and background
12
Table 21 Kinetic parameters for the chlorine evolution reactions from 5 M NaCl at 25oC [16]
Electrode material j0 mA cm-2
Tafel slope mV Mechanism
Pt 85 72 ii
Ir 64 76 ii
Rh 59 90 ii
Pt07Ir03 (smooth) 085 86 ii
Pt07Ir03 (thermally formed) 375 36 ii
Ru 02 38-40 ii
RuO2-TiO2Ti 125 40 ii
Vitreous carbon 03 120 i
Graphite 12 40-120 ii
Fe3O4 55times10-5
85 -
TiO2 40times10-2
30-120 i
IrO2 117 40 ii
(RuO2)03(Co3O4)01(TiO2)06 01 40 -
Ru03Pt03Ce04O2 30 32 other
Ru03Pt07O2 10 31 other
Co3O4 (thermally formed) 85times10-3
40 other
The activation energy of the reaction steps (catalytic effect) is related to the adsorption
strength of the intermediates bonded to the electrocatalyst surface (active sites) RuO2 is
the most widely studied anode materials for chlorine evolution The investigation of the
atomic scale surface catalytic reactivity of RuO2 reveals that the presence of the
coordinatively unsaturated surface sites (cus) of cus-Ru atoms and bridge-bonded Obr
atoms are the active sites [17] Density functional theory calculations indicate that at the
RuO2 (110) surface the adsorption energies of intermediates determine the reaction paths
and the selectivity of electrode reaction [12]
Electrode reactions can be charge-transfer controlled andor mass-transfer controlled For
the charge-transfer controlled process the rate equation is expressed by the Butler-Volmer
equation (Eq (216)) Mass-transfer controlled process can be observed from the
polarization curve either at highly applied current density under galvanostatic mode or at
high polarization potential under potentiostatic mode
2 Theory and background
13
223 Anode electrocatalyst coatings
The electrocatalyst could accelerate the electron transfer at the electrodeelectrolyte
interface (Figure 22) Industrially electrocatalyst is desired to bring about high current
density at lower applied potential ie to obtain high product yield per unit of energy
consumption Electrocatalysts are utilized in the coating form generally in order to
maximize the utilization of catalyst materials A three-phase interface of gas product solid
electrode and aqueous electrolyte exists in the chlorine evolution process Cl- ions are
oxidized to Cl2 by the loss the electrons to the anode The crucial factors for the practical
application of the electrocatalysts are the activity (to reduce the overpotential) (chemical
electrochemical and mechanical) stability selectivity and the cost of catalyst material and
manufacturing
2231 Electrode Materials
The expansion in the range of electrode materials is striking during the past 50 years of
electrocatalysis [ 18 ] However the practical applications of electrocatalysts are a
compromise between the technical economic and environmental targets Besides the
historical fluctuations in the materials cost dominate significantly the selection in
electrocatalytic materials In this regard noble metals andor their oxides play a critical
role in the past several decades [1920] and could even remain so for the foreseeable future
Platinum and graphite were employed as anode materials in the electrolytic chlorine
production The former is expensive and the latter is instable mechanically and
electrochemically The development of the dimensionally stable anodes (DSA) is a
revolution in the chlor-alkali industry compared to the prior graphite anode [82122] It
consists of commonly electrocatalytic coating containing platinum group metals or oxides
of platinum group metal and valve metal oxides coated onto an electrically conductive
valve metal base or alloy containing valve metal such as titanium tantalum nickel and
zirconium Ruthenium dioxide has been recognized as one of the best electrode materials
for chlorine evolution reaction The loss of the electrocatalytic activity of the ruthenium
2 Theory and background
14
dioxide caused by the electrochemical dissolution of active ruthenium species depresses
the long-term stability of the electrode [23] In chlor-alkali industry mixed RuO2-TiO2
with TiO2 as stability promoter is commonly used to inhibit the loss of active component
and reduce the material cost of the anode coatings Due to the same crystal symmetry
between RuO2 and TiO2 the formation of solid solution is possibly responsible for their
durability [24] The decrease of the ruthenium content below 10 mol is restricted due to
the poor electrical conductivity of the coatings which contributes to the voltage drop
significantly [25]
The electrocatalytic activity of the anode coatings depends on two major factors the
electronic and geometric factors The former is related to the chemical composition and
structure while the latter to the surface and layer morphology They are also more often
mentioned in another way in the literatures as the true electrocatalytic activity and apparent
electrocytalytic activity Metal or their oxide of platinum group elements such as platinum
iridium palladium and rhodium has been used as active additives into RuO2-TiO2 system
to improve the electrocatalytic activity of anode coatings for chlorine evolution Due to the
conflict of technical and economic problems industrial electrocatalysts prefer the activer
and cheaper materials In contrast to the improvement of the electrocatalytic activity
originated from the electronic effect due to the addition of precious metal promoters less
expensive transition metal as additives will contribute to the electrocatalytic activity by
geometric factors The most widely investigated RuO2-based oxide electrode materials are
listed in Table 22 S Trasatti summarized and classified the electrode oxides for chlorine
and oxygen evolution reactions into the rutile (RuO2-based) spinel (Co3O4-based)
perovskite (NiM2O4-based) etc types [26] Transition metals have also the potential to
show proper individual catalytic activity The doped multicomponent electrocatalysts are
expected to exhibit synergetic effect to improve the activity stability and selectivity
Numerous electrode materials exhibit high catalytic activity both for the chlorine evolution
and for the oxygen evolution Note that the oxygen evolution reaction (the anode side
reaction for the chlorine evolution 2 22H O O 4H 4e ) exhibits a lower standard
reversible potential (123 V vs NHE) than the one for chlorine evolution reaction (136 V
vs NHE) The former is thermodynamically favoured However the exchange current
densities of the chlorine evolution reactions are usually substantially greater than those of
2 Theory and background
15
oxygen evolution reactions ie the overpotential for chlorine evolution reactions at the
anode is lower than that for oxygen evolution reactions Therefore chlorine evolution is
the dominant reaction during the electrolysis of saturated aqueous NaCl solution in the low
pH range of 2~3 The selectivity of anode coatings is evaluated by the electrode potential
difference (2OE -
2ClE ) for the O2Cl2 evolution reactions Further purification of the desired
products is necessary in the industrial process
Table 22 Overview of the most investigated RuO2-based electrode materials for chlorine evolution
reaction
Material mol Preparation route Ref
RuO2+IrO2 100 TD [27]
RuO2+TiO2 5~30 TD [28]
5~50 TD [25]
20 SG [29]
40 SG [30]
30sect TD [11]
RuO2+TiO2+CeO2 30 TD [31]
RuO2+TiO2+SnO2 19~33 TD [32]
25 TD [33]
RuO2+TiO2+ CeO2+Nb2O5 30 TD [3435]
RuO2+CeO2 25~100 SG [36]
RuO2+TiO2+PtOx 30~100 TD [37]
RuO2+TiO2+CrNbO4 10~20 TD [28]
RuO2+TiO2+Cr2WO6 5~76 TD [27]
RuO2+TiO2+Cr2WO6+CoWO4 1~10 TD [27]
RuO2+MnO2 85 Solid state reaction [38]
RuO2boron-doped diamond - SG [3940]
RuO2areogel-SiO2 - Cryogenic decomposition of RuO4 [41]
Molar percent of noble metal elements
TD = thermal decomposition method SG = sol-gel method
sect Commercial DSA electrode
2 Theory and background
16
2232 Preparation route of RuO2-based materials
RuO2 can be prepared at relatively low temperature (350~550 oC) by the thermal
decomposition of RuCl3 dissolved in water or alcohols onto an inert metallic substrate such
as titanium tantalum Mixed oxide can be obtained by adding the additional precursor salts
into the coating solutions This technique is adopted routinely in the chlor-alkali industry
It is known that the oxide layers are not homogeneous in the structure and composition It
contains the non-stoichiometric Ru3+
and chloride impurities with the mixed amorphous
and crystalline structure The thermal decomposition process of RuCl3 to form RuO2 has
been analyzed by the EXAFS (extended X-ray absorption fine structure) combined with X-
ray diffraction [42] The simultaneous formation of the Ru-O bonds and the break of Ru-Cl
bonds occur at the sintering temperature from 300~400oC The change in the coordination
number with the calcination temperature was accompanied by the change in the lattice
constants The formation of solid solution has been confirmed for the binary RuO2-IrO2
system starting from the thermal decomposition of RuCl3 and IrCl3 inorganic salts
Sol-gel technique has the potential to replace the traditional thermal decomposition route
due to some intrinsic advantages More intimate mixing of multi-component at molecular
scale can be achieved by the hydrolysis and condensation reactions Different sol-gel
preparation routes have been demonstrated as summarized in Table 23
Single crystal RuO2 has been prepared by the vapour deposition technique operated at high
temperature to investigate the crystal plane dependent electrochemical properties [4344]
For the rutile structure RuO2 the metal cations locate at the corners and center of the
tetragonal unit cell and each cation is surrounded by six oxygen ions to form an octahedral
array RuO2 with the (100) or (101) orientation has only Ru atoms at the top plane whereas
at the (110) orientation plane both Ru and O atoms present Besides the atomic densities
of Ru and O and the number of active sites are different for different crystal planes The
kinetics investigation of the chlorine evolution on the RuO2 (110) and (230) showed that
the (230) plane is more active than the (110) plane [45]
2 Theory and background
17
Table 23 Summary of the sol-gel preparation route to obtain the coating solutions
Electrode Precursor(s) Preparation details Ref
Ru04Ti06O2Ti RuCl3 TiCl3 forced hydrolysis of RuCl3 and TiCl3 in HCl solutions
separately for different time then mixing
[30]
RuIrTiO2Ti RuCl3 TiCl3
H3IrCl6
forced hydrolysis of precursors separately then mixing [46]
RuO2Ti RuCl3xH2O refluxing the mixture of RuCl3 + ethanol + sodium
ethoxide washing the RuOxHy precipitate redispersing
the oxide into ethanol
[47]
RuO2Ti RuCl3xH2O RuCl3+citric acid + ethylene glycol Pechini route [48]
CexRu1-xO2Ti RuCl33H2O
Ce(NO3)6H2O
precursors + alcohol + glycol + citric acid
Pechini route
[36]
Ru02Ti08O2Ti RuCl33H2O
Ti(OC4H9)4
RuCl3 + n-C4H9OH acetylacetone Ti(OC4H9)4 with
controlled adding sequence then HNO3 or NH4OH was
added to catalyze the hydrolysis and condensation
reactions
[29]
2233 Deactivation mechanism of electrode
Figure 23 Sketch of the morphology of oxide coated electrodes [49] (a) electrolyte (b) oxide
layer (c) substrate (1) grain boundaries (2) island containing oxide crystallite (3) pore (4)
electrolytecoating interface (5) coatingsubstrate interface
The sketch of the cross-section morphology of the oxide layers supported onto the
underlying substrate is shown in Figure 23 Deactivation mechanism analysis of oxide
film coated titanium anodes implies that the dissolution of active component(s) (ruthenium
2 Theory and background
18
species) and the growth of insulating TiOx interlayer between Ti-substrate and oxide layer
(shown in Figure 24) are responsible for the loss of electrochemical activities [5051]
2 TiOx interlayer
1 active oxide layer
dissolution
Ti-substrate
2 TiOx interlayer
1 active oxide layer
dissolution
Ti-substrate Figure 24 Sketch of the DSAreg structure with compact catalytic layer or cracky catalytic layer
onto the Ti-substrate [51]
Although highly crackyporous films are favourable in terms of electrocatalytic properties
with respect to the electrode durability a compact and impermeable layer could provide
good protection of Ti-substrate from passivation Various strategies have been developed
to prevent the passivation of the substrates caused by the contact with electrolyte in the
electrolysis of aqueous solution of sodium chloride or hydrochloric acid As described in
EP 0046449 A1 multiple coatingsintering cycles are commonly applied in order to
increase the coating thickness and to prolong the service life The cracks and pores within
the first layer are filled by the next applied coating solutions The amount of inner defects
is gradually reduced after each stage of the cycle
To avoid the formation of the TiOx interlayers using titanium as substrate alternative
substrates or modified substrates are used In WO 2008046784 A1 an electrically
conductive titanium alloy substrate is used without the deterioration of the electrocatalytic
activity V Panić et al describe a Ti3SiC2 as anode coating substrate possessing higher
corrosion stability than titanium [52] EP 0 538 955 A1 describes an anode with semi-
conducting oxide interlayer such as titanium suboxide or higher valent metal ions doped
titanium oxide F Gestermann et al describe an electrode coating with titanium carbide
andor titanium boride interlayer [53]
2 Theory and background
19
224 Gas evolution and electrochemical noise
Cl- is oxidized to molecular chlorine by the anodic reactions As the reactions proceed
bubbles appear in the vicinity of electrode surface with the continuous local release of the
supersaturation of dissolved Cl2 gas in the electrolyte when the convection and diffusion
fail to do it [54] The supersaturated electrolyte recovers the stable thermodynamic state by
transferring the excess of dissolved gas molecules into vapour phase [55]
Gas bubble evolution includes a series of events such as bubble nucleation growth
coalescence detachment and lingering in the vicinity of electrode surface which causes
the chaos and turbulence of the electrochemical system Bubble nucleation may occur
within the liquid bulk in a manner of homogeneous nucleation or on a rough surface in a
way of heterogeneous nucleation The latter is the case of gas evolving on the electrode
surface Once a tiny bubble is formed at the nucleation sites at the surface of electrode a
gasliquid meniscus interface is created The concentration gradient of dissolved Cl2
between the liquid bulk and the bubble surface is the driving force responsible for the gas
molecules diffuse through the meniscus interface which results in the growth of bubble
The bubble is anchored to its nucleation sites and keeps growing When the buoyancy
force overcomes the capillary force anchoring the bubble to the nucleation sites the bubble
detaches and ascends upward [56]
Under the supersaturated conditions Ostwald ripening occurs when the disperse phase of
gas bubbles is slightly soluble in the continuous phase of electrolyte wherein the driving
force is Laplace pressure (for a spherical bubble PL = 2γ r where γ is the interfacial
tension and r is the bubble radius) [57] Consequently smaller bubbles decrease in size
while larger bubbles get larger as the gas diffuses from smaller to larger bubbles This
phenomenon is known as the Kelvin effect for gas in liquid The large bubbles grow at the
expense of the small ones The bubble size distribution becomes broader On the other
hand the bubble coalescence occurs when the film between the bubbles ruptures
Subsequently the Laplace pressure drives the bubbles to form a larger single bubble Thus
the coalescence results in the disappearance of the dispersion The coalescence by film
rupture can be caused by thermal fluctuations (~kBT) or mechanical agitation
2 Theory and background
20
The bubble evolution is a remarkably practical problem in terms of the loss of energy in
the chlor-alkali industry Usually the potential drop across the electrolyte is calculated
using Ohmrsquos law if the medium is homogenous However if the gas bubbles are generated
at the electrode interface the current lines go around the insulating gas bubbles the
specific conductivity of the medium decreases and accordingly the increase in ohmic drops
The technical data from the De Nora mercury cells show that the gas bubble effects
contribute ca 4 of the total cell voltage [6] The ohmic resistance dependence on the
electrode configurations (vertical horizontal upwards or downwards) current densities and
bubble froth layer thickness has been investigated by Kiuchi et al [58] Numerous efforts
of theoretical analysis and experimental observation have been made upon the
electrochemical gas evolving electrodes [59] As a matter of fact it is very delicate to get a
comprehensive understanding for the complex electrode process To simplify tractable
model and experimental setup are designed purposefully to isolate the individual effect
concerned to the electrode process The characteristic parameters of bubbles such as the
residence time the size and size distribution of detached bubbles have been determined by
using see-through cells with the help of video camera and laser Doppler velocimetry [60
61] The electrochemical events of gas bubble evolution occurred on the electrode surface
(and vicinity of electrode surface if froth layer is taken into consideration) cause the chaos
of the electrochemical system As an alternative of the optical technique the analysis of the
electrochemical signal fluctuation (fluctuation of potential or current signal) is a powerful
tool in the monitoring of electrochemical events occurred on the electrode surface
Considerable attention has been paid to the electrochemical noise signals analysis in the
fields of corrosion studies [62] electrode process in lithium batteries [63] estimating the
electrode surface morphologies using electrochemical noise data [64] Electrochemical
noise analysis is also being used to extract information of gas evolving behaviour on the
electrodeelectrolyte interface The characteristic parameters such as bubble size
detachment rate can be deduced from the noise data by using suitable noise analysis
techniques [54] The amplitude and shape of the signal fluctuations can be correlated with
the electrochemical events occurred The signal analysis is mainly based on the
mathematic algorithms and computerized data processing Different approaches have been
proposed for the noise data analysis statistical spectral and chaos theory-based methods
[65]
2 Theory and background
21
23 Sol-gel synthesis
The sol-gel process is a versatile solution-chemical process widely used in the fields of
materials science and ceramic engineering The sol-gel methods are used primarily for the
preparation of metal oxides starting from a chemical solution which acts as the precursor
for the build-up of metal oxide networks The starting materials used typically in the
preparation of the sol are usually inorganic metal salts or metal organic compounds such as
metal alkoxides which undergo various forms of hydrolysis and polycondensation
reactions The formation of a metal oxide involves the connection of metal ion centers with
oxo (-O-) or hydroxo (-OH-) bridges Thus the metal-oxo or metal-hydroxo bonds are
generated in the colloid solution (sol) The transition of the liquid sol into a solid phase
(gel) by removing the liquid solvent requires a drying process in which the significant
shrinkage and densification of the network occur Afterwards a post-sintering process is
often necessary in order to favour the further polycondensation and enhance the
mechanical properties and structural stability for the final practical applications
Applying the sol-gel process it is possible to fabricate ceramic materials in a wide variety
of forms ultra-fine powders thin film coatings ceramic fibers microporous inorganic
membranes or extremely porous aerogel materials One of the distinct features of the sol-
gel technique compared to the conversional solid state reactions or thermal decomposition
routes is the molecular-scale structural homogeneity especially for the preparation of
mixed oxide materials Moreover the structural densification is often achieved at a relative
low sintering temperature
231 The hydrolysis and condensation reactions
The preparation of SiO2 by sol-gel technique is the most thoroughly investigated process
which can be traced back to 1880s since the first observation of the hydrolysis reaction of
2 Theory and background
22
tetraethyl orthosilicate (Si(OC2H5)4 or Si(OR)4 where R = C2H5 abbreviated as TEOS)
under acidic conditions
The Si(OR)4 forms a stable solution in the absence of water The introduction of water into
the system initiates the hydrolysis reactions by the nucleophilic attacks The first step
hydrolysis reaction occurs by replace one OR group with one OH group as follow
Depending on the amount of water and catalyst present hydrolysis reactions may proceed
to completion (the leftmost path in Figure 25) so that all of the OR groups are replaced by
OH groups as follows
A series of intermediate species Si(OR)n(OH)4-n would be produced as the result of partial
hydrolysis Variation in the number of n has profound consequences for the morphology
and structure of the resulting Si-O-Si networks
The first step condensation occurs after the first step hydrolysis reaction by linking two
Si(OR)3(OH) molecules (nucleophilic substitution) and releasing one molar H2O to form
the first Si-O-Si bond in the colloid solution Afterwards the successive and overlapped
hydrolysis and condensation reactions proceed to form the three-dimensional Si-O-Si
macromolecule networks The competitive hydrolysis and condensation reactions would
dominate the final network towards linear (the rightmost path in Figure 25 low water
concentration or slow hydrolysis rate) or branched structure (the middle paths in Figure
25) which is one of the most critical aspects of sol-gel process
2 Theory and background
23
Figure 25 The formation of O-Si-O networks from the precursor Si(OR)4 by the successive and
overlapped hydrolysis (h) and polycondensation (c) reactions
The oxidation state (z = 4) and coordination number (N = 4) of silicon are equal However
in this case of z lt N such as the sol-gel process of vanadium pentoxide (V2O5) started from
the sodium metavanadate aqueous solution (NaVO3) the coordination expansion occurs
owing to the attack of nucleophilic reagents [66] After acidification performed through ion
exchange the colorless solution turns into yellow solution of vanadic acid The H3VO4 (or
VO(OH)3) is obtained by further aging and the coordination expansion of VO(OH)3
occurs via the nucleophilic addition of two molar H2O giving the hexa-coordinated
Si
2 Theory and background
24
VO(OH)3(OH2)2 in which one molar H2O attached to V ion center along the z axis
opposite to the VO double bond the second one is in the direction of y axis opposite to an
OH group
A distinct feature of the condensation reaction is that it cannot proceed along the z axis
Fast olation reactions (a condensation process in which a hydroxyl bridge is formed
between two metal centers M-OH-Mrsquo) along the y axis give rise to corner sharing chain
nevertheless the oxolation reactions (a condensation process in which an oxo bridge is
formed between two metal centers M-O-Mrsquo) along the x axis result in the edge sharing
double chains The difference in the linkage manner of the basic building-block based on
the controllable hydrolysis and condensation reaction rate is a prominent nature of the sol-
gel process which is particularly important for the preparation of desired structure of metal
oxide with respect to the oxide with various polymorphs
A similar effect has been demonstrated for the titanium (IV) isopropoxide (Ti(OiPr)4) TiO2
is another class of material particularly important in the sol-gel chemistry Titanium
dioxide (TiO2) exists in nature as rutile anatase and brookite The crystalline form size
and morphology of titania are critically important with reference to its performance for
most of the applications The microstructure and the related properties could be well
modulated by various parameters in the sol-gel chemistry such as solution pH chelating
reagent the nature of the precursor
The lower the electronegativities of the transition metals the more susceptible are their
alkoxides against the hydrolysis Complexing ligands such as bidentate acetylacetonate
2 Theory and background
25
(acac) can be used to slow down the fast hydrolysis and condensation reactions For the
preparation of mixed oxide the complexing ligands could control the competitive
hydrolysis and condensation reaction rates of the different precursors
Figure 26 Partial substituation of Ti(OiPr)4 (a) by acac One or two O
iPr
- ligands is substituted by
acac to form Ti(OiPr)3(acac) (b) and Ti(O
iPr)2(acac)2 (c) [ 67]
The analogous ligand displacement can also be obtained by using organic acids such as
formic acid acetic acid propionic acid and butyric acid [68] The alkyl-peroxo complexes
Ti(OOR)n(OiPr)4-n (R = Me Et Pr Bu etc) are produced in this case and the organic acid
acts as solvent for the precursors simultaneously
The basic building-block of the various TiO2 polymorphs is octahedral TiO6 The rutile
phase is characterized by linear chains of TiO6 octahedra that share a pair of opposite
edges while in anatase a TiO6 octahedron shares four edges with its neighbors to form the
zigzag ribbon structure In the brookite phase three edges of TiO6 octahedron are shared
by other octahedra
2 Theory and background
26
232 The formation of sol-gel coatings
The formation of films is one of the most important aspects of the sol-gel process Various
techniques such as dip coating spin coating brush coating spray coating have been
applied to obtain the desired film structures and properties The simple coating technique
facilitates the up-scaling operation for large scale application in industrial process The
substrate with various complex geometric shapes such as mesh rod and foam can be
deposited with the particulate precursors by liquid-based coating techniques
The preparation of the coating solution the selection of the coating technique and the
control of the post treatment conditions are critical factors in tailoring the resulting coating
structure and performance Composite oxides can be obtained by doping and mixing the
corresponding precursor salts into the coating solutions The stable coating solution which
can be exposed to air and moisture without the formation of sediments is very important
for the practical application The coating thickness microstructure and morphology can be
well controlled by using suitable coating technique The crystallization route of the initial
amorphous materials could determine the final phase structure phase composition
Therefore the electrocatalytic properties of sol-gel oxide coatings can be governed
effectively by controlling the preparation parameters and details
233 The drying and post-sintering
After applying the wet coating solution onto the substrates the subsequent thermal
treatment steps (drying sintering) are followed to densify the films and finish the
crystallization transformation of the initial amorphous structure As liquids evaporate from
the wet gel films during the drying process the M-O-M networks begin to shrink by
expelling the liquids towards the exterior in order to balance the capillary tension (see
Figure 27) For sol-gel films deposited onto a substrate the networks shrink more on the
drying side and warping occurs as observed in Figure 28 The difference in shrinkage rate
between the inside and outside of the gel body and the mismatching of the thermal
2 Theory and background
27
expansion coefficient between the substrate and the film are the cause of tensile stress (see
Figure 28)
rrr
Figure 27 Schematic illustration of the shrinkage of gel networks during the drying process [69]
The initial networks (left) lose liquid and accordingly the capillary tension develops in the liquid
(right r is the radius of the meniscus which is related to the radius of pore a and the contact angle
θ) and draws back the network into the liquid until the network stiffens
Figure 28 Tensile stress evolution and crack formation in gel films under heat-treatment (such as
drying and sintering) [70]
For the filmsubstrate assembly structure (Figure 28) with given substrate (material and
thickness) the tensile stress (σ) in coatings is associated with the thickness of oxide
coatings (hf) according to Stoneyrsquos equation
2
2 1
1 1( )
6(1 )
s s
s f
E h
h R R (220)
where Es and νs are elastic constant and Poissonrsquos ratio of substrate respectively hs and hf
are thickness of substrate and coating respectively R1 R2 are the radii of curvature of the
substrate before and after deposition Note that thinner coating and lower tensile stress will
reduce the difference between R1 and R2 and depress the possibility of crack formation
2 Theory and background
28
Kozuka et al [7071] have demonstrated that crack-free thick films (gt 1microm) can be
obtained by the single-step dip-coating method by using poly(vinylpyrrolidone) (PVP) as
stress-relaxation agent The idea behind is to retard the condensation reactions (which
results in the gel pore collapse under heat-treatment) and simultaneously to promote the
structural relaxation through strong hydrogen bonding interaction between the C=O groups
of the PVP and the OH groups of the gel bodies Stepwise heat treatment was executed and
a sintering temperature up to 700 oC was used to decompose the PVP However the
preparation of crack-free coatings using PVP-containing sol solution is not suitable in this
work because the complete decomposition of PVP is difficult especially when the single
layer is thick (gt 1microm) Note that for the preparation of titanium supported oxide electrode
coatings high sintering temperature (gt500 oC) has to be avoided due to the possible
formation of the insulating TiOx interlayer Besides the existence of the residual PVP in
the oxide matrix as contaminants could cause negative effects such as the influence in
oxide layer conductivity electrochemical stability
2 Theory and background
29
24 Experimental methods
241 Structural characterization
For the substrate supported electrocatalyst the most commonly used technique to disclose
the structure and surface information are the diffraction techniques (X-ray diffraction
electron diffraction neutron diffraction) electron microscopic techniques (SEM TEM)
and vibrational spectroscopic techniques (IR Raman)
2411 X-ray diffraction
In 1895 WC Roumlntgen (a German physicist) discovered the X-rays In 1921 M v Laue (a
German physicist) discovered that X-rays can be diffracted or scattered by the orderly
arrays of atoms in a crystal The three-dimensional atomic arrangement in a crystal is
deduced from the directions and intensities of the diffracted X-ray beams Crystalline
material can be considered as an infinite recurrence of parallel atomic planes with an
interplanar distance d When a beam of monochromatic X-rays is incident on the atoms in
a crystal the wavelets scattered by the atoms in each plane combine to form a reflected
wave The interference patterns of the scattered radiation are recorded by a detector The
interference is constructive when the Bragg condition for diffraction is fulfilled
ie 2 sinn d where n is diffraction order λ is X-ray wavelength θ is Bragg angle or
incident angle
The X-ray diffraction patterns allow the qualitative and quantitative crystal structure
characterization concerning the crystallite size and distribution phase composition and
percentage lattice parameters from the position intensity (which depends on the type of
atoms in the elementary cell and their positions site occupancy scattering factor etc) and
shape of the diffraction peaks The volume-weighted crystallite size (D the mean size of
the ordered domains or the mean dimension of the coherently diffracting domains) can be
estimated from the main diffraction peak by using Scherrerrsquos equation
2 Theory and background
30
09
cosD (221)
where λ is the X-ray wavelength β is the full width at the half-maximum intensity (FWHM)
in radians and θ is the Bragg angle
Various factors can result in the peak broadening such as the crystallite size (which is
caused by the finite size of domains diffracting essentially incoherently with respect to one
another) instrumental distortion lattice microstrain (which is caused by the displacements
of the atoms with respect to their reference-lattice position) [72 73] In contrast the
Warren and Averbachrsquos method which is based on the Fourier deconvolution of the
measured peaks and the instrument broadening since the measured peak profile is actually
the convolution of a function for the pure peak profile and a function of the instrumental
broadening is capable of providing the information of area-weighted crystallite size
crystallite size distribution and lattice microstrain Rietveld refinement analysis [74] which
uses a least-squares fit approach to refine a theoretical line profile until it matches the
measured diffraction profile is a powerful tool for quantitative phase analysis More
reliable structure parameters crystalline components can be obtained
2412 Scanning electron microscopy (SEM)
For particles with sizes down to nanometer~submicrometer it is essential to use electron
microscopy rather than optical microscopy to examine them The sample surface
topography can be visualized by scanning it with a high-energy beam of electrons (typical
energy range 5~20 keV) in a raster scan pattern Secondary electrons (generated by
inelastic scattering during the energy exchange between the electron beam and the sample)
are the common type to produce the SEM signals by the interactions between the electron
beam and the atoms at or near the sample surface The size of the interaction volume
depends on the electron energy the atomic number of the specimen and the density of the
specimen
2 Theory and background
31
2413 Energy dispersive X-ray spectroscopy (EDX or EDS)
EDX coupled with SEM analysis is used to obtain the qualitative element analysis from the
emission of characteristic X-rays from a specimen when a material is bombarded with
electrons in an electron beam instrument When the sample is bombarded by the electron
beam of the SEM electrons are ejected from the atoms comprising the sample surface A
resulting electron vacancy is then filled by an electron from the higher shell and an X-ray
is emitted to balance the energy difference between the two electrons The EDX X-ray
detector counts the emitted X-rays and measures their energy
2414 Transmission electron microscopy (TEM)
TEM is an imaging technique with a significantly higher resolution than light microscopes
owning to the small de Broglie wavelength of electrons A beam of electrons (typical
energy range 100~400 keV) is transmitted through an ultra thin solid sample interacting
with the specimen The transmitted beam containing information about the electron density
phase and periodicity is used to form an image
2415 Selected area electron diffraction (SAED)
SAED is a crystallographic technique coupled with TEM to obtain the information of
spots of interest from the TEM images In this case high-energy electrons pass through the
specimen electrons with a wavelength of a fraction of a nanometer and the spacing
between atoms in a solid is slight larger than the electron wavelength Thus the atoms act
as a diffraction grating to the electrons Part of the electrons will be scattered determined
by the crystal structure of the sample while others pass through without deflection As a
diffraction technique the SAED can be used to identify the crystal structures and study the
crystal defects in an area as small as several hundred nm The crystal structure lattice
parameters of the unit cell can be deduced from the reciprocal lattice of the sample crystal
2 Theory and background
32
2416 Raman spectroscopy
In the Raman technique the sample is illuminated with monochromatic light usually
generated by a laser Two types of scattered light are produced Rayleigh scattering
emerges with exactly the same energy and wavelength as the incident light Raman
scattering which is usually much less intensive then Rayleigh scatter emerges at either
longer or shorter wavelength than the incident light As a consequence the vibrational
transition of frequency was reflected from the Raman lines Each peak in a Raman
spectrum corresponds to a particular vibrational transition For inorganic solids the lattice
vibrations give rise to peaks in the region about 100~700 cm-1
Raman spectroscopy is
sensitive to the small lattice vibrations in inorganic solid even with very low phase
fractions In contrast X-ray diffraction patterns could provide information about the long-
range order Raman spectroscopy gives more reliable information than X-ray diffraction
when applied to local structural analysis of inorganic materials Due to the difference in
principal selection rules the active modes in Raman spectra and IR are different They
produce complementary information The vibrational mode to be Raman active is that the
vibrations involved must produce a change in polarizability [75]
242 Electrochemical characterization
2421 Cyclic voltammetry (CV)
Cyclic voltammetry is used for obtaining qualitative information about the electrochemical
reactions of an electrode surface such as the redox processes heterogeneous electron-
transfer reactions or adsorption processes It offers a rapid location of redox potential of
the electroactive species or a current response at the working electrode as a function of the
applied potential The current response is monitored during the potential sweep (Figure
29) The potential sweep range (Emin~Emax) and the sweep rate can be controlled
experimentally Additionally CV can provide information about the reversibility of the
chargingdischarging process
2 Theory and background
33
Cyclic voltammetry can produce informative characterization of oxide coatings if taken in
conditions where no Faradaic process occurs and the solvent is not electrochemically
decomposed A non-faradaic process involves the accumulation of charges at the
metalsolution interface which is called the electrical double layer However Faradaic
processes are associated with electron transfer across the interface result in redox of
species The shape of the voltammograms provides evidence of intermediate species
surface redox transitions or phase formations
Figure 29 (left) The triangular potential sweep waveform (one cycle is shown) used for the CV
measurement (right) The typical cyclic voltammogram recorded corresponding to the potential
sweep
To investigate the capacitor-like behaviour of oxide electrodes the voltammetric charge
density (qa) can be obtained by graphical integration of the voltammograms in the potential
range without the Faradaic reaction and calculated by using the equation
a
Sq (222)
where S (mA V cm-2
) is the integrated area of the anodic branch and υ (mV s-1) is the
potential sweep rate It provides some diagnostic criteria to assess the morphology and
evaluate the relative electroactive surface area of oxide electrodes assuming that the
voltammetric charge density is proportional to the surface concentration of active sites
The dependence of the voltammetric charge density on the sweep rate could provide
information about the oxide coating morphology
2 Theory and background
34
2422 Chronopotentiometry (CP)
The electrocatalytic activity of the electrode coatings can be evaluated in a relative way by
comparing the electrode potential for a given constant current density (termed as
chronopotentiometry) The CP measurement is performed generally by stepping from an
initial current typically zero to some finite value (left in Figure 210) and monitoring the
potential vs time (right in Figure 210) The overall redox reaction rate (current density) is
fixed and the potential of the working electrode is then monitored as a function of time
Generally the CP curves contain plateaus that correspond to the steady-state redox
potential of electroactive species The analysis of the noise in the recorded potential signal
can help the identification of the physico-chemical process associated with the noise source
at the electrode surface
Figure 210 (left) Current excitation signal for a chronopotentiometry measurement with an
interrupt from t1 to t2 (right) Potential-time profile for the CP measurement corresponding to the
current signal
For the CP measurement with a current interrupt the potential response vs time is shown
in the right panel in Figure 210 The current is interrupted at time t1 the potential drops
from the steady state A to B instantaneously with a potential difference of iR and then
decays with time The potential decay curve is also called as potential relaxation curve
After sufficiently long time the potential will decrease to the open circuit potential At
time t2 the current is applied once again the potential jumps immediately and then
increases non-linearly until reaches again the steady-state value The potential build-up
2 Theory and background
35
curve is also called as pseudocapacitor charging curve or potential transient curve The
decay process and charging process are non-steady-state processes Note that both the
chargingdischarging of the double layer and the Faradaic process contribute to the non-
steady-state process The characterization of the rough or porous electrode surface can be
carried out by analysing the chargingdischarging behaviour at the electrodeelectrolyte
interface Note that the double-layer capacitance arises from the electrostatic charging of
the electrode surface whereas the pseudocapacitance involves the electrochemical
adsorptiondesorption of reactive species along with the electron transfer [76]
2423 Galvanostatic polarization
The E-I polarization curves of a given electrode can be measured either galvanostatically
or potentiostatically The former measures the potential under steady-state conditions by
applying a constant current The latter records the steady-state current by imposing a
constant potential Prior to the polarization measurement the electrode should be activated
firstly For the galvanostatic polarization measurement current is applied stepwise with or
without intermediate current interrupt (Figure 211) The parameters for the experiments
are the current value and the length of the current steps (current interrupt is optional) This
Tafel slope can be determined from the polarization curves (potential vs log-current
curves) after the iR-correction
Figure 211 Current steps profile for the galvanostatic polarization measurements Electrodes were
activated at current density j0 for a certain time before starting the current steps (j1 j2hellip)
2 Theory and background
36
2424 Electrochemical impedance spectroscopy (EIS)
Impedance spectroscopy (IS) is a powerful tool for the investigation of frequency-
dependent electrical properties of materials and their interfaces The Electrochemical
impedance spectroscopy (EIS) measurements are performed by applying a stimulus current
(or potential) to the electrode and observing the potential (or current) response at different
frequency In a galvanostatic impedance measurement the monochromatic excitation
current expressed as a function of time has the form 0 sin( )tI I t where It is the current
at time t I0 is the amplitude of the excitation signal and ω = 2πf is the angular frequency
For a linear electrochemical system the resulting potential response 0 sin( )tE E t is
shifted in phase The complex impedance Z(ω) is obtained from the complex potential
and current ( ) tre im
t
EZ Z iZ
I where 1i The impedance is therefore expressed in
terms of a magnitude Z and a phase shift The most common representation of
impedance data is the Nyquist-plot (-Zim is plotted versus Zre) or Bode-plot ( Z and are
plotted as a function of log frequency)
For an electrode-solution interface with the occurrence of a Faradaic charge-transfer
reaction which is controlled by the charge-transfer step an equivalent circuit Re(RctCdl) is
normally used to represent the interface where Re is the solution resistance Rct is the
charge-transfer resistance and Cdl is the double layer capacitance More than one semi-
circle could present from the Nyquist plot for a complex system For the porous or rough
electrode surface a suppressed semicircle in the Nyquist plot originating from the
frequency dispersion of the interfacial impedance can be observed A constant phase
element (CPE) is often used to replace the capacitance element When the electrode
reaction is controlled by the mass-transfer step the Warburg element (W) can be involved
in the equivalent circuit Accordingly the Warburg straight line can be observed in the low
frequency region of the Nyquist plot
3 Experimental
37
3 Experimental
This section contains the experimental details regarding the electrocatalyst preparation by
sol-gel based routes followed by the structural characterization and electrochemical
performance analysis of electrocatalysts for chlorine evolution reactions
31 Preparation of electrocatalyst coatings
311 Pre-treatment of Ti-substrates
Equation Chapter 3 Section 1
Titanium plates with a diameter of 15 mm and a thickness of 2 mm (Goodfellow purity
996) were sandblasted (one side) and etched in 10 oxalic acid at 80 oC for 2 h to clean
and roughen the surface and then rinsed with isopropanol and dried in a nitrogen flow
Afterwards the titanium substrates were freshly coated with sol solutions For up-scaling
expanded titanium metal (100times100 mm2) used as substrates were pre-treated by following
the same procedure
312 Sol-gel synthesis of mixed oxide coatings
All chemicals used were listed in Appendix A1 and applied without further purification
Two different routes of acetic acid and propionic acid catalyzed sol-gel procedures were
applied to prepare the sol solutions
3121 RuTiO2 sol solutions prepared by acetic acid-isopropanol route
The general sol-gel recipe used to prepare 01125 M RuTiO2 binary oxides is as follows
The molar ratio of precursors chelating agent acetic acid and water is
Ru Ti DAA CH3COOH H2O = n (1-n) 3 640 1
3 Experimental
38
where DAA is 4-hydroxy-4-methyl-2-pentanone synonym diacetone alcohol n is the molar
content of ruthenium in RuTiO2 binary oxide
Addition sequence
isopropanol gtgt DAA gtgt Ti(i-OPr)4
gtgt H2O gtgt CH3COOH
RuCl3middotxH2O in isopropanol
Embodiment of the preparation procedure The preparation of 01125 M Ru04Ti06O2 sol
solutions for example were obtained by dissolving 1685 mg RuCl3middotxH2O (36 Ru)
(06 mmol Ru) into 6 mL isopropanol and stirred overnight (Solution A) 2665 microL Ti(i-
OPr)4 (09 mmol Ti) was added into the premixed solution of 5615 microL (45 mmol) 4-
hydroxy-4-methyl-2-pentanone in 647 mL isopropanol (Solution B) and keep stirring for
30 min Solution A and Solution B were ultrasonically mixed to acquire a clear solution
Afterwards 27microL deionized water (15 mmol) and 129 microL acetic acid (0225 mmol) were
added into the above solution The as-prepared solution was covered and kept stirring
overnight at room temperature
3122 RuTiMOx sol solutions prepared by propionic acid-isopropanol route
The general sol-gel recipe used to prepare RuTiMOx multicomponent oxides is carried out
by using hot isopropanol and propionic acid mixture (1 1 in volume) as co-solvents to
dissolve the precursor salts for the preparation of RuTiMOx where M is doping element
such as Ir V Sn Mo Zr etc
Embodiment of the preparation procedure The preparation of 01125 M
Ru01Ir01V005Sn04Ti035Ox sol solutions for example were obtained by adding 498 mg
Ru(acac)3 (0125 mmol) 612 mg Ir(acac)3 (0125 mmol) 166 mg VO(acac)2
(00625 mmol) 2076 mg Sn(i-OPr)4middotC3H7OH (05 mmol) and 1295 microL Ti(i-OPr)4
(04375 mmol) into 111 mL isopropanol and 111 mL propionic acid mixture respectively
The above solutions were refluxed at 150 oC for 30 min with vigorous stirring and then
3 Experimental
39
mixed after cooling down to room temperature The mixed solutions were homogeneous
and transparent with wine-red colour
3123 Preparation of Ti substrates supported oxide coatings
Titanium plates were drop-coated with 50 microL coating solutions (01125 M) using a
micropipetter The wet coatings were air-dried and sintered at 250 oC for 10 min and then
450 oC for 10 min in static air conditions The droppingdryingsintering cycle was repeated
8 times corresponding to a total metal loading amount of 45 μmol per Ti-plate (177 cm2
geometric surface area) After deposition of the final coating (the 8th
coating) the coated
titanium plates were sintered at 450 oC for another 1 h to finish the preparation process
313 Preparation of crack-free coatings
The crack-free and impermeable coatings were obtained by repetitious soaking-
withdrawing technique after obtaining the sol solutions The photograph of home-made
dip-coater is shown in Figure 31
Figure 31 Image of the home-made sol-gel dip-coater device The lifting arm movement speed
can be changed by each 1 mm min-1
and with a maximum of 200 mm min-1
The titanium substrates were immersed in the coating solutions for 20 s and then
withdrawn upwards vertically from the coating solutions with a controlled withdrawal
3 Experimental
40
speed The wet coatings were air-dried and sintered at 250 oC for 10 min or 90
oC for
30 min and then 450 oC for 5 min in static air conditions The soaking-withdrawing-
drying-sintering cycles were repeated many times in order to obtain thicker crack-free
coatings The single layer thickness of oxide coatings can be changed by the withdrawing
speed and the concentration of sol solutions
314 Preparation of porous coatings
The coating solutions were obtained by adding a certain amount of La(NO3)3 middot 6H2O or
polyvinylpyrrolidone (PVP) into the sol solutions prepared as described above The coating
processes were same as described before Pores were created by chemical leaching
(soaking the coated titanium plates into the 5 HCl aqueous solution at a temperature of
60 oC for 15 min with slight stirring) for the coatings prepared from La-containing sol
solutions or by organics burning for the coatings prepared from the PVP-containing sol
solutions
Embodiment of the preparation procedure To prepare Ru03Sn07O2 porous coatings for
example the coating solutions were obtained by dissolving 379 mg RuCl3 middot xH2O (36 Ru)
(0135 mmol) into 133 mL isopropanol and keep stirring overnight (Solution A) 1308
mg Sn(i-OPr)4middotC3H7OH (0315 mmol) was added into the mixture of 134 mL isopropanol
and 133 ml propionic acid and then refluxed at 150 oC for 30 min with vigorous stirring
(Solution B) Afterwards 39 mg La(NO3)3 middot 6H2O (009 mmol) was added into the hot
Solution B and kept stirring for another 20min until the solutions cool down to room
temperature Finally Solution A was added dropwise into the above solutions with
vigorous stirring The titanium plates were drop-coated with 50 microL coating solution using
a micropipetter The wet coatings were air-dried and sintered at 250 oC for 10 min and
then 450 oC for 10 min in static air conditions The coated titanium plates were soaked in
the 5 HCl aqueous solution at a temperature of 60 oC for 15 min with slight stirring to
leach away the lanthanum oxide The coating-sintering-leaching cycle was repeated for 8
times corresponding to a total ruthenium loading amount of 135 μmol per Ti-plate (1766 cm2
geometric surface area) followed by a final sintering at 450 oC for 1 h to finish the
preparation process
3 Experimental
41
315 Combined sol-gel and solvothermal synthesis
RuTiO2 sol solutions were prepared by the acetic acid-isopropanol route as described
above Titanium substrates were drop-coated with 50 microL coating solutions (01125 M) per
single layer using a micropipetter the process was repeated for 8 times with intermediate
air-drying and thermal stabilization at 200 oC (or 100
oC 250
oC) for 10 min each time
Figure 32 Images of autoclave pressure vessel and heating oven (left) Teflon liner (middle) and
the schematic diagram (right) for solvothermal processing of electrode coatings
A 250 mL teflon sealed stainless-steel autoclave (Figure 32 left middle) was used for
solvothermal processing of the above obtained amorphous coatings The coated Ti-plates
were put into a glass vial and located into the 30 mL diluted sol solutions (or 30 mL
isopropanol) filled autoclave (Figure 32 right) The Ti-plate was isolated with the filled sol
solutions by the glass vial The autoclave was heated to 150 oC with a heating rate of
10 oCmin and held at 150
oC for 24 h then furnace cooled down to room temperature
The solvothermally processed coating was taken out and post-sintered at 450 oC for 1h
under static air conditions
3 Experimental
42
32 Structural characterization of electrocatalysts
321 X-ray diffraction (XRD)
The phase structure of the prepared coatings was identified using a Siemens D500
diffractometer (Cu Kα12 radiation λKα1 = 15406 Aring λKα2 = 15444 Aring) operated at 35 kV
and 26 mA over a 2θ range of 20-60 o with a scanning step of 002
o 4s The crystal
structures of the solvothermally processed coatings were refined using the analytical
software TOPAS 21 based on the Rietveld methods to obtain the corresponding phase
weight percentage lattice parameters (a c) and crystallite size with the kind help of Prof
Dr Klaus Stoumlwe (Technical Chemistry Universitaumlt des Saarlandes) Degussa P-25 TiO2
powder was used as standard for the instrumental calibration [77]
High temperature X-ray diffraction (HT-XRD) was conducted on a Siemens D-5000
diffractometer with Cu Kα radiation operated at 40 kV and 30 mA to characterize the phase
evolution with temperature of the gel powders from room temperature to 600 oC with a
20 oC interval and a 30
oC min
-1 heating rate at a 2θ range of 22~44
o
322 Raman spectroscopy
The purpose for the measurements of the Raman spectrum is to obtain the lattice vibration
information of a crystal [ 78 ] A HORIBA-Jobin-Yvon LabRAM ARAMIS Raman
spectrometer using a 6328 nm excitation (He-Ne laser 10 mW) was employed to record
the Raman spectra and a silicon single-crystal was used for instrument calibration The
laser light was focused onto the sample using a 100times objective lens
323 Scanning electron microscopy and energy dispersive analysis (SEM-EDS)
The microstructure and elemental distribution were analyzed by scanning electron
microscopy (SEM) and energy dispersive spectrometer (EDS) using JOEL JSM-7000F
operated with an accelerating voltage 20 kV
3 Experimental
43
324 Transmission electron microscopy and electron diffraction (TEM-ED)
The transmission electron microscopy (TEM) and selected area electron diffraction (SAED)
were carried out using a JEOL JEM-2010 microscope operated at 200 kV
33 Electrochemical characterization
The electrochemical measurements of electrode coatings were carried out using a home-
made medium-throughput multi-cell The schematic diagram of the three-electrode
configuration of a single cell is shown in Figure 33 The photographs of the
electrochemical test cell are shown in Figure 34 The raw data were acquired by EC-Labreg
software for further analysis
Figure 33 Schematic diagram of the three-electrode configuration cell for the electrochemical
performance measurements of electrocatalyst coatings Ti plates (15 mm in diameter) supported
sol-gel coatings were used as working electrode with an exposed geometrical area of 1 cm-2
RuO2
coated titanium mesh (prepared by using sol-gel coating solutions) as counter electrode and
AgAgClKCl(saturated) as reference electrode The reference electrode was carefully positioned
close to the working electrode by using a Luggin capillary to minimize the uncompensated
electrolyte resistance
3 Experimental
44
The working electrode and the counter electrode are connected to a DC power supplier
through an ampemeter The potential of the working electrode is measured with respect to
a reference electrode The potential difference between the working electrode and the
reference electrode consists of the potential of the working electrode and ohmic drop (iR)
from the electrolyte between the reference and working electrode The iR-correction can be
done by using electrochemical impedance spectroscopy measurement or using current
interruption technique
Figure 34 Electrochemical test cells (a) single cell (b) 16-cell array (c) 8-cell array with forced
convection of electrolyte and (d) Electrochemical impedance instrument
Electrochemical performance measurements (CV CP galvanostatic polarization and EIS)
were performed in 35 M NaCl pH 3 at room temperature unless otherwise noted EIS
measurement of rotating disk electrode facing downwards (2000 rpm exposed area
177 cm2) was carried out using in a galvanostatic mode (i = 100 mA) The frequency
range was from 1 kHz to 1 Hz The raw data acquired by EC-Labreg
was exported into
ZSimpWin for impedance data analysis Then the data were fitted using appropriate
equivalent circuit by ZSimpWin analysis software
4 Results and discussion
45
4 Results and discussion
The results obtained in this work are presented in this chapter Four sections are included
the optimization in chemical composition of mixed RuTiMOx oxide electrocatalysts
prepared by sol-gel route in Section 41 the preparation of the oxide coatings with
controlled morphologies such as the crack-free coatings porous coatings and the
electrochemical property characterization in Section 42 the modification in the phase
structure of the mixed RuO2-TiO2 oxide coatings by solvothermal processing of the
xerogel coatings in Section 43 and the analysis of gas bubble behaviour of electrolytic
chlorine evolution at the gas-evolving electrodes in Section 44
41 Chemical compositions of the electrocatalysts
411 Influence of preparation parameters
Equation Chapter 4 Section 1
Prior to the deposition of oxide coatings onto the titanium substrates the substrates were
pre-treated by sand blasting and chemical etching to clean and roughen the surface The
surface topography of the Ti-substrates (15 mm in diameter) after the pre-treatment (sand
blasting and chemical etching) was studied by Atomic Force Microscopy (AFM) (Surface
Imaging Systems SIS GmbH) as shown in Figure 41 The clean and rough surface (mean
roughness 137 μm) is desirable for good adhesion between the substrate and oxide
coating
4 Results and discussion
46
Figure 41 Surface topography analysis of titanium metal substrate after pre-treatment by sand
blasting and chemical etching Top AFM image Bottom cross section analysis Statistical data of
the region of interest Maximal height difference 3232 μm Mean roughness 1373 μm Root
mean square 06371 μm
4111 Oxide loading amount and coating thickness
Oxide loading amount is one of the important parameters related to the coating service life
As shown in Figure 42 the electrode potential of the Ru025Ti075O2 coatings exhibits a
linear decrease with the oxide loading amounts at the range of 35~125 g m-2
due to the
effective utilization of the active sites depends on the penetration depth of the electrolytes
into the inner parts of the mud-crack oxide coatings It has been reported that the active
surface area (corresponding to the voltammetric charges measured by cyclic voltammetry
method) increases with coating thickness until it reaches to a plateau value [79] The
further increase in the thickness of the oxide coating can only prolong its service life
Another important factor concerning the available active surface area is the coating surface
morphologies (mud-crack layer porous layer crack-free compact layer etc) which will
be discussed in Section 42
The commercially available anodes for chlorine evolution reactions consist of the standard
composition of Ru03Ti07O2 deposited onto titanium substrates [1128] and with an oxide
loading amount about 20~30 g m-2
[29] For comparison purposes in this work the oxide
coatings were prepared by sol-gel method with the constant metal molar amounts of
45times10-5
mol per Ti-substrate plate (diameter 15 mm) and a fixed number of oxide layers
(8-layer films) Accordingly the mass of the oxide coatings could vary with the chemical
composition and the molar ratio of the components (For instance for a coating with
Ru03Ti07O2 the oxide loading amount is 244 g m-2
) Therefore the decrease in noble
4 Results and discussion
47
metal percentage means a decrease in the absolute quantity of the noble metal in the
resulting coatings
2 4 6 8 10 12 14
130
132
134
136
138
140
142
144
146
4-layer
3-layer2-layer
E
V v
s
AgA
gC
l
Oxide loading amount g m-2
1-layer
Figure 42 Dependence of performance on the oxide loading amounts of Ru025Ti075O2 coatings
Electrode potential measured under galvanostatic mode at a current density of 100 mA cm-2
in
35M NaCl pH 3 room temperature The number of the oxide layers is marked out corresponding
to the oxide loading amount Square dot indicates crack-free coating prepared by dipping-
withdrawing method (see Section 313)
4112 Influence of sintering conditions on the crystallization phase transition of powders
Thermal sintering is a necessary preparation step to obtain the mechanical and
electrochemical stability of the ceramic oxide coatings The crystallinity degree crystallite
size voltammetric charge etc depend on the sintering conditions such as the sintering
temperature and sintering time [3380] Increase in the sintering temperature could increase
the degree of crystallinity enhance the coating stability and on the other hand promote the
crystal growth reduce the active surface area induce the growth of insulating TiOx
interlayer due to the oxidization of underlying substrate under higher temperatures
(gt 500 oC) and O2-containing ambience
Although the powders behave differently from the coatings in the phase transition
behaviour and their properties [ 81 ] some helpful information for optimizing the
4 Results and discussion
48
preparation parameters for coatings can be obtained by using powders as research objects
Thermogravimetry and differential scanning calorimetry (TG-DSC) (Figure 43a) and high
temperature X-ray diffraction (HT-XRD) (Figure 44) were performed to investigate the
decomposition of residual organics and the amorphous-to-crystalline transition process of
xerogel powders during sintering
Figure 43 (a) TG-DSC data for air-dried Ru025Ti075O2 xerogel powders (prepared by using acetic
acid as catalyst for the hydrolysis and condensation reactions) recorded by elevating the
temperature from 35 oC to 1000
oC with a ramping rate of 10
oC min
-1 under mixed N2 (5 ml min
-1)
+ air (15 ml min-1
) flow (b) The coupled FTIR spectra are recorded continuously as a function of
temperature (Time index was shown in place of temperature) for the evolved products analysis (c)
Metastable rutile solid solution Ru025Ti075O2 powders decomposed into two separate RuO2 and
TiO2 phases after TG-DSC measurements
4 Results and discussion
49
The TG curve exhibits mass loss characteristics of the gel powders (Figure 43a) A weight
loss of 43 from room temperature to 450 oC and a slight weight loss of 07 from 450
oC
to 1000 oC were observed The wide endothermic peak around 115
oC associated with the
first weight loss between 90~180 oC can be assigned to the elimination of adsorbed
moisture and residual organic solvent which can be confirmed from the absorption band of
hydroxyl stretch vibration vOH at 3500~4000 cm-1
and ndashCH3 at 1500 cm-1
(Figure 43b)
The decomposition of carbonaceous compounds in the gel powders was confirmed by the
appearance of CO2 and CO as the decomposition products detected in the range
200~450 oC (Figure 43b) The two exothermal peaks are therefore evident from the
residual organic combustion along with the amorphous-to-crystalline transformation since
crystallization starts at 260 oC from HT-XRD results (Figure 44) The wide exothermal
peak from 320~470 oC implies that the decomposition of organics may occur progressively
Figure 44 HT-XRD patterns of air-dried Ru025Ti075O2 xerogel powders recorded on a Siemens D-
5000 diffractometer from 240 oC to 600
oC with a 20
oC interval (diffraction patterns of powders
with temperatures lower than 240 oC were amorphous and not shown here) and 30
oC min
-1 heating
rate at a 2θ range of 24~44o
As shown from HT-XRD (Figure 44) the crystallization of xerogel powders starts at
260 oC with the formation of rutile solid solution From 260
oC to 600
oC the single rutile
solid solution phase was transferred into a mixed RuO2 and rutile solid solution phases and
4 Results and discussion
50
accompanied by the position shift of the (110) diffraction peaks of the solid solution phases
toward the TiO2 side Furthermore the rutile RuO2-TiO2 solid solution decomposed
completely into separate RuO2 and rutile TiO2 phases for the powders after TG-DSC
measurements (Figure 43c)
Table 41 Dependence of the properties of Ru025Ti075O2 powders prepared by acetic acid-
isopropanol route on the sintering temperature
Sintering
temperature oC
SBET m2 g
-1 Median pore
radius nm
Crystallite size
nm
250 2225 274 amorphous
450 552 324 23
600 126 797 gt 25
Calculated from the X-ray diffraction peaks using Scherrerrsquos equation
Table 41 summarizes the surface area median pore radius measured by the BET gas
adsorption technique and the crystallite size as a function of the sintering temperature for
the Ru025Ti075O2 powders The BET specific surface area decreases with increasing
sintering temperature due to the grain coarsening as usual In contrast the pore size
showed a slight increasing trend with the sintering temperature The increase in the pore
size from 250 oC to 450
oC is possibly due to the continuous combustion of organic
impurities Further increase in the pore size from 450 oC to 600
oC is likely due to the
decomposition of the metastable rutile solid solution phase into separated phases which
results in the interpenetration of neighbouring pores
Note that the specific surface area of powder samples obtained from BET results is the
geometric surface area For the electrocatalysts used as coating form in the electrolyte
environment only the electroactive surface area should be taken into account It has been
observed that there is no simple linear relationship between the voltammetric charge
density for coatings against the BET surface area for powders [8283]
4 Results and discussion
51
4113 Influence of sintering conditions on the phase transition surface morphology and
electrochemical properties of coatings
25 30 35 40 45 50 55 60
RuO2 40-1290
TiO2 21-1276
Ti 44-1294
450oC-450
oC
250oC-450
oC
90oC-450
oC
Inte
nsity
au
2 o
Figure 45 XRD patterns of Ru04Ti06O2 coatings prepared by two-step sintering (1st at 90 250 and
450 oC for 10 min then 2
nd at 450
oC for 10 min) of air-dried coatings
For the preparation of oxide coatings repetitious coatingsintering were employed in order
to obtain the desired oxide loading amount and a two-step sintering process was generally
used to remove the solvent at the 1st step under relative lower temperature and then
stabilize and crystallize the oxide coating at the 2nd
step under higher temperature The
influence of the sintering temperature in the 1st and 2
nd steps on the XRD patterns of
Ru04Ti06O2 coatings is shown in Figure 45 and Figure 46 Although there are no obvious
differences of the final phase structures in Figure 45 the relatively mild sintering
conditions (250 oC 10 min) were used as the 1
st sintering treatment in the following
sections except where otherwise noted By keeping the same conditions in the 1st sintering
steps the amorphous-like structure was observed when the temperature of the 2nd
sintering
was lower than 250 oC whereas the decomposition of the metastable rutile RuO2-TiO2
solid solution was confirmed by the presence of RuO2 (110) shoulder when the 2nd
sintering temperature is 550 oC (Figure 46)
4 Results and discussion
52
Figure 46 XRD patterns of Ru04Ti06O2 coatings prepared by two-step sintering (1st at 250
oC for
10 min then 2nd
at 250 350 400 450 500 550 oC for 10 min) of air-dried coatings Inset Local
enlarged rutile (110) peaks of Ru04Ti06O2 coatings corresponding to coatings with the 2nd
sintering
temperatures of 350 450 550 oC
Sintering treatment of the titanium substrate supported oxide coating leads to a build-up of
the in-plane tensile stress in the oxide layer The mud-crack structure is formed to release
the thermal mismatch stress between the substrate and the oxide layer when the magnitude
of this tension is high enough [84] The cracks also promote the subsequent sintering
Figure 47 shows the typical mud-crack surface morphologies of sol-gel coatings sintered
at different temperatures There is no obvious difference in the size of the cleavage block
(island) with the increase in sintering temperature but the islands turn up at higher
temperatures due to the further shrinkage and densification The formed gaps between the
islands are favourable for the free access of electrolytes into the inner catalytic active sites
Meanwhile this encourages the passivation of the underlying substrate during the long-
term employment due to the direct chemical and electrochemical attack on the substrate by
electrolyte The design and control in coating morphologies in order to protect the
underlying substrate will be discussed in Section 42
4 Results and discussion
53
Figure 47 SEM images of surface morphologies of Ru04Ti06O2 coatings sintered at different
temperature (1st step sintering at 250
oC for 10 min) Scale bar 10 microm
The sintering conditions have significant influence on the final electrochemical
performance of oxide coatings As shown in Figure 48 with the increase of sintering
temperatures from 350 oC to 500
oC the voltammetric charges (ie the electrochemically
active surface area of oxide electrode) evaluated by integrating the anodic branches of the
cyclic voltammograms decrease from 47 mC cm-2
to 12 mC cm-2
Accordingly the
electrode potential for the chlorine evolution reactions increases by about 120 mV with the
increase of the sintering temperature from 350 oC to 500
oC (Figure 48)
RuO2-based electrode coatings contain the partial hydrated RuOx(OH)y which accounts for
the pseudo-capacitive properties For the CV curves recorded in the potential sweep
window without Faradaic chlorine evolution reactions the solid-state surface redox
transition of active species is represented by the pseudo-capacitive
protonationdeprotonation [8586]
4 Results and discussion
54
RuO (OH) H e RuO (OH)x y x y 0 2 (41)
The continuous change of δ during the proton exchange process occurs over a window of
about 12 V [87] Indeed the amorphous-like RuO2 nH2O is the target structure employed
as electrochemical supercapacitors [8889] The capability of the proton exchange of the
RuO2-based electrode coatings with the solution could be alleviated by thermal sintering
which dehydrates the hydrated ruthenium species and is responsible for the decrease in the
voltammetric charge density with the increase of sintering temperature
350 400 450 500
116
118
120
122
124
126
128
130
Sintering temperature oC
E
V v
s
Ag
Ag
Cl
10
15
20
25
30
35
40
45
50
Vo
ltam
me
tric c
harg
e m
C c
m-2
Figure 48 Dependence of voltammetric charges density () and electrode potential () (measured
at a current density of 100 mA cm-2
in 35M NaCl pH3 room temperature) on the sintering
temperature of Ru04Ti06O2 coating corresponding to Figure 46
412 Chemical composition of electrocatalysts
Mixed oxides using the electrocatalytically active component RuO2 (Table 22) andor IrO2
combined with inert oxide(s) TiO2 SnO2 V2O5 ZrO2 CeO2 etc represent the most
widely studied electrocatalyst materials in the attempt to enhance the catalytic activity to
modify the microstructure to reduce the material costs [90919293] The noble metal
oxides provide the active sites and conductive paths whereas inert oxides are used to dilute
and stabilize the active component
4 Results and discussion
55
Thin coatings of RuO2-based oxide can be deposited onto heat resistant substrates by the
thermal decomposition of corresponding metal salts The metal salts are usually dissolved
into suitable solvents and the substrates are wetted with the coating solutions by various
techniques such as brushing spraying After drying the substrate supported wet coatings
are sintered in air at high temperature to decompose the salts and to burn the carbonaceous
residues to get the final oxide or mixed oxide This process can be only applicable for the
metal substrate which does not oxidize at the required temperature Since the beginning
temperature for the titanium oxidation is about 500 oC the incomplete decomposition of
ruthenium precursor salts is one of the main problems encountered in the preparation
process Heterogeneity in microstructure is another intrinsic drawback of the oxide
coatings prepared by the conventional thermal decomposition technique [33] and it could
limit the ability to develop new electrocatalysts by optimized combination of
multicomponent composite oxides The inhomogenous elemental distribution could be due
to (i) the different solubilities of the precursor salts during the drying process (ii) some
nuclei of single oxide are formed before the firing step (iii) the differences of the salts
oxidation rate [94] Thus multi phase components with local enrichment of one phase is the
main feature of thermal decomposition derived oxide coatings
In the aspect of the microstructural homogeneity of composite oxides the low-temperature
sol-gel route prefers the formation of homogenously distributed oxo bridges between metal
centres (M-O-Mrsquo) by the hydrolysis and condensation reactions of molecular precursors
High crystallinity of oxides at lower sintering temperatures with less phase impurities of
the sol-gel derived materials have demonstrated higher activity and stability in comparison
with those prepared by thermal decomposition route [294895] However few studies
have been devoted to evaluate the multi-doping effects of sol-gel derived composite oxide
electrocatalysts so far with respect to nanoscale structural homogeneity (Table 23)
4121 Doping effect of mixed oxides
Although IrO2 is less active than RuO2 for chlorine evolution reaction (Figure 413) the
partial replacement of RuO2 by IrO2 was done in order to reduce the material cost
(considering the fluctuations in the market price) In addition iridium has the ability to
4 Results and discussion
56
enhance the durability of the RuO2-TiO2 oxide coatings [4696] IrO2 has the same rutile
tetragonal structure as RuO2 and TiO2 XRD patterns show that the diffraction peaks
become broader with the increase in Ir content in the Ru04-xIrxTi06O2 mixed oxide (Figure
49) indicating the decrease in crystallite size (Figure 412) As a consequence the
voltammetric charge density increases with the doping of Ir into binary RuTiO2 system
(Figure 412)
25 30 35 40 45 50 55 60
+ Ti-Substrate
rutile solid solution
+
+
++
e
dcb
Inte
nsity a
u
2 o
a
Figure 49 XRD patterns of Ru04-xIrxTi06O2 coatings prepared by acetic acid-isopropanol route
(IrCl3 was used as precursor salt and with the addition of HNO3 to dissolve the IrCl3 other
preparation details are described in the experimental section) (a) x = 0 (b) x = 01 (c) x = 02 (d) x
= 03 (e) x = 04
Table 42 Structural data for some metal oxides with rutile structure [97]
TiO2 RuO2 IrO2 SnO2 CrO2 NbO2 VO2
Metal ionic radii nm 0068 0067 0068 0071 0062 0074 0063
Lattice parameters ca 06441 06905 07011 06726 06596 06255 06260
Cell volume Aring3 6243 6278 6413 7151 5703 7120 5915
Compared to the reported XRD phase analysis results for the industrial IrO2-RuO2-TiO2Ti
electrode with a molar ratio of IrRu = 11 [96] the relative intensity of the rutile (110)
diffraction peaks at 2θ = 2762o is weaker for the present electrode using the diffraction
4 Results and discussion
57
peaks from Ti-substrate as reference The stronger and narrower X-ray diffraction peaks
from the industrial electrode could arise from the larger crystallite size rather than the
thicker oxide layer
SnO2 has been used as dopants added into RuTiO2 system to replace TiO2 The substitution
of Ti by Sn in the Ru04SnxTi06-xO2 mixed oxide results in the obvious shift of the rutile
diffraction peaks towards the SnO2 side and the broadening of diffraction peaks (Figure
410) The rutile structure has edge-sharing octahedrally coordinated metal ions which
form chains along the [001] direction [97] The M-O bond distances are not equal for the
MO6 octahedra with different metal ion centers Thus with the existence of the dopant ions
in the host lattice the lattice structural distortion could be caused by the difference in the
metal ionic radii (Table 42) M-O bond distances In contrast for the RuIrTiO2 system
due to the similarity in the metal ions radii and unit cell volume of the dioxide there is no
position shift observed in the diffraction peaks (Figure 49)
25 30 35 40 45 50 55 60
a
d
c
b
2 o
Inte
nsity a
u
Figure 410 XRD patterns of Ru04SnxTi06-xO2 coatings prepared by acetic acid-isopropanol route
(a) x = 0 (b) x = 02 (c) x = 04 (d) x = 06 The position of the diffraction peaks from the JCPDS
database of Ti-substrate (44-1294) RuO2 (40-1290) TiO2 (21-1276) SnO2 (41-1445)
4 Results and discussion
58
A single phase of rutile structure was formed for the Ru04Sn04Ti02O2 ternary oxide with a
crystallite size of about 5 nm (Figure 412) The growth of crystal has been inhibited in the
multicomponent system The voltammetric charge density increases four times compared
to the one of the binary Ru04Ti06O2 oxide Since the voltammetric charge density
represents the amount of protons exchanged between the oxide coating and the aqueous
electrolyte and the SnO2 does not show any notable redox behaviour in the CV potential
sweep range [98] therefore the surface redox equilibria (Eq (41)) are dominated by the
ruthenium species both for the binary Ru04Ti06O2 coatings and ternary Ru04Sn04Ti02O2
coatings The electrode potential for chlorine evolution reduces to about 116 V for the
Ru04Sn04Ti02O2 coatings ie a reduction of 90 mV compared to the Ru04Ti06O2 coatings
(Figure 413) The improvement in the electrocatalytic activity for oxygen evolution
reactions by the substitution of Ti by Sn in the Ru03SnxTi07-xO2 has also been reported [99]
25 30 35 40 45 50 55 60
(220)(211)
(101)
(110)
Ti 44-1294
RuO2 40-1290
TiO2 21-1276
a
b
c
d
X-ray diffraction of Ru04
Ti06-x
LaxO
2
Inte
nsity
au
2 o
Figure 411 XRD patterns of Ru04Ti06-xLaxO2 coatings prepared by acetic acid-isopropanol route
(a) x = 0 (b) x = 005 (c) x = 010 (d) x = 015
The doping of lanthanum into RuTiO2 system is different from the homogeneous doping of
Ir Sn The La2O3 has hexagonal crystal structure and the ionic radius of La3+
is 01016 nm
[100] which is very large in comparison with Ti4+
and Ru4+
(Table 42) Due to the
heterogeneous doping the substitution of La3+
for Ti4+
could affect the lattice symmetry
significantly
4 Results and discussion
59
0 10 20 30 40 50 60
0
4
8
12
16
20
24
28
M = La
M = Ir
Cry
sta
llite
siz
e
nm
M mol
M = Sn
(a)
0 10 20 30 40 50 60
0
10
20
30
40
Vo
lta
mm
etr
ic c
ha
rge
(m
Cc
m-2)
M mol
M = La
M = Ir
M = Sn
(b)
Figure 412 (a) Dependence of the crystallite size (calculated by using Scherrerrsquos equation) on the
coating composition Ru04SnxTi06-xO2 Ru04LaxTi06-xO2 Ru04-xIrxTi06O2 (b) Dependence of the
voltammetric charge density on the coating composition Ru04SnxTi06-xO2 Ru04LaxTi06-xO2 Ru04-
xIrxTi06O2 Potential sweep rate 50 mV s-1
With the doping of lanthanum the (110) (101) (220) diffraction peaks shift towards RuO2
side (Figure 411) No separate phase was observed for the coatings containing different
amount of lanthanum dopants The lanthanum dopant does not have a significant influence
on the crystallite size (Figure 412) Interestingly the voltammetric charge density
increases evidently for the lanthanum-containing coatings although the crystallite size is
larger than in the iridium- or tin-containing coatings (Figure 412) This is due to the
leaching characters of lanthanum oxide in the acidified solution which creates accessible
pores in the oxide matrix and accordingly provides higher active surface area The apparent
electrocatalytic activity was enhanced by the geometric effect (Figure 413)
4 Results and discussion
60
commercial Ru03Ti07O2 coating
Ru04Ti06O2
Ru01Ir03Ti06O2
Ru02Ir02Ti06O2
Ru03Ir01Ti06O2
Ru04Sn06O2
Ru04Sn04Ti02O2
Ru04Sn02Ti04O2
Ru04Ti055La005Ox
Ru04Ti05La01Ox
Ru04Ti045La015Ox
110
115
120
125
130
135
140
E V
vs A
gA
gC
l
Coating composition
Reference line
Figure 413 Electrode potential measured by chronopotentiometry in 35 M NaCl pH 3 at j = 100
mA cm-2
at room temperature for different coatings The measurement error of potential is about
20 mV The red reference line is the electrode potential value of the commercial Ru03Ti07O2Ti
electrode measured under the same conditions
Although the RuTiMOx coatings with M = Sn La shows improved electrocatalytic
performance (Figure 413) the high content of ruthenium in the mixed oxide could reduce
the oxygenchlorine electrode potential difference [21] since the selectivity for the
oxygenchlorine evolution reactions depends on the chemical composition of oxide
coatings [101] Therefore the addition of suitable dopants into the RuTiO2 system to
reduce the ruthenium molar content is not only technically necessary but also economically
important
Figure 414 compares the electrocatalytic performance of some ternary oxide RuTiMOx
coatings with M = V Zr Cr Mo prepared by the propionic acid-isopropanol route The
molar percentage of ruthenium is 25 or 15 which is below that of the commercial
electrode (30) Ru025Ti07V005Ox coatings show the best performance with an electrode
potential of about 117 V Unlike the oxides of Sn Zr Cr Mo the vanadium oxides such
as V2O5 VO2 exhibit electrochemical activity which has been widely investigated as
electrochemical supercapacitors [88102103] The mechanisms for the enhancement of
the electrochemical properties for chlorine evolution reactions with vanadium-containing
mixed oxide coatings are worth to be investigated further
4 Results and discussion
61
Ru025Ti065V01Ox
Ru025Ti065Zr01Ox
Ru025Ti065Cr01Ox
Ru025Ti065Mo01Ox
Ru025Ti07V005Ox
Ru025Ti07Zr005Ox
Ru025Ti07Cr005Ox
Ru025Ti07Mo005Ox
Ru015Ti075V01Ox
Ru015Ti075Zr01Ox
Ru015Ti075Cr01Ox
Ru015Ti075Mo01Ox
Ru015Ti08V005Ox
Ru015Ti08Zr005Ox
Ru015Ti08Cr005Ox
Ru015Ti08Mo005Ox
110
115
120
125
130
135
140
E V
vs A
gA
gC
l
Coating composition
Reference line
Figure 414 Electrode potential measured by chronopotentiometry in 35 M NaCl pH 3 at j = 100
mA cm-2
at room temperature for different coatings The measurement error of the potential is
about 20 mV The red reference line is the electrode potential value of the commercial
Ru03Ti07O2Ti electrode measured under the same conditions
4122 Microhomogeneous mixed oxide prepared by propionic acid-isopropanol route
On the basis of the above obtained results that the ternary RuTiMOx electrocatalysts with
M = Sn V exhibit improved electrocatalytic activity compared to the binary RuO2-TiO2
oxide further optimization of the electrocatalytic properties by using pentanary composite
oxides Ru01Ir01V005Sn04Ti035Ox with reduced noble metal content were investigated
herein
It is difficult experimentally to obtain stable sol solutions using the previous acetic acid-
isopropanol route for the preparation of the pentanary oxide Indeed mixed phases with
enrichment of individual component have been observed by other researchers by using the
sol-gel route to prepare the mixed oxide RuIrTiO2 [46] RuTiO2 [104] due to the unsuitable
recipe The presence of amorphous structure due to the incomplete crystallization metallic
ruthenium due to the incomplete hydrolysis reactions and single anatase TiO2 due to the
competitive hydrolysis reactions are undesirable for application as electrocatalysts [104]
No special advantages could be achieved from the sol-gel route in comparison with the
4 Results and discussion
62
conventional thermal decomposition route if the problems mentioned above can not be
resolved effectively
To obtain stable and homogenous initial sol solutions carboxylic acid acting as solvent
acid catalysts and also chelating reagents have been reported to overcome some common
difficulties encountered in the sol-gel synthesis of composite oxides due to the difference
in hydrolysis reactivity and dissolvability among various precursors [105106107108]
Once the metal alkoxides or acetylacetonates dissolve separately in the hot mixed
propionic acid and isopropanol solvents the ligand exchange reaction occurs [ 109 ]
Various metal cations are chelated due to the carboxylation and the formation of metal
propionates The propionate end groups act as steric hindrance to keep the dispersion of the
metal ions Thus the differences in reactivity against hydrolysis of the various precursors
could be harmonized After various metal precursors were dissolved and stabilized into
propionic acid and isopropanol mixture they were mixed to allow the further hydrolysis
and condensation reactions to build up the M-O-Mrsquo network
The pentanary oxide was prepared herein by propionic acid-isopropanol route to
investigate the microstructural homogeneity of the composite oxide materials For
comparison Ru04Ti06O2 and Ru025Ti07V005Ox coatings were prepared in the same way
and characterized under identical conditions
Figure 415 shows the phase structures of the composite oxide coatings deposited onto
titanium substrates for the binary Ru04Ti06O2 and pentanary Ru01Ir01V005Sn04Ti035Ox
Single phase rutile-type solid solutions were formed in both cases The inhibition effect of
crystal growth is more distinct in the pentanary oxide compared to the binary oxide
observed from the weaker and broader diffraction peaks of rutile configuration The
crystallite size was estimated from the rutile (110) peaks by using Scherrerrsquos equation The
calculated results were 4 nm and 16 nm for the pentanary composite and binary composite
respectively Due to the multi-doping in the composite oxides different metal ions
coordination and high structural distortion effects could be responsible for the inhibition of
crystal growth against the thermal sintering The decrease in the crystal dimension down to
a few nanometres could increase the coordinatively unsaturated sites of active component
and therefore the catalytic reactivity [110]
4 Results and discussion
63
25 30 35 40 45 50 55 60
Inte
nsity
au
2 o
b
rutile
+ substrate
+
++
+
a
Figure 415 X-ray diffraction patterns of the electrode coatings prepared by the propionic acid sol-
gel route (a) Ru04Ti06O2 (b) Ru01Ir01V005Sn04Ti035Ox
The microstructural homogeneity of the Ru01Ir01V005Sn04Ti035Ox coatings was
investigated by SEM-EDS The EDS elemental mapping results for the pentanary oxide are
shown in Figure 416 Due to the long acquisition time (20 min) the inevitable specimen
drift is monitored by comparing the SEM images before and after the acquisition as shown
in Figure 416a-b Several agglomerates observed from the SEM images on the coating
surface were selected as reference points Irrespective of the drift of the specimen towards
left-down during the acquisition there is no indication of individual element enrichment
observed from the EDS mapping images at the positions corresponding to the several
agglomerates attached on the coating surface Uniform elemental distributions in the whole
ranges were observed from the EDS maps thus one may suspect that there are no
discrepancies in the chemical composition between the agglomerates and the flat coating
surfaces and the multi-components of Ru Ir V and Sn are micro-homogenously dispersed
throughout the oxide matrix
4 Results and discussion
64
Figure 416 SEM images before (a) and after (b) EDS mapping showing the slight specimen drift
during the 20min acquisition time and the corresponding EDS elemental mapping images of
Ru01Ir01V005Sn04Ti035Ox oxide coatings Magnification times85000
The quantitative elemental composition analysis of the pentanary oxide obtained from the
SEM-EDS (Figure 417) shows the molar ratio of Ru Ir V Sn which is close to the
nominal composition The content of Ti identified is higher than the nominal value owing
to the electronsrsquo penetration through the oxide layers for the EDS analysis The electron-
4 Results and discussion
65
specimen interaction volume contains then parts from the underlying titanium substrate
with the applied acceleration voltage
0 1 2 3 4 5 6 7 8 9 10 11 12
Ir LIr LV K
V K
Ti K
Sn L
Sn L
Sn L
Ru LRu L
Ir M
keV
O K
Figure 417 Energy dispersive X-ray spectroscopy (EDS the X-ray intensity vs X-ray energy) of
the Ru01Ir01V005Sn04Ti035Ox coating The sample areas for EDS analysis corresponds to the SEM
image Figure 416a The elemental compositions identified quantitatively were (at ) 229 Ru
206 Ir 124 V 1127 Sn 1300 Ti 7014 O
Electrochemical cyclic voltammetry analysis for the obtained pentanary oxide is shown in
Figure 418 The voltammetric charge density calculated by the integration of the anodic
branch was 155 mC cm-2
for the Ru01Ir01V005Sn04Ti035Ox coatings which is about
fourfold larger than the one for Ru04Ti06O2 coatings It is well known that the
voltammetric charge density is a measure of the amount of the accessible electroactive
sites of the electrode surface The dopants of Ir Sn contribute to the decrease in the
crystallite size as confirmed in the previous section The addition of V is in order to
increase the electrocatalytic activity for chlorine evolution The Ru is partially substituted
by Ir with the intent of reducing the material costs and enhancing the stability of the
electrocatalysts [46]
4 Results and discussion
66
02 04 06 08 10-08
-06
-04
-02
00
02
04
06
08
j
mA
cm
-2
E V vs AgAgCl
Ru04
Ti06
O2
Ru01
Ir01
V005
Sn04
Ti035
Ox
Figure 418 Cyclic voltammograms of the Ru04Ti06O2 coating and the Ru01Ir01V005Sn04Ti035Ox
coating The cyclic voltammetry was measured in 35 M NaCl pH 3 room temperature AgAgCl
as reference electrode The potential was scanned from 02 to 10 V with a potential sweep rate υ
= 20 mV s-1
Exposed electrode surface areas 1 cm2
The galvanostatic polarization measurements for the Ru01Ir01V005Sn04Ti035Ox coatings
and Ru04Ti06O2 coatings are shown in Figure 419 For the current density steps from 05
to 100 mA cm-2
ie from the slight to the intensive chlorine evolution region the
electrode potential response was recorded Lower electrode potentials for chlorine
evolution were observed for the Ru01Ir01V005Sn04Ti035Ox coatings than for the
Ru04Ti06O2 coatings and the difference is larger at higher current densities The electrode
potential difference is about 80 mV at the current density of 100 mA cm-2
Compared to
the commercial Ru03Ti07O2 coatings (Figure 413) a decrease of electrode potential of
about 30mV is achieved for the Ru01Ir01V005Sn04Ti035Ox coatings measured under the
same conditions However the Ru04Ti06O2 coatings show worse performance than the
commercial Ru03Ti07O2 coatings The geometric effect could contribute to the higher
activity for the commercial coatings in this case due to the possible porous structure of the
inner oxide layer [1196]
The electrode potential value is stable at lower current densities but increases continuously
at higher current densities during the chlorine evolution reaction The reasons for the linear
drift of the electrode potential are not known The polarization curves plotted by taking the
middle value for the drift potential signal versus log j (Figure 420) are characterized by
4 Results and discussion
67
two Tafel slopes for both electrodes indicating the kinetic and mass transfer controlled
reaction mechanisms
Figure 419 Galvanostatic polarization profiles of Ru04Ti06O2 and Ru01Ir01V005Sn04Ti035Ox
coatings measured in 35 M NaCl pH 3 50 oC AgAgCl as reference electrode The applied
current densities were j (mA cm-2
) = 05 1 2 4 10 20 30 50 70 100 Exposed electrode
surface areas 1 cm2
10-1
100
101
102
110
115
120
125
130 Ru
04Ti
06O
2
Ru01
Ir01
V005
Sn04
Ti035
Ox
E
V v
s
AgA
gC
l
j mA cm-2
Figure 420 The E-log j curves obtained from Figure 419 without the iR-correction
The electrochemical impedance analysis allows separating various factors such as ohmic
resistance of electrolyte oxide film and interface response of the electrocatalytic coating
exposed to the electrolyte Figure 421 shows the impedance spectra of the composite
oxide coatings The semicircles corresponding to charge transfer for chlorine evolution
reactions were observed in the Nyquist plots (Figure 421a) The double logarithmic plots
4 Results and discussion
68
of ndashZ΄΄ vs f (Figure 421b) show clearly that one relaxation time exists [111] Using a
proposed equivalent circuit Re(QdlRct)(QfRf) [ 112 ] where Re is the electrolyte ohmic
resistance Rct and Rf are the charge transfer resistance and oxide film resistance
respectively while Qdl and Qf are constant phase elements related to the capacitance of the
charge transfer process and oxide film respectively The fitted parameters are summarized
in Table 43
00 01 02 03 04 05 06 07 0800
01
02
03
04
Commercial Ru03
Ti07
O2 coating
Ru025
Ti07
V005
O2
Ru01
Ir01
V005
Sn04
Ti035
O2
Ru04
Ti06
O2
-Z
Zcorr
(a)
100
101
102
103
10-2
10-1
100
-Z
f Hz
(b)
Figure 421 Impedance diagram for the sol-gel-derived Ru04Ti06O2 Ru025Ti07V005Ox
Ru01Ir01V005Sn04Ti035Ox coatings and commercial coating with the nominal composition
Ru03Ti07O2 measured in 35 M NaCl pH 3 at room temperature using in a galvanostatic mode
(applied current i = 100 mA) Exposed surface area 177 cm-2
(a) Nyquist plots for better clarity
the real parts were corrected by removing the electrolyte ohmic resistance (b) The double
logarithmic plots of ndashZPrime vs f Solid lines represent the fitted results using equivalent circuit
Re(QdlRct)(QfRf)
It was found that the oxide film resistance of the composite oxide ceramic coatings was so
small (~ 0075 Ω) even for the coating containing 10 Ru and 10 Ir which are different
from the reported critical concentration of 25~30 Ru or Ir to keep metallic conductivity
of oxide matrix [113] This behaviour can be well explained by the microstructural
homogeneity of the composite oxides Unlike the thermal decomposition prepared
materials in which poorly doped composite oxides consist of individual domains of
conductive noble metal oxide and inert and insulating valve metal oxide the highly
dispersed Ru andor Ir in the composite oxides prepared by the propionic acid-isopropanol
route assure the continuous conduction path
4 Results and discussion
69
Table 43 Parameters of the equivalent circuit (Re(QdlRct)(QfRf)) used to describe the impedance
behaviour of the composite oxide coatings
Re (Ω)
Qdl Rct (Ω)
Qf Rf (Ω)
Y0 (Ω-1
sn) n
Y0 (Ω
-1s
n) n
Ru04Ti06O2 06624 001133 084 06677 211 099 003158
Ru025Ti07V005Ox 02746 003087 093 01994 08138 079 007984
Ru01Ir01V005Sn04Ti035Ox 02359 006159 088 02174 5712 060 007528
Commercial coating 02196 005100 090 02484 5307 098 002885
A constant phase element (Q) instead of capacitance (C) is used to describe a practical electrode with
different degrees of surface roughness or a nonuniform distribution of surface active sites n is a
number between 0 and 1 (n = 1 for a pure capacitance) It means that the capacitor element has
characteristics intermediate between a capacitor and a resistor
The reciprocal of the charge transfer resistance 1Rct reflects the electrocatalytic activity
of the oxide coatings for the chlorine evolution reactions [112] Based on the fitted
parameters the activity of the coatings follows the sequence Ru025Ti07V005Ox gt
Ru01Ir01V005Sn04Ti035Ox gt commercial coating gt Ru04Ti06O2 (Table 43) This order is
consistent with the electrode potential measured by chronopotentiometry
Owing to the decrease in crystallite size the pseudocapacitance of the pentanary oxide was
twice that of the ternary oxide which means the active surface areas increase twice
although the pentanary oxide contains less content of noble metal The commercial
Ru03Ti07O2 coating has larger pseudocapacitance than the Ru04Ti06O2 coating which
confirms the assumption that the porous inner oxide layer of the commercial coating
contributes to the apparent electrocatalytic activity as geometric factor by increasing the
accessible surface area
4 Results and discussion
70
413 Conclusion
In this section the mixed oxide electrocatalyst RuTiMOx coatings were prepared by two
different sol-gel routes to investigate the influence of chemical composition on the
electrocatalytic activity for chlorine evolution reactions of the oxide coatings and their
structure-property correlation
An initial study of the influence of the coating preparation parameters on the coating
performance has been carried out to establish experimentally the suitable oxide loading
amount sintering conditions The acetic acid-isopropanol route is suitable for the
preparation of binary RuTiO2 system whereas the propionic acid-isopropanol route
possesses the advantage for the synthesis of mixed multicomponent RuTiMOx system
such as the ternary and pentanary oxide
The substitution of Sn V Cr La for the Ti in the RuTiMOx system increases the
electrocatalytic activity effectively The decrease in crystallite size and the corresponding
increase in the voltammetric charge density can be realized by the doping of Ir Sn into the
RuTiO2 system Compared to the commercial Ru03Ti07O2 coating the simultaneous
enhancement in the electrocatalytic activity and the reduction of noble metal content have
been achieved by using the Ru025Ti07V005Ox or Ru01Ir01V005Sn04Ti035Ox coating
The geometric factor could also play a critical role for the improvement of the apparent
electrocatalytic activity Porous structure of oxide layer is favourable for the practical
applications This has been deduced from the electrochemical properties of RuTiLaOx
coating and commercial coating The fabrication of pores with the intent of enhancing the
apparent catalytic activity will be discussed in the next section
4 Results and discussion
71
42 Morphology-controlled preparation
This section presents two different ways to control the coating morphology including the
fabrication of crack-free coating as inner layer to protect the substrate against passivation
and the preparation of porous coating as outer layer to increase the electrode specific
surface area
Traditionally the electrode coatings prepared by thermal decomposition of the
corresponding inorganic salts exhibit a mud-crack surface morphology Similarly the
typical surface morphologies of the sol-gel-derived oxide coatings are shown in Figure
422 The surface consists of islands with the size ca 4 μm in length boundary gaps ca
1~3 μm in width close-stacked particles with a diameter ca 30 nm inter-grain regions and
pores These flaws (such as cracks cavities and gaps) facilitate the penetration of
electrolytes and provide high accessible inner active surface areas which are responsible
for the electrocatalytic properties as a geometrical factor in contrast to the intrinsic
electrocatalytic activity related to the electrocatalyst materials (Section 41)
Figure 422 Representative SEM images of Ru04Ti06O2 coating show the typical mud-crack
characteristics of the sol-gel drop-coating prepared coatings Scale bar Left 10 μm Inset in Left
1 μm Right (enlarged image of the island) 100 nm
4 Results and discussion
72
421 Crack-free coatings
Controlled-preparation in surface morphologies such as the number of pores pore size
particle size cracks are critical to the enhancement in the electrocatalytic performance On
the other hand the penetration of electrolytes onto the underlying substrates through the
cracks could accelerate the deactivation of electrode due to the growth of an insulating
TiOx interlayer between the substrate and the oxide layer as described above A protective
and crack-free inner layer has been taken into account in this section
Figure 423 SEM images of crack-free Ru025Ti075O2 coatings prepared by dip-coating method by
(a b) propionic acid-isopropanol route (c d) acetic acid-isopropanol route 25 layers with oxide
loading of 42 g m-2 from 01125 M precursor solution and (e) acetic acid-isopropanol route 6
layers with oxide loading of 37 g m-2 from 045 M precursor solution Scale bar (a c e) 10 microm
(b d) 100 nm
4 Results and discussion
73
Herein a repetitive sol-gel dipping-withdrawing technique was performed to prepare crack-
free coatings (see Section 313) In this case the tensile stress was relaxed right away
through plastic deformation for each single thin layer after the heat-treatment without the
formation of cracks It is critical to control the single layer thickness (should be below a
critical thickness ie the maximal thickness without the formation of cracks) and thicker
crack-free coatings have been obtained by increasing the repetitive times of
dippingdryingsintering Acetic acid-isopropanol route and propionic acid-isopropanol
route were used to prepare the sol solutions As shown in Figure 423 in order to obtain the
crack-free coatings with comparable oxide loading amount or thickness more dipping-
withdrawingdryingsintering cycles are required if the concentration of coating solutions is
lower The coating solution and its concentration and the substrate withdrawing rate are
important factors to obtain crack-free coatings
Figure 424 SEM images of surface morphologies of Ru025Ti075O2 coatings (a) crack-mud coating
prepared by drop-coating (b) crack-free coating prepared by dipping-withdrawing method Scale
bar (a) 10 microm (b) 100 nm
Except for the direct observation of the mud-crack or crack-free surface morphologies by
SEM (Figure 424) electrochemical cyclic voltammetry provides in-situ characterization
of the electrolyte penetration into the inner cracks and the electrochemical response of the
surface (outer surface islands inner cracks gaps) to the applied potential sweep (Figure
425) One of the prominent characteristics of the crack-free coating is the impermeability
for electrolytes and accordingly the protective properties for the underlying titanium
substrates
(a) (b)
4 Results and discussion
74
02 04 06 08 10-020
-015
-010
-005
000
005
010
015
020
j
mA
cm
-2
E V (vs AgAgCl)
mud-crack coating crack-free coating
(a)
0 50 100 150 2000
2
4
6
8
10
12
14
qa
mC
cm
-2
mV s-1
crack-free coating mud-crack coating
(b)
Figure 425 (a) CV curves of Ru025Ti075O2 coating with different surface morphologies
corresponding to Figure 424 recorded in 35M NaCl pH 3 at room temperature with a scan rate
of 50mV s-1
(b) Dependence of voltammetric charges (qa) on the potential sweep rates (υ) for the
coating with crack-free or typical mud-crack surface morphology
The penetration behaviour of electrolyte through the oxide coatings (or the wetting of
oxide coating by electrolytes) as a function of potential sweep rate was evaluated by
plotting the voltammetric charges (qa) against the potential sweep rates (υ) as shown in
Figure 425 The voltammetric charges for the mud-crack coating show an initial sharp
decrease with the potential sweep rate from 5~50mV s-1
and then keep constant when the
potential sweep rate exceeds 50 mV s-1
In contrast the voltammetric charges for the crack-
free coating are independent of the potential sweep rate
This phenomenon can be explained from the relationship between the qa with the
electrochemically accessible surface of the oxide coated electrodes At very high potential
sweep rate only the outermost oxide layer gives response to the fast potential sweep
whereas for the slower potential sweep the electrochemical response from the much
deeper inside layer contributes to the total voltammetric charges by the progressively
penetration of electrolyte through the flaws The crack-free coatings prepared in this work
show the unique impermeable characteristics for the electrolyte of aqueous solution
sodium chloride This provides the possibility to protect the underlying titanium substrate
from passivation due to the direct contact with electrolyte under the harsh chlorine
evolution environment Further investigation to evaluate the long-term service life of the
oxide layer with the protective inner crack-free layer is necessary
4 Results and discussion
75
422 Porous oxide film coated electrodes
Porous electrodes are widely used in many technological applications such as energy
storage capacitive deionization water desalination and fuel cell materials [114] Porous
structures are usually employed to facilitate the electrolyte penetration through the pore
gaps and increase the material usage by creating highly available surface areas Porous
electrodes are expected to maximize the coating capacitance Pore size and distribution are
the critical factors related to the increase of the pseudo-capacitance of materials A
confinement of solvation ion in nano-channel has also been reported by Ohkubo et al[115]
In the case if the pore size is smaller than the corresponding ion size then there is no room
to accommodate one ion per pore The charge-storage mechanism in nanoporous materials
has been developed [116] Traditional double-layer model was used to describe the outer
surface charging and the double-cylinder model was applied to the inner pores Other
researchers proposed that the pore space within the electrode is filled with electrolyte
exchanging ions with a thin double-layer lsquolsquoskinrsquorsquo on the electron-conducting electrode
matrix [114]
Nano-pores have been created by chemical leaching routes by mixing leachable elements
(lanthanum for instance) into the oxide matrix (RuTiLaOx) The electrode coating
RuTiLaOx was prepared by multiple dropping-drying-sintering cycles The increase in the
number of pores by the subsequent leaching of lanthanum oxide will increase the
electrochemically accessible surface areas The in-situ electrochemical cyclic voltammetry
was used to monitor the change of electrode surface area by the cyclic potential sweep in
05 M hydrochloric acid Figure 426 shows the voltammetric charge density (qa obtained
by means of the EC-Lab software by integrating the anodic branches of the
cyclovoltammograms) of electrodes as a function of the voltammetric cycling times for
Ru04Ti045La015Ox (dotted line) and Ru04Ti06O2 (solid line) The qa of the Ru04Ti06O2
coating is independent of the voltammetric cycling times indicating that there are no
changes in the characteristics of the oxide electrode However a continuous increase in the
qa for the Ru04Ti045La015Ox coating was observed from the 2nd
potential cycle to the 79th
potential cycle This is caused by the continuous leaching of lanthanum oxide away from
4 Results and discussion
76
the oxide matrix during the voltammetric cycling and the simultaneous increase of the
coating porosity Open pores rather than closed pores are created by the chemical leaching
route which can be utilized fully in the aqueous solution system
0 10 20 30 40 50 60 70 80 9010
20
30
40
50
60
70
80
90
100
qa
mC
cm
-2
Cycling times
Ru04
Ti06
O2
Ru04
Ti045
La015
Ox
Figure 426 The voltammetric charge density (qa) of electrodes as a function of the voltammetric
cycling times for the Ru04Ti06O2 coating (solid line) and Ru04Ti045La015Ox (dotted line) The cyclic
voltammetry was measured in 05 M HCl room temperature AgAgCl as reference electrode The
potential was scanned from 02 to 10 V with a potential sweep rate υ = 50 mV s-1
The exposed
electrode areas is 1 cm2
4221 Porous electrode coating Ru03Sn07O2
In order to investigate systematically the electrochemical properties of porous electrode
coatings Ru03Sn07O2middot x La2O3 coatings (x = 0 005 01 02) were deposited onto
titanium substrates by propionic acid based sol-gel route Porosity is obtained by chemical
leaching of La2O3 with 163 M HCl (135 mL 37 wt HCl were diluted to 100 mL with
water) at 60 oC for 10 min with slight stirring after the deposition of each single layer
Coatings were obtained by 8 dropping-drying-sintering-leaching cycles and a final
sintering at 450 oC for 1h
4 Results and discussion
77
Figure 427 SEM images of (a b) Ru03Sn07O2 and (c d) Ru03Sn07O2 middot 020 La2O3 after lanthanum
oxide leaching prepared by propionic acid sol-gel method Scale bar (a) 1 microm (b c d) 100 nm
Figure 428 Energy-dispersive X-ray spectroscopy (EDS) of (a) Ru03Sn07O2 Ti and (b)
Ru03Sn07O2 middot 020 La2O3 Ti after lanthanum oxide leaching The absence of lanthanum species
(La Lα1 4651 keV La Lβ1 5042 keV) inside the oxide layer was confirmed
a b
c d
4 Results and discussion
78
A comparative observation of the surface morphologies of the Ru03Sn07O2 middot x La2O3
coatings (x = 0 020) is shown in Figure 427 The film electrodes prepared by the
dropping-sintering-leaching cycles possess typical mud-crack structures The cracks
provide a facilitated penetration path for the electrolyte for the electrode reactions
Meanwhile the split islands compose the entity of the electrocatalyst materials Nanopores
with a diameter around 15 nm (mesopores) were observed from the
Ru03Sn07O2 middot 020 La2O3 coating after lanthanum oxide leaching Energy-dispersive X-ray
spectroscopy (EDS) in Figure 428 shows that there is no residual lanthanum left in the
final oxide matrix
0 50 100 150 2008
12
16
20
24
28
32
qa
mC
cm
-2
v mV s-1
x = 0
x = 005
x = 015
x = 020
(a)
0 50 100 150 20006
07
08
09
10
No
rma
lize
d q
a
mV s-1
x = 0
x = 005
x = 015
x = 020
(b)
Figure 429 (a) Anodic charges as a function of potential scan rate as obtained by integration of the
cyclic voltammograms for Ru03Sn07O2 ∙ xLa2O3 film electrodes in 35 M NaCl pH 3 at room
temperature (b) Normalized voltammetric charges as a function of potential scan rate obtained by
dividing the voltammetric charges by the voltammetric charges measured at 5 mV s-1
The pores created by lanthanum oxide leaching increase the electrochemically accessible
sites effectively as confirmed by the increase in voltammetric charge densities (qa) in
4 Results and discussion
79
Figure 429a Accordingly the inner active sites contribute more to the electrochemical
response than the outer active sites for the porous electrodes observed from the normalized
voltammetric charges (Figure 429b)
A possible explanation for this phenomenon is that the embedded lanthanum clusters
within the split islands were leached away after the leaching of the outwards exposed
lanthanum clusters attached on the cracks and cavities which results in the formation of
three dimensional interpenetrating networks of inner pores within the islands Ultimately
the porous islands represent electrodes with higher inner geometric surface area These
pores in-situ created by hydrochloric acid liquid-phase-diffusion will be
electrocatalytically accessible to the NaCl electrolyte
4222 Impedance behaviour of porous electrode coatings
The substrateoxide coatingelectrolyte interfaces can be well investigated by using the
electrochemical impedance spectroscopy (EIS) The electrode interface response to the
applied small-signal stimulus in the frequency domain represents the information of
adsorption diffusion electron transfer at the electrodeelectrolyte interface The
electrochemical system can be described by using the serial andor parallel combinations of
various circuit elements such as resistor inductor and capacitor
Typically the impedance data are analyzed by fitting the data to an equivalent circuit The
most often used equivalent circuit for mixed metal oxide electrode coatings is shown in
Figure 430a which contains a ohmic resistance element (Re) a double layer capacitance
(Cdl) in parallel with a charge transfer resistance for chlorine evolution reaction (Rct) a film
capacitance (Cf) in parallel with a film resistance (Rf) All capacitors can be replaced by
constant phase elements (Q) to account for the inhomogeneities in the electrode system
The impedance of this equivalent circuit Re(CdlRct)(CfRf) has the expression
1 1
1 1e
dl f
ct f
Z R
j C j CR R
(42)
For the porous electrode coatings the porosity or roughness of the oxide matrix could be
expected to lead to a frequency dispersion of the interfacial impedance A transmission line
4 Results and discussion
80
model is generally used to describe the electrode system considering that the
electrochemical reaction could take place down the depth of the pore [117] Figure 430b
shows the physical model of electrode coatings with cylindrical pores Accordingly the
impedance of this equivalent circuit Re(CdloutRctout)( CdlinRctin)(CfRf) has the more complex
expression
1 1 1
1 1 1e
dl out dl in f
ct out ct in f
Z R
j C j C j CR R R
(43)
Figure 430 Physical model and equivalent circuit used to simulate the electrode response and to fit
the impedance data for the present electrodes with Ru03Sn07O2 middot x La2O3 coatings (a) The
conventional mixed metal oxide electrode (b) porous electrode with a cylindrical pore accessible to
the electrolyte [118119] Re describes the ohmic resistance of the electrolyte (RfCf) describes the
coatingsubstrate interface (RctCdl) describes the active coatingsolution interface Rct describes the
charge transfer resistance and Cdl describes the double layer capacitance
4 Results and discussion
81
017 019 021 023 025 027000
001
002
003
004
-Z
o
hm
Z ohm
Figure 431 Nyquist plot (dotted points) for the film electrodes Ru03Sn07O2 measured with a
rotating disk electrode (2000 rmp) at an applied current density of 566 mA cm-2
in 35 M NaCl pH
3 at room temperature Solid curves show the fitting results by using equivalent circuit R(CR)(CR)
030 032 034 036 038 040000
001
002
003
004
-Z
o
hm
Z ohm
Figure 432 Nyquist plot (dotted points) for the film electrodes Ru03Sn07O2 ∙ 015 La2O3 measured
with a rotating disk electrode (2000 rmp) at an applied current density of 566 mA cm-2
in 35 M
NaCl pH 3 at room temperature Solid curves show the fitting results by using equivalent circuit
R(CR)(CR)(CR)
The electrochemical impedance spectroscopy was recorded in 35 M NaCl pH 3 at room
temperature using a rotating disk electrode (2000 rmp exposed surface areas 177 cm2) at
applied current density 566 mA cm-2
(Figure 431 Figure 432) where the electric double-
layer responds jointly with the Faradaic redox processes The strongly scattered data points
arising from the gas bubble-induced fluctuations in recording the electroanalytical signals
have been rejected for further data fitting analysis The impedance data in the low
frequency region reflects the chlorine evolution reactions at the interface between the oxide
coating and the electrolyte solution whereas the impedance data at the high frequency
4 Results and discussion
82
region is related to the oxide coating properties A very good fit (χ2
lt 1times10-4
) for the
impedance data has been achieved by using the equivalent circuit described in Figure 430
Two characteristic time constants (1 1
2c RC
f
) corresponding to the two
semicircles (Figure 431) were obtained for the Ru03Sn07O2 coatings whereas three
characteristic time constants corresponding to the pore-containing coatings were observed
Table 44 Parameters of the equivalent circuit used to describe the impedance behaviour of the
Ru03Sn07O2 middot x La2O3 coatings in 35 M NaCl pH 3 at room temperature measured under
galvanostatic impedance mode with a current density of 566 mA cm-2
Physical units Resistance
Ω pseudocapacitance mF
x 0 005 015 020
Equivalent circuit R(CR)(CR) R(CR)(CR)(CR) R(CR)(CR)(CR) R(CR)(CR)(CR)
Re 01775 02357 03096 0737
Cout
1901 1039 1649 2188
Rout
005559 004595 004678 005381
Cin - 1175 2214 5370
Rin - 002349 001973 001176
Cf 04153 01835 05598 1061
Rf 002541 00124 001089 001399
χ2 7476E-5 8827E-5 1890E-5 6652E-6
Conventional electrochemical techniques such as cyclic voltammetry encounter the
problem when high current density is applied that the bulk electrolyte ohmic drop will
distort the measured electrode capacity behaviour For impedance measurements the bulk
electrolyte ohmic drop (Re) can be isolated from other electrochemical parameters (Table
44) The electrolyte ohmic drop depends on the distance between the working electrode
and the reference electrode The oxide film resistance Rf is about 001 Ω (Table 44) for the
Ru03Sn07O2 middot x La2O3 coatings corresponding to the small semicircle at high frequency
4 Results and discussion
83
domain in the Nyquist plots (Figure 432) The film resistance originates from the mixed
metal oxide coating and the interface between the oxide coating and titanium substrate
The small value in Rf indicates that the oxide coating is metallically conductive Note that
the Rf can be used for the investigation in electrode deactivation due to the passivation of
titanium substrate The parameter of Cdl reflects the number of electrocatalytically active
sites similarly to the voltammetric charge density (qa) obtained in cyclic voltammetry
measurements
For the porous coatings Ru03Sn07O2 xLa2O3 (x = 005 015 02) the outer surface
response behaviour (Cout Rout) is similar to the Ru03Sn07O2 coatings whereas the inner
surface exhibits the distinct capacitive behaviour (Cin) due to the existence of numerous
accessible nanopores The effect of the electrode pore geometry such as the pore radius
and depth is complicated and not well understood so far especially for the gas-evolving
electrodes On the one hand the electrodes should be designed by using nanoporous
structures to maximize the specific electrode surface areas on the other hand the pores
should be designed so that the movement and migration of reactant ions and product
molecules are not inhibited Some theoretical models have been developed to consider the
pore geometry [120] The dependence of the gradient of the potential distribution along the
center of the pore and ion concentration on the pore radius and depth has been modelled
using a planar electrode containing cylindrical pores The charging time of the Stern layer
(where the electrochemical reactions occur such as the ion dissociation and redox couples)
and the diffuse layer the percentage distribution of the total charge within the Stern layer
and the diffuse layer are governed by the surface potential ion concentration pore depth
and radius For low surface potential the diffuse layer accounts for a larger percentage of
the total charge than the Stern layer The charging behaviour of porous Ru03Sn07O2
electrode coatings will be discussed in the next section
4223 Charging behaviour of porous electrode coatings
The analytical technique to characterize the interfacial response of the electrode in the
electrolyte are impedance charging transient and open circuit potential relaxation after
interrupting the polarization current [121122123] The electrochemically accessible
4 Results and discussion
84
surface area of a rough and porous electrode was characterized herein based on the
electrochemical charging behaviour of porous electrode coating under slightly
galvanostatic polarization
0 100 200 300 400 500 600
06
07
08
09
10
11
Time s
x = 0 x = 005 x = 010 x = 015 x = 020
E
V v
s
Ag
Ag
Cl
(a)
1 10 1000
2
4
6
8
10
12
14
16
x = 015
x = 020
x = 010
x = 0 x = 005
dE
d
t m
V s
-1
Time s
(b)
Figure 433 (a) Representative potential response of Ru03Sn07O2 middot x La2O3 electrode coatings with
different porosity to the suddenly applied current density step at j = 05 mA cm-2
Conditions
forced electrolyte convection cell 35 M NaCl pH 3 at 50 oC Time record length 10 min The
data points were recorded with a time interval of 5 s (b) The slope of the potential response versus
log(t) corresponding to the recorded data in (a)
Galvanostatic charging behaviour of the porous electrodes was characterized at low
polarization current density conditions (j = 05 mA cm-2
) in order to get a comprehension
of the electrode potential E(t) dependence on the porosity as shown in Figure 433a At
low polarization current density conditions the chlorine evolution reactions proceed mildly
through molecular diffusion into bulk electrolyte rather than the formation of bubbles (see
4 Results and discussion
85
wavelet analysis of bubble-induced potential noise in Section 444) After the current
supply the initial potential increases instantaneously to about 06 V The potential plateau
was observed after 3 min for Ru03Sn07O2 electrode coating whereas the potential
equilibration time or the response time of the system to a step current exceeds 10 min for
the pore-containing electrode coatings which indicates a progressively deeper penetration
of the electrolyte into the inner spaces for the pore-containing electrode coatings
The rate of the potential response (the charging dynamics) slows down linearly with the
logarithm of time log(t) (Figure 433b) with a turning point at around 10s Before this
turning point the rates of potential response are close to each other for different coatings
indicating that the similar charging behaviour of the outer exposed surface and wider
cracks which is independent of the inner structure and morphologies The decrease in the
charging rate especially for the pore-containing oxide coatings after the turning point
implies that the slow inner pore charging process prevails For the anodic charging
behaviour of RuO2 film electrodes in HClO4 it has been reported [124] similarly that the
potential response takes several to about 20 min to reach a final steady-state potential
plateau Galvanostatic anodic charging curves for the porous PbO2Ti electrodes in Na2SO4
solution show the same charging profiles [125]
Note that the time-dependent potential in response to a current step is the potential
difference between the electrode and a point (where the tip of the Luggin capillary
reference electrode is positioned) in the bulk solution It consists of the potential difference
across the Stern layer and the potential difference across the part of the diffuse layer
according to the Gouy-Chapman-Stern model for the dilute solution [114] For the
concentrated solution (35 M NaCl as supporting electrolyte for instance) the time
evolution of the double layer concretely the expansion of the double layer due to the ion
crowding into the nano-channels occurs until an equilibrium is reached
The electrodeelectrolyte interface behaves as a capacitor In the absence of a redox couple
at the electrode surface the charge on the capacitor is proportional to the voltage drop
across the capacitor For the oxide film electrode the capacitance is a function of the
dielectric properties of the oxide material electrode area and the space between the
electrode and the electrostatically bound ions (usually on the order of the Debye screening
4 Results and discussion
86
length [126]) The charge-storage mechanism for the electric double-layer capacitor is that
the energy is stored non-Faradaically by charging the electrochemical double-layer at the
interface between the porous electrode and the electrolyte
When the Faradaic reaction is involved at the electrodeelectrolyte interface the
pseudocapacitance behaviour of the oxide film electrode originates from the ion diffusion
and the parallel redox processes of the active species (Eq (41)) For the redox
pseudocapacitor the total applied current (i0 = j0 middot A = 05 mA) at the porous electrode
consists of the current for charging the double layer (non-Faradaic current or capacitive
current dQdldt) and the current corresponding to the Faradaic charge transfer reaction
(Faradaic current iF) at the electrodeelectrolyte interface [127] ie
dl0 F
dlF dl
dQi i
dt
dCdEi C E
dt dt
(44)
The Faradaic current (iF) depends on the electron transfer kinetics and the diffusion rate of
the redox species to the electrode surface For the mass transfer controlled process the
current is related to the diffusion rate of the redox species (i = nFAJ where n is the number
of electrons F is Faradayrsquos constant A is electrode area and J is the flux of the redox
species to the surface governed by the Fickrsquos law) At the slight polarization conditions the
electrode reaction is under kinetic control
The charge of the double layer (Qdl) is a function of the double layer capacitance (Cdl) and
electrode potential (E) ie Qdl = f(Cdl E) The Cdl is dependent on the surface coverage
percentage of the electrode by gas bubbles at intensive gas evolution conditions For
simplicity at low applied current density conditions the surface coverage of the electrode
by gas bubbles is negligible and then the electric double layer capacitance (Cdl) is assumed
as constant at steady state Before reaching the steady state the electric double-layer
capacitance increases due to the increasing utilization of the inner surface In the case that
the Faradaic current is substantially greater than the double layer charging current the
analysis of the capacitive behaviour of the porous electrodes based on the galvanostatic
charging profiles becomes meaningless For the non-ideally polarizable electrode (ie the
Faradaic reaction is inevitable) when electrochemical Faradaic reactions are not
4 Results and discussion
87
significant after applying a current step the chemical ions adsorption and desorption occur
at the interface of outer plane surface and inner pores
The charging processes investigated in this work for the porous RuO2-based electrode
coatings are more complicated than the characterization of the supercapacitance behaviour
of electrode materials The process involves the electric double-layer charging the
pseudocapacitive charging of the Faradaic protonationdeprotonation process
RuO (OH) H e RuO (OH)x y x y (Eq (41)) and the interference of the chlorine
evolution reactions (Eq (25)) The quantitative separation of various factors is difficult
4 Results and discussion
88
423 Conclusion
In this section the oxide coatings with the designed morphology have been achieved
experimentally With the intention to protect the underlying titanium substrate against
passivation the crack-free and impermeable inner oxide layer has been prepared In order
to increase the electrocatalytically accessible active surface area a nanopore-containing
oxide layer has been prepared which can be used potentially as top layer onto the above
mentioned crack-free inner layer
The electrode coatings used for the chlorine evolution reactions possess the typical mud-
crack surface feature which is favourable to increase the utilization of the electrocatalyst
materials due to the penetration of electrolyte into the gaps (with the size of about 1 μm)
Unfortunately the cracks facilitate simultaneously the direct contact of the electrolyte with
the underlying substrate under the caustic conditions Electrode deactivation occurs prior
to the complete dissolution of the active ruthenium component as has been confirmed by
other researchers Therefore crack-free oxide coatings were fabricated as protective inner
layer No cracks were observed at the surface of coatings from the SEM images from the
scale bar 10 μm to 100 nm by controlling the reduplicate dippingdryingsintering process
CV as an in-situ analysis technique confirms the impermeable character of the obtained
crack-free coatings
Nanopore-containing oxide coatings were prepared by the chemical leaching method The
increase in the electrocatalytic accessible surface area was investigated by CV and EIS
The existence of the inner pores within the oxide matrix exhibits the unique
electrochemical response behaviour The charging behaviour of the porous electrode
coatings was studied by monitoring the time-dependent potential response under the slight
galvanostatic polarization conditions Further investigations of the pore size and shape and
its possible influence on the bubble release have to be performed to obtain the optimal pore
geometry
4 Results and discussion
89
43 Solvothermal-assisted synthesis
431 Phase structure of Ru-Ti-O system
The oxide materials prepared by sol-gel method are more often amorphous in the xerogel
stage post-sintering is necessary to crystallize the xerogel to remove the residual organics
to reinforce the thermal and mechanical stability and to increase the wear resistance and
durability The final phase structure of the mixed oxide in the Ru-Ti-O system depends on
the thermodynamic conditions Rutile-type Ru-Ti-O solid solution is the most common
structure used as active phase for chlorine evolution reactions Depending on the
preparation conditions such as sintering temperature [128] sintering atmosphere [129]
Ru Ti ratio [130] the product form (such as powders thin films) and the underlying
substrates [ 131 ] anatase structure of single TiO2 or anatase Ru-Ti-O solid solution
presents a secondary phase or a major phase [104] coexisting with rutile structure
In view of the Ru-Ti-O employed as electrocatalyst coatings for the chlorine evolution
reactions two necessary conditions have to be satisfied i) the electronic conductivity of
the oxide coating ruthenium species as conductive components should ensure the
continuous conductive path in the oxide coating matrix ii) coating stability which is
obtained by thermal sintering of the gel body Thus the feasibility to modify the Ru-Ti-O
coating phase structure under the restricted conditions of RuTi ratio (15~40 Ru mol) and
thermal sintering temperature (450 oC) becomes a remarkable issue
At ambient pressure TiO2 exists in three different polymorphs anatase rutile brookite
The structure parameters are listed in Table 45 The phase transition from the metastable
anatase to the thermodynamically stable rutile can be induced by various factors such as
ion impurities thermal sintering etc as shown in Figure 434 Further details concerning
the effects of pressure-temperature on the TiO2 polymorphs anatase brookite rutile and
TiO2-II (orthorhombic Pbcn) TiO2-B (monoclinic P21 c) please refer to [132133]
4 Results and discussion
90
Table 45 Data for some TiO2 polymorphs [134]
Structure Space group Density g cm-3
Unit-cell parameters Aring
Rutile tetragonal P42 mnm 413 a = 45933 c = 29592
Anatase tetragonal I41 amd 379 a = 37852 c = 95139
Brookite orthorhombic Pbca 399 a = 917 b = 546 c = 514
Anatase Rutile
Promoter
Ru4+
thermally sintering
Inhibitor
V5+ Nb5+
hydrothermal
TiO6 octahedron
Anatase Rutile
Promoter
Ru4+
thermally sintering
Inhibitor
V5+ Nb5+
hydrothermal
TiO6 octahedron
Figure 434 (top) The TiO6 octahedron building block for various TiO2 polymorphs The linkage
manners of the TiO6 building block are different for the various TiO2 polymorphs (bottom) The
linkage manners TiO6 octahedra for anatase and rutile configuration and the anatase-to-rutile
transition induced by various factors among which the hydrothermal processing could inhibit the
anatase-to-rutile phase transition
For particular applications such as photocatalysts the anatase phase is desirable In such
cases the inhibition of the phase transition has been put into practice The Gibbs free
energies of the different polymorphs are temperature and pressure dependent
( G U P V T S ) The high pressure-induced phase transition prefers the more
dense structure with increased atoms or ions coordination number On the contrary the
high temperature-induced transition favours the more open structure with lower atoms or
ions coordination number [135] Therefore high pressure and high temperature cause
opposite effects in the crystallization process Based on this fact a pressure-induced
crystallization route was adopted in the following sections to modify the phase structure of
the Ru-Ti-O coating system
4 Results and discussion
91
432 Solvothermal crystallization of Ru-O-Ti xerogel coatings
Solvothermal processing routes (or termed as hydrothermal when H2O used as filling
solvent) are widely used to convert amorphous materials to crystalline ones and increase
their crystallinity The solvothermal crystallization is a particular route operated under
auto-generated pressure (the driving force for the phase transition) within a sealed
autoclave at a temperature above the boiling point of the filling solvents (H2O or organic
solvents) The high pressure conditions are more often used to produce the metastable-
phase materials
Prior to the solvothermal processing the amorphous Ru-O-Ti coatings were obtained by
repeating the drop-coating air-drying thermal stabilization (at 200 oC for 10 min)
processes The thermal stabilizing step is necessary to facilitate the wetting of the next
drop of sol solution onto the existing layer and thus to obtain a thick layer 2-propanol
(physical properties see Table 46) used as solvent with a filling fraction of 12 was added
into a Teflon sealed autoclave The amorphous Ru-O-Ti xerogel coatings supported onto
titanium plates (see Experimental section) were located into the Teflon holder and then the
autoclave was heated with a ramping rate 10 oC min
-1 to 150
oC (lower than the critical
temperature 2352 oC of 2-propanol subcritical domain) and kept for different time
The auto-generated pressure in the sealed autoclave can be estimated by using the Peng-
Robinson equation of state proposed in the review by Rajamathi [136] (A comparison of
the Peng-Robinson equation of state with the van der Waals equation of state please refer
to Appendix A5)
2 22
m m m
RT ap
V b V bV b (45)
where R = 8314 J mol-1
K-1
is the gas constant p and T are the pressure and temperature
respectively Vm is the molar volume of the liquid in the autoclave the parameters a b are
given by
4 Results and discussion
92
12
22 2045724 1 1
c r
c
R T f Ta
p (46)
007780
c
c
RTb
p (47)
where Tc pc are the critical temperature and critical pressure of the solvent 2-propanol
Tr = T Tc is the reduced temperature fω = 037464 + 154226ω - 026992ω2 ω is acentric
factor Thus the estimated pressure in the autoclave of the present system is around
2times106 Pa
Table 46 Physical properties of pure 2-propanol [137]
Molecular weight
g mol-1
Boiling point
K at 1atm
Critical
temperature K
Critical
pressure Pa Acentric factor
60097 35548 50831 47343 times106 066615
Figure 435 TEM image of powders scratched from the coating surface of as thermally stabilized
(at 200 oC for 10min) Ru025Ti075O2 coating
Ru025Ti075O2 coatings after thermal stabilizing treatment (200 oC) were amorphous-like
(Figure 438) TEM image (Figure 435) of the powders scratched from the Ti-plate
supported coatings shows the amorphous features The amorphous coatings were
crystallized under the subcritical curing conditions (gas-liquid co-existence state of 2-
propanol) It is worth noting that the solvothermal processing of the xerogel coatings
4 Results and discussion
93
(isolated from the filled solvent by a glass bottle) performed herein is different from the
impregnating process of solvothermal reactions [138139]
4000 3500 3000 2500 2000 1500 1000 50030
40
50
60
70
80
90
100
672
1116
460
8121
436
1521
1616
3393
(a)
Tra
nsm
itta
nce
Wave number cm-1
(b)
Figure 436 FTIR of Ru025Ti075O2 xreogel powders measured using the KBr pellet method (a) air-
dried xerogel after solvothermal processing at 150 oC for 3 h (b) air-dried xerogel Xerogel
powders were obtained by removing the solvents of the sol solution in uncovered glass bottle at
room temperature For solvothermal processing powders were put into a glass bottle and then
located in the Teflon holder
The solvothermal effect in the decomposition of organics was investigated by powder
FTIR spectroscopy (Figure 436) Xerogel powders were prepared by removing the
solvents of the sol solution in uncovered glass bottle at room temperature for several days
For solvothermal processing powders were put into a glass bottle and then located in the
Teflon holder The broad absorption band centered at 3393 cm-1
and weak absorption band
at 1616 cm-1
in Figure 436 are associated with the physisorbed water [140] Residual
organic compounds were partially eliminated after solvothermal processing at 150 oC for
3 h which can be confirmed by the decrease in absorption intensity at 1521cm-1
and
1436cm-1
(vCOO- vibrations) [141] The vibration band at 812cm
-1 in Figure 436b can be
assigned to the O-O stretching mode of the Ti-OO-Ti or Ti-OOH groups [142] The bands
centered at 460cm-1
observed in the FTIR spectra are due to the Ru-O-Ti stretching
vibrations [143] The disappearance of the vibration band at 812 cm-1
after solvothermal
4 Results and discussion
94
processing implies that the solvothermal processing promotes the further polycondensation
reactions (oxolation reactions) The analysis of xerogel powders provides auxiliary
information for the understanding of the structure evolution of xerogel coatings under the
solvothermal curing conditions
The surface morphologies of the solvothermally processed coatings were observed with
SEM as shown in Figure 437 (top middle) The typical mud-crack structures were
observed for the solvothermally processed coatings both before and after post-sintering
treatment The initial cracks might have formed during the thermal stabilizing of the
xerogel coatings at 200 oC (ie before the solvothermal processing) These cracks will help
expose the inner layers of the coating matrix to the solvothermal curing atmosphere After
post-sintering more cracks were formed due to the further release of the stress The
particle size of the Ru025Ti075O2 after solvothermal curing and post-sintering was ca
15 nm observed from the TEM image (Figure 437 bottom)
Phase evolution as a function of post-sintering temperature of Ru025Ti075O2 coatings
without (Figure 438) and with (Figure 439) solvothermal processing was investigated by
XRD For the coatings prepared without solvothermal processing the amorphous structure
was observed below 300 oC Above 350
oC single rutile solid solution phase was formed
With the increase of sintering temperature until to 450 oC the crystallinity was increased
gradually In contrast for the coatings prepared with solvothermal processing the distinct
phase evolution behaviour was observed The coating phase transition from amorphous to
single anatase was observed after sintering at 300 oC Therefore we can deduce that the
solvothermal processing is effective to help modify the coating phase structure Post-
sintering at higher temperatures (350~450 oC) results in the crystallization of the rutile
phase Thus the final structure was mixed anatase-rutile phase
4 Results and discussion
95
Figure 437 SEM images of surface morphologies for the solvothermally processed Ru025Ti075O2
coatings (thermally stabilized at 200 oC for 10min) (top) and then post-sintered at 450
oC for 10min
(middle) TEM images of powders scratched from the coating surface of Ru025Ti075O2 coating after
solvothermal processing and post-sintering at 450 oC for 10min (bottom)
4 Results and discussion
96
20 25 30 35 40 45 50 55 60
rutile
Ti
d)
c)
b)
a)
Inte
nsity
au
2 o
300oC
350oC
400oC
450oC
20 25 30 35 40 45 50 55 60
Ti-substrate
RuO2
rutile TiO2
2
Figure 438 XRD patterns of Ru025Ti075O2 coatings prepared by thermal stabilization at 200
oC for
10min each xerogel layer and then annealed at different temperatures for 10min
20 25 30 35 40 45 50 55 60
anatase
rutile
Inte
nsity a
u
Ti
d)
c)
b)
a)
2 o
300oC
350oC
400oC
450oC
20 25 30 35 40 45 50 55 60
Ti-substrate
anatase TiO2
RuO2
rutile TiO2
2
Figure 439 XRD patterns of Ru025Ti075O2 coatings prepared by thermal stabilization at 200
oC for
10min each xerogel layer and then solvothermally processed at 150oC for 3 h and finally annealed
at different temperatures for 10 min
4 Results and discussion
97
433 Solvothermal processing parameters
To obtain the amorphous coatings for the subsequent solvothermal processing the initial
thermal stabilizing temperature is an important parameter which can impose influence on
the subsequent coating phase evolution and accordingly the electrochemical properties of
Ru025Ti075O2 coatings Lower thermal stabilizing temperature provides more flexibility to
modify the coating phase structure for the subsequent solvothermal curing As shown in
Figure 440 higher percentage of anatase phase was obtained in the final mixed anatase-
rutile phase when the coatings were prepared with the initial thermal stabilizing
temperature of 100 oC However for the coatings prepared with the initial thermal
stabilization temperature of 250 oC as shown in Figure 441 only tiny anatase grains
contained in the final anatase-rutile structure are observed Compared with the exclusively
thermal sintering prepared coatings a common interest for the coatings prepared with
solvothermal processing is that the anatase percentage in the final phase structure increases
25 30 35 40 45 50 55 60
Inte
nsity
au
2
a)
b)
Figure 440 XRD patterns of Ru025Ti075O2 coatings prepared by thermal stabilization at 100
oC for
10min each xerogel layer and then (a) thermally sintered at 450 oC for 1 h (b) solvothermally
processed at 150 oC for 24h and finally sintered at 450
oC for 1 h
4 Results and discussion
98
25 30 35 40 45 50 55 60
Inte
nsity a
u
2 o
a)
b)
Figure 441 XRD patterns of Ru025Ti075O2 coatings prepared by thermal stabilization at 250
oC for
10min each xerogel layer and then (a) thermally sintered at 450 oC for 1 h (b) solvothermally
processed at 150 oC for 24h and finally sintered at 450
oC for 1 h
The electrocatalytic activity of the solvothermally prepared coatings was evaluated by
chronopotentiometry as shown in Figure 442 The comparative investigation shows that
the coatings prepared by exclusively thermal sintering possess higher electrode potential
(ca 142 V vs AgAgCl) for the chlorine evolution reactions whereas a decrease in
electrode potential was observed for the coatings prepared by solvothermal curing In
particular for the coatings prepared with lower initial thermal stabilization temperature
(100 oC) a decrease of electrode potential by ca 170 mV has been achieved This is
extremely important as a demonstration for the reduction of energy-loss in the industrial
chlor-alkali process The explanation for the enhanced activity of the solvothermally
processed coatings will be discussed in the following section
4 Results and discussion
99
500 1000 1500 2000 2500 300010
11
12
13
14
15
E V
vs A
gA
gC
l
Time s
a)
b)
500 1000 1500 2000 2500 300010
11
12
13
14
15
E V
vs A
gA
gC
l
Time s
a)
b)
Figure 442 Chronopotentiometric curves of Ru025Ti075O2 coatings recorded at a constant current
density j = 100 mA cm-2
in 35 M NaCl pH3 at room temperature Left corresponding to Figure
440 and Right corresponding to Figure 441
The molar content of ruthenium in the RuxTi1-xO2 binary oxide coatings is another
important parameter to determine the electrocatalytic activity The XRD patterns of
coatings containing different ruthenium content are shown in Figure 443 In all three cases
of x = 04 025 and 015 the (110) peaks (after the peak position correction using the Ti-
substrate (101) peak as reference JCPDS 44-1294) were located in between the pure rutile
TiO2 (27447o) and pure RuO2 (2801
o) which indicates that the rutile solid solutions were
formed The (110) diffraction peak corresponding to rutile structure displays a shift toward
higher angles with the increase of ruthenium content which is related to the change in
lattice parameters The lattice parameters for the rutile RuO2 and anatase rutile TiO2 are
listed in Appendix A6 Except the Ru015Ti085O2 coating weak and broad anatase (101)
peaks are present along with the rutile solid solution phase for the Ru025Ti075O2 and
Ru040Ti060O2 coatings Ru040Ti060O2 coatings exhibit better apparent electrocatalytic
activity for the chlorine evolution reactions than other coatings containing less ruthenium
as shown in Figure 444
4 Results and discussion
100
23 24 25 26 27 28 29 30
Inte
nsity a
u
2 o
RuO2 (110)
TiO2 rutile (110)
b)
a)
c)
TiO2 anatase (101)
Figure 443 X-ray diffraction patterns of RuxTi1-xO2 coatings (a) x = 04 (b) x = 025 (c) x = 015
Coatings were prepared by thermal stabilization at 200 oC for 10min each xerogel layer and then
solvothermally processed at 150 oC for 3 h and final post-calcination at 450
oC for 1 h
0 500 1000 1500 2000 2500 3000 3500100
105
110
115
120
125
130
E
V v
s
AgA
gC
l
Time s
a)
b)
c)
Figure 444 Chronopotentiometric curves of RuxTi1-xO2 coatings corresponding to Figure 443
recorded at a constant current density j = 100 mA cm-2
in 35 M NaCl pH 3 at room temperature
It is worth noting that the single anatase TiO2 is an insulating phase and pure TiO2 is inert
for chlorine evolution reactions One of the motivations of using mixed RuO2-TiO2 binary
oxides as electrocatalytic coating is that ruthenium (active component) and titanium have
similar ionic radius and their oxides possess the same tetragonal rutile structure which
facilitates the formation of rutile solid solution structure (the active phase for chlorine
evolution reactions)
4 Results and discussion
101
It has been proven that the formation of anatase solid solution is possible for the TiSnO2
[144] and TiRuO2 systems [128] however it is limited to lower Sn or Ru contents
(lt 10 mol) and lower sintering temperatures (lt 400 oC) In this case the materials are
worthless to be used as electrocatalysts for chlorine evolution reactions It is a
contradiction to obtain electrocatalysts with high activity (which requires the higher
ruthenium content) and simultaneously with anatase solid solution structure
434 Structure-property correlation of sol-gelsolvothermal prepared Ru04Ti06O2
coatings
Figure 445 Schematic illustration of the coating structure formation of in-situ supported rutile
nanocrystals Ru072Ti028O2 onto anatase TiO2 (a) Ru-O-Ti xerogel coating with rutile-type local
order structure (b) coating containing anatase TiO2 pre-crystallized by solvothermal processing
(step A 150 oC for 24 h) of (a) (c) coating with supported structure of Ru072Ti028O2TiO2 after
post-sintering treatment (step B 450 oC for 1 h) of (b) (d) coating with single rutile structure
obtained by post-sintering treatment (step B) of (a)
To explain the experimental data for the observed enhancement of electrocatalytic activity
of the mixed anatase-rutile RuTiO2 coatings prepared by solvothermal curing a systematic
investigation of the structure-property correlation was carried out by using Ru04Ti06O2
coating as an example The detailed procedure to obtain the coating is illustrated in Figure
445 Starting from the Ru-O-Ti xerogel coating (Figure 445a) two different routes were
4 Results and discussion
102
adopted to obtain the resulting coating i) exclusive post-sintering treatment a) rarr d) ii)
solvothermal curing with subsequent post-sintering a) rarr b) rarr c)
25 30 35 40 45 50 55 60
2 o
Inte
nsity a
u
anatase
rutile
substrate
d)
c)
b)
a)
25 30 35 40 45 50 55 60
2 o
anatase TiO2
rutile TiO2
RuO2
Ti -substrate
Figure 446 XRD patterns of electrodes with coatings (a) (b) (c) and (d) corresponding to (a) (b)
(c) and (d) in Figure 445
The phase development of the deposited Ru-O-Ti xerogel coatings on titanium substrates
both with and without solvothermal processing was studied by XRD (Figure 446) and
Raman spectroscopy (Figure 448) As shown in Figure 446a the amorphous structure of
the thermally stabilized Ru-O-Ti xerogel coatings was confirmed and only the presence of
diffraction peaks from the titanium substrate (JCPDS 44-1294) Raman spectra applied as
a sensitive local probe (Figure 448a) show the vibration bands at 610 114 cm-1
assigned
to the A1g and B1u mode of rutile lattice [145146] suggesting the formation of rutile
particles within the xerogel coatings Post-sintering treatments of the xerogel coatings
result in the densification and crystallization of the gel networks Similarly to what has
been reported by exclusively direct thermal sintering of Ru-O-Ti xerogel coatings at
450 oC for 1 h (Figure 446d) a single rutile solid solution phase with a rutile crystallite
size of 17 nm was formed (Table 47)
4 Results and discussion
103
Figure 447 (a b) Rietveld structure refinement of X-ray diffraction patterns corresponding to the
diffraction profiles in Figure 446c d respectively Red curve is the fitting result Phase
composition (Ti substrate anatase TiO2 rutile RuxTi1-xO2) and its weight percent lattice parameters
were obtained and summarized in Table 47 Commercial TiO2 P25 was used for the diffractometer
instrument calibration
In contrast starting from the amorphous Ru-O-Ti xerogel coating the crystallization
induced by solvothermal processing (150 oC for 24 h) results in the formation of a single
anatase phase (Figure 446b) Consistent with the XRD results a new sharp Raman band
(Figure 448b) at 153 cm-1
along with weak bands at 204 399 cm-1
can be assigned to the
anatase characteristic bands of Eg(1) Eg(2) B1g respectively [144147] A rutile phase with a
weak and broad (110) peak appears after the post-sintering treatment (Figure 446c) The
crystal growth of the rutile structure in the coating is retarded significantly based on the
Rietveld refinement analysis results (ca 3 nm) (Table 47) Recalling that the rutile
nanoparticles have been detected by Raman spectroscopy within the xerogel coating thus
it can be deduced that the nanocrystals with the size of 3 nm originate from the growth of
these initial rutile nanoparticles on the local scale surrounding the anatase phase (ca 20nm)
(Table 47)
RU40-CRAW
2Th [deg]58565452504846444240383634323028262422201816
Co
un
ts [
cp
s]
300
250
200
150
100
50
0
-50
RU40-CRAW Ti 3693
Anatase 005
Rutile 6302
RU40-S-CRAW
2Th [deg]58565452504846444240383634323028262422201816
Co
un
ts [
cp
s]
300
250
200
150
100
50
0
-50
RU40-S-CRAW Ti 3312
Anatase 2253
Rutile 4435
(a)
(b)
[o]
4 Results and discussion
104
For the coating prepared by the a) rarr b) rarr c) route (Figure 445) the lattice parameters
obtained by Rietveld structure refinement (Table 47) confirmed the formation of rutile-
type RuxTi1-xO2 solid solution where x = 072 was calculated using the Vegardrsquos law [148]
1- 2 2 2Ru Ti O TiO RuO = (1- ) +
x xc a c a x c a x (48)
ie 06775 = 06442 times (1-x) + 06906 x
Table 47 Results of Rietveld refinement of XRD data corresponding to Figure 445 c d
Coating Phase Phase wt a Aring c Aring Crystallite size nm
Figure 445c rutile 663 4526(4) 3066(5) 34(2)
anatase 337 3788(1) 9497(4) 203(7)
Figure 445d rutile 100 4575(1) 2997(1) 172(4)
700 600 500 400 300 200 100
Inte
nsity
au
d)
c)
b)
Raman shift cm-1
a)610
514
114
496
617
399 204
153
Figure 448 Raman spectra of coatings (a) (b) (c) and (d) corresponding to (a) (b) (c) and (d) in
Figure 445 A HORIBA-Jobin-Yvon LabRAM ARAMIS Raman spectrometer using a 6328 nm
excitation (He-Ne laser 10 mW) was employed to record the Raman spectra and a silicon single-
crystal was used to instrument calibration The laser light was focused onto the sample using a
100times objective lens
4 Results and discussion
105
The Raman bands at 496 cm-1
(Figure 448c) show the evident shift from the Eg mode
positions of rutile TiO2 nanocrystals (447 cm-1
) [ 149 ] and rutile RuO2 nanocrystals
(511 cm-1
) [150] which is caused by the lattice distortion arising from the incorporation of
Ti into the RuO2 There is no evidence for Ru incorporation into the anatase TiO2 lattice
These results reveal that the coating consists of rutile-type Ru072Ti028O2 solid solution and
undoped anatase TiO2 Along with the quantitative Rietveld phase analysis (Table 47) the
calculated RuTi molar ratio in the coating is 4159 which agrees well with the nominal
composition (4060)
For the coating prepared by the a) rarr d) route (Figure 445) the existence of a ruthenium-
containing amorphous structure in the oxide matrix was confirmed by the Raman band at
514 cm-1
(Figure 448) attributed to RuO2 Eg mode [150] since no separated RuO2 phase
has been detected in the XRD Prior studies showed the complete crystallization of the Ru-
O-Ti xerogel at higher temperatures (gt 500 oC) [ 151 ] It can be concluded that the
solvothermal processing effectively assists the crystallization of oxide coating
Figure 449 (a) The bright-field and (b) high-resolution TEM images (scale bar 2 nm) of powder
samples scratched from the coating prepared by a) rarr b) rarr c) route (Figure 445) The inset of
electron diffraction pattern in (a) showing the diffraction rings of anatase TiO2 phase Powders
were obtained by a mechanical scratching of the Ti-substrate supported coating and subsequently
dispersed ultrasonically into ethanol A drop of the particles dispersion was deposited on the TEM
copper grid and allowed to evaporate under ambient conditions
4 Results and discussion
106
Unlike the O2-rich thermal sintering the solvothermal processing creates a particular
crystallization environment wherein atomic short-range diffusion organics removal and
restricted grains growth occur within the xerogel networks at mild temperature under
elevated pressure conditions [152] The undoped spherical anatase TiO2 was formed by the
local enrichment of titanium species oriented along the (101) direction as visualized from
the transmission electron microscopy images (Figure 449) Nanoclusters of a few
nanometers in size were observed on the surface of anatase TiO2 which are supposed to be
rutile Ru072Ti028O2 nanocrystals The phase stabilization of the nanostructural TiO2
exhibits a strong dependence on particle size and surface chemistry [153] The as-obtained
anatase TiO2 particles are thermally stable during the post-sintering treatment and thus act
as an ideal support for the subsequent dispersion of the active rutile phase [154] Owing to
the steric barrier effects of support and the restrained thermal motion of rutile particles the
detrimental rutile particle growth during the post-sintering is inhibited which is beneficial
for the practical applications Although the undoped anatase TiO2 is insulating the
electronic conduction path could be assured by interconnected particles of rutile
Ru072Ti028O2 or rutile particles separated with very small gaps (tunneling effect) [41]
The capacitive behaviour was examined by monitoring current densities of the oxide
coatings in the acidified NaCl electrolyte (Figure 450) The number of electrochemically
active sites of the coatings estimated in terms of the integrated area of the anodic branches
in the cyclovoltammograms shows a 4-fold increase in the solvothermalpost-sintering
prepared coating (Figure 450a) to that in the direct thermal sintering prepared coating
(Figure 450b) This is roughly close to the increase in geometric surface area calculated by
decreasing the crystal size from 17 nm to 3 nm assuming spherical particle morphology
This suggests that active rutile nanocrystals in the solvothermalpost-sintering prepared
coating are highly dispersed and electrochemically accessible More importantly the onset
of the chlorine evolution reactions at much lower positive potential (ca 085 V
vs AgAgCl) was observed for the electrode with the solvothermalpost-sintering prepared
coating (Figure 450a) indicating a significant activity enhancement Considering that only
surface exposed species are responsible for the surface redox process the significant
increase in the coordinatively unsaturated surface sites due to the nanoscale effect can
account for the enhancement in electrocatalytic activity of the in-situ supported rutile
nanocrystals [110]
4 Results and discussion
107
01 02 03 04 05 06 07 08 09 10 11-06
-04
-02
00
02
04
06
08
10
j
mA
cm
-2
E V vs AgAgCl
(b)
(a)
Figure 450 Cyclovoltammograms recorded for the electrodes with coatings (a) prepared by a) rarr b)
rarr c) route and (b) prepared by a) rarr d) route (Figure 445) with a scan rate of 20 mV s-1
in 35 M
NaCl aqueous solution pH 3 controlled by HCl additions at room temperature using RuO2 coated
titanium wire as counter electrode and AgAgCl as reference electrode The reference electrode was
carefully positioned close to the working electrode by using a Luggin capillary to minimize the
uncompensated electrolyte resistance The working electrodes were used with an exposed area of
1 cm2
100
101
102
105
110
115
120
125
130
(b)
E
V v
s
AgA
gC
l
j mA cm-2
(a)
Figure 451 Galvanostatic polarization curves for the electrodes with coatings (a) prepared by a) rarr
b) rarr c) route and (b) prepared by a) rarr d) route (Figure 445) recorded in 35 M NaCl pH 3 at
50 oC
The polarization behaviour of the electrodes between the solvothermalpost-sintering
prepared coating (Figure 451a) and the direct thermal sintering prepared coating (Figure
4 Results and discussion
108
451b) is compared The former is clearly more active than the later only a slight
overpotential is necessary to keep an intensive chlorine evolution reaction for the
solvothermalpost-sintering prepared coating The difference in Tafel slope implies that a
different reaction mechanism is involved Two basic reaction paths of the chlorine
evolution reactions on electrode surfaces have been proposed Cl- discharge (in which the
adsorption species of Clad on the active sites are formed) followed by either chemical
desorption (CD) or electrochemical desorption (ED) [35] Two Tafel slopes of 61 mV dec
-
1 (ED determining) and 148 mV dec
-1 (mass transfer determining) were observed for the
direct thermal sintering prepared coating at the lower and higher current density regions
respectively In contrast one Tafel slope of 25 mV dec-1
(CD determining) was observed
for the solvothermalpost-sintering prepared coating The ED occurs on the active sites
with the participation of electron transfer but the CD may proceed on the inert anatase
TiO2 support Anatase TiO2 may play a role analogously to boron-doped diamond (BDD)
support in RuO2BDD [40] the desorption rate of the intermediate species could be
accelerated by their surface diffusion from the active sites to the neighbouring inert support
due to the weakened binding interaction
Based on the elaborate investigation of the structure-property correlations of solvothermal-
assisted preparation of Ru04Ti06O2 coatings it can be concluded that the solvothermal
curing of amorphous Ru-O-Ti xerogel coatings helps the formation of anatase TiO2 nano-
particles within the oxide coating matrix which act subsequently as support particles for
the growth of active rutile RuxTi1-xO2 solid solution phase Due to the steric isolation
effects of anatase TiO2 particles the crystal growth of active rutile structure is inhibited
which has been observed for the coatings with various ruthenium content and solvothermal
processing conditions from the broad rutile (110) X-ray diffraction peaks by comparing
with those prepared by direct thermal sintering The novel structure of electrocatalytic
coating with in-situ supported nanocrystals RuxTi1-xO2TiO2 exhibits a significant
enhancement in electrocatalytic activity for chlorine evolution reactions This structural
and crystal size controlled preparation strategy of mixed oxide catalyst coatings will assist
the design of advanced heterocatalysts the understanding of the electrocatalytic effects at
nanoscale and help to improve the energy efficiency of industrial electrolysis
4 Results and discussion
109
435 Conclusion
In this section the crystallization of the Ru-O-Ti xerogel coatings has been tailored by
using the solvothermal processing route under elevated pressure conditions in order to
modify the phase structure of mixed oxide and to study the phase structure-property
correlation of the binary RuxTi1-xO2 oxide coatings
A single rutile solid solution structure of the RuxTi1-xO2 coatings is the usual phase
structure obtained by the sol-gel route Thermal sintering treatment of the xerogel coatings
assists the combustion of organic residues and the amorphous-to-crystalline transformation
In contrast solvothermal curing (150 oC 2 MPa 3~24 h) of the thermally stabilized (at
100~250oC) xerogel coatings with the subsequent post-sintering (450
oC 1h) promotes the
formation of mixed anatase-rutile phase with improved electrocatalytic activity for the
chlorine evolution reactions
The phase and structure transition of the Ru-O-Ti xerogel coatings (nominal composition
Ru04Ti06O2) with and without solvothermal processing has been traced by using XRD
Raman spectroscopy Phase identified in the final oxide coatings consists of a single
anatase TiO2 and rutile type RuxTi1-xO2 solid solution Nanoscaled RuxTi1-xO2 solid solution
particles (3 nm) were supported surrounding the larger anatase TiO2 particles (20 nm)
Attributed to the high dispersion of the active components (rutile solid solution particle)
and the increase in the coordinatively unsaturated surface sites a significant enhancement
in the electrocatalytic activity has been achieved
This work demonstrates a novel way to obtain the highly active oxide electrocatalyst
coatings The preparation of the alternative binary oxide system such as RuSnO2 RuVOx
using the proposed route could possibly exhibit the combined advantages such as the high
activity and low ruthenium content based on the results obtained in Section 41
4 Results and discussion
110
4 Results and discussion
111
44 Electrochemical noise analysis of gas-evolving electrodes
The electrochemical generation of gas molecules of chlorine at the electrode surface is a
discharging process The discharge current densities which determine the production rate
of chlorine are related to the electrode overpotential exchange current density of the
electrode reactions supersaturation of the electrolyte with gas molecules and the charge
transfer coefficients etc [155] The generation and removal of gas bubbles at the electrode
surface cause additional ohmic drop due to the coverage and shielding effect of bubbles on
the surface and vicinity of the electrode As shown in Figure 452 individual gas bubble
evolution is present at very low applied current densities and the nucleation-growth-
detachment is the whole life course of bubble evolution in this case Coalescence of
adjacent bubbles could occur more frequently for the electrodes with poor wettability with
electrolyte Intensive bubble evolution at higher applied current densities results in the
formation of a froth layer adjacent to the electrode
Figure 452 The sketch of gas bubble evolution events as a function of applied current densities
Theoretically bubbles form starting at a low value of critical current density below which the
chlorine molecules diffuse into the bulk solution rather than form bubbles The nucleation growth
and detachment events overlap at higher applied current densities
4 Results and discussion
112
Bubble behaviour on the gas-evolving electrodes has attracted considerable interest in the
electrolytic gas generation processes such as H2 O2 Cl2 [156157158159] Bubble-
induced effects such as blocking the electrode active surface adding extra ohmic drop
causing chaos in mass transfer and current distributions [59160] are associated with
energy losses in industrial electrolysis Identifying the bubble behaviour is essential to get
insight into the electrode materials and structure dependent properties in order to guide the
optimization in electrode preparation The quasi-periodic bubble events occurring at the
electrode surface could result in periodic fluctuations of the electroanalytical signals such
as potential current or resistance etc This provides the possibility to identify the bubble
evolution behaviour by analyzing the bubble-induced electrochemical noise
441 Data acquisition of potential fluctuations
Ru025Ti065V01Ox ternary oxide coated titanium plates were used as working electrodes
facing upwards with an exposed area of 1 cm2 The electrode potential fluctuations ΔV(t)
were recorded galvanostatically between 05 and 100 mA cm-2
in 35 M NaCl pH 3
electrolytes at 50 oC (Figure 453) The time series of potential fluctuations data were
acquired with a sampling interval (∆t) of 5 ms using EC-Lab software (Bio-Logic SAS)
The reciprocal of the sampling interval is the sampling frequency (fs = 1∆t) which is 200
Hz in this case According to the Nyquist sampling theorem the highest frequency (fmax) in
the original signal should be below 100 Hz ( smax
1
2 2
ff
t) as prerequisite for perfect
signal reconstruction The time series segments chosen out of the chronopotentiograms
with a recording duration of T = 300 s were used for further signal analysis
4 Results and discussion
113
Figure 453 Top Protocol for the measurement of electrode potential under galvanostatic
polarization mode with an initial activation of the electrode at a current density of 100 mA cm-2
for
20 min followed by the applied current density steps of j = 05 1 2 4 10 20 30 50 70
100 mA cm-2
Bottom A representation of the electrochemical potential fluctuation signals
observed in the measurement of electrode potential under galvanostatic polarization in 35 M NaCl
pH 3 at 50 oC in a forced convection cell for the Ru025Ti065V01Ox coating The time series of
potential fluctuations data were acquired with a sampling interval of 5 ms (ie sampling frequency
200 Hz) using the EC-Lab software
The current noise from instrument output was also monitored (top in Figure 453) and its
conversion to potential response was quite small compared to bubble induced potential
fluctuations However the distortion in instrument current output could cause sharp jumps
in the potential response Therefore the analytical segments must be chosen carefully to
exclude an abnormal noise record
4 Results and discussion
114
Figure 454 (a) The zero-averaged time series of current noise from the computer-controlled
galvanostat with the set output of 100 mA the current segment was chosen out of Figure 453 (b)
the corresponding sample autocorrelation function (ACF) of the current noise and (c) the
corresponding Fourier power spectral density (PSD) of the current noise
The time series segment of current noise from the instrument output and its autocorrelation
function (ACF) Fourier power spectral density (PSD) were shown in Figure 454 The
applied current was 100 mA with a variance of around 15 microA during the experiment
(Figure 454a) The autocorrelation function of the random current noise shows a
maximum value of one (ACFmax = 1) at zero time lag and approaches to zero elsewhere
(Figure 454b) The Fourier PSD shows the flat profile at all frequencies and larger
4 Results and discussion
115
fluctuations in the high frequency region (Figure 454c) These results indicate that the
current noise from the galvanostat output is a random discrete white noise We must keep
in mind that the chaotic potential fluctuations ΔE(t) as a consequence of the accumulated
events occurring between the working electrode and reference electrode [160] consist of
periodic potential response induced by quasi-periodic bubble formation and their
detachment along with superimposed random background noise which is partially from
the instrument current output noise
442 Statistical analysis of potential fluctuations
One of the most common phenomena observed on the gas evolving electrodes is the
electrochemical fluctuations of potential or current signals as shown in Figure 453
Violent fluctuations in the measured potential value were observed at higher applied
current densities which are correlated to the intensive bubble evolution at the higher
applied current density regions A representative time series segment of potential
fluctuations with a time length of 300 s chosen out of the chronopotentiometric curves
recorded in Figure 453 was shown in Figure 455
The sample standard deviation (σ) of a statistical data set is used commonly as a measure
of the variability or dispersion Larger standard deviation indicates that the data points are
dispersed over a larger range of values The large fluctuations in potential value are
associated with the intensive bubble evolution process whereas the slight fluctuations
indicate a slow and mild bubble evolution process As shown in Figure 456 a linear
relationship exists between the standard deviation of potential fluctuations and the applied
current density at the range of 05~70 mA cm-2
However for the standard deviation value
calculated from the potential value measured at the current density of 100 mA cm-2
the
deviation of the data points away from the linear part is due to the drift of the measured
potential signal The uncertainty in the drift term of the electroanalytical signal makes it
difficult to analyze and explain the experimental data By extrapolating the linear part (blue
line in Figure 456) to zero current density the obtained intercept in y-axis is around 013
mV indicating the existence of background noise even without chlorine bubbles present at
the electrode surface
4 Results and discussion
116
Figure 455 Potential fluctuation segment with a record length of 300 s chosen out of the
chronopotentiometric curves recorded in Figure 453 at the current density of 70 mA cm-2
The
mean of the discrete time series is ltEgt = 118849 V (red dashed line) and the standard deviation (σ)
of potential noise data is 039941 mV (blue dashed lines)
0 20 40 60 80 10000
02
04
06
08
10
12
14
m
V
j mA cm-2
Figure 456 Plot of the standard deviation (σ) of potential fluctuation segments as a function of
applied current density (j) in Figure 453 The data point (marked with red square) of standard
deviation corresponding to the current density of 100 mA cm-2
deviates away from the linear part
(solid line) due to the signal drift of recorded potential during the experiment
For better clarity the potential fluctuations ΔE(t) as a response to the applied current
density (j) were normalized by (E(t)-micro)σ where micro is mean value and σ is standard
deviation This allows us to observe clearly the local patterns and temporal structures (such
4 Results and discussion
117
as time dependence trend and periodicity) of the time series as shown in Figure 457 in
the time domain The normalized time series with the amplitudes in the same range (-5~5)
indicates that a linear correlation exists between j and σ of the potential fluctuations [161]
The drift in potential record (Figure 457d) reduces its amplitude due to the increase in σ
The variability of potential signal is strongly dependent on j Long lasting random noise is
the main feature at low j implying the slow bubble evolution whereas transient impulse
variance prevails at high j as the consequences of the intensive chlorine evolution events
Figure 457 The normalized time series segments of potential noise with a record length of 300 s
(the number of the discrete data points is 60 000) for chlorine evolution under galvanostatic
polarization in 35 M NaCl pH 3 at 50 oC at a current density of (a) 4 mA cm
-2 (b) 30 mA cm
-2 (c)
70 mA cm-2
(d) 100 mA cm-2
Note that the above statistical analysis results could not provide any information about the
periodicity of gas bubble evolution although the periodic information is contained within
the noise data It is necessary to use more advanced and effective mathematical method
and signal processing technique to extract the characteristic bubble evolution information
4 Results and discussion
118
The following sections demonstrate two widely used signal analysis methods Fourier
transform and wavelet transform
443 Fourier analysis of potential fluctuations
Fourier transform (FT) is an operation that transforms the signal from the time domain into
the frequency domain The time series of potential signal can be represented in the
frequency domain by a Fourier power spectral density function (PSD) The PSD describes
how the power per unit of frequency (spectral) of a time series is distributed with the
frequency The typical PSD units for the potential noise signals are mV2 Hz
-1 The value
[Hz-1
] refers to a bandwidth rather than to the frequency in Hz along the x-axis The
integral of the PSD over a given frequency band calculates the average power in the signal
over that frequency band Note that the peaks in the Fourier PSD spectra do not reflect the
power at a given frequency The popular way to estimate the PSD is based on the
computation of the squared modulus of the Fourier transform of the time series through
fast Fourier transform (FFT) which requires the zero-padding of the time series to a length
of an integer power of 2
The characteristic parameters of bubble evolution such as the detachment diameter
frequency and population density have been derived from the theoretical models based on
the Fourier power spectra of the electrochemical noise data [157162163] The plateau-f -α
roll-off profiles of PSD where α is power-law slope can be used to separate various
factors associated with the fluctuation in electrochemical signals and to estimate
quantitatively the characteristic parameters of bubble evolution by fitting the profiles to
theoretical equations However in the cases of overlapped PSD curves or the absence of
frequency-localized plateau and peaks in PSD curves [164165] the Fourier PSD is
incapable of providing further information
4 Results and discussion
119
Figure 458 Fourier power spectral densities (PSD) of potential noise data corresponding to Figure
457 at the current density of (a) 4 mA cm-2
(b) 30 mA cm-2
(c) 70 mA cm-2
(d) 100 mA cm-2
Fourier PSD plots of potential noise recorded at different current densities are shown in
Figure 458 Although there are obvious differences in noise time series profiles (Figure
457) it is impossible to distinguish the noise series by the PSD curves due to the extreme
similarity of Figure 458 a-d since the PSD analysis is based on the perfectly
distinguishable PSD profiles among different noise data The PSD analysis obscures the
important underlying information of bubble evolution in this case In addition some
restrictions of PSD in the analysis of noise data have also been emphasized in cases of
impulse or drift signals [65] As a matter of fact non-stationary signals which dissatisfy
the fundamental assumptions of Fourier analysis [166] could appear in bubble evolution
process for practical electrolysis
4 Results and discussion
120
444 Wavelet analysis of potential fluctuations
Accurate feature extraction of the periodicity from the chaotic time series can provide
characteristic correspondence of bubble behaviour As a powerful alternative to Fourier
transform wavelet transform (WT) has been utilized widely in the field of analytical
chemistry such as spectroscopy chromatography and electroanalytical signals [167] By
the convolution operation of the input data sequence with a scaled wavelet function WT
possesses the capability to visualize the frequency contents localized in time of a signal In
this section a straightforward analysis strategy based on wavelet analysis of potential noise
data has been presented to identify the characteristic Cl2 bubble evolution behaviour when
Fourier analysis is proven to be helpless
The normalized complex Morlet wavelet function (a product of a complex exponential
wave and a Gaussian envelope 1 4 is a normalization factor) [168] is given by
1 4 2
0 0( ) exp( )exp( 2)t i t t (49)
where 0 is the wavelet value at the non-dimensional time t (Figure 459) and ω0 = 6 is a
non-dimensional parameter was used to calculate the local wavelet power spectra using
algorithm proposed by Torrence and Compo [169]
Figure 459 Complex Morlet wavelet base function (Eq (49)) in the time domain with the wave-
like oscillation Real part (black curve) and imaginary part (red curve)
4 Results and discussion
121
The relation between the equivalent Fourier periods (p) and wavelet scales (s) for Morlet
wavelet is given by
2
0 0
41033
2
sp s (410)
Significance test against red noise background spectra under null hypothesis for the
wavelet power spectra was conducted to identify the physically meaningful components of
the potential fluctuations [169] The global wavelet power spectra were calculated by the
statistical average of the wavelet power spectrum over time [170] excluding the data
points within the cone-of-influence due to the edge-effects for a time series with truncated
boundaries It should be stressed that the global wavelet spectrum is the biased estimator of
the true signal power P(f) rather than the original signal amplitude |ΔV(t)| To correlate
approximately the potential amplitude with the dominant periodic events the power peaks
in the global wavelet power spectra were modulated by ( )P f f where Δf = 1s 2 is the
frequency bandwidth [168171172]
The one-dimensional time series were depicted into two-dimensional time-period local
wavelet power spectra (left column in Figure 460) by performing WT which visualizes
the periodic contents of bubble evolution and simultaneously how the periodic contents
evolve over time The extracted features were highlighted from wavelet power contours by
computing the local maxima of squared modulus of the wavelet coefficients The cross-
hatched regions mark out the cone-of-influence caused by edge effects The right column
in Figure 460 shows the global wavelet power spectrum (black curves) along with the 5
significance levels (red dashed curves)
Note that for the present time series and the type of wavelet used the maximal reliable
period (pmax) to satisfy the wavelet detection criterion is 73 s given by [173]
max
1033
3 2
Tp (411)
where T = N Δt = 300 s is the total sampling time of the time series segment N = 60 000
is the number of the sampled data points in the time series segment Δt = 5 ms is sampling
interval Therefore some peaks exceeding the 73 s limit have to be rejected before
4 Results and discussion
122
considering the bubble behaviour Experimentally the artefacts of long-period contents
could be attributed to the assembly and detachment of bubbles at the electrode border [157]
Figure 460 (left column) Local wavelet power spectra (the noise power increases from dark blue
contours to red contours) corresponding to time series in Figure 457 at the current density of (a)
4 mA cm-2
(b) 30 mA cm-2
(c) 70 mA cm-2
(d) 100 mA cm-2
Cross-hatched regions define the
cone-of-influence (right column) The corresponding global wavelet power spectra (black solid
curves) along with 5 significance levels (red dashed curves) and modulated global wavelet
power amplitude spectra (blue solid curves shown on relative scales)
4 Results and discussion
123
As observed from the peaks in the global wavelet power spectra (black curves right
column in Figure 460) several time patterns were well resolved corresponding to each
applied current density indicating that bubble evolution is characterized by multi-period
events This reflects the electrocatalytical and morphological heterogeneities of the discrete
nucleation sites and electrode surface In contrast simulations from the PSD profiles
usually return a single value of bubble release frequency for a given current density [174]
which should be applied restrictively to the cases of perfectly uniform electrodes WT is
superior to Fourier analysis to reflect the reality in this respect At smaller wavelet scales
the events with periods less than 1 s were captured from the potential fluctuations and the
resulting wavelet power peaks were below the 5 significance level At higher j the peaks
attributed to short-period events of 2~4 s become distinct implying the increased release
frequency of bubbles
The WT yields a wide frequency bandwidth ( 1 2 1033 2f s p ) in the higher
frequency regions and accordingly the wavelet power peaks get smoothed out By
modulating the true potential fluctuations power by ( )P f f the relative amplitudes of
the high-frequency (short-period) components of bubble evolution were amplified (blue
curves right column in Figure 460) Approximately the modulated peak amplitudes
represent the contribution of different periodic events to the total σ of potential fluctuations
[172] Thus the dominant characteristic periodic components causing the actual potential
fluctuations |ΔV(t)| at gas-evolving electrodes can be well resolved A linear relationship of
dominant bubble characteristic frequency fc = 1p with applied j was obtained (Figure 461)
Considering the frequency localization is more precise at large scale of wavelet analysis
the value of data points at low j is more accurate in Figure 461
Theoretically a limiting current density (jlim) corresponding to the initial bubble nucleation
can be obtained from the intercept on horizontal axis (Figure 461) which is related to the
electrode properties controlling the gas-evolving behaviour A value of jlim = 104 mA cm-2
for the present electrode was obtained roughly using wavelet analysis of the noise data
mathematically Similar values were found for H2 and O2 evolution [175176] Below this
threshold the removal of product molecules proceeds through diffusion into bulk solution
rather than through gas evolution Wavelet analysis of potential fluctuations time series for
j = 1 mA cm-2
proves that periodic events are absent and wavelet power peaks are below
4 Results and discussion
124
the 5 significance level indicating a purely random process and confirming the bubble-
free presumption when j lt jlim The jlim is an important identifier of gas-evolving electrodes
and often difficult to be determined by traditional analysis [175]
0 10 20 30 40 50 60 70 80 90 100000
005
010
015
020
025
030
035
040f c
H
z
j mA cm-2
y = 000356x - 000369
R2 = 098
Figure 461 Dominant characteristic frequency (fc) of bubble evolution resolved from the
modulated global wavelet power amplitude spectra as a function of applied current density
Fourier transform contains no information about the time evolution of the spectra In
contrast local wavelet power spectra reveal not only the frequency contents but also their
time localization The transitions of bubble evolution events can be observed from the time
history of wavelet power The discontinuity of certain frequency contents over the whole
time record implies that the time series of potential fluctuations are not strictly wide-sense
stationary signals [166] The time spans of the dominant events along time axis (local
wavelet power spectra in Figure 460) shortened with the increase of j At low j the broad
time spans were observed as evidence of anchored bubble growth and coalescence events
for a longer time until substantial buoyancy force raises the bubbles up Compared to
bubble departure although bubble coalescence imposes weaker influence on the electrode
surface shadowing [162] it exerts a pronounced effect on micro-convection and current
distribution For an electrode easily wetted by electrolyte the formed bubbles are prone to
detach rather than coalescence This provides a feasible way for in-situ evaluation of the
wettability of different electrodes by comparing the bubble coalescence behaviour Much
4 Results and discussion
125
finer separation of contours in the local wavelet power spectra at j = 100 mA cm-2
implies
that short-time and numerous bubbles release is the dominant characters and the bubble
coalescence effects fade away
This section demonstrates and validates the methodology for the identification of bubble
evolution behaviour using wavelet analysis of potential fluctuations data The obtained
results confirm that the abundant and valuable information hidden in the noise data can be
easily extracted using wavelet transform which is independent of theoretical models or
visual observations The local detailed behaviour and global behaviour of bubble evolution
can be visualized from the time-frequency localization A more realistic evaluation of
bubble behaviour on any arbitrary electrode geometry can be actualized using the proposed
analytical method The analytical resolution and sensitivity of potential signals can be
further improved by optimal selection of wavelet basis function and algorithm Further
investigation to compare the electrode morphology and structure dependent gas bubble
evolution behaviour is necessary to guide the controlled coating preparation technique
445 Influence of electrolysis temperature on the bubble evolution behaviour
Electrolysis temperature is one of the most critical parameters to maximize the electrolysis
efficiency for the electrolytic chlorine production processes For the anodic
reaction2
2Cl Cl 2e the theoretical electrochemical equilibrium potential Ee
(
2
2
0
2ln
2
Cl
e cl Cl
Cl
pRTE E
F
) decreases with the increase of electrolysis temperature T
(The argument of the logarithm is negative in the equation) Meanwhile the electrolysis
temperature imposes an influence on the bubble-induced potential fluctuations as shown in
Figure 462 Lower amplitudes of potential noise were observed at higher electrolysis
temperatures Above 50 oC the influence of electrolysis temperature on the amplitude of
the potential fluctuations was negligible (Figure 462) The influence of electrolysis
4 Results and discussion
126
temperature on the potential fluctuations is evident at higher applied current densities in
which region the bubble evolution is intensive
H Vogt qualitatively summarized the influence of electrolysis temperature on the anode
effects [163] Increasing electrolysis temperature can increase the diffusion coefficient of
dissolved gas enhance the mass transfer lower the bubble population density and change
the wettability of electrode coatings Bubbles easily detach away from the electrode
surface and with larger bubble diameter at higher electrolysis temperatures The rate of
heterogeneous bubble nucleation is a function of electrolysis temperature and contact angle
[177] Note that the dependence of bubble behaviour on the electrolytic conditions for H2
O2 Cl2 is different A direct comparison of bubble behaviour with reported results for
different gases in the electrolytic system does not make sense
10 10000
05
10
15
20
25
30
705030
m
V
j mA cm-2
25 oC
50 oC
80 oC
20
Figure 462 Standard deviation of potential fluctuations (σE) as a function of the applied current
density on a logarithmic scale and as a function of the electrolysis temperature () 25 oC ()
50 oC () 80
oC Steady-state current-potential curves for chlorine evolution reactions measured
galvanostatically in 35 M NaCl pH 3 with forced convection of electrolyte (volumetric flow rate
of electrolyte 100 mL min-1
) for the electrode coating Ru025Ti065V01Ox (see Section 441)
4 Results and discussion
127
(a)
(b)
(c)
Figure 463 Local wavelet power spectra show the influence of electrolysis temperature on the
bubble detachment period for the electrode coating Ru025Ti065V01Ox (see Section 441) The
potential noise data points were recorded in 35 M NaCl pH 3 at a current density of 05 kA m-2
at
the electrolysis temperature of (a) 25 oC (b) 50
oC and (c) 80
oC
The dependence of bubble evolution behaviour on the electrolysis temperature was
investigated by performing wavelet transform of the recorded potential fluctuation signals
The local wavelet power spectra (ie the three-dimensional time-period-wavelet power
plots) and the modulated global wavelet power spectra (which reflects the real contribution
of the frequency components to the total fluctuations of the potential noise signal) for the
potential noise were shown in Figure 463 and Figure 464 respectively
4 Results and discussion
128
05 1 2 4 8 16 32 6400
05
10
15
20
25
30
22
12
78
48
63
146329
25
18
22
6733
(P(f
)f)
0510
3
Period s
25 oC
50 oC
80 oC
11
Figure 464 Modulated global wavelet power spectra corresponding to the local wavelet power
spectra in Figure 463 The potential noise data points were recorded in 35 M NaCl pH 3 at a
current density of 05 kA m-2
at the electrolysis temperature of (Δ) 25 oC () 50
oC and () 80
oC
The time-period localized wavelet power ridges (ie the local maximum of the wavelet
power) observed in the local wavelet power spectra (Figure 463) show the frequency
components (ie frequency- or period-localized characteristic of wavelet transform) of
bubble evolution events and meanwhile when they occur (ie time-localized characteristic
of wavelet transform) Short-period bubble evolution events become dominant at higher
electrolysis temperatures (Figure 463 Figure 464) The 33- and 67-second periodic
events observed at the electrolysis temperature of 80 oC (Figure 463c) frequently occur at
certain intervals over the 300-second time-record The 25-second periodic events happen
only once during the 300-second time-record (Figure 463c) The analysis of the amplitude
of the peaks in the modulated global wavelet power spectra (Figure 464) must be done
carefully in the presence of the fortuitous events (such as the 25-second periodic events in
Figure 463c) The relative amplitude of the period-peaks in the modulated global wavelet
power spectra (Figure 464) approximately represents the relative contribution of the
period-components to the total amplitude of the potential fluctuations Thus the highest
period-peak in the modulated global wavelet power spectra corresponds to dominant
bubble evolution events causing the potential fluctuations
4 Results and discussion
129
0 20 40 60 80 10000
01
02
03
04
05
06
f c
Hz
j mA cm-2
80 oC
50 oC
25 oC
Figure 465 Dominant characteristic frequency (fc) of bubble evolution resolved from the
modulated global wavelet power amplitude spectra as a function of applied current density and
electrolysis temperature () 25 oC () 50
oC and () 80
oC
The resolved dominant characteristic bubble evolution frequency (fc) as a function of
current density and electrolysis temperature was shown in Figure 465 A linear
dependence of the fc on the current density was observed at each electrolysis temperature
The difference in the slope of the fitting lines implies the different bubble detachment rates
under various electrolysis temperature conditions High temperature electrolysis
accelerates the detachment of the chlorine bubble The limiting current densities (jlim)
corresponding to the initial bubble nucleation at different electrolysis temperatures
obtained from the intercept of the fitting line on horizontal axis in Figure 465 are roughly
equal
4 Results and discussion
130
446 Case analysis Bubble evolution behaviour for the commercial electrode and
sol-gel Ru03Sn07O2 electrode coatings
In this section the bubble evolution behaviour for a very active Ru03Sn07O2 electrocatalyst
coating prepared by the sol-gel route (see Section 314 ruthenium metal loading amount
was 77 g m-2
) was analyzed based on the potential noise data A commercial
Ru03Ti07O2Ti electrode with a ruthenium metal loading amount of 121 g m-2
prepared by
thermal decomposition technique was used for a comparative investigation The titanium
supported Ru03Ti07O2 and sol-gel derived Ru03Sn07O2 electrocatalyst coatings were
prepared by using the similar procedure of coatingdryingsintering cycles Accordingly
the typical mud-crack surface structures were observed for both electrode coatings and the
crack gaps in the commercial coating were broader than that in the sol-gel Ru03Sn07O2
coating (Figure 466)
Figure 466 SEM images of commercial Ru03Ti07O2 and sol-gel Ru03Sn07O2 coatings show the
typical mud-crack surface morphologies
The electrocatalytic activity toward the chlorine evolution reactions of the as-obtained sol-
gel Ru03Sn07O2 coating and the commercial Ru03Ti07O2 electrode coating were evaluated
by steady state chronopotentiometric measurements in 35 M NaCl pH 3 at 80 oC with the
applied current density stepping from 004 to 4 kA m-2
The potential fluctuation data
4 Results and discussion
131
points were recorded using the same way as described in Section 441 The electrocatalytic
activity of the commercial Ru03Ti07O2 electrode coating and sol-gel Ru03Sn07O2 coating
for chlorine evolution reactions was compared in Figure 467 At the applied current
density of 4 kA m-2
the sol-gel Ru03Sn07O2 coating shifts down the electrode potential
around 60 mV compared to the commercial Ru03Ti07O2 electrode coating although the
sol-gel Ru03Sn07O2 coating contains less ruthenium loading amount (77 g Ru m-2
) than
the commercial coating (121 g Ru m-2
) As shown in the inset in Figure 467 the standard
deviation of the potential noise (σE) linearly increases with logj for the sol-gel Ru03Sn07O2
coating whereas for the commercial electrode the σE increases slowly form 004 to
1 kA m-2
and then increases sharply from 1 to 4 kA m-2
10-2
10-1
100
101
110
112
114
116
118
120
122
124
10-2
10-1
100
1010
1
2
3
4
E
mV
j kA m-2
E
- iR
V
vs A
gA
gC
l
j kA m-2
Figure 467 Steady-state current-potential curves for chlorine evolution reactions measured
galvanostatically in 35 M NaCl pH 3 at 80 oC with forced convection of electrolyte for ()
commercial Ru03Ti07O2 electrode coating (Δ) sol-gel Ru03Sn07O2 electrode coating Mean
potential values were corrected for the electrolyte ohmic resistance (E-iR) Inset shows the standard
deviation of potential fluctuations (σE) as a function of current density
Oscillating gas bubbles impose significant influence on the mixing hydrodynamics and
mass transfer in the electrolysis system Except for the factor of bubble detachment rate
4 Results and discussion
132
increase either in bubble size or in bubble population density can result in large
fluctuations in the electrode potential signals Quantitative study of various factors
contributed to the chaos of electrolysis system is necessary to improve design of electrode
coatings
Figure 468 Chronopotentiometric response of electrodes (the mean values μE were removed) (a)
commercial electrode (b) sol-gel Ru03Sn07O2 electrode coating in 35 M NaCl (pH 3) at 80 oC and
polarized at 4 kA m-2
A time series segment of 300 s was chosen from the chronopotentiometry
measurements (sampling frequency 200 Hz) for the statistical analysis Right column shows the
corresponding histograms of potential noise data fitted with a normal distribution (red curves)
The representative potential fluctuation noise recorded galvanostatically at 4 kA m-2
for the
commercial coating and sol-gel derived coating was shown in Figure 468 The noise
amplitude is about four times larger for the commercial coating than that for the sol-gel
coating suggesting a more chaotic bubble evolution process at the electrodeelectrolyte
interface for the former The potential noise obeys a normal distribution law for both
coatings It has been proposed that the amplitude of the potential noise is associated with
the bubble diameter [162] Thus larger bubbles could be generated at the commercial
coating than that at the sol-gel coating The bubble evolution behaviour could be governed
by the local activity the distribution and spacing of the active sites at the electrode surface
The characteristics of bubble evolution events at the electrode surface were identified by
the electrochemical noise analysis technique as shown in Figure 469 and Figure 470
4 Results and discussion
133
(a) (d)
(b) (e)
(c) (f)
Figure 469 Local wavelet power spectra (three-dimensional time-period-wavelet power plots) of
potential noise for the (abc) commercial electrode and (def) sol-gel Ru03Sn07O2 electrode
coating The potential noise data were recorded in 35 M NaCl pH 3 at 80 oC at a current density
of (ad) 4 (be) 05 (cf) 004 kA m-2
The short-periodic bubble evolution events become evident at higher applied current
densities For the commercial electrode galvanostatically polarized at 4 kA m-2
the bubble
evolution induced larger potential fluctuations (Figure 468a) The potential fluctuations in
Figure 468a were caused by four resolved periodic-components (or frequency-
components) 26 7 14 and 31 s (Figure 470) The amplitudes of the wavelet power ridges
for the short-periodic events (2~16 s) were comparable to those for the long-periodic
events (16~64 s) as observed from Figure 469a This indicates that the short-periodic
events contribute more to the total amplitude of the potential fluctuations than the long-
4 Results and discussion
134
periodic events The quantitative analysis was shown in the modulated wavelet power
spectra (ie the (P(f)Δf)05
vs period plots top in Figure 470) since the standard
deviations of the potential fluctuations (σE) were approximately proportional to the
P(f)Δf)05
[172] Therefore the 26- and 7-s periodic events contribute around two times
larger to the amplitudes of the potential fluctuations (Figure 468a) than the 14- and 31-s
periodic events In comparison with the sol-gel Ru03Sn07O2 coating the 4 8 16 and 26 s
periodic events (red lines top in Figure 470) contribute equally to the amplitudes of the
potential fluctuations (Figure 468b)
05 1 2 4 8 16 32 6400
03
06
09
12
5030
17
10
4526
8
Period s
j = 004 kA m-2
00
04
08
12
16
20
(P
(f)
f)0
51
03
58
32
12
46
26
4622
15
j = 05 kA m-2
64
0
4
8
12
16
20
51
261684
31
14
726
j = 4 kA m-2
Figure 470 Modulated global wavelet power spectra for the () commercial electrode and (Δ) sol-
gel Ru03Sn07O2 electrode coating
4 Results and discussion
135
Interestingly the relative contribution of the periodic events to the amplitudes of potential
fluctuations changes with the applied current density as shown in Figure 470 For the
commercial electrode the dominant periodic events causing the potential fluctuations
change from 45-s at 004 kA m-2
to 15-s at 05 kA m-2
and then to 26-s at 4 kA m-2
(black
curves in Figure 470) For the sol-gel Ru03Sn07O2 coating the similar phenomena were
only observed at current density from 004 to 05 kA m-2
The wettability of the oxide
coatings could change with the electrolysis conditions (such as temperature and current
density) which depends on the coating materials This could be a reason for the different
bubble evolution behaviour observed for the commercial and sol-gel coatings
For the gas-evolving electrode molecular chlorine is partially dissolved and diffuses into
the bulk electrolyte the rest exists as adhering bubbles at the electrodeelectrolyte interface
The efficiency of gas evolution is defined as the ratio of gas bubble evolved at the
electrode to the total amount of molecular chlorine generated According to the Faradayrsquos
law equivalent amount of chlorine was produced per unit time at both electrodes polarized
at the same current density Assuming that all of the chlorine produced exists as bubbles
close to the electrode surface at the extraordinary high current density of j = 4 kA m-2
(ie
the gas evolution efficiency is 100) the total volume flux density of chlorine produced is
g
g
1j j
V jRTn v
At zFp At (412)
where A is the electrode surface area t is the sampling duration of bubble events R is gas
constant T is absolute electrolysis temperature z = 2 is the number of electrons transferred
for the electrode reaction F is Faradayrsquos constant p is the gas pressure in the bubbles nj is
the number of adhering bubbles with the volume of vgj The total volume flux density of
chlorine produced is 006 cm3cm
-2s
-1 at j = 4 kA m
-2 80
oC p asymp1 bar and assuming the gas
evolution efficiency and the current efficiency are 100 The bubble population density
buble volume bubble coverage fraction etc are important parameters for the systematic
evaluation of the gas-evolving electrodes The development of a mathematical model and
the experimental observation of bubble evolution processes using video camera could be
helpful to deduce the various parameters
4 Results and discussion
136
447 Conclusion
In this section chlorine bubble evolution behaviour at the electrode surface was identified
by analyzing the bubble-induced electrochemical noise (electrode potential noise) using the
mathematic analysis methods such as standard deviation autocorrelation function Fourier
power spectral density and wavelet transform
Bubble effects at the gas-evolving electrode cause additional ohmic drop due to the
blocking and shielding effect of the electrode surface by the formed or anchored bubbles
which could depend on the surface morphology of the electrode coatings and the electrode
materials Identification of the bubble behaviour is necessary to assist the design of
electrode structure and the selection of suitable electrode materials
A statistical quantity such as the standard deviation of the electrochemical noise is able to
establish the correlation between the noise intensity and the cell operation parameters
electrode materials etc However for the electroanalytical signals with undesirable drift
the statistical analysis encounters the difficulty to provide reliable results
The transformation of the signals from the time domain to the frequency domain using
Fourier transform methods is expected to provide the frequency information of bubble
evolution contained within the noisy signals However the Fourier transform is not able to
distinguish the signals with similar features As an alternative the wavelet transform is
capable of providing accurate time-frequency localization which is used in this work to
extract the characteristic frequency information of bubble evolution
The dependence of the bubble evolution behaviour on the applied current density and
electrolysis temperature was investigated A linear relationship between the dominant
characteristic frequency of bubble evolution and the current density was observed High
temperature electrolysis accelerates the detachment of the chlorine bubble A systematic
and comparative analysis of the electrode activity bubble induced noise and bubble
evolution behaviour for the commercial Ru03Ti07O2 coating and sol-gel derived
4 Results and discussion
137
Ru03Sn07O2 coating was carried out The periodic bubble evolution events causing the
potential fluctuations were resolved from the wavelet analysis of potential noise data The
dominant periodic events contributing to the total amplitude of the potential noise (or the
total standard deviation of the potential noise) have been analyzed by the modulated
wavelet power spectra Future work to develop a mathematical model is essential to deduce
more valuable bubble parameters such as the bubble population density bubble size
bubble coverage fraction and gas evolution efficiency etc
4 Results and discussion
138
5 Summary and conclusions
139
5 Summary and conclusions
A multi-perspective investigation including (i) the selection of electrocatalyst materials (ii)
the design of coating morphology (iii) the modification of the phase structure and (iv) the
identification of the bubble evolution behaviour has been carried out in this work The
electrocatalytic performance of sol-gel derived oxide coatings has been optimized by
choosing the chemical composition and by controlling the surface morphology In order to
avoid the underlying substrate passivation a crack-free inner protective layer was
fabricated purposely A wavelet-based analytical strategy has been developed to identify
the bubble effects for the electrochemical chlorine evolution reactions The structural and
electrochemical characterization was performed to disclose the material-structure-property
correlations
Based on the typical binary RuxTi1-xO2 oxide system the multi-component system
RuTiMOx have been prepared by using acetic acid and propionic acid catalyzed sol-gel
routes to optimize the chemical composition-dependent electrocatalytic activity and to
reduce the ruthenium content It has been proven that the doping of vanadium andor tin
element(s) into the RuTiO2 system is able to enhance significantly the electrocatalytic
activity of oxide coatings compared to the binary RuTiO2 system Compared to the
commercial electrode coating Ru03Ti07O2 a reduction in the electrode potential (measured
in 35 M NaCl pH 3 with an applied current density of 100 mA cm-2
ie 1 kA m
-2) by
about 80 mV has been achieved for the sol-gel-derived oxide coatings with 15~30 mol
ruthenium This indicates the possibility of a considerable reduction of the total electric
energy consumption for the present industrial membrane process (cell voltage 31 V) of the
electrolysis of NaCl aqueous solution or for the membrane process using an oxygen
depolarized cathode
It has been confirmed by other researchers that the electrode deactivation occurs before the
complete dissolution of the active ruthenium components due to the formation of TiOx
interlayers between the substrate and the electrocatalyst layer by the penetration of
5 Summary and conclusions
140
electrolyte through the cracky gaps of the oxide coatings The crack-free oxide coatings
(no visible cracks gaps can be seen from SEM images) were prepared purposely by
reduplicate dipping-withdrawing-drying-sintering steps with the intention to protect the
underlying titanium substrates against passivation The electrochemical cyclic voltammetry
analysis shows that the obtained crack-free coatings have the impermeable characters for
electrolyte Thus the attack of the electrolyte on the titanium substrates can be avoided
Nanopore-containing oxide coatings were prepared by using the lanthanum leaching
technique in order to increase the active surface area of the oxide coatings The utilization
of the nanopores was investigated by electrochemical cyclic voltammetry and impedance
spectroscopy The charging behaviour of the nanopore-containing oxide coatings was
studied by analyzing the charging curves recorded galvanostatically under slight
polarization conditions Further work to evaluate the dependence of the performance on the
pore size geometry and its gradient distribution is recommended
Solvothermal processing of the xerogel oxide coatings has been demonstrated with the
purpose to modify the phase structure of mixed RuTiO2 oxide coatings The solvothermal
processing of the amorphous Ru-O-Ti xerogel coatings with subsequent thermal sintering
treatment results in the formation of a mixed anataserutile structure with improved
electrocatalytic activity for the chlorine evolution reactions The structural and phase
development of the xerogel coatings processed solvothermally were traced by using X-ray
diffraction and Raman spectroscopy It has been deduced that the unique structure
nanoparticles of rutile structure RuxTi1-xO2 (3 nm) decorating larger anatase TiO2 particles
(20 nm) is responsible for the enhanced electrocatalytic activity
Bubble effects at the gas-evolving electrodes have been analyzed preliminaryly by
performing wavelet transforms of the bubble-induced potential fluctuation signals The Cl2
gas bubble evolution at the electrode surface is characterized by multi-period events The
dominant characteristic frequency of bubble evolution as a function of the applied current
density has been extracted out of the noisy signals Further work is necessary to understand
the interrelationship between materials structure and morphology on the one hand and the
bubble evolution behaviour on the other hand
Appendix 141
Appendix
A1 Chemicals
Description CAS No Molecular Formula Molecular
Weight
g mol-1
Density
g mL-1
Supplier
4-Hydroxy-4-methyl-2-pentanone 99 123-42-2 (CH3)2C(OH)CH2COCH3 11616 0931 Sigma-Aldrich
Acetic acid 64-19-7 C2H4O2 6005 104 UdS
Hydrochloric acid 37 7647-01-0 HCl 3646 119 ABCR
Iridium (III) 24-pentanedionate 999 15635-87-7 C15H21IrO6 4895 - ABCR
Isopropanol 67-63-0 C3H8O 6010 0785 UdS
Lanthanum(III) nitrate hexahydrate 99 10277-43-7 La(NO3)3∙6H2O 43301 - ABCR
Oxalic acid dihydrate 98 6153-56-6 C2H2O4 12607 165 ABCR
Polyvinylpyrrolidone average MW 58000 9003-39-8 (C6H9NO)n - - Alfa Aesar
Propionic acid 99+ 79-09-4 CH3CH2CO2H 7408 0992 Alfa Aesar
Ruthenium (III) 24-pentanedionate 14284-93-6 Ru(C5H7O2)3 39840 - Alfa Aesar
Ruthenium (III) chloride hydrate (36Ru) 999 14898-67-0 RuCl3 20743 - ABCR
Tin(IV) isopropoxide isopropanol adduct 98 (metals
basis)
132951-93-0 Sn[OCH(CH3)2]4C3H7OH 41515 - Alfa Aesar
Titanium (IV) isoproxide 97 546-68-9 Ti[OCH(CH3)2]4 28422 096 Sigma-Aldrich
Vanadium (IV) oxide bis (24-pentanedionate) 3153-26-2 C10H14O5V 26516 - ABCR
Zirconium (IV) n-propoxide 70ww in n-propanol 23519-77-9 Zr[O(CH2)2CH3]4 32756 1044 Alfa Aesar
Moisture sensitive Zentrales Chemikalienlager der UdS
Appendix
142
A2 Software
Programme Version Manufacturer
CorelDRAW 10 Corel Corporation (Ottawa Canada)
EC-Lab V995 Bio-Logic SAS (Claix France)
MATLAB 70 The MathWorks Inc (Massachusetts USA)
OriginPro 81 OriginLab Corporation (Northampton USA)
ZSimpWin 310 EChem Software (Michigan USA)
Appendix 143
A3 List of abbreviations Nomenclature
Abbreviation Description
ACF Autocorrelation function
AFM Atomic force microscopy
BDD Boron-doped diamond
CD Chemical desorption
CP Chronopotentiometry
cus Coordinatively unsaturated surface sites
CV Cyclic voltammetry
DSA Dimensionally stable anode
DSC Differential scanning calorimetry
ED Electrochemical desorption
EDS Energy dispersive X-ray spectroscopy
EIS Electrochemical impedance spectroscopy
FT Fourier transform
FTIR Fourier transform infrared spectroscopy
HEC Hydrogen evolving cathode
HT-XRD High temperature X-ray diffraction
IS Impedance spectroscopy
ODC Oxygen depolarized cathode
PSD Power spectral density
PVP Poly(vinylpyrrolidone)
SEM Scanning electron microscope
StDev Standard deviation
TEM Transmission electron microscope
TG Thermogravimetry
WT Wavelet transform
XRD X-ray diffraction
Appendix
144
A4 The calculation of energy consumption for chlorine production
For the industrial electrolytic chlorine (Cl2 71 g mol-1
) production from NaCl aqueous
solution Cl- is oxidized by the loss of electron to the anode 2
1
2Cl Cl e The
driving force for the electrode reaction is provided by applying a cell voltage for instance
31 V Assume the chlorine current efficiency is 98 Then for the production of 1 ton Cl2
the energy consumption is calculated as follows
The molar number of the electron transfer is
- -1000 kg098 1000 g 1 mol e 2878443 mol
M =1ton 1kg 3545 g ton of chlorinee
e
The amount of charge transfer is calculated according to the Faradayrsquos law
-23 1 19
--1
9
M Avogadro number charge of an electron
2878443 mol = 6022137 10 mol 1602177 10 C
ton of chlorine
2878443 mol = 9648531 C mol
ton of chlorine
277727 10 C=
ton of chlorine
e
e
e
The energy consumption (kWh) for the production of 1 ton Cl2 is
9 9 3277727 10 C 860954 10 J 2392 10 kWh31 V = =
ton of chlorine ton of chlorine ton of chlorine
(The energy per unit charge is the potential difference 1V = 1J C-1
1 kWh = 1000A times 1V times3600s = 1000 C s-1
times 1V times3600s = 36times106 CV = 36times10
6 J)
Appendix 145
A5 Peng-Robinson and van der Waals equations of state
The equation of state is a thermodynamic equation describing the state of matter under a
given set of physical conditions (such as temperature pressure volume) Cubic equations
of state are widely used in chemical engineering practice for the calculation and prediction
of the properties of fluids or their mixtures The van der Waals equation of state
(2
m m
RT ap
V b V
2
27
64
c
c
RTa
p and
8
c
c
RTb
p 1873) is developed based on the
modification of the ideal gas law (PVm = RT) However it has limited accuracy for the
prediction of properties of compressed fluids Other equations of state have been
developed on the basis of the van der Waals equation of state such as Redlich-Kwong
equation of state ( 1 2
m m m
RT ap
V b T V V b
2 25042748 c
c
R Ta
p and
008662 c
c
RTb
p
1949) and Peng-Robinson equation of state (2 22
m m m
RT ap
V b V bV b 1976)
(Ref TY Kwak GA Mansoori Chem Eng Sci 1986 41 1303)
The Peng-Robinson equation of state is applicable to the prediction of the properties of
subcritical and supercritical fluids
Appendix
146
A6 JCPDS standard data of RuO2 TiO2
Pattern Lattice 2θ o d Aring hkl IImax
RuO2 40-1290 tetragonal
P42mnm (136)
a = 449940
c = 310710
Vcell = 6290
28010
35051
40022
40548
44997
54247
57931
59439
65542
65912
66991
69542
74126
77572
83395
86435
87750
93163
94487
96886
99494
99926
113537
115443
318300
255800
225100
222300
201300
168960
159060
155380
142310
141600
139580
135070
127810
122970
115800
112490
111140
106050
104910
102940
100930
100610
092090
091110
110
101
200
111
210
211
220
002
310
221
112
301
202
212
321
400
222
330
312
411
103
420
213
402
100
77
12
6
1
39
9
6
5
3
8
7
4
1
5
1
4
2
4
3
3
2
4
1
Pattern Lattice 2θ o d Aring hkl IImax
TiO2 21-1276 rutile
tetragonal
P42mnm (136)
a = 459330
c = 295920
Vcell = 6243
27447
36086
39188
41226
44052
54323
56642
62742
64040
65480
69010
69790
72410
74411
76510
79822
82335
84260
87464
89557
90708
95275
96017
324700
248700
229700
218800
205400
168740
162370
147970
145280
142430
135980
134650
130410
127390
124410
120060
117020
114830
111430
109360
108270
104250
103640
110
101
200
111
210
211
220
002
310
221
301
112
311
320
202
212
321
400
410
222
330
411
312
100
50
8
25
10
60
20
10
10
2
20
12
2
1
4
2
6
4
2
8
4
6
6
Appendix 147
97176
98514
105099
106019
109406
116227
117527
120059
122788
123660
131847
136549
140052
143116
155869
102710
101670
097030
096440
094380
090720
090090
088920
087740
087380
084370
082920
081960
081200
078770
420
331
421
103
113
402
510
213
431
332
422
303
521
440
530
4
1
2
2
2
4
4
8
8
8
6
8
12
2
2
Pattern Lattice 2θ o d Aring hkl IImax
TiO2 21-1272 anatase
body-centered
tegragonal
I41amd (141)
a = 378520
c = 951390
Vcell = 13631
25281
36947
37801
38576
48050
53891
55062
62121
62690
68762
70311
74031
75032
76020
80727
82139
82662
83149
93220
94181
95143
98318
99804
101221
107448
108963
112840
113861
114909
118439
120104
121725
122336
131035
135998
137391
143887
352000
243100
237800
233200
189200
169990
166650
149300
148080
136410
133780
127950
126490
125090
118940
117250
116640
116080
106000
105170
104360
101820
100700
099670
095550
094640
092460
091920
091380
089660
088900
088190
087930
084640
083080
082680
081020
101
103
004
112
200
105
211
213
204
116
220
107
215
301
008
303
224
312
217
305
321
109
208
323
316
400
307
325
411
219
228
413
404
420
327
415
309
100
10
20
10
35
20
20
4
14
6
6
2
10
4
2
2
6
4
2
4
4
2
2
2
4
4
2
2
2
4
2
2
2
2
2
4
2
Appendix
148
150039
152633
079740
079280
424
0012
4
2
Pattern Lattice 2θ o d Aring hkl IImax
TiO2 29-1360 brookite
orthorhombisch
Pcab (61)
a = 54558
b = 91819
c = 51429
Vcell = 25763
25340
25689
30808
32791
36252
37297
37934
38371
38576
39205
39967
40153
42340
46072
48012
49173
49694
52012
54205
55234
55711
57176
57685
59991
62065
63065
63416
63643
64104
64603
65003
65876
68768
70432
71490
71931
73648
76949
79025
79283
83643
84288
84724
86743
95590
95993
97609
102559
103201
351200
346500
290000
272900
247600
240900
237000
234400
233200
229600
225400
224400
213300
196850
189340
185140
183320
175680
169080
166170
164860
160980
159680
154080
149420
147290
146560
146090
145150
144150
143360
141670
136400
133580
131860
131160
128520
123810
121070
120740
115520
114800
114320
112170
103990
103660
102370
098730
098290
120
111
121
200
012
201
131
220
211
040
112
022
221
032
231
132
212
240
320
241
151
113
232
123
052
160
312
251
203
133
213
161
400
332
401
233
004
024
431
124
333
080
441
044
521
281
324
125
372
100
80
90
4
25
18
6
4
4
5
8
18
16
16
30
18
3
3
20
30
5
13
2
7
10
4
9
12
12
6
10
9
5
8
3
2
2
10
2
1
4
2
2
4
3
2
4
2
4
Appendix 149
A7 Phase diagram of binary RuO2-TiO2 system
Figure A1 Phase diagram of RuO2-TiO2 system Top ss1 solid solution of RuO2 in TiO2 ss2
solid solution of TiO2 in RuO2 Below phase composition of the TiO2-RuO2-Cl system A region
with dominating anatase solid solution R region with dominating rutile solid solution (Ref YuE
Roginskaya ID Belova BSh Galyamov FKh Chibirova RR Shifrina Mater Chem Phys
1989 22 203)
Appendix
150
A8 Mathematic basics of noise analysis
A81 Standard deviation
For the statistical method considering a discrete time-series x(t) measured by sampling
the signal at constant intervals t taking N points in the time record the acquisition time
of the record is T = N ∙t Accordingly the sampling frequency is indicated as 1t in Hz
The easier way to characterize a time series of random signal (x0 x1hellip xN-1) is to calculate
its arithmetic mean value (the mean intensity over all values of times) x and sample
standard deviation s defined as
1
0 1 1
0
1
NN
i
i
x x xx x
N N (A1)
1 2
0
1
1
N
i
i
s x xN
(A2)
The noise signal intensity and the fluctuation amplitude of current density (or potential)
can be obtained from the above calculation and the measurement results allow different
electrocatalysts to be compared as a function of applied potential (or current density) For
the electrode surface with larger anchored bubbles larger amplitudes of signal fluctuation
(ie larger standard deviation) are expected
A82 Autocorrelation function
For the analysis of time domain signals autocorrelation is often used to judge the presence
of a periodic signal which has been buried in the noise The autocorrelation function (ACF)
of a periodic signal is also periodic and more important with the same signal period and
frequency The autocorrelation is defined as the expected value of the product of a random
variable or signal x(t) with a time-shifted version of itself x(t+ τ) where τ is an integer
multiple of the time interval t This illustrates how the signal resembles a delayed version
of itself The estimation of the mean normalized (biased) autocorrelation of a discrete time
series (x0 x1hellip xN-1) is obtained by using
Appendix 151
1
0
1 2
0
1
( )1
N k
i i k
ixx N
i
i
x x x xN
R k
x xN
(A3)
where xi (i = 0 1 hellip N-1) is the amplitude of the time series k = 0 1 hellip N-1 is the time
lags Various formulas can be found from the literature for the estimation of
autocorrelation functions The autocorrelation attenuates from Rxx(0) = 1 to the zero base
line of the correlation function in the present formula which makes it easy to analyze the
data
The correlation is calculated using a fast algorithm based on the correlation theorem (the
Fourier transform of an autocorrelation function is equal to the product of the Fourier
transform of the function and the complex conjugate of the Fourier transform of the
function)
F Rxx(τ) = X(f) X(f) = |X(f)|
2 (A4)
where x(t) is the input signal X(f) is the Fourier transform of x(t) and X(f) the complex
conjugate of X(f) F is the Fourier transform Rxx(τ) is the autocorrelation of x(t) then we
have
Rxx(τ) = F -1X(f) X
(f) (A5)
where F -1 is the inverse Fourier transform The Fourier transform x(t)
FX(f) is
defined as X(f) =
x (t) e-2πjtf
dt
A83 Fourier transform
Regarding the spectral methods the signals are studied in frequency domain In the time
domain signals are represented as amplitude versus time whereas in the frequency domain
signals are expressed as amplitude versus frequency It is more intuitional to see the period
and amplitude of individual event contained in the overlapped transients The transform of
Appendix
152
time-domain data to frequency-domain data is executed by Fourier transformation For a
discrete sequence xi of length N its discrete Fourier transform (DFT) is given by
1 2
0
( )
ikN jN
DFT i
i
f k x e
(A6)
where k = 01hellipN-1 j is the imaginary unit The difference of frequency responses of two
random signals can be distinguished from the Fourier transform even if they possess a
common mean value and similar overall randomness
Power spectral density (PSD) of a random signal is the distribution of the signal power
over frequency domain which is computed based on the fast Fourier transform (FFT)
algorithm To determine the PSD the signal has to be stationary which means there should
be no signal drift as a function of time By definition the power spectral density of a
random time series x(t) is the average of the Fourier transform magnitude squared over a
time interval If the signal is a wide-sense stationary process (the signalrsquos mean and
variance do not change over time or position de-trending is necessary for a non-stationary
signal) then the PSD is the Fourier transform of the autocorrelation function
2( ) ( )
j f
x xxS f R e d (A7)
The power of a random signal x(t) over a given band of frequencies (in the range f1~f2)
can be calculated as follows
2
112 ( )
f
xf
P S f df (A8)
The slope of the PSD plot on a log-log scale has been proposed as a characterization of
bubble evolution mechanisms such as diffusion-controlled bubble growth bubble
coalescence and gas oscillatory behaviour caused by the synchronized gas production and
gas release Besides the PSD plots contain the information of magnitude and
characteristic frequency and frequency distribution of the signal
In the Fourier analysis the linear time-invariant signals are correlated with sine waves by
linear time-invariant operators For the non-stationary or transient signals the Fourier
Appendix 153
analysis becomes invalid In addition the Fourier transform gives frequency components
presented in the signals but loses the time localized information
A84 Wavelet transform
Wavelet analysis represents a more accurate and efficient method of time-frequency
localization in the analysis of electrochemical noise signals and has been used to overcome
the limitations of the Fourier transform The information of both the amplitude of any
periodic signals within the series and how the amplitude varies with time can be resolved
Wavelet transform of a function x(t) is defined as
1( ) ( )
t bW b a x t dt
aa (A9)
where b a are time index and wavelet scale respectively Function ( )t is called as the
mother wavelet the asterisk () denotes the complex conjugate The mother wavelet ( )t
is scaled by a factor of a and shifted by a factor of b to obtain the wavelet
basis1
t b
aa
The plots of wavelet power spectrum give the high time and frequency resolutions of
dominant events of a time (or spatial) series The wavelet analysis results are very sensitive
to the selection of mother wavelet function and the related parameters and even
contradictory results could be yielded among different analysis [169] This fact should be
kept in mind in the practical applications
Wavelet analysis has been widely used in signal and image processing and has been proved
to be universal in various applications and fields In chemistry wavelet transform has been
utilized for signal processing in the analytical chemistry including infrared spectroscopy
UV-Vis spectroscopy mass spectrometry chromatography X-ray diffraction and various
electroanalytical signals (Ref X-G Shao A K-M Leung F-T Chau Acc Chem Res
2003 36 276)
Appendix
154
A9 MATLAB source code
The present MATLAB code is written for the purpose of demonstration The details of the
wavelet algorithms are explained somewhere else (See C Torrence G P Compo A
practical guide to wavelet analysis Bull Am Meteor Soc 1998 79 61) The following
MATLAB code is adapted from the Torrencersquos code for the Morlet wavelet transform The
Torrencersquos subprograms chisquare_solvem and chisquare_invm were directly called
herein by the main program wavelet_fourier(xfsdjsminfname) A 30-day trial version
of MATLAB R2009b was kindly offered by The MathWorks Inc (Massachusetts USA)
The further data analysis using a licensed MATLAB version 70 was carried out in the
group of our project partner Prof Dr WF Maier Technical Chemistry Saarland
University
----------------------------------------------------------------------------
Fourier transform amp Wavelet transform (Modified TC98 source code)
Edited on 29 Jan 2010 by Ruiyong Chen
Reference
CTorrence GCompohttppaoscoloradoeduresearchwavelets
Global wavelet spectrum excludes points within the coi herein
Note that for TC98rsquos code global_ws=variance(sum(power)length(x))
INPUTS
x = raw time series of potential fluctuations acquired by EC-Lab software
fs = sampling frequency 200 Hz
dj = wavelet scale resolution
smin = determine the smallest scale
fname = figure name
OUTPUTS
a) Potential fluctuations under galvanostatic polarization mode
b) Frequency spectrum
Appendix 155
c) FFT periodogram
d) Local wavelet power spectrum
e) Global wavelet spectrum
whos
Command Window INPUTS
load x20sc_seg11_100mA_51878dat
x=x20sc_seg11_100mA_51878
fname=20sc_seg11_100mA_51878
wavelet_fourier(x20002550fname)
----------------------------------------------------------------------------
function wavelet_fourier(xfsdjsminfname)
x_zeromean=x-mean(x)
variance=std(x)^2 the square of the standard deviation delta^2
x=(x-mean(x))sqrt(variance) normalized by std with variance = 1
fs=200 sampling frequency
time=(0length(x)-1)(1fs) construct time array
FFT
p=nextpow2(x) returns the smallest power of two that
satisfies 2^p gt= abs(x)
n1=2^nextpow2(length(x))
f1=(0length(x)-1)(fsn1) frequency range
y=fft(xn1) DFT zero padding
mag=abs(y) Amplitude of the DFT Frequency spectrum
power1= yconj(y)n1 power of the DFT
wavelet transform Morlet omega_0=6
mother=Morlet
k0=6
dt=1fs
dj=025
smin=50
s0= smin dt
j1=fix(log2(length(x)smin))
Appendix
156
j1=j1dj
scale=s02^((0j1)dj) construct scale array 1-by-(j1+1)
fourier_factor=(4pi)(k0 + sqrt(2 + k0^2)) fourier_factor=1033044
period=scalefourier_factor compute Fourier period
cone of influence
coi = fourier_factorsqrt(2)dt
[1E-51((length(x)+1)2-1)fliplr((1(length(x)2-1)))1E-5]
zero padding construct Fourier angular frequency array omega_k
z(1length(x))=x-mean(x) x is the normalized time series see above
base2=fix(log(length(x))log(2)+04999)
z=[zzeros(12^(base2+1)- length(x))] new time series z
n=length(z) Attention n is not equal to n1
k=[1fix((n2))]
k=k((2pi)(ndt))
omegak=[0k-k(fix((n-1)2)-11)] 1-by-n
wavelet transform
f=fft(z) 1-by-n complex
wave=zeros(j1+1n) construct empty wave array(j1+1)-by-n matrix of zeros
wave=wave+1iwave make it complex
nomegak=length(omegak)
for a1 = 1j1+1
expnt = -(scale(a1)omegak - k0)^22(omegak gt 0)
norm = sqrt(scale(a1) omegak (2))(pi^(-025))sqrt(nomegak)
sqrt(scale omegak (2)) sqrt(nomegak) = sqrt(scale2pidt)
daughter = normexp(expnt)
daughter = daughter(omegak gt 0)
wave(a1) = ifft(fdaughter)
end
wavelet transform coefficients(j1+1)-by-length(x)
coefs=wave(1length(x))
power=(abs(coefs))^2
transpose=power length(x)-by-(j1+1)
global wavelet power spectrum includes points within coi
Appendix 157
break terminates the execution of a for or while loop
In nested loops break exits only from the loop in which it occurs
returns the index of the maximal period (id_period) outside the coi
for id_period=1j1+1
if (period(id_period)gt=max(coi))id_period=id_period-1 break end
end
global wavelet power spectrum excludes points within coi
for b1=id_period-1 1
if mod(length(x)2) == 0 length(x) is even
valid=fix((max(coi)-period(b1))(max(coi)-period(1))
fix((length(x)+1)2-1))
middle= ceil((length(x)+1)2-1)
low=middle-valid
high=middle+1+valid
global_ws_excoi(b1)=sum(transpose(lowhighb1))(2(valid+1))
else length(x) is odd
valid=fix((max(coi)-period(b1))(max(coi)-period(1))
fix((length(x)+1)2-1))
middle= ceil((length(x)+1)2-1)+1
low=middle-valid
high=middle+valid
global_ws_excoi(b1)=sum(transpose(lowhighb1))(2valid+1)
end
global_ws_excoi(b1)=variance global_ws_excoi(b1)
end
significance test
lag1=072
gamma_factor=232
freq=dtperiod
pk = (1-lag1^2)(1-2lag1cos(freq2pi)+lag1^2)
fft_theor = variancepk include time-series variance
dof=length(x) -scale
dof = 2sqrt(1 + (dofdtgamma_factor scale)^2 )
Appendix
158
Default confidence level 095
chisquare_inv(0952)=59915
signif = fft_theorchisquare_inv(0952)2 signif(1-by(j1+1))
ones(1length(x))returns a 1-by-length(x) matrix of ones
sig95 = (signif)(ones(1length(x)))
sig95 = powersig95 when ratio gt 1 power is significant
significance level for global wavelet spectrum
for a1 = 1j1+1
chisquare = chisquare_inv(095dof(a1))dof(a1)
global_signif(a1)= fft_theor(a1)chisquare 1-by-(j1+1)
end
OUTPUTS
a) Normalized potential fluctuations
b) Frequency spectrum
c) FFT Periodogram
d) Local wavelet power spectrum
e) Global wavelet spectrum
whos
subplot(position[01 080 055 010])
plot(timexk) plot normalized time series
hold on
plot([1 max(time)][0 0]w--) magenta color
hold off
xlabel(Time s)
ylabel(Amplitude)
set(gcaFontSize8)
set(gcaXLim[min(time) max(time)])
text(-01513(a)scFontSize8) marking on the figure
text(xytextsc) adds the text in the quotes text to
location (xy)on the current axes
sc assuming lower left corner is (00) and upper right corner is (11)
set(gcfcolorwhite)
subplot(position[01 060 055 010])
Appendix 159
plot(f1(1n12)mag(1n12)2n1k) plot FFT amplitude vs frequency
The first half of the frequency range (0~Nyquist frequency fs2) is
sufficient to identify the component frequencies in the data
xlabel(Frequency Hz)
ylabel(Amplitude)
set(gcaFontSize8)
set(gcaXLim[f1(1) 2]) set maximal x-axes 2 Hz
text(-01513(b)scFontSize8)
set(gcfcolorwhite)
plot FFT periodogram (plot of power versus frequency)
loglog(xy) logarithmic scale
subplot(position[01 035 055 015])
loglog(f1(1n12)power1(1n12)k)
xlabel(Frequency Hz)
ylabel(FFT PSD)
set(gcaFontSize8)
set(gcaYLim[1E-10 1E5]
YTick[1E-10 1E-5 1E0 1E5])
text(-01512(c)scFontSize8)
set(gcfcolorwhite)
grid on
Contour plot wavelet power spectrum
subplot(position[01 01 055 015])
levels = [00625012502505124816] 1-by-9
Yticks = 2^(fix(log2(min(period)))fix(log2(max(period))))
contour(timelog2(period)log2(power)log2(levels))
xlabel(Time s)
ylabel(Period s)
set(gcaYLimlog2([min(period)max(period)])
YDirreverse
YTicklog2(Yticks())
YTickLabelYticks)
set(gcaFontSize8)
Appendix
160
text(-01512(d)scFontSize8)
set(gcfcolorwhite)
hold on
level at -99 (fake) and 1(5 significance level)
contour(timelog2(period)sig95[-991]k)
hold on
plot(timelog2(coi)k) cone-of-influence
hold off
plot global wavelet spectrum excludes points within the coi
plot([min(global_ws) max(global_ws)][log2(max(coi))
log2(max(coi))]r--)
subplot(position[072 01 015 015])
plot(global_ws_excoilog2(period(1id_period))k)
xlabel(Power)
set(gcaYLimlog2([min(period)max(period)])
YDirreverse
YTicklog2(Yticks())
YTickLabelYticks)
set(gcaXLim[-002max(global_ws_excoi) 12max(global_ws_excoi)])
set(gcaYgridon)
set(gcaFontSize8)
text(-0312(e)scFontSize8)
set(gcfcolorwhite)
hold on
plot significance level
plot(global_signif(1id_period)log2(period(1id_period))r--)
plot(global_signiflog2(period)r--)
hold off
save figure as fig tif
saveas(gcffnamefig)
saveas(gcffnametif)
whos
end of code
Appendix 161
A10 Publications
A101 Journal article
1 R Chen V Trieu H Natter K Stoumlwe WF Maier R Hempelmann A Bulan J
Kintrup R Weber
In-situ supported nanoscale RuxTi1-xO2 on anatase TiO2 with improved electroactivity
Chem Mater 2010 22 6215-6217
A102 Patents
2 R Chen V Trieu H Natter R Hempelmann A Bulan J Kintrup R Weber
Verfahren zur Herstellung von Anodenbeschichtungen fuumlr die Elektrolytische
Chlorherstellung
Deutsches Patent Anmeldetag 28102010
3 R Chen V Trieu H Natter R Hempelmann A Bulan J Kintrup R Weber
Anoden mit erhoumlhtem Anatas-Gehalt fuumlr die elektrolytische Chlorgewinnung
Deutsches Patent Aktenzeichen 10 2010 030 2937 Anmeldetag 21062010
A103 Conference proceedings
4 V Trieu R Chen H Natter R Hempelmann
Ru-based Mixed Oxide Electrodes Prepared by Electrochemical Deposition
Poster Electrochemistry 2010 From Microscopic Understanding to Global Impact
Bochum 13-15092010
5 R Chen V Trieu H Natter R Hempelmann K Stoumlwe W F Maier
Oxide Catalysts for Electrochemical Chlorine Evolution Prepared by Sol-gel Route
Talk Minisymposium From molecules to Materials Saarbruumlcken 10-11092009
Appendix
162
A11 Acknowledgements
The present work was carried out at the Institute of Physical Chemistry at Saarland
University in the period from Sep 2006 to Sep 2010 under the supervision of Prof Dr
Rolf Hempelmann I gratefully acknowledge and thank Prof Hempelmann for providing
me the great opportunity and for showing his enthusiastic support for my Ph D research
work Thanks to Dr Harald Natter for many fruitful discussions Thanks to Mrs Sylvia
Kuhn for showing endless patience for the SEM TEM measurements Thanks to Josef
Wilhelm and Dieter Muumlnch for the help in technical problems
Special thanks to my partner Mr Vinh Trieu who measured electrochemically all of my
Sol-Gel coatings with great passions and burdened me with several GB of the very
precious raw data I am very grateful for his help to screen out the well-pleasing coatings
I would also like to acknowledge Prof Dr Wilhelm F Maier Prof Dr Klaus Stoumlwe and
their research group at the Institute of Technical Chemistry at Saarland University for the
practical help in the sol-gel preparation Thanks to Prof Dr Wilhelm F Maier for kindly
providing the MATLAB software program Thanks to Prof Dr Klaus Stoumlwe for XRD
Rietveld refinement analysis
The Bayer MaterialScience AG (Project lsquolsquoIdentifizierung und Charakterisierung von
Elektrokatalysatoren fuumlr die Chlorherstellungrsquorsquo) and BMBF (Joint project
lsquolsquoEffizienzsteigerung bei der Chlor-Herstellungrsquorsquo FKZ 033R018G) are acknowledged for
financial support for the research projects I would like to acknowledge our industrial
project partners Mr Andreas Bulan Dr Juumlrgen Kintrup Dr Rainer Weber for organizing
the projects and their valuable advice
Finally I would like to gratefully thank my family for their love and support and
especially my wife Shuhua for all her love and patience
Ruiyong Chen
Saarbruumlcken 2010
Appendix 163
A12 References
[1] J Fauvarque The chlorine industry Pure amp Appl Chem 1996 68 1713
[2] TF OBrien TV Bommaraju F Hine Handbook of Chlor-Alkali Technology
Vol 1 Fundamentals Springer New York 2005 p17
[3] H Deacon Improvements in manufacture of chlorine US Patent 165 802 1875
[4] httpworldchlorinecomproductsindexhtml
[5] I Moussallem J Joumlrissen U Kunz S Pinnow T Turek Chlor-alkali electrolysis
with oxygen depolarized cathodes history present status and future prospects J
Appl Electrochem 2008 38 1177
[6] S Trasatti Electrolysis understanding the success of DSA
Electrochim Acta
2000 45 2377
[7] J Kintrup R Weber A Bulan M Weis Energy-efficient chlorine production with
gas diffusion electrodes (ODC) Electrochemistry-Crossing boundaries Oct 2008
Gieszligen Germany
[8] HB Beer Improvements in or relating to electrodes for electrolysis British Patent
1 147 442 1965
[9] HB Beer The invention and industrial development of metal anodes J
Electrochem Soc 1980 127 303C
[10] O De Nora Anwendung maszligbestaumlndiger aktivierter Titan-Anoden bei der
Chloralkali-Elektrolyse (Use of dimensionally stable activated titanium anodes in
alkali-metal chloride electrolysis) Chemie Ingenieur Technik (Chem Eng Technol)
1970 42 222
[11] GRP Malpass RS Neves AJ Motheo A comparative study of commercial and
laboratory-made TiRu03Ti07O2 DSA
electrodes lsquolsquoIn-sitursquorsquo and lsquolsquoex-sitursquorsquo surface
characterization and organic oxidation activity Electrochim Acta 2006 52 936
[12] HA Hansen IC Man F Studt F Abild-Pedersen T Bligaard J Rossmeisl
Electrochemical chlorine evolution at rutile oxide (110) surfaces Phys Chem
Chem Phys 2010 12 283
Appendix
164
[13] S Trasatti WEOrsquoGrady in Advances in Electrochemistry and Electrochemical
Engineering Vol 12 H Gerischer and CW Tobias Editors Wiley New York
1981 p 117
[14] S Trasatti G Lodi Electrodes of conductive metallic oxides Elsevier 1980 pp
301-358
[15] S Trasatti Progress in the understanding of the mechanism of chlorine evolution at
oxide electrodes Electrochim Acta 1987 32 369
[16] TF OBrien TV Bommaraju F Hine Handbook of Chlor-Alkali Technology
Vol 1 Chemistry and Electrochemistry of the Chlor-Alkali Process Springer New
York 2005 p 111
[17] H Over Ruthenium dioxide a fascinating material for atomic scale surface
chemistry Appl Phys A 2002 75 37
[18] V De Nora TT Nguyen Non-carbon anodes with active coatings WO
2005090641 A2 2005
[19] HB Beer Composite catalytic material particularly for electrolysis electrodes and
method of manufacture US Patent 4 585 540 1986
[20] DF Difranco KL Hardee Pd-containing coating for low chlorine overpotential
WO 2006028443 A1 2006
[21] PCS Hayfield Development of the noble metaloxide coated titanium electrode
Part II The move from platinumiridium to ruthenium oxide electrocatalysts
Platinum Metals Rev 1998 42 46
[22] F Herlitz Titanium in the electrochemical industry use and protection Stainless
Steel World 2004 wwwstain-steel-worldnet
[23] T Loučka The reason for the loss of activity of titanium anodes coated with a layer
of RuO2 and TiO2 J Appl Electrochem 1977 7 211
[24] HB Beer Electrode and coating therefore US Patent 3 632 498 1972
[25] J Aromaa O Forseacuten Evaluation of the electrochemical activity of a Ti-RuO2-TiO2
permanent anode Electrochim Acta 2006 51 6104
[26] S Trasatti Electrocatalysis in the anodic evolution of oxygen and chlorine
Electrochim Acta 1984 29 1503
Appendix 165
[27] C Angelinetta S Trasatti LjD Atanasoska ZS Minevski RT Atanasoski
Effect of preparation on the surface and electrocatalytic properties of RuO2+IrO2
mixed oxide electrodes Mater Chem Phys 1989 22 231
[28] SV Evdokimov Electrochemical and corrosion behavior of electrode materials
based on compositions of ruthenium dioxide and based-metal oxides Russ J
Electrochem 2002 38 583
[29] M Aparicio LC Klein Thin and thick RuO2-TiO2 coatings on titanium substrates
by the sol-gel process J Sol-Gel Sci Technol 2004 29 81
[30] V Panić A Dekanski S Milonjić R Atanasoki B Nikolić Influence of the
aging time of RuO2 and TiO2 sols on the electrochemical properties and behavior
for the chlorine evolution reaction of activated titanium anodes obtained by the sol-
gel procedure Electrochim Acta 2000 46 415
[31] LA De Faria JFC Boodts S Trasatti Physico-chemical and electrochemical
characterization of Ru-based ternary oxides containing Ti and Ce Electrochim
Acta 1992 37 2511
[32] KJ OrsquoLeary US Patent 3 776 834 1973
[33] YuE Roginskaya OV Morozova The role of hydrated oxides in formation and
structure of DSA-type oxide electrocatalysts Electrochim Acta 1995 40 817
[34] MHP Santana LM Da Silva LA De Faria Investigation of surface properties
of Ru-based oxide electrodes containing Ti Ce and Nb Electrochim Acta 2003 48
1885
[35] MHP Santana LA De Faria Oxygen and chlorine evolution on
RuO2+TiO2+CeO2+Nb2O5 mixed oxide electrodes Electrochim Acta 2006 51
3578
[36] T Zhang D Tang Y Shao X Ke S You Synthesis and characterization of
nanoscale Ce(x)Ru(1-x)O2 coatings with electrochemical activity J Am Ceram Soc
2007 90 989
[37] TAF Lassali JfC Boodts S Trasatti Electrocatalytic activity of the ternary
oxide Ru03PtxTi(07-x)O2 for chlorine evolution Electrochim Acta 1994 39 1545
[38] CR Davidson JM Sedlak Halogen evolution with improved anode catalyst
WO1981003186 1981
Appendix
166
[39] A De Battisti S Ferro M Dal Colle Electrocatalysis at conductive diamond
modified by noble-metal oxides J Phys Chem B 2001 105 1679
[40] S Ferro A De Battisti Electrocatalysis and chlorine evolution reaction at
ruthenium dioxide deposited on conductive diamond J Phys Chem B 2002 106
2249
[41] JV Ryan AD Berry ML Anderson JW Long RM Stroud VM Cepak VM
Browning DR Rolison CI Merzbacher Electronic connection to the interior of a
mesoporous insulator with nanowires of crystalline RuO2 Nature 2000 406 169
[42] T Arikawa Y Takasu Y Murakami K Asakura Y Iwasawa Characterization of
the structure of RuO2-IrO2Ti electrodes by EXAFS J Phys Chem B 1998 102
3736
[43] LM Doubova S Daolio A De Battisti Examination of RuO2 single-crystal
surfaces charge storage mechanism in H2SO4 aqueous solution J Electroanal
Chem 2002 532 25
[44] WE OrsquoGrady AK Goel FH Pollak HL Park YS Huang Cyclic
voltammetry on RuO2 (100) (101) (001) and (110) lsquolsquoas-grownrsquorsquo single-crystal
surfaces J Electroanal Chem 1983 151 295
[45] E Guerrini V Consonni S Trasatti Surface and electrocatalytic properties of
well-defined and vicinal RuO2 single crystal faces J Solid State Electrochem 2005
9 320
[46] Z Yi C Kangning W Wei J Wang S Lee Effect of IrO2 loading on RuO2-IrO2-
TiO2 anodes A study of microstructure and working life for the chlorine evolution
reaction Ceram Int 2007 33 1087
[47] V Panić A Dekanski S Milonjić VB Mišković-Stanković B Nikolić Activity
and stability of RuO2-coated titanium anodes prepared via the alkoxide route J
Serb Chem Soc 2006 71 1173
[48] AJ Terezo EC Pereira Preparation and characterization of TiRuO2 anodes
obtained by sol-gel and conventional routes Mater Lett 2002 53 339
[49] S Trasatti Physical electrochemistry of ceramic oxides Electrochim Acta 1991
36 225
Appendix 167
[50] SM Hoseinieh F Ashrafizadeh MH Maddahi A comparative investigation of
the corrosion bahavior of RuO2-IrO2-TiO2 coated titanium anodes in chloride
solutions J Electrochem Soc 2010 157 E50
[51] LM Da Silva KC Fernandes LA De Faria JFC Boodts Electrochemical
impedance spectroscopy study during accelerated life test of conductive oxides
Ti(Ru+Ti+Ce)O2-system Electrochim Acta 2004 49 4893
[52] V Panić A Dekanski V Jovanović VD Jović MW Barsoum Ruthenium
oxide based coatings formed on Ti3SiC2 support 57th
Annual Meeting of the
International Society of Electrochemistry Book of Abstracts II Edinburgh UK
2006 p S4-P-19
[53] F Gestermann H-D Pinter G Speer P Fabian R Scannel Electrode for
electrolysis in acid media US Patent 7 211 177 B2 2007
[54] C Gabrielli F Huet R P Nogueira Electrochemical noise measurements of
coalescence and gas-oscillator phenomena on gas-evolving electrodes J
Electrochem Soc 2002 149 E71
[55] F Lugli F Zerbetto An introduction to bubble dynamics Phys Chem Chem
Phys 2007 9 2447
[56] G Liger-Belair M Vignes-Adler C Voisin B Robillard P Jeandet Langmuir
2002 18 1294-1301
[57] R Ettelaie E Dickinson Z Du BS Murray Disproportionation of clustered
protein-stabilized bubbles at planar air-water interfaces J Colloid Interface Sci
2003 263 47
[58] D Kiuchi H Matsushima Y Fukunaka K Kuribayashi Ohmic resistance
measurement of bubble froth layer in water electrolysis under microgravity J
Electrochem Soc 2006 153 E138
[59] J Dukovic CW Tobias Influence of attached bubbles on potential drop and
current distribution at gas-evolving electrodes J Electrochem Soc 1987 134 331
[60] L Cassayre TA Utigard S Bouvet Visualizing gas evolution on graphite and
oxygen-evolving anodes JOM 2002 54 41
[61] P Boissonneau P Byrne Experimental investigation of bubble-induced free
convection in a small electrochemical cell J Appl Electrochem 2000 30 767
Appendix
168
[62] A Legat V Doleček Chaotic analysis of electrochemical noise measured on
stainless steel J Electrochem Soc 1995 142 1851
[63] BM Grafov LS Kanevskii MG Astafiev Noise characterization of surface
processes of the Liorganic electrolyte interface J Appl Electrochem 2005 35
1271
[64] L Kwiatkowski Phosphate coatings porosity Review of new approaches Surface
Engineering 2004 20 292
[65] A Aballe M Bethencourt F J Botana M Marcos Using wavelets transform in
the analysis of electrochemical noise data Electrochim Acta 1999 44 4805
[66] J Livage F Beteille C Roux M Chatry P Davidson Sol-gel synthesis of oxide
materials Acta Mater 1998 46 743
[67] BL Cushing VL Kolesnichenko CJO Connor Recent advances in the liquid-
phase synthesis of inorganic nanoparticles Chem Rev 2004 104 3893
[68] DE Babushkin EP Talsi Formation solution structure and reactivity of
alkylperoxo complexes of titanium J Mol Catal A Chem 2003 200 165
[69] CJ Brinker GW Scherer Sol-Gel science The physics and chemistry of sol-gel
processing Academic Press Inc 1990 p 459
[70] H Kozuka M Kajimura T Hirano K Katayama Crack-free thick ceramic
coating films via non-repetitive dip-coating using polyvinylpyrrolidones as stress-
relaxing agent J Sol-Gel Sci Technol 2000 19 205
[71] H Kozuka M Kajimura Single-step dip coating of crack-free BaTiO3 films gt 1μm
thick effect of poly(vinylpyrrolidone) on critical thickness J Am Ceram Soc
2000 83 1056
[72] JGM van Berkum AC Vermeulen R Delhez TH De Keijser EJ Mittemeijer
Applicabilities of the Warren-Averbach analysis and an alternative analysis for
separation of size and strain broadening J Appl Cryst 1994 27 345
[73] H Savaloni M Gholipour-Shahraki MA Player A comparison of different
methods for X-ray diffraction line broadening analysis of Ti and Ag UHV
deposited thin films nanostructural dependence on substrate temperature and film
thickness J Phys D Appl Phys 2006 39 2231
[74] HR Rietveld Line profiles of neutron powder-diffraction peaks for structure
refinement Acta Cryst 1967 2 151
Appendix 169
[75] AR West Solid state chemistry and its applications John Wiley amp Sons 1984 pp
71-75
[76] E Rasten Electrocatalysis in water electrolysis with solid polymer electrolyte
PhD Dissertation Norwegian University of Science and Technology 2001 p 13
[77] T Ohno K Sarukawa K Tokieda M Matsumura Morphology of a TiO2
photocatalyst (Degussa P-25) consisting of Anatase and rutile crystalline phases J
Catal 2001 203 82
[78] R Loudon The Raman effect in crystals Adv Phys 1964 13 423
[79] OR Camara S Trasatti Surface electrochemical properties of Ti(RuO2+ZrO2)
electrodes Electrochim Acta 1996 41 419
[80] S Ardizzone A Carugati G Lodi S Trasatti Surface structure of ruthenium
dioxide electrodes and kinetics of chlorine evolution J Electrochem Soc 1982
129 1689
[81] F Hine M Yasuda T Yoshida Studies on the oxide-coated metal anodes for
chlor-alkali cells J Electrochem Soc 1977 124 500
[82] LD Burke OJ Murphy JF OrsquoNeill S Venkatesan The oxygen electrode Part
8-Oxygen evolution at ruthenium dioxide anodes J Chem Soc Faraday Trans 1
1977 73 1659
[83] LD Burke OJ Murphy Surface area-voltammetric charge correlation for
RuO2TiO2-based anodes J Electroanal Chem 1980 112 39
[84] RG Hutchinson NA Fleck ACF Cocks A sintering model for thermal barrier
coatings Acta Mater 2006 54 1297
[85] V Panić A Dekanski VB Mišković-Stanković S Milonjić B Nikolić On the
deactivation mechanism of RuO2-TiO2Ti anodes prepared by the sol-gel procedure
J Electroanal Chem 2005 579 67
[86] S Trasatti Oxideaqueous solution interfaces interplay of surface chemistry and
electrocatalysis Mater Chem Phys 1987 16 157
[87] P Simon Y Gogotsi Materials for electrochemical capacitors Nat Mater 2008 7
845
[88] W Sugimoto T Shibutani Y Murakami Y Tkasu Charge storage capabilities of
rutile-type RuO2-VO2 solid solution for electrochemical supercapacitors
Electrochem Solid-State Lett 2002 5 A170
Appendix
170
[89] C-C Hu K-H Chang M-C Lin Y-T Wu Design and tailoring of the
nanotubular arrayed architecture of hydrous RuO2 for next generation
supercapacitors Nano Lett 2006 6 2690
[90] Y-Y Chen T Zhang X Wang Y-Q Shao D Tang Phase structure and
microstructure of a nanoscale TiO2-RuO2-IrO2-Ta2O5 anode coating on titanium J
Am Ceram Soc 2008 91 4154
[91] A Marshall B Boslashrresen G Hagen M Tsypkin R Tunold Preparation and
characterization of nanocrystalline IrxSn1-xO2 electrocatalytic powders Mater
Chem Phys 2005 94 226
[92] S Ardizzone CL Bianchi G Cappelletti M Ionita A Minguzzi S Ronfinini A
Vertova Composite ternary SnO2-IrO2-Ta2O5 oxide electrocatalysts J Electroanal
Chem 2006 589 160
[93] K Macounovaacute M Makarova J Franc J Jirkovskyacute P Krtil Influence of oxygen
on reactivity of Ru1-xFexO2-y-doped materials Electrochem Solid-State Lett 2008
11 F27
[94] C Angelinetta S Trasatti LjD Atanososka RT Atanasoski Surface properties
of RuO2+IrO2 mixed oxide electrodes J Electroanal Chem 1986 214 535
[95] VV Panić A Dekanski SK Milonjić RT Atanasoski BŽ Nikolić RuO2-TiO2
coated titanium anodes obtained by the sol-gel procedure and their electrochemical
behaviour in the chlorine evolution reaction Colloids Surf A 1999 157 269
[96] Y Takasu W Sugimoto Y Nishiki S Nakamatsu Structural analyses of RuO2-
TiO2Ti and IrO2-RuO2-TiO2Ti anodes used in industrial chlor-alkali membrane
processes J Appl Electrochem 2010 DOI 101007s10800-010-0137-3
[97] AA Bolzan C Fong BJ Kennedy CJ Howard Structural studies of rutile-type
metal dioxides Acta Cryst 1997 B53 373
[98] J Gaudet AC Tavares S Trasatti D Guay Physicochemical characterization of
mixed RuO2-SnO2 solid solutions Chem Mater 2005 17 1570
[99] AI Onuchukwu S Trasatti Effect of substitution of SnO2 for TiO2 on the surface
and electrocatalytic properties of RuO2+TiO2 electrodes J Appl Electrochem
1991 21 858
Appendix 171
[100] S Yuan Q Sheng J Zhang H Yamashita D He Synthesis of thermally stable
mesoporous TiO2 and investigation of its photocatalytic activity Micropor
Mesopor Mat 2008 110 501
[101] K Macounovaacute M Makarova J Jirkovskỳ J Franc P Krtil Parallel oxygen and
chlorine evolution on Ru1-xNixO2-y nanostructured electrodes Electrochem Acta
2008 53 6126
[102] Y Takasu S Mizutani M Kumagai S Sawaguchi Y Murakami Ti-V-W-OTi
oxide electrodes as candidates for electrochemical capacitors Electrochem Solid-
State Lett 1999 2 1
[103] K Takahashi Y Wang K Lee G Cao Fabrication and Li+-intercalation
properties of V2O5-TiO2 composite nanorod arrays Appl Phy A 2006 82 27
[104] JR Osman JA Crayston A Pratt DT Richens RuO2-TiO2 mixed oxides
prepared from the hydrolysis of the metal alkoxides Mater Chem Phys 2008 110
256
[105] M Kraumlmer T Schmidt K Stoumlwe WF Maier Structural and catalytic aspects of
sol-gel derived copper manganese oxides as low-temperature CO oxidation catalyst
Appl Catal A 2006 302 257
[106] L Hernaacuten J Morales L Saacutenchez J Santos Use of Li-M-Mn-O [M = Co Cr Ti]
spinels prepared by a sol-gel method as cathodes in high-voltage lithium batteries
Solid State Ionics 1999 118 179
[107] LJQ Maia VR Mastelaro S Pairis AC Hernandes A Ibanez A sol-gel route
for the development of rare-earth aluminium borate nanopowders and transparent
thin films J Solid State Chem 2007 180 611
[108] JM Miller LJ Lakshmi Spectroscopic characterization of sol-gel-derived mixed
oxides J Phys Chem B 1998 102 6465
[109] FR Kogler M Jupa M Puchberger U Schubert Control of the ratio of
functional and non-functional ligands in clusters of the type
Zr6O4(OH)4(carboxylate)12 for their use as building blocks for inorganic-organic
hybrid polymers J Mater Chem 2004 14 3133
[110] H Over YD Kim AP Seitsonen S Wendt E Lundgren M Schmid P Varga
A Morgante G Ertl Atomic-scale structure and catalytic reactivity of the
RuO2(110) surface Science 2000 287 1474
Appendix
172
[111] E Haumlrk K Lust A Jaumlnes E Lust Electrochemical impedance study of hydrogen
evolution on Bi(001) electrode in the HClO4 aqueous solutions J Solid State
Electrochem 2009 13 745
[112] LK Xu JD Scantlebury Microstructure and electrochemical properties of IrO2-
Ta2O5 coated titanium anodes J Electrochem Soc 2003 150 B254
[113] R Lin PL Taberna J Chmiola D Guay Y Gogotsi P Simon Microelectrode
study of pore size ion size and solvent effects on the chargedischarge behaviour
of microporous carbons for electrical double-layer capacitors J Electrochem Soc
2009 156 A7
[114] PM Biesheuvel MZ Bazant Nonlinear dynamics of capacitive charging and
desalination by porous electrodes Phys Rev E 2010 81 031502
[115] T Ohkubo T Konishi Y Hattori H Kanoh T Fujikawa K Kaneko Restricted
hydration structures of Rb and Br ions confined in slit-shaped carbon nanospace J
Am Chem Soc 2002 124 11860
[116] J Huang BG Sumpter V Meunier Theoretical model for nanoporous carbon
supercapacitors Angew Chem Int Ed 2008 47 520
[117] E Barsoukov JR Macdonald Impedance spectroscopy Theory experiment and
applications (second Edition) John Wiley amp Sons Inc 2005 p 75
[118] J Bisquert M Graumltzel Q Wang F Fabregat-Santiago Three-channel
transmission line impedance model for mesoscopic oxide electrodes functionalized
with a conductive coating J Phys Chem B 2006 110 11284
[119] F Fabregat-Santiago EM Barea J Bisquert GK Mor K Shankar CA Grimes
High carrier density and capacitance in TiO2 nanotube arrays induced by
electrochemical doping J Am Chem Soc 2008 130 11312
[120] J Lim JD Whitcomb JG Boyd J Varghese Effect of electrode pore geometry
modelled using Nerst-Planck-Poisson-modified stern layer model Comput Mech
2009 43 461
[121] L Bai L Gao BE Conway Problem of in situ real-area determination in
evaluation of performance of rough or porous gas-evolving electrocatalysts Part
1-Basis for distinction between capacitance of the double layer and the
pseudocapacitance due to adsorbed H in the H2 evolution reaction at Pt J Chem
Soc Faraday Trans 1993 89 235
Appendix 173
[122] JC Myland KB Oldham Which of three voltammetric methods when applied to
a reversible electrode reaction can best cope with double-layer capacitance and
severe uncompensated resistance Anal Chem 2000 72 3210
[123] V Lazarov D Stoychev Method for determination of the kinetic parameters in
electrolytes containing surface-active substances accounting for the influence of
electrode potential on the changes of the free electrode surface Electroanalysis
2004 16 211
[124] D Galizzioli F Tantardini S Trasatti Ruthenium dioxide a new electrode
material I Behaviour in acid solutions of inert electrolytes J Appl Electrochem
1974 4 57
[125] N Munichandraiah S Sathyanayana Insoluble anode of porous lead dioxide for
electrosynthesis preparation and characterization J Appl Electrochem 1987 17
22
[126] M van Soestbergen PM Biesheuvel MZ Bazant Diffuse-charge effects on the
transient response of electrochemical cells Phys Rev E 2010 81 021503
[127] R Liu J Duay T Lane SB Lee Synthesis and characterization of
RuO2poly(34-ethylenedioxythiophene) composite nanotubes for supercapacitors
Phys Chem Chem Phys 2010 12 4309
[128] MT Colomer MJ Velasco JR Jurado Synthesis and thermal evolution of TiO2-
RuO2 xerogels J Sol-Gel Sci Technol 2006 39 211
[129] J Maacutelek A Watanabe T Mitsuhashi Sol-gel preparation of rutile type solid
solution in TiO2-RuO2 system J Therm Anal Cal 2000 60 699
[130] PH Duvigneaud A Coussement Effect of chlorine on solid solution formation in
ruthenium titanium dioxide coatings J Solid State Chem 1984 52 22
[131] F Hine M Yasuda T Yoshida Studies on the oxide-coated metal anodes for
chlorine-alkali cells J Electrochem Soc 1977 124 500
[132] J Muscat V Swamy NM Harrison First-principles calculations of the phase
stability of TiO2 Phys Rev B 2002 65 224112
[133] F Dachille PY Simons R Roy Pressure-temperature studies of anatase brookite
rutile and TiO2-II American Mineralogist 1968 53 1929
Appendix
174
[134] JF Banfield DR Veblen Conversion of perovskite to anatase and TiO2 (B) a
TEM study and the use of fundamental building blocks for understanding
relationships among the TiO2 minerals American Mineralogist 1992 77 545
[135] AR West Solid state chemistry and its applications John Wiley amp Sons 1984 p
445
[136] M Rajamathi R Seshadri Oxide and chalcogenide nanoparticles from
hydrothermalsolvothermal reactions Curr Opin Solid State Mater 2002 6 337
[137] J Cho J-K Jeon Optimization study on the azeotropic distillation process for
isopropyl alcohol dehydration Korean J Chem Eng 2006 23 1
[138] M Wu G Lin D Chen G Wang D He S Feng R Xu Sol-hydrothermal
synthesis and hydrothermally structural evolution of nanocrystal titanium dioxide
Chem Mater 2002 14 1974
[139] G Demazeau Solvothermal reactions an original route for the synthesis of novel
materials J Mater Sci 2008 43 2104
[140] G Li L Li J Boerio-Goates BF Woodfield High purity anatase TiO2
nanocrystals Near room-temperature synthesis grain growth kinetics and surface
hydration chemistry J Am Chem Soc 2005 127 8659
[141] LM Bronstein X Huang J Retrum A Schmucker M Pink BD Stein B
Dragnea Influence of iron oleate complex structure on iron oxide nanoparticle
formation Chem Mater 2007 19 3624
[142] httpwwwelectrochemorgdlma206pdfs1540pdf
[143] I Shaltout Crystallization kinetics and structure of (TeO2-TiO2-Fe2O3) glasses J
Mater Sci 2000 35 323
[144] MM Oliveira DC Schnitzler AJG Zarbin (TiSn)O2 mixed oxides
nanoparticles obtained by the sol-gel route Chem Mater 2003 15 1903
[145] V Swamy Size-dependent modifications of the first-order Raman spectra of
nanostructured rutile TiO2 Phys Rev B 2008 77 195414
[146] M Ocantildea V Forneacutes JV Garciacutea Ramos CJ Serna Factors affecting the infrared
and Raman spectra of rutile powders J Solid State Chem 1988 75 364
[147] H Liu W Yang Y Ma Y Cao J Yao J Zhang T Hu Synthesis and
characterization of titania prepared by using a photoassisted sol-gel method
Langmuir 2003 19 3001
Appendix 175
[148] L Vegard Die Konstitution der Mischkristalle und die Raumfuumlllung der Atome Z
Phys 1921 5 17
[149] H Nakano N Hasuike K Kisoda K Nishio T Isshiki H Harima Synthesis of
TiO2 nanocrystals controlled by means of the size of magnetic elements and the
level of doping with them J Phys Condens Matter 2009 21 064214
[150] AV Korotcov Y-S Huang K-K Tiong D-S Tsai Raman scattering
characterization of well-aligned RuO2 and IrO2 nanocrystals Raman Spectrosc
2007 38 737
[151] MT Colomer MJ Velasco Rutile-type dense ceramics fabricated by pressureless
sitering of Ti1-xRuxO2 powders prepared by sol-gel J Eur Ceram Soc 2007 27
2369
[152] BL Cushing VL Kolesnichenko CJ OrsquoConnor Recent advances in the liquid-
phase synthesis of inorganic nanoparticles Chem Rev 2004 104 3893
[153] AS Barnard L A Curtiss Prediction of TiO2 nanoparticle phase and shape
transitions controlled by surface chemistry Nano Lett 2005 5 1261
[154] SC Pillai P Periyat R George DE McCormack MK Seery H Hayden J
Colreavy D Corr SJ Hinder Synthesis of high-temperature stable anatase TiO2
photocatalyst J Phys Chem C 2007 111 1605
[155] YuG Chirkov VI Rostokin Gas-generating porous electrodes Effect of the
porous space structure on polarization curves Russ J Electrochem 2001 37 353
[156] D Kiuchi H Matsushima Y Fukunaka K Kuribayashi Ohmic resistance
measurements of bubble froth layer in water electrolysis under microgravity J
Electrochem Soc 2006 153 E138
[157] C Gabrielli F Huet RP Nogueira Electrochemical noise measurements of
coalescence and gas-oscillator phenomena on gas-evolving electrodes J
Electrochem Soc 2002 149 E71
[158] L Zhang Y Zhang X Zhang Z Li G Shen M Ye C Fan H Fang J Hu
Electrochemically controlled formation and growth of hydrogen nanobubbles
Langmuir 2006 22 8109
[159] M Boinet D Marlot JC Lenain S Maximovitch F Dalard RP Nogueira First
results from coupled acousto-ultrasonics and electrochemical noise technique
applied to gas evolving electrodes Electrochem Commun 2007 9 2174
Appendix
176
[160] C Gabrielli F Huet M Keddam Real-time measurement of electrolyte resistance
fluctuations J Electrochem Soc 1991 138 L82
[161] DR Hodgson Application of electrochemical noise and in situ microscopy to the
study of bubble evolution on chlorine evolving anodes Electrochim Acta 1996 41
605
[162] C Gabrielli F Huet M Keddam A Sahar Investigation of water electrolysis by
spectral analysis I Influence of the current density J Appl Electrochem 1989 19
683
[163] H Vogt Contribution to the interpretation of the anode effect Electrochim Acta
1997 42 2695
[164] F Huet M Musiani RP Nogueira Electrochemical noise analysis of O2 evolution
on PbO2 and PbO2-matrix composites containing Co or Ru oxides Electrochim
Acta 2003 48 3981
[165] F Huet M Musiani RP Nogueira Oxygen evolution on electrodes of different
roughness An electrochemical noise study J Solid State Electrochem 2004 8
786
[166] A Maksumov R Vidu A Palazoglu P Stroeve Enhanced feature analysis using
wavelets for scanning probe microscopy images of surfaces J Colloid Interface
Sci 2004 272 365
[167] X-G Shao AK-M Leung F-T Chau Wavelet A new trend in chemistry Acc
Chem Res 2003 36 276
[168] I Simonovski M Boltežar The norms and variances of the Gabor Morlet and
general harmonic wavelet functions J Sound Vib 2003 264 545
[169] C Torrence GP Compo A practical guide to wavelet analysis Bull Am
Meteorol Soc 1998 79 61
[170] B Cazelles M Chavez GC De Magny J-F Gueacutegan S Hales Time-depedent
spectral analysis of epidemiological time-series with wavelets J R Soc Interface
2007 4 625
[171] R Buumlssow An algorithm for the continous Morlet wavelet transform Mech Syst
Signal Pr 2007 21 2970
[172] P Lachowicz Wavelet analysis a new significance test for signals dominated by
intrinsic red-noise variability arXiv09064176v1 [astro-phHE]
Appendix 177
[173] DS Bloomfield RTJ McAteer M Mathioudakis DR Williams FP Keenan
Propagating waves and magnetohydrodynamic mode coupling in the quiet-sun
network Astrophys J 2004 604 936
[174] JM Silva RP Nogueira L De Miranda F Huet Hydrogen absorption estimation
on Pd electrodes from electrochemical noise measurements in single-compartment
cells J Electrochem Soc 2001 148 E241
[175] D Schoumlnfuss L Muumlller On the current-potential curve of a very fast hydrogen
evolution process up to high current densities Electrochim Acta 1994 39 2097
[176] H Vogt Ouml Aras RJ Balzer The limits of the analogy between boiling and gas
evolution at electrodes Int J Heat Mass Transfer 2004 47 787
[177] SD Lubetkin The fundamentals of bubble evolution Chem Soc Rev 1995 24
243


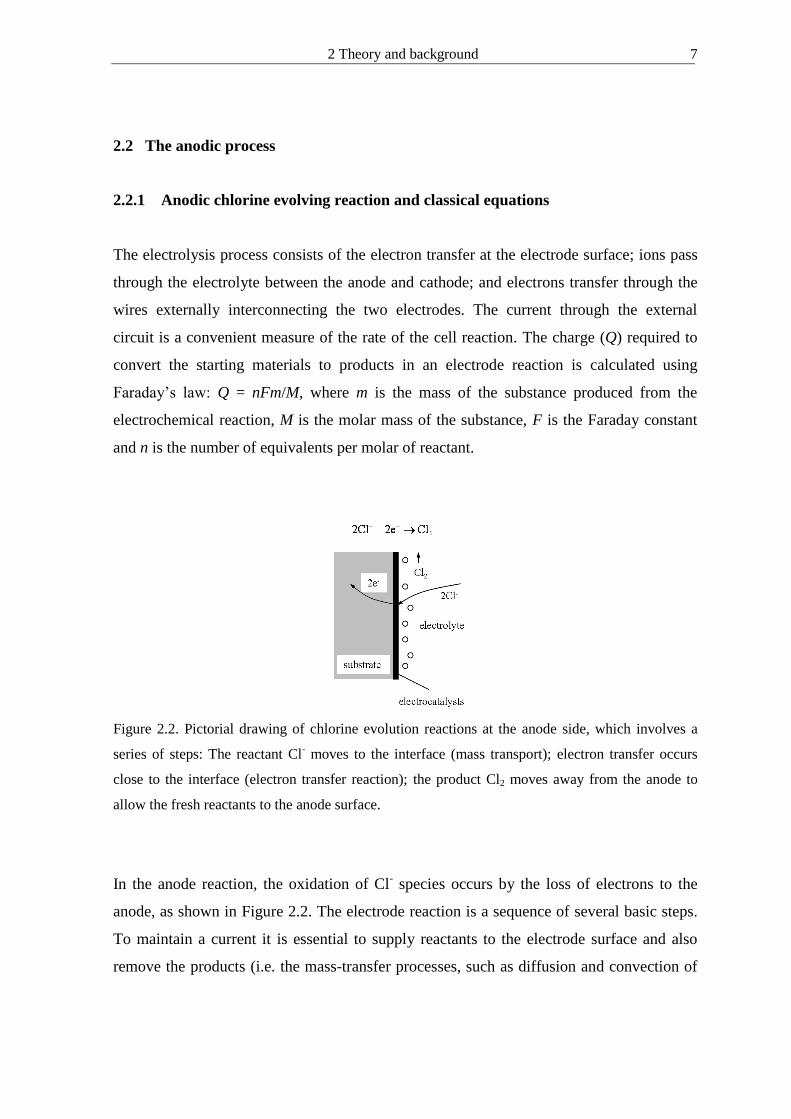
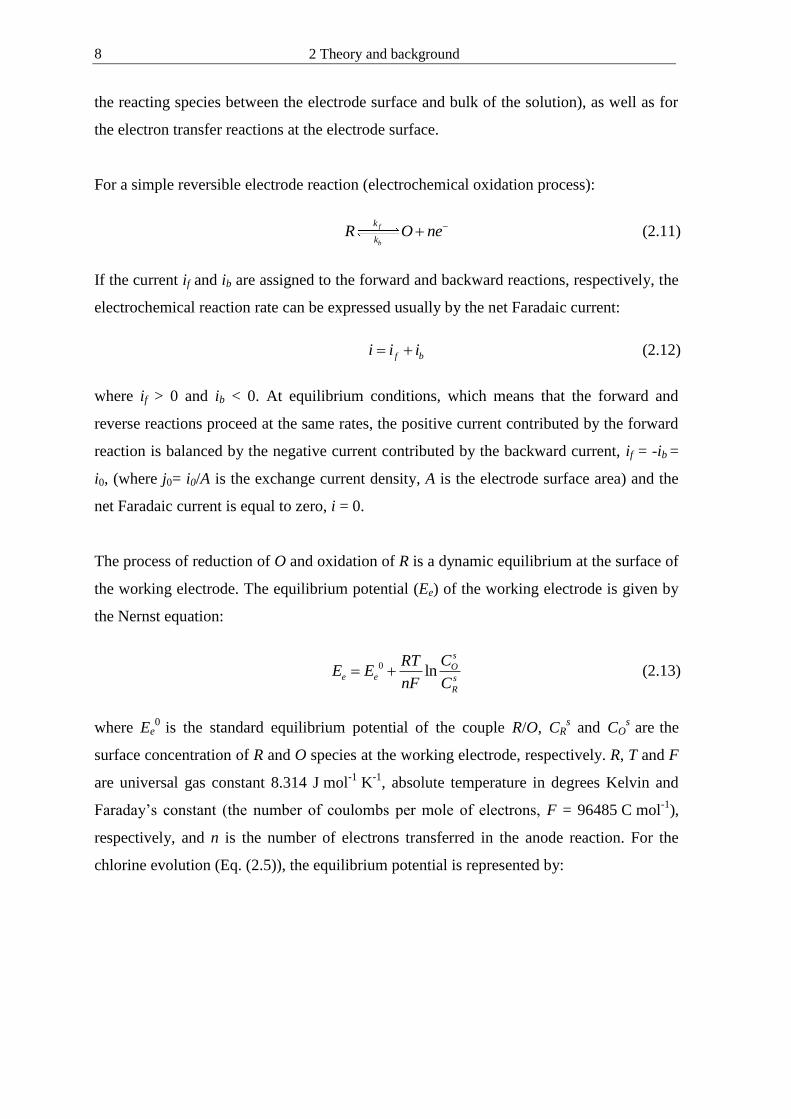


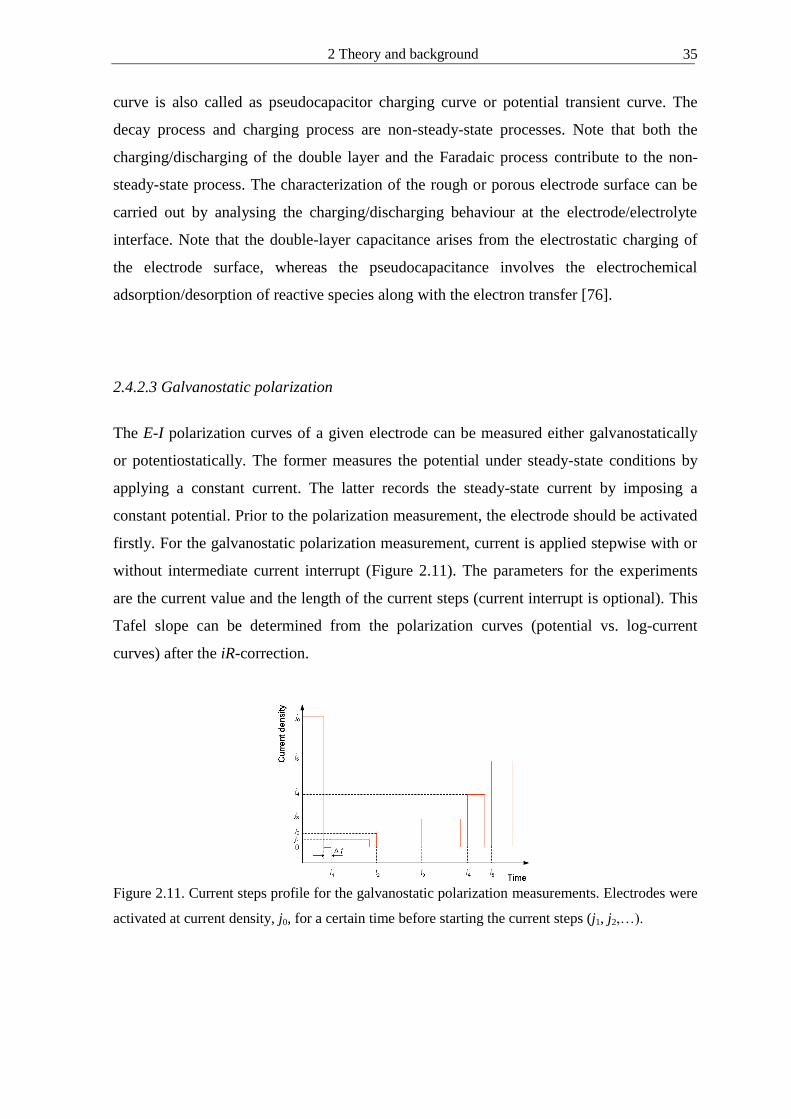


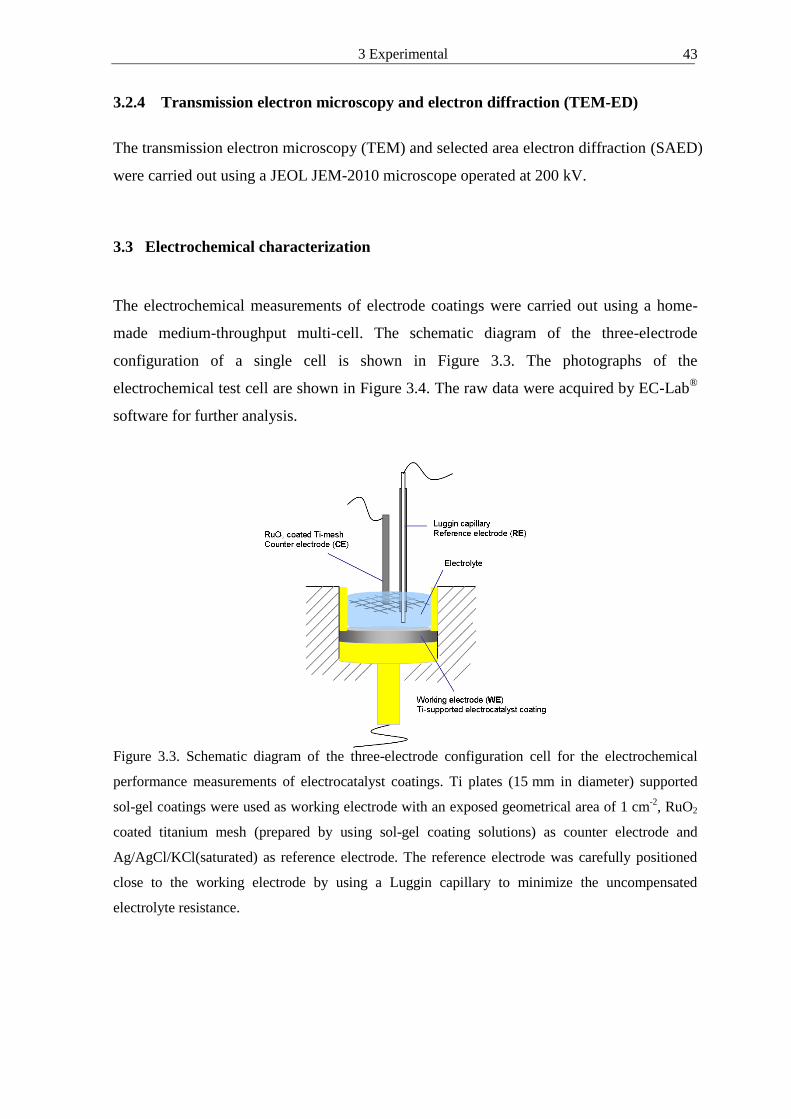


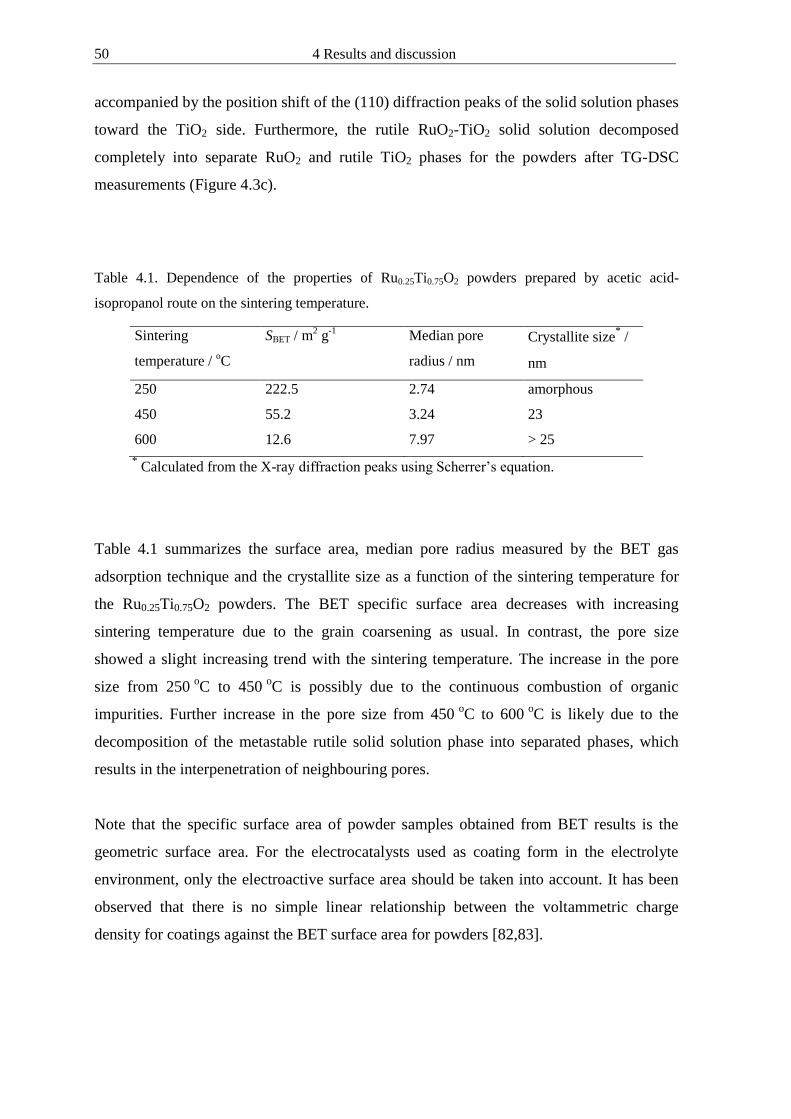


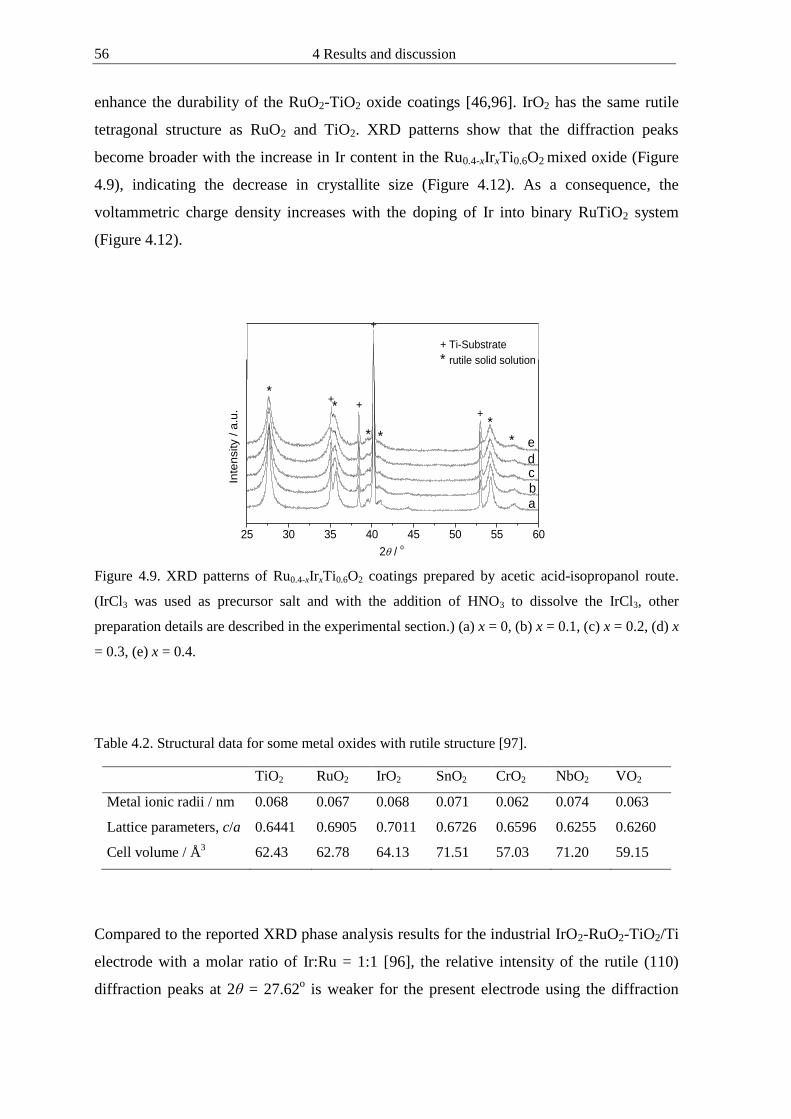


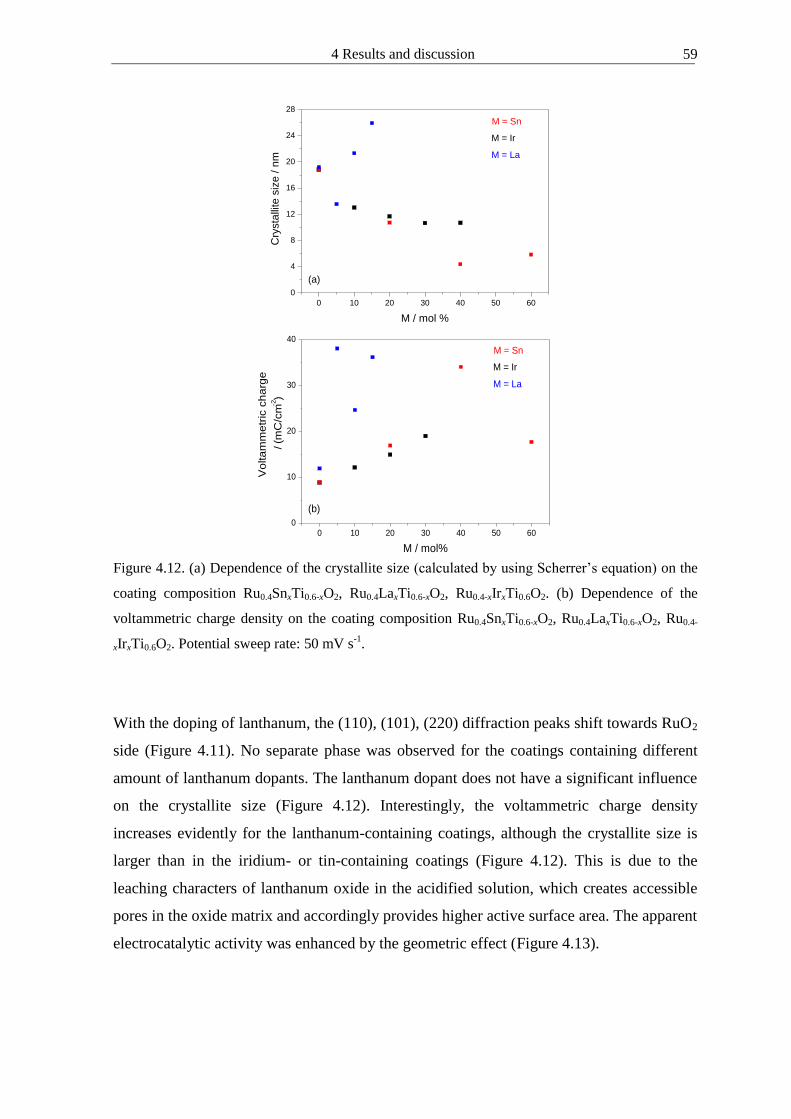

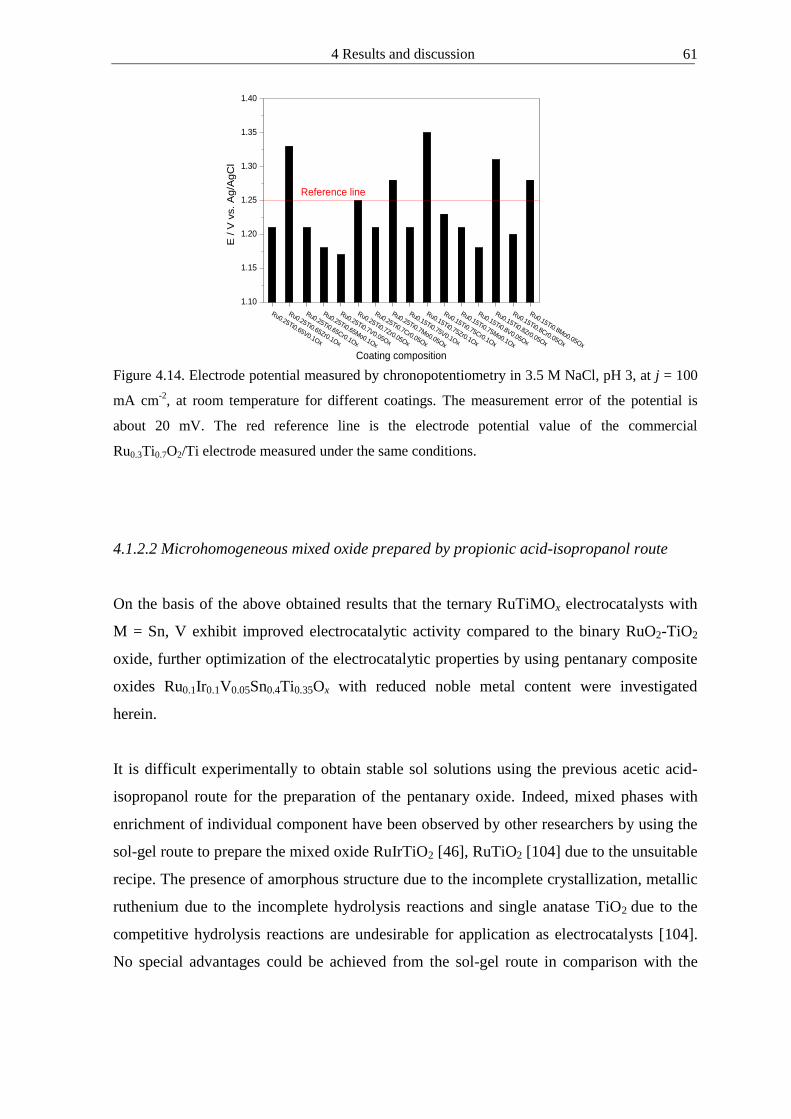
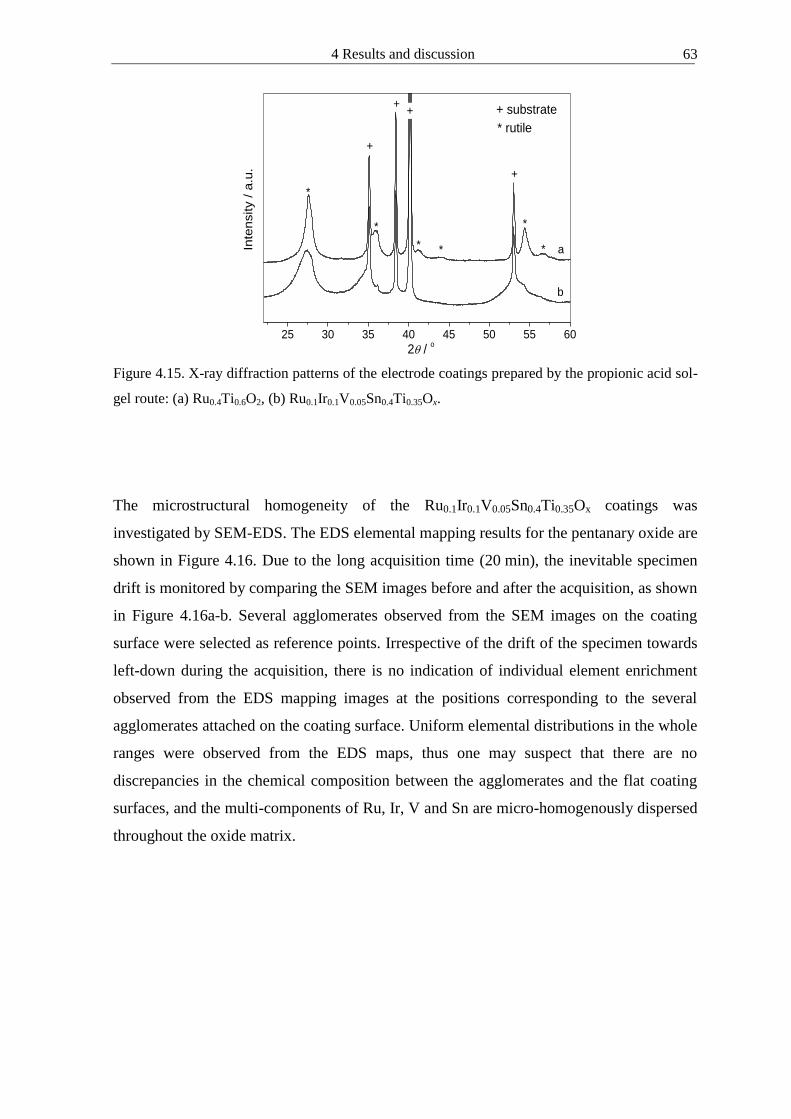


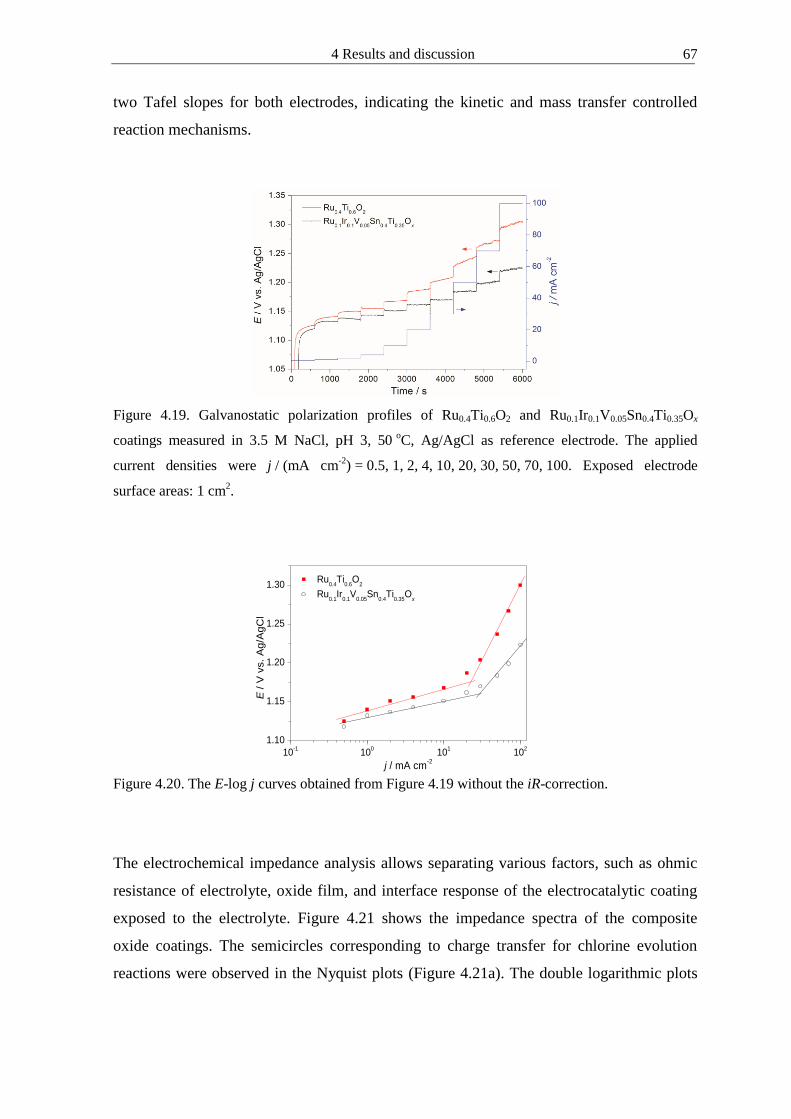
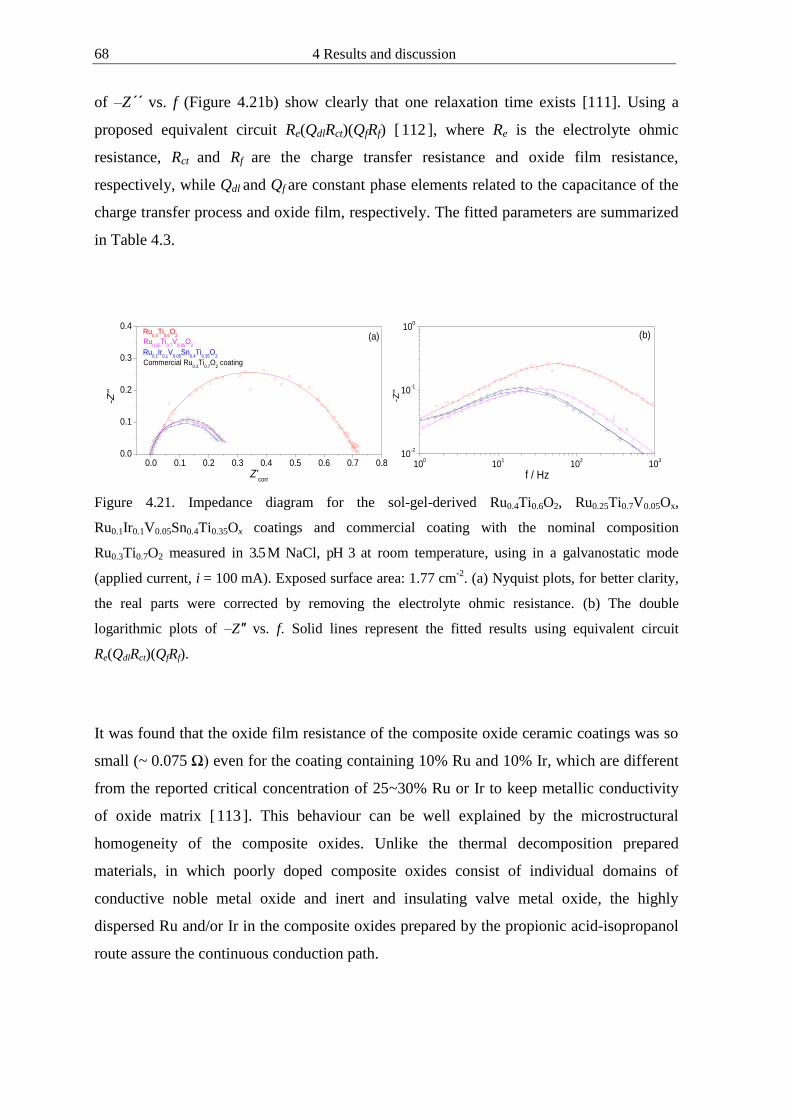
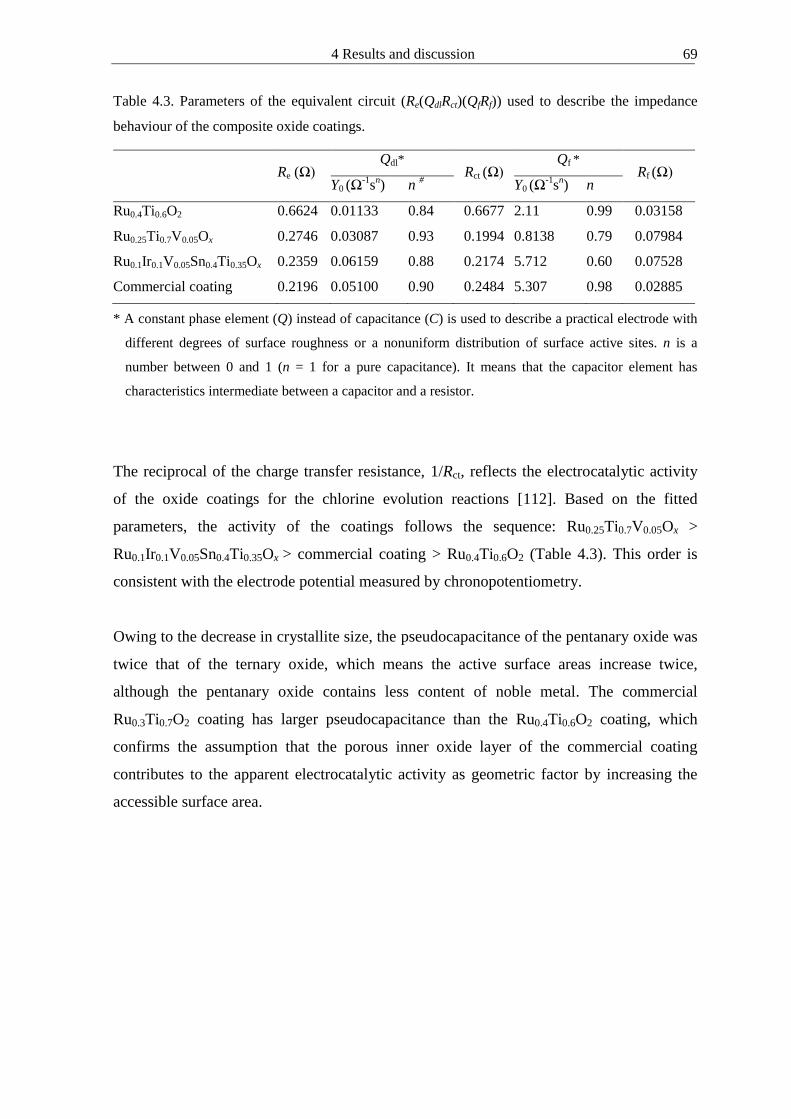
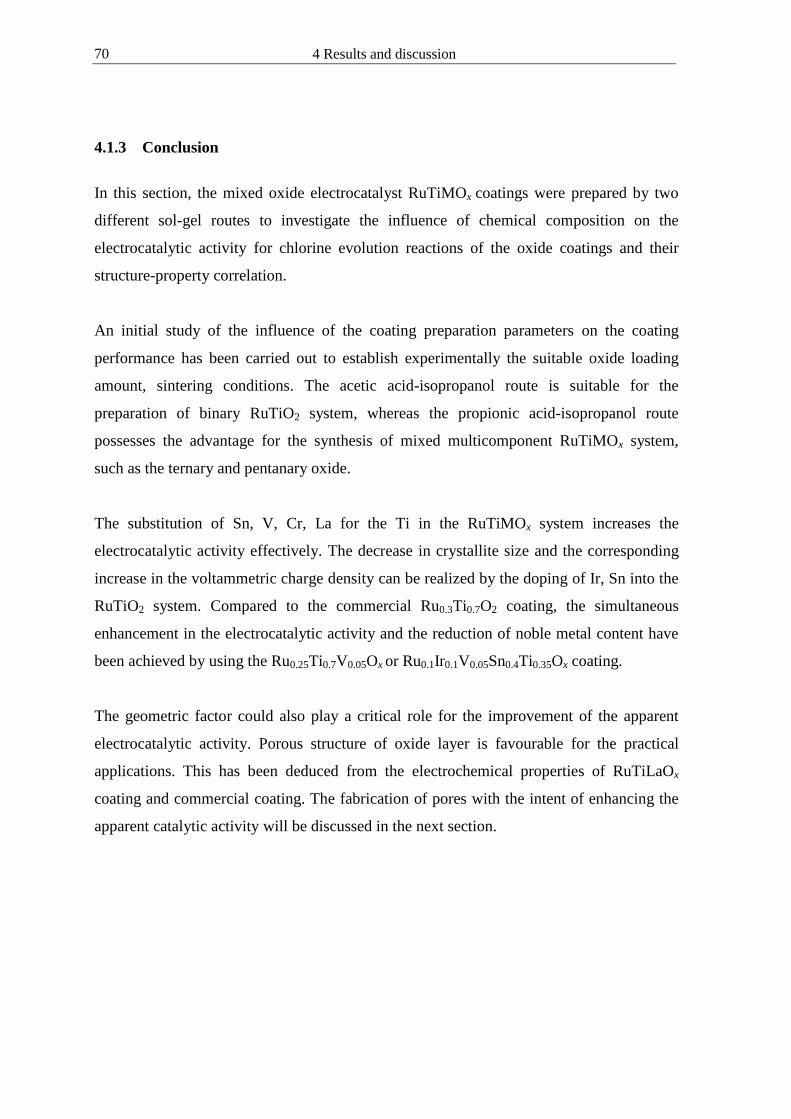


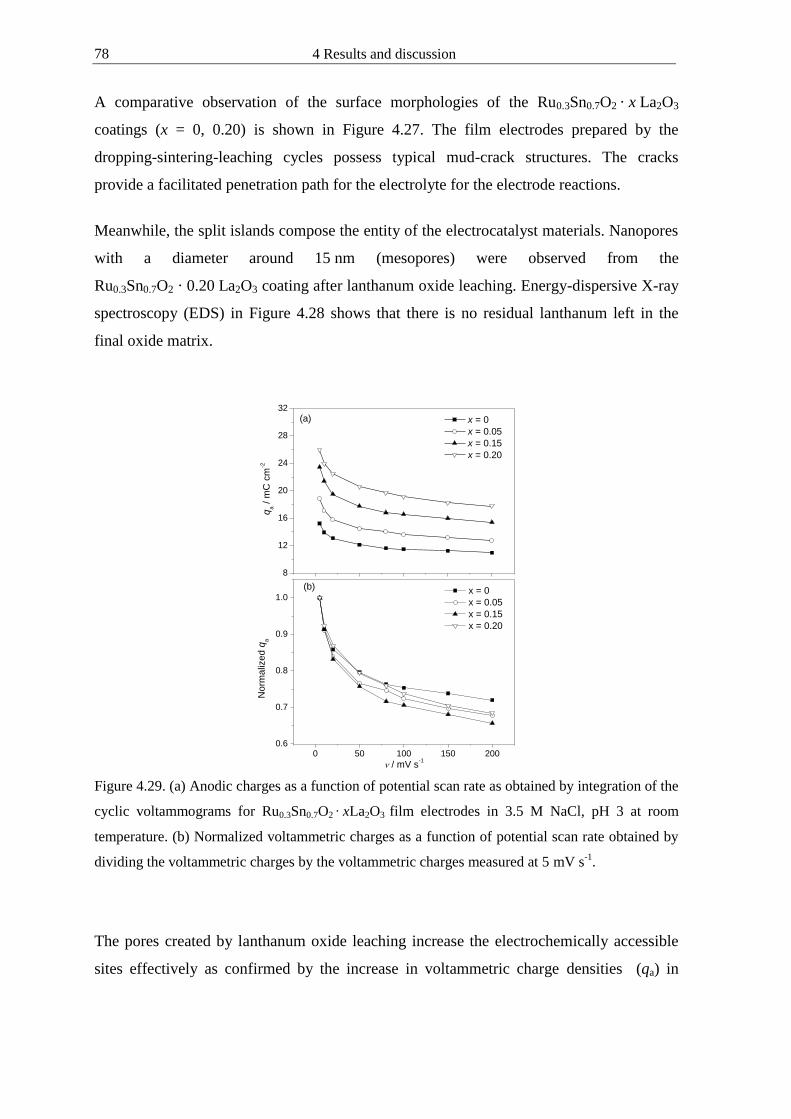


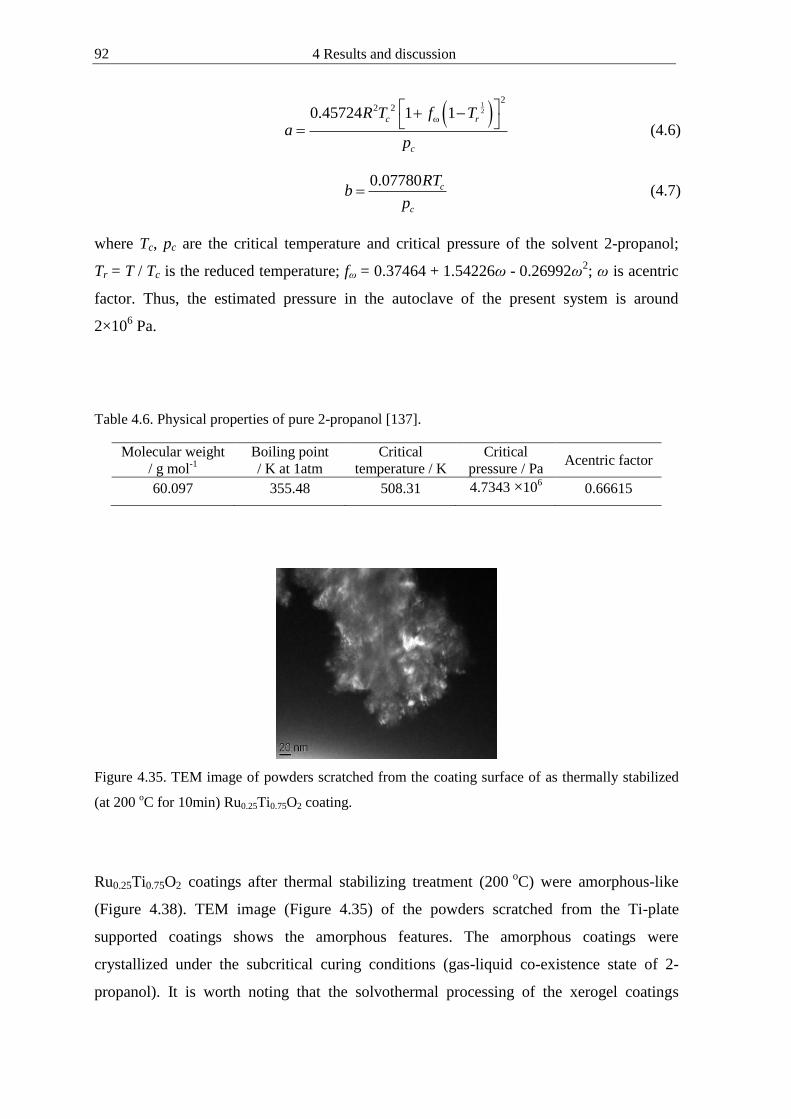


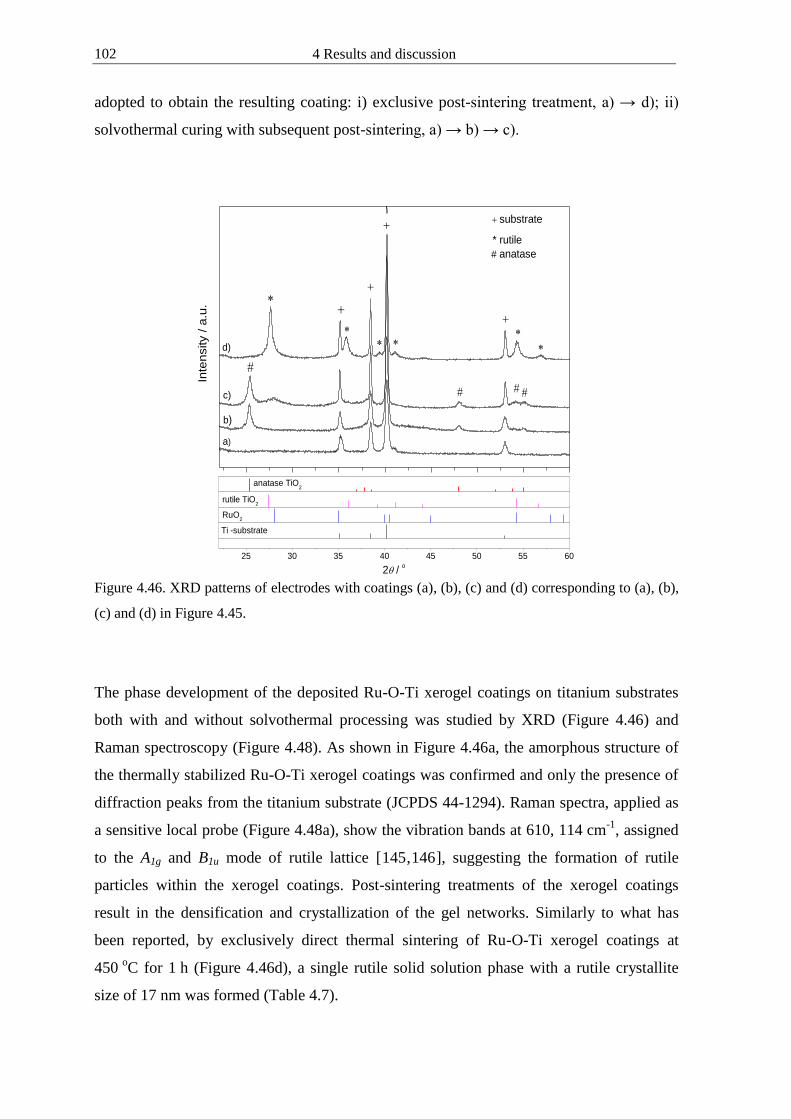
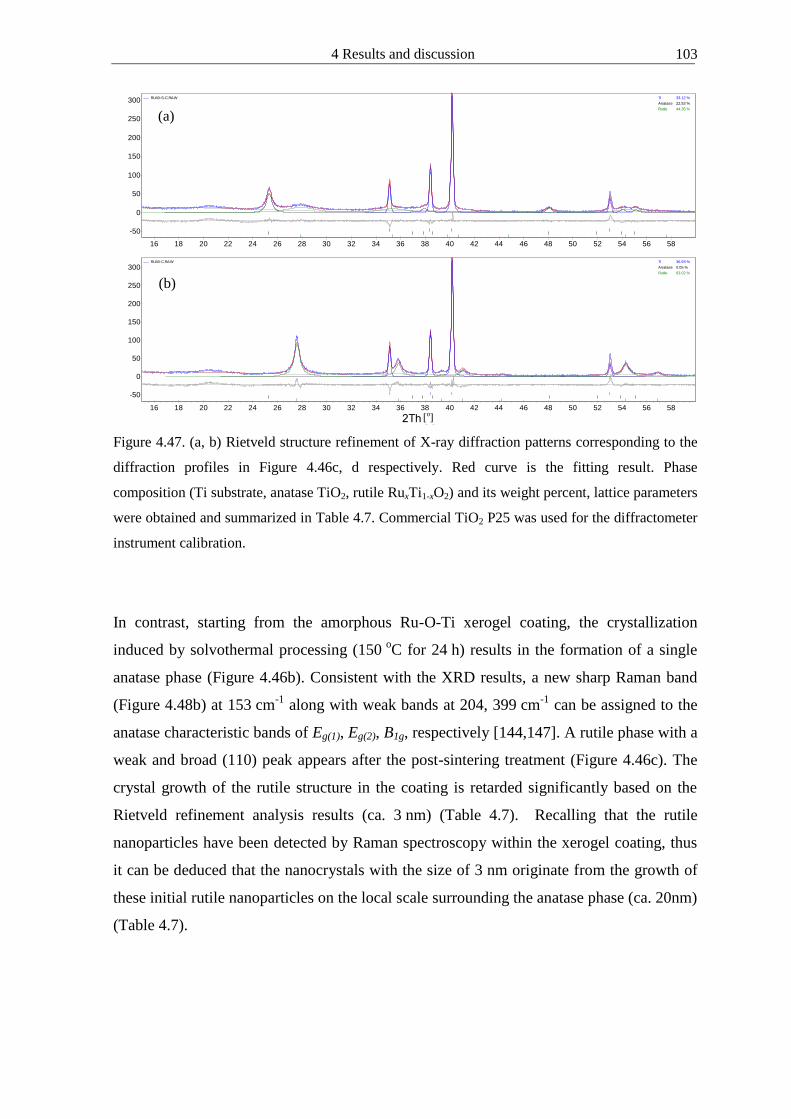


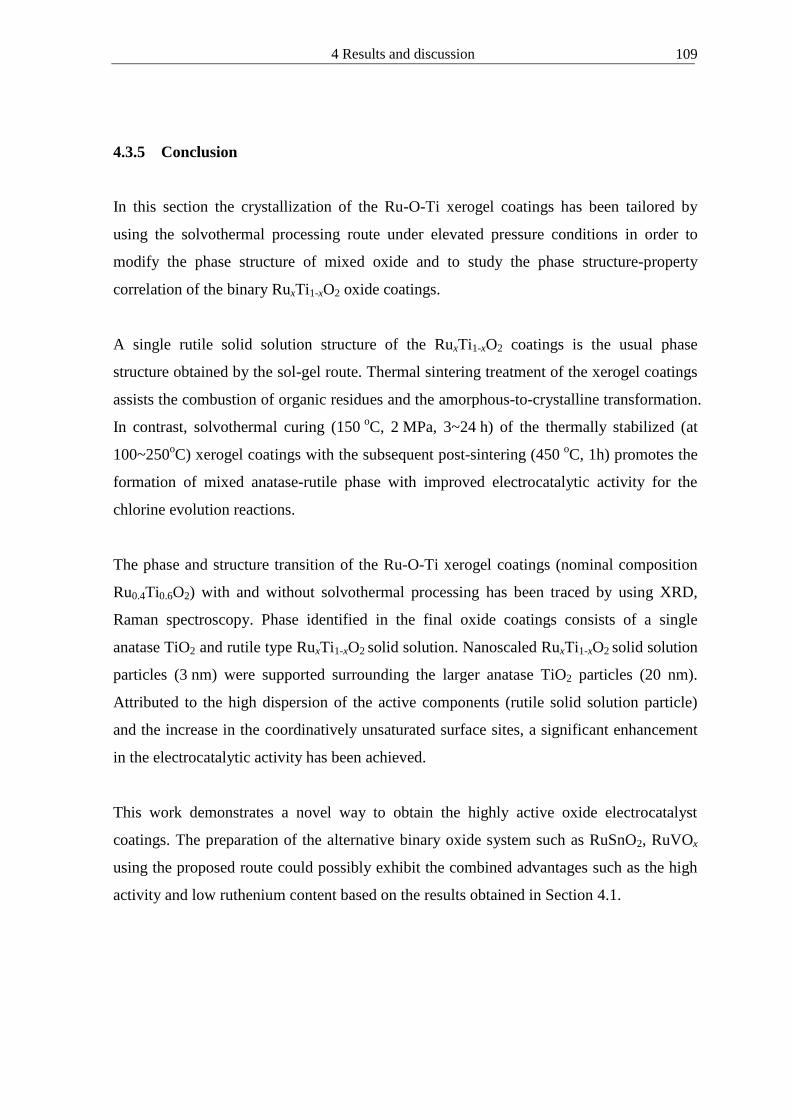


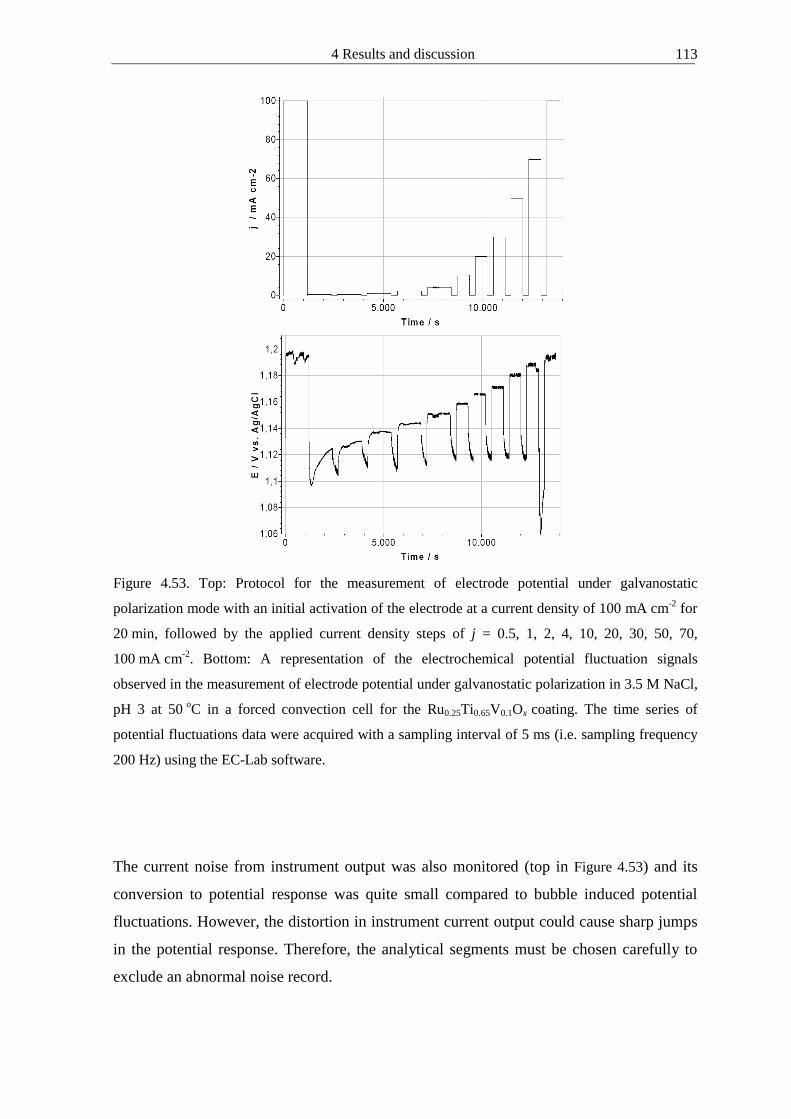
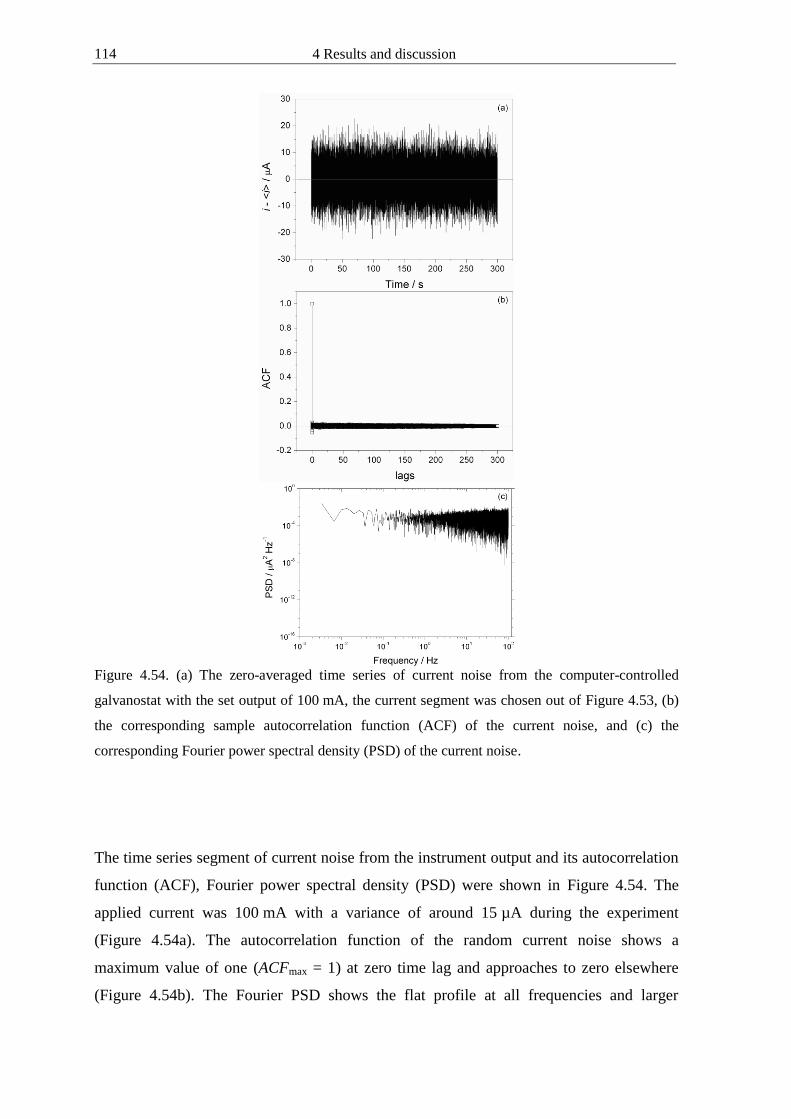

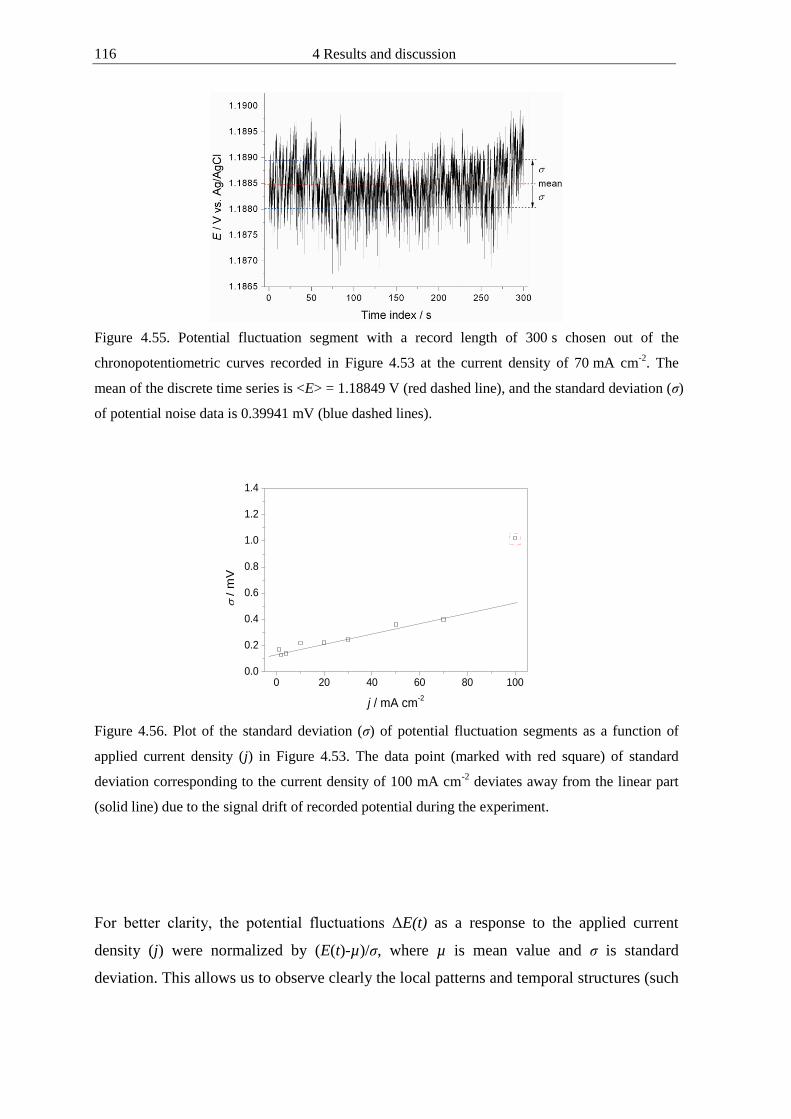


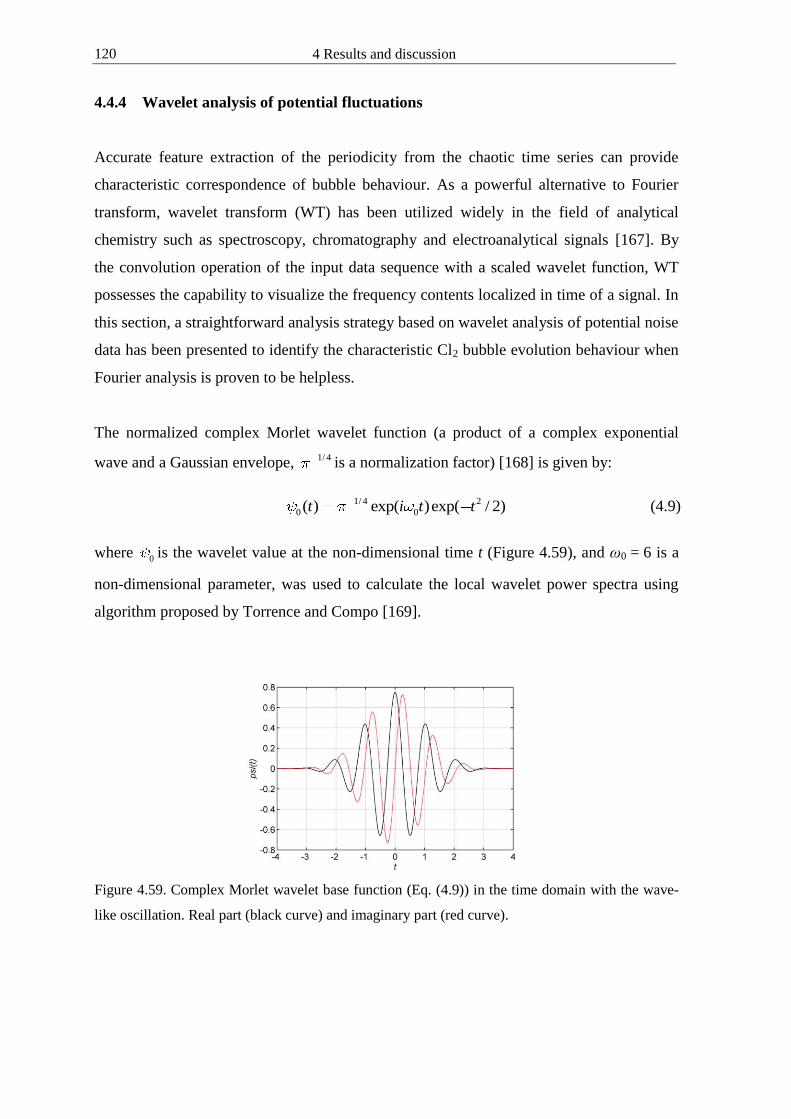


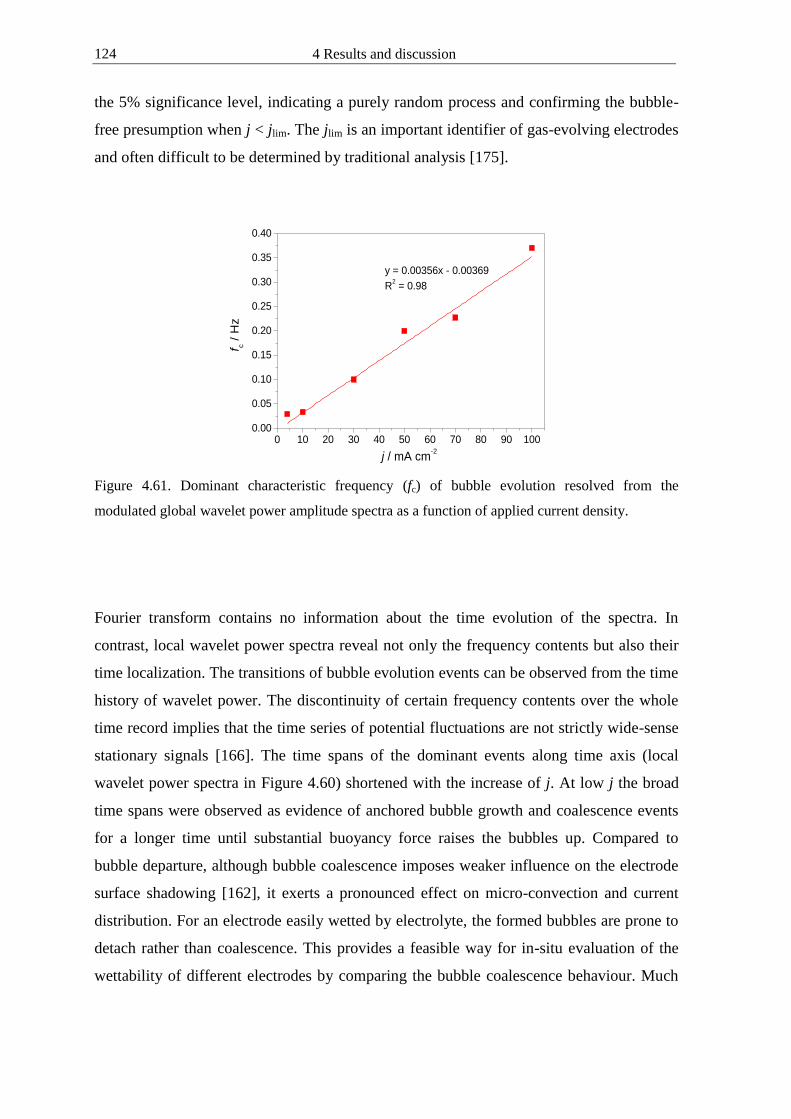


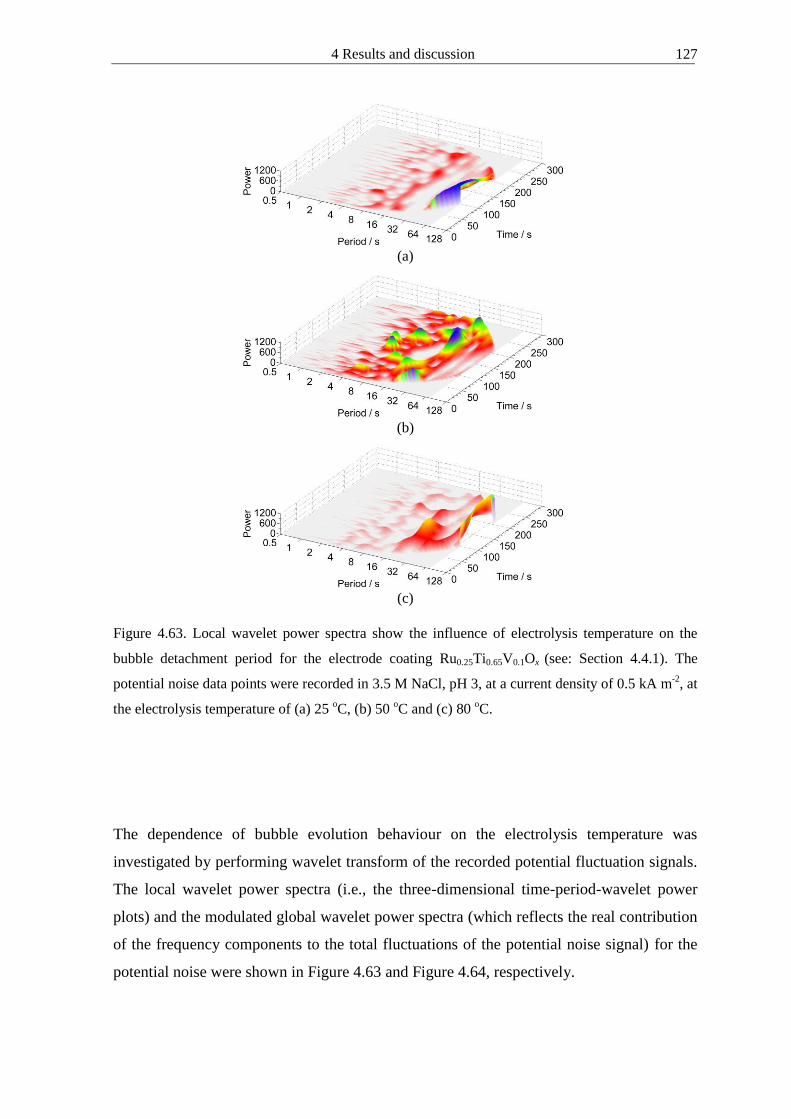


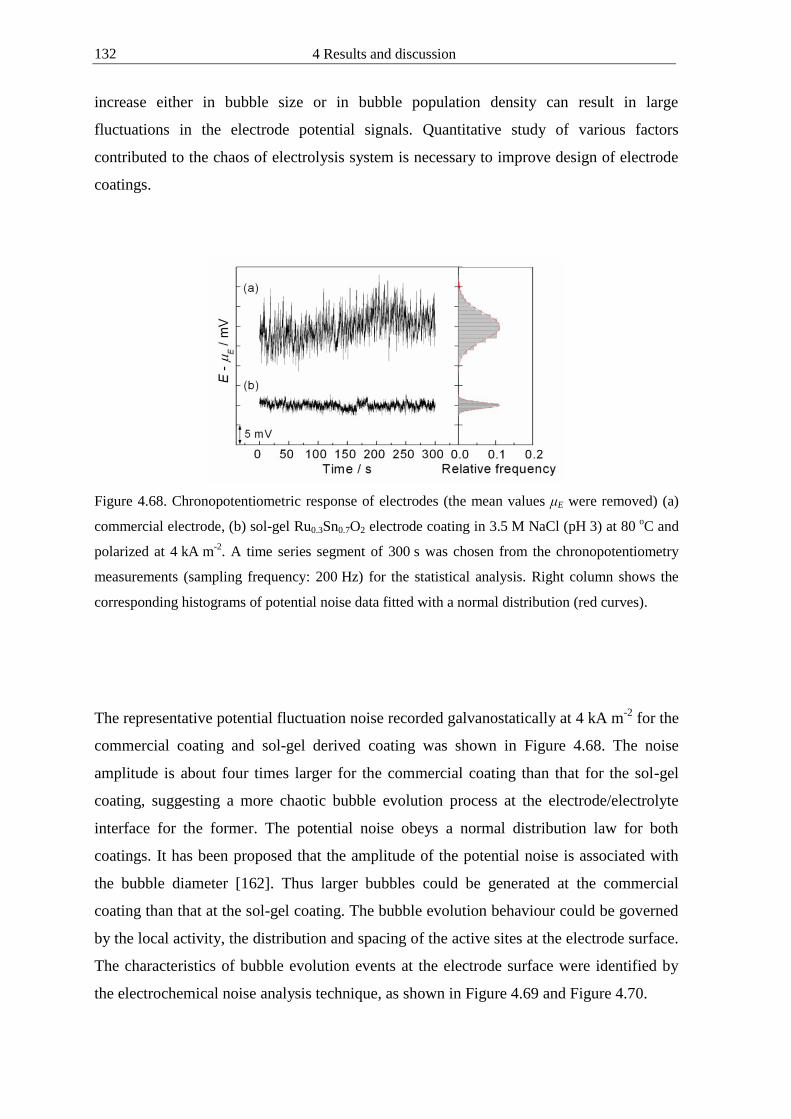


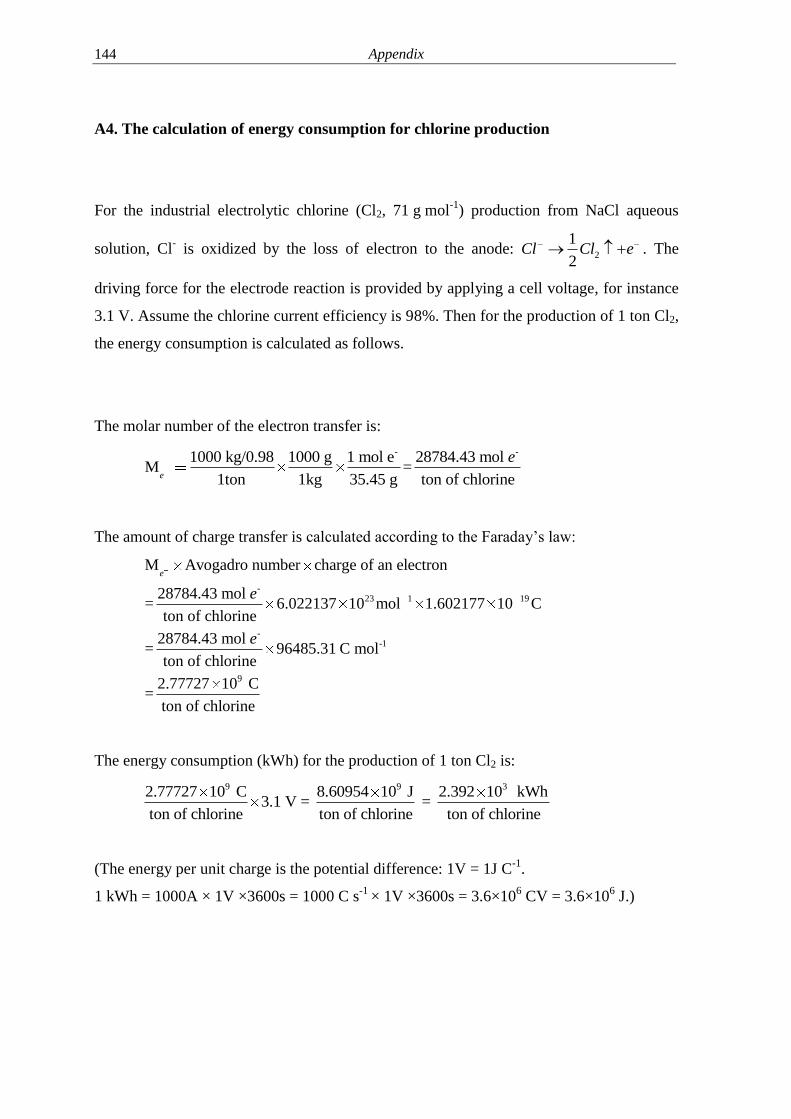


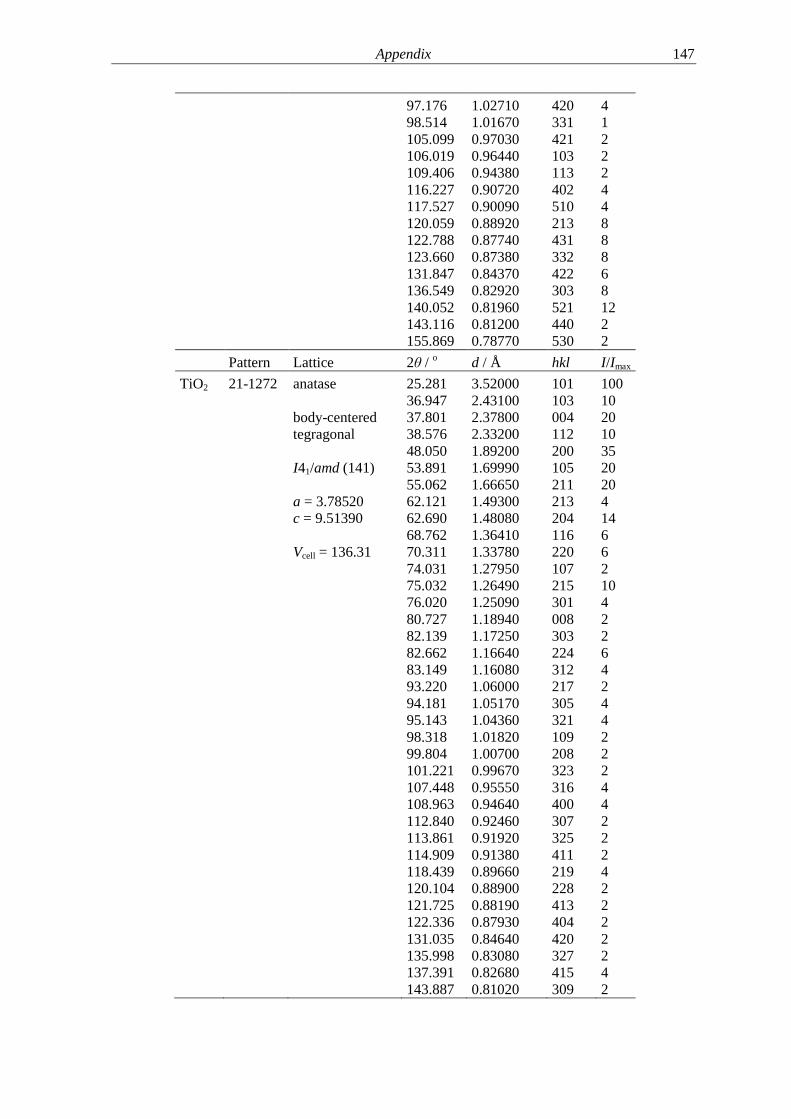

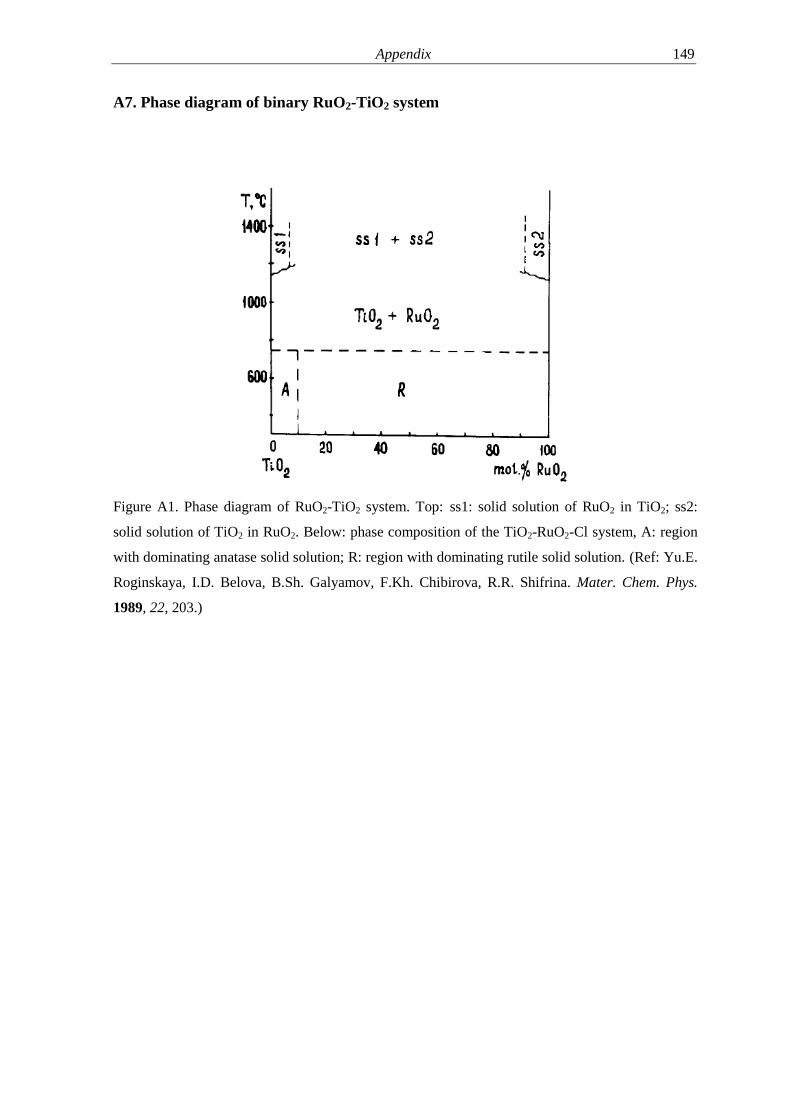


![Electrochemical miRNA Biosensors: The Benefits of ...€¦ · electrochemical nanobiosensors [6, 7]. The electrochemical nanobiosensors are pulling together the advantages of electrochemical](https://static.fdokument.com/doc/165x107/5f5dab2fa5702b13b4580399/electrochemical-mirna-biosensors-the-benefits-of-electrochemical-nanobiosensors.jpg)