
Tentang Allianz di Asia Allianz hadir di Asia Pasifik sejak ...
Upload
truongduongCategory
view
231download
0
Lithospheric Deformations in Central Asia
derived from Gravity Data
Dissertation
zur Erlangung des Doktorgrades
der Naturwissenschaften im Fachbereich
Geowissenschaften
der Universität Hamburg
vorgelegt von
Xiaodian Jiang
aus Qingdao, China
Hamburg
Dezember 2004
Als Dissertation angenommen vom Fachbereich Geowissenschaften der Universität Hamburg
auf Grund der Gutachten von Prof. Dr. H. K. Wong
und Dr. T. Lüdmann
Hamburg, den 15.Dez. 2004
Prof. Dr. H. Schleicher Dekan
des Fachbereichs Geowissenschaften
Contents Abstract ------------------------------------------------------------------------------------------------ 1
Chapter 1. Introduction ---------------------------------------------------------------------------- 3
Chapter 2. General geological setting of Central Asia --------------------------------------- 6
Chapter 3. Methods --------------------------------------------------------------------------------- 26
3.1 Introduction ------------------------------------------------------------------------------------ 26
3.2 Flexure of an elastic lithosphere: theory and model -------------------------------------- 28
3.3 Finite difference solution to the equation for flexure of an elastic lithosphere ------- 35
3.3.1 The two-dimensional equation -------------------------------------------------------- 35
3.3.2 The three-dimensional equation ------------------------------------------------------ 36
Chapter 4. Data --------------------------------------------------------------------------------------- 42
Chapter 5. Results ----------------------------------------------------------------------------------- 47
5.1 Flexural modelling of the laterally varying elastic strength of the lithosphere
in Central Asia --------------------------------------------------------------------------------- 47
5.2 Lithospheric deformations beneath the Altyn Tagh and West Kunlun faults from
new gravity survey data ----------------------------------------------------------------------- 61
5.3 Lithospheric deformations in the Tien Shan ---------------------------------------------- 72
5.4 Tectonic stress field in the Tien Shan ------------------------------------------------------ 84
Chapter 6. Discussions ----------------------------------------------------------------------------- 96
Chapter 7. Conclusions ----------------------------------------------------------------------------114
References -------------------------------------------------------------------------------------------- 116
Zusammenfassung ---------------------------------------------------------------------------------- 133
Acknowledgements
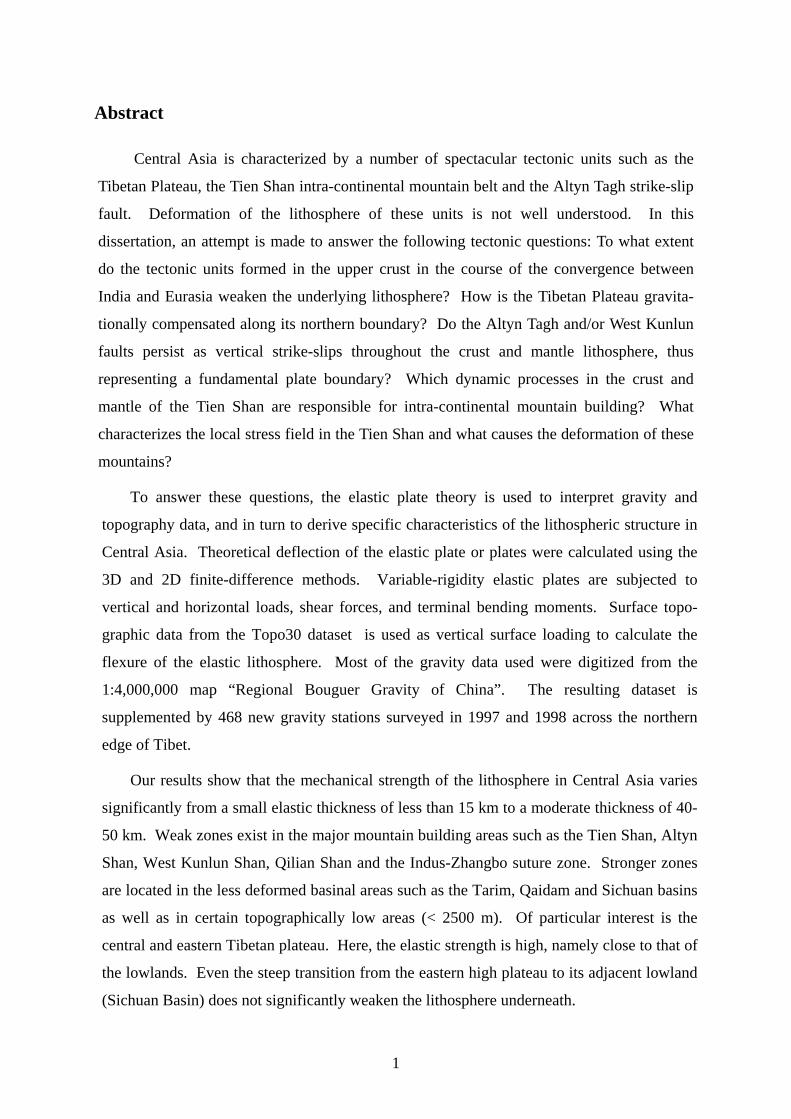
Abstract
Central Asia is characterized by a number of spectacular tectonic units such as the
Tibetan Plateau, the Tien Shan intra-continental mountain belt and the Altyn Tagh strike-slip
fault. Deformation of the lithosphere of these units is not well understood. In this
dissertation, an attempt is made to answer the following tectonic questions: To what extent
do the tectonic units formed in the upper crust in the course of the convergence between
India and Eurasia weaken the underlying lithosphere? How is the Tibetan Plateau gravita-
tionally compensated along its northern boundary? Do the Altyn Tagh and/or West Kunlun
faults persist as vertical strike-slips throughout the crust and mantle lithosphere, thus
representing a fundamental plate boundary? Which dynamic processes in the crust and
mantle of the Tien Shan are responsible for intra-continental mountain building? What
characterizes the local stress field in the Tien Shan and what causes the deformation of these
mountains?
To answer these questions, the elastic plate theory is used to interpret gravity and
topography data, and in turn to derive specific characteristics of the lithospheric structure in
Central Asia. Theoretical deflection of the elastic plate or plates were calculated using the
3D and 2D finite-difference methods. Variable-rigidity elastic plates are subjected to
vertical and horizontal loads, shear forces, and terminal bending moments. Surface topo-
graphic data from the Topo30 dataset is used as vertical surface loading to calculate the
flexure of the elastic lithosphere. Most of the gravity data used were digitized from the
1:4,000,000 map “Regional Bouguer Gravity of China”. The resulting dataset is
supplemented by 468 new gravity stations surveyed in 1997 and 1998 across the northern
edge of Tibet.
Our results show that the mechanical strength of the lithosphere in Central Asia varies
significantly from a small elastic thickness of less than 15 km to a moderate thickness of 40-
50 km. Weak zones exist in the major mountain building areas such as the Tien Shan, Altyn
Shan, West Kunlun Shan, Qilian Shan and the Indus-Zhangbo suture zone. Stronger zones
are located in the less deformed basinal areas such as the Tarim, Qaidam and Sichuan basins
as well as in certain topographically low areas (< 2500 m). Of particular interest is the
central and eastern Tibetan plateau. Here, the elastic strength is high, namely close to that of
the lowlands. Even the steep transition from the eastern high plateau to its adjacent lowland
(Sichuan Basin) does not significantly weaken the lithosphere underneath.
1
A number of plausible models of crustal structure were constructed in an effort to
reproduce the main features of the Bouguer gravity and topographic data by integrating
information on the sedimentary column derived from exploration seismology in the Tarim
and Qaidam basins. Based on the gravity fit, it was found that elastic strength across the
Altyn Tagh Fault is zero, allowing for the possibility that this fault cuts through the entire
lithosphere and has a negligible thrust component currently or in the past. This result is
consistent with tectonic models that assume the creation of a thickened crust in northern
Tibet through thick-skinned thrust sheets progressively overriding Asia to the northeast as
the Altyn Tagh, behaving as a classical transform fault, propagates in that direction. Farther
west, the gravity observations across the West Kunlun Fault are best explained by significant
underthrusting of the high topography by an elastic plate with effective thicknesses between
30 and 40 km, in agreement with geological interpretations and modelling of earlier, but
very sparse gravity observations.
Sediment corrections in the Zungar and Tarim basins north and south of the Tien Shan
respectively as well as 2D modelling along four profiles were carried out. A number of
plausible models of lithospheric structure were also tested in order to reproduce the main
features of the Bouguer gravity and topography in the space domain. Our results indicate
that the lithospheric elastic strength across the western Tien Shan is zero, suggesting that the
Southern Tien Shan Thrust Fault cuts through the entire lithosphere. In contrast, the gravity
data are best fitted by an underthrusting elastic plate with an effective thickness of 40-45 km
in the Tarim and Zungar basins, decreasing to 20-25 km beneath the Tien Shan. Deforma-
tions of the Tien Shan are dominated by underthrusting of a rigid plate beneath the mountain
range.
We examined the local stress field in the Tien Shan and analysed how the older orogenic
event is related to the reactivation of the Tien Shan under the present tectonic regime. We
calculated the sum of the stress fields from (1) interaction between the Indian and Eurasian
plates, (2) the elevated gravitational potential energy, and (3) bending of the lithosphere in
the Tien Shan area. This composite stress field is consistent with the stress derived from
seismic focal solutions, GPS measurements and surface geology. Our results show that the
flexural stress field resulting from bending of the lithosphere beneath the Tien Shan
contributes the most to the total stress field. Furthermore, they suggest that the Tien Shan
uplifted in response to a local intra-continental stress field rather than to the regional stress
caused by the collision between India and Eurasia.
2
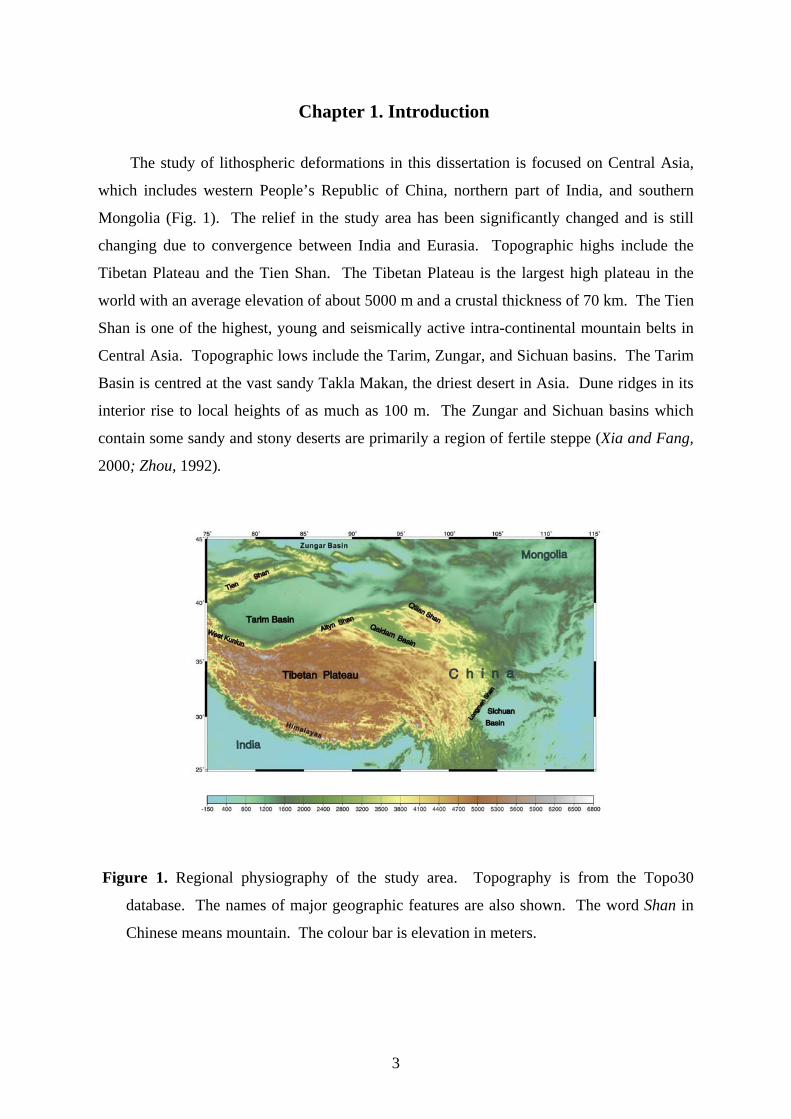
Chapter 1. Introduction The study of lithospheric deformations in this dissertation is focused on Central Asia,
which includes western People’s Republic of China, northern part of India, and southern
Mongolia (Fig. 1). The relief in the study area has been significantly changed and is still
changing due to convergence between India and Eurasia. Topographic highs include the
Tibetan Plateau and the Tien Shan. The Tibetan Plateau is the largest high plateau in the
world with an average elevation of about 5000 m and a crustal thickness of 70 km. The Tien
Shan is one of the highest, young and seismically active intra-continental mountain belts in
Central Asia. Topographic lows include the Tarim, Zungar, and Sichuan basins. The Tarim
Basin is centred at the vast sandy Takla Makan, the driest desert in Asia. Dune ridges in its
interior rise to local heights of as much as 100 m. The Zungar and Sichuan basins which
contain some sandy and stony deserts are primarily a region of fertile steppe (Xia and Fang,
2000; Zhou, 1992).
Figure 1. Regional physiography of the study area. Topography is from the Topo30
database. The names of major geographic features are also shown. The word Shan in
Chinese means mountain. The colour bar is elevation in meters.
3
The Tibetan Plateau is bordered by the Himalaya mountains in the south, the Qilian,
Kunlun and Altyn faults in the north, and Longman Shan in the east (Fig. 1). The Himalayas
are the highest mountains in the world. The Altyn Tagh is one of the largest intra-
continental strike-slip faults on Earth. The surface of the Tibetan Plateau is covered with
salt lakes and marshes, and is transected by several low relief mountain ranges (Larson et
al., 1999; Leven et al., 2000; Rong and Jackson, 2000). Many large rivers in Asia, such as
the Indus, Yangtze, and Yellow River, originate from this high plateau (Harrison et al.,
1992). A large range of vertical ecosystem zones exists from the high Himalayas to the low
Indian subcontinent.
With the closure of the Tethys and the collision between the Indian subcontinent and
Eurasia in the Paleogene (Allegre et al., 1984; Dewey and Burke, 1973; Gansser, 1974;
Molnar and Tapponnier, 1975), spectacular deformation belts were formed. This collision is
still active today, making Tibet an unique natural laboratory for geologists and geophysicists
to study continental lithospheric composition, inter- and intra-plate deformation, the
geological processes involved in continent-continent collision, and the effects of mountain
building and highland formation.
Geoscientists have been focusing on Central Asia for the last three decades. The
studies carried out aim at a better understanding of the mechanisms of uplift of the Tibetan
Plateau, the deep structure of the continental crust in this collision zone, and the interactions
between crust and mantle in a rapidly evolving mountain. More general aims include major
tectonic processes shaping the Earth, tectonic evolution of the continental lithosphere and its
relationship to global tectonics.
In our study area, many tectonic questions are still under debate. For example, is the
plateau uplifted uniformly and what mechanisms thickened the Tibetan crust? What are the
crust and mantle features in the continent-continent collision zone? To what extent are these
upper crustal features coupled with deformations of the upper mantle lithosphere beneath
them? Does the Tarim Basin subduct beneath the Tibetan Plateau anywhere along the Altyn
Tagh or Western Kunlun faults? Although our understanding of Central Asian tectonics has
significantly improved through numerous scientific expeditions to Tibet in the past two
decades, the data collected in this area are still very limited relative to the size of the region.
Because large-scale lithospheric deformations usually define regional tectonic features,
we will focus on three questions in this dissertation. Firstly, is the upper crustal flexure in
Central Asia coupled with or decoupled from the deformation of the upper mantle litho-
4

sphere? Here, we hope to derive information on the laterally inhomogeneous lithosphere in
Central Asia and determine the elastic strengths of the different tectonic units. Secondly,
how is the plateau compensated along its northern boundary? Is there evidence that the Altyn
Tagh persists as a vertical strike-slip fault throughout the crust and mantle lithosphere, thus
representing a fundamental plate boundary? Thirdly, what are the major tectonic
consequences of uplift of the Tien Shan? And fourthly, what are the deep structure and
kinematics of the deformations in the Tien Shen? Our ultimate goal is to better understand
the dynamic processes responsible for intra-continental mountain building.
5
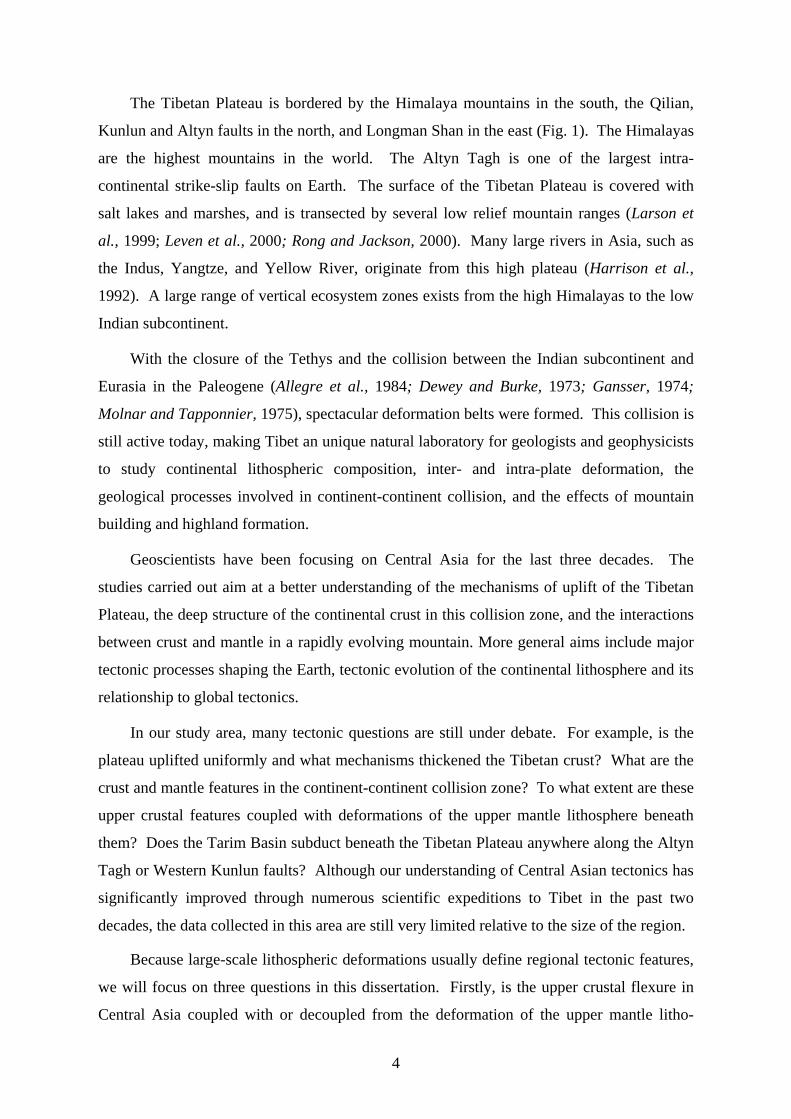
Chapter 2. General geological setting of Central Asia Tectonics in Central Asia is characterized by relative convergence of the Indian, Pacific
and Philippine plates toward the Eurasian plate. Our study area lies in as well as near this
convergence zone, and includes the majority of the Yangtze block, the Sino-Korean
platform, the Tarim block, the Qaidam block, the Tibetan Plateau and the Mongolian block
(Sengör, 1996; Yin and Harrison 2000). These blocks are separated by suture zones, the
geometry and distribution of which have been significantly modified by various tectonic
events (Fig. 2). The Yangtze block and the Sino-Korean platform were sutured in the Late
Triassic along the Qilian-Qinling suture zone (Yin and Nie, 1996). The Mongolian and Sino-
Korean blocks were sutured along the Tien Shan-Yin Shan suture zone in the Permian and
the Jurassic (Calais et al., 2002; Petit et al., 2002). The Tien Shan also separates the Tarim
block from Mongolia (Neil and Houseman, 1997). The Altyn Tagh Fault separates the
Tarim block from the Qaidam block. The Indian subcontinent underthrusts the Tibet block
along the Indus-Zhangbo suture zone (Tapponnier et al., 2001).
Figure 2. Simplified map of the major tectonic blocks and tectonic boundaries of the study
area, modified from Yin and Harrison (2000) and Tapponnier et al. (2001). Blue lines
are major faults. The background lines are topography in meters. The arrows indicate
strike-slip direction.
The following discussion outlines the geological framework of these regions, especially
their tectono-stratigraphic and tectonic features.
6
The Yangtze block
The Yangtze block is bounded by the Qinling Fault to the north, and the Longmen and
Xian Shuihe faults to the west. To the east, it extends into the East China Sea (Fig. 3).
Sichuan Basin is the major sedimentary basin in this block.
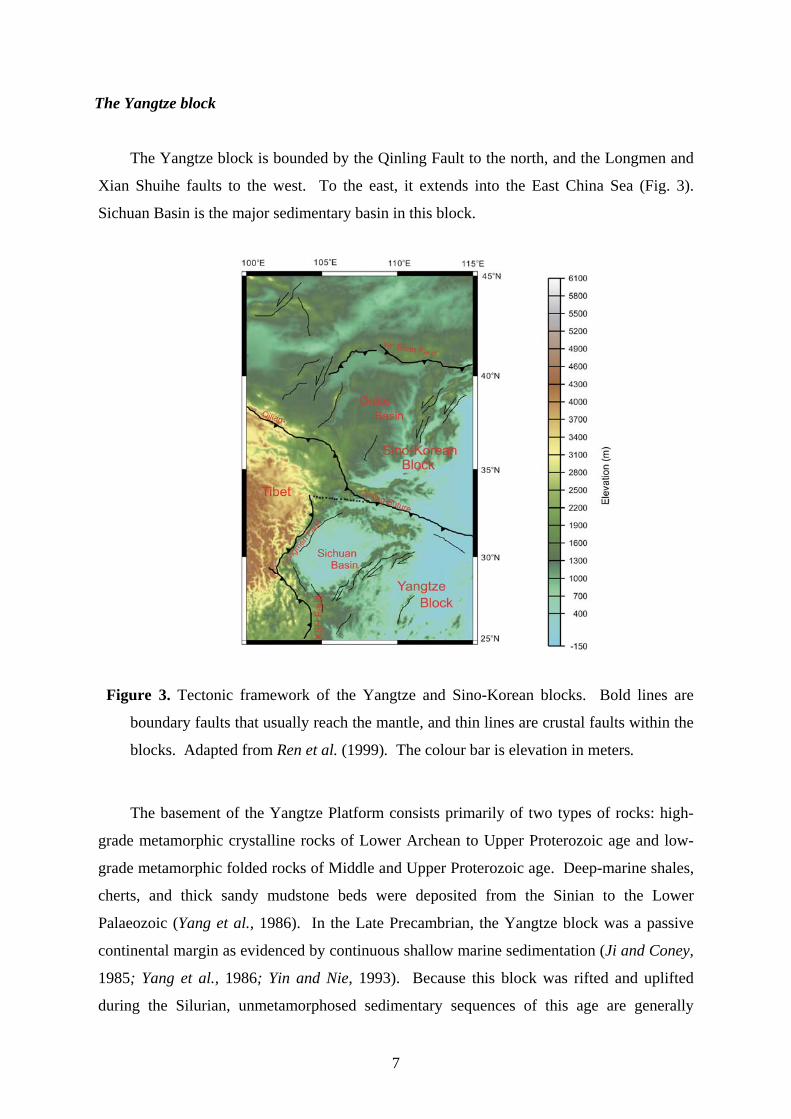
Figure 3. Tectonic framework of the Yangtze and Sino-Korean blocks. Bold lines are
boundary faults that usually reach the mantle, and thin lines are crustal faults within the
blocks. Adapted from Ren et al. (1999). The colour bar is elevation in meters.
The basement of the Yangtze Platform consists primarily of two types of rocks: high-
grade metamorphic crystalline rocks of Lower Archean to Upper Proterozoic age and low-
grade metamorphic folded rocks of Middle and Upper Proterozoic age. Deep-marine shales,
cherts, and thick sandy mudstone beds were deposited from the Sinian to the Lower
Palaeozoic (Yang et al., 1986). In the Late Precambrian, the Yangtze block was a passive
continental margin as evidenced by continuous shallow marine sedimentation (Ji and Coney,
1985; Yang et al., 1986; Yin and Nie, 1993). Because this block was rifted and uplifted
during the Silurian, unmetamorphosed sedimentary sequences of this age are generally
7
absent. The Devonian and Carboniferous sediments are confined to the edge of this block.
Limestones, mudstones and interbedded basalts were deposited in the Permian. Between the
Upper Permian and the Triassic, the sedimentation pattern changed on the Yangtze block,
with dominantly shallow marine sedimentation giving way to terrestrial clastic
sedimentation. This marine to terrestrial transition may be a result of the collision between
the Yangtze and Sino-Korean blocks (Yin and Nie, 1996). The Jurassic fluvial sediments
conformably overlie a Triassic series (Yang and Besse, 2001). The unconformity at the base
of the Eocene indicates a pre-Eocene phase of deformation related to the last phase of
orogeny from Late Cretaceous to Early Tertiary. The Cenozoic sediments consist of a
sequence of terrestrial fluvial and alluvial deposits (Fig. 4).
After occasional connections with East Gondwanaland up to the Devonian, the Yangtze
block was left at low-latitude positions, while East Gondwanaland drifted rapidly towards
the South Pole during the mid-Carboniferous (Hacker et al., 1996; Yin and Nie, 1996). The
Yangtze block acted as a stable unit with relatively little internal deformations until
Mesozoic time. The Mesozoic continent-continent collision and contemporaneous
northward subduction and subsequent exhumation of the continental Yangtze plate (Hacker
et al., 1996; 2000) led to complex, large-scale crustal shortening along the Qilian-Qinling
suture (Ratschbacher et al., 2000). This deformation is reflected in major changes in
depositional patterns: from shallow marine to non-marine in character. As a result of the
collision of India with Eurasia in the Cenozoic, deformations occurred along the western
margin of the Yangtze block. A series of NE trending folds and faults appeared in the
southwestern Yangtze block (Fig. 3).
The Sino-Korean block
The Sino-Korean block is bounded by the Qilian-Qinling Fault to the south and west,
and the Yin Shan Fault to the north (Fig. 3). The Yangtze and Mongolia blocks lie to its
south and north, respectively. It extends into the Gulf of Bohai and the northern Yellow Sea.
The Sino-Korean block is the oldest block in China and consists of high-grade
metamorphic Lower Archean basement rocks with complicated superimposed folds. The
Sino-Korean block and the Yangtze block are similar stable cratons, but their stratigraphies
are significantly different (Fig. 4). From the Proterozoic to the Lower Palaeozoic, stable
shallow water clastics and carbonates were widely distributed in the Sino-Korean block,
8
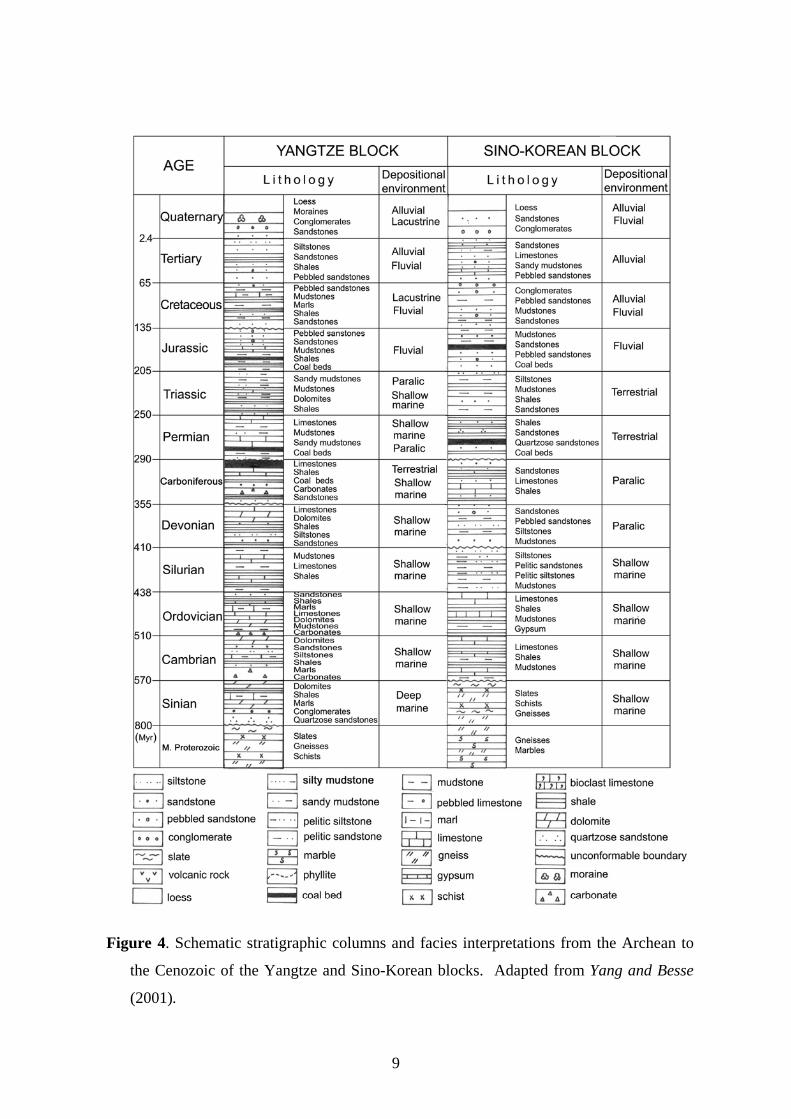
Figure 4. Schematic stratigraphic columns and facies interpretations from the Archean to
the Cenozoic of the Yangtze and Sino-Korean blocks. Adapted from Yang and Besse
(2001).
9
and Sinian strata were rare except in the marginal areas. There are abundant volcanic rocks
in the Precambrian sequences (Rong et al., 2001; Wang, 1985; Yang et al., 1986; Yin and
Nie, 1993). During the Carboniferous to the Permian, a transition from marine to terrestrial
deposition occurred. This terrestrial deposition continued to the Triassic. Sandstones, mud-
stones and interbedded conglomerates were deposited in the Mesozoic. The Cenozoic
sediments are alluvial, fluvial and lacustrine.
Analogous to the Yangtze block, the Sino-Korean block was also at equatorial latitudes
but at a different longitude in the Palaeozoic, and it drifted northward at the beginning of the
Carboniferous (Wu et al., 1990). Collision between the Yangtze and Sino-Korean blocks
started during the Mesozoic, and was completed before the Cretaceous (Wang et al., 2001;
Gilder and Courtillot, 1997). The two blocks were sutured along the Qilian-Qinling
orogenic zone with large-scale crustal overthrusting (Li et al., 1978; Mattauer et al., 1985;
Meng and Zhang, 1999; Oberhänsli et al., 2002). In the Permian and the Jurassic, both
subduction of the Qaidam block from the southwest (Ritts et al., 2001; Yin and Nie, 1996)
and underthrusting of the Siberia block from the north resulted in NE-trending folds and
faults in the Sino-Korean block with significant crustal shortening (Burov et al., 1993; Darby
and Ritts 2002) (Fig. 3). Various basins (e.g., the Ordos Basin) developed in the Sino-
Korean block from the Mesozoic to the Cenozoic.
The Tarim block
The Tarim block is bounded by the Tien Shan Fault to the north, the West Kunlun Fault
to the southwest and the Altyn Tagh Fault to south (Fig. 5). This isolated rigid block is
surrounded on all sides by active intraplate or interplate orogenic zones.
The Tarim Basin has a Neogene sediment cover with a maximum thickness of 15 km
(Jia et al., 1991). Its basement consists of strata of Sinian age or older, including high-grade
metamorphic rocks of Archean age, intermediate-grade metamorphic rocks of Lower
Proterozoic age and low-grade metamorphic rocks of Middle and Upper Proterozoic age
(Zhou and Chen, 1990). The basin was in a stable, deep marine depositional environment
with carbonates and sandstones during the Lower Palaeozoic (Zhou and Chen, 1990).
During the Silurian, the passive continental margin changed into a volcanic arc in the
northern Tarim block and the southern Tarim block was subjected to regional uplift, so that
Silurian sediments are absent. The Tarim block was characterized by shallow marine
10
deposition during the Devonian and the Carboniferous (Carroll et al., 1995; Zhou and Chen,
1990). It began to receive terrestrial sediments during Mesozoic time (Fig. 6). Fluvial and
alluvial strata with dominant sandstones were deposited in the Triassic. The Jurassic and
Cretaceous strata unconformably overlie older units of siltstones and mudstones (Sobel
1995; Sobel et al., 2001). The Cenozoic sediments are characterized by a series of red
mudstones, siltstones, sandstones and red beds which were deposited in alluvial and
lacustrine environments (Jolivet et al., 2001).
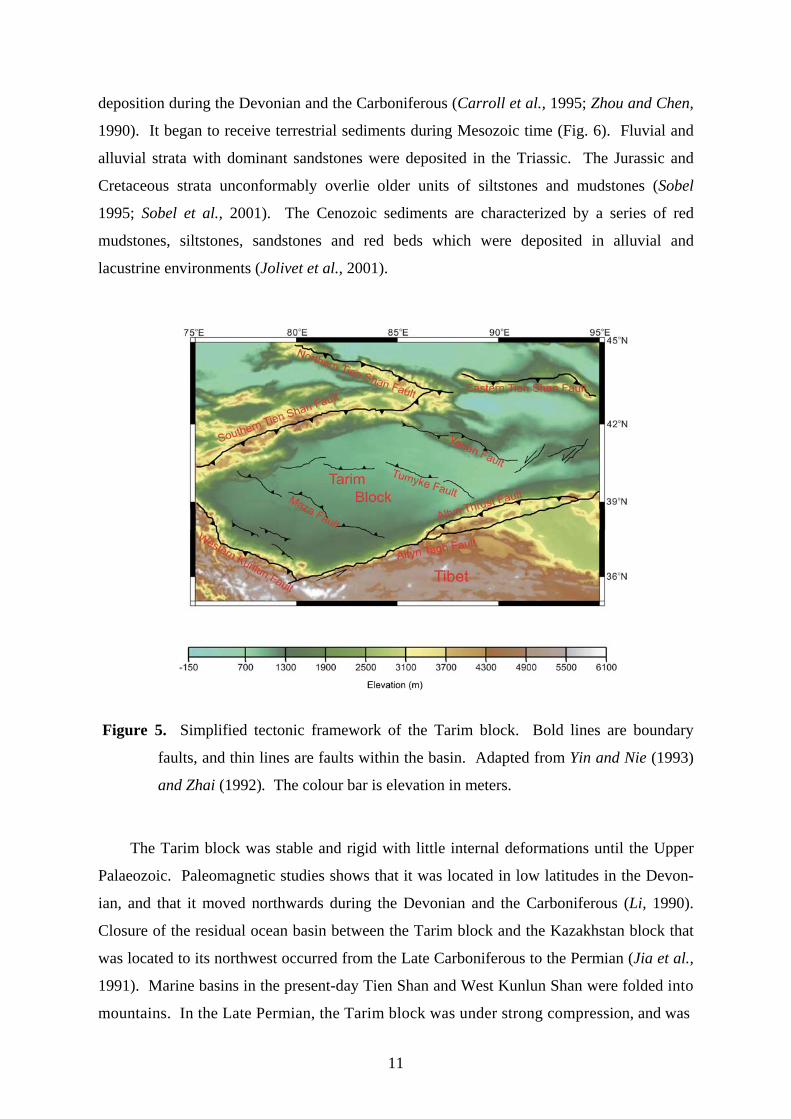
Figure 5. Simplified tectonic framework of the Tarim block. Bold lines are boundary
faults, and thin lines are faults within the basin. Adapted from Yin and Nie (1993)
and Zhai (1992). The colour bar is elevation in meters.
The Tarim block was stable and rigid with little internal deformations until the Upper
Palaeozoic. Paleomagnetic studies shows that it was located in low latitudes in the Devon-
ian, and that it moved northwards during the Devonian and the Carboniferous (Li, 1990).
Closure of the residual ocean basin between the Tarim block and the Kazakhstan block that
was located to its northwest occurred from the Late Carboniferous to the Permian (Jia et al.,
1991). Marine basins in the present-day Tien Shan and West Kunlun Shan were folded into
mountains. In the Late Permian, the Tarim block was under strong compression, and was
11
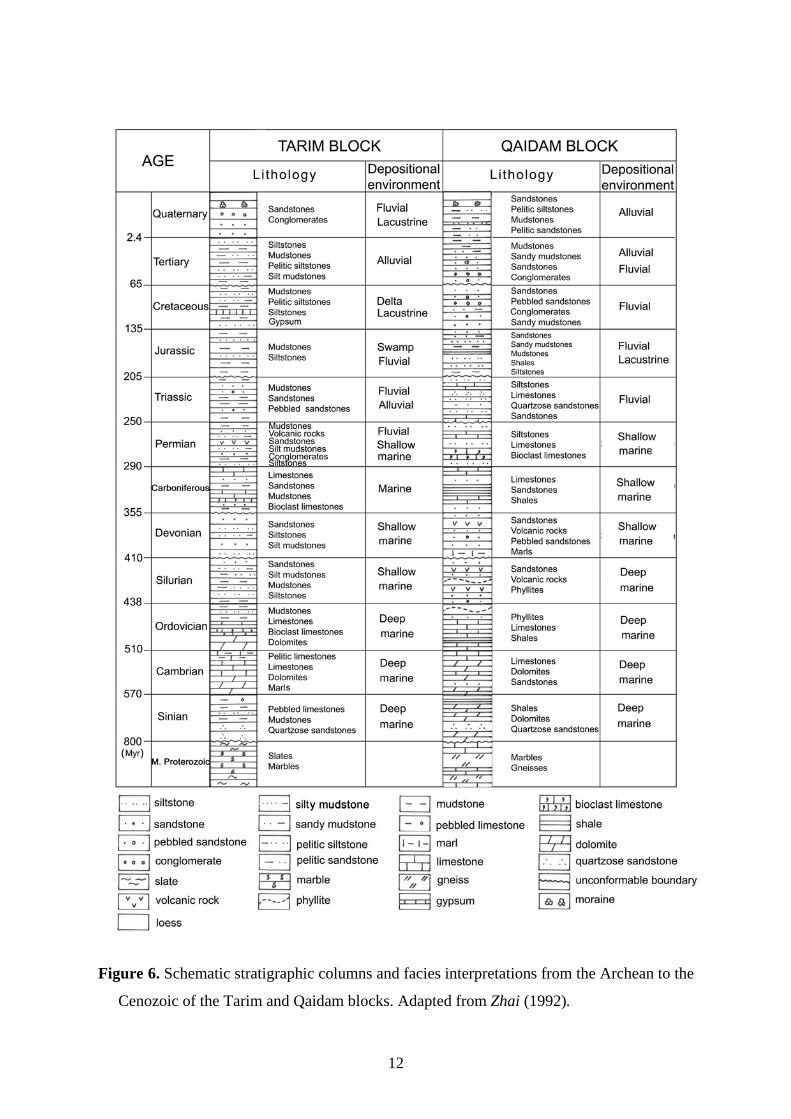
Figure 6. Schematic stratigraphic columns and facies interpretations from the Archean to the
Cenozoic of the Tarim and Qaidam blocks. Adapted from Zhai (1992).
12
folded and uplifted at its edges. During the Cenozoic, a series of flexural foreland basins
developed along the northern and southern edges of the Tarim Basin (Sobel and Dumitru,
1997) in response to the collision between India and Eurasia (Yin and Nie, 1996). Although
the Tarim Basin has remained relatively undeformed during this collision, the large N-S
directed compression in both the Mesozoic and the Cenozoic generated a series of near east-
west trending faults, such as the Yanan Fault and the Maza Fault (Fig. 5).
The Qaidam block
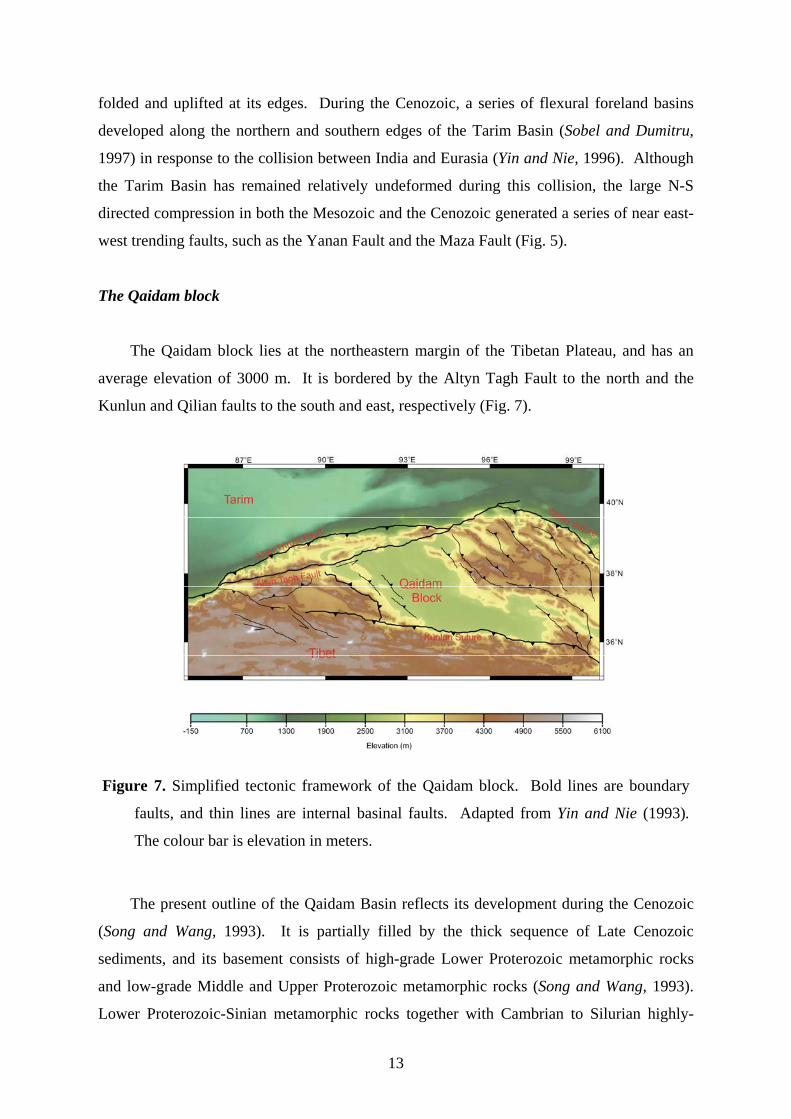
The Qaidam block lies at the northeastern margin of the Tibetan Plateau, and has an
average elevation of 3000 m. It is bordered by the Altyn Tagh Fault to the north and the
Kunlun and Qilian faults to the south and east, respectively (Fig. 7).
Figure 7. Simplified tectonic framework of the Qaidam block. Bold lines are boundary
faults, and thin lines are internal basinal faults. Adapted from Yin and Nie (1993).
The colour bar is elevation in meters.
The present outline of the Qaidam Basin reflects its development during the Cenozoic
(Song and Wang, 1993). It is partially filled by the thick sequence of Late Cenozoic
sediments, and its basement consists of high-grade Lower Proterozoic metamorphic rocks
and low-grade Middle and Upper Proterozoic metamorphic rocks (Song and Wang, 1993).
Lower Proterozoic-Sinian metamorphic rocks together with Cambrian to Silurian highly-
13
deformed deep-marine and volcanic rocks are exposed along the southeastern margin of this
block (Delville et al., 2001; Yin and Nie, 1993). The Devonian strata are clastic and the
Carboniferous and Permian sections consist of shallow marine limestones. The Mesozoic
strata are entirely non-marine (Ritt and Biffi, 2001). During the Triassic and the Lower
Jurassic, lacustrine sediments (mudstones and shales) were deposited. These are overlain by
a fluvial and alluvial sequence (Fig. 6). The Upper Jurassic and Cretaceous strata in this
block are dominated by sandy and conglomeratic red beds which overlie the older units
unconformably. The Tertiary strata are saline lacustrine deposits interbedded with terrestrial
sedimentary rocks, in particular hematite-rich sandstones (Song and Wang, 1993). A thick
Quaternary sequence also occurs in the Qaidam Basin (Qinghai BGM, 1989).
The Qaidam block was stable and suffered only limited deformations until the Meso-
zoic, when it underthrusted the Sino-Korean block along the Qilian mountain range and
developed a series of folds and faults in front of the thrust (Ritt and Biffi, 2001). Three
unconformities of Paleocene-Eocene, Early Pliocene, and Early Quaternary age have been
recognized in the Cenozoic sequences of the Qaidam Basin. These unconformities are
possibly related to phases of the India-Eurasian collision (Hacker et al., 2000; Yin and Nie,
1996). At the end of the Pliocene, the Qaidam Basin was uplifted by renewed tectonic
movements (Métivier and Gaudemer, 1997; Métivier et al., 1998). Cenozoic tectonic
activity documented in the basin is weak (Bailey and Anderson, 1982; Jolivet et al., 2001;
Dupont-Nivet et al., 2002; Zhu and Helmberger, 1998), only NW-SE trending folds are
occasionally developed between the thrust faults.
The Tibetan block and the Himalaya fold belt
The Tibetan block (Tibetan Plateau) is bounded by the Himalayas to the southwest, and
the Kunlun and Altyn Tagh faults to the north (Fig. 8). A series of alternating, deep, forested
valleys and high mountain ranges such as the Longmen Mountains define its eastern margin
(Fig. 2). Significant crustal shortening (at least 1400 km) occurred in the Tibetan Plateau.
The Indian-Eurasian collision starting 50 million years ago is responsible for the formation
of the highest mountains (the Himalaya Mountains) and the largest plateau on Earth (the
Tibetan Plateau) as well as many present-day tectonic features in large parts of Central Asia.
From south to north, the Tibetan Plateau is divided into: the Himalaya fold belt, Lhasa
micro-block, Qiangtang micro-block and the Songpan-Gangzi fold belt (Fig. 8) (Brown et
14

al., 1996; Chen and Molnar, 1981; Kind et al., 2002; Patzelt et al., 1996; Yin et al., 1994).
The Main Boundary Thrust constitutes the southern edge and the Indus-Zhangbo suture
marks the northern edge of the Himalaya fold belt. The Lhasa micro-block is located
between the Indus-Zhangbo suture and the Bangong-Nujiang suture. The Bangong-Nujiang
and Jinsha sutures form the southern and northern edges of the Qiangtang micro-block
respectively. The Songpan-Gangzi fold belt in northern Tibet is bounded by the Kunlun
Fault to the north, and the Jinsha suture to the south (McNamara et al., 1995; Molnar, 1988;
Yin, 2000).
Figure 8. Map of major tectonic micro-blocks, fold belts and tectonic boundaries of the
Tibet block. MFT: Main Frontal Thrust, MCT: Main Central Thrust. The black solid
line gives the location of a geological profile from Yadong to the Kunlun Mountains
shown in Fig. 11. Adapted from Kind et al. (2002) and Tapponnier et al. (2001). The
colour bar is elevation in meters.
The basement of the Himalaya fold belt comprises crystalline gneiss of Lower
Cambrian age (Finlayson et al., 2002; Gahagan et al., 1988; Grujic et al., 1996; Hoffman,
1991; Vannay and Steck, 1995). The Palaeozoic strata are characteristic of stable,
continuous and shallow marine deposition. The Devonian formations consist of littoral to
shallow marine quartzose sandstones, and the Carboniferous and Permian beds comprise
terrestrial deposits of conglomerates, sands and shales. Shallow marine conditions also
15
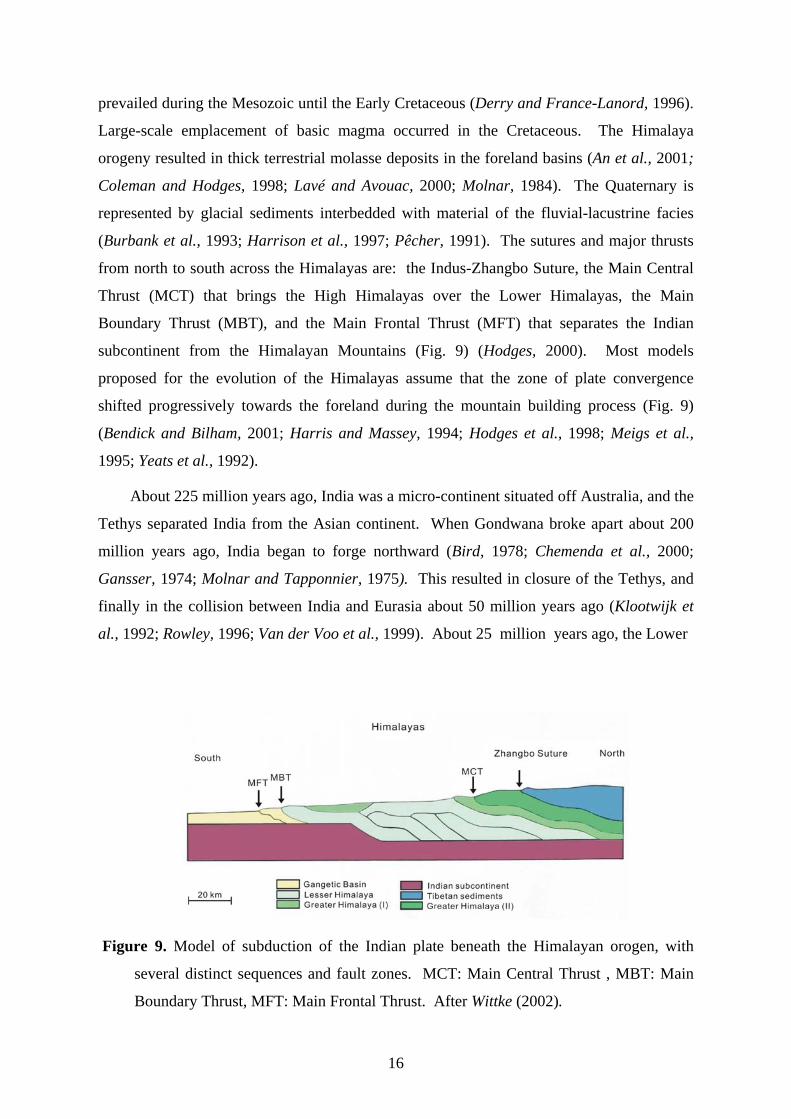
prevailed during the Mesozoic until the Early Cretaceous (Derry and France-Lanord, 1996).
Large-scale emplacement of basic magma occurred in the Cretaceous. The Himalaya
orogeny resulted in thick terrestrial molasse deposits in the foreland basins (An et al., 2001;
Coleman and Hodges, 1998; Lavé and Avouac, 2000; Molnar, 1984). The Quaternary is
represented by glacial sediments interbedded with material of the fluvial-lacustrine facies
(Burbank et al., 1993; Harrison et al., 1997; Pêcher, 1991). The sutures and major thrusts
from north to south across the Himalayas are: the Indus-Zhangbo Suture, the Main Central
Thrust (MCT) that brings the High Himalayas over the Lower Himalayas, the Main
Boundary Thrust (MBT), and the Main Frontal Thrust (MFT) that separates the Indian
subcontinent from the Himalayan Mountains (Fig. 9) (Hodges, 2000). Most models
proposed for the evolution of the Himalayas assume that the zone of plate convergence
shifted progressively towards the foreland during the mountain building process (Fig. 9)
(Bendick and Bilham, 2001; Harris and Massey, 1994; Hodges et al., 1998; Meigs et al.,
1995; Yeats et al., 1992).
About 225 million years ago, India was a micro-continent situated off Australia, and the
Tethys separated India from the Asian continent. When Gondwana broke apart about 200
million years ago, India began to forge northward (Bird, 1978; Chemenda et al., 2000;
Gansser, 1974; Molnar and Tapponnier, 1975). This resulted in closure of the Tethys, and
finally in the collision between India and Eurasia about 50 million years ago (Klootwijk et
al., 1992; Rowley, 1996; Van der Voo et al., 1999). About 25 million years ago, the Lower
Figure 9. Model of subduction of the Indian plate beneath the Himalayan orogen, with
several distinct sequences and fault zones. MCT: Main Central Thrust , MBT: Main
Boundary Thrust, MFT: Main Frontal Thrust. After Wittke (2002).
16
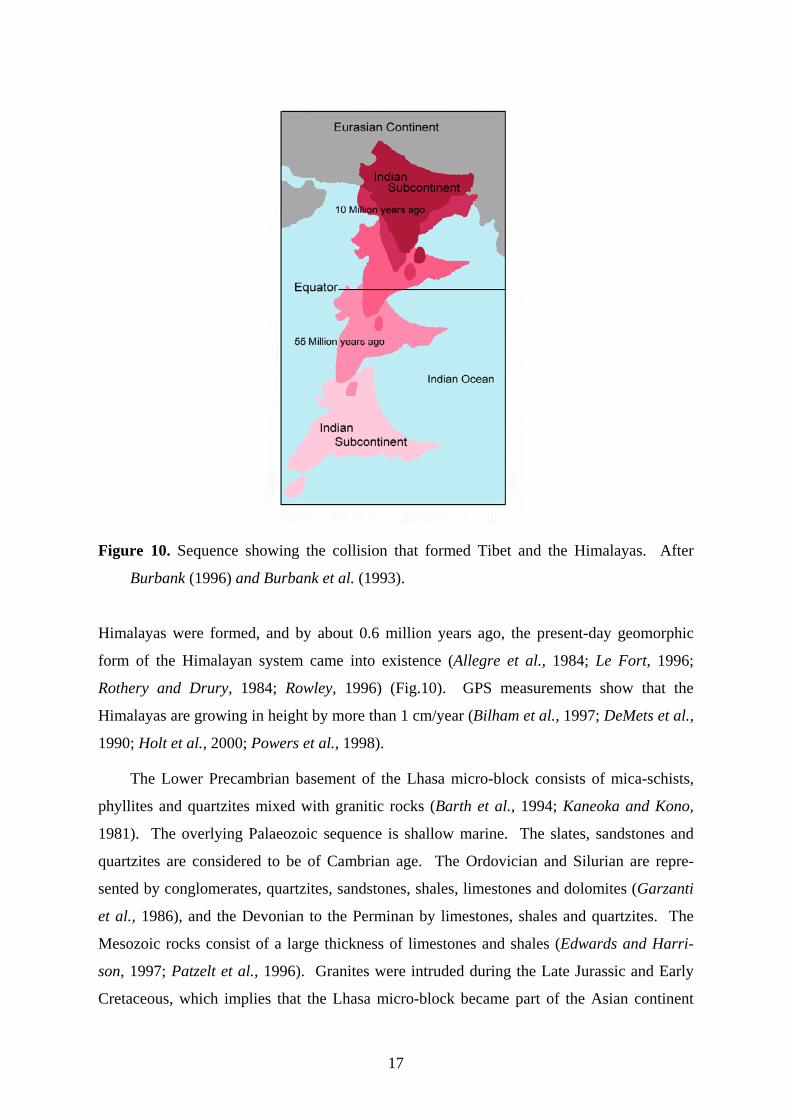
Figure 10. Sequence showing the collision that formed Tibet and the Himalayas. After
Burbank (1996) and Burbank et al. (1993).
Himalayas were formed, and by about 0.6 million years ago, the present-day geomorphic
form of the Himalayan system came into existence (Allegre et al., 1984; Le Fort, 1996;
Rothery and Drury, 1984; Rowley, 1996) (Fig.10). GPS measurements show that the
Himalayas are growing in height by more than 1 cm/year (Bilham et al., 1997; DeMets et al.,
1990; Holt et al., 2000; Powers et al., 1998).
The Lower Precambrian basement of the Lhasa micro-block consists of mica-schists,
phyllites and quartzites mixed with granitic rocks (Barth et al., 1994; Kaneoka and Kono,
1981). The overlying Palaeozoic sequence is shallow marine. The slates, sandstones and
quartzites are considered to be of Cambrian age. The Ordovician and Silurian are repre-
sented by conglomerates, quartzites, sandstones, shales, limestones and dolomites (Garzanti
et al., 1986), and the Devonian to the Perminan by limestones, shales and quartzites. The
Mesozoic rocks consist of a large thickness of limestones and shales (Edwards and Harri-
son, 1997; Patzelt et al., 1996). Granites were intruded during the Late Jurassic and Early
Cretaceous, which implies that the Lhasa micro-block became part of the Asian continent
17
during the Late Yanshan movement (Hirn et al., 1984; Patzelt et al., 1996). The Cenozoic is
represented by sandstones and shales in this area (Jain et al., 2000; Noble and Searle, 1995).
The Qiangtang micro-block is a stable tectonic unit with a metamorphic Lower
Precambrian crystalline basement (Shen et al., 2001; Yin and Harrison, 2000). Stable
shallow marine deposition occurred during the Ordovician to the Carboniferous. The older
zircon ages are similar to those of the gneisses within the Lhasa micro-block and the
Himalaya belt, implying that the Qiangtang micro-block was contiguous with them along the
northern margin of Gondwana during Earliest Paleozoic time. Flysch was laid down in the
Permian, and carbonates and clastic rocks in the Triassic. The Late Triassic-Early Jurassic
metamorphic core complex consists of rocks of the amphibolite facies. From the Cretaceous
to the Tertiary, this block was characterized by terrestrial sedimentation.
The Songpan-Gangze fold belt formed during Jurassic time (Dewey et al., 1988).
Stable Palaeozoic strata overlie the Precambrian basement. This area subsided in the
Permian, and a thick, clastic, marine sequence was deposited in the Triassic. It is
characterized by an intensely deformed Triassic-Jurassic sequence of deep marine deposits.
This area was folded during the Indosinian movement. Terrestrial sedimentation occurred at
the margin of the Kunlun Fault and in the intermontane basins.
The fold belts and micro-blocks discussed above are characterized by fold-and-thrust
belts, which developed over a large area with regional decolléments (Fig. 11) since the Indo-
Asian collision at about 50 Ma (Yin and Harrison, 2000). Deformations in the mantle
lithosphere of Tibet is possibly decoupled from surface faulting (Chen et al., 2000;
McNamara et al., 1995; Molnar and Lyon-Caen, 1989; Wei et al., 2001). The upper crust
and the upper mantle deform at their own characteristic wavelengths (Alsdorf and Nelson,
1999; Herquel et al., 1995; Holt and Wallace, 1990; Jin et al., 1994, 1996; Royden et al.,
1997). A weak, low viscosity lower crust exists between the strong upper crust and the
upper mantle. The lower crust absorbs the advancing Indian lithosphere through thickening,
and with it uplift of the Tibetan Plateau (Nelson et al., 1996).
The evolution of the Tibetan Plateau may be divided into the following stages: The
first stage is closure of the Tethys and initiation of subduction of the Indian continent beneath
the Eurasian plate (Barazangi and Ni, 1982; Jin et al., 1996; Lyon-Caen and Molnar, 1983;
Tapponnier et al., 2001; Zhao et al., 1993). Indian underplating reaches to the Banggong
suture (Chen et al., 1996; Jin et al., 1996; Nie et al., 1990; Royden and Burchfiel 1995). The
second stage is crustal shortening (Avouac and Peltzer, 1993). Strain along the
18
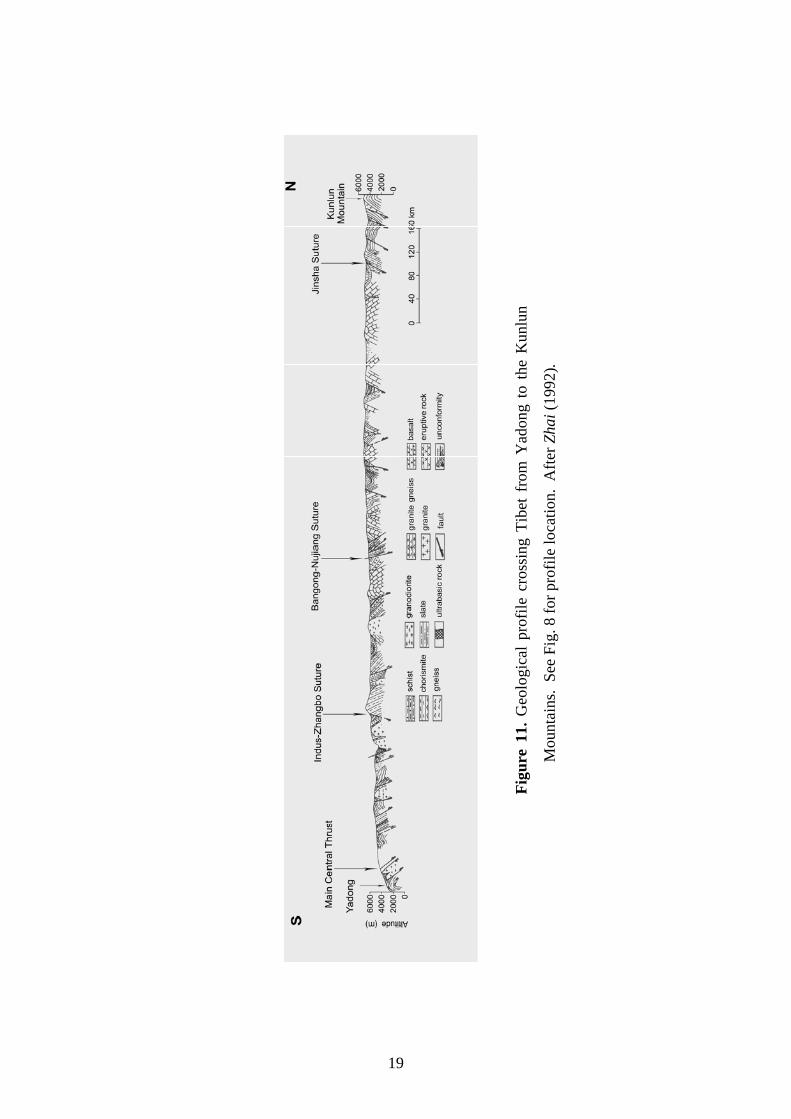
Figu
re 1
1. G
eolo
gica
l pr
ofile
cro
ssin
g Ti
bet
from
Yad
ong
to t
he K
unlu
n
Mou
ntai
ns.
See
Fig.
8 fo
r pro
file
loca
tion.
Afte
r Zha
i (19
92).
19
southern edge of the Tibetan Plateau accommodates 80% of the convergence between India
and Eurasia (Bilham et al., 2001; Harrison et al., 1992). GPS measurements show that India
and southern Tibet converge at a rate of about 20 mm/year (Bilham et al., 1997; Holt et al.,
2000; Larson et al., 1999; Rong and Jackson, 2000). The third stage is uplift of the Tibetan
Plateau, which occurs following crustal shortening. The fourth stage is strike-slip faulting.
A series of large, roughly east-west trending, left-lateral strike-slip faults formed within the
Tibetan Plateau (Jain et al., 2000; Molnar, 1984; Tapponnier et al., 1982). These strike-slips
accommodate the regional north-south shortening by eastward mass translation, whereby
mass from the Tibetan Plateau is transferred to the southeast along these major strike-slip
faults (England and Molnar, 1997; Holt and Haines, 1993; Tapponnier et al., 2001).
The origin of the Tibetan Plateau is still under debate. There are three major theories
on its uplift. The first is basement reactivation (Dewey and Burke, 1973). The continental
crust may have been simply shortened by folding and thrusting, and lithospheric deformation
may have been distributed throughout the Himalayas and Tibet (Masek et al., 1994). The
second model is continental subduction (Fielding et al., 1994; Kong et al., 1997; Ni and
Barazangi, 1984; Willett and Beaumount, 1994). The Indian lithosphere subducted beneath
the entire Tibetan Plateau and produced subsequent uplift. The third is continental injection
(Zhao and Morgen, 1987). The fact that the area of weakening of the Indian plate coincides
with the edge of the plateau suggests that it marks the location where Indian crust is skinned
off the mantle lithosphere and injected into the Tibetan lower crust.
The Tien Shan orogenic belt
1000-1800 km north of the convergent boundary between the Indian and Eurasian
plates lies the intra-continental Tien Shan orogenic belt. It extends east-west for
approximately 2500 km. It is flanked by the Tarim Basin to the south and the mountain
range is divided into the north and south Tien Shan respectively (Fig. 2).
Granite gneisses of Lower Proterozoic age form the basement of the Tien Shan
(Bukharin, 1978). They are unconformably overlain by marine sediments including
calcareous shales, dolomites and limestones of Cambrian age (Mukhin, 1989). Deep-marine
deposition of sandstones and shales dominated in the Ordovician. From the Silurian to the
Devonian, carbonates and shallow marine successions accumulated, especially in the Tien
Shan foreland basin (Akhber and Mushkin, 1976; Chen, 1985). There, an unconformable,
20
thick molasse sequence was laid down in the Carboniferous, probably as a result of the
continuing uplift of this area (Bukharin, 1978; Moore, et al., 1991). Throughout the
Permian, volcanism with the extrusion of rhyolites was widespread. Mesozoic rocks include
red conglomerates, carbonaceous sandstones and mudstones, followed by gypsum,
mudstones and limestones (Yin and Nie, 1996). They are overlain by Paleogene gypsum,
dolomites and limestones, which are separated from the lower Neogene conglomerates by an
unconformity (Bullen et al., 2001; Chen et al., 2002). Shortening in the Tien Shan began in
early Neogene time (Burchfiel et al., 1999). This is documented by the marked
unconformity separating marine Paleogene strata from continental Neogene strata (Yin and
Nie, 1996).
The Tien Shan is a Paleozoic orogenic belt reactivated by folding and faulting in the
Tertiary under the present tectonic regime (Beloussov et al., 1980; Carrol et al., 1995; Gao
et al., 1998; Hendrix et al., 1994). Since the Late Carboniferous and Early Permian, marine
basins in the present-day Tien Shan were closed and folded into mountains. The Mongolia
block underthrusted southward, and suturing along the Tien Shan in the Last Permian
produced much of the structural and metamorphic fabric of the mountain interior (Dewey
and Burke, 1973; Gansser 1974; Gao et al., 1998). After a period of quiescence in the
Mesozoic and Early Tertiary, tectonic activity resumed in the Eocene in response to the
collision of India with Eurasia (Avouac et al., 1993; Molnar and Tapponnier, 1975). Even
though the Tien Shan is about 1000 km away from this collision zone, active folding and
thrusting are contemporaneous with the collision. During the last 10 m.y., the Tien Shan has
been uplifted about 3 km on the average (Abdraknmatov et al., 1996; Burov et al., 1990,
1998; Jin, 1997; Stephen et al., 2002).
The Altyn Tagh Fault
The Altyn Tagh Fault is one of the most striking structural features attributed to the
Cenozoic collision between India and Asia (Molnar and Tapponnier, 1975). It is predomin-
antly a left-lateral strike-slip fault that extends at least 1600 km along the northern edge of
the Tibetan Plateau (Fig. 2). It separates the Tarim Basin to the north from the Qaidam
Basin in the south, and lies between the Western Kunlun thrust belt to the west and the
Qilian thrust zone to the east. North of the Altyn Tagh Fault is the Altyn Thrust Fault, which
joins the Altyn Tagh Fault at a depth of 80 km, then continues to underthrust steeply
21
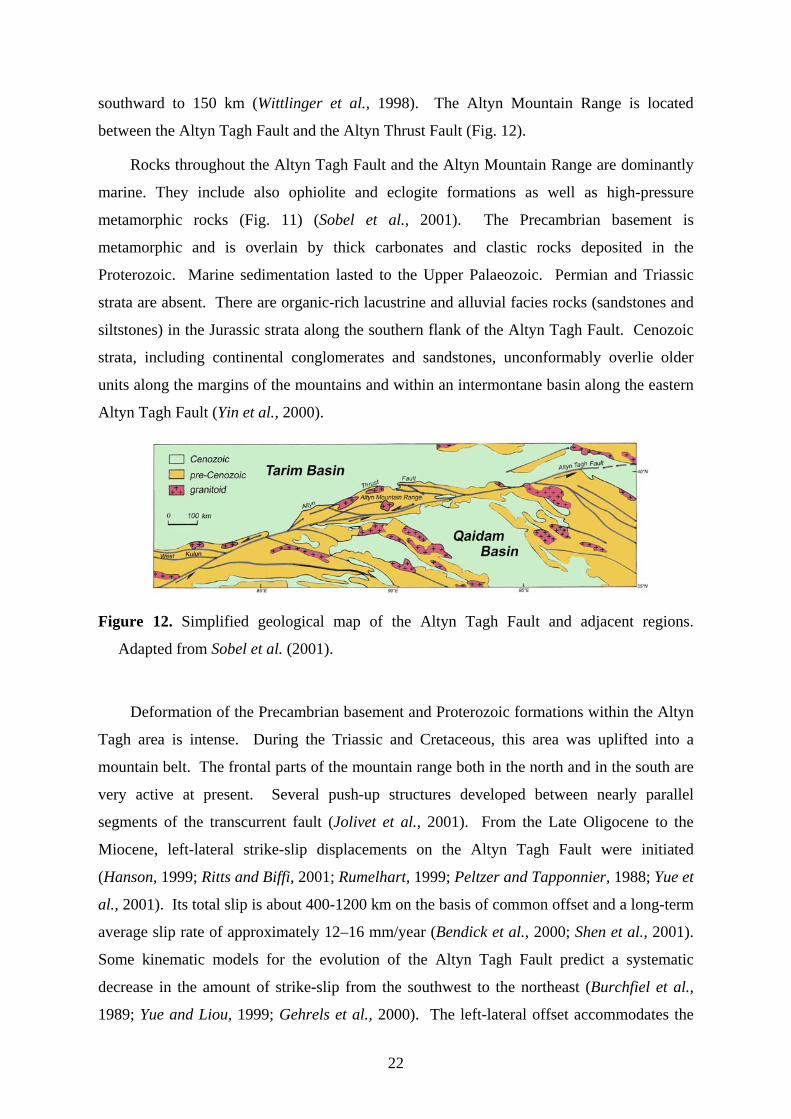
southward to 150 km (Wittlinger et al., 1998). The Altyn Mountain Range is located
between the Altyn Tagh Fault and the Altyn Thrust Fault (Fig. 12).
Rocks throughout the Altyn Tagh Fault and the Altyn Mountain Range are dominantly
marine. They include also ophiolite and eclogite formations as well as high-pressure
metamorphic rocks (Fig. 11) (Sobel et al., 2001). The Precambrian basement is
metamorphic and is overlain by thick carbonates and clastic rocks deposited in the
Proterozoic. Marine sedimentation lasted to the Upper Palaeozoic. Permian and Triassic
strata are absent. There are organic-rich lacustrine and alluvial facies rocks (sandstones and
siltstones) in the Jurassic strata along the southern flank of the Altyn Tagh Fault. Cenozoic
strata, including continental conglomerates and sandstones, unconformably overlie older
units along the margins of the mountains and within an intermontane basin along the eastern
Altyn Tagh Fault (Yin et al., 2000).
Figure 12. Simplified geological map of the Altyn Tagh Fault and adjacent regions.
Adapted from Sobel et al. (2001).
Deformation of the Precambrian basement and Proterozoic formations within the Altyn
Tagh area is intense. During the Triassic and Cretaceous, this area was uplifted into a
mountain belt. The frontal parts of the mountain range both in the north and in the south are
very active at present. Several push-up structures developed between nearly parallel
segments of the transcurrent fault (Jolivet et al., 2001). From the Late Oligocene to the
Miocene, left-lateral strike-slip displacements on the Altyn Tagh Fault were initiated
(Hanson, 1999; Ritts and Biffi, 2001; Rumelhart, 1999; Peltzer and Tapponnier, 1988; Yue et
al., 2001). Its total slip is about 400-1200 km on the basis of common offset and a long-term
average slip rate of approximately 12–16 mm/year (Bendick et al., 2000; Shen et al., 2001).
Some kinematic models for the evolution of the Altyn Tagh Fault predict a systematic
decrease in the amount of strike-slip from the southwest to the northeast (Burchfiel et al.,
1989; Yue and Liou, 1999; Gehrels et al., 2000). The left-lateral offset accommodates the
22
northeastward extrusion of the Tibetan Plateau (Tapponnier and Molnar, 1977; Peltzer and
Tapponnier, 1988; Yue and Liou, 1999). The total offset along the Altyn Tagh Fault may
provide an answer to the question of whether the convergence between India and Asia has
been largely accommodated by the extrusion of Asia towards Indochina (Avouac et al.,
1993; Peltzer and Tapponnier, 1988; Peltzer et al., 1989), or by shortening within the crust
and mantle (Burchfiel et al., 1989), perhaps even including subduction of mantle lithosphere
(Jin et al., 1996; Wittlinger et al., 1998).
The evolution of Central Asia
Based on the description above, we discuss here the general geological evolution of
Central Asia, beginning in the Proterozoic and continuing through the Cenozoic.
During the Proterozoic and Lower Palaeozoic, the Yangtze, Sino-Korean, Tarim,
Qaidam and Tibet blocks were at low-latitude positions, or they lie in the southern
hemisphere (Scotese and Sager, 1988; Scotese and Barrett, 1990; Sengör, 1996). The
Mongolia block was in the western hemisphere (Powell 1993). These blocks were
characterized by a stable, continuous, deep-marine depositional environment at that time (Ji
and Coney, 1985; Zhou and Chen, 1990).
During the Devonian, the Tarim block and the Sino-Korean block drifted together
northward (Wu et al., 1990; Yin and Nie, 1996), while the Mongolia block drifted eastward
(Fig. 13a). In the Carboniferous, the residual ocean basin between the Tarim and
Kazakhstan blocks closed and the Tarim and Sino-Korean micro-continents formerly in this
ocean collided with the Kazakhstan-Siberia continent (Fig. 13b). The Qaidam and Tarim
blocks formed a single unit at that time (Yin and Nie, 1996). The Yangtze block drifted
rapidly northward during the mid-Carboniferous (Hacker et al., 1996; 1998; 2000). From
the Devonian to the Carboniferous, the Tarim, Qaidam and Sino-Korean blocks were
characterized by shallow marine deposition, and only the Yangtze block received sediments
at its edge (Yang and Besse, 2001). The Qiangtang micro-block (the northern part of the
Tibet block) drifted northward at the beginning of the Permian. During the Late Permian,
the Sino-Korean block collided with the Mongolia block along the Yin Shan suture zone,
closing the ocean between them (Webb et al., 1999).
During the Triassic, the Yangtze block collided with the Sino-Korean block along the
Qilian-Qinling suture zone (Faure et al., 2001). Simultaneously, the Qaidam block
23
underthrusted the Sino-Korean block along the Qilian mountain range (Ritt and Biffi, 2001).
Collision between the Yangtze and Sino-Korean blocks squeezed the northern part of the
Qaidam block westward, extruding it from its original position (Mattauer et al., 1985). The
Qiangtang micro-block and Indochina drifted northward continuously and the Lhasa micro-
block (the southern part of the Tibet block), began to drift northward (Fig. 13c). During the
Jurassic, the Siberia block collided with the Mongolia block along the Mongolo-Okhotsk
suture, closing the Solonker Ocean between them (Powell, 1993). At that time, the
Qiangtang micro-block and Indochina collided with the combined Qaidam-Tarim-Yangtze-
Sino-Korean continent along the Kunlun suture. During the Late Cretaceous, the Lhasa
micro-block collided with the Qiangtang micro-block along the Bangong-Nujiang suture.
Meanwhile, the India subcontinent began to drift northward (Fig. 13d). In the Mesozoic,
shallow marine sedimentation succeeded by terrestrial clastic sedimentation took place in the
Yangtze, Sino-Korean, Tarim and Qaidam blocks (Yin and Nie, 1996; Sobel et al., 2001; Ritt
and Biffi, 2001).
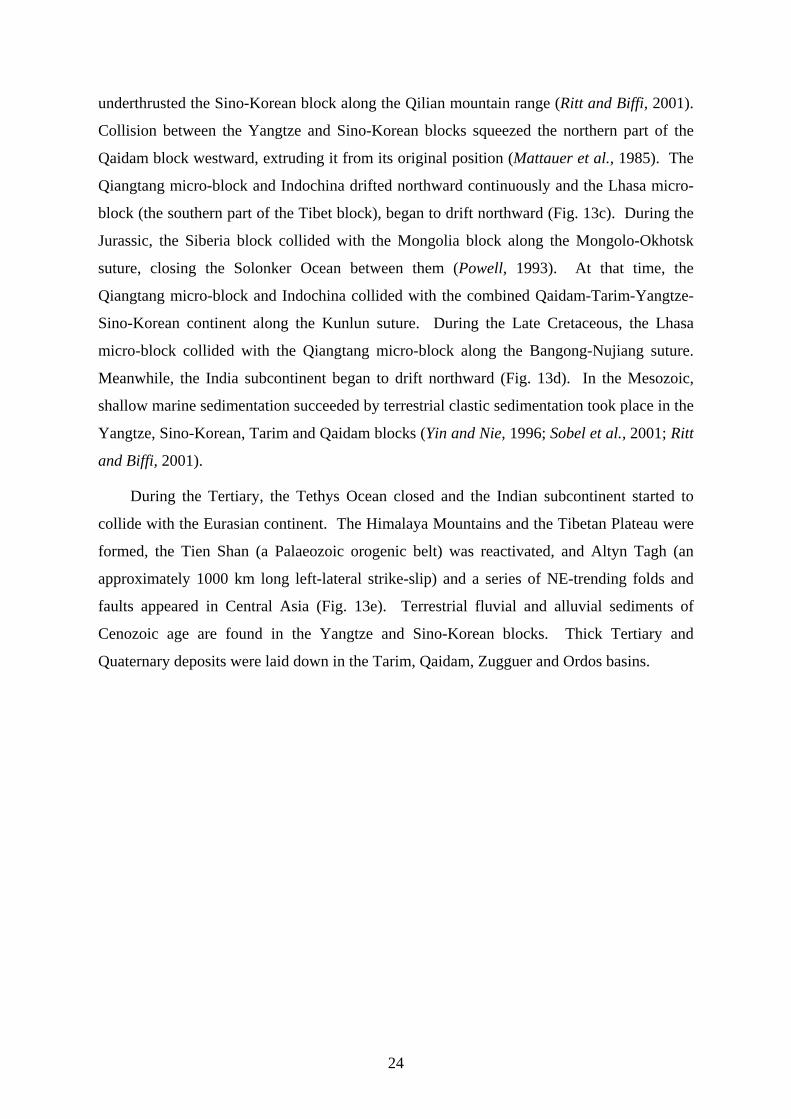
During the Tertiary, the Tethys Ocean closed and the Indian subcontinent started to
collide with the Eurasian continent. The Himalaya Mountains and the Tibetan Plateau were
formed, the Tien Shan (a Palaeozoic orogenic belt) was reactivated, and Altyn Tagh (an
approximately 1000 km long left-lateral strike-slip) and a series of NE-trending folds and
faults appeared in Central Asia (Fig. 13e). Terrestrial fluvial and alluvial sediments of
Cenozoic age are found in the Yangtze and Sino-Korean blocks. Thick Tertiary and
Quaternary deposits were laid down in the Tarim, Qaidam, Zugguer and Ordos basins.
24
Figure 13. Evolution of the major tectonic blocks in Central Asia, beginning in the Protero-
zoic and continuing through the Cenozoic. Adapted from the website of Northern
Arizona University (2001).
25
Chapter 3. Methods
3.1 Introduction The surface faults of a continent are often unrelated to the lithospheric mantle in a
simple manner on account of heterogeneities in the deformational properties of continental
rocks (Lyon-Caen and Molnar, 1984; Watts et al., 1980; Zhao and Morgan, 1987; Burchfiel
and Royden, 1985; Allen et al., 1991; Willett and Beaumount, 1994). The lithosphere of
Tibet has two strong layers, the upper crust and the uppermost mantle, which are decoupled
from each other by a weak lower crust with a lower seismic velocity (Jin et al., 1994;
Herquel et al., 1995; Zeng and Gao, 1995). Therefore, crustal structures derived from
surficial geologic and geodetic information may not correspond to the deep lithospheric
deformations. In such a case, we must rely on geophysical observations to deduce plate
interactions at depth. Reflection and refraction seismic profiles that reveal the locations of
prominent reflectors and lateral variations in seismic velocities often provide the most
straightforward constraints on the lithospheric structure. Thus, our knowledge on the deep
structure of the lithosphere is primarily derived from seismic data. The INDEPTH
(International Deep Profiling of Tibet and the Himalayas) project, for example, improved
significantly our knowledge on the geological structures and evolution of the Tibetan
Plateau. Since 1992, two profiles have been obtained in the framework of this project: the
main INDEPTH profiles extending from the crest of the High Himalayas to the central
Qiangtang Terrane, covering a distance of about 800 km, along which seismic reflection and
broadband earthquake data have been collected, and the INDEPTH magnetotelluric (MT)
profile crossing northern Tibet and extending into the Qaidam Basin (Nelson et al., 1996;
Brown et al., 1996; Kind et al., 1996; Chen et al., 1996).
Seismic data are expensive and time-consuming to acquire, particularly in a moun-
tainous setting. Applying the elastic plate theory of the lithosphere to the interpretation of
gravity and topographic data has also been successful in deducing lithospheric structure in
the oceans and on the continents at a fraction of the cost of a seismic survey (Watts et al.,
1980; McNutt and Menard, 1982; Sheffels and McNutt, 1986; Jin et al., 1996). Plate
tectonics is based on the assumption that the Earth's outermost layer, the lithosphere,
behaves rigidly on large geological time scales. The main evidence for this rigidity has
come from studies of the way the lithosphere responds to surface loads such as ice sheets,
sediments, and volcanoes. By comparing observations of flexure to calculations based on
26
elastic plate models, it is possible to constrain the long-term elastic strength of the
lithosphere.
The lithosphere is the rheologically strong portion of the crust and upper mantle that
does not undergo significant viscous relaxation on the geological time scale and deforms
elastically up to the point when it fails in a brittle or ductile fashion. The thickness of the
mechanical lithosphere is constrained by the depth of faulting and the vertical deflection of
the lithosphere in response to loads (Forsyth, 1985). The mechanical stiffness of a plate is
often described by its flexural rigidity D, which is controlled by the effective elastic
thickness Te of the plate. In response to the weight of a load (topographic or otherwise), the
lithosphere flexures until the deflection of density interfaces and the bending stress within
the plate balance the load.
Application of the elastic plate theory to geological problems are well known and dates
back to Vening Meinesz (1941). Modelling the ocean lithosphere as an elastic plate is
particularly common since the advent of plate tectonics. In most cases, the flexural response
of an oceanic plate takes the form of deformation of its crust. Modelling results show that
the elastic thickness (which is determined by the flexural rigidity) increases with the age of
the lithosphere at the time of loading. Therefore, as the oceanic lithosphere ages and cools,
it becomes more rigid in its response to surface loads. Some of the notable applications have
been loading of the lithosphere by islands, seamounts and bending of downgoing plates in
subduction zones (Judge and McNutt, 1991; McNutt and Menard, 1978; Turcotte et al.,
1978; Walcott, 1970; Watts and Cochran, 1974; Watts and Brink, 1989). For the continental
lithosphere, crustal deformation may not be a response to its deep flexure.
The traditional three dimensional method to calibrate the mechanical strength of the
continental lithosphere is based on the coherence theory of Forsyth (1985), and the method
has been applied to a variety of continents such as Africa (Bechtel et al., 1987), Australia
(Zuber et al., 1989), North America (Bechtel et al., 1990), the Tibetan portion of Asia (Jin et
al., 1994), and western North America (Armstrong and Watts, 2001; Lowry and Smith,
1994). In order to calculate the mechanical strengths of different tectonic blocks within a
continental plate with the coherence method, the study area has to be divided into
rectangular regions of various sizes to approximate the sizes of the tectonic blocks. The
necessity of a rectangular region is a consequence of the coherence theory which uses the
spectral approach and requires a homogeneous mechanical strength within the rectangle.
The spectral approach has its deficiencies. Firstly, a tectonic block is obviously seldom
27
rectangular in shape due to its geological nature. Secondly, the coherence calculation
requires a constant mechanical strength for a block. Unfortunately, a tectonic block is
usually deformed and weakened at its boundary because of interaction with neighbouring
blocks. A good example is the Tarim block. It has a strong core, but is weakened on its
northern and southern edges because boundary crust is skinned during underthrusting
beneath Tibet and the Tien Shan. Thirdly, the spectral calculation requires a proper
rectangle sizes, otherwise the edge effect of Fourier transforms will deteriorate the modelling
result (Lowry and Smith, 1994). Wees (1994) and Jin (1997) developed a 3D finite
difference method in the space domain which takes the natural geometry and inhomogeneity
of tectonic blocks into account.
3.2 Flexure of an elastic lithosphere: theory and model
The topography of the Earth is very varied, from rolling hills to jagged mountain peaks
and deeply-incised river valleys. This topography is often strongly influenced by the
underlying geology. Many events during the Earth's geologic history leave characteristic
topographic imprints. For example, undeformed sedimentary layers have a different
topographic expression compared with folded strata, and igneous rocks can have a distinct
relief. Mountain belts are the result of plate collisions, with accompanying folding and
faulting of rocks, igneous intrusive and extrusive activity, and metamorphism.
Physical and geophysical properties measured on the surface of the Earth reflect the
state of the Earth's interior, rock composition and geological evolution. The Earth’s gravity
field for example yields information on lithospheric deformations. The wavelength of
gravity features depends on the dimension of the corresponding surface deformations as well
as on the subsurface structure. High-resolution gravity and topographic anomalies combined
with forward and "inverse" modelling techniques have often been used to estimate the
geophysical characteristics of the continental elastic lithosphere. Complex near-surface
geological events can be extremely difficult to unravel, even with the aid of borehole
samples. Modern geophysical techniques can help to make a more accurate geologic
interpretation and a better comprehensive site evaluation possible.
The bending of the lithosphere, approximated as an elastic thin plate, can be quantified
using the conservation of angular momentum. Thus, the fundamental equation for the
flexure of a plate considered as a continuous medium is (Turcotte et al., 1978):
28
∫∫∫ ∫∫ ∫∫∫ ×+×=∂∂
×∂∂ dvfrdsTrdv
tur
tvvvv
vv ρ ( 1 )
where rv is the location vector, uv the displacement of a particle in a plate, Tv
the tractional
force on a unit area (which is independent of coordinates), fv
the body force on a unit
volume, ρ the density, s the surface area, v the volume, and t the time.
Because plate movements are slow, a plate can be considered to be in a steady state so
that the left-hand side of equation (1) can be neglected:
∫∫ ∫∫∫ ×+×= dvfrdsTrvvvv0 ( 2 )
Introducing the Levi-Civita symbols ijkε , for which
⎪⎪⎪
⎩
⎪⎪⎪
⎨
⎧
=−
=
=
,0
321 ,213 ,1321
312 ,231 ,1231
otherwise
ijk
ijk
ijk ε
equation (2) becomes:
0=+∫∫ ∫∫∫ dvfxdsTx kjijkkjijk εε 3 ,2 ,1=i ( 3 )
Equation (3) describes flexural bending around the x-axis (i = 1), the y-axis (i = 2), and the z-
axis (i = 3). Rotation around the vertical z-axis is negligible if we do not consider any
rotation between and within tectonic blocks. Then, equation (3) only has terms for which i =
1 and j = 2. Using the Cauchy formula, the traction Tv
is related to the stress ijτ by:
jjijiji nnT ττ ==
where ijτ is stress tensor, and the direction cosine of the stress surface. Thus, equation
(3) becomes:
jn
⎪⎩
⎪⎨⎧
=+
=+
∫∫ ∫∫∫∫∫ ∫∫∫
0
0
22
11
dvfxdsnx
dvfxdsnx
kjjkllkjjk
kjjkllkjjk
ετε
ετε ( 4 )
The lithosphere is a thin plate, its lateral dimension being much larger than its thick-
ness. So, one may assume that the compression perpendicular to the plate and shearing
parallel to the plate can be ignored:
033 == kk ττ 3 ,2 ,1=k
This gives:
29
( )( )∫∫ ∫∫∫
∫∫ ∫∫∫=++
=++−
0
0
22211113
12221123
dvfxdsnnx
dvfxdsnnx
kjjk
kjjk
εττ
εττ ( 5 )
Because
dxdydsndxdzdsndydzdsn === 321 ,,
( ) ( zyxxxx ,,,, 321 ⇔ )
,,, 213312321 dxdxdsndxdxdsndxdxdsn ===
equation (5) becomes:
( )
( )⎪⎩
⎪⎨⎧
=++
=++−
∫∫ ∫∫∫∫∫ ∫∫∫
0
0
2312132113
1312232123
dvfxdxdxdxdxx
dvfxdxdxdxdxx
kjjk
kjjk
εττ
εττ ( 6 )
If the thickness of the plate is h, and the coordinate of the neutral surface is 0, then:
⎪⎪
⎩
⎪⎪
⎨
⎧
=+⎟⎟⎠
⎞⎜⎜⎝
⎛+⎟⎟
⎠
⎞⎜⎜⎝
⎛
=+⎟⎟⎠
⎞⎜⎜⎝
⎛−+⎟⎟
⎠
⎞⎜⎜⎝
⎛−
∫ ∫ ∫∫∫∫∫
∫ ∫ ∫∫∫∫∫
−−
−−
0
0
2132132
223113
2
2
1132232
223123
2
2
dvfxdxdxxdxdxx
dvfxdxdxxdxdxx
kjjk
h
h
h
h
kjjk
h
h
h
h
εττ
εττ
( 7 )
The bending moments can be defined by (Wang, 1984):
⎪⎪⎪⎪⎪
⎩
⎪⎪⎪⎪⎪
⎨
⎧
=
=
=
=
∫
∫
∫
∫
−
−
−
−
33212
221
33122
212
33222
222
33112
211
dxxM
dxxM
dxxM
dxxM
h
h
h
h
h
h
h
h
τ
τ
τ
τ
( 8 )
Here and describe normal bending of the flexural plate around the y- and x-axes
respectively. Similarly, and describe shear bending of the flexural plate around the
y- and x-axes.
11M 22M
12M 21M
Substituting equation (8) into equation (7), we obtain:
∫ ∫ ∫∫∫∫ ∫ ∫∫∫
=++
=+−−
0
0
2112211
1122212
dvfxdxMdxM
dvfxdxMdxM
kjjk
kjjk
ε
ε ( 9 )
30

⎪⎪
⎩
⎪⎪
⎨
⎧
=+∂∂
+∂∂
=+∂∂
−∂∂
−
∫
∫
−
−
0
0
2
232
2
12
1
11
2
231
2
22
1
12
h
h kjjk
h
h kjjk
dxfxx
Mx
M
dxfxx
Mx
M
ε
ε ( 10 )
Taking 2x∂∂ and
1x∂∂ respectively in the above equations, and subtracting one from the
other, we have:
02 22
222
21
122
21
112
=−+∂
∂+
∂∂∂
+∂
∂BA
xM
xxM
xM
( 11 )
where A and are defined by: B
⎟⎟⎠
⎞⎜⎜⎝
⎛∂∂
≡
⎟⎟⎠
⎞⎜⎜⎝
⎛∂∂
≡
∫
∫
−
−
2
231
2
2
232
1
h
h kjjk
h
h kjjk
dxfxx
B
dxfxx
A
ε
ε
It is obvious that
⎟⎟⎠
⎞⎜⎜⎝
⎛
∂∂
= ∫−2
232
1
h
h kjjk dxfxx
A ε
( )
( ) ⎥⎦
⎤⎢⎣
⎡+−
∂∂
=
⎥⎦
⎤⎢⎣
⎡+
∂∂
=
∫
∫
−
−
32
21331
1
2
231323131213
1
dxfxfxx
dxfxfxx
h
h
h
h εε
B ( ) ⎥⎦
⎤⎢⎣
⎡−
∂∂
= ∫− 32
22332
2
dxfxfxx
h
h
By defining the flexure of the lithosphere as:
( ),, 213 xxxw ≡
we have
( )
( )⎪⎪
⎩
⎪⎪
⎨
⎧
⎥⎦
⎤⎢⎣
⎡∂∂
−∂∂
+=
⎥⎦
⎤⎢⎣
⎡∂∂
+∂∂
−−=
∫
∫
−
−
.3222
323
2
2
3111
313
2
2
dxwfxx
fxfB
dxwfxx
fxfA
h
h
h
h
By assuming that the change in body force f can be neglected, i.e.,
31
, 01
1
2
2
1
3
2
3 =∂∂
=∂∂
=∂∂
=∂∂
xf
xf
xf
xf
we have
1
2
22 2
3 3 1 1212 2
22 2
3 3 2 2 3222 2
( )h h
h h x
h h
h h x
w3A f dx f dx dx
x
wB f dx f dx dxx
− −
− −
⎧ ∂= − +⎪ ∂⎪
⎨∂⎪ = −⎪ ∂⎩
∫ ∫ ∫
∫ ∫ ∫
We define horizontal loading as:
. 32
2
2222
312
2111
2
1
⎪⎪⎩
⎪⎪⎨
⎧
≡
≡
∫ ∫
∫ ∫
−
−
dxxdfN
dxxdfN
h
h x
h
h x
This gives: 2
23 3 11 2
12
22
3 3 22 222
( )h
h
h
h
wA f dx Nx
wB f dx Nx
−
−
⎧ ∂= − +⎪ ∂⎪
⎨∂⎪ = −⎪ ∂⎩
∫
∫
where and describe normal tectonic compression or extension of the thin plate in
force per unit length. On substituting
11N 22N
A and into equation (11), we obtain: B
∫−=∂∂
+∂∂
+∂
∂+
∂∂∂
+∂∂ 2
2332
2
2
2221
2
1122
222
21
122
21
112
22h
h dxfxwN
xwN
xM
xxM
xM ( 12 )
Airy isostasy requires that:
( ) tccm ghwg ρρρ =− ,
where is topography, th mρ is mantle density, cρ is crustal density, w is plate flexure, and
is gravitational acceleration. Airy isostasy holds when there is no horizontal support to the
loading on a plate. Thus, the vertical compensation is:
g
( )∫−
+−−=2
2332
h
h tccm ghwgdxf ρρρ ( 13 )
On substituting equation (13) into (12) and converting coordinates (x1, x2, x3) to (x, y, z),
we have (Turcotte and Schubert, 1982):
( ) ( ) ( ) tcyyxxxyyyxx ghyxgw
yyxwN
xyxwN
yxM
yM
xM ρρ =∆+
∂∂
+∂
∂+
∂∂
∂+
∂
∂+
∂∂ ,,,2 2
2
2
22
2
2
2
2
( 14 )
32

If we consider that the lithosphere is purely elastic and isotropic, then, using the
Generalized Hook’s Law, we have:
⎟⎠⎞
⎜⎝⎛
−+
+= ijkkijij v
vv
E δεετ11
, ( 15 )
where E is Young’s modulus, Poisson’s ratio, v ijε the strain tensor, and ijδ the Dirac delta
function. With the thin plate assumption, compression and extension perpendicular to the
plate can be neglected, i.e.,
033 =ε .
We obtain:
⎥⎦⎤
⎢⎣⎡+
=
⎥⎦
⎤⎢⎣
⎡⎟⎠⎞
⎜⎝⎛
−+
+=
⎥⎦
⎤⎢⎣
⎡⎟⎠⎞
⎜⎝⎛
−+
+=
1212
2222
1111
1
11
11
εν
τ
εν
νεν
τ
εν
νεν
τ
E
E
E
kk
kk
where kkε = 11ε + 22ε .
The strain and displacement of a particle are related by:
( )ijjiij ,, uu +=21ε
j
iji x
uu
∂∂
=,
Therefore,
( )
( )1,12,2222
2,21,1211
1
1
uuE
uuE
νν
τ
νν
τ
+−
=
+−
= ( 16 )
=12τ ( )1,22.121
1uuE
++ν
.
We assume there is no shear strain parallel to the thin plate. Thus,
( )
( )⎪⎪⎩
⎪⎪⎨
⎧
=+=
=+=
. uu
uu
,,
,,
021
021
322332
311331
ε
ε
From the above two equations, we can derive the following :
33
⎪⎪
⎩
⎪⎪
⎨
⎧
−=
−=
−=
−=
321,31,2
312,32,1
322,32,2
311,31,1
xuuxuuxuu
xuu
kj
ijki xx
uu
∂∂∂
=2
, . ( 17 )
On substituting equation (17) into (16) and (8), we have:
( )
( ) 323
2
211,322,3222
323
2
222,311,3211
1
1
dxxuuEM
dxxuuEM
h
h
h
h
∫
∫
−
−
+−
−=
+−
−=
νν
νν
−=12M ( )21,312,321
1uuE
++ν ∫−2
23
23
h
h dxx .
This gives:
( )( )
( )( )11,322,32
3
22
22,311,32
3
11
112
112
uuEhM
uuEhM
νν
νν
+−
−=
+−
−= ( 18 )
=12M121
3
12.3huE
ν+− .
We define the flexural rigidity D of the lithosphere as:
( )2
3
112 ν−≡
EhD ( 19 )
Putting the equation (19) into (18), we have:
( )(( )⎪
⎪⎩
⎪⎪⎨
⎧
−−=
+−=
+−=
12,312
11,322,322
22,311,311
1 uDM
uuDM
uuDM
ν
ν
ν
)
)
( 20 )
with . On substituting equation (20) into (14), converting coordinates (x( yxwwu ,3 == 1,
x2, x3) into (x, y, z), and making the symbols consistent, we obtain the fundamental equation
for flexure of the elastic lithosphere (Wees and Cloetingh, 1994; Jin, 1997).
( )⎭⎬⎫
⎩⎨⎧
⎥⎦
⎤⎢⎣
⎡∂∂
+∂∂
∂∂
2
2
2
2
2
2
,yw
xwyxD
xν ( )
⎭⎬⎫
⎩⎨⎧
⎥⎦
⎤⎢⎣
⎡∂∂
+∂∂
∂∂
+ 2
2
2
2
2
2
,xw
ywyxD
yν
( )( ) ⎥⎦
⎤⎢⎣
⎡∂∂
∂−
∂∂∂
+yx
wyxDyx
22
1,2 ν ( ) tcghyxgwywN
xwN ρρ =∆+
∂∂
+∂∂
+ ,2
2
222
2
11 ( 21 )
34

3.3 Finite difference solution to the equation for flexure of an elastic lithosphere
3.3.1 The two-dimensional equation
For the case of a profile, the equation for the flexure of an elastic plate (21) becomes:
( ) ( ) tcghxgwdx
wdNdx
wdxDdxd ρρ =∆++⎥
⎦
⎤⎢⎣
⎡2
2
112
2
2
2
. ( 22 )
We define the finite differences:
( ) dxwww nnn 211 −+ −=′
( ) 211 2 dxwwww nnnn −+ +−=′′
( ) 32112 33 dxwwwww nnnnn −−++ −+−=′′′
( ) ( ) 42112
4 464 dxwwwwww nnnnnn −−++ +−+−=
where n defines a finite node point, n = 1, 2, 3, 4, ……N, and dx is sample interval along
the x-axis. On substituting the above finite difference formulas into equation (22), we obtain:
( )2112 464 −−++ +−+− nnnnnn wwwwwD
( )( 211211 33 −−++−+ )−+−−+ nnnnnn wwwwDD
( )( )112
11 22 −+−+ +−⋅++−+ nnnnnnn wwwPdxDDD
44 dxqwgdx nn =∆+ ρ
where . By combining the terms that are similar, we obtain: n
Npn 11≡
[ ]112 −++ −+ nnnn DDDw
[ ]2111 462 dxPDDDw nnnnn ++−−+ −++
[ ]4211 22210 gdxdxPDDDw nnnnn ρ∆+−−−+ −+
[ ]2111 246 dxPDDDw nnnnn +−+−+ −+−
[ ] 4112 dxqDDDw nnnnn =+−+ −+− . ( 23 )
This leads to a linear equation for (Sheffels and McNutt 1986): w4
22,11,,11,22, dxqwawawawawa nnnnnnnnnnnnnnnn =++++ ++++−−−−
qwA vv = ( 24 )
where
35

⎥⎥⎥⎥⎥⎥⎥⎥⎥
⎦
⎤
⎢⎢⎢⎢⎢⎢⎢⎢⎢
⎣
⎡
=
+
+
−
−
2
1
0
1
2
n
n
n
www
www
w Mv
⎥⎥⎥⎥⎥⎥
⎦
⎤
⎢⎢⎢⎢⎢⎢
⎣
⎡
=
−
n
n
q
1
1
0
Mv Nn L ,2 ,1 ,0=
⎥⎥⎥⎥⎥⎥
⎦
⎤
⎢⎢⎢⎢⎢⎢
⎣
⎡
=
++−−
−
−−
2112
2423222120
1312111011
0201001020
NnNnNnNnNn aaaaa
aaaaaaaaaa
aaaaa
AO
There are N+1 equations and N+5 unknowns, so that , , , can be obtained
using the boundary conditions.
2−w 1−w 1+Nw 2+Nw
3.3.2 The three-dimensional equation
We translate the three dimensional equation for the flexure of an elastic plate (21) into a
finite difference equation (Wees and Cloetingh 1994; Jin 1997):
( )[ ]jjiiijjjijij ,,, vwwD + + ( )[ ]
iiiiijjjijij ,,, wvwD +
+ ( )[ ] ij,ijij,ij wvD −12 + + +jjijjj ,wN iiijii ,wN [ ]gwij ρ∆ = ( 25 ) ijghρc
where jj, and ii, are second order derivatives,
( ) ( )
( ) ( )
( ) ( ) ( )( ) ( )( ) ( )( ) ( )( )
⎪⎪⎪⎪
⎩
⎪⎪⎪⎪
⎨
⎧
⎥⎦
⎤⎢⎣
⎡ −−
−=⎥
⎦
⎤⎢⎣
⎡ −=
+−=
+−=
−−−++−++−+
−+
−+
dxdy
wwdy
wwdy
www
dywww
w
dxwww
w
jijijiji
j
jijijjij
jiijjiiiij
jiijjijjij
2222
2
2
11111111
,
11,
211
,
211
,
The first term on the left-hand side of equation (25) is:
( )[ ]jjiiijjjijij ,,, vwwD +
( ) ( ) ( ) ( )⎥⎦
⎤⎢⎣
⎡⎟⎟⎠
⎞⎜⎜⎝
⎛ +−+
+−= −+−+
211
211 22
dywww
dxwww
D jiijjijiijjiij
( ) ( )
⎪⎩
⎪⎨⎧
⎥⎦
⎤⎢⎣
⎡ +−+
+−= +−+++++
+ 2)1)(1(1)1(1
2)1()2(
)1(2
221dy
wwwv
dxwww
Ddx
jijijijijijiji
36
⎥⎦
⎤⎢⎣
⎡ +−+
+−− −+−+
2)1()1(
2)1()1( 22
2dy
wwwv
dxwww
D jiijjijiijjiij
⎥⎦
⎤⎢⎣
⎡ +−+
+−+ −−−−+−−
− 2)1)(1()1()1)(1(
2)2()1(
)1(
22dy
wwwv
dxwww
D jijijijijiijji
The second term on the left-hand side of equation (25) is:
( )[ ]( ) ( ) ( ) ( )
( )( )( ) ( ) ( )( ) ( ) ( )
( )( )( ) ( ) ( )( ) ( )
⎭⎬⎫⎥⎦
⎤⎢⎣
⎡ +−+
+−+
⎥⎦
⎤⎢⎣
⎡ +−+
+−−
⎩⎨⎧
⎥⎦
⎤⎢⎣
⎡ +−+
+−=
⎥⎦
⎤⎢⎣
⎡⎟⎟⎠
⎞⎜⎜⎝
⎛ +−+
+−=
+
−−−−−+−−
−+−+
++−+++++
−+−+
221
211111
1
211
211
212
211111
12
211
211
22
222
221
22
dywww
dxwww
vD
dywww
dxwww
vD
dywww
dxwww
vDdy
dywww
dxwww
vD
wvwD
)(
)()()()(
)
,
,,,
jijiijjijijiji
jiijjijiijjiij
ijjijijijijiji
ii
jiijjijiijjiij
iiiiijjjijij
The third term on the left-hand side of equation (25) is:
( )[ ] ij,ijij,ij wvD −12
( ) ( ) ( )
ijj,
,
2dyww
vD j1ij1iij
⎥⎥⎦
⎤
⎢⎢⎣
⎡⎟⎟⎠
⎞⎜⎜⎝
⎛ −−= −+12
( ) ( )( ) ( )( ) ( )( ) ( )( )
ij,dy
wwdy
wwdx
vD 1j1i1j1i1j1i1j1iij
⎭⎬⎫
⎩⎨⎧
⎥⎦
⎤⎢⎣
⎡ −−
−−= −−−++−++
222112
( ) ( ) ( )( ) ( ) ( )( ) ( )
⎪⎩
⎪⎨⎧
⎥⎦
⎤⎢⎣
⎡ −−
−−= −−++++
+ dyww
dyww
dxvD
dyjijijiji
ji 22211
22 112112
1
( ) ( ) ( ) ( )( ) ( ) ( )( )
j,dyww
dyww
dxvD jijijiji
ji⎭⎬⎫⎥⎦
⎤⎢⎣
⎡ −−
−−− −−−+−+
− 22211 121121
1
( )( ) ( ) ( )( ) ( ) ( )
⎪⎩
⎪⎨⎧
⎥⎥⎦
⎤
⎢⎢⎣
⎡ −−
−−= ++++
++ dyww
dy
ww
dxvD
dxdyijjijiji
ji 22211
222 2122
11
( )( )( ) ( ) ( )( ) ( )
⎭⎬⎫⎥⎦
⎤⎢⎣
⎡ −−
−−− −+−+
+− dyww
dyww
dxvD jiijjiji
ji 22211 2222
11
( )( ) ( ) ( ) ( )( ) ( )
⎪⎩
⎪⎨⎧
⎥⎦
⎤⎢⎣
⎡ −−
−−− −−++
−+ dyww
dyww
dxvD
dxdyjijiijji
ji 22211
222 2222
11
37

( )( )( ) ( ) ( ) ( )( )
⎭⎬⎫⎥⎦
⎤⎢⎣
⎡ −−
−−− −−−−
−− dyww
dyww
dxvD jijijiij
ji 22211 2222
11
The fourth term on the left-hand side of equation (25) is:
( ) ( )2
11 2dx
wwwNwN ,
−+ +−= jiijji
jjjjijjj
( ) ⎥⎦
⎤⎢⎣
⎡= − 21 dx
Nw jj
ji ⎥⎦
⎤⎢⎣
⎡−+ 2
2dx
Nw jj
ij ( ) ⎥⎦
⎤⎢⎣
⎡+ + 21 dx
Nw jj
ji
The fifth term on the left-hand side of equation (25) is:
( ) ( )2
11 2dy
wwwNwN ,
jiijjiiiiiijii
−+ +−=
( ) ⎥⎦
⎤⎢⎣
⎡= − 21 dy
Nw iiji ⎥
⎦
⎤⎢⎣
⎡−+ 2
2dy
Nw iiij ( ) ⎥
⎦
⎤⎢⎣
⎡+ + 21 dy
Nw iiji
The sixth term on the left-hand side of equation (25) is:
[ ]gwij ρ∆
We combine terms with similar subscripts. There are 25 finite difference terms for each
spatial point ( ,i j ) (Jin and Jiang, 2002):
qwA vv =
a ( )( )22 −− ji ( )( )112281
−−−
= jiDdydxv
a ( ) ji 2− ( ) ( )( ) ( )( )( )11112214 811
−−+−− −−−
+= jijiji DDdydxvD
dy
a ( )( )22 +− ji ( )( )112281
+−−
= jiDdydxv
a ( )( )11 −− ji ( ) ( ) jiji DdydxvD
dydxv
122122 −− +=
a ( ) ji 1− 22
2dydxv
−= ( ) ( ) 2141224
222dyND
dyD
dydxvD
dyvD ii
jijiijij +−−− −−
a ( )( )11 +− ji ( ) ( ) jiji DdydxvD
dydxv
122122 −+ +=
a ( )2−ji ( ) ( )( ) ( )( )( )11112214 811
−−−+− −−−
+= jijiji DDdydxvD
dx
38
a ( )1−ji ( ) ( )122144
222−− −−−= jijiij D
dydxvD
dxD
dx 2222
dxN
Ddydxv jj
ij +−
a ij ( ) ( )1422414
1441−+ +++= jiijijji D
dxD
dydxvD
dxD
dx ( ) ijji DdydxvD
dy 2214
41++ +
( ) ( )( ) ( )( )(1 1 14 4 2 2
4 1 18ij i j i j i j
vD D D Ddy dy dx dy− + + 1 1− +
−+ + + + +
gdyN
dxN
DD iijjjiji ρ∆+−−+ −−−+ 22)1)(1()1)(1(
22)
a ( )1+ji ( ) ( ) 2224122142222
dxN
DdydxvD
dxD
dydxvD
dxjj
ijijjiji +−−−−= ++
a =( )2+ji ( ) ( )( ) ( )( )( )11112214 811
+−+++ −−−
+ jijiji DDdydxvD
dx
a ( )( )11 −+ ji ( ) ( ) jiji DdydxvD
dydxv
122122 +− +=
a ( ) ji 1+ ( ) ( ) 241412
222
2222dyND
dyvD
dyvD
dydxvD
dydxv ii
ijjijiij +−−−−= ++
a ( )( )11 ++ ji ( ) ( ) jiji DdydxvD
dydxv
122122 ++ +=
a ( )( )22 −+ ji ( )( )112281
−+−
= jiDdydxv
a ( ) ji 2+ ( ) ( )( ) ( )( )( )11112214 811
−++++ −−−
+= jijiji DDdydxvD
dy
a ( )( )22 ++ ji ( )( )112281
++−
= jiDdydxv
The other items are zero.
qij = ijghρc
yN , , ,i L321= ; xN , , ,j L321=
Thus, there are ( )( )44 ++ yx NN variables for yx NN × equations. Boundary conditions are
therefore needed to solve these finite difference equations. Because the flexure of the plate
at the boundary is unknown, the simplest assumption at the boundaries is Airy isostasy (Jin,
1997):
ijghρ∆ρgw cij =
39
ijc
ij hwρρ∆
=
We shall also assume that the boundaries are flat. That is,
( ) ( ) 02
0 11, =
−=→=
∂∂ −+
dxww
wxw jiji
jij
( ) ( )11 −=+ ji
ww ji
( ) ( ) 02
0 11, =
−=→=
∂∂ −+
dyww
wyw jiji
iij
( ) ( ) jiww ji 11 −
=+
This gives the boundary conditions for equation (25):
( ) ( )
( ) ( )⎪⎪⎪
⎩
⎪⎪⎪
⎨
⎧
=
=∆
=
−+
−+
jiji
jiji
ijc
ij
ww
ww
hw
11
11
ρρ
xx
yy
N ,N , ,j
N ,N , ,i
101
101
+−=
+−= ( 26 )
The flexure equations (23) and (25) for a two- and three-dimensional elastic plate
respectively are now complete.
We processed the gravity data from the Tien Shan and the northern and northwestern
margins of Tibet, Altyn Tagh and West Kunlun using the 2D elastic plate equation (22) for
pairs of variably-rigid elastic plates subjected to vertical and horizontal loads, shear forces,
and terminal bending moments. Because of the lack of constraints on the structure of the
upper mantle beneath this area, we had to allow for a considerable latitude in possible plate
models. For example, we searched for the best fitting models by assuming either one
continuous plate beneath our study area or two separate plates (a severed plate). The elastic
thickness of the plate or plates was allowed to vary laterally, and we had to consider the
possibility of lateral compression on the system. The corresponding gravity was computed
using the 2D Okabe's (1979) formula. The crust and mantle densities assigned are 2670
kg/m
h
3 and 3300 kg/m3 respectively.
In our 3D model, we allowed the mechanical strengths of the lithosphere to vary
according to the geological nature of each tectonic block. Firstly, we assumed that the
effective lithospheric elastic thickness is (rigidity h D ), and calculated the flexure based
on the equation (25). Using the gravity formula of Parker (1972), the theoretical gravity
w
40
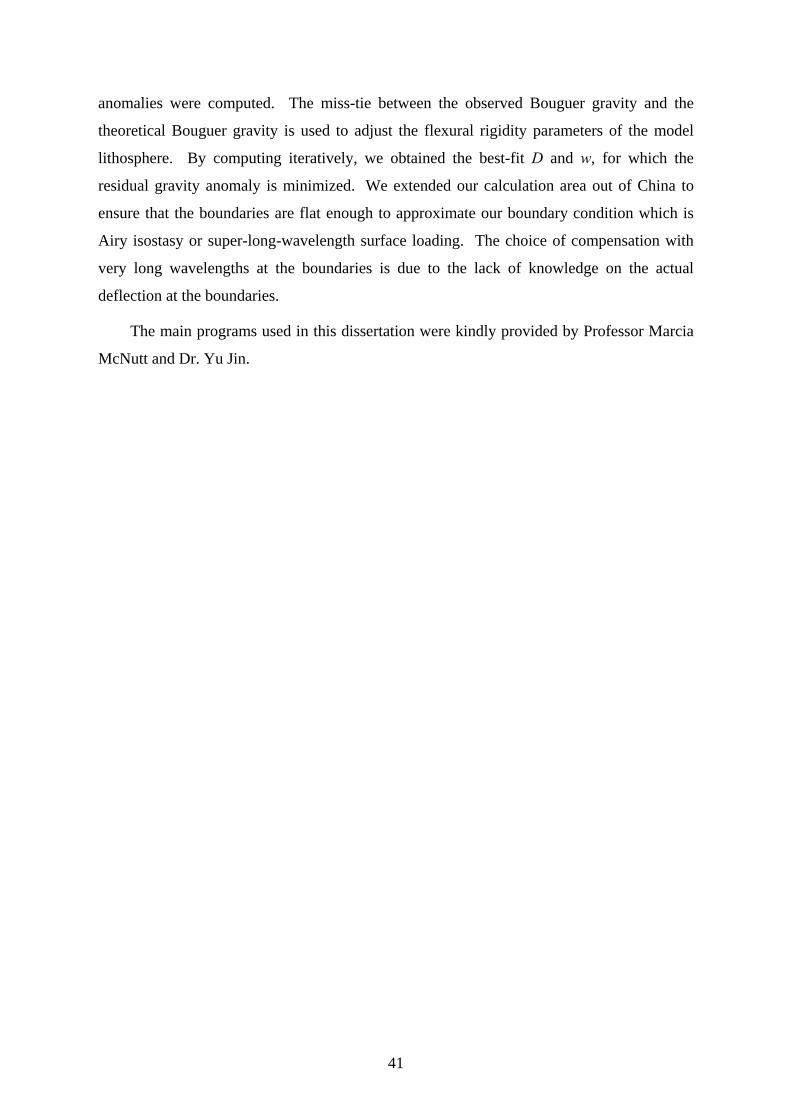
anomalies were computed. The miss-tie between the observed Bouguer gravity and the
theoretical Bouguer gravity is used to adjust the flexural rigidity parameters of the model
lithosphere. By computing iteratively, we obtained the best-fit D and w, for which the
residual gravity anomaly is minimized. We extended our calculation area out of China to
ensure that the boundaries are flat enough to approximate our boundary condition which is
Airy isostasy or super-long-wavelength surface loading. The choice of compensation with
very long wavelengths at the boundaries is due to the lack of knowledge on the actual
deflection at the boundaries.
The main programs used in this dissertation were kindly provided by Professor Marcia
McNutt and Dr. Yu Jin.
41
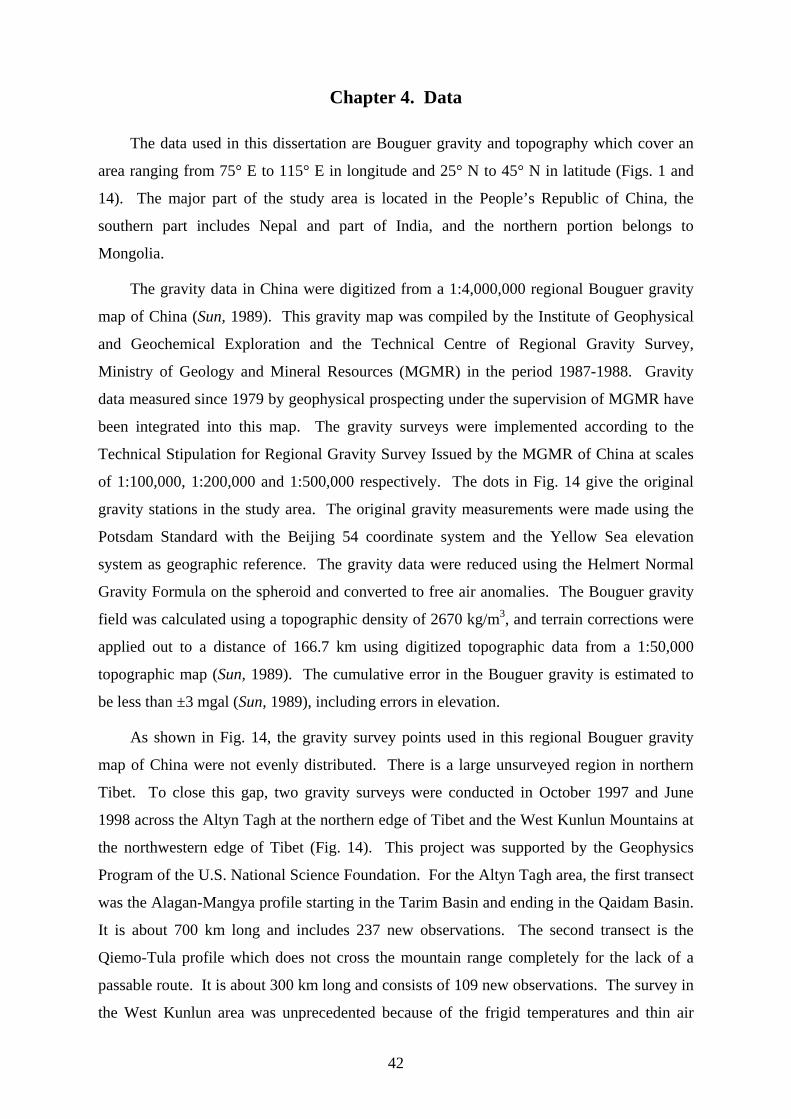
Chapter 4. Data
The data used in this dissertation are Bouguer gravity and topography which cover an
area ranging from 75° E to 115° E in longitude and 25° N to 45° N in latitude (Figs. 1 and
14). The major part of the study area is located in the People’s Republic of China, the
southern part includes Nepal and part of India, and the northern portion belongs to
Mongolia.
The gravity data in China were digitized from a 1:4,000,000 regional Bouguer gravity
map of China (Sun, 1989). This gravity map was compiled by the Institute of Geophysical
and Geochemical Exploration and the Technical Centre of Regional Gravity Survey,
Ministry of Geology and Mineral Resources (MGMR) in the period 1987-1988. Gravity
data measured since 1979 by geophysical prospecting under the supervision of MGMR have
been integrated into this map. The gravity surveys were implemented according to the
Technical Stipulation for Regional Gravity Survey Issued by the MGMR of China at scales
of 1:100,000, 1:200,000 and 1:500,000 respectively. The dots in Fig. 14 give the original
gravity stations in the study area. The original gravity measurements were made using the
Potsdam Standard with the Beijing 54 coordinate system and the Yellow Sea elevation
system as geographic reference. The gravity data were reduced using the Helmert Normal
Gravity Formula on the spheroid and converted to free air anomalies. The Bouguer gravity
field was calculated using a topographic density of 2670 kg/m3, and terrain corrections were
applied out to a distance of 166.7 km using digitized topographic data from a 1:50,000
topographic map (Sun, 1989). The cumulative error in the Bouguer gravity is estimated to
be less than ±3 mgal (Sun, 1989), including errors in elevation.
As shown in Fig. 14, the gravity survey points used in this regional Bouguer gravity
map of China were not evenly distributed. There is a large unsurveyed region in northern
Tibet. To close this gap, two gravity surveys were conducted in October 1997 and June
1998 across the Altyn Tagh at the northern edge of Tibet and the West Kunlun Mountains at
the northwestern edge of Tibet (Fig. 14). This project was supported by the Geophysics
Program of the U.S. National Science Foundation. For the Altyn Tagh area, the first transect
was the Alagan-Mangya profile starting in the Tarim Basin and ending in the Qaidam Basin.
It is about 700 km long and includes 237 new observations. The second transect is the
Qiemo-Tula profile which does not cross the mountain range completely for the lack of a
passable route. It is about 300 km long and consists of 109 new observations. The survey in
the West Kunlun area was unprecedented because of the frigid temperatures and thin air
42
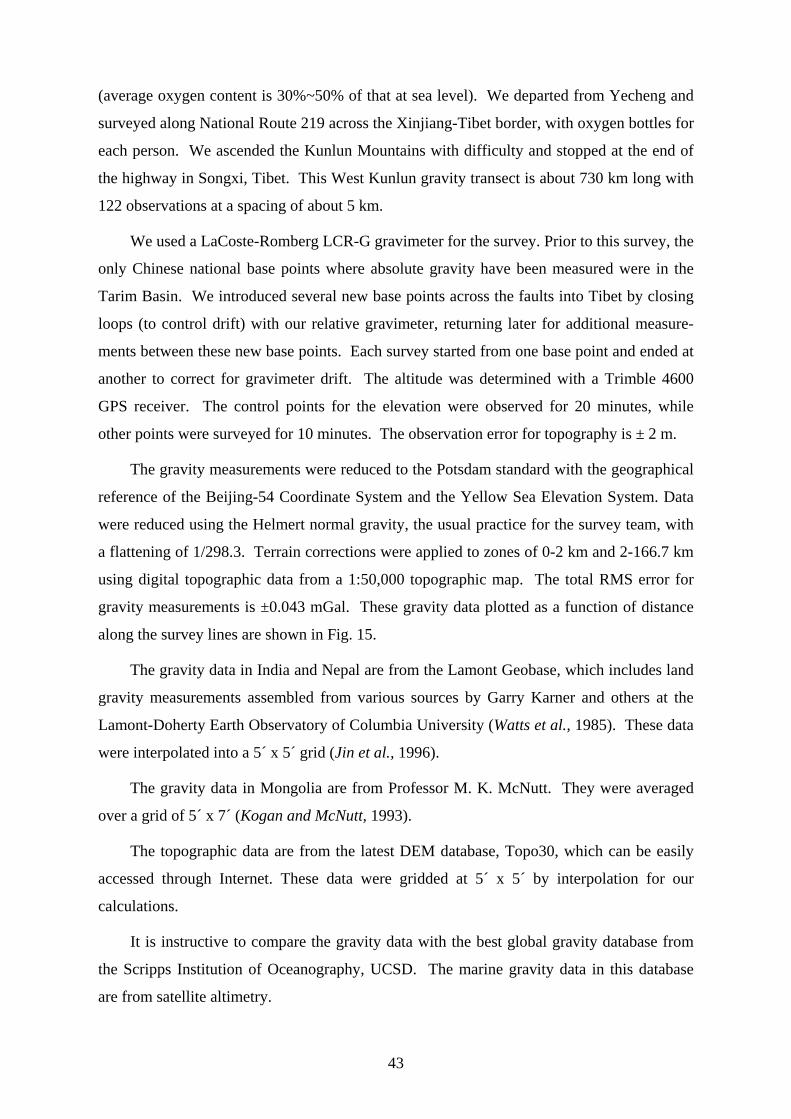
(average oxygen content is 30%~50% of that at sea level). We departed from Yecheng and
surveyed along National Route 219 across the Xinjiang-Tibet border, with oxygen bottles for
each person. We ascended the Kunlun Mountains with difficulty and stopped at the end of
the highway in Songxi, Tibet. This West Kunlun gravity transect is about 730 km long with
122 observations at a spacing of about 5 km.
We used a LaCoste-Romberg LCR-G gravimeter for the survey. Prior to this survey, the
only Chinese national base points where absolute gravity have been measured were in the
Tarim Basin. We introduced several new base points across the faults into Tibet by closing
loops (to control drift) with our relative gravimeter, returning later for additional measure-
ments between these new base points. Each survey started from one base point and ended at
another to correct for gravimeter drift. The altitude was determined with a Trimble 4600
GPS receiver. The control points for the elevation were observed for 20 minutes, while
other points were surveyed for 10 minutes. The observation error for topography is ± 2 m.
The gravity measurements were reduced to the Potsdam standard with the geographical
reference of the Beijing-54 Coordinate System and the Yellow Sea Elevation System. Data
were reduced using the Helmert normal gravity, the usual practice for the survey team, with
a flattening of 1/298.3. Terrain corrections were applied to zones of 0-2 km and 2-166.7 km
using digital topographic data from a 1:50,000 topographic map. The total RMS error for
gravity measurements is ±0.043 mGal. These gravity data plotted as a function of distance
along the survey lines are shown in Fig. 15.
The gravity data in India and Nepal are from the Lamont Geobase, which includes land
gravity measurements assembled from various sources by Garry Karner and others at the
Lamont-Doherty Earth Observatory of Columbia University (Watts et al., 1985). These data
were interpolated into a 5´ x 5´ grid (Jin et al., 1996).
The gravity data in Mongolia are from Professor M. K. McNutt. They were averaged
over a grid of 5´ x 7´ (Kogan and McNutt, 1993).
The topographic data are from the latest DEM database, Topo30, which can be easily
accessed through Internet. These data were gridded at 5´ x 5´ by interpolation for our
calculations.
It is instructive to compare the gravity data with the best global gravity database from
the Scripps Institution of Oceanography, UCSD. The marine gravity data in this database
are from satellite altimetry.
43
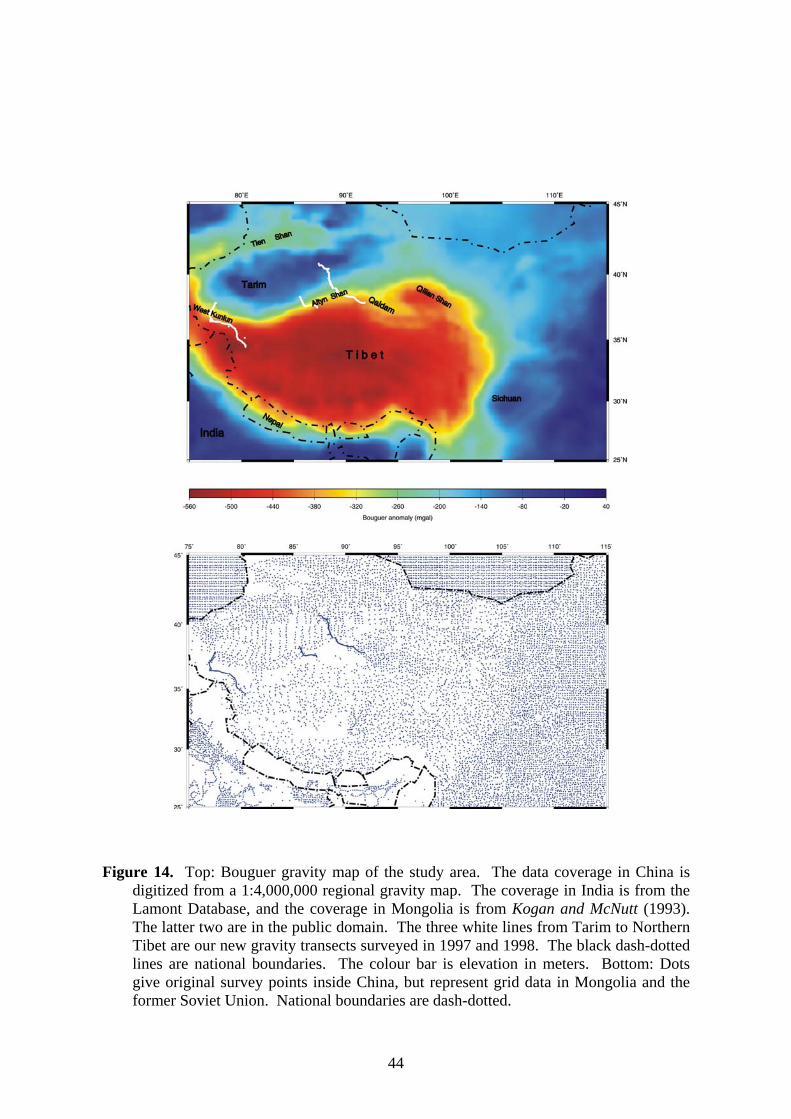
Figure 14. Top: Bouguer gravity map of the study area. The data coverage in China is digitized from a 1:4,000,000 regional gravity map. The coverage in India is from the Lamont Database, and the coverage in Mongolia is from Kogan and McNutt (1993). The latter two are in the public domain. The three white lines from Tarim to Northern Tibet are our new gravity transects surveyed in 1997 and 1998. The black dash-dotted lines are national boundaries. The colour bar is elevation in meters. Bottom: Dots give original survey points inside China, but represent grid data in Mongolia and the former Soviet Union. National boundaries are dash-dotted.
44
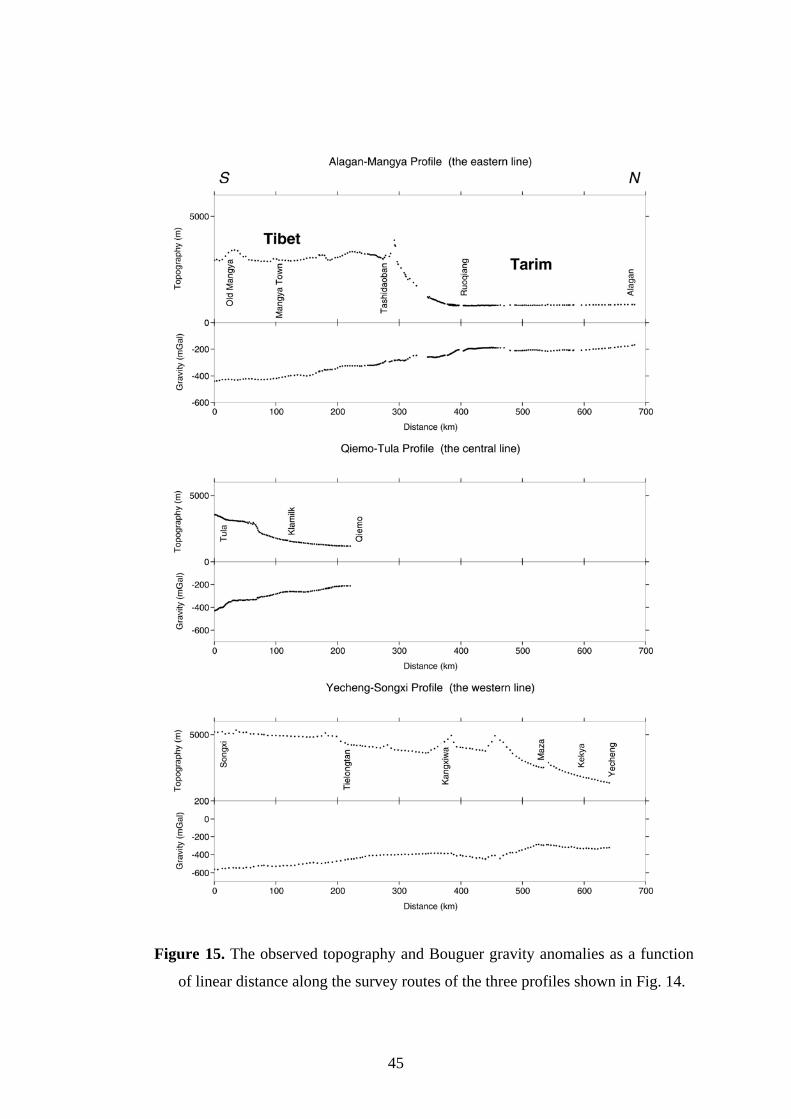
Figure 15. The observed topography and Bouguer gravity anomalies as a function
of linear distance along the survey routes of the three profiles shown in Fig. 14.
45
If waves, winds, tides and currents are ignored, the surface of the ocean is an "equi-
potential surface" of the Earth's gravity field. This equi-potential surface of the earth is
approximately an ellipsoid of revolution. While this ellipsoidal shape fits the earth remark-
ably well, the actual ocean surface deviates from this ideal ellipsoid. The bumps and dips in
the ocean surface are caused by minute variations in the Earth's gravitational field. Using a
very accurate radar mounted on a satellite, these tiny bumps and dips in the geoid height can
be measured. The height of the satellite above the ellipsoid h* is measured by tracking the
satellite from a globally-distributed network of laser stations, and the height of the satellite
above the closest ocean surface h is measured with a microwave radar. The geoid height H is
approximately equal to h* – h. These raw geoid heights are converted into grids of gravity
anomaly (Sandwell and Smith, 1997), which can then be compared with shipboard gravity
measurements.
Land gravity cannot be measured yet by satellite altimetry, though ideally this can be
done by measuring variations in the Doppler wave velocity from a satellite. The grid gravity
data in the Scripps Global Gravity Database is an integration of existing land gravity and
satellite gravity (Sandwell and Smith, 1997). This database shows that the average gravity
anomaly over the Tibetan Plateau is –300 mgal; our land gravity anomalies on the plateau
however average at –500 mgal. CMP seismic reflection results of the Tibet INDEPTH
project and earthquake focal depths indicate that the average crustal thickness is about 70 km
(Makovsky et al., 1996; Nelson et al., 1996), suggesting that our gravity anomaly average of
–500 mgal is probably more reliable.
Commercial gravity databases such as that from the company GEOTECH are available
but very expensive. It is not known whether Chinese gravity data are incorporated into these
commercial databases. Apart from commercial gravity databases, the price and resolution of
which are unknown to us, our gravity data are currently the best data available
46
Chapter 5. Results
5.1 Flexural modelling of the laterally varying elastic strength of the lithosphere in
Central Asia
Estimation of the mechanical strength of the Earth’s lithosphere helps earth scientists
to better understand the processes of global tectonics as well as inter- and intra-plate
deformations. The average mechanical strengths of plates vary from one plate to another.
Within a plate, the mechanical strength can also change from one tectonic block to another
due to variations in tectonic evolution and accretion history from block to block. Plate
interactions may reactivate zones of weakness between tectonic blocks in a plate, and
induce significant earthquakes and faulting. Brittle failure associated with faulting together
with a weak middle/lower crust may decouple upper crustal deformations from deforma-
tions of the upper mantle, or a new plate boundary may form if deformations are coupled
throughout the lithosphere. The elastic thickness of the lithosphere (Te) is an excellent
physical parameter to measure the extent of deformation of different tectonic blocks. Weak
blocks (or weak zones) with low Te values tend to deform first under the same background
tectonic stress field (in this case the compressional stress field caused by the convergence
between India and Eurasia).
One of the important scientific questions tackled in this dissertation is: To what extent
do the upper crustal deformations in Central Asia resulting from the convergence between
India and Eurasia weaken the underlying lithosphere? To try to answer this question, the
elastic strengths of each tectonic unit is calculated using numerical 3D modelling of the
gravity and topographic data (see Chapter 3).
Because flexure of the plate at its boundary is unknown, we assumed Airy isostasy at
the boundaries for the 3D flexural equation (25). The geometry of our study area was
chosen in such a way that our boundary condition, namely that Airy isostasy is established
or the wavelengths of the surface loads are extremely long, is approximately valid. Results
for the test of Airy isostasy at the boundaries of our study area are shown in Fig. 16.
The 3D flexural model allows the mechanical strength of the lithosphere to be varied
according to the geological nature of each tectonic block in the study area. Topographic
data are used as an input loading force to calculate the flexure of the elastic lithosphere, and
the flexure is converted to flexural stress field and elastic rigidity of the plate. The initial
model in our calculations assumed that Central Asia has an average elastic thickness of 40
47
km (Lyon-Caen and Molnar, 1984; Jin et al., 1994, 1996), and that the corresponding value
for India is 80 km (Karner and Watts, 1983; Lyon-Caen and Molnar, 1983) (Fig. 17). The
stress was calculated iteratively by adjusting the flexural rigidity parameters of the model
lithosphere until the observed gravity and topography are well approximated. The best fit
was reached after six iterations, and the corresponding effective elastic thickness (Te)
distribution is shown in Fig. 18. This figure shows significant variations in the strength of
the lithosphere in Central Asia. There are five weak belts where the elastic thickness is less
than 15 km. They correspond to the following five tectonic belts from south to north:
Indus-Zhangbo suture, West Kunlun Fault, Altyn Tagh Fault, Qilian suture and Tien Shan
suture. A moderately rigid (Te = 40-50 km) lithosphere characterizes the tectonic units
Mongolia, Sino-Korea, Yangtze, Tarim and Qaidam blocks, Zungar Basin, East Tien Shan,
and eastern Tibetan Plateau. Thus, the old, stable Chinese continent does not have a higher
lithospheric rigidity. Te remains within the range of 40-50 km even when we increase the
initial average elastic thickness of 40 km to 50 km and then to 60 km, suggesting that the
moderate rigidity is not an artefact.
The miss-tie between the observed Bouguer gravity and the calculated Bouguer gravity
was used as a measure of the goodness of fit of the model. We calculated the Bouguer
gravity from lithospheric flexure with the best-fit Te (Fig. 19). Figure 20 shows the residual
anomalies of this model (the difference between the observed and the calculated Bouguer
anomalies at the best fit). For comparison, the initial residuals between the observed
Bouguer anomalies and the values calculated with the initial elastic thickness distribution
are shown in Fig. 21. The best-fit RMS residual is 24.54 mgal, which is significantly lower
than the initial RMS residual of 34.84 mgal. Fig. 20 shows that, over large parts of the
study area, the best-fit gravity residuals are close to zero. Exceptions include the large
positive residuals in southwestern Tibet north of the Indian subcontinent, which may be
artefacts since here, gravity survey stations are lacking (Fig. 22). In addition, large negative
residuals are found in the Tarim, Zungar, Qaidam, Sichuan and Gangetic basins and a large
positive linear residual anomaly occurs at the southern boundary of Tibet (Fig. 23). The
negative residuals in the basins are probably a result of lateral lithospheric density
variations. Structural maps of the basement of the Tarim, Qaidam, Zungar and Sichuan
basins based on oil exploration seismic data suggest that the maximum sediment thick-
nesses reach 12 km (Teng et al., 1991; Figs. 24-27). Contributions to the Bouguer gravity
by these thick, lower-density sediments in the four basins are estimated to be over 100 mgal
48
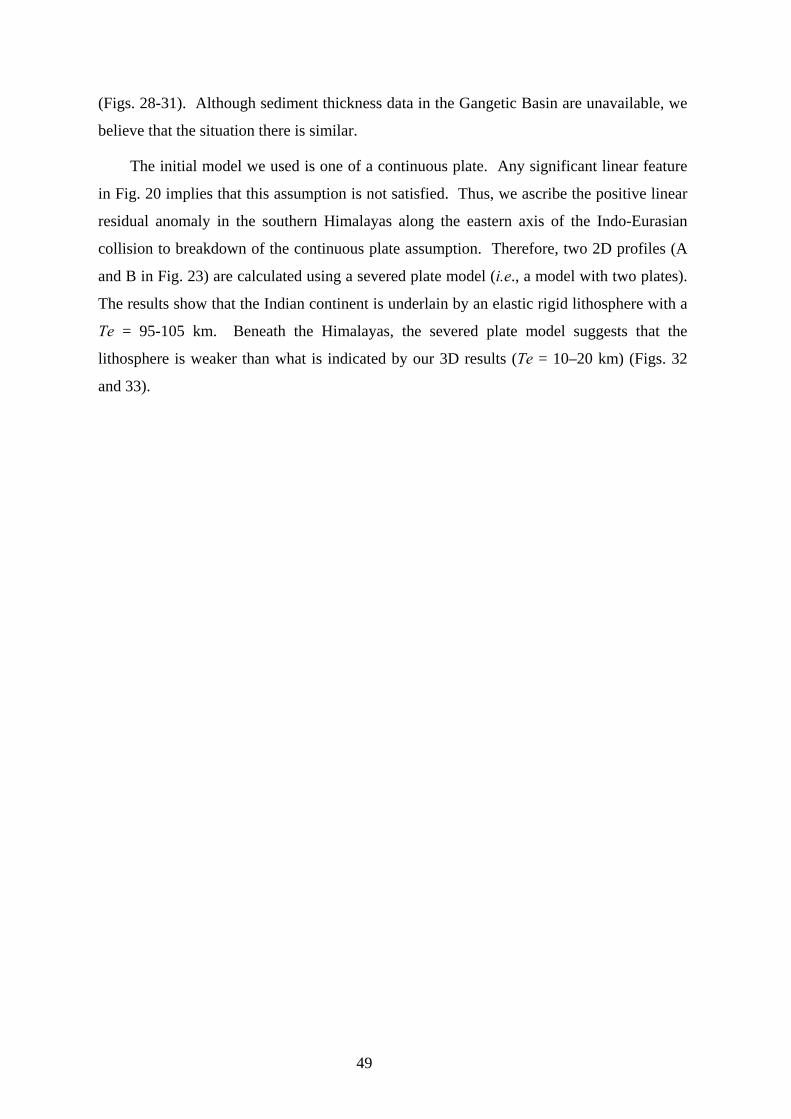
(Figs. 28-31). Although sediment thickness data in the Gangetic Basin are unavailable, we
believe that the situation there is similar.
The initial model we used is one of a continuous plate. Any significant linear feature
in Fig. 20 implies that this assumption is not satisfied. Thus, we ascribe the positive linear
residual anomaly in the southern Himalayas along the eastern axis of the Indo-Eurasian
collision to breakdown of the continuous plate assumption. Therefore, two 2D profiles (A
and B in Fig. 23) are calculated using a severed plate model (i.e., a model with two plates).
The results show that the Indian continent is underlain by an elastic rigid lithosphere with a
Te = 95-105 km. Beneath the Himalayas, the severed plate model suggests that the
lithosphere is weaker than what is indicated by our 3D results (Te = 10–20 km) (Figs. 32
and 33).
49
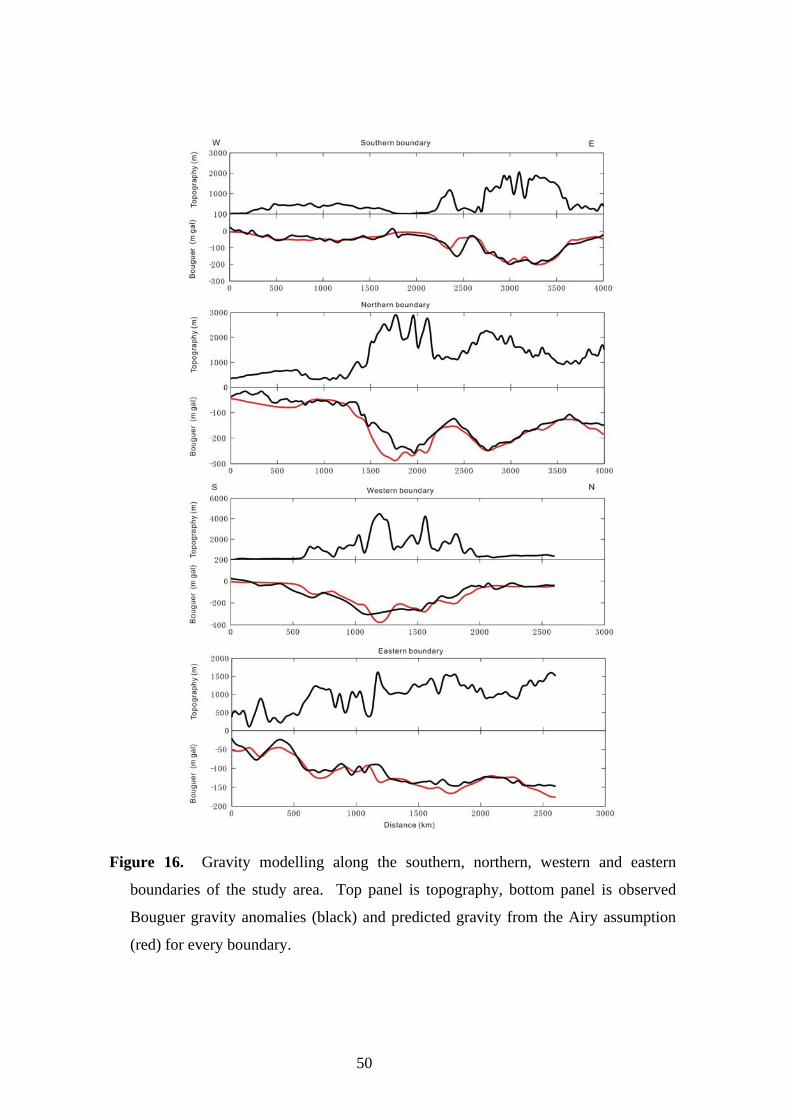
Figure 16. Gravity modelling along the southern, northern, western and eastern
boundaries of the study area. Top panel is topography, bottom panel is observed
Bouguer gravity anomalies (black) and predicted gravity from the Airy assumption
(red) for every boundary.
50
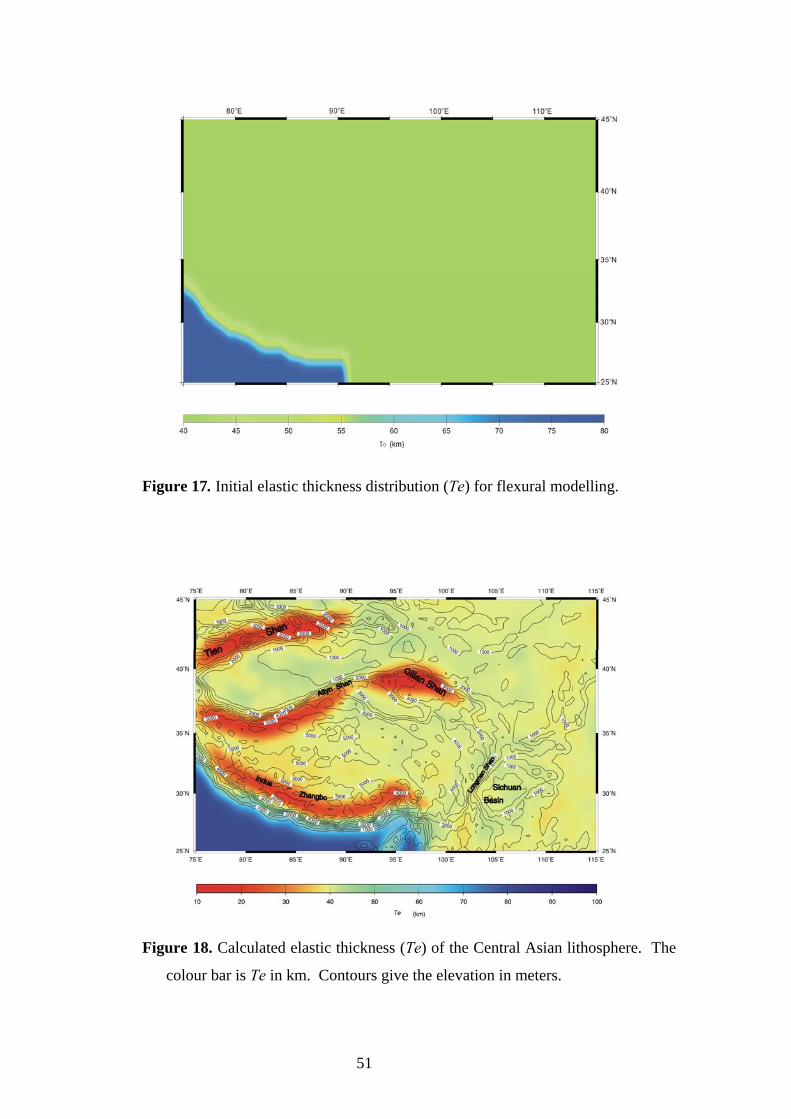
Figure 17. Initial elastic thickness distribution (Te) for flexural modelling.
Figure 18. Calculated elastic thickness (Te) of the Central Asian lithosphere. The
colour bar is Te in km. Contours give the elevation in meters.
51
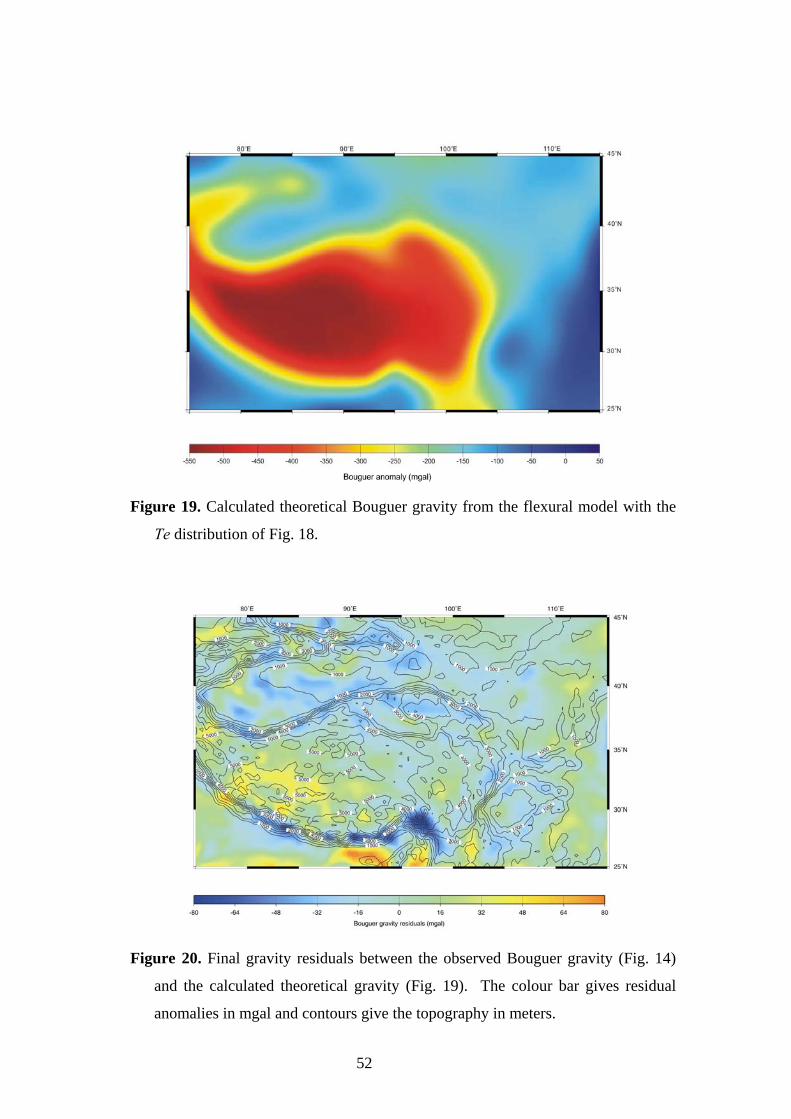
Figure 19. Calculated theoretical Bouguer gravity from the flexural model with the
Te distribution of Fig. 18.
Figure 20. Final gravity residuals between the observed Bouguer gravity (Fig. 14)
and the calculated theoretical gravity (Fig. 19). The colour bar gives residual
anomalies in mgal and contours give the topography in meters.
52
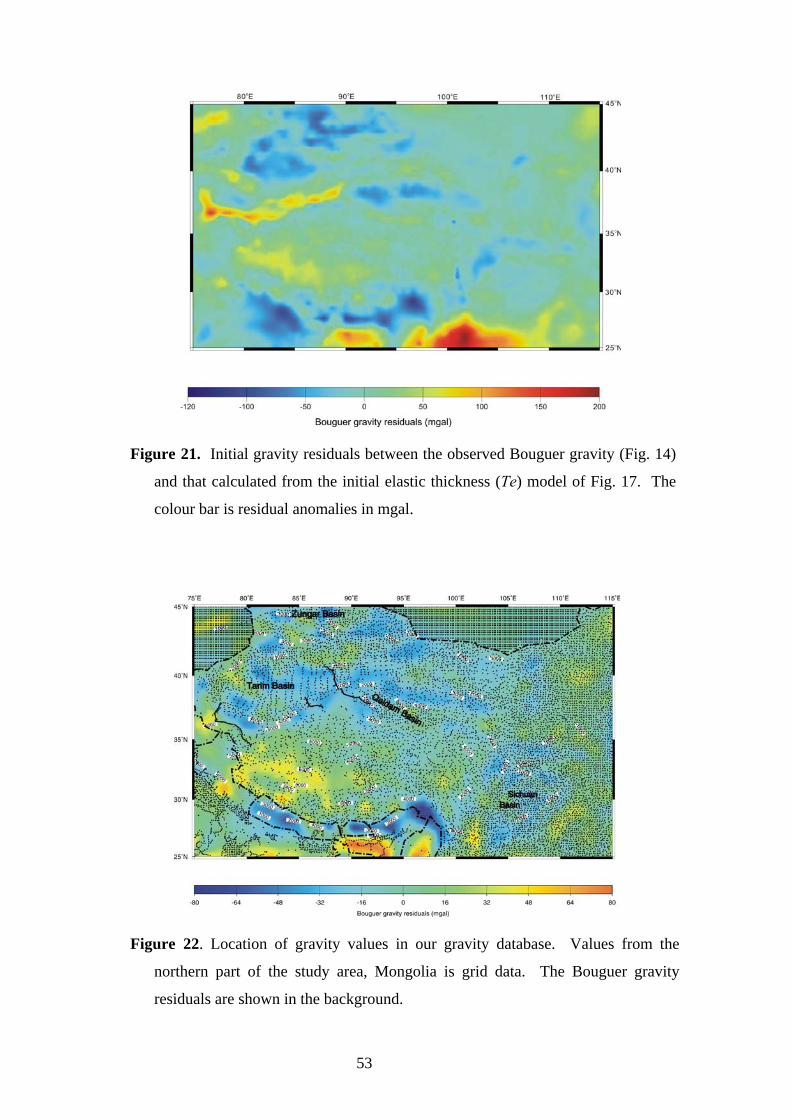
Figure 21. Initial gravity residuals between the observed Bouguer gravity (Fig. 14)
and that calculated from the initial elastic thickness (Te) model of Fig. 17. The
colour bar is residual anomalies in mgal.
Figure 22. Location of gravity values in our gravity database. Values from the
northern part of the study area, Mongolia is grid data. The Bouguer gravity
residuals are shown in the background.
53
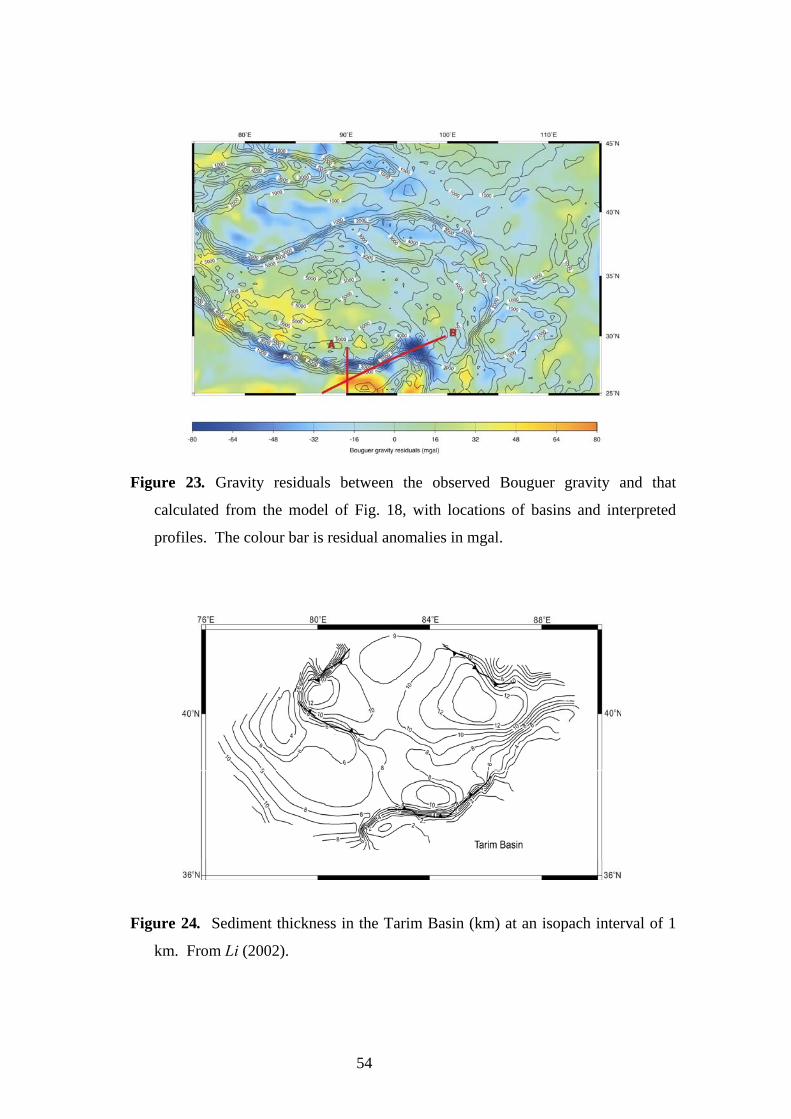
Figure 23. Gravity residuals between the observed Bouguer gravity and that
calculated from the model of Fig. 18, with locations of basins and interpreted
profiles. The colour bar is residual anomalies in mgal.
Figure 24. Sediment thickness in the Tarim Basin (km) at an isopach interval of 1
km. From Li (2002).
54
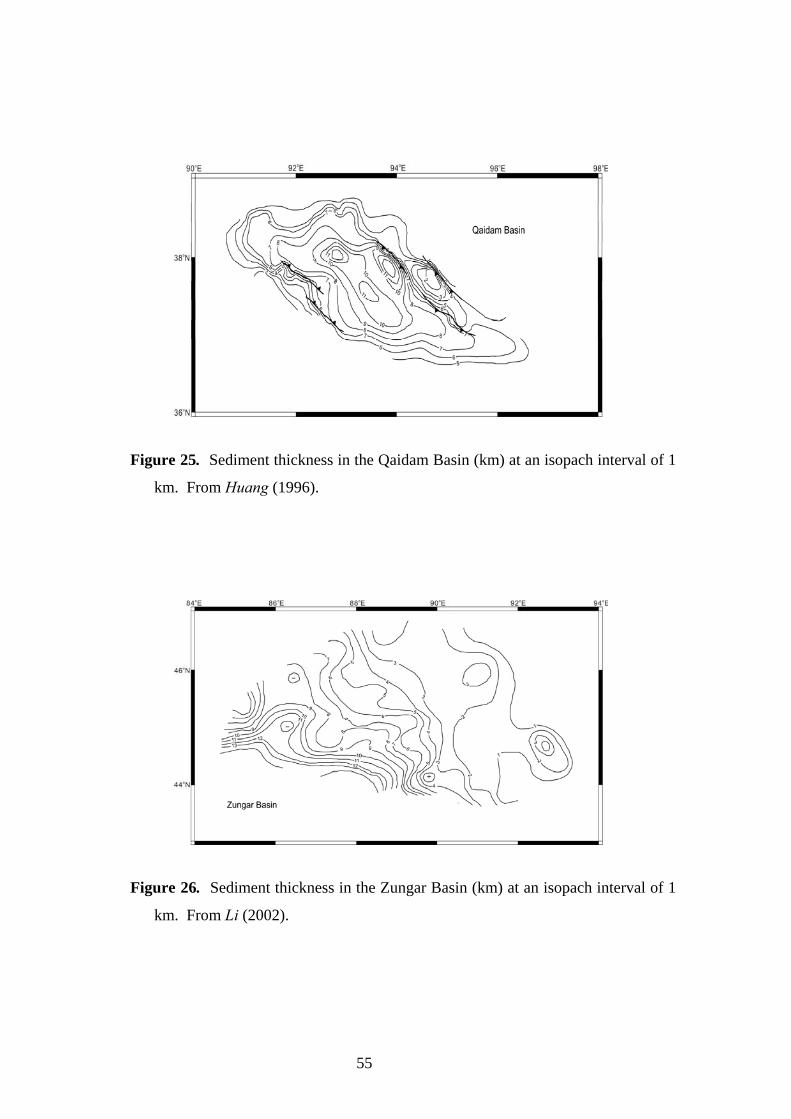
Figure 25. Sediment thickness in the Qaidam Basin (km) at an isopach interval of 1
km. From Huang (1996).
Figure 26. Sediment thickness in the Zungar Basin (km) at an isopach interval of 1
km. From Li (2002).
55

Figure 27. Sediment thickness in the Sichuan Basin (km) at an isopach interval of 1
km. From Song and Lou (1995).
Figure 28. Predicted Bouguer gravity with sediment correction in the Tarim Basin
in mgal at 10 mgal intervals.
56
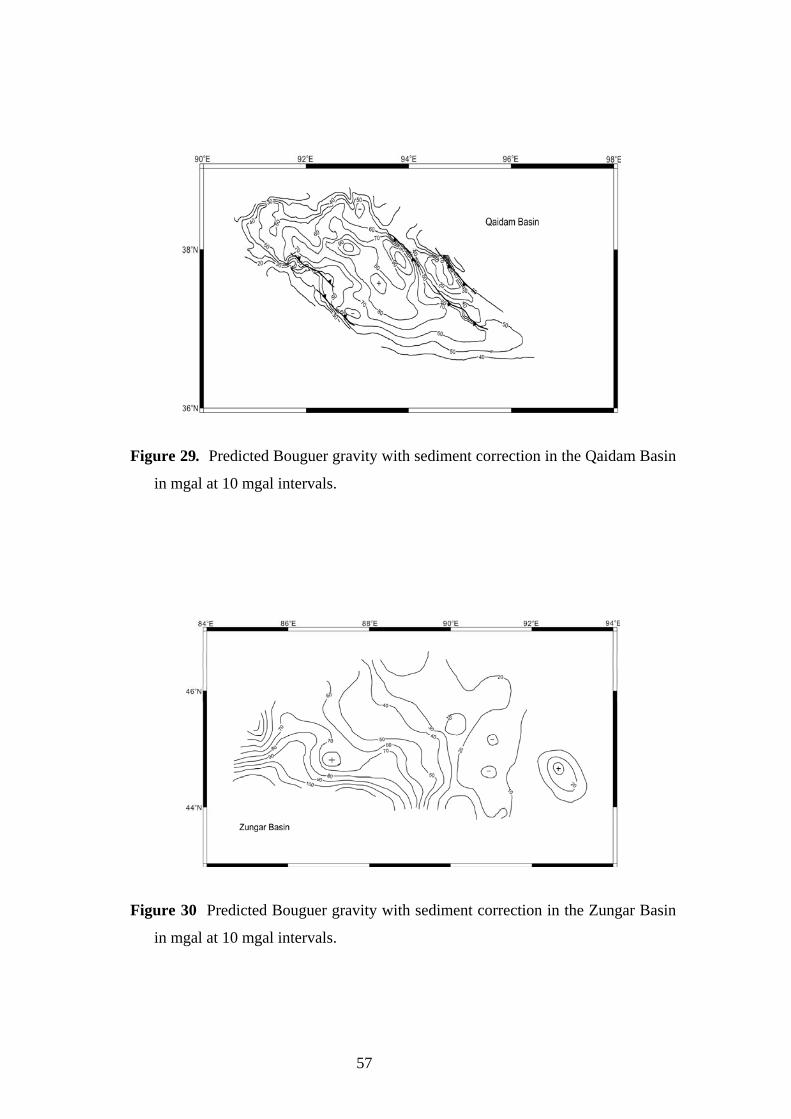
Figure 29. Predicted Bouguer gravity with sediment correction in the Qaidam Basin
in mgal at 10 mgal intervals.
Figure 30 Predicted Bouguer gravity with sediment correction in the Zungar Basin
in mgal at 10 mgal intervals.
57
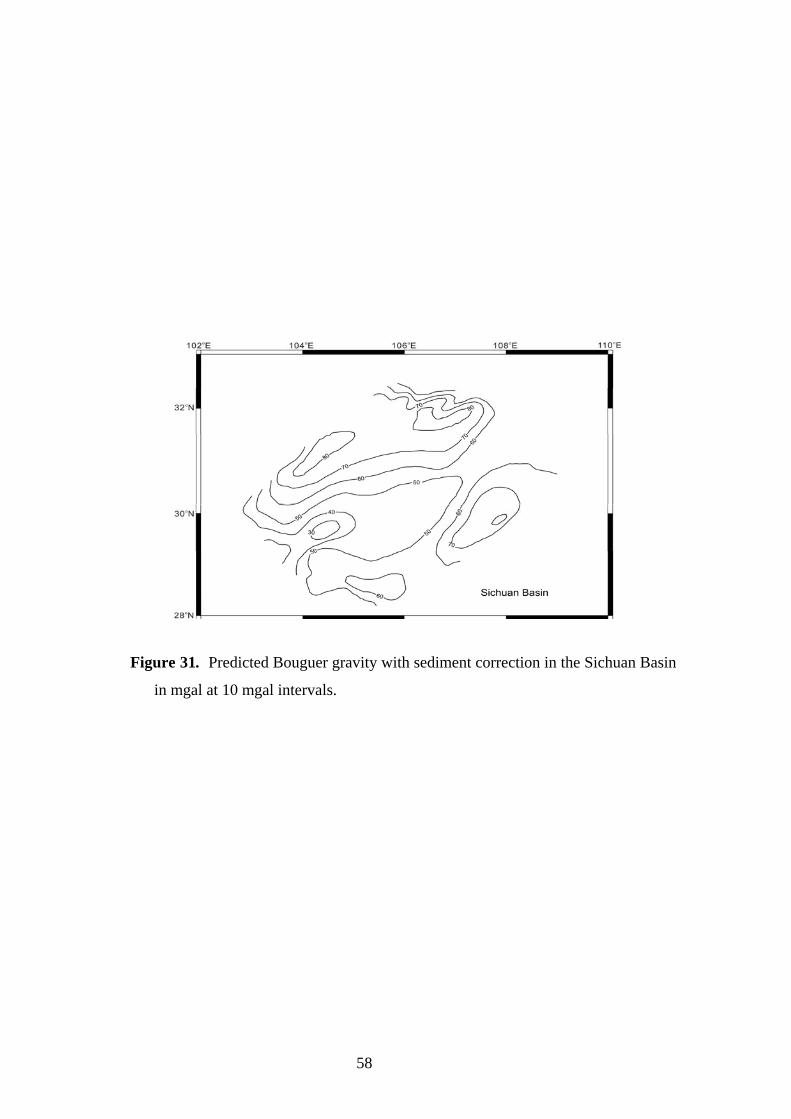
Figure 31. Predicted Bouguer gravity with sediment correction in the Sichuan Basin
in mgal at 10 mgal intervals.
58
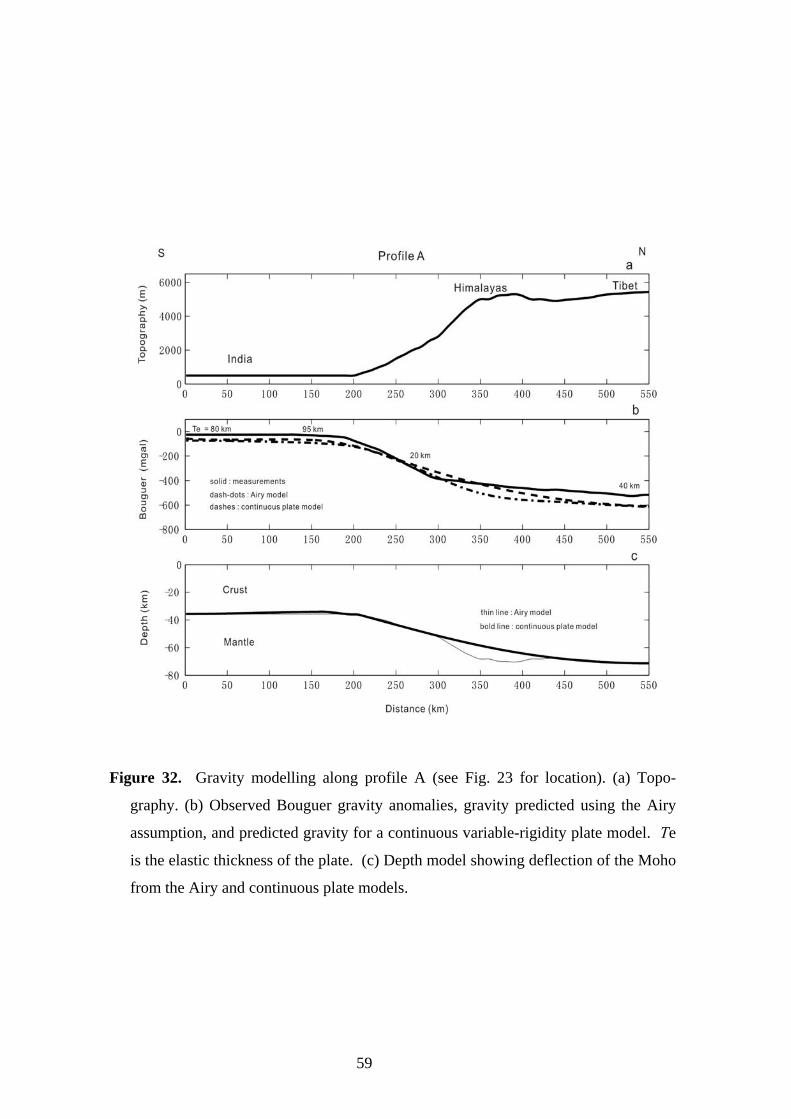
Figure 32. Gravity modelling along profile A (see Fig. 23 for location). (a) Topo-
graphy. (b) Observed Bouguer gravity anomalies, gravity predicted using the Airy
assumption, and predicted gravity for a continuous variable-rigidity plate model. Te
is the elastic thickness of the plate. (c) Depth model showing deflection of the Moho
from the Airy and continuous plate models.
59
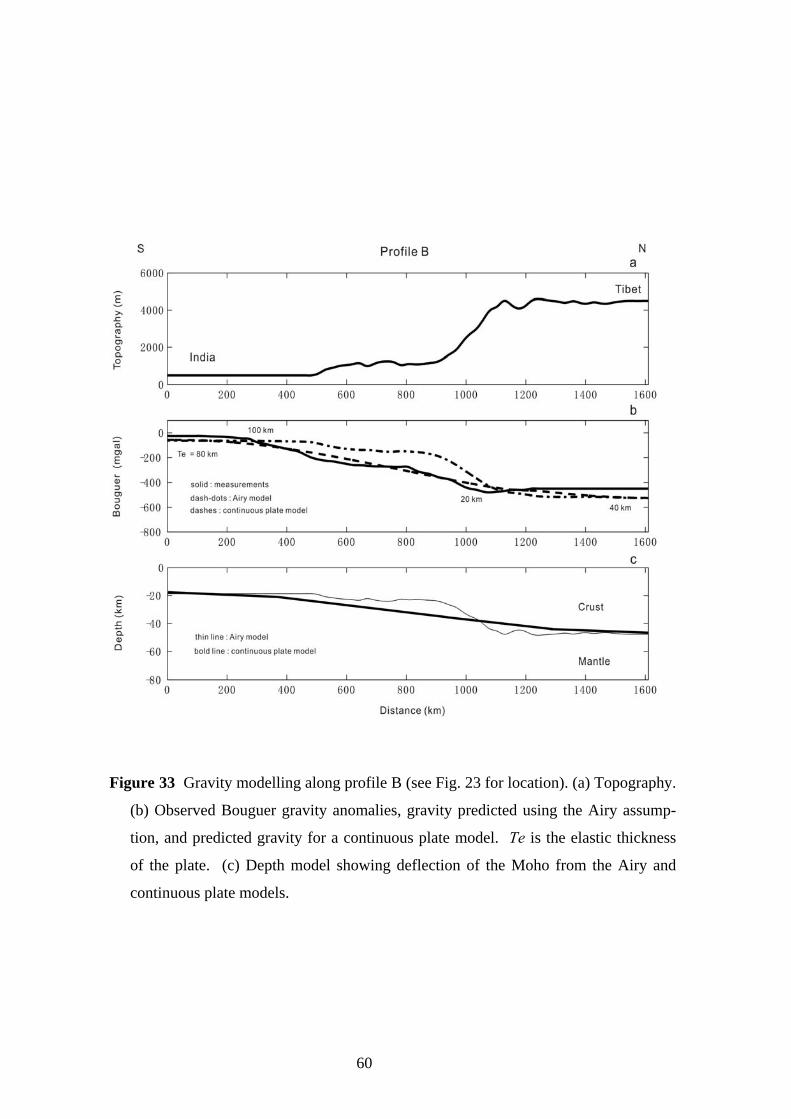
Figure 33 Gravity modelling along profile B (see Fig. 23 for location). (a) Topography.
(b) Observed Bouguer gravity anomalies, gravity predicted using the Airy assump-
tion, and predicted gravity for a continuous plate model. Te is the elastic thickness
of the plate. (c) Depth model showing deflection of the Moho from the Airy and
continuous plate models.
60
5.2 Lithospheric deformations beneath the Altyn Tagh and West Kunlun faults from
new gravity survey data
Uplift of the Tibetan Plateau is due to the collision of the Indian plate with Eurasia
beginning at about 50 Ma (Boulin, 1981; Royden and Burchfiel, 1995; Kind et al., 2002;
Sinha-Roy, 1982; Tapponnier et al., 2001). Some of the north-south shortening in Central
Asia in response to this collision was accommodated when the flexural foredeep of the
West Kunlun developed along the southern edge of the Tarim Basin. East of the Kunlun
foredeep is a spectacular left-lateral strike-slip fault, the Altyn Tagh Fault (Fig. 15), with an
east-west extent of at least 1600 km along the northern edge of the Tibetan Plateau. Here,
an attempt is made to place some constraints on the deep structure of this fault along the
northern edge of Tibet using the 2D flexural model [formula (22)] of Chapter 3.
Our 2D flexural modelling results are presented starting from the western profile
across the West Kunlun Fault to the two eastern profiles across the Altyn Tagh Fault.
We used the 468 new gravity and elevation stations along three survey lines in our
model (Fig. 34). The data points were projected onto straight profiles trending roughly
perpendicular to the trace of the Altyn Tagh and the West Kunlun faults. In addition, the
western and central profiles were extended to cover both the highland and the lowland
using digitized regional gravity data (black dots in Fig. 34). Digitized data, including those
from a 1:2,500,000 regional gravity map, are added at the ends of our modelling profiles.
Data coverage in the extended areas (especially in the Tarim Basin) was sufficient for this
purpose, and our new surveys provided an important data source to fill the rough terrain gap
between the basin and the highland of Tibet.
The surface load was assigned a density of 2670 kg/m3 in the mountain areas, while a
value of 2450 kg/m3 was used for the Tarim and Qaidam basins. The latter value is derived
from a density log located at 87°20 'E and 40°05 'N (red dot in the Tarim Basin in Fig. 34).
Publication of this well log (Fig. 35) is made possible by an agreement between the Ocean
University of China and the Shenli Oil Complex. The gravity contributions of the sedi-
ments in the Tarim and Qaidam basins have to be taken into account because they reach
100 mgal according to our estimates. The basement depths are taken from the contour
maps of Huang (1996). The density log shows a density break at about 1105 m well depth.
Above the break, the average density is about 2350 kg/m3, and below the break, it is around
2500 kg/m3. Because the sedimentary thickness is generally greater than 5 km, an average
density of 2450 kg/m3 was used in our modelling.
61
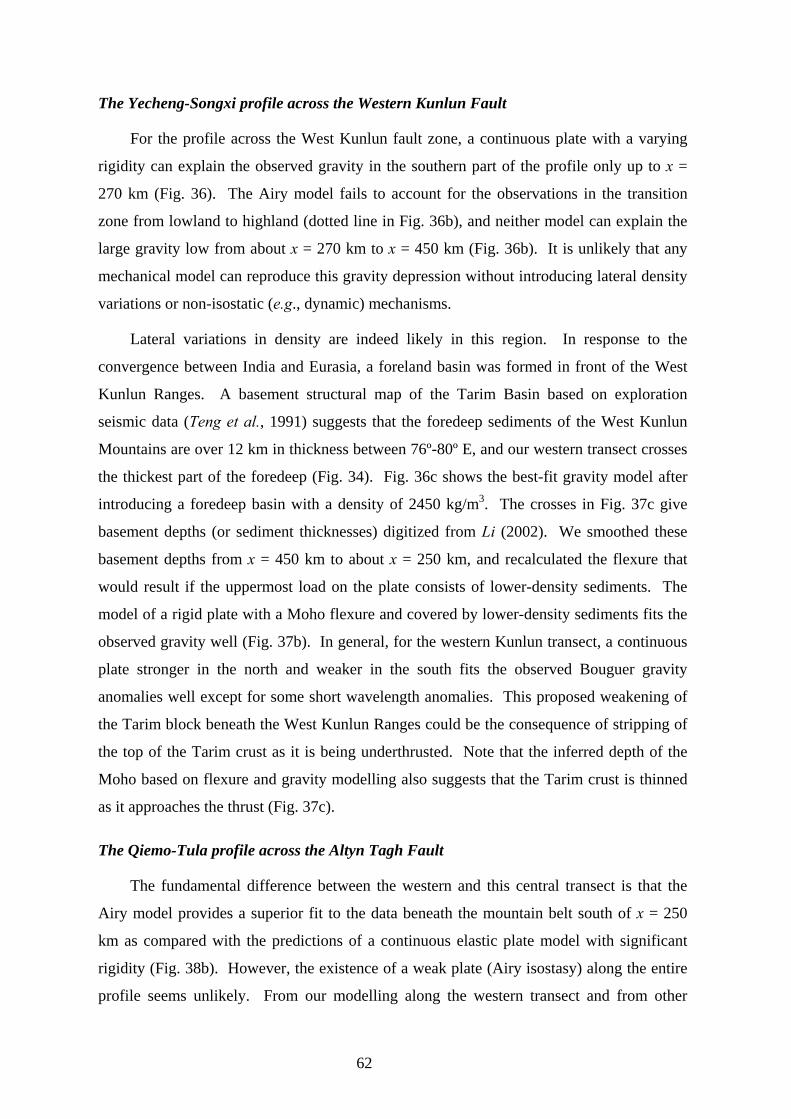
The Yecheng-Songxi profile across the Western Kunlun Fault
For the profile across the West Kunlun fault zone, a continuous plate with a varying
rigidity can explain the observed gravity in the southern part of the profile only up to x =
270 km (Fig. 36). The Airy model fails to account for the observations in the transition
zone from lowland to highland (dotted line in Fig. 36b), and neither model can explain the
large gravity low from about x = 270 km to x = 450 km (Fig. 36b). It is unlikely that any
mechanical model can reproduce this gravity depression without introducing lateral density
variations or non-isostatic (e.g., dynamic) mechanisms.
Lateral variations in density are indeed likely in this region. In response to the
convergence between India and Eurasia, a foreland basin was formed in front of the West
Kunlun Ranges. A basement structural map of the Tarim Basin based on exploration
seismic data (Teng et al., 1991) suggests that the foredeep sediments of the West Kunlun
Mountains are over 12 km in thickness between 76º-80º E, and our western transect crosses
the thickest part of the foredeep (Fig. 34). Fig. 36c shows the best-fit gravity model after
introducing a foredeep basin with a density of 2450 kg/m3. The crosses in Fig. 37c give
basement depths (or sediment thicknesses) digitized from Li (2002). We smoothed these
basement depths from x = 450 km to about x = 250 km, and recalculated the flexure that
would result if the uppermost load on the plate consists of lower-density sediments. The
model of a rigid plate with a Moho flexure and covered by lower-density sediments fits the
observed gravity well (Fig. 37b). In general, for the western Kunlun transect, a continuous
plate stronger in the north and weaker in the south fits the observed Bouguer gravity
anomalies well except for some short wavelength anomalies. This proposed weakening of
the Tarim block beneath the West Kunlun Ranges could be the consequence of stripping of
the top of the Tarim crust as it is being underthrusted. Note that the inferred depth of the
Moho based on flexure and gravity modelling also suggests that the Tarim crust is thinned
as it approaches the thrust (Fig. 37c).
The Qiemo-Tula profile across the Altyn Tagh Fault
The fundamental difference between the western and this central transect is that the
Airy model provides a superior fit to the data beneath the mountain belt south of x = 250
km as compared with the predictions of a continuous elastic plate model with significant
rigidity (Fig. 38b). However, the existence of a weak plate (Airy isostasy) along the entire
profile seems unlikely. From our modelling along the western transect and from other
62
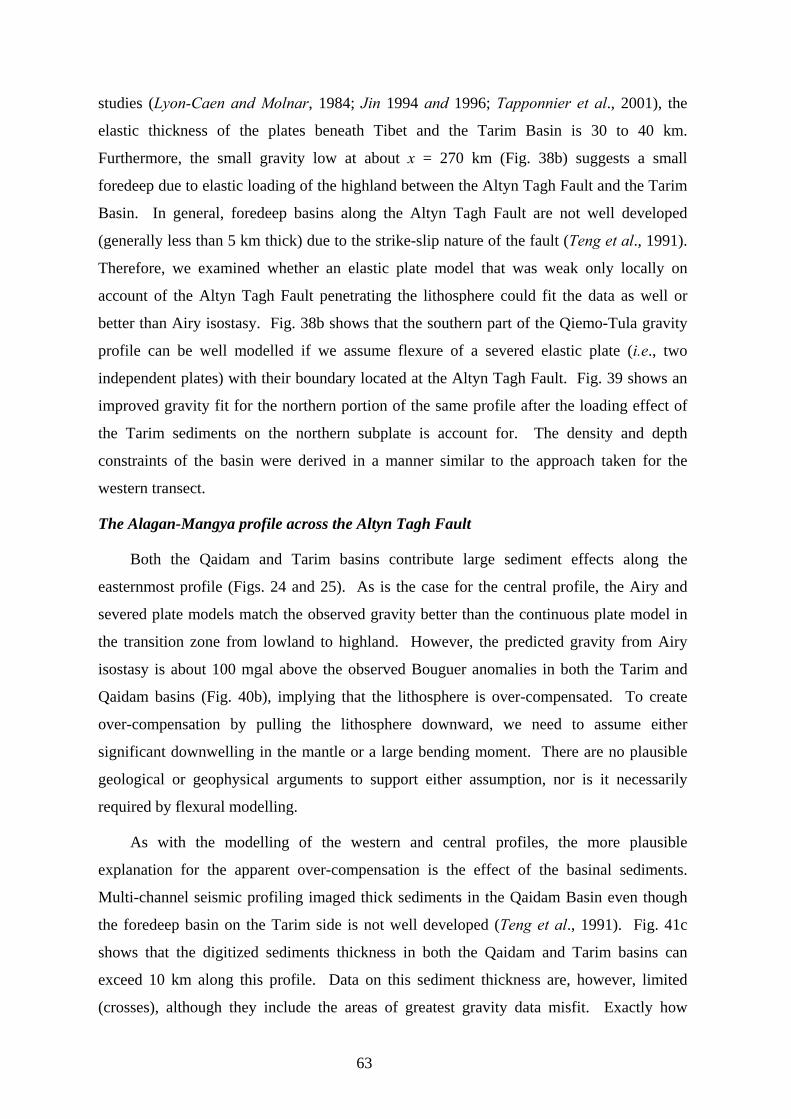
studies (Lyon-Caen and Molnar, 1984; Jin 1994 and 1996; Tapponnier et al., 2001), the
elastic thickness of the plates beneath Tibet and the Tarim Basin is 30 to 40 km.
Furthermore, the small gravity low at about x = 270 km (Fig. 38b) suggests a small
foredeep due to elastic loading of the highland between the Altyn Tagh Fault and the Tarim
Basin. In general, foredeep basins along the Altyn Tagh Fault are not well developed
(generally less than 5 km thick) due to the strike-slip nature of the fault (Teng et al., 1991).
Therefore, we examined whether an elastic plate model that was weak only locally on
account of the Altyn Tagh Fault penetrating the lithosphere could fit the data as well or
better than Airy isostasy. Fig. 38b shows that the southern part of the Qiemo-Tula gravity
profile can be well modelled if we assume flexure of a severed elastic plate (i.e., two
independent plates) with their boundary located at the Altyn Tagh Fault. Fig. 39 shows an
improved gravity fit for the northern portion of the same profile after the loading effect of
the Tarim sediments on the northern subplate is account for. The density and depth
constraints of the basin were derived in a manner similar to the approach taken for the
western transect.
The Alagan-Mangya profile across the Altyn Tagh Fault
Both the Qaidam and Tarim basins contribute large sediment effects along the
easternmost profile (Figs. 24 and 25). As is the case for the central profile, the Airy and
severed plate models match the observed gravity better than the continuous plate model in
the transition zone from lowland to highland. However, the predicted gravity from Airy
isostasy is about 100 mgal above the observed Bouguer anomalies in both the Tarim and
Qaidam basins (Fig. 40b), implying that the lithosphere is over-compensated. To create
over-compensation by pulling the lithosphere downward, we need to assume either
significant downwelling in the mantle or a large bending moment. There are no plausible
geological or geophysical arguments to support either assumption, nor is it necessarily
required by flexural modelling.
As with the modelling of the western and central profiles, the more plausible
explanation for the apparent over-compensation is the effect of the basinal sediments.
Multi-channel seismic profiling imaged thick sediments in the Qaidam Basin even though
the foredeep basin on the Tarim side is not well developed (Teng et al., 1991). Fig. 41c
shows that the digitized sediments thickness in both the Qaidam and Tarim basins can
exceed 10 km along this profile. Data on this sediment thickness are, however, limited
(crosses), although they include the areas of greatest gravity data misfit. Exactly how
63
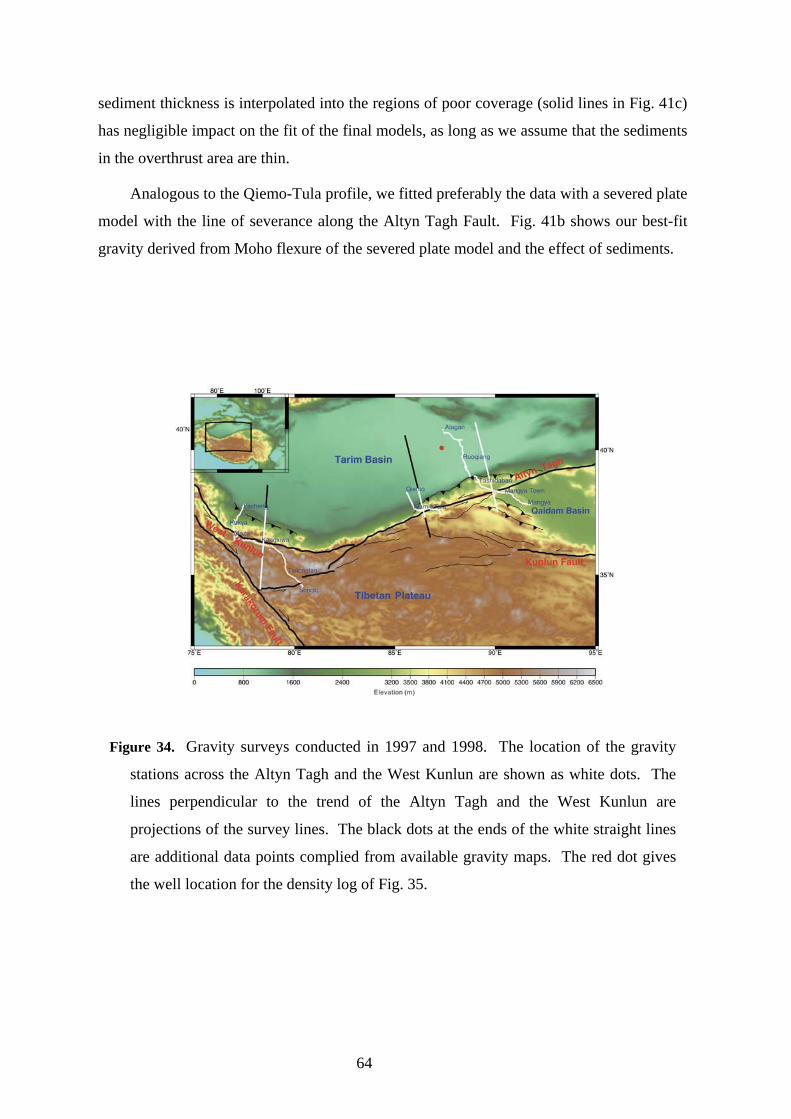
sediment thickness is interpolated into the regions of poor coverage (solid lines in Fig. 41c)
has negligible impact on the fit of the final models, as long as we assume that the sediments
in the overthrust area are thin.
Analogous to the Qiemo-Tula profile, we fitted preferably the data with a severed plate
model with the line of severance along the Altyn Tagh Fault. Fig. 41b shows our best-fit
gravity derived from Moho flexure of the severed plate model and the effect of sediments.
Figure 34. Gravity surveys conducted in 1997 and 1998. The location of the gravity
stations across the Altyn Tagh and the West Kunlun are shown as white dots. The
lines perpendicular to the trend of the Altyn Tagh and the West Kunlun are
projections of the survey lines. The black dots at the ends of the white straight lines
are additional data points complied from available gravity maps. The red dot gives
the well location for the density log of Fig. 35.
64
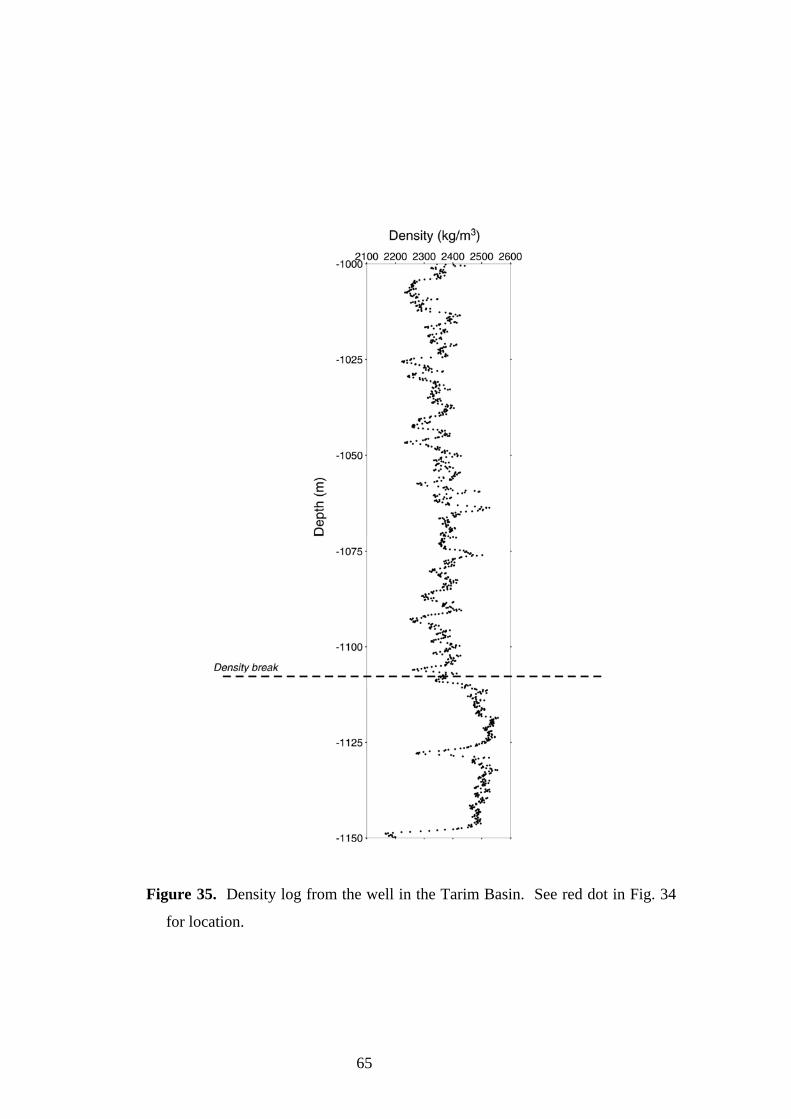
Figure 35. Density log from the well in the Tarim Basin. See red dot in Fig. 34
for location.
65
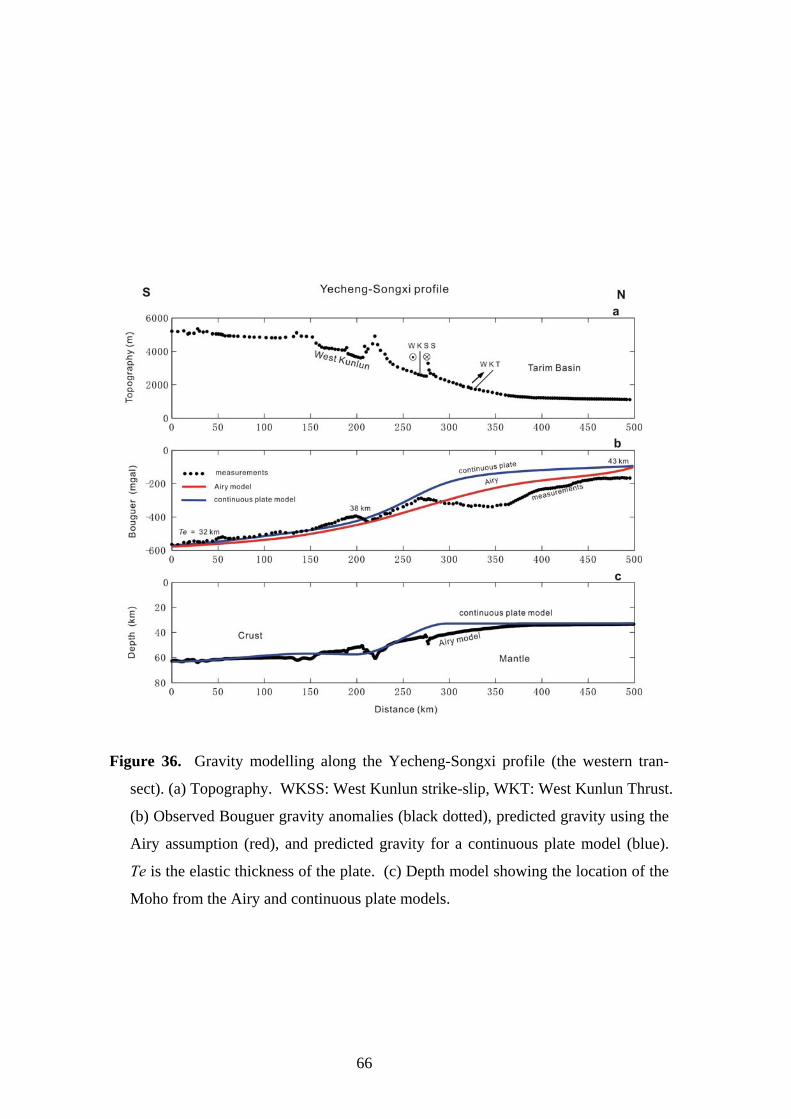
Figure 36. Gravity modelling along the Yecheng-Songxi profile (the western tran-
sect). (a) Topography. WKSS: West Kunlun strike-slip, WKT: West Kunlun Thrust.
(b) Observed Bouguer gravity anomalies (black dotted), predicted gravity using the
Airy assumption (red), and predicted gravity for a continuous plate model (blue).
Te is the elastic thickness of the plate. (c) Depth model showing the location of the
Moho from the Airy and continuous plate models.
66
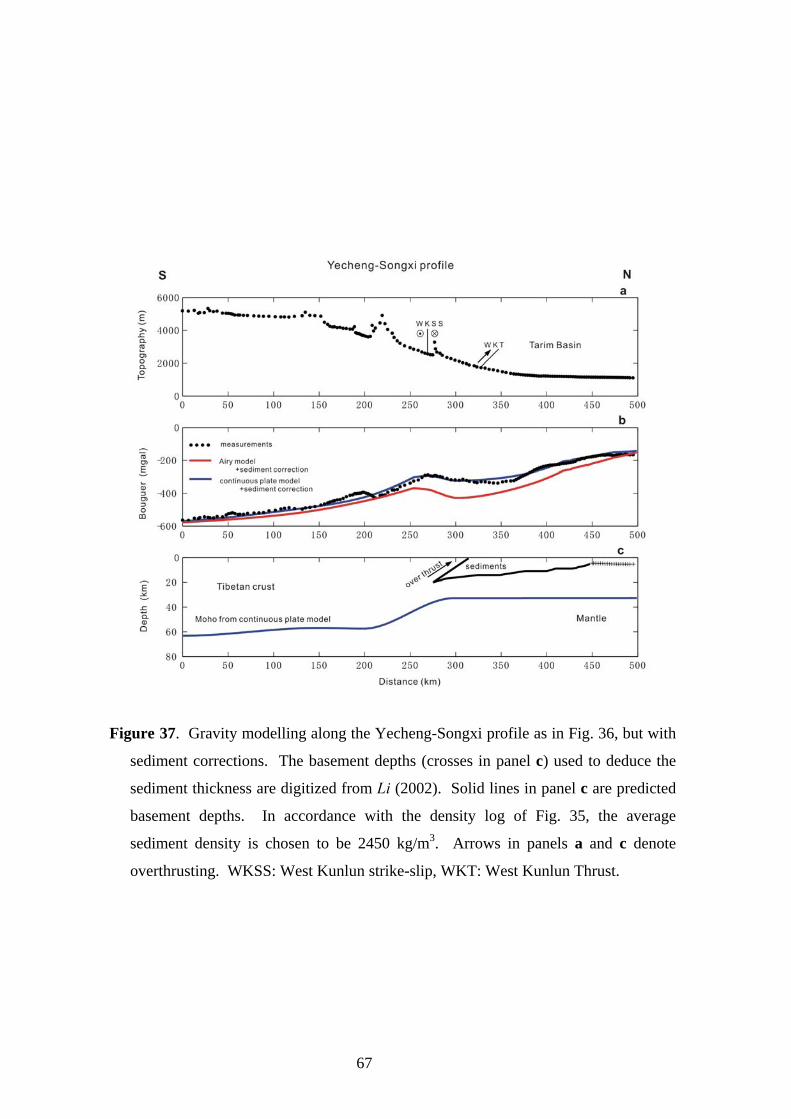
Figure 37. Gravity modelling along the Yecheng-Songxi profile as in Fig. 36, but with
sediment corrections. The basement depths (crosses in panel c) used to deduce the
sediment thickness are digitized from Li (2002). Solid lines in panel c are predicted
basement depths. In accordance with the density log of Fig. 35, the average
sediment density is chosen to be 2450 kg/m3. Arrows in panels a and c denote
overthrusting. WKSS: West Kunlun strike-slip, WKT: West Kunlun Thrust.
67
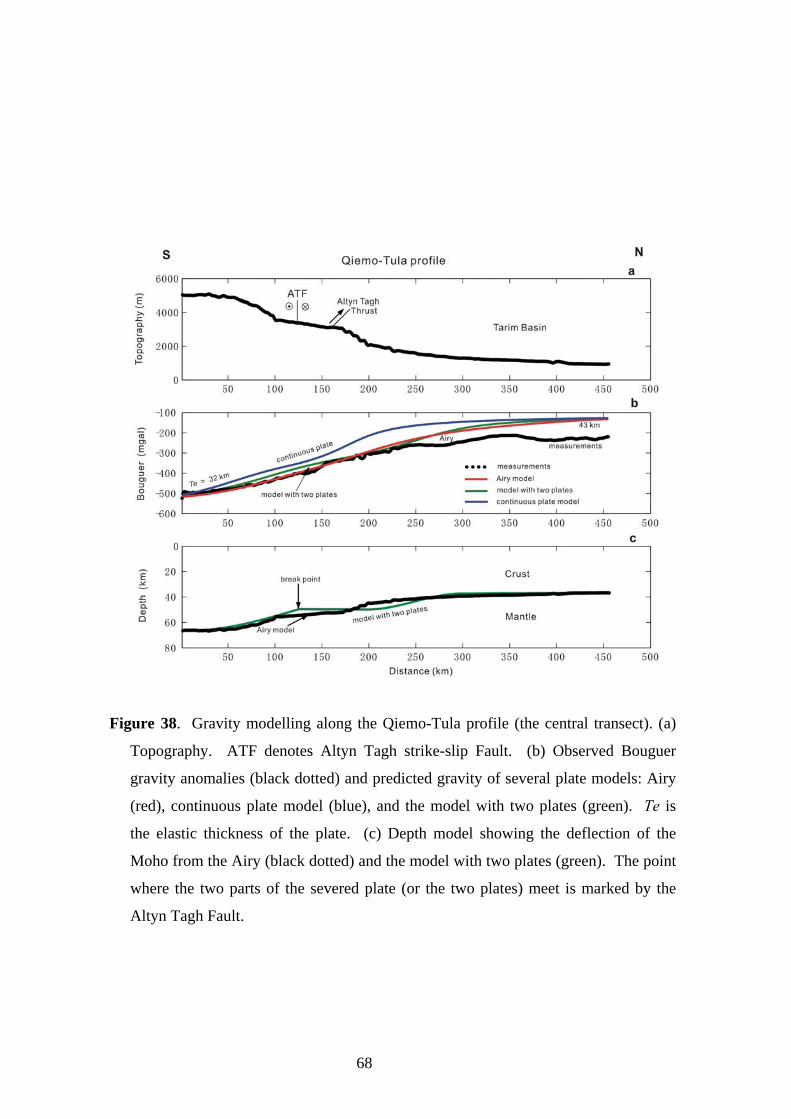
Figure 38. Gravity modelling along the Qiemo-Tula profile (the central transect). (a)
Topography. ATF denotes Altyn Tagh strike-slip Fault. (b) Observed Bouguer
gravity anomalies (black dotted) and predicted gravity of several plate models: Airy
(red), continuous plate model (blue), and the model with two plates (green). Te is
the elastic thickness of the plate. (c) Depth model showing the deflection of the
Moho from the Airy (black dotted) and the model with two plates (green). The point
where the two parts of the severed plate (or the two plates) meet is marked by the
Altyn Tagh Fault.
68

Figure 39. Gravity modelling along the Qiemo-Tula profile as in Fig. 38, but with
sediment corrections. The basement depths (crosses in panel c) used to deduce the
sediment thickness are digitized from Huang (1996). Dots are predicted basement
depths. Based on the density log in Fig. 35, the average sediment density is chosen
to be 2450 kg/m3. ATF denotes Altyn Tagh strike-slip Fault.
69
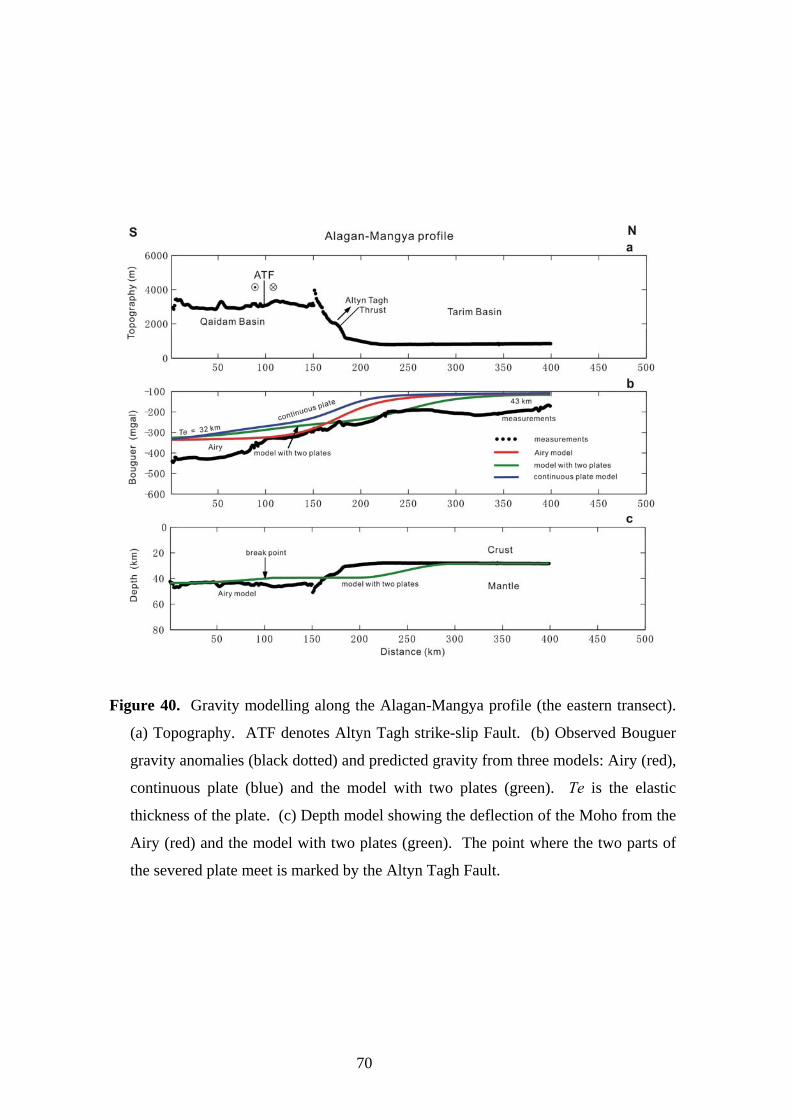
Figure 40. Gravity modelling along the Alagan-Mangya profile (the eastern transect).
(a) Topography. ATF denotes Altyn Tagh strike-slip Fault. (b) Observed Bouguer
gravity anomalies (black dotted) and predicted gravity from three models: Airy (red),
continuous plate (blue) and the model with two plates (green). Te is the elastic
thickness of the plate. (c) Depth model showing the deflection of the Moho from the
Airy (red) and the model with two plates (green). The point where the two parts of
the severed plate meet is marked by the Altyn Tagh Fault.
70
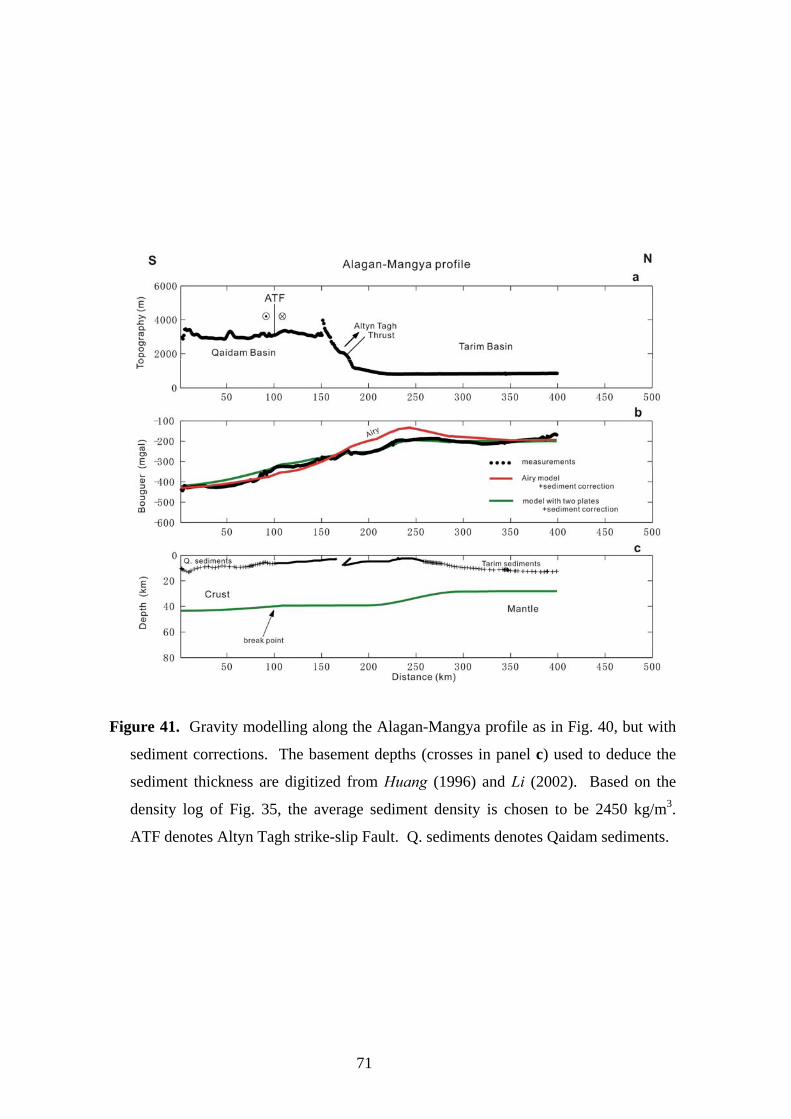
Figure 41. Gravity modelling along the Alagan-Mangya profile as in Fig. 40, but with
sediment corrections. The basement depths (crosses in panel c) used to deduce the
sediment thickness are digitized from Huang (1996) and Li (2002). Based on the
density log of Fig. 35, the average sediment density is chosen to be 2450 kg/m3.
ATF denotes Altyn Tagh strike-slip Fault. Q. sediments denotes Qaidam sediments.
71
5.3 Lithospheric deformations in the Tien Shan
Many aspects of intra-continental deformations are still an enigma. This is true also of
the Tien Shan in central Asia. It is one of the young and very active intra-continental ranges
in the world and is bounded by the Kazakh Platform to the northwest, the Zungar Basin to
the northeast and the Tarim Basin to the south (Fig. 42). Though over 1500 km north of the
Indian-Eurasian collision zone, the Tien Shan presently absorbs about 30% of the total
relative plate convergence of 45 mm/yr (Abdrakhmatov et al., 1996; DeMets et al., 1994;
Holt et al., 2000). Global Positioning System (GPS) measurements indicate that the 12–13
mm/yr north-south shortening is broadly distributed across the northern two thirds of the
central Tien Shan (Abdrakhmatov et al., 1996). Thus, the Tien Shan is an excellent location
to study localized deformations in an intra-continental setting. Various aspects of active
tectonics in the Tien Shan, including timing of the uplift, rates of slip on thrust systems that
bound the margins, and Quaternary shortening in the interior of the fold belt have been
investigated in detail (Avouac et al., 1993; Brown et al., 1998; Burchfiel et al., 1999;
England and Molnar, 1997; Sun et al., 2004; Thompson et al., 2002; Yin et al., 1998).
Lithospheric folding with wavelengths of 50 and 300-360 km has been reported using thin
elastic plate modelling of gravity data (Burov et al.,1990; 1993), and dynamic processes are
found to occur both in the crust and the mantle lithosphere beneath mountain ranges (Kogan
and McNutt 1993; Lyon-Caen and Molnar, 1983). Here, we modelled lateral hetero-
geneities in high-resolution Bouguer gravity and topographic data to elucidate the dynamic
processes in the crust and mantle responsible for them.
Areas adjacent to the Tien Shan, namely the Kazakh Platform and the Tarim and
Zungar basins, are stable Precambrian structures that have suffered little deformation during
the Cenozoic convergence of India and Asia (Carroll et al., 1995; Yin and Nie, 1996). The
Tien Shan itself consists mainly of a Lower Proterozoic gneissic basement (Bukharin,
1978). Its marine basins were closed in the Early Permian and the fold belt itself developed
during the middle Permian as a consequence of final collision and suturing of the Tarim
continent with the Kazakh continent (Hendrix et al., 1994). The change from marine to
continental sedimentation and the marked angular unconformity separating the Paleogene
and Neogene strata (Zhang, 2003) are consistent with Cenozoic tectonic reactivation in the
Tien Shan in response to the Indian-Asian collision (e.g. Chen et al., 1999; Me′ tivier and
Gaudemer, 1998; Sobel and Dumitru, 1997). Recent tectonics in the Tien Shan appears to
be dominated by thrusting on roughly E-W striking faults and by folding of Cenozoic
72
sediments (Molnar and Tapponnier, 1975; Tapponnier and Molnar, 1979; Molnar et al.,
1994; Thompson et al., 2002). The maximum crustal thickness in the Tien Shan reaches 50
km and is larger than that of its adjacent areas (Burbank et al., 1999; Molnar and
Tapponnier, 1975). It is not clear whether the surface thrust faults here are related to the
structure of the lithospheric mantle in any simple way since deformational properties of
continental rocks are heterogeneous and the crustal thickness is extremely large. Therefore,
we analysed geophysical data to better understand plate interactions at depth.
We begin by quantifying lateral heterogeneities of the deep structure using high-
resolution Bouguer gravity and topographic data in order to elucidate the dynamic pro-
cesses in the crust and mantle responsible for these lateral heterogeneities. Then we shall
calculate the lithospheric stress to better understand the Tien Shan local stress field. At a
late stage, we hope to better understand the dynamic processes responsible for intra-
continental mountain building in general.
The locations of the four transects used in our two dimensional modelling are shown in
Figs. 42 is numbered 1 to 4 from east to west across the Tien Shan.
The sediment layers imaged seismically in the foreland basins of the Tarim and Zungar
basins along the four lines modelled two-dimensionally are shown in Fig. 43 (dotted lines in
the lower panels of Fig. 43). These layers were extended from x = 440 to about 500 km on
profile 1 (wedge marked by straight solid lines), from x = 490 to about 540 km on profile 2,
and from x = 90 to about 190 km on profile 3 in a smooth fashion to simulate
underthrusting. Figure 43 shows the calculated gravity effects for a sediment density of
2450 kg/m3 along the four profiles. They amount to over 100 mgal, in agreement with
Braitenberg et al. (2003) and our 3D results of section 5.1.
Our modelling suggests that there are large discrepancies between the calculated
Bouguer anomalies of the Airy model and the observed data along each of the four profiles
(see panel b of Figs. 44-46 and 48). This model, for which topographic relief is pointwise
compensated by crustal thickening at the Moho, produces a theoretical Bouguer gravity
anomaly that resembles an inverted, low-pass filtered version of the topography. The
predicted gravity at the edge of the Tien Shan, and in the northern Tarim Basin (western
profiles) and southern Zungar Basin (eastern profiles) are much greater than what is
observed.
73
Regional compensation occurs by elastic lithospheric flexure, whereby the lithosphere
is deflected by topographic and subsurface loads. The relationship between topography and
gravity anomalies due to the compensating mass at depth provides an estimate of the
flexural strength of the elastic lithosphere using our thin plate model in the space domain.
Figure 44 examines the fit to the gravity data along profile 1 for several models: Airy
isostasy (Te = 0 km), a continuous elastic plate with uniform rigidity (Te = 40 km) and
variable rigidity respectively, and a model of two separate plates. The constant rigidity
model fails to explain the observations in the transition zone from low basins to high
mountains. Assuming that the plate is broken at the Southern Tien Shan Thrust Fault
results in a worse fit. The successful model consists of a continuous plate with an elastic
thickness of 40 km in the Tarim Basin, decreasing to 25 km beneath the Tien Shan and
increasing to 45 km in the Zungar Basin. The model with Moho flexure of a rigid plate,
which is slightly stronger in the basins than in the ranges, fits the observed gravity well
except for some short wavelength anomalies. Its RMS residual is 6.8 mgal. The
lithosphere is weakened by about 10 km in elastic thickness, which is consistent with the
missing crust of the thrusting lithosphere of the Tarim and Zungar basins.
Modelling along profile 2 provides results similar to those along profile 1. A
continuous plate with a laterally varying elastic thickness (Te = 45 km in the Tarim Basin,
decreasing to 25 km beneath the Tien Shan and increasing to 45 km in the Zungar Basin) is
required for a best fit of the observed Bouguer gravity (blue line in Fig. 45b). Its RMS
residual is 7.5 mgal. The Airy and the uniform rigidity (Te = 40 km) elastic plate models
fail to fit the observed gravity (red and orange lines of Fig. 45b). Analogously, assuming
that the plate is broken at the Southern Tien Shan Thrust Fault produces a worse fit (green
line). Because a break point is not required along the two eastern profiles, the mantle
lithosphere and the lowermost crust of the Tarim and Zungar basins here could be the same
as the lithosphere beneath the Tien Shan ranges.
There are fundamental differences between the two eastern profiles and the western
transect 3. As shown in Fig. 46, several models fail to explain the observed gravity. These
are: Airy isostasy (red line, Te = 0 km), uniform rigidity plate model (orange line, Te = 40
km), and two variable-rigidity continuous elastic plate models, one having an elastic
thickness of 40 km both in the Tarim and Zungar basins, decreasing to 25 km beneath the
Tien Shan (light blue line) and the other with an elastic thickness of 40 km in the Tarim
Basin, decreasing to 20 km beneath the Tien Shan and increasing to 45 in the Zungar Basin
74
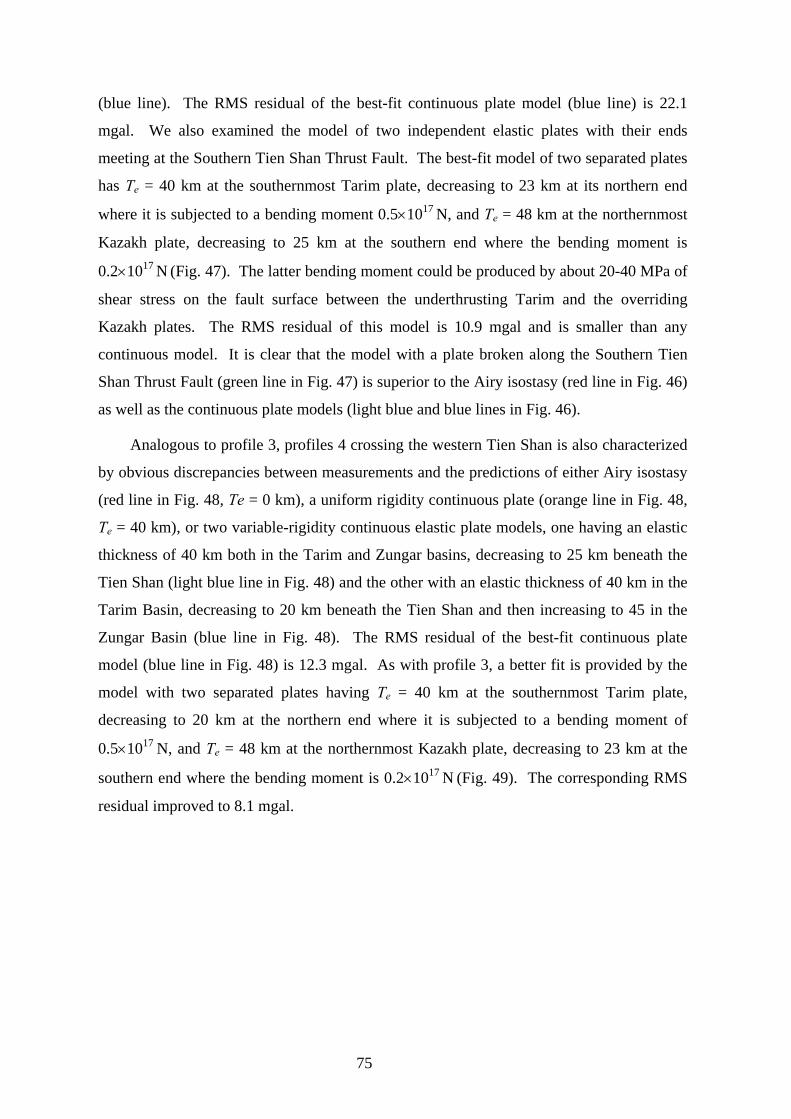
(blue line). The RMS residual of the best-fit continuous plate model (blue line) is 22.1
mgal. We also examined the model of two independent elastic plates with their ends
meeting at the Southern Tien Shan Thrust Fault. The best-fit model of two separated plates
has Te = 40 km at the southernmost Tarim plate, decreasing to 23 km at its northern end
where it is subjected to a bending moment 0.5×10¹⁷ N, and Te = 48 km at the northernmost
Kazakh plate, decreasing to 25 km at the southern end where the bending moment is
0.2×10¹⁷ N (Fig. 47). The latter bending moment could be produced by about 20-40 MPa of
shear stress on the fault surface between the underthrusting Tarim and the overriding
Kazakh plates. The RMS residual of this model is 10.9 mgal and is smaller than any
continuous model. It is clear that the model with a plate broken along the Southern Tien
Shan Thrust Fault (green line in Fig. 47) is superior to the Airy isostasy (red line in Fig. 46)
as well as the continuous plate models (light blue and blue lines in Fig. 46).
Analogous to profile 3, profiles 4 crossing the western Tien Shan is also characterized
by obvious discrepancies between measurements and the predictions of either Airy isostasy
(red line in Fig. 48, Te = 0 km), a uniform rigidity continuous plate (orange line in Fig. 48,
Te = 40 km), or two variable-rigidity continuous elastic plate models, one having an elastic
thickness of 40 km both in the Tarim and Zungar basins, decreasing to 25 km beneath the
Tien Shan (light blue line in Fig. 48) and the other with an elastic thickness of 40 km in the
Tarim Basin, decreasing to 20 km beneath the Tien Shan and then increasing to 45 in the
Zungar Basin (blue line in Fig. 48). The RMS residual of the best-fit continuous plate
model (blue line in Fig. 48) is 12.3 mgal. As with profile 3, a better fit is provided by the
model with two separated plates having Te = 40 km at the southernmost Tarim plate,
decreasing to 20 km at the northern end where it is subjected to a bending moment of
0.5×10¹⁷ N, and Te = 48 km at the northernmost Kazakh plate, decreasing to 23 km at the
southern end where the bending moment is 0.2×10¹⁷ N (Fig. 49). The corresponding RMS
residual improved to 8.1 mgal.
75
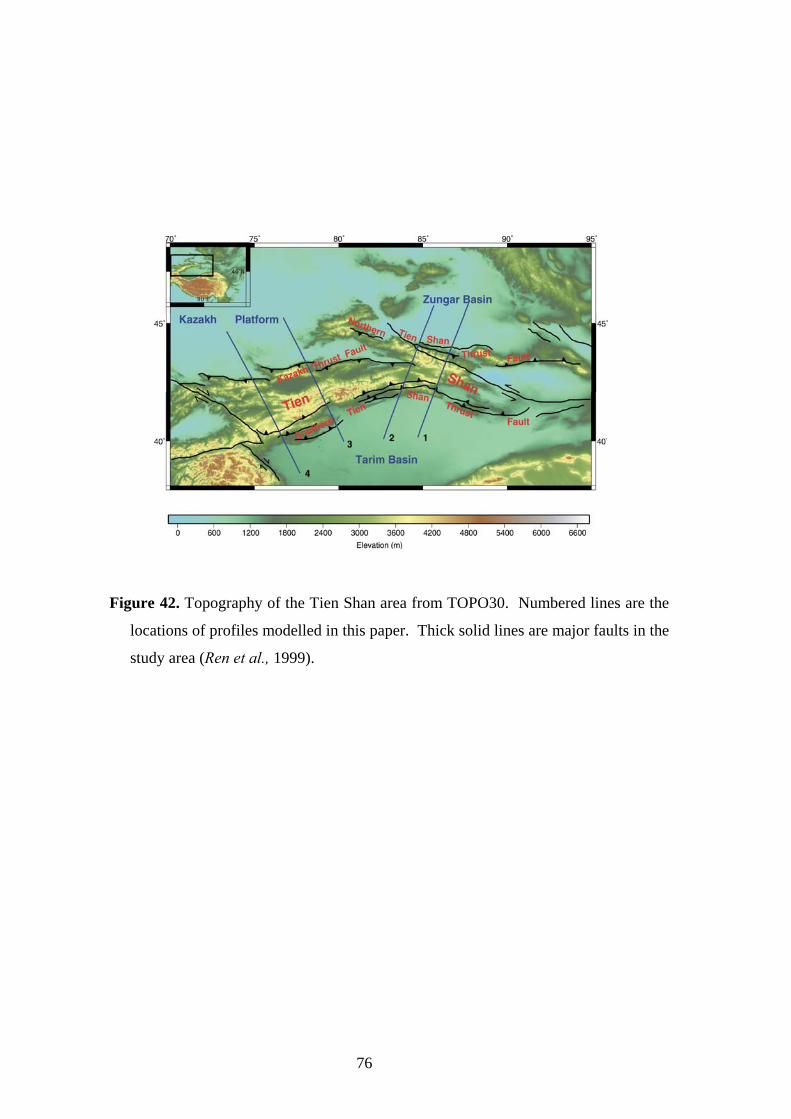
Figure 42. Topography of the Tien Shan area from TOPO30. Numbered lines are the
locations of profiles modelled in this paper. Thick solid lines are major faults in the
study area (Ren et al., 1999).
76
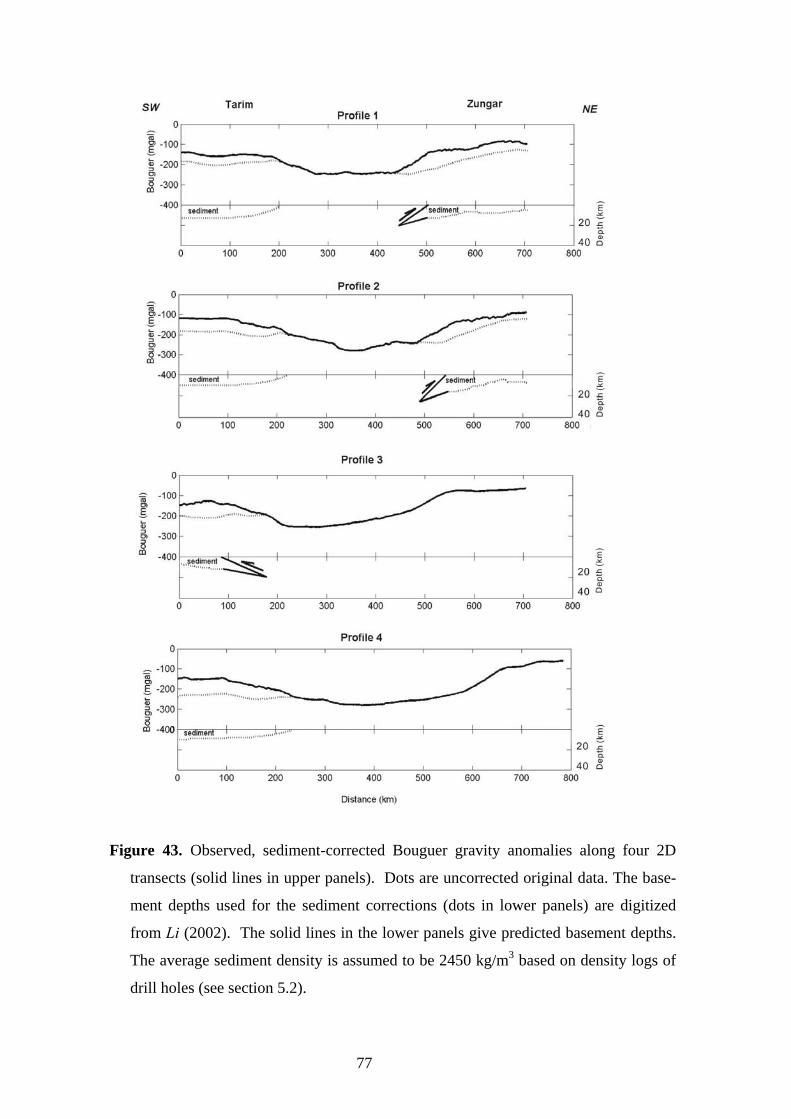
Figure 43. Observed, sediment-corrected Bouguer gravity anomalies along four 2D
transects (solid lines in upper panels). Dots are uncorrected original data. The base-
ment depths used for the sediment corrections (dots in lower panels) are digitized
from Li (2002). The solid lines in the lower panels give predicted basement depths.
The average sediment density is assumed to be 2450 kg/m3 based on density logs of
drill holes (see section 5.2).
77
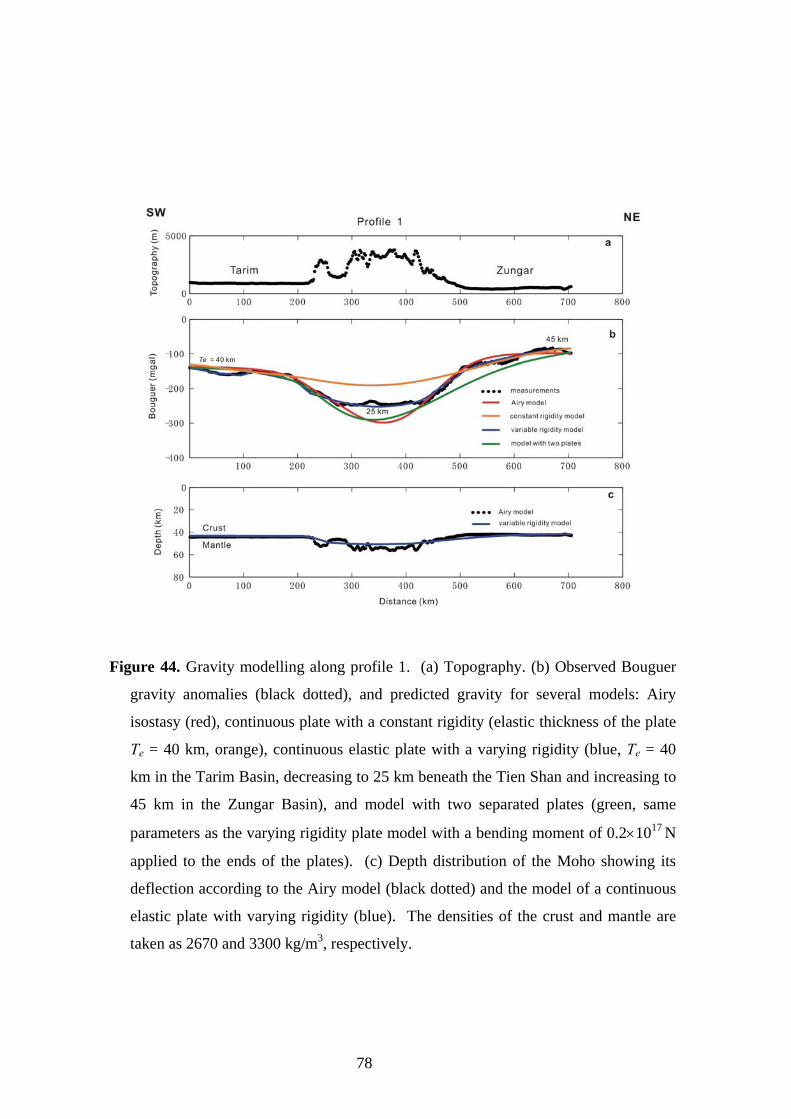
Figure 44. Gravity modelling along profile 1. (a) Topography. (b) Observed Bouguer
gravity anomalies (black dotted), and predicted gravity for several models: Airy
isostasy (red), continuous plate with a constant rigidity (elastic thickness of the plate
Te = 40 km, orange), continuous elastic plate with a varying rigidity (blue, Te = 40
km in the Tarim Basin, decreasing to 25 km beneath the Tien Shan and increasing to
45 km in the Zungar Basin), and model with two separated plates (green, same
parameters as the varying rigidity plate model with a bending moment of 0.2×10¹⁷ N
applied to the ends of the plates). (c) Depth distribution of the Moho showing its
deflection according to the Airy model (black dotted) and the model of a continuous
elastic plate with varying rigidity (blue). The densities of the crust and mantle are
taken as 2670 and 3300 kg/m3, respectively.
78
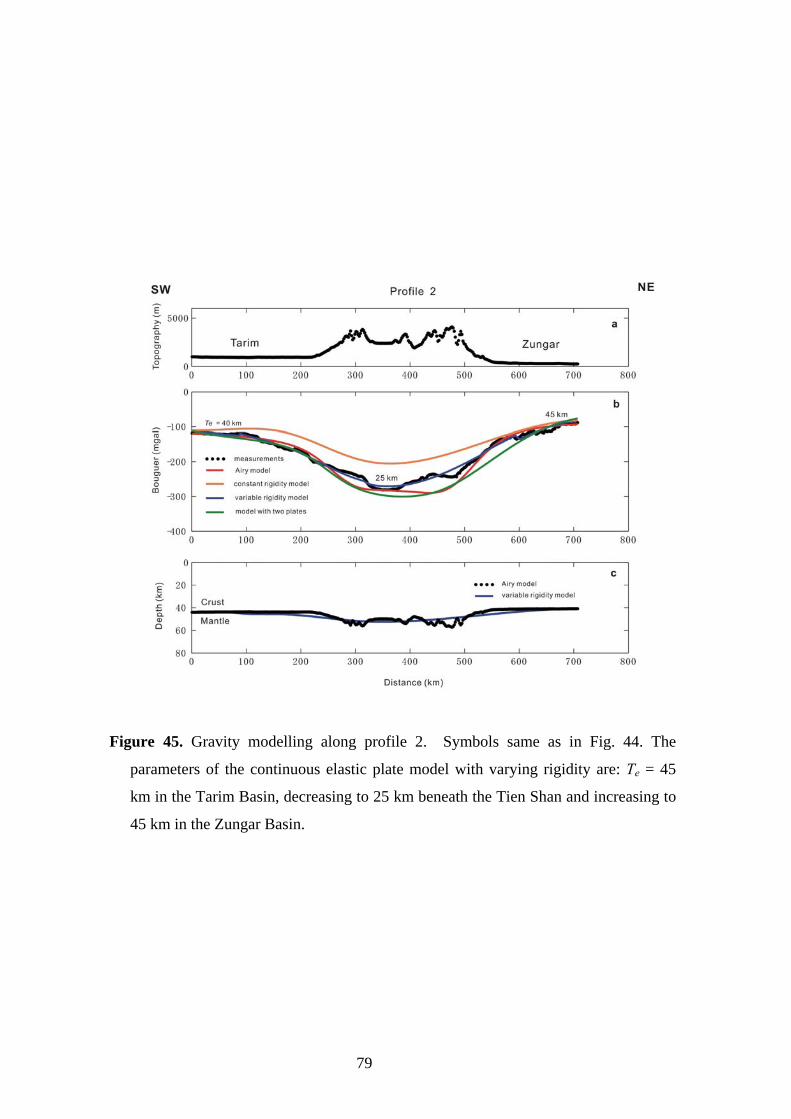
Figure 45. Gravity modelling along profile 2. Symbols same as in Fig. 44. The
parameters of the continuous elastic plate model with varying rigidity are: Te = 45
km in the Tarim Basin, decreasing to 25 km beneath the Tien Shan and increasing to
45 km in the Zungar Basin.
79
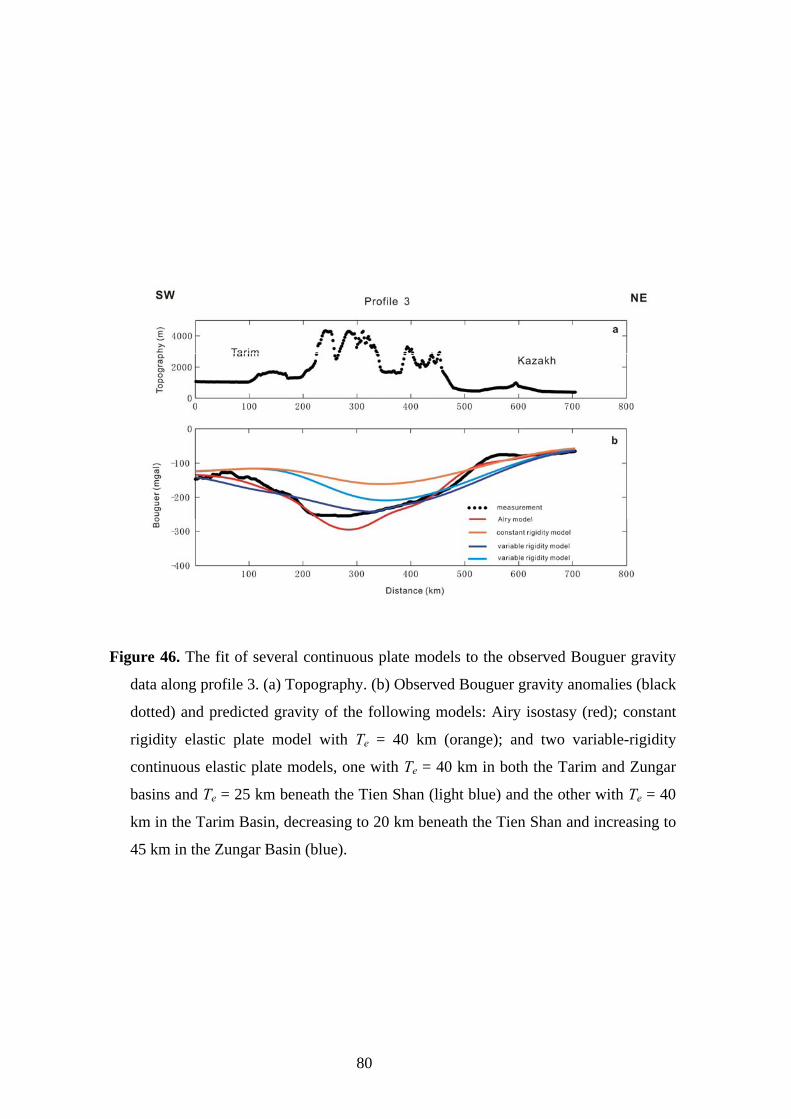
Figure 46. The fit of several continuous plate models to the observed Bouguer gravity
data along profile 3. (a) Topography. (b) Observed Bouguer gravity anomalies (black
dotted) and predicted gravity of the following models: Airy isostasy (red); constant
rigidity elastic plate model with Te = 40 km (orange); and two variable-rigidity
continuous elastic plate models, one with Te = 40 km in both the Tarim and Zungar
basins and Te = 25 km beneath the Tien Shan (light blue) and the other with Te = 40
km in the Tarim Basin, decreasing to 20 km beneath the Tien Shan and increasing to
45 km in the Zungar Basin (blue).
80
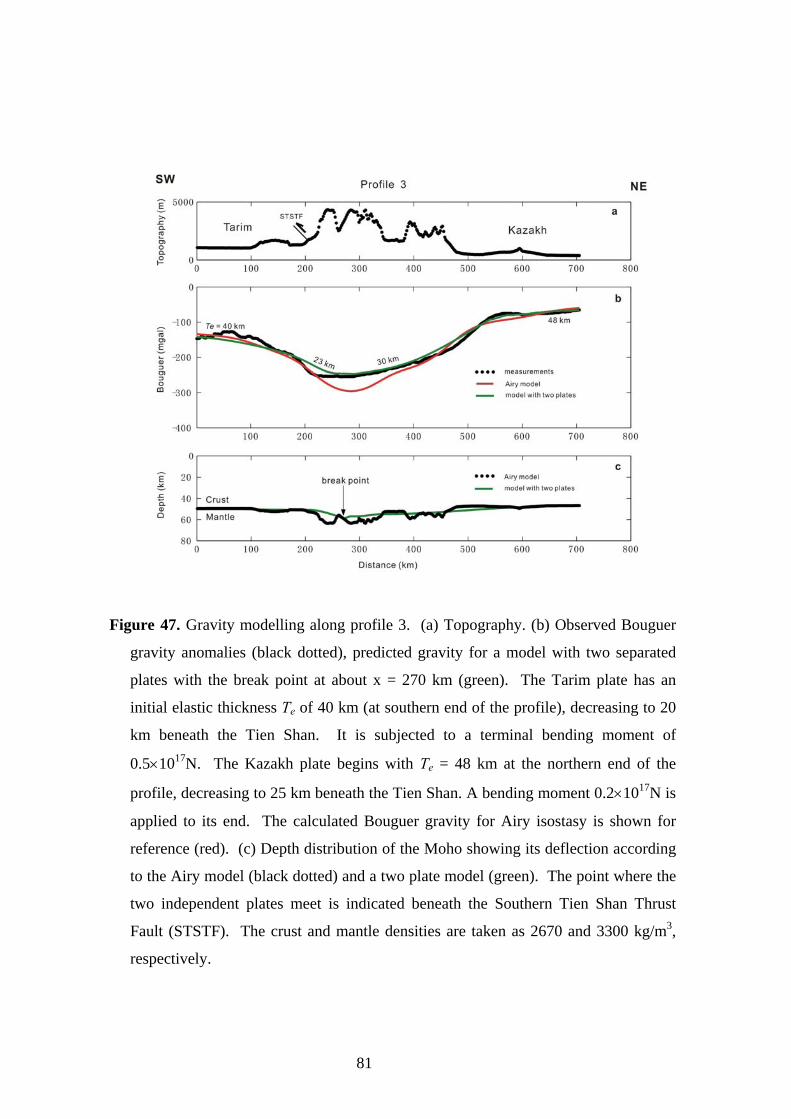
Figure 47. Gravity modelling along profile 3. (a) Topography. (b) Observed Bouguer
gravity anomalies (black dotted), predicted gravity for a model with two separated
plates with the break point at about x = 270 km (green). The Tarim plate has an
initial elastic thickness Te of 40 km (at southern end of the profile), decreasing to 20
km beneath the Tien Shan. It is subjected to a terminal bending moment of
0.5×10¹⁷N. The Kazakh plate begins with Te = 48 km at the northern end of the
profile, decreasing to 25 km beneath the Tien Shan. A bending moment 0.2×10¹⁷N is
applied to its end. The calculated Bouguer gravity for Airy isostasy is shown for
reference (red). (c) Depth distribution of the Moho showing its deflection according
to the Airy model (black dotted) and a two plate model (green). The point where the
two independent plates meet is indicated beneath the Southern Tien Shan Thrust
Fault (STSTF). The crust and mantle densities are taken as 2670 and 3300 kg/m3,
respectively.
81
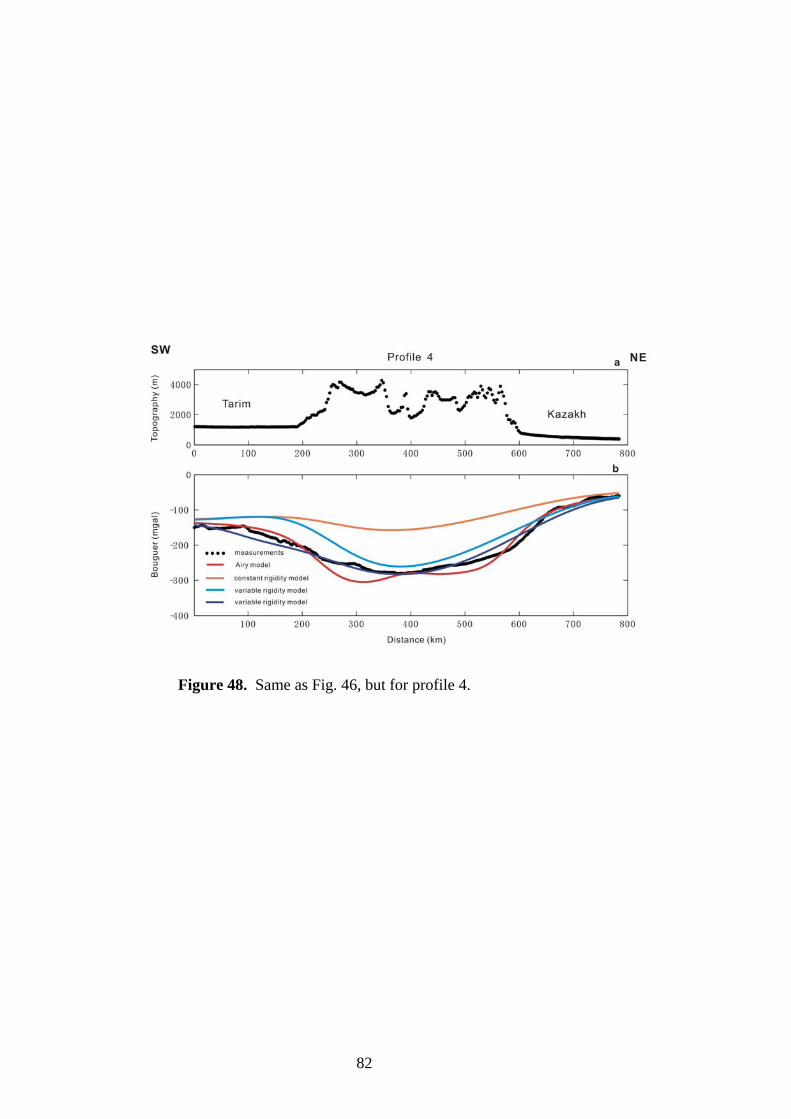
Figure 48. Same as Fig. 46, but for profile 4.
82
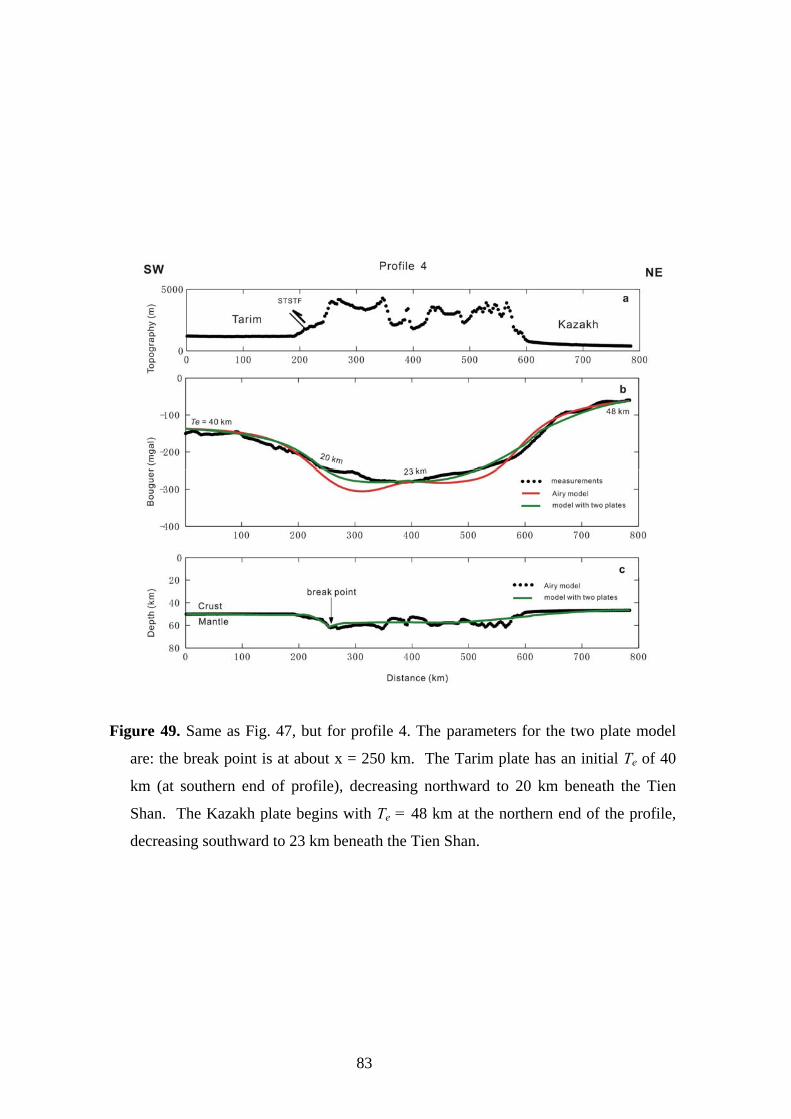
Figure 49. Same as Fig. 47, but for profile 4. The parameters for the two plate model
are: the break point is at about x = 250 km. The Tarim plate has an initial Te of 40
km (at southern end of profile), decreasing northward to 20 km beneath the Tien
Shan. The Kazakh plate begins with Te = 48 km at the northern end of the profile,
decreasing southward to 23 km beneath the Tien Shan.
83
5.4 Tectonic stress field in the Tien Shan
As already stated, the convergence between India and Eurasia leads to a major
compression in the direction of N 10° E in Central Asia (e.g., England and Molnar, 1997;
Molnar and Tapponnier, 1975; Wang et al., 2001), for which the distribution of the
averaged vertical stress has been calculated using a viscous model (Fig. 50) (Flesch et al.,
2001). However, deformations observed in the Tien Shan are not consistent with the
direction of convergence between India and Eurasia. Earthquake focal solutions, geodetic
GPS measurements, geological evidence and viscous thin-shell modelling show that the
direction of principal stress in the Tien Shan is roughly normal to the strike of the
mountain belt (Abdraknmatov et al., 1996; England and Molnar 1997a; Holt et al., 2000;
Neil and Houseman, 1997; Reinecker et al., 2003; Thompson et al., 2002; Fig. 50). It is
very likely that there is a causal relationship between the Indian-Eurasian collision and the
formation of this intraplate mountain belt. If the Tien Shan is an unusually weak region
and stress is transmitted from the plate boundary to the plate interior and is concentrated at
the zone of weakness, then the stress field of the Tien Shan should be oriented at about N
10° E rather than normal to its strike. Thus, we tested the hypothesis that the compressive
stress is generated locally by the underlying mantle circulation induced by the collision.
Here, we consider three sources of lithospheric stress, each of which can be calibrated
fairly reliably both in terms of magnitude and direction. These are: the boundary force
caused by the collision between the Indian and Eurasian plates; the topographic stress field
caused by elevated gravitational potential energy; and flexure of the elastic plate caused by
bending of the lithosphere. We hope to thereby better understand the localized stress field
in and the cause for deformation of the Tien Shan.
Stress from the boundary force
Observations from seismic focal mechanisms, well bore breakout, fault slip, neo-
tectonic structure, Cenozoic volcanic alignments, hydraulic fracturing, and overcoring
demonstrate that large regions within the interiors of plates have consistent stress orienta-
tions and are principally dominated by compression except for highly elevated areas
(Zoback, 1992; Coblentz and Richardson, 1996). The global pattern of intraplate stress can
be explained simply by forces, mainly ridge push and collisional forces at trenches, applied
at the plate boundary (Richardson, 1976). Also, the orientation of the principal stress axes
of the stress tensor can be constrained by specifying the direction of just one of the
84

horizontal principal stresses (Zoback, 1989). In Central Asia, the regional stress field is
dominated by horizontal compression generated by the collision of India with the southern
margin of Asia and its convergence direction is well constrained (N 10° E), although its
magnitude is more difficult to estimate. McAdoo and Sandwell (1985) and Zuber (1987)
estimated that it is several hundred MPa based on observations of folding of the oceanic
lithosphere in the central Indian basin. Flesch et al. (2001), on the other hand, suggested
using a viscous model that it may be an order of magnitude smaller. Coblentz et al. (1995)
predicted that the stress fields in most regions of Australia due to ridge push force acting on
the India-Australian plate approaches 20 MPa. To test our hypothesis, we shall choose 50,
300 and 46 MPa respectively for the components of the stress vector with a compressional
principal stress direction of N 10° E and a magnitude of 308 MPa (Jin, 1997). Alternatively,
we shall assume that the boundary stress field is given by the quantitative stress field of
Flesch et al. (2001).
Stress from elevated topographic gravitational potential energy
Regions of high topography are exceptions to the rule that plate interiors are generally
in a compressonal stress state. Highly uplifted topography has a high gravitational potential
energy and is inherently unstable. It tends to spread laterally in order to return to its
minimum energy state. This tendency to spread causes extension in the interior of
highlands and compression in the surrounding lowlands (Fig. 51) (McGarr, 1988; Savage
and Morin, 2002). For highly elevated regions, the extensional forces can exceed the
regional compressional force, leading to the formation of normal faults (Molnar and Lyon-
Caen, 1989). Normal faults of the Tibetan Plateau are typical examples.
We estimate the horizontal and vertical stresses Sh and Sv due to variations in
gravitational potential energy by using McGarr’s formula (1988):
Sh = Sv = − cρ × g × th
where is topography, is gravitational acceleration and th g cρ is crustal density. Extension
is positive. In the Tien Shan area, the maximum magnitude of this (compressive) stress is
1.58 MPa and the minimum (extensional stress) is −126 MPa.
Flexural stress from lithospheric bending
85
In addition to the horizontal forces described above, topography also represents
vertical loads on an elastic lithosphere (e.g., Bank et al., 1977; Watts et al., 1980; McNutt,
1983; Forsyth, 1985). As the plate flexures beneath the loads, the top of the elastic plate is
placed under relative extension or compression, depending on whether the plate is curved
concave upwards or downwards. The bottom of the plate would be subjected to the
opposite stress state. The neutral surface is the boundary between compression and
extension (Fig. 52).
To evaluate the flexural stress, we first solved the equation governing the flexure of an
elastic lithosphere (equation 21, Chapter 3) to determine the lithospheric flexure of the Tien
Shan (Jin, 1997; Wees and Cloetingh, 1994). The laterally inhomogeneous rigidities used
(D) are based on the elastic thicknesses (Te) from gravity modelling (Fig. 18). ,
and of equation 21 that are due to the convergence between India and Asia here are
given by:
11N 22N
12N
(N11, N22, N12) = (S11, S22, S12) × h
where (S11, S22, S12) = (50, 300, 46) MPa (Jin, 1997) or the quantitative stress field of
Flesch et al. (2001).
The flexural equation is solved by the finite difference method (Jin 1997; Wees and
Cloetingh, 1994). The region chosen for the calculations lies between 70 – 110° E and 25
– 50° N, and the boundaries are assumed flat enough that the boundary conditions can be
approximated by Airy isostasy. The choice of Airy isostasy (compensation with very long
wavelengths) at the boundaries is due to the lack of knowledge on the actual deflections at
these locations. The topography and sediment columns in the Tarim and Zungar basins are
considered to be vertical loads on the elastic lithosphere. The flexural stress is calculated
using the following equations (Jin, 1997):
⎪⎪⎪⎪
⎩
⎪⎪⎪⎪
⎨
⎧
∂∂∂
+−=
⎥⎦
⎤⎢⎣
⎡∂∂
−−
+∂∂
−+−=
⎥⎦
⎤⎢⎣
⎡∂∂
−+
∂∂
−−
+−=
xyw
vEz
yw
vv
xw
vv
vEz
yw
vv
xw
vv
vEz
xy
yy
xx
2
2
2
2
2
2
2
2
2
1
211
211
21211
1
τ
τ
τ
86
where τ is flexural stress, z the depth coordinate (positive is down and zero is at the
centre of the plate where the neutral surface of the bending lithosphere is located). Using
this model, the flexural stress can be calculated at any depth in the lithosphere. It reaches
a maximum at the top and bottom of the lithospheric plate.
Figure 53 shows the 3D flexure of the Central Asian lithosphere in the region
between 70° – 110° E and 25° –50° N, for which the background stress components are
assumed to be (50, 300, 46) MPa (Jin, 1997) (Fig. 53a) or identical to the quantitative
stress field of Flesch et al. (2001) (Fig. 53b) respectively. Because of the large
topographic loading in the area, the calculated lithosphere flexure w is large. After w is
determined, the flexural stress distribution is estimated using the flexural stress equation.
Figures 54a-c give the stress fields calculated from the deflections of the elastic litho-
sphere shown in Fig. 53a at depths of zero, 1/4 and 1/8 of the thickness of the lithosphere
respectively. Analogously, stress fields when the deflections of the elastic lithosphere
shown in Fig. 51b are used are given in Figs. 55a-c.
Figures 56a-b show the average flexural stress field in the Tien Shan and its
adjoining areas calculated using a background stress of 308 MPa (Jin, 1997) (components
of 50, 300 and 46 MPa) and that from Flesch et al. (2001) respectively (see Figs. 54 and
55). For the former case, the maximum magnitude (compression) of the average flexural
stress is 169 MPa and the minimum magnitude (extension) is -99 MPa. For the latter
case, the corresponding values are 114 MPa and -118 MPa respectively. We note that the
maximum average flexural stress of the stress field applied is only 40 MPa (Flesch et al.,
2001). Thus, the magnitude and distribution of the local flexural stress field in the Tien
Shan using the two different regional stress fields are similar, being characterized by a
dominance of vertical loading. Figure 56 shows in addition that: (1) the greater the
elastic bending of the plate in response to topographic loading, the larger a role the
flexural stress field plays in our study area; (2) the Tien Shan mountain belt is under a
large compression, while the Tarim and Zungar basins are under extension; (3) the stress
field is oriented perpendicular to the strike of the load (i.e., the mountain belt), rather than
to the major collision direction between India and Eurasia; (4) the flexural stress
comprises over 40 % of the total stress (Fig. 57); and (5) the principal stress direction is
NW-SE in the western Tien Shan but rotates to N-S in the central part and NE-SW in the
easternmost areas. The stress direction is NW-SE in the westernmost Tarim Basin and is
87

roughly N-S elsewhere, while the corresponding directions in the Zungar Basin are NE-
SW in the easternmost areas and N-S elsewhere respectively.
88
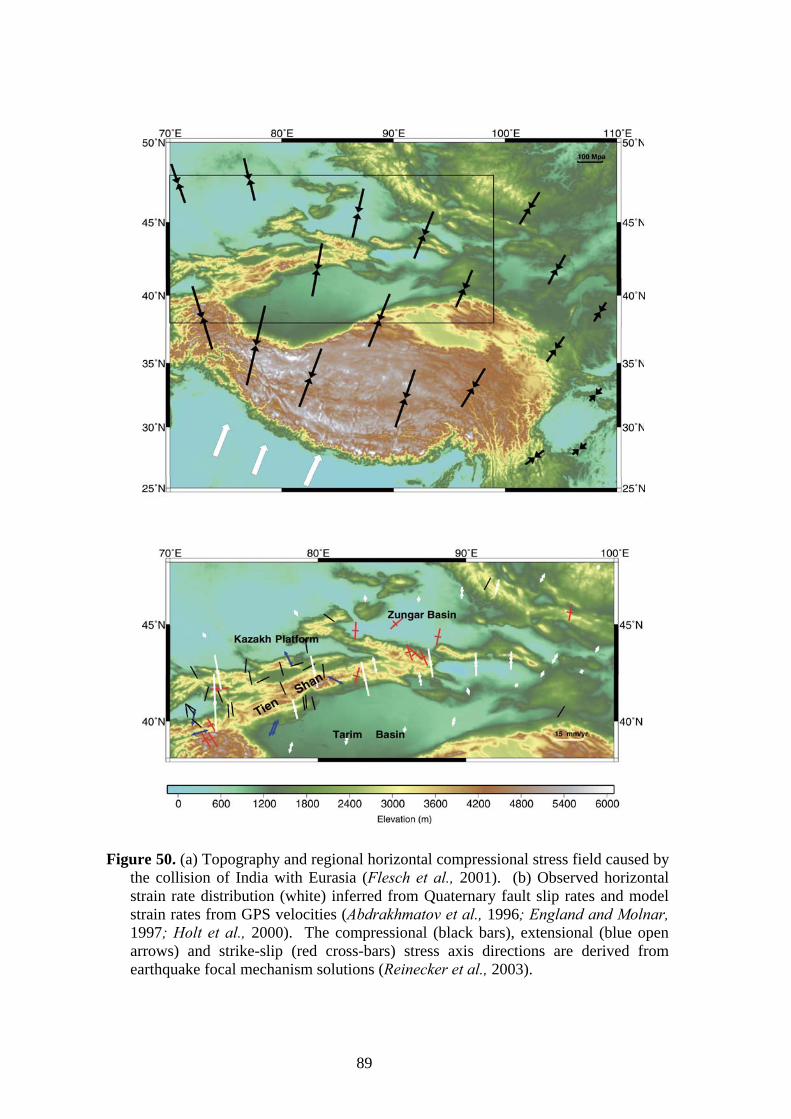
Figure 50. (a) Topography and regional horizontal compressional stress field caused by the collision of India with Eurasia (Flesch et al., 2001). (b) Observed horizontal strain rate distribution (white) inferred from Quaternary fault slip rates and model strain rates from GPS velocities (Abdrakhmatov et al., 1996; England and Molnar, 1997; Holt et al., 2000). The compressional (black bars), extensional (blue open arrows) and strike-slip (red cross-bars) stress axis directions are derived from earthquake focal mechanism solutions (Reinecker et al., 2003).
89
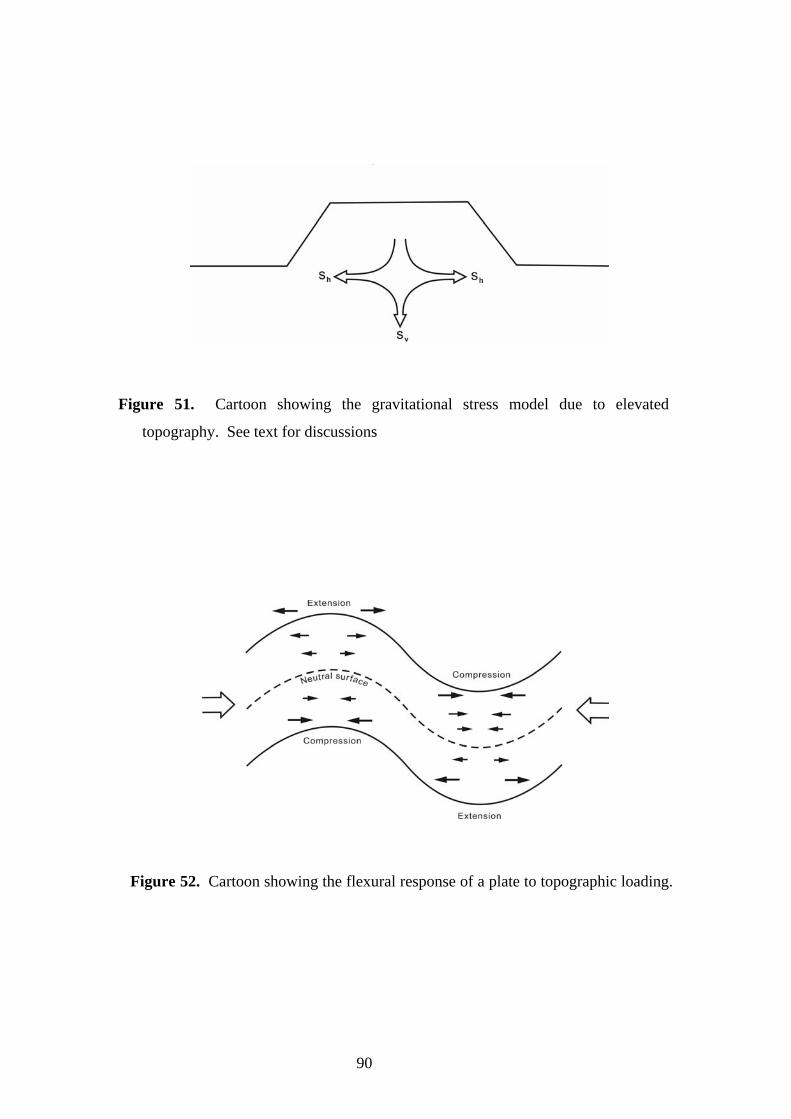
Figure 51. Cartoon showing the gravitational stress model due to elevated
topography. See text for discussions
Figure 52. Cartoon showing the flexural response of a plate to topographic loading.
90
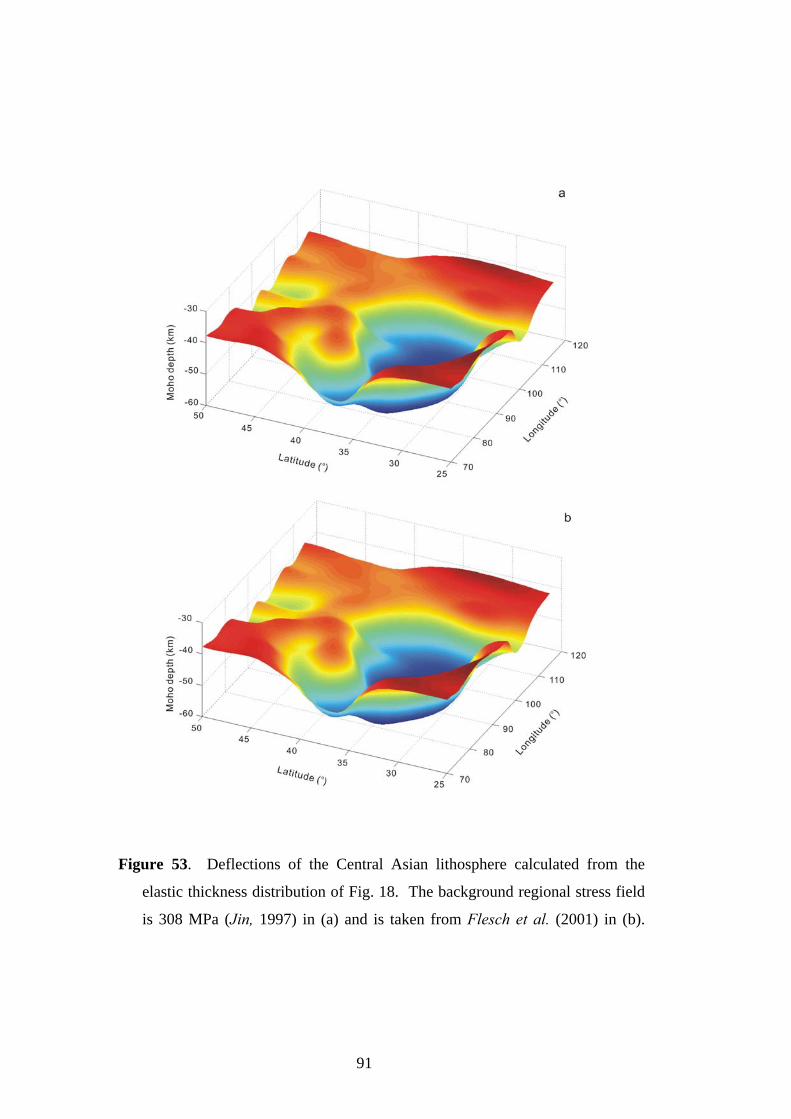
Figure 53. Deflections of the Central Asian lithosphere calculated from the
elastic thickness distribution of Fig. 18. The background regional stress field
is 308 MPa (Jin, 1997) in (a) and is taken from Flesch et al. (2001) in (b).
91
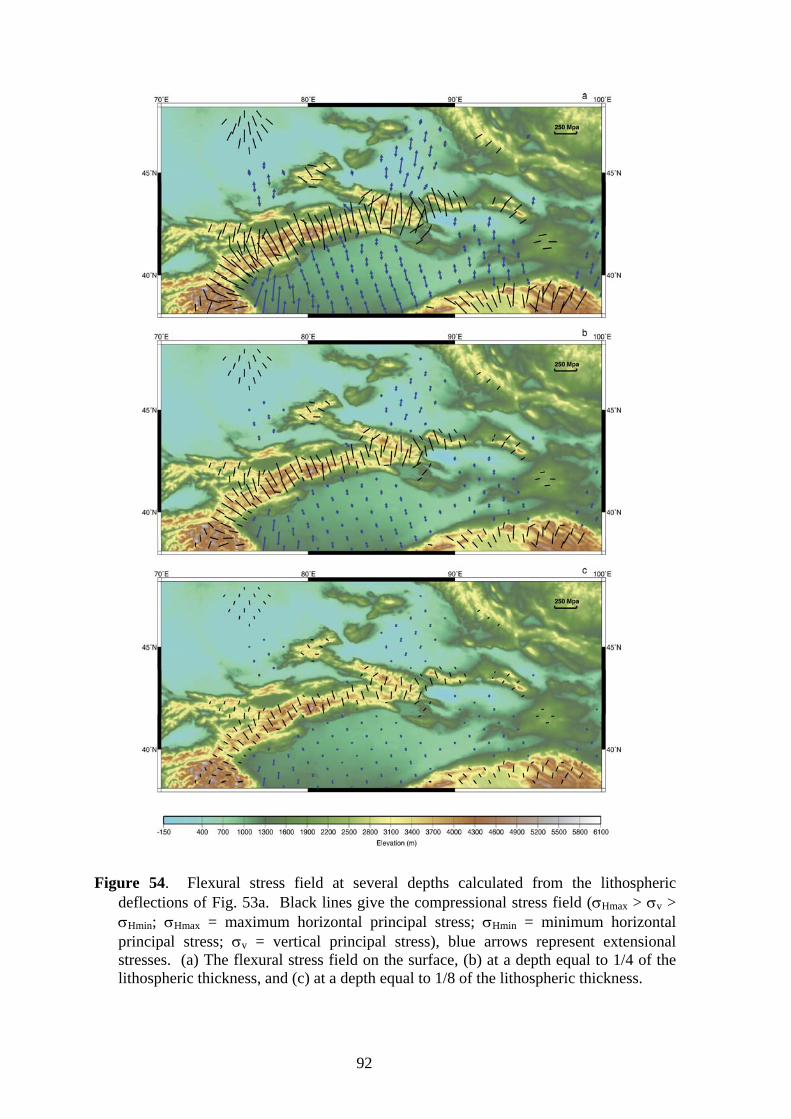
Figure 54. Flexural stress field at several depths calculated from the lithospheric deflections of Fig. 53a. Black lines give the compressional stress field (σHmax > σv > σHmin; σHmax = maximum horizontal principal stress; σHmin = minimum horizontal principal stress; σv = vertical principal stress), blue arrows represent extensional stresses. (a) The flexural stress field on the surface, (b) at a depth equal to 1/4 of the lithospheric thickness, and (c) at a depth equal to 1/8 of the lithospheric thickness.
92
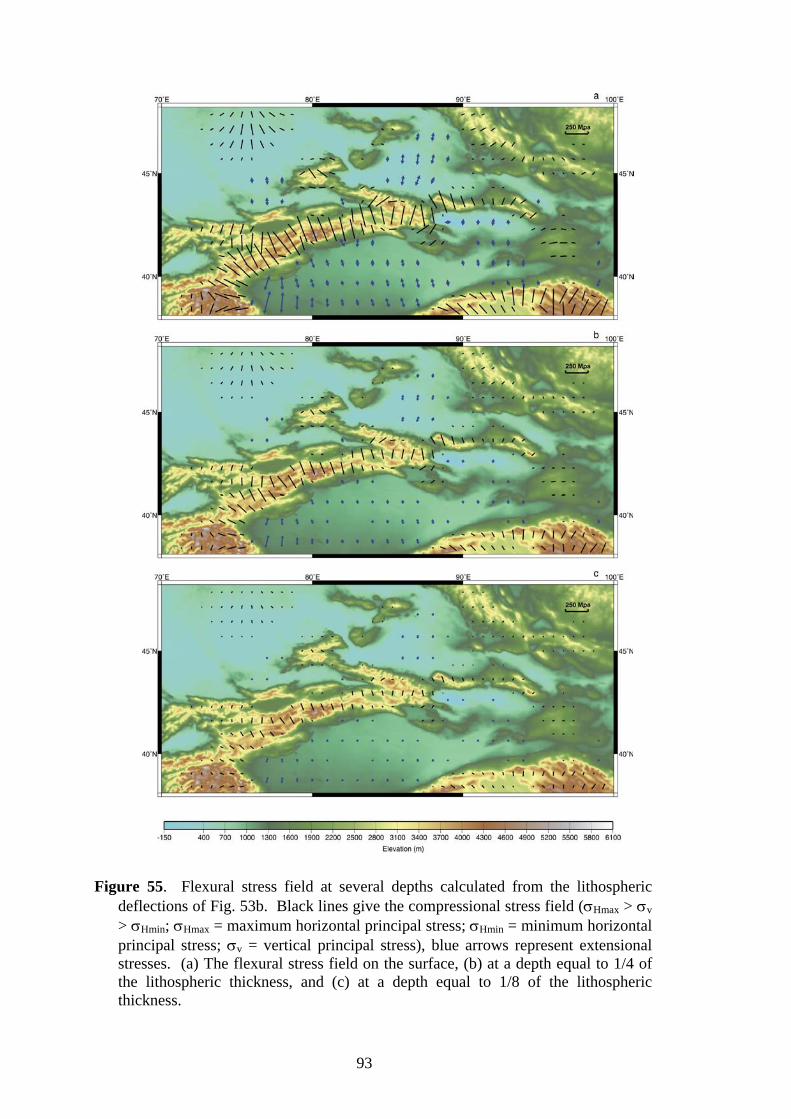
Figure 55. Flexural stress field at several depths calculated from the lithospheric deflections of Fig. 53b. Black lines give the compressional stress field (σHmax > σv > σHmin; σHmax = maximum horizontal principal stress; σHmin = minimum horizontal principal stress; σv = vertical principal stress), blue arrows represent extensional stresses. (a) The flexural stress field on the surface, (b) at a depth equal to 1/4 of the lithospheric thickness, and (c) at a depth equal to 1/8 of the lithospheric thickness.
93
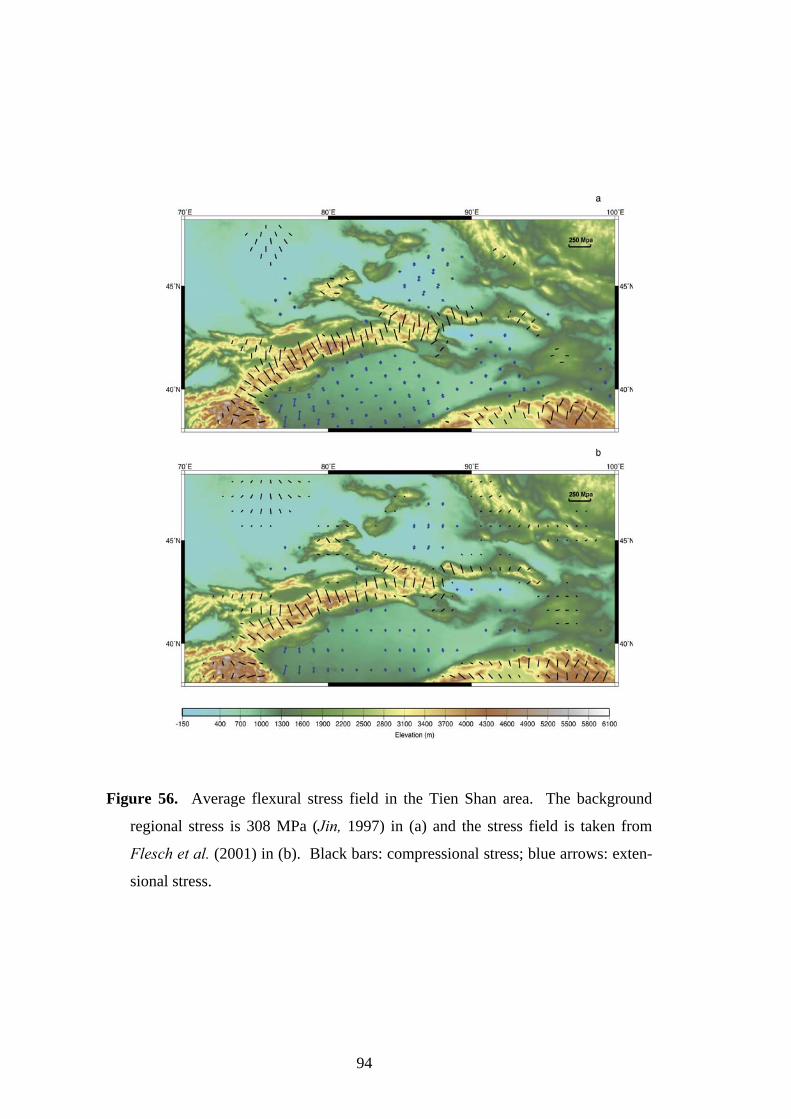
Figure 56. Average flexural stress field in the Tien Shan area. The background
regional stress is 308 MPa (Jin, 1997) in (a) and the stress field is taken from
Flesch et al. (2001) in (b). Black bars: compressional stress; blue arrows: exten-
sional stress.
94
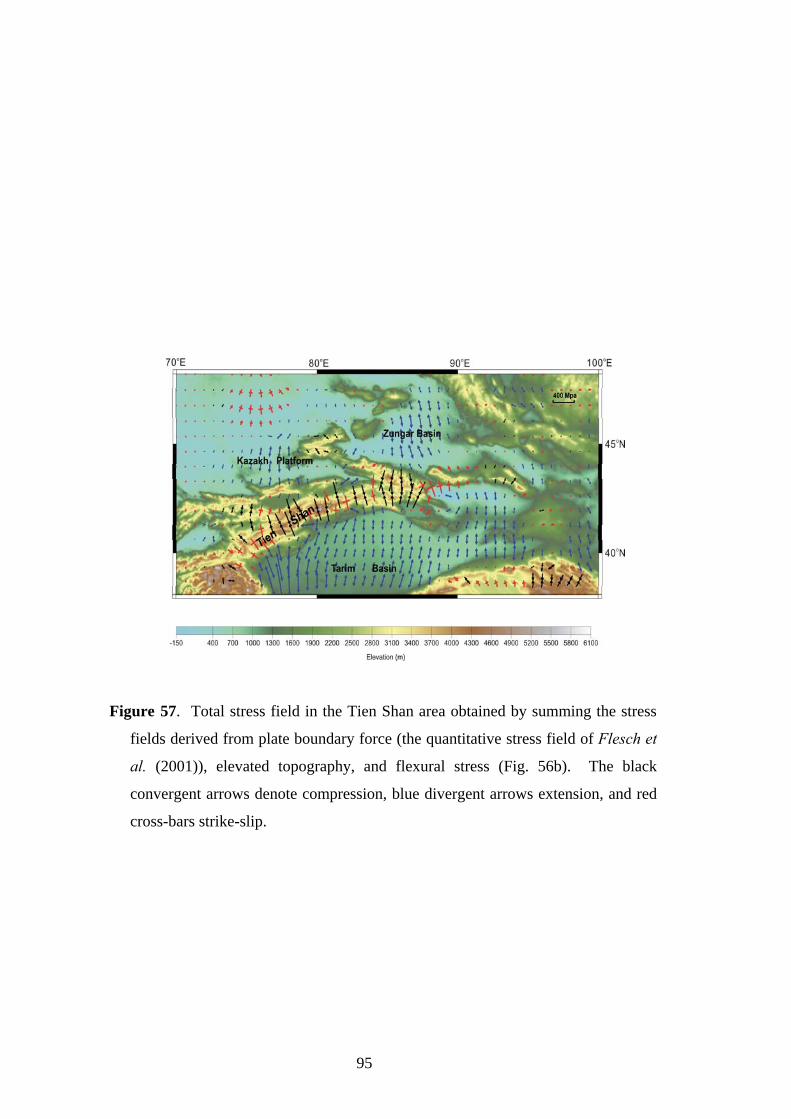
Figure 57. Total stress field in the Tien Shan area obtained by summing the stress
fields derived from plate boundary force (the quantitative stress field of Flesch et
al. (2001)), elevated topography, and flexural stress (Fig. 56b). The black
convergent arrows denote compression, blue divergent arrows extension, and red
cross-bars strike-slip.
95
Chapter 6. Discussion
Our modelling shows that the 3D flexure of the Central Asian lithosphere is charac-
terized by a large downward deflection where topographic loading is high (Fig. 53). The
largest lithospheric bending (65–70 km) occurs on the northern and southern Tibetan
Plateau; bending over the central plateau is in comparison moderate (60-63 km). (A plate
flex upwards or downwards depending on whether it is under relative extension or
compression. Plate bending is always downwards in our study area, and ‘bending’ means
‘bending downwards’ in this dissertation). In contrast, flexure in northeastern Tibet between
the Altyn Tagh Fault and the Kunlun Fault is low, the lowest values being reached in the
Qaidam Basin (58 km). The Tarim Basin and the Yangtze and Sino-Korean blocks have
suffered very low lithospheric flexure (45–50 km). Seismic reflection imaging of the Moho
in the Tarim Basin shows that it dips southward from a depth of 42 km to a depth of 50 km
(Kao et al., 2001), and teleseismic tomography across Altyn Tagh give a mean crustal
thickness of 54 km for the Qaidam Basin (Wittlinger, 1998). Our modelling results on
lithospheric bending are therefore compatible with these measurements.
Our gravity modelling of the strength of the lithosphere in Central Asia suggests that
the strong Indian plate weakens the Eurasia plate in the course of collision (Fig. 18).
However, the degree of weakening varies from place to place within Eurasia. Firstly, the
lithosphere at the collision zone on both sides of the Zhangbo suture zone suffers a large
weakening with low Te values of 10-20 km or less. Secondly, although the Tien Shan is far
from the collision zone, it is currently a very active thrust belt. Brittle failure caused by this
thrusting weakens the lithosphere of the Tien Shan with Te value similar to that of the
Zhangbo suture zone. Thirdly, the rigid Tarim block with a Precambrian or Lower
Palaeozoic basement (Avouac et al., 1993; Yin 1993; Zhou and Chen, 1990) functions as a
barrier to the northward motion of India. Fourthly, the lithosphere beneath Qilian Shan is
another highly weakened area. The mechanism of its weakening is similar to that of the
Tien Shan. Fifthly, the Yangtze and Sino-Korean blocks as well as the eastern boundary of
the Tibetan Plateau where the elevation drops from >4 km on the plateau to <1 km in the
Sichuan Basin via Longmen Shan have high elastic strengths. The sharp decrease in Te
along the eastern boundary of the Tibetan Plateau indicates that large changes in mantle
structure are restricted to major crustal boundaries. Beneath the central Altyn Tagh Fault,
teleseismic tomography reveals a steep, low-P-wave velocity anomaly (relative to the
96
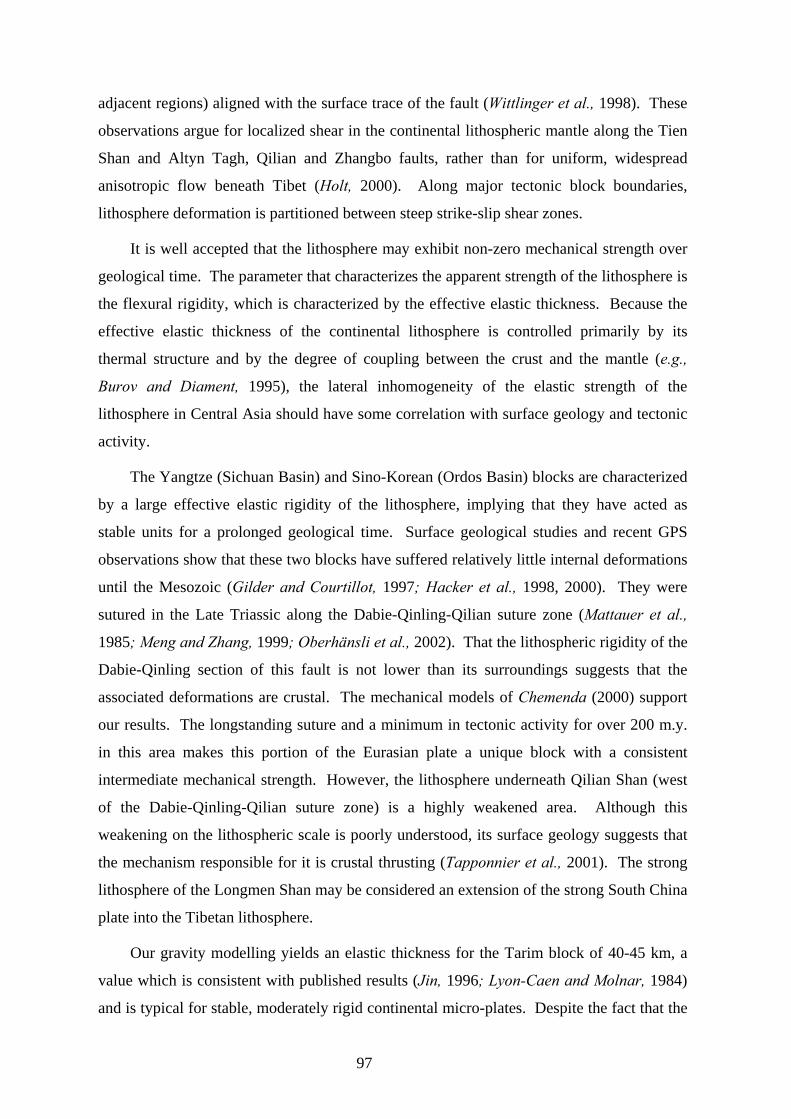
adjacent regions) aligned with the surface trace of the fault (Wittlinger et al., 1998). These
observations argue for localized shear in the continental lithospheric mantle along the Tien
Shan and Altyn Tagh, Qilian and Zhangbo faults, rather than for uniform, widespread
anisotropic flow beneath Tibet (Holt, 2000). Along major tectonic block boundaries,
lithosphere deformation is partitioned between steep strike-slip shear zones.
It is well accepted that the lithosphere may exhibit non-zero mechanical strength over
geological time. The parameter that characterizes the apparent strength of the lithosphere is
the flexural rigidity, which is characterized by the effective elastic thickness. Because the
effective elastic thickness of the continental lithosphere is controlled primarily by its
thermal structure and by the degree of coupling between the crust and the mantle (e.g.,
Burov and Diament, 1995), the lateral inhomogeneity of the elastic strength of the
lithosphere in Central Asia should have some correlation with surface geology and tectonic
activity.
The Yangtze (Sichuan Basin) and Sino-Korean (Ordos Basin) blocks are characterized
by a large effective elastic rigidity of the lithosphere, implying that they have acted as
stable units for a prolonged geological time. Surface geological studies and recent GPS
observations show that these two blocks have suffered relatively little internal deformations
until the Mesozoic (Gilder and Courtillot, 1997; Hacker et al., 1998, 2000). They were
sutured in the Late Triassic along the Dabie-Qinling-Qilian suture zone (Mattauer et al.,
1985; Meng and Zhang, 1999; Oberhänsli et al., 2002). That the lithospheric rigidity of the
Dabie-Qinling section of this fault is not lower than its surroundings suggests that the
associated deformations are crustal. The mechanical models of Chemenda (2000) support
our results. The longstanding suture and a minimum in tectonic activity for over 200 m.y.
in this area makes this portion of the Eurasian plate a unique block with a consistent
intermediate mechanical strength. However, the lithosphere underneath Qilian Shan (west
of the Dabie-Qinling-Qilian suture zone) is a highly weakened area. Although this
weakening on the lithospheric scale is poorly understood, its surface geology suggests that
the mechanism responsible for it is crustal thrusting (Tapponnier et al., 2001). The strong
lithosphere of the Longmen Shan may be considered an extension of the strong South China
plate into the Tibetan lithosphere.
Our gravity modelling yields an elastic thickness for the Tarim block of 40-45 km, a
value which is consistent with published results (Jin, 1996; Lyon-Caen and Molnar, 1984)
and is typical for stable, moderately rigid continental micro-plates. Despite the fact that the
97
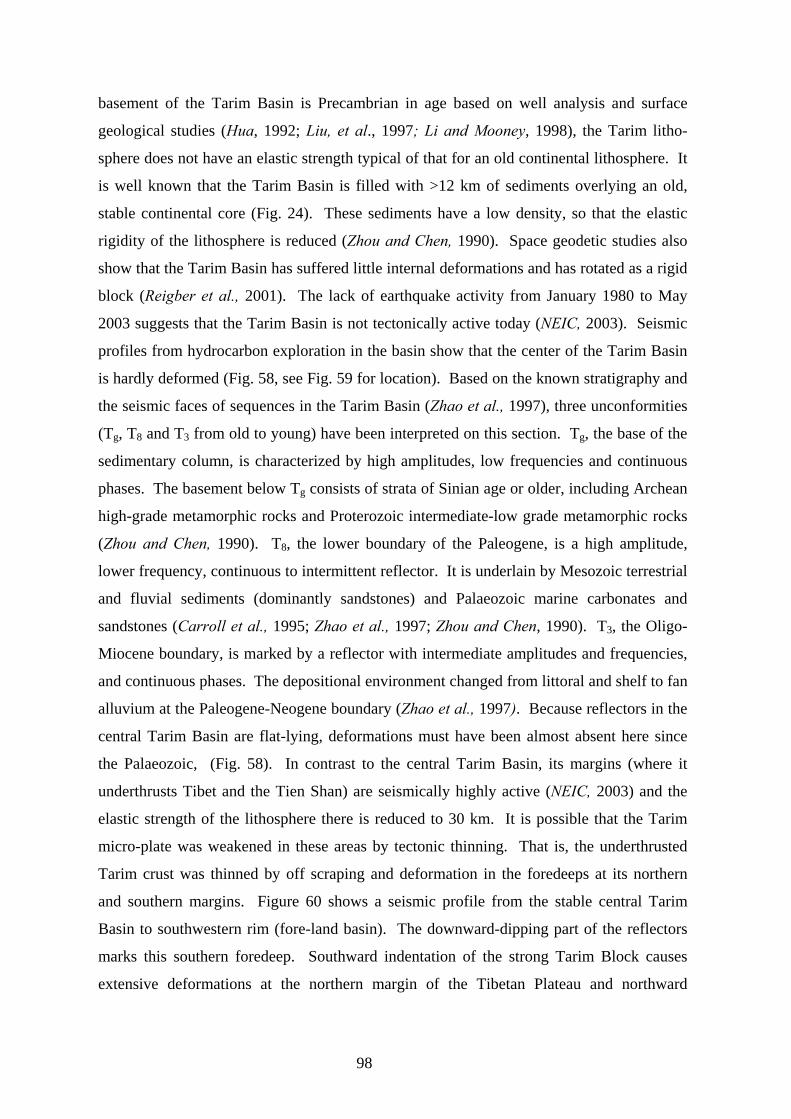
basement of the Tarim Basin is Precambrian in age based on well analysis and surface
geological studies (Hua, 1992; Liu, et al., 1997; Li and Mooney, 1998), the Tarim litho-
sphere does not have an elastic strength typical of that for an old continental lithosphere. It
is well known that the Tarim Basin is filled with >12 km of sediments overlying an old,
stable continental core (Fig. 24). These sediments have a low density, so that the elastic
rigidity of the lithosphere is reduced (Zhou and Chen, 1990). Space geodetic studies also
show that the Tarim Basin has suffered little internal deformations and has rotated as a rigid
block (Reigber et al., 2001). The lack of earthquake activity from January 1980 to May
2003 suggests that the Tarim Basin is not tectonically active today (NEIC, 2003). Seismic
profiles from hydrocarbon exploration in the basin show that the center of the Tarim Basin
is hardly deformed (Fig. 58, see Fig. 59 for location). Based on the known stratigraphy and
the seismic faces of sequences in the Tarim Basin (Zhao et al., 1997), three unconformities
(Tg, T8 and T3 from old to young) have been interpreted on this section. Tg, the base of the
sedimentary column, is characterized by high amplitudes, low frequencies and continuous
phases. The basement below Tg consists of strata of Sinian age or older, including Archean
high-grade metamorphic rocks and Proterozoic intermediate-low grade metamorphic rocks
(Zhou and Chen, 1990). T8, the lower boundary of the Paleogene, is a high amplitude,
lower frequency, continuous to intermittent reflector. It is underlain by Mesozoic terrestrial
and fluvial sediments (dominantly sandstones) and Palaeozoic marine carbonates and
sandstones (Carroll et al., 1995; Zhao et al., 1997; Zhou and Chen, 1990). T3, the Oligo-
Miocene boundary, is marked by a reflector with intermediate amplitudes and frequencies,
and continuous phases. The depositional environment changed from littoral and shelf to fan
alluvium at the Paleogene-Neogene boundary (Zhao et al., 1997). Because reflectors in the
central Tarim Basin are flat-lying, deformations must have been almost absent here since
the Palaeozoic, (Fig. 58). In contrast to the central Tarim Basin, its margins (where it
underthrusts Tibet and the Tien Shan) are seismically highly active (NEIC, 2003) and the
elastic strength of the lithosphere there is reduced to 30 km. It is possible that the Tarim
micro-plate was weakened in these areas by tectonic thinning. That is, the underthrusted
Tarim crust was thinned by off scraping and deformation in the foredeeps at its northern
and southern margins. Figure 60 shows a seismic profile from the stable central Tarim
Basin to southwestern rim (fore-land basin). The downward-dipping part of the reflectors
marks this southern foredeep. Southward indentation of the strong Tarim Block causes
extensive deformations at the northern margin of the Tibetan Plateau and northward
98
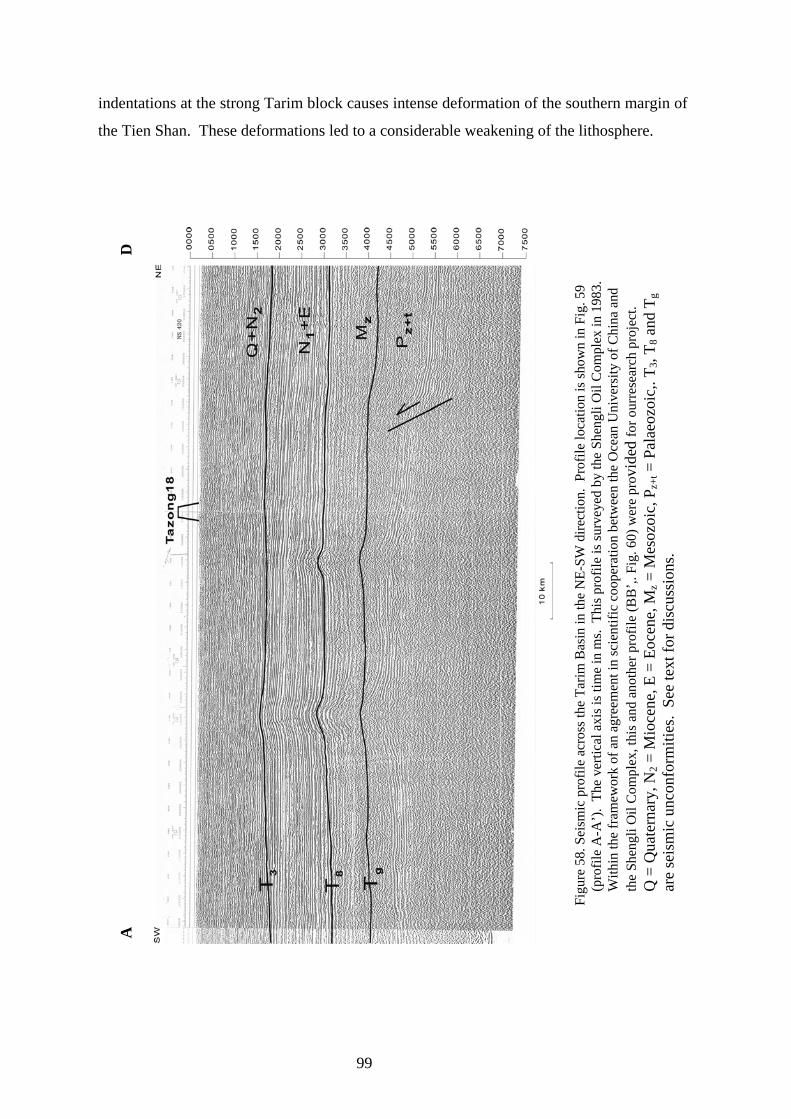
indentations at the strong Tarim block causes intense deformation of the southern margin of
the Tien Shan. These deformations led to a considerable weakening of the lithosphere.
A
D
Fi
gure
58.
Sei
smic
pro
file
acro
ss th
e Ta
rim B
asin
in th
e N
E-SW
dire
ctio
n. P
rofil
e lo
catio
n is
show
n in
Fig
. 59
(pro
file
A-A
’).
The
verti
cal a
xis i
s tim
e in
ms.
Thi
s pro
file
is su
rvey
ed b
y th
e Sh
engl
i Oil
Com
plex
in 1
983.
W
ithin
the
fram
ewor
k of
an
agre
emen
t in
scie
ntifi
c co
oper
atio
n be
twee
n th
e O
cean
Uni
vers
ity o
f Chi
na a
nd
the
Shen
gli O
il C
ompl
ex, t
his a
nd a
noth
er p
rofil
e (B
B’,.
Fig
. 60)
wer
e pr
ovid
ed fo
r our
rese
arch
pro
ject
. Q
= Q
uate
rnar
y, N
2 = M
ioce
ne, E
= E
ocen
e, M
z = M
esoz
oic,
Pz+
t = P
alae
ozoi
c,. T
3, T 8
and
Tg
are
seis
mic
unc
onfo
rmiti
es.
See
text
for d
iscu
ssio
ns.
99
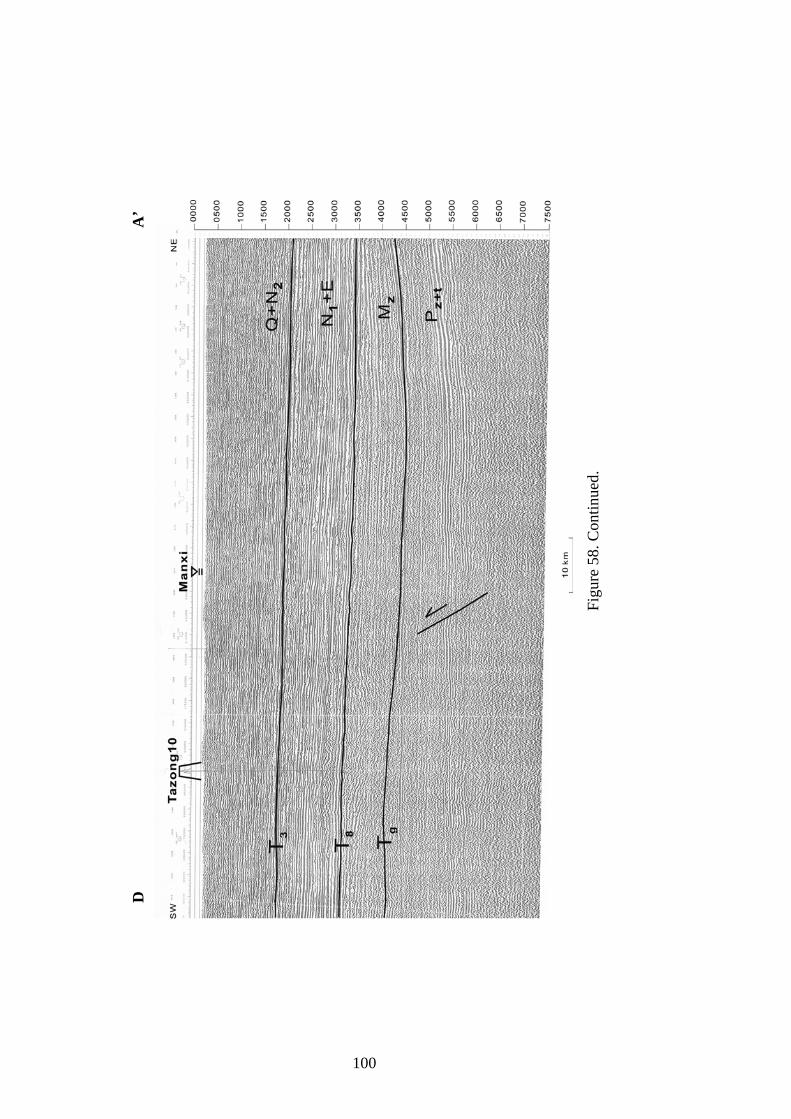
D
A’
Figu
re 5
8. C
ontin
ued.
100
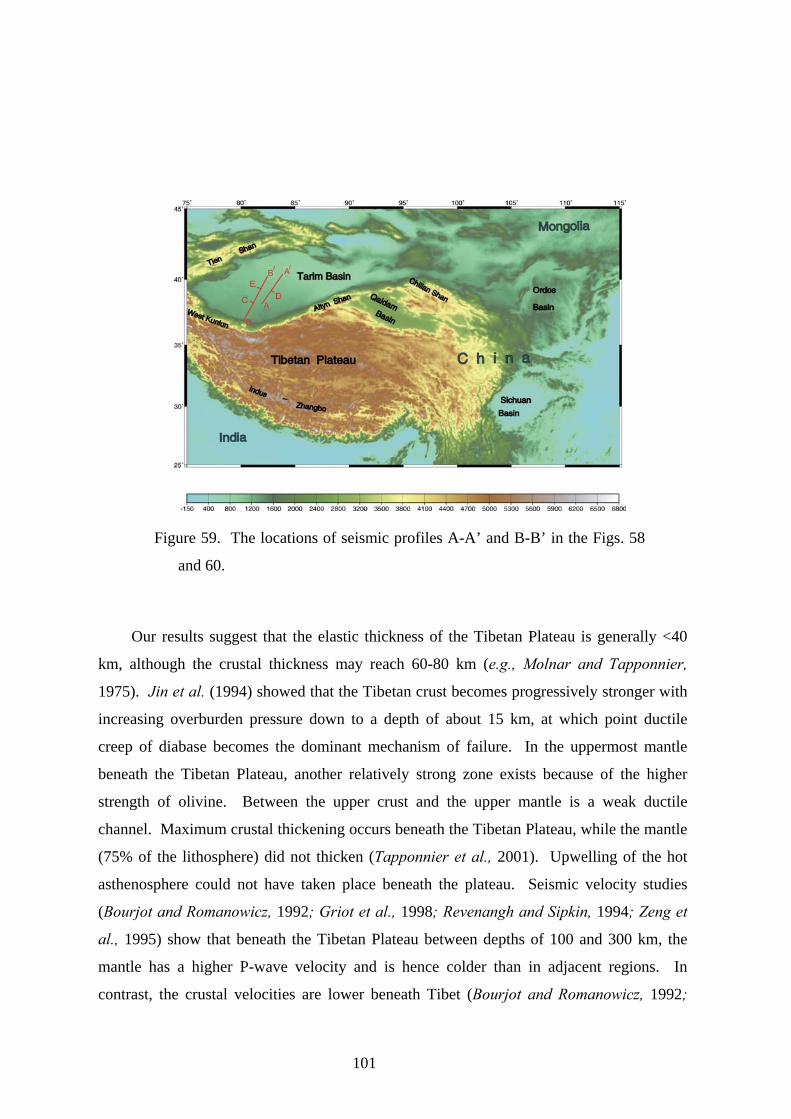
Figure 59. The locations of seismic profiles A-A’ and B-B’ in the Figs. 58
and 60.
Our results suggest that the elastic thickness of the Tibetan Plateau is generally <40
km, although the crustal thickness may reach 60-80 km (e.g., Molnar and Tapponnier,
1975). Jin et al. (1994) showed that the Tibetan crust becomes progressively stronger with
increasing overburden pressure down to a depth of about 15 km, at which point ductile
creep of diabase becomes the dominant mechanism of failure. In the uppermost mantle
beneath the Tibetan Plateau, another relatively strong zone exists because of the higher
strength of olivine. Between the upper crust and the upper mantle is a weak ductile
channel. Maximum crustal thickening occurs beneath the Tibetan Plateau, while the mantle
(75% of the lithosphere) did not thicken (Tapponnier et al., 2001). Upwelling of the hot
asthenosphere could not have taken place beneath the plateau. Seismic velocity studies
(Bourjot and Romanowicz, 1992; Griot et al., 1998; Revenangh and Sipkin, 1994; Zeng et
al., 1995) show that beneath the Tibetan Plateau between depths of 100 and 300 km, the
mantle has a higher P-wave velocity and is hence colder than in adjacent regions. In
contrast, the crustal velocities are lower beneath Tibet (Bourjot and Romanowicz, 1992;
101
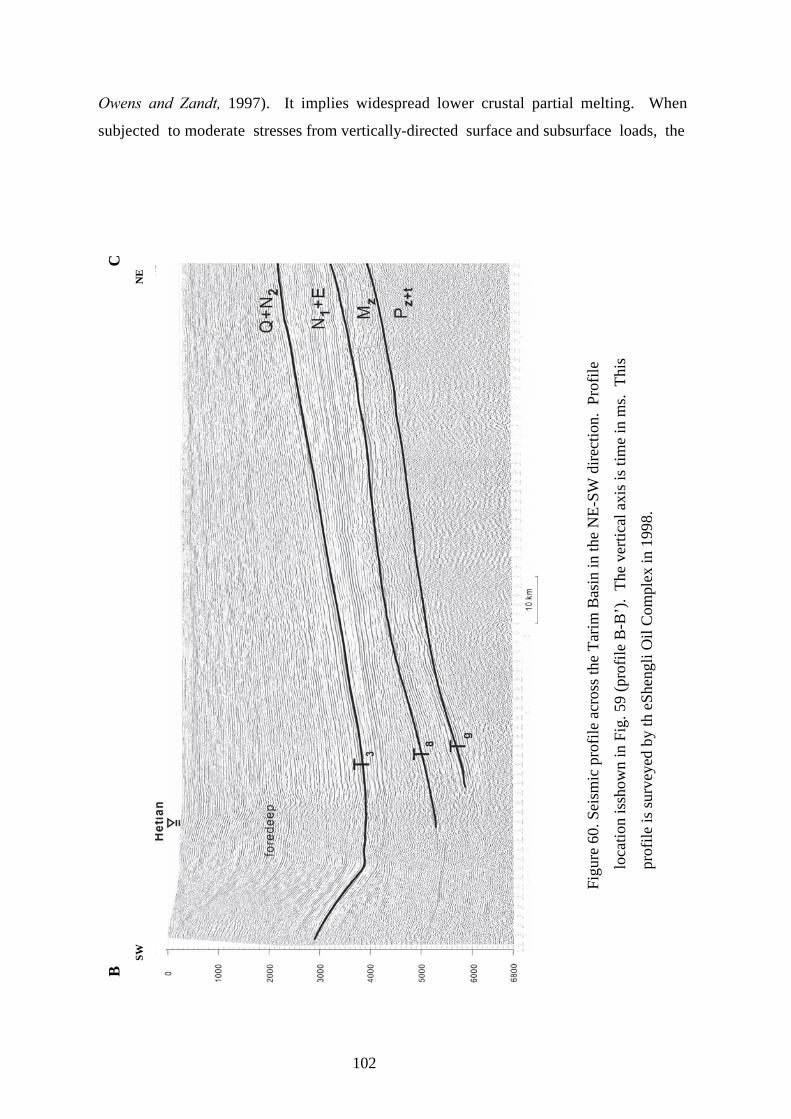
Owens and Zandt, 1997). It implies widespread lower crustal partial melting. When
subjected to moderate stresses from vertically-directed surface and subsurface loads, the
B
C
SW
N
E
Figu
re 6
0. S
eism
ic p
rofil
e ac
ross
the
Tarim
Bas
in in
the
NE-
SW d
irect
ion.
Pro
file
l
ocat
ion
issh
own
in F
ig. 5
9 (p
rofil
e B
-B’)
. Th
e ve
rtica
l axi
s is t
ime
in m
s. T
his
p
rofil
e is
surv
eyed
by
th e
Shen
gli O
il C
ompl
ex in
199
8.
102

C
E
Figu
re 6
0. C
ontin
ued.
103
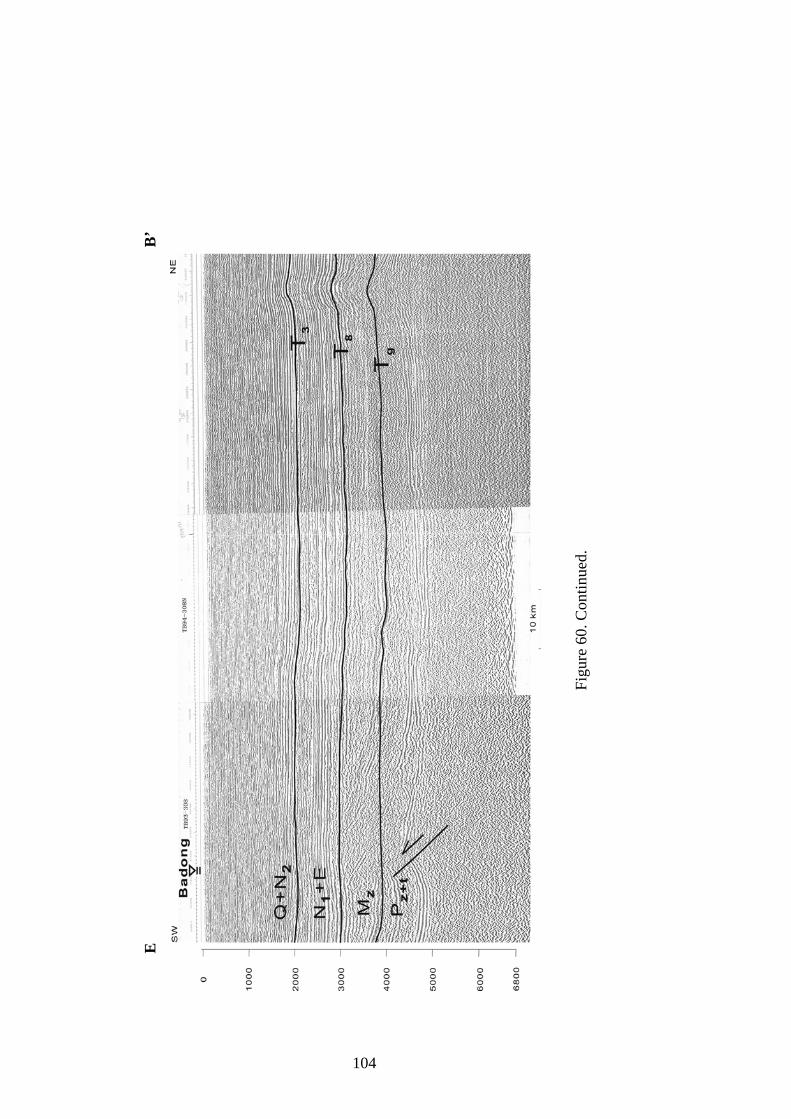
E
B’
Figu
re 6
0. C
ontin
ued.
104
overall mechanical behaviour of the two rheologically strong regions separated by a ductile
channel is governed by an effective elastic thickness given by (Tc3 + Tm3)1/3 (McNutt et al.,
1988, where Tc denotes upper crust rigidity and Tm the upper mantle rigidity). In our case,
it is slightly more than the effective elastic thickness of the stronger of the two layers.
Thus, our moderate rigidity model of the Tibetan Plateau is plausible.
The elastic thickness Te stays more-or-less constant for the area south of the Zhangbo
suture and for India. Some of the young N-S trending rifts extend across the Zhangbo
suture into the Greater Himalayas (Armijo 1986; Armijo et al., 1989; Monlar and Lyon-
Caen, 1989), a region underlain by the bending Indian-continental mantle (Lyon-Caen and
Molnar, 1984; Zhao et al., 1993). Lithospheric thinning did not occur here. Extension
south of Tibet is interpreted to have resulted from a combination of dextral strike-slip and
high topography along the Main Frontal Thrust (Armijo et al., 1989; McCaffre and
Nabelek, 1998).
Our results indicate that the interior and eastern parts of Tibet have the same elastic
strength as the Yangtze block and the eastern lowlands. If central and eastern Tibet
originally belonged to the same tectonic unit as the Yangtze block or if the two units have
been welded together long enough, then the similarity in the lithospheric strength of these
two tectonic units is understandable. However, northern Tibet was not accreted to the Sino-
Korean and Yangtze blocks until the Late Jurassic or Early Cretaceous (Yin, 1996), and the
Lhasa block was not welded to the Yangtze block until the Eocene or later. The flat
topography over large areas in the interior of the plateau has been taken to indicate a lack of
Tertiary shortening. However, studies show that thrusting and sinistral strike-slip faulting
have been dominant here and are equivalent to crustal deformation processes in Tibet since
the Eocene, viz. thrusting and strike-slip faulting north and east of the Indus-Zangbo suture
(Achache et al., 1984; Métivier et al., 1998). In the central plateau between the Kunlun and
Tanggula ranges, strong folding of the Paleogene red beds unconformably overlain by more
gently-warped Neogene sandstones implies a certain amount of shortening (Chang et al.,
1986; Yin et al., 1994).
The drastic variations in Te in the study area and with it the local strength reduction
near the suture zone are related to differences in the composition of the crust or to the
presence of major faults, as suggested by Burov et al. (1998). Our 2D model shows that the
lithospheric strength beneath the West Kunlun and Altyn ranges decreases gradually from
the Tarim Basin to the Tibetan Plateau.
105
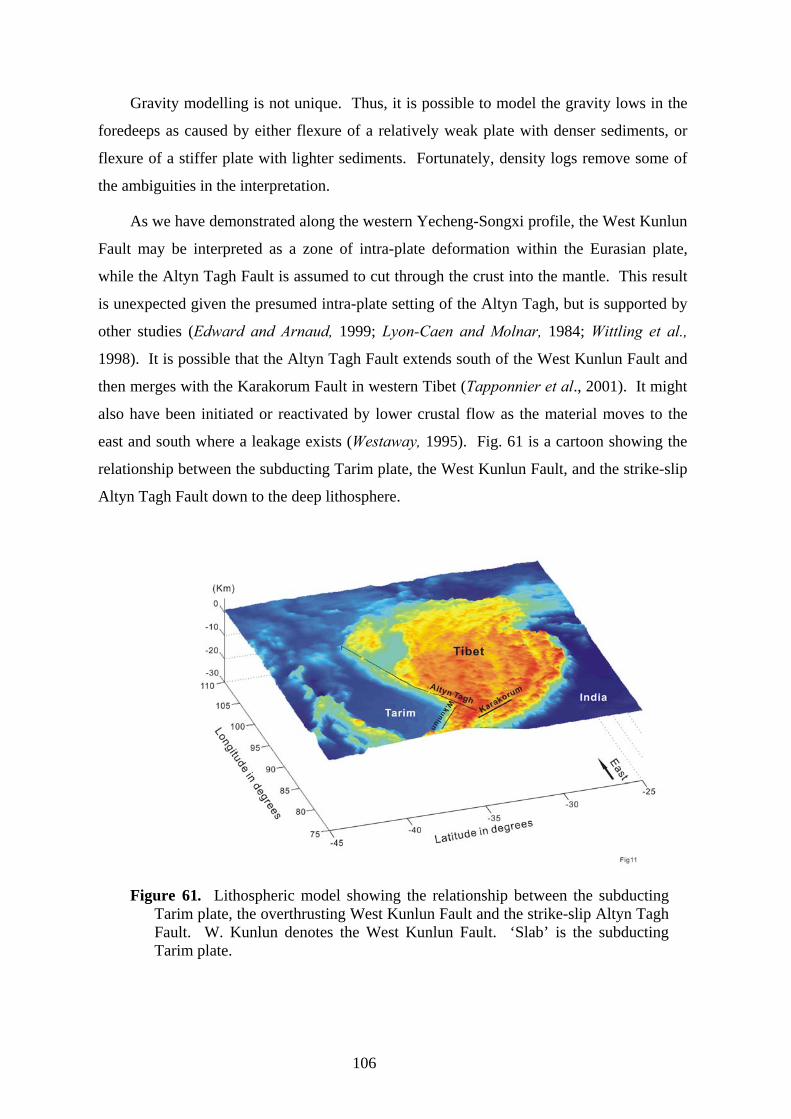
Gravity modelling is not unique. Thus, it is possible to model the gravity lows in the
foredeeps as caused by either flexure of a relatively weak plate with denser sediments, or
flexure of a stiffer plate with lighter sediments. Fortunately, density logs remove some of
the ambiguities in the interpretation.
As we have demonstrated along the western Yecheng-Songxi profile, the West Kunlun
Fault may be interpreted as a zone of intra-plate deformation within the Eurasian plate,
while the Altyn Tagh Fault is assumed to cut through the crust into the mantle. This result
is unexpected given the presumed intra-plate setting of the Altyn Tagh, but is supported by
other studies (Edward and Arnaud, 1999; Lyon-Caen and Molnar, 1984; Wittling et al.,
1998). It is possible that the Altyn Tagh Fault extends south of the West Kunlun Fault and
then merges with the Karakorum Fault in western Tibet (Tapponnier et al., 2001). It might
also have been initiated or reactivated by lower crustal flow as the material moves to the
east and south where a leakage exists (Westaway, 1995). Fig. 61 is a cartoon showing the
relationship between the subducting Tarim plate, the West Kunlun Fault, and the strike-slip
Altyn Tagh Fault down to the deep lithosphere.
Figure 61. Lithospheric model showing the relationship between the subducting Tarim plate, the overthrusting West Kunlun Fault and the strike-slip Altyn Tagh Fault. W. Kunlun denotes the West Kunlun Fault. ‘Slab’ is the subducting Tarim plate.
106
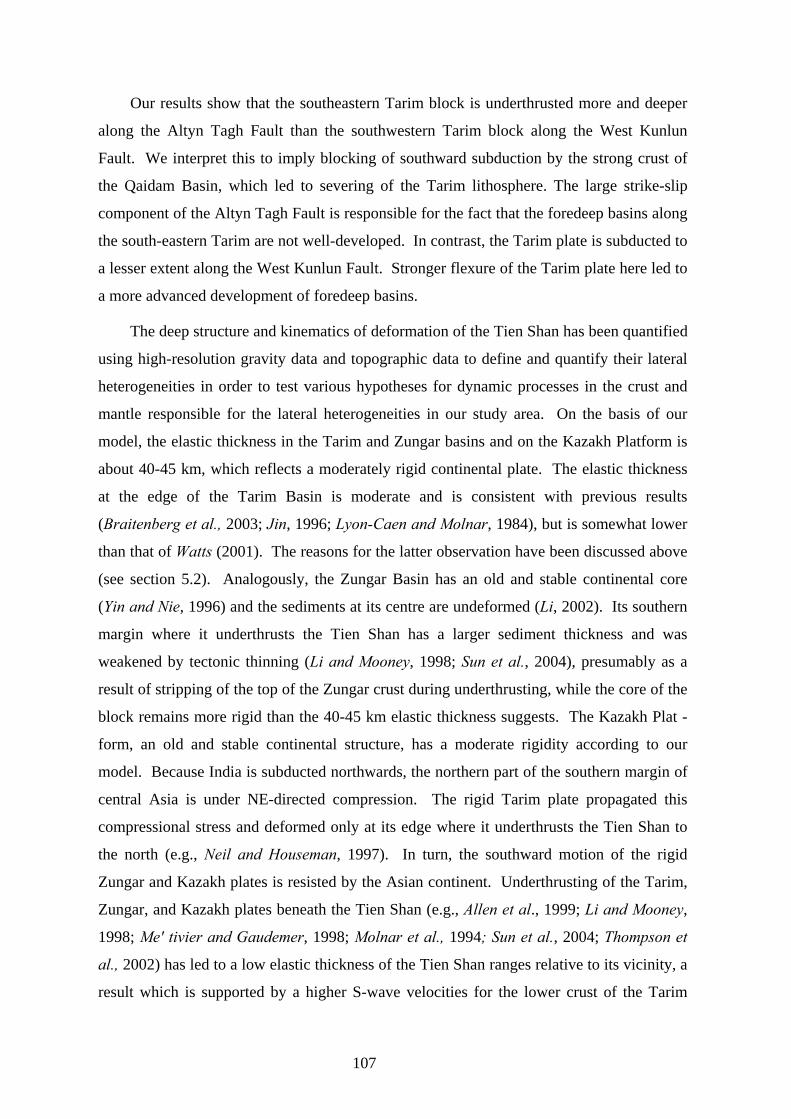
Our results show that the southeastern Tarim block is underthrusted more and deeper
along the Altyn Tagh Fault than the southwestern Tarim block along the West Kunlun
Fault. We interpret this to imply blocking of southward subduction by the strong crust of
the Qaidam Basin, which led to severing of the Tarim lithosphere. The large strike-slip
component of the Altyn Tagh Fault is responsible for the fact that the foredeep basins along
the south-eastern Tarim are not well-developed. In contrast, the Tarim plate is subducted to
a lesser extent along the West Kunlun Fault. Stronger flexure of the Tarim plate here led to
a more advanced development of foredeep basins.
The deep structure and kinematics of deformation of the Tien Shan has been quantified
using high-resolution gravity data and topographic data to define and quantify their lateral
heterogeneities in order to test various hypotheses for dynamic processes in the crust and
mantle responsible for the lateral heterogeneities in our study area. On the basis of our
model, the elastic thickness in the Tarim and Zungar basins and on the Kazakh Platform is
about 40-45 km, which reflects a moderately rigid continental plate. The elastic thickness
at the edge of the Tarim Basin is moderate and is consistent with previous results
(Braitenberg et al., 2003; Jin, 1996; Lyon-Caen and Molnar, 1984), but is somewhat lower
than that of Watts (2001). The reasons for the latter observation have been discussed above
(see section 5.2). Analogously, the Zungar Basin has an old and stable continental core
(Yin and Nie, 1996) and the sediments at its centre are undeformed (Li, 2002). Its southern
margin where it underthrusts the Tien Shan has a larger sediment thickness and was
weakened by tectonic thinning (Li and Mooney, 1998; Sun et al., 2004), presumably as a
result of stripping of the top of the Zungar crust during underthrusting, while the core of the
block remains more rigid than the 40-45 km elastic thickness suggests. The Kazakh Plat -
form, an old and stable continental structure, has a moderate rigidity according to our
model. Because India is subducted northwards, the northern part of the southern margin of
central Asia is under NE-directed compression. The rigid Tarim plate propagated this
compressional stress and deformed only at its edge where it underthrusts the Tien Shan to
the north (e.g., Neil and Houseman, 1997). In turn, the southward motion of the rigid
Zungar and Kazakh plates is resisted by the Asian continent. Underthrusting of the Tarim,
Zungar, and Kazakh plates beneath the Tien Shan (e.g., Allen et al., 1999; Li and Mooney,
1998; Me′ tivier and Gaudemer, 1998; Molnar et al., 1994; Sun et al., 2004; Thompson et
al., 2002) has led to a low elastic thickness of the Tien Shan ranges relative to its vicinity, a
result which is supported by a higher S-wave velocities for the lower crust of the Tarim
107
Basin than for the Tien Shan (Kosarev et al., 1993; Roecker et al., 1993). Thus, it is
reasonable that our best-fit model to the gravity data across the Tien Shan requires that the
plate be very weak or be broken at the thrust faults.
Figure 62 shows the epicentre distribution of earthquakes with magnitudes larger than
2.5 for the period January 1, 1978 to May 31, 2003, recorded by the China Digital Seismic
network (CDSN). It indicates that seismicity is low within the Tarim, Zungar, and Kazakh
plates where the lithosphere has a large elastic thickness, but is high in the Tien Shan ranges
where the lithospheric elastic thickness is small. This result supports our gravity model,
which suggests underthrusting along the margins of the rigid Tarim, Zungar and Kazakh
plates beneath the Tien Shan while their centres remain undeformed. A similar situation
occurs in the Tibetan Plateau and to the north (Braitenberg et al., 2003).
Figure 62. Epicentre distribution of earthquakes with magnitudes larger than 2.5
for the period January 1, 1978 to May 31, 2003, recorded by the China Digital
Seismic network (CDSN).
108
Our results indicate that deformation of the Tien Shan is dominated by underthrusting
of the Tarim, Zungar, and Kazakh plates. The amount of this underthrusting may be
sufficient to support the topography of the Tien Shan. Thrusting skimmed the lighter and
lower-density crust of the thrusting plates off their lithosphere to become surface loads of
the Tien Shan lithosphere, leading to crustal thickening there. The series of surficial
reverse faults along the northern and southern margins of the Tien Shan support our
interpretation (Thompson et al., 2002). Loading caused the Tien Shan lithosphere to bend,
which in turn increased uplift. The stress field calculations demonstrate that the Tien Shan
mountain belt is under large compression (Jin, 1997).
Deformation of the Tien Shan is not uniform according to our model. It is confined to
the crust along profiles 1 and 2, while it involves the entire lithosphere along profiles 3 and
4. Figures 63 and 64 are 3-D cartoons illustrating this point. Current shortening of the Tien
Shan occurs throughout the entire lithosphere in western Tien Shan but is only crustal in the
eastern Tien Shan. Geological features and GPS measurements also suggest that shortening
across the Tien Shan is inhomogeneous and spatially dependent (Burchfiel et al., 1999;
Wang et al., 2001). We hypothesize that the oblique collision between India and Asia
(Tapponnier et al., 2001), which is a major controlling factor for the tectonic development
of Central Asia, may have also resulted in inhomogeneous deformations in the Tien Shan.
Thus, uplift of the Tien Shan orogenic belt is a consequence of the Indian-Asian collision.
Although this conclusion is not new, our Bouguer gravity analysis provides a means to map
the thrusting occurring beneath the Tien Shan.
Our result is not consistent with previous gravity studies (Burov et al., 1990). By
analysing 1° × 1° gravity data in Central Asia, Burov et al. (1990) showed that western Tien
Shan is close to Airy isostatic equilibrium and eastern Tien Shan is over-compensated.
They suggest that in the eastern Tien Shan a deep mass, or a dynamic flow in the
asthenosphere, is pulling down the mountain root. Further investigations, especially deep
seismic imagery, are need for a better understanding of mountain building and intra-
continental deformations.
109
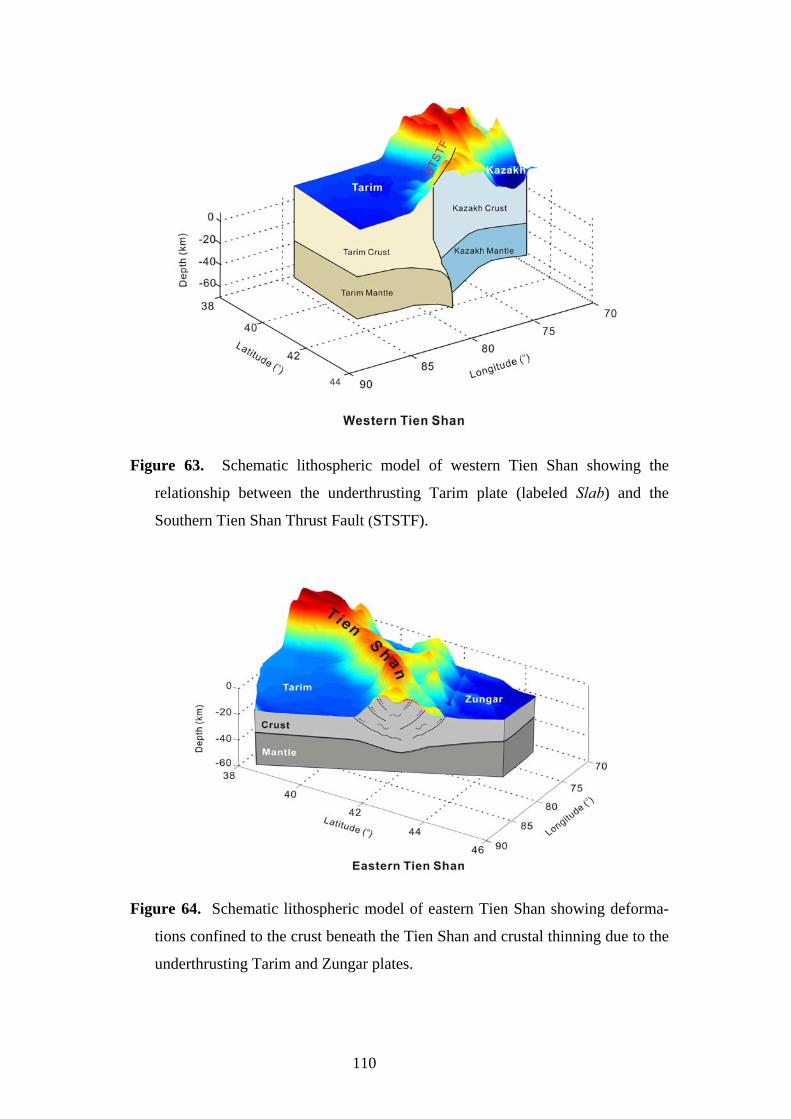
Figure 63. Schematic lithospheric model of western Tien Shan showing the
relationship between the underthrusting Tarim plate (labeled Slab) and the
Southern Tien Shan Thrust Fault (STSTF).
Figure 64. Schematic lithospheric model of eastern Tien Shan showing deforma-
tions confined to the crust beneath the Tien Shan and crustal thinning due to the
underthrusting Tarim and Zungar plates.
110
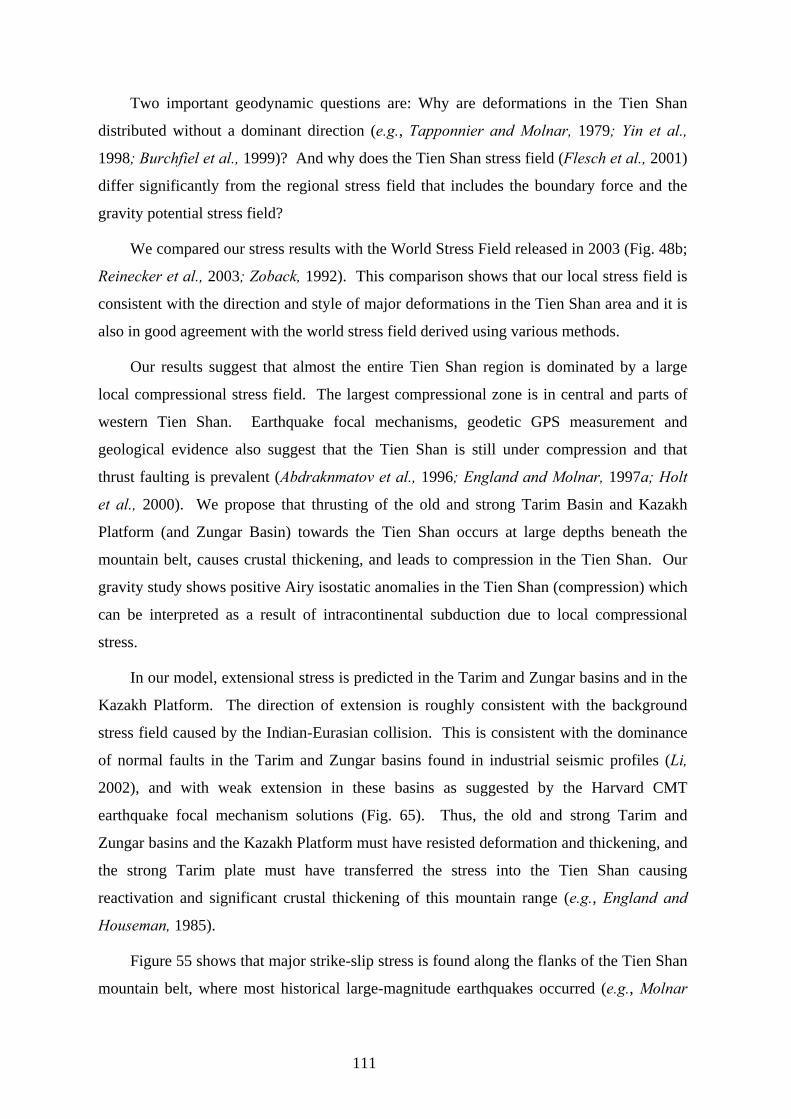
Two important geodynamic questions are: Why are deformations in the Tien Shan
distributed without a dominant direction (e.g., Tapponnier and Molnar, 1979; Yin et al.,
1998; Burchfiel et al., 1999)? And why does the Tien Shan stress field (Flesch et al., 2001)
differ significantly from the regional stress field that includes the boundary force and the
gravity potential stress field?
We compared our stress results with the World Stress Field released in 2003 (Fig. 48b;
Reinecker et al., 2003; Zoback, 1992). This comparison shows that our local stress field is
consistent with the direction and style of major deformations in the Tien Shan area and it is
also in good agreement with the world stress field derived using various methods.
Our results suggest that almost the entire Tien Shan region is dominated by a large
local compressional stress field. The largest compressional zone is in central and parts of
western Tien Shan. Earthquake focal mechanisms, geodetic GPS measurement and
geological evidence also suggest that the Tien Shan is still under compression and that
thrust faulting is prevalent (Abdraknmatov et al., 1996; England and Molnar, 1997a; Holt
et al., 2000). We propose that thrusting of the old and strong Tarim Basin and Kazakh
Platform (and Zungar Basin) towards the Tien Shan occurs at large depths beneath the
mountain belt, causes crustal thickening, and leads to compression in the Tien Shan. Our
gravity study shows positive Airy isostatic anomalies in the Tien Shan (compression) which
can be interpreted as a result of intracontinental subduction due to local compressional
stress.
In our model, extensional stress is predicted in the Tarim and Zungar basins and in the
Kazakh Platform. The direction of extension is roughly consistent with the background
stress field caused by the Indian-Eurasian collision. This is consistent with the dominance
of normal faults in the Tarim and Zungar basins found in industrial seismic profiles (Li,
2002), and with weak extension in these basins as suggested by the Harvard CMT
earthquake focal mechanism solutions (Fig. 65). Thus, the old and strong Tarim and
Zungar basins and the Kazakh Platform must have resisted deformation and thickening, and
the strong Tarim plate must have transferred the stress into the Tien Shan causing
reactivation and significant crustal thickening of this mountain range (e.g., England and
Houseman, 1985).
Figure 55 shows that major strike-slip stress is found along the flanks of the Tien Shan
mountain belt, where most historical large-magnitude earthquakes occurred (e.g., Molnar
111
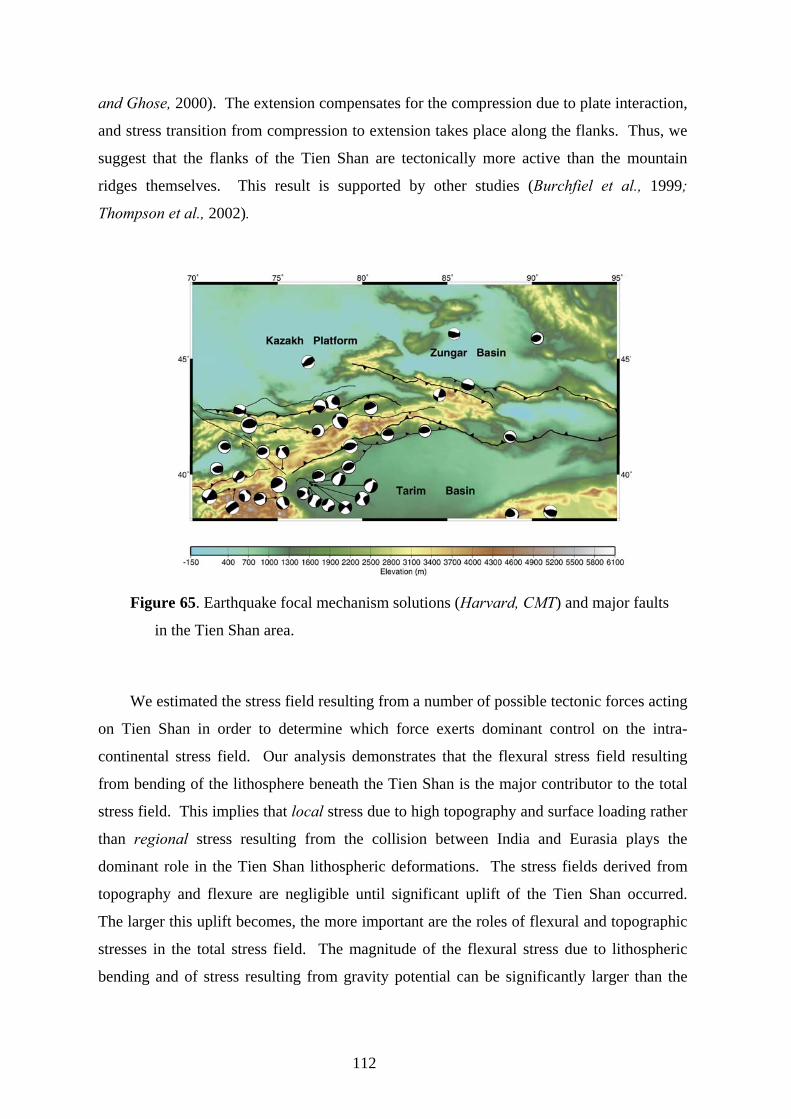
and Ghose, 2000). The extension compensates for the compression due to plate interaction,
and stress transition from compression to extension takes place along the flanks. Thus, we
suggest that the flanks of the Tien Shan are tectonically more active than the mountain
ridges themselves. This result is supported by other studies (Burchfiel et al., 1999;
Thompson et al., 2002).
Figure 65. Earthquake focal mechanism solutions (Harvard, CMT) and major faults
in the Tien Shan area.
We estimated the stress field resulting from a number of possible tectonic forces acting
on Tien Shan in order to determine which force exerts dominant control on the intra-
continental stress field. Our analysis demonstrates that the flexural stress field resulting
from bending of the lithosphere beneath the Tien Shan is the major contributor to the total
stress field. This implies that local stress due to high topography and surface loading rather
than regional stress resulting from the collision between India and Eurasia plays the
dominant role in the Tien Shan lithospheric deformations. The stress fields derived from
topography and flexure are negligible until significant uplift of the Tien Shan occurred.
The larger this uplift becomes, the more important are the roles of flexural and topographic
stresses in the total stress field. The magnitude of the flexural stress due to lithospheric
bending and of stress resulting from gravity potential can be significantly larger than the
112
background stress (i.e., the stress field due to the collision between India and Eurasia)
because they accumulate in response to loads at long geological time scales.
In order to understand how the old orogenies are correlated with the reactivation of the
Tien Shan under the present tectonic regime, Jin (1997) calculated the stress field in Central
Asia assuming that the Tien Shan had either 0 %, 20 % or 40 % of the present topography.
His results show that there is no concentration of stress at the location of the Tien Shan in
the first case, that a small deflection occurs in the elastic plate underlying the proto-Tien
Shan in the second case, and that plate flexural stress is concentrated beneath the Tien Shan
in the last case. We propose that it is the combination of intra-continental subduction and a
low-relief mountain belt that concentrates the stress from the elevated plateau and triggered
the latest rejuvenation of this mountain belt.
113
Chapter 7. Conclusions
Based on the elastic plate theory, two- and three-dimensional governing equations of
flexure are analysed in the space domain in order to test various hypotheses for dynamic
processes in the crust and mantle responsible for the lateral heterogeneity in the study area of
this dissertation in Central Asia.
Our results show that the mechanical strength of the lithosphere in Central Asia varies
significantly from a weak elastic strength of less than 15 km to a moderate strength of 40-50
km. Weak zones exist in the major mountain building areas such as Tien Shan, Altyn Shan,
West Kunlun Shan, Qilian Shan and the Indus-Zhangbo suture zone. Stronger zones are
located in the less-deformed basin areas such as the Tarim, Qaidam, and Sichuan basins as
well as certain topographically lower areas (< 2500 m). The lithosphere beneath Tibet has a
small elastic thickness, varying from Te = 10 to 40 km. The low values in the Indus-
Zhangbo suture zone (with Te values of 10-20 km or less) are ascribed to weakening during
the suturing process. Although the Tibetan crust is much thicker than average, it has a low
elastic thickness. This is consistent with other geophysical observations which suggest the
presence of a partially molten mid-lower crust (e.g., Nelson et al., 1996; Owens and Zandt,
1997). In contrast, the central and the eastern parts of the Tibetan plateau has a considerable
elastic strength close to the elastic thickness of the lowlands. Even the steep transition from
the high eastern plateau to its adjacent lowland (Sichuan Basin) does not significantly
weaken the lithosphere underneath. Our mechanical modelling of the elastic strength of the
lithosphere is implemented in the space domain to accommodate the considerably irregular
geometries of the tectonic units due to strong compression from the Indian plate, and the
calculated strength variations generally fit well to the geometric shapes of the various
tectonic blocks. The final RMS fit between the observed and calculated Bouguer gravity is
24.54 mgal.
Our results suggest that the Altyn Tagh Fault possibly cuts through the entire litho-
sphere of Asia and accommodates motion between Asia and the Tibetan plate. If the Altyn
Tagh Fault defines the northern boundary of the eastward extrusion of Tibet, then the
extrusion will not only affect the Tibetan crust, but also its upper mantle lithosphere. In
contrast, it is possible to fit the gravity data across the West Kunlun Fault with a continuous
elastic plate model. Our preferred model for the lithospheric structure beneath the West
Kunlun Fault includes a moderately stiff Tarim plate underthrusting the Tibetan Plateau.
The Eurasian plate is weakened during this underthrusting from an elastic thickness of about
114
40-45 km in the Tarim Basin to about 30-35 km beneath the Tibetan Plateau. Based on our
models, the magnitude and scale of the southward-directed underthrusting of the Tarim plate
is larger in the west beneath the West Kunlun Fault than in the east beneath the highland
north of the Altyn Tagh Fault.
Modelling of gravity data suggests that the Tarim, Zungar, and Kazakh plates are
moderately rigid. The Tien Shan ranges have an elastic thickness lower than that of its
adjacent areas. Gravity data across the eastern Tien Shan are best fitted by a continuous
elastic plate model. Here, the moderately stiff Tarim and Zungar plates underthrust the
mountains, thereby weakening from Te = 40-45 km to about 20-25 km beneath the
mountains. In contrast, we suggest that the Southern Tien Shan Thrust Fault cuts the entire
lithosphere at the western Tien Shan. Here, shortening involves the crust as well as the
upper mantle lithosphere.
Our analysis of the stress field for a number of possible tectonic forces acting on the
Tien Shan demonstrates that the flexural stress field resulting from bending of the litho-
sphere beneath the Tien Shan is the major contributor to the total stress field. This implies
that the local stress due to high topography and surface loading but not regional stress
resulting from the collision between India and Eurasia plays the most important role in Tien
Shan lithospheric deformations. The stress fields derived from topography and flexure are
negligible until significant uplift of the Tien Shan occurred. The larger this uplift becomes,
the more important are the roles of flexural and topographic stresses in the total stress field.
The magnitude of the flexural stress due to lithosphere bending and of stress resulting from
gravity potential can be significantly larger than the background stress (i.e., the stress field
due to the collision between India and Eurasia) because they accumulate over time.
Furthermore, our stress field results in Tien Shan suggest that the Tien Shan uplifted in
response to a local intra-continental stress field.
115
References
Abdrakhmatov, K. Y., Aldazhanov, S. A., Hager, B. H., Hamburger, M. W., Herring, T. A.,
Kalabarv, K. B., Makarov, V. I., Molnar, P., Panasyuk, S. V., Prilepin, M. T., Reilinger, R. E., Sadybakasov, I. S., Souter, B. J., Trapeznikov, Y. A., Tsurkov, V. Ye. and A. V. Zubovich, 1996. Relatively recent construction of the Tien Shan inferred from GPS measurements of present-day crustal deformation rates, Nature, 384, 450–453.
Achache, J., Courtillot, V. and Y. X. Zhou, 1984. Paleogeographic and tectonic evolution of southern Tibet since middle Cretaceous time: new paleomagnetic data and synthesis, J. Geophys. Res., 89, 10,311–10,339.
Ahern, J. L. and R. C. Ditmars, 1985. Rejuvenation of continental lithosphere beneath an intracratonic basin, Tectonophys., 120, 21-35.
Akhber, D. Ya. and I. V. Mushkin, 1976. The Kyzyl-Kum-Nurata deep fault, Tien Shan, Geotectonics, 10, 58-62.
Allegre C. J. and 35 others, 1984. Structure and evolution of the Himalaya-Tibet orogenic belt, Nature, 307, 17-22.
Allen, M. B., Windley, B. F., Zhang, C., Zhao, Z. Y. and G. R. Wang, 1991. Basin evolution within and adjacent to the Tien Shan Range, NW China, J. Geol. Soc. Lond., 148, 369-378.
Allen, M. B., Vincent, S. J. and P. J. Wheeler, 1999. Late Cenozoic tectonics of the Kepingtage thrust zone Interactions of the Tien Shan and Tarim Basin, Northwest China, Tectonics, 18, 639-654.
Alsdorf, D. and K. D. Nelson, 1999. Tibetan satellite magnetic low: Evidence for widespread melt in the Tibetan crust? Geology, 27, 943-946.
An, Z. S., Kutzbach, J. E., Prell, W. L. and S. C. Porter, 2001. Evolution of Asian monsoons and phased uplift of the Himalaya-Tibetan plateau since Late Miocene times, Nature, 411, 62-66.
Armijo, R., 1986. Quaternary extension in southern Tibet: Field observations and tectonic implications, J. Geophys. Res., 91, 13,803-13,872.
Armijo, R., Tapponnier P. and T. Han, 1989. Late Cenozoic right-lateral strike-slip faulting in southern Tibet, J. Geophys. Res., 1989, 94, 2787-2838.
Armstrong, G. D. and A. B. Watts, 2001. Spatial variations in Te in the southern Appalachians, eastern United states, J. Geophys. Res., 106, 22,009-22,026.
Arnauld, N. O., Vidal, P., Tapponnier, P., Matt, W. M. and W. M. Deng, 1992. The high K2O volcanism of northwestern Tibet: Geochemistry and tectonic implication, Earth and Planet. Sci. Lett., 111, 351-367,
Avouac, J. P. and G. Peltzer, 1993. Active tectonics in southern Xinjing, China: Analysis of terrace riser and normal fault scarp degradation along the Hotan-Qira fault system, J. Geophys. Res., 98, 21,773-21,807.
Avouac, J. P., Tapponnier, P., Bai, M., You, H., Wang, G., 1993. Active faulting and folding in the northern Tien Shan and rotation of Tarim relative to Dzungaria and Kazakhstan, J. Geophys. Res., 98, 6755-6769.
116
Bailey, G. B. and P. D. Anderson, 1982. Applications of Landsat imagery to problems of petroleum exploration in the Qaidam basin, China, Amer. Assoc. Petrol. Geol. Bull., 66, 1348-1354.
Bank, R. J., Parker, R. L. and S. P. Huetis, 1977. Isostatic compensation on a continental scale: local versus regional mechanisms, Geophys. J. R. Astron. Soc., 51, 431-452.
Barazangi, M. and J. Ni, 1982. Velocities and propagation characteristics of Pn and Sn waves beneath the Himalayan Arc and Tibetan Plateau: Possible evidence for underthrusting of Indian continental lithosphere beneath Tibet, Geology, 10, 179-185.
Barth, S., Oberli, F. and M. Meier, 1994. Th-Pb versus U-Pb isotope systematics in allanite from co-genetic rhyolite and granodiorite: implications for geochronology, Earth and Planet. Sci. Lett., 124, 149-159.
Bechtel, T. D., Forsyth, D. W. and C. J. Swain, 1987. Mechanisms of isostatic compensation in the vicinity of the East African Rift, Kenya, Geophys. J. R. Astron. Soc., 90, 445-465.
Bechtel, T. D., Forsyth, D. W., Sharpton, V. L. and R. A. Grieve, 1990. Variations in effective elastic thickness of the North American lithosphere, Nature, 343, 636.
Beloussov, V. V. and 11 others, 1980. Structure of the lithosphere along deep seismic sounding profile: Tien Shan-Pamirs-Karakorum-Himalayas, Tectonophysics, 70, 193-221.
Bendick, R., Bilham, R., Freymueller, J., Larson, K. and G. Yin, 2000. Geodetic evidence for a low slip rate in the Altyn Tagh Fault System, Nature, 404, 69-72.
Bendick, R. and R. Bilham, 2001. How perfect is the Himalaya? Geology, 29, 791-794.
Bilham, R., Larson, K. and J. Freymueller, 1997. GPS measurements of present-day convergence across the Nepal Himalaya, Nature, 386, 61-64.
Bilham, R., Gaur, V. K. and P. Molnar, 2001. Himalayan seismic hazard, Science, 293, 1,442-1,444.
Bird, P., 1978. Initiation of intracontinental subduction in the Himalaya. J. Geophys. Res., 83, 4975-4987.
Bourjot, L. and B. Romanowicz, 1992. Crust and upper mantle tomography in Tibet using surface waves, Geophys. Res. Lett., 19, 881-884.
Boulin, J., 1981. Afghanistan structure, Greater India concept and eastern Tethys evolution, Tectonophysics, 72, 261-287.
Braitenberg, C., Wang, Y., Fang, J., Hsu, H. T. 2003. Spatial variations of flexure parameters over the Tibet-Quighai Plateau, Earth Planet. Sci. Lett., 205, 211-224.
Brown, L. D., Zhao, W., Nelson, K. D., Hauck, M., Alsdorf, D., Ross, A., Cogan, M., Clark, M., Liu, X. and J. Che, 1996. Bright spots, structure, and magmatism in southern Tibet from INDEPTH seismic reflection profiling, Science, 274, 1,688-1,690.
Brown, E. T., Bourles, D. L., Burchfiel, B. C., Deng, Q., Li, J., Molnar, P., Raisbeck, G. M. and F. Yiou, 1998. Estimation of slip rates in the southern Tien Shan using cosmic ray exposure dates of abandoned alluvial fans, Geol. Soc. Am. Bull., 110, 377–386.
117
Bukharin A. K., 1978. Two tectonic sectors of the southern Tien Shan geosynclinal system, Int. Geol. Rev., 3, 331-334.
Bullen, M. E., Burbank, D. W., Abdrakhmatov, K. Y. and J. Garver, 2001. Late Cenozoic tectonic evolution of the northwestern Tien Shan: Constraints from magnetostrati-graphy, detrital fission track, and basin analysis, Geol. Soc. Am. Bull., 113, 1544-1559.
Burbank, D. W., 1996, Bedrock incision, rock uplift and threshold hillslopes in the northwestern Himalayas, Nature, 379, 505-510.
Burbank, D. W., Derry, L. A. and C. France-Lanord, 1993. Reduced Himalayan sediment production 8 Myr ago despite an intensified monsoon, Nature, 364, 48-50.
Burbank, D. W., McLean, J. K., Bullen, M., Abdrakhmatov, K. Y., Miller, M. M., 1999. Partitioning of intermontane basins by thrust-related folding, Tien Shan, Kyrgyzstan, Basin Res., 11, 75–92.
Burchfiel, B. C. and L. H. Royden, 1985. North-south extension within the convergent Himalayan region, Geology, 13, 679-682.
Burchfiel, B. C., Deng, Q., Molnar, P., Royden, L., Wang, Y. and W. Zhang, 1989. Intracrustal detachment within zones of continental deformation, Geology, 17, 748-752.
Burchfiel, B. C., Brown, E. T., Deng, Q., Feng, X., Li, J., Molnar, P., Shi, J., Wu, Z. and H. You, 1999. Crustal shortening on the margins of the Tien Shan, Xinjiang, China, Int. Geol. Rev., 41, 665– 700.
Burov, E. B., Kogan, M., Lyon-Caen, H. and P. Molnar, 1990. Gravity anomalies, the deep structure, and dynamic processes beneath the Tien Shan, Earth Planet. Sci. Lett., 96, 367-383.
Burov E. B., Lobkovsky L. I., Cloetingh, S. and A. M. Nikishin, 1993. Continental lithosphere folding in Central Asia (Part II): constraints from gravity and topography, Tectonophysics, 226, 74-87.
Burov, E. B. and M. Diament, 1995. The effective elastic thickness (Te) of continental lithosphere: What does it really mean? J. Geophys. Res., 100, 3905-3927.
Burov, E. B., Jaupart, C. and J. C. Mareschal, 1998. Large-scale crustal heterogeneities and lithospheric strength in cratons, Earth and Planet., Sci. Lett., 164, 205-219.
Burtman, V. S., Skobelev, S. F. and P. Molnar, 1996. Late Cenozoic slip on the Talasa-Ferghana Fault, the Tien Shan, Central Asia, Geol. Soc. Am. Bull.,108, 1004–1021.
Calais E., Vergnolle, M., Déverchère, J., Lukhnev, A., San'kov, V. and S. Amarjargal, 2002. Are post-seismic effects of the M = 8.4 Bolnay earthquake (July 12, 1905) still influen-cing GPS velocities in the Mongolia-Baikal area? Geophys. J. Int., 149, 157-168.
Carroll, A. R., Graham, S. A., Hendrix, M. A., Yang, D. and D. Zhou, 1995. Late Paleozoic tectonic amalgamation of northwestern China: sedimentary record of the northern Tarim, northwestern Junggar Basins, Bull. Geol. Soc. Am., 107, 571-594.
Chang, C. and 26 others, 1986. Preliminary conclusions of the Royal Society and Academia Sinica 1985 geotraverse of Tibet, Nature, 323, 501–507.
Chemenda, A. I., Burg, J. P. and M. Mattauer, 2000. Evolutionary model of the Himalaya-Tibet system: geopoem based on new modelling, geological and geophysical data, Earth and Planet. Sci. Lett., 174, 397-409.
118
Chen, J., Burbank, D. W., Scharer, K., Sobel, E., Yin, J., Rubin, C. M. and R. Zhao, 2002. Magnetostratigraphy of the Upper Cenozoic strata in the southwestern Chinese Tian Shan: rates of Pleistocene folding and thrusting, Earth and Planet. Sci. Lett., 195, 113-130.
Chen, L., Booker, J. R., Jones, A. G., Wu, N., Unsworth, M. J., Wei, W. and H. Tan, 1996. Electrically conductive crust in southern Tibet from INDEPTH magnetotelluric surveying, Science, 274, 1,694-1,696.
Chen, W. P. and P. Molnar, 1981. Constraints on the seismic wave velocity structure beneath the Tibetan Plateau and their tectonic implications, J. Geophys. Res., 86, 5937-5962.
Chen, Z., 1985. 1:2,000,000 geologic map of Xinjiang Uygur Autonomous region, China, Geological Publishing House, Beijing (in Chinese).
Chen, C., Lu, H., Jia, D., Cai, D. and S. Wu, 1999. Closing history of the southern Tianshan oceanic basin, western China: an oblique collisional orogeny, Tectonophysics, 302, 23–40.
Chen, Z., Burchfiel, B.C., Liu, Y., King, R.W., Royden, L. H., Tang, W., Wang, E., Zhao, J. and X. Zhang, 2000. Global Positioning System measurements from eastern Tibet and their implications for India/Eurasia intercontinental deformation. J. Geophys. Res., 105, 16,215-16,277.
China Digital Seismic Network (CDSN), http://www.eq-igp.ac.cn/bdcndsn/index.html
Coblentz, D. D. and R. M. Richardson, 1996. Analysis of the South American intraplate stress field, J. Geophys. Res., 101, 8643-8657.
Coblentz, D. D., Sandiford, M., Richardson, R. M., Zhou, S. and R. Hillis, 1995. The origins of the intraplate stress field in continental Australia, Earth and Planet. Sci. Lett., 133, 299-309.
Coleman, M. E. and K.V. Hodges, 1998. Contrasting Oligocene and Miocene thermal histories from the hanging wall and footwall of the South Tibetan detachment in the central Nepal Himalaya from 40Ar/39Ar thermochronology, Marsyandi Valley, central Nepal, Tectonics, 17, 726-740.
Cowgill, E., Yin, A., Rumelhart, P., Xiao-Feng, W. and Z. Qing, 1997. Kinematics of the central Altyn Tagh fault system, NW China, EOS, Trans. AGU, 78, Fall Meet. suppl., F173.
Darby, B. J. and B. D. Ritts, 2002. Mesozoic contractional deformation in the middle of the Asian tectonic collage: the enigmatic Western Ordos fold-thrust belt, China, Earth and Planet. Sci. Lett., 205, 13-24.
Delville, N., Arnaud, N., Montel, J. M., Brunel, M. and E. Sobel, 2001. Paleozoic to Cenozoic deformation along the Altyn-Tagh Fault in the Altun Shan range, Eastern Qilian Shan, NE Tibet China, in Hendrix, M. S. and Davis, G. A., ed., Paleozoic and Mesozoic Tectonic Evolution of Central and Eastern Asia: From Continental Assembly to Intracontinental Deformation, Geol. Soc. Am. Mem. 194, 269-292.
DeMets, C., Gordon, R. G., Argus, D. F. and S. Stein, 1990. Current plate motions, Geophys. J. Int., 101, 425-478.
DeMets, C., Gordon, R. G., Argus, D. F. and S. Stein 1994. Effect of recent revisions to the geomagnetic reversal time scale on estimates of current plate motions, Geophys. Res. Lett., 21, 2191–2194.
119
Derry L. A. and C. France-Lanord, 1996. Neogene Himalayan weathering history and river 87Sr/86Sr: Impact on the marine Sr record, Earth and Planet. Sci. Letts., 142, 59-76.
Dewey, J. F. and K. C. Burke, 1973. Tibetan, Variscan, and Precambrian basement reacti-vation: Products of continental collision, Journal of Geology, 81, 683-692.
Dewey, J. F., Shackleton, R. M., Chang, C. F. and Y. Y. Sun, 1988. The tectonic evolution of the Tibetan plateau, Phil. Trans. R. Soc. London A, 327, 379-413.
Dupont-Nivet, G., Butler, R. F., Yin, A. and X. Chen, 2002. Paleomagnetism indicates no Neogene rotation of the Qaidam Basin n Tibet during Indo-Asian collision, Geology, 30, 263-266.
Edwards, M. A. and T. M. Harrison, 1997. When did the roof collapse? Late Miocene north-south extension in the High Himalaya revealed by Th-Pb monazite dating of the Khula Kangri granite, Geology, 25, 543-546.
Edward, R. S. and N. Arnaud, 1999. A possible middle Paleozoic suture in the Altyn Tagh, NW China, Tectonics, 18, 1, 64-74.
England, P. and G. Houseman, 1985. Role of lithospheric strength heterogeneities in the tectonics of Tibet and neighbouring regions, Nature, 315, 297-301.
England, P. C. and G. Houseman, 1989. Extension during the continental convergence, with application to the Tibet Plateau, J. Geophys. Res., 94, 17,561-17,579.
England, P. and P. Molnar, 1997. The field of crustal velocity in Asia calculated from Quaternary rates of slip on faults, Geophys. J. Int., 130, 551-582.
England, P. and P. Molnar, 1997a. Active deformation of Asia: From kinematics to dynamics, Science, 278, 647-650.
Faure M, Lin, W. and L. N. Breton, 2001. Where is the North China-South China block boundary in eastern China? Geology, 29, 119-122.
Fielding, E., Isacks, B., Barazangi, M. and C. Duncan, 1994. How flat is Tibet? Geology, 22, 163-167.
Finlayson, D. P., Montgomery, D. R. and B. Hallet, 2002. Spatial coincidence of rapid inferred erosion with young metamorphic massifs in the Himalayas, Geology, 30, 219–222.
Flesch, L. M., Haines, A. J. and W. E. Holt, 2001. Dynamics of the India-Eurasia collision zone, J. Geophys. Res., 106, 16435-16460.
Forsyth, D. W.,1985. Subsurface loading and estimates of the flexural rigidity of continental lithosphere, J. Geophys. Res., 90, B14, 12,623-12,632.
Gahagan, L. M., Scotese, C. R., Royer, J.-Y., Sandwell, D. T., Winn, J. K., Tomlins, R. L., Ross, M. I., Newman, J. S., Mueller, R. D., Mayes, C. L., Lawver, L. A. and C. E. Heubeck, 1988. Tectonic fabric of the ocean basins from satellite altimetry data, in C.R. Scotese and W. W. Sager (eds), Mesozoic and Cenozoic Plate Reconstructions, Tectonophysics, 155, 1-26.
Gansser, A., 1974. Himalaya, in Mesozoic-Cenozoic Orogenic Belts, edited by A. M. Spencer, Geological Society of London, Scottish Academic Press, Edinburgh, 267-278.
Gao, J., Li, M. S., Xiao, X. C., Tang, Y. G. and G. Q. He, 1998. Paleozoic tectonic evolution of the Tien Shan Orogen, northwestern China, Tectonophysics, 287, 213-231.
120
Garzanti, E., Casnedi, R. and F. Jadoul, 1986. Sedimentary evidence of a Cambro-Ordovician orogenic event in the northwestern Himalaya, Sediment. Geol., 48, 237-265.
Gehrels, G., Yin, A., Chen, X. and X. Wang, 2000. Constraints on the offset of the eastern Altyn Tagh fault, western China: EOS, Trans. AGU 81, F1093.
Gilder, S. and V. Courtillot, 1997. Timing of the north-south China collision from new Middle to Late Mesozoic palaeomagnetic data from the North China Block, J. Geophys. Res., 102, 17,713-17, 727.
Griot, D., Montagner, J. P. and P. Tapponnier, 1998. Phase velocity structure from Rayleigh and Love waves in the Tibet and its neighboring regions, J. Geophys. Res., 103, 21, 215-21,232.
Grujic, D., Casey, M., Davidson, C., Hollister, L. S., Kündig, R., Pavlis, T. and S. Schmid, 1996. Ductile extrusion of the High Himalayan Crystalline in Bhutan: evidence from quartz microfabrics, Tectonophysics, 260, 21-43.
Hacker, B. R., Wang, X., Eide, E. A. and L. Ratschbacher, 1996. Qinling-Dabie ultrahigh-pressure collisional orogen: a critical review of existing data and suggestions for future research, An Yin and T.M. Harrison, eds., The Tectonics of Asia: Prentice-Hall Publishers, 345-370.
Hacker, B.R., Ratschbacher, L., Webb, L. E., Ireland, T., Walker, D. and S. Dong, 1998. U/Pb zircon ages constrain the architecture of the ultrahigh-pressure Qinling-Dabie Orogen, China, Earth and Planet. Sci. Lett., 161, 215-230.
Hacker, B. R., Ratschbacher, L., Webb, L. E., McWilliams, M., Ireland, T., Dong, S., Calvert, A. and H. R. Wenk, 2000. Exhumation of the ultrahigh-pressure continental crust in east-central China: Late Triassic-Early Jurassic extension. J. Geophys. Res., 105, 13,339-13,364.
Hanson, A. D., 1999. Organic geochemistry and petroleum geology, tectonics and basin analysis of southern Tarim and northern Qaidam basins, northwest China, Ph. D. dissert., Stanford University, Stanford California, 388 pp.
Harris, N. and J. Massey, 1994. Decompression and anatexis of Himalayan metapelites, Tectonics, 13, 1,537-1,546.
Harrison, T. M., Copeland, P., Kidd, W. S. F. and A. Yin, 1992. Raising Tibet, Science 255, 1,663-1,670.
Harrison, T. M., Ryerson, F. J., Le-Fort, P., Yin, A., Lovera, O. M. and E. J. Catlos, 1997. A late Miocene-Pliocene origin for the central Himalayan inverted metamorphism, Earth and Planet. Sci. Lett., 146, 1-2, E1-E7.
Hendrix, M. A., Dumitra, T. A. and S. A. Graham, 1994. Late Oligocene-early Miocene unroofing in the Chinese Tien Shan: An early effect of the India-Asia collision, Geology, 22, 487-490.
Herquel, G., Wittlinger, G. and J. Guilbert, 1995. Anisotropy and crustal thickness of northern Tibet, new constraints of tectonic modelling, Geophys. Res. Lett., 22, 1,925-1,928.
Hirn, A., Nercessian, A, Sapin, M., Jobert, G., Xin, X. Z., Yuan, G. E. and T. J. Wen, 1984. Lhasa block and bordering sutures: a continuation of the 500-km Moho traverse through Tibet, Nature, 307, 25-27.
121
Hodges, K., Bowring, S., Davidek, K., Hawkins, D. and M. Krol, 1998. Evidence for rapid displacement on Himalayan normal faults and the importance of tectonic denudation in the evolution of mountain ranges, Geology, 26, 483-486.
Hodges, K., 2000. Tectonics of the Himalaya and southern Tibet from two perspectives, Geol. Soc. Am. Bull., 112, 324–350.
Hoffman, P. F., 1991. Did the breakout of Laurentia turn Gondwanaland inside out? Science, 252, 1409-1412.
Holt, W. E. and T. C. Wallace, 1990. Crustal thickness and upper mantle velocities in the Tibetan Plateau region from the inversion of regional Pn1 waveforms: Evidence for a thick upper mantle lid beneath southern Tibet, J. Geophy. Res., 95, 12,499-12,526.
Holt, W. E. and A. J. Haines, 1993. Velocity fields in deforming Asia from the inversion of earthquake-released strains, Tectonics, 12, 1-20.
Holt, W. E., Chamot-Rooke, N., Le Pichon, X. and A. J. Haines, 2000. Velocity field in Asia inferred from Quaternary fault slip rates and Global Positioning System observations, J. Geophys. Res., 105, 19,185–19,209.
Hsu, K. J., Sun, S. and J. L. Li, 1988. Huanan Alps, not South China platform, Scientia Sinica (Series B), 1, 109-119 (in Chinese).
Hua, Q., 1992. 33 Ma rock was first found in North Tarim Xinjiang, Science Bull., 7, 627-630 (in Chinese).
Huang, H. Ch., 1996. Geology of Qaidam Basin and its Petroleum Prediction, Geological Publishing house, Beijing, 30-36 (in Chinese).
Jahn, B. M., Zhou, X. H. and J. L. Li, 1990. Formation and tectonic evolution of southeastern China and Taiwan: isotopic and geochemical constraints, Tectonophysics, 183, 145-160.
Jain, A. K., Kumar, D., Singh, S., Kumar, A. and N. Lal, 2000. Timing, quantification and tectonic modelling of Pliocene-Quaternary movements in the NW Himalaya: evidence from fission track dating, Earth and Planet. Sci. Lett., 179, 437-451.
Ji, X. and P. J. Coney, 1985. Accreted terranes of China, in Howell, D.G. (ed.), Tectono-stratigraphic Terranes of the Circum-Pacific Region. Circum-Pacific Council for Energy and Mineral Resources Earth Science Series, Number 1. Houston, Texas, U.S.A., 349-361.
Jia, C., Yao, H., Wi, G. and L. Li, 1991. Plate tectonic evolution and characteristics of major tectonic units of Tarim basin, In: The Tarim Basin, ed., Tong, X. and Liang, D., Xingjiang Scientific Publishing House, Wulumiqi, 207-255 (in Chinese).
Jin, Y., McNutt, M. K. and Y. S. Zhu, 1994. Evidence from gravity and topography data for folding of Tibet, Nature, 371, 669-674.
Jin, Y., McNutt, M. K. and Y. S. Zhu, 1996. Mapping the descent of Indian and Eurasian plates beneath the Tibetan plateau from gravity anomalies, J. Geophys. Res., 101, B5, 11,275-11,290.
Jin, Y., 1997. State-of-Stress and Rheology of Tibet and its Vicinity from Gravity Anomalies and Numerical Models, MIT, Ph. D. dissert., 40-46.
Jin, Y. and X. D. Jiang, 2002. Lithosphere Dynamics, Scientific Publishing House, Beijing, 59-67 (in Chinese).
122
Jolivet, M., Brunel, M., Seward, D., Xu, Z., Yang, J., Roger, F., Tapponnier, P., Malavieille, J., Arnaud, N. and C. Wu, 2001. Mesozoic and Cenozoic tectonics of the northern edge of the Tibet plateau: fission-track constraints, Tectonophysics, 343, 111-134.
Judge, A. V. and M. K. McNutt, 1991. The relationship between plate curvature and elastic plate thickness: A study of the Peru-Chile trench, J. Geophys. Res., 96, 16,625-16,640.
Kaneoka, I. and M. Kono, 1981. 40Ar/39Ar dating of Himalayan rocks from the Mount Everest region, J. Geophys. Res., 49, 207-211.
Kao, H., Gao, R., Rau, R. J., Shi, D. N., Chen, R. Y., Guan, Y. and F. Wu, 2001. Seismic image of the Tarim Basin and its collision with Tibet, Geology, 29, 575-578.
Karner, G. D. and A. B. Watts, 1983. Gravity anomalies and flexure of the lithosphere at mountain ranges. J. Geophys. Res., 88, 10,449-10,477.
Kind, R., Ni, J., Zhao, W., Wu, J., Yuan, X., Zhao, L., Sandvol, E., Reese, C., Nabelek, J. and T. Hearn, 1996. Evidence from earthquake data for a partially molten crustal layer in southern Tibet, Science, 274, 1,692-1,694.
Kind, R., Yuan, X., Saul, J., Nelson, D., Sobolev, S. V., Mechie, J., Zhao, W., Kosarev, G., Ni, J., Achauer, U. and M. Jiang, 2002. Seismic images of crust and upper mantle beneath Tibet: evidence for Eurasian plate subduction, Science, 298, 1219-1221.
Klootwijk, C. T., Gee, J. S., Pierce, J. W., Smith, G. M. and P. L. McFadden, 1992. An early India-Asia contact: palaeomagnetic constraints from Ninetyeast Ridge, ODP Leg 121, Geology, 20, 395-398.
Kogan, M. G. and M. K. McNutt, 1993. Gravity field over northern Eurasia and variations in the strength of the upper mantle, Science, 259, 473-479.
Kong, X., Yin, A. and T. M. Harrison, 1997. Evaluating the role of pre-existing weaknesses and topographic distributions in the Indo-Asian collision by use of a thin-shell numerical model, Geology, 25, 527-530.
Kosarev, G. L., Peterson, N. V., Vinnik, L. P. and S. W. Roecker, 1993. Receiver functions for the Tien Shan analog broadband network: Contrasts in the evolution of structures across the Talasso-Fergana fault, J. Geophys. Res., 98, 4437-4448.
Larson, K. M., Burgmann, R., Bilham, R. and J. T. Freymueller, 1999. Kinematics of the India-Eurasia collision zone from GPS measurements, J. Geophys. Res., 104, 1,077-1,093.
Lavé, J. and J. P. Avouac, 2000. Active folding of fluvial terraces across the Siwalik Hills, Himalayas of central Nepal. J. Geophys. Res., 105, 5735-5770.
Le Fort, 1996. Evolution of the Himalaya, in The Tectonic Evolution of Asia, Yin, A and T. M. Harrison (eds.), Cambridge University Press, 95-109.
Leven, V., Park, J., Brandon, T. M. and W. Menke, 2000. Thinning of the upper mantle during late Paleozoic Appalachian orogenesis, Geology, 3, 239–242.
Li, C. Y., Liu, Y., Zhu, B. C., Feng, Y. M. and H. C. Wu, 1978. Structural evolution of Qinling and Qilian Shan, In Scientific Papers on Geology and International Exchange, Geological Publishing House, Beijing, 174-197 (in Chinese).
Li, J. G., 2002. Geology of Tarim and Zungar basins and their Petroleum Prediction, Shengli Oil Complex, Dongying (internal publication, in Chinese).
123
Li, S. L. and W. D. Mooney, 1998. Crustal structure of China from deep seismic sounding profiles, Tectonophysics, 288, 105-113.
Li, Y.,1990. An apparent polar wander path from the Tarim block, China, Tectonophysics, 181, 31-41.
Liu, L. B. and M. D. Zoback, 1992. The effect of topography on the state of stress in the crust: application to the site of the Cajon Pass Scientific Drilling Project, J. Geophys. Res., 97, 5095-5108.
Liu X., Yao, J. X. and Y. Wang, 1997. The review of tectonic attribution of the Tarim plate, Geological Review, 43, 1-9 (in Chinese).
Lowry, A. R. and R. B. Smith, 1994. Flexural rigidity of the Basin and Range-Colorado Plateau-Rocky Mountain transition from coherence analysis of gravity and topography, J. Geophys. Res., 99, B10, 20,123-20,140.
Lu, X. X., Zhang, Y. W. and Z. Jin, 1997. Reservoir formation cycle of Tarim Basin, Chinese Science Bulletin, 42, 245-247 (in Chinese).
Lyon-Caen, H. and P. Molnar, 1983. Constrains on the structure of the Himalayas from an analysis of gravity anomalies and a flexural model of the lithosphere, J. Geophys. Res., 88, 8171-8192.
Lyon-Caen, H. and P. Molnar, 1984. Gravity anomalies and the structure of western Tibet and the southern Tarim basin, Geophys. Res. Lett., 11, 1251-1254.
Makovsky, Y., Klemperer, S. L., Ratschbacher, L., Brown, L. D., Li, M., Zhao, W. and F. Meng, 1996. INDEPTH wide-angle reflection observation of P-wave-to-S-wave conversion from crustal bright spots in Tibet, Science, 274, 1690-1691.
Masek, J. G., Isacks, B. L. and E. J. Fielding, 1994. Rift flank uplift in Tibet: Evidence for a viscous lower crust, Tectonics, 13, 2, 659-667.
Mattauer, M., Matte, P., Malavieille, J., Tapponnier, P., Maluski, H., Xu, Q., Lun, L. and Q. Tang, 1985. Tectonics of the Qinling belt: Build-up and evolution of eastern Asia, Nature, 317, 496-500.
McAdoo, D. C. and D. T. Sandwell, 1985. Folding of oceanic lithosphere, J. Geophys. Res., 90, B10, 8563-8569.
McCaffrey, R. and J. Nabelek, 1998. Role of oblique convergence in the active deformation of the Himalayas and southern Tibet plateau, Geology, 26, 691-694.
McGarr, A., 1988. On the state of lithospheric stress in the absence of applied tectonic forces, J. Geophys. Res., 93, 13609-13617.
McNamara, D. E., T. J. Owens, P. G. Silver and F. T. Wu, 1994. Shear wave anisotropy beneath the Tibetan plateau, J. Geophys. Res., 99, 13,655-13,665.
McNamara, D. E., T. J. Owens and W. R. Walter, 1995. Observations of regional phase propagation across the Tibetan Plateau, J. Geophys. Res., 100, 22,215-22,229.
McNutt, M. K. and H. W. Menard, 1978. Lithospheric flexure and uplifted atolls, J. Geophys. Res., 83 , 1206-1212.
McNutt, M. K. and H. W. Menard, 1982. Constraints on yield strength in the oceanic lithosphere derived from observations of flexure, Geophys. J. R. Astron. Soc., 71, 363-394.
124
McNutt, M. K., 1983. Influence of plate subduction on isostatic compensation in northern California, Tectonics, 2, 399-415.
McNutt, M. K., Diament, M. and M. G. Kogan, 1988. Variations of elastic plate thickness at continental thrust belts, J. Geophys. Res., 93, B8, 8825-8838.
Meigs, A. J., Burbank, D. W. and R. A. Beck, 1995. Middle-late Miocene [>10 Ma] formation of the Main Boundary Thrust in the Western Himalaya, Geology, 23, 423-426.
Meng, Q. R. and G. W. Zhang, 1999. Timing of collision of the north and south China blocks: Controversy and reconciliation, Geology, 27, 2, 123-126.
Me′ tivier, F. and Y. Gaudemer, 1997. Mass transfer between eastern Tien Shan and adjacent basins (central Asia), constraints on regional tectonics and topography, Geophys. J. Int., 128, 1-17.
Me′ tivier, F. and Y. Gaudemer, 1998. Mass transfer between eastern Tien Shan and adjacent basins (central Asia): constraints on regional tectonics and topography, Geophys. J. Int., 128, 1–17.
Meriaux, A., Tapponnier, P., Ryerson, F. J., Ven der Woerd, J., King, G., Meyer, B., Finkel, R. and M. Caffee, 1997. Application of cosmogenic 10Be and 26Al dating to neo-tectonics of the Altyn Tagh fault in central Asia, EOS, Trans. AGU, 78, Fall Meeting Suppl., F173.
Meyer, B., Tapponnier, P., Gaudemwe, Y., Peltzer, G., Guo, S. and Z. Chen, 1996. Rate of left-lateral movement along the easternmost segment of the Altyn Tagh fault, east of 96°E (China), Geophys. J. Int., 124, 29-44.
Molnar, P. and P. Tapponnier, 1975. Cenozoic tectonics of Asia: effects of a continental collision, Science, 189, 419-426.
Molnar, P. and P. Tapponnier, 1978. Active tectonics of Tibet, J. Geophys. Res., 83, 5361-5375.
Molnar, P., 1984. Structure and tectonics of the Himalaya, Ann. Review of Earth and Planet. Sci., 12, 489–518.
Molnar, P., 1988. A review of geophysical constraints on the deep structure of the Tibetan plateau, the Himalayas and Karakorum, and their tectonics, Phil. Trans. R. Soc. Lond., A326, 33-88.
Molnar, P. and H. Lyon-Caen, 1989. Fault plane solutions of earthquakes and active tectonics of Tibetan plateau and its margins, Geophys. J. Int., 99, 123-153.
Molnar, P., Brown, E. T., Burchfiel, B. C., Deng, Q., Feng, X., Li, J., Raisbeck, G. M., Shi, J., Wu, Z., Yiou, F. and H. You, 1994. Quaternary climate change and the formation of river terraces across growing anticlines on the north flank of the Tien Shan, China, J. Geol., 102, 583–602.
Molnar, P. and S. Ghose, 2000. Seismic moments of major earthquakes and the rate of shortening across the Tien Shan, Geophys. Res. Lett., 27, 2377-2380.
Moore, J. C., Diebold, J., Fisher, M. A., Sample, J., Brocher, T., Talwani, M., Ewing, J., Huene, R. V., Rowe, C., Stone, D., Stevens, C. and D. Sawyer, 1991. EDGE deep seismic reflection transect of the eastern Aleutian arc-trench layered lower crust reveals underplating and continental growth, Geology, 19, 420-424.
125
Mukhin, P. A., Abdullaev, K. A., Minaev, V. E., Khristov, S. E. and S. A. Egamberdyev 1989. Paleozoic geodynamics of Central Asia, Int. Geol. Rev., 31, 1073-1083.
NEIC, 2003. USGS National Earthquake Information Center, http://neic.usgs.gov/neis/epic/ epic.html.
Neil, E. A. and G. A. Houseman, 1997. Geodynamics of the Tarim Basin and the Tian Shan in Central Asia, Tectonics, 16, 571-584.
Nelson, K. D., Zhao, W. J., Brown, L. D., Kuo, J., Che, J., Liu, X., Klemperer, S. L., Makovsky, Y., Meissner, R., Mechie, J., Kind, R., Wenzel, F., Ni, J., Nabelek, J., Chen, L., Tan, H., Wei, W., Jones, A. G., Booker, J., Unsworth, M., Kidd, W. S. F., Hauck, M., Alsdorf, D., Ross, A., Cogan, M., Wu, C. D., Sandvol, E. and M. Edwards, 1996. Partially molten middle crust beneath southern Tibet: Synthesis of Project INDEPTH results, Science, 274, 1684-1687.
Ni, J. and M., Barazangi, 1984. Seismotectonics of the Himalayan collision zone: Geometry of the underthrusting Indian plate beneath Himalaya, J. Geophys. Res., 89, 1147-1164.
Nie, S., Rowley, D. B. and A. M. Ziegler, 1990. Constraints on the location of the Asian microcontinents in the Palaeo-Tethys during the Late Palaeozoic, In: W. S. McKerrow and C. R. Scotese, eds., Palaeozoic Biogeography and Palaeogeography, Geological Society of London, Memoir 12, 397-410.
Noble, S. R. and M. P. Searle, 1995. Age of crustal melting and leucogranite formation from U-Pb zircon and monazite dating in the western Himalaya, Zanskar, India, Geology, 23, 1135-1138.
Northern Arizona University home page, 2001. http://jan.ucc.nau.edu/~rcb7/globaltext2. html.
Oberhänsli, R., Marlinotli, G., Schmid, R. and X. Liu, 2002. Preservation of primary volcanic textures in the ultrahigh-pressure terrain of Dabie Shan, Geology, 30, 699-702.
Okabe, M., 1979. Analytical expressions for gravity anomalies due to homogeneous poly-hedral bodies and translations into magnetic anomalies, Geophysics, 44, 730-741.
Owens, T. J. and G. Zandt, 1997. The implications of crustal property variations on models of Tibetan Plateau evolution, Nature, 387, 37-43.
Parker, R. L. 1972. The rapid calculation of potential anomalies, Geophys, J. R. astr. Soc., 31, 447-455.
Patzelt, A., Huami, L., Wang, J. and E. Appel, 1996. Palaeomagnetism of Cretaceous to Tertiary sediments from southern Tibet: evidence for the extent of the northern margin of India prior to the collision with Eurasia, Tectonophysics, 259, 259-284.
Pêcher, A., 1991. The contact between the Higher Himalayan crystallines and the Tibetan sedimentary series: Miocene large-scale dextral shearing, Tectonics, 10, 587-598.
Peltzer, G. and P. Tapponnier, 1988. Formation and evolution of strike-slip faults, rifts and basin during the Indian-Asia collision: An experimental approach, J. Geophys. Res., 93, 15,085-15,117.
Peltzer, G., Tapponnier, P. and R. Armijo, 1989. Magnitude of Late Quaternary left-lateral displacements along the north edge of Tibet, Science, 246, 1285-1289.
126
Petit, C., Déverchère, J., Calais, E., San'kov, V. and D. Fairhead, 2002. Deep structure and mechanical behavior of the lithosphere in the Hangai-Hövsgöl region, Mongolia: New constraints from gravity modeling, Earth and Planet. Sci. Lett., 197, 133-149.
Powers, P. M., Lillie, R. J. and R. S. Yeats, 1998. Structure and shortening of the Kangra and Dehra Dun reentrants, Sub-Himalaya, India, Geol. Soc. Am. Bull., 110, 1010-1027.
Powell, C. McA., 1993. Assembly of Gondwanaland - Open forum, in Findlay, R. H., Unrug, R., Banks, M. R., and Veevers, J. J., eds., Gondwana Eight: Assembly, Evolution and Dispersal, Balkema, Rotterdam, 218-237.
Qinghai BGM (Qinghai Bureau of Geology and Mineral Resource), 1989. Geology History of Qinghai Region, Geological Publishing House, 79-88 (in Chinese).
Ratschbacher, L., Hacker, B. R., Webb, L. E., McWilliams, M. O., Ireland, T., Dong, S., Calvert, A., Chateigner, D. and H. R. Wenk, 2000. Exhumation of the ultrahigh-pressure continental crust in East-Central China: Cretaceous and Cenozoic unroofing and the Tan-Lu Fault, J. Geophys. Res., B6, 105, 13,308-13,338.
Reigber, B., Michel, G. W., Galas, R., Angermann, D., Klotz, J., Chen, J. Y., Papschev, A., Arslanov, R., Tzurkov, V. E. and M. C. Ishanov, 2001. New space geodetic constraints on the distribution of deformation in Central Asia, Earth and Planet. Sci. Lett., 191, 157-165.
Reinecker, J., Heidbach, O. and B. Mueller, 2003. The 2003 release of the World Stress Map (available online at www.world- stress-map.org).
Ren, J. X., Wang, Z. X., Chen, B. W. and C. Jiang, 1999. Tectonic Map of China, Geo-logical Publishing House, Beijing (in Chinese).
Revenaugh, J. and S. A. Sipkin, 1994. Mantle discontinuity structure beneath China, J. Geophys. Res., 99, 21,911-21,927.
Richardson, R. M., Solomon, S. C. and N. H. Sleep, 1976. Intraplate stress as an indicator of plate tectonic driving forces, J. Geophys. Res., 81, 1847-1856.
Ritts, B. D. and U. Biffi, 2001. Mesozoic northeast Qaidam basin: response to contractional reactivation of Qilian Shan, and implications for extent of Mesozoic intracontinental deformation in central Asia, In Hendrix, M. S. and Davis, G. A., ed., Paleozoic and Mesozoic Tectonics of Central Asia -- From Continent Assembly to Intracontinental Deformation, Geol. Soc. of Am. Mem. 194, 293-316.
Ritts, B. D., Darby, B. J. and T. Cope, 2001. Early Jurassic extensional basin formation in the Daqing Shan segment of the Yinshan belt, northern North China Block, Inner Mongolia, Tectonophysics, 339, 235-253.
Roecker, S. W., Sabitova, T. M., Vinnik, L. P., Burmakov, Y. A., Golvanov, M. I., Mamatkanova, R. and L. Munirova, 1993. Three-dimensional elastic wave velocity structure of the western and central Tien Shan, J. Geophys. Res., 98, B9, 15,779-15,795.
Rong, Y. and D. D. Jackson, 2000. Kinematics of Tibetan Plateau from GPS measurements (abstract), EOS Trans. AGU, Fall Meeting Supplement, F122.
Rong J., Johnson, M. E., Baarli, B. G., Li, W., Su, W. and J. Wang, 2001. Continental island from the Upper Silurian (Ludlow) Sino-Korean Plate, Chinese Science Bulletin, 46, 238-241 (in Chinese).
127
Rothery, D. A. and S. A. Drury, 1984. The neotectonics of the Tibetan Plateau, Tectonics, 3, 19-26.
Rowley, D. B., 1996. Age of initiation of collision between India and Asia: a review of stratigraphic data, Earth and Planet. Sci. Lett., 145, 1-13.
Royden, L. and B. C. Burchfiel, 1995. Crustal thickening in eastern Tibet without surface shortening: A natural result of flow within a weak lower crust, EOS Trans. AGU, 76, Fall Meeting Supplement, F567.
Royden, L. H., Burchfiel, B. C., King, R. W., Wang, E., Chen, Z., Shen, F. and Y. Liu, 1997. Surface deformation and lower crustal flow in eastern Tibet, Science, 276, 788-790.
Rumelhart, P. E., 1999. Cenozoic Basin Evolution of Southern Tarim, Northwestern China: Implications for the Uplift History of the Tibetan Plateau, Ph. D. dissert., University of California, Los Angeles, 268 pp.
Sandwell, D. T. and W. H. F. Smith, 1997. Marine gravity anomaly from Geosat and ERS 1 satellite altimetry, J. Geophys. Res., 102, 10,039-10,054.
Savage, W. Z. and R. H. Morin, 2002. Topographic stress perturbations in southern Davis Mountains, west Texas 1. Polarity reversal of principal stress, J. Geophys. Res., ETG5.
Scotese, C. R. and W. W. Sager, 1988. Mesozoic and Cenozoic plate tectonic reconstruc-tions, Tectonophysics, 155, 27-48.
Scotese, C. R. and S. F. Barrett, 1990. Gondwana's movement over the south pole during the Palaeozoic: evidence from lithological indicators of climate, in W. S. McKerrow and C. R. Scotese, eds., Palaeozoic Biogeography and Palaeogeography, Geological Society of London, Memoir 12, 75-86.
Sengör, A. M. C., 1996. Paleotectonics of Asia: fragments of a synthesis, in An Yin and Mark Harrison (eds.), The Tectonic Evolution of Asia, 486-641.
Sheffels, B. and M. K. McNutt, 1986. Role of subsurface loads and regional compensation in the isostatic balance of the Transverse Ranges, California: Evidence for inter-continental subduction, J. Geophys. Res., 91, 6,419-6,431.
Shen, F., Royden, L. H. and B. C. Burchfiel, 2001. Large-scale crustal deformation of the Tibetan Plateau, J. Geophys. Res., 106, 6,793-6,816.
Sinha-Roy, S., 1982. Introductions of Tethyan blocks and evolution of Asian fold belt, Tectonophysics, 82, 277-297.
Sobel, E. R., 1995. Basin Analysis and Apatite Thermochronology of the Jurassic-Paleogene Western Tarim Basin, Ph. D. dissert., Stanford, California, Stanford University, 308 pp.
Sobel, E. R. and T. A. Dumitru, 1997. Exhumation of the margins of the western Tarim basin during the Himalayan orogeny, J. Geophys. Res., 102, 5043-5064.
Sobel, E. R., Arnaud, N., Jolivet, M., Ritts, B. D. and M. Brunel, 2001. Jurassic exhumation history of the Altyn Tagh, NW China. In Hendrix, M. S. and Davis, G. A., eds., Paleozoic and Mesozoic Tectonics of Central Asia -- From Continent Assembly to Intracontinental Deformation, Geological Society of America Memoir 194, 247-268.
Song, T. and X. Wang, 1993. Structural styles and stratigraphic patterns of syndepositional faults in a contractional setting; example from Qaidam Basin, northwestern China, Am. Assoc. Pet. Geol. Bull., 77, 102-117.
128
Song, H. B. and Z. L. Lou, 1995. The study of the basement and deep geological structures of Sichuan Basin, China, Earth Science Frontiers, 3-4, 231-237 (in Chinese).
Stephen C. T., Weldon, R. J., Rubin, C. M., Abdrakhmatov, K., Molnar, P. and G. W. Berger, 2002. Late Quaternary slip rates across the central Tien Shan, Kyrgyzstan, central Asia, J. Geophys. Res., 107, ETG 7.
Sun, W. K., 1989. Bouguer Gravity Anomaly Map of the People's Republic of China, Chinese Academy of Geoexploration, Beijing (in Chinese).
Sun, J. M., Zhu, R. X. and J. Bowler, 2004. Timing of the Tianshan Mountains uplift onstrained by magnetostratigraphic analysis of molasse deposits, Earth Planet. Sci. Lett., 219, 239-253
Tapponnier, P. and P. Molnar, 1977. Active faulting and tectonics in China, J. Geophys. Res., 82, 2,905-2,930.
Tapponnier, P. and P. Molnar, 1979. Active faulting and Cenozoic tectonics of the Tien Shan, Mongolia, and Baikal regions, J. Geophys. Res., 84, 3425–3459.
Tapponnier, P., Peltzer, G. and A. Y. Ledain, 1982. Extrusion tectonics in Asia: new insights from simple experiments with plasticine, Geology, 10, 611-616.
Tapponnier, P., Peltzer, G. and R. Armijo, 1986. On the mechanics of the collision between India and Asia, Coward, M. P. & Ries, A. C., eds., Collision Tectonics, Geol. Soc. Amer. Special Publication, 19, 115-157.
Tapponnier, P., Xu, Z. Q., Roger, F., Meyer, B., Arnaud, N., Wittlinger, G. and J. S. Yang, 2001. Oblique stepwise rise and growth of the Tibet Plateau, Science, 294, 1671-1677.
Teng, J., Yang, H., Wang, Q., Ge, R., Dong, P., Jia, S. and X. Li, 1991. Hydrocarbon in the Tarim Basin Based on Geophysical Data, Scientific Publishing House, Beijing. p. 20 and 60.
Thompson, S. C., Weldon, R. J., Rubin, C. M., Abdrakhmatov, K., Molnar, P. and G. W. Berger, 2002. Late Quaternary slip rates across the central Tien Shan, Kyrgyzstan, central Asia, J. Geophys. Res., 107, ETG7.
Turcotte, D. L., McAdoo, D. C. and J. G. Caldwell, 1978. An elastic-perfectly plastic analysis of the bending of the lithosphere at a trench, Tectonophysics, 47, 193-205.
Turcotte, D. L. and G. Schubert 1982. Geodynamics: Application of Continuum Physics to Geological Problems, John Wiley and Sons, 115-140.
Van der Voo, R., Spakman, W. and H. Bijwaard, 1999. Tethyan subducted slabs under India, Earth and Planet. Sci. Lett., 171, 7-20.
Vannay, J. C. and A. Steck, 1995. Tectonic evolution of the High Himalayan Crystalline and of the Tethyan Zone in Upper Lahul (NW Himalaya, India), Tectonics, 14, 253-263.
Vening Meinesz, F. A., 1941. Gravity over the Hawaiian archipelago and over the Madeira area, K. Ned. Akad. Wet., 44.
Walcott, R. I., 1970. Flexure of the lithosphere over the Hawaiian Islands, Tectonophysics, 9, 435-446.
Wang, L., 1984. Elastic Theory, Science Publishing House, Beijing, 380-385 (in Chinese).
129
Wang, H., 1985. Atlas of the Paleogeography of China, Institute of Geology, Chinese Academy of Sciences, Wuhan College of Geology, Cartographic Publishing House, Beijing, 143 (in Chinese).
Wang, Q., Zhang, P. Z., Freymueller, J. T., Bilham, R., Larson, K. M., Lai, X., You, X., Niu, Z., Wu, J., Li, Y., Liu, J., Yang, Z. and Q. Chen, 2001. Present-day deformation in China constrained by global positioning system measurements, Science, 294, 574-577.
Wang, Y. H. and J. C. Mareschal, 1999. Elastic thickness of the lithosphere in the Central Canadian Shield, Geophys. Res. Lett. 26, 3033-3036.
Watts, A. B. and J. R. Cochran, 1974. Gravity anomalies and flexure of the lithosphere along the Hawaiian-Emperor seamount chain, Geophys. J. R. astron. Soc., 38, 119-141.
Watts, A. B., Bodine, J. H. and M. S. Steckler, 1980. Observations of flexure and the state of stress in the oceanic lithosphere, J. Geophys. Res., 85, 6,369-6,376.
Watts, A. B., Karner, G. D., Wessel, P. and J. Hastings, 1985. Global Gravity Bank System, Technical Report 4, CU-1-85, Office of Naval Research, Washington D. C.
Watts, A. B. and U. S. T. Brink, 1989. Crustal structure, flexure, and subsidence history of the Hawaiian Islands, J. Geophys. Res., 94, 10,473-10,500.
Watts, A. B. and E. B. Burov, 2003. Lithospheric strength and its relationship to the elastic and seismogenic layer thickness, Earth and Planet. Sci. Lett., 213, 113-131.
Webb, L. E., Graham, S. A., Johnson, C. L., Badarch, G. and M. Hendrix, 1999. Occurrence, age, and implications of the Yagan–Onch Hayrhan metamorphic core complex, southern Mongolia, Geology, 27, 143-146.
Wees, J. D. van and S. Cloetingh, 1994. A finite-difference technique to incorporate spatial variations in rigidity and planar faults into 3-D models for lithospheric flexure, Geophys. J. Int., 117, 179-195.
Wei, W., Unsworth, M., Jones, A., Booker, J., Tan, H., Nelson, D., Chen, L., Li, S., Solon, K., Bedrosian, P., Jin, S., Deng, M., Ledo, J., Kay, D. and B. Roberts, 2001. Detection of widespread fluids in the Tibetan crust by magnetotelluric studies, Science, 292, 716-718.
Westaway, R., 1995. Crustal volume balance during the India-Eurasia collision and altitude of the Tibetan plateau: A working hypothesis, J. Geophys. Res., 100, 15,173–15,192.
Willett, S. D. and C. Beaumount, 1994. Subduction of Asian lithospheric mantle beneath Tibet inferred from models of continental collision, Nature, 369, 642-645.
Wittke, J. H., http://jan.ucc.nau.edu/~wittke/Tibet/Himalaya.html, 2002.
Wittlinger, G., Tapponnier, P., Poupinet, G., Jiang, M., Shi, T. N., Herquuel, G. and F. Masson, 1998. Tomographic evidence for localized lithospheric shear along the Altun fault, Science, 282, 74-76.
Wu, H., Zhau, R., Liu, C. and C. Chang, 1990. Paleomagnetic observation in North China Block from Late Paleozoic to Triassic, Acta Geophysical Sinica, 33, 694-701 (in Chinese).
Xia, X. C. and S. Y. Fang, 2000. Research progress of desert science in China, Chinese Science Bulletin, 24, 2209-2213 (in Chinese).
130
Yang, Q. and Y. Jin, 1984. Integrated Geophysical Data Interpretation of Northern China Basin, Tech. Rept., Publ. of BGP, Ministry of Petroleum, P. R. China, 22-30 (in Chinese).
Yang, Z. and J. Besse, 2001. New Mesozoic apparent polar wander path for South China: tectonic consequences, J. Geophys. Res., 106, 8493-8520.
Yang, Z. Y., Chen, Y. Q. and H. Z. Wang, 1986. The Geology of China, Oxford, Clarendon Press, 112-135.
Yang, Z. Y., Otofuji, Y.-I., Sun, Z. M. and B. C. Huang, 2002. Magnetostratigraphic constraints on the Gondwana origin of North China: Cambrian/Ordovician boundary results, Geophys. J. Int. 151, 1-10.
Yeats, R. S., Nakata, T., Farah, A., Fort, M., Mirza, M. A., Pandey, M. R. and R. S. Stein, 1992. The Himalayan Frontal Fault System, Annales Tectonicae, 6, 85-98.
Yin, A. and S. Nie, 1993. Development of the Tan-Lu fault as a transform system during collision of the north and south China blocks, east-central China, Tectonics, 12, 801-813.
Yin, A., Harrison, T. M., Ryerson, F. J., Chen, W. J., Kidd, W. S. F. and P. Copeland, 1994. Tertiary structural evolution of the Gangdese thrust system, southeastern Tibet, J. Geophys. Res., 99, B9, 18,175-18,201.
Yin, A., and S. Nie, 1996. A Phanerozoic palinspastic reconstruction of China and its neighboring regions, The Tectonic Evolution of Asia, in An Yin and Mark Harrison (eds.), 442- 481.
Yin, A., Nie, S., Craig, P., Harrison, T. M., Ryerson, F. J., Qian, X. and G. Yang, 1998. Late Cenozoic tectonic evolution of the southern Chinese Tien Shan, Tectonics, 17, 1-27.
Yin, A., 2000. Mode of Cenozoic east-west extension in Tibet suggests a common origin of rifts in Asia during Indo-Asian collision, J. of Geophys. Res., 105, 21,745-21,759.
Yin A. and T. N. Harrison, 2000. Geologic evolution of the Himalayan-Tibetan orogen, Annu. Rev. Earth. Planet. Sci., 28, 211-280.
Yu, Z. and K. M. McNutt, 1995. Development of intracontinental orogens: The Tien Shan, EOS, Trans., 76, F567.
Yue, Y. and J. G. Liou, 1999. A two-stage evolution model for the Altyn Tagh fault, China, Geology, 27, 227–230.
Yue, Y., Ritts, B. D. and S. Graham, 2001. Initiation and long-term slip history of the Altyn Tagh fault, International Geology Review, 43, 1087-1093.
Zeng, R. S. and R. Gao, 1995. A review on the studies of lithosphere structures and dynamics in Tibetan Plateau, China National Report on Seismology and Physics of the Earth's Interior for the XXIst General Assembly of IUGG, China Meteorological Press, Beijing, 41-53 (in Chinese).
Zhai, G. M., 1992. Petroleum Geology of China, Petroleum Industry Publishing House, Beijing, 33-59 (in Chinese).
Zhang, P. Z., 2003. Late Cenozoic tectonic deformation in the Tien Shan and foredeep basins, Science Bull., 48, 2499-2500 (in Chinese).
131
Zhao, R., Liu, C. and H. Song, 1997. Comprehensive geological study report and appraisal of the Tarim exploration area, internal publication of the Geological Research Institute of the Shengli Oil Complex, 23-35.
Zhao, W. J., Nelson, K. D. and Project INDEPTH Team, 1993. Deep seismic reflection evidence for continental underthrusting beneath southern Tibet, Nature, 366, 9, 557-559.
Zhao, W. L. and W. J. P. Morgan, 1987. Injection of Indian crust into Tibetan lower crust; a two-dimensional finite element model study, Tectonics, 6, 489-504.
Zhou S. W., 1992. China Provincial Geography, Foreign Languages Press, Beijing, 58-80 (in Chinese).
Zhou, Z. and P. Chen, 1990. Paleontology, Stratigraphy, and Geologic Evolution of the Tarim Basin, Science Publishing House, Beijing, 78-117 (in Chinese).
Zhu, L. and D. V. Helmberger, 1998. Moho offset across the northern margin of the Tibetan Plateau, Science, 281, 1170-1172.
Zoback, M. L., Zoback, M. D., Adams, J., Assumpcao, M., Bell, S., Bergman, E. A., Blürnling, P., Brereton, N. R., Denham, D., Ding, J., Fuchs, K., Gay, N., Gregersen, S., Gupta, H. K., Gvishiani, A., Jacob, K., Klein, R., Knoll, P., Magee, M., Mercier, J. L., Müller, B. C., Paquin, C., Rajendran, K., Stephansson, O., Suarez, G., Suter, M., Udias, A., Xiao, Z. H. and M. Z. Zhin, 1989. Global patterns of tectonic stress, Nature, 28, 291-296.
Zoback, M. L., 1992. First- and second-order patterns of stress in the lithosphere: The world stress map project, J. Geophys. Res., 97, 11,703-11,728.
Zuber, M. T., 1987. Compression of oceanic lithosphere: An analysis of intraplate deforma-tion in the Central Indian basin, J. Geophys. Res., 92, 4817-4825.
Zuber, M. T., Bechtel, T. D. and D. W. Forsyth, 1989. Effective elastic thickness of the lithosphere and mechanisms of isostatic compensation in Australia, J. Geophys. Res., 94, 9353-9367.
132
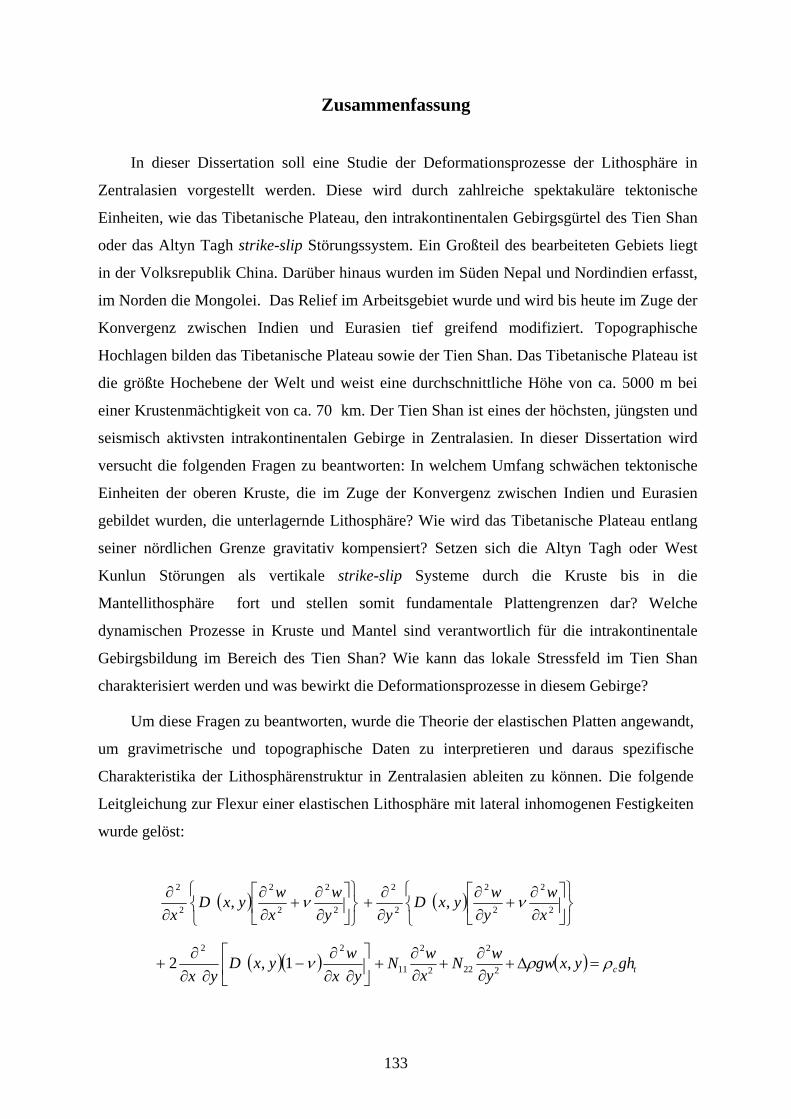
Zusammenfassung
In dieser Dissertation soll eine Studie der Deformationsprozesse der Lithosphäre in
Zentralasien vorgestellt werden. Diese wird durch zahlreiche spektakuläre tektonische
Einheiten, wie das Tibetanische Plateau, den intrakontinentalen Gebirgsgürtel des Tien Shan
oder das Altyn Tagh strike-slip Störungssystem. Ein Großteil des bearbeiteten Gebiets liegt
in der Volksrepublik China. Darüber hinaus wurden im Süden Nepal und Nordindien erfasst,
im Norden die Mongolei. Das Relief im Arbeitsgebiet wurde und wird bis heute im Zuge der
Konvergenz zwischen Indien und Eurasien tief greifend modifiziert. Topographische
Hochlagen bilden das Tibetanische Plateau sowie der Tien Shan. Das Tibetanische Plateau ist
die größte Hochebene der Welt und weist eine durchschnittliche Höhe von ca. 5000 m bei
einer Krustenmächtigkeit von ca. 70 km. Der Tien Shan ist eines der höchsten, jüngsten und
seismisch aktivsten intrakontinentalen Gebirge in Zentralasien. In dieser Dissertation wird
versucht die folgenden Fragen zu beantworten: In welchem Umfang schwächen tektonische
Einheiten der oberen Kruste, die im Zuge der Konvergenz zwischen Indien und Eurasien
gebildet wurden, die unterlagernde Lithosphäre? Wie wird das Tibetanische Plateau entlang
seiner nördlichen Grenze gravitativ kompensiert? Setzen sich die Altyn Tagh oder West
Kunlun Störungen als vertikale strike-slip Systeme durch die Kruste bis in die
Mantellithosphäre fort und stellen somit fundamentale Plattengrenzen dar? Welche
dynamischen Prozesse in Kruste und Mantel sind verantwortlich für die intrakontinentale
Gebirgsbildung im Bereich des Tien Shan? Wie kann das lokale Stressfeld im Tien Shan
charakterisiert werden und was bewirkt die Deformationsprozesse in diesem Gebirge?
Um diese Fragen zu beantworten, wurde die Theorie der elastischen Platten angewandt,
um gravimetrische und topographische Daten zu interpretieren und daraus spezifische
Charakteristika der Lithosphärenstruktur in Zentralasien ableiten zu können. Die folgende
Leitgleichung zur Flexur einer elastischen Lithosphäre mit lateral inhomogenen Festigkeiten
wurde gelöst:
( )⎭⎬⎫
⎩⎨⎧
⎥⎦
⎤⎢⎣
⎡∂∂
+∂∂
∂∂
2
2
2
2
2
2
,yw
xwyxD
xν ( )
⎭⎬⎫
⎩⎨⎧
⎥⎦
⎤⎢⎣
⎡∂∂
+∂∂
∂∂
+ 2
2
2
2
2
2
,xw
ywyxD
yν
( )( ) ⎥⎦
⎤⎢⎣
⎡∂∂
∂−
∂∂∂
+yx
wyxDyx
22
1,2 ν ( ) tcghyxgwywN
xwN ρρ =∆+
∂∂
+∂∂
+ ,2
2
222
2
11
133
In der w die Plattenflexur, ht die Topographie, ρc die Krustendichte, ∆ρ die
Dichteabweichung der Kruste und Mantel, N die tektonischen Hintergrundkräfte in Kraft pro
Längeneinheit und D die Biegesteifigkeit der Lithosphäre (beschreibt die physische Stärke
der elastischen Platte) darstellen. Diese Gleichung wurde mit Hilfe der 3D und 2D finite-
Differenzen Methoden gelöst. Platten von variabler Festigkeit werden je nach ihrer
geologischen Beschaffenheit vertikalen und horizontalen Auflasten, Scherspannungen und
endständigen Biegemomenten ausgesetzt. Mit Hilfe der theoretischen Abweichungen der
elastischen Platten von den finite-Differenzen Lösungen konnten theoretische gravimetrische
Anomalien berechnet werden; dazu wurden die 2D Formel nach Okabe oder die 3D Formel
nach Parker benutzt. Der Fehler der theoretischen im Vergleich zur gemessenen Bouguer
Gravimetrie wurde zur Justierung Biegesteifigkeitsparameter der modellierten Lithosphäre
eingesetzt. Durch eine iterative Berechnung konnte ein best-fit Modell erzeugt werden
(zusammen mit optimierten Werten für D und w), das eine minimierte gravimetrische
Anomalie aufweist.
Die Datenbasis dieser Dissertation bilden Bouguer Gravimetrie und topographische
Daten. Die Oberflächentopographie aus dem Topo30- Datenset wurde als vertikale Auflast
benutzt, um die Flexur der elastischen Lithosphäre zu berechnen. Gravimetrische Daten aus
China wurden von der Karte ’Regional Bouguer Gravity of China’ im Maßstab 1:4.000.000
digitalisiert. Diese Karte wurde zwischen 1987 und 1988 vom Institut für Geophysikalische
und Geochemische Exploration sowie dem Technischen Zentrum für Regionale Gravimetrie
des Ministeriums für Geologie und Mineralische Rohstoffe (MGMR) erstellt. Gravimetrische
Daten, die im Auftrag des MGMR seit 1979 zu Prospektionszwecken gewonnen wurden, sind
in die Karte integriert. Die Messungen wurden den technischen Standards des MGMR
entsprechend in Maßstäben von 1:100.000, 1:200.000 und 1:500.000 durchgeführt.
Ergänzend wurden der Datenbasis 468 neue Messpunkte hinzugefügt, die 1997 und 1998 im
Bereich des Altyn Tagh im Norden Tibets sowie des West Kunlun Gebirges im Nordwesten
gewonnen wurden. Gravimetrische Daten aus Indien stammen aus der Lamont Geobase,
solche aus der Mongolei wurden McNutt et al. entnommen.
Die Ergebnisse der Modellierung zeigen, dass die mechanische Festigkeit der
Lithosphäre in Zentralasien deutlich schwankt, zwischen kleinen, elastischen Mächtigkeiten
von weniger als 15 km zu moderaten Werten von 40-50 km. Schwächezonen existieren in
den großen Gebieten der Gebirgsbildung wie dem Tien Shan, Altyn Shan, West Kunlun
Shan, Qilian Shan oder der Indus-Zhangbo Sutur. Stärkere Zonen befinden sich in den
weniger deformierten Beckenbereichen, z.B. in den Tarim, Qaidam oder den Sichuan Becken
134
oder in bestimmten, niedrig gelegenen Gebieten (< 2500 m). Von besonderem Interesse ist
das zentrale und das östliche Tibetanische Plateau. Hier liegt eine hohe elastische elastische
Festigkeit vor, ähnlich der in topographisch niedrigen Gebieten. Auch der steil abfallende
Übergang vom östlichen Plateau zum angrenzenden Tiefland (Sichuan Becken) schwächt die
darunter liegende Lithosphäre nicht maßgeblich. Die gewonnenen Resultate zeigen, dass die
Deformationsprozesse in weiten Bereichen Tibets nur in der Kruste, nicht aber durch die
gesamte Lithosphäre stattfinden und das die hohe Krustenmächtigkeit in Tibet in erster Linie
durch Spröddeformation und Faltung in der Oberkruste hervorgerufen wird. Die mechanische
Modellierung der elastischen Festigkeit der Lithosphäre wurde räumlich implementiert um
die irreguläre Geometrie der tektonischen Einheiten zu berücksichtigen; die berechneten
Variationen der elastischen Festigkeit stimmen dabei gut mit den geometrischen Formen der
verschiedenen tektonischen Blöcke überein.
Neue gravimetrische und topographische Daten aus den Gebieten der Altyn Tagh und
West Kunlun Störungssysteme wurden benutzt, um Schüsselstellen des oben beschriebenen
tektonischen Modells für die nördliche Grenze des Tibetanischen Plateaus zu testen. Die
gemessene Gravimetrie entlang dreier Profile wurde in Bouguer-Anomalien konvertiert, um
flexurale Modelle der isostatischen Kompensation des großen Reliefunterschieds an den
Störungssystemen ableiten zu können. Alle Versuche, die wesentlichen Merkmale der
gravimetrischen Anomalien anhand eines isostatischen Modells nachzubilden, das eine
Flexur der Moho als Hauptursache für das beobachtete gravimetrische Muster ansieht,
scheiterten. Eine Anzahl plausibler Modelle der Krustenstruktur wurden dann mit Hilfe von
Informationen aus explorationsseismischen Daten über die Sedimentsäule in den Tarim und
Qaidam Becken erstellt. Eine Betrachtung des gravimetrischen best-fit Modells zeigte, das
die elastische Festigkeit über das Altyn Tagh Störungssystem Null beträgt, was zur Annahme
berechtigt, das dieses Störungssystem die gesamte Lithosphäre durchschlägt und zur Zeit und
in der Vergangenheit nur eine vernachlässigbar kleine aufschiebende Komponente aufweist.
Das Ergebnis stimmt mit tektonischen Modellen überein, die annehmen, das die Bildung der
verdickten Kruste in Nord-Tibet durch thick-skinned Deckenüberschiebungen hervorgerufen
wird, die sich fortschreitend nach Nordosten über Asien schieben während das Altyn Tagh
Störungssystem im Sinne einer klassischen Transformstörung in die gleiche Richtung
propagiert. Weiter westlich können die gravimetrischen Beobachtungen am West Kunlun
Störungssystem am besten durch deutliches underthrusting der hoch gelegenen Gebiete durch
eine elastische Platte mit einer effektiven Mächtigkeit zwischen 30 und 40 km erklärt
135
werden. Diese Interpretation stimmt mit der Modellierung früher gemachter gravimetrischer
Beobachtungen überein, die jedoch eine sehr geringe Messdichte aufwiesen.
Eine Korrektur der Sedimentsäule in den Zungar und Tarim Becken im Norden und
Süden des Tien Shan sowie eine 2D Modellierung entlang von vier Profilen wurde
durchgeführt. Plausible Modelle der Lithosphärenstruktur wurden ebenso getestet, um die
wesentlichen Merkmale der Bouguer Gravimetrie und der Topographie räumlich
nachzuvollziehen. Die Resultate legen nahe, das die elastische Festigkeit über den westlichen
Tien Shan Null beträgt, was für ein Fortbestehen der südlichen Tien Shan Aufschiebung
durch die gesamte Lithosphäre spricht. Tektonische Verkürzungsprozesse im westlichen Tien
Shan umfassen die gesamte Lithosphäre. Im Gegensatz dazu passen die gravimetrischen
Daten am besten zu einer unterschiebenden elastischen Platte mit einer effektiven
Mächtigkeit von 40-45 km im Bereich der Tarim und Zungar Becken, die auf 20-25 km unter
dem östlichen Tien Shan abnimmt. Für diesen Bereich sagt das best-fit Modell einer
kontinuierlichen elastischen Platte geringere elastische Mächtigkeiten im Tien Shan Gebirge
als in den benachbarten Gebieten vorraus. Wir schlagen vor, das die Deformationsprozesse
im Tien Shan vom underthrusting einer starren Platte unter das Gebirge hervorgerufen
werden.
Der Tien Shan wurde im Durchschnitt um ca. 3 km im Verlauf der letzten 10 Millionen
Jahre angehoben, obwohl er in 1200-2000 km Entfernung zur Kollisionszone zwischen
Indien und Eurasien liegt. Dies kann mit Hilfe der Theorie der Plattentektonik nicht erklärt
werden. Darüber hinaus kann das lokale Stressfeld im Tien Shan nicht aus dem regionalen
Stressfeld abgeleitet werden, das durch Kompression an der Plattengrenze hervorgerufen
wird. In dieser Dissertation wurde das lokale Stressfeld im Tien Shan untersucht und der
Zusammenhang zwischen einer älteren Phase der Gebirgsbildung und der Reaktivierung des
Tien Shan unter dem heutigen tektonischen Regime analysiert. Die Summe der Stressfelder
wurde Anhand der folgenden Faktoren berechnet: (1) Interaktion zwischen der Indischen und
Eurasischen Platte, (2) die erhöhte gravitative Potentialenergie und (3) Biegung der
Lithosphäre im Tien Shan. Dieses zusammengesetzte Stressfeld stimmt mit Vorhersagen
anhand von seismischen Herdflächenlösungen, GPS-Messungen und der
Oberflächengeologie überein. Die Resultate zeigen, das der tektonische Biegestress, der aus
der Biegung der Lithosphäre unterhalb des Tien Shan resultiert, maßgeblich zum
Gesamtstressfeld beiträgt. Darüber hinaus legen sie nahe, das die Hebung des Tien Shan eher
in Folge eines lokalen intrakontinentalen Stressfeldes erfolgte, als von der Kollision zwischen
Indien und Eurasien hervorgerufen wurde.
136
Acknowledgments
I would like first of all to express my deep gratitude to all those who have encouraged and
helped me to finish my dissertation, although I feel rather lost in finding the proper English
words to express myself.
I would also like to express my sincere thanks to my supervisor, Professor How Kin Wong.
Many geological terminologies in English were new to me. I feel very lucky that during my Ph.
D. studies at the University of Hamburg, Professor Wong has always been very patient and
understanding in discussions and is always sympathetic to problems that I encountered.
I owe my gratitude to Professor Marcia K. McNutt at the Monterey Bay Aquarium
Research Institute. She ignited my interest in lithosphere dynamics. From May to August,
1997, and June to October, 1999, I worked in her laboratory at MIT and at the University of
California Santa Cruz, and learnt the theory and method of using Bouguer gravity and topo-
graphic data to describe the dynamics of the lithosphere.
Special thanks are due to my former classmate Dr. Yu Jin of the Chevron Petroleum
Company, U.S.A. The initial program code I used came from him. He also offered me his
patient help in model design, programming and choice of model parameters.
The warmth of all members of the research group of Professor Wong, especially that of Dr.
Thomas Lüdmann, Philipp Konerding and Kai Berglar, has been a great source of comfort for
me during my stay in Hamburg far away from home.
My thanks go also to Ms. Fang Ye, Haiying Gao and Haiyan Long, who helped me in the
preparation of several maps with GMT.
And, last but not least, my most hearty thanks to my husband for his love. He has been
waiting for me for such a long time.


![Review Role of Plant Derived Alkaloids and Their Mechanism ...Role of Plant Derived Alkaloids and Their Mechanism in Neurodegenerative Disorders ... occurrence of symptoms [24]. Cerebral](https://static.fdokument.com/doc/165x107/5e802dca61852c006f69dbc8/review-role-of-plant-derived-alkaloids-and-their-mechanism-role-of-plant-derived.jpg)