
ePubWU Institutional Repository · ePubWU Institutional Repository Michael Uher Airport Dubai -...
197
ePub WU Institutional Repository Michael Uher Airport Dubai - Evaluation of Dubai as a First Choice Hub for International Travellers Working Paper Original Citation: Uher, Michael (2005) Airport Dubai - Evaluation of Dubai as a First Choice Hub for International Travellers. Schriftenreihe des Instituts für Transportwirtschaft und Logistik - Verkehr, 03/2005. Institut für Transportwirtschaft und Logistik, WU Vienna University of Economics and Business, Vienna. This version is available at: Available in ePub WU : June 2010 ePub WU , the institutional repository of the WU Vienna University of Economics and Business, is provided by the University Library and the IT-Services. The aim is to enable open access to the scholarly output of the WU.
Transcript of ePubWU Institutional Repository · ePubWU Institutional Repository Michael Uher Airport Dubai -...

ePubWU Institutional Repository
Michael Uher
Airport Dubai - Evaluation of Dubai as a First Choice Hub for InternationalTravellers
Working Paper
Original Citation:Uher, Michael (2005) Airport Dubai - Evaluation of Dubai as a First Choice Hub for InternationalTravellers. Schriftenreihe des Instituts für Transportwirtschaft und Logistik - Verkehr, 03/2005.Institut für Transportwirtschaft und Logistik, WU Vienna University of Economics and Business,Vienna.
This version is available at: http://epub.wu.ac.at/1406/Available in ePubWU: June 2010
ePubWU, the institutional repository of the WU Vienna University of Economics and Business, isprovided by the University Library and the IT-Services. The aim is to enable open access to thescholarly output of the WU.
http://epub.wu.ac.at/
Institut für Transportwirtschaft und LogistikInstitute of Transport Economics and LogisticsVienna University of Economics and Business Administration
Schriftenreihe des Instituts für Transportwirtschaft und Logistik Nr. 3 (2005)
Uher, Michael
Airport Dubai – Evaluation of Dubai as a First Choice Hub for International Travellers
Herausgeber: die Professoren des Instituts für Transportwirtschaft und Logistik
II
Airport Dubai - Evaluation of Dubai as a First Choice Hub for International Travellers
Michael Uher
Vienna University of Economics and Business Administration
Institute of Transport Economics and Logistics Professor Sebastian Kummer
III
Contents
Contents................................................................................................................................................... III List of Illustrations ..........................................................................................................VI List of Tables..................................................................................................................IX List of Abbreviations.......................................................................................................XI Airlines ......................................................................................................................XII Airports .....................................................................................................................XIII Abstract ........................................................................................................................1
1. Introduction and Historic Process ..............................................................2
2. Basic Terms and Definitions........................................................................7 2.1. Airport .............................................................................................................7 2.2. Hub .................................................................................................................8 2.2.1. General Definition of a Hub.............................................................................8 2.2.2. Types of Hubs...............................................................................................10 2.2.2.1. Joop Krul.......................................................................................................10 2.2.2.2. The Boston Consulting Group.......................................................................10 2.2.2.3. Rüdiger Sterzenbach, Roland Conrady and Walter Fauska.........................13 2.2.2.4. Kenneth Button, Kingsley Haynes, Roger Stough ........................................14 2.2.2.5. Wilhelm Pompl ..............................................................................................15 2.2.3. Focus City.....................................................................................................15
3. Accessibility Theories and Methods.........................................................16 3.1. Accessibility Theories and Studies of Various Authors.................................16 3.1.1. R.J. Johnston ...............................................................................................18 3.1.2. Brian S. Hoyle and Richard D. Knowles ......................................................18 3.1.3. Gösta Ihde ...................................................................................................19 3.1.4. ETH Zürich: Axhausen/Tschopp/Fröhlich/Keller .........................................20 3.1.5. Siamak Baradaran and Farideh Ramjerdi ....................................................22 3.1.6. Britton Harris ................................................................................................23 3.1.7. Piet Rietveld and Frank Bruinsma ...............................................................24 3.1.8. Scottish Executive CRU ...............................................................................27 3.2. Accessibility Theories and Methods in the Civil Aviation Industry ................28 3.3. Accessiblity: Empirical Analysis of Hub-and-Spoke Systems .......................30 3.4. Application of the Concepts and Studies to the Thesis.................................31
IV
4. Studies and Concepts about the Comparison of Hubs...........................32 4.1. Characteristics of Hubs.................................................................................32 4.1.1. Advantages of the Hub-and-Spoke System..................................................35 4.1.2. Disadvantages of the Hub-and-Spoke System.............................................41 4.1.3. Critical Review ..............................................................................................45 4.2. Criteria Affecting the Choice of Airports........................................................46 4.2.1. Passengers’ Perspectives ............................................................................47 4.2.2. Airlines’ Perspectives....................................................................................50 4.3. Approach to Hub Measurement ....................................................................51 4.3.1. Strategic Quality of a Hub.............................................................................54 4.3.1.1. Geographic Centrality ...................................................................................54 4.3.1.2. Strength of Feed ...........................................................................................55 4.3.1.3. Local Traffic ..................................................................................................56 4.3.1.4. Hub Dominance ............................................................................................57 4.3.1.5. Expansion Capacity ......................................................................................59 4.3.1.6. Attractiveness to Passengers .......................................................................59 4.3.1.7. Hub Efficiency...............................................................................................60
5. Hypothesis and Analysis ...........................................................................65 5.1. General Overview and Concept of the Analysis ...........................................65 5.2. Presentation of the European-Asian Air Traffic.............................................66 5.2.1. The European-Asian Air Traffic in General ...................................................66 5.2.2. The European-Asian Air Traffic via Dubai Airport .........................................68 5.3. Determinants of Measurement: Measurement Elements and Attributes ......70 5.4. Customer Segments, Demands and Expectations .......................................76 5.4.1. Business Travel and Business Travellers .....................................................84 5.4.1.1. Corporate Business Travellers......................................................................94 5.4.1.2. Independent Business Travellers..................................................................95 5.4.2. Leisure Travel and Leisure Travellers...........................................................95 5.4.3. Connecting Passengers................................................................................97 5.4.4. Local Passengers .......................................................................................103 5.5. Empirical Findings.......................................................................................104 5.5.1. Price and Yield............................................................................................105 5.5.1.1. Economy Class...........................................................................................112 5.5.1.2. Business Class ...........................................................................................114 5.5.2. Aeronautical Charges, Taxes and Access Costs........................................116 5.5.2.1. Aeronautical Charges ................................................................................116

V
5.5.2.2. Forms of Aeronautical Charges ..................................................................117 5.5.2.3. The Level of Aeronautical Charges, the Impact and the Criticism..............120 5.5.2.4. Access Costs ..............................................................................................126 5.5.3. Safety..........................................................................................................127 5.5.4. Schedule, Schedule Convenience and Total Travel Time ..........................129 5.5.5. Minimum Connecting Time and Connectivity Ratio ....................................131 5.5.6. Comfort, Quality, Image and Service on Ground ........................................133 5.5.6.1. Comfort and Quality ....................................................................................133 5.5.6.2. Service on Ground......................................................................................136 5.5.6.3. Airport Measurement ..................................................................................137 5.5.6.4. Dubai International Airport’s Profile, Quality and Innovations.....................138 5.5.7. Comfort, Quality, Image and Service in the Air...........................................142 5.5.8. Frequent Flyer Programme and Alliance ....................................................144 5.5.9. Value of (Travel) Time ................................................................................151 5.6. Validity of the Empirical Findings and Critical Approach.............................156 5.7. Summary ....................................................................................................157 6. Forecast and Prospects ...........................................................................158 6.1. Prognosis to Airports’ Future Prospects with Reference to
Empirical Findings.......................................................................................158 6.2. Future Development of the Aviation Industry with Reference to the
European-Asian Air Traffic..........................................................................161 6.2.1. Market and Commercial Driven Changes...................................................161 6.2.2. Technical and Infrastructure Driven Changes.............................................163 6.2.2.1. Technical Driven Changes..........................................................................163 6.2.2.2. Infrastructure Driven Changes....................................................................165 6.3. Critical Conclusion ......................................................................................165
Acknowledgments .......................................................................................................167
Bibliography ................................................................................................................168

VI
List of Illustrations
Figure 1: International Traffic Trends by Region RPK % Change
2002 vs. 2001 and 2003 vs. 2002 ..................................................................4 Figure 2: Airport Passenger Growth by World Region since 11 September 2001 ..........5 Figure 3 :Mega Hub Consolidation ...............................................................................12 Figure 4: Process of Modal Choice from the Individual’s Point of View .......................17 Figure 5: Progress of Accessibility ..............................................................................17 Figure 6: Components of Accessibility .........................................................................18 Figure 7: Accessibility over Time .................................................................................19 Figure 8: Creation of a Hub ..........................................................................................34 Figure 9: Leverage of a Hub ........................................................................................37 Figure 10: How Important was Frankfurt Airport and Lufthansa’s Hub
for Your Investment Decisions and Choices of Location in Favour
of the Rhein-Main Region?.........................................................................40 Figure 11: Main Carriers at European and Asian Airports ...........................................44 Figure 12: European Airport Landscape ......................................................................53 Figure 13: Asian Airport Landscape .............................................................................53 Figure 14 : Minimum Connecting Times MCT ..............................................................61 Figure 15: Star Alliance Terminal Distribution...............................................................62 Figure 16: Hub Indicator Analysis ................................................................................64 Figure 17: Europe vs. Asia Traffic YoY Growth (%) .....................................................67 Figure 18: European vs. Asian Aircraft Movement YoY Growth (%) ............................67 Figure 19: European vs. Asian Passenger Volume YoY Growth (%) ..........................68 Figure 20: Dubai Airport Trend of Available Seats and Frequency- Flights
to/from Western Europe ............................................................................69 Figure 21: Dubai Airport Trend of Available Seats and Frequency - Flights
to/from Asia/Pacific.....................................................................................69 Figure 22: Travel Choice Framework ...........................................................................72 Figure 23: Why Passengers Would Change Their Favourite Airline ............................75 Figure 24: Market Segmentation According Reason of Travel ....................................76 Figure 25: Market-Segmentation ..................................................................................77 Figure 26: Components of Air Travel Demand .............................................................78 Figure 27: Descriptive and Influential Elements of Demand ........................................80 Figure 28: Customer Value ..........................................................................................80 Figure 29: Booking Behaviour ......................................................................................81 Figure 30: Product Demand of the Different Customer Groups ...................................81

VII
Figure 31: Seize and Shape of Future Air Traffic .........................................................83 Figure 32: Mode of Surface Transport used by Passengers at
London Heathrow in 2001 ............................................................................88 Figure 33: Fare Display of a Flight from Frankfurt to Dubai on Lufthansa ...................90 Figure 34: Kind of Travellers on Board of Lufthansa Schedule Flights ........................96 Figure 35: Connections Through Singapore May 1993 ...............................................98 Figure 36: Transfer Times ............................................................................................99 Figure 37: Arrival and Departure Waves of all Emirates operated flights at Dubai ....100 Figure 38: Arrival and Departure Waves of all Lufthansa operated flights
at Frankfurt ................................................................................................100 Figure 39: Hubstructure Vienna Trafficsystem 2000 ..................................................101 Figure 40: Hubstructure Vienna Trafficsystem 2002 ..................................................101 Figure 41: Transit Passengers on Flight OS 94 Washington – Vienna
15th Dec. 2004 part 1 .................................................................................102 Figure 42: Transit Passengers on Flight OS 94 Washington – Vienna
15th Dec. 2004 part 2 .................................................................................103 Figure 43: IATA Tariff System Structure of Passenger Fares ....................................105 Figure 44: Ticket Prices Under Certain Market Structures .........................................109 Figure 45: Costs for Flights out of Europe to the Far East .........................................111 Figure 46: Aeronautical Charges and Taxes for an International
B737-800 Turnaround in 2002....................................................................121 Figure 47: Airport and Non-Airport Related Costs .....................................................122 Figure 48: Variable Costs vs. Landing – Fly Over Charges .......................................123 Figure 49: Revenue Breakdown of European Airports ...............................................123 Figure 50: Benchmark Aeronautical Charges and Taxes for an
International B737-800 Turnaround in 2002 ...............................................126 Figure 51: Transfer Times ..........................................................................................131 Figure 52: Hub Connectivity .......................................................................................132 Figure 53: Overall Passenger Satisfaction in 2002 ....................................................134 Figure 54: Number of Frequent Flyers on Board of
Austrian Airlines OS 87 Vienna-New York..................................................146 Figure 55: Number of Frequent Flyers on Board of
Austrian Airlines OS 451 Vienna-London ...................................................147 Figure 56: Revenue Passenger Kilometres 2002 ......................................................149 Figure 57: Global Passenger Share 2002 ..................................................................149 Figure 58: Frequent Flyer Programmes .....................................................................150 Figure 59: Valuation of Travel Time as a Function of Trip Duration ...........................153

VIII
Figure 60: Valuation of Travel Time as a Function of Trip Duration Under
Certainty (Variance = 0) and Uncertainty (Variance > 0) ...........................154 Figure 61: Different Strategies for Different Types of Airports ...................................158 Figure 62: Hub Consolidation .....................................................................................159 Figure 63: Possible Airport Scenario’s for DXB .........................................................160 Figure 64: Average Growth Rate per Year 1999-2009 ..............................................161 Figure 65: Market Life Cycle ......................................................................................162
IX
List of Tables
Table 1: Forms of hubs ................................................................................................11 Table 2: Logic of Accessibility ......................................................................................22 Table 3: Alternative operationalizations of accessibility ...............................................26 Table 4: Markets in a Hub and Spokes System ...........................................................36 Table 5: Real Price of Hubs .........................................................................................40 Table 6: Selected Airlines’ Hub Domination in 1999 and 2000 ....................................43 Table 7: Passenger Choice Survey London .................................................................48 Table 8: Airport Choice – Historic Overview of Various Authors ..................................50 Table 9: Local Traffic Potential .....................................................................................52 Table 10: World’s Airport Ranking in Terms of Passengers 1st Quarter 2004 ............54 Table 11: Air Traffic Measurement ...............................................................................54 Table 12: Ticket Prorate ...............................................................................................57 Table 13: Airports’ Main Carriers .................................................................................58 Table 14: Alliance Hub Dominance ..............................................................................59 Table 15: Minimum Connecting Times MCT ................................................................60 Table 16: European Hub Performance, 1989-95 .........................................................63 Table 17: Flights’ Analysis out of Dubai .......................................................................70 Table 18: Key Product Features ..................................................................................73 Table 19: Importance of Product Features in Choice of Airlines ..................................74 Table 20: Factors Affecting the Level and Growth of Passenger Demand ..................77 Table 21: Market Segmentation Business Travel ........................................................85 Table 22: Non-Stop Flights New York – London ..........................................................86 Table 23: Check-in Closure for International Long Distance Flights ............................91 Table 24: British Airways Ticket Price for London – New York – London ....................94 Table 25: Market Segmentation Private Travel ............................................................97 Table 26: Average Economy Class Normal Fares (Schedule Services) 1993 ...........107 Table 27: Demand Elasticities of Air Passenger Travel .............................................108 Table 28: Unit Costs of Different Classes on Singapore Airlines’
Boeing B777-300 .......................................................................................110 Table 29: Costs for Flights out of Europe ...................................................................111 Table 30: Europe to/from North East Asia: Passengers results
by class of service, 1999 ...........................................................................112 Table 31: Economy Class Benchmark ........................................................................114 Table 32: Business Class Benchmark ........................................................................116
X
Table 33: Average Fuel Prices Paid by International Scheduled Airlines,
Sept. 1999 .................................................................................................119 Table 34: Average Fuel Prices Paid by International Airlines at
Selected Airports, Oct. 2001 ......................................................................120 Table 35: Representative Airport Charges for a Boeing 747, Oct. 2000 ....................122 Table 36: Aeronautical Charges and Taxes Benchmark.............................................125 Table 37: Surface Transport Costs (Fares in EUR) ...................................................126 Table 38: Maintenance Costs ....................................................................................127 Table 39: Safety Statistic ...........................................................................................128 Table 40: International Aviation Safety Assessment (IASA) Program .......................128 Table 41: Total Travel Time Benchmark .....................................................................130 Table 42: Best International Transit Airport 2004 .......................................................132 Table 43: Overall Passenger Satisfaction Levels .......................................................134 Table 44: Criteria Most Frequently Used to Measure Quality of Service at
ACI Airports ...............................................................................................135 Table 45: Comfort Benchmark on Ground ................................................................137 Table 46: Airport Satisfaction Rate ............................................................................137 Table 47: Aetra Customer Satisfaction Survey 2003 by ACI & IATA .........................138 Table 48: Airport Security Ranking ............................................................................138 Table 49: Dubai International Airport Ranking ...........................................................141 Table 50: Comfort Benchmark on Board ....................................................................143 Table 51: Airline Benchmark ......................................................................................143 Table 52: The Influence of Frequent Flyer Programmes ...........................................145 Table 53: Global Passenger Share 2002 ...................................................................148 Table 54: Alliance Key Statistics ................................................................................148 Table 55: Aircraft Technical Details ...........................................................................164

XI
List of Abbreviations
AEA........................ Association of European Airlines
ANA........................ All Nippon Airways
ASK........................ Available Seat Kilometre
ATC........................ Air Traffic Control
ATK ........................ Available Tonne Kilometre
BAA........................ British Airport Authority
CRS ....................... Computer Reservation System
DB .......................... Deutsche Bahn
DDF........................ Dubai Duty Free
DMU....................... Decision Making Unit
EU .......................... European Union
FAA ........................ (US) Federal Aviation Administration
FFP ........................ Frequent Flyer Programme
FSNC ..................... Full Service Network Carrier
IACO ...................... International Civil Aviation Organization
IATA ....................... International Air Transport Association
ILS.......................... Instrumental Landing System
IT............................ Inclusive Tour
LCC........................ Low Cost Carrier
MAW ...................... Maximum Authorized Weight
MCT ....................... Minimum Connecting Time
MTOW.................... Maximum Take Off Weight
n.a. ......................... no author
n.av. ....................... not available
O&D ....................... Origin and Destiantion
PAX........................ Passenger
PNR ....................... Passenger Name Record
RPK........................ Revenue Passenger Kilometre
SARS ..................... Severe Acute Respiratory Syndrome
SCNF ..................... French Rail
SLA ........................ Service Level Agreement
SPA........................ Strategic Partnership Agreement
TWA ....................... Trans World Airlines
UZA........................ Unique Zurich Airport
YoY ........................ Year on Year

XII
Airlines
AA .......................... American
Airlines
AC .......................... Air Canada
AF .......................... Air France
AI ........................... Air India
AZ .......................... Alitalia
BA .......................... British Airways
BD .......................... British Midland
CI ........................... China Airlines
CO.......................... Continental
Airlines
CX .......................... Cathay Pacific
DL .......................... Delta Airlines
EK .......................... Emirates
IB............................ Iberia
JD........................... Japan Air
System
JL ........................... Japan Airlines
KA .......................... Dragonair
KL........................... KLM Royal
Dutch Airlines
KU .......................... Kuwait Airlines
LH .......................... German
Lufthansa
LX........................... Swiss Airlines
MH ......................... Malaysia
Airlines
MU ......................... China Eastern
MX.......................... Mexicana
NH.......................... All Nippon
Airways
NW ......................... Northwest
Airlines
OA.......................... Olympic Airways
OS ..........................Austrian Airlines
Group
PG ..........................Bangkok Airways
RG ..........................Varig
SK...........................SAS Scandinavian
Airlines
SN ..........................Sabena
SQ ..........................Singapore Airlines
SR ..........................Swissair
TG ..........................Thai Airways
TW..........................Trans World Airlines
U2...........................Easy Jet
UA ..........................United Airlines
VS...........................Virgin Atlantic

XIII
Airports
ALA ........................ Almaty
ALB ........................ Albany
AMM....................... Amman
AMS ....................... Amsterdam
Shipol
ARN ....................... Stockolm
Arlanda
ATH........................ Athens
Eleftherios
Venizelos
ATL ........................ Atlanta GA
Hartsfield
BAH........................ Bahrain
BEG ....................... Belgrade
BKK........................ Bangkok
BOM....................... Mumbai
Chhatrapati
Shivaji
BUD ....................... Budapest
Ferihegy
CAI ......................... Cairo
CDG ....................... Paris Charles de
Gaulle
CPH ....................... Copenhagen
Kastrup
DAM ....................... Damascus
DEL ........................ Delhi Indira
Ghandi
DEN ....................... Denver
DFW....................... Dallas/Fort
Worth
DME ...................... Moscow
Domodedovo
DNK ....................... Dnepropetrovsk
DOH ....................... Doha
DXB ........................Dubai
ESB ........................Ankara Esenboga
EVN ........................Yerevan
EWR .......................Newark Liberty Field
EZE ........................Buenos Aires Ezeiza
FCO........................Rome
FRA ........................Frankfurt Rhein-Main
FRU ........................Bishkek
FUK ........................Fukuoka
GRZ........................Graz Thalerhof
HKG........................Hong Kong
HND........................Tokyo Handa
IAD .........................Washington Dulles
IAH .........................Houston George Bush
ICN .........................Seoul Incheon
IST.......................... Istanbul
ITM .........................Osaka Itami
JFK .........................New York John F.
Kennedy
KBP ........................Kiev Borispol
KIX..........................Osaka Kansai
KLU ........................Klagenfurt
KSC ........................Kosice
KTM........................Kathmandu Tribhuvan
KUL ........................Kuala Lumpur
LAX.........................Los Angeles
LGA ........................New York La Guardia
LGW .......................London Gatwick
LHR ........................London Heathrow
LNZ.........................Linz
MAD .......................Madrid Barajas
MSP........................Minneapolis/Saint
Paul International
MUC .......................Munich Franz-Josef
Strauss

XIV
MXP ....................... Milan Malpensa
NRT........................ Tokyo Narita
NUE ....................... Nuremberg
ODS ....................... Odessa Central
ORD ....................... Chicago O’Hare
ORY ....................... Paris Orly
OTP........................ Bucharest
Otopeni
PDX........................ Portland
PEK........................ Beijing Capitol
PRG ....................... Praque Ruzyne
PVG ....................... Shanghai
RIX ......................... Riga
International
SFO........................ San Francisco
SIN ......................... Singapore
Changi
SJJ ......................... Sarajevo
SKG........................Thessaloniki
SKP ........................Skopje
SOF ........................Sofia Vrazhdebna
SVO........................Moscow
Sheremetyevo
SYD ........................Sydney NS Kingsford
Smith
TBS ........................Tbilisi Novo
Alexeyevka
TGD........................Podgorica
TIA..........................Tirane Rinas
TLV.........................Tel Aviv Ben Gurion
TSR ........................Timisoara
TXL.........................Berlin Tegel
VIE..........................Vienna
WAW ......................Warsaw Okecie
ZAG ........................Zagreb
ZRH ........................Zürich Kloten

1
Abstract
The aviation industry is in a state of radical antagonisms. Passengers demand quick
and cheap transport on the one hand, but expect the highest comfort in terms of
service, schedule convenience or non-stop travel on the other hand. The development
of more efficient and economical aircraft supports the trend of falling tariffs together
with better accessibility. Aspects of comfort on the ground as well as in the air are
changing, since falling yields force airlines to reconsider their strategies to attract
passengers. The market has become instabile somehow. Customers have interesting
choices, when it comes to select the favourite airline for their European–Asian travel.
They are free to choose the transfer point of their journey. Dubai has emerged to
become a reasonable alternative to the overcrowded classic mega-hubs (London, Paris
or Frankfurt) in Europe. The airport convinces with little minimum connecting times, low
aeronautical charges and a growing number of new destinations. Rising traffic figures
justify an evaluation of this Arabian hub.
This paper analysis, if a shift to Dubai makes sense for the international traveller, when
he has to travel from Europe to Asia; discussing the idea of the hub and spoke system,
measuring customers, their demands along with their expectations. It aims to offer
more insight into the problem with the help of accessibility methods in general including
theories applicable to the aviation industry. Hub-structures as well as -models are
evaluated to understand airports’ problems and demonstrate passengers’ demands.
The main part of the study seeks to develop and interpret air travellers’ individual
choices among a representative selection of connecting airports on the basis of a large
number of empirical surveys. According to Doganis’ evaluation, the following
parameters help to measure passengers’ tradeoffs among travel decision - together
with the route preference - in order to create a conceptional framework: Price, taxes
(which affect the choice of route, as airlines add taxes plus other surcharges to the
ticket fare), safety, schedule-convenience (incl. total travel time), connectivity-ratio,
comfort-quality-image and the airlines’ frequent flyer programmes. Finally the value of
(travel) time plays an important role in cost benefit analysis and relativity towards price,
total travel time plus service benefits. The empirical results provide indications, that
Dubai makes a good job to compete with the classic mega-hubs. The airport is leading
with the lowest aeronautical charges and offers the cheapest fares on selected routes.
In terms of service aspects Dubai - together with the home airline Emirates - offers
outstanding standards. Both partners, however, suffer from long total travel times and a
missing alliance, which leads to an unattractive frequent flyer programme. Although the
basis for a successful future exists, there is still a great job to do!
2
Airport Dubai - Evaluation of Dubai as a First Choice Hub for
International Travellers
1. Introduction and Historic Process
Profitability has always been an fundamental goal for the airline industry, which is in
constant motion. The continuing growth of passengers and aircraft movements
necessitates a rise of investments in airport and aircraft capacity. Unfortunately, “the
airline industry presents an enigma: high growth rates during the last forty years have
produced only marginal profitability.” 1 The events of September 11, Severe Acute
Respiratory Syndrome (SARS), crisis in Iraq or development and growth of the Low
Cost Carriers (LCC) have only exacerbated existing weaknesses. Yields drop down, as
airlines compete with each other for the lowest prices. Full Service Network Carriers
(FSNC)2 report losses and announce layoffs. Although government assistance has
been forthcoming, it is by far not enough to repair the industry. Up to this very moment
it is still too early to predict winners and losers in this environment. What we can
forecast is that competitive advantage will go to the airport and airline that can respond
quickly and decisively to increased pressure to restructure, consolidate and segment
the industry.
This constraint gathers speed and demands immediate attention from every member of
the aviation industry. There is no doubt that the increasing economic pressure will force
an industry wide restruction. Although the impact might vary across air-carriers, none
will completely avoid the combined effects of lower demand, rising insurance, security
costs and lower yields.3 Airlines cut staff, defer marketing expenses, reduce capacity,
retire equipment early and postpone plane deliveries.
This negative effect does not apply to the airports. As there exists only little
competition, they enjoy some kind of monopoly. They do, however, face other kind of
complications: capacity restrictions (lack of space/terminals, runways, etc.), regulation
of traffic hours (night traffic termination) and suffer from the consequences of ATC Air
Traffic Control irregularities.
1 Doganis (2002), p.1 2 see Pels / Nijkamp / Rietveld (1997), p.4 3 see Merrill Lynch (2003b), p.10

3
Nevertheless, airports have enough funds to provide and improve the perfect departure
or arrival facilities for their partners in this business-field. The future of world’s airports
is directly linked with airlines’ success and vice versa. Therefore this study focuses on
both airports together with airlines, as an individual approach fails to understand the
real problems (and challenges) of the industry.
In the Middle East, Dubai International Airport DXB and its home airline Emirates do
not seem to participate in this market trend. The carrier seeks for new employees,
orders a large amount of aircraft and boosts capacity. The airport increases the number
of total passengers including revenues and introduces one giant enlargement project
after the other. What might be the reason for this outstanding success in contrast to the
slow growth of the whole industry? Traditionally European passengers are more
seduced into choosing local carriers, rather than to select Dubai as their transit station.
It definitely has to be more than a marketing strategy, as facts and quality rankings
validate impressions of success and approbation. What is the reason, why Dubai
Airport in cooperation with Emirates has a high likelihood to win customers’ satisfaction
and voyage decision? This paper measures travel possibilities for a journey between
Europe and Asia in terms of accessibility, compares product and service of selected
major competitive airlines as well as airports. As a result it will provide an answer to all
these questions! Samples are taken from several airlines, alliances and airports around
the globe, which provide the global attitude of this work.
“Since antiquity, the Middle East has been a land bridge between Europe and Asia and
Europe and Africa.”4 Airline Deregulation in 1978 has generated new demand for air
travel, as fares have become lower and level of service improved. With reference to the
Table of March 2004 Monthly International Statistics 5 , „there was an exceptional
growth record by Middle Eastern carriers who posted March year on year same month
jumps of 40.2%.” 6
„Over the first quarter Middle Eastern carriers posted results that were not less
impressive: 30.7%.“ 7 All figures refer to passenger traffic.
4 Fletcher (2003), p.239 5 see IATA (2004b), in: http://www1.iata.org/pressroom/pr/2004-05-03-10.htm 6 IATA (2004b), in: http://www1.iata.org/pressroom/pr/2004-05-03-10.htm 7 IATA (2004b), in: http://www1.iata.org/pressroom/pr/2004-05-03-10.htm

4
In comparison to the Middle East, the North American sector had only a 9.6% and the
European Sector 8.5% growth over the first quarter. International Traffic Trends for a
period of 12 months show a similar positive course for the Middle Eastern region.8
-4,9
2
5,8
-9,4
-0,9
-7,2
8,713,1
6,4
9,2
1,9
1,2
-10
-5
0
5
10
15
Euro
pe
Asia
Paci
fic
Nor
thAm
eric
a
Mid
dle
East
Latin
Amer
ica
Afric
a
International Traffic Trends by Region RPK % Change 2002 vs. 2001 and 2003 vs. 2002
Change 2002 vs. 2001 Change 2003 vs. 2002
Figure 1: International Traffic Trends by Region RPK % Change 2002 vs. 2001 and 2003 vs. 2002 9
These figures determine the importance of the region. Dubai International Airport
together with the best-known airline in the Gulf: Emirates 10, this topic is undoubtedly
worth to be discussed. “Dubai Airport is the largest airport in the region. In 2002, it
handled 19 million passengers compared with just 4.5 million in 1989.” 11 „The
Department of Civil Aviation is committed to build an airport which will not only be
among top airports in the world but will be known as the 21st century airport hub.“12
The airport’s capacity will increase up to 100 million passengers in 2025 13.
8 see IATA (2004b), in: http://www1.iata.org/pressroom/pr/2004-05-03-10.htm 9 see IATA (2003c), in: http://www1.iata.org/pressroom/pr/2003-02-10-02.htm ; IATA (2004a), in: http://www1.iata.org/industry_stats/2004-28-01-01.htm 10 See Teyeb (2004), in: http://www.travel-watch.com/gulfair.htm 11 Graham (2003), p.173 12 Siemens (2003), in: http://www.siemens.com/index.jsp?sdc_pnid=0&sdc_sid=11672683082&sdc_content.htm 13 see Newton (2003), p. 6

5
The successive impacts of September 11, a world economic slowdown and SARS
have been devastating. Industry losses in 2001 and 2002 amounted to US$ 25 billion.14
However, traffic figures go back to normal. “Traffic grew in all regions! The industry is
showing clear signs of its ability to match capacity to demand.” 15
-20
-15
-10
-5
0
5
Mon
thly
gro
wth
co
mpa
red
to p
revi
ous
year
(%)
Afri
ca
Asia
/Pac
ific
Eur
ope
Latin
Amer
ica
Mid
dle
East
Nor
thAm
eric
a
Airport passenger growth by world region since 11 Sept. 2001
Nov.01 Mar 02 Aug.02
Figure 2: Airport Passenger Growth by World Region since 11 September 200116
Finally, “the number of passengers grew by 20.3% in the first quarter of 2004
compared to 2003. The Middle East had an increase of 44%, Asia of 35%, North
America of 20% and Europe of 13%.” 17
Consequently two questions arise: Would travellers use Dubai airport as a hub for their
European – Asian journey? Moreover, will Dubai succeed in convincing passengers to
consider the airport as an international hub under the sign of technical developments
and changes such as the Airbus A380 , A340-500 or Boeing’s B7E7? In terms of
monetary factors, this work will answer the question, if Dubai Airport is the cheaper or
more expensive travel opportunity.
14 see ATA (2003b), in: http://www1.iata.org/pressroom/pr/2003-06-02-04.htm 15 IATA 2004b), in: http://www1.iata.org/pressroom/pr/2004-05-03-10.htm 16 see Graham (2003), p.254 17 APA (2004a), in: www.apa-defacto.at
6
The paper gives a detailed overview about the idea of the hub-and-spoke system.
Accessibility theories help to understand the essence of the measurement analysis.
General concepts and studies about the comparison of hubs include a presentation of
crucial aviation subject matters.
The study draws attention to the European – Asian Air Traffic. It compares Dubai
International Airport with other primary hubs in Europe: Paris CDG, Frankfurt FRA,
London Heathrow LHR 18 and discusses questions like, “Would Business and Leisure
Travellers use Dubai International Airport as a first choice hub?”. It introduces
measurement analysis in order to determine differences and advantages between the
selected primary hubs. Focus is on the measurement criteria: price, benefit, time,
comfort, service, safety, schedule convenience, image as well as frequent flyer
programmes and alliances. Attention, however, is also on value of time as it plays an
important role in a cost benefit analysis and relativity towards price, total travel time as
well as service benefits.
The paper evaluates travellers’ individual choices. Additionally it obtains detailed
information about their characteristics, preferences and attitudes towards airport as
well as air-carrier services. Development and interpretation of passengers’ choices
among a representative selection of connecting airports rests on the foundation of a
large number of empirical surveys in this field including an enormous amount of
literature.
Finally, a forecast determines Dubai’s role in the international aviation industry with
references to market, commercial, infrastructure and technical driven changes. It
reveals if Dubai can attract enough passengers and participate in the booming
European-Asian air traffic.
18 for Prime Hub classification see The Boston Consulting Group (2004), p.20

7
2. Basic Terms and Definitions
Airlines deal with various sever problems in daily business life. “They provide network
services that are non-durable (in the sense that once a flight leaves, it has been
‘consumed’). For any flight there is a finite capacity involving the carriage of variety of
different clients,... but also various classes of passenger.
These different classes extend beyond explicit divisions into such categories as
‘business class’ and ‘coach19’ and embody differences in time preferences, fares and
ticket flexibility that characterize the vast diversity of users of air transportation. Airlines
provide an intermediate product ... and air transportation imposes externalities on third
parties ... .
There are also various forms of economy associated with scale of services provided,
the length of time an operator has served a market and the structure the network
adopted. To support airline operations a large and technologically sophisticated
infrastructure is required.”20
2.1. Airport
”The general definition for airports in legislation refers to any area of land or water used
or intended to be used for the landing or taking off of aircraft and includes, ..., special
types of facilities like seaplane bases, heliports and those facilities to accommodate tilt
rotor aircraft. An airport includes an appurtenant area used or intended to be used for
airport buildings and facilities, as well as rights of way together with those buildings,
facilities.” 21
The arrangement of airports varies: either according to legal criterion, technical
criterion or to the function. 22
“The statue further defines airports by categories that include commercial service,
primary, cargo service, reliever and general aviation airports.” 23
19 US airlines also refer ‘coach’ class to ‘economy’ class 20 Button / Stough (2000), p.15f. 21 FAA (2004), in: http://www.faa.gov/apr/planning/stats/ 22 see Maurer (2003), p. 70 ff. 23 FAA (2004), in: http://www.faa.gov/apr/planning/stats/

8
Technical scales according to International Civil Aviation Organization (IACO) –
standard are dimensions of the runways (length: 900 m up to 2500 m and over;
minimum width: 30 m up to 60 m) as well as load-carrying-capacity per wheel of the
aircraft (six different classes exist: 7000 kgs up to 45000 kgs). Additionally we
distinguish airports according to the Instrumental Landing System (ILS) equiped for the
operating approach: Cat. I , II or III.24
2.2. Hub
2.2.1. General Definition of a Hub
A hub in the aviation business is characterised, as “a special net-design, within the
traffic between two points is not directly linked, but via a central point called hub.” 25 It
accumulates and distributes passengers from and to outlying points 26 ; or – in other
words – carriers feed services into small number of major airports and distribute them
to their final destinations.27
According to the Association of European Airlines, a hub is “a single airport at which
one or several airlines offer an integrated network of connecting services to a wide
range of destinations at a high frequency” 28 or the airport functions "as a central
transfer point of an airline.” 29
“Hubs are airports that have a large preponderance of flights operated as part of an
essentially radial network by one carrier. In a few rare cases there is a general
recognition that a hub has two main carriers but this only applies to a few major
airports.” 30 (i.e.: Chicago O’Hare: American Airlines, United Airlines; Tokyo – Narita:
ANA All Nippon Airlines, JAL Japan Airlines, United Airlines, Northwest Airlines;
London – Heathrow: British Airways, Virgin Atlantic, British Midland).
24 see Maurer (2003), p. 71 ; Pompl (2002), p. 165 25 Mayer (2000), p. 6 26 see Stephen Holloway (2003), p.449 27 see Button / Haynes / Stough (1998), p. 20 28 AEA (1995), p.23 29 Austrian Airlines (1998), p.110 30 Button / Stough (2000), p.233

9
With reference to Button & Stough, "academic studies have thought a hub to entail
carriers feeding three or more banks of traffic daily through an airport from some 4 or
more cities.” 31
“In particular, the following features typify the hub city when compared to urban areas
with airports offering other forms of air transport services:” 32
• More frequent flights
• More direct flights
• More opportunities for same day return flights
• Greater likelihood of international flights
• Services geared to local market needs (e.g., serving destinations attractive to
residents) ...
...
• At the same time, residents of hub cities have the same opportunities of
linking to other major hubs as do those living in non-hubs
Historically seen the hub and spoke system “has often been less a consequence of
market forces and more the result of institutional arrangements”33 created by relaxation
of regulations within the EU area. “The concept of hubbing was first developed in the
1970s by Federal Express” 34 . Financial crises in the early 1980s led to industry
consolidation and the creation of the hub and spoke system 35 “for both costs and
revenue reasons” 36. “While this may entail passengers taking longer over any trip than
would be the case with direct flights, it generally means that users have a much wider
selection of services to choose from. The airlines can also offer lower average fares
because of the economics of scale, scope and density that they can reap.” 37
31 Button / Stough (2000), p.232 32 Button / Stough (2000), p.238 33 Button / Haynes / Stough (1998), p. 21 34 Doganis (2002), p.254 35 see Rhoades / Waguespack (2000), p.88 36 Button / Stough (2000), p.233 37 Button / Stough (2000), p.232

10
2.2.2. Types of Hubs
There are different perspectives found in the literature when talking about the several
types of hubs. One fact, however, applies to all theories: “The importance of hubs
ranges from small regional hubs up to large continental mega hubs. ... The design of
the hub varies a lot according to the function of the whole network.” 38
2.2.2.1. Joop Krul
Joop Krul distinguishes between: 39
● Prime hub
● Secondary hub
● Feeder airport
● Origin&Destination O&D airport
2.2.2.2. The Boston Consulting Group
A recent study by The Boston Consulting Group describes similar forms of hubs: 40
● Primary international hubs
● Secondary hubs
● International “Origin and Destination” (O&D) airports
● Regional airports
The authors of this study also introduce the term “mega hub”. An airport has to meet
certain criteria in order to become such a mega hub. It must be home to a leading
along with financial secure carrier.
This airline has to be a major player in its respective alliance. A central location
together with a large, affluent catchment area is mandatory. The airport’s focus has to
be on the dominant member of the alliance, providing outstanding service and
innovative products in order to remain vital.
38 Fauska (2003), p.11 39 see Krul (2004), p. 19 40 see The Boston Consulting Group (2004), p.4

11
Forms of
hubs
Key characteristics Airline Example No. of
airports
International
hubs
High share of transit
traffic
Large catchment area
PAX in excess of 40M
Main hub of major
international airline
Leadership role in
alliance
Atlanta
ATL
PAX: 79M
18
International
O&Ds
Lower share of transfer
traffic
Large catchment area
PAX in excess of 20M
Main hub of
international long-
distance airline or
secondary hub of
major airline
Subordinate or niche
player in alliance
Sydney
SYD
PAX: 22M
32
Secondary
hubs and
O&Ds
Low share of transfer
traffic
Sizeable catchment
area but often
overlapping
PAX around 10M
Main hub of regional
airline or secondary
hub of major airline
Subordinate role in
alliance
Vienna VIE
PAX: 12M
~150
Regionals No transfer traffic
Smaller or remote
catchment areas
PAX below 10M
Regional airlines
Low Cost Carrier
LCC
Albany
ALB
PAX: 1.5M
~2400
PAX...Passenger(s) M...Million O&D...Origin and Destination
Table 1: Forms of hubs 41
41 The Boston Consulting Group (2004), p. 4
12
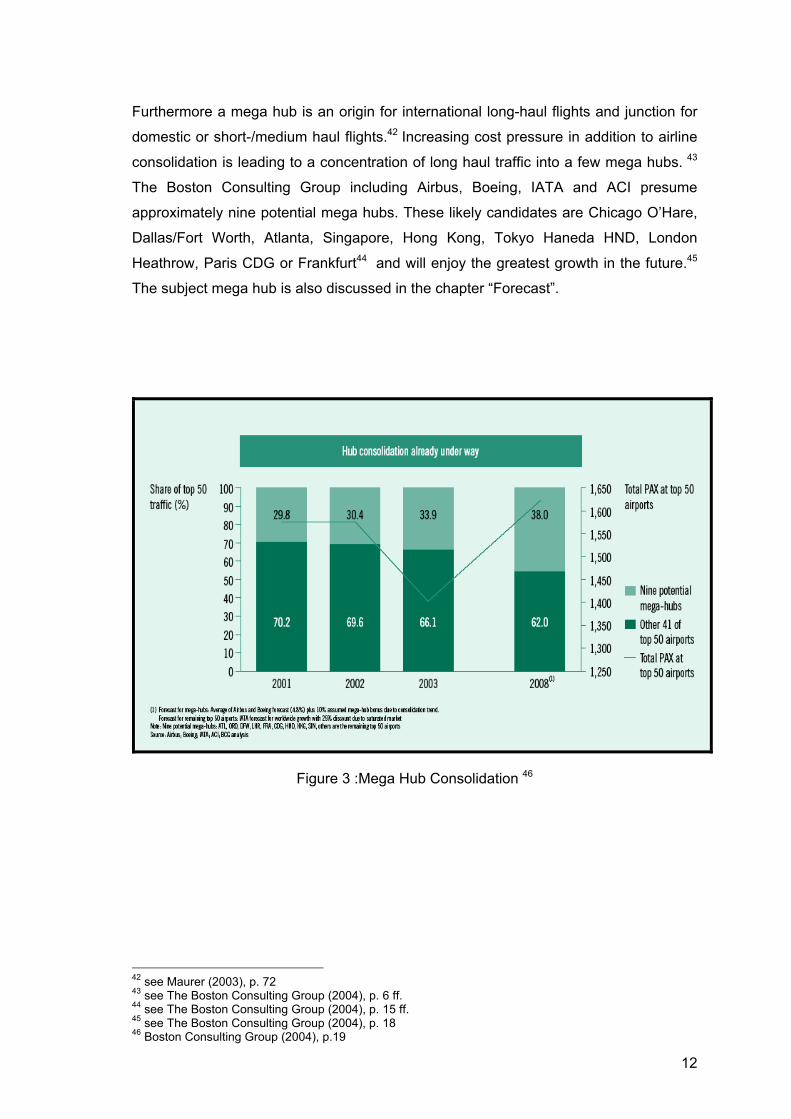
Furthermore a mega hub is an origin for international long-haul flights and junction for
domestic or short-/medium haul flights.42 Increasing cost pressure in addition to airline
consolidation is leading to a concentration of long haul traffic into a few mega hubs. 43
The Boston Consulting Group including Airbus, Boeing, IATA and ACI presume
approximately nine potential mega hubs. These likely candidates are Chicago O’Hare,
Dallas/Fort Worth, Atlanta, Singapore, Hong Kong, Tokyo Haneda HND, London
Heathrow, Paris CDG or Frankfurt44 and will enjoy the greatest growth in the future.45
The subject mega hub is also discussed in the chapter “Forecast”.
Figure 3 :Mega Hub Consolidation 46
42 see Maurer (2003), p. 72 43 see The Boston Consulting Group (2004), p. 6 ff. 44 see The Boston Consulting Group (2004), p. 15 ff. 45 see The Boston Consulting Group (2004), p. 18 46 Boston Consulting Group (2004), p.19

13
2.2.2.3. Rüdiger Sterzenbach, Roland Conrady and Walter Fauska
All three authors have equal definitions of hubs: 47
a) Regional hub : The regional hub is a link between long haul and regional
destinations. Airlines use smaller aircraft for feeding long distance flights, which is the
main criterion for this kind of hub.
b) Secondary hub : The secondary hub should assist associated long haul hubs, like
a branch without competition. Distance between main and secondary hub is not big.
Examples would be Lufthansa’s Frankfurt and Munich hubs 48 or All Nippon Airways’
(ANA) Tokyo Narita and Osaka Kansai hubs.
c) Hourglass hub : An hourglass hub bundles flights from one direction (north) to
another direction (south).
d) Fortress hub : Domination of an airport (in terms of slots, etc.) and missing
possibilities for capacity enlargements characterize a fortress hub.
e) Double hubbing : “A double hub is the case if an airline runs two different hubs with
two networks. These two hubs are linked with each other.” 49
h) Direction hub : When a direct flight connects two airports, the expression direction
hub is used. “The concept of a direction hub replaces this direct connection with
additional inter hubs. These inter hubs have just two spokes directed to the main hubs.
The inter- or direction hubs do not offer connections to any other directions.” 50
g) Mega hub : “The mega hub presents the highest form of competition between
different airlines. An airport is called a mega hub if many different airlines have
established an own hub there.” 51 Examples are present on every continent, i.e.: Tokyo-
Narita, London-Heathrow, Frankfurt, Chicago O’Hare, etc.
47 see Sterzenbach / Conrady (2003), p. 118 f. ; Fauska (2003), p. 12ff. 48 see Pompl (1998), p. 337 49 Fauska (2003), p. 16 50 Fauska (2003), p.19 51 Fauska (2003), p.18

14
f) Multiple hubbing : We can talk about a multiple hub system, in case an airline runs
several hubs (more than two). A direct service links all hubs. United Airlines serves the
US-market via Chicago, Washington D.C., San Francisco, Los Angeles and Denver.
“International alliances have led to de facto multi-hub services with a carrier in, say,
Europe basing its operations around a hub but linking its services with those of a US
airline that has its own domestic hub-and-spoke network.” 52 (i.e. British Airways and
American Airlines link One World's home bases London and Chicago so good, that
both carriers are able to adjust their operations and offer smoothest connections).
Furthermore SAS has a multinational multiple hub system. The Scandinavian airline
from Denmark, Norwegian and Sweden has Copenhagen, Oslo and Stockholm as its
hubs, serving 3 continents.
Former Qualiflyer Group 53 introduced a “small hub” idea in the late nineties. Instead of
one -or a few- large transit airport(s), which consequently leads into long connecting-
and waiting times, the Qualiflyer Group offered an eleven-hubs system in Europe with
small airports, respective short distance between the gates, clear number of transit-
passengers etc. These eleven airports (Brussels, Euro Airport Basel-Mulhouse-
Freiburg, Istanbul, Lisbon, Milan-Malpensa, Montpellier, Nice, Paris-Orly, Salzburg,
Vienna and Zurich) linked 200 cities within Europe. Alliance focus was mainly on
Europe.54
i) Rolling hub : Rolling hubs do not have any harmonized connecting flights.
Compared to a “normal” hub, if lacks of flights coordination.
2.2.2.4. Kenneth Button, Kingsley Haynes, Roger Stough
Button, Haynes and Stough delineate hub-and-spoke structures: 55
• linear networks simply link separate airports and there is no dominant focus
• simple hubs involve various `spoke’ services operating independently from
each other
52 Button / Stough (2000), p.56 53 Qualiflyer Group Airlines at that time: Swissair, Austrian Airlines, Sabena, TAP Air Portugal, Turkish Airlines, AOM French Airlines, Crossair, Lauda Air, Tyrolean Airlines, Air Littoral and Air Europe 54 see The Qualiflyer Group (1999), p.1 55 see Button / Haynes / Stough (1998), p. 20

15
• complex hubs involve flights connecting with arrivals and departures
scheduled within a short period
• directional hubs from an hour-glass pattern with, for example, flights from the
east coordinating with those to the west but with limited coordination with
either south or north traffic
• multiple hubs exist when the operations of an airline through several hubs are
coordinated; often this may involve combining directional hub activities
especially when there are long-haul operations involved.
2.2.2.5. Wilhelm Pompl
Wilhelm Pompl distinguishes between the following forms of hubs: 56
• Hourglass hub
• Regional hub
• Muli-hubbing
• Secondary hub
• Mega hub
2.2.3. Focus City
For the seek of completeness the term Focus City has to be discussed too. As
investments for new hubs needs the appropriate city location, but also a huge amount
of money, airlines tend to build “Focus Cities” instead. Trans World Airlines (TWA)
introduced San Juan, Puerto Rico as its Focus City in the Caribbean. The airline
offered non-stop services to Aruba, Boston, Fort Lauderdale, Los Angeles, New York,
Orlando, St. Louis and Santo Domingo. 57
Along with the success of San Juan, TWA had “announced Los Angeles as its second
focus city, ... . TWA defines a focus city a major base for operations without the cost or
commitment of a hub.” 58
56 see Pompl (1998), p.337 57 see Trans World Airlines (1999), p.7 58 World Airline News (2000), in: www.findarticles.com/p/articles/mi_m0ZCK/is_29_10/ai_63644639

16
Some airlines even downsized former hub operations to focus cities due to economical
reasons: In May 2004, US Airways demoted Pittsburgh from a hub to a focus city.
This meant a cut to 240 daily flights to 65 cities, compared with 373 daily flights to 102
cities before the change.59
Consequently, a focus city is an airport, “where airlines have a big enough
concentration of revenue to create stand-alone flight schedules.” 60 “The focus cities
are like very small hubs that allow ... to diversify ... route structure.” 61
3. Accessibility Theories and Methods
3.1. Accessibility Theories and Studies of Various Authors
The term “accessibility” has many different forms of definition in basic literature:
Basically, accessibility is the ability to get in contact with a person or a thing. 62 It
defines the ability to reach a destination of choice (spatial).63 Statically accessibility is a
state of attachment. The number of physical links determines the level of accessibility64
Therefore, we can consider accessibility as some kind of symmetric model, 65 which
means: the way London is linked with Paris is also valid for the contrary!
“Spatial mobility indicates at the same time the propensity and the facility of a person to
move and the realisation of this propensity in the form of the movement; a movement
being understood as an act aiming at cancelling the distance separating two places
within the framework of a given activity ... Access and accessibility are the two sides of
the same medal: access expresses a request – derived from the request for transport –
while accessibility expresses the supply’s level of the system of the transport (or
communication), which allows the realisation of a need for common life.” 66
59 see Fitzpatrick (2004), in: www.post-gazette.com/pg/pp/04203/349437.stm ; Fitzpatrick/Belko (2004), in: www.post-gazette.com/pg/pp/04127/311838.stm 60 Woodyard (2004), in: www.usatoday.com/travel/news/2004-07-26-direct-flights-2_x.htm 61 St. Louis Commerce Magazine (1999), in: www.stlcommercemagazine.com/archives/december1999/profile.htm 62 see Harris (2001), in: http://www.bts.gov/publications/jts/v4n23/index.html 63 see FHWA (n.av.), in: http://www.fhwa.dot.gov/planning/toolbox/accessibility_overview.htm 64 see Baradaran / Ramjerdi (2001), in: http://www.bts.gov/publications/jts/v4n23/index.html 65 see Harris (2001), in http://www.bts.gov/publications/jts/v4n23/index.html 66 Swiss National Science Foundation (2004)

17
Figure 4: Process of Modal Choice from the Individual’s Point of View 67
Accessibility certainly influences both progress of population and improvements on
traffic-infrastructure. They, however, have an impact – dependent on investments in
infrastructure - on the progress of accessibility and vice versa.
Figure 5: Progress of Accessibility 68
67 Swiss National Science Foundation (2004), p.2 68 Gätzi (2004), p.2 ; Keller (2002), p.3
Investments in infrastructure
Improvements Traffic-infrastructure
Progress Population
Progress Accessibility
Evaluation and
process of decision
Qualities asked on the
system of transportation
Inquiries about the system of
transportation
System of transportation
Qualities of modes and
Disponibility of modes and
Personal values
Experiences
Social references
Movement needs
Opportunities
Postponement of movement
Modal choice
Act of movementOutcomes
Short term
Long term
ACCESSIBILITY
ACCESS

18
Geopolitically, accessibility is defined by direct or indirect, temporary or constant
admission to the traffic system. 69
3.1.1. R.J. Johnston 70
R.J.Johnston describes accessibility “as the ability to move to particular destinations” 71
Accessibility is “the relative opportunity of interaction and contact. In human geography,
accessibility has usually been treated in purely geometric terms.
Location analysis uses Graph Theory to identify patterns of differential accessibility
through a two-stage reduction of contact networks:
a) they are transformed into simple graphs, from which a series of topological indices
can be derived and
b) these graphs are then reexpressed as connectivity matrices whose successive
power expansions bring out higher-order network structures.” 72
3.1.2. Brian S. Hoyle and Richard D. Knowles 73
The basic components of accessibility are people and facility (or activity)! people link facility/activity
Figure 6: Components of Accessibility 74
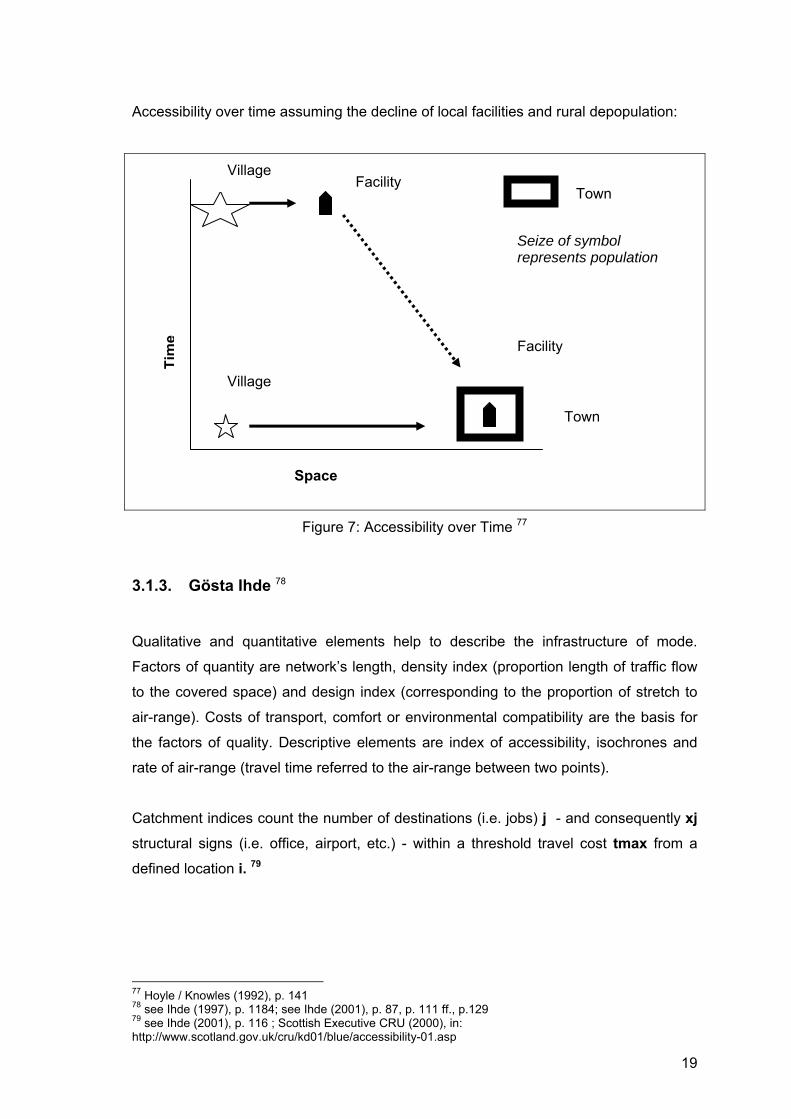
“Resident in location A seeks access to location B in order to acquire goods or services
… transport is needed to overcome the distance barrier that separates them” 75 “… the
numbers and relative location of local facilities constrain the length, cost and choice of
possible journeys … qualified by its frequency, timing and fare level.” 76
69 see Maier / Atzkern (1992), p.179 70 see Johnston (1999) 71 Johnston (1999), p. 499 72 Johnston (1999), p. 2 73 see Hoyle / Knowles (1992), p. 137 ff. 74 Compiled by the author 75 Hoyle / Knowles (1992), p. 137 76 Hoyle / Knowles (1992), p. 140
19
Accessibility over time assuming the decline of local facilities and rural depopulation:
Figure 7: Accessibility over Time 77
3.1.3. Gösta Ihde 78
Qualitative and quantitative elements help to describe the infrastructure of mode.
Factors of quantity are network’s length, density index (proportion length of traffic flow
to the covered space) and design index (corresponding to the proportion of stretch to
air-range). Costs of transport, comfort or environmental compatibility are the basis for
the factors of quality. Descriptive elements are index of accessibility, isochrones and
rate of air-range (travel time referred to the air-range between two points).
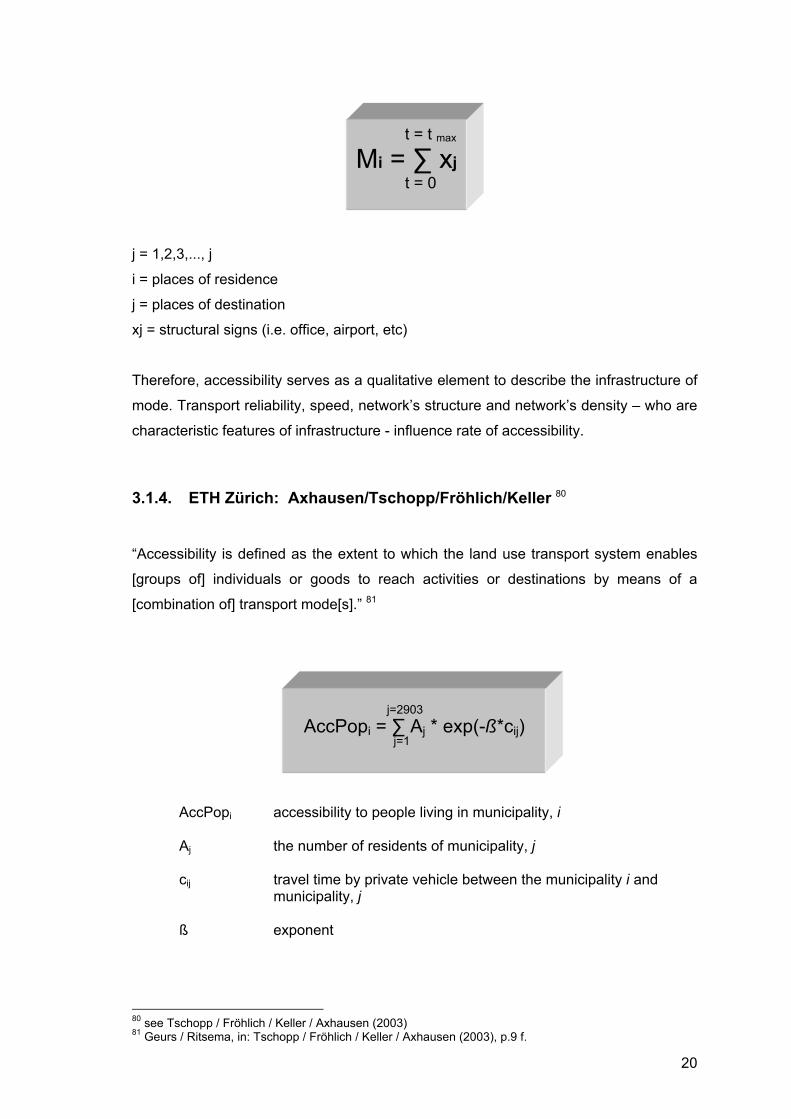
Catchment indices count the number of destinations (i.e. jobs) j - and consequently xj structural signs (i.e. office, airport, etc.) - within a threshold travel cost tmax from a
defined location i. 79
77 Hoyle / Knowles (1992), p. 141 78 see Ihde (1997), p. 1184; see Ihde (2001), p. 87, p. 111 ff., p.129 79 see Ihde (2001), p. 116 ; Scottish Executive CRU (2000), in: http://www.scotland.gov.uk/cru/kd01/blue/accessibility-01.asp
Village
Village
Facility
Facility
Town
Town
Space
Tim
e
Seize of symbol represents population
20
j = 1,2,3,..., j
i = places of residence
j = places of destination
xj = structural signs (i.e. office, airport, etc)
Therefore, accessibility serves as a qualitative element to describe the infrastructure of
mode. Transport reliability, speed, network’s structure and network’s density – who are
characteristic features of infrastructure - influence rate of accessibility.
3.1.4. ETH Zürich: Axhausen/Tschopp/Fröhlich/Keller 80
“Accessibility is defined as the extent to which the land use transport system enables
[groups of] individuals or goods to reach activities or destinations by means of a
[combination of] transport mode[s].” 81
AccPopi accessibility to people living in municipality, i
Aj the number of residents of municipality, j
cij travel time by private vehicle between the municipality i and municipality, j
ß exponent
80 see Tschopp / Fröhlich / Keller / Axhausen (2003) 81 Geurs / Ritsema, in: Tschopp / Fröhlich / Keller / Axhausen (2003), p.9 f.
t = t max
Mi = ∑ xj t = 0
j=2903 AccPopi = ∑ Aj * exp(-ß*cij)
j=1

21
The reasons why accessibility is desirable are: 82
● Wide selection of opportunities (better adjustment of demand and supply)
● More opportunities to reach additional customers / to set activities
● Improve financial strength for network development
Accessibility can either be measured from one source to one destination or from one
source to all/several destinations: 83
From one source to one destination:
● Connection (with a certain level of quality available)
● Travel time below a certain/fixed marginal value
● Generalized costs below a certain/fixed marginal value
From one source to all/several destinations:
● Number of cities that can be reached according above-mentioned criterion
● Sum of opportunities that can be reached according above-mentioned criterion
● Sum of weighted opportunities (potential)84 :
Ai Accessibility from a destination i X j Opportunities for interaction/activity
k ij exponentially weighted generalized cost of travel
i Location of origin i
j Destination j
82 see Axhausen (2004), p.11 83 see Axhausen / Fröhlich (2004), p.4 84 for additional information and explanation please also refer to the chapter Accessibility in Civil Aviation
k ij < k max Ai = ln ∑ X j ƒ (k ij)
k ij = 0

22
The potential-theorem presumes that each attraction of X j exudes a certain utility.
Utility, however, is weighted by k ij and decreases if travel costs grow. The total
attractiveness of location i is the sum of all partial attractions ( X j ƒ (k ij) ). 85
Another frequently used approach is the isochronic-theorem: It counts the number of
activities that can be reached within a certain travel time from a specific location.86
Logic of Accessibility
Traffic-system Supply Demand Low utility costs Larger markets Superior selection
Higher traffic performance Specialization & higher wages Better quality Superior capacity Productivity growth Lower prices/fares
Additional funds for preservation/extension
Table 2: Logic of Accessibility 87
With reference to M.E. O’Kelley and M.W. Horner (2001) ETH Zürich studies
introduced a sub from of accessibility, called “accessibility per person (ApP)” 88, which
is the quotient of: zone i ‘s accessibility and zone i ‘s population. 89
3.1.5. Siamak Baradaran and Farideh Ramjerdi 90
Although there is no universal acknowledged definition of accessibility, measures are
classified by travel-costs, gravity, constraints-based, utility and composite approaches.
Basically, the location needs notes connected or not. “The extent of accessibility can
also be calculated as the number of different links and modes to which the specific
location has access.” 91
85 see Gätzi (2004), p.20 f. 86 see Gätzi (2004), p. 3 87 see Axhausen / Fröhlich (2004), p.6 88 translated from the original term: Erreichbarkeit pro Person (EpP) 89 see Gätzi (2004), p.21 90 see Baradaran / Ramjerdi (2001) , in: http://www.bts.gov/publications/jts/v4n23/index.html 91 Baradaran / Ramjerdi (2001) , in: http://www.bts.gov/publications/jts/v4n23/index.html
∑ A i
ApP i = --------------
∑ P i

23
Accessibility indicators describe characteristics of the physical infrastructure
(i.e.: accessibility to certain links, the network or modes). Objective – or process –
indicators reveal the level of service of the infrastructure network from the supplier’s
perspective. Comprehension of differences between accessibility indicators
necessitates classification:
● travel-costs approach
● gravity or opportunities approach
● constraints-based approach
● utility-based surplus approach
● composite approach
Travel distance, travel time and generalized travel costs help to measure the degree of
spatial separation between locations. Generalized travel costs include costs of vehicle
use, fares, taxes, etc. Travel time does also include waiting-, transfer- and auxiliary
times in addition to in vehicle time and fares. The perception of utility derived from
waiting time is not equal to the in-vehicle time.92
3.1.6. Britton Harris 93
The noun access is the habit or power of getting near or into contact with somebody or
something according to the Oxford English Dictionary.
“Generally access is symmetrical: if A has access to B, then B has access to A. Its
measurement, however, may be asymmetrical.
Accessibility is a set of measures of varied form and content that makes it possible to
overcome local myopia. As a quality of places, it varies from place to place
independent of any local conditions except connections with the rest of the region.
Thus, accessibility’s fundamental source is the distribution of properly specified
activities over the region, but it also depends on the costs of the means of interaction
between places, ..., and on the separation from the place of measurement from the
target activity to be accessed.
92 see Baradaran / Ramjerdi (2001) , in: http://www.bts.gov/publications/jts/v4n23/index.html 93 see Harris (2001), in http://www.bts.gov/publications/jts/v4n23/index.html

24
First, we select a target being viewed as it is distributed over all locations in the region.
Second, we identify those variations in costs of access between the viewing point and
other locations that will influence choices. Third, we decide how a view will evaluate
these costs as diminishing the importance of less accessible targets.
Valid measurements of separation include airline distance, route distances, travel time,
costs, lack of safety or convenience, amenity and weighted combinations of these.
These measurements may vary by mode and time of day, and according to personal
choice procedures for routes.” 94
3.1.7. Piet Rietveld and Frank Bruinsma 95
Rietveld and Bruinsma describe accessibility as the potential of opportunities for
interaction. Accessibility is precise per type of user and per trip purpose, so aspects
have to be profoundly defined. Both authors give to understand, that it becomes a trip
purpose specific.96 In order to measure accessibility, information like the location of
nodes, the length of links or data on transport costs such as travel time, fares, et al are
mandatory. Some types of definition require additional material (i.e. data on spatial
interaction patterns, parameters of models describing these spatial interactions).97
Rietveld and Bruinsma list a number of possible operationalizations, as a large number
of surveys exist. This table gives a detailed overview about the different definitions.98
94 Harris (2001), in http://www.bts.gov/publications/jts/v4n23/index.html 95 see Rietveld / Bruinsma (1998), p.33 ff. 96 see Rietveld / Bruinsma (1998), p.33 97 see Rietveld / Bruinsma (1998), p.36 98 see Rietveld / Bruinsma (1998), p.34 f.

25
Definition Assumptions/ Remarks
Example
Acc1 A node has access to a
network if a link exists
between the node and
the network
Accessibility actually
means access or
connectivity;
accessibility is a binary
variable: 1 or 0
The city of Bonn is
connected to the
German autobahn
network
Acc2 The accessibility of a
node with respect to a
network is the distance
one has to travel to the
nearest node on the
network
If accessibility defined
as according to acc1
equals 1, acc2 attains
its most favourable
outcome (acc1=1
implies acc2=0)
The distance of village A
to the nearest point of
entry of the national
expressway system is
16km. The distance from
Gent to Brussels airport
is 60 km
Acc3 The accessibility of a
node in a network is the
total number of direct
connections with other
nodes
From Rotterdam airport
one can fly to 12
destinations without
changing planes
Acc4 The accessibility of a
node in a network is the
total number of links
connected to this node
From Hanover the
railway lines extend in
four directions
Acc5 The accessibility of a
node to another node is
measured as the travel
cost between these
nodes
This definition
considers accessibility
in a strictly bilateral way
without summation
across destinations
It takes 2,5 hours to fly
from London to Lisbon;
the costs of a round-trip
are USD 460
Acc6 The accessibility of a
node in a network is the
weighted average
travel cost between the
particular node and all
nodes in the network
Weights may relate to
the masses of the
nodes, or to the total
number of trips made to
the nodes
The average distance
from Vienna to all major
cities in Europe weighted
by population size is 880
km; when weighted by
the shares in the total
number of trips it is
350 km

26
Acc7 The accessibility of a
node in a network is the
expected value of the
maximum utility of a
visit to any node
Utility of a visit to a
certain node is
assumed to depend on:
-the mass of the node
-the travel costs of a
trip to the node
-a stochastic term
The accessibility of Milan
for road transport in
Europe is 56 compared
with Frankfurt 100
(index)
Acc8 The accessibility of a
node in a network is
(proportional to) the
spatial interaction
between the node and
all other nodes
The spatial interaction
between nodes may be
directly measured or
computed by means of
a spatial interaction
model
See acc7
Acc9 The accessibility of a
node in a network is the
total number of people
one can reach from the
node within a certain
transport cost limit
The transport costs limit
can be formulated in
any dimension:
distance, travel time,
etc.
From Copenhagen one
can reach 80 million
people within a time
interval of 4 hours
Acc10 The accessibility of a
node is the inverse of
the balancing factor in
a singly or doubly
constrained spatial
interaction model
This interpretation has
been given by several
authors
See acc7
Acc11 Accessibility is
measured by means of
expert judgement
No formal definition is
given
The five European cities
with the best accessibility
are: A,B,C,D and E
Table 3: Alternative operationalizations of accessibility 99
99 Rietveld / Bruinsma (1998), p.34 f.

27
3.1.8. Scottish Executive CRU 100
The Scottish Executive CRU does not define accessibility. The paper draws attention
on measuring accessibility only and describes three generic, but overlapping types of
indicators:
Simple indicators are the number of opportunities within a given travel cost or –time;
measures of the travel cost, time, etc. are required to reach a given number of
opportunities. Opportunity measures are the sum of all available opportunities and
weighted by a measure of deterrence based upon how easily the opportunities can be
reached. Value measures define the attractiveness of the available opportunities to
represent their values as a transport choice.
In order to observe accessibility opportunity terms, we need to express deterrence
functions and the sizes of the zones. The type of opportunity depends upon
consideration of origins or destinations. Origin accessibility examines the opportunities
available to an individual or a business (opportunity term based upon the land use of
alternative destinations). Destination accessibility considers the catchments for a
destination (opportunity term based upon land uses and type of traveller at alternative
origins). Land-uses of interest include employment, education, health, social, shopping
and leisure. Types of travellers take account of mobility, employment status and age.
Factors as time, travel cost, distance or generalised cost/time measure deterrence
function and must include effects of different types of travel, the costs associated with
each as well as effects of time waiting for a vehicle.
In terms of the zoning system, strategic transport improvements will require a wide
geographical coverage, but a fairly coarse zoning system may be adequate! 101
100 see Scottish Executive CRU(2000) , in: http://www.scotland.gov.uk/cru/kd01/blue/accessibility-01.asp 101 see Scottish Executive CRU(2000), in: http://www.scotland.gov.uk/cru/kd01/blue/accessibility-01.asp

28
3.2. Accessibility Theories and Methods in the Civil Aviation Industry
In civil aviation, there is no specific or in other words, “no universally acknowledged
definition of accessibility” 102 found in books equal to the previous chapters. Travel
restrictions and number of - reachable - structural elements help to measure
accessibility. Resistance may be night closure for traffic at an airport or speed and
noise limits. Examples for structural elements are workplace, city or trading centre.
Time and cost-constraints are mandatory general set-ups.103 Indications are based
upon – simple - elements like price (travel cost), travel-time (including waiting time),
distance, cost of transport or frequencies 104 and specify the potential of possible
interaction.105
In terms of accessibility’s travel indicators, we have to consider that travel time
includes: 106
● Access time to departure airport (average of public transport and car access)
● Transfer time (change of traffic mode)
● Check-in time (destination- and airport specific)
● Flight time including connecting time
● Access time from arrival airport to central station destination
Accessibility measure in the aviation industry: 107
102 Baradaran / Ramjerdi (2001) , in: http://www.bts.gov/publications/jts/v4n23/index.html 103 see Ihde (1997), p.1184 ; Ihde (2001), p.115 104 see Marche / Papinutti (1993), p.289; Scottish Executive CRU(2000) , in: http://www.scotland.gov.uk/cru/kd01/blue/accessibility-01.asp; Martellato / Nijkamp / Reggiani (1998), p.165f 105 see Baradaran / Ramjerdi (2001), in: http://www.bts.gov/publications/jts/v4n23/index.html 106 see Axhausen / Bleisch (2003a), p.14 ; Axhausen / Bleisch (2003b), p.9 107 see Axhausen / Bleisch (2003a), p.8
k ij < k max Ai = ln ∑ X j ƒ (k ij)
k ij = 0
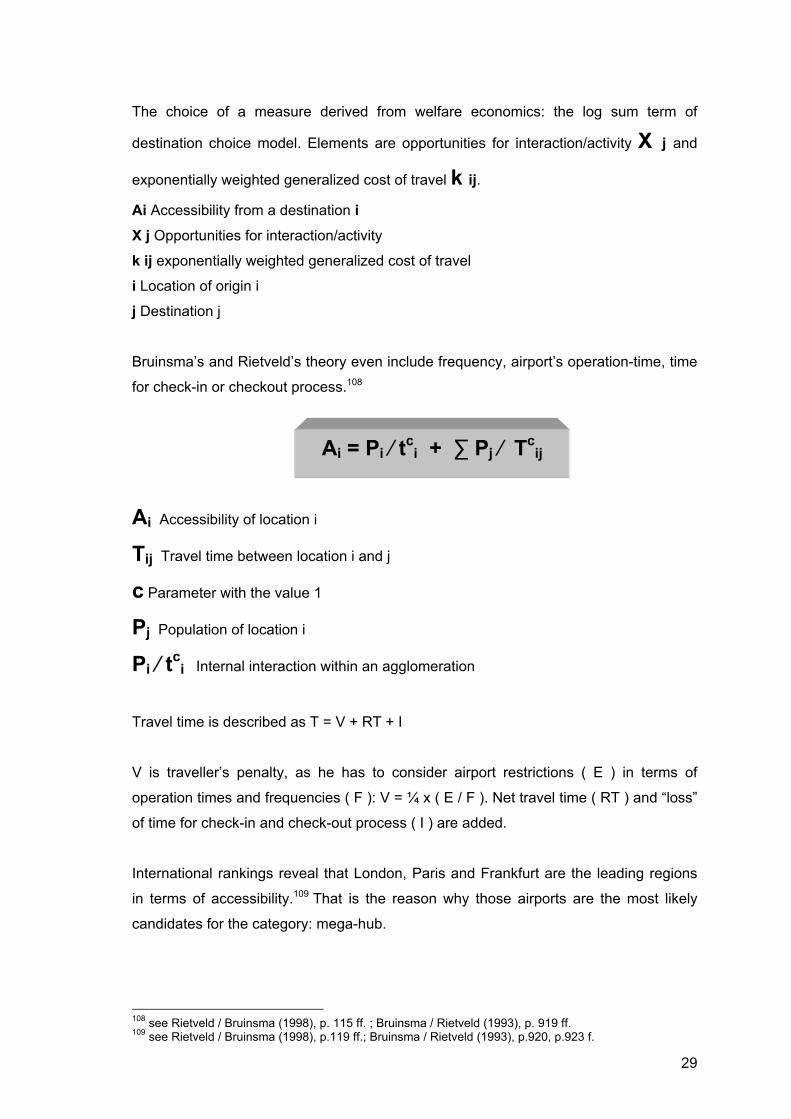
29
The choice of a measure derived from welfare economics: the log sum term of
destination choice model. Elements are opportunities for interaction/activity X j and
exponentially weighted generalized cost of travel k ij. Ai Accessibility from a destination i X j Opportunities for interaction/activity
k ij exponentially weighted generalized cost of travel
i Location of origin i
j Destination j
Bruinsma’s and Rietveld’s theory even include frequency, airport’s operation-time, time
for check-in or checkout process.108
Ai Accessibility of location i
Tij Travel time between location i and j
c Parameter with the value 1
Pj Population of location i
Pi ⁄ tci Internal interaction within an agglomeration
Travel time is described as T = V + RT + I
V is traveller’s penalty, as he has to consider airport restrictions ( E ) in terms of
operation times and frequencies ( F ): V = ¼ x ( E / F ). Net travel time ( RT ) and “loss”
of time for check-in and check-out process ( I ) are added.
International rankings reveal that London, Paris and Frankfurt are the leading regions
in terms of accessibility.109 That is the reason why those airports are the most likely
candidates for the category: mega-hub.
108 see Rietveld / Bruinsma (1998), p. 115 ff. ; Bruinsma / Rietveld (1993), p. 919 ff. 109 see Rietveld / Bruinsma (1998), p.119 ff.; Bruinsma / Rietveld (1993), p.920, p.923 f.
Ai = Pi ⁄ tci + ∑ Pj ⁄ Tc
ij

30
3.3. Accessiblity: Empirical Analysis of Hub-and-Spoke Systems110
“The quality (w) of a certain hub-airport ... is influenced by a lot of different quality
factors (f) ... and the weighting factor (g).” 111
Quality factors are:
Flight connections of the hub-airline FCH
(fixed and a positive indication, weighting ration: 0,2)
Connecting time CT
(fixed and a negative indication, weighting ration: 0,125)
Change of terminals CHT
(fixed and a negative indication, weighting ration: 0,05)
Number of total hub-destinations NTD
(fixed and a positive indication, weighting ration: 0,1)
Delayed flights of the hub-airline DFH
(variable and a negative indication, weighting ration: 0,25)
Length of the flight delay LD
(variable and a negative indication, weighting ration: 0,25)
All these factors finally result in the formular:
110 see Fauska (2003), p.35 ff. 111 Fauska (2003), p.35
→ →
w = ( f ) x ( g )
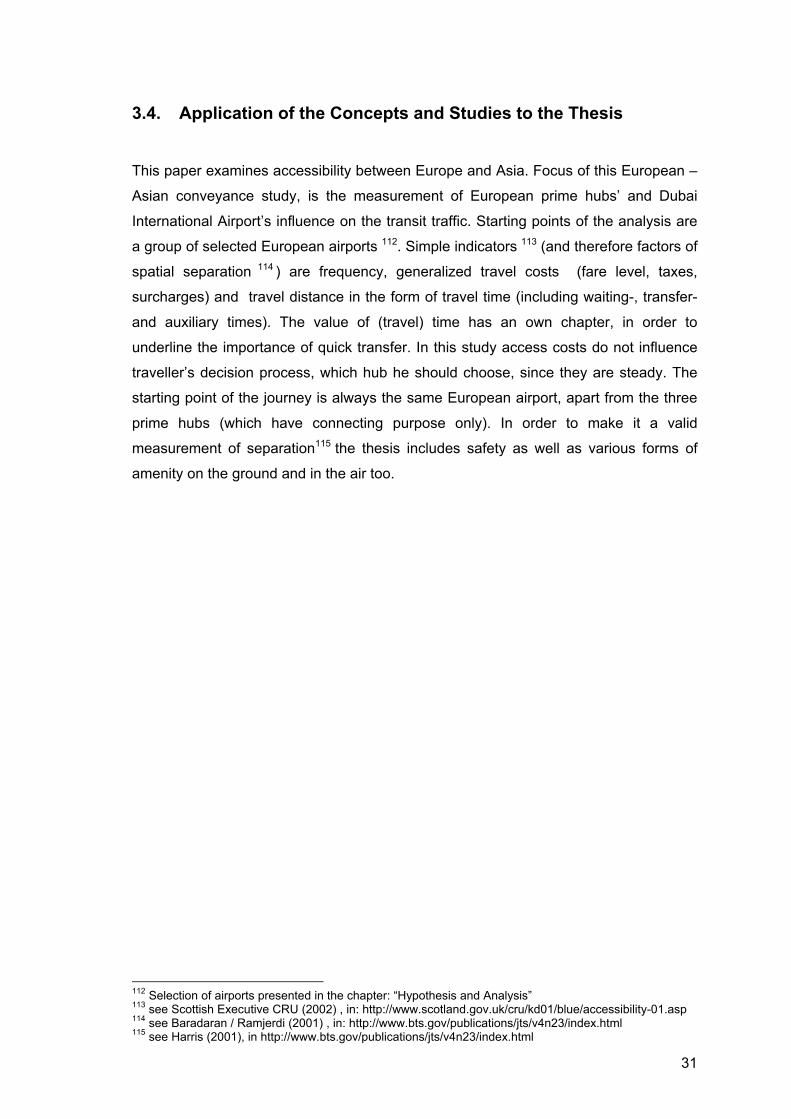
31
3.4. Application of the Concepts and Studies to the Thesis
This paper examines accessibility between Europe and Asia. Focus of this European –
Asian conveyance study, is the measurement of European prime hubs’ and Dubai
International Airport’s influence on the transit traffic. Starting points of the analysis are
a group of selected European airports 112. Simple indicators 113 (and therefore factors of
spatial separation 114 ) are frequency, generalized travel costs (fare level, taxes,
surcharges) and travel distance in the form of travel time (including waiting-, transfer-
and auxiliary times). The value of (travel) time has an own chapter, in order to
underline the importance of quick transfer. In this study access costs do not influence
traveller’s decision process, which hub he should choose, since they are steady. The
starting point of the journey is always the same European airport, apart from the three
prime hubs (which have connecting purpose only). In order to make it a valid
measurement of separation115 the thesis includes safety as well as various forms of
amenity on the ground and in the air too.
112 Selection of airports presented in the chapter: “Hypothesis and Analysis” 113 see Scottish Executive CRU (2002) , in: http://www.scotland.gov.uk/cru/kd01/blue/accessibility-01.asp 114 see Baradaran / Ramjerdi (2001) , in: http://www.bts.gov/publications/jts/v4n23/index.html 115 see Harris (2001), in http://www.bts.gov/publications/jts/v4n23/index.html

32
4. Studies and Concepts about the Comparison of Hubs
4.1. Characteristics of Hubs
“Since the enactment of the Airline Deregulation Act, the major US domestic carriers
have developed hub-and-spoke structures for their operations. These have been
instrumental in helping to reduce the overall costs of air travel to the US public and to
increase the travel options that are available. This hubbing effect also means that the
quantity and quality of air services varies quite considerably between cities in the
country.” 116
With the hubbing structure, “flights are funnelled in banks into a number of large hubs
where substantial numbers of passengers change aircraft to complete their journeys.
These banks involve the coordinated arrival of large number of flights in a short space
of time and then equally coordinated departure of flights within a narrow time window.
Larger hubs may well have up to seven or more such banks a day. Travel time would
be longer for many people but fares fell and the range of potential flight combinations
available to any particular destination expanded considerably.” 117 “Users have a much
wider selection of services to choose from.” 118
Airline mergers and strategic alliances created multiple hubs, especially in a very large
market as in the entire US or linked alliance markets (i.e. Europe and USA). 119 Main
competition “is generally between the alternative networks rather than over individual
links.” 120 An example is the Chicago – London (both are One World and Star Alliance
hubs) route: One World Alliance’s members American Airlines and British Airways
compete with Star Alliance’s United Airlines. The same competition applies for the New
York – London route. Additionally Delta Airlines (from New York JFK) and Continental
Airlines (from Newark EWR) offer alternative flights to London Gatwick LGW. Virgin
Atlantic – presently independent from any major alliance – serve London Heathrow
LHR, London Gatwick, New York JFK and Newark.
Once again, main competition is between alliances’ hubs. To understand the
importance of a hub, the London – New York route is a perfect illustration to show
116 Button / Stough (2000), p. 231 117 Button / Stough (2000), p.53 f. 118 Button / Stough (2000), p.232 119 see Button / Stough (2000), p.55 f. 120 Button / Stough (2000), p.57

33
effects of competition or mistakes to avoid, as seven airlines offer non-stop service and
it has always been some kind of “battle-route”.
Prices for Business Class Tickets are substantially more expensive (172% on average)
than on other routes. Airlines generate artificially high revenue on the Heathrow – US
route at the expense of fair competition, lower fares and customer choice. The
Bermuda II aviation agreement of 1977 limits operation between Heathrow and the US
to four carriers: American Airlines, United Airlines, British Airways and Virgin Atlantic.
This treaty grants them to decide frequencies and fare prices.121
This effect harmed a former global player: Trans World Airlines. Suffering financial
problems TWA sold its traffic rights between New York and London Heathrow to
American Airlines for US$ 445 million (price also included 2 additional routes) 122 and
had to move to London Gatwick instead. Consequentially they faced a sheer decline of
yields on this route (Revenues declined by US$ 1 Bill.). London Gatwick does not seem
to attract so many high yield passengers and has not so many connecting flights to
international destinations as London Heathrow offers. London Heathrow is the gateway
to Europe. After the airline has sold all of its U.S. routes to London (total amount for
sold rights to American Airlines and USAir 123 was US$ 700 million), international
business travellers’ options of flying TWA were severely limited. 124
According to a survey made at London’s airports in 1998/99 in order to find out
passengers’ reasons for choice of Heathrow airport, 19% chose London Heathrow
because of good connecting flights, whereas only 6,8% favoured London Gatwick.125
Travelling from the USA or Asia to any European city via London, would make London
Heathrow the preferred choice, in order to avoid long journeys between these two
airports 126. European connections out of Gatwick are limited to leisure destinations -
operated by charter or low cost airlines - and only selected business destinations, with
less frequencies than out of Heathrow.127
121 see BMI (2002), in: http://www.flybmi.com/bmi/engb/aboutbmi/presscentre/pressreleases.aspx?year2002&rid=121; Madslien (2001) , in: http://news.bbc.co.uk/1/hi/business/1143137.stm; Milligan (2002), in: http://news.bbc.co.uk/1/hi/business/2194751.stm; The United Kingdom Parliament (1998), in: http://www.publications.parliament.uk/pa/ld199798/ldselect/ldeucom/156/8060405.htm 122 see Hanlon (1999), p.109 123 now US Airways 124 see Jenkins (1999), in: http://www.planebusiness.com/perspective/p060899jenkins.html 125 see Graham (2003), p. 185 126 Minimum connecting time between London Heathrow and London Gatwick is 230 minutes, including a coach journey of at least 60 minutes 127 see BAA (2004), in: http://www.baa.co.uk/main/airports/gatwick/terminal_information_frame.html
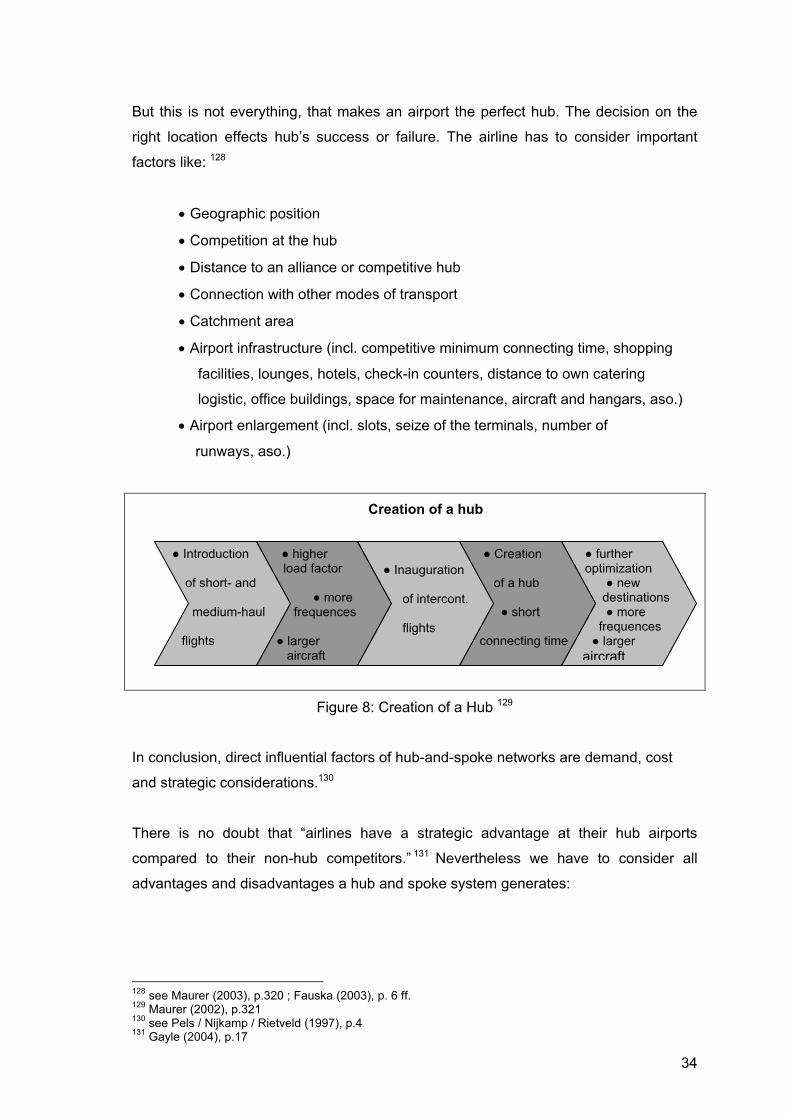
34
But this is not everything, that makes an airport the perfect hub. The decision on the
right location effects hub’s success or failure. The airline has to consider important
factors like: 128
• Geographic position
• Competition at the hub
• Distance to an alliance or competitive hub
• Connection with other modes of transport
• Catchment area
• Airport infrastructure (incl. competitive minimum connecting time, shopping
facilities, lounges, hotels, check-in counters, distance to own catering
logistic, office buildings, space for maintenance, aircraft and hangars, aso.)
• Airport enlargement (incl. slots, seize of the terminals, number of
runways, aso.)
Figure 8: Creation of a Hub 129
In conclusion, direct influential factors of hub-and-spoke networks are demand, cost
and strategic considerations.130
There is no doubt that “airlines have a strategic advantage at their hub airports
compared to their non-hub competitors.” 131 Nevertheless we have to consider all
advantages and disadvantages a hub and spoke system generates:
128 see Maurer (2003), p.320 ; Fauska (2003), p. 6 ff. 129 Maurer (2002), p.321 130 see Pels / Nijkamp / Rietveld (1997), p.4 131 Gayle (2004), p.17
● Introduction of short- and medium-haul flights
● higher load factor
● more frequences ● larger aircraft
● further optimization ● new destinations ● more frequences ● larger
aircraft
● Creation of a hub ● short connecting time
● Inauguration of intercont. flights
Creation of a hub

35
4.1.1. Advantages of the Hub-and-Spoke System
Hubs have a large number of positive effects on the airports themselve, on the home-
based airlines and also on their regions: 132
a) Economies of Scope
Economies of scope come from the ability to spread costs across the range of services
(ability to feed high volume of traffic through large terminal on banks of flights from a
variety of origins with passengers destined for a variety of other cities).133 “A better use
of aircraft and crew help to save costs. A carrier that offers a larger network of services
is more attractive to the traveller.” 134
b) Economies of Density
Economies of density result from high – most possible - utilization of infrastructure.135
“Early analysis indicated, for instance, that due to economies of density, a 1% rise in
the number of passengers an airline carried resulted in a 0.8% reduction in total costs,
although more recent analysis indicated savings could be greater.” 136 “Unit cost
declines when the airline adds flights or seats on existing routes. Higher route
frequency decreases travellers’ time costs: self-reinforcing demand, known as the
Mohring effect.” 137 Samples would be feeder- or connection code sharing.138
c) Economies of Scale
There is also the opportunity to enjoy cost savings from fleet standardization139 and
“lower unit costs can be obtained by large scale producers” 140 (sample: larger aircraft
with lower costs per passenger-tonne km 141 ). As each flight produces fixed and
variable cost per seat, cost per passenger decreases with aircraft seize.142
132 see Fauska (2003), p. 21 ff. ; Mayer (2000), p.27 ; Button / Stough (2000), p.231 ff. ; Pompl (1998), p. 337 ff. ; Hanlon (1999), p.133 ff., Sterzenbach / Conrady (2003), p. 283 f. 133 see Button / Stough (2000), p.233 134 Fridström (2003), p. 21 135 see Button / Stough (2000), p.233 136 Brückner / Spiller (1994), p. 379 f., in Button / Stough (2000), p.233 137 Fridström (2003), p. 22 138 see Pompl ( 2002), p.146 139 see Button / Stough (2000), p.233 140 Shaw (2004), p.77 141 Pompl (2002), p.146 142 see Brückner (2002), p.2

36
d) Loadfactor
Since the airline bundles all flights via a hub, it generates higher load factors within the
entire network. This results in profit improvement of the flights within the network.
Although smaller aircraft operate on low demand destinations only, they consolidate
additional passenger traffic, influence the network’s load factor and allow airlines to
capitalise on the economies of aircraft seize. 143
e) Network enlargement
Hub and spoke networks increase flight frequency and aircraft size, while stimulating
local traffic in and out of the hub. 144 “An important advantage in hub and spoke
networks, in which routes radiate from a central hub airport to a number of outlying
spoke airports, is the effect they have in multiplying by permutation the number of city
pairs an airline can serve. When airports are linked via a hub, the number of available
city pairs is much greater than when they are linked directly... .” 145
Number of
spokes
Maximum number of
connecting markets
Number of local
markets
Maximum number of city
pair markets
N n(n-1)/2 N n(n+1)/2
5 10 5 15
10 45 10 55
25 300 25 325
50 1225 50 1275
100 4950 100 5050
Table 4: Markets in a Hub and Spokes System 146
“If there are n spokes, an airline can provide through connecting services for up to a
theoretical maximum of n(n-1)/2 city pairs. When these are added to the n city pairs
to/from the hub itself, the total possible city pair markets is n(n+1)/2.” 147
143 see Fauska (2003), p.21 f. 144 see Brückner (2002), p.19 145 Hanlon (1999), p.84 146 Hanlon (1999), p.85 147 Hanlon (1999), p.85
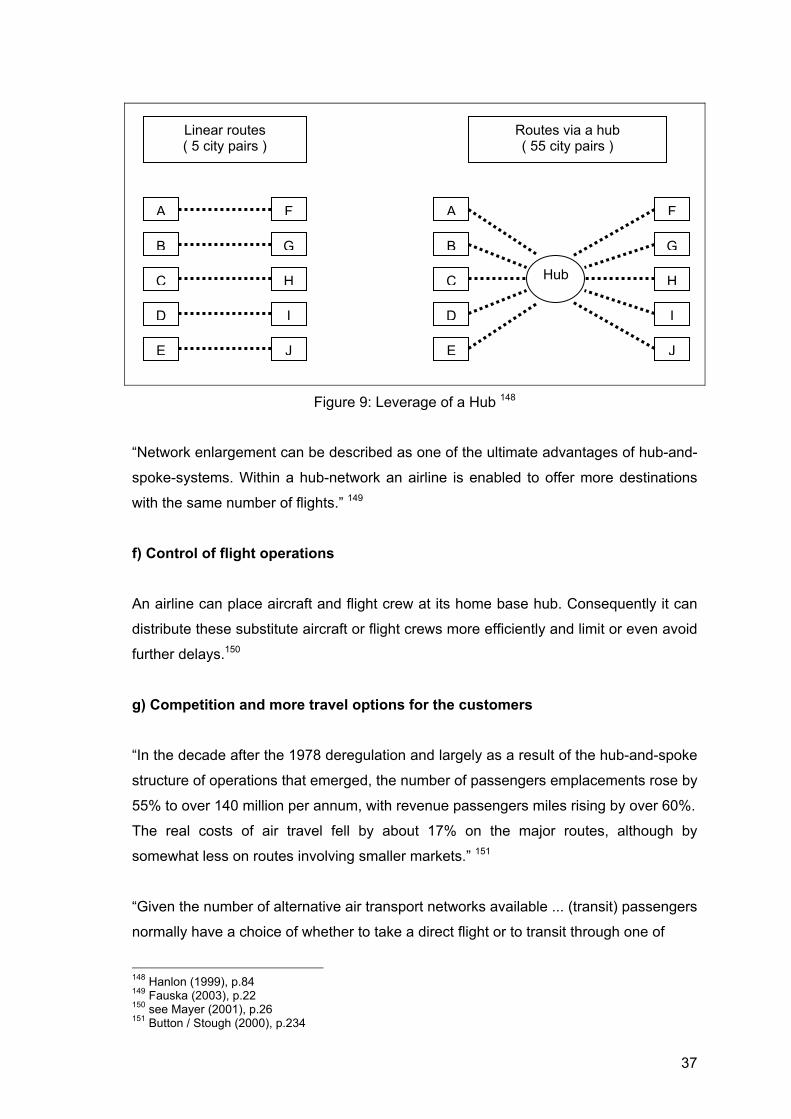
37
Figure 9: Leverage of a Hub 148
“Network enlargement can be described as one of the ultimate advantages of hub-and-
spoke-systems. Within a hub-network an airline is enabled to offer more destinations
with the same number of flights.” 149
f) Control of flight operations
An airline can place aircraft and flight crew at its home base hub. Consequently it can
distribute these substitute aircraft or flight crews more efficiently and limit or even avoid
further delays.150
g) Competition and more travel options for the customers
“In the decade after the 1978 deregulation and largely as a result of the hub-and-spoke
structure of operations that emerged, the number of passengers emplacements rose by
55% to over 140 million per annum, with revenue passengers miles rising by over 60%.
The real costs of air travel fell by about 17% on the major routes, although by
somewhat less on routes involving smaller markets.” 151
“Given the number of alternative air transport networks available ... (transit) passengers
normally have a choice of whether to take a direct flight or to transit through one of
148 Hanlon (1999), p.84 149 Fauska (2003), p.22 150 see Mayer (2001), p.26 151 Button / Stough (2000), p.234
A
B
C
D
F
E
G
H
I
J
Linear routes ( 5 city pairs )
Routes via a hub ( 55 city pairs )
Hub
A
J
I
H
G
F
E
D
C
B

38
several hubs. The fact that a hub is dominated by a single carrier does not constitute a
monopoly position because people can opt for alternative routings. The hubs effectively
compete with each other for” 152 transit traffic.
Established airlines control slots, gates and other ground service facilities at their home
hubs. A new competitor can hardly gain an economically necessary amount of slots.
For that reason the airline successfully avoids or at least hinders competition. 153
In times “when travel demand is low, when flights are expensive to operate and when
passengers place a high value on flight but are not excessively inconvenienced by the
extra travel time required for a connecting trip” 154 airlines do prefer hub and spoke
networks.
h) Environmental situation
“The concentration of flights on a certain hub location leads to less environmental
pollution because hubbing-system reduces the number of necessary flights.
Nevertheless the environment of a hub-location will have to face an increased pollution
of emissions and noise because of the concentration of air and ground traffic at this
specific airport.” 155
i) Market penetration
The use of small aircraft allows to operate economical flights to smaller cities or
destinations with lower demand.156 “The hubbing airline is able to go deeper into the
market and to attract new passengers.” 157
j) Fortress Effect
As soon as one airline dominates a hub, competitors can hardly hit it. In order to
establish new destinations and frequencies successfully, the competitive airline needs
152 Button /Stough (2000), p.238 f. 153 see Mayer (2000), p. 24 f. 154 Brückner (2002), p. 19 155 Fauska (2003), p. 24 156 See Pompl (1998), p. 338 157 Fauska (2003), p. 21
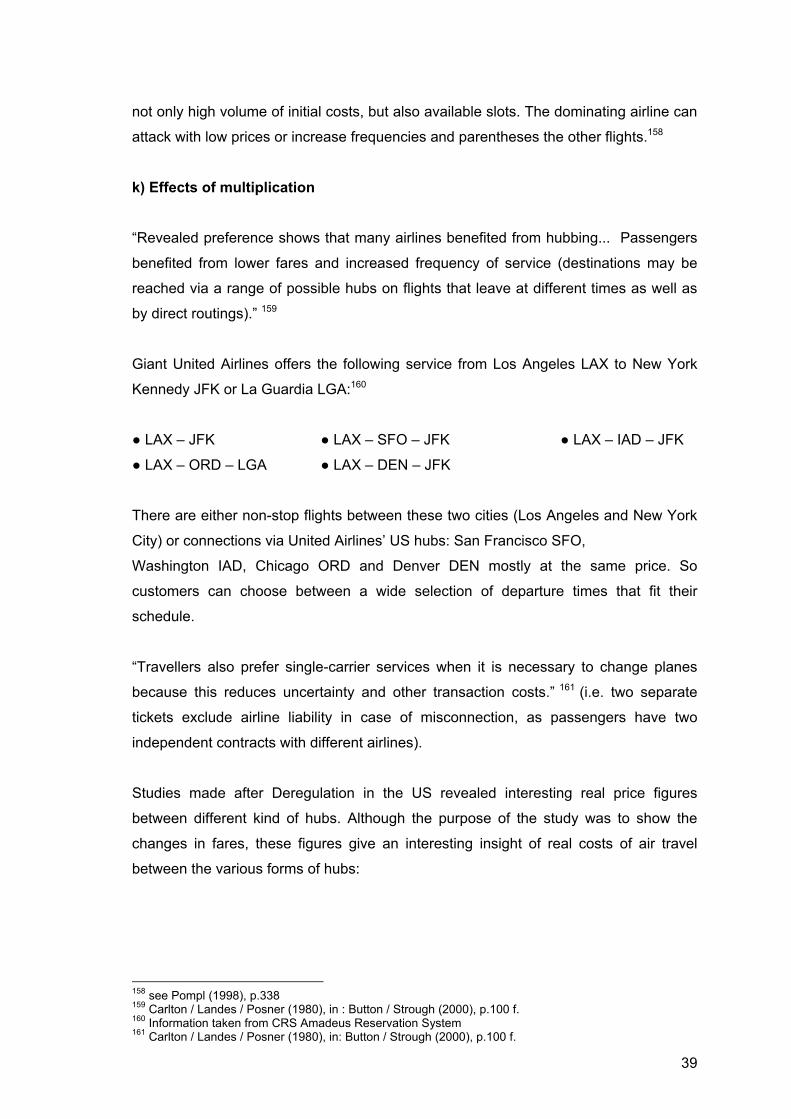
39
not only high volume of initial costs, but also available slots. The dominating airline can
attack with low prices or increase frequencies and parentheses the other flights.158
k) Effects of multiplication
“Revealed preference shows that many airlines benefited from hubbing... Passengers
benefited from lower fares and increased frequency of service (destinations may be
reached via a range of possible hubs on flights that leave at different times as well as
by direct routings).” 159
Giant United Airlines offers the following service from Los Angeles LAX to New York
Kennedy JFK or La Guardia LGA:160
● LAX – JFK ● LAX – SFO – JFK ● LAX – IAD – JFK
● LAX – ORD – LGA ● LAX – DEN – JFK
There are either non-stop flights between these two cities (Los Angeles and New York
City) or connections via United Airlines’ US hubs: San Francisco SFO,
Washington IAD, Chicago ORD and Denver DEN mostly at the same price. So
customers can choose between a wide selection of departure times that fit their
schedule.
“Travellers also prefer single-carrier services when it is necessary to change planes
because this reduces uncertainty and other transaction costs.” 161 (i.e. two separate
tickets exclude airline liability in case of misconnection, as passengers have two
independent contracts with different airlines).
Studies made after Deregulation in the US revealed interesting real price figures
between different kind of hubs. Although the purpose of the study was to show the
changes in fares, these figures give an interesting insight of real costs of air travel
between the various forms of hubs:
158 see Pompl (1998), p.338 159 Carlton / Landes / Posner (1980), in : Button / Strough (2000), p.100 f. 160 Information taken from CRS Amadeus Reservation System 161 Carlton / Landes / Posner (1980), in: Button / Strough (2000), p.100 f.

40
Real price (US cents per mile) Market type 1979 1985
Large hub – large hub 4.4 3.6
Large hub – medium hub 4.7 4.0
Large hub – small hub 4.9 4.1
Large hub – non hub 5.3 4.6
Medium hub – medium hub 4.9 4.1
Medium hub – small hub 5.1 4.4
Medium hub – non hub 5.5 5.1
Small hub – small hub 5.4 4.8
Small hub – non hub 5.7 5.3
Non hub – non hub 6.2 5.8
Table 5: Real Price of Hubs 162
Finally airports - and especially hubs - create, attract and stimulate business as well as
its region. Hub might be an important reason why corporation decide to settle in (or at
least close to) a city. Their existance can easily boost a company with the help of a
global air-link or even influence investment decisions.
How Important was Frankfurt Airport and Lufthansa's Hub for Your Investment Decisons and Choices of Location in
Favour of the Rhein-Main Region?
48%
24%
17%
11%
very important
important
less important
unimportant
Figure 10: How Important was Frankfurt Airport and Lufthansa’s Hub for Your
Investment Decisions and Choices of Location in Favour of the Rhein-Main Region?163
162 Rastatter / Stein (1988), in: Button / Stough (2000), p.101 163 Lufthansa Konzern (2004b), in: http://konzern.lufthansa.com/de.html/ueber_uns/mobilitaet/drehscheibe/standortfaktorluftverkehr.html

41
Lufthansa asked companies around Frankfurt Airport about the importance of direct
flights. About 78% of the interviewees consider direct flights out of Frankfurt as very
important.
Without the advantages that an airport or hub offers, companies are more likely
tempted into moving to any alternative location. 164 Attracting large corporations
guarantees constant income as a result of rising demand.
4.1.2. Disadvantages of the Hub-and-Spoke System
Although the number of advantages a hub creates is very long, we also have to
consider the disadvantages it causes: 165
a) Flight delays and reduction of comfort
Travelling via a hub extend travel time compared to direct flights. Changing flights
reduces the comfort of travel. 166
b) Fluctuating demand of capacity
Before and after the peak period personnel as well as infrastructure capacities are not
fully stretched and therefore cause additional costs. 167
c) Air traffic control
During peak time numbers of arrivals and departures increase rapidly. Capacities of the
airport infrastructure and personnel capacities are overloaded. 168
164 see NZZ (2001), in: http://www.nzz.ch/dossiers/2001/swissair/2001.12.20-wi-article7V4ZL.html; NZZ (2004a), in: http://www.nzz.ch/dossiers/2003/fluglaerm/2004.04.29-zh-article9KCWT.html; NZZ (2004b), in: http://www.nzz.ch/dossiers/2003/fluglaerm/2004.08.21-zh-article9SXRE.html; Pompl (2002 ), p.177; Lufthansa Konzern (2004b), in: http://konzern.lufthansa.com/de.html/ueber_uns/mobilitaet/drehscheibe/standortfaktorluftverkehr.html 165 see Fauska (2003), p. 24 ff.; Sterzenbach / Conrady (2003), p. 285 ; G.Mayer (2000), p. 16 ff.; NZZ (2001), in: http://www.nzz.ch/dossiers/2001/swissair/2001.12.20-wi-article7V4ZL.html 166 see Mayer (2000), p. 27 167 see Mayer (2000), p. 28 168 see Mayer (2000), p. 27

42
d) Increasing landing and handling fee
Airport authorities improve infrastructure in order to meet the high standard an
international hub requires. However, “the hub airport responds to price increases of
airlines by increasing its own price. The same holds true for its response to price
increase of other airports.” 169 As monopolies, airports have been able to pass on the
costs of excess capacity to the carriers in the form of higher charges – costs that few of
today’s financially unstable airlines can afford (i.e. San Francisco airport raised landing
and terminal charges by 23,8%).170
e) Ground infrastructure
“The fact is that operating without a hub can translate into enormous savings, since
airlines do not have to fund the staff and infrastructure necessary to accommodate
connecting traffic.” 171
f) Critical public opinion towards environmental pollution
Noise, car traffic and air pollution are the direct consequence of increasing aircraft
traffic at a hub.
g) Increasing route fee
Indirect connections cause higher route fees as direct flights. Longer distances,
departure-, arrival- and ground handling fees increase costs. Very short flights show a
higher demand of fuel.172
h) Monopoly power
“The prime concern that has been voiced about hubbing is that it confers monopoly
power on the major carrier at a hub airport. The carrier is then in a position to charge
high fares to those captive to that airport.” 173
169 Pels / Nijkamp / Rietveld (1997), p. 12 170 The Boston Consulting Group (2004), p. 13 171 see Gazvinian (2002), p. 55 172 see Mayer (2000), p. 29 173 Button / Stough (2000), p. 235

43
However, “the fact that a hub is dominated by a single carrier does not constitute a
monopoly position because people can opt for alternative routings. The hubs effectively
compete with each other for” 174 transit traffic.
Monopolist’s flight frequency, traffic volumes and aircraft size are inefficiently low
according welfare analysis.175
As the hub airline dominates the hub, there is a de facto market partitioning between
flag carriers. Very few routs exhibit more than two airlines.176
Airline City Hub Airport Airline's percentage of hub departures
in 1999 in 2000 SAS Copenhagen Kastrup 53 55 Stockholm Arlanda 46 50 Oslo Garermoen 43 44 Finnair Helsinki H.-Vantaa 64 63 British London Heathrow 37 38 Airways Gatwick 64 65 Lufthansa Frankfurt Rhein-Main 62 59 Munich F.J.Strauss 50 53 KLM Amsterdam Schipol 44 41 Iberia Madrid Barajas 55 55 Air France Paris C.D.Gaulle 57 55 Orly 47 55 Alitalia Rome Fiumicino 53 55
Table 6: Selected Airlines’ Hub Domination in 1999 and 2000 177
In terms of alliance foundation and –monopoly it has to be noted that an “alliance
increases traffic and reduces fares on spoke-to-spoke markets; whereas ... on hub-to-
hub markets ... decreases traffic and increase fares for travel between hubs.” 178
The majority of European airports depend on one main carrier, exceeding 50% of flight
share. In Asia only Bangkok exceeds with 51%. At the other airports airline monopoly is
not yet present.179
174 Button / Stough (2000), p.238 f. 175 see Brückner (2002), p.19 176 see Fridström (2003), p. 24 177 Fridström (2003), p.26 178 Bilotkach (2002), p.2 179 see The Boston Consulting Group (2004), p.16

44
48
31
41
51
46
44
24
34
39
0 50 100
Share of Main Carrier %
Tokyo HND
Hong Kong HKG
Seoul ICN
Bangkok BKK
Singapore SIN
Sydney SYD
Tokyo NRT
Beijing PEK
Dubai DXB
ASIA/PACIFIC
5136
2466
5360
494751
595357
5941
0 50 100
Share of Main Carrier %
London Heathrow LHRFrankfurt FRA
Paris CDGAmsterdam AMS
Madrid MADLondon Gatwick LGW
Rome FCOMunich MUC
Paris ORYBarcelona BCN
Zurich ZRHBrussels BRU
Manchester MANMilan MXP
EUROPE
Figure 11: Main Carriers at European and Asian Airports 180
180 see The Boston Consulting Group (2004), p.16 ; OAG (2004b), p.7
45
i) Price increase
In order to attract transit passengers, airlines use a common strategy of indirect flights’
cross-subsidization with the help of direct flights out of their hubs. (Business)
Passengers have to accept a “hub premium” for a better “service” and higher number
of destination, which is used to reduce feeder flight fares.
In practice, the price charged on a leg can even exceed the price charged on a path
including the leg, as interhub competition and lack of competition on spoke markets
exist. An airline compensates passengers with higher frequencies or via the price for
indirect travels. Besides, according K. Button being no hub has the advantage of
cheaper ticket fares, but less numbers of direct flights on the other hand.181 Finally, the
creation of an alliance increases fares for travel between hubs of the newly formed
partnership, decreases fares for travel on the spoke-to-spoke market and leaves all
other fares unchanged.182
4.1.3. Critical Review
Hub and spoke networks bring benefits to all types of passengers (business as well as
leisure). Larger aircraft and therefore better level of comfort, lower seat-mile costs,
higher frequencies and lower fares are the positive results of a network that is based
upon a hub and spoke principle.183 However, in case of airport or hub domination by
single airlines, fares will increase, as an effect of monopoly power.
“Compared to the model of point-to-point routing the hubbing system enables airline
companies to offer flights even to smaller regional airports or destinations with lower
passenger and cargo flow.” 184
Competitive connecting procedure reduces transfer times and increases customer
service (travel comfort). In case passengers face longer transfer connections, high
yield passengers have to be attracted and entertained with the help of unique lounges
or other products: Virgin Atlantic’s Clubhouse at London Heathrow for instance offers
music room, library, beauty salon, video-games area plus different food and drink
181 see NZZ (2001), in: http://www.nzz.ch/dossiers/2001/swissair/2001.12.20-wi-article7V4ZL.html; see Spiller (1989), in Pels / Nijkamp / Rietveld (1997), p.4 ff. 182 see Brückner (2001), in: Bilotkach (2002), p.17 183 see Shaw (1999), p.125 184 Fauksa (2003), p.31

46
options 185. Primarily hubs accommodate such facilities. In addition to lounges, a wide
range of shopping and business facilities characterize hubs, so travellers can find
entertainment to kill time or simply work. Coordination of flight schedules within an
alliance or the share of facilities at the hubs (check-in counters, transfer desks,
lounges,...) makes travel easier and more attractive to the passengers.
Flying via hubs, however, results in longer travel time. Bundling of flights effects traffic
congestions and flight delays. It depends on the priority of the departing flight, if the
aircraft waits for transfer passengers or not.
As flights with the shortest minimum connecting time (MCT) sell best 186, airlines are
interested to limit MCTs for their hubs. EU-law regulates ranking of flight display on
CRS computer reservation systems: On top of the screen, the system has to show non-
stop flights assorted according departure times, followed by direct-(one-stop)-flights
without a change of the aircraft and connecting flights. The latter must be sorted in
obedience to total travel time.187 In case of a little delay, however, passengers are not
able to reach their connecting flights and airlines have to rebook them. The
consequences are dissatisfaction, anger, stress, decrease of comfort and finally
avoidance of the hub, where the irregularity has happened.
4.2. Criteria Affecting the Choice of Airports
Customers can choose between a wide selection of airports. Competition has become
tougher than it was in the past, when each city had only one main airport. International
air travel has increased, slots have become very rare at most airports and congestion
in the air as well as on the ground have got worse. Facility extension or creation has
become the logical result of this booming industry. Some cities like - New York or
London - have three airports or even more (New York Kennedy, La Guardia, Newark
respectively London Heathrow, Gatwick, Stansted, City, Luton). Therefore it is not
always a question of the home carrier - who dominates flights out of a city - why
passenger choose a certain airport.
185 see Virgin Atlantic (2004), in: www.virgin-atlantic.com/engb/whatsonboard/clubhouse/lhrclubhouse.jsp 186 Neutral search for flights with the help of CRS computer reservation systems like Amadeus, display flights with the shortest travel time first 187 see Sterzenbach (1996), p.65

47
Several factors influence the decision about departure and arrival airport. The most
important parameters of competition are: 188
● Number of daily flights (cross border European or intercontinental flights)
● Number of international airlines offering flights from the appropriate airport
● Accessibility with ground transport facilities including ease of operation
● No – or at least limited - night traffic restrictions
● Level and structure of aeronautical infrastructure charges (departure/arrival tax,
ground handling fee, etc.)
● Level of security (departure/arrival area, passenger and baggage checks)
● Additional service infrastructure (hotel, shops, cultural sights, communication
centres)
● Slot availability and reduced delays due to Air Traffic Control (ATC)
4.2.1. Passengers’ Perspectives
Passengers must decide on both an airline and an airport for their travel. From their
point of view, the following factors are relevant, when it comes to choose an airport for
the journey: 189
● Destinations of flights
● Flight fare
● Flight availability and timing
● Frequency of service
● Image and reliability of an airline
● Airline alliance policy and frequent flyer programme
● Surface access costs to the airport
● Ease of access to the airport
● Car parking costs
● Range and quality of shops, catering and other commercial facilities
● Image of the airport and ease of use.
188 see Aberle (2003), p.35 189 see Graham (2003), p.184

48
A survey made in 1998/99 at London Heathrow and Gatwick airport clearly shows the
reasons why passengers chose one airport rather than the other.
Reason for choice London Heathrow London Gatwick
Near home 12,8 % 20 %
Flights/package available 38 % 51,3 %
Connecting flights 19 % 6,8 %
Near business 6,1 % 2,4 %
Near leisure 4,5 % 2,4 %
Economic/cheaper 6,2 % 7,5 %
Prefer airport 2,7 % 2,2 %
Timing of flights 4,6 % 2,2 %
Better surface access 0,1 % 0,7 %
Other 6 % 4,5 %
Table 7: Passenger Choice Survey London 190
Several historic studies focus on the subject airport choice. Generally speaking, access
time to airport as well as frequency of service from the airport to the desired destination
dominate the process of airport preference. A combination of access time and cost
finally measure airport access. Views about price signification differ considerably (no
influence on business traveller – influence for leisure traveller ...), thus different
travellers consider different sets of alternatives. Decision’s hierarchy, however, might
depend on various factors, such as travel purpose or sensitivity to price/cost and time.
This summary of major findings gives an overview of miscellaneous results.
190 Graham (2003), p. 185

49
Author(s) Variables Considered in Model(s)
Important Results
R. E. Skinner
Jr., 1976
Air carrier level of service
measures, ground accessibility
measures, flight frequency
Improvements in airport access
are the most effective means of
capturing more passengers
G. Harvey,
1987
Airport access time, relative and
direct flight frequency
Airport access time and flight
frequency provide good
approximation of airport choice.
Beyond a threshold level,
additional direct flights to a
destination do not make an airport
more attractive
N. Ashford,
M.Bencheman
n, 1987
Travel time to airport, number of
flights per day, air fare
Business travellers most sensitive
to airport access time, while
leisure travellers are most
sensitive to air fare and airport
access time
N. N. Ndoh,
D. E. Pitfield,
R. E. Caves,
1990
Airport access time, average
journey time, average
connection time to hub, number
of seats, flight frequency
Business travellers value access
time the most over any other
variable
J. David
Innes, D. H.
Doucet, 1990
Ticket type, length of stay, who
paid the trip, trip purpose,
aircraft type, flying time ( direct
vs. non-stop)
Type of aircraft plays significant
role in airport choice (air travellers
are willing to travel far for access
to jet service). Passengers prefer
direct flights versus connecting,
and shorter flights routes.
A. I. Ozoka,
N.Ashford,
1989
Airport access time, flight
frequency, air fare
Improving ground access to
airport is the best (and possible
only) means of increasing an
airport’s market share.
A. Thompson,
R. Caves,
1992
Airport access time, flight
frequency, air fare, number of
seats
Those departing from origins
closer to the airport are more
sensitive to access time than
those living further away.

50
M. Furuichi,
F. Koppleman,
1994
Airport access travel time and
cost, line-haul travel time and
cost, relative flight frequency
Access travel cost valued more
highly than line-haul travel cost.
Both business and pleasure
travellers have very high values of
access and line-haul time, as well
as flight frequency
R. Windle,
M. Dresner,
1995
Airport access time, weekly
flight frequency, airport
experience
Airport access time and flight
frequency are significant. Airport
experience comes out to be
significant, but could be proxy for
omitted variables.
E. Pels,
P. Nijkamp,
P. Rietveld,
2001
Flight frequency, airport access
time, air fare
Passengers first choose
departure airport, then choose
airline is statistically favourable to
the opposite. Little difference
between business and leisure
travellers
E. Pels,
P. Nijkamp,
P. Rietveld,
2003
Airport distance and access
time, average fare, daily flight
frequency
Access time most significant
variable in airport choice
Table 8: Airport Choice – Historic Overview of Various Authors 191
4.2.2. Airlines’ Perspectives
Even airlines try to take advantage of airports’ competition. The impact of aeronautical
charges on airline operations has become an crucial factor since 11th Sept. 2001.
Economic recession, poor financial position as well as reduced passenger demand
force airlines to measure their external costs such as airport charges. Passengers
expect high level of quality (in relation to the fare) and they have become choosy.
Therefore the question of airport selection is more important than ever and depends
on: 192
191 Basar / Bhat (2003), p. 36 ff. 192 see Graham (2003), p. 184 ; Pels / Nijkamp / Rietveld (1997), p.16

51
● Catchment area and potential demand ● Slot availability
● Competition ● Network compatibility
● Airport fees and availability of discounts ● Marketing support
● Other airport costs (i.e.: fuel, handling) ● Range and quality of facilities
● Ease of transfer connections ● Maintenance facilities
● Environmental restrictions ● Airport efficiency
This selection includes important aspects for all airports and airlines, as it causes “a
strategic advantage at their hub airports compared to their non-hub competitors” 193,
since “potential passengers are more likely to choose itineraries where the origin
airport is a hub.” 194 However, price competition between airports apparently has little
effect on the airline’s choice where to locate its hub. Hubs will be located in nodes with
the highest level of demand. Consequently nodes that compete for a hub position
should try to increase their market share at the expense of alternative hubs.195
4.3. Approach to Hub Measurement
Each single area has its own characteristic. The USA is characterized through its high
“volume of traffic and seize of the airlines.” 196 “The US majors’ short haul fleet is
double that of the AEA and the Orient airlines combined.” 197 Due to the greater
distances they have to cover throughout their networks, the Orient airlines own a large
number of long-range aircraft such as Boeing B747s, B777s or Airbus A340s, Airbus
A330s. Additionally they have attracted attention by firm orders of the Airbus A380.
Europe, however, as a more compact and centre concentrated airport scenario, shows
a 860 km average journey distance for international traffic. In contrast to Europe,
average journey distance in the USA is 1410 km and 1350 km in the Orient.198
“Both US and Orient airlines enjoy particularly low infrastructure charges – en-route
and landing fees – than the Europeans. In case of the Far East carriers, this accounts
for almost half the unit costs differential.” 199
193 Gayle (2004), p.17 194 Gayle (2004), p.17 195 see Pels / Nijkamp / Rietveld (1997), p.15 196 AEA (1995), p. 16 197 AEA (1995), p. 16 198 see AEA (1995), p. 17 199 AEA (1995), p. 17

52
The local traffic potential of an airport is determined through:200
• natural factors, it cannot directly influence
• range and supply-policy of services
Legal basic conditions limit scope for action.
Traffic attraction
Local traffic potential
Original traffic potential Connecting traffic potential
Natural determination factors:
Supply-political determination factors
Supply-political determination factors
Natural determination factors:
Economic structure
of the airport’s
region
Quality of airport’s
performances
Quality of airport’s
performances
Geographic location
within the patterns
of international air
traffic movement
Density of
population and
social demographic
structure of the
airport’s region
Airport’s Pay policy Airport’s Pay policy Economic structure
within the airport’s
original catchment
area
Geographic
location
Efficiency of the
connecting feeder
modes on ground
Efficiency of the
connecting feeder
modes on ground
Density of
population and
social economic
structure of the
airport’s original
catchment area
Intermodal feed Intermodal feed Intermodal feed Intermodal feed
Table 9: Local Traffic Potential 201
200 see Wolf (2003), p. 14 201 Wolf (2003), p.14

53
Figure 12: European Airport Landscape 202
Figure 13: Asian Airport Landscape 203
202 The Boston Consulting Group (2004), p.12 203 The Boston Consulting Group (2004), p. 13

54
World's biggest airports Passengers
1 Atlanta 41.396.286 9 Denver 21.748.562 2 Chicago 36.391.038 10 Las Vegas 20.359.945 3 London 32.254.174 11 Amsterdam 20.020.014 4 Tokyo 29.529.791 12 Phoenix 19.527.071 5 Los Angeles 29.362.911 13 Madrid 18.321.543 6 Dallas/Ft.Worth 29.261.888 14 Minneapolis/St. Paul 18.065.818 7 Paris 24.377.551 15 Bangkok 17.845.012 8 Frankfurt 24.303.089
Table 10: World’s Airport Ranking in Terms of Passengers 1st Quarter 2004 204
Air Traffic Measurement Airport Mio. passengers Departures/Arrivals
London Heathrow LHR 65 467 Frankfurt FRA 49,3 447 Paris CDG 48,3 518 Amsterdam AMS 36,6 432 Rome FCO 26,3 283 Zurich ZRH 22,6 325 Stockholm ARN 18,5 279 Copenhagen CPH 18,4 304 Dubai DXB 16,0 394
Table 11: Air Traffic Measurement 205
4.3.1. Strategic Quality of a Hub
The strategic quality of a hub depends on various factors: 206
4.3.1.1. Geographic Centrality
“The more central a hub is to its flows it is serving, the less route deviation it
imposes.” 207
204 Reischl (2004), p.46 205 Dubai International Airport (2004), in: http://213.42.52.88/DIAInternet/About+DIA/Statistics/ ; The Emirates Group (2004), in: http://www.ekgroup.com/; Aberle (2003), p.35 206 see Holloway (2003), p.380 ff. 207 Holloway (2003), p.380
55
4.3.1.2. Strength of Feed
“Any type of network grows stronger with each connection that is added to it” 208
a) Regional feed
Regional carriers link secondary and tertiary points more efficiently due to better suited
fleet and cost structures to short haul routes. Lufthansa uses service from its regional
partners: Air Dolomiti, City Line, Eurowings, Augsburg Airways and Contact Air.209
b) Feed for long haul international services
“Significant international hubs generally rely on either or both regional and short-
/medium-haul mainline feed. Emirate’s extensive feed from the Indian subcontinent into
its Dubai hub allows it to operate a daily non-stop Dubai-Birmingham (UK) service
tapping ethnic O&D markets.” 210
c) Alliance feed
Passengers are exchanged within the alliance partners’ networks throughout their
hubs. This determines the need for strong alliance partners. “Around $500 million of
Delta’s approximately $16 billion revenue in 2000 was attributable to alliance flows.” 211
d) Intermodal feed
It is common to sign a cooperation-agreement with speed train services (i.e. air-rail
code share into Newark EWR: Continental and Amtrak 212; United has code share
ground links with SCNF French Rail ex Paris CDG within France and with Thalys
International Rail from Paris CDG to Brussels 213 ; Lufthansa has a cooperation with
Deutsche Bahn DB ICE trains between Frankfurt and Munich or Berlin and Cologne
and Hamburg : Coach nr. 12 is exclusively reserved for Lufthansa passengers.
208 Holloway (2003), p.382 209 see Lufthansa (2004c), p.8 210 Holloway (2003), p.383 211 Pinkham (2001), in: Holloway (2003), p.384 212 see Holloway (2003), p.384 213 see United Airlines (2001), p.84f.

56
Each seat has a Lufthansa seat number corresponding with seats on board of an
aircraft (1A, 9F,...) 214 ) or with trucks to feed freight. Additionally airlines offer code
shares with bus companies in case ultra short haul flights are not reasonable enough:
Lufthansa introduced bus services from Innsbruck and Salzburg into Munich or
between Frankfurt and Strasbourg 215, Austrian Airlines had a bus service from Almaty
ALA to Bishkek FRU or still offers bus service between Montreal and Ottawa together
with its code share partner Air Canada 216 . United Airlines offers extensive bus
groundlink from its hubs Denver, Chicago O’Hare, San Francisco but also from
Portland PDX 217 . Generally the airline checks through the baggage and the passenger
receives a boarding pass until his final destination. Additionally members of the
frequent traveller programme earn miles when using such code share partners on
ground. Both intermodal feed and straight O&D competition from trains will help to
release slots at those hubs that are well connected to the rail network .
4.3.1.3. Local Traffic
Besides the presence of connecting passengers, local traffic is the basis of a
successful hub. “An ideal minimum of total hub traffic range from 25 to 40 per cent.
Insufficient local traffic was one of the reasons behind withdrawal from some of their
secondary hubs by US majors in the 1990s. Absence of strong, high-yield local traffic
may leave a hub over-dependent on flow traffic which can in some cases be relatively
low yield business if other airlines are competing to attract it over alternative hubs.” 218
Small home markets make it difficult for airlines, regardless of quality or service. In
case of a connecting flight (in cooperation with alliance partners), the profit is smaller,
as every participating airline receives a prorate of the ticket fare.
This sample ticket was issued for the route Linz – Vienna – Washington D.C. on
Austrian Airlines (OS962/OS93) with a connection on United Airlines from Washington
D.C. to Chicago (UA563). The homebound travel with Lufthansa originated from
Washington D.C. to Frankfurt and ended in Linz (LH419/LH3522). The total cost of the
ticket was EUR 725,- excluding and EUR 935,- including all taxes and surcharges
(Fare Basis: MLPX/HLSX6MW). It shows the prorate each airline gets for its own leg.
Connecting flights like Linz – Vienna or Frankfurt – Vienna have a value of EUR 47,-
214 see Lufthansa (2001b), p.11 and p.362 215 see Lufthansa (2001b), p.298 216 see Austrian Airlines (2004), p.15 217 see United Airlines (2001), p.74 ff. 218 Holloway (2003), p.385

57
each (for the respective airline). The carrier operating the long-range flight absorbs the
rest of the ticket price.
Table 12: Ticket Prorate 219
Ticketnumbers show only first and last digits, according code of privacy.
4.3.1.4. Hub Dominance
Hub dominance is measured through: 220
● Percentage of aircraft departures ● Slot control
● Gate control ● Terminal space
Hub dominance finally results in:
● “Supply-curve” effects ● Economies of scope
● Economies of density ● High station resource utilisation
● Premium yields from local traffic ● Local marketing strength
● Protection behind a significant structural barrier to enter (especially at slot-
constrained airports)
219 compiled by the author according Austrian Airlines ticket scanning system 220 see Holloway (2003), p.385
DOCNO 257 83XXXXXX69 0 and DOCNO 257 83XXXXXX70 CPNNO PROTYP 4 Y ------------------------------------------------------------------------------------------------------------------------------------------------------- DESCRIPTION SALE COUPON 01 COUPON 02 COUPON 03 COUPON 04 COUPON 05 FROM/TO LNZ / VIE VIE / IAD IAD / ORD IAD / FRA FRA / LNZ CARRIER/CLASS OS / M OS / M UA / M LH / H LH / H FAREBASE/TD MLPX MLPX MLPX HLSX6MW HLSX6MW FB/TD PRORATE PRT/ESAC PROV.CUR/AMT USD 58,83 348,01 78,73 359,71 58,39 PRORATE EUR 47,19 279,19 63,16 288,58 46,84 PRORATE USD 58,83 348,01 78,73 359,71 58,39 PRORATE EUR 47,19 279,19 63,16 288,58 46,84 NETTOPRORATE EUR 40,12 237,31 60,00 274,15 44,50 NETTOPRORATE USD 50,01 295,81 74,79 341,72 55,47 NETTOPRORATE EUR 40,12 237,31 60,00 274,15 44,50 FARECALC: LNZ OS X/E/VIE OS X/WAS UA CHI M472.85/-WAS LH X/FRA LH LNZ M407.15NUC880.00END ROE0.823727XT EUR8.72AT3.85YC10.56US10.56US2.39XA5.39XY3.86AY40.00 YQ10.43RA45.00XP3.47XF IAD4.5

58
“Dominant carriers charge a higher price to passengers originating from its hub, without
being punished for it by lower demand.”221 Lijesen, Rietveld and Nijkamp’s study show,
that Lufthansa, Swissair and Air France charge significant premiums for direct flights
from their hubs. 222 Button and Stough add, that “the fact that a hub is dominated by a
single carrier does not constitute a monopoly position because people can opt for
alternative routings. The hubs effectively compete with each other for” 223 transit traffic.
There is no doubt, that the home carrier not only serves the largest number of
destinations, but it also does it at a higher frequency than its competitors do (with the
competitor’s hub as the sole exception).
In the United States half of the biggest airports had a dominant carrier with 70% or
more of the passenger traffic and at most remaining airports the major carriers had a
50-70% share by the late 1990s.224 In Europe, however, the dominance was not so
clear. At only two of the major European airports does the base airline offer more than
65 % of the seats available. This may be because all the European airports are also
international gateways. Further, European airlines generally operate only one single
hub, though some are trying to develop a second one.225 In Asia share of main carrier
never exceeds 50% - except Bangkok reached 51% in 2004 – with an average value of
40% at major airports.226
Airport % of flights/frequencies by lead 3
carriers in 2001 LHR BA: 39,8% BD: 13,2% LH: 4,0% FRA LH: 59,1% BA: 3,6% OS: 3,0% CDG AF: 5,6% BA: 5,4% LH: 4,8% AMS KL: 42,9% BA: 5,4% U2: 4,6% BKK TG: 44,6% PG: 9,2% CI: 2,9% HKG CX: 25,0% KA: 12,8% MU: 8,1% SIN SQ: 39,7% MH: 6,9% MI: 6,4% NRT JL: 22,0% NH: 12,8% NW: 11,8% HND NH: 39,9% JD: 29,1% JL: 22,5%
Table 13: Airports’ Main Carriers 227
221 Lijesen / Rietveld / Nijkamp (2000), p.2 222 see Lijesen / Rietveld / Nijkamp (2000), p.15 223 Button / Stough (2000), p.238 f. 224 see Maurer (2001), p.321; Doganis (2002), p.256 225 see Doganis (2002), p.256 226 see The Boston Consulting Group (2004), p.16 227 see Airline Business (2002), p.45 f. , in: Maurer (2003), p.75 f.

59
Share of passenger service at main European hubs by leading global alliances
Airport One-world Sky Team Star Alliance
Amsterdam Schipol 6,6 % 58,9 % 8,1 %
Paris Charles de
Gaulle
8,8 % 55,9 % 12,5 %
Frankfurt Rhein-Main 6,9 % 4,6 % 65,9 %
London Heathrow 46,1 % 5,3 % 26,6 %
Munich FJ Strauss 3,8 % 5,7 % 55,0 %
Members of the Wings alliance (KLM, Alitalia, Continental and Northwest) are now
members of the Sky Team. Figures already include these new airlines
Table 14: Alliance Hub Dominance 228
Once an airline has established dominance, it is very difficult for the others to set up a
rival hub at the same airport. The hub operator occupies most of the terminal gates and
runway slots are limited.229 Moreover, the home carrier is hub’s best client and major
source of financing, with the result to deter entry or even hinder competitors.230
4.3.1.5. Expansion Capacity
“Whilst capacity constrains do impose a barrier to entry and so protect incumbents, the
lack of terminal space and/or runway slots might be a significant strategic constraint” 231
(i.e. London Heathrow, Frankfurt, New York JFK). Hong Kong closed its old airport Kai
Tak and opened Check Lap Kok 1998 due to limit of space. Examples exist all over the
world, where airports authorities made huge investments in order to be fit for the future
(Milan Malpensa MXP, Athens’ Eleftherios Venizelos Airport ATH, Seoul Incheon ICN
or Buenos Aires’ Ezeiza EZE).
4.3.1.6. Attractiveness to Passengers
What really matters for the passengers is hard to measure. Whether it is price or any
physical factor - lounges, check-in, leisure / business facilities - or even the range as
well as timing of connections offered, the reasons for choosing a hub are most
different.
228 Baker (2002), p.69, in: Maurer (2003), p.79 229 see Doganis (2002), p.257 230 see Lijesen / Rietveld / Nijkamp (2000), p.3 f. 231 Holloway (2003), p.385 f.
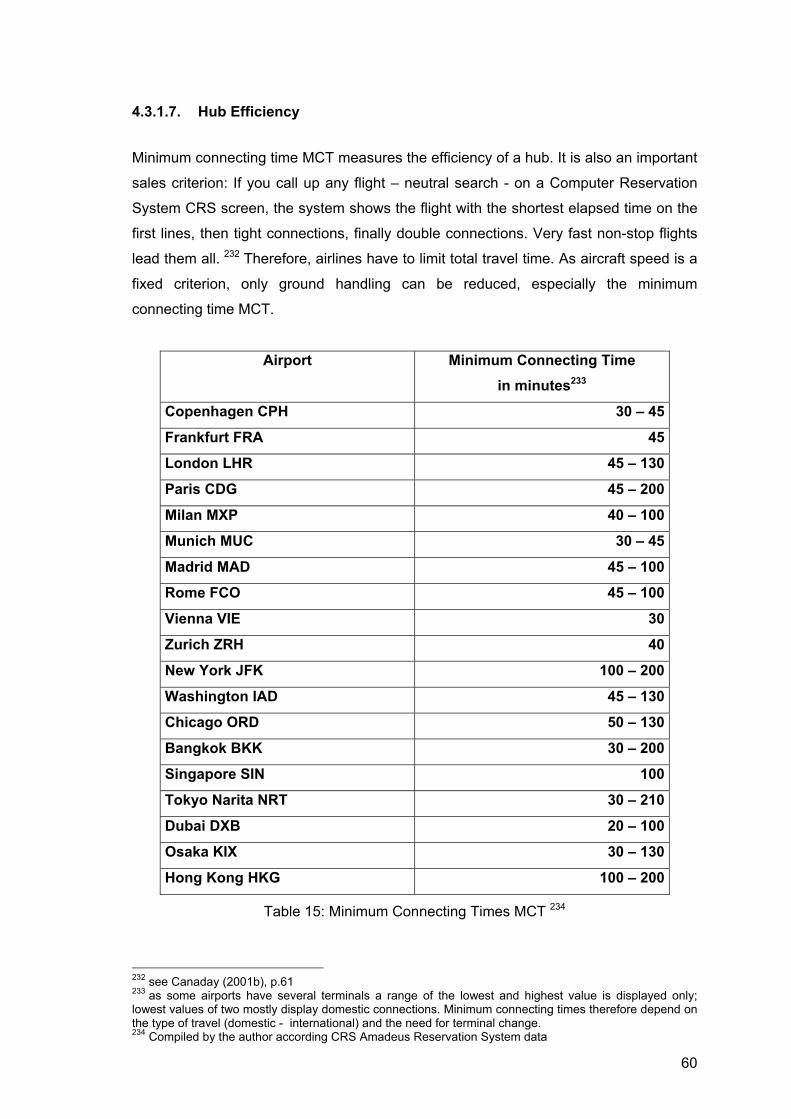
60
4.3.1.7. Hub Efficiency
Minimum connecting time MCT measures the efficiency of a hub. It is also an important
sales criterion: If you call up any flight – neutral search - on a Computer Reservation
System CRS screen, the system shows the flight with the shortest elapsed time on the
first lines, then tight connections, finally double connections. Very fast non-stop flights
lead them all. 232 Therefore, airlines have to limit total travel time. As aircraft speed is a
fixed criterion, only ground handling can be reduced, especially the minimum
connecting time MCT.
Airport Minimum Connecting Time in minutes233
Copenhagen CPH 30 – 45
Frankfurt FRA 45
London LHR 45 – 130
Paris CDG 45 – 200
Milan MXP 40 – 100
Munich MUC 30 – 45
Madrid MAD 45 – 100
Rome FCO 45 – 100
Vienna VIE 30
Zurich ZRH 40
New York JFK 100 – 200
Washington IAD 45 – 130
Chicago ORD 50 – 130
Bangkok BKK 30 – 200
Singapore SIN 100
Tokyo Narita NRT 30 – 210
Dubai DXB 20 – 100
Osaka KIX 30 – 130
Hong Kong HKG 100 – 200
Table 15: Minimum Connecting Times MCT 234
232 see Canaday (2001b), p.61 233 as some airports have several terminals a range of the lowest and highest value is displayed only; lowest values of two mostly display domestic connections. Minimum connecting times therefore depend on the type of travel (domestic - international) and the need for terminal change. 234 Compiled by the author according CRS Amadeus Reservation System data

61
0
50
100
150
200
250M
CT
in M
inut
es
CPH FRA LHR CDG MXP MUCMADFCO VIE ZRH JFK IAD ORD BKK SIN NRT DXB HKG KIX
Minimum Connecting Times (MCT)
Minimum Maximum
Figure 14 : Minimum Connecting Times MCT 235
This means that customers - who use CRS Computer Reservation Systems like
Amadeus - see connections via a hub with a short minimum connecting time first and
are therefore eager to choose this flight rather than competitive ones.
However, a short minimum connecting time creates problems too. Sometimes baggage
does not make the connection, as the airport distributes it through an automatic centre
under or besides the terminal. Passengers sometimes receive their bags with the next
arriving flight or even later. Passport control might slow down the connecting process
and result in misconnections. In case of insufficient infrastructure passengers also
might not be able to reach their connecting flight on time. At some airports aeroplanes
are not able to dock on gates or skybridges and are dependent on buses to bring
passengers to the gates (this process is time-consuming). Airlines can limit such
irregularities, when they move under one roof. They proximate their gates and check-in
areas close to each other, in order to avoid long transfers for baggage and passengers.
This, unfortunately, is not always the case or possible. Considering selected airports of
the Star Alliance allows an interesting insight: 236
235 compiled by the author according CRS Amadeus Reservation System data 236 see Star Alliance (2002), p.92 ff.
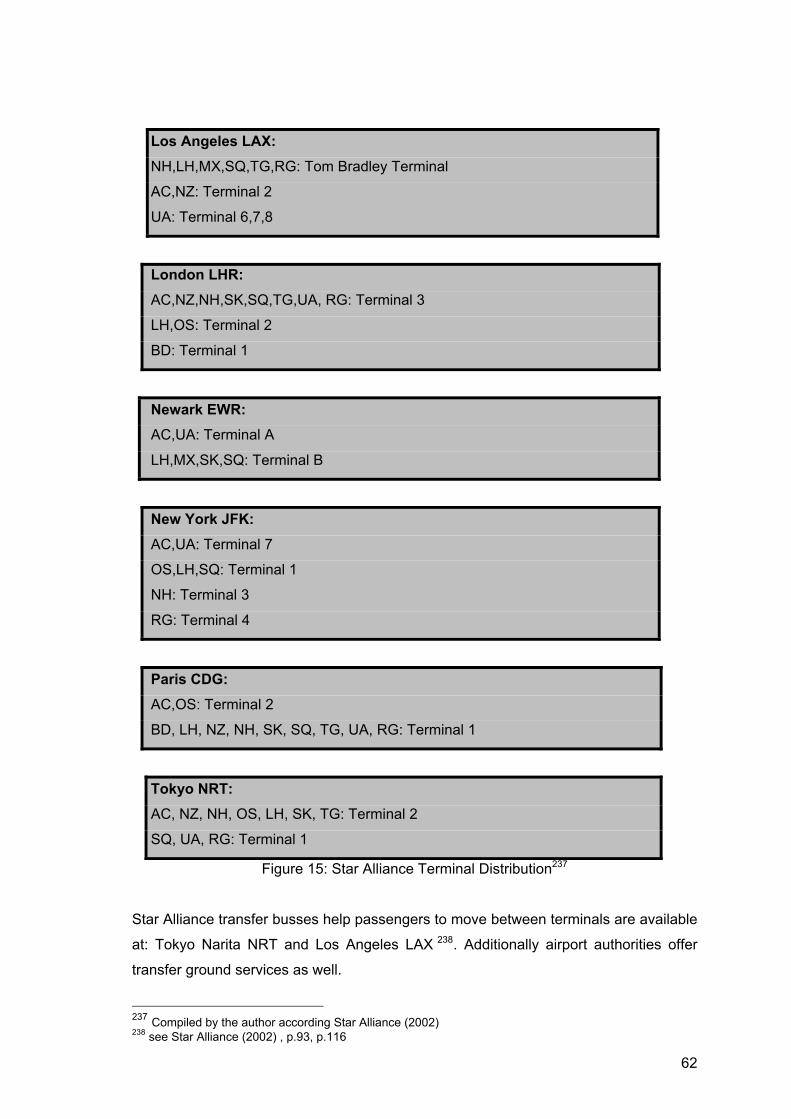
62
Los Angeles LAX: NH,LH,MX,SQ,TG,RG: Tom Bradley Terminal
AC,NZ: Terminal 2
UA: Terminal 6,7,8
London LHR: AC,NZ,NH,SK,SQ,TG,UA, RG: Terminal 3
LH,OS: Terminal 2
BD: Terminal 1
Newark EWR: AC,UA: Terminal A
LH,MX,SK,SQ: Terminal B
New York JFK: AC,UA: Terminal 7
OS,LH,SQ: Terminal 1
NH: Terminal 3
RG: Terminal 4
Paris CDG: AC,OS: Terminal 2
BD, LH, NZ, NH, SK, SQ, TG, UA, RG: Terminal 1
Tokyo NRT: AC, NZ, NH, OS, LH, SK, TG: Terminal 2
SQ, UA, RG: Terminal 1
Figure 15: Star Alliance Terminal Distribution237
Star Alliance transfer busses help passengers to move between terminals are available
at: Tokyo Narita NRT and Los Angeles LAX 238. Additionally airport authorities offer
transfer ground services as well.
237 Compiled by the author according Star Alliance (2002) 238 see Star Alliance (2002) , p.93, p.116

63
“Long MCs at a hub can feed through into less efficient resource utilisation.” 239 “On-line
schedule co-ordination can be measured using a connectivity ratio, which shows the
degree to which linkages are more than purely random. It allows for varying volumes of
flights operated and different minimum connect times at each of the hubs.” 240 Austrian,
Swissair and KLM convince with highly integrated schedules. The graph also shows
that British Airways, Alitalia and Air France are “way behind with connections that were
little more than random. A ratio of 1.0 suggests connections are no better than would
be expected with random pattern of schedules. A ration of 2.0 suggests twice as many
connections would be achieved on this random basis.” 241
Airport Hub airline Connectivity ratio
1989 1995
Vienna Austrian 2.2
Amsterdam KLM 1.9 1.8
Zurich Swissair 1.9
Frankfurt Lufthansa 1.6 1.6
Brussels Sabena 1.6 1.8
Copenhagen SAS 1.4
Rome Alitalia 1.2 1.2
London Heathrow British Airways 1.1 1.0
London Gatwick British Airways 1.1
Madrid Iberia 1.0 0.9
Paris CDG Air France 0.9 1.4
Athens Olympic 0.9
Table 16: European Hub Performance, 1989-95 242
239 Holloway (2003), p. 386 240 Doganis (2002), p.258 241 Doganis (2002), p.258 242 Doganis (2002), p.259
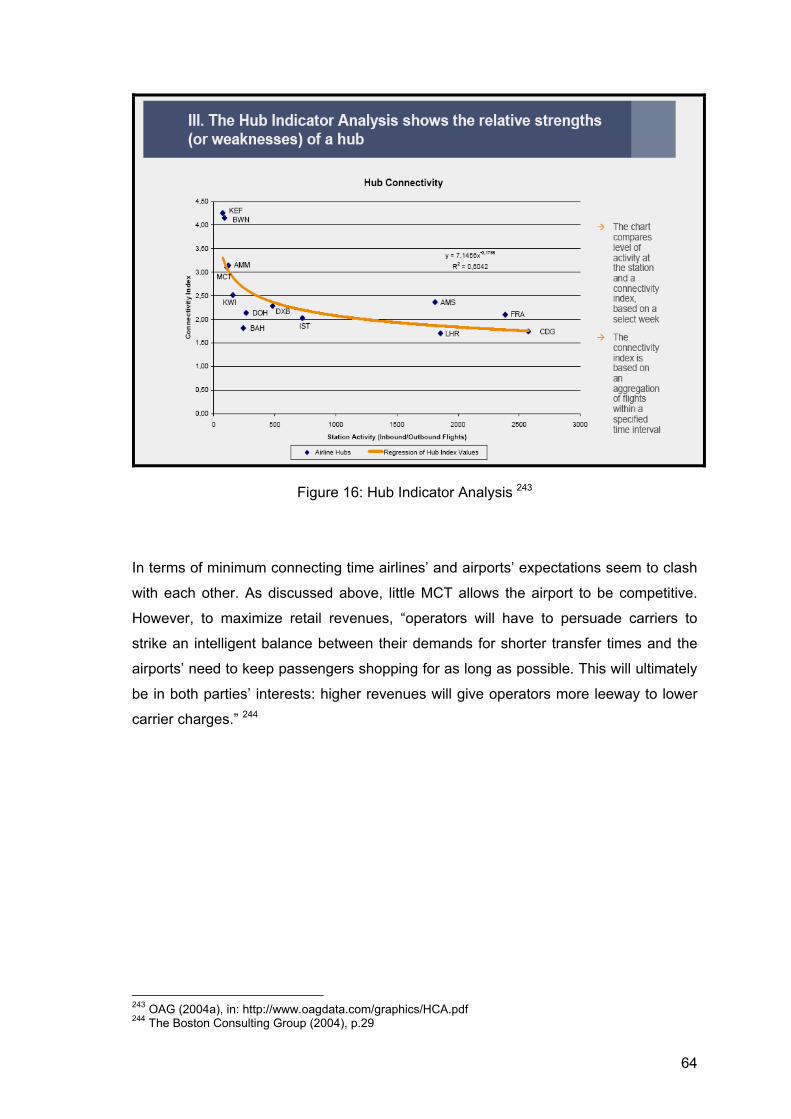
64
Figure 16: Hub Indicator Analysis 243
In terms of minimum connecting time airlines’ and airports’ expectations seem to clash
with each other. As discussed above, little MCT allows the airport to be competitive.
However, to maximize retail revenues, “operators will have to persuade carriers to
strike an intelligent balance between their demands for shorter transfer times and the
airports’ need to keep passengers shopping for as long as possible. This will ultimately
be in both parties’ interests: higher revenues will give operators more leeway to lower
carrier charges.” 244
243 OAG (2004a), in: http://www.oagdata.com/graphics/HCA.pdf 244 The Boston Consulting Group (2004), p.29

65
5. Hypothesis and Analysis
5.1. General Overview and Concept of the Analysis
The main purpose of this paper is to analyse the influence of Dubai International Airport
on the European-Asian traffic. It compares transit travel via Dubai to Europe’s prime
hubs: Frankfurt, London-Heathrow and Paris CDG with the help of selected parameters
(or product features). It is not only a question of the airport itself, but also of the home
airline, as passengers choose a combination of both: airlines’ and airports’ features.
Consequently this makes it a homogeneous product and it is not possible to examine
the airport individually without the home-based airline. According to Doganis’
evaluation, the following parameters help to measure passenger’s travel decision
together with the choice of route (implying airport and airline) 245 : Price (Economy- and
Business Class), taxes (which affect the choice of route, as airlines add taxes and
other surcharges to the ticket fare), safety, schedule - convenience (including total
travel time), connectivity - ratio, comfort-quality-image as well as the airlines’ frequent
flyer programme. Additionally this chapter discusses the various customer segments
including their individual demands.
As passengers normally choose one airline or one alliance for travel (i.e. Rome –
Frankfurt – Bangkok with Lufthansa respectively Star Alliance), there is no need to
analyse traffic possibilities and itinerary conjunctions of competitive airlines (i.e. Rome
– Frankfurt with Alitalia and Frankfurt – Bangkok with Lufthansa)246. Alliance members
harmonize their schedules and fares within the partnership. Travellers normally do not
mix competitive alliance products. It does not make sense for them to switch between
non-partner carriers. Therefore the study focuses exclusively on the home-alliance. In
this analysis, flights via Frankfurt include Star Alliance members only (with Lufthansa or
Lufthansa code share flight number), flights via London-Heathrow include One World
Alliance (with British Airways or British Airways code share flight number) and flights
via Paris CDG Sky Team (with Air France or Air France code share flight number).
Evaluation via Dubai embraces Emirates flights or code share flights only, as the airline
does not belong to any alliance yet.
245 see Doganis (2002), p. 236 ff. 246 see Doganis (2002), p.255

66
The paper also uses several internationally recognized travel surveys as a basis of
discussion. For example, the 10 million web poll Skytrax is an influential and honoured
quality guide for the international aviation industry. 247 Experts and international
travellers can cast their votes. International surveys finally approve the ratings.
As a result, the analytical treatments provide a choice of travellers’ considerations and
set of determinants.
5.2. Presentation of the European-Asian Air Traffic
5.2.1. The European-Asian Air Traffic in General
“The world air transport is very concentrated. Half of the world’s largest fleet is
operated by just 17 largest airlines (of some 650 worldwide) and half of all available
seat-kilometre flown by scheduled airlines are focused on the top 6% of routes linking
no more than 33 airports. In terms of scheduled passengers-kilometre (PK) carried, we
can distinguish”: 248
Intra North American: 33,3 %
North Atlantic traffic: 11,6 %
Intra-Asia: 10,6 %
Intra-Europe: 8,5 %
Europe – Asia travels: 7,4 % Transpacific flights: 6,6 %
European Global Players Air France generated 10% of its traffic from the Middle East,
24% from Europe and 17% from the Asian market (RPK 2002), British Airways: 10%
(from the Middle East); 22,1% (from Europe) and 15,3% (from the Asian market),
KLM: 8,2%; 13,2% and 24,8%, Lufthansa: 6,5%; 26,3% and 25,8%. 249
In terms of aircraft expansion, the strongest growth area is Asia/Pacific, with a fleet’s
cumulative annual growth rate of 8,9% during the 1991-2000 period against 4,1% in
Europe and 3,6% in the US. 250
247 see Skytrax (2004c), in: http://www.airlinequality.com/AirportRanking/security-DEF.htm ; Clark (2003), p.1, in: http://www.ekgroup.com 248 Airlinesgate (2004a), in: http://airlinesgate.free.fr/articles/industry3.htm 249 see Merrill Lynch (2003b), p.13 250 see Airlinesgate (2004a), in: http://airlinesgate.free.fr/articles/industry3.htm
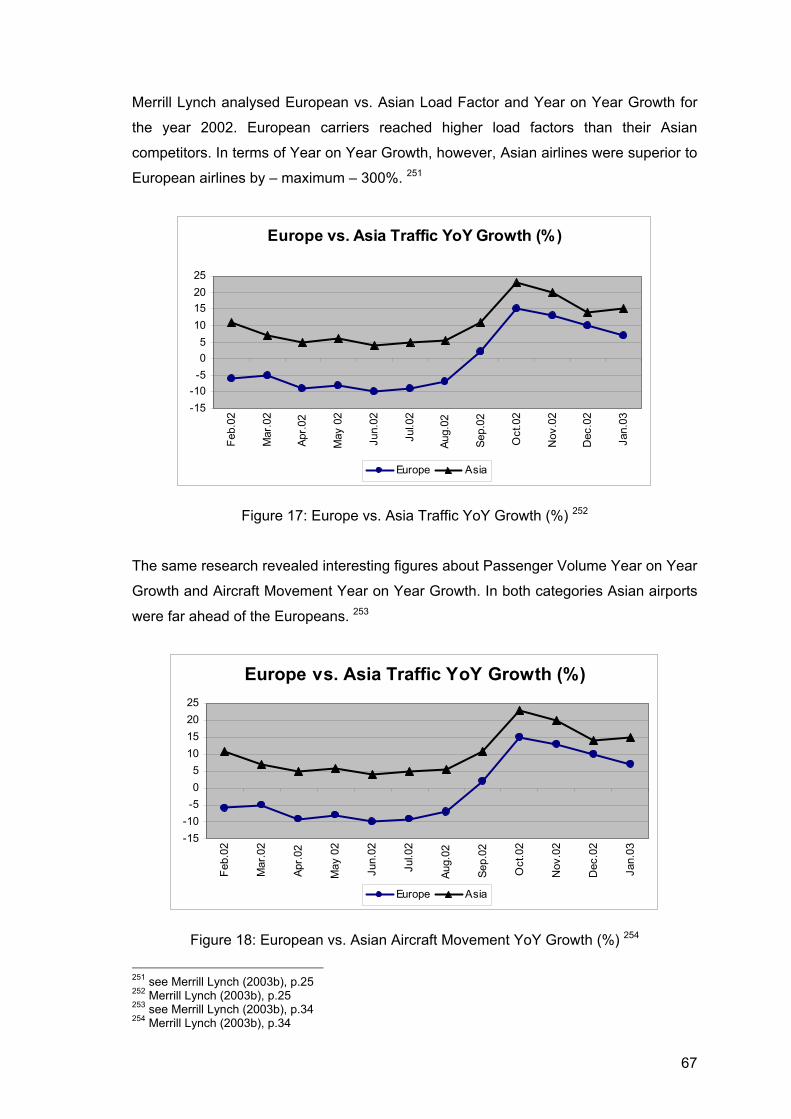
67
Merrill Lynch analysed European vs. Asian Load Factor and Year on Year Growth for
the year 2002. European carriers reached higher load factors than their Asian
competitors. In terms of Year on Year Growth, however, Asian airlines were superior to
European airlines by – maximum – 300%. 251
Europe vs. Asia Traffic YoY Growth (%)
-15-10-505
10152025
Feb.
02
Mar
.02
Apr.0
2
May
02
Jun.
02
Jul.0
2
Aug.
02
Sep.
02
Oct
.02
Nov
.02
Dec
.02
Jan.
03
Europe Asia
Figure 17: Europe vs. Asia Traffic YoY Growth (%) 252
The same research revealed interesting figures about Passenger Volume Year on Year
Growth and Aircraft Movement Year on Year Growth. In both categories Asian airports
were far ahead of the Europeans. 253
Europe vs. Asia Traffic YoY Growth (%)
-15-10-505
10152025
Feb.
02
Mar
.02
Apr.0
2
May
02
Jun.
02
Jul.0
2
Aug.
02
Sep.
02
Oct
.02
Nov
.02
Dec
.02
Jan.
03
Europe Asia
Figure 18: European vs. Asian Aircraft Movement YoY Growth (%) 254
251 see Merrill Lynch (2003b), p.25 252 Merrill Lynch (2003b), p.25 253 see Merrill Lynch (2003b), p.34 254 Merrill Lynch (2003b), p.34

68
European vs. Asian Passenger Volume YoY Growth (%)
-15
-10
-5
0
5
10
15
20
Mar
.02
Apr.0
2
May
02
Jun.
02
Jul.0
2
Aug.
02
Sep.
02
Oct
.02
Nov
.02
Dec
.02
Jan.
03
Feb.
03
Europe Asia
Strongest growth
in Asia, but slowing
Figure 19: European vs. Asian Passenger Volume YoY Growth (%) 255
5.2.2. The European-Asian Air Traffic via Dubai Airport
Dubai International Airport is a rising hub for flights to/from Europe and to/from
Asia/Pacific. According OAG analysts the number of frequencies climbed by 12% for
Western European flights and 45% for the Asian/Pacific region. In terms of capacity the
number of available seats to/from Western Europe increased by 28% and to/from
Asia/Pacific by 47% (2004 vs. 2001).256 London is the top destination with the highest
number of available seats to/from Dubai Airport (44.000 seats: Febr. 2004). Frankfurt
also reached the “Top 10” list with 15.000 seats. From the Asia/Pacific region only
Mumbai (20.000) and Singapore (15.000) qualified to be a top destination. All other
cities of this list are Arabian destinations. 257 Analysis by flight duration revealed that
the majority of flights out of Dubai are short haul. This “has enabled the airport to
establish itself as one of the most significant hubs in the Gulf.” 258
255 Merrill Lynch (2003b), p.34 256 see OAG (2004b), in: http://www.oagdata.com/upload/oagDubaireport.pdf , p.4 257 see OAG (2004b), in: http://www.oagdata.com/upload/oagDubaireport.pdf, p.5 ff. 258 OAG (2004b), in: http://www.oagdata.com/upload/oagDubaireport.pdf , p.6

69
Dubai Airport Trend of Available Seats and Frequency - Flights to/from Western Europe
0
5000
10000
15000
20000
25000
2001 2002 2003 2004
Tota
l Fre
quen
cies
0
1000000
2000000
3000000
4000000
5000000
6000000
7000000
8000000
Ava
ilabl
e S
eats
Frequency Seats
Figure 20: Dubai Airport Trend of Available Seats and Frequency- Flights to/from
Western Europe 259
Dubai Airport Trend of Available Seats and Frequency - Flights to/from Asia/Pacific
0
5000
10000
15000
20000
25000
30000
35000
40000
2001 2002 2003 2004
Tota
l Fre
quen
cy
0
2000000
4000000
6000000
8000000
10000000
12000000
Ava
ilabl
e S
eats
Frequency Seats
Figure 21: Dubai Airport Trend of Available Seats and Frequency - Flights to/from
Asia/Pacific260
259 compiled by the author according: OAG (2004b), in: http://www.oagdata.com/upload/oagDubaireport.pdf , p. 17 ff. 260 compiled by the author according: OAG (2004b), in: http://www.oagdata.com/upload/oagDubaireport.pdf , p. 17 ff.

70
FLIGHT DURATION FREQUENCIES AVAILABLE SEATS
Less than 2 hours 38% 30%
Between 2-5 hours 34% 34%
More than 5 hours 28% 36%
Table 17: Flights’ Analysis out of Dubai 261
5.3. Determinants of Measurement: Measurement Elements and Attributes
Generally speaking, “airlines compete on the basis of service quality (frequency), fare
and capacity.” 262 “Customers ... buy airline tickets. And tickets give them a bundle of
service features, including check-in service, cabin service, food, in-flight movies,
seating, and timely arrival. Some of these features influence a customer’s choice of
airline much more than others.” 263 Airlines sell their customers service: the flight itself,
defined by: 264
● The journey, which is the mean of transportation from departure airport to final
destination airport within a certain time range and the maximum level of security.
● Number and frequency of departures and arrivals
● Level of comfort in terms of seat comfort, pitch, equipment
● In-flight-service (meals, movies, entertainment,...)
● Ground service (Web or telephone check-in, lounge, e-ticket,...)
● Travel support (Destination information, telephone sales,...)
● General impression of the airline
● Price
All those attributes are the basis of competition in the airline industry, “they are bundles
of features, some of which influence customers more than others” 265 implying that
consumers have different tastes for each product characteristic. The hierarchy of
decision depends on several factors including a passenger’s travel purpose and a
passenger’s sensitivity to variables like time or costs.
261 OAG(2004b), in: http://www.oagdata.com/upload/oagDubaireport.pdf , p.6 262 Pels / Nijkamp / Rietveld (1997), p.2 263 Mercer Management Consulting (2002), p.1 264 see Bresson / Köhne / Westbrock (2003), p.3 f. 265 Mercer Management Consulting (2002), p.1

71
Additionally “demographic information such as age and income are likely to be
correlated with taste and thus may explain consumers’ choice of differentiated products
... higher income passengers are more likely to choose itineraries covering shorter
distances ... that are expected to be more expensive ... compared to lower income
passengers. Higher income passengers have a higher opportunity cost of time and
thus more willing to pay a higher price for an itinerary that has a more convenient travel
schedule.” 266
In order to measure key product features or preferences, a conceptual framework
based upon an individual traveller approach has to be designed. Air traveller seeks
information from travel agents, airline websites or call centres. Additional information
increases the utility of traveller’s choice. “The probability that an individual selects an
option is defined as the probability that its utility is larger than the utility of all other
alternatives. Travellers seek to maximize air travel utility by choosing the air travel
option with the highest utility.” 267 The graph “Travel Choice Framework” should help to
show a possible process of choice. Choices as carrier, departure time, fare class are
only examples. The latter figure by R. Doganis illustrates an extended list of product
features.
An airport’s and airline’s “potential customer will be influenced by five key product
features in making travel decisions and, more important, in choosing between airlines.
The ultimate aim of product planning is to attract and hold customers from the market
segments that an airline is targeting and to do so profitably. Product planning is
deciding what product features to offer in each market segment in which an airline is
hoping to sell its services or products.” 268
A survey by Scandinavian SAS revealed that departure/arrival times and non-
stop/direct service are important, whereas aircraft type is totally insignificant. The
International Foundation of Airline Passenger Association found out, that punctuality,
convenient schedules and frequency are the most important features. There is,
however, a difference of valuation in terms of short/medium or longer sectors: On long-
range flights comfort based attributes are preferred to schedule based features. On
short/medium flights it is the other way round.269
266 Gayle (2004), p.18 f. 267 Proussaloglou / Koppelman (1999), p.195 268 Doganis (2001), p.236 f. 269 see Doganis (2002), p. 238 f.
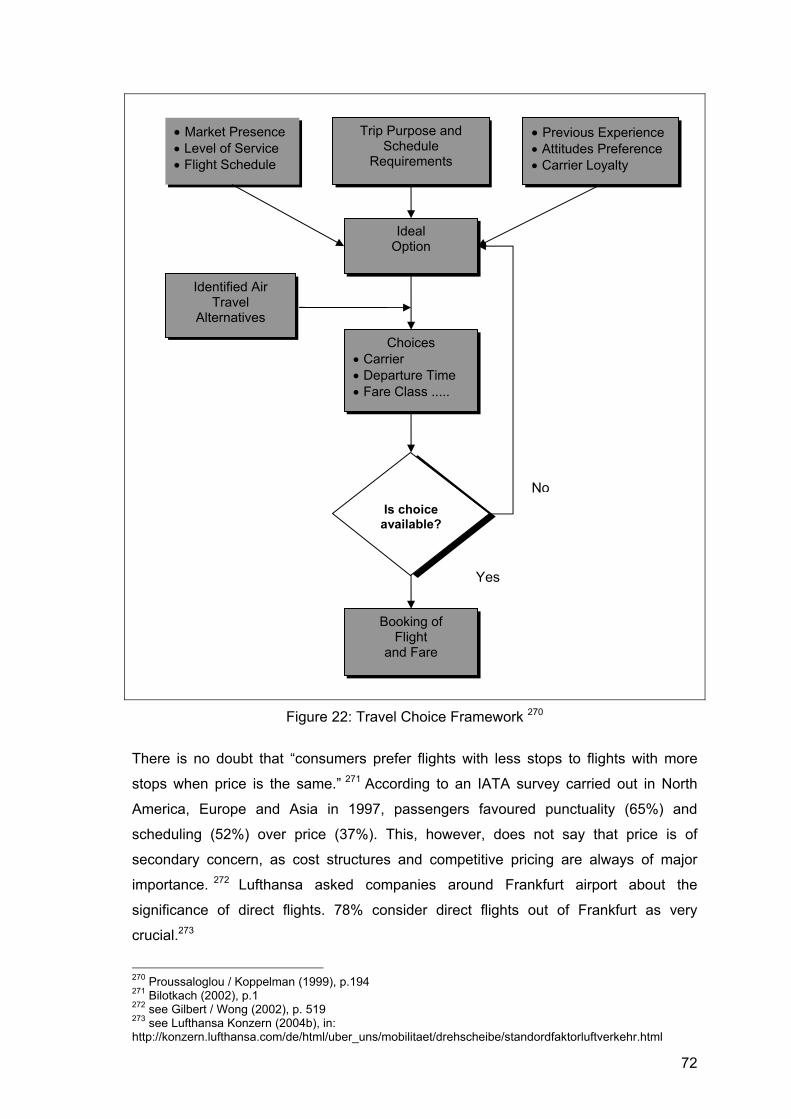
72
Figure 22: Travel Choice Framework 270
There is no doubt that “consumers prefer flights with less stops to flights with more
stops when price is the same.” 271 According to an IATA survey carried out in North
America, Europe and Asia in 1997, passengers favoured punctuality (65%) and
scheduling (52%) over price (37%). This, however, does not say that price is of
secondary concern, as cost structures and competitive pricing are always of major
importance. 272 Lufthansa asked companies around Frankfurt airport about the
significance of direct flights. 78% consider direct flights out of Frankfurt as very
crucial.273
270 Proussaloglou / Koppelman (1999), p.194 271 Bilotkach (2002), p.1 272 see Gilbert / Wong (2002), p. 519 273 see Lufthansa Konzern (2004b), in: http://konzern.lufthansa.com/de/html/uber_uns/mobilitaet/drehscheibe/standordfaktorluftverkehr.html
Booking of Flight
and Fare
Identified Air Travel
Alternatives
Choices • Carrier • Departure Time • Fare Class .....
• Previous Experience • Attitudes Preference • Carrier Loyalty
Ideal Option
Trip Purpose and Schedule
Requirements
• Market Presence • Level of Service • Flight Schedule
Is choice
available?
No
Yes

73
1 Price Fare levels and conditions
2 Schedule-based Points served and routeings
Frequency
Timings
Connections
Punctuality
3 Comfort-based Type of aircraft
Interior configuration
Individual space
On-board service
Ground/terminal service
Airline lounges
In-flight entertainment
4 Convenience Distribution/reservations system
Capacity management policy
Seat availability
5 Image Reputation for safety
Branding
Frequent Flyer programmes/loyalty
schemes
Promotion and advertising
Market positioning
Table 18: Key Product Features 274
The fact that the airport in question is an airline’s hub, flight schedule offered by this
specific airline is more convenient as well as customer ‘s higher tendency towards hub
airline’s frequent flyer programme are all samples of possible reasons, why
passengers are more likely to choose a specific hub airline.275
Airline comparisons assist to evaluate price, punctuality, safety or frequent flyer
programmes. Several magazines or global marketing information service companies
(i.e.:J.D.Power) award official reputation regularly to the airlines and airports. The same
applies to “soft” attributes like efficient check-in 276 or friendliness 277.
274 Doganis (2002), p. 237 275 see Proussaloglou/Koppelman (1995) , p.195; Berry (1990), Schumann (1986), in: Gayle (2004), p.15 f. 276 Efficient check-in measurement with the help of time stamps for premium and economy customers. In-house Quality Managers publish corporate standards within an airline/alliance 277 Passenger surveys made on board and on the ground allow to rate the level of comfort
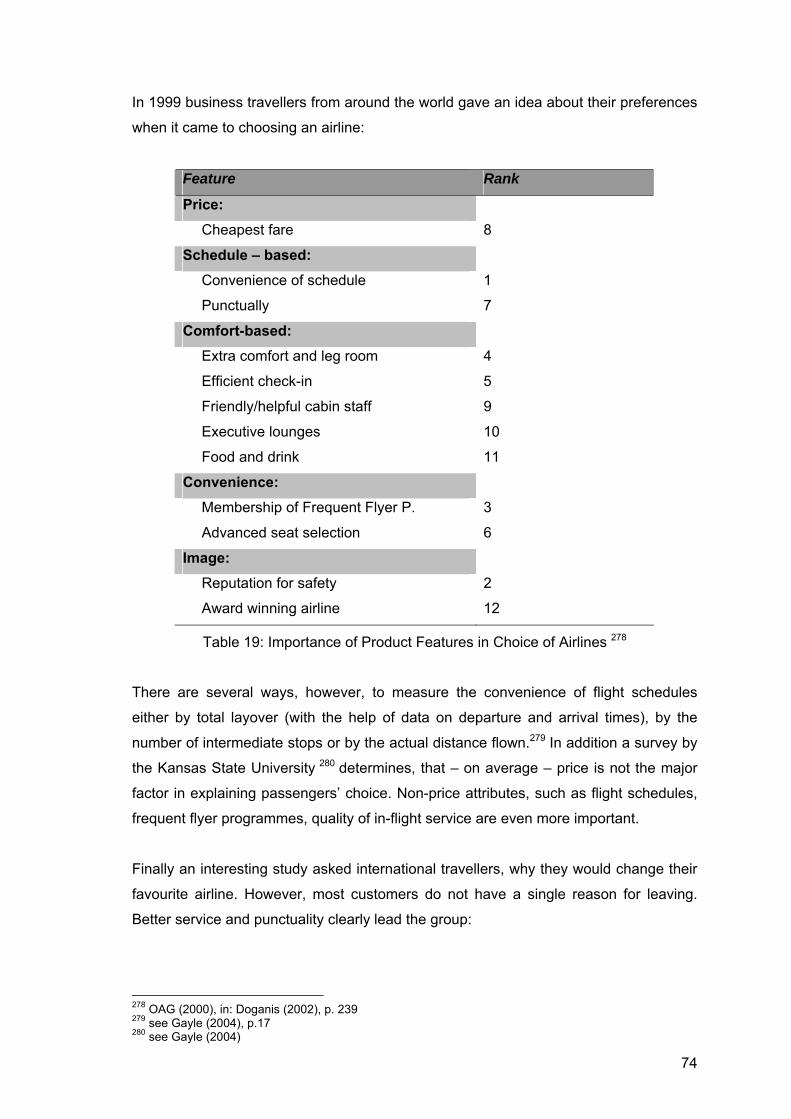
74
In 1999 business travellers from around the world gave an idea about their preferences
when it came to choosing an airline:
Feature Rank
Price: Cheapest fare 8
Schedule – based: Convenience of schedule 1
Punctually 7
Comfort-based: Extra comfort and leg room 4
Efficient check-in 5
Friendly/helpful cabin staff 9
Executive lounges 10
Food and drink 11
Convenience: Membership of Frequent Flyer P. 3
Advanced seat selection 6
Image: Reputation for safety 2
Award winning airline 12
Table 19: Importance of Product Features in Choice of Airlines 278
There are several ways, however, to measure the convenience of flight schedules
either by total layover (with the help of data on departure and arrival times), by the
number of intermediate stops or by the actual distance flown.279 In addition a survey by
the Kansas State University 280 determines, that – on average – price is not the major
factor in explaining passengers’ choice. Non-price attributes, such as flight schedules,
frequent flyer programmes, quality of in-flight service are even more important.
Finally an interesting study asked international travellers, why they would change their
favourite airline. However, most customers do not have a single reason for leaving.
Better service and punctuality clearly lead the group:
278 OAG (2000), in: Doganis (2002), p. 239 279 see Gayle (2004), p.17 280 see Gayle (2004)

75
0 5 10 15 20 25
% of the answ ers
Better service
Punctuality
Competitive prices
Convenient schedule
Better in-f light service
Friendly staff
Superior catering
Frequent Flyer P.
Extra legroom
Frequency
Why Passengers Would Change Their Favourite Airline
Figure 23: Why Passengers Would Change Their Favourite Airline 281
Airlines have to understand their customers’ needs and purchase behaviour with the
final target: fulfillment of expectations -keeping them profitably satisfied- results in a
repurchase. Interestingly, companies that offer superior service are able to charge a
premium of 8%.282 Besides, it is crucial to know, that “the differences in expectations of
service are derived from different passenger cultures. So if passengers are of different
ethnic groups/nationalities then there will be significant difference in their expectations
of desired airline service quality.” 283
281 Sostar (2004), in: https://www2.one-intra.net 282 see Gilbert / Wong (2003), p.519 283 Gilbert / Wong (2003), p.520
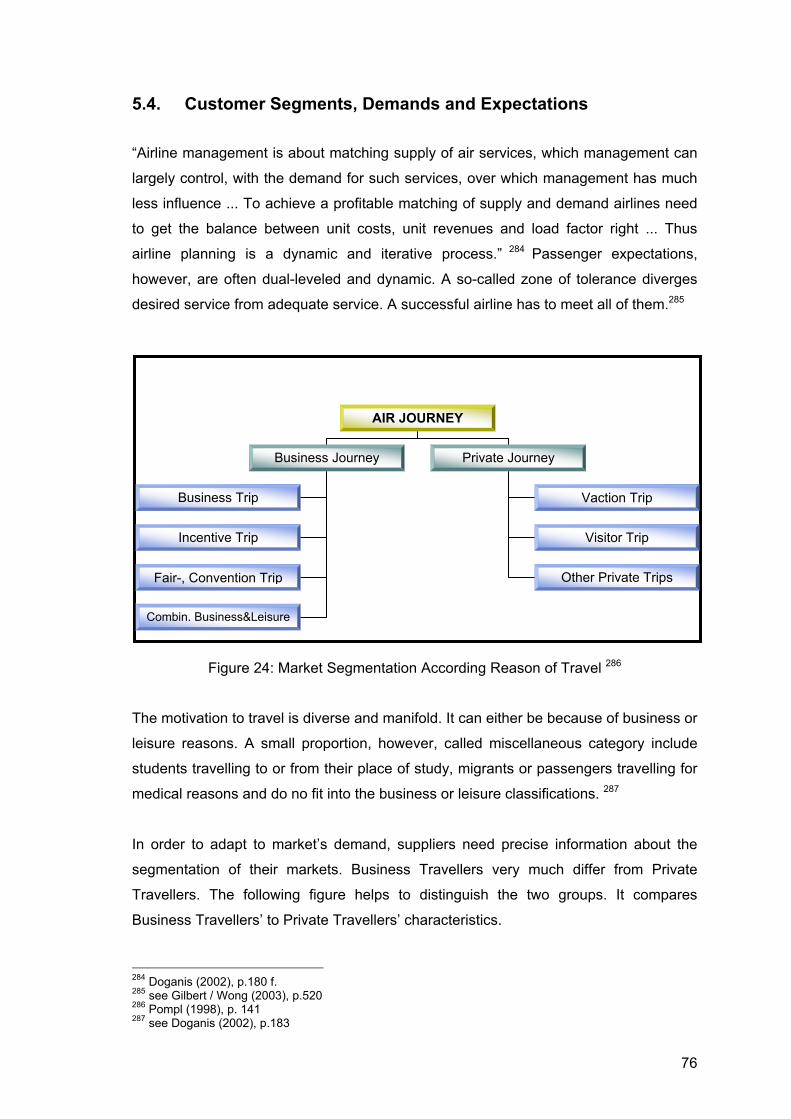
76
5.4. Customer Segments, Demands and Expectations
“Airline management is about matching supply of air services, which management can
largely control, with the demand for such services, over which management has much
less influence ... To achieve a profitable matching of supply and demand airlines need
to get the balance between unit costs, unit revenues and load factor right ... Thus
airline planning is a dynamic and iterative process.” 284 Passenger expectations,
however, are often dual-leveled and dynamic. A so-called zone of tolerance diverges
desired service from adequate service. A successful airline has to meet all of them.285
Figure 24: Market Segmentation According Reason of Travel 286
The motivation to travel is diverse and manifold. It can either be because of business or
leisure reasons. A small proportion, however, called miscellaneous category include
students travelling to or from their place of study, migrants or passengers travelling for
medical reasons and do no fit into the business or leisure classifications. 287
In order to adapt to market’s demand, suppliers need precise information about the
segmentation of their markets. Business Travellers very much differ from Private
Travellers. The following figure helps to distinguish the two groups. It compares
Business Travellers’ to Private Travellers’ characteristics.
284 Doganis (2002), p.180 f. 285 see Gilbert / Wong (2003), p.520 286 Pompl (1998), p. 141 287 see Doganis (2002), p.183
AIR JOURNEY
Business Journey Private Journey
Business Trip
Incentive Trip
Vaction Trip
Visitor Trip
Other Private Trips Fair-, Convention Trip
Combin. Business&Leisure

77
Figure 25: Market-Segmentation 288
“The demand for passenger services arises from the complex interaction of a large
number of factors which affect the different market segments differentially. Those
factors fall broadly into two groups.” 289
Factors affecting the level and growth of passenger demand
Factors affecting all markets Factors affecting particular routes
Level of personal disposable income Level of tourist attraction:
Supply conditions: Scenic/climatic/historical/religious
Fare levels Attributes
Speed of air travel Adequacy of tourist infrastructure
Convenience of air travel Comparative prices
Level of economic activity/trade Exchange rate fluctuations
Population size and growth rate Travel restrictions
Social environment: Historical/cultural links
Length of paid holidays Earlier population movements
Attitudes to travel Current labour flows
Nature of economic activity
Table 20: Factors Affecting the Level and Growth of Passenger Demand 290
288 Maurer (2001), p.276 289 Doganis (2002), p.196 290 Doganis (2002), p. 196
Market-segmentation
Business Traveller Private Traveller
No elasticity towards price
Last minute bookings
Need high level of ticket/flexibility
Expects perfect service&product
Price elastic
Early booking behaviour
Very flexible travelplaning
Often Frequent Flyer
High yield customer
Low yield customer
Economy Class
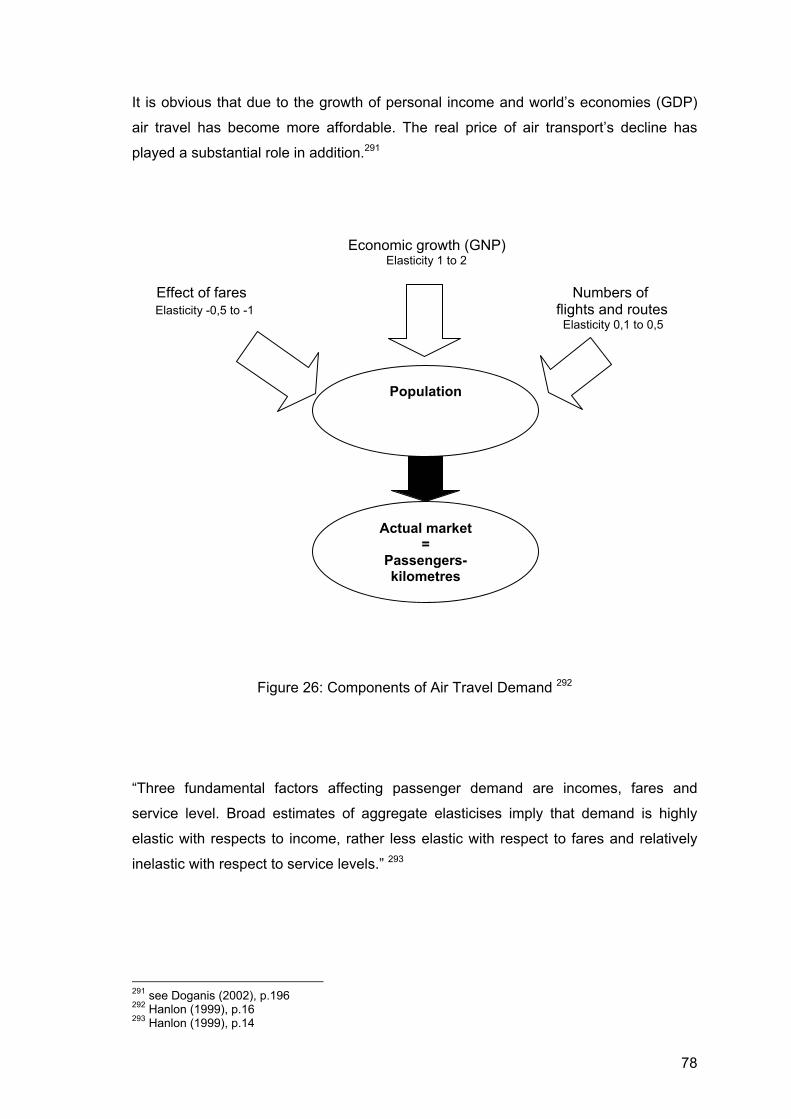
78
It is obvious that due to the growth of personal income and world’s economies (GDP)
air travel has become more affordable. The real price of air transport’s decline has
played a substantial role in addition.291
Economic growth (GNP) Elasticity 1 to 2
Effect of fares Numbers of Elasticity -0,5 to -1 flights and routes
Elasticity 0,1 to 0,5
Figure 26: Components of Air Travel Demand 292
“Three fundamental factors affecting passenger demand are incomes, fares and
service level. Broad estimates of aggregate elasticises imply that demand is highly
elastic with respects to income, rather less elastic with respect to fares and relatively
inelastic with respect to service levels.” 293
291 see Doganis (2002), p.196 292 Hanlon (1999), p.16 293 Hanlon (1999), p.14
Actual market =
Passengers-kilometres
Population

79
A Kansas State University study attempted to explicit model passengers’ heterogeneity
within a discrete choice econometric model of demand for air travel:
Consumer i chooses among J different products offered in market t by competing
airlines. Products are defined as a unique combination of airline and flight itinerary (i.e.
flight Paris – Bangkok on Air France, Paris – Bangkok on Thai Airways or Paris – Dubai
– Bangkok on Emirates; all products are in the same market!). The indirect utility Uijt
that consumer i gets from consuming a product in market t is given by this formula,
where dj are product fixed effects (i.e. in-flight service, frequent flyer programme)
capturing characteristics of the products that are the same across markets, xjt is a
vector of observed product characteristics, βi is a vector of consumer taste parameters
for different product characteristics, pjt is the price for the product J, αi represents
the marginal utility of price, ∆ ξit are differences in unobserved product characteristics
and εijt represents the random component of utility that is assumed independent and
identically distributed across consumers, products and markets. βi and αi are
individual-specific, implying that consumers have different tastes for each product
characteristic. The variables in xjt are “Hub”, “Hub x Distance” and “Distance x Market
t”. 294 If the level of demand exceeds a critical value, the airline decides for a fully
connected network.295
294 Gayle (2004), p. 3 ff. 295 see Pels / Nijkamp / Rietveld (1997), p.8
Uijt = dj + xjt βi – αi pjt + ∆ ξit + εijt

80
Descriptive and influential elements of demand are:
Figure 27: Descriptive and Influential Elements of Demand 296
Yet supply-features do not only affect demand but demand does it also vice versa.
Yield Management defines the value of a traveller – regardless of the journey’s
purpose – with the help of the following parameters:
Figure 28: Customer Value 297
296 Compiled by the autor using Doganis (2002), p.181, p. 198 data 297 Maurer (2001), p.318
DEMAND
● aircraft selection
● route
development
● sheduling
● product planning
● pricing, level of air
fares
● quality of ground
handling
● departure & arrival
times
● aircraft speed
● frequency of
service
● seat availibility
● in-flight service
● advertisement
SUPPLY
SUPPLY
Customer Data
(CRM, FFP)
Value of
Customer
Sales – lead (point of sales
market)
Route
(O&D network)
Class of service
(F,C,Y) ¥ price

81
In addition Yield Management needs to know when customers prefer to make their
reservations.
Figure 29: Booking Behaviour 298
Consequently two groups of travellers use air traffic services: business or leisure
travellers. Their very own reasons of travel allow to distinguish them.299
Customer
ranking
Seat
availability
on demand
High
frequency of
service
Ability to
cancel/
change res.
Stop-over
en route
Inflight
standards &
comfort
Quick
check-
in/check-out
Low
fare
Very
essential 5
4 3 2 Not
essential 1
Emergency business Routine business
Weekend holiday Holidaymaker two-week holiday
Figure 30: Product Demand of the Different Customer Groups 300
298 Sterzenbach / Conrady (2003), p. 346 299 Pompl (1998), p. 141 300 Doganis (2002), p. 189
Number of reservations
Days prior departure 0 365
Business Traveller - - - - Leisure Traveller
82
A Passenger Survey made by the Austrian Airlines Group end of 2003 testified that
approximately 60 % of the airline’s passengers are on a business journey and 40 % on
a leisure trip.301 However, this does not imply that 60% of the tickets sold are business
class fares. Even businesspersons search for low fare tickets – leisure customer
sometimes use miles to get upgrades or indulge themselves with a business class
ticket.
Ostrowski and O’Brien determine that “ survey evidence indicates, for example, that
schedule convenience (especially frequency) is by far the most important factor for
business travellers’ choice of airline and is the second most important feature for
leisure travellers.” 302 “By offering ... scheduling convenient to business needs at a
premium price, carriers can attract the users, but this does cost the airlines money.
Business Travellers are generally much less price-sensitive but exhibit more demands
on quality of service (e.g., in terms of time and frequency of flights, availability of
lounge facilities and frequent flyer bonuses).” 303 They also “value a large service
network more than do leisure travellers and again are willing to pay for this additional
service factor. It reduces their generalized costs of travel.” 304
“The cost of the average business trip is not assessed purely in terms of air fares but
rather in terms of generalized costs. Generalized costs embrace, among other things,
air travel time, time spent in terminals, time spent getting to and from airports, air fares,
money costs of getting to and from the airports, costs of overnight stays and costs of
time wasted due to infrequent flights.” 305
Additionally Stephen Shaw distinguishes between “customer” and “consumers”.
“‘Customers’ are those people who actually travel. ... They make their existence clear
by reporting for flights and their requirements and preferences can be analysed using
questionnaires. ... They may not be decision-makers about things that matter. In
marketing, such decision-makers are defined as ‘Customer’.” 306 Based upon a survey,
64% of the passengers had the ability to make their own airline selection decision.307
301 see Feldkircher (2004), p.1 302 Ostrowski / O’Brien in Button / Stough (2000), p.236 303 Button / Stough (2000), p. 236 304 Button / Stough (2000), p. 239 305 Button / Stough (2000), p.238 306 Shaw (2004), p.8 f. 307 see Cathay Pacific (1999) in Gilbert / Wong (2003), p. 521

83
To have a better understanding about the industrial buying behaviour, we divide a
Decision-Making Unit or DMU into five categories: Deciders: These are people who
make the final purchasing decision. Gatekeepers: People who control the flow of
information into the Decision-Making Unit. Users: People who will actually use the
product or service once it has been purchased. Because of this, they are very
concerned about the quality and utility of the product, and less worried about the cost
of obtaining it. Buyers: People who negotiate the final deal with the different suppliers.
Influencers: People who do not use a product, or become involved in detailed
negotiations with suppliers, but who do influence the final outcome of the buying
process. They can come from both outside and inside a firm. 308
Figure 31: Seize and Shape of Future Air Traffic 309
308 see Shaw (2004), p.12 ff. 309 Wheatcroft (1981), p.104, in : Pompl (1998), p.149
DEMAND IN THE
AIRLINEBUSINESS
SUPPLY IN THE
AIRLINEBUSINESS
Private Demand
Business Demand
Growth in population
GNP Gross National Product
International trade
Generousity in holiday
traffic
Competitive forms of
communication Technical development
Availibility of production factors
Costs
Air-fares
Social Development
Increase of leisure time
Income

84
5.4.1. Business Travel and Business Travellers
Business travellers include not only members of the traditional group such as middle-,
senior management, executives, established lawyers, architects, consultants and other
professionals, but also junior (managerial or professional) staff, supervisory clerical and
skilled (manual) workers nowadays. 310
Business demand is characterized by its variability on time and space and by the
extremely important factor of its high ‘willingness to pay’. Exceptionally, it demonstrates
some resistance to costs, although only for those companies where the cost of travel
makes up a sizeable part of their budgets.” 311 This customer group shows a propensity
for luxury travel. 312 Compared to leisure travellers, business travellers are “less price
sensitive but exhibit more demands on quality of service (e.g. time and frequency of
flights, lounge facilities and frequent flyer bonuses). By offering flexible tickets,
comfortable on- and off-plane amenities and scheduling convenient to business needs
at a premium price, carriers can exploit this willingness to pay.” 313
In terms of flight schedule and revenue, business travel is the most important field of
interest or category for commercial airline industry. Business traveller has to change
his schedule at short notice, he needs to reach his destination as quickly as possible,
on time and directly; in addition he expects flexibility from his airline-ticket. In other
terms the airline has to focus on factors like flexibility, route network and frequency,
when price should play a minor part. 314
A business customer travels for his company’s benefit. The corporation makes the
travel decision, with the ambition to maximise corporate benefit. He represents 33% of
international travel and generally the demand of this group is not very price elastic. 315
Although this group is less price elastic, they are often not free to choose, as
companies tend to limit business travel expenses.“ Airlines use incentives such as
frequent flyer programs and business lounges” 316 , more flexible tariff rules or special
discounts.
310 see Doganis (2002), p.187 311 Ponti (1996), p. 559 312 see Ponti (1996), p. 559 313 Button / Haynes / Stough (1998), p. 23 314 see Sterzenbach (1996), p.140 315 see Bresson / Köhne / Westbrock (2003), p.4 316 Button / Haynes / Stough (1998), p. 24

85
Demand for business travel is related to level of trade, commercial interaction between
two city pairs or the nature of industrial, commercial and other activities in an airport’s
hinterland (i.e. London as a banking and financial centre). 317
With reference to W. Pompl, there are many different categories of Business
Travellers:
Business Traveller ● Hard Money Traveller Independent businessperson travelling at his own expense
● Soft Money Traveller Corporate businessman travelling on an expense account
● Medium Money Traveller Conference or incentive business traveller within a group
● Interim Traveller Combining personal travel with business trip
● Frequent Short Traveller Business traveller who constantly flies a short-haul route
● Periodic Traveller Sales person who makes a round of stops on a steady itinerary
Table 21: Market Segmentation Business Travel 318
Several factors influence the Business Travellers’ decisions for a specific airline and its
hub:319
• Total time of travel • Time of departure
• Frequency • Attractiveness of the connecting airport
• Price of the ticket • Frequent flyer programme
• Minimum connecting time • Quality of connections
• Short connections and ways at the airport
317 see Dognais (2002), p.199 f. 318 IATA (1993), p.73 , in: Pompl (2002), p.190 319 see Mauer (2003), p.305 ; Hanlon (1999), p.146

86
Therefore, Business Travellers’ demands are: 320
a) Schedule (frequency and timings) and Total Travel Time
As their business - schedules might change, business travellers expect high frequency
and convenient departure/arrival times. It is essential for them to have extensive
opportunities. Total travel time is another sales criterion. Due to their expensive value
of time, business travellers do not want to travel 20 hours, if they can choose a flight
with 14 hours of total travel time instead.
Flight Nbr. Routing Dep./Arr./Travel Time BA 186 EWR B LHR 4 0810 1955 6:45 VS 018 EWR B LHR 3 0820 2000 6:40 AA 142 JFK 8 LHR 3 0830 2015 6:45 BA 178 JFK 7 LHR 4 0900 2040 6:40 BA 112 JFK 7 LHR 4 1830 0625+1 6:55 AA 100 JFK 8 LHR 3 1830 0625+1 6:55 CO 018 EWR C LGW S 1840 0640+1 7:00 BA 184 EWR B LHR 4 1850 0635+1 6:45 UA 956 JFK 7 LHR 3 1900 0655+1 6:55 BA 174 JFK 7 LHR 4 1901 0655+1 6:54 AA 122 JFK 8 LHR 3 1905 0655+1 6:50 UA 956 JFK 7 LHR 3 1905 0700+1 6:55 AI 112 JFK 4 LHR 3 1915 0650+1 6:35 VS 004 JFK 4 LHR 3 1930 0710+1 6:40 BA 176 JFK 7 LHR 4 1950 0755+1 7:05 AA 104 JFK 8 LHR 3 1955 0740+1 6:45 CO 028 EWR C LGW S 2030 0830+1 7:00 BA 188 EWR B LHR 4 2040 0820+1 6:40 BA 114 JFK 7 LHR 4 2050 0850+1 7:00 VS 046 JFK 4 LHR 3 2110 0850+1 6:40 AA 132 JFK 8 LHR 3 2115 0900+1 6:45 KU 102 JFK 4 LHR 3 2115 0900+1 6:45 VS 002 EWR B LHR 3 2125 0905+1 6:40 UA 904 JFK 7 LHR 3 2130 0925+1 6:55 BA 116 JFK 7 LHR 4 2150 0950+1 7:00 VS 010 JFK 4 LHR 3 2250 1040+1 6:50 BA 182 JFK 7 LHR 4 2300 1100+1 7:00 AA 116 JFK 8 LHR 3 2355 1140+1 6:45 LHR 4/LGW S – indicate Terminal; +1: arrival the following day
Local times only
Table 22: Non-Stop Flights New York – London 321
320 see Corporate Travel Survey by IATA and OAG Business Travel Lifestyle Survey, in: Shaw (2004) p. 28 ff. ; Maurer (2003), p.335 321 compiled by the author according CRS Amadeus Reservation System data

87
On many long haul routes, an adequate frequency is one daily flight. On denser routes,
double daily flights may be appropriate (European-Asian routes). In few cases, though,
there will be the need for six up to eight flights a day (Europe-USA) which help to
provide adequate customer choice and discourage entry by competitors on short
routes. A big number of flights characterize the prestigious route from London to New
York. The traveller is free to choose the departure time of choice. A flexible ticket
allows the passenger to rebook his flight to any alternative airline. Compared to two
daily flights between Frankfurt and Hong Kong or five daily flights between London and
Hong Kong (examples), high yield passengers are more flexible on the trans-atlantic
route than they are on eastbound flights to Asia. Additionally airlines try to extend
numbers of flights between alliance hubs in order to provide quicker and more
convenient connections.
Today on long haul routes, a significant consideration alongside frequency is that there
should be direct, non-stop flights available to the customer. As manufacturers innovate
aircraft with even longer ranges (Boeing B 767ER, B 777, B7E7 or Airbus’ A 330,
A 340 and future A 380), it has become possible to operate a much greater number of
destinations without any stop.
b) Punctuality
Flight delays mean inconvenience, missed appointments and, perhaps, loss of
customers. As Business Travellers use evening periods for their return, missed
connections of the very last flight always results in an involuntary overnight stay at the
airline’s hub. Even worse is a “miss-connection” to destinations, which are not daily
served. 322 New business destinations like Baku, Yerevan are hardly operated. 323
Therefore, it might happen that they end up at an airport waiting one or more days for
the next connection.
c) Airport Location and Access
Especially on short-haul routes, passengers prefer service from a local, easily
accessible airport, rather than from a more distant (international or national) hub. In the
USA, US major airlines use smaller airports for shorter domestic flights. As New York’s
La Guardia Airport LGA is closer to Manhattan than John F. Kennedy JFK or Newark
322 please see also Connecting Passenger Chapter 323 see CRS Amadeus Reservation System
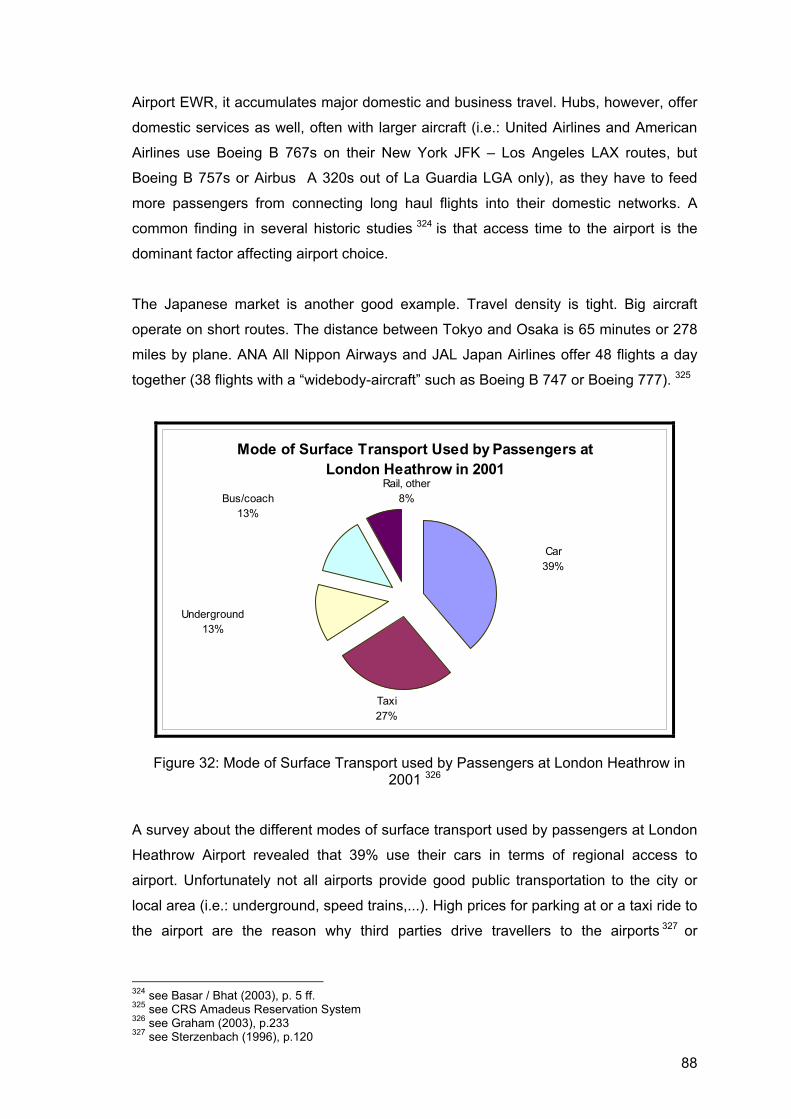
88
Airport EWR, it accumulates major domestic and business travel. Hubs, however, offer
domestic services as well, often with larger aircraft (i.e.: United Airlines and American
Airlines use Boeing B 767s on their New York JFK – Los Angeles LAX routes, but
Boeing B 757s or Airbus A 320s out of La Guardia LGA only), as they have to feed
more passengers from connecting long haul flights into their domestic networks. A
common finding in several historic studies 324 is that access time to the airport is the
dominant factor affecting airport choice.
The Japanese market is another good example. Travel density is tight. Big aircraft
operate on short routes. The distance between Tokyo and Osaka is 65 minutes or 278
miles by plane. ANA All Nippon Airways and JAL Japan Airlines offer 48 flights a day
together (38 flights with a “widebody-aircraft” such as Boeing B 747 or Boeing 777). 325
Mode of Surface Transport Used by Passengers at London Heathrow in 2001
Taxi27%
Underground13%
Bus/coach13%
Rail, other8%
Car39%
Figure 32: Mode of Surface Transport used by Passengers at London Heathrow in 2001 326
A survey about the different modes of surface transport used by passengers at London
Heathrow Airport revealed that 39% use their cars in terms of regional access to
airport. Unfortunately not all airports provide good public transportation to the city or
local area (i.e.: underground, speed trains,...). High prices for parking at or a taxi ride to
the airport are the reason why third parties drive travellers to the airports 327 or
324 see Basar / Bhat (2003), p. 5 ff. 325 see CRS Amadeus Reservation System 326 see Graham (2003), p.233 327 see Sterzenbach (1996), p.120
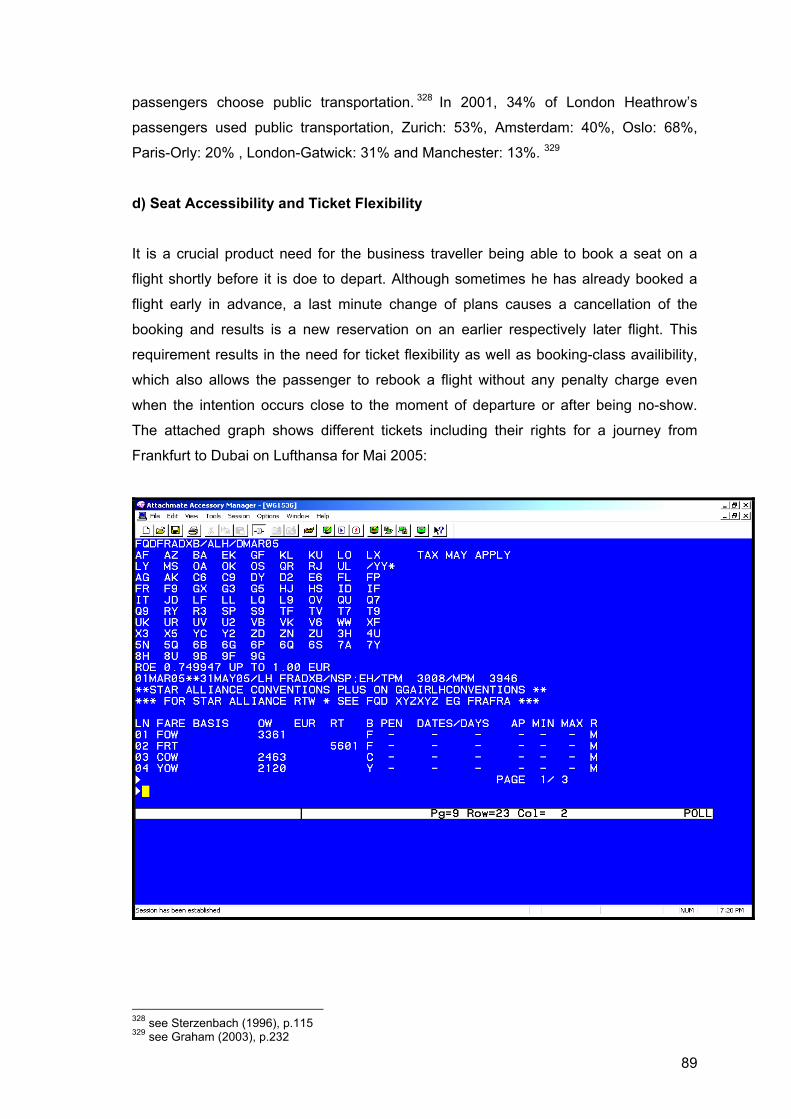
89
passengers choose public transportation. 328 In 2001, 34% of London Heathrow’s
passengers used public transportation, Zurich: 53%, Amsterdam: 40%, Oslo: 68%,
Paris-Orly: 20% , London-Gatwick: 31% and Manchester: 13%. 329
d) Seat Accessibility and Ticket Flexibility
It is a crucial product need for the business traveller being able to book a seat on a
flight shortly before it is doe to depart. Although sometimes he has already booked a
flight early in advance, a last minute change of plans causes a cancellation of the
booking and results is a new reservation on an earlier respectively later flight. This
requirement results in the need for ticket flexibility as well as booking-class availibility,
which also allows the passenger to rebook a flight without any penalty charge even
when the intention occurs close to the moment of departure or after being no-show.
The attached graph shows different tickets including their rights for a journey from
Frankfurt to Dubai on Lufthansa for Mai 2005:
328 see Sterzenbach (1996), p.115 329 see Graham (2003), p.232

90
LN ... Line number
Fare Basis ... Type of Fare (some kind of code for the airline)
OW/RT ... One Way / Round Trip Fare, quoted in EUR, excluding tax and other surcharges
B ... Booking Class: First Class F - Business Class C, D, Z – Economy Class Y, B, M, H, Q, V, W,
PEN ... Penalty: NRF: Non refundable, - : no penalty, + : some penalty applies (i.e.: EUR 125,-
rebooking fee)
Dates/Days ... Valid for a special/selected period only
AP ... Advanced Purchase : Ticket must be issued and paid until x days before departure
MIN ... Minimum Stay : 7 – 7 days, SU – Sunday rule
MAX ... Maximum Stay : 1M – 1 month
Figure 33: Fare Display of a Flight from Frankfurt to Dubai on Lufthansa 330
Total flexibility is available to full fare passengers, who spend between EUR 3.389,-
and 5.601,- (excluding taxes and surcharges) for their flight from Frankfurt to Dubai.
They can even buy their tickets without an advance purchase penalty and airlines sell
these (high yield) seats even, if they are heavily overbooked (booking class is nearly
always available).
330 compiled by the author according CRS Amadeus Reservation System data

91
In addition to that premium frequent travellers get a booking guarantee. Gold
customers do always get a seat in the full fare Economy Class if they make their
booking at least 24 hours before departure with the major alliances. 331
As schedules of premium passengers are tight, some airlines grant them more flexible
minimum check-in times:
Check-in closure British Airways Lufthansa Emirates Air France for int. long distance flights London Heathrow Frankfurt Dubai* Paris First Class & Gold Card 45 min 30 min 60 min 60 minBusiness Class 45 min 30 min 60 min 60 minEconomy Class 120 min 40 min 180 min 60 min* and all other Emirates stations
Table 23: Check-in Closure for International Long Distance Flights 332
A long-haul trip often requires at least three days out of someone’s diary. Finding such
a gap normally takes a great deal of more pre-planning in comparison with a short-haul
flight. Businesspersons accomplish such short-haul flights on a day-return basis.
Therefore, the last-minute availability of a seat is of less importance on a long haul
flight.
e) Frequent Flyer Benefits
According to S. Shaw these benefits can be important building market loyalty. He
admonishes, however, not to exaggerate their impact on short haul routes. As mileage
points on a short journey are quite small, passengers choose flights because of
appropriate departure timing and the availability of a seat. Therefore frequent flyer
miles simply act as a welcome bonus.
On a long haul route, substantial numbers of points are at stake. Travelling Business or
First Class might entitle them to travel free within Europe on some programmes. There
is a greater likelihood of a passenger on a long haul flight choosing the airline whose
frequent flyer programme he is supporting, even if this means travelling earlier or later
than he would ideally likes.
331 see Skyteam (2004), in: http://www.skyteam.com ; Skywards (2004), in: http://www.skywards.com ; Star Alliance (2002) , p.14 ff. 332 Compiled by the author according CRS Amadeus Reservation System data

92
f) Airport Service and Connecting Times
Especially on short flights, time spent at the airport may exceed the flight time.
Business Travellers demand several opportunities as late check-in, separated check-in
areas and ticket counters, fast lanes at passport and security checks, arrival plus
departure lounges, premium baggage service or service centres.
Long-haul passengers tend to check in earlier than those on short trips, presumably
because, with lower frequencies, the penalty of missing a flight will be greater. The
offer of a very late check-in time may therefore be less important. In contrast, though,
lounge facilities will be of greater significance.
Connecting passengers do not want to waste too much time on ground. Therefore
connecting times must be as short as possible on one hand, but long enough to
guarantee transit. The airport itself has to be attractive due to its facilities, general
standard or at least with the help of perfect marketing campaigns.
g) In-Flight Service
In-flight experience may be a crucial one for choice-of-an-airline decisions, even on
routes where flight times are only three-quarters-of-an-hour or so. Nowadays also
European airlines want their passengers to pay for food and beverages on board in
Economy Class on certain flights. Therefore segregation between Business/First 333
and Economy Class is crucial. Airlines must pander to the pride and ego of those who
pay Business Class fares and convince them to do so with perfect in-flight service as
seat comfort or meals.
Seating comfort on board, a separate cabin that allows to sleep and work, meal quality
and in-flight entertainment, all figure prominently in the business traveller’s long haul
expectations. The following trends in the aviation industry are remarkable: In the 90s
some major airlines replaced traditional First and Business Class on long haul routs
with new Business/First Classes. As they were not able to sell First Class seats any
more, they introduced a mixed form of a premium class. Legroom between 120 and
140 cm became the standard in the industry and meal service - equal to traditional First
Class - should convince high yield passengers to travel with airlines like:
333 On US domestic flights you can only find Economy and First Class cabins on narrow body aircraft, as in Europe Business and Economy Class is offered only. First Class seats in the US are more comfortable as they do not use convertible seat systems like European carriers do. They can be compared to the traditional Business Class Seats on long haul routes during the 80s and 90s.
93
Trans World Airlines TWA334, Continental, USAir 335, Air Canada, Austrian Airlines 336,
Delta Airlines, Alitalia, SAS – Scandinavian Airlines System, or TAP – Air Portugal.
New brands should convey a touch of luxury, whether it is TWA’s Trans World One
Class, Continental’s BusinessFirst, Austrian Airlines’ Grand Class or TAP’s Navigator
Class.
One decade later British Airways was the first airline that introduced flat beds or so
called suites in the traditional First Class. Now major airlines like: Qantas, Singapore
Airlines, Swiss Airlines, United Airlines or American Airlines offer such outstanding
suites too. Full reclining beds that are quite similar to the suites can be found on board
of Lufthansa, Air France, Iberia, ANA – All Nippon Airlines or JAL – Japan Airlines.
Market leader was Emirates, who introduced separated and lockable cubes, in order to
guarantee real private atmosphere on board of the airline’s latest aircraft. So the airline
is the only one, which offers “room service in the sky”. 337
In the same decade some airlines upgraded their traditional Business Class, using
attractive marketing campaigns. British Airways again perfectly knew how to create a
new trend, after airlines like Air New Zealand or Eva Air had been successful with this
idea before. More legroom or even -nearly- full reclining seats aimed to attract high
yield passengers. Lufthansa or ANA – All Nippon Airlines soon followed. Not all
passengers, however, are able to pay Business Class Fares on long haul routes.
However, they demand some extra legroom, space to work and service for a small or
extra additional charge. British Airways calls this Premium Economy Class “World
Traveller Plus” on its long haul network, which includes more legroom, hand-baggage
and mileage. Air France offers its Economy Full Fare Passengers on routes to Europe,
North Africa and Israel a separate cabin called Tempo Challenge.338 United Airlines
introduced Economy Plus on its North American flights (incl. Canada, Puerto Rico,
Mexico and Central America) providing extended legroom. Seats are available to all
“Mileage Plus” 339 members with Premier status or higher and full fare Economy ticket
holders on a first come, first served basis. 340
334 filed bankruptcy and was bought by American Airlines 335 now US Airways 336 now Austrian 337 see APA (2004b), in: http://www.apa-defacto.at; Vorne Sitzen (2004b): First Class, in: http://www.vorne-sitzen.de/cgi-bin/dbn/playout.pl?Out=sfs_vs_fc.html 338 see Air France (2002), p.24 339 Mileage Plus is United Airlines’ frequent flyer programme 340 see United Airlines (2001), p. 13
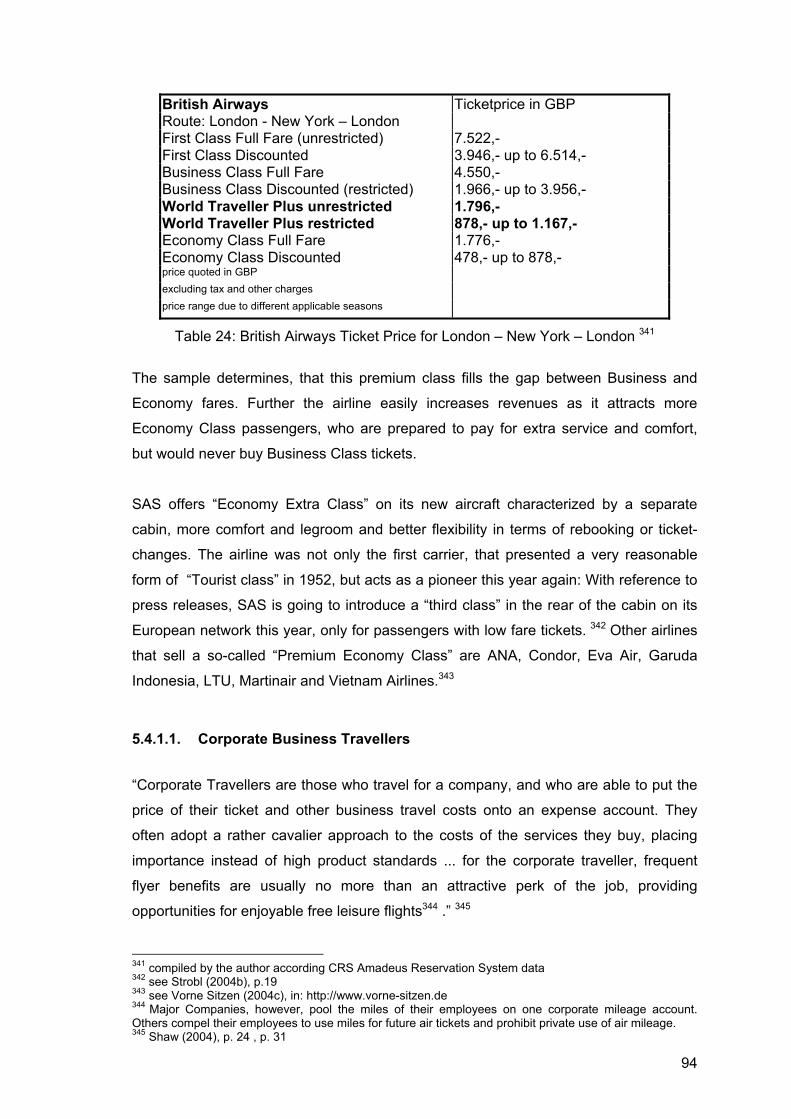
94
British Airways Ticketprice in GBP Route: London - New York – London First Class Full Fare (unrestricted) 7.522,- First Class Discounted 3.946,- up to 6.514,- Business Class Full Fare 4.550,- Business Class Discounted (restricted) 1.966,- up to 3.956,- World Traveller Plus unrestricted 1.796,- World Traveller Plus restricted 878,- up to 1.167,- Economy Class Full Fare 1.776,- Economy Class Discounted 478,- up to 878,- price quoted in GBP excluding tax and other charges price range due to different applicable seasons
Table 24: British Airways Ticket Price for London – New York – London 341
The sample determines, that this premium class fills the gap between Business and
Economy fares. Further the airline easily increases revenues as it attracts more
Economy Class passengers, who are prepared to pay for extra service and comfort,
but would never buy Business Class tickets.
SAS offers “Economy Extra Class” on its new aircraft characterized by a separate
cabin, more comfort and legroom and better flexibility in terms of rebooking or ticket-
changes. The airline was not only the first carrier, that presented a very reasonable
form of “Tourist class” in 1952, but acts as a pioneer this year again: With reference to
press releases, SAS is going to introduce a “third class” in the rear of the cabin on its
European network this year, only for passengers with low fare tickets. 342 Other airlines
that sell a so-called “Premium Economy Class” are ANA, Condor, Eva Air, Garuda
Indonesia, LTU, Martinair and Vietnam Airlines.343
5.4.1.1. Corporate Business Travellers
“Corporate Travellers are those who travel for a company, and who are able to put the
price of their ticket and other business travel costs onto an expense account. They
often adopt a rather cavalier approach to the costs of the services they buy, placing
importance instead of high product standards ... for the corporate traveller, frequent
flyer benefits are usually no more than an attractive perk of the job, providing
opportunities for enjoyable free leisure flights344 .” 345
341 compiled by the author according CRS Amadeus Reservation System data 342 see Strobl (2004b), p.19 343 see Vorne Sitzen (2004c), in: http://www.vorne-sitzen.de 344 Major Companies, however, pool the miles of their employees on one corporate mileage account. Others compel their employees to use miles for future air tickets and prohibit private use of air mileage. 345 Shaw (2004), p. 24 , p. 31
95
5.4.1.2. Independent Business Travellers
“Independent business travellers, on the other hand, are those who are self-employed
or who work for small companies. These people feel to a much greater degree that the
price of an air ticket is coming out of their own pocket ... “ 346 “With independent
business travellers, the fundamental needs remain exactly the same in terms of
frequency, timings, safety, punctuality, seat accessibility and ticket flexibility. Price,
though, assumes a greater significance than in the corporate market. The independent
traveller will trade off cheaper ticket prices against product frills such as standards of
seating comfort, free drinks and in-flight meals ... for the independent traveller free
flights are much more commonly used for business travel purposes and provide a
welcome opportunity to reduce expenditure on air tickets.” 347
5.4.2. Leisure Travel and Leisure Travellers
Leisure travellers are most strictly related to earnings. Their demand grows in relation
to optional income (e.g. income that exceeds essential consumption) and the
availability of free time. 348 “The most significant socio-economic variable affecting the
demand for leisure travel is personal or household income, since leisure trips are paid
by the passenger, who may also be paying for a spouse and one or more children.” 349
Lowest price enjoy highest priority over short-term availability, flexibility and frequency.
Nevertheless safety is the most important criterion for this passenger group at all.350
Leisure travellers have different kinds of motivation: 351
● Volatility driven orientation: the traveller tries to escape.
● Adventure driven orientation: the traveller wants to be away (from home or in motion)
● Destination driven orientation: the traveller aims to arrive at a certain destination
Their travel ambitions are personal and maximise their own utility. Leisure travellers
represent 66% of international travel. Their demand is very price elastic. 352
346 Shaw (2004), p. 24 , p. 31 347 Shaw (2004) p. 31 348 see Ponti (1996), p. 559 349 Doganis (2002), p. 187 350 see Sterzenbach (1996), p. 140 f. 351 see Opaschowski (2000), p.36 f. 352 see Bresson / Köhne / Westbrock (2003), p.4

96
Several factors characterize leisure travellers: 353 Origin, fortune, level of education,
fields of interests, need for beach&sun, need for cultural sights, etc. and are the
explanation for the rising demand for “inclusive tours 354”. Leisure mobility is based
upon time, money, motorization plus thirst for adventure; and lead to three different
forms of leisure traffic: 355
● Day trip traffic (return flight on the same day, without the need for a hotel)
● Short trip traffic (short trips up to a length of 4 days)
● Vacation traffic (holiday trip with 5 days minimum)
Lufthansa affirmed that 45% of its schedule flights’ (charter flights excluded) customers
are leisure travellers: 356
Kind of Travellers on Board of Lufthansa Schedule Flights
Leisure Travellers;
45%Business Travellers;
55%
Figure 34: Kind of Travellers on Board of Lufthansa Schedule Flights 357
In contrast to business travel, “leisure travel is also related to taste. Tourist destinations
can inexplicably fall into or out of favour.” 358
353 see Hoggart (2000), p. 4 354 Inclusive Tour (IT) is a holiday package where a single charge includes travel, hotel accomodation and possible local ground transports, etc. Selling agent is an intermediary such as a tour operator, travel agent or student union. 355 see Opaschowski (2000), p. 24 356 see Lenz (2000), p. 91 357 see Lenz (2000), p. 91 358 Doganis (2002), p. 199
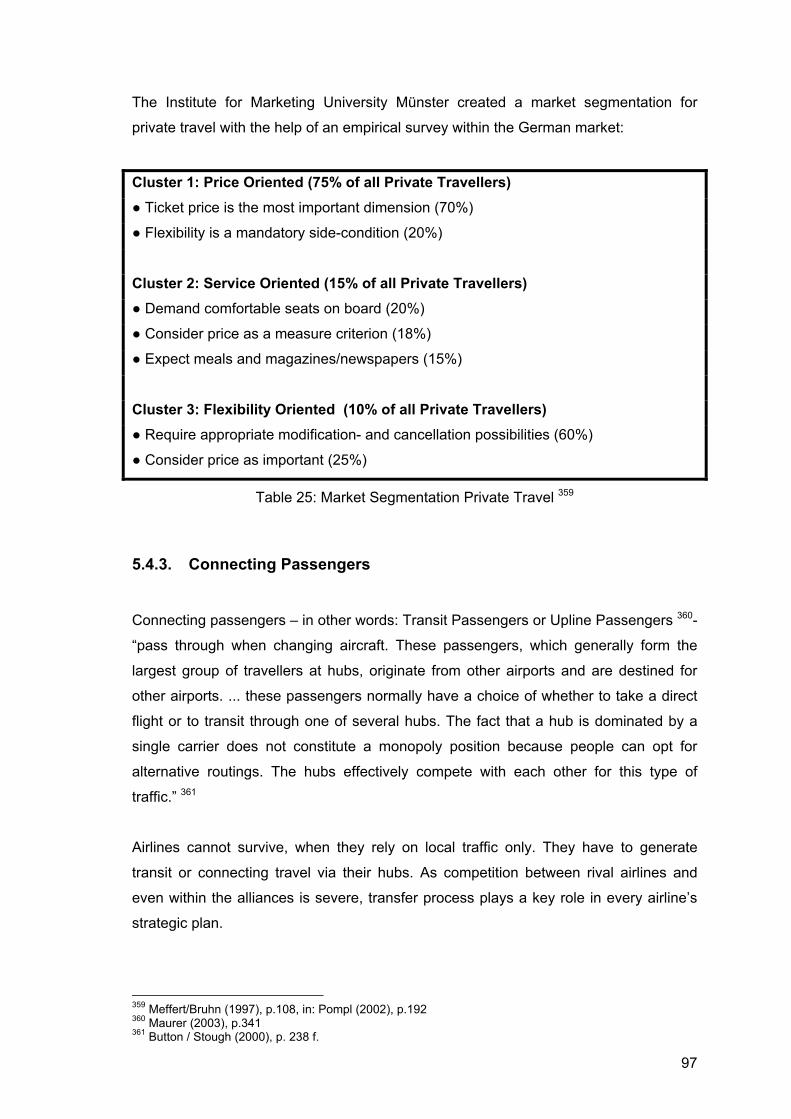
97
The Institute for Marketing University Münster created a market segmentation for
private travel with the help of an empirical survey within the German market:
Cluster 1: Price Oriented (75% of all Private Travellers) ● Ticket price is the most important dimension (70%)
● Flexibility is a mandatory side-condition (20%)
Cluster 2: Service Oriented (15% of all Private Travellers) ● Demand comfortable seats on board (20%)
● Consider price as a measure criterion (18%)
● Expect meals and magazines/newspapers (15%)
Cluster 3: Flexibility Oriented (10% of all Private Travellers) ● Require appropriate modification- and cancellation possibilities (60%)
● Consider price as important (25%)
Table 25: Market Segmentation Private Travel 359
5.4.3. Connecting Passengers
Connecting passengers – in other words: Transit Passengers or Upline Passengers 360-
“pass through when changing aircraft. These passengers, which generally form the
largest group of travellers at hubs, originate from other airports and are destined for
other airports. ... these passengers normally have a choice of whether to take a direct
flight or to transit through one of several hubs. The fact that a hub is dominated by a
single carrier does not constitute a monopoly position because people can opt for
alternative routings. The hubs effectively compete with each other for this type of
traffic.” 361
Airlines cannot survive, when they rely on local traffic only. They have to generate
transit or connecting travel via their hubs. As competition between rival airlines and
even within the alliances is severe, transfer process plays a key role in every airline’s
strategic plan.
359 Meffert/Bruhn (1997), p.108, in: Pompl (2002), p.192 360 Maurer (2003), p.341 361 Button / Stough (2000), p. 238 f.

98
“The requirements of the connecting passenger are, ..., a mixture of those which
prevail in the short-haul and long-haul point-to-point markets. The connecting
passenger requires a high frequency of flights in exactly the same ways as the point-to-
point market does. It requires a spread of flights throughout the day, because long-haul
flights depart from a hub at different times, while point-to-point traveller requires peaks
early and late in the business day.” 362 Following, several examples show the varying
strategies of transfer traffic systems to illustrate its importance.
“The classic example in the United States is at Hartsfield Airport in Atlanta ... with 600
daily departures. More than 20 000 Delta Airlines passengers change planes in Atlanta
each day ... Each of Delta’s arriving and departing waves consists of over 50 aircraft,
requiring all four runways to be used simultaneously ... Each pair of arriving and
departing waves is known as a ‘complex’. The scheduled duration of each complex –
from the time the first aircraft lands to the time the last aircraft takes off – is no more
than 90 minutes ... Each complex in Atlanta generates a total of 2 500 possible city pair
linkages.” 363
Figure 35: Connections Through Singapore May 1993 364
362 Shaw (2004), p.33 363 Hanlon (1999), p.95 364 Hanlon (1999), p.96
SINGAPORE
London
Paris
Manchester
AmsterdamFrankfurt
Copenhagen
Athens
ViennaZurichRome
Berlin
Sydney
Adelaide Christchurch
AucklandBrisbanePerth Melbourne Darwin
Arrivals from Europe : 1600 - 1800 Departures to Europe : 2300 - 2345
Arrivals from Australia:2030 - 2130 Departures to Australia: 2000 - 2130
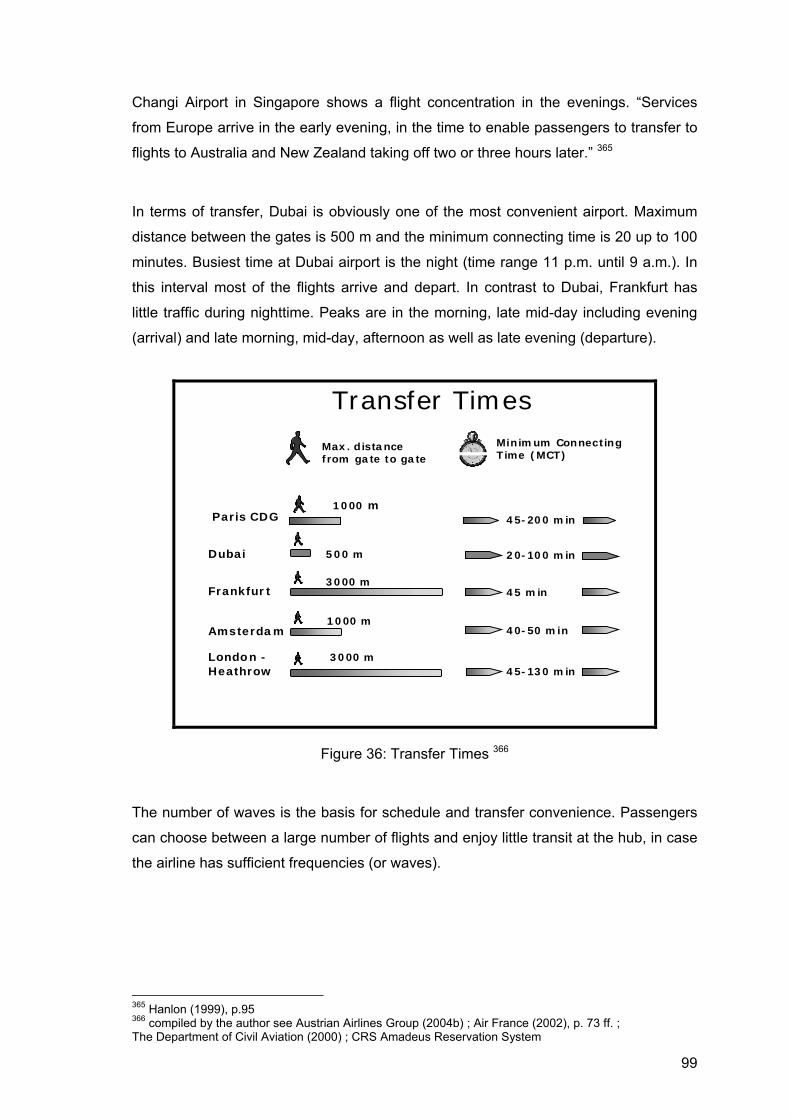
99
Changi Airport in Singapore shows a flight concentration in the evenings. “Services
from Europe arrive in the early evening, in the time to enable passengers to transfer to
flights to Australia and New Zealand taking off two or three hours later.” 365
In terms of transfer, Dubai is obviously one of the most convenient airport. Maximum
distance between the gates is 500 m and the minimum connecting time is 20 up to 100
minutes. Busiest time at Dubai airport is the night (time range 11 p.m. until 9 a.m.). In
this interval most of the flights arrive and depart. In contrast to Dubai, Frankfurt has
little traffic during nighttime. Peaks are in the morning, late mid-day including evening
(arrival) and late morning, mid-day, afternoon as well as late evening (departure).
Max. distancefrom gate to gate
Dubai 500 m
Amsterdam1000 m
London -Heathrow
3000 m
Frankfurt3000 m
Minimum Connecting Time (MCT)
20-100 min
40-50 min
45-130 min
45 min
Transfer Times
1000 mParis CDG 45-200 min
Figure 36: Transfer Times 366
The number of waves is the basis for schedule and transfer convenience. Passengers
can choose between a large number of flights and enjoy little transit at the hub, in case
the airline has sufficient frequencies (or waves).
365 Hanlon (1999), p.95 366 compiled by the author see Austrian Airlines Group (2004b) ; Air France (2002), p. 73 ff. ; The Department of Civil Aviation (2000) ; CRS Amadeus Reservation System

100
Arrival and Departure Waves of all Emirates operated flights at Dubai
02468
101214
05:0
0-05
:30
06:0
0-06
:30
07:0
0-07
:30
08:0
0-08
:30
09:0
0-09
:30
10:0
0-10
:30
11:0
0-11
:30
12:0
0-12
:30
13:0
0-13
:30
14:0
0-14
:30
15:0
0-15
:30
16:0
0-16
:30
17:0
0-17
:30
18:0
0-18
:30
19:0
0-19
:30
20:0
0-20
:30
21:0
0-21
:30
22:0
0-22
:30
23:0
0-23
:30
00:0
0-00
:30
01:0
0-01
:30
02:0
0-02
:30
03:0
0-03
:30
04:0
0-04
:30
Time
Num
ber o
f flig
hts
Departure Arrival
Figure 37: Arrival and Departure Waves of all Emirates operated flights at Dubai 367
Arrival and Departure Waves of all Lufthansa operated flights at Frankfurt
0
5
10
15
20
25
30
05:0
0-05
:30
06:0
0-06
:30
07:0
0-07
:30
08:0
0-08
:30
09:0
0-09
:30
10:0
0-10
:30
11:0
0-11
:30
12:0
0-12
:30
13:0
0-13
:30
14:0
0-14
:30
15:0
0-15
:30
16:0
0-16
:30
17:0
0-17
:30
18:0
0-18
:30
19:0
0-19
:30
20:0
0-20
:30
21:0
0-21
:30
22:0
0-22
:30
23:0
0-23
:30
Time
Num
ber o
f flig
hts
Departure Arrival
Figure 38: Arrival and Departure Waves of all Lufthansa operated flights at Frankfurt 368
367 compiled by the author according Emirates (2004b) data 368 compiled by the author according Lufthansa (2004c) data

101
In 2002 Austrian Airlines introduced a new traffic system. A fourth and fifth frequency
helped the airline to generate more traffic from West Europe to its Vienna hub.
EAST EUROPERoundtrip
OW
1900
2000
1600
1700
1800
2200
900
1000
1100
700
800
1200
1300
1400
WEST EUROPE Nightstop
WEST EUROPE Nightstop
WEST EUROPEMorning-Roundtrip
WEST EUROPEEv ening-Roundtrip
MIDDLE EASTRoundtrip
Hubstructure Vienna-Trafficsystem 2000 by Austrian Airlines
2200
700
800
Figure 39: Hubstructure Vienna Trafficsystem 2000 369
OW
1900
2000
1600
1700
1800
2200
900
1000
1100
700
800
1200
1300
1400WEST EUROPE
5thFrequence
WEST EUROPE 4thFrequence
Hubstructure Vienna-Trafficsystem 2002 by Austrian Airlines
4th & 5th Frequence
WEST EUROPE Nightstop
WEST EUROPE Nightstop
WEST EUROPEMorning-Roundtrip
WEST EUROPEEv ening-Roundtrip
EAST EUROPERoundtrip
MIDDLE EASTRoundtrip
Figure 40: Hubstructure Vienna Trafficsystem 2002 370
369 Austrian Airlines Group (2002) 370 Austrian Airlines Group (2002)

102
“Punctuality assumes even greater importance for the connecting passenger. A delay
of an hour to a connecting passenger’s flight into a hub may result in the long-haul
flight being missed. This may cause an actual delay of a day or more, on routes which
are only served at a comparatively low frequency.” 371
The following graph shows all departure times of OS 94’s connecting passengers.
Austrian Airlines’ flight OS 94 from Washington D.C. to Vienna on 15. December
arrived in Vienna at 9.00 a.m. local time with 167 transit passengers 372 on board. The
first downline passenger373 left Vienna at 10.00 a.m with flight OS 137 to Nuremberg,
the last one at 10.15 p.m. on board of OS 641 to Yerevan.
Figure 41: Transit Passengers on Flight OS 94 Washington – Vienna 15th Dec. 2004
part 1 374
On board of flight OS 94 was a total load of 246 passengers, with 68 % transit
bookings. For only 79 passengers Vienna was the final destination respectively onward
flights were booked in a separate PNR. Most popular connecting destinations were
New Delhi and Pristina that day.
371 Shaw (2004), p.33 372 CRS Amadeus Reservation System shows only connecting flights that are booked in the same PNR-Passenger Name Record 373 Maurer (2003), p.341 374 compiled by the author according CRS Amadeus Reservation System data
OS
94 1
5. D
ecem
ber 2
004
Was
hing
ton
D.C
. – V
ienn
a ar
rival
: 9.0
0 a.
m.
Transit passengers’ booked connecting flights leave Vienna at….
10.00 11.00 16.15 10.05 11.05 10.10 17.10 10.15 12.55 17.30 10.20 10.25 13.25 22.15 10.30 13.30 10.35 13.35 10.40 13.40 10.45 10.50 15.10 10.55

103
1
9
1 3
5
22
5
1 2 3 3
53 1 2
10
1 1
4 6 5
1
15
1
84 1 3 3 3 2
9 8 81 1
6
79
0
10
20
30
40
50
60
70
80
AMS
BEG
BUD
CAI
DAM DEL
DN
KD
XB ESB
EVN
GR
ZKB
PKI
VKL
UKS
CKT
MLN
ZM
UC
NU
EO
DS
OTP
PRG
PRN
RIX
SJJ
SKG
SKP
SOF
SVO
TBS
TGD
TIA
TLV
TSR
TXL
WA
ZAG
VIE*
Transit-passengers flight OS 94 Washington D.C. - Vienna 15. December 2004 - 246 passengers
Figure 42: Transit Passengers on Flight OS 94 Washington – Vienna 15th Dec. 2004
part 2 375
Sterzenbach verifies this high level of transit passengers: Hub airlines have increased
this level from 10% in the 80s up to 70% today. 376 Eventually “complexing of flight
schedules ensures that the probability of the first outgoing service to any particular
destination being by the same airline as the delivering flight is disproportionately high.
Interlineable fares, involving transfer from one airline to another, therefore become no
longer necessary.” 377
5.4.4. Local Passengers
Local Passengers are a “group of travellers, those residing at a hub airport city, are
open to exploitation. They have no choice in terms of using the hub as an origin and
return destination for their trips; they are in a sense captive. The concern is whether
direct fares to and from hub airports are excessively high due to the lack of competition
with other hub based airline networks.” 378
375 compiled by the author according CRS Amadeus Reservation System data 376 see Darrow / Leimkuhler / Smith (1992), p.15 in Sterzenbach (1996), p. 312 377 Doganis (2002), p.255 378 Button / Stough (2000), p. 239

104
However, “the value of frequent flyer mileage is greatest for residents of a city that
serves as the hub for a large hug-and-spoke network because it translates into
convenient free travel to a multitude of destinations.” 379 Additionally “residents living in
the region around a hub airport enjoy advantage of having a range of destinations open
to them that exceeds those in comparable regions without a hub. In economic terms,
residents enjoy external benefits from having transit passengers passing through their
local airport that allow them access to a major scheduled air transport network.”380
Passengers have to accept a “hub premium” for a better “service” and higher number
of destination, which is used to reduce feeder flight fares. In practice, the price charged
on a leg can even exceed the price charged on a path including the leg, as interhub
competition and lack of competition on spoke markets exist. An airline compensates
passengers with higher frequencies or via the price for indirect travels. According to the
FAA, “for people who live close to the hub airport, hubbing is beneficial because many
non-stop flights are available to many cities that would not otherwise be able to support
such service.” 381
5.5. Empirical Findings
Measurement’s focus is on transit travel via Frankfurt (LH), Paris CDG (AF), London
Heathrow (BA) and Dubai (EK). All or at least the majority of the selected airlines have
to serve the arrival and departure destinations in this benchmark. In a few cases
competitive airlines were not able to offer any connection via their home hubs or do not
even serve a destination (i.e. there is no possible connection between Moscow and
Delhi on British Airways or British Airways-One World code share flight). In this case
the box is left blank and does not show any value. If an airline cannot offer any
connection, there is no price published on this route, except the IATA standard tarif,
which is applicable to all carriers on the same route. This is the reason, why selected
price boxes are without a value. Origin cities are: Rome (FCO), Athens (ATH), Zurich
(ZRH), Dusseldorf (DUS), Munich (MUC), Istanbul (IST), Manchester (MAN), Moscow
(SVO or DME 382 ), Nice (NCE), Glasgow (GLA), Vienna (VIE) and Milan (MXP).
Destination cities are: Bangkok (BKK), Shanghai (PVG), Osaka (KIX), Hong Kong
(HKG), Singapore (SIN), Delhi (DEL) and Mumbai (BOM).
379 Button / Stough (2000), p. 239 380 Button / Stough (2000), p. 239 381 FAA (1991), p.6, in: Button / Stough (2000), p.239 382 BA and EK serve DME; AF and LH serve SVO
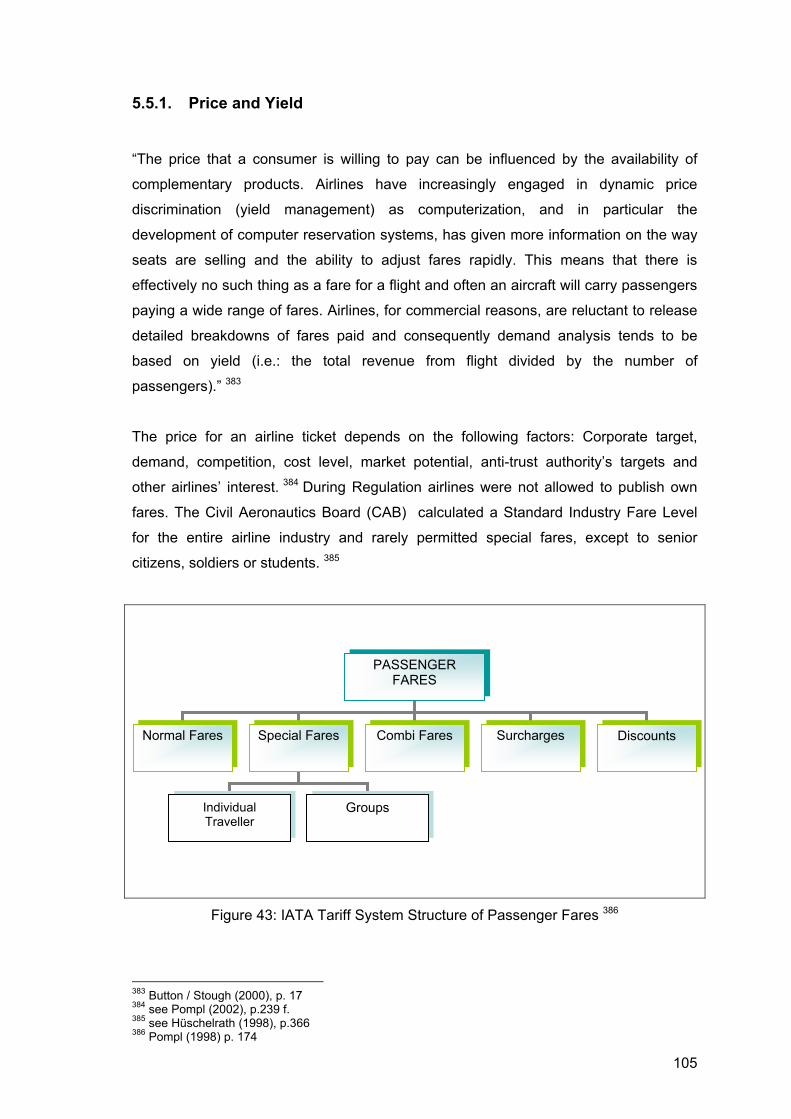
105
5.5.1. Price and Yield
“The price that a consumer is willing to pay can be influenced by the availability of
complementary products. Airlines have increasingly engaged in dynamic price
discrimination (yield management) as computerization, and in particular the
development of computer reservation systems, has given more information on the way
seats are selling and the ability to adjust fares rapidly. This means that there is
effectively no such thing as a fare for a flight and often an aircraft will carry passengers
paying a wide range of fares. Airlines, for commercial reasons, are reluctant to release
detailed breakdowns of fares paid and consequently demand analysis tends to be
based on yield (i.e.: the total revenue from flight divided by the number of
passengers).” 383
The price for an airline ticket depends on the following factors: Corporate target,
demand, competition, cost level, market potential, anti-trust authority’s targets and
other airlines’ interest. 384 During Regulation airlines were not allowed to publish own
fares. The Civil Aeronautics Board (CAB) calculated a Standard Industry Fare Level
for the entire airline industry and rarely permitted special fares, except to senior
citizens, soldiers or students. 385
Figure 43: IATA Tariff System Structure of Passenger Fares 386
383 Button / Stough (2000), p. 17 384 see Pompl (2002), p.239 f. 385 see Hüschelrath (1998), p.366 386 Pompl (1998) p. 174
PASSENGER FARES
Normal Fares Special Fares Combi Fares Surcharges Discounts
Individual Traveller
Groups
106
Until 1978 all members of the International Air Transport Association (IATA) agreed to
fixed fares that were binding to all members and consequently prevented any kind of
fare-competition or price dumping between members. 387
IATA Interlining is the mutual acceptance of tickets including clearing of reciprocal
liabilities with the help of IATA Clearing House in Geneva. From this very moment an
airline is not limited to the sale of its own tickets. Airlines now accept passengers with
tickets from other competitors too. 388 (i.e. American Airlines in Chicago issued a ticket
for : Chicago – London Frankfurt vv. on an American Airlines document: 001 389 .
Lufthansa accepts the passenger on the London – Frankfurt flight, because of the
interlining agreement between these two carriers).
IATA introduced three tariff-areas: 390
• North-, Middle- and South America
• Europe, Africa and Middle East
• Asia, Australia and Oceania
Fares were valid for two years on a basis of a special cost allocation base: 391
• Length of the route
• Volume of traffic
• Fuel price
• Airport taxes
• Competitive pressure of alternative carriers (i.e. rail, road, water,...)
1978’s Deregulation Act, however, brought many changes, including the ones on fares.
“The effect of these new liberal agreements on fares, number of carriers and traffic
growth was dramatic. Where new airlines entered routes previously operated by only
two carriers, normally one from each country, fares dropped significantly. The lower
fares and the new entrants in turn stimulated traffic growth. In 1983 ... the cheapest
London – Amsterdam fare was an advance purchase fare of GBP 82,- return and only
three other reduced fares were available. Within two years of the new bilateral, fifteen
different discount fares were available and the lowest was GBP 55,- return.” 392
387 see Joppien ( 2003), p. 256 ; Sterzenbach / Conrady (2003), p. 52 ff. 388 see Joppien ( 2003), p. 256 ; Sterzenbach / Conrady (2003) p. 52 ff. 389 American Airlines’ documents are characterized by an 001 prefix 390 see Joppien ( 2003), p. 257 ; Sterzenbach (1996), p. 289 391 see Joppien ( 2003), p. 257 392 see Doganis (2001), p. 27
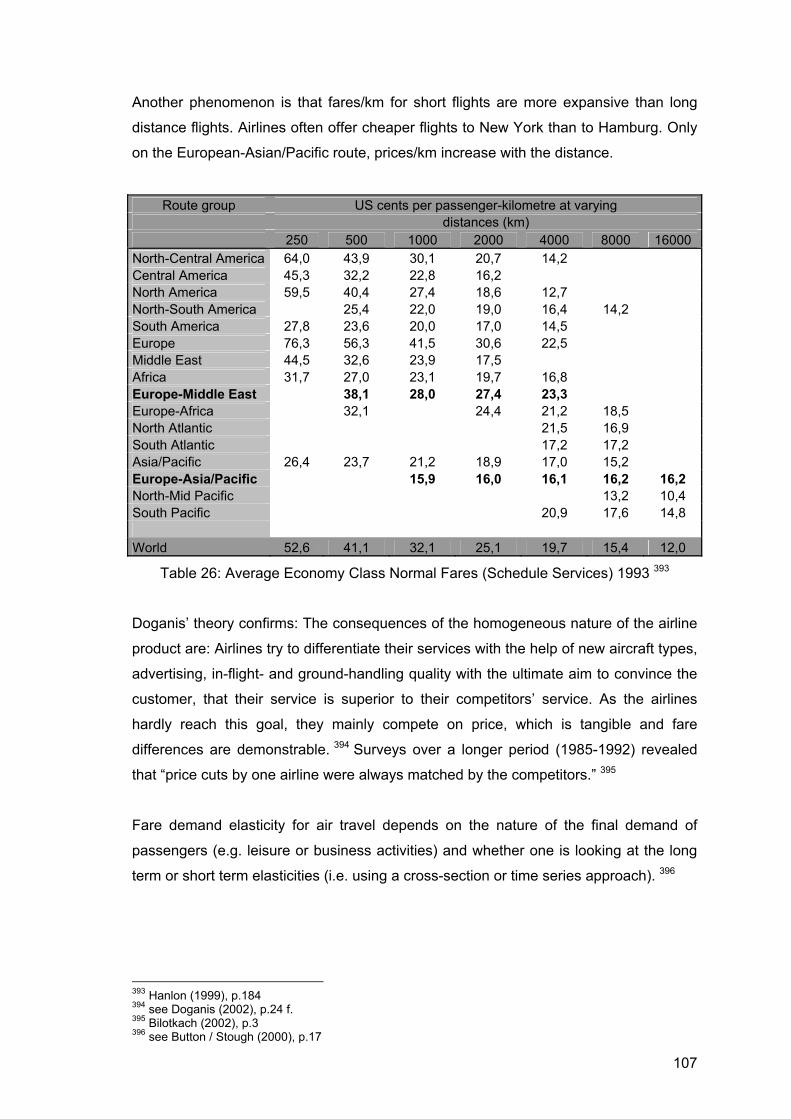
107
Another phenomenon is that fares/km for short flights are more expansive than long
distance flights. Airlines often offer cheaper flights to New York than to Hamburg. Only
on the European-Asian/Pacific route, prices/km increase with the distance.
Route group US cents per passenger-kilometre at varying distances (km) 250 500 1000 2000 4000 8000 16000
North-Central America 64,0 43,9 30,1 20,7 14,2 Central America 45,3 32,2 22,8 16,2 North America 59,5 40,4 27,4 18,6 12,7 North-South America 25,4 22,0 19,0 16,4 14,2 South America 27,8 23,6 20,0 17,0 14,5 Europe 76,3 56,3 41,5 30,6 22,5 Middle East 44,5 32,6 23,9 17,5 Africa 31,7 27,0 23,1 19,7 16,8 Europe-Middle East 38,1 28,0 27,4 23,3 Europe-Africa 32,1 24,4 21,2 18,5 North Atlantic 21,5 16,9 South Atlantic 17,2 17,2 Asia/Pacific 26,4 23,7 21,2 18,9 17,0 15,2 Europe-Asia/Pacific 15,9 16,0 16,1 16,2 16,2 North-Mid Pacific 13,2 10,4 South Pacific 20,9 17,6 14,8 World 52,6 41,1 32,1 25,1 19,7 15,4 12,0
Table 26: Average Economy Class Normal Fares (Schedule Services) 1993 393
Doganis’ theory confirms: The consequences of the homogeneous nature of the airline
product are: Airlines try to differentiate their services with the help of new aircraft types,
advertising, in-flight- and ground-handling quality with the ultimate aim to convince the
customer, that their service is superior to their competitors’ service. As the airlines
hardly reach this goal, they mainly compete on price, which is tangible and fare
differences are demonstrable. 394 Surveys over a longer period (1985-1992) revealed
that “price cuts by one airline were always matched by the competitors.” 395
Fare demand elasticity for air travel depends on the nature of the final demand of
passengers (e.g. leisure or business activities) and whether one is looking at the long
term or short term elasticities (i.e. using a cross-section or time series approach). 396
393 Hanlon (1999), p.184 394 see Doganis (2002), p.24 f. 395 Bilotkach (2002), p.3 396 see Button / Stough (2000), p.17

108
There is some evidence that the estimated elasticities vary by fare class (first class,
standard economy and discount) and by distance. This corresponds to the intuitive
notion that price-sensitive leisure travellers form the majority of long distance
passengers while less price sensitive business travellers make short journeys. 397
Time series Cross-section Others*
Leisure travel 0.40 – 1.98, 192 1.52 1.40 – 3.30, 2.20-4.6
Business travel 0.65 1.15 0.90
Mixed or unknown
0.82, 0.91, 0.36 - 1.81 1.12 - 1.28, 1.48
0.76 – 0.84, 1.39, 1.63, 1.85, 2.83 - 4.51
0.53 – 1.00, 1.80 – 1.90
Ranges of estimates from –0.4 to 4.51 are used with reference to the Marshallian demand elasticities.
Table 27: Demand Elasticities of Air Passenger Travel 398
“The data in the table confirms that the demand for business travel is less sensitive to
fare changes than is the demand for leisure travel. It is not only fare that can be
important in determining demand, ..., factors such as ‘bonuses’ associated with
frequent flyer programs may also be important.” 399 “Simply looking at fares charged by
traffic originating from a hub airport compared with other non-hubs can be misleading.
Full allowance must be made for a variety of factors, including the following:
• On average, yield (i.e. fare per mile) falls with distance travelled reflecting the
importance of take-off and landing costs in the overall costs of air travel. The differing
average flight lengths from airports need controlling for.
• Carriers offer different levels of service, and strict comparisons should therefore
compare the fares of a carrier at a concentrated hub with fares of the same carrier
elsewhere.
• flights can involve a number of segments (even if a passenger is originating from a
hub) and this should be allowed for.
• When comparing airports, it is important to look at the type of competition a carrier is
confronted with; e.g., have any of the airports got services by low cost carriers such as
AirTran or Southwest?
397 see Button / Stough (2000), p.17 398 Oum / Stanbury / Tretheway (1991), in: Button / Stough (2000), p.17 399 Button / Stough (2000), p.19

109
The demand for airline service is highly volatile. ... There is an inevitable catching up
effect in fares over business cycle, and short-term calculations can be misleading.” 400
Finally, “the concern is whether direct fares to and from hub airports are excessively
high due to the lack of competition with other hub based airline networks.” 401 “The
empirical evidence does seem superficially to indicate that some fares at hub airports
levied by a dominant carrier can be higher than for other airlines. Empirical work at the
Brookings Institution using carefully constructed data, however, indicates that this
premium in 1993 was only about 5% and that it represented less than 2% of the
estimated annual benefits of deregulation.” 402
In order to attract transit passengers, airlines use a common strategy of indirect flights’
cross-subsidization with the help of direct flights out of their hubs. (Business)
Passengers have to accept a “hub premium” for a better “service” and higher number
of destinations, which is used to reduce feeder flight fares. In practice, the price
charged on a leg can even exceed the price charged on a path including the leg.
Interhub competition and lack of competition on spoke markets are the reasons for this
phenomenon. An airline compensates passengers with higher frequencies or via the
price for indirect travels. Besides according K. Button being no hub has the advantage
of cheaper ticket fares, but less numbers of direct flights on the other hand. 403
Ticket Prices Under Certain Market Structures
00,050,1
0,150,2
0,250,3
0,350,4
0,450,5
Business faresper km
Economy faresper km
Special fares per km
EUR
Monoploy Destinations
Destinations with 2 competitiveairlinesDestinations with at least 2competitive airlines
Figure 44: Ticket Prices Under Certain Market Structures 404
400 Button / Stough (2000), p. 235 f. 401 Button / Stough (2000), p. 239 402 Morrison / Winston (1995), in: Button&Stough (2000), p. 239 403 see NZZ (2001), in: http://www.nzz.ch/dossiers/2001/swissair/2001.12.20-wi-article7V4ZL.html ; Spiller (1989) in: Pels / Nijkamp / Rietveld (1997), p.4 ff. 404 Pompl (2002), p.452

110
Additionally the number of competitive airlines at one airport or hub strongly influences
ticket prices. Destinations with at least two competitive airlines, result in up to 24%
lower fares as the following table “Ticket prices under certain market structures” shows.
Before prices are set, costs of a particular flight have to be measured. “In allocating
costs to routes airlines have to make some arbitrary decisions, particularly with regard
to the allocation of certain overhead and fixed costs.” In the airlines business “there are
three major cost categories: ... variable direct operating costs ... (fuel-, variable flight
and cabin crew costs, landing or en-route charges, inflight catering), ... fixed -or
standing direct- costs ... (fixed annual flight and cabin crew costs, insurance, aircraft
standing charges) ... and indirect operating costs ... (station and ground costs,
passenger service costs on the ground, general and administrative overheads ... costs
of any sales offices and promotion) ...” 405
As a descriptive sample, Singapore Airlines uses a Boeing B777-300 with a
configuration of 18 seats in First Class, 49 seats in Business Class and 265 Economy
Class seats.406 Singapore Airlines has a total passenger yield on schedule service of
56.3 US cents per passenger tonne kilometre in 1999. 407
Variable First Business Economy
(F) (C) (Y)
1 Costs per seat if all economy 100
2 Seat pitch (inches) 78 52 32
3 Seat costs index allowing for seat pitch 244 162 100
4 Number of seats abreast 6 7 9
5 Seat cost index allowing for pitch plus seat
abreast
366 208 100
6 Planning load factor (%) 50 65 80
7 Cost per passenger adjusted for load factor 732 320 125
8 Passenger specific costs 40 25 10
9 Costs per passenger including 772 345 135
Passenger specific costs
10 Cost per passenger if Y=100 571 255 100
Table 28: Unit Costs of Different Classes on Singapore Airlines’ Boeing B777-300 408
405 Dognais (2002), p.288 406 Configuration Singapore Airlines used in 2001 407 see ICAO (1999), in: Doganis (2002), p.294 408 see Doganis (2002), p.290
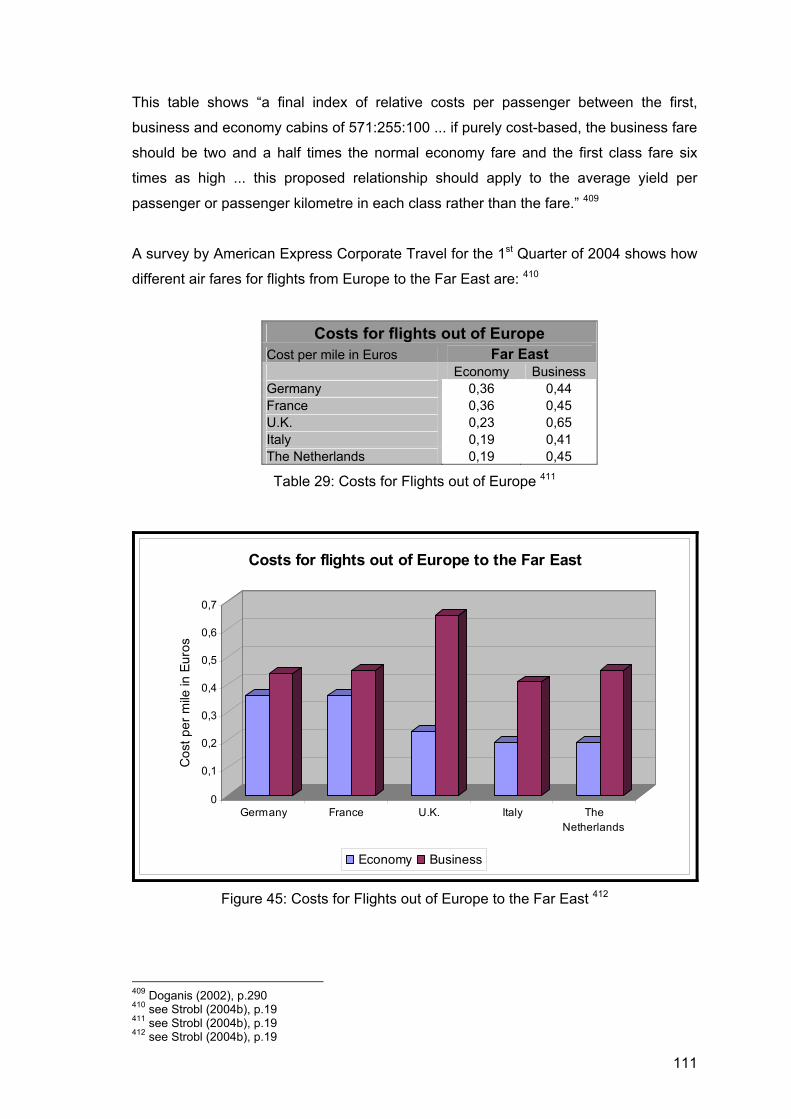
111
This table shows “a final index of relative costs per passenger between the first,
business and economy cabins of 571:255:100 ... if purely cost-based, the business fare
should be two and a half times the normal economy fare and the first class fare six
times as high ... this proposed relationship should apply to the average yield per
passenger or passenger kilometre in each class rather than the fare.” 409
A survey by American Express Corporate Travel for the 1st Quarter of 2004 shows how
different air fares for flights from Europe to the Far East are: 410
Costs for flights out of Europe Cost per mile in Euros Far East Economy Business Germany 0,36 0,44 France 0,36 0,45 U.K. 0,23 0,65 Italy 0,19 0,41 The Netherlands 0,19 0,45
Table 29: Costs for Flights out of Europe 411
0
0,1
0,2
0,3
0,4
0,5
0,6
0,7
Cos
t per
mile
in E
uros
Germany France U.K. Italy TheNetherlands
Costs for flights out of Europe to the Far East
Economy Business
Figure 45: Costs for Flights out of Europe to the Far East 412
409 Doganis (2002), p.290 410 see Strobl (2004b), p.19 411 see Strobl (2004b), p.19 412 see Strobl (2004b), p.19
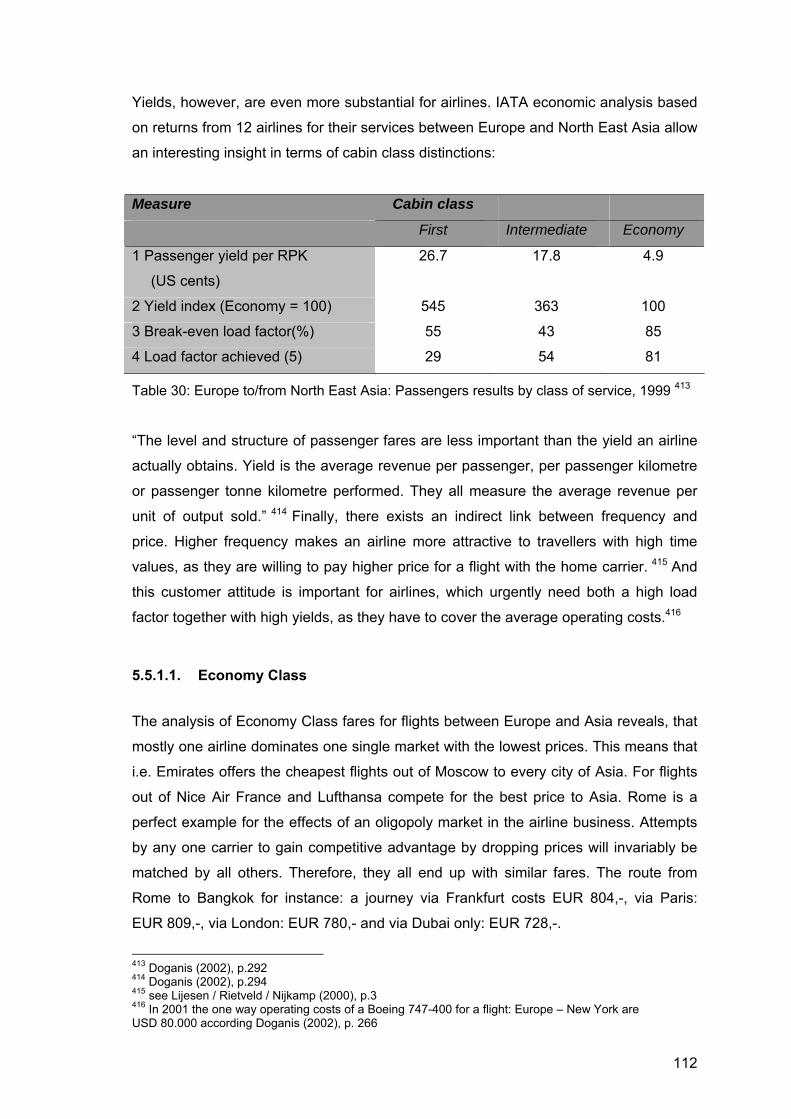
112
Yields, however, are even more substantial for airlines. IATA economic analysis based
on returns from 12 airlines for their services between Europe and North East Asia allow
an interesting insight in terms of cabin class distinctions:
Measure Cabin class
First Intermediate Economy
1 Passenger yield per RPK
(US cents)
26.7 17.8 4.9
2 Yield index (Economy = 100) 545 363 100
3 Break-even load factor(%) 55 43 85
4 Load factor achieved (5) 29 54 81
Table 30: Europe to/from North East Asia: Passengers results by class of service, 1999 413
“The level and structure of passenger fares are less important than the yield an airline
actually obtains. Yield is the average revenue per passenger, per passenger kilometre
or passenger tonne kilometre performed. They all measure the average revenue per
unit of output sold.” 414 Finally, there exists an indirect link between frequency and
price. Higher frequency makes an airline more attractive to travellers with high time
values, as they are willing to pay higher price for a flight with the home carrier. 415 And
this customer attitude is important for airlines, which urgently need both a high load
factor together with high yields, as they have to cover the average operating costs.416
5.5.1.1. Economy Class
The analysis of Economy Class fares for flights between Europe and Asia reveals, that
mostly one airline dominates one single market with the lowest prices. This means that
i.e. Emirates offers the cheapest flights out of Moscow to every city of Asia. For flights
out of Nice Air France and Lufthansa compete for the best price to Asia. Rome is a
perfect example for the effects of an oligopoly market in the airline business. Attempts
by any one carrier to gain competitive advantage by dropping prices will invariably be
matched by all others. Therefore, they all end up with similar fares. The route from
Rome to Bangkok for instance: a journey via Frankfurt costs EUR 804,-, via Paris:
EUR 809,-, via London: EUR 780,- and via Dubai only: EUR 728,-.
413 Doganis (2002), p.292 414 Doganis (2002), p.294 415 see Lijesen / Rietveld / Nijkamp (2000), p.3 416 In 2001 the one way operating costs of a Boeing 747-400 for a flight: Europe – New York are USD 80.000 according Doganis (2002), p. 266

113
Additionally the case study shows, that there are tremendous differences between the
lowest and highest tariff. If a customer chooses to fly from Moscow to Shanghai via
Dubai, he pays only EUR 565,-. Flying via Frankfurt however, means that the
passenger is charged EUR 2251,- for the same destination. There are also examples,
where Dubai is the most expensive hub to choose: A flight from Nice to Hong Kong
costs EUR 2.344,- via Dubai and only EUR 730,- via Paris or Frankfurt.
There is definitely no relation between the distance and the price.
Fares are based on a sample journey from 15th March 2005 (outbound) until 23rd March
2005 (homebound) [+/- 1day]. All tariffs are quoted in Euros and include taxes as well
as other surcharges. Price request was made late October 2004.
To
From BKK PVG KIX HKG SIN DEL BOM 804 675 1021 683 814 760 760 LH FCO 809 606 968 643 708 692 692 AF 780 587 790 739 739 BA 728 711 682 715 713 762 762 EK 1131 832 955 832 848 842 842 LH ATH 804 841 1013 838 854 808 808 AF 1958 844 2031 2300 2300 BA 624 633 736 636 634 644 644 EK 1350 1959 1959 1285 1507 1373 1373 LH ZRH 792 725 1934 712 803 655 655 AF 1555 941 1039 838 838 BA 858 866 837 829 828 903 903 EK 808 676 1928 684 822 642 642 LH DUS 816 747 835 734 930 650 650 AF 1427 530 1515 658 658 BA 1360 1454 1880 1398 1425 2110 2110 EK 873 682 1933 689 827 647 647 LH MUC 820 751 839 739 934 654 654 AF 1432 534 1668 663 663 BA 1365 1459 1886 1404 1431 2264 2264 EK 1318 1539 2021 1252 1477 1341 1341 LH IST 773 804 815 811 783 AF 1089 804 1565 2028 BA 551 559 682 562 561 498 498 EK 807 526 651 603 817 607 607 LH MAN 786 695 1331 559 611 762 762 AF 1104 662 881 946 946 BA 816 754 2005 755 755 804 804 EK

114
1516 2251 2382 1693 1697 1378 1378 LH SVO 802 884 895 778 773 879 879 AF DME 727 779 737 907 BA 557 565 755 568 522 553 553 EK 771 729 891 730 801 726 726 LH NCE 771 730 891 730 801 726 726 AF 986 642 993 900 900 BA 1934 2445 2067 2344 2094 1848 1848 EK 854 1703 966 681 1240 823 823 LH GLA 811 720 1273 585 636 AF 1103 662 871 946 946 BA 750 758 803 760 760 809 809 EK 973 851 992 1023 983 858 858 LH VIE 730 737 848 619 773 744 744 AF 992 592 942 717 717 BA 767 913 874 829 915 766 766 EK 801 676 1022 683 814 761 761 LH MXP 810 606 968 643 709 693 693 AF 781 587 790 740 740 BA 728 711 682 715 713 762 762 EK
All fares quoted in EUR incl. taxes and charges Source: CRS Amadeus
Outbound: 15th March 2005; Homebound: 23rd March 2005
Table 31: Economy Class Benchmark417
5.5.1.2. Business Class
Business Class fares show a similar trend as it applies to the Economy Class case
study. There is mostly one airline that dominates one market. A flight via Dubai is only
a reasonable decision when the journey starts at Athens, Zurich, Istanbul, Moscow,
Glasgow, Vienna or Milan (with a few exceptions). Rome – Bangkok together with Nice
– Osaka are two low fare routes in markets dominated by competitive airlines.
It is interesting that a Business Class ticket from Zurich to Osaka costs as little as
EUR 2.678,- when the flight goes via Dubai. In case the customers choose Frankfurt or
Paris as the transit airport, he has to pay EUR 6.853,- or EUR 7.445,- instead.
Once again, fares are based on a sample journey from 15th March 2005 (outbound)
until 23rd March 2005 (homebound) [+/- 1day]. All tariffs are quoted in Euros and
include taxes as well as other surcharges. Price request was made late October 2004.
417 compiled by the author according CRS Amadeus Reservation System data

115
to from BKK PVG KIX HKG SIN DEL BOM
2213 675 1021 683 814 760 760 LH FCO 2218 606 968 643 708 692 692 AF
2192 2548 2302 1896 1914 BA 1678 1986 1697 1986 1688 1932 1932 EK 1718 1894 2507 1775 1798 1742 1742 LH
ATH 1724 1903 2363 1781 1804 1748 1748 AF 3753 2143 4123 3372 3372 BA 1623 1726 1675 1725 2342 1616 1666 EK 4998 5742 6853 5577 5086 4319 4319 LH
ZRH 2501 3021 7445 2914 2505 2466 2415 AF 3526 3019 3212 2606 2606 BA 2660 2668 2678 2667 2669 2281 2281 EK 3069 3820 6402 3667 3496 3845 3845 LH
DUS 3077 3827 5979 4020 3404 3667 3667 AF 4220 2967 4298 2119 2119 BA 4350 5083 6171 5061 4440 3688 3688 EK 3074 3826 6407 3672 3501 3850 3850 LH
MUC 3081 3831 5983 4025 3408 3661 3661 AF 4225 2971 4303 2123 2123 BA 4365 5088 6177 5066 4446 3694 3694 EK 3744 4092 6178 3883 3824 3706 3856 LH
IST 2173 2257 2344 2261 2107 AF 2615 2469 3485 2676 BA 1241 1249 2172 1249 1251 1018 1018 EK 2105 2113 2523 2390 2523 1771 1701 LH
MAN 4810 3998 5750 5654 5222 4472 4472 AF 3865 4992 4062 3670 4479 BA 2744 2752 2765 2752 2752 2576 2576 EK 4375 4729 4660 5121 4514 3723 3723 LH
SVO 3165 2414 2425 3176 2264 2788 2788 AF DME 3064 3388 3073 3232 BA
1809 1810 1980 1817 1819 1813 1813 EK 5782 6529 7054 6677 6659 4613 4613 LH
NCE 4960 5846 7290 5849 5731 4108 4108 AF 5762 4963 4565 4105 4105 BA 5591 6316 6430 6456 6442 4456 4456 EK 5274 5906 7003 5733 5243 4476 4476 LH
GLA 4577 3981 5733 5980 5033 AF 3864 4992 4062 3670 4479 BA 2748 2756 2767 2756 2758 2581 2581 EK 2714 3262 3283 2825 2724 2858 2858 LH
VIE 2319 2687 2838 2490 2329 2463 2463 AF 5029 2852 5048 2279 2279 BA 2344 2352 2363 2352 2354 2127 2127 EK
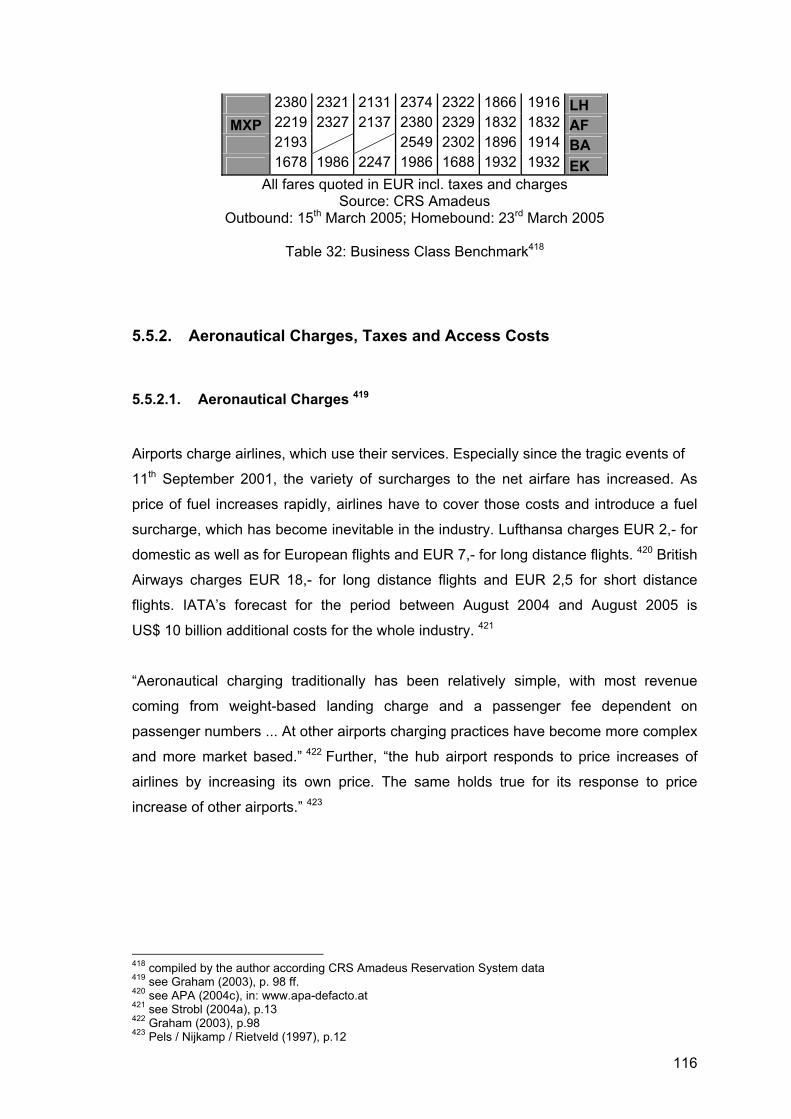
116
2380 2321 2131 2374 2322 1866 1916 LH MXP 2219 2327 2137 2380 2329 1832 1832 AF
2193 2549 2302 1896 1914 BA 1678 1986 2247 1986 1688 1932 1932 EK
All fares quoted in EUR incl. taxes and charges Source: CRS Amadeus
Outbound: 15th March 2005; Homebound: 23rd March 2005
Table 32: Business Class Benchmark418
5.5.2. Aeronautical Charges, Taxes and Access Costs
5.5.2.1. Aeronautical Charges 419
Airports charge airlines, which use their services. Especially since the tragic events of
11th September 2001, the variety of surcharges to the net airfare has increased. As
price of fuel increases rapidly, airlines have to cover those costs and introduce a fuel
surcharge, which has become inevitable in the industry. Lufthansa charges EUR 2,- for
domestic as well as for European flights and EUR 7,- for long distance flights. 420 British
Airways charges EUR 18,- for long distance flights and EUR 2,5 for short distance
flights. IATA’s forecast for the period between August 2004 and August 2005 is
US$ 10 billion additional costs for the whole industry. 421
“Aeronautical charging traditionally has been relatively simple, with most revenue
coming from weight-based landing charge and a passenger fee dependent on
passenger numbers ... At other airports charging practices have become more complex
and more market based.” 422 Further, “the hub airport responds to price increases of
airlines by increasing its own price. The same holds true for its response to price
increase of other airports.” 423
418 compiled by the author according CRS Amadeus Reservation System data 419 see Graham (2003), p. 98 ff. 420 see APA (2004c), in: www.apa-defacto.at 421 see Strobl (2004a), p.13 422 Graham (2003), p.98 423 Pels / Nijkamp / Rietveld (1997), p.12
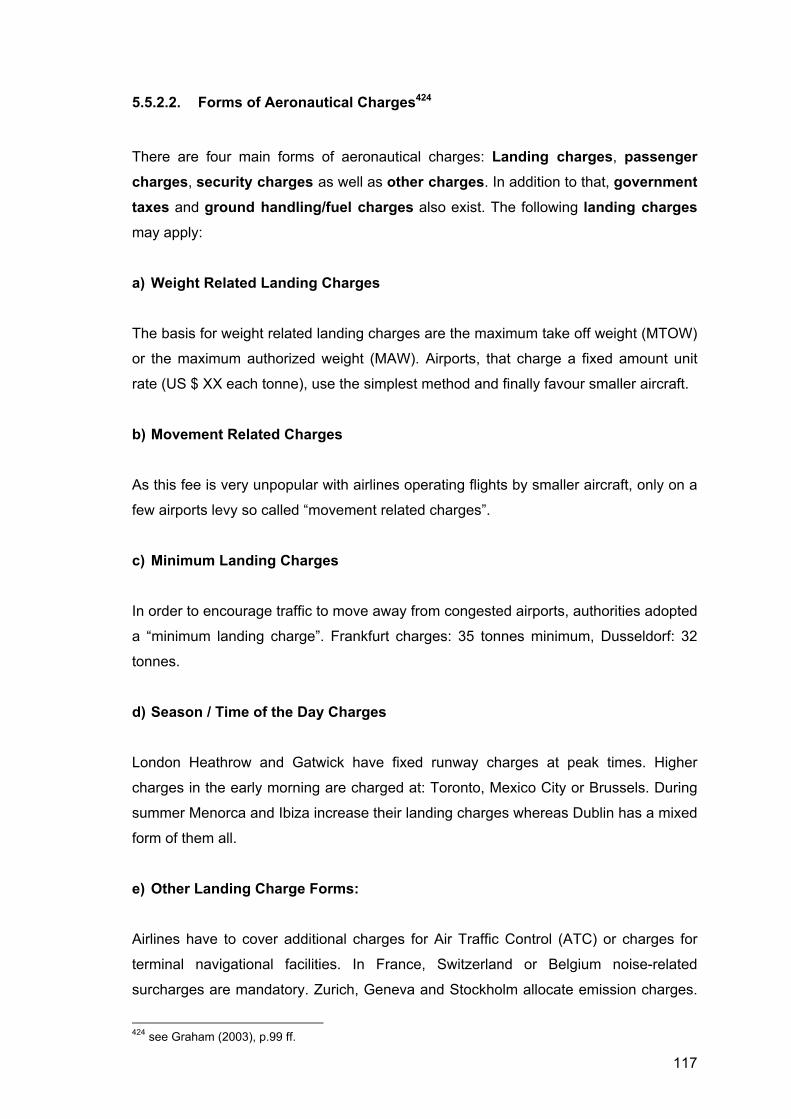
117
5.5.2.2. Forms of Aeronautical Charges424
There are four main forms of aeronautical charges: Landing charges, passenger charges, security charges as well as other charges. In addition to that, government taxes and ground handling/fuel charges also exist. The following landing charges
may apply:
a) Weight Related Landing Charges
The basis for weight related landing charges are the maximum take off weight (MTOW)
or the maximum authorized weight (MAW). Airports, that charge a fixed amount unit
rate (US $ XX each tonne), use the simplest method and finally favour smaller aircraft.
b) Movement Related Charges
As this fee is very unpopular with airlines operating flights by smaller aircraft, only on a
few airports levy so called “movement related charges”.
c) Minimum Landing Charges
In order to encourage traffic to move away from congested airports, authorities adopted
a “minimum landing charge”. Frankfurt charges: 35 tonnes minimum, Dusseldorf: 32
tonnes.
d) Season / Time of the Day Charges
London Heathrow and Gatwick have fixed runway charges at peak times. Higher
charges in the early morning are charged at: Toronto, Mexico City or Brussels. During
summer Menorca and Ibiza increase their landing charges whereas Dublin has a mixed
form of them all.
e) Other Landing Charge Forms:
Airlines have to cover additional charges for Air Traffic Control (ATC) or charges for
terminal navigational facilities. In France, Switzerland or Belgium noise-related
surcharges are mandatory. Zurich, Geneva and Stockholm allocate emission charges.
424 see Graham (2003), p.99 ff.

118
“Elsewhere, more standard ICAO ‘chapter’ classifications are used. The level of noise,
which aircraft make and the areas on ground, affected by the aircraft noise, serve as
the basis of classification. This is the practice at the German and London airports and
those serving the cities of Stockholm, and Oslo.” 425 France, Italy and Korea charge a
separate noise tax.
Passenger Charges:
The second group of aeronautical taxes are the “passenger charges”, collected per
departing passenger, with different rates for domestic, regional/EU or international
travel. Some airports charge smaller amounts for transfer passengers: Amsterdam,
Dublin, Frankfurt, Helsinki, Vienna and Copenhagen. On top of that Stockholm, Tokyo
and Taipeh waive this fee completely, in order to encourage transit traffic.
Security Charges:
The reason why airport authorities charge security fees is the mandatory demand for
higher security level after the events of 11th September 2001. Its duty is to finance
airport security. “The provision of security services may be performed by airport’s own
employees, or by private company under contract to the airport, the airlines, or a
government agency.” 426
Other Charges:
In comparison to the previously mentioned duties, the shares for parking charges or
lighting charges are very small. Aircraft's weight or the wingspan serve as a basis for
parking charges in Singapore, Malaysia, Oman, Malta and some U.S. airports, such as
Boston, Houston or Miami. Parking for a period of 1 up to 4 hours is free at most
airports, except BAA plc’s London airports, Frankfurt, Hong Kong, Amsterdam,
Dusseldorf, Manchester, Vienna or Canadian airports. There is a lighting charge in
France and Italy. Other services for charges are fire fighting, storage facilities or hangar
use.
425 Graham (2003), p.100 426 Graham (2003), p.101

119
Government Taxes:
Government taxes are charged for departing passengers. They do not directly go to the
airport operator.
Ground Handling and Fuel Charges:
a) Ground Handling Fees:
In case the airline chooses service provided by the airport rather than leaving it to
handling agents or other airlines, it has to pay so-called ground handling fees. These
fees cover ramp handling, passenger handling, apron buses, aircraft cleaning, ground
power or push back.
b) Fuel Charges:
Fuel companies collect fuel charges, with the Middle East as an exception. There the
airports offer all services to the airline in one overall package. Transport from seaport
to the airport, handling costs at the airport, import duties on fuel by the government and
fix price measures by the government influence the charge. It is interesting that fuel is
also expensive at Middle East airports, as close refineries do not meet local demand.
There is no doubt that at any airline's home base price for fuel is the lowest. Other
discount factors are number of daily departures, size of aircraft and the sector
distances over which they will be flying. 427 Various additional factors also influence the
price, such as the size of the airline, scale of its operation at the airport in question and
airline’s use of service by the same handling agent and fuel company at other airports.
Region
Afri
ca
Mid
dle
Eas
t
Eas
tern
Eur
ope
Med
iter
rane
an
Latin
Am
eric
a
Far
Eas
t/Pac
if
Wes
tern
Eur
ope
Nor
th
Am
eric
a
Wor
ld
Ave
rage
Average fuel price
88.3
85.8
77.1
74.3
72.5
72.3
67.1
66.0
70.4
Cents per US gallon
Table 33: Average Fuel Prices Paid by International Scheduled Airlines, Sept. 1999 428
427 see Doganis (2002), p.107 428 Doganis (2002), p.107

120
“The level of fuel prices paid by airlines varies markedly between airports – even
between airports in the same region.” 429 African and Middle East airports charge the
highest rates, as US airports have cheap prices. Europe and Asia show a great
diversity. Many airlines hedge by taking so-called call options in order to control
increases in fuel costs.430
Jeddah 101.2 Delhi 107.0 Bangkok 79.7 Rome 86.4 Budapest 113
Dubai 96.1 Tokyo 89.5 New York 72.3 Madrid 88.5 Zurich 98.5
Bahrain 95.6 K.Lumpur 82.4 London 83.7 Frankfurt 85.8 Vienna 97
Cairo 87.6 Singap. 80.8 Paris 87.2 Amsterd. 83.4 Athens 87.4
(cents per US gallon)
Table 34: Average Fuel Prices Paid by International Airlines at Selected Airports, Oct. 2001 431
5.5.2.3. The Level of Aeronautical Charges, the Impact and the Criticism
“There is a wide spread of charges (excluding taxes) ranging from less than 300 Euros
at Dubai airport over 5000 Euros at New York Newark, Moscow, Kansai, and Athens.
Dubai has not increased its charges for many years and reduced them after 11th
September 2001.”432 IATA Director General Giovanni Bisignani wanted to freeze or at
least lower them in the difficult period after the year 2001, as in 2000-01 the operating
margins reached 27,6% for airports and 23,4% for air navigation service providers.433
As the total costs for the airlines of added security in 2002 was about US$ 3 billion, he
attached that “Governments should implement and pay for aviation security not the
airlines, not the airports and not their customers who are already taxpayers.” 434
As monopolies, airports have been able to pass on the costs of excess capacity to the
carriers in the form of higher charges – costs that few of today’s financially unstable
airlines can afford. In 2000 the top 10 airport companies (ranked by revenues 2000)
reached a cash margin of 42% and a profit margin of 12%. The top 10 airlines,
however, accounted for 12% cash margin together with 3% profit margin, which
undoubtedly manifest the current discrepancy in the aviation industry. 435
429 Doganis (2002), p.108 430 see Doganis (2002), p.109 431 Doganis (2002), p.108 432 Graham (2003), p.104 433 see IATA (2003a), in: http://www1.iata.org/pressroom/pr/2003-03-27-07.htm 434 IATA (2002b), in: http://www1.iata.org/pressroom/pr/2002-10-29-36.htm 435 see The Boston Consutling Group (2004), p.11

121
0
2000
4000
6000
8000
10000
12000
Cha
rges
and
taxe
s (E
uros
)
New York - Newark
Osaka - Kansai
Amsterdam
London- Heathrow
Paris CDG
Singapore
Hong Kong
Seoul ICN
Dubai
Aeronautical charges and taxes for an international B737-800 turnaround in 2002
Aircraft related Passenger related Government taxes
Figure 46: Aeronautical Charges and Taxes for an International B737-800 Turnaround in 2002436
Airlines are paying over US$ 15 billion to airports and air traffic service providers
annually for their international services alone. In 2002 it accounted for nearly 10 % of
airline operating costs. Another survey - covering 2000 and 2001 - revealed that
airports recorded operating margins of 27,6% (London Heathrow: 41%, Frankfurt: 32%)
compared to 4,8% for the top 150 airlines. 437 However, some airports actively reacted
and lowered their charges in order to encourage airlines: Amsterdam reduced landing
fees by 4,5%, Singapore by 10%, Athens by 15-23%, Dubai by 50%, Copenhagen by
10% for international flights only and Cyprus airports temporarily waived landing fees
for all flights. 438 Vienna airport reduced landing fees by 16% and waived parking fees
for the time between 10 p.m. and 6 a.m. Incentives are offered for flights to Eastern
Europe, with a refund up to 40% of the landing fees. Long distance flights do also
benefit from this incentive programme. 439 Hong Kong airport maintained the 15%
reduction in landing and parking charges which it had introduced in 2000 to strength its
position as a major hub airport in the Asian region.440 Munich airport – Lufthansa’s
second hub - increased landing charges by 2%. Passengers pay EUR 9,86 for
domestic, EUR 10,6 for European and EUR 12,08 for long distance flights.441
436 Graham (2003), p. 105 437 see IATA (2002a), in: http://www1.iata.org/pressroom/pr/2002-10-08-34.htm 438 see Graham (2003), p.106 439 see APA (2004e), in: http://www.apa-defacto.at 440 see Graham (2003), p.106 441 see APA (2004d), in: http://www.apa-defacto.at

122
Airport charges typically account for one quarter of the price of the average airline
ticket. This figure summarizes the latest findings of the Boston Consulting Group:
144 (103%)
4 24 18 16 10 10 8 8 12 24 10
020406080
100120140160
Tota
l Tic
ket P
rice
Prof
it M
argi
n
Tick
etin
g an
d Sa
les
Cre
w
Airc
raft
Cos
ts
Pass
enge
r Ser
vice
Fuel
and
Oil
Adm
in. &
oth
er
En-r
oute
Cha
rges
Mai
nten
ance
Stat
ion
and
Gro
und
Han
dlin
g
Aero
naut
ical
Cha
rges
Airport and Non-Airport Related Costs
Airport related costs: 34 (24,4%)
Non-Airport related costs: 140 (100%)
Values in brackets show % of Total Cost
Figure 47: Airport and Non-Airport Related Costs 442
USD Airport charge related to: Airport charges Government
per turn-round Aircraft Passenger Total Taxes
New York JFK 10,681 5,614 16,295 8,308
Tokyo NRT 9,779 5,265 16,044 0
Vienna 4,176 4,502 8,678 0
Frankfurt 3,366 4,909 8,276 0
Amsterdam 3,523 4,166 7,689 0
Paris CDG 3,591 2,404 5,995 0
Delhi 1,954 3,618 5,572 0
Hong Kong 3,714 1,676 5,390 2,149
London LHR 1,797 3,583 5,380 9,683
Bangkok 1,541 3,836 5,376 0
Singapore 2,220 2,864 5,085 0
Rome FCO 2,250 2,763 5,013 0
Table 35: Representative Airport Charges for a Boeing 747, Oct. 2000 443
442 compiled by the author according: The Boston Consulting Group (2004), p.22 443 Doganis (2002), p.111
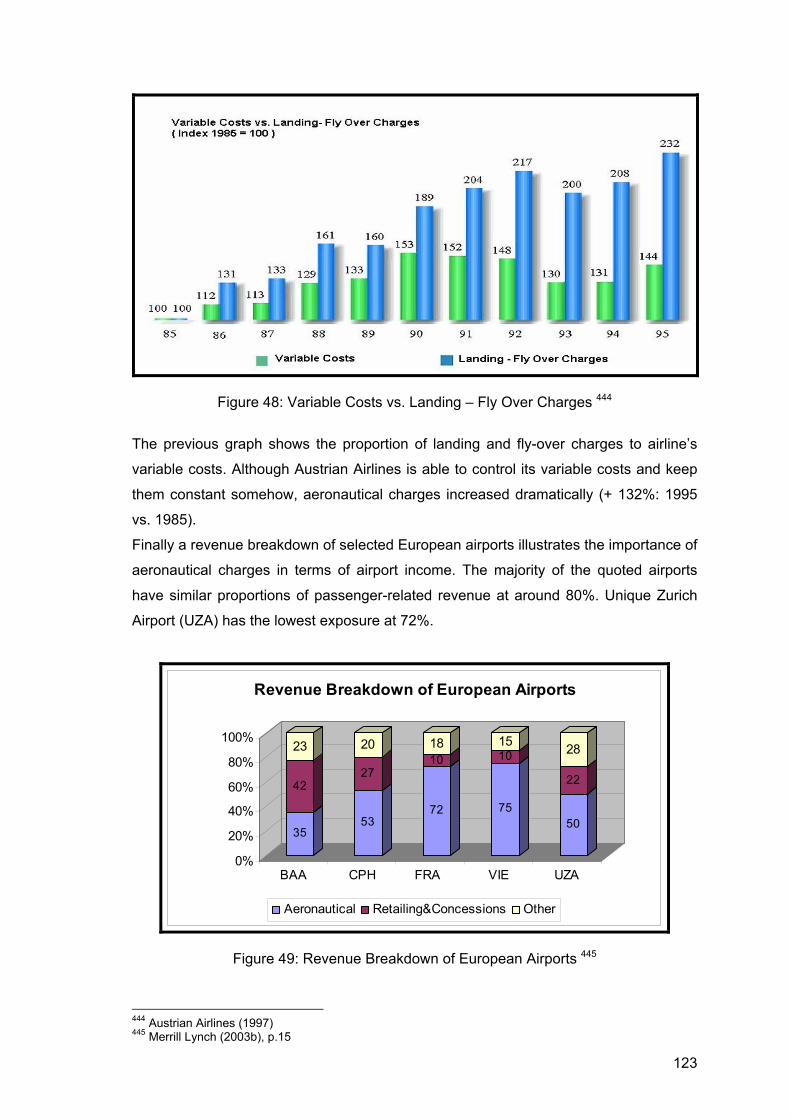
123
Figure 48: Variable Costs vs. Landing – Fly Over Charges 444
The previous graph shows the proportion of landing and fly-over charges to airline’s
variable costs. Although Austrian Airlines is able to control its variable costs and keep
them constant somehow, aeronautical charges increased dramatically (+ 132%: 1995
vs. 1985).
Finally a revenue breakdown of selected European airports illustrates the importance of
aeronautical charges in terms of airport income. The majority of the quoted airports
have similar proportions of passenger-related revenue at around 80%. Unique Zurich
Airport (UZA) has the lowest exposure at 72%.
35
42
23
53
27
20
72
1018
75
1015
50
22
28
0%
20%
40%
60%
80%
100%
BAA CPH FRA VIE UZA
Revenue Breakdown of European Airports
Aeronautical Retailing&Concessions Other
Figure 49: Revenue Breakdown of European Airports 445
444 Austrian Airlines (1997) 445 Merrill Lynch (2003b), p.15

124
However “the huge financial pressures on the major carriers will leave them with little
choice but to consolidate their traffic into mega hubs, sidelining many of today’s
primary and secondary hubs” 446, as not all carriers can choose the more efficient polar
routes and avoid overflight charges. 447 Without doubt Dubai is definitely the cheapest
transit airport in this case study. There is no route where passengers pay a lower
airport taxes. The most expensive route in terms of aeronautical charges is Glasgow –
Frankfurt – Osaka with EUR 186,-. In comparison taxes for a flight from Glasgow to
Osaka via Dubai are as little as EUR 78,-.
Undeniably customers do not make their final decision based on airport charges. But
as these taxes are added to the fare, it certainly has an effect. The following
aeronautical charges and taxes apply for flights departng on 15th March 2005
(outbound) and returning 23rd March 2005 (homebound) [+/- 1day]. All taxes are quoted
in Euros. Price request was made late October 2004.
to From BKK PVG KIX HKG SIN DEL BOM
113 120 131 124 122 116 116 LH FCO 118 127 138 130 128 132 132 AF
92 103 102 96 96 BA 28 36 47 36 38 32 32 EK 138 144 157 150 148 142 142 LH
ATH 144 153 163 156 154 148 148 AF 118 129 127 122 122 BA 41 50 60 49 51 45 45 EK 105 113 124 116 115 109 109 LH
ZRH 134 143 153 146 144 138 138 AF 105 116 114 108 108 BA 76 84 94 83 85 121 121 EK 113 121 132 125 123 117 117 LH
DUS 121 129 140 132 31 125 125 AF 94 106 103 99 99 BA 56 74 84 74 75 69 69 EK 118 127 137 130 128 122 122 LH
MUC 125 133 144 137 35 119 119 AF 99 110 108 103 103 BA 71 79 90 79 81 75 75 EK 93 101 112 104 102 97 97 LH
IST 122 130 141 134 132 AF 93 107 102 96 BA 26 34 45 34 36 30 30 EK
446 The Boston Consulting Group (2004), p.14 447 see Canaday (2001a), p.73

125
121 129 140 132 131 125 125 LH MAN 148 156 167 159 157 152 152 AF
116 127 125 119 119 BA 55 63 76 63 63 58 58 EK 98 105 117 109 108 102 102 LH
SVO 128 136 147 139 137 131 131 AF DME 91 102 100 95 BA
62 63 81 70 72 66 66 EK 121 129 141 133 131 125 125 LH
NCE 121 130 141 133 131 125 125 AF 101 113 110 105 105 BA 89 97 81 97 99 93 93 EK 168 185 186 179 177 168 168 LH
GLA 131 139 150 142 140 AF 115 127 125 119 119 BA 59 67 78 67 69 63 63 EK 124 132 143 135 134 128 128 LH
VIE 130 138 149 141 140 134 134 AF 104 115 113 107 107 BA 37 45 56 45 47 40 40 EK 110 121 132 124 122 116 116 LH
MXP 119 127 138 130 129 132 132 AF 93 104 102 96 96 BA 28 36 47 36 38 32 32 EK
All taxes quoted in EUR Source: CRS Amadeus
Applicable for flights outbound: 15th March 2005; homebound: 23rd March 2005
Table 36: Aeronautical Charges and Taxes Benchmark448
In terms of aeronautical charges, Dubai is the most competitive airport with EUR 200,-
aircraft related taxes for an international Boeing B737-800 turnaround. Unfortunately
there is no comparable data for Frankfurt available. Therefore the benchmark is limited
to Paris, London and Dubai only. A similar survey by Cranfield University, however,
helps to integrate Frankfurt into this benchmark. Frankfurt’s aircraft related charges for
a Boeing 747 in October 2000 were quite comparable to those of Paris CDG.
Government taxes were equal to Paris CDG and passenger charges twice as much as
Paris CDG imposed.449 Consequently we can assume that the same ratio applies for a
Boeing B737-800.
448 compiled by the author according CRS Amadeus Reservation System data 449 see Doganis (2002), p.111

126
01000200030004000500060007000
Cha
rges
and
Tax
es
(Eur
oes)
London LHR Paris CDG Dubai
Aeronautical Charges and Taxes Benchmark
Aircraft related Passenger related Government taxes
Figure 50: Benchmark Aeronautical Charges and Taxes for an International B737-800
Turnaround in 2002450
5.5.2.4. Access Costs
Fares in EUR Taxi Train Bus Underground
Rome 41,32 9,5 4,13 Athens 29,35 2,93 Zurich 33 5 Dusseldorf 20 1,75 5,1 Munich 60 8 9,5 Istanbul 40 0,76 2,28 Manchester 17,12 3,28 Moscow 43,46 2,04 0,54 Nice 20,58 3,51 Glasgow 12,84 2,85 2,85 Vienna 25 8 6 Milan 70 9 4,5 Bangkok 5,84 1,95 Shanghai 4,13 1,84 Osaka 117 18 9,5 Hong Kong 39 9,74 3,9 Singapore 10,64 2,31 0,9 Delhi 7 0,87 Bombay 9 London 35,67 21,4 10 5,71 Paris 38 7,75 10,00 Frankfurt 4,5 2,9 Dubai 2 0,41
Table 37: Surface Transport Costs 451 (Fares in EUR)
450 see Graham (2003) p. 105 451 compiled by the author according CRS Amadeus Reservation System data
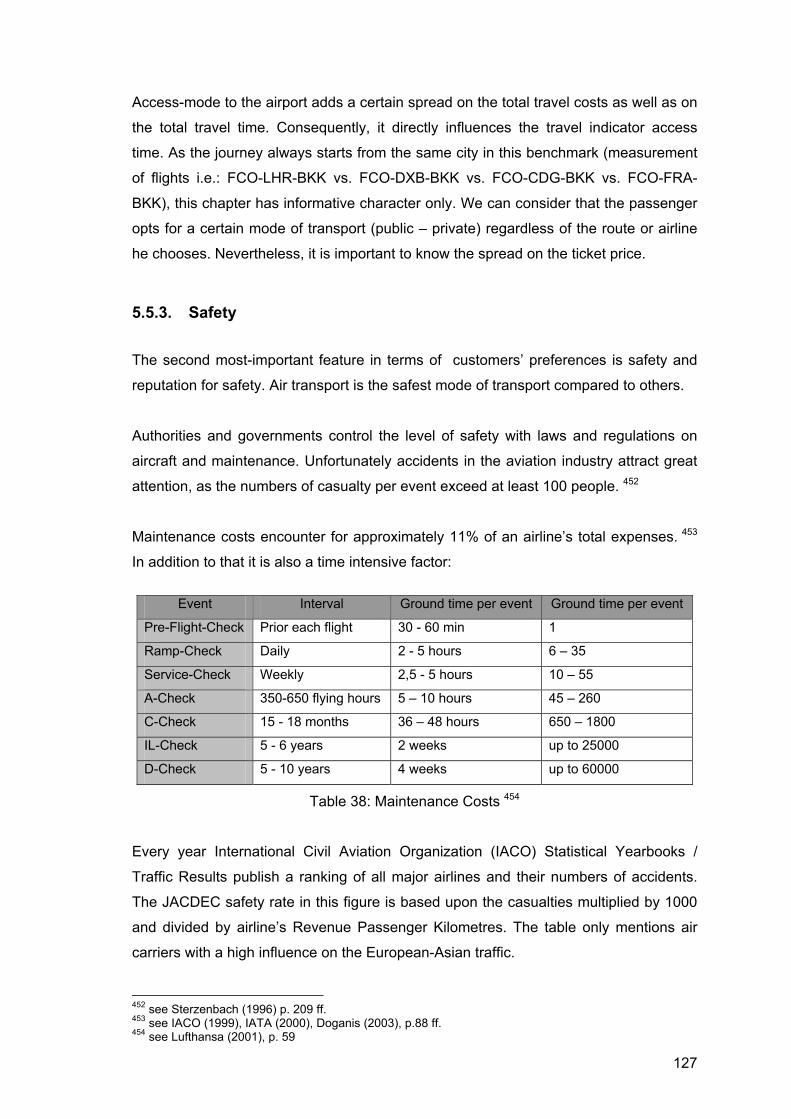
127
Access-mode to the airport adds a certain spread on the total travel costs as well as on
the total travel time. Consequently, it directly influences the travel indicator access
time. As the journey always starts from the same city in this benchmark (measurement
of flights i.e.: FCO-LHR-BKK vs. FCO-DXB-BKK vs. FCO-CDG-BKK vs. FCO-FRA-
BKK), this chapter has informative character only. We can consider that the passenger
opts for a certain mode of transport (public – private) regardless of the route or airline
he chooses. Nevertheless, it is important to know the spread on the ticket price.
5.5.3. Safety
The second most-important feature in terms of customers’ preferences is safety and
reputation for safety. Air transport is the safest mode of transport compared to others.
Authorities and governments control the level of safety with laws and regulations on
aircraft and maintenance. Unfortunately accidents in the aviation industry attract great
attention, as the numbers of casualty per event exceed at least 100 people. 452
Maintenance costs encounter for approximately 11% of an airline’s total expenses. 453
In addition to that it is also a time intensive factor:
Event Interval Ground time per event Ground time per event
Pre-Flight-Check Prior each flight 30 - 60 min 1
Ramp-Check Daily 2 - 5 hours 6 – 35
Service-Check Weekly 2,5 - 5 hours 10 – 55
A-Check 350-650 flying hours 5 – 10 hours 45 – 260
C-Check 15 - 18 months 36 – 48 hours 650 – 1800
IL-Check 5 - 6 years 2 weeks up to 25000
D-Check 5 - 10 years 4 weeks up to 60000
Table 38: Maintenance Costs 454
Every year International Civil Aviation Organization (IACO) Statistical Yearbooks /
Traffic Results publish a ranking of all major airlines and their numbers of accidents.
The JACDEC safety rate in this figure is based upon the casualties multiplied by 1000
and divided by airline’s Revenue Passenger Kilometres. The table only mentions air
carriers with a high influence on the European-Asian traffic.
452 see Sterzenbach (1996) p. 209 ff. 453 see IACO (1999), IATA (2000), Doganis (2003), p.88 ff. 454 see Lufthansa (2001), p. 59

128
Airline Foundation Number of lost aircraft casualties
JACDEC Safety-rate
Emirates 1985 0 0 0,00British Airways 1935 5 67 0,04Lufthansa 1926 3 61 0,05Air France 1933 8 220 0,22 Cathay Pacific 1946 0 0 0,00All Nippon Airw. 1958 0 0 0,00United Airlines 1931 8 261 0,08Singapore Airlines 1972 1 83 0,09Northwest Airlines 1926 3 165 0,09SAS 1946 5 110 0,26KLM 1919 3 251 0,30Japan Airlines 1951 6 584 0,42Asiana 1988 1 68 0,54Thai Airways Int. 1959 10 429 0,88Garuda Indones. 1949 14 411 1,39
Table 39: Safety Statistic 455
IACO also measures, which countries meet the IACO safety standard. Only “exotic”
countries like Haiti, Honduras, Swaziland, etc. do not meet category 1. The same
applies for Bulgaria, Serbia and Montenegro (Formerly Republic of Yugoslavia),
Argentina or Uruguay. Here is an extract of the 2004 report:
FAA Flight Standards Service International Aviation Safety Assessment (IASA) Program COUNTRY CATEGORY COUNTRY CATEGORY Australia 1 Italy 1 Austria 1 Japan 1 China 1 Saudi Arabia 1 France 1 Singapore 1 Germany 1 Thailand 1 India 1 United Arab Emirates 1 Indonesia 1 United Kingdom 1 Argentina 2 Uruguay 2* Category 1 Meets ICAO Standards Category 2 Does Not Meet ICAO Standards Note - For those countries not serving the U.S. at the time of the assessment, an asterisk " * " will be added to their Category 2 determination.
Table 40: International Aviation Safety Assessment (IASA) Program 456
455 see Jecdec (2004), in: http://www.jecdec.de ; FAA (2003), in: http://www.iaco.org 456 FAA (2003), in: http://www.iaco.org

129
5.5.4. Schedule, Schedule Convenience and Total Travel Time
Connecting flights to prime hubs leave Europe between 3 p.m. and 9 p.m. (except
flights to India on Lufthansa, British Airways and Air France, which depart in the
morning). As there is normally only one flight (possibility each airline) eastbound,
passengers have no (or limited) chance to choose between different departure
possibilities compared to the huge amount on the trans-atlantic route. Passengers can
choose to leave Zurich with Emirates at 2.45 p.m. with an arrival time in Bangkok at
12.10 a.m. the following day (EK 88 / EK 384) or prefer Lufthansa flight at 7.20 p.m.
and arrive in Bangkok at 2.10 p.m. the following day (LH 3729 / LH 744). The -
personal - value of an earlier or later departure time is not measurable and its
importance varies from event to event. Total travel time – which is the only comparable
constant factor here – serves as the basis for schedule convenience measurement. In
terms of total travel time, Frankfurt convinces as the ideal transit station. Although
Dubai has the smallest maximum distance from one gate to the other including the
smallest Minimum Connecting Time, it seldom makes sense to travel via the Middle
East, except for flights out of Istanbul together with selected flights out of Moscow,
Rome as well as Athens. It has to be mentioned, however, that the travel time
differences are not more than 3 hours (average). In some cases, travel via Dubai is a
lot closer to the quickest route than these 3 hours. But other flights take up to 7 hours
longer than via alternative airports.
All values of the total travel time are based on a sample journey from 15th March 2005
(outbound) until 23rd March 2005 (homebound) [+/- 1day]. All values are quoted in
hours and decimal system. Request was made late October 2004.
to
from BKK PVG KIX HKG SIN DEL BOM 12,9 13,3 14,2 13,8 14,6 10,3 10,7 LH
FCO 15 14 14,9 16 16,1 11,2 11,7 AF 15,3 15,6 16,8 13,1 14,1 BA 13,3 20,9 15,5 14,6 13,8 11,8 10,8 EK 14,1 15,3 19,3 14,8 16,9 15,5 15,8 LH
ATH 16,4 16,3 19,4 17 17,5 12,7 13,2 AF 19,8 17,8 20,9 13,8 17,8 BA 15,7 23,3 17,9 17 16,3 14,3 13,3 EK 12,8 13,4 13,7 13,8 14,6 9,83 10,2 LH
ZRH 14,9 14,8 15 15,5 16 13,5 11,3 AF 14,9 15,6 16,1 10,9 12,8 BA 15,4 23,1 17,7 16,8 16 14 13,2 EK

130
12,1 13,5 13,2 13,8 13,8 9,33 9,67 LH DUS 14 13,8 14,3 14,6 15,1 11,1 11,5 AF
14,6 14,3 15,8 13,5 12,8 BA 13,4 16,1 17,8 16,9 16,2 14,2 13,2 EK 12 12,6 13,1 13 13,8 9,25 9,5 LH
MUC 13,8 13,7 15 14,4 14,9 11,3 11,8 AF 16 17 17,2 13,9 13,2 BA 13,6 16,1 17,7 16,8 14,9 9,75 15,5 EK 14 15,3 19,8 15,8 16,2 16,3 14,9 LH
IST 20,2 20 17,2 20,8 21,3 AF 18,1 19,2 19,3 15,2 BA 12 19,7 14,3 13,3 12,6 13,6 9,58 EK 12,6 15,3 14,2 14,7 14,3 10,3 10,7 LH
MAN 13,8 13,6 15,1 14,3 14,8 11 11,4 AF 13,3 13,5 14,9 11,4 11,8 BA 14,6 17,1 18,4 17,5 19,8 14,8 13,8 EK 15 15,5 19,6 15,9 16,7 15,8 12,9 LH
SVO 17 16,9 18,4 17,7 18,2 13,3 13,8 AF DME 17,1 17,8 19,2 16,3 BA
12,5 21,5 17,1 16,2 15,4 13,4 12,4 EK 13,1 13,3 14,6 13,8 14,8 10,8 11,1 LH
NCE 13,8 13,6 15,2 14,3 14,8 11,1 11,5 AF 17,7 15,8 17,2 13,3 12,5 BA 16,2 23,3 17,8 16,9 16,2 14,2 13,2 EK 16,1 16,3 16,6 16,8 18,1 12,8 12,1 LH
GLA 18,6 18,4 17,8 19,2 19,7 AF 14,1 14,1 15,3 12,8 12,1 BA 15 23,8 18,4 17,5 16,8 14,8 13,8 EK 12,8 13,3 13,6 13,8 14,1 9,75 10,1 LH
VIE 14,8 14,6 15,1 15,3 15,8 11,3 11,8 AF 15 16,1 16,2 13,3 12,6 BA 15 22,7 17,3 16,3 15,6 13,6 12,6 EK 12,8 13,3 13,8 13,7 14,8 9,92 10,3 LH
MXP 13,7 13,5 14,7 14,3 14,8 11,3 11,7 AF 16 15,8 16,8 12,9 12,5 BA 14,9 22,6 17,2 18,7 15,5 13,5 12,5 EK n.c. ... no connection possible according schedule
time quoted in hours (decimal system)
Outbound: 15th March 2005; Homebound: 23rd March 2005 Source: CRS Amadeus
Table 41: Total Travel Time Benchmark457
457 compiled by the author according CRS Amadeus Reservation System data

131
5.5.5. Minimum Connecting Time and Connectivity Ratio
It is not always a question of flight speed. Time on ground has to be limited as good as
possible. Although all airlines and alliances offer outstanding ground service (Lounges,
Arrival Service, Health Clubs, Shower-facilities, etc.), passengers normally want to
leave an airport as quick as possible. Therefore it is crucial that minimum connecting
time and the maximum distance from one (arrival) gate to another (departure) gate are
shortest. Competitive connecting procedure reduces transfer times and increases
customer service (travel comfort). Dubai does not only offer the shortest “maximum
distance from gate to gate” with 500m but also the quickest minimum connecting time:
20 minutes up to 100 minutes according to the type of connection. Transfer via London
Heathrow means to expect a maximum walking (or running – in case the flight is
delayed) distance of 3 kms and a minimum connecting time of 45 up to 130 minutes.
Transfer Times
Max. distancefrom gate to gate
Minimum Connecting Time (MCT)
Dubai500 m
20-100 min
Paris CDG
3000 m
3000 m
1000 m45-200 min
45 min
45-130 minLondon Heathrow
Frankfurt
Figure 51: Transfer Times 458
“On-line schedule co-ordination can be measured using a connectivity ratio, which
shows the degree to which linkages are more than purely random. It allows for varying
volumes of flights operated and different minimum connect times at each of the
hubs.” 459
458 compiled by the author see Austrian Airlines Group (2004b) ; Air France (2002), p. 73 ff. ; The Department of Civil Aviation (2000) ; CRS Amadeus Reservation System 459 Doganis (2002), p.258
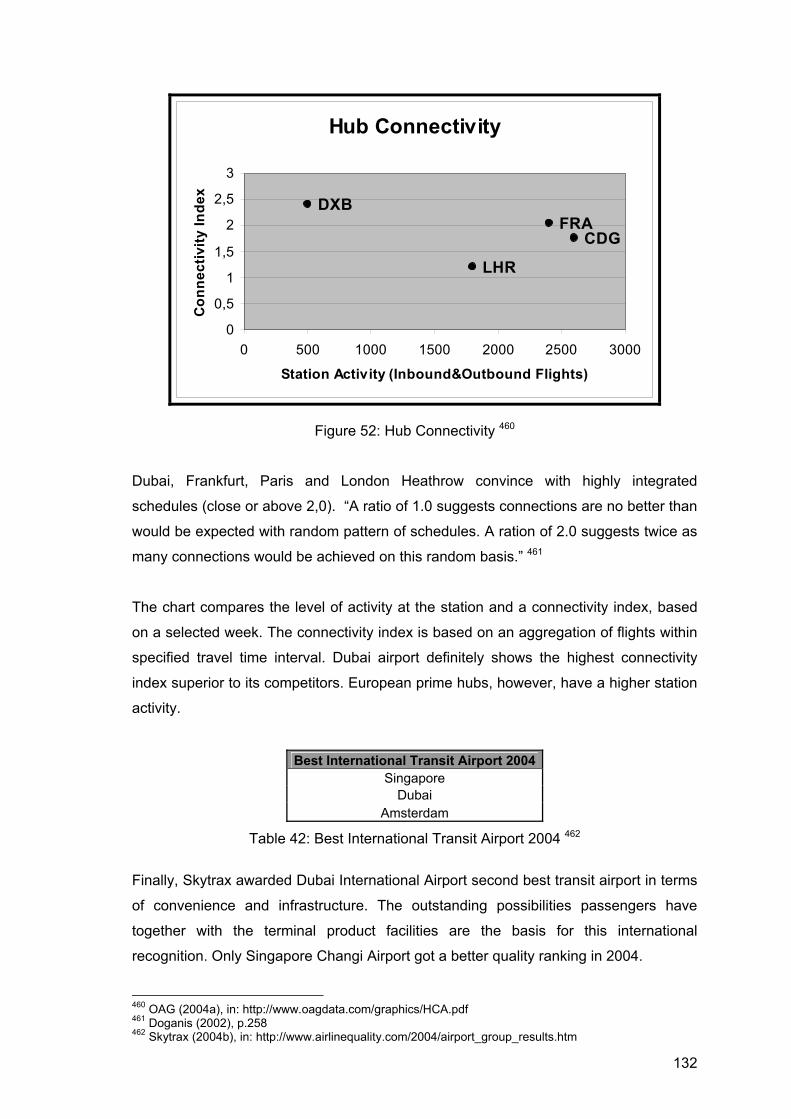
132
Hub Connectivity
DXB
LHR
FRA CDG
0
0,5
1
1,5
2
2,5
3
0 500 1000 1500 2000 2500 3000
Station Activity (Inbound&Outbound Flights)
Con
nect
ivity
Inde
x
Figure 52: Hub Connectivity 460
Dubai, Frankfurt, Paris and London Heathrow convince with highly integrated
schedules (close or above 2,0). “A ratio of 1.0 suggests connections are no better than
would be expected with random pattern of schedules. A ration of 2.0 suggests twice as
many connections would be achieved on this random basis.” 461
The chart compares the level of activity at the station and a connectivity index, based
on a selected week. The connectivity index is based on an aggregation of flights within
specified travel time interval. Dubai airport definitely shows the highest connectivity
index superior to its competitors. European prime hubs, however, have a higher station
activity.
Best International Transit Airport 2004Singapore
Dubai Amsterdam
Table 42: Best International Transit Airport 2004 462
Finally, Skytrax awarded Dubai International Airport second best transit airport in terms
of convenience and infrastructure. The outstanding possibilities passengers have
together with the terminal product facilities are the basis for this international
recognition. Only Singapore Changi Airport got a better quality ranking in 2004.
460 OAG (2004a), in: http://www.oagdata.com/graphics/HCA.pdf 461 Doganis (2002), p.258 462 Skytrax (2004b), in: http://www.airlinequality.com/2004/airport_group_results.htm

133
5.5.6. Comfort, Quality, Image and Service on Ground
5.5.6.1. Comfort and Quality
Most of the time airports offer one overall product: appeal to a very heterogeneous
collection of passengers. Pressure was coming from the travelling customer, as he
became more experienced and demanding. Privatization supported competition
between airports. It is hard, however, to measure quality of service because of the
characteristic uneven spread of demand. Airport service is a result of combined
activities of several organizations (i.e.: airlines, handling agents, customs control,
immigration officers, concessionaires), with partial control by the airport authorities
themselves.
Travellers arrive at airports with different kind of expectations, which lead to a level of
segmentation’s increase: separate check-in areas, airline and contract lounges, fast
track systems, valet parking or concept lounges (i.e. pay-as-you-go lounge at London
Heathrow for a GBP 25,- entrance and no membership need or KLM’s “Holideck” at
London Heathrow to cater for families with children).463
Airport measurements allow verifying the service standard many airports adopt with the
help of objective and subjective measures. “Objective indicators measure the service
delivered and can cover areas such as flight delays, availability of lifts, escalators and
trolleys, and operational research surveys such as queue length, space provision,
waiting time, and baggage reclaim time.” 464 As objective indicators cannot measure if
customers feel safe or are satisfied with the equipment, there is a need to look at
passengers’ satisfaction ratings. 465 Mystery shoppers, comment/complaint cards,
customer services are popular tools. ACI and IATA publish the results of their
worldwide surveys and have an essential marketing effect. 466 “In 2002, Dubai achieved
the overall highest ranking in the survey followed by Singapore Changai and
Copenhagen ... In 2001, Dubai was not included in the study ... for European airports,
for example, in 2001, Helsinki was ranked first by business travellers whilst
Copenhagen had the highest ratings from leisure passengers ... The regularity with
which the IATA survey is undertaken has meant that is has been generally accepted
within the industry. ” 467
463 see Graham (2003), p.75 464 Graham (2003), p.76 465 see Graham (2003), p. 78 466 see Graham (2003), p. 78 ff. 467 Graham (2003), p. 81

134
Overall passenger satisfaction levels: best performing airport from IATA's 2001 global airport monitor by size of airport Airports > 25 million Airports 15-25 million Airports < 15 million annual passengers annual passengers Annual passengers
1. Singapore 1. Sydney 1. Helsinki 2. Hong Kong 2. Copenhagen 2. Vienna 3. Minneapolis 3. Manchester 3. Birmingham 4. Amsterdam 4. Vancouver 4. Oslo 5. Atlanta/Seattle 5. Zurich 5. Geneva
Table 43: Overall Passenger Satisfaction Levels 468
Rating categories in IATA’s Global Airport Monitor are: 469
● Overall passenger satisfaction ● Restaurant/eating facilities
● Way finding/signposting ● Ground transport to/from the airport
● Flight information ● Courtesy of airport staff
● Connection making with other flights ● Waiting/gate areas
● Shopping facilities ● Parking facilities
Overall Passenger Satisfaction in 2002
4,22
4,12
3,75
3,76
3,77
3,88
3,96
3,99
3,92
4,35
0 0,5 1 1,5 2 2,5 3 3,5 4 4,5 5
Dubai
Singapore
Hong Kong
Copenhagen
Kuala Lumpur
Seoul
Athens
Vacouver
Cincinnati
Sydney
Ratings on a scale of 1=poor to 5=excellent
Figure 53: Overall Passenger Satisfaction in 2002 470
In order to guarantee an exact quality of service, airlines tend to arrange service level
agreements (SLAs) or strategic partnership agreements (SPAs). 471
468 Radia / Morris (2002), p.31 ff., in: Graham (2003), p.81 469 see IATA (2003d), in: http://www.iata.org/productsandservices/gam.htm ; Sterzenbach / Conrady (2003), p. 130 470 IATA (2003d), p. 5, in: http://www.iata.org/productsandservices/gam.htm 471 see Graham (2003), p.82

135
ACI also publishes its investigated quality of service measurement at airports. All areas
are represented except South America. Overall, 120 airports responded (i.e. Frankfurt,
Paris, Chicago, Johannesburg, Tokyo or Sydney). Forty-three percent of the
respondents said that they used objective criteria, while 62% used subjective criteria.
The survey included measures like: availability of trolleys, elevators, escalators, moving
walkways, conveyors, taxi services, waiting time, queue length at check-in, security
and immigration cleanliness, baggage delivery, complaints and comments. 472
Criteria most frequently used to measure quality of service at ACI airports Airport process Objective criteria Subjective criteria
General Response to/analysis of Overall customer satisfaction on complaints/mail comments terms of attractiveness/ Availability of lifts/escalators/ convenience/quality moving walkways etc Availability of trolleys Cleanliness Quality of public announcements Terminal atmosphere/temperature Availability/quality of trolleys Cleanliness (especially toilets) Seating areas Telecommunication facilities Security/airport safety Flight information Overall satisfaction displays, information desk/telephone Check-in Waiting time/queue Overall satisfaction Security check Waiting time/queue Immigration Waiting time/queue Catering Overall satisfaction Quality of goods Value for money Choice Shops, commercial Overall satisfaction services (banks, post Range of goods offices, etc.) Value for money Staff courtesy Baggage delivery Delivery time Overall satisfaction Waiting/delivery time Ground access Taxi availability/waiting time Overall satisfaction: ground access/public transportation
Table 44: Criteria Most Frequently Used to Measure Quality of Service at ACI Airports 473
472 see Graham (2003), p.78 f. 473 ACI (2000), in: Graham (2003), p.79

136
5.5.6.2. Service on Ground
We have to distinguish between service offered by the airport authorities and by the
airlines themselves. Especially in the USA airlines finance new terminals, which they
finally own. Therefore they directly influence the infrastructure according to their
passengers’ needs and expectations (i.e. United’s and American’s terminals at Chicago
O’Hare or JFK’s Terminal One Group: Lufthansa, Air France, Japan Airlines and
Korean). 474
“Airline decisions about the level of airport service they offer to their customers will be a
reflection of their overall business strategy.” 475 “Major efforts have been made in recent
years to establish airport service as a significant area of product differentiation.” 476
Emirates and ANA offer limousine services to premium passengers, Eva Air a free
coach service within city limits. Other tools are curbside check-in or separate check-in
counters for premium passengers in order to avoid long lines. Airlines also provide fast
tracks at customs, security or passport control at their home hubs or at other important
destinations. “Hub airports are often provided with executive lounges, separate
ticket/check-in facilities and other attributes that benefit local travellers but that are not
costless.” 477
Lounge service is an important factor to attract high yield passengers, whether it is a
departure or arrival lounge. Some airlines have contract with luxurious airport hotels.
United Airlines calls its programme “United Arrivals Suite”. The airline offers its First
Class and full fare Business Class customers, who arrive after an international night
flight in the morning rooms with showers, business centres and breakfast.478 Some
lounges or airports enjoy special recognition: business traveller magazines always
recommend Virgin Atlantic’s Clubhouses. Singapore Airport even makes free cinema,
sauna or jacuzzi available to its customers. Copenhagen airport offers a wide range of
service facilities: Shopping Centres or Sauna.
Star Alliance introduced the first worldwide Star Alliance lounge in Zurich. This is the
first lounge build and equipped by a joint Star Alliance budget. In contrast to other Star
Alliance destinations, you can find only one lounge in Zurich now. Members have to
pay staff or equipment only once.
474 see Maurer (2003), p.244 475 Shaw (2004), p.164 476 Shaw (2004), p.165 477 Button / Stough (2000), p. 236 478 see United Airlines (2003), p.3

137
This optimizes costs, as at other stations like London Heathrow, Bangkok or Hong
Kong you can find up to 5 alliance partner’s lounges in one terminal. 479
5.5.6.3. Airport Measurement
Passengers also rated the hubs of the major carriers. In this benchmark, Skytrax
evaluates airport services at Paris CDG, London LHR, Dubai DXB and Frankfurt FRA.
Ratings depend on the service provided by the airports, handling agents and airlines.
Comfort Benchmark
On Ground CDG LHR DXB FRA
Airport Services (Air France)(British
Airways) (Emirates) (Lufthansa) Check-in premium ++++ ++++ +++++ ++++Check-in economy +++ +++ ++++ ++++Transfer Service – premium +++ +++ ++++ +++Transfer Service – economy +++ +++ +++ +++Arrival Service ++++ ++++ ++++ ++++First Class Lounge – product facilities ++++ +++++ +++++ +++First Class Lounge – staff service +++ +++ ++++ +++Business Class Lounge – product facilities +++ ++++ +++++ +++Business Class Lounge – staff service +++ +++ +++ +++ Source: Skytrax +++++ best + worst
Table 45: Comfort Benchmark on Ground 480
Airports Airport Satisfaction Rate
Changi Singapore 87,95% Heathrow Terminal 4 87,20% Dubai International 87,10% Hong Kong International 87,03% Copenhagen 86,80% Kuala Lumpur 85,28% Barcelona 85,28% Schipol, Amsterdam 85,23%
Table 46: Airport Satisfaction Rate 481
479 see Star Alliance (2002), p. 81 ff. 480 see Skytrax (2004d), in : http://www.airlinequality.com/Airlines/AF.htm, Skytrax (2004e), in: http://www.airlinequality.com/Airlines/BA.htm, Skytrax (2004f), in: http://www.airlinequality.com/Airlines/EK.htm, Skytrax (2004g), in: http://www.airlinequality.com/airlines/LH.htm 481 see Condé Nast Traveller (2004b), in : http://www.cntraveller.com/ReadersAwards/2004/Airports/

138
AETRA Customer Satisfaction Survey 2003 by ACI & IATA Best Airport Worldwide Europe Middle East/Africa Asia
Dubai Copenhagen Dubai Singapore Singapore Athens Cape Town Kuala Lumpur
Kuala Lumpur Brussels Durban Seoul Incheon
Table 47: Aetra Customer Satisfaction Survey 2003 by ACI & IATA 482
Additionally ACI and IATA made passenger satisfaction surveys. Dubai was the best
airport worldwide in 2003. The major traveller magazine Conde Nast published its
annual airport satisfaction rate in 2004. London had a satisfaction level of 87,2% and
close behind followed Dubai with 87,1%. This third internationally recognized survey
determines, that Dubai offers an outstanding quality standard in terms of airport
services.
5.5.6.4. Dubai International Airport’s Profile, Quality and Innovations
The 10 million web poll Skytrax is an influential and honoured quality guide for the
international aviation industry. 483 Experts and international travellers can cast their
votes. International surveys finally approve the ratings. Unfortunately Skytrax has not
concluded its latest survey yet. Dubai International Airport’s and London Heathrow’s
data is available, Frankfurt’s and Paris CDG’s not. No other – comparable to Skytrax –
rating or measurement report has been found, which offers such an outstanding
amount of information.
Dubai International Airport got four stars (out of five) in Skytrax’s airport ranking.
London Heathrow got “only” three stars. In the main categories terminal product
facilities and airport staff service, Dubai won four stars (London: three stars).
Airport Security “Comfort” Terminal(s)
Security
Perimeter/Externals
Dubai DXB
Frankfurt FRA
3 stars rated fair, maximum 5 stars (excellent) – minimum 1 star (very poor)
Table 48: Airport Security Ranking 484
482 see IATA (2003d), in: http://www.iata.org/productsandservices/gam.htm 483 see Skytrax (2004c), in: http://www.airlinequality.com/AirportRanking/security-DEF.htm ; Clark (2003), p.1, in: http://www.ekgroup.com 484 see Skytrax (2004c), in: http://www.airlinequality.com/AirportRanking/security-DEF.htm

139
The standard of airport web side was honoured with three stars (London four stars). 485
Airport Security is another main subject. In Skytrax’s Security report was only data for
Dubai and Frankfurt available.
“Many of the Gulf airports are in fierce competition for transit and transfer traffic – albeit
to a lesser extent nowadays because of more non-stop long-haul flights.” 486 They have
probably done more than any other airports in the world to attract passengers by
promoting the duty free facilities on offer.” 487 “In December 1993 the airport introduced
the first Dubai Duty Free (DDF) shop. Since 1984, the turnover associated with these
sales has increased by over 1000 per cent, totalling around US$ 306 million in 2002. It
is the fifth largest duty free outlet at an airport in terms of turnover.” 488
In order to attract even more transit passengers, “the DDF launched its ‘Dubai Duty
Free Finest Surprise’ to mark the expansion of its shopping complex.” 489 Customers
are able to win a Rolls Royce Bentley Mulsanne car. Tickets for this competition are
sold only within the Duty Free area, the cheapest one for USD $100,-. “After 1991 two
cars were offered simultaneously and, by early 2003, 1078 luxury cars had been won
by travellers from over 65 different countries.” 490
The airport has started more investments in order to attract as many international
passengers as possible. On the one hand there is the Dubai Shopping Festival every
year, Dubai Summer Surprises, FIFA World Youth Championship, Dubai Rugby
Sevens, Dubai World Cub and other events. 491 On the other hand the city of Dubai
attempts to attract business and leisure travellers with new – out of state architecture.
“In 2000 a new duty-free complex was opened and covers an area of 9000 square
metres and is four times larger than the previous shop. All routes to the 27 departure
gates go through the retail area. To commemorate the opening of these new facilities,
the airport launched another promotion called the ‘Dubai Duty Free Finest Cyber
Surprise’. The promotion offered US$ 1 million to winners,... for nearly
$ 300 a ticket. “ 492
485 see Skytrax (2004h), in: http://www.airlinequality.com/AirportRanking/dxb.htm ; Skytrax (2004i), in: http://www.airlinequality.com/AirportRanking/lhr.htm 486 Graham (2003), p.172 487 Graham (2003), p.173 488 Graham (2003), p.173 489 Graham (2003), p.173 490 Graham (2003), p.173 491 see Clark (2003), p.11, in: http://www.ekgroup.com 492 Graham (2003), p.173

140
“In support of Commercial’s strategic objective to grow passenger traffic to Dubai, a
number of tactical products were developed in partnership with Dubai’s leading hotels,
generating sales in excess of 120.000 hotel nights. Meetings, trade fairs, conventions
and conferences were supported by special fares and promotions and for passengers
wanting a short break in Dubai; the successful Dubai Stopover programme was further
enhanced.” 493
Here is a selection of Dubai International Airport’s Star Ranking: This survey approves,
that Dubai is – in terms of measurable quality – an ideal hub or connecting airport for
international travellers. It convinces with outstanding service facilities and can easily
compete with European prime hubs. IATA and ACI’s Customer Satisfactory Survey
also affirms that impression.
Transportation
Public Transport facilities +++ Cost/Location of Public Transportation ++++
Easy access by car ++++Cost/Location/Availability of taxis ++++
Cost/Location of Hotel Shuttle buses ++++Location/Access to Car Rental facilities ++++
Arrivals / Departures
Waiting times at Check-in ++++ Baggage trolley/carts throughout the
airport ++++ Connecting between Terminal(s) +++ Time/distance to Boarding gates +++
Clear Directional signing around airport ++++ Walking distance – Arrivals, Transit, etc. +++
Waiting times for baggage delivery ++++
Security / Immigration / Customs Waiting times at Security screening
points +++ Efficiency of Security screening points ++++
Waiting times at Immigration +++ Attitude/Friendliness of Immigration
staff ++++Customs Clearance procedures ++++
Attitude of Customs staff ++++
Food & Beverage Selection of restaurants/food outlets ++++
Prices of food and beverages ++++Staff Service in restaurant/food outlets +++
Language abilities of staff ++++
493 Clark (2003), p.11 , in: http://www.ekgroup.com
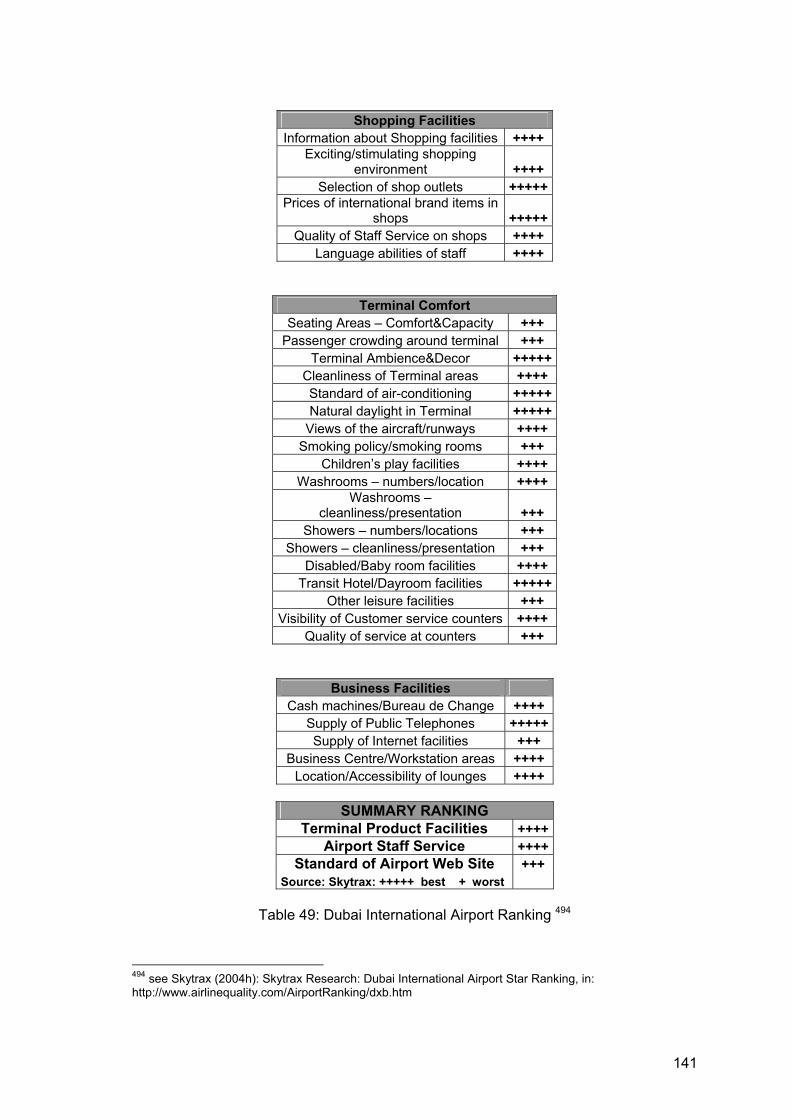
141
Shopping Facilities
Information about Shopping facilities ++++ Exciting/stimulating shopping
environment ++++ Selection of shop outlets +++++
Prices of international brand items in shops +++++
Quality of Staff Service on shops ++++ Language abilities of staff ++++
Terminal Comfort Seating Areas – Comfort&Capacity +++
Passenger crowding around terminal +++ Terminal Ambience&Decor +++++
Cleanliness of Terminal areas ++++ Standard of air-conditioning +++++Natural daylight in Terminal +++++
Views of the aircraft/runways ++++ Smoking policy/smoking rooms +++
Children’s play facilities ++++ Washrooms – numbers/location ++++
Washrooms – cleanliness/presentation +++
Showers – numbers/locations +++ Showers – cleanliness/presentation +++
Disabled/Baby room facilities ++++ Transit Hotel/Dayroom facilities +++++
Other leisure facilities +++ Visibility of Customer service counters ++++
Quality of service at counters +++
Business Facilities Cash machines/Bureau de Change ++++
Supply of Public Telephones +++++Supply of Internet facilities +++
Business Centre/Workstation areas ++++ Location/Accessibility of lounges ++++
SUMMARY RANKING
Terminal Product Facilities ++++Airport Staff Service ++++
Standard of Airport Web Site +++ Source: Skytrax: +++++ best + worst
Table 49: Dubai International Airport Ranking 494
494 see Skytrax (2004h): Skytrax Research: Dubai International Airport Star Ranking, in: http://www.airlinequality.com/AirportRanking/dxb.htm
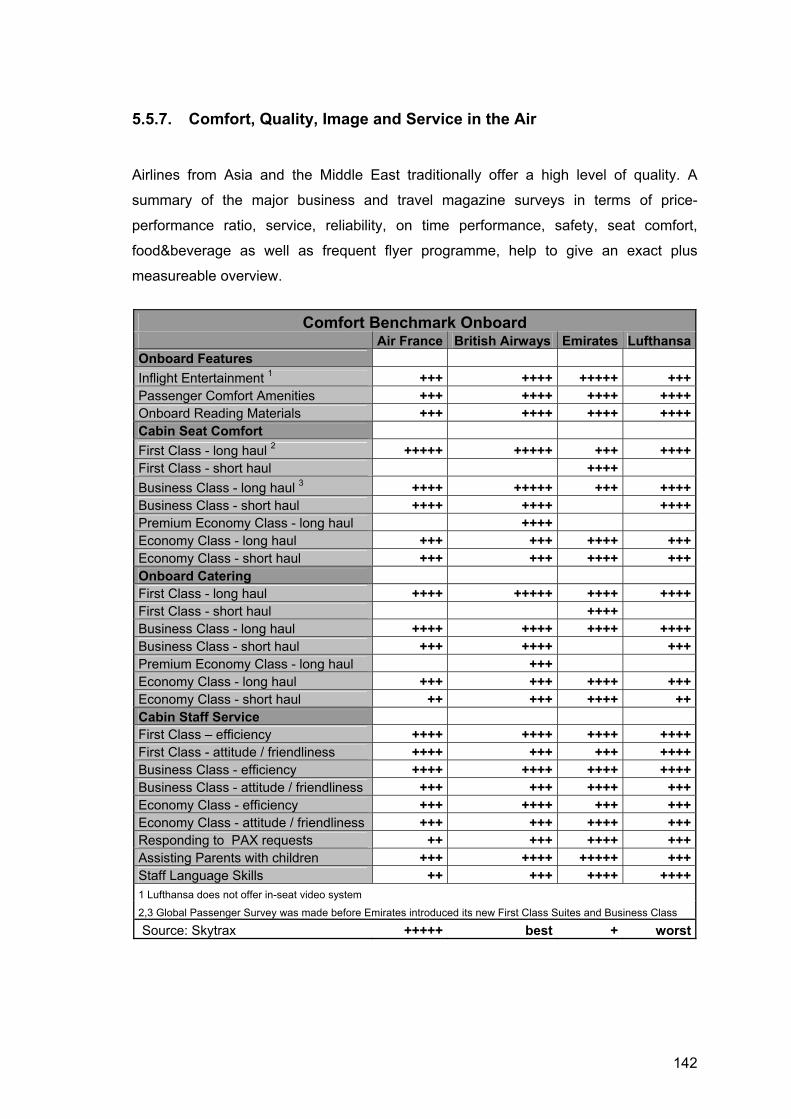
142
5.5.7. Comfort, Quality, Image and Service in the Air
Airlines from Asia and the Middle East traditionally offer a high level of quality. A
summary of the major business and travel magazine surveys in terms of price-
performance ratio, service, reliability, on time performance, safety, seat comfort,
food&beverage as well as frequent flyer programme, help to give an exact plus
measureable overview.
Comfort Benchmark Onboard
Air France British Airways Emirates LufthansaOnboard Features Inflight Entertainment 1 +++ ++++ +++++ +++Passenger Comfort Amenities +++ ++++ ++++ ++++Onboard Reading Materials +++ ++++ ++++ ++++Cabin Seat Comfort First Class - long haul 2 +++++ +++++ +++ ++++First Class - short haul ++++ Business Class - long haul 3 ++++ +++++ +++ ++++Business Class - short haul ++++ ++++ ++++Premium Economy Class - long haul ++++ Economy Class - long haul +++ +++ ++++ +++Economy Class - short haul +++ +++ ++++ +++Onboard Catering First Class - long haul ++++ +++++ ++++ ++++First Class - short haul ++++ Business Class - long haul ++++ ++++ ++++ ++++Business Class - short haul +++ ++++ +++Premium Economy Class - long haul +++ Economy Class - long haul +++ +++ ++++ +++Economy Class - short haul ++ +++ ++++ ++Cabin Staff Service First Class – efficiency ++++ ++++ ++++ ++++First Class - attitude / friendliness ++++ +++ +++ ++++Business Class - efficiency ++++ ++++ ++++ ++++Business Class - attitude / friendliness +++ +++ ++++ +++Economy Class - efficiency +++ ++++ +++ +++Economy Class - attitude / friendliness +++ +++ ++++ +++Responding to PAX requests ++ +++ ++++ +++Assisting Parents with children +++ ++++ +++++ +++Staff Language Skills ++ +++ ++++ ++++1 Lufthansa does not offer in-seat video system
2,3 Global Passenger Survey was made before Emirates introduced its new First Class Suites and Business Class
Source: Skytrax +++++ best + worst

143
Comfort Benchmark Comfort Benchmark Economy Class Business Class
Airline Seat Pitch Decline Airline Seat Pitch Decline Air France 81 cm 30° Air France 155 cm 180°British Airways 81 cm 15 cm British Airways 185 cm 180°Emirates 84 cm 17 cm Emirates 152 cm 180°Lufthansa 81 cm 31° Lufthansa 150 cm 180°Seat Pitch is the distance between a row of seats - the measurement from the same position on two seats, one behind the other (and not the legroom)
Table 50: Comfort Benchmark on Board 495
Business Travel Intercontinental flights
Airline Satisfaction Rate Airline Grade Singapore Airlines 88,50% Singapore Airlines 1,7British Airways 88,40% Malaysia Airline 1,85Emirates 87,75% Emirates 1,97Cathay Pacific 86,65% Thai Airways 2,01Air New Zealand 86,47% Quantas 2,12 Swiss 2,16 KLM 2,2 Lufthansa 2,24 British Airways 2,25 Air France 2,42
Leisure Travel - Short Haul Leisure Travel - Long Haul Airline Satisfaction Rate Airline Satisfaction Rate
British Airways 87,34% Air New Zealand 90,08%BMI 87,30% Singapore Airlines 89,91%KLM 87,23% British Airways 87,90%SAS 86,67% Virgin Atlantic 87,46%Swiss 86,07% Emirates 87,40%Emirates 85,76% Qantas 86,90%Air France 84,85% Cathay Pacific 85,46%Lufthansa 84,71% Malaysia Airlines 84,91%Silk Air 84,24% Thai Airways 84,76%Monarch Airlines 83,49% United Airlines 83,88%
Table 51: Airline Benchmark 496
495 see Vorne Sitzen (2004b), in: http://www.vornesitzen.de/cgi-bin/dbn/playout.pl?Out=sfs_vs_dc.html ; Hassenmeier (1996), p.20ff ; Sterzenbach / Conrady (2003), p. 396 ; Skytrax (2004d), in: http://www.airlinequality.com/Airlines/AF.htm ; Skytrax (2004e), in: http://www.airlinequality.com/Airlines/BA.htm ; Skytrax (2004f), in: http://www.airlinequality.com/Airlines/EK.htm; Skytrax (2004g), in: http://www.airlinequality.com/Airlines/LH.htm 496 see n.a.(2004a), p.29 ; Condé Nast Traveller (2004a), in : http://www.cntraveller.com/ReadersAwards/2004/Airlines/

144
5.5.8. Frequent Flyer Programme and Alliance
From the moment American Airlines introduced the first frequent flyer programme
(FFP) American Advantage in 1981, “it was an immediate success.” 497 . The rest of the
world soon copied this idea, as airlines recognised the power and attraction of such
loyalty programmes. Finally “almost all significant airlines have their own FFP, or are
partners in a joint-venture programme.” 498 “Frequent flyer programmes are popular and
most regular business travellers are members of at least one programme. Residing
near a hub airport where a single carrier serves a wide range of destinations allows a
more rapid accumulation of miles and a larger choice of how these ultimately may be
used. If many carriers serve a hub, then accumulation can become piecemeal and
utilization of the miles much less convenient.” 499
In order to attract and retain members, programmes have to fulfil customers’ as well as
airline’s requirements. As unredeemed mileage credits are liability on the airline’s
balance, therefore cost control is necessary. Consequently certain airlines introduced a
time limit for spending. Available award travel seats have to be limited in accordance to
high and low season in order to optimize revenues. Passengers, however, demand
cooperation with other airlines, alliances, car-rental companies or hotel chains in order
to accrue and redeem miles for awards. They also expect class bonus when travelling
Business or First Class, lounge excess, separated check-in counters plus free baggage
allowance.
“The importance of frequent flyer programmes for retaining airline customer loyalty is
well documented and this loyalty is enhanced when convenient travel to a host of
destinations is possible on a particular carrier. The value of frequent flyer mileage is
greatest for residents of a city that serves a hub for a large hug-and-spoke network
because it translates into convenient free travel to a multitude of destinations.” 500
“Tiers of membership are now an essential component of a state-of-the-art frequent
flyer programme.” 501 Some tiers can be earned (i.e. Lufthansa’s Frequent Traveller
FTL status), some can only be awarded (former Qualiflyer “Circle” or the latest “HON-
Circle” by Lufthansa and Austrian Airlines Group ) and a few ones are exclusively for
497 Shaw, (2004), p.235 498 Shaw, (2004), p.235 499 Button / Stough (2000), p. 236 500 Button / Stough (2000), p.239 501 Shaw (2004), p.239

145
special branches of the industry (Air France’s Petroleum Club 502 ). Within the alliance
all silver and gold members enjoy recognition of points as well as outstanding service
according to their status. (i.e. Star Alliance Gold and Silver Card).
While membership is free for the majority of loyalty programmes, some of them “require
payment of membership fee (e.g., Qantas’s Australian’s Flight Deck), but all offer
members private lounges, refreshments and, often, business facilities. They represent
sunk costs to airline travellers and hence, at the margin, are an incentive to stay with
an airline once a club is joined.” 503
Major carriers or members of a big alliance have significant advantages. “Large
incumbents with their extensive route networks give travellers a greater opportunity to
earn miles and also have a more diverse set of destinations to offer when the traveller
accumulates enough miles to earn an award.” 504 A US General Accounting Office
(1990) study revealed that 81% of business travellers choose flights to build up their
frequent flyer mileage more than half the time: 505
How often US business travellers choose flights
to build up frequent flyer miles
Percentage of travel
agents reporting
Always or almost always 57
More than half the time 24
About half the time 9
Less than half the time 4
Rarely, if ever 2
Other 3
Table 52: The Influence of Frequent Flyer Programmes 506
“A frequent flyer programme is an example of loyalty-inducing marketing device that is
intended to reduce consumer’s sensitivity to price. Empirical studies by Nako (1992),
Proussaloglou and Koppelman (1995) and Suzuki (2003) have shown that frequent
flyer programmes significantly affect travellers’ choice of airlines.” 507
502 Air France’s Petrolium Club is for customers, who work in the oil and gas industry. At Paris CDG seperate check-in counters, lounge and hotel service are offered. Club benefits service will be introduced at other destinations soon. (see Air France (1999), p. 5 ; Air France (2002), p. 29 ; Air France (2004), in: http://www.airfrance.com ) 503 Button / Stough (2000), p.17 504 Button / Stough (2000), p.19 505 see Button / Stough (200), p.19 506 Hanlon (1999), p.54 507 Gayle (2004), p.2
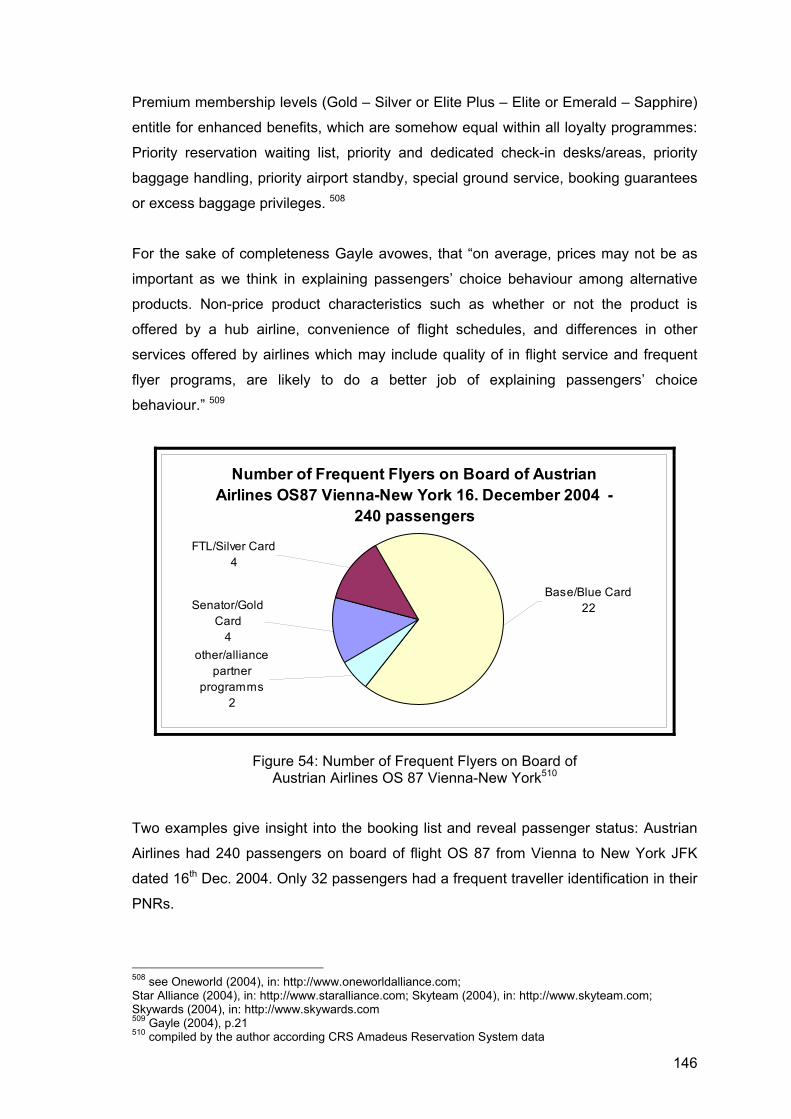
146
Premium membership levels (Gold – Silver or Elite Plus – Elite or Emerald – Sapphire)
entitle for enhanced benefits, which are somehow equal within all loyalty programmes:
Priority reservation waiting list, priority and dedicated check-in desks/areas, priority
baggage handling, priority airport standby, special ground service, booking guarantees
or excess baggage privileges. 508
For the sake of completeness Gayle avowes, that “on average, prices may not be as
important as we think in explaining passengers’ choice behaviour among alternative
products. Non-price product characteristics such as whether or not the product is
offered by a hub airline, convenience of flight schedules, and differences in other
services offered by airlines which may include quality of in flight service and frequent
flyer programs, are likely to do a better job of explaining passengers’ choice
behaviour.” 509
Number of Frequent Flyers on Board of Austrian Airlines OS87 Vienna-New York 16. December 2004 -
240 passengers
Base/Blue Card22
other/alliance partner
programms2
Senator/Gold Card
4
FTL/Silver Card4
Figure 54: Number of Frequent Flyers on Board of Austrian Airlines OS 87 Vienna-New York510
Two examples give insight into the booking list and reveal passenger status: Austrian
Airlines had 240 passengers on board of flight OS 87 from Vienna to New York JFK
dated 16th Dec. 2004. Only 32 passengers had a frequent traveller identification in their
PNRs.
508 see Oneworld (2004), in: http://www.oneworldalliance.com; Star Alliance (2004), in: http://www.staralliance.com; Skyteam (2004), in: http://www.skyteam.com; Skywards (2004), in: http://www.skywards.com 509 Gayle (2004), p.21 510 compiled by the author according CRS Amadeus Reservation System data

147
Number of Frequent Flyers on board of Austrian Airlines OS451 Vienna-London 16. December 2004 -
90 passengers
Senator/Gold Card
8
FTL/Silver Card4
other/alliance partner
programms2
Base/Blue Card17
Figure 55: Number of Frequent Flyers on Board of Austrian Airlines OS 451 Vienna-London511
It is common, however, that some travellers do not quote their frequent flyer number at
the moment of booking or check-in. They send their boarding passes to the local airline
office after the journey is completed in order to accrual miles. In contrast to the
previous sample, flight OS 451 from Vienna to London Heathrow had 90 passengers
on board. A lot more frequent travellers were on the booking list: 31 people that day.
Alliances help airlines to capture revenue synergies of an expanded network. They
gain as much as 70% - 80% of outright merger benefits, as they are very effective at
redirecting traffic to the benefit of the alliance members along with cost savings aspects
(share of terminal facilities, consolidating ticket offices, joint purchase). 512
At the moment Star Alliance is the ultimate leader in the aviation business. It has grown
so big, that its members created some kind of “subsidiary”: Regional Star Alliance,
including for instance: Adria, Blue1 or Croatia Airlines. SAA South African Airways and
TAP Air Portugal will join Star Alliance soon.
511 compiled by the author according CRS Amadeus Reservation System data 512 see Airlinesgate (2004a), in: http://airlinesgate.free.fr/industry.htm
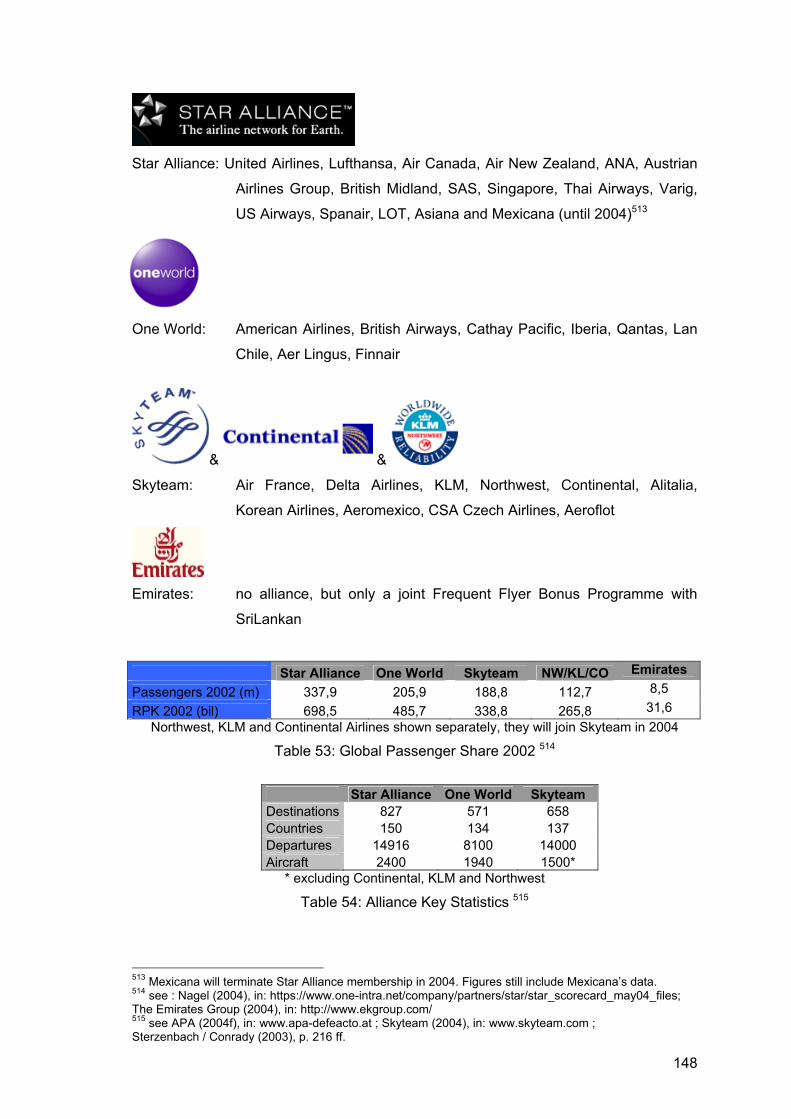
148
Star Alliance: United Airlines, Lufthansa, Air Canada, Air New Zealand, ANA, Austrian
Airlines Group, British Midland, SAS, Singapore, Thai Airways, Varig,
US Airways, Spanair, LOT, Asiana and Mexicana (until 2004)513
One World: American Airlines, British Airways, Cathay Pacific, Iberia, Qantas, Lan
Chile, Aer Lingus, Finnair
& &
Skyteam: Air France, Delta Airlines, KLM, Northwest, Continental, Alitalia,
Korean Airlines, Aeromexico, CSA Czech Airlines, Aeroflot
Emirates: no alliance, but only a joint Frequent Flyer Bonus Programme with
SriLankan
Star Alliance One World Skyteam NW/KL/CO Emirates Passengers 2002 (m) 337,9 205,9 188,8 112,7 8,5
RPK 2002 (bil) 698,5 485,7 338,8 265,8 31,6 Northwest, KLM and Continental Airlines shown separately, they will join Skyteam in 2004
Table 53: Global Passenger Share 2002 514
Star Alliance One World Skyteam Destinations 827 571 658 Countries 150 134 137 Departures 14916 8100 14000 Aircraft 2400 1940 1500*
* excluding Continental, KLM and Northwest
Table 54: Alliance Key Statistics 515
513 Mexicana will terminate Star Alliance membership in 2004. Figures still include Mexicana’s data. 514 see : Nagel (2004), in: https://www.one-intra.net/company/partners/star/star_scorecard_may04_files; The Emirates Group (2004), in: http://www.ekgroup.com/ 515 see APA (2004f), in: www.apa-defeacto.at ; Skyteam (2004), in: www.skyteam.com ; Sterzenbach / Conrady (2003), p. 216 ff.

149
26,10%
18,10%
12,70%
9,90%
1,18% 33,20%
0% 5% 10% 15% 20% 25% 30% 35%
Star Alliance
One World
Skyteam
NW/KL/CO
Emirates
Others
Revenue Passenger Kilometers 2002
Figure 56: Revenue Passenger Kilometres 2002 516
Global Passenger Share 2002
Skyteam 14,00%
NW/KL/CO 8,40%
Emirates 0,63%
Others 37,20%
One World 15,30%
Star Alliance 25,10%
Figure 57: Global Passenger Share 2002 517
516 see : Nagel (2004), in: https://www.one-intra.net/company/partners/star/star_scorecard_may04_files; The Emirates Group (2004), in: http://www.ekgroup.com/ 517 see : Nagel (2004), in: https://www.one-intra.net/company/partners/star/star_scorecard_may04_files; The Emirates Group (2004), in: http://www.ekgroup.com/

150
Presently Emirates is not a member of any alliance, but prefers to cooperate with
members of the Star Alliance, Sky Team or One World according to the route. The
airline has code share agreements with Air India, Air Mauritius, British Airways,
Continental Airlines, Japan Airlines, Philippine Airlines, Royal Air Maroc, South African
Airlines, SriLankan and Thai Airways. Partner contracts within the frequent flyer
programme Skywards exist with British Airways, Continental Airlines, Delta Airlines,
Japan Airline, Singapore Airlines, South African Airways and United Airlines.
Due to the Air France and KLM merger, only partial information about the updated
frequent flyer bonus programme is available. According to the Skyteam website,
members of Air France’s Frequence Plus programme, have access to 390 lounges
worldwide (including Skyteam alliance lounges). It is the top loyalty scheme for
frequent flyers, when lounges are the crucial criteria. Lufthansa’s Miles&More
programme provides the most airline partners and other partners such as hotel chains,
car rental companies, etc. Consequently it is travellers’ first choice in these categories.
3277
285
20
29
250
17
36
350
21 22
150
7
25
75
0
50
100
150
200
250
300
350
Miles&More ExecutiveClub
FréquencePlus
FlyingDutchman
Skywards
Frequent Flyer Programmes
Number of Airline Partners Other Partners Lounges (incl. Alliance Lounges)
AF/KL merger leads to a combination of both FFPs *
* No final and updated data available. Total number of lounges: 390 after the merger
Figure 58: Frequent Flyer Programmes 518
518 compiled by the author according: Miles&More (2004), Skywards (2004), Emirates (2004a), in: http: //www.emirates.com/at/TravellerInformation/airport/EmiratesAirportLounges/EmiratesAirportLounges.asp

151
As Emirates has not joined or introduced an alliance, the airline is limited to its own or
SriLankan’s facilities. They, however, offer its customers miles on seven Skywards
partners. To be more attractive to business travellers, Emirates definitely has to take
measures and improve the seize of its loyalty scheme. In addition to that, the airline
urgently has to reconsider company’s strategy to keep away from any alliance.
5.5.9. Value of (Travel) Time
As “time is money” – which is more applicable to business people rather than to leisure
travellers – the (total) value of travel time plays a significant role in accessibility
analysis. Airline’s customers have to judge, if cheaper flights - with longer total travel
times - should be favoured rather than non-stop flights, which mostly embrace less total
travel times but higher fares.
Studies by E. Pels, E.T. Verhoef and P. Rietveld are the basis for this chapter and
should show the approach to the valuation of travel time. Not solely monetary costs
influence travel behaviour, but also time-related costs; and both result in generalised
costs. Personal features like income or travel motive, transport modes and
environmental/situational features (weather, strike) highly affect the valuation of travel
time. Additionally the issue of reliability has a major impact on travel behaviour and on
cost benefit analysis, as speed as well as reliability does not always go hand in
hand.519
Utility (or generalised costs) depends on: monetary costs, travel time ( waiting time, in-
vehicle time, access time,...) or other comfort aspects and are donated as x1, ..., xj .
Each trip component ( car ride to the airport, check-in process, boarding,...) needs
time: t1, ..., tj. The total monetary expenditure made for this trip is p. In terms of
reliability, we have to consider uncertainty, which means that the traveller does not
know the exact value of the choice characteristics 520. It relates to both traveller’s lack
of knowledge of the traveller and the structural unreliability of transport networks. In
other words, uncertainty may affect the comfort of a trip: unreliability of service may
lead to overcrowded areas, various types of stress due to uncertainty: Decision makers
experience cognitive and social stress in decisions, otherwise aspects of regret, stress
or frustration, that they chose the wrong alternative.
519 see Rietveld (2003), p.2 520 examples: examine uncertainty on the monetary costs of a trip, on travel times, in the transport system, in the quality of destination, safety or fear,...

152
Furthermore each feature xj has a density of possible results gj(xj) with a mean μj and
a variance σ²j . Density gj(xj) depends on the traveller i him/herself. With the influence
on situational circumstances z ( time of day, type of day, weather, strike, accident,...),
density can be generalised to: gji(xji|z). Aspects of uncertainty might be: punctuality
(flights within 15 minutes of schedule are not regarded as delayed, but as on time in
airline business 521 ), safe arrival or comfort aspects fj(xj|z) (i.e. to get a seat on board –
avoid overbooking situation, rebookings,...). 522
Utility ( U ) as a linear function of travel time and price without uncertainty:
U = a1 x t1 + ... + a8 x t8 + b x p
The marginal value 523 of each travel time component j is defined as the marginal rate
of substitution between travel time tj plus price and can be computed as aj ⁄ b. In case
ttot is the total trip time, the average value of time (VOT) for the whole trip is:
Average VOT = Σj ( tj ⁄ ttot ) aj ⁄ b Marginal values are defined as the change in price necessary to compensate traveller
for a loss of one unit travel time so that he remains at the same level of utility. 524
Assuming uncertainty is valued via expected utility ( W ), marginal values of travel time
are constant, it is equal to:
W = Σj aj E ( tj ) + b x p
E ( tj ) represents the expected value of tj - and is called the expected value operator.
Again the value of each travel component j can just be computed as aj ⁄ b.
This represents the chance in price necessary to compensate a traveller for loss of
expected travel time of one unit so that he remains at the same level of expected utility.
Therefore uncertainty effects only the average duration of the various trip
components. 525
521 see Pompl (2002), p.462 ; CAA (2004), in: http://www.caa.co.uk/caanews/caanews.asp?nid=928 ; AEA (2004a), p.3 522 see Rietveld (2003), p.2 ff., p. 9, p. 15 523 assumption that marginal value of travel time is constant 524 see Rietveld (2003), p.5 f. 525 see Rietveld (2003), p.6 f.

153
In case the valuation of time depends on the length of travel time, aj x tj must be
replaced by fj ( tj ), where fj ( tj ) is a non-linear function of tj:
U = fj ( tj ) + ... + fj ( tj ) + b x p
As we face no uncertainty, the marginal value of travel time component j is
VOT = d [ fj ( tj ) ] ⁄ d [ tj ] ⁄ b
Depending on the level of tj . 526
Figure 59:Valuation of Travel Time as a Function of Trip Duration 527
If uncertainty is valued via the expected utility and the marginal value of travel time is
not constant, the value of time estimate for a trip time j is:
VOTj = [ dF ( α1 , ... αN ; µ1 , ... µ8 ; σ11 , ... , σJJ) ⁄ dµj ] ⁄ b
526 see Rietveld (2003), p.7 f. 527 Rietveld (2003), p.19

154
The value of time estimate of trip time j depends on all parameters, including the
means and variances and covariances of the travel time components. Whereas now
f1 ( t1 ) + ... + f8 ( t8 ) depend on parameters α1 , ... αN and now the joint density g ( t1 , ... , t8 ) has parameters for expected values of travel times µ1 , ... µ8 and their
variances and covariances σij . 528
When activities are either scheduled or not scheduled, uncertainty on travel time is
always problematic. Supposing uncertainty is valued via expected utility with a penalty
for standard deviation and the marginal value of travel time is constant, the
corresponding value of travel time would be:
VOT = d [ aj + c aj σj hj ] ⁄ b
Figure 60: Valuation of Travel Time as a Function of Trip Duration Under Certainty
(Variance = 0) and Uncertainty (Variance > 0) 529
C is the weight given to the standard deviation relative to the average. The above-
mentioned formula is only valid, if the marginal value of expected travel time and the
variance would increase. With the normal distribution, the standard deviation and mean
are not interrelated.530
528 see Rietveld (2003), p.8 529 Rietveld (2003), p.20 530 this means hj = 0

155
In skewed distributions (i.e. exponential or gamma distribution), mean and standard
deviation are proportional to each other. When proportionality between mean and
standard deviation exist, uncertainty is implicitly incorporated in the estimate of the
value of travel time. 531
Finally scheduling costs are relevant when a targeted time of arrival is given and losses
are faced at late arrival (i.e. meeting,..). They also imply a strong non-linearity in the
valuation of travel time. The utility of a trip is:
U = a1 x t1 + ... + a8 x t8 + b x SDE + c x SDL + d x DL + b x p
T* is the desired arrival time, t the total travel time, SDE the early schedule delay 532.
SDL is the late schedule delay 533 and DL a dummy that assumes the value 1 when
SDL > 0. PL is the probability of late arrival, which is needed in the formula of expected
utility, in case unreliability occurs:
E ( U ) = Σj aj E (tj) + const. Σ (t) + d x pL + b x p
The term with the expected values of travel time takes into account the weights:
Σj aj E (tj)
The standard deviation reads in terms of total unweighted travel time ( t1 , ... , t8 ). 534
“Ignoring the standard deviation and the probability of a late arrival, leads to high
estimates for the value of time in the case of schedule activities. This must be one of
the main reasons why a general result from the literature is that value of time for
commuting and business trip is so high.” 535 Eric Pels and Erik T. Verhoef 536 reflect
about passengers’ and airlines’ value of time in their study about Airport Congestion
Pricing with the help of the generalized user cost function. The average time loss per
passenger per flight due to congestion at node h, Φh is assumed to increase linearly in
the total frequency at that node:
531 see Rietveld (2003), p.9 ff. 532 number of minutes arrived before t* 533 number of minutes arrived after t* 534 see Rietveld (2003), p. 11 ff. 535 Gunn (2001), in: Rietveld (2003), p. 13

156
For explanation, ηh is the sloe of the congestion function, Φh gives the sum of time
losses during departure and arrival on the airport. λi is the given product of the load
factor and seat capacity, and thus gives the number of passengers per flight
( q i transported by airline i ). ƒi is the airlines frequency [ ( 1 ⁄ λi ) q i ]. The inverse
aggregate demand ( D ) is linear in the form: α – β ∑ q i , whereas α represents the
maximum reservation price along with β as the demand sensitivity parameter. So finally
the passenger’s value of time is defined:
VOT p = [ gi – pi ] ⁄ Φi
With Φi as the sum of time loss, gi as the generalized user cost function together with p
as the fare. 537
5.6. Validity of the Empirical Findings and Critical Approach
The model represents a common application to measure the relative importance of
several driving forces (frequent flyer programme, price, schedule-convenience, etc.).
However, the study is not without its limitations. It does not (due to capacity
constraints) show decision-elasticisities as interviews were disregarded. The selection
of routes is limited to a group of destinations, all carriers serve via one of the four
competitive hubs538. A study with alternative departure and arrival cities possibly offers
different results. The analytical treatment definitely provides suggestions for future
research and policy implications. It examines the determinants of air travel demand
along with elements of consideration. The study adopts a market research approach,
conducts an econometric analysis and identifies the relative importance of factors that
influence travellers’ options.
The estimated choice parameters allow quantifying passengers’ tradeoffs among these
driving forces, emerging in a conceptional framework, which provides a means to
quantify and test hypothesis about Dubai as a first choice hub for international
travellers.
536 see Pels / Verhoef (2003), p. 2 ff. 537 see Pels / Verhoef (2003), p.2 ff. 538 Dubai, Frankfurt, London, Paris
2 2 Φh = ηh ∑ ƒi = ηh ∑ ( 1 ⁄ λi ) q i
i = 1 i = 1
157
Nevertheless competition between each parameter is vivid. The outcome is
measurable, but the proportion of the influence only anticipatory. Several studies reveal
passengers’ preferences. They provide an easy to understand ranking, telling the
reader which product feature is superior to the other. But no statistic answers the
question, how the customer finally decides, in case a situation like the following might
occur: A flight via Dubai is considered as the cheapest possibility, London-Heathrow
rated the most luxury airport, the connection via Frankfurt resulting in the quickest total
travel time and Air France’s frequent flyer programme being the best loyalty scheme for
this passenger. Probably conjoint measurement analysis may provide a partial help,
but does not bring total clarification. Consequently a lot of research is still to do, if we
do not want to work solely with approximate values or assumptions.
5.7. Summary
The paper develops an extensive evaluation of measurement methods, strategies and
results. In the model, a set of parameters is created on a literature basis. It deals with
the issue of key product feature and with arbitrage-affecting travel decisions from the -
divergent- passengers’ point of views.
Dubai airport fails to succeed in terms of frequent flyer programme, total travel time or
price. Some routes are cheaper via Dubai and even the travel time is less than via
other hubs. Still, the “classic” European mega-hubs attract the majority of the
passengers with a perfect -and wide spread- schedule together with a profound
frequent flyer programme. The valuation of travel time emphasizes the importance of
minimized total travel time and schedule convenience. In respect to service features,
quality standards and safety, Dubai is the perfect choice for travel. In addition, the
outstanding comfort-level convinces passengers to choose Dubai as their transfer
point. However, it is also the exciting stop-over programme, which serves as an
attractive bonus to the passenger, who can experience the Arabian culture no matter if
it is a business or leisure trip.
Undoubtedly, each parameter must not be considered on a case-by-case basis. The
customer finally decides upon the logical sum of the current framework excluding
equilibrium of these driving forces, after he has generated a personal arrangement of
perspectives. The beneficial effects of competition and development imply an even
large set of choices for the traveller (i.e. with regard to price, quality, service, etc.).
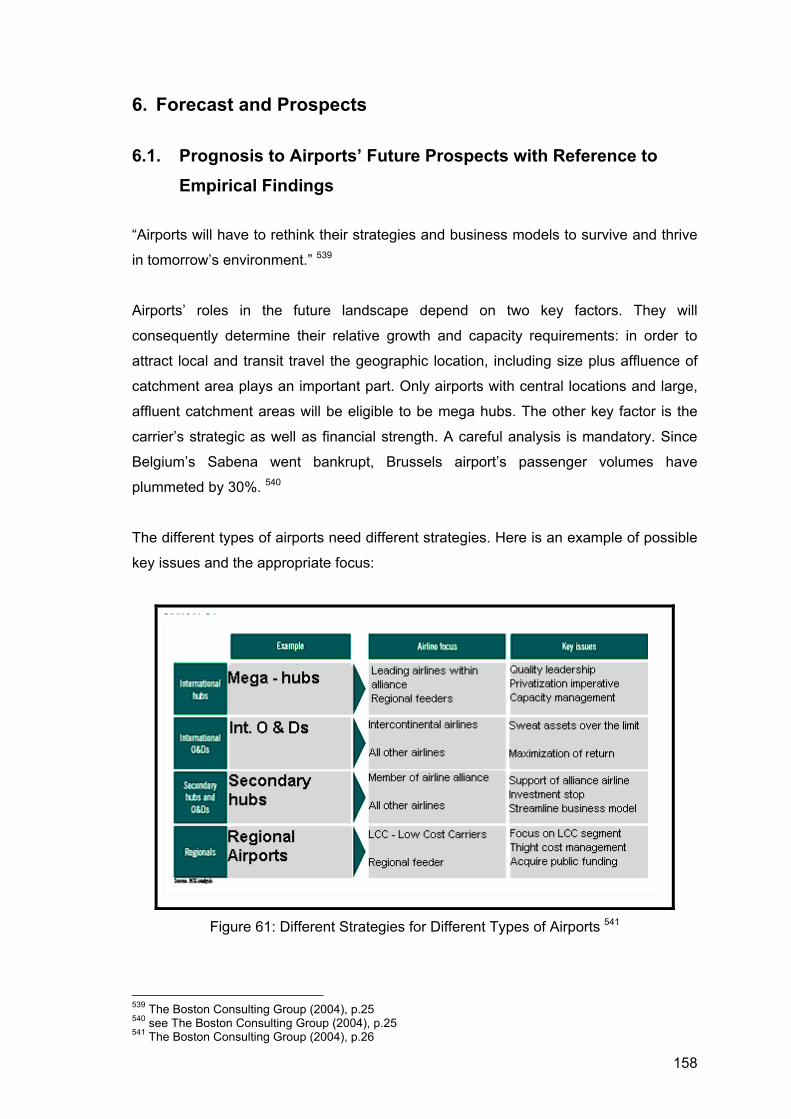
158
6. Forecast and Prospects
6.1. Prognosis to Airports’ Future Prospects with Reference to Empirical Findings
“Airports will have to rethink their strategies and business models to survive and thrive
in tomorrow’s environment.” 539
Airports’ roles in the future landscape depend on two key factors. They will
consequently determine their relative growth and capacity requirements: in order to
attract local and transit travel the geographic location, including size plus affluence of
catchment area plays an important part. Only airports with central locations and large,
affluent catchment areas will be eligible to be mega hubs. The other key factor is the
carrier’s strategic as well as financial strength. A careful analysis is mandatory. Since
Belgium’s Sabena went bankrupt, Brussels airport’s passenger volumes have
plummeted by 30%. 540
The different types of airports need different strategies. Here is an example of possible
key issues and the appropriate focus:
Figure 61: Different Strategies for Different Types of Airports 541
539 The Boston Consulting Group (2004), p.25 540 see The Boston Consulting Group (2004), p.25 541 The Boston Consulting Group (2004), p.26

159
Attractive O&D locations along with some regional airports will benefit from an increase
in – financially attractive – point-to-point travel in the short to medium range travel-field.
Among the large airports, significant long-term growth is left to mega hubs and O&D
locations that feature prominently in the alliances’ schedules. Mega hubs will not only
profit from the consolidation of long haul traffic. The huge financial pressures on the
major carriers will leave them with little choice but to consolidate their traffic into mega
hubs, sidelining many of today’s primary and secondary hubs. Secondary hubs will lose
this kind of traffic along with point-to-point travel. Therefore they will experience much
less growth. The rise of point-to-point travel will strengthen selected O&D locations
plus regional airports. 542
Figure 62: Hub Consolidation 543
Frankfurt, London Heathrow and Paris CDG are the most probable candidates to
become a European mega hub. Munich’s or Madrid’s future will be the role of a
secondary hub. Focus on point-to-point travel is international O&D’s fate, which
includes airports like Zurich or Milan. 544 But where will Dubai go? There is no special
analysis about the future of this airport. A scenario drawn for international airports by
Joop Krul is used a basis for an expectation:
542 see The Boston Consulting Group (2004), p.5, p.14, p.18 543 The Boston Consulting Group (2004), p.20 544 see The Boston Consulting Group (2004), p.20

160
Figure 63: Possible Airport Scenario’s for DXB 545
Dubai’s airport future goes hand in hand with Emirates expansion plans. In case Dubai
became a secondary hub, the airport could serve a feeder function for prime hubs. It
additionally could offer a broad short- and middle range network, including a small
intercontinental network. If Dubai turned into an Origin and Destination airport, it could
end up in a point-to-point traffic airport only. Dubai airport and its market will serve as a
gate for short- and middle range as well as intercontinental network. From this very
moment, Dubai will not play a specific hub function any more. 546
This paper cannot answer the question where Dubai will go in the near future, as the
airline industry is still in a state of radical antagonism. The aviation sector is in constant
motion. The introduction of advanced aircraft redistribute airports-airlines and alliances
roles. The decision of a new partner directly inclines the role of the partners’ home
airports. In case Swiss either joins One World or Star Alliance (respectively mergers
with or is taken over by another airline), Zurich definitely will be downgraded to an O&D
airport. Emirates’ strategy influences Dubai’s future, the same way as the airport’s
operations affect Emirates vice versa.
545 compiled by the author acc. Krul (2004), p.19; The Boston Consulting Group (2004), p.4 546 see Krul (2004), p. 19 ff. ; The Boston Consulting Group (2004), p.20 ff.
SECONDARY HUB CPH MUC AMS LGW
VIE DXB ?
FEEDER AIRPORT
NUE YVR FLR INN
PRIME HUB
LHR FRA CDG NRT
ATL DXB ?
O&D AIRPORT
ZRH MXP BRU MAN
SYD DXB ?
Hierachy position of
airport
high
low small large
Broadness of network
POSSIBLE AIRPORT SCENARIO’S FOR DXB

161
6.2. Future Development of the Aviation Industry with Reference to the European-Asian Air Traffic
Growth rates for the European-Asian traffic look good. They depend on economic
development in addition to future crisis, war or strikes. Another obstacle, however, is
the problem of Air Traffic Control both on the ground and in the air. Most airports have
already reached their limits (in terms of capacity, slots, etc.). The same applies to flight
routes. 547 Airbus expects that travel volume for the European-Asian traffic will rise by
6,5% until 2009. Likely Dubai will accrue a major portion, as the airport has no
constraints and can grow. In addition the home-based airline Emirates provides an
extensive network together with the latest aircraft. Large and modern types of aircraft
help to keep operating costs low. Consequently travel via Dubai convinces with
competitive price.
5,5% 6,5%5,4%
6,5%
0%
1%
2%
3%
4%
5%
6%
7%
Intra - European Europe - Asia Intra - Asian Europe -China
Average Growth Rate per Year 1999 - 2009
Figure 64: Average Growth Rate per Year 1999-2009 548
6.2.1. Market and Commercial Driven Changes
World’s “regions are at different stages in the life cycle of the industry. A possible
hypothesis is that growth follows an S-sharped pattern over time: slow to begin with,
then rapid and finally slow again when the industry reaches maturity.
547 see Pompl (2002), p. 473 ff. 548 Airbus (2000), p.68, in: Pompl (2002), p.474

162
On this interpretation Africa would appear to be the beginning stage” 549; in the rapid
growth stage Asia, Middle East and Latin America appear. North America and Europe
are very close to enter the mature stage.
Beginning
stage Transition Rapid growth
stage Transition Mature stage
V
olum
e
When does this growth market… Africa
US and Europe Latin
America Middle East
Asia
... become this mature industry?
Time
Figure 65: Market Life Cycle 550
“A lot of companies (no matter of their seize) reduce budget for commercial travel.
Managers face new situations and have to fly Economy Class instead of Business
Class. Airlines have to adapt to these changes in the industry with Fare and Service –
adjustments.” 551 The decline in business travel forces airlines to introduce new ideas in
order to attract high yield customers. Lufthansa launched business-class-only-flights on
selected transatlantic routes. Private Air’s Boeing 737 and Airbus A319 operate flights
between Dusseldorf, Munich and Newark with 48 business class only seats on behalf
of the German airline. The airline industry has clearly become more open to novel
solutions. In the United States, the use of teleconferencing and videoconferencing rose
by more than 50 percent in 2001. Many companies expect their employees to travel
economy class. Fractional jet ownership schemes are another current trend, in which
companies buy shares in corporate jets. So top priority is luring back business
travellers. In addition, Qatar Airways introduced a converted Airbus A319 to attract high
yield travellers. 552
549 Hanlon (1999), p.14 550 Sterzenbach / Conrady (2003), p. 391 551 n.a. (2004b) 552 see Gazvinian (2002), p.54 ; Lufthansa (2004c), p. 163

163
6.2.2. Technical and Infrastructure Driven Changes
6.2.2.1. Technical Driven Changes
Only the largest hubs with significant feeder capacity will be equipped to handle mega
planes such as the Airbus A380. The introduction of this new generation of mega
planes, which will require large airports with substantial feeder capacity, will accelerate
the shift to mega hubs.553 Airbus expects that traffic between international mega hubs
like Frankfurt, Singapore, New York or Tokyo will constantly grow. There is an urgent
need for an aircraft with a high load factor and extended range. The Airbus A380 will
have a capacity of 555 passengers and a range of 15.000 km.554 Currently 12 different
customers (such as Emirates, Lufthansa, Singapore Airlines, Virgin Atlantic, Air France
or Qantas) have already made 133 firm orders. 555 Airports and Ground handling
companies have to adopt their infrastructure to the new giant aircraft. Upgraded
terminals as well as gates are mandatory. Some airports like Dubai and Frankfurt
introduced improvement plans. The government already approved Frankfurt’s
maintenance-hall.556 Dubai will offer 23 gates for the Airbus A380 and guarantees to
board the aircraft within 60 minutes, with the help of a multiple-gate area.557 Paris CDG
is fit for aircraft since 2001.558
For example, the Airbus A340-500 is already in service for ultra long range. Singapore
Airlines uses the aircraft on its Singapore – New York route for an 18 hours non-stop
flight, Emirates for Sydney and New York flights (14-15 hours).559 It would also be
possible for the airline to serve Dubai – Los Angeles and San Francisco non-stop
within 17 hours or possibly operate Rio de Janeiro as well as Sao Paulo non-stop.560
Air Canada would be able to connect Toronto with cities in Asia like Singapore or
Indonesia, even Australia.561 European carriers might not have so many operational
areas for such types of long distance aircraft. There would not be enough customers to
operate a Frankfurt – Honolulu or Sydney route.562 The A340-500 enables airlines to
serve routes of 15.000 km distance without a technical stop. They, however, have to
attract high yield customers to justify such routes.
553 see The Boston Consulting Group (2004), p. 5, p.16 554 see Deckstein / Hawranek / Klawitter (2004), p.85 ; Sterzenbach / Conrady (2003), p. 262 555 see Lyberth (2004), p.9; Deckstein / Hawranek / Klawitter (2004), p.95; Airbus (2004), in: http://www.airbus.com 556 see APA (2004g), in: http://www.apa-defacto.at 557 see Newton (2003), p. 5 558 see Aéroports de Paris (2004), in : http://www.adp.fr 559 see Stolzke (2004), in: http://www.apa-defacto.at 560 see Stevens (2001), p.34 561 see Canaday (2001a), p.73 562 see Stolzke (2004), in: http://www.apa-defacto.at

164
The growth of the more profitable point-to-point travel draws traffic passengers from
hubs, especially secondary hubs. The arrival of the new Boeing 7E7 supports this
development. This aircraft is able to bypass hubs by providing direct point-to-point
travel.563
Technical Details B747-400 A380 A340-500 B7E7
10.750 km 11.500 km 14.446 km 6.500 - 16.000 kmRange with full passenger load Passengers 420 555 250 - 300 200 - 300
Table 55: Aircraft Technical Details 564
It definitely makes sense to introduce these new types of aircraft. “For premium
travellers, the elapsed-time rankings are like lowest fare rankings for many leisure
travellers: the prime choice variable. This makes sense, of course, because time is
money to business travellers ... you can get the biggest bang for the buck if you are
15% faster on the longest trips.” 565
Therefore such long-range non-stop flights are attractive to travellers, because they
increase the timesavings, by either avoiding stops at all or at least the ground handling
– connecting processes. These new aircraft and airlines’ firm order prove, that there is
a need for quick non-stop travel anywhere in the world. As the Airbus A380 is able to
reduce tariffs by 15 up to 20% 566, passengers might not have to choose cheaper
connecting flights any more.
Boeing and Airbus have different expectations: Whereas Boeing supposes that there
will only be a high demand for point-to-point travel with smaller aircraft, Airbus assumes
growth on medium and long-range routes to big hubs.567 This situation jeopardizes
Dubai’s role as an international hub, because high yield travellers expect quick
connections and aircraft of the latest generation. In case major airlines offer flights with
giant aircraft (implying low seat costs) even from non mega hub airports, Dubai might
easily lose its role as a connecting airport between Europe and Asia.
563 see The Boston Consulting Group (2004), p. 17 564 see Deckstein / Hawranek / Klawitter (2004) ; Fraport AG (2004), in: http://www.apa-defacto.at ; APA (2004h), in: http://www.apa-defacot.at ; Stolzke (2004a), in: http://www.apa-defacto.at ; Air Canada (2004), in: http://www.aircanada.com/fleet ; Sterzenbach / Conrady (2003), p. 262 565 Canaday (2001b), p.61 566 see Airbus (2004), in: http://www.airbus.com 567 see Stolzke (2004b), in: http://www.apa-defacto.at

165
6.2.2.2. Infrastructure Driven Changes
Some prime hubs have problems to expand and therefore cope with passenger growth.
A highway, Air Force base, a residential area and forest, bound Frankfurt. Forty
percent of Lufthansa’s intercontinental departures faced a delay 568 with an average of
33 minutes in 2002. Figures for 2004 got better. Lufthansa’s long haul on time
departures were about 68,5%. London Heathrow urgently needs a third runway and
terminal 5. The airport is running to a capacity of 97%. In 2002, 30% of British Airway’s
intercontinental departures were delayed by an average of 31 minutes. 2004, 73% of
British Airways’ long haul departures were on time. Paris CDG is fit for the future as the
new terminal 2E opened in 2003, but still has delay problems: In 2002, 51% of Air
France intercontinental flights were delayed by 47 minutes (average). 2004 the
percentage of on time departures improved and reached 57,4%. No problems at all has
Dubai airport. There is enough space for expansion plans and no residendents or
environmental restrictions. A new terminal dedicated entirely to Emirates and two new
concourses will be completed by 2006. They will push the capacity of the airport up to
70 million passengers. 569 It is a question of slots obligations and possibilities. If airlines
cannot operate as desired, it will also harm their home airports. Constraints are the
limitations for future success, as competitors are waiting for a chance to succeed – no
mistake allowed! In this category Dubai airport definitely has the best cards for the
future!
6.3. Critical Conclusion
Airports and its allies airlines both face the same set of trends (positive and negative) in
the industry. Their responses to those trends will depend on their financial as well as
competitive strength; guaranteed success will come only when both are able to attract
customers.
One priority is always the aim to secure financial stability and a lower cost base. Both
partners have to focus on a long-term survival strategy, whereas vigilance and
creativity in raising cash together with cutting costs are crucial.
568 Flights within 15 minutes of schedule are not considered as delay, but as on-time according AEA (2004a) 569 see Newton (2003), p.4 ff. ; Aéroports de Paris (2004), in : http://www.adp.fr, Heathrow Authority (2004), in: http://www.airconsult.gov.uk ; Heathrow (2004), in: http://www.baa.co.uk/main/airports/heathrow ; APA (2004i), in: http://www.apa-defacto.at ; AEA (2002) ; AEA (2004a)

166
Additionally they have to stimulate demand. Ultimately, financial retrenchment
represents only part of the equation.
Airports and airlines have to wheedle, cajole or otherwise convince customers to return
to the skies as often as possible. Pulling the price lever may be the only way to entice
travellers to return, but this is a short-term solution that favours the player with the
lowest cost structure.
All players should look for short-term opportunities to differentiate and reinforce long-
term relationships (i.e. make the stay at the airport or in the sky an unforgettable
event). The challenge for all is to stimulate demand without destroying yield.
Another problem is the regulatory issue. Governments will influence the competitive
environment with decisions about financial support, competitive rules and foreign
ownership. There is no doubt that airport operators prosper as local or regional
monopolies leave the airlines little negotiation leverage. Legislators might redistribute
some of the industry’s earnings by ensuring the same level of competitiveness between
airlines, airports and organizations they do business with. Airlines and airports have to
treat themselves as partners, as airports’ future lies in closer cooperation with the
major airlines.
All participants have to reinforce their competitive strengths. Major airlines with
privileged access to and cooperation with a strong hub (i.e. Air France – Paris CDG,
Lufthansa – Frankfurt, British Airways – London Heathrow or Emirates – Dubai) should
enforce their efforts to squeeze efficiency from their hub-and spoke networks, with the
help of the airports themselves, providing excellent infrastructure and high quality level.
In Europe this cooperation seems to be rigidly. As the technical leap possibly excludes
Dubai from the European-Asian traffic flow, the airport has to set new quality standards
to attract customers. Since the financial situation is more than healthy and fortunate, it
is undoubtedly a small challenge for the airport as well as the airline. The sole
uncertainty that still remains, is, how will the passenger react to all those changes?
167
Unfortunately, the aviation industry suffers from highly unstable psychological impacts
mentioned above. Doing nothing or even doing more of the same is simply not an
option. Although securing financial stability is a common and urgent requirement,
success will ultimately depend on how demand is stimulated and competitive strengths
can be reinforced.
The value of sound strategy development and execution has never been higher.
Acknowledgments
The author wishes to thank the Institute of Transport Economics and Logistics together
with everyone, who supported this paper with faith, force, friendship plus inspiration.
168
Bibliography
Aberle (2003): Aberle, G.: Transportwirtschaft, 4. Aufl., München/Wien 2003 ACI (2000): Airports Council International ACI: Quality of Service at Airports, 2000 AEA (1995): AEA Association of European Airlines: European Airport Getting to the Hub of the Problem or The Problem of Getting to the Hub, Brussels, April 1995 AEA (2002): AEA Association of European Airlines: AEA Punctuality Data – Annual, 2002, Brussels, 13. Feb. 2003 AEA (2004a): AEA Association of European Airlines: AEA Consumer Report for January 2004, Brussels, 5. March 2004 AEA (2004b): AEA Association of European Airlines: European Airline Delays in 1st Quarter 2004, Brussels 4. June 2004 AEA (2004c): AEA Association of European Airlines: European Airline Delays in 2nd Quarter 2004, Brussels 13. August 2004 Aéroports de Paris (2004): ADP Aéroports de Paris, Paris CDG, in: http://www.adp.fr (10.10.2005) Airbus (2000): Airbus Industry: Global Market Forecast 2000-2019, http://www2.airbus.com/pdfs/media/GMF2000.pdf (04.08.2001) Airbus (2004): Airbus Industry, in: http://www.airbus.com (8.12.2004) Air Canada (2004): Air Canada, in: http://www.aircanada.com/fleet (8.12.2004) Air France (1999): Frequence Plus Newsletter, No.24, June 1999, Paris/Frankfurt 1999 Air France (2002): Air France World Wide Timetable 27 Oct 02 – 29 Mar 03, Paris 2002 Air France (2004): http://www.airfrance.com (1.10.2004) Airline Business (2002): Airlines Business (ed.): The Airline Industry Guide 2002/03, p.45-60 Airlinesgate (2004a) : Airports and Airspaces Congestion Issues, IATA/ICAO/Merrill Lynch/ BNP Economic Research, in: http://airlinesgate.free.fr/articles/industry3.htm (18.09. 2004) Airlinesgate (2004b): Airline Industry and Strategies, IATA/ICAO/Merrill Lynch/BNP/ Economic Research, in: http://airlinesgate.free.fr/articles.htm (18.09.2004) Airlinesgate (2004c): Fleet Dynamics and Long Term Outlook, IATA/ICAO/Merrill Lynch/BNP Economic Research, in: http://airlinesgate.free.fr/fleet%20outlook.htm (18.09.2004) APA (2004a): Austria Presse Agentur: IATA Weltweiter Flugverkehr auf Erholungskurs, Wien 28.7.2004, in: http://www.apa-defacto.at (1.10.2004)

169
APA (2004b): Austria Presse Agentur: Luxus-Airline Emirates nimmt ab Mai Wien ins Streckennetz auf, Wien 18.3.2004, in: http://www.apa-defacto.at (1.10.2004) APA (2004c): Austria Presse Agentur: Ölpreis – Lufthansa berät über neue Preisrunde, Wien 29.9.2004, in: http://www.apa-defacto.at (1.10.2004) APA (2004d): Austria Presse Agentur: Flughafen München erhöht Start- und Landegebühren, Wien 28.9.2004, in: http://www.apa-defacto.at (1.10.2004) APA (2004e): Austria Presse Agentur: Flughafen Wien senkt Landetarife und Parktarife für Flugzeuge, Wien 30.9.2004, in: http://www.apa-defacto.at (1.10.2004) APA (2004f): Austria Presse Agentur: Europas Giganten im Luftverkehrsmarkt, Wien/Hamburg 4.5.2004, in: http://www.apa-defacto.at (1.10.2004) APA (2004g): Austria Presse Agentur: A 380-Wartungshalle am Frankfurter Flughafen genehmigt, Wien/Wiesbaden 29.11.2004, in: http://www.apa-defacto.at (8.12.2004) APA (2004h): Austria Presse Agentur: EADS will schon Montag über Langstreckenjet A 350 entscheiden, Wien/Paris 26.11.2004, in: http://www.apa-defacto.at (8.12.2004) APA (2004i): Austria Presse Agentur: Slots an Flughäfen werden zur heiß begehrten Handelsware, Wien/Salzburg, 26.3.2004, in: http://www.apa-defacto.at (1.10.2004) Ashford / Benchemam (1987): Ashford, N./Benchemam, M.: Passengers’ Choice of Airport: An Application of the Multinominal Logit Model, in: Transportation Research Record, 1147, 1987, p.1-5 Austrian Airlines (1997): Austrian Airlines Facts 1996/97 Airline Information Pack, Vienna 1997 Austrian Airlines (1998): Austrian Airlines, Annual Report 1998, Vienna, 1998 Austrian Airlines (2004): Austrian Airlines Timetable, 28 Mar 2004 – 30 Oct 2004, Vienna 2004 Austrian Airlines Group (2002): Austrian Airlines Group Presentation: Turnaround der Austrian Airlines Group und die Herausforderungen für die Zukunft, Vienna 2002 Austrian Airlines Group (2004a): in: http://www.aua.com (20.9.2004) Austrian Airlines Group (2004b): Austrian Airlines Group Presentation: Russian Agents Meet Austrian Airlines, 2nd Nov. 2004, Vienna 2004 Austrian Airlines Group (2004c): Austrian Airlines Group Presentation: Navigating through Challenges, March 2004, Vienna 2004 Axhausen / Bleisch (2003a): Axhausen, K.W./Bleisch, A.: Accessibility of Regions, First Results of the IBC Development Module „Accessibility“, BAK International Benchmark Club IBC Forum 2003, Basel June 2003 Axhausen / Bleisch (2003b): Axhausen, K.W./Bleisch, A.: Die Erreichbarkeit Zürichs im internationalen Vergleich, Zürcher Benchmarking Forum 2003, Zürich 2003 Axhausen (2004): Axhausen, K.W.: Trends in der Erreichbarkeit und der Mobilität der Schweiz, ETH Zürich, Zürich 2004
170
Axhausen / Fröhlich (2004): Axhausen, K.W./Fröhlich, P.: Erreichbarkeitsuntersuchungen für Luft, Schiene und Straße, ETH Zürich, Zürich 2004 Axhausen / König (2004): Axhausen, K.W./König A.: Swiss Value of Time Study: First Results, Presentation at the Centre for Transport Studies, Imperial College, London 2004 BAA (2004): Gatwick Airline Information, British Airports Authority, in: http://www.baa.co.uk/main/airports/gatwick/terminal_information_frame.html (15.09.2004) Baker (2000): Baker, C.: Slow Shuffle, Alliance Terminals, in: Airline Business, December 2000, p.68-69 Baradaran / Ramjerdi (2001): Baradaran, S./Ramjerdi, F.:Performance of Accessibility Measures in Europe, in: Journal of Transportation and Statistics, Volume 4, nrs. 2/3, 2001, p. 31-48, in: http://www.bts.gov/publications/jts/v4n23/index.html (10.09.2004) Basar / Bhat (2003): Basar,G./Bhat, C.: A Parameterized Consideration Set Model for Airport Choice: An Application to the San Fransico Bay Area, The University of Texas at Austin, Austin 2003 Bauer (2004): Bauer, P.: US-Luftfahrt im Aufruhr – Krisenstimmung, in: APA Austria Presse Agentur, 13. Sept. 2004: http://www.apa-defacto.at (16.9.2004) Berry (1990): Berry, S.: Airport Presence as Product Differentiation, in: The American Economic Review, Vol. 80, 1990, p.394-399 Bilotkach (2002): Bilotkach, V.: A Simple Model of Price Competition between International Airline Alliances, The University of Arizona, Tuscon, Arizona 2002 Blackstone / Buck / Hakim (2003): Blackstone, E.A./Buck, A.J./Hakim, S.: Determinants of Airport Choice in a Multi-airport Region, Temple University, Philadelphia October 2003 BMI (2002): British Midland, in: http://www.flybmi.com/bmi/engb/aboutbmi/presscentre/ pressreleases.aspx?year2002&rid=121 (10.10.2004) Bresson / Köhne / Westbrock (2003): Bresson, F./Köhne, T./ Westbrock, B.: Rationalisierung der Preisbildungsstruktur der Lufthansa, Universität Mannheim, Mannheim 2003 Bruinsma / Rietveld (1993): Bruinsma, F./Rietveld, P.: Urban Agglomerations in European Infrastructure Networks Urban Studies, Volume 30, Number 6, 1993, p. 919 – 934 Brückner (2001): Brückner, J.K.: The Economics of International Codesharing: An Analysis of Airline Alliances, in: International Journal of Industrial Organization, Vol. 19, December 2001 Brückner (2002): Brückner, J.K.: Network Structure and Airline Scheduling, University of Illinois at Urbana-Champaign, 2002

171
Brückner / Spiller (1994): Brueckner, J.J./Spiller P.T.: Economics of Traffic Density in the Deregulated Airline Industry, in: Journal of Law and Economics, 37, 1994, p. 379-415 Button (2002): Button, K.: Debunking Some Common Myths about Airport Hubs, in: Journal of Air Transport Management , No. 8, 2002 Button / Haynes / Stough (1998): Button, K./Haynes K./Stough, R.: Flying into the Future, Air Transport Policy in the European Union, Cheltenham/Glos, 1998 Button / Strough (2000): Button, K./Strough, R.: Air Transport Networks, Northampton / Cheltenham / Glos 2000 CAA (2004): Civil Aviation Authority CAA: Punctuality of UK Flights in January to March 2004, London 15 July 2004, in: http://www.caa.co.uk/caanews/caanews.asp?nid=928 (15.09.2004) Canaday (2001a): Canaday, H.: The Next Generation, in: Airlines International – The Magazine for the Members of the International Air Transport Association IATA, Volume 7 Issue 3, May – June 2001, Norwich 2001, p.72 - 77 Canaday (2001b): Canaday, H.: New Widebodies Reshape Global Networks, in: Airlines International – The Magazine for the Members of the International Air Transport Association IATA, Volume 7 Issue 3, May – June 2001, Norwich 2001, p.60-62 Carlsson (2002): Carlsson, F.: Price and Frequency Choice under Monopoly and Competition in Aviation Markets, Göteborg University, Göteborg June 2002 Carlton / Landes / Posner (1980): Carlton, D.W./Landes, W.M./Posner, R.A.: Benefits and Costs of Airline Mergers: A Case Study, in: Bell Journal of Economics, 11, 1980, p.65-83 Cathay Pacific (1999): Cathay Pacific Airways : Reflex Survey Reflex Demographic Information 1996-1999, Hong Kong 1999 Clark (2003): Clark,T: Chairman’s Review, in http://www.ekgroup.com (2.09.2004) Condé Nast Traveller (2004a): Condé Nast Traveller Readers’ Travel Awards 2004 Airlines, in : http://www.cntraveller.com/ReadersAwards/2004/Airlines (1.12.2004) Condé Nast Traveller (2004b): Condé Nast Traveller Readers’ Travel Awards 2004 Airports, in : http://www.cntraveller.com/ReadersAwards/2004/Airports (1.12.2004) Darrow / Leimkuhler / Smith (1992): Darrow, R.M./Leimkuhler, J.F./Smith, B.C., Yield Management at American Airlines, in Interfaces 22, American Airlines (ed.), Dallas 1992 Deckstein / Hawranek / Klawitter (2004): Deckstein, D./Hawranek, D./Klawitter, N.: Das Zehn Milliarden Abenteuer, in: Der Spiegel Vol. 20, 2004, p.84-95 Doganis (2001): Doganis, R.: The Airline Business in the Twenty-First Century, London/ New York 2001

172
Doganis (2002): Doganis, R.: Flying off Course, The Economics of International Airlines, 3rd ed. , London 2002 Dubai International Airport (2004) :Dubai International Airport, in: http://213.42.52.88/DIAInternet/About+DIA/Statistics/ (29.09.2004) Emirates (2004a): Emirates, in :http://www.emirates.com/at/TravellerInformation/ airport/EmiratesAirportLounges/EmiratesAirportLounges.asp (10.09.2004) Emirates (2004b): Emirates: Worldwide Timetable 1st June – 30th October 2004, Dubai 2004 FAA (1991): US Federal Aviation Administration: A Case Study of Potential New Connecting Hub Airports Report to Congress, Washington 1991, in: http://ntl.bts.gov/lib/000/500/521/hub.pdf (3.9.2004) FAA (2003): US Federal Aviation Administration: Flight Standard Service International Aviation Safety Assessment (IASA) Program, in: http://www.iaco.org (8.10.2004) FAA (2004): US Federal Aviation Administration, in: http://www.faa.gov/apr/planning/stats/ (18.09.2004) Fauska (2003): Fauska, W:: The Hubbing Dilemma – Trade-off between Hub Quality and Flight Delays, Vienna 2003 Feldkircher (2004): Feldkircher, W: Passenger Survey – Bistro Service, Austrian Airlines Group Business Monitoring, 21. Jan. 2004 Fletcher (2003): Fletcher, E.: Transport in the Middle East, in: Whitelegg, J. / Haq, G. (ed.): The Earthscan Reader on World Transport Policy and Practice, London 2003, p.239 - 246 FHWA (n.av.): U.S. Department of Transportation – Federal Highway Administration (ed.) Accessibility, in: http://www.fhwa.dot.gov/planning/toolbox/accessibility_overview.htm (10.09.2004) Fitzpatrick (2004): Fitzpatrick, D.: US Airways Dropping 133 Trips, 37 Destinations from Pittsburgh, Pittsburgh 21st Jul. 2004, in: http://www.post-gazette.com/pg/pp/04203/349437.stm (21.08.2004) Fitzpatrick / Belko (2004): Firtzpatrick, D./ Belko, M.: US Airways now calls Pittsburgh a „Focus City“, Pittsburgh 6th May 2004, in: http://www.postgazette.com/pg/pp/04127/311838.stm (21.08.2004) Frank-Keyes (2004): Frank-Keyes, J.: The Way Forward – The Soerensen Interview, in: Communiqué Airport Business, June/July 2004, p.7-17 Fraport AG (2004): Fraport AG: Flughafen Frankfurt bereitet sich vor auf Abfertigung des Super Airbus A 380, in: APA Austria Presse Agentur, Wien/Frankfurt 13.9.2004, in: http://www.apa-defacto.at (3.12.2004) French, Trevor: Airports in Europe – Meeting the Market Challenge, London 1999 Fridström (2003): Fridström, L.: Competitive Airlines, Hamburg Aviation Conference, Hamburg February 2003
173
Furuichi / Koppelman (1994): Furuichi, M./Koopelman, F.: An Analysis of Air Travelers’ Departure Airport and Destination Choice Behavior, in: Transportation Research A, 28 (3), 1994 Gayle (2004): Gayle, P.G.: Does Price Matter? Price and Non-Price Competition in the Airline Industry, Kansas State University, Manhattan 2004 Gazvinian (2002): Gazvinian, J.: A New World in the Sky, in: Newsweek The Future of Travel, New York July22/July29 2002, p. 54-55 Gätzi (2004): Gätzi, M.: Raumstruktur und Erreichbarkeit am Beispiel der Schweiz zwischen 1950 und 2000, Zürich 2004 Geurs / Ritsema (2003): Geurs, K.T./ Ritsema van Eck, J.R.: Evaluation of Accessibility Impacts of Land-use Scenarios: The Implications of Job Competition, Land-use and Infrastructure Developments for the Netherlands, in: Environment and Planning, 30 (1), p.69-87 Gilbert / Wong (2003): Gilbert, D./Wong, R.K.C.: Passenger Expectations and Airline Services: A Hong Kong Based Study, in: Tourism Management 24, 2003, p.519-532 Graham (2003): Graham, A.: Managing Airports, An International Perspective, 2nd ed., Oxford 2003 Gunn (2001): Gunn, H.F.: Valuation of Travel Time Savings and Losses, in: Henscher, D./ Button, K. (eds): Handbook of Transport Modelling, Elsevier Amsterdam, 2001, p.433-448 Haggett (2001): Haggett, P.: Geographie. Eine globale Synthese, 3. Aufl., Ulmen/Stuttgart 2001 Hanlon (1999): Hanlon, P.: Global Airlines, Competition in a Transnational Industry, 2nd ed., Oxford, 1999 Harris (2001): Harris, B.: Accessibility: Concepts and Applications, in: Journal of Transportation and Statistics, Volume 4, Numbers 2/3, 2001, p.15-30, in: http://www.bts.gov/publications/jts/v4n23/index.html (3.9.2004) Harvey (1987): Harvey, G.: Airport choice in a multiple airport region, in: Transportation Research A, 21 (6), 1987, p.439-449 Hassenmeier (1996): Hassenmeier, J.A.: Tortur für Große Economy Class Vergleich, in: Business Traveller 3/96, Hamburg 1996, p. 20-23 Heathrow (2004): London Heathrow Airport , in: http://www.baa.co.uk/main/airports/heathrow (3.9.2004) Heathrow Authority (2004): London Heathrow Airport Authority , in: http://www.airconsult.gov.uk (3.9.2004) Holloway (2003): Holloway, S.: Straight and Level: Practical Airline Economics, 2nd Ed., Hampshire/Aldershot/Burlington 2003 Hoggart (2000): Hoggart, R.: Physische und kulturelle Mobilität – Die Führungskraft als Europäer, in: IFMO, Inst. für Mobilitätsforschung (Hrsg.): Freizeitverkehr, Aktuelle und künftige Herausforderungen und Chancen, Berlin 2000, p.1-21
174
Hoyle / Knowles (1992): Hoyle, B.S./Knowles, R.D.: Modern Transport Geography, London/Chichester 1992 Hüschelrath (1998): Hüschelrath, K.: Liberalisierung im Luftverkehr, Marburg 1998 IACO (1999): International Civil Aviation Organisation IACO, Digest of Statistics, Series F, No. 485, Financial Data, Montreal 1999 IATA (1993): IATA International Air Transport Association: Airline Marketing, Montreal/Geneva 1993 IATA (2000): International Air Transport Association, Airline Economic Results and Prospects, IATA Airline Economic Task Force, Montreal 2000 IATA (2002a): IATA International Air Transport Association : Airlines can no Longer Pay for Airport Monopolistic Iinefficiency, 8th Oct. 2002, in: http://www1.oata.org/pressroom/pr/2002-10-08-34.htm (15.06.2004) IATA (2002b): IATA International Air Transport Association : Short Sighted Security Measures Hurting Airlines, 29th Oct. 2002, in: http://www1.iata.org/pressroom/pr/2002-10-29-36.htm (15.06.2004) IATA (2003a): IATA International Air Transport Association : Airports and Air Traffic Control Must Reduce Costs, 27nd Mar. 2003, in: http://www1.iata.org/pressroom/pr/2003-03-27-07.htm (15.06.2004) IATA (2003b): IATA International Air Transport Association: Industry in Crisis, Change Essential, Washington 2nd June 2003, in: http://www1.iata.org/pressroom/pr/2003-06-02-04.htm (2.6.2004) IATA (2003c): IATA International Air Transport Association: International Traffic Statisitcs 2002, 10th Febr. 2003 http://www1.iata.org/pressroom/pr/2003-02-10-02.htm (15.6.2004) IATA (2003d): IATA Global Airport Monitor: Top Performers, May 2003, in: http://www.iata.org/productsandservices/gam.htm (15.6.2004) IATA (2004a): IATA International Air Transport Association: International Traffic Statistics 2003 A Difficult Year Ending on an Upbeat Note, 27th Jan. 2004, in: http://www1.iata.org/industry_stats/2004-28-01-01.htm (15.6.2004) IATA (2004b): IATA International Air Transport Association: Driving Industry Change in Partnership with Tourism, 3rd May 2004, in : http://www1.iata.org/pressroom/pr/2004-05-03-10.htm (1.10.2004) Ihde (1997): Ihde, G.B.: Verkehrsinfrastrukturausstattung, in: Bloech, J./Ihde, G. B. (Hrsg.), Vahlens Großes Logistiklexikon, München 1997 Ihde (2001): Ihde, G.B.: Transport, Verkehr, Logistik, 3. Auf., München 2001 Innes / Doucet (1990): Innes, J.D./Doucet, D.H.: Effects of Access Distance and Level of Service on Airport Choice, in: Journal of Transportation Engineering, 116 (4), 1990, p.507-516
175
Jenkins (1999): Jenkins, D.: Executive Director Aviation Institute, George Washington University, 7. June 1999, in: http://www.planebusiness.com/perspective/p060899jenkins.html (15.09.2004) Johnston (1999): Johnston, R.J.: The Dictionary of Human Geography, 2nd ed., Oxford 1999 Joppien (2003): Joppien, M.G.: Strategisches Airline Management, Evolutionstheorie und Luftverkehrsstrategien, Bern 2003 Keller (2002): Keller, P.: Erreichbarkeit als Schlüsselgröße in der Verkehrs- und Siedlungsplanung, ETH Zürich, Bern 2002 Koller (2004): Koller, T: Der Luftverkehr im politischen Delirium, in: Neue Zürcher Zeitung, Zürich 17. Jul. 2004, http://www.nzz.ch/servletsdossiers/2003/fluglaerm/2004.07.17-il-article9PHY5.html (31.10.2004) Krul (2004): Krul, J.: The Differing Impact on Schiphol of a KLM-AF rather than a KLM-BA Alliance, in: 7th Hamburg Aviation Conference, Hamburg 20th Febr. 2004 Lawton (2003): Lawton, T.C.: Cleared for Take Off, Structure and Strategy in Low Fare Airline Business, Hants/Aldershot 2003 Lehman Brothers (2002): Anderson, N./Weston, M./Patel, A./Kinzler, H.: European Flag Carriers, Lehman Brothers, London, November 22, 2002 Lenz (2000): Lenz, M.: Handlungsbedarf im Freizeitverkehr aus der Sicht von Mobilitätsanbietern, in: IFMO, Inst. für Mobilitätsforschung (Hrsg.): Freizeitverkehr, Aktuelle und künftige Herausforderungen und Chancen, Berlin 2000, p.87-95 Levinson (2002): Levinson, D.M.: Financing Transportation Networks, Cheltenham/Northampton, 2002 Lijesen / Rietveld / Nijkamp (2000): Lijesen, M.G./Rietveld, P./Nijkamp, P.: Do European Carriers Dominate Their Hubs?, Tinbergen Institute, Amsterdam 2000 Lufthansa (2001a) : Lufthansa Zahlen, Daten, Fakten 2000/2001, Frankfurt /Köln 2001 Lufthansa (2001b): Lufthansa Timetable, 28 Oct 01- 30 Mar 02, Köln 2001 Lufthansa (2004a): Lufthansa, in: http://www.lufthansa.com (3.11.2004) Lufthansa (2004b): Lufthansa, in: http://www.lufthansa.de (3.11.2004) Lufthansa (2004c): Lufthansa Timetable 31 Oct 04 – 26 Mar 05, Köln 2004 Lufthansa Konzern (2004a): Lufthansa Konzern, in: http://konzern.lufthansa.com (3.11.2004) Lufthansa Konzern (2004b): Lufthansa Konzern, in: http://konzern.lufthansa.com/de.html/ueber_uns/mobilitaet/drehscheibe/standortfaktorluftverkehr.html (3.11.2004) Lyberth (2004): Lyberth, J.: Auch Riesen haben klein angefangen, in: Der Standard, 6.12.2004, p.9

176
Madslien (2001): Madslien, J.: British Midland Aiming for the US, in: BBC News 1st Febr. 2001, in: http://news.bbc.co.uk/1/hi/business/1143137.stm , (1.11.2004) Maier / Atzkern (1992): Maier, J./Atzkern, H.D.: Verkehrsgeographie: Verkehrsstrukturen, Verkehrspolitik, Verkehrsplanung, Stuttgart 1992 Martellato / Nijkamp / Reggiani (1998): Martellato, D. / Nijkamp, P. / Reggiani, A.: Measurement and Measures of Network Accessibility: Economic Perspectives, in: Button, K. / Nijkamp, P. / Priemus, H. (ed.): Transport Networks in Europe, Cheltenham 1999, p.161-179 Maurer (2001): Maurer, P.: Luftverkehrsmanagement, 2. Aufl., München/Wien 2001 Maurer (2003): Maurer, P.: Luftverkehrsmanagement, 3. Aufl., München/Wien 2003 Mayer (2000): Mayer, G.: Strategische Logistikplanung von Hub&Spokesystemen, 1. Aufl., Darmstadt 2000 Meffert / Bruhn (1997): Meffert, H./Bruhn, M.: Dienstleistungsmarketing, 2. Aufl., Wiesbaden 1997 Mensen (2003): Mensen, H.: Handbuch der Luftfahrt, Berlin/Heidelberg/New York 2003 Mercer Management Consulting (2002): Glynn,S./ Jones, E. (contributors) : Keeping the Customer (profitably) satisfied, Mercer Management Consulting, Marsh&McLennan Companies, London 2002 Merrill Lynch (2003a): Anderson, C./Bor, A./Curley, M./Chu, A.: Aviation – December Traffic Statistics – Is there a Message ? Merrill Lynch, London 10. Jan. 2003 Merrill Lynch (2003b): Bor, A./Curley, M./Anderson,C./Chu, A. (contributors): Transport in Pictures – What is the Price for War? European Transport, Merrill Lynch, London, 2003 Miles&More (2004): Benchmarking Frequent Flyer Programs, Frankfurt, July 2004 Milligan (2002): Milligan, B.: Open Skies Talks Resume, in: BBC News 15th Aug. 2002, in: http://news.bbc.co.uk/1/hi/business/2194751.stm (3.9.2004) Morrison / Winston (1995): Morrison, S.A./Winston, C.: The Evolution of the Airline Industry, Brookings Institute, Washington 1995 n.a. (2004a): Airline Vergleich, in: Format, Nr. 35, 2004, p. 29 n.a. (2004b): Vagn Soerensen – CEO of the Austrian Airlines Group, Interview in the ORF news programme ZIB2 (1.12. 2004) Nagel (2004): Nagel, S.: Star Alliance Scorecard Network Facts and Figures, Frankfurt 2004, in: https://www.one-intra.net/company/partners/star/star_scorecard_may04_files (21.8.2004) Nako (1992):Nako , S.M.:Frequent Flyer Programs and Business Travelers: An Empirical Investigation, in: Logistics and Transport Review 28(4), 1992, p. 395-414
177
Ndoh / Pitfield / Caves (1990): Ndoh, N.N./Pitfield, D.E./Caves, R.E.: Air Transportation Passenger Route Choice: A Nested Multinominal Logit Analysis, in: Fischer, M.M./Nijkamp, P./Papageorgiou,Y.Y. (ed.): Spatial Choices and Processes, North Holland 1990, p.349-365 Neumeister (2001): Neumeister, K.H.: Airlines and Tourism – A Mutual Beneficial Relationship, Brussels 2001, in: AEA: https://www.aea.be/AEAWebsite/datafiles/Tourism.pdf (18.11.04) Newton (2003): Newton, G.: Second to None, in: Airlines International – The Magazine for the Members of the International Air Transport Association IATA, Issue 12/1, December 2003 – January 2004, Norwich 2003, p. 4-9 NZZ (2001): Neue Zürcher Zeitung: Was bringt ein Hub? Eine ökonomische Sicht auf Luftverkehrsknoten, Zürich 20.Dec.2001, in: http://www.nzz.ch/dossiers/2001/swissair/2001.12.20-wi-article7V4ZL.html (19.9.2004) NZZ (2004a): Neue Zürcher Zeitung: Ein Plafond für den Flughafen Zürich?, Zürich 29. Apr. 2004, in: http://www.nzz.ch/dossiers/2003/fluglaerm/2004.04.29-zh-article9KCWT.html (30.10.2004) NZZ (2004b): Neue Zürcher Zeitung: Der Flughafen kritisiert den Luftfahrtbericht, Zürich 21. Aug. 2004, in: http://www.nzz.ch/dossiers/2003/fluglaerm/ 2004.08.21-zh-article9SXRE.html (31.10.2004) OAG (2000): OAG: Business Travel Lifestyle Survey, Dunstable 1999 OAG (2004a): Graphics and Data, in: http://www.oagdata.com/graphics/HCA.pdf (15.9.2004) OAG (2004b): Schedules Analysis Full Report Dubai Airport, in: http://www.oagdata.com/upload/oagDubaireport.pdf (10.12.2004) Opaschowski (2000): Opaschowski, H.W.: Freizeitmobilität in Erlebniswelten, in IFMO, Inst. für Mobilitätsforschung (Hrsg.): Freizeitverkehr, Aktuelle und künftige Herausforderungen und Chancen, Berlin 2000, p.21-43 Oneworld (2004), Oneworld Alliance, in: http://www.oneworldalliance.com (10.12.2004) Ostrowski / O’Brien (1991): Ostrowski, P.L./O’Brien, T.V.: Predicting Consumer Loyalty for Airlines Passengers, Northern Illinois University, Illinois 1991 Oum / Tretheway (1990): Oum, T.H./Tretheway, M.W.: Airline hub-and-spoke system, in: Transporttation Research Forum Proceedings, 30, 1990, p. 380 – 393 Oum / Stanbury / Tretheway (1991): Oum, T.H./Stanbury, W.T./Tretheway, M.W.: Airline deregulation in Canada and its economic effect, in: Transportation Journal, 30, 1991, p. 4 -22 Oum / Zhang / Zhang (1996): Oum, T.H./Zhang, A./Zhang, H.: A note on the optimal pricing in a hub-and-spoke system, in: Transportation Research, B/30, 1996, p. 11 – 18 Ozoka / Ashford (1989): Ozoka, A.I./Ashford, N.: Application of Disaggregate Modeling in Aviation Systems Planning in Nigeria: A Case Study, in: Transportation Research Record, 1214, 1989, p.10-20

178
Pels / Nijkamp / Rietveld (1997): Pels, E./Nijkamp, P./Rietveld, P.: Subsitution and Complementarity in Aviation: Airports vs. Airlines, University Amsterdam, Amsterdam 1997 Pels / Nijkamp / Rietveld (2001): Pels, E./Nijkamp, P./Rietveld, P.: Airport and Airline Choice in a Multiple Airport Region: An Empirical Analysis for the San Francisco Bay Area, in: Regional Studies, 35 (1), 2001, p.1-9 Pels / Nijkmap / Rietveld (2003): Pels, E./Nijkamp, P./Rietveld, P.: Access to and Competition between Airports: A Case Study for the San Francisco Bay Area, in: Transportation Research A, 37 (1), 2003, p.71-83 Pels / Verhoef (2003): Pels, E./Verhoef, E.T.: The Economics of Airport Congestion Pricing, Vrije University, Amsterdam 2003 Pinkham (2001): Pinkham, R.: Bringing Delta Home, in: Airline Business, March 2001 Polster (1982): Polster, W.: Baukonzepte und Ausrüstungssysteme von Verkehrsflughäfen, Wien 1982 Pompl (1998): Pompl, W.: Luftverkehr, Eine Ökonomische und Politische Einführung, 3. Aufl., Berlin/Heidelberg/New York 1998 Pompl (2002): Pompl, W.: Luftverkehr, Eine Ökonomische und Politische Einführung, 4. Aufl., Berlin/Heidelberg/New York 2002 Ponti (1996): Ponti, M.: Market Organisation, in: The European conference of Ministers of Transport (ECMT), Transport: New Problems, New Solutions, Introductory Reports and Summary of discussions, Luxembourg, 9-11 May 1995, Paris 1996, p. 555 - 583 Proussaloglou / Koppelmann (1995): Proussaloglou, K./Koppelmann, F.: Air Carrier Demand: An Analysis of Market Share Determinants, in: Transportation, 22, 1995, p.371-388 Proussaloglou / Koppelmann (1999): Proussaloglou, K./Koppelmann, F.: The Choice of Air Carrier, Flight, and Fare Class, in: Journal of Air Transport Management 5, 1999, p.193-201 Radia / Morris (2002): Radia, S. / Morris, P.: A Measure of Success, in: Airport World, 2002, p.31 – 33 Rastatter / Stein (1998): Rastatter, E.H./Stein, R.: The US Experience with Deregulation, Presentation to the Transport Research Board Annual Meeting, Washington 1998 Reischl (2004): Reischl, G.: Alle 35 Sekunden ein Flugzeug, in: Kurier, 3.10.2004, Wien 2004, p. 46 Rhoades / Waguespack (2002): Rhoades, D.L./Waguespack, B.Jr.: Judging a Book by it’s Cover: The Relationship between Service and Safety Quality in US National and Regional Airlines, in: Journal of Air Transport Management 6, 2002, p.87-94 Rietveld (2003): Rietveld, P.: Valuation of Travel Time and Traveller Information in Multimodal Personal Travel under Uncertainty, Vrije University, Amsterdam 2003

179
Rietveld / Bruinsma (1998): Rietveld, P./Bruinsma, F.: Is Transport Infrstructure Effective?, Berlin/Heidelberg/New York, 1998 Schmidt (2000): Schmidt, G.H.E.: Handbuch Airlinemanagement, München/Wien 2000 Schneiderbauer (2000): Schneiderbauer, D.: Wie Flughäfen die Herausforderung der Zukunft bewältigen können, in: DVWG Deutsche Verkehrswissenschaftlichen Gesellschaft, 7. Luftverkehrsforum der DVWG, Globalisierungstendenzen in der Luftfahrtbranche Frankfurt 2000, Bergisch Gladbach 2000, p. 6-34 Schumann (1986): Schumann, H.: Oligopolistic Nonlinear Pricing – A Study of Trading Stamps and Airline Frequent Flyer Programs, Unpublished Ph.D. Dissertation, Northwestern University, 1986 Scottish Executive CRU (2000): Halden, D./McGuigan, D./Nisbet, A./McKinnon, A./Derek Halden Consultancy, Scottish Executive Central Research Unit (ed.): Accessibility: Review of Measuring Techniques and their Application, 2000, in: http://www.scotland.gov.uk/cru/kd01/blue/accessibility-01.asp (3.9.2004) Shaw (1999): Shaw, S.: Airline Marketing and Management, 4th ed., Hants/Aldershot/Brookfield, 1999 Shaw (2004): Shaw, S.: Airline Marketing and Management, 5th ed., Hants/Aldershot/Brookfield 2004 Siemens (2003): Siemens Dematic Wins Airport Order from United Arab Emirates, 11.12.2003, in: http://www.siemens.com/index.jsp?sdc_pnid=0&sdc_sid=11672683082&sdc_content.htm (15.8.2004) Skinner (1976): Skinner/R.E.Jr.: Airport Choice: An empirical Study, in: Transport Engineering Journal, 102 (4), 1976, p.871-883 Skyteam (2004): Skyteam Alliance, in: http://www.skyteam.com (10.12.2004) Skytrax (2004a): Skytrax Research : Global Airline Seating Guide 2004, in: http://www.airlinequality.com/Product/seats_global.htm (3.11.2004) Skytrax (2004b): Skytrax Research: Airport of the Year 2004 Results Best International Transit Airport 2004, in: http://www.airlinequality.com/2004/airport_group_results.htm (3.11.2004) Skytrax (2004c): Skytrax Research: World Airport Security Rating 2004, in: http://www.airlinequality.com/AirportRanking/security-DEF.htm (3.11.2004) Skytrax (2004d): Skytrax Research: Air France Star Ranking, in: http://www.airlinequality.com/Airlines/AF.htm (3.11.2004) Skytrax (2004e): Skytrax Research: British Airways Star Ranking, in: http://www.airlinequality.com/Airlines/BA.htm (3.11.2004) Skytrax (2004f): Skytrax Research: Emirates Star Ranking, in: http://www.airlinequality.com/Airlines/EK.htm (3.11.2004) Skytrax (2004g): Skytrax Research: Lufthansa Product and Service Star Ranking, in: http://www.airlinequality.com/Airlines/LH.htm (3.11.2004)

180
Skytrax (2004h): Skytrax Research: Dubai International Airport Star Ranking, in: http://www.airlinequality.com/AirportRanking/dxb.htm (3.11.2004) Skytrax (2004i): Skytrax Research: London Heathrow Airport Star Ranking, in: http://www.airlinequality.com/AirportRanking/lhr.htm (3.11.2004) Skytrax (2004j): Skytrax Research: Airline Seat Guide for Airlines in Asia 2004, in: http://www.airlinequality.com/Product/seats_asia.htm (3.11.2004) Skytrax (2004k): Skytrax Research: Airline Seat Guide for Airlines in Europe 2004, in: http://www.airlinequality.com/Product/seats_europe.htm (3.11.2004) Skywards (2004): Skywards Frequent Flyer Programme, in: http://www.skywards.com and http://www.emirates.com/at/Skywards.asp (10.12.2004) Sostar (2004): Sostar, M.: Why passengers would change their favourite airline, Austrian Airlines Group, 2004, in: https://www2.one-intra.net (3.12.2004) Southwest Airlines (2004) : Routemap and Destinations, in : http://www.southwest.com/travel_center/routemap_dyn.html (15.09.2004) Spiller (1989): Spiller, P.T.: A Note on Pricing of Hub-and-spoke Networks, in: Economics Letters, 30, 1989, p.165-169 Star Alliance (2002): Products and Services Reference Guide for Employees of Star Alliance Member Carriers, 6th ed., Frankfurt 2002 Star Alliance (2004): Star Alliance, in: http://www.staralliance.com (10.12.2004) Sterzenbach (1996): Sterzenbach, R.: Luftverkehr, Betriebswirtschaftliches Lehr- und Handbuch, München/Wien 1996 Sterzenbach (1999): Sterzenbach, R.: Luftverkehr – Betriebswirtschaftliches Lehr- und Handbuch, 2. Aufl., München/Wien 1999 Sterzenbach / Conrady (2003): Sterzenbach, R./Conrady, R.: Luftverkehr, 3. Aufl., München/Wien 2003 Stevens (2001): Stevens, R.: Reshaping the Art of Travel, in: Airlines International – The Magazine for the Members of the International Air Transport Association IATA, Volume 7 Issue 3, May – June 2001, Norwich 2001, p. 32 - 35 St. Louis Commerce Magazine (1999): St. Louis Commerce Magazine : A Profile about William Compton President and Chief Executive Officer Trans World Airlines, St. Louis 1999, in: www.stlcommercemagazine.com/archives/december1999/profile.htm (21.08.2004) Stolzke (2004a): Stolzke, H.: Marathon über den Wolken: Airlines setzen auf Ultralangstrecken, in: APA Austria Presse Agentur, Wien/Singapur 9.7.2004, in: http://www.apa-defacto.at (29.08.2004) Stolzke (2004b): Stolzke, H.: Airbus und Boeing sehen sich auf unterschiedlichen Erfolgswegen, in: APA Austria Presse Agentur, Wien/Farnborough 19.7.2004, in: http://www.apa-defacto.at (29.8.2004)

181
Strobl (2004a): Strobl, G.: Kerosin macht Billigfliegen teuerer, in: Der Standard, Wien 10.8.2004, p. 13 Strobl (2004b): Strobl, G.: Preisverfall bei Flugreisen, aber Österreich unter den teuersten, in: Der Standard, Wien 21.8.2004, p.19 Strömer (1999): Strömer, F.: Flughäfen als Wirtschaftsstandort, Wien 1999 Suzuki / Crum / Audino (2003): Suzuki, Y./Crum, M.R./Audino, M.J.: Airport Choice, Leakage, and Experience in Single-Airport Regions, in: Journal of Transportation Engineering, forthcoming, 2003 Swiss National Science Foundation (2004) : Swiss National Science Foundation (ed.), National Research Programm NRP41, in: http://www.nfp41.ch (S-1 – S-9) (31.10.2004) Teyeb (2004), Teyeb, M.: The Gulf Trouble in the Air, 2004, in: http://www.travel-watch.com/gulfair.htm (2.9.2004) The Boston Consulting Group (2004): Stelter, D./Fechtel, A./Desai, P. et al.: Airports Dawn of a New Era. Preparing for one of the Industry’s Biggest Shake-ups, The Boston Consulting Group, Munich 2004 The Department Of Civil Aviation (2000): The Department Of Civil Aviation: Dubai, Dubai 2000 The Emirates Group (2004): The Emirates Group Operating Statistics, in: http://www.ekgroup.com/ (29.10.2004) The Qualiflyer Group (1999): The Qualiflyer Group: Flying European Style, 1999 The United Kingdom Parliament (1998): n.a.: The United Kingdom Parliament House of Lords. Minutes of Evidence, Examination of witnesses (Questions 1-19) Sir Michael Bishop et al., London 4th June 1998, in: http://www.publications.parliament.uk/pa/ld199798/ ldselect/ldeucom/156/8060405.htm (3.12.2004) Thompson / Caves (1993): Thompson, A./Caves, R. : The Project Market Share for a new Small Airport in the North of England, in: Regional Studies, 27 (2), 1993, p.137-147 Trans World Airlines (1999): Trans World Airlines TWA Worldwide Timetable, St. Louis, Sept. 8th 1999 Tretheway (2004): Tretheway, M.: What Changes Are Needed to Allow the Global Airline Industry to Re-invent or Re-structure Itself?, in: 7th Hamburg Aviation Conference, Hamburg Febr. 2004 Tschopp / Fröhlich / Keller / Axhausen (2003): Tschopp, M./Fröhlich, P./Keller, P./Axhausen, K.W.: Accessibility, Spatial Organisation and Demography in Switzerland through 1850 to 2000, Paper presented at the T²M Conference Eidhoven November 2003, ETH Zürich, Zürich 2003 United Airlines (2001): United Airlines Worldwide Timetable Vol. 4, 2001, Jun 7 – Jul 8, Geneva/Elk Grove Township/Chicago 2001

182
United Airlines (2003): United Airlines Flughafen Lounges – Weltweiter Komfort, Frankfurt/Chicago 2003 Vill (2000): Vill, W.: Kommerzielle Entwicklung als Faktor für den wirtschaftlichen Erfolg von Flughäfen, in: DVWG Deutsche Verkehrswissenschaftlichen Gesellschaft, 7. Luftverkehrsforum der DVWG, Globalisierungstendenzen in der Luftfahrtbranche Frankfurt 2000, Bergisch Gladbach 2000, p. 57-63 Virgin Atlantic (2004): in www.virgin-atlantic.com/engb/whatsonboard/clubhouse/lhrclubhouse.jsp (28.08.2004) Vorne Sitzen (2004a): Business Class, in: http://www.vorne-sitzen.de/cgi-bin/dbn/playout.pl?Out=sfs_vs_bc.html (28.8.2004) Vorne Sitzen (2004b): First Class, in: http://www.vorne-sitzen.de/cgi-bin/dbn/playout.pl?Out=sfs_vs_fc.html (28.8.2004) Vorne Sitzen (2004c): Premium Economy Class, in: http://www.vorne-sitzen.de (28.8.2004) Wheacroft (1981): Wheacroft, S.: The Seize and Shape of Future Air Traffic, in: Wassenberg, H.A./Fenema, H.P. (eds.) : International Air Transport in the Eighties, Deventer 1981, p.92 Whitelegg / Hag (2003): Whitelegg, J./Haq, G.(ed.):The Earthscan Reader on World Transport Policy and Practice, London, 2003 Windle / Dresner (1995): Windle, R./Dresner, M.: Airport Choice in Mutliple-Airport Regions, in: Journal of Transportation Engineering, 121 (4), 1995, p.332-337 Wolf (2003): Wolf, H.: Privatisierung im Flughafensektor, Eine ordnungspolitische Analyse, Berlin 2003 Woodyard (2004): Woodyard, C.: Two Airlines Steer Clear of Hubs, 26th July 2004, in: www.usatoday.com/travel/news/2004-07-26-direct-flights-2_x.htm (21.8.2004) World Airline News (2000): World Airline News: TWA Takes Step Nearer to Domestic Carrier Status, 21st Jul. 2000, in: www.findarticles.com/p/articles/mi_m0ZCK/is_29_10/ai_63644639 (21.8.2004) Wrobel (2002): Wrobel, M.: Flughäfen in der Region, Frankfurt 2002 Zoglin / Donnelly (2002): Zoglin,R./Donnelley,S.B.: Welcome to Amercia’s Best-Run Airport, in: TIME Magazine Making Airports Secure, Vol. 160, no.3, New York July 15 2002, p.18-25