Extraction of polyphenols and synthesis of new activated ...
12
1 SCIENTIFIC REPORTS | (2019) 9:17706 | https://doi.org/10.1038/s41598-019-54205-y www.nature.com/scientificreports Extraction of polyphenols and synthesis of new activated carbon from spent coffee grounds Marina Ramón-Gonçalves 1 , Lorena Alcaraz 1 , Susana Pérez-Ferreras 2 , María Eugenia León-González 3 , Noelia Rosales-Conrado 3 & Félix A. López 1* A valorization process of spent coffee grounds (SCG) was studied. Thus, a two-stage process, the first stage of polyphenols extraction and synthesis of a carbonaceous precursor and a subsequent stage of obtaining activated carbon (AC) by means of a carbonization process from the precursor of the previous stage, was performed. The extraction was carried out with a hydro-alcoholic solution in a pressure reactor, modifying time, temperature and different mixtures EtOH:H 2 O. To optimize the polyphenols extraction, a two-level factorial experimental design with three replicates at the central point was used. The best results were obtained by using a temperature of 80 °C during 30 min with a mixture of EtOH:H 2 O 50:50 (v/v). Caffeine and chlorogenic acid were the most abundant compounds in the analysed extracts, ranging from 0.09 to 4.8 mg∙g −1 and 0.06 to 9.7 mg∙g −1 , respectively. Similarly, an experimental design was realized in order to analyze the influence of different variables in the AC obtained process (reaction time, temperature and KOH:precursor ratio). The best results were 1 h, 850 °C, and a mixture of 2.5:1. The obtained activated carbons exhibit a great specific surface (between 1600 m 2 ∙g −1 and 2330 m 2 ∙g −1 ) with a microporous surface. Finally, the adsorption capacity of the activated carbons was evaluated by methylene blue adsorption. Coffee is a popular and consumed beverage worldwide and during the last 150 years has grown steadily in com- mercial importance 1,2 . Statistical evaluation reveals that around 50% of the coffee produced worldwide is used for drinking purposes 3 . As reported by the International Coffee Organization (ICO, 2018), 9.4 million tons of coffee were produced globally in 2018 4–7 , which entails a great generation of coffee waste. Worldwide, large amounts of coffee waste such as pulp, husk, coffee beans and spent coffee grounds are generated daily 7,8 . Around 650 kg of spent coffee grounds are generated by 1000 kg of green coffee beans processed 6 . In the upcoming years, with the high coffee production and the great number of waste generated 9 , it is necessary to find novel applications for reusing coffee residues, including those produced during coffee beverage preparation. Waste recycling offers many environmental, social and financial benefits 8,10,11 . e generated spent coffee grounds can be converted to biofuels, food additives, biosorbents, activated carbons, phenolic antioxidants, among other 1,3,10,12 . ese residues contain substantial amounts of high value-added products such as carbohydrates, proteins, pectins and bioactive compounds like polyphenols 6 . e polyphenols present in SCG are a group of secondary metabolites of plants, which are the constituents of a great number of fruit and vegetables, and beverages such as tea, coffee and wine and the main antioxidants in the human diet 13 . us, caffeic acid is a well-known non-flavonoid phenolic compound abundant in coffee, presenting potent antioxidant and neuroprotective properties 14 . Polyphenols might have different properties as an antioxidant, antiproliferative, anti-allergic, anticarcinogen, antimicrobial, antitumor, anti-inflammatory and neuroprotective activities 5,15 , that are of potential attention for the agrifood, cosmetic and pharmaceutical indus- tries 6,16,17 . In this sense, several studies focused on the extraction of bioactive polyphenols from different food by-products such as agricultural residues, underutilized fruits, spent coffee ground (SCG) 18 , residual brewing yeast 19 or beer residues 20 , citrus peels waste 21 , grape pomace seeds and skin 22 or grapefruit solid waste have been described. 1 National Center for Metallurgical Research (CENIM), Spanish National Research Council (CSIC), Avda. Gregorio del Amo, 8, 28040, Madrid, Spain. 2 Institute of Catalysis and Petrochemistry (ICP), Spanish National Research Council (CSIC), C/Marie Curie, 2, 28049, Madrid, Spain. 3 Department of Analytic Chemistry, Faculty of Chemistry, Complutense University of Madrid (UCM), Avda. Complutense s/n, 28040, Madrid, Spain. *email: [email protected] OPEN
Transcript of Extraction of polyphenols and synthesis of new activated ...

1Scientific RepoRtS | (2019) 9:17706 | https://doi.org/10.1038/s41598-019-54205-y
www.nature.com/scientificreports
extraction of polyphenols and synthesis of new activated carbon from spent coffee groundsMarina Ramón-Gonçalves1, Lorena Alcaraz1, Susana pérez-ferreras2, María Eugenia León-González3, noelia Rosales-conrado3 & félix A. López1*
A valorization process of spent coffee grounds (SCG) was studied. Thus, a two-stage process, the first stage of polyphenols extraction and synthesis of a carbonaceous precursor and a subsequent stage of obtaining activated carbon (AC) by means of a carbonization process from the precursor of the previous stage, was performed. The extraction was carried out with a hydro-alcoholic solution in a pressure reactor, modifying time, temperature and different mixtures EtOH:H2o. to optimize the polyphenols extraction, a two-level factorial experimental design with three replicates at the central point was used. The best results were obtained by using a temperature of 80 °C during 30 min with a mixture of EtOH:H2O 50:50 (v/v). Caffeine and chlorogenic acid were the most abundant compounds in the analysed extracts, ranging from 0.09 to 4.8 mg∙g−1 and 0.06 to 9.7 mg∙g−1, respectively. Similarly, an experimental design was realized in order to analyze the influence of different variables in the AC obtained process (reaction time, temperature and KOH:precursor ratio). The best results were 1 h, 850 °C, and a mixture of 2.5:1. The obtained activated carbons exhibit a great specific surface (between 1600 m2∙g−1 and 2330 m2∙g−1) with a microporous surface. Finally, the adsorption capacity of the activated carbons was evaluated by methylene blue adsorption.
Coffee is a popular and consumed beverage worldwide and during the last 150 years has grown steadily in com-mercial importance1,2. Statistical evaluation reveals that around 50% of the coffee produced worldwide is used for drinking purposes3. As reported by the International Coffee Organization (ICO, 2018), 9.4 million tons of coffee were produced globally in 20184–7, which entails a great generation of coffee waste. Worldwide, large amounts of coffee waste such as pulp, husk, coffee beans and spent coffee grounds are generated daily7,8. Around 650 kg of spent coffee grounds are generated by 1000 kg of green coffee beans processed6. In the upcoming years, with the high coffee production and the great number of waste generated9, it is necessary to find novel applications for reusing coffee residues, including those produced during coffee beverage preparation. Waste recycling offers many environmental, social and financial benefits8,10,11. The generated spent coffee grounds can be converted to biofuels, food additives, biosorbents, activated carbons, phenolic antioxidants, among other1,3,10,12. These residues contain substantial amounts of high value-added products such as carbohydrates, proteins, pectins and bioactive compounds like polyphenols6.
The polyphenols present in SCG are a group of secondary metabolites of plants, which are the constituents of a great number of fruit and vegetables, and beverages such as tea, coffee and wine and the main antioxidants in the human diet13. Thus, caffeic acid is a well-known non-flavonoid phenolic compound abundant in coffee, presenting potent antioxidant and neuroprotective properties14. Polyphenols might have different properties as an antioxidant, antiproliferative, anti-allergic, anticarcinogen, antimicrobial, antitumor, anti-inflammatory and neuroprotective activities5,15, that are of potential attention for the agrifood, cosmetic and pharmaceutical indus-tries6,16,17. In this sense, several studies focused on the extraction of bioactive polyphenols from different food by-products such as agricultural residues, underutilized fruits, spent coffee ground (SCG)18, residual brewing yeast19 or beer residues20, citrus peels waste21, grape pomace seeds and skin22 or grapefruit solid waste have been described.
1National Center for Metallurgical Research (CENIM), Spanish National Research Council (CSIC), Avda. Gregorio del Amo, 8, 28040, Madrid, Spain. 2Institute of Catalysis and Petrochemistry (ICP), Spanish National Research Council (CSIC), C/Marie Curie, 2, 28049, Madrid, Spain. 3Department of Analytic Chemistry, Faculty of Chemistry, Complutense University of Madrid (UCM), Avda. Complutense s/n, 28040, Madrid, Spain. *email: [email protected]
open

2Scientific RepoRtS | (2019) 9:17706 | https://doi.org/10.1038/s41598-019-54205-y
www.nature.com/scientificreportswww.nature.com/scientificreports/
On the other hand, activated carbon (AC) is a porous solid that is used in many industrial sectors. Within its wide variety of applications, the most common use of AC is to removal several pollutants from wastewater due to its low cost and simplicity the process9,23–25. Their textural properties, including their high specific surface and microporosity, make it an ideal compound to remove contaminants through physical adsorption processes26. Other AC applications are the employment as a decolourizer for food industry, catalysis, purification steps for the chemical and pharmaceutical industry, for the elimination of gases, improving the noble metals or storing energy27,28. Commercial ACs are mostly obtained from biomass waste29,30, which after a carbonization process are used as a precursor of activated carbon such as residues derives from tea, coffee or grapes and olives bones31–33. One of the most used mechanisms for the synthesis of a carbonaceous precursor, which is used in this work, is hydrothermal carbonization. This mechanism is suitable for residues with high moisture content (>50% weight) -such as spent coffee grounds- obviating the need for energy drying before or during the process34. In addition, after the process, a liquid is obtained that contains compounds of value-added such as polyphenols and the use of a relatively low temperature (80 °C with the typical processing temperatures ranges for biomass from 270 °C to 370 °C)35 and low pressure (11 MPa), avoids degradation of the phenolic compounds present in the sample36.
There are previous investigations about the polyphenols extraction and the activated carbons obtention from coffee wastes. However, to the best of our knowledge, a process which involves both the polyphenols extraction and the subsequently activated carbon obtention have not been described. The aim of the present work was the development of a simple, easy and ecofriendly methodology in optimal experimental conditions that allow not only the synthesis of a suitable carbonaceous precursor used to obtain an activated carbon with high specific sur-face area by means of hydrothermal synthesis followed by a KOH chemical activation, based on the reuse of spent coffee grounds obtained after coffee beverage preparation, but also the recovery of an aqueous solution, from the hydrothermal synthesis, rich in polyphenols that can be identified and quantified.
Materials and MethodsObtaining of the spent coffee ground (SCG) extracts. The waste recovered after coffee bever-age preparation (SCG, spent coffee ground,) comes from the canteen of the National Center for Metallurgical Research (Superior Council of Scientific Investigations) in Madrid. The coffee ground used was a mixture of 10 (wt, %) torrefacto roasted and 90 (wt, %) natural roasted. Torrefacto coffee is a special class, highly consumed in Spain, obtained through coffee beans roasting in the presence of sugar to increase its flavour. Spent coffee grounds were generated after espresso extraction from the purchased coffee.
The SCG samples were maintained at −20 °C until analysis. Moisture content of the SCG was obtained by the sample drying at 80 °C during 48 h.
Capillary liquid chromatography with ultraviolet detection (cLC-DAD) and spectrophotometric analysis. The instruments used to identify the different analytes were provided by the analytical depart-ment of the Complutense University of Madrid. These instruments were used in other similar analyzes18,19. An Agilent cLC Instrument Mod. 1100 Series (Agilent Technologies, Madrid, Spain) formed by a G1379A degasser, a G1376A binary capillary pump and a G1315B diode array detector (500 nL, 10 mm pathlength) was used for cLC analysis. A stainless steel loop with a volume of 10 µL was coupled to a Rheodyne injection valve. The cap-illary analytical column was a Synergy Fusion 4 µm C18 (150 mm × 0.3 mm I.D.) from Phenomenex (Torrance, CA, USA). Data acquisition and processing were performed with the Agilent Chemstation Software Package for Microsoft Windows.
Caffeine and polyphenols identification was carried out using a previously reported method by León-González et al.19. Wavelengths of 220, 260, 292, 310 and 365 nm were chosen for the UV-diode array detection. Quantitative analysis was realized at 260 nm for 3,4-dihydroxybenzoic, caffeine, rutin and quercetin, 292 nm for both naringin and gallic acid, 310 nm for chlorogenic acid, trans-ferulic acid resveratrol and p-coumaric acid and 365 nm for kaempferol.
Vijayalaxmi et al.12 and Shrikanta et al.37 modified spectrophotometric methods were employed for deter-mining Total Flavonoid Content (TFC), Total Polyphenol Content (TPC) and Total Antioxidant Activity (TAA).
obtention and optimization of polyphenols extraction and activated carbon conditions by experimental design. The extraction of polyphenols from SCG samples were done in a Berghof BR3000 reactor at controlled temperature and pressure. An amount of 45 g of SCG were added to 600 mL of a hydro-alcoholic solution with different EtOH:H2O ratios (Table S1). The extraction time and the extraction temperature was modified between the range 15 and 30 min and 80–120 °C, respectively, while the pressure was kept constant at 50 bar. After cooling down at room temperature, the resulting suspension was centrifuged for 1 h. The solid obtained (H-SCG) was separated, and an aliquot of the resulting solution was used to quantify the individual polyphenol and caffeine present in the sample by cLC-DAD.
In addition, two-level factorial design with three replicates at the central point was planned to maximize the extracted amount of the target polyphenols and caffeine from SCG samples. For it, a chromatographic study for the identification of the experimental factors that could most influence in the polyphenol extraction (i.e. extrac-tion time, extraction temperature, pressure and nature of the extraction solution) was carried out previously. As a result, nature of the extraction solution, extraction time and extraction temperature were selected as critical experimental factors and included in the experimental design. Extracted amount (mg∙g−1) of caffeic acid, rutin, trans-ferulic acid, naringin, kaempferol, resveratrol and caffeine were fixed as responses, and the optimization criterion for the analysis of the performed experimental design was the maximization of response values for the analytes evaluated. Table S1 summarized the different conditions used in the optimization process.
After the extraction process optimization, the hydro-alcoholic solution obtained under optimum conditions which containing the maximum amounts of the polyphenols extracted (WS), was evaporated in a rotavapor R-100
3Scientific RepoRtS | (2019) 9:17706 | https://doi.org/10.1038/s41598-019-54205-y
www.nature.com/scientificreportswww.nature.com/scientificreports/
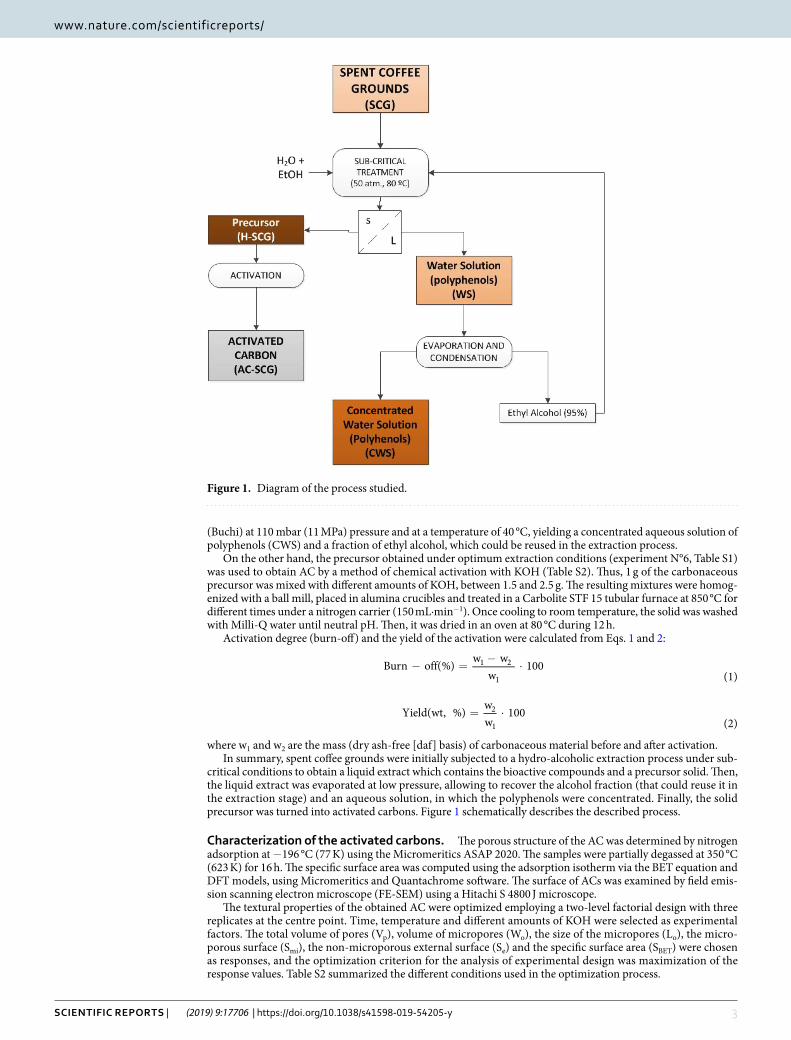
(Buchi) at 110 mbar (11 MPa) pressure and at a temperature of 40 °C, yielding a concentrated aqueous solution of polyphenols (CWS) and a fraction of ethyl alcohol, which could be reused in the extraction process.
On the other hand, the precursor obtained under optimum extraction conditions (experiment N°6, Table S1) was used to obtain AC by a method of chemical activation with KOH (Table S2). Thus, 1 g of the carbonaceous precursor was mixed with different amounts of KOH, between 1.5 and 2.5 g. The resulting mixtures were homog-enized with a ball mill, placed in alumina crucibles and treated in a Carbolite STF 15 tubular furnace at 850 °C for different times under a nitrogen carrier (150 mL∙min−1). Once cooling to room temperature, the solid was washed with Milli-Q water until neutral pH. Then, it was dried in an oven at 80 °C during 12 h.
Activation degree (burn-off) and the yield of the activation were calculated from Eqs. 1 and 2:
− =−Burn off(%) w ww
100(1)
1 2
1·
·=Yield(wt, %) ww
100(2)
2
1
where w1 and w2 are the mass (dry ash-free [daf] basis) of carbonaceous material before and after activation.In summary, spent coffee grounds were initially subjected to a hydro-alcoholic extraction process under sub-
critical conditions to obtain a liquid extract which contains the bioactive compounds and a precursor solid. Then, the liquid extract was evaporated at low pressure, allowing to recover the alcohol fraction (that could reuse it in the extraction stage) and an aqueous solution, in which the polyphenols were concentrated. Finally, the solid precursor was turned into activated carbons. Figure 1 schematically describes the described process.
characterization of the activated carbons. The porous structure of the AC was determined by nitrogen adsorption at −196 °C (77 K) using the Micromeritics ASAP 2020. The samples were partially degassed at 350 °C (623 K) for 16 h. The specific surface area was computed using the adsorption isotherm via the BET equation and DFT models, using Micromeritics and Quantachrome software. The surface of ACs was examined by field emis-sion scanning electron microscope (FE-SEM) using a Hitachi S 4800 J microscope.
The textural properties of the obtained AC were optimized employing a two-level factorial design with three replicates at the centre point. Time, temperature and different amounts of KOH were selected as experimental factors. The total volume of pores (Vp), volume of micropores (Wo), the size of the micropores (Lo), the micro-porous surface (Smi), the non-microporous external surface (Se) and the specific surface area (SBET) were chosen as responses, and the optimization criterion for the analysis of experimental design was maximization of the response values. Table S2 summarized the different conditions used in the optimization process.
Figure 1. Diagram of the process studied.

4Scientific RepoRtS | (2019) 9:17706 | https://doi.org/10.1038/s41598-019-54205-y
www.nature.com/scientificreportswww.nature.com/scientificreports/
Batch adsorption experiments. The adsorption capacity of MB by the obtained AC was investigated. Different adsorption experiments were carried out. For it, 10 mg of the PCF-28 CA were added to MB solutions of concentration 10 mg∙L−1. The mixtures were magnetically stirred at 350 rpm in a thermostatic-controlled bath. Aliquots were extracted every 5 min (up to 30 min), every 10 min (up to 60 min) and finally, every 60 min (until equilibrium is reached). The amount of the MB in solution was calculated by UV-Vis spectroscopy at 610 nm employing a Zuzi Spectrophotometer 4101.
The adsorbed MB amount per gram of AC (qe) was calculated from Eq. 3:
q (C C )Vm (3)e
0 e=−
where Co and Ce are the initial and at the equilibrium MB concentration in the solution (mg∙L−1), respectively, V is the volume of the solution (L) and m is the mass of the AC (g) employed.
In order to evaluate the thermodynamic study, the linear form of the Langmuir38 (Eq. 4), Freundlich39 (Eq. 5) and Temkin40 (Eq. 6) isotherms were employed.
Cq
1q b
1q
c(4)
e
e m me= +
= +lnq lnK 1n
lnc (5)e F e
· ·= +B RTb
q lnA lnc(6)T
e T e
where Ce and qe are the MB concentration (mg∙L−1) and the MB amount adsorbed per mass of AC at equilibrium (mg∙g−1), respectively; qm is the maximum adsorption capacity of the AC (mg∙g−1) and b is the Langmuir equilib-rium constant (L∙mg−1); KF (L∙g−1) and n are adsorption constants; AT is the Temkin isotherm equilibrium binding constant (L∙g−1), bT is the Temkin isotherm constant and R is the universal gas constant (8.314·103 kJ∙K−1∙mol−1).
Moreover, non-dimensional Langmuir constant41 (RL) was determined using Eq. 7:
R 11 bC (7)L
0=
+
where C0 is the initial concentration of MB (mg∙L−1).RL value could indicate that the adsorption process is unfavourable (RL > 1), linear (RL = 1), favourable
(0 < RL < 1) or irreversible (RL = 0)42.The kinetic data were also analyzed using a pseudo-first-order43 (Eq. 8) and pseudo-second-order models44
(Eq. 9):
ln(q q ) lnq K t (8)e t e 1 ·− = −
·tq
1K q
1q
t(9)t 2 e
2e
= +
where K1 and K2 are the pseudo-first (min−1) and pseudo-second-order (g∙min∙mg−1) adsorption constants.Finally, the thermodynamic equilibrium constant as the Gibbs free energy (ΔG0) (Eq. 10), the standard
enthalpy (ΔH0) and the entropy (ΔS0) (Eq. 11) were determined using the following equations45:
G RT lnK (10)0Δ = − α
lnK SR
HRT (11)
0 0=
Δ−
Δα
where Kα is the thermodynamic equilibrium constant (Eq. 12):
=αK CC (12)
s
e
where Cs and Ce are the solid (mg∙g−1) and liquid (mg∙L−1) phase concentration at equilibrium.
Results and DiscussionOptimization of polyphenol extraction conditions by experimental design. For optimization of the polyphenol extraction conditions from spent coffee ground (SCG), a two-level factorial experimental design was planned. According to Table S1, a total of 11 runs were performed. The obtained extracts for each tested con-dition were analyzed by capillary LC-DAD allowing both the individual detection and quantification of extracted polyphenols. Analysis of the experimental results allowed determining the best experimental extraction condi-tions for achieving the maximum response with regard to the composition of the extraction solvent (EtOH:H2O

5Scientific RepoRtS | (2019) 9:17706 | https://doi.org/10.1038/s41598-019-54205-y
www.nature.com/scientificreportswww.nature.com/scientificreports/
mixture), temperature and extraction time. The extracted amounts for each detected polyphenol from the 11 tested conditions are shown in Table S3. Among them, n° 6 and n° 8 experiments (Table S3) exhibit the highest polyphenols content. Experiment n° 6 showed the highest extracted amounts (mg∙g−1) for caffeine, caffeic acid and trans-ferulic acid, while for rutin and naringin the conditions of experiment n° 8 provided higher contents. For resveratrol, a similar concentration was obtained in all the experiments, whereas in the case of kaempferol, its concentration was below the limit of quantification (LOQ) determined by cLC-DAD. In order to determine the significant effects and the interactions between them, an estimated normalized response surfaces for each analyte were plotted. As an example, Fig. S1 shows the three-dimensional graphs obtained for caffeic acid and rutin in the extracts obtained from spent coffee ground sample (SCG) under specific extraction conditions. The caffeic acid amount increased with the EtOH:H2O ratio and the extraction time, while the extraction time and temperature have more influence in the rutin concentration. So, the obtained results indicate that it is not possible to obtain the maximum amount of the analytes in the same extraction conditions. For this reason, a multiple response analysis (MRA) was carried out. In this way, it is possible to determine the combination of the experimental fac-tors which simultaneously optimized the studied responses. As a compromise, the optimum conditions to obtain the maximum responses for the target analytes were 30 min for the extraction time, a temperature of 80 °C, and a mixture of EtOH:H2O (50:50, v/v) as extraction solvent. Under these conditions, experimental responses were in agreement with those predicted by means of the experimental design analysis.
Polyphenols determination by cLC-DAD in the extracts from SCG. Individual polyphenols deter-mination before and after the evaporation process (CWS and organic solution) were carried out by capillary liquid chromatography (cLC-DAD). Figure 2 shows the chromatogram registered for a mixture of the standards was used for the identification of the different polyphenols studied and caffeine. In addition, Table 1 shows the extracted amount (mg analyte·g−1 dried sample) in the different evaluated extracts. As can be observed, CWS exhibit the highest polyphenols and caffeine (except rutin and kaempferol) content followed by SCG, while in the other extracts (WS, H-SCG and ethanol) lower amounts were found. Furthermore, it is observed that the evap-oration process leads to concentrate polyphenol and caffeine compounds in the aqueous solution, while residual amounts remain in the organic solution.
estimation of tpc, tfc, and tAA in the extracts obtained from ScG samples. Total polyphenol (TPC), flavonoid content (TFC), and antioxidant activity (TAA) indexes of the obtained extracts from SCG under the optimum extraction conditions mentioned above were experimentally evaluated. The results obtained by applying spectrophotometric methods for the extract before the evaporation (i.e. WS) were (14 ± 8) mg GAE∙g−1 DW, (10.7 ± 0.8) mg QE·g−1 DW, (14.5 ± 0.3) mg GAE∙g−1 DW, for TPC, TFC and TAA, respectively. In addition, in the case of the CWS (the obtained extract after evaporation process), (49 ± 1) mg GAE∙g−1 DW, (56 ± 7) mg QE·g−1 DW, (23 ± 2) mg GAE∙g−1 DW for TPC, TFC and TAA were obtained. Results are expressed per gram of dried (DW) sample and they are related to the amount of gallic acid (GAE) or quercetin (QE). As can be observed, after the evaporation process (WS extract), there was an increase in the TFC and TPC and TAA estimated values.
Optimization of textural and morphological properties by factorial experimental design. For optimization of the textural and morphological properties of AC from precursor (H-SCG) under the optimum extraction conditions, a factorial experimental design was planned again (Table S2). Once a total of 11 experi-ments were performed. The subsequent analysis of the experimental results allowed to determine the best con-ditions for the maximum response. Table S4 shows the textural properties of the ACs obtained in the different
Figure 2. Chromatogram of a standard mixture (80 µg/L) obtained by the cLC-DAD optimized method. (1) Gallic acid; (2) Dihydroxybenzoic acid; (3) Chlorogenic acid; (4) Caffeine; (5) Caffeic acid; (6) p-Coumaric acid; (7) Trans- Ferulic acid; (8) Rutin; (9) Naringin; (10) Resveratrol; (11) Quercetin; (12) Kaempferol.

6Scientific RepoRtS | (2019) 9:17706 | https://doi.org/10.1038/s41598-019-54205-y
www.nature.com/scientificreportswww.nature.com/scientificreports/
experiments analyzed. The obtained results for Smi, Se and SBET showed significant effects for both time and tem-perature factors, and for interaction factors between temperature and KOH:precursor. As can be observed, the ACs have a microporous microstructure (Smi ≈ SBET), their volume of micropores (Wo) is similar to the pore volume (Vp). The pore sizes (Lo) are, in all cases, less than 2.2 nm. The BET surface area varies between 1377–2330 m2∙g−1. In general, an increase in the values of the variables studied can be observed in those experiments that have the highest temperature (850 °C). The nitrogen adsorption isotherms carried out at −196 °C for ACs of the experiments n°3 and n°5, that correspond to those that have the highest and lowest specific surface of all the active carbons obtained, are shown in Fig. S2. According to the International Union of Pure and Applied Chemistry (IUPAC), the shapes of these isotherms are of type I for experiment n° 5 and II for the experiment n° 3. At low relative pressures (p/p0 < 0.1), large volumes of N2 were adsorbed for both ACs samples46, which is typical of microporous solids The quantity adsorbed of N2 at p/p0 ~ 1 range between 350 and 758 cm3∙g−1.
Similar to the polyphenol extraction studies, estimated normalized response surfaces were plotted for the studied responses. Figure S3 shows the three-dimensional graphs obtained for SBET and Wo parameters in the sample studied. The rest of response presented similar surfaces to those shown in Fig. S3, where the response variable increases with the temperature, which corroborates the results previously mentioned. Moreover, it was necessary again to carry out MRA due to the heterogeneity in the experimental conditions. As a compromise, the optimum conditions to obtain the maximum responses were a time of 1 h, a temperature of 850 °C, and a mixture of KOH:precursor at the ratio 2.5:1.
characterization of the active carbons. Regarding the characterization of active carbon, Table 2 exhibits burn-off and the yield of the activation process in the experimental assays carried out by means of the exper-imental design. As can be observed, when the carbonization temperature increases, the burn-off does it and the AC recovery (wt %) decreases. The burn-off values range between 82% and 96% and the yields between 4% and 18.5%. A comparative of the initial residue (SCG), the precursor (H-SCG) and optimized activated carbon (AC-SCG-8) elemental chemical compositions are shown in Table S5. Chemical analysis showed a high carbon content for SCG and H-SCG (51.2% and 51.6%, respectively) and as consequence of the carbonization process used the C content of the AC-SCG-8 was increased up to 84% in the activated carbon compared to the initial precursor. In addition, Table S5 also showed a low sulphur content (0.1%) for the three samples analyzed.
Figure 3 shows, as an example, FE-SEM micrographs of the ACs obtained from the n° 5 (a) and n° 3 (b) experiments. These FE-SEM images were taken in order to observe the surface morphology of the samples. The images of the ACs show a lot of cavities indicating a microporous nature in both samples, according to the results
Compound (mg·g−1)*
Sample Code
SCG H-SCG WS CWS Ethanol
Caffeine 2.476 0.26 0.99 4.833 0.089
Chlorogenic acid LOD LOD n.d. 9.689 LOD
p-Coumaric acid 0.155 0.229 n.d. 0.348 0.046
trans- Ferulic acid 0.166 0.157 0.110 0.177 0.024
Rutin 0.086 LOD 0.064 LOD LOD
Naringin 0.214 0.096 0.143 0.423 0.010
Resveratrol 0.071 0.066 0.07 0.093 0.013
Quercetin 0.076 0.073 n.d. 0.095 0.015
Kaempferol 0.053 0.098 LOD 0.028 0.014
Table 1. Amounts of phenolic compounds and caffeine extracted from different solute. *Extracted amounts are expressed as mg per gram of dried sample. LOD: determined at the concentration levels of the method detection limit, n.d: no detected, SCG = extract from spent coffee grounds, H-SCG = extract from precursor, WS = extract obtained before the evaporation process, CWS = concentrated extract obtained after the evaporation process, Ethanol = organic solution obtained after the evaporation process.
Experiment Burn-off (wt, % daf) Yield (wt, %)
AC-SCG-1 82 18
AC-SCG-2 82 18
AC-SCG-3 95 5
AC-SCG-4 96 4
AC-SCG-5 81 18
AC-SCG-6 86 13
AC-SCG-7 93 7
AC-SCG-8 96 4
AC-SCG-9 88 12
Table 2. The variation of the burn-off and yield of the activation process.

7Scientific RepoRtS | (2019) 9:17706 | https://doi.org/10.1038/s41598-019-54205-y
www.nature.com/scientificreportswww.nature.com/scientificreports/
obtained in the characterization of the ACs obtained. However, the AC obtained from the n° 3 experiment exhib-its a greater number of pores compared with the AC obtained under the conditions of experiment n° 5.
Adsorption of methylene blue. Thermodynamic adsorption studies. In order to analyze the possible MB adsorption mechanism, different isotherms were assessed at different temperatures. The calculated parameters values for the different isotherms in the linear form, using the Eqs. 2–4, are summarized in Table 3. The highest obtained R2 correlation coefficient values were for the Langmuir isotherm.
The calculated values qm increase with the temperature, in accordance with previous studies related to the MB adsorption by ACs obtained from different wastes32,47. In addition, the calculated values are similar to the qm experimental obtained (between 411–813 mg∙g−1).
The calculated Langmuir non-dimensional factor (RL) in all cases were between the range of 0 < RL < 1. These results reveal that the methylene blue adsorption by the obtained activated carbon is a favourable process41 inde-pendently of the temperature used.
Thermodynamic parameters were calculated at different temperatures using Eqs. 10 and 11. The negative value obtained of enthalpy (∆H°) (−77.81 J·mol−1) indicates that the process is exothermic. In addition, the entropy (∆S°) was positive, 68.10 J·mol−1·K−1, which indicate the increased disorder at the solid-solution inter-face components. Finally, the free Gibbs energies (∆G°) (−205.73 kJ·mol−1 at 30 °C; −226.17 kJ·mol−1 at 60 °C
Figure 3. Morphology of activated carbons (ACs) obtained from experiment 5 (a) and experiment 3 (b) examined by FE-SEM.
T (°C)
Langmuir Freundlich Temkin
qm (mg∙g−1) B (mg−1) RL R2 Kf (g−1) n 1/n R2 AT bT R2
30 411.5 18.7 0.003 0.999 340.8 6.4 0.2 0.972 4011.9 60.3 0.962
60 775.2 8.9 0.006 0.999 567.2 3.6 0.3 0.819 224.5 24.9 0.921
80 813.1 3.7 0.013 0.993 510.9 3.9 0.3 0.988 400.3 31.5 0.905
Table 3. Langmuir, Freundlich and Temkin calculated parameters for MB adsorption.

8Scientific RepoRtS | (2019) 9:17706 | https://doi.org/10.1038/s41598-019-54205-y
www.nature.com/scientificreportswww.nature.com/scientificreports/
and 239.79 kJ·mol−1 at 80 °C) were also negatives and exhibit that this process is spontaneous and favourable thermodynamically.
The obtained negative value of enthalpy (∆H°) indicates that the process is exothermic. In addition, the entropy (∆S°) was positive, which indicate the increased disorder at the solid-solution interface components. Finally, the free Gibbs energies (∆G°) were also negatives and exhibit that this process is spontaneous and favour-able thermodynamically.
Kinetic adsorption studies. The adsorption kinetics experiments were also realized at different temperatures. Table 4 exhibits the obtained results. A pseudo-second-order model was the best fit in all cases, such as indicated the correlation coefficients obtained. K2 constant increased with temperature. The obtained results indicate that an increment of the temperature enhances the MB adsorption. The process activation energy (Ea) was calculated fitting the observed kinetics rate constants logarithm (ln K2,obs) versus the inverse of temperature (1/T)48, where the slope is −Ea/R. This value is used to estimate whether the process is a physical (readily reversible reactions and the energy requirements are small between the range of 5 to 40 kJ∙mol−1 or chemical adsorption (a process that requires higher energies, between 40 to 800 kJ∙mol−1, with stronger forces)48. The calculated activation energy in the present case was 16.25 kJ·mol−1. The obtained value could be suggested a physic-sorption process.
Isothermal and kinetic models, qm values and activation agents of different adsorbents are exhibit in Table 5. As can be observed, many cases the KOH is used as an activation agent. In general, a better fit to the Langmuir model isotherm was found for the adsorption isotherms. Moreover, the adsorption kinetics were best fitted a pseudo-second-order model in the majority of the presented cases. With respect to the adsorption capacity, spent coffee grounds, wine wastes and wastes carpets have the highest adsorption capacity values (qm) while orange peel has the lowest value.
ConclusionsA valorization process to re-use spent coffee ground was assessed. A hydrothermal treatment was employed to obtain a hydro-alcoholic extraction solution of the inherent high added value polyphenols, in addition to a car-bonaceous precursor used for a subsequent transformation into activated carbon (AC). Factorial experimental designs were used to optimize the polyphenols extraction conditions and the activated carbons obtention. For it, extraction time, extraction temperature and EtOH:H2O ratio were evaluated to the polyphenols extraction. 30 min of the extraction time, a temperature of 80 °C, and EtOH:H2O ratio (50:50, v/v) as extraction solvent were found to obtain the maximum responses. With respect to the activated carbon obtention, time and tem-perature of the calcination and KOH:precursor ratio have been evaluated. In this case, the optimum conditions to obtain the maximum responses were 1 h, 850 °C, and a mixture of KOH:precursor ratio 2.5:1. The obtained
T (°C)
Pseudo-first order Pseudo-second order
k1 (min−1) qe (mg·g−1) R2 k2·(10−3) (g∙min∙mg−1) qe (mg∙g−1) R2
30 0.046 38.05 0.871 2.85 201.99 0.999
60 0.097 92.5 0.965 3.77 200.49 0.999
80 0.101 36.73 0.877 7.60 199.74 0.999
Table 4. Kinetic parameters and correlation coefficients for the MB adsorption.
Precursor of the activated carbon
Activation agent
qm (mg·g−1) Isothermal model Kinetic model References
Spent coffee grounds† KOH 411–813 Langmuir Pseudo-second order This work
Wine wastes† KOH 714–847 Langmuir Pseudo-second-order (Alcaraz et al.)32
Wastes carpets H3PO4 403–769.2 Langmuir Pseudo-second-order (Hassan et al.)49
Date stones ZnCl2 398.2 Langmuir Pseudo-second-order (Ahmed et al.et al.)50
Bamboo KOH 454.2 Langmuir Pseudo-second-order (Hameed et al.)51
Coconut husk KOH 437.8 Langmuir Pseudo-second-order (Tan et al.)52
Vetiver roots H3PO4 423 Langmuir Pseudo-second-order (Altenor et al.)53
Acorn shell ZnCl2 312.5 Langmuir — (Altintig et al.)27
Sucrose† KOH 704.2 Langmuir Elovich (Bedin et al.)54
Hazelnut shells† KOH 524 Langmuir Pseudo-second-order (Unur et al.)55
Posidonia oceanica (L.) ZnCl2 285.7 Langmuir Dubinin-Raduchkevich (Dural et al.)56
Orange peel ZnCl2 150 — — (Köseoʇlu et al.)57
Peach Stones H3PO4 444.3 Tóth and RedlichPeterson — (Álvarez-Torrellas et al.)58
Grape waste ZnCl2 417 Langmuir — (Sayʇili et al.)59
Waste tea CH3COOK 554.3 Langmuir — (Auta et al.)60
Table 5. Maximum monolayer adsorption capacity (qm), isothermal and kinetic models of various adsorbents for MB adsorption. †Hydrothermal treatment for obtained the precursor.
9Scientific RepoRtS | (2019) 9:17706 | https://doi.org/10.1038/s41598-019-54205-y
www.nature.com/scientificreportswww.nature.com/scientificreports/
extracts are characterized by high values of total flavonoid content, in a range between 11–56 mg QE∙g−1 DW, and total polyphenol content, in a range between 14–49 mg GAE∙g−1 DW, as well as considerable antioxidant activities. In addition, all obtained activated carbons exhibit a microporous structure, with high specific sur-faces, between 1600 m2∙g−1 and 2330 m2∙g−1, provides them with excellent adsorption properties. Methylene blue adsorption capacity onto the obtained activated carbon have been evaluated. Thermodynamic and kinetic stud-ies were assessed. Langmuir isotherm and pseudo-second order model were the best fitted obtained. Finally, a thermodynamic study reveals that the MB adsorption is a spontaneous and favourable process. All these results yield high-quality AC and extracts with high value-added compounds, from spent coffee grounds, with potential interest for many industries. The present work also represents a promising alternative for reusing and valorization of this coffee residue, which is produced in very high amounts and it is commonly used as organic fertilizer.
Received: 1 August 2019; Accepted: 11 November 2019;Published: xx xx xxxx
References 1. Campos-Vega, R., Loarca-Piña, G., Vergara-Castañeda, H. A. & Dave Oomah, B. Spent coffee grounds: A review on current research
and future prospects. Trends Food Sci. Technol. 45, 24–36 (2015). 2. Ricciardi, P., Torchia, F., Belloni, E., Lascaro, E. & Buratti, C. Environmental characterisation of coffee chaff, a new recycled material
for building applications. Constr. Build. Mater. 147, 185–193 (2017). 3. Karmee, S. K. A spent coffee grounds based biorefinery for the production of biofuels, biopolymers, antioxidants and biocomposites.
Waste Manag. 72, 240–254 (2018). 4. Janissen, B. & Huynh, T. Chemical composition and value-adding applications of coffee industry by-products: A review. Resour.
Conserv. Recycl. 128, 110–117 (2018). 5. Iriondo-DeHond, A. et al. Validation of coffee by-products as novel food ingredients. Innov. Food Sci. Emerg. Technol. 0–1, https://
doi.org/10.1016/j.ifset.2018.06.010 (2018). 6. Nascimento, K. Sdo et al. Phenolic compounds, antioxidant capacity and physicochemical properties of Brazilian Apis mellifera
honeys. LWT - Food Sci. Technol. 91, 85–94 (2018). 7. Zheng, Z., Huyan, Y., Li, H., Sun, S. & Xu, Y. na l P re of. Sensors Actuators B. Chem. 127065, https://doi.org/10.1016/j.
snb.2019.127065 (2019). 8. Atabani, A. E. et al. Valorization of spent coffee grounds into biofuels and value-added products: Pathway towards integrated bio-
refinery. Fuel 254, 115640 (2019). 9. Franciski, M. A. et al. Development of CO2 activated biochar from solid wastes of a beer industry and its application for methylene
blue adsorption. Waste Manag. 78, 630–638 (2018). 10. Kovalcik, A., Obruca, S. & Marova, I. Valorization of Spent Coffee Grounds: A review. Food Bioprod. Process. 110, 104–119 (2018). 11. Du, C. et al. Valorization of food waste into biofertiliser and its field application. J. Clean. Prod. 187, 273–284 (2018). 12. Vijayalaxmi, S., Jayalakshmi, S. K. & Sreeramulu, K. Polyphenols from different agricultural residues: extraction, identification and
their antioxidant properties. J. Food Sci. Technol. 52, 2761–2769 (2015). 13. Engida, A. M., Faika, S., Nguyen-Thi, B. T. & Ju, Y. H. Analysis of major antioxidants from extracts of Myrmecodia pendans by UV/
visible spectrophotometer, liquid chromatography/tandem mass spectrometry, and high-performance liquid chromatography/UV techniques. J. Food Drug Anal. 23, 303–309 (2015).
14. Deshmukh, R., Kaundal, M. & Bansal, V. & Samardeep. Caffeic acid attenuates oxidative stress, learning and memory deficit in intra-cerebroventricular streptozotocin induced experimental dementia in rats. Biomed. Pharmacother. 81, 56–62 (2016).
15. García-Blanco, T., Dávalos, A. & Visioli, F. Tea, cocoa, coffee, and affective disorders: vicious or virtuous cycle? J. Affect. Disord. 224, 61–68 (2017).
16. Castro, A. C. C. M. et al. Green coffee seed residue: A sustainable source of antioxidant compounds. Food Chem. 246, 48–57 (2018). 17. Rui, L. et al. Enhanced solubility and antioxidant activity of chlorogenic acid-chitosan conjugates due to the conjugation of chitosan
with chlorogenic acid. Carbohydr. Polym. 170, 206–216 (2017). 18. Ramón-Gonçalves, M., Gómez-Mejía, E., Rosales-Conrado, N., León-González, M. E. & Madrid, Y. Extraction, identification and
quantification of polyphenols from spent coffee grounds by chromatographic methods and chemometric analyses. Waste Manag. 96, 15–24 (2019).
19. León-González, M. E., Gómez-Mejía, E., Rosales-Conrado, N. & Madrid-Albarrán, Y. Residual brewing yeast as a source of polyphenols: Extraction, identification and quantification by chromatographic and chemometric tools. Food Chem. 267, 246–254 (2018).
20. Munekata, P. E. S., Franco, D., Trindade, M. A. & Lorenzo, J. M. Characterization of phenolic composition in chestnut leaves and beer residue by LC-DAD-ESI-MS. LWT - Food Sci. Technol. 68, 52–58 (2016).
21. Gómez-Mejía, E., Rosales-Conrado, N., León-González, M. E. & Madrid, Y. Citrus peels waste as a source of value-added compounds: Extraction and quantification of bioactive polyphenols. Food Chem. 295, 289–299 (2019).
22. Ky, I. & Teissedre, P. L. Characterisation of Mediterranean grape pomace seed and skin extracts: Polyphenolic content and antioxidant activity. Molecules 20, 2190–2207 (2015).
23. Ibupoto, A. S. et al. Reusable carbon nanofibers for efficient removal of methylene blue from aqueous solution. Chem. Eng. Res. Des. 136, 744–752 (2018).
24. Pawar, R. R. et al. Porous synthetic hectorite clay-alginate composite beads for effective adsorption of methylene blue dye from aqueous solution. Int. J. Biol. Macromol. 114, 1315–1324 (2018).
25. Alguacil, F., Alcaraz, L., García-Díaz, I. & López, F. Removal of Pb2+ in Wastewater via Adsorption onto an Activated Carbon Produced from Winemaking Waste. Metals (Basel). 8, 697 (2018).
26. Suganya, S. & P., S. K. Influence of ultrasonic waves on preparation of active carbon from coffee waste for the reclamation of effluents containing Cr(VI) ions. J. Ind. Eng. Chem. 60, 418–430 (2018).
27. Altintig, E. & Kirkil, S. Preparation and properties of Ag-coated activated carbon nanocomposites produced from wild chestnut shell by ZnCl2 activation. J. Taiwan Inst. Chem. Eng. 63, 180–188 (2016).
28. Filippín, A. J., Luna, N. S., Pozzi, M. T., Pérez, J. D. & Obtención Y Caracterización De Carbón Activado a Partir De Residuos Olivícolas Y Oleícolas Por Activacion Física Obtaining and Characterizing of Carbon Activated From Olivic and Olive-Residues By Physical Activation. 8, 59–71 (2017).
29. Amerkhanova, S., Shlyapov, R. & Uali, A. The active carbons modified by industrial wastes in process of sorption concentration of toxic organic compounds and heavy metals ions. Colloids Surfaces A Physicochem. Eng. Asp. 532, 36–40 (2017).
30. Rattanapan, S., Srikram, J. & Kongsune, P. Adsorption of Methyl Orange on Coffee grounds Activated Carbon. Energy Procedia 138, 949–954 (2017).
31. Laksaci, H., Khelifi, A., Trari, M. & Addoun, A. Synthesis and characterization of microporous activated carbon from coffee grounds using potassium hydroxides. J. Clean. Prod. 147, 254–262 (2017).

1 0Scientific RepoRtS | (2019) 9:17706 | https://doi.org/10.1038/s41598-019-54205-y
www.nature.com/scientificreportswww.nature.com/scientificreports/
32. Alcaraz, L., López Fernández, A., García-Díaz, I. & López, F. A. Preparation and characterization of activated carbons from winemaking wastes and their adsorption of methylene blue. Adsorpt. Sci. Technol. 36, 1331–1351 (2018).
33. Alcaraz, L. et al. Dysprosium removal from water using active carbons obtained from spent coffee ground. Nanomaterials. 9, 1372 (2019).
34. Afolabi, O. O. D., Sohail, M. & Cheng, Y.-L. Optimisation and characterisation of hydrochar production from spent coffee grounds by hydrothermal carbonisation. Renew. Energy 147, 1380–1391 (2020).
35. Yang, J., (Sophia)He, Q. & Yang, L. A review on hydrothermal co-liquefaction of biomass. Appl. Energy 250, 926–945 (2019). 36. do Amaral Souza, F. et al. Thermosonication applied on camu–camu nectars processing: Effect on bioactive compounds and quality
parameters. Food Bioprod. Process. 116, 212–218 (2019). 37. Shrikanta, A., Kumar, A. & Govindaswamy, V. Resveratrol content and antioxidant properties of underutilized fruits. J. Food Sci.
Technol. 52, 383–390 (2015). 38. Langmuir, I. The adsorption of gases on plane surfaces of glass, mica and platinum. J. Am. Chem. Soc. 40, 1361–1403 (1918). 39. Freundlich, H. & Heller, W. The Adsorption of cis - and trans -Azobenzene. J. Am. Chem. Soc. 61, 2228–2230 (1939). 40. Johnson, R. D. & Arnold, F. H. The temkin isotherm describes heterogeneous protein adsorption. Biochim. Biophys. Acta (BBA)/
Protein Struct. Mol. 1247, 293–297 (1995). 41. Hall, K. R., Eagleton, L. C., Acrivos, A. & Vermeulen, T. Pore- and Solid-Diffusion Kinetics in Fixed-Bed Adsorption under
Constant-Pattern Conditions. Ind. Eng. Chem. Fundam. 5, 212–223 (1966). 42. Adebisi, G. A., Chowdhury, Z. Z. & Alaba, P. A. Equilibrium, kinetic, and thermodynamic studies of lead ion and zinc ion adsorption
from aqueous solution onto activated carbon prepared from palm oil mill effluent. J. Clean. Prod. 148, 958–968 (2017). 43. Lagergren, S. Zur theorie der sogenannten adsorption geloster stoffe, Kungliga Svenska Vetenskapsakademiens. Handlingar 24, 1–39
(1898). 44. Ho, Y. & McKay, G. Pseudo-second order model for sorption processes. Process Biochem. 34, 451–465 (1999). 45. El-Aila, H. J., Elsousy, K. M. & Hartany, K. A. Kinetics, equilibrium, and isotherm of the adsorption of cyanide by MDFSD. Arab. J.
Chem. 9, S198–S203 (2016). 46. Cheng, S. et al. Comparison of activated carbon and iron/cerium modified activated carbon to remove methylene blue from
wastewater. J. Environ. Sci. (China), https://doi.org/10.1016/j.jes.2016.12.027 (2016). 47. Senthil Kumar, P. et al. Effect of temperature on the adsorption of methylene blue dye onto sulfuric acid–treated orange peel. Chem.
Eng. Commun. 201, 1526–1547 (2014). 48. Boparai, H. K., Joseph, M. & O’Carroll, D. M. Kinetics and thermodynamics of cadmium ion removal by adsorption onto nano
zerovalent iron particles. J. Hazard. Mater. 186, 458–465 (2011). 49. Hassan, A. F. & Elhadidy, H. Production of activated carbons from waste carpets and its application in methylene blue adsorption:
Kinetic and thermodynamic studies. J. Environ. Chem. Eng. 5, 955–963 (2017). 50. Ahmed, M. J. & Dhedan, S. K. Equilibrium isotherms and kinetics modeling of methylene blue adsorption on agricultural wastes-
based activated carbons. Fluid Phase Equilib. 317, 9–14 (2012). 51. Hameed, B., Din, A. & Ahmad, A. Adsorption of methylene blue onto bamboo-based activated carbon: Kinetics and equilibrium
studies. J. Hazard. Mater. 141, 819–825 (2007). 52. Tan, I. A. W., Ahmad, A. L. & Hameed, B. H. Adsorption of basic dye on high-surface-area activated carbon prepared from coconut
husk: Equilibrium, kinetic and thermodynamic studies. J. Hazard. Mater. 154, 337–346 (2008). 53. Altenor, S. et al. Adsorption studies of methylene blue and phenol onto vetiver roots activated carbon prepared by chemical
activation. J. Hazard. Mater. 165, 1029–1039 (2009). 54. Bedin, K. C., Martins, A. C., Cazetta, A. L., Pezoti, O. & Almeida, V. C. KOH-activated carbon prepared from sucrose spherical
carbon: Adsorption equilibrium, kinetic and thermodynamic studies for Methylene Blue removal. Chem. Eng. J. 286, 476–484 (2016).
55. Unur, E. Functional nanoporous carbons from hydrothermally treated biomass for environmental purification. Microporous Mesoporous Mater. 168, 92–101 (2013).
56. Dural, M. U., Cavas, L., Papageorgiou, S. K. & Katsaros, F. K. Methylene blue adsorption on activated carbon prepared from Posidonia oceanica (L.) dead leaves: Kinetics and equilibrium studies. Chem. Eng. J. 168, 77–85 (2011).
57. Köseoʇlu, E. & Akmil-Başar, C. Preparation, structural evaluation and adsorptive properties of activated carbon from agricultural waste biomass. Adv. Powder Technol. 26, 811–818 (2015).
58. Álvarez-Torrellas, S., García-Lovera, R., Rodríguez, A. & García, J. Removal of methylene blue by adsorption on mesoporous carbon from peach stones. Chemical Engineering Transactions 43 (2015).
59. Sayʇili, H., Güzel, F. & Önal, Y. Conversion of grape industrial processing waste to activated carbon sorbent and its performance in cationic and anionic dyes adsorption. J. Clean. Prod. 93, 84–93 (2015).
60. Auta, M. & Hameed, B. H. Optimized waste tea activated carbon for adsorption of Methylene Blue and Acid Blue 29 dyes using response surface methodology. Chem. Eng. J. 175, 233–243 (2011).
AcknowledgementsTo the Technical Research Support Unit of the Institute of Catalysis and Petroleum Chemistry (CSIC) for support in the textural characterization of activated carbon. Mª Eugenia Léon-González and Noelia Rosales-Conrado thank the Spanish Commission of Science and Technology (CTQ2017-83569-C2-1-R) and the Comunidad of Madrid and European funding from FSE and FEDER programs for financial support (project S2018/BAA-4393, AVANSECAL-II-CM).
Author contributionsM.E.L. and F.A.L. conceived the study; M.R.-G., L.A. and S.P.F. carried out the experiments; M.E.L., N.R.C. and F.A.L. helped in the analyses and discussion of the results; M.R.-G. and L.A. wrote the manuscript. All authors contributed to the review, edit, and approval of the paper.
Competing interestsThe authors declare no competing interests.
Additional informationSupplementary information is available for this paper at https://doi.org/10.1038/s41598-019-54205-y.Correspondence and requests for materials should be addressed to F.A.L.Reprints and permissions information is available at www.nature.com/reprints.

1 1Scientific RepoRtS | (2019) 9:17706 | https://doi.org/10.1038/s41598-019-54205-y
www.nature.com/scientificreportswww.nature.com/scientificreports/
Publisher’s note Springer Nature remains neutral with regard to jurisdictional claims in published maps and institutional affiliations.
Open Access This article is licensed under a Creative Commons Attribution 4.0 International License, which permits use, sharing, adaptation, distribution and reproduction in any medium or
format, as long as you give appropriate credit to the original author(s) and the source, provide a link to the Cre-ative Commons license, and indicate if changes were made. The images or other third party material in this article are included in the article’s Creative Commons license, unless indicated otherwise in a credit line to the material. If material is not included in the article’s Creative Commons license and your intended use is not per-mitted by statutory regulation or exceeds the permitted use, you will need to obtain permission directly from the copyright holder. To view a copy of this license, visit http://creativecommons.org/licenses/by/4.0/. © The Author(s) 2019

Scientific Reports is a copyright of Springer, 2019. All Rights Reserved.