Globale Anforderungen der Flugzeugentwicklung ...gelhfrankfurt.de/PDF DATEIEN/2016-11-11 Globale...
39
PRIVATE AND CONFIDENTIAL © Bombardier Inc. or its subsidiaries. All rights reserved. Globale Anforderungen der Flugzeugentwicklung Technologieentwicklung und Paradigmenwechsel Sichtweise Betreiber – Entwickler - Einkauf Nico Buchholz, Sr. Vice President & CPO Sources all charts: Bombardier, Lufthansa Fleet Management, N.Buchholz incl 2013 & European Business School lecturing papers
Transcript of Globale Anforderungen der Flugzeugentwicklung ...gelhfrankfurt.de/PDF DATEIEN/2016-11-11 Globale...

PR
IVA
TE
AN
D C
ON
FID
EN
TIA
L
© B
om
ba
rdie
r In
c. o
r its s
ub
sid
iarie
s. A
ll rig
hts
re
se
rved
.
Globale Anforderungen
der Flugzeugentwicklung
Technologieentwicklung
und Paradigmenwechsel
Sichtweise Betreiber –
Entwickler - Einkauf
Nico Buchholz, Sr. Vice President & CPO
Sources all charts:
Bombardier, Lufthansa Fleet
Management, N.Buchholz incl
2013 & European Business
School lecturing papers

PR
IVA
TE
AN
D C
ON
FID
EN
TIA
L
© B
om
bard
ier
Inc. or
its s
ubsid
iarie
s. A
ll rig
hts
reserv
ed.
2
Corporate structure
Global aerospace and rail transportation leader with $18.2B in revenues
1. Bombardier Inc. owns 100% of the CRJ Series and Q Series commercial aircraft programs.
2. Including intersegment revenues
Note: Revenues are for the fiscal year ended December 31, 2015. The C Series Aircraft Limited Partnership did not
recognize any revenues in 2015.
30%49.5%
50.5% 70%100%1 100%
Bombardier Inc.Government of Québec
Caisse de dépôt et placement du Québec (CDPQ)
C Series Aircraft Limited
Partnership
Bombardier
Commercial
Aircraft
Bombardier
Business
Aircraft
Bombardier
Aerostructures
and Engineering
Services
Bombardier
Transportation
100%
Revenues
$7.0B
Revenues2
$1.8B
Revenues
$8.3B
Revenues
$2.4B
PR
IVA
TE
AN
D C
ON
FID
EN
TIA
L
© B
om
bard
ier
Inc. or
its s
ubsid
iarie
s. A
ll rig
hts
reserv
ed.
3
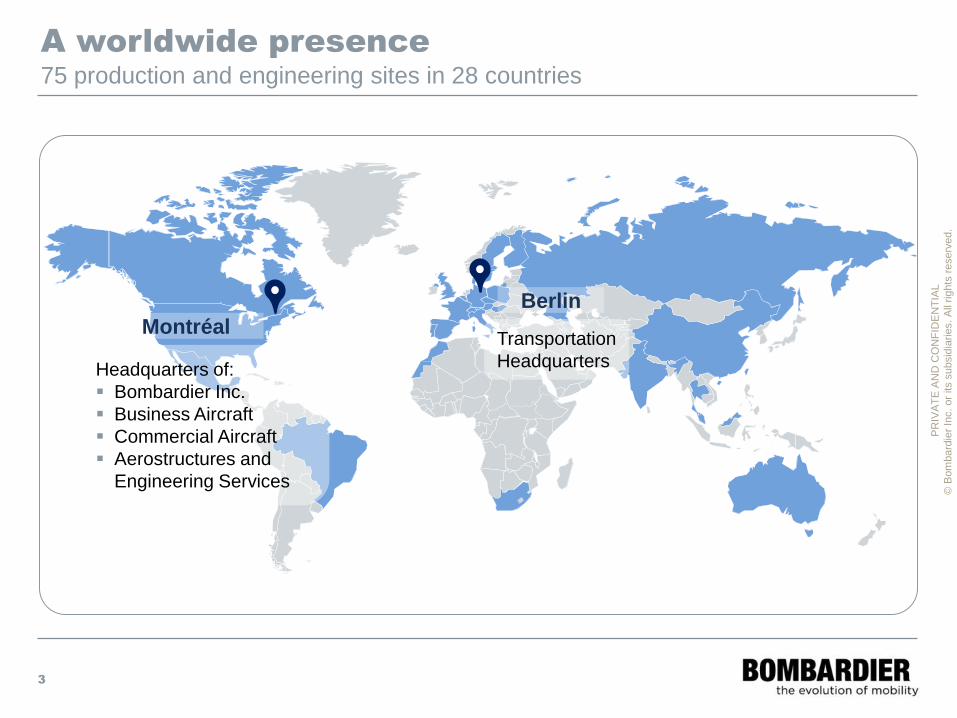
A worldwide presence
75 production and engineering sites in 28 countries
Montréal
Berlin
Headquarters of:
Bombardier Inc.
Business Aircraft
Commercial Aircraft
Aerostructures and
Engineering Services
Transportation
Headquarters

PR
IVA
TE
AN
D C
ON
FID
EN
TIA
L
© B
om
bard
ier
Inc. or
its s
ubsid
iarie
s. A
ll rig
hts
reserv
ed.
4
TRANSPORTATION
Market share by region
We have the broadest portfolio of rail solutions globally
In Europe, BT is the
market leader in all
major rolling stock
segments
Market leader for
metros in North
America, the biggest
segment of the region
Strong in India and
leader in the fast
growing Australian
market
Highest global
market share, making
BT the industry leader
outside China
Queensland Rail
New Generation
R179 New YorkRegio 2N FranceTRAXX South Africa
#2
#1 BT ~32%
#2 #2#3
BT ~38%
#3
BT ~18%
OthersOthers
OthersCompetitor
#2
#3
BT ~ 22%
Others
Global Rolling Stock market1 Europe1 North America 1,2 Asia-Pacific excl. China1
1. Based on BT management's tracking of published Rolling Stock orders in 2010-14 outside China; excluding
Services, Systems and Signalling, and Diesel Locomotives outside Europe
2. North America comprises United States, Canada and Mexico

PR
IVA
TE
AN
D C
ON
FID
EN
TIA
L
© B
om
bard
ier
Inc. or
its s
ubsid
iarie
s. A
ll rig
hts
reserv
ed.
Today fleet decisions (should) follow a clear process,
market requirement and business case
Today’s World
CAPEX & CVA – clear value added
Concise risk assessments
Linkage to company value proposition
Low seatmile cost with high performance / comfort / ecology / …
Sustainable
Market driven and flexible
…but what experience is the passenger after (business, holiday, shopping,..)
1950ies: Pilots
1960/70ies:
Engineers
1980ies: Commercial
(Marketing)
today: Economic-
ecologic awareness

PR
IVA
TE
AN
D C
ON
FID
EN
TIA
L
© B
om
bard
ier
Inc. or
its s
ubsid
iarie
s. A
ll rig
hts
reserv
ed.
Squaring the circle from the airline ops view
Plus
Determine a low complexity fleet,
market driven multiple aircraft
sizes offering high flexibility in
operation and performance while
being state of the (technical) art
and sustainable highly economical
with the least possible
environmental impact.
Conflicting Interests
Homogeneous fleet vs Operational flexibility
Economies of Scale vs Product differentiation
Fleet commonality vs Risk mitigation/-spread
Innovative aircraft vs Low capital expenditure
Fast airport turnaround vs economies of scale
Source: EBS, WHU lecturing material and Lufthansa Fleetmanagement
PR
IVA
TE
AN
D C
ON
FID
EN
TIA
L
© B
om
ba
rdie
r In
c. o
r its s
ub
sid
iarie
s. A
ll rig
hts
re
se
rved
.
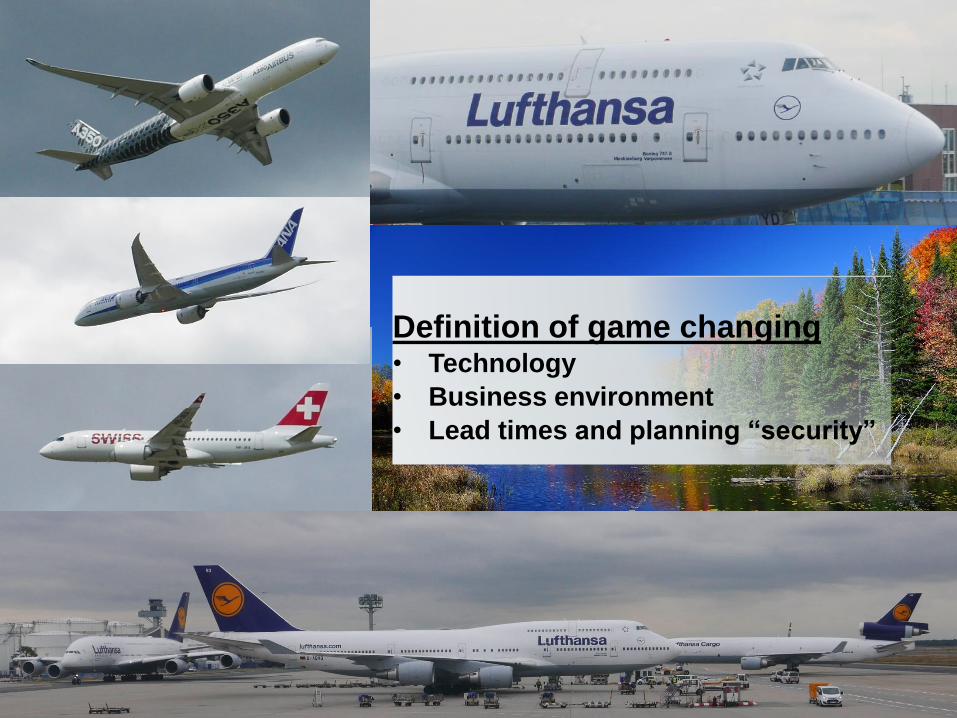
Definition of game changing• Technology
• Business environment
• Lead times and planning “security”
PR
IVA
TE
AN
D C
ON
FID
EN
TIA
L
© B
om
ba
rdie
r In
c. o
r its s
ub
sid
iarie
s. A
ll rig
hts
re
se
rved
.
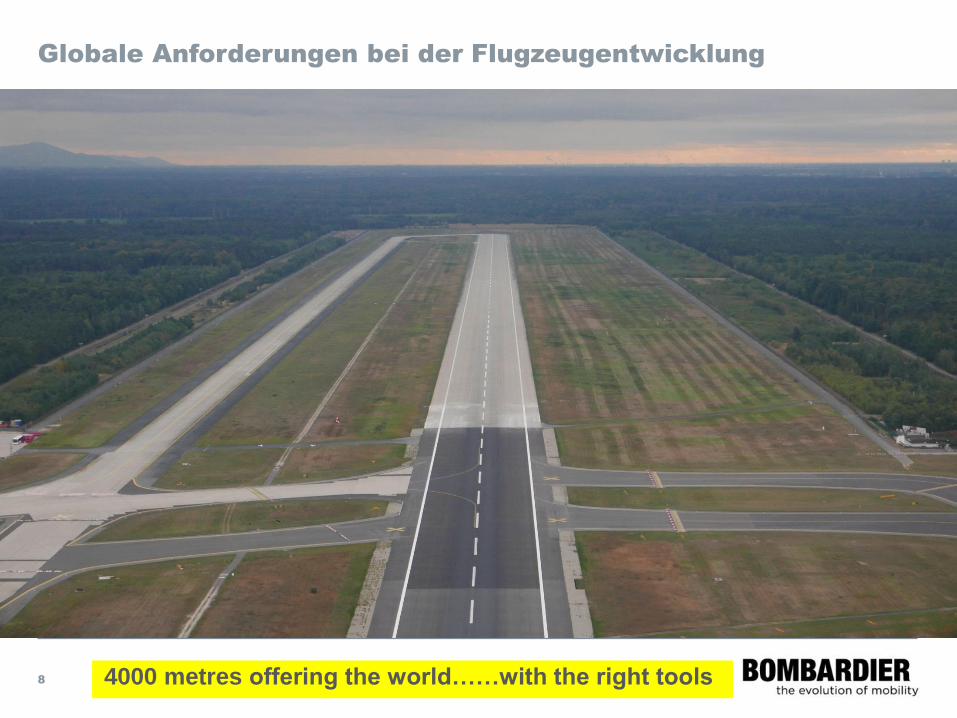
Globale Anforderungen bei der Flugzeugentwicklung
8 4000 metres offering the world……with the right tools

PR
IVA
TE
AN
D C
ON
FID
EN
TIA
L
© B
om
bard
ier
Inc. or
its s
ubsid
iarie
s. A
ll rig
hts
reserv
ed.
General Overview
PR
IVA
TE
AN
D C
ON
FID
EN
TIA
L
© B
om
bard
ier
Inc. or
its s
ubsid
iarie
s. A
ll rig
hts
reserv
ed.
10
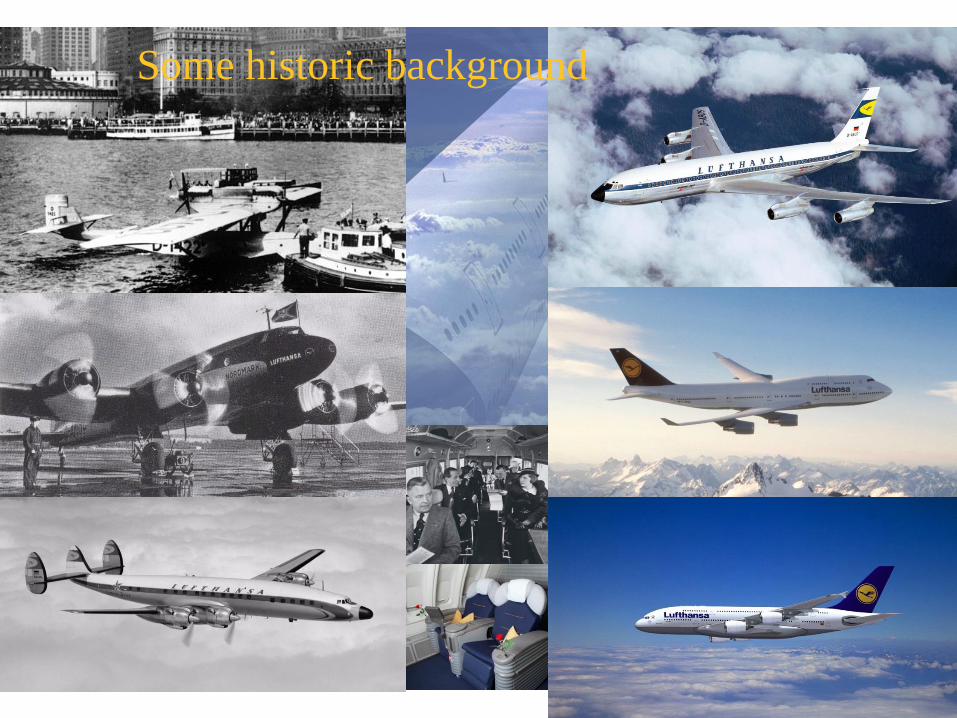
Some historic background

PR
IVA
TE
AN
D C
ON
FID
EN
TIA
L
© B
om
bard
ier
Inc. or
its s
ubsid
iarie
s. A
ll rig
hts
reserv
ed.
Aircraft 1948: 2290 1998: >15500 2010: > 20000
Passengers 1948: 24 million 1998: 1285 million
Passenger journeys 1945: 9 million 1999: 1,5 billion 2010: >2 billion
History of commercial aviation
Speed, range, sizeprovided economic leaps to foster
growth of the industry

PR
IVA
TE
AN
D C
ON
FID
EN
TIA
L
© B
om
bard
ier
Inc. or
its s
ubsid
iarie
s. A
ll rig
hts
reserv
ed.
Airliner evolutionary leaps – transportation efficiency gains so
far
1950 1960 1970 1980 1990 2000 2010
10 0000
20 0000
30 0000
40 0000
50 0000
60 0000
Seat kilometres per hour
DC-8-63
747-400
A380-800
DC-10-30/L1011-200
MD-11747-200 Combi

PR
IVA
TE
AN
D C
ON
FID
EN
TIA
L
© B
om
bard
ier
Inc. or
its s
ubsid
iarie
s. A
ll rig
hts
reserv
ed.
t
Ope
ratin
g C
ost
B727
DC-9
B737-300
MD-80
A320Fam
B737NG
All innovations and experience
from airline/MRO operations
transferred into new aircraft
1980 20001990 20XX1970
New technologies have delivered more efficient aircraft from platform to platform
??

PR
IVA
TE
AN
D C
ON
FID
EN
TIA
L
© B
om
bard
ier
Inc. or
its s
ubsid
iarie
s. A
ll rig
hts
reserv
ed.
Group Fleet Strategy and Aircraft Evaluation - Reasoning
Plan Buy Fly Sell
Neutral, „marketing-free“ Aircraft Evaluation
• Coordinated input of LH-group requirements in new aircraft programs / designs
• Influence and judge manufacturers‘ product strategies through constant dialogue
• Independent aircraft evaluation (economical and operational)
• perform a standardized, consistent cost and performance benchmark of competing
existing and projected aircraft
• Negotiation of performance guarantees in purchasing campaigns and tracking of
compliance
• Interface to external R&D establishments
• Issue fleet development recommendations to the LH-group members
Fleet Mgmt
Sources: Lufthansa Fleet Management 2013 & European Business School

PR
IVA
TE
AN
D C
ON
FID
EN
TIA
L
© B
om
bard
ier
Inc. or
its s
ubsid
iarie
s. A
ll rig
hts
reserv
ed.
Technology Trends…
PR
IVA
TE
AN
D C
ON
FID
EN
TIA
L
© B
om
bard
ier
Inc. or
its s
ubsid
iarie
s. A
ll rig
hts
reserv
ed.
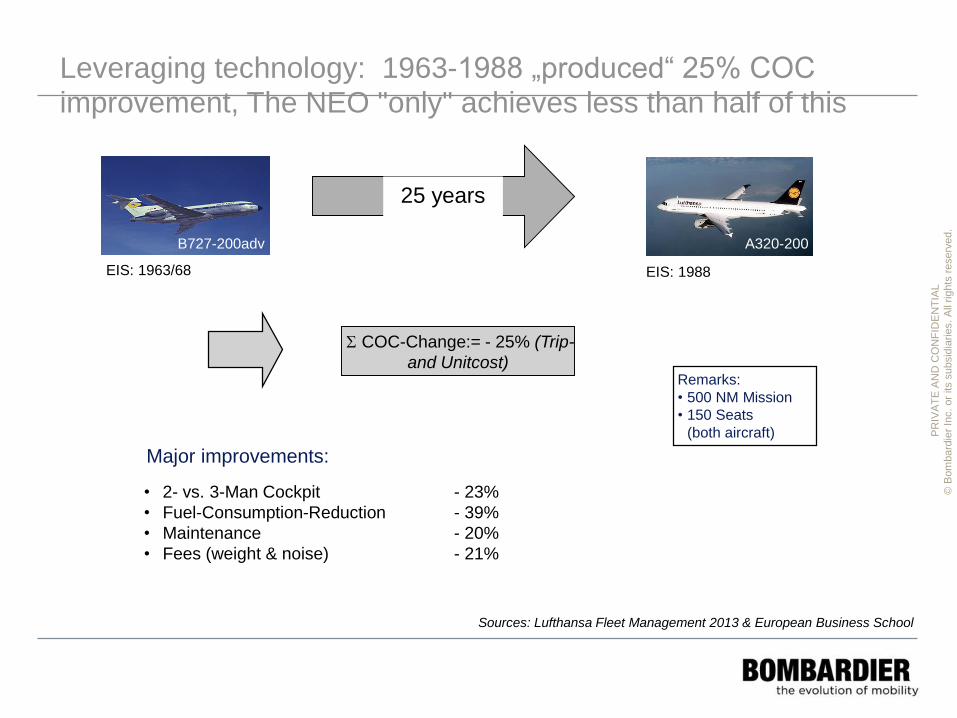
25 years
Remarks:
• 500 NM Mission
• 150 Seats
(both aircraft)
EIS: 1963/68
B727-200adv A320-200
EIS: 1988
S COC-Change:= - 25% (Trip-
and Unitcost)
• 2- vs. 3-Man Cockpit - 23%
• Fuel-Consumption-Reduction - 39%
• Maintenance - 20%
• Fees (weight & noise) - 21%
Major improvements:
Leveraging technology: 1963-1988 „produced“ 25% COC
improvement, The NEO "only" achieves less than half of this
Sources: Lufthansa Fleet Management 2013 & European Business School
PR
IVA
TE
AN
D C
ON
FID
EN
TIA
L
© B
om
ba
rdie
r In
c. o
r its s
ub
sid
iarie
s. A
ll rig
hts
re
se
rved
.
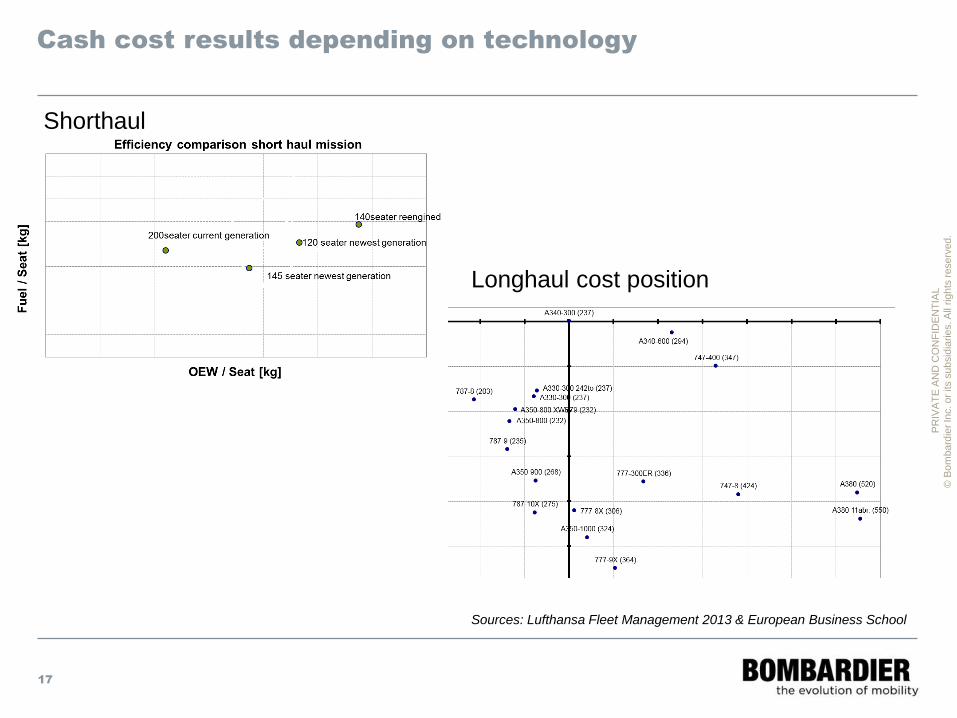
Cash cost results depending on technology
17
Sources: Lufthansa Fleet Management 2013 & European Business School
Shorthaul
Longhaul cost position

PR
IVA
TE
AN
D C
ON
FID
EN
TIA
L
© B
om
bard
ier
Inc. or
its s
ubsid
iarie
s. A
ll rig
hts
reserv
ed.
Economies of scale and customer needs – the reality!
RELATIVE COST POSITIONS
THEN AND TOMORROW
ALL DATA IS THERE SINCE LONG
…..EVALUATE OR CONCLUDE
The challenge of changing algorythms…..
0
50
100
150
Range
noise
seatmilecost
profitper
flight
tripcost
500 seater 300 seaterTrip cost = risk
Seatm
ilecost
= r
ew
ard
better
bette
r
future
Aircraft size increasing

PR
IVA
TE
AN
D C
ON
FID
EN
TIA
L
© B
om
bard
ier
Inc. or
its s
ubsid
iarie
s. A
ll rig
hts
reserv
ed.
Co
st/
SK
O
Size
Co
st/
SK
O
Size
Size200 300 400 500 Size250
300
400
500
PA
X a
nd
bre
ak
eve
n
PA
X a
nd
bre
ak
eve
n
danger of uncontrolled yield errosion; market
growth necessary to achieve "unit cost"
with introduction of "new A/C technologies" no
inherent growth necessary to retain unit cost
level
traditional Situation starting 2018
Due to different product life cycles there will be an era without
economies of scale starting in the second half of this decade
Sources: Lufthansa Fleet Management 2013 & European Business School

PR
IVA
TE
AN
D C
ON
FID
EN
TIA
L
© B
om
bard
ier
Inc. or
its s
ubsid
iarie
s. A
ll rig
hts
reserv
ed.
Capital Cost
Cash-cost dominate on long haul aircraft
Cash Operating Cost (COC)

PR
IVA
TE
AN
D C
ON
FID
EN
TIA
L
© B
om
bard
ier
Inc. or
its s
ubsid
iarie
s. A
ll rig
hts
reserv
ed.
To manage cost is to understand the levers that
impact each cost element; Cash cost determine the
quality of the asset
Fuel
Total Maintenance Cost
Landing Fees
Handling Fees
Navigation Fees
Cockpit Crews
Cabin Crews
typ
ica
l ca
sh o
pe
ratin
g c
ost
(CO
C)
of
long
hau
l a
ircra
ft
Cost elements have to be measured for their
competitive sustainability100%
Source: Corporate Fleet Strategy and Aircraft Evaluation

PR
IVA
TE
AN
D C
ON
FID
EN
TIA
L
© B
om
bard
ier
Inc. or
its s
ubsid
iarie
s. A
ll rig
hts
reserv
ed.
The payload-range of an aircraft to assess
the most efficient production tool
OEW
Range =
OEWcost
+ PayloadRevenue & cost
= MZFW + Fuelcost
= MTOW
given variable
Useable Payload is determined by Aircraft Weight and Design

PR
IVA
TE
AN
D C
ON
FID
EN
TIA
L
© B
om
bard
ier
Inc. or
its s
ubsid
iarie
s. A
ll rig
hts
reserv
ed.
What is really driving Airlines? Influencing and Stakeholders
Fleet is just a tool…Age should not be a reason, money is
MarketNetwork
Economy ,Competiton
Passengers
consumer patterns
Population growth
ManufacturersTechnology
Aircraft
EnvironmentNoise
Emissions
ETS
ResearchFuture Technologies
Innovative Solutions
Mobility patterns
InfrastructureCongestion
AirlineBusiness Model
Fleet Strategy
Cost Structure
Risk
RegulationsOpen-Skies
Traffic Rights
• More electric / solar
• Hi Integrated Systems & Big Data
• Weight (20%) and reliability
• Aero configuaration close to 10%
(shape and morphing wing)
• Speed, range
• Additive manufacturing
• Engines
• ….
• « reinvent » flying
• Passenger centric
• ….
PR
IVA
TE
AN
D C
ON
FID
EN
TIA
L
© B
om
bard
ier
Inc. or
its s
ubsid
iarie
s. A
ll rig
hts
reserv
ed.
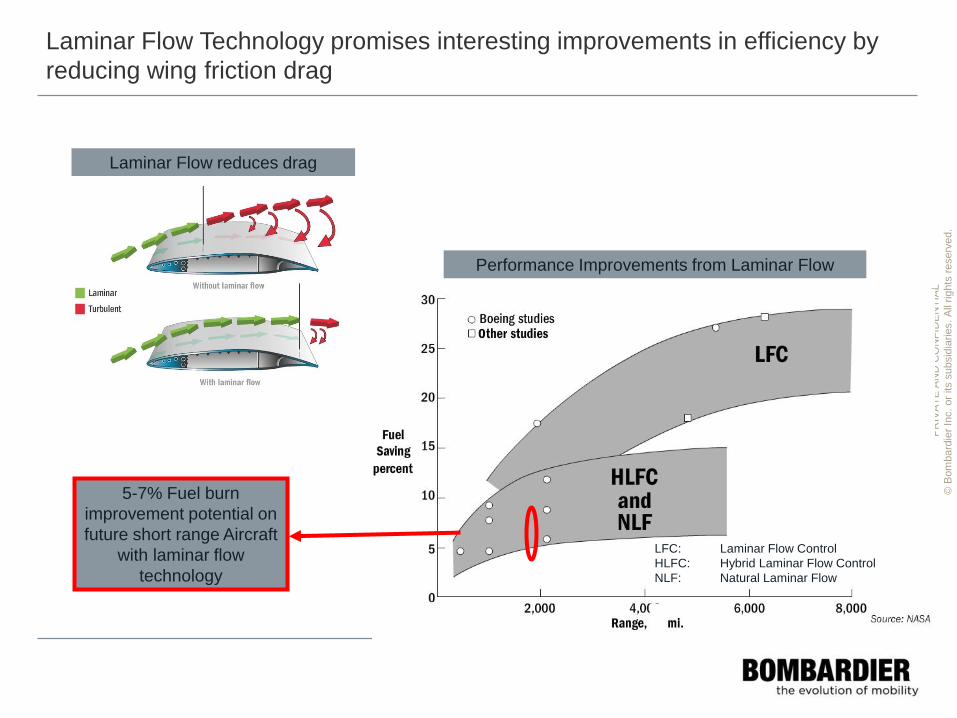
LFC: Laminar Flow Control
HLFC: Hybrid Laminar Flow Control
NLF: Natural Laminar Flow
Performance Improvements from Laminar Flow
Laminar Flow reduces drag
Laminar Flow Technology promises interesting improvements in efficiency by
reducing wing friction drag
5-7% Fuel burn
improvement potential on
future short range Aircraft
with laminar flow
technology
PR
IVA
TE
AN
D C
ON
FID
EN
TIA
L
© B
om
bard
ier
Inc. or
its s
ubsid
iarie
s. A
ll rig
hts
reserv
ed.
25
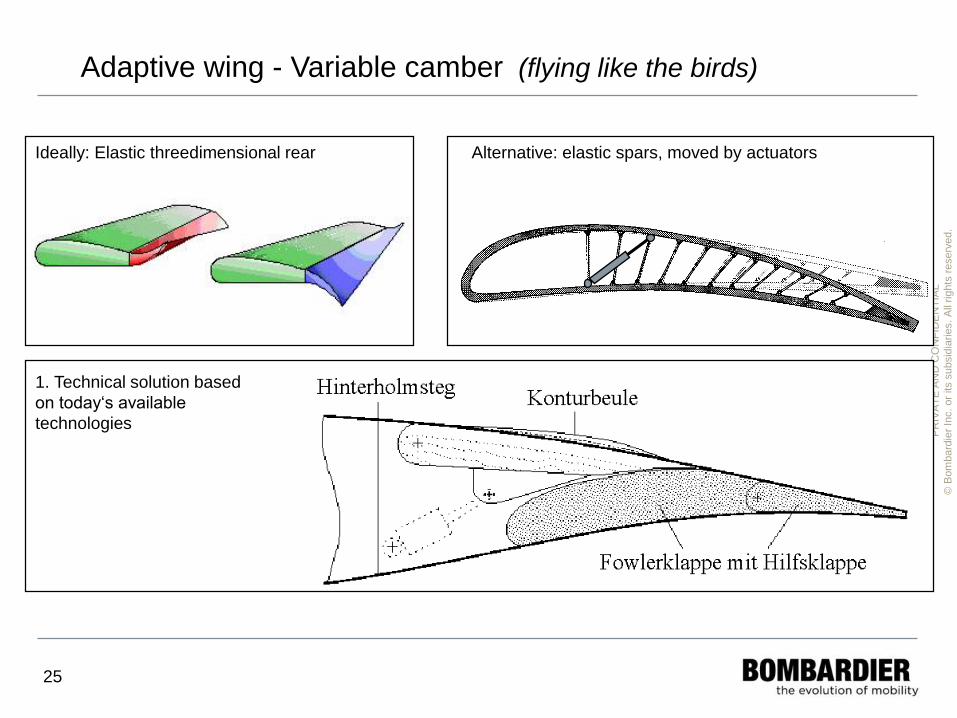
Adaptive wing - Variable camber (flying like the birds)
Alternative: elastic spars, moved by actuatorsIdeally: Elastic threedimensional rear
1. Technical solution based
on today‘s available
technologies
PR
IVA
TE
AN
D C
ON
FID
EN
TIA
L
© B
om
bard
ier
Inc. or
its s
ubsid
iarie
s. A
ll rig
hts
reserv
ed.
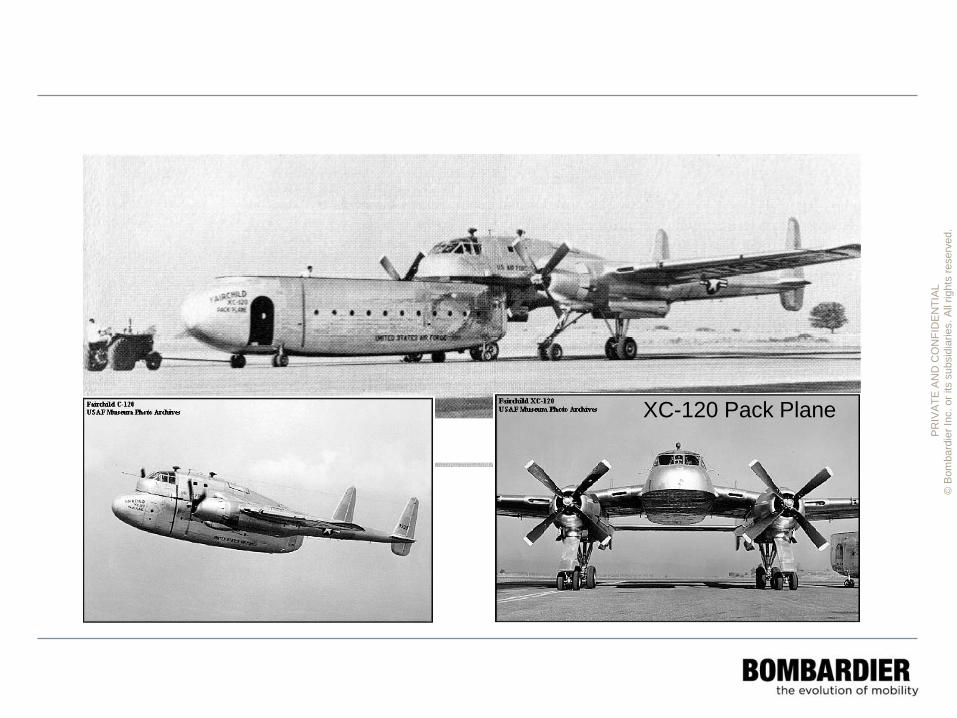
XC-120 Pack Plane

PR
IVA
TE
AN
D C
ON
FID
EN
TIA
L
© B
om
bard
ier
Inc. or
its s
ubsid
iarie
s. A
ll rig
hts
reserv
ed.
„Oblique Flying Wing“
Source: unknown

PR
IVA
TE
AN
D C
ON
FID
EN
TIA
L
© B
om
bard
ier
Inc. or
its s
ubsid
iarie
s. A
ll rig
hts
reserv
ed.
28
Blended Wing Concept
Source: Aerospace Testing October 2007
July 2007
test flight
PR
IVA
TE
AN
D C
ON
FID
EN
TIA
L
© B
om
bard
ier
Inc. or
its s
ubsid
iarie
s. A
ll rig
hts
reserv
ed.
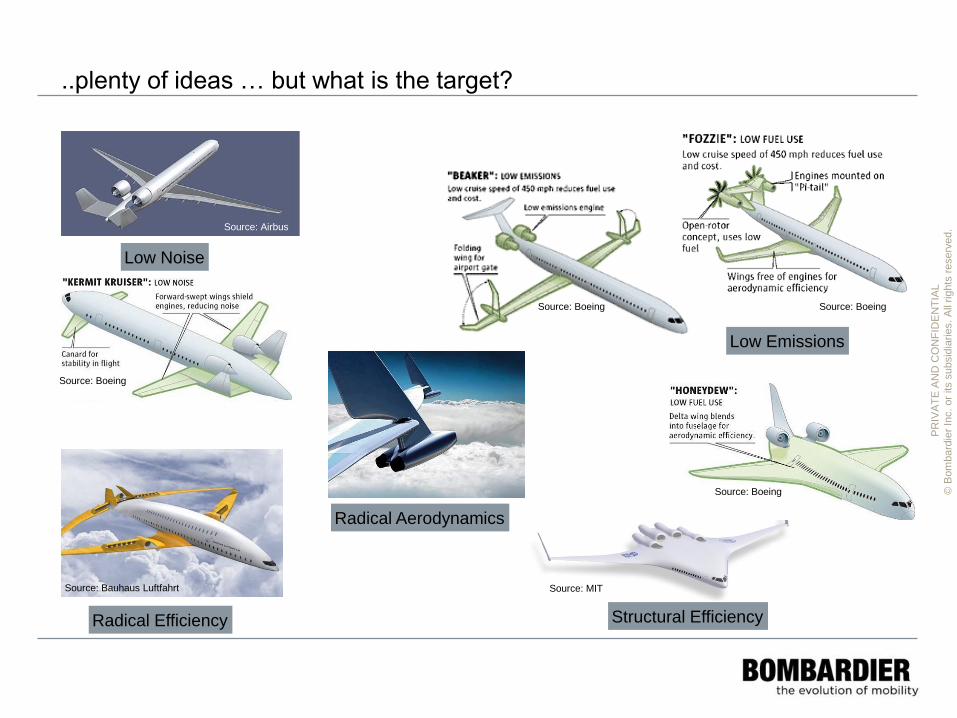
..plenty of ideas … but what is the target?
Source: Bauhaus Luftfahrt
Radical Efficiency
Radical Aerodynamics
Low Noise
Source: Airbus
Source: Boeing
Structural Efficiency
Source: MIT
Low Emissions
Source: Boeing Source: Boeing
Source: Boeing

PR
IVA
TE
AN
D C
ON
FID
EN
TIA
L
© B
om
bard
ier
Inc. or
its s
ubsid
iarie
s. A
ll rig
hts
reserv
ed.
The Future…Engine Design has tradeoffs
PR
IVA
TE
AN
D C
ON
FID
EN
TIA
L
© B
om
bard
ier
Inc. or
its s
ubsid
iarie
s. A
ll rig
hts
reserv
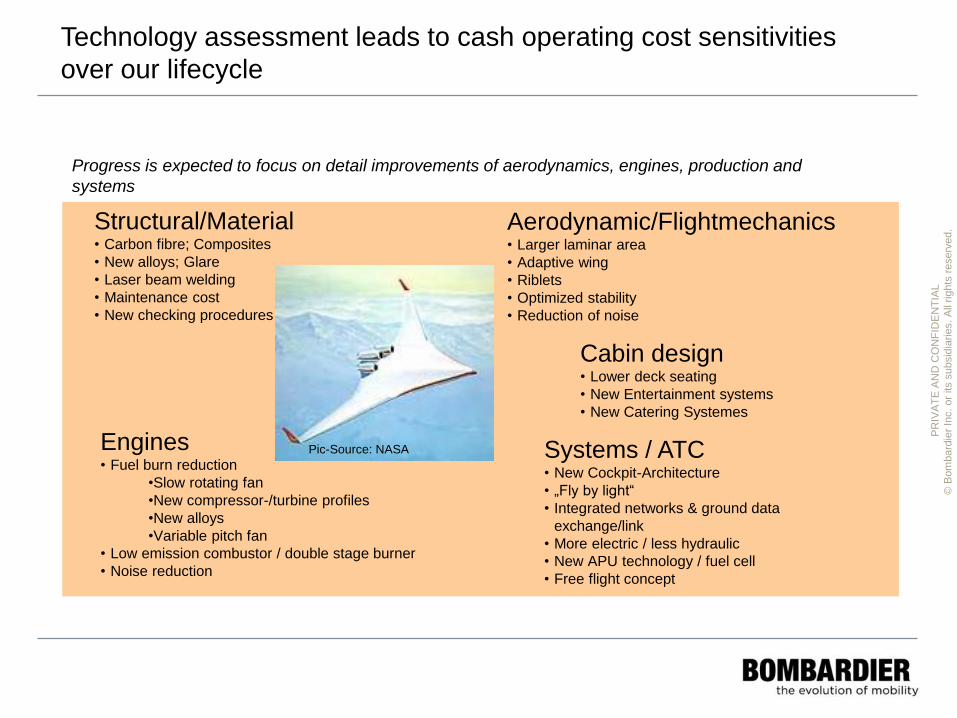
ed.Structural/Material
• Carbon fibre; Composites
• New alloys; Glare
• Laser beam welding
• Maintenance cost
• New checking procedures
Engines• Fuel burn reduction
•Slow rotating fan
•New compressor-/turbine profiles
•New alloys
•Variable pitch fan
• Low emission combustor / double stage burner
• Noise reduction
Aerodynamic/Flightmechanics• Larger laminar area
• Adaptive wing
• Riblets
• Optimized stability
• Reduction of noise
Systems / ATC• New Cockpit-Architecture
• „Fly by light“
• Integrated networks & ground data
exchange/link
• More electric / less hydraulic
• New APU technology / fuel cell
• Free flight concept
Cabin design• Lower deck seating
• New Entertainment systems
• New Catering Systemes
Technology assessment leads to cash operating cost sensitivities
over our lifecycle
Pic-Source: NASA
Progress is expected to focus on detail improvements of aerodynamics, engines, production and
systems
PR
IVA
TE
AN
D C
ON
FID
EN
TIA
L
© B
om
bard
ier
Inc. or
its s
ubsid
iarie
s. A
ll rig
hts
reserv
ed.
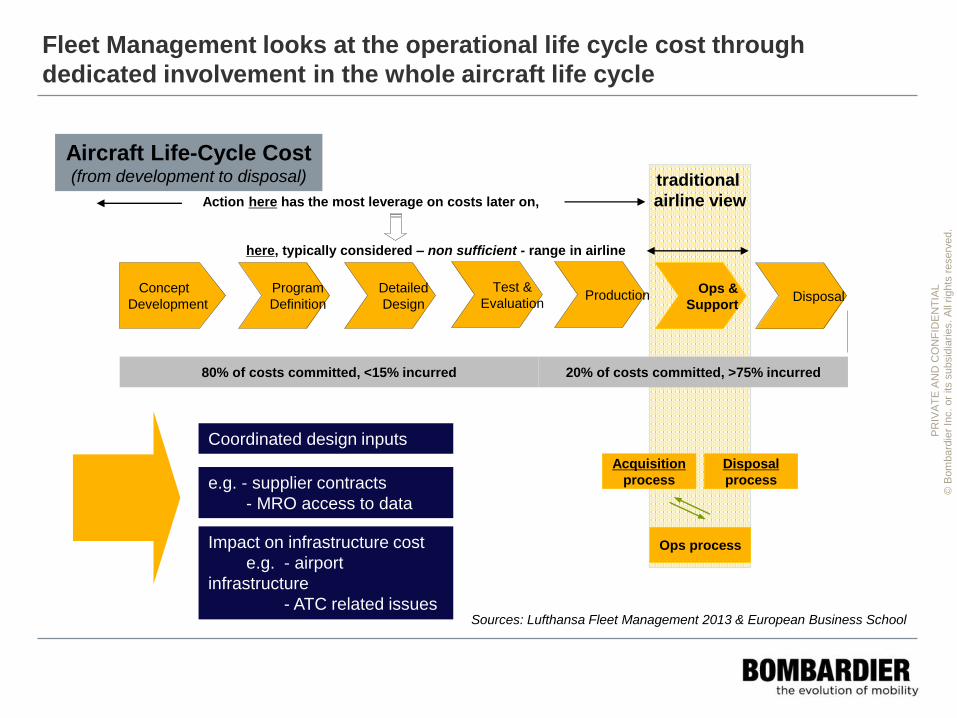
Concept
Development
Detailed
Design
Program
Definition
Test &
EvaluationProduction
Ops &
SupportDisposal
80% of costs committed, <15% incurred
Acquisition
process
Ops process
Disposal
process
Fleet Management looks at the operational life cycle cost through
dedicated involvement in the whole aircraft life cycle
20% of costs committed, >75% incurred
traditional
airline view
Aircraft Life-Cycle Cost(from development to disposal)
e.g. - supplier contracts
- MRO access to data
Impact on infrastructure cost
e.g. - airport
infrastructure
- ATC related issues
Coordinated design inputs
Action here has the most leverage on costs later on,
here, typically considered – non sufficient - range in airline
Sources: Lufthansa Fleet Management 2013 & European Business School

PR
IVA
TE
AN
D C
ON
FID
EN
TIA
L
© B
om
bard
ier
Inc. or
its s
ubsid
iarie
s. A
ll rig
hts
reserv
ed.
Some evaluation points…………
Performance Data
Range, Speed, Take-off and Landing
Capabilities
Cash Operating Cost
Fuel, Fees, Maintenance, Emission Cost
Technology and flexibility
Environmental issues
Noise-, CO2´- and pollution emission
Cabin Product
Cabin comfort, seat width
Fleet Strategy
Industry Politics
Risk assessment
Assessment of competitors
Infrastructure issues
Sources: Lufthansa Fleet Management 2013 & European Business School
Size / payload
Range
Speed
Belly-Volume
T/O performance
Noise and emissions
Passenger comfort
Infrastructure at airports
$ Purchase price
$ Value keeping, residual value
$ Empty weight
$ Crewing
$ Fuel burn
$ Maintenance cost
$ Fleet commonality
$ Product support available

PR
IVA
TE
AN
D C
ON
FID
EN
TIA
L
© B
om
bard
ier
Inc. or
its s
ubsid
iarie
s. A
ll rig
hts
reserv
ed.
Revenue
Data and IT Tools
Maximize Yield and Load
Factor for increased profitability
Design of
pricing
products
Setting of
price levels
and conditions
Steering
availability of
booking classes
Initiation of
capacities
adjustments
Framework Airline Business
The airline product is perishable.
An empty seat is worthless after
the plane is airborne.
We are active on the global
market. Others worldwide are
competing for the same customers
(valid for airlines and OEMs)
A booking does not guarantee a
sold seat yet.
Demand varies significantly by
time of day and season.
PricingYield
Management
PR
IVA
TE
AN
D C
ON
FID
EN
TIA
L
© B
om
bard
ier
Inc. or
its s
ubsid
iarie
s. A
ll rig
hts
reserv
ed.
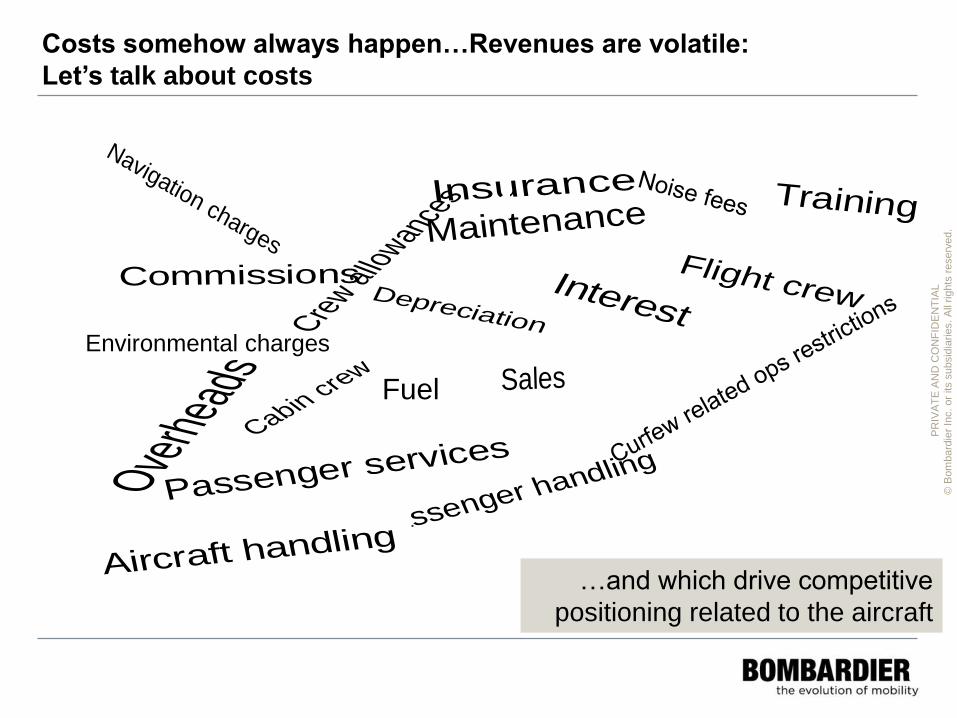
Overhe
ads Sales
Flight crew
Fuel
Maintenance
Cabin crew
Training
Passenger handling
Aircraft handling
Navigation charges
Commissions
Passenger services
Depreciation
Interest
Insurance
Crew al
lowan
ces
Costs somehow always happen…Revenues are volatile:
Let’s talk about costs
Environmental charges
…and which drive competitive
positioning related to the aircraft
PR
IVA
TE
AN
D C
ON
FID
EN
TIA
L
© B
om
bard
ier
Inc. or
its s
ubsid
iarie
s. A
ll rig
hts
reserv
ed.
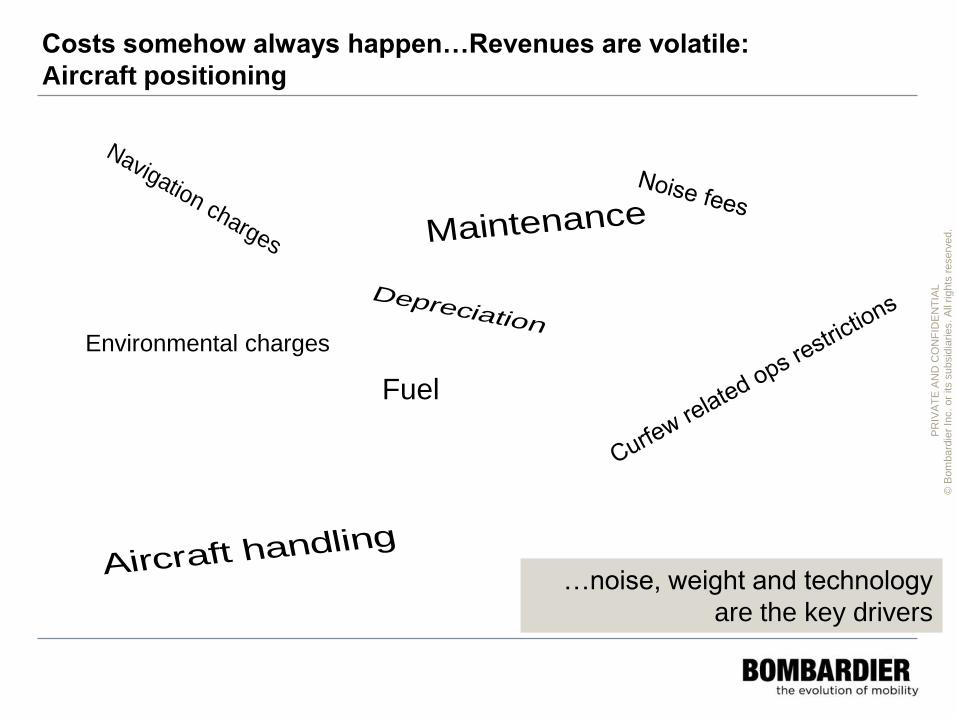
Fuel
Maintenance
Aircraft handling
Navigation charges
Depreciation
Costs somehow always happen…Revenues are volatile:
Aircraft positioning
Environmental charges
…noise, weight and technology
are the key drivers
PR
IVA
TE
AN
D C
ON
FID
EN
TIA
L
© B
om
bard
ier
Inc. or
its s
ubsid
iarie
s. A
ll rig
hts
reserv
ed.
nswers
uestionsQ
PR
IVA
TE
AN
D C
ON
FID
EN
TIA
L
© B
om
bard
ier
Inc. or
its s
ubsid
iarie
s. A
ll rig
hts
reserv
ed.
Danke

PR
IVA
TE
AN
D C
ON
FID
EN
TIA
L
© B
om
bard
ier
Inc. or
its s
ubsid
iarie
s. A
ll rig
hts
reserv
ed.
Caution Regarding Forward-Looking Statements
This presentation includes forward-looking statements, which may involve, but are not limited to: statements with respect to the Corporation’s objectives, guidance, targets, goals, priorities,
market and strategies, financial position, beliefs, prospects, plans, expectations, anticipations, estimates and intentions; general economic and business outlook, prospects and trends of an
industry; expected growth in demand for products and services; product development, including projected design, characteristics, capacity or performance; expected or scheduled entry-into-
service of products and services, orders, deliveries, testing, lead times, certifications and project execution in general; competitive position; the expected impact of the legislative and
regulatory environment and legal proceedings on the Corporation’s business and operations; available liquidities and ongoing review of strategic and financial alternatives; the receipt and
use of the remaining investment by the Government of Québec in the C Series Aircraft Limited Partnership (the C Series Investment); the effects of the C Series Investment and of the
private placement of a minority stake in Transportation to the CDPQ (the CDPQ Investment and, with the C Series Investment, the Investments) on the range of options available to us,
including regarding the Corporation’s participation in future industry consolidation; the capital and governance structure of the Transportation segment following the CDPQ Investment, and of
the Commercial Aircraft segment following the C Series Investment; the impact and expected benefits of the Investments on the Corporation’s operations, infrastructure, opportunities,
financial condition, access to capital and overall strategy; and the impact of the sale of equity on the Corporation’s balance sheet and liquidity position. The implementation of the Share
Consolidation is subject to a number of conditions, including but not limited to, Toronto Stock Exchange approval. The Board of Directors has authority, notwithstanding approval of the
Share Consolidation by shareholders, to determine in its discretion not to proceed with the Share Consolidation, without further approval or action by, or prior notice to, shareholders. At this
time, no decision has been made by the Board of Directors and there can be no assurance that the Share Consolidation will be implemented as proposed or at all, or as to the timing thereof,
or that the Share Consolidation will result in the contemplated initial post-consolidation share price of Class A Shares or Class B Subordinate Voting Shares.
Forward-looking statements can generally be identified by the use of forward-looking terminology such as “may”, “will”, “expect”, “intend”, “anticipate”, “plan”, “foresee”, “believe”, “continue”,
“maintain” or “align”, the negative of these terms, variations of them or similar terminology. By their nature, forward-looking statements require management to make assumptions and are
subject to important known and unknown risks and uncertainties, which may cause actual results in future periods to differ materially from forecast results. While management considers their
assumptions to be reasonable and appropriate based on information currently available, there is risk that they may not be accurate.
Certain factors that could cause actual results to differ materially from those anticipated in the forward-looking statements include, but are not limited to, risks associated with general
economic conditions, risks associated with the Corporation’s business environment (such as risks associated with the financial condition of the airline industry, of business aircraft customers,
and of the rail industry; trade policy; increased competition; political instability and force majeure), operational risks (such as risks related to developing new products and services;
development of new business; the certification and homologation of products and services; fixed-price commitments and production and project execution; pressures on cash flows based on
project-cycle fluctuations and seasonality; the Corporation’s ability to successfully implement the Corporation’s strategy and transformation plan; doing business with partners; product
performance warranty and casualty claim losses; regulatory and legal proceedings; the environment; dependence on certain customers and suppliers; human resources; reliance on
information systems; reliance on and protection of intellectual property rights; and adequacy of insurance coverage), financing risks (such as risks related to liquidity and access to capital
markets; retirement benefit plan risk; exposure to credit risk; existing debt and interest payment requirements; certain restrictive debt covenants; financing support provided for the benefit of
certain customers; and reliance on government support), market risks (such as risks related to foreign currency fluctuations; changing interest rates; decreases in residual values; increases
in commodity prices; and inflation rate fluctuations). For more details, see the Risks and uncertainties section in Other in the Management’s Discussion and Analysis (MD&A) of the
Corporation’s financial report for the fiscal year ended December 31, 2015. For additional information with respect to the assumptions underlying the forward-looking statements made in this
presentation, refer to the Guidance and forward-looking statements sections in the MD&A of the Corporation’s financial report for the fiscal year ended December 31, 2015.
Readers are cautioned that the foregoing list of factors that may affect future growth, results and performance is not exhaustive and undue reliance should not be placed on forward-looking
statements. The forward-looking statements set forth herein reflect management’s expectations as at the date of this presentation and are subject to change after such date. Unless
otherwise required by applicable securities laws, the Corporation expressly disclaims any intention, and assumes no obligation to update or revise any forward-looking statements, whether
as a result of new information, future events or otherwise. The forward-looking statements contained in this presentation are expressly qualified by this cautionary statement.
All amounts in this presentation are expressed in U.S. dollars unless otherwise indicated.
Bombardier Inc. and its subsidiaries’ names, abbreviations thereof, logos, and product and service designators are all either the registered or unregistered trademarks or trade names of
Bombardier Inc. and its subsidiaries. Names, abbreviations of names, logos, and product and service designators of other companies are either the registered or unregistered trademarks or
trade names of their respective owners. Use of names, abbreviations of names, logos, and product and service designators of other companies does not imply any endorsement by any other
such company.