Impurity Profiling of Challenging Active Pharmaceutical ......Impurity Profiling of Challenging...
204
Impurity Profiling of Challenging Active Pharmaceutical Ingredients without Chromophore DISSERTATION zur Erlangung des naturwissenschaftlichen Doktorgrades der Julius-Maximilians-Universität Würzburg vorgelegt von Oliver Wahl aus Birkenfeld/Nahe Würzburg 2016
Transcript of Impurity Profiling of Challenging Active Pharmaceutical ......Impurity Profiling of Challenging...
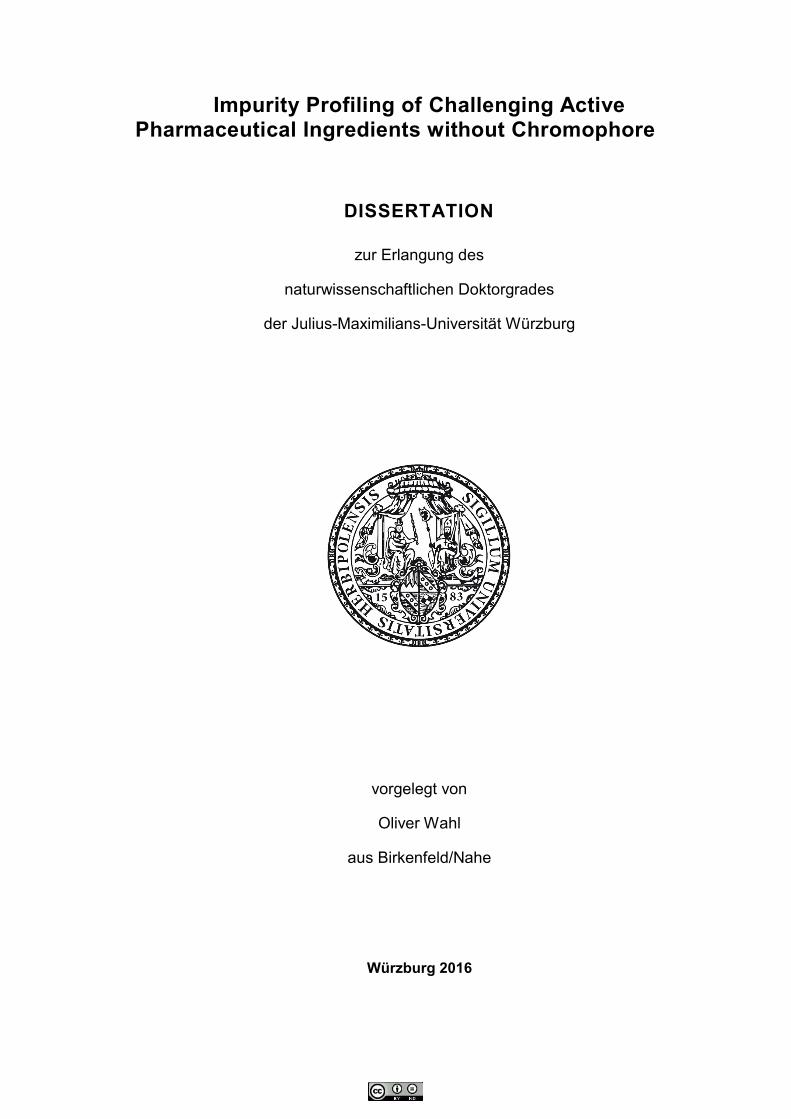
Impurity Profiling of Challenging Active Pharmaceutical Ingredients without Chromophore
DISSERTATION
zur Erlangung des
naturwissenschaftlichen Doktorgrades
der Julius-Maximilians-Universität Würzburg
vorgelegt von
Oliver Wahl
aus Birkenfeld/Nahe
Würzburg 2016

I
Eingereicht bei der Fakultät für Chemie und Pharmazie am:
……………………………….
Gutachter der schriftlichen Arbeit:
1. Gutachter …………………………………..
2. Gutachter …………………………………..
Prüfer des öffentlichen Promotionskolloquiums:
1. Prüfer …………………………………..
2. Prüfer …………………………………..
3. Prüfer …………………………………..
Datum des öffentlichen Promotionskolloquiums:
…………………………………..
Doktorurkunde ausgehändigt am:
…………………………………..

II
Adoramos a perfeição, porque não a podemos ter;
repugna-la-íamos, se a tivéssemos. O perfeito é o desumano,
porque o humano é imperfeito.
Fernando Pessoa (1888-1935)
Für meine Familie!
III
Die vorliegende Arbeit wurde auf Anregung und unter Anleitung von
Frau Prof. Dr. Ulrike Holzgrabe
am Lehrstuhl für Pharmazeutische Chemie
des Instituts für Pharmazie und Lebensmittelchemie
der Julius-Maximilians Universität Würzburg angefertigt.
Ihr gebührt besonderer Dank für die Aufnahme in die Arbeitsgruppe und für das in
mich gesetzte Vertrauen. Sie hat mir in zahlreichen Diskussionen wertvolle Anregungen zur
Problemlösung gegeben und mir das eigenverantwortliche Anfertigen dieser Arbeit
ermöglicht.
Außerdem ermöglichte Sie mir mit einem halbjährigen Auslandsaufenthalt tiefe
Einblicke in die Arbeit des EDQM in Strasbourg und gab mir damit eine sehr wertvolle
Erfahrung mit auf den Weg.
Danke!
Weiterer Dank gebührt dem Bundesinstitut für Arzneimittel und Medizinprodukte in
Bonn für die Finanzierung dieser Arbeit.
IV
Danke!
Merci!
Allen anderen, die mich in dieser Zeit auf die eine oder andere Art unterstützt haben
und denjenigen, die diese Zeit zu einer unvergesslichen gemacht haben:
David, Jogi, Miri, Lu, Christiane, Nina, Melli, Maike, Klaus, Ines, Flo, Regina,
Anna, Antonio, Steffi, Daniela, Nils, Alex, Jan, Michael, Raphael, Markus, Katja,
Christine, Lina, Frau Möhler, Frau Ebner, Frau Kosikors
Andreas Lodi, Sylvie Jorajuria, Stefan Almeling, Remmelt, Jean-Yves, Gilles,
Cédric, Joel, Yusuf, Nicole, Nathalie, Chantal, Jochen, Sebastien, Brigitte, Marianne,
Sophie, Stephanie M., Stephanie F., Noud, Christelle, Laurence, Michele, Olivier,
Marion, Cees-Jan, Christian, Pascal, Sophie, Hassina, Christian, Silvia, Sylvie D.,
Agnès, Fatiha, Valerie, Emilie, Philippe, Matthias, Emilie, Peter, Gwenaelle, Manuela

V
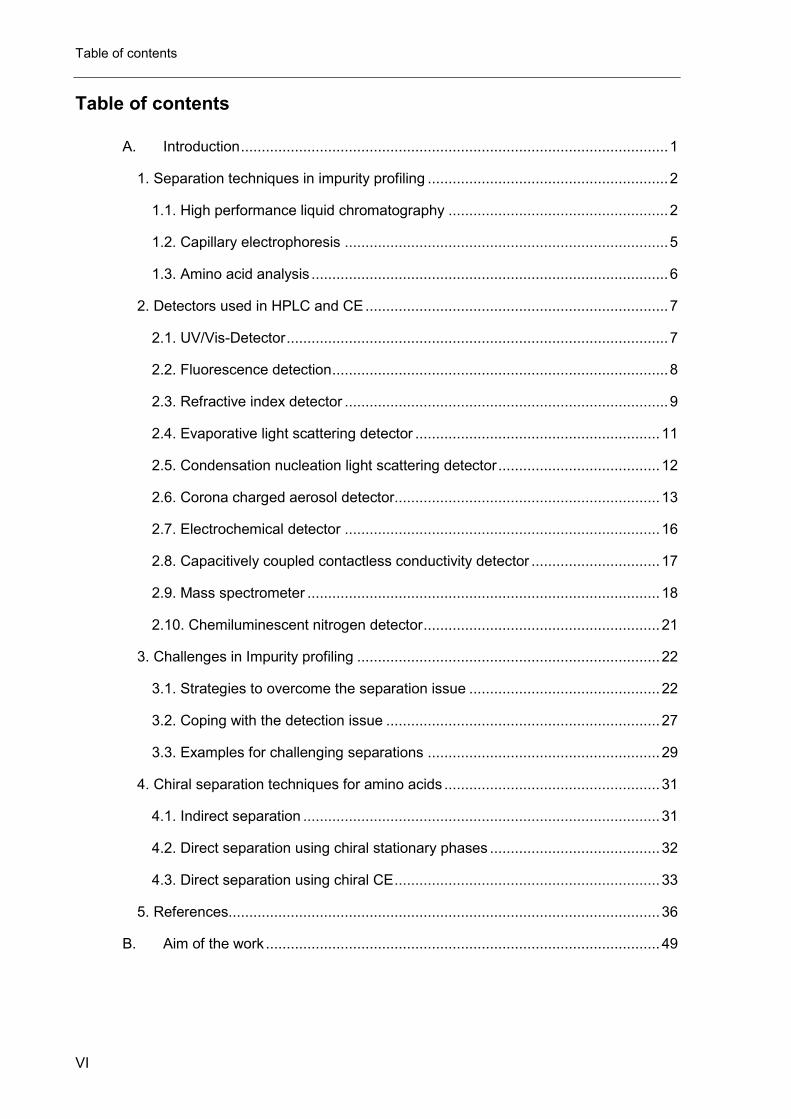
Table of contents
VI
Table of contents
A. Introduction ....................................................................................................... 1
1. Separation techniques in impurity profiling .......................................................... 2
1.1. High performance liquid chromatography ..................................................... 2
1.2. Capillary electrophoresis .............................................................................. 5
1.3. Amino acid analysis ...................................................................................... 6
2. Detectors used in HPLC and CE ......................................................................... 7
2.1. UV/Vis-Detector ............................................................................................ 7
2.2. Fluorescence detection ................................................................................. 8
2.3. Refractive index detector .............................................................................. 9
2.4. Evaporative light scattering detector ........................................................... 11
2.5. Condensation nucleation light scattering detector ....................................... 12
2.6. Corona charged aerosol detector................................................................ 13
2.7. Electrochemical detector ............................................................................ 16
2.8. Capacitively coupled contactless conductivity detector ............................... 17
2.9. Mass spectrometer ..................................................................................... 18
2.10. Chemiluminescent nitrogen detector ......................................................... 21
3. Challenges in Impurity profiling ......................................................................... 22
3.1. Strategies to overcome the separation issue .............................................. 22
3.2. Coping with the detection issue .................................................................. 27
3.3. Examples for challenging separations ........................................................ 29
4. Chiral separation techniques for amino acids .................................................... 31
4.1. Indirect separation ...................................................................................... 31
4.2. Direct separation using chiral stationary phases ......................................... 32
4.3. Direct separation using chiral CE ................................................................ 33
5. References........................................................................................................ 36
B. Aim of the work ............................................................................................... 49
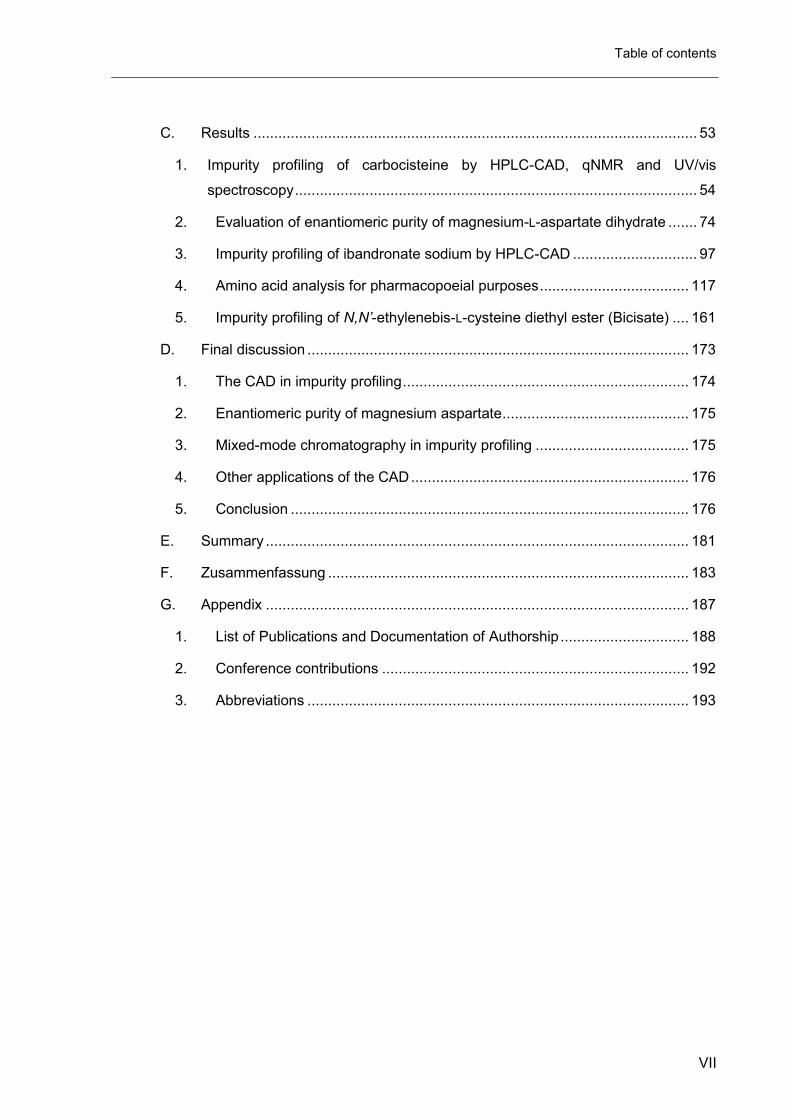
Table of contents
VII
C. Results ........................................................................................................... 53
1. Impurity profiling of carbocisteine by HPLC-CAD, qNMR and UV/vis
spectroscopy ................................................................................................. 54
2. Evaluation of enantiomeric purity of magnesium-L-aspartate dihydrate ....... 74
3. Impurity profiling of ibandronate sodium by HPLC-CAD .............................. 97
4. Amino acid analysis for pharmacopoeial purposes .................................... 117
5. Impurity profiling of N,N’-ethylenebis-L-cysteine diethyl ester (Bicisate) .... 161
D. Final discussion ............................................................................................ 173
1. The CAD in impurity profiling ..................................................................... 174
2. Enantiomeric purity of magnesium aspartate ............................................. 175
3. Mixed-mode chromatography in impurity profiling ..................................... 175
4. Other applications of the CAD ................................................................... 176
5. Conclusion ................................................................................................ 176
E. Summary ...................................................................................................... 181
F. Zusammenfassung ....................................................................................... 183
G. Appendix ...................................................................................................... 187
1. List of Publications and Documentation of Authorship ............................... 188
2. Conference contributions .......................................................................... 192
3. Abbreviations ............................................................................................ 193


1
A
A. Introduction
Introduction
2
1. Separation techniques in impurity profiling
The three most important separation techniques used in the European
Pharmacopoeia for the assessment of related substances are high performance liquid
chromatography, gas chromatography and capillary electrophoresis. The techniques used in
this work, HPLC and CE, are introduced in the following part.
1.1. High performance liquid chromatography
Chromatography is a process of separation using adsorption and distribution
processes between a stationary and a mobile phase moving along the stationary phase. In
HPLC, the mobile phase is pumped with moderately high pressure (typically 50 – 350 bar)
through a steel column packed with small uniform beads or irregular formed particles of
stationary phase. The analytes are detected after the column using a suitable detection
device. A chromatogram based on the analog data provided by the detector is yielded by
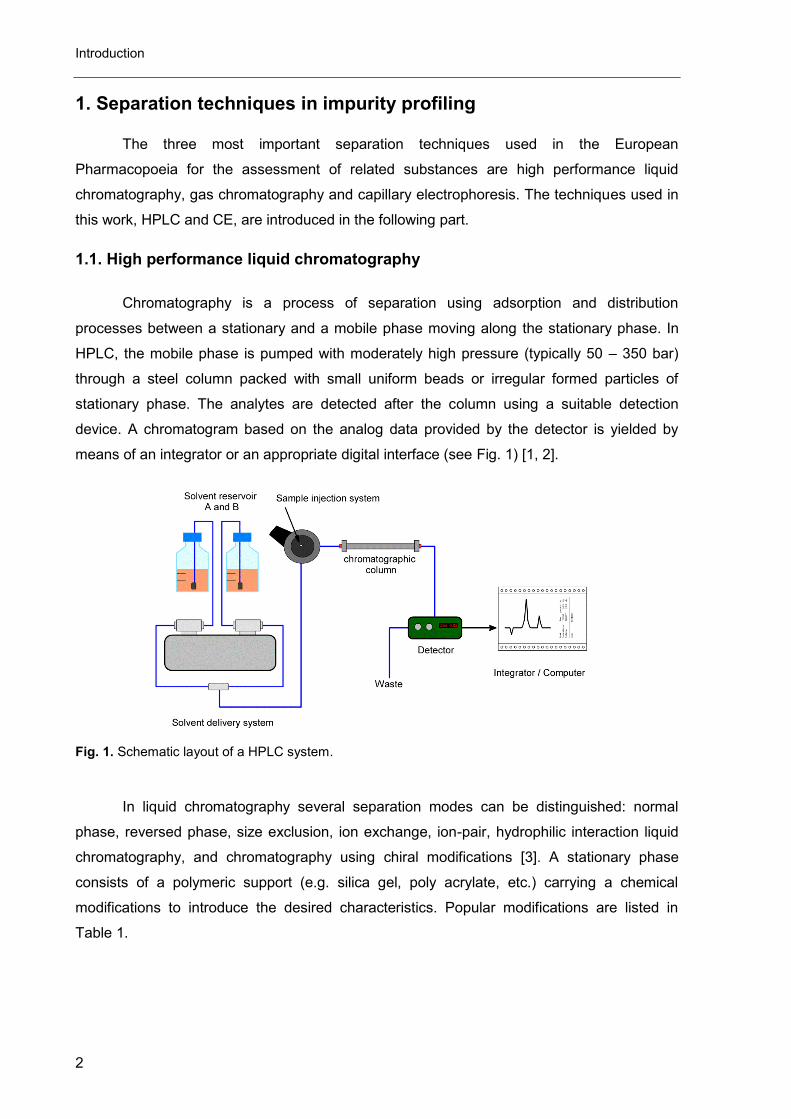
means of an integrator or an appropriate digital interface (see Fig. 1) [1, 2].
Fig. 1. Schematic layout of a HPLC system.
In liquid chromatography several separation modes can be distinguished: normal
phase, reversed phase, size exclusion, ion exchange, ion-pair, hydrophilic interaction liquid
chromatography, and chromatography using chiral modifications [3]. A stationary phase
consists of a polymeric support (e.g. silica gel, poly acrylate, etc.) carrying a chemical
modifications to introduce the desired characteristics. Popular modifications are listed in
Table 1.
Separation techniques in impurity profiling
3
Table 1 Types of stationary phases applied in HPLC analytics [1, 2, 4].
Chemistry separation mode main application
C-1 reversed phase large biomolecules
C-4 reversed phase
C-8 reversed phase very lipophilic SM, peptides
C-18 reversed phase lipophilic SM, small peptides
Phenyl reversed phase alternative to C-18 with modified selectivity PFP reversed phase
CN reversed phase or NP hydrophilic SM
Diol HILIC very hydrophilic SM
Amide HILIC very hydrophilic SM
plain silica gel HILIC or NP very hydrophilic SM
NH2 HILIC or WAX very hydrophilic SM, carbohydrates
sulfonate SCX cationic SM, inorganic cations
quaternary amine SAX anionic SM, inorganic anions
methacrylate gel size exclusion large biomolecules, polymers
HILIC, hydrophilic interaction liquid chromatography; NP, normal phase; SAX, strong anion exchange; SCX, strong cation exchange; SM, small molecules
Today, most of the separations described in the Ph. Eur. [4] for the determination of
related substances are based on reversed phase chromatography. The stationary phase is
chemically modified silica gel with a more or less hydrophobic group at the surface of the
particles. Mobile phases are usually a mixture of water or aqueous buffer and acetonitrile,
tetrahydrofuran or methanol as organic modifier. The selectivity of the separation can be
adjusted by the type of stationary phase, column temperature, the choice and proportion of
organic modifier, buffer type, buffer concentration and pH [2].
The composition of the mobile phase has to consider both the separation and the
applied detection principle. For instance the UV cutoff of a solvent or buffer salt has to be
considered in UV detection and the volatility of the mobile phase is an issue when using LC-
MS or other techniques that involve the evaporation of the mobile phase (e.g. CAD, ELSD,
NQAD). Common mobile phase additives are summarized in Table 2 and Table 3. Selected
physical properties of organic modifier common in HPLC analysis are displayed in Table 4.
The most common detection technique applied in the Ph. Eur. is UV detection because it is
straightforward and applicable for most of the monographed substances.
Introduction
4
Table 2 Selection of buffer salts used in HPLC and their properties [2].
Buffer usable range volatile UV cutoffa
dihydrogen phosphate 1.1 – 3.1 no < 200nm
hydrogen phosphate 6.2 – 8.2 no < 200 nm
phosphate 11.3 – 13.3 no < 200 nm
dihydrogen citrate 2.1 – 4.1 no 230 nm (10 mM)
hydrogen citrate 3.7 – 5.7 no 230 nm (10 mM)
citrate 5.4 – 7.4 no 230 nm (10 mM)
acetate 3.8 – 5.8 yesb 210 nm (10 mM)
formate 2.7 – 4.7 yesb 210 nm (10 mM)
bicarbonate 5.1 – 7.1 yesb < 200 nm
borate 8.3 – 10.3 yesb -
a Wavelength at which aqueous solution absorbs > 0.5 AU;
b only volatile when used as ammonium salt
Table 3 Selection of acids and bases used in HPLC and their properties [2].
pKa (25 °C) compound volatile UV cutoffa
0.3 trifluoroacetic acid yes 210 nm (0.1%)
2.15, 7.20 and 12.33 phosphoric acid no < 200 nm
3.13, 4.76 and 6.40 citric acid no 230 nm (10 mM)
3.75 formic acid yes 210 nm (0.1%)
4.76 acetic acid yes 210 nm (0.1%)
4.76 citric acid no 230 nm (10 mM)
4.86 propionic acid yes 210 nm (0.1%)
6.10 carbonic acid yes < 200 nm
9.23 boric acid yes -
9.25 ammonia yes 200 nm (10 mM)
10.72 triethylamine yes 200 nm (10 mM)
11.27 pyrrolidine yes - a Wavelength at which aqueous solution absorbs > 0.5 AU
Table 4 Selection of mobile phase components used in HPLC and their properties [2].
solvent separation mode polarity index dielectric constant UV cutoff
a
Water RP 10.2 80 -
Acetonitrile RP or HILIC 5.8 37.5 < 190 nm
Methanol RP or HILIC 5.1 32.7 205 nm
THF RP or NP 4.0 7.6 212 nmb
Acetone RP or NP 5.1 20.7 330 nm
Ethanol RP or NP 4.3 24.6 210 nm
Isopropanol RP or NP 3.9 19.9 205 nm
Hexane NP 0.1 1.9 195 nm
Methylene chloride NP 3.1 8.9 233 nm
Ethyl acetate NP 4.4 6.0 256 nm a wavelength at which solvent absorbs 1.0 AU;
b without stabilizer, with stabilizer (e.g. BHT) only usable with RID
Separation techniques in impurity profiling
5
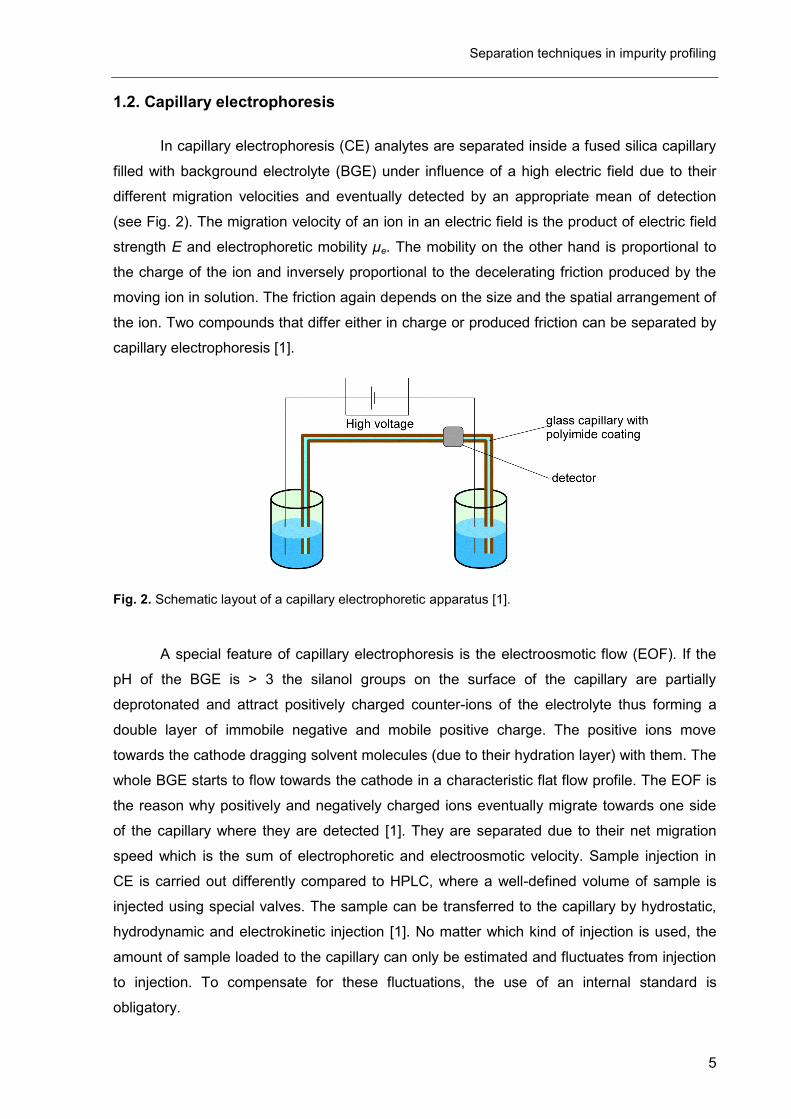
1.2. Capillary electrophoresis
In capillary electrophoresis (CE) analytes are separated inside a fused silica capillary
filled with background electrolyte (BGE) under influence of a high electric field due to their
different migration velocities and eventually detected by an appropriate mean of detection
(see Fig. 2). The migration velocity of an ion in an electric field is the product of electric field
strength E and electrophoretic mobility µe. The mobility on the other hand is proportional to
the charge of the ion and inversely proportional to the decelerating friction produced by the
moving ion in solution. The friction again depends on the size and the spatial arrangement of
the ion. Two compounds that differ either in charge or produced friction can be separated by
capillary electrophoresis [1].
Fig. 2. Schematic layout of a capillary electrophoretic apparatus [1].
A special feature of capillary electrophoresis is the electroosmotic flow (EOF). If the
pH of the BGE is > 3 the silanol groups on the surface of the capillary are partially
deprotonated and attract positively charged counter-ions of the electrolyte thus forming a
double layer of immobile negative and mobile positive charge. The positive ions move
towards the cathode dragging solvent molecules (due to their hydration layer) with them. The
whole BGE starts to flow towards the cathode in a characteristic flat flow profile. The EOF is
the reason why positively and negatively charged ions eventually migrate towards one side
of the capillary where they are detected [1]. They are separated due to their net migration
speed which is the sum of electrophoretic and electroosmotic velocity. Sample injection in
CE is carried out differently compared to HPLC, where a well-defined volume of sample is
injected using special valves. The sample can be transferred to the capillary by hydrostatic,
hydrodynamic and electrokinetic injection [1]. No matter which kind of injection is used, the
amount of sample loaded to the capillary can only be estimated and fluctuates from injection
to injection. To compensate for these fluctuations, the use of an internal standard is
obligatory.
Introduction
6
The main advantages of CE are the extremely high separation efficiency of about 20-
to 100-times the usual plate count obtained in HPLC, easy separation of ionic species,
comparatively cheap and straightforward optical resolution of small molecules using
cyclodextrins or other modifiers in the BGE. A very small sample volume needed (usually
only a few nL) and CE is a versatile tool due to the different applications such as MEKC and
MEEKC enabling the separation of neutral species [1].
1.3. Amino acid analysis
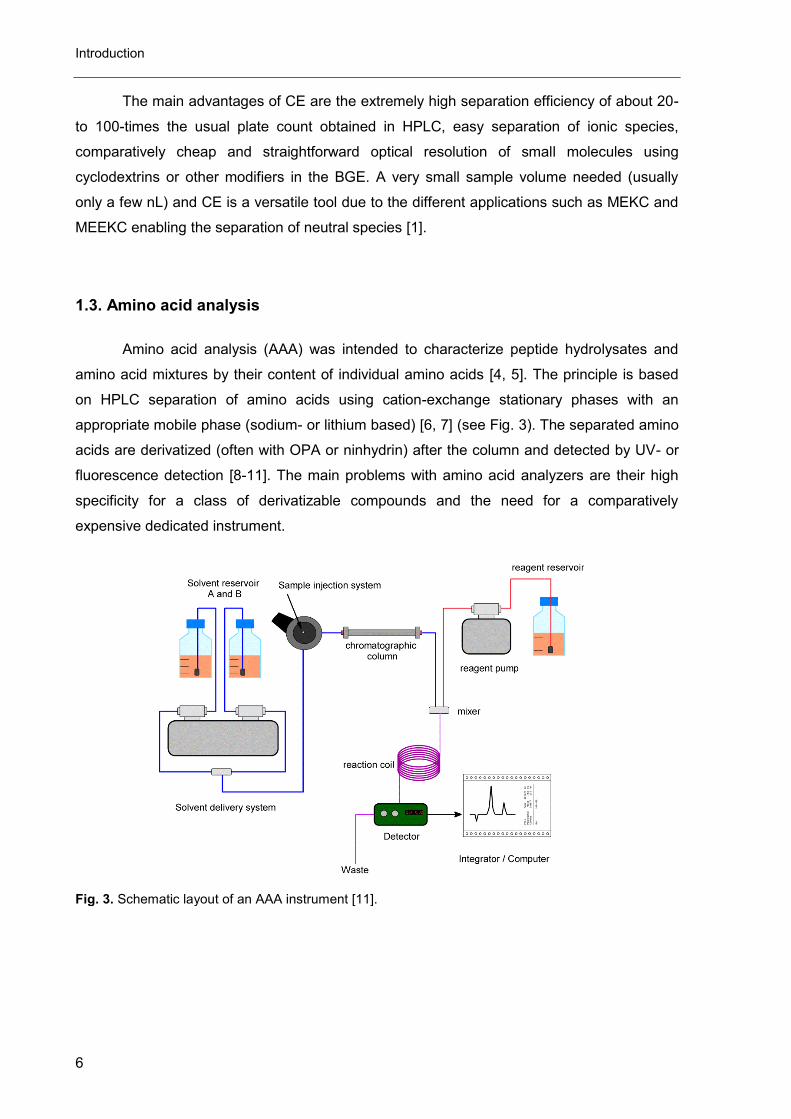
Amino acid analysis (AAA) was intended to characterize peptide hydrolysates and
amino acid mixtures by their content of individual amino acids [4, 5]. The principle is based
on HPLC separation of amino acids using cation-exchange stationary phases with an
appropriate mobile phase (sodium- or lithium based) [6, 7] (see Fig. 3). The separated amino
acids are derivatized (often with OPA or ninhydrin) after the column and detected by UV- or
fluorescence detection [8-11]. The main problems with amino acid analyzers are their high
specificity for a class of derivatizable compounds and the need for a comparatively
expensive dedicated instrument.
Fig. 3. Schematic layout of an AAA instrument [11].
Detectors used in HPLC and CE
7
2. Detectors used in HPLC and CE
With a few exceptions HPLC and CE use the same detection principles. The main
difference for most detectors is the location of detection: In CE the detection usually takes
place inside of the system (capillary) whereas in HPLC analytics the column eluate is
analyzed outside. This is very important when using concentration sensitive detectors
because the peak area is strongly dependent on the dwell time in the detector. To
compensate for different migration speed and therefore detector dwell time, the corrected
peak area (peak area divided by migration time) is usually used in CE.
2.1. UV/Vis-Detector
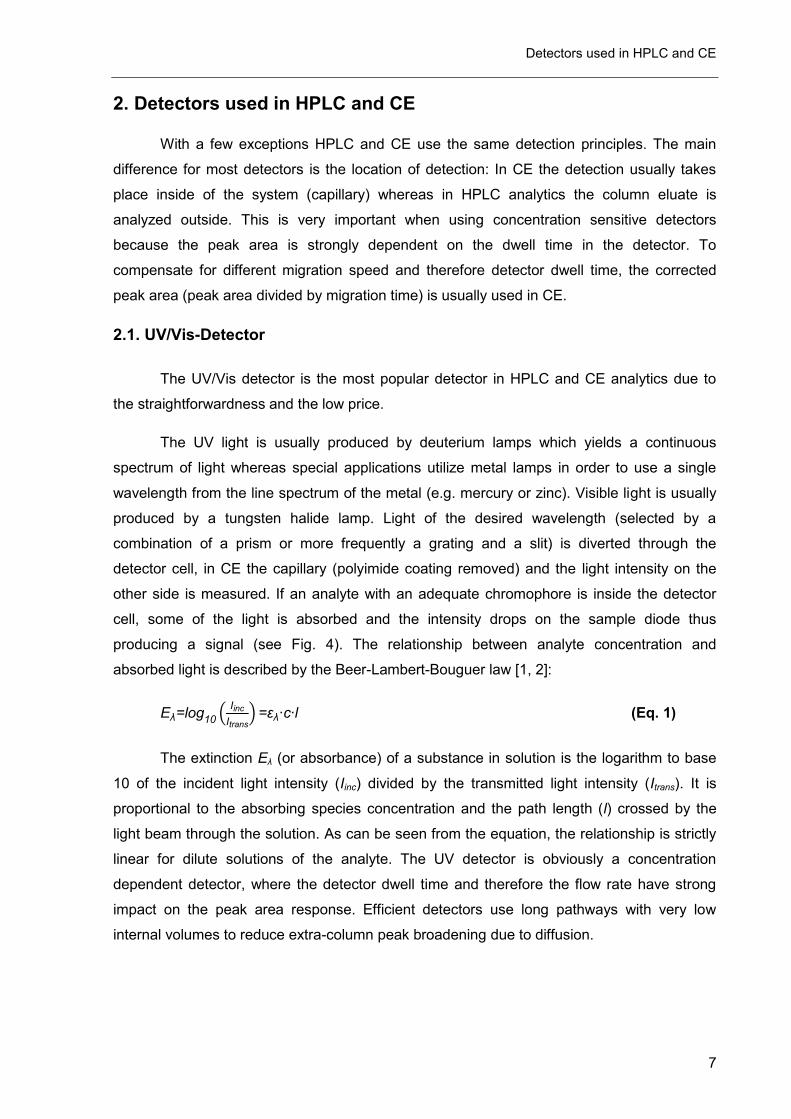
The UV/Vis detector is the most popular detector in HPLC and CE analytics due to
the straightforwardness and the low price.
The UV light is usually produced by deuterium lamps which yields a continuous
spectrum of light whereas special applications utilize metal lamps in order to use a single
wavelength from the line spectrum of the metal (e.g. mercury or zinc). Visible light is usually
produced by a tungsten halide lamp. Light of the desired wavelength (selected by a
combination of a prism or more frequently a grating and a slit) is diverted through the
detector cell, in CE the capillary (polyimide coating removed) and the light intensity on the
other side is measured. If an analyte with an adequate chromophore is inside the detector
cell, some of the light is absorbed and the intensity drops on the sample diode thus
producing a signal (see Fig. 4). The relationship between analyte concentration and
absorbed light is described by the Beer-Lambert-Bouguer law [1, 2]:
Eλ=log10
(Iinc
Itrans) =ελ∙c∙l (Eq. 1)
The extinction Eλ (or absorbance) of a substance in solution is the logarithm to base
10 of the incident light intensity (Iinc) divided by the transmitted light intensity (Itrans). It is
proportional to the absorbing species concentration and the path length (l) crossed by the
light beam through the solution. As can be seen from the equation, the relationship is strictly
linear for dilute solutions of the analyte. The UV detector is obviously a concentration
dependent detector, where the detector dwell time and therefore the flow rate have strong
impact on the peak area response. Efficient detectors use long pathways with very low
internal volumes to reduce extra-column peak broadening due to diffusion.
Introduction
8
Fig. 4. Principle of an UV/Vis detector [1, 2].
2.2. Fluorescence detection
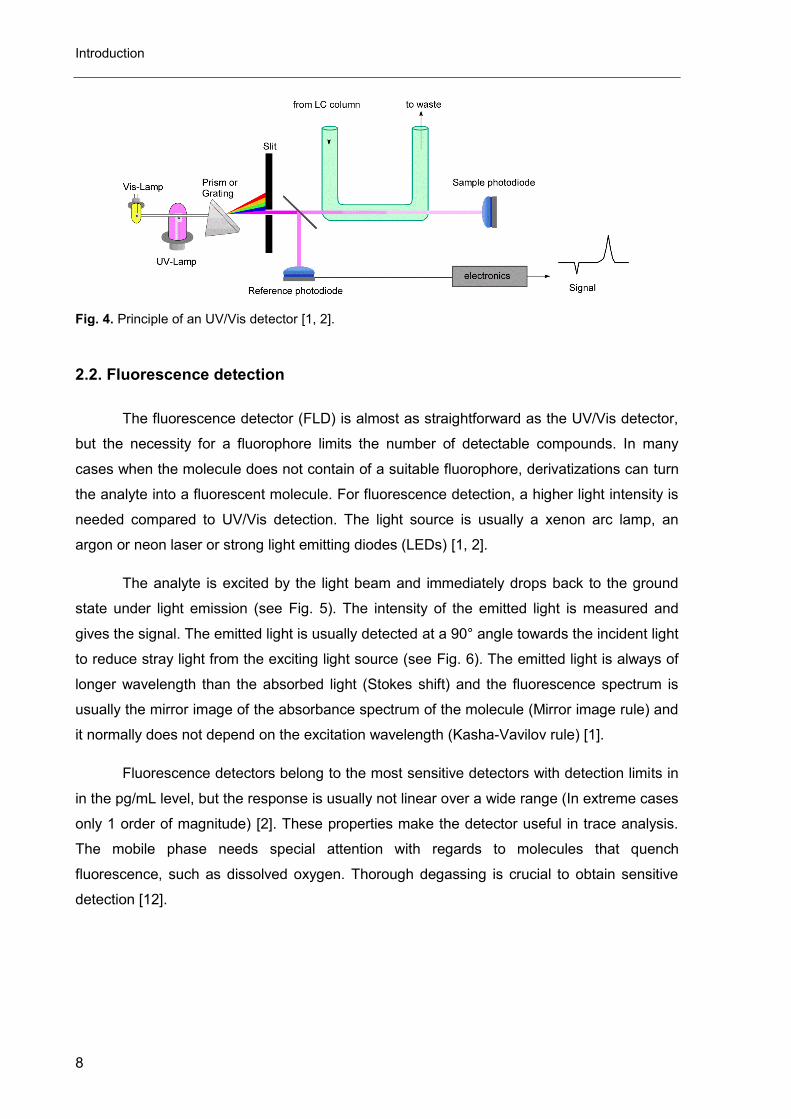
The fluorescence detector (FLD) is almost as straightforward as the UV/Vis detector,
but the necessity for a fluorophore limits the number of detectable compounds. In many
cases when the molecule does not contain of a suitable fluorophore, derivatizations can turn
the analyte into a fluorescent molecule. For fluorescence detection, a higher light intensity is
needed compared to UV/Vis detection. The light source is usually a xenon arc lamp, an
argon or neon laser or strong light emitting diodes (LEDs) [1, 2].
The analyte is excited by the light beam and immediately drops back to the ground
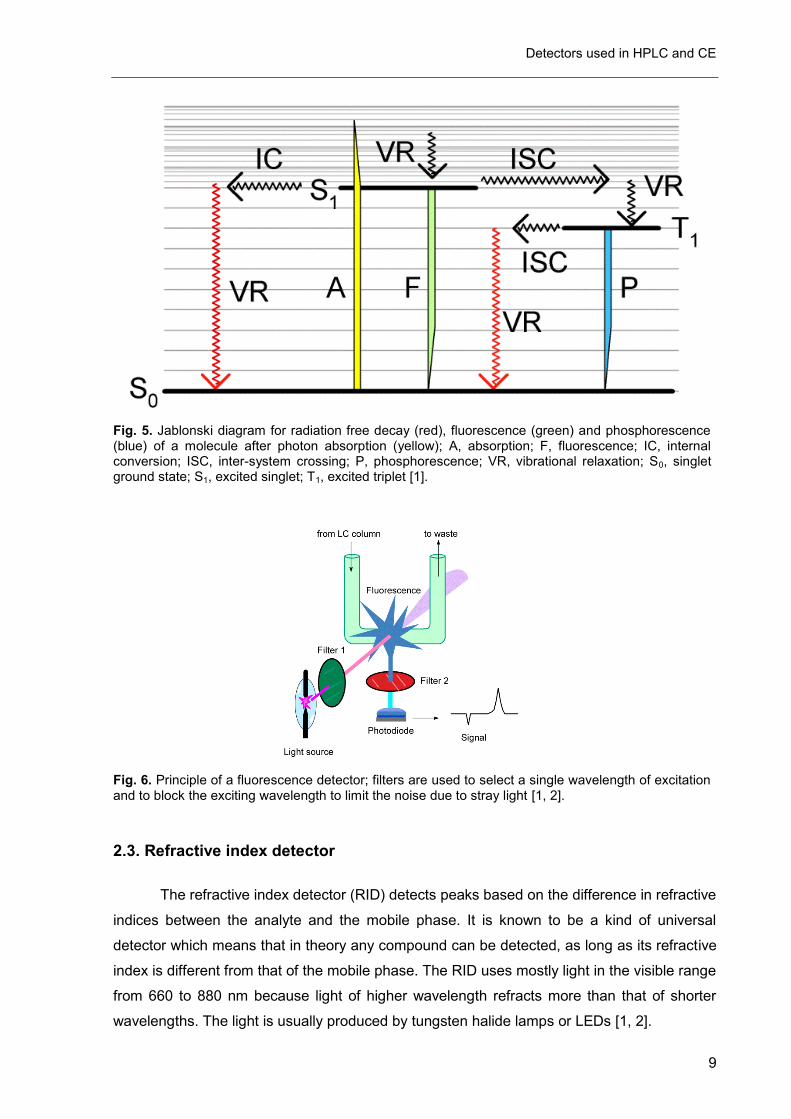
state under light emission (see Fig. 5). The intensity of the emitted light is measured and
gives the signal. The emitted light is usually detected at a 90° angle towards the incident light
to reduce stray light from the exciting light source (see Fig. 6). The emitted light is always of
longer wavelength than the absorbed light (Stokes shift) and the fluorescence spectrum is
usually the mirror image of the absorbance spectrum of the molecule (Mirror image rule) and
it normally does not depend on the excitation wavelength (Kasha-Vavilov rule) [1].
Fluorescence detectors belong to the most sensitive detectors with detection limits in
in the pg/mL level, but the response is usually not linear over a wide range (In extreme cases
only 1 order of magnitude) [2]. These properties make the detector useful in trace analysis.
The mobile phase needs special attention with regards to molecules that quench
fluorescence, such as dissolved oxygen. Thorough degassing is crucial to obtain sensitive
detection [12].
Detectors used in HPLC and CE
9
Fig. 5. Jablonski diagram for radiation free decay (red), fluorescence (green) and phosphorescence (blue) of a molecule after photon absorption (yellow); A, absorption; F, fluorescence; IC, internal conversion; ISC, inter-system crossing; P, phosphorescence; VR, vibrational relaxation; S0, singlet ground state; S1, excited singlet; T1, excited triplet [1].
Fig. 6. Principle of a fluorescence detector; filters are used to select a single wavelength of excitation and to block the exciting wavelength to limit the noise due to stray light [1, 2].
2.3. Refractive index detector
The refractive index detector (RID) detects peaks based on the difference in refractive
indices between the analyte and the mobile phase. It is known to be a kind of universal
detector which means that in theory any compound can be detected, as long as its refractive
index is different from that of the mobile phase. The RID uses mostly light in the visible range
from 660 to 880 nm because light of higher wavelength refracts more than that of shorter
wavelengths. The light is usually produced by tungsten halide lamps or LEDs [1, 2].
Introduction
10
A beam of light refracts when it passes from one medium into another. The
relationship between angle of incidence and the angle of refraction is expressed in Snell’s
Law of refraction [1, 2]:
n= n2
n1=
sin α1
sin α2 (Eq. 2)
where:
n = Refractive index of medium 1 relative to medium 2
n2 = Refractive index of medium 2
n1 = Refractive index of medium 1
α1 = Angle of incident light in medium 1
α2 = Angle of refraction in medium 2
For small angles of external deflection (γ), the difference between the refractive indices of
medium 1 and medium 2 is proportional to the angle of external deflection according to:
tan γ= n1-n2
n1 (Eq. 3)
The refractive index is affected by the wavelength of the light source and the optical
density. The density however depends on the composition, the temperature and the
pressure. A substance eluting from the column will change the composition and therefore
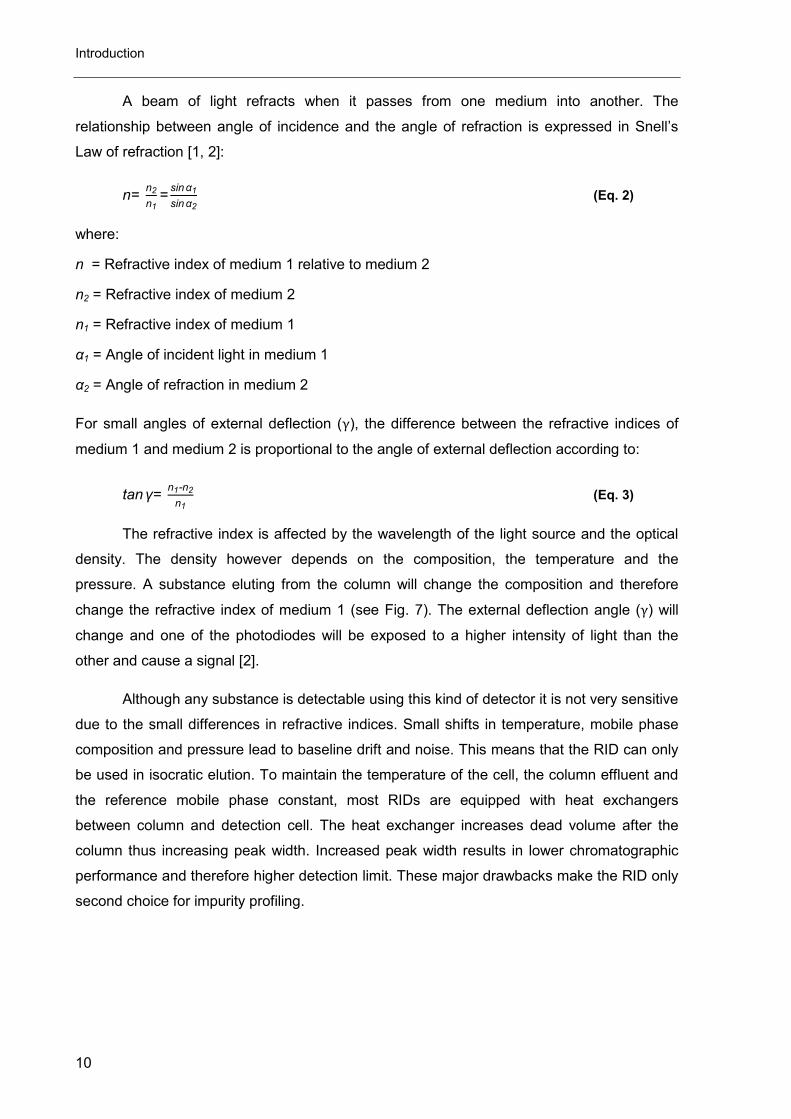
change the refractive index of medium 1 (see Fig. 7). The external deflection angle (γ) will
change and one of the photodiodes will be exposed to a higher intensity of light than the
other and cause a signal [2].
Although any substance is detectable using this kind of detector it is not very sensitive
due to the small differences in refractive indices. Small shifts in temperature, mobile phase
composition and pressure lead to baseline drift and noise. This means that the RID can only
be used in isocratic elution. To maintain the temperature of the cell, the column effluent and
the reference mobile phase constant, most RIDs are equipped with heat exchangers
between column and detection cell. The heat exchanger increases dead volume after the
column thus increasing peak width. Increased peak width results in lower chromatographic
performance and therefore higher detection limit. These major drawbacks make the RID only
second choice for impurity profiling.
Detectors used in HPLC and CE
11
Fig. 7. Principle of a refractive index detector [2].
2.4. Evaporative light scattering detector
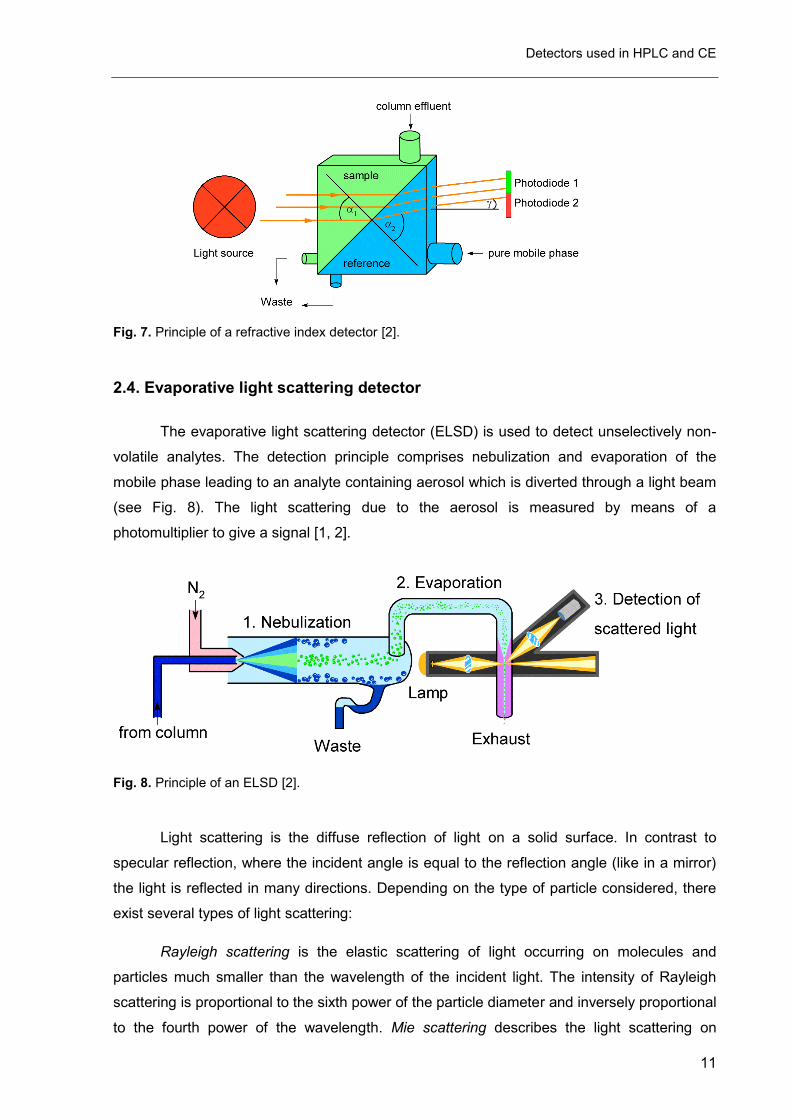
The evaporative light scattering detector (ELSD) is used to detect unselectively non-
volatile analytes. The detection principle comprises nebulization and evaporation of the
mobile phase leading to an analyte containing aerosol which is diverted through a light beam
(see Fig. 8). The light scattering due to the aerosol is measured by means of a
photomultiplier to give a signal [1, 2].
Fig. 8. Principle of an ELSD [2].
Light scattering is the diffuse reflection of light on a solid surface. In contrast to
specular reflection, where the incident angle is equal to the reflection angle (like in a mirror)
the light is reflected in many directions. Depending on the type of particle considered, there
exist several types of light scattering:
Rayleigh scattering is the elastic scattering of light occurring on molecules and
particles much smaller than the wavelength of the incident light. The intensity of Rayleigh
scattering is proportional to the sixth power of the particle diameter and inversely proportional
to the fourth power of the wavelength. Mie scattering describes the light scattering on
Introduction
12
spherical particles if the particle size is in between 0.1 to 1.0 times λ. The intensity is not
strongly dependent on the wavelength and it is proportional to the fourth power of the particle
diameter. If the particle diameter is much bigger than the applied wavelength refraction-
reflection scattering occurs. The scattered light is proportional to the second power of the
particle diameter. Tyndall scattering is basically the same type of scattering as Mie
scattering, without the limitation to spherical particles. Brillouin scattering is a type of inelastic
scattering in liquids and solids. Inelastic means that the wavelength of scattered light differs
from the wavelength of the incident light. The incoming light interacts with so-called acoustic
phonons. These phonons correspond to vibrations of the lattice or elastic waves in liquids.
Another type of inelastic scattering is Raman scattering where the light creates or annihilates
intra-molecular vibrations and rotations, so-called optical phonons [13].
As a peak elutes from the column, the analyte concentration and therefore mean
particle diameter in the detector increases from near-zero to a maximum and returns to near-
zero. Since the particle diameter determines the type of light scattering, it is possible that
three types of scattering occur if the concentration of the analyte is sufficiently high:
Rayleigh, Mie and reflection-refraction scattering. Because the intensity of scattered light is
strongly related to the particle diameter and it is different for all three types of light scattering
the response can never be strictly linear over a broad range of concentration [13].
Nevertheless wide concentration ranges can be covered by using quadratic fit or log-log
responses. Other types of light scattering (see above) can occur, but usually with a much
lower intensity, so that their contribution to the total intensity could be neglected.
The light sources used in ELSD are usually LEDs, tungsten halide lamps, or laser
light sources producing visible light. Because Raleigh scattering intensity is highly dependent
on the wavelength, changes in sensitivity have to be considered when a method is
transferred to another version of ELSD (with another light source) [14].
2.5. Condensation nucleation light scattering detector
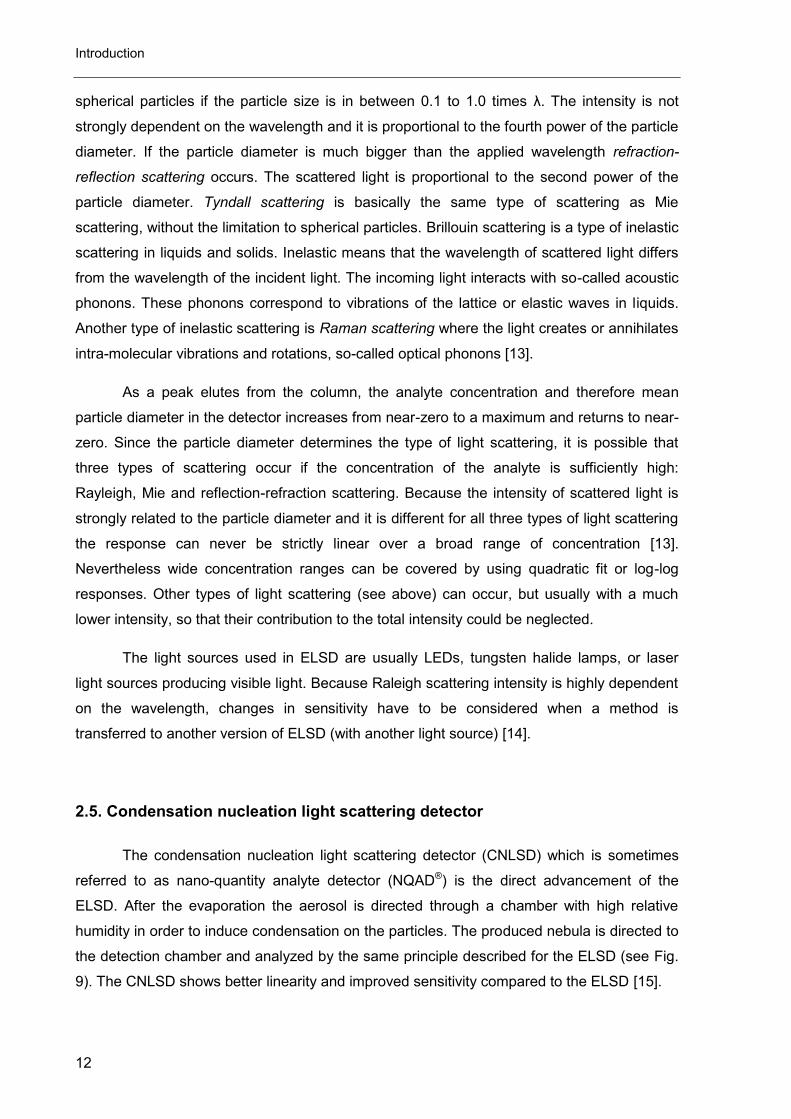
The condensation nucleation light scattering detector (CNLSD) which is sometimes
referred to as nano-quantity analyte detector (NQAD®) is the direct advancement of the
ELSD. After the evaporation the aerosol is directed through a chamber with high relative
humidity in order to induce condensation on the particles. The produced nebula is directed to
the detection chamber and analyzed by the same principle described for the ELSD (see Fig.
9). The CNLSD shows better linearity and improved sensitivity compared to the ELSD [15].
Detectors used in HPLC and CE
13
Fig. 9. Principle of the CNLSD [15]
2.6. Corona charged aerosol detector
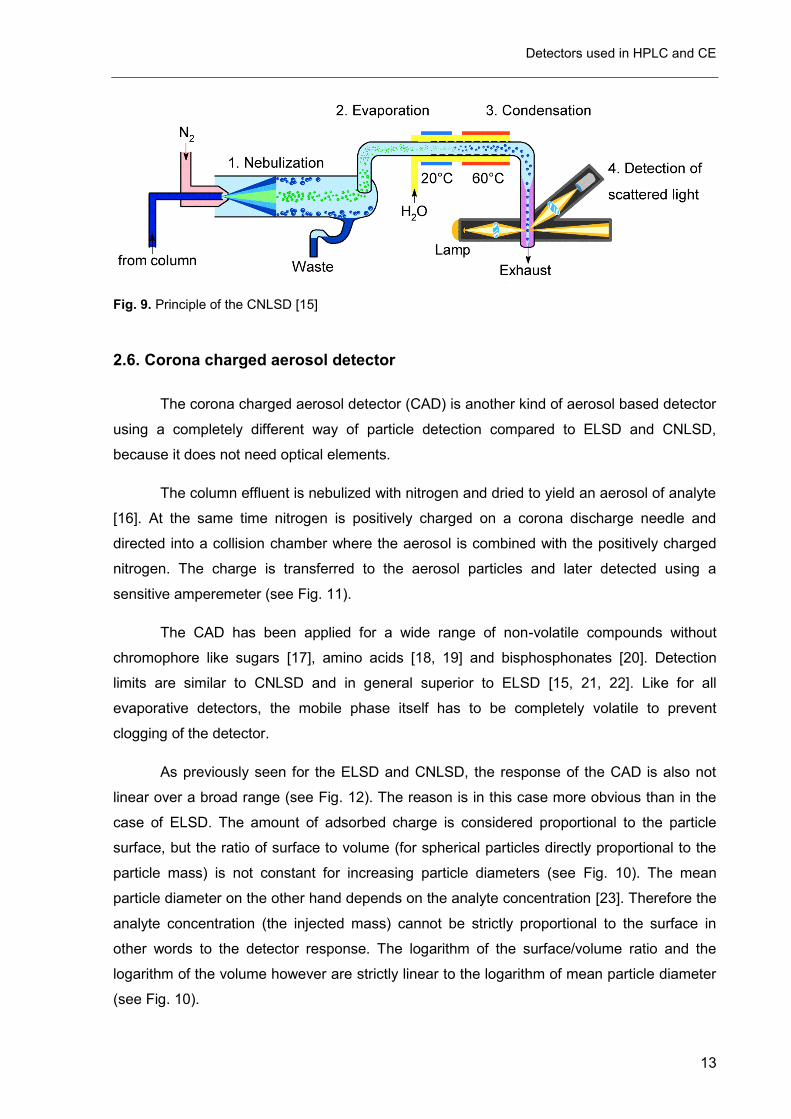
The corona charged aerosol detector (CAD) is another kind of aerosol based detector
using a completely different way of particle detection compared to ELSD and CNLSD,
because it does not need optical elements.
The column effluent is nebulized with nitrogen and dried to yield an aerosol of analyte
[16]. At the same time nitrogen is positively charged on a corona discharge needle and
directed into a collision chamber where the aerosol is combined with the positively charged
nitrogen. The charge is transferred to the aerosol particles and later detected using a
sensitive amperemeter (see Fig. 11).
The CAD has been applied for a wide range of non-volatile compounds without
chromophore like sugars [17], amino acids [18, 19] and bisphosphonates [20]. Detection
limits are similar to CNLSD and in general superior to ELSD [15, 21, 22]. Like for all
evaporative detectors, the mobile phase itself has to be completely volatile to prevent
clogging of the detector.
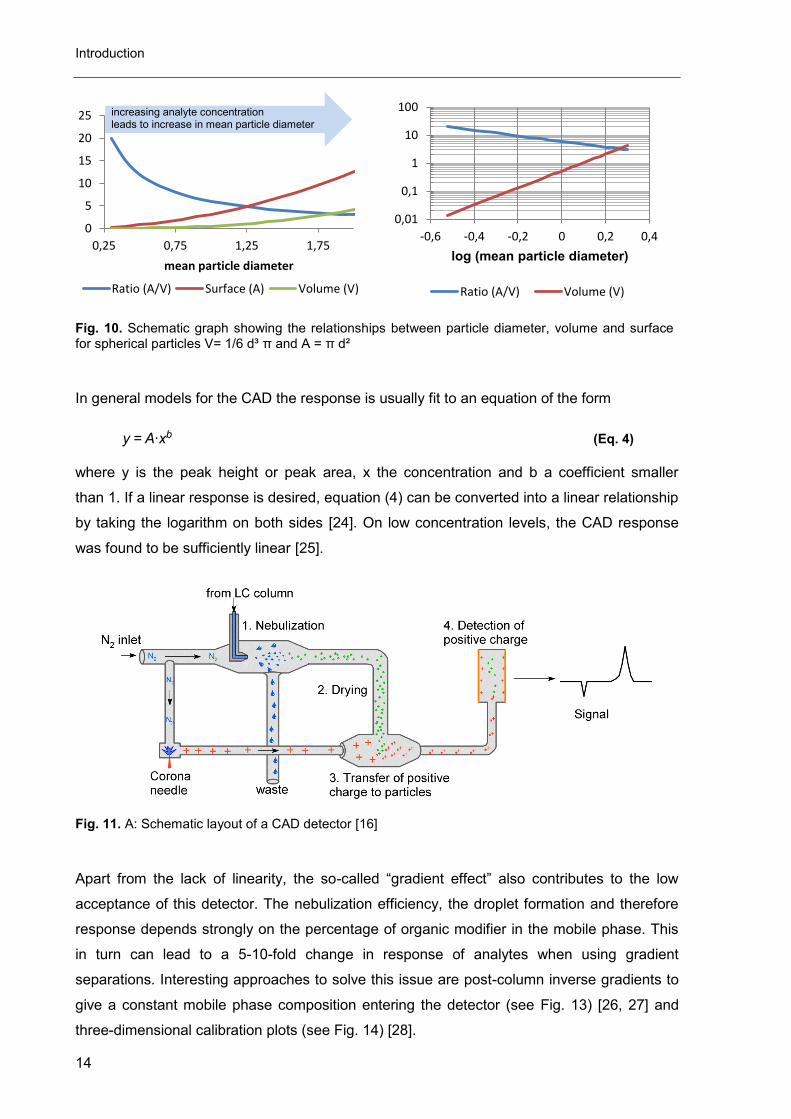
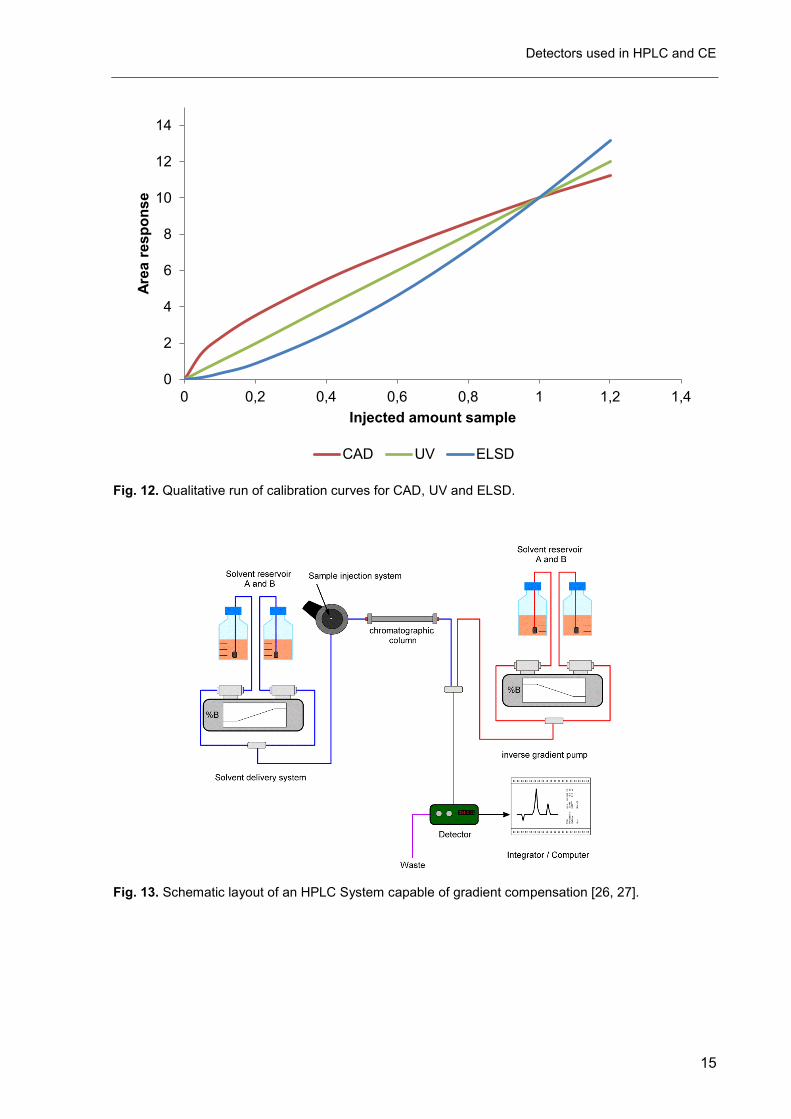
As previously seen for the ELSD and CNLSD, the response of the CAD is also not
linear over a broad range (see Fig. 12). The reason is in this case more obvious than in the
case of ELSD. The amount of adsorbed charge is considered proportional to the particle
surface, but the ratio of surface to volume (for spherical particles directly proportional to the
particle mass) is not constant for increasing particle diameters (see Fig. 10). The mean
particle diameter on the other hand depends on the analyte concentration [23]. Therefore the
analyte concentration (the injected mass) cannot be strictly proportional to the surface in
other words to the detector response. The logarithm of the surface/volume ratio and the
logarithm of the volume however are strictly linear to the logarithm of mean particle diameter
(see Fig. 10).
Introduction
14
Fig. 10. Schematic graph showing the relationships between particle diameter, volume and surface for spherical particles V= 1/6 d³ π and A = π d²
In general models for the CAD the response is usually fit to an equation of the form
y = A∙xb (Eq. 4)
where y is the peak height or peak area, x the concentration and b a coefficient smaller
than 1. If a linear response is desired, equation (4) can be converted into a linear relationship
by taking the logarithm on both sides [24]. On low concentration levels, the CAD response
was found to be sufficiently linear [25].
Fig. 11. A: Schematic layout of a CAD detector [16]
Apart from the lack of linearity, the so-called “gradient effect” also contributes to the low
acceptance of this detector. The nebulization efficiency, the droplet formation and therefore
response depends strongly on the percentage of organic modifier in the mobile phase. This
in turn can lead to a 5-10-fold change in response of analytes when using gradient
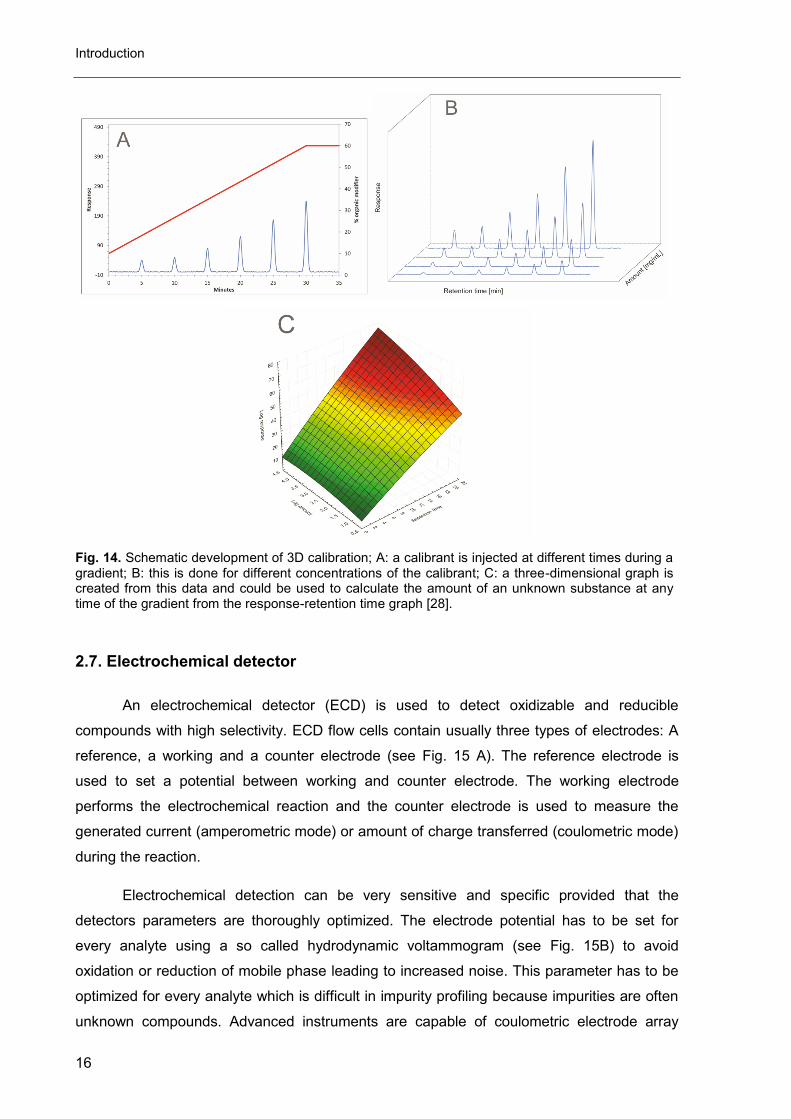
separations. Interesting approaches to solve this issue are post-column inverse gradients to
give a constant mobile phase composition entering the detector (see Fig. 13) [26, 27] and
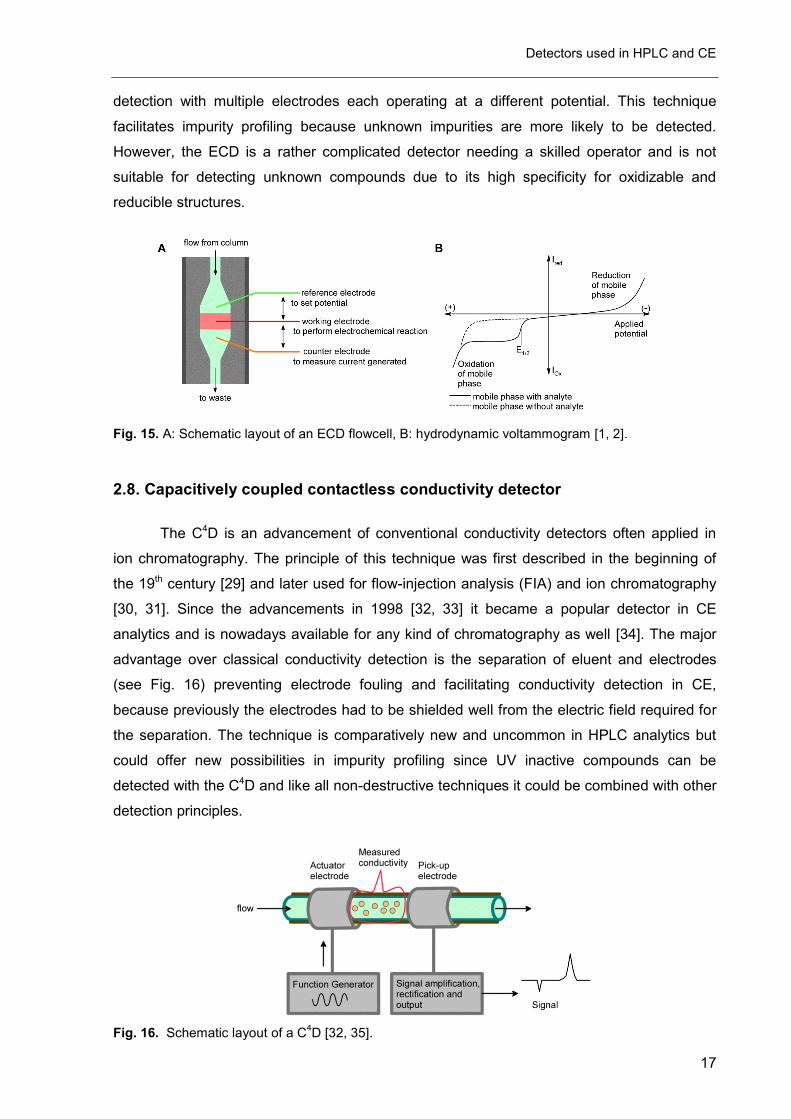
three-dimensional calibration plots (see Fig. 14) [28].
0
5
10
15
20
25
0,25 0,75 1,25 1,75
mean particle diameter
Ratio (A/V) Surface (A) Volume (V)
0,01
0,1
1
10
100
-0,6 -0,4 -0,2 0 0,2 0,4
log (mean particle diameter)
Ratio (A/V) Volume (V)
increasing analyte concentration leads to increase in mean particle diameter
Detectors used in HPLC and CE
15
Fig. 12. Qualitative run of calibration curves for CAD, UV and ELSD.
Fig. 13. Schematic layout of an HPLC System capable of gradient compensation [26, 27].
0
2
4
6
8
10
12
14
0 0,2 0,4 0,6 0,8 1 1,2 1,4
Are
a r
es
po
ns
e
Injected amount sample
CAD UV ELSD
Introduction
16
Fig. 14. Schematic development of 3D calibration; A: a calibrant is injected at different times during a gradient; B: this is done for different concentrations of the calibrant; C: a three-dimensional graph is created from this data and could be used to calculate the amount of an unknown substance at any time of the gradient from the response-retention time graph [28].
2.7. Electrochemical detector
An electrochemical detector (ECD) is used to detect oxidizable and reducible
compounds with high selectivity. ECD flow cells contain usually three types of electrodes: A
reference, a working and a counter electrode (see Fig. 15 A). The reference electrode is
used to set a potential between working and counter electrode. The working electrode
performs the electrochemical reaction and the counter electrode is used to measure the
generated current (amperometric mode) or amount of charge transferred (coulometric mode)
during the reaction.
Electrochemical detection can be very sensitive and specific provided that the
detectors parameters are thoroughly optimized. The electrode potential has to be set for
every analyte using a so called hydrodynamic voltammogram (see Fig. 15B) to avoid
oxidation or reduction of mobile phase leading to increased noise. This parameter has to be
optimized for every analyte which is difficult in impurity profiling because impurities are often
unknown compounds. Advanced instruments are capable of coulometric electrode array
Detectors used in HPLC and CE
17
detection with multiple electrodes each operating at a different potential. This technique
facilitates impurity profiling because unknown impurities are more likely to be detected.
However, the ECD is a rather complicated detector needing a skilled operator and is not
suitable for detecting unknown compounds due to its high specificity for oxidizable and
reducible structures.
Fig. 15. A: Schematic layout of an ECD flowcell, B: hydrodynamic voltammogram [1, 2].
2.8. Capacitively coupled contactless conductivity detector
The C4D is an advancement of conventional conductivity detectors often applied in
ion chromatography. The principle of this technique was first described in the beginning of
the 19th century [29] and later used for flow-injection analysis (FIA) and ion chromatography
[30, 31]. Since the advancements in 1998 [32, 33] it became a popular detector in CE
analytics and is nowadays available for any kind of chromatography as well [34]. The major
advantage over classical conductivity detection is the separation of eluent and electrodes
(see Fig. 16) preventing electrode fouling and facilitating conductivity detection in CE,
because previously the electrodes had to be shielded well from the electric field required for
the separation. The technique is comparatively new and uncommon in HPLC analytics but
could offer new possibilities in impurity profiling since UV inactive compounds can be
detected with the C4D and like all non-destructive techniques it could be combined with other
detection principles.
Fig. 16. Schematic layout of a C4D [32, 35].
Introduction
18
2.9. Mass spectrometer
The combination of LC or CE and mass spectrometry is far from being simple. The
removal of the mobile phase leads to a huge amount of gaseous mobile phase, which needs
to be separated before the analytes can enter the mass spectrometer in order to maintain the
required high vacuum inside. This task is performed by the LC-MS interface which takes care
of mobile phase evaporation and analyte ion generation. Ever since suitable interfaces like
electrospray ionization (ESI), atmospheric-pressure chemical ionization (APCI) and
atmospheric-pressure photoionization (APPI) have been developed, the acceptance and
application of LC-MS techniques has grown larger and larger. It is today one of the most
powerful combinations with regards to sensitivity and selectivity. On the other hand, the
acquisition and maintenance of those instruments is rather costly, because they need
continuous high vacuum, nitrogen, and in some cases helium supply.
The aforementioned interfaces belong to so-called soft-ionization techniques. This
means that the analyte is usually not fragmented during the ionization process in contrast to
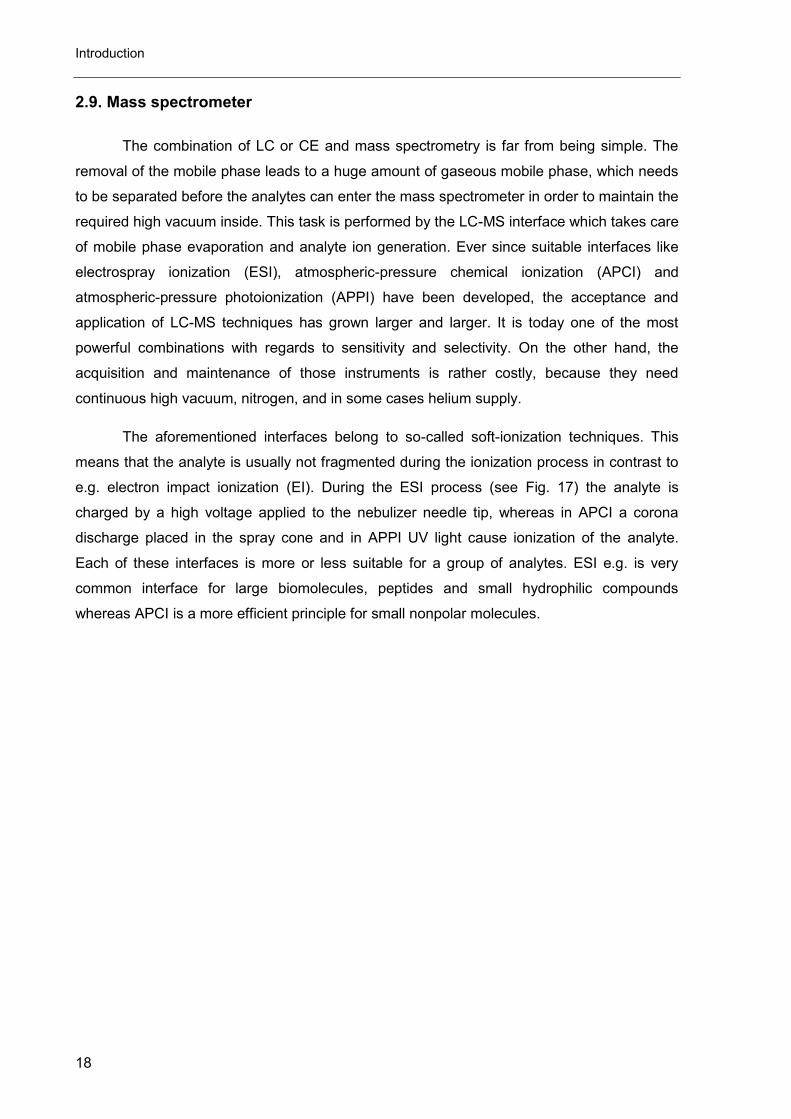
e.g. electron impact ionization (EI). During the ESI process (see Fig. 17) the analyte is
charged by a high voltage applied to the nebulizer needle tip, whereas in APCI a corona
discharge placed in the spray cone and in APPI UV light cause ionization of the analyte.
Each of these interfaces is more or less suitable for a group of analytes. ESI e.g. is very
common interface for large biomolecules, peptides and small hydrophilic compounds
whereas APCI is a more efficient principle for small nonpolar molecules.
Detectors used in HPLC and CE
19
Fig. 17. Schematic of the electrospray interface for LC-MS detection; a charge is transferred to the analytes during the nebulization process by high voltage at the end of the nebulizer needle tip; the droplets are reduced in size until the repulsion of the equally charged analyte particles leads to a sudden burst of the droplet creating smaller droplets (coulomb explosion); This process is repeated until single ions are emitted from the droplet surface and dragged through the glass capillary into the mass spectrometer [2]
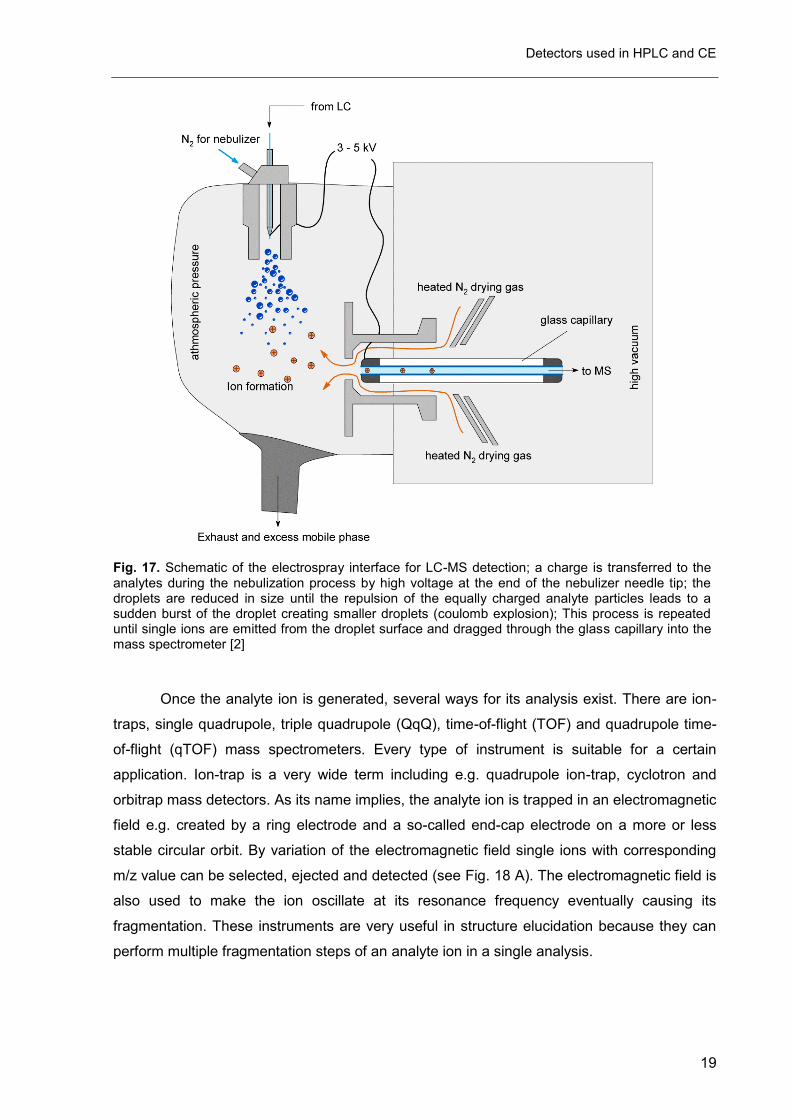
Once the analyte ion is generated, several ways for its analysis exist. There are ion-
traps, single quadrupole, triple quadrupole (QqQ), time-of-flight (TOF) and quadrupole time-
of-flight (qTOF) mass spectrometers. Every type of instrument is suitable for a certain
application. Ion-trap is a very wide term including e.g. quadrupole ion-trap, cyclotron and
orbitrap mass detectors. As its name implies, the analyte ion is trapped in an electromagnetic
field e.g. created by a ring electrode and a so-called end-cap electrode on a more or less
stable circular orbit. By variation of the electromagnetic field single ions with corresponding
m/z value can be selected, ejected and detected (see Fig. 18 A). The electromagnetic field is
also used to make the ion oscillate at its resonance frequency eventually causing its
fragmentation. These instruments are very useful in structure elucidation because they can
perform multiple fragmentation steps of an analyte ion in a single analysis.
Introduction
20
The QqQ mass spectrometer is used for quantification of trace levels in difficult
matrices with high specificity. Typical applications are therapeutic drug monitoring, doping
control, forensics and toxicology (e.g. of food and plants). The QqQ is hereby usually used in
multiple reaction monitoring (MRM) mode. The analyte ion is selected by the first quadrupole,
fragmented by collision induced dissociation in the second quadrupole and the daughter ions
are analyzed in the third quadrupole (see Fig. 18 B). Thus, the analyte is characterized by
specific transitions (qualifier transition for identification and quantifier transition for
quantification) to exclude that random matrix peaks interfere with the analysis. The use of
internal standards, usually stable isotopically tagged analyte (deuterated, preferably 13C
labelled) compensate for matrix effects and analyte loss during extraction and sample
preparation.
The coupling of CE and MS is possible but not very common, because the technique
requires a high level of know-how and routine to yield a rugged method.
Main applications of LC-MS in impurity profiling are the identification of unknown
compounds (e.g. by qTOF or ion-trap) and the sensitive and specific control of extraordinarily
toxic impurities (QqQ).
Fig. 18. Schematic of ion-trap (A) and triple quadrupole (B) mass analyzers; CID, collision induced dissociation; quad, quadrupole [2]
Detectors used in HPLC and CE
21
2.10. Chemiluminescent nitrogen detector
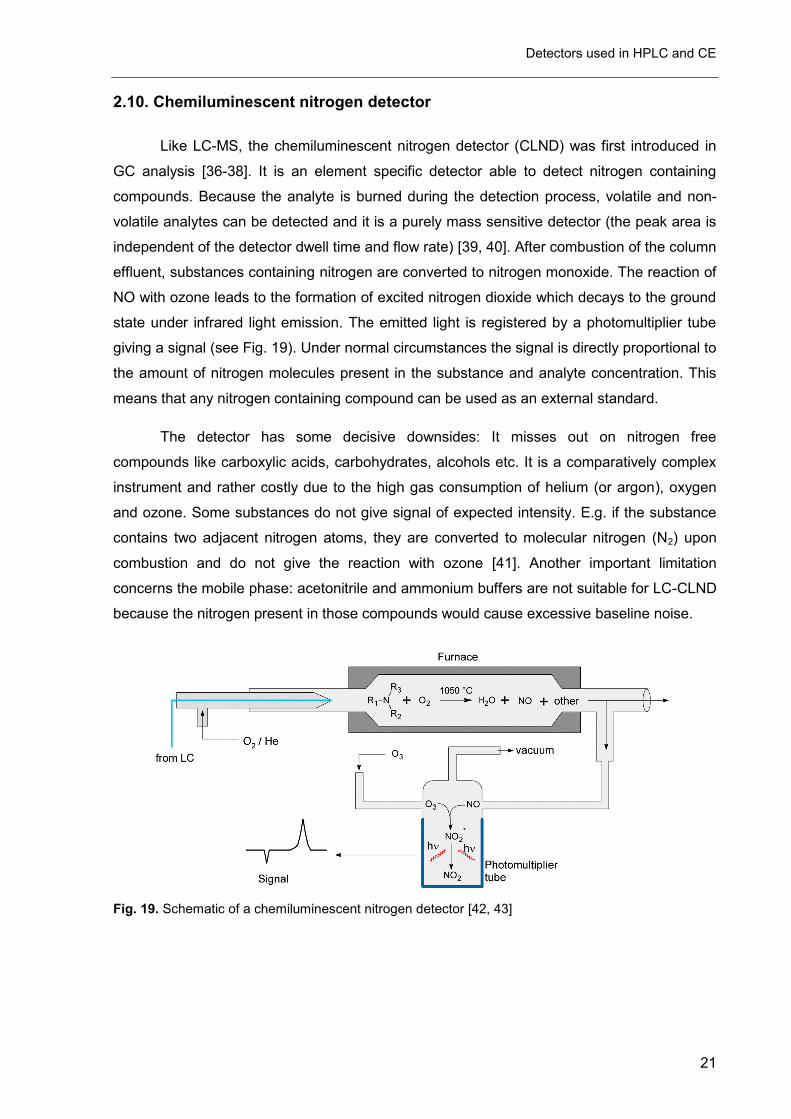
Like LC-MS, the chemiluminescent nitrogen detector (CLND) was first introduced in
GC analysis [36-38]. It is an element specific detector able to detect nitrogen containing
compounds. Because the analyte is burned during the detection process, volatile and non-
volatile analytes can be detected and it is a purely mass sensitive detector (the peak area is
independent of the detector dwell time and flow rate) [39, 40]. After combustion of the column
effluent, substances containing nitrogen are converted to nitrogen monoxide. The reaction of
NO with ozone leads to the formation of excited nitrogen dioxide which decays to the ground
state under infrared light emission. The emitted light is registered by a photomultiplier tube
giving a signal (see Fig. 19). Under normal circumstances the signal is directly proportional to
the amount of nitrogen molecules present in the substance and analyte concentration. This
means that any nitrogen containing compound can be used as an external standard.
The detector has some decisive downsides: It misses out on nitrogen free
compounds like carboxylic acids, carbohydrates, alcohols etc. It is a comparatively complex
instrument and rather costly due to the high gas consumption of helium (or argon), oxygen
and ozone. Some substances do not give signal of expected intensity. E.g. if the substance
contains two adjacent nitrogen atoms, they are converted to molecular nitrogen (N2) upon
combustion and do not give the reaction with ozone [41]. Another important limitation
concerns the mobile phase: acetonitrile and ammonium buffers are not suitable for LC-CLND
because the nitrogen present in those compounds would cause excessive baseline noise.
Fig. 19. Schematic of a chemiluminescent nitrogen detector [42, 43]
Introduction
22
3. Challenges in Impurity profiling
The purity assessment of substances monographed in the Ph. Eur. is based in large
part on HPLC separation followed by a suitable detection principle. Only a handful of
monographs rely on capillary electrophoresis to determine related substances.
When it comes to impurity profiling using HPLC, analytes can impose several
challenges: The most common detection principle is UV/vis absorbance detection, which is
suitable for the greater part of analytes. On the other hand substances lacking a suitable
chromophore are difficult to detect by this technique. Many of these compounds have
structures also that make them difficult to separate on conventional reversed phase HPLC
columns because of high hydrophilicity and/or because of their ionic character. The
quantification of unknown impurities by UV detection is another important aspect. If
unidentified compounds with unknown response factors are quantified using an external
standard the concerned impurity might be highly over- or underestimated.
3.1. Strategies to overcome the separation issue
There are several approaches to address challenging separations. In HPLC analytics
these approaches conclude the variation of mobile phase composition (pH, organic modifier,
buffer salt type and concentration) and the change of the stationary phase. In cases where
the popular reversed phase chromatography does not yield satisfactory results, the following
methodologies are used to overcome a challenging separation.
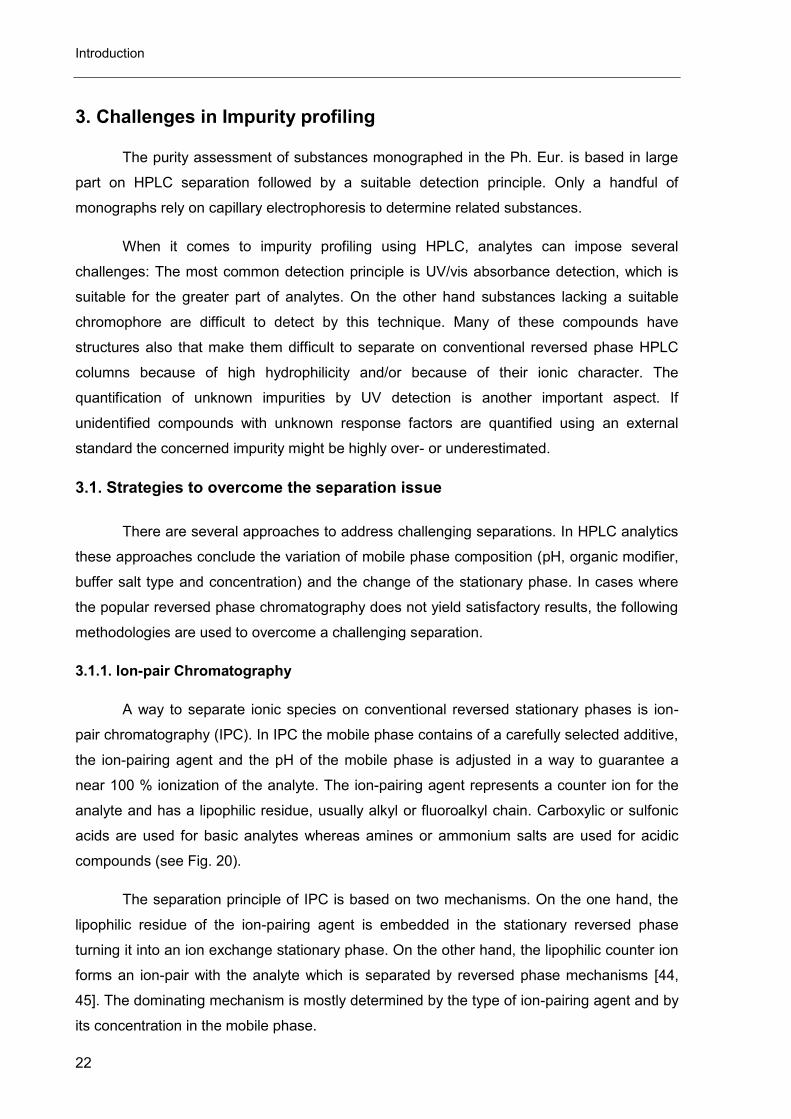
3.1.1. Ion-pair Chromatography
A way to separate ionic species on conventional reversed stationary phases is ion-
pair chromatography (IPC). In IPC the mobile phase contains of a carefully selected additive,
the ion-pairing agent and the pH of the mobile phase is adjusted in a way to guarantee a
near 100 % ionization of the analyte. The ion-pairing agent represents a counter ion for the
analyte and has a lipophilic residue, usually alkyl or fluoroalkyl chain. Carboxylic or sulfonic
acids are used for basic analytes whereas amines or ammonium salts are used for acidic
compounds (see Fig. 20).
The separation principle of IPC is based on two mechanisms. On the one hand, the
lipophilic residue of the ion-pairing agent is embedded in the stationary reversed phase
turning it into an ion exchange stationary phase. On the other hand, the lipophilic counter ion
forms an ion-pair with the analyte which is separated by reversed phase mechanisms [44,
45]. The dominating mechanism is mostly determined by the type of ion-pairing agent and by
its concentration in the mobile phase.
Challenges in impurity profiling
23
Although difficult analytes like oligonucleotides, nucleotide phosphates,
bisphosphonates and amino acids have been separated using IPC [46-50] the technique
comes with some drawbacks: A RP column used with ion-pairing agents is contaminated
with the reagent forever, it cannot be used for other applications. The use of extreme pH to
force the ionization of the analyte lowers the life time of the column. The (re)equilibration can
take very long, especially when gradient separations are used. A more serious issue is the
bioaccumulation and suspected long-term toxicity of some ion-pairing agents (e.g. long chain
perfluorinated carboxylic acids) [51]. Last but not least, the price for ion-pairing agents is
usually a multiple of the price of simpler mobile phase additives (e.g. TFA, formic and
phosphoric acid) making the technique rather costly.
Fig. 20. A choice of ion-pairing agents used in IPC.
3.1.2. Mixed-mode Chromatography
Mixed mode chromatography (MMC) fills the gap between ion chromatography and
RP chromatography, because the separation of ionizable and neutral analytes is possible in
a single run [52, 53]. Mixed mode columns are especially useful for impurity profiling because
it was demonstrated that the loading capacity of these columns is higher for charged
analytes compared to ordinary C18 columns [54]. Separation of critical peaks is easier
because the principle peaks width is reduced and the probability for unknown compounds
covered by the main peak is lower. The mixture of multiple retention mechanisms enables
separation of a wide variety of compounds. E.g. the combination of reversed phase and ion
exchange is an intriguing alternative to reversed phase ion-pairing chromatography [55]
without the downsides of IPC.
Introduction
24
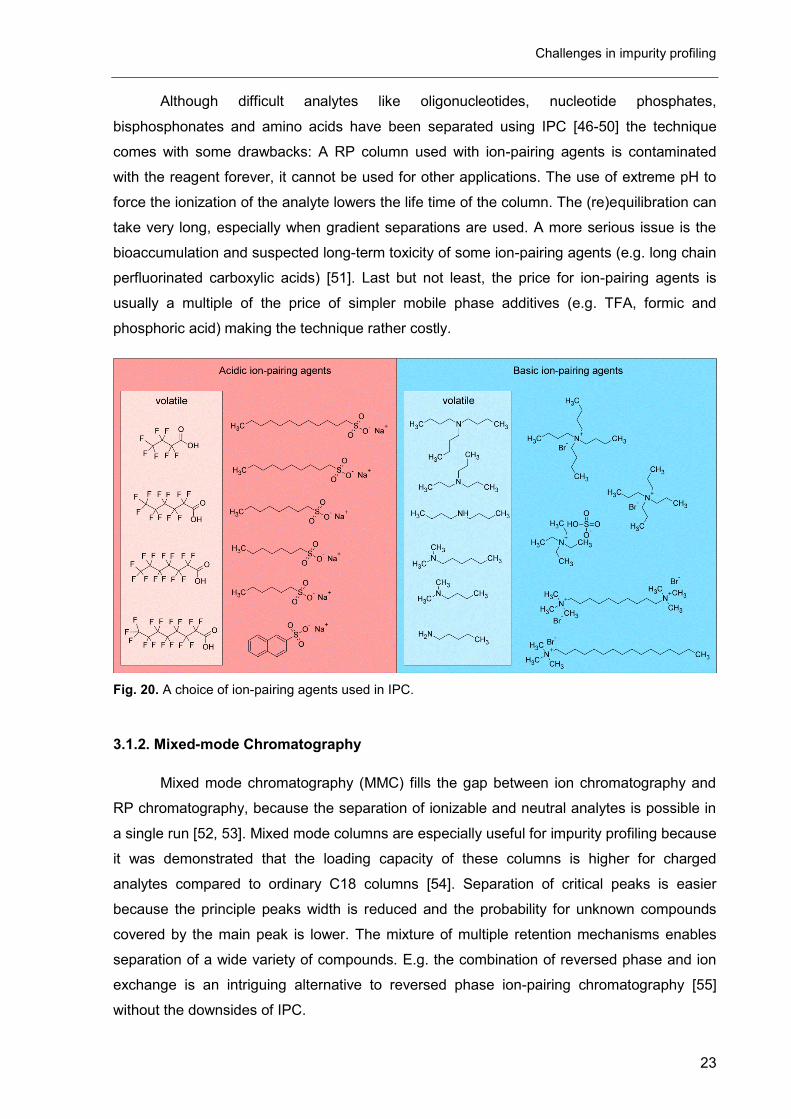
There are several ways to achieve mixed mode chromatography: Two
chromatographic columns with different stationary phases could be connected in series, one
chromatographic column could contain two stationary phases as a mixture or the functional
groups are embedded into the stationary phase (e.g. ammonium groups carrying octadecyl
residues). Some types of mixed-mode stationary phases are depicted in Fig. 21. A choice of
commercially available mixed-mode columns is listed in Table 5.
Fig. 21. Types of mixed mode stationary phases.
Mixed mode chromatography can solve separation problems, but is not as
straightforward as common RP chromatography. The buffer ionic strength, pH and organic
modifier have to be selected and tuned carefully, as their impact on the separation is
considerably larger compared to RP chromatography. Another issue is the fact that one
mixed mode column usually cannot be replaced by a mixed mode column with the same
functionalities of a different brand and there is no standardization like USP categories for
these kinds of columns. The composition of the stationary phases and the functional groups
might not be identical although the column is of the same type (e.g. RP18 and SAX) [56].
This is reflected by the applications listed in Table 1 where the comparison of several mixed
mode columns for one separation problem often leads to very different results regarding
retention, elution order and peak shape. The column lifetime compared to common reversed
phase columns seems to be reduced at least in some cases.
Challenges in impurity profiling
25
Table 5 Examples for commercially available mixed mode columns and latest applications
Column brand name Functional group literature
Primesep 100 RP and SCX [57-59]
Primesep SB RP and SAX [20]
Coresep SBa RP and SAX [60]
Obelisc R RP, HILIC and IEX [61, 62]
Obelisc N HILIC and IEX [61, 63]
Primesep 200 RP and WCX [52]
Acclaim Trinity P1 RP, SCX and WAX [62, 64]
Acclaim Trinity P2 HILIC, SAX and WCX [65]
OmniPac PAX RP and SAX [66, 67]
OmniPac PCX RP and SCX [68]
Acclaim Mixed-Mode WAX-1 RP and WAX [69, 70]
Acclaim Mixed-Mode HILIC-1 RP and HILIC [71]
Acclaim Mixed-Mode WCX-1 RP and WCX [72]
Scherzo SM-C18 RP, WAX and WCX [62, 73]
Scherzo SS-C18 RP, SAX and SCX
TCI Dual ODS-CX10 RP and SCX
TCI Dual ODS-AX20 RP and SAX a solid-core particles; HILIC: hydrophilic interaction liquid chromatography, IEX: ion exchange, RP:
reversed phase, SAX: strong anion exchange, SCX: strong cation exchange, WAX: weak anion
exchange, WCX: weak cation exchange
3.1.3. Derivatization of the analyte
Derivatization procedures are used to modify the analyte structure in order to
increase its retention on a stationary phase and to introduce a chromophore for UV or
fluorescence detection. Suitable derivatization sites are primary or secondary amines,
hydroxyl groups and carboxylic acids.
Innumerous reagents for the derivatization of all kinds of chemical compounds are
available on the market. A very common reason for derivatization is the introduction of a
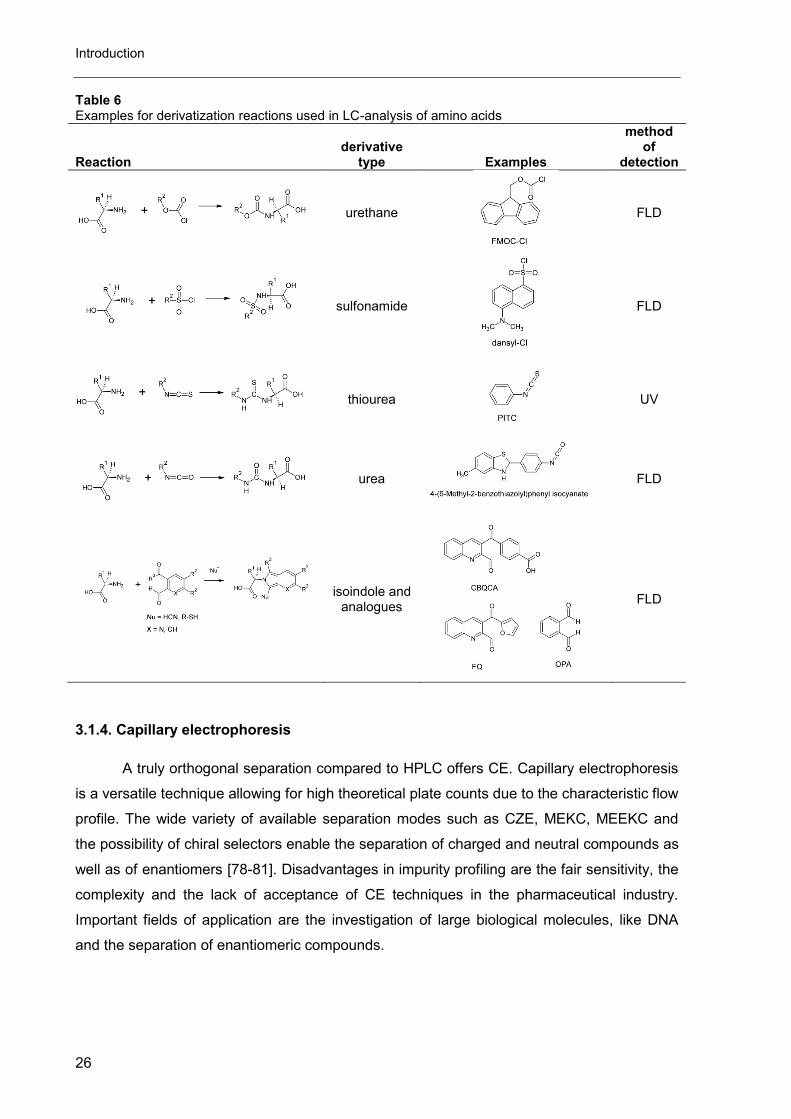
chromo- or fluorophores in LC analysis of challenging compounds (see Table 6). Examples
for challenging compounds are e.g. carbohydrates [74], fatty acids [75], amino acids [76],
aliphatic amines and bisphosphonates [77]. Since the newly introduced chromophore usually
represents an aromatic hydrocarbon, the retention of the derivative on reversed phase
stationary phases is enhanced at the same time. Thus, derivatization is able to kill two birds
with one stone.
Introduction
26
Table 6 Examples for derivatization reactions used in LC-analysis of amino acids
Reaction derivative
type Examples
method of
detection
urethane
FLD
sulfonamide
FLD
thiourea
UV
urea
FLD
isoindole and analogues
FLD
3.1.4. Capillary electrophoresis
A truly orthogonal separation compared to HPLC offers CE. Capillary electrophoresis
is a versatile technique allowing for high theoretical plate counts due to the characteristic flow
profile. The wide variety of available separation modes such as CZE, MEKC, MEEKC and
the possibility of chiral selectors enable the separation of charged and neutral compounds as
well as of enantiomers [78-81]. Disadvantages in impurity profiling are the fair sensitivity, the
complexity and the lack of acceptance of CE techniques in the pharmaceutical industry.
Important fields of application are the investigation of large biological molecules, like DNA
and the separation of enantiomeric compounds.
Challenges in impurity profiling
27
3.2. Coping with the detection issue
The detection of substances without strong chromophore (conjugated double bonds)
imposes a great challenge to analysts. Besides RID, which is very popular in carbohydrate
analysis, the following detection principles can be used to detect those substances with
adequate sensitivity.
3.2.1. Direct UV-detection
In some cases the analyte may be detected at low wavelength (< 210 nm) but the
detection limit is usually insufficient for impurity profiling. However, in some cases when the
mobile phase is sufficiently transparent for the low wavelength and the analytes possess
moderately strong chromophores, such as amides, thiols or thioethers, the direct detection is
possible [58].
3.2.2. Derivatization
As mentioned before, the introduction of fluoro- and chromophores can improve
retention as well as detection limits, but comes with decisive downsides for impurity profiling:
1. The involvement of another substance with its own impurities and degradation
products could impair the results.
2. All available derivatization reagents are more or less specific for a class of
analytes, rendering the detection blind towards compounds that do not have the
necessary feature to react with the reagent.
3. Some substances yield multiple or unexpected products, especially when the
derivatization conditions are not precisely maintained within the specifications.
4. Degradation products of derivatives might lead to misinterpretation of the result.
5. Post-column derivatization leads to decreased chromatographic performance due
to the high dead volume between column and detector resulting in extra-column
band broadening.
Introduction
28
3.2.3. Universal detection
So-called universal detectors can detect substances for the best part independent of
their chemical structure. ELSD, CNLSD, CLND, MS, CAD and to some extent C4D belong to
this group. Although called universal, the response is never completely independent of the
analytes physical-chemical properties. Each detection principle comes with its own
disadvantages and fields of application. In the end several detectors (universal and others)
have to be assessed in order to get maximum certainty and to choose the most suitable
detection principle. In many cases a combination is possible and sensible [82].
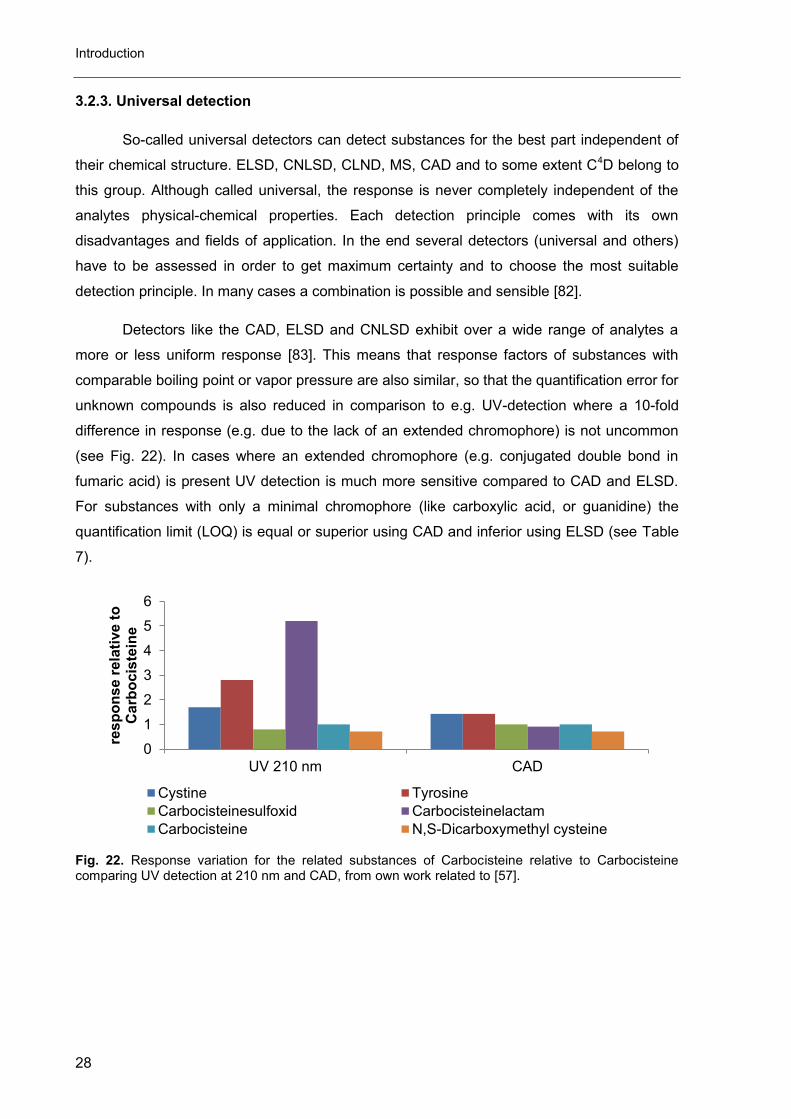
Detectors like the CAD, ELSD and CNLSD exhibit over a wide range of analytes a
more or less uniform response [83]. This means that response factors of substances with
comparable boiling point or vapor pressure are also similar, so that the quantification error for
unknown compounds is also reduced in comparison to e.g. UV-detection where a 10-fold
difference in response (e.g. due to the lack of an extended chromophore) is not uncommon
(see Fig. 22). In cases where an extended chromophore (e.g. conjugated double bond in
fumaric acid) is present UV detection is much more sensitive compared to CAD and ELSD.
For substances with only a minimal chromophore (like carboxylic acid, or guanidine) the
quantification limit (LOQ) is equal or superior using CAD and inferior using ELSD (see Table
7).
Fig. 22. Response variation for the related substances of Carbocisteine relative to Carbocisteine comparing UV detection at 210 nm and CAD, from own work related to [57].
0
1
2
3
4
5
6
UV 210 nm CAD
res
po
ns
e r
ela
tive
to
C
arb
oc
iste
ine
Cystine Tyrosine
Carbocisteinesulfoxid Carbocisteinelactam
Carbocisteine N,S-Dicarboxymethyl cysteine
Challenges in impurity profiling
29
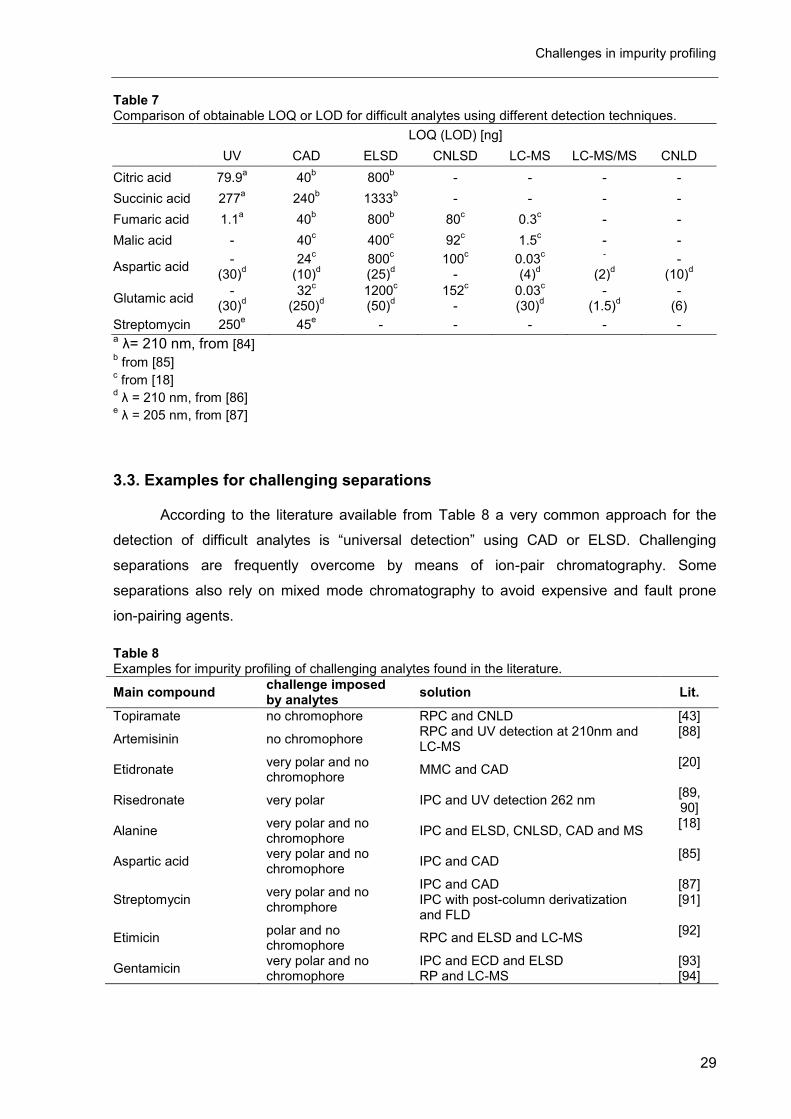
Table 7 Comparison of obtainable LOQ or LOD for difficult analytes using different detection techniques.
LOQ (LOD) [ng]
UV CAD ELSD CNLSD LC-MS LC-MS/MS CNLD
Citric acid 79.9a 40
b 800
b - - - -
Succinic acid 277a 240
b 1333
b - - - -
Fumaric acid 1.1a 40
b 800
b 80
c 0.3
c - -
Malic acid - 40c 400
c 92
c 1.5
c - -
Aspartic acid -
(30)d
24c
(10)d
800c
(25)d
100c
- 0.03
c
(4)d
-
(2)d
- (10)
d
Glutamic acid -
(30)d
32c
(250)d
1200c
(50)d
152c
- 0.03
c
(30)d
-
(1.5)d
- (6)
Streptomycin 250e 45
e - - - - -
a λ= 210 nm, from [84] b from [85]
c from [18]
d λ = 210 nm, from [86]
e λ = 205 nm, from [87]
3.3. Examples for challenging separations
According to the literature available from Table 8 a very common approach for the
detection of difficult analytes is “universal detection” using CAD or ELSD. Challenging
separations are frequently overcome by means of ion-pair chromatography. Some
separations also rely on mixed mode chromatography to avoid expensive and fault prone
ion-pairing agents.
Table 8 Examples for impurity profiling of challenging analytes found in the literature.
Main compound challenge imposed by analytes
solution Lit.
Topiramate no chromophore RPC and CNLD [43]
Artemisinin no chromophore RPC and UV detection at 210nm and LC-MS
[88]
Etidronate very polar and no chromophore
MMC and CAD [20]
Risedronate very polar IPC and UV detection 262 nm [89, 90]
Alanine very polar and no chromophore
IPC and ELSD, CNLSD, CAD and MS [18]
Aspartic acid very polar and no chromophore
IPC and CAD [85]
Streptomycin very polar and no chromphore
IPC and CAD IPC with post-column derivatization and FLD
[87] [91]
Etimicin polar and no chromophore
RPC and ELSD and LC-MS [92]
Gentamicin very polar and no chromophore
IPC and ECD and ELSD RP and LC-MS
[93] [94]
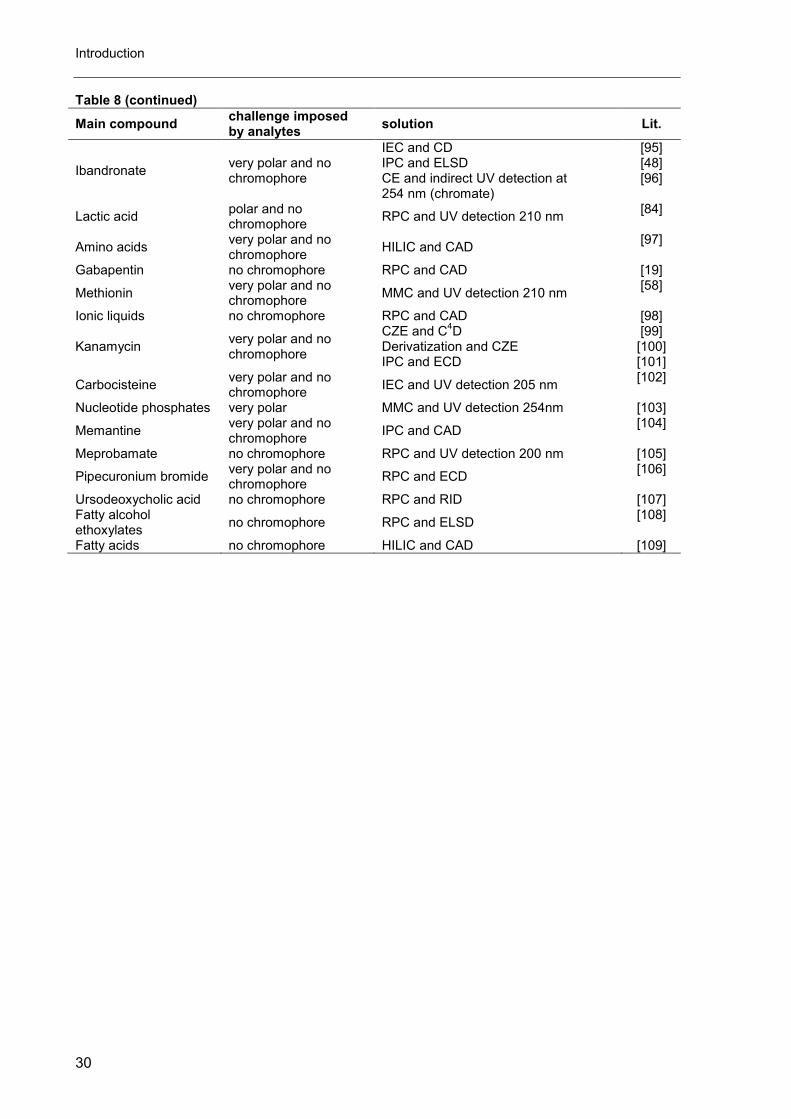
Introduction
30
Table 8 (continued)
Main compound challenge imposed by analytes
solution Lit.
Ibandronate very polar and no chromophore
IEC and CD IPC and ELSD CE and indirect UV detection at 254 nm (chromate)
[95] [48] [96]
Lactic acid polar and no chromophore
RPC and UV detection 210 nm [84]
Amino acids very polar and no chromophore
HILIC and CAD [97]
Gabapentin no chromophore RPC and CAD [19]
Methionin very polar and no chromophore
MMC and UV detection 210 nm [58]
Ionic liquids no chromophore RPC and CAD [98]
Kanamycin very polar and no chromophore
CZE and C4D
Derivatization and CZE IPC and ECD
[99] [100] [101]
Carbocisteine very polar and no chromophore
IEC and UV detection 205 nm [102]
Nucleotide phosphates very polar MMC and UV detection 254nm [103]
Memantine very polar and no chromophore
IPC and CAD [104]
Meprobamate no chromophore RPC and UV detection 200 nm [105]
Pipecuronium bromide very polar and no chromophore
RPC and ECD [106]
Ursodeoxycholic acid no chromophore RPC and RID [107] Fatty alcohol ethoxylates
no chromophore RPC and ELSD [108]
Fatty acids no chromophore HILIC and CAD [109]
Chiral separation techniques for amino acids
31
4. Chiral separation techniques for amino acids
4.1. Indirect separation
The indirect separation of enantiomers comprises the reaction of the sample with an
enantiomerically pure reagent to form two diastereomeric compounds. This pair of
diastereomers is afterwards separated using an achiral stationary phase, usually in reversed
phase mode or by CE. Crucial requirements for this method are highly pure derivatization
reagents, complete derivatization, chemical and configurational stable derivatives and a
suitable derivatization site, such as amines, alcohols and thiols [2].
In order to obtain reliable and reproducible results, the analyte and the reagent have
to react in a selective reaction to yield well defined products. This is e.g. not the case if the
analyte contains multiple functional groups that undergo the derivatization reaction or if the
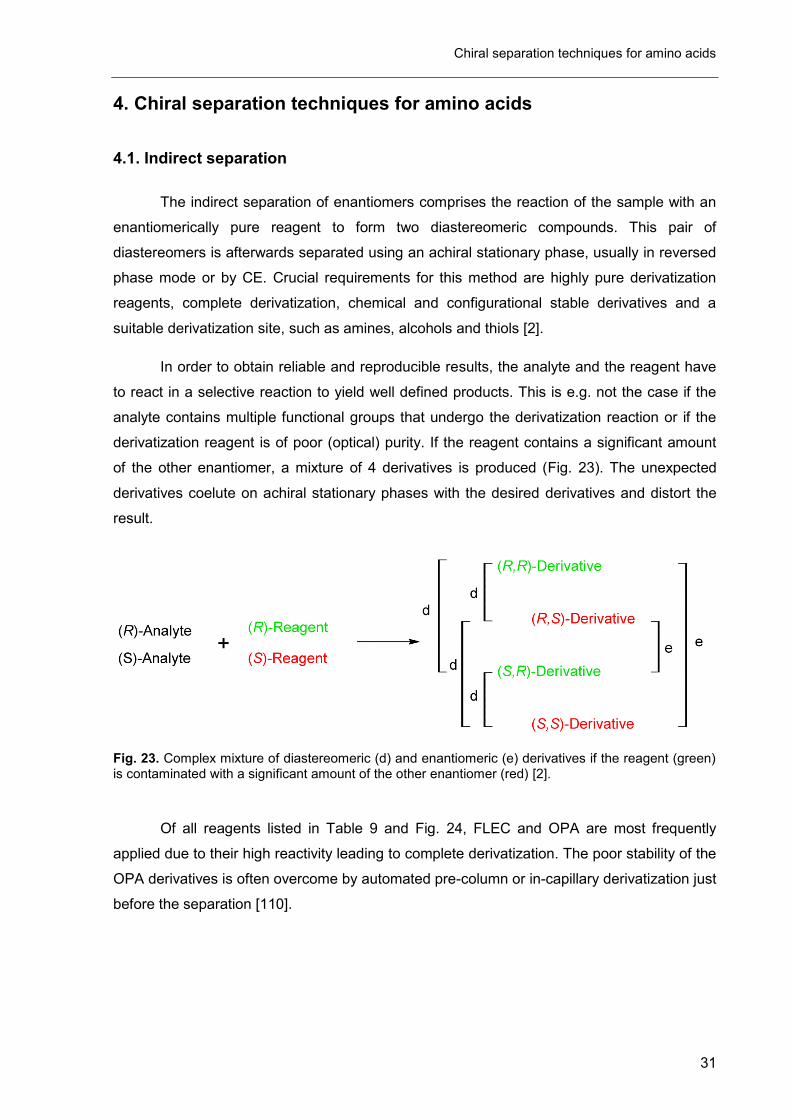
derivatization reagent is of poor (optical) purity. If the reagent contains a significant amount
of the other enantiomer, a mixture of 4 derivatives is produced (Fig. 23). The unexpected
derivatives coelute on achiral stationary phases with the desired derivatives and distort the
result.
Fig. 23. Complex mixture of diastereomeric (d) and enantiomeric (e) derivatives if the reagent (green) is contaminated with a significant amount of the other enantiomer (red) [2].
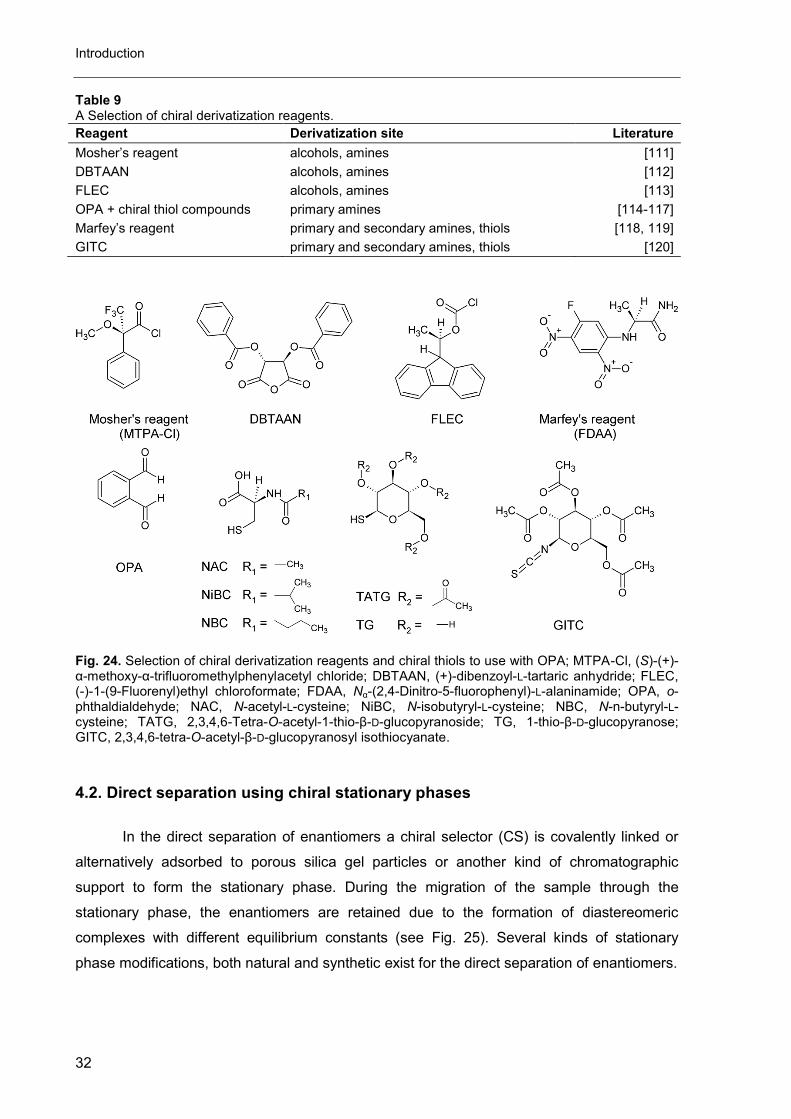
Of all reagents listed in Table 9 and Fig. 24, FLEC and OPA are most frequently
applied due to their high reactivity leading to complete derivatization. The poor stability of the
OPA derivatives is often overcome by automated pre-column or in-capillary derivatization just
before the separation [110].
Introduction
32
Table 9 A Selection of chiral derivatization reagents.
Reagent Derivatization site Literature
Mosher’s reagent alcohols, amines [111]
DBTAAN alcohols, amines [112]
FLEC alcohols, amines [113]
OPA + chiral thiol compounds primary amines [114-117]
Marfey’s reagent primary and secondary amines, thiols [118, 119]
GITC primary and secondary amines, thiols [120]
Fig. 24. Selection of chiral derivatization reagents and chiral thiols to use with OPA; MTPA-Cl, (S)-(+)-α-methoxy-α-trifluoromethylphenylacetyl chloride; DBTAAN, (+)-dibenzoyl-L-tartaric anhydride; FLEC, (-)-1-(9-Fluorenyl)ethyl chloroformate; FDAA, Nα-(2,4-Dinitro-5-fluorophenyl)-L-alaninamide; OPA, o-phthaldialdehyde; NAC, N-acetyl-L-cysteine; NiBC, N-isobutyryl-L-cysteine; NBC, N-n-butyryl-L-cysteine; TATG, 2,3,4,6-Tetra-O-acetyl-1-thio-β-D-glucopyranoside; TG, 1-thio-β-D-glucopyranose; GITC, 2,3,4,6-tetra-O-acetyl-β-D-glucopyranosyl isothiocyanate.
4.2. Direct separation using chiral stationary phases
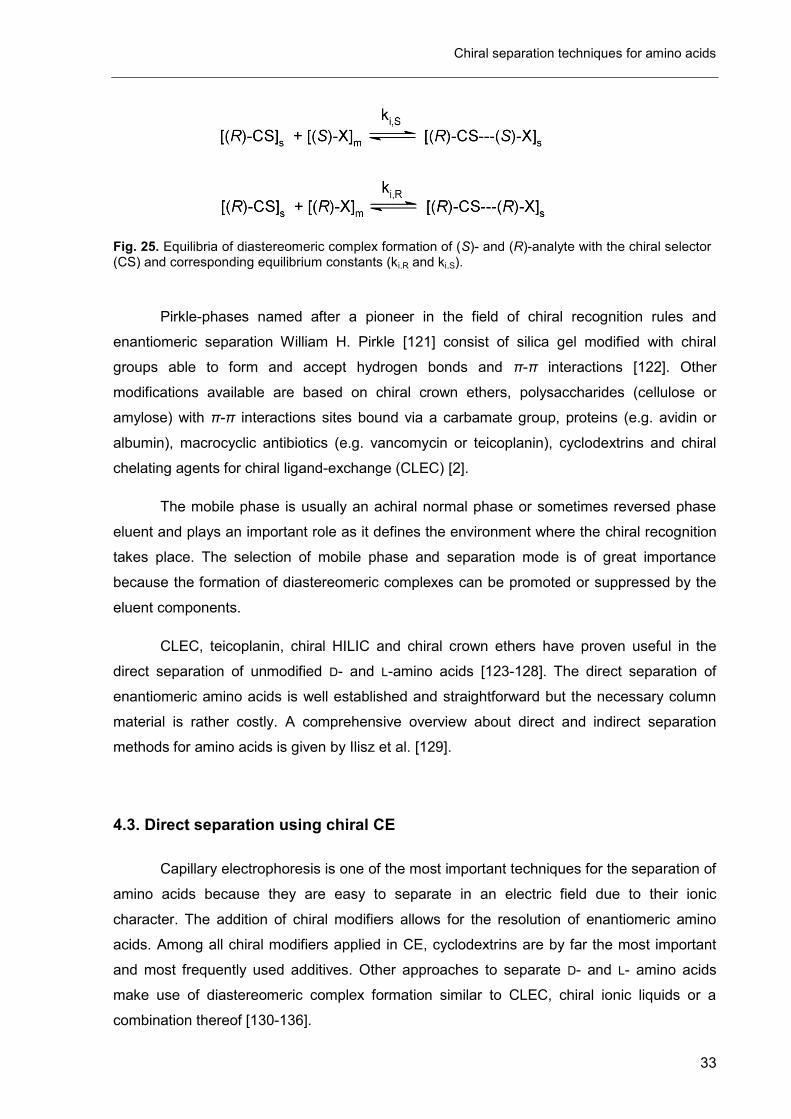
In the direct separation of enantiomers a chiral selector (CS) is covalently linked or
alternatively adsorbed to porous silica gel particles or another kind of chromatographic
support to form the stationary phase. During the migration of the sample through the
stationary phase, the enantiomers are retained due to the formation of diastereomeric
complexes with different equilibrium constants (see Fig. 25). Several kinds of stationary
phase modifications, both natural and synthetic exist for the direct separation of enantiomers.
Chiral separation techniques for amino acids
33
Fig. 25. Equilibria of diastereomeric complex formation of (S)- and (R)-analyte with the chiral selector (CS) and corresponding equilibrium constants (ki,R and ki,S).
Pirkle-phases named after a pioneer in the field of chiral recognition rules and
enantiomeric separation William H. Pirkle [121] consist of silica gel modified with chiral
groups able to form and accept hydrogen bonds and π-π interactions [122]. Other
modifications available are based on chiral crown ethers, polysaccharides (cellulose or
amylose) with π-π interactions sites bound via a carbamate group, proteins (e.g. avidin or
albumin), macrocyclic antibiotics (e.g. vancomycin or teicoplanin), cyclodextrins and chiral
chelating agents for chiral ligand-exchange (CLEC) [2].
The mobile phase is usually an achiral normal phase or sometimes reversed phase
eluent and plays an important role as it defines the environment where the chiral recognition
takes place. The selection of mobile phase and separation mode is of great importance
because the formation of diastereomeric complexes can be promoted or suppressed by the
eluent components.
CLEC, teicoplanin, chiral HILIC and chiral crown ethers have proven useful in the
direct separation of unmodified D- and L-amino acids [123-128]. The direct separation of
enantiomeric amino acids is well established and straightforward but the necessary column
material is rather costly. A comprehensive overview about direct and indirect separation
methods for amino acids is given by Ilisz et al. [129].
4.3. Direct separation using chiral CE
Capillary electrophoresis is one of the most important techniques for the separation of
amino acids because they are easy to separate in an electric field due to their ionic
character. The addition of chiral modifiers allows for the resolution of enantiomeric amino
acids. Among all chiral modifiers applied in CE, cyclodextrins are by far the most important
and most frequently used additives. Other approaches to separate D- and L- amino acids
make use of diastereomeric complex formation similar to CLEC, chiral ionic liquids or a
combination thereof [130-136].
Introduction
34
Since the other techniques are still on a research stage, the application of
cyclodextrins (CD) is from the analytical point of view the most reasonable approach for
pharmacopoeial impurity profiling. They are commercially available in many different
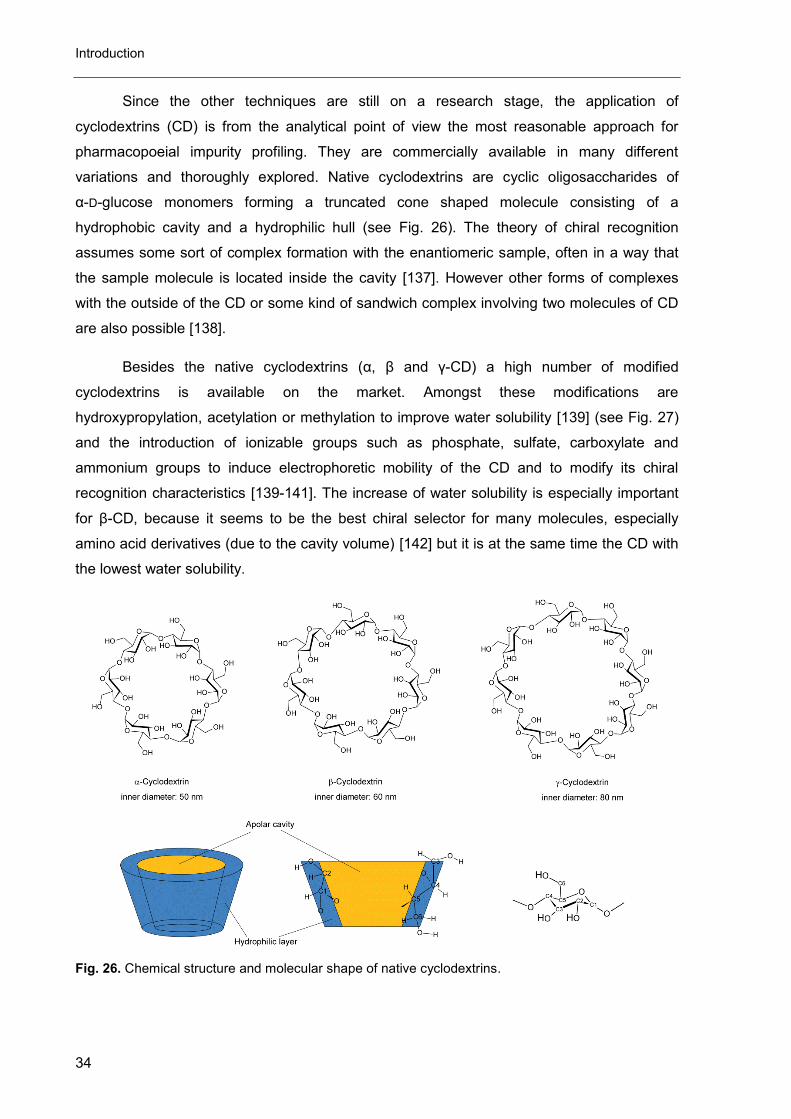
variations and thoroughly explored. Native cyclodextrins are cyclic oligosaccharides of
α-D-glucose monomers forming a truncated cone shaped molecule consisting of a
hydrophobic cavity and a hydrophilic hull (see Fig. 26). The theory of chiral recognition
assumes some sort of complex formation with the enantiomeric sample, often in a way that
the sample molecule is located inside the cavity [137]. However other forms of complexes
with the outside of the CD or some kind of sandwich complex involving two molecules of CD
are also possible [138].
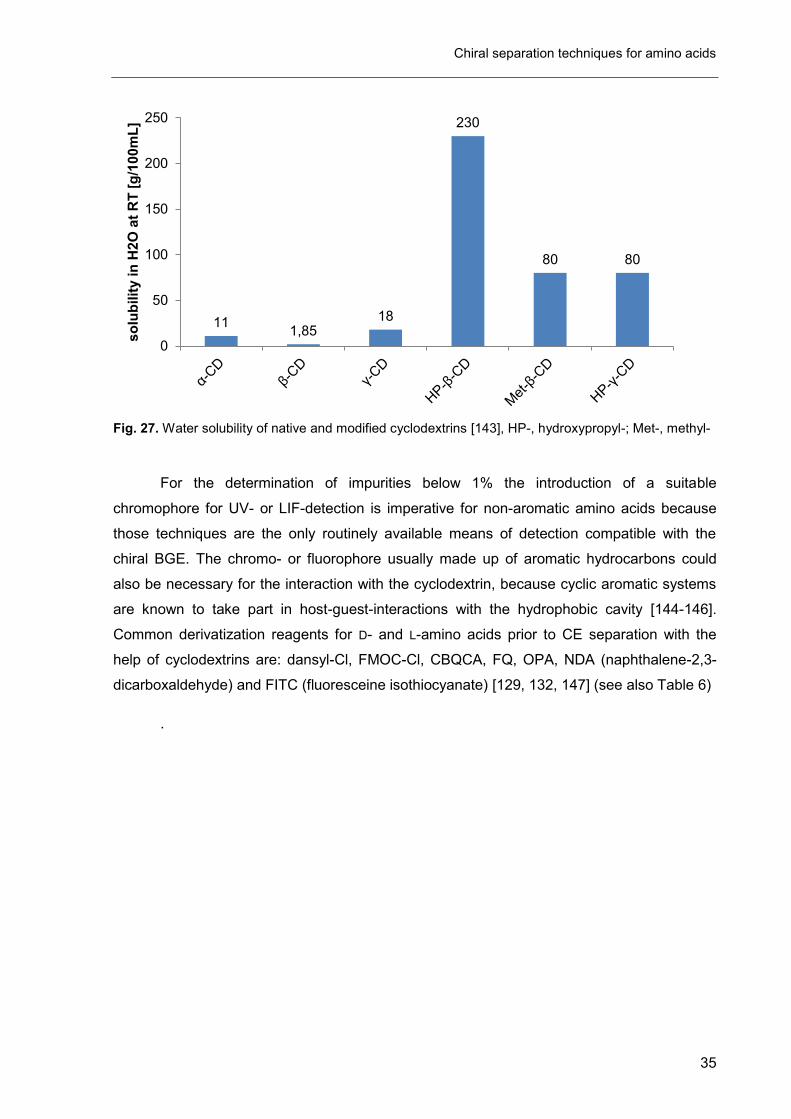
Besides the native cyclodextrins (α, β and γ-CD) a high number of modified
cyclodextrins is available on the market. Amongst these modifications are
hydroxypropylation, acetylation or methylation to improve water solubility [139] (see Fig. 27)
and the introduction of ionizable groups such as phosphate, sulfate, carboxylate and
ammonium groups to induce electrophoretic mobility of the CD and to modify its chiral
recognition characteristics [139-141]. The increase of water solubility is especially important
for β-CD, because it seems to be the best chiral selector for many molecules, especially
amino acid derivatives (due to the cavity volume) [142] but it is at the same time the CD with
the lowest water solubility.
Fig. 26. Chemical structure and molecular shape of native cyclodextrins.
Chiral separation techniques for amino acids
35
Fig. 27. Water solubility of native and modified cyclodextrins [143], HP-, hydroxypropyl-; Met-, methyl-
For the determination of impurities below 1% the introduction of a suitable
chromophore for UV- or LIF-detection is imperative for non-aromatic amino acids because
those techniques are the only routinely available means of detection compatible with the
chiral BGE. The chromo- or fluorophore usually made up of aromatic hydrocarbons could
also be necessary for the interaction with the cyclodextrin, because cyclic aromatic systems
are known to take part in host-guest-interactions with the hydrophobic cavity [144-146].
Common derivatization reagents for D- and L-amino acids prior to CE separation with the
help of cyclodextrins are: dansyl-Cl, FMOC-Cl, CBQCA, FQ, OPA, NDA (naphthalene-2,3-
dicarboxaldehyde) and FITC (fluoresceine isothiocyanate) [129, 132, 147] (see also Table 6)
.
11 1,85
18
230
80 80
0
50
100
150
200
250s
olu
bilit
y i
n H
2O
at
RT
[g
/10
0m
L]
Introduction
36
5. References
[1] D.A. Skoog, F.J. Holler, S.R. Crouch, Instrumentelle Analytik, Springer Spektrum, Berlin,
2013.
[2] L.R. Snyder, J.J. Kirkland, J.W. Dolan, Introduction to modern liquid chromatography, 3rd ed.,
Wiley, Hoboken, N. J., 2010.
[3] Chromatographic separation techniques, in: European Directorate for the Quality of Medicines
& HealthCare (Eds.), European Pharmacopoeia, 8th Edition, Strasbourg, France, 2014, pp.
[4] Ph. Eur. 8th edition, Council of Europe, Strasbourg, France, 2016.
[5] L.S. Ettre, C.W. Gehrke, The development of the amino acid analyzer, LC GC N Am, 24
(2006) 390-400.
[6] P. Adriaens, B. Meesschaert, W. Wuyts, H. Vaderhaeghe, H. Eyssen, Separation of ninhydrin-
positive compounds on a single-column amino acid analyzer using lithium buffers, J.
Chromatogr., 140 (1977) 103-108.
[7] A. Wainer, The chromatography of ninhydrin negative compounds on an amino acid analyzer
column, J. Chromatogr., 26 (1967) 48-53.
[8] E. Lund, J. Thomsen, K. Brunfeldt, Use of o-phthalaldehyde for fluorescence detection in
conventional amino acid analyzers - Sub-nanomole sensitivity in analysis of
phenylthiohydantoin-amino acids, J. Chromatogr., 130 (1977) 51-54.
[9] R.L. Cunico, T. Schlabach, Comparison of ninhydrin and o-phthalaldehyde post-column
detection techniques for high-performance liquid chromatography of free amino acids, J.
Chromatogr., 266 (1983) 461-470.
[10] S. Moore, W.H. Stein, Photometric ninhydrin method for use in the chromatography of amino
acids, J. Biol. Chem., 176 (1948) 367-388.
[11] D.H. Spackman, W.H. Stein, S. Moore, Automatic recording apparatus for use in the
chromatography of amino acids, Anal. Chem., 30 (1958) 1190-1206.
[12] S.R. Bakalyar, M.P.T. Bradley, R. Honganen, The Role of Dissolved Gases in High-
Performance Liquid Chromatography, J. Chromatogr., 158 (1978) 277-293.
[13] M. Kohler, W. Haerdi, P. Christen, J.L. Veuthey, The evaporative light scattering detector:
some applications in pharmaceutical analysis, Trac.-Trend. Anal. Chem., 16 (1997) 475-484.
References
37
[14] M. Righezza, G. Guiochon, Effect of the Wavelength of the Laser-Beam on the Response of
an Evaporative Light-Scattering Detector, J. Liq. Chromatogr., 11 (1988) 2709-2729.
[15] J.M. Cintrón, D.S. Risley, Hydrophilic interaction chromatography with aerosol-based
detectors (ELSD, CAD, NQAD) for polar compounds lacking a UV chromophore in an
intravenous formulation, J. Pharm. Biomed. Anal., 78-79 (2013) 14-18.
[16] A.D. Yim, P.H. Gamache, R.S. McCarthy (Dionex Corporation), Nebulizer for charged aerosol
detection (CAD) system, US 20140352411, 2014.
[17] J.P. Hutchinson, T. Remenyi, P. Nesterenko, W. Farrell, E. Groeber, R. Szucs, G. Dicinoski,
P.R. Haddad, Investigation of polar organic solvents compatible with corona charged aerosol
detection and their use for the determination of sugars by hydrophilic interaction liquid
chromatography, Anal. Chim. Acta, 750 (2012) 199-206.
[18] U. Holzgrabe, C.J. Nap, T. Beyer, S. Almeling, Alternatives to amino acid analysis for the
purity control of pharmaceutical grade L-alanine, J. Sep. Sci., 33 (2010) 2402-2410.
[19] P.K. Ragham, K.B. Chandrasekhar, Development and validation of a stability-indicating RP-
HPLC-CAD method for gabapentin and its related impurities in presence of degradation
products, J. Pharm. Biomed. Anal., 125 (2016) 122-129.
[20] X.K. Liu, J.B. Fang, N. Cauchon, P.Z. Zhou, Direct stability-indicating method development
and validation for analysis of etidronate disodium using a mixed-mode column and charged
aerosol detector, J. Pharm. Biomed. Anal., 46 (2008) 639-644.
[21] T. Vehovec, A. Obreza, Review of operating principle and applications of the charged aerosol
detector, J. Chromatogr. A, 1217 (2010) 1549-1556.
[22] N. Vervoort, D. Daemen, G. Török, Performance evaluation of evaporative light scattering
detection and charged aerosol detection in reversed phase liquid chromatography, J.
Chromatogr. A, 1189 (2008) 92-100.
[23] M. Righezza, G. Guiochon, Effects of the Nature of the Solvent and Solutes on the Response
of a Light-Scattering Detector, J. Liq. Chromatogr., 11 (1988) 1967-2004.
[24] J.P. Hutchinson, J.F. Li, W. Farrell, E. Groeber, R. Szucs, G. Dicinoski, P.R. Haddad,
Universal response model for a corona charged aerosol detector, J. Chromatogr. A, 1217
(2010) 7418-7427.
[25] R.W. Dixon, D.S. Peterson, Development and testing of a detection method for liquid
chromatography based on aerosol charging, Anal. Chem., 74 (2002) 2930-2937.
[26] T. Gorecki, F. Lynen, R. Szucs, P. Sandra, Universal response in liquid chromatography using
charged aerosol detection, Anal. Chem., 78 (2006) 3186-3192.
Introduction
38
[27] A. de Villiers, T. Gorecki, F. Lynen, R. Szucs, P. Sandra, Improving the universal response of
evaporative light scattering detection by mobile phase compensation, J. Chromatogr. A, 1161
(2007) 183-191.
[28] B.T. Mathews, P.D. Higginson, R. Lyons, J.C. Mitchell, N.W. Sach, M.J. Snowden, M.R.
Taylor, A.G. Wright, Improving quantitative measurements for the evaporative light scattering
detector, Chromatographia, 60 (2004) 625-633.
[29] H. Zahn, Über das Leitvermögen von starken Elektrolyten für Hochfrequenzströme, Physik A
Hadrons and Nuclei, 51 (1928) 350-354.
[30] E. Pungor, F. Pal, K. Toth, Oscillometric Flow Cell for Measurement of Conductivity and
Permittivity, Anal. Chem., 55 (1983) 1728-1731.
[31] J.F. Alder, P.R. Fielden, A.J. Clark, Simultaneous Conductivity and Permittivity Detector with a
Single Cell for Liquid-Chromatography, Anal. Chem., 56 (1984) 985-988.
[32] J.A.F. da Silva, C.L. do Lago, An oscillometric detector for capillary electrophoresis, Anal.
Chem., 70 (1998) 4339-4343.
[33] A.J. Zemann, E. Schnell, D. Volgger, G.K. Bonn, Contactless conductivity detection for
capillary electrophoresis, Anal. Chem., 70 (1998) 563-567.
[34] P. Jankovics, S. Chopra, M.N. El-Attug, D. Cabooter, K. Wolfs, B. Noszál, A. Van Schepdael,
E. Adams, Exploring the possibilities of capacitively coupled contactless conductivity detection
in combination with liquid chromatography for the analysis of polar compounds using
aminoglycosides as test case, J. Pharm. Biomed. Anal., 112 (2015) 155-168.
[35] P. Hauser, E.A. Villar, J. Tanyanyiwa (Peter C. Hauser), Method and apparatus for performing
high-voltage contactless conductivity (HV-CCD) electrophoresis, US 20050109621, 2005.
[36] A. Robbat, N.P. Corso, P.J. Doherty, M.H. Wolf, Gas-Chromatographic Chemiluminescent
Detection and Evaluation of Predictive Models for Identifying Nitrated Polycyclic Aromatic-
Hydrocarbons in a Diesel Fuel Particulate Extract, Anal. Chem., 58 (1986) 2078-2084.
[37] L.O. Courthaudon, E.M. Fujinari, Nitrogen-Specific Gas-Chromatography Detection Based on
Chemiluminescence, LC GC-Mag. Sep. Sci., 9 (1991) 732-734.
[38] A. Robbat, N.P. Corso, T.Y. Liu, Evaluation of a Nitrosyl-Specific Gas-Phase Chemi-
Luminescent Detector with High-Performance Liquid-Chromatography, Anal. Chem., 60
(1988) 173-174.
[39] X.W. Yan, Detection by ozone-induced chemiluminescence in chromatography, J.
Chromatogr. A, 842 (1999) 267-308.
References
39
[40] W.L. Fitch, A.K. Szardenings, E.M. Fujinari, Chemiluminescent nitrogen detection for HPLC:
An important new tool in organic analytical chemistry, Tetrahedron Lett., 38 (1997) 1689-1692.
[41] D. Corens, M. Carpentier, M. Schroven, L. Meerpoel, Liquid chromatography-mass
spectrometry with chemiluminescent nitrogen detection for on-line quantitative analysis of
compound collections: advantages and limitations, J. Chromatogr. A, 1056 (2004) 67-75.
[42] S.N. Bhattachar, J.A. Wesley, C. Seadeek, Evaluation of the chemiluminescent nitrogen
detector for solubility determinations to support drug discovery, J. Pharm. Biomed. Anal., 41
(2006) 152-157.
[43] M. Styslo-Zalasik, W.Y. Li, Determination of topiramate and its degradation product in liquid
oral solutions by high performance liquid chromatography with a chemiluminescent nitrogen
detector, J. Pharm. Biomed. Anal., 37 (2005) 529-534.
[44] T. Cecchi, Theoretical Models of Ion Pair Chromatography: A Close Up of Recent Literature
Production, J. Liq. Chromatogr. R T, 38 (2015) 404-414.
[45] T. Cecchi, Ion pairing chromatography, Crit. Rev. Anal. Chem., 38 (2008) 161-213.
[46] K. Horňák, H. Schmidheiny, J. Pernthaler, High-throughput determination of dissolved free
amino acids in unconcentrated freshwater by ion-pairing liquid chromatography and mass
spectrometry, J. Chromatogr. A, 1440 (2016) 85-93.
[47] M. Mateos-Vivas, E. Rodríguez-Gonzalo, D. García-Gómez, R. Carabias-Martínez,
Hydrophilic interaction chromatography coupled to tandem mass spectrometry in the presence
of hydrophilic ion-pairing reagents for the separation of nucleosides and nucleotide mono-, di-
and triphosphates, J. Chromatogr. A, 1414 (2015) 129-137.
[48] Y. Jiang, Z. Xie, Determination of ibandronate and its degradation products by ion-pair RP LC
with evaporative light-scattering detection, Chromatographia, 62 (2005) 257-261.
[49] M. Biba, C.J. Welch, J.P. Foley, Investigation of a new core-shell particle column for ion-pair
reversed-phase liquid chromatography analysis of oligonucleotides, J. Pharm. Biomed. Anal.,
96 (2014) 54-57.
[50] Z. Xie, Y. Jiang, D.Q. Zhang, Simple analysis of four bisphosphonates simultaneously by
reverse phase liquid chromatography using n-amylamine as volatile ion-pairing agent, J.
Chromatogr. A, 1104 (2006) 173-178.
[51] ECHA, Adopted opinions on restriction proposals. http://echa.europa.eu/previous-
consultations-on-restriction-proposals/-/substance-rev/1908/term, (accessed 26/04/2016)
Introduction
40
[52] J.Y. Li, S. Shao, M.S. Jaworsky, P.T. Kurtulik, Simultaneous determination of cations,
zwitterions and neutral compounds using mixed-mode reversed-phase and cation-exchange
high-performance liquid chromatography, J. Chromatogr. A, 1185 (2008) 185-193.
[53] H. Luo, L.J. Ma, C. Paek, P.W. Carr, Application of silica-based hyper-crosslinked sulfonate-
modified reversed stationary phases for separating highly hydrophilic basic compounds, J.
Chromatogr. A, 1202 (2008) 8-18.
[54] N.H. Davies, M.R. Euerby, D.V. McCalley, A study of retention and overloading of basic
compounds with mixed-mode reversed-phase/cation-exchange columns in high performance
liquid chromatography, J. Chromatogr. A, 1138 (2007) 65-72.
[55] T. Taylor, Mixed-Mode HPLC Separations: What, Why, and How, LC GC N. Am. 32 (2014)
226-226.
[56] H. Luo, L.J. Ma, Y. Zhang, P.W. Carr, Synthesis and characterization of silica-based hyper-
crosslinked sulfonate-modified reversed stationary phases, J. Chromatogr. A, 1182 (2008) 41-
55.
[57] O. Wahl, U. Holzgrabe, Impurity profiling of carbocisteine by HPLC-CAD, qNMR and UV/vis
spectroscopy, J. Pharm. Biomed. Anal., 95 (2014) 1-10.
[58] R. Kühnreich, U. Holzgrabe, Impurity profiling of l-methionine by HPLC on a mixed mode
column, J. Pharm. Biomed. Anal., 122 (2016) 118-125.
[59] C. Lamouroux, G. Foglia, G. Le Rouzo, How to separate ionic liquids: Use of Hydrophilic
Interaction Liquid Chromatography and mixed mode phases, J. Chromatogr. A, 1218 (2011)
3022-3028.
[60] O. Wahl, U. Holzgrabe, Impurity profiling of ibandronate sodium by HPLC-CAD, J. Pharm.
Biomed. Anal., 114 (2015) 254-264.
[61] H. Guo, L.S. Riter, C.E. Wujcik, D.W. Armstrong, Direct and sensitive determination of
glyphosate and aminomethylphosphonic acid in environmental water samples by high
performance liquid chromatography coupled to electrospray tandem mass spectrometry, J.
Chromatogr. A, (2016)
[62] X.D. Liu, C.A. Pohl, Comparison of reversed-phase/cation-exchange/anion-exchange trimodal
stationary phases and their use in active pharmaceutical ingredient and counterion
determinations, J. Chromatogr. A, 1232 (2012) 190-195.
[63] A.M. Botero-Coy, M. Ibáñez, J.V. Sancho, F. Hernández, Direct liquid chromatography-
tandem mass spectrometry determination of underivatized glyphosate in rice, maize and
soybean, J. Chromatogr. A, 1313 (2013) 157-165.
References
41
[64] D. Ilko, C.J. Nap, U. Holzgrabe, S. Almeling, Validation and application of an HPLC-CAD-
TOF/MS method for identification and quantification of pharmaceutical counterions, Pharmeur.
Bio. Sci. Notes, 2014 (2014) 81-91.
[65] P. Kubica, J. Namieśnik, A. Wasik, Comparison of hydrophilic interaction and reversed phase
liquid chromatography coupled with tandem mass spectrometry for the determination of eight
artificial sweeteners and common steviol glycosides in popular beverages, J. Pharm. Biomed.
Anal., (2016)
[66] E.W. Tsai, D.P. Ip, M.A. Brooks, Determination of Alendronate in Pharmaceutical Dosage
Formulations by Ion Chromatography with Conductivity Detection, J. Chromatogr., 596 (1992)
217-224.
[67] L. Joergensen, A. Weimann, H.F. Botte, Ion Chromatography as a Tool for Optimization and
Control of Fermentation Processes, J. Chromatogr., 602 (1992) 179-188.
[68] J. Cheng, P. Jandik, N. Avdalovic, Use of disposable gold working electrodes for cation
chromatography-integrated pulsed amperometric detection of sulfur-containing amino acids, J.
Chromatogr. A, 997 (2003) 73-78.
[69] C.Y. Hao, D. Morse, F. Morra, X.M. Zhao, P. Yang, B. Nunn, Direct aqueous determination of
glyphosate and related compounds by liquid chromatography/tandem mass spectrometry
using reversed-phase and weak anion-exchange mixed-mode column, J. Chromatogr. A, 1218
(2011) 5638-5643.
[70] A.M.V. Schou-Pedersen, C. Cornett, N. Nyberg, J. Østergaard, S.H. Hansen, Structure
elucidation and quantification of impurities formed between 6-aminocaproic acid and the
excipients citric acid and sorbitol in an oral solution using high-resolution mass spectrometry
and nuclear magnetic resonance spectroscopy, J. Pharm. Biomed. Anal., 107 (2015) 333-340.
[71] J. Han, H. Moon, Y. Hong, S. Yang, W.J. Jeong, K.S. Lee, H. Chung, Determination of
glyphosate and its metabolite in emergency room in Korea, Forensic Sci. Int., 265 (2016) 41-
46.
[72] Y.Q. Tian, L.M. Chen, L.H. Gao, M.L. Wu, W.A. Dick, Comparison of three methods for
detection of melamine in compost and soil, Sci. Total Environ., 417 (2012) 255-262.
[73] W. Kwon, J.Y. Kim, S. Suh, M.K. In, Simultaneous determination of creatinine and uric acid in
urine by liquid chromatography-tandem mass spectrometry with polarity switching electrospray
ionization, Forensic Sci. Int., 221 (2012) 57-64.
[74] D.J. Harvey, Derivatization of carbohydrates for analysis by chromatography; electrophoresis
and mass spectrometry, J. Chromatogr. B, 879 (2011) 1196-1225.
Introduction
42
[75] G.L. Li, J.M. You, Y.R. Suo, C.H. Song, Z.W. Sun, L.A. Xia, X.N. Zhao, J.Y. Shi, A developed
pre-column derivatization method for the determination of free fatty acids in edible oils by
reversed-phase HPLC with fluorescence detection and its application to Lycium barbarum
seed oil, Food Chem., 125 (2011) 1365-1372.
[76] G.H. Zheng, W.W. Jin, P. Fan, X.N. Feng, Y. Bai, T. Tao, L.J. Yu, A novel method for
detecting amino acids derivatized with phenyl isothiocyanate by high-performance liquid
chromatography-electrospray ionization mass spectrometry, Int J. Mass Spectrom., 392
(2015) 1-6.
[77] G. Flesch, N. Tominaga, P. Degen, Improved Determination of the Bisphosphonate
Pamidronate Disodium in Plasma and Urine by Precolumn Derivatization with Fluorescamine,
High-Performance Liquid-Chromatography and Fluorescence Detection, J. Chromatogr.
Biomed., 568 (1991) 261-266.
[78] M. Wedig, N. Novatchev, T. Worch, S. Laug, U. Holzgrabe, Evaluation of the impurity profile of
alcuronium by means of capillary electrophoresis, J. Pharm. Biomed. Anal., 28 (2002) 983-
990.
[79] N. Novatchev, U. Holzgrabe, Evaluation of amino sugar, low molecular peptide and amino
acid impurities of biotechnologically produced amino acids by means of CE, J. Pharm.
Biomed. Anal., 28 (2002) 475-486.
[80] Y. Bitar, U. Holzgrabe, Impurity profiling of atropine sulfate by microemulsion electrokinetic
chromatography, J. Pharm. Biomed. Anal., 44 (2007) 623-633.
[81] C. Borst, U. Holzgrabe, Comparison of chiral electrophoretic separation methods for
phenethylamines and application on impurity analysis, J. Pharm. Biomed. Anal., 53 (2010)
1201-1209.
[82] E.W. Taylor, M.G. Qian, G.D. Dollinger, Simultaneous on-line characterization of small organic
molecules derived from combinatorial libraries for identity, quantity, and purity by reversed-
phase HPLC with chemiluminescent nitrogen, UV, and mass spectrometric detection, Anal.
Chem., 70 (1998) 3339-3347.
[83] P.H. Gamache, R.S. McCarthy, S.M. Freeto, D.J. Asa, M.J. Woodcock, K. Laws, R.O. Cole,
HPLC analysis of non-volatile analytes using charged aerosol detection, LCGC N. Am., 18
(2005) 345-354.
[84] M.S. Qureshi, S.S. Bhongale, A.K. Thorave, Determination of organic acid impurities in lactic
acid obtained by fermentation of sugarcane juice, J. Chromatogr. A, 1218 (2011) 7147-7157.
References
43
[85] U. Holzgrabe, C.J. Nap, S. Almeling, Control of impurities in l-aspartic acid and l-alanine by
high-performance liquid chromatography coupled with a corona charged aerosol detector, J.
Chromatogr. A, 1217 (2010) 294-301.
[86] K. Petritis, C. Elfakir, M. Dreux, A comparative study of commercial liquid chromatographic
detectors for the analysis of underivatized amino acids, J. Chromatogr. A, 961 (2002) 9-21.
[87] U. Holzgrabe, C.J. Nap, N. Kunz, S. Almeling, Identification and control of impurities in
streptomycin sulfate by high-performance liquid chromatography coupled with mass detection
and corona charged-aerosol detection, J. Pharm. Biomed. Anal., 56 (2011) 271-279.
[88] R.W. Stringham, M. Pennell, W. Cabri, G. Carzana, F. Giorgi, S. Lalli, G. Marazzi, M. Torri,
Identification of impurities in artemisinin, their behavior in high performance liquid
chromatography and implications for the quality of derived anti-malarial drugs, J. Chromatogr.
A, 1218 (2011) 6838-6842.
[89] D. Kyriakides, I. Panderi, Development and validation of a reversed-phase ion-pair high-
performance liquid chromatographic method for the determination of risedronate in
pharmaceutical preparations, Anal. Chim. Acta, 584 (2007) 153-159.
[90] H.J. Jia, W. Li, K. Zhao, Determination of risedronate in rat plasma samples by ion-pair high-
performance liquid chromatography with UV detector, Anal. Chim. Acta, 562 (2006) 171-175.
[91] H. Kubo, Y. Kobayashi, T. Kinoshita, Fluorescence Determination of Streptomycin in Serum
by Reversed-Phase Ion-Pairing Liquid-Chromatography, Anal. Chem., 58 (1986) 2653-2655.
[92] H. Wang, Z.J. Zhang, F. Xiong, L.Y. Wu, P. Li, W.C. Ye, Isolation and structure
characterization of related impurities in etimicin sulfate by LC/ESI-MSn and NMR, J. Pharm.
Biomed. Anal., 55 (2011) 902-907.
[93] V. Manyanga, O. Grishina, Z. Yun, J. Hoogmartens, E. Adams, Comparison of liquid
chromatographic methods with direct detection for the analysis of gentamicin, J. Pharm.
Biomed. Anal., 45 (2007) 257-262.
[94] R. Grahek, L. Zupančič-Kralj, Identification of gentamicin impurities by liquid chromatography
tandem mass spectrometry, J. Pharm. Biomed. Anal., 50 (2009) 1037-1043.
[95] M.N. Kumar, K.S.R.P. Kumar, V.J. Kumar, S.J. Prasanna, H.K. Sharma, V.K. Reddy, Stability
indicating ion chromatography method for the simultaneous determination of ibandronate
sodium drug substance and its impurities, J. Pharm. Biomed. Anal., 54 (2011) 596-601.
[96] J.A.B. Rodriguez, M.F. Desimone, S.L. Iglesias, S.A. Giorgieri, L.E. Diaz, Validation of a
capillary electrophoresis method for the analysis of ibandronate related impurities, J. Pharm.
Biomed. Anal., 44 (2007) 305-308.
Introduction
44
[97] A. Socia, J.P. Foley, Direct determination of amino acids by hydrophilic interaction liquid
chromatography with charged aerosol detection, J. Chromatogr. A, (2016)
[98] A. Stojanovic, M. Lämmerhofer, D. Kogelnig, S. Schiesel, M. Sturm, M. Galanski, R. Krachler,
B.K. Keppler, W. Lindner, Analysis of quaternary ammonium and phosphonium ionic liquids by
reversed-phase high-performance liquid chromatography with charged aerosol detection and
unified calibration, J. Chromatogr. A, 1209 (2008) 179-187.
[99] M.N. El-Attug, E. Adams, J. Hoogmartens, A. Van Schepdael, Capacitively coupled
contactless conductivity detection as an alternative detection mode in CE for the analysis of
kanamycin sulphate and its related substances, J. Sep. Sci., 34 (2011) 2448-2454.
[100] E. Kaale, A. Van Schepdael, E. Roets, J. Hoogmartens, Development and validation of a
simple capillary zone electrophoresis method for the analysis of kanamycin sulfate with UV
detection after pre-capillary derivatization, J. Chromatogr. A, 924 (2001) 451-458.
[101] V. Manyanga, R.L. Dhulipalla, J. Hoogmartens, E. Adams, Improved liquid chromatographic
method with pulsed electrochemical detection for the analysis of kanamycin, J. Chromatogr. A,
1217 (2010) 3748-3753.
[102] A. Fanigliulo, P. De Filippis, O. Curcuruto, P. Repeto, D. Roveda, M. Hartenstein, E. Adams,
D. Cabooter, Development and validation of a stability indicating method for S-carboxymethyl-
L-cysteine and related degradation products in oral syrup formulation, J. Pharm. Biomed.
Anal., 115 (2015) 39-47.
[103] H. Eastwood, F. Xia, M.C. Lo, J. Zhou, J.B. Jordan, J. McCarter, W.W. Barnhart, K.H. Gahm,
Development of a nucleotide sugar purification method using a mixed mode column & mass
spectrometry detection, J. Pharm. Biomed. Anal., 115 (2015) 402-409.
[104] L. Rystov, R. Chadwick, K. Krock, T. Wang, Simultaneous determination of Maillard reaction
impurities in memantine tablets using HPLC with charged aerosol detector, J. Pharm. Biomed.
Anal., 56 (2011) 887-894.
[105] K. Karthikeyan, G.T. Arularasu, V. Murali, K.C. Pillai, Identification, isolation, characterization
and response factor determination of process-related impurity in meprobamate drug
substance, J. Pharm. Biomed. Anal., 54 (2011) 208-212.
[106] A. Błażewicz, Z. Fijałek, K. Samsel, Determination of pipecuronium bromide and its impurities
in pharmaceutical preparation by high-performance liquid chromatography with coulometric
electrode array detection, J. Chromatogr. A, 1201 (2008) 191-195.
[107] A. Peepliwal, C.G. Bonde, K.G. Bothara, A validated RP-HPLC method for quantitative
determination of related impurities of ursodeoxycholic acid (API) by refractive index detection,
J. Pharm. Biomed. Anal., 54 (2011) 845-849.
References
45
[108] D. Lee, S. Rumbelow, S.K.R. Williams, Identification and quantitation of trace impurities in
fatty alcohol ethoxylates using HPLC and MALDI-TOF mass spectrometry, Anal. Chim. Acta,
654 (2009) 59-63.
[109] C.E. Roy, T. Kauss, S. Prevot, P. Barthelemy, K. Gaudin, Analysis of fatty acid samples by
hydrophilic interaction liquid chromatography and charged aerosol detector, J. Chromatogr. A,
1383 (2015) 121-126.
[110] I. Fradi, E. Farcas, A. Ben Said, M.L. Yans, C. Lamalle, G.W. Somsen, A. Prior, G.J. de Jong,
M. Kallel, J. Crommen, A.C. Servais, M. Fillet, In-capillary derivatization with (-)-1-(9-
fluorenyl)ethyl chloroformate as chiral labeling agent for the electrophoretic separation of
amino acids, J. Chromatogr. A, 1363 (2014) 338-347.
[111] R.J. Bopp, J.H. Kennedy, Practical Considerations for Chiral Separations of Pharmaceutical
Compounds, LC GC, 6 (1988) 514-522.
[112] W. Lindner, C. Leitner, G. Uray, Liquid-Chromatographic Separation of Enantiomeric
Alkanolamines Via Diastereomeric Tartaric Acid Monoesters, J. Chromatogr., 316 (1984) 605-
616.
[113] F. Lai, A. Mayer, T. Sheehan, Chiral Separation and Detection Enhancement of Propranolol
Using Automated Precolumn Derivatization, J. Pharm. Biomed. Anal., 11 (1993) 117-120.
[114] H. Brückner, R. Wittner, H. Godel, Automated Enantioseparation of Amino-Acids by
Derivatization with Ortho-Phthaldialdehyde and N-Acylated Cysteines, J. Chromatogr., 476
(1989) 73-82.
[115] H. Brückner, T. Westhauser, H. Godel, Liquid-Chromatographic Determination of D-Amino-
Acids and L-Amino-Acids by Derivatization with O-Phthaldialdehyde and N-Isobutyryl-L-
Cysteine - Applications with Reference to the Analysis of Peptidic Antibiotics, Toxins, Drugs
and Pharmaceutically Used Amino-Acids, J. Chromatogr. A, 711 (1995) 201-215.
[116] S. Einarsson, S. Folestad, B. Josefsson, Separation of Amino-Acid Enantiomers Using
Precolumn Derivatization with Ortho-Phthalaldehyde and 2,3,4,6-Tetra-O-Acetyl-1-Thio-Beta-
Glucopyranoside, J. Liq. Chromatogr., 10 (1987) 1589-1601.
[117] A. Jegorov, J. Triska, T. Trnka, M. Cerny, Separation of Alpha-Amino-Acid Enantiomers by
Reversed-Phase High-Performance Liquid-Chromatography after Derivatization with Ortho-
Phthaldialdehyde and a Sodium-Salt of 1-Thio-Beta-D-Glucose, J. Chromatogr. Biomed.
Appl., 434 (1988) 417-422.
[118] H. Brückner, C. Gah, High-Performance Liquid-Chromatographic Separation of dl-Amino
Acids Derivatized with Chiral Variants of Sanger Reagent, J. Chromatogr., 555 (1991) 81-95.
Introduction
46
[119] R. Bhushan, H. Brückner, Use of Marfey's reagent and analogs for chiral amino acid analysis:
Assessment and applications to natural products and biological systems, J. Chromatogr. B,
879 (2011) 3148-3161.
[120] N. Nimura, H. Ogura, T. Kinoshita, Reversed-Phase Liquid-Chromatographic Resolution of
Amino-Acid Enantiomers by Derivatization with 2,3,4,6-Tetra-O-Acetyl-Beta-D-Glucopyranosyl
Isothiocyanate, J. Chromatogr., 202 (1980) 375-379.
[121] W.H. Pirkle, T.C. Pochapsky, Chiral Stationary Phases for the Direct LC Separation of
Enantiomers, Adv. Chromatogr., 27 (1987) 73-127.
[122] W.H. Pirkle, T.C. Pochapsky, Considerations of Chiral Recognition Relevant to the Liquid-
Chromatographic Separation of Enantiomers, Chem. Rev., 89 (1989) 347-362.
[123] K. Petritis, A. Valleix, C. Elfakir, M. Dreux, Simultaneous analysis of underivatized chiral amino
acids by liquid chromatography-ionspray tandem mass spectrometry using a teicoplanin chiral
stationary phase, J. Chromatogr. A, 913 (2001) 331-340.
[124] M.H. Hyun, J.S. Jin, W.J. Lee, Liquid chromatographic resolution of racemic amino acids and
their derivatives on a new chiral stationary phase based on crown ether, J. Chromatogr. A,
822 (1998) 155-161.
[125] M.H. Hyun, J.S. Jin, S.C. Han, Y.J. Cho, The effect of analyte lipophilicity on the resolution of
alpha-amino acids on a HPLC chiral stationary phase based on crown ether, Microchem. J.,
70 (2001) 205-209.
[126] M.H. Hyun, S.C. Han, B.H. Lipshutz, Y.J. Shin, C.J. Welch, New chiral crown ether stationary
phase for the liquid chromatographic resolution of alpha-amino acid enantiomers, J.
Chromatogr. A, 910 (2001) 359-365.
[127] G. Galaverna, R. Corradini, E. Demunari, A. Dossena, R. Marchelli, Chiral Separation of
Unmodified Amino-Acids by Ligand-Exchange High-Performance Liquid-Chromatography
Using Copper(II) Complexes of L-Amino-Acid Amides as Additives to the Eluent, J.
Chromatogr. A, 657 (1993) 43-54.
[128] T. Zhang, E. Holder, P. Franco, W. Lindner, Method development and optimization on
cinchona and chiral sulfonic acid-based zwitterionic stationary phases for enantiomer
separations of free amino acids by high-performance liquid chromatography, J. Chromatogr.
A, 1363 (2014) 191-199.
[129] I. Ilisz, A. Aranyi, Z. Pataj, A. Péter, Recent advances in the direct and indirect liquid
chromatographic enantioseparation of amino acids and related compounds: A review, J.
Pharm. Biomed. Anal., 69 (2012) 28-41.
References
47
[130] X.Y. Mu, L. Qi, J. Qiao, X.Z. Yang, H.M. Ma, Enantioseparation of dansyl amino acids and
dipeptides by chiral ligand exchange capillary electrophoresis based on Zn(II)-L-
hydroxyproline complexes coordinating with gamma-cyclodextrins, Anal. Chim. Acta, 846
(2014) 68-74.
[131] X.Y. Mu, L. Qi, H.Z. Zhang, Y. Shen, J. Qiao, H.M. Ma, Ionic liquids with amino acids as
cations: Novel chiral ligands in chiral ligand-exchange capillary electrophoresis, Talanta, 97
(2012) 349-354.
[132] A. Giuffrida, G. Maccarrone, V. Cucinotta, S. Orlandini, A. Contino, Recent advances in chiral
separation of amino acids using capillary electromigration techniques, J. Chromatogr. A, 1363
(2014) 41-50.
[133] S. Terabe, K. Otsuka, H. Nishi, Separation of Enantiomers by Capillary Electrophoretic
Techniques, J. Chromatogr. A, 666 (1994) 295-319.
[134] B.D. Wu, Q.Q. Wang, L. Guo, R. Shen, J.W. Xie, L.H. Yun, B.H. Zhong, Amino-substituted
beta-cyclodextrin copper(II) complexes for the electrophoretic enantioseparation of dansyl
amino acids: Role of dual chelate-inclusion interaction and mechanism, Anal. Chim. Acta, 558
(2006) 80-85.
[135] X.N. Lu, Y. Chen, L. Guo, Y.F. Yang, Chiral separation of underivatized amino acids by ligand-
exchange capillary electrophoresis using a copper(II)-l-lysine complex as selector, J.
Chromatogr. A, 945 (2002) 249-255.
[136] V. Cucinotta, A. Giuffrida, G. Grasso, G. Maccarrone, G. Vecchio, Ligand exchange chiral
separations by cyclodextrin derivatives in capillary electrophoresis, Analyst., 128 (2003) 134-
136.
[137] M.V. Rekharsky, Y. Inoue, Complexation thermodynamics of cyclodextrins, Chem. Rev., 98
(1998) 1875-1917.
[138] J.L. Clark, J.J. Stezowski, Molecular recognition in cyclodextrin complexes of amino acid
derivatives. 1. Crystallographic studies of beta-cyclodextrin complexes with N-acetyl-L-
phenylalanine methyl ester and N-acetyl-L-phenylalanine amide pseudopeptides, J. Am.
Chem. Soc., 123 (2001) 9880-9888.
[139] B. Chankvetadze, G. Endresz, G. Blaschke, Charged cyclodextrin derivatives as chiral
selectors in capillary electrophoresis, Chem. Soc. Rev., 25 (1996) 141-&.
[140] C. Schonbeck, P. Westh, R. Holm, Complexation Thermodynamics of Modified Cyclodextrins:
Extended Cavities and Distorted Structures, J. Phys. Chem. B, 118 (2014) 10120-10129.
[141] P. Zakaria, M. Macka, P.R. Haddad, Selectivity control in the separation of aromatic amino
acid enantiomers with sulphated beta-cyclodextrin, J. Chromatogr. A, 1031 (2004) 179-186.
Introduction
48
[142] F. Kitagawa, K. Otsuka, Recent progress in capillary electrophoretic analysis of amino acid
enantiomers, J. Chromatogr. B, 879 (2011) 3078-3095.
[143] Product information available from Wacker Chemie AG.
http://www.wacker.com/cms/de/products/ (accessed 12/04/2016)
[144] B.D. Wagner, G.J. McManus, Enhancement of the fluorescence and stability of o-
phthalaldehyde-derived isoindoles of amino acids using hydroxypropyl-beta-cyclodextrin, Anal.
Biochem., 317 (2003) 233-239.
[145] C. Hellriegel, H. Händel, M. Wedig, S. Steinhauer, F. Sörgel, K. Albert, U. Holzgrabe, Study on
the chiral recognition of the enantiomers of ephedrine derivatives with neutral and sulfated
heptakis(2,3-O-diacetyl)-beta-cyclodextrins using capillary electrophoresis, UV, nuclear
magnetic resonance spectroscopy and mass spectrometry, J. Chromatogr. A, 914 (2001) 315-
324.
[146] M. Wedig, S. Laug, T. Christians, M. Thunhorst, U. Holzgrabe, Do we know the mechanism of
chiral recognition between cyclodextrins and analytes?, J. Pharm. Biomed. Anal., 27 (2002)
531-540.
[147] X.N. Lu, Y. Chen, Chiral separation of amino acids derivatized with fluoresceine-5-
isothiocyanate by capillary electrophoresis and laser-induced fluorescence detection using
mixed selectors of beta-cyclodextrin and sodium taurocholate, J. Chromatogr. A, 955 (2002)
133-140.

49
B
B. Aim of the work
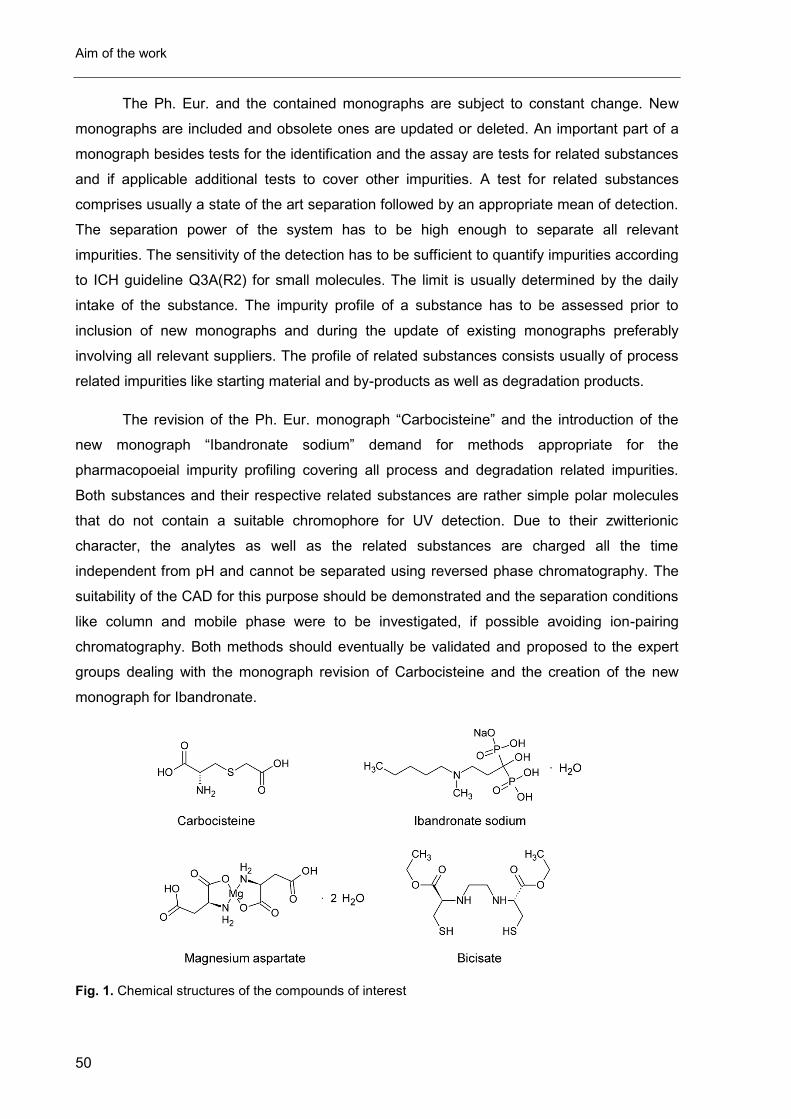
Aim of the work
50
The Ph. Eur. and the contained monographs are subject to constant change. New
monographs are included and obsolete ones are updated or deleted. An important part of a
monograph besides tests for the identification and the assay are tests for related substances
and if applicable additional tests to cover other impurities. A test for related substances
comprises usually a state of the art separation followed by an appropriate mean of detection.
The separation power of the system has to be high enough to separate all relevant
impurities. The sensitivity of the detection has to be sufficient to quantify impurities according
to ICH guideline Q3A(R2) for small molecules. The limit is usually determined by the daily
intake of the substance. The impurity profile of a substance has to be assessed prior to
inclusion of new monographs and during the update of existing monographs preferably
involving all relevant suppliers. The profile of related substances consists usually of process
related impurities like starting material and by-products as well as degradation products.
The revision of the Ph. Eur. monograph “Carbocisteine” and the introduction of the
new monograph “Ibandronate sodium” demand for methods appropriate for the
pharmacopoeial impurity profiling covering all process and degradation related impurities.
Both substances and their respective related substances are rather simple polar molecules
that do not contain a suitable chromophore for UV detection. Due to their zwitterionic
character, the analytes as well as the related substances are charged all the time
independent from pH and cannot be separated using reversed phase chromatography. The
suitability of the CAD for this purpose should be demonstrated and the separation conditions
like column and mobile phase were to be investigated, if possible avoiding ion-pairing
chromatography. Both methods should eventually be validated and proposed to the expert
groups dealing with the monograph revision of Carbocisteine and the creation of the new
monograph for Ibandronate.
Fig. 1. Chemical structures of the compounds of interest
Aim of the work
51
A method for the analysis of related substances of the 99mTc chelating amino acid
derivative Bicisate should be developed and validated. The substance is a rather lipophilic
ester without strong chromophores. The related substances (precursors, by-products and
degradants) are very hydrophilic, ionizable and some are semi-volatile. A suitable stationary
phase should be combined with UV-CAD detection to cover all possible impurities.
The enantiomeric purity of magnesium-L-aspartate dihydrate was to be investigated.
The reason for partial racemization during the synthesis should be studied and analytical
methods appropriate for the purity assessment in the Ph. Eur. were to be developed and
validated.

Aim of the work
52

53
C
C. Results
54
1. Impurity profiling of carbocisteine by HPLC-CAD, qNMR and
UV/vis spectroscopy
Wahl, O., Holzgrabe, U.
Reprinted with permission from
Journal of Pharmaceutical and Biomedical Analysis 95 (2014) 1-10
ABSTRACT
For the impurity profiling of the mucolytic and anti-inflammatory drug carbocisteine a
high performance liquid chromatographic (HPLC) method using corona charged aerosol
detection (CAD) was developed and fully validated following the ICH guideline Q2(R1). The
response was linear (R2> 0.995) over a small concentration range (0.05–0.25 or 0.10–0.60 %
respectively) and a detection limit of at least 0.03% was registered. The separation was
achieved on a mixed mode column combining hydrophobic C18 and strong cation exchange
retention mechanisms using a mass spectrometer compatible volatile mobile phase
consisting of trifluoroacetic acid 10 mM and acetonitrile 12 % (V/V). Impurities, not
assessable by HPLC-CAD such as the volatile chloroacetic acid and the unstable cysteine,
were determined by quantitative NMR (qNMR) with maleic acid as internal standard and
UV/vis spectroscopy after reaction with Ellman’s reagent, respectively. Six batches of three
different manufacturers were tested by means of those methods. The purity varied from
below 99.0 to higher than 99.8 per cent. The major impurities of all batches were the starting
material cystine and N,S-dicarboxymethylcysteine being a synthesis by-product
Abbreviations: CAD, corona charged aerosol detector; COPD, chronic obstructive
lung disease; Ph. Eur., European Pharmacopoeia; AAs, amino acids; OPA, ortho-
phthalaldehyde; FMOC, fluorenylmethyloxycarbonyl chloride; DABS-Cl,
dimethylaminoazobenzene-4-sulfonyl chloride; PITC, phenyl isothiocyanate; CBQCA, 3-(4-
carboxybenzoyl)quinolone-2-carboxaldehyde; API, active pharmaceutical ingredient; AAA,
amino acid analyzer; ELSD, evaporative light scattering detector; CLND, chemiluminescent
nitrogen detector; qNMR, quantitative NMR; DTNB, 5,5-dithiobis(2-nitrobenzoic acid); TFA,
trifluoroacetic acid; ICH, International Conference on Harmonisation; R2, coefficient of
determination; S/N, signal-to-noise ratio.
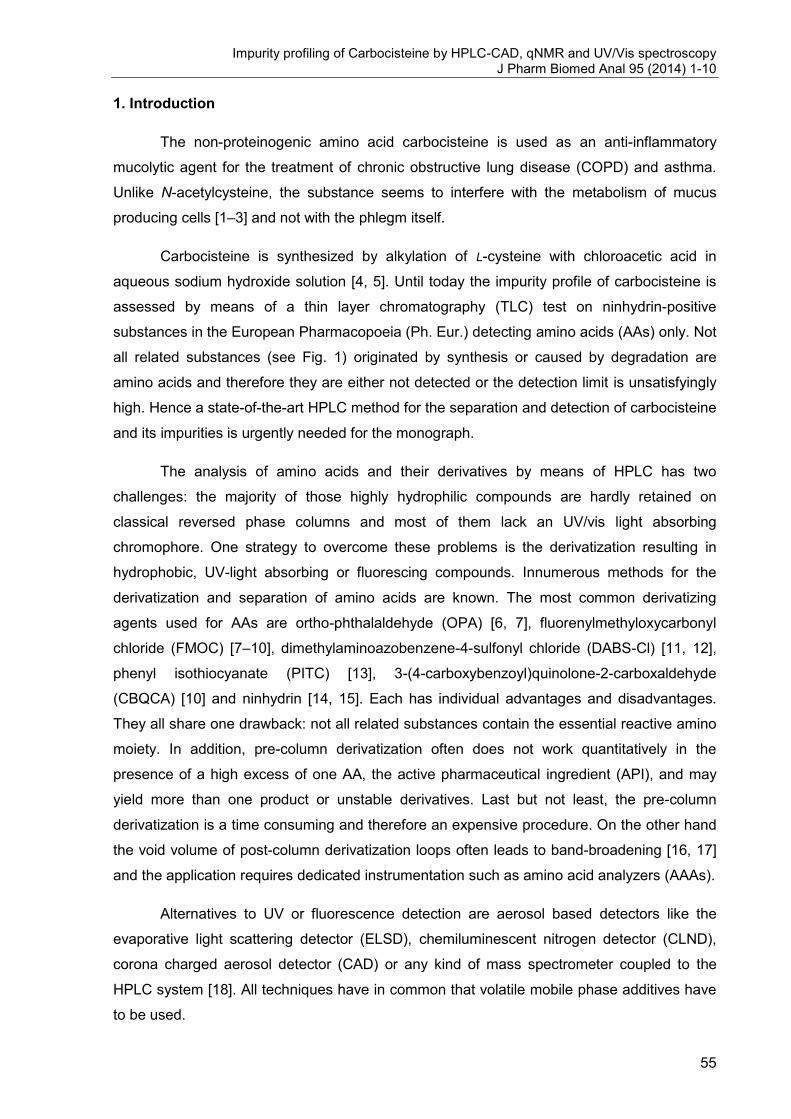
Impurity profiling of Carbocisteine by HPLC-CAD, qNMR and UV/Vis spectroscopy J Pharm Biomed Anal 95 (2014) 1-10
55
1. Introduction
The non-proteinogenic amino acid carbocisteine is used as an anti-inflammatory
mucolytic agent for the treatment of chronic obstructive lung disease (COPD) and asthma.
Unlike N-acetylcysteine, the substance seems to interfere with the metabolism of mucus
producing cells [1–3] and not with the phlegm itself.
Carbocisteine is synthesized by alkylation of L-cysteine with chloroacetic acid in
aqueous sodium hydroxide solution [4, 5]. Until today the impurity profile of carbocisteine is
assessed by means of a thin layer chromatography (TLC) test on ninhydrin-positive
substances in the European Pharmacopoeia (Ph. Eur.) detecting amino acids (AAs) only. Not
all related substances (see Fig. 1) originated by synthesis or caused by degradation are
amino acids and therefore they are either not detected or the detection limit is unsatisfyingly
high. Hence a state-of-the-art HPLC method for the separation and detection of carbocisteine
and its impurities is urgently needed for the monograph.
The analysis of amino acids and their derivatives by means of HPLC has two
challenges: the majority of those highly hydrophilic compounds are hardly retained on
classical reversed phase columns and most of them lack an UV/vis light absorbing
chromophore. One strategy to overcome these problems is the derivatization resulting in
hydrophobic, UV-light absorbing or fluorescing compounds. Innumerous methods for the
derivatization and separation of amino acids are known. The most common derivatizing
agents used for AAs are ortho-phthalaldehyde (OPA) [6, 7], fluorenylmethyloxycarbonyl
chloride (FMOC) [7–10], dimethylaminoazobenzene-4-sulfonyl chloride (DABS-Cl) [11, 12],
phenyl isothiocyanate (PITC) [13], 3-(4-carboxybenzoyl)quinolone-2-carboxaldehyde
(CBQCA) [10] and ninhydrin [14, 15]. Each has individual advantages and disadvantages.
They all share one drawback: not all related substances contain the essential reactive amino
moiety. In addition, pre-column derivatization often does not work quantitatively in the
presence of a high excess of one AA, the active pharmaceutical ingredient (API), and may
yield more than one product or unstable derivatives. Last but not least, the pre-column
derivatization is a time consuming and therefore an expensive procedure. On the other hand
the void volume of post-column derivatization loops often leads to band-broadening [16, 17]
and the application requires dedicated instrumentation such as amino acid analyzers (AAAs).
Alternatives to UV or fluorescence detection are aerosol based detectors like the
evaporative light scattering detector (ELSD), chemiluminescent nitrogen detector (CLND),
corona charged aerosol detector (CAD) or any kind of mass spectrometer coupled to the
HPLC system [18]. All techniques have in common that volatile mobile phase additives have
to be used.
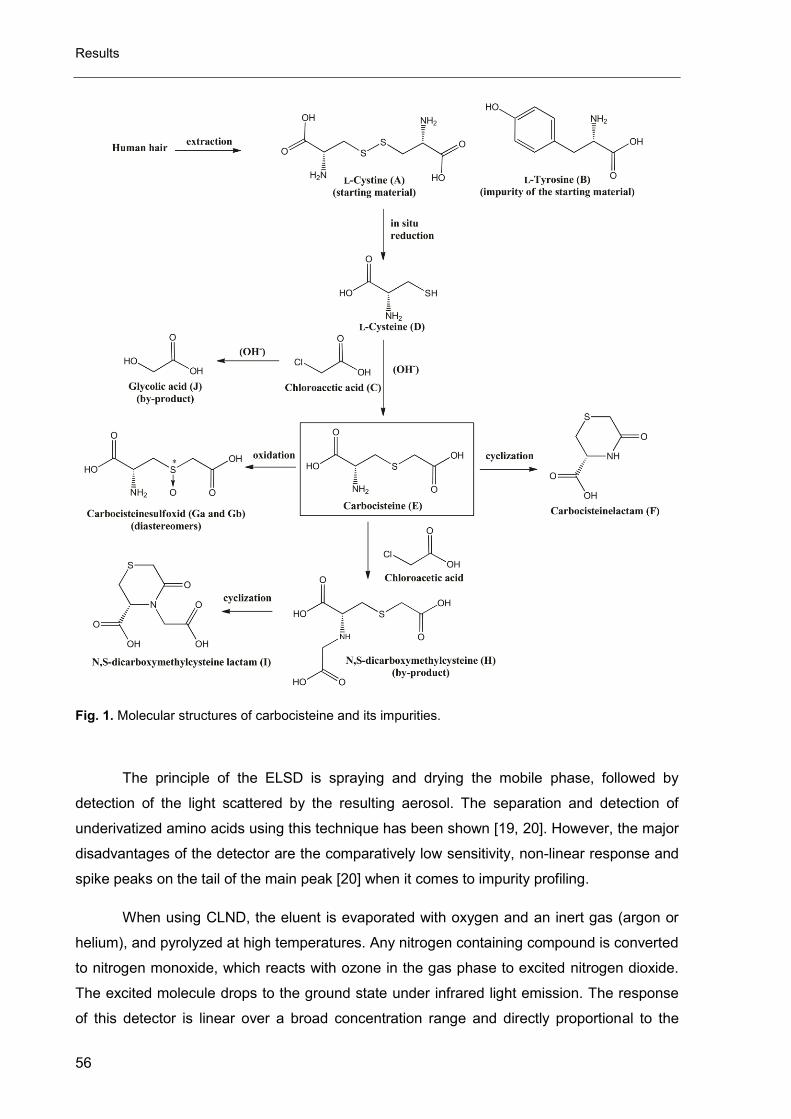
Results
56
Fig. 1. Molecular structures of carbocisteine and its impurities.
The principle of the ELSD is spraying and drying the mobile phase, followed by
detection of the light scattered by the resulting aerosol. The separation and detection of
underivatized amino acids using this technique has been shown [19, 20]. However, the major
disadvantages of the detector are the comparatively low sensitivity, non-linear response and
spike peaks on the tail of the main peak [20] when it comes to impurity profiling.
When using CLND, the eluent is evaporated with oxygen and an inert gas (argon or
helium), and pyrolyzed at high temperatures. Any nitrogen containing compound is converted
to nitrogen monoxide, which reacts with ozone in the gas phase to excited nitrogen dioxide.
The excited molecule drops to the ground state under infrared light emission. The response
of this detector is linear over a broad concentration range and directly proportional to the
Impurity profiling of Carbocisteine by HPLC-CAD, qNMR and UV/Vis spectroscopy J Pharm Biomed Anal 95 (2014) 1-10
57
number of nitrogen atoms in the molecule [21, 22]. The CLND was successfully applied to
the separation and detection of free amino acids when using a reversed phase
chromatography with pentadecafluorooctanoic acid as an ion pair reagent [23].
The detection mechanism of the CAD comprises the formation of an aerosol of the
column effluent and the transfer of positively charged nitrogen molecules to the aerosol
particles with subsequent amperometric detection of those charged particles. The detector
response is more or less independent of the molecular structure but highly dependent on the
molecules’ physical properties like vapor pressure so that only non-volatile substances can
be detected [24]. Unlike the CLND, the CAD is able to detect a wider spectrum of
substances, like organic acids or aminoglycosides [25], which makes it a good choice for a
test for related substances [26]. In contrast to the ELSD, the CAD has an almost linear
response in a small dedicated concentration range of about two orders of magnitude [27, 28]
which is usually sufficient for impurity assessment when an external standard at an
appropriate concentration is used. For both detectors, the response depends on the
concentration of organic modifier in the mobile phase. This leads to a loss of the universal
response, when running a gradient separation. A counter gradient can compensate for this
loss of sensitivity [29].Alternatively an isocratic elution protocol has to be applied.
The aim of this study was to determine the content of carbocisteine and to assess the
amount of its related substances, i.e. cystine, tyrosine, cysteine, chloroacetic acid,
carbocisteinelactam, carbocisteinesulfoxid and N,S-dicarboxymethylcysteine (see Fig. 1).
Since the CAD allows for volatile mobile phases only and volatile ion pairing agents create
problems when it comes to validation, a mixed mode column with embedded strong cation
exchanger, which made ion pair chromatography unnecessary, was used. The pros and cons
of this method will be discussed.
Results
58
2. Experimental
2.1. Chemicals and reagents
The carbocisteine reference standard, all impurities (except C and J see Fig. 1), and
batch samples were obtained from the European Directorate for the Quality of Medicines &
Health-Care (EDQM) (Strasbourg, France). HPLC grade acetonitrile and 0.1 M hydrochloric
acid were purchased from VWR International S.A.S. (Fontenay-sous-Bois, France), glycolic
acid, trifluoroacetic acid, ammonium hydroxide solution (28–30%), 5,5’-dithiobis(2-
nitrobenzoic acid), sodium deuteroxide (NaOD) 40 wt% in D2O (99.5% D-atom) and maleic
acid standard for quantitative NMR (qNMR) (TraceCERT®) from Sigma–Aldrich Chemie
GmbH (Steinheim, Germany). Deuterium oxide (99.9% D-atom) was obtained from Deutero
GmbH (Kastellaun, Germany). Potassium dihydrogen phosphate was acquired from
Grüssing GmbH (Filsum, Germany). We purchased sodium hydroxide solution 50% and
chloroacetic acid from Merck KGaA (Darmstadt, Germany). All chemicals used for
quantification were of analytical grade or even better. Ultra-pure water was produced by a
water purification system from Merck Millipore (Schwalbach, Germany). All solutions were
filtered through a 0.22 µm PTFE filter supplied by Machery-Nagel GmbH & Co. KG (Düren,
Germany) prior to use.
2.2. Apparatus
The HPLC was performed on an Agilent 1200 modular chromatographic system
consisting of online vacuum degasser, binary pump, auto sampler, thermostatted column
compartment and a photo-diode array detector (Agilent Technologies, Waldbronn,
Germany).The Corona CAD detector (Thermo Fisher, Courtaboeuf, France) was linked to the
HPLC system by a 0.25 mm internal diameter PEEK capillary and a 0.22 µm stainless steel
inlet-frit. Highly pure nitrogen for the detector was produced by a Nitrogen Generator
(Thermo Fisher, Courtaboeuf, France). The inlet pressure (nitrogen) was 35.0 psi. The peak
areas were integrated automatically using the Agilent ChemStation® Rev B.03.02 software
program.
The experiment with post-column addition of acetonitrile was performed on a Dionex
UltiMate®3000 X2 chromatographic system (Dionex, Courtaboeuf, France) equipped with a
ternary pump, an online degasser, a thermostatted autosampler, a thermostatted column
compartment and a single wavelength UV/vis detector. Acetonitrile was added via a mixing-
tee installed between detector and column. Detection was performed with a Corona CAD
ultra RS (Thermo Fisher, Courtaboeuf, France). Gas inlet pressure (nitrogen) was 35.0 psi.
The detection range was set to 100 pA and filter to “none”. Nebulizer was set to 35 °C. The
chromatograms were processed using Waters Empower®2 build 2154 software program.
Impurity profiling of Carbocisteine by HPLC-CAD, qNMR and UV/Vis spectroscopy J Pharm Biomed Anal 95 (2014) 1-10
59
Mass spectrometry experiments were performed on a LC/MSD Trap G2445D ESI ion
trap (Agilent Technologies, Waldbronn, Germany) with an syringe pump KDS100 (KD
Scientific, Holliston MA, USA) coupled to the electro spray ionization (ESI) interface. The flow
rate was 40 µL/h. Nebulizer pressure: 15 psi, dry gas flow: 5 L/min, dry temperature: 325 °C,
capillary voltage 3500 V, collision gas: helium. All NMR experiments were carried out on a
Bruker Avance® (Karlsruhe, Germany; 1H 400.132 MHz 13C 100.613 MHz). The spectra were
processed using Bruker TopSpin v3.0 software program. 1H NMR experiments were
performed with 64 scans at a sample spinning frequency of 20 Hz, 300 K and a flip angle of
30 °, whereas 13C NMR was measured with 1024 scans with 1H decoupling and rotation
(20 Hz). The experiments were carried out with broad band observer (BBO BB-H 5 mm)
probe. The content of chloroacetic and glycolic acid (C and J) was determined with inverted
broad band observer probe (BBI BB-H 5 mm) at 300 K using 32 scans without rotation and a
flip angle of 30 ° observing the 1H nuclei. The relaxation delay between two scans was set to
60 s. Spectral width of 20.55 ppm and transmitter offset at 6.175 ppm was applied.
UV/vis absorption spectroscopy experiments were performed on a Shimadzu UVmini-
1240 UV/vis spectroscop (Shimadzu Deutschland GmbH, Duisburg, Germany).
2.3. Chromatographic procedure
A mixed mode column SIELC Primesep®100 (250 mm × 4.6 mm i.d., with a particle
size of 5 µm and pore size of 100 Å, SIELC Technologies, Prospect Heights IL, USA) was
used as stationary phase. The Agilent chromatographic system was operated isocratically at
20 °C using a mobile phase composed of aqueous TFA (1 %, V/V)–acetonitrile–water
(8:12:80, V/V/V), a flow-rate of 1.3 mL/min and CAD detection with the filter set to “high”. The
injection volume was 20 µL.
2.3.1 Preparation of solutions
For the sample solutions 50 mg of carbocisteine were dissolved in 0.3 mL of a 30 g/L
ammonia solution and diluted with water to 10.0 mL, resulting in a pH of approx. 8.75. The
sample solutions were prepared immediately before analysis. The reference solution is
produced by dilution of the sample solution 1:1000 (0.1%) with water. The system suitability
solution is prepared as follows: 10 mg of carbocisteine, cystine and tyrosine were dissolved
in 0.25 ml of a 40 g/L sodium hydroxide solution and diluted to 50.0 mL with water.5.0 mL of
this solution were diluted to 100.0 mL with water. For the impurity stock solutions, 2.5 mg of
each impurity, except tyrosine, were individually dissolved in water and diluted to 10.0 mL
with the same solvent. 2.5 mg of tyrosine were dissolved in 0.15 mL of a 30 g/L ammonia
solution and diluted to 10.0 mL with water. The stock solutions were stored at 2–8 °C,
Results
60
protected from light and daily diluted to an appropriate concentration with water or were used
for spiking sample solutions.
2.4. Quantitative determination of chloroacetic and glycolic acid
80.0 mg of carbocisteine and 2.5 mg of maleic acid were dissolved in a mixture of
720 µL D2O and 80 µL sodium deuteroxide (40 %, w/V in D2O). The sample solutions were
immediately subjected to quantitative NMR analysis. After manual phase and automatic
baseline correction, the methylene singlet of chloroacetic acid at 4.07 ppm (2H), methylene
singlet of glycolic acid at 3.95 ppm (2H) and the methine protons singlet of maleic acid at
6.02 ppm (2H) were integrated and quantified using the following relationship:
w(C,J)= MW(C,J)
MW(IS)×
A(C,J)
A(IS)×
m(IS)
m(E)×100 (1)
where MW(C, J) and MW(IS) are the molecular weights in g/mol and A(C, J) and
A(IS) are the areas for the selected NMR signals of the examined impurity (C, J) and maleic
acid (IS), respectively. The masses (weights) in mg of maleic acid (IS) and carbocisteine (E)
are m(IS) and m(E). The examined impurity content is then expressed by w(C, J) in per cent.
2.5. NMR spectra of di-sodium N,S-dicarboxymethylcysteinelactam and the free acid
Free acid (H): 10 mg of tri-sodium-N,S-dicarboxymethylcysteine in 700 µL deuterium
oxide. This solution was subjected to NMR studies immediately after preparation. 1H NMR
(D2O, δ (ppm), J (Hz)): 2.77 (d, 2H, -CH2CH-, J=6.4), 3.07-3.18 (m, 2H, HOOC-CH2-S-), 3.20
(s, 2H, -NH-CH2-COOH), 3.22 (t, 1H, -CH2CH-, J=6.4). 13C NMR (D2O, δ (ppm)): 34.89
(-CH2CH-), 37.23 (-S-CH2-COOH), 50.74 (-NH-CH2-COOH), 61.99 (-CH2CH-), 178.06
(HOOC-CH2-S-), 178.52 (-CH2CH-COOH), 179.60 (-NH-CH2-COOH). MS (neg. ESI): m/z
236
Lactam (I): 9 mg of tri-sodium-N,S-dicarboxymethylcysteine were dissolved in 10 mL
0.1 M hydrochloric acid and stirred for two weeks at room temperature. The solution was
neutralized with aqueous sodium hydroxide solution 0.1 M, the pH set to 8.75 and
lyophilized. The residue was dissolved in 700 µL of deuterium oxide and subjected to NMR
studies immediately. 1H NMR (D2O, δ (ppm), J (Hz)): 3.05-3.09 (m, -CH2CH-), 3.21 (d, 1H,
J=17.4, S-CH2-C=O), 3.22 (d, 1H, J=17.0, N-CH2-COOH), 3.26-3.31 (m, -CH2CH-),
3.57 (d, 1H, J=17.4, S-CH2-C=O), 4.27 (t, 1H, J=3.8, -CH-CH2-NC=O), 4.51 (d, 1H, J=17.1,
N-CH2-COOH). 13C NMR (D2O, δ (ppm)): 28.18 (-CH2CH-), 29.35 (S-CH2-C=O), 52.45
(N-CH2-COOH), 65.02 (O=CN-CH-CH2), 168.33 (-N-C=O), 175.80 (-CH2CH-COOH), 176.50
(-N-CH2-COOH). MS (neg. ESI): m/z 218
Impurity profiling of Carbocisteine by HPLC-CAD, qNMR and UV/Vis spectroscopy J Pharm Biomed Anal 95 (2014) 1-10
61
2.6. Determination of cysteine
The test is based on the redox reaction of cysteine with 5,5’-dithiobis(2-nitrobenzoic
acid) (DTNB) at alkaline pH [30, 31], was developed and validated at Moehs Ibérica S.L.
(Rubí, Spain) (personal communication). The absorbance at 410 nm was read exactly 300 s
after the addition of 0.5 mL reagent solution to the sample, reference or blank solution. The
content cysteine was calculated using the following equation:
w(D) = c(ref) ∙ Abs(sample)
c(E) ∙ Abs(ref)×100 (2)
where c(ref) and c(E) are the concentrations in mg/mL of cysteine in the reference
solution and carbocisteine in the sample solution, respectively. Abs(sample) and Abs(ref) are
the absorbances of the sample and the reference solution. The content of cysteine is then
expressed by w(D) in per cent.
2.6.1. Preparation of solutions
The buffer solution pH 8.0 was prepared by mixing 500.0 mL of a 0.2 M aqueous
potassium dihydrogen phosphate solution with 468.0 mL of a 0.2 M aqueous sodium
hydroxide solution. The resulting solution was diluted with water to 2000.0 mL. The sample
solution was prepared by dissolving 200 mg of carbocisteine in 1.0 ml of a sodium hydroxide
solution (40 g/L) and subsequent dilution to 20.0 mL with buffer solution pH 8.0. For the
reference solution, 58.0 mg of cysteine hydrochloride monohydrate CRS were dissolved in
buffer solution pH 8.0 and diluted to 100.0 mL with the same solvent. 0.25 mL of this solution
was diluted to 20.0 ml with buffer solution pH 8.0. The reagent solution was prepared by dis-
solving 40.0 mg of DTNB in buffer solution pH 8.0 and subsequent dilution to 10.0 mL with
the same solvent.
3. Results and discussion discussion
3.1. HPLC method development
3.1.1. Chromatographic procedure
The mixed mode column combines reversed phase retention mechanism with strong
cation exchange due to the embedded sulfonic acid entities. When operating the column with
acidic mobile phases, neutral compounds or carboxylic acids, i.e. carbocisteinelactam, are
retained by the reversed phase mechanism whereas hydrophilic basic substances such as
carbocisteine and cystine are separated by the cation exchange mechanism. Lipophilic basic
com-pounds, i.e. tyrosine, are retained by both mechanisms. The influence of temperature,
acetonitrile, trifluoroacetic acid (TFA) and flow-rate was studied in order to optimize the
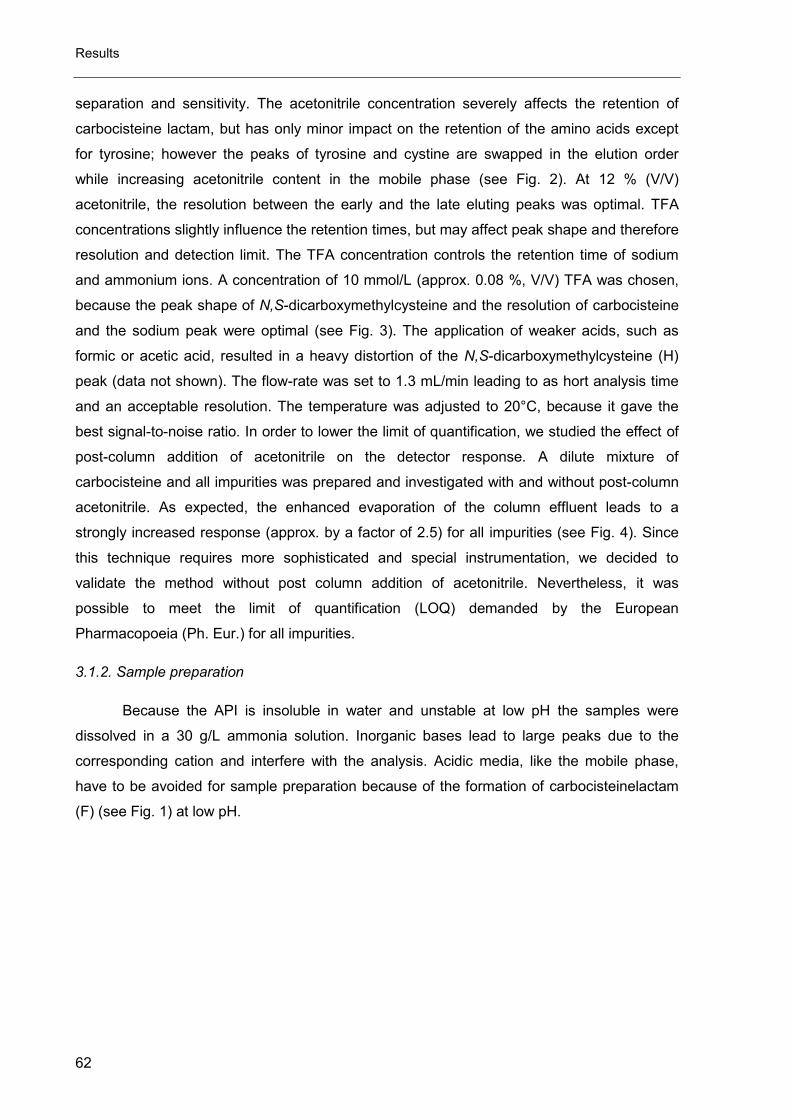
Results
62
separation and sensitivity. The acetonitrile concentration severely affects the retention of
carbocisteine lactam, but has only minor impact on the retention of the amino acids except
for tyrosine; however the peaks of tyrosine and cystine are swapped in the elution order
while increasing acetonitrile content in the mobile phase (see Fig. 2). At 12 % (V/V)
acetonitrile, the resolution between the early and the late eluting peaks was optimal. TFA
concentrations slightly influence the retention times, but may affect peak shape and therefore
resolution and detection limit. The TFA concentration controls the retention time of sodium
and ammonium ions. A concentration of 10 mmol/L (approx. 0.08 %, V/V) TFA was chosen,
because the peak shape of N,S-dicarboxymethylcysteine and the resolution of carbocisteine
and the sodium peak were optimal (see Fig. 3). The application of weaker acids, such as
formic or acetic acid, resulted in a heavy distortion of the N,S-dicarboxymethylcysteine (H)
peak (data not shown). The flow-rate was set to 1.3 mL/min leading to as hort analysis time
and an acceptable resolution. The temperature was adjusted to 20°C, because it gave the
best signal-to-noise ratio. In order to lower the limit of quantification, we studied the effect of
post-column addition of acetonitrile on the detector response. A dilute mixture of
carbocisteine and all impurities was prepared and investigated with and without post-column
acetonitrile. As expected, the enhanced evaporation of the column effluent leads to a
strongly increased response (approx. by a factor of 2.5) for all impurities (see Fig. 4). Since
this technique requires more sophisticated and special instrumentation, we decided to
validate the method without post column addition of acetonitrile. Nevertheless, it was
possible to meet the limit of quantification (LOQ) demanded by the European
Pharmacopoeia (Ph. Eur.) for all impurities.
3.1.2. Sample preparation
Because the API is insoluble in water and unstable at low pH the samples were
dissolved in a 30 g/L ammonia solution. Inorganic bases lead to large peaks due to the
corresponding cation and interfere with the analysis. Acidic media, like the mobile phase,
have to be avoided for sample preparation because of the formation of carbocisteinelactam
(F) (see Fig. 1) at low pH.
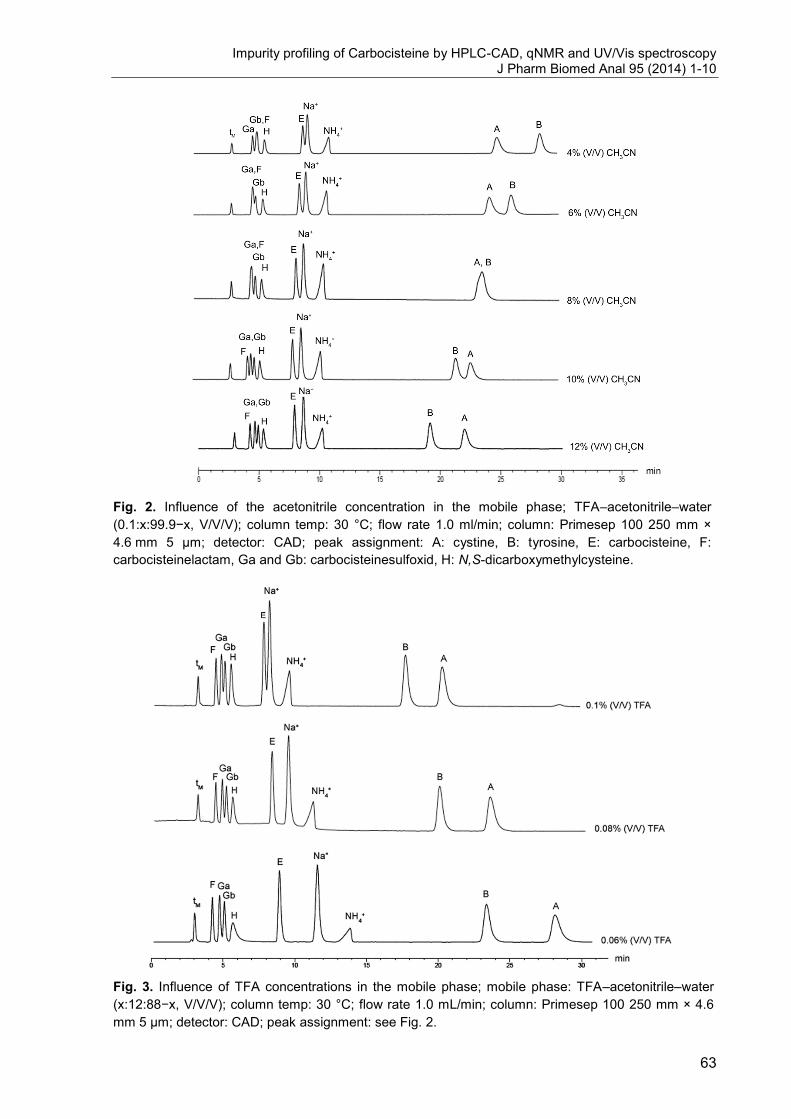
Impurity profiling of Carbocisteine by HPLC-CAD, qNMR and UV/Vis spectroscopy J Pharm Biomed Anal 95 (2014) 1-10
63
Fig. 2. Influence of the acetonitrile concentration in the mobile phase; TFA–acetonitrile–water
(0.1:x:99.9−x, V/V/V); column temp: 30 °C; flow rate 1.0 ml/min; column: Primesep 100 250 mm ×
4.6 mm 5 µm; detector: CAD; peak assignment: A: cystine, B: tyrosine, E: carbocisteine, F:
carbocisteinelactam, Ga and Gb: carbocisteinesulfoxid, H: N,S-dicarboxymethylcysteine.
Fig. 3. Influence of TFA concentrations in the mobile phase; mobile phase: TFA–acetonitrile–water
(x:12:88−x, V/V/V); column temp: 30 °C; flow rate 1.0 mL/min; column: Primesep 100 250 mm × 4.6
mm 5 µm; detector: CAD; peak assignment: see Fig. 2.
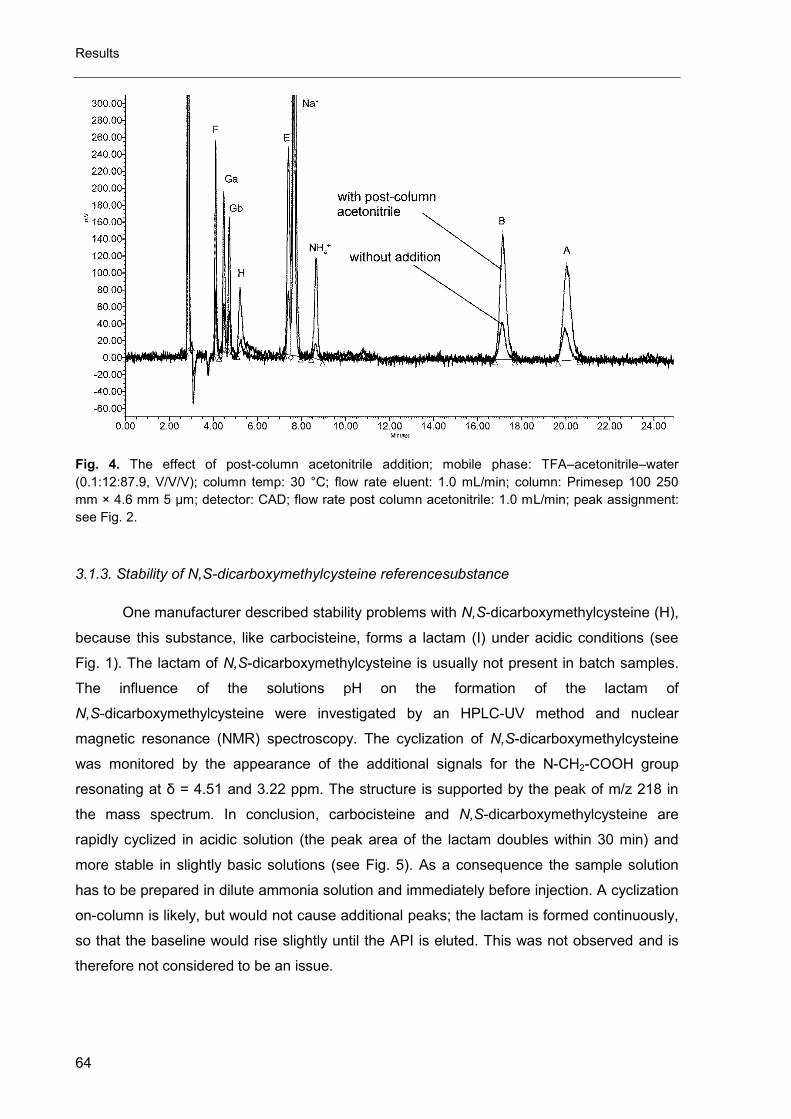
Results
64
Fig. 4. The effect of post-column acetonitrile addition; mobile phase: TFA–acetonitrile–water
(0.1:12:87.9, V/V/V); column temp: 30 °C; flow rate eluent: 1.0 mL/min; column: Primesep 100 250
mm × 4.6 mm 5 µm; detector: CAD; flow rate post column acetonitrile: 1.0 mL/min; peak assignment:
see Fig. 2.
3.1.3. Stability of N,S-dicarboxymethylcysteine referencesubstance
One manufacturer described stability problems with N,S-dicarboxymethylcysteine (H),
because this substance, like carbocisteine, forms a lactam (I) under acidic conditions (see
Fig. 1). The lactam of N,S-dicarboxymethylcysteine is usually not present in batch samples.
The influence of the solutions pH on the formation of the lactam of
N,S-dicarboxymethylcysteine were investigated by an HPLC-UV method and nuclear
magnetic resonance (NMR) spectroscopy. The cyclization of N,S-dicarboxymethylcysteine
was monitored by the appearance of the additional signals for the N-CH2-COOH group
resonating at δ = 4.51 and 3.22 ppm. The structure is supported by the peak of m/z 218 in
the mass spectrum. In conclusion, carbocisteine and N,S-dicarboxymethylcysteine are
rapidly cyclized in acidic solution (the peak area of the lactam doubles within 30 min) and
more stable in slightly basic solutions (see Fig. 5). As a consequence the sample solution
has to be prepared in dilute ammonia solution and immediately before injection. A cyclization
on-column is likely, but would not cause additional peaks; the lactam is formed continuously,
so that the baseline would rise slightly until the API is eluted. This was not observed and is
therefore not considered to be an issue.
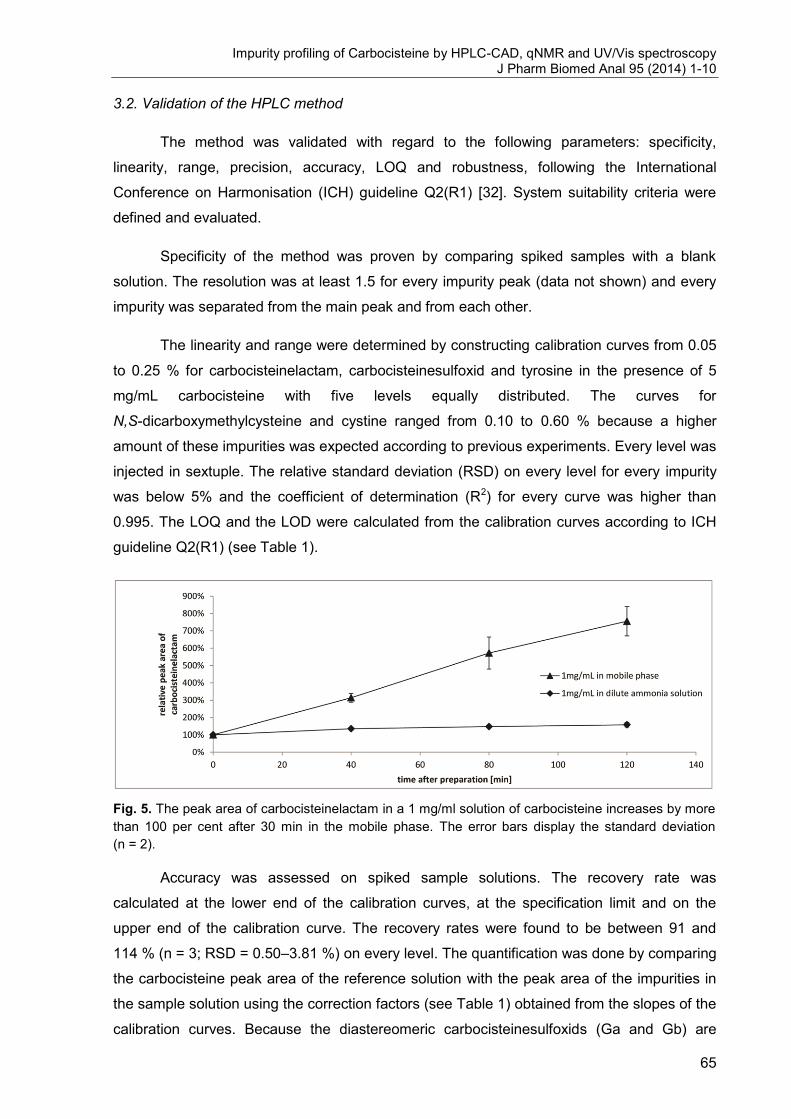
Impurity profiling of Carbocisteine by HPLC-CAD, qNMR and UV/Vis spectroscopy J Pharm Biomed Anal 95 (2014) 1-10
65
3.2. Validation of the HPLC method
The method was validated with regard to the following parameters: specificity,
linearity, range, precision, accuracy, LOQ and robustness, following the International
Conference on Harmonisation (ICH) guideline Q2(R1) [32]. System suitability criteria were
defined and evaluated.
Specificity of the method was proven by comparing spiked samples with a blank
solution. The resolution was at least 1.5 for every impurity peak (data not shown) and every
impurity was separated from the main peak and from each other.
The linearity and range were determined by constructing calibration curves from 0.05
to 0.25 % for carbocisteinelactam, carbocisteinesulfoxid and tyrosine in the presence of 5
mg/mL carbocisteine with five levels equally distributed. The curves for
N,S-dicarboxymethylcysteine and cystine ranged from 0.10 to 0.60 % because a higher
amount of these impurities was expected according to previous experiments. Every level was
injected in sextuple. The relative standard deviation (RSD) on every level for every impurity
was below 5% and the coefficient of determination (R2) for every curve was higher than
0.995. The LOQ and the LOD were calculated from the calibration curves according to ICH
guideline Q2(R1) (see Table 1).
Fig. 5. The peak area of carbocisteinelactam in a 1 mg/ml solution of carbocisteine increases by more
than 100 per cent after 30 min in the mobile phase. The error bars display the standard deviation
(n = 2).
Accuracy was assessed on spiked sample solutions. The recovery rate was
calculated at the lower end of the calibration curves, at the specification limit and on the
upper end of the calibration curve. The recovery rates were found to be between 91 and
114 % (n = 3; RSD = 0.50–3.81 %) on every level. The quantification was done by comparing
the carbocisteine peak area of the reference solution with the peak area of the impurities in
the sample solution using the correction factors (see Table 1) obtained from the slopes of the
calibration curves. Because the diastereomeric carbocisteinesulfoxids (Ga and Gb) are
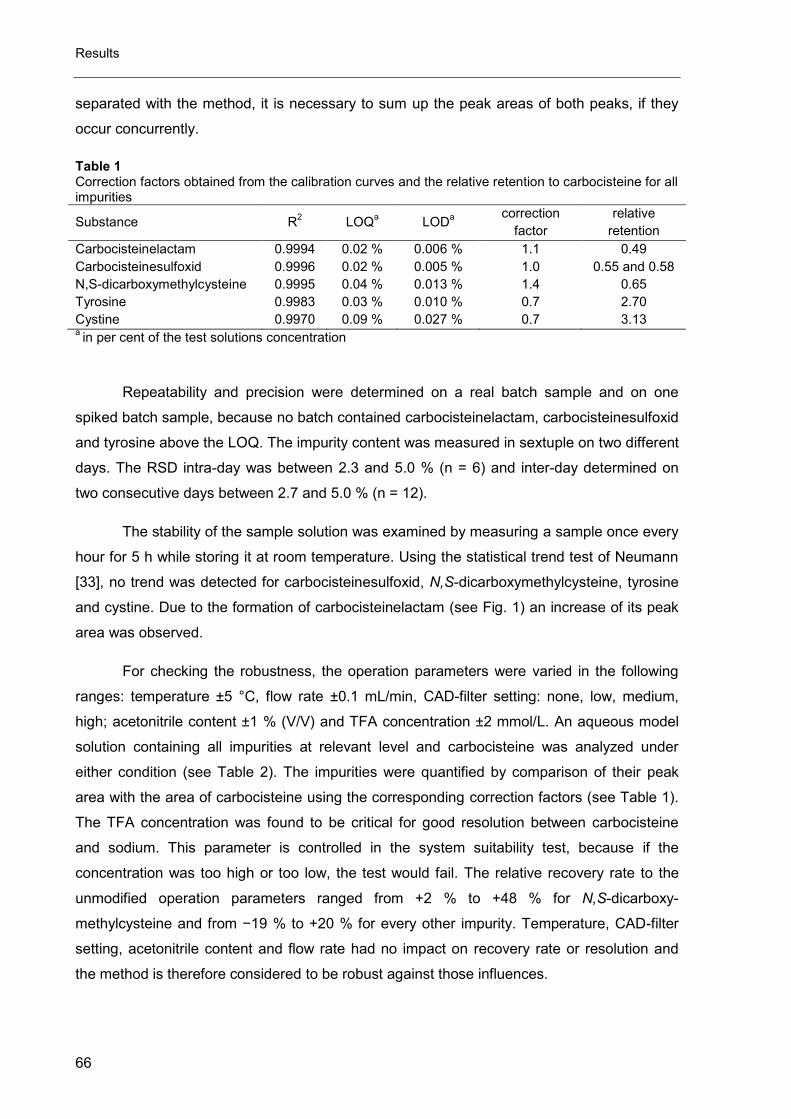
Results
66
separated with the method, it is necessary to sum up the peak areas of both peaks, if they
occur concurrently.
Table 1 Correction factors obtained from the calibration curves and the relative retention to carbocisteine for all impurities
Substance R2 LOQ
a LOD
a
correction
factor
relative
retention
Carbocisteinelactam 0.9994 0.02 % 0.006 % 1.1 0.49
Carbocisteinesulfoxid 0.9996 0.02 % 0.005 % 1.0 0.55 and 0.58
N,S-dicarboxymethylcysteine 0.9995 0.04 % 0.013 % 1.4 0.65
Tyrosine 0.9983 0.03 % 0.010 % 0.7 2.70
Cystine 0.9970 0.09 % 0.027 % 0.7 3.13 a in per cent of the test solutions concentration
Repeatability and precision were determined on a real batch sample and on one
spiked batch sample, because no batch contained carbocisteinelactam, carbocisteinesulfoxid
and tyrosine above the LOQ. The impurity content was measured in sextuple on two different
days. The RSD intra-day was between 2.3 and 5.0 % (n = 6) and inter-day determined on
two consecutive days between 2.7 and 5.0 % (n = 12).
The stability of the sample solution was examined by measuring a sample once every
hour for 5 h while storing it at room temperature. Using the statistical trend test of Neumann
[33], no trend was detected for carbocisteinesulfoxid, N,S-dicarboxymethylcysteine, tyrosine
and cystine. Due to the formation of carbocisteinelactam (see Fig. 1) an increase of its peak
area was observed.
For checking the robustness, the operation parameters were varied in the following
ranges: temperature ±5 °C, flow rate ±0.1 mL/min, CAD-filter setting: none, low, medium,
high; acetonitrile content ±1 % (V/V) and TFA concentration ±2 mmol/L. An aqueous model
solution containing all impurities at relevant level and carbocisteine was analyzed under
either condition (see Table 2). The impurities were quantified by comparison of their peak
area with the area of carbocisteine using the corresponding correction factors (see Table 1).
The TFA concentration was found to be critical for good resolution between carbocisteine
and sodium. This parameter is controlled in the system suitability test, because if the
concentration was too high or too low, the test would fail. The relative recovery rate to the
unmodified operation parameters ranged from +2 % to +48 % for N,S-dicarboxy-
methylcysteine and from −19 % to +20 % for every other impurity. Temperature, CAD-filter
setting, acetonitrile content and flow rate had no impact on recovery rate or resolution and
the method is therefore considered to be robust against those influences.
Impurity profiling of Carbocisteine by HPLC-CAD, qNMR and UV/Vis spectroscopy J Pharm Biomed Anal 95 (2014) 1-10
67
Ta
ble
2
Me
tho
d p
ara
me
ter
rob
ustn
ess s
tudy –
in
flu
ence
on
cri
tica
l p
ara
me
ters
: re
cove
ry r
ate
, re
so
lutio
n a
nd
sig
na
l-to
-nois
e-r
atio
(S
/N)
Cystin
e
0.4
0 %
a
Tyro
sin
e
0.0
9 %
a
So
diu
m
Ca
rbo
-
cis
tein
e
0.1
% a
N,S
-
dic
arb
oxy
me
thyl
cyste
ine
0.1
3 %
a
Su
lfoxid
B
0.0
3 %
a
Su
lfoxid
A
0.0
3 %
a
La
cta
m
0.0
6 %
a
S/N
Re
so
lution
recove
ry
rate
S/N
Re
so
lution
recove
ry
rate
S/N
S/N
Re
so
lution
S/N
Re
so
lution
recove
ry
rate
S/N
Re
so
lution
recove
ry
rate
S/N
Re
so
lution
recove
ry
rate
S/N
Re
so
lution
recove
ry
rate
no
va
ria
tio
n
11
8
4.3
10
0 %
33
17
.2
10
0 %
3.6
62
8.2
50
1.6
10
0 %
24
1.2
10
0 %
27
1.6
10
0 %
46
-
10
0%
flo
w r
ate
1.2
mL
/min
14
6
4.4
10
3 %
41
17
10
1 %
3.7
78
8.4
63
1.6
10
5 %
31
1.3
11
7 %
35
1.7
10
3 %
58
-
10
3 %
1.4
mL
/min
10
6
4.2
10
2 %
29
16
.9
10
9 %
3.5
53
7.8
47
1.5
10
9 %
21
1.2
10
3 %
24
1.5
10
0 %
39
-
10
3 %
tem
pe
ratu
re
15
°C
11
1
3.8
10
3 %
29
18
.8
97
%
3.1
59
8.3
51
1.7
10
9 %
24
1.3
10
3 %
27
1.5
10
3 %
43
-
10
2 %
a in
pe
r ce
nt o
f th
e t
est so
lution
s c
once
ntr
ation
25
°C
10
4
4.7
10
2 %
29
15
.4
10
1 %
2.6
51
8
43
1.4
10
8 %
21
1.1
11
0 %
24
1.6
10
6 %
38
-
10
7 %
CA
D f
ilte
r s
ett
ing
no
ne
76
4.4
10
1 %
21
23
94
%
4.6
48
10
37
2
10
8 %
24
1.9
11
0 %
29
2.7
10
9 %
50
-
10
3 %
low
72
4.3
10
1 %
20
17
10
0 %
4.5
45
9.7
35
2
10
3 %
23
1.9
10
3 %
26
2.7
10
3 %
45
-
10
2 %
me
diu
m
11
2
4.4
10
0 %
30
17
.2
10
1 %
4.3
65
9.4
52
1.9
10
5 %
30
1.7
10
0 %
34
2.3
10
0 %
59
-
10
2 %
Ace
ton
itri
le
11
%
62
2.8
10
4 %
17
17
.6
10
8 %
3.4
32
8.5
26
1.6
10
2 %
12
1.2
10
3 %
14
1.2
10
6 %
23
-
10
5 %
13
%
17
9
5.4
97
%
47
16
.7
84
%
3.5
87
7.5
87
1.4
12
8 %
42
1.2
12
0 %
47
1.8
11
2 %
71
-
10
5 %
Tri
flu
oro
ace
tic
ac
id
8m
M
11
8
4.9
95
%
29
16
81
%
2.7
70
7.1
41
1.5
10
5 %
30
1.3
11
3 %
34
1.6
10
9 %
55
-
10
5 %
12
mM
11
8
3.5
11
2 %
30
18
.9
10
2 %
1.3
54
7.7
69
1.6
14
8 %
22
1.1
11
3 %
25
1.4
11
5 %
39
-
10
9 %
Results
68
For the establishment of a system suitability test, the resolution between
carbocisteine and sodium as well as between tyrosine and cystine was studied. Sodium is
always present because it is dis-solved from the utilized glassware and is detectable by the
CAD. Thus, we had to ensure that the peak is separated from carbocisteine, since it is used
for the quantification of the impurities. The resolution between the peaks due to carbocisteine
and sodium is at least 3.0 controlled by the TFA concentration, whereas the acetonitrile
content controls the resolution between tyrosine and cystine. It should be at least 3.5.
3.3. Other impurities
The alkylation reagent chloroacetic acid cannot properly be detected by the CAD
because the compound is volatile. The substance is detectable with HPLC-UV in very
concentrated sample solutions at a low wavelength (λ = 210 nm). The same holds true for its
degradation product glycolic acid. Also, both impurities are well visible in the 1H NMR
spectrum at 4.07 and 3.95 ppm (see Fig. 6) for the methylene group of chloroacetic acid and
glycolic acid, respectively. By means of integration of these signals, the amount of both
impurities could be calculated in comparison to maleic acid as an internal standard. The
method was validated for chloroacetic acid only, because the amount of glycolic acid
detected in batch samples was very low and thus of minor interest. The linearity and range
were determined from 0.05 to 1.0 per cent (R2= 0.9996). The method was found to be
precise [RSD = 3.7 % (n = 6) measured in a batch sample containing 0.09 per cent
chloroacetic acid] and accurate (proportional systematic error 1.5 % and constant systematic
error 0.1 ppm). The accuracy was determined on a spiked batch sample. The spiked
concentrations of 0.05, 0.10 and 0.15 per cent were measured in triplicate; the recovery rates
ranged from 99 to 101 %. The LOQ determined from the slope of the calibration curve
according to ICH guideline Q2(R1) is 0.03 per cent (S/N was 165 at this level). However, the
sample solution is unstable. The integral of the chloroacetic acid signal decreases by almost
40% within 2 h after sample preparation while the glycolic acid signal increases. Cysteine on
the other hand could selectively be determined by UV/vis spectroscopy at 410 nm after the
reaction with Ellman’s reagent (DTNB) at alkaline pH. This method was validated at Moehs
Ibérica S.L. (Spain). The linearity was determined over the range of 0.025–0.2 per cent
(R2= 0.9985). The inter- and intra-day precision was demonstrated by RSDs of 8.6 and
1.8 %. (n = 14 and n = 6). The accuracy was determined in between 0.05 and 0.2 percent
(recovery rates ranging from 98 to 102 %). The LOQ calculated from the regression line is
0.04 per cent. The results of the batch tests are displayed in Table 3 together with those of
the HPLC-CAD experiments.
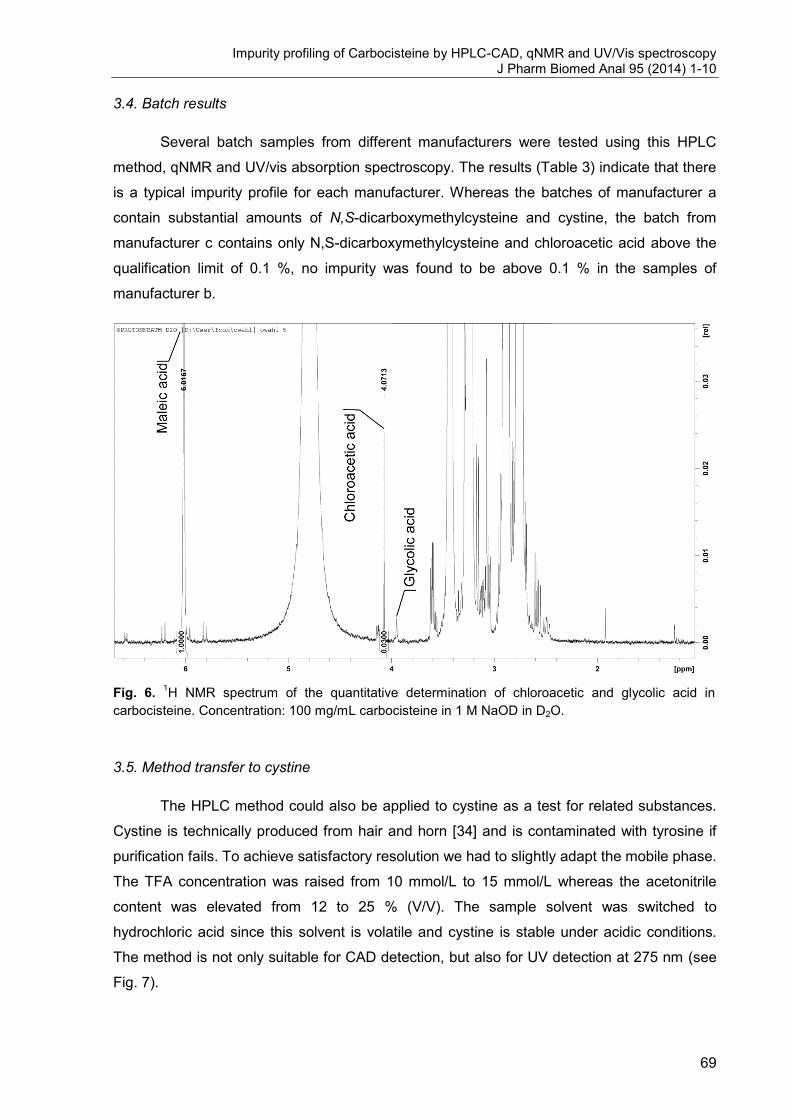
Impurity profiling of Carbocisteine by HPLC-CAD, qNMR and UV/Vis spectroscopy J Pharm Biomed Anal 95 (2014) 1-10
69
3.4. Batch results
Several batch samples from different manufacturers were tested using this HPLC
method, qNMR and UV/vis absorption spectroscopy. The results (Table 3) indicate that there
is a typical impurity profile for each manufacturer. Whereas the batches of manufacturer a
contain substantial amounts of N,S-dicarboxymethylcysteine and cystine, the batch from
manufacturer c contains only N,S-dicarboxymethylcysteine and chloroacetic acid above the
qualification limit of 0.1 %, no impurity was found to be above 0.1 % in the samples of
manufacturer b.
Fig. 6. 1H NMR spectrum of the quantitative determination of chloroacetic and glycolic acid in
carbocisteine. Concentration: 100 mg/mL carbocisteine in 1 M NaOD in D2O.
3.5. Method transfer to cystine
The HPLC method could also be applied to cystine as a test for related substances.
Cystine is technically produced from hair and horn [34] and is contaminated with tyrosine if
purification fails. To achieve satisfactory resolution we had to slightly adapt the mobile phase.
The TFA concentration was raised from 10 mmol/L to 15 mmol/L whereas the acetonitrile
content was elevated from 12 to 25 % (V/V). The sample solvent was switched to
hydrochloric acid since this solvent is volatile and cystine is stable under acidic conditions.
The method is not only suitable for CAD detection, but also for UV detection at 275 nm (see
Fig. 7).
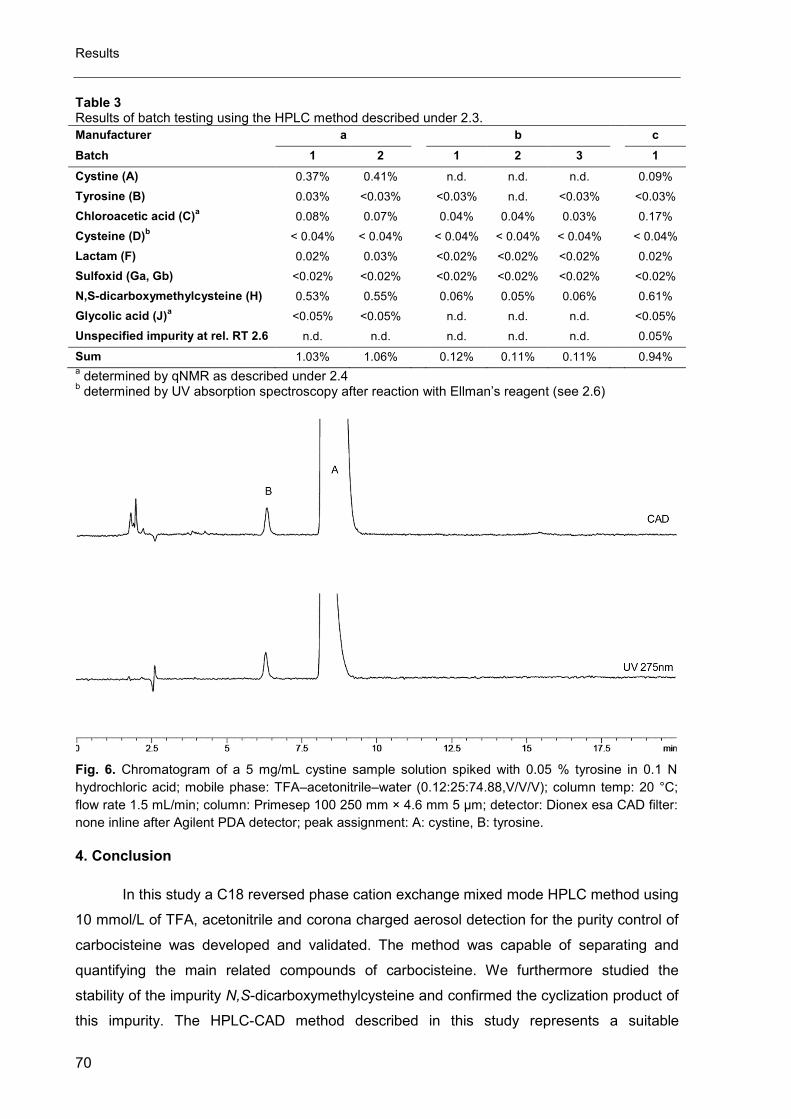
Results
70
Table 3 Results of batch testing using the HPLC method described under 2.3.
Manufacturer a b c
Batch 1 2 1 2 3 1
Cystine (A) 0.37% 0.41% n.d. n.d. n.d. 0.09%
Tyrosine (B) 0.03% <0.03% <0.03% n.d. <0.03% <0.03%
Chloroacetic acid (C)a 0.08% 0.07% 0.04% 0.04% 0.03% 0.17%
Cysteine (D)b < 0.04% < 0.04% < 0.04% < 0.04% < 0.04% < 0.04%
Lactam (F) 0.02% 0.03% <0.02% <0.02% <0.02% 0.02%
Sulfoxid (Ga, Gb) <0.02% <0.02% <0.02% <0.02% <0.02% <0.02%
N,S-dicarboxymethylcysteine (H) 0.53% 0.55% 0.06% 0.05% 0.06% 0.61%
Glycolic acid (J)a <0.05% <0.05% n.d. n.d. n.d. <0.05%
Unspecified impurity at rel. RT 2.6 n.d. n.d. n.d. n.d. n.d. 0.05%
Sum 1.03% 1.06% 0.12% 0.11% 0.11% 0.94% a determined by qNMR as described under 2.4
b determined by UV absorption spectroscopy after reaction with Ellman’s reagent (see 2.6)
Fig. 6. Chromatogram of a 5 mg/mL cystine sample solution spiked with 0.05 % tyrosine in 0.1 N
hydrochloric acid; mobile phase: TFA–acetonitrile–water (0.12:25:74.88,V/V/V); column temp: 20 °C;
flow rate 1.5 mL/min; column: Primesep 100 250 mm × 4.6 mm 5 µm; detector: Dionex esa CAD filter:
none inline after Agilent PDA detector; peak assignment: A: cystine, B: tyrosine.
4. Conclusion
In this study a C18 reversed phase cation exchange mixed mode HPLC method using
10 mmol/L of TFA, acetonitrile and corona charged aerosol detection for the purity control of
carbocisteine was developed and validated. The method was capable of separating and
quantifying the main related compounds of carbocisteine. We furthermore studied the
stability of the impurity N,S-dicarboxymethylcysteine and confirmed the cyclization product of
this impurity. The HPLC-CAD method described in this study represents a suitable
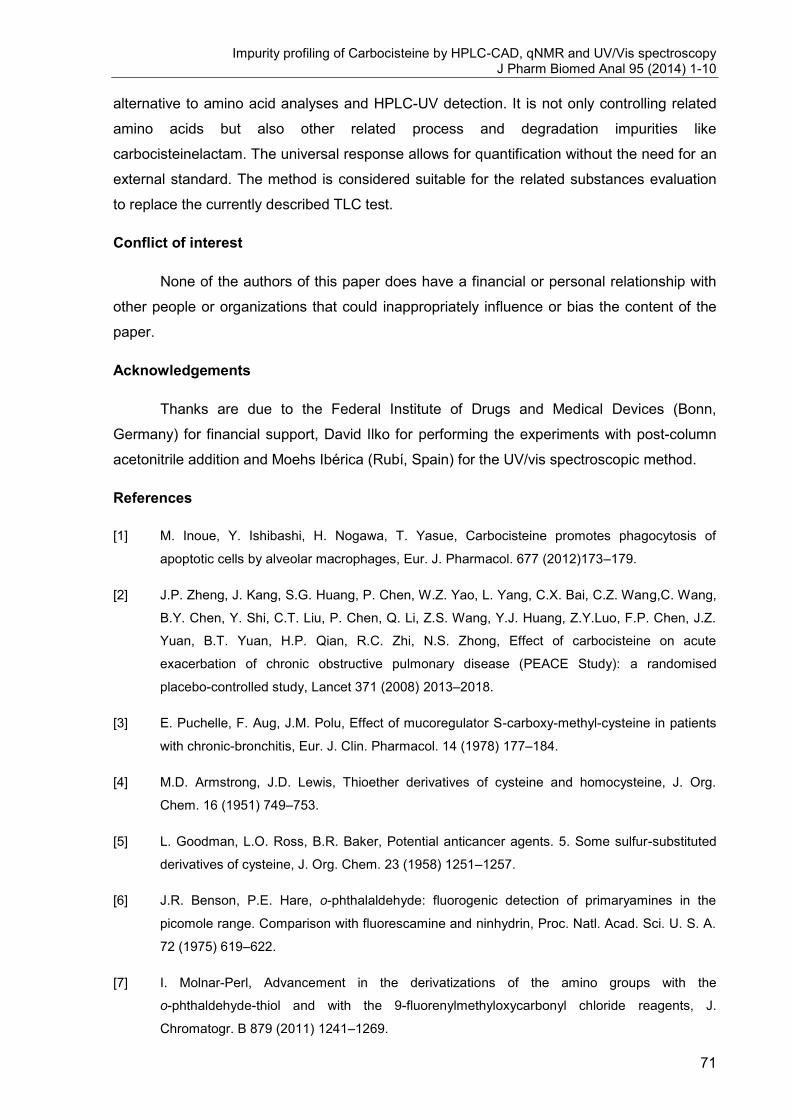
Impurity profiling of Carbocisteine by HPLC-CAD, qNMR and UV/Vis spectroscopy J Pharm Biomed Anal 95 (2014) 1-10
71
alternative to amino acid analyses and HPLC-UV detection. It is not only controlling related
amino acids but also other related process and degradation impurities like
carbocisteinelactam. The universal response allows for quantification without the need for an
external standard. The method is considered suitable for the related substances evaluation
to replace the currently described TLC test.
Conflict of interest
None of the authors of this paper does have a financial or personal relationship with
other people or organizations that could inappropriately influence or bias the content of the
paper.
Acknowledgements
Thanks are due to the Federal Institute of Drugs and Medical Devices (Bonn,
Germany) for financial support, David Ilko for performing the experiments with post-column
acetonitrile addition and Moehs Ibérica (Rubí, Spain) for the UV/vis spectroscopic method.
References
[1] M. Inoue, Y. Ishibashi, H. Nogawa, T. Yasue, Carbocisteine promotes phagocytosis of
apoptotic cells by alveolar macrophages, Eur. J. Pharmacol. 677 (2012)173–179.
[2] J.P. Zheng, J. Kang, S.G. Huang, P. Chen, W.Z. Yao, L. Yang, C.X. Bai, C.Z. Wang,C. Wang,
B.Y. Chen, Y. Shi, C.T. Liu, P. Chen, Q. Li, Z.S. Wang, Y.J. Huang, Z.Y.Luo, F.P. Chen, J.Z.
Yuan, B.T. Yuan, H.P. Qian, R.C. Zhi, N.S. Zhong, Effect of carbocisteine on acute
exacerbation of chronic obstructive pulmonary disease (PEACE Study): a randomised
placebo-controlled study, Lancet 371 (2008) 2013–2018.
[3] E. Puchelle, F. Aug, J.M. Polu, Effect of mucoregulator S-carboxy-methyl-cysteine in patients
with chronic-bronchitis, Eur. J. Clin. Pharmacol. 14 (1978) 177–184.
[4] M.D. Armstrong, J.D. Lewis, Thioether derivatives of cysteine and homocysteine, J. Org.
Chem. 16 (1951) 749–753.
[5] L. Goodman, L.O. Ross, B.R. Baker, Potential anticancer agents. 5. Some sulfur-substituted
derivatives of cysteine, J. Org. Chem. 23 (1958) 1251–1257.
[6] J.R. Benson, P.E. Hare, o-phthalaldehyde: fluorogenic detection of primaryamines in the
picomole range. Comparison with fluorescamine and ninhydrin, Proc. Natl. Acad. Sci. U. S. A.
72 (1975) 619–622.
[7] I. Molnar-Perl, Advancement in the derivatizations of the amino groups with the
o-phthaldehyde-thiol and with the 9-fluorenylmethyloxycarbonyl chloride reagents, J.
Chromatogr. B 879 (2011) 1241–1269.
Results
72
[8] A. Jambor, I. Molnar-Perl, Amino acid analysis by high-performance liquid chromatography
after derivatization with 9-fluorenylmethyloxycarbonyl chloride Literature overview and further
study, J. Chromatogr. A 1216 (2009) 3064–3077.
[9] N. Novatchev, U. Holzgrabe, Evaluation of the impurity profile of amino acids by means of CE,
J. Pharm. Biomed. Anal. 26 (2001) 779–789.
[10] S. Kopec, U. Holzgrabe, Amino acids: aspects of impurity profiling by means of CE,
Electrophoresis 28 (2007) 2153–2167.
[11] E.H.J.M. Jansen, R.H. Vandenberg, R. Bothmiedema, L. Doorn, Advantages and limitations of
precolumn derivatization of amino-acids with dabsyl chloride, J.Chromatogr. A 553 (1991)
123–133.
[12] S. Hernandez-Cassou, J. Saurina, Derivatization strategies for the determination of biogenic
amines in wines by chromatographic and electrophoretic techniques, J. Chromatogr. B 879
(2011) 1270–1281.
[13] B.A. Bidlingmeyer, S.A. Cohen, T.L. Tarvin, Rapid analysis of amino acids using pre-column
derivatization, J. Chromatogr. B 336 (1984) 93–104.
[14] S.W. Sun, Y.C. Lin, Y.M. Weng, M.J. Chen, Efficiency improvements on ninhydrin method for
amino acid quantification, J. Food Compos. Anal. 19 (2006) 112–117.
[15] S. Yokoyama, J. Hiramatsu, A modified ninhydrin reagent using ascorbic acid instead of
potassium cyanide, J. Biosci. Bioeng. 95 (2003) 204–205.
[16] C.K. Zacharis, P.D. Tzanavaras, Liquid chromatography coupled to on-line postcolumn
derivatization for the determination of organic compounds: a review on instrumentation and
chemistries, Anal. Chim. Acta 798 (2013) 1–24.
[17] R.W. Frei, L. Michel, W. Santi, New aspects of post-column derivatization in high-performance
liquid-chromatography, J. Chromatogr. A 142 (1977) 261–270.
[18] U. Holzgrabe, C.J. Nap, T. Beyer, S. Almeling, Alternatives to amino acid analysis for the
purity control of pharmaceutical grade L-alanine, J. Sep. Sci. 33 (2010) 2402–2410.
[19] H.J.C. das Neves, Z.B. Morais, HPLC assay of underivatized free amino acids with column
switching and evaporative light-scattering detection, J. High Resolut. Chromatogr. 20 (1997)
115–118.
[20] S. Almeling, U. Holzgrabe, Use of evaporative light scattering detection for the quality control
of drug substances: influence of different liquid chromatographic and evaporative light
scattering detector parameters on the appearance of spike peaks, J. Chromatogr. A 1217
(2010) 2163–2170.
Impurity profiling of Carbocisteine by HPLC-CAD, qNMR and UV/Vis spectroscopy J Pharm Biomed Anal 95 (2014) 1-10
73
[21] X.W. Yan, Detection by ozone-induced chemiluminescence in chromatography, J.
Chromatogr. A 842 (1999) 267–308.
[22] W.L. Fitch, A.K. Szardenings, E.M. Fujinari, Chemiluminescent nitrogen detection for HPLC:
an important new tool in organic analytical chemistry, Tetrahedron Lett. 38 (1997) 1689–1692.
[23] K. Petritis, C. Elfakir, M. Dreux, A comparative study of commercial liquid chromatographic
detectors for the analysis of underivatized amino acids, J. Chromatogr. A 961 (2002) 9–21.
[24] B. Zhang, X. Li, B. Yan, Advances in HPLC detection – towards universal detection, Anal.
Bioanal. Chem. 390 (2008) 299–301.
[25] U. Holzgrabe, C.J. Nap, N. Kunz, S. Almeling, Identification and control of impurities in
streptomycin sulfate by high-performance liquid chromatography coupled with mass detection
and corona charged-aerosol detection, J. Pharm.Biomed. Anal. 56 (2011) 271–279.
[26] U. Holzgrabe, C.J. Nap, S. Almeling, Control of impurities in L-aspartic acid and L-alanine by
high-performance liquid chromatography coupled with a corona charged aerosol detector, J.
Chromatogr. A 1217 (2010) 294–301.
[27] T.H. Mourey, L.E. Oppenheimer, Principles of operation of an evaporative light-scattering
detector for liquid-chromatography, Anal. Chem. 56 (1984) 2427–2434.
[28] S. Almeling, D. Ilko, U. Holzgrabe, Charged aerosol detection in pharmaceutical analysis, J.
Pharm. Biomed. Anal. 69 (2012) 50–63.
[29] T. Gorecki, F. Lynen, R. Szucs, P. Sandra, Universal response in liquid chromatography using
charged aerosol detection, Anal. Chem. 78 (2006) 3186–3192.
[30] G.L. Ellman, A colorimetric method for determining low concentrations of mercaptans, Arch.
Biochem. Biophys. 74 (1958) 443–450.
[31] G.L. Ellman, Tissue sulfhydryl groups, Arch. Biochem. Biophys. 82 (1959) 70–77.
[32] ICH Guideline, Q2(R1), Validation of Analytical Procedures: Text and Methodology, 2013.
[33] S. Kromidas, Handbuch Validierung in der Analytik, 1st ed., WILEY-VCH Verlag GmbH,
Weinheim, 2000, pp. 64–65.
[34] O. Folin, On the preparation of cystine, J. Biol. Chem. 8 (1910) 9–10.
74
2. Evaluation of enantiomeric purity of magnesium-L-aspartate
dihydrate
Wahl, O., Holzgrabe, U.
Reprinted with permission from
Journal of Pharmaceutical and Biomedical Analysis 102 (2015) 100-109
ABSTRACT
Magnesium supplementation in form of organic magnesium salts is a very popular
practice. We examined the enantiomeric purity of “Magnesium aspartate dihydrate”
monographed in the European Pharmacopeia. A chiral capillary zone electrophoresis using
(2-hydroxypropyl)-β-cyclodextrin coupled to laser induced fluorescence detection and a
HPLC-fluorescence method with chiral derivatization using o-phthaldialdehyde and N-acetyl-
L-cysteine as an orthogonal method were developed and validated. Two batch samples of
this substance and three drug products containing the salt were analyzed by means of both
methods. The concentration of the D-enantiomer of aspartic acid ranged from 0.03 to 0.12%.
Simulations of the synthesis revealed that the D-aspartic acid content is elevated if the
dissolution of L-aspartic acid was performed at acidic pH values.
Abbreviations: API, active pharmaceutical ingredient; CBQCA, 3-(4-carboxybenzoyl)
quinolone-2-carboxaldehyde; DMSO, dimethyl sulfoxide; DOE, design of experiments;
EDQM, European Directorate for the Quality of Medicines& HealthCare; FLD, fluorescence
detection; HP-β-CD, (2-hydroxypropyl)-β-cyclodextrin; ICH, International Conference on
Harmonisation; IEP, isoelectric point; IS, internal standard; KF, Karl-Fischer; LIF, laser
induced fluorescence; MeCN, acetonitrile; NAC, N-acetyl-L-cysteine; NMDA, N-methyl-D-
aspartate; OPA, o-phthaldialdehyde; PFP, pentafluorophenyl; Ph. Eur., European
Pharmacopeia; PH, phenyl-hexyl; PVDF, polyvinylidene fluoride.
Evaluation of enantiomeric purity of magnesium-L-aspartate dihydrate J Pharm Biomed Anal 102 (2015) 100-109
75
1. Introduction
Innumerous magnesium salts for the sometimes controversially discussed treatment
of hypomagnesaemia and cramp prophylaxis are currently available on the market [1, 2]. The
salts are classified according to the anion into organic and inorganic magnesium salts.
Among the inorganic magnesium salts as drug products are magnesium oxide (MgO),
magnesium carbonate (MgCO3), magnesium hydroxide (Mg(OH)2), magnesium hydrogen
phosphate (MgHPO4) and magnesium chloride (MgCl2). The organic salts, mostly salts of
carboxylic acids, possess a higher solubility in water and are therefore supposed to be better
bioavailable [3, 4]. Nevertheless, according to latest work, there is no special benefit of the
organic salts for the reconstitution of the normal magnesium status compared to the
inorganic salts [5, 6]. At least from the pharmaceutical point of view, the better soluble
organic salts seem to be more suitable for the production of effervescent tablets and
powders because the resulting liquid dosage form is a solution and not a suspension. The
organic salts are salts of citric, glucuronic, acetic, glutamic or aspartic acid. In the case of
aspartic acid there are three relevant salts: magnesium aspartate hydrochloride trihydrate,
magnesium bis(hydrogen-DL-aspartate) tetrahydrate and magnesium bis(L-hydrogen-
aspartate) dihydrate (Fig. 1). The latter one is in the focus of this study. The substance is
monographed in the European Pharmacopeia (Ph. Eur.) with the title “magnesium aspartate
dihydrate” [7] and should contain the L-amino acid only. Among the amino acids, aspartic
acid exhibits the highest racemization rate in peptide or protein structures [8]. That is why the
D-aspartic acid content in aged tissue, fossil, tooth or bone samples is widely utilized for the
age determination of those samples [9–13]. The mechanism of racemization in peptides,
however, is different to that of the free amino acid because the amide moiety is required in
the proposed mechanisms for peptides [14–16]. Because of its neuroexcitatory effect on
NMDA (N-methyl-D-asparatate) receptors [17–20] and interference with several endocrinal
and hormonal systems [21–25] the D-aspartic acid concentration has to be restricted and
controlled by means of a sensitive CE or HPLC method.
Due to the highest daily dose of approx. 1.8 g magnesium bis(hydrogenaspartate)
dihydrate, any impurity (in our case D-aspartic acid) above 0.06 % (1 mg daily intake) has to
be specified and qualified according to ICH guideline Q3A(R2) [26]. However, two challenges
have to be faced: on the one hand the separation of the enantiomers and on the other hand
the fact that aspartic acid lacks a chromophore for UV detection. The enantiomeric resolution
of amino acids can be achieved by many techniques. The chromatographic separation of D-
and L-amino acids has been shown e.g. on chiral stationary crown ether phases [27–29], by
chiral ligand exchange chromatography [30–32] or by chiral gas chromatography after
derivatization [33]. However, the detection problem is not overcome by most of those
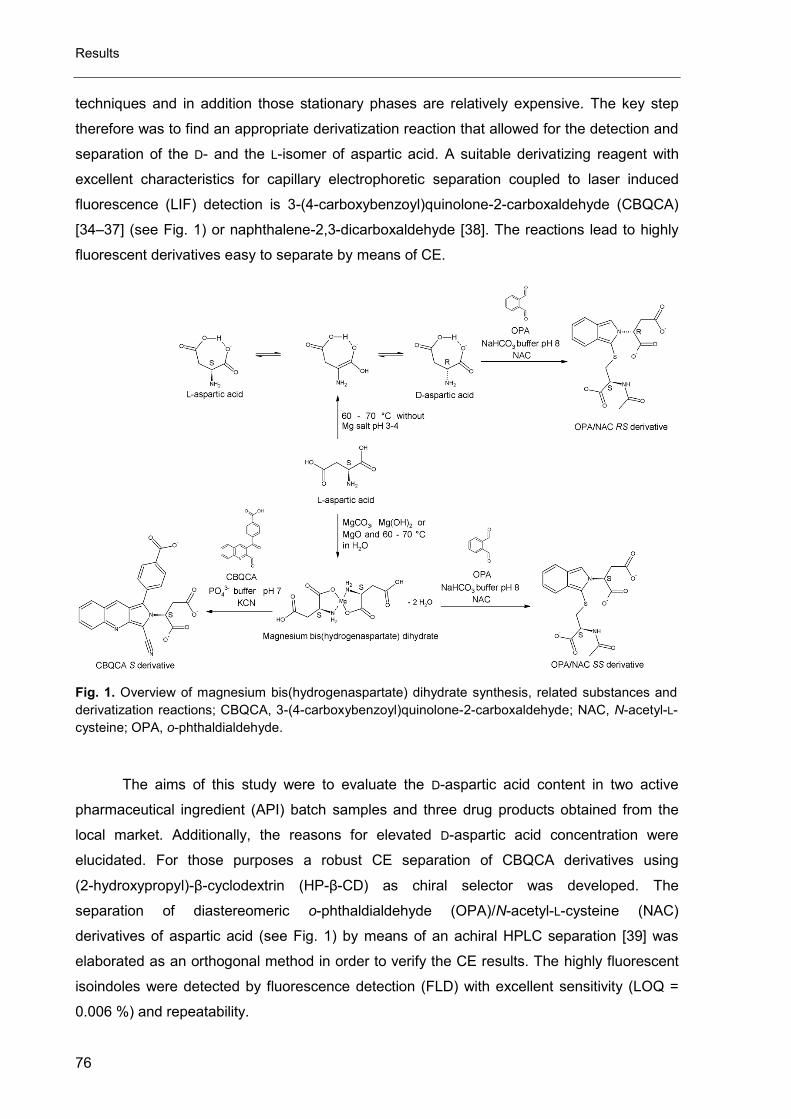
Results
76
techniques and in addition those stationary phases are relatively expensive. The key step
therefore was to find an appropriate derivatization reaction that allowed for the detection and
separation of the D- and the L-isomer of aspartic acid. A suitable derivatizing reagent with
excellent characteristics for capillary electrophoretic separation coupled to laser induced
fluorescence (LIF) detection is 3-(4-carboxybenzoyl)quinolone-2-carboxaldehyde (CBQCA)
[34–37] (see Fig. 1) or naphthalene-2,3-dicarboxaldehyde [38]. The reactions lead to highly
fluorescent derivatives easy to separate by means of CE.
Fig. 1. Overview of magnesium bis(hydrogenaspartate) dihydrate synthesis, related substances and
derivatization reactions; CBQCA, 3-(4-carboxybenzoyl)quinolone-2-carboxaldehyde; NAC, N-acetyl-L-
cysteine; OPA, o-phthaldialdehyde.
The aims of this study were to evaluate the D-aspartic acid content in two active
pharmaceutical ingredient (API) batch samples and three drug products obtained from the
local market. Additionally, the reasons for elevated D-aspartic acid concentration were
elucidated. For those purposes a robust CE separation of CBQCA derivatives using
(2-hydroxypropyl)-β-cyclodextrin (HP-β-CD) as chiral selector was developed. The
separation of diastereomeric o-phthaldialdehyde (OPA)/N-acetyl-L-cysteine (NAC)
derivatives of aspartic acid (see Fig. 1) by means of an achiral HPLC separation [39] was
elaborated as an orthogonal method in order to verify the CE results. The highly fluorescent
isoindoles were detected by fluorescence detection (FLD) with excellent sensitivity (LOQ =
0.006 %) and repeatability.
Evaluation of enantiomeric purity of magnesium-L-aspartate dihydrate J Pharm Biomed Anal 102 (2015) 100-109
77
2. Experimental
2.1. Chemicals and materials
The magnesium aspartate dihydrate batch samples and L-aspartic acid were obtained
from the European Directorate for the Quality of Medicines & HealthCare (EDQM)
(Strasbourg, France). Magnaspart® 20 powder, Magnerot® A 500 granulate and Magnesium
Verla® effervescent tablets were bought from a local pharmacy. HPLC grade acetonitrile,
methanol, ammonium acetate and sodium hydrogen carbonate were purchased from VWR
International S.A.S. (Fontenay-sous-Bois, France), hydrochloric acid 37 %, (2-
hydroxypropyl)- β-cyclodextrin with average MW = 1380 g/mol (HP-β-CD), sodium
tetraborate decahydrate, acetic acid ≥ 99.9 %,ammonium formate, hydrochloric acid 37 %,
HYDRANAL®-Titrant 5, HYDRANAL®-Solvent, N-acetyl-L-cysteine (NAC) 99 %, L-glutamic
acid > 99.5 %, magnesium oxide, magnesium carbonate, magnesium hydroxide and o-
phthaldialdehyde (OPA) from Sigma–Aldrich Chemie GmbH (Steinheim, Germany), D-
aspartic acid from Alfa Aesar (Karlsruhe, Germany), L-aspartic acid, disodium hydrogen
phosphate dihydrate, sodium dihydrogen phosphate monohydrate, formamide, Acilit®,
Neutralit® and Alkalit® indicator paper for pH measurement (catalog number: 109565) from
Merck KGaA (Darmstadt, Germany), dimethyl sulfoxide 99.9 % from Acros Organics (Geel,
Beglium), CBQCA and potassium cyanide from Molecular Probes (Eugene, Oregon, USA),
2-propanol ≥ 99.7 % from Bernd Kraft GmbH (Duisburg, Germany). All chemicals used were
of analytical grade or even better. Ultrapure water was produced using the “MilliQ Synthesis”
water purification system by Merck Millipore (Schwalbach, Germany). HPLC columns tested
during method development are summarized in Table 1.
Table 1 Overview of stationary phases screened during method development
phase brand name manufacturer dimensions
PH Nucleodur®
Phenyl-Hexyl Machery-Nagel GmbH & Co. KG, Düren, Germany
150 x 4.6 mm i.d., 3 µm
C18 Luna® C18 Phenomenex, Aschaffenburg,
Germany 100 x 4.6 mm i.d., 3 µm
C12 Synergi® MAX-RP Phenomenex, Aschaffenburg,
Germany 150 x 4.6 mm i.d., 4 µm
C8 Nucleodur® C8ec Machery-Nagel GmbH & Co. KG,
Düren, Germany 150 x 4.6 mm i.d., 3 µm
C4 Beta-Basic-4® Thermo Fisher Scientific Inc. Waltham
MA, USA 250 x 4.6 mm i.d., 5 µm
C1 YMC-Pack® TMS YMC Europe GmbH, Dinslaken,
Germany 100 x 4.6 mm i.d., 5 µm
Results
78
2.2. Instrumentation
All CE separations were performed by means of a Beckman Coulter P/ACE System
MDQ (Fullerton CA, USA), equipped with a LIF-detector using an argon-ion-laser The fused-
silica capillaries (BGB Analytik, Schloßböckelheim, Germany) employed for the analysis of
magnesium aspartate samples after derivatization with CBQCA were of 75 µm internal
diameter and effective length of 40.0 cm (total length of 50.2 cm). All HPLC separations were
carried out using an Agilent 1200 modular chromatographic system consisting of online
vacuum degasser, binary pump, thermostatted auto sampler, thermostatted column
compartment, a photodiode array detector and a fluorescence detector (Agilent
Technologies, Waldbronn, Germany). Water content was determined by means of a
TitroLine® KF (Schott Instruments, Mainz, Germany) automatic titration system. The optical
rotation was determined using a PerkinElmer 241 Polarimeter equipped with a thermostatted
cuvette, 1 dm in length (PerkinElmer, Waltham MA, USA).
2.3. Capillary electrophoretic procedure
For the first method development attempts with borate buffer, the derivatized samples
were loaded by pressure injection (6.89 kPa) for 5 s on the anode side. Separation was
carried out with the following running buffers: 500 µM HP-β-CD were dissolved in 0.5, 1.0,
1.5, 2.0 or 2.5 mL DMSO and 5.0 mL of a 70 mM disodium tetraborate decahydrate solution,
previously adjusted to pH 9.3 with 0.1 M sodium hydroxide solution. The resulting solution
was diluted to 10.0 mL with water and filtrated (0.22 µm PVDF-filter) prior to use. The
capillary was kept at 20 °C. Separation was achieved at a voltage of +30 kV (current
approximately 60 µA) with LIF detection at λexc= 488 nm and λem= 520 nm (fix band pass
filter).
The separation method with phosphate buffer used pressure injection (6.89 kPa) for
10 s on the anode side, the running buffers consisted of 100, 150, 180 and 200 µM of HP-β-
CD, respectively,1.8 mL of DMSO and 3.0, 4.0 or 5.0 mL of a 0.1 M phosphate buffer pH 7.0,
7.5 or 8.0 subsequently diluted to 10.0 mL with water. The final separation buffer was
composed of 180 µM of HP-β-CD, 1.8 mL of DMSO and 5 mL 0.1 M phosphate buffer pH 7
subsequently diluted to 10.0 mL. The capillary was kept at 25 °C and a voltage of +20 kV
applied (current approximately 80 µA) with LIF detection at λexc= 488 nm and λem= 520 nm
(fix band pass filter). New capillaries were conditioned by rinsing with 1 M NaOH (10 min,
206 kPa) followed by water (10 min, 206 kPa) and running buffer (180 s, 138 kPa). Between
runs the capillaries were rinsed with 0.1 M NaOH (60 s, 206 kPa) followed by water,
2-propanol, water and running buffer (each 120 s, 206 kPa). Constant migration times were
observed throughout the studies.
Evaluation of enantiomeric purity of magnesium-L-aspartate dihydrate J Pharm Biomed Anal 102 (2015) 100-109
79
2.3.1. Preparation of solutions
0.1 M phosphate buffer pH 7.0/7.5/8.0: A 17.8 g/L solution of disodium hydrogen
phosphate dihydrate was added to a 13.8 g/L solution of sodium dihydrogen phosphate
monohydrate until the pH was 7.0, 7.5 and 8.0, respectively. Preparation of the CBQCA
reagent: 5 mg of CBQCA were dissolved in 1.64 mL of DMSO. The internal standard solution
was prepared by dissolving 40.0 mg of L-glutamic acid in 0.3 mL sodium hydroxide solution
(1 M) and dilution to 10.0 mL with water. For the spiking solution, 40.0 mg of D-aspartic acid
were dissolved in 0.3 mL sodium hydroxide solution (1 M) and diluted to 10.0 mL with water.
Preparation of the reference solution for the correction factor: 6.4 mg of L-aspartic were
dissolved in 0.1 M phosphate buffer solution pH 7.0 and spiked with 10 µL of internal
standard solution, 10 µL of spiking solution and eventually diluted to 5.0 mL with 0.1 M
phosphate buffer solution pH 7.0. The resolution due to the peaks of L- and D-aspartic acid
was determined from a resolution reference solution containing 4 mg L- and 4 mg of D-
aspartic acid in 10.0 mL of 0.1 M phosphate buffer pH 7.0. Preparation of test solutions: 8.0
mg of the substance to be examined and 10 µL of the internal standard solution were dis-
solved in and diluted to 5.0 mL with 0.1 M phosphate buffer solution pH 7.0.
2.3.2. Derivatization procedure
0.20 mL of the test or the reference solution were diluted to 10.0 mL with 0.1 M
phosphate buffer pH 7.0. 20 µL of the dilutions were added to 40 µL of a 0.65 g/L solution of
potassium cyanide and thoroughly mixed after addition of 20 µL of the CBQCA reagent. After
1, 2, 3, 4, 5, 6 or 24 h reaction time at room temperature protected from light, 120 µL of water
were added to the mixture which was then mixed and subjected to CE analysis.
2.4. Chromatographic procedure
A column with pentafluorophenyl modification: Kinetex® PFP (150 × 4.6 mm i.d.;
particle size: 2.6 µm; pore size: 100 Å, Phenomenex, Aschaffenburg, Germany) was used as
a stationary phase. The chromatographic system was operated isocratically at 10 °C using a
mobile phase composed of an aqueous ammonium acetate solution (50 mM, pH adjusted to
5.0 with glacial acetic acid) and acetonitrile (1000:50, V/V) applying a flow-rate of 1.0
mL/min. The column was flushed after every run with a mixture of acetonitrile and water
(70:30 V/V) for 10 min at 1.0 mL/min. The fluorescence detector was set to an excitation
wavelength of 345 nm and the emission was recorded at 445 nm. The injection and
derivatization was done by an injector program described under Section 2.4.2.
Results
80
2.4.1. Preparation of solutions
OPA reagent solution: 15 mg of o-phthaldialdehyde were dissolved in 2.0 mL of a 4.2
g/L solution of NaHCO3 and stored at 8 °C in the auto sampler within an amber glass vial.
The NAC buffer was a solution containing 18 g/L NAC and 26 g/L NaHCO3, degassed by
sonication and stored at 4–8 °C. Reference solution: 5.0 mg of L-aspartic, 5.0 mg of L-
glutamic and 5.0 mg D-aspartic acid were dissolved in and diluted to 10.0 mL with a 4.2 g/L
solution of NaHCO3 and diluted again 1:100 with the same solvent. 0.1 mL of this solution
was diluted to 1.0 mL with NAC buffer.
The internal standard (IS) solution was a 0.1 mg/mL solution of L-glutamic acid in a
4.2 g/L solution of NaHCO3. For the API sample test solution 10.0 mg of magnesium
aspartate dihydrate or 8.0 mg of L-aspartic acid and 0.1 mL of IS solution were dissolved in a
4.2 g/L solution of NaHCO3 and diluted to 10.0 mL with the same solvent. This stock solution
was subsequently diluted 1:4 with NAC buffer before injection. The drug product test solution
was prepared by dissolution of an amount of the drug product equal to 10.0 mg of
magnesium aspartate dihydrate and 0.1 mL of IS solution in a 4.2 g/L solution of NaHCO3
and subsequent dilution to 10.0 mL with the same solvent. This stock solution was finally
filtrated (0.22 µm cellulose acetate) and diluted 1:4 with NAC buffer before injection.
2.4.1. Derivatization procedure
The auto sampler drew 2 µL of OPA reagent solution, then test or reference solution,
and subsequently OPA reagent solution again, mixed the 6 µL by up- and down-movement
of the syringe cylinder with a speed of 100 µL/min and a volume of 2 µL. The derivatives
were injected after 3, 4, 5, 6, 7, 8, 9 and 10 min reaction time, respectively.
2.5. Determination of water by Karl-Fischer (KF) titration
125 mg of magnesium aspartate dihydrate were dissolved in 10.0 mL of formamide
by sonication and diluted to 25.0 mL with anhydrous methanol. 20.0 mL of this solution were
diluted with the HYDRANAL®-solvent for KF and titrated with methanolic iodine solution
(HYDRANAL®-Titrant 5) using biamperometric endpoint detection. A blank titration was
performed.
2.6. Determination of the specific rotation
0.5 g of magnesium aspartate dihydrate were dissolved in 5 mol/L hydrochloric acid,
spiked with 0, 250, 500, 750, 1000 and 1250 µL of a 20 mg/mL solution of D-aspartic acid in
5 M hydrochloric acid and diluted to 25.0 mL with the same acid. The optical rotation of this
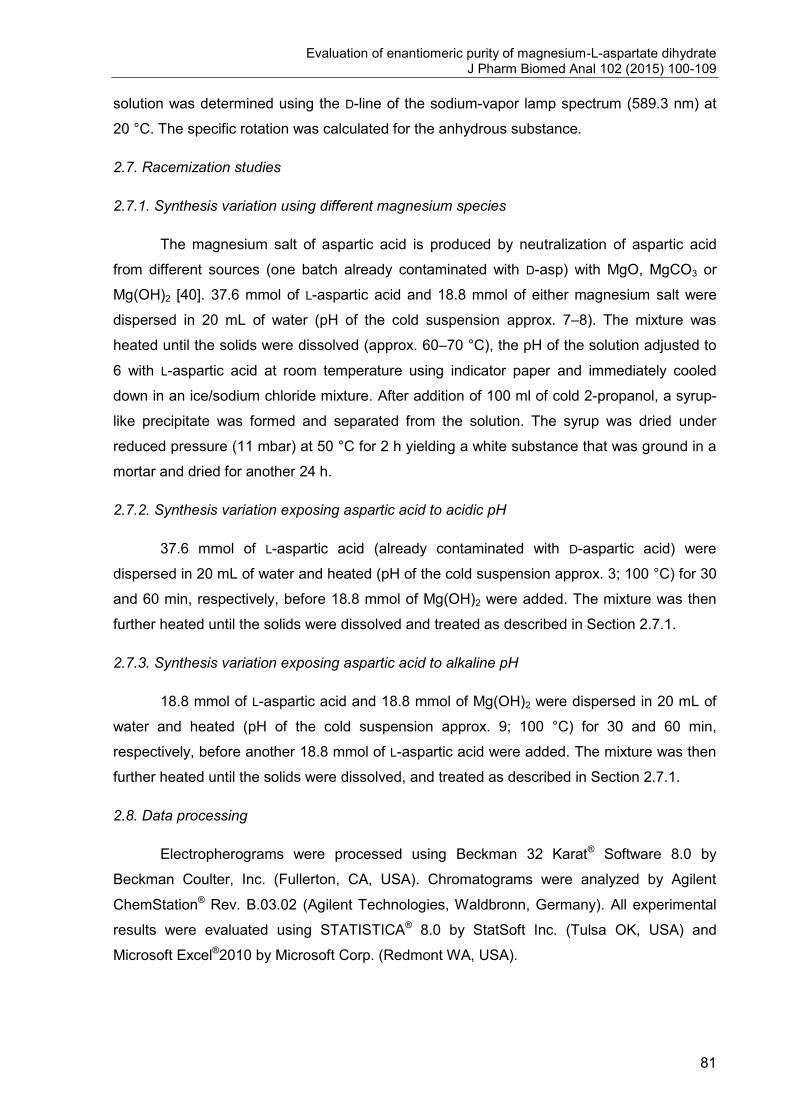
Evaluation of enantiomeric purity of magnesium-L-aspartate dihydrate J Pharm Biomed Anal 102 (2015) 100-109
81
solution was determined using the D-line of the sodium-vapor lamp spectrum (589.3 nm) at
20 °C. The specific rotation was calculated for the anhydrous substance.
2.7. Racemization studies
2.7.1. Synthesis variation using different magnesium species
The magnesium salt of aspartic acid is produced by neutralization of aspartic acid
from different sources (one batch already contaminated with D-asp) with MgO, MgCO3 or
Mg(OH)2 [40]. 37.6 mmol of L-aspartic acid and 18.8 mmol of either magnesium salt were
dispersed in 20 mL of water (pH of the cold suspension approx. 7–8). The mixture was
heated until the solids were dissolved (approx. 60–70 °C), the pH of the solution adjusted to
6 with L-aspartic acid at room temperature using indicator paper and immediately cooled
down in an ice/sodium chloride mixture. After addition of 100 ml of cold 2-propanol, a syrup-
like precipitate was formed and separated from the solution. The syrup was dried under
reduced pressure (11 mbar) at 50 °C for 2 h yielding a white substance that was ground in a
mortar and dried for another 24 h.
2.7.2. Synthesis variation exposing aspartic acid to acidic pH
37.6 mmol of L-aspartic acid (already contaminated with D-aspartic acid) were
dispersed in 20 mL of water and heated (pH of the cold suspension approx. 3; 100 °C) for 30
and 60 min, respectively, before 18.8 mmol of Mg(OH)2 were added. The mixture was then
further heated until the solids were dissolved and treated as described in Section 2.7.1.
2.7.3. Synthesis variation exposing aspartic acid to alkaline pH
18.8 mmol of L-aspartic acid and 18.8 mmol of Mg(OH)2 were dispersed in 20 mL of
water and heated (pH of the cold suspension approx. 9; 100 °C) for 30 and 60 min,
respectively, before another 18.8 mmol of L-aspartic acid were added. The mixture was then
further heated until the solids were dissolved, and treated as described in Section 2.7.1.
2.8. Data processing
Electropherograms were processed using Beckman 32 Karat® Software 8.0 by
Beckman Coulter, Inc. (Fullerton, CA, USA). Chromatograms were analyzed by Agilent
ChemStation® Rev. B.03.02 (Agilent Technologies, Waldbronn, Germany). All experimental
results were evaluated using STATISTICA® 8.0 by StatSoft Inc. (Tulsa OK, USA) and
Microsoft Excel®2010 by Microsoft Corp. (Redmont WA, USA).
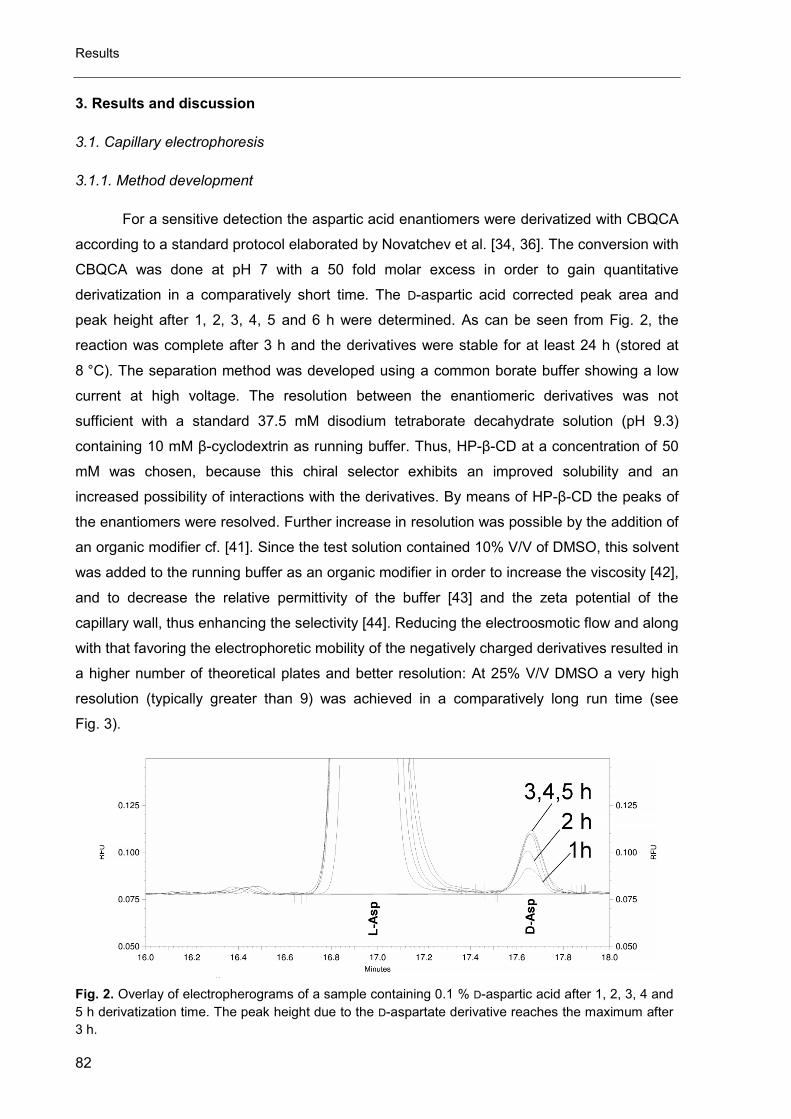
Results
82
3. Results and discussion
3.1. Capillary electrophoresis
3.1.1. Method development
For a sensitive detection the aspartic acid enantiomers were derivatized with CBQCA
according to a standard protocol elaborated by Novatchev et al. [34, 36]. The conversion with
CBQCA was done at pH 7 with a 50 fold molar excess in order to gain quantitative
derivatization in a comparatively short time. The D-aspartic acid corrected peak area and
peak height after 1, 2, 3, 4, 5 and 6 h were determined. As can be seen from Fig. 2, the
reaction was complete after 3 h and the derivatives were stable for at least 24 h (stored at
8 °C). The separation method was developed using a common borate buffer showing a low
current at high voltage. The resolution between the enantiomeric derivatives was not
sufficient with a standard 37.5 mM disodium tetraborate decahydrate solution (pH 9.3)
containing 10 mM β-cyclodextrin as running buffer. Thus, HP-β-CD at a concentration of 50
mM was chosen, because this chiral selector exhibits an improved solubility and an
increased possibility of interactions with the derivatives. By means of HP-β-CD the peaks of
the enantiomers were resolved. Further increase in resolution was possible by the addition of
an organic modifier cf. [41]. Since the test solution contained 10% V/V of DMSO, this solvent
was added to the running buffer as an organic modifier in order to increase the viscosity [42],
and to decrease the relative permittivity of the buffer [43] and the zeta potential of the
capillary wall, thus enhancing the selectivity [44]. Reducing the electroosmotic flow and along
with that favoring the electrophoretic mobility of the negatively charged derivatives resulted in
a higher number of theoretical plates and better resolution: At 25% V/V DMSO a very high
resolution (typically greater than 9) was achieved in a comparatively long run time (see
Fig. 3).
Fig. 2. Overlay of electropherograms of a sample containing 0.1 % D-aspartic acid after 1, 2, 3, 4 and
5 h derivatization time. The peak height due to the D-aspartate derivative reaches the maximum after
3 h.
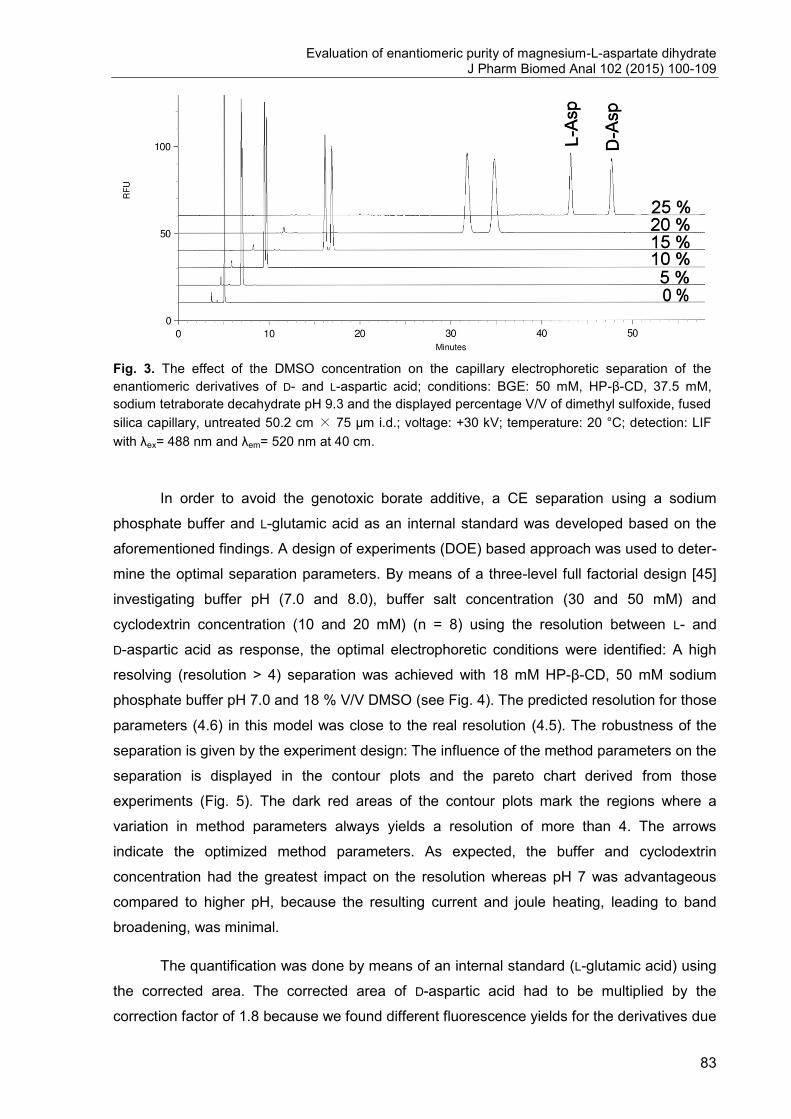
Evaluation of enantiomeric purity of magnesium-L-aspartate dihydrate J Pharm Biomed Anal 102 (2015) 100-109
83
Fig. 3. The effect of the DMSO concentration on the capillary electrophoretic separation of the
enantiomeric derivatives of D- and L-aspartic acid; conditions: BGE: 50 mM, HP-β-CD, 37.5 mM,
sodium tetraborate decahydrate pH 9.3 and the displayed percentage V/V of dimethyl sulfoxide, fused
silica capillary, untreated 50.2 cm × 75 µm i.d.; voltage: +30 kV; temperature: 20 °C; detection: LIF
with λex= 488 nm and λem= 520 nm at 40 cm.
In order to avoid the genotoxic borate additive, a CE separation using a sodium
phosphate buffer and L-glutamic acid as an internal standard was developed based on the
aforementioned findings. A design of experiments (DOE) based approach was used to deter-
mine the optimal separation parameters. By means of a three-level full factorial design [45]
investigating buffer pH (7.0 and 8.0), buffer salt concentration (30 and 50 mM) and
cyclodextrin concentration (10 and 20 mM) (n = 8) using the resolution between L- and
D-aspartic acid as response, the optimal electrophoretic conditions were identified: A high
resolving (resolution > 4) separation was achieved with 18 mM HP-β-CD, 50 mM sodium
phosphate buffer pH 7.0 and 18 % V/V DMSO (see Fig. 4). The predicted resolution for those
parameters (4.6) in this model was close to the real resolution (4.5). The robustness of the
separation is given by the experiment design: The influence of the method parameters on the
separation is displayed in the contour plots and the pareto chart derived from those
experiments (Fig. 5). The dark red areas of the contour plots mark the regions where a
variation in method parameters always yields a resolution of more than 4. The arrows
indicate the optimized method parameters. As expected, the buffer and cyclodextrin
concentration had the greatest impact on the resolution whereas pH 7 was advantageous
compared to higher pH, because the resulting current and joule heating, leading to band
broadening, was minimal.
The quantification was done by means of an internal standard (L-glutamic acid) using
the corrected area. The corrected area of D-aspartic acid had to be multiplied by the
correction factor of 1.8 because we found different fluorescence yields for the derivatives due
Results
84
to D-aspartic acid and L-glutamic acid at 520 nm, possibly due to the proximity of the
β-carboxylate to the fluorophore in the aspartic acid derivative resulting in partial
fluorescence quenching. The correction factor was determined in the presence and in the
absence of L-aspartic acid (50- and more than 16,000-fold molar excess of CBQCA
compared to the total amino acid concentration) excluding the possibility of an incomplete
derivatization.
3.1.2. Method validation
The linearity was determined over the range of 0.1–0.5 % D-aspartic acid spiked to a
magnesium aspartate batch sample containing approx. 0.1 % D-aspartic acid. The coefficient
of determination was found to be higher than 0.995 (R2= 0.9994). The accuracy was
determined using another batch sample spiked from 0.1 to 0.5 %. The recovery rates ranged
from 87 to 90 % (RSD < 1.5 % n = 2). The intermediate precision was tested on an API batch
sample containing 0.11 % D-aspartic acid (RSD < 10 %, n = 6). The LOQ (S/N of 10) was
found to be 0.03 % determined via a successive addition of D-aspartic acid to a blank
solution until the S/N ratio reached 10.
Fig. 4. Representative electropherogram obtained from a test solution (CBQCA derivatives) –
migration order: L-glutamic acid (IS), L-aspartic acid, D-aspartic acid (D-Asp = 0.11 %); electrophoretic
conditions: BGE: 18 mM, HP-β-CD 18 % V/V DMSO and 50 mM phosphate buffer pH 7.0, fused silica
capillary, untreated 50.2 cm × 75 µm i.d.; voltage: +20 kV; temperature: 25 °C; detection: LIF with
λex= 488 nm and λem= 520 nm at 40 cm.
3.2. Chromatographic method
3.2.1. Method development and optimization
The separation method development was based on previous work by Aswad [39] and
optimized regarding resolution and limit of detection (LOD). They used an isocratic elution
protocol with 50 mM sodium acetate pH 5.9 and 8 % V/V methanol in combination with an
octadecyl-modified silica gel column.
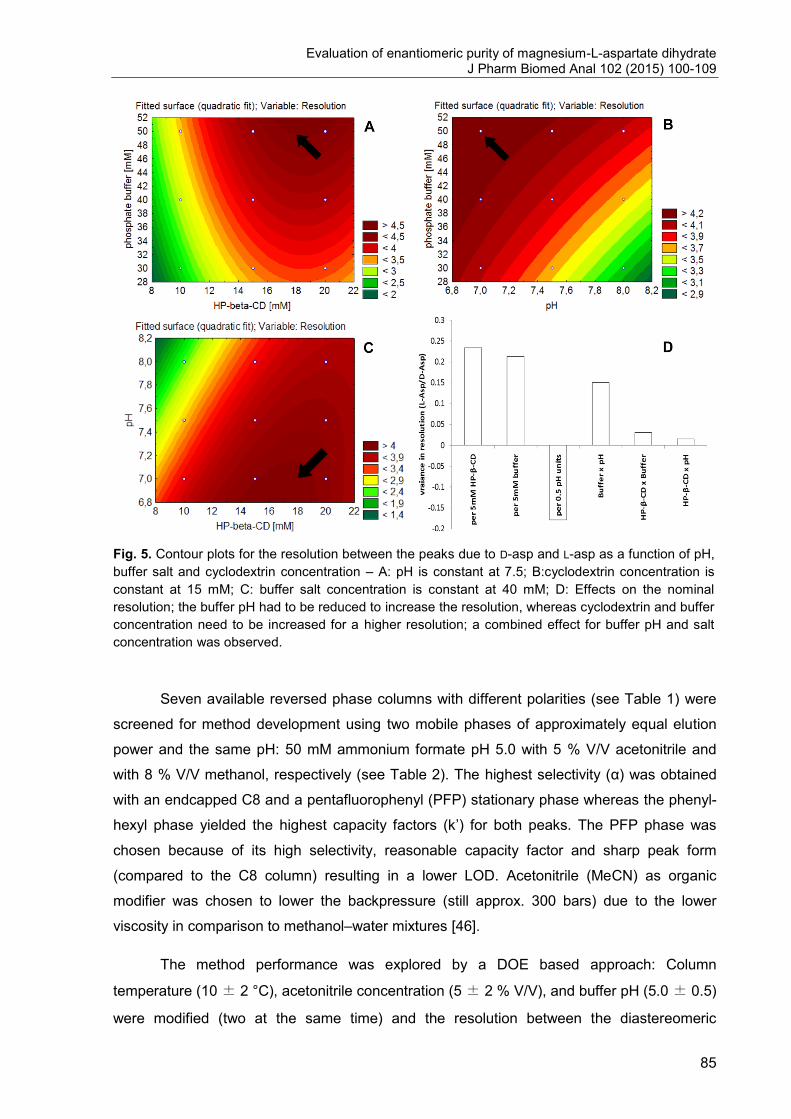
Evaluation of enantiomeric purity of magnesium-L-aspartate dihydrate J Pharm Biomed Anal 102 (2015) 100-109
85
Fig. 5. Contour plots for the resolution between the peaks due to D-asp and L-asp as a function of pH,
buffer salt and cyclodextrin concentration – A: pH is constant at 7.5; B:cyclodextrin concentration is
constant at 15 mM; C: buffer salt concentration is constant at 40 mM; D: Effects on the nominal
resolution; the buffer pH had to be reduced to increase the resolution, whereas cyclodextrin and buffer
concentration need to be increased for a higher resolution; a combined effect for buffer pH and salt
concentration was observed.
Seven available reversed phase columns with different polarities (see Table 1) were
screened for method development using two mobile phases of approximately equal elution
power and the same pH: 50 mM ammonium formate pH 5.0 with 5 % V/V acetonitrile and
with 8 % V/V methanol, respectively (see Table 2). The highest selectivity (α) was obtained
with an endcapped C8 and a pentafluorophenyl (PFP) stationary phase whereas the phenyl-
hexyl phase yielded the highest capacity factors (k’) for both peaks. The PFP phase was
chosen because of its high selectivity, reasonable capacity factor and sharp peak form
(compared to the C8 column) resulting in a lower LOD. Acetonitrile (MeCN) as organic
modifier was chosen to lower the backpressure (still approx. 300 bars) due to the lower
viscosity in comparison to methanol–water mixtures [46].
The method performance was explored by a DOE based approach: Column
temperature (10 ± 2 °C), acetonitrile concentration (5 ± 2 % V/V), and buffer pH (5.0 ± 0.5)
were modified (two at the same time) and the resolution between the diastereomeric
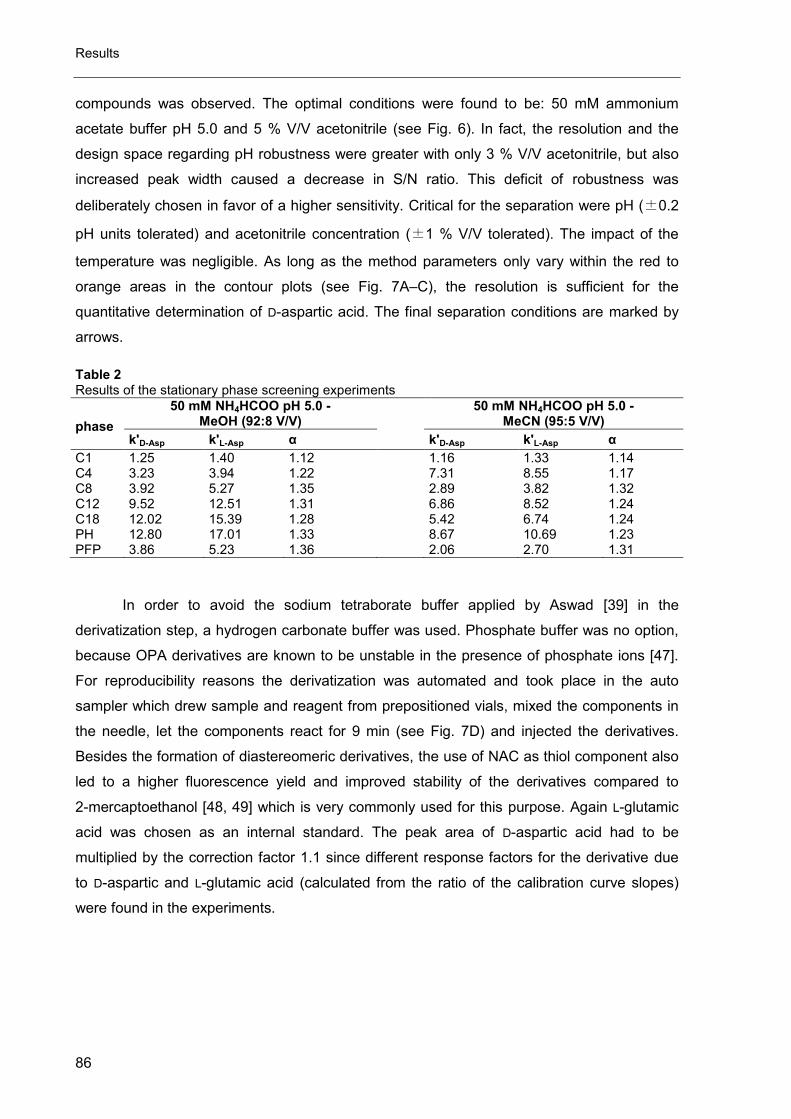
Results
86
compounds was observed. The optimal conditions were found to be: 50 mM ammonium
acetate buffer pH 5.0 and 5 % V/V acetonitrile (see Fig. 6). In fact, the resolution and the
design space regarding pH robustness were greater with only 3 % V/V acetonitrile, but also
increased peak width caused a decrease in S/N ratio. This deficit of robustness was
deliberately chosen in favor of a higher sensitivity. Critical for the separation were pH (±0.2
pH units tolerated) and acetonitrile concentration (±1 % V/V tolerated). The impact of the
temperature was negligible. As long as the method parameters only vary within the red to
orange areas in the contour plots (see Fig. 7A–C), the resolution is sufficient for the
quantitative determination of D-aspartic acid. The final separation conditions are marked by
arrows.
Table 2 Results of the stationary phase screening experiments
phase
50 mM NH4HCOO pH 5.0 - MeOH (92:8 V/V)
50 mM NH4HCOO pH 5.0 - MeCN (95:5 V/V)
k'D-Asp k'L-Asp α k'D-Asp k'L-Asp α
C1 1.25 1.40 1.12
1.16 1.33 1.14 C4 3.23 3.94 1.22
7.31 8.55 1.17
C8 3.92 5.27 1.35
2.89 3.82 1.32 C12 9.52 12.51 1.31
6.86 8.52 1.24
C18 12.02 15.39 1.28
5.42 6.74 1.24 PH 12.80 17.01 1.33
8.67 10.69 1.23
PFP 3.86 5.23 1.36
2.06 2.70 1.31
In order to avoid the sodium tetraborate buffer applied by Aswad [39] in the
derivatization step, a hydrogen carbonate buffer was used. Phosphate buffer was no option,
because OPA derivatives are known to be unstable in the presence of phosphate ions [47].
For reproducibility reasons the derivatization was automated and took place in the auto
sampler which drew sample and reagent from prepositioned vials, mixed the components in
the needle, let the components react for 9 min (see Fig. 7D) and injected the derivatives.
Besides the formation of diastereomeric derivatives, the use of NAC as thiol component also
led to a higher fluorescence yield and improved stability of the derivatives compared to
2-mercaptoethanol [48, 49] which is very commonly used for this purpose. Again L-glutamic
acid was chosen as an internal standard. The peak area of D-aspartic acid had to be
multiplied by the correction factor 1.1 since different response factors for the derivative due
to D-aspartic and L-glutamic acid (calculated from the ratio of the calibration curve slopes)
were found in the experiments.
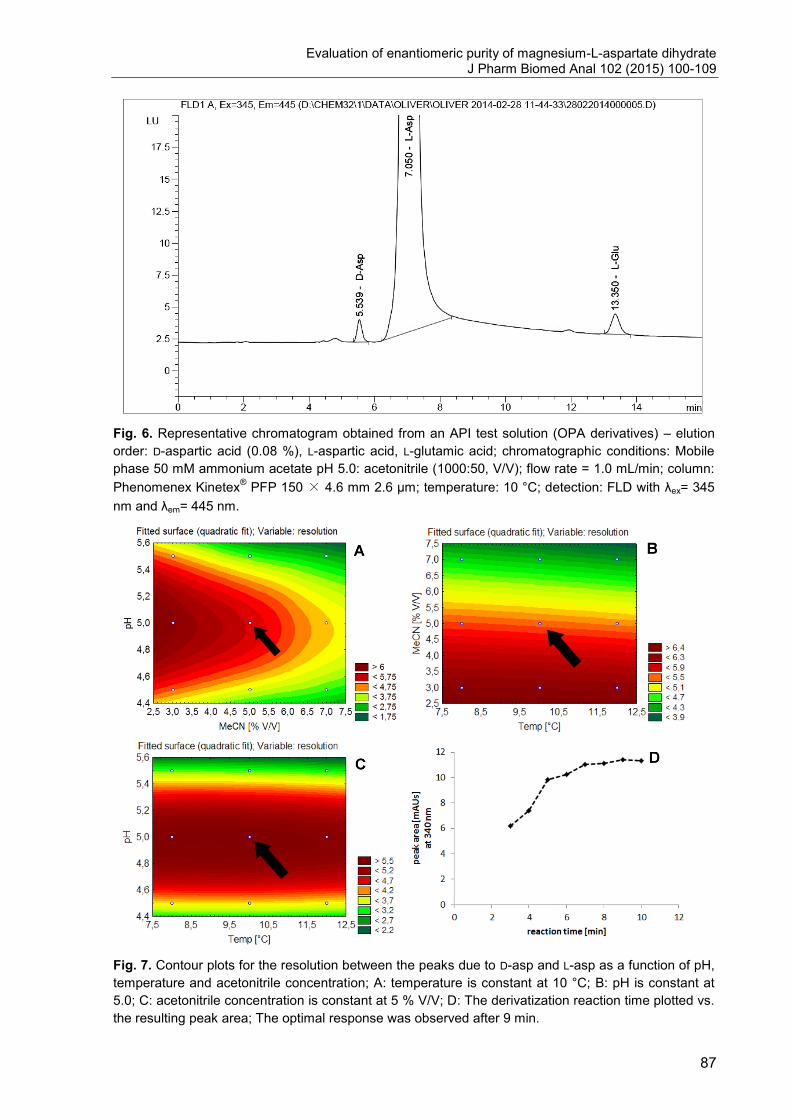
Evaluation of enantiomeric purity of magnesium-L-aspartate dihydrate J Pharm Biomed Anal 102 (2015) 100-109
87
Fig. 6. Representative chromatogram obtained from an API test solution (OPA derivatives) – elution
order: D-aspartic acid (0.08 %), L-aspartic acid, L-glutamic acid; chromatographic conditions: Mobile
phase 50 mM ammonium acetate pH 5.0: acetonitrile (1000:50, V/V); flow rate = 1.0 mL/min; column:
Phenomenex Kinetex® PFP 150 × 4.6 mm 2.6 µm; temperature: 10 °C; detection: FLD with λex= 345
nm and λem= 445 nm.
Fig. 7. Contour plots for the resolution between the peaks due to D-asp and L-asp as a function of pH,
temperature and acetonitrile concentration; A: temperature is constant at 10 °C; B: pH is constant at
5.0; C: acetonitrile concentration is constant at 5 % V/V; D: The derivatization reaction time plotted vs.
the resulting peak area; The optimal response was observed after 9 min.
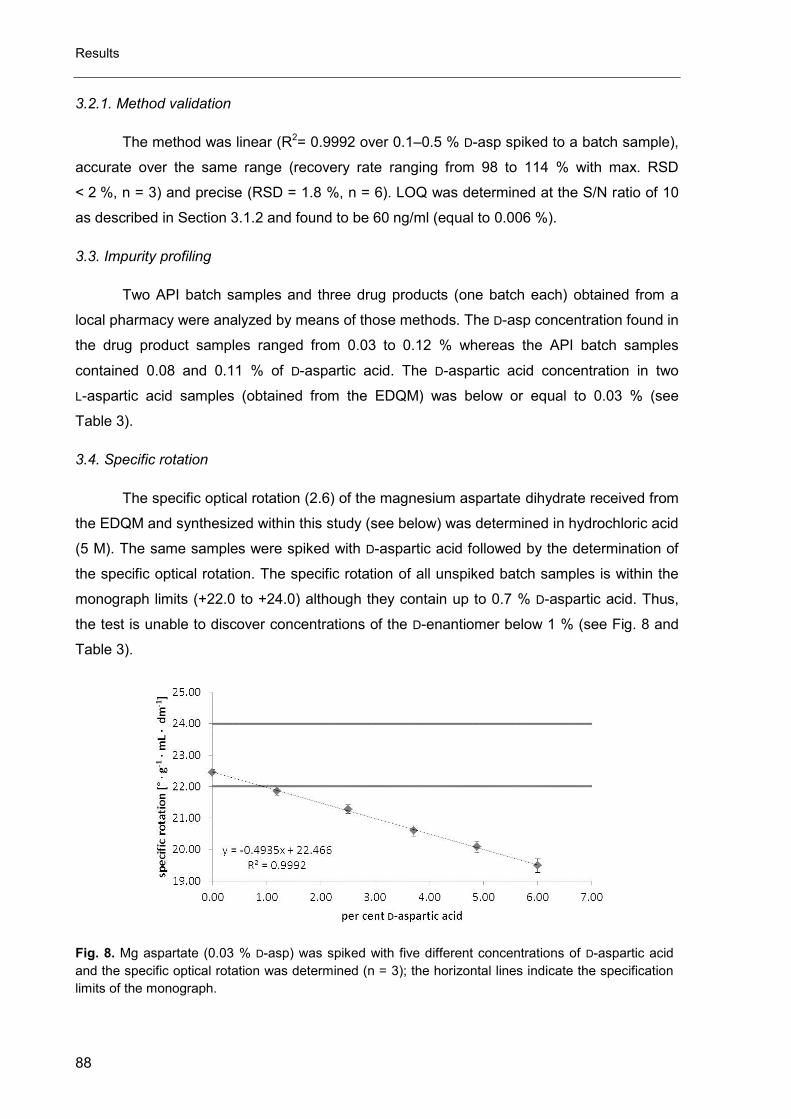
Results
88
3.2.1. Method validation
The method was linear (R2= 0.9992 over 0.1–0.5 % D-asp spiked to a batch sample),
accurate over the same range (recovery rate ranging from 98 to 114 % with max. RSD
< 2 %, n = 3) and precise (RSD = 1.8 %, n = 6). LOQ was determined at the S/N ratio of 10
as described in Section 3.1.2 and found to be 60 ng/ml (equal to 0.006 %).
3.3. Impurity profiling
Two API batch samples and three drug products (one batch each) obtained from a
local pharmacy were analyzed by means of those methods. The D-asp concentration found in
the drug product samples ranged from 0.03 to 0.12 % whereas the API batch samples
contained 0.08 and 0.11 % of D-aspartic acid. The D-aspartic acid concentration in two
L-aspartic acid samples (obtained from the EDQM) was below or equal to 0.03 % (see
Table 3).
3.4. Specific rotation
The specific optical rotation (2.6) of the magnesium aspartate dihydrate received from
the EDQM and synthesized within this study (see below) was determined in hydrochloric acid
(5 M). The same samples were spiked with D-aspartic acid followed by the determination of
the specific optical rotation. The specific rotation of all unspiked batch samples is within the
monograph limits (+22.0 to +24.0) although they contain up to 0.7 % D-aspartic acid. Thus,
the test is unable to discover concentrations of the D-enantiomer below 1 % (see Fig. 8 and
Table 3).
Fig. 8. Mg aspartate (0.03 % D-asp) was spiked with five different concentrations of D-aspartic acid
and the specific optical rotation was determined (n = 3); the horizontal lines indicate the specification
limits of the monograph.
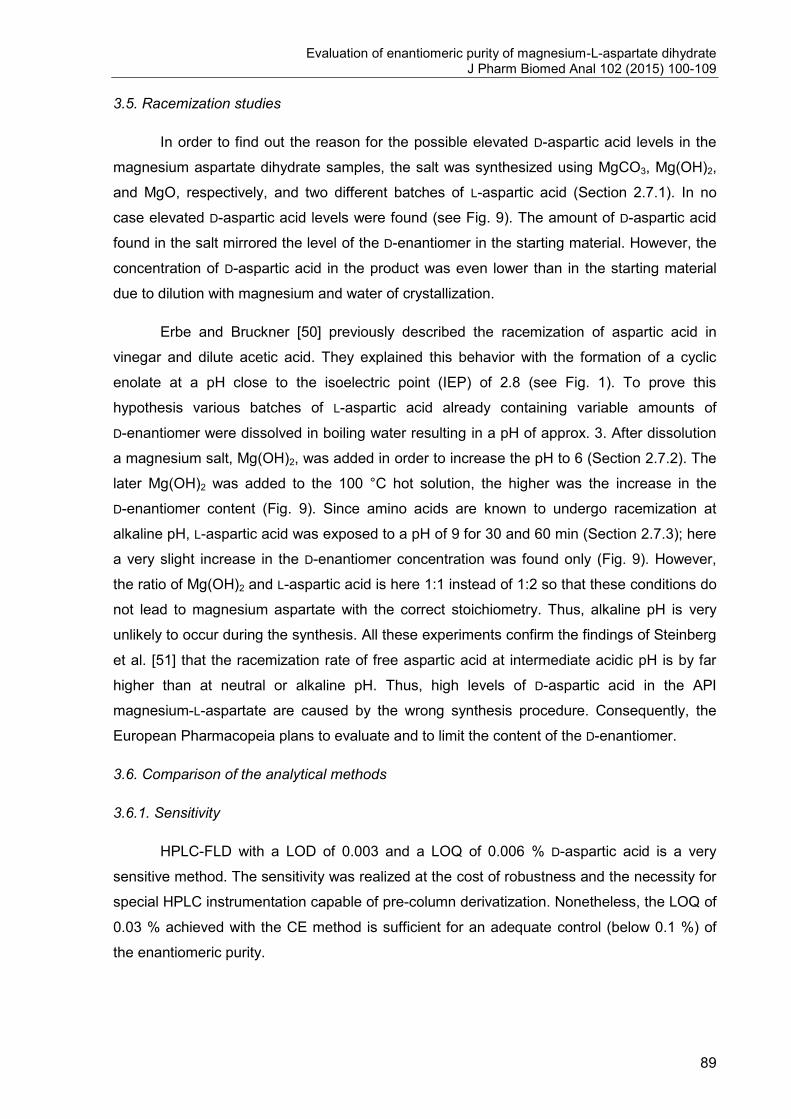
Evaluation of enantiomeric purity of magnesium-L-aspartate dihydrate J Pharm Biomed Anal 102 (2015) 100-109
89
3.5. Racemization studies
In order to find out the reason for the possible elevated D-aspartic acid levels in the
magnesium aspartate dihydrate samples, the salt was synthesized using MgCO3, Mg(OH)2,
and MgO, respectively, and two different batches of L-aspartic acid (Section 2.7.1). In no
case elevated D-aspartic acid levels were found (see Fig. 9). The amount of D-aspartic acid
found in the salt mirrored the level of the D-enantiomer in the starting material. However, the
concentration of D-aspartic acid in the product was even lower than in the starting material
due to dilution with magnesium and water of crystallization.
Erbe and Bruckner [50] previously described the racemization of aspartic acid in
vinegar and dilute acetic acid. They explained this behavior with the formation of a cyclic
enolate at a pH close to the isoelectric point (IEP) of 2.8 (see Fig. 1). To prove this
hypothesis various batches of L-aspartic acid already containing variable amounts of
D-enantiomer were dissolved in boiling water resulting in a pH of approx. 3. After dissolution
a magnesium salt, Mg(OH)2, was added in order to increase the pH to 6 (Section 2.7.2). The
later Mg(OH)2 was added to the 100 °C hot solution, the higher was the increase in the
D-enantiomer content (Fig. 9). Since amino acids are known to undergo racemization at
alkaline pH, L-aspartic acid was exposed to a pH of 9 for 30 and 60 min (Section 2.7.3); here
a very slight increase in the D-enantiomer concentration was found only (Fig. 9). However,
the ratio of Mg(OH)2 and L-aspartic acid is here 1:1 instead of 1:2 so that these conditions do
not lead to magnesium aspartate with the correct stoichiometry. Thus, alkaline pH is very
unlikely to occur during the synthesis. All these experiments confirm the findings of Steinberg
et al. [51] that the racemization rate of free aspartic acid at intermediate acidic pH is by far
higher than at neutral or alkaline pH. Thus, high levels of D-aspartic acid in the API
magnesium-L-aspartate are caused by the wrong synthesis procedure. Consequently, the
European Pharmacopeia plans to evaluate and to limit the content of the D-enantiomer.
3.6. Comparison of the analytical methods
3.6.1. Sensitivity
HPLC-FLD with a LOD of 0.003 and a LOQ of 0.006 % D-aspartic acid is a very
sensitive method. The sensitivity was realized at the cost of robustness and the necessity for
special HPLC instrumentation capable of pre-column derivatization. Nonetheless, the LOQ of
0.03 % achieved with the CE method is sufficient for an adequate control (below 0.1 %) of
the enantiomeric purity.
Results
90
Table 3 Average results of the performed determinations (n = 2) and specific rotation (n = 3) ± SD
Substance Source Specific optical
rotation [° mL g-1
dm-1
] D-Asp by
HPLC-FLDa
D-Asp by CE-LIF
a
Mg L-aspartate EDQM +22.60 ± 0.10 0.10 ± 0.00 0.11 ± 0.01 Mg L-aspartate EDQM +23.11 ± 0.09 0.08 ± 0.00 0.10 ± 0.01 Mg L-aspartate own synthesis (2.7.1) +22.46 ± 0.09 0.02 ± 0.00 0.03 ± 0.00 Mg L-aspartate own synthesis (2.7.1) +22.29 ± 0.18 0.16 ± 0.02 0.17 ± 0.02 Mg L-aspartate own synthesis (2.7.1) +22.97 ± 0.15 0.16 ± 0.00 0.19 ± 0.02 Mg L-aspartate own synthesis (2.7.2) +22.49 ± 0.14 0.39 ± 0.02 0.40 ± 0.04 Mg L-aspartate own synthesis (2.7.2) +23.37± 0.21 0.41 ± 0.02 0.42 ± 0.04 Mg L-aspartate own synthesis (2.7.2) +22.86 ± 0.20 0.69 ± 0.03 0.64 ± 0.06 Mg L-aspartate own synthesis (2.7.2) +22.54 ± 0.21 0.69 ± 0.03 0.67 ± 0.05 Mg L-aspartate own synthesis (2.7.3) - 0.03 ± 0.00 - Mg L-aspartate own synthesis (2.7.3) - 0.03 ± 0.00 - Mg L-aspartate own synthesis (2.7.3) - 0.04 ± 0.00 - Mg L-aspartate own synthesis (2.7.3) - 0.03 ± 0.00 - Magnaspart
® 20 local pharmacy - 0.12 ± 0.00
b -
Magnerot® A 500 local pharmacy - 0.10 ± 0.00
b -
Magnesium Verla
®
local pharmacy - 0.03± 0.00b -
L-aspartic acid EDQM - 0.03± 0.00 < LOQ L-aspartic acid EDQM - 0.02± 0.00 < LOQ L-aspartic acid Merck KGaA - 0.21± 0.00 - a in % of the test solutions concentration
b in % of the declared content
Fig. 9. The content of D-aspartic acid in the synthesized magnesium aspartate dihydrate samples is
compared to the concentration of the D-enantiomer in the corresponding starting material. The salt
was produced from Mg(OH)2, MgCO3, MgO and L-aspartic acid at neutral, acidic and alkaline pH
(n = 2).
Evaluation of enantiomeric purity of magnesium-L-aspartate dihydrate J Pharm Biomed Anal 102 (2015) 100-109
91
3.6.2. Repeatability
The HPLC method is highly repeatable because of the automated process of
derivatization and precise sampling procedure. Both methods benefit from the use of an
internal standard which equalizes dosing, reaction time and, in the case of the CE method,
migration time imprecision. However, the use of an internal standard is almost obligatory
since area normalization would not lead to an adequate result because of the poor linearity of
the fluorescence response over such a wide range. The derivatization step in the CE method
takes much longer (3 h vs. 9 min) but is easily transferable to any laboratory making it the
ideal method for a pharmacopeia.
3.6.3. Deduction
The quick HPLC method is mostly suitable as a screening procedure with high
throughput whereas the time consuming CE method is ideal for the Ph. Eur., because it is
feasible in almost every laboratory able to perform CE-LIF analysis. Nevertheless, most of
today’s available HPLC instruments are capable of automated pre-column derivatization so
that many laboratories could perform this test as well. In conclusion both methods have
proven suitable for the control of the enantiomeric purity of magnesium L-aspartate dihydrate.
4. Conclusion
In summary there are two reasons for a high D-aspartic acid concentration in Mg
aspartate dihydrate: The starting material for the synthesis was already contaminated with
the D-enantiomer and/or the amino acid was exposed to heat and simultaneously to a pH
close to its IEP (2.8). Avoiding acidic pH the synthesis of batches with less than 0.03 % of
the D-enantiomer is possible. Against the background of D-aspartic acid mimicking the action
of glutamate by activating NMDA receptors [17–20] and interfering with several endocrinal
and hormonal systems [21–25], the use of racemic magnesium bis(hydrogen-DL-aspartate)
tetrahydrate appears to be out of date and the chiral purity of magnesium bis(hydrogen-
aspartate)dihydrate should be controlled by a sensitive method to guarantee the quality and
the safety of the API. The current employed test “specific optical rotation” of the Ph. Eur. is
not suitable to effectively control the enantiomeric purity of the substance. Either one of the
herein presented methods is accomplishing this task. The HPLC-FLD method combines high
sensitivity and a quick determination with very good precision, whereas the CE-LIF method is
easily transferable to other CE systems because it does not need special instrumentation
capable of online derivatization, but uses a time consuming manual sample preparation step
prior to analysis instead.
Results
92
Conflict of interest statement
None of the authors of this paper does have a financial or personal relationship with
other people or organizations that could inappropriately influence or bias the content of the
paper.
Acknowledgement
Thanks are due to the Federal Institute of Drugs and Medical Devices (Bonn,
Germany) for financial support and the European Directorate for the Quality of Medicines &
HealthCare for the sample and reference substance supply.
References
[1] S.R. Garrison, G.M. Allan, R.K. Sekhon, V.M. Musini, K.M. Khan, Magnesium forskeletal
muscle cramps, Cochrane Database Syst. Rev. (2012).
[2] L.O. Dahle, G. Berg, M. Hammar, M. Hurtig, L. Larsson, The effect of oral mag-nesium
substitution on pregnancy-induced leg cramps, Am. J. Obstet. Gynecol.173 (1995) 175–180.
[3] M. Firoz, M. Graber, Bioavailability of US commercial magnesium preparations, Magnes. Res.
14 (2001) 257–262.
[4] J.S. Lindberg, M.M. Zobitz, J.R. Poindexter, C.Y.C. Pak, Magnesium bioavailability from
magnesium citrate and magnesium-oxide, J. Am. Coll. Nutr. 9 (1990) 48–55.
[5] C. Coudray, M. Rambeau, C. Feillet-Coudray, E. Gueux, J.C. Tressol, A. Mazur, Y.
Rayssiguier, Study of magnesium bioavailability from ten organic and inorganic Mg salts in
Mg-depleted rats using a stable isotope approach, Magnes. Res. 18 (2005) 215–223.
[6] S.W. Golf, Zur biologischen Vergleichbarkeit und biochemischen Wirksamkeit
pharmazeutischer Magnesiumverbindungen, J. Miner. Stoffwechs. 6 (1999) 11–21.
[7] Magnesium aspartate dihydrate, European Pharmacopoeia, 8th edition, European Directorate
for the Quality of Medicines & HealthCare, Strasbourg, France, 2014.
[8] J.L. Bada, In vivo racemization in mammalian proteins, Method. Enzymol. 106 (1984) 98–115.
[9] O.A. Sherwood, D.B. Scott, M.J. Risk, Late holocene radiocarbon and aspartic acid
racemization dating of deep-sea octocorals, Geochim. Cosmochim. Acta 70 (2006) 2806–
2814.
[10] C.R. Sloss, C.V. Murray-Wallace, B.G. Jones, T. Wallin, Aspartic acid racemization dating of
mid-Holocene to recent estuarine sedimentation in New South Wales, Australia: a pilot study,
Mar. Geol. 212 (2004) 45–59.
Evaluation of enantiomeric purity of magnesium-L-aspartate dihydrate J Pharm Biomed Anal 102 (2015) 100-109
93
[11] R.E. Taylor, P.J. Ennis, P.J. Slota, L.A. Payen, Non-age-related variations in aspartic-acid
racemization in bone from a radiocarbon-dated late Holocene archaeological site,
Radiocarbon 31 (1989) 1048–1056.
[12] S. Arany, S. Ohtani, T. Yamamoto, T. Sugiyama, Comparison of aspartic acid racemization
between mammoth and human dentinal tissues, Arch. Oral Biol. 52 (2007) 20–25.
[13] S. Arany, S. Ohtani, Age estimation of bloodstains: a preliminary report based on aspartic acid
racemization rate, Forensic Sci. Int. 212 (2011) E36–E39.
[14] O. Takahashi, K. Kobayashi, A. Oda, Computational modeling of the enolization in a direct
mechanism of racemization of the aspartic acid residue, Chem. Biodivers. 7 (2010) 1630–
1633.
[15] O. Takahashi, K. Kobayashi, A. Oda, Modeling the enolization of succinimide derivatives, a
key step of racemization of aspartic acid residues: importance of a two-H2O mechanism,
Chem. Biodivers. 7 (2010) 1349–1356.
[16] J.L. Radkiewicz, H. Zipse, S. Clarke, K.N. Houk, Accelerated racemization of aspartic acid and
asparagine residues via succinimide intermediates: an ab initio theoretical exploration of
mechanism, J. Am. Chem. Soc. 118 (1996) 9148–9155.
[17] M.J. Schell, O.B. Cooper, S.H. Snyder, D-aspartate localizations imply neuronal and
neuroendocrine roles, Proc. Natl. Acad. Sci. U. S. A. 94 (1997) 2013–2018.
[18] H. Wang, H. Wolosker, J.F. Morris, J. Pevsner, S.H. Snyder, D.J. Selkoe, Naturally occurring
free D-aspartate is a nuclear component of cells in the mammalian hypothalamo-
neurohypophyseal system, Neuroscience 109 (2002) 1–4.
[19] H. Wang, H. Wolosker, J. Pevsner, S.H. Snyder, D.J. Selkoe, Regulation of rat magnocellular
neurosecretory system by d-aspartate: evidence for biological role(s) of a naturally occurring
free D-amino acid in mammals, J. Endocrinol.167 (2000) 247–252.
[20] H. Wolosker, A. D’Aniello, S.H. Snyder, D-Aspartate disposition in neuronal and endocrine
tissues: ontogeny, biosynthesis and release, Neuroscience 100 (2000) 183–189.
[21] N. Ota, T. Shi, J.V. Sweedler, D-Aspartate acts as a signaling molecule in nervous and
neuroendocrine systems, Amino Acids 43 (2012) 1873–1886.
[22] M. Pampillo, T. Scimonelli, M.C. Bottino, B.H. Duvilanski, V. Rettori, A. Seilicovich, M. Lasaga,
The effect of D-aspartate on luteinizing hormone-releasing hormone, alpha-melanocyte-
stimulating hormone, GABA and dopamine release, Neuroreport 13 (2002) 2341–2344.
[23] E. Topo, A. Soricelli, A. D’Aniello, S. Ronsini, G. D’Aniello, The role and molecular mechanism
of D-aspartic acid in the release and synthesis of LH and testosterone in humans and rats,
Reprod. Biol. Endocrin. 7 (2009) 120.
Results
94
[24] C. Lamanna, L. Assisi, V. Botte, M.M. Di Fiore, Involvement of D-Asp in P450 aromatase
activity and estrogen receptors in boar testis, Amino Acids 32 (2007) 45–51.
[25] H. Homma, Biochemistry of d-aspartate in mammalian cells, Amino Acids 32 (2007) 3–11.
[26] Impurities in new drug substances, ICH, Q3A(R2), 2006.
[27] M.H. Hyun, J.S. Jin, W.J. Lee, Liquid chromatographic resolution of racemic amino acids and
their derivatives on a new chiral stationary phase based on crown ether, J. Chromatogr. A 822
(1998) 155–161.
[28] M.H. Hyun, J.S. Jin, S.C. Han, Y.J. Cho, The effect of analyte lipophilicity on the resolution of
alpha-amino acids on a HPLC chiral stationary phase based on crown ether, Microchem. J. 70
(2001) 205–209.
[29] M.H. Hyun, S.C. Han, B.H. Lipshutz, Y.J. Shin, C.J. Welch, New chiral crown ether stationary
phase for the liquid chromatographic resolution of alpha-amino acid enantiomers, J.
Chromatogr. A 910 (2001) 359–365.
[30] G. Galaverna, R. Corradini, E. Demunari, A. Dossena, R. Marchelli, Chiral separation of
unmodified amino-acids by ligand-exchange high-performance liquid-chromatography using
copper(II) complexes of l-amino-acid amides as additives to the eluent, J. Chromatogr. A 657
(1993) 43–54.
[31] N. Sanaie, C.A. Haynes, Interpreting the effects of temperature and solvent composition on
separation of amino-acid racemates by chiral ligand-exchange chromatography, J.
Chromatogr. A 1104 (2006) 164–172.
[32] B. Natalini, R. Sardella, G. Carbone, A. Macchiarulo, R. Pellicciari, The effect of the copper(II)
salt anion in the chiral ligand-exchange chromatography of amino acids, Anal. Chim. Acta 638
(2009) 225–233.
[33] H. Ali, R. Patzold, H. Bruckner, Determination of L- and D-amino acids in smoke-less tobacco
products and tobacco, Food Chem. 99 (2006) 803–812.
[34] E.A. Arriaga, Y.N. Zhang, N.J. Dovichi, Use of 3-(p-Carboxybenzoyl)quinoline-2-
carboxaldehyde to label amino-acids for high-sensitivity fluorescence detection in capillary
electrophoresis, Anal. Chim. Acta 299 (1995) 319–326.
[35] S. Kopec, U. Holzgrabe, Amino acids: aspects of impurity profiling by means of CE,
Electrophoresis 28 (2007) 2153–2167.
[36] N. Novatchev, U. Holzgrabe, Evaluation of amino sugar, low molecular peptide and amino acid
impurities of biotechnologically produced amino acids by means of CE, J. Pharm. Biomed.
Anal. 28 (2002) 475–486.
Evaluation of enantiomeric purity of magnesium-L-aspartate dihydrate J Pharm Biomed Anal 102 (2015) 100-109
95
[37] M. Ummadi, B.C. Weimer, Use of capillary electrophoresis and laser-induced fluorescence for
attomole detection of amino acids, J. Chromatogr. A 964 (2002) 243–253.
[38] K.C. Lin, M.M. Hsieh, C.W. Chang, E.P. Lin, T.H. Wu, Stacking and separation of aspartic acid
enantiomers under discontinuous system by capillary electrophoresis with light-emitting diode-
induced fluorescence detection, Talanta 82 (2010) 1912–1918.
[39] D.W. Aswad, Determination of D-aspartate and L-aspartate in amino-acid mixtures by high-
performance liquid-chromatography after derivatization with achiral adduct of
o-phthaldialdehyde, Anal. Biochem. 137 (1984) 405–409.
[40] H.J. Shaolin Huang, F. Liu, F. Wang, Y. Zhang, Method for Preparing Magnesium Aspartate,
CN 101239925 (A), Beijing Jingwei Xinkang Pharma, China, 2008.
[41] T.J. Ward, M. Nichols, L. Sturdivant, C.C. King, Use of organic modifiers to enhance chiral
selectivity in capillary electrophoresis, Amino Acids 8 (1995) 337–344.
[42] J. Catalan, C. Diaz, F. Garcia-Blanco, Characterization of binary solvent mixtures of DMSO
with water and other cosolvents, J. Org. Chem. 66 (2001) 5846–5852.
[43] I. Plowas, J. Swiergiel, J. Jadzyn, Relative static permittivity of dimethyl sulfoxide plus water
mixtures, J. Chem. Eng. Data 58 (2013) 1741–1746.
[44] S. Orlandini, R. Gotti, S. Furlanetto, Multivariate optimization of capillary electrophoresis
methods: a critical review, J. Pharm. Biomed. Anal. 87 (2014) 290–307.
[45] D. Montgomery, Design and Analysis of Experiments, 4th edition, John Wiley& Sons, New
York, NY, 1996.
[46] J.W. Thompson, T.J. Kaiser, J.W. Jorgenson, Viscosity measurements of methanol-water and
acetonitrile-water mixtures at pressures up to 3500 bar using a novel capillary time-of-flight
viscometer, J. Chromatogr. A 1134 (2006) 201–209.
[47] P. Campins-Falco, C. Molins-Legua, A. Sevillano-Cabeza, L.A.T. Genaro, o-phthalaldehyde-
N-acetylcysteine polyamine derivatives: formation and stability in solution and in C-18
supports, J. Chromatogr. B 759 (2001) 285–297.
[48] I. Molnar-Perl, A. Vasanits, Stability and characteristics of the o-phthaldialdehyde/
3-mercaptopropionic acid and o-phthaldialdehyde/N-acetyl-L-cysteine reagents and their
amino acid derivatives measured by high-performance liquid chromatography, J. Chromatogr.
A 835 (1999) 73–91.
[49] R. Hanczko, I. Molnar-Perl, Derivatization, stability and chromatographic behavior of
o-phthaldialdehyde amino acid and amine derivatives: o-phthaldialdehyde/2-mercaptoethanol
reagent, Chromatographia 57 (2003) S103–S113.
Results
96
[50] T. Erbe, H. Bruckner, Studies on the optical isomerization of dietary amino acids in vinegar
and aqueous acetic acid, Eur. Food Res. Technol. 211 (2000) 6–12.
[51] S.M. Steinberg, P.M. Masters, J.L. Bada, The racemization of free and peptide-bound serine
and aspartic-acid at 100-degrees-c as a function of pH—implications for in vivo racemization,
Bioorg. Chem. 12 (1984) 349–355.
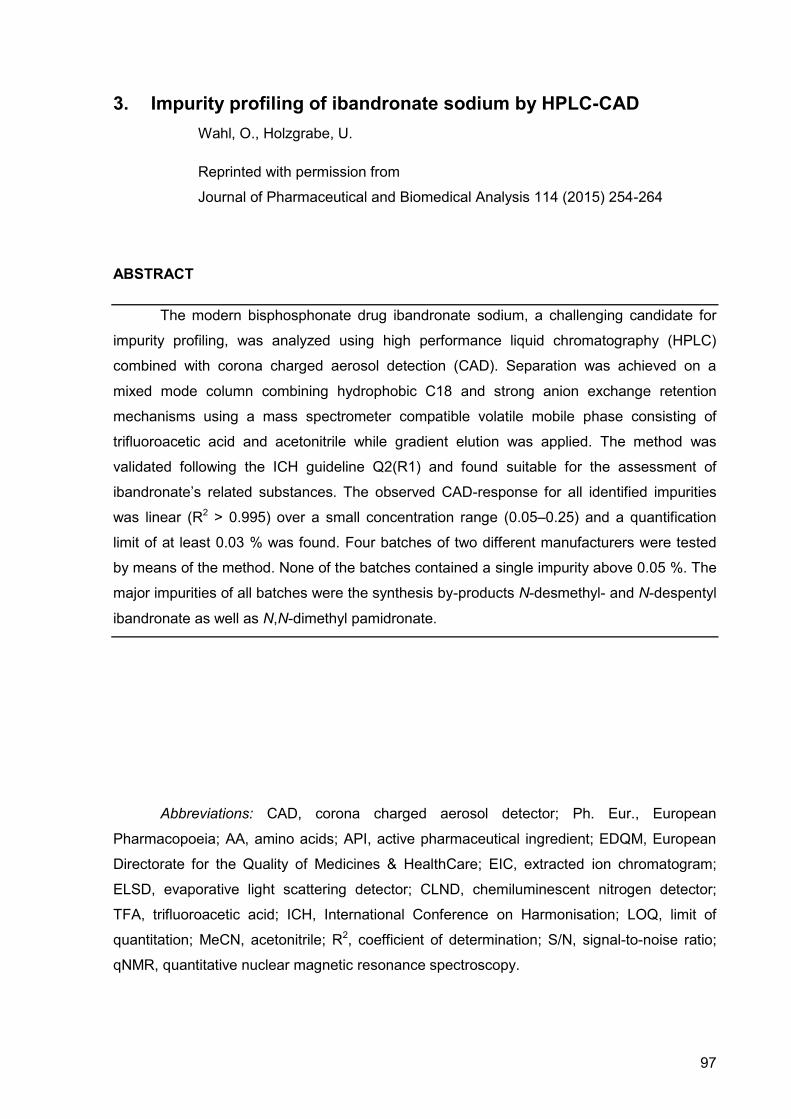
97
3. Impurity profiling of ibandronate sodium by HPLC-CAD
Wahl, O., Holzgrabe, U.
Reprinted with permission from
Journal of Pharmaceutical and Biomedical Analysis 114 (2015) 254-264
ABSTRACT
The modern bisphosphonate drug ibandronate sodium, a challenging candidate for
impurity profiling, was analyzed using high performance liquid chromatography (HPLC)
combined with corona charged aerosol detection (CAD). Separation was achieved on a
mixed mode column combining hydrophobic C18 and strong anion exchange retention
mechanisms using a mass spectrometer compatible volatile mobile phase consisting of
trifluoroacetic acid and acetonitrile while gradient elution was applied. The method was
validated following the ICH guideline Q2(R1) and found suitable for the assessment of
ibandronate’s related substances. The observed CAD-response for all identified impurities
was linear (R2 > 0.995) over a small concentration range (0.05–0.25) and a quantification
limit of at least 0.03 % was found. Four batches of two different manufacturers were tested
by means of the method. None of the batches contained a single impurity above 0.05 %. The
major impurities of all batches were the synthesis by-products N-desmethyl- and N-despentyl
ibandronate as well as N,N-dimethyl pamidronate.
Abbreviations: CAD, corona charged aerosol detector; Ph. Eur., European
Pharmacopoeia; AA, amino acids; API, active pharmaceutical ingredient; EDQM, European
Directorate for the Quality of Medicines & HealthCare; EIC, extracted ion chromatogram;
ELSD, evaporative light scattering detector; CLND, chemiluminescent nitrogen detector;
TFA, trifluoroacetic acid; ICH, International Conference on Harmonisation; LOQ, limit of
quantitation; MeCN, acetonitrile; R2, coefficient of determination; S/N, signal-to-noise ratio;
qNMR, quantitative nuclear magnetic resonance spectroscopy.
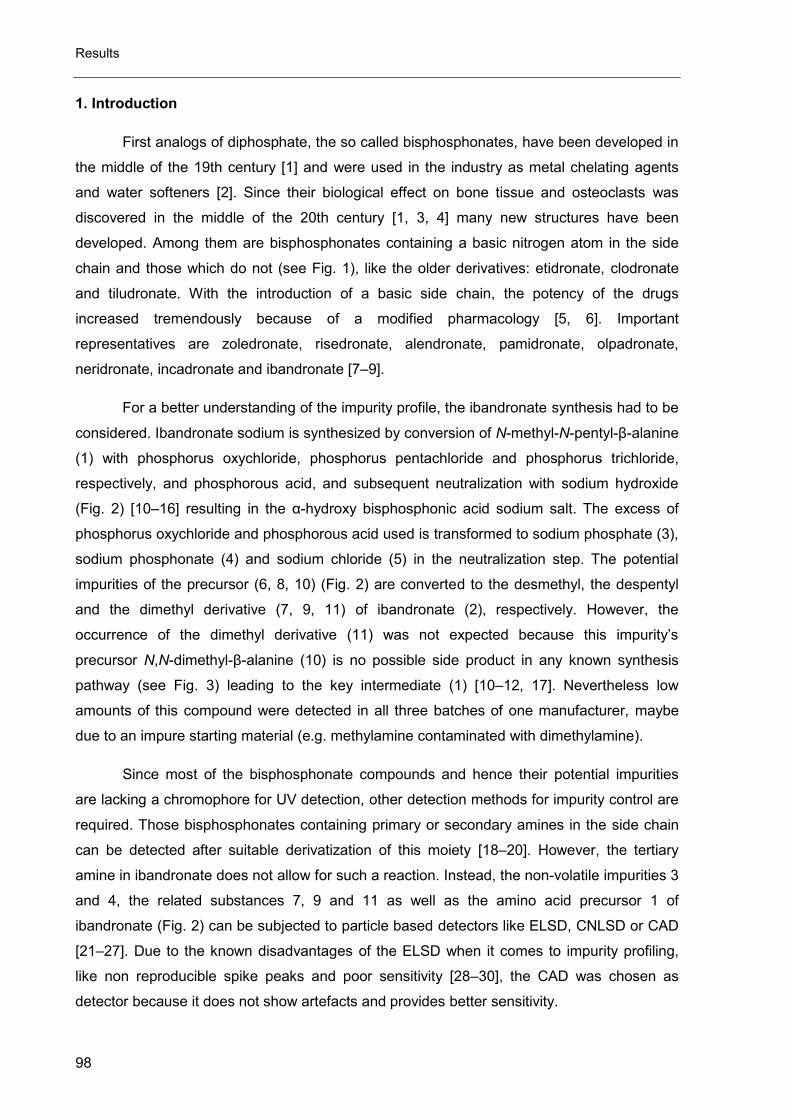
Results
98
1. Introduction
First analogs of diphosphate, the so called bisphosphonates, have been developed in
the middle of the 19th century [1] and were used in the industry as metal chelating agents
and water softeners [2]. Since their biological effect on bone tissue and osteoclasts was
discovered in the middle of the 20th century [1, 3, 4] many new structures have been
developed. Among them are bisphosphonates containing a basic nitrogen atom in the side
chain and those which do not (see Fig. 1), like the older derivatives: etidronate, clodronate
and tiludronate. With the introduction of a basic side chain, the potency of the drugs
increased tremendously because of a modified pharmacology [5, 6]. Important
representatives are zoledronate, risedronate, alendronate, pamidronate, olpadronate,
neridronate, incadronate and ibandronate [7–9].
For a better understanding of the impurity profile, the ibandronate synthesis had to be
considered. Ibandronate sodium is synthesized by conversion of N-methyl-N-pentyl-β-alanine
(1) with phosphorus oxychloride, phosphorus pentachloride and phosphorus trichloride,
respectively, and phosphorous acid, and subsequent neutralization with sodium hydroxide
(Fig. 2) [10–16] resulting in the α-hydroxy bisphosphonic acid sodium salt. The excess of
phosphorus oxychloride and phosphorous acid used is transformed to sodium phosphate (3),
sodium phosphonate (4) and sodium chloride (5) in the neutralization step. The potential
impurities of the precursor (6, 8, 10) (Fig. 2) are converted to the desmethyl, the despentyl
and the dimethyl derivative (7, 9, 11) of ibandronate (2), respectively. However, the
occurrence of the dimethyl derivative (11) was not expected because this impurity’s
precursor N,N-dimethyl-β-alanine (10) is no possible side product in any known synthesis
pathway (see Fig. 3) leading to the key intermediate (1) [10–12, 17]. Nevertheless low
amounts of this compound were detected in all three batches of one manufacturer, maybe
due to an impure starting material (e.g. methylamine contaminated with dimethylamine).
Since most of the bisphosphonate compounds and hence their potential impurities
are lacking a chromophore for UV detection, other detection methods for impurity control are
required. Those bisphosphonates containing primary or secondary amines in the side chain
can be detected after suitable derivatization of this moiety [18–20]. However, the tertiary
amine in ibandronate does not allow for such a reaction. Instead, the non-volatile impurities 3
and 4, the related substances 7, 9 and 11 as well as the amino acid precursor 1 of
ibandronate (Fig. 2) can be subjected to particle based detectors like ELSD, CNLSD or CAD
[21–27]. Due to the known disadvantages of the ELSD when it comes to impurity profiling,
like non reproducible spike peaks and poor sensitivity [28–30], the CAD was chosen as
detector because it does not show artefacts and provides better sensitivity.
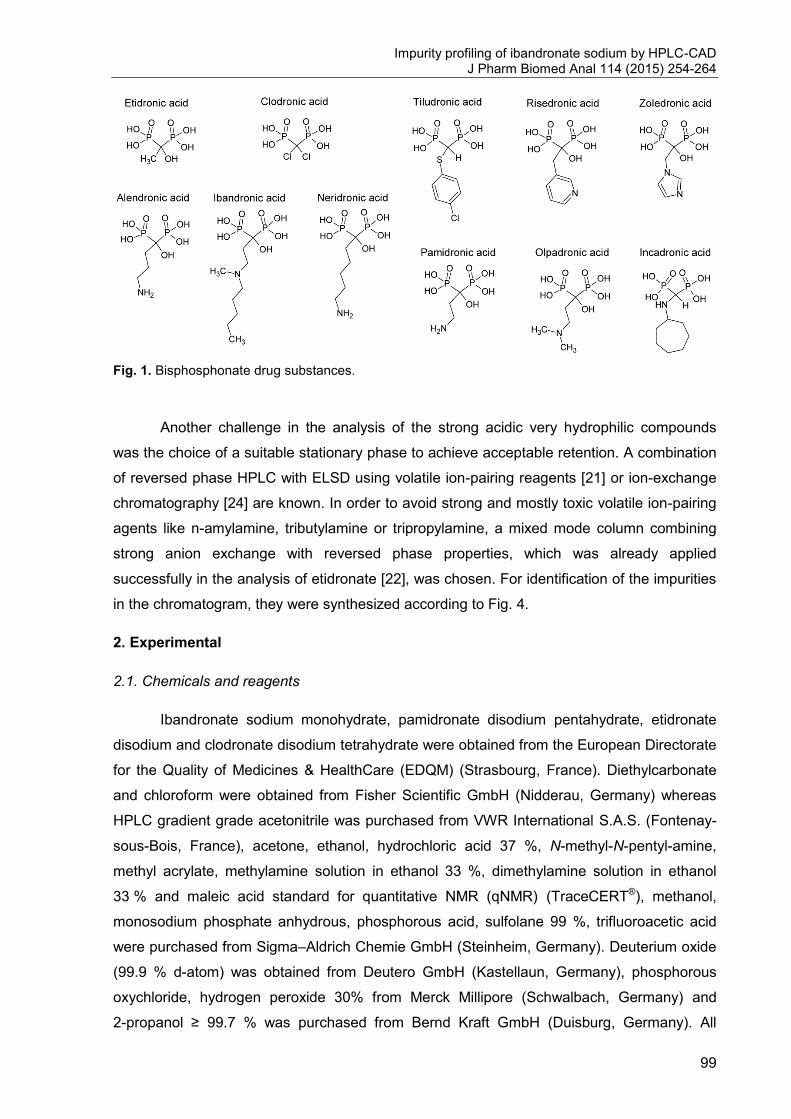
Impurity profiling of ibandronate sodium by HPLC-CAD J Pharm Biomed Anal 114 (2015) 254-264
99
Fig. 1. Bisphosphonate drug substances.
Another challenge in the analysis of the strong acidic very hydrophilic compounds
was the choice of a suitable stationary phase to achieve acceptable retention. A combination
of reversed phase HPLC with ELSD using volatile ion-pairing reagents [21] or ion-exchange
chromatography [24] are known. In order to avoid strong and mostly toxic volatile ion-pairing
agents like n-amylamine, tributylamine or tripropylamine, a mixed mode column combining
strong anion exchange with reversed phase properties, which was already applied
successfully in the analysis of etidronate [22], was chosen. For identification of the impurities
in the chromatogram, they were synthesized according to Fig. 4.
2. Experimental
2.1. Chemicals and reagents
Ibandronate sodium monohydrate, pamidronate disodium pentahydrate, etidronate
disodium and clodronate disodium tetrahydrate were obtained from the European Directorate
for the Quality of Medicines & HealthCare (EDQM) (Strasbourg, France). Diethylcarbonate
and chloroform were obtained from Fisher Scientific GmbH (Nidderau, Germany) whereas
HPLC gradient grade acetonitrile was purchased from VWR International S.A.S. (Fontenay-
sous-Bois, France), acetone, ethanol, hydrochloric acid 37 %, N-methyl-N-pentyl-amine,
methyl acrylate, methylamine solution in ethanol 33 %, dimethylamine solution in ethanol
33 % and maleic acid standard for quantitative NMR (qNMR) (TraceCERT®), methanol,
monosodium phosphate anhydrous, phosphorous acid, sulfolane 99 %, trifluoroacetic acid
were purchased from Sigma–Aldrich Chemie GmbH (Steinheim, Germany). Deuterium oxide
(99.9 % d-atom) was obtained from Deutero GmbH (Kastellaun, Germany), phosphorous
oxychloride, hydrogen peroxide 30% from Merck Millipore (Schwalbach, Germany) and
2-propanol ≥ 99.7 % was purchased from Bernd Kraft GmbH (Duisburg, Germany). All
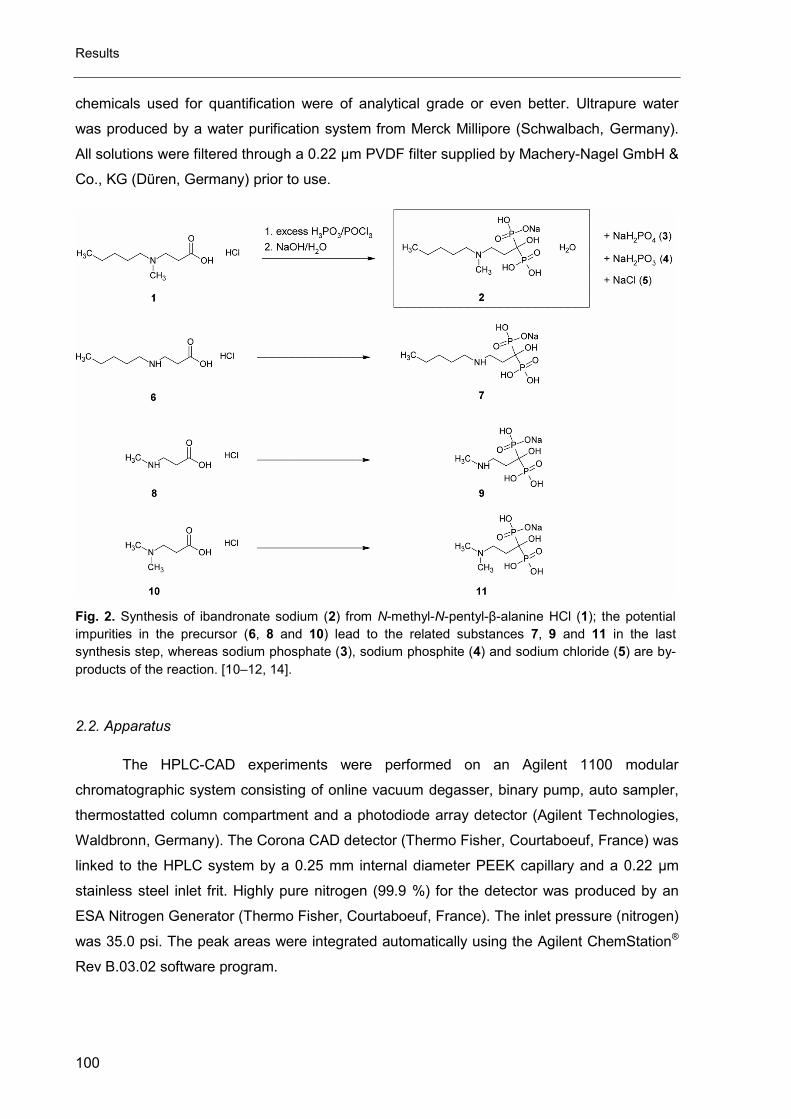
Results
100
chemicals used for quantification were of analytical grade or even better. Ultrapure water
was produced by a water purification system from Merck Millipore (Schwalbach, Germany).
All solutions were filtered through a 0.22 µm PVDF filter supplied by Machery-Nagel GmbH &
Co., KG (Düren, Germany) prior to use.
Fig. 2. Synthesis of ibandronate sodium (2) from N-methyl-N-pentyl-β-alanine HCl (1); the potential
impurities in the precursor (6, 8 and 10) lead to the related substances 7, 9 and 11 in the last
synthesis step, whereas sodium phosphate (3), sodium phosphite (4) and sodium chloride (5) are by-
products of the reaction. [10–12, 14].
2.2. Apparatus
The HPLC-CAD experiments were performed on an Agilent 1100 modular
chromatographic system consisting of online vacuum degasser, binary pump, auto sampler,
thermostatted column compartment and a photodiode array detector (Agilent Technologies,
Waldbronn, Germany). The Corona CAD detector (Thermo Fisher, Courtaboeuf, France) was
linked to the HPLC system by a 0.25 mm internal diameter PEEK capillary and a 0.22 µm
stainless steel inlet frit. Highly pure nitrogen (99.9 %) for the detector was produced by an
ESA Nitrogen Generator (Thermo Fisher, Courtaboeuf, France). The inlet pressure (nitrogen)
was 35.0 psi. The peak areas were integrated automatically using the Agilent ChemStation®
Rev B.03.02 software program.
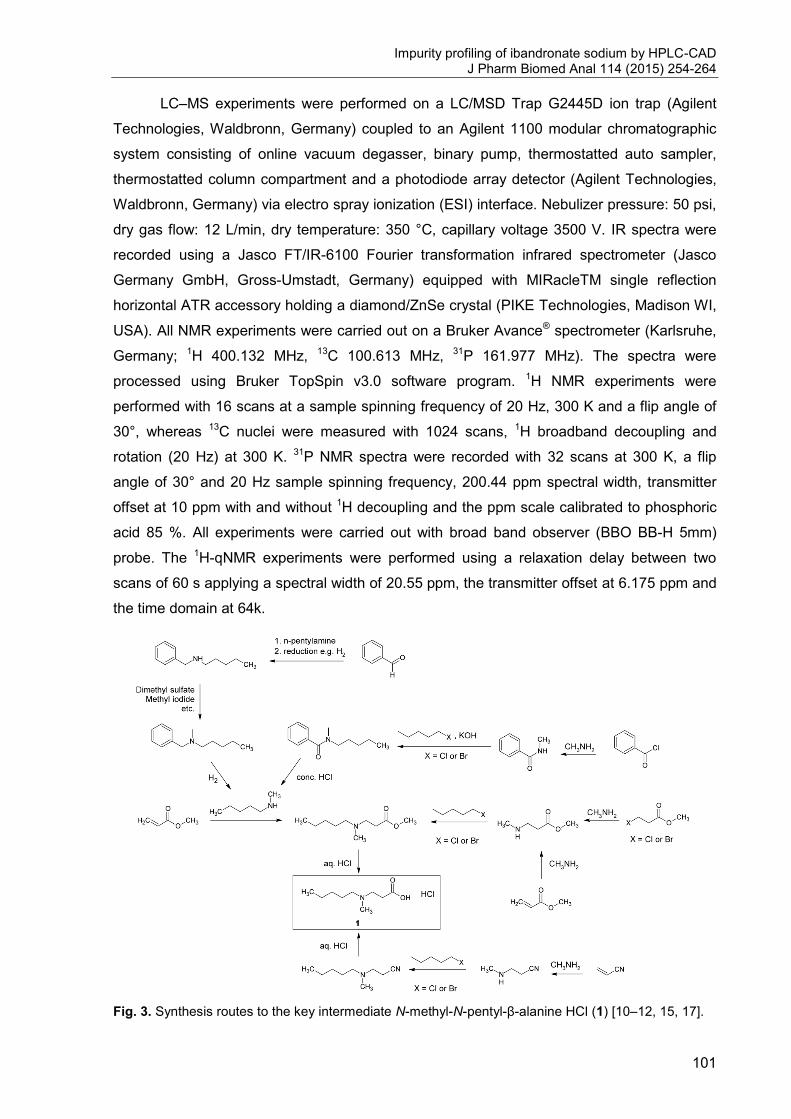
Impurity profiling of ibandronate sodium by HPLC-CAD J Pharm Biomed Anal 114 (2015) 254-264
101
LC–MS experiments were performed on a LC/MSD Trap G2445D ion trap (Agilent
Technologies, Waldbronn, Germany) coupled to an Agilent 1100 modular chromatographic
system consisting of online vacuum degasser, binary pump, thermostatted auto sampler,
thermostatted column compartment and a photodiode array detector (Agilent Technologies,
Waldbronn, Germany) via electro spray ionization (ESI) interface. Nebulizer pressure: 50 psi,
dry gas flow: 12 L/min, dry temperature: 350 °C, capillary voltage 3500 V. IR spectra were
recorded using a Jasco FT/IR-6100 Fourier transformation infrared spectrometer (Jasco
Germany GmbH, Gross-Umstadt, Germany) equipped with MIRacleTM single reflection
horizontal ATR accessory holding a diamond/ZnSe crystal (PIKE Technologies, Madison WI,
USA). All NMR experiments were carried out on a Bruker Avance® spectrometer (Karlsruhe,
Germany; 1H 400.132 MHz, 13C 100.613 MHz, 31P 161.977 MHz). The spectra were
processed using Bruker TopSpin v3.0 software program. 1H NMR experiments were
performed with 16 scans at a sample spinning frequency of 20 Hz, 300 K and a flip angle of
30°, whereas 13C nuclei were measured with 1024 scans, 1H broadband decoupling and
rotation (20 Hz) at 300 K. 31P NMR spectra were recorded with 32 scans at 300 K, a flip
angle of 30° and 20 Hz sample spinning frequency, 200.44 ppm spectral width, transmitter
offset at 10 ppm with and without 1H decoupling and the ppm scale calibrated to phosphoric
acid 85 %. All experiments were carried out with broad band observer (BBO BB-H 5mm)
probe. The 1H-qNMR experiments were performed using a relaxation delay between two
scans of 60 s applying a spectral width of 20.55 ppm, the transmitter offset at 6.175 ppm and
the time domain at 64k.
Fig. 3. Synthesis routes to the key intermediate N-methyl-N-pentyl-β-alanine HCl (1) [10–12, 15, 17].
Results
102
2.3. Chromatographic procedure
A mixed mode column SIELC Coresep® SB (150×4.6mm i.d., with a particle size of
2.7 µm and pore size of 100 Å, SIELC Technologies, Prospect Heights IL, USA) was used as
stationary phase. The chromatographic system was operated using gradient elution at 25 °C.
Mobile phase A was ultrapure water while mobile phase B was composed of 15 % v/v MeCN
containing 15 mmol/L TFA. The flow-rate was set to 1.2 mL/min and CAD detection with the
filter set to “none” was applied. The injection volume was 10 µL. Gradient: 0–3 min: 30 % B;
3–10 min: 30–100 % B; 10–17 min: 100 % B. The last isocratic step of the gradient was
modified for the analysis of etidronate and clodronate: 0–3 min: 30 % B; 3–10 min: 30–100 %
B; 10–20 min: 100 % B and 0–3 min: 30 % B; 3–10 min: 30–100 % B; 10–30 min: 100 % B,
respectively.
Fig. 4. Synthesis route to the impurities 1, 7, 9 and 11 according to the general procedure for the
preparation of α-hydroxy bisphosphonic acids [16].
The chromatographic conditions for LC–MS were the same as for HPLC–CAD except
for the flow rate which was set to 1.0 mL/min to match the requirements of the ESI-source.
The column effluent was subjected to the ESI-source from 2 to 11 min only when running
sample solutions in order to protect the instrument from high amounts of sodium (eluting at
1.0 min) and ibandronic acid (at 13.0 min).
2.3.1. Preparations of solutions
The test solutions for HPLC–CAD and LC–MS were 20 mg/mL solutions of
ibandronate sodium monohydrate in water. 1 mg/mL solutions of the impurities (calculated as
free base or acid, respectively) in water were prepared for spiking the test solutions. For the
test solutions for linearity 20 mg ibandronate sodium monohydrate were spiked with 10, 20,
30, 40 and 50 µL of each 1 mg/mL impurity stock solution and diluted to 1.0 mL. The
reference solutions for quantification contained 0.02 mg/mL of phenylalanine, phosphorous
acid, sodium dihydrogen phosphate and ibandronate sodium monohydrate, respectively. The
system suitability solution was composed of 5 mg phenylalanine, 5 mg sodium dihydrogen
phosphate and 5 mg pamidronate sodium pentahydrate dissolved in 100.0 mL water. All
Impurity profiling of ibandronate sodium by HPLC-CAD J Pharm Biomed Anal 114 (2015) 254-264
103
solutions were stored at 4 to 8 °C. A 20 mg/mL solution of ibandronate sodium monohydrate
in 3 % hydrogen peroxide solution was prepared for the forced degradation experiment and
kept at room temperature for 5 days.
2.4. Quantitative NMR spectroscopy
5 mg of the substance to be examined and 5 mg of maleic acid were dissolved in
700 µL D2O and immediately subjected to quantitative NMR analysis. After manual phase
and automatic baseline correction, a suitable signal of the substance to be examined and the
methine protons singlet of maleic acid as an internal standard at 6.02 ppm (2H) were
integrated and quantified using the following relationship:
w(X)= MW(X)
MW(IS)∙
A(X)
A(IS)∙
m(IS)
m(X)∙
N(IS)
N(X) (1)
where MW(X) and MW(IS) are the molecular weights in g/mol, N(IS) and N(X) the
numbers of protons, A(X) and A(IS) are the areas for the selected NMR signals of the
examined substance (X) and maleic acid (IS), respectively. The masses (weights) in mg of
maleic acid (IS) and the substance (X) are m(IS) and m(X). The purity of the tested
compound is then expressed by w(X) [31].
2.5. Synthesis of the impurities
2.5.1. N-Methyl-N-pentyl-β-alanine HCl (1)
The substance was prepared from N-methyl-N-pentyl-amine and methyl acrylate
according to Junghans and Baetz [11] (105 mg, yield: 9.5 %, purity 99 % qNMR). 1H-NMR
(D2O) δH (ppm) 0.84 (m, 3H, H3C-(CH2)4N-), 1.3 (m, 4H, H3C-(CH2)2-(CH2)2-N-), 1.7 (m, 2H,
H3C-(CH2)2-CH2-CH2-N-), 2.82 (s, 3H, H3C-(CH2)4-N-CH3) , 2.84 (t, 3JHH = 6.8 Hz, 2H, -N-
CH2-CH2-COOH), 3.04 – 3.18 (m, 2H, H3C-(CH2)3-CH2-N-), 3.25 – 3.54 (m, 2H, -N-CH2-CH2-
COOH) ;13C-NMR (D2O) δC (ppm) 12.98 (H3C-(CH2)4-N-), 21.44 (H3C-CH2-(CH2)3-N-), 23.10
(H3C-(CH2)2-CH2-CH2-N-), 27.72 (H3C-CH2-CH2-(CH2)2-N-), 28.64 (-N-CH2-CH2-COOH) ,
39.99 (H3C-(CH2)4-N-CH3), 51.23 (-N-CH2-CH2-COOH), 56.63 (H3C-(CH2)4-CH2-N-), 174.08
(-N-(CH2)2-COOH); ESI-MS (m/z): 174.0 ([M+H]+, found), 174.3 ([M+H]+, calculated); IR (FT):
ν (cm–1) = 2954 (m), 2644 (m), 1718 (s, C=O), 1468 (m), 1433 (m), 1420 (m), 1405 (m), 1368
(m), 1296 (m), 1198 (s, C-O), 1153 (m), 992 (m), 850 (m) , 799 (w) , 732 (w) , 653 (m)
Results
104
2.5.2. N-pentyl-β-alanine HCl (6)
23.18 g (0.2 mol) of pentylamine were dissolved in 20 mL ethanol. 8.6 g (0.1 mol)
Methylacrylate were dissolved in 75 mL methanol and added drop wise to the solution of
pentylamine over 1 hour at room temperature. Afterwards, the solvent was removed in
vacuo, 200 mL of 0.5 M sodium hydroxide were added and refluxed for 1 hour. The aqueous
phase was extracted 4 times with 25 mL of chloroform to remove the residual pentylamine.
The chloroform extract was discarded and the pH of the aqueous phase was set to 4.5 with
hydrochloric acid. Sodium chloride was then precipitated by the addition of methanol. Most of
the solvent was then removed in vacuo and the hydrochloride 6 precipitated from the solution
after the addition of acetone upon storage at –20 °C for several days. The compound was
obtained after recrystallization from acetone/water as white powder (2.0g, yield: 10.2%).
1H-NMR (D2O) δH (ppm) 0.82 (m, 3H, H3C-(CH2)4N-), 1.29 (m, 4H, H3C-(CH2)2-(CH2)2-N-),
1.64 (m, 2H, H3C-(CH2)2-CH2-CH2-N-), 2.77 (t, 3JHH = 6.6 Hz, 2H, -N-CH2-CH2-COOH), 3.02
(m, 2H, H3C-(CH2)3-CH2-N-), 3.27 (t, 3JHH= 6.6 Hz, 2H, -N-CH2-CH2-COOH); 13C-NMR (D2O)
δC (ppm) 13.01 (H3C-(CH2)4-N-), 21.43 (H3C-CH2-(CH2)3-N-), 24.98 (H3C-(CH2)2-CH2-CH2-N-
), 27.77 (H3C-CH2-CH2-(CH2)2-N-), 30.14 (-N-CH2-CH2-COOH) , 42.76 (-N-CH2-CH2-COOH),
47.82 (H3C-(CH2)4-CH2-N-), 174.30 (-N-(CH2)2-COOH); IR (FT): ν (cm–1) = 2930 (sb), 2765
(sb), 2474 (m), 1696 (s, st, C=O), 1438 (m), 1400 (m), 1303 (m), 1226 (m, st, C-O), 1050 (w),
907 (wb), 799 (w), 731 (w), 680 (w)
2.5.3. 1-Hydroxy-3-[amino]propane-1,1-diyl bis(phosphonic acid) sodium (7) (pentyl)
The substance was synthesized from 6, phosphorous acid and phosphorus
oxychloride following the general procedure for the preparation of α-hydroxy bisphosphonic
acids published by Kieczykowski et al. [16]. (100 mg, purity 91.4% by qNMR). 1H-NMR (D2O)
δH (ppm) 0.81 (m, 3H, H3C-(CH2)4N-), 1.28 (m, 4H, H3C-(CH2)2-(CH2)2-N-), 1.61 (m, 2H, H3C-
(CH2)2-CH2-CH2-N-), 2.27 (tt, 3JHH = 6.9 Hz, 3JHP = 13.0 Hz, 2H, -N-CH2-CH2- COH(PO3H)2),
2.97 (m, 2H, H3C-(CH2)3-CH2-N-), 3.31 (t, 3JHH = 6.9 Hz, 2H, -N-CH2-CH2-COH(PO3H)2); 13C-
NMR (D2O) δC (ppm) 13.01 (H3C-(CH2)4-N-), 21.46 (H3C-CH2-(CH2)3-N-), 25.30 (H3C-CH2)2-
CH2-CH2-N-), 27.81 (H3C-CH2-CH2-(CH2)2-N-), 29.58 (-N-CH2-CH2-COH(PO3H)2), 44.08 (t,
2JCP = 7.7 Hz, -N-CH2-CH2-COH(PO3H)2), 47.70 (H3C-(CH2)4-CH2-N-), 72.43 (t, 1JCP = 134.4
Hz, -N-(CH2)2-COH(PO3H)2); 31P-NMR (D2O) δH (ppm) 17.04 (t, 3JHP = 13.0 Hz); ESI-MS
(m/z): 306.1 ([M+H]+, found), 306.1 ([M+H]+, calculated) 304.8 ([M-H]-, found), 304.1 ([M-H]-,
calculated); IR (FT): ν (cm–1) = 2956 (m), 1603 (w), 1455 (w, δ, C-H), 1391 (w), 1331 (w),
1153 (s, st, P=O), 1080 (m), 1012 (sb, st, P=O), 926 (sb, st, P–O), 900 (s, st, P–O), 768 (m),
676 (m)
Impurity profiling of ibandronate sodium by HPLC-CAD J Pharm Biomed Anal 114 (2015) 254-264
105
2.5.4. N-Methyl-β-alanine HCl (8)
The methyl ester of 8 was prepared from methylamine and methyl acrylate according
to Lv et al. [32]. The methyl ester was then directly converted into 8 without further
purification according to Blower et al. [33] (4.4g, yield: 31.5%). 1H-NMR (D2O) δH (ppm) 2.79
(s, 3H, -HN-CH3) , 2.87 (t, J = 6.4 Hz, 2H, -N-CH2-CH2-COOH), 3.35 (t, J = 6.44 Hz, 2H, -N-
CH2-CH2-COOH);13C-NMR (D2O) δC (ppm) 29.99 (-N-CH2-CH2-COOH) , 33.02 (-HN-CH3),
44.48 (-N-CH2-CH2-COOH), 174.28 (-N-CH2-CH2-COOH); IR (FT): ν (cm–1) = 3073 (sb), 2832
(sb), 1731 (s, st, C=O), 1556 (m, δ, N-H), 1465 (m), 1454 (m), 1428 (m), 1402 (m), 1350 (m),
1289 (m), 1188 (m, st, C-O), 1157 (m), 1074 (w) , 1025 (m) , 952 (w) , 886 (m), 757 (m)
2.5.5. 1-Hydroxy-3-[amino]propane-1,1-diyl bis(phosphonic acid) sodium (9) (methyl)
The substance was prepared from 8, phosphorous acid and phosphorus oxychloride
according to Blower and Rafael [33] and the general procedure for the preparation of
α-hydroxy bisphosphonic acids (Kieczykowski et al. [16]) (340 mg, purity: 92.5% free acid by
qNMR). 1H-NMR (D2O) δH (ppm) 2.27 (tt, 3JHH = 6.8 Hz, 3JHP = 12.6 Hz, 2H, -N-CH2-CH2-
COH(PO3H)2), 2.66 (s, 3H, -HN-CH3), 3.3 (t, 3JHH = 6.8 Hz, -N-CH2-CH2-COH(PO3H)2);13C-
NMR (D2O) δC (ppm) 29.41 (-N-(CH2)2-COH(PO3H)2), 32.81 (H3C-N-), 45.92 (t, 2JCP = 7.5 Hz,
-N-CH2-CH2-COH(PO3H)2), 72.54 (t, 1JCP = 134.6 Hz -N-(CH2)2-COH(PO3H)2); 31P-NMR
(D2O) δH (ppm) 16.95 (t, 3JHP = 12.6 Hz); ESI-MS (m/z): 250.0 ([M+H]+, found), 250.1
([M+H]+, calculated), 248.0 ([M-H]-, found), 248.1 ([M-H]-, calculated); IR (FT): ν (cm–1) =
3141 (s), 2716 (m), 1607 (w), 1486 (w), 1466 (w), 1400 (w), 1314 (wb), 1153 (s, st, P=O),
1082 (m), 1053 (s, st, P=O), 1015 (s, st, P–O), 934 (sb), 901 (s, st, P–O), 867 (m), 775 (w),
671 (m)
2.5.6. N,N-Dimethyl-β-alanine HCl (10)
The methyl ester of 10 was prepared from dimethylamine and methyl acrylate
according to Annenkov et al. [34]. The methyl ester was then treated without further
purification as described by Devarajan et al. [35] to obtain the compound 10. (2.1g, yield: 65
%). 1H-NMR (D2O) δH (ppm) 2.84 (t, J = 6.7 Hz, 2H, -N-CH2-CH2-COOH), 2.87 (s, 6H, -HN-
(CH3)2), 3.38 (t, J = 6.7 Hz, 2H, -N-CH2-CH2-COOH);13C-NMR (D2O) δC (ppm) 28.86 (-N-CH2-
CH2-COOH) , 42.97 (-HN-(CH3)2), 53.15 (-N-CH2-CH2-COOH), 173.95 (-N-(CH2)2-COOH); IR
(FT): ν (cm–1) = 2964 (sb), 2696 (sb), 1718 (s, st, C=O), 1468 (m), 1421 (m), 1402 (m), 1370
(m), 1298 (m), 1240 (m), 1197 (s, st, C-O), 1162 (m), 1149 (m), 1010 (w) , 970 (m) , 909 (w) ,
855 (m), 798 (m)
Results
106
2.5.7. 1-Hydroxy-3-[amino]propane-1,1-diyl bis(phosphonic acid) HCl (11) (dimethyl)
The compound was prepared from 10, phosphorous acid and phosphorus oxychloride
according to Martin et al. [36] and treated as described by Blower and Rafael [33] to yield the
hydrochloride (11) instead of the sodium salt of 11. (300 mg, yield 15%, purity: 94.5% by
qNMR). 1H-NMR (D2O) δH (ppm) 2.32 (tt, 3JHH = 6.9 Hz, 3JHP = 13.0, 2H, -N-CH2-CH2-
COH(PO3H)2), 2.84 (s, 6H, -HN-(CH3)2), 3.41 (t, 3JHH = 6.9 Hz, -N-CH2-CH2-
COH(PO3H)2);13C-NMR (D2O) δC (ppm) 28.03 (-N-CH2-CH2-COH(PO3H)2), 42.85 ((H3C)2-N-),
54.47 (t, 2JCP = 7.0 Hz, -N-CH2-CH2-COH(PO3H)2), 72.08 (t, 1JCP = 138.5 Hz -N-(CH2)2-
COH(PO3H)2); 31P-NMR (D2O) δH (ppm) 16.87 (t, 3JHP = 13.0); ESI-MS (m/z): 264.0 ([M+H]+,
found), 264.04 ([M+H]+, calculated), 262.0 ([M-H]-, found), 262.02 ([M-H]-, calculated); IR
(FT): ν (cm–1) = 3128 (m), 2770 (m), 1472 (w), 1380 (w), 1280 (wb), 1154 (s, st, P=O), 1095
(m), 1059 (s, st, P=O), 1028 (s, st, P–O), 978 (m), 901 (s, st, P–O), 951 (m), 927 (m), 898
(m), 712 (w), 670 (w)
3. Results and discussion
3.1. HPLC method development
3.1.1. Chromatographic procedure
Ibandronic acid and its impurities are strong acids hardly retained on conventional
reversed phases. Moreover, the only difference between the API and the related substances
is the chain length of the N-alkyl residue demanding for lipophilic interactions for the
separation. Avoiding the conventional solution, the application of ion-pairing agents, a mixed
mode column combining reversed phase retention mechanism with strong anion exchange
moieties was successfully applied for the separation. When operating the column with acidic
mobile phases, neutral compounds or weak carboxylic acids are retained by the reversed
phase mechanism whereas hydrophilic strong acidic substances such as olpadronic acid
(11) are separated by the anion exchange mechanism. Strong acidic compounds also
containing lipophilic entities, i.e. ibandronic acid, are retained by both mechanisms. The
method was developed using a column length of 50 mm allowing for short run times and high
throughput. In order to improve the separation of the precursor (1) from the sodium peak, a
longer sized column (150 mm) was applied successfully and eventually used for validation
and batch testing. Different kinds of mobile phase additives and buffers were checked.
Acidified ammonium formate and acetate buffers within the allowed pH range (1.5–5) of the
column led to poor peak shapes and thus decreased sensitivity. Only trifluoroacetic acid
proved strong enough to suppress the dissociation of the strong acidic bisphosphonates.
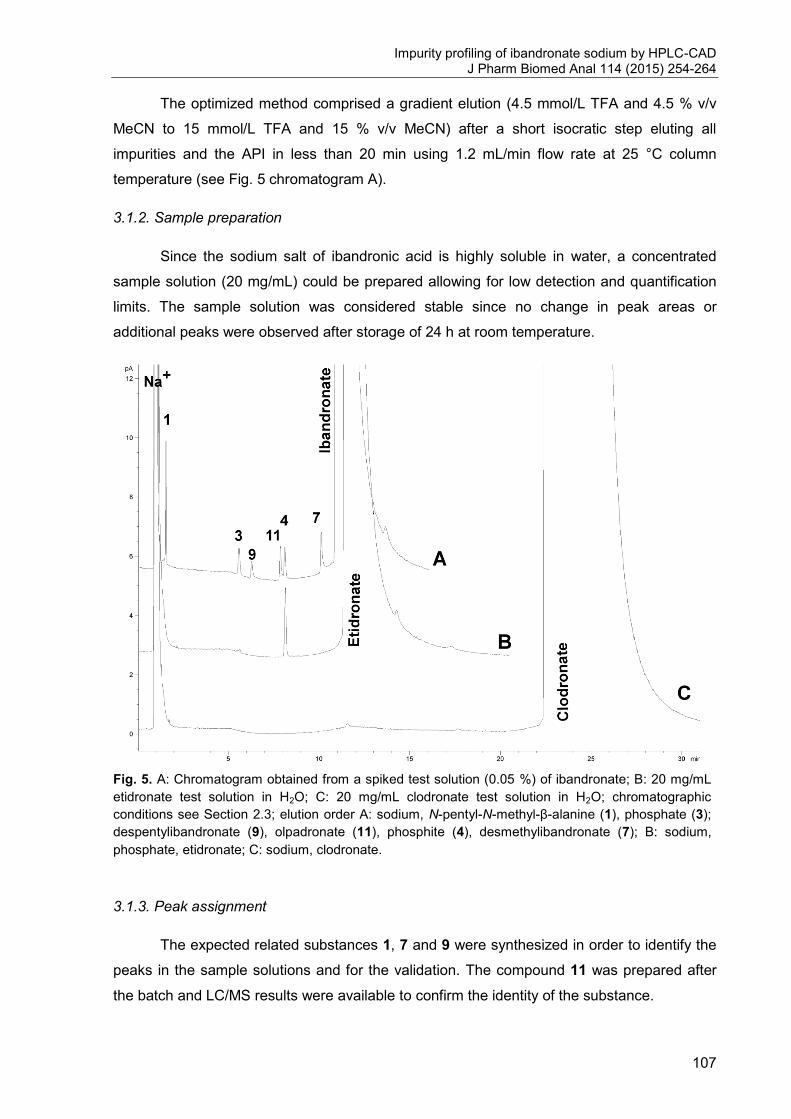
Impurity profiling of ibandronate sodium by HPLC-CAD J Pharm Biomed Anal 114 (2015) 254-264
107
The optimized method comprised a gradient elution (4.5 mmol/L TFA and 4.5 % v/v
MeCN to 15 mmol/L TFA and 15 % v/v MeCN) after a short isocratic step eluting all
impurities and the API in less than 20 min using 1.2 mL/min flow rate at 25 °C column
temperature (see Fig. 5 chromatogram A).
3.1.2. Sample preparation
Since the sodium salt of ibandronic acid is highly soluble in water, a concentrated
sample solution (20 mg/mL) could be prepared allowing for low detection and quantification
limits. The sample solution was considered stable since no change in peak areas or
additional peaks were observed after storage of 24 h at room temperature.
Fig. 5. A: Chromatogram obtained from a spiked test solution (0.05 %) of ibandronate; B: 20 mg/mL
etidronate test solution in H2O; C: 20 mg/mL clodronate test solution in H2O; chromatographic
conditions see Section 2.3; elution order A: sodium, N-pentyl-N-methyl-β-alanine (1), phosphate (3);
despentylibandronate (9), olpadronate (11), phosphite (4), desmethylibandronate (7); B: sodium,
phosphate, etidronate; C: sodium, clodronate.
3.1.3. Peak assignment
The expected related substances 1, 7 and 9 were synthesized in order to identify the
peaks in the sample solutions and for the validation. The compound 11 was prepared after
the batch and LC/MS results were available to confirm the identity of the substance.
Results
108
3.2. Validation of the HPLC method
The method was validated for impurity profiling with regards to the following
parameters: specificity, linearity, range, precision, accuracy, LOQ and robustness, following
the International Conference on Harmonisation (ICH) guideline Q2(R1) [37]. System
suitability criteria were defined and evaluated. The purpose of this work was to develop a
method applicable for the Ph. Eur. Since the drug substance is administered in doses of 150
mg p.o. once a month, 50 mg once a day or 3 mg i.v. once in three months a reporting
threshold of 0.05 % was applied according to ICH guideline Q3A(R2) [38].
Specificity of the method was proven by comparing spiked samples with a blank
solution and by a forced degradation experiment. The resolution was at least 1.5 for every
identified impurity peak and every impurity was separated from the main peak, the sodium
peak, from oxidative degradation products and from each other (see Fig. 5 chromatogram A
and Fig. 7).
The linearity and range for all impurities (1, 3, 4, 7, 9, 11) and phenylalanine (external
reference) were determined by constructing calibration curves from 10 to 50 µg/mL (equal to
0.05–0.25 %) in spiked test solutions to account for possible interactions with the matrix (e.g.
sodium or the peak caused by ibandronic acid). The coefficient of determination was at least
0.997 (see Table 1).
The LOQ for each identified impurity (1, 3, 4, 7, 9, 11) was calculated from the
standard deviation and the slope of the calibration curve according to ICH guideline Q2(R1).
The LOQs calculated were 0.03 % or even less (see Table 1) and the S/Ns at the
corresponding LOQ was 20 or higher.
Accuracy was assessed on spiked sample solutions. The recovery rate was
calculated at 0.05, 0.10 and 0.15 %. The recovery rates were found to be between 81 and
120 % (n = 3, RSD = 0.30–4.81 %) on each level. The quantification of impurities eluting in
front of phosphate (3) was done by comparing the phenylalanine peak area as an external
standard in the reference solution for quantification with the peak area of the impurities
detected in the sample solution whereas later eluting substances were quantified using the
phosphite (4) peak in the same reference solution using the correction factors obtained from
the calibration curve slopes (see Table 1). This procedure was necessary due to the rising
concentration of organic modifier enhancing the evaporation of mobile phase and thus
increased response of late eluting compounds.
Repeatability and precision were determined on a real batch sample and on one
spiked batch sample, because no batch contained all impurities above the LOQ. The impurity
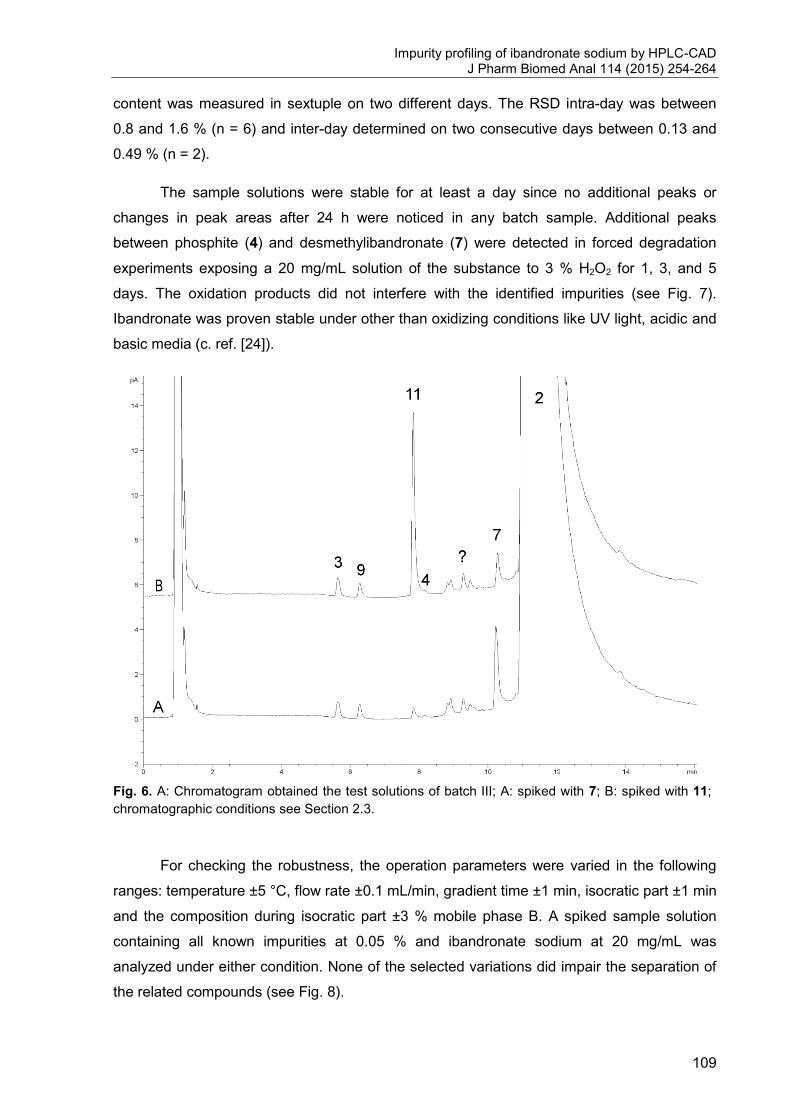
Impurity profiling of ibandronate sodium by HPLC-CAD J Pharm Biomed Anal 114 (2015) 254-264
109
content was measured in sextuple on two different days. The RSD intra-day was between
0.8 and 1.6 % (n = 6) and inter-day determined on two consecutive days between 0.13 and
0.49 % (n = 2).
The sample solutions were stable for at least a day since no additional peaks or
changes in peak areas after 24 h were noticed in any batch sample. Additional peaks
between phosphite (4) and desmethylibandronate (7) were detected in forced degradation
experiments exposing a 20 mg/mL solution of the substance to 3 % H2O2 for 1, 3, and 5
days. The oxidation products did not interfere with the identified impurities (see Fig. 7).
Ibandronate was proven stable under other than oxidizing conditions like UV light, acidic and
basic media (c. ref. [24]).
Fig. 6. A: Chromatogram obtained the test solutions of batch III; A: spiked with 7; B: spiked with 11;
chromatographic conditions see Section 2.3.
For checking the robustness, the operation parameters were varied in the following
ranges: temperature ±5 °C, flow rate ±0.1 mL/min, gradient time ±1 min, isocratic part ±1 min
and the composition during isocratic part ±3 % mobile phase B. A spiked sample solution
containing all known impurities at 0.05 % and ibandronate sodium at 20 mg/mL was
analyzed under either condition. None of the selected variations did impair the separation of
the related compounds (see Fig. 8).
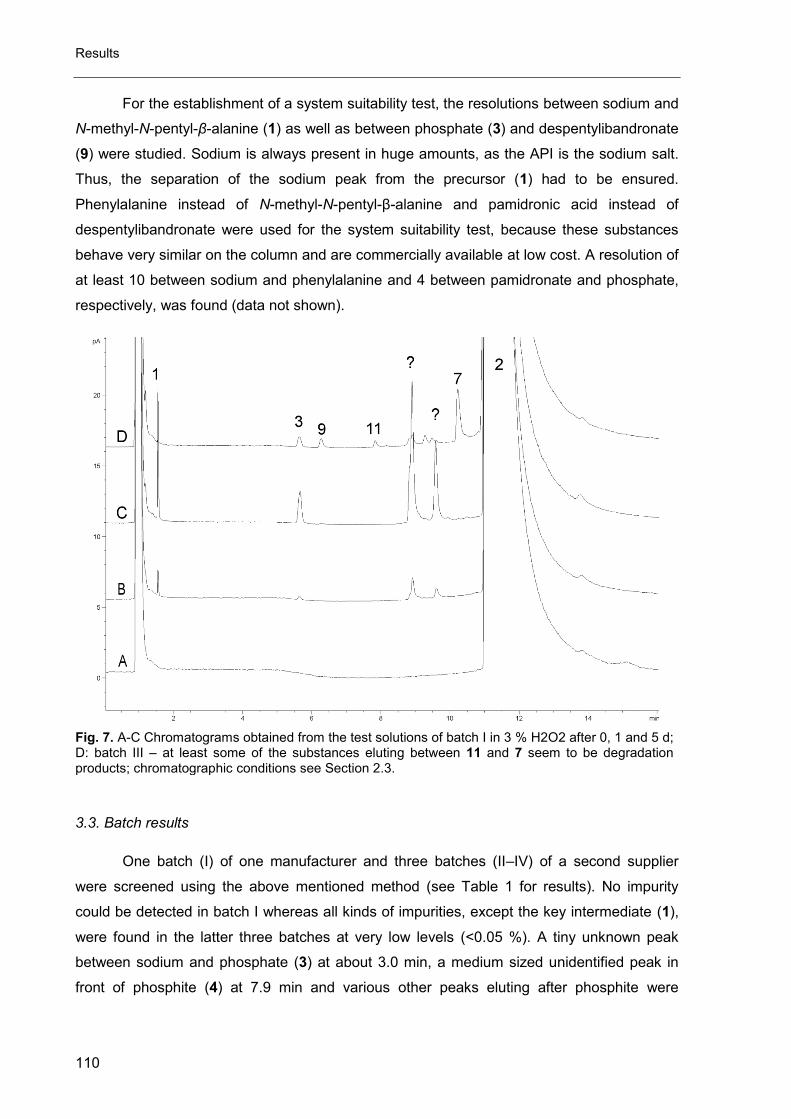
Results
110
For the establishment of a system suitability test, the resolutions between sodium and
N-methyl-N-pentyl-β-alanine (1) as well as between phosphate (3) and despentylibandronate
(9) were studied. Sodium is always present in huge amounts, as the API is the sodium salt.
Thus, the separation of the sodium peak from the precursor (1) had to be ensured.
Phenylalanine instead of N-methyl-N-pentyl-β-alanine and pamidronic acid instead of
despentylibandronate were used for the system suitability test, because these substances
behave very similar on the column and are commercially available at low cost. A resolution of
at least 10 between sodium and phenylalanine and 4 between pamidronate and phosphate,
respectively, was found (data not shown).
Fig. 7. A-C Chromatograms obtained from the test solutions of batch I in 3 % H2O2 after 0, 1 and 5 d; D: batch III – at least some of the substances eluting between 11 and 7 seem to be degradation products; chromatographic conditions see Section 2.3.
3.3. Batch results
One batch (I) of one manufacturer and three batches (II–IV) of a second supplier
were screened using the above mentioned method (see Table 1 for results). No impurity
could be detected in batch I whereas all kinds of impurities, except the key intermediate (1),
were found in the latter three batches at very low levels (<0.05 %). A tiny unknown peak
between sodium and phosphate (3) at about 3.0 min, a medium sized unidentified peak in
front of phosphite (4) at 7.9 min and various other peaks eluting after phosphite were
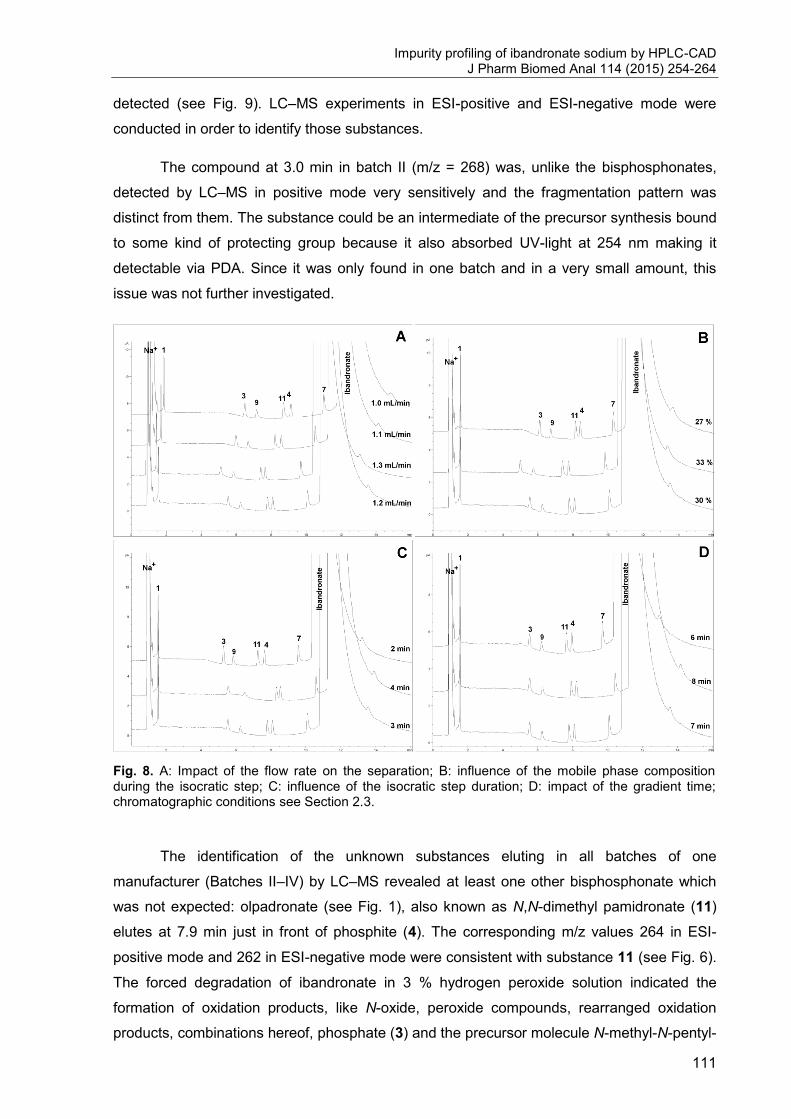
Impurity profiling of ibandronate sodium by HPLC-CAD J Pharm Biomed Anal 114 (2015) 254-264
111
detected (see Fig. 9). LC–MS experiments in ESI-positive and ESI-negative mode were
conducted in order to identify those substances.
The compound at 3.0 min in batch II (m/z = 268) was, unlike the bisphosphonates,
detected by LC–MS in positive mode very sensitively and the fragmentation pattern was
distinct from them. The substance could be an intermediate of the precursor synthesis bound
to some kind of protecting group because it also absorbed UV-light at 254 nm making it
detectable via PDA. Since it was only found in one batch and in a very small amount, this
issue was not further investigated.
Fig. 8. A: Impact of the flow rate on the separation; B: influence of the mobile phase composition during the isocratic step; C: influence of the isocratic step duration; D: impact of the gradient time; chromatographic conditions see Section 2.3.
The identification of the unknown substances eluting in all batches of one
manufacturer (Batches II–IV) by LC–MS revealed at least one other bisphosphonate which
was not expected: olpadronate (see Fig. 1), also known as N,N-dimethyl pamidronate (11)
elutes at 7.9 min just in front of phosphite (4). The corresponding m/z values 264 in ESI-
positive mode and 262 in ESI-negative mode were consistent with substance 11 (see Fig. 6).
The forced degradation of ibandronate in 3 % hydrogen peroxide solution indicated the
formation of oxidation products, like N-oxide, peroxide compounds, rearranged oxidation
products, combinations hereof, phosphate (3) and the precursor molecule N-methyl-N-pentyl-
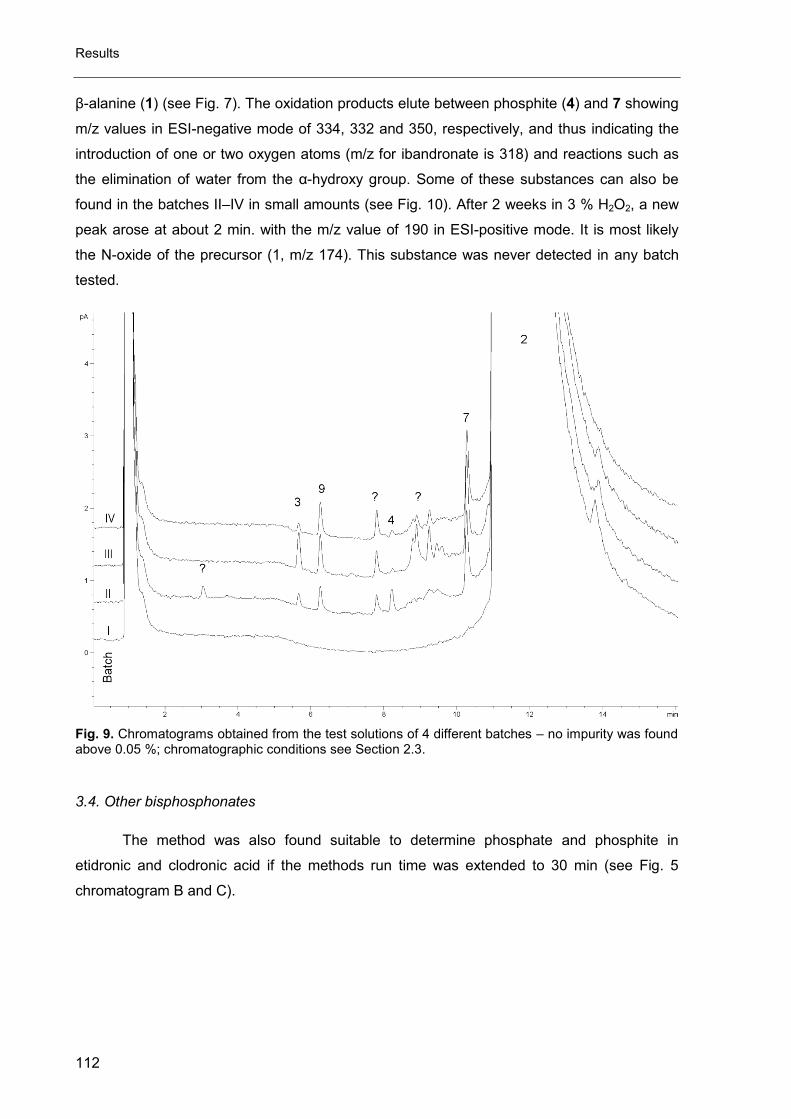
Results
112
β-alanine (1) (see Fig. 7). The oxidation products elute between phosphite (4) and 7 showing
m/z values in ESI-negative mode of 334, 332 and 350, respectively, and thus indicating the
introduction of one or two oxygen atoms (m/z for ibandronate is 318) and reactions such as
the elimination of water from the α-hydroxy group. Some of these substances can also be
found in the batches II–IV in small amounts (see Fig. 10). After 2 weeks in 3 % H2O2, a new
peak arose at about 2 min. with the m/z value of 190 in ESI-positive mode. It is most likely
the N-oxide of the precursor (1, m/z 174). This substance was never detected in any batch
tested.
Fig. 9. Chromatograms obtained from the test solutions of 4 different batches – no impurity was found above 0.05 %; chromatographic conditions see Section 2.3.
3.4. Other bisphosphonates
The method was also found suitable to determine phosphate and phosphite in
etidronic and clodronic acid if the methods run time was extended to 30 min (see Fig. 5
chromatogram B and C).
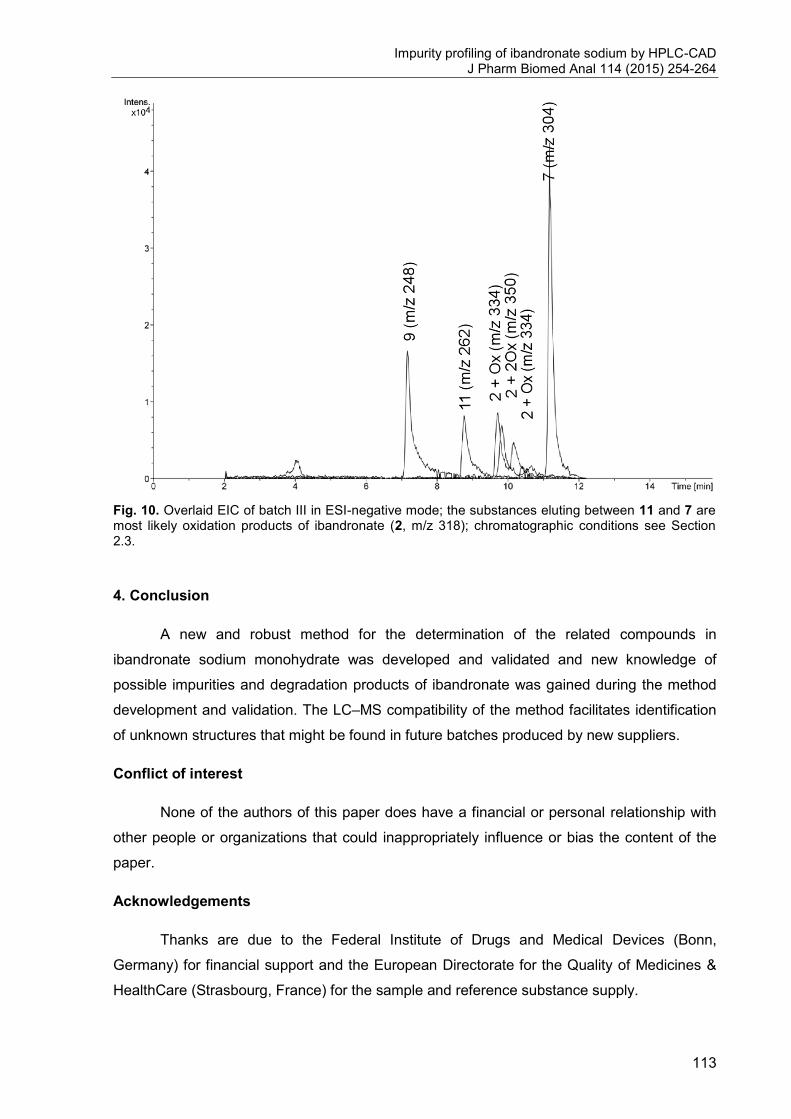
Impurity profiling of ibandronate sodium by HPLC-CAD J Pharm Biomed Anal 114 (2015) 254-264
113
Fig. 10. Overlaid EIC of batch III in ESI-negative mode; the substances eluting between 11 and 7 are most likely oxidation products of ibandronate (2, m/z 318); chromatographic conditions see Section 2.3.
4. Conclusion
A new and robust method for the determination of the related compounds in
ibandronate sodium monohydrate was developed and validated and new knowledge of
possible impurities and degradation products of ibandronate was gained during the method
development and validation. The LC–MS compatibility of the method facilitates identification
of unknown structures that might be found in future batches produced by new suppliers.
Conflict of interest
None of the authors of this paper does have a financial or personal relationship with
other people or organizations that could inappropriately influence or bias the content of the
paper.
Acknowledgements
Thanks are due to the Federal Institute of Drugs and Medical Devices (Bonn,
Germany) for financial support and the European Directorate for the Quality of Medicines &
HealthCare (Strasbourg, France) for the sample and reference substance supply.
Results
114
References
[1] H. Fleisch, Development of bisphosphonates, Breast Cancer Res. 4 (2002) 30–34.
[2] R.G.G. Russell, M.J. Rogers, Bisphosphonates: from the laboratory to the clinic and back
again, Bone 25 (1999) 97–106.
[3] M.J. Rogers, S. Gordon, H.L. Benford, F.P. Coxon, S.P. Luckman, J. Monkkonen, J.C. Frith,
Cellular and molecular mechanisms of action of bisphosphonates, Cancer 88 (2000) 2961–
2978.
[4] R.G.G. Russell, P.I. Croucher, M.J. Rogers, Bisphosphonates: pharmacology, mechanisms of
action and clinical uses, Osteoporosis Int. 9 (1999) 66–80.
[5] M.T. Drake, B.L. Clarke, S. Khosla, Bisphosphonates: mechanism of action and role in clinical
practice, Mayo Clin. Proc. 83 (2008) 1032–1045.
[6] A.A. Reszka, G.A. Rodan, Nitrogen-containing bisphosphonate mechanism of action, Mini-rev.
Med. Chem. 4 (2004) 711–719.
[7] J. Barrett, E. Worth, F. Bauss, S. Epstein, Ibandronate: a clinical pharmacological and
pharmacokinetic update, J. Clin. Pharmacol. 44 (2004) 951–965.
[8] J.H. Lin, Bisphosphonates: a review of their pharmacokinetic properties, Bone 18 (1996) 75–
85.
[9] F. Bauss, R.C. Schimmer, Ibandronate: the first once-monthly oral bisphosphonate for
treatment of postmenopausal osteoporosis, Ther. Clin. Risk Manage. 2 (2006) 3–18.
[10] Z. Jun, Z., Zaiwei, L. Xie, Preparation method of sodium ibandronate, CN20111215751
20110729, China (2013).
[11] B. Junghans, F. Baetz, Process for the Preparation of Ibandronate, MX20070005114
20070427, Switzerland (2007).
[12] X. Kui, C. Zhenghao, W. Wei, Y. Jiajiu, Method for preparing sodium Ibandronate
monohydrate, CN20131150772 20130426, China. 02/05/2014.
[13] R.D. Ramchandra, K.R. Narayanrao, G.M. Ganpati, Process for the Synthesis of Ibandronate
sodium, NZ20070573137 20070622 (2011).
[14] M. Egorov, S. Aoun, M. Padrines, F. Redini, D. Heymann, J. Lebreton, M. Mathe-Allainmat, A
one-pot synthesis of 1-hydroxy-1,1-bis(phosphonic acid)s starting from the corresponding
carboxylic acids, Eur. J. Org. Chem. (2011) 7148–7154.
[15] R.M. Pulla, V. Usharani, C.N. Venkaiah, Improved Process for the Preparation of Ibandronate
Sodium,WO2006IN00251 20060717, India (2007).
Impurity profiling of ibandronate sodium by HPLC-CAD J Pharm Biomed Anal 114 (2015) 254-264
115
[16] G.R. Kieczykowski, R.B. Jobson, D.G. Melillo, D.F. Reinhold, V.J. Grenda, I. Shinkai,
Preparation of (4-amino-1-hydroxybutylidene)bisphosphonic acid sodium salt, MK-217
(alendronate sodium). An improved procedure for the preparation of 1-hydroxy-1,1-
bisphosphonic acids, J. Org. Chem. 60 (1995) 8310–8312.
[17] V.V.R.M.K. Reddy, U.S. Chintamani, D. Udaykiran, C. Madhusudhan, K. Mukkanti, A facile
preparation of N-methylpentan-1-amine: a key intermediate for ibandronate sodium, Indian J.
Chem. B 49 (2010) 1257–1260.
[18] G. Flesch, S.A. Hauffe, Determination of the bisphosphonate pamidronate disodium in urine
by pre-column derivatization with fluorescamine, high-performance liquid-chromatography and
fluorescence detection, J. Chromatogr. Biomed. 489 (1989) 446–451.
[19] G. Flesch, N. Tominaga, P. Degen, Improved determination of the bisphosphonate
pamidronate disodium in plasma and urine by precolumn derivatization with fluorescamine,
high-performance liquid-chromatography and fluorescence detection, J. Chromatogr. Biomed.
568 (1991) 261–266.
[20] J.A. Wong, K.W. Renton, J.F.S. Crocker, P.A. O’Regan, P.D. Acott, Determination of
pamidronate in human whole blood and urine by reversed-phase HPLC with fluorescence
detection, Biomed. Chromatogr. 18 (2004) 98–101.
[21] Y. Jiang, Z. Xie, Determination of ibandronate and its degradation products by ion-pair RP LC
with evaporative light-scattering detection, Chromatographia 62 (2005) 257–261.
[22] X.K. Liu, J.B. Fang, N. Cauchon, P.Z. Zhou, Direct stability-indicating method development
and validation for analysis of etidronate disodium using a mixed-mode column and charged
aerosol detector, J. Pharm. Biomed. Anal. 46 (2008) 639–644.
[23] C.K. Zacharis, P.D. Tzanavaras, Determination of bisphosphonate active pharmaceutical
ingredients in pharmaceuticals and biological material: a review of analytical methods, J.
Pharm. Biomed. Anal. 48 (2008) 483–496.
[24] M.N. Kumar, K.S.R.P. Kumar, V.J. Kumar, S.J. Prasanna, H.K. Sharma, V.K. Reddy, Stability
indicating ion chromatography method for the simultaneous determination of ibandronate
sodium drug substance and its impurities, J. Pharm. Biomed. Anal. 54 (2011) 596–601.
[25] L.B. Allen, J.A. Koropchak, Condensation nucleation light-scattering - a new approach to
development of high-sensitivity, universal detectors for separations, Anal. Chem. 65 (1993)
841–844.
[26] T. Vehovec, A. Obreza, Review of operating principle applications of the charged aerosol
detector, J. Chromatogr. A 1217 (2010) 1549–1556.
[27] U. Holzgrabe, C.J. Nap, T. Beyer, S. Almeling, Alternatives to amino acid analysis for the
purity control of pharmaceutical grade L-alanine, J. Sep. Sci. 33 (2010) 2402–2410.
Results
116
[28] S. Almeling, U. Holzgrabe, Use of evaporative light scattering detection for the quality control
of drug substances: influence of different liquid chromatographic and evaporative light
scattering detector parameters on the appearance of spike peaks, J. Chromatogr. A 1217
(2010) 2163–2170.
[29] S. Almeling, D. Ilko, U. Holzgrabe, Charged aerosol detection in pharmaceutical analysis, J.
Pharm. Biomed. Anal. 69 (2012) 50–63.
[30] R.W. Dixon, D.S. Peterson, Development and testing of a detection method for liquid
chromatography based on aerosol charging, Anal. Chem. 74 (2002) 2930–2937.
[31] S. Mahajan, I.P. Singh, Determining and reporting purity of organic molecules: why qNMR?
Magn. Reson. Chem. 51 (2012) 76–81.
[32] J.L. Lv, J. Li, D. Zhang-Negrerie, S.Y. Shang, Q.Z. Gao, Y.F. Du, K. Zhao, Constructions of
tetrahydro-gamma-carboline skeletons via intramolecular oxidative carbon–carbon bond
formation of enamines, Org. Biomol. Chem. 11 (2013) 1929–1932.
[33] P.J.T. Blower, Martin de Rosales Rafael, Bisphosphonate Compounds for Chelating
Radionuclides, WO2010GB00692 20100407, Great Britain (2010).
[34] V.V. Annenkov, S.N. Zelinskiy, E.N. Danilovtseva, C.C. Perry, Synthesis of biomimetic
polyamines, Arkivoc (2009) 116–130.
[35] H. Devarajan-Ketha, K.B. Sloan, N,N’-Dialkylaminoalkylcarbonyl (DAAC) prodrugs and
aminoalkylcarbonyl (AAC) prodrugs of 4-hydroxyacetanilide and naltrexone with improved skin
permeation properties, Bioorg. Med. Chem. Lett. 21 (2011) 4078–4082.
[36] M.B. Martin, J.S. Grimley, J.C. Lewis, H.T. Heath, B.N. Bailey, H. Kendrick, V. Yardley, A.
Caldera, R. Lira, J.A. Urbina, S.N.J. Moreno, R. Docampo, S.L. Croft, E. Oldfield,
Bisphosphonates inhibit the growth of Trypanosoma brucei, Trypanosoma cruzi, Leishmania
donovani, Toxoplasma gondii, and Plasmodium falciparum: a potential route to chemotherapy,
J. Med. Chem. 44 (2001) 909–916.
[37] ICH Guideline, Q2(R1) Validation of Analytical Procedures, Text and Methodology, 2005.
[38] ICH Guideline, Q3A(R2), Impurities in new drug substances, 2006.
117
4. Amino acid analysis for pharmacopoeial purposes
Wahl, O., Holzgrabe, U.
Reprinted with permission from
Talanta 154 (2016) 150-163
ABSTRACT
The impurity profile of amino acids depends strongly on the production process. Since there
are many different production methods (e.g. fermentation, protein hydrolysis or chemical
synthesis) universal, state of the art methods are required to determine the impurity profile of
amino acids produced by all relevant competitors. At the moment TLC tests provided by the
Ph. Eur. are being replaced by a very specific amino acid analysis procedure possibly
missing out on currently unknown process related impurities. Production methods and
possible impurities as well as separation and detection methods suitable for said impurities
are subject to this review.
Abbreviations: AA, amino acid; AAA, amino acid analysis; APCI, atmospheric
pressure chemical ionization; APPI, atmospheric pressure photo ionization; C4D, capacitively
coupled contactless conductivity detector; CAD, corona charged aerosol detector; CBQCA,
3-(4-carboxybenzoyl)quinolone-2-carboxaldehyde; CE, capillary electrophoresis; CLND,
chemiluminescent nitrogen detector; CZE, capillary zone electrophoresis; CNLSD,
condensation nucleation light scattering detector; ECD, electrochemical detector; ELSD,
evaporative light scattering detector; ESI, electrospray ionization; FID, flame ionization
detector; FLD, fluorescence detector; FMOC-Cl, fluorenylmethoxycarbonyl chloride; FQ, 3-
(furan-2-carbonyl)quinolone-2-carbaldehyde; HILIC, hydrophilic interaction liquid
chromatography; HPLC, high performance liquid chromatography; IEC, ion-exchange
chromatography; IPC, ion-pairing chromatography; LED, light emitting diode; LIF, laser
induced fluorescence; LOD, limit of detection; MEKC, micellar electrokinetic chromatography;
MOPS, 3-(N-morpholino)propanesulfonic acid; NAC, N-acetylcystein; NQAD, Nano quantity
analyte detector (see CNLSD); OPA, o-phtalaldehyde; PGC, porous graphitic carbon; Ph.
Eur., European Pharmacopoeia; PITC, phenylisothiocyanate; QqQ, triple quadrupole; RID,
refractive index detector; TLC, Thin-layer chromatography; TOF, time-of-flight; UHPLC, ultra-
high performance liquid chromatography;
Results
118
1. Introduction
Amino acids (AA) belong to the most important chemical structures on earth. They
are building blocks of vital proteins and peptides, neurotransmitters, nourishment, poison,
antibiotics, and transporters [1]. Thus, they are subject to great scientific interest [2]. In the
pharmaceutical industry AA are used as starting material for therapeutic proteins, peptides
and small molecules (e.g. Methotrexate, N-acetylcystein, pemetrexed, captopril, etc), as
components of total parenteral nutrition, excipients [3-6], and active pharmaceutical
ingredients (API), e.g. L-DOPA, Carbocisteine, Gabapentin, etc.
The quality and the safety of the applied AA for the intended purpose have to be
assured by adequate analytical procedures and tests. The challenging part in purity
assessment is in most cases the separation and detection of related substances. Since
amino acids (natural and synthetic) are rather hydrophilic compounds and are lacking a
chromophore, separation as well as detection by HPLC is very difficult. The nature of the
impurities present in AA depends highly on their origin (e.g. recombinant, synthetic or other)
and on possible modification reactions such as acylation or alkylation. Often, the related
compounds are other AA, degraded AA, and precursors, causing the same challenges
regarding separation and detection. Since the second half of the 20th century [7, 8] the
detection of AA was facilitated by numerous derivatization reactions each coming along with
particular advantages and disadvantages (see Fig. 1 for some examples). During the last
decades, great effort has been made to find ways to separate and detect amino acids without
time-consuming and fault-prone derivatization steps. Recent trends in AA analytics use
HILIC or mixed-mode columns combined with CNLSD, CAD, C4D or LC-MS, respectively.
The application of those comparatively new techniques enjoys increasing popularity in the
field of research and discovery, whereas official regulatory authorities are more reluctant in
the adoption of new ways to analyze AA and rather rely on comparatively old techniques like
TLC and amino acid analysis (AAA) with post-column derivatization. Thus, this review
focuses on content determination and impurity profiling of AA by liquid chromatography
without using derivatization reactions.
2. Preparation of amino acids
Nowadays AAs are produced via various ways. Since the production pathway
determines the impurity profile the manufacturing is summarized below. For the
monographed AA the most common production pathways are summarized in Table 1.
Amino acid analysis for pharmacopoeial purposes Talanta 154 (2016) 150-163
119
2.1. Chemical synthesis
Since Adolph Strecker developed the first chemical synthesis of α-amino acids in the
middle of the 19th century [9] many different variants of this reaction and other ways of
producing amino acids have been established in order to obtain enantiomerically pure
products and/or to improve yields. There are also specific syntheses e.g. for Lys: Toray and
DSM procedure [10]. The question rises whether all impurities from all commercially used
synthesis variants using different precursors and/or reagents are covered by a given test [11-
17]. Besides Strecker synthesis another way to obtain racemic α-amino acids is the
amination of α-hydroxy carboxylic acids [18].
2.1.1. Chiral resolution
Although asymmetric syntheses are available, they often do not provide
enantiomerically pure D- and L-forms, respectively, are expensive, elaborate and thus often
not profitable. Nevertheless, some approaches of racemate separation found their way into
the commercial production of amino acids. E.g. the conversion of racemic methionine
comprising acetylation and specific enzymatic deacetylation of the L-form is today an
important and elegant way to obtain L-methionine [19]. Chiral resolution using additional
steps like fractional crystallization of diastereomeric precursors [20] is essential to convert
racemic AAs into one enantiomer after chemical synthesis.
2.2. Recombinant synthesis by microorganisms and fermentation
The biochemical synthesis of AA using microorganisms involves several advantages
over chemical total synthesis, e.g. the enantiomeric selectivity. On the other hand it is a very
sensitive process needing a high level of know-how. Frequently applied bacteria in those
processes belong inter alia to Corynebacterium, Bacillus, Brevibacterium and Escherichia
coli strains [21-23]. The production of one amino acid is usually up-regulated in these
microbes whereas the growth inhibitory effect of the AA in question is removed by means of
genetic engineering. The produced AA is eventually excreted and accumulated in the liquid
phase. After separation of the biomass from the cell culture medium, the amino acid(s) are
extracted from the solution and purified [24-27]. The removal of carbon and nitrogen sources
or nutrients e.g. sugars, sugar alcohols, starch, amino acids, urea [28], “crude glycerol” [29]
and organic acids like malic, fumaric or succinic acid needs to be assured. Residual
components from the broth like antibiotics (e.g. penicillin, tetracycline, kanamycin,
streptomycin or chloramphenicol [26, 27, 29-31]), co-substrates (e.g. biotin, thiamin [32, 33]),
buffers like MOPS [25, 28] and growth inhibitors like β-(2-thienyl)-DL-alanine [34] need to be
removed. Strategies to purify the AA include centrifugation and membrane filtration to
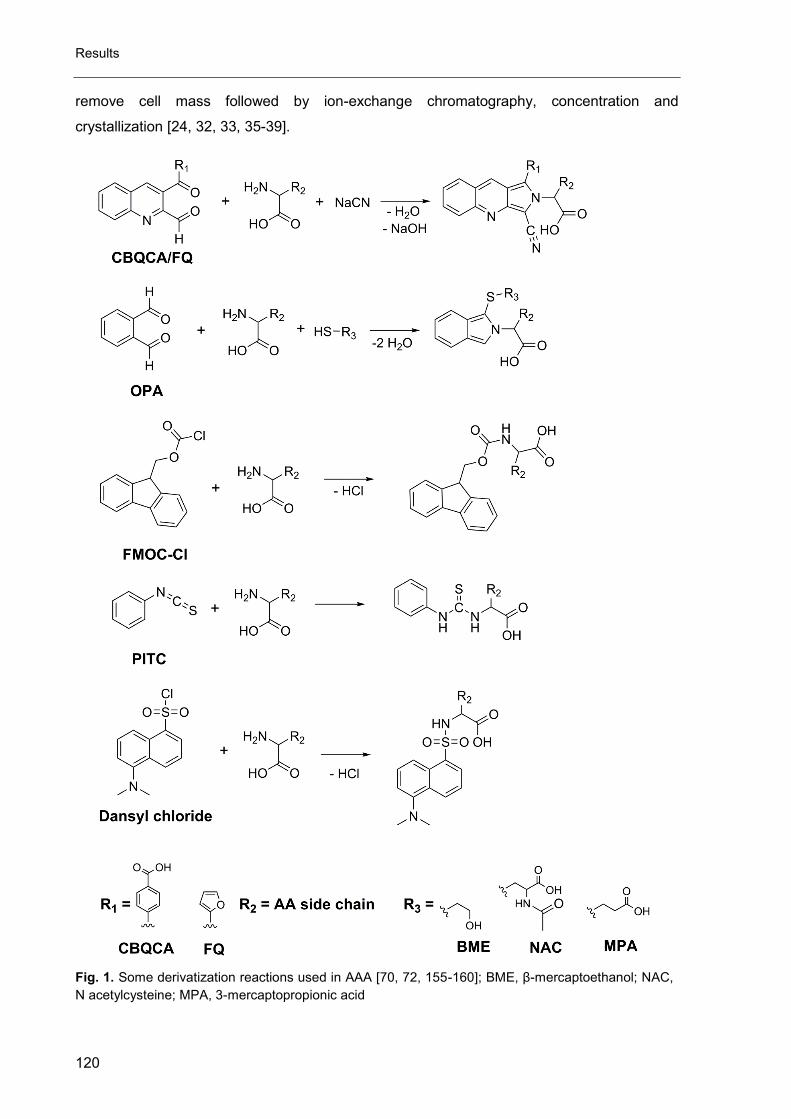
Results
120
remove cell mass followed by ion-exchange chromatography, concentration and
crystallization [24, 32, 33, 35-39].
Fig. 1. Some derivatization reactions used in AAA [70, 72, 155-160]; BME, β-mercaptoethanol; NAC,
N acetylcysteine; MPA, 3-mercaptopropionic acid
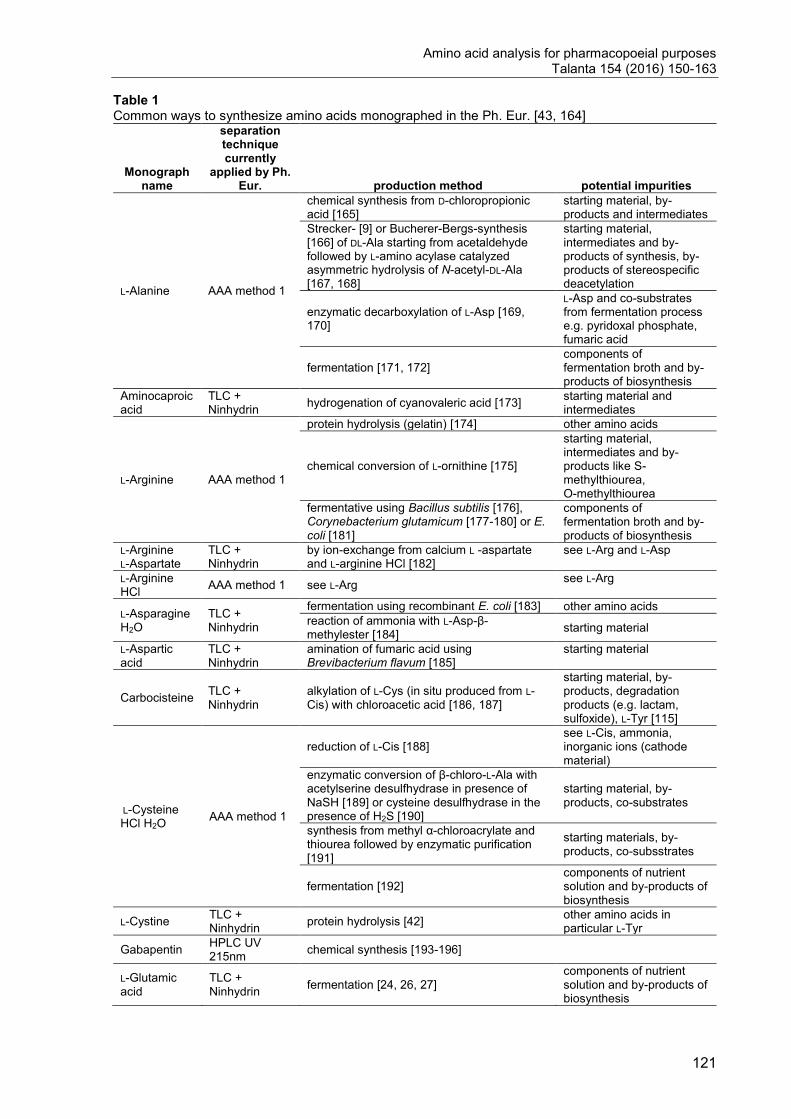
Amino acid analysis for pharmacopoeial purposes Talanta 154 (2016) 150-163
121
Table 1 Common ways to synthesize amino acids monographed in the Ph. Eur. [43, 164]
Monograph name
separation technique currently
applied by Ph. Eur. production method potential impurities
L-Alanine AAA method 1
chemical synthesis from D-chloropropionic acid [165]
starting material, by-products and intermediates
Strecker- [9] or Bucherer-Bergs-synthesis [166] of DL-Ala starting from acetaldehyde followed by L-amino acylase catalyzed asymmetric hydrolysis of N-acetyl-DL-Ala [167, 168]
starting material, intermediates and by-products of synthesis, by-products of stereospecific deacetylation
enzymatic decarboxylation of L-Asp [169, 170]
L-Asp and co-substrates from fermentation process e.g. pyridoxal phosphate, fumaric acid
fermentation [171, 172] components of fermentation broth and by-products of biosynthesis
Aminocaproic acid
TLC + Ninhydrin
hydrogenation of cyanovaleric acid [173] starting material and intermediates
L-Arginine AAA method 1
protein hydrolysis (gelatin) [174] other amino acids
chemical conversion of L-ornithine [175]
starting material, intermediates and by-products like S-methylthiourea, O-methylthiourea
fermentative using Bacillus subtilis [176], Corynebacterium glutamicum [177-180] or E. coli [181]
components of fermentation broth and by-products of biosynthesis
L-Arginine L-Aspartate
TLC + Ninhydrin
by ion-exchange from calcium L -aspartate and L-arginine HCl [182]
see L-Arg and L-Asp
L-Arginine HCl
AAA method 1 see L-Arg see L-Arg
L-Asparagine H2O
TLC + Ninhydrin
fermentation using recombinant E. coli [183] other amino acids
reaction of ammonia with L-Asp-β-methylester [184]
starting material
L-Aspartic acid
TLC + Ninhydrin
amination of fumaric acid using Brevibacterium flavum [185]
starting material
Carbocisteine TLC + Ninhydrin
alkylation of L-Cys (in situ produced from L-Cis) with chloroacetic acid [186, 187]
starting material, by-products, degradation products (e.g. lactam, sulfoxide), L-Tyr [115]
L-Cysteine HCl H2O
AAA method 1
reduction of L-Cis [188] see L-Cis, ammonia, inorganic ions (cathode material)
enzymatic conversion of β-chloro-L-Ala with acetylserine desulfhydrase in presence of NaSH [189] or cysteine desulfhydrase in the presence of H2S [190]
starting material, by-products, co-substrates
synthesis from methyl α-chloroacrylate and thiourea followed by enzymatic purification [191]
starting materials, by-products, co-subsstrates
fermentation [192] components of nutrient solution and by-products of biosynthesis
L-Cystine TLC + Ninhydrin
protein hydrolysis [42] other amino acids in particular L-Tyr
Gabapentin HPLC UV 215nm
chemical synthesis [193-196]
L-Glutamic acid
TLC + Ninhydrin
fermentation [24, 26, 27] components of nutrient solution and by-products of biosynthesis
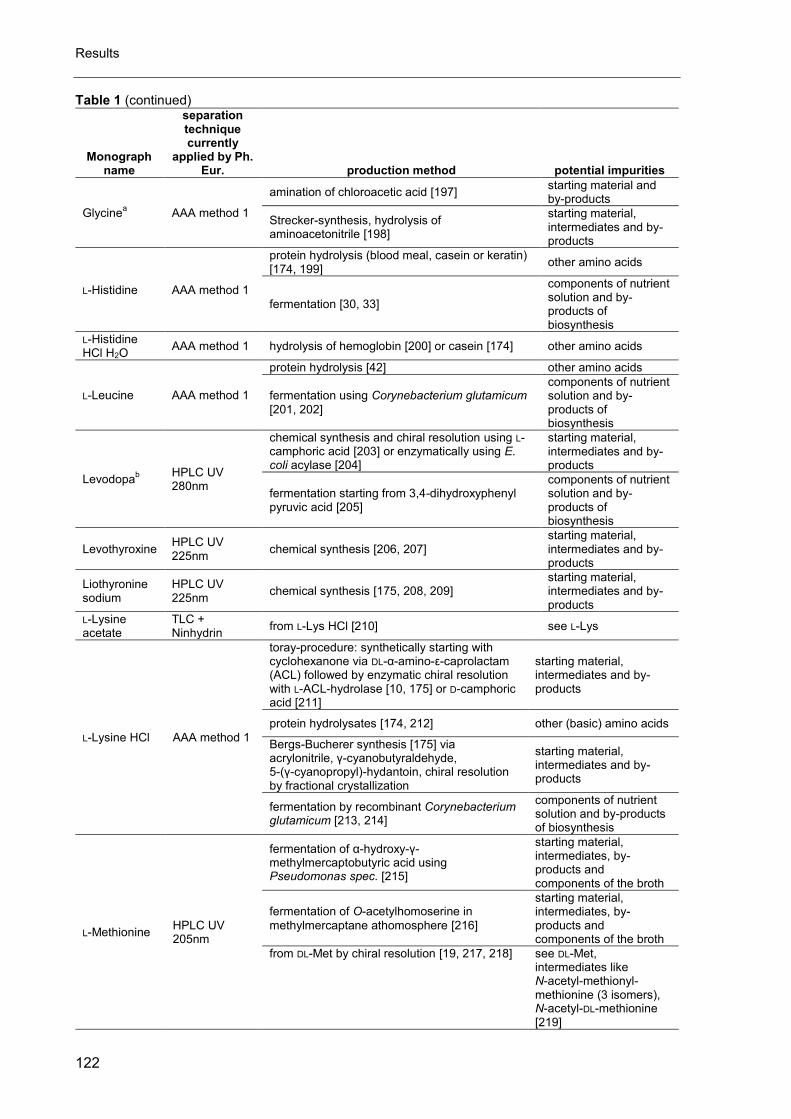
Results
122
Table 1 (continued)
Monograph name
separation technique currently
applied by Ph. Eur. production method potential impurities
Glycinea AAA method 1
amination of chloroacetic acid [197] starting material and by-products
Strecker-synthesis, hydrolysis of aminoacetonitrile [198]
starting material, intermediates and by-products
L-Histidine AAA method 1
protein hydrolysis (blood meal, casein or keratin) [174, 199]
other amino acids
fermentation [30, 33]
components of nutrient solution and by-products of biosynthesis
L-Histidine HCl H2O
AAA method 1 hydrolysis of hemoglobin [200] or casein [174] other amino acids
L-Leucine AAA method 1
protein hydrolysis [42] other amino acids
fermentation using Corynebacterium glutamicum
[201, 202]
components of nutrient solution and by-products of biosynthesis
Levodopab
HPLC UV 280nm
chemical synthesis and chiral resolution using L-camphoric acid [203] or enzymatically using E. coli acylase [204]
starting material, intermediates and by-products
fermentation starting from 3,4-dihydroxyphenyl pyruvic acid [205]
components of nutrient solution and by-products of biosynthesis
Levothyroxine HPLC UV 225nm
chemical synthesis [206, 207] starting material, intermediates and by-products
Liothyronine sodium
HPLC UV 225nm
chemical synthesis [175, 208, 209] starting material, intermediates and by-products
L-Lysine acetate
TLC + Ninhydrin
from L-Lys HCl [210] see L-Lys
L-Lysine HCl AAA method 1
toray-procedure: synthetically starting with cyclohexanone via DL-α-amino-ε-caprolactam (ACL) followed by enzymatic chiral resolution with L-ACL-hydrolase [10, 175] or D-camphoric acid [211]
starting material, intermediates and by-products
protein hydrolysates [174, 212] other (basic) amino acids
Bergs-Bucherer synthesis [175] via acrylonitrile, γ-cyanobutyraldehyde, 5-(γ-cyanopropyl)-hydantoin, chiral resolution by fractional crystallization
starting material, intermediates and by-products
fermentation by recombinant Corynebacterium glutamicum [213, 214]
components of nutrient solution and by-products of biosynthesis
L-Methionine HPLC UV 205nm
fermentation of α-hydroxy-γ-methylmercaptobutyric acid using Pseudomonas spec. [215]
starting material, intermediates, by-products and components of the broth
fermentation of O-acetylhomoserine in
methylmercaptane athomosphere [216]
starting material, intermediates, by-products and components of the broth
from DL-Met by chiral resolution [19, 217, 218] see DL-Met, intermediates like N-acetyl-methionyl-methionine (3 isomers), N-acetyl-DL-methionine [219]
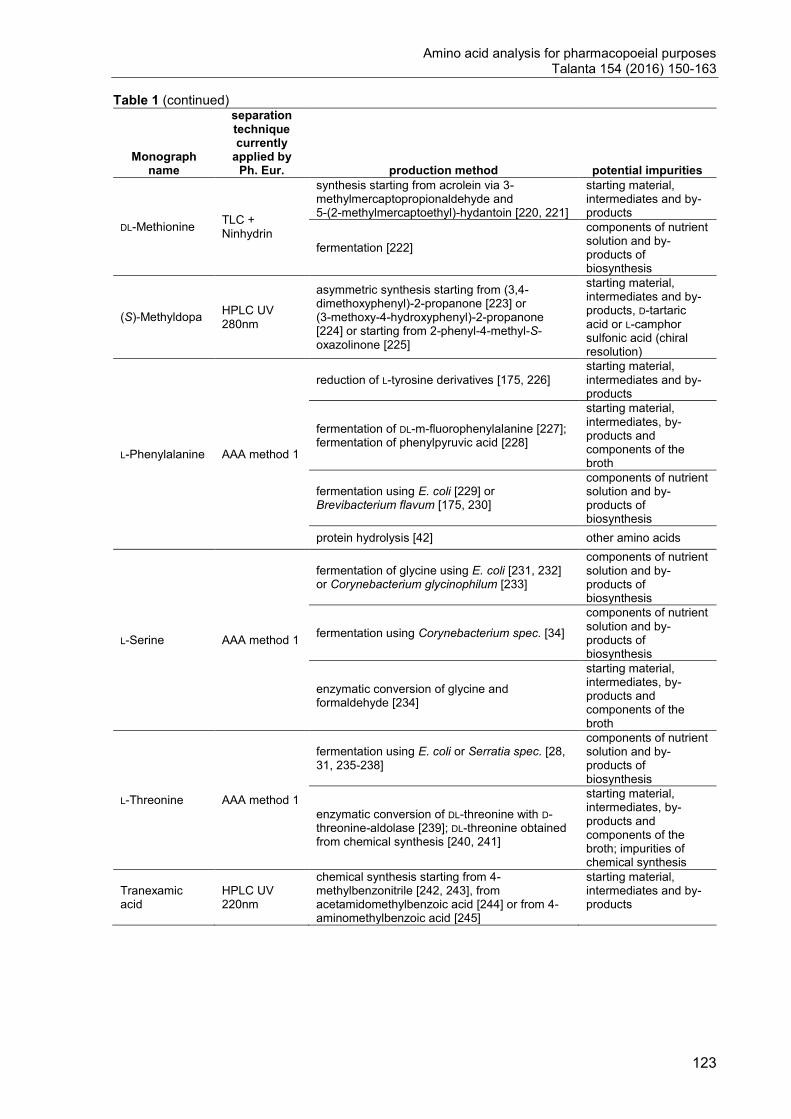
Amino acid analysis for pharmacopoeial purposes Talanta 154 (2016) 150-163
123
Table 1 (continued)
Monograph name
separation technique currently
applied by Ph. Eur. production method potential impurities
DL-Methionine TLC + Ninhydrin
synthesis starting from acrolein via 3-methylmercaptopropionaldehyde and 5-(2-methylmercaptoethyl)-hydantoin [220, 221]
starting material, intermediates and by-products
fermentation [222]
components of nutrient solution and by-products of biosynthesis
(S)-Methyldopa HPLC UV 280nm
asymmetric synthesis starting from (3,4-dimethoxyphenyl)-2-propanone [223] or (3-methoxy-4-hydroxyphenyl)-2-propanone [224] or starting from 2-phenyl-4-methyl-S-oxazolinone [225]
starting material, intermediates and by-products, D-tartaric acid or L-camphor sulfonic acid (chiral resolution)
L-Phenylalanine AAA method 1
reduction of L-tyrosine derivatives [175, 226] starting material, intermediates and by-products
fermentation of DL-m-fluorophenylalanine [227]; fermentation of phenylpyruvic acid [228]
starting material, intermediates, by-products and components of the broth
fermentation using E. coli [229] or Brevibacterium flavum [175, 230]
components of nutrient solution and by-products of biosynthesis
protein hydrolysis [42] other amino acids
L-Serine AAA method 1
fermentation of glycine using E. coli [231, 232] or Corynebacterium glycinophilum [233]
components of nutrient solution and by-products of biosynthesis
fermentation using Corynebacterium spec. [34]
components of nutrient solution and by-products of biosynthesis
enzymatic conversion of glycine and formaldehyde [234]
starting material, intermediates, by-products and components of the broth
L-Threonine AAA method 1
fermentation using E. coli or Serratia spec. [28, 31, 235-238]
components of nutrient solution and by-products of biosynthesis
enzymatic conversion of DL-threonine with D-threonine-aldolase [239]; DL-threonine obtained from chemical synthesis [240, 241]
starting material, intermediates, by-products and components of the broth; impurities of chemical synthesis
Tranexamic acid
HPLC UV 220nm
chemical synthesis starting from 4-methylbenzonitrile [242, 243], from acetamidomethylbenzoic acid [244] or from 4-aminomethylbenzoic acid [245]
starting material, intermediates and by-products
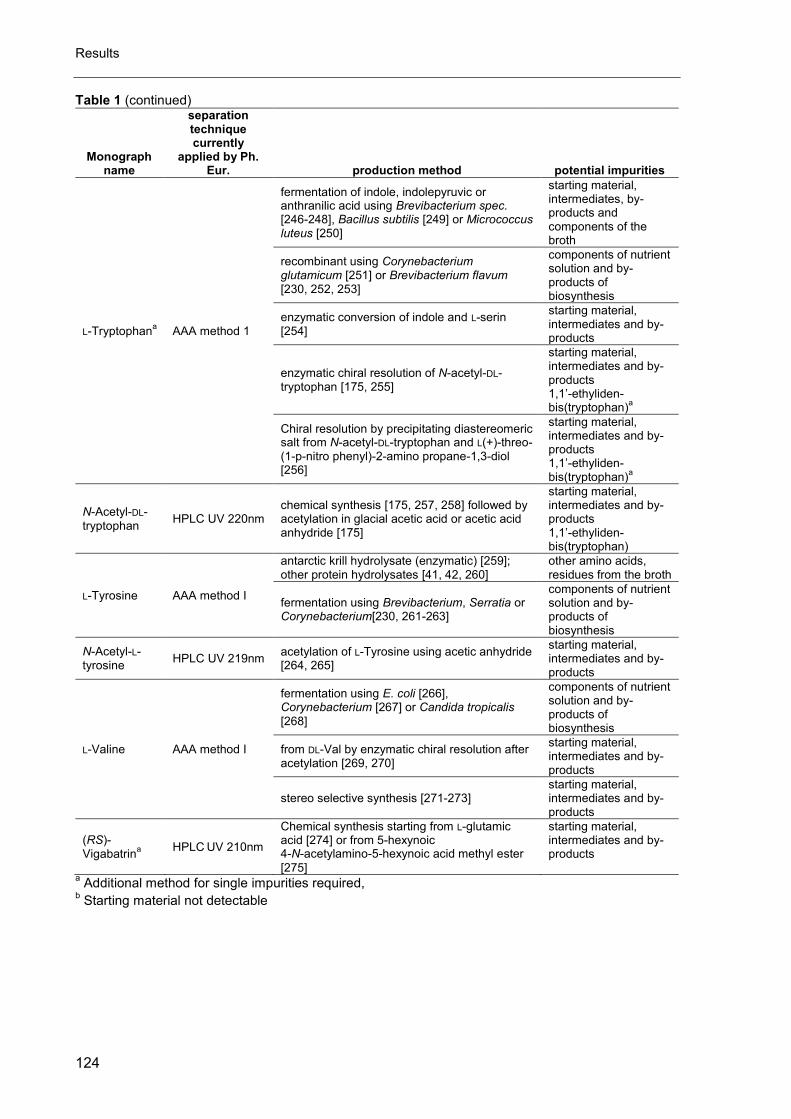
Results
124
Table 1 (continued)
Monograph name
separation technique currently
applied by Ph. Eur. production method potential impurities
L-Tryptophana AAA method 1
fermentation of indole, indolepyruvic or anthranilic acid using Brevibacterium spec. [246-248], Bacillus subtilis [249] or Micrococcus luteus [250]
starting material, intermediates, by-products and components of the broth
recombinant using Corynebacterium glutamicum [251] or Brevibacterium flavum [230, 252, 253]
components of nutrient solution and by-products of biosynthesis
enzymatic conversion of indole and L-serin [254]
starting material, intermediates and by-products
enzymatic chiral resolution of N-acetyl-DL-tryptophan [175, 255]
starting material, intermediates and by-products 1,1’-ethyliden-bis(tryptophan)
a
Chiral resolution by precipitating diastereomeric salt from N-acetyl-DL-tryptophan and L(+)-threo-(1-p-nitro phenyl)-2-amino propane-1,3-diol [256]
starting material, intermediates and by-products 1,1’-ethyliden-bis(tryptophan)
a
N-Acetyl-DL-
tryptophan HPLC UV 220nm
chemical synthesis [175, 257, 258] followed by acetylation in glacial acetic acid or acetic acid anhydride [175]
starting material, intermediates and by-products 1,1’-ethyliden-bis(tryptophan)
L-Tyrosine AAA method I
antarctic krill hydrolysate (enzymatic) [259]; other protein hydrolysates [41, 42, 260]
other amino acids, residues from the broth
fermentation using Brevibacterium, Serratia or Corynebacterium[230, 261-263]
components of nutrient solution and by-products of biosynthesis
N-Acetyl-L-tyrosine
HPLC UV 219nm acetylation of L-Tyrosine using acetic anhydride [264, 265]
starting material, intermediates and by-products
L-Valine AAA method I
fermentation using E. coli [266], Corynebacterium [267] or Candida tropicalis
[268]
components of nutrient solution and by-products of biosynthesis
from DL-Val by enzymatic chiral resolution after acetylation [269, 270]
starting material, intermediates and by-products
stereo selective synthesis [271-273] starting material, intermediates and by-products
(RS)-Vigabatrin
a
HPLC UV 210nm
Chemical synthesis starting from L-glutamic acid [274] or from 5-hexynoic 4-N-acetylamino-5-hexynoic acid methyl ester
[275]
starting material, intermediates and by-products
a Additional method for single impurities required,
b Starting material not detectable
Amino acid analysis for pharmacopoeial purposes Talanta 154 (2016) 150-163
125
Table 2 Possible impurities in amino acids produced by fermentation and detection methods.
Origin of impurities Potential impurities Separation and detection method
Enzymatic chiral resolution
N-acetyl amino acids HPLC direct UV detection at 210nm [219]
D-amino acids
chiral MEKC or CZE of underivatized AA or dansyl derivatives
[276, 277]
chiral LC of underivatized AA using teicoplanin stationary phase and MS detection
[278]
Fermentation
carbon sources
low molecular alcohols and sugar alcohols
CZE with direct UV detection [279]
GC with FID [280]
organic acids like pyruvic, acetic, fumaric, malic or lactic acid
IEC with suppressed conductivity detection
[281]
Mixed mode Chromatography with CAD
[282]
CZE with C4D [283]
IEC with RID [85]
carbohydrates
HILIC with CAD [284, 285]
PGC-LC with CAD [286]
HPLC with RID [82-85]
IEC with pulsed amperometric detection
[287]
CZE with direct UV detection [279]
CZE with RID [86]
CZE with C4D after derivatization with AETMA
[288]
antibiotics
gentamicin
IPC with CAD [289]
IPC with RID [290]
IPC and ECD [291]
IPC with ELSD [292, 293]
CZE with UV detection at 195nm [294]
IPC with LC-MS detection [295]
streptomycin
IPC using CAD or IPC with UV detection at 205nm
[114]
IPC with C4D [296]
tetracycline
RP HPLC with UV detection at 360 nm
[297]
RP HPLC with FLD λex = 374 λem = 495 nm
[298]
RP UHPLC MS detection [299]
kanamycin
IPC with pulsed amperometric detection
[300]
CZE after pre-capillary derivatization (OPA)
[301]
IPC with ELSD [293]
IPC with C4D [296, 302]
Results
126
Table 2 (continued) Origin of impurities Potential impurities Separation and detection method
antibiotics chloramphenicol
RP HPLC with tandem MS [303]
RP HPLC with UV detection at 280 nm or 275 nm
[304, 305]
RP HPLC with electrochemical detection
[305]
RP HPLC with CNLSD detection [306]
other components in the broth
amino acids
IPC with tandem MS [307]
AAA with post-column ninhydrin derivatization
[44, 46, 47]
UHPLC with CAD [118]
AAA with post-column OPA derivatization
[63]
IPC with post-column 1,2-naphthoquinone-4-sulfonate derivatization
[67]
RP-HPLC with pre-column FMOC-Cl derivatization
[70]
CE after pre-capillary derivatization (FMOC or CBQCA) using LIF or UV detection
[308, 309]
CZE with RID [86]
IPC with ELSD detection [310]
IEC with ECD (amperometric) [311]
IPC with CLND [88, 96]
IEC with ECD (pulsed amperometric) [312]
biotin
RP-HPLC with ECD (coulometric) [313]
RP-HPLC with CAD [314]
RP-HPLC with UV detection [315]
RP-HPLC with FLD [315]
CZE with UV detection at 210 nm [316]
MEKC with UV detection at 214 nm [317]
CZE with MS detection [318]
thiamin
RP-HPLC with CAD [314]
RP-HPLC with UV detection at 275 nm
[319]
MEKC with UV detection at 214 nm [317]
CZE with MS detection [318]
pyridoxal phosphate RP-HPLC with FLD after post column derivatization
[320]
AAA: amino acid analysis, AETMA: (2-aminoethyl)trimethylammonium chloride hydrochloride, C4D: capacitively
coupled contactless conductivity detector, CAD: corona charged aerosol detector, CLND: chemiluminescent
nitrogen detector, CZE: capillary zone electrophoresis, ECD: electrochemical detection, ELSD: evaporative light
scattering detector, FID: flame ionization detector, FLD: fluorescence detection, GC: gas chromatography, HPLC:
high performance liquid chromatography, IEC: ion-exchange chromatography, IPC: ion-pairing chromatography,
MEKC: micellar electrokinetic chromatography, PGC: porous graphitic carbon, RP: reversed phase, UHPLC:
ultra-high performance liquid chromatography
Amino acid analysis for pharmacopoeial purposes Talanta 154 (2016) 150-163
127
Fig. 2. Reaction of primary α-amino acids and proline with ninhydrin [161, 162]
2.3. Protein hydrolysis
Acidic hydrolysis of peptides and proteins yields solutions of the amino acids present
in the chosen precursor. The crude hydrolysate is purified by fractionated crystallization and
chromatographic procedures [21, 40-42]. The amino acid composition of the hydrolysate is
controlled by the chosen protein starting material and the method of hydrolysis. Obviously,
mainly enantiomerically pure AAs are yielded by this procedure. In turn, only natural amino
acids are accessible by this method. The starting material and method of hydrolyzation have
to be chosen carefully to make sure that posttranslational modifications or degraded amino
acids do not find their way into the final product. AAs prone to degradation are Met, Cys and
Trp. They are converted to methionine sulfoxide, methionine sulfone, cysteic acid and
oxidation products of Trp. Other amino acids such as Asn and Gln e.g. are usually converted
to their corresponding acid (D- and L-form due to partial racemization) and are therefore not
easily accessible by protein hydrolysis.
Results
128
3. Analytical methods for amino acids
Fermentation is today the most common way to produce AA. Beside antibiotics and
carbohydrates possible impurities due to the fermentation process are ketones and acids
occurring as starting material and intermediates in the biosynthesis. Methods to determine
those impurities are listed in Table 2. The most frequently used techniques are summarized
in the following part.
3.1. Pharmacopoeial methods
3.1.1. Thin-layer chromatography
Thin-layer chromatography (TLC) is an appropriate mean of identification in
combination with additional tests. For impurity profiling, the method is obsolete due to the
lack of sensitivity and resolving power. Some AA monographed in the Ph. Eur. still rely on a
TLC test combined with ninhydrin detection as a test for related amino acids and great effort
is made to replace those TLC tests by more sensitive and specific tests. In most cases it is
replaced by amino acid analysis (AAA).
3.1.2. Amino acid analysis (2.2.56)
Chapter 2.2.56 of the Ph. Eur. [43] defines AAA as a “methodology used to determine
the amino acid composition or content of proteins, peptides, and other pharmaceutical
preparations”. It is discriminated between methods of “protein hydrolysis” and
“methodologies of amino acid analysis”. In the current version 8.8 of the Ph. Eur. there are
11 methods for hydrolysis and 8 methods for AAA described. Although AAA is not intended
for this purpose, some of the currently monographed amino acids use analysis method 1 to
determine related “ninhydrin-positive substances”. This method comprises the separation of
the test solution on an cation-exchange resin using lithium- [44] or sodium-based [45] mobile
phases and the post-column derivatization of the analytes with ninhydrin [46, 47]. Since the
ninhydrin derivatization is well-known and characterized (see Fig. 2), it is also known that
some amino acids yield multiple products and thus variation in response if parameters such
as temperature, time and pH are not precisely maintained (e.g. in the case of Arg, Asn, Trp,
Cys and Lys [48-56], see Fig. 3). The post-column derivatization comes with high specificity,
because all possible derivatization products of one AA are covered by a single peak,
whereas the resolving power of the chromatographic system suffers from post-column dead
volume leading to peak broadening [57-59]. Hence the results produced by AAA might be
reliable provided that reaction conditions are strictly constant for both sample and AA
standard. However, the procedure is not only time consuming and costly due to the fact that
a special instrument has to be used but it is also completely blind towards compounds that
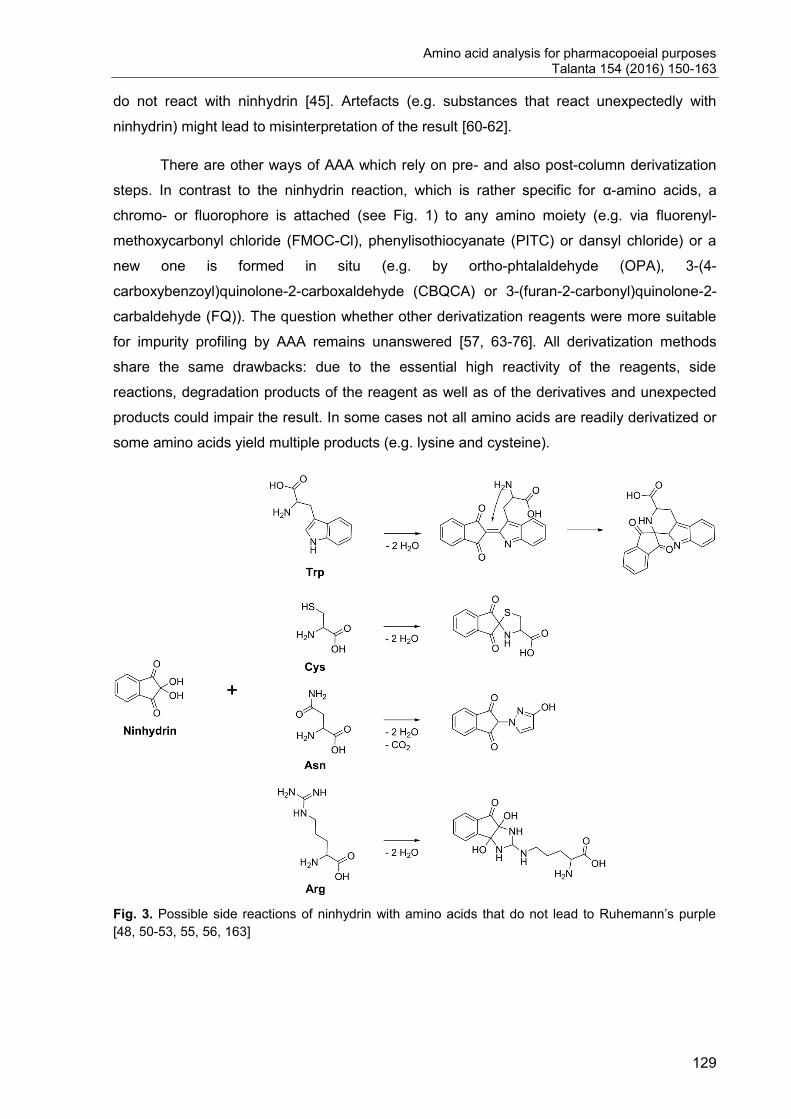
Amino acid analysis for pharmacopoeial purposes Talanta 154 (2016) 150-163
129
do not react with ninhydrin [45]. Artefacts (e.g. substances that react unexpectedly with
ninhydrin) might lead to misinterpretation of the result [60-62].
There are other ways of AAA which rely on pre- and also post-column derivatization
steps. In contrast to the ninhydrin reaction, which is rather specific for α-amino acids, a
chromo- or fluorophore is attached (see Fig. 1) to any amino moiety (e.g. via fluorenyl-
methoxycarbonyl chloride (FMOC-Cl), phenylisothiocyanate (PITC) or dansyl chloride) or a
new one is formed in situ (e.g. by ortho-phtalaldehyde (OPA), 3-(4-
carboxybenzoyl)quinolone-2-carboxaldehyde (CBQCA) or 3-(furan-2-carbonyl)quinolone-2-
carbaldehyde (FQ)). The question whether other derivatization reagents were more suitable
for impurity profiling by AAA remains unanswered [57, 63-76]. All derivatization methods
share the same drawbacks: due to the essential high reactivity of the reagents, side
reactions, degradation products of the reagent as well as of the derivatives and unexpected
products could impair the result. In some cases not all amino acids are readily derivatized or
some amino acids yield multiple products (e.g. lysine and cysteine).
Fig. 3. Possible side reactions of ninhydrin with amino acids that do not lead to Ruhemann’s purple
[48, 50-53, 55, 56, 163]
Results
130
3.1.3. UV detection
Most amino acids lack a suitable chromophore, like conjugated double bonds, for UV
detection. However, the absorbance due to the n π* transition of the carboxylic acid at
about 210 nm enables the direct detection of underivatized amino acids at low wavelength
(< 220 nm) [77-79]. Nevertheless, the poor sensitivity is one of the major drawbacks of the
direct UV-detection. Improved sensitivity is provided by modern detectors with high sensitivity
flow cells, high energy lamps and improved optics. Modern high efficiency columns minimize
band broadening and highly pure acetonitrile shows reduced absorption at low wavelength.
Other organic solvents are usually useless due to UV cutoff at about 220 nm or higher. The
preparation of a highly concentrated sample solution for the determination of related
substances can also compensate for the low sensitivity.
3.2. Methods used in research and discovery
3.2.1. Electrochemical detection (ECD)
The electrochemical detection after ion chromatographic separation was for a long time the
most common method of detection for underivatized AA. In general there are three types of
electrochemical detectors, amperometric and coulometric detectors, and a combination of
both. This technique needs a skilled operator, is fault-prone and not suitable for impurity
assessment because the most important advantage of these detection techniques is their
high specificity for oxidizable or reducible compounds which, at the same time, limits the
amount of detectable substances [80].
3.2.2. Refractive Index (RI) detection
The principle of the RID comprises the comparison of the RI of the column effluent or
separation buffer (in CE) with the RI of pure mobile phase. Any substance eluting from the
column changes the RI and therefore causes a signal in the detector. Although it is
considered a universal detector, there are some decisive downsides: Due to the
comparatively small differences in RIs, the detection limit is usually higher than that of other
detectors (UV, CAD, CNLSD), it is not compatible to gradient elution and extremely sensible
to temperature shifts. The latter aspect is dealt with in modern instruments, but the lack of
sensitivity and the restriction to isocratic elution makes this detector only second choice for
the determination of related substances [81].
The RID is a common detector in carbohydrate analysis [82-85] whereas the detection of AA
by means of RID is rarely described in capillary zone electrophoresis (CZE) [86, 87] or HPLC
[88].
Amino acid analysis for pharmacopoeial purposes Talanta 154 (2016) 150-163
131
3.2.3. Evaporative and condensation nucleation light scattering detection (ELSD and
CNLSD)
In the late 1980s the ELSD was the next milestone to universal detection [89-92] after the
RID. The CNLSD (also referred to as NQAD) is considered the direct advancement of the
ELSD [93, 94]. Both principles are based on the evaporation of the column effluent at
elevated temperatures producing an aerosol which contains the analyte. The mobile phase
has to be completely volatile to get a sufficiently low background noise. In the ELSD, the
aerosol is directed through a chamber equipped with a light source and the amount of light
scattered by the aerosol is measured whereas in the CNLSD the aerosol is combined with
water (n-butanol at the research stage) vapor before the light scattering is measured. The
vapor condenses on the particles increasing their diameter and therefore augments light
scattering and response. Both detectors use light of different wavelengths in the visible
range, in some cases emitted from laser light emitting diodes (LEDs) [95]. Possible
interactions with the analyte, if it absorbs at the applied wavelength, have to be considered,
especially if substances are not quantified against themselves as external reference but
against other substances with different structure (e.g. if the analyte is unknown). Although
this might be rarely the case, as ELSD and CNLSD are usually applied for substances
lacking a chromophore, some attention should be paid to this matter when using one of these
techniques. ELSD and CNLSD have proven useful in the analysis of underivatized amino
acids [96-98] although the LOD is in general equal or higher compared to low wavelength UV
detection [88]. A major problem of the ELSD in impurity analysis is due to spike peaks on the
tail of principle peaks leading to misinterpretation of the chromatogram. These spike peaks
are completely random and unavoidable because of the necessary high sample
concentration for impurity profiling [97].
3.2.4. Corona charged aerosol detector (CAD)
The corona charged aerosol detector is another aerosol based technique [99-103]. Instead of
measuring the scattered light, the particles are diverted through a stream of positively
charged nitrogen gas and the adsorbed charge is determined by a sensitive amperemeter
[104]. The detector response is considered proportional to the total particle surface. This
explains one important characteristic of the CAD: Since the surface is not directly
proportional to the particle volume (ideally referred to as spherical) and therefore not
proportional to the analyte mass, the response is not strictly linear [100]. Nevertheless,
several applications have demonstrated that the response is sufficiently linear over two
orders of magnitude which is adequate for determinations of related substances in most
cases. However, logarithmic regression is suitable if an extended calibration range is
required [105]. Furthermore, the same limitations (at the same time advantages) apply as for
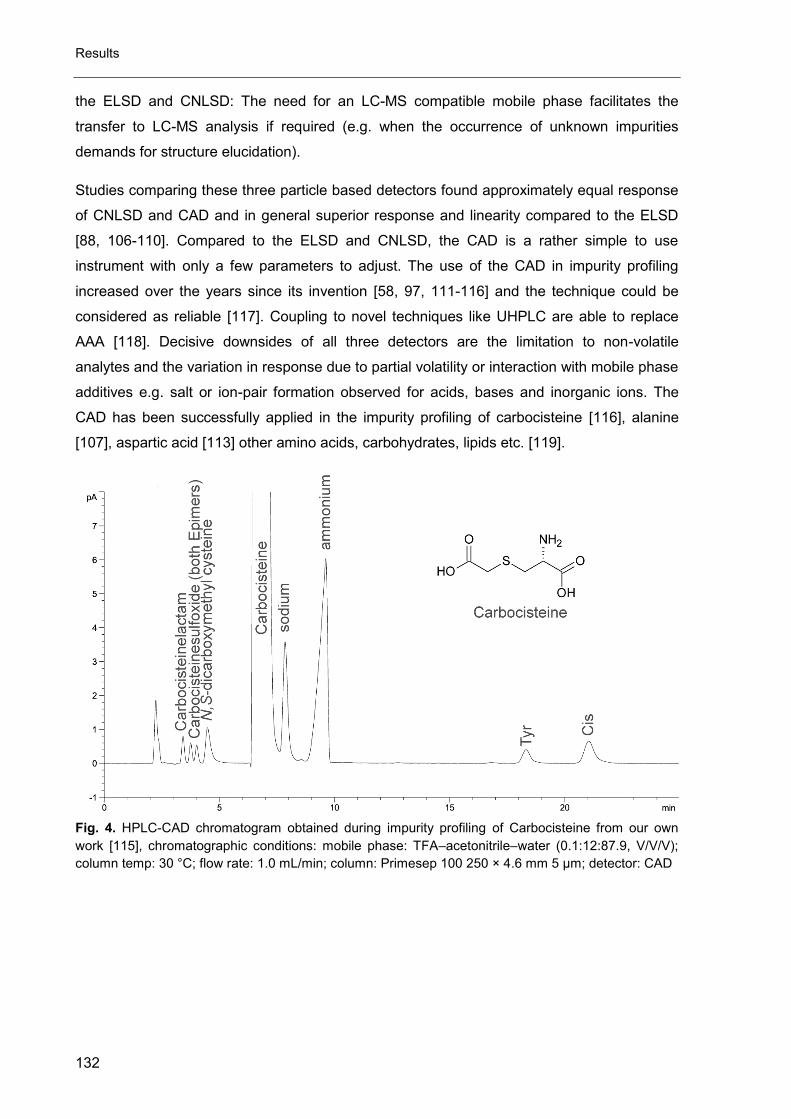
Results
132
the ELSD and CNLSD: The need for an LC-MS compatible mobile phase facilitates the
transfer to LC-MS analysis if required (e.g. when the occurrence of unknown impurities
demands for structure elucidation).
Studies comparing these three particle based detectors found approximately equal response
of CNLSD and CAD and in general superior response and linearity compared to the ELSD
[88, 106-110]. Compared to the ELSD and CNLSD, the CAD is a rather simple to use
instrument with only a few parameters to adjust. The use of the CAD in impurity profiling
increased over the years since its invention [58, 97, 111-116] and the technique could be
considered as reliable [117]. Coupling to novel techniques like UHPLC are able to replace
AAA [118]. Decisive downsides of all three detectors are the limitation to non-volatile
analytes and the variation in response due to partial volatility or interaction with mobile phase
additives e.g. salt or ion-pair formation observed for acids, bases and inorganic ions. The
CAD has been successfully applied in the impurity profiling of carbocisteine [116], alanine
[107], aspartic acid [113] other amino acids, carbohydrates, lipids etc. [119].
Fig. 4. HPLC-CAD chromatogram obtained during impurity profiling of Carbocisteine from our own
work [115], chromatographic conditions: mobile phase: TFA–acetonitrile–water (0.1:12:87.9, V/V/V);
column temp: 30 °C; flow rate: 1.0 mL/min; column: Primesep 100 250 × 4.6 mm 5 μm; detector: CAD
Amino acid analysis for pharmacopoeial purposes Talanta 154 (2016) 150-163
133
3.2.5. Chemiluminescent nitrogen detection (CLND)
In the CLND the column effluent is vaporized with oxygen and an inert gas (argon or helium),
and pyrolyzed at high temperatures. Any nitrogen containing compound is converted to
nitrogen monoxide, which reacts with ozone in the gas phase to excited nitrogen dioxide. The
excited molecule drops to the ground state under infrared light emission. The emitted light
intensity is linear over a broad concentration range and directly proportional to the number of
nitrogen atoms in the molecule [120, 121]. Major drawback of this detector is the specificity
for nitrogen containing compounds which also limits the available components for the mobile
phase. Acetonitrile, ammonium buffers and amine ion-pairing agents cannot be used with the
CLND due to the baseline noise caused by the contained nitrogen. On the other hand, it is
possible to quantify volatile and semi volatile analytes because the reaction takes place in
the gas phase. Despite of the limitations regarding mobile phase composition, amino acid
analysis is possible using methanol and perfluorinated carboxylic acids as ion-pairing agents
[88, 96] but the specificity for nitrogen containing compounds limits the number of detectable
substances in impurity profiling.
3.2.6. LC-MS
Since the introduction of soft ionization techniques such as ESI, APCI and APPI the coupling
of liquid chromatographic systems to almost any type of mass spectrometer has been
possible. Very common types of instruments coupled to one of these ionization interfaces are
triple quadrupole (QqQ), time of flight (TOF), quadrupole TOF, and ion-trap mass
spectrometers, respectively. Each instrument/interface combination holds its own
advantages and fields of application. Triple quadrupole mass spectrometers are mainly
applied in trace analytics from difficult matrices (e.g. blood and other body fluids or plant
extracts) [122-125] because of their high sensitivity and specificity (robust method design
assumed) whereas TOF, qTOF and ion-traps (e.g. orbitrap) are very powerful tools of
structure elucidation, because the high m/z precision permits calculation of sum formulae.
This information combined with fragment spectra obtainable from MS/MS experiments (e.g.
using qTOF or ion trap) even allows for amino acid sequencing of small peptides [126, 127].
Impurity profiling is usually not a domain of LC-MS analysis due to the poor linearity and the
need of internal standards (ideally stable isotope tagged analyte). Last but not least, the
costliness of these instruments is a limitation for most laboratories dealing with routine quality
analyses.
Nevertheless, if an impurity has to be detected very sensitively and specifically, e.g. because
it is extraordinarily toxic, the application of LC-MS techniques in the Ph. Eur. has to be
considered on behalf of safety and innocuousness like it has been the case for meldonium
Results
134
dihydrate, oseltamivir phosphate, imatinib mesilate and the confirmatory test for aristolochic
acids in herbal drugs (2.8.21) method C. Impurities found in these substances are not AA but
issue the same challenges regarding detection and separation. During the investigations
related to the tryptophan incident [128] this powerful technique [129] was unfortunately only
applied after the disaster had happened [130-132].
3.2.7. Capacitively coupled contactless conductivity detection (C4D)
C4D is a relatively new so called universal detector applied in CE and HPLC analytics of
underivatized amino acids [133-145]. The detection principle is based on the measurement
of the eluents or running buffers conductivity by means of electromagnetic signals send
through the detector cell [146-148]. Analytes passing the detector change the conductivity
and produce a signal. Like UV detection, it is a non-destructive detection principle showing
sensitivity equal or superior to UV detection [139]. Like all non-destructive detectors this
technique could be combined with UV and MS detectors in order to obtain more information
about the analyte like UV-spectra and/or mass spectra in a single analysis.
3.2.8. Combining detection techniques
Combination of destructive and non-destructive detection techniques by hyphenation and by
means of flow splitting can be very useful to acquire information about unknown structures.
Some extreme applications combining 3 or more detection principles [149-151] are certainly
not routinely available in pharmaceutical laboratories, but the combination of UV and CAD is
as simple as it is powerful to obtain information about unknown impurities [152]. The
determination of non-volatile, but UV inactive compounds as well as the detection of volatile,
but UV active contaminants is possible using this combination. The UV-detector effluent that
is usually diverted to the waste is simply directed to the CAD. This is feasible by any
laboratory without further equipment or instrumentation and the additional detection
dimension introduces higher certainty regarding the substance purity. The combination of
UV-FLD-ECD already proved capable of replacing AAA in certain cases [153].
3.3. Other monographed substances that could profit from modern detection principles.
There is basically no substance relying on a test for related substances applying LC-
UV detection that would not profit from orthogonal detection techniques like LC-MS or LC-
CAD. Those tests applying a detection wavelength above 220 nm could benefit from aerosol
based techniques like CAD, CNLSD or ELSD or C4D because unknown impurities without
chromophore might be present but undetected whereas the detection limit of methods using
very low wavelength could be lowered by using alternative detection principles. The impurity
profiling of the unnatural AAs gabapentin, tranexamic acid and vigabatrin could benefit from
Amino acid analysis for pharmacopoeial purposes Talanta 154 (2016) 150-163
135
alternative techniques also [154]. The application of C4D in HPLC analysis is a
comparatively new and unexplored area but could prove useful in the purity assessment of
substances lacking an adequate chromophore for UV-detection.
4. Conclusion
Due to the many ways of producing amino acids and the diversity of suppliers, more
general, state of the art methods for the quality control of amino acids should be used.
Methods meeting these criteria are available but seem to be disregarded in favor of the very
specific, to some extend “blind”, amino acid analysis. In some cases the Ph. Eur. deals with
this issue by additional tests for single impurities complicating the test procedure instead of
providing a single method covering all impurities. It is at least necessary to check extensively
for ninhydrin-negative impurities before transferring an old TLC method to AAA. A substance
that has been monitored by TLC for decades could have been contaminated with ninhydrin-
negative compounds for years that are still not visible using the AAA; changes in the
synthetic process or in the supply chain could cause new contaminants that are not detected
after derivatization, e.g. the tryptophan incident [128]. Currently available AAs are from high
quality and purity, but as more and more competitors expand on the market, the quality
provided by future manufacturers has to be assured by using less specific methods for
impurity profiling.
Conflict of interest statement
None of the authors of this paper has a financial or personal relationship with other
people or organizations that could inappropriately influence or bias the content of the paper
Acknowledgement
Thanks are due to the Federal Institute of Drugs and Medical Devices (Bonn,
Germany) for financial support.
Results
136
References
[1] A.B. Hughes, amino acids, peptides and proteins in organic chemistry, Wiley-VCH, Weinheim,
2009.
[2] J.S. Ma, Unnatural amino acids in drug discovery, Chim. Oggi, 21 (2003) 65-68.
[3] R. Laitinen, K. Löbmann, H. Grohganz, C. Strachan, T. Rades, Amino acids as co-amorphous
excipients for simvastatin and glibenclamide: Physical properties and stability, Mol.
Pharmaceut., 11 (2014) 2381-2389.
[4] B.J. Mishra, A. Kaul, P. Trivedi, L-Cysteine conjugated poly L-lactide nanoparticles containing
5-fluorouracil: formulation, characterization, release and uptake by tissues in vivo, Drug Deliv.,
22 (2015) 214-222.
[5] U. Bürger, H. Wolf, Investigations on utilization of parenterally administered amino acids by
premature and hypotrophic neonates. III. Composition of an amino acid solution according to
pharmacokinetic principles, Eur. J. Pediatr., 122 (1976) 169-175.
[6] A.V. Katdare, C. Lui, S.N. Kleinhart (Merck & Co., Inc.), High-content ibuprofen lysinate
pharmaceutical formulation, EP 0505180B1, 1996.
[7] D.A. MacFadyen, On the mechanism of the reaction of ninhydrin with α-amino acids. I.
Absorption spectra of ninhydrin and certain derivatives, J. Biol. Chem., 186 (1950) 1-12.
[8] D.A. MacFadyen, N. Fowler, On the mechanism of the reaction of ninhydrin with α-amino
acids. II. A spectrophotometric study of hydrindantin reactions, J. Biol. Chem., 186 (1950) 13-
22.
[9] A. Strecker, Über die künstliche Bildung der Milchsäure und einen neuen, dem Glycocoll
homologen Körper, Liebigs Ann. Chem., (1850) 27-45.
[10] T. Fukumura (Toray Industries, Inc.), Process for preparing L-lysine, US 3770585, 1973.
[11] K. Yasukawa, R. Hasemi, Y. Asano, Dynamic kinetic resolution of α-aminonitriles to form
chiral α-amino acids, Adv. Synth. Catal., 353 (2011) 2328-2332.
[12] A.A. Sathe, D.R. Hartline, A.T. Radosevich, A synthesis of α-amino acids via direct reductive
carboxylation of imines with carbon dioxide, Chem. Commun., 49 (2013) 5040-5042.
[13] H. Yan, J.S. Oh, J.W. Lee, C.E. Song, Scalable organocatalytic asymmetric Strecker reactions
catalysed by a chiral cyanide generator, Nat. Commun., 3 (2012)
Amino acid analysis for pharmacopoeial purposes Talanta 154 (2016) 150-163
137
[14] T. Mita, J.Y. Chen, M. Sugawara, Y. Sato, One-pot synthesis of α-amino acids from imines
through CO2 incorporation: An alternative method for Strecker synthesis, Angew. Chem. Int.
Edit., 50 (2011) 1393-1396.
[15] M. Gomes, R. Hernández-Valdés, C.E.S.J. Marques, M.L. Bastos, D.A.G. Aranda, O.A.C.
Antunes, Enantioselective heterogeneous catalytic production of α-amino acids, React. Kinet.
Catal. Lett., 87 (2005) 19-24.
[16] M.S. Iyer, K.M. Gigstad, N.D. Namdev, M. Lipton, Asymmetric catalysis of the Strecker amino
acid synthesis by a cyclic dipeptide, J Am Chem Soc, 118 (1996) 4910-4911.
[17] S.J. Zuend, M.P. Coughlin, M.P. Lalonde, E.N. Jacobsen, Scaleable catalytic asymmetric
Strecker syntheses of unnatural α-amino acids, Nature, 461 (2009) 968-970.
[18] R. Bou Chedid, A. Oftring, W. Staffel, M. Biel, J.-P. Melder, C. Grünanger (BASF), Process for
preparing racemic α-amino acids, EP 2794552, 2012.
[19] S. Tokuyama, K. Hatano, Overexpression of the gene for N-acylamino acid racemase from
Amycolatopsis sp TS-1-60 in Escherichia coli and continuous production of optically active
methionine by a bioreactor, Appl. Microbiol. Biot., 44 (1996) 774-777.
[20] P. Allegrini, G. Barreca, A. Rosi, G. Soriato (Zambon), Process for the preparation of optically
pure phenylalanine, WO 9958493, 1999.
[21] A. Kleemann, W. Leuchtenberger, B. Hoppe, H. Tanner, Amino acids., in: W. Gerhartz (Eds.),
Ullmanns Encyclopedia of Industrial Chemistry, VCH Verlagsgesellschaft mbH,Weinheim,
1985, pp. 57-97.
[22] W. Ladner, U. Pressler, W. Siegel (BASF), Verfahren zur herstellung von L-lysin
produzierenden mikroorganismen, WO 1992001785, 1992.
[23] K. Yamada, H.I.T.N.S. Tsutsui, K. Yotsumoto, M. Shirai (Toray Industries, Inc.), Verfahren zur
Herstellung von L-Threonin durch Fermentation, EP 0205849, 1991.
[24] S. Samsonova, V. Samsonov, Y. Rostova, M. Gusyatiner (Ajinomoto Co., Inc.), A method for
producing an L-amino acid belonging to the glutamate family, using a coryneform bacterium,
WO 2012147989, 2012.
[25] A. Marx, B. Moeckel, W. Pfefferle, H. Sahm, A. de Graaf, L. Eggeling (Degussa AG), Process
for the fermentative production of L-amino acids using coryneform bacteria, EP 1029919,
2000.
[26] L. Eggeling, K. Krumbach, H. Sahm, G. Thierbach Process for the fermentative preparation of
L-glutamic acid using coryneform bacteria, US 2002127662, 2002.
Results
138
[27] M. Sato, N. Akiyoshi (Ajinomoto Co., Inc.), Method for producing L-glutamic acid, US 6653110,
2003.
[28] M. Rieping (Degussa AG), Process for the fermentative preparation of L-threonine, WO
2001092545, 2001.
[29] Y. Nagai, Y. Masumitsu (Ajinomoto Co., Inc.), A method for producing L-lysine, EP 2202299,
2010.
[30] T. Mizukami, R. Katsumata, T. Oka (Kyowa Hakko Kogyo Co., Ltd.), Process for producing
histidine, US 4927758 A, 1990.
[31] H. Thomas, R. Mechthild (Degussa AG), Fermentation process for the preparation of L-
threonine, WO 2002018543, 2002.
[32] T. Nakanishi, H. Hagino (Kyowa Hakko Kogyo Kabushiki Kaisha), Process for producing L-
proline by fermentation, US 4444885, 1984.
[33] Y. Kotani, K. Kino (Kyowa Hakko Kogyo Co., Ltd.), Process for producing L-histidine by
fermentation, US 4725541 A, 1988.
[34] M. Suga, M. Sugimoto, T. Osumi, T. Nakamatsu, W. Hibino, M. Ito (Ajinomoto Co., Inc.),
Method of producing L-serine by fermentation, US 20030175912, 2003.
[35] A. Yuan, C. Zhang, D. Chen, X. Xing (Jiahe Biolog Technology Co.), Method for producing
lysine acetate for injection, CN 102229540, 2013.
[36] S. Miyahara, T. Matsumoto, T. Miyahara, A. Sakaguchi, K. Nitta (Mitsui Toatsu Chemicals
Inc.), Method for separating glycine and L-serine from a solution containing same, US
4733009, 1988.
[37] B. Hegedus, A. Krasso (Hoffmann La Roche Inc.), Process for the purification of L-serine, US
3742034, 1973.
[38] J.S. Choi, T.H. Kim, S.H. Kim (BASF Aktiengesellschaft Patents, Trademarks and Licenses),
Method for recovering a basic amino acid form a fermentation liquor ll, US 20080193985,
2008.
[39] H. Ito, A. Nishi, M. Miyazawa, M. Naruse (Ajinomoto Co., Inc.), Process for isolating and
purifying amino acids, US 4956471, 1990.
[40] H.J. Almquist, D.J. Gorton (F E Booth Company Inc), Amino acid extraction, US 2471053,
1949.
[41] F.A. Hoglan, J.P.A. Pugh (International Mineral & Chemical Corp.), Treatment of protein
hydrolysates, US 2751408, 1956.
Amino acid analysis for pharmacopoeial purposes Talanta 154 (2016) 150-163
139
[42] W. Steinmetzer (Societé d'assistance technique pour produits Nestlé S.A.), Process for
recovering amino acids from protein hydrolysates, US 4496703, 1985.
[43] Ph. Eur. 8th edition, Council of Europe, Strasbourg, France, 2016.
[44] P. Adriaens, B. Meesschaert, W. Wuyts, H. Vaderhaeghe, H. Eyssen, Separation of ninhydrin-
positive compounds on a single-column amino acid analyzer using lithium buffers, J.
Chromatogr., 140 (1977) 103-108.
[45] A. Wainer, The chromatography of ninhydrin negative compounds on an amino acid analyzer
column, J. Chromatogr., 26 (1967) 48-53.
[46] S. Moore, W.H. Stein, Photometric ninhydrin method for use in the chromatography of amino
acids, J. Biol. Chem., 176 (1948) 367-388.
[47] D.H. Spackman, W.H. Stein, S. Moore, Automatic recording apparatus for use in the
chromatography of amino acids, Anal. Chem., 30 (1958) 1190-1206.
[48] M. Friedman, J.W. Finley, Methods of tryptophan analysis, J. Agr. Food Chem., 19 (1971)
626-631.
[49] S. Sotgia, A. Zinellu, G.A. Pinna, L. Deiana, C. Carru, Application of an unusual ninhydrin-
based reaction for the indirect chiral resolution of D,L-penicillamine, Talanta, 85 (2011) 1783-
1785.
[50] S. Sotgia, A. Zinellu, E. Pisanu, G.A. Pinna, L. Deiana, C. Carru, Enantiomeric reversed-
phase high-performance liquid chromatography resolution of D-/L-penicillamine after
spirocyclization with ninhydrin and by using copper(II)-L-proline complex as a chiral selector in
the mobile phase, J. Chromatogr. A, 1205 (2008) 90-93.
[51] G. Prota, E. Ponsiglione, Reaction of ninhydrin with cysteine and its analogs: A revision,
Tetrahedron, 29 (1973) 4271-4274.
[52] K. Takahashi, Specific modification of arginine residues in proteins with ninhydrin, J.
Biochem., 80 (1976) 1173-1176.
[53] S.J. Sheng, J.J. Kraft, S.M. Schuster, A specific quantitative colorimetric assay for L-
asparagine, Anal. Biochem., 211 (1993) 242-249.
[54] P.J. Lamothe, P.G. McCormic, Influence of acidity on reaction of ninhydrin with amino acids,
Anal. Chem., 44 (1972) 821-825.
[55] A. Schönberg, E. Singer, Chemistry of ninhydrin and other cyclic 1,2,3-tricarbonyl compounds,
Tetrahedron, 34 (1978) 1285-1300.
Results
140
[56] A. Heesing, R. Muller-Matthesius, H. Rose, Reaction of ninhydrin with tryptophan, Liebigs
Ann. Chem., 735 (1970) 72-76.
[57] M. Roth, Fluorescence reaction for amino acids, Anal. Chem., 43 (1971) 880-882.
[58] J.S. Sun, H.X. Guo, D. Semin, J. Cheetham, Direct separation and detection of biogenic
amines by ion-pair liquid chromatography with chemiluminescent nitrogen detector, J.
Chromatogr. A, 1218 (2011) 4689-4697.
[59] L.R. Snyder, Reaction colorimeters as detectors in high-performance liquid chromatography -
Extra-column band broadening with segmented flow through reaction coil, J. Chromatogr., 125
(1976) 287-306.
[60] I.E.P. Taylor, Artefacts in amino acid analysis - Ninhydrin-positive products of carbohydrate
hydrolysis, J. Chromatogr., 50 (1970) 331-333.
[61] R.M. Zacharius, W.L. Porter, Further studies on behavior of some non-nitrogenous
compounds with ninhydrin during automatic ion exchange chromatography, J. Chromatogr.,
30 (1967) 190-197.
[62] L.B. James, Amino acid analysis - a fall-off in performance, J. Chromatogr., 408 (1987) 291-
295.
[63] R.L. Cunico, T. Schlabach, Comparison of ninhydrin and o-phthalaldehyde post-column
detection techniques for high-performance liquid chromatography of free amino acids, J.
Chromatogr., 266 (1983) 461-470.
[64] E. Lund, J. Thomsen, K. Brunfeldt, Use of o-phthalaldehyde for fluorescence detection in
conventional amino acid analyzers - Sub-nanomole sensitivity in analysis of
phenylthiohydantoin-amino acids, J. Chromatogr., 130 (1977) 51-54.
[65] M.I. Azilawati, D.M. Hashim, B. Jamilah, I. Amin, Validation of a reverse-phase high-
performance liquid chromatography method for the determination of amino acids in gelatins by
application of 6-aminoquinolyl-N-hydroxysuccinimidyl carbamate reagent, J. Chromatogr. A,
1353 (2014) 49-56.
[66] J. Harmeyer, H.P. Sallmann, L. Ayoub, Use of 2,4,6-trinitrobenzene sulfonic acid for
demonstration of amino acids in automatic amino acid analysers, J. Chromatogr., 32 (1968)
258-268.
[67] J. Saurina, S. Hernández-Cassou, Determination of amino acids by ion-pair liquid
chromatography with postcolumn derivatization using 1,2-naphthoquinone-4-sulfonate, J.
Chromatogr. A, 676 (1994) 311-319.
Amino acid analysis for pharmacopoeial purposes Talanta 154 (2016) 150-163
141
[68] S. Hernandéz-Cassou, J. Saurina, Derivatization strategies for the determination of biogenic
amines in wines by chromatographic and electrophoretic techniques, J. Chromatogr. B, 879
(2011) 1270-81.
[69] R. Hanczkó, I. Molnár-Perl, Derivatization, stability and chromatographic behavior of o-
phthaldialdehyde amino acid and amine derivatives: o-phthaldialdehyde/2-mercaptoethanol
reagent, Chromatographia, 57 (2003) S103-S113.
[70] A. Jambor, I. Molnár-Perl, Amino acid analysis by high-performance liquid chromatography
after derivatization with 9-fluorenylmethyloxycarbonyl chloride Literature overview and further
study, J. Chromatogr. A, 1216 (2009) 3064-77.
[71] I. Molnár-Perl, Advancement in the derivatizations of the amino groups with the o-
phthaldehyde-thiol and with the 9-fluorenylmethyloxycarbonyl chloride reagents, J.
Chromatogr. B, 879 (2011) 1241-1269.
[72] I. Molnár-Perl, A. Vasanits, Stability and characteristics of the o-phthaldialdehyde/3-
mercaptopropionic acid and o-phthaldialdehyde/N-acetyl-L-cysteine reagents and their amino
acid derivatives measured by high-performance liquid chromatography, J. Chromatogr. A, 835
(1999) 73-91.
[73] G. Sarwar, H.G. Botting, Evaluation of liquid chromatographic analysis of nutritionally
important amino acids in food and physiological samples, J. Chromatogr. Biomed. Appl., 615
(1993) 1-22.
[74] D. Fekkes, State-of-the-art of high-performance liquid chromatographic analysis of amino
acids in physiological samples, J. Chromatogr. B Biomed. Appl., 682 (1996) 3-22.
[75] S.A. Cohen, B.A. Bidlingmeyer, T.L. Tarvin, PITC derivatives in amino acid analysis, Nature,
320 (1986) 769-770.
[76] P. Lindroth, K. Mopper, High performance liquid chromatographic determination of
subpicomole amounts of amino acids by precolumn fluorescence derivatization with o-
phthaldialdehyde, Anal. Chem., 51 (1979) 1667-1674.
[77] R. Schuster, Determination of free amino acids by high performance liquid chromatography,
Anal. Chem., 52 (1980) 617-620.
[78] A. Fialaire, E. Postaire, R. Prognon, D. Pradeau, Bioavailability prediction of amino acids and
peptides in nutritive mixtures by separation on non-polar stationary phases by high-
performance liquid chromatography and direct UV Detection at 210 nm, J. Liq. Chromatogr.,
16 (1993) 3003-3015.
Results
142
[79] Y. Yokoyama, S. Tsuji, H. Sato, Simultaneous determination of creatinine, creatine, and UV-
absorbing amino acids using dual-mode gradient low-capacity cation-exchange
chromatography, J. Chromatogr. A, 1085 (2005) 110-116.
[80] I.G. Casella, M. Contursi, Isocratic ion chromatographic determination of underivatized amino
acids by electrochemical detection, Anal. Chim. Acta, 478 (2003) 179-189.
[81] A.J. Collins, Comparison of refractive index, low-wavelength UV and UV visualization
detection methods for the high-performance liquid chromatographic determination of
hexamethonium bromide in an injection formulation, J. Chromatogr., 354 (1986) 459-462.
[82] T. Buttler, L. Gorton, G. Markovarga, Characterization of a sampling unit based on tangential
flow filtration for online bioprocess monitoring, Anal. Chim. Acta, 279 (1993) 27-37.
[83] T.A. Buttler, K.A.J. Johansson, L.G.O. Gorton, G.A. Markovarga, Online fermentation process
monitoring of carbohydrates and ethanol using tangential flow filtration and column liquid
chromatography, Anal. Chem., 65 (1993) 2628-2636.
[84] N.C. van de Merbel, H. Lingeman, U.A.T. Brinkman, A. Kolhorn, L.C. de Rijke, Automated
monitoring of biotechnological processes using on-line ultrafiltration and column liquid
chromatography, Anal. Chim. Acta, 279 (1993) 39-50.
[85] F. Weigang, M. Reiter, A. Jungbauer, H. Katinger, High-performance liquid chromatographic
determination of metabolic products for fermentation control of mammalian cell culture:
Analysis of carbohydrates, organic-acids and orthophosphate using refractive index and
ultraviolet detectors, J. Chromatogr. Biomed. Appl., 497 (1989) 59-68.
[86] A.R. Ivanov, I.V. Nazimov, A.P. Lobazov, G.B. Popkovich, Direct determination of amino acids
and carbohydrates by high-performance capillary electrophoresis with refractometric
detection, J. Chromatogr. A, 894 (2000) 253-257.
[87] A.G. Mosina, I.O. Mel'nikov, I.V. Nazimov, Y.M. Glubokov, Capillary electrophoresis on
unmodified genetically coded amino acids, J. Anal. Chem., 64 (2009) 637-641.
[88] K. Petritis, C. Elfakir, M. Dreux, A comparative study of commercial liquid chromatographic
detectors for the analysis of underivatized amino acids, J. Chromatogr. A, 961 (2002) 9-21.
[89] G. Guiochon, A. Moysan, C. Holley, Influence of various parameters on the response factors
of the evaporative light scattering detector for a number of non-volatile compounds, J. Liq.
Chromatogr., 11 (1988) 2547-2570.
[90] J.M. Charlesworth, Evaporative analyzer as a mass detector for liquid chromatography, Anal.
Chem., 50 (1978) 1414-1420.
Amino acid analysis for pharmacopoeial purposes Talanta 154 (2016) 150-163
143
[91] R. Macrae, J. Dick, Analysis of carbohydrates using the mass detector, J. Chromatogr., 210
(1981) 138-145.
[92] T.H. Mourey, L.E. Oppenheimer, Principles of operation of an evaporative light-scattering
detector for liquid-chromatography, Anal. Chem., 56 (1984) 2427-2434.
[93] L.B. Allen, J.A. Koropchak, Condensation nucleation light-scattering: A new approach to
development of high-sensitivity, universal detectors for separations, Anal. Chem., 65 (1993)
841-844.
[94] D.R. Oberreit, F.R. Quant, D.B. Blackford Measuring analyte concentrations in liquids, US
20080137065, 2008.
[95] K. Gaudin, A. Baillet, P. Chaminade, Application of a xenon arc lamp as a light source for
evaporative light scattering detection, Anal. Bioanal. Chem., 384 (2006) 1302-1307.
[96] K.N. Petritis, P. Chaimbault, C. Elfakir, M. Dreux, Ion-pair reversed-phase liquid
chromatography for determination of polar underivatized amino acids using perfluorinated
carboxylic acids as ion pairing agent, J. Chromatogr. A, 833 (1999) 147-155.
[97] S. Almeling, U. Holzgrabe, Use of evaporative light scattering detection for the quality control
of drug substances: Influence of different liquid chromatographic and evaporative light
scattering detector parameters on the appearance of spike peaks, J. Chromatogr. A, 1217
(2010) 2163-2170.
[98] D. Yan, G. Li, X.H. Xiao, X.P. Dong, Z.L. Li, Direct determination of fourteen underivatized
amino acids from Whitmania pigra by using liquid chromatography-evaporative light scattering
detection, J. Chromatogr. A, 1138 (2007) 301-304.
[99] T. Gorecki, F. Lynen, R. Szucs, P. Sandra, Universal response in liquid chromatography using
charged aerosol detection, Anal. Chem., 78 (2006) 3186-3192.
[100] P.H. Gamache, R.S. McCarthy, S.M. Freeto, D.J. Asa, M.J. Woodcock, K. Laws, R.O. Cole,
HPLC analysis of non-volatile analytes using charged aerosol detection, LCGC N. Am., 18
(2005) 345-354.
[101] R.W. Dixon, D.S. Peterson, Development and testing of a detection method for liquid
chromatography based on aerosol charging, Anal. Chem., 74 (2002) 2930-2937.
[102] S.L. Kaufman (TSI incorporated), Evaporative electrical detector, US 6568245, 2003.
[103] A.D. Yim, P.H. Gamache, R.S. McCarthy (Dionex Corporation), Nebulizer for charged aerosol
detection (CAD) system, US 20140352411, 2014.
Results
144
[104] L.E. Magnusson, D.S. Risley, J.A. Koropchak, Aerosol-based detectors for liquid
chromatography, J. Chromatogr. A, 1421 (2015) 68-81.
[105] D. Ilko, A. Braun, O. Germershaus, L. Meinel, U. Holzgrabe, Fatty acid composition analysis in
polysorbate 80 with high performance liquid chromatography coupled to charged aerosol
detection, Eur. J. Pharm. Biopharm., 94 (2015) 569-574.
[106] N. Vervoort, D. Daemen, G. Török, Performance evaluation of evaporative light scattering
detection and charged aerosol detection in reversed phase liquid chromatography, J.
Chromatogr. A, 1189 (2008) 92-100.
[107] U. Holzgrabe, C.J. Nap, T. Beyer, S. Almeling, Alternatives to amino acid analysis for the
purity control of pharmaceutical grade L-alanine, J. Sep. Sci., 33 (2010) 2402-2410.
[108] R.D. Cohen, Y. Liu, X.Y. Gong, Analysis of volatile bases by high performance liquid
chromatography with aerosol-based detection, J. Chromatogr. A, 1229 (2012) 172-179.
[109] J.P. Hutchinson, J.F. Li, W. Farrell, E. Groeber, R. Szucs, G. Dicinoski, P.R. Haddad,
Comparison of the response of four aerosol detectors used with ultra high pressure liquid
chromatography, J. Chromatogr. A, 1218 (2011) 1646-1655.
[110] T. Vehovec, A. Obreza, Review of operating principle and applications of the charged aerosol
detector, J. Chromatogr. A, 1217 (2010) 1549-1556.
[111] Z. Long, Z.M. Guo, X.D. Liu, Q. Zhang, X.G. Liu, Y. Jin, L.N. Liang, H.S. Li, J. Wei, N.P. Wu, A
sensitive non-derivatization method for apramycin and impurities analysis using hydrophilic
interaction liquid chromatography and charged aerosol detection, Talanta, 146 (2016) 423-
429.
[112] S. Almeling, D. Ilko, U. Holzgrabe, Charged aerosol detection in pharmaceutical analysis, J.
Pharm. Biomed. Anal., 69 (2012) 50-63.
[113] U. Holzgrabe, C.J. Nap, S. Almeling, Control of impurities in L-aspartic acid and L-alanine by
high-performance liquid chromatography coupled with a corona charged aerosol detector, J.
Chromatogr. A, 1217 (2010) 294-301.
[114] U. Holzgrabe, C.J. Nap, N. Kunz, S. Almeling, Identification and control of impurities in
streptomycin sulfate by high-performance liquid chromatography coupled with mass detection
and corona charged-aerosol detection, J. Pharm. Biomed. Anal., 56 (2011) 271-279.
[115] O. Wahl, U. Holzgrabe, Impurity profiling of carbocisteine by HPLC-CAD, qNMR and UV/vis
spectroscopy, J. Pharm. Biomed. Anal., 95 (2014) 1-10.
[116] O. Wahl, U. Holzgrabe, Impurity profiling of ibandronate sodium by HPLC-CAD, J. Pharm.
Biomed. Anal., 114 (2015) 254-264.
Amino acid analysis for pharmacopoeial purposes Talanta 154 (2016) 150-163
145
[117] J. Reilly, B. Everatt, C. Aldcroft, Implementation of charged aerosol detection in routine
reversed phase liquid chromatography methods, J. Liq. Chromatogr. Rel. Technol., 31 (2008)
3132-3142.
[118] C. Crafts, B. Bailey, I. Acworth, UHPLC analysis of underivatized amino acids.
http://www.chromatographyonline.com/uhplc-analysis-underivatized-amino-acids, 2011
(accessed 23.02.2016)
[119] M. Ligor, S. Studzinska, A. Horna, B. Buszewski, Corona charged aerosol detection: An
analytical approach, Crit. Rev. Anal. Chem., 43 (2013) 64-78.
[120] X.W. Yan, Detection by ozone-induced chemiluminescence in chromatography, J.
Chromatogr. A, 842 (1999) 267-308.
[121] W.L. Fitch, A.K. Szardenings, E.M. Fujinari, Chemiluminescent nitrogen detection for HPLC:
An important new tool in organic analytical chemistry, Tetrahedron Lett., 38 (1997) 1689-1692.
[122] R.N.X. Xu, L.M. Fan, M.J. Rieser, T.A. El-Shourbagy, Recent advances in high-throughput
quantitative bioanalysis by LC-MS/MS, J. Pharm. Biomed. Anal., 44 (2007) 342-355.
[123] J.L. Wolfender, HPLC in natural product analysis: The detection issue, Planta Med., 75 (2009)
719-734.
[124] M. Vogeser, C. Seger, A decade of HPLC-MS/MS in the routine clinical laboratory - Goals for
further developments, Clin. Biochem., 41 (2008) 649-662.
[125] W.A.H. Waterval, J.L.J.M. Scheijen, M.M.J.C. Ortmans-Ploemen, C.D. Habets-van der Poel,
J. Bierau, Quantitative UPLC-MS/MS analysis of underivatised amino acids in body fluids is a
reliable tool for the diagnosis and follow-up of patients with inborn errors of metabolism, Clin.
Chim. Acta, 407 (2009) 36-42.
[126] E. de Hoffmann, Tandem mass spectrometry: A primer, J. Mass Spectrom., 31 (1996) 129-
137.
[127] W.J. Griffiths, A.P. Jonsson, S.Y. Liu, D.K. Rai, Y.Q. Wang, Electrospray and tandem mass
spectrometry in biochemistry, Biochem. J., 355 (2001) 545-561.
[128] M.L. Kamb, J.J. Murphy, J.L. Jones, J.C. Caston, K. Nederlof, L.F. Horney, L.A. Swygert, H.
Falk, E.M. Kilbourne, Eosinophilia-myalgia syndrome in L-tryptophan-exposed patients, Jama,
267 (1992) 77-82.
[129] B.L. Williamson, L.M. Benson, A.J. Tomlinson, A.N. Mayeno, G.J. Gleich, S. Naylor, On-line
HPLC-tandem mass spectrometry analysis of contaminants of L-tryptophan associated with
the onset of the eosinophilia-myalgia syndrome, Toxicol Lett., 92 (1997) 139-148.
Results
146
[130] L.A. Swygert, E.F. Maes, L.E. Sewell, L. Miller, H. Falk, E.M. Kilbourne, Eosinophilia-myalgia
syndrome. Results of national surveillance, Jama, 264 (1990) 1698-1703.
[131] J. Varga, S.A. Jimenez, J. Uitto, L-tryptophan and the eosinophilia-myalgia syndrome: current
understanding of the etiology and pathogenesis, J. Invest. Dermatol., 100 (1993) 97S-105S.
[132] E.A. Belongia, C.W. Hedberg, G.J. Gleich, K.E. White, A.N. Mayeno, D.A. Loegering, S.L.
Dunnette, P.L. Pirie, K.L. MacDonald, M.T. Osterholm, An investigation of the cause of the
eosinophilia-myalgia syndrome associated with tryptophan use, N. Engl. J. Med., 323 (1990)
357-65.
[133] P. Kubáň, P.C. Hauser, Application of gradient programs for the determination of
underivatized amino acids and small peptides in reversed-phase high-performance liquid
chromatography with contactless conductivity detection, J. Chromatogr. A, 1128 (2006) 97-
104.
[134] M. Pumera, J. Wang, F. Opekar, I. Jelínek, J. Feldman, H. Löwe, S. Hardt, Contactless
conductivity detector for microchip capillary electrophoresis, Anal. Chem., 74 (2002) 1968-
1971.
[135] P. Kubáň, P.C. Hauser, Contactless conductivity detection in capillary electrophoresis: A
review, Electroanal., 16 (2004) 2009-2021.
[136] P. Coufal, J. Zuska, T. van de Goor, V. Smith, B. Gaš, Separation of twenty underivatized
essential amino acids by capillary zone electrophoresis with contactless conductivity
detection, Electrophoresis, 24 (2003) 671-677.
[137] J. Tanyanyiwa, K. Schweizer, P.C. Hauser, High-voltage contactless conductivity detection of
underivatized amino acids in capillary electrophoresis, Electrophoresis, 24 (2003) 2119-2124.
[138] K. Včeláková, I. Zusková, E. Kenndler, B. Gaš, Determination of cationic mobilities and pKa
values of 22 amino acids by capillary zone electrophoresis, Electrophoresis, 25 (2004) 309-
317.
[139] P. Kubáň, E.M. Abad-Villar, P.C. Hauser, Evaluation of contactless conductivity detection for
the determination of UV absorbing and non-UV absorbing species in reversed-phase high-
performance liquid chromatography, J. Chromatogr. A, 1107 (2006) 159-164.
[140] P. Kubáň, P.C. Hauser, Contactless conductivity detection for analytical techniques-
Developments from 2012 to 2014, Electrophoresis, 36 (2015) 195-211.
[141] T.A. Sullivan (Fresenius Medical Care Holdings, Inc.), Conductivity detector for fluids, US
8525533, 2013.
Amino acid analysis for pharmacopoeial purposes Talanta 154 (2016) 150-163
147
[142] S.M. Harrison, I. Kaml, V. Prokoratova, M. Mazanek, E. Kenndler, Animal glues in mixtures of
natural binding media used in artistic and historic objects: identification by capillary zone
electrophoresis, Anal. Bioanal. Chem., 382 (2005) 1520-1526.
[143] E. Samcová, P. Tůma, Determination of proteinogenic amino acids in human plasma by
capillary electrophoresis with contactless conductivity detection, Electroanal., 18 (2006) 152-
157.
[144] P. Tůma, E. Samcová, K. Andělová, Determination of free amino acids and related
compounds in amniotic fluid by capillary electrophoresis with contactless conductivity
detection, J. Chromatogr. B, 839 (2006) 12-18.
[145] E.M. Abad-Villar, P. Kubáň, P.C. Hauser, Determination of biochemical species on
electrophoresis chips with an external contactless conductivity detector, Electrophoresis, 26
(2005) 3609-3614.
[146] J.A.F. da Silva, C.L. do Lago, An oscillometric detector for capillary electrophoresis, Anal.
Chem., 70 (1998) 4339-4343.
[147] A.J. Zemann, E. Schnell, D. Volgger, G.K. Bonn, Contactless conductivity detection for
capillary electrophoresis, Anal. Chem., 70 (1998) 563-567.
[148] P. Hauser, E.A. Villar, J. Tanyanyiwa (Peter C. Hauser), Method and apparatus for performing
high-voltage contactless conductivity (HV-CCD) electrophoresis, US 20050109621, 2005.
[149] Y.T. Jiang, D. Hascall, D.L. Li, J.H. Pease, A charged aerosol detector/chemiluminescent
nitrogen detector/liquid chromatography/mass spectrometry system for regular and fragment
compound analysis in drug discovery, J. Chromatogr. A, 1411 (2015) 63-68.
[150] Y. Takano, Y. Chikaraishi, N. Ohkouchi, Isolation of underivatized amino acids by ion-pair high
performance liquid chromatography for precise measurement of nitrogen isotopic composition
of amino acids: Development of comprehensive LC x GC/C/IRMS method, Int. J. Mass.
Spectrom., 379 (2015) 16-25.
[151] K. Zhang, Y. Li, M. Tsang, N.P. Chetwyn, Analysis of pharmaceutical impurities using multi-
heartcutting 2D LC coupled with UV-charged aerosol MS detection, J. Sep. Sci., 36 (2013)
2986-2992.
[152] P. Sun, X.D. Wang, L. Alquier, C.A. Maryanoff, Determination of relative response factors of
impurities in paclitaxel with high performance liquid chromatography equipped with ultraviolet
and charged aerosol detectors, J. Chromatogr. A, 1177 (2008) 87-91.
[153] P. Agrafiotou, S. Sotiropoulos, A. Pappa-Louisi, Direct RP-HPLC determination of
underivatized amino acids with online dual UV absorbance, fluorescence, and multiple
electrochemical detection, J. Sep. Sci., 32 (2009) 949-954.
Results
148
[154] S. Jia, J.H. Park, J. Lee, S.W. Kwon, Comparison of two aerosol-based detectors for the
analysis of gabapentin in pharmaceutical formulations by hydrophilic interaction
chromatography, Talanta, 85 (2011) 2301-2306.
[155] B.N. Jones, J.P. Gilligan, o-Phthaldialdehyde precolumn derivatization and reversed-phase
high-performance liquid chromatography of polypeptide hydrolysates and physiological fluids,
J. Chromatogr., 266 (1983) 471-82.
[156] B.N. Jones, S. Pääbo, S. Stein, Amino acid analysis and enzymatic sequence determination
of peptides by an improved o-phthaldialdehyde precolumn labeling procedure, J. Liq.
Chromatogr., 4 (1981) 565-586.
[157] H.A. Moye, A.J. Boning, A versatile fluorogenic labeling reagent for primary and secondary
amines: 9-fluorenylmethyl chloroformate, Anal. Lett., 12 (1979) 25-35.
[158] S.S. Simons, D.F. Johnson, Structure of fluorescent adduct formed in reaction of o-
phthalaldehyde and thiols with amines, J. Am. Chem. Soc., 98 (1976) 7098-7099.
[159] P. Edman, Preparation of phenyl thiohydantoins from some natural amino acids, Acta Chem.
Scand., 4 (1950) 277-282.
[160] B.A. Bidlingmeyer, S.A. Cohen, T.L. Tarvin, Rapid analysis of amino acids using pre-column
derivatization, J. Chromatogr., 336 (1984) 93-104.
[161] D.J. McCaldin, The chemistry of ninhydrin, Chem. Rev., 60 (1960) 39-51.
[162] M. Friedman, L.D. Williams, Stoichiometry of formation of ruhemann's purple in ninhydrin
reaction, Bioorg. Chem., 3 (1974) 267-280.
[163] M. Friedman, Applications of the ninhydrin reaction for analysis of amino acids, peptides, and
proteins to agricultural and biomedical sciences, J. Agr. Food Chem., 52 (2004) 385-406.
[164] S. Kopec, U. Holzgrabe, Impurity profile of amino acids?, Pharmeur. Sci. Notes, 2005 (2005)
39-45.
[165] A. Paul, P. Tonne, E. Roske, H. Siegel (BASF AG), Preparation of D- or L-alanine or high
enantiomeric purity, US 4962231, 1990.
[166] H. Bergs Verfahren zur Darstellung von Hydantoinen, DE 566094, 1932.
[167] A.B. Santoyo, J.B. Rodriguez, J.L.G. Carrasco, E.G. Gomez, I.A. Rojo, M.L.A. Teruel,
Production of optically pure l-alanine by immobilized Pseudomonas sp. BA2 cells, J. Chem.
Technol. Biot., 73 (1998) 197-202.
Amino acid analysis for pharmacopoeial purposes Talanta 154 (2016) 150-163
149
[168] A.S. Bommarius, K. Drauz, K. Gunther, G. Knaup, M. Schwarm, L-methionine related L-amino
acids by acylase cleavage of their corresponding N-acetyl-DL-derivatives, Tetrahedron-
Asymmetr., 8 (1997) 3197-3200.
[169] H. Jianpo, Z. Xiaobin, J. Guangyu, T. Siqing (Anhui Huaheng Bioengineering), Method for
producing optically pure L-alanine by one Pseudomonas and two enzymes, CN 101580864,
2009.
[170] I. Chibata, T. Tosa, T. Sato, K. Yamamoto (Tanabe Seiyaku Co., Ltd.), Process for preparing
L-alanine, US 3898128, 1975.
[171] R. Katsumata, S. Hashimoto, I. Kawamoto, M. Suzuki, H. Yoshida, H. Hagino, K. Nakayama
(Kyowa Hakko Kogyo Co., Ltd.), Process for producing L-alanine by fermentation with
Arthrobacter, US 5478733, 1995.
[172] A.G. Azizian, A.A. Ambartsumian, M.A. Ananikian, S.M. Kocharian Method for preparing L-
alanine, US 5124257, 1992.
[173] E. Bunel, T. Koch, R. Ozer, S. Sengupta (Du Pont), Production of 6-aminocaproic acid, WO
0240440, 2002.
[174] E.E. Howe, T. Max (Merck & Co.), Recovery of arginine, histidine, and lysine from protein
hydrolysates, US 2480654, 1949.
[175] W. Blaschek, S. Ebel, U. Hilgenfeldt, U. Holzgrabe, J. Reichling, V. Schulz, W. Barthlott, H.-D.
Höltje, Hagers Enzyklopädie der Arzneistoffe und Drogen.
http://www.drugbase.de/de/datenbanken/hagers-enzyklopaedie.html, 2015 (accessed
25.02.2016)
[176] I. Chibata, M. Kisumi, J. Kato (Tanabe Seiyaku Co., Ltd.), Process for producing L-arginine by
fermentation, US 3902967, 1975.
[177] Y.H. Park, H.W. Kim, J.H. Lee, S.Y. Hwang (CJ Cheiljedang Co.), Method for producing L-
arginine using Corynebacterium glutamicum, US 20090311757, 2009.
[178] M. Ikeda, T. Nakano, S. Mitsuhashi, M. Hayashi, K. Tanaka (Kyowa Hakko Kogyo Co., Ltd.),
Process for producing L-arginine, L-ornithine or L-citrulline, US 20090123980, 2009.
[179] M. Suga, Y. Kuwabara, K. Hashiguchi, H. Ito, T. Nakamatsu, O. Kurahashi (Ajinomoto Co.,
Inc.), Method for producing L-arginine, US 20030124686, 2003.
[180] R. Katsumata, H. Yokoi (Kyowa Hakko Kogyo Co., Inc.), Process for producing L-arginine, US
5017482, 1991.
Results
150
[181] M. Lunts, S. Fomina, T. Leonova, M. Gusyatiner (Ajinomoto Co., Inc.), Bacterium having
ability to produce L-glutamic acid, L-proline or L-arginine and method for producing L-glutamic
acid, L-proline or L-arginine, US 20040191876, 2004.
[182] M.D. Sackler Method of manufacture of arginine aspartate, US 3487103, 1969.
[183] S. Mitsuhashi, T. Nishino (Kyowa Hakko Kogyo Co., Ltd.), Production of L-asparagine by using
microorganism transformants, JP 2013106588, 2011.
[184] J. Li, J. Zha, Y. Wan (Anhui Application Technology Institute), Improved technology for
chemical preparation of L-asparagine, CN 1149577, 1997.
[185] M. Terasawa, H. Yukawa, Y. Takayama, Production of L-aspartic acid from Brevibacterium by
the cell re-using process, Process Biochem., 20 (1985) 124-128.
[186] M.D. Armstrong, J.D. Lewis, Thioether derivatives of cysteine and homocysteine, J. Org.
Chem., 16 (1951) 749-753.
[187] L. Goodman, L.O. Ross, B.R. Baker, Potential anticancer agents. V. some sulfur-substituted
derivatives of cysteine, J. Org. Chem., 23 (1958) 1251-1257.
[188] J.D. Genders, N.L. Weinberg, D.J. Mazur (The Electrosynthesis Co., Inc.), High yield methods
for electrochemical preparation of cysteine and analogues, US 5106463, 1992.
[189] T. Nagasawa, G.S. Dhillon, T. Ishii, H. Yamada, Enzymatic-synthesis of L-cysteine by O-
acetylserine sulfhydrylase of 3-Chloro-L-alanine resistant Bacillus sphaericus L-118, J.
Biotechnol., 2 (1985) 365-377.
[190] H. Kumagai, H. Tanaka, S. Sejima, H. Yamada, Elimination and replacement reactions of β-
chloro-L-alanine by cysteine desulfhydrase from Aerobacter aerogenes, Agr. Biol. Chem., 41
(1977) 2071-2075.
[191] H. Behringer, P. Zillikens, Die synthese der 2-amino-thiazolin-carbonsäure-4 und über eine
neue cystin-synthese, Liebigs Ann. Chem., 574 (1951) 140-156.
[192] A. Reutter-Maier, M. Brunner, T. Dassler (Wacker Chemie AG), Method for production of
natural L-cysteine by fermentation, US 20140141474, 2014.
[193] Z. Peng, W. Zhu (NHWA Pharma Corporation), Process for the preparation of gabapentin
hydrochloride, US 7667071, 2010.
[194] A. Kumar, S.R. Soudagar, A.M. Nijasure, N.B. Panda, P. Gautam, G.R. Thakur (IPCA
Laboratories Ltd.), Process for synthesis of gabapentin, US 20080103334, 2008.
[195] F. Tenconi, C. Giordani, N. Caraccia (Bioindustria Laboratorio Italiano Medicinali S.P.A.),
Process for the preparation of gabapentin, US 6576790, 2003.
Amino acid analysis for pharmacopoeial purposes Talanta 154 (2016) 150-163
151
[196] R. Giovanetti, A. Nicoli, M. Verzini, G. Soriato, L. Cotarca (Zach System S.P.A.), Process for
the preparation of gabapentin, US 7417166, 2008.
[197] L. Yang, N. Jiang, Z. Zhao, Synthesis of glycine using two-step reaction approach in alcohol
and its purification, Adv. Mat. Res., 396-398 (2012) 1711-1715.
[198] T. Mizuno, N. Tabei, H. Okamura, H. Sato, M. Oosu, Y. Too (Sumitomo Chemical Co.),
Preparation of α-amino acids, JP 03093757A, 1991.
[199] W. Xianbing, Z. Ping, X. Guan, Z. Qingqun, L. Dexiang (Shine Star Hubei Biolog Engineering),
Method for producing L-histidine, CN 101125831B, 2010.
[200] X. Jiang Histidine hydrochloride production method, CN 104744373A, 2015.
[201] M.H. Updike, G.J. Calton (W. R. Grace & Co.), Fermentative preparation of L-leucine, US
4421854, 1983.
[202] S. Kurihara, K. Araki, H. Ueda, M. Ikumo (Kyowa Hakko Kogyo Kabushiki Kaisha),
Preparation of L-leucine by fermentation, US 3668073, 1972.
[203] J.M. Chemerda, S. Meyer, D.F. Reinhold (Merck & Co. Inc.), Method of preparing optically
active L-α-methyl-3,4-dihydroxy phenylalanine, US 3366679, 1968.
[204] P. Bamberg, B. Sjoberg (Astra Laekemedel), Stereoselective preparation of L-dopa and L-m-
tyrosine and novel compounds, US 3838008, 1974.
[205] R.L. Dyer, D.J. Lewis (G.D. Searle & Co.), Process for the preparation of L-DOPA, EP
0189938A2, 1986.
[206] C.A.P.R. Rao (Azico Pharmaceuticals Private Ltd.), Novel process for the preparation of
levothyroxine sodium, WO 2015011573, 2015.
[207] B.M. Khamar, R. Gurusamy, M.N. Ravi, V.M. Reddy, B. Edde, R. Ponnaiah, I.A. Modi (Cadila
Pharmaceuticals Ltd.), An improved process for the preparation of levothyroxine sodium with
reduced levels of impurities, WO 2009136249, 2009.
[208] R.R. Kumar, W.L. Aubrey (Glaxo Lab Ltd.), Preparation of triiodothyronine, US 2993928,
1961.
[209] S. Sanganabhatla, S. Srivastava, S.B. Narayanan, M.A. Khan (Glenmark Generics Ltd.), A
process for the preparation of liothyronine and its pharmaceutically acceptable salts thereof,
IN 2009MU01400, 2009.
[210] J. Ning, L. Cai (Wuxi Jinghai Amino Acid Co.), Preparation of bulk drug of lysine acetate, CN
104829477, 2015.
Results
152
[211] H.C. White (Dow Chemical Co.), Resolution of DL-lysine with D-camphoric acid, US 2859244,
1958.
[212] E.V. McCollum, A.A. Rider, The preparation of lysine from protein hydrolysates, J. Biol.
Chem., 190 (1951) 451-453.
[213] P. Fürst, Dietary L-lysine supplementation: a promising nutritional tool in the prophylaxis and
treatment of osteoporosis, Nutrition, 9 (1993) 71-72.
[214] O. Zelder, C. Klopprogge, H. Schroder, S. Haefner, B. Kröger, P. Kiefer, E. Heinzle, C.
Wittmann (BASF), Methods for the preparation of lysine by fermentation of Corynebacterium
glutamicum, US 8048651B2, 2011.
[215] Sumitomo Chemical Co., Process for producing L-methionine, GB 970203, 1964.
[216] G. Fremy, P. Barre, Y. Kim So, K. Son Sung, M. Lee Sang (Arkema, CJ Cheiljedang Corp.),
Preparation of L-methionine, WO 2013029690, 2013.
[217] A. Kleemann, K. Klostermann, W. Leuchtenberger, R.E. Moerck, M. Karrenbauer (Degussa
AG), Process for the isolation of L-amino acids, US 4827029, 1989.
[218] A. Bommarius, K. Drauz, S. Verseck (Degussa AG), Process for the production of amino acids
using racemase and acylase, US 6656710, 2003.
[219] R. Kühnreich, U. Holzgrabe, Impurity profiling of L-methionine by HPLC on a mixed mode
column, J. Pharm. Biomed. Anal., 122 (2016) 118-125.
[220] F. Geiger, B. Halsberghe, H.J. Hasselbach, K. Hentschel, K. Huthmacher, M. Korfer, S.P.
Mannsfeld, H. Tanner, F. Theissen, J. Vanrobaeys (Degussa AG), Process for the preparation
of D,L-methionine or the salt thereof, US 5990349, 1999.
[221] C. Casse (Adisseo France SAS, Claude Casse), Process for preparing 2-hydroxy-4-
(methylthio)butyronitrile and methionine, WO 2008006977, 2008.
[222] K. Nakayama, K. Araki (Kyowa Hakko Kogyo Co., Ltd.), Process for producing L-methionine,
US 3729381, 1973.
[223] Y. Huang, W. Hu, W. Sun, T. Liu, Y. Wang, J. Tu (Zhejiang Chiral Medicine Chemicals Co.),
Process for preparation of L-methyldopa, CN 102531939, 2012.
[224] D.F. Reinhold, Fireston.Ra, W.A. Gaines, J.M. Chemerda, Sletzing.M, Synthesis of L-α-
methyldopa from asymmetric intermediates, J. Org. Chem., 33 (1968) 1209-1213.
[225] E. Biekert, R. Kallischnigg (Knoll AG), Preparation of L-α-methyldopa, US 3440278, 1969.
Amino acid analysis for pharmacopoeial purposes Talanta 154 (2016) 150-163
153
[226] M. Tanaka, T. Kishi, Y. Kato (Kyowa Hakko Kogyo Co., Ltd.), Process for the preparation of
phenylalanine, US 3410896, 1968.
[227] O. Kurahashi, T. Tsuchida, H. Kawashima, H. Enei (Ajinomoto Co., Inc.), Method for
producing L-phenylalanine by fermentation, US 4591562, 1986.
[228] H. Voelskow, R. Keller, M. Schlingmann, M. Platen, J. Then, G. Wöhner (Hoechst AG),
Process for the preparation of L-phenylalanine, US 4745059, 1988.
[229] H.Y. Kim, H. Rhym, D.J. Lee, C.H. Won, B.L. Lim, H.G. Choi (Miwon Co., Ltd.), Method for
production of L-phenylalanine by recombinant E. coli, US 5304475, 1994.
[230] R. Katsumata, M. Ikeda (Kyowa Hakko Kogyo Co., Ltd.), Process for producing L-tryptophan,
L-tyrosine or L-phenylalanine, US 5605818, 1997.
[231] D. Ura, T. Hashimukai, T. Matsumoto, N. Fukuhara (Mitsui Toatsu Chemicals), Process for the
preparation of L-serine by an enzymatic method, US 5382517, 1995.
[232] K. Ishiwata, N. Makiguchi, H. Kawashima, T. Suzuki, M. Imadegawa (Mitsui Toatsu Chemicals
Inc.), Process for the preparation of L-serine, DE 3505353, 1985.
[233] G.G. Lovinger, S.A. Whitehead (W. R. Grace & Co.), Microorganism strains for the
fermentative preparation of L-serine, US 4528273, 1985.
[234] H. Yamade (Kyowa Hakko Kogyo Kabushiki Kaisha), Process for preparing L-serine, US
3755081, 1973.
[235] T. Hermann, M. Rieping (Degussa AG), Fermentation process for the preparation of L-
threonine, US 20030190712, 2003.
[236] M. Rieping (Degussa AG), Processes for the fermentative preparation of L-threonine using
strains of Escherichia in which the yjgF gene is inactivated, US 7638313, 2009.
[237] T. Hermann, D. Kruse, M. Rieping, G. Thierbach (Degussa AG), A process for preparing L-
threonine, WO 2005014843, 2005.
[238] S.Y. Lee, K.H. Lee, J.H. Park, T.Y. KIM (Korea Advanced Institute of Science and
Technology), L-threonine overproducing microorganism and method for preparing L-threonine
using the same, EP 2121918, 2011.
[239] M. Kato, T. Miyoshi, I. Kibayashi, M. Ikemi, H. Gomi, Y. Ishimatsu, N. Koizumi, H. Yamada
(Denki Kagaku Kogyo Kabushiki Kaisha), Process for preparing L-threonine, US 4492757,
1985.
Results
154
[240] K. Pfister, C.A. Robinson, A.C. Shabica, M. Tishler, The synthesis of DL-threonine. II.
Interconversion of DL-threonine and DL-allothreonine, J. Am. Chem. Soc., 71 (1949) 1101-
1105.
[241] A.C. Shabica (Merck & Co. Inc.), Process for the preparation of DL-threonine, US 2461847,
1949.
[242] M. Levine, R. Sedlecky, Preparation of p-aminomethylcyclohexylcarboxylic and m-
aminomethylcyclohexylcarboxylic acid, J. Org. Chem., 24 (1959) 115-116.
[243] P. Ravi, P.K. Neela, N.R. Nimmakayala, T.R. Ampolu, R. Turka, M. Venkateswarlu (Davuluri
Ramamohan Rao), An improved process for the preparation of tranexamic acid, WO
2015104721, 2015.
[244] T. Miki, T. Naito, A. Okano (Daiichi Seiyaku Co, Mitsubishi Chem. Ind.), Process for the
production of trans-4-aminomethylcyclohexane-1-carboxylic acid, US 3449411, 1969.
[245] H. Itoh, K. Itoh, C. Shibuya, Y. Usubuchi (Asahi Kasei Kogyo Kabushiki Kaisha), Process for
preparing 4-aminomethyl cyclohexane carboxylic acid-1, US 3923879, 1975.
[246] T. Tsuchida, O. Kurahashi, H. Kawashima, S. Nakamori, H. Enei (Ajinomoto Co., Inc.),
Method for producing L-tryptophan by fermentation, US 4588687, 1986.
[247] S.V. Gatenbeck, P.O. Hedman (AB Bofors), Fermentative process for the production of L-
tryptophan and its derivatives, US 3963572, 1976.
[248] I. Shiio, S. Sugimoto, K. Kawamura (Ajinomoto Co., Inc.), Process for the production of L-
tryptophan by a fermentation process, EP 0128637 B1, 1987.
[249] J.E. Thiemann, H. Pagani (Lepetit Spa), Production of L-tryptophan by fermentation, US
3700558, 1972.
[250] O. Hiroshi (Chugai Pharmaceutical), Process for the production of L-tryptophan by
fermentation, US 3385762, 1968.
[251] K. Nakayama, H. Hagino (Kyowa Hakko Kogyo Co., Ltd.), Process for producing L-tryptophan,
US 3849251, 1974.
[252] I. Shiio, S. Sugimoto, K. Kawamura (Ajinomoto Co., Inc.), Process for the production of L-
tryptophan using sulfaguanidine-resistant microorganisms, US 4618580, 1986.
[253] K. Arima, I. Nugami, M. Yoneda (Takedo Chemical Industries Ltd.), Method for producing L-
tryptophan, US 3801457, 1974.
[254] S.M.T.I.A. Ogawa, S. Iguchi, S. Morita, H. Kuwamoto (Mitsui Toatsu Chemicals Inc.), Process
for producing L-tryptophane, EP 0438591B1, 1994.
Amino acid analysis for pharmacopoeial purposes Talanta 154 (2016) 150-163
155
[255] T. Uzuki, M. Takahashi, M. Noda, Y. Komachiya, H. Wakamatsu (Ajinomoto Co., Inc.),
Selective deacylation of N-acyl-DL-amino acids, US 3907638, 1975.
[256] A. Gaston, V. Leon, H. Rene (Roussel Uclaf), Process of resolving DL-acyl tryptophan
compounds and products obtained thereby, US 2797226, 1957.
[257] D.T. Warner, O.A. Moe, Amino acids. I. New syntheses of DL-tryptophan, DL-ornithine and DL-
glutamic Acid, J. Am. Chem. Soc., 70 (1948) 2765-2767.
[258] H.R. Snyder, J.A. MacDonald, A synthesis of tryptophan and tryptophan analogs, J. Am.
Chem. Soc., 77 (1955) 1257-1259.
[259] C. Xue, Y. Wang, Y. Chang, J. Xu, J. Wang, Q. Tang (Ocean Univ China), Method for
preparing L-tyrosine from antarctic krill, CN 104178534, 2014.
[260] B.B. Dowling (International Minerals & Chemicals Corp.), Purification of tyrosine, US 2661371,
1953.
[261] L.J. Templeton, D.T.K. Van (Du Pont), Method of enhancing L-tyrosine production in
recombinant bacteria, WO 2008060387, 2008.
[262] T. Oka, R. Katsumata, A. Ozaki, T. Mizukami, H. Yokoi, M. Hara (Kyowa Hakko Kogyo Co.,
Ltd.), Process for preparing L-tyrosine, EP 0332234B1, 1993.
[263] H. Hagino, K. Nakayama, H. Yoshida (Kyowa Hakko Kogyo Co., Ltd.), Process for the
production of L-tyrosine, US 3787287, 1974.
[264] (Xinyi Hanling Bio Engineering), Preparation method of N-acetyl-L-tyrosine, CN 102827018,
2012.
[265] A. Liu (Wuhan University Hoyo Pharmace), Process for preparing N-acetyl-L-tyrosine, CN
1262534, 2006.
[266] H. Matsui, T. Tsuchida, S. Nakamori (Ajinomoto), Method for producing L-valine by
fermentation, US 4391907, 1983.
[267] S. Abe, K. Takayama (Kyowa Hakko Kogyo Co., Ltd.), Verfahren zur biotechnischen
Herstellung von L-Valin, DE 1517825B1, 1970.
[268] C. Zhang, J. Pu, Y. Yu, L. Chen, M. Chen, G. Zu (Dalian Polytechnic University), Candida
tropicalis and method for preparing L-valine through microbiological method, CN 103695325,
2014.
[269] S.M. Birnbaum, L. Levintow, R.B. Kingsley, J.P. Greenstein, Specificity of amino acid
acylases, J. Biol. Chem., 194 (1952) 455-470.
Results
156
[270] R. Marshall, S.M. Birnbaum, J.P. Greenstein, Cobalt ion activation of renal acylase-I, J. Am.
Chem. Soc., 78 (1956) 4636-4642.
[271] H. Kunz, W. Pfrengle, Carbohydrates as chiral templates - Asymmetric Ugi-synthesis of α-
amino acids using galactosylamines as the chiral matrices, Tetrahedron, 44 (1988) 5487-
5494.
[272] H. Kunz, W. Sager, W. Pfrengle, D. Schanzenbach, Reversal of asymmetric induction in
stereoselective Strecker synthesis on galactosyl amine as the chiral Matrix, Tetrahedron Lett.,
29 (1988) 4397-4400.
[273] D.S. Matteson, E.C. Beedle, A directed chiral synthesis of amino acids from boronic esters,
Tetrahedron Lett., 28 (1987) 4499-4502.
[274] W. Frieben, F. Gerhart (Merrel Toraude & Co.), Process for preparing 4-amino-5-hexanoic
acid, GB 2133002, 1984.
[275] B.W. Metcalf, M. Jung (Richardson-Merrell Inc.), Olefinic derivatives of amino acids, US
3960927, 1976.
[276] Z.X. Zheng, J.M. Lin, F. Qu, Chiral separation of underivatized and dansyl amino acids by
ligand-exchange micellar electrokinetic capillary chromatography using a copper(II)-L-valine
complex as selector, J. Chromatogr. A, 1007 (2003) 189-196.
[277] X.N. Lu, Y. Chen, L. Guo, Y.F. Yang, Chiral separation of underivatized amino acids by ligand-
exchange capillary electrophoresis using a copper(II)-L-lysine complex as selector, J.
Chromatogr. A, 945 (2002) 249-255.
[278] K. Petritis, A. Valleix, C. Elfakir, M. Dreux, Simultaneous analysis of underivatized chiral amino
acids by liquid chromatography-ionspray tandem mass spectrometry using a teicoplanin chiral
stationary phase, J. Chromatogr. A, 913 (2001) 331-340.
[279] J.D. Oliver, A.T. Sutton, N. Karu, M. Phillips, J. Markham, P. Peiris, E.F. Hilder, P.
Castignolles, Simple and robust monitoring of ethanol fermentations by capillary
electrophoresis, Biotechnol. Appl. Bioc., 62 (2015) 329-342.
[280] T. Hložek, M. Bursová, R. Čabala, Fast determination of ethylene glycol, 1,2-propylene glycol
and glycolic acid in blood serum and urine for emergency and clinical toxicology by GC-FID,
Talanta, 130 (2014) 470-474.
[281] Dionex Corporation, the determination of inorganic anions and organic acids in fermentation
broth. Application note 123. http://www.dionex.com/en-us/webdocs/4082-
AN123_LPN1030_2.pdf, (accessed 11.02.2016)
Amino acid analysis for pharmacopoeial purposes Talanta 154 (2016) 150-163
157
[282] D. Ilko, C.J. Nap, U. Holzgrabe, S. Almeling, Validation and application of an HPLC-CAD-
TOF/MS method for identification and quantification of pharmaceutical counterions, Pharmeur.
Bio. Sci. Notes, 2014 (2014) 81-91.
[283] P. Kubáň, P. Ďurč, M. Bittová, F. Foret, Separation of oxalate, formate and glycolate in human
body fluid samples by capillary electrophoresis with contactless conductometric detection, J.
Chromatogr. A, 1325 (2014) 241-246.
[284] J.P. Hutchinson, T. Remenyi, P. Nesterenko, W. Farrell, E. Groeber, R. Szucs, G. Dicinoski,
P.R. Haddad, Investigation of polar organic solvents compatible with corona charged aerosol
detection and their use for the determination of sugars by hydrophilic interaction liquid
chromatography, Anal. Chim. Acta, 750 (2012) 199-206.
[285] S. Inagaki, J.Z. Min, T. Toyo'oka, Direct detection method of oligosaccharides by high-
performance liquid chromatography with charged aerosol detection, Biomed. Chromatogr., 21
(2007) 338-342.
[286] M. Melmer, T. Stangler, A. Premstaller, W. Lindner, Solvent effects on the retention of
oligosaccharides in porous graphitic carbon liquid chromatography, J. Chromatogr. A, 1217
(2010) 6092-6096.
[287] V.P. Hanko, J.S. Rohrer, Determination of carbohydrates, sugar alcohols, and glycols in cell
cultures and fermentation broths using high-performance anion-exchange chromatography
with pulsed amperometric detection, Anal. Biochem., 283 (2000) 192-199.
[288] J. Partyka, F. Foret, Cationic labeling of oligosaccharides for electrophoretic preconcentration
and separation with contactless conductivity detection, J. Chromatogr. A, 1267 (2012) 116-
120.
[289] A. Joseph, A. Rustum, Development and validation of a RP-HPLC method for the
determination of gentamicin sulfate and its related substances in a pharmaceutical cream
using a short pentafluorophenyl column and a charged aerosol detector, J. Pharm. Biomed.
Anal., 51 (2010) 521-531.
[290] D. Samain, P. Dupin, P. Delrieu, G. Inchauspe, Multidimensional ion-pair HPLC for the
purification of aminoglycoside antibiotics with refractive index detection, Chromatographia, 24
(1987) 748-752.
[291] V. Manyanga, K. Kreft, B. Divjak, J. Hoogmartens, E. Adams, Improved liquid
chromatographic method with pulsed electrochemical detection for the analysis of gentamicin,
J. Chromatogr. A, 1189 (2008) 347-354.
Results
158
[292] V. Manyanga, O. Grishina, Z. Yun, J. Hoogmartens, E. Adams, Comparison of liquid
chromatographic methods with direct detection for the analysis of gentamicin, J. Pharm.
Biomed. Anal., 45 (2007) 257-262.
[293] N.C. Megoulas, M.A. Koupparis, Development and validation of a novel LC/ELSD method for
the quantitation of gentamicin sulfate components in pharmaceuticals, J. Pharm. Biomed.
Anal., 36 (2004) 73-79.
[294] H. Curiel, W. Vanderaerden, H. Velez, J. Hoogmartens, A. Van Schepdael, Analysis of
underivatized gentamicin by capillary electrophoresis with UV detection, J. Pharm. Biomed.
Anal., 44 (2007) 49-56.
[295] R. Grahek, L. Zupančič-Kralj, Identification of gentamicin impurities by liquid chromatography
tandem mass spectrometry, J. Pharm. Biomed. Anal., 50 (2009) 1037-1043.
[296] P. Jankovics, S. Chopra, M.N. El-Attug, D. Cabooter, K. Wolfs, B. Noszál, A. Van Schepdael,
E. Adams, Exploring the possibilities of capacitively coupled contactless conductivity detection
in combination with liquid chromatography for the analysis of polar compounds using
aminoglycosides as test case, J. Pharm. Biomed. Anal., 112 (2015) 155-168.
[297] W.H. Tsai, T.C. Huang, H.H. Chen, J.J. Huang, M.H. Hsue, H.Y. Chuang, Y.W. Wu,
Determination of tetracyclines in surface water and milk by the magnesium hydroxide
coprecipitation method, J. Chromatogr. A, 1217 (2010) 415-418.
[298] J. Chico, S. Meca, C. R., M.D. Prat, M. Granados, Restricted access materials for sample
clean-up in the analysis of trace levels of tetracyclines by liquid chromatography - Application
to food and environmental analysis, J. Chromatogr. A, 1181 (2008) 1-8.
[299] A. Jia, Y. Xiao, J.Y. Hu, M. Asami, S. Kunikane, Simultaneous determination of tetracyclines
and their degradation products in environmental waters by liquid chromatography-electrospray
tandem mass spectrometry, J. Chromatogr. A, 1216 (2009) 4655-4662.
[300] V. Manyanga, R.L. Dhulipalla, J. Hoogmartens, E. Adams, Improved liquid chromatographic
method with pulsed electrochemical detection for the analysis of kanamycin, J. Chromatogr. A,
1217 (2010) 3748-3753.
[301] E. Kaale, A. Van Schepdael, E. Roets, J. Hoogmartens, Development and validation of a
simple capillary zone electrophoresis method for the analysis of kanamycin sulfate with UV
detection after pre-capillary derivatization, J. Chromatogr. A, 924 (2001) 451-458.
[302] M.N. El-Attug, E. Adams, J. Hoogmartens, A. Van Schepdael, Capacitively coupled
contactless conductivity detection as an alternative detection mode in CE for the analysis of
kanamycin sulphate and its related substances, J. Sep. Sci., 34 (2011) 2448-2454.
Amino acid analysis for pharmacopoeial purposes Talanta 154 (2016) 150-163
159
[303] M. Gaugain, M.P. Chotard, D. Hurtaud-Pessel, E. Verdon, Comprehensive validation of a
liquid chromatography-tandem mass spectrometry method for the confirmation of
chloramphenicol in urine including stability of the glucuronide conjugate and efficiency of
deconjugation, J. Chromatogr. B Anal. Technol. Biomed Life Sci., 1011 (2016) 145-150.
[304] G.S. Sadana, A.B. Ghogare, Simultaneous determination of chloramphenicol and benzocaine
in topical formulations by high-performance liquid chromatography, J. Chromatogr., 542
(1991) 515-520.
[305] S. Aboukhalil, W.H. Aboukhalil, A.N. Masoud, A.A. Yunis, High-performance liquid
chromatographic determination of chloramphenicol and four analogs using reductive and
oxidative electrochemical and ultraviolet detection, J. Chromatogr. Biomed. Appl., 417 (1987)
111-119.
[306] J. Olšovská, Z. Kameník, T. Cajthaml, Hyphenated ultra high-performance liquid
chromatography-Nano quantity analyte detector technique for determination of compounds
with low UV absorption, J. Chromatogr. A, 1216 (2009) 5774-5778.
[307] A. Le, A. Ng, T. Kwan, K. Cusmano-Ozog, T.M. Cowan, A rapid, sensitive method for
quantitative analysis of underivatized amino acids by liquid chromatography-tandem mass
spectrometry (LC-MS/MS), J. Chromatogr. B Anal. Technol. Biomed. Life Sci., 944 (2014)
166-174.
[308] N. Novatchev, U. Holzgrabe, Evaluation of amino sugar, low molecular peptide and amino
acid impurities of biotechnologically produced amino acids by means of CE, J. Pharm.
Biomed. Anal., 28 (2002) 475-86.
[309] N. Novatchev, U. Holzgrabe, Evaluation of the impurity profile of amino acids by means of CE,
J. Pharm. Biomed. Anal., 26 (2001) 779-789.
[310] P. Chaimbault, K. Petritis, C. Elfakir, M. Dreux, Ion-pair chromatography on a porous graphitic
carbon stationary phase for the analysis of twenty underivatized protein amino acids, J.
Chromatogr. A, 870 (2000) 245-254.
[311] I.C. Casella, M. Gatta, T.R.I. Cataldi, Amperometric determination of underivatized amino
acids at a nickel-modified gold electrode by anion-exchange chromatography, J. Chromatogr.
A, 878 (2000) 57-67.
[312] V.P. Hanko, J.S. Rohrer, Determination of amino acids in cell culture and fermentation broth
media using anion-exchange chromatography with integrated pulsed amperometric detection,
Anal. Biochem., 324 (2004) 29-38.
Results
160
[313] A. Zerzaňová, V. Žižkovský, R. Kučera, J. Klimeš, I. Jesenský, J. Dohnal, D. Barrón, Using of
HPLC coupled with coulometric detector for the determination of biotin in pharmaceuticals, J.
Pharm. Biomed. Anal., 45 (2007) 730-735.
[314] I. Márquez-Sillero, S. Cárdenas, M. Valcárcel, Determination of water-soluble vitamins in
infant milk and dietary supplement using a liquid chromatography on-line coupled to a corona-
charged aerosol detector, J. Chromatogr. A, 1313 (2013) 253-258.
[315] E. Livaniou, D. Costopoulou, I. Vassiliadou, L. Leondiadis, J.O. Nyalala, D.S. Ithakissios, G.P.
Evangelatos, Analytical techniques for determining biotin, J. Chromatogr. A, 881 (2000) 331-
343.
[316] T. Peréz-Ruiz, C. Martínez-Lozano, A. Sanz, E. Bravo, Electrophoretic behaviour of biotin and
biocytin in capillary electrophoresis. Determination of biotin in pharmaceutical formulations,
Chromatographia, 58 (2003) 757-762.
[317] D.C. da Silva, J.V. Visentainer, N.E. de Souza, C.C. Oliveira, Micellar electrokinetic
chromatography method for determination of the ten water-soluble vitamins in food
supplements, Food Anal. Method., 6 (2013) 1592-1606.
[318] K. Marakova, J. Piestansky, E. Havranek, P. Mikus, Simultaneous analysis of vitamins B in
pharmaceuticals and dietary supplements by capillary electrophoresis hyphenated with triple
quadrupole mass spectrometry, Pharmazie, 69 (2014) 663-668.
[319] P.F. Jin, L.F. Xia, Z. Li, N. Che, D. Zou, X. Hu, Rapid determination of thiamine, riboflavin,
niacinamide, pantothenic acid, pyridoxine, folic acid and ascorbic acid in Vitamins with
Minerals Tablets by high-performance liquid chromatography with diode array detector, J.
Pharm. Biomed. Anal., 70 (2012) 151-157.
[320] C.J. Argoudelis, Simple high-performance liquid chromatographic method for the
determination of all seven vitamin B6-related compounds, J. Chromatogr. A, 790 (1997) 83-91.
161
5. Impurity profiling of N,N’-ethylenebis-L-cysteine diethyl ester
(Bicisate)
Wahl, O., Holzgrabe, U.
Unpublished manuscript
ABSTRACT
A HILIC HPLC-UV-CAD method for the impurity profiling of the 99mTc chelating agent
bicisate has been developed and evaluated. Bicisate and its impurities were separated by
means of isocratic elution on a zwitterionic stationary phase using 7.5 mmol/L trifluoroacetic
acid and acetonitrile (47.5:52.5 % V/V) as mobile phase. Five different batches of a
manufacturer were tested using the method and LC-MS experiments were conducted in
order to identify the impurities. The predominant impurities found were the oxidation product
(disulfide), the monoester of ethylene dicysteine and an unknown compound with an m/z of
293 in ESI positive mode. A new degradation product of bicisate, bicisate lactam, was
identified during sample solution stability assessment.
Abbreviations: ECD, N,N’-ethylenebis-L-cysteine diethyl ester; ENMC, N-methyl-
cysteine ethyl ester; ESI, electro spray ionization; SPECT, single-photon emission computed
tomography; EC, N,N’-ethylene-L-biscysteine; ECM, ethylene cysteine monoethyl ester;
ETCA, L-thiazolidine-4-carboxylic acid ethyl ester; NMC, N-methyl-cysteine; TCA,
L-thiazolidine-4-carboxylic acid;
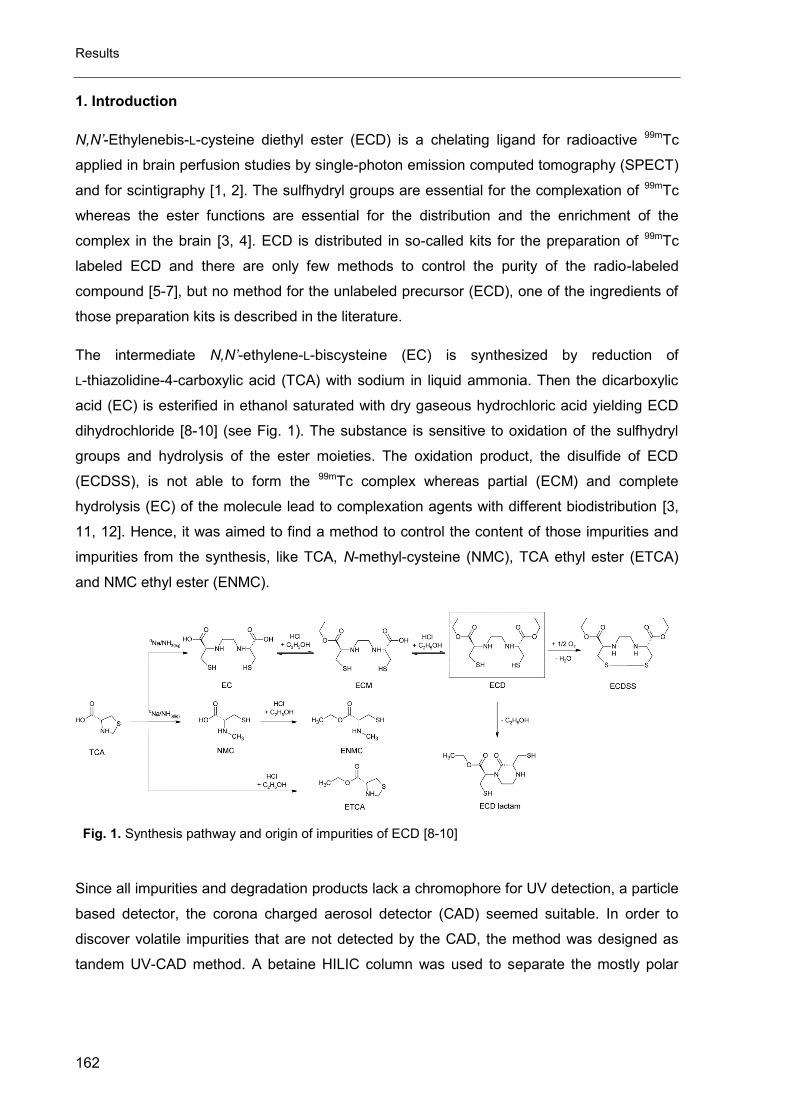
Results
162
1. Introduction
N,N’-Ethylenebis-L-cysteine diethyl ester (ECD) is a chelating ligand for radioactive 99mTc
applied in brain perfusion studies by single-photon emission computed tomography (SPECT)
and for scintigraphy [1, 2]. The sulfhydryl groups are essential for the complexation of 99mTc
whereas the ester functions are essential for the distribution and the enrichment of the
complex in the brain [3, 4]. ECD is distributed in so-called kits for the preparation of 99mTc
labeled ECD and there are only few methods to control the purity of the radio-labeled
compound [5-7], but no method for the unlabeled precursor (ECD), one of the ingredients of
those preparation kits is described in the literature.
The intermediate N,N’-ethylene-L-biscysteine (EC) is synthesized by reduction of
L-thiazolidine-4-carboxylic acid (TCA) with sodium in liquid ammonia. Then the dicarboxylic
acid (EC) is esterified in ethanol saturated with dry gaseous hydrochloric acid yielding ECD
dihydrochloride [8-10] (see Fig. 1). The substance is sensitive to oxidation of the sulfhydryl
groups and hydrolysis of the ester moieties. The oxidation product, the disulfide of ECD
(ECDSS), is not able to form the 99mTc complex whereas partial (ECM) and complete
hydrolysis (EC) of the molecule lead to complexation agents with different biodistribution [3,
11, 12]. Hence, it was aimed to find a method to control the content of those impurities and
impurities from the synthesis, like TCA, N-methyl-cysteine (NMC), TCA ethyl ester (ETCA)
and NMC ethyl ester (ENMC).
Fig. 1. Synthesis pathway and origin of impurities of ECD [8-10]
Since all impurities and degradation products lack a chromophore for UV detection, a particle
based detector, the corona charged aerosol detector (CAD) seemed suitable. In order to
discover volatile impurities that are not detected by the CAD, the method was designed as
tandem UV-CAD method. A betaine HILIC column was used to separate the mostly polar
Impurity profiling of N,N’-ethylenebis-L-cysteine diethyl ester (Bicisate)
163
analytes with detection at 215 nm followed by CAD detection. Because the substance is
administered only once, the thresholds according to ICH guideline Q3A(R2) for a substance
with a daily dose lower or equal to 2 g per day were applied. Thus an identification threshold
of 0.1 % and a reporting threshold of 0.05 % were applied.
2. Experimental
2.1. Chemicals and reagents
Samples of ECD and the process related impurities were obtained from the group of
Prof. Alfons Verbruggen (Laboratory for Radiopharmacy, K.U. Leuven, Belgium). HPLC
gradient grade acetonitrile was purchased from VWR International S.A.S. (Fontenay-sous-
Bois, France) and trifluoroacetic acid from Sigma-Aldrich Chemie GmbH (Steinheim,
Germany). All chemicals used for quantification were of analytical grade or even better.
Ultrapure water was produced by a water purification system from Merck Millipore
(Schwalbach, Germany). All solutions were filtered through a 0.22 µm PVDF filter supplied by
Machery-Nagel GmbH & Co. KG (Düren, Germany) prior to use.
2.2. Apparatus
The HPLC-CAD experiments were performed on an Agilent 1100 modular chromatographic
system consisting of online vacuum degasser, binary pump, auto sampler, thermostatted
column compartment and a photodiode array detector (Agilent Technologies, Waldbronn,
Germany). The Corona CAD detector (Thermo Fisher, Courtaboeuf, France) was linked to
the HPLC system by a 0.25 mm internal diameter PEEK capillary and a 0.22 µm stainless
steel inlet-frit. Highly pure nitrogen (99.9 %) for the detector was produced by an ESA
Nitrogen Generator (Thermo Fisher, Courtaboeuf, France). The inlet pressure (nitrogen) was
35.0 psi. The peak areas were integrated automatically using the Agilent ChemStation® Rev
B.03.02 software program.
LC-MS experiments were performed on a LC/MSD Trap G2445D ion trap (Agilent
Technologies, Waldbronn, Germany) coupled to an Agilent 1100 modular chromatographic
system consisting of online vacuum degasser, binary pump, thermostatted auto sampler,
thermostatted column compartment and a photodiode array detector (Agilent Technologies,
Waldbronn, Germany) via electro spray ionization (ESI) interface. Nebulizer pressure: 50 psi,
dry gas flow: 12 L/min, dry temperature: 350 °C, capillary voltage 3500 V. Trap parameters:
ion polarity: positive, source type: ESI, trap drive: 24.2, octopole RF amplitude: 156.6 Vpp,
capillary exit: 115 V, skimmer: 40 V, oct 1 DC: 12 V, oct 2 DC 1.70 V, scan begin: 50 m/z,
Results
164
scan end: 700 m/z, averages: 7 spectra, max accumulation time: 200 ms, ICC target: 30000,
charge control: on.
2.2. Chromatographic procedure
A betaine HILIC column SIELC Obelisc® N (150 x 4.6 mm i.d., with a particle size of
5 µm and pore size of 100 Å, SIELC Technologies, Prospect Heights IL, USA) was used as
stationary phase. The chromatographic system was operated isocratically at 25 °C. The
mobile phase was composed of 7.5 mM trifluoroacetic acid-acetonitrile (47.5:52.5 % V/V)
and the flow-rate was set to 1.0 mL/min. The column effluent was subjected to UV detection
at 215 nm followed by CAD detection with the filter set to “none”. The injection volume was
10 µL.
The chromatographic conditions for LC/MS were the same as for HPLC-CAD. When running
sample solutions the column effluent was subjected to the ESI-source from 0 to 15 and from
35 to 60 min only in order to protect the instrument from high amounts of ECD (eluting at
about 15 min).
2.2.1. Preparation of solutions
The test solutions for HPLC-CAD and LC/MS were 5 mg/mL solutions of ECD
dihydrochloride in water. 1 mg/mL solutions of the impurities TCA, ETCA, EC and NMC
(calculated as free base or acid, respectively) in 0.1 mol/L hydrochloric acid were prepared
for spiking the test solutions. For the test solutions for accuracy 5 mg ECD dihydrochloride
were spiked with 2.5, 5.0 and 7.5 µL of each 1 mg/mL impurity stock solution and diluted to
1.0 mL. All solutions were stored at -20 °C.
3. Results and discussion
3.1. Method development
Since most of the compounds are extremely hydrophilic (e.g. TCA, EC and NMC) and
not retained on conventional reversed phase columns, the separation mechanism of
hydrophilic interaction liquid chromatography (HILIC) seemed suitable for an acceptable
retention. Since the studied compounds contain basic, acidic or either moiety, the choice fell
on a betaine HILIC stationary phase in order to use the strong electrostatic interactions
between the charged analytes and the stationary phase.
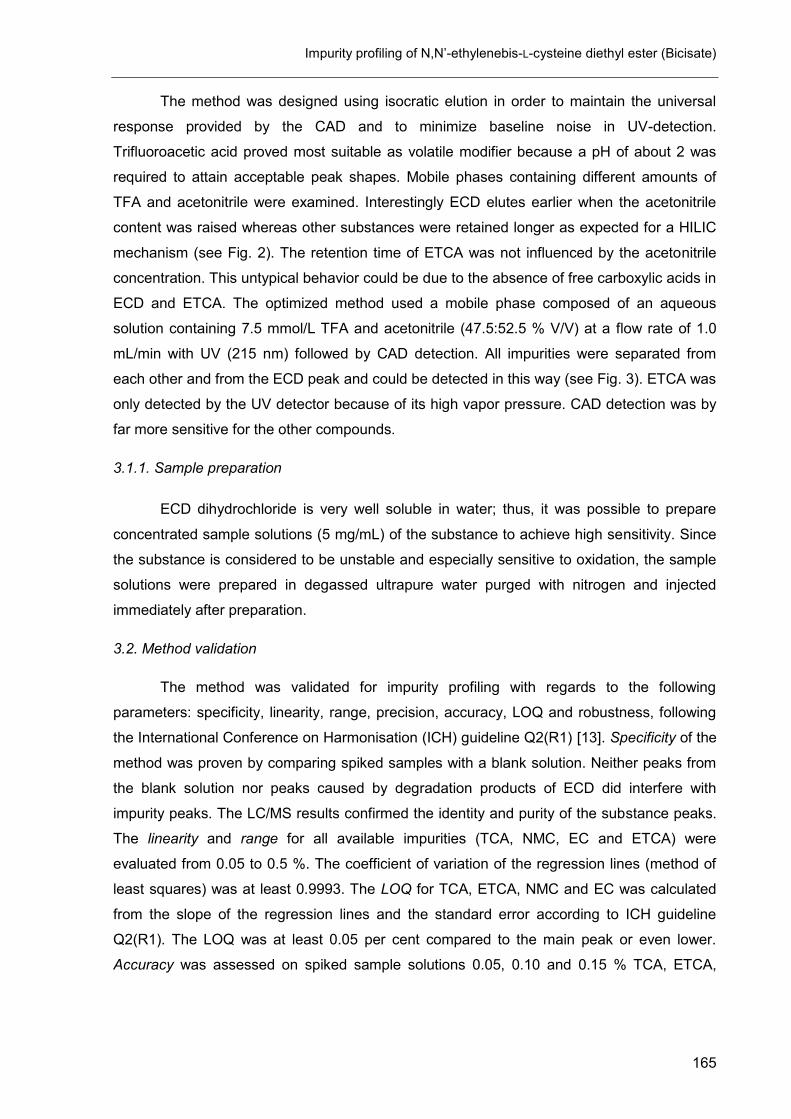
Impurity profiling of N,N’-ethylenebis-L-cysteine diethyl ester (Bicisate)
165
The method was designed using isocratic elution in order to maintain the universal
response provided by the CAD and to minimize baseline noise in UV-detection.
Trifluoroacetic acid proved most suitable as volatile modifier because a pH of about 2 was
required to attain acceptable peak shapes. Mobile phases containing different amounts of
TFA and acetonitrile were examined. Interestingly ECD elutes earlier when the acetonitrile
content was raised whereas other substances were retained longer as expected for a HILIC
mechanism (see Fig. 2). The retention time of ETCA was not influenced by the acetonitrile
concentration. This untypical behavior could be due to the absence of free carboxylic acids in
ECD and ETCA. The optimized method used a mobile phase composed of an aqueous
solution containing 7.5 mmol/L TFA and acetonitrile (47.5:52.5 % V/V) at a flow rate of 1.0
mL/min with UV (215 nm) followed by CAD detection. All impurities were separated from
each other and from the ECD peak and could be detected in this way (see Fig. 3). ETCA was
only detected by the UV detector because of its high vapor pressure. CAD detection was by
far more sensitive for the other compounds.
3.1.1. Sample preparation
ECD dihydrochloride is very well soluble in water; thus, it was possible to prepare
concentrated sample solutions (5 mg/mL) of the substance to achieve high sensitivity. Since
the substance is considered to be unstable and especially sensitive to oxidation, the sample
solutions were prepared in degassed ultrapure water purged with nitrogen and injected
immediately after preparation.
3.2. Method validation
The method was validated for impurity profiling with regards to the following
parameters: specificity, linearity, range, precision, accuracy, LOQ and robustness, following
the International Conference on Harmonisation (ICH) guideline Q2(R1) [13]. Specificity of the
method was proven by comparing spiked samples with a blank solution. Neither peaks from
the blank solution nor peaks caused by degradation products of ECD did interfere with
impurity peaks. The LC/MS results confirmed the identity and purity of the substance peaks.
The linearity and range for all available impurities (TCA, NMC, EC and ETCA) were
evaluated from 0.05 to 0.5 %. The coefficient of variation of the regression lines (method of
least squares) was at least 0.9993. The LOQ for TCA, ETCA, NMC and EC was calculated
from the slope of the regression lines and the standard error according to ICH guideline
Q2(R1). The LOQ was at least 0.05 per cent compared to the main peak or even lower.
Accuracy was assessed on spiked sample solutions 0.05, 0.10 and 0.15 % TCA, ETCA,
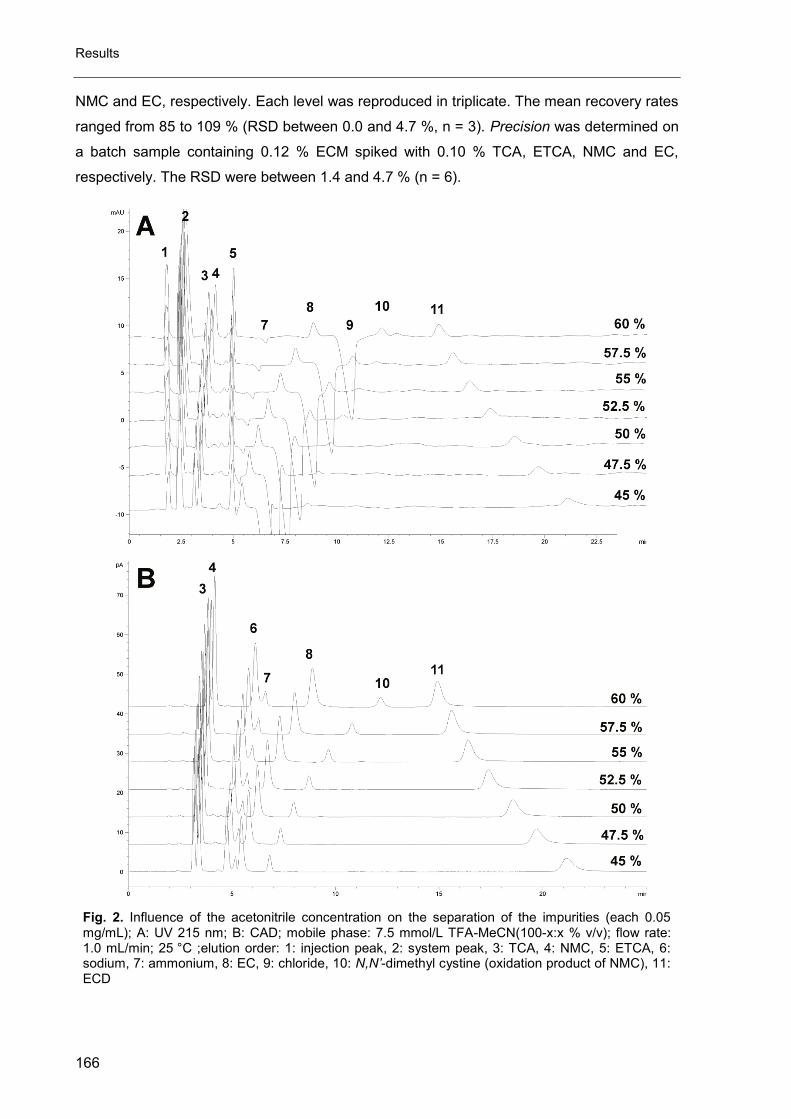
Results
166
NMC and EC, respectively. Each level was reproduced in triplicate. The mean recovery rates
ranged from 85 to 109 % (RSD between 0.0 and 4.7 %, n = 3). Precision was determined on
a batch sample containing 0.12 % ECM spiked with 0.10 % TCA, ETCA, NMC and EC,
respectively. The RSD were between 1.4 and 4.7 % (n = 6).
Fig. 2. Influence of the acetonitrile concentration on the separation of the impurities (each 0.05 mg/mL); A: UV 215 nm; B: CAD; mobile phase: 7.5 mmol/L TFA-MeCN(100-x:x % v/v); flow rate: 1.0 mL/min; 25 °C ;elution order: 1: injection peak, 2: system peak, 3: TCA, 4: NMC, 5: ETCA, 6: sodium, 7: ammonium, 8: EC, 9: chloride, 10: N,N’-dimethyl cystine (oxidation product of NMC), 11: ECD
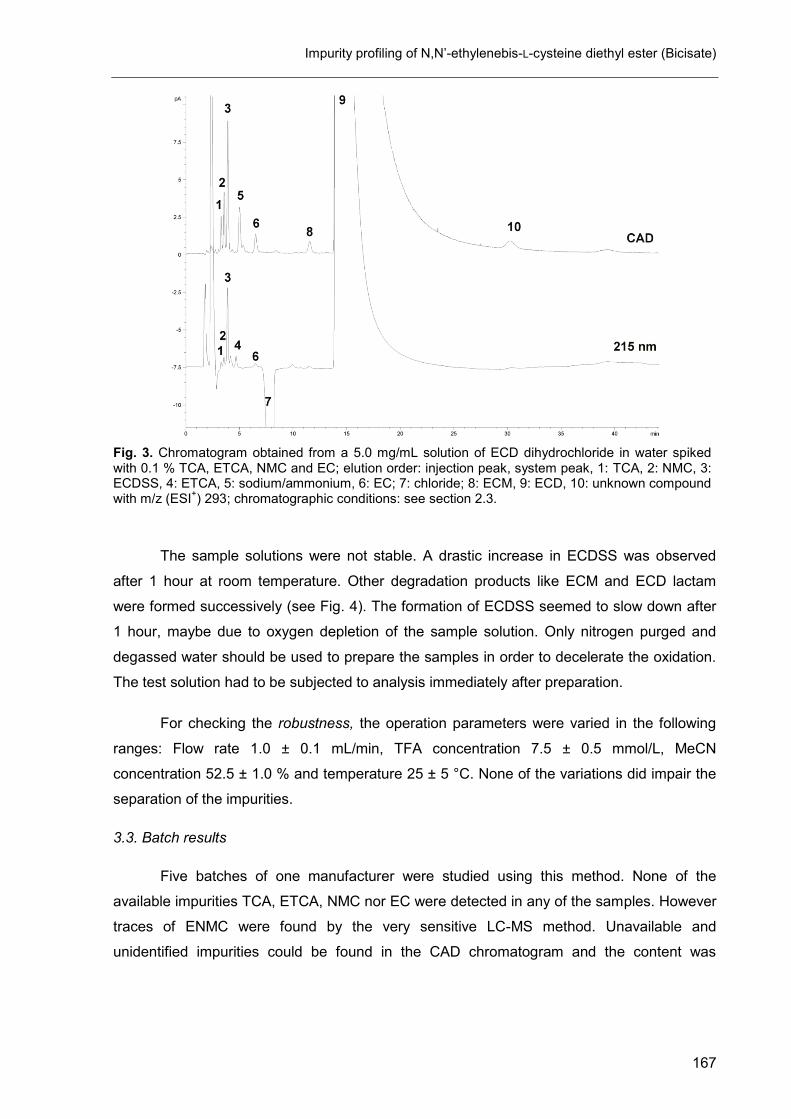
Impurity profiling of N,N’-ethylenebis-L-cysteine diethyl ester (Bicisate)
167
Fig. 3. Chromatogram obtained from a 5.0 mg/mL solution of ECD dihydrochloride in water spiked with 0.1 % TCA, ETCA, NMC and EC; elution order: injection peak, system peak, 1: TCA, 2: NMC, 3: ECDSS, 4: ETCA, 5: sodium/ammonium, 6: EC; 7: chloride; 8: ECM, 9: ECD, 10: unknown compound with m/z (ESI
+) 293; chromatographic conditions: see section 2.3.
The sample solutions were not stable. A drastic increase in ECDSS was observed
after 1 hour at room temperature. Other degradation products like ECM and ECD lactam
were formed successively (see Fig. 4). The formation of ECDSS seemed to slow down after
1 hour, maybe due to oxygen depletion of the sample solution. Only nitrogen purged and
degassed water should be used to prepare the samples in order to decelerate the oxidation.
The test solution had to be subjected to analysis immediately after preparation.
For checking the robustness, the operation parameters were varied in the following
ranges: Flow rate 1.0 ± 0.1 mL/min, TFA concentration 7.5 ± 0.5 mmol/L, MeCN
concentration 52.5 ± 1.0 % and temperature 25 ± 5 °C. None of the variations did impair the
separation of the impurities.
3.3. Batch results
Five batches of one manufacturer were studied using this method. None of the
available impurities TCA, ETCA, NMC nor EC were detected in any of the samples. However
traces of ENMC were found by the very sensitive LC-MS method. Unavailable and
unidentified impurities could be found in the CAD chromatogram and the content was
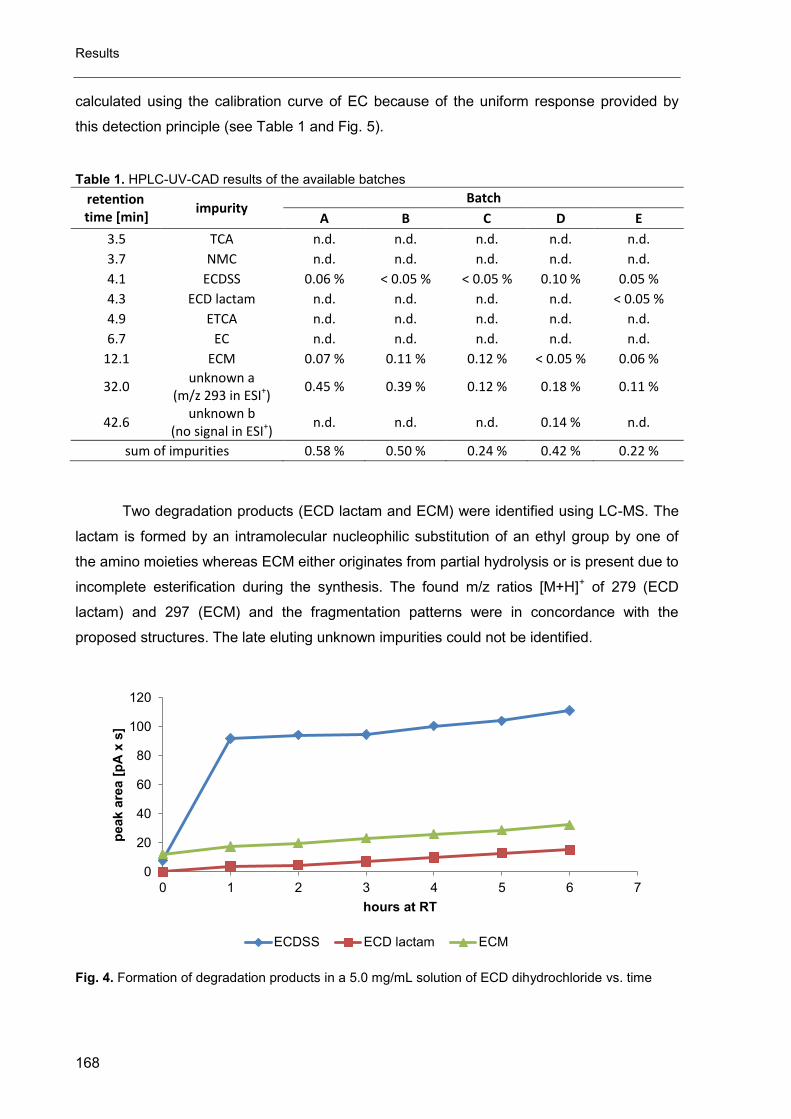
Results
168
calculated using the calibration curve of EC because of the uniform response provided by
this detection principle (see Table 1 and Fig. 5).
Table 1. HPLC-UV-CAD results of the available batches
retention time [min]
impurity Batch
A B C D E
3.5 TCA n.d. n.d. n.d. n.d. n.d.
3.7 NMC n.d. n.d. n.d. n.d. n.d.
4.1 ECDSS 0.06 % < 0.05 % < 0.05 % 0.10 % 0.05 %
4.3 ECD lactam n.d. n.d. n.d. n.d. < 0.05 %
4.9 ETCA n.d. n.d. n.d. n.d. n.d.
6.7 EC n.d. n.d. n.d. n.d. n.d.
12.1 ECM 0.07 % 0.11 % 0.12 % < 0.05 % 0.06 %
32.0 unknown a
(m/z 293 in ESI+) 0.45 % 0.39 % 0.12 % 0.18 % 0.11 %
42.6 unknown b
(no signal in ESI+) n.d. n.d. n.d. 0.14 % n.d.
sum of impurities 0.58 % 0.50 % 0.24 % 0.42 % 0.22 %
Two degradation products (ECD lactam and ECM) were identified using LC-MS. The
lactam is formed by an intramolecular nucleophilic substitution of an ethyl group by one of
the amino moieties whereas ECM either originates from partial hydrolysis or is present due to
incomplete esterification during the synthesis. The found m/z ratios [M+H]+ of 279 (ECD
lactam) and 297 (ECM) and the fragmentation patterns were in concordance with the
proposed structures. The late eluting unknown impurities could not be identified.
Fig. 4. Formation of degradation products in a 5.0 mg/mL solution of ECD dihydrochloride vs. time
0
20
40
60
80
100
120
0 1 2 3 4 5 6 7
peak a
rea [
pA
x s
]
hours at RT
ECDSS ECD lactam ECM
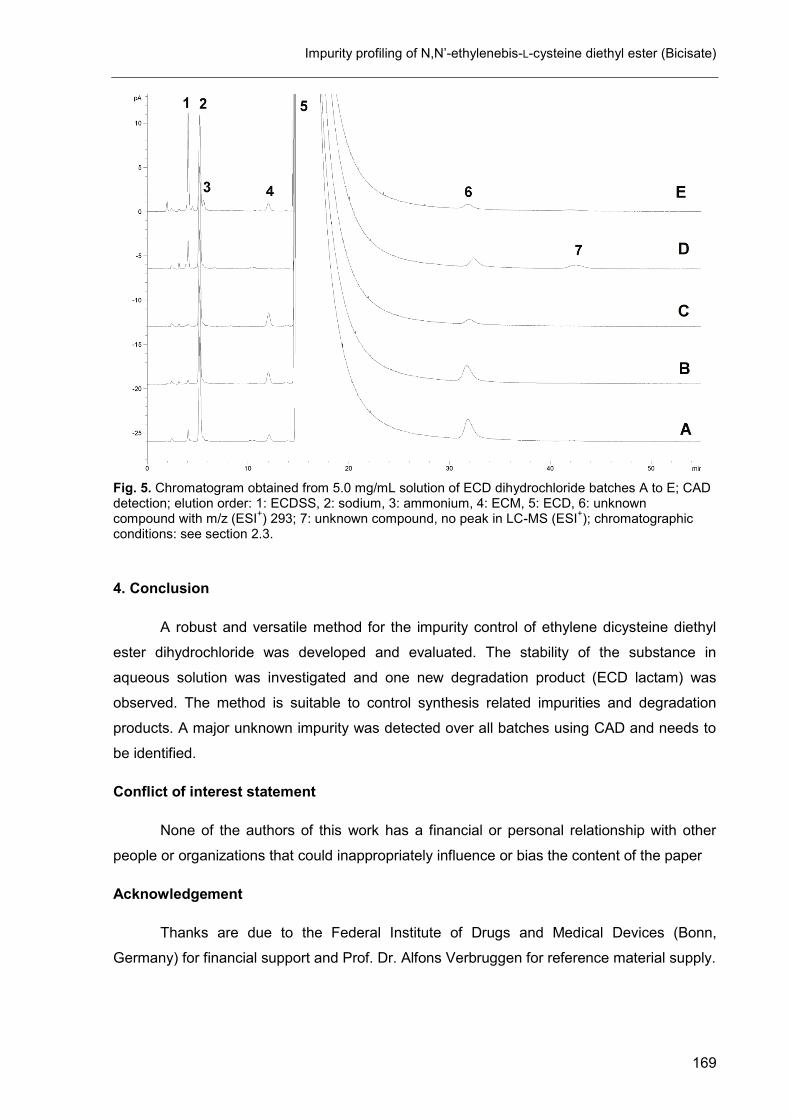
Impurity profiling of N,N’-ethylenebis-L-cysteine diethyl ester (Bicisate)
169
Fig. 5. Chromatogram obtained from 5.0 mg/mL solution of ECD dihydrochloride batches A to E; CAD detection; elution order: 1: ECDSS, 2: sodium, 3: ammonium, 4: ECM, 5: ECD, 6: unknown compound with m/z (ESI
+) 293; 7: unknown compound, no peak in LC-MS (ESI
+); chromatographic
conditions: see section 2.3.
4. Conclusion
A robust and versatile method for the impurity control of ethylene dicysteine diethyl
ester dihydrochloride was developed and evaluated. The stability of the substance in
aqueous solution was investigated and one new degradation product (ECD lactam) was
observed. The method is suitable to control synthesis related impurities and degradation
products. A major unknown impurity was detected over all batches using CAD and needs to
be identified.
Conflict of interest statement
None of the authors of this work has a financial or personal relationship with other
people or organizations that could inappropriately influence or bias the content of the paper
Acknowledgement
Thanks are due to the Federal Institute of Drugs and Medical Devices (Bonn,
Germany) for financial support and Prof. Dr. Alfons Verbruggen for reference material supply.
Results
170
References
[1] J. Leveille, G. Demonceau, M. Deroo, P. Rigo, R. Taillefer, R.A. Morgan, D. Kupranick, R.C.
Walovitch, Characterization of Technetium-99m L,L-Ecd for Brain Perfusion Imaging .2.
Biodistribution and Brain Imaging in Humans, J. Nucl. Med., 30 (1989) 1902-1910.
[2] R.C. Walovitch, T.C. Hill, S.T. Garrity, E.H. Cheesman, B.A. Burgess, D.H. Oleary, A.D.
Watson, M.V. Ganey, R.A. Morgan, S.J. Williams, Characterization of Technetium-99m L,L-
Ecd for Brain Perfusion Imaging .1. Pharmacology of Technetium-99m Ecd in Nonhuman-
Primates, J. Nucl. Med., 30 (1989) 1892-1901.
[3] H.P. Vanbilloen, B.J. Cleynhens, A.M. Verbruggen, Importance of the two ester functions for
the brain retention of Tc-99m-labelled ethylene dicysteine diethyl ester (Tc-99m-ECD), Nucl.
Med. Biol., 25 (1998) 569-575.
[4] R.C. Walovitch, E.H. Cheesman, L.J. Maheu, K.M. Hall, Studies of the Retention Mechanism
of the Brain Perfusion Imaging Agent Tc-99m-Bicisate (Tc-99m-Ecd), J. Cerebr. Blood. F.
Met., 14 (1994) S4-S11.
[5] T. Verduyckt, D. Kieffer, D. Huyghe, B. Cleynhens, K. Verbeke, A. Verbruggen, G. Bormans,
Identity confirmation of 99mTc-MAG3, 99mTc-sestamibi and 99mTc-ECD using radio-LC-MS,
J. Pharm. Biomed. Anal., 32 (2003) 669-78.
[6] K.C. Amin, G.B. Saha, R.T. Go, A rapid chromatographic method for quality control of
technetium-99m-bicisate, J. Nucl. Med. Tech., 25 (1997) 49-51.
[7] C. Tsopelas, D. Smyth, Characterization and quality control analysis of 99mTc-bicisate, J.
Nucl. Med. Tech., 33 (2005) 89-93.
[8] T. Assaad, Synthesis and characterization of novel benzovesamicol analogs, Turk. J. Chem.,
35 (2011) 189-200.
[9] M. Yanagi, T. Uehara, Y. Uchida, S. Kiyota, M. Kinoshita, Y. Higaki, H. Akizawa, H. Hanaoka,
Y. Arano, Chemical Design of Tc-99m-Labeled Probes for Targeting Osteogenic Bone Region,
Bioconjug. Chem., 24 (2013) 1248-1255.
[10] P. Blondeau, C. Berse, D. Gravel, Dimerization of an Intermediate during Sodium in Liquid
Ammonia Reduction of L-Thiazolidine-4-Carboxylic Acid, Can. J. Chem., 45 (1967) 49-52.
[11] E. Durand, P. Chaumet-Riffaud, N. Grenier, Functional Renal Imaging: New Trends in
Radiology and Nuclear Medicine, Semin. Nucl. Med., 41 (2011) 61-72.
Impurity profiling of N,N’-ethylenebis-L-cysteine diethyl ester (Bicisate)
171
[12] L. Kabasakal, Technetium-99m ethylene dicysteine: a new renal tubular function agent, Eur. J.
Nucl. Med., 27 (2000) 351-357.
[13] ICH, Validation of Analytical Procedures: Text and Methodology, ICH, Q2(R1).
http://www.ich.org, 1996 (accessed November 2014)

Results
172

173
D
D. Final discussion
Final Discussion
174
The aim of the studies performed here was to find appropriate means of analysis to
determine related substances of challenging analytes. These challenges in particular
comprise the lack of a chromophore in the analyte molecule and physical-chemical
properties such as high hydrophilicity or amphoterism impeding both detection and
separation by HPLC. The benefit of mixed-mode chromatography, a promising approach to
address the separation and the potential of the corona charged aerosol detector for
pharmacopoeial purposes were evaluated.
1. The CAD in impurity profiling
The CAD turned out to be a valuable alternative to commonly applied detection
principles. The greater part of related substances could be detected with sufficient sensitivity
and linearity. However, the impurity profiling of Carbocisteine illustrates one of the major
drawbacks of CAD detection: volatile and semi-volatile analytes cannot be detected. In this
special case the most toxic impurity, chloroacetic acid, was not detectable using this
technique. The combination of UV and CAD applied for Bicisate was suitable to overcome
this problem for a semi-volatile ester. However, for chloroacetic acid UV detection was also
not suitable due to the low response of the substance. The content of chloroacetic acid was
determined by qNMR to get an idea about how much of this compound could be expected in
the API. Because qNMR, especially for a single impurity, is not a desirable method for the
Ph. Eur., additional methods were evaluated for the assessment of chloroacetic acid. A GC
method with derivatization (ethyl ester) proposed by a manufacturer of carbocisteine and a
new ion-chromatography method with conductivity detection were tested. All three methods
yielded similar results (data not included in this work).
Overall, the CAD was a useful detector for all non-volatile compounds and enabled
the detection of several unexpected und unknown impurities. The direct transfer of a CAD
method to LC-MS proved very helpful in the identification of those unknown impurities in
Ibandronate and Bicisate. It is a valuable additional technique and should be considered
more frequently in the impurity profiling to find unexpected substances. The combination of
UV and CAD is easily feasible and covers a higher number of detectable analytes when
mobile phases with a low UV-cut off are used. However, the only available volatile modifiers
with low UV cut-off are TFA, analogue fluorinated acids and TEA.
Final discussion
175
2. Enantiomeric purity of magnesium aspartate
The direct separation of underivatized non-aromatic amino acids is rarely described in
the literature. However, special stationary phases are available for the separation of D- and L-
amino acids. These columns are rather expensive and are dedicated to a single separation
problem. It could be demonstrated that the indirect separation on a conventional PFP
reversed phase and the direct separation of CBQCA derivatives by CZE yield sufficiently
precise results with excellent sensitivity.
It was shown that aspartic acids racemizes rather quickly compared to other amino
acids in moderately acidic solution. Optimal parameters for the synthesis process could be
deducted from these findings. Furthermore, it was outlined, that the test for optical rotation in
the Ph. Eur. is unable to detect D-aspartic acid below 1 % and additional tests are necessary
to ensure the optical purity of the salt.
3. Mixed-mode chromatography in impurity profiling
Three different kinds of mixed-mode columns were used during this work: A RP-18
with embedded strong cation exchanger (Carbocisteine), a RP-18 with embedded strong
anion exchanger (Ibandronate) and a betaine HILIC (Bicisate), which includes HILIC and ion-
exchange mechanisms in this case.
The principle of mixed-mode chromatography was clearly outlined during the
development of the method for Carbocisteine and Bicisate. The retention of neutral impurities
or compounds where one mechanism of retention dominates (e.g. RP for Tyrosine) is mainly
influenced by the amount of organic modifier, whereas ionic species are mostly affected by
ionic strength of the mobile phases (e.g. TFA concentration). This characteristic behavior
allows for the fine tuning of a separation in a different way compared to IPC where the
increase of organic modifier usually leads to a decreased retention of all analytes.
An important objection to the use of mixed-mode chromatography for pharmacopoeial
purposes is the limitation to only a few manufacturers and the comparatively short lifetime of
the columns. On the other hand, they are useful in preliminary screening experiments in
order to discover potential and new impurities. “Conventional” more generic methods, e.g.
using IPC could be developed based on these findings.
Final Discussion
176
4. Other applications of the CAD
The CAD has not only proven useful in impurity profiling, but is also becoming more
and more popular for other very interesting potential applications. Comparatively new is the
application in blood sample analysis and metabolomics. The detector is here not used for the
quantification of the compounds of interest but as a screening tool to determine the sample
clean up efficiency. Many matrix compounds like amino acids, derivatives and physiological
metabolites which could interfere with the actual analysis (suppression of MS-signal) are well
detectable by CAD [1]. In another study the ratio of DAD to CAD response as a compound
specific property is used for peak identification in the blood sample [2].
Another field of application where the detector has been used before but still holds
interesting possibilities is the analysis of excipients. Excipients are often very similar to what
is herein referred to as a challenging analyte. Inorganic salts, polymers for gel formation,
triglycerides, surfactants, starch, sugars, and sugar alcohols belong to the most frequently
applied excipients in pharmaceutical technology. Many of these substances e.g.
polysorbates are mixtures of many similar compounds and the quality is usually verified by a
variety of inconvenient methods such as saponification value, acid and peroxide value. Using
HPLC-CAD it was possible to characterize these surfactants and a relationship between the
composition and their functionality related characteristics like critical micelle concentration,
cloud point and hydrophilic-lipophilic balance was discovered [3]. The analysis of polidocanol
[4], polyethylene glycol [5] and lipids [6] is also described in the literature.
The ability to detect excipients could be used for a future application of the CAD:
fingerprinting of whole formulations (after suitable sample preparation) in order to assign an
unknown sample to a manufacturer or to discover counterfeit drug products in a similar way
like the detector has been used before to verify the authenticity of food products (e.g. olive
oil) [7]. Additional information like MS, UV or DAD chromatograms could be combined with
the CAD chromatogram to retrieve more information from the sample if necessary.
5. Conclusion
In all cases were the CAD could be used for impurity profiling the calibration curves
were sufficiently linear for single point calibration over a small range and quantification limits
were always acceptable for impurity analysis (see Table 1). It could be demonstrated, that
the CAD was capable of detection of difficult analytes and the possibilities of mixed-mode
chromatography in the separation of hydrophilic compounds were outlined. The CAD is a
useful additional detector in impurity profiling increasing the amount of detectable
substances. In cases were the expected impurities are not known it is of particular interest
because the response is for a great part independent of the structure, as long as the analyte
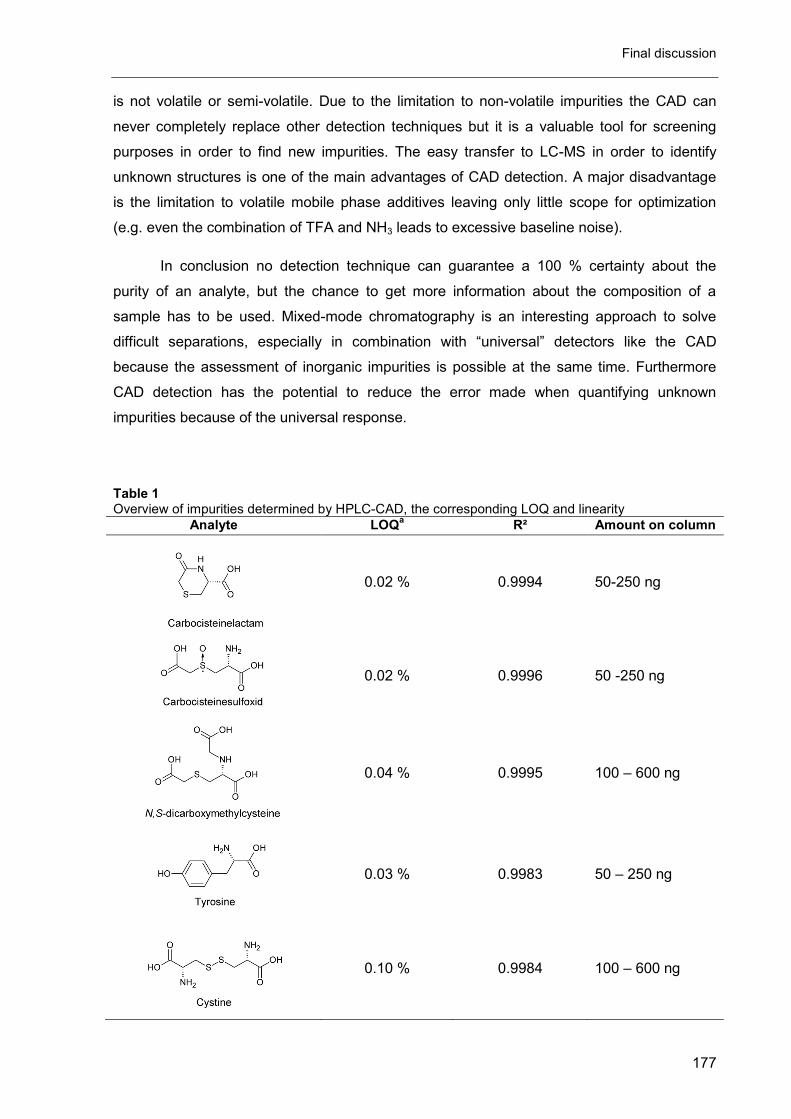
Final discussion
177
is not volatile or semi-volatile. Due to the limitation to non-volatile impurities the CAD can
never completely replace other detection techniques but it is a valuable tool for screening
purposes in order to find new impurities. The easy transfer to LC-MS in order to identify
unknown structures is one of the main advantages of CAD detection. A major disadvantage
is the limitation to volatile mobile phase additives leaving only little scope for optimization
(e.g. even the combination of TFA and NH3 leads to excessive baseline noise).
In conclusion no detection technique can guarantee a 100 % certainty about the
purity of an analyte, but the chance to get more information about the composition of a
sample has to be used. Mixed-mode chromatography is an interesting approach to solve
difficult separations, especially in combination with “universal” detectors like the CAD
because the assessment of inorganic impurities is possible at the same time. Furthermore
CAD detection has the potential to reduce the error made when quantifying unknown
impurities because of the universal response.
Table 1 Overview of impurities determined by HPLC-CAD, the corresponding LOQ and linearity
Analyte LOQa R² Amount on column
0.02 % 0.9994 50-250 ng
0.02 % 0.9996 50 -250 ng
0.04 % 0.9995 100 – 600 ng
0.03 % 0.9983 50 – 250 ng
0.10 % 0.9984 100 – 600 ng
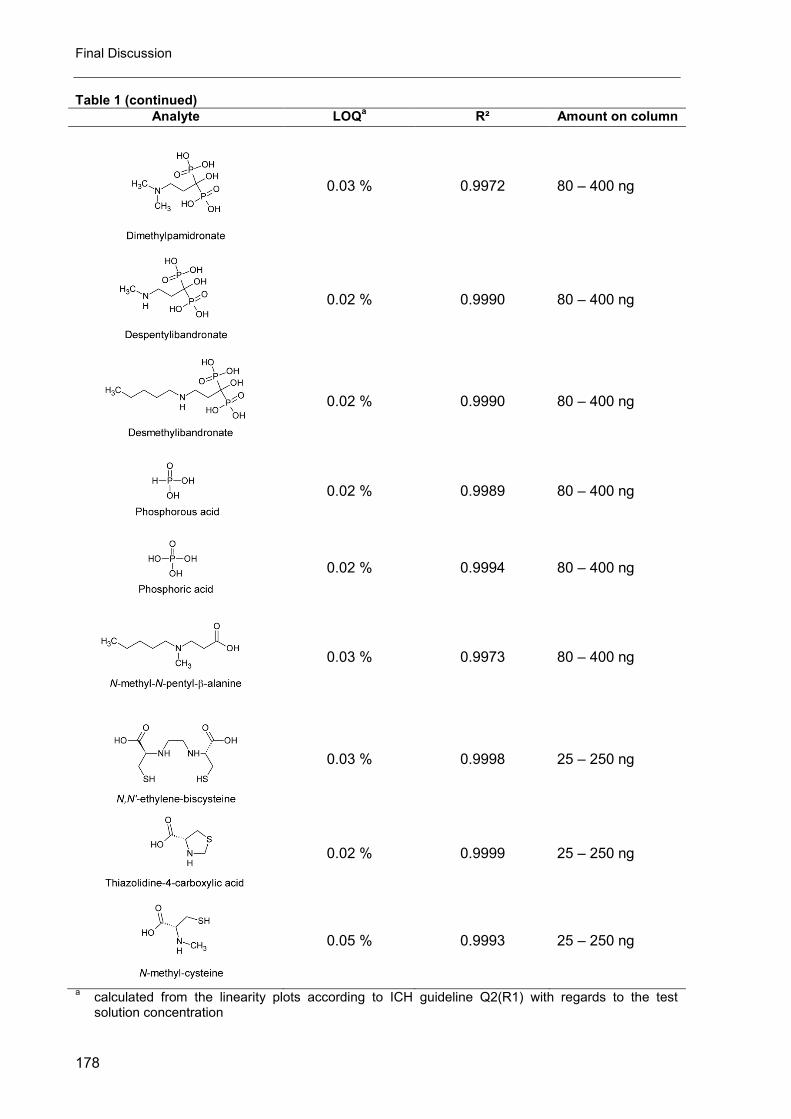
Final Discussion
178
Table 1 (continued)
Analyte LOQa R² Amount on column
0.03 % 0.9972 80 – 400 ng
0.02 % 0.9990 80 – 400 ng
0.02 % 0.9990 80 – 400 ng
0.02 % 0.9989 80 – 400 ng
0.02 % 0.9994 80 – 400 ng
0.03 % 0.9973 80 – 400 ng
0.03 % 0.9998 25 – 250 ng
0.02 % 0.9999 25 – 250 ng
0.05 % 0.9993 25 – 250 ng
a calculated from the linearity plots according to ICH guideline Q2(R1) with regards to the test
solution concentration
Final discussion
179
References
[1] D. Schimek, K.A. Francesconi, A. Mautner, G. Libiseller, R. Raml, C. Magnes, Matrix removal
in state of the art sample preparation methods for serum by charged aerosol detection and
metabolomics-based LC-MS, Anal. Chim. Acta, 915 (2016) 56-63.
[2] J. Viinamäki, I. Ojanperä, Photodiode array to charged aerosol detector response ratio
enables comprehensive quantitative monitoring of basic drugs in blood by ultra-high
performance liquid chromatography, Anal. Chim. Acta, 865 (2015) 1-7.
[3] A.C. Braun, D. Ilko, B. Merget, H. Gieseler, O. Germershaus, U. Holzgrabe, L. Meinel,
Predicting critical micelle concentration and micelle molecular weight of polysorbate 80 using
compendial methods, Eur. J. Pharm. Biopharm., 94 (2015) 559-568.
[4] D. Ilko, S. Puhl, L. Meinel, O. Germershaus, U. Holzgrabe, Simple and rapid high performance
liquid chromatography method for the determination of polidocanol as bulk product and in
pharmaceutical polymer matrices using charged aerosol detection, J. Pharm. Biomed. Anal.,
104 (2015) 17-20.
[5] D.W. Kou, G. Manius, S.D. Zhan, H.P. Chokshi, Size exclusion chromatography with Corona
charged aerosol detector for the analysis of polyethylene glycol polymer, J. Chromatogr. A,
1216 (2009) 5424-5428.
[6] C. Schönherr, S. Touchene, G. Wilser, R. Peschka-Süss, G. Francese, Simple and precise
detection of lipid compounds present within liposomal formulations using a charged aerosol
detector, J. Chromatogr. A, 1216 (2009) 781-786.
[7] J.M. Bosque-Sendra, L. Cuadros-Rodríguez, C. Ruiz-Samblás, A.P. de la Mata, Combining
chromatography and chemometrics for the characterization and authentication of fats and oils
from triacylglycerol compositional data, Anal. Chim. Acta, 724 (2012) 1-11.

Final Discussion
180

181
E
E. Summary
Summary
182
The impurity profiling of pharmaceutical ingredients can oppose many challenges.
The best part of active pharmaceutical ingredients (APIs) and the related substances are
detectable by UV detection, a very common detection principle. However, if an API lacks a
suitable chromophore other means of detection are necessary. The corona charged aerosol
detector (CAD) is a detector capable of detecting substances independent of their chemical
structure. This “universal” detector has only one limitation: The analyte has to have a
sufficiently low vapor pressure. Another important challenge that comes often together with
the lack of a chromophore concerns the separation. These substances (e.g. most amino
acids and derivatives) often contain structures that make them difficult to retain on
conventional reversed phase columns.
Possible solutions to overcome these challenges, like the application of the CAD and
the benefit of so-called mixed-mode stationary phases in impurity profiling for
pharmacopoeial purposes were explored in this work. The related substances analyzed in
this thesis comprise amino acids, inorganic ions, bisphosphonic acids, basic and acidic
derivatives of amino acids (esters and amides).
The successful development and validation of mixed-mode liquid chromatography
methods with CAD detection for carbocisteine and ibandronate sodium might help to
increase the acceptance of this versatile detector in the pharmaceutical industry and in
official authorities dealing with the determination of related substances.
The combination of UV and CAD detection proved very useful during the analysis of
Bicisate. Most of the related substances and some unidentified impurities were detectable by
CAD whereas a synthesis by-product, a semi-volatile ester, was only detectable in the UV
trace. The simple combination covers all relevant impurities in a single analysis.
Two truly orthogonal methods regarding separation and detection for the
enantiomeric purity of magnesium-L-aspartate helped to find the reason for elevated
D-aspartic acid content in the drug substance. A very quick and sensitive indirect separation
using the OPA derivatization with NAC was developed as a powerful screening tool, whereas
the direct separation of D- and L-CBQCA-Asp derivatives confirmed the results. Both
methods were optimized in order to do without substances mentioned on the REACH list, like
sodium tetraborate which is very frequently applied in standard derivatization protocols and
CE separations.
The importance of orthogonal detection principles in the determination of related
substances of amino acids was discussed in a review article dealing with the revision of
amino acid monographs in the Ph. Eur..

183
F
F. Zusammenfassung
Zusammenfassung
184
Die Reinheitsprüfung pharmazeutischer Wirkstoffe kann den Analytiker vor
verschiedene Hürden stellen. So gilt für den größten Teil pharmazeutischer Wirkstoffe und
deren verwandte Substanzen, dass sie mit Hilfe des weit verbreiteten UV-Detektors
nachweisbar sind. Verfügt ein Wirkstoff hingegen nicht über ein geeignetes Chromophor, so
benötigt man andere Möglichkeiten der Detektion. Der corona charged aerosol detector
(CAD) ist in der Lage Substanzen unabhängig von ihrer chemischen Struktur zu detektieren,
vorausgesetzt, sie sind schwerflüchtig. Eine weitere Herausforderung, die häufig mit dem
Fehlen eines Chromophors einhergeht betrifft die Trennung. Verbindungen dieser Art (z.B.
die meisten Aminosäuren und deren Derivate) enthalten häufig Strukturen, die eine
Trennung auf konventionellen Umkehrphasen erschweren.
Mögliche Ansätze um die genannten Herausforderungen zu meistern, wie zum
Beispiel die Verwendung des CAD und sogenannter mixed-mode Phasen in der
pharmazeutischen Reinheitsanalytik wurden erarbeitet und an konkreten Anwendungen
erprobt. Die in dieser Arbeit bestimmten verwandten Substanzen sind vor allem
Aminosäuren, anorganische Ionen, Bisphosphonate sowie basische und saure Derivate von
Aminosäuren (Ester und Amide).
Die erfolgreiche Entwicklung und Validierung von mixed-mode flüssig-
chromatographischer Methoden kombiniert mit CAD für Carbocistein und Ibandronat Natrium
könnte dabei helfen die Akzeptanz in der Pharmazeutischen Industrie und bei den für
Reinheitsprüfungen zuständigen Behörden für diesen vielseitigen Detektor zu verbessern.
Die Kombination von UV-Detektion und CAD erwies sich bei der Analyse von Bicisate
als sehr nützlich. Die meisten verwandten Substanzen und einige unbekannte
Verunreinigungen konnten mittels CAD detektiert werden, während ein Nebenprodukt der
Synthese, ein halb-flüchtiger Ester, nur mit Hilfe des UV Detektors sichtbar war. Die
Kombination zweier Detektionstechniken ermöglichte die Bestimmung aller relevanten
Verunreinigungen in einer einzigen Analyse.
Die Bestimmung der optischen Reinheit von Magnesium-L-Aspartat gelang mittels
zweier orthogonaler Methoden und der Grund für das Auftreten von erhöhten
Konzentrationen an D-Aspartat wurde gefunden. Eine schnelle indirekte Bestimmung der
OPA/NAC-Derivate eignete sich als Screening-tool, während die direkte Trennung der
enantiomeren CBQCA-Derivate die Ergebnisse bestätigte. Beide Methoden wurden im
Hinblick darauf optimiert, dass sie ohne Substanzen wie Natriumtetraborat, eine Substanz
auf der REACH Liste für besonders besorgniserregende Substanzen, sowie gebräuchlicher
Puffer bei Derivatisierungsreaktionen und CZE Trennungen, auskamen.
Zusammenfassung
185
Die Bedeutung von orthogonalen Detektionstechniken bei der Bestimmung der
verwandten Substanzen von Aminosäuren wurde in einem Übersichtsartikel, der in
Zusammenhang mit der Revision von Aminosäuren Monographien des Europäischen
Arzneibuches steht, diskutiert.

Zusammenfassung
186

187
G
G. Appendix
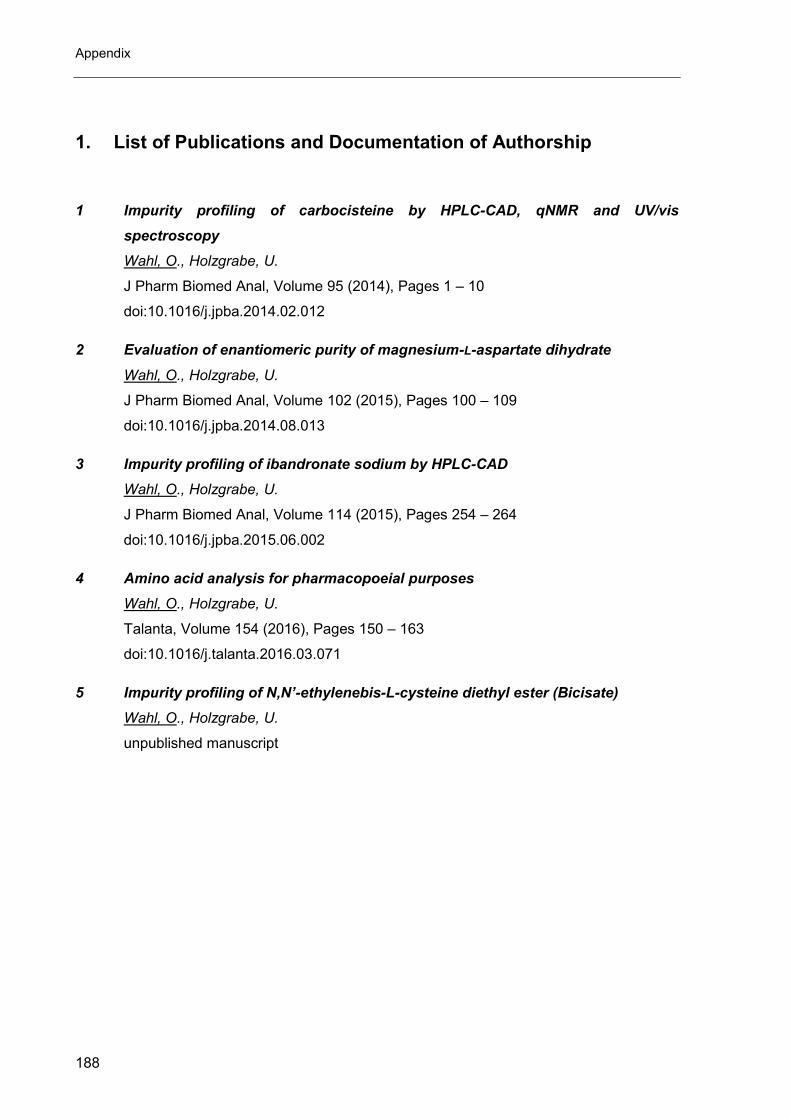
Appendix
188
1. List of Publications and Documentation of Authorship
1 Impurity profiling of carbocisteine by HPLC-CAD, qNMR and UV/vis
spectroscopy
Wahl, O., Holzgrabe, U.
J Pharm Biomed Anal, Volume 95 (2014), Pages 1 – 10
doi:10.1016/j.jpba.2014.02.012
2 Evaluation of enantiomeric purity of magnesium-L-aspartate dihydrate
Wahl, O., Holzgrabe, U.
J Pharm Biomed Anal, Volume 102 (2015), Pages 100 – 109
doi:10.1016/j.jpba.2014.08.013
3 Impurity profiling of ibandronate sodium by HPLC-CAD
Wahl, O., Holzgrabe, U.
J Pharm Biomed Anal, Volume 114 (2015), Pages 254 – 264
doi:10.1016/j.jpba.2015.06.002
4 Amino acid analysis for pharmacopoeial purposes
Wahl, O., Holzgrabe, U.
Talanta, Volume 154 (2016), Pages 150 – 163
doi:10.1016/j.talanta.2016.03.071
5 Impurity profiling of N,N’-ethylenebis-L-cysteine diethyl ester (Bicisate)
Wahl, O., Holzgrabe, U.
unpublished manuscript
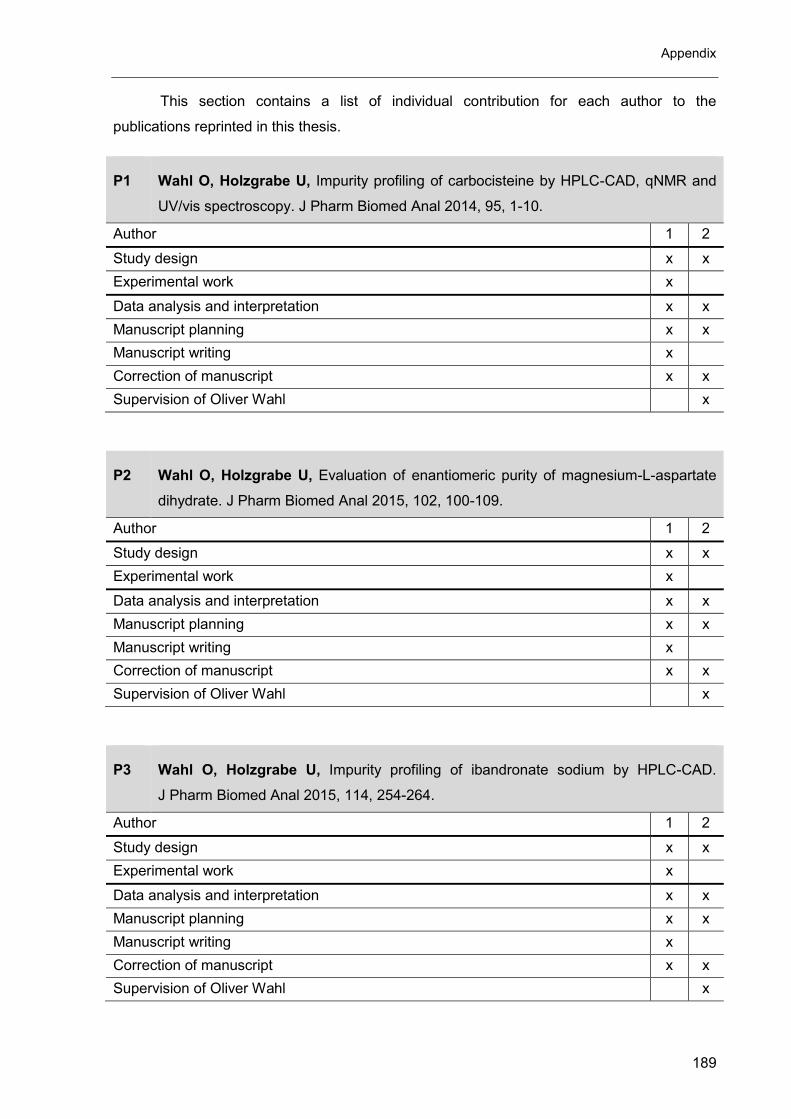
Appendix
189
This section contains a list of individual contribution for each author to the
publications reprinted in this thesis.
P1 Wahl O, Holzgrabe U, Impurity profiling of carbocisteine by HPLC-CAD, qNMR and
UV/vis spectroscopy. J Pharm Biomed Anal 2014, 95, 1-10.
Author 1 2
Study design x x
Experimental work x
Data analysis and interpretation x x
Manuscript planning x x
Manuscript writing x
Correction of manuscript x x
Supervision of Oliver Wahl x
P2 Wahl O, Holzgrabe U, Evaluation of enantiomeric purity of magnesium-L-aspartate
dihydrate. J Pharm Biomed Anal 2015, 102, 100-109.
Author 1 2
Study design x x
Experimental work x
Data analysis and interpretation x x
Manuscript planning x x
Manuscript writing x
Correction of manuscript x x
Supervision of Oliver Wahl x
P3 Wahl O, Holzgrabe U, Impurity profiling of ibandronate sodium by HPLC-CAD.
J Pharm Biomed Anal 2015, 114, 254-264.
Author 1 2
Study design x x
Experimental work x
Data analysis and interpretation x x
Manuscript planning x x
Manuscript writing x
Correction of manuscript x x
Supervision of Oliver Wahl x
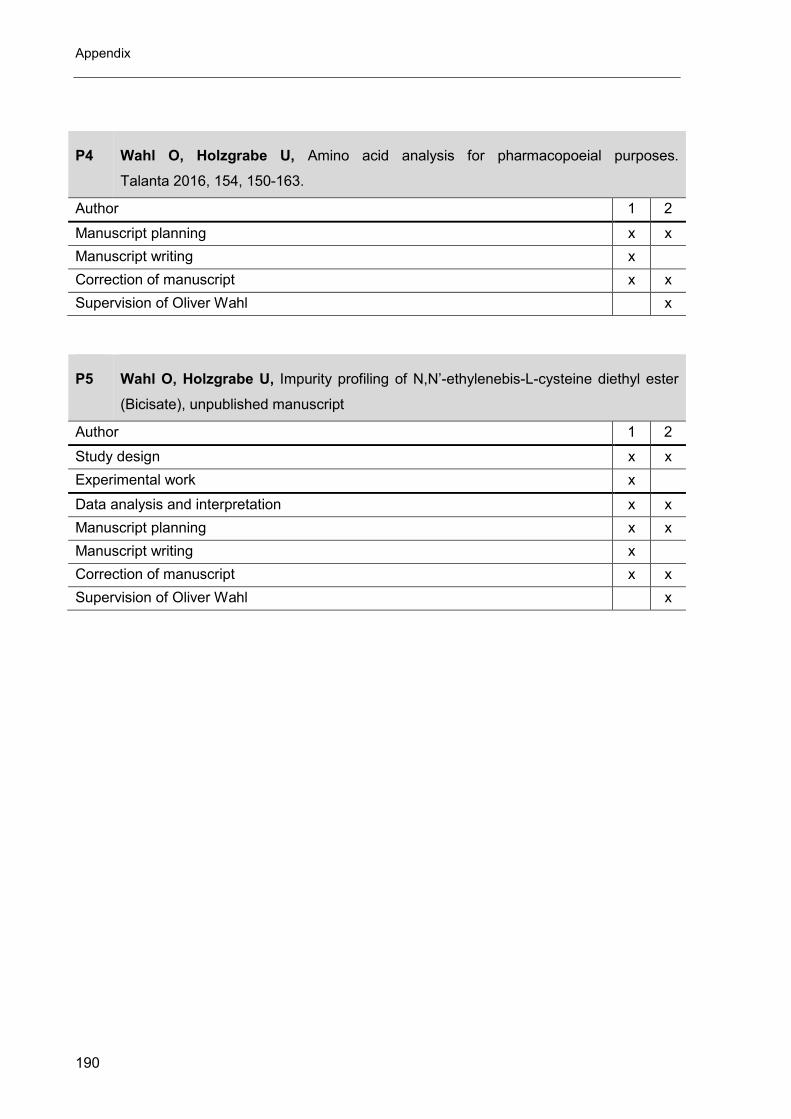
Appendix
190
P4 Wahl O, Holzgrabe U, Amino acid analysis for pharmacopoeial purposes.
Talanta 2016, 154, 150-163.
Author 1 2
Manuscript planning x x
Manuscript writing x
Correction of manuscript x x
Supervision of Oliver Wahl x
P5 Wahl O, Holzgrabe U, Impurity profiling of N,N’-ethylenebis-L-cysteine diethyl ester
(Bicisate), unpublished manuscript
Author 1 2
Study design x x
Experimental work x
Data analysis and interpretation x x
Manuscript planning x x
Manuscript writing x
Correction of manuscript x x
Supervision of Oliver Wahl x
Appendix
191
Erklärung zu den Eigenanteilen des Doktoranden an Publikationen und
Zweitpublikationsrechten bei einer kumulativen Dissertation.
Für alle in dieser kumulativen Dissertation verwendeten Manuskripte liegen die notwendigen
Genehmigungen der Verlage („reprint permissions“) für die Zweitpublikation vor, außer das
betreffende Kapitel ist nicht publiziert. Dieser Umstand wird einerseits durch die genaue
Angabe der Literaturstelle der Erstpublikation auf der ersten Seite des betreffenden Kapitels
deutlich gemacht oder die bisherige Nichtveröffentlichung durch den Vermerk „unpublished“
oder „nicht veröffentlicht“ gekennzeichnet.
Die Mitautorin der in dieser kumulativen Dissertation verwendeten Manuskripte ist sowohl
über die Nutzung als auch über die oben angegebenen Eigenanteile informiert.
Die Beiträge der Mitautorin an den Publikationen sind in den vorausgehenden Tabellen
aufgeführt.
Prof. Dr. Ulrike Holzgrabe ________________ _______________________
Ort, Datum Unterschrift
Oliver Wahl ________________ _______________________
Ort, Datum Unterschrift
Appendix
192
2. Conference contributions
Wahl, O., Holzgrabe, U.
Tests for related substances of amino acids by HPLC-CAD
Pharmaceutical and Biomedical Analysis 2013, Bologna
Wahl, O., Holzgrabe, U.
Enantiomeric purity of Magnesium bis(L-hydrogenaspartate) dihydrate
DPhG Jahrestagung 2014, Frankfurt a. M.
Appendix
193
3. Abbreviations
AAA amino acid analysis
APCI atmospheric-pressure chemical ionization
APPI atmospheric-pressure photoionization
AU absorbance unit
BGE background electrolyte
BHT butylated hydroxytoluene
C4D capacitively coupled contactless conductivity detector
CAD corona charged aerosol detector
CBQCA 3-(4-carboxybenzoyl)quinolone-2-carboxaldehyde
CE capillary electrophoresis
CD cyclodextrin
CLEC chiral ligand-exchange
CNLD chemiluminescent nitrogen detector
CNLSD condensation nucleation light scattering detector
CS chiral selector
CZE capillary zone electrophoresis
DBTAAN (+)-dibenzoyl-L-tartaric anhydride
ECD electrochemical detector
EI electron impact ionization
ELSD evaporative light scattering detector
EOF electroosmotic flow
ESI electrospray ionization
FDAA Nα-(2,4-Dinitro-5-fluorophenyl)-L-alaninamide
FIA flow-injection analysis
FITC fluoresceine isothiocyanate
FLD fluorescence detector
FLEC (-)-1-(9-Fluorenyl)ethyl chloroformate
FMOC-Cl fluorenylmethoxycarbonyl chloride
FQ 3-(2-furoyl) quinoline-2-carboxaldehyde
GITC 2,3,4,6-tetra-O-acetyl-β-D-glucopyranosyl isothiocyanate
HILIC hydrophilic interaction liquid chromatography
IEX ion exchange
IPC ion-pair chromatography
LED light emitting diode
LOD limit of detection
LOQ limit of quantification
MEEKC micro emulsion electrokinetik chromatography
MEKC micellar electrokinetik chromatography
MMC mixed mode chromatography
MRM multiple reaction monitoring
Appendix
194
MTPA-Cl (S)-(+)-α-methoxy-α-trifluoromethylphenylacetyl chloride
NAC N-acetyl-L-cysteine
NBC N-n-butyryl-L-cysteine
NDA naphthalene-2,3-dicarboxaldehyde
NiBC N-isobutyryl-L-cysteine
NQAD nano-quantity analyte detector
OPA o-phthaldialehyde
Ph. Eur. European pharmacopoeia
PITC phenylisothiocyanate
QqQ triple quadrupole mass spectrometer
qTOF quadrupole time-of-flight mass spectrometer
RID refractive index detector
RP reversed phase
SAX strong anion exchange
SCX strong cation exchange
TATG 2,3,4,6-Tetra-O-acetyl-1-thio-β-D-glucopyranoside
TFA trifluoroacetic acid
TG 1-thio-β-D-glucopyranose
TOF time-of-flight mass spectrometer
USP United States pharmacopoeia
WAX weak anion exchange
WCX weak cation exchange


![University of Groningen Cerebral Palsy Einspieler, Christa ...Introduction Facilitating integration between the health care and social sectors is important but challenging [1–4].](https://static.fdokument.com/doc/165x107/60c422ca1413ee2e476af52e/university-of-groningen-cerebral-palsy-einspieler-christa-introduction-facilitating.jpg)


![MODULHANDBUCH Masterstudiengang Arzneimittelforschung 4 ...€¦ · 2 . Modulprüfung - Mündliche Abschlussprüfung 1. SUMME 6. 9 [II / AFL] Basics in pharmaceutical formulation](https://static.fdokument.com/doc/165x107/5e12ddf49c7bd447a23227ce/modulhandbuch-masterstudiengang-arzneimittelforschung-4-2-modulprfung-.jpg)