Influence of Exercise on Circulating Human Hematopoietic ...
77
Dissertation Influence of Exercise on Circulating Human Hematopoietic Stem and Progenitor Cells submitted by Mag.rer.nat. BSc Julia Maria KRÖPFL For the Academic Degree of Doktorin der medizinischen Wissenschaft (Dr. scient. med.) at the Medical University of Graz Institute of Biophysics under supervision of Univ.-Prof. Mag. Dr. Wolfram MÜLLER O.Univ.-Prof. Dr.med.univ. Gottfried DOHR Assoz. Prof. Priv.-Doz. Mag. Dr.rer.nat. Sandra WALLNER-LIEBMANN 2013
Transcript of Influence of Exercise on Circulating Human Hematopoietic ...

Dissertation
Influence of Exercise on
Circulating Human Hematopoietic
Stem and Progenitor Cells
submitted by
Mag.rer.nat. BSc
Julia Maria KRÖPFL
For the Academic Degree of
Doktorin der medizinischen Wissenschaft
(Dr. scient. med.)
at the
Medical University of Graz
Institute of Biophysics
under supervision of
Univ.-Prof. Mag. Dr. Wolfram MÜLLER
O.Univ.-Prof. Dr.med.univ. Gottfried DOHR
Assoz. Prof. Priv.-Doz. Mag. Dr.rer.nat. Sandra WALLNER-LIEBMANN
2013

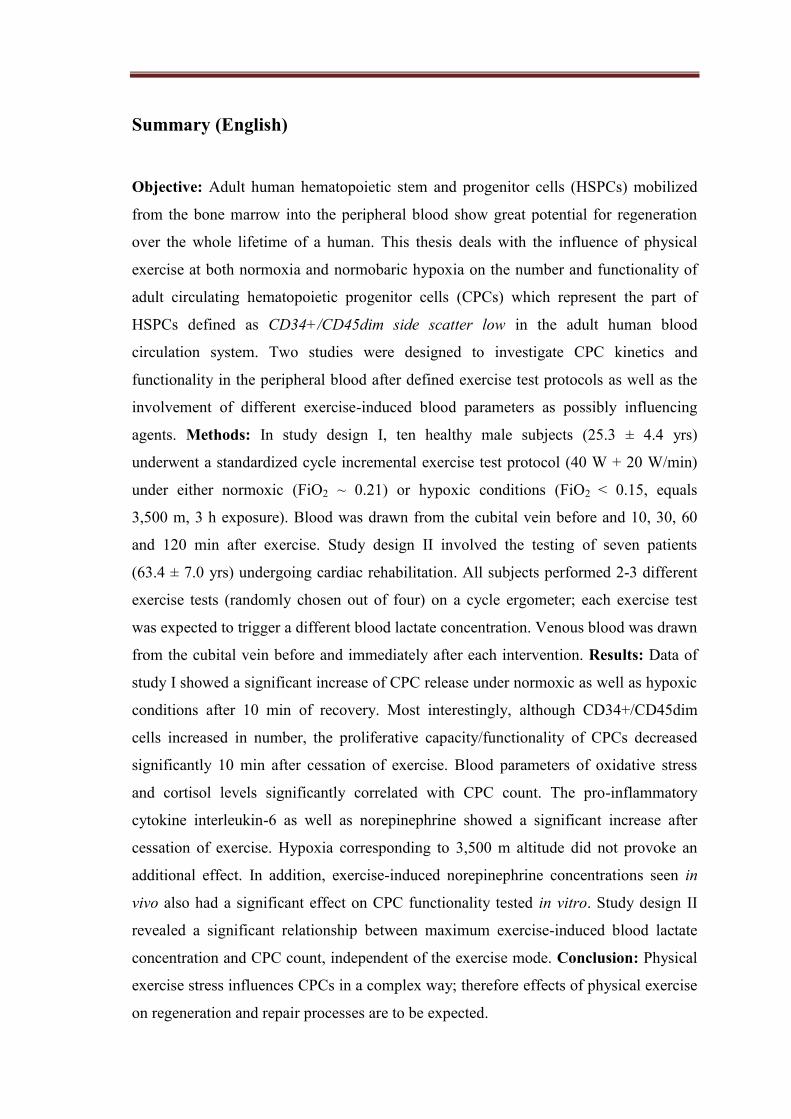
Summary (English)
Objective: Adult human hematopoietic stem and progenitor cells (HSPCs) mobilized
from the bone marrow into the peripheral blood show great potential for regeneration
over the whole lifetime of a human. This thesis deals with the influence of physical
exercise at both normoxia and normobaric hypoxia on the number and functionality of
adult circulating hematopoietic progenitor cells (CPCs) which represent the part of
HSPCs defined as CD34+/CD45dim side scatter low in the adult human blood
circulation system. Two studies were designed to investigate CPC kinetics and
functionality in the peripheral blood after defined exercise test protocols as well as the
involvement of different exercise-induced blood parameters as possibly influencing
agents. Methods: In study design I, ten healthy male subjects (25.3 ± 4.4 yrs)
underwent a standardized cycle incremental exercise test protocol (40 W + 20 W/min)
under either normoxic (FiO2 ~ 0.21) or hypoxic conditions (FiO2 < 0.15, equals
3,500 m, 3 h exposure). Blood was drawn from the cubital vein before and 10, 30, 60
and 120 min after exercise. Study design II involved the testing of seven patients
(63.4 ± 7.0 yrs) undergoing cardiac rehabilitation. All subjects performed 2-3 different
exercise tests (randomly chosen out of four) on a cycle ergometer; each exercise test
was expected to trigger a different blood lactate concentration. Venous blood was drawn
from the cubital vein before and immediately after each intervention. Results: Data of
study I showed a significant increase of CPC release under normoxic as well as hypoxic
conditions after 10 min of recovery. Most interestingly, although CD34+/CD45dim
cells increased in number, the proliferative capacity/functionality of CPCs decreased
significantly 10 min after cessation of exercise. Blood parameters of oxidative stress
and cortisol levels significantly correlated with CPC count. The pro-inflammatory
cytokine interleukin-6 as well as norepinephrine showed a significant increase after
cessation of exercise. Hypoxia corresponding to 3,500 m altitude did not provoke an
additional effect. In addition, exercise-induced norepinephrine concentrations seen in
vivo also had a significant effect on CPC functionality tested in vitro. Study design II
revealed a significant relationship between maximum exercise-induced blood lactate
concentration and CPC count, independent of the exercise mode. Conclusion: Physical
exercise stress influences CPCs in a complex way; therefore effects of physical exercise
on regeneration and repair processes are to be expected.

Zusammenfassung (German)
Zielsetzung: Aus dem Knochenmark mobilisierte adulte humane hämatopoetische
Stamm- und Progenitorzellen (HSPZ) spielen für körperliche Regenerationsprozesse
lebenslang eine wichtige Rolle. Diese Dissertation behandelt den Einfluss von
körperlicher Belastung unter Normoxie sowie auch Hypoxie auf Anzahl und
Funktionalität adulter zirkulierender hämatopoetischer Progenitorzellen (ZPZ), die
CD34+/CD45dim side scatter low HSPZ im peripheren Blut darstellen. Zwei Studien
Designs wurden konzipiert um die ZPZ Kinetik und Funktionalität im peripheren Blut
einerseits nach definierten Bewegungsprotokollen zu erfassen sowie auch die
Beteiligung von bewegungsinduzierten Blutparametern als mögliche Einflussfaktoren
zu untersuchen. Methoden: In Studie I wurden zehn gesunde, männliche Probanden
(25.3 ± 4.4 Jahre) einer standardisierten Rad-Ergometrie (40 W + 20 W/Min) unter
normoxischen (FiO2 ~ 0.21) als auch hypoxischen Bedingungen (FiO2 < 0.15, entspricht
3500 m, für 3 h) unterzogen. Blut wurde sowohl vor als auch 10, 30, 60 und 120
Minuten nach Belastung aus der Ellenbeuge entnommen. Studie II testete sieben
Patienten (63.4 ± 7.0 Jahre) in der kardiologischen Rehabilitation. Alle Probanden
führten 2-3 unterschiedliche Belastungstests (zufällig ausgewählt aus vier) auf einem
Rad-Ergometer durch; jedes Belastungsprotokoll sollte eine andere Blutlaktat-
Konzentration hervorrufen. Ergebnisse: Studie I zeigte eine signifikante Erhöhung der
ZPZ Ausschüttung 10 min nach Ende der Belastung unter normoxischen als auch
hypoxischen Bedingungen. Interessanterweise verringerte sich die Funktionalität der
ZPZ 10 Minuten nach Ende der Belastung signifikant, obwohl sich die Anzahl an
CD34+/CD45dim Zellen erhöhte. Oxidative Stressparameter und Cortisol korrelierten
signifikant mit dem ZPZ Level. Interleukin-6 als auch Noradrenalin (NA) zeigten einen
signifikanten Anstieg nach Ende der Belastung. Hypoxie auf einer Höhe von 3500 m
ergab keinen zusätzlichen Einfluss. Die in vivo ermittelte bewegungsinduzierte NA-
Konzentration zeigte ebenfalls einen signifikanten Effekt auf die ZPZ Funktionalität in
vitro. Studie II enthüllte eine signifikante Korrelation zwischen der maximal
akkumulierten Blutlaktat-Konzentration und der Anzahl an ZPZ unabhängig vom
Bewegungsprotokoll. Conclusio: Der Stress körperlicher Belastung beeinflusst die ZPZ
Anzahl und Funktionalität in sehr komplexer Weise und könnte somit bei Regeneration
und Reparaturmechanismen eine wichtige Rolle spielen.
Table of contents
1
Introduction
1.1 The fate of adult hematopoietic stem and progenitor cells in
the bone marrow: Hematopoiesis 1
1.2 The environment makes the rule 3
1.3
Possible trigger mechanisms for HSPCs from the bone
marrow to the peripheral blood
5
1.4
Possible signaling cascades triggered by exercise forcing
HSPCs to the peripheral blood
5
1.5 Hematopoietic stem and progenitor cells in the peripheral
blood: number and functionality 7
1.6 Aim of the thesis and research questions 8
2
Methods
2.1 Subjects and study designs 9
2.2 Used exercise test protocols 11
2.3 Nutritious anamnesis: 24 h-recall 12
2.4 Blood sample collection and post-processing 13
2.5 Analysis of circulating hematopoietic progenitor cells 13
2.5.1 FACS Calibur baseline 15
2.6 Primary and secondary colony forming unit (CFU) assays 15
2.7 Analysis of secondary colony forming unit (CFU) assays 17
2.8 Evaluation of oxidative stress parameters (MDA, MPO) 18
2.9 Evaluation of inflammatory parameters (IL-6) 18
2.10 Determination of stress hormones (cortisol, norepinephrine) 18
2.11 Reevaluation of in vivo study results in vitro
(study I) 19
2.12 Statistics 20

3
Results
3.1 Results of study I 21
3.1.1 Exercise performance evaluation 21
3.1.2 Nutritious status 21
3.1.3 Blood cell counts 21
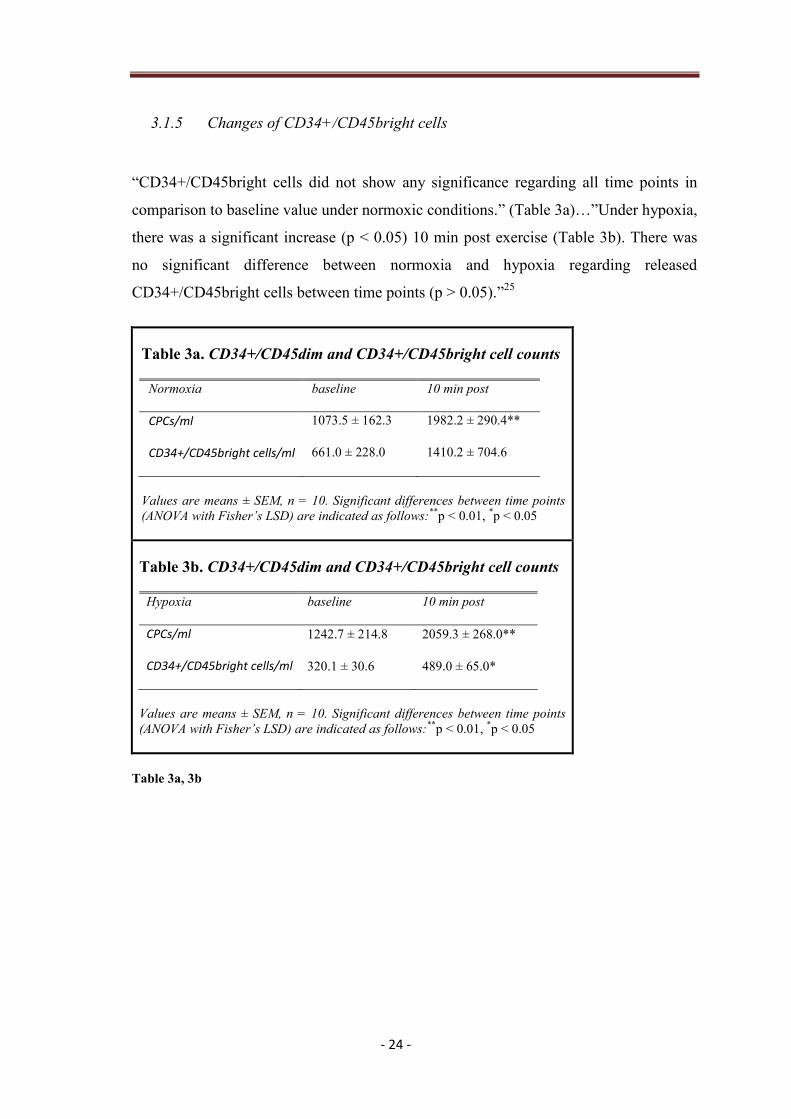
3.1.4 Changes of CD34+/CD45dim cells 23
3.1.5 Changes of CD34+/CD45bright cells 24
3.1.6 Primary CFU assays with EPO 25
3.1.7 Secondary CFU assays 26
3.1.8 Kinetics of oxidative stress parameters 27
3.1.9 Relationship of CPC release to oxidative stress values 29
3.1.10 Inflammatory parameter kinetics (interleukin-6) 33
3.1.11 Cortisol and norepinephrine kinetics 34
3.1.12 Influence of norepinephrine and lactate on HSPC
functionality 37
3.2 Results of study II 38
3.2.1. Influence of blood lactate on HSPC mobilization 38
4
Discussion
A HSPC kinetics before/after exercise 39
B Influence of hypoxia on HSPC mobilization 40
C HSPC functionality before/after exercise 41
D Influence of oxidative stress parameters (MDA, MPO)
on HSPC mobilization
42
E Influence of inflammatory parameters (IL-6) on HSPC
mobilization
43

F Influence of stress hormones (cortisol, norepinephrine)
on HSPC mobilization
44
G Influence of norepinephrine and lactate on HSPC
functionality 45
H Influence of blood lactate on HSPC mobilization 47
4.1 Limitations to study design I 48
4.2 Limitations to study design II 48
5 Conclusion and Outlook
5.1 Summary of the effect of exercise on HSPCs 49
5.2 Importance for clinical applications 52
6
References 54
7
Abbreviations 63
8
Annex: additional publications and awards 65
Acknowledgements 68
Declaration 70

- 1 -
1 Introduction
1.1 The fate of adult hematopoietic stem and progenitor cells in the bone marrow:
Hematopoiesis
Hematopoietic stem and progenitor cells (HSCs) are responsible for substituting a
person’s blood cells during the whole lifetime. Chute et al. (2010) summarized the
current knowledge regarding hematopoiesis in one of their articles in 20101 (Fig. 1).
HSCs can be subdivided into long- (LTHSC) and short-term (STHSC) repopulating
stem cells within the bone marrow, depending on how long their self-renewal ability
lasts. A multipotent progenitor cell (MPP) can evolve in both leucocyte and erythrocyte
lineages by a common myeloid progenitor cell (CMP) or can also develop into the
lymphoid lineage by a common lymphoid progenitor cell (CLP). The leucocyte lineage
is characterized by granulocyte monocyte progenitor cells (GMP) that develop to
monocytes, and eosinophil, basophil or neutrophil granulocytes, whereas the origin of
the erythrocyte lineage is the megakaryocyte-erythroid progenitor cell (MEP) that
subsequently forms red blood cells (RBCs) and megakaryocytes. The CLP development
ends either in B- or T-cells. Self-renewal ability and therefore functionality of these
progenitor cells can be proofed by different types of repopulating assays (CRU,
competitive repopulating unit assay; CFU-Spleen, colony forming unit-spleen assay;
CFC-D 14, colony-forming cell assay, incubation for 14 days).
Each hematopoietic stem cell pool has its own characteristics. The main criteria
defining HSCs are specific surface proteins that can be useful in separating HSCs from
other stem cell types2. In general you can subdivide into three different kinds of stem
cells that can be isolated from the bone marrow: hematopoietic (HSCs), endothelial
(ESCs) and mesenchymal (MSCs) stem cells for blood, vascular and structural
development and repair. According to Lancrin et al. (2009) endothelial stem cells have
the same origin as hematopoietic stem cells called the hemangioblast3. This is why it is
very important to exactly define the surface profile of target cells in order to separate
these two populations. Both populations are marked with the CD34 surface protein, but
ESCs are CD45 negative. Therefore it is possible to derive a more or less pure
population of hematopoietic stem and progenitor cells (HSPCs) by using a

- 2 -
CD34+/CD45dim side scatter low (CD34+/CD45dim SSClow) antibody combination in
a cell sorting analysis (flow cytometry) that will be described in detail in the methods
section of this thesis.
Figure 1: The fate of hematopoietic stem cells during hematopoiesis, reproduced with permission from
Chute et al. (2010)1. Phenotypes and functional assays used to characterize each of the individual stem-
and progenitor cell pools are shown. Erythrocytes (RBC) are the carriers of oxygen in the blood;
leucocytes (monocytes, granulocytes, lymphocytes) are responsible for the immune system and
thrombocytes, build from megacaryocytes in the bone marrow, are important for blood coagulation.
LTHSC, Long-term repopulating hematopoietic stem cell; STHSC, short-term repopulating hematopoietic
stem cell; MPP, multipotent progenitor cell; CMP, common myeloid progenitor cell; MEP,
megakaryocyte-erythroid progenitor cell; GMP, granulocyte monocyte progenitor cell; CLP, common
lymphoid progenitor cell; RBC, red blood cell; 34-KLS, CD34-c-kit+lineage-sca-1+ cells; CRU,
competitive repopulating unit assay; CFU-Spleen, colony forming unit-spleen assay; CFC, colony-
forming cell assay, day 14;

- 3 -
1.2 The environment makes the rule
In the bone marrow HSCs are sitting in a microenvironment called the stem cell niche4.
This niche is made up of supportive non-hematopoietic cell populations, such as
mesenchymal stromal cells, adipocytes, endothelial cells and an extracellular matrix
consisting of fibronectin, collagen, proteoglycans, heparins and binding sites for
signaling molecules. These micro-environmental cellular and matrix components supply
cytokines and cell-cell signals important for maintenance of steady-state hematopoiesis
and a rapid response to hematopoietic demand involving mobilization processes5.
Depending on their surrounding influences HSCs are driven into different development
stages. Li summarized in 2011 the possible stages of HSCs during their development6:
1.relative quiescence, 2. self-renewal and 3. ability to differentiate into multiple
lineages. Usually most HSCs present in the bone marrow remain quiescent and only few
of them enter the cell cycle towards differentiation. Self-renewal and differentiation are
the most important features of stem cells, which enable them to give rise to themselves
and at the same time differentiate into more mature cells, which is called asymmetric
cell division. Stem cells, however, can also do symmetric cell division by only
increasing the existing number of their kind, which is needed after injuries,
chemotherapy or engraftment after hematopoietic stem cell transplantation in order to
have enough cells to participate in regeneration processes. A defining feature of stem
cells is their ability to periodically divide in a symmetric as well as an asymmetric way.
The molecular switch between symmetric and asymmetric cell division, however, still
remains elusive7.
The strict regulation of these two different division processes is very important in order
to maintain tissue homoeostasis and a functioning stem cell pool in the bone marrow.
Extrinsic (such as bone-lining osteoblast cells and stem cell factor signaling, Wnt or
hedgehog signaling pathways) and intrinsic regulators (such as different transcription
factors e.g. p53 or Lnk) make the decision between relative quiescence, self-renewal
and differentiation6.Once on the path of differentiation, HSPCs can be mobilized to
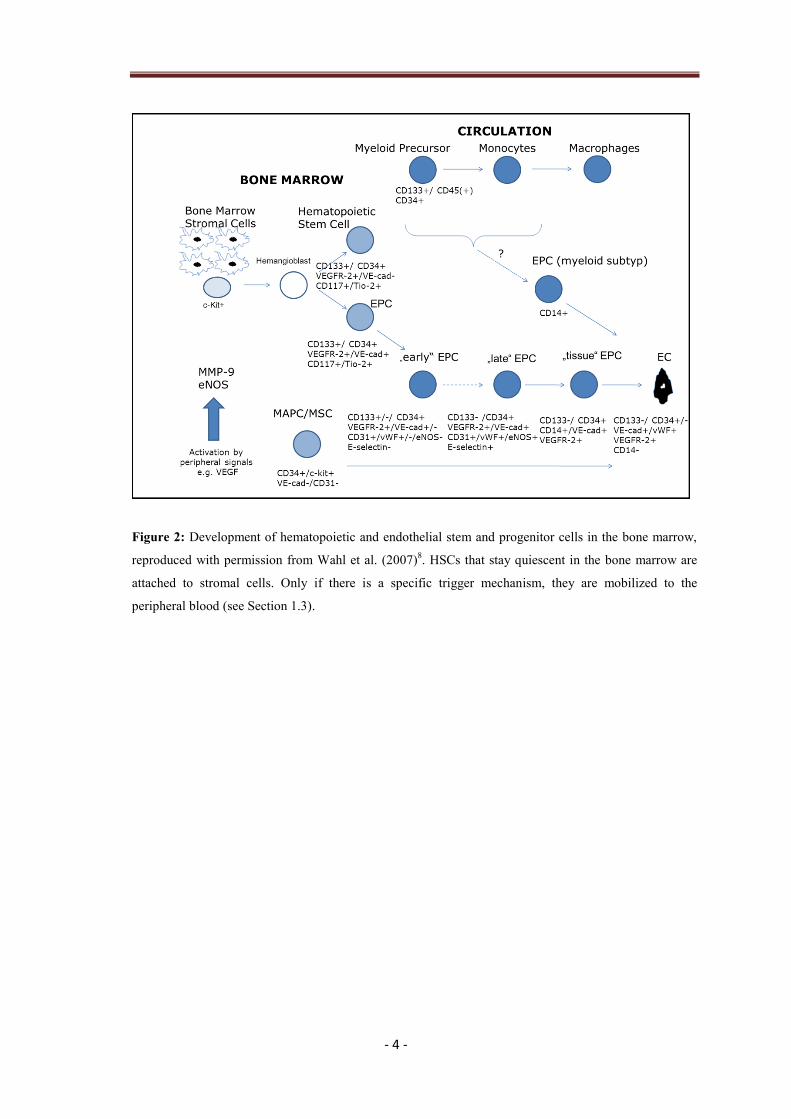
leave the bone marrow and enter circulation8 (Fig. 2), triggered by different factors.
- 4 -
Figure 2: Development of hematopoietic and endothelial stem and progenitor cells in the bone marrow,
reproduced with permission from Wahl et al. (2007)8. HSCs that stay quiescent in the bone marrow are
attached to stromal cells. Only if there is a specific trigger mechanism, they are mobilized to the
peripheral blood (see Section 1.3).
- 5 -
1.3 Possible trigger mechanisms for HSPCs from the bone marrow to the
peripheral blood
Under normal conditions, there are few HSPCs in the peripheral blood, approximately
one of 10 000 cells (0.01 % of blood cells). There are various trigger mechanisms that
are responsible for mobilizing HSPCs from the bone marrow to the circulation. Lanza et
al. (2004) summarized some experimental models for stem cell mobilization5: Very well
documented ways of forcing HSPCs to leave the bone marrow are the injections of
cytokines, signaling molecules such as stem cell factor 1 (SCF-1), colony stimulating
factors (CSFs), different Interleukins (IL-3, IL-5, IL-6, IL-7) or growth factors (such as
erythropoietin). These procedures also find broad clinical applications and are highly
researched especially in leukemia settings, whereas HSPC mobilization by granulocyte
colony-stimulating factor is seen as the gold standard today9, 10
. Other mechanisms to
release HSPCs from the bone marrow of humans is to externally stress the body through
either e.g. a hypoxic environment11
or physical exercise12, 13
.
1.4 Possible signaling cascades triggered by exercise forcing HSPCs to the
peripheral blood
Exercise has an effect on the bone marrow and triggers HSPCs to the circulation, ideally
to places of tissue defects, where regeneration is needed. Wahl et al. (2007)
hypothesizes two possible signaling cascades triggered by exercise for endothelial
progenitor cell (EPC) and HSPC mobilization8: Exercise-induced elevated oxygen
consumption forces tissue hypoxia and ischemia in the blood, which in turn elevates
transcription factors and growth hormones that could trigger stem and progenitor cells.
Another signaling cascade could be the exercise-induced elevated blood flow increasing
shear stress in blood vessels and therefore also raising needed growth hormones for
stem and progenitor mobilization (Fig. 3). And it is even possible that there are other
triggers that are not yet identified, such as the exercise-induced increase in reactive
oxygen species, measured by blood parameters of oxidative stress (such as
malondialdehyd or myeloperoxidase), increased pro-inflammatory cytokines (such as
interleukin-6), elevated stress hormones (such as cortisol or norepinephrine) or physical
strain (indicated by a raised blood lactate concentration).

- 6 -
It is very likely that the effect of exercise on hematopoietic stem and progenitor cells is
a combination of the possible trigger mechanisms named above. One goal of this thesis
was to evaluate the importance of different exercise-induced factors for hematopoietic
stem and progenitor cell mobilization as well as cell number and functionality in the
peripheral blood.
Figure 3: Possible signaling cascades triggered by exercise, reproduced and modified with permission
from Wahl et al. (2007)8. Exercise increases body functions such as oxygen consumption or blood flow
through the vascular system which in-turn raise transcription factors and growth hormones needed for
mobilization.

- 7 -
1.5 Hematopoietic stem and progenitor cells in the peripheral blood: number and
functionality
The positive influence of exercise on circulating hematopoietic progenitor cell (CPC)
number has well been documented. Morici et al. (2005) showed an increase of
hematopoietic progenitor levels after 1,000 m all-out rowing exercise14
, whereas
Bonsignore et al (2002) found an increase of circulating hematopoietic progenitor cells
after a marathon12
.Muscle electrostimulation or hypobaric hypoxia on their own did not
force progenitor mobilization, but the combination of both stimuli achieved this15
.
Thijssen et al. (2006) suggested that baseline and exercise-induced numbers of HSCs
and EPCs were not dependent on a person’s training status13
. Laufs et al. (2005) found a
maximal increase of progenitors 10-30 min after intensive running16
, whereas Moebius-
Winkler et al. found the peak-point of CD34+ cells 210 min after the onset of 4 h
constant-load exercise17
. One main goal of this thesis was to identify the kinetics of
CPCs in the peripheral blood after a standardized cycle incremental step test protocol
(ergometry).
When talking about exercise, it is also important to think about the involvement of stem
and progenitor cells in regeneration processes that are occurring with physical activity18-
20. Since not only the number of CPCs in the peripheral blood but also their
functionality/proliferative capacity is very important for recovery and tissue repair, the
main goal of this thesis was to address CPC functionality. What does functionality of a
stem and progenitor cell mean? One special characteristic of stem cells compared to
other cell types is their potential for self-renewal. Even after multiple generations, they
still show the ability to form colonies21, 22
. In the context of physical strain, circulating
hematopoietic progenitor cell functionality has not yet been investigated extensively.
“Only a limited number of studies addressed the effect of exercise on CPC colony
formation in human subjects23
, where only the different types of CPCs were studied by
colony forming unit assays but not for their functionality. Animal based data are also
sparse, but some results were given by Stelzer et al. (2010). The influence of voluntary
life-long exercise on the decline of bone marrow derived hematopoietic progenitor cell
quality was investigated during aging in rats24
, where a higher proliferative capacity of
myeloid progenitor cells in a voluntary life-long exercising group of rats was found.
This raises the question whether the exposure to acute stressors, such as high intensity

- 8 -
physical exercise, also forces hematopoietic stem cell renewal and regeneration in the
human body, supported by the release of CPCs into the peripheral blood.”25
1.6 Aim of the thesis and research questions
The aim of this thesis was to evaluate the influence of a standardized cycle incremental
step test protocol (ergometry) on hematopoietic stem and progenitor cell (HSPC)
number and functionality in the peripheral blood in health and disease. Two study
designs were formulated where the first study design was used to investigate the
following research questions in healthy subjects:
A. HSPC kinetics in peripheral blood
B. Influence of hypoxia on HSPC mobilization
C. HSPC functionality before/after exercise
D. Influence of oxidative stress (MDA, MPO) on HSPC mobilization
E. Influence of inflammatory parameters (IL-6) on HSPC mobilization
F. Influence of stress hormones (cortisol, norepinephrine) on HSPC mobilization
G. Influence of norepinephrine and lactate on HSPC functionality
The second study design investigated the following:
H. Influence of blood lactate concentration on HSPC mobilization in heart disease
patients
- 9 -
2 Methods
2.1 Subjects and study designs
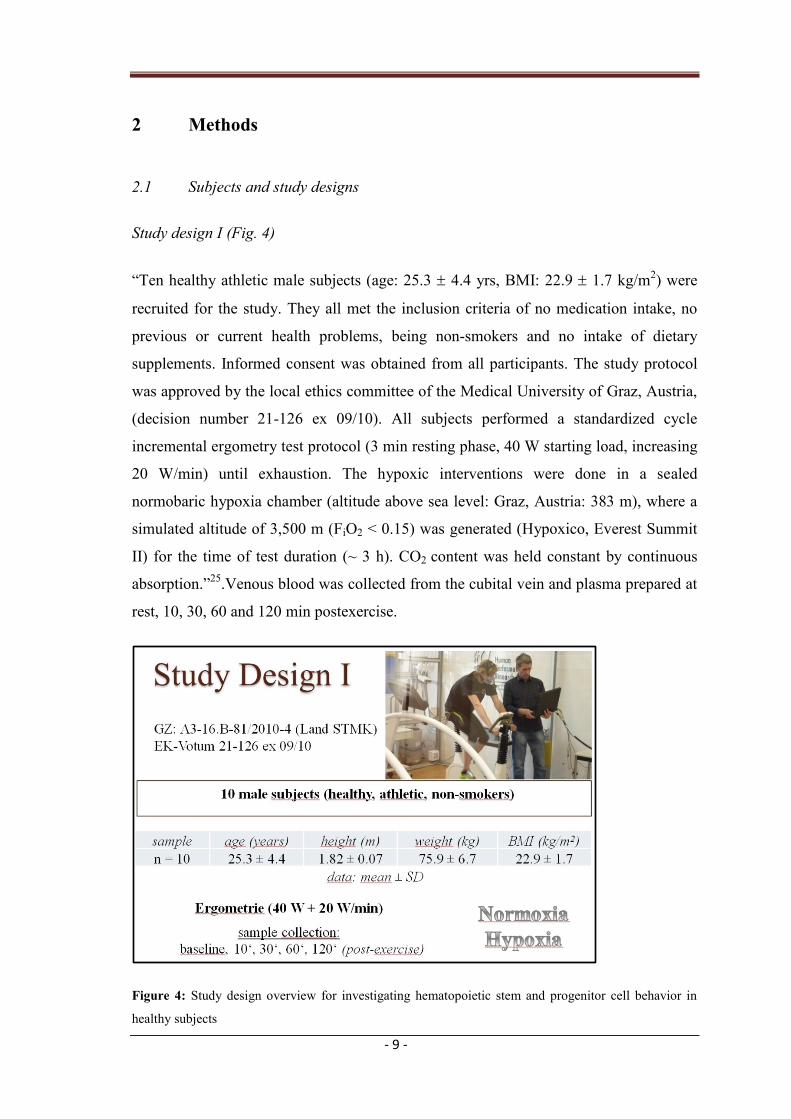
Study design I (Fig. 4)
“Ten healthy athletic male subjects (age: 25.3 4.4 yrs, BMI: 22.9 1.7 kg/m2) were
recruited for the study. They all met the inclusion criteria of no medication intake, no
previous or current health problems, being non-smokers and no intake of dietary
supplements. Informed consent was obtained from all participants. The study protocol
was approved by the local ethics committee of the Medical University of Graz, Austria,
(decision number 21-126 ex 09/10). All subjects performed a standardized cycle
incremental ergometry test protocol (3 min resting phase, 40 W starting load, increasing
20 W/min) until exhaustion. The hypoxic interventions were done in a sealed
normobaric hypoxia chamber (altitude above sea level: Graz, Austria: 383 m), where a
simulated altitude of 3,500 m (FiO2 < 0.15) was generated (Hypoxico, Everest Summit
II) for the time of test duration (~ 3 h). CO2 content was held constant by continuous
absorption.”25
.Venous blood was collected from the cubital vein and plasma prepared at
rest, 10, 30, 60 and 120 min postexercise.
Figure 4: Study design overview for investigating hematopoietic stem and progenitor cell behavior in
healthy subjects

- 10 -
Study design II (Fig. 5)
Seven patients (age: 63.4 ± 7.0 yrs, BMI: 28.0 ± 3.0 kg/m2) were included in the study.
They all met the inclusion criteria of being part of the recovery program for coronary
incidences phase-III at ZARG (Centre for Ambulant Rehabilitation Graz, Graz,
Austria). Informed consent was obtained from all participants. The study protocol was
approved by the local ethics committee of the Medical University of Graz, Austria,
(decision number 23-397 ex 10/11). All subjects performed 2-3 different randomized
exercise test protocols (n = 18) out of 4 possibilities (ergometry, constant-load, short-
interval or long-interval tests) on an electronically braked cycle ergometer (Ergoline
Reha System, Ergoline, Germany), where each exercise test protocol would trigger a
different blood lactate concentration. Venous blood was drawn from the cubital vein
before and immediately after each intervention.
Figure 5: Study design overview for investigating hematopoietic stem and progenitor cell behavior in
patients recovering from coronary incidences.

- 11 -
2.2 Used exercise test protocols
Study design I
Ergometry: cycle incremental step test protocol
Work load started at 40 W and was increased by 20 W every minute until
exhaustion (Fig. 4)26
. “The subjects ECG was monitored by a physician and the
heart rate (HR, PE 4000, Polar Electro), blood lactate concentration (lactate,
Biosen S-line, EKF-Diagnostic) and gas exchange variables (ZAN 800, ZAN)
were measured throughout the tests as well as during 3 minute of active and 3
minute of passive recovery. Maximal oxygen uptake (VO2max) and maximal
power output (Pmax) were determined as markers of exercise performance. Test
duration was depending on the individual physical condition (min-max: 16-23
minutes under normoxia, 16-20 minutes under hypoxia, respectively).”25
Study design II
Exercise intensity prescription was done by means of percentage of output
power of lactate-turn-points 1 and 2 (LTP1, LTP2) according to Hofmann and
Tschakert (2011) 27
and Mezzani et al. (2012)28
. Blood lactate concentration was
evaluated by means of ear-capillary method (lactate, Biosen S-line, EKF-
Diagnostic). Additionally, electrocardiogram (Cardiosoft v6.51 GE Healthcare,
GE Healthcare, UK), heart rate (PE 4000, Polar Electro, Finland) as well as gas
exchange variables (MetaMax 3B, Cortex, Germany) were monitored.
Ergometry: symptom-limited cycle incremental step test protocol
Power increments were 10 W per minute starting out from 10 W26
.
Cycle constant-load test:
Warm up phase consisted of 3 work load steps (one work load step per minute),
depending on the individual target work load (Ptarget), which was defined as 20 %
below output power at lactate-turn-point 2 (PLTP2) from ergometry and was
maintained for 28 minutes. Cool down phase lasted for 5 min (passive recovery).

- 12 -
Cycle short- and long high-intensity interval-tests:
In general, interval-tests are determined by peak work load (Ppeak), recovery
work load (Prec), peak work load duration (tpeak), and recovery work load
duration (trec). By these four parameters the mean work load (Pmean) can be
calculated as such recpeak
recrecpeakpeak
meantt
tPtPP
(formula 2.2)
29
or any other individual parameter can be calculated by knowing the other three
ones and Pmean.
In addition, the number of intervals is of importance. Interval tests were
maintained for 28 min (no warm up or cool down phase included).
Long intervals (4 x 4 min):
Warm up phase was the same as for constant load test. Pmean was defined as 20 %
below PLTP2 from ergometry, Ppeak as output power at 85 % of the maximal heart
rate (HRmax) from ergometry, tpeak as 4 min, trec as 3 min, and Prec was
subsequently calculated according to formula 2.2.Cool down phase was the same
as for constant load test adopted and modified according to Wisloff et al.
(2007)30
.
Short intervals (20 sec):
Warm up phase was the same as for constant load test. Pmean was defined as 20%
below PLTP2 from ergometry, Ppeak as Pmax from ergometry, tpeak as 20 sec, Prec as
10 % below PLTP1 from ergometry, and trec was subsequently calculated
according to formula 2.2. Cool down phase was the same as for constant load
test adopted and modified according to Tschakert et al. (2011)31
.
2.3 Nutritious anamnesis: 24 h-recall
Nutritious status of subjects was addressed before each exercise test by means
of a 24 h-recall32
and evaluated with a specialized program (nut.s science,
Vienna, Austria).
- 13 -
2.4 Blood sample collection and post-processing
“Blood from the cubital vein was collected in EDTA tubes for oxidative stress
measurements as well as stem and progenitor cell counts and in ammonium-heparin
tubes for stem and progenitor cell isolation and functionality tests.”…”They were kept
at room temperature until analysis for counting of total blood cells (Hematology
Analyzer KX-21N, Sysmex) and estimation of circulating progenitor cell (CPC)
numbers by flow cytometry (FACS Calibur, BD Biosciences).”…” Blood samples were
centrifuged (~1156 g, 10 min) and plasma was stored at - 80°C until analysis.”25
. For
study I, blood samples were obtained at rest, 10 min, 30 min, 60 min and 120 min after
the intervention. “All blood preparations for flow cytometry analysis for all 5 different
time points (per subject and test) were done at the same time and day. Oxidative stress
markers and CPC counts were obtained from all 10 subjects; progenitor cell
functionality tests (secondary CFU-GM assays) were done for a subgroup of 6 subjects
for normoxic as well as hypoxic conditions. To avoid the influence of diurnal variation,
the incremental test was always performed at the same time of day (starting at 8:00
am).”25
. For study design 2, blood samples were only collected before and directly after
each exercise test.
2.5 Analysis of circulating hematopoietic progenitor cells
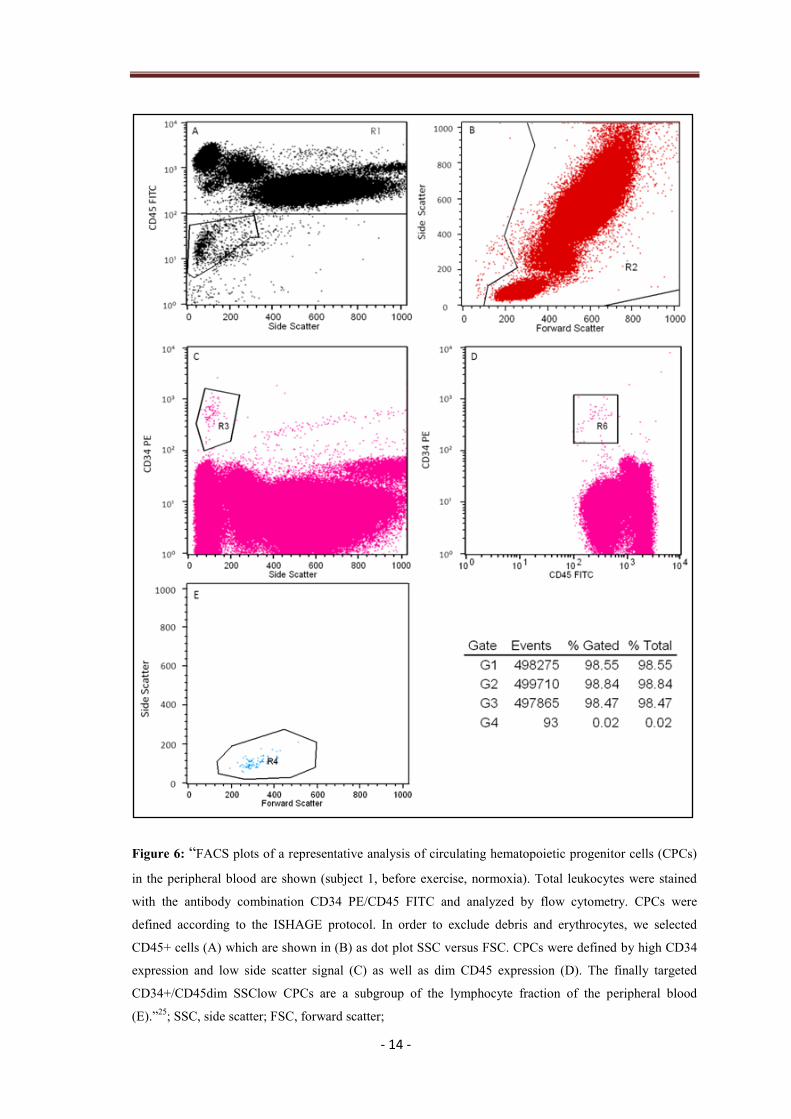
“The gating strategy followed the two-platform ISHAGE guidelines based on light
scatter characteristics and presence of CD34+/CD45dim SSClow HSCs/HPCs33
”
(Fig. 6)…”Gates were established using umbilical cord blood. CPCs in the peripheral
blood were analyzed by flow cytometry using the antibody combination
CD34-PE/CD45-FITC (BD Biosciences, Vienna, Austria) following the instructions of
the manufacturer. Flow cytometry, using a FACSCalibur (BD Biosciences; Cell Quest
Pro Software) was performed with correct fluorescent parameters (compensation and
light scatter gating), excluding dead cells. In total 500,000 leukocytes were acquired and
the percentage of CD34+/CD45dim CPCs within the leukocyte fraction was determined.
The total CD34+/CD45dim cell number per ml peripheral blood was calculated based
on the counts of CPCs related to the leukocyte fraction.”25
- 14 -
Figure 6: “FACS plots of a representative analysis of circulating hematopoietic progenitor cells (CPCs)
in the peripheral blood are shown (subject 1, before exercise, normoxia). Total leukocytes were stained
with the antibody combination CD34 PE/CD45 FITC and analyzed by flow cytometry. CPCs were
defined according to the ISHAGE protocol. In order to exclude debris and erythrocytes, we selected
CD45+ cells (A) which are shown in (B) as dot plot SSC versus FSC. CPCs were defined by high CD34
expression and low side scatter signal (C) as well as dim CD45 expression (D). The finally targeted
CD34+/CD45dim SSClow CPCs are a subgroup of the lymphocyte fraction of the peripheral blood
(E).”25
; SSC, side scatter; FSC, forward scatter;

- 15 -
2.5.1 FACS Calibur baseline
The flow cytometry sampling procedure was evaluated pooling mean values
(n = 3) out of 6 different sample preparations (Table 1). The intra-assay coefficient of
variation (CV) for the used FACS Calibur (BD Biosciences) was 9.2 % for total
CD34+/CD45 dim cells. This is within the range of already published results12, 23
.
Table 1. Precision of the used measurement method (FACS Calibur)
Sample 1 Sample 2 Sample 3 Sample 4 Sample 5 Sample 6
mean CPC/ml 1432.2 1836.7 2136.1 1711.0 786.0 1078.1
SD CPC/ml 164.2 201.6 123.8 143.5 43.4 143.3
CV, % 11 11 6 8 6 13
Table 1
2.6 Primary and secondary colony forming unit (CFU) assays
Analyzing the acquired data of study 1, CFU assays were performed for a subgroup of 6
subjects. “Peripheral mononuclear blood cells (PMNC) were isolated from heparin-
anticoagulated blood by standard Ficoll density gradient centrifugation (Histopaque®,
Sigma-Aldrich, Vienna, Austria) according to the manufacturer’s instructions using
seven to nine ml of heparin-anticoagulated blood. Cells for CFU-assays were collected
before and 10 min after ergometry. The harvested cell pellet was resuspended in
DMEM/F-12 culture medium (Gibco®
, Invitrogen, Lofer, Austria) and cell counts were
estimated using a CASY®
cell counter (Roche Diagnostics, Risch, Switzerland). For the
CFU assay with erythropoietin (EPO), mononuclear cells were plated at a concentration
of 1.5*105 cells/ml in 500 µl methylcellulose culture medium (MethoCult
® H4434,
StemCell Technologies, Vancouver, Canada) in 12-well flat-bottom suspension culture
plates (Greiner Bio One, Kremsmünster, Austria) and incubated at 37°C in a humidified
atmosphere containing 5 % CO2 for 14 days. Colonies consisting of more than 40 cells
were scored and gave information on the frequency of myeloid progenitor cells (BFU-E
and CFU-GM).

- 16 -
For the secondary CFU-GM assay, mononuclear cells were plated at a concentration of
1.5*105 cells/ml in 500 µl methylcellulose culture medium without EPO (MethoCult
®
H4534, StemCell Technologies) in 12-well flat-bottom suspension culture plates
(Greiner Bio One, Kremsmünster, Austria) and incubated at 37°C in a humidified
atmosphere containing 5 % CO2 for 8 days. After counting, 90 primary CFU-GM
colonies consisting of more than 40 cells were individually plucked from the
methylcellulose culture medium; each single colony was transferred to a separate well
of a 48-well flat-bottom microtitre plate, dispersed in alpha medium (Gibco®
)
supplemented with 15 % FBS and thoroughly mixed with methylcellulose culture
medium to obtain a single cell suspension 21
. After 14-16 days each well was again
scored for the presence and number of CFU-GM colonies consisting of more than 40
cells (= secondary CFU-GM). The secondary replating capacity correlates with the
proliferative capacity of myeloid progenitor cells21, 22
.” (Fig. 7)25

- 17 -
2.7 Analysis of secondary colony forming unit (CFU) assays
“For analysis of secondary CFUs, the number of secondary CFU-GM produced by each
primary CFU-GM was used as raw data. Counts exceeding a number of 100 were
truncated. The secondary replating capacity of an individual was defined as the mean
log 2 of the number of colonies plus one for the following reasons: The log 2 scale is
natural as the distribution of the number of secondary colony-forming cells is skewed to
the right. One was added as the log 2 of zero cannot be calculated and the log 2 of this
number is a continuous measure of number of duplications of a primary CFU-GM. This
measure has properties similar to the measure used by Gordon et al. (1998)21
; as counts
of zero are adequately taken into account the log scale reduces the skewness as well.
Cumulative percentages are expressed as Area Under the Curve, AUC24, 34, 35
.”25
Figure 7: CFU-GM colony under 400 x magnification36

- 18 -
2.8 Evaluation of oxidative stress parameters (MDA, MPO)
“Aliquots of plasma were prepared and stored at -80°C until analysis. Malondialdehyde
was determined with a high-performance liquid chromatographic (HPLC) method
with spectrofluorimetric detection as described by Khoschsorur et al.37
.
Myeloperoxidase concentration was measured by the Architect-i-System (Architect
MPO assay, Abbott Laboratories Diagnostics, Abbott Park, IL, USA), using the
automated chemiluminescent microparticle immunoassay (CMIA) technology38
.
Detection limits were 0.2 µmol/l for MDA and 2.9 µg/l for MPO.”25
2.9 Evaluation of inflammatory parameters (IL-6)
Interleukin-6 (IL-6) was analyzed by means of electrochemiluminescence immunoassay
(Roche Diagnostics, South San Francisco, Calif).
2.10 Determination of stress hormones (cortisol, norepinephrine)
Serum cortisol was determined by luminescence immunoassay (Bayer, Leverkusen,
Germany)39
. Intra-assay and interassay variation coefficients for ELISA were below
10 %.
For catecholamine determination blood samples were collected in ammonium-heparin
coated vials, containing 1.25 mg of glutathione per ml blood. After immediate
centrifugation at 1,300 g for 10 min, plasma samples were treated with ClinRepR
complete kit (RECIPE, Munich, Germany) as follows: 1.0 ml plasma was spiked with
an internal standard and was transferred into the sample preparation column.
Catecholamines were adsorbed at aluminium oxide and isolated from the sample matrix.
The plasma supernatant free of catecholamines was removed by centrifugation.
Interfering substances, being co-adsorbed at aluminium oxide, were removed by three
consecutive washing steps. Afterwards catecholamines were eluted from the sample
preparation column and were stable for injection (40µl) into the high-performance
liquid chromatography (HPLC) system. Conjugated catecholamines were determined by
a sulfatase/glucuronidase mixture (Sigma, Munich, Germany)after hydrolysis. Free and
- 19 -
conjugated catecholamines were assayed by HPLC using an amperometrical detector
(RECIPE, Munich, Germany) and specialized software (ClarityTM, DataApex, Prague,
Czech Republic).
2.11 Reevaluation of in vivo study results in vitro (study I)
As a comparison to the already accomplished results, a timely separated single blood
withdrawal was performed in a randomized subgroup of 6 subjects. In order to
reevaluate the influence of exercise-induced stress parameters norepinephrine and blood
lactate concentration determined in vivo, their impact on CPC functionality was also
analyzed in cell culture in vitro. Circulating hematopoietic progenitor cells were
incubated with the detected concentrations at rest, and after exhausting physical strain
(free NE: 5*10-9
ng/ml baseline, 5*10-8
ng/ml directly after ergometry;
La: 0.01 mmol/l baseline, 12 mmol/l directly after ergometry).

- 20 -
2.12 Statistics
Data are given as means ± SEM, except for physiological exercise/nutritious variables
and subject specifications (age, BMI), which are reported as means ± SD, and primary
CFU assay statistics, which are presented as median, minimum, maximum. “Statistical
analysis was done with SPSS (IBM SPSS Statistics 19). All used variables were tested
for normal distribution with the Kolmogorov-Smirnov test (p > 0.05)”.25
Changes in
blood cell counts, CD34+/CD45dim cells, MDA, MPO, IL-6, norepinephrine and
cortisol levels during both normoxic and hypoxic interventions were tested by repeated-
measures ANOVAs with Fisher’s-LSD (Least Significant Difference), whereas changes
in secondary CFUs before/10 min after the incremental test and secondary CFUs
incubated with NE (concentration after ergometry vs. baseline), La (concentration of
baseline vs. control) or both (concentration of NE after ergometry vs. concentration of
NE + La after ergometry) as well as differences between normoxia and hypoxia were
assessed by paired t-tests (one- or two-tailed tests, depending on the presence/absence
of previous hypothesis). Pearson’s product-moment correlation coefficient40
was used
for calculating the relationship between blood parameters and absolute as well as delta
CD34+/CD45dim counts. "For pooling values, Friedman’s test was used to verify if
samples came from the same distribution.”…”A p-value < 0.05 was considered as
significant.”25

- 21 -
3 Results
3.1 Results of study I
Study I revealed the following results:
3.1.1 Exercise performance evaluation
“Subjects showed the following physical parameters recorded under both conditions
(mean SD): maximal heart rate (normoxia: 189.5 7.7/min, hypoxia: 185.3
7.3/min), maximal work load (normoxia: 314 49.9 W, hypoxia: 274 29.9 W),
maximal blood lactate concentration (normoxia: 12.6 2.1 mmol/l, hypoxia:
12.0 2.0 mmol/l ) and maximal oxygen uptake (normoxia: 51.8 7.4 ml/kg/min,
hypoxia: 43.1 8.3 ml/kg/min).”25
3.1.2 Nutritious status
During the study-time,subjects showed a satisfying nutritious status (listed in g, mean ±
SD), where proteins (102.6 ± 29.6), carbohydrates (273.5 ± 92.6) and fat (86.4 ± 23.3)
were within acceptable ranges.
3.1.3 Blood cell counts
“Red blood cells (RBCs), white blood cells (WBCs), platelets, hematocrit (Hct), and
neutrophils showed a significant rise 10 min after the intervention (10 min post) under
normoxic conditions. Similarly, all these variables as well as lymphocytes increased
significantly under hypoxic conditions. All values went back to baseline after another
20 min (30 min post) and RBCs, Hct, and lymphocytes dropped significantly under
baseline values after another 30 min (60 min post) under hypoxic conditions (not
apparent under normoxia). At the last blood collection (120 min post) the level of
WBCs and neutrophils increased significantly again under normoxia and hypoxia

- 22 -
respectively, whereas RBCs, Hct and lymphocytes stayed significantly below baseline
values under hypoxic conditions.”25
(Table 2a, 2b)
Table 2a. Pre and post exerciseblood parameters under normoxic conditions
Blood Collection baseline 10 min post 30 min post 60 min post 120 min post
RBC, 106/µl 5.13 0.10 5.47 0.11*** 5.20 0.11 5.08 0.10 5.08 0.10
Hct, % 45.1 0.7 48.7 0.9*** 45.7 0.9 44.5 0.7 44.3 0.7
Platelets, 103/µl 185 10 222 7** 189 9 180 9 186 9
WBC, 103/µl 4.84 0.30 8.32 0.95** 5.79 0.71 5.63 0.74 8.17 0.98**
Neutrophils, 103/µl 2.64 0.16 4.37 0.31* 3.62 0.15 3.89 0.14 6.20 0.13**
Lymphocytes, 103/µl 1.62 0.14 3.08 0.39 1.59 0.20 1.15 0.14 1.22 0.14
Values are means ± SEM, n = 10. Significant differences between time points are indicated as follows: ***
p < 0.001, **
p < 0.01, *p < 0.05
Table 2b. Pre and post exerciseblood parameters under hypoxic conditions
Blood Collection baseline 10 min post 30 min post 60 min post 120 min post
RBC, 106/µl 5.19 0.10 5.42 0.1*** 5.12 0.11 4.93 0.12*** 5.05 0.07**
Hct, % 45.3 0.6 47.9 0.7*** 44.8 0.7 43.0 0.9*** 44.0 0.5**
Platelets, 103/µl 192 10 223 8*** 188 10 177 10 187 8
WBC, 103/µl 5.15 0.37 8.13 0.60*** 5.57 0.57 5.34 0.55 7.01 0.76*
Neutrophils, 103/µl 2.84 0.26 4.04 0.47** 3.40 0.54 3.53 0.50 4.99 0.72*
Lymphocytes, 103/µl 1.75 0.15 3.20 0.3*** 1.62 0.14 1.30 0.12** 1.44 0.12**
Values are means ± SEM, n = 10. Significant differences between time points are indicated as follows: ***
p < 0.001, **
p < 0.01, *p < 0.05
Table 2a, 2b

- 23 -
3.1.4 Changes of CD34+/CD45dim cells
“A significant twofold rise (p < 0.01) of circulating hematopoietic progenitor cells was
observed 10 min following the exercise intervention under both test conditions”
(normoxia, hypoxia, Fig. 8, Table 3a, 3b)…”A significant decrease below baseline
(p < 0.01) values was only observed under normoxic conditions 120 min post exercise.
There was a significant decrease 30 min, 60 min and 120 min post exercise in
comparison to the peak value 10 min post exercise (p < 0.01).
There was no significant difference between normoxic and hypoxic conditions
regarding the number of CD34+/CD45dim cells released at all-time points of blood
collection (p > 0.05).”25
baseline 10 min post 30 min post 60 min post 120 min post
0
500
1000
1500
2000
2500
Normoxia
Hypoxia
****
**
time of blood collection
me
an
CD
34
+/C
D4
5d
im c
ell
s/m
l
Figure 8: “CPC (CD34+/CD45dim) kinetics triggered by a maximal incremental exercise intervention
under normoxic and hypoxic conditions. Time of blood collection: baseline (1), 10 min (2), 30 min (3), 60
min (4) and 120 min (5) after the intervention. Data are reported as means ± SEM. There was a significant
increase in CD34+/CD45dim cell number 10 min after cessation of exercise (2) and also a significant
decrease to below baseline values 120 min post exercise (5) during normoxia (** p < 0.01). During
hypoxia, the CD34+/CD45dim cell level returned to baseline values 120 min postexercise (5). There was
no significant difference between normoxia and hypoxia (p > 0.05) for all time points of blood
collection.”25
- 24 -
3.1.5 Changes of CD34+/CD45bright cells
“CD34+/CD45bright cells did not show any significance regarding all time points in
comparison to baseline value under normoxic conditions.” (Table 3a)…”Under hypoxia,
there was a significant increase (p < 0.05) 10 min post exercise (Table 3b). There was
no significant difference between normoxia and hypoxia regarding released
CD34+/CD45bright cells between time points (p > 0.05).”25
Table 3a. CD34+/CD45dim and CD34+/CD45bright cell counts
Normoxia baseline 10 min post
CPCs/ml 1073.5 ± 162.3 1982.2 ± 290.4**
CD34+/CD45bright cells/ml 661.0 ± 228.0 1410.2 ± 704.6
Values are means ± SEM, n = 10. Significant differences between time points
(ANOVA with Fisher’s LSD) are indicated as follows:**
p < 0.01, *p < 0.05
Table 3b. CD34+/CD45dim and CD34+/CD45bright cell counts
Hypoxia baseline 10 min post
CPCs/ml 1242.7 ± 214.8 2059.3 ± 268.0**
CD34+/CD45bright cells/ml 320.1 ± 30.6 489.0 ± 65.0*
Values are means ± SEM, n = 10. Significant differences between time points
(ANOVA with Fisher’s LSD) are indicated as follows:**
p < 0.01, *p < 0.05
Table 3a, 3b

- 25 -
3.1.6 Primary CFU assays with EPO
“Primary CFU assays showed no significant difference (two-tailed paired t-test,
p > 0.05) between baseline and 10 min post exercise values under both test conditions
(n = 6).”…“Pooled values (Friedman’s test, p > 0.05) did also not turn out to be
significant (n = 12, p > 0.05).”25
. Descriptive statistics of BFU-E and CFU-GM data is
summarized in Table 4a, 4b.
Table 4a. Primary CFU assay results: BFU-E descriptive statistics (n = 6)
BFU-E
Baseline
(normoxia)
10min
post(normoxia)
Baseline
(hypoxia)
10 min post
(hypoxia)
Median 144 145.5 170 165
Minimum 69 78 91 62
Maximum 247 303 381 360
Table 4b. Primary CFU assay results: CFU-GM descriptive statistics (n = 6)
CFU-GM
Baseline
(normoxia)
10min
post(normoxia)
Baseline
(hypoxia)
10 min post
(hypoxia)
Median 18 24.5 17 17
Minimum 10 7 12 10
Maximum 72 35 24 23
Table 4a, 4b

- 26 -
3.1.7 Secondary CFU assays
“Under normoxic conditions, secondary colony forming units showed a
significant decline in proliferation capacity 10 min after physical exertion”
(one-tailed paired t-test, p < 0.05, 1-β (power) = 0.85, Fig. 9)…”Under hypoxic
conditions only a trend was seen (p = 0.07). As hypoxia had no additional effect
(Friedman’s test, p > 0.05), values were pooled (n = 12), which also resulted in a
significant decline of proliferative capacity 10 min post exercise.”25
(p < 0.05,
Fig. 9).
Normoxia Hypoxia Both-60
-40
-20
0
*
n.s. *
A
UC
as
% o
f b
ase
lin
e v
alu
e
Figure 9: “Box-plot statistics of the change in functionality/proliferative capacity 10 min after cessation
of exercise for normoxia, hypoxia and all values pooled; data are expressed as Area Under the Curve
(AUC). Secondary colony forming units were significantly decreased 10 min post exercise under
normoxic conditions (* p < 0.05), a trend was seen under hypoxic conditions (p = 0.07), and significantly
decreased as pooled values (both, * p < 0.05). “25
. Normoxia, Hypoxia: n = 6, Both: n = 12

- 27 -
3.1.8 Kinetics of oxidative stress parameters
“Parameters of oxidative stress showed a dynamic pattern similar to that of circulating
hematopoietic progenitor cells” (Fig. 8, 10, 11)…”Under normoxia, MDA rose
significantly above baseline values 10 min after the intervention (p < 0.05) and dropped
significantly below baseline 60 and 120 min post exercise.” (Fig. 10, p < 0.01)…”There
was a significant decrease 30 min, 60 min and 120 min post exercise in comparison to
the peak value 10 min post exercise (p < 0.01). Exercise under hypoxic conditions
showed the same results, except with no significant increase 10 min after the
intervention due to relatively high baseline values. Sixty and 120 minutes post exercise
there was a significant difference from the peak value 10 min post exercise
(p < 0.05).”25
. MPO only showed a significant difference from baseline values 10 min
after physical exertion under hypoxic conditions (Fig. 11, p < 0.01) as well as a
significant decrease 30 min post exercise in comparison to the peak value 10 min
postexercise (p < 0.01).
baseline 10 min post 30 min post 60 min post 120 min post
0.0
0.2
0.4
0.6
0.8
1.0
Normoxia
Hypoxia
*
**
** **
time of blood collection
me
an
MD
A (
µm
ol/
l)
Figure 10: “Malondialdehyde (MDA) kinetics before and after the maximal incremental exercise
intervention for normoxia and hypoxia; time of blood collection: baseline (1), 10 min (2), 30 min (3), 60
min (4) and 120 min (5) after the intervention. Data are reported as means ± SEM. Malondialdehyde
kinetics are similar to those of CPCs, which suggests a contemporaneous trigger effect of
Malondialdehyde levels on the release of CPCs. There were significant differences for both normoxia and
hypoxia at different time points in comparison to baseline values (* p < 0.05, ** p < 0.01).”25

- 28 -
“There was no significant difference between the releases of MDA/MPO levels under
normoxic vs. hypoxic conditions at all times of blood collection (p > 0.05).”25
baseline 10 min post 30 min post 60 min post 120 min post
0
20
40
60
Normoxia
Hypoxia
**
time of blood collection
me
an
MP
O (
µg
/l)
Figure 11: “Myeloperoxidase (MPO) kinetics before and after the maximal incremental exercise
intervention for normoxia and hypoxia; time of blood collection: baseline (1), 10 min (2), 30 min (3), 60
min (4) and 120 min (5) after the intervention. Data are reported as means ± SEM. The high SEM of the
baseline mean under normoxic conditions can be traced back to two very high sampling values at this
time point, probably due to underlying short-term inflammatory processes. Myeloperoxidase kinetics are
similar to those of circulating hematopoietic progenitor cells (CPCs), which also suggests a
contemporaneous trigger effect of Myeloperoxidase levels on the release of CPCs. There was a significant
difference 10 min post exercise compared to baseline values (** p < 0.01) for hypoxic conditions.”25

- 29 -
3.1.9 Relationship of CPC release to oxidative stress values
“A correlation of released CPCs for all 10 subjects between sampling time points and
the respective MDA/MPO differences resulted in significant outcomes for
normoxia (r = 0.389/0.484; p < 0.05/p < 0.01) and hypoxia (r = 0.326/0.427; p < 0.05/
p < 0.01)”25
, (n = 40: 10 subjects, 4 time-differences, Fig. 12-15).
Normoxia:
-3000 -1000 1000 3000
-50
-30
-10
10
30
50
70
90r = 0.484
p < 0.01
n = 40
DeltaHSC
De
lta
MP
O
Figure 12: Correlations of released circulating hematopoietic progenitor cells (CPCs) and respective
differences in myeloperoxidase (MPO) are shown under normoxic conditions. Data are represented in a
cumulative way, where correlations are done for all 10 subjects at all 4 time differences (n = 40). There
were significant positive correlations of released CPCs and the respective MPO differences for both
normoxic and hypoxic interventions, modified from Kroepfl and Pekovits et al. (2012)25
.

- 30 -
-2000 -1000 0 1000 2000 3000
-30
-10
10
30
50
70
90r = 0.389
p < 0.05
n = 40
-50
DeltaHSC
De
lta
MD
A
Figure 13: Correlations of released circulating hematopoietic progenitor cells (CPCs) and respective
differences in malondialdehyd (MDA) are shown under normoxic conditions. Data are represented in a
cumulative way, where correlations are done for all 10 subjects at all 4 time differences (n = 40). There
were significant positive correlations of released CPCs and the respective MDA differences for both
normoxic and hypoxic interventions, modified from Kroepfl and Pekovits et al. (2012)25
.

- 31 -
Hypoxia:
-3000 -2000 -1000 0 1000 2000
-30
-10
10
30r = 0.427
p < 0.01
n = 40
DeltaHSC
De
lta
MP
O
Figure 14: Correlations of released circulating hematopoietic progenitor cells (CPCs) and respective
differences in myeloperoxidase (MPO) are shown under hypoxic conditions. Data are represented in a
cumulative way, where correlations are done for all 10 subjects at all 4 time differences (n = 40). There
were significant positive correlations of released CPCs and the respective MPO differences for both
normoxic and hypoxic interventions, modified from Kroepfl and Pekovits et al. (2012)25
.

- 32 -
-3000 -2000 -1000 0 1000 2000
-30
-10
10
30
50r = 0.326
p < 0.05
n = 40
DeltaHSC
De
lta
MD
A
Figure 15: Correlations of released circulating hematopoietic progenitor cells (CPCs) and respective
differences in malondialdehyd (MDA) are shown under hypoxic conditions. Data are represented in a
cumulative way, where correlations are done for all 10 subjects at all 4 time differences (n = 40). There
were significant positive correlations of released CPCs and the respective MDA differences for both
normoxic and hypoxic interventions, modified from Kroepfl and Pekovits et al. (2012)25
.

- 33 -
3.1.10 Inflammatory parameter kinetics (interleukin-6)
Interleukin-6 (IL-6) levels showed different kinetics as observed by Moebius-Winkler et
al. (2009) under normoxic conditions17
(Fig.16). In our study, after a time delayed onset
(until 10 min postexercise), IL-6 levels started to rise significantly above baseline
values after 30 min postexercise (p < 0.01) reaching its peak-point at 120 min
postexercise (p < 0.05). In the Moebius-Winkler study 120 min postexercise IL-6 levels
had already begun to drop and returned to baseline 24 h postexercise. Significant
correlations were detected for IL-6 levels with platelets (r = 0.328, p < 0.05) and
neutrophils (r = 0.365, p < 0.01). Hypoxic conditions revealed a significant rise of IL-6
levels already 10 min postexercise (p < 0.01), also reaching its peak-point after 120 min
postexercise (Fig. 16, not significant). Correlations were similar as under normoxia
(platelets: r = 0.345, p < 0.05; neutrophils: r = 0.487, p < 0.01), except for lymphocytes
(r = - 0.301, p < 0.05). There was no significant difference between the releases of IL-6
levels under normoxic vs. hypoxic conditions at all times of blood collection (p > 0.05).
baseline 10 min post 30 min post 60 min post 120 min post
0
1
2
3
4
5
6
7
Normoxia
Hypoxia
*
**
*
*
**
**
time of blood collection
me
an
IL
-6 (
pg
/ml)
Figure 16: IL-6 kinetics in the peripheral blood before and after an ergometry: time of blood collection:
baseline (1), 10 min (2), 30 min (3), 60 min (4) and 120 min (5) after the intervention. Data are reported
as means ± SEM. The increase in IL-6 shows time-delayed kinetics as the one of CPCs.
There were significant differences at all time points postexercise compared to baseline values
(* p < 0.05, ** p < 0.01).

- 34 -
3.1.11 Cortisol and norepinephrine kinetics
Under normoxic as well as hypoxic conditions plasma cortisol levels showed a similar
pattern to the kinetics of CPCs, increasing significantly 10 min postexercise and
dropping significantly below baseline values 120 min postexercise (p < 0.01, Fig.17).
Significant correlations were visible for plasma cortisol and red blood cells (r = 0.474,
p < 0.01) and platelets (r = 0.344, p < 0.05) under normoxia. There was also a
significant relationship between released cortisol levels and the difference in CPCs
between time-points for normoxic conditions (r = 0.374, p < 0.05). Under hypoxia
cortisol levels significantly correlated with white blood cells (r = 0.312, p < 0.05), red
blood cells (r = 0.473, p < 0.01) and lymphocytes (r = 0.420, p < 0.01). There was no
significant difference between the releases of cortisol levels under normoxic vs. hypoxic
conditions at all times of blood collection (p > 0.05)
baseline 10 min post 30 min post 60 min post 120 min post
0
50
100
150
200
250 Normoxia
Hypoxia
****
**
**
time of blood collection
me
an
Co
rtis
ol
(ng
/ml)
Figure 17: Cortisol kinetics in the peripheral blood before and after an ergometry; time of blood
collection: baseline (1), 10 min (2), 30 min (3), 60 min (4) and 120 min (5) after the intervention. Data are
reported as means ± SEM. Plasma cortisol follows the same patterns as CPC kinetics in the circulation
which may suggest a contemporaneous trigger effect on CPC mobilization.There were significant
differences 10 min and 120 min postexercise compared to baseline values (** p < 0.01).
Free norepinephrine (free NE) levels showed a significant 10-fold rise directly after
cessation of exercise under normoxic as well as hypoxic conditions, whereas 10 min

- 35 -
postexercise levels were only 2.5 fold increased under normoxia (p < 0.05) and almost
disappeared under hypoxia (p < 0.001). Bound norepinephrine (bound NE) levels
significantly increased directly after the intervention under normoxic conditions
(p < 0.05) and did not significantly change under hypoxic conditions (Table 5a, 5b).
Table 5a. Free norepinephrine levels
Free NE Baseline
(normoxia)
Directly after
(normoxia)
10 min post
(normoxia)
Mean
± SEM
800.42
± 94.81
8198.71 ***
± 1095.17
2006.27 *
± 399.60
N 10 10 8
Baseline
(hypoxia)
Directly after
(hypoxia)
10 min post
(hypoxia)
Mean
± SEM
850.33
± 80.53
7794.90 ***
± 887.08
27.38 ***
± 7.30
N 10 10 8
Significant differences between time points (ANOVA with Fisher’s LSD) are
indicated as follows: ***
p < 0.001, *p < 0.05
Table 5b.Bound norepinephrine levels
Bound NE Baseline
(normoxia)
Directly after
(normoxia)
10 min post
(normoxia)
Mean
± SEM
2225.61
± 667.50
2631.93 *
± 688.19
3020.85
± 899.49
N 10 10 8
Baseline
(hypoxia)
Directly after
(hypoxia)
10 min post
(hypoxia)
Mean
± SEM
2363.82
± 562.20
2323.20
± 663.32
2195.23
± 526.72
N 10 10 8
Significant differences between time points (ANOVA with Fisher’s LSD) are
indicated as follows: ***
p < 0.001, *p < 0.05
Table5a, 5b: NE kinetics
- 36 -
Significant correlations between free norepinephrine levels to CPC absolute counts were
observed (NE sampled directly after cessation of exercise, CPCs sampled 10 min
postexercise; normoxia/hypoxia: r = 0.663/ r = 0.592, p < 0.01, n = 20). There was no
significant difference between the releases of neither free nor bound NE levels under
normoxic vs. hypoxic conditions at all times of blood collection (p > 0.05).

- 37 -
3.1.12 Influence of norepinephrine and lactate on HSPC functionality
The influence of the exercise-induced stress parameters norepinephrine (NE) and
maximal blood lactate concentration (Lamax) were evaluated in vitro. The in vivo study
design was modeled by incubating isolated mononuclear cells from a randomly chosen
subgroup of six subjects with both stress parameters separately and together. Stress
parameter concentrations were taken from the in vivo study results (free NE:
5*10-9
ng/ml baseline, 5*10-8
ng/ml directly after an ergometry; La: 0.01 mmol/l
baseline, 12 mmol/l directly after an ergometry). Circulating hematopoietic progenitor
cells incubated with a NE concentration of 5 x 10⁻⁸
mol/l showed a significant decrease
in CPC functionality in vitro (p < 0.05) compared to baseline. A La concentration
simulating baseline conditions did not show any significant influence on the
functionality of CPCs. Simultaneously adding both substances at an ergometry-induced
concentration to the cell culture, a trend was visible (p = 0.08, Fig. 18).
NE NE + La
0.0
0.5
1.0
1.5
Incubation conditions
AU
C
Figure 18: Box-plot statistics (n = 6) of the influence of norepinephrine and blood lactate concentration
on CPC functionality of the in vitro study results; data are expressed as Area Under the Curve (AUC).
Secondary colony forming units were not significantly decreased in cell culture under the influence of
both stress parameters at the same time, but a definite decreasing trend could be detected (p = 0.08).

- 38 -
3.2 Results of study II
Study II revealed the following result:
3.2.1 Influence of blood lactate on HSPC mobilization
The results of study II showed a significant positive correlation (r = 0.63,
p < 0.01) between the difference in HSPCs in the peripheral blood and the maximal
blood lactate concentration (Lamax) accumulated during each test independent of the
exercise mode (Fig. 19). This suggests a direct influence of Lamax on HSPC release from
the bone marrow.
-1 1 2 3
-50
50
100
150
max. blood lactate concentration
standardised (mmol/l)
Delta CPC/ml blood
(% of baseline)
r = 0.63
p < 0.01
n = 18
Figure 19: Relationship of the release of circulating hematopoietic progenitor cells in the peripheral
blood and the maximal accumulated blood lactate concentration. Maximal blood lactate was standardized
in order to get rid of the interaction of the subject variable; modified according to Kroepfl et al. (2012)41
.

- 39 -
4 Discussion
The main result of study I is that ergometry increases circulating progenitor cell
frequency twofold 10 min post exercise, but at the same time reduces hematopoietic
colony forming capacity.
A. HSPC kinetics before/after exercise
“Little information on kinetics of circulating progenitor cell release can be found in the
literature. Moebius-Winkler et al.17
stated in 2009 that endurance exercise of 4 hours
cycling led to significant changes in circulating progenitor cells during exercise with a
maximum at 210 min after the onset. The pattern of progenitor cell kinetics after the
intervention differed from our results. In the Moebius-Winkler study, blood was not
collected 10 min post exercise, and 30 min post exercise the stem cell level had already
diminished, but values did not return to baseline. In contrast, our results showed a peak
release of CD34+/CD45dim cells at 10 min after short-term incremental exercise, where
values are already back to baseline 30 min after the cessation of exercise (at this time
point there was also a significant decrease to the peak value 10 min post exercise).
Furthermore, 120 min post exercise under normoxic conditions, we saw a significant
decrease in the progenitor cell level, unlike the Moebius-Winkler group. These findings
indicate a different fate of circulating progenitor cells during endurance type and short-
term high intensity exercise. Similar to our findings, Bonsignore et al.23
reported a
different response of hematopoietic progenitors to endurance and maximal exercise.”25

- 40 -
B. Influence of hypoxia on HSPC mobilization
Under hypoxic conditions there was also a significant twofold rise of CPCs visible 10
min post exercise and values returned back to baseline 120 min after cessation of
exercise. “Hypoxia at moderate altitude does not seem to have a significantly different
effect on progenitor cell release than exercise under normoxic conditions until 60 min
post exercise. Regarding the last time point of blood collection (120 min post exercise),
it can be hypothesized that homing dynamics might be different under normoxic and
hypoxic conditions, as suggested by Lekli et al. in 200942
. Progenitors could also
migrate from the peripheral blood into surrounding tissues, possibly for repair
processes43, 44
. Moreover, the CD34+/CD45bright cell fraction, which shows light-
scatter properties that are consistent with monocytes45
, significantly increased under
hypoxia 10 min post exercise (Table 3b).”…”Within the study-specific observation
time, our findings also suggest that short-term hypoxia at moderate altitude does not
have any additional forcing effect on CPC release.”25
In addition, one has to consider
the time-delayed effect of hypoxia at moderate altitudes on EPO production and
hematopoiesis. “According to Bärtsch et al. 200846
even high altitudes show a delayed
effect on erythropoiesis. In addition, intermittent hypoxia at 12-10 % O2 did not show
any effect on EPO production47
. Katayama et al. (2004)48
reports that even 3h at 12.3%
O2 daily over 14 days did not show any effect on EPO in plasma.”25

- 41 -
C. HSPC functionality before/after exercise
“The most interesting finding is the significant decrease of the proliferative capacity
expressed as AUC values in the secondary colony forming unit (CFU-GM) assay.
Although the frequency of CD34+/CD45dim cells in the flow cytometry analysis
increases significantly after ergometry, the functionality/proliferative capacity of CPCs
in the peripheral blood decreases. Moreover, the frequency of colonies in the CFU assay
with EPO showed no significant increase, which also suggests that, the
functionality/proliferative capacity of CPCs decreased significantly 10 min after
cessation of exercise. Different outcomes, however, were detected after an endurance
exercise model in mice49
, where BFU-E and CFU-GM counts significantly increased in
exercise-trained animals vs. sedentary controls. Our group also found a significant
increase in the proliferative capacity of bone marrow derived HSCs/HPCs after a life-
long voluntary exercise versus sedentary housing condition in a rat model24
. This
additionally suggests a different response of HSC/HPC behavior to endurance and
maximal exercise. As far as we know, this is the first study to turn attention to the
importance of the functionality/proliferative capacity of CPCs in association with cell
frequency and exercise. Our results, as described above, lead to multiple hypotheses.
Obviously, the proliferative capacity of hematopoietic progenitor cells in the peripheral
blood 10 min post exercise is significantly reduced compared to baseline values. On the
one hand this suggests that the cells present are more differentiated progenitors50
and
have already been decreased in their proliferative capacity (shown by secondary CFU-
GM expressed as AUC)24, 34
. The measure of CPC functionality by a secondary CFU-
GM assay gives only information of the impairment of white progenitor cells. On the
other hand, this raises the question whether progenitor release is triggered by increased
shear stress in the vascular intraepithelial layer in blood vessels outside of the bone
marrow, where CPCs could just be detached from the vessel walls due to the increased
blood flow and not directly come from the bone marrow itself51
. Since the
CD34+CD45dim cell fraction also contains circulating endothelial progenitor cells52
, it
is to discuss whether the obvious discrepancy between the increase in CPCs and
obtained colony counts is due to exaggerated mobilization of endothelial but not
hematopoietic progenitors. According to the manufacturer, the MethoCult® culture
medium does not support the growth of endothelial progenitor cells. Another hypothesis

- 42 -
might be that only cells near to the sinusoids in the bone marrow are mobilized; unlike
the ones in the far end of the bone marrow cavity, these do not have very efficient
repopulating activity, as summarized by Cross et al. in 200953
.”25
D. Influence of oxidative stress parameters (MDA, MPO) on HSPC mobilization
“Exercise-induced regeneration might home younger progenitors from the peripheral
blood to surrounding tissues where they are needed for repair and substitution
processes54
. In this context, oxidative stress might also play an important role, because it
has already been linked to disrupted signal transduction pathways55
. A rise of oxidative
stress markers, as seen in our study, may also lead to a decrease of secondary colony
forming units in murine HSCs/HPCs34
. In 2010 Wang and Lin56
showed that systemic
hypoxia can promote lymphocyte apoptosis induced by oxidative stress during moderate
exercise. This raises the question whether apoptosis of circulating CPCs could also be
induced by oxidative stress triggered by incremental exercise. In this case, our results
may suggest that exercise on its own has an influence on apoptotic processes due to
oxidative stress (significantly reduced proliferative capacity 10 min post under
normoxia). The results of our study also provide evidence that hematopoietic progenitor
cell mobilization might be triggered by a contemporaneous induction of oxidative stress
as indicated by elevated malondialdehyde (MDA) or myeloperoxidase (MPO) levels
due to physical exercise. There was a significant positive correlation between the
differences in CPCs in the peripheral blood and releases in MDA/MPO plasma levels
for both normoxia and hypoxia. It is well known that ROS act as second messenger
molecules but also have the potential to damage cellular structures by oxidation57, 58
. In
the case of HSCs/HPCs the influence of ROS resulted in a dose-dependent decrease of
colony formation due to a p38/mitogen-activated protein kinase (MAPK) dependent
pathway34
. This pathway is of important physiological relevance, because ROS have a
great influence on apoptosis, self-renewal, senescence, proliferation and differentiation
of hematopoietic and endothelial progenitor cells, as documented in the work of Case et
al. (2008)59
. Furthermore, a restriction of the self-renewal capacity of HSCs due to an
accumulation of oxidative DNA damage was reported in the work of Yahata et al.
(2011)60
. Regarding the HSC/HPC release from the bone marrow, Hosokawa et al.
(2007) found that the N-cadherin-mediated cell adhesion is suppressed by ROS, which
- 43 -
results in an exit of HSCs from the bone marrow niche61
. This finding supports our
fairly weak but significant correlations between the difference in MDA/MPO levels and
CPC counts.”25
E. Influence of inflammatory parameters (IL-6) on HSPC mobilization
The importance of Interleukin-6 (IL-6) in context of hematopoietic progenitor cell
mobilization has not yet been very well researched. IL-6 is usually associated with
endothelial progenitor cell number modulation, playing a role in acute inflammatory
processes as well as angiogenesis and vascular remodeling62, 63
. Studies investigating
the influence of exercise on IL-6 plasma levelsand hematopoietic stem and progenitor
cell mobilization are discordant regarding their results. A 1000m all-out rowing
intervention did not significantly change IL-6 plasma levels14
, whereas 4h cycling
at 70 % of the individual anaerobic threshold increased IL-6 levels 16.5 fold17
. A
marathon revealed a significant rise of IL-6 levels at the end12
. CD34+ cell number,
however, increased after all the named interventions. These results show that different
exercise protocols have unequal impact on the pro-inflammatory marker IL-6 with a
simultaneous increase in hematopoietic progenitors. This suggests an indirect effect of
IL-6 on the fate of hematopoietic progenitors, possibly triggered by a neural activation
of bone marrow stromal cells, which in turn actives ERK and p38-MAPK signaling as
suggested by Rezaee et al. in 201064
. The activation of MAPK signaling was also found
by Schraml et al. (2009) in a mouse model34
, where an influence of a noradrenergic
stimulus on HSPC functionality was seen. It is also suggested that an elevation of IL-6
is regulated by central and peripheral catecholamines65, 66
and could therefore also have
an impact on HSPC mobilization (see Section F). Furthermore our study also showed
the significant involvement of IL-6 in known neutrophil activation (under normoxic as
well as hypoxic conditions) and T-lymphocyte regulation (only under additional
hypoxic stress).
- 44 -
F. Influence of stress hormones (cortisol, norepinephrine) on HSPC mobilization
An exhaustive ergometric strain significantly increased cortisol levels 10 min after
cessation of exercise and significantly decreased them below baseline values 120 min
post exercise under normoxic as well as hypoxic conditions. Cortisol kinetics followed
CPC kinetics in the peripheral blood, both reaching their peak-points 10 min post
exercise (Fig. 8, Fig. 17). This suggested a contemporaneous trigger effect of cortisol on
hematopoietic stem and progenitor cells, which was supported by the significant
positive relationship between time-points of the two parameters. According to Dimitrov
et al. (2009)67
, CXCR4 up-regulation on T-cell subsets followed cortisol infusion in
young, healthy, male subjects. It is to discuss if cortisol might also induce the
expression of CXCR4 on hematopoietic stem and progenitor cellsand in turn might lead
to homing processes.
Catecholamines, in contrast to cortisol, act by recruiting immune cells to the peripheral
circulation68
. In our study, free norepinephrine (free NE) levels were 10-fold elevated
directly after the exercise intervention and highly significantly correlated with CPC
number in the peripheral blood before and after exercise (NE sampled directly after
cessation of exercise, CPCs sampled 10 min postexercise), which indicated a
noradrenergic effect on CPCs under normoxic as well as hypoxic conditions. A
postexercise rise of NE has already been described in the literature69
, but it has not yet
been frequently connected to hematopoietic progenitor cell stimulation. According to
Benschop et al. (1996) and Dar et al. (2011) increased catecholamines resulted in
elevated leucocytes68
and hematopoietic stem and progenitor cells70
in the peripheral
blood. Furthermore, mice showing a reduced production of NE failed to respond to
HSPC mobilization by G-CSF71
. As recently shown, circadian HSPC release from the
bone marrow follows rhythmic secretion of norepinephrine from nerve terminals which
can be seen as a contributing mechanism to HSPC egress72
. The impact of
catecholamines on cells present in the bone marrow, progenitor mobilization, and
erythropoiesis may be regulated by the dose and duration of the neurotransmitter
stimulus71, 73
. All these findings support our hypothesis that hematopietic stem and
progenitor cell modulation could be triggered by catecholamines.
- 45 -
Since exercise activates the sympathetic nervous system and the hypothalamic-pituiary-
adrenal (HPA) axis, exercise can be seen as a stress model (Fig. 22). Taken the effect of
NE and cortisol together, it would result in an elevated mobilization of hematopoietic
stem and progenitor cells to the circulation by elevated NE levels, where at the same
time elevated cortisol levels may affect the hematopoietic component of the bone
marrow microenvironment through Notch signaling74, 75
. It is left to discuss if this
mechanism might lead to CPC homing processes and could explain the increased CPC
number and reduced progenitor cell functionality found in our study.
G. Influence of norepinephrine and lactate on HSPC functionality
In a pilot study76
as well as after an ultra-distance race77
, we found a significant
relationship between HSPC release and maximal blood lactate values. This result
formed the hypothesis that both exercise-induced physical stress parameters could have
an influence on progenitor cell number and functionality. In study I the influence of NE
and/or lactate on cell functionality was determined in vitro.
NE levels equivalent to exhausting exercise significantly reduced CPC functionality in
vitro, besides an already suggested influence on CPC mobilization (see Section H). To
evaluate a possible direct effect, La + NE were added to CPCs in cell culture in vitro.
Norepinephrine alone showed a significantly reduced CPC functionality with
concentrations found after exercise, whereas a physiological dose didnot have a
significant impact on CPC functionality. This underlines a possible direct influence on
CPC functionality besides known mobilization effects. A possible indirect trigger
function on CPC modulation, however, cannot be excluded. Ye et al. (1998) described
lactate uptake into a cell using a rat hindlimb model78
. The same authors found that
lactate uptake by the skeletal muscle cell was inhibited by arterial noradrenaline
(norepinephrine) possibly related to its vasoconstrictive action. Besides glucose, lactate
represents one of a cell’s important energy sources. When lactate uptake into a cell is
inhibited, the cell could react by up-regulating the enzyme lactate-dehydrogenase
(LDH) in order to produce lactate itself. Kumar et al. had the same association in
198079
: In the norepinephrine-treated C6 rat glial tumor cell line the synthesis rate of
two different lactate dehydrogenase types (LDH-1, LDH-5) significantly increased.
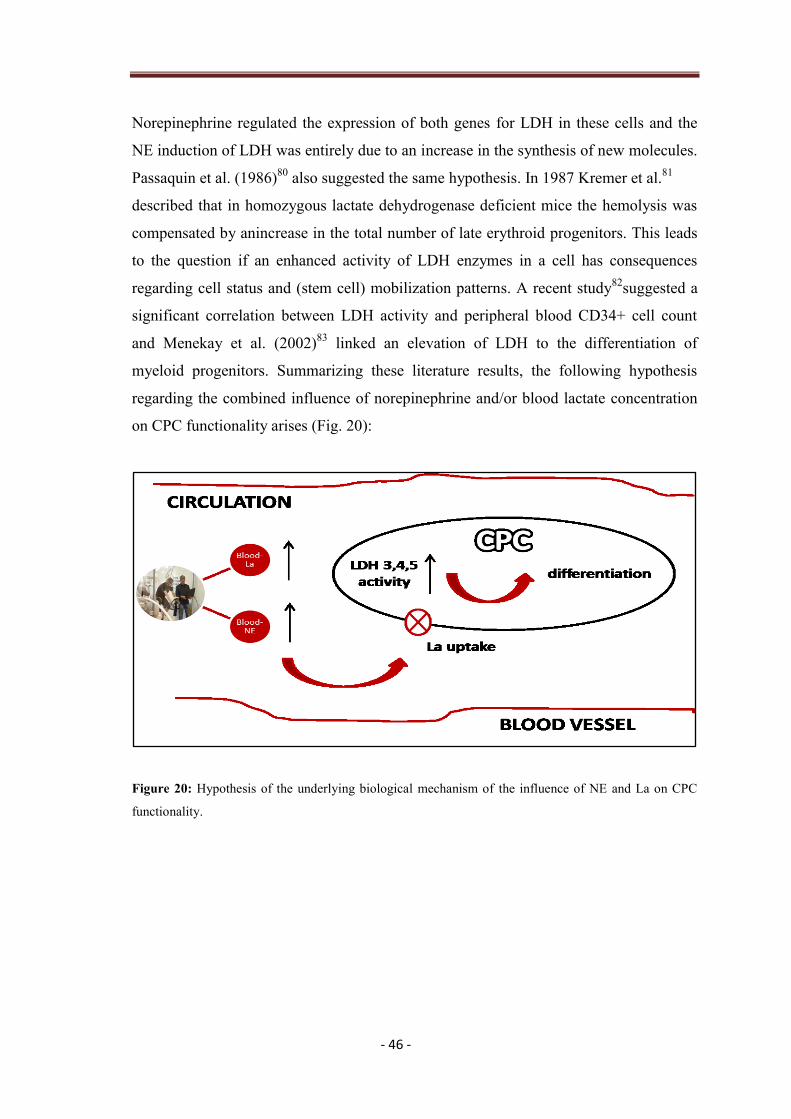
- 46 -
Norepinephrine regulated the expression of both genes for LDH in these cells and the
NE induction of LDH was entirely due to an increase in the synthesis of new molecules.
Passaquin et al. (1986)80
also suggested the same hypothesis. In 1987 Kremer et al.81
described that in homozygous lactate dehydrogenase deficient mice the hemolysis was
compensated by anincrease in the total number of late erythroid progenitors. This leads
to the question if an enhanced activity of LDH enzymes in a cell has consequences
regarding cell status and (stem cell) mobilization patterns. A recent study82
suggested a
significant correlation between LDH activity and peripheral blood CD34+ cell count
and Menekay et al. (2002)83
linked an elevation of LDH to the differentiation of
myeloid progenitors. Summarizing these literature results, the following hypothesis
regarding the combined influence of norepinephrine and/or blood lactate concentration
on CPC functionality arises (Fig. 20):
Figure 20: Hypothesis of the underlying biological mechanism of the influence of NE and La on CPC
functionality.

- 47 -
H. Influence of blood lactate on HSPC mobilization
The influence of blood lactate concentration on stem cell mobilization has still not been
very well investigated so far, especially in heart disease patients. There are only a few
studies that link lactate (La) to hematopoietic stem and progenitor mobilization. In the
work of Milovanova et al. (2008) the recruitment and differentiation of circulating
stem/progenitor cells in subcutaneous Matrigel in mice was assessed. Including a
polymer to elevate the lactate concentration in the Matrigel the number of stem and
progenitor cells increased by 3.6 fold84
. Egan et al. (2007) described a strong positive
correlation between serum lactate dehydrogenase and stem cell mobilization in patients
with hematologic malignancies85
. Lactate seems to be an important parameter in
deciding when to start apharesis and could also be a trigger mechanism for
hematopoietic stem and progenitor cells to leave the bone marrow.

- 48 -
4.1 Limitations to study design I
“Only healthy athletic male subjects were used in this study design, which limits the
results to a very specific group of people.
Determining cell functionality:
Limiting dilution transplant experiments are the gold-standard regarding the analysis of
stem cell quality, but impracticable for this experimental design due to the following
simple reason: The frequency of circulating hematopoietic progenitor cells in the human
peripheral blood is very low. To reach the required number of 1*105
CD34+ cells for
transplantation in a NOD/SCID mouse model60, 86
, a blood withdrawal of 200 ml would
be necessary at each time point, which is infeasible and not justifiable.The secondary
CFU assay, however, is a measurement of the clonal myeloid proliferative capacity and
therefore function of CPCs21, 24, 34
and only requires a reasonable amount of peripheral
blood for the procedure.”25
4.2 Limitations to study design II
The biggest drawback of this study design is that only the relationship of the number of
CPCs and blood lactate concentration in the peripheral blood was analyzed. Underlying
pathophysiological mechanisms are still to be elucidated in further studies. Furthermore,
it has to be mentioned that the subject group was inhomogeneous regarding the
variables sex (1 female participant) and age (range: 54-72 yrs).

- 49 -
5 Conclusion and Outlook
5.1 Summary of the effect of exercise on HSPCs
The underlying biological mechanisms of how exercise acts on circulating
hematopoietic stem and progenitor cells are complex and not easy to summarize. All
possibly involved mechanisms discussed in this thesis are important when speaking of
an ergometry-induced effect on CPCs. High intensity exercise acts as physical stress on
the body and elevates stress hormones such as cortisol and norepinephrine (NE) in the
peripheral blood. Furthermore, exercise produces oxidative stress and raises parameters
associated with free radical oxygen species (ROS) in blood plasma, such as
Malondialdehyd (MDA) and Myeloperoxydase (MPO). At the same time an ergometry
also triggers a short-term inflammation in the body, which is confirmed by elevated
plasma levels of the cytokine interleukin-6 (IL-6). Ergometry-induced physical strain
also leads to elevated levels of blood lactate concentration (Fig. 21).
Figure 21: Complex influence of exercise on the body.

- 50 -
All these effects have a contemporaneous impact on the dynamics and functionality of
stem and progenitor cells present in the bone marrow and in the circulation. Exercise-
induced NE levels triggered from the locus ceruleus/norepinephrine (LC/NE)
sympathetic system69
, act on the bone marrow and trigger HSPC mobilization to the
peripheral blood. Contrary, elevated cortisol levels triggered from the hypothalamic-
pituiary-adrenal axis (HPA), support homing processes from the circulation into the
tissue. All these effects taken together could justify the increased mobilization
mechanisms of hematopoietic stem and progenitor cellsto the circulation 10 min
postexercise, since triggering processes predominate, and homing by cortisol is possibly
time-delayed (Fig. 22). In addition, both elevated oxidative stress (ROS) and
inflammatory parameters (IL-6) support HSPC mobilization from the bone marrow.
Figure 22: Summary of exercise-induced changes of blood parameters in humans and their influence on
CPC number and functionality; modified with permission from Mastorakos et al. (2005)69
. Exercise-
induced stress has an impact on the HPA (hypothalamic-pituiary-adrenal axis) as well as the sympathetic
nervous system, which are interrelated by different hormones (POMC, Proopiomelanocortin;
β-Endorphin; α-MSH, α-melanozyt stimulating hormone). The end-products glucocorticoids (cortisol)
and catecholamines (norepinephrine) act on HSPC mobilization and functionality, as well as does
exercise-induced IL-6 and oxidative stress (ROS).

- 51 -
The same parameters that act on HSPC mobilization from the bone marrow could have
an impact on cell functionality in the peripheral blood. In this thesis also the impact of
NE and La on cell functionality was evaluated and the following hypothesis stated:
An increased level of NE in the peripheral blood inhibits La uptake into the circulating
stem or progenitor cell that induces an elevation of the cell’s production of lactate
dehydrogenase, which in turn drives the cell into differentiation. This is one possible
mechanism to explain the reduced cell functionality found 10 min after cessation of
ergometry.
- 52 -
5.2 Importance for clinical applications
The certainty that exercise has an impact on circulating hematopoietic stem and
progenitor cells in the peripheral blood leads to multiple applications in the fields of
regenerative and preventive medicine. First, it seems obvious that an elevated level of
circulating hematopoietic stem and progenitor cells in the circulation may be beneficial
to support tissue renewal and patient recovery43, 87
. Exercise has an impact on the bone
marrow and releases hematopoietic progenitors to the circulation, ideally to places
of tissue defects, where regeneration and cell substitution is needed (Fig. 23). Second,
exercise represents a non-invasive method to elevate the amount of CPCs and could
therefore be easily integrated in rehabilitation programs. Patients would also profit from
the positive side effects of an additional exercise therapy, such as psychological
improvement, muscle strengthening or a higher cardiopulmonary capacity. Third, it
could be a possibility to ease apheresis procedures for healthy donors by combining the
application of stem cell triggering growth factors such as G-CSF with a standardized
exercise test protocol, which could possibly reduce the amount of the injected growth
factor. It still has to be discussed, however, if stem cells triggered by exercise are
“potent” enough to be used in transplantation protocols and the perfect timing for
apharesis would also have to be evaluated.

- 53 -
Figure 23: Exercise-induced released HSPCs are led to places of tissue defects to support regeneration
processes, modified and reproduced with permission from Koerbling an Estrov et al. (2003)43
, Copyright
Massachusetts Medical Society.
Last, but not less important would be the application of CPCs in preventive medicine.
Healthy people could keep their stem cell pool in the bone marrow through the right
amount of exercise in balance and would benefit from the multiple functions of CPCs
for a lifetime24
.

- 54 -
6 References
1. Chute JP, Ross JR, McDonnell DP. Minireview: Nuclear receptors,
hematopoiesis, and stem cells. Mol Endocrinol. Jan 2010;24(1):1-10.
2. Wognum AW, Eaves AC, Thomas TE. Identification and isolation of
hematopoietic stem cells. Arch Med Res. Nov-Dec 2003;34(6):461-475.
3. Lancrin C, Sroczynska P, Stephenson C, Allen T, Kouskoff V, Lacaud G. The
haemangioblast generates haematopoietic cells through a haemogenic
endothelium stage. Nature. Feb 12 2009;457(7231):892-895.
4. Mendez-Ferrer S, Michurina TV, Ferraro F, et al. Mesenchymal and
haematopoietic stem cells form a unique bone marrow niche. Nature. Aug 12
2010;466(7308):829-834.
5. Lanza R, Weissman I, Thomson J, et al. Handbook of Stem Cells, Two-Volume
Set: Volume 1-Embryonic Stem Cells; Volume 2-Adult & Fetal Stem Cells (v.
1)2004.
6. Li J. Quiescence regulators for hematopoietic stem cell. Exp Hematol. May
2011;39(5):511-520.
7. Morrison SJ, Kimble J. Asymmetric and symmetric stem-cell divisions in
development and cancer. Nature. Jun 29 2006;441(7097):1068-1074.
8. Wahl P, Bloch W, Schmidt A. Exercise has a positive effect on endothelial
progenitor cells, which could be necessary for vascular adaptation processes.
Int J Sports Med. May 2007;28(5):374-380.
9. Pelus LM. Peripheral blood stem cell mobilization: new regimens, new cells,
where do we stand. Curr Opin Hematol. Jul 2008;15(4):285-292.
10. Vose JM, Ho AD, Coiffier B, et al. Advances in mobilization for the
optimization of autologous stem cell transplantation. Leuk Lymphoma. Sep
2009;50(9):1412-1421.
11. Theiss HD, Adam M, Greie S, Schobersberger W, Humpeler E, Franz WM.
Increased levels of circulating progenitor cells after 1- week sojourn at
moderate altitude (Austrian Moderate Altitude Study II, AMAS II). Resp
Physiol Neurobi. 2008;160:232-238.
12. Bonsignore MR, Morici G, Santoro A, et al. Circulating hematopoietic
progenitor cells in runners. J Appl Physiol. Nov 2002;93(5):1691-1697.
- 55 -
13. Thijssen DH, Vos JB, Verseyden C, et al. Haematopoietic stem cells and
endothelial progenitor cells in healthy men: effect of aging and training. Aging
Cell. Dec 2006;5(6):495-503.
14. Morici G, Zangla D, Santoro A, et al. Supramaximal exercise mobilizes
hematopoietic progenitors and reticulocytes in athletes. Am J Physiol Regul
Integr Comp Physiol. Nov 2005;289(5):R1496-1503.
15. Viscor G, Javierre C, Pages T, et al. Combined intermittent hypoxia and
surface muscle electrostimulation as a method to increase peripheral blood
progenitor cell concentration. J Transl Med. 2009;7:91.
16. Laufs U, Urhausen A, Werner N, et al. Running exercise of different duration
and intensity: effect on endothelial progenitor cells in healthy subjects. Eur J
Cardiovasc Prev Rehabil. Aug 2005;12(4):407-414.
17. Mobius-Winkler S, Hilberg T, Menzel K, et al. Time-dependent mobilization
of circulating progenitor cells during strenuous exercise in healthy individuals.
J Appl Physiol. Dec 2009;107(6):1943-1950.
18. Volaklis KA, Tokmakidis SP, Halle M. Acute and chronic effects of exercise
on circulating endothelial progenitor cells in healthy and diseased patients. Clin
Res Cardiol. Nov 2 2012 [Epub ahead of print 2012/11/03].
19. Moreno PR, Sanz J, Fuster V. Promoting mechanisms of vascular health:
circulating progenitor cells, angiogenesis, and reverse cholesterol transport. J
Am Coll Cardiol. Jun 23 2009;53(25):2315-2323.
20. Paulsen G, Mikkelsen UR, Raastad T, Peake JM. Leucocytes, cytokines and
satellite cells: what role do they play in muscle damage and regeneration
following eccentric exercise? Exerc Immunol Rev. 2012;18:42-97.
21. Gordon MY, Marley SB, Lewis JL, et al. Treatment with interferon-alpha
preferentially reduces the capacity for amplification of granulocyte-
macrophage progenitors (CFU-GM) from patients with chronic myeloid
leukemia but spares normal CFU-GM. J Clin Invest. Aug 15 1998;102(4):710-
715.
22. Withey JM, Marley SB, Kaeda J, Harvey AJ, Crompton MR, Gordon MY.
Targeting primary human leukaemia cells with RNA interference: Bcr-Abl
targeting inhibits myeloid progenitor self-renewal in chronic myeloid
leukaemia cells. Br J Haematol. May 2005;129(3):377-380.

- 56 -
23. Bonsignore MR, Morici G, Riccioni R, et al. Hemopoietic and angiogenetic
progenitors in healthy athletes: different responses to endurance and maximal
exercise. J Appl Physiol. Jul 2010;109(1):60-67.
24. Stelzer I, Fuchs R, Schraml E, et al. Decline of bone marrow-derived
hematopoietic progenitor cell quality during aging in the rat. Exp Aging Res.
Jul 2010;36(3):359-370.
25. Kroepfl JM, Pekovits K, Stelzer I, et al. Exercise increases the frequency of
circulating hematopoietic progenitor cells but reduces hematopoietic colony
forming capacity. Stem Cells Dev May 22 2012 21(16):2915-2925.
26. Wonisch M, Berent R, Klicpera M, et al. Praxisleitlinien Ergometrie. Journal
für Kardiologie - Austrian Journal of Cardiology. 2008;15 [Suppl A]:3-17.
27. Hofmann P, Tschakert G. Special needs to prescribe exercise intensity for
scientific studies. Cardiol Res Pract.2011:209-302.
28. Mezzani A, Hamm LF, Jones AM, et al. Aerobic exercise intensity assessment
and prescription in cardiac rehabilitation: a joint position statement of the
European Association for Cardiovascular Prevention and Rehabilitation, the
American Association of Cardiovascular and Pulmonary Rehabilitation and the
Canadian Association of Cardiac Rehabilitation. Eur J Prev Cardiol. Oct 26
2012.
29. Tschakert G, Groeschl W, Schwaberger G, von Duvillard SP, Hofmann P.
Prescription for aerobic high-intensity interval training by means of
incremental exercise tests markers. Med Sci Sports Exerc. 2009;41((5,
Suppl.)):430.
30. Wisloff U, Stoylen A, Loennechen JP, et al. Superior cardiovascular effect of
aerobic interval training versus moderate continuous training in heart failure
patients: a randomized study. Circulation. Jun 19 2007;115(24):3086-3094.
31. Tschakert G, Gröschl W, Hofmann P. Physiological responses during short and
long high-intensity interval and continuous exercise. Paper presented at:
Annual Meeting of the American College of Sports Medicine2011 (Abstract);
Denver, Colorado, USA.
32. Gibson RS. Principles of Nutritional Assessment. 2nd ed: Oxford University
Press; 2005.
- 57 -
33. Gajkowska A, Oldak T, Jastrzewska M, et al. Flow cytometric enumeration of
CD34+ hematopoietic stem and progenitor cells in leukapheresis product and
bone marrow for clinical transplantation: a comparison of three methods. Folia
Histochem Cytobiol. 2006;44(1):53-60.
34. Schraml E, Fuchs R, Kotzbeck P, Grillari J, Schauenstein K. Acute adrenergic
stress inhibits proliferation of murine hematopoietic progenitor cells via
p38/MAPK signaling. Stem Cells Dev. Mar 2009;18(2):215-227.
35. Schraml E, Voglauer R, Fortschegger K, et al. Haploinsufficiency of
senescence evasion factor causes defects of hematopoietic stem cells functions.
Stem Cells Dev. Apr 2008;17(2):355-366.
36. Kroepfl JM, Pekovits K, Stelzer I, et al. Bewegungseinfluss auf zirkulierende
hämatopoetische Stamm- und Progenitorzellen unter Normoxie und Hypoxie
(Influence of exercise on circulating hematopoietic stem and progenitor cells
under normoxic and hypoxic conditions). ÖGAHM Jahrbuch. 2012 (in print).
37. Khoschsorur GA, Winklhofer-Roob BM, Rabl H, Auer T, Peng Z, Schaur RJ.
Evaluation of a Sensitive HPLC Method for the Determination of
Malondialdehyd, and Application of the Method to Different Biological
Materials. Chromatographia. 2000;52:181-184.
38. Zelzer S, Khoschsorur G, Stettin M, Weihrauch G, Truschnig-Wilders M.
Determination of myeloperoxidase in EDTA plasma: comparison of an
enzyme-linked immunosorbent assay with a chemiluminescent automated
immunoassay. Clin Chim Acta. Aug 2009;406(1-2):62-65.
39. Graupp M, Wehr E, Schweighofer N, Pieber TR, Obermayer-Pietsch B.
Association of genetic variants in the two isoforms of 5alpha-reductase,
SRD5A1 and SRD5A2, in lean patients with polycystic ovary syndrome. Eur J
Obstet Gynecol Reprod Biol. Aug 2011;157(2):175-179.
40. Zar JH. Biostatistical Analysis. 4th ed. London: Pearson Education Inc.; 2006.
41. Kroepfl JM, Tschakert G, Pekovits K, et al. Relationship between exercise-
induced blood lactate concentration and hematopoietic stem cell mobilization
in heart disease patients. J Tissue Eng Regen M. 2012(6 (Suppl.1)):105
(Abstract).
42. Lekli I, Gurusamy N, Ray D, Tosaki A, Das DK. Redox regulation of stem cell
mobilization. Can J Physiol Pharmacol. Dec 2009;87(12):989-995.

- 58 -
43. Koerbling M, Estrov Z. Adult Stem Cells for Tissue Repair- A New
Therapeutic Concept? N Engl J Med. 2003;349(6):570-582.
44. Sandri M, Adams V, Gielen S, et al. Effects of exercise and ischemia on
mobilization and functional activation of blood-derived progenitor cells in
patients with ischemic syndromes: results of 3 randomized studies. Circulation.
Jun 28 2005;111(25):3391-3399.
45. Zerbini G, Lorenzi M, Palini A. Tumor angiogenesis. N Engl J Med. Aug 14
2008;359(7):763; author reply 764.
46. Bartsch P, Saltin B. General introduction to altitude adaptation and mountain
sickness. Scand J Med Sci Sports. Aug 2008;18 Suppl 1:1-10.
47. Julian CG, Gore CJ, Wilber RL, et al. Intermittent normobaric hypoxia does
not alter performance or erythropoietic markers in highly trained distance
runners. J Appl Physiol. May 2004;96(5):1800-1807.
48. Katayama K, Sato K, Matsuo H, Ishida K, Iwasaki K, Miyamura M. Effect of
intermittent hypoxia on oxygen uptake during submaximal exercise in
endurance athletes. Eur J Appl Physiol. Jun 2004;92(1-2):75-83.
49. Baker JM, De Lisio M, Parise G. Endurance exercise training promotes
medullary hematopoiesis. FASEB J. Dec 2011;25(12):4348-4357.
50. Wardyn GG, Rennard SI, Brusnahan SK, et al. Effects of exercise on
hematological parameters, circulating side population cells, and cytokines. Exp
Hematol. Feb 2008;36(2):216-223.
51. Wojciechowski JC, Narasipura SD, Charles N, et al. Capture and enrichment of
CD34-positive haematopoietic stem and progenitor cells from blood circulation
using P-selectin in an implantable device. Br J Haematol. Mar
2008;140(6):673-681.
52. Bellows CF, Zhang Y, Simmons PJ, Khalsa AS, Kolonin MG. Influence of
BMI on level of circulating progenitor cells. Obesity (Silver Spring). Aug
2011;19(8):1722-1726.
53. Cross M, Alt R, Niederwieser D. The case for a metabolic stem cell niche Cells
Tissues Organs. 2008;188:150-159.
54. Spiegel A, Shivtiel S, Kalinkovich A, et al. Catecholaminergic
neurotransmitters regulate migration and repopulation of immature human
CD34+ cells through Wnt signaling. Nat Immunol. Oct 2007;8(10):1123-1131.

- 59 -
55. Haddad JJ. Redox and oxidant-mediated regulation of apoptosis signaling
pathways: immune-pharmaco-redox conception of oxidative siege versus cell
death commitment Int Immunopharmacol. 2004;4(4):475-493.
56. Wang JS, Lin CT. Systemic hypoxia promotes lymphocyte apoptosis induced
by oxidative stress during moderate exercise. Eur J Appl Physiol. Jan
2010;108(2):371-382.
57. Adler V, Yin Z, Tew KD, Ronai Z. Role of redox potential and reactive oxygen
species in stress signaling. Oncogene. Nov 1 1999;18(45):6104-6111.
58. Camello-Almaraz C, Gomez-Pinilla PJ, Pozo MJ, Camello PJ. Mitochondrial
reactive oxygen species and Ca2+ signaling. Am J Physiol Cell Physiol. Nov
2006;291(5):C1082-1088.
59. Case J, Ingram DA, Haneline LS. Oxidative stress impairs endothelial
progenitor cell function. Antioxid Redox Signal. Nov 2008;10(11):1895-1907.
60. Yahata T, Takanashi T, Muguruma Y, et al. Accumulation of oxidative DNA
damage restricts the self-renewal capacity of human hematopoietic stem cells.
Blood. Sep 15 2011;118(11):2941-2950.
61. Hosokawa K, Arai F, Yoshihara H, et al. Function of oxidative stress in the
regulation of hematopoietic stem cell-niche interaction. Biochem Biophys Res
Commun. Nov 23 2007;363(3):578-583.
62. Cesari F, Caporale R, Marcucci R, et al. NT-proBNP and the anti-inflammatory
cytokines are correlated with endothelial progenitor cells' response to cardiac
surgery. Atherosclerosis. Jul 2008;199(1):138-146.
63. Fan Y, Ye J, Shen F, et al. Interleukin-6 stimulates circulating blood-derived
endothelial progenitor cell angiogenesis in vitro. J Cereb Blood Flow Metab.
Jan 2008;28(1):90-98.
64. Rezaee F, Rellick SL, Piedimonte G, et al. Neurotrophins regulate bone
marrow stromal cell IL-6 expression through the MAPK pathway. PLoS One.
2010;5(3):e9690.
65. Yu CX, Zhu B, Xu SF, Cao XD, Wu GC. The analgesic effects of peripheral
and central administration of melatonin in rats. Eur J Pharmacol. Sep 1
2000;403(1-2):49-53.
- 60 -
66. DeRijk RH, Boelen A, Tilders FJ, Berkenbosch F. Induction of plasma
interleukin-6 by circulating adrenaline in the rat. Psychoneuroendocrino.
1994;19(2):155-163.
67. Dimitrov S, Benedict C, Heutling D, Westermann J, Born J, Lange T. Cortisol
and epinephrine control opposing circadian rhythms in T cell subsets. Blood.
May 21 2009;113(21):5134-5143.
68. Benschop RJ, Rodriguez-Feuerhahn M, Schedlowski M. Catecholamine-
induced leukocytosis: early observations, current research, and future
directions. Brain Behav Immun. Jun 1996;10(2):77-91.
69. Mastorakos G, Pavlatou M, Diamanti-Kandarakis E, Chrousos GP. Exercise
and the stress system. Hormones. Apr-Jun 2005;4(2):73-89.
70. Dar A, Schajnovitz A, Lapid K, et al. Rapid mobilization of hematopoietic
progenitors by AMD3100 and catecholamines is mediated by CXCR4-
dependent SDF-1 release from bone marrow stromal cells. Leukemia. Aug
2011;25(8):1286-1296.
71. Katayama Y, Battista M, Kao WM, et al. Signals from the sympathetic nervous
system regulate hematopoietic stem cell egress from bone marrow. Cell. Jan 27
2006;124(2):407-421.
72. Mendez-Ferrer S, Battista M, Frenette PS. Cooperation of beta(2)- and beta(3)-
adrenergic receptors in hematopoietic progenitor cell mobilization. Ann N Y
Acad Sci. Mar 2010;1192:139-144.
73. Penn A, Mohr AM, Shah SG, et al. Dose-response relationship between
norepinephrine and erythropoiesis: evidence for a critical threshold. J Surg Res.
Oct 2010;163(2):e85-90.
74. Porter RL, Calvi LM. Communications between bone cells and hematopoietic
stem cells. Arch Biochem Biophys. May 15 2008;473(2):193-200.
75. Pereira RM, Delany AM, Durant D, Canalis E. Cortisol regulates the
expression of Notch in osteoblasts. J Cell Biochem. 2002;85:252-258.
76. Kroepfl J, Pekovits K, Stelzer I, et al. Are hematopoietic stem cell kinetics
linked to different exercise modes? Med Sci Sports Exerc. 2010;42(5):365-366
(Abstract).

- 61 -
77. Stelzer I, Kroepfl JM, Pekovits K, et al. High-volume exercise induced stress
leads to a decline of hematopoetic cell functionality in an ultra-distance
exercise model. Clin Chem Lab Med. 2012;50(4):A83-A84 (Abstract).
78. Ye JM, Steen JT, Matthias A, Clark MG, Colquhoun EQ. Effects of
noradrenaline and flow on lactate uptake in the perfused rat hindlimb. Acta
Physiol Scand. May 1998;163(1):49-57.
79. Kumar S, McGinnis JF, de Vellis J. Catecholamine regulation of lactate
dehydrogenase in rat brain cell culture. Norepinephrine differentially increases
the rate of synthesis of the individual subunits in the C6 glial tumor cell line. J
Biol Chem. Mar 25 1980;255(6):2315-2321.
80. Passaquin AC, Coupin G, Poindron P. Rat interferon inhibits catecholamine-
inducible synthesis of lactic dehydrogenase in rat glial tumoral C6 cells. J
Interferon Res. Apr 1986;6(2):71-77.
81. Kremer JP, Datta T, Pretsch W, Charles DJ, Dormer P. Mechanisms of
compensation of hemolytic anemia in a lactate dehydrogenase mouse mutant.
Exp Hematol. Jul 1987;15(6):664-670.
82. Donmez A, Kabaroglu C, Gokmen N, Tombuloglu M. The difference in lactate
dehydrogenase activity between pre- and post-mobilization periods is a good
indicator of successful stem cell mobilization. Transfus Apher Sci. Jun 16 2012
[Epub ahead of print 2012/06/20].
83. Menekay S, Ozsan GH, Demirkan F, et al. Effect of granulocyte-colony-
stimulating factor on serum lactate dehydrogenase levels and isoenzymes in a
rabbit model. Acta Haematol. 2002;107(1):18-22.
84. Milovanova TN, Bhopale VM, Sorokina EM, et al. Lactate stimulates
vasculogenic stem cells via the thioredoxin system and engages an autocrine
activation loop involving hypoxia-inducible factor 1. Mol Cell Biol. Oct
2008;28(20):6248-6261.
85. Egan K, Singh V, Gidron A, Mehta J. Correlation between serum lactate
dehydrogenase and stem cell mobilization. Bone Marrow Transplant. Nov
2007;40(10):931-934.
86. Ko KH, Holmes T, Palladinetti P, et al. GSK-3beta inhibition promotes
engraftment of ex vivo-expanded hematopoietic stem cells and modulates gene
expression. Stem Cells. Jan 2011;29(1):108-118.

- 62 -
87. Brunner S, Engelmann MG, Franz WM. Stem cell mobilisation for myocardial
repair. Expert Opin Biol Ther. Nov 2008;8(11):1675-1690.

- 63 -
7 Abbreviations
HSC hematopoietic stem cell
EPC endothelial stem cell
EC endothelial cell
MSC mesenchymal stem cells
LTHSC long-term repopulating HSC
STHSC short-term repopulating HSC
MPP multipotent progenitor cell
CMP common myeloid progenitor cell
MEP megakaryocyte-erythroid progenitor cell
GMP granulocyte monocyte progenitor cell
CLP common lymphoid progenitor cell
RBC red blood cell (erythrocyte)
34-KLS CD34- c-kit+lineage- sca-1+ cell
CRU competitive repopulating unit assay
CFU-Spleen colony forming unit-spleen assay
CFC colony-forming cell assay, d 14
HSPC hematopoietic stem and progenitor cell
CPC circulating hematopoietic progenitor cell
SSClow side scatter low
FSC forward scatter
RBC red blood cells
WBC white blood cells
Hct hematocrit
VEGF vascular endothelial growth factor
VEGF-2 vascular endothelial growth factor-2
p53 tumor protein 53
Lnk SH2B adaptor protein 3
VE-cad = CD144 vascular endothelial-cadherin
MMP-9 matrixmetallopeptidase-9
eNOS endothelial nitric oxide synthase
E-selectin endothelial-leukocyte adhesion molecule 1
- 64 -
vWF von Willebrand factor
CD 14, 31, 34, 45, 117, 133 cluster of differentiation
SCF-1 stem cell factor-1
IL-3, 5, 6,7 interleukin
VO2max maximal oxygen uptake
Pmax maximal output power
Pmean mean output power
Ppeak peak work load
Ptarget individual target work load
PLTP1 work load at LTP1
PLTP2 work load at LTP2
Prec recovery work load
trec recovery work load duration
tpeak peak work load duration
Lamax maximal blood lactate concentration
NE norepinephrine
MDA malondialdehyde
MPO myeloperoxidase
HIF-1 hypoxia-inducible-factor-1
EPO erythropoietin
CFU colony forming unit
CFU-GM CFU-granulocyte-macrophage
BFU-E burst forming unit-erytroid

- 65 -
8 Annex: additional publications and awards
Kröpfl, Julia; Karin, Pekovits; Stelzer, Ingeborg; Sedlmayr, Peter; Gröschl, Werner; Hofmann, Peter;
Domej, Wolfgang; Dohr, Gottfried; Müller, Wolfram: Are hematopoietic stem cell kinetics linked to
different exercise modes?, in: Medicine and Science in Sports and Exercise 42,5 (2010), 365 - 366.
(Abstract)
ARE HEMATOPOIETIC STEM CELL KINETICS LINKED TO DIFFERENT
EXERCISE MODES?
Hematopoieticstem- and progenitor cell release from the bone marrow to the peripheral
circulation is known to be enforced by physical work load and hypoxia. The exact stem
cell kinetics induced by these stressors, however, has not yet been identified.
PURPOSE: The aim of the study was to determine the effect of endurance exercise,
anaerobic exercise, and hypoxia on the number of hematopoietic stem cells (HSC) in the
peripheral circulation. METHODS: A single subject (25yrs, male, 1.88 m, 79 kg,
VO2max = 57.6 ml.kg-1
.min-1
, non-smoker, healthy) performed different exercise tests
in this pilot study. Incremental (I, Pmax = 360 W, PLTP2 = 243 W), constant-load all-out
(CLA, 220 W for 31 min), CL at 70% of all-out duration (CL70), and transition power
(TP30, 30s all-out at 9,7 % body weight ~ 770 W) tests as well as a hypoxia test (HY,
gradual O2-saturation decrease from 97 % to 75 % within 23 min) without physical
work load were carried out between 8:00 AM and 11:00 AM. Peripheral blood was
collected before as well as 10, 30, 60 and 120 min after the intervention. HSCs
(CD 34/ CD 45 positive) were analysed by means of flow cytometry analysis.
RESULTS: I, CLA, CL70 and TP30 showed an increasing stem cell release 10 to 30
min after the intervention, whereas hypoxia alone did not. I and TP30 were associated
with the highest stem cell increase (ΔI = 788 CD34+/CD45
+ cells/ml, ΔTP30 = 701
CD34+/CD45
+ cells/ml respectively) and also with the highest maximal lactate values
(Lamax,I = 11.97 mmol.l-1
, Lamax,TP30 = 13.77 mmol.l-1
respectively). Hypoxia was linked
to a decrease in HSC counts in the peripheral blood (ΔHY = -253 CD34+/CD45
+ cells/ml)
and was also linked to very low lactate values (Lamax,HY = 0.80 mmol.l-1
). There was a
significant correlation between HSC counts and lactate concentration (r = 0.95, p<0.05).
CONCLUSIONS: Results of this pilot study suggest that HSC release from the bone
marrow is increased by exercise modes that provide high lactate concentrations, such as
I or TP30. Accumulated blood lactate concentration may support HSC mobilization.

- 66 -
Kröpfl, Julia; Pekovits, Karin; Stelzer, Ingeborg; Sedlmayr, Peter; Hofmann, Peter; Dohr, Gottfried;
Müller, Wolfram: Stem cell kinetics induced by different high intensive exercise bouts, in: European
International Society for Cellular Therapy (ISCT-Europe) (Ed): Final Programm - European International
Society for Cellular Therapy (ISCT-Europe) (2010), 72 (Abstract)
STEM CELL KINETICS INDUCED BY DIFFERENT HIGH INTENSIVE
EXERCISE BOUTS
The release of hematopoietic stem- and progenitor cells (HSCs) from the bone marrow
to the peripheral blood can be modulated by different triggers such as hypoxia or
physical work load. PURPOSE: The aim of the study was to determine the effect of
different high intensive exercise bouts (endurance and anaerobic) on the number of
HSCs in the peripheral blood. METHODS: A single subject (25yrs, male, 1.88 m,
79 kg, VO2max = 57.6 ml/min/kg, non-smoker, healthy) performed different cycle
ergometer exercise tests in this pilot study. Incremental (I, Pmax = 360W,
PLTP2 = 243W), constant-load all-out (CLA, 220W for 31 min) just below LTP2, CL at
70 % of all-out duration (CL70), sprint power series (SP10, 10 s 7 x all-out at 4-18 %
body weight ~ 318W-1431W, 5 min rest in-between) and transition power (TP30, 1 x
30 s all-out at 9,7% body weight ~ 770W) tests were carried out between 8am and 11am
on different days in a randomized order. Peripheral blood was drawn before as well as
10, 30, 60 and 120 minutes after the intervention. HSCs (CD34/CD45 positive) were
analyzed by means of flow cytometry analysis. RESULTS: I, CLA, CL70 and TP30
showed an increasing stem cell release 10 to 30 min after the intervention, whereas
SP10 did not. I and TP30 were associated with the highest stem cell increase. CLA and
CL70 mobilized approximately the same amount of HSCs. SP10, however, was linked
to a decrease of HSCs in the peripheral blood (Table 1). CONCLUSIONS: We suggest
that high intensive exercise bouts (at or beyond LTP2) need at least a time duration of
30 s or more to mobilize HSCs from the bone marrow to the peripheral blood. In
addition, accumulated lactate might support HSC release.
Table 1
- 67 -
Kröpfl, Julia; Pekovits, Karin; Stelzer, Ingeborg; Zelzer, Sieglinde; Hofmann, Peter; Dohr, Gottfried;
Müller, Wolfram; Domej, Wolfgang: 24 h Overnight-Trial: stem cell mobilization at moderate altitudes,
in: Österreichische Gesellschaft für Alpin- und Höhenmedizin (ÖGAHM) (Ed): ÖGAHM Jahrbuch
(2011), 115-124
24 h OVERNIGHT-TRIAL: STEM CELL MOBILIZATION AT MODERATE
ALTITUDES
Little information on the influence of hypoxia at moderate altitudes on adult
hematopoietic stem and progenitor cell (HSC/HPC) mobilization can be found in the
literature. Regarding the effect of hypoxia alone or hypoxia in combination with
physical exercise on HSC/HPC release data are sparse. This makes it necessary to
separately evaluate the two possible stem cell triggers hypoxia and/or exercise. The aim
of the current pilot study was to investigate the influence of hypoxia at a simulated
moderate altitude of 3,500 m on hematopoietic stem cell release to the peripheral blood
in inactive subjects. Methods: Three healthy, male subjects were studied in a 24 h
overnight trial in a hypoxia chamber. They were supervised all the time with respect to
their activity level and their food and water uptake. Venous blood samples were
collected every four hours. HSC/HPC counts and plasma levels of malondialdehyd
(MDA), a standard oxidative stress marker, were analyzed at each blood collection.
Blood lactate concentration and heart rate were monitored as additional parameters.
Results: Subjects remained inactive throughout all 24 h (no increase in blood lactate
concentration and heart rate). HSC/HPC counts and MDA plasma levels did not show
any increasing tendency during the 24 h period in the hypoxia chamber, although all
subjects clearly responded to hypoxia (decreased oxygen saturation). Conclusions: 24 h
of hypoxia at a simulated moderate altitude of 3,500 m did not have any mobilizing
influence on hematopoietic stem cell release from the bone marrow to the peripheral
blood in inactive subjects, although data are limited due to the low number of subjects.
Awards
Young Investigator Grant of the Karl-Franzens University of Graz (2010/2012)
ÖGAHM Science Award 2010
1st Poster Award at the Congress for Cardiac Rehabilitation (Vienna, Austria,
October 2012)
- 68 -
Acknowledgements
This dissertation was an interdisciplinary project, where a lot of different people
supported this work. First of all, I am very grateful to Wolfram Müller for the
possibility of becoming a member of his research group and consecutively being
involved in this interesting project. It was a pleasure to work with you and to learn from
you! I want to thank Gottfried Dohr and Sandra Wallner-Liebmann for being great
supervisors and project coordinators. Without their ideas and support this project would
not have come to life. In addition, I want to express my appreciation to Gottfried Dohr
to have been able to do all the lab work at the Institute of Cell Biology, Histology and
Embryology.
Furthermore, I am immensely thankful to Ingeborg Stelzer for sharing her huge
knowledge and skills and for her moral as well as work support. My sincere thanks also
go to Karin Pekovits for her involvement in optimizing the cell culture procedure and
the FACS analysis in the beginning, her valuable help during the study and for having
been a good friend.
I want to thank the whole team of the former HPRGraz
named Alfred Fürhapter-Rieger,
Gerhard Tschakert, Claus Cagran, Philipp Huber, Werner Gröschl, Evelyn Schneider,
Alex Müller, Tanja Zarfl, Patrick Rossmann, Peter Rohrer, Stefan Zunzer, Stefan Spirk
and Mario Frei for their continuous help, advice and an enthusiastic work environment.
Thanks for the great three years I could be part of this institution!
My sincere thanks also go to Peter Hofmann for his continuous and reliable support in
various issues as well as Wolfgang Domej for all his help regarding the hypoxia
chamber and the Land STMK financed project.
Many thanks to Monika Siwetz, Nina Flieser, Bernhard Robinig, Peter Schönbacher,
Rudolf Schmied and Beate Scheiber at the Institute of Cell Biology, Histology and
Embryology for their assistance during the study, Peter Sedlmayr for his introduction to
flow cytometry analysis as well as Gregor Weiss and Lukas Schinagl for their excellent
stirring.
Thanks are also given to Robert Fuchs for his competent advice while publishing,
Sieglinde Zelzer for her help regarding the oxidative stress level evaluation as well as
Brigitte Poncza and Nathalie Allard for the determination of catecholamines.

- 69 -
I am very thankful to Elisabeth Stummer for broading
my horizons regarding the philosophy of doing a PhD.
Special thanks are given to Markus Auer and my friends
for their maintaining motivation. Finally I thank my
family for being my anchor in highs and lows.
http://oe1.orf.at/
In addition, I want to express my appreciation to Land STMK, Austrian Association for
Alpine Medicine (ÖGAHM), Franz-Lanyar Stiftung and Doctoral School for Lifestyle-
Related Diseases (Med Uni Graz) for their financial support.
- 70 -
Declaration
Hereby I declare that this thesis is my own original work and that I have fully
acknowledged by name all of those individuals and organizations that have contributed
to the research for this thesis. Due acknowledgement has been made in the text to all
other material used. Throughout this thesis and in all related publications I followed the
guidelines of “Good Scientific Practice”.
Please note that parts of this thesis have already been published:
Kroepfl JM, Pekovits K, Stelzer I, et al. Exercise increases the frequency of circulating
hematopoietic progenitor cells but reduces hematopoietic colony forming capacity. Stem
Cells Dev 2012, 21(16):2915-25.
Date Signature
Graz, 21.12.2012


![CHIRURGIE - bdc.de · [7] Internetbased Perioperative Exercise Program in Patients With Barrett’s Carcinoma Scheduled for Esophagectomy [8] Postoperative negative pressure incision](https://static.fdokument.com/doc/165x107/5d026c2988c993b06c8c5c7d/chirurgie-bdcde-7-internetbased-perioperative-exercise-program-in-patients.jpg)


![Cochrane DatabaseofSystematicReviewsfysak.alstahaug.ipage.no/wp-content/uploads/2019/11/Larun_et_al-2017... · [Intervention Review] Exercise therapy for chronic fatigue syndrome](https://static.fdokument.com/doc/165x107/6047fe7ab9507a609843a7f7/cochrane-databaseofsy-intervention-review-exercise-therapy-for-chronic-fatigue.jpg)