Infrared ellipsometry on mixed functional polymer brushes ... · “In Situ Infrared Ellipsometry...
104
Infrared ellipsometry on mixed functional polymer brushes designed to control surface characteristics vorgelegt von M. Sc. Chemie Annika Kroning geb. in Diepholz von der Fakultät II – Mathematik und Naturwissenschaften der Technischen Universität Berlin zur Erlangung des akademischen Grades Doktor der Naturwissenschaften - Dr. rer. nat - genehmigte Dissertation Promotionsausschuss: Vorsitzender: Prof. Dr. Peter Hildebrandt Gutachter: Prof. Dr. Norbert Esser Gutachter: PD Dr. Karsten Hinrichs Gutachter: Prof. Dr. Klaus Rademann Tag der wissenschaftlichen Aussprache: 29.08.2017 Berlin 2017
Transcript of Infrared ellipsometry on mixed functional polymer brushes ... · “In Situ Infrared Ellipsometry...
Infrared ellipsometry on mixed functionalpolymer brushes designed to control
surface characteristics
vorgelegt vonM. Sc. Chemie
Annika Kroninggeb. in Diepholz
von der Fakultät II – Mathematik und Naturwissenschaftender Technischen Universität Berlin
zur Erlangung des akademischen Grades
Doktor der Naturwissenschaften- Dr. rer. nat -
genehmigte Dissertation
Promotionsausschuss:
Vorsitzender: Prof. Dr. Peter HildebrandtGutachter: Prof. Dr. Norbert EsserGutachter: PD Dr. Karsten HinrichsGutachter: Prof. Dr. Klaus Rademann
Tag der wissenschaftlichen Aussprache: 29.08.2017
Berlin 2017

List of publications
• A. Kroning, A. Furchner, D. Aulich, E. Bittrich, S. Rauch, P. Uhlmann, K.-J. Ei-chhorn, M. Seeber, I. Luzinov, S. M. Kilbey II, B. S. Lokitz, S. Minko, K. Hinrichs,“In Situ Infrared Ellipsometry for Protein Adsorption Studies on Ultrathin SmartPolymer Brushes in Aqueous Environment”, ACS Applied Materials & Interfaces2015, 7, 12430–12439. doi: 10.1021/am5075997
• A. Kroning, A. Furchner, S. Adam, P. Uhlmann, K. Hinrichs, “Probing carbonyl–water hydrogen bond interactions in thin polyoxazoline brushes”, Biointerphases2016, 11 (1), 019005. doi: 10.1116/1.4939249
• A. Furchner, A. Kroning, S. Rauch, P. Uhlmann, K.-J. Eichhorn, K. Hinrichs,“Molecular Interactions and Hydration States of Ultrathin Functional Films at theSolid–Liquid Interface”, Analytical Chemistry 2017, 89 (6), 3240–3244.doi: 10.1021/acs.analchem.7b00208
List of contributions at academic conferences and meetings
• A. Furchner, A. Kroning, E. Bittrich, S. Rauch, M. König, P. Uhlmann, K.-J. Ei-chhorn, K. Hinrichs, “Studies on the Swelling Behavior of Thin Polymer BrushFilms with In Situ Infrared Spectroscopic Ellipsometry”, Poster presentation onthe 245th ACS National Meeting, PMSE (Polymeric Materials: Science and Engi-neering), April 7–11, 2013, New Orleans, USA.
• A. Kroning, A. Furchner, M. Seeber, I. Luzinov, K. Hinrichs, “IR spectroscopy onmixed functional polymer interfaces to characterize their switching behavior”,Poster presentation at the Forschungsforum Adlershof, November 12, 2013, Ber-lin-Adlershof, Germany.
• A. Kroning, A. Furchner, M. Seeber, I. Luzinov, K. Hinrichs, “In Situ InfraredSpectroscopic Ellipsometry on Temperature-Responsive Copolymer Brushes”,Poster presentation on the 8th Workshop Ellipsometry, March 10–12, 2014, Dres-den, Germany.
• A. Kroning, A. Furchner, M. Seeber, I. Luzinov, S. Minko, K. Hinrichs, “Poly(N-iso-propyl acrylamide) in mixed polymer brushes: Temperature-responsive behaviorstudied with infrared spectroscopy” Poster presentation on the 248th ACS Na-tional Meeting, PMSE (Polymeric Materials: Science and Engineering), August10–14, 2014, San Francisco, USA.
• A. Kroning, A. Furchner, M. Seeber, I. Luzinov, S. Minko, S. M. Kilbey II, B.S. Lokitz, K. Hinrichs, “Temperature-responsive behavior of poly(N-isopropylacrylamide) in mixed polymer brushes studied with in-situ infrared ellipsometry”,Poster presentation at the Forschungsforum Adlershof, November 11, 2014, Ber-lin-Adlershof, Germany.
• A. Kroning, A. Furchner, E. Bittrich, M. Seeber, I. Luzinov, S. M. Kilbey II, B.S. Lokitz, O. Trotsenko, S. Minko, K. Hinrichs, “In-situ infrared ellipsometricstudies on temperature-responsive polymer brushes”, Poster presentation on the9th Workshop Ellipsometry, February 23–25, 2015, Twente, Netherlands.
iii

• A. Kroning, A. Furchner, M. Seeber, I. Luzinov, S. M. Kilbey II, B. S. Lokitz,O. Trotsenko, S. Minko, K. Hinrichs, “In-situ infrared ellipsometric studies onthe thermoresponsive behavior of copolymer brushes and their interaction withproteins”, Oral presentation at the E-MRS Spring Meeting, May 11–15, 2015,Lille, France.
iv

To my running shoes. . .
v

Contents
1 Introduction 1
2 Functional Polymer Brushes 52.1 General Properties . . . . . . . . . . . . . . . . . . . . . . . . . . . . . . . 52.2 Temperature-responsive brushes . . . . . . . . . . . . . . . . . . . . . . . 7
3 Methods and Experimental Settings 113.1 Spectroscopic Ellipsometry . . . . . . . . . . . . . . . . . . . . . . . . . . 12
3.1.1 Basic principles . . . . . . . . . . . . . . . . . . . . . . . . . . . . . 13Jones and Stokes formalism . . . . . . . . . . . . . . . . . 14
3.1.2 Determination of tanΨ and ∆ . . . . . . . . . . . . . . . . . . . . . 153.1.3 Experimental Setup . . . . . . . . . . . . . . . . . . . . . . . . . . . 17
VIS Ellipsometry . . . . . . . . . . . . . . . . . . . . . . . 17Infrared Ellipsometry . . . . . . . . . . . . . . . . . . . . 17
3.2 Atomic Force Microscopy . . . . . . . . . . . . . . . . . . . . . . . . . . . 19
4 Sample Preparation and Data Evaluation 214.1 Materials . . . . . . . . . . . . . . . . . . . . . . . . . . . . . . . . . . . . . 214.2 Polymer Syntheses and Brush Preparations . . . . . . . . . . . . . . . . . 23
4.2.1 Poly(2-oxazoline) Brushes . . . . . . . . . . . . . . . . . . . . . . . 23Polymerization . . . . . . . . . . . . . . . . . . . . . . . . 23Characterization of the polymer chains . . . . . . . . . . 23Brush preparation . . . . . . . . . . . . . . . . . . . . . . 23Pre-characterization of the brushes . . . . . . . . . . . . 24Preparation of spin-coated layers on gold . . . . . . . . 24
4.2.2 Block-Copolymer Brushes PNIPAAm-b-PGMA . . . . . . . . . . . 25Brush preparation . . . . . . . . . . . . . . . . . . . . . . 25Pre-characterization of the brushes . . . . . . . . . . . . 26
4.3 Data Analysis . . . . . . . . . . . . . . . . . . . . . . . . . . . . . . . . . . 274.3.1 Correction of IR-SE Spectra . . . . . . . . . . . . . . . . . . . . . . 284.3.2 Layer Models . . . . . . . . . . . . . . . . . . . . . . . . . . . . . . 304.3.3 Simulation . . . . . . . . . . . . . . . . . . . . . . . . . . . . . . . . 31
5 Results and Discussion 335.1 Poly(2-alkyl-2-oxazoline)s . . . . . . . . . . . . . . . . . . . . . . . . . . . 34
5.1.1 Characterization in dry state . . . . . . . . . . . . . . . . . . . . . 34IR-SE spectra of POx layers on gold substrates . . . . . . 34Simulations of POx on gold substrates . . . . . . . . . . 36IR-SE spectra on silicon . . . . . . . . . . . . . . . . . . . 37Simulation of POx on silicon . . . . . . . . . . . . . . . . 39
5.1.2 In situ swelling behavior . . . . . . . . . . . . . . . . . . . . . . . . 40
vii
Transition of POx chains in water . . . . . . . . . . . . . 40Transition of POx brushes in water . . . . . . . . . . . . 41Simulations of in situ POx spectra . . . . . . . . . . . . . 46
5.2 Block-copolymer brushes PNIPAAm-b-PGMA . . . . . . . . . . . . . . . 525.2.1 Characterization of the dry brushes . . . . . . . . . . . . . . . . . 52
Thickness and composition . . . . . . . . . . . . . . . . . 52Brush surface characterization . . . . . . . . . . . . . . . 56
5.2.2 In situ swelling behavior . . . . . . . . . . . . . . . . . . . . . . . . 57In situ AFM . . . . . . . . . . . . . . . . . . . . . . . . . . 58In situ VIS Ellipsometry . . . . . . . . . . . . . . . . . . . 59In situ IR Ellipsometry . . . . . . . . . . . . . . . . . . . 60
5.3 Protein adsorption . . . . . . . . . . . . . . . . . . . . . . . . . . . . . . . 655.3.1 Fibrinogen adsorption on Silicon and PGMA . . . . . . . . . . . . 665.3.2 Fibrinogen adsorption experiments on PNIPAAm-b-PGMA brushes 68
Summary 73
Bibliography 77
viii
List of Figures
2.1 Structures of the anchoring polymer PGMA and different polymers usedto fabricate polymer brushes. . . . . . . . . . . . . . . . . . . . . . . . . . 6
2.2 Scheme of the possible interactions of PNIPAAm and POx in water. . . 92.3 Mesomeric structures of an amide group. . . . . . . . . . . . . . . . . . . 10
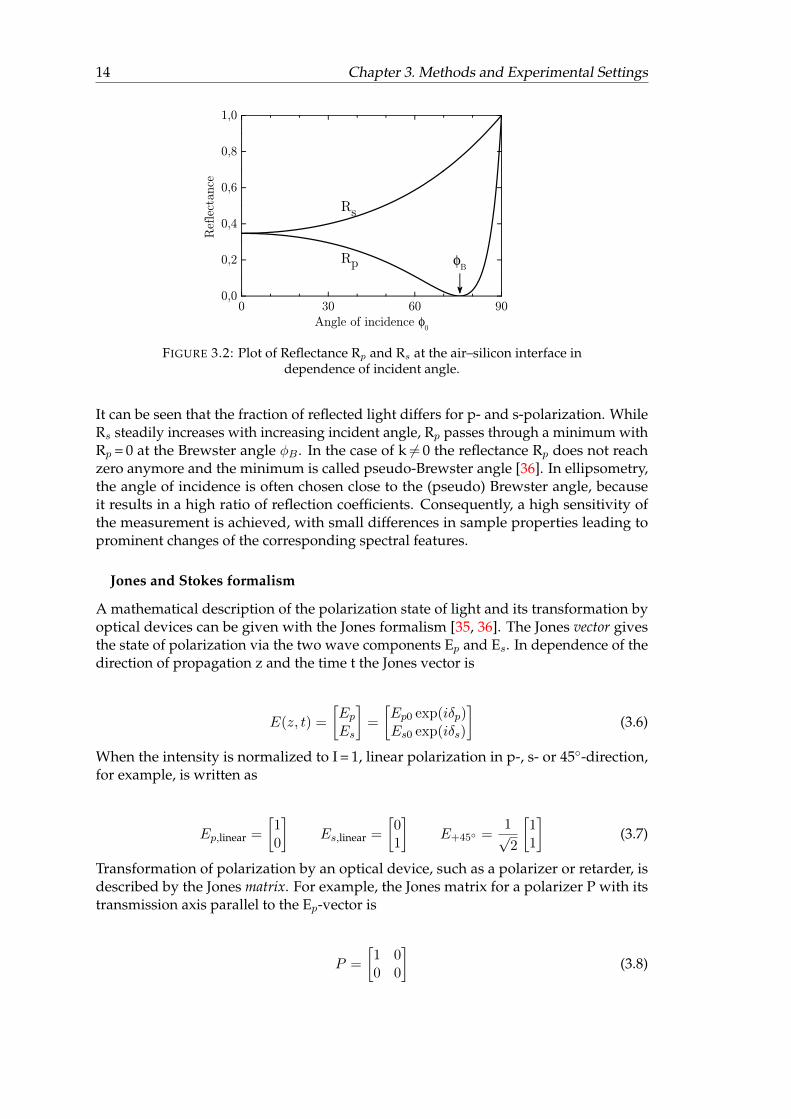
3.1 Scheme of a simple ellipsometric setup. . . . . . . . . . . . . . . . . . . . 123.2 Plot of Reflectance at the air–silicon interface in dependence of incidence
angle. . . . . . . . . . . . . . . . . . . . . . . . . . . . . . . . . . . . . . . . 143.3 Scheme of the IR-SE setup with a cross-section of the in situ cell. . . . . . 183.4 Scheme of the general setup of an atomic force microscope. . . . . . . . . 19
4.1 Measured, corrected and simulated in situ tanΨ spectra of PcPrOx in H2Oat 20◦C. . . . . . . . . . . . . . . . . . . . . . . . . . . . . . . . . . . . . . . 29
4.2 Schemes of the layer models used for the simulations. . . . . . . . . . . . 31
5.1 Ex situ tanΨ spectra and their second derivatives of spin-coated POxlayers on gold. . . . . . . . . . . . . . . . . . . . . . . . . . . . . . . . . . . 35
5.2 Measured and simulated tanΨ spectra of the POx layers on gold in thefingerprint range. . . . . . . . . . . . . . . . . . . . . . . . . . . . . . . . . 37
5.3 Measured and simulated ex situ tanΨ spectra of POx brushes on siliconand POx layers on gold. . . . . . . . . . . . . . . . . . . . . . . . . . . . . 38
5.4 Ex situ measured and simulated tanΨ spectra of dry POx brushes onsilicon in the fingerprint range. . . . . . . . . . . . . . . . . . . . . . . . . 40
5.5 In situ tanΨ spectra of POx brushes in H2O at low and high temperaturein the range of the carbonyl band. . . . . . . . . . . . . . . . . . . . . . . . 42
5.6 Temperature-dependent in situ tanΨ spectra of POx and their secondderivatives. . . . . . . . . . . . . . . . . . . . . . . . . . . . . . . . . . . . . 43
5.7 Plot of the temperature-dependent ν(C=O) frequency of PcPrOx andcopolymer25 in D2O in the in situ tanΨ spectra compared to the swollenthickness determined with VIS ellipsometry in H2O. . . . . . . . . . . . . 45
5.8 Measured and simulated in situ tanΨ spectra of PcPrOx in normal anddeuterated water at 20◦C and 45◦C. . . . . . . . . . . . . . . . . . . . . . . 48
5.9 Measured and simulated in situ tanΨ spectra of PMeOx in normal waterat 20◦C and 45◦C. . . . . . . . . . . . . . . . . . . . . . . . . . . . . . . . . 49
5.10 Combination of the data on PcPrOx and PMeOx to create a model layerfor the swollen copolymer brush using the effective medium approximation. 49
5.11 Measured and two exemplary simulated in situ tanΨ spectra of copoly-mer25 in H2O at 20◦C. . . . . . . . . . . . . . . . . . . . . . . . . . . . . . 50
5.12 tanΨ spectra and their second derivatives of PNIPAAm-b-PGMA block-copolymer brushes in dry state. . . . . . . . . . . . . . . . . . . . . . . . . 54
ix
5.13 Possible interactions between the funtional groups of PNIPAAm andPGMA in dry state. . . . . . . . . . . . . . . . . . . . . . . . . . . . . . . . 55
5.14 AFM images of PNIPAAm-b-PGMA block-copolymer brushes. . . . . . . 565.15 AFM height profile of PNI-70. . . . . . . . . . . . . . . . . . . . . . . . . . 575.16 AFM in situ profiles of PNIPAAm-b-PGMA block-copolymer brushes at a
step edge. . . . . . . . . . . . . . . . . . . . . . . . . . . . . . . . . . . . . . 585.17 In situ VIS ellipsometry swelling results of a ddry = 27.7 nm PNI-70 brush
in water. . . . . . . . . . . . . . . . . . . . . . . . . . . . . . . . . . . . . . 605.18 In situ tanΨ spectra of PNI-70 block-copolymer brush (70.6% PNIPAAm)
in water and their second derivatives. . . . . . . . . . . . . . . . . . . . . 615.19 In situ tanΨ spectra of PNI-40 block-copolymer brush (40.8% PNIPAAm)
in water and their second derivatives. . . . . . . . . . . . . . . . . . . . . 625.20 In situ tanΨ spectra of the two PNIPAAm-b-PGMA block-copolymer
brushes and a traditional PNIPAAm brush. . . . . . . . . . . . . . . . . . 625.21 Change of the ν(H2O) amplitudes of a traditional PNIPAAm brush and
the two copolymer brushes in dependence of temperature in comparisonto an optical simulation of a swollen brush without temperature-respon-sive behavior. . . . . . . . . . . . . . . . . . . . . . . . . . . . . . . . . . . 63
5.22 IR-SE spectra of FIB adsorption to silicon and PGMA. . . . . . . . . . . . 675.23 Direct comparison of IR-SE spectra of FIB adsorption to silicon and PGMA. 685.24 In situ IR-SE spectra of protein adsorption experiments on PNIPAAm-
containing polymer brushes at temperatures above and below PNI-PAAm’s LCST. . . . . . . . . . . . . . . . . . . . . . . . . . . . . . . . . . . 70
5.25 In situ IR-SE spectra of PNI-70 at 25 and 55 ◦C. . . . . . . . . . . . . . . . 715.26 Photograph of an intact PNI-70 sample and the damaged sample. . . . . 71
x
List of Tables
4.1 List of materials used in this work. . . . . . . . . . . . . . . . . . . . . . . 224.2 List of instruments and software used in this work. . . . . . . . . . . . . 224.3 Characteristics of the poly(2-oxazoline)s used for brush preparation. . . 244.4 Dry layer thicknesses ddry, Si for the prepared POx brushes on Si and
layers on Au as well as the grafting densities σ of the brushes on Si. . . . 244.5 Parameters of the two block-copolymers used for PNIPAAm-b-PGMA
brush preparation. . . . . . . . . . . . . . . . . . . . . . . . . . . . . . . . 254.6 Parameters of the two sets of PNIPAAm-b-PGMA copolymer brushes
studied in this work. . . . . . . . . . . . . . . . . . . . . . . . . . . . . . . 26
5.1 Band Assignments of dry POx brushes. . . . . . . . . . . . . . . . . . . . 365.2 Thicknesses, H2O volume fraction, and swelling degrees of POx brushes
determined via in situ VIS ellipsometry. . . . . . . . . . . . . . . . . . . . 435.3 Band Assignments of dry block-copolymer brushes. . . . . . . . . . . . . 535.4 Root mean square roughness of the copolymer layers under different
conditions. . . . . . . . . . . . . . . . . . . . . . . . . . . . . . . . . . . . . 575.5 In situ thickness results of the copolymer brushes and of a traditional
PNIPAAm brush. . . . . . . . . . . . . . . . . . . . . . . . . . . . . . . . . 595.6 VIS ellipsometry results on switching behavior and protein adsorption
experiments on PNIPAAm-b-PGMA brushes. . . . . . . . . . . . . . . . . 69
xi


List of Abbreviations and Symbols
AFM Atomic Force MicroscopyAR-XPS Angle-Resolved X-ray Photon Spectroscopycopolymer10 poly(2-(methyl-[stat]-cyclopropyl)-2-oxazoline) with
10% MeOxcopolymer25 poly(2-(methyl-[stat]-cyclopropyl)-2-oxazoline) with
25% MeOxcPrOx 2-cyclopropyl-2-oxazolineCROP Cationic Ring-Opening Polymerization~D dielectric displacementd(dry) dry layer thicknessd(T) swollen layer thickness at temperature T~E electric fieldEMA effective medium approximationEsterOx methyl-3-(oxazol-2-yl) propionatefi volume fraction of substance iFIB fibrinogenGMA glycidyl methacrylateh layer thickness (brush height)H-bond hydrogen bondIPF Leibniz-Institut für PolymerforschungIR infraredIR-SE Infrared Spectroscopic Ellipsometryk absorption coefficientLCST lower critical solution temperaturemeas measuredMEK methyl ether ketoneMeOx 2-methyl-2-oxazolinen real refractive indexN complex refractive indexNA Avogadro‘s number (6.022 x 10²³ mol−1)NIPAAm N-isopropyl acrylamideORNL Oak Ridge National LaboratoryPAA poly(acrylic acid)PcPrOx poly(2-cyclopropyl-2-oxazoline)PEEK polyether ether ketonePEtOx poly(2-ethyl-2-oxazoline)PGMA poly(glycidyl methacrylate)PID controller proportional-integral-derivative controllerPiPrOx poly(2-isopropyl-2-oxazoline)PMeOx poly(2-methyl-2-oxazoline)PNI-40 PNIPAAm-b-PGMA copolymer brush with 40.8%
PNIPAAm content
xiii

PNI-70 PNIPAAm-b-PGMA copolymer brush with 70.6%PNIPAAm content
PNIPAAm poly(N-isopropylacrylamide)PNIPAAm-b-PGMA [Poly(N-isopropylacrylamide)]-block-[poly(glycidyl
methacrylate)]POx poly(2-alkyl-2-oxazoline)QNMTM quantitative nanomechanical mappingR reflectanceRAFT reversible addition fragmentaion chain transferref referencerms root mean squarerp,s reflection coefficient in p- and s-polarizationsim simulatedSTM scanning tunneling microscopeTcp cloud point temperaturetp,s transmission coefficient in p- and s-polarizationUCST upper critical solution temperatureVIS visibleXPS X-ray Photoelectron SpectroscopyΓ surface coverageδp,s phase of p- and s-polarizationε dielectric functionλ wavelengthρ complex reflectance ratio% polymer bulk densityσ grafting densityφ0 angle of incidenceφB Brewster angleω frequency
xiv
Chapter 1
Introduction
Materials science on the nanoscale has become very important in the past decades.With surfaces and interfaces being the central area where electric, catalytic or biologicalprocesses take place, a suitable modification of these interfaces is of great value. Thesurface properties of a material can be modified by coating it with a thin layer withoutaltering its bulk properties. An example for biological applications of such coatings areantifouling layers on medical implants [1, 2]. Other applications are thin layers not toprotect a material from interaction with its environment but to induce a special interaction,e. g. antibody recognition, controlled protein adsorption, or cell adhesion/detachmentand proliferation [3–9].
This thesis focuses on such special interactions. It is part of a joint DFG-NSF projectwith partners from the USA and Germany within the materials world network called"Switchable polymer interfaces for bottom-up stimulation of mammalian cells“. Thelong-term goal of the project is to design a material that can be used for the controlledattachment, proliferation, and detachment of cells. Functional polymer films are suitablecoatings for these applications, because of their biocompatibility and chemical stability.Their functionality is based on an external stimulus, for example a variation of pHvalue [10–12], salinity [12, 13], temperature [14–17], or magnetic field [18, 19], thatinduces a profound change of surface properties of the film. Using temperature asstimulus is very useful for the design of bioactive surfaces, since biological samplesare very sensitive to changes in pH or ion concentrations [20]. The polymers poly(N-isopropyl acrylamide) [PNIPAAm] and poly(2-alkyl-2-oxazoline)s [POx] are such tem-perature-responsive polymers, which is why they were studied in this work.
The polymers were used as a special kind of nanometer-thin functional coating,called polymer brushes. Such brushes consist of polymers densely grafted to a substrateat one chain end, resulting in a thin layer of chains protruding from the surface likebristles on a brush [21, 22]. Due to the high grafting density the polymer chains are inclose contact and forced to unidirectionally stretch away from the substrate. By that auniform responsive behavior upon application of the stimulus is achieved [23].
PNIPAAm is a widely studied polymer with temperature-responsive behavior [24–29]. It is hydrophilic and undergoes a transition to a more hydrophobic state in waterwhen the temperature is raised. The temperature around which this transition takesplace is called lower critical solution temperature (LCST). The other polymer class stu-died in this work are POx. They show temperature-responsive behavior when the alkylside group is an ethyl (–C2H5) or propyl (–C3H7) group [17, 30–33]. Both PNIPAAmand POx contain amide groups that can interact with water via hydrogen bonds. Thecurrent work focuses on the temperature-responsive switching behavior of PNIPAAmand POx between a hydrophilic and a hydrophobic state. The characterization is doneby probing the solid–liquid interface in situ to examine the interactions between thepolymer’s functional groups and water molecules. Since the functional behavior could
1

2 Chapter 1. Introduction
possibly enable controlled attachment and detachment of proteins or cells, which is theoverall goal of the project, protein adsorption experiments were also performed on someof the brushes.
Studying the interface between a material and its environment means being sensitiveto the interface or a thin layer at the interface, ideally without disturbing the natureof the layer. Ellipsometry is such a surface-sensitive and non-destructive method [34–37]. It is an optical technique providing valuable information about a material via thereflection of polarized light at the interface of interest. This can be done without theneed of a label like isotopes or fluorescencent markers [38]. Measurement of organicmaterials is often done with infrared (IR) light, since the spectral features are correlatedwith molecular vibrations. The frequency of a vibration is characteristic for molecularbonds and functional groups, therefore it is useful for a qualitative analysis. Infraredspectroscopic ellipsometry (IR-SE) delivers absolute spectra that allow for identificationof spectral changes due to changes of interaction or aging [39–41].
Because of these advantages, in situ IR-SE was chosen to study the polymer brushesin aqueous solution. An in situ cell was utilized that enables to probe the brush layerwhile it is in contact with solution [10, 42]. We were interested in the in situ behavior ofpolymer brushes of PNIPAAm and POx upon application of the stimuli as well as theirinteraction with biological macromolecules. IR-SE spectra of these brushes were mainlyevaluated qualitatively. Optical modeling was applied to extract semi-quantitativeinformation about the optical characteristics of the layers in different states. Also,simulations of some IR bands that contain several components have been performed.Our aim was to interpret the ellipsometric spectra with respect to the interactionswithin the polymer brushes themselves as well as the interactions between polymer andsolution.
The two polymers PNIPAAm and POx were chosen, because both are temperature-responsive with an LCST in the physiologically relevant temperature range. Based onthese polymers, two different brush systems have been prepared: On the one hand, POxbrushes were studied. The POx polymer chains used for brush preparation containedtwo different alkyl side chains, either in their pure form or as statistical copolymerscontaining both types of side chain. Copolymerization shifted the LCST of POx intothe same temperature range as the LCST of PNIPAAm, and therefore it was possi-ble to compare the switching behavior of POx and PNIPAAm brushes. On the otherhand, PNIPAAm brushes were prepared by a modified grafting-to procedure using ablock-copolymer of PNIPAAm and the anchoring polymer PGMA. Our measurementswere focused on the switching behavior of these block-copolymer brushes, their inte-raction with proteins, and comparison to the traditionally prepared PNIPAAm brushes.PNIPAAm has been reported protein-repellent in many cases [7, 43–46] and previousstudies in our group have shown the same behavior [47]. PGMA on the other hand hasa high affinity to proteins [48], so we used this different polymer–protein interactionin protein adsorption experiments as inidcator for the presence of PGMA blocks at thebrush surface.
This thesis is structured as follows: First, an introduction to functional polymer brus-hes, particularly temperature-responsive ones, is given in chapter 2. In chapter 3 thetheoretical background about optics and its use in ellipsometry is explained. The setupof the IR-SE instrument is described, including the special case of in situ measurements.Sample preparation will be described in chapter 4 which is divided into two sections.First, the preparation of the two kinds of polymer brushes is described. Grafting of the
Chapter 1. Introduction 3
block-copolymer brushes was done on a research visit to the group of Igor Luzinov atClemson University, USA. The preparation of polyoxazoline brushes included polymersynthesis and was done by Stefan Adam at IPF in Dresden. The second section ofthe chapter deals with the data analysis. It contains the spectral correction as well asthe use of layer modeling to extract optical constants and quantitative data from themeasurements.
Chapter 5 is about the results of this work. It contains three sections: The firsttwo sections are about the block-copolymer brushes and POx. They each describe acharacterization of the brushes in dry state followed by the in situ swelling experimentsin aqueous solution. The switching behavior was evalutated mainly with IR-SE but alsocomplementary methods like visible ellipsometry (VIS-SE) and atomic force microscopy(AFM) were used. Finally, the interaction of polymer brushes with proteins is adressedin the third section. Adsorption experiments with the protein fibrinogen were conductedon the block copolymer brushes containing PNIPAAm. The results were compared tofindings on the interaction between proteins and PNIPAAm from previous experimentsin our group as well as from literature. A summary of the work is given at the end,including a short outlook on future possibilities.

Chapter 2
Functional Polymer Brushes
2.1 General Properties
Functional organic interfaces are promising systems for a wide variety of biological andmedical applications [3]. They can be useful in drug delivery, as synthetic membra-nes, biosensors, or as biomimetic surfaces to control e. g. protein adsorption and cellgrowth [4, 7, 49–52].
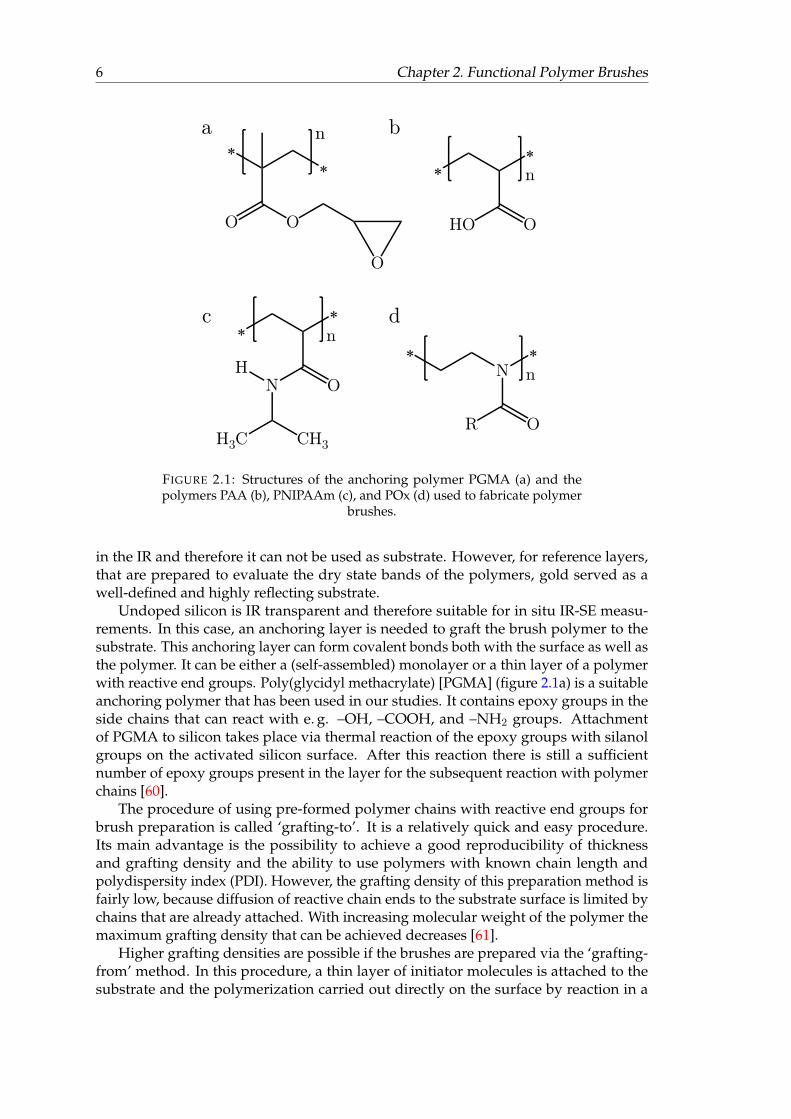
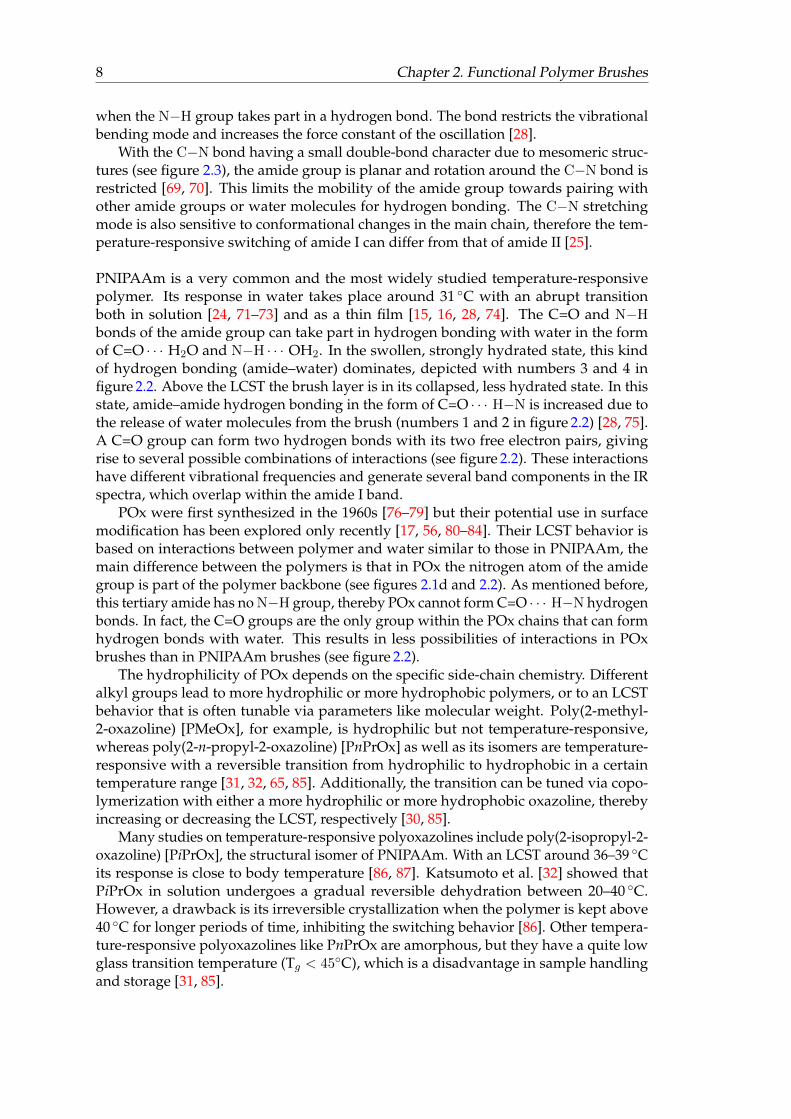
Polymers are ideal candidates in this matter, because they can be designed accordingto a desired function. There are many biocompatible, non-toxic polymers available thatexhibit functional behavior. Their functionality relies on a change in the environment(external stimulus), inducing a change of the polymer properties [4]. Several differentenvironmental changes can induce such functional behavior, depending on the chemicalstructure of the polymer. For example, a change of pH triggers the response of polye-lectrolytes, e.g. poly(acrylic acid) [PAA] (figure 2.1b), that change between a chargedand a less charged or neutral state [10]. Another example is a change of temperatureor solvent that can induce the response in uncharged polymers because it relies onhydrophobic/hydrophilic interactions between polymer and solvent [29, 53–55]. Thetemperature-responsive transition takes place around the critical solution temperature.A transformation from hydrophobic to hydrophilic at increasing temperature is calledupper critical solution temperature (UCST), while the opposite behavior—from hyd-rophilic to hydrophobic—is called lower critical solution temperature (LCST) [26]. Thelatter is the case for the two polymers studied in this work, PNIPAAm and POx. TheLCST of PNIPAAm (figure 2.1c) takes place around 31 ◦C [24]. Free PNIPAAm chains inaqueous solution transform from an extended coil below the LCST to a globule abovethe LCST followed by aggregation and phase separation. Thin PNIPAAm layers suchas brushes respond in a cumulative way to the stimulus due to strong interaction witheach other. They switch from a highly swollen to a collapsed state.
POx (figure 2.1d) is another temperature-responsive polymer with LCST behavior,that has recently been used to fabricate biocompatible switchable surfaces [17, 56]. BothPNIPAAm and POx have been of interest as potential alternatives to poly(ethyleneglycol) [PEG] [54, 57]. PEG is being commercially used due to its biocompatibility andantifouling characteristics, but has been reported to be sensitive towards oxidation [2,57–59].
Preparation of polymer brushes depends on the substrate as well as the desired brusharchitecture. On gold they can be readily prepared via the reaction of thiol end groupsof polymer chains with the gold surface [4]. Gold is a highly reflective substrate, whichis an advantage in ellipsometry to obtain a good signal-to-noise ratio. However, in situIR-SE measurements require to direct the IR beam through the substrate, because thepenetration depth of IR light in water is too low. Unfortunately, gold is not transparent
5
6 Chapter 2. Functional Polymer Brushes
FIGURE 2.1: Structures of the anchoring polymer PGMA (a) and thepolymers PAA (b), PNIPAAm (c), and POx (d) used to fabricate polymer
brushes.
in the IR and therefore it can not be used as substrate. However, for reference layers,that are prepared to evaluate the dry state bands of the polymers, gold served as awell-defined and highly reflecting substrate.
Undoped silicon is IR transparent and therefore suitable for in situ IR-SE measu-rements. In this case, an anchoring layer is needed to graft the brush polymer to thesubstrate. This anchoring layer can form covalent bonds both with the surface as well asthe polymer. It can be either a (self-assembled) monolayer or a thin layer of a polymerwith reactive end groups. Poly(glycidyl methacrylate) [PGMA] (figure 2.1a) is a suitableanchoring polymer that has been used in our studies. It contains epoxy groups in theside chains that can react with e. g. –OH, –COOH, and –NH2 groups. Attachmentof PGMA to silicon takes place via thermal reaction of the epoxy groups with silanolgroups on the activated silicon surface. After this reaction there is still a sufficientnumber of epoxy groups present in the layer for the subsequent reaction with polymerchains [60].
The procedure of using pre-formed polymer chains with reactive end groups forbrush preparation is called ‘grafting-to’. It is a relatively quick and easy procedure.Its main advantage is the possibility to achieve a good reproducibility of thicknessand grafting density and the ability to use polymers with known chain length andpolydispersity index (PDI). However, the grafting density of this preparation method isfairly low, because diffusion of reactive chain ends to the substrate surface is limited bychains that are already attached. With increasing molecular weight of the polymer themaximum grafting density that can be achieved decreases [61].
Higher grafting densities are possible if the brushes are prepared via the ‘grafting-from’ method. In this procedure, a thin layer of initiator molecules is attached to thesubstrate and the polymerization carried out directly on the surface by reaction in a
Chapter 2. Functional Polymer Brushes 7
monomer solution of the desired brush polymer units. With this method higher graftingdensities can be achieved and very long chains can be produced, which in turn results inthicker brushes [46, 62]. This procedure is more complicated and the resulting brushescontain chains with an unknown, and probably very high, PDI value. Due to thesedrawbacks the ‘grafting-from’ method has not been used for brushes studied in thiswork.
Although the traditional brushes studied in our group are prepared via ‘grafting-to’,the synthesis still contains several steps [16, 43]. These include two separate graftingsteps of the PGMA anchoring layer and the polymer brush layer. For applicationsdemanding a high-throughput preparation, a faster procedure is advantageous. Thiscould be obtained by using a pre-formed block-copolymer of the anchoring polymerPGMA and the brush polymer. In that way, one-step grafting of the block-copolymerchains onto the silicon substrate is possible, because only PGMA can covalently attachto the silicon surface, while the brush polymer chains remain mobile [63, 64].
2.2 Temperature-responsive brushes
Amongst the possible triggers of smart polymer brushes, temperature is the mostinteresting one. It has been intensely focused on in the last two decades, in particularfor potential biotechnological applications like bioactive surfaces and drug-deliverysystems due to its ease of operation [20, 49, 65]. PNIPAAm and POx, the latter witha propyl group in the side chain, are the temperature-responsive polymers used here.They show LCST behavior in the physiological temperature range, being soluble inaqueous solutions at low temperatures and becoming insoluble when the temperature isincreased. The responsive behavior is based upon a thermodynamically driven changeof polymer–polymer and polymer–water interactions in the form of hydrogen bonds.
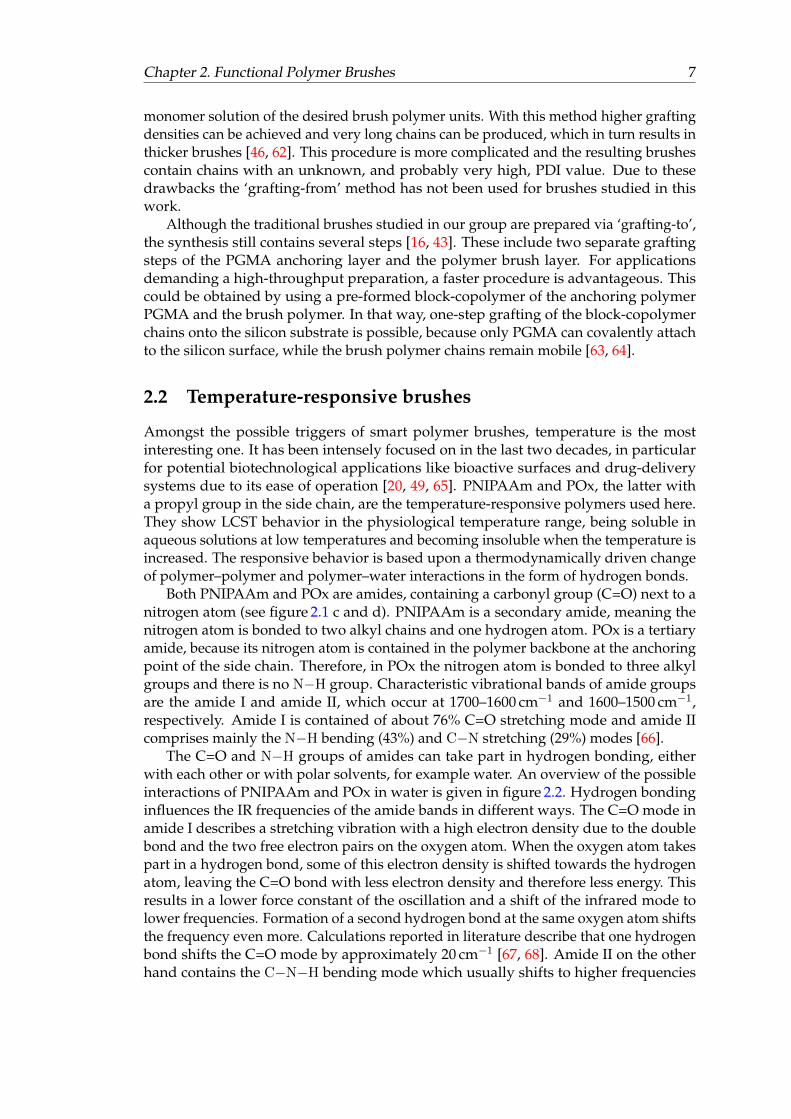
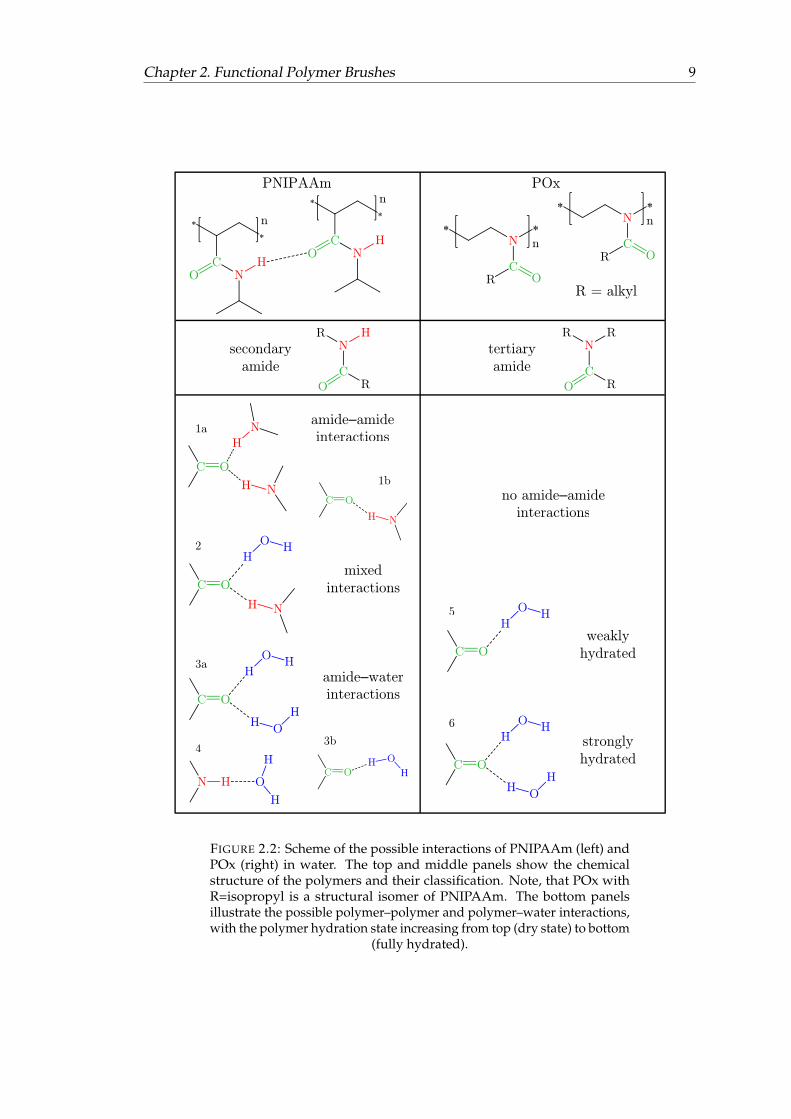
Both PNIPAAm and POx are amides, containing a carbonyl group (C=O) next to anitrogen atom (see figure 2.1 c and d). PNIPAAm is a secondary amide, meaning thenitrogen atom is bonded to two alkyl chains and one hydrogen atom. POx is a tertiaryamide, because its nitrogen atom is contained in the polymer backbone at the anchoringpoint of the side chain. Therefore, in POx the nitrogen atom is bonded to three alkylgroups and there is no N−H group. Characteristic vibrational bands of amide groupsare the amide I and amide II, which occur at 1700–1600 cm−1 and 1600–1500 cm−1,respectively. Amide I is contained of about 76% C=O stretching mode and amide IIcomprises mainly the N−H bending (43%) and C−N stretching (29%) modes [66].
The C=O and N−H groups of amides can take part in hydrogen bonding, eitherwith each other or with polar solvents, for example water. An overview of the possibleinteractions of PNIPAAm and POx in water is given in figure 2.2. Hydrogen bondinginfluences the IR frequencies of the amide bands in different ways. The C=O mode inamide I describes a stretching vibration with a high electron density due to the doublebond and the two free electron pairs on the oxygen atom. When the oxygen atom takespart in a hydrogen bond, some of this electron density is shifted towards the hydrogenatom, leaving the C=O bond with less electron density and therefore less energy. Thisresults in a lower force constant of the oscillation and a shift of the infrared mode tolower frequencies. Formation of a second hydrogen bond at the same oxygen atom shiftsthe frequency even more. Calculations reported in literature describe that one hydrogenbond shifts the C=O mode by approximately 20 cm−1 [67, 68]. Amide II on the otherhand contains the C−N−H bending mode which usually shifts to higher frequencies
8 Chapter 2. Functional Polymer Brushes
when the N−H group takes part in a hydrogen bond. The bond restricts the vibrationalbending mode and increases the force constant of the oscillation [28].
With the C−N bond having a small double-bond character due to mesomeric struc-tures (see figure 2.3), the amide group is planar and rotation around the C−N bond isrestricted [69, 70]. This limits the mobility of the amide group towards pairing withother amide groups or water molecules for hydrogen bonding. The C−N stretchingmode is also sensitive to conformational changes in the main chain, therefore the tem-perature-responsive switching of amide I can differ from that of amide II [25].
PNIPAAm is a very common and the most widely studied temperature-responsivepolymer. Its response in water takes place around 31 ◦C with an abrupt transitionboth in solution [24, 71–73] and as a thin film [15, 16, 28, 74]. The C=O and N−Hbonds of the amide group can take part in hydrogen bonding with water in the formof C=O · · · H2O and N−H · · · OH2. In the swollen, strongly hydrated state, this kindof hydrogen bonding (amide–water) dominates, depicted with numbers 3 and 4 infigure 2.2. Above the LCST the brush layer is in its collapsed, less hydrated state. In thisstate, amide–amide hydrogen bonding in the form of C=O · · · H−N is increased due tothe release of water molecules from the brush (numbers 1 and 2 in figure 2.2) [28, 75].A C=O group can form two hydrogen bonds with its two free electron pairs, givingrise to several possible combinations of interactions (see figure 2.2). These interactionshave different vibrational frequencies and generate several band components in the IRspectra, which overlap within the amide I band.
POx were first synthesized in the 1960s [76–79] but their potential use in surfacemodification has been explored only recently [17, 56, 80–84]. Their LCST behavior isbased on interactions between polymer and water similar to those in PNIPAAm, themain difference between the polymers is that in POx the nitrogen atom of the amidegroup is part of the polymer backbone (see figures 2.1d and 2.2). As mentioned before,this tertiary amide has no N−H group, thereby POx cannot form C=O · · · H−N hydrogenbonds. In fact, the C=O groups are the only group within the POx chains that can formhydrogen bonds with water. This results in less possibilities of interactions in POxbrushes than in PNIPAAm brushes (see figure 2.2).
The hydrophilicity of POx depends on the specific side-chain chemistry. Differentalkyl groups lead to more hydrophilic or more hydrophobic polymers, or to an LCSTbehavior that is often tunable via parameters like molecular weight. Poly(2-methyl-2-oxazoline) [PMeOx], for example, is hydrophilic but not temperature-responsive,whereas poly(2-n-propyl-2-oxazoline) [PnPrOx] as well as its isomers are temperature-responsive with a reversible transition from hydrophilic to hydrophobic in a certaintemperature range [31, 32, 65, 85]. Additionally, the transition can be tuned via copo-lymerization with either a more hydrophilic or more hydrophobic oxazoline, therebyincreasing or decreasing the LCST, respectively [30, 85].
Many studies on temperature-responsive polyoxazolines include poly(2-isopropyl-2-oxazoline) [PiPrOx], the structural isomer of PNIPAAm. With an LCST around 36–39 ◦Cits response is close to body temperature [86, 87]. Katsumoto et al. [32] showed thatPiPrOx in solution undergoes a gradual reversible dehydration between 20–40 ◦C.However, a drawback is its irreversible crystallization when the polymer is kept above40 ◦C for longer periods of time, inhibiting the switching behavior [86]. Other tempera-ture-responsive polyoxazolines like PnPrOx are amorphous, but they have a quite lowglass transition temperature (Tg < 45◦C), which is a disadvantage in sample handlingand storage [31, 85].
Chapter 2. Functional Polymer Brushes 9
FIGURE 2.2: Scheme of the possible interactions of PNIPAAm (left) andPOx (right) in water. The top and middle panels show the chemicalstructure of the polymers and their classification. Note, that POx withR=isopropyl is a structural isomer of PNIPAAm. The bottom panelsillustrate the possible polymer–polymer and polymer–water interactions,with the polymer hydration state increasing from top (dry state) to bottom
(fully hydrated).
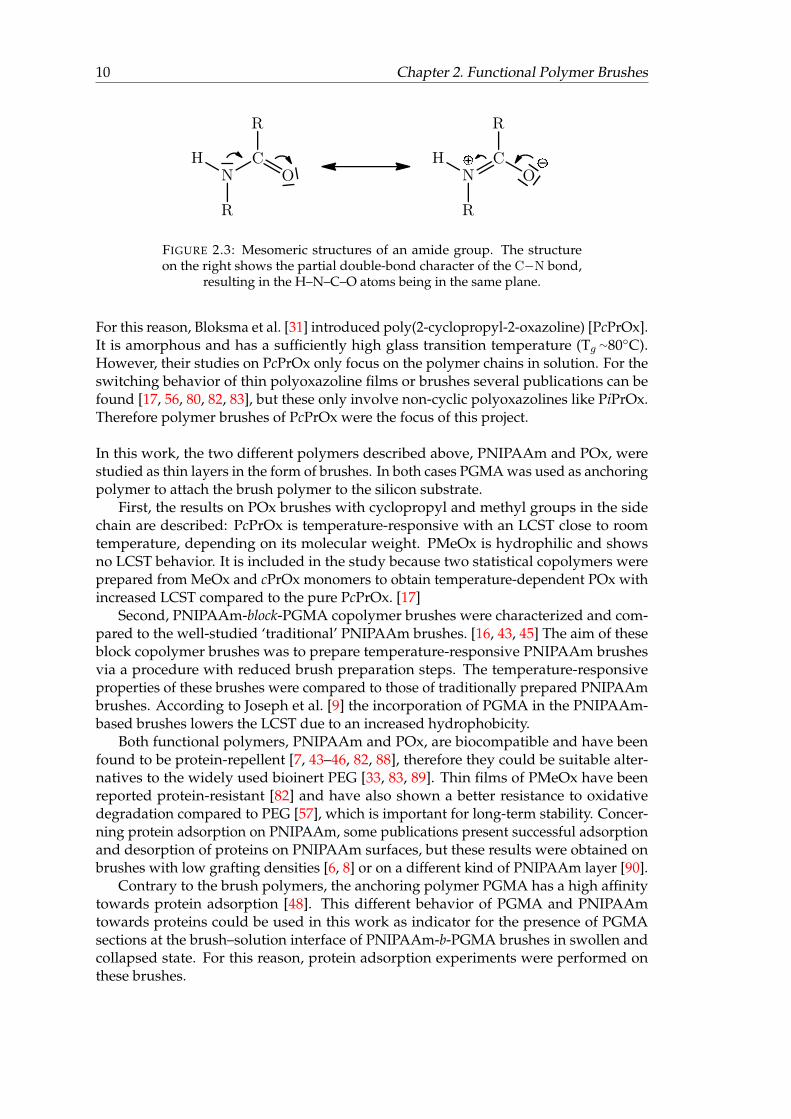
10 Chapter 2. Functional Polymer Brushes
FIGURE 2.3: Mesomeric structures of an amide group. The structureon the right shows the partial double-bond character of the C−N bond,
resulting in the H–N–C–O atoms being in the same plane.
For this reason, Bloksma et al. [31] introduced poly(2-cyclopropyl-2-oxazoline) [PcPrOx].It is amorphous and has a sufficiently high glass transition temperature (Tg ∼80◦C).However, their studies on PcPrOx only focus on the polymer chains in solution. For theswitching behavior of thin polyoxazoline films or brushes several publications can befound [17, 56, 80, 82, 83], but these only involve non-cyclic polyoxazolines like PiPrOx.Therefore polymer brushes of PcPrOx were the focus of this project.
In this work, the two different polymers described above, PNIPAAm and POx, werestudied as thin layers in the form of brushes. In both cases PGMA was used as anchoringpolymer to attach the brush polymer to the silicon substrate.
First, the results on POx brushes with cyclopropyl and methyl groups in the sidechain are described: PcPrOx is temperature-responsive with an LCST close to roomtemperature, depending on its molecular weight. PMeOx is hydrophilic and showsno LCST behavior. It is included in the study because two statistical copolymers wereprepared from MeOx and cPrOx monomers to obtain temperature-dependent POx withincreased LCST compared to the pure PcPrOx. [17]
Second, PNIPAAm-block-PGMA copolymer brushes were characterized and com-pared to the well-studied ‘traditional’ PNIPAAm brushes. [16, 43, 45] The aim of theseblock copolymer brushes was to prepare temperature-responsive PNIPAAm brushesvia a procedure with reduced brush preparation steps. The temperature-responsiveproperties of these brushes were compared to those of traditionally prepared PNIPAAmbrushes. According to Joseph et al. [9] the incorporation of PGMA in the PNIPAAm-based brushes lowers the LCST due to an increased hydrophobicity.
Both functional polymers, PNIPAAm and POx, are biocompatible and have beenfound to be protein-repellent [7, 43–46, 82, 88], therefore they could be suitable alter-natives to the widely used bioinert PEG [33, 83, 89]. Thin films of PMeOx have beenreported protein-resistant [82] and have also shown a better resistance to oxidativedegradation compared to PEG [57], which is important for long-term stability. Concer-ning protein adsorption on PNIPAAm, some publications present successful adsorptionand desorption of proteins on PNIPAAm surfaces, but these results were obtained onbrushes with low grafting densities [6, 8] or on a different kind of PNIPAAm layer [90].
Contrary to the brush polymers, the anchoring polymer PGMA has a high affinitytowards protein adsorption [48]. This different behavior of PGMA and PNIPAAmtowards proteins could be used in this work as indicator for the presence of PGMAsections at the brush–solution interface of PNIPAAm-b-PGMA brushes in swollen andcollapsed state. For this reason, protein adsorption experiments were performed onthese brushes.
Chapter 3
Methods and Experimental Settings
Optical spectroscopy in general is the study of interactions of electromagnetic radiationwith matter. For example, spectroscopic measurement techniques are based on measu-rement of absorption, emission, reflection, or scattering of light. The electromagneticspectrum spans a wide range, from low-energetic radiowaves to high-energetic X-rays,and can excite very different processes in a material. For example, visible (VIS) andultraviolet (UV) light excites electronic states in atoms or molecules while the infrared(IR) light excites molecular vibrations. Therefore the respective spectroscopic techniquesprovide different information about the sample [91].
Spectroscopic Ellipsometry (SE) is a non-invasive optical technique that employspolarized light to characterize surfaces and thin layers. Very common is its application inthe UV and VIS ranges due to high intensity light sources, enabling fast measurementsdown to the level of seconds or milliseconds [34, 36]. Due to its sensitivity to changes inrefractive index n and thickness d it is commercially used to examine thin layers andlayer stacks, for example in the semiconductor industry [92]. Organic layers often showsimilar refractive indices in the UV-VIS which results in a low optical contrast betweenthe layers. In these cases, IR radiation is advantageous, as it excites molecular vibrationsthat show characteristic spectral signals of functional groups and their orientation [93],and thereby results in a high optical contrast when applied to SE. This enables to evalu-ate the molecular structure, composition, and anisotropy of the material as well as itsinteractions with the environment. The drawback of lower intensity of IR light sourcescompared to the VIS range is overcome in FTIR by the use of an interferometer. Everyscan of the recorded interferogram contains the full spectral range, thereby no intensityis lost (throughput advantage) and no monochromator is needed (multiplex advan-tage) [94]. Even though the signal-to-noise ratio is lower than in the UV and VIS ranges,information about molecular interactions provided by IR-SE is highly valuable for thestudy of organic layers and sensitive biological samples [40]. With the development ofin situ setups for ellipsometry the technique has gained increasing attention for studiesat the solid–liquid interface. For example, surfaces and thin layers can be probed incontact with liquids under different environmental conditions to evaluate interactionswith the liquid, the degree of swelling, and changes in conformation. Additionally,adsorption processes of e.g. proteins and cells can be monitored [38].
Another method to study surfaces or interfaces is AFM. It is a surface scanningtechnique providing information about the topography and roughness on a sub-nano-meter scale. This can be used to examine sample homogeneity and impurities. In somecases it is also applied to determine layer thickness by scanning the edge of a layer.
11
12 Chapter 3. Methods and Experimental Settings
In this chapter a summary of the above mentioned techniques will be given. The firstsection deals with the principle of ellipsometry and its use for thin layer characterization.It will be explained which quantities are measured and how they are connected to thesample parameters. This is followed by the arrangement of the instrumental setupsfor ex situ and in situ measurements, as these differ especially for measurements inthe IR. In the second section a brief summary about atomic force microscopy (AFM) isgiven, which was performed on the brushes both in air and in water as a complementarytechnique.
3.1 Spectroscopic Ellipsometry
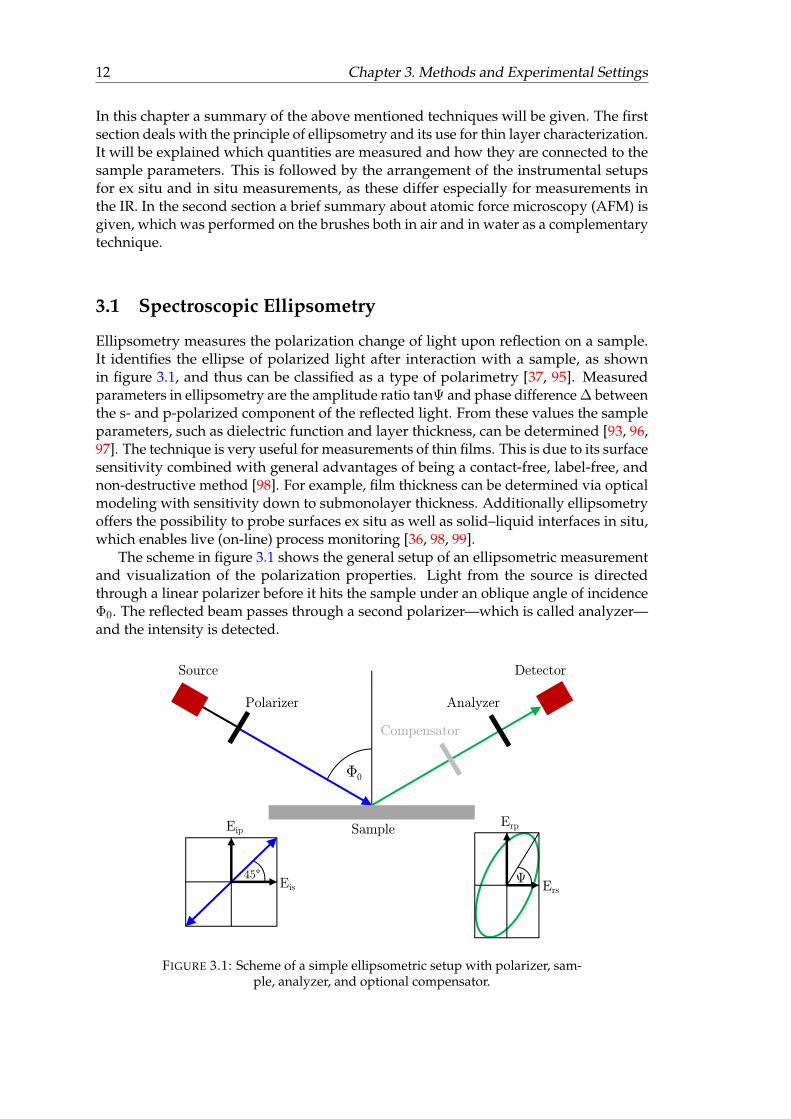
Ellipsometry measures the polarization change of light upon reflection on a sample.It identifies the ellipse of polarized light after interaction with a sample, as shownin figure 3.1, and thus can be classified as a type of polarimetry [37, 95]. Measuredparameters in ellipsometry are the amplitude ratio tanΨ and phase difference ∆ betweenthe s- and p-polarized component of the reflected light. From these values the sampleparameters, such as dielectric function and layer thickness, can be determined [93, 96,97]. The technique is very useful for measurements of thin films. This is due to its surfacesensitivity combined with general advantages of being a contact-free, label-free, andnon-destructive method [98]. For example, film thickness can be determined via opticalmodeling with sensitivity down to submonolayer thickness. Additionally ellipsometryoffers the possibility to probe surfaces ex situ as well as solid–liquid interfaces in situ,which enables live (on-line) process monitoring [36, 98, 99].
The scheme in figure 3.1 shows the general setup of an ellipsometric measurementand visualization of the polarization properties. Light from the source is directedthrough a linear polarizer before it hits the sample under an oblique angle of incidenceΦ0. The reflected beam passes through a second polarizer—which is called analyzer—and the intensity is detected.
FIGURE 3.1: Scheme of a simple ellipsometric setup with polarizer, sam-ple, analyzer, and optional compensator.
Chapter 3. Methods and Experimental Settings 13
3.1.1 Basic principles
The propagation of electromagnetic radiation and its interaction with matter is describedby Maxwell’s equations. One relation derived from these equations is the dielectricdisplacement ~D, that describes the dielectric function ε of the material acting on theelectric field ~E [36, 100].
~D = ε ~E (3.1)
The dielectric function is a function of frequency and connected to the complex re-fractive index N via equation 3.2. Both optical parameters comprised within—the realrefractive index n and absorption coefficient k—are also dependent on frequency [92, 97].
ε = N2
with N = n+ ik(3.2)
In the case of polarized light, the reflected and transmitted part of the electromagneticwave can be described by Fresnel’s equations, which are a result of Maxwell’s equations.They describe the polarization of light as a superposition of two linearly oscillatingwave vectors oriented orthogonally to each other (equation 3.3) [35, 36]. One is definedparallel (p) and the other one perpendicular (s) to the plane of incidence, which is theplane spanned by the incoming light and the surface normal.
r(p,s) =Er(p,s)
Ei(p,s]
t(p,s) =Et(p,s)
Ei(p,s]
(3.3)
Here, Ep and Es are the electric field components parallel and perpendicular to the planeof incidence. The index stands for the incident (i), reflected (r), and transmitted (t) beam,respectively. For reflected light, their ratio is called the complex reflectance ratio ρ
ρ =rprs
= tan Ψei∆ (3.4)
which is the fundamental equation in ellipsometry [34, 35]. It includes the previouslymentioned amplitude ratio tanΨ and phase difference ∆ between the two orthogonalcomponents of the ellipse [97],
tan Ψ =|rp||rs|
∆ = δp − δs (3.5)
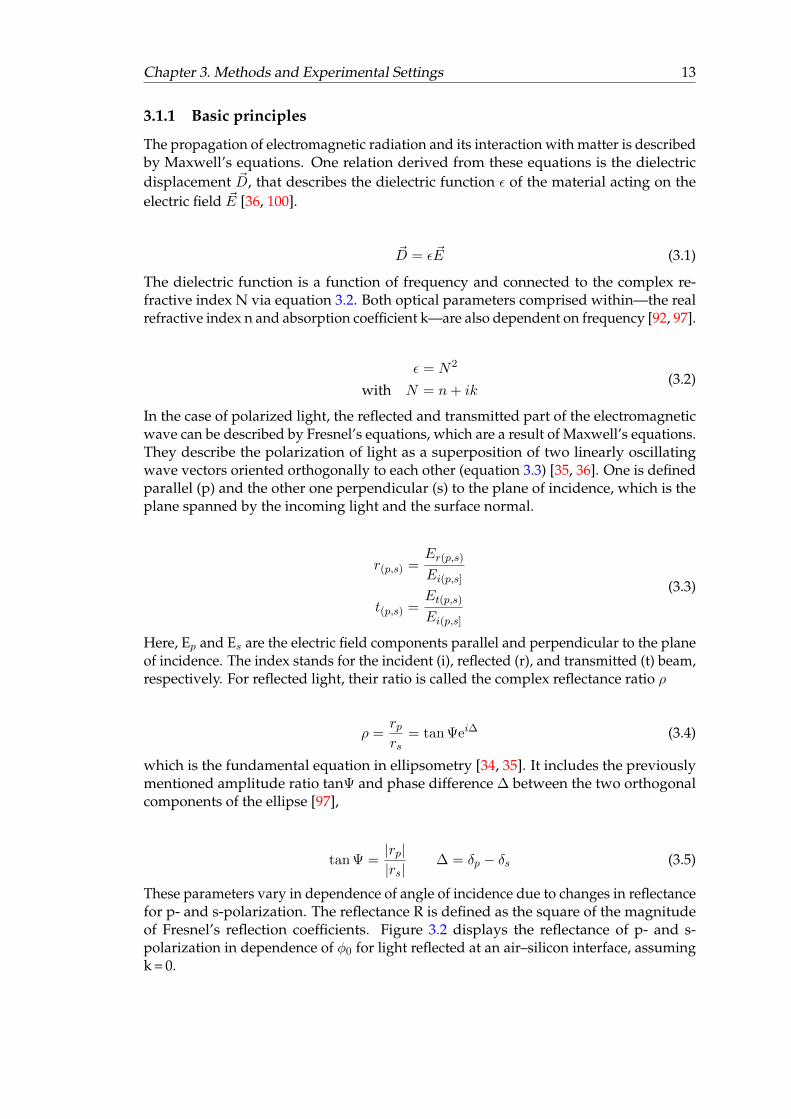
These parameters vary in dependence of angle of incidence due to changes in reflectancefor p- and s-polarization. The reflectance R is defined as the square of the magnitudeof Fresnel’s reflection coefficients. Figure 3.2 displays the reflectance of p- and s-polarization in dependence of φ0 for light reflected at an air–silicon interface, assumingk = 0.
14 Chapter 3. Methods and Experimental Settings
FIGURE 3.2: Plot of Reflectance Rp and Rs at the air–silicon interface independence of incident angle.
It can be seen that the fraction of reflected light differs for p- and s-polarization. WhileRs steadily increases with increasing incident angle, Rp passes through a minimum withRp = 0 at the Brewster angle φB . In the case of k 6= 0 the reflectance Rp does not reachzero anymore and the minimum is called pseudo-Brewster angle [36]. In ellipsometry,the angle of incidence is often chosen close to the (pseudo) Brewster angle, becauseit results in a high ratio of reflection coefficients. Consequently, a high sensitivity ofthe measurement is achieved, with small differences in sample properties leading toprominent changes of the corresponding spectral features.
Jones and Stokes formalism
A mathematical description of the polarization state of light and its transformation byoptical devices can be given with the Jones formalism [35, 36]. The Jones vector givesthe state of polarization via the two wave components Ep and Es. In dependence of thedirection of propagation z and the time t the Jones vector is
E(z, t) =
[Ep
Es
]=
[Ep0 exp(iδp)Es0 exp(iδs)
](3.6)
When the intensity is normalized to I = 1, linear polarization in p-, s- or 45◦-direction,for example, is written as
Ep,linear =
[10
]Es,linear =
[01
]E+45◦ =
1√2
[11
](3.7)
Transformation of polarization by an optical device, such as a polarizer or retarder, isdescribed by the Jones matrix. For example, the Jones matrix for a polarizer P with itstransmission axis parallel to the Ep-vector is
P =
[1 00 0
](3.8)
Chapter 3. Methods and Experimental Settings 15
and the polarization state of incident light linearly polarized at 45◦ that passes such apolarizer can be calculated via multiplication of the incident Jones vector from the leftwith the polarizer’s matrix
[Ep
Es
]=
1√2
[1 00 0
] [11
]=
1√2
[10
](3.9)
A drawback of the Jones formalism is that it can only describe completely polarizedlight. If one has to deal with partial polarization due to depolarization effects fromoptical components or the sample, or incomplete polarization at the polarizers (as it isthe case in real experiments) the Stokes formalism is used [35, 36].
The Stokes parameters are the ones being measured in ellipsometry and can bedefined as light intensities at different polarizer settings (equation 3.10). S0 representsthe total intensity. For totally polarized light the last equation in 3.10 is equality, whilethe inequality stands for partially polarized light [101, 102].
S0 = I0◦ + I90◦
S1 = I0◦ − I90◦
S2 = I+45◦ − I−45◦
S3 = IR − ILwith S2
0 ≥ S21 + S2
2 + S23
(3.10)
Their correlation to Ψ and ∆ is given in equation 3.11, normalized to the total intensityS0 [35, 36].
S0 = 1
S1 = − cos(2Ψ)
S2 = sin(2Ψ) cos ∆
S3 = − sin(2Ψ) sin ∆
(3.11)
3.1.2 Determination of tanΨ and ∆
With an ellipsometric configuration as depicted in figure 3.1, the field amplitude E at thedetector can be described in dependence of the azimuth angles P and A at the polarizerand analyzer, respectively [35], as
E = Ei(rp cosP cosA+ rs sinP sinA) (3.12)
Due to polarization effects of the source or a polarization-dependent detector, it is ne-cessary to set the corresponding polarizer at a fixed value while rotating the other. Ithas become common practice to set the fixed polarizer to α1 = 45◦, thereby the incidentfield amplitudes are of equal magnitude. The detected intensity in dependence of the
16 Chapter 3. Methods and Experimental Settings
rotating polarizer’s azimuth α2 is
I(α2) =1
2(S0 + S1 cos(2α2) + S2 sin(2α2)) (3.13)
In an FTIR spectrometer the interferometer has partly polarizing properties, therefore inan ellipsometer coupled to an FTIR the polarizer in front of the sample should be theone with fixed azimuth. Instead, the analyzer is set to four positions at 0◦, 90◦, +45◦, and−45◦ respectively. This approach has already been shown in the definitions of the Stokesparameters in equation 3.10. From these measured intensities Ψ and ∆ can be derived via
cos 2Ψ =I(90◦)− I(0◦)
I(90◦) + I(0◦)
sin 2Ψ cos ∆ =I(+45◦)− I(−45◦)
I(+45◦) + I(−45◦)
(3.14)
Note that ∆ is not determined directly but via cos ∆, resulting in inaccuracy for valuesof cos ∆ ≈ ±1. This can lead to improper thickness determination, since ∆ is moresensitive to thickness changes than tanΨ. To overcome this, measurements of the samesettings with a retarder, which is placed between sample and detector to induce anadditional phase shift δ, are recorded. It results in the value cos(∆ + δ) and, togetherwith the measurement without retarder, ∆ can be determined with good sensitivity [35].A drawback of this procedure is the double amount of time necessary for the measu-rements. For the studies conducted in this work, measurements with retarder werenot performed. Instead, the thickness results obtained from in situ VIS ellipsometricmeasurements and in situ AFM were used. Therefore, in IR-SE the spectra of tanΨwere sufficient to gain the desired information about the polymer brushes and theirinteraction with the environment.
A different way to determine tanΨ is via direct measurement of the intensities ofEp and Es and calculation of tanΨ. This is done by fixing both polarizers to the sameazimuth and results in a higher number of photons at the detector. If P = A = 0◦,cosP = cosA = 1 and sinP = sinA = 0 in equation 3.12. In an analogous manner,setting both polarizers to 90◦ leads to cosP = cosA = 0 and sinP = sinA = 1. As itturns out, the reflection coefficients are directly accessible which leads to tanΨ accordingto
tan Ψ =|Ei rp||Ei rs|
=|rp||rs|
with I ∝ |E|2 tan Ψ =
√I(0◦, 0◦)
I(90◦, 90◦)
(3.15)
In the case of an isotropic bulk sample or the presence of only one isotropic layerbetween the bulk and ambient media, measurement of the two ellipsometric parametersenables to derive n and k directly [35, 37]. However, when more layers are present onthe sample the number of unknown parameters exceeds the number of measured ones,so that the sample properties are not directly accessible anymore. Instead, an opticallayer model is used to describe the light path through the layers and the changes at
Chapter 3. Methods and Experimental Settings 17
each interface. Modeling is also necessary for anisotropic samples [92]. With iterativemethods the parameters of the model are varied to achieve the best fit between measuredand simulated spectra [93, 97]. There are various dielectric function models that can beused to describe the sample and to extract physical properties of the layers. Some areapplied in a spectral region where the sample is transparent (e.g. Cauchy model), whileothers include oscillators to account for resonance frequencies (e.g. Drude, Lorentz,Gaussian models). A description of the models used in this work will be given insection 4.3.
3.1.3 Experimental Setup
VIS Ellipsometry
The majority of ellipsometric applications use light in the UV–VIS range for fast determi-nation of thin layer thickness and refractive index as well as live monitoring of thin-filmgrowth, etching, and thermal oxidation processes [36]. In this work, VIS ellipsometrywas employed ex situ to pre-characterize the polymer brush samples and in situ to obtainresults on the swelling behavior of the brushes. Most of the VIS ellipsometry measure-ments were done by Eva Bittrich and Stefan Adam at IPF Dresden. The ex situ setupcorresponds to figure 3.1. Measurements were performed under ambient conditions(23–25 ◦C,≈ 30% humidity) at different angles of incidence with Ψ and ∆ being recordedin dependence of wavelength. Results were used to check the samples for successfulgrafting of the polymer brushes as well as dry layer characterization.
For in situ VIS ellipsometry measurements the samples were placed in a temper-ature-controlled cuvette with its side windows oriented to be perpendicular to theincoming radiation. The angle of incidence was set to 68◦ [28, 37]. The sequence ofin situ measurements usually started with the sample in dry state, followed by fillingthe cuvette with solution and probing at temperatures in the range of 15–55◦C. In thecase of protein adsorption experiments the in situ sequence consisted of two parts: First,the sample was measured in plain buffer solution at the desired temperatures. Then,buffer solution was replaced with protein-containing buffer and measurements wererepeated at the same temperatures as before. Finally, a rinsing step with buffer solutionwas performed to evaluate possible protein desorption. In all cases, phosphate-bufferedsaline (PBS) was used at a concentration of 0.01 mol/l and a pH of 7.4. Protein solutionswere prepared with a concentration of 0.25 mg/ml in PBS.
Infrared Ellipsometry
Ex situ IR-SE measurements of the polymer brushes were recorded with the angleof incidence set to 65◦. For silicon with n = 3.42 at 400 cm−1 the Brewster angle isapproximately 74◦ (see section 3.1.1). The samples were mounted on a simple holderso that the reflexion at the sample–air interface was detected. The scheme shown infigure 3.1 basically represents the ex situ setup for IR-SE measurements. Here, an FTIRspectrometer is used as source and the ellipsometer is placed in an acrylic glass boxpurged with dried air to reduce atmospheric absorptions from water and carbon dioxide.Data was recorded after sufficient purging of the ellipsometric compartment. Thedecrease in humidity could be followed in the IR spectra via the decrease of atmosphericwater bands in the range of 1900–1300 cm−1. The best results were obtained afterpurging the chamber for about 1 hour, resulting in a remaining relative humidity of< 0.01%.
18 Chapter 3. Methods and Experimental Settings
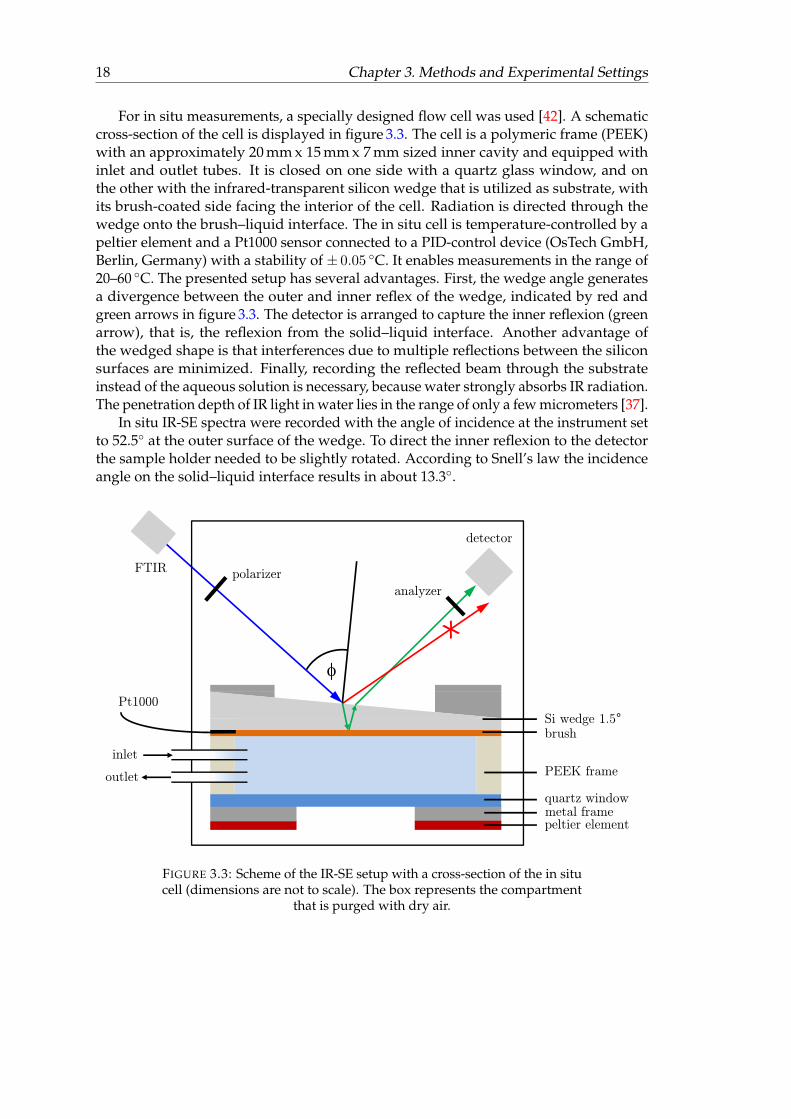
For in situ measurements, a specially designed flow cell was used [42]. A schematiccross-section of the cell is displayed in figure 3.3. The cell is a polymeric frame (PEEK)with an approximately 20 mm x 15 mm x 7 mm sized inner cavity and equipped withinlet and outlet tubes. It is closed on one side with a quartz glass window, and onthe other with the infrared-transparent silicon wedge that is utilized as substrate, withits brush-coated side facing the interior of the cell. Radiation is directed through thewedge onto the brush–liquid interface. The in situ cell is temperature-controlled by apeltier element and a Pt1000 sensor connected to a PID-control device (OsTech GmbH,Berlin, Germany) with a stability of ± 0.05 ◦C. It enables measurements in the range of20–60 ◦C. The presented setup has several advantages. First, the wedge angle generatesa divergence between the outer and inner reflex of the wedge, indicated by red andgreen arrows in figure 3.3. The detector is arranged to capture the inner reflexion (greenarrow), that is, the reflexion from the solid–liquid interface. Another advantage ofthe wedged shape is that interferences due to multiple reflections between the siliconsurfaces are minimized. Finally, recording the reflected beam through the substrateinstead of the aqueous solution is necessary, because water strongly absorbs IR radiation.The penetration depth of IR light in water lies in the range of only a few micrometers [37].
In situ IR-SE spectra were recorded with the angle of incidence at the instrument setto 52.5◦ at the outer surface of the wedge. To direct the inner reflexion to the detectorthe sample holder needed to be slightly rotated. According to Snell’s law the incidenceangle on the solid–liquid interface results in about 13.3◦.
FIGURE 3.3: Scheme of the IR-SE setup with a cross-section of the in situcell (dimensions are not to scale). The box represents the compartment
that is purged with dry air.
Chapter 3. Methods and Experimental Settings 19
The course of in situ tanΨ measurements was as follows: First, the measurements ofthe reference substrate were performed. This was done in dry state, meaning with theflow cell purged with Ar or N2. Then the cell was filled with the liquid (water, buffersolution, protein solution) and the temperature set to the desired value. When a stabletemperature was reached (± 0.1 ◦C) the measurement was started. This was repeateduntil spectra at all desired temperatures and in all desired solutions had been recorded.
3.2 Atomic Force Microscopy
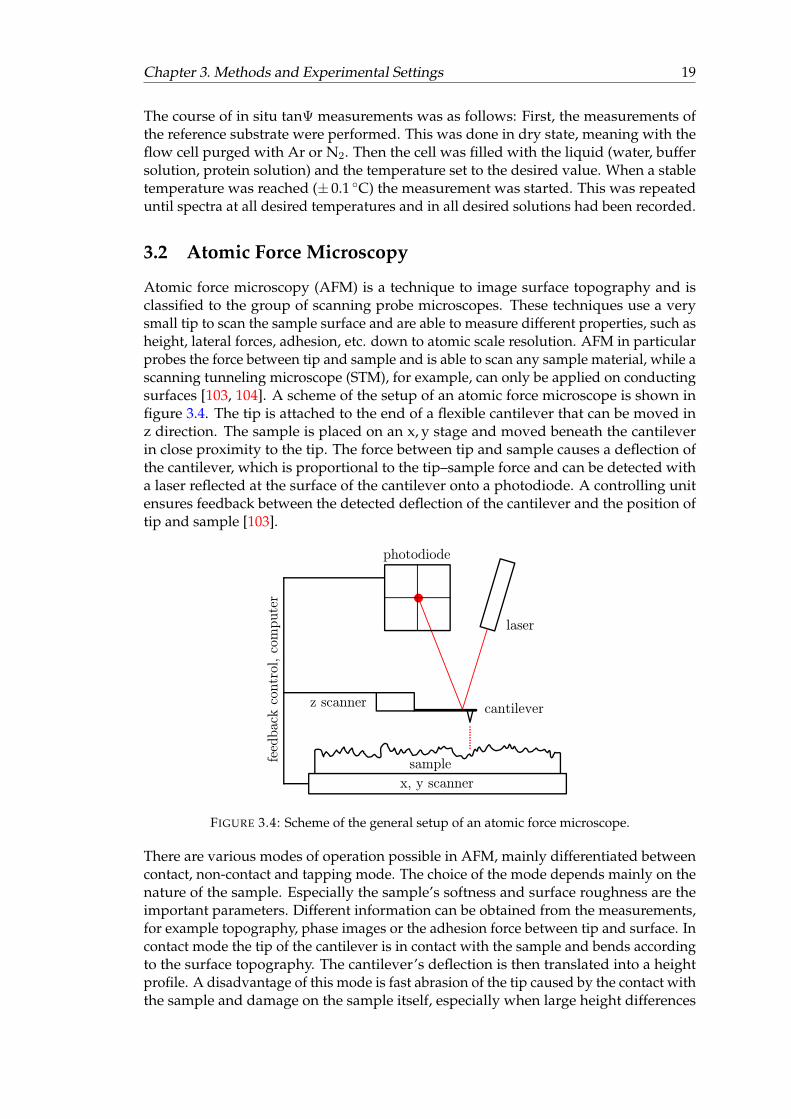
Atomic force microscopy (AFM) is a technique to image surface topography and isclassified to the group of scanning probe microscopes. These techniques use a verysmall tip to scan the sample surface and are able to measure different properties, such asheight, lateral forces, adhesion, etc. down to atomic scale resolution. AFM in particularprobes the force between tip and sample and is able to scan any sample material, while ascanning tunneling microscope (STM), for example, can only be applied on conductingsurfaces [103, 104]. A scheme of the setup of an atomic force microscope is shown infigure 3.4. The tip is attached to the end of a flexible cantilever that can be moved inz direction. The sample is placed on an x, y stage and moved beneath the cantileverin close proximity to the tip. The force between tip and sample causes a deflection ofthe cantilever, which is proportional to the tip–sample force and can be detected witha laser reflected at the surface of the cantilever onto a photodiode. A controlling unitensures feedback between the detected deflection of the cantilever and the position oftip and sample [103].
FIGURE 3.4: Scheme of the general setup of an atomic force microscope.
There are various modes of operation possible in AFM, mainly differentiated betweencontact, non-contact and tapping mode. The choice of the mode depends mainly on thenature of the sample. Especially the sample’s softness and surface roughness are theimportant parameters. Different information can be obtained from the measurements,for example topography, phase images or the adhesion force between tip and surface. Incontact mode the tip of the cantilever is in contact with the sample and bends accordingto the surface topography. The cantilever’s deflection is then translated into a heightprofile. A disadvantage of this mode is fast abrasion of the tip caused by the contact withthe sample and damage on the sample itself, especially when large height differences
20 Chapter 3. Methods and Experimental Settings
occur on the sample over a short distance. Therefore this mode is preferred on hardsamples with low roughness [105].
Non-contact and tapping (=intermittent contact) modes use an oscillating cantilever,thus they are often referred to as dynamic modes. These modes cause less damage tothe tip due to reduced contact between sample and tip, so they are suitable to measuresoft structures such as biological samples and organic thin films. In tapping mode,the cantilever is oscillated at a fixed frequency at or near its resonance frequency. It isheld at a close distance to the sample and only touches it intermittently. The change offorces between tip and surface results in a change of oscillation amplitude, which actsas feedback parameter. In non-contact mode the cantilever is oscillated exactly at itsresonance frequency and in most cases does not touch the sample, resulting in even lesssample damage than tapping mode. Feedback parameter in this case is the change ofresonance frequency due to tip-sample interactions. In both these dynamic modes, thez-position of the cantilever is adjusted by the feedback controller to restore the initialcondition. This information is translated into a topography image [106].
In this work AFM measurements were only performed in the dynamic modes on thePNIPAAm-b-PGMA copolymer brushes, since the contact mode would cause too muchdamage to soft samples like polymers [105]. The non-contact mode was used at the ParkSystems instrument in Berlin to record topography images in dry state under ambientconditions. The oscillation amplitude was set in the range of 9–16 nm. This mode waschosen to prevent damage to the sample, especially because the samples were usedafterwards for the IR-SE experiments.
In situ AFM scans and thickness determination were performed on additional PNI-PAAm-b-PGMA copolymer brushes on silicon wafers. The experiments were done inthe laboratory of Sergiy Minko’s group at University of Georgia with supervision byOleksandr Trotsenko. The instrument used is a Bruker Dimension Icon which operatesin the PeakForce QNMTM tapping mode. The tapping frequency was set to 2 kHz anda peak force of 1.5 nN. This tapping mode works with intermittent tip–sample contactand, additionally to the height image, records a force curve at each tapping of the samplemap from which a topographic image of the adhesion force is generated. Comparedto the conventional tapping force the damage of the tip is reduced by control of themaximum force between tip and sample [107]. For thickness determination of thecopolymer brushes a part of the brush layer was scratched away with a needle thatis softer than silicon but harder than the polymer. AFM scans were recorded at theresulting step edge in dry state as well as in water at 25 ◦C and 40 ◦C. During the drystate measurements the sample chamber was purged with nitrogen and the sample washeated to 65 ◦C to remove atmospheric water from the brushes. Measurements in waterwere performed by placing a drop on the sample and dipping the cantilever into it toscan the solid–liquid interface. The sample stage is equipped with a heating plate andallows temperature control with a precision of ± 0.1 ◦C.
Data evaluation of AFM images was made with the open source software Gwyddion.It provided image tools such as regression analysis to determine the average height in aselected region of the sample. This tool was used to calculate the height difference atthe step edge on PNIPAAm-b-PGMA copolymer brushes. Height profiles and surfaceroughness were also extracted.
Chapter 4
Sample Preparation and DataEvaluation
This chapter summarizes details on synthesis, preparation, and characterization andhow this was integrated in the cooperation with partners in the USA and Germany. Itbegins with a list of materials and instruments used for sample preparation and in situexperiments. Afterwards, the polymer synthesis and characterization of the resultingpolymer chains are briefly introduced for each polymer system. This is followed bythe detailed description of brush preparation and preliminary characterization of thebrushes, which were performed in the laboratories of cooperation partners at ClemsonUniversity (USA), Clarkson University (USA), and IPF Dresden (Germany). The lastsection of this chapter describes the data evaluation and simulation procedure, includingcorrections that were made to be able to fit simulated data to the measured spectra.
4.1 Materials
The two different systems of temperature-sensitive polymer brushes are based on thewell-known polymer PNIPAAm and on POx. All brushes were prepared by the ‘graf-ting-to’ method with PGMA used as anchor between substrate and brush polymer.Table 4.1 lists the used polymers and materials, which were either purchased or synthe-sized by cooperation partners. A list of used devices and software is given in table 4.2.
21
22 Chapter 4. Sample Preparation and Data Evaluation
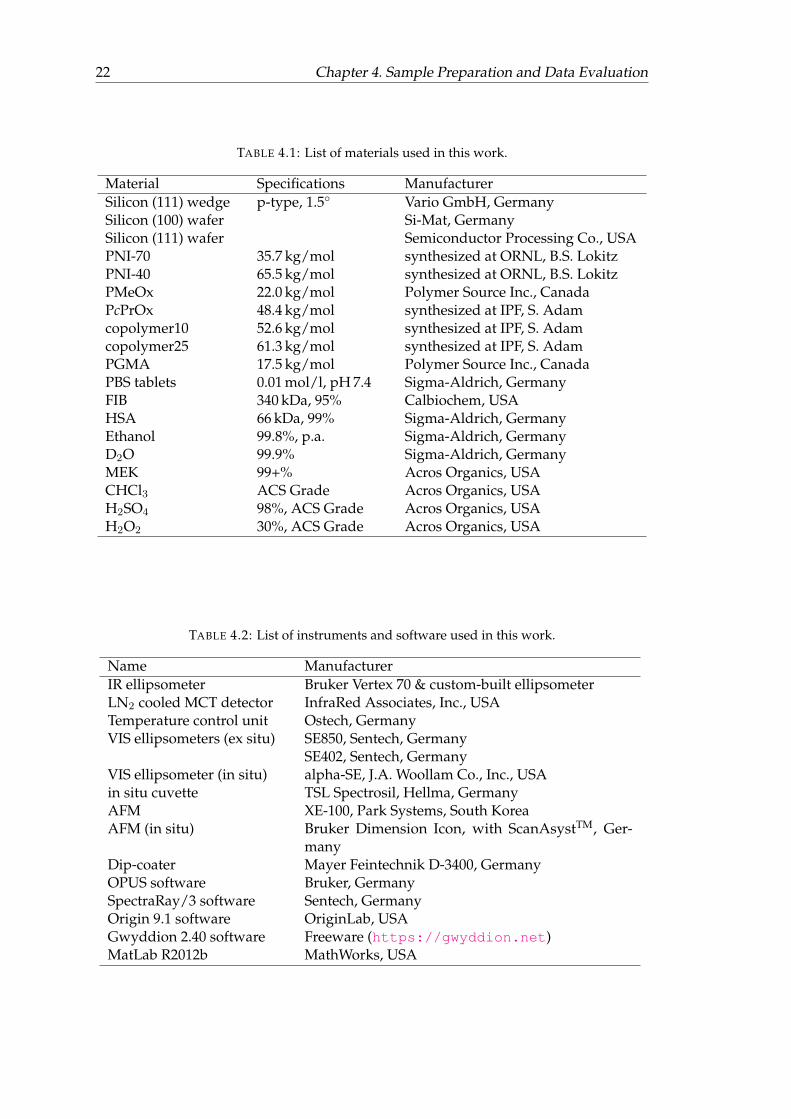
TABLE 4.1: List of materials used in this work.
Material Specifications ManufacturerSilicon (111) wedge p-type, 1.5◦ Vario GmbH, GermanySilicon (100) wafer Si-Mat, GermanySilicon (111) wafer Semiconductor Processing Co., USAPNI-70 35.7 kg/mol synthesized at ORNL, B.S. LokitzPNI-40 65.5 kg/mol synthesized at ORNL, B.S. LokitzPMeOx 22.0 kg/mol Polymer Source Inc., CanadaPcPrOx 48.4 kg/mol synthesized at IPF, S. Adamcopolymer10 52.6 kg/mol synthesized at IPF, S. Adamcopolymer25 61.3 kg/mol synthesized at IPF, S. AdamPGMA 17.5 kg/mol Polymer Source Inc., CanadaPBS tablets 0.01 mol/l, pH 7.4 Sigma-Aldrich, GermanyFIB 340 kDa, 95% Calbiochem, USAHSA 66 kDa, 99% Sigma-Aldrich, GermanyEthanol 99.8%, p.a. Sigma-Aldrich, GermanyD2O 99.9% Sigma-Aldrich, GermanyMEK 99+% Acros Organics, USACHCl3 ACS Grade Acros Organics, USAH2SO4 98%, ACS Grade Acros Organics, USAH2O2 30%, ACS Grade Acros Organics, USA
TABLE 4.2: List of instruments and software used in this work.
Name ManufacturerIR ellipsometer Bruker Vertex 70 & custom-built ellipsometerLN2 cooled MCT detector InfraRed Associates, Inc., USATemperature control unit Ostech, GermanyVIS ellipsometers (ex situ) SE850, Sentech, Germany
SE402, Sentech, GermanyVIS ellipsometer (in situ) alpha-SE, J.A. Woollam Co., Inc., USAin situ cuvette TSL Spectrosil, Hellma, GermanyAFM XE-100, Park Systems, South KoreaAFM (in situ) Bruker Dimension Icon, with ScanAsystTM, Ger-
manyDip-coater Mayer Feintechnik D-3400, GermanyOPUS software Bruker, GermanySpectraRay/3 software Sentech, GermanyOrigin 9.1 software OriginLab, USAGwyddion 2.40 software Freeware (https://gwyddion.net)MatLab R2012b MathWorks, USA
Chapter 4. Sample Preparation and Data Evaluation 23
4.2 Polymer Syntheses and Brush Preparations
4.2.1 Poly(2-oxazoline) Brushes
POx synthesis and brush preparation was done at IPF in Dresden by Stefan Adam.PMeOx was purchased, the other polymers were synthesized via a microwave-assistedcationic ring-opening polymerization (CROP) in benzonitrile [108]. Except for MeOxthe used monomers cPrOx and methyl-3-(oxazol-2-yl) propionate (EsterOx) were alsosynthesized at the IPF as described elsewhere [31, 108, 109].
Polymerization
First, a short starting block of 2–4 EsterOx units bearing methyl ester groups in the sidechain was synthesized via initiation by methyl triflate. This EsterOx block served asinitiator for the CROP of the main polymer. The monomer solution for the CROP reactioneither contained only cPrOx or a mixture of cPrOx and MeOx in the ratio 3:1 or 9:1,resulting in statistic POx copolymers with 25% (copolymer25) and 10% (copolymer10)MeOx, respectively. Polymerizations were performed under microwave heating at100 ◦C. The living chain ends were terminated via hydrolysis (PcPrOx, copolymer10) orwith piperidine (copolymer25). According to experiments of our collaboration partnersat IPF the end groups did not have any effect on the temperature-responsive polymercharacteristics. For purification, the polymers were precipitated in cold n-hexane,redissolved in CHCl3, and dried under reduced pressure. To transform the methyl estergroups of the EsterOx block into free carboxylic groups, the polymers were hydrolyzedvia a modified procedure according to Rueda et al. [110]. More detailed descriptionsof the monomer synthesis as well as the polymerization procedure can be found inliterature [31, 108, 109].
Characterization of the polymer chains
Molecular weights of the resulting polymers were determined with size exclusionchromatography at IPF Dresden (see table 4.3). Turbidity measurements were performedto determine the cloud point temperature (Tcp) of the polyoxazoline chains in solution.Tcp is defined as the temperature at which a polymer solution turns from transparent toopaque due to the phase separation of the solution. The experiments were conductedat IPF Dresden on a UV-VIS spectrophotometer (Agilent Varian Cary 50) containing atemperature-controlled cuvette holder. The optical path length in the quartz cuvetteswas 4 mm. Absorption values of POx solutions of different concentrations between1–50 mg/ml were measured at a wavelength of 550 nm in the range of 15–45 ◦C in 1 ◦C-steps and converted into transmission values [108, 111]. Tcp was set as the inflectionpoint of the transmittance vs. temperature curve. The Tcp values at 50 mg/ml are givenin table 4.3.
Brush preparation
Polyoxazoline brushes were prepared via the ‘grafting-to’ approach [56] on polished,infrared-transparent silicon wedges (1.5◦) with (111)-orientation. The wedges werecleaned by ultrasonication in ethanol followed by an oxygen plasma treatment toremove organic residues and activate the surface with silanol groups. On these cleanedand activated silicon substrates a thin (∼ 2.0 nm) PGMA anchoring layer was depositedvia spin-coating from a 0.3 mg/ml (0.02 wt %) solution in CHCl3. Annealing at 100 ◦C
24 Chapter 4. Sample Preparation and Data Evaluation
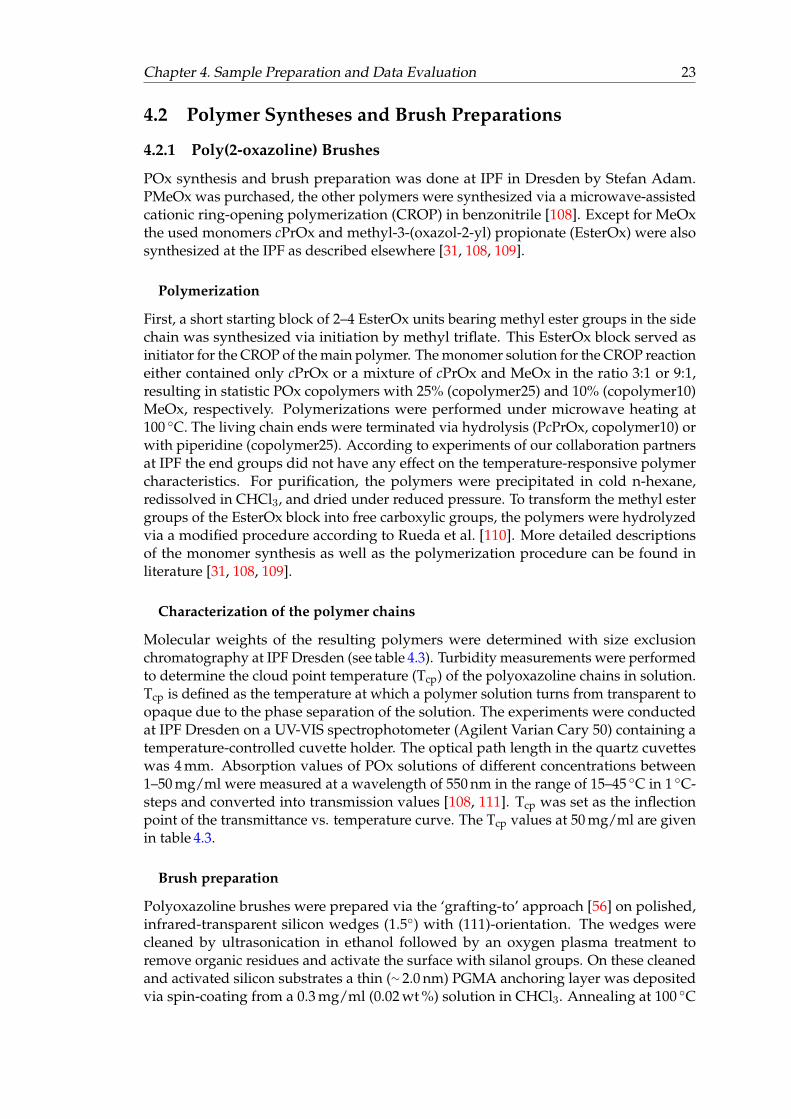
TABLE 4.3: Characteristics of the poly(2-oxazoline)s used for brush pre-paration: Molecular weight Mn, polydispersity index (PDI), cloud point
temperature Tcp at c=50 mg/ml, and glass transition temperature Tg.
POx Mn [kg/mol] PDI Tcp [◦C] Tg [◦C]PcPrOx 48.4 1.23 18.0 81
Copolymer10 52.6 1.09 22.7 81Copolymer25 61.3 1.41 29.4 82
PMeOx 22.0 1.27 – n/a
TABLE 4.4: Dry layer thicknesses ddry for the prepared POx brushes onSi and spin-coated layers on Au as well as the grafting densities σ of the
brushes on Si.
POx ddry,Si σ ddry, Au[nm] [chains/nm2] [nm]
PcPrOx 10.1 ± 0.1 0.13 ± 0.001 79.8 ± 0.3Copolymer10 10.1 ± 0.1 0.12 ± 0.001 –Copolymer25 10.5 ± 0.1 0.10 ± 0.001 87.2 ± 0.3
PMeOx 4.8 ± 0.1 0.13 ± 0.01 85.9 ± 0.5
for 20 min under vacuum lead to a reaction between the silanol groups on the surfaceand the epoxy groups of the PGMA side chains. The resulting covalently bound andcross-linked PGMA layer was still equipped with a sufficient number of epoxy groupsfor the subsequent polymer chain attachment. Grafting of the polyoxazoline brushlayer was performed by spin-coating a 0.5 wt % POx solution in CHCl3 on top of thePGMA anchoring layer. This layer was annealed under vacuum at 150 ◦C for 2 h toform a covalent bond between PGMA and the COOH-end-functionalized POx chains.Ungrafted polymer chains were washed out by rinsing several times with CHCl3. Thespin-coating and annealing procedure of POx was repeated three times to obtain highgrafting densities (see table 4.4). It turned out that three repetitions are sufficient toreach almost maximum surface coverage, because after a fourth cycle only a minorincrease in grafting density occurred.
Pre-characterization of the brushes
Dry layer thickness (ddry) of the brushes was determined with VIS ellipsometry andthese values used to calculate the grafting density σ of the brushes via equation 4.1.In this equation, % describes the polymer bulk density and NA is Avogadro’s number.The bulk density of the POx used in this work is not known, however, literature valuesof similar POx are 1.01–1.05 g/cm3. Therefore, an estimated value of 1.00 g/cm3 wasused for the calculations [108, 112]. Results are given in table 4.4 and show very similargrafting densities due to the repeated grafting process.
σ =ddry · % ·NA
Mn(4.1)
Preparation of spin-coated layers on gold
Additionally to the brushes, thicker spin-coated layers of PcPrOx, PMeOx and copoly-mer25 (25% MeOx) were prepared on gold-coated glass slides without a PGMA layer
Chapter 4. Sample Preparation and Data Evaluation 25
underneath. This was done by spin-coating a ∼1 wt % POx solution in CHCl3 directlyonto the gold layer. Thickness values of the resulting layers were determined with VISellipsometry and are given in table 4.4.
4.2.2 Block-Copolymer Brushes PNIPAAm-b-PGMA
Synthesis of the linear PNIPAAm-b-PGMA chains was performed by Bradley Lokitzat Oak Ridge National Laboratory (ORNL). This was done from glycidyl methacrylate(GMA) and N-isopropyl acrylamide (NIPAAm) monomers via reversible addition frag-mentation chain transfer (RAFT) polymerization. Details about the reaction procedurecan be found in literature [63, 64]. The parameters of the resulting polymers are givenin table 4.5. Block-Copolymers with two different compositions of block lengths wereused for the brush preparation, which was done on a research visit to the group ofIgor Luzinov at Clemson University together with Michael Seeber and Yuriy Galabura.Michael Seeber also studied the resulting brushes with different methods in dry state aswell as in situ [63]. A short summary of these results is given in this section after thepreparation procedure.
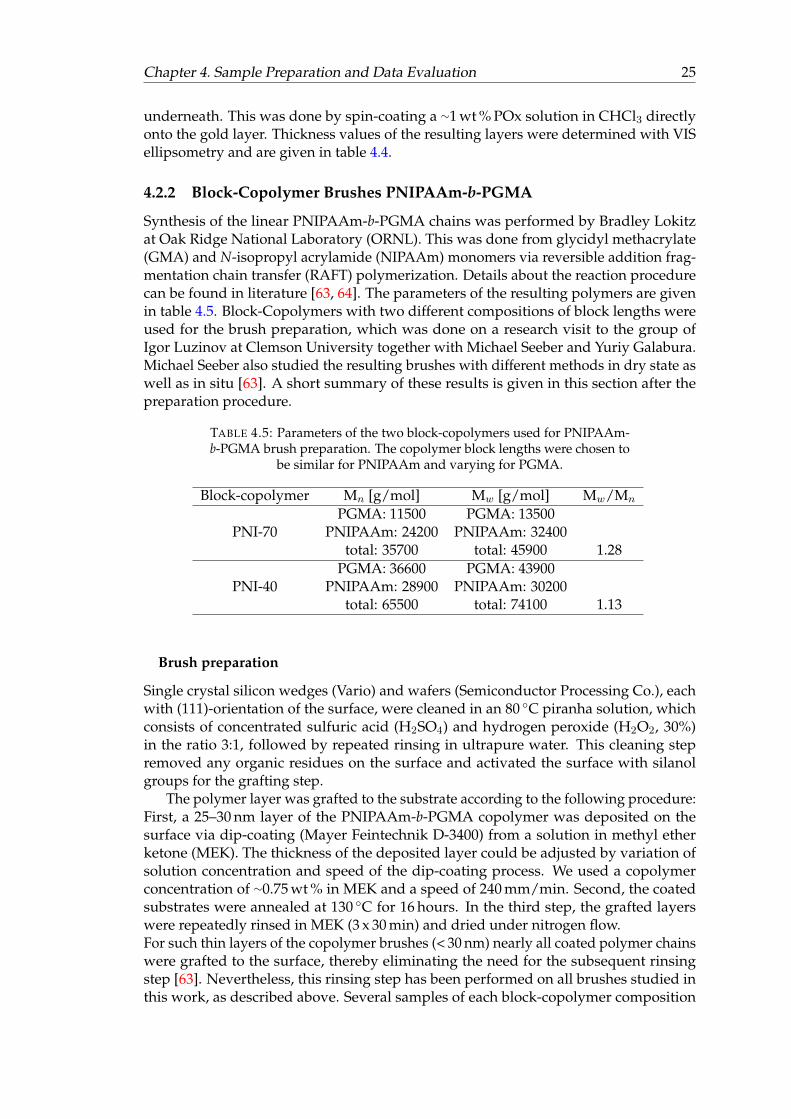
TABLE 4.5: Parameters of the two block-copolymers used for PNIPAAm-b-PGMA brush preparation. The copolymer block lengths were chosen to
be similar for PNIPAAm and varying for PGMA.
Block-copolymer Mn [g/mol] Mw [g/mol] Mw/Mn
PNI-70PGMA: 11500 PGMA: 13500
PNIPAAm: 24200 PNIPAAm: 32400total: 35700 total: 45900 1.28
PNI-40PGMA: 36600 PGMA: 43900
PNIPAAm: 28900 PNIPAAm: 30200total: 65500 total: 74100 1.13
Brush preparation
Single crystal silicon wedges (Vario) and wafers (Semiconductor Processing Co.), eachwith (111)-orientation of the surface, were cleaned in an 80 ◦C piranha solution, whichconsists of concentrated sulfuric acid (H2SO4) and hydrogen peroxide (H2O2, 30%)in the ratio 3:1, followed by repeated rinsing in ultrapure water. This cleaning stepremoved any organic residues on the surface and activated the surface with silanolgroups for the grafting step.
The polymer layer was grafted to the substrate according to the following procedure:First, a 25–30 nm layer of the PNIPAAm-b-PGMA copolymer was deposited on thesurface via dip-coating (Mayer Feintechnik D-3400) from a solution in methyl etherketone (MEK). The thickness of the deposited layer could be adjusted by variation ofsolution concentration and speed of the dip-coating process. We used a copolymerconcentration of ∼0.75 wt % in MEK and a speed of 240 mm/min. Second, the coatedsubstrates were annealed at 130 ◦C for 16 hours. In the third step, the grafted layerswere repeatedly rinsed in MEK (3 x 30 min) and dried under nitrogen flow.For such thin layers of the copolymer brushes (< 30 nm) nearly all coated polymer chainswere grafted to the surface, thereby eliminating the need for the subsequent rinsingstep [63]. Nevertheless, this rinsing step has been performed on all brushes studied inthis work, as described above. Several samples of each block-copolymer composition
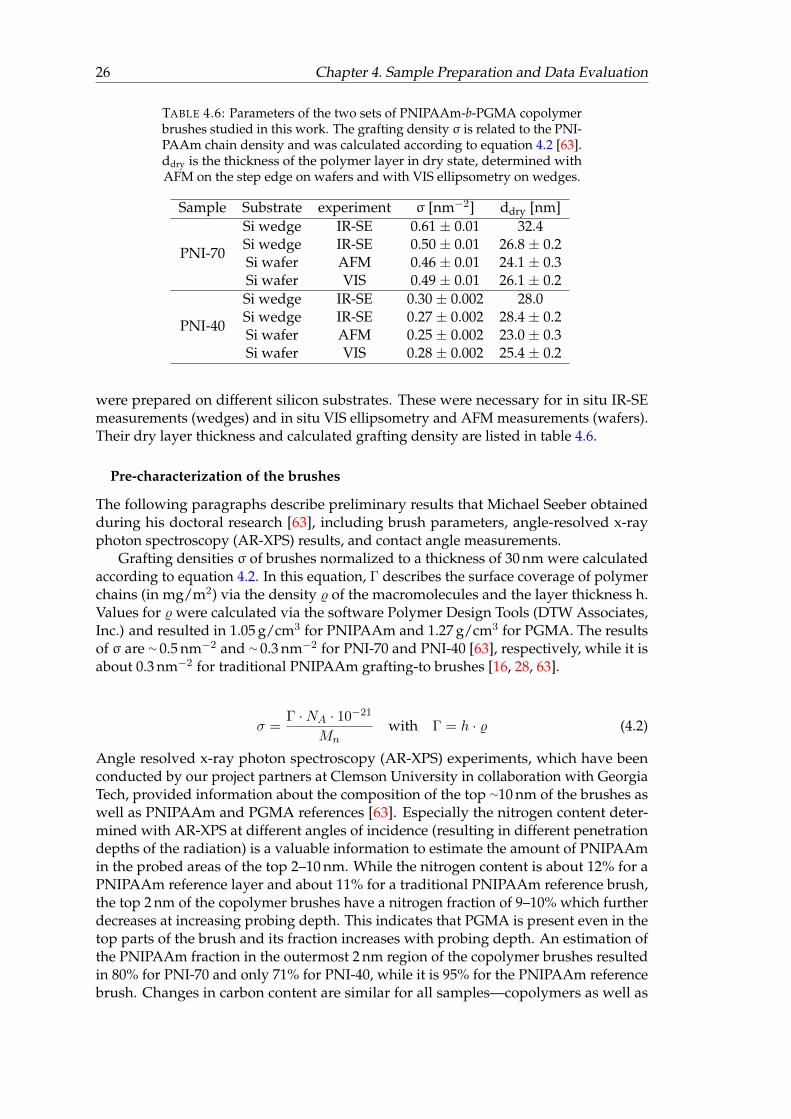
26 Chapter 4. Sample Preparation and Data Evaluation
TABLE 4.6: Parameters of the two sets of PNIPAAm-b-PGMA copolymerbrushes studied in this work. The grafting density σ is related to the PNI-PAAm chain density and was calculated according to equation 4.2 [63].ddry is the thickness of the polymer layer in dry state, determined withAFM on the step edge on wafers and with VIS ellipsometry on wedges.
Sample Substrate experiment σ [nm−2] ddry [nm]
PNI-70
Si wedge IR-SE 0.61 ± 0.01 32.4Si wedge IR-SE 0.50 ± 0.01 26.8 ± 0.2Si wafer AFM 0.46 ± 0.01 24.1 ± 0.3Si wafer VIS 0.49 ± 0.01 26.1 ± 0.2
PNI-40
Si wedge IR-SE 0.30 ± 0.002 28.0Si wedge IR-SE 0.27 ± 0.002 28.4 ± 0.2Si wafer AFM 0.25 ± 0.002 23.0 ± 0.3Si wafer VIS 0.28 ± 0.002 25.4 ± 0.2
were prepared on different silicon substrates. These were necessary for in situ IR-SEmeasurements (wedges) and in situ VIS ellipsometry and AFM measurements (wafers).Their dry layer thickness and calculated grafting density are listed in table 4.6.
Pre-characterization of the brushes
The following paragraphs describe preliminary results that Michael Seeber obtainedduring his doctoral research [63], including brush parameters, angle-resolved x-rayphoton spectroscopy (AR-XPS) results, and contact angle measurements.
Grafting densities σ of brushes normalized to a thickness of 30 nm were calculatedaccording to equation 4.2. In this equation, Γ describes the surface coverage of polymerchains (in mg/m2) via the density % of the macromolecules and the layer thickness h.Values for % were calculated via the software Polymer Design Tools (DTW Associates,Inc.) and resulted in 1.05 g/cm3 for PNIPAAm and 1.27 g/cm3 for PGMA. The resultsof σ are ∼ 0.5 nm−2 and ∼ 0.3 nm−2 for PNI-70 and PNI-40 [63], respectively, while it isabout 0.3 nm−2 for traditional PNIPAAm grafting-to brushes [16, 28, 63].
σ =Γ ·NA · 10−21
Mnwith Γ = h · % (4.2)
Angle resolved x-ray photon spectroscopy (AR-XPS) experiments, which have beenconducted by our project partners at Clemson University in collaboration with GeorgiaTech, provided information about the composition of the top ∼10 nm of the brushes aswell as PNIPAAm and PGMA references [63]. Especially the nitrogen content deter-mined with AR-XPS at different angles of incidence (resulting in different penetrationdepths of the radiation) is a valuable information to estimate the amount of PNIPAAmin the probed areas of the top 2–10 nm. While the nitrogen content is about 12% for aPNIPAAm reference layer and about 11% for a traditional PNIPAAm reference brush,the top 2 nm of the copolymer brushes have a nitrogen fraction of 9–10% which furtherdecreases at increasing probing depth. This indicates that PGMA is present even in thetop parts of the brush and its fraction increases with probing depth. An estimation ofthe PNIPAAm fraction in the outermost 2 nm region of the copolymer brushes resultedin 80% for PNI-70 and only 71% for PNI-40, while it is 95% for the PNIPAAm referencebrush. Changes in carbon content are similar for all samples—copolymers as well as
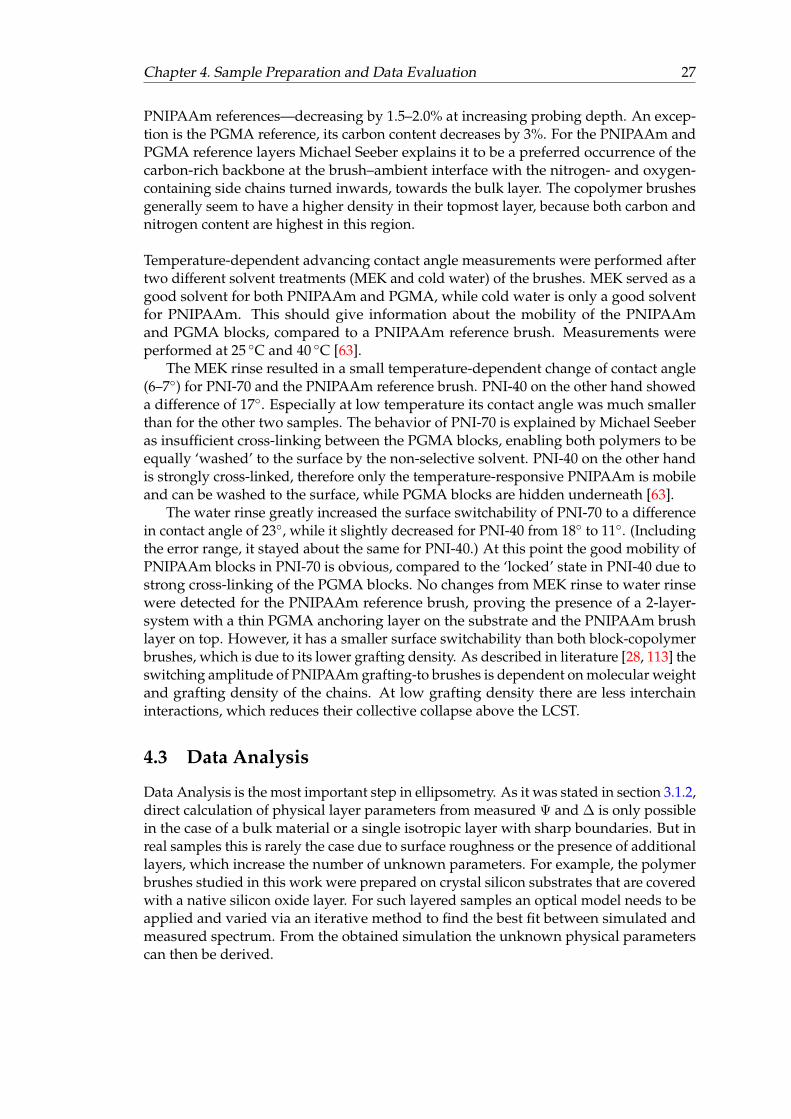
Chapter 4. Sample Preparation and Data Evaluation 27
PNIPAAm references—decreasing by 1.5–2.0% at increasing probing depth. An excep-tion is the PGMA reference, its carbon content decreases by 3%. For the PNIPAAm andPGMA reference layers Michael Seeber explains it to be a preferred occurrence of thecarbon-rich backbone at the brush–ambient interface with the nitrogen- and oxygen-containing side chains turned inwards, towards the bulk layer. The copolymer brushesgenerally seem to have a higher density in their topmost layer, because both carbon andnitrogen content are highest in this region.
Temperature-dependent advancing contact angle measurements were performed aftertwo different solvent treatments (MEK and cold water) of the brushes. MEK served as agood solvent for both PNIPAAm and PGMA, while cold water is only a good solventfor PNIPAAm. This should give information about the mobility of the PNIPAAmand PGMA blocks, compared to a PNIPAAm reference brush. Measurements wereperformed at 25 ◦C and 40 ◦C [63].
The MEK rinse resulted in a small temperature-dependent change of contact angle(6–7◦) for PNI-70 and the PNIPAAm reference brush. PNI-40 on the other hand showeda difference of 17◦. Especially at low temperature its contact angle was much smallerthan for the other two samples. The behavior of PNI-70 is explained by Michael Seeberas insufficient cross-linking between the PGMA blocks, enabling both polymers to beequally ‘washed’ to the surface by the non-selective solvent. PNI-40 on the other handis strongly cross-linked, therefore only the temperature-responsive PNIPAAm is mobileand can be washed to the surface, while PGMA blocks are hidden underneath [63].
The water rinse greatly increased the surface switchability of PNI-70 to a differencein contact angle of 23◦, while it slightly decreased for PNI-40 from 18◦ to 11◦. (Includingthe error range, it stayed about the same for PNI-40.) At this point the good mobility ofPNIPAAm blocks in PNI-70 is obvious, compared to the ‘locked’ state in PNI-40 due tostrong cross-linking of the PGMA blocks. No changes from MEK rinse to water rinsewere detected for the PNIPAAm reference brush, proving the presence of a 2-layer-system with a thin PGMA anchoring layer on the substrate and the PNIPAAm brushlayer on top. However, it has a smaller surface switchability than both block-copolymerbrushes, which is due to its lower grafting density. As described in literature [28, 113] theswitching amplitude of PNIPAAm grafting-to brushes is dependent on molecular weightand grafting density of the chains. At low grafting density there are less interchaininteractions, which reduces their collective collapse above the LCST.
4.3 Data Analysis
Data Analysis is the most important step in ellipsometry. As it was stated in section 3.1.2,direct calculation of physical layer parameters from measured Ψ and ∆ is only possiblein the case of a bulk material or a single isotropic layer with sharp boundaries. But inreal samples this is rarely the case due to surface roughness or the presence of additionallayers, which increase the number of unknown parameters. For example, the polymerbrushes studied in this work were prepared on crystal silicon substrates that are coveredwith a native silicon oxide layer. For such layered samples an optical model needs to beapplied and varied via an iterative method to find the best fit between simulated andmeasured spectrum. From the obtained simulation the unknown physical parameterscan then be derived.
28 Chapter 4. Sample Preparation and Data Evaluation
In IR-SE, even without modeling one can learn a lot about the sample by qualitativespectral analysis. Position and shape of the vibrational bands can give information aboutfunctional groups present in the layer and also about interactions between differentgroups or with surrounding molecules. For thin layers, these signals are small and mightoverlap with bulk signals. Even though ellipsometry is known to be a reference-freemethod, where only the polarization state of the reflected beam is analyzed, in IR-SEit is advantageous to record a reference spectrum of the uncoated substrate. The ratiobetween tanΨ spectra of sample and reference is then used for interpretation. Thisway the vibrational bands of the sample can be resolved from overlapping substratebands [114].
To be able to import our measured data into the simulation program and comparesimulated and measured tanΨ spectra, spectral correction was necessary. In the follo-wing sections these corrections as well as different layer models and simulation fittingprocedures, that were employed on the spectra in this work, are described.
4.3.1 Correction of IR-SE Spectra
Measurements are never ideal. Usually the various components of an instrument inducesome kind of imperfection, especially optical components. In an FTIR for example, thebeam-splitter is a common source for partial polarization. Furthermore, collimationmirrors may not have an exact focus point, and there can be adsorbate layers on thesurfaces of optical devices. Some of these instrumental errors can be removed in IR-SEvia an empty channel measurement (E) to which sample measurements are referenced.This has been done with all spectra recorded in this work. Equation 3.15 then reads
tan Ψ =
√I(0◦, 0◦)/E(0◦, 0◦)
I(90◦, 90◦)/E(90◦, 90◦)(4.3)
Additionally, reference measurements of uncoated substrates were recorded under thesame conditions as the respective samples. The ratio tanΨsample, meas/tanΨref, meas wasthen used for spectral interpretation. Especially for in situ measurements this referencingwas necessary to resolve the small polymer bands within the large bulk water signals.
The upper panel of figure 4.1 shows exemplarily the measured tanΨ spectra of aPcPrOx brush in water at 20 ◦C as well as the respective Si reference spectrum underidentical conditions. These spectra are the result of equation 4.3. The graphs look thesame due to the bulk water signals around 3600 cm−1 and 1650 cm−1. Calculation of thequotient tanΨbrush/tanΨSi removes the bulk water signals and the polymer bands of thethin layer become visible, as can be seen in the lower panel of figure 4.1 (grey spectrum).In the following analysis within this work only the quotient spectra will be shown.
A problem we faced in the simulation of IR-SE spectra was that the simulationprogram SpectraRay/3 can only handle raw data, meaning a simulation of referencedspectra is not possible. To be able to compare referenced spectra of measurementand simulation, two spectra needed to be simulated: One for the sample and one forthe reference. Since measured and simulated reference spectra (with the referencesimulated from literature data) also show deviations between each other, we useda modified raw spectrum for the import to SpectraRay/3: The referenced spectrumtanΨsample, meas/tanΨref, meas was multiplied again with a simulated reference spectrumtanΨref, sim.
Chapter 4. Sample Preparation and Data Evaluation 29
FIGURE 4.1: Measured, corrected and simulated in situ tanΨ spectraof PcPrOx in H2O at 20◦C. The upper panel shows the raw measuredspectra of brush and reference. The ratio of the two is shown in the lowerpanel (grey spectrum), as well as the corrected (blue) and simulated (red)
spectra.
The above procedure is sufficient for ex situ tanΨ spectra. Applying this proce-dure to in situ tanΨ spectra to enable their import into the simulation program invol-ves further corrections. We now have to deal with a deviation of the baseline, thatis caused by the two silicon wedges—sample and reference—not being mounted inexactly the same way into the in situ cell. This difference can be determined by for-ming the quotient of sample and reference tanΨ spectra measured with a dry cell:tanΨsample, dry, meas/tanΨref, dry, meas. The ratio between the referenced sample in wetstate and the one in dry state then removes the deviation of the baseline. Unfortunately,the ratio still contains the sample’s dry state bands in the denominator, leading to anunwanted introduction of the dry state bands in the in situ spectrum. Its correctionrequires a third term tanΨsample, dry, sim/tanΨref, dry, sim that needs to be simulated andmultplied with the previously mentioned ratio. The full in situ correction then reads
tan Ψcorr =(
tan Ψsample, wet, meastan Ψref, wet, meas
)
(tan Ψsample, dry, meas
tan Ψref, dry, meas)·
tan Ψsample, dry, sim
tan Ψref, dry, sim(4.4)
In the case of POx brushes this correction worked well, because a good simulation ofex situ spectra of thick spin-coated POx films on gold could be obtained. Using thisdataset to simulate the polymer brush in the dry in situ cell (last term in equation 4.4)
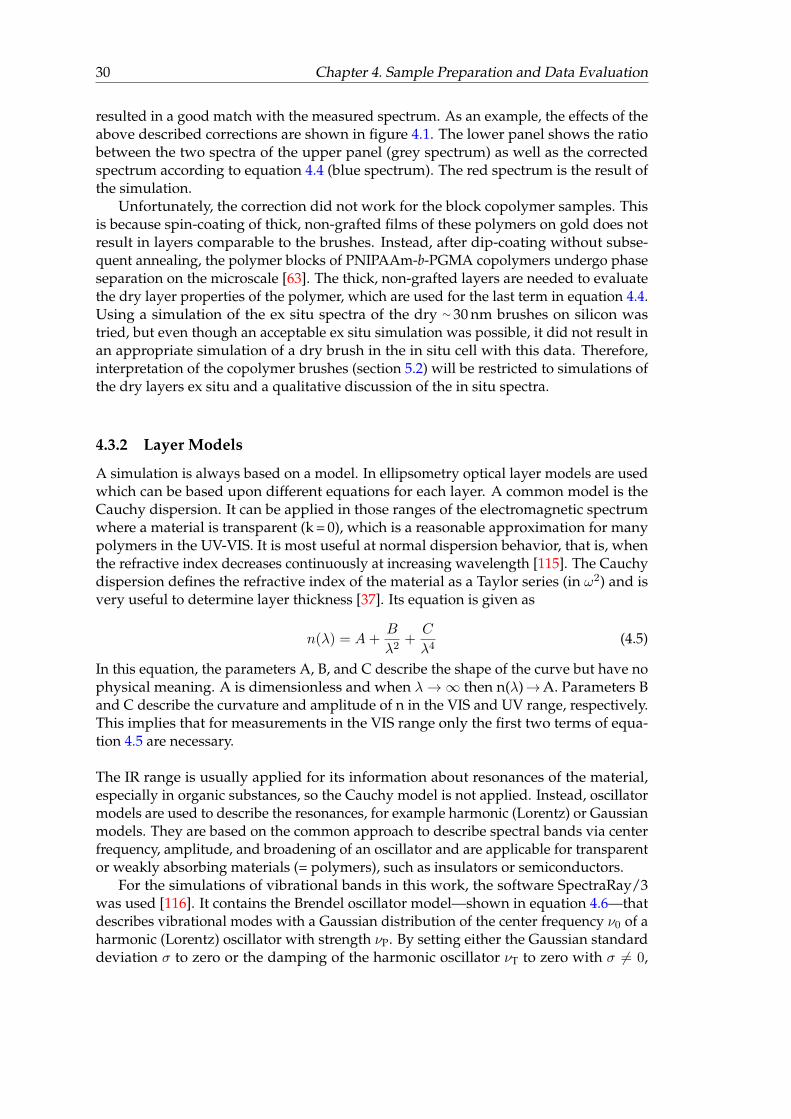
30 Chapter 4. Sample Preparation and Data Evaluation
resulted in a good match with the measured spectrum. As an example, the effects of theabove described corrections are shown in figure 4.1. The lower panel shows the ratiobetween the two spectra of the upper panel (grey spectrum) as well as the correctedspectrum according to equation 4.4 (blue spectrum). The red spectrum is the result ofthe simulation.
Unfortunately, the correction did not work for the block copolymer samples. Thisis because spin-coating of thick, non-grafted films of these polymers on gold does notresult in layers comparable to the brushes. Instead, after dip-coating without subse-quent annealing, the polymer blocks of PNIPAAm-b-PGMA copolymers undergo phaseseparation on the microscale [63]. The thick, non-grafted layers are needed to evaluatethe dry layer properties of the polymer, which are used for the last term in equation 4.4.Using a simulation of the ex situ spectra of the dry ∼ 30 nm brushes on silicon wastried, but even though an acceptable ex situ simulation was possible, it did not result inan appropriate simulation of a dry brush in the in situ cell with this data. Therefore,interpretation of the copolymer brushes (section 5.2) will be restricted to simulations ofthe dry layers ex situ and a qualitative discussion of the in situ spectra.
4.3.2 Layer Models
A simulation is always based on a model. In ellipsometry optical layer models are usedwhich can be based upon different equations for each layer. A common model is theCauchy dispersion. It can be applied in those ranges of the electromagnetic spectrumwhere a material is transparent (k = 0), which is a reasonable approximation for manypolymers in the UV-VIS. It is most useful at normal dispersion behavior, that is, whenthe refractive index decreases continuously at increasing wavelength [115]. The Cauchydispersion defines the refractive index of the material as a Taylor series (in ω2) and isvery useful to determine layer thickness [37]. Its equation is given as
n(λ) = A+B
λ2+C
λ4(4.5)
In this equation, the parameters A, B, and C describe the shape of the curve but have nophysical meaning. A is dimensionless and when λ→∞ then n(λ)→A. Parameters Band C describe the curvature and amplitude of n in the VIS and UV range, respectively.This implies that for measurements in the VIS range only the first two terms of equa-tion 4.5 are necessary.
The IR range is usually applied for its information about resonances of the material,especially in organic substances, so the Cauchy model is not applied. Instead, oscillatormodels are used to describe the resonances, for example harmonic (Lorentz) or Gaussianmodels. They are based on the common approach to describe spectral bands via centerfrequency, amplitude, and broadening of an oscillator and are applicable for transparentor weakly absorbing materials (= polymers), such as insulators or semiconductors.
For the simulations of vibrational bands in this work, the software SpectraRay/3was used [116]. It contains the Brendel oscillator model—shown in equation 4.6—thatdescribes vibrational modes with a Gaussian distribution of the center frequency ν0 of aharmonic (Lorentz) oscillator with strength νP. By setting either the Gaussian standarddeviation σ to zero or the damping of the harmonic oscillator νT to zero with σ 6= 0,
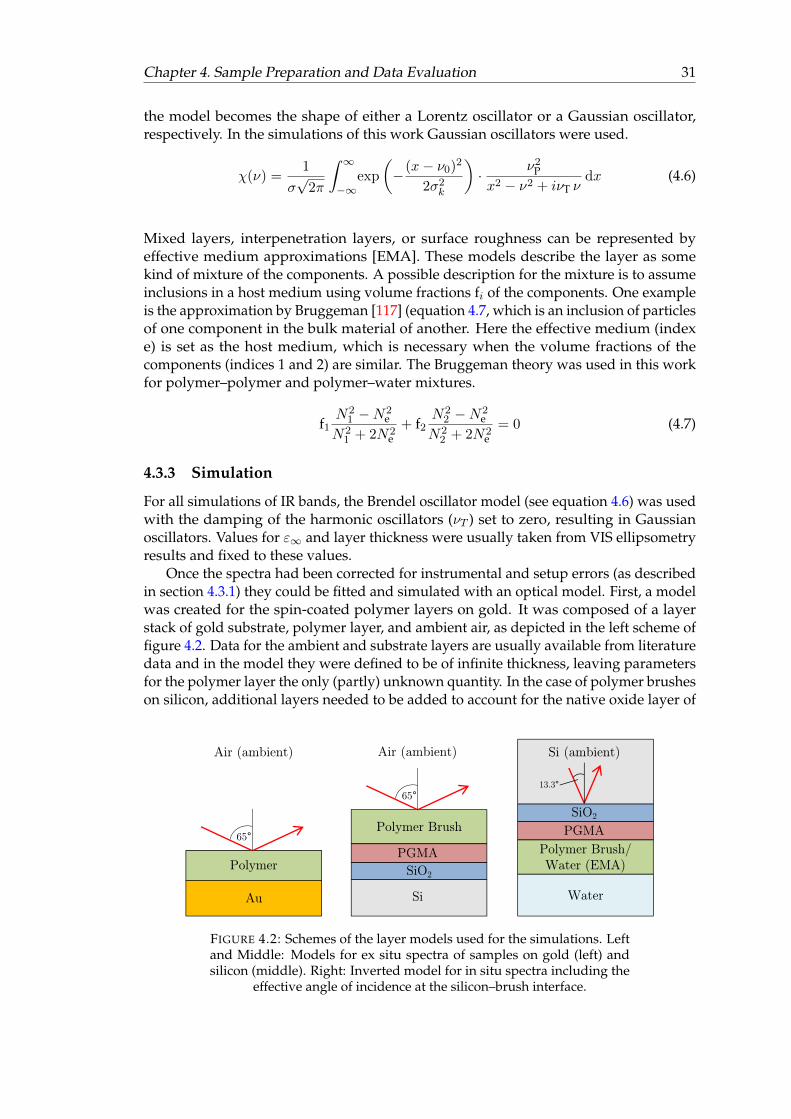
Chapter 4. Sample Preparation and Data Evaluation 31
the model becomes the shape of either a Lorentz oscillator or a Gaussian oscillator,respectively. In the simulations of this work Gaussian oscillators were used.
χ(ν) =1
σ√
2π
∫ ∞−∞
exp
(−(x− ν0)2
2σ2k
)·
ν2P
x2 − ν2 + iνT νdx (4.6)
Mixed layers, interpenetration layers, or surface roughness can be represented byeffective medium approximations [EMA]. These models describe the layer as somekind of mixture of the components. A possible description for the mixture is to assumeinclusions in a host medium using volume fractions fi of the components. One exampleis the approximation by Bruggeman [117] (equation 4.7, which is an inclusion of particlesof one component in the bulk material of another. Here the effective medium (indexe) is set as the host medium, which is necessary when the volume fractions of thecomponents (indices 1 and 2) are similar. The Bruggeman theory was used in this workfor polymer–polymer and polymer–water mixtures.
f1N2
1 −N2e
N21 + 2N2
e+ f2
N22 −N2
e
N22 + 2N2
e= 0 (4.7)
4.3.3 Simulation
For all simulations of IR bands, the Brendel oscillator model (see equation 4.6) was usedwith the damping of the harmonic oscillators (νT ) set to zero, resulting in Gaussianoscillators. Values for ε∞ and layer thickness were usually taken from VIS ellipsometryresults and fixed to these values.
Once the spectra had been corrected for instrumental and setup errors (as describedin section 4.3.1) they could be fitted and simulated with an optical model. First, a modelwas created for the spin-coated polymer layers on gold. It was composed of a layerstack of gold substrate, polymer layer, and ambient air, as depicted in the left scheme offigure 4.2. Data for the ambient and substrate layers are usually available from literaturedata and in the model they were defined to be of infinite thickness, leaving parametersfor the polymer layer the only (partly) unknown quantity. In the case of polymer brusheson silicon, additional layers needed to be added to account for the native oxide layer of
FIGURE 4.2: Schemes of the layer models used for the simulations. Leftand Middle: Models for ex situ spectra of samples on gold (left) andsilicon (middle). Right: Inverted model for in situ spectra including the
effective angle of incidence at the silicon–brush interface.

32 Chapter 4. Sample Preparation and Data Evaluation
the substrate and the PGMA anchoring layer (middle scheme in figure 4.2). These can bemodeled with literature data or by extracting the dielectric function from measurementsand simulation of thick layers of the materials. The data for both the silicon oxide andPGMA layers was taken from previous studies of our group [47, 118]. Evaluation of thethickness of these additional layers was done by VIS ellipsometry after each graftingstep during the synthesis procedure. For in situ IR-SE measurements the order of layersin the model was changed and the angle of incidence adjusted, shown in the scheme onthe right in figure 4.2.
The simulation itself is an iterative best-fit procedure. The oscillator values (fre-quency, amplitude, width) are varied to obtain the best fit between measured andsimulated spectrum. From the final simulation the sample parameters can be extracted,such as layer thickness d, refractive index n, absorption coefficient k.
Chapter 5
Results and Discussion
The experiments in this work are focused on two different types of thermoresponsivepolymer brushes. One type was prepared from POx made of either cyclopropyl-2-oxazoline or methyl-2-oxazoline monomers as well as statistical copolymers of the two.The other type of brushes was synthesised from block-copolymers made of PNIPAAmand the anchoring polymer PGMA. All brushes were prepared via the grafting-to met-hod. In situ experiments were performed on both types of brushes to gain informationabout their swelling degree and functional behavior in water upon application of thetemperature stimulus. Additionally, they were compared to the well-studied behaviorof traditional PNIPAAm brushes in water.
IR-SE studies were used to probe optical characteristics of the various brushes andfilms at the brush–air and brush–water interface. Spectra are discussed with respectto specific vibrational bands and interpreted via optical simulations. Frequency andband shape provide valuable insights into the interactions of the functional groups withother molecules in close proximity. Changes in the environment induce changes ofthe interactions, which are visible in the spectra. An example for such interactions arehydrogen bonds (see figure 2.2 on page 9).
With the interpretation of vibrational bands and their changes in the IR spectraone can deduce certain mechanisms, such as thermo-responsive switching between ahydrophilic and hydrophobic state which is the prominent characteristic of PNIPAAmand POx. Other possible mechanisms are pH-dependent dissociation of functionalgroups [10] or a solvent-induced change of polymer properties [67]. Since the ν(C=O)band is the most prominent band, takes part in hydrogen bonding, and is present inboth PNIPAAm and POx, it was used in these studies as marker for thermo-responsivechanges of the interactions between polymer and water.
The detailed results of IR-SE and complementary methods (VIS ellipsometry and AFM)are presented in this chapter. VIS ellipsometry measurements and optical modelingwere used to determine total layer thickness, water content and refractive index of thebrushes. AFM scans were evaluated to estimate surface roughness and sample homoge-neity. Additionally, in situ AFM measurements were made on some samples with thescratch method to determine brush layer thickness in swollen and collapsed state. Thefirst section deals with the experiments on POx brushes followed in the second sectionby the results on brushes from PNIPAAm-b-PGMA copolymers. Both sections include acomparison to literature studies of the well-known PNIPAAm grafting-to brushes. Thelast section deals with protein experiments on silicon, PGMA, and PNIPAAm-b-PGMAbrushes and an outlook to further studies as well as possible applications.
33
34 Chapter 5. Results and Discussion
5.1 Poly(2-alkyl-2-oxazoline)s
In situ IR-SE was applied to characterize the thermoresponsive behavior of POx brushfilms consisting of either pure PcPrOx or statistical copolymers containing cPrOx andMeOx. Two different copolymers were used, with a composition of either 90% cPrOxand 10% MeOx or 75% cPrOx and 25% MeOx (see section 4.2.1). Additionally, a purePMeOx brush—that shows no temperature sensitivity—was studied for comparison.
The section begins with a characterization of thicker layers of the polymers as wellas the brushes, both in dry state, and simulations to determine their optical constants.Afterwards, the temperature-dependent sensitivity of the brushes in water is described,which was monitored via the characteristic amide I vibrational band positioned at 1650–1600 cm−1. This band is a direct measure for changes in polymer–water interactionssince its frequency shifts when N–C=O groups are involved in hydrogen bonding.Besides the qualitative evaluation of the in situ spectra, simulations on the amide I bandwere performed in order to gain some quantitative results about the interactions withinthe brushes.
5.1.1 Characterization in dry state
IR-SE was first applied ex situ on three spin-coated POx layers on gold as well ason the four POx brushes on silicon (see table 4.4). Evaluation of the obtained tanΨspectra involved vibrational band assignments as well as optical simulations, includingdry-state oscillators in the range of the amide I band, to characterize the pure PcPrOxand PMeOx layers. The simulation results could then be used to model the copolymersamples and determine their composition.
IR-SE spectra of POx layers on gold substrates
In the upper panel of figure 5.1 tanΨ spectra of the spin-coated polymer layers ongold are displayed. All bands in these spectra can be assigned to POx since no PGMAanchoring layer is present on those samples. One can clearly identify the strong amide Imode situated at 1660–1650 cm−1 which is mainly composed of the C=O stretchingvibration. This band is positioned at highest frequency for PMeOx (1660 cm−1) andshifts to lower frequencies with increasing content of PcPrOx, down to 1650 cm−1 forthe pure PcPrOx. The shift might be due to the electron withdrawing effect of thecyclopropyl group compared to the methyl group [31].
POx are tertiary amides, meaning there is no N−H group in their structure (seefigure 2.1). This leads to the absence of an amide II band in the IR spectra that wouldotherwise appear around 1550 cm−1. Without this N−H group, and without the presenceof any other hydrogen-donating groups in POx, no intramolecular hydrogen bondinteractions between C=O and such groups are possible. Therefore the measuredν(C=O) band of dry polyoxazolines corresponds to free, that is, non-interacting carbonylgroups.
Second derivatives of the POx tanΨ spectra however, reveal two components withinthe C=O stretching mode, a very intense one at 1662–1652 cm−1 and another weak oneat lower wavenumbers (see lower panel in figure 5.1). The low-intensity componentmight be due to the formation of very weak hydrogen bonds between C=O and C–Hgroups [119, 120], generally lowering the frequency of stretching vibrations, such as
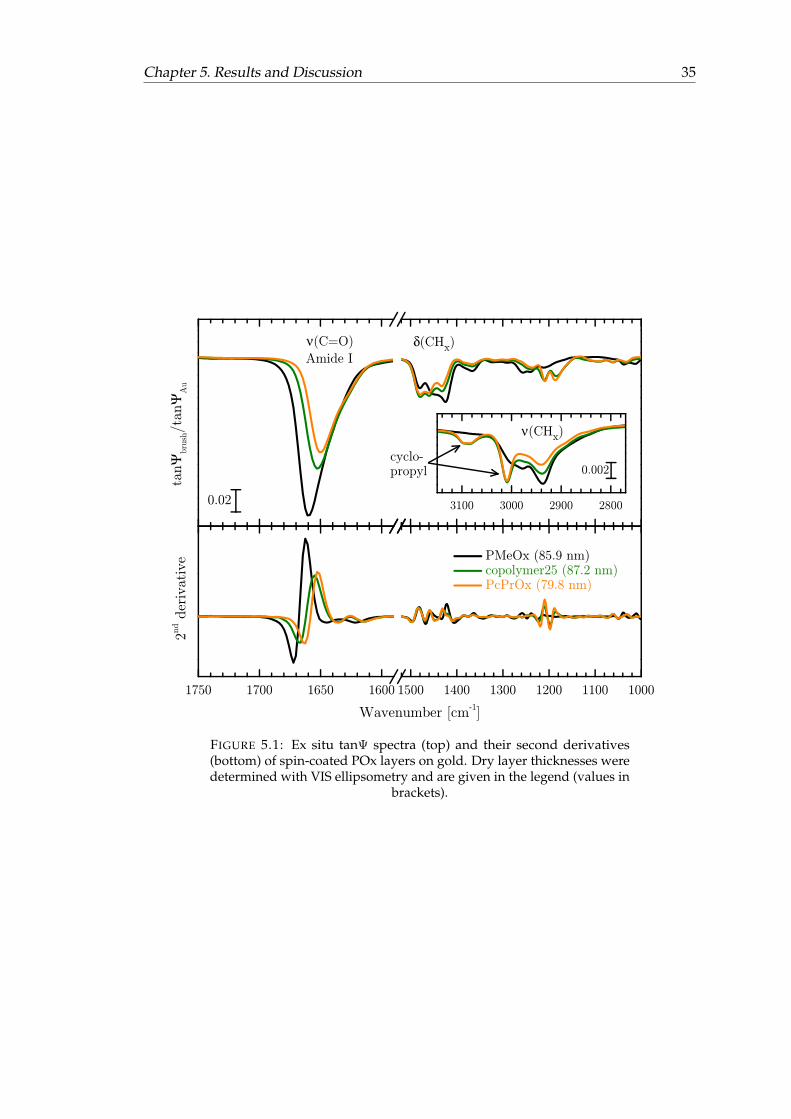
Chapter 5. Results and Discussion 35
FIGURE 5.1: Ex situ tanΨ spectra (top) and their second derivatives(bottom) of spin-coated POx layers on gold. Dry layer thicknesses weredetermined with VIS ellipsometry and are given in the legend (values in
brackets).
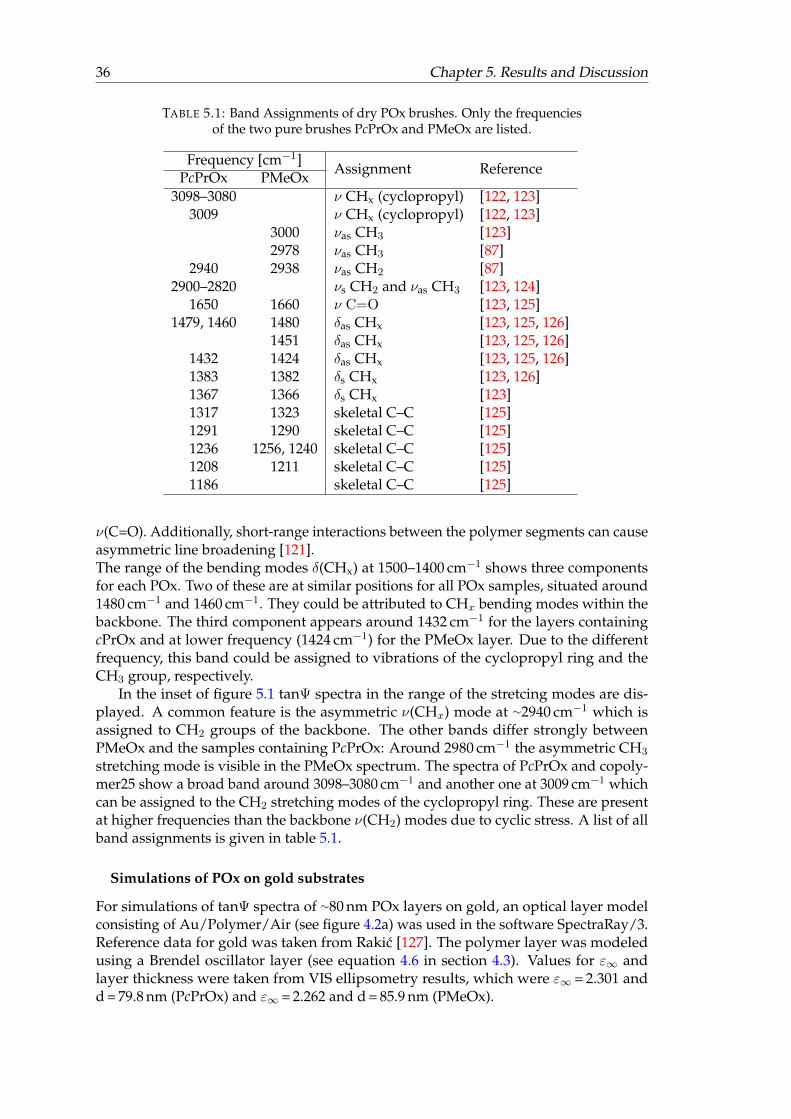
36 Chapter 5. Results and Discussion
TABLE 5.1: Band Assignments of dry POx brushes. Only the frequenciesof the two pure brushes PcPrOx and PMeOx are listed.
Frequency [cm−1]Assignment Reference
PcPrOx PMeOx3098–3080 ν CHx (cyclopropyl) [122, 123]
3009 ν CHx (cyclopropyl) [122, 123]3000 νas CH3 [123]2978 νas CH3 [87]
2940 2938 νas CH2 [87]2900–2820 νs CH2 and νas CH3 [123, 124]
1650 1660 ν C=O [123, 125]1479, 1460 1480 δas CHx [123, 125, 126]
1451 δas CHx [123, 125, 126]1432 1424 δas CHx [123, 125, 126]1383 1382 δs CHx [123, 126]1367 1366 δs CHx [123]1317 1323 skeletal C–C [125]1291 1290 skeletal C–C [125]1236 1256, 1240 skeletal C–C [125]1208 1211 skeletal C–C [125]1186 skeletal C–C [125]
ν(C=O). Additionally, short-range interactions between the polymer segments can causeasymmetric line broadening [121].The range of the bending modes δ(CHx) at 1500–1400 cm−1 shows three componentsfor each POx. Two of these are at similar positions for all POx samples, situated around1480 cm−1 and 1460 cm−1. They could be attributed to CHx bending modes within thebackbone. The third component appears around 1432 cm−1 for the layers containingcPrOx and at lower frequency (1424 cm−1) for the PMeOx layer. Due to the differentfrequency, this band could be assigned to vibrations of the cyclopropyl ring and theCH3 group, respectively.
In the inset of figure 5.1 tanΨ spectra in the range of the stretcing modes are dis-played. A common feature is the asymmetric ν(CHx) mode at ∼2940 cm−1 which isassigned to CH2 groups of the backbone. The other bands differ strongly betweenPMeOx and the samples containing PcPrOx: Around 2980 cm−1 the asymmetric CH3
stretching mode is visible in the PMeOx spectrum. The spectra of PcPrOx and copoly-mer25 show a broad band around 3098–3080 cm−1 and another one at 3009 cm−1 whichcan be assigned to the CH2 stretching modes of the cyclopropyl ring. These are presentat higher frequencies than the backbone ν(CH2) modes due to cyclic stress. A list of allband assignments is given in table 5.1.
Simulations of POx on gold substrates
For simulations of tanΨ spectra of ∼80 nm POx layers on gold, an optical layer modelconsisting of Au/Polymer/Air (see figure 4.2a) was used in the software SpectraRay/3.Reference data for gold was taken from Rakic [127]. The polymer layer was modeledusing a Brendel oscillator layer (see equation 4.6 in section 4.3). Values for ε∞ andlayer thickness were taken from VIS ellipsometry results, which were ε∞ = 2.301 andd = 79.8 nm (PcPrOx) and ε∞ = 2.262 and d = 85.9 nm (PMeOx).
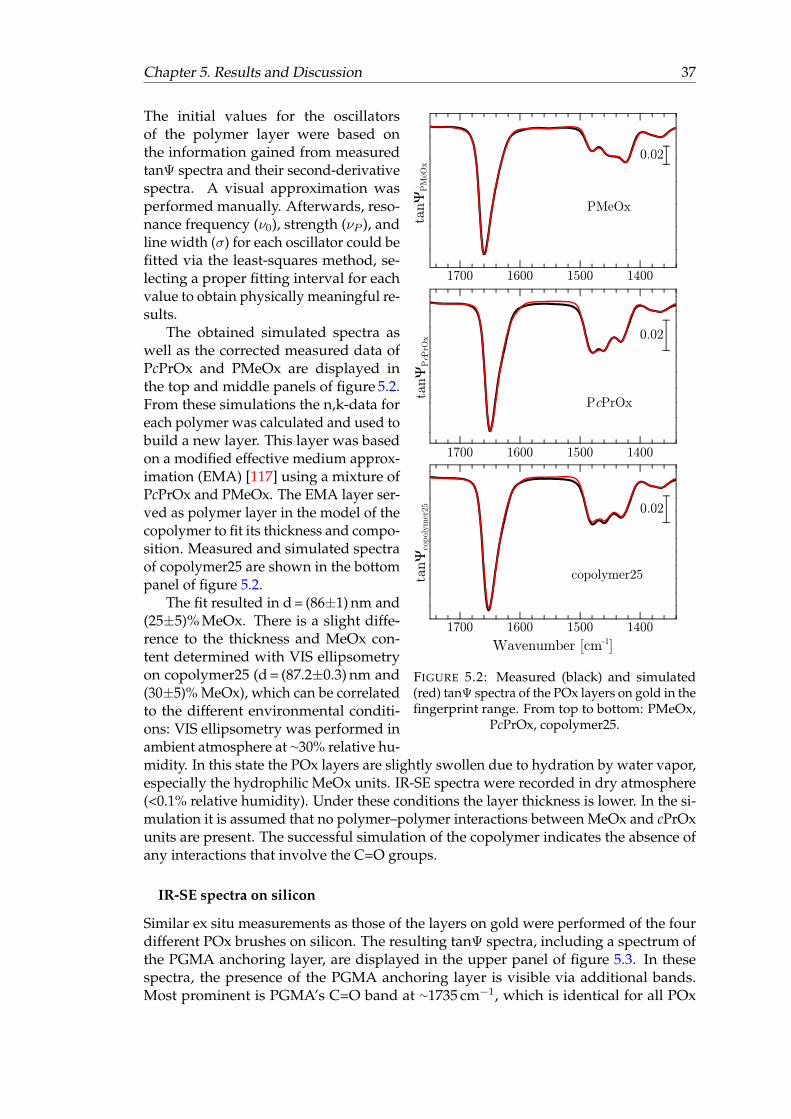
Chapter 5. Results and Discussion 37
FIGURE 5.2: Measured (black) and simulated(red) tanΨ spectra of the POx layers on gold in thefingerprint range. From top to bottom: PMeOx,
PcPrOx, copolymer25.
The initial values for the oscillatorsof the polymer layer were based onthe information gained from measuredtanΨ spectra and their second-derivativespectra. A visual approximation wasperformed manually. Afterwards, reso-nance frequency (ν0), strength (νP ), andline width (σ) for each oscillator could befitted via the least-squares method, se-lecting a proper fitting interval for eachvalue to obtain physically meaningful re-sults.
The obtained simulated spectra aswell as the corrected measured data ofPcPrOx and PMeOx are displayed inthe top and middle panels of figure 5.2.From these simulations the n,k-data foreach polymer was calculated and used tobuild a new layer. This layer was basedon a modified effective medium approx-imation (EMA) [117] using a mixture ofPcPrOx and PMeOx. The EMA layer ser-ved as polymer layer in the model of thecopolymer to fit its thickness and compo-sition. Measured and simulated spectraof copolymer25 are shown in the bottompanel of figure 5.2.
The fit resulted in d = (86±1) nm and(25±5)% MeOx. There is a slight diffe-rence to the thickness and MeOx con-tent determined with VIS ellipsometryon copolymer25 (d = (87.2±0.3) nm and(30±5)% MeOx), which can be correlatedto the different environmental conditi-ons: VIS ellipsometry was performed inambient atmosphere at ∼30% relative hu-midity. In this state the POx layers are slightly swollen due to hydration by water vapor,especially the hydrophilic MeOx units. IR-SE spectra were recorded in dry atmosphere(<0.1% relative humidity). Under these conditions the layer thickness is lower. In the si-mulation it is assumed that no polymer–polymer interactions between MeOx and cPrOxunits are present. The successful simulation of the copolymer indicates the absence ofany interactions that involve the C=O groups.
IR-SE spectra on silicon
Similar ex situ measurements as those of the layers on gold were performed of the fourdifferent POx brushes on silicon. The resulting tanΨ spectra, including a spectrum ofthe PGMA anchoring layer, are displayed in the upper panel of figure 5.3. In thesespectra, the presence of the PGMA anchoring layer is visible via additional bands.Most prominent is PGMA’s C=O band at ∼1735 cm−1, which is identical for all POx
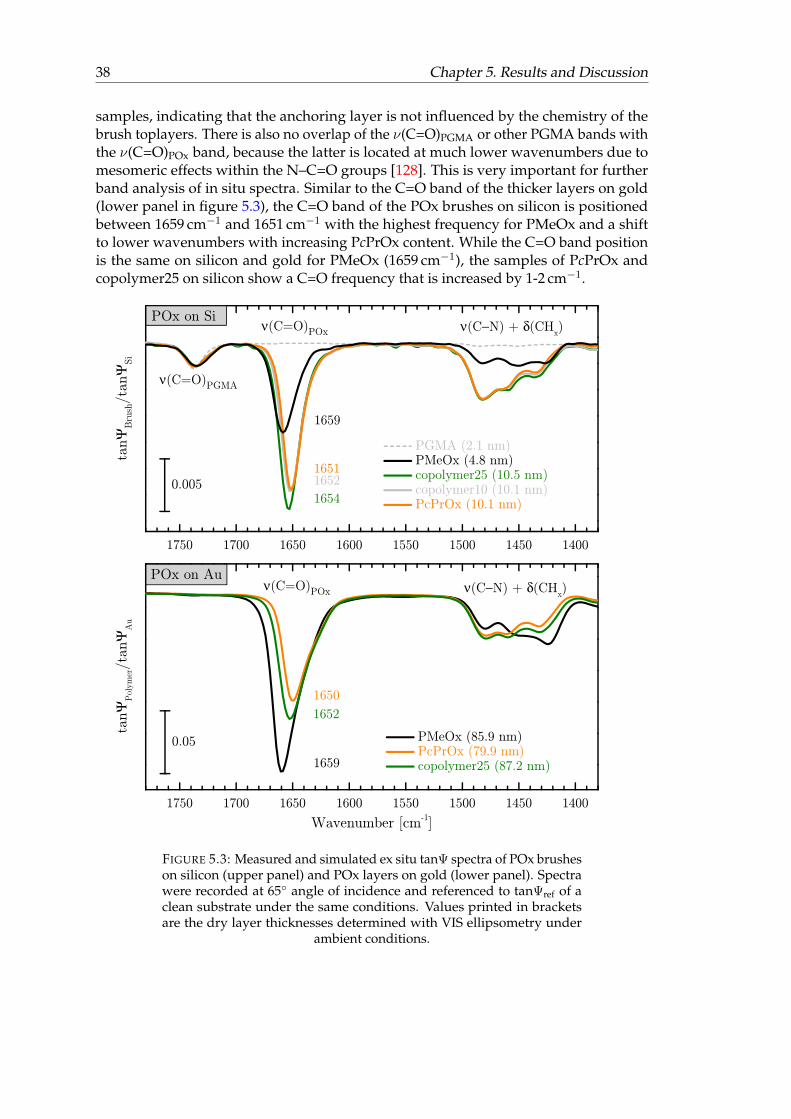
38 Chapter 5. Results and Discussion
samples, indicating that the anchoring layer is not influenced by the chemistry of thebrush toplayers. There is also no overlap of the ν(C=O)PGMA or other PGMA bands withthe ν(C=O)POx band, because the latter is located at much lower wavenumbers due tomesomeric effects within the N–C=O groups [128]. This is very important for furtherband analysis of in situ spectra. Similar to the C=O band of the thicker layers on gold(lower panel in figure 5.3), the C=O band of the POx brushes on silicon is positionedbetween 1659 cm−1 and 1651 cm−1 with the highest frequency for PMeOx and a shiftto lower wavenumbers with increasing PcPrOx content. While the C=O band positionis the same on silicon and gold for PMeOx (1659 cm−1), the samples of PcPrOx andcopolymer25 on silicon show a C=O frequency that is increased by 1-2 cm−1.
FIGURE 5.3: Measured and simulated ex situ tanΨ spectra of POx brusheson silicon (upper panel) and POx layers on gold (lower panel). Spectrawere recorded at 65◦ angle of incidence and referenced to tanΨref of aclean substrate under the same conditions. Values printed in bracketsare the dry layer thicknesses determined with VIS ellipsometry under
ambient conditions.
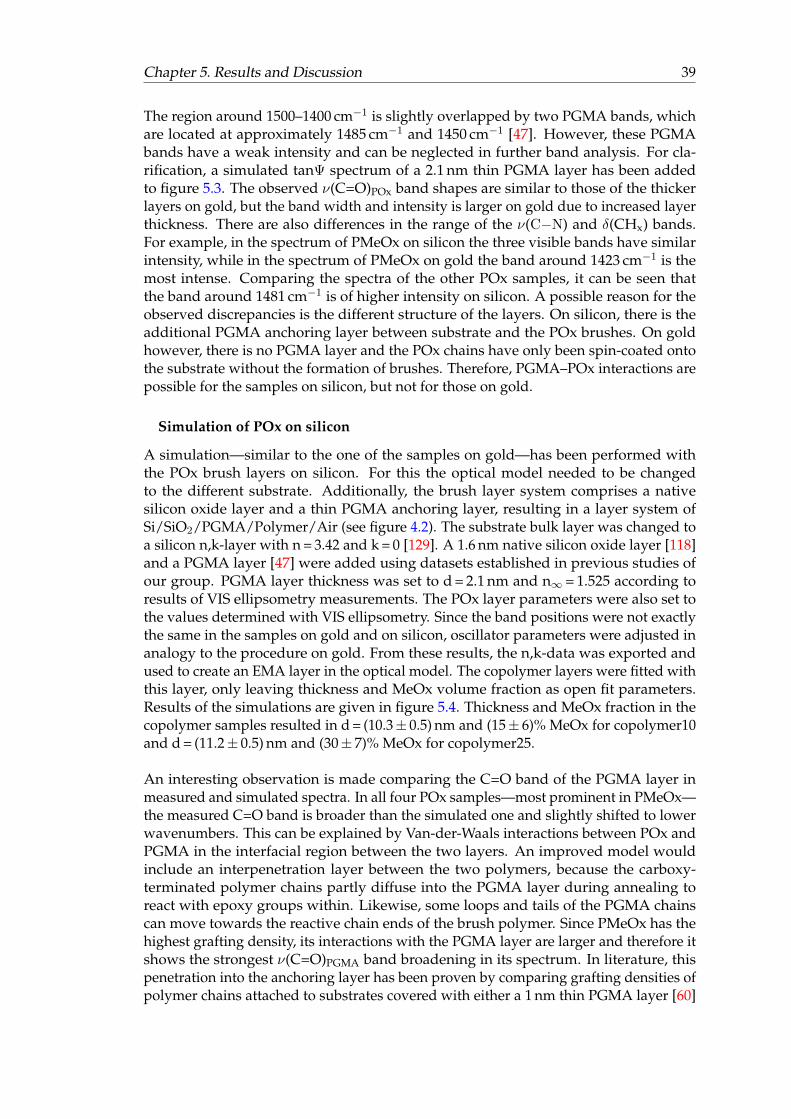
Chapter 5. Results and Discussion 39
The region around 1500–1400 cm−1 is slightly overlapped by two PGMA bands, whichare located at approximately 1485 cm−1 and 1450 cm−1 [47]. However, these PGMAbands have a weak intensity and can be neglected in further band analysis. For cla-rification, a simulated tanΨ spectrum of a 2.1 nm thin PGMA layer has been addedto figure 5.3. The observed ν(C=O)POx band shapes are similar to those of the thickerlayers on gold, but the band width and intensity is larger on gold due to increased layerthickness. There are also differences in the range of the ν(C−N) and δ(CHx) bands.For example, in the spectrum of PMeOx on silicon the three visible bands have similarintensity, while in the spectrum of PMeOx on gold the band around 1423 cm−1 is themost intense. Comparing the spectra of the other POx samples, it can be seen thatthe band around 1481 cm−1 is of higher intensity on silicon. A possible reason for theobserved discrepancies is the different structure of the layers. On silicon, there is theadditional PGMA anchoring layer between substrate and the POx brushes. On goldhowever, there is no PGMA layer and the POx chains have only been spin-coated ontothe substrate without the formation of brushes. Therefore, PGMA–POx interactions arepossible for the samples on silicon, but not for those on gold.
Simulation of POx on silicon
A simulation—similar to the one of the samples on gold—has been performed withthe POx brush layers on silicon. For this the optical model needed to be changedto the different substrate. Additionally, the brush layer system comprises a nativesilicon oxide layer and a thin PGMA anchoring layer, resulting in a layer system ofSi/SiO2/PGMA/Polymer/Air (see figure 4.2). The substrate bulk layer was changed toa silicon n,k-layer with n = 3.42 and k = 0 [129]. A 1.6 nm native silicon oxide layer [118]and a PGMA layer [47] were added using datasets established in previous studies ofour group. PGMA layer thickness was set to d = 2.1 nm and n∞ = 1.525 according toresults of VIS ellipsometry measurements. The POx layer parameters were also set tothe values determined with VIS ellipsometry. Since the band positions were not exactlythe same in the samples on gold and on silicon, oscillator parameters were adjusted inanalogy to the procedure on gold. From these results, the n,k-data was exported andused to create an EMA layer in the optical model. The copolymer layers were fitted withthis layer, only leaving thickness and MeOx volume fraction as open fit parameters.Results of the simulations are given in figure 5.4. Thickness and MeOx fraction in thecopolymer samples resulted in d = (10.3± 0.5) nm and (15± 6)% MeOx for copolymer10and d = (11.2± 0.5) nm and (30± 7)% MeOx for copolymer25.
An interesting observation is made comparing the C=O band of the PGMA layer inmeasured and simulated spectra. In all four POx samples—most prominent in PMeOx—the measured C=O band is broader than the simulated one and slightly shifted to lowerwavenumbers. This can be explained by Van-der-Waals interactions between POx andPGMA in the interfacial region between the two layers. An improved model wouldinclude an interpenetration layer between the two polymers, because the carboxy-terminated polymer chains partly diffuse into the PGMA layer during annealing toreact with epoxy groups within. Likewise, some loops and tails of the PGMA chainscan move towards the reactive chain ends of the brush polymer. Since PMeOx has thehighest grafting density, its interactions with the PGMA layer are larger and therefore itshows the strongest ν(C=O)PGMA band broadening in its spectrum. In literature, thispenetration into the anchoring layer has been proven by comparing grafting densities ofpolymer chains attached to substrates covered with either a 1 nm thin PGMA layer [60]
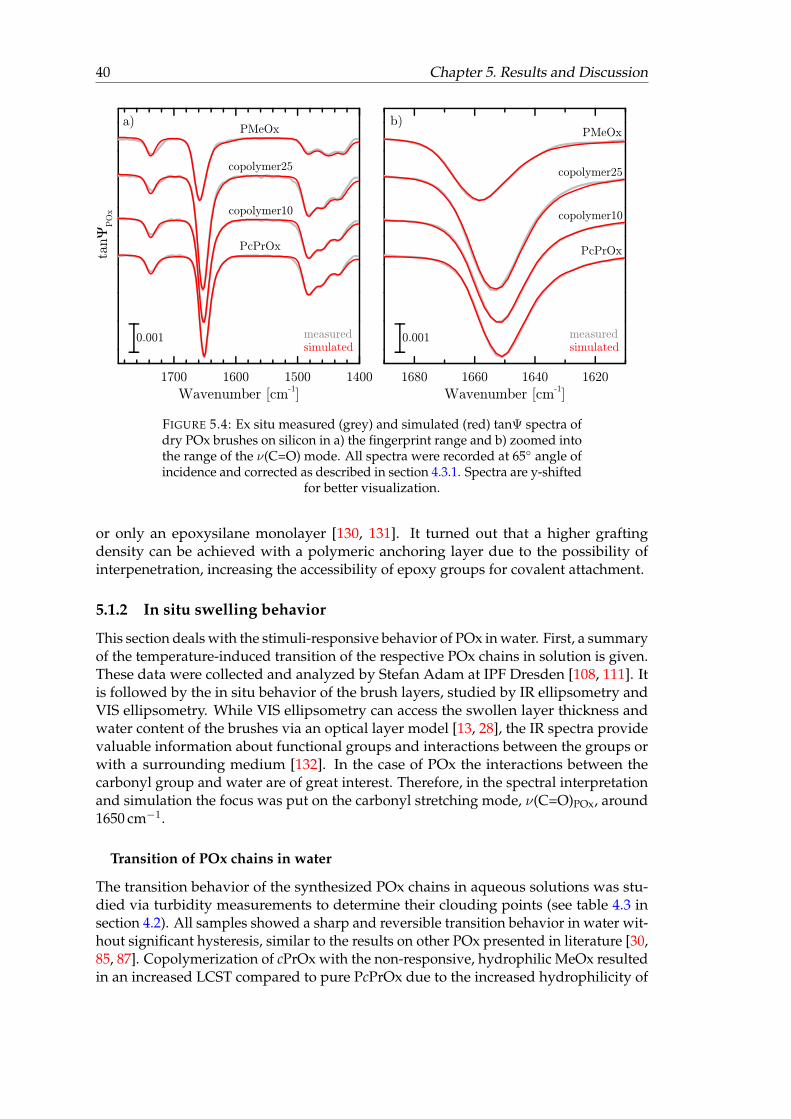
40 Chapter 5. Results and Discussion
FIGURE 5.4: Ex situ measured (grey) and simulated (red) tanΨ spectra ofdry POx brushes on silicon in a) the fingerprint range and b) zoomed intothe range of the ν(C=O) mode. All spectra were recorded at 65◦ angle ofincidence and corrected as described in section 4.3.1. Spectra are y-shifted
for better visualization.
or only an epoxysilane monolayer [130, 131]. It turned out that a higher graftingdensity can be achieved with a polymeric anchoring layer due to the possibility ofinterpenetration, increasing the accessibility of epoxy groups for covalent attachment.
5.1.2 In situ swelling behavior
This section deals with the stimuli-responsive behavior of POx in water. First, a summaryof the temperature-induced transition of the respective POx chains in solution is given.These data were collected and analyzed by Stefan Adam at IPF Dresden [108, 111]. Itis followed by the in situ behavior of the brush layers, studied by IR ellipsometry andVIS ellipsometry. While VIS ellipsometry can access the swollen layer thickness andwater content of the brushes via an optical layer model [13, 28], the IR spectra providevaluable information about functional groups and interactions between the groups orwith a surrounding medium [132]. In the case of POx the interactions between thecarbonyl group and water are of great interest. Therefore, in the spectral interpretationand simulation the focus was put on the carbonyl stretching mode, ν(C=O)POx, around1650 cm−1.
Transition of POx chains in water
The transition behavior of the synthesized POx chains in aqueous solutions was stu-died via turbidity measurements to determine their clouding points (see table 4.3 insection 4.2). All samples showed a sharp and reversible transition behavior in water wit-hout significant hysteresis, similar to the results on other POx presented in literature [30,85, 87]. Copolymerization of cPrOx with the non-responsive, hydrophilic MeOx resultedin an increased LCST compared to pure PcPrOx due to the increased hydrophilicity of
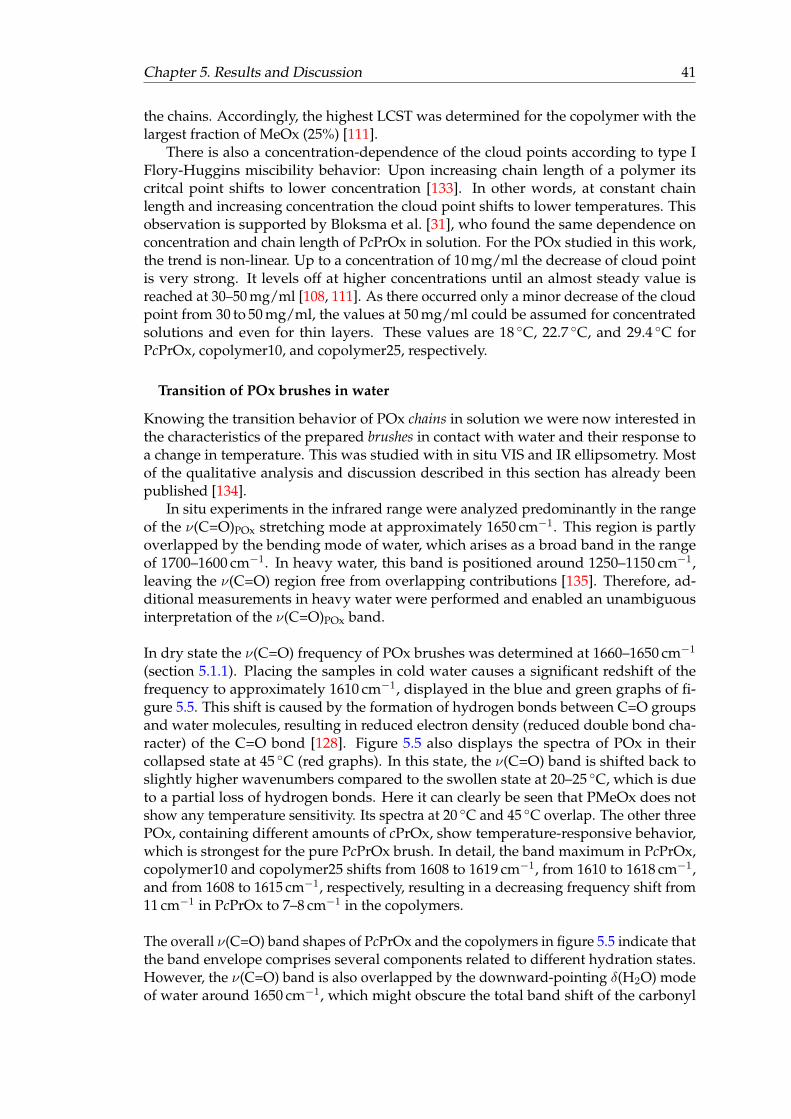
Chapter 5. Results and Discussion 41
the chains. Accordingly, the highest LCST was determined for the copolymer with thelargest fraction of MeOx (25%) [111].
There is also a concentration-dependence of the cloud points according to type IFlory-Huggins miscibility behavior: Upon increasing chain length of a polymer itscritcal point shifts to lower concentration [133]. In other words, at constant chainlength and increasing concentration the cloud point shifts to lower temperatures. Thisobservation is supported by Bloksma et al. [31], who found the same dependence onconcentration and chain length of PcPrOx in solution. For the POx studied in this work,the trend is non-linear. Up to a concentration of 10 mg/ml the decrease of cloud pointis very strong. It levels off at higher concentrations until an almost steady value isreached at 30–50 mg/ml [108, 111]. As there occurred only a minor decrease of the cloudpoint from 30 to 50 mg/ml, the values at 50 mg/ml could be assumed for concentratedsolutions and even for thin layers. These values are 18 ◦C, 22.7 ◦C, and 29.4 ◦C forPcPrOx, copolymer10, and copolymer25, respectively.
Transition of POx brushes in water
Knowing the transition behavior of POx chains in solution we were now interested inthe characteristics of the prepared brushes in contact with water and their response toa change in temperature. This was studied with in situ VIS and IR ellipsometry. Mostof the qualitative analysis and discussion described in this section has already beenpublished [134].
In situ experiments in the infrared range were analyzed predominantly in the rangeof the ν(C=O)POx stretching mode at approximately 1650 cm−1. This region is partlyoverlapped by the bending mode of water, which arises as a broad band in the rangeof 1700–1600 cm−1. In heavy water, this band is positioned around 1250–1150 cm−1,leaving the ν(C=O) region free from overlapping contributions [135]. Therefore, ad-ditional measurements in heavy water were performed and enabled an unambiguousinterpretation of the ν(C=O)POx band.
In dry state the ν(C=O) frequency of POx brushes was determined at 1660–1650 cm−1
(section 5.1.1). Placing the samples in cold water causes a significant redshift of thefrequency to approximately 1610 cm−1, displayed in the blue and green graphs of fi-gure 5.5. This shift is caused by the formation of hydrogen bonds between C=O groupsand water molecules, resulting in reduced electron density (reduced double bond cha-racter) of the C=O bond [128]. Figure 5.5 also displays the spectra of POx in theircollapsed state at 45 ◦C (red graphs). In this state, the ν(C=O) band is shifted back toslightly higher wavenumbers compared to the swollen state at 20–25 ◦C, which is dueto a partial loss of hydrogen bonds. Here it can clearly be seen that PMeOx does notshow any temperature sensitivity. Its spectra at 20 ◦C and 45 ◦C overlap. The other threePOx, containing different amounts of cPrOx, show temperature-responsive behavior,which is strongest for the pure PcPrOx brush. In detail, the band maximum in PcPrOx,copolymer10 and copolymer25 shifts from 1608 to 1619 cm−1, from 1610 to 1618 cm−1,and from 1608 to 1615 cm−1, respectively, resulting in a decreasing frequency shift from11 cm−1 in PcPrOx to 7–8 cm−1 in the copolymers.
The overall ν(C=O) band shapes of PcPrOx and the copolymers in figure 5.5 indicate thatthe band envelope comprises several components related to different hydration states.However, the ν(C=O) band is also overlapped by the downward-pointing δ(H2O) modeof water around 1650 cm−1, which might obscure the total band shift of the carbonyl
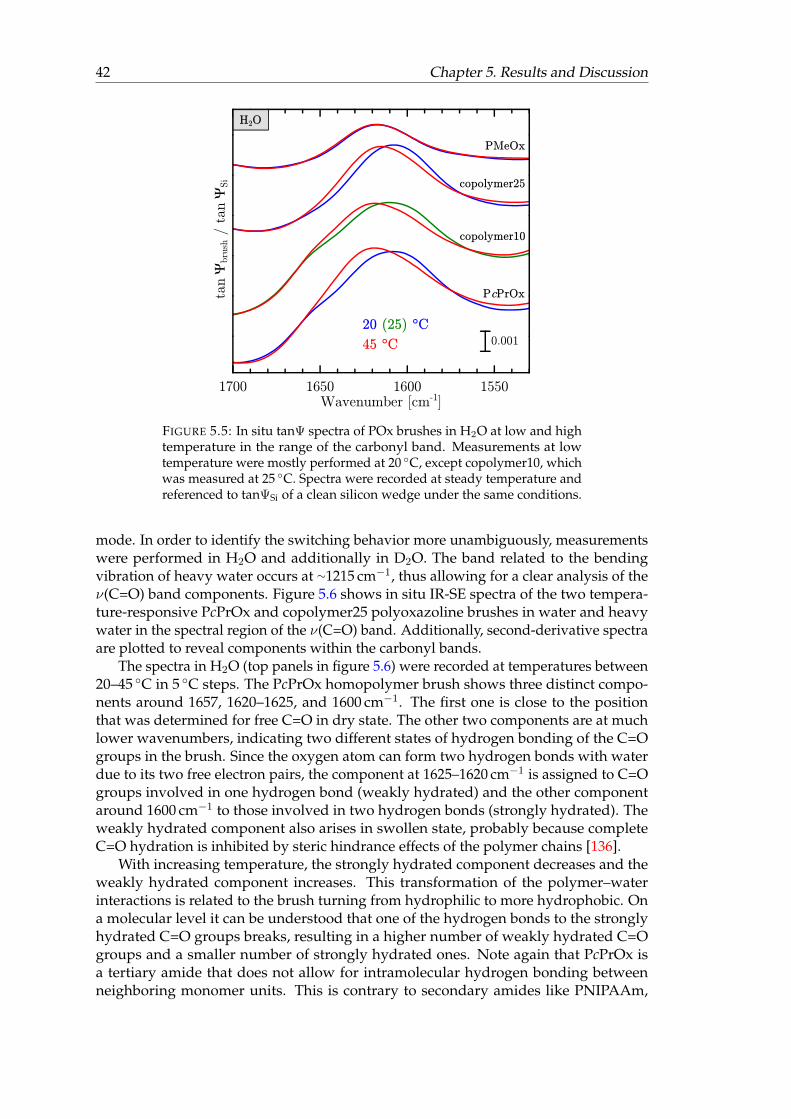
42 Chapter 5. Results and Discussion
FIGURE 5.5: In situ tanΨ spectra of POx brushes in H2O at low and hightemperature in the range of the carbonyl band. Measurements at lowtemperature were mostly performed at 20 ◦C, except copolymer10, whichwas measured at 25 ◦C. Spectra were recorded at steady temperature andreferenced to tanΨSi of a clean silicon wedge under the same conditions.
mode. In order to identify the switching behavior more unambiguously, measurementswere performed in H2O and additionally in D2O. The band related to the bendingvibration of heavy water occurs at ∼1215 cm−1, thus allowing for a clear analysis of theν(C=O) band components. Figure 5.6 shows in situ IR-SE spectra of the two tempera-ture-responsive PcPrOx and copolymer25 polyoxazoline brushes in water and heavywater in the spectral region of the ν(C=O) band. Additionally, second-derivative spectraare plotted to reveal components within the carbonyl bands.
The spectra in H2O (top panels in figure 5.6) were recorded at temperatures between20–45 ◦C in 5 ◦C steps. The PcPrOx homopolymer brush shows three distinct compo-nents around 1657, 1620–1625, and 1600 cm−1. The first one is close to the positionthat was determined for free C=O in dry state. The other two components are at muchlower wavenumbers, indicating two different states of hydrogen bonding of the C=Ogroups in the brush. Since the oxygen atom can form two hydrogen bonds with waterdue to its two free electron pairs, the component at 1625–1620 cm−1 is assigned to C=Ogroups involved in one hydrogen bond (weakly hydrated) and the other componentaround 1600 cm−1 to those involved in two hydrogen bonds (strongly hydrated). Theweakly hydrated component also arises in swollen state, probably because completeC=O hydration is inhibited by steric hindrance effects of the polymer chains [136].
With increasing temperature, the strongly hydrated component decreases and theweakly hydrated component increases. This transformation of the polymer–waterinteractions is related to the brush turning from hydrophilic to more hydrophobic. Ona molecular level it can be understood that one of the hydrogen bonds to the stronglyhydrated C=O groups breaks, resulting in a higher number of weakly hydrated C=Ogroups and a smaller number of strongly hydrated ones. Note again that PcPrOx isa tertiary amide that does not allow for intramolecular hydrogen bonding betweenneighboring monomer units. This is contrary to secondary amides like PNIPAAm,
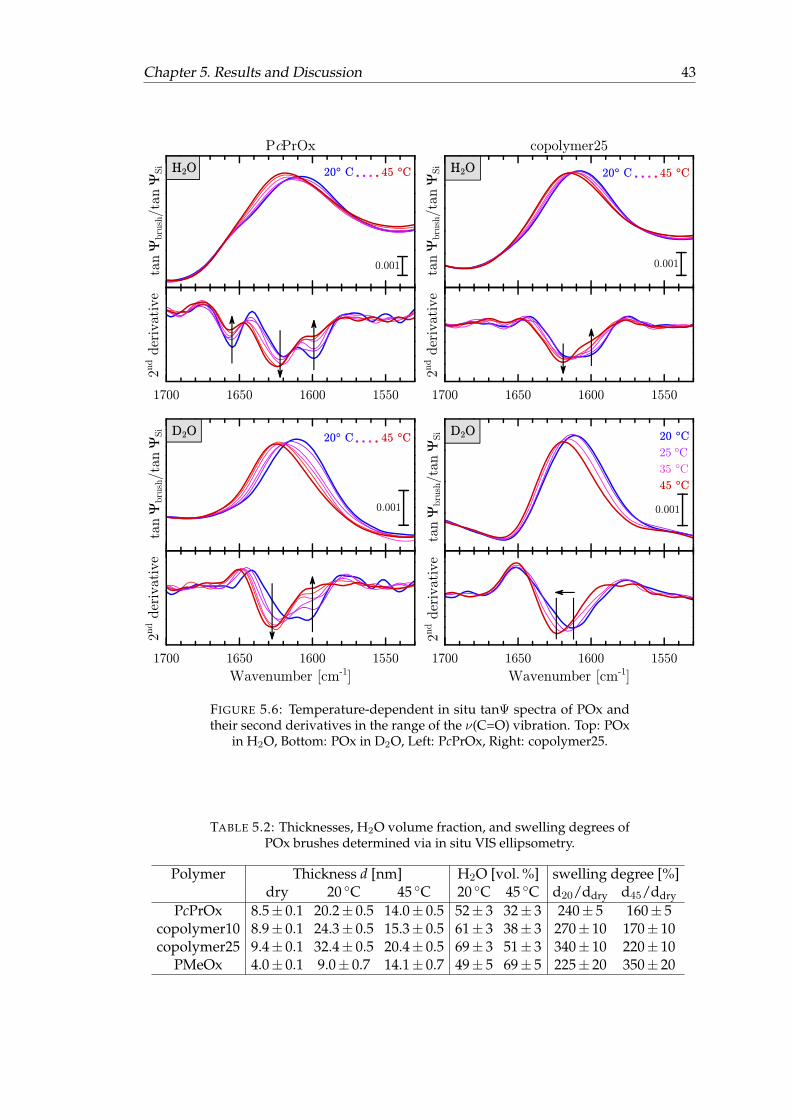
Chapter 5. Results and Discussion 43
FIGURE 5.6: Temperature-dependent in situ tanΨ spectra of POx andtheir second derivatives in the range of the ν(C=O) vibration. Top: POx
in H2O, Bottom: POx in D2O, Left: PcPrOx, Right: copolymer25.
TABLE 5.2: Thicknesses, H2O volume fraction, and swelling degrees ofPOx brushes determined via in situ VIS ellipsometry.
Polymer Thickness d [nm] H2O [vol. %] swelling degree [%]dry 20 ◦C 45 ◦C 20 ◦C 45 ◦C d20/ddry d45/ddry
PcPrOx 8.5± 0.1 20.2± 0.5 14.0± 0.5 52± 3 32± 3 240± 5 160± 5copolymer10 8.9± 0.1 24.3± 0.5 15.3± 0.5 61± 3 38± 3 270± 10 170± 10copolymer25 9.4± 0.1 32.4± 0.5 20.4± 0.5 69± 3 51± 3 340± 10 220± 10
PMeOx 4.0± 0.1 9.0± 0.7 14.1± 0.7 49± 5 69± 5 225± 20 350± 20
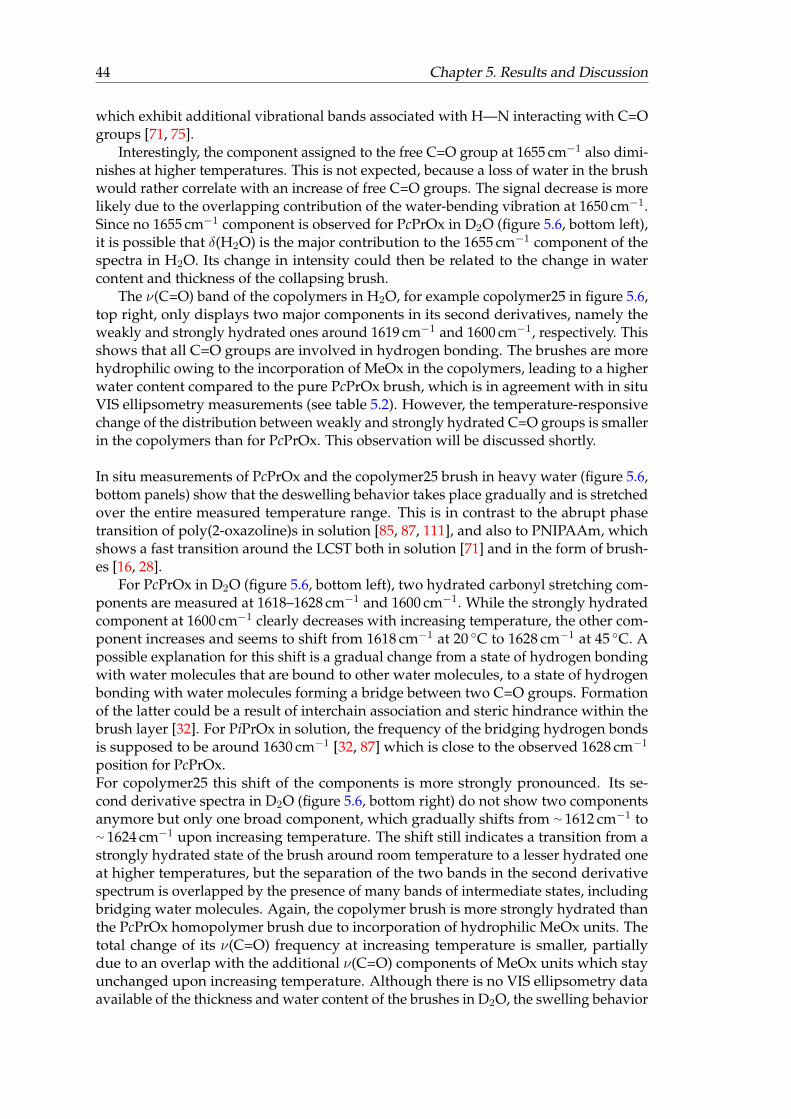
44 Chapter 5. Results and Discussion
which exhibit additional vibrational bands associated with H—N interacting with C=Ogroups [71, 75].
Interestingly, the component assigned to the free C=O group at 1655 cm−1 also dimi-nishes at higher temperatures. This is not expected, because a loss of water in the brushwould rather correlate with an increase of free C=O groups. The signal decrease is morelikely due to the overlapping contribution of the water-bending vibration at 1650 cm−1.Since no 1655 cm−1 component is observed for PcPrOx in D2O (figure 5.6, bottom left),it is possible that δ(H2O) is the major contribution to the 1655 cm−1 component of thespectra in H2O. Its change in intensity could then be related to the change in watercontent and thickness of the collapsing brush.
The ν(C=O) band of the copolymers in H2O, for example copolymer25 in figure 5.6,top right, only displays two major components in its second derivatives, namely theweakly and strongly hydrated ones around 1619 cm−1 and 1600 cm−1, respectively. Thisshows that all C=O groups are involved in hydrogen bonding. The brushes are morehydrophilic owing to the incorporation of MeOx in the copolymers, leading to a higherwater content compared to the pure PcPrOx brush, which is in agreement with in situVIS ellipsometry measurements (see table 5.2). However, the temperature-responsivechange of the distribution between weakly and strongly hydrated C=O groups is smallerin the copolymers than for PcPrOx. This observation will be discussed shortly.
In situ measurements of PcPrOx and the copolymer25 brush in heavy water (figure 5.6,bottom panels) show that the deswelling behavior takes place gradually and is stretchedover the entire measured temperature range. This is in contrast to the abrupt phasetransition of poly(2-oxazoline)s in solution [85, 87, 111], and also to PNIPAAm, whichshows a fast transition around the LCST both in solution [71] and in the form of brush-es [16, 28].
For PcPrOx in D2O (figure 5.6, bottom left), two hydrated carbonyl stretching com-ponents are measured at 1618–1628 cm−1 and 1600 cm−1. While the strongly hydratedcomponent at 1600 cm−1 clearly decreases with increasing temperature, the other com-ponent increases and seems to shift from 1618 cm−1 at 20 ◦C to 1628 cm−1 at 45 ◦C. Apossible explanation for this shift is a gradual change from a state of hydrogen bondingwith water molecules that are bound to other water molecules, to a state of hydrogenbonding with water molecules forming a bridge between two C=O groups. Formationof the latter could be a result of interchain association and steric hindrance within thebrush layer [32]. For PiPrOx in solution, the frequency of the bridging hydrogen bondsis supposed to be around 1630 cm−1 [32, 87] which is close to the observed 1628 cm−1
position for PcPrOx.For copolymer25 this shift of the components is more strongly pronounced. Its se-cond derivative spectra in D2O (figure 5.6, bottom right) do not show two componentsanymore but only one broad component, which gradually shifts from ∼ 1612 cm−1 to∼ 1624 cm−1 upon increasing temperature. The shift still indicates a transition from astrongly hydrated state of the brush around room temperature to a lesser hydrated oneat higher temperatures, but the separation of the two bands in the second derivativespectrum is overlapped by the presence of many bands of intermediate states, includingbridging water molecules. Again, the copolymer brush is more strongly hydrated thanthe PcPrOx homopolymer brush due to incorporation of hydrophilic MeOx units. Thetotal change of its ν(C=O) frequency at increasing temperature is smaller, partiallydue to an overlap with the additional ν(C=O) components of MeOx units which stayunchanged upon increasing temperature. Although there is no VIS ellipsometry dataavailable of the thickness and water content of the brushes in D2O, the swelling behavior
Chapter 5. Results and Discussion 45
FIGURE 5.7: Plot of the temperature-dependent ν(C=O) frequency (top)of PcPrOx and copolymer25 in D2O in the in situ tanΨ spectra comparedto the swollen thickness (bottom) determined with VIS ellipsometry inH2O. Corresponding swelling degrees to the brush thickness at 20 ◦C and45 ◦C are 240% and 190% (PcPrOx) and 345% and 220% (copolymer25).
can be assumed to be similar to the results of swelling experiments in normal water.
A comparison between the ν(C=O) frequency shift measured in the infrared and thetotal change in water content of the brushes measured in the visible range is visualizedin figure 5.7. In IR spectra the transition of the brush can be followed via the frequencyshift of certain functional groups, in this case via the ν(C=O) band (top panel). InVIS ellipsometry the swollen brush thickness is a quantity that gives complementaryinformation about the switching behavior (lower panel). However, the total valueof swollen brush thickness is dependent on the dry thickness and cannot be directlycompared between the two brushes. To be able to do so, we calculated the swellingdegree (ratio between dry and swollen thickness, in percent) of the two brushes at 20 ◦Cand 45 ◦C. The resulting values are 240% and 190% for PcPrOx and 345% and 220% forcopolymer25, respectively.
As mentioned before, for the POx samples we observed different results from thetwo techniques: While in IR-SE the frequency difference between lowest and highesttemperature is greater for the PcPrOx brush, VIS ellipsometry results show a largerdifference in swelling degree (and water content) in the copolymer brush.
Note that despite their different swelling degree in the hydrated state at 20 ◦C the
46 Chapter 5. Results and Discussion
ν(C=O) frequency of both PcPrOx and copolymer25 is at the same position (1610 cm−1).This indicates similar hydration states of the brushes’ C=O groups. A possible reason isthat, due to the stronger hydrophilicity of the copolymer brush, more water is present inthe layer. This additional water does not interact with the polymer, but causes a higherswelling degree and a different behavior of molecular interactions between polymerand water when the temperature is changed. While the transition of the pure PcPrOxbrush can be followed clearly via the decrease of strongly hydrated C=O groups in favorof weakly hydrated ones, the transition of the copolymer brush is more blurred due tothe overlap of different forms of interaction between C=O and water, such as bridgingwater molecules. Also there is a smaller fraction of the temperature-responsive cPrOxunits in the copolymer25 brush compared to the homopolymer PcPrOx brush, leadingto the observed frequency shift being smaller.
VIS ellipsometry results on the other hand indicate a greater change in water contentand swelling degree of the copolymer brush. It has to be taken into account, that the twomethods operate in different wavelength ranges and with different experimental set-ups. While in VIS ellipsometry the brush–solution interface is probed directly throughthe solution, in IR-SE the interface is probed through the substrate and the brush layer.Consequently the surface and its roughness is probed differently. This could have aneffect on the results of the brush layer, especially in the swollen state when there is asmaller contrast between the refractive index of swollen brush and water. Additionally,different spot sizes were probed with the two methods. In IR-SE, an area of about 1 cm2
is probed, while in VIS ellipsometry the area is in the range of mm2 or less.We conclude that in the copolymer there is a certain amount of additional water
present that does not interact with C=O groups, therefore it does not take part inchanges of C=O frequency. However, these water molecules still contribute to theoverall swelling of the brush layer. The observed differences in swelling could be due tothe different chain length of the polymers, from which the brushes have been prepared.A dependency of the swelling behavior on molecular weight, and consequently ongrafting density, has been described in literature [28, 80, 113, 137] and for the presentPOx samples such a dependency is very likely. Copolymer25 has the longest chains(61.3 kg/mol), while PcPrOx chains are much shorter (48.4 kg/mol). Still, both polymersin hydrated state show the same IR frequency of the C=O band (figure 5.7). In contrast tothe temperature-responsive brushes, the hydrophilic PMeOx brush—with a molecularweight of only 22.0 kg/mol and a higher grafting density—shows a ν(C=O) frequencyof 1618 cm−1 in water (not shown in the graph). This indicates that PMeOx is not fullyhydrated, even though it is the most hydrophilic of the three POx samples. The lowmolecular weight resulted in a much thinner PMeOx brush layer, which also influencesthe swelling behavior. One cannot define a single reason for the deviations in swellingbehavior, because the parameters brush thickness, molecular weight, and graftingdensity are dependent on each other and influence the functional behavior of the brush.
Simulations of in situ POx spectra
Based on the simulations of ex situ tanΨ spectra in section 5.1.1, the optical model wasadjusted to fit the in situ measurements (see figure 4.2 in section 4.3.3). The angle ofincidence was adapted to ∼ 13.3◦ according to the geometry at the inner surface of thewedge. Measured spectra of the dry brushes in the empty in situ cell were correctedas described in section 4.3.1 to be able to simulate the spectra. In the model, oscillatorparameters of the polymer layer as well as the angle of incidence were slightly adjustedto find the best fit between corrected measurement and simulation. These dry state
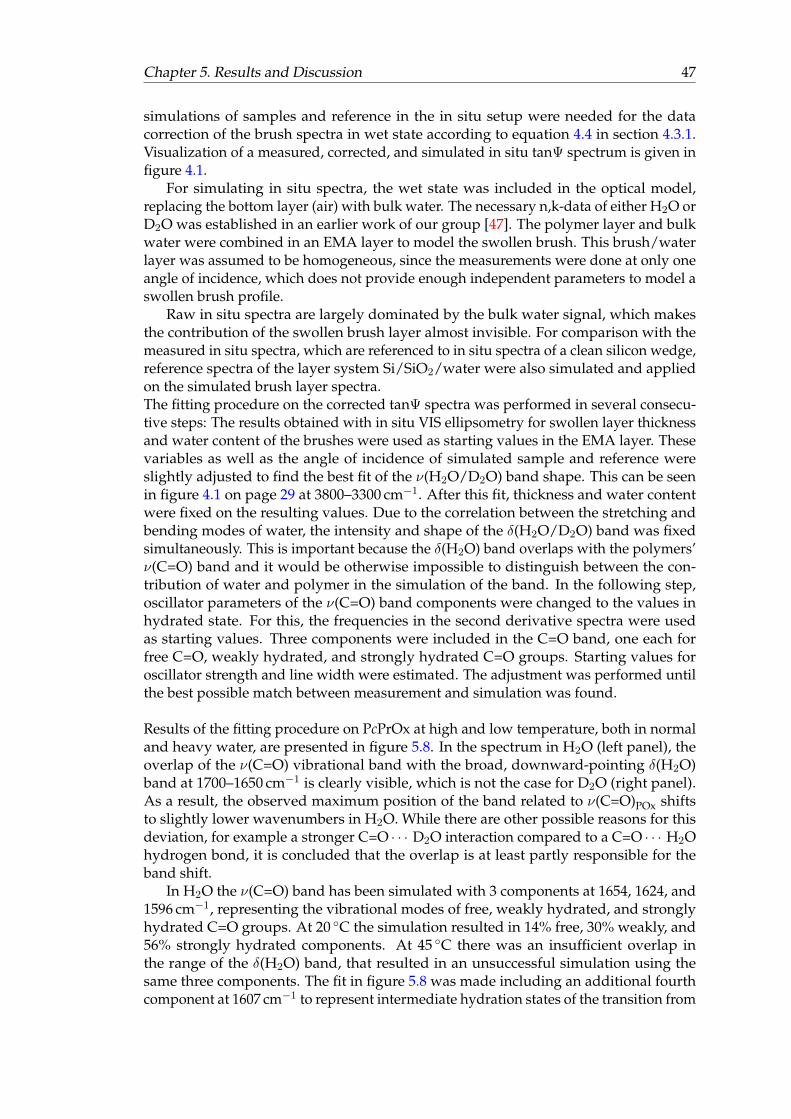
Chapter 5. Results and Discussion 47
simulations of samples and reference in the in situ setup were needed for the datacorrection of the brush spectra in wet state according to equation 4.4 in section 4.3.1.Visualization of a measured, corrected, and simulated in situ tanΨ spectrum is given infigure 4.1.
For simulating in situ spectra, the wet state was included in the optical model,replacing the bottom layer (air) with bulk water. The necessary n,k-data of either H2O orD2O was established in an earlier work of our group [47]. The polymer layer and bulkwater were combined in an EMA layer to model the swollen brush. This brush/waterlayer was assumed to be homogeneous, since the measurements were done at only oneangle of incidence, which does not provide enough independent parameters to model aswollen brush profile.
Raw in situ spectra are largely dominated by the bulk water signal, which makesthe contribution of the swollen brush layer almost invisible. For comparison with themeasured in situ spectra, which are referenced to in situ spectra of a clean silicon wedge,reference spectra of the layer system Si/SiO2/water were also simulated and appliedon the simulated brush layer spectra.The fitting procedure on the corrected tanΨ spectra was performed in several consecu-tive steps: The results obtained with in situ VIS ellipsometry for swollen layer thicknessand water content of the brushes were used as starting values in the EMA layer. Thesevariables as well as the angle of incidence of simulated sample and reference wereslightly adjusted to find the best fit of the ν(H2O/D2O) band shape. This can be seenin figure 4.1 on page 29 at 3800–3300 cm−1. After this fit, thickness and water contentwere fixed on the resulting values. Due to the correlation between the stretching andbending modes of water, the intensity and shape of the δ(H2O/D2O) band was fixedsimultaneously. This is important because the δ(H2O) band overlaps with the polymers’ν(C=O) band and it would be otherwise impossible to distinguish between the con-tribution of water and polymer in the simulation of the band. In the following step,oscillator parameters of the ν(C=O) band components were changed to the values inhydrated state. For this, the frequencies in the second derivative spectra were usedas starting values. Three components were included in the C=O band, one each forfree C=O, weakly hydrated, and strongly hydrated C=O groups. Starting values foroscillator strength and line width were estimated. The adjustment was performed untilthe best possible match between measurement and simulation was found.
Results of the fitting procedure on PcPrOx at high and low temperature, both in normaland heavy water, are presented in figure 5.8. In the spectrum in H2O (left panel), theoverlap of the ν(C=O) vibrational band with the broad, downward-pointing δ(H2O)band at 1700–1650 cm−1 is clearly visible, which is not the case for D2O (right panel).As a result, the observed maximum position of the band related to ν(C=O)POx shiftsto slightly lower wavenumbers in H2O. While there are other possible reasons for thisdeviation, for example a stronger C=O · · · D2O interaction compared to a C=O · · · H2Ohydrogen bond, it is concluded that the overlap is at least partly responsible for theband shift.
In H2O the ν(C=O) band has been simulated with 3 components at 1654, 1624, and1596 cm−1, representing the vibrational modes of free, weakly hydrated, and stronglyhydrated C=O groups. At 20 ◦C the simulation resulted in 14% free, 30% weakly, and56% strongly hydrated components. At 45 ◦C there was an insufficient overlap inthe range of the δ(H2O) band, that resulted in an unsuccessful simulation using thesame three components. The fit in figure 5.8 was made including an additional fourthcomponent at 1607 cm−1 to represent intermediate hydration states of the transition from
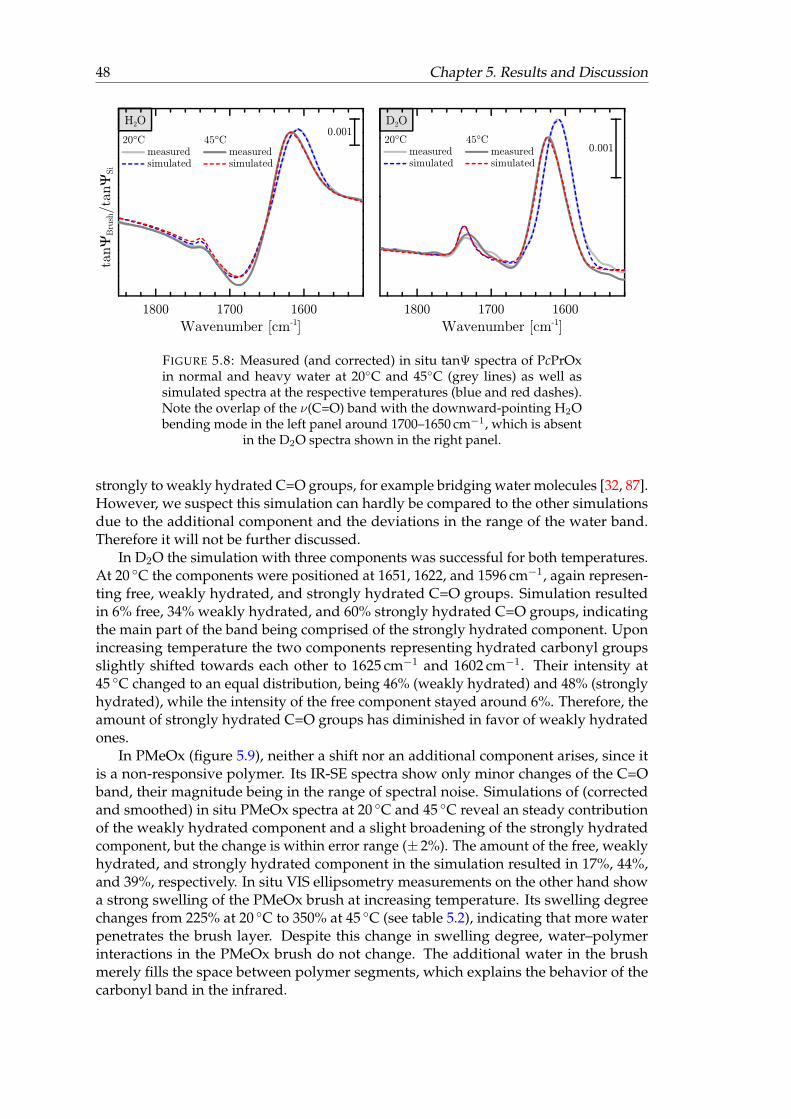
48 Chapter 5. Results and Discussion
FIGURE 5.8: Measured (and corrected) in situ tanΨ spectra of PcPrOxin normal and heavy water at 20◦C and 45◦C (grey lines) as well assimulated spectra at the respective temperatures (blue and red dashes).Note the overlap of the ν(C=O) band with the downward-pointing H2Obending mode in the left panel around 1700–1650 cm−1, which is absent
in the D2O spectra shown in the right panel.
strongly to weakly hydrated C=O groups, for example bridging water molecules [32, 87].However, we suspect this simulation can hardly be compared to the other simulationsdue to the additional component and the deviations in the range of the water band.Therefore it will not be further discussed.
In D2O the simulation with three components was successful for both temperatures.At 20 ◦C the components were positioned at 1651, 1622, and 1596 cm−1, again represen-ting free, weakly hydrated, and strongly hydrated C=O groups. Simulation resultedin 6% free, 34% weakly hydrated, and 60% strongly hydrated C=O groups, indicatingthe main part of the band being comprised of the strongly hydrated component. Uponincreasing temperature the two components representing hydrated carbonyl groupsslightly shifted towards each other to 1625 cm−1 and 1602 cm−1. Their intensity at45 ◦C changed to an equal distribution, being 46% (weakly hydrated) and 48% (stronglyhydrated), while the intensity of the free component stayed around 6%. Therefore, theamount of strongly hydrated C=O groups has diminished in favor of weakly hydratedones.
In PMeOx (figure 5.9), neither a shift nor an additional component arises, since itis a non-responsive polymer. Its IR-SE spectra show only minor changes of the C=Oband, their magnitude being in the range of spectral noise. Simulations of (correctedand smoothed) in situ PMeOx spectra at 20 ◦C and 45 ◦C reveal an steady contributionof the weakly hydrated component and a slight broadening of the strongly hydratedcomponent, but the change is within error range (± 2%). The amount of the free, weaklyhydrated, and strongly hydrated component in the simulation resulted in 17%, 44%,and 39%, respectively. In situ VIS ellipsometry measurements on the other hand showa strong swelling of the PMeOx brush at increasing temperature. Its swelling degreechanges from 225% at 20 ◦C to 350% at 45 ◦C (see table 5.2), indicating that more waterpenetrates the brush layer. Despite this change in swelling degree, water–polymerinteractions in the PMeOx brush do not change. The additional water in the brushmerely fills the space between polymer segments, which explains the behavior of thecarbonyl band in the infrared.
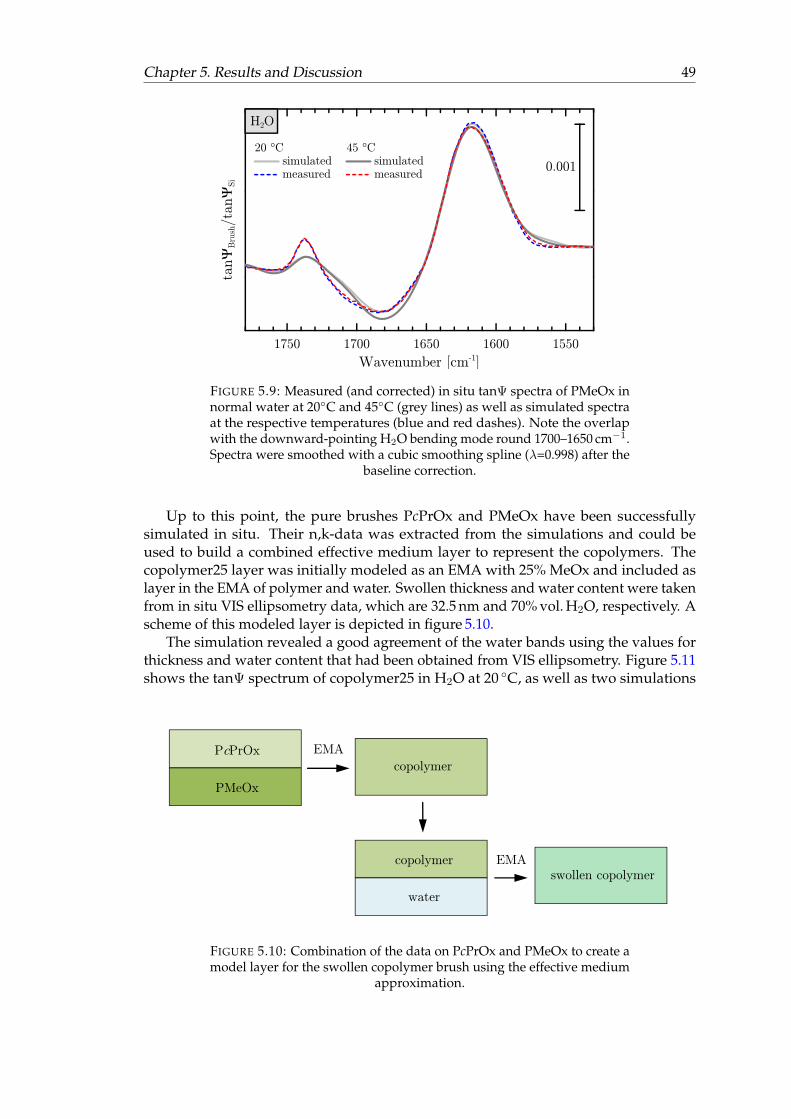
Chapter 5. Results and Discussion 49
FIGURE 5.9: Measured (and corrected) in situ tanΨ spectra of PMeOx innormal water at 20◦C and 45◦C (grey lines) as well as simulated spectraat the respective temperatures (blue and red dashes). Note the overlapwith the downward-pointing H2O bending mode round 1700–1650 cm−1.Spectra were smoothed with a cubic smoothing spline (λ=0.998) after the
baseline correction.
Up to this point, the pure brushes PcPrOx and PMeOx have been successfullysimulated in situ. Their n,k-data was extracted from the simulations and could beused to build a combined effective medium layer to represent the copolymers. Thecopolymer25 layer was initially modeled as an EMA with 25% MeOx and included aslayer in the EMA of polymer and water. Swollen thickness and water content were takenfrom in situ VIS ellipsometry data, which are 32.5 nm and 70% vol. H2O, respectively. Ascheme of this modeled layer is depicted in figure 5.10.
The simulation revealed a good agreement of the water bands using the values forthickness and water content that had been obtained from VIS ellipsometry. Figure 5.11shows the tanΨ spectrum of copolymer25 in H2O at 20 ◦C, as well as two simulations
FIGURE 5.10: Combination of the data on PcPrOx and PMeOx to create amodel layer for the swollen copolymer brush using the effective medium
approximation.
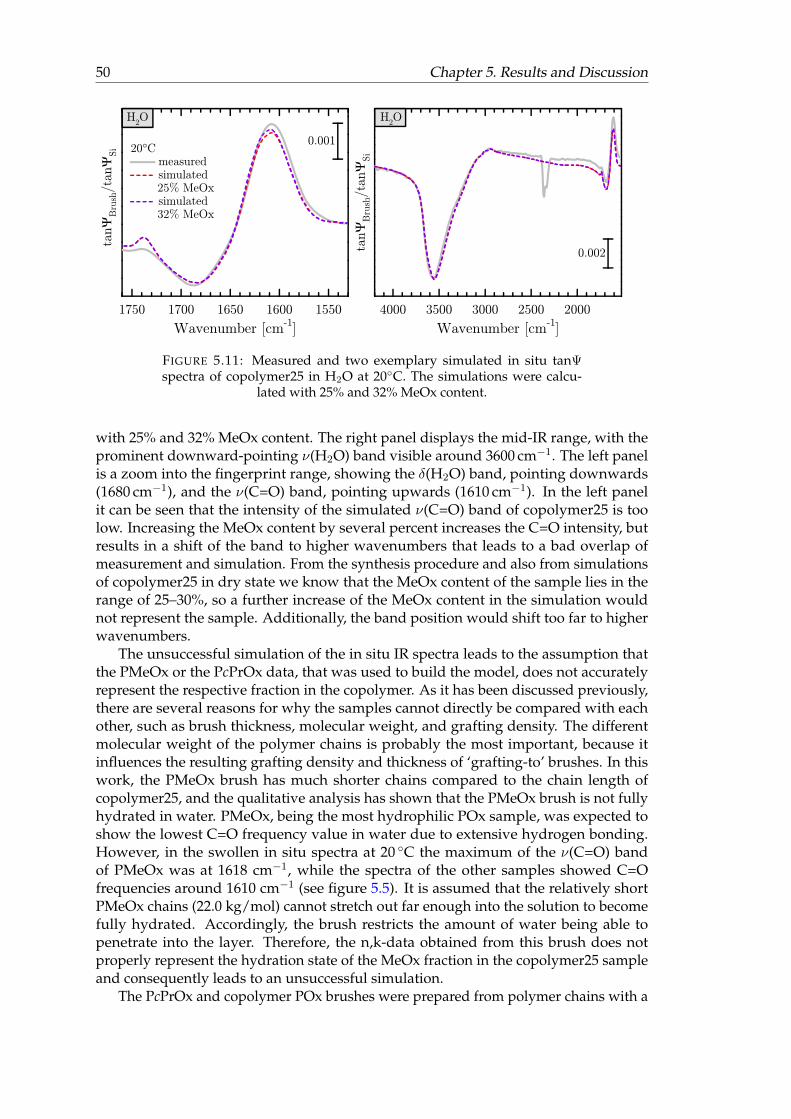
50 Chapter 5. Results and Discussion
FIGURE 5.11: Measured and two exemplary simulated in situ tanΨspectra of copolymer25 in H2O at 20◦C. The simulations were calcu-
lated with 25% and 32% MeOx content.
with 25% and 32% MeOx content. The right panel displays the mid-IR range, with theprominent downward-pointing ν(H2O) band visible around 3600 cm−1. The left panelis a zoom into the fingerprint range, showing the δ(H2O) band, pointing downwards(1680 cm−1), and the ν(C=O) band, pointing upwards (1610 cm−1). In the left panelit can be seen that the intensity of the simulated ν(C=O) band of copolymer25 is toolow. Increasing the MeOx content by several percent increases the C=O intensity, butresults in a shift of the band to higher wavenumbers that leads to a bad overlap ofmeasurement and simulation. From the synthesis procedure and also from simulationsof copolymer25 in dry state we know that the MeOx content of the sample lies in therange of 25–30%, so a further increase of the MeOx content in the simulation wouldnot represent the sample. Additionally, the band position would shift too far to higherwavenumbers.
The unsuccessful simulation of the in situ IR spectra leads to the assumption thatthe PMeOx or the PcPrOx data, that was used to build the model, does not accuratelyrepresent the respective fraction in the copolymer. As it has been discussed previously,there are several reasons for why the samples cannot directly be compared with eachother, such as brush thickness, molecular weight, and grafting density. The differentmolecular weight of the polymer chains is probably the most important, because itinfluences the resulting grafting density and thickness of ‘grafting-to’ brushes. In thiswork, the PMeOx brush has much shorter chains compared to the chain length ofcopolymer25, and the qualitative analysis has shown that the PMeOx brush is not fullyhydrated in water. PMeOx, being the most hydrophilic POx sample, was expected toshow the lowest C=O frequency value in water due to extensive hydrogen bonding.However, in the swollen in situ spectra at 20 ◦C the maximum of the ν(C=O) bandof PMeOx was at 1618 cm−1, while the spectra of the other samples showed C=Ofrequencies around 1610 cm−1 (see figure 5.5). It is assumed that the relatively shortPMeOx chains (22.0 kg/mol) cannot stretch out far enough into the solution to becomefully hydrated. Accordingly, the brush restricts the amount of water being able topenetrate into the layer. Therefore, the n,k-data obtained from this brush does notproperly represent the hydration state of the MeOx fraction in the copolymer25 sampleand consequently leads to an unsuccessful simulation.
The PcPrOx and copolymer POx brushes were prepared from polymer chains with a
Chapter 5. Results and Discussion 51
much higher molecular weight (48.4–61.3 kg/mol), resulting in a lower grafting density.The effect can be seen in figure 5.7. Both copolymer25 and PcPrOx can be assumed tobe fully hydrated, because the ν(C=O) frequency in swollen state is the same for bothbrushes. The additional water content in copolymer25 has two explanations: First, itretains more water due to its increased hydrophilicity, caused by the 25% MeOx content.Second, it has the longest polymer chains (61.3 kg/mol) and therefore the lowest graftingdensity, which leaves more space between the chains for water molecules. Since thePMeOx brush with its low molecular weight does not reach a fully hydrated state incold water, it does not serve as suitable reference to simulate the copolymer spectrumfrom pure PMeOx and PcPrOx data. To be able to do so, the pure brushes, from whichthe reference data is obtained, need to have a similar grafting density—and thereforea similar chain length—as the copolymer. If this is successful, POx can be suitablefor modeling mixed polymer brushes. For example, their ν(C=O) band is easier tounderstand than the one in PNIPAAm. With the N−H group missing in POx, thenumber of interactions of the C=O group is limited to interactions with the solvent,because no direct interactions between the polymer chains can take place. This hasbeen shown via the successful simulation of the POx samples in dry state, including thecopolymer samples (see section 5.1.1). It might even be possible to include the oscillatorsof the C=O components of the two different POx to evaluate the contribution of eachcomponent.
52 Chapter 5. Results and Discussion
5.2 Block-copolymer brushes PNIPAAm-b-PGMA
The idea behind the preparation of brushes from PNIPAAm-b-PGMA copolymers wasto combine the two grafting steps of PGMA and PNIPAAm into one step, reducingtime and effort needed for production. Brushes were produced in the group of IgorLuzinov at Clemson university [63] from two different block-copolymers via dip-coatingfrom solution, as described in chapter 4. The block lenghts were chosen to be similarfor PNIPAAm (Mn∼25 kg/mol) while the PGMA block was either much shorter orlonger. This ensured the resulting brushes to have similar PNIPAAm chain lengths forcomparison with each other. Properties of the polymer chains and the prepared brushesare given in tables 4.5 and 4.6.
Covalent attachment of the copolymers to the substrate takes place via the PGMAblocks. There also occurrs cross-linking between these blocks, while PNIPAAm remainsmobile, only being tethered to PGMA at one end. Ideally, this results in a PGMA-dominated layer close to the substrate, a PNIPAAm brush layer at the top, and aninterpenetration layer between these two. Regarding the fact that only the PGMA blockscan form covalent bonds to the silicon substrate, the part of the polymer layer directlyin contact with the substrate has to contain mainly PGMA. The thickness fractions andcomposition of interpenetration layer and top layer of the brush are unknown and it ispossible that there is a composition gradient throughout the brush layer, starting withmainly PGMA at the substrate and ending with mainly PNIPAAm at the surface. AsAR-XPS measurements of the top 2–10 nm of the brushes have shown (see section 4.2.2),even the topmost few nanometers contain PGMA, with the PGMA content increasingat increasing depth. This leads to a reduced mobility of the PNIPAAm chains, becausethey are partly trapped within the cross-linked PGMA network. The studies in thiswork aimed at resolving the structural nature of the copolymer brushes as well as thePNIPAAm chain mobility—an indicator for the switching abilities—and to compare theresponsive behavior to traditional PNIPAAm brushes.
5.2.1 Characterization of the dry brushes
Previous studies of the PNIPAAm-b-PGMA brushes in dry state were perfomed atClemson University by Michael Seeber to determine brush composition and surfaceproperties [63]. The results are summarized in section 4.2.2. In this section the characte-rization of the brushes in dry state will be described, which has been perfomed withVIS and IR ellipsometry as well as with AFM.
Thickness and composition
VIS ellipsometry has been applied to determine brush thickness on the Si wedges, their‘dry state’ referring to the brushes at ambient conditions of ∼ 25 ◦C and ∼ 30% relativehumidity. On Si wafers the brush thickness was determined from AFM scans at the stepedge of a scratch that was made in the brush layer. These scans were performed in an Arpurged atmosphere at 65 ◦C to remove any residual water within the brush layer. Thepurging did not result in a fully dried environment due to the large chamber volume.However, humidity was decreased to about 20% in the bulk volume of the chamberand even lower in the immediate surrounding of the sample, because the Ar gas flowwas directed directly over the sample surface. Thickness results are listed in table 4.6in section 4.2.2 and show that the values determined with VIS ellipsometry are several
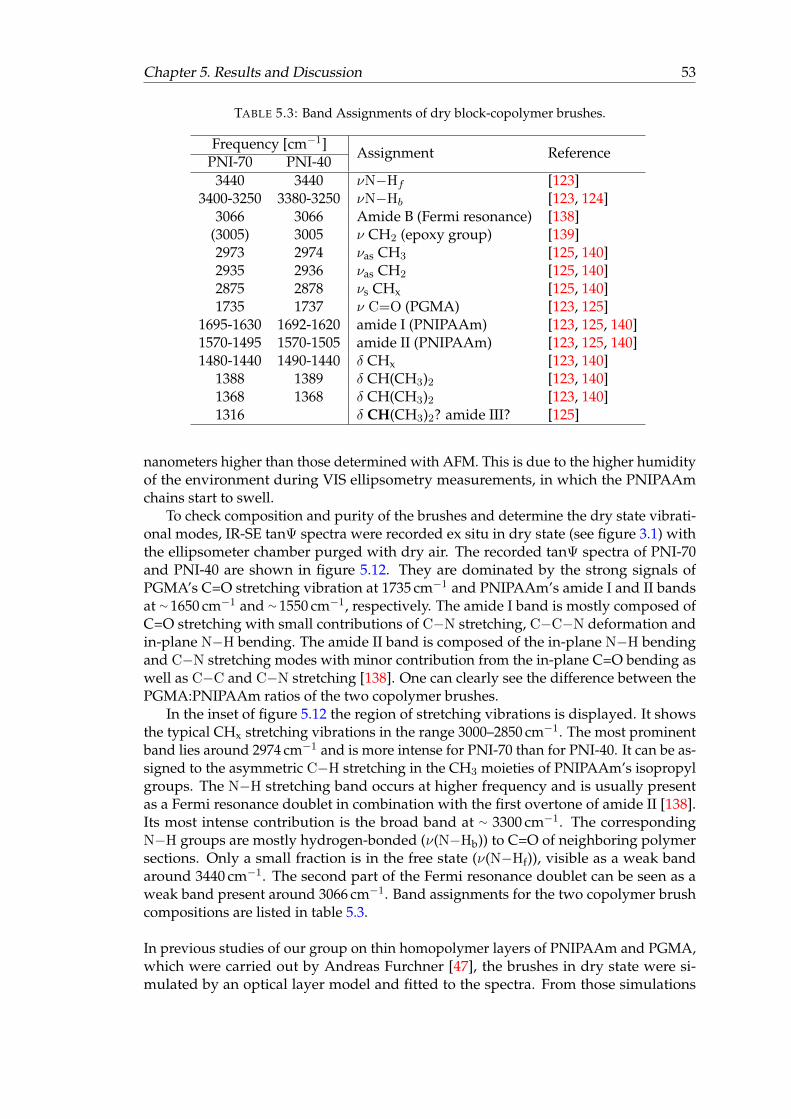
Chapter 5. Results and Discussion 53
TABLE 5.3: Band Assignments of dry block-copolymer brushes.
Frequency [cm−1]Assignment Reference
PNI-70 PNI-403440 3440 νN−Hf [123]
3400-3250 3380-3250 νN−Hb [123, 124]3066 3066 Amide B (Fermi resonance) [138]
(3005) 3005 ν CH2 (epoxy group) [139]2973 2974 νas CH3 [125, 140]2935 2936 νas CH2 [125, 140]2875 2878 νs CHx [125, 140]1735 1737 ν C=O (PGMA) [123, 125]
1695-1630 1692-1620 amide I (PNIPAAm) [123, 125, 140]1570-1495 1570-1505 amide II (PNIPAAm) [123, 125, 140]1480-1440 1490-1440 δ CHx [123, 140]
1388 1389 δ CH(CH3)2 [123, 140]1368 1368 δ CH(CH3)2 [123, 140]1316 δ CH(CH3)2? amide III? [125]
nanometers higher than those determined with AFM. This is due to the higher humidityof the environment during VIS ellipsometry measurements, in which the PNIPAAmchains start to swell.
To check composition and purity of the brushes and determine the dry state vibrati-onal modes, IR-SE tanΨ spectra were recorded ex situ in dry state (see figure 3.1) withthe ellipsometer chamber purged with dry air. The recorded tanΨ spectra of PNI-70and PNI-40 are shown in figure 5.12. They are dominated by the strong signals ofPGMA’s C=O stretching vibration at 1735 cm−1 and PNIPAAm’s amide I and II bandsat ∼ 1650 cm−1 and ∼ 1550 cm−1, respectively. The amide I band is mostly composed ofC=O stretching with small contributions of C−N stretching, C−C−N deformation andin-plane N−H bending. The amide II band is composed of the in-plane N−H bendingand C−N stretching modes with minor contribution from the in-plane C=O bending aswell as C−C and C−N stretching [138]. One can clearly see the difference between thePGMA:PNIPAAm ratios of the two copolymer brushes.
In the inset of figure 5.12 the region of stretching vibrations is displayed. It showsthe typical CHx stretching vibrations in the range 3000–2850 cm−1. The most prominentband lies around 2974 cm−1 and is more intense for PNI-70 than for PNI-40. It can be as-signed to the asymmetric C−H stretching in the CH3 moieties of PNIPAAm’s isopropylgroups. The N−H stretching band occurs at higher frequency and is usually presentas a Fermi resonance doublet in combination with the first overtone of amide II [138].Its most intense contribution is the broad band at ∼ 3300 cm−1. The correspondingN−H groups are mostly hydrogen-bonded (ν(N−Hb)) to C=O of neighboring polymersections. Only a small fraction is in the free state (ν(N−Hf)), visible as a weak bandaround 3440 cm−1. The second part of the Fermi resonance doublet can be seen as aweak band present around 3066 cm−1. Band assignments for the two copolymer brushcompositions are listed in table 5.3.
In previous studies of our group on thin homopolymer layers of PNIPAAm and PGMA,which were carried out by Andreas Furchner [47], the brushes in dry state were si-mulated by an optical layer model and fitted to the spectra. From those simulations
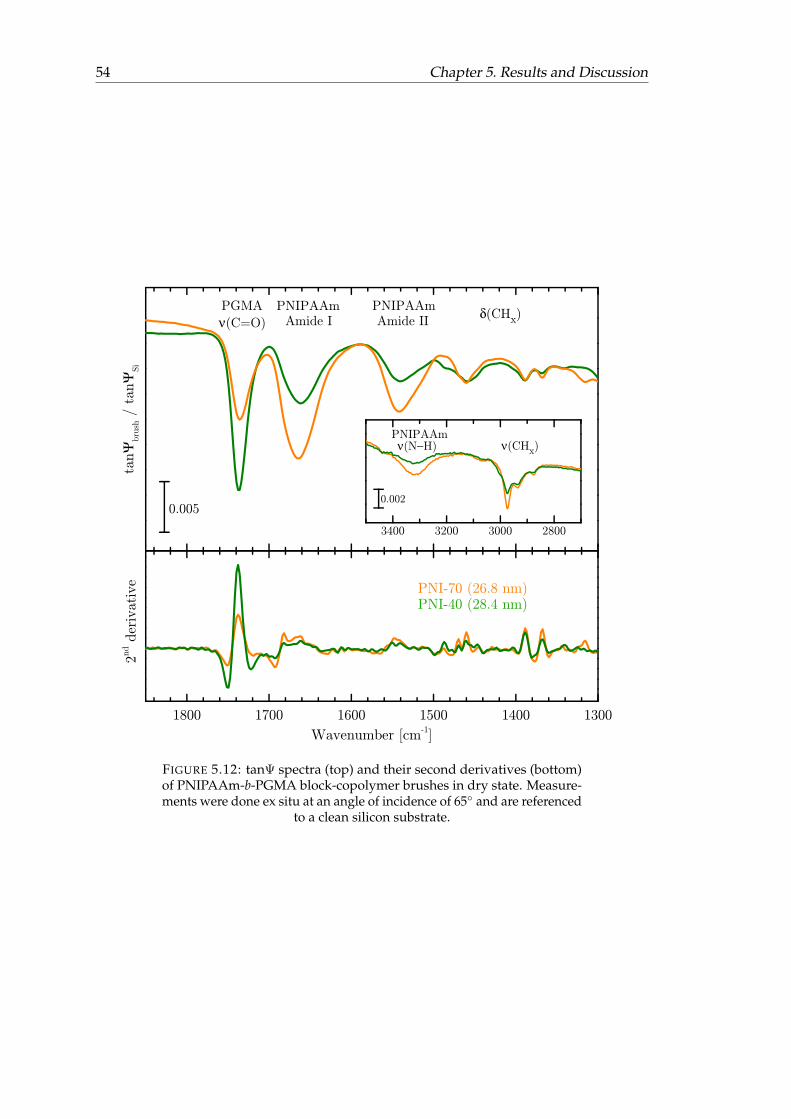
54 Chapter 5. Results and Discussion
FIGURE 5.12: tanΨ spectra (top) and their second derivatives (bottom)of PNIPAAm-b-PGMA block-copolymer brushes in dry state. Measure-ments were done ex situ at an angle of incidence of 65◦ and are referenced
to a clean silicon substrate.
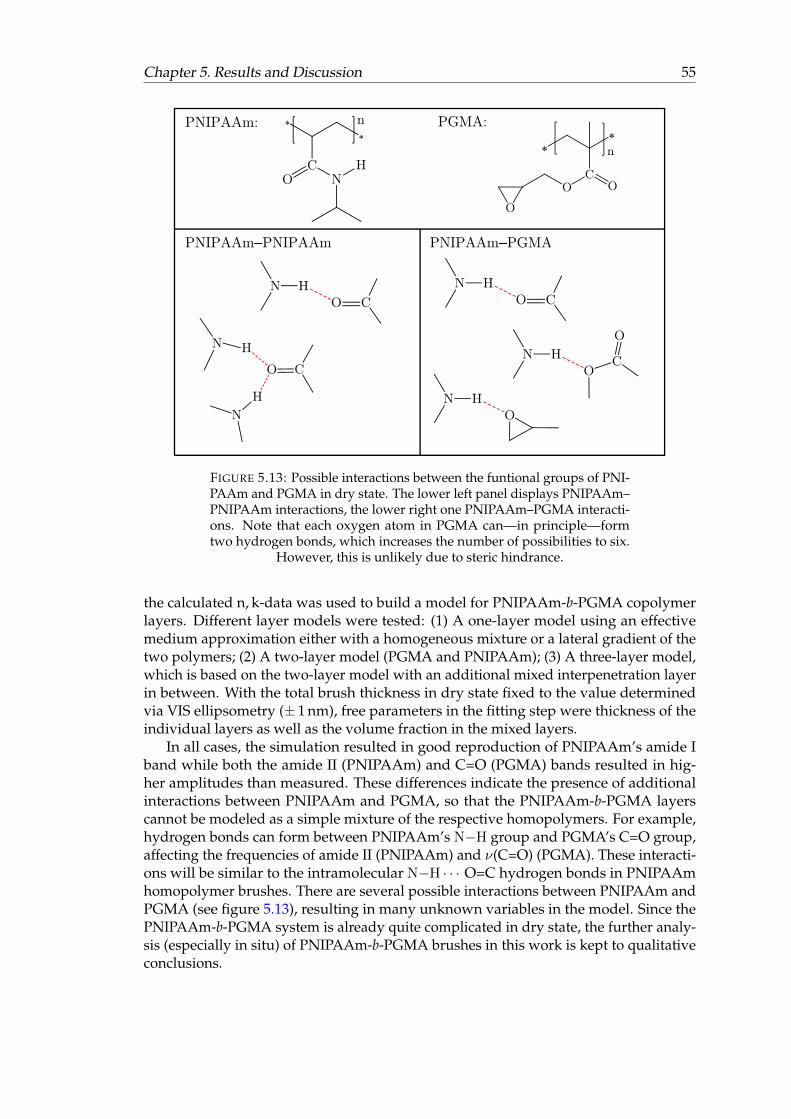
Chapter 5. Results and Discussion 55
FIGURE 5.13: Possible interactions between the funtional groups of PNI-PAAm and PGMA in dry state. The lower left panel displays PNIPAAm–PNIPAAm interactions, the lower right one PNIPAAm–PGMA interacti-ons. Note that each oxygen atom in PGMA can—in principle—formtwo hydrogen bonds, which increases the number of possibilities to six.
However, this is unlikely due to steric hindrance.
the calculated n, k-data was used to build a model for PNIPAAm-b-PGMA copolymerlayers. Different layer models were tested: (1) A one-layer model using an effectivemedium approximation either with a homogeneous mixture or a lateral gradient of thetwo polymers; (2) A two-layer model (PGMA and PNIPAAm); (3) A three-layer model,which is based on the two-layer model with an additional mixed interpenetration layerin between. With the total brush thickness in dry state fixed to the value determinedvia VIS ellipsometry (± 1 nm), free parameters in the fitting step were thickness of theindividual layers as well as the volume fraction in the mixed layers.
In all cases, the simulation resulted in good reproduction of PNIPAAm’s amide Iband while both the amide II (PNIPAAm) and C=O (PGMA) bands resulted in hig-her amplitudes than measured. These differences indicate the presence of additionalinteractions between PNIPAAm and PGMA, so that the PNIPAAm-b-PGMA layerscannot be modeled as a simple mixture of the respective homopolymers. For example,hydrogen bonds can form between PNIPAAm’s N−H group and PGMA’s C=O group,affecting the frequencies of amide II (PNIPAAm) and ν(C=O) (PGMA). These interacti-ons will be similar to the intramolecular N−H · · · O=C hydrogen bonds in PNIPAAmhomopolymer brushes. There are several possible interactions between PNIPAAm andPGMA (see figure 5.13), resulting in many unknown variables in the model. Since thePNIPAAm-b-PGMA system is already quite complicated in dry state, the further analy-sis (especially in situ) of PNIPAAm-b-PGMA brushes in this work is kept to qualitativeconclusions.
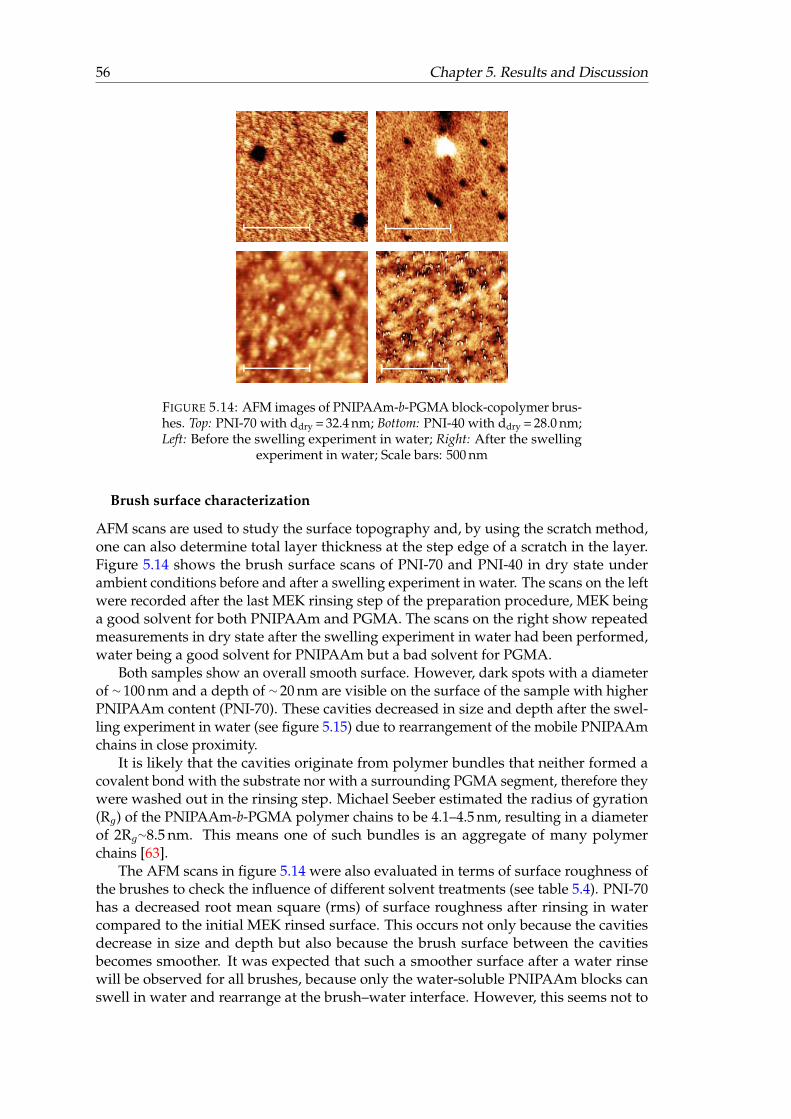
56 Chapter 5. Results and Discussion
FIGURE 5.14: AFM images of PNIPAAm-b-PGMA block-copolymer brus-hes. Top: PNI-70 with ddry = 32.4 nm; Bottom: PNI-40 with ddry = 28.0 nm;Left: Before the swelling experiment in water; Right: After the swelling
experiment in water; Scale bars: 500 nm
Brush surface characterization
AFM scans are used to study the surface topography and, by using the scratch method,one can also determine total layer thickness at the step edge of a scratch in the layer.Figure 5.14 shows the brush surface scans of PNI-70 and PNI-40 in dry state underambient conditions before and after a swelling experiment in water. The scans on the leftwere recorded after the last MEK rinsing step of the preparation procedure, MEK beinga good solvent for both PNIPAAm and PGMA. The scans on the right show repeatedmeasurements in dry state after the swelling experiment in water had been performed,water being a good solvent for PNIPAAm but a bad solvent for PGMA.
Both samples show an overall smooth surface. However, dark spots with a diameterof ∼ 100 nm and a depth of ∼ 20 nm are visible on the surface of the sample with higherPNIPAAm content (PNI-70). These cavities decreased in size and depth after the swel-ling experiment in water (see figure 5.15) due to rearrangement of the mobile PNIPAAmchains in close proximity.
It is likely that the cavities originate from polymer bundles that neither formed acovalent bond with the substrate nor with a surrounding PGMA segment, therefore theywere washed out in the rinsing step. Michael Seeber estimated the radius of gyration(Rg) of the PNIPAAm-b-PGMA polymer chains to be 4.1–4.5 nm, resulting in a diameterof 2Rg∼8.5 nm. This means one of such bundles is an aggregate of many polymerchains [63].
The AFM scans in figure 5.14 were also evaluated in terms of surface roughness ofthe brushes to check the influence of different solvent treatments (see table 5.4). PNI-70has a decreased root mean square (rms) of surface roughness after rinsing in watercompared to the initial MEK rinsed surface. This occurs not only because the cavitiesdecrease in size and depth but also because the brush surface between the cavitiesbecomes smoother. It was expected that such a smoother surface after a water rinsewill be observed for all brushes, because only the water-soluble PNIPAAm blocks canswell in water and rearrange at the brush–water interface. However, this seems not to
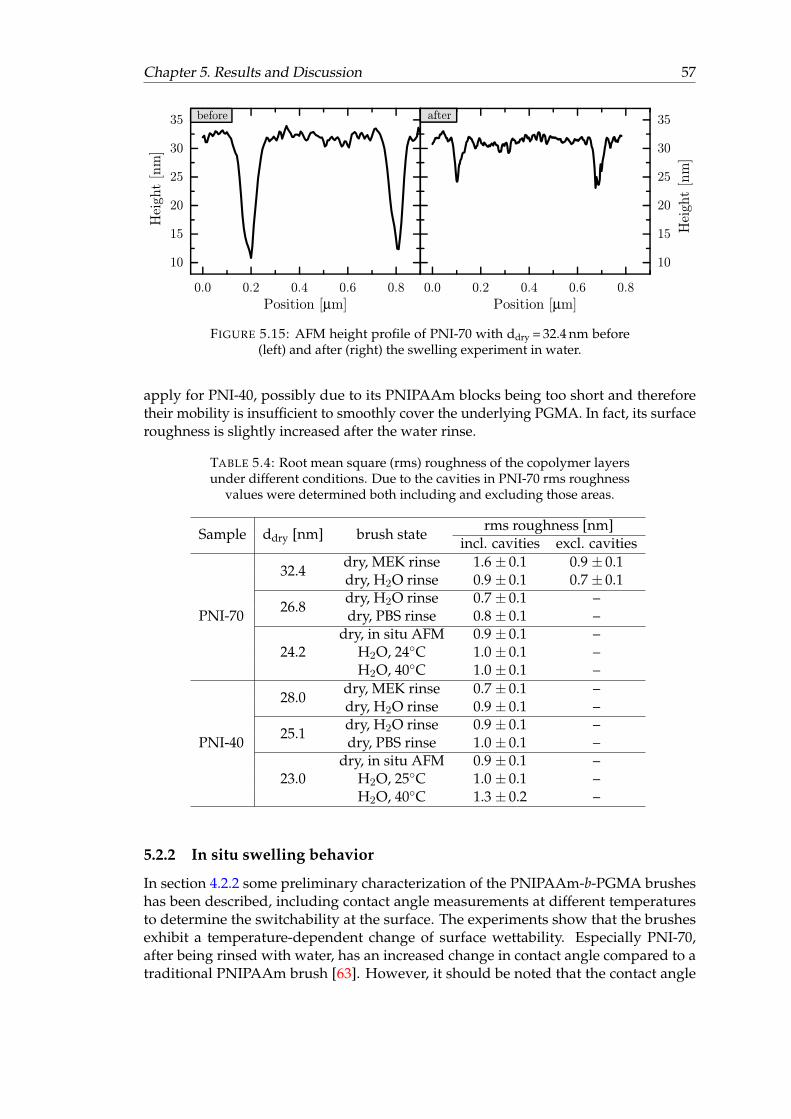
Chapter 5. Results and Discussion 57
FIGURE 5.15: AFM height profile of PNI-70 with ddry = 32.4 nm before(left) and after (right) the swelling experiment in water.
apply for PNI-40, possibly due to its PNIPAAm blocks being too short and thereforetheir mobility is insufficient to smoothly cover the underlying PGMA. In fact, its surfaceroughness is slightly increased after the water rinse.
TABLE 5.4: Root mean square (rms) roughness of the copolymer layersunder different conditions. Due to the cavities in PNI-70 rms roughness
values were determined both including and excluding those areas.
Sample ddry [nm] brush staterms roughness [nm]
incl. cavities excl. cavities
PNI-70
32.4dry, MEK rinse 1.6 ± 0.1 0.9 ± 0.1dry, H2O rinse 0.9 ± 0.1 0.7 ± 0.1
26.8dry, H2O rinse 0.7 ± 0.1 –dry, PBS rinse 0.8 ± 0.1 –
24.2dry, in situ AFM 0.9 ± 0.1 –
H2O, 24◦C 1.0 ± 0.1 –H2O, 40◦C 1.0 ± 0.1 –
PNI-40
28.0dry, MEK rinse 0.7 ± 0.1 –dry, H2O rinse 0.9 ± 0.1 –
25.1dry, H2O rinse 0.9 ± 0.1 –dry, PBS rinse 1.0 ± 0.1 –
23.0dry, in situ AFM 0.9 ± 0.1 –
H2O, 25◦C 1.0 ± 0.1 –H2O, 40◦C 1.3 ± 0.2 –
5.2.2 In situ swelling behavior
In section 4.2.2 some preliminary characterization of the PNIPAAm-b-PGMA brusheshas been described, including contact angle measurements at different temperaturesto determine the switchability at the surface. The experiments show that the brushesexhibit a temperature-dependent change of surface wettability. Especially PNI-70,after being rinsed with water, has an increased change in contact angle compared to atraditional PNIPAAm brush [63]. However, it should be noted that the contact angle
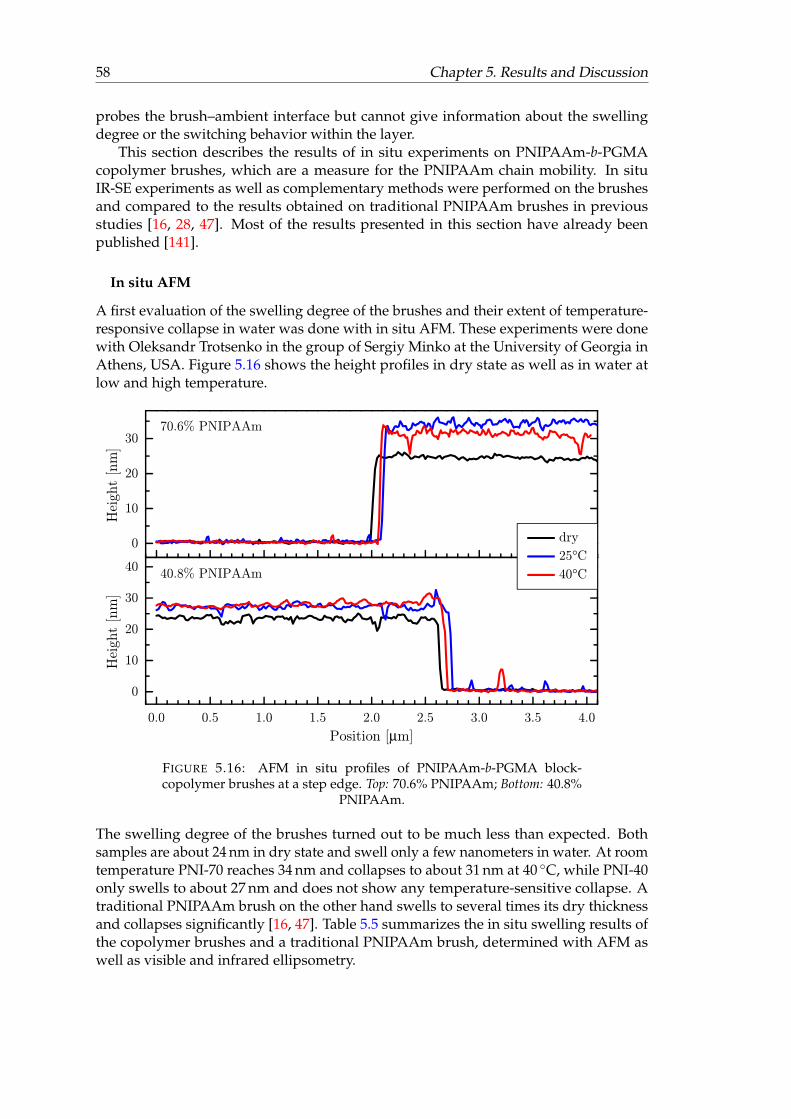
58 Chapter 5. Results and Discussion
probes the brush–ambient interface but cannot give information about the swellingdegree or the switching behavior within the layer.
This section describes the results of in situ experiments on PNIPAAm-b-PGMAcopolymer brushes, which are a measure for the PNIPAAm chain mobility. In situIR-SE experiments as well as complementary methods were performed on the brushesand compared to the results obtained on traditional PNIPAAm brushes in previousstudies [16, 28, 47]. Most of the results presented in this section have already beenpublished [141].
In situ AFM
A first evaluation of the swelling degree of the brushes and their extent of temperature-responsive collapse in water was done with in situ AFM. These experiments were donewith Oleksandr Trotsenko in the group of Sergiy Minko at the University of Georgia inAthens, USA. Figure 5.16 shows the height profiles in dry state as well as in water atlow and high temperature.
FIGURE 5.16: AFM in situ profiles of PNIPAAm-b-PGMA block-copolymer brushes at a step edge. Top: 70.6% PNIPAAm; Bottom: 40.8%
PNIPAAm.
The swelling degree of the brushes turned out to be much less than expected. Bothsamples are about 24 nm in dry state and swell only a few nanometers in water. At roomtemperature PNI-70 reaches 34 nm and collapses to about 31 nm at 40 ◦C, while PNI-40only swells to about 27 nm and does not show any temperature-sensitive collapse. Atraditional PNIPAAm brush on the other hand swells to several times its dry thicknessand collapses significantly [16, 47]. Table 5.5 summarizes the in situ swelling results ofthe copolymer brushes and a traditional PNIPAAm brush, determined with AFM aswell as visible and infrared ellipsometry.
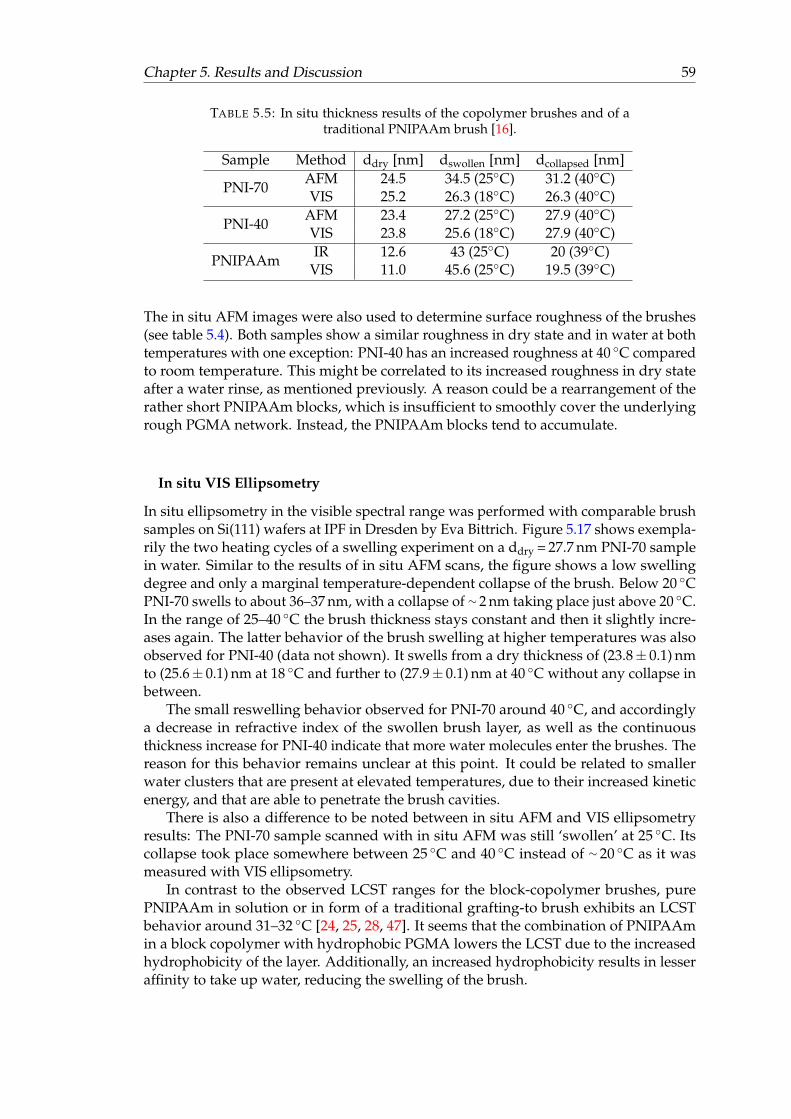
Chapter 5. Results and Discussion 59
TABLE 5.5: In situ thickness results of the copolymer brushes and of atraditional PNIPAAm brush [16].
Sample Method ddry [nm] dswollen [nm] dcollapsed [nm]
PNI-70AFM 24.5 34.5 (25◦C) 31.2 (40◦C)VIS 25.2 26.3 (18◦C) 26.3 (40◦C)
PNI-40AFM 23.4 27.2 (25◦C) 27.9 (40◦C)VIS 23.8 25.6 (18◦C) 27.9 (40◦C)
PNIPAAmIR 12.6 43 (25◦C) 20 (39◦C)
VIS 11.0 45.6 (25◦C) 19.5 (39◦C)
The in situ AFM images were also used to determine surface roughness of the brushes(see table 5.4). Both samples show a similar roughness in dry state and in water at bothtemperatures with one exception: PNI-40 has an increased roughness at 40 ◦C comparedto room temperature. This might be correlated to its increased roughness in dry stateafter a water rinse, as mentioned previously. A reason could be a rearrangement of therather short PNIPAAm blocks, which is insufficient to smoothly cover the underlyingrough PGMA network. Instead, the PNIPAAm blocks tend to accumulate.
In situ VIS Ellipsometry
In situ ellipsometry in the visible spectral range was performed with comparable brushsamples on Si(111) wafers at IPF in Dresden by Eva Bittrich. Figure 5.17 shows exempla-rily the two heating cycles of a swelling experiment on a ddry = 27.7 nm PNI-70 samplein water. Similar to the results of in situ AFM scans, the figure shows a low swellingdegree and only a marginal temperature-dependent collapse of the brush. Below 20 ◦CPNI-70 swells to about 36–37 nm, with a collapse of ∼ 2 nm taking place just above 20 ◦C.In the range of 25–40 ◦C the brush thickness stays constant and then it slightly incre-ases again. The latter behavior of the brush swelling at higher temperatures was alsoobserved for PNI-40 (data not shown). It swells from a dry thickness of (23.8± 0.1) nmto (25.6± 0.1) nm at 18 ◦C and further to (27.9± 0.1) nm at 40 ◦C without any collapse inbetween.
The small reswelling behavior observed for PNI-70 around 40 ◦C, and accordinglya decrease in refractive index of the swollen brush layer, as well as the continuousthickness increase for PNI-40 indicate that more water molecules enter the brushes. Thereason for this behavior remains unclear at this point. It could be related to smallerwater clusters that are present at elevated temperatures, due to their increased kineticenergy, and that are able to penetrate the brush cavities.
There is also a difference to be noted between in situ AFM and VIS ellipsometryresults: The PNI-70 sample scanned with in situ AFM was still ‘swollen’ at 25 ◦C. Itscollapse took place somewhere between 25 ◦C and 40 ◦C instead of ∼ 20 ◦C as it wasmeasured with VIS ellipsometry.
In contrast to the observed LCST ranges for the block-copolymer brushes, purePNIPAAm in solution or in form of a traditional grafting-to brush exhibits an LCSTbehavior around 31–32 ◦C [24, 25, 28, 47]. It seems that the combination of PNIPAAmin a block copolymer with hydrophobic PGMA lowers the LCST due to the increasedhydrophobicity of the layer. Additionally, an increased hydrophobicity results in lesseraffinity to take up water, reducing the swelling of the brush.
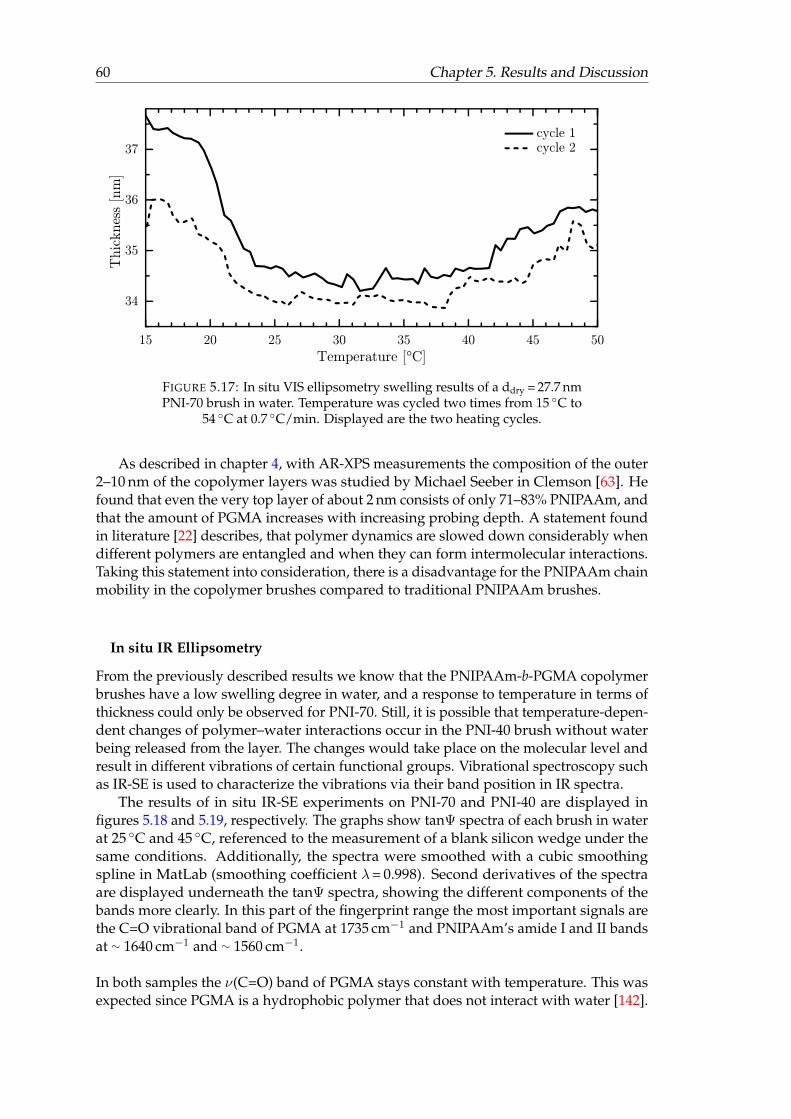
60 Chapter 5. Results and Discussion
FIGURE 5.17: In situ VIS ellipsometry swelling results of a ddry = 27.7 nmPNI-70 brush in water. Temperature was cycled two times from 15 ◦C to
54 ◦C at 0.7 ◦C/min. Displayed are the two heating cycles.
As described in chapter 4, with AR-XPS measurements the composition of the outer2–10 nm of the copolymer layers was studied by Michael Seeber in Clemson [63]. Hefound that even the very top layer of about 2 nm consists of only 71–83% PNIPAAm, andthat the amount of PGMA increases with increasing probing depth. A statement foundin literature [22] describes, that polymer dynamics are slowed down considerably whendifferent polymers are entangled and when they can form intermolecular interactions.Taking this statement into consideration, there is a disadvantage for the PNIPAAm chainmobility in the copolymer brushes compared to traditional PNIPAAm brushes.
In situ IR Ellipsometry
From the previously described results we know that the PNIPAAm-b-PGMA copolymerbrushes have a low swelling degree in water, and a response to temperature in terms ofthickness could only be observed for PNI-70. Still, it is possible that temperature-depen-dent changes of polymer–water interactions occur in the PNI-40 brush without waterbeing released from the layer. The changes would take place on the molecular level andresult in different vibrations of certain functional groups. Vibrational spectroscopy suchas IR-SE is used to characterize the vibrations via their band position in IR spectra.
The results of in situ IR-SE experiments on PNI-70 and PNI-40 are displayed infigures 5.18 and 5.19, respectively. The graphs show tanΨ spectra of each brush in waterat 25 ◦C and 45 ◦C, referenced to the measurement of a blank silicon wedge under thesame conditions. Additionally, the spectra were smoothed with a cubic smoothingspline in MatLab (smoothing coefficient λ= 0.998). Second derivatives of the spectraare displayed underneath the tanΨ spectra, showing the different components of thebands more clearly. In this part of the fingerprint range the most important signals arethe C=O vibrational band of PGMA at 1735 cm−1 and PNIPAAm’s amide I and II bandsat ∼ 1640 cm−1 and ∼ 1560 cm−1.
In both samples the ν(C=O) band of PGMA stays constant with temperature. This wasexpected since PGMA is a hydrophobic polymer that does not interact with water [142].
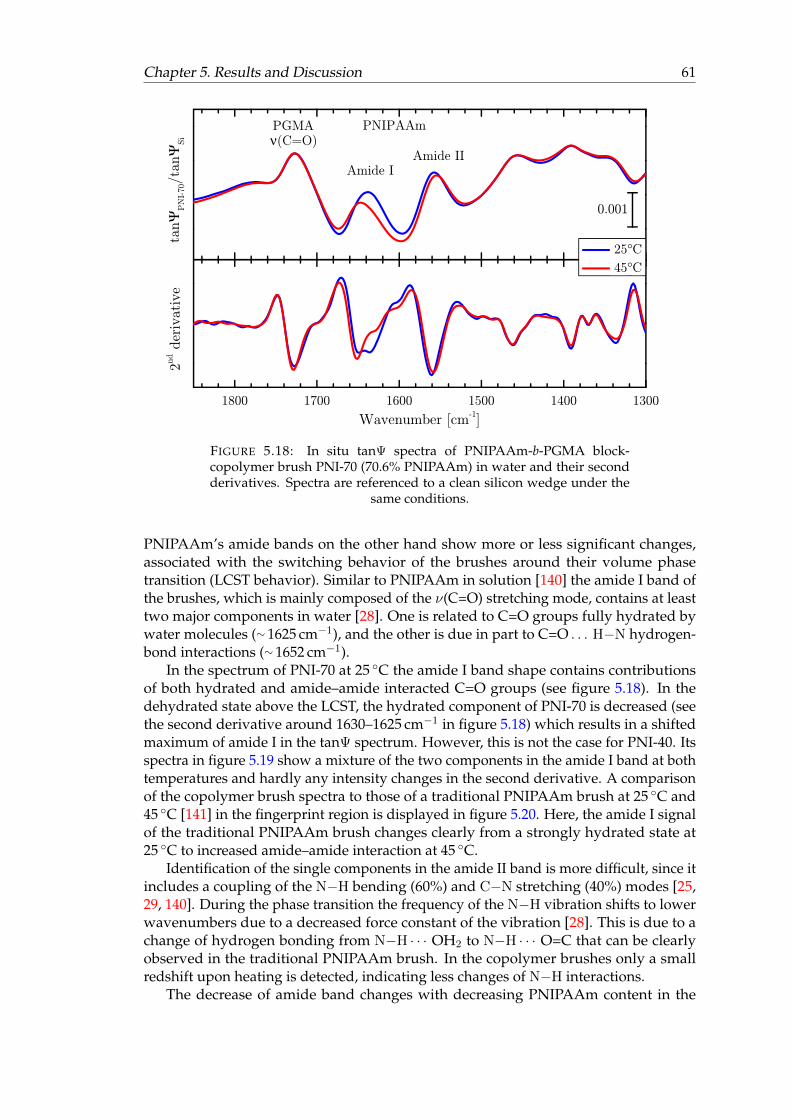
Chapter 5. Results and Discussion 61
FIGURE 5.18: In situ tanΨ spectra of PNIPAAm-b-PGMA block-copolymer brush PNI-70 (70.6% PNIPAAm) in water and their secondderivatives. Spectra are referenced to a clean silicon wedge under the
same conditions.
PNIPAAm’s amide bands on the other hand show more or less significant changes,associated with the switching behavior of the brushes around their volume phasetransition (LCST behavior). Similar to PNIPAAm in solution [140] the amide I band ofthe brushes, which is mainly composed of the ν(C=O) stretching mode, contains at leasttwo major components in water [28]. One is related to C=O groups fully hydrated bywater molecules (∼ 1625 cm−1), and the other is due in part to C=O . . . H−N hydrogen-bond interactions (∼ 1652 cm−1).
In the spectrum of PNI-70 at 25 ◦C the amide I band shape contains contributionsof both hydrated and amide–amide interacted C=O groups (see figure 5.18). In thedehydrated state above the LCST, the hydrated component of PNI-70 is decreased (seethe second derivative around 1630–1625 cm−1 in figure 5.18) which results in a shiftedmaximum of amide I in the tanΨ spectrum. However, this is not the case for PNI-40. Itsspectra in figure 5.19 show a mixture of the two components in the amide I band at bothtemperatures and hardly any intensity changes in the second derivative. A comparisonof the copolymer brush spectra to those of a traditional PNIPAAm brush at 25 ◦C and45 ◦C [141] in the fingerprint region is displayed in figure 5.20. Here, the amide I signalof the traditional PNIPAAm brush changes clearly from a strongly hydrated state at25 ◦C to increased amide–amide interaction at 45 ◦C.
Identification of the single components in the amide II band is more difficult, since itincludes a coupling of the N−H bending (60%) and C−N stretching (40%) modes [25,29, 140]. During the phase transition the frequency of the N−H vibration shifts to lowerwavenumbers due to a decreased force constant of the vibration [28]. This is due to achange of hydrogen bonding from N−H · · · OH2 to N−H · · · O=C that can be clearlyobserved in the traditional PNIPAAm brush. In the copolymer brushes only a smallredshift upon heating is detected, indicating less changes of N−H interactions.
The decrease of amide band changes with decreasing PNIPAAm content in the
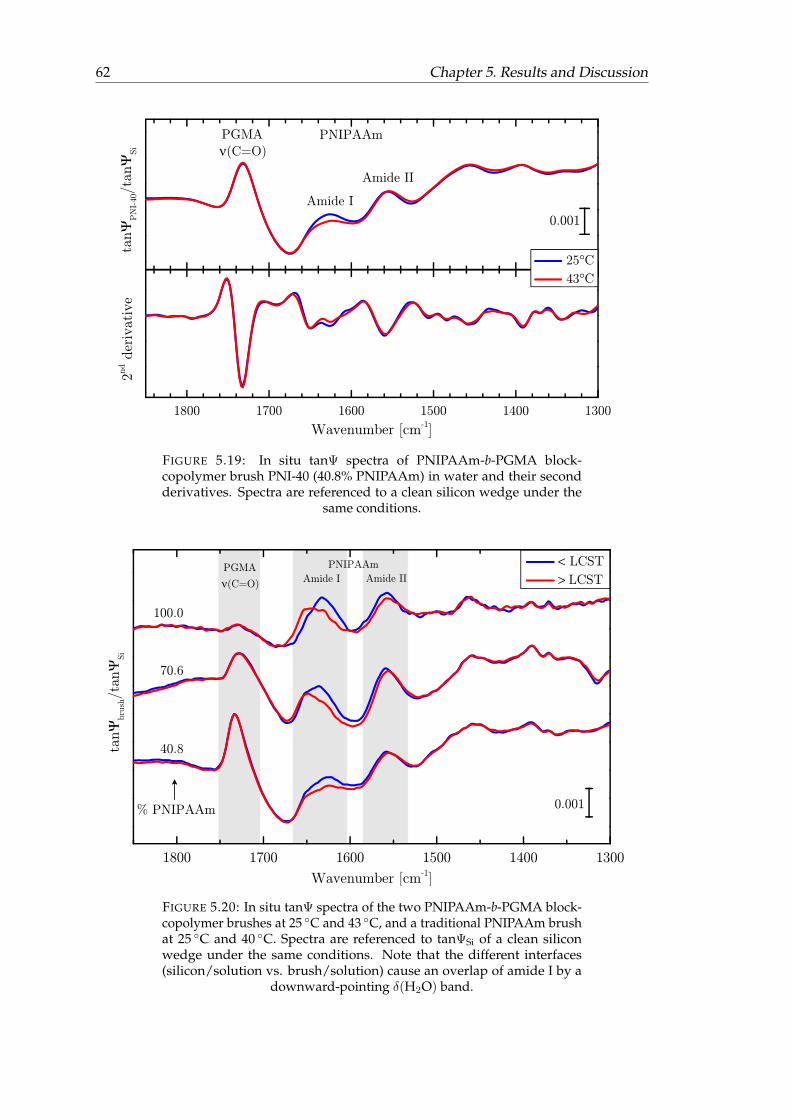
62 Chapter 5. Results and Discussion
FIGURE 5.19: In situ tanΨ spectra of PNIPAAm-b-PGMA block-copolymer brush PNI-40 (40.8% PNIPAAm) in water and their secondderivatives. Spectra are referenced to a clean silicon wedge under the
same conditions.
FIGURE 5.20: In situ tanΨ spectra of the two PNIPAAm-b-PGMA block-copolymer brushes at 25 ◦C and 43 ◦C, and a traditional PNIPAAm brushat 25 ◦C and 40 ◦C. Spectra are referenced to tanΨSi of a clean siliconwedge under the same conditions. Note that the different interfaces(silicon/solution vs. brush/solution) cause an overlap of amide I by a
downward-pointing δ(H2O) band.
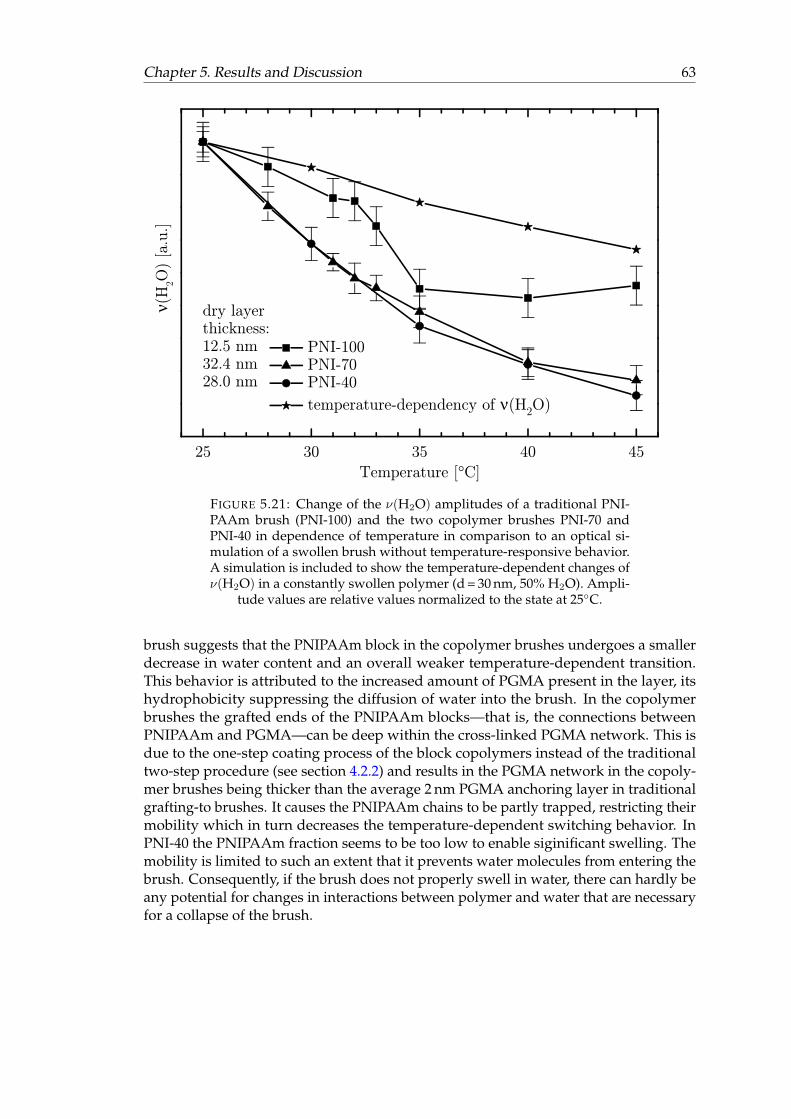
Chapter 5. Results and Discussion 63
FIGURE 5.21: Change of the ν(H2O) amplitudes of a traditional PNI-PAAm brush (PNI-100) and the two copolymer brushes PNI-70 andPNI-40 in dependence of temperature in comparison to an optical si-mulation of a swollen brush without temperature-responsive behavior.A simulation is included to show the temperature-dependent changes ofν(H2O) in a constantly swollen polymer (d = 30 nm, 50% H2O). Ampli-
tude values are relative values normalized to the state at 25◦C.
brush suggests that the PNIPAAm block in the copolymer brushes undergoes a smallerdecrease in water content and an overall weaker temperature-dependent transition.This behavior is attributed to the increased amount of PGMA present in the layer, itshydrophobicity suppressing the diffusion of water into the brush. In the copolymerbrushes the grafted ends of the PNIPAAm blocks—that is, the connections betweenPNIPAAm and PGMA—can be deep within the cross-linked PGMA network. This isdue to the one-step coating process of the block copolymers instead of the traditionaltwo-step procedure (see section 4.2.2) and results in the PGMA network in the copoly-mer brushes being thicker than the average 2 nm PGMA anchoring layer in traditionalgrafting-to brushes. It causes the PNIPAAm chains to be partly trapped, restricting theirmobility which in turn decreases the temperature-dependent switching behavior. InPNI-40 the PNIPAAm fraction seems to be too low to enable siginificant swelling. Themobility is limited to such an extent that it prevents water molecules from entering thebrush. Consequently, if the brush does not properly swell in water, there can hardly beany potential for changes in interactions between polymer and water that are necessaryfor a collapse of the brush.
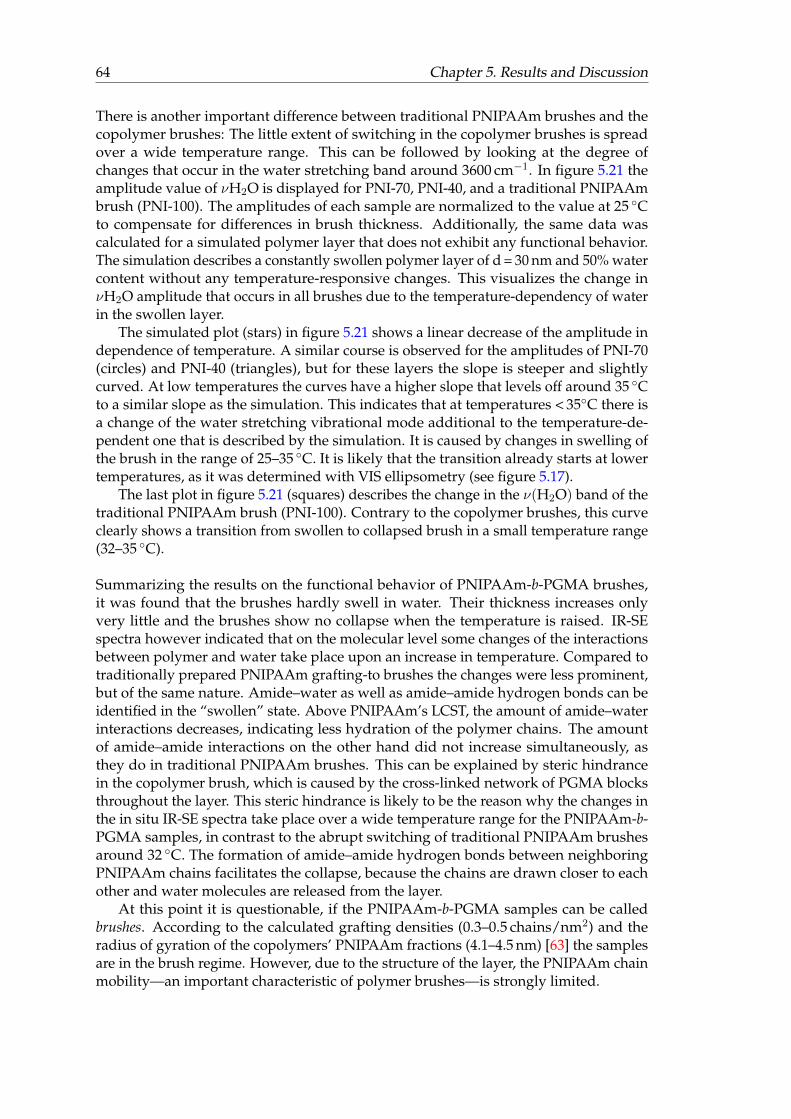
64 Chapter 5. Results and Discussion
There is another important difference between traditional PNIPAAm brushes and thecopolymer brushes: The little extent of switching in the copolymer brushes is spreadover a wide temperature range. This can be followed by looking at the degree ofchanges that occur in the water stretching band around 3600 cm−1. In figure 5.21 theamplitude value of νH2O is displayed for PNI-70, PNI-40, and a traditional PNIPAAmbrush (PNI-100). The amplitudes of each sample are normalized to the value at 25 ◦Cto compensate for differences in brush thickness. Additionally, the same data wascalculated for a simulated polymer layer that does not exhibit any functional behavior.The simulation describes a constantly swollen polymer layer of d = 30 nm and 50% watercontent without any temperature-responsive changes. This visualizes the change inνH2O amplitude that occurs in all brushes due to the temperature-dependency of waterin the swollen layer.
The simulated plot (stars) in figure 5.21 shows a linear decrease of the amplitude independence of temperature. A similar course is observed for the amplitudes of PNI-70(circles) and PNI-40 (triangles), but for these layers the slope is steeper and slightlycurved. At low temperatures the curves have a higher slope that levels off around 35 ◦Cto a similar slope as the simulation. This indicates that at temperatures < 35◦C there isa change of the water stretching vibrational mode additional to the temperature-de-pendent one that is described by the simulation. It is caused by changes in swelling ofthe brush in the range of 25–35 ◦C. It is likely that the transition already starts at lowertemperatures, as it was determined with VIS ellipsometry (see figure 5.17).
The last plot in figure 5.21 (squares) describes the change in the ν(H2O) band of thetraditional PNIPAAm brush (PNI-100). Contrary to the copolymer brushes, this curveclearly shows a transition from swollen to collapsed brush in a small temperature range(32–35 ◦C).
Summarizing the results on the functional behavior of PNIPAAm-b-PGMA brushes,it was found that the brushes hardly swell in water. Their thickness increases onlyvery little and the brushes show no collapse when the temperature is raised. IR-SEspectra however indicated that on the molecular level some changes of the interactionsbetween polymer and water take place upon an increase in temperature. Compared totraditionally prepared PNIPAAm grafting-to brushes the changes were less prominent,but of the same nature. Amide–water as well as amide–amide hydrogen bonds can beidentified in the “swollen” state. Above PNIPAAm’s LCST, the amount of amide–waterinteractions decreases, indicating less hydration of the polymer chains. The amountof amide–amide interactions on the other hand did not increase simultaneously, asthey do in traditional PNIPAAm brushes. This can be explained by steric hindrancein the copolymer brush, which is caused by the cross-linked network of PGMA blocksthroughout the layer. This steric hindrance is likely to be the reason why the changes inthe in situ IR-SE spectra take place over a wide temperature range for the PNIPAAm-b-PGMA samples, in contrast to the abrupt switching of traditional PNIPAAm brushesaround 32 ◦C. The formation of amide–amide hydrogen bonds between neighboringPNIPAAm chains facilitates the collapse, because the chains are drawn closer to eachother and water molecules are released from the layer.
At this point it is questionable, if the PNIPAAm-b-PGMA samples can be calledbrushes. According to the calculated grafting densities (0.3–0.5 chains/nm2) and theradius of gyration of the copolymers’ PNIPAAm fractions (4.1–4.5 nm) [63] the samplesare in the brush regime. However, due to the structure of the layer, the PNIPAAm chainmobility—an important characteristic of polymer brushes—is strongly limited.
Chapter 5. Results and Discussion 65
5.3 Protein adsorption
Proteins are an important class of biomacromolecules, being involved in a large numberof biological processes. They are composed of a long chain of amino acids connected viaamide bonds, the so-called peptide bonds. The sequence along the peptide chain is calledprimary structure. These chains are folded to form a secondary structure, e.g. α -helicesor β -sheets, and the folded sections can further interact with each other, which is calledtertiary structure. When several of such clusters interact with each other to form the fullprotein, it is called quarternary structure. Apart from the primary structure, the otherstructures are formed mostly by non-covalent interactions, especially hydrogen bondingand hydrophobic interactions. The resulting three-dimensional structure is highlyspecific [143]. It is also the reason why proteins are very sensitive to environmentalchanges, such as pH or temperature [144]. This leads to unfolding and denaturation ofthe protein and consequently to a loss of protein function. Similar processes can happenupon adsorption of the protein [145].
In some cases protein stability can be enhanced via immobilization in a membrane oron a surface. For example, immobilization of trypsin can enhance its stability at elevatedtemperatures or basic pH (6–10) and increase its storage stability in buffer solution [146].In such cases, the type of immobilization—covalent linking, physical adsorption, etc.—isof importance to maintain protein activity [144, 147]. Possible applications for suchimmobilized proteins are catalytic reactions, biosensors, or tissue engineering [50].
The latter was being focused on in the joint DFG–NSF project in which this workwas involved. As described in chapter 2, the goal of the project was to create functionalpolymer interfaces that can control cell attachment and detachment and maybe evencell proliferation via immobilization of growth factors within the polymer. Adsorptionof cells to a surface takes place via membrane proteins or extracellular proteins [5].Therefore the first step to evaluate the brushes’ behavior towards biomolecules is tostudy the adsorption and desorption of simple proteins on the surfaces.
PNIPAAm has been of high interest because it is biocompatible and shows a tem-perature-dependent transition close to the physiological temperature. For traditionalPNIPAAm brushes both protein adsorbing [6, 8, 90] and repelling [7, 43–46] resultsare described in literature, depending on the molecular weight and grafting densityof the chains. Considering brushes with thickness and grafting density similar tothe brushes studied in our group (grafting density 0.1–0.3 chains/nm2, thickness up to30 nm) PNIPAAm is protein-resistant in most cases. This is advantageous for biomedicalapplications which demand that the surfaces do not adsorb proteins or other biomole-cules [148, 149]. Examples for PNIPAAm brushes with protein adsorption abilities arethose with low grafting densities [8] or PNIPAAm-co-PGMA surfaces [9].
Protein adsorption is mainly dependent on hydrophilic and hydrophobic interacti-ons. Usually, the uncharged, hydrophobic domains are hidden in the inner core of aprotein and most of the charged ones are present at or close to the surface [144]. Theresulting net charge is individual for each protein and pH-dependent, with the pHvalue at which a protein has a net charge of zero being called the isoelectric point (IEP).Since driving forces of protein adsorption are usually of hydrophobic origin, the IEP isan important value around which the respective protein adsorbs strongest [145, 150].Unfolding can enhance hydrophobic protein–surface interactions, leading to strong ad-sorption, but it is often irreversible because extensive unfolding leads to denaturation ofthe protein. Thermodynamic reasons can also be a driving force for protein adsorption.This has been found in a study of protein adsorption on polyelectrolyte brushes, where
66 Chapter 5. Results and Discussion
apart from electrostatic repulsion also entropic forces influence the protein affinity ofthe brush [151].
Protein adsorption to polymer brushes can take place in three different generic modesthat are called primary, secondary, and ternary adsorption [3, 152]. Primary adsorptiontakes place when the protein diffuses between the polymer chains and adsorbs directlyto the substrate surface. Secondary and ternary adsorption describe adsorption to thepolymer chains, either on top of the brush surface (secondary adsorption) or withinthe brush (ternary adsorption). Which mode of adsorption takes place is dependent onseveral factors, for example protein size, grafting density of the brush, chain length, orpolymer–protein interactions.
The blood plasma protein fibrinogen (FIB) was chosen for the adsorption expe-riments because it strongly (and in many cases irreversibly) adsorbs to hydrophobicsurfaces [153], serving as a good indicator for the presence of PGMA segments on thetop of the copolymer brushes. FIB is an elongated 340 kDa blood plasma protein withapproximate dimensions of 5 x 5 x 45 nm [154]. Its IEP lies around pH 5.5 [155, 156].
Adsorption on PNIPAAm-b-PGMA brush samples was determined with in situellipsometry in the VIS and IR ranges. Additionally, FIB adsorption was performed ona plain silicon substrate and a thin PGMA layer. In all experiments measurements ofadsorption processes monitiored under otherwise identical conditions were referen-ced to the spectrum of the initial sample spectrum before the adsorption, leading totanΨsample+protein/tanΨsample.
5.3.1 Fibrinogen adsorption on Silicon and PGMA
Prior to the protein experiments on polymer brushes, the adsorption of FIB on a siliconsubstrate (hydrophilic surface) as well as on a ∼ 2.5 nm thin PGMA layer (hydrophobicsurface) was evaluated. Both of these substances are expected to adsorb FIB [48, 157].Their affinity towards proteins is important for our studies on polymer brushes, becausethey might influence the adsorption results due to primary and ternary adsorption.Especially in the case of PGMA we were interested in the adsorption results, becausePGMA is present in the copolymer brushes and might have an influence on the behaviorof the brush–liquid interface towards proteins. Additionally, knowledge of the protein’samide bands is necessary, since PNIPAAm also contains amide groups, causing anoverlap of the vibrational bands in the spectra.
Figure 5.22 displays in situ tanΨ spectra of bare silicon (left) and the thin PGMAlayer (right) immersed in FIB solution, referenced to the same samples in protein-freebuffer solution. Referenced in situ tanΨ spectra are a measure of the change in opticalcontrast of the brush–solution interface. Upon protein adsorption, upward-pointingvibrational amide I and II bands will become visible, which is clearly the case in theseexperiments. On both samples, FIB adsorption is evidenced by the presence of strongamide I and II bands around 1650 cm−1 and 1550 cm−1, respectively.
On silicon the subsequent spectra at 25, 45 and again at 25 ◦C show an increase ofadsorbed FIB over a time period of about 6 hours. The shape of the amide bands doesnot differ when adsorption takes place at 25 or 45 ◦C, the latter being just below thetemperature of the first denaturation step of FIB [158, 159]. The additional spectrumof the adsorbed layer recorded in protein-free PBS after a buffer rinse at 25 ◦C (greenspectrum in figure 5.22) also shows no decrease in the amide bands. This indicates thatFIB is strongly adsorbed to the substrate and its structure in the adsorbed state does notchange in the measured temperature range.
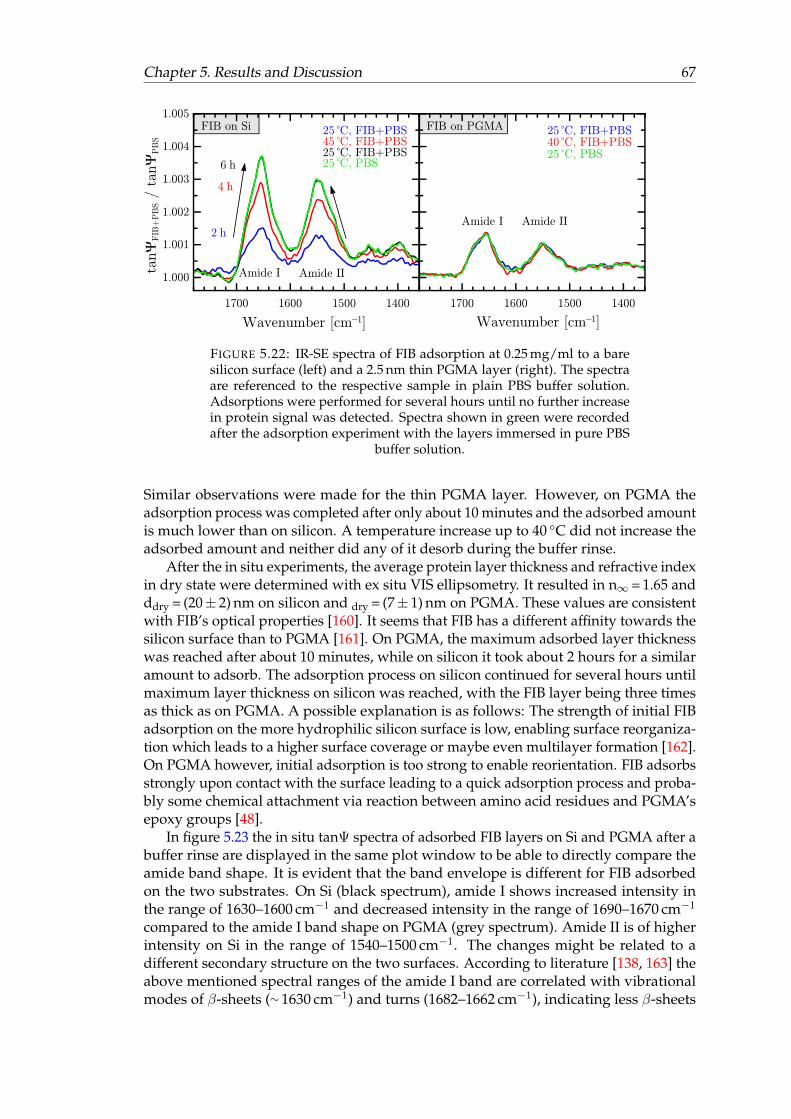
Chapter 5. Results and Discussion 67
FIGURE 5.22: IR-SE spectra of FIB adsorption at 0.25 mg/ml to a baresilicon surface (left) and a 2.5 nm thin PGMA layer (right). The spectraare referenced to the respective sample in plain PBS buffer solution.Adsorptions were performed for several hours until no further increasein protein signal was detected. Spectra shown in green were recordedafter the adsorption experiment with the layers immersed in pure PBS
buffer solution.
Similar observations were made for the thin PGMA layer. However, on PGMA theadsorption process was completed after only about 10 minutes and the adsorbed amountis much lower than on silicon. A temperature increase up to 40 ◦C did not increase theadsorbed amount and neither did any of it desorb during the buffer rinse.
After the in situ experiments, the average protein layer thickness and refractive indexin dry state were determined with ex situ VIS ellipsometry. It resulted in n∞ = 1.65 andddry = (20± 2) nm on silicon and dry = (7± 1) nm on PGMA. These values are consistentwith FIB’s optical properties [160]. It seems that FIB has a different affinity towards thesilicon surface than to PGMA [161]. On PGMA, the maximum adsorbed layer thicknesswas reached after about 10 minutes, while on silicon it took about 2 hours for a similaramount to adsorb. The adsorption process on silicon continued for several hours untilmaximum layer thickness on silicon was reached, with the FIB layer being three timesas thick as on PGMA. A possible explanation is as follows: The strength of initial FIBadsorption on the more hydrophilic silicon surface is low, enabling surface reorganiza-tion which leads to a higher surface coverage or maybe even multilayer formation [162].On PGMA however, initial adsorption is too strong to enable reorientation. FIB adsorbsstrongly upon contact with the surface leading to a quick adsorption process and proba-bly some chemical attachment via reaction between amino acid residues and PGMA’sepoxy groups [48].
In figure 5.23 the in situ tanΨ spectra of adsorbed FIB layers on Si and PGMA after abuffer rinse are displayed in the same plot window to be able to directly compare theamide band shape. It is evident that the band envelope is different for FIB adsorbedon the two substrates. On Si (black spectrum), amide I shows increased intensity inthe range of 1630–1600 cm−1 and decreased intensity in the range of 1690–1670 cm−1
compared to the amide I band shape on PGMA (grey spectrum). Amide II is of higherintensity on Si in the range of 1540–1500 cm−1. The changes might be related to adifferent secondary structure on the two surfaces. According to literature [138, 163] theabove mentioned spectral ranges of the amide I band are correlated with vibrationalmodes of β-sheets (∼ 1630 cm−1) and turns (1682–1662 cm−1), indicating less β-sheets
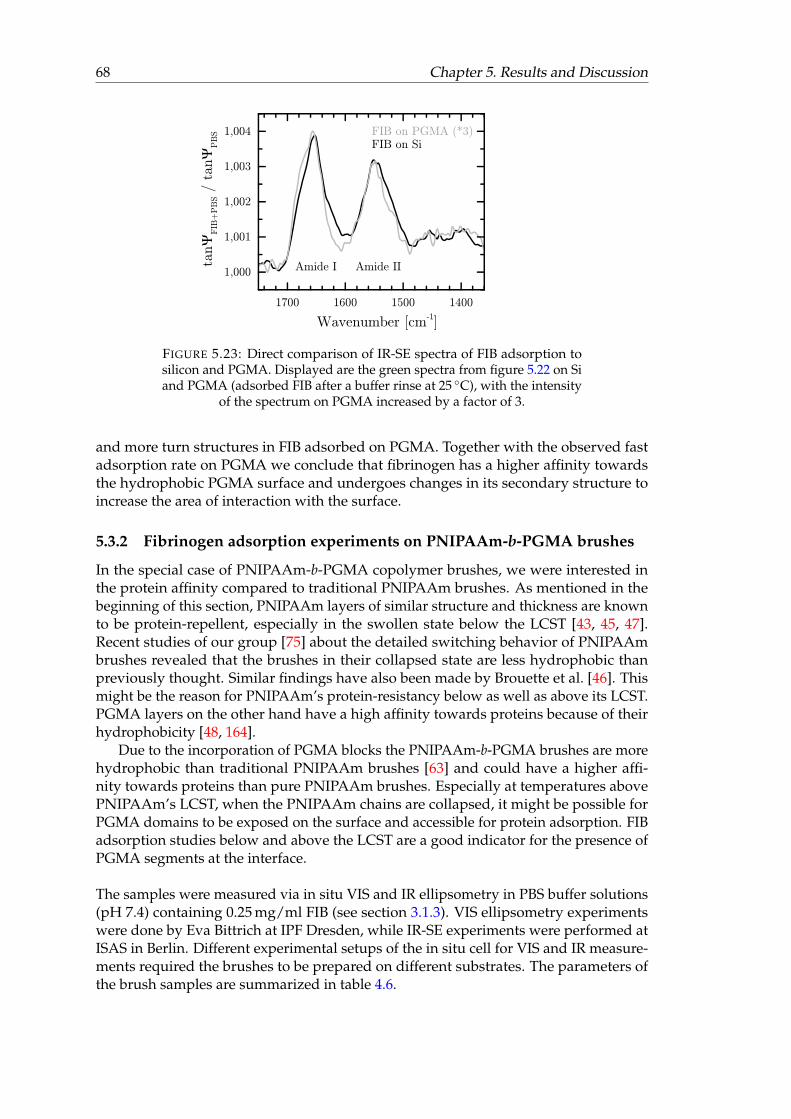
68 Chapter 5. Results and Discussion
FIGURE 5.23: Direct comparison of IR-SE spectra of FIB adsorption tosilicon and PGMA. Displayed are the green spectra from figure 5.22 on Siand PGMA (adsorbed FIB after a buffer rinse at 25 ◦C), with the intensity
of the spectrum on PGMA increased by a factor of 3.
and more turn structures in FIB adsorbed on PGMA. Together with the observed fastadsorption rate on PGMA we conclude that fibrinogen has a higher affinity towardsthe hydrophobic PGMA surface and undergoes changes in its secondary structure toincrease the area of interaction with the surface.
5.3.2 Fibrinogen adsorption experiments on PNIPAAm-b-PGMA brushes
In the special case of PNIPAAm-b-PGMA copolymer brushes, we were interested inthe protein affinity compared to traditional PNIPAAm brushes. As mentioned in thebeginning of this section, PNIPAAm layers of similar structure and thickness are knownto be protein-repellent, especially in the swollen state below the LCST [43, 45, 47].Recent studies of our group [75] about the detailed switching behavior of PNIPAAmbrushes revealed that the brushes in their collapsed state are less hydrophobic thanpreviously thought. Similar findings have also been made by Brouette et al. [46]. Thismight be the reason for PNIPAAm’s protein-resistancy below as well as above its LCST.PGMA layers on the other hand have a high affinity towards proteins because of theirhydrophobicity [48, 164].
Due to the incorporation of PGMA blocks the PNIPAAm-b-PGMA brushes are morehydrophobic than traditional PNIPAAm brushes [63] and could have a higher affi-nity towards proteins than pure PNIPAAm brushes. Especially at temperatures abovePNIPAAm’s LCST, when the PNIPAAm chains are collapsed, it might be possible forPGMA domains to be exposed on the surface and accessible for protein adsorption. FIBadsorption studies below and above the LCST are a good indicator for the presence ofPGMA segments at the interface.
The samples were measured via in situ VIS and IR ellipsometry in PBS buffer solutions(pH 7.4) containing 0.25 mg/ml FIB (see section 3.1.3). VIS ellipsometry experimentswere done by Eva Bittrich at IPF Dresden, while IR-SE experiments were performed atISAS in Berlin. Different experimental setups of the in situ cell for VIS and IR measure-ments required the brushes to be prepared on different substrates. The parameters ofthe brush samples are summarized in table 4.6.
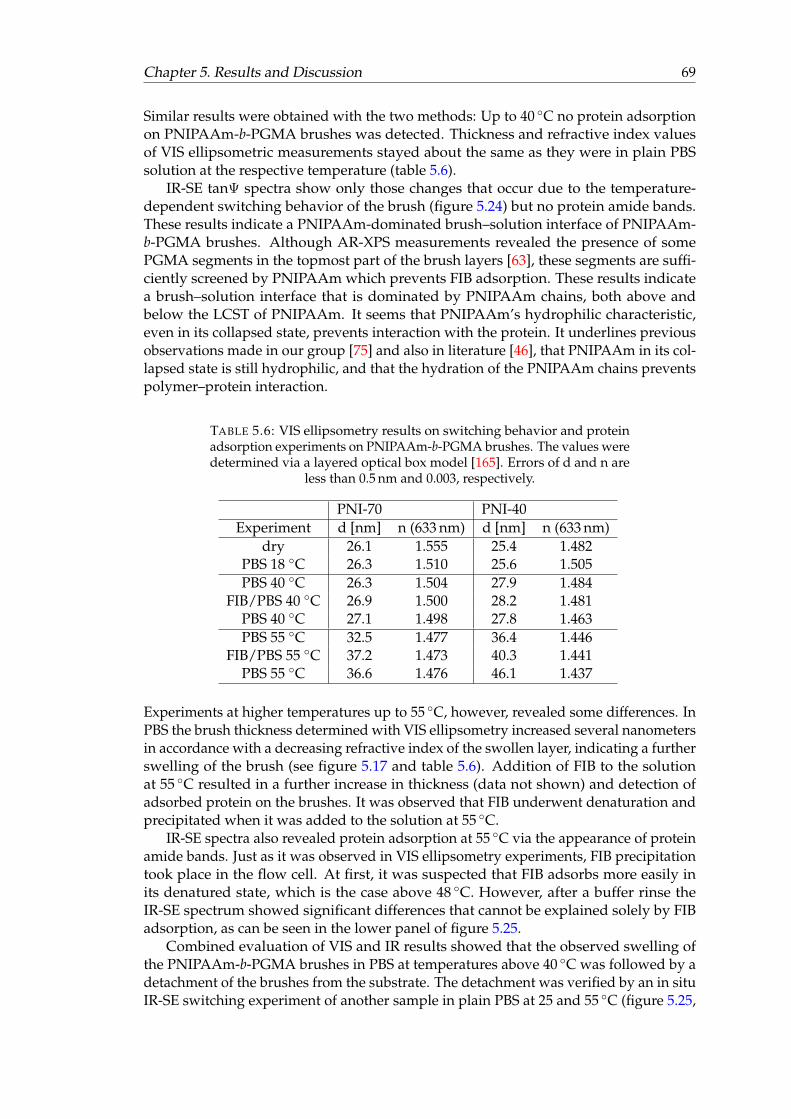
Chapter 5. Results and Discussion 69
Similar results were obtained with the two methods: Up to 40 ◦C no protein adsorptionon PNIPAAm-b-PGMA brushes was detected. Thickness and refractive index valuesof VIS ellipsometric measurements stayed about the same as they were in plain PBSsolution at the respective temperature (table 5.6).
IR-SE tanΨ spectra show only those changes that occur due to the temperature-dependent switching behavior of the brush (figure 5.24) but no protein amide bands.These results indicate a PNIPAAm-dominated brush–solution interface of PNIPAAm-b-PGMA brushes. Although AR-XPS measurements revealed the presence of somePGMA segments in the topmost part of the brush layers [63], these segments are suffi-ciently screened by PNIPAAm which prevents FIB adsorption. These results indicatea brush–solution interface that is dominated by PNIPAAm chains, both above andbelow the LCST of PNIPAAm. It seems that PNIPAAm’s hydrophilic characteristic,even in its collapsed state, prevents interaction with the protein. It underlines previousobservations made in our group [75] and also in literature [46], that PNIPAAm in its col-lapsed state is still hydrophilic, and that the hydration of the PNIPAAm chains preventspolymer–protein interaction.
TABLE 5.6: VIS ellipsometry results on switching behavior and proteinadsorption experiments on PNIPAAm-b-PGMA brushes. The values weredetermined via a layered optical box model [165]. Errors of d and n are
less than 0.5 nm and 0.003, respectively.
PNI-70 PNI-40Experiment d [nm] n (633 nm) d [nm] n (633 nm)
dry 26.1 1.555 25.4 1.482PBS 18 ◦C 26.3 1.510 25.6 1.505PBS 40 ◦C 26.3 1.504 27.9 1.484
FIB/PBS 40 ◦C 26.9 1.500 28.2 1.481PBS 40 ◦C 27.1 1.498 27.8 1.463PBS 55 ◦C 32.5 1.477 36.4 1.446
FIB/PBS 55 ◦C 37.2 1.473 40.3 1.441PBS 55 ◦C 36.6 1.476 46.1 1.437
Experiments at higher temperatures up to 55 ◦C, however, revealed some differences. InPBS the brush thickness determined with VIS ellipsometry increased several nanometersin accordance with a decreasing refractive index of the swollen layer, indicating a furtherswelling of the brush (see figure 5.17 and table 5.6). Addition of FIB to the solutionat 55 ◦C resulted in a further increase in thickness (data not shown) and detection ofadsorbed protein on the brushes. It was observed that FIB underwent denaturation andprecipitated when it was added to the solution at 55 ◦C.
IR-SE spectra also revealed protein adsorption at 55 ◦C via the appearance of proteinamide bands. Just as it was observed in VIS ellipsometry experiments, FIB precipitationtook place in the flow cell. At first, it was suspected that FIB adsorbs more easily inits denatured state, which is the case above 48 ◦C. However, after a buffer rinse theIR-SE spectrum showed significant differences that cannot be explained solely by FIBadsorption, as can be seen in the lower panel of figure 5.25.
Combined evaluation of VIS and IR results showed that the observed swelling ofthe PNIPAAm-b-PGMA brushes in PBS at temperatures above 40 ◦C was followed by adetachment of the brushes from the substrate. The detachment was verified by an in situIR-SE switching experiment of another sample in plain PBS at 25 and 55 ◦C (figure 5.25,
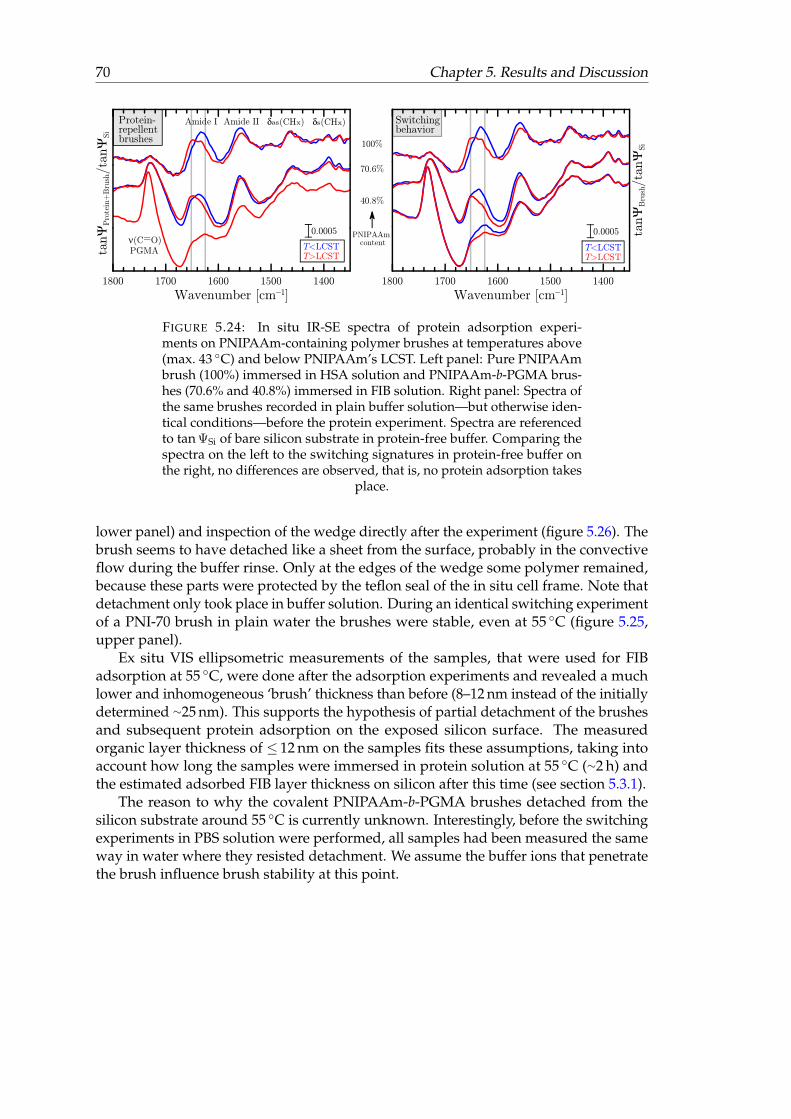
70 Chapter 5. Results and Discussion
FIGURE 5.24: In situ IR-SE spectra of protein adsorption experi-ments on PNIPAAm-containing polymer brushes at temperatures above(max. 43 ◦C) and below PNIPAAm’s LCST. Left panel: Pure PNIPAAmbrush (100%) immersed in HSA solution and PNIPAAm-b-PGMA brus-hes (70.6% and 40.8%) immersed in FIB solution. Right panel: Spectra ofthe same brushes recorded in plain buffer solution—but otherwise iden-tical conditions—before the protein experiment. Spectra are referencedto tan ΨSi of bare silicon substrate in protein-free buffer. Comparing thespectra on the left to the switching signatures in protein-free buffer onthe right, no differences are observed, that is, no protein adsorption takes
place.
lower panel) and inspection of the wedge directly after the experiment (figure 5.26). Thebrush seems to have detached like a sheet from the surface, probably in the convectiveflow during the buffer rinse. Only at the edges of the wedge some polymer remained,because these parts were protected by the teflon seal of the in situ cell frame. Note thatdetachment only took place in buffer solution. During an identical switching experimentof a PNI-70 brush in plain water the brushes were stable, even at 55 ◦C (figure 5.25,upper panel).
Ex situ VIS ellipsometric measurements of the samples, that were used for FIBadsorption at 55 ◦C, were done after the adsorption experiments and revealed a muchlower and inhomogeneous ‘brush’ thickness than before (8–12 nm instead of the initiallydetermined ∼25 nm). This supports the hypothesis of partial detachment of the brushesand subsequent protein adsorption on the exposed silicon surface. The measuredorganic layer thickness of ≤ 12 nm on the samples fits these assumptions, taking intoaccount how long the samples were immersed in protein solution at 55 ◦C (∼2 h) andthe estimated adsorbed FIB layer thickness on silicon after this time (see section 5.3.1).
The reason to why the covalent PNIPAAm-b-PGMA brushes detached from thesilicon substrate around 55 ◦C is currently unknown. Interestingly, before the switchingexperiments in PBS solution were performed, all samples had been measured the sameway in water where they resisted detachment. We assume the buffer ions that penetratethe brush influence brush stability at this point.
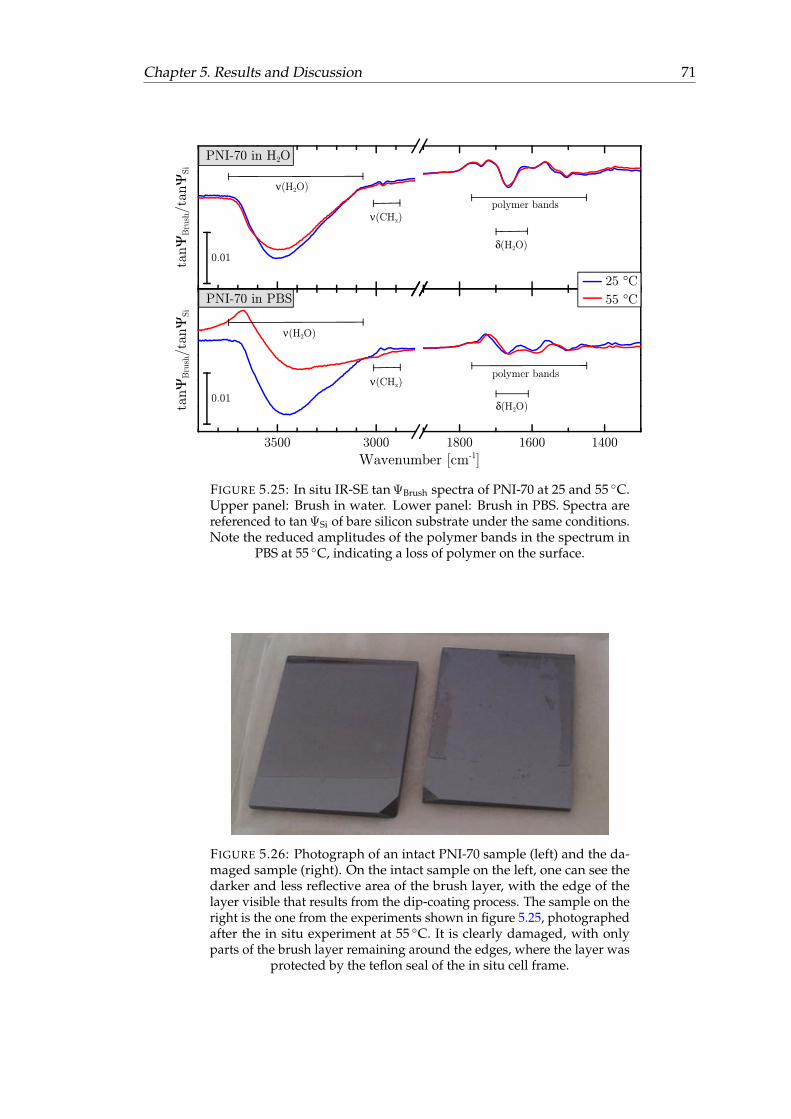
Chapter 5. Results and Discussion 71
FIGURE 5.25: In situ IR-SE tan ΨBrush spectra of PNI-70 at 25 and 55 ◦C.Upper panel: Brush in water. Lower panel: Brush in PBS. Spectra arereferenced to tan ΨSi of bare silicon substrate under the same conditions.Note the reduced amplitudes of the polymer bands in the spectrum in
PBS at 55 ◦C, indicating a loss of polymer on the surface.
FIGURE 5.26: Photograph of an intact PNI-70 sample (left) and the da-maged sample (right). On the intact sample on the left, one can see thedarker and less reflective area of the brush layer, with the edge of thelayer visible that results from the dip-coating process. The sample on theright is the one from the experiments shown in figure 5.25, photographedafter the in situ experiment at 55 ◦C. It is clearly damaged, with onlyparts of the brush layer remaining around the edges, where the layer was
protected by the teflon seal of the in situ cell frame.

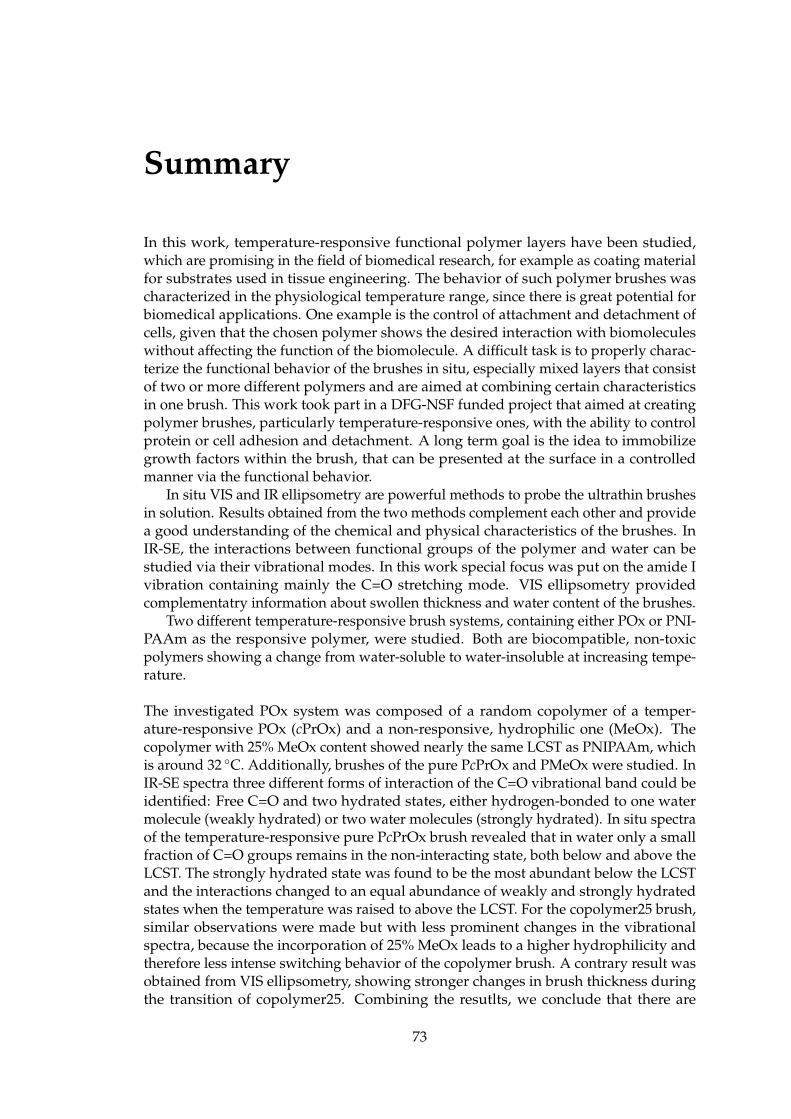
Summary
In this work, temperature-responsive functional polymer layers have been studied,which are promising in the field of biomedical research, for example as coating materialfor substrates used in tissue engineering. The behavior of such polymer brushes wascharacterized in the physiological temperature range, since there is great potential forbiomedical applications. One example is the control of attachment and detachment ofcells, given that the chosen polymer shows the desired interaction with biomoleculeswithout affecting the function of the biomolecule. A difficult task is to properly charac-terize the functional behavior of the brushes in situ, especially mixed layers that consistof two or more different polymers and are aimed at combining certain characteristicsin one brush. This work took part in a DFG-NSF funded project that aimed at creatingpolymer brushes, particularly temperature-responsive ones, with the ability to controlprotein or cell adhesion and detachment. A long term goal is the idea to immobilizegrowth factors within the brush, that can be presented at the surface in a controlledmanner via the functional behavior.
In situ VIS and IR ellipsometry are powerful methods to probe the ultrathin brushesin solution. Results obtained from the two methods complement each other and providea good understanding of the chemical and physical characteristics of the brushes. InIR-SE, the interactions between functional groups of the polymer and water can bestudied via their vibrational modes. In this work special focus was put on the amide Ivibration containing mainly the C=O stretching mode. VIS ellipsometry providedcomplementatry information about swollen thickness and water content of the brushes.
Two different temperature-responsive brush systems, containing either POx or PNI-PAAm as the responsive polymer, were studied. Both are biocompatible, non-toxicpolymers showing a change from water-soluble to water-insoluble at increasing tempe-rature.
The investigated POx system was composed of a random copolymer of a temper-ature-responsive POx (cPrOx) and a non-responsive, hydrophilic one (MeOx). Thecopolymer with 25% MeOx content showed nearly the same LCST as PNIPAAm, whichis around 32 ◦C. Additionally, brushes of the pure PcPrOx and PMeOx were studied. InIR-SE spectra three different forms of interaction of the C=O vibrational band could beidentified: Free C=O and two hydrated states, either hydrogen-bonded to one watermolecule (weakly hydrated) or two water molecules (strongly hydrated). In situ spectraof the temperature-responsive pure PcPrOx brush revealed that in water only a smallfraction of C=O groups remains in the non-interacting state, both below and above theLCST. The strongly hydrated state was found to be the most abundant below the LCSTand the interactions changed to an equal abundance of weakly and strongly hydratedstates when the temperature was raised to above the LCST. For the copolymer25 brush,similar observations were made but with less prominent changes in the vibrationalspectra, because the incorporation of 25% MeOx leads to a higher hydrophilicity andtherefore less intense switching behavior of the copolymer brush. A contrary result wasobtained from VIS ellipsometry, showing stronger changes in brush thickness duringthe transition of copolymer25. Combining the resutlts, we conclude that there are
73
74 Chapter 5. Results and Discussion
additional water molecules present in the swollen brush. These do not directly interactwith polymer chains but contribute to the swelling and collapse of the brush.
Due to the missing N−H group in POx there is no other possibility for C=O groupsto form hydrogen bonds, making POx brushes a simple example for the simulation ofmixed polymer brushes. In dry state IR-SE spectra, the copolymer composition wassuccessfully simulated using previously determined optical constants of the pure POxbrushes. In aqueous environment it was possible to simulate the pure PcPrOx andPMeOx spectra in the range of the C=O stretching mode via three oscillator contributi-ons representing the three forms of interaction. However, the PMeOx brush revealedincomplete swelling, that was identified by a lower redshift of the C=O frequency inswollen state compared to the other POx samples and was probably caused by thelow molecular weight of PMeOx chains in the pure brush. The C=O moieties in thecopolymer25 sample on the other hand—both in cPrOx and MeOx sections—were fullyhydrated. Using the optical constants from the pure PMeOx brush lead to a bad repre-sentation of the MeOx fraction in copolymer25 and consequently to an unsuccessfulsimulation. To be able to properly simulate the mixed brushes, pure POx brushes withsimilar molecular weights need to be studied, that show the same hydration in water asthe desired mixed brush.
The PNIPAAm-containing brushes were prepared from a block-copolymer of PNIPAAmand the anchoring polymer PGMA. These PNIPAAm-b-PGMA brushes were studied asalternative to the well-known traditional PNIPAAm brushes, with focus on the switchingbehavior and the interaction with proteins below and above PNIPAAm’s LCST. Thefirst IR-SE experiments in dry state proved the difficulty to simulate mixed brusheswhen interactions between the polymers are present. A simulation trial of the mixedPNIPAAm-b-PGMA brushes by using optical constants of PNIPAAm and PGMA wasnot successful. It revealed that the brushes can not be represented by data of the purepolymers, because the PNIPAAm and PGMA blocks are intertwined in the layer wherethey form additional interactions between their functional groups. Further evaluationwas therefore focused on qualitative characterization of the switching behavior, usingin situ IR and VIS ellipsometry as well as in situ AFM. Both VIS ellipsometry and AFMexperiments showed only a small swelling of the ∼ 30 nm PNIPAAm-b-PGMA layersin cold water and hardly any collapse upon increasing temperature. The results stoodin contrast to the strong swelling and deswelling behavior of traditional PNIPAAmbrushes. Nevertheless, in situ IR-SE spectra revealed changes of interactions of theamide groups in the PNIPAAm blocks. The changes were less intense than in traditionalPNIPAAm brushes, which can be correlated with a decrease of PNIPAAm contentin the layer. It was concluded that there is a small amount of water present in thebrushes interacting with the PNIPAAm blocks. Changes in temperature result in achange from amide–water to amide–amide interactions but the water molecules remaintrapped in the brush. This is caused by the cross-linked hydrophobic PGMA networkthroughout the brush layer, restricting the mobility of water and PNIPAAm chains andconsequently preventing the swelling and collapse of the brush. In situ AFM imagesrevealed a smooth surface of the brushes, both at low and higher temperatures. Thislead to the conclusion that only the topmost part of the layer can swell in water, as it isdominated by PNIPAAm blocks.
In the last part, protein adsorption experiments on PNIPAAm-b-PGMA brusheswere performed to evaluate the presence of PGMA segments at the brush–solution in-terface. PGMA has a high protein affinity due to its hydrophobicity while PNIPAAm ishydrophilic and mostly protein-repellent. The chosen protein FIB was also adsorbed to
Chapter 5. Results and Discussion 75
a plain silicon substrate and a thin PGMA layer. On Si the adsorption took much longerand the resulting FIB layer was much thicker than on PGMA. It was concluded that theinteraction between silicon and FIB is less strong, enabling reorientation of the elongatedprotein molecules to form a thicker layer. On PGMA however, hydrophobic interactionslead to strong adsorption and partial unfolding of the protein. On PNIPAAm-b-PGMAbrushes no FIB adsorption took place. In situ IR-SE spectra only showed the switchingbehavior in the amide bands. This proves the immediate brush–solution interface to bedominated by PNIPAAm blocks, that sufficiently cover underlying PGMA and preventany interaction between PGMA and FIB. At this point, IR-SE was advantageous, as itis very sensitive to small amounts of adsorbed biomolecules. Hence, it is an optimalmethod to study antifouling properties.
Overall, POx brushes can be a suitable alternative to PNIPAAm brushes. The mostprominent difference is the missing N−H group in POx. This leads to the impossibilityof amide–amide hydrogen-bond interactions and consequently to a slower switchingprocess compared to the abrupt transition of PNIPAAm brushes. Additionally, it can beuseful when growth factors are immobilized within a brush. Growth factors are proteinsthat stimulate cellular growth or proliferation. In IR-SE, using POx brushes can helpdifferentiate between spectral signals of brush and growth factor, which is difficult forPNIPAAm brushes due to their structural similarity to proteins. IR-SE is a valuable toolto distinguish these different vibrational modes and study their interactions with theenvironment.
The technique also helped to gain insight into the interactions of the mixed PNI-PAAm-b-PGMA system with water, even though the layers showed no collapse. Infuture studies involving growth factors, the sensitivity for changes of interactions withinthe brush can help to identify the influence of the growth factor on the functional brushbehavior. IR-SE is an ideal method in this case, because the spectral signals of biomo-lecules are directly visible and the method is very sensitive to changes of interactions.Complementary (in situ) AFM measurements can provide surface topography images,e. g. to evaluate if the growth factor molecules are sufficiently hidden within the brushlayer.


Bibliography
[1] S. Sharma, R. W. Johnson, T. A. Desai, Langmuir 2004, 20, 348–356, DOI 10.1021/la034753l.
[2] F. Zhang, E. T. Kang, K. G. Neoh, P. Wang, K. L. Tan, Journal of Biomedical MaterialsResearch: Part A 2001, 56, 324–332, DOI 10.1002/1097-4636(20010905)56:3<324::AID-JBM1100>3.0.CO;2-P.
[3] M. Krishnamoorthy, S. Hakobyan, M. Ramstedt, J. E. Gautrot, Chemical Reviews2014, 114, 10976–11026, DOI 10.1021/cr500252u.
[4] P. M. Mendes, Chemical Society Reviews 2008, 37, 2512–2529, DOI 10.1039/B714635N.
[5] M. Mrksich, Chemical Society Reviews 2000, 29, 267–273, DOI 10.1039/A705397E.
[6] D. L. Huber, R. P. Manginell, M. A. Samara, B.-I. Kim, B. C. Bunker, Science 2003,301, 352–354, DOI 10.1126/science.1080759.
[7] Q. Yu, Y. Zhang, H. Chen, F. Zhou, Z. Wu, H. Huang, J. L. Brash, Langmuir 2010,26, 8582–8588, DOI 10.1021/la904663m.
[8] C. Xue, B.-C. Choi, S. Choi, P. V. Braun, D. E. Leckband, Advanced FunctionalMaterials 2012, 22, 2394–2401, DOI 10.1002/adfm.201103056.
[9] N. Joseph, T. Prasad, V. Raj, P. R. Anil-Kumar, K. Sreenivasan, T. V. Kumary,Journal of Bioactive and Compatible Polymers 2010, 25, 58–74, DOI 10.1177/0883911509353481.
[10] D. Aulich, O. Hoy, I. Luzinov, M. Brücher, R. Hergenröder, E. Bittrich, K.-J.Eichhorn, P. Uhlmann, M. Stamm, N. Esser, K. Hinrichs, Langmuir 2010, 26,12926–12932, DOI 10.1021/la101762f.
[11] O. Hoy, B. Zdyrko, R. Lupitskyy, R. Sheparovych, D. Aulich, J. Wang, E. Bittrich,K.-J. Eichhorn, P. Uhlmann, K. Hinrichs, M. Müller, M. Stamm, S. Minko, I.Luzinov, Advanced Functional Materials 2010, 20, 2240–2247, DOI 10.1002/adfm.201000170.
[12] T. Wu, P. Gong, I. Szleifer, P. Vlcek, V. Šubr, J. Genzer, Macromolecules 2007, 40,8756–8764, DOI 10.1021/ma0710176.
[13] E. Bittrich, M. Kuntzsch, K.-J. Eichhorn, P. Uhlmann, Journal of Polymer Science:Part B: Polymer Physics 2010, 48, 1606–1615, DOI 10.1002/polb.22021.
[14] T. Okano, N. Yamada, H. Sakai, Y. Sakurai, Journal of Biomedical Materials Research1993, 27, 1243–1251, DOI 10.1002/jbm.820271005.
[15] S. Balamurugan, S. Mendez, S. S. Balamurugan, M. J. O’Brien-II, G. P. López,Langmuir 2003, 19, 2545–2549, DOI 10.1021/la026787j.
[16] A. Furchner, E. Bittrich, P. Uhlmann, K.-J. Eichhorn, K. Hinrichs, Thin Solid Films2013, 541, 41–45, DOI 10.1016/j.tsf.2012.10.135.
77
78 BIBLIOGRAPHY
[17] A. Dworak, A. Utrata-Wesołek, N. Oleszko, W. Wałach, B. Trzebicka, J. Anioł,A. L. Sieron, A. Klama-Baryła, M. Kawecki, Journal of Materials Science: Materialsin Medicine 2014, 25, 1149–1163, DOI 10.1007/s10856-013-5135-7.
[18] M. R. Islam, Y. Gao, X. Li, Q. M. Zhang, M. Wei, M. J. Serpe, Chinese ScienceBulletin 2014, 59, 4237–4255, DOI 10.1007/s11434-014-0545-6.
[19] J. Thévenot, H. Oliveira, O. Sandre, S. Lecommandoux, Chemical Society Reviews2013, 42, 7099–7116, DOI 10.1039/C3CS60058K.
[20] E. Wischerhoff, N. Badi, J.-F. Lutz, A. Laschewsky, Soft Matter 2010, 6, 705–713,DOI 10.1039/B913594D.
[21] P. G. deGennes, Macromolecules 1980, 13, 1069–1075, DOI 10.1021/ma60077a009.
[22] S. T. Milner, Science 1991, 251, 905–914, DOI 10.1126/science.251.4996.905.
[23] W. J. Brittain, S. Minko, Journal of Polymer Science: Part A: Polymer Chemistry 2007,45, 3505–3512, DOI 10.1002/pola.22180.
[24] M. Heskins, J. E. Guillet, Journal of Macromolecular Science Part A: Chemistry 1968,8, 1441–1455, DOI 10.1080/10601326808051910.
[25] Y. Katsumoto, T. Tanaka, H. Sato, Y. Ozaki, Journal of Physical Chemistry A 2002,106, 3429–3435, DOI 10.1021/jp0124903.
[26] T. Chen, R. Ferris, J. Zhang, R. Ducker, S. Zauscher, Progress in Polymer Science2010, 35, 94–112, DOI 10.1016/j.progpolymsci.2009.11.004.
[27] M. Nakayama, T. Okano, F. M. Winnik, Material Matters 2010, 5.3, 56, http://www.sigmaaldrich.com/technical-documents/articles/material-matters/poly-n-isopropylacrylamide.html.
[28] E. Bittrich, S. Burkert, M. Müller, K.-J. Eichhorn, M. Stamm, P. Uhlmann, Langmuir2012, 28, 3439–3448, DOI 10.1021/la204230a.
[29] C. Hashimoto, A. Nagamoto, T. Maruyama, N. Kariyama, Y. Irisa, A. Ikehata,Y. Ozaki, Macromolecules 2013, 46, 1041–1053, DOI 10.1021/ma302317m.
[30] R. Hoogenboom, H. M. L. Thijs, M. J.H. C. Jochems, B. M. van Lankvelt, M. W. M.Fijten, U. S. Schubert, Chemical Communications 2008, 1, 5758–5760, DOI 10.1039/b813140f.
[31] M. M. Bloksma, C. Weber, I. Y. Perevyazko, A. Kuse, A. Baumgärtel, A. Vollrath,R. Hoogenboom, U. S. Schubert, Macromolecules 2011, 44, 4057–4064, DOI 10.1021/ma200514n.
[32] Y. Katsumoto, A. Tsuchiizu, X. Qiu, F. M. Winnik, Macromolecules 2012, 45, 3531–3541, DOI 10.1021/ma300252e.
[33] N. Zhang, R. Luxenhofer, R. Jordan, Macromolecular Chemistry and Physics 2012,213, 1963–1969, DOI 10.1002/macp.201200261.
[34] R. M. A. Azzam in Handbook of Optics, (Ed.: M. Bass), McGraw Hill, New York,2010, pp. 16.1–16.25.
[35] H. G. Tompkins, E. A. Irene, Handbook of Ellipsometry, Springer, Heidelberg, 2005.
[36] H. Fujiwara, Spectroscopic Ellipsometry, Principles and Applications, John Wiley &Sons, Ltd, Chichester, 2007.
[37] K. Hinrichs, K.-J. Eichhorn, Ellipsometry of Functional Organic Surfaces and Films,Springer Series in Surface Sciences, Volume 52, Heidelberg, 2014.
BIBLIOGRAPHY 79
[38] H. Arwin, Thin Solid Films 2000, 377–378, 48–56, DOI 10 . 1016 / S0040 -6090(00)01385-7.
[39] A. Röseler, Infrared Spectroscopic Ellipsometry, Akademie-Verlag, Berlin, 1990.
[40] E. H. Korte, A. Röseler, Analyst 1998, 123, 647–651, DOI 10.1039/A707112D.
[41] A. Röseler, E.-H. Korte in Handbook of Vibrational Spectroscopy, Vol. 2, (Eds.: J.Chalmers, P. Griffiths), John Wiley & Sons, Ltd, 2002.
[42] Y. Mikhaylova, L. Ionov, J. Rappich, M. Gensch, N. Esser, S. Minko, K.-J. Ei-chhorn, M. Stamm, K. Hinrichs, Analytical Chemistry 2007, 79, 7676–7682, DOI10.1021/ac070853a.
[43] S. Burkert, E. Bittrich, M. Kuntzsch, M. Müller, K.-J. Eichhorn, C. Bellmann, P.Uhlmann, M. Stamm, Langmuir 2010, 26, 1786–1795, DOI 10.1021/la902505q.
[44] Q. Yu, Y. Zhang, H. Chen, Z. Wu, H. Huang, C. Cheng, Colloids and Surfaces B:Biointerfaces 2010, 76, 468–474, DOI 10.1016/j.colsurfb.2009.12.006.
[45] C. Xue, N. Yonet-Tanyeri, N. Brouette, M. Sferrazza, P. V. Braun, D. E. Leckband,Langmuir 2011, 27, 8810–8818, DOI 10.1021/la2001909.
[46] N. Brouette, C. Xue, M. Haertlein, M. Moulin, G. Fragneto, D. E. Leckband, A.Halperin, M. Sferrazza, The European Physical Journal Special Topics 2012, 213,343–353, DOI 10.1140/epjst/e2012-01681-4.
[47] A. Furchner, PhD thesis, Technische Universität Berlin, 2014, http://nbn-resolving.de/urn:nbn:de:kobv:83-opus4-50904.
[48] B. Zdyrko, O. Hoy, I. Luzinov, Biointerphases 2009, 4, FA17–FA21, DOI 10.1116/1.3101907.
[49] V. R. de-la Rosa, Journal of Materials Science: Materials in Medicine 2014, 25, 1211–1225, DOI 10.1007/s10856-013-5034-y.
[50] H. Chen, L. Yuan, W. Song, Z. Wu, D. Li, Progress in Polymer Science 2008, 33,1059–1087, DOI 10.1016/j.progpolymsci.2008.07.006.
[51] J. E. Raynor, J. R. Capadona, D. M. Collard, T. A. Petrie, A. J. García, Biointerphases2009, 4, FA3–FA16, DOI 10.1116/1.3089252.
[52] M. Nakayama, N. Yamada, Y. Kumashiro, H. Kanazawa, M. Yamato, T. Okano,Macromolecular Bioscience 2012, 12, 751–760, DOI 10.1002/mabi.201200018.
[53] S. Fujishige, K. Kubota, I. Ando, ACS The Journal of Physical Chemistry 1989, 93,3311–3313, DOI 10.1021/j100345a085.
[54] G. Karlström, O. Engkvist in Poly(ethylene glycol) - Chemistry and Biological Appli-cations, (Eds.: J. Harris, S. Zalipsky), American Chemical Society, 1997.
[55] C. Weber, R. Hoogenboom, U. S. Schubert, Progress in Polymer Science 2012, 37,686–714, DOI 10.1016/j.progpolymsci.2011.10.002.
[56] M. Agrawal, J. C. Rueda, P. Uhlmann, M. Müller, F. Simon, M. Stamm, ACSApplied Materials and Interfaces 2012, 4, 1357–1364, DOI 10.1021/am2016188.
[57] B. Pidhatika, M. Rodenstein, Y. Chen, E. Rakhmatullina, A. Mühlebach, C. Acik-goz, M. Textor, R. Konradi, Biointerphases 2012, 7, 1–15, DOI 10.1007/s13758-011-0001-y.
[58] J. Ulbricht, R. Jordan, R. Luxenhofer, Biomaterials 2014, 35, 4848–4861, DOI 10.1016/j.biomaterials.2014.02.029.
80 BIBLIOGRAPHY
[59] C. W. McGary, Journal of Polymer Science 1960, 46, 51–57, DOI 10.1002/pol.1960.1204614705.
[60] K. S. Iyer, B. Zdyrko, H. Malz, J. Pionteck, I. Luzinov, Macromolecules 2003, 36,6519–6526, DOI 10.1021/ma034460z.
[61] B. Zdyrko, I. Luzinov, Macromolecular Rapid Communications 2011, 32, 859–869,DOI 10.1002/marc.201100162.
[62] S. Minko, Journal of Macromolecular Science Part C: Polymer Reviews 2006, 46, 397–420, DOI 10.1080/15583720600945402.
[63] M. Seeber, PhD thesis, Clemson University, 2013, http://tigerprints.clemson.edu/all\textbackslash_dissertations/1138.
[64] B. S. Lokitz, J. Wei, J. P. Hinestrosa, I. Ivanov, J. F. Browning, J. F. Ankner, S. M.Kilbey-II, J. M. Messman, Macromolecules 2012, 45, 6438–6449, DOI 10.1021/ma300991p.
[65] R. Hoogenboom, Angewandte Chemie International Edition 2009, 48, 7978–7994,DOI 10.1002/anie.200901607.
[66] V. P. Tolstoy, I. V. Chernyshova, V. A. Skryshevsky, Handbook of Infrared Spectroscopyof Ultrathin Films, John Wiley & Sons, Ltd, Hoboken, New Jersey, 2003.
[67] Y. Katsumoto, T. Tanaka, K. Ihara, M. Koyama, Y. Ozaki, Journal of PhysicalChemistry B 2007, 111, 12730–12737, DOI 10.1021/jp0750452.
[68] G. Eaton, P. P. Rastogi, M. C. R. Symons, Journal of the Chemical Society FaradayTransactions 1: Physical Chemistry in Condensed Phases 1989, 85, 3257–3271, DOI10.1039/F19898503257.
[69] G. A. Petsko, D. Ringe, Protein Structure and Function, New Science Press Ltd,London, 2004.
[70] E. V. Anslyn, D. A. Dougherty, Modern Physical Organic Chemistry, UniversityScience Books, Sausalito, 2006.
[71] Y. Maeda, T. Nakamura, I. Ikeda, Macromolecules 2001, 34, 1391–1399, DOI 10.1021/ma001306t.
[72] O. Ramon, E. Kesselman, R. Berkovici, Y. Cohen, Y. Paz, Journal of Polymer Science:Part B: Polymer Physics 2001, 39, 1665–1677, DOI 10.1002/polb.1138.
[73] Y. Katsumoto, T. Tanaka, Y. Ozaki, Macromolecular Symposia 2004, 205, 209–223,DOI 10.1002/masy.200450120.
[74] M. R. Islam, A. Ahiabu, X. Li, M. J. Serpe, Sensors 2014, 14, 8984–8995, DOI10.3390/s140508984.
[75] A. Furchner, A. Kroning, S. Rauch, P. Uhlmann, K.-J. Eichhorn, K. Hinrichs,Analytical Chemistry 2017, 89, 3240–3244, DOI 10.1021/acs.analchem.7b00208.
[76] T. G. Bassiri, A. Levy, M. Litt, Polymer Letters 1967, 5, 871–879, DOI 10.1002/pol.1967.110050927.
[77] T. Kagiya, S. Narisawa, T. Maeda, K. Fukui, Polymer Letters 1966, 4, 257–260, DOI10.1002/pol.1966.110040405.
[78] W. Seeliger, E. Aufderhaar, W. Diepers, R. Feinauer, R. Nehring, W. Thier, H.Hellmann, Angewandte Chemie International Edition 1966, 5, 875–888, DOI 10.1002/anie.196608751.
BIBLIOGRAPHY 81
[79] D. A. Tomalia, D. P. Sheetz, Journal of Polymer Science: Part A-1 1966, 4, 2253–2265,DOI 10.1002/pol.1966.150040919.
[80] F. Rehfeldt, M. Tanaka, Langmuir 2002, 18, 4908–4914, DOI 10.1021/la0112559.
[81] B.-J. Chang, O. Prucker, E. Groh, A. Wallrath, M. Dahm, J. Rühe, Colloids andSurfaces A: Physicochemical and Engineering Aspects 2002, 198–200, 519–526, DOI10.1016/S0927-7757(01)00952-9.
[82] R. Konradi, B. Pidhatika, A. Mühlebach, M. Textor, Langmuir 2008, 24, 613–616,DOI 10.1021/la702917z.
[83] R. Konradi, C. Acikgoz, M. Textor, Macromolecular Rapid Communications 2012,33, 1663–1676, DOI 10.1002/marc.201200422.
[84] B. Pidhatika, J. Möller, E. M. Benetti, R. Konradi, E. Rakhmatullina, A. Mühle-bach, R. Zimmermann, C. Werner, V. Vogel, M. Textor, Biomaterials 2010, 31, 9462–9472, DOI 10.1016/j.biomaterials.2010.08.033.
[85] M. Glassner, K. Lava, V. R. de-la Rosa, R. Hoogenboom, Journal of Polymer SciencePart A: Polymer Chemistry 2014, 52, 3118–3122, DOI 10.1002/pola.27364.
[86] C. Diehl, P. Cernoch, I. Zenke, H. Runge, R. Pitschke, J. Hartmann, B. Tiersch,H. Schlaad, Soft Matter 2010, 6, 3784–3788, DOI 10.1039/C0SM00114G.
[87] T. Li, H. Tang, P. Wu, Langmuir 2015, 31, 6870–6878, DOI 10.1021/acs.langmuir.5b01009.
[88] N. Zhang, T. Pompe, I. Amin, R. Luxenhofer, C. Werner, R. Jordan, MacromolecularBioscience 2012, 12, 926–936, DOI 10.1002/mabi.201200026.
[89] H. Ma, D. Li, X. Sheng, B. Zhao, A. Chilkoti, Langmuir 2006, 22, 3751–3756, DOI10.1021/la052796r.
[90] X. Chen, H. E. Canavan, D. J. Graham, D. G. Castner, B. D. Ratner, Biointerphases2006, 1, 61–72, DOI 10.1116/1.2187980.
[91] D. W. Ball, The Basics of Spectroscopy, SPIE Press, Bellingham, 2001.
[92] A. Röseler in Analytiker Taschenbuch, Vol. 14, (Eds.: H. Günzler, A. Bahadir,R. Borsdorf, K. Danzer, W. Fresenius, R. Galensa, W. Huber, I. Lüderwald, G.Schwedt, G. Tölg, H. Wisser), Springer, 1996.
[93] J. L. Keddie, Current Opinion in Colloid & Interface Science 2001, 6, 102–110, DOI10.1016/S1359-0294(01)00070-X.
[94] H. Günzler, H.-M. Heise, IR Spektroskopie - Eine Einführung, Wiley-VCH, Wein-heim, 1996.
[95] R. M. A. Azzam, Surface Science 1976, 56, 6–18, DOI 10.1016/0039-6028(76)90430-1.
[96] G. E. Jellison-Jr, Thin Solid Films 1993, 234, 416–422, DOI 10.1016/0040-6090(93)90298-4.
[97] E. H. Korte, K. Hinrichs, A. Röseler, Spectrochimica Acta Part B 2002, 57, 1625–1634, DOI 10.1016/S0584-8547(02)00100-3.
[98] J. N. Hilfiker, N. Singh, T. Tiwald, D. Convey, S. M. Smith, J. H. Baker, H. G.Tompkins, Thin Solid Films 2008, 516, 7979–7989, DOI 10.1016/j.tsf.2008.04.060.
82 BIBLIOGRAPHY
[99] M. Losurdo, M. Bergmair, G. Bruno, D. Cattelan, C. Cobet, A. deMartino, K.Fleischer, Z. Dohcevic-Mitrovic, N. Esser, M. Galliet, R. Gajic, D. Hemzal, K.Hingerl, J. Humlicek, R. Ossikovski, Z. V. Popovic, O. Saxl, Journal of NanoparticleResearch 2009, 11, 1521–1554, DOI 10.1007/s11051-009-9662-6.
[100] L. D. Landau, E. M. Lifshitz, Electrodynamics of Continuous Media, Pergamon Press,Oxford, 1984.
[101] J. M. Bennett in Handbook of Optics, (Ed.: M. Bass), McGraw Hill, New York, 2010,pp. 12.1–12.31.
[102] R. M. A. Azzam, N. M. Bashara, Ellipsometry and Polarized Light, Elsevier, Am-sterdam, 1987.
[103] B. Voigtländer, Scanning Probe Microscopy, Springer, Heidelberg, 2015.
[104] P. Eaton, P. West, Atomic Force Microscopy, Oxford University Press, Oxford, 2010.
[105] C. R. Blanchard, The Chemical Educator 1996, 1, 1–8, DOI 10.1007/s00897960059a.
[106] R. García, R. Pérez, Surface Science Reports 2002, 47, 197–301, DOI 10.1016/S0167-5729(02)00077-8.
[107] B. Pittenger, N. Erina, C. Su, Quantitative Mechanical Property Mapping atthe Nanoscale with PeakForce QNM, AN128, application note, Veeco Instru-ments Inc., 2010, https://www.analytic- news.com/papers/pdf/scienceanalyticse1.pdf.
[108] S. Adam, PhD thesis, Technische Universität Dresden, 2016, http://www.qucosa.de/fileadmin/data/qucosa/documents/21156/Thesis_Stefan_Adam_PDFA-2b.pdf.
[109] M. T. Zarka, O. Nuyken, R. Weberskirch, Chemistry – A European Journal 2003, 9,3228–3234, DOI 10.1002/chem.200304729.
[110] J. C. Rueda, S. Zschoche, H. Komber, F. Krahl, K.-F. Arndt, B. Voit, MacromolecularChemistry and Physics 2010, 211, 706–716, DOI 10.1002/macp.200900437.
[111] S. Adam, K.-J. Eichhorn, U. Oertel, M. Stamm, P. Uhlmann, “The thermo-responsivebehavior of novel Poly(2-oxazolines) in solution and as polymer brushes”, inpreparation.
[112] M. Litt, F. Rahl, L. G. Roldan, Journal of Polymer Science: Part A-2 1969, 7, 463–473,DOI 10.1002/pol.1969.160070302.
[113] K. N. Plunkett, X. Zhu, J. S. Moore, D. E. Leckband, Langmuir 2006, 22, 4259–4266,DOI 10.1021/la0531502.
[114] K. Hinrichs, M. Gensch, N. Nikonenko, J. Pionteck, K.-J. Eichhorn, MacromolecularSymposia 2005, 230, 26–32, DOI 10.1002/masy.200551138.
[115] Cauchy and related Empirical Dispersion Formulae for Transparent Materials,TN14, technical note, Horiba, 2006, http://www.horiba.com/fileadmin/uploads/Scientific/Downloads/OpticalSchool_CN/TN/ellipsometer/Cauchy_and_related_empirical_dispersion_Formulae_for_Transparent_Materials.pdf.
[116] U. Richter, G. Dittmar, H. Ketelsen, SpectraRay/3 Software manual, SENTECHInstruments GmbH, 2012.
[117] D. A. G. Bruggeman, Annalen der Physik 1935, 24, 636–664, DOI 10.1002/andp.19354160705.
BIBLIOGRAPHY 83
[118] K. Hinrichs, K. Roodenko, J. Rappich, Electrochemistry Communications 2008, 10,315–318, DOI 10.1016/j.elecom.2007.12.014.
[119] D. J. Sutor, Journal of the Chemical Society 1963, 1105–1110, DOI 10.1039/JR9630001105.
[120] G. R. Desiraju, Accounts of Chemical Research 1996, 29, 441–449, DOI 10.1021/ar950135n.
[121] J. J. Turner in Handbook of Vibrational Spectroscopy, Vol. 1, (Eds.: J. Chalmers, P.Griffiths), John Wiley & Sons, Ltd, Chichester, 2002.
[122] H. E. Simmons, E. P. Blanchard, H. E. Hartzler, The Journal of Organic Chemistry1966, 31, 295–301, DOI 10.1021/jo01339a066.
[123] E. Pretsch, P. Bühlmann, C. Affolter, Structure Determination of Organic Compounds,Tables of Spectral Data, 3rd ed., Springer, Berlin Heidelberg, 2000.
[124] J. B. Lambert, Introduction to Organic Spectroscopy, Macmillan, New York, 1987.
[125] J. Coates in Encyclopedia of Analytical Chemistry, (Ed.: R. Meyers), John Wiley &Sons, Ltd, Chichester, 2000, pp. 10815–10837.
[126] B. H. Stuart, Infrared Spectroscopy: Fundamentals and Applications, John Wiley &Sons, Ltd, Chichester, 2004.
[127] A. D. Rakic, A. B. Djurišic, J. M. Elazar, M. L. Majewski, Applied Optics 1998, 37,5271–5283, DOI 10.1364/AO.37.005271.
[128] D. N. Sathyanarayana, Vibrational Spectroscopy: Theory and Applications, New AgeInternational, New Delhi, 2004.
[129] Handbook of Optical Constants of Solids, (Ed.: E. D. Palik), Academic Press, SanDiego, 1985.
[130] I. Luzinov, D. Julthongpiput, H. Malz, J. Pionteck, V. V. Tsukruk, Macromolecules2000, 33, 1043–1048, DOI 10.1021/ma990926v.
[131] J. Draper, S. Minko, I. Tokarev, M. Stamm, I. Luzinov, Langmuir 2004, 20, 4064–4075, DOI 10.1021/la0361316.
[132] K. Hinrichs, A. Röseler, M. Gensch, E. H. Korte, Thin Solid Films 2004, 455–456,266–271, DOI 10.1016/j.tsf.2004.01.011.
[133] F. Meeussen, E. Nies, H. Berghmans, S. Verbrugghe, E. Goethals, F. DuPrez,Polymer 2000, 41, 8597–8602, DOI 10.1016/S0032-3861(00)00255-X.
[134] A. Kroning, A. Furchner, S. Adam, P. Uhlmann, K. Hinrichs, Biointerphases 2016,11, 019005, DOI 10.1116/1.4939249.
[135] Y. Maréchal, Journal of Chemical Physics 1991, 95, 5565–5573, DOI 10.1063/1.461630.
[136] Y. Katsumoto, T. Tanaka, Y. Ozaki, Journal of Physical Chemistry B 2005, 109, 20690–20696, DOI 10.1021/jp052263r.
[137] I. A. Paun, V. Ion, C.-R. Luculescu, M. Dinescu, S. Canulescu, J. Schou, AppliedPhysics A 2012, 109, 223–232, DOI 10.1007/s00339-012-7038-8.
[138] A. Barth, Biochimica et Biophysica Acta–Bioenergetics 2007, 1767, 1073–1101, DOI10.1016/j.bbabio.2007.06.004.
[139] H. B. Henbest, G. D. Meakins, B. Nicholls, K. J. Taylor, Journal of the ChemicalSociety 1957, 1, 1459–1462, DOI 10.1039/JR9570001459.
84 BIBLIOGRAPHY
[140] Y. Maeda, T. Higuchi, I. Ikeda, Langmuir 2000, 16, 7503–7509, DOI 10.1021/la0001575.
[141] A. Kroning, A. Furchner, D. Aulich, E. Bittrich, S. Rauch, P. Uhlmann, K.-J.Eichhorn, M. Seeber, I. Luzinov, S. M. Kilbey-II, B. S. Lokitz, S. Minko, K. Hin-richs, ACS Applied Materials and Interfaces 2015, 7, 12430–12439, DOI 10.1021/am5075997.
[142] T. Fukuda, N. Kohara, Y. Onogi, H. Inagaki, Journal of Applied Polymer Science1991, 43, 2201–2205, DOI 10.1002/app.1991.070431207.
[143] G. Walsh, Proteins. Biochemistry and Biotechnology, John Wiley & Sons, Ltd, Chi-chester, 2002.
[144] V. M. Balcão, M. M.D. C. Vila, Advanced Drug Delivery Reviews 2015, 93, 25–41,DOI 10.1016/j.addr.2014.10.005.
[145] W. Norde, Macromolecular Symposia 1996, 103, 5–18, DOI 10.1002/masy.19961030104.
[146] K. Atacan, B. Çakıroglu, M. Özacar, Food Chemistry 2016, 212, 460–468, DOI10.1016/j.foodchem.2016.06.011.
[147] L. S. Wong, F. Khan, J. Micklefield, Chemical Reviews 2009, 109, 4025–4053, DOI10.1021/cr8004668.
[148] L. Vroman, Annals of the New York Academy of Sciences 1987, 516, 300–305, DOI10.1111/j.1749-6632.1987.tb33050.x.
[149] B. D. Ratner, S. J. Bryant, Annual Review of Biomedical Engineering 2004, 6, 41–75,DOI 10.1146/annurev.bioeng.6.040803.140027.
[150] M. Malmsten, Journal of Colloid and Interface Science 1998, 207, 186–199, DOI10.1006/jcis.1998.5763.
[151] P. Uhlmann, N. Houbenov, N. Brenner, K. Grundke, S. Burkert, M. Stamm,Langmuir 2007, 23, 57–64, DOI 10.1021/la061557g.
[152] E. P. K. Currie, W. Norde, M. A. Cohen-Stuart, Advances in Colloid and InterfaceScience 2003, 100–102, 205–265, DOI 10.1016/S0001-8686(02)00061-1.
[153] R. S. Kane, P. Deschatelets, G. M. Whitesides, Langmuir 2003, 19, 2388–2391, DOI10.1021/la020737x.
[154] L. E. Averett, M. H. Schoenfisch, Analyst 2010, 135, 1201–1209, DOI 10.1039/b924814e.
[155] E. A. Caspary, R. A. Kekwick, Biochemical Journal 1957, 67, 41–48, https://www.ncbi.nlm.nih.gov/pmc/articles/PMC1200105/.
[156] D. A. D. Parry, J. M. Squire in Advances in Protein Chemistry, Vol. 70, (Eds.: F.Richards, D. Eisenberg, J. Kuriyan), Elsevier Academic Press, 2005.
[157] J. Kim, G. A. Somorjai, Journal of the American Chemical Society 2003, 125, 3150–3158, DOI 10.1021/ja028987n.
[158] G. Marx, X. Mou, A. Hotovely-Salomon, L. Levdansky, E. Gaberman, D. Belenky,R. Gorodetsky, Journal of Biomedical Materials Research Part B: Applied Biomaterials2008, 84B, 49–57, DOI 10.1002/jbm.b.30842.
[159] Y. Chen, H. Mao, X. Zhang, Y. Gong, N. Zhao, International Journal of BiologicalMacromolecules 1999, 26, 129–134, DOI 10.1016/S0141-8130(99)00073-2.
BIBLIOGRAPHY 85
[160] H. Arwin, Thin Solid Films 2011, 519, 2589–2592, DOI 10.1016/j.tsf.2010.11.082.
[161] S. Tunc, M. F. Maitz, G. Steiner, L. Vázquez, M. T. Pham, R. Salzer, Colloids andSurfaces B: Biointerfaces 2005, 42, 219–225, DOI 10.1016/j.colsurfb.2005.03.004.
[162] M. L. Clarke, J. Wang, Z. Chen, Journal of Physical Chemistry B 2005, 109, 22027–22035, DOI 10.1021/jp054456k.
[163] M.-J. Desroches, S. Omanovic, Physical Chemistry Chemical Physics 2008, 10, 2502–2512, DOI 10.1039/B719371H.
[164] A. Toscano, M. M. Santore, Langmuir 2006, 22, 2588–2597, DOI 10.1021/la051641g.
[165] E. Bittrich, PhD thesis, Technische Universität Dresden, 2010, http://www.qucosa.de/fileadmin/data/qucosa/documents/6266/Dissertation-Eva-Bittrich.pdf.

AcknowledgementsFirst, I would like to express my sincere gratitude and thanks to my supervisor, PDDr. Karsten Hinrichs for his continuous support of my Ph.D. study. His guidance andpatience helped me throughout the long and exhausting experience of my researchand writing the thesis. I am truly grateful for the opportunity he has given me and thefaith he had in me to get insight into ellipsometry, a technique unknown to me at thebeginning of my graduate studies.
I would like to thank Prof. Dr. Norbert Esser for the possibility to conduct myresearch at ISAS Berlin and for reviewing this work. Thanks also go to Prof. Dr. KlausRademann from the chemistry department of Humboldt-Universität zu Berlin, whogratefully agreed to review this thesis as my external consultant.
Many thanks go to the Deutsche Forschungsgemeinschaft (DFG) for financial sup-port and our cooperation partners within the DFG-NSF project: Dr. Petra Uhlmann,Dr. Klaus-Jochen Eichhorn, Dr. Meike König, Dr. Stefan Adam, and Dr. Eva Bittrich fromthe Leibniz-Institut für Polymerforschung Dresden, Prof. Dr. Igor Luzinov and Dr. Mi-chael Seeber from Clemson University, Prof. Dr. Sergiy Minko, Dr. Oleksandr Trotsenkoand Timothy Enright from the University of Georgia, Athens, and Prof. Dr. MarcusMüller and Dr. Fabien Leonforte from the Universität Göttingen. Especially I wouldlike to thank Meike, Stefan, Eva, Michael, and Oleksandr for sample preparation andmany interesting discussions, as well as Stefan and Eva for the in situ VIS ellipso-metry measurements and valuable insights into understanding the behavior of polymerbrushes.
Great thanks go to the In situ IR spectroscopy group at ISAS. Most of all, I wouldlike to thank my roommate and co-mentor, Dr. Andreas Furchner, for introducing meinto ellipsometry and the in situ setup as well as endless interesting discussions. Hispatience and knowledge are truly inspiring and took a great part in making this workpossible. Thanks also go to Özgür Savas, Timur Shaykhutdinov, Christoph Kratz,Dimitra Gkogkou, Kristina Lovrek, and Ilona Engler for a great working atmosphere,helpful discussions, technical support in the laboratory, as well as making lunch andcoffee breaks truly enjoyable. At this point I would also like to thank the technical staffand all colleagues at ISAS Berlin for a nice atmosphere.
I deeply thank my family and close friends for support and kindness throughoutthe entire journey of my studies with all its ups and downs. And last but not least,my deepest thanks go to my beloved running shoes and my crew, the adidas RunnersBerlin. Running together through the streets of Berlin, to the beat of good music, alwayscleared my head in the evenings. I believe I would not have been able to finish thisthesis without the refreshing and energized feeling that the exercise gave me.
87

Declaration of Authorship
I hereby declare that this thesis titled ’Infrared ellipsometry on mixed functional poly-mer brushes designed to control surface characteristics’ and the work presented in it aremy own. I confirm that I am the sole author of the present work unless otherwise stated.Where I have consulted the published work of others, this is always clearly attributed.All sources of information have been acknowledged. This thesis or parts of it have notbeen submitted for a degree or any other qualification at this University or any otherinstitution. I have prepared this thesis for the degree of Dr.rer. nat. between September2012 and March 2017 under supervision at the Leibniz-Institut für Analytische Wissen-schaften – ISAS – e. V. in Berlin.
Signed:
Date:
89