
Investigation of the role of microRNAs in …hss.ulb.uni-bonn.de/2015/4173/4173.pdf ·...
139
Investigation of the role of microRNAs in Spinocerebellar Ataxia type 3 Dissertation zur Erlangung des Doktorgrades (Dr. rer. nat.) der Mathematisch-Naturwissenschaftlichen Fakultät der Rheinischen Friedrich-Wilhelms-Universität Bonn vorgelegt von Rohit Nalavade aus Pune, Indien Bonn, 2015
-
Upload
trinhkhanh -
Category
Documents
-
view
216 -
download
0
Transcript of Investigation of the role of microRNAs in …hss.ulb.uni-bonn.de/2015/4173/4173.pdf ·...

Investigation of the role of microRNAs in
Spinocerebellar Ataxia type 3
Dissertation
zur
Erlangung des Doktorgrades (Dr. rer. nat.)
der
Mathematisch-Naturwissenschaftlichen Fakultät
der
Rheinischen Friedrich-Wilhelms-Universität Bonn
vorgelegt von
Rohit Nalavade
aus
Pune, Indien
Bonn, 2015

ii
Angefertigt mit Genehmigung der Mathematisch-Naturwissenschaftlichen Fakultät der
Rheinischen Friedrich-Wilhelms-Universität Bonn
1. Gutachter: PD Dr. Bernd Evert
2. Gutachter: Prof. Dr. Jörg Höhfeld
Tag der Promotion: 20.10.2015
Erscheinungsjahr: 2015

iii
Declaration
I hereby confirm that this dissertation is my own work. It was written independently
without the help of aid unless stated otherwise. Any concepts, data taken from other
sources have been indicated as such. This work has never before been submitted to any
University. I have not applied for a Doctoral procedure before.
An Eides statt versichere ich, dass die vorgelegte Arbeit - abgesehen von den
ausdrücklich bezeichneten Hilfsmitteln - persönlich, selbständig und ohne Benutzung
anderer als der angegebenen Hilfsmittel angefertigt wurde, die aus anderen Quellen
direkt oder indirekt übernommenen Daten und Konzepte unter Angabe der Quelle
kenntlich gemacht sind, die vorgelegte Arbeit oder ähnliche Arbeiten nicht bereits
anderweitig als Dissertation eingereicht worden ist bzw. sind, kein früherer
Promotionsversuch unternommen worden ist, für die inhaltlich-materielle Erstellung
der vorgelegten Arbeit keine fremde Hilfe, insbesondere keine entgeltliche Hilfe von
Vermittlungs- bzw. Beratungsdiensten (Promotionsberater oder andere Personen) in
Anspruch genommen wurde sowie keinerlei Dritte vom Doktoranden unmittelbar oder
mittelbar geldwerte Leistungen für Tätigkeiten erhalten haben, die im Zusammenhang
mit dem Inhalt der vorgelegten Arbeit stehen.
Ort, Datum Unterschrift

iv
Acknowledgements
This thesis would not have been possible without the support and help of several
people. First and foremost I want to thank my two supervisors PD Dr. Bernd Evert and
Dr. Sybille Krauss for giving me the opportunity to work in their laboratories. It was
great working with both of them and I really learnt a lot about science and also outside
science from them. Both always had time for discussions regarding experiments and
advice on the way forward. They trusted me and were always patient with me. I would
like to thank Prof. Höhfeld for consenting to be my second referee and Prof. Haas and
PD Dr. Eichert for agreeing to be part of my thesis committee. Also, I would like to
thank Prof. Nicotera for creating an ideal research environment with great
infrastructure at DZNE Bonn.
I would like to thank my lab mates for their constant support, help and for making our
lab such a fun place to work. Thanks to Stephanie, who from my first day in the lab
has always helped me and taught me several techniques. A special thanks to Frank for
teaching me mouse related techniques and along with Nadine and Judith for the
discussions and tips during progress reports. Separate thanks to Nadine for ferrying
me back to the lab after our journal clubs. Also, I would like to thank our collaborators
in the Institute of Reconstructive Neurobiology, especially Dr. Michael Peitz and
Johannes Jungverdorben for providing me material for experiments and Dr. Stefan
Bonn at DZNE, Göttingen for conducting the gene and miRNA expression profiles. I
also worked on occasions closely with other labs and facilities in DZNE and hence
thanks to members of the work groups Jackson, Tamguney, Fuhrmann, Bano, Fava
who helped me with the use of equipment in their labs. I would like to thank Clemens,
Melvin and Devon for their help with analysis of profiling data, Kevin for help with
the microscope, Julia for her guidance with mouse related work and Christoph for his
help with the microscopy images. I really appreciate the help provided by Nancy with
administrative issues and the IT Dept. for IT support. I would also like to thank Dr.
Peter Breuer and other members of the Neurobiology workgroup in the University
clinic Bonn for their help. I would like to thank my parents who constantly supported
me although I was half a globe away from them. Finally I would like to thank Tulika
for always being there for me. Being a biologist herself, she was able to understand the
ups and downs of lab life and was always at hand to help me through difficult times.
v
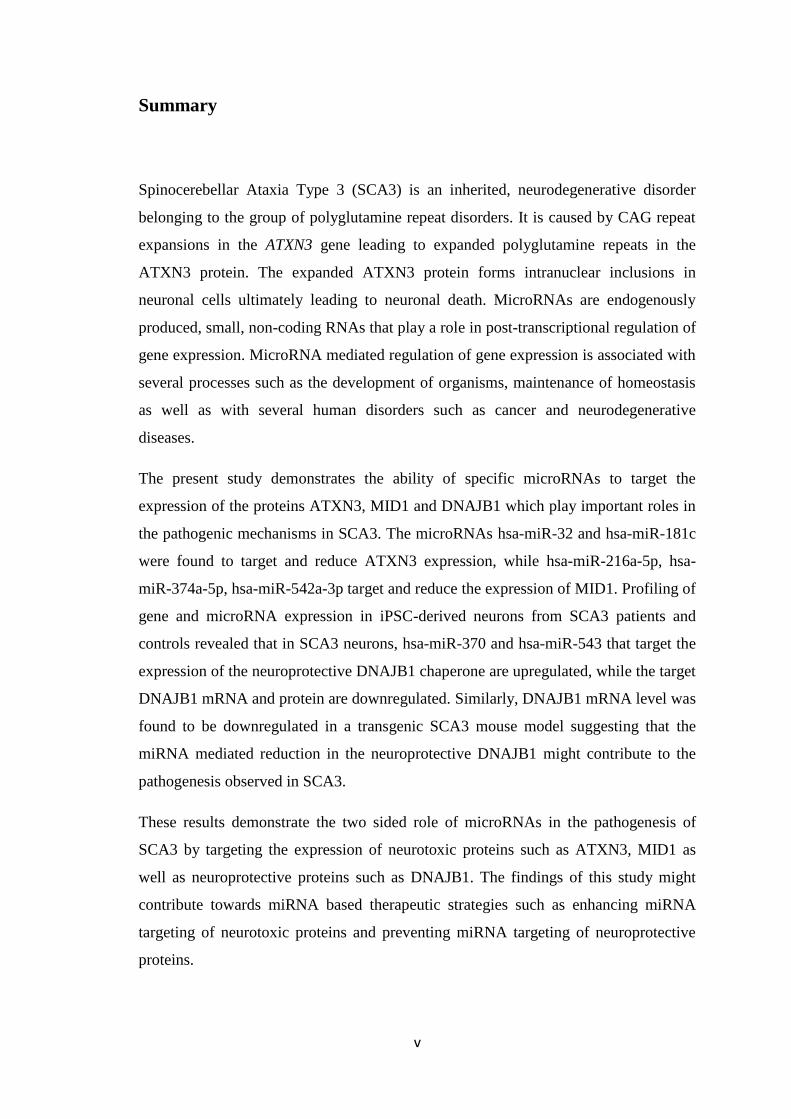
Summary
Spinocerebellar Ataxia Type 3 (SCA3) is an inherited, neurodegenerative disorder
belonging to the group of polyglutamine repeat disorders. It is caused by CAG repeat
expansions in the ATXN3 gene leading to expanded polyglutamine repeats in the
ATXN3 protein. The expanded ATXN3 protein forms intranuclear inclusions in
neuronal cells ultimately leading to neuronal death. MicroRNAs are endogenously
produced, small, non-coding RNAs that play a role in post-transcriptional regulation of
gene expression. MicroRNA mediated regulation of gene expression is associated with
several processes such as the development of organisms, maintenance of homeostasis
as well as with several human disorders such as cancer and neurodegenerative
diseases.
The present study demonstrates the ability of specific microRNAs to target the
expression of the proteins ATXN3, MID1 and DNAJB1 which play important roles in
the pathogenic mechanisms in SCA3. The microRNAs hsa-miR-32 and hsa-miR-181c
were found to target and reduce ATXN3 expression, while hsa-miR-216a-5p, hsa-
miR-374a-5p, hsa-miR-542a-3p target and reduce the expression of MID1. Profiling of
gene and microRNA expression in iPSC-derived neurons from SCA3 patients and
controls revealed that in SCA3 neurons, hsa-miR-370 and hsa-miR-543 that target the
expression of the neuroprotective DNAJB1 chaperone are upregulated, while the target
DNAJB1 mRNA and protein are downregulated. Similarly, DNAJB1 mRNA level was
found to be downregulated in a transgenic SCA3 mouse model suggesting that the
miRNA mediated reduction in the neuroprotective DNAJB1 might contribute to the
pathogenesis observed in SCA3.
These results demonstrate the two sided role of microRNAs in the pathogenesis of
SCA3 by targeting the expression of neurotoxic proteins such as ATXN3, MID1 as
well as neuroprotective proteins such as DNAJB1. The findings of this study might
contribute towards miRNA based therapeutic strategies such as enhancing miRNA
targeting of neurotoxic proteins and preventing miRNA targeting of neuroprotective
proteins.
vi
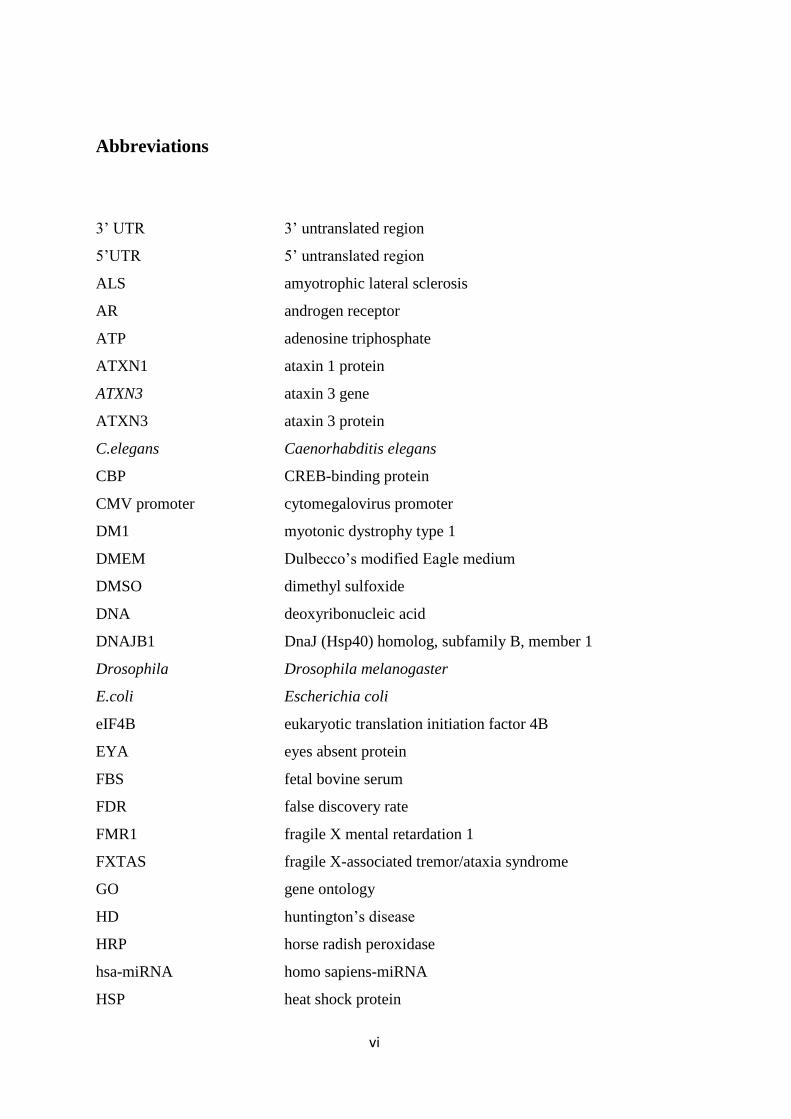
Abbreviations
3’ UTR 3’ untranslated region
5’UTR 5’ untranslated region
ALS amyotrophic lateral sclerosis
AR androgen receptor
ATP adenosine triphosphate
ATXN1 ataxin 1 protein
ATXN3 ataxin 3 gene
ATXN3 ataxin 3 protein
C.elegans Caenorhabditis elegans
CBP CREB-binding protein
CMV promoter cytomegalovirus promoter
DM1 myotonic dystrophy type 1
DMEM Dulbecco’s modified Eagle medium
DMSO dimethyl sulfoxide
DNA deoxyribonucleic acid
DNAJB1 DnaJ (Hsp40) homolog, subfamily B, member 1
Drosophila Drosophila melanogaster
E.coli Escherichia coli
eIF4B eukaryotic translation initiation factor 4B
EYA eyes absent protein
FBS fetal bovine serum
FDR false discovery rate
FMR1 fragile X mental retardation 1
FXTAS fragile X-associated tremor/ataxia syndrome
GO gene ontology
HD huntington’s disease
HRP horse radish peroxidase
hsa-miRNA homo sapiens-miRNA
HSP heat shock protein
vii
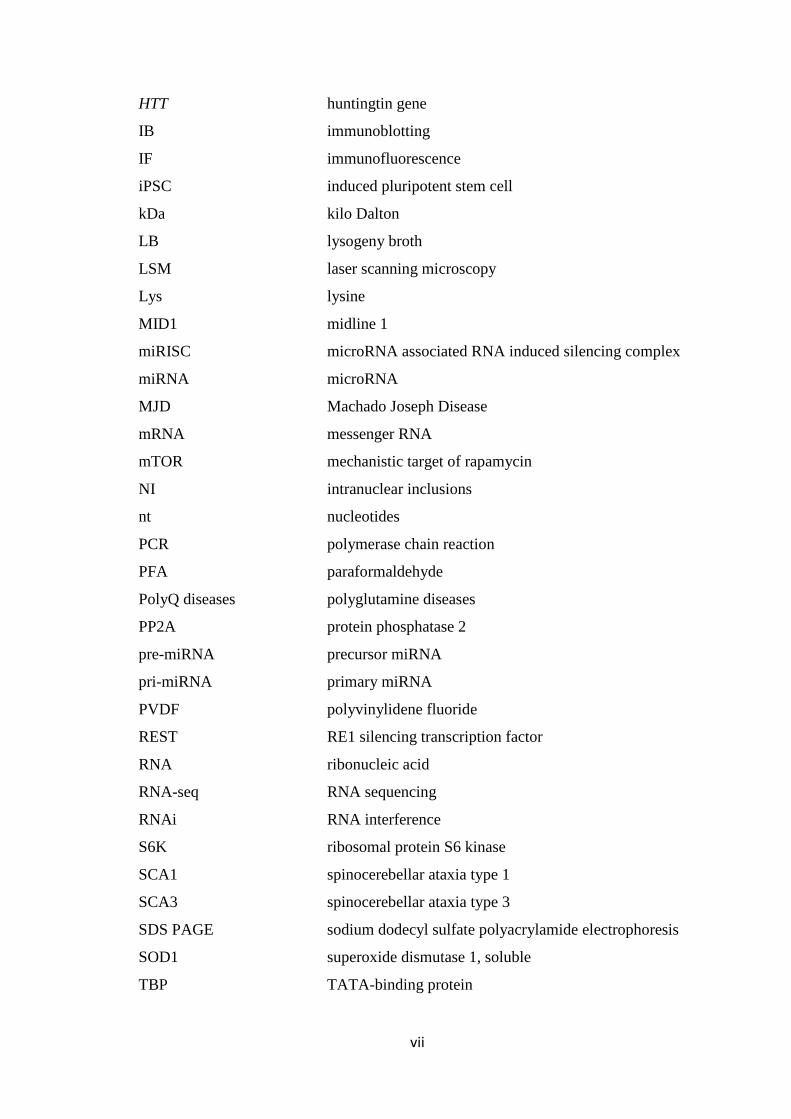
HTT huntingtin gene
IB immunoblotting
IF immunofluorescence
iPSC induced pluripotent stem cell
kDa kilo Dalton
LB lysogeny broth
LSM laser scanning microscopy
Lys lysine
MID1 midline 1
miRISC microRNA associated RNA induced silencing complex
miRNA microRNA
MJD Machado Joseph Disease
mRNA messenger RNA
mTOR mechanistic target of rapamycin
NI intranuclear inclusions
nt nucleotides
PCR polymerase chain reaction
PFA paraformaldehyde
PolyQ diseases polyglutamine diseases
PP2A protein phosphatase 2
pre-miRNA precursor miRNA
pri-miRNA primary miRNA
PVDF polyvinylidene fluoride
REST RE1 silencing transcription factor
RNA ribonucleic acid
RNA-seq RNA sequencing
RNAi RNA interference
S6K ribosomal protein S6 kinase
SCA1 spinocerebellar ataxia type 1
SCA3 spinocerebellar ataxia type 3
SDS PAGE sodium dodecyl sulfate polyacrylamide electrophoresis
SOD1 superoxide dismutase 1, soluble
TBP TATA-binding protein

viii
UIM ubiquitin interacting motif
V volt
WC match Watson-Crick match
YAC yeast artificial chromosome
μG microgram
μL microliter
ix
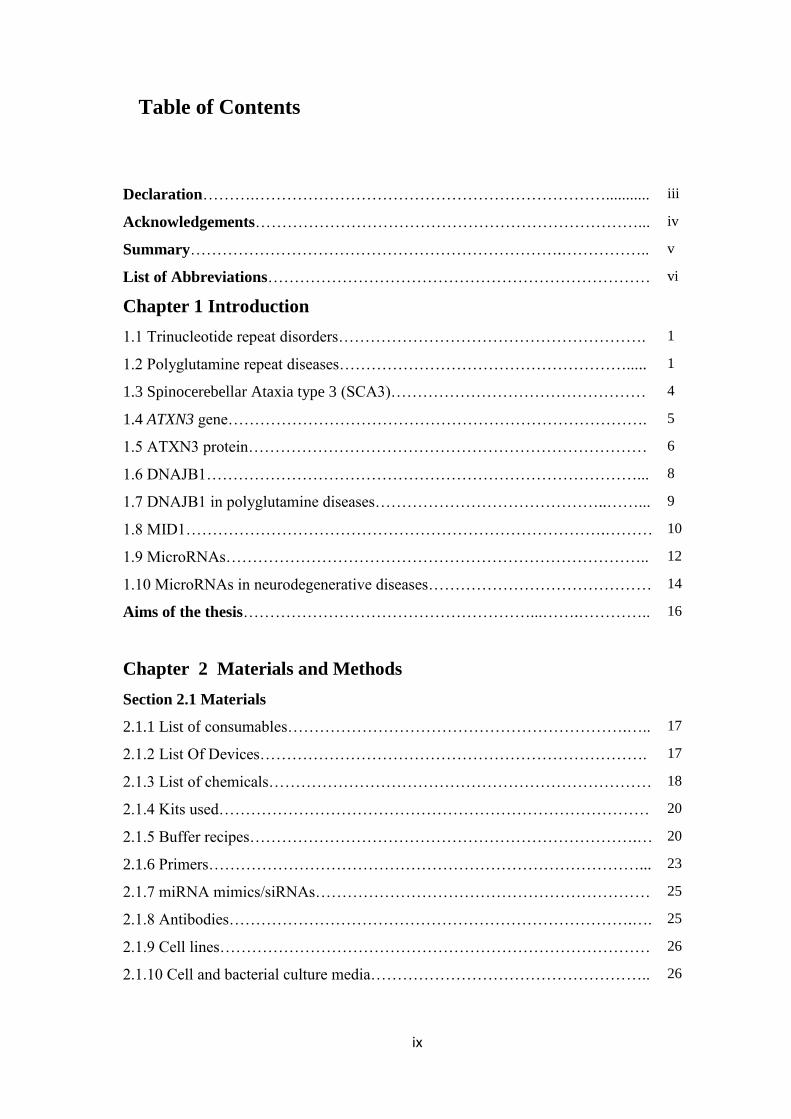
Table of Contents
Declaration……….…………………………………………………………........... iii
Acknowledgements………………………………………………………………... iv
Summary…………………………………………………………….…………….. v
List of Abbreviations……………………………………………………………… vi
Chapter 1 Introduction
1.1 Trinucleotide repeat disorders…………………………………………………. 1
1.2 Polyglutamine repeat diseases………………………………………………..... 1
1.3 Spinocerebellar Ataxia type 3 (SCA3)………………………………………… 4
1.4 ATXN3 gene……………………………………………………………………. 5
1.5 ATXN3 protein………………………………………………………………… 6
1.6 DNAJB1………………………………………………………………………... 8
1.7 DNAJB1 in polyglutamine diseases……………………………………..……... 9
1.8 MID1…………………………………………………………………….……… 10
1.9 MicroRNAs…………………………………………………………………….. 12
1.10 MicroRNAs in neurodegenerative diseases…………………………………… 14
Aims of the thesis………………………………………………...…….…………..
16
Chapter 2 Materials and Methods
Section 2.1 Materials
2.1.1 List of consumables……………………………………………………….….. 17
2.1.2 List Of Devices………………………………………………………………. 17
2.1.3 List of chemicals……………………………………………………………… 18
2.1.4 Kits used……………………………………………………………………… 20
2.1.5 Buffer recipes……………………………………………………………….… 20
2.1.6 Primers………………………………………………………………………... 23
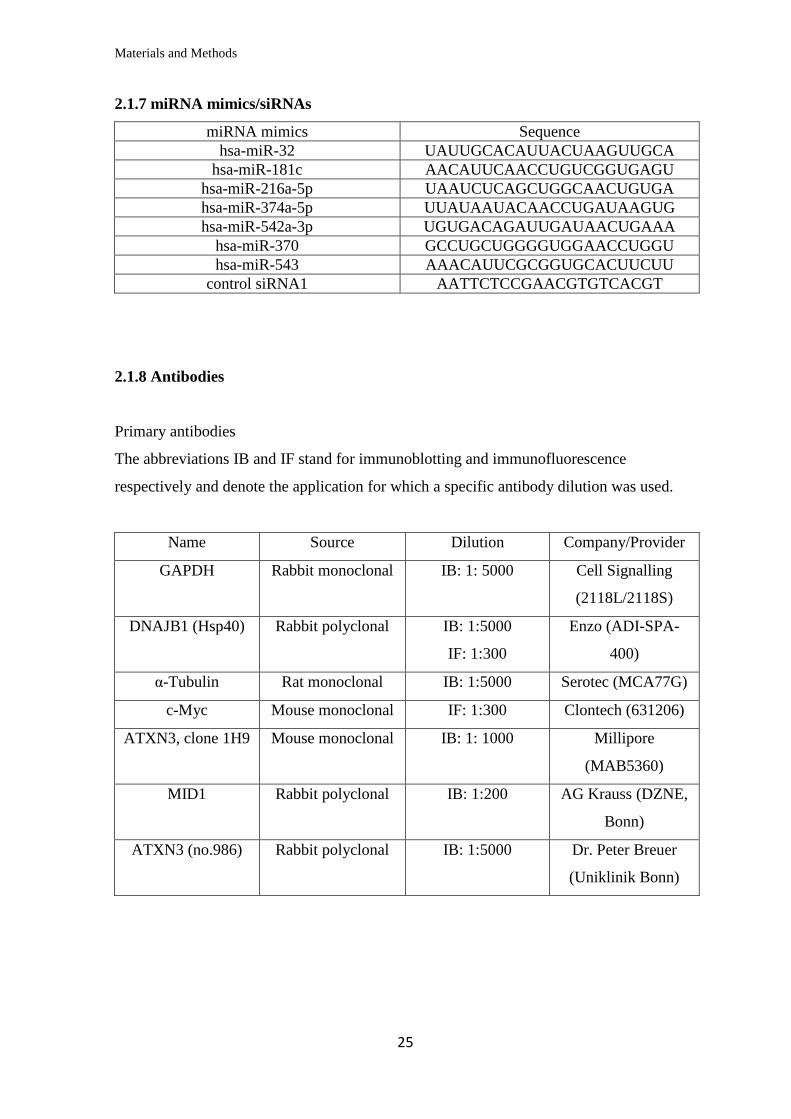
2.1.7 miRNA mimics/siRNAs……………………………………………………… 25
2.1.8 Antibodies………………………………………………………………….…. 25
2.1.9 Cell lines……………………………………………………………………… 26
2.1.10 Cell and bacterial culture media…………………………………………….. 26
x
Section 2.2 Methods
2.2.1 Prediction of miRNA target sites………………………………...…………… 27
2.2.2 Molecular cloning………………………………………………..…………… 28
2.2.3 Cell culture methods………………………………………………..………… 34
2.2.4 Molecular biology methods…………………………………………..………. 39
2.2.5 Microscopy and image analysis………………………………………..……... 44
2.2.6 Mouse hindbrain isolation………………………………………………..….. 44
2.2.7 Gene and miRNA expression profiling and analysis………….……………… 45
2.2.8 Software used……………………………………………………….…………
46
Chapter 3 Results
3.1 miRNA targeting of ATXN3
3.1.1 In silico prediction of miRNAs targeting the 3’UTR of ATXN3
mRNA…………………………………………………………………………….....
48
3.1.2 Validation of the ability of the selected miRNAs to bind at specific sites on
the 3’UTR of ATXN3 mRNA………………………………………………………
50
3.1.3 Analysis of the miRNAs’ effect on endogenous ATXN3 mRNA and protein
levels in human cell lines…………………………………………………..………..
52
3.2 miRNAs targeting Midline 1 (MID1)
3.2.1 In silico prediction of miRNAs targeting the 3’UTR of MID1
mRNA……………………………………………………………………….
57
3.2.2 Validation of the ability of selected miRNAs to bind at specific sites on the
3’UTR of MID1 mRNA……………………………………………………………
59
3.2.3 Analysis of the miRNAs’ effect on endogenous MID1 mRNA and protein
levels in human cell lines……………………………………………….…………..
60
3.3 Analysis of differentially expressed miRNAs in iPSC-derived SCA3
neurons
xi
3.3.1 Neurons derived from SCA3 iPSCs express wild type as well as the mutant
ATXN3 allele…………………………………………………………….………….
63
3.3.2 Gene expression profiling of SCA3 neurons…………………………...…….. 64
3.3.3 Gene Ontology (GO) term enrichment analysis……………………………… 66
3.3.4 Pathway enrichment analysis………………………………...……………….. 70
3.3.5 Protein interaction analysis……………………...……………………………. 71
3.3.6 MicroRNA expression profiling of the SCA3 neurons……………………..... 73
3.3.7 Target selection from gene expression and miRNA expression profiling for
further validation…………………………………………..………………...……..
76
3.3.8 Quantification of DNAJB1 mRNA and protein levels in iPSC-derived
neurons……………………………………………………………………………...
78
3.3.9 Validation of the ability of specific miRNAs to bind at specific binding sites
on the 3’UTR of DNAJB1 mRNA………………………………………………...
79
3.3.10 Analysis of the miRNAs’ effect on endogenous DNAJB1 mRNA and
protein levels in human cell lines……………………………….…………………..
82
3.3.11 Analysis of the miRNAs’ effect on aggregation of expanded ATXN3……... 84
3.3.12 Quantification of DNAJB1 mRNA and protein levels in a transgenic mouse
model of SCA3……………………………………………………………………...
85
Chapter 4 Discussion
4.1 miRNAs target ATXN3 3’UTR and downregulate ATXN3 mRNA and protein
expression……………………………………………………..…………………….
88
4.2 miRNAs target MID1 3’UTR and downregulate MID1 mRNA and protein
expression…………………………………………………..…………………….....
90
4.3 The use of iPSC-derived SCA3 neurons to analyse SCA3 associated gene and
miRNA expression………………………………………………………………….
91
4.4 miRNAs target DNAJB1 3’UTR and downregulate DNAJB1 mRNA and
protein expression………………………………………………..………………….
96
Concluding remarks………………………………………………………………. 98
Appendix………………………………………………………….………………... 99
References………………………………………………………….………………. 111
Curriculum Vitae………………………………………………………………….. 128

Introduction
1
Chapter 1 Introduction
1.1 Trinucleotide repeat disorders
Trinucleotide repeat disorders are a class of inherited, neurological disorders characterized
by expansions of trinucleotide repeats. With 16 disorders, they form the largest group of
inherited neurodegenerative diseases. The trinucleotide expansions are unstable and
studies have shown that the number of trinucleotide repeats might increase in successive
generations (Fu et al, 1991). These mutations are therefore termed as ‘dynamic’ mutations.
Since the severity of symptoms and the age of onset are dependent on the number of
trinucleotide repeats, the instability of the repeats explains the variability of the symptoms
and the age of onset (Orr & Zoghbi, 2007). The exact trinucleotide sequence that is
expanded and the pathogenic mechanism vary amongst the trinucleotide disorders. For
example CTG expansions in the DMPK gene cause Myotonic Dystrophy type 1 (DM1)
where the expanded mRNA mediates the pathogenicity (Mankodi et al, 2002). CGG
expansions in the FMR1 gene cause Fragile X syndrome (FXTAS) where the pathogenesis
is mediated by an inability of the FMR1 gene to be expressed into FMRP protein (Pieretti
et al, 1991). Relevant to this study are the CAG repeat disorders where the expanded
polyglutamine chain coded by CAG repeat expansions mediates the pathogenesis.
1.2 Polyglutamine repeat diseases
Polyglutamine (PolyQ) diseases are a subset of the trinucleotide repeat disorders where
expansions of the trinucleotide repeat CAG occur in the coding regions of various genes.
Since CAG codes for the amino acid glutamine, these diseases are characterized by
expanded glutamine repeats in the mutant proteins. Except for the presence of
polyglutamine repeats, these proteins are unrelated (La Spada et al, 1994; Zoghbi & Orr,
2000).
A hallmark of all these diseases is the formation of intraneuronal inclusions, which
primarily include the expanded polyglutamine proteins, but in which several other proteins
such as ubiquitin and components of the proteasome are sequestered (Davies et al, 1998;
Ross, 1997; Rubinsztein et al, 1999). The neurons that develop intraneuronal inclusions

Introduction
2
vary between the different polyglutamine diseases; this results in a pattern of atrophy that
is unique for each polyglutamine disease, and also explains the differential symptoms seen
in each disease. The exact mechanism through which the presence of these mutant proteins
leads to neuronal death is not yet known. Several mechanisms such as proteolytic cleavage
of the mutant protein, shuttling of the mutant protein to the nucleus and its subsequent
aggregation, failure to clear the mutant protein as well as mitochondrial dysfunction have
been shown to contribute to the observed neuronal death (Weber et al, 2014). As of now
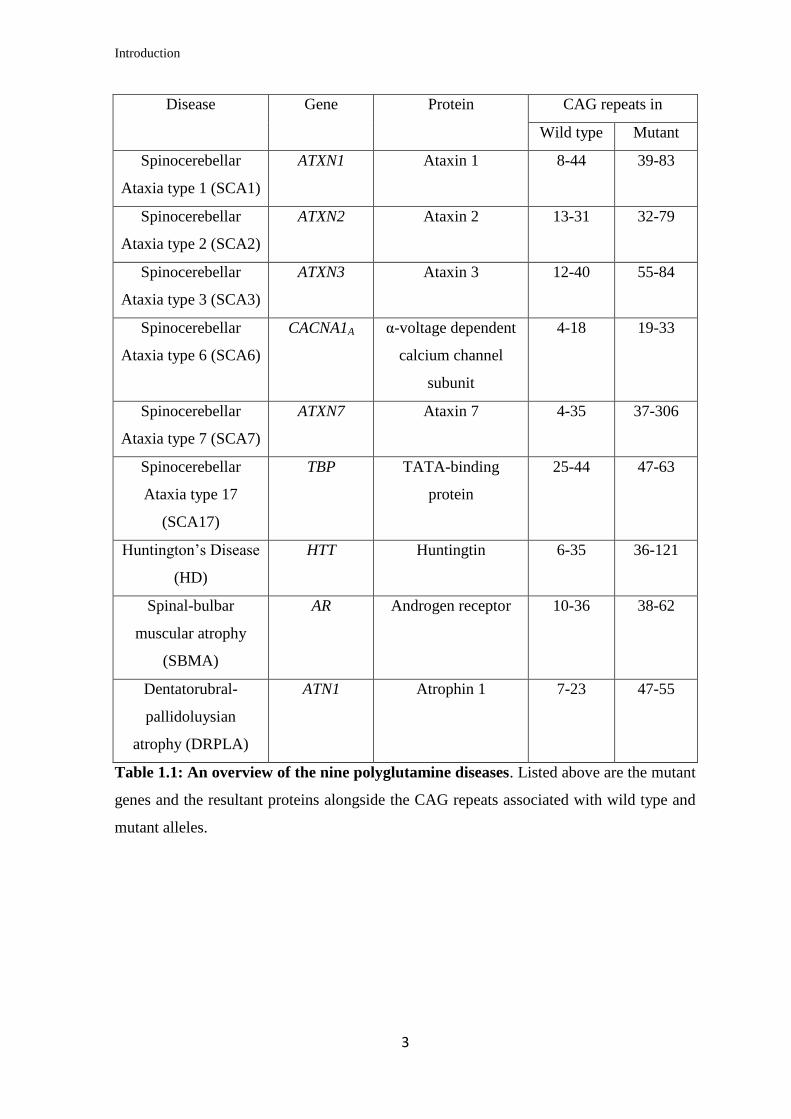
there are nine polyglutamine diseases known. Table 1.1 gives an overview of the genes
mutated, the resultant proteins and the CAG repeat expansions associated with each
polyglutamine disorder. Amongst the polyglutamine diseases one of the best studied is the
most prevalent of the inherited ataxias, the Spinocerebellar Ataxia type 3 (SCA3) that is
also the disorder studied in this project.
Introduction
3
Disease Gene Protein CAG repeats in
Wild type Mutant
Spinocerebellar
Ataxia type 1 (SCA1)
ATXN1 Ataxin 1 8-44 39-83
Spinocerebellar
Ataxia type 2 (SCA2)
ATXN2 Ataxin 2 13-31 32-79
Spinocerebellar
Ataxia type 3 (SCA3)
ATXN3 Ataxin 3 12-40 55-84
Spinocerebellar
Ataxia type 6 (SCA6)
CACNA1A α-voltage dependent
calcium channel
subunit
4-18 19-33
Spinocerebellar
Ataxia type 7 (SCA7)
ATXN7 Ataxin 7 4-35 37-306
Spinocerebellar
Ataxia type 17
(SCA17)
TBP TATA-binding
protein
25-44 47-63
Huntington’s Disease
(HD)
HTT Huntingtin 6-35 36-121
Spinal-bulbar
muscular atrophy
(SBMA)
AR Androgen receptor 10-36 38-62
Dentatorubral-
pallidoluysian
atrophy (DRPLA)
ATN1 Atrophin 1 7-23 47-55
Table 1.1: An overview of the nine polyglutamine diseases. Listed above are the mutant
genes and the resultant proteins alongside the CAG repeats associated with wild type and
mutant alleles.
Introduction
4
1.3 Spinocerebellar Ataxia type 3 (SCA3)
SCA3 is also known as Machado Joseph disease (MJD), named after Portuguese families
originating from the Azores islands in whose members the symptoms of the disease were
first described. Initially MJD and SCA3 were thought of as two different diseases with
similar symptoms. It was only when the genetic locus of both these inherited diseases was
discovered to be located in the same region of chromosome 14 that consensus was reached
that both these diseases constitute a single disorder encompassing a rather heterogeneous
group of symptoms (Kawaguchi et al, 1994; Stevanin et al, 1994; Twist et al, 1995). After
initial studies in descendants from Portuguese ancestry, in the middle of the 1990s SCA3
was increasingly described in patients from several countries such as Japan, China, and
Germany etc. thus widening the scope of its study (Schols et al, 1996; Soong et al, 1997;
Takiyama et al, 1995). In several regions of the world SCA3 is the most prevalent of the
dominant spinocerebellar ataxias (Schols et al, 1996; Trott et al, 2006; Watanabe et al,
1998).
The symptoms of SCA3 are heterogeneous, with deficits of the cerebellar, pyramidal,
extrapyramidal systems seen to various degrees. The most common associated symptoms
include cerebellar ataxia, opthalmoplegia (paralysis of eye muscles), bulging eyes,
dystonia, incontinence, weight loss and involuntary contractions of the facial muscles.
Owing to the heterogeneity, the symptoms have been grouped into 4 subgroups to aid in
diagnosis. The type of symptoms and the age of onset are correlated to the number of
CAG repeats in the expanded ATXN3 gene, with the mean age of onset around 36 years
(Durr et al, 1996; Riess et al, 2008).
The neuropathology of SCA3 is associated with degeneration and atrophy in the
cerebellum, thalamus, parts of the midbrain, pons, medulla oblongata and basal ganglia.
The neuronal loss affects the nuclei of oculomotor, vestibular, somatomotor and ingestion-
related loops (Durr et al, 1996; Rub et al, 2013; Seidel et al, 2012b).
Introduction
5
1.4 ATXN3 gene
The ATXN3 gene is present on chromosome 14 in humans. Its sequence is evolutionarily
conserved as sequences homologous to human ATXN3 have been found in the animal
genomes such as mouse, rat, Drosophila, C.elegans as well as the plant genomes of
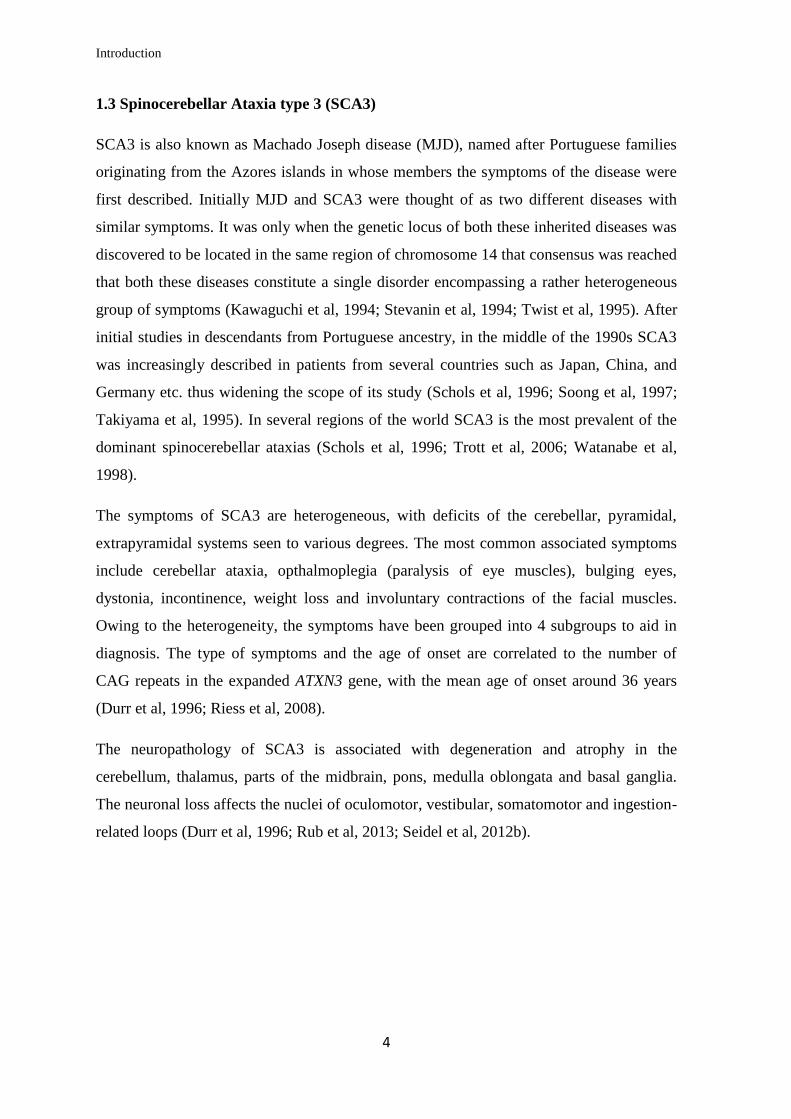
A.thaliana and rice (Albrecht et al, 2003). The ATXN3 gene has 11 exons and the ATXN3
mRNA has several splice variants (Ichikawa et al, 2001) (Fig 1.1). In humans, healthy
individuals have up to 44 CAG repeats in the ATXN3 gene whereas SCA3 patients have
between 52-86 CAG repeats. Individuals with 45-51 CAG repeats might or might not
develop the disease, a phenomenon known as incomplete penetrance. Individuals with
CAG repeats more than 55 definitely develop SCA3 (Todd & Paulson, 2010).
Figure 1.1: Structure of the ATXN3 gene, mRNA and protein. Exons are denoted in
dark blue, introns in grey and the untranslated regions in light blue. As seen in (a) the
ATXN3 gene is composed of a total of 11 exons interspersed by introns that are omitted in
the ATXN3 mRNA (b). The initial 7 exons code for the Josephin domain in the ATXN3
protein, the rest of the exons code for the C-terminal domain with the polyQ chain
encoded by the 10th
exon (c).
Introduction
6
1.5 ATXN3 protein
The ATXN3 protein is encoded by the ATXN3 gene. In humans ATXN3 is expressed
throughout the body primarily as a cytoplasmic protein, although it is also present in the
nucleus and the mitochondria to some extent. It is widely expressed in the brain, even in
areas which are unaffected by SCA3 (Paulson et al, 1997a) (Trottier et al, 1998). The wild
type ATXN3 has a molecular weight of 42 kDa, whereas the molecular weight of the
mutant protein is increased considerably due to the expanded polyglutamine chain.
Structural studies have elucidated that ATXN3 is made up of a globular N-terminal
domain known as the Josephin domain and an unstructured C-terminal domain that
contains the polyglutamine repeat tract (Masino et al, 2003) (Fig 1.1). The Josephin
domain has two ubiquitin binding sites and has ubiquitin protease activity (Chow et al,
2004; Nicastro et al, 2009) whereas the C-terminal domain has ubiquitin interacting motifs
(UIMs) which define the specificity of the Josephin domain to cleave ubiquitin chains
having linkages at Lys63
(Winborn et al, 2008).
ATXN3 functions as a ubiquitin protease and binds to poly-ubiquitylated proteins
especially ones with four or more ubiquitins in chain through a specific domain known as
the Ubiquitin Interacting Motif (UIM) (Burnett et al, 2003; Chai et al, 2004; Donaldson et
al, 2003; Doss-Pepe et al, 2003). Analysis of the structure of the Josephin domain also
revealed that ATXN3 belongs to the family of papain-like cysteine proteases (Nicastro et
al, 2005). Besides, ATXN3 has been shown to interact with chromatin via histone binding
and function as a transcriptional co-repressor, whereby it controls the transcription of
several genes including genes coding for cell surface-associated proteins (Evert et al,
2006; Evert et al, 2003; Li et al, 2002).
The cell toxicity mediated by expanded ATXN3 is triggered by its proteolytic cleavage to
form an aggregate prone fragment; a phenomenon seen in several polyQ disorders and
called the toxic fragment hypothesis (Wellington et al, 1998). The expanded ATXN3 is
cleaved by calcium dependent calpain proteases to form an aggregation prone C-terminal
fragment containing the expanded polyglutamine stretch that is enough to induce
aggregation and cell toxicity (Haacke et al, 2006; Haacke et al, 2007; Ikeda et al, 1996).
The expanded ATXN3 fragment forms intranuclear inclusions (NIs) in neurons in affected
brain regions in which several other proteins are recruited and sequestered including the
full-length ATXN3 (Paulson et al, 1997b; Schmidt et al, 1998). Other proteins shown to be
Introduction
7
recruited into the NIs are polyglutamine repeat containing proteins such as the TATA-
binding protein (TBP), Eyes Absent (EYA) protein in a Drosophila model of SCA3 (Perez
et al, 1998), several proteins that bind to ATXN3 such as the transcriptional co-activator
CREB-binding protein (CBP) (McCampbell et al, 2000), human homolog of the yeast
DNA repair protein HHR23 (Wang et al, 2000) as well as the 26 proteasome (Chai et al,
1999b) and ubiquitin (Schmidt et al, 1998). This recruitment and sequestration of proteins
might be accompanied with a partial or complete loss of their function thereby
contributing to the cell toxicity. Since the inclusions are formed only in the nucleus, the
localization of the expanded ATXN3 to the nucleus is key to the aggregation-mediated
toxicity (Bichelmeier et al, 2007). Other studies have documented the involvement of a
variety of mechanisms and pathways that might mediate toxicity in SCA3. These include
the downregulation of autophagy (Menzies et al, 2010; Nascimento-Ferreira et al, 2011),
oxidative stress leading to mitochondrial dysfunction (Tsai et al, 2004; Yu et al, 2009),
inflammation (Evert et al, 2001).
It is worth mentioning that although the main body of research has shown that aggregates
mediate toxicity in polyQ diseases, there is also evidence on the contrary, i.e. the
oligomeric fractions of the polyQ proteins mediate toxicity whereas aggregate formation
serves to limit the amount of oligomers in the cells (Arrasate et al, 2004; Lajoie & Snapp,
2010; Leitman et al, 2013). The question of whether oligomeric fraction or the aggregates
form the basis of toxicity in SCA3 is as yet still open to debate.
Several animal models have been established to study the molecular mechanism,
pathogenesis and phenotypic effects of the expression of expanded ATXN3, either full
length or just the pathogenic, aggregate prone fragment. Owing to the conservation of
basic cellular pathways and mechanisms, transgenic Drosophila and C.elegans expressing
the expanded human ATXN3 transgene have been instrumental in understanding the
pathogenic mechanisms associated with SCA3 (Teixeira-Castro et al, 2011; Warrick et al,
1998). A number of transgenic mouse models have been shown to exhibit phenotypic
effects such as gait abnormalities and progressive ataxia, along with cerebellar
neurodegeneration and the presence of intranuclear inclusions (Cemal et al, 2002; Chou et
al, 2008; Ikeda et al, 1996). A conditional knockout model of SCA3 transgenic mice
exhibited a progressive neurological phenotype, which could be reversed by turning off
the expression of mutant ATXN3 in early stages of the disease (Boy et al, 2009).
Alternately, SCA3 models created by injecting lentiviral vectors expressing the expanded
Introduction
8
ATXN3 into either rats or mice also exhibited the hallmarks of SCA3, i.e. formation of
intranuclear inclusions and progressive neuronal cell loss (Alves et al, 2008; Nobrega et al,
2013). A recent development is the preparation of iPSCs (Induced Pluripotent Stem Cells)
from fibroblasts from SCA3 patients. Neurons derived from these iPSCs exhibit the
formation of aggregates following calpain-mediated cleavage induced by glutamate
excitation (Koch et al, 2011).
Research into deciphering the molecular mechanisms of SCA3 and other polyQ diseases
revealed the role of several proteins in the pathogenesis and disease progression of these
diseases. Two of these proteins: namely the chaperone DNAJB1 (HSP40) and the CAG
repeat mRNA interacting protein MID1, are also a part of the current study.
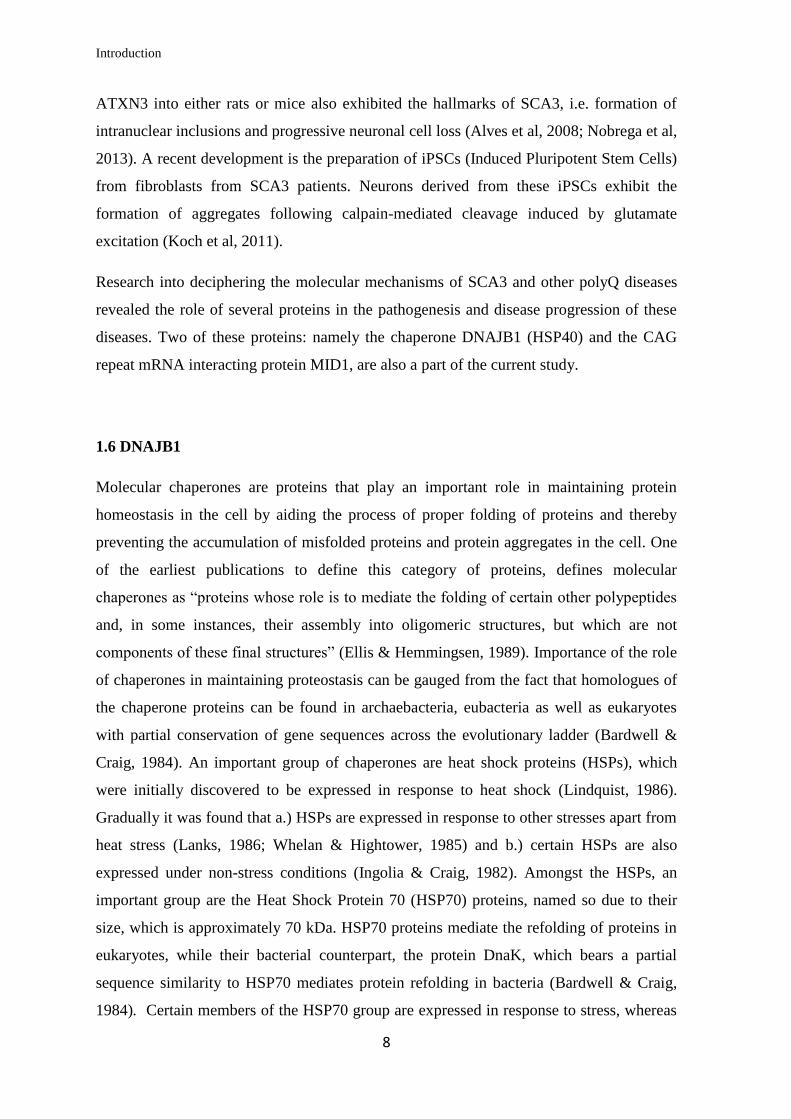
1.6 DNAJB1
Molecular chaperones are proteins that play an important role in maintaining protein
homeostasis in the cell by aiding the process of proper folding of proteins and thereby
preventing the accumulation of misfolded proteins and protein aggregates in the cell. One
of the earliest publications to define this category of proteins, defines molecular
chaperones as “proteins whose role is to mediate the folding of certain other polypeptides
and, in some instances, their assembly into oligomeric structures, but which are not
components of these final structures” (Ellis & Hemmingsen, 1989). Importance of the role
of chaperones in maintaining proteostasis can be gauged from the fact that homologues of
the chaperone proteins can be found in archaebacteria, eubacteria as well as eukaryotes
with partial conservation of gene sequences across the evolutionary ladder (Bardwell &
Craig, 1984). An important group of chaperones are heat shock proteins (HSPs), which
were initially discovered to be expressed in response to heat shock (Lindquist, 1986).
Gradually it was found that a.) HSPs are expressed in response to other stresses apart from
heat stress (Lanks, 1986; Whelan & Hightower, 1985) and b.) certain HSPs are also
expressed under non-stress conditions (Ingolia & Craig, 1982). Amongst the HSPs, an
important group are the Heat Shock Protein 70 (HSP70) proteins, named so due to their
size, which is approximately 70 kDa. HSP70 proteins mediate the refolding of proteins in
eukaryotes, while their bacterial counterpart, the protein DnaK, which bears a partial
sequence similarity to HSP70 mediates protein refolding in bacteria (Bardwell & Craig,
1984). Certain members of the HSP70 group are expressed in response to stress, whereas
Introduction
9
some such as Hsc70 are expressed constitutively under non stress conditions (Ingolia &
Craig, 1982). The HSP70 proteins however are not able to refold proteins alone. In 1990
Ohtsuka and colleagues described for the first time a 40 kDa protein, which was expressed
in cells along with HSP70 in response to stress (Ohtsuka et al, 1990). Further studies
elucidated that this protein, named HSP40 or HDJ-1 since it bears a partial sequence
similarity to the bacterial DnaJ chaperone, is a mammalian homologue of the Dnaj whose
association with the DnaK in bacteria is essential for the chaperone function of DnaK
(Hattori et al, 1992; Ohtsuka, 1993; Raabe & Manley, 1991). Proof of the co-chaperone
function of HDJ-1 was found when it was discovered that it physically interacts with
HSP70 and in the presence of ATP this complex is able to refold a substrate, which is
normally a misfolded protein or an unfolded protein intermediate (Freeman & Morimoto,
1996; Freeman et al, 1995; Sugito et al, 1995). The HSP70-HSP40 machinery was found
to be active in the nucleus as well as the cytoplasm (Michels et al, 1997). Subsequently it
was found that HDJ-1 is just one of several HSP40 proteins which comprise the DNAJ
group of co-chaperones, characterized by the presence of a ‘J-domain’ through which they
interact with the HSP70 chaperones. Although studies have shown that several members
of the DNAJ family potentially play a role in the aggregation of polyglutamine expanded
proteins, one member, DNAJB1 has been of particular interest since a majority of studies
have found it to be the dominant member of the DNAJ family associated with
polyglutamine aggregates in cells.
1.7 DNAJB1 in polyglutamine diseases
The phenomenon of aggregation is seen in several diseases where mutations in genes
render the mutated proteins unable to fold in the appropriate way. In many cases these
aggregates contain not only the misfolded protein but also other interacting proteins and
components of the proteasome machinery such as ubiquitin, subunits of the proteasome
and chaperones, which try to clear these aggregates (Chai et al, 1999b; Schmidt et al,
1998). The HSP70-HSP40 chaperones have been found to be co-localized with protein
aggregates seen in several inherited disorders such as the mutant SOD1 aggregates in
familial ALS (Takeuchi et al, 2002), mutant transcription factor Hoxd13 with poly-alanine
repeat expansions (Albrecht et al, 2004) as well as mutant proteins with polyglutamine
Introduction
10
repeats such as androgen receptor (AR) (Bailey et al, 2002), ATXN1 (Cummings et al,
1998), ATXN3 (Chai et al, 1999a) and huntingtin (Muchowski et al, 2000).
Although some studies have implicated other members of the DNAJ family as the co-
chaperones associated with HSP70 during interactions with polyglutamine mediated
aggregates, the majority of the studies have exhibited that the DNAJB1 is the active
HSP40 co-chaperone that binds to HSP70 in such interactions. The HSP70-HSP40
chaperones seem to bind to polyQ aggregates and prevent the propagation of the fibril like
detergent insoluble aggregates, forming detergent soluble amorphous aggregates that are
also less toxic (Muchowski et al, 2000). Several cell culture studies have shown that the
overexpression of the DNAJB1 chaperone suppresses polyQ aggregate formation and the
associated cell toxicity (Chai et al, 1999a; Jana et al, 2000). The underlying mechanism is
thought to be that the DNAJB1 recognizes and binds to the misfolded polyQ protein and
attempts to refold it in such a way that it is recognized by the HSP70. HSP70 then binds to
the protein and, in an ATP dependent reaction converts it into a less toxic form that can be
degraded (Lotz et al, 2010; Rujano et al, 2007). The yeast homologue of DNAJB1, Sis1p
is sequestered by polyQ-expanded proteins, thus rendering it unable to perform its
function of binding and transporting misfolded proteins to the nucleus for proteasomal
degradation. As a result the misfolded proteins form toxic, cytoplasmic aggregates (Park et
al, 2013). A similar phenomenon was observed in neurons from SCA3 patients where
DNAJB1 co-localized with the intranuclear inclusions and was markedly decreased from
the cytoplasm (Seidel et al, 2012a). Along with other HSP40 chaperones it was found that
the differential expression of DNAJB1 seems to play a role in the CAG independent age of
onset of symptoms in SCA3 patients (Zijlstra et al, 2010).
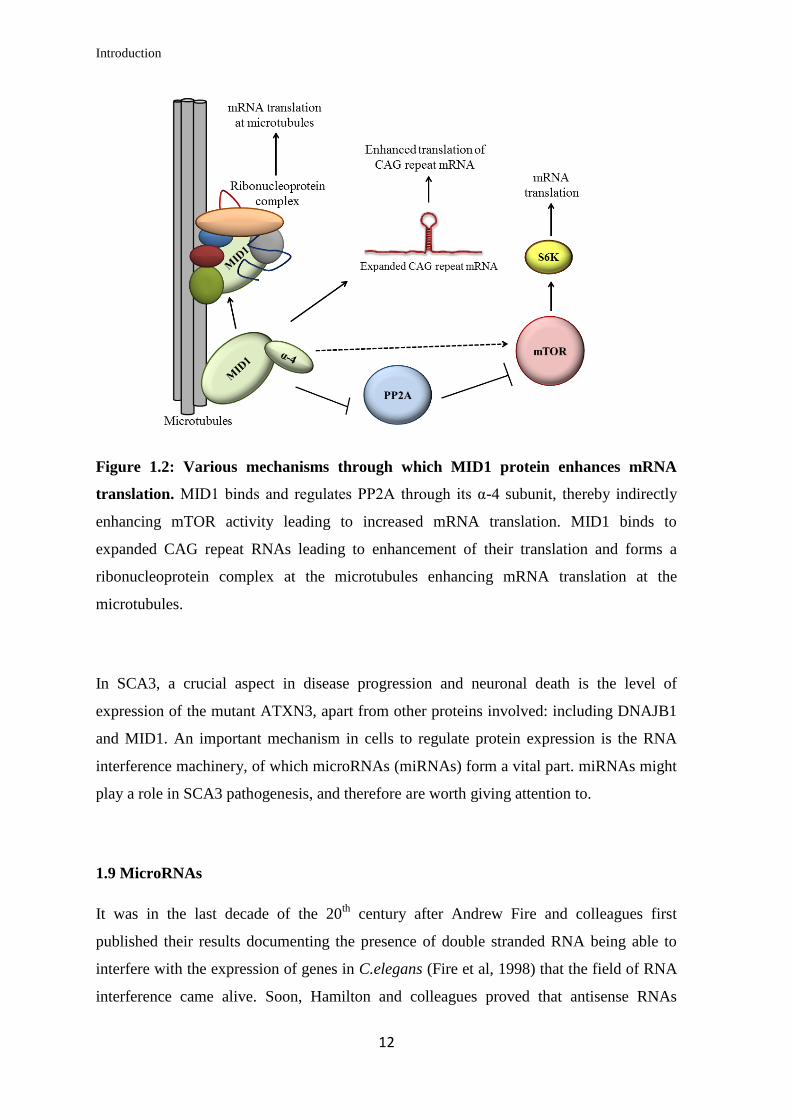
1.8 MID1
The MID1 protein encoded by the MID1 gene is an E3 ubiquitin ligase (Quaderi et al,
1997; Trockenbacher et al, 2001). It associates with microtubules and has been shown to
bind and regulate the activity of several proteins as well as mRNAs, including CAG repeat
mRNAs (Krauss et al, 2013; Schweiger et al, 1999). MID1 binds to Protein Phosphatase
2A (PP2Ac) via its alpha-4 subunit and regulates its activity by mediating its degradation
by the proteasome (Liu et al, 2001; Trockenbacher et al, 2001). Since the protein mTOR
Kinase is a target of PP2A, MID1 indirectly also regulates the activity of mTOR (Liu et al,
Introduction
11
2011). PP2A and mTOR together regulate mRNA translation in cells by regulating the
phosphorylation of proteins such as ribosomal S6 kinase (S6K), which further targets
proteins important for translation such as elongation factor 4B (elF4B) and ribosomal S6
(Holz et al, 2005). Further proof that MID1 plays a crucial role in translation regulation is
provided by findings that MID1 binds to proteins associated with mRNA transport and
translation as well as mRNAs, which have a specific motif known as a MIDAS motif
(Aranda-Orgilles et al, 2011; Aranda-Orgilles et al, 2008). Thus it forms a
ribonucleoprotein complex at the microtubules and mediates the translation of specific
mRNAs at the microtubules. This mechanism suggests that MID1 might play a crucial role
in neurons, where translation in axons would probably be preceded by mRNA transport
along the microtubules. Apart from these findings, which exhibit the importance of MID1
in translation, the most important finding relevant to this study is the one that MID1 along
with PP2A and S6K is able to bind to the CAG repeat region of HTT mRNA in a repeat-
length dependent manner. This binding has an effect on augmenting the translation of the
CAG repeat RNA into the HTT protein with expanded polyglutamine repeats (Krauss et
al, 2013). Also, a recent study has elucidated that MID1 binds to the AR mRNA at the
CAG repeats and that the overexpression of MID1 leads to increased levels of the AR
protein while the levels of AR mRNA remain unchanged (Kohler et al, 2014). Figure 1.2
gives an overview of the role of MID1 in mRNA translation via the various mechanisms
described above.
Introduction
12
Figure 1.2: Various mechanisms through which MID1 protein enhances mRNA
translation. MID1 binds and regulates PP2A through its α-4 subunit, thereby indirectly
enhancing mTOR activity leading to increased mRNA translation. MID1 binds to
expanded CAG repeat RNAs leading to enhancement of their translation and forms a
ribonucleoprotein complex at the microtubules enhancing mRNA translation at the
microtubules.
In SCA3, a crucial aspect in disease progression and neuronal death is the level of
expression of the mutant ATXN3, apart from other proteins involved: including DNAJB1
and MID1. An important mechanism in cells to regulate protein expression is the RNA
interference machinery, of which microRNAs (miRNAs) form a vital part. miRNAs might
play a role in SCA3 pathogenesis, and therefore are worth giving attention to.
1.9 MicroRNAs
It was in the last decade of the 20th
century after Andrew Fire and colleagues first
published their results documenting the presence of double stranded RNA being able to
interfere with the expression of genes in C.elegans (Fire et al, 1998) that the field of RNA
interference came alive. Soon, Hamilton and colleagues proved that antisense RNAs

Introduction
13
regulating gene expression are also present in plants (Hamilton & Baulcombe, 1999) while
Tuschl et al. observed RNA interference mediated by double stranded RNAs in
Drosophila (Tuschl et al, 1999). It was soon discovered that RNA interference is mediated
by a ribonucleoprotein complex that includes short RNAs which confer specificity for the
target mRNA (Elbashir et al, 2001; Hammond et al, 2000; Zamore et al, 2000)
MicroRNAs are endogenously produced, non-coding RNAs that are a part of the RNA
interference machinery of the cell (Lagos-Quintana et al, 2001). miRNAs share partial
sequence complementarity with their ‘target’ sequences present on mRNAs, mostly in the
3’ untranslated region (3’UTR) of the mRNAs (Lai, 2002). miRNAs in association with a
protein complex known as the miRISC (miRNA associated RNA Induced Silencing
Complex) bind to the above mentioned complementary sequences on their ‘target’
mRNAs. This binding either blocks the translation of the mRNA or leads to its
degradation (Hutvagner & Zamore, 2002); in either way regulating the expression of the
protein coded by the target mRNA. miRNAs have been found to play important roles in
plants (Palatnik et al, 2003; Reinhart et al, 2002), C.elegans (Lau et al, 2001; Lee &
Ambros, 2001; Lim et al, 2003), Drosophila (Xu et al, 2003) and in mammals (Chen et al,
2004; Lagos-Quintana et al, 2002). miRNAs are estimated to target upto 30% genes in the
human genome (Lewis et al, 2005). As such miRNAs have been shown to play crucial
roles in several important pathways in the development of organisms (Houbaviy et al,
2003; Krichevsky et al, 2003; Lim et al, 2003; Pasquinelli & Ruvkun, 2002; Sempere et al,
2004) as well as in several important diseases such as cancer, heart disease,
neurodegenerative diseases etc. An indication of their importance in translational
regulation can be found from the fact that miRNA sequences and their binding sites on the
mRNAs are evolutionarily conserved. miRNAs are transcribed from miRNA coding genes
as well as from introns into several hundred nucleotide long primary miRNA transcripts in
the cell nucleus (Lee et al, 2002) (Fig 1.3). These transcripts serve as templates for the
RNAses Drosha and its cofactor Pasha, which cleave these transcripts into premature 70-
80 nucleotide long miRNAs (pre-miRNAs) (Lee et al, 2003). The pre-miRs are exported
from the nucleus into the cytoplasm via the exportin complex (Lund et al, 2004; Yi et al,
2003). In the cytoplasm, the pre-miRNAs are further cleaved by the RNAse Dicer to form
a duplex of miRNAs (Bernstein et al, 2001). Of this duplex, one strand (the guide strand)
eventually associates with miRISC and plays a role in translational repression of mRNAs.
The other strand (passenger strand or * strand) has a far less probability of being
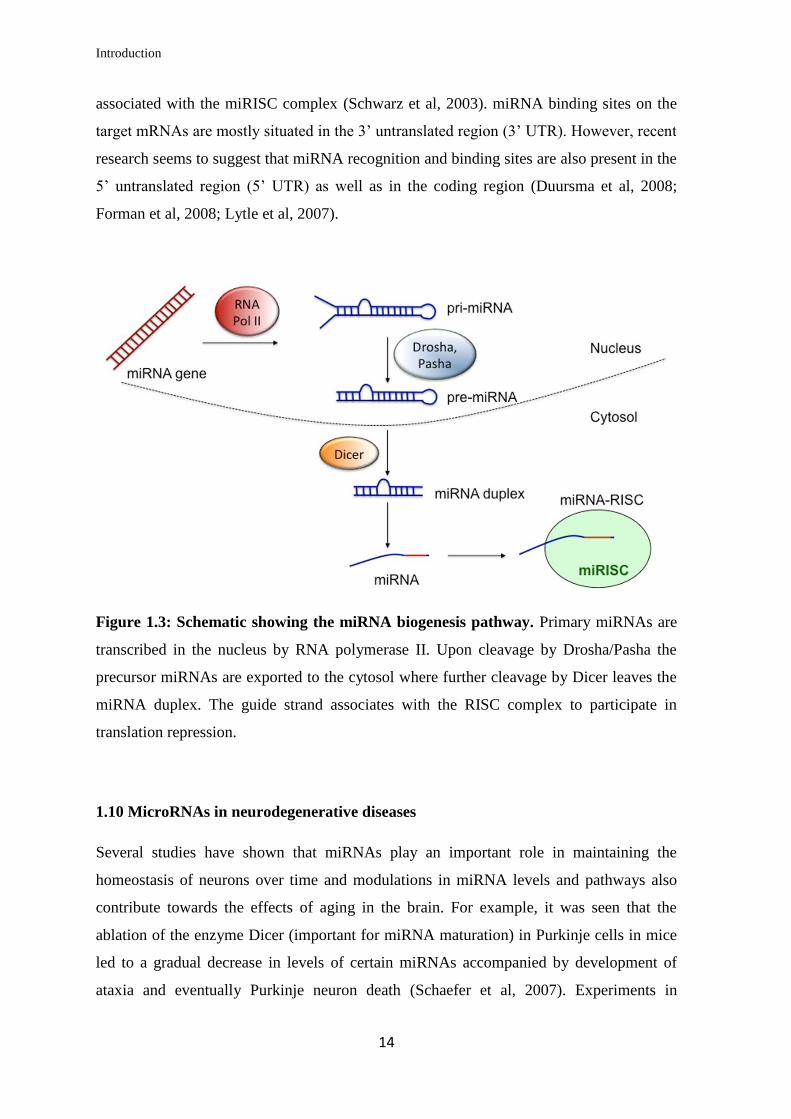
Introduction
14
associated with the miRISC complex (Schwarz et al, 2003). miRNA binding sites on the
target mRNAs are mostly situated in the 3’ untranslated region (3’ UTR). However, recent
research seems to suggest that miRNA recognition and binding sites are also present in the
5’ untranslated region (5’ UTR) as well as in the coding region (Duursma et al, 2008;
Forman et al, 2008; Lytle et al, 2007).
Figure 1.3: Schematic showing the miRNA biogenesis pathway. Primary miRNAs are
transcribed in the nucleus by RNA polymerase II. Upon cleavage by Drosha/Pasha the
precursor miRNAs are exported to the cytosol where further cleavage by Dicer leaves the
miRNA duplex. The guide strand associates with the RISC complex to participate in
translation repression.
1.10 MicroRNAs in neurodegenerative diseases
Several studies have shown that miRNAs play an important role in maintaining the
homeostasis of neurons over time and modulations in miRNA levels and pathways also
contribute towards the effects of aging in the brain. For example, it was seen that the
ablation of the enzyme Dicer (important for miRNA maturation) in Purkinje cells in mice
led to a gradual decrease in levels of certain miRNAs accompanied by development of
ataxia and eventually Purkinje neuron death (Schaefer et al, 2007). Experiments in
Introduction
15
Drosophila uncovered that a miRNA, the miR-34 is essential for a normal lifespan and
prevents untimely ageing (Liu et al, 2012). Various miRNAs have also been shown to play
a role in the pathogenesis of neurodegenerative diseases such as Alzheimer’s disease
(Lehmann et al, 2012; Wong et al, 2013), Friedreich Ataxia (Mahishi et al, 2012), Fragile
X Associated Tremor/Ataxia Syndrome (FXTAS) (Tan et al, 2012; Zongaro et al, 2013).
With regards to the involvement of miRNAs in polyglutamine diseases, most of the
research as yet has been in Huntington’s disease. Studies in mouse, primate models of HD,
as well as HD patients exhibited altered expression of miRNAs and proteins that are either
involved in miRNA pathways or are probable targets of the altered miRNAs (Jin et al,
2012; Kocerha et al, 2014; Lee et al, 2011). Many of these miRNAs are regulated by the
transcriptional repressor REST, which is activated in HD (Johnson et al, 2008; Marti et al,
2010; Packer et al, 2008). An altered expression of miRNAs and its role in toxicity has
also been seen in models of SCA1 (Lee et al, 2008; Persengiev et al, 2011; Rodriguez-
Lebron et al, 2013). Not much has as yet been published regarding the role of miRNAs in
SCA3. In a Drosophila model of SCA3, it was seen that hampered miRNA processing
brought about by mutation of the Dicer enzyme enhances toxicity associated with the
expression of mutant ATXN3. A miRNA named Bantam was also found to be vital to
prevent degeneration (Bilen et al, 2006).
Aims of the thesis
16
Aims of the thesis
SCA3 is an inherited disorder caused by CAG repeat expansions in the ATXN3 gene,
leading to expanded polyglutamine repeats in the ATXN3 protein coded by this gene. The
expression of the expanded ATXN3 protein leads to neurotoxicity via several mechanisms
involving the soluble form as well as the intraneuronal aggregates formed by the mutant
ATXN3 protein. miRNAs are endogenously produced, non-coding RNAs that play an
important role in post-translational gene regulation via the RNA interference (RNAi)
mechanism. miRNAs in association with specific protein complexes block the translation
or degrade mRNAs by binding at specific target sites mostly on the 3’UTR of the mRNA.
miRNAs play an important role in maintaining homeostasis and response to stress and
disease. On the other hand, dysregulation of miRNAs has been shown to be associated
with several human disorders.
This study aimed at elucidating the role of miRNAs in SCA3 where the expanded ATXN3
protein triggers the involvement of multiple proteins and pathways in pathogenesis.
miRNAs might be differentially expressed in SCA3 cells in response to the metabolic
stress and protein aggregates to downregulate the expression of mutant ATXN3 and other
neurotoxic proteins such as MID1 which has been shown to augment the translation of
mRNAs with expanded CAG repeats. With this consideration, ATXN3 and MID1 were
chosen as candidate neurotoxic proteins to analyse the ability of miRNAs to target their
expression. The aim here was to find miRNAs that bind at specific sites on the 3’UTR of
ATXN3 and MID1 mRNAs and to validate the ability of these miRNAs to regulate the
mRNA and protein expression of ATXN3 and MID1 in human cell lines. Another aim of
this study was to elucidate miRNA targeting of gene expression relevant to SCA3
pathogenesis using iPSC-derived neurons from SCA3 patients and controls. For this
purpose, gene expression and miRNA expression profiles from iPSC-derived neurons
were analysed to choose relevant candidate proteins that might be targeted by miRNAs.
Finally, the study aimed at validation of miRNA targeting of the chosen candidate in terms
of specific binding, regulation of candidate mRNA and protein expression in human cell
lines.
Materials and Methods
17
Chapter 2 Materials and Methods
Section 2.1 Materials
2.1.1 List of consumables
0.1-5 mL Combitips: Eppendorf Research
1.5 mL/2 mL safe lock tubes: Sarstedt
10-1000 μL pipette tips: Nerbeplus
100/250 mL conical flasks
15 mL/20 mL Screw cap centrifuge tubes: VWR International
5/10/25/50 mL serological pipettes: Sarstedt
8 well glass chamber slide: Lab Tek II, NUNC (154534)
96-well reaction plate: Applied Biosystems (4306737)
Disposable hypodermic needle (0.60*30 mm): 100 Sterican, Braun Medical AG
Filter paper: Bio Rad (cat: 1703969)
Glass plates (Short/1.0mm spacer): Mini Protean System
Pasteur pipettes: Carl Roth GmbH
Petri plates
PVDF membrane: Roche Diagnostics GmbH (Ref: 03010040001)
Syringe, 5 mL: Braun Medical AG
Tissue culture flask: TPP 75 cm2 (90075)/150 cm
2 (90150)
Tissue culture test plate (12 well): TPP (92012)
2.1.2 List of Devices
0.2-1000 μL Pipettes: Eppendorf Research
Agarose gel electrophoresis chamber: Sub-Cell GT (Bio Rad)
Agarose Gel/Immunoblot imaging system: Stella (Raytest)
Automatic pipette: Multipette stream (Eppendorf)
Bacterial culture shaker/incubator: Kuhner Shaker X (Lab Therm)
Bacterial plates incubator: Binder
Cell analysis system: CASY (Innovatis)
Centrifuge for 1.5/2 mL tubes: Heraeus Fresco 21 (Thermo Scientific)
Centrifuge for 15/50 mL tubes: Heraeus Multifuge X3R (Thermo Scientific)
Materials and Methods
18
CO2 incubator: Heracell 240i (Thermo Scientific)
Confocal Laser Scanning microscope: LSM 700 (Zeiss)
Fluorometer: Qubit (Life Technologies)
Heating block: Thermomixer comfort (Eppendorf)
Ice machine: Ziegra Labor
Laminar Airflow hood: Mars Safety Class 2 (Scanlaf)
Light microscope: Primovert (Zeiss)
Luminescence signal plate reader: Envision Plate reader (Perkin Elmer)
Microwave oven: NN-SD450W (Panasonic)
PCR Cycler: DNA Engine Dyad (Bio Rad)
pH meter: SevenEasy (Mettler Toledo)
Powerpack: Powerpac Universal (Bio Rad)
Real-time PCR cycler: 7900HT Fast Real-time PCR systems (Applied BioSystems)
Roller Mixer: Stuart SRT6
SDS PAGE Blotter: Trans Blot Semi dry Transfer cell (Bio Rad)
SDS PAGE chamber: Mini Protean Tetra System (Bio-Rad)
Sonicator: Bandelin Sonoplus
Ultra Violet Trans illuminator: TL-2000 (Ultra Violet Products)
Vortex mixer: Vortex Genie 2 (Scientific Industries Inc)
Water Bath: Type 1083 (GFL)
Water purification system: Purelab Option-Q (Elga)
Weighing balance: Type 572 (Kern and Sohn GmbH)
2.1.3 List of chemicals
Chemical Manufacturer (Catalogue no.)
2-Mercaptoethanol Sigma Life Science (63689-100ML-F)
Acetic acid Sigma Aldrich (A6283-500ML)
Acrylamide-bis 30% (37.5:1) Merck KGaA (1.00639.1000)
Adenosine 5’ triphosphate disodium salt
hydrate
Aldrich Chemistry (A26209-5G)
Agar Sigma Aldrich (05040-1KG)
Agarose peqGOLD (35.1020)
Albumin, IgG free Carl Roth GmbH (3737.3)
Materials and Methods
19
Ammonium Persulphate (APS) Sigma (A 3678.100G)
Bromophenol Blue Sigma Aldrich (B8026-25G)
Coelenterazine p.j.k. GmbH (260350)
Coenzyme A, sodium salt hydrate Sigma (C4780)
DL-Dithiothreitol Sigma Life Science (43815-5G)
D-Luciferin sodium salt p.j.k. GmbH (269149)
DNA ladder 1 kb Thermo Scientific GeneRuler (SM0313)
DNA ladder 100 bp Thermo Scientific GeneRuler (SM0243)
DNA loading dye (6x) Fermentas (R0611)
Dulbecco’s Modified Eagle Medium
(DMEM) + GlutaMAX
Gibco (21885-025 500ML)
Dulbecco’s Phosphate Buffered Saline
(DPBS)
Gibco (14190-094)
Ethylene Diamine TetraAcetic acid
(EDTA)
Sigma Aldrich GmbH (03610.1KG)
Fluoroshield mounting medium with DAPI Sigma (F6057)
Foetal bovine serum PAN Biotech (1502-P122011)
Gel Red nucleic acid stain Biotium (41003)
Glycine Carl Roth GmbH (3790.3)
Hydrochloric acid (HCl) 32% Carl Roth GmbH (P074.1)
Hydrogen Peroxide (H2O2) Sigma Aldrich (95299-500ML)
LB broth powder Sigma Life Science (L7658-1KG)
Luminol Aldrich Chemistry (123072)
Magnesium sulphate heptahydrate
(MgSO4.7H2O)
Sigma Aldrich (13142-1KG)
Methanol Carl Roth GmbH (4627.2)
Opti-MEM Gibco (31985-070)
Passive Lysis Buffer (5x) Promega (E1941)
p-Coumaric Acid Sigma Life Sciences (C9008-25G)
Penicillin-Streptomycin Gibco (15140-122 100ML)
Protein Standard ladder Bio Rad Precision Plus Kaleidoscope (161-
0375)
Roti-Phenol Carl Roth GmbH (0038.2)
Materials and Methods
20
Sodium Chloride (NaCl) Sigma (S30.14-5KG)
Sodium Dodecyl Sulphate (SDS) 20%
solution in H2O
Sigma Life Science (05030-1L-F)
TEMED Carl Roth GmbH (2367.1)
Tricine Sigma Life Science (T0377-1KG)
Tris (hydroxymethyl) aminomethane Sigma Aldrich (252859-500G)
Trypsin-EDTA Gibco (25300-054 100ML)
Tryptone Carl Roth GmbH (8952.2)
Tween-20 Sigma Life Science (P5927-500ML)
Yeast extract Carl Roth GmbH (2904.3)
2.1.4 Kits used
Name Manufacturer (Catalogue no.)
QIAquick PCR purification kit Qiagen (28104)
QIAquick Gel Extraction kit Qiagen (28706)
GenElute five-minute plasmid miniprep kit Sigma life science (PFM250-1KT)
JetStar 2.0 plasmid purification maxikit Genomed GmbH (220020)
miRVana miRNA isolation kit Ambion (AM 1560)
RNeasy Plus mini kit Qiagen (74134)
Qubit Protein Assay kit Life Technologies (Q33212)
2.1.5 Buffer recipes
SDS PAGE sample buffer (2x)
EDTA 25mM
Tris 100 mM
Glycerol 20%
SDS 4%
2 Mercaptoethanol 2%
Bromophenol blue 0.004%
SDS PAGE buffer (1x)
Tris 25 mM
Glycine 190 mM
SDS 0.1%
Materials and Methods
21
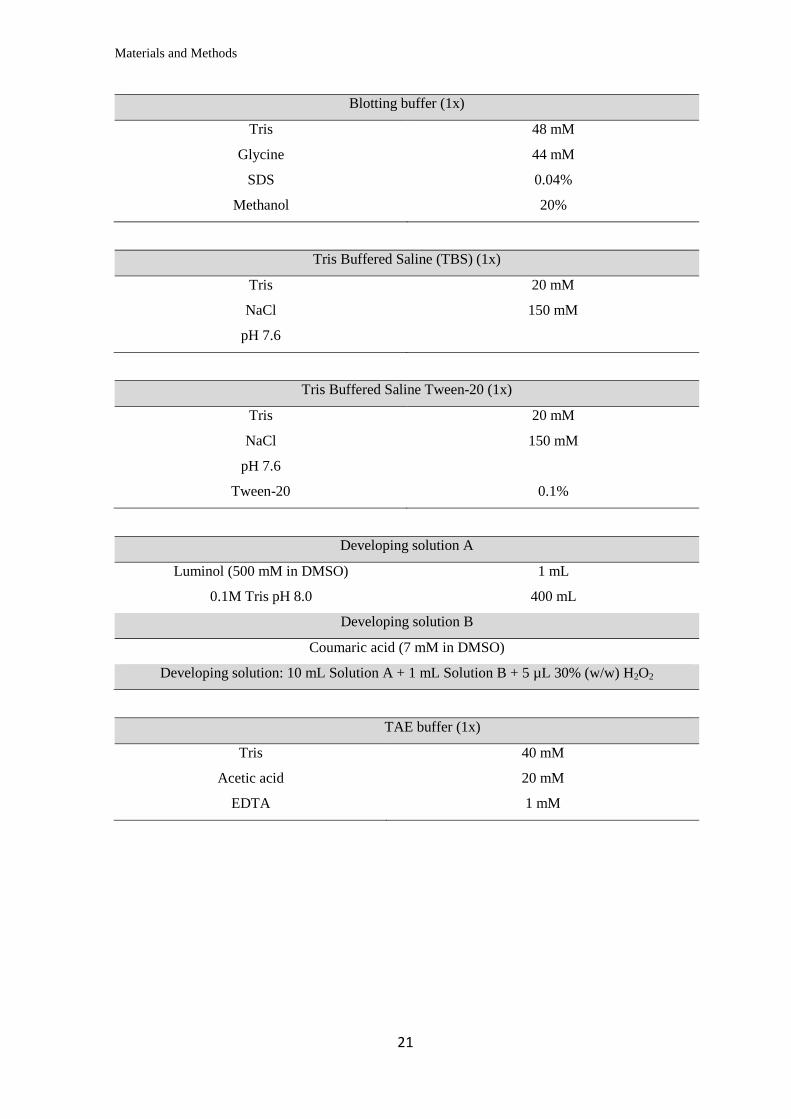
Blotting buffer (1x)
Tris 48 mM
Glycine 44 mM
SDS 0.04%
Methanol 20%
Tris Buffered Saline (TBS) (1x)
Tris 20 mM
NaCl 150 mM
pH 7.6
Tris Buffered Saline Tween-20 (1x)
Tris 20 mM
NaCl 150 mM
pH 7.6
Tween-20 0.1%
Developing solution A
Luminol (500 mM in DMSO) 1 mL
0.1M Tris pH 8.0 400 mL
Developing solution B
Coumaric acid (7 mM in DMSO)
Developing solution: 10 mL Solution A + 1 mL Solution B + 5 µL 30% (w/w) H2O2
TAE buffer (1x)
Tris 40 mM
Acetic acid 20 mM
EDTA 1 mM
Materials and Methods
22
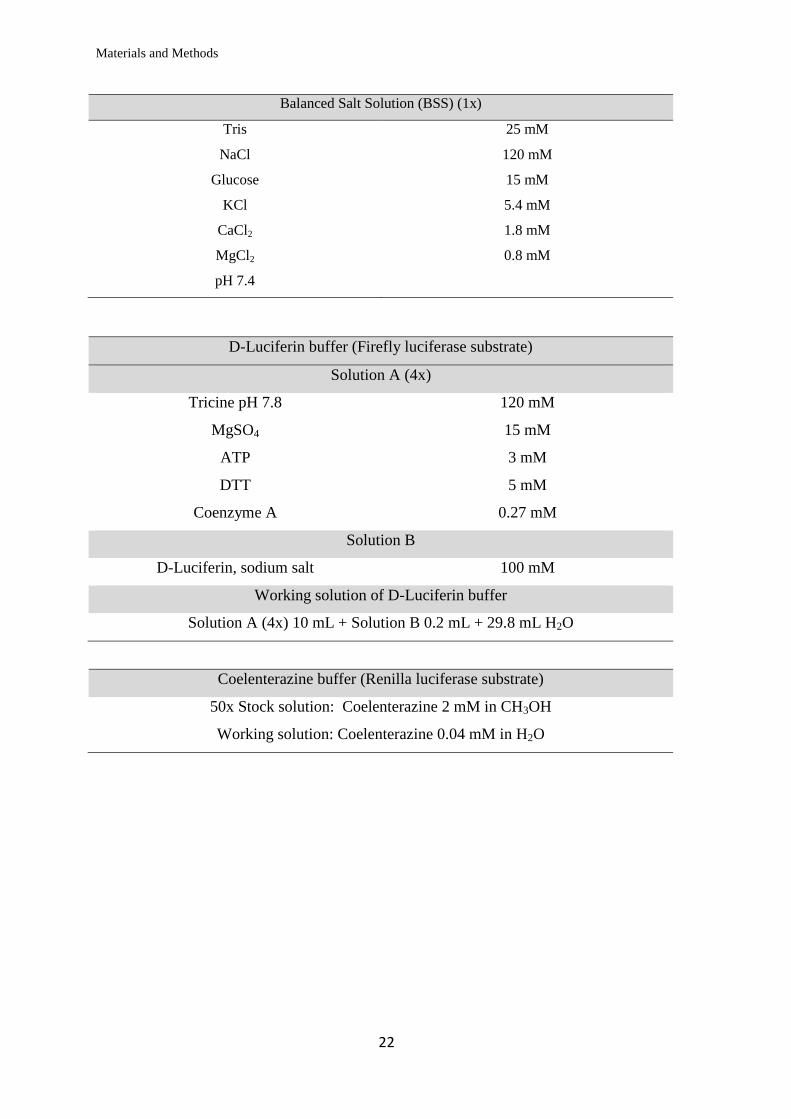
Balanced Salt Solution (BSS) (1x)
Tris 25 mM
NaCl 120 mM
Glucose 15 mM
KCl 5.4 mM
CaCl2 1.8 mM
MgCl2 0.8 mM
pH 7.4
D-Luciferin buffer (Firefly luciferase substrate)
Solution A (4x)
Tricine pH 7.8 120 mM
MgSO4 15 mM
ATP 3 mM
DTT 5 mM
Coenzyme A 0.27 mM
Solution B
D-Luciferin, sodium salt 100 mM
Working solution of D-Luciferin buffer
Solution A (4x) 10 mL + Solution B 0.2 mL + 29.8 mL H2O
Coelenterazine buffer (Renilla luciferase substrate)
50x Stock solution: Coelenterazine 2 mM in CH3OH
Working solution: Coelenterazine 0.04 mM in H2O
Materials and Methods
23
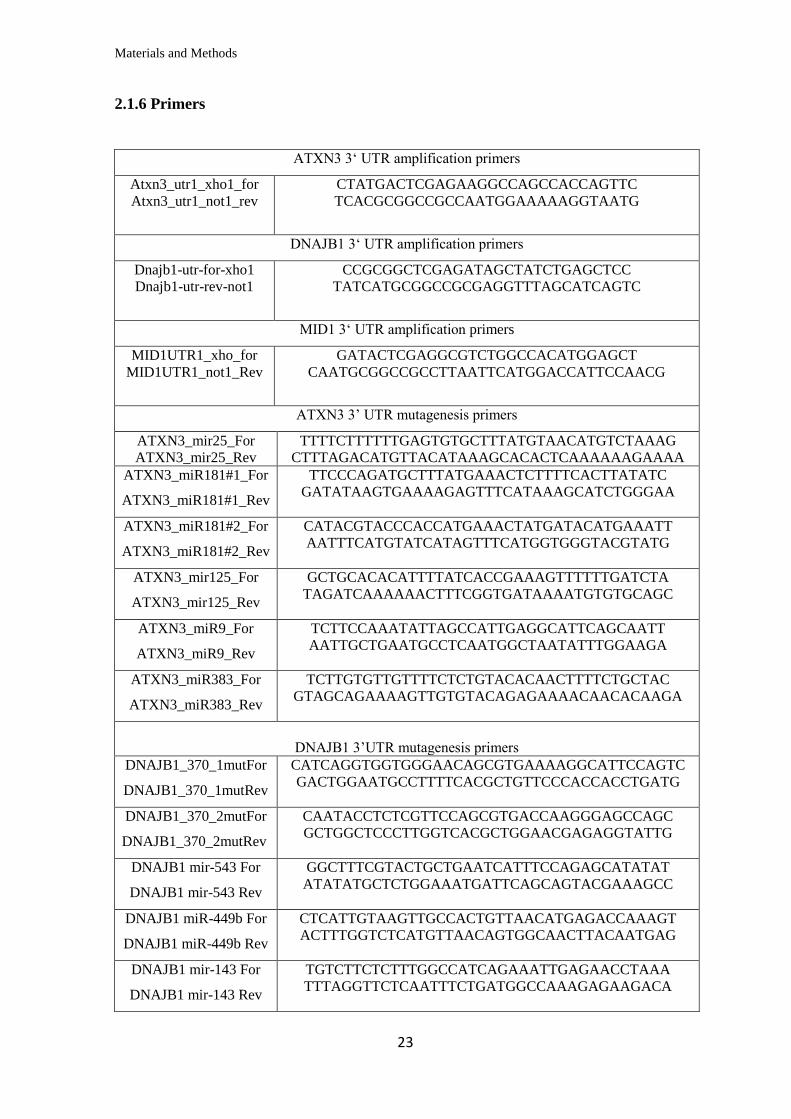
2.1.6 Primers
ATXN3 3‘ UTR amplification primers
Atxn3_utr1_xho1_for
Atxn3_utr1_not1_rev
CTATGACTCGAGAAGGCCAGCCACCAGTTC
TCACGCGGCCGCCAATGGAAAAAGGTAATG
DNAJB1 3‘ UTR amplification primers
Dnajb1-utr-for-xho1
Dnajb1-utr-rev-not1
CCGCGGCTCGAGATAGCTATCTGAGCTCC
TATCATGCGGCCGCGAGGTTTAGCATCAGTC
MID1 3‘ UTR amplification primers
MID1UTR1_xho_for
MID1UTR1_not1_Rev
GATACTCGAGGCGTCTGGCCACATGGAGCT
CAATGCGGCCGCCTTAATTCATGGACCATTCCAACG
ATXN3 3’ UTR mutagenesis primers
ATXN3_mir25_For
ATXN3_mir25_Rev
TTTTCTTTTTTGAGTGTGCTTTATGTAACATGTCTAAAG
CTTTAGACATGTTACATAAAGCACACTCAAAAAAGAAAA
ATXN3_miR181#1_For
ATXN3_miR181#1_Rev
TTCCCAGATGCTTTATGAAACTCTTTTCACTTATATC
GATATAAGTGAAAAGAGTTTCATAAAGCATCTGGGAA
ATXN3_miR181#2_For
ATXN3_miR181#2_Rev
CATACGTACCCACCATGAAACTATGATACATGAAATT
AATTTCATGTATCATAGTTTCATGGTGGGTACGTATG
ATXN3_mir125_For
ATXN3_mir125_Rev
GCTGCACACATTTTATCACCGAAAGTTTTTTGATCTA
TAGATCAAAAAACTTTCGGTGATAAAATGTGTGCAGC
ATXN3_miR9_For
ATXN3_miR9_Rev
TCTTCCAAATATTAGCCATTGAGGCATTCAGCAATT
AATTGCTGAATGCCTCAATGGCTAATATTTGGAAGA
ATXN3_miR383_For
ATXN3_miR383_Rev
TCTTGTGTTGTTTTCTCTGTACACAACTTTTCTGCTAC
GTAGCAGAAAAGTTGTGTACAGAGAAAACAACACAAGA
DNAJB1 3’UTR mutagenesis primers
DNAJB1_370_1mutFor
DNAJB1_370_1mutRev
CATCAGGTGGTGGGAACAGCGTGAAAAGGCATTCCAGTC
GACTGGAATGCCTTTTCACGCTGTTCCCACCACCTGATG
DNAJB1_370_2mutFor
DNAJB1_370_2mutRev
CAATACCTCTCGTTCCAGCGTGACCAAGGGAGCCAGC
GCTGGCTCCCTTGGTCACGCTGGAACGAGAGGTATTG
DNAJB1 mir-543 For
DNAJB1 mir-543 Rev
GGCTTTCGTACTGCTGAATCATTTCCAGAGCATATAT
ATATATGCTCTGGAAATGATTCAGCAGTACGAAAGCC
DNAJB1 miR-449b For
DNAJB1 miR-449b Rev
CTCATTGTAAGTTGCCACTGTTAACATGAGACCAAAGT
ACTTTGGTCTCATGTTAACAGTGGCAACTTACAATGAG
DNAJB1 mir-143 For
DNAJB1 mir-143 Rev
TGTCTTCTCTTTGGCCATCAGAAATTGAGAACCTAAA
TTTAGGTTCTCAATTTCTGATGGCCAAAGAGAAGACA
Materials and Methods
24
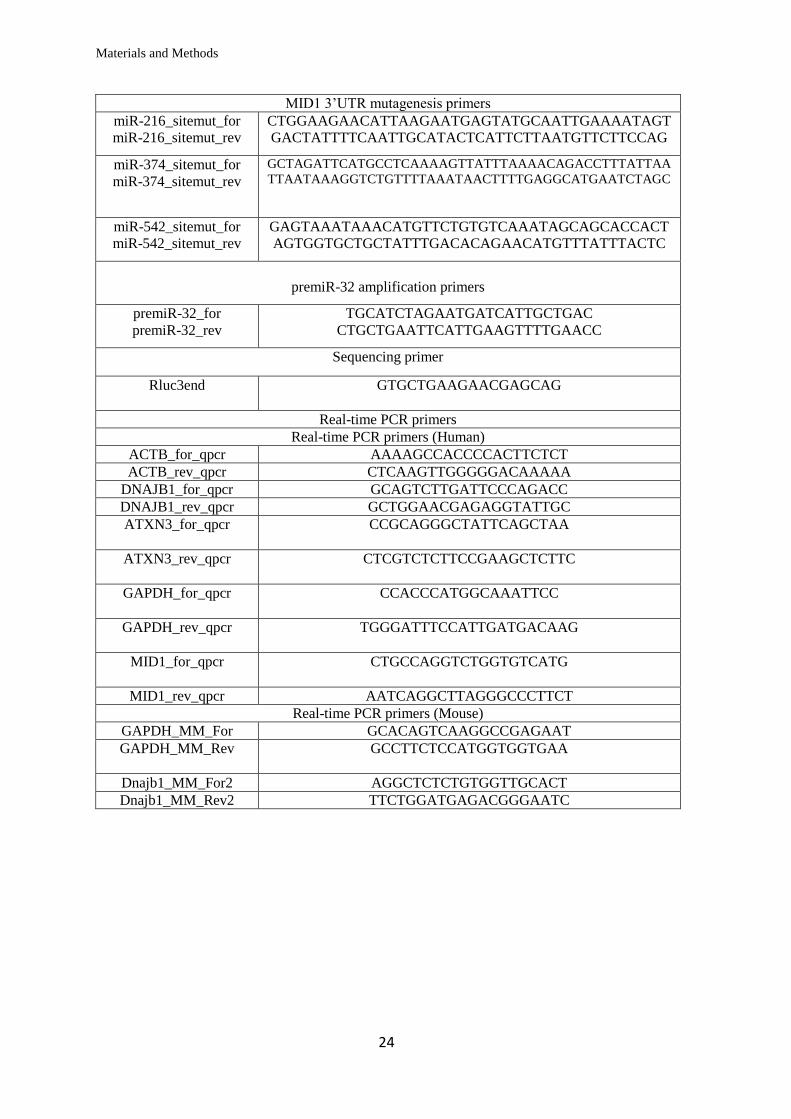
MID1 3’UTR mutagenesis primers
miR-216_sitemut_for
miR-216_sitemut_rev
CTGGAAGAACATTAAGAATGAGTATGCAATTGAAAATAGT
GACTATTTTCAATTGCATACTCATTCTTAATGTTCTTCCAG
miR-374_sitemut_for
miR-374_sitemut_rev
GCTAGATTCATGCCTCAAAAGTTATTTAAAACAGACCTTTATTAA
TTAATAAAGGTCTGTTTTAAATAACTTTTGAGGCATGAATCTAGC
miR-542_sitemut_for
miR-542_sitemut_rev
GAGTAAATAAACATGTTCTGTGTCAAATAGCAGCACCACT
AGTGGTGCTGCTATTTGACACAGAACATGTTTATTTACTC
premiR-32 amplification primers
premiR-32_for
premiR-32_rev
TGCATCTAGAATGATCATTGCTGAC
CTGCTGAATTCATTGAAGTTTTGAACC
Sequencing primer
Rluc3end GTGCTGAAGAACGAGCAG
Real-time PCR primers
Real-time PCR primers (Human)
ACTB_for_qpcr AAAAGCCACCCCACTTCTCT
ACTB_rev_qpcr CTCAAGTTGGGGGACAAAAA
DNAJB1_for_qpcr GCAGTCTTGATTCCCAGACC
DNAJB1_rev_qpcr GCTGGAACGAGAGGTATTGC
ATXN3_for_qpcr CCGCAGGGCTATTCAGCTAA
ATXN3_rev_qpcr CTCGTCTCTTCCGAAGCTCTTC
GAPDH_for_qpcr CCACCCATGGCAAATTCC
GAPDH_rev_qpcr TGGGATTTCCATTGATGACAAG
MID1_for_qpcr CTGCCAGGTCTGGTGTCATG
MID1_rev_qpcr AATCAGGCTTAGGGCCCTTCT
Real-time PCR primers (Mouse)
GAPDH_MM_For GCACAGTCAAGGCCGAGAAT
GAPDH_MM_Rev GCCTTCTCCATGGTGGTGAA
Dnajb1_MM_For2 AGGCTCTCTGTGGTTGCACT
Dnajb1_MM_Rev2 TTCTGGATGAGACGGGAATC
Materials and Methods
25
2.1.7 miRNA mimics/siRNAs
miRNA mimics Sequence
hsa-miR-32 UAUUGCACAUUACUAAGUUGCA
hsa-miR-181c AACAUUCAACCUGUCGGUGAGU
hsa-miR-216a-5p UAAUCUCAGCUGGCAACUGUGA
hsa-miR-374a-5p UUAUAAUACAACCUGAUAAGUG
hsa-miR-542a-3p UGUGACAGAUUGAUAACUGAAA
hsa-miR-370 GCCUGCUGGGGUGGAACCUGGU
hsa-miR-543 AAACAUUCGCGGUGCACUUCUU
control siRNA1 AATTCTCCGAACGTGTCACGT
2.1.8 Antibodies
Primary antibodies
The abbreviations IB and IF stand for immunoblotting and immunofluorescence
respectively and denote the application for which a specific antibody dilution was used.
Name Source Dilution Company/Provider
GAPDH Rabbit monoclonal IB: 1: 5000 Cell Signalling
(2118L/2118S)
DNAJB1 (Hsp40) Rabbit polyclonal IB: 1:5000
IF: 1:300
Enzo (ADI-SPA-
400)
α-Tubulin Rat monoclonal IB: 1:5000 Serotec (MCA77G)
c-Myc Mouse monoclonal IF: 1:300 Clontech (631206)
ATXN3, clone 1H9 Mouse monoclonal IB: 1: 1000 Millipore
(MAB5360)
MID1 Rabbit polyclonal IB: 1:200 AG Krauss (DZNE,
Bonn)
ATXN3 (no.986) Rabbit polyclonal IB: 1:5000 Dr. Peter Breuer
(Uniklinik Bonn)
Materials and Methods
26
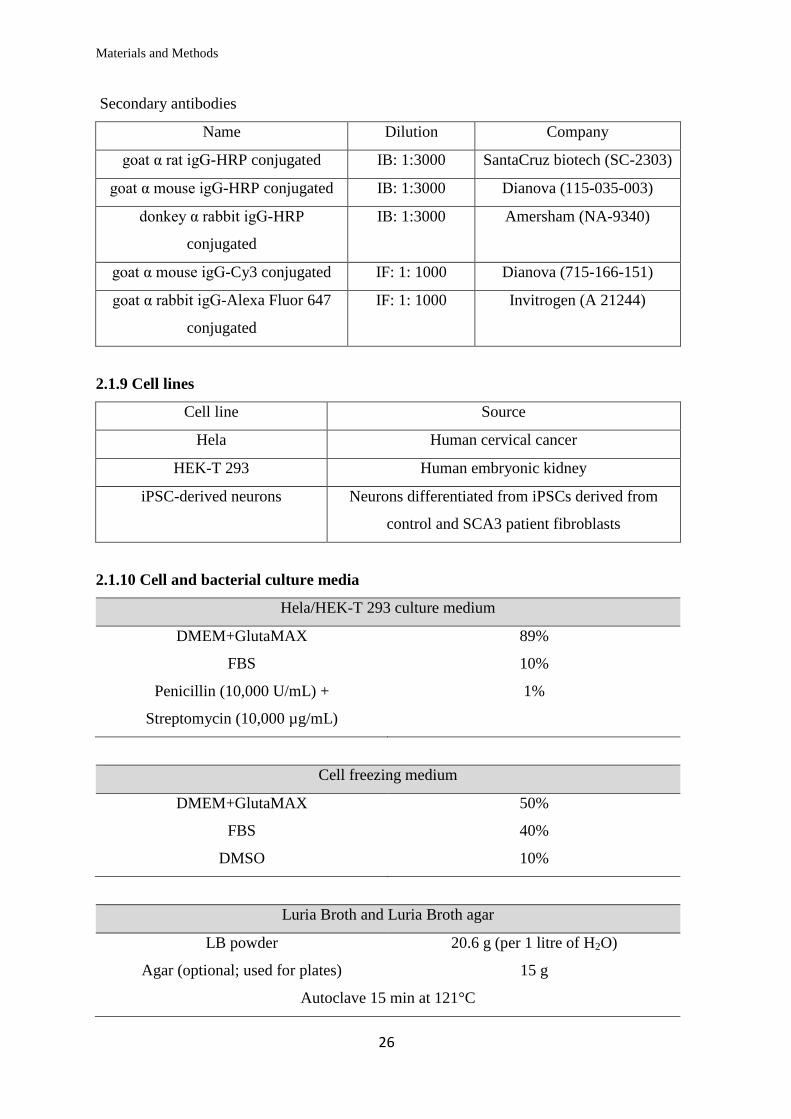
Secondary antibodies
Name Dilution Company
goat α rat igG-HRP conjugated IB: 1:3000 SantaCruz biotech (SC-2303)
goat α mouse igG-HRP conjugated IB: 1:3000 Dianova (115-035-003)
donkey α rabbit igG-HRP
conjugated
IB: 1:3000 Amersham (NA-9340)
goat α mouse igG-Cy3 conjugated IF: 1: 1000 Dianova (715-166-151)
goat α rabbit igG-Alexa Fluor 647
conjugated
IF: 1: 1000 Invitrogen (A 21244)
2.1.9 Cell lines
Cell line Source
Hela Human cervical cancer
HEK-T 293 Human embryonic kidney
iPSC-derived neurons Neurons differentiated from iPSCs derived from
control and SCA3 patient fibroblasts
2.1.10 Cell and bacterial culture media
Hela/HEK-T 293 culture medium
DMEM+GlutaMAX 89%
FBS 10%
Penicillin (10,000 U/mL) +
Streptomycin (10,000 µg/mL)
1%
Cell freezing medium
DMEM+GlutaMAX 50%
FBS 40%
DMSO 10%
Luria Broth and Luria Broth agar
LB powder 20.6 g (per 1 litre of H2O)
Agar (optional; used for plates) 15 g
Autoclave 15 min at 121°C

Materials and Methods
27
Section 2.2 Methods
2.2.1 Prediction of miRNA target sites
Predictions for miRNA binding sites on 3’UTRs of ATXN3, MID1, DNAJB1 were done
using the following two target prediction tools:
1. TargetScan Human prediction database Release 6.2, June 2012 (www.targetscan.org)
(Lewis et al, 2005)
TargetScan considers several parameters contributing to mRNA targeting by stable
mRNA-miRNA binding at specific sites such as:
Type of Watson-Crick (WC) match at the seed region of the miRNA (8mer, 7mer-
m8, 7mer-A1) (Grimson et al, 2007)
WC match at the 3’ end of the miRNA (Friedman et al, 2009; Grimson et al,
2007)
Number of A and U nucleotides flanking the miRNA sequence (Grimson et al,
2007)
Position of the target site within the entire mRNA (Grimson et al, 2007)
Free energy of the mRNA-miRNA duplex (Garcia et al, 2011)
Abundance of mRNAs with target sites for a particular miRNA (Garcia et al,
2011)
Preferential evolutionary conservation of the specific target site to maintain
miRNA targeting (Lewis et al, 2005)
For the TargetScan predictions, the longest 3’UTR of the respective mRNAs was
considered. miRNAs belonging to miRNA families either conserved only in mammals or
conserved broadly in vertebrates were considered for the predictions.
2. miRanda-miRSVR database, August 2010 Release (www.mirna.org) (Betel et al, 2010;
Betel et al, 2008)
For the miRanda-miRSVR predictions, the species was defined (Homo sapiens) and the
predictions for the suggested transcript were considered along with miRNA binding
alignment details.
Materials and Methods
28
2.2.2 Molecular cloning
Cloning of 3’UTR sequence into the luciferase reporter vector
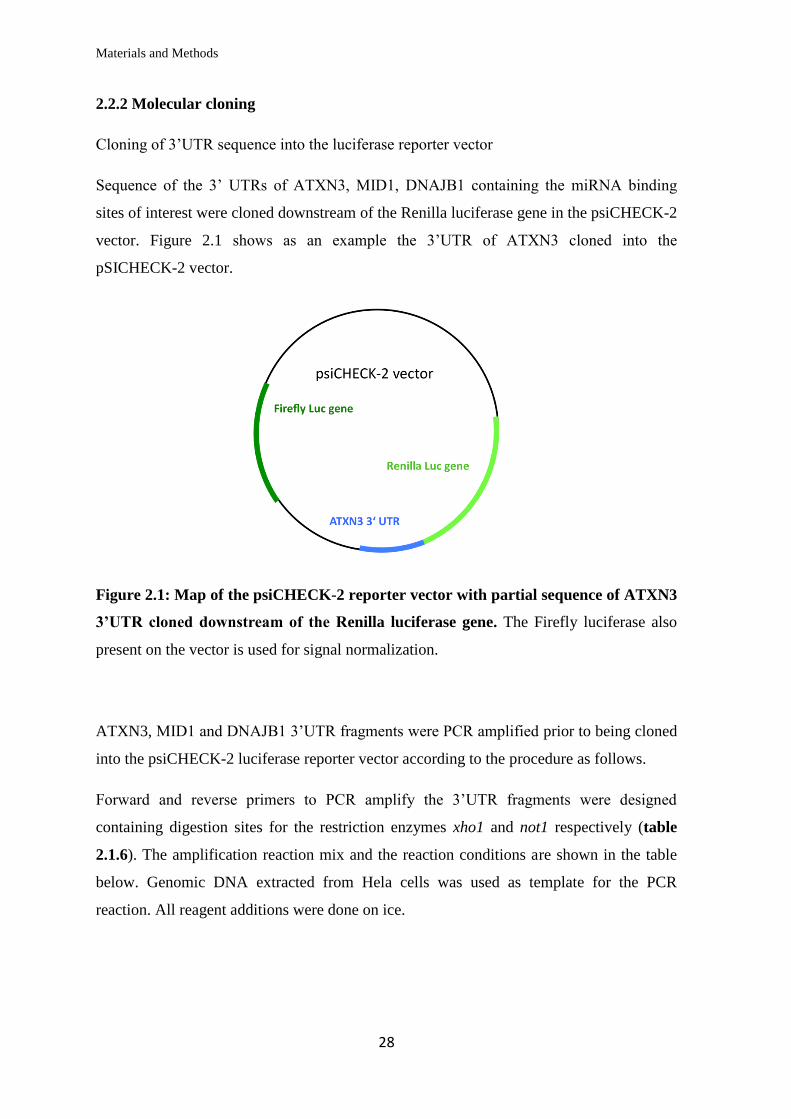
Sequence of the 3’ UTRs of ATXN3, MID1, DNAJB1 containing the miRNA binding
sites of interest were cloned downstream of the Renilla luciferase gene in the psiCHECK-2
vector. Figure 2.1 shows as an example the 3’UTR of ATXN3 cloned into the
pSICHECK-2 vector.
Figure 2.1: Map of the psiCHECK-2 reporter vector with partial sequence of ATXN3
3’UTR cloned downstream of the Renilla luciferase gene. The Firefly luciferase also
present on the vector is used for signal normalization.
ATXN3, MID1 and DNAJB1 3’UTR fragments were PCR amplified prior to being cloned
into the psiCHECK-2 luciferase reporter vector according to the procedure as follows.
Forward and reverse primers to PCR amplify the 3’UTR fragments were designed
containing digestion sites for the restriction enzymes xho1 and not1 respectively (table
2.1.6). The amplification reaction mix and the reaction conditions are shown in the table
below. Genomic DNA extracted from Hela cells was used as template for the PCR
reaction. All reagent additions were done on ice.
Materials and Methods
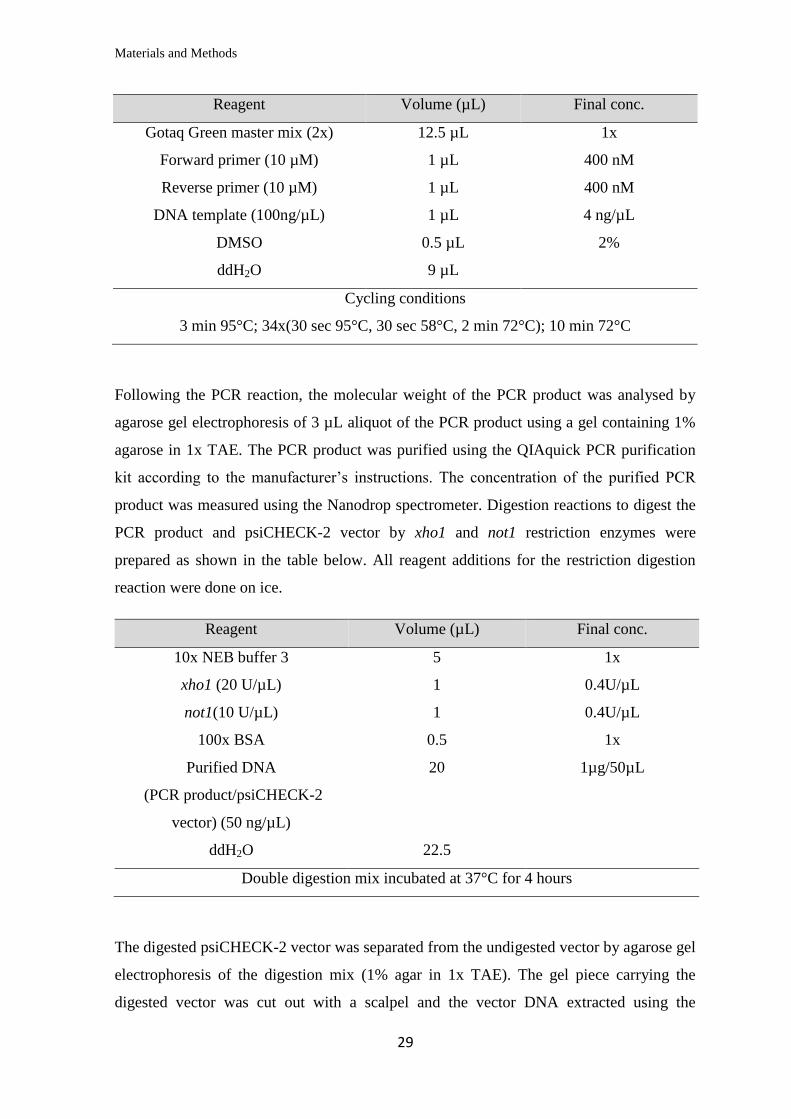
29
Reagent Volume (µL) Final conc.
Gotaq Green master mix (2x) 12.5 µL 1x
Forward primer (10 µM) 1 µL 400 nM
Reverse primer (10 µM) 1 µL 400 nM
DNA template (100ng/µL) 1 µL 4 ng/µL
DMSO 0.5 µL 2%
ddH2O 9 µL
Cycling conditions
3 min 95°C; 34x(30 sec 95°C, 30 sec 58°C, 2 min 72°C); 10 min 72°C
Following the PCR reaction, the molecular weight of the PCR product was analysed by
agarose gel electrophoresis of 3 µL aliquot of the PCR product using a gel containing 1%
agarose in 1x TAE. The PCR product was purified using the QIAquick PCR purification
kit according to the manufacturer’s instructions. The concentration of the purified PCR
product was measured using the Nanodrop spectrometer. Digestion reactions to digest the
PCR product and psiCHECK-2 vector by xho1 and not1 restriction enzymes were
prepared as shown in the table below. All reagent additions for the restriction digestion
reaction were done on ice.
Reagent Volume (µL) Final conc.
10x NEB buffer 3 5 1x
xho1 (20 U/µL) 1 0.4U/µL
not1(10 U/µL) 1 0.4U/µL
100x BSA 0.5 1x
Purified DNA
(PCR product/psiCHECK-2
vector) (50 ng/µL)
20 1µg/50µL
ddH2O 22.5
Double digestion mix incubated at 37°C for 4 hours
The digested psiCHECK-2 vector was separated from the undigested vector by agarose gel
electrophoresis of the digestion mix (1% agar in 1x TAE). The gel piece carrying the
digested vector was cut out with a scalpel and the vector DNA extracted using the
Materials and Methods
30
QIAquick Gel extraction kit using the manufacturer’s instructions. Meanwhile the double
digested PCR product was purified using the QIAquick PCR purification kit according to
the manufacturer’s instructions. The DNA concentration of the digested, purified PCR
product and psiCHECK-2 vector was measured using the Nanodrop spectrometer.
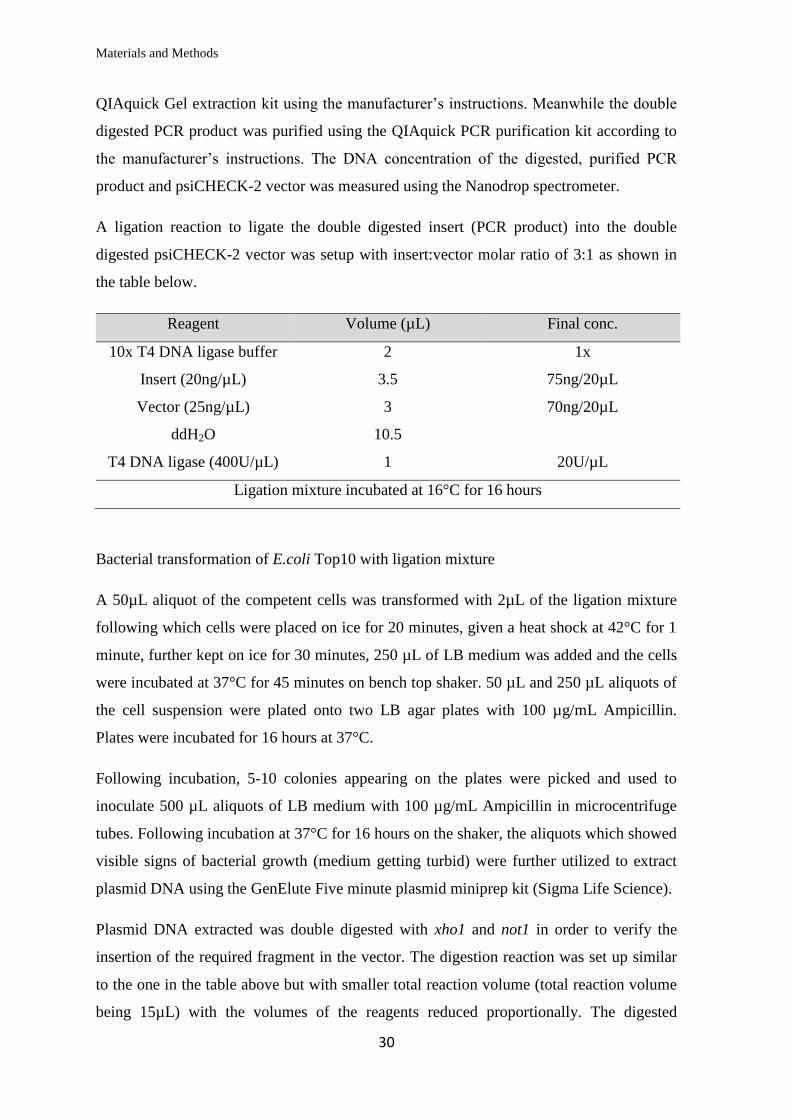
A ligation reaction to ligate the double digested insert (PCR product) into the double
digested psiCHECK-2 vector was setup with insert:vector molar ratio of 3:1 as shown in
the table below.
Reagent Volume (µL) Final conc.
10x T4 DNA ligase buffer 2 1x
Insert (20ng/µL) 3.5 75ng/20µL
Vector (25ng/µL) 3 70ng/20µL
ddH2O 10.5
T4 DNA ligase (400U/µL) 1 20U/µL
Ligation mixture incubated at 16°C for 16 hours
Bacterial transformation of E.coli Top10 with ligation mixture
A 50µL aliquot of the competent cells was transformed with 2µL of the ligation mixture
following which cells were placed on ice for 20 minutes, given a heat shock at 42°C for 1
minute, further kept on ice for 30 minutes, 250 µL of LB medium was added and the cells
were incubated at 37°C for 45 minutes on bench top shaker. 50 µL and 250 µL aliquots of
the cell suspension were plated onto two LB agar plates with 100 µg/mL Ampicillin.
Plates were incubated for 16 hours at 37°C.
Following incubation, 5-10 colonies appearing on the plates were picked and used to
inoculate 500 µL aliquots of LB medium with 100 µg/mL Ampicillin in microcentrifuge
tubes. Following incubation at 37°C for 16 hours on the shaker, the aliquots which showed
visible signs of bacterial growth (medium getting turbid) were further utilized to extract
plasmid DNA using the GenElute Five minute plasmid miniprep kit (Sigma Life Science).
Plasmid DNA extracted was double digested with xho1 and not1 in order to verify the
insertion of the required fragment in the vector. The digestion reaction was set up similar
to the one in the table above but with smaller total reaction volume (total reaction volume
being 15µL) with the volumes of the reagents reduced proportionally. The digested
Materials and Methods
31
plasmid DNA was run on 1% agarose gel to separate the cleaved insert from the vector.
Up to three clones carrying the insert as suggested by agarose gel electrophoresis were
sequenced using the reverse primer used for PCR amplification and the Rluc3’end primer.
The sequencing was done by GATC Biotech and the sequences were analysed using the
4Peaks software.
Based on the sequencing results a bacterial clone carrying the plasmid with the desired
insert sequence was chosen for generation of large amounts of the plasmid to be used for
transfection experiments of mammalian cells. For this, 100 mL of LB with 100µg/mL of
Ampicillin was inoculated with an aliquot of the bacterial clone. The inoculum was
incubated in a shaker incubator at 37°C for 16 hours at 150 rpm. Plasmid DNA was
extracted from the bacterial suspension using the Jetstar 2.0 plasmid maxiprep kit. The
purified plasmid DNA was eluted in 1 mL of Nuclease free H2O and the DNA
concentration measured using the Nanodrop spectrometer.
The presence of the insert and its sequence were verified once more by repeating the xho1,
not1 double digest and sequencing as described above.
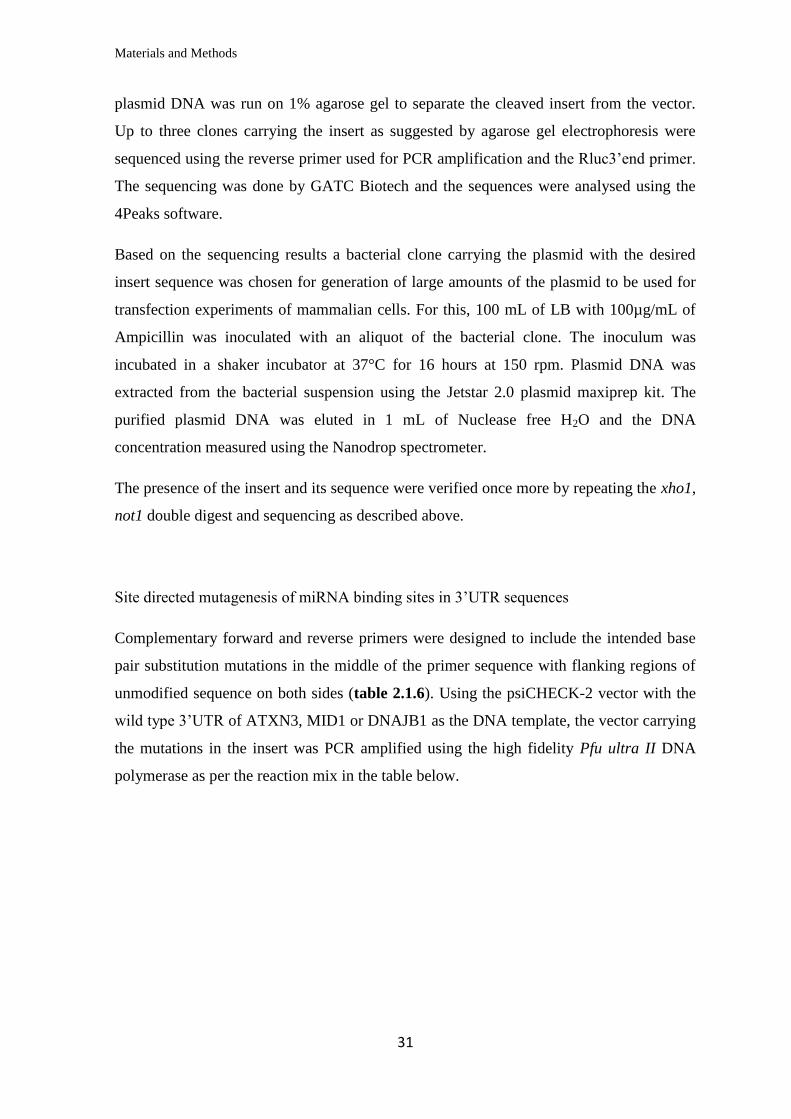
Site directed mutagenesis of miRNA binding sites in 3’UTR sequences
Complementary forward and reverse primers were designed to include the intended base
pair substitution mutations in the middle of the primer sequence with flanking regions of
unmodified sequence on both sides (table 2.1.6). Using the psiCHECK-2 vector with the
wild type 3’UTR of ATXN3, MID1 or DNAJB1 as the DNA template, the vector carrying
the mutations in the insert was PCR amplified using the high fidelity Pfu ultra II DNA
polymerase as per the reaction mix in the table below.
Materials and Methods
32
Reagent Volume (µL) Final conc.
10x Pfu ultra II HF reaction buffer 5 1x
Forward primer (10 µM) 1 200 nM
Reverse primer (10 µM) 1 200 nM
DNA template (50 ng/µL) 1 1ng/µL
dNTP mix (40 mM) 1 800 µM
DMSO 3 6%
ddH2O 37
Pfu ultra II HF polymerase (2.5U/µL) 1 0.05U/µL
Cycling conditions
1 min 95°C; 18x (50 sec 95°C, 50 sec 60°C, 8 min 68°C); 7 min 68°C
1 µL of Dpn I restriction enzyme (10U/µL) was added to the PCR product and the product
was incubated at 37°C for 2 hours to digest the non-mutated vector. 5 µL of the digested
product was separated on 1% agarose gel. Presence of a band at the expected molecular
weight confirmed the PCR amplification of the vector with the mutant insert. The
subsequent procedure including bacterial transformation, plasmid DNA extraction,
sequencing was the same as described before.
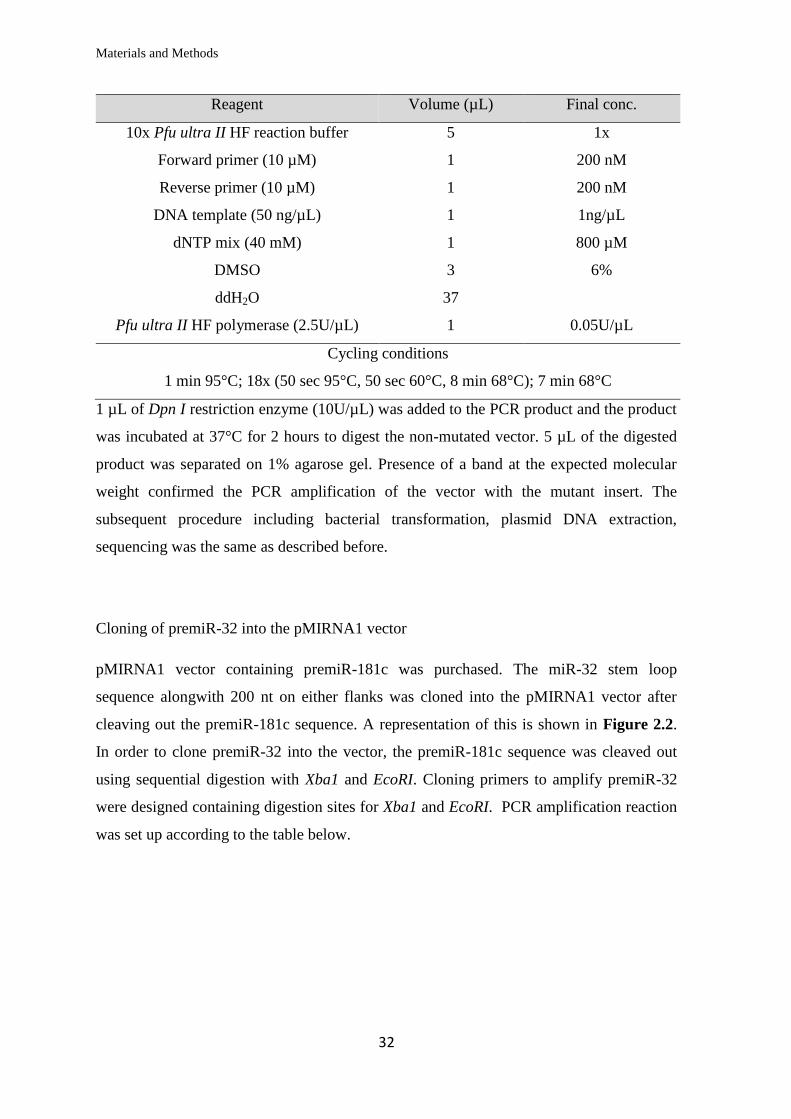
Cloning of premiR-32 into the pMIRNA1 vector
pMIRNA1 vector containing premiR-181c was purchased. The miR-32 stem loop
sequence alongwith 200 nt on either flanks was cloned into the pMIRNA1 vector after
cleaving out the premiR-181c sequence. A representation of this is shown in Figure 2.2.
In order to clone premiR-32 into the vector, the premiR-181c sequence was cleaved out
using sequential digestion with Xba1 and EcoRI. Cloning primers to amplify premiR-32
were designed containing digestion sites for Xba1 and EcoRI. PCR amplification reaction
was set up according to the table below.
Materials and Methods
33
Reagent Volume (µL) Final conc.
Gotaq Green master mix (2x) 12.5 µL 1x
Forward primer (10 µM) 1 µL 400 nM
Reverse primer (10 µM) 1 µL 400 nM
DNA template (100ng/µL) 1 µL 4 ng/µL
DMSO 0.5 µL 2%
ddH2O 9 µL
Cycling conditions
3 min 95°C; 34x(30 sec 95°C, 30 sec 60°C, 2 min 72°C); 10 min 72°C
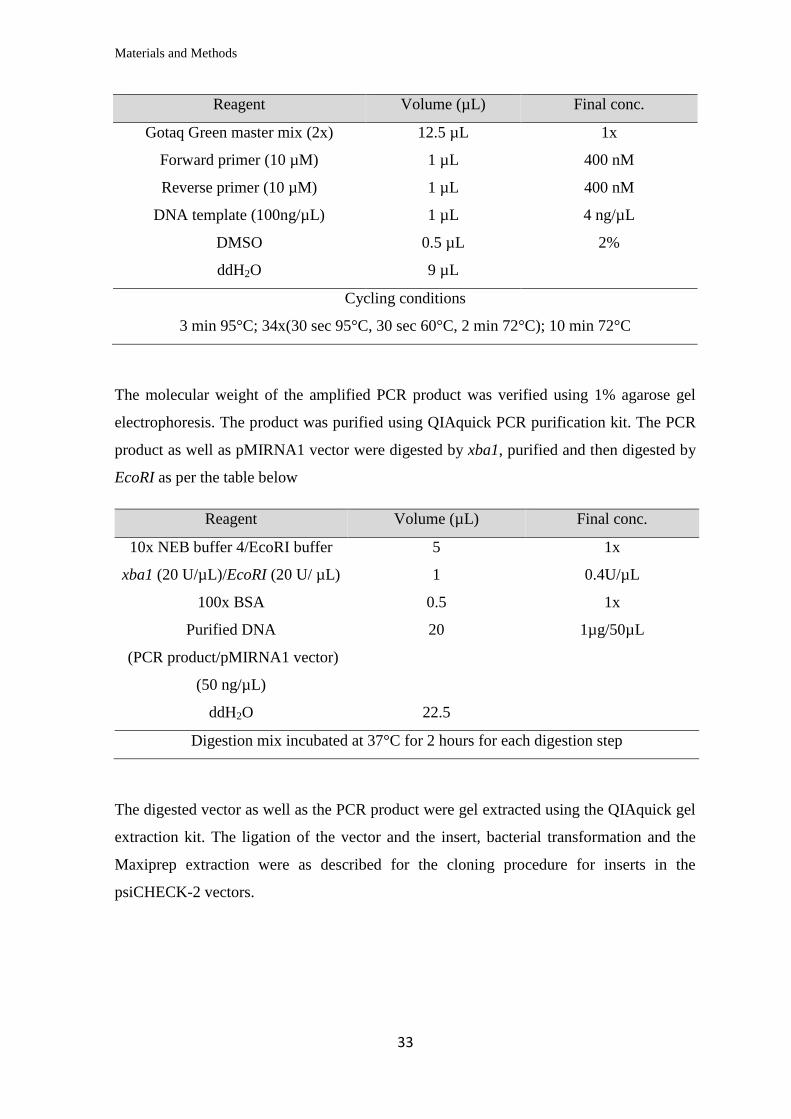
The molecular weight of the amplified PCR product was verified using 1% agarose gel
electrophoresis. The product was purified using QIAquick PCR purification kit. The PCR
product as well as pMIRNA1 vector were digested by xba1, purified and then digested by
EcoRI as per the table below
Reagent Volume (µL) Final conc.
10x NEB buffer 4/EcoRI buffer 5 1x
xba1 (20 U/µL)/EcoRI (20 U/ µL) 1 0.4U/µL
100x BSA 0.5 1x
Purified DNA
(PCR product/pMIRNA1 vector)
(50 ng/µL)
20 1µg/50µL
ddH2O 22.5
Digestion mix incubated at 37°C for 2 hours for each digestion step
The digested vector as well as the PCR product were gel extracted using the QIAquick gel
extraction kit. The ligation of the vector and the insert, bacterial transformation and the
Maxiprep extraction were as described for the cloning procedure for inserts in the
psiCHECK-2 vectors.
Materials and Methods
34
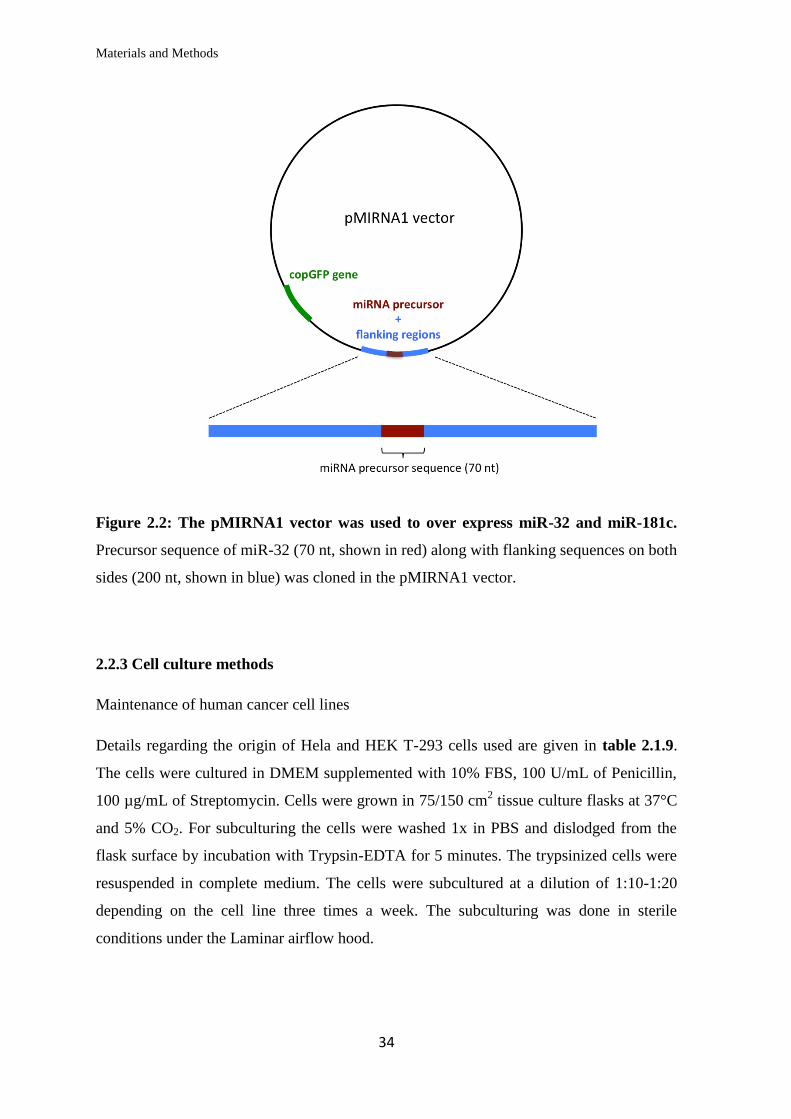
Figure 2.2: The pMIRNA1 vector was used to over express miR-32 and miR-181c.
Precursor sequence of miR-32 (70 nt, shown in red) along with flanking sequences on both
sides (200 nt, shown in blue) was cloned in the pMIRNA1 vector.
2.2.3 Cell culture methods
Maintenance of human cancer cell lines
Details regarding the origin of Hela and HEK T-293 cells used are given in table 2.1.9.
The cells were cultured in DMEM supplemented with 10% FBS, 100 U/mL of Penicillin,
100 µg/mL of Streptomycin. Cells were grown in 75/150 cm2 tissue culture flasks at 37°C
and 5% CO2. For subculturing the cells were washed 1x in PBS and dislodged from the
flask surface by incubation with Trypsin-EDTA for 5 minutes. The trypsinized cells were
resuspended in complete medium. The cells were subcultured at a dilution of 1:10-1:20
depending on the cell line three times a week. The subculturing was done in sterile
conditions under the Laminar airflow hood.
Materials and Methods
35
Counting of cells
Cells were trypsinized and resuspended in complete medium. 25 µL of the cell suspension
was diluted in 10 mL of CASY ton solution in a CASY tube. The capillary of the CASY
cell analysis system was washed 1x in CASY ton. The CASY tube carrying the cell
suspension was placed under the capillary and the cells counted choosing the appropriate
program (default programs for Hela and HEK T-293 cells were used). Cell count per mL
was calculated by considering the dilution factor (by multiplying the displayed cell count
by 4).
Freezing of cells
Cells grown to about 80% confluency in tissue culture flasks were trypsinized, suspended
in complete medium and transferred to 50 mL centrifuge tube. Cells were counted to
determine the cell count per mL and centrifuged at 1500 rpm for 5 minutes in order to
pellet them. The supernatant was removed and the cells were resuspended in ice cool
freezing medium (50% DMEM, 40% FBS, 10% DMSO). The volume of freezing medium
for resuspension was such that the cell count would be 2 million cells per mL of freezing
medium. 1 mL aliquots of the resuspended cells were prepared in cryo tubes. The cryo
tubes were immediately transferred to a pre cooled cell freezing container containing
isopropyl alcohol and transferred to -80°C freezer. After storage -80°C for 24 hours the
cells were transferred to the liquid nitrogen tank for long term storage.
Thawing of cells
Cells frozen in liquid nitrogen were thawed by immersing the cryo tube in water bath at
37°C till the ice crystals inside the cryo tube had melted. Cells from each cryo tube were
transferred to 150 cm2 tissue culture flask containing complete medium. Cells were
incubated under appropriate culture conditions (37°C, 5% CO2) for 24 hours after which
the medium was replaced with fresh complete medium.

Materials and Methods
36
Transfection of miRNA mimics and control siRNAs
Cells were transfected with miRNA mimics and control siRNAs using the method of
reverse transfection, in which the transfection mix was added to the cell culture plate first
and cells were then seeded into the mix. Two separate solutions, solution A containing the
miRNA mimics or control siRNAs and solution B containing the transfection reagent
Lipofectamine 2000 were prepared separately in microcentrifuge tubes. For the miRNA
mimics, each mimic was transfected at a final amount of 30 picomoles per well of the 12-
well plate. The control siRNA amounts were adjusted according to the number of miRNA
mimics transfected together such that the total RNA amount was equal in the control/test
wells. Therefore, 60 picomoles of control siRNA were used in the experiment where two
miRNAs transfected, 90 picomoles of control siRNA for experiment where three miRNAs
were transfected. The table below shows the transfection mix preparation for experiment
with two miRNA mimics.
Volume per one well of 12-well plate (µL)
Solution A Opti-MEM 47
miRNA1 stock (20 µM)
miRNA2 stock (20 µM)
1.5
1.5
Solution B Opti-MEM 49
Lipofectamine 2000 1
Solution A was added dropwise to solution B to make up the transfection mix. The
transfection mix was incubated on the benchtop for 20 minutes. The transfection mix was
then added to each well of a 12-well plate. While the transfection mix was incubating, the
cells were trypsinized, counted and a cell suspension with a cell count of 100,000 cells/mL
was prepared in complete medium. 1 mL of the cell suspension was added dropwise to
each well of the 12-well plate already containing the transfection mix. The cells were
grown for 48 hours under appropriate culture conditions (37°C, 5% CO2).
Transfection of Luciferase reporter vectors
Cells were transfected with Luciferase reporter constructs using the method of forward
transfection, in which the cells were seeded in plates prior to transfection. In this
experiment, the cells were seeded in 12-well tissue culture plates at a density of 100,000
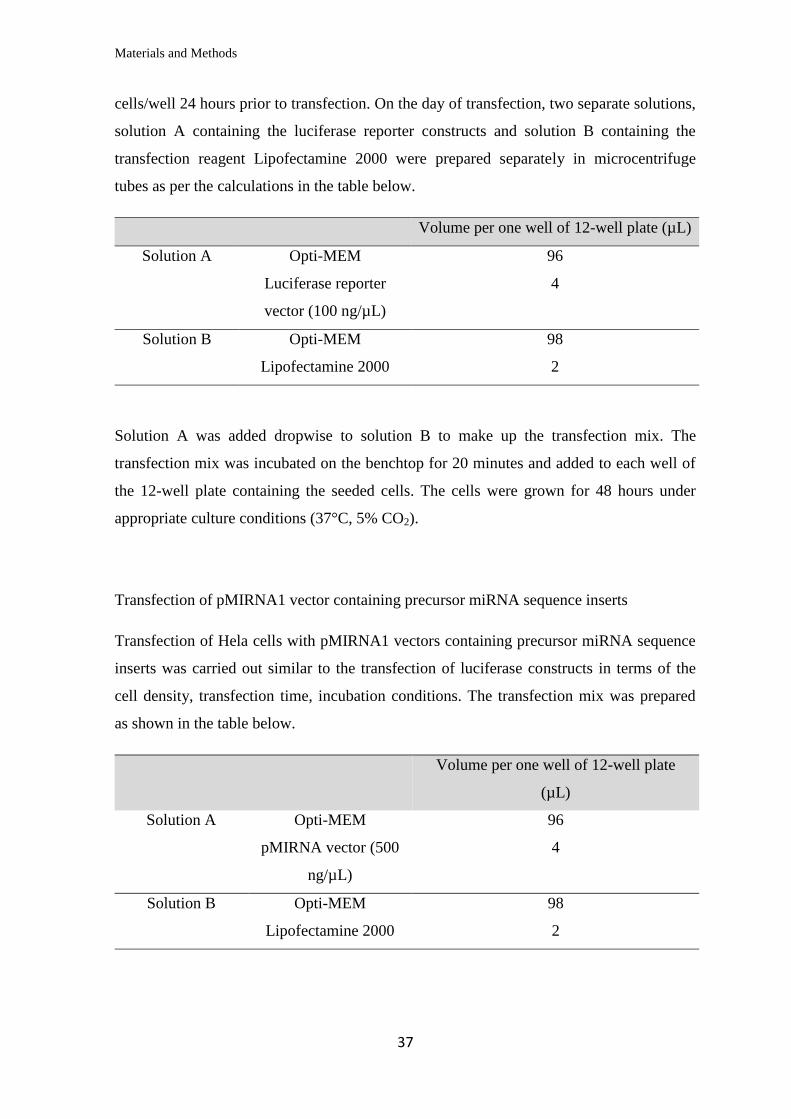
Materials and Methods
37
cells/well 24 hours prior to transfection. On the day of transfection, two separate solutions,
solution A containing the luciferase reporter constructs and solution B containing the
transfection reagent Lipofectamine 2000 were prepared separately in microcentrifuge
tubes as per the calculations in the table below.
Volume per one well of 12-well plate (µL)
Solution A Opti-MEM 96
Luciferase reporter
vector (100 ng/µL)
4
Solution B Opti-MEM 98
Lipofectamine 2000 2
Solution A was added dropwise to solution B to make up the transfection mix. The
transfection mix was incubated on the benchtop for 20 minutes and added to each well of
the 12-well plate containing the seeded cells. The cells were grown for 48 hours under
appropriate culture conditions (37°C, 5% CO2).
Transfection of pMIRNA1 vector containing precursor miRNA sequence inserts
Transfection of Hela cells with pMIRNA1 vectors containing precursor miRNA sequence
inserts was carried out similar to the transfection of luciferase constructs in terms of the
cell density, transfection time, incubation conditions. The transfection mix was prepared
as shown in the table below.
Volume per one well of 12-well plate
(µL)
Solution A Opti-MEM 96
pMIRNA vector (500
ng/µL)
4
Solution B Opti-MEM 98
Lipofectamine 2000 2
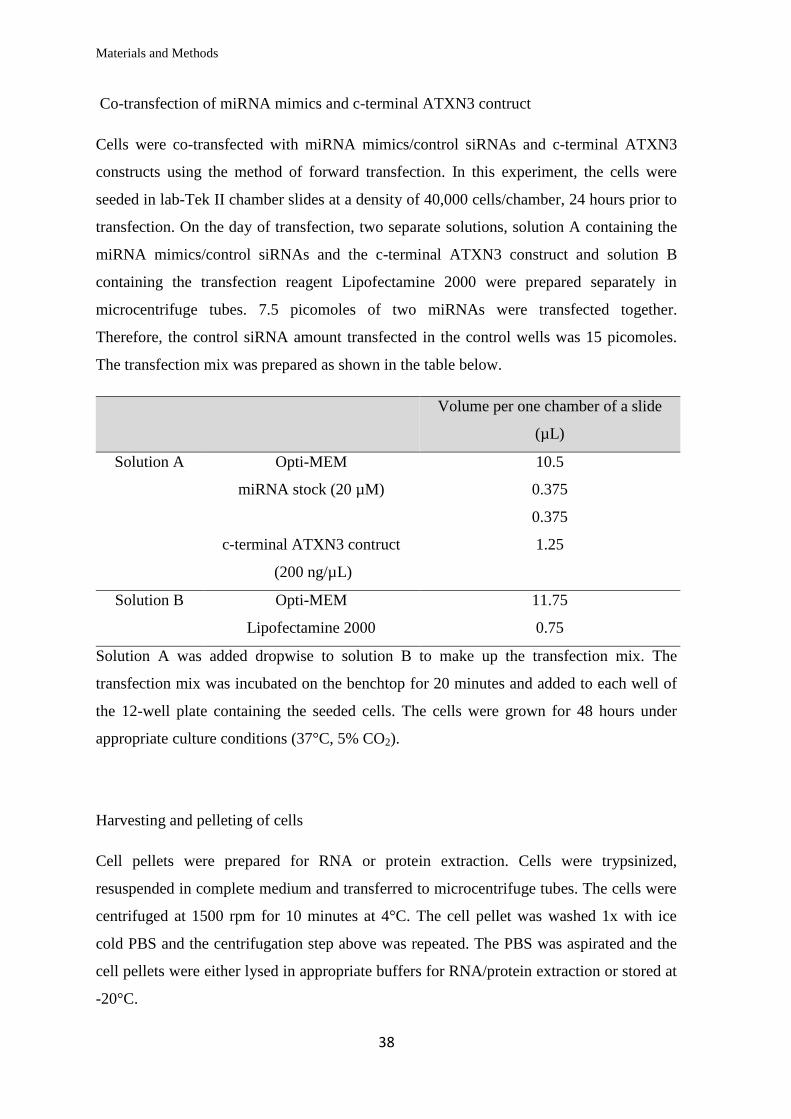
Materials and Methods
38
Co-transfection of miRNA mimics and c-terminal ATXN3 contruct
Cells were co-transfected with miRNA mimics/control siRNAs and c-terminal ATXN3
constructs using the method of forward transfection. In this experiment, the cells were
seeded in lab-Tek II chamber slides at a density of 40,000 cells/chamber, 24 hours prior to
transfection. On the day of transfection, two separate solutions, solution A containing the
miRNA mimics/control siRNAs and the c-terminal ATXN3 construct and solution B
containing the transfection reagent Lipofectamine 2000 were prepared separately in
microcentrifuge tubes. 7.5 picomoles of two miRNAs were transfected together.
Therefore, the control siRNA amount transfected in the control wells was 15 picomoles.
The transfection mix was prepared as shown in the table below.
Volume per one chamber of a slide
(µL)
Solution A Opti-MEM 10.5
miRNA stock (20 µM) 0.375
0.375
c-terminal ATXN3 contruct
(200 ng/µL)
1.25
Solution B Opti-MEM 11.75
Lipofectamine 2000 0.75
Solution A was added dropwise to solution B to make up the transfection mix. The
transfection mix was incubated on the benchtop for 20 minutes and added to each well of
the 12-well plate containing the seeded cells. The cells were grown for 48 hours under
appropriate culture conditions (37°C, 5% CO2).
Harvesting and pelleting of cells
Cell pellets were prepared for RNA or protein extraction. Cells were trypsinized,
resuspended in complete medium and transferred to microcentrifuge tubes. The cells were
centrifuged at 1500 rpm for 10 minutes at 4°C. The cell pellet was washed 1x with ice
cold PBS and the centrifugation step above was repeated. The PBS was aspirated and the
cell pellets were either lysed in appropriate buffers for RNA/protein extraction or stored at
-20°C.
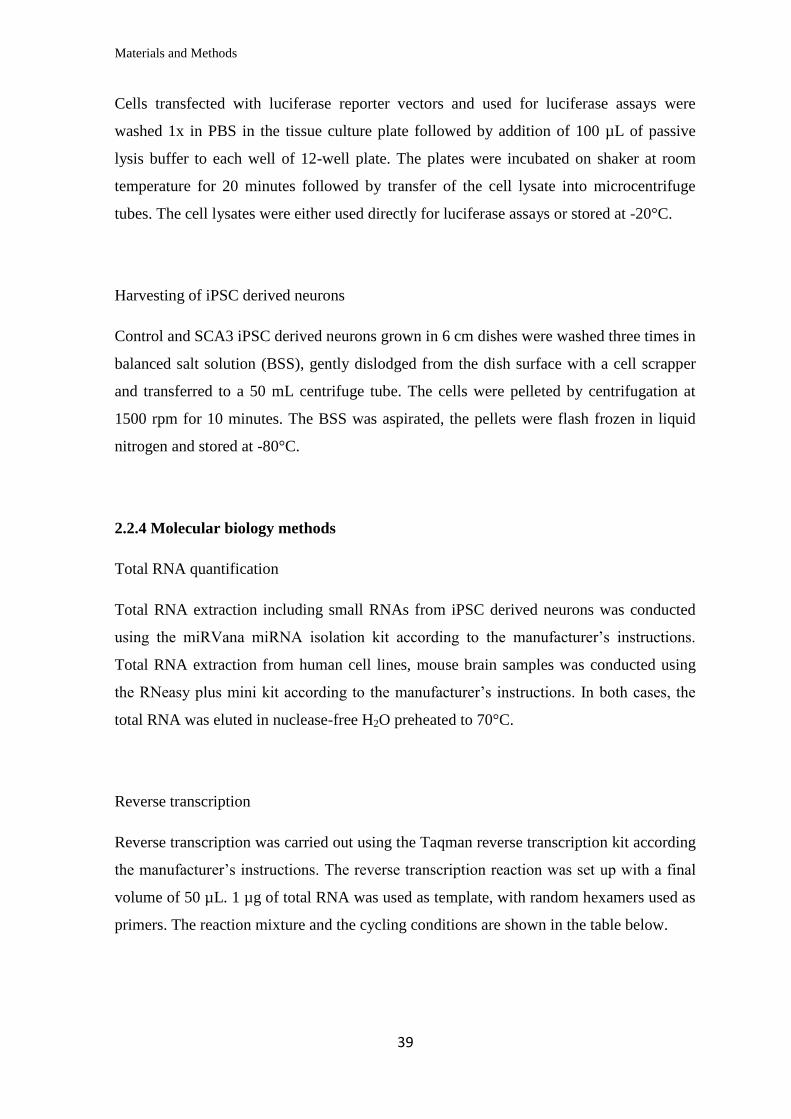
Materials and Methods
39
Cells transfected with luciferase reporter vectors and used for luciferase assays were
washed 1x in PBS in the tissue culture plate followed by addition of 100 µL of passive
lysis buffer to each well of 12-well plate. The plates were incubated on shaker at room
temperature for 20 minutes followed by transfer of the cell lysate into microcentrifuge
tubes. The cell lysates were either used directly for luciferase assays or stored at -20°C.
Harvesting of iPSC derived neurons
Control and SCA3 iPSC derived neurons grown in 6 cm dishes were washed three times in
balanced salt solution (BSS), gently dislodged from the dish surface with a cell scrapper
and transferred to a 50 mL centrifuge tube. The cells were pelleted by centrifugation at
1500 rpm for 10 minutes. The BSS was aspirated, the pellets were flash frozen in liquid
nitrogen and stored at -80°C.
2.2.4 Molecular biology methods
Total RNA quantification
Total RNA extraction including small RNAs from iPSC derived neurons was conducted
using the miRVana miRNA isolation kit according to the manufacturer’s instructions.
Total RNA extraction from human cell lines, mouse brain samples was conducted using
the RNeasy plus mini kit according to the manufacturer’s instructions. In both cases, the
total RNA was eluted in nuclease-free H2O preheated to 70°C.
Reverse transcription
Reverse transcription was carried out using the Taqman reverse transcription kit according
the manufacturer’s instructions. The reverse transcription reaction was set up with a final
volume of 50 µL. 1 µg of total RNA was used as template, with random hexamers used as
primers. The reaction mixture and the cycling conditions are shown in the table below.

Materials and Methods
40
Reagent Volume (µL) Final conc.
10x Reverse transcriptase buffer 5 1x
MgCl2 (25 mM) 11 5.5 mM
dNTPs (10 mM) 10 2 mM
Random hexamers (50 µM) 2.5 2.5 µM
RNase Inhibitor (20 U/µL) 1 0.4 U/µL
Multiscribe reverse transcriptase
(50 U/µL)
2.5 1 U/µL
RNA template (500 ng/µL) 2 20 ng/µL
Nuclease free H2O 16
Cycling conditions
10 min 25°C; 30 min 37°C; 5 min 95°C; hold 4°C
SYBR Green Real-time PCR
SYBR Green dye based real-time PCR amplification was done in the 7900HT Fast Real-
time PCR cycler in 384 well plates. SYBR Green PCR master mix (Life technologies)
containing SYBR Green1 dye, Amplitaq DNA polymerase and dNTPs with dUTP was
used for amplification. cDNA produced by reverse transcription of RNA samples was
diluted 1:10 to be used as template for the real-time PCR. Primers used in the real-time
PCR have been listed in table 2.1.6. In each experiment, serial dilutions of one of the
samples (usually one of the controls) were prepared to serve as reference for plotting of a
standard curve plot for cDNA quantification. The PCR mix in each well and the cycling
conditions were as described in the table below. All samples were loaded in triplicates. A
dissociation stage was added at the end of each amplification cycle to check for
amplification of multiple products. Following the amplification, wells flagged for errors in
the signal were omitted from the calculations. Data was exported to MS Excel for analysis.
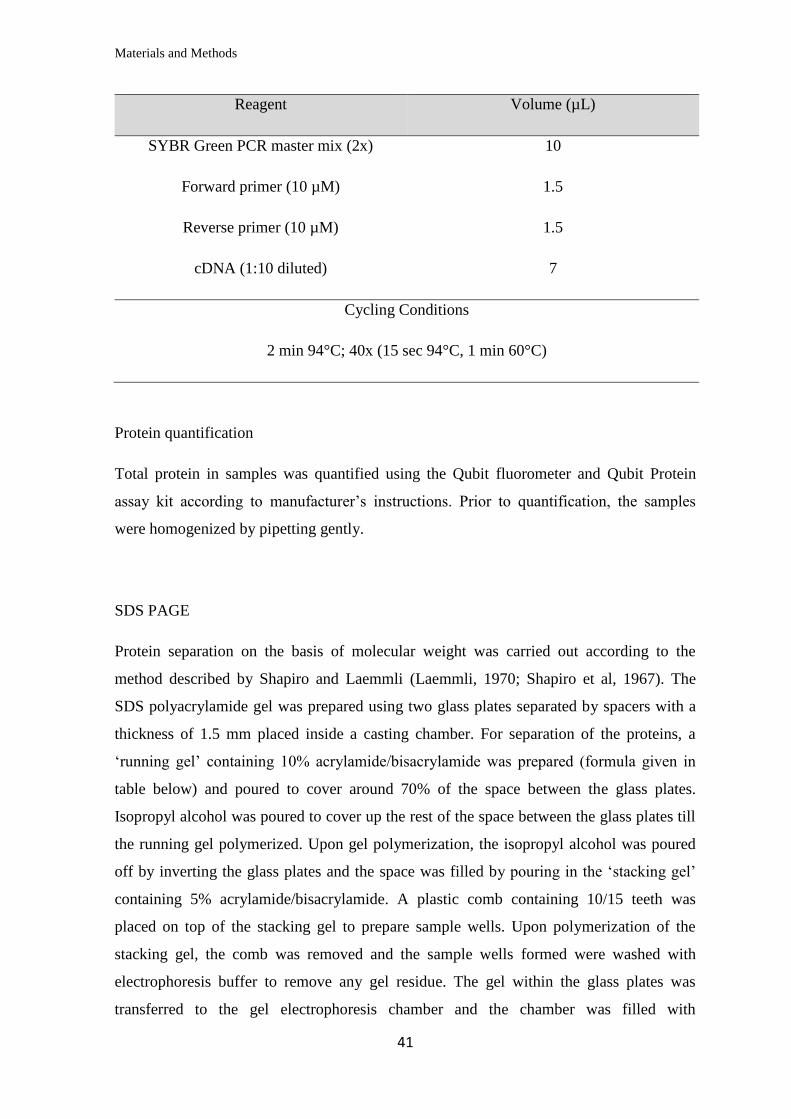
Materials and Methods
41
Reagent Volume (µL)
SYBR Green PCR master mix (2x) 10
Forward primer (10 µM) 1.5
Reverse primer (10 µM) 1.5
cDNA (1:10 diluted) 7
Cycling Conditions
2 min 94°C; 40x (15 sec 94°C, 1 min 60°C)
Protein quantification
Total protein in samples was quantified using the Qubit fluorometer and Qubit Protein
assay kit according to manufacturer’s instructions. Prior to quantification, the samples
were homogenized by pipetting gently.
SDS PAGE
Protein separation on the basis of molecular weight was carried out according to the
method described by Shapiro and Laemmli (Laemmli, 1970; Shapiro et al, 1967). The
SDS polyacrylamide gel was prepared using two glass plates separated by spacers with a
thickness of 1.5 mm placed inside a casting chamber. For separation of the proteins, a
‘running gel’ containing 10% acrylamide/bisacrylamide was prepared (formula given in
table below) and poured to cover around 70% of the space between the glass plates.
Isopropyl alcohol was poured to cover up the rest of the space between the glass plates till
the running gel polymerized. Upon gel polymerization, the isopropyl alcohol was poured
off by inverting the glass plates and the space was filled by pouring in the ‘stacking gel’
containing 5% acrylamide/bisacrylamide. A plastic comb containing 10/15 teeth was
placed on top of the stacking gel to prepare sample wells. Upon polymerization of the
stacking gel, the comb was removed and the sample wells formed were washed with
electrophoresis buffer to remove any gel residue. The gel within the glass plates was
transferred to the gel electrophoresis chamber and the chamber was filled with
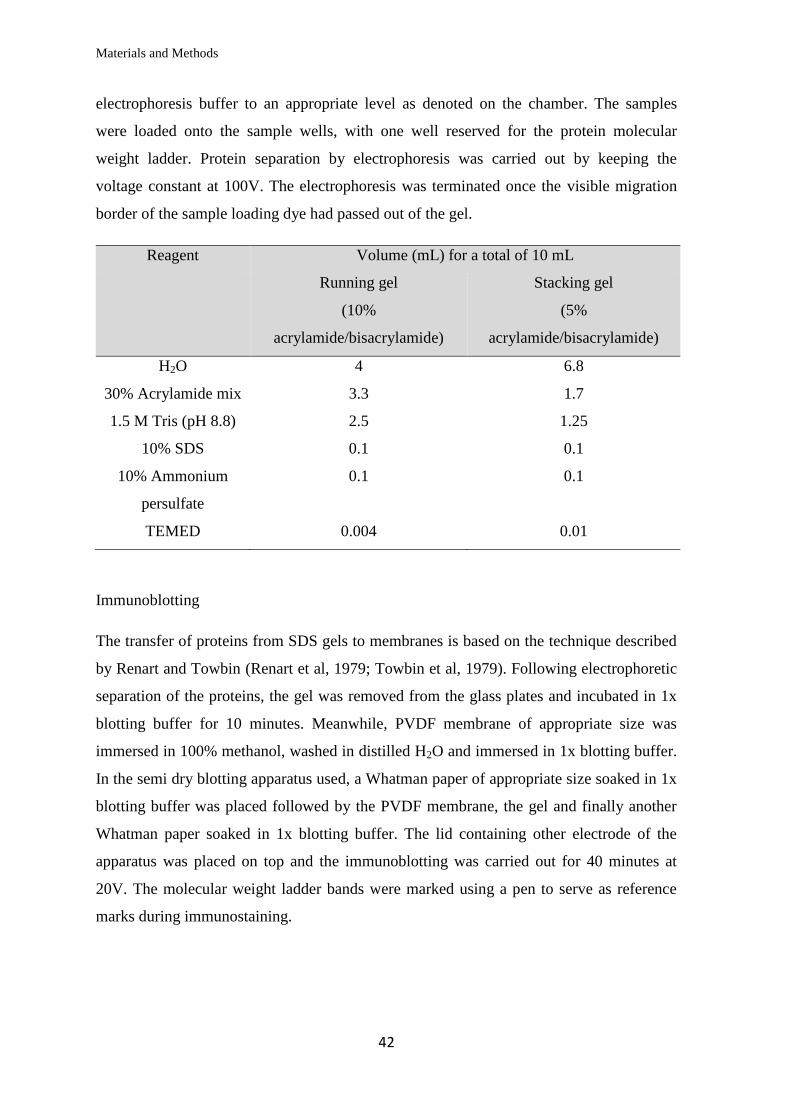
Materials and Methods
42
electrophoresis buffer to an appropriate level as denoted on the chamber. The samples
were loaded onto the sample wells, with one well reserved for the protein molecular
weight ladder. Protein separation by electrophoresis was carried out by keeping the
voltage constant at 100V. The electrophoresis was terminated once the visible migration
border of the sample loading dye had passed out of the gel.
Reagent Volume (mL) for a total of 10 mL
Running gel
(10%
acrylamide/bisacrylamide)
Stacking gel
(5%
acrylamide/bisacrylamide)
H2O 4 6.8
30% Acrylamide mix 3.3 1.7
1.5 M Tris (pH 8.8) 2.5 1.25
10% SDS 0.1 0.1
10% Ammonium
persulfate
0.1 0.1
TEMED 0.004 0.01
Immunoblotting
The transfer of proteins from SDS gels to membranes is based on the technique described
by Renart and Towbin (Renart et al, 1979; Towbin et al, 1979). Following electrophoretic
separation of the proteins, the gel was removed from the glass plates and incubated in 1x
blotting buffer for 10 minutes. Meanwhile, PVDF membrane of appropriate size was
immersed in 100% methanol, washed in distilled H2O and immersed in 1x blotting buffer.
In the semi dry blotting apparatus used, a Whatman paper of appropriate size soaked in 1x
blotting buffer was placed followed by the PVDF membrane, the gel and finally another
Whatman paper soaked in 1x blotting buffer. The lid containing other electrode of the
apparatus was placed on top and the immunoblotting was carried out for 40 minutes at
20V. The molecular weight ladder bands were marked using a pen to serve as reference
marks during immunostaining.
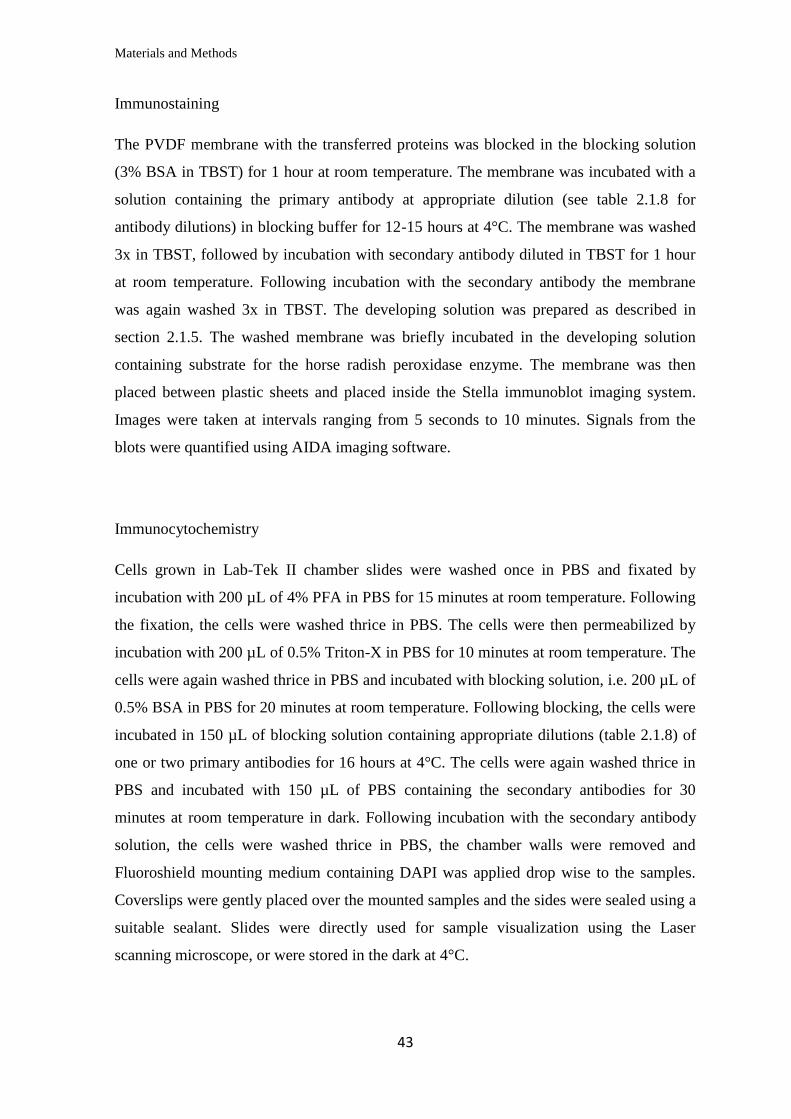
Materials and Methods
43
Immunostaining
The PVDF membrane with the transferred proteins was blocked in the blocking solution
(3% BSA in TBST) for 1 hour at room temperature. The membrane was incubated with a
solution containing the primary antibody at appropriate dilution (see table 2.1.8 for
antibody dilutions) in blocking buffer for 12-15 hours at 4°C. The membrane was washed
3x in TBST, followed by incubation with secondary antibody diluted in TBST for 1 hour
at room temperature. Following incubation with the secondary antibody the membrane
was again washed 3x in TBST. The developing solution was prepared as described in
section 2.1.5. The washed membrane was briefly incubated in the developing solution
containing substrate for the horse radish peroxidase enzyme. The membrane was then
placed between plastic sheets and placed inside the Stella immunoblot imaging system.
Images were taken at intervals ranging from 5 seconds to 10 minutes. Signals from the
blots were quantified using AIDA imaging software.
Immunocytochemistry
Cells grown in Lab-Tek II chamber slides were washed once in PBS and fixated by
incubation with 200 µL of 4% PFA in PBS for 15 minutes at room temperature. Following
the fixation, the cells were washed thrice in PBS. The cells were then permeabilized by
incubation with 200 µL of 0.5% Triton-X in PBS for 10 minutes at room temperature. The
cells were again washed thrice in PBS and incubated with blocking solution, i.e. 200 µL of
0.5% BSA in PBS for 20 minutes at room temperature. Following blocking, the cells were
incubated in 150 µL of blocking solution containing appropriate dilutions (table 2.1.8) of
one or two primary antibodies for 16 hours at 4°C. The cells were again washed thrice in
PBS and incubated with 150 µL of PBS containing the secondary antibodies for 30
minutes at room temperature in dark. Following incubation with the secondary antibody
solution, the cells were washed thrice in PBS, the chamber walls were removed and
Fluoroshield mounting medium containing DAPI was applied drop wise to the samples.
Coverslips were gently placed over the mounted samples and the sides were sealed using a
suitable sealant. Slides were directly used for sample visualization using the Laser
scanning microscope, or were stored in the dark at 4°C.

Materials and Methods
44
Luciferase assay
Lysates to be used for luciferase assay were diluted in H2O to attain a concentration of 1
μg/μL. 10 μg of the protein lysate was pipetted into each well of a 96-well white plate.
Each sample was pipetted in triplicate, for both the renilla and firefly luciferase
measurements. Substrates for firefly and renilla luciferase were prepared as per the recipe
given in section 2.1.5. The luciferase assay was conducted in Envision plate reader (Perkin
Elmer). The reader was programmed to inject 40 μL renilla and firefly substrates in each
well and measure luminescence signal following a lag of 2 seconds. Signal values were
exported to and analysed in MS Excel.
2.2.5 Microscopy and image analysis
Confocal optical images of immunostained cells were taken using the Zeiss LSM 700
microscope with a 20x air objective. Images were acquired using the Zen 2009 software
through tilescans of multiple replicate chambers on the slide with identical transfection
conditions. Image analysis to count the number of cells with aggregates was done using an
algorithm setup by Dr. Möhl (Data and Image Analysis facility, DZNE Bonn).
2.2.6 Mouse hindbrain isolation
The maintenance and work with the B6.SCA3-YAC-84Q mice was conducted according
to relevant national authority guidelines. 26 week old control and transgenic mice were
sacrificed and the brain dissected to separate the hindbrain including the cerebellum, pons
and the brain stem. The hindbrain was flash frozen in liquid nitrogen and broken up using
a mortar and a pestle.
Total RNA was extracted from the pulverized hindbrain using the RNEasy plus mini kit.
RNA was quantified using the Nanodrop spectrometer. cDNA extraction and SYBR Green
real-time PCR was done according to the procedure described before. Protein was
extracted by homogenizing the pulverized hindbrain samples in SDS PAGE sample buffer,
sonication and boiling at 95°C for 10 minutes.
Materials and Methods
45
2.2.7 Gene and miRNA expression profiling and analysis
Gene and miRNA expression profiling by RNA-seq
The gene expression and miRNA expression profiling was done using the technique of
RNA-seq by the group of Dr. Stefan Bonn (Work group for computational analysis of
biological networks, DZNE Göttingen) on an Illumina HiSeq2000TM with libraries
prepared according to the Illumina TruSeq mRNA and small RNA protocols respectively.
The FASTQ files generated for the gene expression profiling were used for analysis by the
CLC Workbench (details below) in house. The analysis of the miRNA expression profile
including steps such as trimming, sequence quality check, alignment of the sequences to
small RNA transcript databases and differential small RNA analysis was conducted by the
aforementioned group.
Differential gene expression analysis by CLC genomics workbench
The gene expression profile data was analysed using the CLC genomics workbench. RNA-
seq files for the gene expression profile were imported to the CLC server. The sequences
were trimmed using default parameters to remove low quality sequences, ambiguous
nucleotides and sequences below specific, defined length. The sequences were then
assembled, i.e. they were aligned by comparing to reference sequences from GenBank, in
order to make contiguous sequences. Default parameters were used for sequence
assembly. The control and SCA3 patient samples were grouped into ‘control’ and ‘patient’
groups respectively. An experiment was then set up to analyse the differential expression
of genes between the control and patient groups. Results were displayed including
parameters such as mean expression values in the groups, fold changes in gene expression
between the two groups with the p-values corrected for False Discovery Rate (FDR). The
data was exported to MS Excel where it was sorted, filtered and arranged in lists which
served as starting points for Gene Ontology analysis, pathway analysis.

Materials and Methods
46
Gene ontology and pathway analysis of dysregulated genes
Gene Ontology analysis and Pathway analysis was conducted using the Toppfun tool from
the Toppgene Suite (https://toppgene.cchmc.org/enrichment.jsp) (Chen et al, 2009).
Default parameters for the correction, p-value cutoff were used. Lists were exported to MS
Excel to be sorted.
Protein interaction analysis
Protein interaction analysis was conducted using the STRING database, ver 9.1
(http://string-db.org) (Franceschini et al, 2013). The multiple names input option was used
for gene list and the actions view was used for the graphic representation of the protein
interaction analysis.
Pathway analysis of dysregulated miRNAs
miRNA pathway analysis was done using the MIRSYSTEM, May 2014 release (Lu et al,
2012). The ‘miRNAs to targets’ tool was used to calculate the enrichment of the predicted
miRNA targets into pathways via the ‘pathway ranking summary’ option in the tool.
Results were exported to MS Excel for sorting, filtering.
2.2.8 Software used
4Peaks
DNA sequences obtained from Sanger sequencing were analyzed using the 4Peaks
software. The quality of the sequence was verified by analyzing the peaks representing the
four nucleotides in the DNA sequence.
AIDA image analyzer
Immunoblot images were quantified using the AIDA image analysis software from
Raytest. The areas containing signal bands from individual samples were selected and the

Materials and Methods
47
signal intensity measured. After subtraction of the background signal, the signal values
were exported to MS Excel.
GraphPad Prism version 6
Statistical analysis and bar graph images were prepared using the Prism version 6
software.
Results
48
Chapter 3 Results
3.1 miRNA targeting of ATXN3
One of the main goals of this project was the identification of miRNAs able to target the
ATXN3 mRNA by binding at specific sites on the 3’UTR leading to modulation of the
ATXN3 protein expression. Therefore, the following steps were taken:
In silico prediction of miRNAs targeting the 3’UTR of ATXN3 mRNA .
Validation of the ability of the selected miRNAs to bind at specific sites on the
3’UTR of ATXN3 mRNA.
Analysis of the miRNAs’ effect on endogenous ATXN3 mRNA and protein levels
in human cell lines.
3.1.1 In silico prediction of miRNAs targeting the 3’UTR of ATXN3 mRNA
The 3’UTR of ATXN3 mRNA is 5904 nt long. Several tools that enable miRNA target
prediction are available, each with a different algorithm for predicting the strength of the
miRNA-target mRNA binding. The TargetScan tool was primarily used for predictions.
TargetScan considers several parameters contributing to mRNA targeting by stable
mRNA-miRNA binding at specific sites as elaborated in the section of materials and
methods (see 2.2.1). Based on these parameters, there are more than 40 miRNAs predicted
to target ATXN3 3’UTR according to TargetScan. From amongst these, five miRNAs
were chosen for validation experiments as given in table 3.1. Apart from TargetScan, the
chosen miRNAs are also predicted to target ATXN3 3’UTR by miRanda-mirSVR, which
is another widely used algorithm to predict miRNA target predictions.
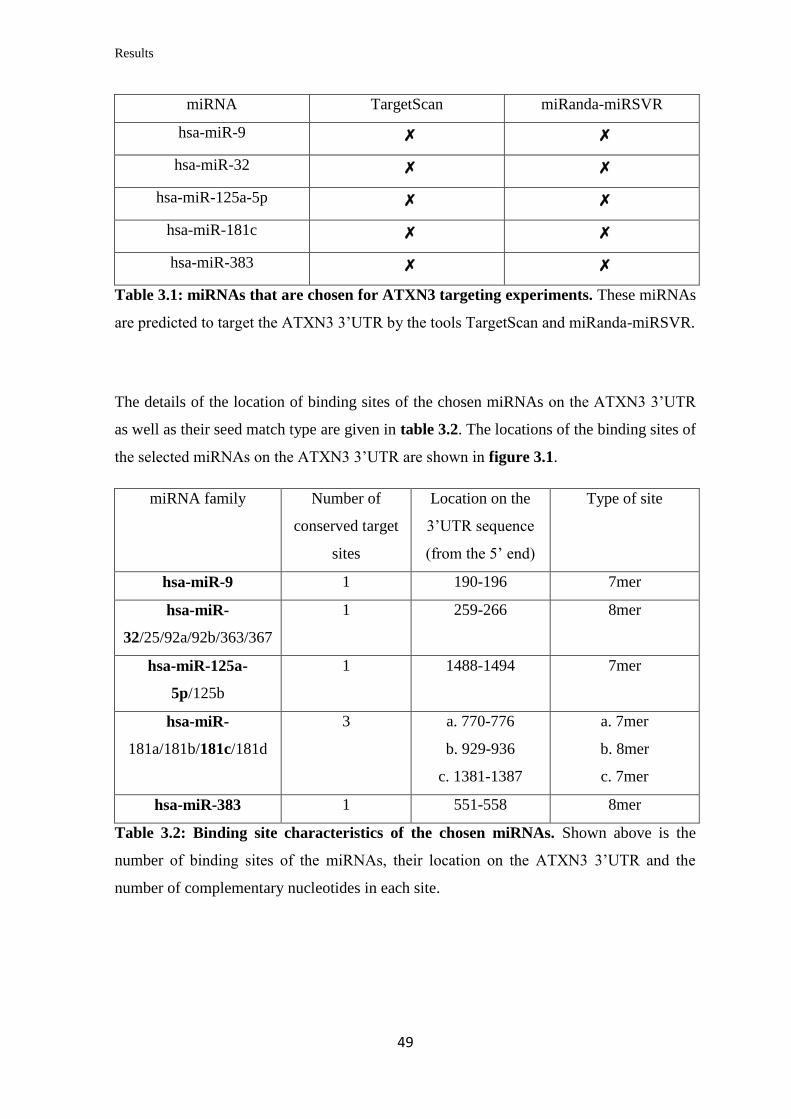
Results
49
miRNA TargetScan miRanda-miRSVR
hsa-miR-9 ✗ ✗
hsa-miR-32 ✗ ✗
hsa-miR-125a-5p ✗ ✗
hsa-miR-181c ✗ ✗
hsa-miR-383 ✗ ✗
Table 3.1: miRNAs that are chosen for ATXN3 targeting experiments. These miRNAs
are predicted to target the ATXN3 3’UTR by the tools TargetScan and miRanda-miRSVR.
The details of the location of binding sites of the chosen miRNAs on the ATXN3 3’UTR
as well as their seed match type are given in table 3.2. The locations of the binding sites of
the selected miRNAs on the ATXN3 3’UTR are shown in figure 3.1.
miRNA family Number of
conserved target
sites
Location on the
3’UTR sequence
(from the 5’ end)
Type of site
hsa-miR-9 1 190-196 7mer
hsa-miR-
32/25/92a/92b/363/367
1 259-266 8mer
hsa-miR-125a-
5p/125b
1 1488-1494 7mer
hsa-miR-
181a/181b/181c/181d
3 a. 770-776
b. 929-936
c. 1381-1387
a. 7mer
b. 8mer
c. 7mer
hsa-miR-383 1 551-558 8mer
Table 3.2: Binding site characteristics of the chosen miRNAs. Shown above is the
number of binding sites of the miRNAs, their location on the ATXN3 3’UTR and the
number of complementary nucleotides in each site.
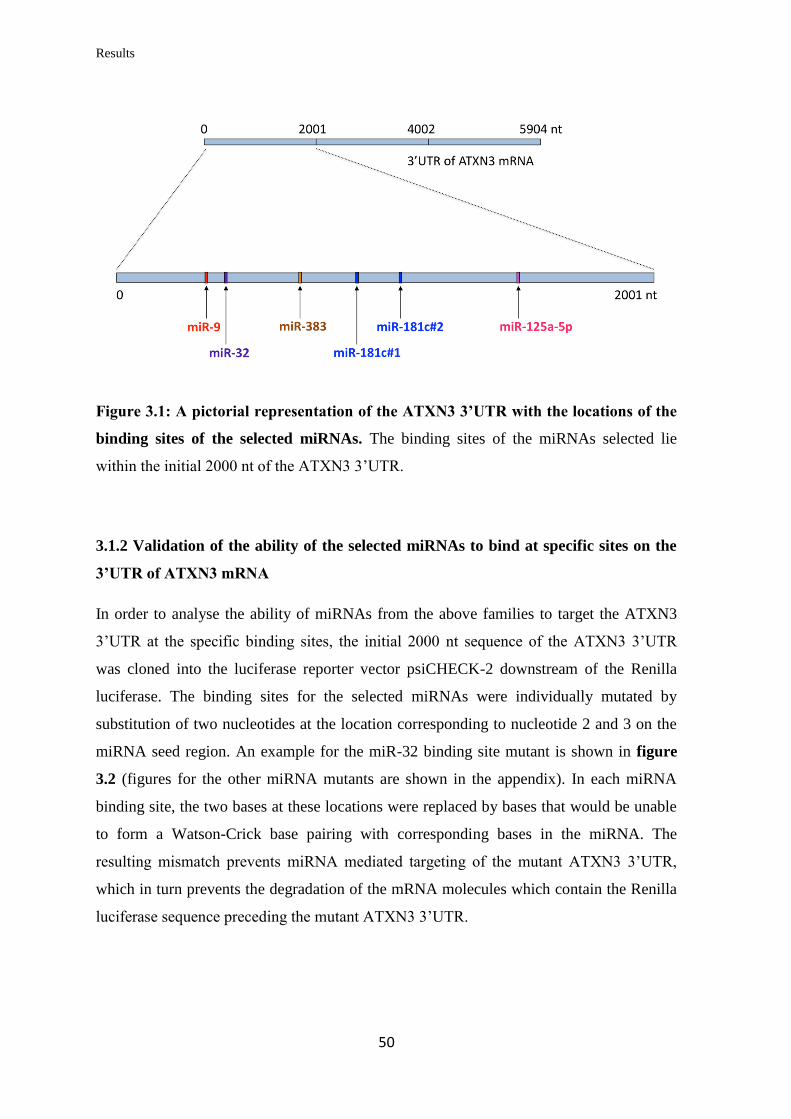
Results
50
Figure 3.1: A pictorial representation of the ATXN3 3’UTR with the locations of the
binding sites of the selected miRNAs. The binding sites of the miRNAs selected lie
within the initial 2000 nt of the ATXN3 3’UTR.
3.1.2 Validation of the ability of the selected miRNAs to bind at specific sites on the
3’UTR of ATXN3 mRNA
In order to analyse the ability of miRNAs from the above families to target the ATXN3
3’UTR at the specific binding sites, the initial 2000 nt sequence of the ATXN3 3’UTR
was cloned into the luciferase reporter vector psiCHECK-2 downstream of the Renilla
luciferase. The binding sites for the selected miRNAs were individually mutated by
substitution of two nucleotides at the location corresponding to nucleotide 2 and 3 on the
miRNA seed region. An example for the miR-32 binding site mutant is shown in figure
3.2 (figures for the other miRNA mutants are shown in the appendix). In each miRNA
binding site, the two bases at these locations were replaced by bases that would be unable
to form a Watson-Crick base pairing with corresponding bases in the miRNA. The
resulting mismatch prevents miRNA mediated targeting of the mutant ATXN3 3’UTR,
which in turn prevents the degradation of the mRNA molecules which contain the Renilla
luciferase sequence preceding the mutant ATXN3 3’UTR.
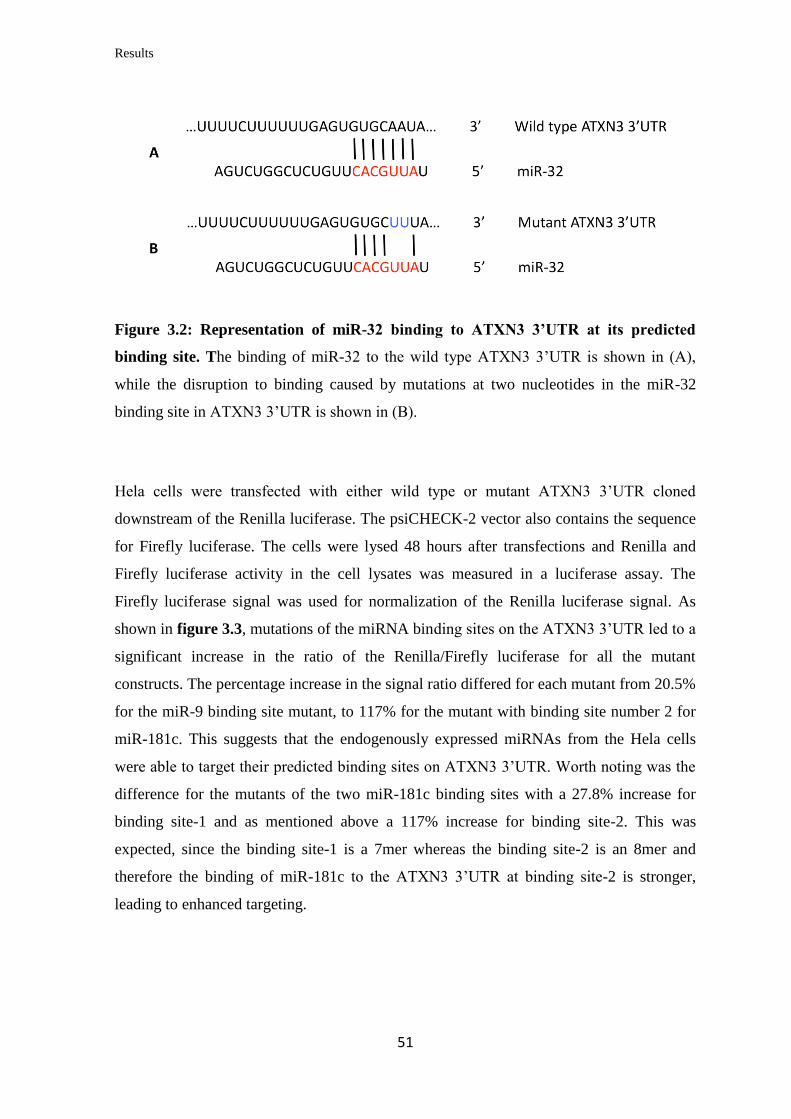
Results
51
Figure 3.2: Representation of miR-32 binding to ATXN3 3’UTR at its predicted
binding site. The binding of miR-32 to the wild type ATXN3 3’UTR is shown in (A),
while the disruption to binding caused by mutations at two nucleotides in the miR-32
binding site in ATXN3 3’UTR is shown in (B).
Hela cells were transfected with either wild type or mutant ATXN3 3’UTR cloned
downstream of the Renilla luciferase. The psiCHECK-2 vector also contains the sequence
for Firefly luciferase. The cells were lysed 48 hours after transfections and Renilla and
Firefly luciferase activity in the cell lysates was measured in a luciferase assay. The
Firefly luciferase signal was used for normalization of the Renilla luciferase signal. As
shown in figure 3.3, mutations of the miRNA binding sites on the ATXN3 3’UTR led to a
significant increase in the ratio of the Renilla/Firefly luciferase for all the mutant
constructs. The percentage increase in the signal ratio differed for each mutant from 20.5%
for the miR-9 binding site mutant, to 117% for the mutant with binding site number 2 for
miR-181c. This suggests that the endogenously expressed miRNAs from the Hela cells
were able to target their predicted binding sites on ATXN3 3’UTR. Worth noting was the
difference for the mutants of the two miR-181c binding sites with a 27.8% increase for
binding site-1 and as mentioned above a 117% increase for binding site-2. This was
expected, since the binding site-1 is a 7mer whereas the binding site-2 is an 8mer and
therefore the binding of miR-181c to the ATXN3 3’UTR at binding site-2 is stronger,
leading to enhanced targeting.
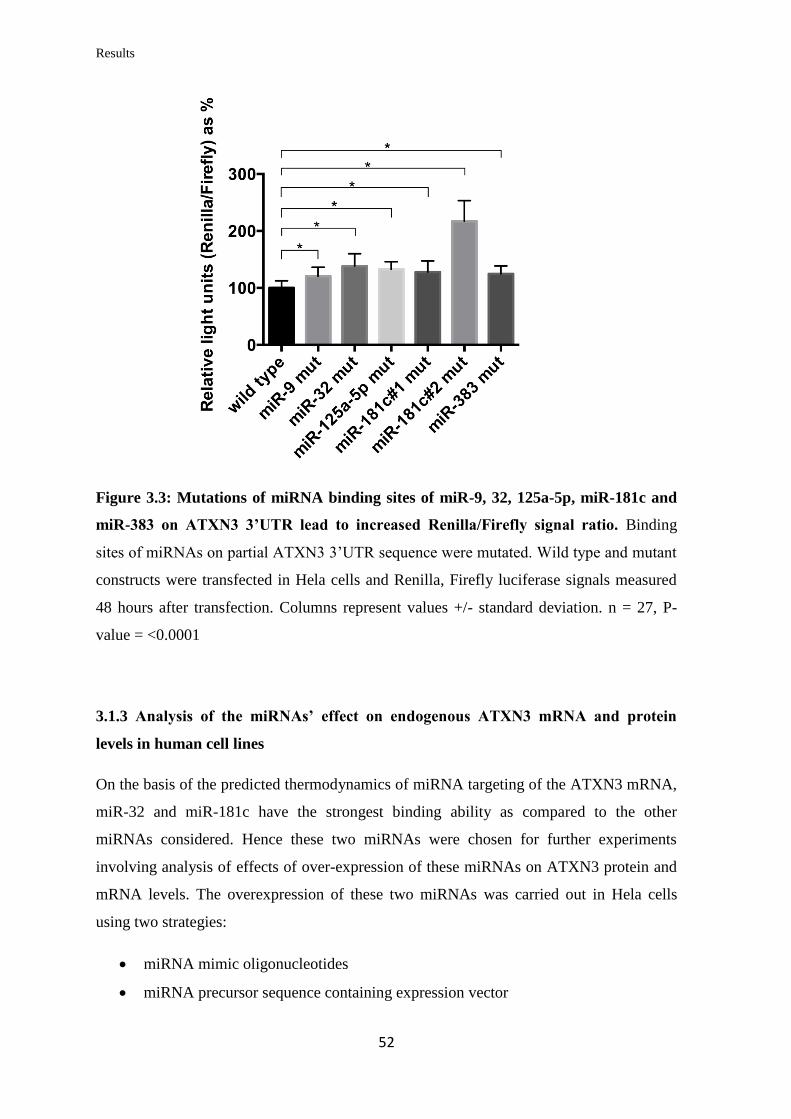
Results
52
Figure 3.3: Mutations of miRNA binding sites of miR-9, 32, 125a-5p, miR-181c and
miR-383 on ATXN3 3’UTR lead to increased Renilla/Firefly signal ratio. Binding
sites of miRNAs on partial ATXN3 3’UTR sequence were mutated. Wild type and mutant
constructs were transfected in Hela cells and Renilla, Firefly luciferase signals measured
48 hours after transfection. Columns represent values +/- standard deviation. n = 27, P-
value = <0.0001
3.1.3 Analysis of the miRNAs’ effect on endogenous ATXN3 mRNA and protein
levels in human cell lines
On the basis of the predicted thermodynamics of miRNA targeting of the ATXN3 mRNA,
miR-32 and miR-181c have the strongest binding ability as compared to the other
miRNAs considered. Hence these two miRNAs were chosen for further experiments
involving analysis of effects of over-expression of these miRNAs on ATXN3 protein and
mRNA levels. The overexpression of these two miRNAs was carried out in Hela cells
using two strategies:
miRNA mimic oligonucleotides
miRNA precursor sequence containing expression vector
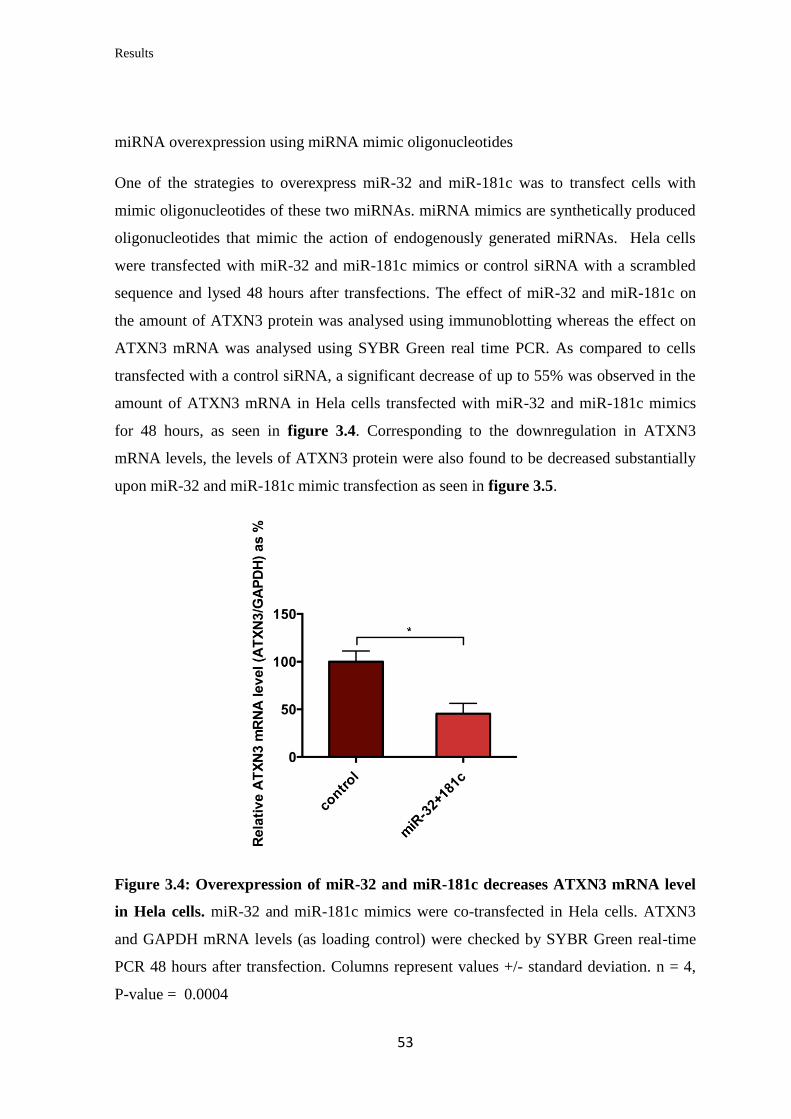
Results
53
miRNA overexpression using miRNA mimic oligonucleotides
One of the strategies to overexpress miR-32 and miR-181c was to transfect cells with
mimic oligonucleotides of these two miRNAs. miRNA mimics are synthetically produced
oligonucleotides that mimic the action of endogenously generated miRNAs. Hela cells
were transfected with miR-32 and miR-181c mimics or control siRNA with a scrambled
sequence and lysed 48 hours after transfections. The effect of miR-32 and miR-181c on
the amount of ATXN3 protein was analysed using immunoblotting whereas the effect on
ATXN3 mRNA was analysed using SYBR Green real time PCR. As compared to cells
transfected with a control siRNA, a significant decrease of up to 55% was observed in the
amount of ATXN3 mRNA in Hela cells transfected with miR-32 and miR-181c mimics
for 48 hours, as seen in figure 3.4. Corresponding to the downregulation in ATXN3
mRNA levels, the levels of ATXN3 protein were also found to be decreased substantially
upon miR-32 and miR-181c mimic transfection as seen in figure 3.5.
Figure 3.4: Overexpression of miR-32 and miR-181c decreases ATXN3 mRNA level
in Hela cells. miR-32 and miR-181c mimics were co-transfected in Hela cells. ATXN3
and GAPDH mRNA levels (as loading control) were checked by SYBR Green real-time
PCR 48 hours after transfection. Columns represent values +/- standard deviation. n = 4,
P-value = 0.0004
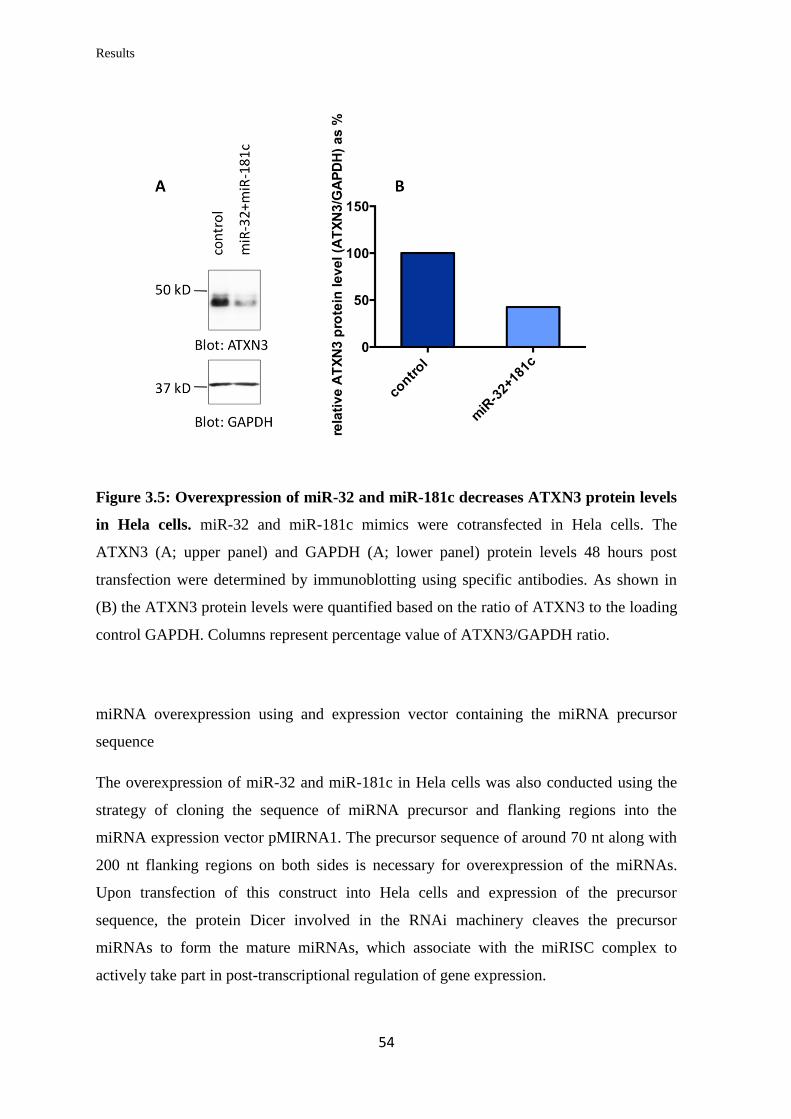
Results
54
Figure 3.5: Overexpression of miR-32 and miR-181c decreases ATXN3 protein levels
in Hela cells. miR-32 and miR-181c mimics were cotransfected in Hela cells. The
ATXN3 (A; upper panel) and GAPDH (A; lower panel) protein levels 48 hours post
transfection were determined by immunoblotting using specific antibodies. As shown in
(B) the ATXN3 protein levels were quantified based on the ratio of ATXN3 to the loading
control GAPDH. Columns represent percentage value of ATXN3/GAPDH ratio.
miRNA overexpression using and expression vector containing the miRNA precursor
sequence
The overexpression of miR-32 and miR-181c in Hela cells was also conducted using the
strategy of cloning the sequence of miRNA precursor and flanking regions into the
miRNA expression vector pMIRNA1. The precursor sequence of around 70 nt along with
200 nt flanking regions on both sides is necessary for overexpression of the miRNAs.
Upon transfection of this construct into Hela cells and expression of the precursor
sequence, the protein Dicer involved in the RNAi machinery cleaves the precursor
miRNAs to form the mature miRNAs, which associate with the miRISC complex to
actively take part in post-transcriptional regulation of gene expression.
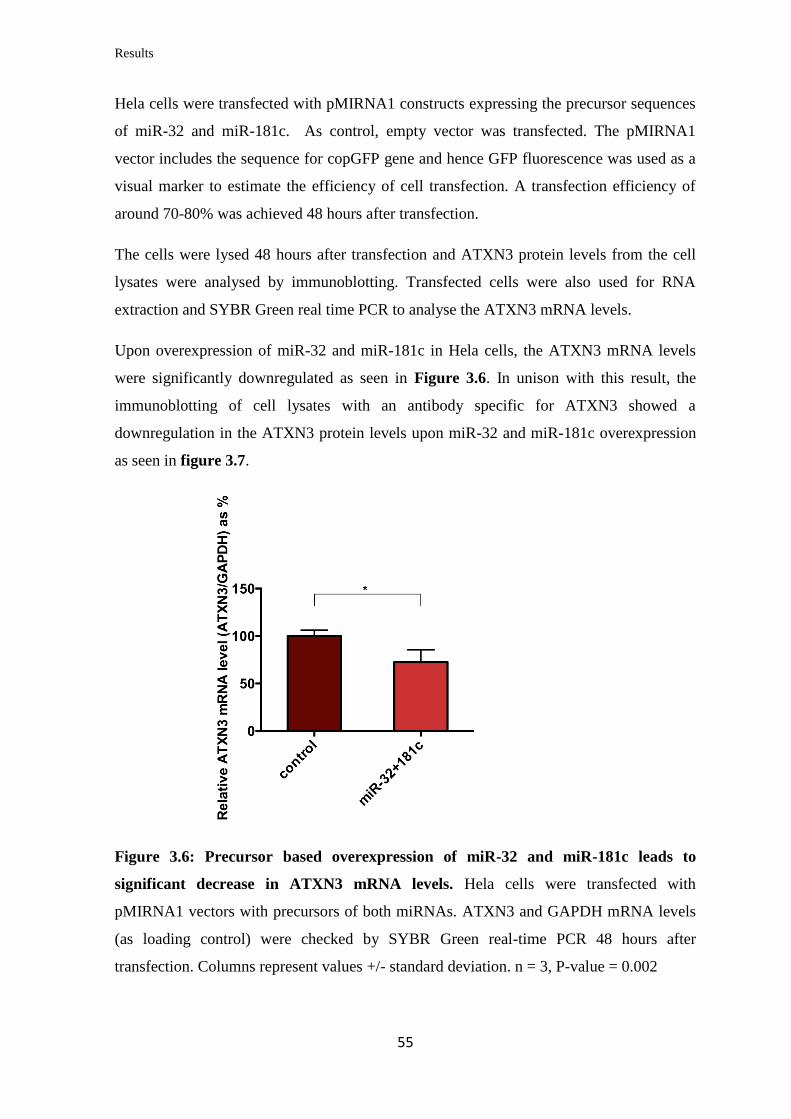
Results
55
Hela cells were transfected with pMIRNA1 constructs expressing the precursor sequences
of miR-32 and miR-181c. As control, empty vector was transfected. The pMIRNA1
vector includes the sequence for copGFP gene and hence GFP fluorescence was used as a
visual marker to estimate the efficiency of cell transfection. A transfection efficiency of
around 70-80% was achieved 48 hours after transfection.
The cells were lysed 48 hours after transfection and ATXN3 protein levels from the cell
lysates were analysed by immunoblotting. Transfected cells were also used for RNA
extraction and SYBR Green real time PCR to analyse the ATXN3 mRNA levels.
Upon overexpression of miR-32 and miR-181c in Hela cells, the ATXN3 mRNA levels
were significantly downregulated as seen in Figure 3.6. In unison with this result, the
immunoblotting of cell lysates with an antibody specific for ATXN3 showed a
downregulation in the ATXN3 protein levels upon miR-32 and miR-181c overexpression
as seen in figure 3.7.
Figure 3.6: Precursor based overexpression of miR-32 and miR-181c leads to
significant decrease in ATXN3 mRNA levels. Hela cells were transfected with
pMIRNA1 vectors with precursors of both miRNAs. ATXN3 and GAPDH mRNA levels
(as loading control) were checked by SYBR Green real-time PCR 48 hours after
transfection. Columns represent values +/- standard deviation. n = 3, P-value = 0.002
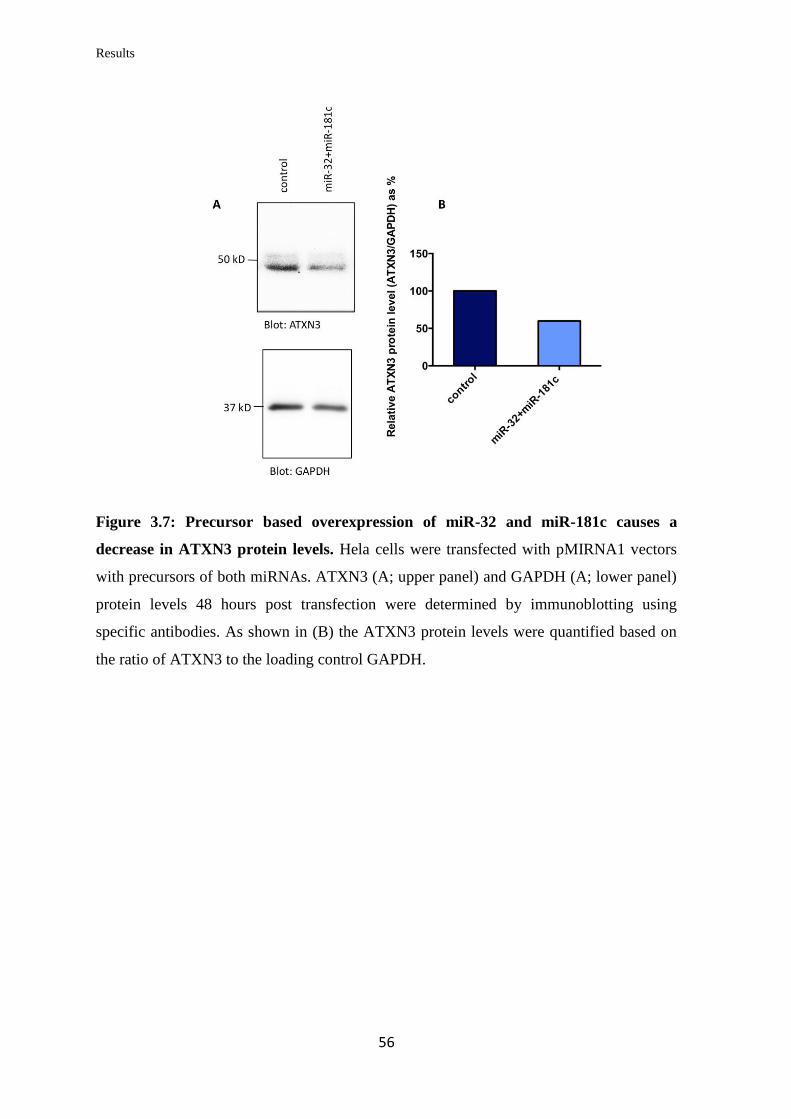
Results
56
Figure 3.7: Precursor based overexpression of miR-32 and miR-181c causes a
decrease in ATXN3 protein levels. Hela cells were transfected with pMIRNA1 vectors
with precursors of both miRNAs. ATXN3 (A; upper panel) and GAPDH (A; lower panel)
protein levels 48 hours post transfection were determined by immunoblotting using
specific antibodies. As shown in (B) the ATXN3 protein levels were quantified based on
the ratio of ATXN3 to the loading control GAPDH.
Results
57
3.2 miRNAs targeting Midline 1 (MID1)
As described in the introduction, the MID1 protein has been shown to play an important
role in the expression of polyQ expanded proteins through its action on the translation of
mRNAs containing expanded CAG repeats. Hence, modulation of MID1 expression might
affect the expression of polyQ protein and disease progress. Deciphering which miRNAs
might be able to target MID1 and modulate its expression was therefore one of the aims of
this project.
The strategy employed to discover the miRNAs targeting MID1 was similar to the one
used for finding miRNAs targeting ATXN3.
Hence the experiments were again divided into the following parts:
In silico prediction of miRNAs targeting the 3’UTR of MID1 mRNA
Validation of the ability of selected miRNAs to bind at specific sites on the 3’UTR
of MID1 mRNA
Analysis of the miRNAs’ effect on endogenous MID1 mRNA and protein levels in
human cell lines
3.2.1 In silico prediction of miRNAs targeting the 3’UTR of MID1 mRNA
The TargetScan miRNA target prediction tool was used to predict miRNAs, which
potentially target the 3’UTR of MID1 mRNA. The MID1 mRNA is 4058 nt long.
TargetScan predicted more than 60 miRNAs, which can potentially target the MID1
3’UTR. Of these, three miRNAs were chosen for validation experiments (table 3.3). Apart
from TargetScan, these miRNAs were also predicted to target MID1 3’UTR by another
miRNA target prediction tool miRanda-miRSVR.
miRNA TargetScan miRanda-miRSVR
hsa-miR-216a-5p ✗ ✗
hsa-miR-374a-5p ✗ ✗
hsa-miR-542a-3p ✗ ✗
Table 3.3: miRNAs that are chosen for MID1 targeting experiments. These 3 miRNAs
are predicted to target MID1 3’UTR by both TargetScan and miRanda-miRSVR.
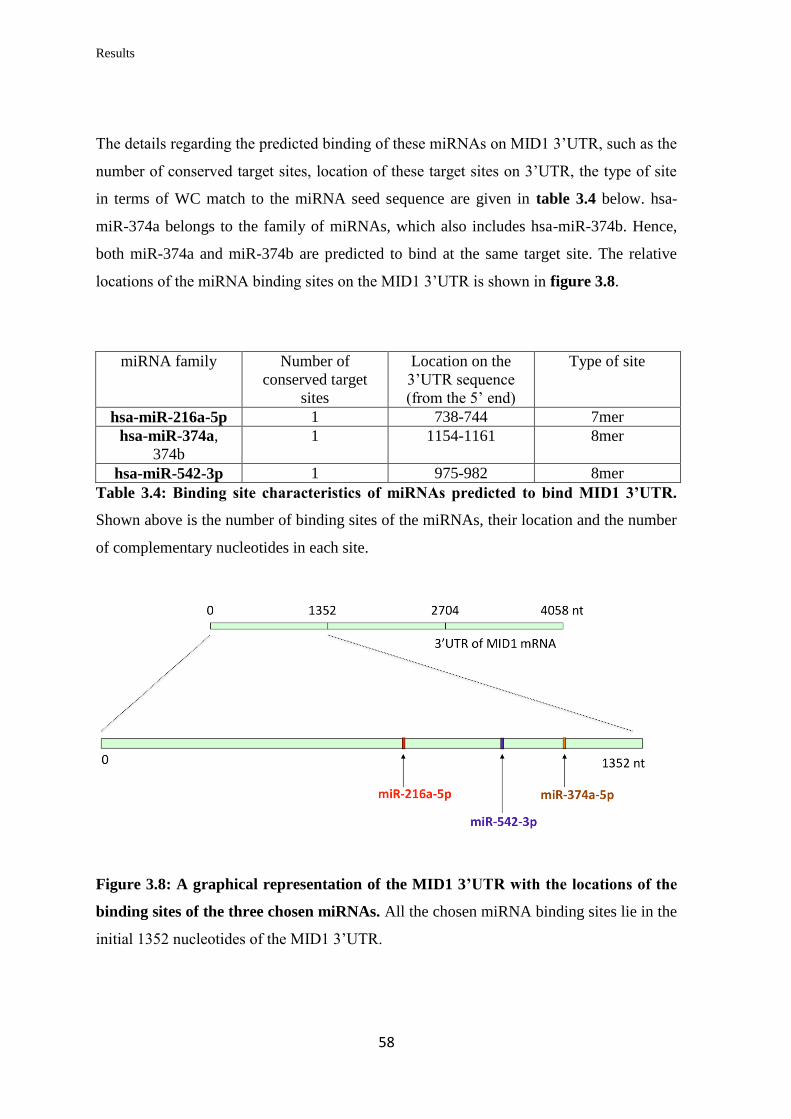
Results
58
The details regarding the predicted binding of these miRNAs on MID1 3’UTR, such as the
number of conserved target sites, location of these target sites on 3’UTR, the type of site
in terms of WC match to the miRNA seed sequence are given in table 3.4 below. hsa-
miR-374a belongs to the family of miRNAs, which also includes hsa-miR-374b. Hence,
both miR-374a and miR-374b are predicted to bind at the same target site. The relative
locations of the miRNA binding sites on the MID1 3’UTR is shown in figure 3.8.
miRNA family Number of
conserved target
sites
Location on the
3’UTR sequence
(from the 5’ end)
Type of site
hsa-miR-216a-5p 1 738-744 7mer
hsa-miR-374a,
374b
1 1154-1161 8mer
hsa-miR-542-3p 1 975-982 8mer
Table 3.4: Binding site characteristics of miRNAs predicted to bind MID1 3’UTR.
Shown above is the number of binding sites of the miRNAs, their location and the number
of complementary nucleotides in each site.
Figure 3.8: A graphical representation of the MID1 3’UTR with the locations of the
binding sites of the three chosen miRNAs. All the chosen miRNA binding sites lie in the
initial 1352 nucleotides of the MID1 3’UTR.

Results
59
3.2.2 Validation of the ability of selected miRNAs to bind at specific sites on the
3’UTR of MID1 mRNA
To verify the ability of miR-216a-5p, miR-374a-5p and miR-542-3p to bind the MID1
3’UTR at specific binding sites, the 1352 nucleotides of the MID1 3’UTR containing the
predicted miRNA binding sites were cloned downstream of the Renilla luciferase in the
luciferase reporter vector psiCHECK-2. The binding sites of the three miRNAs were
mutated by two nucleotide base substitutions on the 3’UTR corresponding to position 2, 3
of the miRNA seed region (example for miR-216a-5p in figure 3.9; figs for other two
mutants in appendix). Wild type and mutant MID1 3’UTRs in psiCHECK-2 were
transfected in Hela cells. Luciferase assays were conducted 48 hours after transfection.
Signals from the Renilla luciferase were normalized by the Firefly luciferase signals.
Figure 3.9: Representation of miR-216a-5p binding to MID1 3’UTR at its specific
binding site. The binding of miR-216a-5p to the wild type MID1 3’UTR is shown in (A),
while the disruption to the binding caused by mutations at two nucleotides in the miR-
216a-5p binding site on MID1 3’UTR is shown in (B).
As seen in figure 3.10, compared to the wild type 3’UTR of MID1, a significant increase
in the signal ratio of Renilla/Firefly was observed for the 3’UTR variants with mutations
in the binding sites of miR-216a-5p, miR-374a-5p and miR-542-3p. This suggests that the
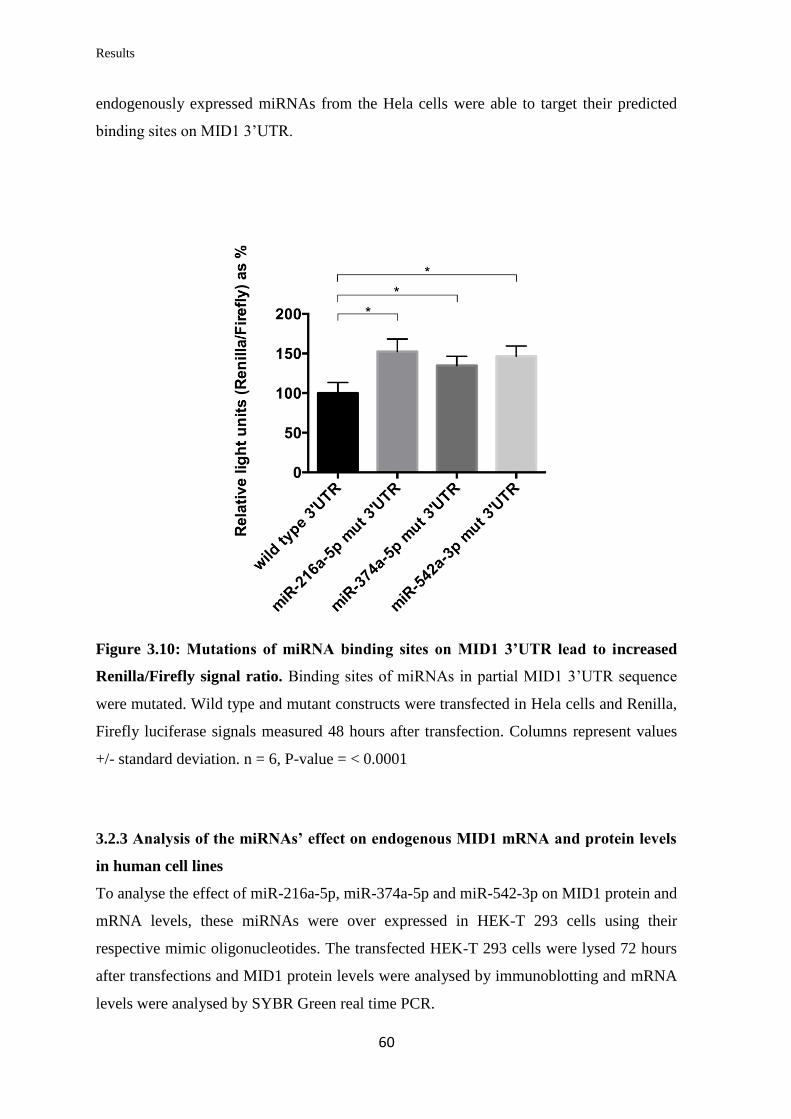
Results
60
endogenously expressed miRNAs from the Hela cells were able to target their predicted
binding sites on MID1 3’UTR.
Figure 3.10: Mutations of miRNA binding sites on MID1 3’UTR lead to increased
Renilla/Firefly signal ratio. Binding sites of miRNAs in partial MID1 3’UTR sequence
were mutated. Wild type and mutant constructs were transfected in Hela cells and Renilla,
Firefly luciferase signals measured 48 hours after transfection. Columns represent values
+/- standard deviation. n = 6, P-value = < 0.0001
3.2.3 Analysis of the miRNAs’ effect on endogenous MID1 mRNA and protein levels
in human cell lines
To analyse the effect of miR-216a-5p, miR-374a-5p and miR-542-3p on MID1 protein and
mRNA levels, these miRNAs were over expressed in HEK-T 293 cells using their
respective mimic oligonucleotides. The transfected HEK-T 293 cells were lysed 72 hours
after transfections and MID1 protein levels were analysed by immunoblotting and mRNA
levels were analysed by SYBR Green real time PCR.
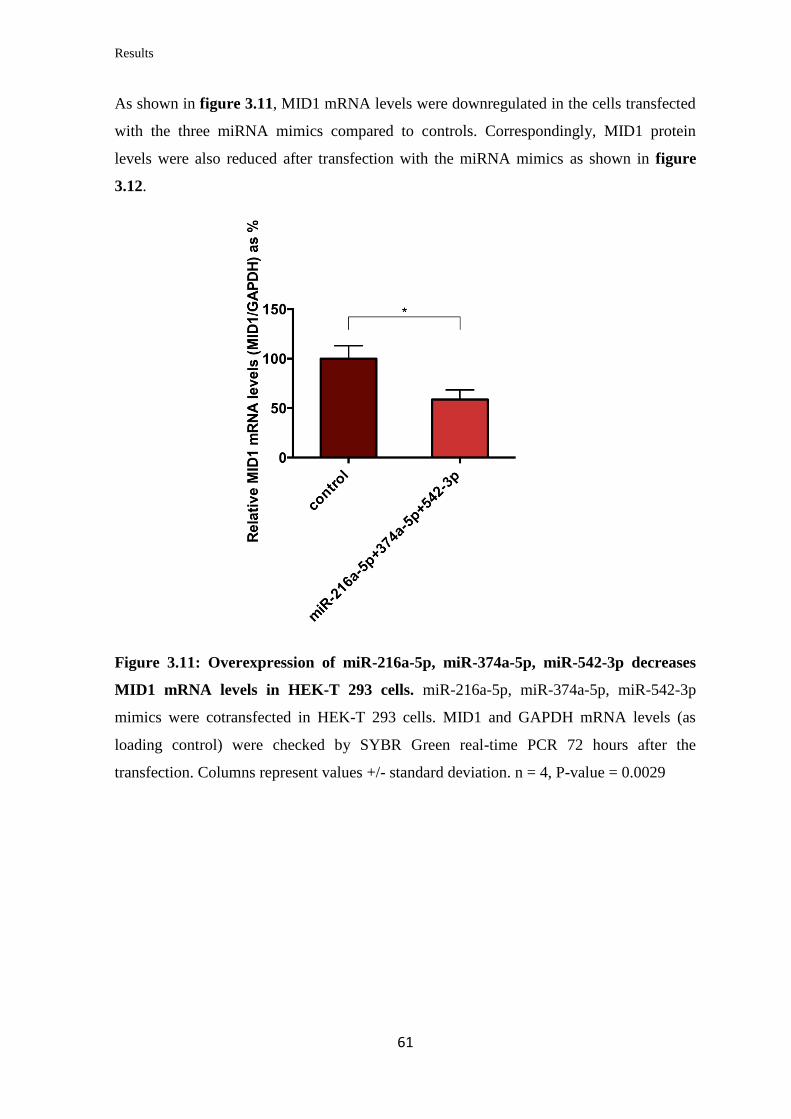
Results
61
As shown in figure 3.11, MID1 mRNA levels were downregulated in the cells transfected
with the three miRNA mimics compared to controls. Correspondingly, MID1 protein
levels were also reduced after transfection with the miRNA mimics as shown in figure
3.12.
Figure 3.11: Overexpression of miR-216a-5p, miR-374a-5p, miR-542-3p decreases
MID1 mRNA levels in HEK-T 293 cells. miR-216a-5p, miR-374a-5p, miR-542-3p
mimics were cotransfected in HEK-T 293 cells. MID1 and GAPDH mRNA levels (as
loading control) were checked by SYBR Green real-time PCR 72 hours after the
transfection. Columns represent values +/- standard deviation. n = 4, P-value = 0.0029
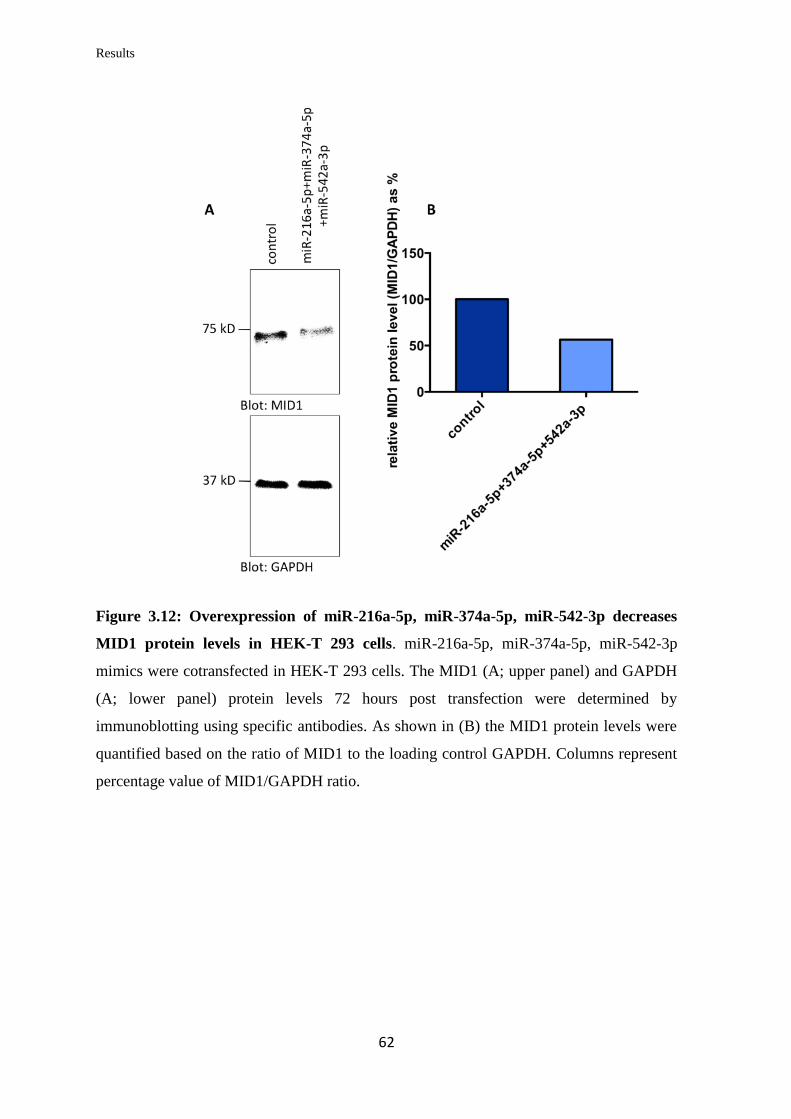
Results
62
Figure 3.12: Overexpression of miR-216a-5p, miR-374a-5p, miR-542-3p decreases
MID1 protein levels in HEK-T 293 cells. miR-216a-5p, miR-374a-5p, miR-542-3p
mimics were cotransfected in HEK-T 293 cells. The MID1 (A; upper panel) and GAPDH
(A; lower panel) protein levels 72 hours post transfection were determined by
immunoblotting using specific antibodies. As shown in (B) the MID1 protein levels were
quantified based on the ratio of MID1 to the loading control GAPDH. Columns represent
percentage value of MID1/GAPDH ratio.
Results
63
3.3 Analysis of differentially expressed miRNAs in iPSC-derived SCA3
neurons
3.3.1 Neurons derived from SCA3 iPSCs express wild type as well as the mutant
ATXN3 allele
To find miRNAs involved in SCA3 pathogenesis, neurons differentiated from Induced
Pluripotent Stem Cells (iPSCs) from SCA3 patients and healthy controls were used. The
iPSC generation, neuronal differentiation, characterization, and culture was conducted by
collaborators in the Institute of Reconstructive Neurobiology, University of Bonn. In
iPSC-derived SCA3 neurons, proteolytic cleavage of expanded ATXN3 by calpains
induced by glutamate treatment of the neurons leads to formation of ATXN3 aggregates,
which is a hallmark of SCA3 pathology (Koch et al, 2011). iPSC-derived neurons from
three SCA3 patients and two healthy controls that had been differentiated for 8 weeks
were used in this study. The details regarding the age, sex, repeat length, age of onset of
the individuals are given in table 3.5. Although the formation of ATXN3 aggregates
requires treatment of the neurons with glutamate, untreated neurons were used for
experiments to decipher dysregulations in mRNAs and miRNAs which might be involved
in the pathogenic mechanisms apart from the obvious, i.e. the toxicity mediated by the
formation of ATXN3 aggregates. The 8 week old neurons were used for extraction of total
RNA including small RNAs as well as the extraction of total protein. The total RNA was
used to generate gene expression and miRNA expression profiles using the technique of
RNA sequencing (RNA-seq). Proteins extracted from these neurons were utilized for
quantification of proteins by immunoblotting. The expression of wild type and mutant
alleles of ATXN3 in the SCA3 neurons was validated by immunoblotting using total
proteins extracts as shown in figure 3.13.
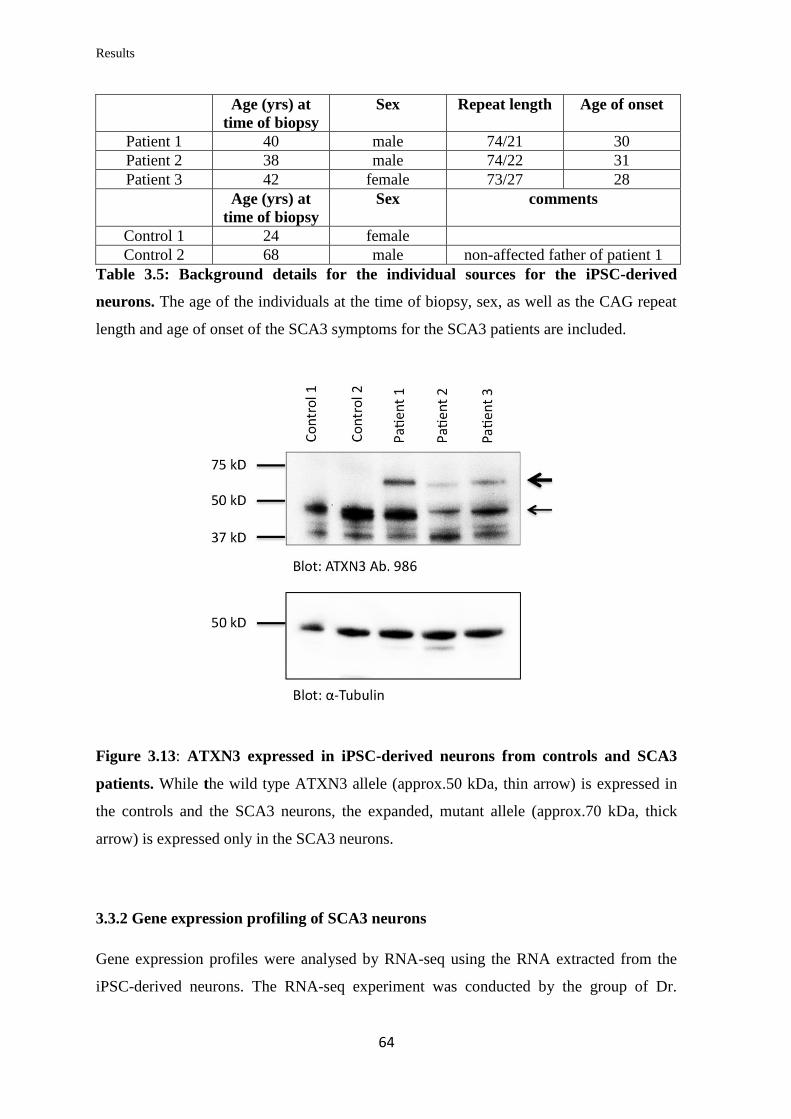
Results
64
Age (yrs) at
time of biopsy
Sex Repeat length Age of onset
Patient 1 40 male 74/21 30
Patient 2 38 male 74/22 31
Patient 3 42 female 73/27 28
Age (yrs) at
time of biopsy
Sex comments
Control 1 24 female
Control 2 68 male non-affected father of patient 1
Table 3.5: Background details for the individual sources for the iPSC-derived
neurons. The age of the individuals at the time of biopsy, sex, as well as the CAG repeat
length and age of onset of the SCA3 symptoms for the SCA3 patients are included.
Figure 3.13: ATXN3 expressed in iPSC-derived neurons from controls and SCA3
patients. While the wild type ATXN3 allele (approx.50 kDa, thin arrow) is expressed in
the controls and the SCA3 neurons, the expanded, mutant allele (approx.70 kDa, thick
arrow) is expressed only in the SCA3 neurons.
3.3.2 Gene expression profiling of SCA3 neurons
Gene expression profiles were analysed by RNA-seq using the RNA extracted from the
iPSC-derived neurons. The RNA-seq experiment was conducted by the group of Dr.
Results
65
Stefan Bonn (Computational analysis of biological networks, DZNE Göttingen). Gene
expression profiles of two controls were compared to the three SCA3 patients with the aim
of finding dysregulated mRNAs in the SCA3 patient neurons. The gene expression
profiles revealed that in SCA3 patient neurons, 71 mRNAs were dysregulated: 41 were
upregulated and 30 were downregulated compared to healthy controls. The top five
upregulated and downregulated genes in the SCA3 neurons are shown in table 3.6. (The
complete list of dysregulated mRNAs is given in the appendix).
Gene symbol
Gene name
Fold change in
SCA3 neurons
FDR
P-value
Genes upregulated in SCA3 neurons
ELAVL2
ELAV like neuron specific
RNA-binding protein 2 4.94 8.37E-03
KIAA1549L KIAA1549-like 4.3 4.00E-02
ANK3
ankyrin 3, node of Ranvier
(ankyrin g) 3.96 2.26E-03
DCC DCC netrin 1 receptor 3.81 2.00E-02
MEX3A
mex3 RNA-binding family
member A 3.37 1.96E-04
Genes downregulated in SCA3 neurons
COLEC12
collectin sub-family member
12 -24.41 4.80E-15
SERPINF1
serpin peptidase inhibitor,
clade F -14.26 4.10E-07
LUM lumican -10.29 6.29E-38
EFEMP2
EGF containing fibulin like
extracellular matrix protein 2 -6.81 7.01E-04
EVA1C eva-1 homolog C (C.elegans) -5.82 5.00E-02
Table 3.6: The five most upregulated and downregulated genes in SCA3 neurons.
Genes have been displayed with fold change in expression in the SCA3 neurons as
compared to healthy controls along with the P-values of differential expression.
Results
66
To understand the relevance of the dysregulation of specific gene expression, the set of
dysregulated mRNAs was analysed using techniques of Gene Ontology (GO) term
enrichment, Pathway enrichment analysis and Protein interaction analysis.
3.3.3 Gene Ontology (GO) term enrichment analysis
The GO term enrichment analysis elucidated the enrichment of the dysregulated genes
with respect to three categories, namely: molecular function, biological process and
cellular component. As seen in table 3.7, the top ranked enriched GO terms pertaining to
molecular function were associated with structural molecule activity, cytoskeletal
regulation and poly(A) RNA binding. The dysregulation status (up or downregulation) of
mRNAs in each of these terms is shown in figure 3.14. The top ranked enriched GO terms
with respect to biological process revealed that the dysregulated genes were associated
with neuron projection, neuron development, axon development, neuron differentiation
and neurogenesis (table 3.8). The up and downregulated genes related to each of these
terms is shown in figure 3.15. The top ranked GO terms associated with cellular
component revealed an enrichment of genes associated with cell projection, neuron
projection and axon (table 3.9). The split-up of the dysregulated genes related to each
term is shown in figure 3.16. It is worth noting that the enrichment of the genes as
ascertained by the False Discovery Rate (FDR) corrected p-values, is highest for the terms
in the category biological process, followed by cellular component and molecular function
in that order.
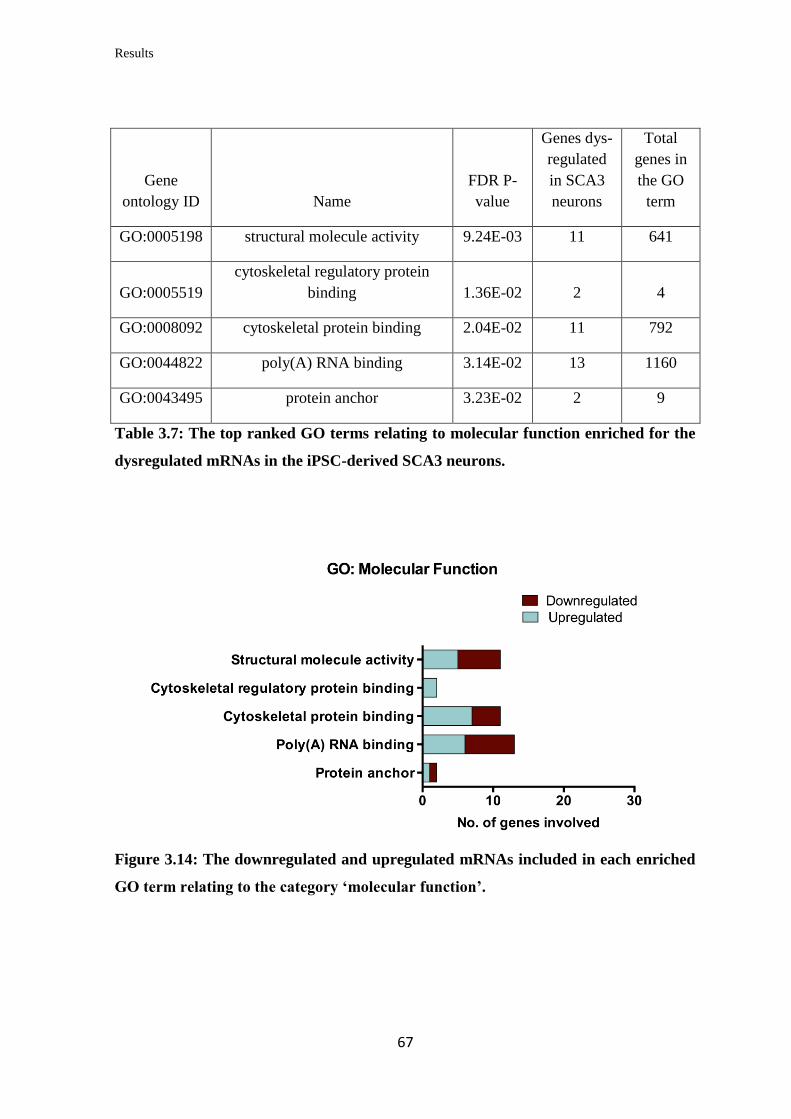
Results
67
Gene
ontology ID Name
FDR P-
value
Genes dys-
regulated
in SCA3
neurons
Total
genes in
the GO
term
GO:0005198 structural molecule activity 9.24E-03 11 641
GO:0005519
cytoskeletal regulatory protein
binding 1.36E-02 2 4
GO:0008092 cytoskeletal protein binding 2.04E-02 11 792
GO:0044822 poly(A) RNA binding 3.14E-02 13 1160
GO:0043495 protein anchor 3.23E-02 2 9
Table 3.7: The top ranked GO terms relating to molecular function enriched for the
dysregulated mRNAs in the iPSC-derived SCA3 neurons.
Figure 3.14: The downregulated and upregulated mRNAs included in each enriched
GO term relating to the category ‘molecular function’.
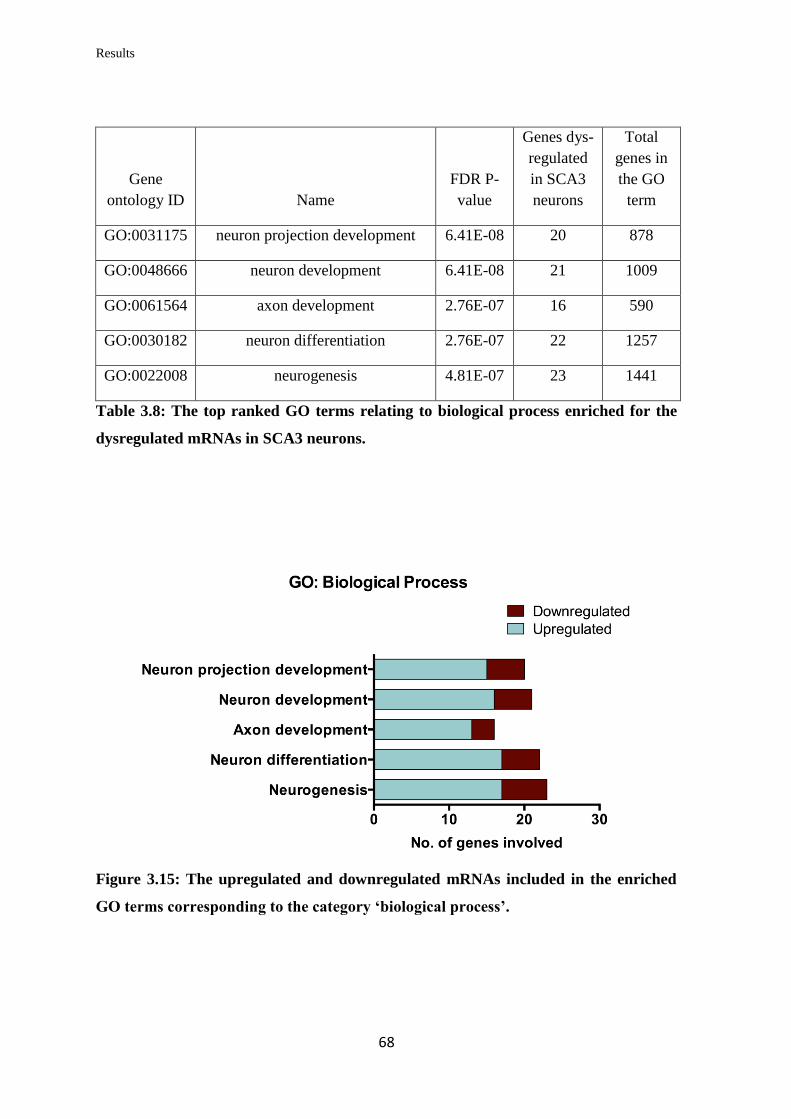
Results
68
Gene
ontology ID Name
FDR P-
value
Genes dys-
regulated
in SCA3
neurons
Total
genes in
the GO
term
GO:0031175 neuron projection development 6.41E-08 20 878
GO:0048666 neuron development 6.41E-08 21 1009
GO:0061564 axon development 2.76E-07 16 590
GO:0030182 neuron differentiation 2.76E-07 22 1257
GO:0022008 neurogenesis 4.81E-07 23 1441
Table 3.8: The top ranked GO terms relating to biological process enriched for the
dysregulated mRNAs in SCA3 neurons.
Figure 3.15: The upregulated and downregulated mRNAs included in the enriched
GO terms corresponding to the category ‘biological process’.
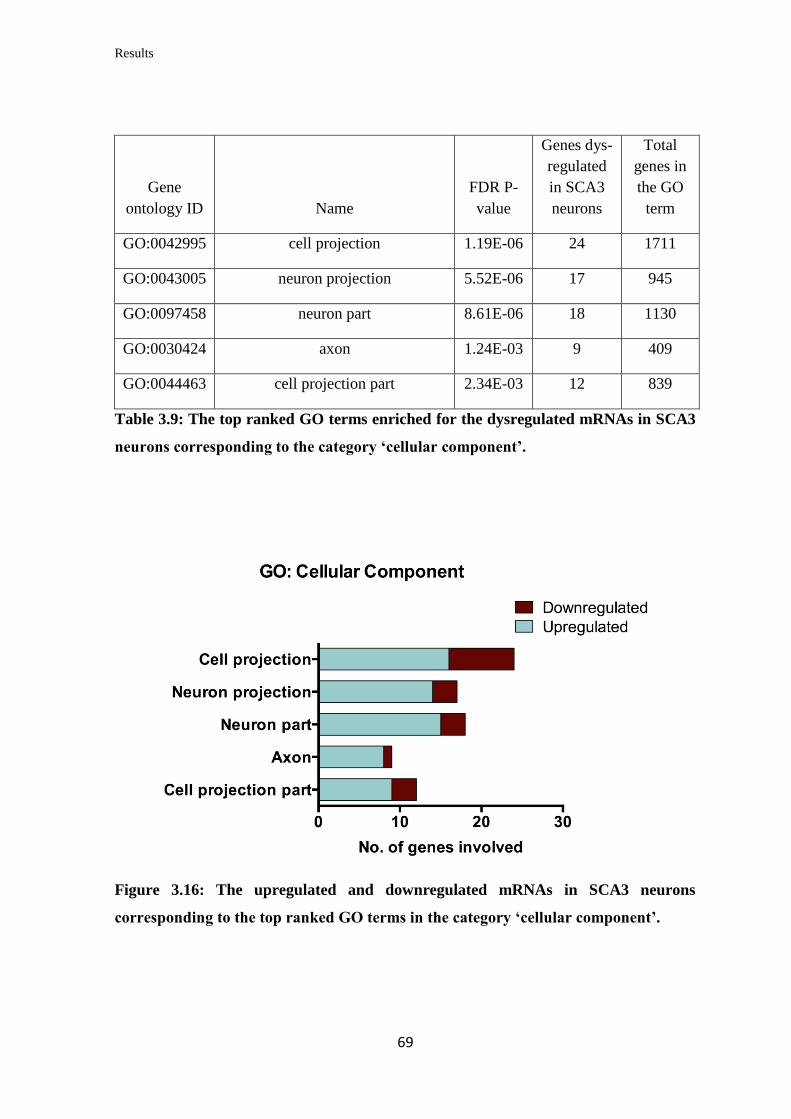
Results
69
Gene
ontology ID Name
FDR P-
value
Genes dys-
regulated
in SCA3
neurons
Total
genes in
the GO
term
GO:0042995 cell projection 1.19E-06 24 1711
GO:0043005 neuron projection 5.52E-06 17 945
GO:0097458 neuron part 8.61E-06 18 1130
GO:0030424 axon 1.24E-03 9 409
GO:0044463 cell projection part 2.34E-03 12 839
Table 3.9: The top ranked GO terms enriched for the dysregulated mRNAs in SCA3
neurons corresponding to the category ‘cellular component’.
Figure 3.16: The upregulated and downregulated mRNAs in SCA3 neurons
corresponding to the top ranked GO terms in the category ‘cellular component’.
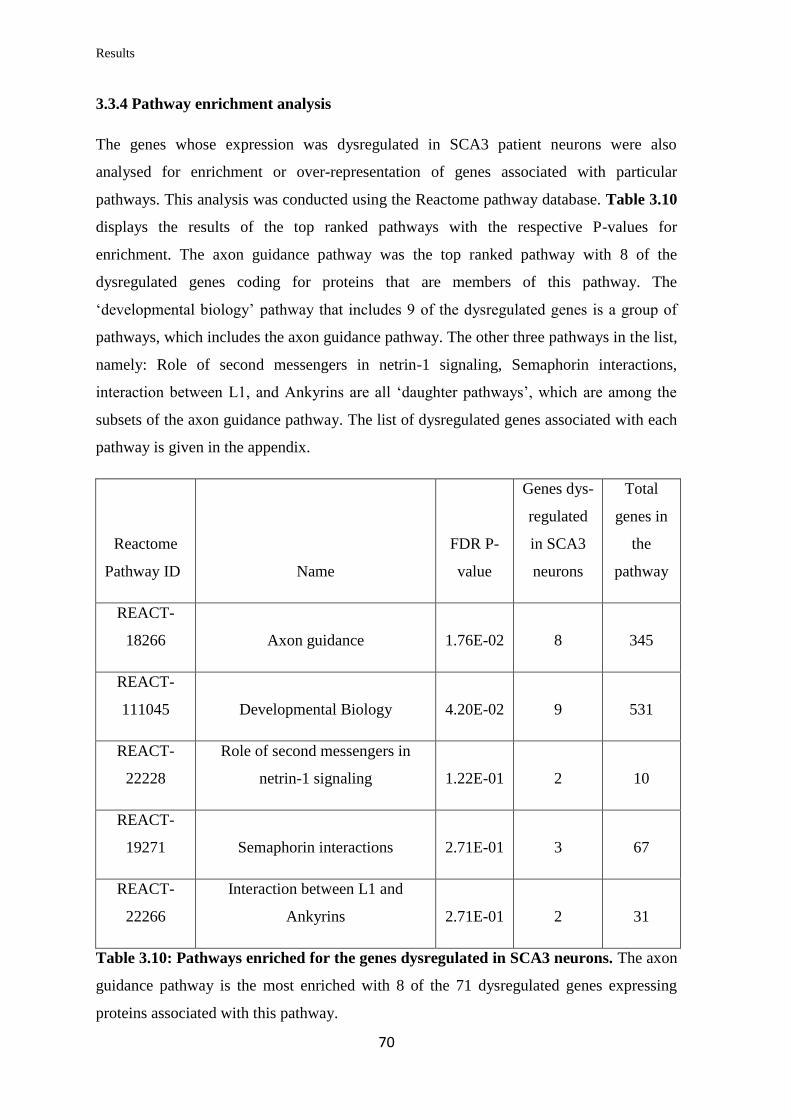
Results
70
3.3.4 Pathway enrichment analysis
The genes whose expression was dysregulated in SCA3 patient neurons were also
analysed for enrichment or over-representation of genes associated with particular
pathways. This analysis was conducted using the Reactome pathway database. Table 3.10
displays the results of the top ranked pathways with the respective P-values for
enrichment. The axon guidance pathway was the top ranked pathway with 8 of the
dysregulated genes coding for proteins that are members of this pathway. The
‘developmental biology’ pathway that includes 9 of the dysregulated genes is a group of
pathways, which includes the axon guidance pathway. The other three pathways in the list,
namely: Role of second messengers in netrin-1 signaling, Semaphorin interactions,
interaction between L1, and Ankyrins are all ‘daughter pathways’, which are among the
subsets of the axon guidance pathway. The list of dysregulated genes associated with each
pathway is given in the appendix.
Reactome
Pathway ID Name
FDR P-
value
Genes dys-
regulated
in SCA3
neurons
Total
genes in
the
pathway
REACT-
18266 Axon guidance 1.76E-02 8 345
REACT-
111045 Developmental Biology 4.20E-02 9 531
REACT-
22228
Role of second messengers in
netrin-1 signaling 1.22E-01 2 10
REACT-
19271 Semaphorin interactions 2.71E-01 3 67
REACT-
22266
Interaction between L1 and
Ankyrins 2.71E-01 2 31
Table 3.10: Pathways enriched for the genes dysregulated in SCA3 neurons. The axon
guidance pathway is the most enriched with 8 of the 71 dysregulated genes expressing
proteins associated with this pathway.
Results
71
3.3.5 Protein interaction analysis
The genes dysregulated in SCA3 patient neurons were also analysed using the protein
interaction database STRING-DB. The input list fed into the algorithm included the 71
dysregulated mRNAs and the addition of ATXN3, with the aim of elucidating if proteins
expressed from the dysregulated genes interact with ATXN3. The results are displayed in
Figure 3.17 as a graphic, where each dysregulated gene product i.e. the resultant protein is
denoted by a sphere. Proteins with known interactions (interactions validated from
published experiments) are connected by lines. The ATXN3 protein is highlighted in the
figure. The only protein known to interact with ATXN3 from amongst all the candidates is
the DNAJB1 protein, coded by the DNAJB1 gene which is found to be downregulated in
SCA3 patient neurons. The DNAJB1 protein is a well-studied chaperone (also known as
one of the Hsp40 chaperones) and has been documented to co-localize with intra-nuclear
inclusions, which are mediated by the expanded ATXN3 in SCA3 neurons (Seidel et al,
2012a).
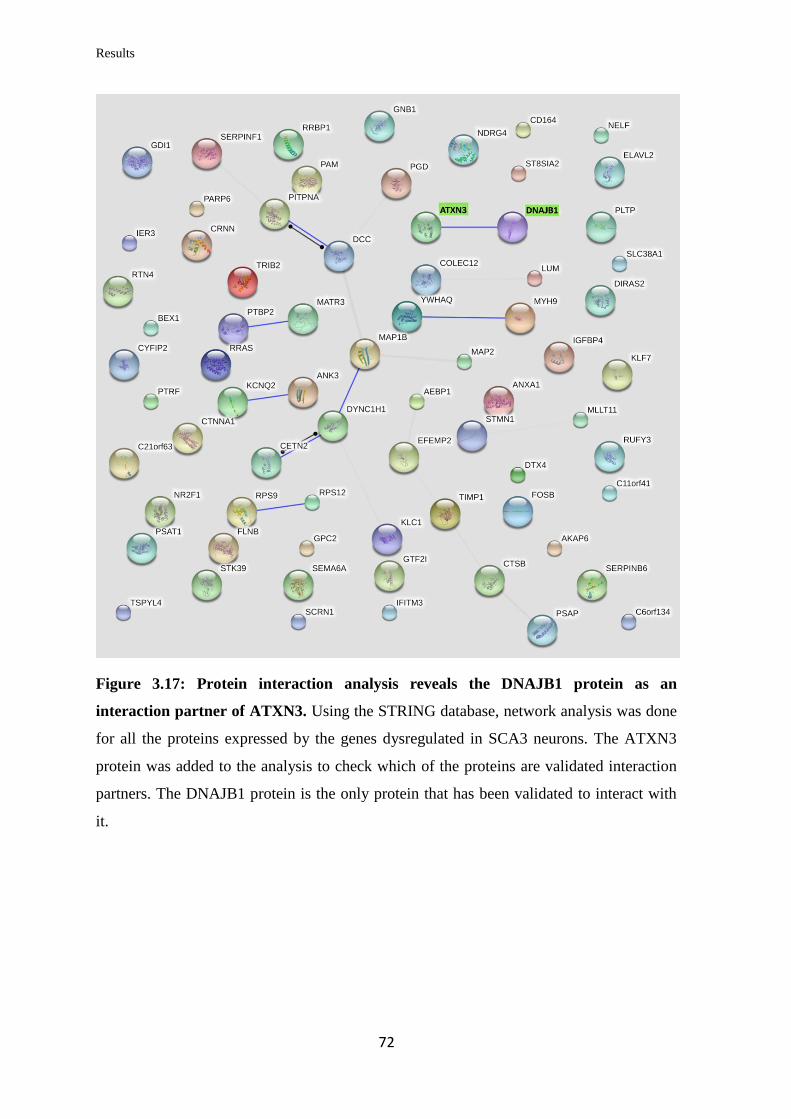
Results
72
Figure 3.17: Protein interaction analysis reveals the DNAJB1 protein as an
interaction partner of ATXN3. Using the STRING database, network analysis was done
for all the proteins expressed by the genes dysregulated in SCA3 neurons. The ATXN3
protein was added to the analysis to check which of the proteins are validated interaction
partners. The DNAJB1 protein is the only protein that has been validated to interact with
it.
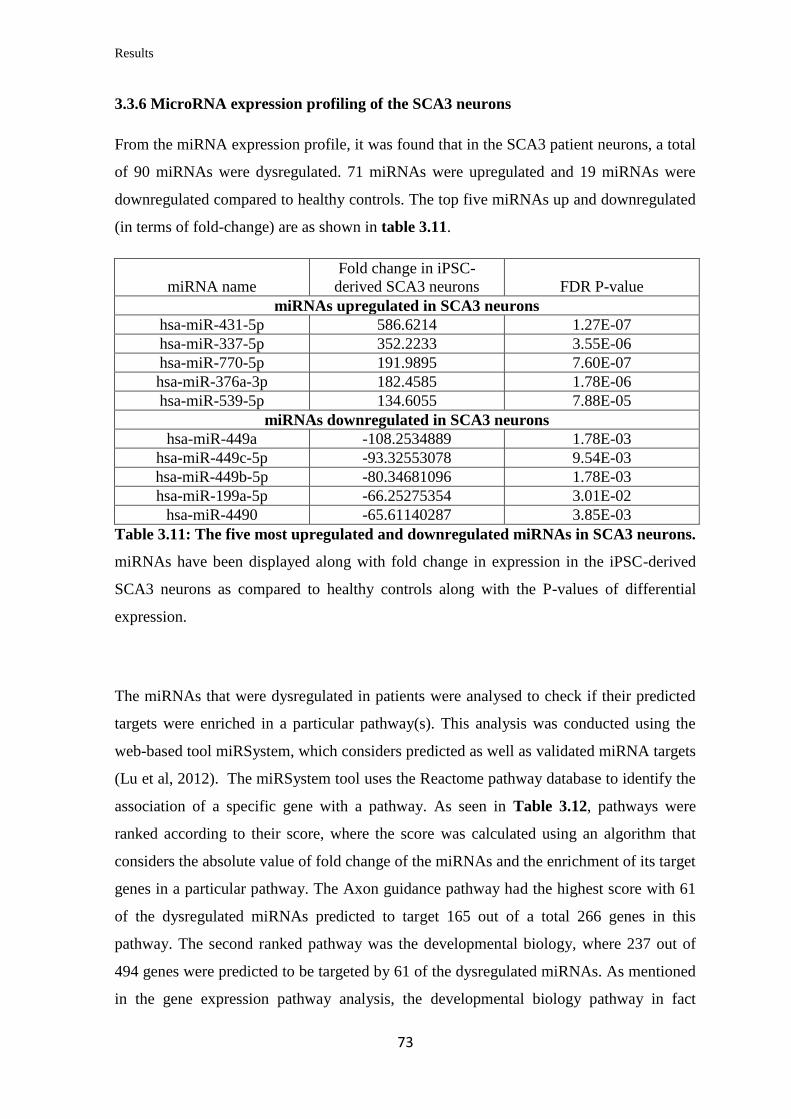
Results
73
3.3.6 MicroRNA expression profiling of the SCA3 neurons
From the miRNA expression profile, it was found that in the SCA3 patient neurons, a total
of 90 miRNAs were dysregulated. 71 miRNAs were upregulated and 19 miRNAs were
downregulated compared to healthy controls. The top five miRNAs up and downregulated
(in terms of fold-change) are as shown in table 3.11.
miRNA name
Fold change in iPSC-
derived SCA3 neurons
FDR P-value
miRNAs upregulated in SCA3 neurons
hsa-miR-431-5p 586.6214 1.27E-07
hsa-miR-337-5p 352.2233 3.55E-06
hsa-miR-770-5p 191.9895 7.60E-07
hsa-miR-376a-3p 182.4585 1.78E-06
hsa-miR-539-5p 134.6055 7.88E-05
miRNAs downregulated in SCA3 neurons
hsa-miR-449a -108.2534889 1.78E-03
hsa-miR-449c-5p -93.32553078 9.54E-03
hsa-miR-449b-5p -80.34681096 1.78E-03
hsa-miR-199a-5p -66.25275354 3.01E-02
hsa-miR-4490 -65.61140287 3.85E-03
Table 3.11: The five most upregulated and downregulated miRNAs in SCA3 neurons.
miRNAs have been displayed along with fold change in expression in the iPSC-derived
SCA3 neurons as compared to healthy controls along with the P-values of differential
expression.
The miRNAs that were dysregulated in patients were analysed to check if their predicted
targets were enriched in a particular pathway(s). This analysis was conducted using the
web-based tool miRSystem, which considers predicted as well as validated miRNA targets
(Lu et al, 2012). The miRSystem tool uses the Reactome pathway database to identify the
association of a specific gene with a pathway. As seen in Table 3.12, pathways were
ranked according to their score, where the score was calculated using an algorithm that
considers the absolute value of fold change of the miRNAs and the enrichment of its target
genes in a particular pathway. The Axon guidance pathway had the highest score with 61
of the dysregulated miRNAs predicted to target 165 out of a total 266 genes in this
pathway. The second ranked pathway was the developmental biology, where 237 out of
494 genes were predicted to be targeted by 61 of the dysregulated miRNAs. As mentioned
in the gene expression pathway analysis, the developmental biology pathway in fact
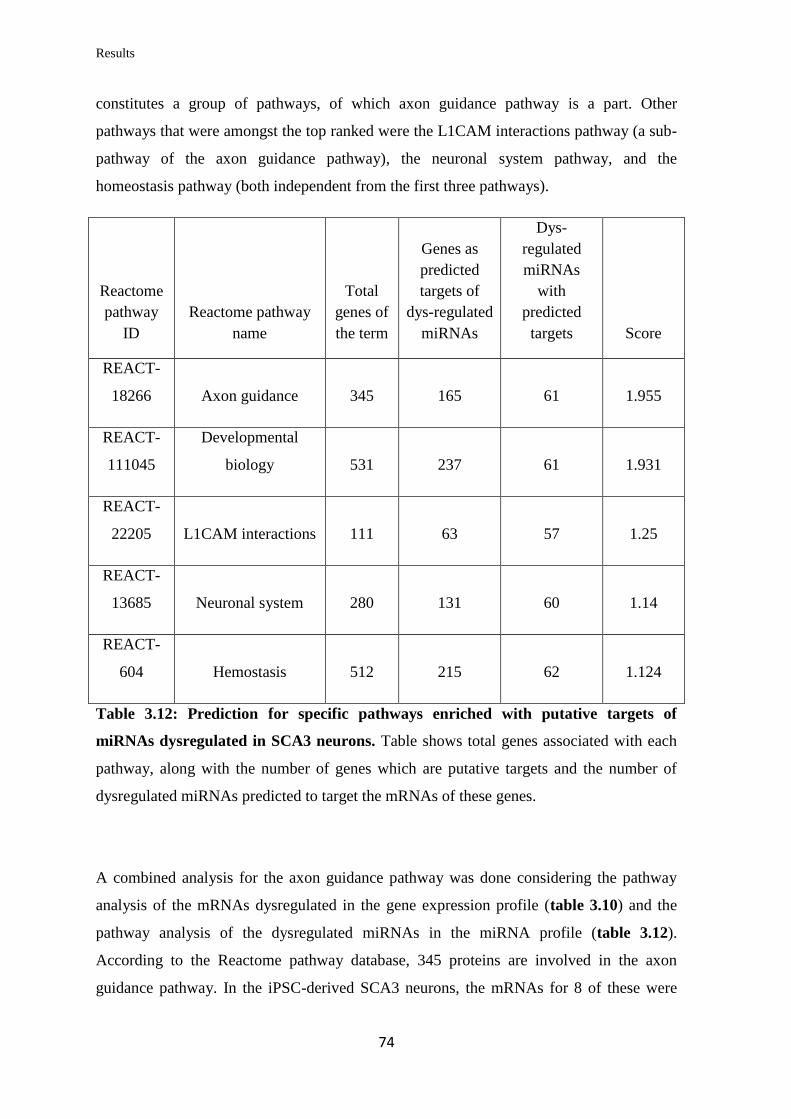
Results
74
constitutes a group of pathways, of which axon guidance pathway is a part. Other
pathways that were amongst the top ranked were the L1CAM interactions pathway (a sub-
pathway of the axon guidance pathway), the neuronal system pathway, and the
homeostasis pathway (both independent from the first three pathways).
Reactome
pathway
ID
Reactome pathway
name
Total
genes of
the term
Genes as
predicted
targets of
dys-regulated
miRNAs
Dys-
regulated
miRNAs
with
predicted
targets Score
REACT-
18266 Axon guidance 345 165 61 1.955
REACT-
111045
Developmental
biology 531 237 61 1.931
REACT-
22205 L1CAM interactions 111 63 57 1.25
REACT-
13685 Neuronal system 280 131 60 1.14
REACT-
604 Hemostasis 512 215 62 1.124
Table 3.12: Prediction for specific pathways enriched with putative targets of
miRNAs dysregulated in SCA3 neurons. Table shows total genes associated with each
pathway, along with the number of genes which are putative targets and the number of
dysregulated miRNAs predicted to target the mRNAs of these genes.
A combined analysis for the axon guidance pathway was done considering the pathway
analysis of the mRNAs dysregulated in the gene expression profile (table 3.10) and the
pathway analysis of the dysregulated miRNAs in the miRNA profile (table 3.12).
According to the Reactome pathway database, 345 proteins are involved in the axon
guidance pathway. In the iPSC-derived SCA3 neurons, the mRNAs for 8 of these were
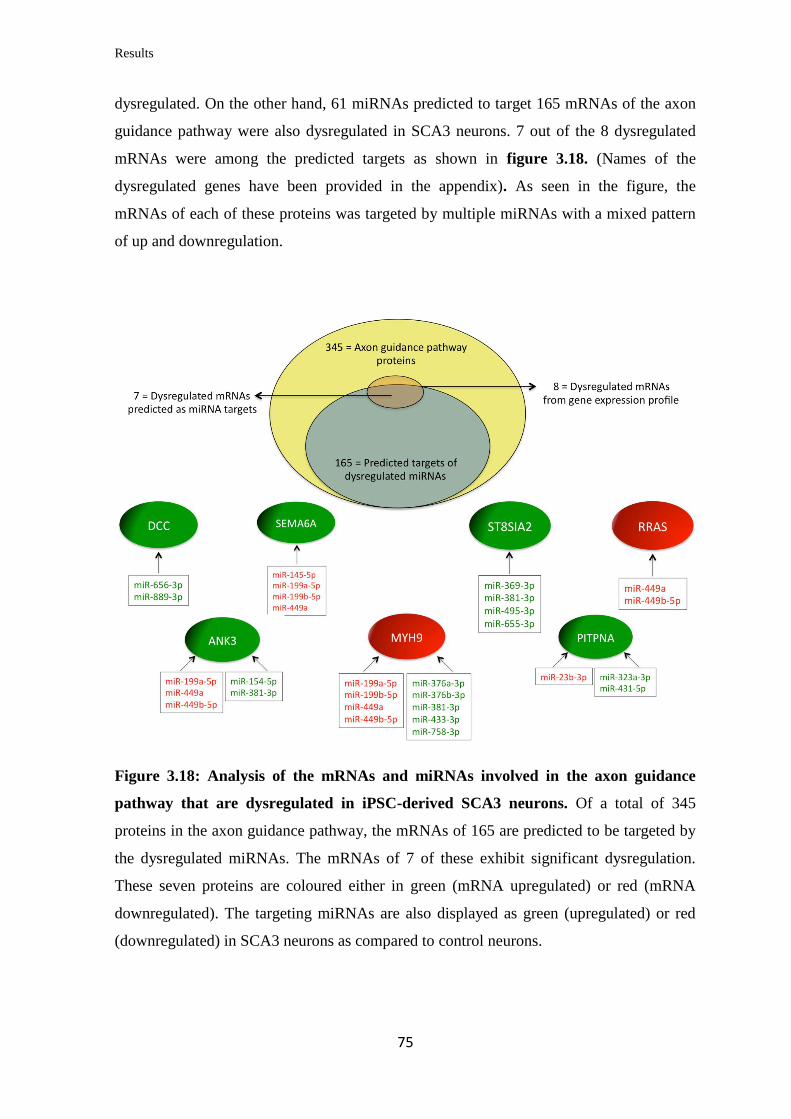
Results
75
dysregulated. On the other hand, 61 miRNAs predicted to target 165 mRNAs of the axon
guidance pathway were also dysregulated in SCA3 neurons. 7 out of the 8 dysregulated
mRNAs were among the predicted targets as shown in figure 3.18. (Names of the
dysregulated genes have been provided in the appendix). As seen in the figure, the
mRNAs of each of these proteins was targeted by multiple miRNAs with a mixed pattern
of up and downregulation.
Figure 3.18: Analysis of the mRNAs and miRNAs involved in the axon guidance
pathway that are dysregulated in iPSC-derived SCA3 neurons. Of a total of 345
proteins in the axon guidance pathway, the mRNAs of 165 are predicted to be targeted by
the dysregulated miRNAs. The mRNAs of 7 of these exhibit significant dysregulation.
These seven proteins are coloured either in green (mRNA upregulated) or red (mRNA
downregulated). The targeting miRNAs are also displayed as green (upregulated) or red
(downregulated) in SCA3 neurons as compared to control neurons.
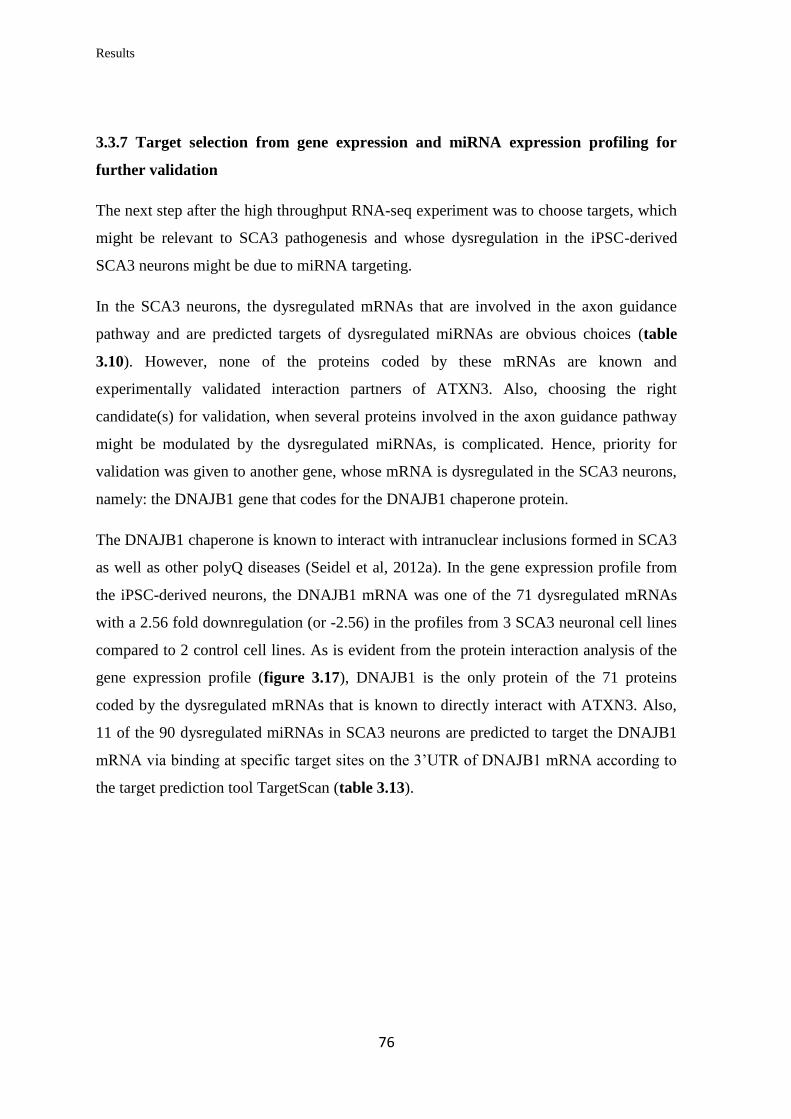
Results
76
3.3.7 Target selection from gene expression and miRNA expression profiling for
further validation
The next step after the high throughput RNA-seq experiment was to choose targets, which
might be relevant to SCA3 pathogenesis and whose dysregulation in the iPSC-derived
SCA3 neurons might be due to miRNA targeting.
In the SCA3 neurons, the dysregulated mRNAs that are involved in the axon guidance
pathway and are predicted targets of dysregulated miRNAs are obvious choices (table
3.10). However, none of the proteins coded by these mRNAs are known and
experimentally validated interaction partners of ATXN3. Also, choosing the right
candidate(s) for validation, when several proteins involved in the axon guidance pathway
might be modulated by the dysregulated miRNAs, is complicated. Hence, priority for
validation was given to another gene, whose mRNA is dysregulated in the SCA3 neurons,
namely: the DNAJB1 gene that codes for the DNAJB1 chaperone protein.
The DNAJB1 chaperone is known to interact with intranuclear inclusions formed in SCA3
as well as other polyQ diseases (Seidel et al, 2012a). In the gene expression profile from
the iPSC-derived neurons, the DNAJB1 mRNA was one of the 71 dysregulated mRNAs
with a 2.56 fold downregulation (or -2.56) in the profiles from 3 SCA3 neuronal cell lines
compared to 2 control cell lines. As is evident from the protein interaction analysis of the
gene expression profile (figure 3.17), DNAJB1 is the only protein of the 71 proteins
coded by the dysregulated mRNAs that is known to directly interact with ATXN3. Also,
11 of the 90 dysregulated miRNAs in SCA3 neurons are predicted to target the DNAJB1
mRNA via binding at specific target sites on the 3’UTR of DNAJB1 mRNA according to
the target prediction tool TargetScan (table 3.13).
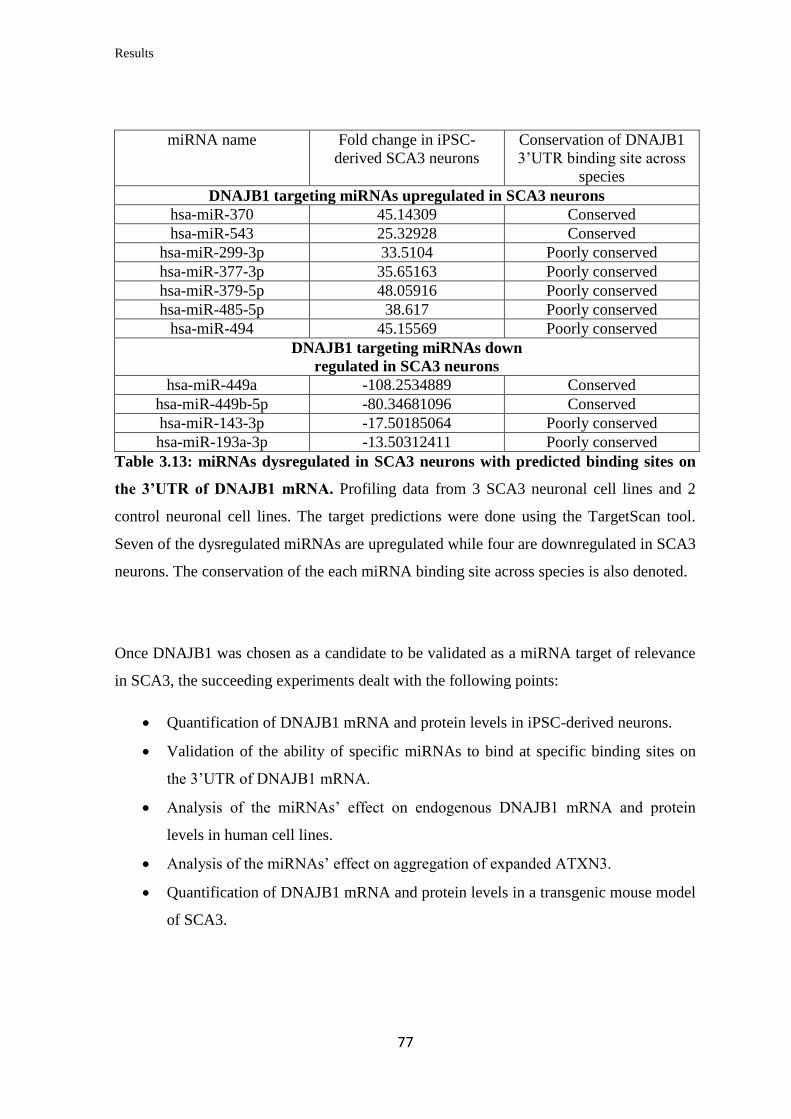
Results
77
miRNA name Fold change in iPSC-
derived SCA3 neurons
Conservation of DNAJB1
3’UTR binding site across
species
DNAJB1 targeting miRNAs upregulated in SCA3 neurons
hsa-miR-370 45.14309 Conserved
hsa-miR-543 25.32928 Conserved
hsa-miR-299-3p 33.5104 Poorly conserved
hsa-miR-377-3p 35.65163 Poorly conserved
hsa-miR-379-5p 48.05916 Poorly conserved
hsa-miR-485-5p 38.617 Poorly conserved
hsa-miR-494 45.15569 Poorly conserved
DNAJB1 targeting miRNAs down
regulated in SCA3 neurons
hsa-miR-449a -108.2534889 Conserved
hsa-miR-449b-5p -80.34681096 Conserved
hsa-miR-143-3p -17.50185064 Poorly conserved
hsa-miR-193a-3p -13.50312411 Poorly conserved
Table 3.13: miRNAs dysregulated in SCA3 neurons with predicted binding sites on
the 3’UTR of DNAJB1 mRNA. Profiling data from 3 SCA3 neuronal cell lines and 2
control neuronal cell lines. The target predictions were done using the TargetScan tool.
Seven of the dysregulated miRNAs are upregulated while four are downregulated in SCA3
neurons. The conservation of the each miRNA binding site across species is also denoted.
Once DNAJB1 was chosen as a candidate to be validated as a miRNA target of relevance
in SCA3, the succeeding experiments dealt with the following points:
Quantification of DNAJB1 mRNA and protein levels in iPSC-derived neurons.
Validation of the ability of specific miRNAs to bind at specific binding sites on
the 3’UTR of DNAJB1 mRNA.
Analysis of the miRNAs’ effect on endogenous DNAJB1 mRNA and protein
levels in human cell lines.
Analysis of the miRNAs’ effect on aggregation of expanded ATXN3.
Quantification of DNAJB1 mRNA and protein levels in a transgenic mouse model
of SCA3.
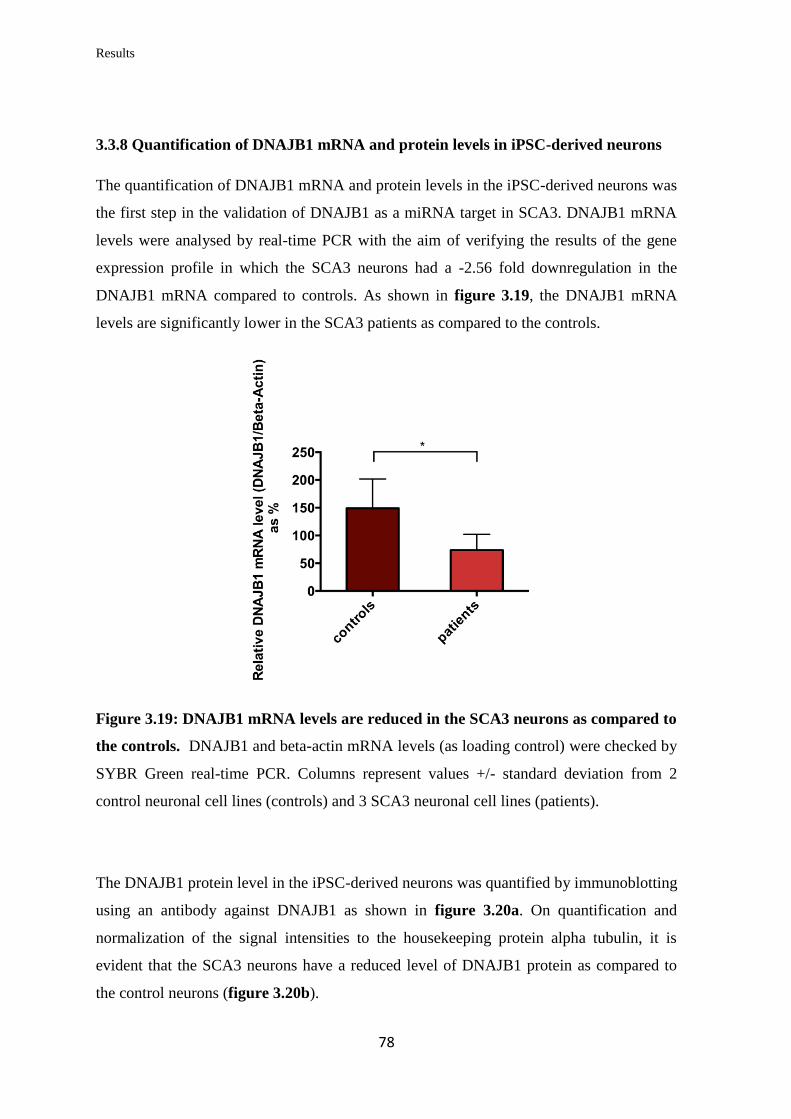
Results
78
3.3.8 Quantification of DNAJB1 mRNA and protein levels in iPSC-derived neurons
The quantification of DNAJB1 mRNA and protein levels in the iPSC-derived neurons was
the first step in the validation of DNAJB1 as a miRNA target in SCA3. DNAJB1 mRNA
levels were analysed by real-time PCR with the aim of verifying the results of the gene
expression profile in which the SCA3 neurons had a -2.56 fold downregulation in the
DNAJB1 mRNA compared to controls. As shown in figure 3.19, the DNAJB1 mRNA
levels are significantly lower in the SCA3 patients as compared to the controls.
Figure 3.19: DNAJB1 mRNA levels are reduced in the SCA3 neurons as compared to
the controls. DNAJB1 and beta-actin mRNA levels (as loading control) were checked by
SYBR Green real-time PCR. Columns represent values +/- standard deviation from 2
control neuronal cell lines (controls) and 3 SCA3 neuronal cell lines (patients).
The DNAJB1 protein level in the iPSC-derived neurons was quantified by immunoblotting
using an antibody against DNAJB1 as shown in figure 3.20a. On quantification and
normalization of the signal intensities to the housekeeping protein alpha tubulin, it is
evident that the SCA3 neurons have a reduced level of DNAJB1 protein as compared to
the control neurons (figure 3.20b).
Results
79
Figure 3.20: DNAJB1 protein levels are reduced in SCA3 neurons as compared to the
controls. DNAJB1 (A; upper panel) and alpha-tubulin (A; lower panel) protein levels
were determined by immunoblotting against specific antibodies. As shown in (B) the
DNAJB1 protein levels were quantified based on the ratio of DNAJB1 to the loading
control alpha-tubulin. Columns represent values +/- standard deviation from 2 control
neuronal cell lines (controls) and 3 SCA3 neuronal cell lines (patients).
3.3.9 Validation of the ability of specific miRNAs to bind at specific binding sites on
the 3’UTR of DNAJB1 mRNA
From the dysregulated miRNAs predicted to target the 3’UTR of DNAJB1 mRNA, four
miRNAs were chosen for validation experiments: miR-543, miR-370, miR-449a and miR-
143. These miRNAs were chosen because they are highly dysregulated in the SCA3
neurons (table 3.13) and because the binding sites of three of them (miR-543, miR-370
and miR-449a) are conserved across species. miR-370 has two conserved binding sites on
DNAJB1 3’UTR. The 3’UTR of DNAJB1 mRNA is 1170 nt long. The locations of the
binding sites for the chosen miRNAs are shown in figure 3.21.
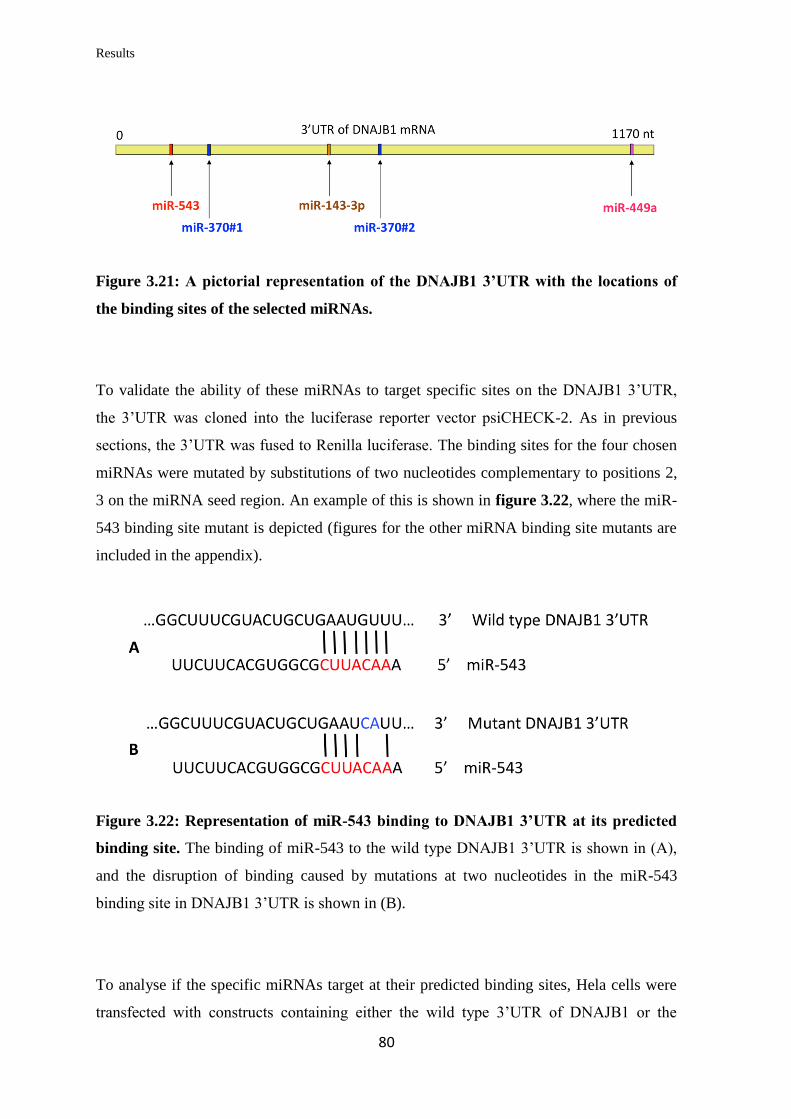
Results
80
Figure 3.21: A pictorial representation of the DNAJB1 3’UTR with the locations of
the binding sites of the selected miRNAs.
To validate the ability of these miRNAs to target specific sites on the DNAJB1 3’UTR,
the 3’UTR was cloned into the luciferase reporter vector psiCHECK-2. As in previous
sections, the 3’UTR was fused to Renilla luciferase. The binding sites for the four chosen
miRNAs were mutated by substitutions of two nucleotides complementary to positions 2,
3 on the miRNA seed region. An example of this is shown in figure 3.22, where the miR-
543 binding site mutant is depicted (figures for the other miRNA binding site mutants are
included in the appendix).
Figure 3.22: Representation of miR-543 binding to DNAJB1 3’UTR at its predicted
binding site. The binding of miR-543 to the wild type DNAJB1 3’UTR is shown in (A),
and the disruption of binding caused by mutations at two nucleotides in the miR-543
binding site in DNAJB1 3’UTR is shown in (B).
To analyse if the specific miRNAs target at their predicted binding sites, Hela cells were
transfected with constructs containing either the wild type 3’UTR of DNAJB1 or the
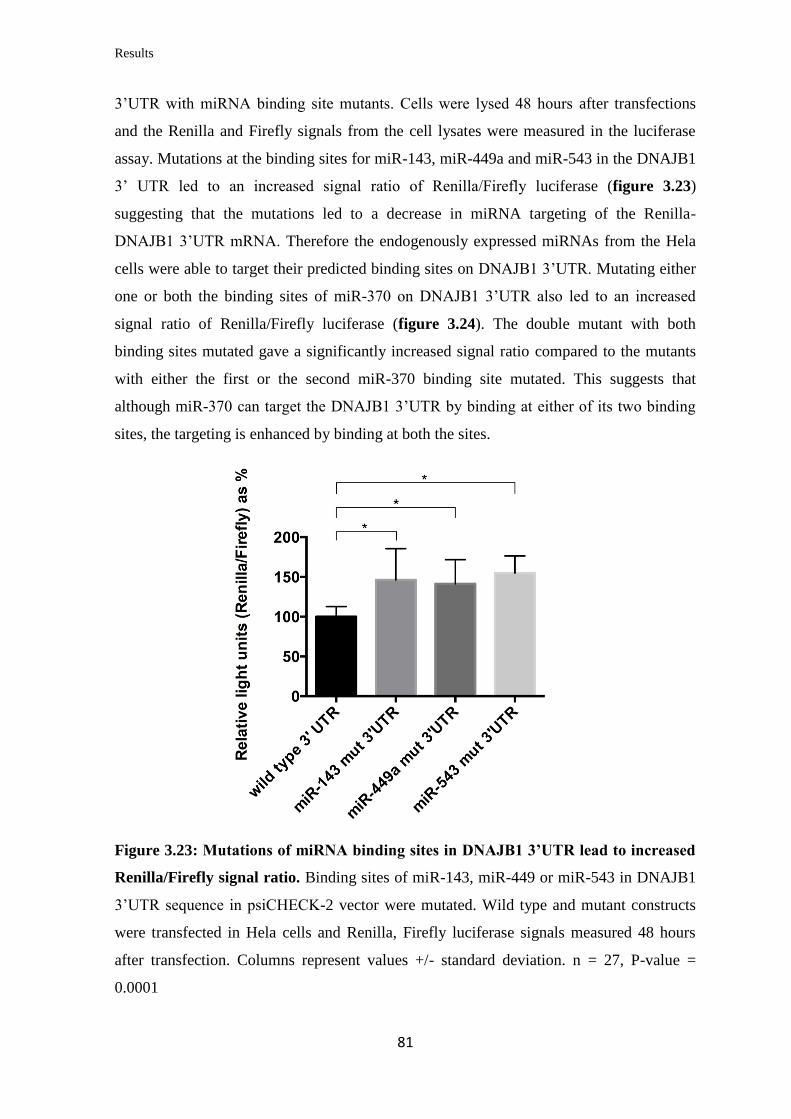
Results
81
3’UTR with miRNA binding site mutants. Cells were lysed 48 hours after transfections
and the Renilla and Firefly signals from the cell lysates were measured in the luciferase
assay. Mutations at the binding sites for miR-143, miR-449a and miR-543 in the DNAJB1
3’ UTR led to an increased signal ratio of Renilla/Firefly luciferase (figure 3.23)
suggesting that the mutations led to a decrease in miRNA targeting of the Renilla-
DNAJB1 3’UTR mRNA. Therefore the endogenously expressed miRNAs from the Hela
cells were able to target their predicted binding sites on DNAJB1 3’UTR. Mutating either
one or both the binding sites of miR-370 on DNAJB1 3’UTR also led to an increased
signal ratio of Renilla/Firefly luciferase (figure 3.24). The double mutant with both
binding sites mutated gave a significantly increased signal ratio compared to the mutants
with either the first or the second miR-370 binding site mutated. This suggests that
although miR-370 can target the DNAJB1 3’UTR by binding at either of its two binding
sites, the targeting is enhanced by binding at both the sites.
Figure 3.23: Mutations of miRNA binding sites in DNAJB1 3’UTR lead to increased
Renilla/Firefly signal ratio. Binding sites of miR-143, miR-449 or miR-543 in DNAJB1
3’UTR sequence in psiCHECK-2 vector were mutated. Wild type and mutant constructs
were transfected in Hela cells and Renilla, Firefly luciferase signals measured 48 hours
after transfection. Columns represent values +/- standard deviation. n = 27, P-value =
0.0001
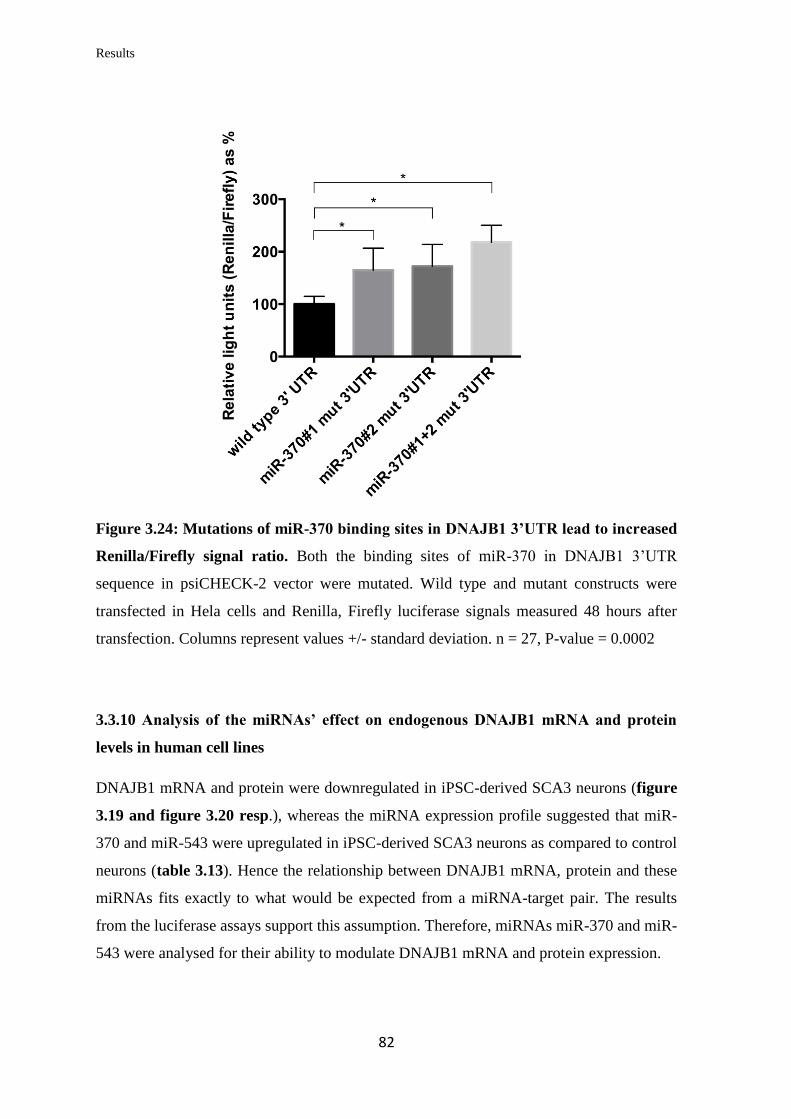
Results
82
Figure 3.24: Mutations of miR-370 binding sites in DNAJB1 3’UTR lead to increased
Renilla/Firefly signal ratio. Both the binding sites of miR-370 in DNAJB1 3’UTR
sequence in psiCHECK-2 vector were mutated. Wild type and mutant constructs were
transfected in Hela cells and Renilla, Firefly luciferase signals measured 48 hours after
transfection. Columns represent values +/- standard deviation. n = 27, P-value = 0.0002
3.3.10 Analysis of the miRNAs’ effect on endogenous DNAJB1 mRNA and protein
levels in human cell lines
DNAJB1 mRNA and protein were downregulated in iPSC-derived SCA3 neurons (figure
3.19 and figure 3.20 resp.), whereas the miRNA expression profile suggested that miR-
370 and miR-543 were upregulated in iPSC-derived SCA3 neurons as compared to control
neurons (table 3.13). Hence the relationship between DNAJB1 mRNA, protein and these
miRNAs fits exactly to what would be expected from a miRNA-target pair. The results
from the luciferase assays support this assumption. Therefore, miRNAs miR-370 and miR-
543 were analysed for their ability to modulate DNAJB1 mRNA and protein expression.
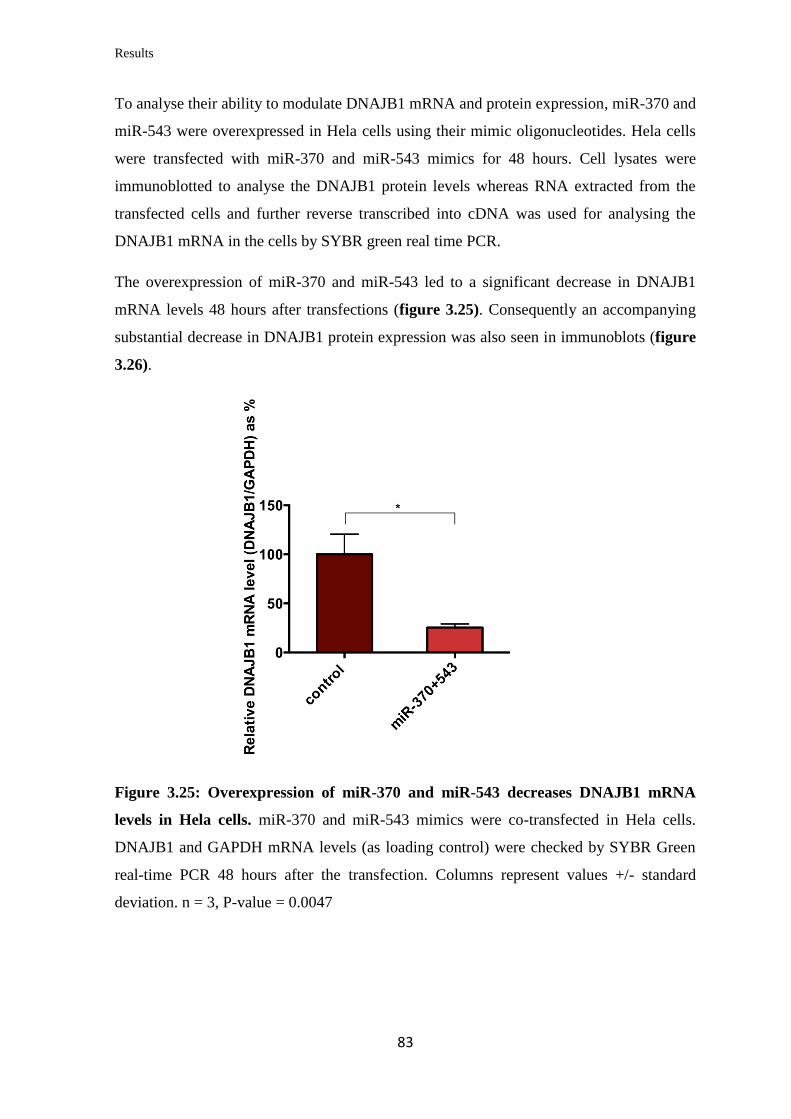
Results
83
To analyse their ability to modulate DNAJB1 mRNA and protein expression, miR-370 and
miR-543 were overexpressed in Hela cells using their mimic oligonucleotides. Hela cells
were transfected with miR-370 and miR-543 mimics for 48 hours. Cell lysates were
immunoblotted to analyse the DNAJB1 protein levels whereas RNA extracted from the
transfected cells and further reverse transcribed into cDNA was used for analysing the
DNAJB1 mRNA in the cells by SYBR green real time PCR.
The overexpression of miR-370 and miR-543 led to a significant decrease in DNAJB1
mRNA levels 48 hours after transfections (figure 3.25). Consequently an accompanying
substantial decrease in DNAJB1 protein expression was also seen in immunoblots (figure
3.26).
Figure 3.25: Overexpression of miR-370 and miR-543 decreases DNAJB1 mRNA
levels in Hela cells. miR-370 and miR-543 mimics were co-transfected in Hela cells.
DNAJB1 and GAPDH mRNA levels (as loading control) were checked by SYBR Green
real-time PCR 48 hours after the transfection. Columns represent values +/- standard
deviation. n = 3, P-value = 0.0047
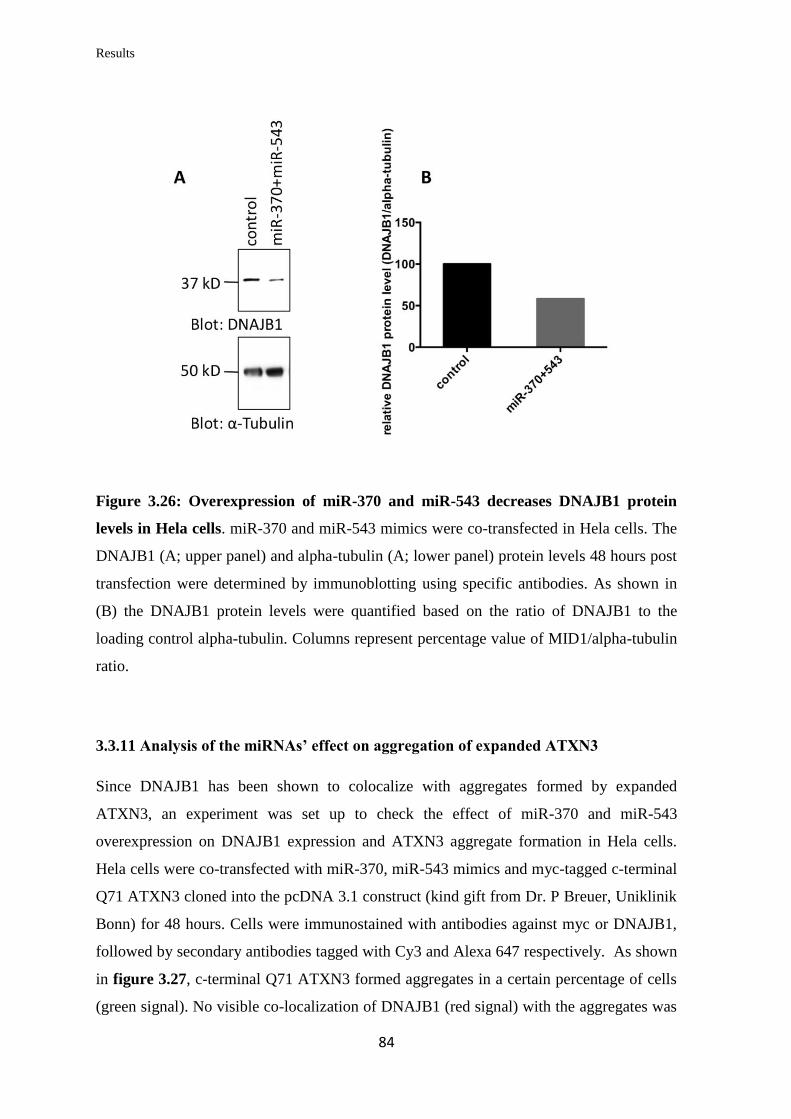
Results
84
Figure 3.26: Overexpression of miR-370 and miR-543 decreases DNAJB1 protein
levels in Hela cells. miR-370 and miR-543 mimics were co-transfected in Hela cells. The
DNAJB1 (A; upper panel) and alpha-tubulin (A; lower panel) protein levels 48 hours post
transfection were determined by immunoblotting using specific antibodies. As shown in
(B) the DNAJB1 protein levels were quantified based on the ratio of DNAJB1 to the
loading control alpha-tubulin. Columns represent percentage value of MID1/alpha-tubulin
ratio.
3.3.11 Analysis of the miRNAs’ effect on aggregation of expanded ATXN3
Since DNAJB1 has been shown to colocalize with aggregates formed by expanded
ATXN3, an experiment was set up to check the effect of miR-370 and miR-543
overexpression on DNAJB1 expression and ATXN3 aggregate formation in Hela cells.
Hela cells were co-transfected with miR-370, miR-543 mimics and myc-tagged c-terminal
Q71 ATXN3 cloned into the pcDNA 3.1 construct (kind gift from Dr. P Breuer, Uniklinik
Bonn) for 48 hours. Cells were immunostained with antibodies against myc or DNAJB1,
followed by secondary antibodies tagged with Cy3 and Alexa 647 respectively. As shown
in figure 3.27, c-terminal Q71 ATXN3 formed aggregates in a certain percentage of cells
(green signal). No visible co-localization of DNAJB1 (red signal) with the aggregates was
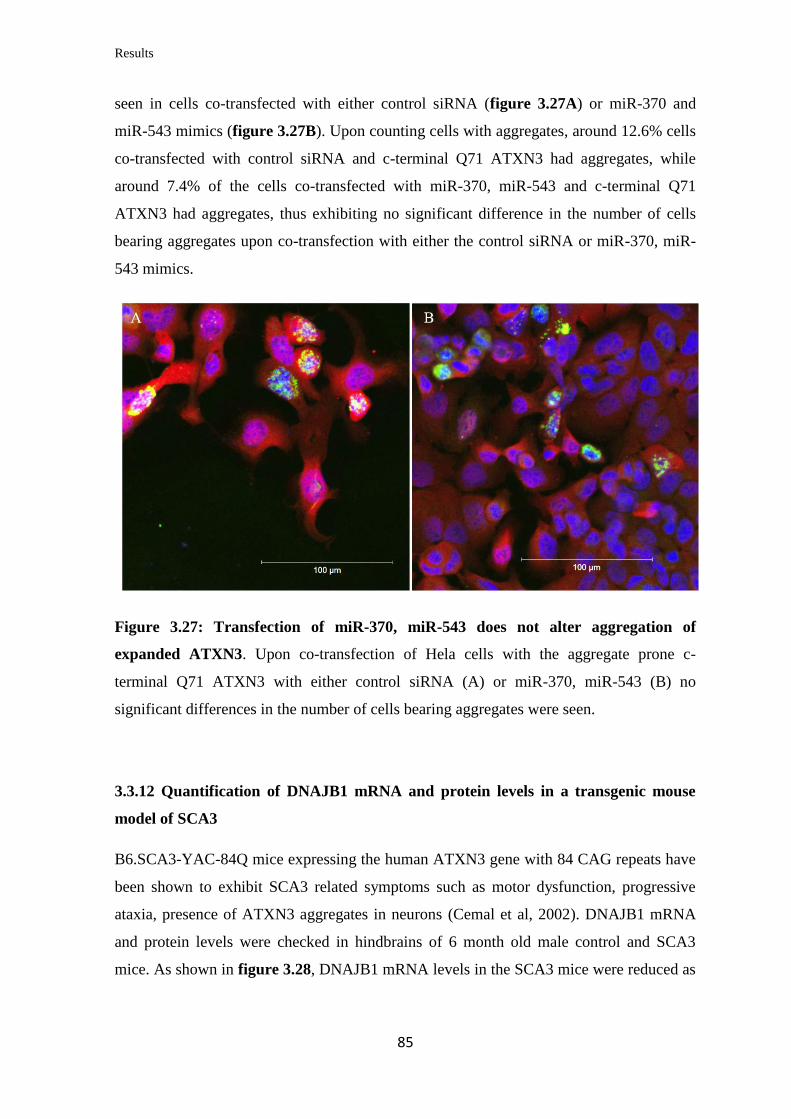
Results
85
seen in cells co-transfected with either control siRNA (figure 3.27A) or miR-370 and
miR-543 mimics (figure 3.27B). Upon counting cells with aggregates, around 12.6% cells
co-transfected with control siRNA and c-terminal Q71 ATXN3 had aggregates, while
around 7.4% of the cells co-transfected with miR-370, miR-543 and c-terminal Q71
ATXN3 had aggregates, thus exhibiting no significant difference in the number of cells
bearing aggregates upon co-transfection with either the control siRNA or miR-370, miR-
543 mimics.
Figure 3.27: Transfection of miR-370, miR-543 does not alter aggregation of
expanded ATXN3. Upon co-transfection of Hela cells with the aggregate prone c-
terminal Q71 ATXN3 with either control siRNA (A) or miR-370, miR-543 (B) no
significant differences in the number of cells bearing aggregates were seen.
3.3.12 Quantification of DNAJB1 mRNA and protein levels in a transgenic mouse
model of SCA3
B6.SCA3-YAC-84Q mice expressing the human ATXN3 gene with 84 CAG repeats have
been shown to exhibit SCA3 related symptoms such as motor dysfunction, progressive
ataxia, presence of ATXN3 aggregates in neurons (Cemal et al, 2002). DNAJB1 mRNA
and protein levels were checked in hindbrains of 6 month old male control and SCA3
mice. As shown in figure 3.28, DNAJB1 mRNA levels in the SCA3 mice were reduced as
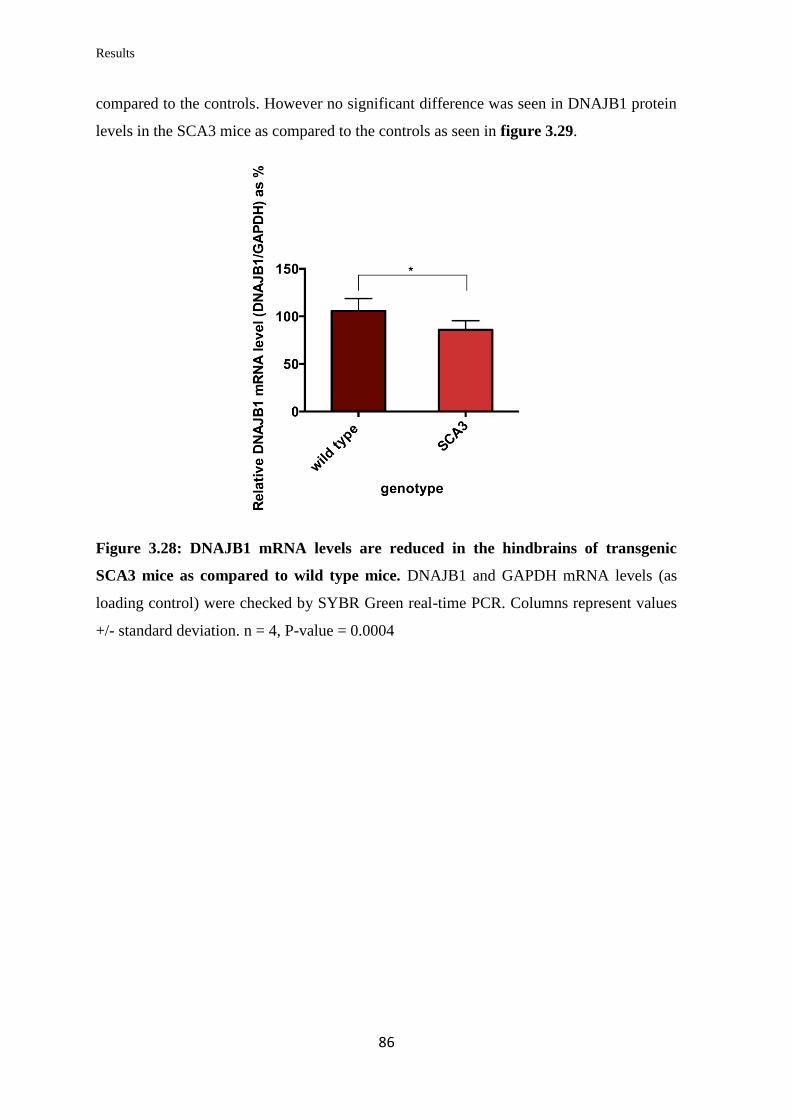
Results
86
compared to the controls. However no significant difference was seen in DNAJB1 protein
levels in the SCA3 mice as compared to the controls as seen in figure 3.29.
Figure 3.28: DNAJB1 mRNA levels are reduced in the hindbrains of transgenic
SCA3 mice as compared to wild type mice. DNAJB1 and GAPDH mRNA levels (as
loading control) were checked by SYBR Green real-time PCR. Columns represent values
+/- standard deviation. n = 4, P-value = 0.0004
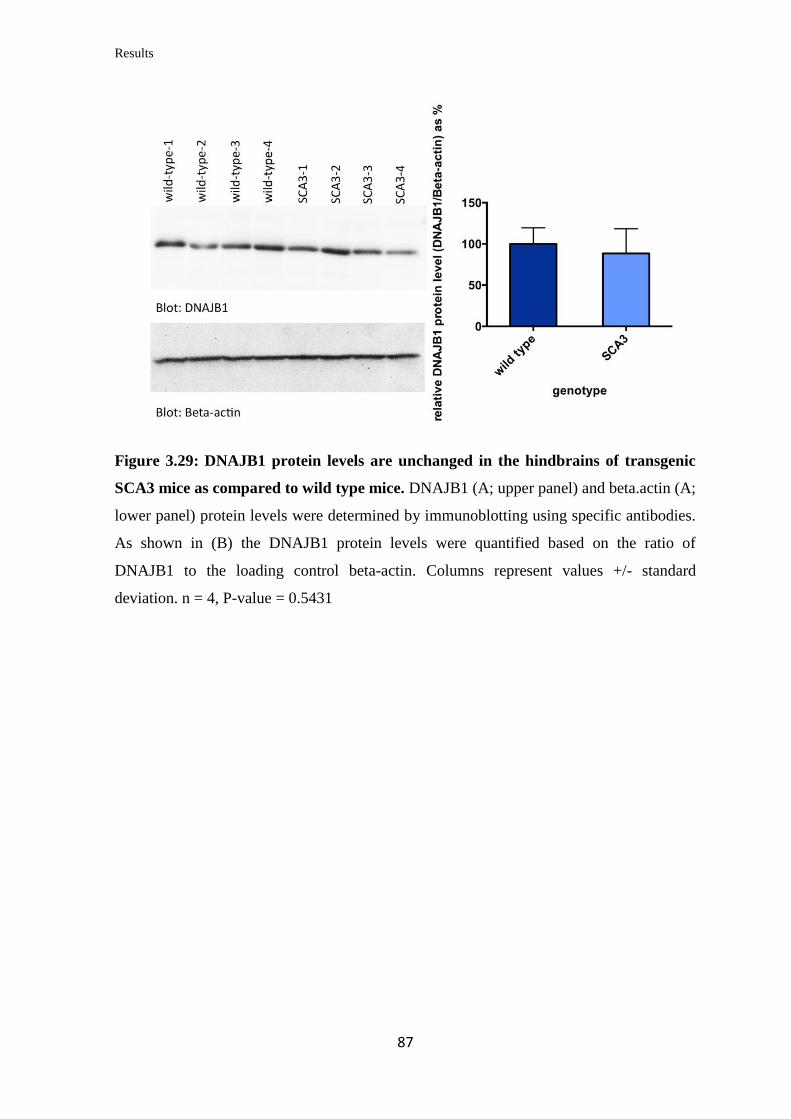
Results
87
Figure 3.29: DNAJB1 protein levels are unchanged in the hindbrains of transgenic
SCA3 mice as compared to wild type mice. DNAJB1 (A; upper panel) and beta.actin (A;
lower panel) protein levels were determined by immunoblotting using specific antibodies.
As shown in (B) the DNAJB1 protein levels were quantified based on the ratio of
DNAJB1 to the loading control beta-actin. Columns represent values +/- standard
deviation. n = 4, P-value = 0.5431
Discussion
88
Chapter 4 Discussion
MicroRNAs are important regulators of gene expression and have been linked to several
diseases including neurodegenerative diseases. In this study, miRNAs that modulate the
expression of specific proteins relevant in the pathogenesis of SCA3 were investigated.
Two miRNAs, hsa-miR-32 and hsa-miR-181c were found to target ATXN3, the protein
mutated in SCA3. Moreover, the study revealed the ability of three miRNAs, hsa-miR-
216a-5p, hsa-miR-374a and hsa-miR-542-3p to target MID1, a protein that stimulates the
translation of expanded CAG repeat mRNAs. Finally, two miRNAs, namely hsa-miR-370
and hsa-miR-543 were ascertained to target DNAJB1, a chaperone that has been shown to
play a role in prevention of SCA3 toxicity. This study suggests that these miRNAs might
act as disease modifiers in SCA3 due to their ability to target the expression of proteins
playing a role in the cell toxicity observed in SCA3.
4.1 miRNAs target ATXN3 3’UTR and downregulate ATXN3 mRNA and protein
expression
Polyglutamine diseases are characterized by the expression of mutant proteins with
expanded glutamine repeats. The mutant proteins form aggregates into which several other
proteins are sequestered contributing to the neurotoxicity observed in polyQ diseases
(McCampbell et al, 2000; Perez et al, 1998). Several cellular mechanisms such as
regulation of protein folding or proteasomal degradation of the aggregate prone proteins
suppress aggregate formation and toxicity (Chai et al, 1999b). The neuronal cell death
seen in the brains of polyQ disease patients over several years can be considered as a
result of a lost battle by the neurons trying to restrict the expression of the mutant protein
as well as other neurotoxic proteins, while at the same time maintaining the expression of
neuroprotective proteins. miRNAs are important for the regulation of gene expression with
up to 30% of human genes estimated to be regulated by miRNAs (Lewis et al, 2005).
Studies are gradually casting a light on the crucial role miRNAs play in the pathogenic
mechanisms in polyQ diseases. Previous studies have shown that the mutant proteins
whose expression is the basis of toxicity in polyQ diseases are directly targeted by
miRNAs and disease progression is modulated by the expression of miRNAs. This has
Discussion
89
been shown to be the case for DRPLA (Karres et al, 2007) and SCA1 (Lee et al, 2008;
Persengiev et al, 2011). In this study, miRNAs predicted to target the 3’UTR of ATXN3
were analysed and the ability of five candidate miRNAs: miR-9, miR-32, miR-125a-5p,
miR-181c and miR-383 to target ATXN3 3’UTR at specific binding sites was validated.
These studies suggest that all the five miRNAs are able to target the ATXN3 3’UTR at
their specific binding sites. The targeting by two of the five miRNAs could be verified,
namely miR-32 and miR-181c led to a downregulation of expression of ATXN3 mRNA
and protein. miR-32 and miR-181c have been previously shown to be associated with the
spread of tumours in colorectal carcinoma and breast cancer respectively (Tominaga et al,
2015; Wu et al, 2013), however this is the first study implicating these miRNAs in the
regulation of ATXN3 expression. Individual overexpression of either miR-32 or miR-181c
did not yield a substantial decrease in ATXN3 levels (data not shown), while a
combination of both miRNAs did. This is not surprising, since there is evidence that
miRNAs function in combination to effectively repress the expression of a common target
mRNA (Vo et al, 2010; Wu et al, 2010). The 3’UTR sequence of wild type and mutant
ATXN3 is identical, therefore miR-32 and miR-181c can be expected to downregulate
both the wild type and the mutant allele of ATXN3. Huang et al have recently shown the
ability of miR-25 to downregulate wild type as well as mutant ATXN3, leading to a
decrease in cell toxicity in a SCA3 model (Huang et al, 2014). miR-25 binds to ATXN3
3’UTR at the same binding site as miR-32 with similar predicted efficiency. These results
taken together suggest that several miRNAs target the ATXN3 3’UTR and regulate
ATXN3 protein expression. Unravelling multiple miRNAs, which target ATXN3, will
help to identify a pool of miRNAs which can be used to build a therapeutic strategy. Using
such a pool will help to overcome the problems of high concentrations of individual
miRNAs and the resultant off target effects.
Further experiments regarding miRNA targeting of ATXN3 would include the use of
lentiviral mediated delivery of miRNAs to iPSC-derived SCA3 neurons. This would verify
the ability of these miRNAs to modulate the expression of the mutant ATXN3 allele as
well as the formation of microaggregates that are formed in these neurons upon glutamate
excitation (Koch et al, 2011). Alternately, such a lentiviral delivery approach could be
used to assess miRNA mediated control of expanded ATXN3 expression in YAC
transgenic mice carrying the expanded ATXN3 locus, or primary neuronal cells prepared
from these mice (Cemal et al, 2002). Although miRNA mediated targeting of ATXN3 is
Discussion
90
not exclusive for the mutant allele (since the mutant and the wild type allele share the
same 3’UTR sequence), a decrease in the wild type ATXN3 as a side-effect might not be
deleterious to the cells. Studies in ATXN3 knock-out mice have shown that these mice,
despite the absence of ATXN3 are viable and fertile (Schmitt et al, 2007; Switonski et al,
2011). Hence, miRNA targeting of ATXN3 might be a viable strategy to counter SCA3
toxicity.
4.2 miRNAs target MID1 3’UTR and downregulate MID1 mRNA and protein
expression
Apart from targeting the mutant proteins in polyQ diseases, there is growing evidence that
miRNAs also modulate the expression of other proteins that contribute to neurotoxicity in
polyQ diseases. In several cases, the disease progression is associated with reduced
expression of these miRNAs leading to an elevated expression of their neurotoxic targets.
In HD, it has been shown that reduced levels of miRNAs as a result of transcriptional
repression by the REST repressor results in elevated levels of miRNA targets, which
might be associated with the pathogenicity of HD (Johnson et al, 2008). A study in animal
and cell models of SCA3 has shown that reduced expression of miRNAs as a result of
mutation in miRNA processing proteins causes enhanced toxicity of the mutant ATXN3
protein suggesting that miRNAs play a protective role by controlling the expression of
pathogenic proteins (Bilen et al, 2006). The protein MID1 was chosen as a neurotoxic
protein candidate for analysing miRNA targeting relevant to SCA3. MID1 is part of a
protein complex that binds CAG repeat mRNAs in a length dependent manner and
stimulates their translation to expanded polyQ repeat proteins. Although studies relevant
to this observation were conducted in a HD model (Krauss et al, 2013), preliminary
studies suggest that MID1 also binds to expanded ATXN3 mRNA in a length dependent
manner (unpublished data according to personal communication with Dr. Sybille Krauss,
DZNE Bonn). MID1 was therefore a valid candidate to study putative miRNA mediated
regulation. This study revealed that three miRNAs: miR-216a-5p, miR-374a, miR-542-3p
target the 3’UTR of MID1 at specific binding sites. Overexpression of these three
miRNAs in HEK T-293 cells led to a decrease in endogenous levels of MID1 mRNA and
protein in these cells. Previous studies have shown MID1 to be a target of miR-135b in
breast cancer (Arigoni et al, 2013), however the ability of miR-216a-5p, miR-374a and
Discussion
91
miR-542-3p to target MID1 has not been previously documented. Since MID1 binds and
aids translation of ATXN3 mRNA in a length dependent manner, the miRNA mediated
downregulation in MID1 might lead to reduction in the translation of the mutant ATXN3
mRNA leaving the wild type allele unaffected. Furthermore, this miRNA mediated
repression of MID1 expression might be beneficial for controlling polyQ toxicity beyond
the repression of mutant ATXN3. It has been shown that the aggregates formed in polyQ
neurons sequester other proteins containing glutamine stretches such as as TATA-binding
protein (TBP), Eyes Absent (EYA) protein (Perez et al, 1998). Although it is not yet
proven, MID1 might be able to bind and stimulate the expression of the CAG repeat
mRNAs of these proteins as well. Therefore, a reduction in MID1 levels might function to
reduce the expression of several proteins that partake in the formation of aggregates in
polyQ diseases. Targeting of MID1 expression using miRNAs could also be a strategy
employed in other CAG repeat disorders.
Further experiments concerning the effects of miRNA targeting of MID1 expression on
CAG repeat mRNAs are required to ascertain if miRNA targeting of MID1 might play a
role in SCA3 and in general polyQ pathogenesis. Reporter constructs carrying different
lengths of CAG repeats, which are available in the laboratory, will be used for further
experiments (Krauss et al, 2013).
4.3 The use of iPSC-derived SCA3 neurons to analyse SCA3 associated gene and
miRNA expression
In parallel to the studies to find miRNAs targeting the neurotoxic proteins ATXN3 and
MID1, access was gained to a recent model system to study SCA3 pathogenesis, viz
neurons derived from Induced Pluripotent Stem Cells (iPSCs) from SCA3 patients (Koch
et al, 2011). The use of iPSCs as model systems to understand pathogenic mechanisms of
diseases, as well as to device therapeutic strategies has been increasing in the recent years
(Okano & Yamanaka, 2014; Park et al, 2008). As compared to other cell lines or animal
models, an important advantage of the use of iPSCs is that they represent patient derived
material that can be further differentiated into cells that are relevant to that particular
disease. In the case of neurodegenerative diseases, the ability to differentiate iPSCs into
neurons provides a very appropriate tool to study disease pathogenesis as well as device
therapeutic strategies. iPSCs derived from primary cells such as fibroblasts or peripheral
Discussion
92
blood lymphocytes from patients of several neurodegenerative diseases such as
Alzheimer’s disease (AD), Parkinson’s disease (PD), Huntington’s disease (HD) have
been studied and in many cases these iPSCs have been further differentiated into neurons
that exhibit pathogenic mechanisms associated with these disorders (Camnasio et al, 2012;
Nguyen et al, 2011; Soldner et al, 2009; Yagi et al, 2011).
Neurons used were differentiated from iPSCs derived from SCA3 patients and healthy
controls to study changes in gene expression and miRNA expression profiles associated
with the expression of the expanded CAG repeat containing ATXN3 allele.
Microaggregates containing ATXN3 have been observed in these neurons upon excitation
with glutamate or NMDA (Koch et al, 2011). However the neurons used in this study,
were not subjected to glutamate excitation. The reason for this was the assumption that
glutamate excitation and resulting flow of Ca2+
ions into the neurons probably leads to
massive and short term changes in gene expression and miRNA expression as the cells
respond to the excitation. The focus in this study was understanding the differences in
gene and miRNA expression in SCA3 and control neurons, which are associated with the
expression of the mutant allele over a longer period of time, and hence, might be
associated with the relatively slower acting mechanisms of cell toxicity.
The RNA isolated from two control lines and three SCA3 lines of iPSC-derived neurons
was used for mRNA and miRNA expression profiling. Although a higher number of
samples would have been preferable in terms of the statistical strength of the results,
additional cell lines were not available at that time.
Comparison of the gene expression profiles of the SCA3 neurons with the control neurons
revealed dysregulation in the expression of several genes. To understand the relevance of
this dysregulation in terms of mechanisms that might be altered due to the presence of
mutant ATXN3, the gene expression data was analysed using gene ontology analysis,
pathway analysis and analysis of the interaction of proteins coded by the dysregulated
genes with the ATXN3 protein.
Discussion
93
Gene and miRNA expression profile suggests alterations in the axon guidance
pathway and the DNAJB1 chaperone in the SCA3 neurons
The gene and miRNA expression profiles from iPSC-derived control and SCA3 neurons
were analysed using various tools which enabled analyses such as gene ontology analysis,
pathway analysis and protein interaction analysis. The gene ontology analysis of the
dysregulated genes is categorized into three categories: molecular function, biological
process and cellular compartment. Considering the enriched terms in all three categories
gives an idea of the significance of the dysregulated gene expression. The enriched terms
for molecular function of the dysregulated genes suggests that the SCA3 neurons might
have altered structural molecule activity, cytoskeletal regulatory protein binding,
cytoskeletal protein binding, poly(A) RNA binding and protein anchor activity. The
enriched terms for the biological processes associated with the dysregulated genes suggest
that the SCA3 neurons have altered neuron development, especially axonal development.
In terms of the cellular location of the proteins coded by the dysregulated genes, the
enriched terms associated with cellular compartment suggest that the proteins are
predominantly located in cellular projections, especially in axonal projections. In
summary, the GO analysis of the dysregulated genes suggests that in comparison with the
controls, the SCA3 neurons have alterations in the binding of cytoskeletal and RNA
binding proteins which might be associated with changes in neurite outgrowth and axonal
development, with localization of a significant number of dysregulated proteins in the
cellular projections such as the axonal projections.
The mechanisms suggested by the GO analysis are reinforced by the pathway analysis of
the dysregulated genes as well as the dysregulated miRNAs in the SCA3 neurons. The
pathway analysis of the dysregulated genes suggests that the SCA3 neurons might have
alterations in the axon guidance pathway. Axon guidance is the process in which neuronal
axons respond to guidance cues to grow and form synapses with specific target neurons
eventually leading to the formation of a neuronal network (Tessier-Lavigne & Goodman,
1996). The guidance cues for axons in this process are molecules expressed by other
neurons and are either secreted or expressed on the cell surface. There are several classes
of proteins such as netrins, semaphorins, Cell Adhesion Molecules (CAMs) that act as
guidance cues enabling attraction or repulsion of axons (Varela-Echavarria & Guthrie,
1997). The recognition of these guidance cues triggers downstream signalling cascades in
the neurons that lead to appropriate response to the cues. The pathway analysis of the
Discussion
94
dysregulated genes in the gene expression profile of SCA3 and control neurons suggests
that the SCA3 neurons might have alterations in mechanisms included in axonal guidance
pathway such as netrin-1 signalling, semaphorin signalling and interactions of the cell
adhesion molecule L1. Several genes that are upregulated in SCA3 neurons code for
proteins that aid in neurite outgrowth via interaction with netrins (such as the genes DCC,
PITPNA), semaphorins (SEMA6A), neural cell adhesion molecules (ANK3, KCNQ2,
ST8SIA2) or the cytoskeleton (MAP1B, MAP2). A higher level of neurite growth in the
SCA3 neurons can be explained by observations from previous studies connecting the
expression of polyQ proteins to altered axonal development and transport. Although
polyQ inclusions, a hallmark of polyQ diseases, have been traditionally observed in
neuronal soma, there are several studies showing the presence of such inclusions in axons.
Axonal inclusions have been in seen in axonal fiber tracts that are degenerated in the
brains of SCA3 patients and HD patient brains (Rub et al, 2014; Seidel et al, 2010).
Besides, axonal inclusions have been observed in cell culture and animal models of HD
(Krench & Littleton, 2013; Li et al, 2001), SBMA (Piccioni et al, 2002) and SCA3 (Cemal
et al, 2002). These axonal inclusions interfere with axonal transport, leading to defects and
even degeneration of neurites (Gunawardena & Goldstein, 2005; Li et al, 2001; Piccioni et
al, 2002). There is also a suggestion that the mere presence of polyQ proteins disturbs
retrograde and anterograde transport along the axons, even when the polyQ protein is not
recruited into inclusions (Szebenyi et al, 2003). Therefore, the elevated neurite growth in
SCA3 neurons as suggested by the profiling experiments might be a protective mechanism
employed by the neurons in response to hindrances in axonal transport leading to
disruption in the supply of molecules that are required in neurite growth. It is also possible
that the elevated neurite growth is simply the result of the individual iPSC-derived cell
lines being in varying stages of neuronal differentiation in culture. Conversely, the
elevated neurite growth could also be associated with MID1 activity. The loss of MID1
function is associated with enhanced axonal growth and elongation in mouse cortex due to
the enhanced activity of PP2A which is targeted for degradation by MID1 (Lu et al, 2013).
Although the study exhibiting this observation was not associated with a polyQ disorder, it
is possible that in the SCA3 neurons the association of MID1 with expanded CAG repeat
ATXN3 mRNA prevents it from carrying out its degradative function towards PP2A,
leading to enhanced axonal growth. Further studies are necessary to establish any
relationship between MID1 and axonal growth in SCA3 neurons.
Discussion
95
The pathway analysis of the putative targets of the miRNAs that are dysregulated in SCA3
neurons also suggests an enrichment of the targeted genes involved in the axon guidance
pathway. Many of the dysregulated miRNAs have putative targets in the axon guidance
pathway and these miRNAs are upregulated as well as downregulated in the SCA3
neurons. While most of the putative targets do not show altered mRNA levels in the SCA3
neurons, a few targets are dysregulated as seen in the gene expression profile. Although
validation studies would be necessary prior to drawing conclusions, enrichment of the
axon guidance pathway in both the gene as well as the miRNA expression profile suggests
that miRNA targeting of gene expression plays a role amongst the mechanisms the SCA3
neurons use to deal with the effects of the presence of pathogenic ATXN3. A short
mention must be made here regarding the expression of miRNAs directly targeting the
expression of ATXN3 and MID1 in the miRNA profile of the SCA3 neurons. As seen in
the profiles, none of the miRNAs analysed to target ATXN3 or MID1 mRNA are
dysregulated in the SCA3 neurons, neither are the ATXN3 or MID1 mRNAs. This
suggests that in these particular neurons, miRNA mediated targeting of ATXN3 and MID1
was either not active, or was carried out with other miRNAs which are not amongst those
predicted to target ATXN3 or MID1 mRNAs.
Protein interaction analysis was done to check if genes coding for known interaction
partners of ATXN3 are dysregulated in SCA3 neurons. This analysis revealed that the
chaperone DNAJB1, which is a known interaction partner of ATXN3, was downregulated
in SCA3 neurons. DNAJB1 is one of the HSP40 chaperones and being a co-chaperone of
HSP70, is essential for the ability of HSP70 to refold proteins that are misfolded (Michels
et al, 1999). DNAJB1 plays a key role in the cellular response to polyQ aggregates
including mutant ATXN3 aggregates in SCA3. It is known that DNAJB1 co-localizes with
SCA3 aggregates and along with HSP70 is involved in the process of converting the toxic
fibril like aggregates into amorphous aggregates which can be degraded (Muchowski et al,
2000). Therefore, the maintenance of DNAJB1 expression levels in the cell would be
important in counteracting the aggregate mediated toxicity seen in SCA3. However the
gene expression profile suggested a downregulation in DNAJB1 mRNA in the SCA3
neurons. Moreover, miRNA expression profile suggested that several miRNAs predicted
to target the DNAJB1 mRNA by binding at 3’UTR are also dysregulated in SCA3
neurons. Considering the importance of DNAJB1 in SCA3, miRNA targeting of DNAJB1
occurring in SCA3 neurons as seen in the profiling experiments was validated.
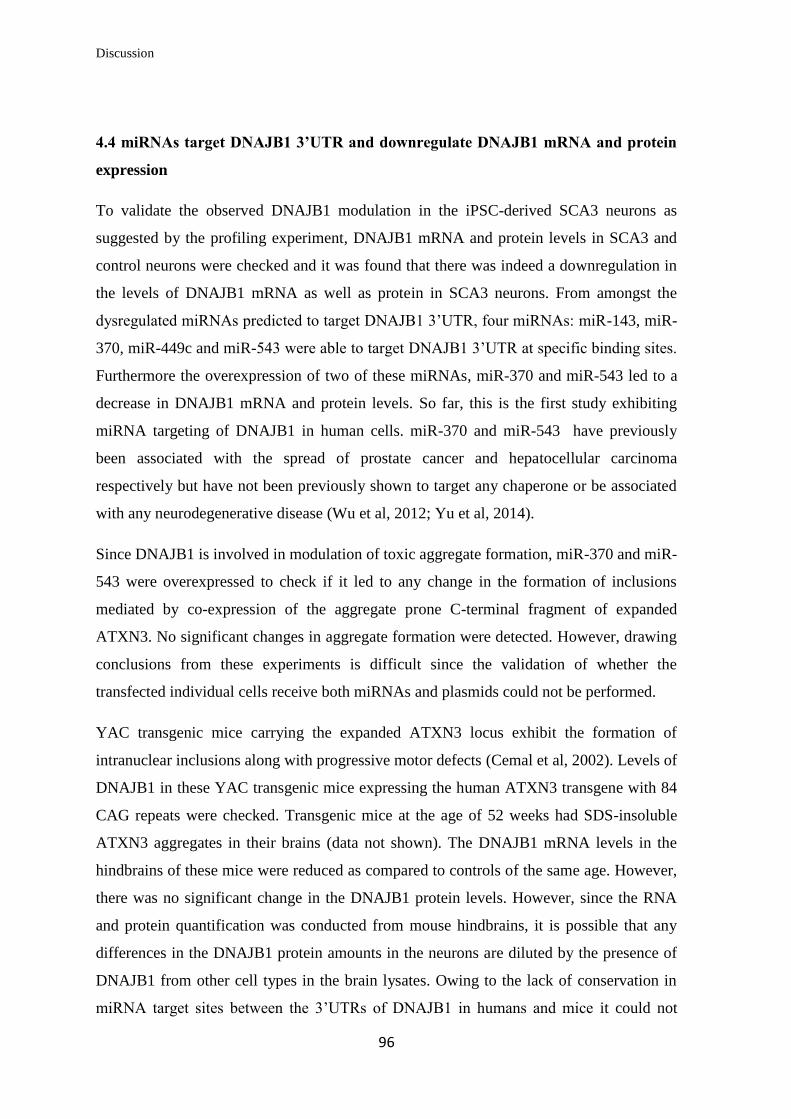
Discussion
96
4.4 miRNAs target DNAJB1 3’UTR and downregulate DNAJB1 mRNA and protein
expression
To validate the observed DNAJB1 modulation in the iPSC-derived SCA3 neurons as
suggested by the profiling experiment, DNAJB1 mRNA and protein levels in SCA3 and
control neurons were checked and it was found that there was indeed a downregulation in
the levels of DNAJB1 mRNA as well as protein in SCA3 neurons. From amongst the
dysregulated miRNAs predicted to target DNAJB1 3’UTR, four miRNAs: miR-143, miR-
370, miR-449c and miR-543 were able to target DNAJB1 3’UTR at specific binding sites.
Furthermore the overexpression of two of these miRNAs, miR-370 and miR-543 led to a
decrease in DNAJB1 mRNA and protein levels. So far, this is the first study exhibiting
miRNA targeting of DNAJB1 in human cells. miR-370 and miR-543 have previously
been associated with the spread of prostate cancer and hepatocellular carcinoma
respectively but have not been previously shown to target any chaperone or be associated
with any neurodegenerative disease (Wu et al, 2012; Yu et al, 2014).
Since DNAJB1 is involved in modulation of toxic aggregate formation, miR-370 and miR-
543 were overexpressed to check if it led to any change in the formation of inclusions
mediated by co-expression of the aggregate prone C-terminal fragment of expanded
ATXN3. No significant changes in aggregate formation were detected. However, drawing
conclusions from these experiments is difficult since the validation of whether the
transfected individual cells receive both miRNAs and plasmids could not be performed.
YAC transgenic mice carrying the expanded ATXN3 locus exhibit the formation of
intranuclear inclusions along with progressive motor defects (Cemal et al, 2002). Levels of
DNAJB1 in these YAC transgenic mice expressing the human ATXN3 transgene with 84
CAG repeats were checked. Transgenic mice at the age of 52 weeks had SDS-insoluble
ATXN3 aggregates in their brains (data not shown). The DNAJB1 mRNA levels in the
hindbrains of these mice were reduced as compared to controls of the same age. However,
there was no significant change in the DNAJB1 protein levels. However, since the RNA
and protein quantification was conducted from mouse hindbrains, it is possible that any
differences in the DNAJB1 protein amounts in the neurons are diluted by the presence of
DNAJB1 from other cell types in the brain lysates. Owing to the lack of conservation in
miRNA target sites between the 3’UTRs of DNAJB1 in humans and mice it could not
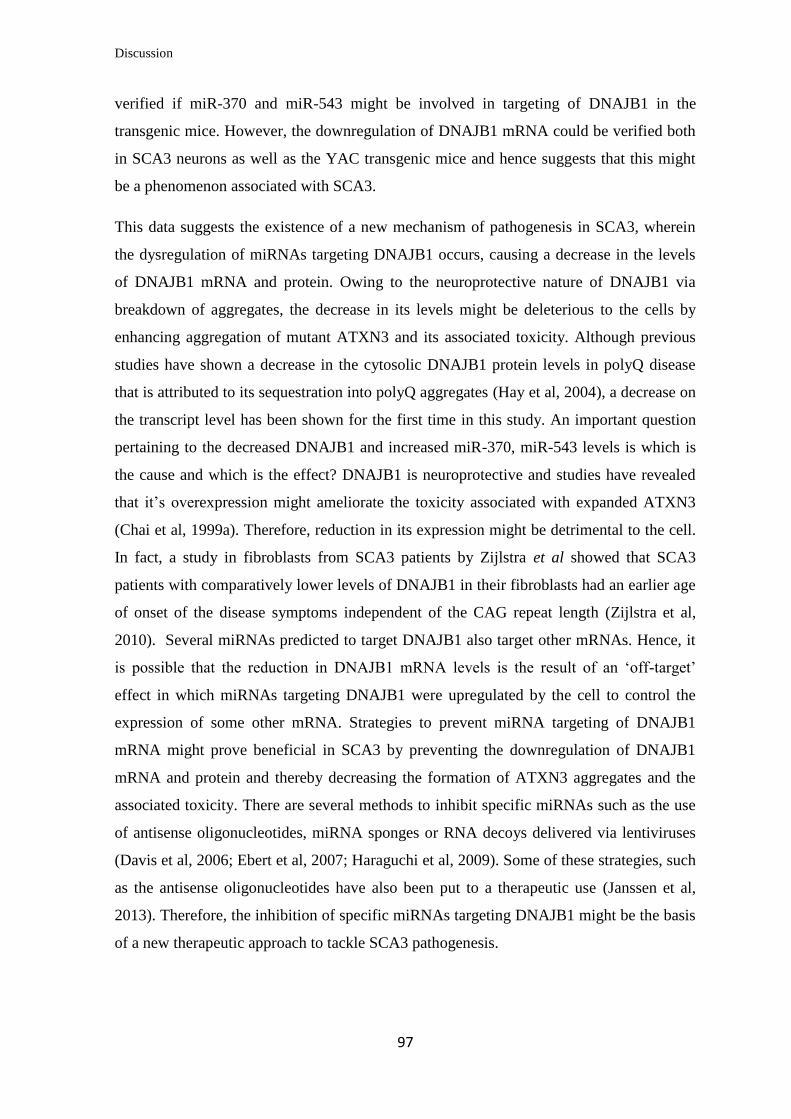
Discussion
97
verified if miR-370 and miR-543 might be involved in targeting of DNAJB1 in the
transgenic mice. However, the downregulation of DNAJB1 mRNA could be verified both
in SCA3 neurons as well as the YAC transgenic mice and hence suggests that this might
be a phenomenon associated with SCA3.
This data suggests the existence of a new mechanism of pathogenesis in SCA3, wherein
the dysregulation of miRNAs targeting DNAJB1 occurs, causing a decrease in the levels
of DNAJB1 mRNA and protein. Owing to the neuroprotective nature of DNAJB1 via
breakdown of aggregates, the decrease in its levels might be deleterious to the cells by
enhancing aggregation of mutant ATXN3 and its associated toxicity. Although previous
studies have shown a decrease in the cytosolic DNAJB1 protein levels in polyQ disease
that is attributed to its sequestration into polyQ aggregates (Hay et al, 2004), a decrease on
the transcript level has been shown for the first time in this study. An important question
pertaining to the decreased DNAJB1 and increased miR-370, miR-543 levels is which is
the cause and which is the effect? DNAJB1 is neuroprotective and studies have revealed
that it’s overexpression might ameliorate the toxicity associated with expanded ATXN3
(Chai et al, 1999a). Therefore, reduction in its expression might be detrimental to the cell.
In fact, a study in fibroblasts from SCA3 patients by Zijlstra et al showed that SCA3
patients with comparatively lower levels of DNAJB1 in their fibroblasts had an earlier age
of onset of the disease symptoms independent of the CAG repeat length (Zijlstra et al,
2010). Several miRNAs predicted to target DNAJB1 also target other mRNAs. Hence, it
is possible that the reduction in DNAJB1 mRNA levels is the result of an ‘off-target’
effect in which miRNAs targeting DNAJB1 were upregulated by the cell to control the
expression of some other mRNA. Strategies to prevent miRNA targeting of DNAJB1
mRNA might prove beneficial in SCA3 by preventing the downregulation of DNAJB1
mRNA and protein and thereby decreasing the formation of ATXN3 aggregates and the
associated toxicity. There are several methods to inhibit specific miRNAs such as the use
of antisense oligonucleotides, miRNA sponges or RNA decoys delivered via lentiviruses
(Davis et al, 2006; Ebert et al, 2007; Haraguchi et al, 2009). Some of these strategies, such
as the antisense oligonucleotides have also been put to a therapeutic use (Janssen et al,
2013). Therefore, the inhibition of specific miRNAs targeting DNAJB1 might be the basis
of a new therapeutic approach to tackle SCA3 pathogenesis.
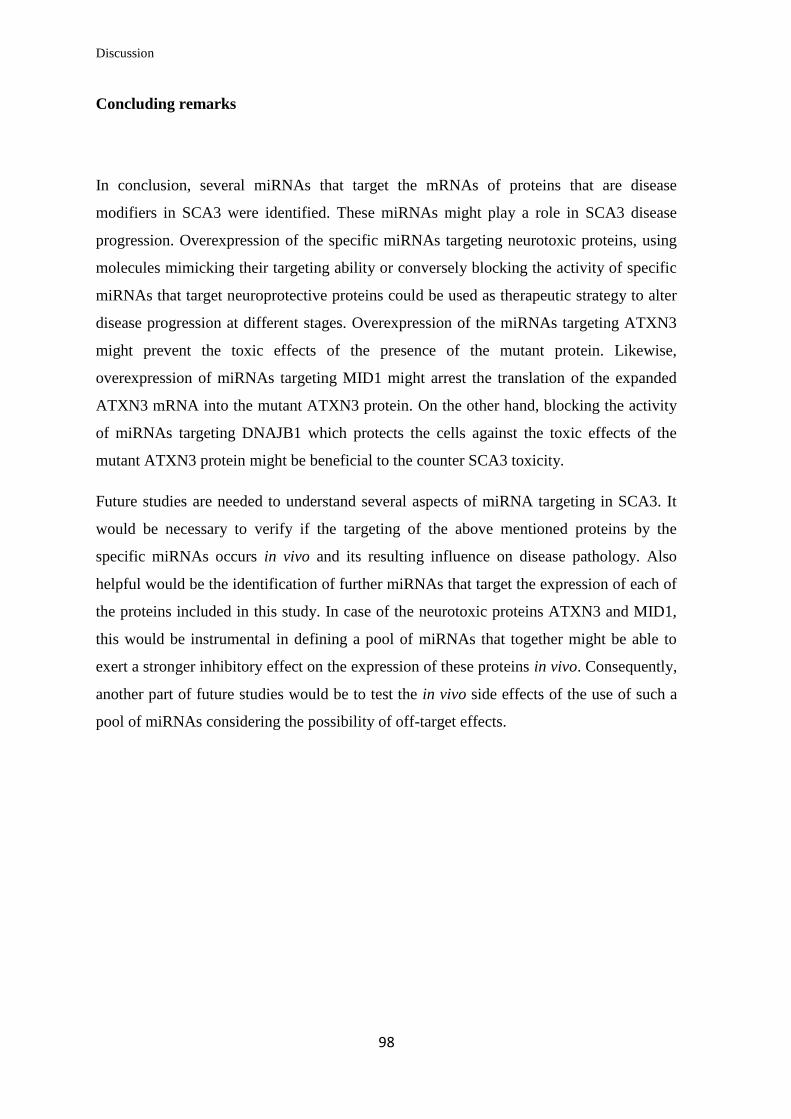
Discussion
98
Concluding remarks
In conclusion, several miRNAs that target the mRNAs of proteins that are disease
modifiers in SCA3 were identified. These miRNAs might play a role in SCA3 disease
progression. Overexpression of the specific miRNAs targeting neurotoxic proteins, using
molecules mimicking their targeting ability or conversely blocking the activity of specific
miRNAs that target neuroprotective proteins could be used as therapeutic strategy to alter
disease progression at different stages. Overexpression of the miRNAs targeting ATXN3
might prevent the toxic effects of the presence of the mutant protein. Likewise,
overexpression of miRNAs targeting MID1 might arrest the translation of the expanded
ATXN3 mRNA into the mutant ATXN3 protein. On the other hand, blocking the activity
of miRNAs targeting DNAJB1 which protects the cells against the toxic effects of the
mutant ATXN3 protein might be beneficial to the counter SCA3 toxicity.
Future studies are needed to understand several aspects of miRNA targeting in SCA3. It
would be necessary to verify if the targeting of the above mentioned proteins by the
specific miRNAs occurs in vivo and its resulting influence on disease pathology. Also
helpful would be the identification of further miRNAs that target the expression of each of
the proteins included in this study. In case of the neurotoxic proteins ATXN3 and MID1,
this would be instrumental in defining a pool of miRNAs that together might be able to
exert a stronger inhibitory effect on the expression of these proteins in vivo. Consequently,
another part of future studies would be to test the in vivo side effects of the use of such a
pool of miRNAs considering the possibility of off-target effects.
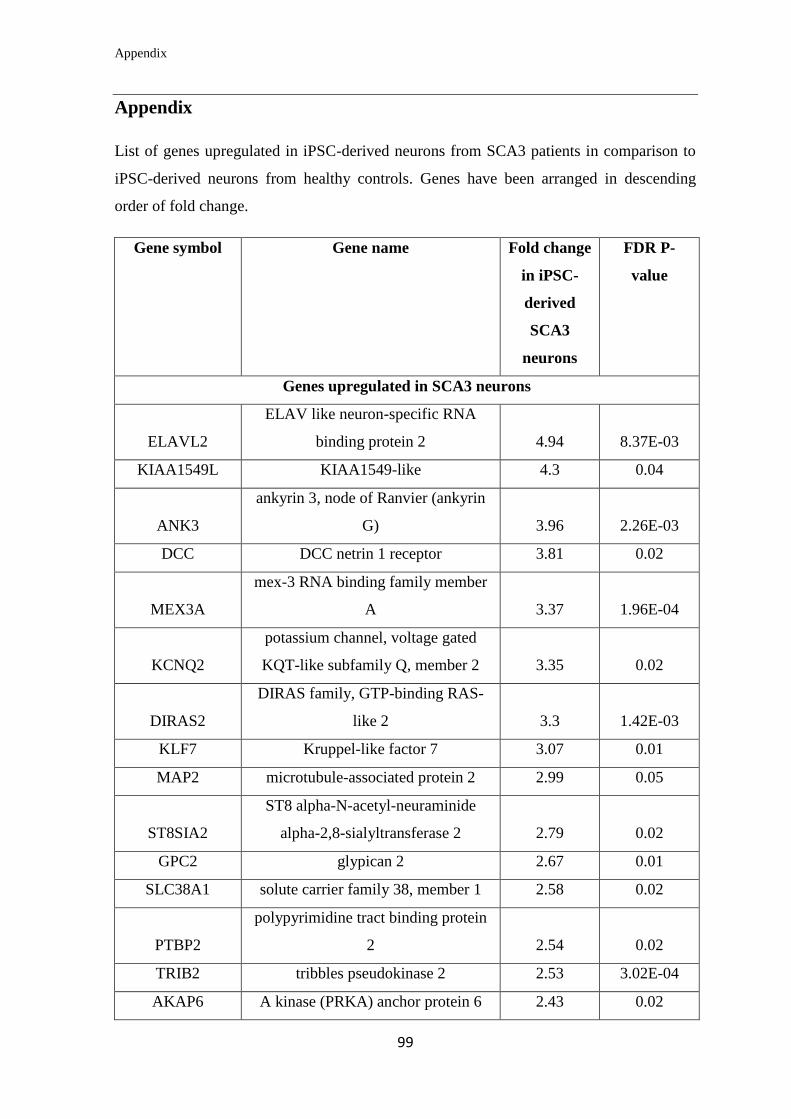
Appendix
99
Appendix
List of genes upregulated in iPSC-derived neurons from SCA3 patients in comparison to
iPSC-derived neurons from healthy controls. Genes have been arranged in descending
order of fold change.
Gene symbol Gene name Fold change
in iPSC-
derived
SCA3
neurons
FDR P-
value
Genes upregulated in SCA3 neurons
ELAVL2
ELAV like neuron-specific RNA
binding protein 2 4.94 8.37E-03
KIAA1549L KIAA1549-like 4.3 0.04
ANK3
ankyrin 3, node of Ranvier (ankyrin
G) 3.96 2.26E-03
DCC DCC netrin 1 receptor 3.81 0.02
MEX3A
mex-3 RNA binding family member
A 3.37 1.96E-04
KCNQ2
potassium channel, voltage gated
KQT-like subfamily Q, member 2 3.35 0.02
DIRAS2
DIRAS family, GTP-binding RAS-
like 2 3.3 1.42E-03
KLF7 Kruppel-like factor 7 3.07 0.01
MAP2 microtubule-associated protein 2 2.99 0.05
ST8SIA2
ST8 alpha-N-acetyl-neuraminide
alpha-2,8-sialyltransferase 2 2.79 0.02
GPC2 glypican 2 2.67 0.01
SLC38A1 solute carrier family 38, member 1 2.58 0.02
PTBP2
polypyrimidine tract binding protein
2 2.54 0.02
TRIB2 tribbles pseudokinase 2 2.53 3.02E-04
AKAP6 A kinase (PRKA) anchor protein 6 2.43 0.02
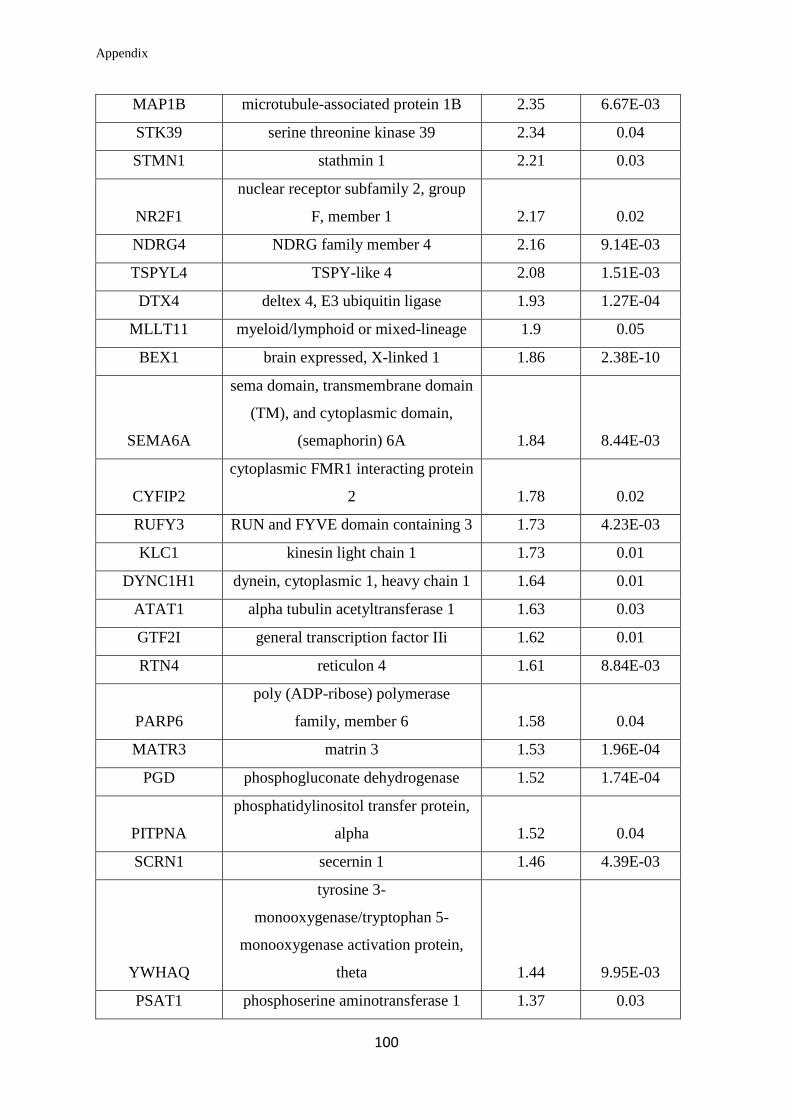
Appendix
100
MAP1B microtubule-associated protein 1B 2.35 6.67E-03
STK39 serine threonine kinase 39 2.34 0.04
STMN1 stathmin 1 2.21 0.03
NR2F1
nuclear receptor subfamily 2, group
F, member 1 2.17 0.02
NDRG4 NDRG family member 4 2.16 9.14E-03
TSPYL4 TSPY-like 4 2.08 1.51E-03
DTX4 deltex 4, E3 ubiquitin ligase 1.93 1.27E-04
MLLT11 myeloid/lymphoid or mixed-lineage 1.9 0.05
BEX1 brain expressed, X-linked 1 1.86 2.38E-10
SEMA6A
sema domain, transmembrane domain
(TM), and cytoplasmic domain,
(semaphorin) 6A 1.84 8.44E-03
CYFIP2
cytoplasmic FMR1 interacting protein
2 1.78 0.02
RUFY3 RUN and FYVE domain containing 3 1.73 4.23E-03
KLC1 kinesin light chain 1 1.73 0.01
DYNC1H1 dynein, cytoplasmic 1, heavy chain 1 1.64 0.01
ATAT1 alpha tubulin acetyltransferase 1 1.63 0.03
GTF2I general transcription factor IIi 1.62 0.01
RTN4 reticulon 4 1.61 8.84E-03
PARP6
poly (ADP-ribose) polymerase
family, member 6 1.58 0.04
MATR3 matrin 3 1.53 1.96E-04
PGD phosphogluconate dehydrogenase 1.52 1.74E-04
PITPNA
phosphatidylinositol transfer protein,
alpha 1.52 0.04
SCRN1 secernin 1 1.46 4.39E-03
YWHAQ
tyrosine 3-
monooxygenase/tryptophan 5-
monooxygenase activation protein,
theta 1.44 9.95E-03
PSAT1 phosphoserine aminotransferase 1 1.37 0.03
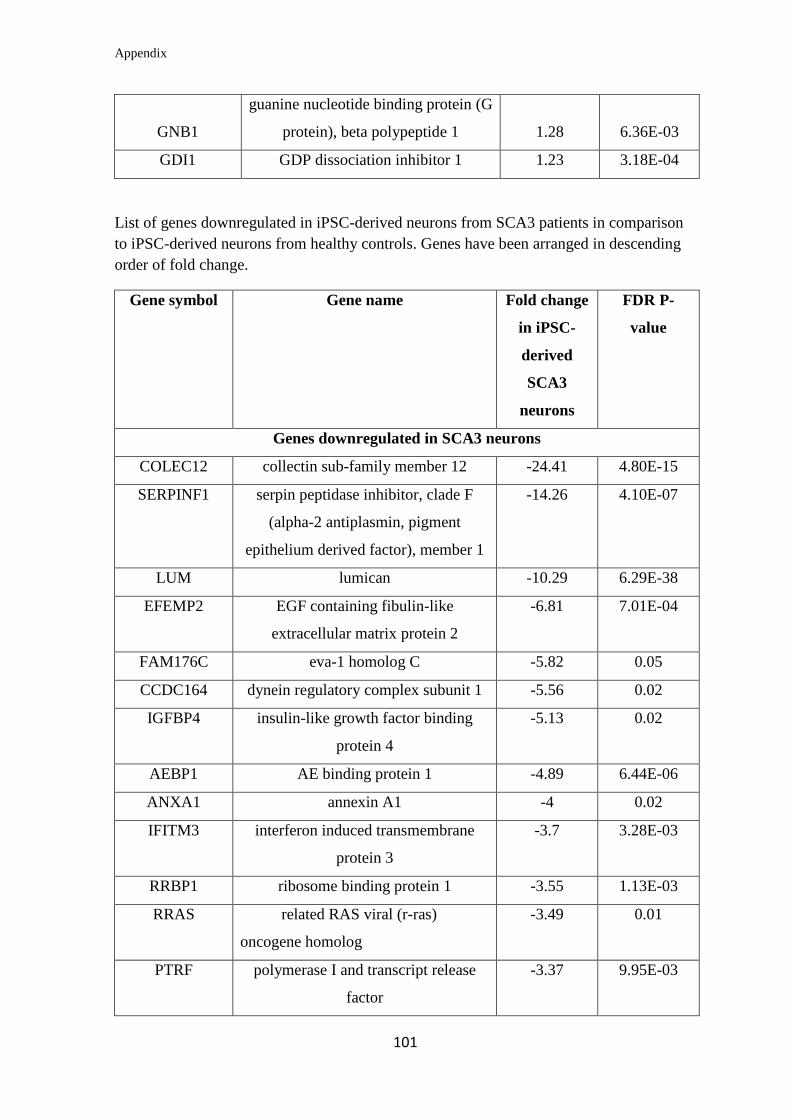
Appendix
101
GNB1
guanine nucleotide binding protein (G
protein), beta polypeptide 1 1.28 6.36E-03
GDI1 GDP dissociation inhibitor 1 1.23 3.18E-04
List of genes downregulated in iPSC-derived neurons from SCA3 patients in comparison
to iPSC-derived neurons from healthy controls. Genes have been arranged in descending
order of fold change.
Gene symbol Gene name Fold change
in iPSC-
derived
SCA3
neurons
FDR P-
value
Genes downregulated in SCA3 neurons
COLEC12 collectin sub-family member 12 -24.41 4.80E-15
SERPINF1 serpin peptidase inhibitor, clade F
(alpha-2 antiplasmin, pigment
epithelium derived factor), member 1
-14.26 4.10E-07
LUM lumican -10.29 6.29E-38
EFEMP2 EGF containing fibulin-like
extracellular matrix protein 2
-6.81 7.01E-04
FAM176C eva-1 homolog C -5.82 0.05
CCDC164 dynein regulatory complex subunit 1 -5.56 0.02
IGFBP4 insulin-like growth factor binding
protein 4
-5.13 0.02
AEBP1 AE binding protein 1 -4.89 6.44E-06
ANXA1 annexin A1 -4 0.02
IFITM3 interferon induced transmembrane
protein 3
-3.7 3.28E-03
RRBP1 ribosome binding protein 1 -3.55 1.13E-03
RRAS related RAS viral (r-ras)
oncogene homolog
-3.49 0.01
PTRF polymerase I and transcript release
factor
-3.37 9.95E-03
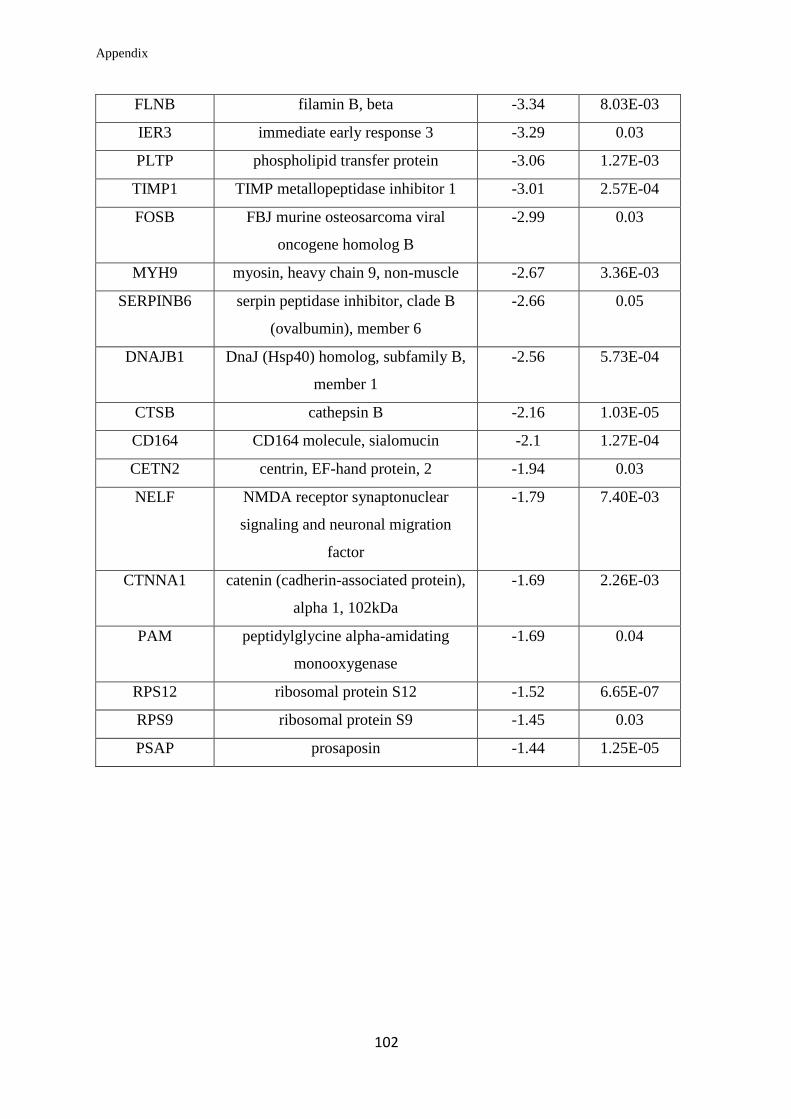
Appendix
102
FLNB filamin B, beta -3.34 8.03E-03
IER3 immediate early response 3 -3.29 0.03
PLTP phospholipid transfer protein -3.06 1.27E-03
TIMP1 TIMP metallopeptidase inhibitor 1 -3.01 2.57E-04
FOSB FBJ murine osteosarcoma viral
oncogene homolog B
-2.99 0.03
MYH9 myosin, heavy chain 9, non-muscle -2.67 3.36E-03
SERPINB6 serpin peptidase inhibitor, clade B
(ovalbumin), member 6
-2.66 0.05
DNAJB1 DnaJ (Hsp40) homolog, subfamily B,
member 1
-2.56 5.73E-04
CTSB cathepsin B -2.16 1.03E-05
CD164 CD164 molecule, sialomucin -2.1 1.27E-04
CETN2 centrin, EF-hand protein, 2 -1.94 0.03
NELF NMDA receptor synaptonuclear
signaling and neuronal migration
factor
-1.79 7.40E-03
CTNNA1 catenin (cadherin-associated protein),
alpha 1, 102kDa
-1.69 2.26E-03
PAM peptidylglycine alpha-amidating
monooxygenase
-1.69 0.04
RPS12 ribosomal protein S12 -1.52 6.65E-07
RPS9 ribosomal protein S9 -1.45 0.03
PSAP prosaposin -1.44 1.25E-05
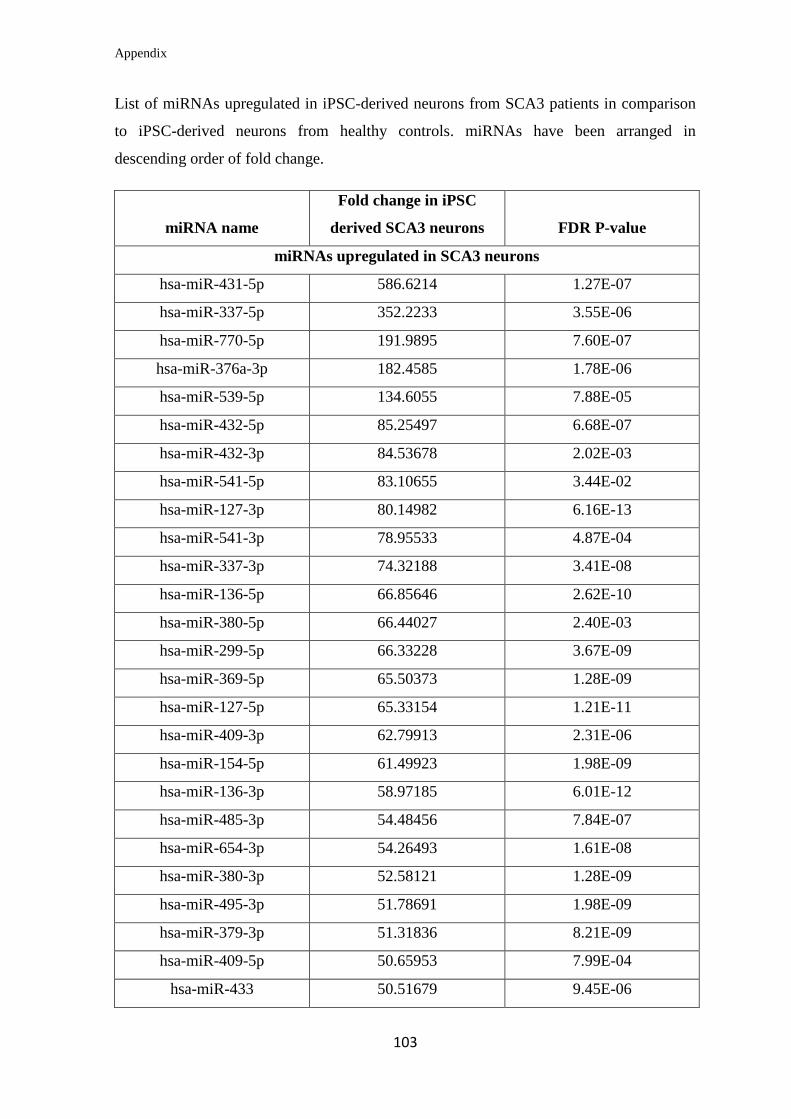
Appendix
103
List of miRNAs upregulated in iPSC-derived neurons from SCA3 patients in comparison
to iPSC-derived neurons from healthy controls. miRNAs have been arranged in
descending order of fold change.
miRNA name
Fold change in iPSC
derived SCA3 neurons
FDR P-value
miRNAs upregulated in SCA3 neurons
hsa-miR-431-5p 586.6214 1.27E-07
hsa-miR-337-5p 352.2233 3.55E-06
hsa-miR-770-5p 191.9895 7.60E-07
hsa-miR-376a-3p 182.4585 1.78E-06
hsa-miR-539-5p 134.6055 7.88E-05
hsa-miR-432-5p 85.25497 6.68E-07
hsa-miR-432-3p 84.53678 2.02E-03
hsa-miR-541-5p 83.10655 3.44E-02
hsa-miR-127-3p 80.14982 6.16E-13
hsa-miR-541-3p 78.95533 4.87E-04
hsa-miR-337-3p 74.32188 3.41E-08
hsa-miR-136-5p 66.85646 2.62E-10
hsa-miR-380-5p 66.44027 2.40E-03
hsa-miR-299-5p 66.33228 3.67E-09
hsa-miR-369-5p 65.50373 1.28E-09
hsa-miR-127-5p 65.33154 1.21E-11
hsa-miR-409-3p 62.79913 2.31E-06
hsa-miR-154-5p 61.49923 1.98E-09
hsa-miR-136-3p 58.97185 6.01E-12
hsa-miR-485-3p 54.48456 7.84E-07
hsa-miR-654-3p 54.26493 1.61E-08
hsa-miR-380-3p 52.58121 1.28E-09
hsa-miR-495-3p 51.78691 1.98E-09
hsa-miR-379-3p 51.31836 8.21E-09
hsa-miR-409-5p 50.65953 7.99E-04
hsa-miR-433 50.51679 9.45E-06
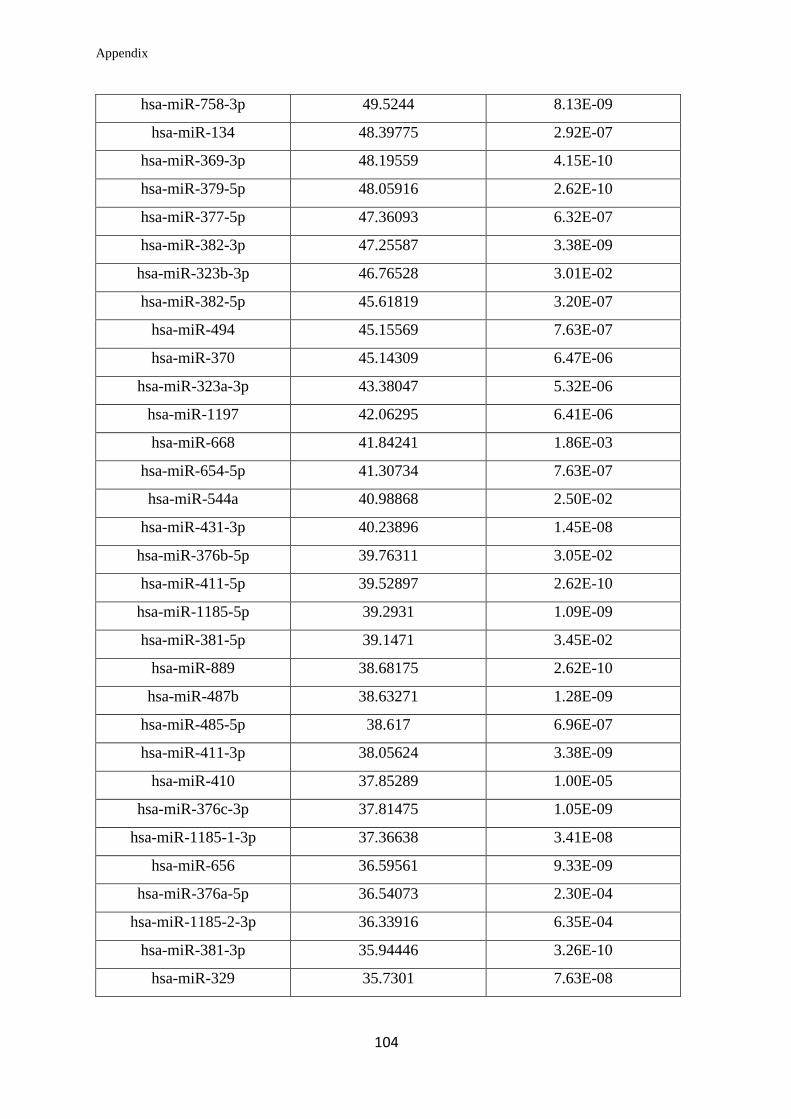
Appendix
104
hsa-miR-758-3p 49.5244 8.13E-09
hsa-miR-134 48.39775 2.92E-07
hsa-miR-369-3p 48.19559 4.15E-10
hsa-miR-379-5p 48.05916 2.62E-10
hsa-miR-377-5p 47.36093 6.32E-07
hsa-miR-382-3p 47.25587 3.38E-09
hsa-miR-323b-3p 46.76528 3.01E-02
hsa-miR-382-5p 45.61819 3.20E-07
hsa-miR-494 45.15569 7.63E-07
hsa-miR-370 45.14309 6.47E-06
hsa-miR-323a-3p 43.38047 5.32E-06
hsa-miR-1197 42.06295 6.41E-06
hsa-miR-668 41.84241 1.86E-03
hsa-miR-654-5p 41.30734 7.63E-07
hsa-miR-544a 40.98868 2.50E-02
hsa-miR-431-3p 40.23896 1.45E-08
hsa-miR-376b-5p 39.76311 3.05E-02
hsa-miR-411-5p 39.52897 2.62E-10
hsa-miR-1185-5p 39.2931 1.09E-09
hsa-miR-381-5p 39.1471 3.45E-02
hsa-miR-889 38.68175 2.62E-10
hsa-miR-487b 38.63271 1.28E-09
hsa-miR-485-5p 38.617 6.96E-07
hsa-miR-411-3p 38.05624 3.38E-09
hsa-miR-410 37.85289 1.00E-05
hsa-miR-376c-3p 37.81475 1.05E-09
hsa-miR-1185-1-3p 37.36638 3.41E-08
hsa-miR-656 36.59561 9.33E-09
hsa-miR-376a-5p 36.54073 2.30E-04
hsa-miR-1185-2-3p 36.33916 6.35E-04
hsa-miR-381-3p 35.94446 3.26E-10
hsa-miR-329 35.7301 7.63E-08
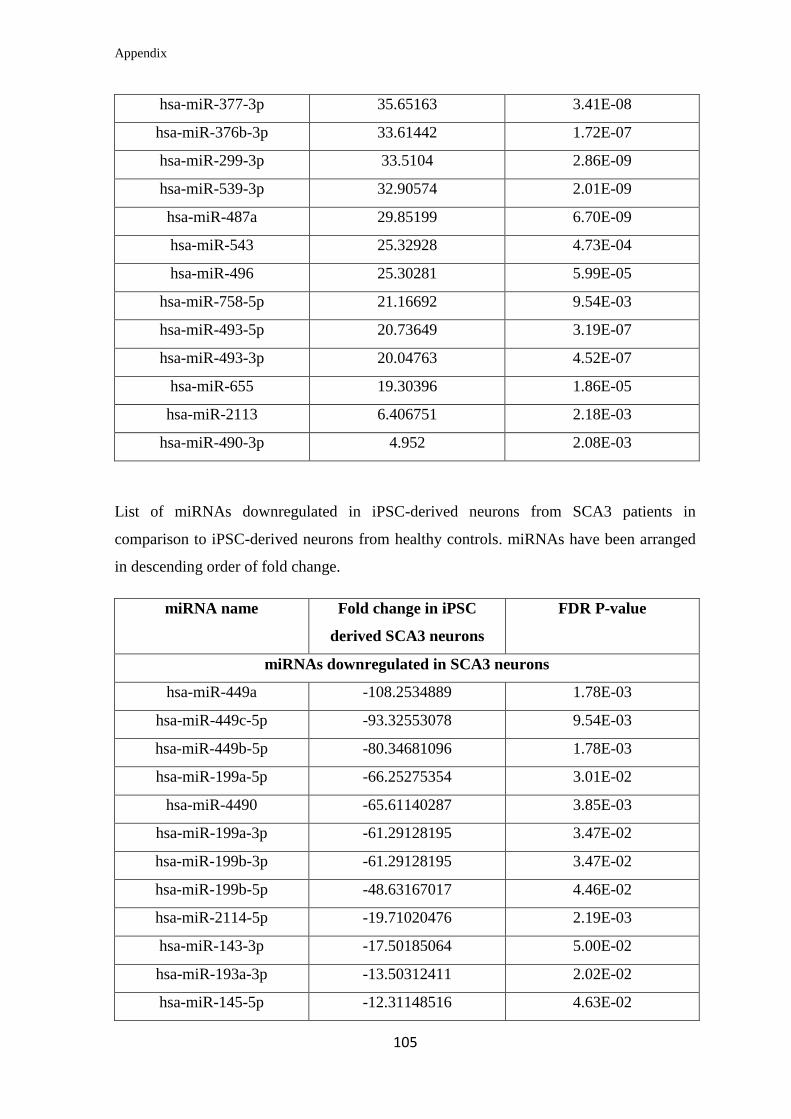
Appendix
105
hsa-miR-377-3p 35.65163 3.41E-08
hsa-miR-376b-3p 33.61442 1.72E-07
hsa-miR-299-3p 33.5104 2.86E-09
hsa-miR-539-3p 32.90574 2.01E-09
hsa-miR-487a 29.85199 6.70E-09
hsa-miR-543 25.32928 4.73E-04
hsa-miR-496 25.30281 5.99E-05
hsa-miR-758-5p 21.16692 9.54E-03
hsa-miR-493-5p 20.73649 3.19E-07
hsa-miR-493-3p 20.04763 4.52E-07
hsa-miR-655 19.30396 1.86E-05
hsa-miR-2113 6.406751 2.18E-03
hsa-miR-490-3p 4.952 2.08E-03
List of miRNAs downregulated in iPSC-derived neurons from SCA3 patients in
comparison to iPSC-derived neurons from healthy controls. miRNAs have been arranged
in descending order of fold change.
miRNA name Fold change in iPSC
derived SCA3 neurons
FDR P-value
miRNAs downregulated in SCA3 neurons
hsa-miR-449a -108.2534889 1.78E-03
hsa-miR-449c-5p -93.32553078 9.54E-03
hsa-miR-449b-5p -80.34681096 1.78E-03
hsa-miR-199a-5p -66.25275354 3.01E-02
hsa-miR-4490 -65.61140287 3.85E-03
hsa-miR-199a-3p -61.29128195 3.47E-02
hsa-miR-199b-3p -61.29128195 3.47E-02
hsa-miR-199b-5p -48.63167017 4.46E-02
hsa-miR-2114-5p -19.71020476 2.19E-03
hsa-miR-143-3p -17.50185064 5.00E-02
hsa-miR-193a-3p -13.50312411 2.02E-02
hsa-miR-145-5p -12.31148516 4.63E-02
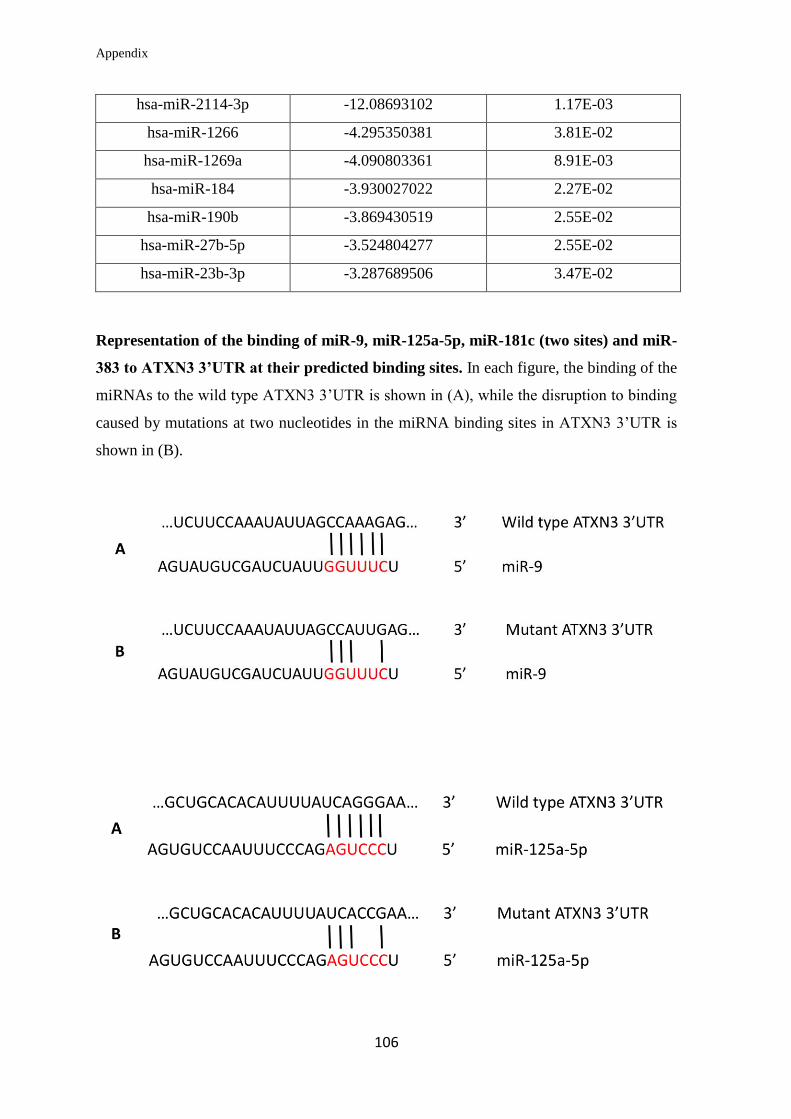
Appendix
106
hsa-miR-2114-3p -12.08693102 1.17E-03
hsa-miR-1266 -4.295350381 3.81E-02
hsa-miR-1269a -4.090803361 8.91E-03
hsa-miR-184 -3.930027022 2.27E-02
hsa-miR-190b -3.869430519 2.55E-02
hsa-miR-27b-5p -3.524804277 2.55E-02
hsa-miR-23b-3p -3.287689506 3.47E-02
Representation of the binding of miR-9, miR-125a-5p, miR-181c (two sites) and miR-
383 to ATXN3 3’UTR at their predicted binding sites. In each figure, the binding of the
miRNAs to the wild type ATXN3 3’UTR is shown in (A), while the disruption to binding
caused by mutations at two nucleotides in the miRNA binding sites in ATXN3 3’UTR is
shown in (B).
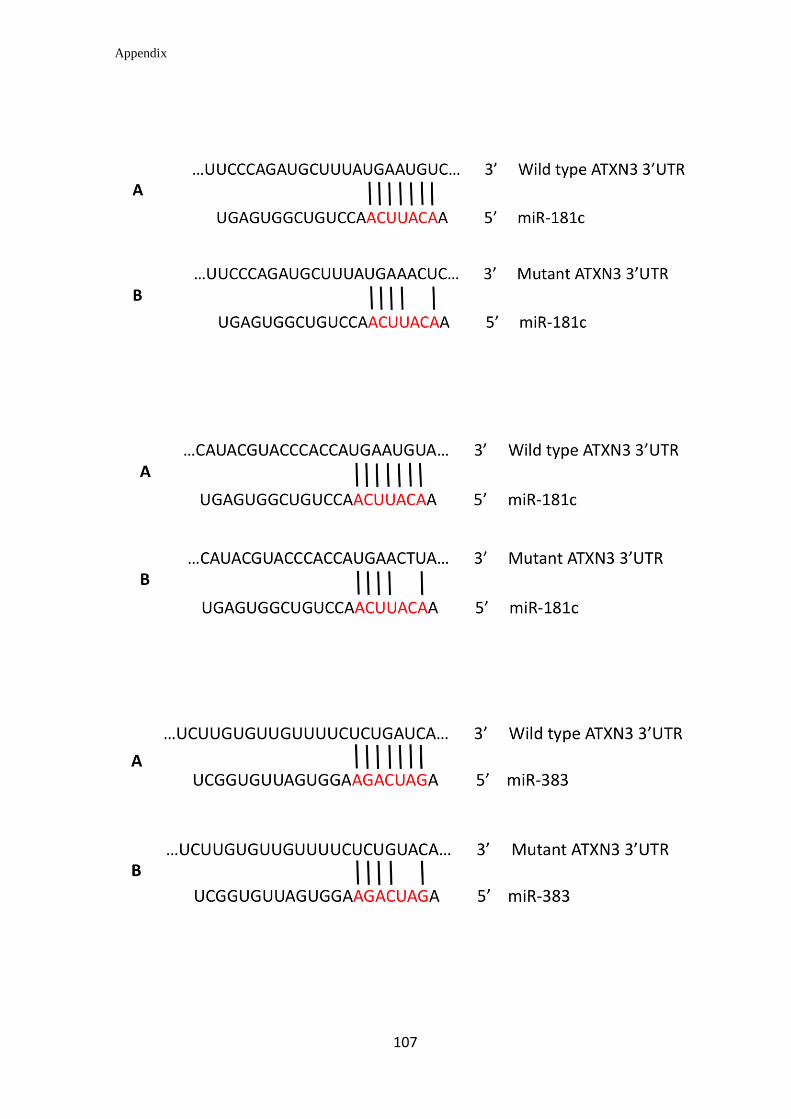
Appendix
107
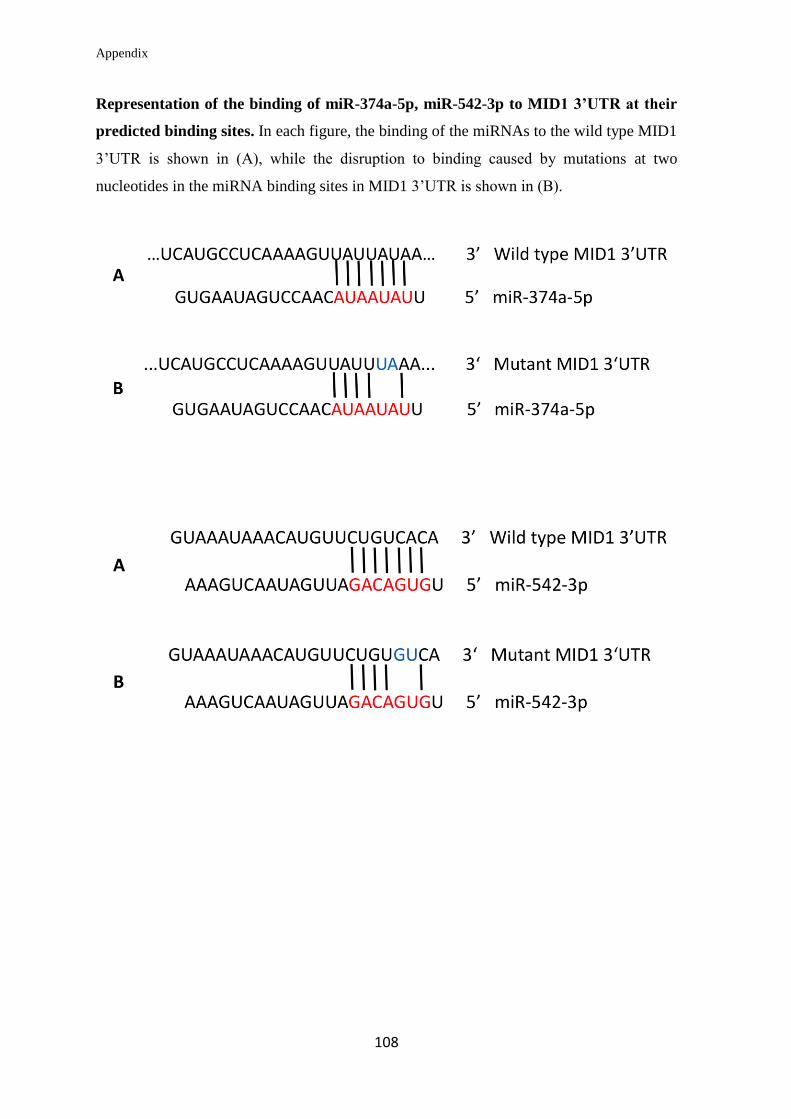
Appendix
108
Representation of the binding of miR-374a-5p, miR-542-3p to MID1 3’UTR at their
predicted binding sites. In each figure, the binding of the miRNAs to the wild type MID1
3’UTR is shown in (A), while the disruption to binding caused by mutations at two
nucleotides in the miRNA binding sites in MID1 3’UTR is shown in (B).
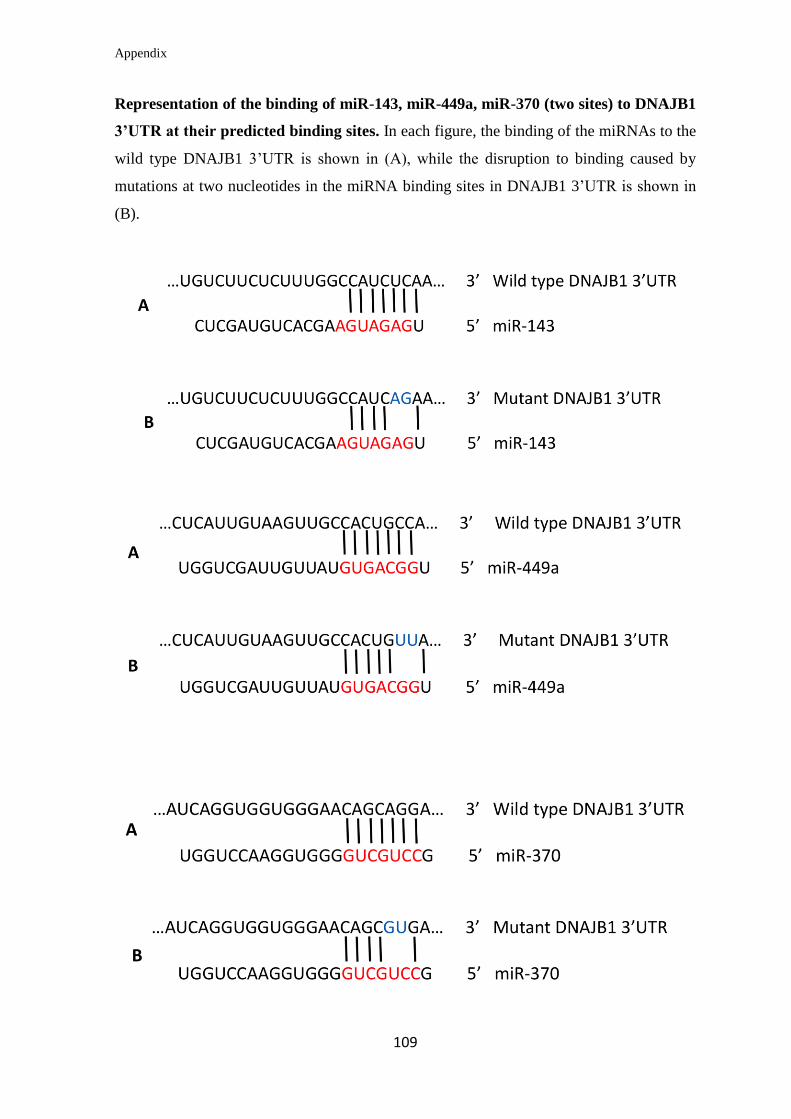
Appendix
109
Representation of the binding of miR-143, miR-449a, miR-370 (two sites) to DNAJB1
3’UTR at their predicted binding sites. In each figure, the binding of the miRNAs to the
wild type DNAJB1 3’UTR is shown in (A), while the disruption to binding caused by
mutations at two nucleotides in the miRNA binding sites in DNAJB1 3’UTR is shown in
(B).

Appendix
110
Curriculum Vitae
111
References
Albrecht AN, Kornak U, Boddrich A, Suring K, Robinson PN, Stiege AC, Lurz R,
Stricker S, Wanker EE, Mundlos S (2004) A molecular pathogenesis for transcription
factor associated poly-alanine tract expansions. Human molecular genetics 13: 2351-2359
Albrecht M, Hoffmann D, Evert BO, Schmitt I, Wullner U, Lengauer T (2003) Structural
modeling of ataxin-3 reveals distant homology to adaptins. Proteins 50: 355-370
Alves S, Regulier E, Nascimento-Ferreira I, Hassig R, Dufour N, Koeppen A, Carvalho
AL, Simoes S, de Lima MC, Brouillet E, Gould VC, Deglon N, de Almeida LP (2008)
Striatal and nigral pathology in a lentiviral rat model of Machado-Joseph disease. Human
molecular genetics 17: 2071-2083
Aranda-Orgilles B, Rutschow D, Zeller R, Karagiannidis AI, Kohler A, Chen C, Wilson T,
Krause S, Roepcke S, Lilley D, Schneider R, Schweiger S (2011) Protein phosphatase 2A
(PP2A)-specific ubiquitin ligase MID1 is a sequence-dependent regulator of translation
efficiency controlling 3-phosphoinositide-dependent protein kinase-1 (PDPK-1). The
Journal of biological chemistry 286: 39945-39957
Aranda-Orgilles B, Trockenbacher A, Winter J, Aigner J, Kohler A, Jastrzebska E, Stahl J,
Muller EC, Otto A, Wanker EE, Schneider R, Schweiger S (2008) The Opitz syndrome
gene product MID1 assembles a microtubule-associated ribonucleoprotein complex.
Human genetics 123: 163-176
Arigoni M, Barutello G, Riccardo F, Ercole E, Cantarella D, Orso F, Conti L, Lanzardo S,
Taverna D, Merighi I, Calogero RA, Cavallo F, Quaglino E (2013) miR-135b coordinates
progression of ErbB2-driven mammary carcinomas through suppression of MID1 and
MTCH2. The American journal of pathology 182: 2058-2070
Arrasate M, Mitra S, Schweitzer ES, Segal MR, Finkbeiner S (2004) Inclusion body
formation reduces levels of mutant huntingtin and the risk of neuronal death. Nature 431:
805-810
Bailey CK, Andriola IF, Kampinga HH, Merry DE (2002) Molecular chaperones enhance
the degradation of expanded polyglutamine repeat androgen receptor in a cellular model of
spinal and bulbar muscular atrophy. Human molecular genetics 11: 515-523
Bardwell JC, Craig EA (1984) Major heat shock gene of Drosophila and the Escherichia
coli heat-inducible dnaK gene are homologous. Proceedings of the National Academy of
Sciences of the United States of America 81: 848-852
Bernstein E, Caudy AA, Hammond SM, Hannon GJ (2001) Role for a bidentate
ribonuclease in the initiation step of RNA interference. Nature 409: 363-366
Curriculum Vitae
112
Betel D, Koppal A, Agius P, Sander C, Leslie C (2010) Comprehensive modeling of
microRNA targets predicts functional non-conserved and non-canonical sites. Genome
biology 11: R90
Betel D, Wilson M, Gabow A, Marks DS, Sander C (2008) The microRNA.org resource:
targets and expression. Nucleic acids research 36: D149-153
Bichelmeier U, Schmidt T, Hubener J, Boy J, Ruttiger L, Habig K, Poths S, Bonin M,
Knipper M, Schmidt WJ, Wilbertz J, Wolburg H, Laccone F, Riess O (2007) Nuclear
localization of ataxin-3 is required for the manifestation of symptoms in SCA3: in vivo
evidence. The Journal of neuroscience : the official journal of the Society for
Neuroscience 27: 7418-7428
Bilen J, Liu N, Burnett BG, Pittman RN, Bonini NM (2006) MicroRNA pathways
modulate polyglutamine-induced neurodegeneration. Molecular cell 24: 157-163
Boy J, Schmidt T, Wolburg H, Mack A, Nuber S, Bottcher M, Schmitt I, Holzmann C,
Zimmermann F, Servadio A, Riess O (2009) Reversibility of symptoms in a conditional
mouse model of spinocerebellar ataxia type 3. Human molecular genetics 18: 4282-4295
Burnett B, Li F, Pittman RN (2003) The polyglutamine neurodegenerative protein ataxin-3
binds polyubiquitylated proteins and has ubiquitin protease activity. Human molecular
genetics 12: 3195-3205
Camnasio S, Delli Carri A, Lombardo A, Grad I, Mariotti C, Castucci A, Rozell B, Lo
Riso P, Castiglioni V, Zuccato C, Rochon C, Takashima Y, Diaferia G, Biunno I, Gellera
C, Jaconi M, Smith A, Hovatta O, Naldini L, Di Donato S, Feki A, Cattaneo E (2012) The
first reported generation of several induced pluripotent stem cell lines from homozygous
and heterozygous Huntington's disease patients demonstrates mutation related enhanced
lysosomal activity. Neurobiology of disease 46: 41-51
Cemal CK, Carroll CJ, Lawrence L, Lowrie MB, Ruddle P, Al-Mahdawi S, King RH,
Pook MA, Huxley C, Chamberlain S (2002) YAC transgenic mice carrying pathological
alleles of the MJD1 locus exhibit a mild and slowly progressive cerebellar deficit. Human
molecular genetics 11: 1075-1094
Chai Y, Berke SS, Cohen RE, Paulson HL (2004) Poly-ubiquitin binding by the
polyglutamine disease protein ataxin-3 links its normal function to protein surveillance
pathways. The Journal of biological chemistry 279: 3605-3611
Chai Y, Koppenhafer SL, Bonini NM, Paulson HL (1999a) Analysis of the role of heat
shock protein (Hsp) molecular chaperones in polyglutamine disease. The Journal of
neuroscience : the official journal of the Society for Neuroscience 19: 10338-10347
Chai Y, Koppenhafer SL, Shoesmith SJ, Perez MK, Paulson HL (1999b) Evidence for
proteasome involvement in polyglutamine disease: localization to nuclear inclusions in
SCA3/MJD and suppression of polyglutamine aggregation in vitro. Human molecular
genetics 8: 673-682
Curriculum Vitae
113
Chen CZ, Li L, Lodish HF, Bartel DP (2004) MicroRNAs modulate hematopoietic lineage
differentiation. Science 303: 83-86
Chen J, Bardes EE, Aronow BJ, Jegga AG (2009) ToppGene Suite for gene list
enrichment analysis and candidate gene prioritization. Nucleic acids research 37: W305-
311
Chou AH, Yeh TH, Ouyang P, Chen YL, Chen SY, Wang HL (2008) Polyglutamine-
expanded ataxin-3 causes cerebellar dysfunction of SCA3 transgenic mice by inducing
transcriptional dysregulation. Neurobiology of disease 31: 89-101
Chow MK, Mackay JP, Whisstock JC, Scanlon MJ, Bottomley SP (2004) Structural and
functional analysis of the Josephin domain of the polyglutamine protein ataxin-3.
Biochemical and biophysical research communications 322: 387-394
Cummings CJ, Mancini MA, Antalffy B, DeFranco DB, Orr HT, Zoghbi HY (1998)
Chaperone suppression of aggregation and altered subcellular proteasome localization
imply protein misfolding in SCA1. Nature genetics 19: 148-154
Davies SW, Beardsall K, Turmaine M, DiFiglia M, Aronin N, Bates GP (1998) Are
neuronal intranuclear inclusions the common neuropathology of triplet-repeat disorders
with polyglutamine-repeat expansions? Lancet 351: 131-133
Davis S, Lollo B, Freier S, Esau C (2006) Improved targeting of miRNA with antisense
oligonucleotides. Nucleic acids research 34: 2294-2304
Donaldson KM, Li W, Ching KA, Batalov S, Tsai CC, Joazeiro CA (2003) Ubiquitin-
mediated sequestration of normal cellular proteins into polyglutamine aggregates.
Proceedings of the National Academy of Sciences of the United States of America 100:
8892-8897
Doss-Pepe EW, Stenroos ES, Johnson WG, Madura K (2003) Ataxin-3 interactions with
rad23 and valosin-containing protein and its associations with ubiquitin chains and the
proteasome are consistent with a role in ubiquitin-mediated proteolysis. Mol Cell Biol 23:
6469-6483
Durr A, Stevanin G, Cancel G, Duyckaerts C, Abbas N, Didierjean O, Chneiweiss H,
Benomar A, Lyon-Caen O, Julien J, Serdaru M, Penet C, Agid Y, Brice A (1996)
Spinocerebellar ataxia 3 and Machado-Joseph disease: clinical, molecular, and
neuropathological features. Annals of neurology 39: 490-499
Duursma AM, Kedde M, Schrier M, le Sage C, Agami R (2008) miR-148 targets human
DNMT3b protein coding region. Rna 14: 872-877
Ebert MS, Neilson JR, Sharp PA (2007) MicroRNA sponges: competitive inhibitors of
small RNAs in mammalian cells. Nature methods 4: 721-726
Elbashir SM, Lendeckel W, Tuschl T (2001) RNA interference is mediated by 21- and 22-
nucleotide RNAs. Genes & development 15: 188-200
Curriculum Vitae
114
Ellis RJ, Hemmingsen SM (1989) Molecular chaperones: proteins essential for the
biogenesis of some macromolecular structures. Trends in biochemical sciences 14: 339-
342
Evert BO, Araujo J, Vieira-Saecker AM, de Vos RA, Harendza S, Klockgether T, Wullner
U (2006) Ataxin-3 represses transcription via chromatin binding, interaction with histone
deacetylase 3, and histone deacetylation. The Journal of neuroscience : the official journal
of the Society for Neuroscience 26: 11474-11486
Evert BO, Vogt IR, Kindermann C, Ozimek L, de Vos RA, Brunt ER, Schmitt I,
Klockgether T, Wullner U (2001) Inflammatory genes are upregulated in expanded ataxin-
3-expressing cell lines and spinocerebellar ataxia type 3 brains. The Journal of
neuroscience : the official journal of the Society for Neuroscience 21: 5389-5396
Evert BO, Vogt IR, Vieira-Saecker AM, Ozimek L, de Vos RA, Brunt ER, Klockgether T,
Wullner U (2003) Gene expression profiling in ataxin-3 expressing cell lines reveals
distinct effects of normal and mutant ataxin-3. Journal of neuropathology and
experimental neurology 62: 1006-1018
Fire A, Xu S, Montgomery MK, Kostas SA, Driver SE, Mello CC (1998) Potent and
specific genetic interference by double-stranded RNA in Caenorhabditis elegans. Nature
391: 806-811
Forman JJ, Legesse-Miller A, Coller HA (2008) A search for conserved sequences in
coding regions reveals that the let-7 microRNA targets Dicer within its coding sequence.
Proceedings of the National Academy of Sciences of the United States of America 105:
14879-14884
Franceschini A, Szklarczyk D, Frankild S, Kuhn M, Simonovic M, Roth A, Lin J,
Minguez P, Bork P, von Mering C, Jensen LJ (2013) STRING v9.1: protein-protein
interaction networks, with increased coverage and integration. Nucleic acids research 41:
D808-815
Freeman BC, Morimoto RI (1996) The human cytosolic molecular chaperones hsp90,
hsp70 (hsc70) and hdj-1 have distinct roles in recognition of a non-native protein and
protein refolding. The EMBO journal 15: 2969-2979
Freeman BC, Myers MP, Schumacher R, Morimoto RI (1995) Identification of a
regulatory motif in Hsp70 that affects ATPase activity, substrate binding and interaction
with HDJ-1. The EMBO journal 14: 2281-2292
Friedman RC, Farh KK, Burge CB, Bartel DP (2009) Most mammalian mRNAs are
conserved targets of microRNAs. Genome research 19: 92-105
Fu YH, Kuhl DP, Pizzuti A, Pieretti M, Sutcliffe JS, Richards S, Verkerk AJ, Holden JJ,
Fenwick RG, Jr., Warren ST, et al. (1991) Variation of the CGG repeat at the fragile X site
results in genetic instability: resolution of the Sherman paradox. Cell 67: 1047-1058
Curriculum Vitae
115
Garcia DM, Baek D, Shin C, Bell GW, Grimson A, Bartel DP (2011) Weak seed-pairing
stability and high target-site abundance decrease the proficiency of lsy-6 and other
microRNAs. Nature structural & molecular biology 18: 1139-1146
Grimson A, Farh KK, Johnston WK, Garrett-Engele P, Lim LP, Bartel DP (2007)
MicroRNA targeting specificity in mammals: determinants beyond seed pairing.
Molecular cell 27: 91-105
Gunawardena S, Goldstein LS (2005) Polyglutamine diseases and transport problems:
deadly traffic jams on neuronal highways. Archives of neurology 62: 46-51
Haacke A, Broadley SA, Boteva R, Tzvetkov N, Hartl FU, Breuer P (2006) Proteolytic
cleavage of polyglutamine-expanded ataxin-3 is critical for aggregation and sequestration
of non-expanded ataxin-3. Human molecular genetics 15: 555-568
Haacke A, Hartl FU, Breuer P (2007) Calpain inhibition is sufficient to suppress
aggregation of polyglutamine-expanded ataxin-3. The Journal of biological chemistry
282: 18851-18856
Hamilton AJ, Baulcombe DC (1999) A species of small antisense RNA in
posttranscriptional gene silencing in plants. Science 286: 950-952
Hammond SM, Bernstein E, Beach D, Hannon GJ (2000) An RNA-directed nuclease
mediates post-transcriptional gene silencing in Drosophila cells. Nature 404: 293-296
Haraguchi T, Ozaki Y, Iba H (2009) Vectors expressing efficient RNA decoys achieve the
long-term suppression of specific microRNA activity in mammalian cells. Nucleic acids
research 37: e43
Hattori H, Liu YC, Tohnai I, Ueda M, Kaneda T, Kobayashi T, Tanabe K, Ohtsuka K
(1992) Intracellular localization and partial amino acid sequence of a stress-inducible 40-
kDa protein in HeLa cells. Cell structure and function 17: 77-86
Hay DG, Sathasivam K, Tobaben S, Stahl B, Marber M, Mestril R, Mahal A, Smith DL,
Woodman B, Bates GP (2004) Progressive decrease in chaperone protein levels in a
mouse model of Huntington's disease and induction of stress proteins as a therapeutic
approach. Human molecular genetics 13: 1389-1405
Holz MK, Ballif BA, Gygi SP, Blenis J (2005) mTOR and S6K1 mediate assembly of the
translation preinitiation complex through dynamic protein interchange and ordered
phosphorylation events. Cell 123: 569-580
Houbaviy HB, Murray MF, Sharp PA (2003) Embryonic stem cell-specific MicroRNAs.
Developmental cell 5: 351-358
Huang F, Zhang L, Long Z, Chen Z, Hou X, Wang C, Peng H, Wang J, Li J, Duan R, Xia
K, Chuang DM, Tang B, Jiang H (2014) miR-25 alleviates polyQ-mediated cytotoxicity
by silencing ATXN3. FEBS letters 588: 4791-4798
Curriculum Vitae
116
Hutvagner G, Zamore PD (2002) A microRNA in a multiple-turnover RNAi enzyme
complex. Science 297: 2056-2060
Ichikawa Y, Goto J, Hattori M, Toyoda A, Ishii K, Jeong SY, Hashida H, Masuda N,
Ogata K, Kasai F, Hirai M, Maciel P, Rouleau GA, Sakaki Y, Kanazawa I (2001) The
genomic structure and expression of MJD, the Machado-Joseph disease gene. Journal of
human genetics 46: 413-422
Ikeda H, Yamaguchi M, Sugai S, Aze Y, Narumiya S, Kakizuka A (1996) Expanded
polyglutamine in the Machado-Joseph disease protein induces cell death in vitro and in
vivo. Nature genetics 13: 196-202
Ingolia TD, Craig EA (1982) Drosophila gene related to the major heat shock-induced
gene is transcribed at normal temperatures and not induced by heat shock. Proceedings of
the National Academy of Sciences of the United States of America 79: 525-529
Jana NR, Tanaka M, Wang G, Nukina N (2000) Polyglutamine length-dependent
interaction of Hsp40 and Hsp70 family chaperones with truncated N-terminal huntingtin:
their role in suppression of aggregation and cellular toxicity. Human molecular genetics 9:
2009-2018
Janssen HL, Reesink HW, Lawitz EJ, Zeuzem S, Rodriguez-Torres M, Patel K, van der
Meer AJ, Patick AK, Chen A, Zhou Y, Persson R, King BD, Kauppinen S, Levin AA,
Hodges MR (2013) Treatment of HCV infection by targeting microRNA. The New
England journal of medicine 368: 1685-1694
Jin J, Cheng Y, Zhang Y, Wood W, Peng Q, Hutchison E, Mattson MP, Becker KG, Duan
W (2012) Interrogation of brain miRNA and mRNA expression profiles reveals a
molecular regulatory network that is perturbed by mutant huntingtin. Journal of
neurochemistry 123: 477-490
Johnson R, Zuccato C, Belyaev ND, Guest DJ, Cattaneo E, Buckley NJ (2008) A
microRNA-based gene dysregulation pathway in Huntington's disease. Neurobiology of
disease 29: 438-445
Karres JS, Hilgers V, Carrera I, Treisman J, Cohen SM (2007) The conserved microRNA
miR-8 tunes atrophin levels to prevent neurodegeneration in Drosophila. Cell 131: 136-
145
Kawaguchi Y, Okamoto T, Taniwaki M, Aizawa M, Inoue M, Katayama S, Kawakami H,
Nakamura S, Nishimura M, Akiguchi I, et al. (1994) CAG expansions in a novel gene for
Machado-Joseph disease at chromosome 14q32.1. Nature genetics 8: 221-228
Kocerha J, Xu Y, Prucha MS, Zhao D, Chan AW (2014) microRNA-128a dysregulation in
transgenic Huntington's disease monkeys. Molecular brain 7: 46
Koch P, Breuer P, Peitz M, Jungverdorben J, Kesavan J, Poppe D, Doerr J, Ladewig J,
Mertens J, Tuting T, Hoffmann P, Klockgether T, Evert BO, Wullner U, Brustle O (2011)
Excitation-induced ataxin-3 aggregation in neurons from patients with Machado-Joseph
disease. Nature 480: 543-546
Curriculum Vitae
117
Kohler A, Demir U, Kickstein E, Krauss S, Aigner J, Aranda-Orgilles B, Karagiannidis
AI, Achmuller C, Bu H, Wunderlich A, Schweiger MR, Schaefer G, Schweiger S, Klocker
H, Schneider R (2014) A hormone-dependent feedback-loop controls androgen receptor
levels by limiting MID1, a novel translation enhancer and promoter of oncogenic
signaling. Molecular cancer 13: 146
Krauss S, Griesche N, Jastrzebska E, Chen C, Rutschow D, Achmuller C, Dorn S, Boesch
SM, Lalowski M, Wanker E, Schneider R, Schweiger S (2013) Translation of HTT mRNA
with expanded CAG repeats is regulated by the MID1-PP2A protein complex. Nature
communications 4: 1511
Krench M, Littleton JT (2013) Modeling Huntington disease in Drosophila: Insights into
axonal transport defects and modifiers of toxicity. Fly 7: 229-236
Krichevsky AM, King KS, Donahue CP, Khrapko K, Kosik KS (2003) A microRNA array
reveals extensive regulation of microRNAs during brain development. Rna 9: 1274-1281
La Spada AR, Paulson HL, Fischbeck KH (1994) Trinucleotide repeat expansion in
neurological disease. Annals of neurology 36: 814-822
Laemmli UK (1970) Cleavage of structural proteins during the assembly of the head of
bacteriophage T4. Nature 227: 680-685
Lagos-Quintana M, Rauhut R, Lendeckel W, Tuschl T (2001) Identification of novel
genes coding for small expressed RNAs. Science 294: 853-858
Lagos-Quintana M, Rauhut R, Yalcin A, Meyer J, Lendeckel W, Tuschl T (2002)
Identification of tissue-specific microRNAs from mouse. Current biology : CB 12: 735-
739
Lai EC (2002) Micro RNAs are complementary to 3' UTR sequence motifs that mediate
negative post-transcriptional regulation. Nature genetics 30: 363-364
Lajoie P, Snapp EL (2010) Formation and toxicity of soluble polyglutamine oligomers in
living cells. PloS one 5: e15245
Lanks KW (1986) Modulators of the eukaryotic heat shock response. Experimental cell
research 165: 1-10
Lau NC, Lim LP, Weinstein EG, Bartel DP (2001) An abundant class of tiny RNAs with
probable regulatory roles in Caenorhabditis elegans. Science 294: 858-862
Lee RC, Ambros V (2001) An extensive class of small RNAs in Caenorhabditis elegans.
Science 294: 862-864
Lee ST, Chu K, Im WS, Yoon HJ, Im JY, Park JE, Park KH, Jung KH, Lee SK, Kim M,
Roh JK (2011) Altered microRNA regulation in Huntington's disease models.
Experimental neurology 227: 172-179
Curriculum Vitae
118
Lee Y, Ahn C, Han J, Choi H, Kim J, Yim J, Lee J, Provost P, Radmark O, Kim S, Kim
VN (2003) The nuclear RNase III Drosha initiates microRNA processing. Nature 425:
415-419
Lee Y, Jeon K, Lee JT, Kim S, Kim VN (2002) MicroRNA maturation: stepwise
processing and subcellular localization. The EMBO journal 21: 4663-4670
Lee Y, Samaco RC, Gatchel JR, Thaller C, Orr HT, Zoghbi HY (2008) miR-19, miR-101
and miR-130 co-regulate ATXN1 levels to potentially modulate SCA1 pathogenesis.
Nature neuroscience 11: 1137-1139
Lehmann SM, Kruger C, Park B, Derkow K, Rosenberger K, Baumgart J, Trimbuch T,
Eom G, Hinz M, Kaul D, Habbel P, Kalin R, Franzoni E, Rybak A, Nguyen D, Veh R,
Ninnemann O, Peters O, Nitsch R, Heppner FL, Golenbock D, Schott E, Ploegh HL,
Wulczyn FG, Lehnardt S (2012) An unconventional role for miRNA: let-7 activates Toll-
like receptor 7 and causes neurodegeneration. Nature neuroscience 15: 827-835
Leitman J, Ulrich Hartl F, Lederkremer GZ (2013) Soluble forms of polyQ-expanded
huntingtin rather than large aggregates cause endoplasmic reticulum stress. Nature
communications 4: 2753
Lewis BP, Burge CB, Bartel DP (2005) Conserved seed pairing, often flanked by
adenosines, indicates that thousands of human genes are microRNA targets. Cell 120: 15-
20
Li F, Macfarlan T, Pittman RN, Chakravarti D (2002) Ataxin-3 is a histone-binding
protein with two independent transcriptional corepressor activities. The Journal of
biological chemistry 277: 45004-45012
Li H, Li SH, Yu ZX, Shelbourne P, Li XJ (2001) Huntingtin aggregate-associated axonal
degeneration is an early pathological event in Huntington's disease mice. The Journal of
neuroscience : the official journal of the Society for Neuroscience 21: 8473-8481
Lim LP, Lau NC, Weinstein EG, Abdelhakim A, Yekta S, Rhoades MW, Burge CB,
Bartel DP (2003) The microRNAs of Caenorhabditis elegans. Genes & development 17:
991-1008
Lindquist S (1986) The heat-shock response. Annual review of biochemistry 55: 1151-
1191
Liu E, Knutzen CA, Krauss S, Schweiger S, Chiang GG (2011) Control of mTORC1
signaling by the Opitz syndrome protein MID1. Proceedings of the National Academy of
Sciences of the United States of America 108: 8680-8685
Liu J, Prickett TD, Elliott E, Meroni G, Brautigan DL (2001) Phosphorylation and
microtubule association of the Opitz syndrome protein mid-1 is regulated by protein
phosphatase 2A via binding to the regulatory subunit alpha 4. Proceedings of the National
Academy of Sciences of the United States of America 98: 6650-6655
Curriculum Vitae
119
Liu N, Landreh M, Cao K, Abe M, Hendriks GJ, Kennerdell JR, Zhu Y, Wang LS, Bonini
NM (2012) The microRNA miR-34 modulates ageing and neurodegeneration in
Drosophila. Nature 482: 519-523
Lotz GP, Legleiter J, Aron R, Mitchell EJ, Huang SY, Ng C, Glabe C, Thompson LM,
Muchowski PJ (2010) Hsp70 and Hsp40 functionally interact with soluble mutant
huntingtin oligomers in a classic ATP-dependent reaction cycle. The Journal of biological
chemistry 285: 38183-38193
Lu T, Chen R, Cox TC, Moldrich RX, Kurniawan N, Tan G, Perry JK, Ashworth A,
Bartlett PF, Xu L, Zhang J, Lu B, Wu M, Shen Q, Liu Y, Richards LJ, Xiong Z (2013) X-
linked microtubule-associated protein, Mid1, regulates axon development. Proceedings of
the National Academy of Sciences of the United States of America 110: 19131-19136
Lu TP, Lee CY, Tsai MH, Chiu YC, Hsiao CK, Lai LC, Chuang EY (2012) miRSystem:
an integrated system for characterizing enriched functions and pathways of microRNA
targets. PloS one 7: e42390
Lund E, Guttinger S, Calado A, Dahlberg JE, Kutay U (2004) Nuclear export of
microRNA precursors. Science 303: 95-98
Lytle JR, Yario TA, Steitz JA (2007) Target mRNAs are repressed as efficiently by
microRNA-binding sites in the 5' UTR as in the 3' UTR. Proceedings of the National
Academy of Sciences of the United States of America 104: 9667-9672
Mahishi LH, Hart RP, Lynch DR, Ratan RR (2012) miR-886-3p levels are elevated in
Friedreich ataxia. The Journal of neuroscience : the official journal of the Society for
Neuroscience 32: 9369-9373
Mankodi A, Takahashi MP, Jiang H, Beck CL, Bowers WJ, Moxley RT, Cannon SC,
Thornton CA (2002) Expanded CUG repeats trigger aberrant splicing of ClC-1 chloride
channel pre-mRNA and hyperexcitability of skeletal muscle in myotonic dystrophy.
Molecular cell 10: 35-44
Marti E, Pantano L, Banez-Coronel M, Llorens F, Minones-Moyano E, Porta S, Sumoy L,
Ferrer I, Estivill X (2010) A myriad of miRNA variants in control and Huntington's
disease brain regions detected by massively parallel sequencing. Nucleic acids research
38: 7219-7235
Masino L, Musi V, Menon RP, Fusi P, Kelly G, Frenkiel TA, Trottier Y, Pastore A (2003)
Domain architecture of the polyglutamine protein ataxin-3: a globular domain followed by
a flexible tail. FEBS letters 549: 21-25
McCampbell A, Taylor JP, Taye AA, Robitschek J, Li M, Walcott J, Merry D, Chai Y,
Paulson H, Sobue G, Fischbeck KH (2000) CREB-binding protein sequestration by
expanded polyglutamine. Human molecular genetics 9: 2197-2202
Menzies FM, Huebener J, Renna M, Bonin M, Riess O, Rubinsztein DC (2010)
Autophagy induction reduces mutant ataxin-3 levels and toxicity in a mouse model of
spinocerebellar ataxia type 3. Brain 133: 93-104
Curriculum Vitae
120
Michels AA, Kanon B, Bensaude O, Kampinga HH (1999) Heat shock protein (Hsp) 40
mutants inhibit Hsp70 in mammalian cells. The Journal of biological chemistry 274:
36757-36763
Michels AA, Kanon B, Konings AW, Ohtsuka K, Bensaude O, Kampinga HH (1997)
Hsp70 and Hsp40 chaperone activities in the cytoplasm and the nucleus of mammalian
cells. The Journal of biological chemistry 272: 33283-33289
Muchowski PJ, Schaffar G, Sittler A, Wanker EE, Hayer-Hartl MK, Hartl FU (2000)
Hsp70 and hsp40 chaperones can inhibit self-assembly of polyglutamine proteins into
amyloid-like fibrils. Proceedings of the National Academy of Sciences of the United States
of America 97: 7841-7846
Nascimento-Ferreira I, Santos-Ferreira T, Sousa-Ferreira L, Auregan G, Onofre I, Alves S,
Dufour N, Colomer Gould VF, Koeppen A, Deglon N, Pereira de Almeida L (2011)
Overexpression of the autophagic beclin-1 protein clears mutant ataxin-3 and alleviates
Machado-Joseph disease. Brain 134: 1400-1415
Nguyen HN, Byers B, Cord B, Shcheglovitov A, Byrne J, Gujar P, Kee K, Schule B,
Dolmetsch RE, Langston W, Palmer TD, Pera RR (2011) LRRK2 mutant iPSC-derived
DA neurons demonstrate increased susceptibility to oxidative stress. Cell stem cell 8: 267-
280
Nicastro G, Masino L, Esposito V, Menon RP, De Simone A, Fraternali F, Pastore A
(2009) Josephin domain of ataxin-3 contains two distinct ubiquitin-binding sites.
Biopolymers 91: 1203-1214
Nicastro G, Menon RP, Masino L, Knowles PP, McDonald NQ, Pastore A (2005) The
solution structure of the Josephin domain of ataxin-3: structural determinants for
molecular recognition. Proceedings of the National Academy of Sciences of the United
States of America 102: 10493-10498
Nobrega C, Nascimento-Ferreira I, Onofre I, Albuquerque D, Conceicao M, Deglon N, de
Almeida LP (2013) Overexpression of mutant ataxin-3 in mouse cerebellum induces
ataxia and cerebellar neuropathology. Cerebellum 12: 441-455
Ohtsuka K (1993) Cloning of a cDNA for heat-shock protein hsp40, a human homologue
of bacterial DnaJ. Biochemical and biophysical research communications 197: 235-240
Ohtsuka K, Masuda A, Nakai A, Nagata K (1990) A novel 40-kDa protein induced by heat
shock and other stresses in mammalian and avian cells. Biochemical and biophysical
research communications 166: 642-647
Okano H, Yamanaka S (2014) iPS cell technologies: significance and applications to CNS
regeneration and disease. Molecular brain 7: 22
Orr HT, Zoghbi HY (2007) Trinucleotide repeat disorders. Annual review of neuroscience
30: 575-621
Curriculum Vitae
121
Packer AN, Xing Y, Harper SQ, Jones L, Davidson BL (2008) The bifunctional
microRNA miR-9/miR-9* regulates REST and CoREST and is downregulated in
Huntington's disease. The Journal of neuroscience : the official journal of the Society for
Neuroscience 28: 14341-14346
Palatnik JF, Allen E, Wu X, Schommer C, Schwab R, Carrington JC, Weigel D (2003)
Control of leaf morphogenesis by microRNAs. Nature 425: 257-263
Park IH, Arora N, Huo H, Maherali N, Ahfeldt T, Shimamura A, Lensch MW, Cowan C,
Hochedlinger K, Daley GQ (2008) Disease-specific induced pluripotent stem cells. Cell
134: 877-886
Park SH, Kukushkin Y, Gupta R, Chen T, Konagai A, Hipp MS, Hayer-Hartl M, Hartl FU
(2013) PolyQ proteins interfere with nuclear degradation of cytosolic proteins by
sequestering the Sis1p chaperone. Cell 154: 134-145
Pasquinelli AE, Ruvkun G (2002) Control of developmental timing by micrornas and their
targets. Annual review of cell and developmental biology 18: 495-513
Paulson HL, Das SS, Crino PB, Perez MK, Patel SC, Gotsdiner D, Fischbeck KH, Pittman
RN (1997a) Machado-Joseph disease gene product is a cytoplasmic protein widely
expressed in brain. Annals of neurology 41: 453-462
Paulson HL, Perez MK, Trottier Y, Trojanowski JQ, Subramony SH, Das SS, Vig P,
Mandel JL, Fischbeck KH, Pittman RN (1997b) Intranuclear inclusions of expanded
polyglutamine protein in spinocerebellar ataxia type 3. Neuron 19: 333-344
Perez MK, Paulson HL, Pendse SJ, Saionz SJ, Bonini NM, Pittman RN (1998)
Recruitment and the role of nuclear localization in polyglutamine-mediated aggregation. J
Cell Biol 143: 1457-1470
Persengiev S, Kondova I, Otting N, Koeppen AH, Bontrop RE (2011) Genome-wide
analysis of miRNA expression reveals a potential role for miR-144 in brain aging and
spinocerebellar ataxia pathogenesis. Neurobiology of aging 32: 2316 e2317-2327
Piccioni F, Pinton P, Simeoni S, Pozzi P, Fascio U, Vismara G, Martini L, Rizzuto R,
Poletti A (2002) Androgen receptor with elongated polyglutamine tract forms aggregates
that alter axonal trafficking and mitochondrial distribution in motor neuronal processes.
FASEB journal : official publication of the Federation of American Societies for
Experimental Biology 16: 1418-1420
Pieretti M, Zhang FP, Fu YH, Warren ST, Oostra BA, Caskey CT, Nelson DL (1991)
Absence of expression of the FMR-1 gene in fragile X syndrome. Cell 66: 817-822
Quaderi NA, Schweiger S, Gaudenz K, Franco B, Rugarli EI, Berger W, Feldman GJ,
Volta M, Andolfi G, Gilgenkrantz S, Marion RW, Hennekam RC, Opitz JM, Muenke M,
Ropers HH, Ballabio A (1997) Opitz G/BBB syndrome, a defect of midline development,
is due to mutations in a new RING finger gene on Xp22. Nature genetics 17: 285-291

Curriculum Vitae
122
Raabe T, Manley JL (1991) A human homologue of the Escherichia coli DnaJ heat-shock
protein. Nucleic acids research 19: 6645
Reinhart BJ, Weinstein EG, Rhoades MW, Bartel B, Bartel DP (2002) MicroRNAs in
plants. Genes & development 16: 1616-1626
Renart J, Reiser J, Stark GR (1979) Transfer of proteins from gels to
diazobenzyloxymethyl-paper and detection with antisera: a method for studying antibody
specificity and antigen structure. Proceedings of the National Academy of Sciences of the
United States of America 76: 3116-3120
Riess O, Rub U, Pastore A, Bauer P, Schols L (2008) SCA3: neurological features,
pathogenesis and animal models. Cerebellum 7: 125-137
Rodriguez-Lebron E, Liu G, Keiser M, Behlke MA, Davidson BL (2013) Altered Purkinje
cell miRNA expression and SCA1 pathogenesis. Neurobiology of disease 54: 456-463
Ross CA (1997) Intranuclear neuronal inclusions: a common pathogenic mechanism for
glutamine-repeat neurodegenerative diseases? Neuron 19: 1147-1150
Rub U, Hentschel M, Stratmann K, Brunt E, Heinsen H, Seidel K, Bouzrou M, Auburger
G, Paulson H, Vonsattel JP, Lange H, Korf HW, den Dunnen W (2014) Huntington's
disease (HD): degeneration of select nuclei, widespread occurrence of neuronal nuclear
and axonal inclusions in the brainstem. Brain pathology 24: 247-260
Rub U, Schols L, Paulson H, Auburger G, Kermer P, Jen JC, Seidel K, Korf HW, Deller T
(2013) Clinical features, neurogenetics and neuropathology of the polyglutamine
spinocerebellar ataxias type 1, 2, 3, 6 and 7. Progress in neurobiology 104: 38-66
Rubinsztein DC, Wyttenbach A, Rankin J (1999) Intracellular inclusions, pathological
markers in diseases caused by expanded polyglutamine tracts? Journal of medical genetics
36: 265-270
Rujano MA, Kampinga HH, Salomons FA (2007) Modulation of polyglutamine inclusion
formation by the Hsp70 chaperone machine. Experimental cell research 313: 3568-3578
Schaefer A, O'Carroll D, Tan CL, Hillman D, Sugimori M, Llinas R, Greengard P (2007)
Cerebellar neurodegeneration in the absence of microRNAs. The Journal of experimental
medicine 204: 1553-1558
Schmidt T, Landwehrmeyer GB, Schmitt I, Trottier Y, Auburger G, Laccone F,
Klockgether T, Volpel M, Epplen JT, Schols L, Riess O (1998) An isoform of ataxin-3
accumulates in the nucleus of neuronal cells in affected brain regions of SCA3 patients.
Brain pathology 8: 669-679
Schmitt I, Linden M, Khazneh H, Evert BO, Breuer P, Klockgether T, Wuellner U (2007)
Inactivation of the mouse Atxn3 (ataxin-3) gene increases protein ubiquitination.
Biochemical and biophysical research communications 362: 734-739
Curriculum Vitae
123
Schols L, Amoiridis G, Epplen JT, Langkafel M, Przuntek H, Riess O (1996) Relations
between genotype and phenotype in German patients with the Machado-Joseph disease
mutation. Journal of neurology, neurosurgery, and psychiatry 61: 466-470
Schwarz DS, Hutvagner G, Du T, Xu Z, Aronin N, Zamore PD (2003) Asymmetry in the
assembly of the RNAi enzyme complex. Cell 115: 199-208
Schweiger S, Foerster J, Lehmann T, Suckow V, Muller YA, Walter G, Davies T, Porter
H, van Bokhoven H, Lunt PW, Traub P, Ropers HH (1999) The Opitz syndrome gene
product, MID1, associates with microtubules. Proceedings of the National Academy of
Sciences of the United States of America 96: 2794-2799
Seidel K, den Dunnen WF, Schultz C, Paulson H, Frank S, de Vos RA, Brunt ER, Deller
T, Kampinga HH, Rub U (2010) Axonal inclusions in spinocerebellar ataxia type 3. Acta
neuropathologica 120: 449-460
Seidel K, Meister M, Dugbartey GJ, Zijlstra MP, Vinet J, Brunt ER, van Leeuwen FW,
Rub U, Kampinga HH, den Dunnen WF (2012a) Cellular protein quality control and the
evolution of aggregates in spinocerebellar ataxia type 3 (SCA3). Neuropathology and
applied neurobiology 38: 548-558
Seidel K, Siswanto S, Brunt ER, den Dunnen W, Korf HW, Rub U (2012b) Brain
pathology of spinocerebellar ataxias. Acta neuropathologica 124: 1-21
Sempere LF, Freemantle S, Pitha-Rowe I, Moss E, Dmitrovsky E, Ambros V (2004)
Expression profiling of mammalian microRNAs uncovers a subset of brain-expressed
microRNAs with possible roles in murine and human neuronal differentiation. Genome
biology 5: R13
Shapiro AL, Vinuela E, Maizel JV, Jr. (1967) Molecular weight estimation of polypeptide
chains by electrophoresis in SDS-polyacrylamide gels. Biochemical and biophysical
research communications 28: 815-820
Soldner F, Hockemeyer D, Beard C, Gao Q, Bell GW, Cook EG, Hargus G, Blak A,
Cooper O, Mitalipova M, Isacson O, Jaenisch R (2009) Parkinson's disease patient-derived
induced pluripotent stem cells free of viral reprogramming factors. Cell 136: 964-977
Soong B, Cheng C, Liu R, Shan D (1997) Machado-Joseph disease: clinical, molecular,
and metabolic characterization in Chinese kindreds. Annals of neurology 41: 446-452
Stevanin G, Le Guern E, Ravise N, Chneiweiss H, Durr A, Cancel G, Vignal A, Boch AL,
Ruberg M, Penet C, et al. (1994) A third locus for autosomal dominant cerebellar ataxia
type I maps to chromosome 14q24.3-qter: evidence for the existence of a fourth locus.
American journal of human genetics 54: 11-20
Sugito K, Yamane M, Hattori H, Hayashi Y, Tohnai I, Ueda M, Tsuchida N, Ohtsuka K
(1995) Interaction between hsp70 and hsp40, eukaryotic homologues of DnaK and DnaJ,
in human cells expressing mutant-type p53. FEBS letters 358: 161-164
Curriculum Vitae
124
Switonski PM, Fiszer A, Kazmierska K, Kurpisz M, Krzyzosiak WJ, Figiel M (2011)
Mouse ataxin-3 functional knock-out model. Neuromolecular medicine 13: 54-65
Szebenyi G, Morfini GA, Babcock A, Gould M, Selkoe K, Stenoien DL, Young M, Faber
PW, MacDonald ME, McPhaul MJ, Brady ST (2003) Neuropathogenic forms of
huntingtin and androgen receptor inhibit fast axonal transport. Neuron 40: 41-52
Takeuchi H, Kobayashi Y, Yoshihara T, Niwa J, Doyu M, Ohtsuka K, Sobue G (2002)
Hsp70 and Hsp40 improve neurite outgrowth and suppress intracytoplasmic aggregate
formation in cultured neuronal cells expressing mutant SOD1. Brain research 949: 11-22
Takiyama Y, Igarashi S, Rogaeva EA, Endo K, Rogaev EI, Tanaka H, Sherrington R,
Sanpei K, Liang Y, Saito M, et al. (1995) Evidence for inter-generational instability in the
CAG repeat in the MJD1 gene and for conserved haplotypes at flanking markers amongst
Japanese and Caucasian subjects with Machado-Joseph disease. Human molecular
genetics 4: 1137-1146
Tan H, Poidevin M, Li H, Chen D, Jin P (2012) MicroRNA-277 modulates the
neurodegeneration caused by Fragile X premutation rCGG repeats. PLoS genetics 8:
e1002681
Teixeira-Castro A, Ailion M, Jalles A, Brignull HR, Vilaca JL, Dias N, Rodrigues P,
Oliveira JF, Neves-Carvalho A, Morimoto RI, Maciel P (2011) Neuron-specific
proteotoxicity of mutant ataxin-3 in C. elegans: rescue by the DAF-16 and HSF-1
pathways. Human molecular genetics 20: 2996-3009
Tessier-Lavigne M, Goodman CS (1996) The molecular biology of axon guidance.
Science 274: 1123-1133
Todd PK, Paulson HL (2010) RNA-mediated neurodegeneration in repeat expansion
disorders. Annals of neurology 67: 291-300
Tominaga N, Kosaka N, Ono M, Katsuda T, Yoshioka Y, Tamura K, Lotvall J, Nakagama
H, Ochiya T (2015) Brain metastatic cancer cells release microRNA-181c-containing
extracellular vesicles capable of destructing blood-brain barrier. Nature communications
6: 6716
Towbin H, Staehelin T, Gordon J (1979) Electrophoretic transfer of proteins from
polyacrylamide gels to nitrocellulose sheets: procedure and some applications.
Proceedings of the National Academy of Sciences of the United States of America 76:
4350-4354
Trockenbacher A, Suckow V, Foerster J, Winter J, Krauss S, Ropers HH, Schneider R,
Schweiger S (2001) MID1, mutated in Opitz syndrome, encodes an ubiquitin ligase that
targets phosphatase 2A for degradation. Nature genetics 29: 287-294
Trott A, Jardim LB, Ludwig HT, Saute JA, Artigalas O, Kieling C, Wanderley HY, Rieder
CR, Monte TL, Socal M, Alonso I, Ferro A, Carvalho T, do Ceu Moreira M, Mendonca P,
Ferreirinha F, Silveira I, Sequeiros J, Giugliani R, Saraiva-Pereira ML (2006)
Curriculum Vitae
125
Spinocerebellar ataxias in 114 Brazilian families: clinical and molecular findings. Clinical
genetics 70: 173-176
Trottier Y, Cancel G, An-Gourfinkel I, Lutz Y, Weber C, Brice A, Hirsch E, Mandel JL
(1998) Heterogeneous intracellular localization and expression of ataxin-3. Neurobiology
of disease 5: 335-347
Tsai HF, Tsai HJ, Hsieh M (2004) Full-length expanded ataxin-3 enhances mitochondrial-
mediated cell death and decreases Bcl-2 expression in human neuroblastoma cells.
Biochemical and biophysical research communications 324: 1274-1282
Tuschl T, Zamore PD, Lehmann R, Bartel DP, Sharp PA (1999) Targeted mRNA
degradation by double-stranded RNA in vitro. Genes & development 13: 3191-3197
Twist EC, Casaubon LK, Ruttledge MH, Rao VS, Macleod PM, Radvany J, Zhao Z,
Rosenberg RN, Farrer LA, Rouleau GA (1995) Machado Joseph disease maps to the same
region of chromosome 14 as the spinocerebellar ataxia type 3 locus. Journal of medical
genetics 32: 25-31
Varela-Echavarria A, Guthrie S (1997) Molecules making waves in axon guidance. Genes
& development 11: 545-557
Vo NK, Dalton RP, Liu N, Olson EN, Goodman RH (2010) Affinity purification of
microRNA-133a with the cardiac transcription factor, Hand2. Proceedings of the National
Academy of Sciences of the United States of America 107: 19231-19236
Wang G, Sawai N, Kotliarova S, Kanazawa I, Nukina N (2000) Ataxin-3, the MJD1 gene
product, interacts with the two human homologs of yeast DNA repair protein RAD23,
HHR23A and HHR23B. Human molecular genetics 9: 1795-1803
Warrick JM, Paulson HL, Gray-Board GL, Bui QT, Fischbeck KH, Pittman RN, Bonini
NM (1998) Expanded polyglutamine protein forms nuclear inclusions and causes neural
degeneration in Drosophila. Cell 93: 939-949
Watanabe H, Tanaka F, Matsumoto M, Doyu M, Ando T, Mitsuma T, Sobue G (1998)
Frequency analysis of autosomal dominant cerebellar ataxias in Japanese patients and
clinical characterization of spinocerebellar ataxia type 6. Clinical genetics 53: 13-19
Weber JJ, Sowa AS, Binder T, Hubener J (2014) From Pathways to Targets:
Understanding the Mechanisms behind Polyglutamine Disease. BioMed research
international 2014: 701758
Wellington CL, Ellerby LM, Hackam AS, Margolis RL, Trifiro MA, Singaraja R,
McCutcheon K, Salvesen GS, Propp SS, Bromm M, Rowland KJ, Zhang T, Rasper D,
Roy S, Thornberry N, Pinsky L, Kakizuka A, Ross CA, Nicholson DW, Bredesen DE,
Hayden MR (1998) Caspase cleavage of gene products associated with triplet expansion
disorders generates truncated fragments containing the polyglutamine tract. The Journal of
biological chemistry 273: 9158-9167
Curriculum Vitae
126
Whelan SA, Hightower LE (1985) Differential induction of glucose-regulated and heat
shock proteins: effects of pH and sulfhydryl-reducing agents on chicken embryo cells.
Journal of cellular physiology 125: 251-258
Winborn BJ, Travis SM, Todi SV, Scaglione KM, Xu P, Williams AJ, Cohen RE, Peng J,
Paulson HL (2008) The deubiquitinating enzyme ataxin-3, a polyglutamine disease
protein, edits Lys63 linkages in mixed linkage ubiquitin chains. The Journal of biological
chemistry 283: 26436-26443
Wong HK, Veremeyko T, Patel N, Lemere CA, Walsh DM, Esau C, Vanderburg C,
Krichevsky AM (2013) De-repression of FOXO3a death axis by microRNA-132 and -212
causes neuronal apoptosis in Alzheimer's disease. Human molecular genetics 22: 3077-
3092
Wu S, Huang S, Ding J, Zhao Y, Liang L, Liu T, Zhan R, He X (2010) Multiple
microRNAs modulate p21Cip1/Waf1 expression by directly targeting its 3' untranslated
region. Oncogene 29: 2302-2308
Wu W, Yang J, Feng X, Wang H, Ye S, Yang P, Tan W, Wei G, Zhou Y (2013)
MicroRNA-32 (miR-32) regulates phosphatase and tensin homologue (PTEN) expression
and promotes growth, migration, and invasion in colorectal carcinoma cells. Molecular
cancer 12: 30
Wu Z, Sun H, Zeng W, He J, Mao X (2012) Upregulation of MircoRNA-370 induces
proliferation in human prostate cancer cells by downregulating the transcription factor
FOXO1. PloS one 7: e45825
Xu P, Vernooy SY, Guo M, Hay BA (2003) The Drosophila microRNA Mir-14
suppresses cell death and is required for normal fat metabolism. Current biology : CB 13:
790-795
Yagi T, Ito D, Okada Y, Akamatsu W, Nihei Y, Yoshizaki T, Yamanaka S, Okano H,
Suzuki N (2011) Modeling familial Alzheimer's disease with induced pluripotent stem
cells. Human molecular genetics 20: 4530-4539
Yi R, Qin Y, Macara IG, Cullen BR (2003) Exportin-5 mediates the nuclear export of pre-
microRNAs and short hairpin RNAs. Genes & development 17: 3011-3016
Yu L, Zhou L, Cheng Y, Sun L, Fan J, Liang J, Guo M, Liu N, Zhu L (2014) MicroRNA-
543 acts as an oncogene by targeting PAQR3 in hepatocellular carcinoma. American
journal of cancer research 4: 897-906
Yu YC, Kuo CL, Cheng WL, Liu CS, Hsieh M (2009) Decreased antioxidant enzyme
activity and increased mitochondrial DNA damage in cellular models of Machado-Joseph
disease. J Neurosci Res 87: 1884-1891
Zamore PD, Tuschl T, Sharp PA, Bartel DP (2000) RNAi: double-stranded RNA directs
the ATP-dependent cleavage of mRNA at 21 to 23 nucleotide intervals. Cell 101: 25-33

Curriculum Vitae
127
Zijlstra MP, Rujano MA, Van Waarde MA, Vis E, Brunt ER, Kampinga HH (2010)
Levels of DNAJB family members (HSP40) correlate with disease onset in patients with
spinocerebellar ataxia type 3. The European journal of neuroscience 32: 760-770
Zoghbi HY, Orr HT (2000) Glutamine repeats and neurodegeneration. Annual review of
neuroscience 23: 217-247
Zongaro S, Hukema R, D'Antoni S, Davidovic L, Barbry P, Catania MV, Willemsen R,
Mari B, Bardoni B (2013) The 3' UTR of FMR1 mRNA is a target of miR-101, miR-129-
5p and miR-221: implications for the molecular pathology of FXTAS at the synapse.
Human molecular genetics 22: 1971-1982